| | |
| | OMB APPROVAL |
| | OMB Number: 3235-0570 Expires: January 31, 2017 Estimated average burden hours per response: 20.6 |
UNITED STATES
SECURITIES AND EXCHANGE COMMISSION
Washington, D.C. 20549
FORM N-CSR
CERTIFIED SHAREHOLDER REPORT OF REGISTERED
MANAGEMENT INVESTMENT COMPANIES
Investment Company Act file number 811-01424
AIM Equity Funds (Invesco Equity Funds)
(Exact name of registrant as specified in charter)
11 Greenway Plaza, Suite 1000 Houston, Texas 77046
(Address of principal executive offices) (Zip code)
Philip A. Taylor 11 Greenway Plaza, Suite 1000 Houston, Texas 77046
(Name and address of agent for service)
| | | | |
| Registrant’s telephone number, including area code: | | (713) 626-1919 | | |
| | |
| Date of fiscal year end: 10/31 | | | | |
| | |
| Date of reporting period: 10/31/15 | | | | |
Item 1. Report to Stockholders.
| | | | |
| | |
 | | Annual Report to Shareholders | | October 31, 2015 |
| | |
| | Invesco Charter Fund |
| | Nasdaq: |
| | A: CHTRX n B: BCHTX n C: CHTCX n R: CHRRX n S: CHRSX n Y: CHTYX |
| | R5: CHTVX n R6: CHFTX |

Letters to Shareholders
| | |

Philip Taylor | | Dear Shareholders: This annual report includes information about your Fund, including performance data and a complete list of its investments as of the close of the reporting period. Inside is a discussion of how your Fund was managed and the factors that affected its performance during the reporting period. I hope you find this report of interest. The US economy expanded and unemployment declined throughout the reporting period. Continuing low energy prices benefited consumers, but a strong US dollar crimped corporate profits. The US Federal Reserve signaled that it was increasingly likely to raise interest rates, based on generally positive economic data, but uncertainty remained about when it might act. Overseas, the story was much different. Low energy prices hurt the economies of some oil-producing nations, such as Brazil and Russia. During the reporting period, the European |
| Central Bank as well as central banks in China and Japan – among other countries – either instituted or maintained extraordinarily accommodative monetary policies in response to economic weakness. |
Investor uncertainty, such as we saw for much of the reporting period – and market volatility, such as we saw at the end of the reporting period – are unfortunate facts of life when it comes to investing. Some investors use these things as excuses to delay saving and investing for their long-term financial goals. That’s why Invesco encourages investors to work with a professional financial adviser who can stress the importance of starting to save and invest early and the importance of adhering to a disciplined investment plan – when times are good and when they’re uncertain. A financial adviser who knows your unique financial situation, investment goals and risk tolerance can be an invaluable partner as you seek to achieve your financial goals. He or she can offer a long-term perspective when markets are volatile and time-tested advice and guidance when your financial situation or investment goals change.
Timely information when and where you want it
Invesco’s efforts to help investors achieve their financial objectives include providing individual investors and financial professionals with timely information about the markets, the economy and investing ��� whenever and wherever they want it.
Our website, invesco.com/us, offers a wide range of market insights and investment perspectives. On the website, you’ll find detailed information about our funds, including prices, performance, holdings and portfolio manager commentaries. You can access information about your account by completing a simple, secure online registration. Click on the “Need to register” link in the “Account Access” box on our homepage to get started.
Invesco’s mobile apps for iPhone® and iPad® (both available free from the App StoreSM) allow you to obtain the same detailed information, monitor your account and create customizable watch lists. Also, they allow you to access investment insights from our investment leaders, market strategists, economists and retirement experts. You can sign up to be alerted when new commentary is added, and you can watch portfolio manager videos and have instant access to Invesco news and updates wherever you may be.
In addition to the resources accessible on our website and through our mobile app, you can obtain timely updates to help you stay informed about the markets, the economy and investing by connecting with Invesco on Twitter, LinkedIn or Facebook. You can access our blog at blog.invesco.us.com. Our goal is to provide you the information you want, when and where you want it.
Have questions?
For questions about your account, feel free to contact an Invesco client services representative at 800 959 4246. For Invesco-related questions or comments, please email me directly at phil@invesco.com.
All of us at Invesco look forward to serving your investment management needs for many years to come. Thank you for investing with us.
Sincerely,

Philip Taylor
Senior Managing Director, Invesco Ltd.
iPhone and iPad are trademarks of Apple Inc., registered in the US and other countries. App Store is a service mark of Apple Inc. Invesco Distributors, Inc. is not affiliated with Apple Inc.
2 Invesco Charter Fund
| | |

Bruce Crockett | | Dear Fellow Shareholders: Among the many important lessons I’ve learned in more than 40 years in a variety of business endeavors is the value of a trusted advocate. As independent chair of the Invesco Funds Board, I can assure you that the members of the Board are strong advocates for the interests of investors in Invesco’s mutual funds. We work hard to represent your interests through oversight of the quality of the investment management services your funds receive and other matters important to your investment, including but not limited to: n Ensuring that Invesco offers a diverse lineup of mutual funds that your financial adviser can use to strive to meet your financial needs as your investment goals change over time. n Monitoring how the portfolio management teams of the Invesco funds are performing in light of changing economic and market conditions. |
| n | | Assessing each portfolio management team’s investment performance within the context of the investment strategy described in the fund’s prospectus. |
| n | | Monitoring for potential conflicts of interests that may impact the nature of the services that your funds receive. |
We believe one of the most important services we provide our fund shareholders is the annual review of the funds’ advisory and sub-advisory contracts with Invesco Advisers and its affiliates. This review is required by the Investment Company Act of 1940 and focuses on the nature and quality of the services Invesco provides as the adviser to the Invesco funds and the reasonableness of the fees that it charges for those services. Each year, we spend months carefully reviewing information received from Invesco and a variety of independent sources, such as performance and fee data prepared by Lipper Inc., an independent, third-party firm widely recognized as a leader in its field. We also meet with our independent legal counsel and other independent advisers to review and help us assess the information that we have received. Our goal is to assure that you receive quality investment management services for a reasonable fee.
I trust the measures outlined above provide assurance that you have a worthy advocate when it comes to choosing the Invesco Funds.
As always, please contact me at bruce@brucecrockett.com with any questions or concerns you may have. On behalf of the Board, we look forward to continuing to represent your interests and serving your needs.
Sincerely,

Bruce L. Crockett
Independent Chair
Invesco Funds Board of Trustees
3 Invesco Charter Fund
Management’s Discussion of Fund Performance
Performance summary
For the fiscal year ended October 31, 2015, Class A shares of Invesco Charter Fund (the Fund), at net asset value (NAV), underperformed the S&P 500 Index and the Russell 1000 Index, the Fund’s broad market and style-specific benchmarks, respectively.
Your Fund’s long-term performance appears later in this report.
Fund vs. Indexes
Total returns, 10/31/14 to 10/31/15, at net asset value (NAV). Performance shown does not include applicable contingent deferred sales charges (CDSC) or front-end sales charges, which would have reduced performance.
| | | | |
Class A Shares | | | -2.53 | % |
Class B Shares | | | -3.22 | |
Class C Shares | | | -3.22 | |
Class R Shares | | | -2.72 | |
Class S Shares | | | -2.42 | |
Class Y Shares | | | -2.24 | |
Class R5 Shares | | | -2.22 | |
Class R6 Shares | | | -2.12 | |
S&P 500 Indexq (Broad Market Index) | | | 5.20 | |
Russell 1000 Indexq (Style-Specific Index) | | | 4.86 | |
Lipper Large-Cap Core Indexn (Peer Group Index) | | | 3.33 | |
Source(s): qFactSet Research Systems Inc.; nLipper Inc.
Market conditions and your Fund
The US economy improved slowly, but steadily, during the fiscal year ended October 31, 2015 – although the health of individual economic sectors varied dramatically. The headline story was the continued slowdown in energy markets, as oil prices plummeted when too much supply overwhelmed slowing global demand. However, the more subtle story, which drove the economy forward during the fiscal year, was the improved position of the US consumer.
As the reporting period began in late 2014, economic growth appeared to be stronger in the US than in the rest of the world. US equity markets were recovering from the initial crash of oil prices when OPEC added additional uncertainty by deciding to maintain high production despite low prices and slowing global growth. In this environment,
commodity-based economies and most currencies underperformed those of the US. The continued strengthening of the US consumer led US equity markets higher through the spring. Continued low interest rates, the increasing availability of credit from lenders and an improving employment picture all contributed to higher consumer confidence. This strength also helped the markets overcome fears that Greece and the eurozone would fail to reach an agreement on a financial bailout plan. In the summer of 2015, however, US equity markets moved sharply lower. A significant downturn in China’s financial markets and weak global economic growth led the US Federal Reserve to delay raising interest rates, which, in turn, increased investor uncertainty and market volatility. In October, however, US markets rallied, recovering from their earlier decline and finishing higher for the fiscal year.
During the fiscal year, stock selection in the telecommunication services sector was the largest contributor to the Fund’s performance relative to its style-specific benchmark. In addition, an underweight allocation to the energy and materials sectors benefited the Fund. The largest detractors from Fund performance included stock selection in the consumer discretionary, consumer staples, financials, health care, industrials and information technology (IT) sectors.
The largest contributor to Fund performance was insurance company, Progressive. During the fiscal year, the company released a strong earnings report with better-than-expected top-line growth supported by the company’s continued gains in market share. This positive outlook boosted the company’s stock price. Also, SKF (not held at the end of the reporting period), an industrial manufacturer of bearings and seals, benefited from an improving European economy during the beginning of the fiscal year.
Sandvik (not held at the end of the reporting period), detracted from Fund performance for the reporting period. The industrial company performed poorly due to its meaningful exposure to the weak energy sector.
In addition, Applied Materials, a semiconductor maker, suffered fallout from a failed merger and struggled to get back into positive territory.
Finally, the Fund’s conservative positioning and allocation to cash hampered performance during the fiscal year. We have been quite active in deploying cash during periods of market volatility. Though the Fund’s allocation to cash decreased, our high single-digit position detracted from Fund performance in the current “risk-on” environment.
During the reporting period, our largest overweight position relative to the Russell 1000 Index was in the health care
| | | | | | |
| Portfolio Composition | |
By sector | | | % of total net assets | |
| | | | |
Information Technology | | | 21.9 | % |
| Financials | | | 19.4 | |
| Health Care | | | 16.9 | |
| Consumer Discretionary | | | 10.2 | |
| Industrials | | | 7.7 | |
| Consumer Staples | | | 6.8 | |
| Energy | | | 5.1 | |
| Utilities | | | 2.8 | |
| Telecommunication Services | | | 0.9 | |
Money Market Funds Plus Other Assets Less Liabilities | | | 8.3 | |
| | | | |
| Top 10 Equity Holdings* |
| | % of total net assets |
| | | | | | |
1. | | Progressive Corp. (The) | | | 3.8 | % |
2. | | American Express Co. | | | 3.0 | |
3. | | Analog Devices, Inc. | | | 2.9 | |
4. | | Taiwan Semiconductor Manufacturing Co. Ltd. | | | 2.9 | |
5. | | TE Connectivity Ltd. | | | 2.4 | |
6. | | EMC Corp. | | | 2.4 | |
7. | | Berkshire Hathaway Inc.–Class A | | | 2.3 | |
8. | | QUALCOMM, Inc. | | | 2.2 | |
9. | | Comcast Corp.–Class A | | | 2.1 | |
10. | | Marsh & McLennan Cos., Inc. | | | 2.1 | |
| | | | |
Total Net Assets | | | $4.6 billion | |
| |
| Total Number of Holdings* | | | 59 | |
The Fund’s holdings are subject to change, and there is no assurance that the Fund will continue to hold any particular security.
*Excluding money market fund holdings.
Data presented here are as of October 31, 2015.
4 Invesco Charter Fund
sector. The Fund also had a slight overweight position in the IT sector. The largest underweight positions were in the consumer discretionary, consumer staples, materials and utilities sectors.
As always, we are focused on companies that provide an attractive return on invested capital, trade at attractive valuations and have a management team with a long-term perspective. In short, we seek to take advantage of the market’s volatile behavior and short-term focus. We believe our conservative approach should position the Fund to navigate the evolving economic backdrop.
As always, we thank you for your continued investment in Invesco Charter Fund.
The views and opinions expressed in management’s discussion of Fund performance are those of Invesco Advisers, Inc. These views and opinions are subject to change at any time based on factors such as market and economic conditions. These views and opinions may not be relied upon as investment advice or recommendations, or as an offer for a particular security. The information is not a complete analysis of every aspect of any market, country, industry, security or the Fund. Statements of fact are from sources considered reliable, but Invesco Advisers, Inc. makes no representation or warranty as to their completeness or accuracy. Although historical performance is no guarantee of future results, these insights may help you understand our investment management philosophy.
See important Fund and, if applicable, index disclosures later in this report.
| | |
 | | Ron Sloan Chartered Financial Analyst, Portfolio Manager and Chief Investment Officer of Invesco’s domestic |
| core investments team, is lead manager of Invesco Charter Fund. He joined Invesco in 1998. Mr. Sloan earned a BS in business administration and an MBA from the University of Missouri. |
| |
 | | Brian Nelson Chartered Financial Analyst, Portfolio Manager, is manager of Invesco Charter Fund. He joined |
| Invesco in 2004. Mr. Nelson earned a BA from the University of California, Santa Barbara. |
5 Invesco Charter Fund
Your Fund’s Long-Term Performance
Results of a $10,000 Investment – Oldest Share Class(es)
Fund and index data from 10/31/05
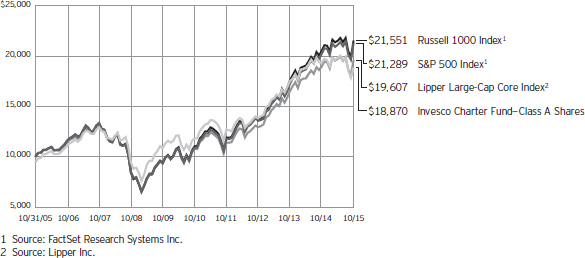
Past performance cannot guarantee comparable future results.
The data shown in the chart include reinvested distributions, applicable sales charges and Fund expenses including
management fees. Index results include reinvested dividends, but they do not reflect sales charges. Performance of the peer group, if applicable, reflects fund expenses and management fees;
performance of a market index does not. Performance shown in the chart and table(s) does not reflect deduction of taxes a shareholder would pay on Fund distributions or sale of Fund shares.
6 Invesco Charter Fund
| | | | |
| Average Annual Total Returns | |
| As of 10/31/15, including maximum applicable sales charges | |
| |
Class A Shares | | | | |
Inception (11/26/68) | | | 10.57 | % |
10 Years | | | 6.56 | |
5 Years | | | 8.58 | |
1 Year | | | -7.87 | |
| |
Class B Shares | | | | |
Inception (6/26/95) | | | 6.99 | % |
10 Years | | | 6.53 | |
5 Years | | | 8.72 | |
1 Year | | | -7.56 | |
| |
Class C Shares | | | | |
Inception (8/4/97) | | | 4.37 | % |
10 Years | | | 6.37 | |
5 Years | | | 9.00 | |
1 Year | | | -4.08 | |
| |
Class R Shares | | | | |
Inception (6/3/02) | | | 6.38 | % |
10 Years | | | 6.90 | |
5 Years | | | 9.55 | |
1 Year | | | -2.72 | |
| |
Class S Shares | | | | |
10 Years | | | 7.23 | % |
5 Years | | | 9.93 | |
1 Year | | | -2.42 | |
| |
Class Y Shares | | | | |
10 Years | | | 7.35 | % |
5 Years | | | 10.10 | |
1 Year | | | -2.24 | |
| |
Class R5 Shares | | | | |
Inception (7/30/91) | | | 8.20 | % |
10 Years | | | 7.60 | |
5 Years | | | 10.21 | |
1 Year | | | -2.22 | |
| |
Class R6 Shares | | | | |
10 Years | | | 7.30 | % |
5 Years | | | 10.10 | |
1 Year | | | -2.12 | |
Class S shares incepted on September 25, 2009. Performance shown prior to that date is that of Class A shares and includes the 12b-1 fees applicable to Class A shares.
Class Y shares incepted on October 3, 2008. Performance shown prior to that date is that of Class A shares and includes the 12b-1 fees applicable to Class A shares.
Class R6 shares incepted on September 24, 2012. Performance shown prior to that date is that of Class A shares and includes the 12b-1 fees applicable to Class A shares.
| | | | |
| Average Annual Total Returns | |
| As of 9/30/15, the most recent calendar quarter end, including maximum applicable sales charges | |
| |
Class A Shares | | | | |
Inception (11/26/68) | | | 10.46 | % |
10 Years | | | 5.72 | |
5 Years | | | 7.88 | |
1 Year | | | -12.89 | |
| |
Class B Shares | | | | |
Inception (6/26/95) | | | 6.73 | % |
10 Years | | | 5.70 | |
5 Years | | | 8.02 | |
1 Year | | | -12.58 | |
| |
Class C Shares | | | | |
Inception (8/4/97) | | | 4.07 | % |
10 Years | | | 5.53 | |
5 Years | | | 8.30 | |
1 Year | | | -9.32 | |
| |
Class R Shares | | | | |
Inception (6/3/02) | | | 5.99 | % |
10 Years | | | 6.06 | |
5 Years | | | 8.84 | |
1 Year | | | -8.02 | |
| |
Class S Shares | | | | |
10 Years | | | 6.39 | % |
5 Years | | | 9.23 | |
1 Year | | | -7.69 | |
| |
Class Y Shares | | | | |
10 Years | | | 6.52 | % |
5 Years | | | 9.39 | |
1 Year | | | -7.55 | |
| |
Class R5 Shares | | | | |
Inception (7/30/91) | | | 7.98 | % |
10 Years | | | 6.76 | |
5 Years | | | 9.52 | |
1 Year | | | -7.48 | |
| |
Class R6 Shares | | | | |
10 Years | | | 6.47 | % |
5 Years | | | 9.40 | |
1 Year | | | -7.37 | |
The performance data quoted represent past performance and cannot guarantee comparable future results; current performance may be lower or higher. Please visit invesco.com/performance for the most recent month-end performance. Performance figures reflect reinvested distributions, changes in net asset value and the effect of the maximum sales charge unless otherwise stated. Investment return and principal value will fluctuate so that you may have a gain or loss when you sell shares.
The net annual Fund operating expense ratio set forth in the most recent Fund prospectus as of the date of this report for Class A, Class B, Class C, Class R, Class S, Class Y, Class R5 and Class R6 shares was 1.07%, 1.82%, 1.82%, 1.32%, 0.97%, 0.82%, 0.74% and 0.65%, respectively.1 The total annual Fund operating expense ratio set forth in the most recent Fund prospectus as of the date of this report for Class A, Class B, Class C, Class R, Class S, Class Y, Class R5 and Class R6 shares was 1.09%, 1.84%, 1.84%, 1.34%, 0.99% 0.84%, 0.76% and 0.67%, respectively. The expense ratios presented above may vary from the expense ratios presented in other sections of this report that are based on expenses incurred during the period covered by this report.
Class A share performance reflects the maximum 5.50% sales charge, and Class B and Class C share performance reflects the applicable contingent deferred sales charge (CDSC) for the period involved. The CDSC on Class B shares declines from 5% beginning at the time of purchase to 0% at the beginning of the seventh year. The CDSC on Class C shares is 1% for the first year after purchase. Class R, Class S, Class Y, Class R5 and Class R6 shares do not have a front-end sales charge or a CDSC; therefore, performance is at net asset value.
The performance of the Fund’s share classes will differ primarily due to different sales charge structures and class expenses.
Fund performance reflects any applicable fee waivers and/or expense reimbursements. Had the adviser not waived fees and/or reimbursed expenses currently or in the past, returns would have been lower. See current prospectus for more information.
| 1 | Total annual Fund operating expenses after any contractual fee waivers and/or expense reimbursements by the adviser in effect through at least June 30, 2017. See current prospectus for more information. |
7 Invesco Charter Fund
Invesco Charter Fund’s investment objective is long-term growth of capital.
| n | | Unless otherwise stated, information presented in this report is as of October 31, 2015, and is based on total net assets. |
| n | | Unless otherwise noted, all data provided by Invesco. |
| n | | To access your Fund’s reports/prospectus, visit invesco.com/fundreports. |
About share classes
| n | | Class B shares may not be purchased for new or additional investments. Please see the prospectus for more information. |
| n | | Class R shares are generally available only to employee benefit plans. Please see the prospectus for more information. |
| n | | Class S shares and Class Y shares are available only to certain investors. Please see the prospectus for more information. |
| n | | Class R5 shares and Class R6 shares are primarily intended for retirement plans that meet certain standards and for institutional investors. Please see the prospectus for more information. |
Principal risks of investing
in the Fund
| n | | Cash/cash equivalents risk. Holding cash or cash equivalents may negatively affect performance. |
| n | | Debt securities risk. The Fund may invest in debt securities that are affected by changing interest rates and changes in their effective maturities and credit quality. |
| n | | Derivatives risk. The value of a derivative instrument depends largely on (and is derived from) the value of an underlying security, currency, commodity, interest rate, index or other asset (each referred to as an underlying asset). In addition to risks relating to the underlying assets, the use of derivatives may include other, possibly greater, risks, including counterparty, leverage and liquidity risks. Counterparty risk is the risk that the counterparty to the derivative contract will default on its obligation to pay the Fund the amount owed or otherwise perform under the derivative contract. Derivatives create leverage risk because they do not require payment up front equal to the economic exposure created by owning the derivative. As a result, an adverse change in the value of the underlying asset could result in the Fund sustaining a loss that is substantially greater than the amount invested in the derivative, which may make the Fund’s returns more volatile and increase the risk of loss. Derivative instruments may also be less liquid than more |
| | | traditional investments and the Fund may be unable to sell or close out its derivative positions at a desirable time or price. This risk may be more acute under adverse market conditions, during which the Fund may be most in need of liquidating its derivative positions. Derivatives may also be harder to value, less tax efficient and subject to changing government regulation that could impact the Fund’s ability to use certain derivatives or their cost. Also, derivatives used for hedging or to gain or limit exposure to a particular market segment may not provide the expected benefits, particularly during adverse market conditions. |
| n | | Foreign securities risk. The Fund’s foreign investments may be affected by changes in a foreign country’s exchange rates, political and social instability, changes in economic or taxation policies, difficulties when enforcing obligations, decreased liquidity, and increased volatility. Foreign companies may be subject to less regulation resulting in less publicly available information about the companies. |
| n | | Management risk. The investment techniques and risk analysis used by the Fund’s portfolio managers may not produce the desired results. |
| n | | Market risk. The prices of and the income generated by the Fund’s securities may decline in response to, among other things, investor sentiment, general economic and market conditions, regional or global instability, and currency and interest rate fluctuations. |
| n | | Small- and mid-capitalization risks. Stocks of small- and mid-sized companies tend to be more vulnerable to adverse developments and may have little or no operating history or track record of success, and limited product lines, markets, management and financial resources. The securities of small- and mid-sized companies may be more volatile due to less market interest and less publicly available information about the issuer. They also may be illiquid or restricted as to resale, or may trade less frequently and in smaller volumes, all of which may cause difficulty when establishing or closing a position at a desirable price. |
About indexes used in this report
| n | | The S&P 500® Index is an unmanaged index considered representative of the US stock market. |
| n | | The Russell 1000® Index is an unmanaged index considered representative of large-cap stocks. The Russell 1000 Index is a trademark/service mark of the Frank Russell Co. Russell® is a trademark of the Frank Russell Co. |
| n | | The Lipper Large-Cap Core Index is an unmanaged index considered representative of large-cap core funds tracked by Lipper. |
| n | | The Fund is not managed to track the performance of any particular index, including the index(es) described here, and consequently, the performance of the Fund may deviate significantly from the performance of the index(es). |
| n | | A direct investment cannot be made in an index. Unless otherwise indicated, index results include reinvested dividends, and they do not reflect sales charges. Performance of the peer group, if applicable, reflects fund expenses; performance of a market index does not. |
Other information
| n | | The returns shown in management’s discussion of Fund performance are based on net asset values (NAVs) calculated for shareholder transactions. Generally accepted accounting principles require adjustments to be made to the net assets of the Fund at period end for financial reporting purposes, and as such, the NAVs for shareholder transactions and the returns based on those NAVs may differ from the NAVs and returns reported in the Financial Highlights. |
| n | | Industry classifications used in this report are generally according to the Global Industry Classification Standard, which was developed by and is the exclusive property and a service mark of MSCI Inc. and Standard & Poor’s. |
|
This report must be accompanied or preceded by a currently effective Fund prospectus, which contains more complete information, including sales charges and expenses. Investors should read it carefully before investing. |
|
NOT FDIC INSURED | MAY LOSE VALUE | NO BANK GUARANTEE |
8 Invesco Charter Fund
Schedule of Investments(a)
October 31, 2015
| | | | | | | | |
| | | Shares | | | Value | |
Common Stocks & Other Equity Interests–91.71% | |
| Advertising–1.22% | |
Publicis Groupe S.A. (France) | | | 871,895 | | | $ | 56,628,082 | |
|
| Apparel, Accessories & Luxury Goods–2.44% | |
LVMH Moet Hennessy Louis Vuitton S.E. (France) | | | 359,197 | | | | 66,831,057 | |
PVH Corp. | | | 512,982 | | | | 46,655,713 | |
| | | | | | | | 113,486,770 | |
|
| Asset Management & Custody Banks–1.82% | |
Northern Trust Corp. | | | 1,199,955 | | | | 84,464,833 | |
|
| Auto Parts & Equipment–0.80% | |
Johnson Controls, Inc. | | | 821,163 | | | | 37,100,144 | |
|
| Biotechnology–3.84% | |
AbbVie Inc. | | | 1,434,309 | | | | 85,413,101 | |
Celgene Corp.(b) | | | 755,377 | | | | 92,692,312 | |
| | | | | | | | 178,105,413 | |
|
| Brewers–0.94% | |
Molson Coors Brewing Co.–Class B | | | 494,133 | | | | 43,533,117 | |
|
| Cable & Satellite–2.08% | |
Comcast Corp.–Class A | | | 1,541,262 | | | | 96,513,826 | |
|
| Communications Equipment–4.85% | |
Cisco Systems, Inc. | | | 2,206,062 | | | | 63,644,889 | |
F5 Networks, Inc.(b) | | | 523,682 | | | | 57,709,756 | |
QUALCOMM, Inc. | | | 1,747,203 | | | | 103,818,802 | |
| | | | | | | | 225,173,447 | |
|
| Consumer Finance–3.02% | |
American Express Co. | | | 1,912,875 | | | | 140,137,223 | |
|
| Department Stores–1.04% | |
Macy’s, Inc. | | | 945,563 | | | | 48,204,802 | |
|
| Distillers & Vintners–1.25% | |
Diageo PLC (United Kingdom) | | | 2,002,419 | | | | 57,873,928 | |
|
| Diversified Banks–3.26% | |
Svenska Handelsbanken AB–Class A (Sweden) | | | 4,468,230 | | | | 60,605,607 | |
U.S. Bancorp | | | 2,145,476 | | | | 90,496,178 | |
| | | | | | | | 151,101,785 | |
|
| Electric Utilities–1.22% | |
Duke Energy Corp. | | | 791,130 | | | | 56,542,061 | |
|
| Electrical Components & Equipment–3.24% | |
ABB Ltd. (Switzerland) | | | 4,092,888 | | | | 77,100,857 | |
Eaton Corp. PLC(b) | | | 1,309,092 | | | | 73,191,334 | |
| | | | | | | | 150,292,191 | |
|
| Electronic Manufacturing Services–2.39% | |
TE Connectivity Ltd. (Switzerland) | | | 1,724,659 | | | | 111,137,026 | |
| | | | | | | | |
| | | Shares | | | Value | |
| Health Care Facilities–1.44% | |
HCA Holdings, Inc.(b) | | | 968,457 | | | $ | 66,620,157 | |
|
| Health Care Services–1.95% | |
Express Scripts Holding Co.(b) | | | 1,046,372 | | | | 90,385,613 | |
|
| Home Improvement Retail–1.24% | |
Lowe’s Cos., Inc. | | | 778,085 | | | | 57,446,016 | |
|
| Household Products–1.37% | |
Procter & Gamble Co. (The) | | | 835,707 | | | | 63,831,301 | |
|
| Hypermarkets & Super Centers–1.24% | |
Wal-Mart Stores, Inc. | | | 1,004,422 | | | | 57,493,115 | |
|
| Industrial Conglomerates–1.84% | |
General Electric Co. | | | 2,949,754 | | | | 85,306,886 | |
|
| Industrial Machinery–2.58% | |
Illinois Tool Works Inc. | | | 528,458 | | | | 48,586,428 | |
Stanley Black & Decker Inc. | | | 673,705 | | | | 71,399,256 | |
| | | | | | | | 119,985,684 | |
|
| Insurance Brokers–2.07% | |
Marsh & McLennan Cos., Inc. | | | 1,725,491 | | | | 96,178,868 | |
|
| Internet Software & Services–0.92% | |
Alphabet Inc.–Class C(b) | | | 60,135 | | | | 42,744,559 | |
|
| Investment Banking & Brokerage–1.67% | |
Charles Schwab Corp. (The) | | | 2,545,828 | | | | 77,698,671 | |
|
| IT Consulting & Other Services–1.86% | |
International Business Machines Corp. | | | 615,275 | | | | 86,187,722 | |
|
| Life & Health Insurance–1.40% | |
AIA Group Ltd. (Hong Kong) | | | 11,108,200 | | | | 64,864,196 | |
|
| Life Sciences Tools & Services–1.26% | |
Thermo Fisher Scientific, Inc. | | | 446,911 | | | | 58,447,021 | |
|
| Movies & Entertainment–1.37% | |
Twenty-First Century Fox, Inc.–Class A | | | 2,072,066 | | | | 63,591,706 | |
|
| Multi-Sector Holdings–2.33% | |
Berkshire Hathaway Inc.–Class A(b) | | | 529 | | | | 108,231,284 | |
|
| Multi-Utilities–1.57% | |
WEC Energy Group, Inc. | | | 1,409,404 | | | | 72,668,870 | |
|
| Oil & Gas Equipment & Services–0.73% | |
Halliburton Co. | | | 878,263 | | | | 33,707,734 | |
|
| Oil & Gas Exploration & Production–4.37% | |
Cabot Oil & Gas Corp. | | | 2,559,376 | | | | 55,564,053 | |
Concho Resources Inc.(b) | | | 582,687 | | | | 67,539,250 | |
EOG Resources, Inc. | | | 928,025 | | | | 79,670,946 | |
| | | | | | | | 202,774,249 | |
See accompanying Notes to Financial Statements which are an integral part of the financial statements.
9 Invesco Charter Fund
| | | | | | | | |
| | | Shares | | | Value | |
| Packaged Foods & Meats–2.02% | |
Danone (France) | | | 942,380 | | | $ | 65,611,441 | |
Mead Johnson Nutrition Co. | | | 345,580 | | | | 28,337,560 | |
| | | | | | | | 93,949,001 | |
|
| Pharmaceuticals–8.45% | |
Allergan PLC(b) | | | 282,925 | | | | 87,273,875 | |
Eli Lilly and Co. | | | 448,289 | | | | 36,566,934 | |
Merck & Co., Inc. | | | 1,376,792 | | | | 75,255,451 | |
Mylan N.V.(b) | | | 231,698 | | | | 10,215,565 | |
Roche Holding AG (Switzerland) | | | 185,618 | | | | 50,284,507 | |
Shire PLC–ADR (Ireland) | | | 334,668 | | | | 75,986,369 | |
Teva Pharmaceutical Industries Ltd.–ADR (Israel) | | | 959,575 | | | | 56,797,244 | |
| | | | | | | | 392,379,945 | |
|
| Property & Casualty Insurance–3.80% | |
Progressive Corp. (The) | | | 5,324,375 | | | | 176,396,544 | |
|
| Semiconductor Equipment–1.29% | |
Applied Materials, Inc. | | | 3,563,013 | | | | 59,751,728 | |
|
| Semiconductors–5.79% | |
Analog Devices, Inc. | | | 2,237,690 | | | | 134,529,923 | |
Taiwan Semiconductor Manufacturing Co. Ltd. (Taiwan) | | | 31,869,019 | | | | 134,153,090 | |
| | | | | | | | 268,683,013 | |
| | | | | | | | |
| | | Shares | | | Value | |
| Systems Software–2.49% | |
Microsoft Corp. | | | 1,604,663 | | | $ | 84,469,460 | |
Oracle Corp. | | | 797,289 | | | | 30,966,705 | |
| | | | | | | | 115,436,165 | |
|
| Technology Hardware, Storage & Peripherals–2.36% | |
EMC Corp. | | | 4,184,724 | | | | 109,723,463 | |
|
| Wireless Telecommunication Services–0.89% | |
Vodafone Group PLC–ADR (United Kingdom) | | | 1,248,837 | | | | 41,174,156 | |
Total Common Stocks & Other Equity Interests
(Cost $3,292,960,513) | | | | 4,255,952,315 | |
|
Money Market Funds–8.29% | |
Liquid Assets Portfolio–Institutional Class, 0.16%(c) | | | 192,307,435 | | | | 192,307,435 | |
Premier Portfolio–Institutional Class,
0.12%(c) | | | 192,307,436 | | | | 192,307,436 | |
Total Money Market Funds
(Cost $384,614,871) | | | | 384,614,871 | |
TOTAL INVESTMENTS–100.00%
(Cost $3,677,575,384) | | | | 4,640,567,186 | |
OTHER ASSETS LESS LIABILITIES–(0.00)% | | | | (152,745 | ) |
NET ASSETS–100.00% | | | $ | 4,640,414,441 | |
Investment Abbreviations:
| | |
| ADR | | – American Depositary Receipt |
Notes to Schedule of Investments:
| (a) | Industry and/or sector classifications used in this report are generally according to the Global Industry Classification Standard, which was developed by and is the exclusive property and a service mark of MSCI Inc. and Standard & Poor’s. |
| (b) | Non-income producing security. |
| (c) | The money market fund and the Fund are affiliated by having the same investment adviser. The rate shown is the 7-day SEC standardized yield as of October 31, 2015. |
See accompanying Notes to Financial Statements which are an integral part of the financial statements.
10 Invesco Charter Fund
Statement of Assets and Liabilities
October 31, 2015
| | | | |
Assets: | |
Investments, at value (Cost $3,292,960,513) | | $ | 4,255,952,315 | |
Investments in affiliated money market funds, at value and cost | | | 384,614,871 | |
Total investments, at value (Cost $3,677,575,384) | | | 4,640,567,186 | |
Foreign currencies, at value (Cost $2,531,815) | | | 2,544,457 | |
Receivable for: | | | | |
Fund shares sold | | | 1,339,472 | |
Dividends | | | 4,067,075 | |
Investment for trustee deferred compensation and retirement plans | | | 1,626,821 | |
Other assets | | | 164,680 | |
Total assets | | | 4,650,309,691 | |
|
Liabilities: | |
Payable for: | | | | |
Fund shares reacquired | | | 5,280,978 | |
Accrued fees to affiliates | | | 2,731,333 | |
Accrued trustees’ and officers’ fees and benefits | | | 6,357 | |
Trustee deferred compensation and retirement plans | | | 1,876,582 | |
Total liabilities | | | 9,895,250 | |
Net assets applicable to shares outstanding | | $ | 4,640,414,441 | |
|
Net assets consist of: | |
Shares of beneficial interest | | $ | 3,155,442,980 | |
Undistributed net investment income | | | 44,677,294 | |
Undistributed net realized gain | | | 477,363,639 | |
Net unrealized appreciation | | | 962,930,528 | |
| | | $ | 4,640,414,441 | |
| | | | |
Net Assets: | |
Class A | | $ | 3,869,487,631 | |
Class B | | $ | 47,808,259 | |
Class C | | $ | 239,764,839 | |
Class R | | $ | 44,079,342 | |
Class S | | $ | 19,328,855 | |
Class Y | | $ | 183,004,904 | |
Class R5 | | $ | 110,943,181 | |
Class R6 | | $ | 125,997,430 | |
|
Shares outstanding, $0.001 par value per share,
with an unlimited number of shares authorized: | |
Class A | | | 190,584,582 | |
Class B | | | 2,484,506 | |
Class C | | | 12,423,402 | |
Class R | | | 2,191,039 | |
Class S | | | 951,056 | |
Class Y | | | 8,970,905 | |
Class R5 | | | 5,274,527 | |
Class R6 | | | 5,987,242 | |
Class A: | | | | |
Net asset value per share | | $ | 20.30 | |
Maximum offering price per share | | | | |
(Net asset value of $20.30 ¸ 94.50%) | | $ | 21.48 | |
Class B: | | | | |
Net asset value and offering price per share | | $ | 19.24 | |
Class C: | | | | |
Net asset value and offering price per share | | $ | 19.30 | |
Class R: | | | | |
Net asset value and offering price per share | | $ | 20.12 | |
Class S: | | | | |
Net asset value and offering price per share | | $ | 20.32 | |
Class Y: | | | | |
Net asset value and offering price per share | | $ | 20.40 | |
Class R5: | | | | |
Net asset value and offering price per share | | $ | 21.03 | |
Class R6: | | | | |
Net asset value and offering price per share | | $ | 21.04 | |
See accompanying Notes to Financial Statements which are an integral part of the financial statements.
11 Invesco Charter Fund
Statement of Operations
For the year ended October 31, 2015
| | | | |
Investment income: | |
Dividends (net of foreign withholding taxes of $4,037,307) | | $ | 105,079,372 | |
Dividends from affiliated money market funds | | | 306,690 | |
Total investment income | | | 105,386,062 | |
| |
Expenses: | | | | |
Advisory fees | | | 32,830,779 | |
Administrative services fees | | | 646,557 | |
Custodian fees | | | 356,195 | |
Distribution fees: | | | | |
Class A | | | 10,612,256 | |
Class B | | | 630,894 | |
Class C | | | 2,666,332 | |
Class R | | | 268,414 | |
Class S | | | 32,842 | |
Transfer agent fees — A, B, C, R, S and Y | | | 9,227,975 | |
Transfer agent fees — R5 | | | 268,839 | |
Transfer agent fees — R6 | | | 3,568 | |
Trustees’ and officers’ fees and benefits | | | 146,582 | |
Other | | | 693,321 | |
Total expenses | | | 58,384,554 | |
Less: Fees waived and expense offset arrangement(s) | | | (826,747 | ) |
Net expenses | | | 57,557,807 | |
Net investment income | | | 47,828,255 | |
| |
Realized and unrealized gain (loss) from: | | | | |
Net realized gain (loss) from: | | | | |
Investment securities (includes net gains from securities sold to affiliates of $2,824,681) | | | 520,594,059 | |
Foreign currencies | | | (1,457,705 | ) |
| | | | 519,136,354 | |
Change in net unrealized appreciation (depreciation) of: | | | | |
Investment securities | | | (671,014,401 | ) |
Foreign currencies | | | 86,065 | |
| | | | (670,928,336 | ) |
Net realized and unrealized gain (loss) | | | (151,791,982 | ) |
Net increase (decrease) in net assets resulting from operations | | $ | (103,963,727 | ) |
See accompanying Notes to Financial Statements which are an integral part of the financial statements.
12 Invesco Charter Fund
Statement of Changes in Net Assets
For the years ended October 31, 2015 and 2014
| | | | | | | | |
| | | 2015 | | | 2014 | |
Operations: | | | | | |
Net investment income | | $ | 47,828,255 | | | $ | 32,995,326 | |
Net realized gain | | | 519,136,354 | | | | 595,450,220 | |
Change in net unrealized appreciation (depreciation) | | | (670,928,336 | ) | | | (13,525,146 | ) |
Net increase (decrease) in net assets resulting from operations | | | (103,963,727 | ) | | | 614,920,400 | |
| | |
Distributions to shareholders from net investment income: | | | | | | | | |
Class A | | | (24,044,646 | ) | | | (40,001,774 | ) |
Class B | | | — | | | | (197,192 | ) |
Class C | | | — | | | | (522,089 | ) |
Class R | | | (168,320 | ) | | | (498,781 | ) |
Class S | | | (146,967 | ) | | | (234,367 | ) |
Class Y | | | (3,667,332 | ) | | | (5,312,405 | ) |
Class R5 | | | (3,407,046 | ) | | | (4,757,782 | ) |
Class R6 | | | (1,272,961 | ) | | | (1,603,465 | ) |
Total distributions from net investment income | | | (32,707,272 | ) | | | (53,127,855 | ) |
| | |
Distributions to shareholders from net realized gains: | | | | | | | | |
Class A | | | (443,314,681 | ) | | | (190,962,726 | ) |
Class B | | | (7,784,121 | ) | | | (4,697,336 | ) |
Class C | | | (28,876,067 | ) | | | (12,436,765 | ) |
Class R | | | (6,514,427 | ) | | | (3,268,865 | ) |
Class S | | | (2,274,423 | ) | | | (1,013,912 | ) |
Class Y | | | (45,748,273 | ) | | | (20,079,702 | ) |
Class R5 | | | (38,554,035 | ) | | | (16,807,748 | ) |
Class R6 | | | (12,930,631 | ) | | | (5,278,097 | ) |
Total distributions from net realized gains | | | (585,996,658 | ) | | | (254,545,151 | ) |
| | |
Share transactions-net: | | | | | | | | |
Class A | | | (85,338,679 | ) | | | (241,498,943 | ) |
Class B | | | (21,106,952 | ) | | | (34,913,299 | ) |
Class C | | | (5,347,090 | ) | | | (14,820,620 | ) |
Class R | | | (16,079,719 | ) | | | (13,454,116 | ) |
Class S | | | (885,785 | ) | | | (2,092,435 | ) |
Class Y | | | (247,402,243 | ) | | | (16,625,719 | ) |
Class R5 | | | (266,338,960 | ) | | | (19,445,527 | ) |
Class R6 | | | 6,980,979 | | | | (2,638,558 | ) |
Net increase (decrease) in net assets resulting from share transactions | | | (635,518,449 | ) | | | (345,489,217 | ) |
Net increase (decrease) in net assets | | | (1,358,186,106 | ) | | | (38,241,823 | ) |
| | |
Net assets: | | | | | | | | |
Beginning of year | | | 5,998,600,547 | | | | 6,036,842,370 | |
End of year (includes undistributed net investment income of $44,677,294 and $30,838,498, respectively) | | $ | 4,640,414,441 | | | $ | 5,998,600,547 | |
See accompanying Notes to Financial Statements which are an integral part of the financial statements.
13 Invesco Charter Fund
Notes to Financial Statements
October 31, 2015
NOTE 1—Significant Accounting Policies
Invesco Charter Fund (the “Fund”) is a series portfolio of AIM Equity Funds (Invesco Equity Funds) (the “Trust”). The Trust is a Delaware statutory trust registered under the Investment Company Act of 1940, as amended (the “1940 Act”), as an open-end series management investment company consisting of three separate portfolios, each authorized to issue an unlimited number of shares of beneficial interest. The assets, liabilities and operations of each portfolio are accounted for separately. Information presented in these financial statements pertains only to the Fund. Matters affecting each portfolio or class will be voted on exclusively by the shareholders of such portfolio or class.
The Fund’s investment objective is long-term growth of capital.
The Fund currently consists of eight different classes of shares: Class A, Class B, Class C, Class R, Class S, Class Y, Class R5 and Class R6. Class A shares are sold with a front-end sales charge unless certain waiver criteria are met and under certain circumstances load waived shares may be subject to contingent deferred sales charges (“CDSC”). Class C shares are sold with a CDSC. Class R, Class S, Class Y, Class R5 and Class R6 shares are sold at net asset value. Effective November 30, 2010, new or additional investments in Class B shares are no longer permitted. Existing shareholders of Class B shares may continue to reinvest dividends and capital gains distributions in Class B shares until they convert to Class A shares. Also, shareholders in Class B shares will be able to exchange those shares for Class B shares of other Invesco Funds offering such shares until they convert to Class A shares. Generally, Class B shares will automatically convert to Class A shares on or about the month-end, which is at least eight years after the date of purchase. Redemption of Class B shares prior to the conversion date will be subject to a CDSC.
The following is a summary of the significant accounting policies followed by the Fund in the preparation of its financial statements.
| A. | Security Valuations — Securities, including restricted securities, are valued according to the following policy. |
A security listed or traded on an exchange (except convertible securities) is valued at its last sales price or official closing price as of the close of the customary trading session on the exchange where the security is principally traded, or lacking any sales or official closing price on a particular day, the security may be valued at the closing bid price on that day. Securities traded in the over-the-counter market are valued based on prices furnished by independent pricing services or market makers. When such securities are valued by an independent pricing service they may be considered fair valued. Futures contracts are valued at the final settlement price set by an exchange on which they are principally traded. Listed options are valued at the mean between the last bid and asked prices from the exchange on which they are principally traded. Options not listed on an exchange are valued by an independent source at the mean between the last bid and asked prices. For purposes of determining net asset value (“NAV”) per share, futures and option contracts generally are valued 15 minutes after the close of the customary trading session of the New York Stock Exchange (“NYSE”).
Investments in open-end and closed-end registered investment companies that do not trade on an exchange are valued at the end-of-day net asset value per share. Investments in open-end and closed-end registered investment companies that trade on an exchange are valued at the last sales price or official closing price as of the close of the customary trading session on the exchange where the security is principally traded.
Debt obligations (including convertible securities) and unlisted equities are fair valued using an evaluated quote provided by an independent pricing service. Evaluated quotes provided by the pricing service may be determined without exclusive reliance on quoted prices, and may reflect appropriate factors such as institution-size trading in similar groups of securities, developments related to specific securities, dividend rate (for unlisted equities), yield (for debt obligations), quality, type of issue, coupon rate (for debt obligations), maturity (for debt obligations), individual trading characteristics and other market data. Debt obligations are subject to interest rate and credit risks. In addition, all debt obligations involve some risk of default with respect to interest and/or principal payments.
Foreign securities’ (including foreign exchange contracts) prices are converted into U.S. dollar amounts using the applicable exchange rates as of the close of the NYSE. If market quotations are available and reliable for foreign exchange-traded equity securities, the securities will be valued at the market quotations. Because trading hours for certain foreign securities end before the close of the NYSE, closing market quotations may become unreliable. If between the time trading ends on a particular security and the close of the customary trading session on the NYSE, events occur that the Adviser determines are significant and make the closing price unreliable, the Fund may fair value the security. If the event is likely to have affected the closing price of the security, the security will be valued at fair value in good faith using procedures approved by the Board of Trustees. Adjustments to closing prices to reflect fair value may also be based on a screening process of an independent pricing service to indicate the degree of certainty, based on historical data, that the closing price in the principal market where a foreign security trades is not the current value as of the close of the NYSE. Foreign securities’ prices meeting the approved degree of certainty that the price is not reflective of current value will be priced at the indication of fair value from the independent pricing service. Multiple factors may be considered by the independent pricing service in determining adjustments to reflect fair value and may include information relating to sector indices, American Depositary Receipts and domestic and foreign index futures. Foreign securities may have additional risks including exchange rate changes, potential for sharply devalued currencies and high inflation, political and economic upheaval, the relative lack of issuer information, relatively low market liquidity and the potential lack of strict financial and accounting controls and standards.
Securities for which market prices are not provided by any of the above methods may be valued based upon quotes furnished by independent sources. The last bid price may be used to value equity securities. The mean between the last bid and asked prices is used to value debt obligations, including corporate loans.
Securities for which market quotations are not readily available or became unreliable are valued at fair value as determined in good faith by or under the supervision of the Trust’s officers following procedures approved by the Board of Trustees. Issuer specific events, market trends, bid/asked quotes of brokers and information providers and other market data may be reviewed in the course of making a good faith determination of a security’s fair value.
The Fund may invest in securities that are subject to interest rate risk, meaning the risk that the prices will generally fall as interest rates rise and, conversely, the prices will generally rise as interest rates fall. Specific securities differ in their sensitivity to changes in interest rates depending on their individual characteristics. Changes in interest rates may result in increased market volatility, which may affect the value and/or liquidity of certain Fund investments.
14 Invesco Charter Fund
Valuations change in response to many factors including the historical and prospective earnings of the issuer, the value of the issuer’s assets, general economic conditions, interest rates, investor perceptions and market liquidity. Because of the inherent uncertainties of valuation, the values reflected in the financial statements may materially differ from the value received upon actual sale of those investments.
| B. | Securities Transactions and Investment Income — Securities transactions are accounted for on a trade date basis. Realized gains or losses on sales are computed on the basis of specific identification of the securities sold. Interest income (net of withholding tax, if any) is recorded on the accrual basis from settlement date. Dividend income (net of withholding tax, if any) is recorded on the ex-dividend date. |
The Fund may periodically participate in litigation related to Fund investments. As such, the Fund may receive proceeds from litigation settlements. Any proceeds received are included in the Statement of Operations as realized gain (loss) for investments no longer held and as unrealized gain (loss) for investments still held.
Brokerage commissions and mark ups are considered transaction costs and are recorded as an increase to the cost basis of securities purchased and/or a reduction of proceeds on a sale of securities. Such transaction costs are included in the determination of net realized and unrealized gain (loss) from investment securities reported in the Statement of Operations and the Statement of Changes in Net Assets and the net realized and unrealized gains (losses) on securities per share in the Financial Highlights. Transaction costs are included in the calculation of the Fund’s net asset value and, accordingly, they reduce the Fund’s total returns. These transaction costs are not considered operating expenses and are not reflected in net investment income reported in the Statement of Operations and the Statement of Changes in Net Assets, or the net investment income per share and the ratios of expenses and net investment income reported in the Financial Highlights, nor are they limited by any expense limitation arrangements between the Fund and the investment adviser.
The Fund allocates income and realized and unrealized capital gains and losses to a class based on the relative net assets of each class.
| C. | Country Determination — For the purposes of making investment selection decisions and presentation in the Schedule of Investments, the investment adviser may determine the country in which an issuer is located and/or credit risk exposure based on various factors. These factors include the laws of the country under which the issuer is organized, where the issuer maintains a principal office, the country in which the issuer derives 50% or more of its total revenues and the country that has the primary market for the issuer’s securities, as well as other criteria. Among the other criteria that may be evaluated for making this determination are the country in which the issuer maintains 50% or more of its assets, the type of security, financial guarantees and enhancements, the nature of the collateral and the sponsor organization. Country of issuer and/or credit risk exposure has been determined to be the United States of America, unless otherwise noted. |
| D. | Distributions — Distributions from net investment income and net realized capital gain, if any, are generally declared and paid annually and recorded on the ex-dividend date. The Fund may elect to treat a portion of the proceeds from redemptions as distributions for federal income tax purposes. |
| E. | Federal Income Taxes — The Fund intends to comply with the requirements of Subchapter M of the Internal Revenue Code of 1986, as amended (the “Internal Revenue Code”), necessary to qualify as a regulated investment company and to distribute substantially all of the Fund’s taxable earnings to shareholders. As such, the Fund will not be subject to federal income taxes on otherwise taxable income (including net realized capital gain) that is distributed to shareholders. Therefore, no provision for federal income taxes is recorded in the financial statements. |
The Fund recognizes the tax benefits of uncertain tax positions only when the position is more likely than not to be sustained. Management has analyzed the Fund’s uncertain tax positions and concluded that no liability for unrecognized tax benefits should be recorded related to uncertain tax positions. Management is not aware of any tax positions for which it is reasonably possible that the total amounts of unrecognized tax benefits will change materially in the next 12 months.
The Fund files tax returns in the U.S. Federal jurisdiction and certain other jurisdictions. Generally, the Fund is subject to examinations by such taxing authorities for up to three years after the filing of the return for the tax period.
| F. | Expenses — Fees provided for under the Rule 12b-1 plan of a particular class of the Fund are charged to the operations of such class. Transfer agency fees and expenses and other shareholder recordkeeping fees and expenses attributable to Class R5 and Class R6 are allocated to each share class based on relative net assets. Sub-accounting fees attributable to Class R5 are charged to the operations of the class. Transfer agency fees and expenses and other shareholder recordkeeping fees and expenses relating to all other classes are allocated among those classes based on relative net assets. All other expenses are allocated among the classes based on relative net assets. |
| G. | Accounting Estimates — The preparation of financial statements in conformity with accounting principles generally accepted in the United States of America (“GAAP”) requires management to make estimates and assumptions that affect the reported amounts of assets and liabilities at the date of the financial statements and the reported amounts of revenues and expenses during the reporting period including estimates and assumptions related to taxation. Actual results could differ from those estimates by a significant amount. In addition, the Fund monitors for material events or transactions that may occur or become known after the period-end date and before the date the financial statements are released to print. |
| H. | Indemnifications — Under the Trust’s organizational documents, each Trustee, officer, employee or other agent of the Trust is indemnified against certain liabilities that may arise out of the performance of their duties to the Fund. Additionally, in the normal course of business, the Fund enters into contracts, including the Fund’s servicing agreements, that contain a variety of indemnification clauses. The Fund’s maximum exposure under these arrangements is unknown as this would involve future claims that may be made against the Fund that have not yet occurred. The risk of material loss as a result of such indemnification claims is considered remote. |
| I. | Foreign Currency Translations — Foreign currency is valued at the close of the NYSE based on quotations posted by banks and major currency dealers. Portfolio securities and other assets and liabilities denominated in foreign currencies are translated into U.S. dollar amounts at date of valuation. Purchases and sales of portfolio securities (net of foreign taxes withheld on disposition) and income items denominated in foreign currencies are translated into U.S. dollar amounts on the respective dates of such transactions. The Fund does not separately account for the portion of the results of operations resulting from changes in foreign exchange rates on investments and the fluctuations arising from changes in market prices of securities held. The combined results of changes in foreign exchange rates and the fluctuation of market prices on investments (net of estimated foreign tax withholding) are included with the net realized and unrealized gain or loss from investments in the Statement of Operations. Reported net realized foreign currency gains or losses arise from (1) sales of foreign currencies, (2) currency gains or losses realized between the trade and settlement dates on securities transactions, and (3) the difference between the amounts of dividends, |
15 Invesco Charter Fund
| | interest, and foreign withholding taxes recorded on the Fund’s books and the U.S. dollar equivalent of the amounts actually received or paid. Net unrealized foreign currency gains and losses arise from changes in the fair values of assets and liabilities, other than investments in securities at fiscal period end, resulting from changes in exchange rates. |
The Fund may invest in foreign securities, which may be subject to foreign taxes on income, gains on investments or currency repatriation, a portion of which may be recoverable. Foreign taxes, if any, are recorded based on the tax regulations and rates that exist in the foreign markets in which the Fund invests and are shown in the Statement of Operations.
| J. | Forward Foreign Currency Contracts — The Fund may engage in foreign currency transactions either on a spot (i.e. for prompt delivery and settlement) basis, or through forward foreign currency contracts, to manage or minimize currency or exchange rate risk. |
The Fund may also enter into forward foreign currency contracts for the purchase or sale of a security denominated in a foreign currency in order to “lock in” the U.S. dollar price of that security, or the Fund may also enter into forward foreign currency contracts that do not provide for physical settlement of the two currencies, but instead are settled by a single cash payment calculated as the difference between the agreed upon exchange rate and the spot rate at settlement based upon an agreed upon notional amount (non-deliverable forwards). The Fund will set aside liquid assets in an amount equal to daily mark-to-market obligation for forward foreign currency contracts.
A forward foreign currency contract is an obligation between two parties (“Counterparties”) to purchase or sell a specific currency for an agreed-upon price at a future date. The use of forward foreign currency contracts does not eliminate fluctuations in the price of the underlying securities the Fund owns or intends to acquire but establishes a rate of exchange in advance. Fluctuations in the value of these contracts are measured by the difference in the contract date and reporting date exchange rates and are recorded as unrealized appreciation (depreciation) until the contracts are closed. When the contracts are closed, realized gains (losses) are recorded. Realized and unrealized gains (losses) on the contracts are included in the Statement of Operations. The primary risks associated with forward foreign currency contracts include failure of the Counterparty to meet the terms of the contract and the value of the foreign currency changing unfavorably. These risks may be in excess of the amounts reflected in the Statement of Assets and Liabilities.
NOTE 2—Advisory Fees and Other Fees Paid to Affiliates
The Trust has entered into a master investment advisory agreement with Invesco Advisers, Inc. (the “Adviser” or “Invesco”). Under the terms of the investment advisory agreement, the Fund pays an advisory fee to the Adviser based on the annual rate of the Fund’s average daily net assets as follows:
| | | | | | |
| Average Daily Net Assets | | Rate |
First $250 million | | | 0 | .695% | | |
Next $4.05 billion | | | 0 | .615% | | |
Next $3.9 billion | | | 0 | .57% | | |
Next $1.8 billion | | | 0 | .545% | | |
Over $10 billion | | | 0 | .52% | | |
For the year ended October 31, 2015, the effective advisory fees incurred by the Fund was 0.61%.
Under the terms of a master sub-advisory agreement between the Adviser and each of Invesco Asset Management Deutschland GmbH, Invesco Asset Management Limited, Invesco Asset Management (Japan) Limited, Invesco Hong Kong Limited, Invesco Senior Secured Management, Inc. and Invesco Canada Ltd. (collectively, the “Affiliated Sub-Advisers”) the Adviser, not the Fund, may pay 40% of the fees paid to the Adviser to any such Affiliated Sub-Adviser(s) that provide(s) discretionary investment management services to the Fund based on the percentage of assets allocated to such Affiliated Sub-Adviser(s).
The Adviser has contractually agreed, through at least June 30, 2016, to waive advisory fees and/or reimburse expenses of all shares to the extent necessary to limit total annual fund operating expenses after fee waiver and/or expense reimbursement (excluding certain items discussed below) of Class A, Class B, Class C, Class R, Class S, Class Y, Class R5 and Class R6 shares to 2.00%, 2.75%, 2.75%, 2.25%, 1.90%, 1.75%, 1.75% and 1.75%, respectively, of average daily net assets. In determining the Adviser’s obligation to waive advisory fees and/or reimburse expenses, the following expenses are not taken into account, and could cause the total annual fund operating expenses after fee waiver and/or expense reimbursement to exceed the numbers reflected above: (1) interest; (2) taxes; (3) dividend expense on short sales; (4) extraordinary or non-routine items, including litigation expenses; and (5) expenses that the Fund has incurred but did not actually pay because of an expense offset arrangement. Unless Invesco continues the fee waiver agreement, it will terminate on June 30, 2016. The fee waiver agreement cannot be terminated during its term. The Adviser did not waive fees and/or reimburse expenses during the period under this expense limitation.
Further, the Adviser has contractually agreed, through at least June 30, 2017, to waive the advisory fee payable by the Fund in an amount equal to 100% of the net advisory fees the Adviser receives from the affiliated money market funds on investments by the Fund of uninvested cash in such affiliated money market funds.
For the year ended October 31, 2015, the Adviser waived advisory fees of $800,509.
The Trust has entered into a master administrative services agreement with Invesco pursuant to which the Fund has agreed to pay Invesco for certain administrative costs incurred in providing accounting services to the Fund. For the year ended October 31, 2015, expenses incurred under the agreement are shown in the Statement of Operations as Administrative services fees.
The Trust has entered into a transfer agency and service agreement with Invesco Investment Services, Inc. (“IIS”) pursuant to which the Fund has agreed to pay IIS a fee for providing transfer agency and shareholder services to the Fund and reimburse IIS for certain expenses incurred by IIS in the course of providing such services. IIS may make payments to intermediaries that provide omnibus account services, sub-accounting services and/or networking services. All fees payable by IIS to intermediaries that provide omnibus account services or sub-accounting are charged back to the Fund, subject to certain limitations approved by the Trust’s Board of Trustees. For the year ended October 31, 2015, expenses incurred under the agreement are shown in the Statement of Operations as Transfer agent fees.
The Trust has entered into master distribution agreements with Invesco Distributors, Inc. (“IDI”) to serve as the distributor for the Class A, Class B, Class C, Class R, Class S, Class Y, Class R5 and Class R6 shares of the Fund. The Trust has adopted plans pursuant to Rule 12b-1 under the 1940 Act
16 Invesco Charter Fund
with respect to the Fund’s Class A, Class B, Class C, Class R and Class S shares (collectively, the “Plans”). The Fund, pursuant to the Plans, pays IDI compensation at the annual rate of 0.25% of the Fund’s average daily net assets of Class A shares, 1.00% of the average daily net assets of Class B and Class C shares, 0.50% of the average daily net assets of Class R shares and 0.15% of the average daily net assets of Class S shares. Of the Plan payments, up to 0.25% of the average daily net assets of Class A, Class B, Class C and Class R shares and 0.15% of the average daily net assets of Class S shares may be paid to furnish continuing personal shareholder services to customers who purchase and own shares of such classes. Any amounts not paid as a service fee under the Plans would constitute an asset-based sales charge. Rules of the Financial Industry Regulatory Authority (“FINRA”) impose a cap on the total sales charges, including asset-based sales charges that may be paid by any class of shares of the Fund. For the year ended October 31, 2015, expenses incurred under the Plans are shown in the Statement of Operations as Distribution fees.
Front-end sales commissions and CDSC (collectively, the “sales charges”) are not recorded as expenses of the Fund. Front-end sales commissions are deducted from proceeds from the sales of Fund shares prior to investment in Class A shares of the Fund. CDSC are deducted from redemption proceeds prior to remittance to the shareholder. During the year ended October 31, 2015, IDI advised the Fund that IDI retained $429,539 in front-end sales commissions from the sale of Class A shares and $3,588, $21,811 and $7,810 from Class A, Class B and Class C shares, respectively, for CDSC imposed on redemptions by shareholders.
For the year ended October 31, 2015, the Fund incurred $1,274 in brokerage commissions with Invesco Capital Markets, Inc., an affiliate of the Adviser and IDI, for portfolio transactions executed on behalf of the Fund.
Certain officers and trustees of the Trust are officers and directors of the Adviser, IIS and/or IDI.
NOTE 3—Additional Valuation Information
GAAP defines fair value as the price that would be received to sell an asset or paid to transfer a liability in an orderly transaction between market participants at the measurement date, under current market conditions. GAAP establishes a hierarchy that prioritizes the inputs to valuation methods, giving the highest priority to readily available unadjusted quoted prices in an active market for identical assets (Level 1) and the lowest priority to significant unobservable inputs (Level 3), generally when market prices are not readily available or are unreliable. Based on the valuation inputs, the securities or other investments are tiered into one of three levels. Changes in valuation methods may result in transfers in or out of an investment’s assigned level:
| | Level 1 — | Prices are determined using quoted prices in an active market for identical assets. |
| | Level 2 — | Prices are determined using other significant observable inputs. Observable inputs are inputs that other market participants may use in pricing a security. These may include quoted prices for similar securities, interest rates, prepayment speeds, credit risk, yield curves, loss severities, default rates, discount rates, volatilities and others. |
| | Level 3 — | Prices are determined using significant unobservable inputs. In situations where quoted prices or observable inputs are unavailable (for example, when there is little or no market activity for an investment at the end of the period), unobservable inputs may be used. Unobservable inputs reflect the Fund’s own assumptions about the factors market participants would use in determining fair value of the securities or instruments and would be based on the best available information. |
The following is a summary of the tiered valuation input levels, as of October 31, 2015. The level assigned to the securities valuations may not be an indication of the risk or liquidity associated with investing in those securities. Because of the inherent uncertainties of valuation, the values reflected in the financial statements may materially differ from the value received upon actual sale of those investments.
| | | | | | | | | | | | | | | | |
| | | Level 1 | | | Level 2 | | | Level 3 | | | Total | |
Equity Securities | | $ | 4,063,242,503 | | | $ | 577,324,683 | | | $ | — | | | $ | 4,640,567,186 | |
NOTE 4—Security Transactions with Affiliated Funds
The Fund is permitted to purchase or sell securities from or to certain other Invesco Funds under specified conditions outlined in procedures adopted by the Board of Trustees of the Trust. The procedures have been designed to ensure that any purchase or sale of securities by the Fund from or to another fund or portfolio that is or could be considered an affiliate by virtue of having a common investment adviser (or affiliated investment advisers), common Trustees and/or common officers complies with Rule 17a-7 of the 1940 Act. Further, as defined under the procedures, each transaction is effected at the current market price. Pursuant to these procedures, for the year ended October 31, 2015, the Fund engaged in securities purchases of $2,986,396 and securities sales of $4,174,506, which resulted in net realized gains of $2,824,681.
NOTE 5—Expense Offset Arrangement(s)
The expense offset arrangement is comprised of transfer agency credits which result from balances in demand deposit accounts used by the transfer agent for clearing shareholder transactions. For the year ended October 31, 2015, the Fund received credits from this arrangement, which resulted in the reduction of the Fund’s total expenses of $26,238.
NOTE 6—Trustees’ and Officers’ Fees and Benefits
Trustees’ and Officers’ Fees and Benefits include amounts accrued by the Fund to pay remuneration to certain Trustees and Officers of the Fund. Trustees have the option to defer compensation payable by the Fund, and Trustees’ and Officers’ Fees and Benefits also include amounts accrued by the Fund to fund such deferred compensation amounts. Those Trustees who defer compensation have the option to select various Invesco Funds in which their deferral accounts shall be deemed to be invested. Finally, certain current Trustees were eligible to participate in a retirement plan that provided for benefits to be paid upon retirement to Trustees over a period of time based on the number of years of service. The Fund may have certain former Trustees who also participate in a retirement plan and receive benefits under such plan. Trustees’ and Officers’ Fees and Benefits include amounts accrued by the Fund to fund such retirement benefits. Obligations under the deferred compensation and retirement plans represent unsecured claims against the general assets of the Fund.
17 Invesco Charter Fund
NOTE 7—Cash Balances
The Fund is permitted to temporarily carry a negative or overdrawn balance in its account with State Street Bank and Trust Company, the custodian bank. Such balances, if any at period end, are shown in the Statement of Assets and Liabilities under the payable caption Amount due custodian. To compensate the custodian bank for such overdrafts, the overdrawn Fund may either (1) leave funds as a compensating balance in the account so the custodian bank can be compensated by earning the additional interest; or (2) compensate by paying the custodian bank at a rate agreed upon by the custodian bank and Invesco, not to exceed the contractually agreed upon rate.
NOTE 8—Distributions to Shareholders and Tax Components of Net Assets
Tax Character of Distributions to Shareholders Paid During the Fiscal Years Ended October 31, 2015 and 2014:
| | | | | | | | |
| | | 2015 | | | 2014 | |
Ordinary income | | $ | 67,468,176 | | | $ | 107,659,751 | |
Long-term capital gain | | | 551,235,754 | | | | 200,013,255 | |
Total distributions | | $ | 618,703,930 | | | $ | 307,673,006 | |
Tax Components of Net Assets at Period-End:
| | | | |
| | | 2015 | |
Undistributed ordinary income | | $ | 46,569,323 | |
Undistributed long-term gain | | | 511,046,676 | |
Net unrealized appreciation — investments | | | 957,191,352 | |
Net unrealized appreciation (depreciation) — other investments | | | (61,274 | ) |
Temporary book/tax differences | | | (1,892,029 | ) |
Capital loss carryforward | | | (27,882,587 | ) |
Shares of beneficial interest | | | 3,155,442,980 | |
Total net assets | | $ | 4,640,414,441 | |
The difference between book-basis and tax-basis unrealized appreciation (depreciation) is due to differences in the timing of recognition of gains and losses on investments for tax and book purposes. The Fund’s net unrealized appreciation difference is attributable primarily to wash sales.
The temporary book/tax differences are a result of timing differences between book and tax recognition of income and/or expenses. The Fund’s temporary book/tax differences are the result of the trustee deferral of compensation and retirement plan benefits.
Capital loss carryforward is calculated and reported as of a specific date. Results of transactions and other activity after that date may affect the amount of capital loss carryforward actually available for the Fund to utilize. Capital losses generated in years beginning after December 22, 2010 can be carried forward for an unlimited period, whereas previous losses expire in eight tax years. Capital losses with an expiration period may not be used to offset capital gains until all net capital losses without an expiration date have been utilized. Capital loss carryforwards with no expiration date will retain their character as either short-term or long-term capital losses instead of as short-term capital losses as under prior law. The ability to utilize capital loss carryforwards in the future may be limited under the Internal Revenue Code and related regulations based on the results of future transactions.
The Fund has a capital loss carryforward as of October 31, 2015, which expires as follows:
| | | | | | | | | | | | |
| Capital Loss Carryforward* | |
| Expiration | | Short-Term | | | Long-Term | | | Total | |
October 31, 2017 | | $ | 18,617,138 | | | $ | — | | | $ | 18,617,138 | |
October 31, 2018 | | | 9,265,449 | | | | — | | | | 9,265,449 | |
| | | $ | 27,882,587 | | | $ | — | | | $ | 27,882,587 | |
| * | Capital loss carryforward as of the date listed above is reduced for limitations, if any, to the extent required by the Internal Revenue Code and may be further limited depending upon a variety of factors, including the realization of net unrealized gains or losses as of the date of any reorganization. |
18 Invesco Charter Fund
NOTE 9—Investment Securities
The aggregate amount of investment securities (other than short-term securities, U.S. Treasury obligations and money market funds, if any) purchased and sold by the Fund during the year ended October 31, 2015 was $2,251,048,677 and $2,548,474,844, respectively. Cost of investments on a tax basis includes the adjustments for financial reporting purposes as of the most recently completed federal income tax reporting period-end.
| | | | |
| Unrealized Appreciation (Depreciation) of Investment Securities on a Tax Basis | |
Aggregate unrealized appreciation of investment securities | | $ | 1,100,622,862 | |
Aggregate unrealized (depreciation) of investment securities | | | (143,431,510 | ) |
Net unrealized appreciation of investment securities | | $ | 957,191,352 | |
Cost of investments for tax purposes is $3,683,375,834.
NOTE 10—Reclassification of Permanent Differences
Primarily as a result of differing book/tax treatment of foreign currency transactions and fair fund adjustments, on October 31, 2015, undistributed net investment income was decreased by $1,282,187 and undistributed net realized gain was increased by $1,282,187. This reclassification had no effect on the net assets of the Fund.
NOTE 11—Share Information
| | | | | | | | | | | | | | | | |
| | | Summary of Share Activity | |
| | | Years ended October 31, | |
| | | 2015(a) | | | 2014 | |
| | | Shares | | | Amount | | | Shares | | | Amount | |
Sold: | | | | | | | | | | | | | | | | |
Class A | | | 7,967,867 | | | $ | 169,658,526 | | | | 9,429,764 | | | $ | 212,644,988 | |
Class B | | | 42,760 | | | | 866,232 | | | | 81,483 | | | | 1,740,050 | |
Class C | | | 961,765 | | | | 19,474,704 | | | | 1,060,470 | | | | 22,962,960 | |
Class R | | | 379,464 | | | | 7,947,415 | | | | 555,010 | | | | 12,425,944 | |
Class S | | | 39,788 | | | | 844,373 | | | | 51,284 | | | | 1,160,275 | |
Class Y | | | 3,694,862 | | | | 79,378,983 | | | | 7,772,139 | | | | 176,979,260 | |
Class R5 | | | 1,641,312 | | | | 37,116,423 | | | | 2,328,738 | | | | 54,392,815 | |
Class R6 | | | 425,650 | | | | 8,981,442 | | | | 254,897 | | | | 5,838,420 | |
| | | | |
Issued as reinvestment of dividends: | | | | | | | | | | | | | | | | |
Class A | | | 20,975,293 | | | | 432,301,008 | | | | 10,131,614 | | | | 212,865,213 | |
Class B | | | 382,019 | | | | 7,510,477 | | | | 233,090 | | | | 4,703,750 | |
Class C | | | 1,354,452 | | | | 26,709,787 | | | | 597,137 | | | | 12,086,051 | |
Class R | | | 326,354 | | | | 6,680,464 | | | | 180,283 | | | | 3,762,516 | |
Class S | | | 116,655 | | | | 2,404,258 | | | | 58,779 | | | | 1,234,951 | |
Class Y | | | 1,865,898 | | | | 38,549,443 | | | | 891,731 | | | | 18,780,072 | |
Class R5 | | | 1,946,724 | | | | 41,445,748 | | | | 973,140 | | | | 21,049,024 | |
Class R6 | | | 667,462 | | | | 14,203,592 | | | | 318,296 | | | | 6,881,562 | |
| | | | |
Automatic conversion of Class B shares to Class A shares: | | | | | | | | | | | | | | | | |
Class A | | | 967,742 | | | | 20,571,723 | | | | 1,234,422 | | | | 27,901,260 | |
Class B | | | (1,017,096 | ) | | | (20,571,723 | ) | | | (1,289,155 | ) | | | (27,901,260 | ) |
| | | | |
Reacquired: | | | | | | | | | | | | | | | | |
Class A | | | (33,421,073 | ) | | | (707,869,936 | ) | | | (30,606,498 | ) | | | (694,910,404 | ) |
Class B | | | (440,174 | ) | | | (8,911,938 | ) | | | (624,686 | ) | | | (13,455,839 | ) |
Class C | | | (2,558,579 | ) | | | (51,531,581 | ) | | | (2,309,651 | ) | | | (49,869,631 | ) |
Class R | | | (1,458,054 | ) | | | (30,707,598 | ) | | | (1,322,291 | ) | | | (29,642,576 | ) |
Class S | | | (198,336 | ) | | | (4,134,416 | ) | | | (197,035 | ) | | | (4,487,661 | ) |
Class Y | | | (17,090,633 | ) | | | (365,330,669 | ) | | | (9,187,321 | ) | | | (212,385,051 | ) |
Class R5 | | | (15,568,006 | ) | | | (344,901,131 | ) | | | (4,083,901 | ) | | | (94,887,366 | ) |
Class R6 | | | (732,416 | ) | | | (16,204,055 | ) | | | (654,781 | ) | | | (15,358,540 | ) |
Net increase (decrease) in share activity | | | (28,728,300 | ) | | $ | (635,518,449 | ) | | | (14,123,042 | ) | | $ | (345,489,217 | ) |
| (a) | There are entities that are record owners of more than 5% of the outstanding shares of the Fund and in the aggregate own 41% of the outstanding shares of the Fund. IDI has an agreement with these entities to sell Fund shares. The Fund, Invesco and/or Invesco affiliates may make payments to these entities, which are considered to be related to the Fund, for providing services to the Fund, Invesco and/or Invesco affiliates including but not limited to services such as securities brokerage, distribution, third party record keeping and account servicing. The Fund has no knowledge as to whether all or any portion of the shares owned of record by these entities are also owned beneficially. |
19 Invesco Charter Fund
NOTE 12—Financial Highlights
The following schedule presents financial highlights for a share of the Fund outstanding throughout the periods indicated.
| | | | | | | | | | | | | | | | | | | | | | | | | | | | | | | | | | | | | | | | | | | | | | | | | | | | | | | | |
| | | Net asset
value,
beginning
of period | | | Net
investment
income
(loss)(a) | | | Net gains
(losses)
on securities
(both
realized and
unrealized) | | | Total from
investment
operations | | | Dividends
from net
investment
income | | | Distributions
from net
realized
gains | | | Total
distributions | | | Net asset
value, end
of period | | | Total
return(b) | | | Net assets,
end of period
(000’s omitted) | | | Ratio of
expenses
to average
net assets
with fee waivers
and/or expenses
absorbed | | | Ratio of
expenses
to average net
assets without
fee waivers
and/or expenses
absorbed | | | Ratio of net
investment
income (loss)
to average
net assets | | | Portfolio
turnover(c) | |
Class A | |
Year ended 10/31/15 | | $ | 23.28 | | | $ | 0.19 | | | $ | (0.74 | ) | | $ | (0.55 | ) | | $ | (0.13 | ) | | $ | (2.30 | ) | | $ | (2.43 | ) | | $ | 20.30 | | | | (2.53 | )% | | $ | 3,869,488 | | | | 1.07 | %(d) | | | 1.08 | %(d) | | | 0.89 | %(d) | | | 47 | % |
Year ended 10/31/14 | | | 22.22 | | | | 0.12 | | | | 2.09 | | | | 2.21 | | | | (0.20 | ) | | | (0.95 | ) | | | (1.15 | ) | | | 23.28 | | | | 10.48 | | | | 4,517,960 | | | | 1.05 | | | | 1.07 | | | | 0.53 | | | | 23 | |
Year ended 10/31/13 | | | 17.73 | | | | 0.19 | | | | 4.49 | | | | 4.68 | | | | (0.19 | ) | | | — | | | | (0.19 | ) | | | 22.22 | | | | 26.63 | | | | 4,529,846 | | | | 1.05 | | | | 1.07 | | | | 0.94 | | | | 35 | |
Year ended 10/31/12 | | | 16.38 | | | | 0.14 | | | | 1.31 | | | | 1.45 | | | | (0.10 | ) | | | — | | | | (0.10 | ) | | | 17.73 | | | | 8.93 | | | | 4,025,451 | | | | 1.10 | | | | 1.12 | | | | 0.79 | | | | 42 | |
Year ended 10/31/11 | | | 15.30 | | | | 0.10 | | | | 1.04 | | | | 1.14 | | | | (0.06 | ) | | | — | | | | (0.06 | ) | | | 16.38 | | | | 7.50 | | | | 4,009,014 | | | | 1.10 | | | | 1.13 | | | | 0.64 | | | | 40 | |
Class B | | | | | | | | | | | | | | | | | | | | | | | | | | | | | | | | | | | | | | | | | | | | | | | | | | | | | | | | |
Year ended 10/31/15 | | | 22.21 | | | | 0.03 | | | | (0.70 | ) | | | (0.67 | ) | | | — | | | | (2.30 | ) | | | (2.30 | ) | | | 19.24 | | | | (3.22 | ) | | | 47,808 | | | | 1.82 | (d) | | | 1.83 | (d) | | | 0.14 | (d) | | | 47 | |
Year ended 10/31/14 | | | 21.25 | | | | (0.05 | ) | | | 2.00 | | | | 1.95 | | | | (0.04 | ) | | | (0.95 | ) | | | (0.99 | ) | | | 22.21 | | | | 9.62 | | | | 78,125 | | | | 1.80 | | | | 1.82 | | | | (0.22 | ) | | | 23 | |
Year ended 10/31/13 | | | 16.96 | | | | 0.04 | | | | 4.30 | | | | 4.34 | | | | (0.05 | ) | | | — | | | | (0.05 | ) | | | 21.25 | | | | 25.63 | | | | 108,696 | | | | 1.80 | | | | 1.82 | | | | 0.19 | | | | 35 | |
Year ended 10/31/12 | | | 15.67 | | | | 0.01 | | | | 1.28 | | | | 1.29 | | | | — | | | | — | | | | — | | | | 16.96 | | | | 8.23 | | | | 125,315 | | | | 1.85 | | | | 1.87 | | | | 0.04 | | | | 42 | |
Year ended 10/31/11 | | | 14.69 | | | | (0.02 | ) | | | 1.00 | | | | 0.98 | | | | — | | | | — | | | | — | | | | 15.67 | | | | 6.67 | | | | 169,243 | | | | 1.85 | | | | 1.88 | | | | (0.11 | ) | | | 40 | |
Class C | | | | | | | | | | | | | | | | | | | | | | | | | | | | | | | | | | | | | | | | | | | | | | | | | | | | | | | | |
Year ended 10/31/15 | | | 22.27 | | | | 0.03 | | | | (0.70 | ) | | | (0.67 | ) | | | — | | | | (2.30 | ) | | | (2.30 | ) | | | 19.30 | | | | (3.22 | ) | | | 239,765 | | | | 1.82 | (d) | | | 1.83 | (d) | | | 0.14 | (d) | | | 47 | |
Year ended 10/31/14 | | | 21.30 | | | | (0.05 | ) | | | 2.01 | | | | 1.96 | | | | (0.04 | ) | | | (0.95 | ) | | | (0.99 | ) | | | 22.27 | | | | 9.64 | | | | 282,091 | | | | 1.80 | | | | 1.82 | | | | (0.22 | ) | | | 23 | |
Year ended 10/31/13 | | | 17.00 | | | | 0.04 | | | | 4.31 | | | | 4.35 | | | | (0.05 | ) | | | — | | | | (0.05 | ) | | | 21.30 | | | | 25.63 | | | | 283,655 | | | | 1.80 | | | | 1.82 | | | | 0.19 | | | | 35 | |
Year ended 10/31/12 | | | 15.71 | | | | 0.01 | | | | 1.28 | | | | 1.29 | | | | — | | | | — | | | | — | | | | 17.00 | | | | 8.21 | | | | 247,719 | | | | 1.85 | | | | 1.87 | | | | 0.04 | | | | 42 | |
Year ended 10/31/11 | | | 14.73 | | | | (0.02 | ) | | | 1.00 | | | | 0.98 | | | | — | | | | — | | | | — | | | | 15.71 | | | | 6.65 | | | | 257,790 | | | | 1.85 | | | | 1.88 | | | | (0.11 | ) | | | 40 | |
Class R | | | | | | | | | | | | | | | | | | | | | | | | | | | | | | | | | | | | | | | | | | | | | | | | | | | | | | | | |
Year ended 10/31/15 | | | 23.07 | | | | 0.13 | | | | (0.72 | ) | | | (0.59 | ) | | | (0.06 | ) | | | (2.30 | ) | | | (2.36 | ) | | | 20.12 | | | | (2.72 | ) | | | 44,079 | | | | 1.32 | (d) | | | 1.33 | (d) | | | 0.64 | (d) | | | 47 | |
Year ended 10/31/14 | | | 22.03 | | | | 0.06 | | | | 2.07 | | | | 2.13 | | | | (0.14 | ) | | | (0.95 | ) | | | (1.09 | ) | | | 23.07 | | | | 10.19 | | | | 67,910 | | | | 1.30 | | | | 1.32 | | | | 0.28 | | | | 23 | |
Year ended 10/31/13 | | | 17.59 | | | | 0.14 | | | | 4.44 | | | | 4.58 | | | | (0.14 | ) | | | — | | | | (0.14 | ) | | | 22.03 | | | | 26.23 | | | | 77,769 | | | | 1.30 | | | | 1.32 | | | | 0.69 | | | | 35 | |
Year ended 10/31/12 | | | 16.25 | | | | 0.09 | | | | 1.32 | | | | 1.41 | | | | (0.07 | ) | | | — | | | | (0.07 | ) | | | 17.59 | | | | 8.73 | | | | 81,503 | | | | 1.35 | | | | 1.37 | | | | 0.54 | | | | 42 | |
Year ended 10/31/11 | | | 15.18 | | | | 0.06 | | | | 1.04 | | | | 1.10 | | | | (0.03 | ) | | | — | | | | (0.03 | ) | | | 16.25 | | | | 7.26 | | | | 66,405 | | | | 1.35 | | | | 1.38 | | | | 0.39 | | | | 40 | |
Class S | | | | | | | | | | | | | | | | | | | | | | | | | | | | | | | | | | | | | | | | | | | | | | | | | | | | | | | | |
Year ended 10/31/15 | | | 23.30 | | | | 0.21 | | | | (0.74 | ) | | | (0.53 | ) | | | (0.15 | ) | | | (2.30 | ) | | | (2.45 | ) | | | 20.32 | | | | (2.42 | ) | | | 19,329 | | | | 0.97 | (d) | | | 0.98 | (d) | | | 0.99 | (d) | | | 47 | |
Year ended 10/31/14 | | | 22.24 | | | | 0.14 | | | | 2.09 | | | | 2.23 | | | | (0.22 | ) | | | (0.95 | ) | | | (1.17 | ) | | | 23.30 | | | | 10.57 | | | | 23,137 | | | | 0.95 | | | | 0.97 | | | | 0.63 | | | | 23 | |
Year ended 10/31/13 | | | 17.75 | | | | 0.21 | | | | 4.48 | | | | 4.69 | | | | (0.20 | ) | | | — | | | | (0.20 | ) | | | 22.24 | | | | 26.73 | | | | 24,014 | | | | 0.95 | | | | 0.97 | | | | 1.04 | | | | 35 | |
Year ended 10/31/12 | | | 16.39 | | | | 0.15 | | | | 1.33 | | | | 1.48 | | | | (0.12 | ) | | | — | | | | (0.12 | ) | | | 17.75 | | | | 9.08 | | | | 21,072 | | | | 1.00 | | | | 1.02 | | | | 0.89 | | | | 42 | |
Year ended 10/31/11 | | | 15.31 | | | | 0.12 | | | | 1.04 | | | | 1.16 | | | | (0.08 | ) | | | — | | | | (0.08 | ) | | | 16.39 | | | | 7.62 | | | | 21,080 | | | | 1.00 | | | | 1.03 | | | | 0.74 | | | | 40 | |
Class Y | | | | | | | | | | | | | | | | | | | | | | | | | | | | | | | | | | | | | | | | | | | | | | | | | | | | | | | | |
Year ended 10/31/15 | | | 23.38 | | | | 0.25 | | | | (0.75 | ) | | | (0.50 | ) | | | (0.18 | ) | | | (2.30 | ) | | | (2.48 | ) | | | 20.40 | | | | (2.24 | ) | | | 183,005 | | | | 0.82 | (d) | | | 0.83 | (d) | | | 1.14 | (d) | | | 47 | |
Year ended 10/31/14 | | | 22.31 | | | | 0.18 | | | | 2.09 | | | | 2.27 | | | | (0.25 | ) | | | (0.95 | ) | | | (1.20 | ) | | | 23.38 | | | | 10.75 | | | | 479,371 | | | | 0.80 | | | | 0.82 | | | | 0.78 | | | | 23 | |
Year ended 10/31/13 | | | 17.81 | | | | 0.24 | | | | 4.49 | | | | 4.73 | | | | (0.23 | ) | | | — | | | | (0.23 | ) | | | 22.31 | | | | 26.89 | | | | 469,066 | | | | 0.80 | | | | 0.82 | | | | 1.19 | | | | 35 | |
Year ended 10/31/12 | | | 16.44 | | | | 0.18 | | | | 1.33 | | | | 1.51 | | | | (0.14 | ) | | | — | | | | (0.14 | ) | | | 17.81 | | | | 9.26 | | | | 362,231 | | | | 0.85 | | | | 0.87 | | | | 1.04 | | | | 42 | |
Year ended 10/31/11 | | | 15.36 | | | | 0.15 | | | | 1.04 | | | | 1.19 | | | | (0.11 | ) | | | — | | | | (0.11 | ) | | | 16.44 | | | | 7.78 | | | | 186,623 | | | | 0.85 | | | | 0.88 | | | | 0.89 | | | | 40 | |
Class R5 | | | | | | | | | | | | | | | | | | | | | | | | | | | | | | | | | | | | | | | | | | | | | | | | | | | | | | | | |
Year ended 10/31/15 | | | 24.04 | | | | 0.27 | | | | (0.78 | ) | | | (0.51 | ) | | | (0.20 | ) | | | (2.30 | ) | | | (2.50 | ) | | | 21.03 | | | | (2.22 | ) | | | 110,943 | | | | 0.73 | (d) | | | 0.74 | (d) | | | 1.23 | (d) | | | 47 | |
Year ended 10/31/14 | | | 22.90 | | | | 0.20 | | | | 2.16 | | | | 2.36 | | | | (0.27 | ) | | | (0.95 | ) | | | (1.22 | ) | | | 24.04 | | | | 10.87 | | | | 414,713 | | | | 0.72 | | | | 0.74 | | | | 0.86 | | | | 23 | |
Year ended 10/31/13 | | | 18.29 | | | | 0.26 | | | | 4.61 | | | | 4.87 | | | | (0.26 | ) | | | — | | | | (0.26 | ) | | | 22.90 | | | | 26.99 | | | | 413,033 | | | | 0.72 | | | | 0.74 | | | | 1.27 | | | | 35 | |
Year ended 10/31/12 | | | 16.87 | | | | 0.22 | | | | 1.36 | | | | 1.58 | | | | (0.16 | ) | | | — | | | | (0.16 | ) | | | 18.29 | | | | 9.43 | | | | 378,446 | | | | 0.68 | | | | 0.70 | | | | 1.21 | | | | 42 | |
Year ended 10/31/11 | | | 15.77 | | | | 0.17 | | | | 1.07 | | | | 1.24 | | | | (0.14 | ) | | | — | | | | (0.14 | ) | | | 16.87 | | | | 7.92 | | | | 404,441 | | | | 0.73 | | | | 0.76 | | | | 1.01 | | | | 40 | |
Class R6 | | | | | | | | | | | | | | | | | | | | | | | | | | | | | | | | | | | | | | | | | | | | | | | | | | | | | | | | |
Year ended 10/31/15 | | | 24.05 | | | | 0.29 | | | | (0.77 | ) | | | (0.48 | ) | | | (0.23 | ) | | | (2.30 | ) | | | (2.53 | ) | | | 21.04 | | | | (2.12 | ) | | | 125,997 | | | | 0.64 | (d) | | | 0.65 | (d) | | | 1.32 | (d) | | | 47 | |
Year ended 10/31/14 | | | 22.91 | | | | 0.22 | | | | 2.16 | | | | 2.38 | | | | (0.29 | ) | | | (0.95 | ) | | | (1.24 | ) | | | 24.05 | | | | 10.96 | | | | 135,294 | | | | 0.63 | | | | 0.65 | | | | 0.95 | | | | 23 | |
Year ended 10/31/13 | | | 18.29 | | | | 0.28 | | | | 4.62 | | | | 4.90 | | | | (0.28 | ) | | | — | | | | (0.28 | ) | | | 22.91 | | | | 27.15 | | | | 130,764 | | | | 0.63 | | | | 0.65 | | | | 1.36 | | | | 35 | |
Year ended 10/31/12(e) | | | 18.64 | | | | 0.02 | | | | (0.37 | ) | | | (0.35 | ) | | | — | | | | — | | | | — | | | | 18.29 | | | | (1.88 | ) | | | 96,034 | | | | 0.60 | (f) | | | 0.63 | (f) | | | 1.29 | (f) | | | 42 | |
| (a) | Calculated using average shares outstanding. |
| (b) | Includes adjustments in accordance with accounting principles generally accepted in the United States of America and as such, the net asset value for financial reporting purposes and the returns based upon those net asset values may differ from the net asset value and returns for shareholder transactions. Does not include sales charges and is not annualized for periods less than one year, if applicable. |
| (c) | Portfolio turnover is calculated at the fund level and is not annualized for periods less than one year, if applicable. For the year ended October 31, 2011, the portfolio turnover calculation excludes the value of securities purchased of $158,423,180 and sold of $177,461,241 in the effort to realign the Fund’s portfolio holdings after the reorganization of Invesco Multi-Sector Fund into the Fund. |
| (d) | Ratios are based on average daily net assets (000’s omitted) of $4,244,902, $63,089, $266,633, $53,683, $21,895, $331,633, $270,966 and $132,421 for Class A, Class B, Class C, Class R, Class S, Class Y, Class R5 and Class R6 shares, respectively. |
| (e) | Commencement date of September 24, 2012. |
20 Invesco Charter Fund
Report of Independent Registered Public Accounting Firm
To the Board of Trustees of AIM Equity Funds (Invesco Equity Funds)
and Shareholders of Invesco Charter Fund:
In our opinion, the accompanying statement of assets and liabilities, including the schedule of investments, and the related statements of operations and of changes in net assets and the financial highlights present fairly, in all material respects, the financial position of Invesco Charter Fund (one of the funds constituting AIM Equity Funds (Invesco Equity Funds), hereafter referred to as the “Fund”) at October 31, 2015, the results of its operations for the year then ended, the changes in its net assets for each of the two years in the period then ended and the financial highlights for each of the five years in the period then ended, in conformity with accounting principles generally accepted in the United States of America. These financial statements and financial highlights (hereafter referred to as “financial statements”) are the responsibility of the Fund’s management. Our responsibility is to express an opinion on these financial statements based on our audits. We conducted our audits of these financial statements in accordance with the standards of the Public Company Accounting Oversight Board (United States). Those standards require that we plan and perform the audit to obtain reasonable assurance about whether the financial statements are free of material misstatement. An audit includes examining, on a test basis, evidence supporting the amounts and disclosures in the financial statements, assessing the accounting principles used and significant estimates made by management, and evaluating the overall financial statement presentation. We believe that our audits, which included confirmation of securities at October 31, 2015 by correspondence with the custodian, provide a reasonable basis for our opinion.
PRICEWATERHOUSECOOPERS LLP
December 23, 2015
Houston, Texas
21 Invesco Charter Fund
Calculating your ongoing Fund expenses
Example
As a shareholder of the Fund, you incur two types of costs: (1) transaction costs, which may include sales charges (loads) on purchase payments or contingent deferred sales charges on redemptions, if any; and (2) ongoing costs, including management fees, distribution and/or service (12b-1) fees, and other Fund expenses. This example is intended to help you understand your ongoing costs (in dollars) of investing in the Fund and to compare these costs with ongoing costs of investing in other mutual funds. The example is based on an investment of $1,000 invested at the beginning of the period and held for the entire period May 1, 2015 through October 31, 2015.
Actual expenses
The table below provides information about actual account values and actual expenses. You may use the information in this table, together with the amount you invested, to estimate the expenses that you paid over the period. Simply divide your account value by $1,000 (for example, an $8,600 account value divided by $1,000 = 8.6), then multiply the result by the number in the table under the heading entitled “Actual Expenses Paid During Period” to estimate the expenses you paid on your account during this period.
Hypothetical example for comparison purposes
The table below also provides information about hypothetical account values and hypothetical expenses based on the Fund’s actual expense ratio and an assumed rate of return of 5% per year before expenses, which is not the Fund’s actual return.
The hypothetical account values and expenses may not be used to estimate the actual ending account balance or expenses you paid for the period. You may use this information to compare the ongoing costs of investing in the Fund and other funds. To do so, compare this 5% hypothetical example with the 5% hypothetical examples that appear in the shareholder reports of the other funds.
Please note that the expenses shown in the table are meant to highlight your ongoing costs only and do not reflect any transaction costs, such as sales charges (loads) on purchase payments or contingent deferred sales charges on redemptions, if any. Therefore, the hypothetical information is useful in comparing ongoing costs only, and will not help you determine the relative total costs of owning different funds. In addition, if these transaction costs were included, your costs would have been higher.
| | | | | | | | | | | | | | | | | | | | | | | | |
Class | | Beginning
Account Value
(05/01/15) | | | ACTUAL | | | HYPOTHETICAL (5% annual return before
expenses) | | | Annualized
Expense
Ratio | |
| | | Ending
Account Value
(10/31/15)1 | | | Expenses
Paid During
Period2 | | | Ending
Account Value
(10/31/15) | | | Expenses
Paid During
Period2 | | |
| A | | $ | 1,000.00 | | | $ | 951.70 | | | $ | 5.31 | | | $ | 1,019.76 | | | $ | 5.50 | | | | 1.08 | % |
| B | | | 1,000.00 | | | | 948.20 | | | | 8.99 | | | | 1,015.98 | | | | 9.30 | | | | 1.83 | |
| C | | | 1,000.00 | | | | 948.40 | | | | 8.99 | | | | 1,015.98 | | | | 9.30 | | | | 1.83 | |
| R | | | 1,000.00 | | | | 950.90 | | | | 6.54 | | | | 1,018.50 | | | | 6.77 | | | | 1.33 | |
| S | | | 1,000.00 | | | | 952.20 | | | | 4.82 | | | | 1,020.27 | | | | 4.99 | | | | 0.98 | |
| Y | | | 1,000.00 | | | | 953.30 | | | | 4.09 | | | | 1,021.02 | | | | 4.23 | | | | 0.83 | |
| R5 | | | 1,000.00 | | | | 953.30 | | | | 3.59 | | | | 1,021.53 | | | | 3.72 | | | | 0.73 | |
| R6 | | | 1,000.00 | | | | 953.80 | | | | 3.15 | | | | 1,021.98 | | | | 3.26 | | | | 0.64 | |
| 1 | The actual ending account value is based on the actual total return of the Fund for the period May 1, 2015 through October 31, 2015, after actual expenses and will differ from the hypothetical ending account value which is based on the Fund’s expense ratio and a hypothetical annual return of 5% before expenses. |
| 2 | Expenses are equal to the Fund’s annualized expense ratio as indicated above multiplied by the average account value over the period, multiplied by 184/365 to reflect the most recent fiscal half year. |
22 �� Invesco Charter Fund
Approval of Investment Advisory and Sub-Advisory Contracts
The Board of Trustees (the Board) of AIM Equity Funds (Invesco Equity Funds) is required under the Investment Company Act of 1940, as amended, to approve annually the renewal of Invesco Charter Fund’s (the Fund) investment advisory agreements. During contract renewal meetings held on June 9-10, 2015, the Board as a whole, and the disinterested or “independent” Trustees, who comprise over 75% of the Board, voting separately, approved the continuance for the Fund of the Master Investment Advisory Agreement with Invesco Advisers, Inc. (Invesco Advisers and the investment advisory agreement) and the Master Intergroup Sub-Advisory Contract for Mutual Funds with Invesco Asset Management Deutschland GmbH, Invesco Asset Management Limited, Invesco Asset Management (Japan) Limited, Invesco Hong Kong Limited, Invesco Senior Secured Management, Inc. and Invesco Canada Ltd. (collectively, the Affiliated Sub-Advisers and the sub-advisory contracts) for another year, effective July 1, 2015.
In evaluating the fairness and reasonableness of compensation under the Fund’s investment advisory agreement and sub-advisory contracts, the Board considered, among other things, the factors discussed below. The Board determined that continuation of the Fund’s investment advisory agreement and the sub-advisory contracts are in the best interest of the Fund and its shareholders and that the compensation payable to Invesco Advisers and the Affiliated Sub-Advisers under the agreements is fair and reasonable.
The Board’s Fund Evaluation Process
The Board’s Investments Committee has established three Sub-Committees, each of which is primarily responsible for overseeing the performance and investment management services provided by Invesco Advisers and the Affiliated Sub-Advisers to a number of the funds advised by Invesco Advisers (the Invesco Funds). The Sub-Committees meet throughout the year to review the performance of their assigned Invesco Funds, including reviewing materials prepared under the direction of the independent Senior Officer, an officer of the Invesco Funds who reports directly to the independent Trustees. Over the course of each year, the Sub-Committees meet with portfolio managers for their assigned Invesco Funds and other members of management to review the performance, investment objective(s), policies, strategies, limitations and investment risks of these funds. The Board had the benefit of reports form the Sub-Committees and Investments Committee throughout the year in considering approval of the continuance of each Invesco Fund’s investment advisory agreement and sub-advisory contracts for another year.
During the contract renewal process, the Board receives comparative performance and
fee data regarding the Invesco Funds prepared by Invesco Advisers and Lipper Inc. (Lipper), an independent provider of investment company data. The Board also receives a report and this independent written evaluation from the Senior Officer. The Senior Officer’s evaluation is prepared as part of his responsibility to manage the process by which the Invesco Funds’ proposed management fees are negotiated during the annual contract renewal process to ensure they are negotiated in a manner that is at arms’ length and reasonable. In addition to meetings with Invesco Advisers and fund counsel, the independent Trustees also discuss the continuance of the investment advisory agreement and sub-advisory contracts in separate sessions with the Senior Officer and with independent legal counsel.
The Trustees recognized that the advisory fee rates for the Invesco Funds are, in many cases, the result of years of review and negotiation. The Trustees’ deliberations and conclusions in a particular year may be based in part on their deliberations and conclusions regarding these same arrangements throughout the year and in prior years. The Trustees’ review and conclusions are based on the comprehensive consideration of all information presented to them and are not the result of any single determinative factor. Moreover, one Trustee may have weighed a particular piece of information or factor differently than another Trustee.
The discussion below is a summary of the Senior Officer’s independent written evaluation with respect to the Fund’s investment advisory agreement as well as a discussion of the material factors and related conclusions that formed the basis for the Board’s approval of the Fund’s investment advisory agreement and sub-advisory contracts. Unless otherwise stated, this information is current as of June 10, 2015, and does not reflect consideration of factors that became known to the Board after that date.
Factors and Conclusions and Summary of Independent Written Fee Evaluation
| A. | Nature, Extent and Quality of Services Provided by Invesco Advisers and the Affiliated Sub-Advisers |
The Board reviewed the advisory services provided to the Fund by Invesco Advisers under the Fund’s investment advisory agreement, the performance of Invesco Advisers in providing these services, and the credentials and experience of the officers and employees of Invesco Advisers who provide these services, including the Fund’s portfolio manager or managers. The Board’s review of the qualifications of Invesco Advisers to provide advisory services included the Board’s consideration of Invesco Advisers’ investment process oversight, independent credit analysis
and investment risk management. The Board also considered non-advisory services that Invesco Advisers and its affiliates provide to the Invesco Funds such as various back office support functions, equity and fixed income trading operations, internal audit, distribution, valuation and legal and compliance.
In determining whether to continue the Fund’s investment advisory agreement, the Board considered the benefits of reapproving an existing relationship and the greater uncertainty that may be associated with entering into a new relationship. The Board concluded that the nature, extent and quality of the services provided to the Fund by Invesco Advisers are appropriate and satisfactory and consistent with the terms of the Fund’s investment advisory agreement.
The Board reviewed the services that may be provided by the Affiliated Sub-Advisers under the sub-advisory contracts and the credentials and experience of the officers and employees of the Affiliated Sub-Advisers who provide these services. The Board noted that the Affiliated Sub-Advisers have offices and personnel that are located in financial centers around the world. As a result, the Affiliated Sub-Advisers can provide research and investment analysis on the markets and economies of various countries in which the Fund may invest, make recommendations regarding securities and assist with security trades. The Board concluded that the sub-advisory contracts benefit the Fund and its shareholders by permitting Invesco Advisers to use the resources and talents of the Affiliated Sub-Advisers in managing the Fund. The Board concluded that the nature, extent and quality of the services that may be provided by the Affiliated Sub-Advisers are appropriate and satisfactory and consistent with the terms of the Fund’s sub-advisory contracts.
The Board considered Fund performance as a relevant factor in considering whether to approve the investment advisory agreement. The Board did not view Fund performance as a relevant factor in considering whether to approve the sub-advisory contracts for the Fund, as no Affiliated Sub-Adviser currently manages assets of the Fund.
The Board compared the Fund’s performance during the past one, three and five calendar years to the performance of funds in the Lipper performance universe and against the Lipper Large-Cap Core Funds Index. The Board noted that performance of Class A shares of the Fund was in the fifth quintile of its performance universe for the one, three and five year periods (the first quintile being the best performing funds and the fifth quintile being the worst performing funds). The Board noted that performance of Class A shares of the Fund was below the performance of the Index for the one, three and five year periods. Invesco Advisers
23 Invesco Charter Fund
noted that the Fund’s defensive bias with higher quality securities and high cash position contributed to underperformance. The Trustees also reviewed more recent Fund performance and this review did not change their conclusions.
| C. | Advisory and Sub-Advisory Fees |
The Board compared the Fund’s contractual management fee rate to the contractual management fee rates of funds in the Fund’s Lipper expense group at a common asset level. The Board noted that the contractual management fee rate for Class A shares of the Fund was above the median contractual management fee rate of funds in its expense group. The Board noted that the term “contractual management fee” may include both advisory and certain administrative services fees, but that Lipper does not provide information on a fund by fund basis as to what is included. The Board noted that Invesco Advisers does not charge the Invesco Funds for the administrative services included in the term as defined by Lipper. The Board also reviewed the methodology used by Lipper in providing expense group information, which includes using each fund’s contractual management fee schedule (including any applicable breakpoints) as reported in the most recent prospectus or statement of additional information for each fund in the expense group.
The Board also compared the Fund’s effective advisory fee rate (the advisory fee rate after advisory fee waivers and before other expense limitations/waivers) to the effective advisory fee rates of other mutual funds advised by Invesco Advisers and its affiliates with investment strategies comparable to those of the Fund. The Board noted that the Fund’s rate was the same as the rate of one mutual fund advised by Invesco Advisers using a similar investment process.
The Board also considered the fees charged by Invesco Advisers and the Affiliated Sub-Advisers to other client accounts with investment strategies comparable to those of the Fund. The Board noted that Invesco Advisers or the Affiliated Sub-Advisers may charge lower fees to large institutional clients. Invesco Advisers reviewed with the Board the significantly greater scope of services it provides to the Invesco Funds relative to certain other types of client accounts. These additional services include provision of administrative services, officers and office space, oversight of service providers, preparation of annual registration statement updates and financial information and regulatory compliance under the Investment Company Act of 1940, as amended.
Invesco Advisers also reviewed generally the higher frequency of shareholder purchases and redemptions in the Invesco Funds relative to the flow of assets for other client accounts. Invesco Advisers advised the Board that advance notice of redemptions is often provided to Invesco Advisers by institutional clients. The Board did note that sub-advisory fee rates charged by the
Affiliated Sub-Advisers to manage the Invesco Funds and to manage other client accounts tended to be more comparable, reflecting a similar scope of services. The information received by the Board demonstrated that the aggregate services provided to the Invesco Funds were sufficiently different from those provided to institutional clients to support the difference in fees.
The Board also considered the services that may be provided by the Affiliated Sub-Advisers pursuant to the sub-advisory contracts, as well as the fees payable by Invesco Advisers to the Affiliated Sub-Advisers pursuant to the sub-advisory contracts. The Board also noted that the sub-advisory fees are not paid directly by the Fund, but rather, are payable by Invesco Advisers to the Affiliated Sub-Advisers.
| D. | Economies of Scale and Breakpoints |
The Board considered the extent to which there are economies of scale in the provision of advisory services to the Fund. The Board also considered whether the Fund benefits from economies of scale through contractual breakpoints in the Fund’s advisory fee schedule. The Board also noted that the Fund shares directly in economies of scale through lower fees charged by third party service providers based on the combined size of the Invesco Funds and other clients advised by Invesco Advisers.
| E. | Profitability and Financial Resources |
The Board reviewed information from Invesco Advisers concerning the costs of the advisory and other services that Invesco Advisers and its affiliates provide to the Fund and the Invesco Funds and the profitability of Invesco Advisers and its affiliates in providing these services. The Board received information from Invesco Advisers about the methodology used to prepare the profitability information. The Board noted that Invesco Advisers continues to operate at a net profit from services Invesco Advisers and its affiliates provide to the Invesco Funds and the Fund. The Board did not deem the level of profits realized by Invesco Advisers and its affiliates from providing services to the Fund to be excessive given the nature, quality and extent of the services provided. The Board received and accepted information from Invesco Advisers demonstrating that Invesco Advisers and each Affiliated Sub-Adviser are financially sound and have the resources necessary to perform their obligations under the investment advisory agreement and sub-advisory contracts.
| F. | Collateral Benefits to Invesco Advisers and its Affiliates |
The Board considered various other benefits received by Invesco Advisers and its affiliates from the relationship with the Fund, including the fees received for providing transfer agency and distribution services to the Fund. The Board considered comparative information regarding fees charged for these services, including information provided by Lipper and other independent sources. The Board considered the performance of Invesco Advisers and its affiliates in providing these services and the
organizational structure employed to provide these services. The Board also considered that these services are provided to the Fund pursuant to written contracts that are reviewed and approved on an annual basis by the Board; and that the services are required for the operation of the Fund.
The Board considered the benefits realized by Invesco Advisers and the Affiliated Sub-Advisers as a result of portfolio brokerage transactions executed through “soft dollar” arrangements. The Board noted that soft dollar arrangements shift the payment obligation for research services from Invesco Advisers and the Affiliated Sub-Advisers to the Invesco Funds and that the research received may be used with other clients of Invesco Advisers and may reduce Invesco Advisers’ and the Affiliated Sub-Advisers’ expenses. The Board also considered that it receives periodic reports from the Chief Compliance Officer of the Invesco Funds demonstrating that these arrangements are consistent with regulatory requirements. The Board did not deem the soft dollar arrangements to be inappropriate.
The Board considered that the Fund’s uninvested cash and cash collateral from any securities lending arrangements may be invested in money market funds advised by Invesco Advisers pursuant to procedures approved by the Board. The Board noted that Invesco Advisers receives advisory fees from these affiliated money market funds attributable to such investments, although Invesco Advisers has contractually agreed to waive through varying periods the advisory fees payable by the Invesco Funds with respect to investments in the affiliated money market funds. The waiver is in an amount equal to 100% of the net advisory fee Invesco Advisers receives from the affiliated money market funds with respect to the Fund’s investment in the affiliated money market funds of uninvested cash, but not cash collateral. The Board concluded that the amount of advisory fees received by Invesco Advisors from the Fund’s investment of cash collateral from any securities lending arrangements in the affiliated money market funds is fair and reasonable.
The Board also considered the Fund may use an affiliated broker to execute certain trades for the Fund to among other things, control information leakage, and were advised that such trades would be executed in compliance with rules under the Investment Company Act of 1940, as amended, and consistent with best execution obligations.
24 Invesco Charter Fund
Tax Information
Form 1099-DIV, Form 1042-S and other year–end tax information provide shareholders with actual calendar year amounts that should be included in their tax returns. Shareholders should consult their tax advisors.
The following distribution information is being provided as required by the Internal Revenue Code or to meet a specific state’s requirement.
The Fund designates the following amounts or, if subsequently determined to be different, the maximum amount allowable for its fiscal year ended October 31, 2015:
| | | | |
Federal and State Income Tax | |
Long-Term Capital Gain Distributions | | $ | 551,235,754 | |
Qualified Dividend Income* | | | 100 | % |
Corporate Dividends Received Deduction* | | | 100 | % |
U.S. Treasury Obligations* | | | 0 | % |
| | * | The above percentages are based on ordinary income dividends paid to shareholders during the Fund’s fiscal year. |
| | | | |
Non-Resident Alien Shareholders | |
Qualified Short-Term Gains | | $ | 34,723,498 | |
25 Invesco Charter Fund
Trustees and Officers
The address of each trustee and officer is AIM Equity Funds (Invesco Equity Funds) (the “Trust”), 11 Greenway Plaza, Suite 1000, Houston, Texas 77046-1173. The trustees serve for the life of the Trust, subject to their earlier death, incapacitation, resignation, retirement or removal as more specifically provided in the Trust’s organizational documents. Each officer serves for a one year term or until their successors are elected and qualified. Column two below includes length of time served with predecessor entities, if any.
| | | | | | | | |
Name, Year of Birth and
Position(s) Held with the Trust | | Trustee and/
or Officer Since | | Principal Occupation(s)
During Past 5 Years | | Number of Funds in Fund Complex Overseen by Trustee | | Other Directorship(s)
Held by Trustee During Past 5 Years |
| Interested Persons | | | | | | | | |
| Martin L. Flanagan1 — 1960 Trustee | | 2007 | | Executive Director, Chief Executive Officer and President, Invesco Ltd. (ultimate parent of Invesco and a global investment management firm); Advisor to the Board, Invesco Advisers, Inc. (formerly known as Invesco Institutional (N.A.), Inc.); Trustee, The Invesco Funds; Vice Chair, Investment Company Institute; and Member of Executive Board, SMU Cox School of Business Formerly: Chairman and Chief Executive Officer, Invesco Advisers, Inc. (registered investment adviser); Director, Chairman, Chief Executive Officer and President, IVZ Inc. (holding company), INVESCO Group Services, Inc. (service provider) and Invesco North American Holdings, Inc. (holding company); Director, Chief Executive Officer and President, Invesco Holding Company Limited (parent of Invesco and a global investment management firm); Director, Invesco Ltd.; Chairman, Investment Company Institute and President, Co-Chief Executive Officer, Co-President, Chief Operating Officer and Chief Financial Officer, Franklin Resources, Inc. (global investment management organization). | | 145 | | None |
Philip A. Taylor2 — 1954 Trustee, President and Principal Executive Officer | | 2006 | | Head of North American Retail and Senior Managing Director, Invesco Ltd.; Director, Co-Chairman, Co-President and Co-Chief Executive Officer, Invesco Advisers, Inc. (formerly known as Invesco Institutional (N.A.), Inc.) (registered investment adviser); Director, Chairman, Chief Executive Officer and President, Invesco Management Group, Inc. (formerly known as Invesco Aim Management Group, Inc.) (financial services holding company); Director and President, INVESCO Funds Group, Inc. (registered investment adviser and registered transfer agent); Director and Chairman, Invesco Investment Services, Inc. (formerly known as Invesco Aim Investment Services, Inc.) (registered transfer agent) and IVZ Distributors, Inc. (formerly known as INVESCO Distributors, Inc.) (registered broker dealer); Chief Executive Officer, Invesco Corporate Class Inc. (corporate mutual fund company) Director, Chairman and Chief Executive Officer, Invesco Canada Ltd. (formerly known as Invesco Trimark Ltd./Invesco Trimark Ltèe) (registered investment adviser and registered transfer agent); Trustee, President and Principal Executive Officer, The Invesco Funds (other than AIM Treasurer’s Series Trust (Invesco Treasurer’s Series Trust), Short-Term Investments Trust and Invesco Management Trust); Trustee and Executive Vice President, The Invesco Funds (AIM Treasurer’s Series Trust (Invesco Treasurer’s Series Trust), Short-Term Investments Trust and Invesco Management Trust only); Director, Invesco Investment Advisers LLC (formerly known as Van Kampen Asset Management); Director, Chief Executive Officer and President, Van Kampen Exchange Corp. Formerly: Director, President and Chairman, Invesco Inc. (holding company), Invesco Canada Holdings Inc. (holding company), Trimark Investments Ltd./Placements Trimark Ltèe and Invesco Financial Services Ltd/Services Financiers Invesco Ltèe; Chief Executive Officer, Invesco Canada Fund Inc (corporate mutual fund company); Director and Chairman, Van Kampen Investor Services Inc.; Director, Chief Executive Officer and President, 1371 Preferred Inc. (holding company) and Van Kampen Investments Inc.; Director and President, AIM GP Canada Inc. (general partner for limited partnerships) and Van Kampen Advisors, Inc.; Director and Chief Executive Officer, Invesco Trimark Dealer Inc. (registered broker dealer); Director, Invesco Distributors, Inc. (formerly known as Invesco Aim Distributors, Inc.) (registered broker dealer); Manager, Invesco PowerShares Capital Management LLC; Director, Chief Executive Officer and President, Invesco Advisers, Inc.; Director, Chairman, Chief Executive Officer and President, Invesco Aim Capital Management, Inc.; President, Invesco Trimark Dealer Inc. and Invesco Trimark Ltd./Invesco Trimark Ltèe; Director and President, AIM Trimark Corporate Class Inc. and AIM Trimark Canada Fund Inc.; Senior Managing Director, Invesco Holding Company Limited; Director and Chairman, Fund Management Company (former registered broker dealer); President and Principal Executive Officer, The Invesco Funds (AIM Treasurer’s Series Trust (Invesco Treasurer’s Series Trust), and Short-Term Investments Trust only); President, AIM Trimark Global Fund Inc. and AIM Trimark Canada Fund Inc.. | | 145 | | None |
| 1 | Mr. Flanagan is considered an interested person (within the meaning of Section 2(a)(19) of the 1940 Act) of the Trust because he is an officer of the Adviser to the Trust, and an officer and a director of Invesco Ltd., ultimate parent of the Adviser. |
| 2 | Mr. Taylor is considered an interested person (within the meaning of Section 2(a)(19) of the 1940 Act) of the Trust because he is an officer and a director of the Adviser. |
T-1 Invesco Charter Fund
Trustees and Officers—(continued)
| | | | | | | | |
Name, Year of Birth and
Position(s) Held with the Trust | | Trustee and/
or Officer Since | | Principal Occupation(s)
During Past 5 Years | | Number of Funds in Fund Complex Overseen by Trustee | | Other Directorship(s)
Held by Trustee During
Past 5 Years |
| Independent Trustees | | | | | | | | |
Bruce L. Crockett — 1944 Trustee and Chair | | 2003 | | Chairman, Crockett Technologies Associates (technology consulting company) Formerly: Director, Captaris (unified messaging provider); Director, President and Chief Executive Officer, COMSAT Corporation; Chairman, Board of Governors of INTELSAT (international communications company); ACE Limited (insurance company); Independent Directors Council and Investment Company Institute | | 145 | | ALPS (Attorneys Liability Protection Society) (insurance company) and Globe Specialty Metals, Inc. (metallurgical company) |
David C. Arch — 1945 Trustee | | 2010 | | Chairman of Blistex Inc., a consumer health care products manufacturer | | 145 | | Board member of the Illinois Manufacturers’ Association; Member of the Board of Visitors, Institute for the Humanities, University of Michigan; Member of the Audit Committee of the Edward-Elmhurst Hospital |
James T. Bunch — 1942 Trustee | | 2000 | | Managing Member, Grumman Hill Group LLC (family office/private equity investments) Formerly: Founder, Green Manning & Bunch Ltd. (investment banking firm) (1988-2010); Executive Committee, United States Golf Association; and Chairman, Board of Governors, Western Golf Association | | 145 | | Chairman of the Board of Trustees, Evans Scholars Foundation; and Chairman of the Board, Denver Film Society |
Rodney F. Dammeyer — 1940 Trustee | | 2010 | | Chairman of CAC, LLC, (private company offering capital investment and management advisory services) Formerly: Prior to 2001, Managing Partner at Equity Group Corporate Investments; Prior to 1995, Chief Executive Officer of Itel Corporation (formerly Anixter International); Prior to 1985, experience includes Senior Vice President and Chief Financial Officer of Household International, Inc., Executive Vice President and Chief Financial Officer of Northwest Industries, Inc. and Partner of Arthur Andersen & Co.; From 1987 to 2010, Director/Trustee of investment companies in the Van Kampen Funds complex | | 145 | | Director of Quidel Corporation and Stericycle, Inc. |
Albert R. Dowden — 1941 Trustee | | 2003 | | Director of a number of public and private business corporations, including the Boss Group, Ltd. (private investment and management); Nature’s Sunshine Products, Inc. and Reich & Tang Funds (5 portfolios) (registered investment company) Formerly: Director, Homeowners of America Holding Corporation/Homeowners of America Insurance Company (property casualty company); Director, Continental Energy Services, LLC (oil and gas pipeline service); Director, CompuDyne Corporation (provider of product and services to the public security market) and Director, Annuity and Life Re (Holdings), Ltd. (reinsurance company); Director, President and Chief Executive Officer, Volvo Group North America, Inc.; Senior Vice President, AB Volvo; Director of various public and private corporations; Chairman, DHJ Media, Inc.; Director, Magellan Insurance Company; and Director, The Hertz Corporation, Genmar Corporation (boat manufacturer), National Media Corporation; Advisory Board of Rotary Power International (designer, manufacturer, and seller of rotary power engines); and Chairman, Cortland Trust, Inc. (registered investment company) | | 145 | | Director of: Nature’s Sunshine Products, Inc., Reich & Tang Funds, Homeowners of America Holding Corporation/ Homeowners of America Insurance Company, the Boss Group |
Jack M. Fields — 1952 Trustee | | 2003 | | Chief Executive Officer, Twenty First Century Group, Inc. (government affairs company); Owner and Chief Executive Officer, Dos Angeles Ranch, L.P. (cattle, hunting, corporate entertainment); and Discovery Global Education Fund (non-profit) Formerly: Chief Executive Officer, Texana Timber LP (sustainable forestry company); Director of Cross Timbers Quail Research Ranch (non-profit); and member of the U.S. House of Representatives | | 145 | | Insperity, Inc. (formerly known as Administaff) |
Prema Mathai-Davis — 1950 Trustee | | 2003 | | Retired. Formerly: Chief Executive Officer, YWCA of the U.S.A. | | 145 | | None |
Larry Soll — 1942 Trustee | | 1997 | | Retired. Formerly: Chairman, Chief Executive Officer and President, Synergen Corp. (a biotechnology company) | | 145 | | None |
Hugo F. Sonnenschein — 1940 Trustee | | 2010 | | President Emeritus and Honorary Trustee of the University of Chicago and the Adam Smith Distinguished Service Professor in the Department of Economics at the University of Chicago. Prior to 2000, President of the University of Chicago | | 145 | | Trustee of the University of Rochester and a member of its investment committee; Member of the National Academy of Sciences and the American Philosophical Society; Fellow of the American Academy of Arts and Sciences |
Raymond Stickel, Jr. — 1944 Trustee | | 2005 | | Retired. Formerly: Director, Mainstay VP Series Funds, Inc. (25 portfolios) and Partner, Deloitte & Touche | | 145 | | None |
T-2 Invesco Charter Fund
Trustees and Officers—(continued)
| | | | | | | | |
Name, Year of Birth and
Position(s) Held with the Trust | | Trustee and/
or Officer Since | | Principal Occupation(s)
During Past 5 Years | | Number of Funds in Fund Complex Overseen by Trustee | | Other Directorship(s)
Held by Trustee During
Past 5 Years |
| Independent Trustees—(continued) |
Suzanne H. Woolsey — 1941 Trustee | | 2014 | | Chief Executive Officer of Woolsey Partners LLC | | 145 | | Emeritus Chair of the Board of Trustees of the Institute for Defense Analyses; Trustee of Colorado College; Trustee of California Institute of Technology; Prior to 2014, Director of Fluor Corp.; Prior to 2010, Trustee of the German Marshall Fund of the United States; Prior to 2010 Trustee of the Rocky Mountain Institute |
| Other Officers | | | | | | | | |
Russell C. Burk — 1958 Senior Vice President and Senior Officer | | 2005 | | Senior Vice President and Senior Officer, The Invesco Funds | | N/A | | N/A |
John M. Zerr — 1962 Senior Vice President, Chief Legal Officer and Secretary | | 2006 | | Director, Senior Vice President, Secretary and General Counsel, Invesco Management Group, Inc. (formerly known as Invesco Aim Management Group, Inc.) and Van Kampen Exchange Corp.; Senior Vice President, Invesco Advisers, Inc. (formerly known as Invesco Institutional (N.A.), Inc.) (registered investment adviser); Senior Vice President and Secretary, Invesco Distributors, Inc. (formerly known as Invesco Aim Distributors, Inc.); Director, Vice President and Secretary, Invesco Investment Services, Inc. (formerly known as Invesco Aim Investment Services, Inc.) and IVZ Distributors, Inc. (formerly known as INVESCO Distributors, Inc.); Director and Vice President, INVESCO Funds Group, Inc.; Senior Vice President, Chief Legal Officer and Secretary, The Invesco Funds; Managing Director, Invesco PowerShares Capital Management LLC; Director, Secretary and General Counsel, Invesco Investment Advisers LLC (formerly known as Van Kampen Asset Management); Secretary and General Counsel, Invesco Capital Markets, Inc. (formerly known as Van Kampen Funds Inc.) and Chief Legal Officer, PowerShares Exchange-Traded Fund Trust, PowerShares Exchange-Traded Fund Trust II, PowerShares India Exchange-Traded Fund Trust, PowerShares Actively Managed Exchange-Traded Fund Trust, and PowerShares Actively Managed Exchange-Traded Commodity Fund Trust Formerly: Director and Vice President, Van Kampen Advisors Inc.; Director, Vice President, Secretary and General Counsel, Van Kampen Investor Services Inc.; Director, Invesco Distributors, Inc. (formerly known as Invesco Aim Distributors, Inc.); Director, Senior Vice President, General Counsel and Secretary, Invesco Aim Advisers, Inc. and Van Kampen Investments Inc.; Director, Vice President and Secretary, Fund Management Company; Director, Senior Vice President, Secretary, General Counsel and Vice President, Invesco Aim Capital Management, Inc.; Chief Operating Officer and General Counsel, Liberty Ridge Capital, Inc. (an investment adviser); Vice President and Secretary, PBHG Funds (an investment company) and PBHG Insurance Series Fund (an investment company); Chief Operating Officer, General Counsel and Secretary, Old Mutual Investment Partners (a broker-dealer); General Counsel and Secretary, Old Mutual Fund Services (an administrator) and Old Mutual Shareholder Services (a shareholder servicing center); Executive Vice President, General Counsel and Secretary, Old Mutual Capital, Inc. (an investment adviser); and Vice President and Secretary, Old Mutual Advisors Funds (an investment company) | | N/A | | N/A |
Sheri Morris — 1964 Vice President, Treasurer and Principal Financial Officer | | 2003 | | Vice President, Treasurer and Principal Financial Officer, The Invesco Funds; Vice President, Invesco Advisers, Inc. (formerly known as Invesco Institutional (N.A.), Inc.) (registered investment adviser); and Vice President, PowerShares Exchange-Traded Fund Trust, PowerShares Exchange-Traded Fund Trust II, PowerShares India Exchange-Traded Fund Trust, PowerShares Actively Managed Exchange-Traded Fund Trust, and PowerShares Actively Managed Exchange-Traded Commodity Fund Trust Formerly: Vice President, Invesco Aim Advisers, Inc., Invesco Aim Capital Management, Inc. and Invesco Aim Private Asset Management, Inc.; Assistant Vice President and Assistant Treasurer, The Invesco Funds and Assistant Vice President, Invesco Advisers, Inc., Invesco Aim Capital Management, Inc. and Invesco Aim Private Asset Management, Inc.; and Treasurer, PowerShares Exchange-Traded Fund Trust, PowerShares Exchange-Traded Fund Trust II, PowerShares India Exchange-Traded Fund Trust and PowerShares Actively Managed Exchange-Traded Fund Trust | | N/A | | N/A |
T-3 Invesco Charter Fund
Trustees and Officers—(continued)
| | | | | | | | |
Name, Year of Birth and
Position(s) Held with the Trust | | Trustee and/
or Officer Since | | Principal Occupation(s)
During Past 5 Years | | Number of Funds in Fund Complex Overseen by Trustee | | Other Directorship(s)
Held by Trustee During
Past 5 Years |
| Other Officers—(continued) | | | | | | | | |
Karen Dunn Kelley — 1960 Vice President | | 2003 | | Senior Managing Director, Investments, Invesco Ltd.; Director, Co-President, Co-Chief Executive Officer, and Co-Chairman, Invesco Advisers, Inc. (formerly known as Invesco Institutional (N.A.), Inc.) (registered investment adviser); Chairman, Invesco Senior Secured Management, Inc.; Senior Vice President, Invesco Management Group, Inc. (formerly known as Invesco Aim Management Group, Inc.); Executive Vice President, Invesco Distributors, Inc. (formerly known as Invesco Aim Distributors, Inc.); Director, Invesco Mortgage Capital Inc. and Invesco Management Company Limited; Vice President, The Invesco Funds (other than AIM Treasurer’s Series Trust (Invesco Treasurer’s Series Trust), Short-Term Investments Trust and Invesco Management Trust); and President and Principal Executive Officer, The Invesco Funds (AIM Treasurer’s Series Trust (Invesco Treasurer’s Series Trust), Short-Term Investments Trust and Invesco Management Trust only) Formerly: Director and President, INVESCO Asset Management (Bermuda) Ltd., Director, INVESCO Global Asset Management Limited and INVESCO Management S.A.; Senior Vice President, Van Kampen Investments Inc. and Invesco Advisers, Inc. (formerly known as Invesco Institutional (N.A.), Inc.) (registered investment adviser); Vice President, Invesco Advisers, Inc. (formerly known as Invesco Institutional (N.A.), Inc.); Director of Cash Management and Senior Vice President, Invesco Advisers, Inc. and Invesco Aim Capital Management, Inc.; Director and President, Fund Management Company; Chief Cash Management Officer, Director of Cash Management, Senior Vice President, and Managing Director, Invesco Aim Capital Management, Inc.; Director of Cash Management, Senior Vice President, and Vice President, Invesco Advisers, Inc. and The Invesco Funds (AIM Treasurer’s Series Trust (Invesco Treasurer’s Series Trust), and Short-Term Investments Trust only) | | N/A | | N/A |
Crissie M. Wisdom — 1969 Anti-Money Laundering Compliance Officer | | 2013 | | Anti-Money Laundering Compliance Officer, Invesco Advisers, Inc. (formerly known as Invesco Institutional (N.A.), Inc.) (registered investment adviser), Invesco Capital Markets, Inc. (formerly known as Van Kampen Funds Inc.), Invesco Distributors, Inc., Invesco Investment Services, Inc., Invesco Management Group, Inc., Van Kampen Exchange Corp., The Invesco Funds, and PowerShares Exchange-Traded Fund Trust, PowerShares Exchange-Traded Fund Trust II, PowerShares India Exchange-Traded Fund Trust, PowerShares Actively Managed Exchange-Traded Fund Trust and PowerShares Actively Managed Exchange-Traded Commodity Fund Trust; Anti-Money Laundering Compliance Officer and Bank Secrecy Act Officer, INVESCO National Trust Company and Invesco Trust Company; and Fraud Prevention Manager and Controls and Risk Analysis Manager for Invesco Investment Services, Inc.. | | N/A | | N/A |
Lisa O. Brinkley — 1959 Chief Compliance Officer | | 2015 | | Senior Vice President and Chief Compliance Officer, Invesco Advisers, Inc. (registered investment adviser) (formerly known as Invesco Institutional (N.A., Inc.); and Chief Compliance Officer, The Invesco Funds Formerly: Global Assurance Officer, Invesco Ltd. and Vice President, The Invesco Funds; Chief Compliance Officer, Invesco Distributors, Inc. (formerly known as Invesco Aim Distributors, Inc.), Invesco Investment Services, Inc.(formerly known as Invesco Aim Investment Services, Inc.) and Van Kampen Investor Services Inc.; Senior Vice President, Invesco Management Group, Inc.; Senior Vice President and Chief Compliance Officer, Invesco Advisers, Inc. and The Invesco Funds; Vice President and Chief Compliance Officer, Invesco Aim Capital Management, Inc. and Invesco Distributors, Inc.; Vice President, Invesco Investment Services, Inc. and Fund Management Company. | | N/A | | N/A |
The Statement of Additional Information of the Trust includes additional information about the Fund’s Trustees and is available upon request, without charge, by calling 1.800.959.4246. Please refer to the Fund’s prospectus for information on the Fund’s sub-advisers.
| | | | | | |
Office of the Fund 11 Greenway Plaza, Suite 1000 Houston, TX 77046-1173 | | Investment Adviser Invesco Advisers, Inc. 1555 Peachtree Street, N.E. Atlanta, GA 30309 | | Distributor Invesco Distributors, Inc. 11 Greenway Plaza, Suite 1000 Houston, TX 77046-1173 | | Auditors PricewaterhouseCoopers LLP 1000 Louisiana Street, Suite 5800 Houston, TX 77002-5678 |
| | | |
| | | | | | |
Counsel to the Fund Stradley Ronon Stevens & Young, LLP 2005 Market Street, Suite 2600 Philadelphia, PA 19103-7018 | | Counsel to the Independent Trustees Goodwin Procter LLP 901 New York Avenue, N.W. Washington, D.C. 20001 | | Transfer Agent Invesco Investment Services, Inc. 11 Greenway Plaza, Suite 1000 Houston, TX 77046-1173 | | Custodian State Street Bank and Trust Company 225 Franklin Street Boston, MA 02110-2801 |
T-4 Invesco Charter Fund

Invesco mailing information
Send general correspondence to Invesco Investment Services, Inc., P.O. Box 219078, Kansas City, MO 64121-9078.
Important notice regarding delivery of security holder documents
To reduce Fund expenses, only one copy of most shareholder documents may be mailed to shareholders with multiple accounts at the same address (Householding). Mailing of your shareholder documents may be householded indefinitely unless you instruct us otherwise. If you do not want the mailing of these documents to be combined with those for other members of your household, please contact Invesco Investment Services, Inc. at 800 959 4246 or contact your financial institution. We will begin sending you individual copies for each account within 30 days after receiving your request.
Fund holdings and proxy voting information
The Fund provides a complete list of its holdings four times in each fiscal year, at the quarter ends. For the second and fourth quarters, the lists appear in the Fund’s semiannual and annual reports to shareholders. For the first and third quarters, the Fund files the lists with the Securities and Exchange Commission (SEC) on Form N-Q. The most recent list of portfolio holdings is available at invesco.com/completeqtrholdings. Shareholders can also look up the Fund’s Forms N-Q on the SEC website at sec.gov. Copies of the Fund’s Forms N-Q may be reviewed and copied at the SEC Public Reference Room in Washington, D.C. You can obtain information on the operation of the Public Reference Room, including information about duplicating fee charges, by calling 202 551 8090 or 800 732 0330, or by electronic request at the following email address: publicinfo@sec.gov. The SEC file numbers for the Fund are shown below.
A description of the policies and procedures that the Fund uses to determine how to vote proxies relating to portfolio securities is available without charge, upon request, from our Client Services department at 800 959 4246 or at invesco.com/proxyguidelines. The information is also available on the SEC website, sec.gov.
| | |
Information regarding how the Fund voted proxies related to its portfolio securities during the most recent 12-month period ended June 30 is available at invesco.com/proxysearch. The information is also available on the SEC website, sec.gov. Invesco Advisers, Inc. is an investment adviser; it provides investment advisory services to individual and institutional clients and does not sell securities. Invesco Distributors, Inc. is the US distributor for Invesco Ltd.’s retail mutual funds, exchange-traded funds and institutional money market funds. Both are wholly owned, indirect subsidiaries of Invesco Ltd. | |  |
| | | | |
| SEC file numbers: 811-01424 and 002-25469 | | CHT-AR-1 | | Invesco Distributors, Inc. |
| | | | |
| | |
 | | Annual Report to Shareholders | | October 31, 2015 |
| | |
| | Invesco Diversified Dividend Fund |
| | Nasdaq: |
| | A: LCEAX n B: LCEDX n C: LCEVX n R: DDFRX n Y: LCEYX n Investor: LCEIX R5: DDFIX n R6: LCEFX |

Letters to Shareholders
| | |

Philip Taylor | | Dear Shareholders: This annual report includes information about your Fund, including performance data and a complete list of its investments as of the close of the reporting period. Inside is a discussion of how your Fund was managed and the factors that affected its performance during the reporting period. I hope you find this report of interest. The US economy expanded and unemployment declined throughout the reporting period. Continuing low energy prices benefited consumers, but a strong US dollar crimped corporate profits. The US Federal Reserve signaled that it was increasingly likely to raise interest rates, based on generally positive economic data, but uncertainty remained about when it might act. Overseas, the story was much different. Low energy prices hurt the economies of some oil-producing nations, such as Brazil and Russia. During the reporting period, the European Central Bank as well as central banks in China and Japan – among other countries – either |
instituted or maintained extraordinarily accommodative monetary policies in response to economic weakness. Investor uncertainty, such as we saw for much of the reporting period – and market volatility, such as we saw at the end of the reporting period – are unfortunate facts of life when it comes to investing. Some investors use these things as excuses to delay saving and investing for their long-term financial goals. That’s why Invesco encourages investors to work with a professional financial adviser who can stress the importance of starting to save and invest early and the importance of adhering to a disciplined investment plan – when times are good and when they’re uncertain. A financial adviser who knows your unique financial situation, investment goals and risk tolerance can be an invaluable partner as you seek to achieve your financial goals. He or she can offer a long-term perspective when markets are volatile and time-tested advice and guidance when your financial situation or investment goals change. |
Timely information when and where you want it
Invesco’s efforts to help investors achieve their financial objectives include providing individual investors and financial professionals with timely information about the markets, the economy and investing – whenever and wherever they want it.
Our website, invesco.com/us, offers a wide range of market insights and investment perspectives. On the website, you’ll find detailed information about our funds, including prices, performance, holdings and portfolio manager commentaries. You can access information about your account by completing a simple, secure online registration. Click on the “Need to register” link in the “Account Access” box on our homepage to get started.
Invesco’s mobile apps for iPhone® and iPad® (both available free from the App StoreSM) allow you to obtain the same detailed information, monitor your account and create customizable watch lists. Also, they allow you to access investment insights from our investment leaders, market strategists, economists and retirement experts. You can sign up to be alerted when new commentary is added, and you can watch portfolio manager videos and have instant access to Invesco news and updates wherever you may be.
In addition to the resources accessible on our website and through our mobile app, you can obtain timely updates to help you stay informed about the markets, the economy and investing by connecting with Invesco on Twitter, LinkedIn or Facebook. You can access our blog at blog.invesco.us.com. Our goal is to provide you the information you want, when and where you want it.
Have questions?
For questions about your account, feel free to contact an Invesco client services representative at 800 959 4246. For Invesco-related questions or comments, please email me directly at phil@invesco.com.
All of us at Invesco look forward to serving your investment management needs for many years to come. Thank you for investing with us.
Sincerely,

Philip Taylor
Senior Managing Director, Invesco Ltd.
iPhone and iPad are trademarks of Apple Inc., registered in the US and other countries. App Store is a service mark of Apple Inc. Invesco Distributors, Inc. is not affiliated with Apple Inc.
2 Invesco Diversified Dividend Fund
| | |

Bruce Crockett | | Dear Fellow Shareholders: Among the many important lessons I’ve learned in more than 40 years in a variety of business endeavors is the value of a trusted advocate. As independent chair of the Invesco Funds Board, I can assure you that the members of the Board are strong advocates for the interests of investors in Invesco’s mutual funds. We work hard to represent your interests through oversight of the quality of the investment management services your funds receive and other matters important to your investment, including but not limited to: n Ensuring that Invesco offers a diverse lineup of mutual funds that your financial adviser can use to strive to meet your financial needs as your investment goals change over time. n Monitoring how the portfolio management teams of the Invesco funds are performing in light of changing economic and market conditions. |
| n | | Assessing each portfolio management team’s investment performance within the context of the investment strategy described in the fund’s prospectus. |
| n | | Monitoring for potential conflicts of interests that may impact the nature of the services that your funds receive. |
We believe one of the most important services we provide our fund shareholders is the annual review of the funds’ advisory and sub-advisory contracts with Invesco Advisers and its affiliates. This review is required by the Investment Company Act of 1940 and focuses on the nature and quality of the services Invesco provides as the adviser to the Invesco funds and the reasonableness of the fees that it charges for those services. Each year, we spend months carefully reviewing information received from Invesco and a variety of independent sources, such as performance and fee data prepared by Lipper Inc., an independent, third-party firm widely recognized as a leader in its field. We also meet with our independent legal counsel and other independent advisers to review and help us assess the information that we have received. Our goal is to assure that you receive quality investment management services for a reasonable fee.
I trust the measures outlined above provide assurance that you have a worthy advocate when it comes to choosing the Invesco Funds.
As always, please contact me at bruce@brucecrockett.com with any questions or concerns you may have. On behalf of the Board, we look forward to continuing to represent your interests and serving your needs.
Sincerely,

Bruce L. Crockett
Independent Chair
Invesco Funds Board of Trustees
3 Invesco Diversified Dividend Fund
Management’s Discussion of Fund Performance
Performance summary
For the fiscal year ended October 31, 2015, Class A shares of Invesco Diversified Dividend Fund (the Fund), at net asset value (NAV), outperformed the Fund’s broad market, style-specific and peer group indexes, the S&P 500 Index, the Russell 1000 Value Index and the Lipper Large-Cap Value Funds Index, respectively.
Your Fund’s long-term performance appears later in this report.
Fund vs. Indexes
Total returns, 10/31/14 to 10/31/15, at net asset value (NAV). Performance shown does not include applicable contingent deferred sales charges (CDSC) or front-end sales charges, which would have reduced performance.
| | | | |
Class A Shares | | | 7.09 | % |
Class B Shares | | | 6.35 | |
Class C Shares | | | 6.36 | |
Class R Shares | | | 6.87 | |
Class Y Shares | | | 7.36 | |
Investor Class Shares | | | 7.16 | |
Class R5 Shares | | | 7.41 | |
Class R6 Shares | | | 7.57 | |
S&P 500 Indexq (Broad Market Index) | | | 5.20 | |
Russell 1000 Value Indexq (Style-Specific Index) | | | 0.53 | |
Lipper Large-Cap Value Funds Indexn (Peer Group Index) | | | 0.66 | |
Source(s): qFactSet Research Systems Inc.; nLipper Inc. | | | | |
Market conditions and your Fund
During the fiscal year ended October 31, 2015, the US economy improved slowly, though the health of individual economic sectors varied dramatically. The energy sector saw a continued slowdown as oil prices fell in response to increasing supply amidst slowing global demand. In contrast, continued low interest rates, increased availability of credit from lenders and a better employment picture all contributed to an improved consumer outlook. However, the US equity markets moved lower in the summer of 2015 as a significant downturn in China’s financial markets and weak global economic growth led to increased investor uncertainty and market volatility. As emerging market concerns abated, US markets recovered from their earlier decline and finished higher for the fiscal year.
During the reporting period, our total
return approach continued to emphasize long-term capital appreciation, current income and capital preservation. We believe the Fund may serve as an equity foundation within a well-diversified asset allocation strategy, complementing more aggressive and cyclical investments. As always, we look for dividend-paying companies with strong profitability, solid balance sheets and capital allocation policies that support sustained or increasing dividends and share repurchases. We perform extensive fundamental research, incorporating both financial statement analysis and an assessment of the potential reward relative to the downside risk, to determine a fair valuation over our two- to three-year investment horizon for each stock. We believe this process may provide a valuable combination of dividend income, price appreciation and capital preservation. We also maintain a
rigorous sell discipline and consider selling or trimming stocks that no longer meet our investment criteria.
The Fund’s investments in the consumer staples sector performed well during the fiscal year and provided the largest contribution to Fund returns. Kraft Heinz (formerly Kraft Foods Group), General Mills and Heineken were all among the largest contributors to Fund performance. Kraft Foods Group accepted an attractive offer to merge with H.J. Heinz. We believed the new combined company had the opportunity to improve profitability through cost savings and better leverage of its domestic and international distribution networks. General Mills improved sales in key categories such as cereal and yogurt that benefited from product innovation. The company’s operating margins were also supported by ongoing cost savings initiatives in North America, which are now being expanded to other divisions within its operations.
Several of the Fund’s holdings in the consumer discretionary sector performed well, including Target. The company took several positive steps under a new chief executive officer, who joined the company in 2014. The firm discontinued operations in Canada, which lowered its capital requirements and improved cash flows. Target also refocused on its core merchandising strengths – apparel, home, beauty and kids – leading to improved traffic and same store sales.
Select financials sector holdings also performed well during the reporting period, including Stancorp Financial Group. Shares of the company rose after it received an offer to be acquired in an all-cash transaction at a value well above its stock price at the time of the announcement.
Energy was the worst-performing area of the market during the fiscal year.
| | | | | | |
| Portfolio Composition | |
By sector | | | % of total net assets | |
| | | | |
Consumer Staples | | | 24.5 | % |
Financials | | | 14.8 | |
Utilities | | | 11.7 | |
Consumer Discretionary | | | 11.4 | |
Industrials | | | 9.4 | |
Energy | | | 6.1 | |
Health Care | | | 5.3 | |
Telecommunication Services | | | 3.4 | |
Information Technology | | | 2.2 | |
Materials | | | 1.7 | |
| Money Market Funds Plus Other Assets Less Liabilities | | | 9.5 | |
| | | | |
| Top 10 Equity Holdings* |
| | % of total net assets |
| | | | | | |
1. | | General Mills, Inc. | | | 3.3 | % |
2. | | Campbell Soup Co. | | | 2.6 | |
3. | | Heineken N.V. | | | 2.6 | |
4. | | Coca-Cola Co. (The) | | | 2.5 | |
5. | | AT&T Inc. | | | 2.3 | |
6. | | Kraft Heinz Co. (The) | | | 2.2 | |
7. | | Eli Lilly and Co. | | | 1.9 | |
8. | | Walgreens Boots Alliance, Inc. | | | 1.9 | |
9. | | PPL Corp. | | | 1.9 | |
10. | | Newell Rubbermaid Inc. | | | 1.8 | |
| | | | |
Total Net Assets | | | $11.8 billion | |
| |
| Total Number of Holdings* | | | 78 | |
The Fund’s holdings are subject to change, and there is no assurance that the Fund will continue to hold any particular security.
*Excluding money market fund holdings.
Data presented here are as of October 31, 2015.
4 Invesco Diversified Dividend Fund
Although the Fund’s underweight position in this sector helped mitigate the negative impact, several of the Fund’s energy holdings declined. Nabors Industries faced declining pricing and utilization for its rig fleet in North America as producers sharply pulled back on expenditures. This challenging environment was partially offset by earnings growth in the company’s international business. Royal Dutch Shell also underperformed during the reporting period following its announced acquisition of BG Group (not a Fund holding). The market’s negative reaction to this news was driven by concerns surrounding execution risk and potential dilution from the deal.
Within the industrials sector, Joy Global’s stock price was negatively affected by concerns about a downturn in mining and energy capital expenditures and fears of industry overcapacity. This was a new investment for the Fund during the fiscal year. We see the company as attractively valued based on our estimate of its normalized earnings power. In our view, its large installed asset base provides for stable, high margin aftermarket revenues that support profitability and cash flows across the cycle.
In addition to Joy Global, we made several other new investments in the energy and industrials sectors as valuations were attractive in areas impacted by the global downturn in commodities. This is an area we approached cautiously, scrutinizing and stress-testing balance sheets and cash flows to measure the ability to withstand likely impairments to asset values.
This profit cycle has seen the largest profit margin expansion in 50 years, despite a weaker than normal economic expansion versus previous cycles, as measured by gross domestic product growth from recession lows.1 A key question for us is how much of the expansion is structural, due to factors like better supply chain management, and how much is cyclical, due to factors such as corporations benefiting from lower funding costs due to historically low interest rates. We are conservative with our expectations for continued profit growth as other elements gain prominence in the market. For example, share buybacks during the reporting period were near peaks seen in the prior profit cycle2, and mergers and acquisitions activity surpassed the prior peaks of 1999 and 2007.3 Further, we have witnessed an unprecedented period of global, coordinated easing by central banks that had driven market valuations higher. The ability to sustain current valuations is
uncertain, particularly as central banks’ policies globally begin to diverge. In this environment, we remain diligent in our assessment of each investment’s risk-reward profile.
The Fund weathered a turbulent fiscal year well, consistent with our long-term mandate to emphasize capital appreciation, current income and capital preservation over a full market cycle. It has been our privilege to oversee Invesco Diversified Dividend Fund, and we thank you for your continued investment.
1 Source: Sanford C. Bernstein & Co., LLC
2 Source: FactSet Research Systems Inc.
3 Source(s): The Wall Street Journal
The views and opinions expressed in management’s discussion of Fund performance are those of Invesco Advisers, Inc. These views and opinions are subject to change at any time based on factors such as market and economic conditions. These views and opinions may not be relied upon as investment advice or recommendations, or as an offer for a particular security. The information is not a complete analysis of every aspect of any market, country, industry, security or the Fund. Statements of fact are from sources considered reliable, but Invesco Advisers, Inc. makes no representation or warranty as to their completeness or accuracy. Although historical performance is no guarantee of future results, these insights may help you understand our investment management philosophy.
See important Fund and, if applicable, index disclosures later in this report.
| | |
 | | Meggan Walsh Chartered Financial Analyst, Portfolio Manager, is lead manager of Invesco Diversified Dividend |
| Fund. She joined Invesco in 1991. Ms. Walsh earned a BS in finance from the University of Maryland and an MBA from Loyola University Maryland. |
| |
 | | Robert Botard Chartered Financial Analyst, Portfolio Manager, is manager of Invesco Diversified Dividend Fund. He |
| joined Invesco in 1993. Mr. Botard earned a BBA in finance and a BBA in international business from The University of Texas at Austin. He also earned a Master of International Management degree from the Thunderbird School of Global Management. |
| |
 | | Kristina Bradshaw Chartered Financial Analyst, Portfolio Manager, is manager of Invesco Diversified Dividend Fund. |
| She joined Invesco in 2006. |
| Ms. Bradshaw earned a BBA with honors from The University of Texas at Austin and an MBA from Stanford University’s Graduate School of Business. |
Assisted by the Dividend Value Team
5 Invesco Diversified Dividend Fund
Your Fund’s Long-Term Performance
Results of a $10,000 Investment – Oldest Share Class(es)
Fund and index data from 10/31/05
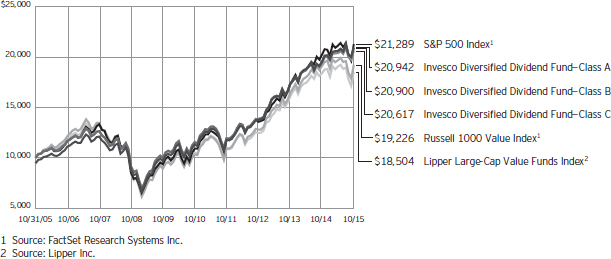
Past performance cannot guarantee comparable future results.
The data shown in the chart include reinvested distributions, applicable sales charges and Fund expenses including management fees. Results for Class B shares are calculated as if a hypothetical
shareholder had liquidated his entire investment in the Fund at the close of the reporting period and paid the contingent deferred sales charges, if applicable. Index results include reinvested dividends, but they do not reflect sales charges. Performance of the peer group,
if applicable, reflects fund expenses and management fees; performance of a market index does not. Performance shown in the chart and table(s) does not reflect deduction of taxes a shareholder would pay on Fund distributions or sale of Fund shares.
6 Invesco Diversified Dividend Fund
| | | | |
| Average Annual Total Returns | |
| As of 10/31/15, including maximum applicable sales charges | |
| |
Class A Shares | | | | |
Inception (12/31/01) | | | 7.34 | % |
10 Years | | | 7.67 | |
5 Years | | | 11.87 | |
1 Year | | | 1.19 | |
| |
Class B Shares | | | | |
Inception (12/31/01) | | | 7.36 | % |
10 Years | | | 7.65 | |
5 Years | | | 12.05 | |
1 Year | | | 1.35 | |
| |
Class C Shares | | | | |
Inception (12/31/01) | | | 7.02 | % |
10 Years | | | 7.50 | |
5 Years | | | 12.30 | |
1 Year | | | 5.36 | |
| |
Class R Shares | | | | |
Inception (10/25/05) | | | 8.14 | % |
10 Years | | | 8.04 | |
5 Years | | | 12.87 | |
1 Year | | | 6.87 | |
| |
Class Y Shares | | | | |
10 Years | | | 8.48 | % |
5 Years | | | 13.43 | |
1 Year | | | 7.36 | |
| |
Investor Class Shares | | | | |
Inception (7/15/05) | | | 7.88 | % |
10 Years | | | 8.35 | |
5 Years | | | 13.19 | |
1 Year | | | 7.16 | |
| |
Class R5 Shares | | | | |
Inception (10/25/05) | | | 8.74 | % |
10 Years | | | 8.64 | |
5 Years | | | 13.50 | |
1 Year | | | 7.41 | |
| |
Class R6 Shares | | | | |
10 Years | | | 8.41 | % |
5 Years | | | 13.41 | |
1 Year | | | 7.57 | |
Class R shares incepted on October 25, 2005. Performance shown prior to that date is that of Class A shares, restated to reflect the higher 12b-1 fees applicable to Class R shares.
Class R5 shares incepted on October 25, 2005. Performance shown prior to that date is that of Class A shares and includes the 12b-1 fees applicable to Class A shares.
Class Y shares incepted on October 3, 2008. Performance shown prior to that date is that of Class A shares and includes the 12b-1 fees applicable to Class A shares.
| | | | |
| Average Annual Total Returns | |
| As of 9/30/15, the most recent calendar quarter end, including maximum applicable sales charges | |
| |
Class A Shares | | | | |
Inception (12/31/01) | | | 7.04 | % |
10 Years | | | 7.10 | |
5 Years | | | 11.54 | |
1 Year | | | -1.01 | |
| |
Class B Shares | | | | |
Inception (12/31/01) | | | 7.06 | % |
10 Years | | | 7.08 | |
5 Years | | | 11.71 | |
1 Year | | | -1.09 | |
| |
Class C Shares | | | | |
Inception (12/31/01) | | | 6.72 | % |
10 Years | | | 6.93 | |
5 Years | | | 11.97 | |
1 Year | | | 2.98 | |
| |
Class R Shares | | | | |
10 Years | | | 7.47 | % |
5 Years | | | 12.54 | |
1 Year | | | 4.51 | |
| |
Class Y Shares | | | | |
10 Years | | | 7.90 | % |
5 Years | | | 13.10 | |
1 Year | | | 5.04 | |
| |
Investor Class Shares | | | | |
Inception (7/15/05) | | | 7.48 | % |
10 Years | | | 7.77 | |
5 Years | | | 12.86 | |
1 Year | | | 4.79 | |
| |
Class R5 Shares | | | | |
10 Years | | | 8.07 | % |
5 Years | | | 13.19 | |
1 Year | | | 5.09 | |
| |
Class R6 Shares | | | | |
10 Years | | | 7.83 | % |
5 Years | | | 13.07 | |
1 Year | | | 5.14 | |
Class R6 shares incepted on September 24, 2012. Performance shown prior to that date is that of Class A shares and includes the 12b-1 fees applicable to Class A shares.
The performance data quoted represent past performance and cannot guarantee comparable future results; current performance may be lower or higher. Please visit invesco.com/performance for the most recent month-end performance. Performance figures reflect reinvested distributions, changes in net asset value and the effect of the maximum sales charge
unless otherwise stated. Investment return and principal value will fluctuate so that you may have a gain or loss when you sell shares.
The net annual Fund operating expense ratio set forth in the most recent Fund prospectus as of the date of this report for Class A, Class B, Class C, Class R, Class Y, Investor Class, Class R5 and Class R6 shares was 0.84%, 1.59%, 1.59%, 1.09%, 0.59%, 0.77%, 0.55%, and 0.45%, respectively.1 The total annual Fund operating expense ratio set forth in the most recent Fund prospectus as of the date of this report for Class A, Class B, Class C, Class R, Class Y, Investor Class, Class R5 and Class R6 shares was 0.85%, 1.60%, 1.60%, 1.10%, 0.60%, 0.78%, 0.56% and 0.46%, respectively. The expense ratios presented above may vary from the expense ratios presented in other sections of this report that are based on expenses incurred during the period covered by this report.
Class A share performance reflects the maximum 5.50% sales charge, and Class B and Class C share performance reflects the applicable contingent deferred sales charge (CDSC) for the period involved. The CDSC on Class B shares declines from 5% beginning at the time of purchase to 0% at the beginning of the seventh year. The CDSC on Class C shares is 1% for the first year after purchase. Class R, Class Y, Investor Class, Class R5 and Class R6 shares do not have a front-end sales charge or a CDSC; therefore, performance is at net asset value.
The performance of the Fund’s share classes will differ primarily due to different sales charge structures and class expenses.
Fund performance reflects any applicable fee waivers and/or expense reimbursements. Had the adviser not waived fees and/or reimbursed expenses currently or in the past, returns would have been lower. See current prospectus for more information.
| 1 | Total annual Fund operating expenses after any contractual fee waivers and/or expense reimbursements by the adviser in effect through at least February 28, 2017. See current prospectus for more information. |
7 Invesco Diversified Dividend Fund
Invesco Diversified Dividend Fund’s investment objective is long-term growth of capital and, secondarily, current income.
| n | | Unless otherwise stated, information presented in this report is as of October 31, 2015, and is based on total net assets. |
| n | | Unless otherwise noted, all data provided by Invesco. |
| n | | To access your Fund’s reports/prospectus, visit invesco.com/fundreports. |
About share classes
| n | | Class B shares may not be purchased for new or additional investments. Please see the prospectus for more information. |
| n | | Class R shares are generally available only to employer sponsored retirement and benefit plans. Please see the prospectus for more information. |
| n | | Class Y shares are available only to certain investors. Please see the prospectus for more information. |
| n | | Investor Class shares are closed to new investors. Contact your financial adviser about purchasing our other share classes. Please see the prospectus for more information |
| n | | Class R5 shares and Class R6 shares are primarily intended for employer sponsored retirement and benefit plans that meet certain standards and for institutional investors. Please see the prospectus for more information. |
Principal risks of investing
in the Fund
| n | | Foreign securities risk. The Fund’s foreign investments may be affected by changes in a foreign country’s exchange rates, political and social instability, changes in economic or taxation policies, difficulties when enforcing obligations, decreased liquidity, and increased volatility. Foreign companies may be subject to less regulation resulting in less publicly available information about the companies. |
| n | | Management risk. The investment techniques and risk analysis used by the Fund’s portfolio managers may not produce the desired results. |
| n | | Market risk. The prices of and the income generated by the Fund’s securities may decline in response to, among other things, investor sentiment, general economic and market conditions, regional or global instability, and currency and interest rate fluctuations. |
| n | | Value investing style risk. The Fund emphasizes a value style of investing, which focuses on undervalued companies |
| | with characteristics for improved valuations. This style of investing is subject to the risk that the valuations never improve or that the returns on value equity securities are less than returns on other styles of investing or the overall stock market. Value stocks also may decline in price, even though in theory they are already underpriced. |
About indexes used in this report
| n | | The S&P 500® Index is an unmanaged index considered representative of the US stock market. |
| n | | The Russell 1000® Value Index is an unmanaged index considered representative of large-cap value stocks. The Russell 1000 Value Index is a trademark/service mark of the Frank Russell Co. Russell® is a trademark of the Frank Russell Co. |
| n | | The Lipper Large-Cap Value Funds Index is an unmanaged index considered representative of large-cap value funds tracked by Lipper. |
| n | | The Fund is not managed to track the performance of any particular index, including the index(es) described here, and consequently, the performance of the Fund may deviate significantly from the performance of the index(es). |
| n | | A direct investment cannot be made in an index. Unless otherwise indicated, index results include reinvested dividends, and they do not reflect sales charges. Performance of the peer group, if applicable, reflects fund expenses; performance of a market index does not. |
Other information
| n | | The returns shown in management’s discussion of Fund performance are based on net asset values (NAVs) calculated for shareholder transactions. Generally accepted accounting principles require adjustments to be made to the net assets of the Fund at period end for financial reporting purposes, and as such, the NAVs for shareholder transactions and the returns based on those |
| | NAVs may differ from the NAVs and returns reported in the Financial Highlights. |
| n | | Industry classifications used in this report are generally according to the Global Industry Classification Standard, which was developed by and is the exclusive property and a service mark of MSCI Inc. and Standard & Poor’s. |
|
This report must be accompanied or preceded by a currently effective Fund prospectus, which contains more complete information, including sales charges and expenses. Investors should read it carefully before investing. |
|
NOT FDIC INSURED | MAY LOSE VALUE | NO BANK GUARANTEE |
8 Invesco Diversified Dividend Fund
Schedule of Investments(a)
October 31, 2015
| | | | | | | | |
| | | Shares | | | Value | |
Common Stocks & Other Equity Interests–90.51% | |
| Aerospace & Defense–3.23% | |
General Dynamics Corp. | | | 1,308,391 | | | $ | 194,400,735 | |
Raytheon Co. | | | 1,587,248 | | | | 186,342,915 | |
| | | | | 380,743,650 | |
|
| Air Freight & Logistics–0.74% | |
United Parcel Service, Inc.–Class B | | | 842,724 | | | | 86,817,426 | |
|
| Apparel Retail–0.86% | |
Guess?, Inc. | | | 1,117,284 | | | | 23,518,828 | |
TJX Cos., Inc. (The) | | | 1,059,081 | | | | 77,514,139 | |
| | | | | 101,032,967 | |
|
| Apparel, Accessories & Luxury Goods–1.34% | |
Coach, Inc. | | | 2,614,106 | | | | 81,560,107 | |
Columbia Sportswear Co. | | | 1,388,853 | | | | 76,178,587 | |
| | | | | 157,738,694 | |
|
| Asset Management & Custody Banks–1.85% | |
Federated Investors, Inc.–Class B | | | 3,886,719 | | | | 119,438,875 | |
Legg Mason, Inc. | | | 2,216,160 | | | | 99,173,160 | |
| | | | | 218,612,035 | |
|
| Auto Parts & Equipment–0.75% | |
Johnson Controls, Inc. | | | 1,954,417 | | | | 88,300,560 | |
|
| Brewers–2.57% | |
Heineken N.V. (Netherlands) | | | 3,329,714 | | | | 303,613,091 | |
|
| Building Products–1.12% | |
Masco Corp. | | | 4,557,821 | | | | 132,176,809 | |
|
| Construction Machinery & Heavy Trucks–0.78% | |
Joy Global Inc.(b) | | | 5,391,194 | | | | 92,620,713 | |
|
| Data Processing & Outsourced Services–0.95% | |
Automatic Data Processing, Inc. | | | 1,288,355 | | | | 112,074,001 | |
|
| Department Stores–0.93% | |
Marks & Spencer Group PLC (United Kingdom) | | | 13,916,927 | | | | 109,888,989 | |
|
| Drug Retail–1.90% | |
Walgreens Boots Alliance, Inc. | | | 2,648,281 | | | | 224,256,435 | |
|
| Electric Utilities–7.61% | |
American Electric Power Co., Inc. | | | 2,377,358 | | | | 134,677,331 | |
Duke Energy Corp. | | | 2,144,852 | | | | 153,292,572 | |
Entergy Corp. | | | 1,014,147 | | | | 69,124,260 | |
Exelon Corp. | | | 6,468,190 | | | | 180,591,865 | |
Pepco Holdings, Inc. | | | 5,326,923 | | | | 141,855,959 | |
PPL Corp. | | | 6,369,715 | | | | 219,118,196 | |
| | | | | 898,660,183 | |
| | | | | | | | |
| | | Shares | | | Value | |
| Electrical Components & Equipment–2.24% | |
ABB Ltd. (Switzerland) | | | 7,775,040 | | | $ | 146,464,366 | |
Emerson Electric Co. | | | 2,507,934 | | | | 118,449,723 | |
| | | | | 264,914,089 | |
|
| Food Distributors–1.69% | |
Sysco Corp. | | | 4,834,420 | | | | 199,419,825 | |
|
| Gas Utilities–1.08% | |
AGL Resources Inc. | | | 2,040,905 | | | | 127,556,563 | |
|
| General Merchandise Stores–1.67% | |
Target Corp. | | | 2,547,028 | | | | 196,579,621 | |
|
| Health Care Equipment–1.08% | |
Stryker Corp. | | | 1,335,361 | | | | 127,687,219 | |
|
| Hotels, Resorts & Cruise Lines–1.03% | |
Accor S.A. (France) | | | 2,439,534 | | | | 121,122,698 | |
|
| Household Products–2.93% | |
Kimberly-Clark Corp. | | | 1,476,396 | | | | 176,739,365 | |
Procter & Gamble Co. (The) | | | 2,212,733 | | | | 169,008,547 | |
| | | | | 345,747,912 | |
|
| Housewares & Specialties–1.78% | |
Newell Rubbermaid Inc. | | | 4,946,403 | | | | 209,875,879 | |
|
| Industrial Machinery–1.29% | |
Flowserve Corp. | | | 1,776,625 | | | | 82,364,335 | |
Pentair PLC (United Kingdom) | | | 1,252,225 | | | | 70,024,422 | |
| | | | | 152,388,757 | |
|
| Integrated Oil & Gas–4.38% | |
Royal Dutch Shell PLC–Class B (United Kingdom) | | | 4,515,379 | | | | 117,957,276 | |
Suncor Energy, Inc. (Canada) | | | 6,430,484 | | | | 191,336,035 | |
TOTAL S.A. (France) | | | 4,290,537 | | | | 207,926,461 | |
| | | | | 517,219,772 | |
|
| Integrated Telecommunication Services–3.42% | |
AT&T Inc. | | | 8,013,052 | | | | 268,517,372 | |
Deutsche Telekom AG (Germany) | | | 7,253,062 | | | | 135,635,150 | |
| | | | | 404,152,522 | |
|
| Investment Banking & Brokerage–1.07% | |
Charles Schwab Corp. (The) | | | 4,152,645 | | | | 126,738,725 | |
|
| Life & Health Insurance–2.03% | |
Lincoln National Corp. | | | 1,380,006 | | | | 73,844,121 | |
StanCorp Financial Group, Inc. | | | 1,446,548 | | | | 165,947,987 | |
| | | | | 239,792,108 | |
|
| Motorcycle Manufacturers–0.81% | |
Harley-Davidson, Inc. | | | 1,942,834 | | | | 96,073,141 | |
See accompanying Notes to Financial Statements which are an integral part of the financial statements.
9 Invesco Diversified Dividend Fund
| | | | | | | | |
| | | Shares | | | Value | |
| Movies & Entertainment–0.84% | |
Time Warner Inc. | | | 1,321,304 | | | $ | 99,547,043 | |
|
| Multi-Line Insurance–1.38% | |
Hartford Financial Services Group, Inc. (The) | | | 3,532,762 | | | | 163,425,570 | |
|
| Multi-Utilities–3.00% | |
Consolidated Edison, Inc. | | | 2,616,360 | | | | 172,025,670 | |
Dominion Resources, Inc. | | | 1,319,675 | | | | 94,264,385 | |
Sempra Energy | | | 853,641 | | | | 87,421,375 | |
| | | | | 353,711,430 | |
|
| Oil & Gas Drilling–0.74% | |
Nabors Industries Ltd. | | | 8,677,097 | | | | 87,118,054 | |
|
| Oil & Gas Equipment & Services–1.00% | |
Baker Hughes Inc. | | | 2,234,451 | | | | 117,710,879 | |
|
| Packaged Foods & Meats–9.88% | |
Campbell Soup Co. | | | 6,110,840 | | | | 310,369,564 | |
General Mills, Inc. | | | 6,741,173 | | | | 391,729,563 | |
Kraft Heinz Co. (The) | | | 3,249,466 | | | | 253,360,864 | |
Mead Johnson Nutrition Co. | | | 825,349 | | | | 67,678,618 | |
Mondelez International Inc.–Class A | | | 3,091,600 | | | | 142,708,256 | |
| | | | | 1,165,846,865 | |
|
| Paper Packaging–1.26% | |
Avery Dennison Corp. | | | 1,152,098 | | | | 74,851,807 | |
Sonoco Products Co. | | | 1,743,826 | | | | 74,443,932 | |
| | | | | 149,295,739 | |
|
| Paper Products–0.41% | |
International Paper Co. | | | 1,123,538 | | | | 47,963,837 | |
|
| Personal Products–0.67% | |
L’Oreal S.A. (France) | | | 434,590 | | | | 79,183,402 | |
|
| Pharmaceuticals–4.20% | |
Bristol-Myers Squibb Co. | | | 1,441,930 | | | | 95,095,283 | |
Eli Lilly and Co. | | | 2,756,432 | | | | 224,842,158 | |
Johnson & Johnson | | | 1,307,753 | | | | 132,122,286 | |
Novartis AG (Switzerland) | | | 484,854 | | | | 43,966,449 | |
| | | | | 496,026,176 | |
|
| Property & Casualty Insurance–0.81% | |
Travelers Cos., Inc. (The) | | | 849,131 | | | | 95,858,399 | |
| | | | | | | | |
| | | Shares | | | Value | |
| Regional Banks–5.93% | |
Cullen/Frost Bankers, Inc. | | | 752,196 | | | $ | 51,480,294 | |
Fifth Third Bancorp | | | 4,860,782 | | | | 92,597,897 | |
KeyCorp | | | 14,429,085 | | | | 179,209,235 | |
M&T Bank Corp. | | | 886,142 | | | | 106,204,119 | |
SunTrust Banks, Inc. | | | 1,824,200 | | | | 75,740,784 | |
Zions Bancorp. | | | 6,787,136 | | | | 195,265,903 | |
| | | | | 700,498,232 | |
|
| Restaurants–1.44% | |
Darden Restaurants, Inc. | | | 2,737,735 | | | | 169,438,419 | |
|
| Semiconductors–0.83% | |
Linear Technology Corp. | | | 2,200,517 | | | | 97,746,965 | |
|
| Soft Drinks–2.50% | |
Coca-Cola Co. (The) | | | 6,957,810 | | | | 294,663,254 | |
|
| Specialized REIT’s–0.45% | |
Weyerhaeuser Co. | | | 1,829,808 | | | | 53,668,269 | |
|
| Systems Software–0.38% | |
Microsoft Corp. | | | 848,279 | | | | 44,653,407 | |
|
| Thrifts & Mortgage Finance–1.29% | |
Hudson City Bancorp, Inc. | | | 15,051,121 | | | | 152,317,345 | |
|
| Tobacco–2.37% | |
Altria Group, Inc. | | | 2,218,194 | | | | 134,134,191 | |
Philip Morris International Inc. | | | 1,649,189 | | | | 145,788,308 | |
| | | | | 279,922,499 | |
Total Common Stocks & Other Equity Interests
(Cost $7,840,754,925) | | | | 10,684,400,168 | |
|
Money Market Funds–10.38% | |
Liquid Assets Portfolio–Institutional Class, 0.16%(c) | | | 612,603,302 | | | | 612,603,302 | |
Premier Portfolio–Institutional Class, 0.12%(c) | | | 612,603,301 | | | | 612,603,301 | |
Total Money Market Funds
(Cost $1,225,206,603) | | | | | | | 1,225,206,603 | |
TOTAL INVESTMENTS–100.89%
(Cost $9,065,961,528) | | | | 11,909,606,771 | |
OTHER ASSETS LESS LIABILITIES–(0.89)% | | | | (105,166,239 | ) |
NET ASSETS–100.00% | | | $ | 11,804,440,532 | |
Investment Abbreviations:
| | |
| REIT | | – Real Estate Investment Trust |
Notes to Schedule of Investments:
| (a) | Industry and/or sector classifications used in this report are generally according to the Global Industry Classification Standard, which was developed by and is the exclusive property and a service mark of MSCI Inc. and Standard & Poor’s. |
| (b) | Affiliated company during the period. The Investment Company Act of 1940 defines an “affiliated person” as an issuance in which a fund holds 5% or more of the outstanding voting securities. The Fund has not owned enough of the outstanding voting securities of the issuer to have control (as defined in the Investment Company Act of 1940) of that issuer. The value of this security as of October 31, 2015 represented less than 1% of the Fund’s Net Assets. See Note 4. |
| (c) | The money market fund and the Fund are affiliated by having the same investment adviser. The rate shown is the 7-day SEC standardized yield as of October 31, 2015. |
See accompanying Notes to Financial Statements which are an integral part of the financial statements.
10 Invesco Diversified Dividend Fund
Statement of Assets and Liabilities
October 31, 2015
| | | | |
Assets: | | | | |
Investments, at value (Cost $7,659,593,779) | | $ | 10,591,779,455 | |
Investments in affiliates, at value (Cost $1,406,367,749) | | | 1,317,827,316 | |
Total investments, at value (Cost $9,065,961,528) | | | 11,909,606,771 | |
Foreign currencies, at value (Cost $128,883) | | | 128,865 | |
Receivable for: | | | | |
Investments sold | | | 33,263,836 | |
Fund shares sold | | | 46,494,352 | |
Dividends | | | 17,987,766 | |
Unrealized appreciation on forward foreign currency contracts outstanding | | | 10,721,335 | |
Investment for trustee deferred compensation and retirement plans | | | 688,681 | |
Other assets | | | 109,011 | |
Total assets | | | 12,019,000,617 | |
| |
Liabilities: | | | | |
Payable for: | | | | |
Investments purchased | | | 200,153,275 | |
Fund shares reacquired | | | 8,522,709 | |
Accrued fees to affiliates | | | 4,821,902 | |
Accrued trustees’ and officers’ fees and benefits | | | 11,011 | |
Accrued other operating expenses | | | 196,900 | |
Trustee deferred compensation and retirement plans | | | 854,288 | |
Total liabilities | | | 214,560,085 | |
Net assets applicable to shares outstanding | | $ | 11,804,440,532 | |
| |
Net assets consist of: | | | | |
Shares of beneficial interest | | $ | 8,475,213,742 | |
Undistributed net investment income | | | 32,597,353 | |
Undistributed net realized gain | | | 442,435,975 | |
Net unrealized appreciation | | | 2,854,193,462 | |
| | | $ | 11,804,440,532 | |
| | | | |
Net Assets: | | | | |
Class A | | $ | 4,715,634,783 | |
Class B | | $ | 22,845,495 | |
Class C | | $ | 440,482,020 | |
Class R | | $ | 204,956,250 | |
Class Y | | $ | 1,183,311,829 | |
Investor Class | | $ | 2,002,937,972 | |
Class R5 | | $ | 2,385,096,061 | |
Class R6 | | $ | 849,176,122 | |
|
Shares outstanding, $0.001 par value per share,
with an unlimited number of shares authorized: | |
Class A | | | 251,072,696 | |
Class B | | | 1,229,779 | |
Class C | | | 23,737,114 | |
Class R | | | 10,880,327 | |
Class Y | | | 62,929,355 | |
Investor Class | | | 106,698,076 | |
Class R5 | | | 126,973,996 | |
Class R6 | | | 45,201,105 | |
Class A: | | | | |
Net asset value per share | | $ | 18.78 | |
Maximum offering price per share | | | | |
(Net asset value of $18.78 ¸ 94.50%) | | $ | 19.87 | |
Class B: | | | | |
Net asset value and offering price per share | | $ | 18.58 | |
Class C: | | | | |
Net asset value and offering price per share | | $ | 18.56 | |
Class R: | | | | |
Net asset value and offering price per share | | $ | 18.84 | |
Class Y: | | | | |
Net asset value and offering price per share | | $ | 18.80 | |
Investor Class: | | | | |
Net asset value and offering price per share | | $ | 18.77 | |
Class R5: | | | | |
Net asset value and offering price per share | | $ | 18.78 | |
Class R6: | | | | |
Net asset value and offering price per share | | $ | 18.79 | |
See accompanying Notes to Financial Statements which are an integral part of the financial statements.
11 Invesco Diversified Dividend Fund
Statement of Operations
For the year ended October 31, 2015
| | | | |
Investment income: | |
Dividends (net of foreign withholding taxes of $3,620,883) | | $ | 268,196,587 | |
Dividends from affiliates | | | 2,374,611 | |
Total investment income | | | 270,571,198 | |
| |
Expenses: | | | | |
Advisory fees | | | 45,702,036 | |
Administrative services fees | | | 816,517 | |
Custodian fees | | | 501,601 | |
Distribution fees: | | | | |
Class A | | | 11,125,503 | |
Class B | | | 265,906 | |
Class C | | | 3,851,813 | |
Class R | | | 783,640 | |
Investor Class | | | 4,437,825 | |
Transfer agent fees — A, B, C, R, Y and Investor | | | 11,535,076 | |
Transfer agent fees — R5 | | | 2,219,720 | |
Transfer agent fees — R6 | | | 17,234 | |
Trustees’ and officers’ fees and benefits | | | 180,059 | |
Other | | | 1,218,123 | |
Total expenses | | | 82,655,053 | |
Less: Fees waived and expense offset arrangement(s) | | | (1,463,823 | ) |
Net expenses | | | 81,191,230 | |
Net investment income | | | 189,379,968 | |
| |
Realized and unrealized gain from: | | | | |
Net realized gain from: | | | | |
Investment securities | | | 434,438,237 | |
Foreign currencies | | | 652,887 | |
Forward foreign currency contracts | | | 42,866,453 | |
| | | | 477,957,577 | |
Change in net unrealized appreciation (depreciation) of: | | | | |
Investment securities | | | 100,045,091 | |
Foreign currencies | | | (193,846 | ) |
Forward foreign currency contracts | | | 1,900,806 | |
| | | | 101,752,051 | |
Net realized and unrealized gain | | | 579,709,628 | |
Net increase in net assets resulting from operations | | $ | 769,089,596 | |
See accompanying Notes to Financial Statements which are an integral part of the financial statements.
12 Invesco Diversified Dividend Fund
Statement of Changes in Net Assets
For the years ended October 31, 2015 and 2014
| | | | | | | | |
| | | 2015 | | | 2014 | |
Operations: | | | | | | | | |
Net investment income | | $ | 189,379,968 | | | $ | 160,649,135 | |
Net realized gain | | | 477,957,577 | | | | 211,483,625 | |
Change in net unrealized appreciation | | | 101,752,051 | | | | 760,955,981 | |
Net increase in net assets resulting from operations | | | 769,089,596 | | | | 1,133,088,741 | |
| | |
Distributions to shareholders from net investment income: | | | | | | | | |
Class A | | | (67,378,784 | ) | | | (58,294,676 | ) |
Class B | | | (208,402 | ) | | | (233,733 | ) |
Class C | | | (2,939,363 | ) | | | (2,229,691 | ) |
Class R | | | (2,012,249 | ) | | | (1,526,526 | ) |
Class Y | | | (16,633,380 | ) | | | (12,063,992 | ) |
Investor Class | | | (31,388,104 | ) | | | (28,706,461 | ) |
Class R5 | | | (39,951,307 | ) | | | (28,436,318 | ) |
Class R6 | | | (17,210,512 | ) | | | (13,235,855 | ) |
Total distributions from net investment income | | | (177,722,101 | ) | | | (144,727,252 | ) |
| | |
Distributions to shareholders from net realized gains: | | | | | | | | |
Class A | | | (84,111,861 | ) | | | (36,438,750 | ) |
Class B | | | (587,690 | ) | | | (348,169 | ) |
Class C | | | (7,110,573 | ) | | | (2,799,031 | ) |
Class R | | | (2,755,974 | ) | | | (1,089,928 | ) |
Class Y | | | (16,899,359 | ) | | | (5,626,934 | ) |
Investor Class | | | (39,162,635 | ) | | | (18,403,733 | ) |
Class R5 | | | (40,314,134 | ) | | | (14,112,888 | ) |
Class R6 | | | (20,768,832 | ) | | | (5,335,137 | ) |
Total distributions from net realized gains | | | (211,711,058 | ) | | | (84,154,570 | ) |
| | |
Share transactions–net: | | | | | | | | |
Class A | | | 357,634,116 | | | | 125,444,610 | |
Class B | | | (7,799,720 | ) | | | (9,406,645 | ) |
Class C | | | 78,983,740 | | | | 41,589,027 | |
Class R | | | 59,455,008 | | | | 16,657,072 | |
Class Y | | | 308,694,919 | | | | 290,145,339 | |
Investor Class | | | (36,776,138 | ) | | | (127,103,575 | ) |
Class R5 | | | 361,308,305 | | | | 383,381,312 | |
Class R6 | | | (118,855,797 | ) | | | 335,145,463 | |
Net increase in net assets resulting from share transactions | | | 1,002,644,433 | | | | 1,055,852,603 | |
Net increase in net assets | | | 1,382,300,870 | | | | 1,960,059,522 | |
| | |
Net assets: | | | | | | | | |
Beginning of year | | | 10,422,139,662 | | | | 8,462,080,140 | |
End of year (includes undistributed net investment income of $32,597,353 and $20,286,588, respectively) | | $ | 11,804,440,532 | | | $ | 10,422,139,662 | |
Notes to Financial Statements
October 31, 2015
NOTE 1—Significant Accounting Policies
Invesco Diversified Dividend Fund (the “Fund”) is a series portfolio of AIM Equity Funds (Invesco Equity Funds) (the “Trust”). The Trust is a Delaware statutory trust registered under the Investment Company Act of 1940, as amended (the “1940 Act”), as an open-end series management investment company consisting of three separate portfolios, each authorized to issue an unlimited number of shares of beneficial interest. The assets, liabilities and operations of each portfolio are accounted for separately. Information presented in these financial statements pertains only to the Fund. Matters affecting each portfolio or class will be voted on exclusively by the shareholders of such portfolio or class.
13 Invesco Diversified Dividend Fund
The Fund’s investment objective is long-term growth of capital and, secondarily, current income.
The Fund currently consists of eight different classes of shares: Class A, Class B, Class C, Class R, Class Y, Investor Class, Class R5 and Class R6. Investor Class shares of the Fund are offered only to certain grandfathered investors. Class A shares are sold with a front-end sales charge unless certain waiver criteria are met and under certain circumstances load waived shares may be subject to contingent deferred sales charges (“CDSC”). Class C shares are sold with a CDSC. Class R, Class Y, Investor Class, Class R5 and Class R6 shares are sold at net asset value. Effective November 30, 2010, new or additional investments in Class B shares are no longer permitted. Existing shareholders of Class B shares may continue to reinvest dividends and capital gains distributions in Class B shares until they convert to Class A shares. Also, shareholders in Class B shares will be able to exchange those shares for Class B shares of other Invesco Funds offering such shares until they convert to Class A shares. Generally, Class B shares will automatically convert to Class A shares on or about the month-end, which is at least eight years after the date of purchase. Redemption of Class B shares prior to the conversion date will be subject to a CDSC.
The following is a summary of the significant accounting policies followed by the Fund in the preparation of its financial statements.
| A. | Security Valuations — Securities, including restricted securities, are valued according to the following policy. |
A security listed or traded on an exchange (except convertible securities) is valued at its last sales price or official closing price as of the close of the customary trading session on the exchange where the security is principally traded, or lacking any sales or official closing price on a particular day, the security may be valued at the closing bid price on that day. Securities traded in the over-the-counter market are valued based on prices furnished by independent pricing services or market makers. When such securities are valued by an independent pricing service they may be considered fair valued. Futures contracts are valued at the final settlement price set by an exchange on which they are principally traded. Listed options are valued at the mean between the last bid and asked prices from the exchange on which they are principally traded. Options not listed on an exchange are valued by an independent source at the mean between the last bid and asked prices. For purposes of determining net asset value (“NAV”) per share, futures and option contracts generally are valued 15 minutes after the close of the customary trading session of the New York Stock Exchange (“NYSE”).
Investments in open-end and closed-end registered investment companies that do not trade on an exchange are valued at the end-of-day net asset value per share. Investments in open-end and closed-end registered investment companies that trade on an exchange are valued at the last sales price or official closing price as of the close of the customary trading session on the exchange where the security is principally traded.
Debt obligations (including convertible securities) and unlisted equities are fair valued using an evaluated quote provided by an independent pricing service. Evaluated quotes provided by the pricing service may be determined without exclusive reliance on quoted prices, and may reflect appropriate factors such as institution-size trading in similar groups of securities, developments related to specific securities, dividend rate (for unlisted equities), yield (for debt obligations), quality, type of issue, coupon rate (for debt obligations), maturity (for debt obligations), individual trading characteristics and other market data. Debt obligations are subject to interest rate and credit risks. In addition, all debt obligations involve some risk of default with respect to interest and/or principal payments.
Foreign securities’ (including foreign exchange contracts) prices are converted into U.S. dollar amounts using the applicable exchange rates as of the close of the NYSE. If market quotations are available and reliable for foreign exchange-traded equity securities, the securities will be valued at the market quotations. Because trading hours for certain foreign securities end before the close of the NYSE, closing market quotations may become unreliable. If between the time trading ends on a particular security and the close of the customary trading session on the NYSE, events occur that the Adviser determines are significant and make the closing price unreliable, the Fund may fair value the security. If the event is likely to have affected the closing price of the security, the security will be valued at fair value in good faith using procedures approved by the Board of Trustees. Adjustments to closing prices to reflect fair value may also be based on a screening process of an independent pricing service to indicate the degree of certainty, based on historical data, that the closing price in the principal market where a foreign security trades is not the current value as of the close of the NYSE. Foreign securities’ prices meeting the approved degree of certainty that the price is not reflective of current value will be priced at the indication of fair value from the independent pricing service. Multiple factors may be considered by the independent pricing service in determining adjustments to reflect fair value and may include information relating to sector indices, American Depositary Receipts and domestic and foreign index futures. Foreign securities may have additional risks including exchange rate changes, potential for sharply devalued currencies and high inflation, political and economic upheaval, the relative lack of issuer information, relatively low market liquidity and the potential lack of strict financial and accounting controls and standards.
Securities for which market prices are not provided by any of the above methods may be valued based upon quotes furnished by independent sources. The last bid price may be used to value equity securities. The mean between the last bid and asked prices is used to value debt obligations, including corporate loans.
Securities for which market quotations are not readily available or became unreliable are valued at fair value as determined in good faith by or under the supervision of the Trust’s officers following procedures approved by the Board of Trustees. Issuer specific events, market trends, bid/asked quotes of brokers and information providers and other market data may be reviewed in the course of making a good faith determination of a security’s fair value.
The Fund may invest in securities that are subject to interest rate risk, meaning the risk that the prices will generally fall as interest rates rise and, conversely, the prices will generally rise as interest rates fall. Specific securities differ in their sensitivity to changes in interest rates depending on their individual characteristics. Changes in interest rates may result in increased market volatility, which may affect the value and/or liquidity of certain Fund investments.
Valuations change in response to many factors including the historical and prospective earnings of the issuer, the value of the issuer’s assets, general economic conditions, interest rates, investor perceptions and market liquidity. Because of the inherent uncertainties of valuation, the values reflected in the financial statements may materially differ from the value received upon actual sale of those investments.
| B. | Securities Transactions and Investment Income — Securities transactions are accounted for on a trade date basis. Realized gains or losses on sales are computed on the basis of specific identification of the securities sold. Interest income (net of withholding tax, if any) is recorded on the accrual basis from settlement date. Dividend income (net of withholding tax, if any) is recorded on the ex-dividend date. |
The Fund may periodically participate in litigation related to Fund investments. As such, the Fund may receive proceeds from litigation settlements. Any proceeds received are included in the Statement of Operations as realized gain (loss) for investments no longer held and as unrealized gain (loss) for investments still held.
14 Invesco Diversified Dividend Fund
Brokerage commissions and mark ups are considered transaction costs and are recorded as an increase to the cost basis of securities purchased and/or a reduction of proceeds on a sale of securities. Such transaction costs are included in the determination of net realized and unrealized gain (loss) from investment securities reported in the Statement of Operations and the Statement of Changes in Net Assets and the net realized and unrealized gains (losses) on securities per share in the Financial Highlights. Transaction costs are included in the calculation of the Fund’s net asset value and, accordingly, they reduce the Fund’s total returns. These transaction costs are not considered operating expenses and are not reflected in net investment income reported in the Statement of Operations and the Statement of Changes in Net Assets, or the net investment income per share and the ratios of expenses and net investment income reported in the Financial Highlights, nor are they limited by any expense limitation arrangements between the Fund and the investment adviser.
The Fund allocates income and realized and unrealized capital gains and losses to a class based on the relative net assets of each class.
| C. | Country Determination — For the purposes of making investment selection decisions and presentation in the Schedule of Investments, the investment adviser may determine the country in which an issuer is located and/or credit risk exposure based on various factors. These factors include the laws of the country under which the issuer is organized, where the issuer maintains a principal office, the country in which the issuer derives 50% or more of its total revenues and the country that has the primary market for the issuer’s securities, as well as other criteria. Among the other criteria that may be evaluated for making this determination are the country in which the issuer maintains 50% or more of its assets, the type of security, financial guarantees and enhancements, the nature of the collateral and the sponsor organization. Country of issuer and/or credit risk exposure has been determined to be the United States of America, unless otherwise noted. |
| D. | Distributions — Distributions from net investment income, if any, are declared and paid quarterly and are recorded on the ex-dividend date. Distributions from net realized capital gain, if any, are generally declared and paid annually and recorded on the ex-dividend date. The Fund may elect to treat a portion of the proceeds from redemptions as distributions for federal income tax purposes. |
| E. | Federal Income Taxes — The Fund intends to comply with the requirements of Subchapter M of the Internal Revenue Code of 1986, as amended (the “Internal Revenue Code”), necessary to qualify as a regulated investment company and to distribute substantially all of the Fund’s taxable earnings to shareholders. As such, the Fund will not be subject to federal income taxes on otherwise taxable income (including net realized capital gain) that is distributed to shareholders. Therefore, no provision for federal income taxes is recorded in the financial statements. |
The Fund recognizes the tax benefits of uncertain tax positions only when the position is more likely than not to be sustained. Management has analyzed the Fund’s uncertain tax positions and concluded that no liability for unrecognized tax benefits should be recorded related to uncertain tax positions. Management is not aware of any tax positions for which it is reasonably possible that the total amounts of unrecognized tax benefits will change materially in the next 12 months.
The Fund files tax returns in the U.S. Federal jurisdiction and certain other jurisdictions. Generally, the Fund is subject to examinations by such taxing authorities for up to three years after the filing of the return for the tax period.
| F. | Expenses — Fees provided for under the Rule 12b-1 plan of a particular class of the Fund are charged to the operations of such class. Transfer agency fees and expenses and other shareholder recordkeeping fees and expenses attributable to Class R5 and Class R6 are allocated to each share class based on relative net assets. Sub-accounting fees attributable to Class R5 are charged to the operations of the class. Transfer agency fees and expenses and other shareholder recordkeeping fees and expenses relating to all other classes are allocated among those classes based on relative net assets. All other expenses are allocated among the classes based on relative net assets. |
| G. | Accounting Estimates — The preparation of financial statements in conformity with accounting principles generally accepted in the United States of America (“GAAP”) requires management to make estimates and assumptions that affect the reported amounts of assets and liabilities at the date of the financial statements and the reported amounts of revenues and expenses during the reporting period including estimates and assumptions related to taxation. Actual results could differ from those estimates by a significant amount. In addition, the Fund monitors for material events or transactions that may occur or become known after the period-end date and before the date the financial statements are released to print. |
| H. | Indemnifications — Under the Trust’s organizational documents, each Trustee, officer, employee or other agent of the Trust is indemnified against certain liabilities that may arise out of the performance of their duties to the Fund. Additionally, in the normal course of business, the Fund enters into contracts, including the Fund’s servicing agreements, that contain a variety of indemnification clauses. The Fund’s maximum exposure under these arrangements is unknown as this would involve future claims that may be made against the Fund that have not yet occurred. The risk of material loss as a result of such indemnification claims is considered remote. |
| I. | Foreign Currency Translations — Foreign currency is valued at the close of the NYSE based on quotations posted by banks and major currency dealers. Portfolio securities and other assets and liabilities denominated in foreign currencies are translated into U.S. dollar amounts at date of valuation. Purchases and sales of portfolio securities (net of foreign taxes withheld on disposition) and income items denominated in foreign currencies are translated into U.S. dollar amounts on the respective dates of such transactions. The Fund does not separately account for the portion of the results of operations resulting from changes in foreign exchange rates on investments and the fluctuations arising from changes in market prices of securities held. The combined results of changes in foreign exchange rates and the fluctuation of market prices on investments (net of estimated foreign tax withholding) are included with the net realized and unrealized gain or loss from investments in the Statement of Operations. Reported net realized foreign currency gains or losses arise from (1) sales of foreign currencies, (2) currency gains or losses realized between the trade and settlement dates on securities transactions, and (3) the difference between the amounts of dividends, interest, and foreign withholding taxes recorded on the Fund’s books and the U.S. dollar equivalent of the amounts actually received or paid. Net unrealized foreign currency gains and losses arise from changes in the fair values of assets and liabilities, other than investments in securities at fiscal period end, resulting from changes in exchange rates. |
The Fund may invest in foreign securities, which may be subject to foreign taxes on income, gains on investments or currency repatriation, a portion of which may be recoverable. Foreign taxes, if any, are recorded based on the tax regulations and rates that exist in the foreign markets in which the Fund invests and are shown in the Statement of Operations.
| J. | Forward Foreign Currency Contracts — The Fund may engage in foreign currency transactions either on a spot (i.e. for prompt delivery and settlement) basis, or through forward foreign currency contracts, to manage or minimize currency or exchange rate risk. |
The Fund may also enter into forward foreign currency contracts for the purchase or sale of a security denominated in a foreign currency in order to “lock in” the U.S. dollar price of that security, or the Fund may also enter into forward foreign currency contracts that do not provide for
15 Invesco Diversified Dividend Fund
physical settlement of the two currencies, but instead are settled by a single cash payment calculated as the difference between the agreed upon exchange rate and the spot rate at settlement based upon an agreed upon notional amount (non-deliverable forwards). The Fund will set aside liquid assets in an amount equal to daily mark-to-market obligation for forward foreign currency contracts.
A forward foreign currency contract is an obligation between two parties (“Counterparties”) to purchase or sell a specific currency for an agreed-upon price at a future date. The use of forward foreign currency contracts does not eliminate fluctuations in the price of the underlying securities the Fund owns or intends to acquire but establishes a rate of exchange in advance. Fluctuations in the value of these contracts are measured by the difference in the contract date and reporting date exchange rates and are recorded as unrealized appreciation (depreciation) until the contracts are closed. When the contracts are closed, realized gains (losses) are recorded. Realized and unrealized gains (losses) on the contracts are included in the Statement of Operations. The primary risks associated with forward foreign currency contracts include failure of the Counterparty to meet the terms of the contract and the value of the foreign currency changing unfavorably. These risks may be in excess of the amounts reflected in the Statement of Assets and Liabilities.
NOTE 2—Advisory Fees and Other Fees Paid to Affiliates
The Trust has entered into a master investment advisory agreement with Invesco Advisers, Inc. (the “Adviser” or “Invesco”). Under the terms of the investment advisory agreement, the Fund pays an advisory fee to the Adviser based on the annual rate of the Fund’s average daily net assets as follows:
| | | | |
| Average Daily Net Assets | | Rate | |
First $350 million | | | 0.60% | |
Next $350 million | | | 0.55% | |
Next $1.3 billion | | | 0.50% | |
Next $2 billion | | | 0.45% | |
Next $2 billion | | | 0.40% | |
Next $2 billion | | | 0.375% | |
Over $8 billion | | | 0.35% | |
For the year ended October 31, 2015, the effective advisory fees incurred by the Fund was 0.41%.
Under the terms of a master sub-advisory agreement between the Adviser and each of Invesco Asset Management Deutschland GmbH, Invesco Asset Management Limited, Invesco Asset Management (Japan) Limited, Invesco Hong Kong Limited, Invesco Senior Secured Management, Inc. and Invesco Canada Ltd. (collectively, the “Affiliated Sub-Advisers”) the Adviser, not the Fund, may pay 40% of the fees paid to the Adviser to any such Affiliated Sub-Adviser(s) that provide(s) discretionary investment management services to the Fund based on the percentage of assets allocated to such Affiliated Sub-Adviser(s).
The Adviser has contractually agreed, through at least June 30, 2016, to waive advisory fees and/or reimburse expenses of all shares to the extent necessary to limit total annual fund operating expenses after fee waiver and/or expense reimbursement (excluding certain items discussed below) of Class A, Class B, Class C, Class R, Class Y, Investor Class, Class R5 and Class R6 shares to 2.00%, 2.75%, 2.75%, 2.25%, 1.75%, 2.00%, 1.75% and 1.75%, respectively, of average daily net assets. In determining the Adviser’s obligation to waive advisory fees and/or reimburse expenses, the following expenses are not taken into account, and could cause the total annual fund operating expenses after fee waiver and/or expense reimbursement to exceed the numbers reflected above: (1) interest; (2) taxes; (3) dividend expense on short sales; (4) extraordinary or non-routine items, including litigation expenses; and (5) expenses that the Fund has incurred but did not actually pay because of an expense offset arrangement. Unless Invesco continues the fee waiver agreement, it will terminate on June 30, 2016. The fee waiver agreement cannot be terminated during its term. The Adviser did not waive fees and/or reimburse expenses during the period under this expense limitation.
Further, the Adviser has contractually agreed, through at least June 30, 2017, to waive the advisory fee payable by the Fund in an amount equal to 100% of the net advisory fees the Adviser receives from the affiliated money market funds on investments by the Fund of uninvested cash in such affiliated money market funds.
For the year ended October 31, 2015, the Adviser waived advisory fees of $1,450,805.
The Trust has entered into a master administrative services agreement with Invesco pursuant to which the Fund has agreed to pay Invesco for certain administrative costs incurred in providing accounting services to the Fund. For the year ended October 31, 2015, expenses incurred under the agreement are shown in the Statement of Operations as Administrative services fees.
The Trust has entered into a transfer agency and service agreement with Invesco Investment Services, Inc. (“IIS”) pursuant to which the Fund has agreed to pay IIS a fee for providing transfer agency and shareholder services to the Fund and reimburse IIS for certain expenses incurred by IIS in the course of providing such services. IIS may make payments to intermediaries that provide omnibus account services, sub-accounting services and/or networking services. All fees payable by IIS to intermediaries that provide omnibus account services or sub-accounting are charged back to the Fund, subject to certain limitations approved by the Trust’s Board of Trustees. For the year ended October 31, 2015, expenses incurred under the agreement are shown in the Statement of Operations as Transfer agent fees.
The Trust has entered into master distribution agreements with Invesco Distributors, Inc. (“IDI”) to serve as the distributor for the Class A, Class B, Class C, Class R, Class Y, Investor Class, Class R5 and Class R6 shares of the Fund. The Trust has adopted plans pursuant to Rule 12b-1 under the 1940 Act with respect to the Fund’s Class A, Class B, Class C, Class R and Investor Class shares (collectively, the “Plans”). The Fund, pursuant to the Plans, pays IDI compensation at the annual rate of 0.25% of the Fund’s average daily net assets of Class A shares, 1.00% of the average daily net assets of Class B and Class C shares and 0.50% of the average daily net assets of Class R shares. The Fund, pursuant to the Investor Class Plan, reimburses IDI for its allocated share of expenses incurred pursuant to the Investor Class Plan for the period, up to a maximum annual rate of 0.25% of the average daily net assets of Investor Class shares. Of the Plan payments, up to 0.25% of the average daily net assets of each class of shares may be paid to furnish continuing personal shareholder services to customers who purchase and own shares of such classes. Any amounts not paid as a service fee under the Plans would constitute an asset-based sales charge. Rules of the Financial Industry Regulatory Authority (“FINRA”) impose a
16 Invesco Diversified Dividend Fund
cap on the total sales charges, including asset-based sales charges, that may be paid by any class of shares of the Fund. For the year ended October 31, 2015, expenses incurred under the Plans are shown in the Statement of Operations as Distribution fees.
Front-end sales commissions and CDSC (collectively, the “sales charges”) are not recorded as expenses of the Fund. Front-end sales commissions are deducted from proceeds from the sales of Fund shares prior to investment in Class A shares of the Fund. CDSC are deducted from redemption proceeds prior to remittance to the shareholder. During the year ended October 31, 2015, IDI advised the Fund that IDI retained $1,357,268 in front-end sales commissions from the sale of Class A shares and $12,792, $7,285 and $21,359 from Class A, Class B and Class C shares, respectively, for CDSC imposed on redemptions by shareholders.
Certain officers and trustees of the Trust are officers and directors of the Adviser, IIS and/or IDI.
NOTE 3—Additional Valuation Information
GAAP defines fair value as the price that would be received to sell an asset or paid to transfer a liability in an orderly transaction between market participants at the measurement date, under current market conditions. GAAP establishes a hierarchy that prioritizes the inputs to valuation methods, giving the highest priority to readily available unadjusted quoted prices in an active market for identical assets (Level 1) and the lowest priority to significant unobservable inputs (Level 3), generally when market prices are not readily available or are unreliable. Based on the valuation inputs, the securities or other investments are tiered into one of three levels. Changes in valuation methods may result in transfers in or out of an investment’s assigned level:
| | Level 1 — | Prices are determined using quoted prices in an active market for identical assets. |
| | Level 2 — | Prices are determined using other significant observable inputs. Observable inputs are inputs that other market participants may use in pricing a security. These may include quoted prices for similar securities, interest rates, prepayment speeds, credit risk, yield curves, loss severities, default rates, discount rates, volatilities and others. |
| | Level 3 — | Prices are determined using significant unobservable inputs. In situations where quoted prices or observable inputs are unavailable (for example, when there is little or no market activity for an investment at the end of the period), unobservable inputs may be used. Unobservable inputs reflect the Fund’s own assumptions about the factors market participants would use in determining fair value of the securities or instruments and would be based on the best available information. |
The following is a summary of the tiered valuation input levels, as of October 31, 2015. The level assigned to the securities valuations may not be an indication of the risk or liquidity associated with investing in those securities. Because of the inherent uncertainties of valuation, the values reflected in the financial statements may materially differ from the value received upon actual sale of those investments.
| | | | | | | | | | | | | | | | |
| | | Level 1 | | | Level 2 | | | Level 3 | | | Total | |
Equity Securities | | $ | 10,779,484,039 | | | $ | 1,130,122,732 | | | $ | — | | | $ | 11,909,606,771 | |
Forward Foreign Currency Contracts* | | | — | | | | 10,721,335 | | | | — | | | | 10,721,335 | |
Total Investments | | $ | 10,779,484,039 | | | $ | 1,140,844,067 | | | $ | — | | | $ | 11,920,328,106 | |
| * | Unrealized appreciation. |
NOTE 4—Investments in Other Affiliates
The 1940 Act defines affiliates as those issuances in which a fund holds 5% or more of the outstanding voting securities. The Fund has not owned enough of the outstanding voting securities of the issuer to have control (as defined in the 1940 Act) of that issuer. The following is a summary of the investments in other affiliates for the year ended October 31, 2015.
| | | | | | | | | | | | | | | | | | | | | | | | | | | | |
| | | Value 10/31/14 | | | Purchases
at Cost | | | Proceeds from Sales | | | Change in
Unrealized
Appreciation
(Depreciation) | | | Realized
Gain | | | Value 10/31/15 | | | Dividend
Income | |
Joy Global Inc. | | $ | — | | | $ | 181,161,146 | | | $ | — | | | $ | (88,540,433 | ) | | $ | — | | | $ | 92,620,713 | | | $ | 1,605,331 | |
NOTE 5—Derivative Investments
Value of Derivative Investments at Period-End
The table below summarizes the value of the Fund’s derivative investments, detailed by primary risk exposure, held as of October 31, 2015:
| | | | | | | | |
| | | Value | |
| Risk Exposure/Derivative Type | | Assets | | | Liabilities | |
Currency risk: | | | | | | | | |
Forward foreign currency contracts(a) | | $ | 10,721,335 | | | $ | — | |
| (a) | Values are disclosed on the Statement of Assets and Liabilities under the caption Unrealized appreciation on forward foreign currency contracts outstanding. |
17 Invesco Diversified Dividend Fund
Effect of Derivative Investments for the year ended October 31, 2015
The table below summarizes the gains on derivative investments, detailed by primary risk exposure, recognized in earnings during the period:
| | | | |
| | | Location of Gain on
Statement of Operations | |
| | Forward Foreign Currency
Contracts | |
Realized Gain: | | | | |
Currency risk | | $ | 42,866,453 | |
Change in Net Unrealized Appreciation: | | | | |
Currency risk | | | 1,900,806 | |
Total | | $ | 44,767,259 | |
The table below summarizes the average notional value of forward foreign currency contracts outstanding during the period.
| | | | |
| | | Forward Foreign Currency
Contracts | |
Average notional value | | $ | 358,017,261 | |
| | | | | | | | | | | | | | | | | | | | | | | | | | |
| Open Forward Foreign Currency Contracts | |
Settlement Date | | | | Contract to | | | Notional
Value | | | Unrealized
Appreciation | |
| | Counterparty | | Deliver | | | Receive | | | |
11/20/15 | | Deutsche Bank Securities Inc. | | | EUR | | | | 111,023,524 | | | | USD | | | | 125,704,720 | | | $ | 122,128,319 | | | $ | 3,576,401 | |
11/20/15 | | Citigroup Global Markets Inc. | | | EUR | | | | 111,024,000 | | | | USD | | | | 125,716,361 | | | | 122,128,843 | | | | 3,587,518 | |
11/20/15 | | Goldman Sachs International | | | EUR | | | | 111,023,524 | | | | USD | | | | 125,685,735 | | | | 122,128,319 | | | | 3,557,416 | |
Total Open Forward Foreign Currency Contracts — Currency Risk | | | $ | 10,721,335 | |
Currency Abbreviations:
| | |
| EUR | | — Euro |
| USD | | — U.S. Dollar |
Offsetting Assets and Liabilities
Accounting Standards Update (“ASU”) No. 2011-11, Disclosures about Offsetting Assets and Liabilities, which was subsequently clarified in Financial Accounting Standards Board ASU 2013-01 “Clarifying the Scope of Disclosures about Offsetting Assets and Liabilities” is intended to enhance disclosures about financial instruments and derivative instruments that are subject to offsetting arrangements on the Statement of Assets and Liabilities and to enable investors to better understand the effect of those arrangements on the Fund’s financial position. In order for an arrangement to be eligible for netting, the Fund must have a basis to conclude that such netting arrangements are legally enforceable. The Fund enters into netting agreements and collateral agreements in an attempt to reduce the Fund’s Counterparty credit risk by providing for a single net settlement with a Counterparty of all financial transactions covered by the agreement in an event of default as defined under such agreement.
The following table presents derivative instruments that are either subject to an enforceable netting agreement or offset by collateral arrangements as of October 31, 2015.
| | | | | | | | | | | | | | | | | | | | |
Counterparty | | Gross amounts
of Recognized
Assets | | | Gross Amounts Not Offset in the
Statement of Assets and Liabilities | | | Net
Amount | |
| | | Financial
Instruments | | | Collateral Received | | |
| | | | Non-Cash | | | Cash | | |
Deutsche Bank Securities Inc. | | $ | 3,576,401 | | | $ | — | | | $ | — | | | $ | — | | | $ | 3,576,401 | |
Citigroup Global Markets Inc. | | | 3,587,518 | | | | — | | | | — | | | | — | | | | 3,587,518 | |
Goldman Sachs International | | | 3,557,416 | | | | — | | | | — | | | | — | | | | 3,557,416 | |
Total | | $ | 10,721,335 | | | $ | — | | | $ | — | | | $ | — | | | $ | 10,721,335 | |
NOTE 6—Expense Offset Arrangement(s)
The expense offset arrangement is comprised of transfer agency credits which result from balances in demand deposit accounts used by the transfer agent for clearing shareholder transactions. For the year ended October 31, 2015, the Fund received credits from this arrangement, which resulted in the reduction of the Fund’s total expenses of $13,018.
18 Invesco Diversified Dividend Fund
NOTE 7—Trustees’ and Officers’ Fees and Benefits
Trustees’ and Officers’ Fees and Benefits include amounts accrued by the Fund to pay remuneration to certain Trustees and Officers of the Fund. Trustees have the option to defer compensation payable by the Fund, and Trustees’ and Officers’ Fees and Benefits also include amounts accrued by the Fund to fund such deferred compensation amounts. Those Trustees who defer compensation have the option to select various Invesco Funds in which their deferral accounts shall be deemed to be invested. Finally, certain current Trustees were eligible to participate in a retirement plan that provided for benefits to be paid upon retirement to Trustees over a period of time based on the number of years of service. The Fund may have certain former Trustees who also participate in a retirement plan and receive benefits under such plan. Trustees’ and Officers’ Fees and Benefits include amounts accrued by the Fund to fund such retirement benefits. Obligations under the deferred compensation and retirement plans represent unsecured claims against the general assets of the Fund.
NOTE 8—Cash Balances
The Fund is permitted to temporarily carry a negative or overdrawn balance in its account with State Street Bank and Trust Company, the custodian bank. Such balances, if any at period end, are shown in the Statement of Assets and Liabilities under the payable caption Amount due custodian. To compensate the custodian bank for such overdrafts, the overdrawn Fund may either (1) leave funds as a compensating balance in the account so the custodian bank can be compensated by earning the additional interest; or (2) compensate by paying the custodian bank at a rate agreed upon by the custodian bank and Invesco, not to exceed the contractually agreed upon rate.
NOTE 9—Distributions to Shareholders and Tax Components of Net Assets
Tax Character of Distributions to Shareholders Paid During the Fiscal Years Ended October 31, 2015 and 2014:
| | | | | | | | |
| | | 2015 | | | 2014 | |
Ordinary income | | $ | 181,384,333 | | | $ | 144,727,252 | |
Long-term capital gain | | | 208,048,826 | | | | 84,154,570 | |
Total distributions | | $ | 389,433,159 | | | $ | 228,881,822 | |
Tax Components of Net Assets at Period-End:
| | | | |
| | | 2015 | |
Undistributed ordinary income | | $ | 44,707,116 | |
Undistributed long-term gain | | | 458,986,005 | |
Net unrealized appreciation — investments | | | 2,843,587,540 | |
Net unrealized appreciation (depreciation) — other investments | | | (173,116 | ) |
Temporary book/tax differences | | | (850,852 | ) |
Capital loss carryforward | | | (17,029,903 | ) |
Shares of beneficial interest | | | 8,475,213,742 | |
Total net assets | | $ | 11,804,440,532 | |
The difference between book-basis and tax-basis unrealized appreciation (depreciation) is due to differences in the timing of recognition of gains and losses on investments for tax and book purposes. The Fund’s net unrealized appreciation difference is attributable primarily to wash sales.
The temporary book/tax differences are a result of timing differences between book and tax recognition of income and/or expenses. The Fund’s temporary book/tax differences are the result of the trustee deferral of compensation and retirement plan benefits.
Capital loss carryforward is calculated and reported as of a specific date. Results of transactions and other activity after that date may affect the amount of capital loss carryforward actually available for the Fund to utilize. Capital losses generated in years beginning after December 22, 2010 can be carried forward for an unlimited period, whereas previous losses expire in eight tax years. Capital losses with an expiration period may not be used to offset capital gains until all net capital losses without an expiration date have been utilized. Capital loss carryforwards with no expiration date will retain their character as either short-term or long-term capital losses instead of as short-term capital losses as under prior law. The ability to utilize capital loss carryforwards in the future may be limited under the Internal Revenue Code and related regulations based on the results of future transactions.
The Fund has a capital loss carryforward as of October 31, 2015, which expires as follows:
| | | | | | | | | | | | |
| Capital Loss Carryforward* | |
| Expiration | | Short-Term | | | Long-Term | | | Total | |
October 31, 2017 | | $ | 17,029,903 | | | $ | — | | | $ | 17,029,903 | |
| * | Capital loss carryforward as of the date listed above is reduced for limitations, if any, to the extent required by the Internal Revenue Code and may be further limited depending upon a variety of factors, including the realization of net unrealized gains or losses as of the date of any reorganization. |
19 Invesco Diversified Dividend Fund
NOTE 10—Investment Securities
The aggregate amount of investment securities (other than short-term securities, U.S. Treasury obligations and money market funds, if any) purchased and sold by the Fund during the year ended October 31, 2015 was $1,749,624,940 and $1,086,030,750, respectively. Cost of investments on a tax basis includes the adjustments for financial reporting purposes as of the most recently completed federal income tax reporting period-end.
| | | | |
| Unrealized Appreciation (Depreciation) of Investment Securities on a Tax Basis | |
Aggregate unrealized appreciation of investment securities | | $ | 3,170,022,248 | |
Aggregate unrealized (depreciation) of investment securities | | | (326,434,708 | ) |
Net unrealized appreciation of investment securities | | $ | 2,843,587,540 | |
Cost of investments for tax purposes is $9,066,019,231.
NOTE 11—Reclassification of Permanent Differences
Primarily as a result of differing book/tax treatment of foreign currency transactions, on October 31, 2015, undistributed net investment income was increased by $652,898 and undistributed net realized gain was decreased by $652,898. This reclassification had no effect on the net assets of the Fund.
NOTE 12—Share Information
| | | | | | | | | | | | | | | | |
| | | Summary of Share Activity | |
| | | Years ended October 31, | |
| | | 2015(a) | | | 2014 | |
| | | Shares | | | Amount | | | Shares | | | Amount | |
Sold: | | | | | | | | | | | | | | | | |
Class A | | | 49,071,513 | | | $ | 908,967,640 | | | | 39,048,451 | | | $ | 675,673,714 | |
Class B | | | 128,997 | | | | 2,364,301 | | | | 121,724 | | | | 2,075,154 | |
Class C | | | 7,543,186 | | | | 138,036,038 | | | | 5,490,729 | | | | 93,843,494 | |
Class R | | | 5,218,131 | | | | 95,069,215 | | | | 2,628,858 | | | | 45,625,910 | |
Class Y | | | 31,767,783 | | | | 589,650,231 | | | | 30,640,781 | | | | 530,835,512 | |
Investor Class | | | 6,156,226 | | | | 114,175,060 | | | | 6,469,029 | | | | 110,955,044 | |
Class R5 | | | 39,348,146 | | | | 727,950,505 | | | | 36,802,517 | | | | 642,518,677 | |
Class R6 | | | 21,894,533 | | | | 408,991,767 | | | | 22,638,270 | | | | 395,617,472 | |
| | | | |
Issued as reinvestment of dividends: | | | | | | | | | | | | | | | | |
Class A | | | 6,750,039 | | | | 121,781,499 | | | | 4,974,176 | | | | 84,433,762 | |
Class B | | | 41,958 | | | | 744,661 | | | | 32,766 | | | | 543,675 | |
Class C | | | 519,418 | | | | 9,219,512 | | | | 275,921 | | | | 4,592,839 | |
Class R | | | 263,465 | | | | 4,766,201 | | | | 153,373 | | | | 2,616,003 | |
Class Y | | | 1,638,950 | | | | 29,651,060 | | | | 924,559 | | | | 15,846,387 | |
Investor Class | | | 3,648,821 | | | | 65,788,807 | | | | 2,590,684 | | | | 44,034,269 | |
Class R5 | | | 4,126,231 | | | | 74,560,754 | | | | 2,286,664 | | | | 39,125,556 | |
Class R6 | | | 1,454,383 | | | | 26,276,678 | | | | 653,482 | | | | 11,224,693 | |
| | | | |
Automatic conversion of Class B shares to Class A shares: | | | | | | | | | | | | | | | | |
Class A | | | 372,517 | | | | 6,929,711 | | | | 401,583 | | | | 6,989,503 | |
Class B | | | (376,599 | ) | | | (6,929,711 | ) | | | (405,914 | ) | | | (6,989,503 | ) |
| | | | |
Reacquired: | | | | | | | | | | | | | | | | |
Class A | | | (36,679,017 | ) | | | (680,044,734 | ) | | | (36,867,696 | ) | | | (641,652,369 | ) |
Class B | | | (216,579 | ) | | | (3,978,971 | ) | | | (293,681 | ) | | | (5,035,971 | ) |
Class C | | | (3,727,814 | ) | | | (68,271,810 | ) | | | (3,308,558 | ) | | | (56,847,306 | ) |
Class R | | | (2,179,666 | ) | | | (40,380,408 | ) | | | (1,810,113 | ) | | | (31,584,841 | ) |
Class Y | | | (16,754,694 | ) | | | (310,606,372 | ) | | | (14,628,076 | ) | | | (256,536,560 | ) |
Investor Class | | | (11,696,608 | ) | | | (216,740,005 | ) | | | (16,230,598 | ) | | | (282,092,888 | ) |
Class R5 | | | (23,678,672 | ) | | | (441,202,954 | ) | | | (17,165,809 | ) | | | (298,262,921 | ) |
Class R6 | | | (29,733,962 | ) | | | (554,124,242 | ) | | | (4,092,437 | ) | | | (71,696,702 | ) |
Net increase in share activity | | | 54,900,686 | | | $ | 1,002,644,433 | | | | 61,330,685 | | | $ | 1,055,852,603 | |
| (a) | There are entities that are record owners of more than 5% of the outstanding shares of the Fund and in the aggregate own 42% of the outstanding shares of the Fund. IDI has an agreement with these entities to sell Fund shares. The Fund, Invesco and/or Invesco affiliates may make payments to these entities, which are considered to be related to the Fund, for providing services to the Fund, Invesco and/or Invesco affiliates including but not limited to services such as securities brokerage, distribution, third party record keeping and account servicing. The Fund has no knowledge as to whether all or any portion of the shares owned of record by these entities are also owned beneficially. |
20 Invesco Diversified Dividend Fund
NOTE 13—Financial Highlights
The following schedule presents financial highlights for a share of the Fund outstanding throughout the periods indicated.
| | | | | | | | | | | | | | | | | | | | | | | | | | | | | | | | | | | | | | | | | | | | | | | | | | | | | | | | |
| | | Net asset
value,
beginning
of period | | | Net
investment
income(a) | | | Net gains
(losses)
on securities
(both
realized and
unrealized) | | | Total from
investment
operations | | | Dividends
from net
investment
income | | | Distributions
from net
realized
gains | | | Total
distributions | | | Net asset
value, end
of period | | | Total
return(b) | | | Net assets,
end of period
(000’s omitted) | | | Ratio of
expenses
to average
net assets
with fee waivers
and/or expenses
absorbed | | | Ratio of
expenses
to average net
assets without
fee waivers
and/or expenses
absorbed | | | Ratio of net
investment
income
to average
net assets | | | Portfolio
turnover(c) | |
Class A | | | | | | | | | | | | | | | | | | | | | | | | | | | | | | | | | | | | | | | | | | | | | | | | | | | | | | | | |
Year ended 10/31/15 | | $ | 18.17 | | | $ | 0.30 | | | $ | 0.95 | | | $ | 1.25 | | | $ | (0.28 | ) | | $ | (0.36 | ) | | $ | (0.64 | ) | | $ | 18.78 | | | | 7.09 | % | | $ | 4,715,635 | | | | 0.82 | %(d) | | | 0.83 | %(d) | | | 1.63 | %(d) | | | 11 | % |
Year ended 10/31/14 | | | 16.52 | | | | 0.28 | | | | 1.78 | | | | 2.06 | | | | (0.25 | ) | | | (0.16 | ) | | | (0.41 | ) | | | 18.17 | | | | 12.68 | | | | 4,206,935 | | | | 0.83 | | | | 0.84 | | | | 1.59 | | | | 6 | |
Year ended 10/31/13 | | | 13.54 | | | | 0.25 | | | | 3.20 | | | | 3.45 | | | | (0.26 | ) | | | (0.21 | ) | | | (0.47 | ) | | | 16.52 | | | | 26.07 | | | | 3,700,473 | | | | 0.86 | | | | 0.87 | | | | 1.65 | | | | 9 | |
Year ended 10/31/12 | | | 11.92 | | | | 0.22 | | | | 1.76 | | | | 1.98 | | | | (0.22 | ) | | | (0.14 | ) | | | (0.36 | ) | | | 13.54 | | | | 17.00 | | | | 2,520,209 | | | | 0.91 | | | | 0.92 | | | | 1.78 | | | | 12 | |
Year ended 10/31/11 | | | 11.67 | | | | 0.19 | | | | 0.29 | | | | 0.48 | | | | (0.23 | ) | | | — | | | | (0.23 | ) | | | 11.92 | | | | 4.15 | | | | 2,121,824 | | | | 0.94 | | | | 0.97 | | | | 1.64 | | | | 20 | |
Class B | | | | | | | | | | | | | | | | | | | | | | | | | | | | | | | | | | | | | | | | | | | | | | | | | | | | | | | | |
Year ended 10/31/15 | | | 17.97 | | | | 0.16 | | | | 0.95 | | | | 1.11 | | | | (0.14 | ) | | | (0.36 | ) | | | (0.50 | ) | | | 18.58 | | | | 6.35 | | | | 22,845 | | | | 1.57 | (d) | | | 1.58 | (d) | | | 0.88 | (d) | | | 11 | |
Year ended 10/31/14 | | | 16.35 | | | | 0.14 | | | | 1.76 | | | | 1.90 | | | | (0.12 | ) | | | (0.16 | ) | | | (0.28 | ) | | | 17.97 | | | | 11.77 | | | | 29,691 | | | | 1.58 | | | | 1.59 | | | | 0.84 | | | | 6 | |
Year ended 10/31/13 | | | 13.40 | | | | 0.13 | | | | 3.17 | | | | 3.30 | | | | (0.14 | ) | | | (0.21 | ) | | | (0.35 | ) | | | 16.35 | | | | 25.16 | | | | 35,912 | | | | 1.61 | | | | 1.62 | | | | 0.90 | | | | 9 | |
Year ended 10/31/12 | | | 11.80 | | | | 0.13 | | | | 1.74 | | | | 1.87 | | | | (0.13 | ) | | | (0.14 | ) | | | (0.27 | ) | | | 13.40 | | | | 16.12 | | | | 35,401 | | | | 1.66 | | | | 1.67 | | | | 1.03 | | | | 12 | |
Year ended 10/31/11 | | | 11.55 | | | | 0.11 | | | | 0.28 | | | | 0.39 | | | | (0.14 | ) | | | — | | | | (0.14 | ) | | | 11.80 | | | | 3.39 | | | | 36,873 | | | | 1.69 | | | | 1.72 | | | | 0.89 | | | | 20 | |
Class C | | | | | | | | | | | | | | | | | | | | | | | | | | | | | | | | | | | | | | | | | | | | | | | | | | | | | | | | |
Year ended 10/31/15 | | | 17.95 | | | | 0.16 | | | | 0.95 | | | | 1.11 | | | | (0.14 | ) | | | (0.36 | ) | | | (0.50 | ) | | | 18.56 | | | | 6.36 | | | | 440,482 | | | | 1.57 | (d) | | | 1.58 | (d) | | | 0.88 | (d) | | | 11 | |
Year ended 10/31/14 | | | 16.33 | | | | 0.14 | | | | 1.76 | | | | 1.90 | | | | (0.12 | ) | | | (0.16 | ) | | | (0.28 | ) | | | 17.95 | | | | 11.79 | | | | 348,340 | | | | 1.58 | | | | 1.59 | | | | 0.84 | | | | 6 | |
Year ended 10/31/13 | | | 13.38 | | | | 0.13 | | | | 3.17 | | | | 3.30 | | | | (0.14 | ) | | | (0.21 | ) | | | (0.35 | ) | | | 16.33 | | | | 25.19 | | | | 276,653 | | | | 1.61 | | | | 1.62 | | | | 0.90 | | | | 9 | |
Year ended 10/31/12 | | | 11.79 | | | | 0.13 | | | | 1.73 | | | | 1.86 | | | | (0.13 | ) | | | (0.14 | ) | | | (0.27 | ) | | | 13.38 | | | | 16.04 | | | | 153,467 | | | | 1.66 | | | | 1.67 | | | | 1.03 | | | | 12 | |
Year ended 10/31/11 | | | 11.53 | | | | 0.11 | | | | 0.29 | | | | 0.40 | | | | (0.14 | ) | | | — | | | | (0.14 | ) | | | 11.79 | | | | 3.48 | | | | 120,031 | | | | 1.69 | | | | 1.72 | | | | 0.89 | | | | 20 | |
Class R | | | | | | | | | | | | | | | | | | | | | | | | | | | | | | | | | | | | | | | | | | | | | | | | | | | | | | | | |
Year ended 10/31/15 | | | 18.22 | | | | 0.26 | | | | 0.96 | | | | 1.22 | | | | (0.24 | ) | | | (0.36 | ) | | | (0.60 | ) | | | 18.84 | | | | 6.87 | | | | 204,956 | | | | 1.07 | (d) | | | 1.08 | (d) | | | 1.38 | (d) | | | 11 | |
Year ended 10/31/14 | | | 16.57 | | | | 0.23 | | | | 1.79 | | | | 2.02 | | | | (0.21 | ) | | | (0.16 | ) | | | (0.37 | ) | | | 18.22 | | | | 12.36 | | | | 138,078 | | | | 1.08 | | | | 1.09 | | | | 1.34 | | | | 6 | |
Year ended 10/31/13 | | | 13.58 | | | | 0.22 | | | | 3.20 | | | | 3.42 | | | | (0.22 | ) | | | (0.21 | ) | | | (0.43 | ) | | | 16.57 | | | | 25.77 | | | | 109,444 | | | | 1.11 | | | | 1.12 | | | | 1.40 | | | | 9 | |
Year ended 10/31/12 | | | 11.96 | | | | 0.19 | | | | 1.76 | | | | 1.95 | | | | (0.19 | ) | | | (0.14 | ) | | | (0.33 | ) | | | 13.58 | | | | 16.66 | | | | 37,948 | | | | 1.16 | | | | 1.17 | | | | 1.53 | | | | 12 | |
Year ended 10/31/11 | | | 11.70 | | | | 0.17 | | | | 0.29 | | | | 0.46 | | | | (0.20 | ) | | | — | | | | (0.20 | ) | | | 11.96 | | | | 3.97 | | | | 19,261 | | | | 1.19 | | | | 1.22 | | | | 1.39 | | | | 20 | |
Class Y | | | | | | | | | | | | | | | | | | | | | | | | | | | | | | | | | | | | | | | | | | | | | | | | | | | | | | | | |
Year ended 10/31/15 | | | 18.19 | | | | 0.35 | | | | 0.95 | | | | 1.30 | | | | (0.33 | ) | | | (0.36 | ) | | | (0.69 | ) | | | 18.80 | | | | 7.36 | | | | 1,183,312 | | | | 0.57 | (d) | | | 0.58 | (d) | | | 1.88 | (d) | | | 11 | |
Year ended 10/31/14 | | | 16.54 | | | | 0.32 | | | | 1.79 | | | | 2.11 | | | | (0.30 | ) | | | (0.16 | ) | | | (0.46 | ) | | | 18.19 | | | | 12.95 | | | | 841,750 | | | | 0.58 | | | | 0.59 | | | | 1.84 | | | | 6 | |
Year ended 10/31/13 | | | 13.56 | | | | 0.29 | | | | 3.19 | | | | 3.48 | | | | (0.29 | ) | | | (0.21 | ) | | | (0.50 | ) | | | 16.54 | | | | 26.35 | | | | 485,248 | | | | 0.61 | | | | 0.62 | | | | 1.90 | | | | 9 | |
Year ended 10/31/12 | | | 11.94 | | | | 0.26 | | | | 1.76 | | | | 2.02 | | | | (0.26 | ) | | | (0.14 | ) | | | (0.40 | ) | | | 13.56 | | | | 17.26 | | | | 179,087 | | | | 0.66 | | | | 0.67 | | | | 2.03 | | | | 12 | |
Year ended 10/31/11 | | | 11.68 | | | | 0.23 | | | | 0.30 | | | | 0.53 | | | | (0.27 | ) | | | — | | | | (0.27 | ) | | | 11.94 | | | | 4.50 | | | | 131,365 | | | | 0.69 | | | | 0.72 | | | | 1.89 | | | | 20 | |
Investor Class | | | | | | | | | | | | | | | | | | | | | | | | | | | | | | | | | | | | | | | | | | | | | | | | | | | | | | | | |
Year ended 10/31/15 | | | 18.16 | | | | 0.31 | | | | 0.96 | | | | 1.27 | | | | (0.30 | ) | | | (0.36 | ) | | | (0.66 | ) | | | 18.77 | | | | 7.16 | (g) | | | 2,002,938 | | | | 0.80 | (d)(g) | | | 0.81 | (d)(g) | | | 1.65 | (d)(g) | | | 11 | |
Year ended 10/31/14 | | | 16.51 | | | | 0.29 | | | | 1.78 | | | | 2.07 | | | | (0.26 | ) | | | (0.16 | ) | | | (0.42 | ) | | | 18.16 | | | | 12.70 | (g) | | | 1,972,400 | | | | 0.76 | (g) | | | 0.77 | (g) | | | 1.66 | (g) | | | 6 | |
Year ended 10/31/13 | | | 13.53 | | | | 0.25 | | | | 3.20 | | | | 3.45 | | | | (0.26 | ) | | | (0.21 | ) | | | (0.47 | ) | | | 16.51 | | | | 26.11 | | | | 1,910,866 | | | | 0.86 | | | | 0.87 | | | | 1.64 | | | | 9 | |
Year ended 10/31/12 | | | 11.92 | | | | 0.23 | | | | 1.75 | | | | 1.98 | | | | (0.23 | ) | | | (0.14 | ) | | | (0.37 | ) | | | 13.53 | | | | 16.95 | | | | 1,444,060 | | | | 0.90 | | | | 0.91 | | | | 1.79 | | | | 12 | |
Year ended 10/31/11 | | | 11.66 | | | | 0.21 | | | | 0.29 | | | | 0.50 | | | | (0.24 | ) | | | — | | | | (0.24 | ) | | | 11.92 | | | | 4.32 | | | | 1,253,533 | | | | 0.87 | | | | 0.90 | | | | 1.71 | | | | 20 | |
Class R5 | | | | | | | | | | | | | | | | | | | | | | | | | | | | | | | | | | | | | | | | | | | | | | | | | | | | | | | | |
Year ended 10/31/15 | | | 18.17 | | | | 0.36 | | | | 0.95 | | | | 1.31 | | | | (0.34 | ) | | | (0.36 | ) | | | (0.70 | ) | | | 18.78 | | | | 7.41 | | | | 2,385,096 | | | | 0.53 | (d) | | | 0.54 | (d) | | | 1.92 | (d) | | | 11 | |
Year ended 10/31/14 | | | 16.52 | | | | 0.33 | | | | 1.78 | | | | 2.11 | | | | (0.30 | ) | | | (0.16 | ) | | | (0.46 | ) | | | 18.17 | | | | 12.99 | | | | 1,947,461 | | | | 0.54 | | | | 0.55 | | | | 1.88 | | | | 6 | |
Year ended 10/31/13 | | | 13.54 | | | | 0.29 | | | | 3.20 | | | | 3.49 | | | | (0.30 | ) | | | (0.21 | ) | | | (0.51 | ) | | | 16.52 | | | | 26.47 | | | | 1,408,407 | | | | 0.57 | | | | 0.58 | | | | 1.94 | | | | 9 | |
Year ended 10/31/12 | | | 11.92 | | | | 0.27 | | | | 1.76 | | | | 2.03 | | | | (0.27 | ) | | | (0.14 | ) | | | (0.41 | ) | | | 13.54 | | | | 17.39 | | | | 720,726 | | | | 0.56 | | | | 0.57 | | | | 2.13 | | | | 12 | |
Year ended 10/31/11 | | | 11.67 | | | | 0.24 | | | | 0.29 | | | | 0.53 | | | | (0.28 | ) | | | — | | | | (0.28 | ) | | | 11.92 | | | | 4.53 | | | | 443,581 | | | | 0.58 | | | | 0.59 | | | | 2.00 | | | | 20 | |
Class R6 | | | | | | | | | | | | | | | | | | | | | | | | | | | | | | | | | | | | | | | | | | | | | | | | | | | | | | | | |
Year ended 10/31/15 | | | 18.17 | | | | 0.37 | | | | 0.97 | | | | 1.34 | | | | (0.36 | ) | | | (0.36 | ) | | | (0.72 | ) | | | 18.79 | | | | 7.57 | | | | 849,176 | | | | 0.43 | (d) | | | 0.44 | (d) | | | 2.02 | (d) | | | 11 | |
Year ended 10/31/14 | | | 16.52 | | | | 0.35 | | | | 1.78 | | | | 2.13 | | | | (0.32 | ) | | | (0.16 | ) | | | (0.48 | ) | | | 18.17 | | | | 13.10 | | | | 937,485 | | | | 0.44 | | | | 0.45 | | | | 1.98 | | | | 6 | |
Year ended 10/31/13 | | | 13.54 | | | | 0.31 | | | | 3.19 | | | | 3.50 | | | | (0.31 | ) | | | (0.21 | ) | | | (0.52 | ) | | | 16.52 | | | | 26.56 | | | | 535,077 | | | | 0.48 | | | | 0.49 | | | | 2.03 | | | | 9 | |
Year ended 10/31/12(e) | | | 13.61 | | | | 0.03 | | | | (0.10 | ) | | | (0.07 | ) | | | — | | | | — | | | | — | | | | 13.54 | | | | (0.51 | ) | | | 166,418 | | | | 0.49 | (f) | | | 0.50 | (f) | | | 2.20 | (f) | | | 12 | |
| (a) | Calculated using average shares outstanding. |
| (b) | Includes adjustments in accordance with accounting principles generally accepted in the United States of America and as such, the net asset value for financial reporting purposes and the returns based upon those net asset values may differ from the net asset value and returns for shareholder transactions. Does not include sales charges and is not annualized for periods less than one year, if applicable. |
| (c) | Portfolio turnover is calculated at the fund level and is not annualized for periods less than one year, if applicable. For the period ended October 31, 2011, the portfolio turnover calculation excludes the value of securities purchased of $1,261,900,843 and sold of $210,298,763 in the effort to realign the Fund’s portfolio holdings after the reorganization of Invesco Dividend Growth Securities, Invesco Financial Services Fund and Invesco Van Kampen Core Equity Fund into the Fund. |
| (d) | Ratios are based on average daily net assets (000’s omitted) of $4,450,201, $26,591, $385,181, $156,728, $945,679, $1,996,288, $2,225,668 and $864,245 for Class A, Class B, Class C, Class R, Class Y, Investor Class, Class R5 and Class R6 shares, respectively. |
| (e) | Commencement date of September 24, 2012. |
| (g) | The total return, ratio of expenses to average net assets and ratio of net investment income (loss) to average net assets reflect actual 12b-1 fees 0.23% and 0.18% for the years ended October 31, 2015 and 2014, respectively. |
21 Invesco Diversified Dividend Fund
Report of Independent Registered Public Accounting Firm
To the Board of Trustees of AIM Equity Funds (Invesco Equity Funds)
and Shareholders of Invesco Diversified Dividend Fund:
In our opinion, the accompanying statement of assets and liabilities, including the schedule of investments, and the related statements of operations and of changes in net assets and the financial highlights present fairly, in all material respects, the financial position of Invesco Diversified Dividend Fund (one of the funds constituting AIM Equity Funds (Invesco Equity Funds), hereafter referred to as the “Fund”) at October 31, 2015, the results of its operations for the year then ended, the changes in its net assets for each of the two years in the period then ended and the financial highlights for each of the five years in the period then ended, in conformity with accounting principles generally accepted in the United States of America. These financial statements and financial highlights (hereafter referred to as “financial statements”) are the responsibility of the Fund’s management. Our responsibility is to express an opinion on these financial statements based on our audits. We conducted our audits of these financial statements in accordance with the standards of the Public Company Accounting Oversight Board (United States). Those standards require that we plan and perform the audit to obtain reasonable assurance about whether the financial statements are free of material misstatement. An audit includes examining, on a test basis, evidence supporting the amounts and disclosures in the financial statements, assessing the accounting principles used and significant estimates made by management, and evaluating the overall financial statement presentation. We believe that our audits, which included confirmation of securities at October 31, 2015 by correspondence with the custodian and brokers, and the application of alternative auditing procedures where confirmations of security purchases have not been received, provide a reasonable basis for our opinion.
PRICEWATERHOUSECOOPERS LLP
December 23, 2015
Houston, Texas
22 Invesco Diversified Dividend Fund
Calculating your ongoing Fund expenses
Example
As a shareholder of the Fund, you incur two types of costs: (1) transaction costs, which may include sales charges (loads) on purchase payments or contingent deferred sales charges on redemptions, if any; and (2) ongoing costs, including management fees, distribution and/or service (12b-1) fees, and other Fund expenses. This example is intended to help you understand your ongoing costs (in dollars) of investing in the Fund and to compare these costs with ongoing costs of investing in other mutual funds. The example is based on an investment of $1,000 invested at the beginning of the period and held for the entire period May 1, 2015 through October 31, 2015.
Actual expenses
The table below provides information about actual account values and actual expenses. You may use the information in this table, together with the amount you invested, to estimate the expenses that you paid over the period. Simply divide your account value by $1,000 (for example, an $8,600 account value divided by $1,000 = 8.6), then multiply the result by the number in the table under the heading entitled “Actual Expenses Paid During Period” to estimate the expenses you paid on your account during this period.
Hypothetical example for comparison purposes
The table below also provides information about hypothetical account values and hypothetical expenses based on the Fund’s actual expense ratio and an assumed rate of return of 5% per year before expenses, which is not the Fund’s actual return.
The hypothetical account values and expenses may not be used to estimate the actual ending account balance or expenses you paid for the period. You may use this information to compare the ongoing costs of investing in the Fund and other funds. To do so, compare this 5% hypothetical example with the 5% hypothetical examples that appear in the shareholder reports of the other funds.
Please note that the expenses shown in the table are meant to highlight your ongoing costs only and do not reflect any transaction costs, such as sales charges (loads) on purchase payments or contingent deferred sales charges on redemptions, if any. Therefore, the hypothetical information is useful in comparing ongoing costs only, and will not help you determine the relative total costs of owning different funds. In addition, if these transaction costs were included, your costs would have been higher.
| | | | | | | | | | | | | | | | | | | | | | | | |
| Class | | Beginning
Account Value
(05/01/15) | | | ACTUAL | | | HYPOTHETICAL (5% annual return before
expenses) | | | Annualized
Expense
Ratio | |
| | | Ending
Account Value
(10/31/15)1 | | | Expenses
Paid During
Period2 | | | Ending
Account Value
(10/31/15) | | | Expenses
Paid During
Period2 | | |
| A | | $ | 1,000.00 | | | $ | 1,014.70 | | | $ | 4.11 | | | $ | 1,021.12 | | | $ | 4.13 | | | | 0.81 | % |
| B | | | 1,000.00 | | | | 1,011.00 | | | | 7.91 | | | | 1,017.34 | | | | 7.93 | | | | 1.56 | |
| C | | | 1,000.00 | | | | 1,011.00 | | | | 7.91 | | | | 1,017.34 | | | | 7.93 | | | | 1.56 | |
| R | | | 1,000.00 | | | | 1,013.40 | | | | 5.38 | | | | 1,019.86 | | | | 5.40 | | | | 1.06 | |
| Y | | | 1,000.00 | | | | 1,016.00 | | | | 2.85 | | | | 1,022.38 | | | | 2.85 | | | | 0.56 | |
| Investor | | | 1,000.00 | | | | 1,015.00 | | | | 3.96 | | | | 1,021.27 | | | | 3.97 | | | | 0.78 | |
| R5 | | | 1,000.00 | | | | 1,016.20 | | | | 2.64 | | | | 1,022.58 | | | | 2.65 | | | | 0.52 | |
| R6 | | | 1,000.00 | | | | 1,016.70 | | | | 2.13 | | | | 1,023.09 | | | | 2.14 | | | | 0.42 | |
| 1 | The actual ending account value is based on the actual total return of the Fund for the period May 1, 2015 through October 31, 2015, after actual expenses and will differ from the hypothetical ending account value which is based on the Fund’s expense ratio and a hypothetical annual return of 5% before expenses. |
| 2 | Expenses are equal to the Fund’s annualized expense ratio as indicated above multiplied by the average account value over the period, multiplied by 184/365 to reflect the most recent fiscal half year. |
23 Invesco Diversified Dividend Fund
Approval of Investment Advisory and Sub-Advisory Contracts
The Board of Trustees (the Board) of AIM Equity Funds (Invesco Equity Funds) is required under the Investment Company Act of 1940, as amended, to approve annually the renewal of Invesco Diversified Dividend Fund’s (the Fund) investment advisory agreements. During contract renewal meetings held on June 9-10, 2015, the Board as a whole, and the disinterested or “independent” Trustees, who comprise over 75% of the Board, voting separately, approved the continuance for the Fund of the Master Investment Advisory Agreement with Invesco Advisers, Inc. (Invesco Advisers and the investment advisory agreement) and the Master Intergroup Sub-Advisory Contract for Mutual Funds with Invesco Asset Management Deutschland GmbH, Invesco Asset Management Limited, Invesco Asset Management (Japan) Limited, Invesco Hong Kong Limited, Invesco Senior Secured Management, Inc. and Invesco Canada Ltd. (collectively, the Affiliated Sub-Advisers and the sub-advisory contracts) for another year, effective July 1, 2015.
In evaluating the fairness and reasonableness of compensation under the Fund’s investment advisory agreement and sub-advisory contracts, the Board considered, among other things, the factors discussed below. The Board determined that continuation of the Fund’s investment advisory agreement and the sub-advisory contracts is in the best interest of the Fund and its shareholders and that the compensation payable to Invesco Advisers and the Affiliated Sub-Advisers under the agreements is fair and reasonable.
The Board’s Fund Evaluation Process
The Board’s Investments Committee has established three Sub-Committees, each of which is primarily responsible for overseeing the performance and investment management services provided by Invesco Advisers and the Affiliated Sub-Advisers to a number of the funds advised by Invesco Advisers (the Invesco Funds). The Sub-Committees meet throughout the year to review the performance of their assigned Invesco Funds, including reviewing materials prepared under the direction of the independent Senior Officer, an officer of the Invesco Funds who reports directly to the independent Trustees. Over the course of each year, the Sub-Committees meet with portfolio managers for their assigned Invesco Funds and other members of management to review the performance, investment objective(s), policies, strategies, limitations and investment risks of these funds. The Board had the benefit of reports form the Sub-Committees and Investments Committee throughout the year in considering approval of the continuance of each Invesco Fund’s investment advisory agreement and sub-advisory contracts for another year.
During the contract renewal process, the Board receives comparative performance and
fee data regarding the Invesco Funds prepared by Invesco Advisers and Lipper Inc. (Lipper), an independent provider of investment company data. The Board also receives a report and this independent written evaluation from the Senior Officer. The Senior Officer’s evaluation is prepared as part of his responsibility to manage the process by which the Invesco Funds’ proposed management fees are negotiated during the annual contract renewal process to ensure they are negotiated in a manner that is at arms’ length and reasonable. In addition to meetings with Invesco Advisers and fund counsel, the independent Trustees also discuss the continuance of the investment advisory agreement and sub-advisory contracts in separate sessions with the Senior Officer and with independent legal counsel.
The Trustees recognized that the advisory fee rates for the Invesco Funds are, in many cases, the result of years of review and negotiation. The Trustees’ deliberations and conclusions in a particular year may be based in part on their deliberations and conclusions regarding these same arrangements throughout the year and in prior years. The Trustees’ review and conclusions are based on the comprehensive consideration of all information presented to them and are not the result of any single determinative factor. Moreover, one Trustee may have weighed a particular piece of information or factor differently than another Trustee.
The discussion below is a summary of the Senior Officer’s independent written evaluation with respect to the Fund’s investment advisory agreement as well as a discussion of the material factors and related conclusions that formed the basis for the Board’s approval of the Fund’s investment advisory agreement and sub-advisory contracts. Unless otherwise stated, this information is current as of June 10, 2015, and does not reflect consideration of factors that became known to the Board after that date.
Factors and Conclusions and Summary of Independent Written Fee Evaluation
| A. | Nature, Extent and Quality of Services Provided by Invesco Advisers and the Affiliated Sub-Advisers |
The Board reviewed the advisory services provided to the Fund by Invesco Advisers under the Fund’s investment advisory agreement, the performance of Invesco Advisers in providing these services, and the credentials and experience of the officers and employees of Invesco Advisers who provide these services, including the Fund’s portfolio manager or managers. The Board’s review of the qualifications of Invesco Advisers to provide advisory services included the Board’s consideration of Invesco Advisers’ investment process oversight, independent credit analysis and investment risk management. The Board
also considered non-advisory services that Invesco Advisers and its affiliates provide to the Invesco Funds such as various back office support functions, equity and fixed income trading operations, internal audit, distribution, valuation and legal and compliance.
In determining whether to continue the Fund’s investment advisory agreement, the Board considered the benefits of reapproving an existing relationship and the greater uncertainty that may be associated with entering into a new relationship. The Board concluded that the nature, extent and quality of the services provided to the Fund by Invesco Advisers are appropriate and satisfactory and consistent with the terms of the Fund’s investment advisory agreement.
The Board reviewed the services that may be provided by the Affiliated Sub-Advisers under the sub-advisory contracts and the credentials and experience of the officers and employees of the Affiliated Sub-Advisers who provide these services. The Board noted that the Affiliated Sub-Advisers have offices and personnel that are located in financial centers around the world. As a result, the Affiliated Sub-Advisers can provide research and investment analysis on the markets and economies of various countries in which the Fund may invest, make recommendations regarding securities and assist with security trades. The Board concluded that the sub-advisory contracts benefit the Fund and its shareholders by permitting Invesco Advisers to use the resources and talents of the Affiliated Sub-Advisers in managing the Fund. The Board concluded that the nature, extent and quality of the services that may be provided by the Affiliated Sub-Advisers are appropriate and satisfactory and consistent with the terms of the Fund’s sub-advisory contracts.
The Board considered Fund performance as a relevant factor in considering whether to approve the investment advisory agreement. The Board did not view Fund performance as a relevant factor in considering whether to approve the sub-advisory contracts for the Fund, as no Affiliated Sub-Adviser currently manages assets of the Fund.
The Board compared the Fund’s performance during the past one, three and five calendar years to the performance of funds in the Lipper performance universe and against the Lipper Large-Cap Value Funds Index. The Board noted that performance of Class A shares of the Fund was in the second quintile of its performance universe for the one and five year periods and the third quintile for the three year period (the first quintile being the best performing funds and the fifth quintile being the worst performing funds). The Board noted that the Fund’s performance was above the performance of the Index for the one and five year periods and below the performance of the Index for the
24 Invesco Diversified Dividend Fund
three year period. Invesco Advisers noted that being overweight in defensive areas and underweight in more cyclical areas such as energy and information technology, along with being overweight in cash were the primary factors influencing the three year performance. The Trustees also reviewed more recent Fund performance and this review did not change their conclusions.
| C. | Advisory and Sub-Advisory Fees |
The Board compared the Fund’s contractual management fee rate to the contractual management fee rates of funds in the Fund’s Lipper expense group at a common asset level. The Board noted that the contractual management fee for Class A shares of the Fund was below the median contractual management fee rate of funds in its expense group. The Board noted that the term “contractual management fee” may include both advisory and certain administrative services fees, but that Lipper does not provide information on a fund by fund basis as to what is included. The Board noted that Invesco Advisers does not charge the Invesco Funds for the administrative services included in the term as defined by Lipper. The Board also reviewed the methodology used by Lipper in providing expense group information, which includes using each fund’s contractual management fee schedule (including any applicable breakpoints) as reported in the most recent prospectus or statement of additional information for each fund in the expense group.
The Board also compared the Fund’s effective advisory fee rate (the advisory fee rate after advisory fee waivers and before other expense limitations/waivers) to the effective advisory fee rates of other funds advised by Invesco Advisers and its affiliates with investment strategies comparable to those of the Fund. The Board noted that the Fund’s rate was below the rate of one such mutual fund and below the rate of an offshore fund advised by Invesco Advisers using a similar investment process.
The Board also considered the fees charged by Invesco Advisers and the Affiliated Sub-Advisers to other client accounts with investment strategies comparable to those of the Fund. The Board noted that Invesco Advisers or the Affiliated Sub-Advisers may charge lower fees to large institutional clients. Invesco Advisers reviewed with the Board the significantly greater scope of services it provides to the Invesco Funds relative to certain other types of client accounts. These additional services include provision of administrative services, officers and office space, oversight of service providers, preparation of annual registration statement updates and financial information and regulatory compliance under the Investment Company Act of 1940, as amended.
Invesco Advisers also reviewed generally the higher frequency of shareholder purchases and redemptions in the Invesco Funds relative to the flow of assets for other client accounts. Invesco Advisers advised the Board that advance notice
of redemptions is often provided to Invesco Advisers by institutional clients. The Board did note that sub-advisory fee rates charged by the Affiliated Sub-Advisers to manage the Invesco Funds and to manage other client accounts tended to be more comparable, reflecting a similar scope of services. The information received by the Board demonstrated that the aggregate services provided to the Invesco Funds were sufficiently different from those provided to institutional clients to support the difference in fees.
The Board also considered the services that may be provided by the Affiliated Sub-Advisers pursuant to the sub-advisory contracts, as well as the fees payable by Invesco Advisers to the Affiliated Sub-Advisers pursuant to the sub-advisory contracts. The Board also noted that the sub-advisory fees are not paid directly by the Fund, but rather, are payable by Invesco Advisers to the Affiliated Sub-Advisers.
| D. | Economies of Scale and Breakpoints |
The Board considered the extent to which there are economies of scale in the provision of advisory services to the Fund. The Board also considered whether the Fund benefits from economies of scale through contractual breakpoints in the Fund’s advisory fee schedule. The Board also noted that the Fund shares directly in economies of scale through lower fees charged by third party service providers based on the combined size of the Invesco Funds and other clients advised by Invesco Advisers.
| E. | Profitability and Financial Resources |
The Board reviewed information from Invesco Advisers concerning the costs of the advisory and other services that Invesco Advisers and its affiliates provide to the Fund and the Invesco Funds and the profitability of Invesco Advisers and its affiliates in providing these services. The Board received information from Invesco Advisers about the methodology used to prepare the profitability information. The Board noted that Invesco Advisers continues to operate at a net profit from services Invesco Advisers and its affiliates provide to the Invesco Funds and the Fund. The Board did not deem the level of profits realized by Invesco Advisers and its affiliates from providing services to the Fund to be excessive given the nature, quality and extent of the services provided. The Board received and accepted information from Invesco Advisers demonstrating that Invesco Advisers and each Affiliated Sub-Adviser are financially sound and have the resources necessary to perform their obligations under the investment advisory agreement and sub-advisory contracts.
| F. | Collateral Benefits to Invesco Advisers and its Affiliates |
The Board considered various other benefits received by Invesco Advisers and its affiliates from the relationship with the Fund, including the fees received for providing transfer agency and distribution services to the Fund. The Board considered comparative information regarding fees charged for these services, including information provided by Lipper and other
independent sources. The Board considered the performance of Invesco Advisers and its affiliates in providing these services and the organizational structure employed to provide these services. The Board also considered that these services are provided to the Fund pursuant to written contracts that are reviewed and approved on an annual basis by the Board; and that the services are required for the operation of the Fund.
The Board considered the benefits realized by Invesco Advisers and the Affiliated Sub-Advisers as a result of portfolio brokerage transactions executed through “soft dollar” arrangements. The Board noted that soft dollar arrangements shift the payment obligation for research services from Invesco Advisers and the Affiliated Sub-Advisers to the Invesco Funds and that the research received may be used with other clients of Invesco Advisers and may reduce Invesco Advisers’ and the Affiliated Sub-Advisers’ expenses. The Board also considered that it receives periodic reports from the Chief Compliance Officer of the Invesco Funds demonstrating that these arrangements are consistent with regulatory requirements. The Board did not deem the soft dollar arrangements to be inappropriate.
The Board considered that the Fund’s uninvested cash and cash collateral from any securities lending arrangements may be invested in money market funds advised by Invesco Advisers pursuant to procedures approved by the Board. The Board noted that Invesco Advisers receives advisory fees from these affiliated money market funds attributable to such investments, although Invesco Advisers has contractually agreed to waive through varying periods the advisory fees payable by the Invesco Funds with respect to investments in the affiliated money market funds. The waiver is in an amount equal to 100% of the net advisory fee Invesco Advisers receives from the affiliated money market funds with respect to the Fund’s investment in the affiliated money market funds of uninvested cash, but not cash collateral. The Board concluded that the amount of advisory fees received by Invesco Advisors from the Fund’s investment of cash collateral from any securities lending arrangements in the affiliated money market funds is fair and reasonable.
The Board also considered the Fund may use an affiliated broker to execute certain trades for the Fund to among other things, control information leakage, and were advised that such trades would be executed in compliance with rules under the Investment Company Act of 1940, as amended, and consistent with best execution obligations.
25 Invesco Diversified Dividend Fund
Tax Information
Form 1099-DIV, Form 1042-S and other year–end tax information provide shareholders with actual calendar year amounts that should be included in their tax returns. Shareholders should consult their tax advisors.
The following distribution information is being provided as required by the Internal Revenue Code or to meet a specific state’s requirement.
The Fund designates the following amounts or, if subsequently determined to be different, the maximum amount allowable for its fiscal year ended October 31, 2015:
| | | | |
Federal and State Income Tax | | | |
Long-Term Capital Gain Distributions | | $ | 208,048,826 | |
Qualified Dividend Income* | | | 100 | % |
Corporate Dividends Received Deduction* | | | 100 | % |
U.S. Treasury Obligations* | | | 0 | % |
| | * | The above percentages are based on ordinary income dividends paid to shareholders during the Fund’s fiscal year. |
| | | | |
Non-Resident Alien Shareholders | | | |
Qualified Short-Term Gains | | $ | 3,662,232 | |
26 Invesco Diversified Dividend Fund
Trustees and Officers
The address of each trustee and officer is AIM Equity Funds (Invesco Equity Funds) (the “Trust”), 11 Greenway Plaza, Suite 1000, Houston, Texas 77046-1173. The trustees serve for the life of the Trust, subject to their earlier death, incapacitation, resignation, retirement or removal as more specifically provided in the Trust’s organizational documents. Each officer serves for a one year term or until their successors are elected and qualified. Column two below includes length of time served with predecessor entities, if any.
| | | | | | | | |
Name, Year of Birth and
Position(s) Held with the Trust | | Trustee and/
or Officer Since | | Principal Occupation(s)
During Past 5 Years | | Number of Funds in Fund Complex Overseen by Trustee | | Other Directorship(s)
Held by Trustee During Past 5 Years |
| Interested Persons | | | | | | | | |
| Martin L. Flanagan1 — 1960 Trustee | | 2007 | | Executive Director, Chief Executive Officer and President, Invesco Ltd. (ultimate parent of Invesco and a global investment management firm); Advisor to the Board, Invesco Advisers, Inc. (formerly known as Invesco Institutional (N.A.), Inc.); Trustee, The Invesco Funds; Vice Chair, Investment Company Institute; and Member of Executive Board, SMU Cox School of Business Formerly: Chairman and Chief Executive Officer, Invesco Advisers, Inc. (registered investment adviser); Director, Chairman, Chief Executive Officer and President, IVZ Inc. (holding company), INVESCO Group Services, Inc. (service provider) and Invesco North American Holdings, Inc. (holding company); Director, Chief Executive Officer and President, Invesco Holding Company Limited (parent of Invesco and a global investment management firm); Director, Invesco Ltd.; Chairman, Investment Company Institute and President, Co-Chief Executive Officer, Co-President, Chief Operating Officer and Chief Financial Officer, Franklin Resources, Inc. (global investment management organization). | | 145 | | None |
Philip A. Taylor2 — 1954 Trustee, President and Principal Executive Officer | | 2006 | | Head of North American Retail and Senior Managing Director, Invesco Ltd.; Director, Co-Chairman, Co-President and Co-Chief Executive Officer, Invesco Advisers, Inc. (formerly known as Invesco Institutional (N.A.), Inc.) (registered investment adviser); Director, Chairman, Chief Executive Officer and President, Invesco Management Group, Inc. (formerly known as Invesco Aim Management Group, Inc.) (financial services holding company); Director and President, INVESCO Funds Group, Inc. (registered investment adviser and registered transfer agent); Director and Chairman, Invesco Investment Services, Inc. (formerly known as Invesco Aim Investment Services, Inc.) (registered transfer agent) and IVZ Distributors, Inc. (formerly known as INVESCO Distributors, Inc.) (registered broker dealer); Chief Executive Officer, Invesco Corporate Class Inc. (corporate mutual fund company) Director, Chairman and Chief Executive Officer, Invesco Canada Ltd. (formerly known as Invesco Trimark Ltd./Invesco Trimark Ltèe) (registered investment adviser and registered transfer agent); Trustee, President and Principal Executive Officer, The Invesco Funds (other than AIM Treasurer’s Series Trust (Invesco Treasurer’s Series Trust), Short-Term Investments Trust and Invesco Management Trust); Trustee and Executive Vice President, The Invesco Funds (AIM Treasurer’s Series Trust (Invesco Treasurer’s Series Trust), Short-Term Investments Trust and Invesco Management Trust only); Director, Invesco Investment Advisers LLC (formerly known as Van Kampen Asset Management); Director, Chief Executive Officer and President, Van Kampen Exchange Corp. Formerly: Director, President and Chairman, Invesco Inc. (holding company), Invesco Canada Holdings Inc. (holding company), Trimark Investments Ltd./Placements Trimark Ltèe and Invesco Financial Services Ltd/Services Financiers Invesco Ltèe; Chief Executive Officer, Invesco Canada Fund Inc (corporate mutual fund company); Director and Chairman, Van Kampen Investor Services Inc.; Director, Chief Executive Officer and President, 1371 Preferred Inc. (holding company) and Van Kampen Investments Inc.; Director and President, AIM GP Canada Inc. (general partner for limited partnerships) and Van Kampen Advisors, Inc.; Director and Chief Executive Officer, Invesco Trimark Dealer Inc. (registered broker dealer); Director, Invesco Distributors, Inc. (formerly known as Invesco Aim Distributors, Inc.) (registered broker dealer); Manager, Invesco PowerShares Capital Management LLC; Director, Chief Executive Officer and President, Invesco Advisers, Inc.; Director, Chairman, Chief Executive Officer and President, Invesco Aim Capital Management, Inc.; President, Invesco Trimark Dealer Inc. and Invesco Trimark Ltd./Invesco Trimark Ltèe; Director and President, AIM Trimark Corporate Class Inc. and AIM Trimark Canada Fund Inc.; Senior Managing Director, Invesco Holding Company Limited; Director and Chairman, Fund Management Company (former registered broker dealer); President and Principal Executive Officer, The Invesco Funds (AIM Treasurer’s Series Trust (Invesco Treasurer’s Series Trust), and Short-Term Investments Trust only); President, AIM Trimark Global Fund Inc. and AIM Trimark Canada Fund Inc.. | | 145 | | None |
| 1 | Mr. Flanagan is considered an interested person (within the meaning of Section 2(a)(19) of the 1940 Act) of the Trust because he is an officer of the Adviser to the Trust, and an officer and a director of Invesco Ltd., ultimate parent of the Adviser. |
| 2 | Mr. Taylor is considered an interested person (within the meaning of Section 2(a)(19) of the 1940 Act) of the Trust because he is an officer and a director of the Adviser. |
T-1 Invesco Diversified Dividend Fund
Trustees and Officers—(continued)
| | | | | | | | |
Name, Year of Birth and
Position(s) Held with the Trust | | Trustee and/
or Officer Since | | Principal Occupation(s)
During Past 5 Years | | Number of Funds in Fund Complex Overseen by Trustee | | Other Directorship(s)
Held by Trustee During
Past 5 Years |
| Independent Trustees | | | | | | | | |
Bruce L. Crockett — 1944 Trustee and Chair | | 2003 | | Chairman, Crockett Technologies Associates (technology consulting company) Formerly: Director, Captaris (unified messaging provider); Director, President and Chief Executive Officer, COMSAT Corporation; Chairman, Board of Governors of INTELSAT (international communications company); ACE Limited (insurance company); Independent Directors Council and Investment Company Institute | | 145 | | ALPS (Attorneys Liability Protection Society) (insurance company) and Globe Specialty Metals, Inc. (metallurgical company) |
David C. Arch — 1945 Trustee | | 2010 | | Chairman of Blistex Inc., a consumer health care products manufacturer | | 145 | | Board member of the Illinois Manufacturers’ Association; Member of the Board of Visitors, Institute for the Humanities, University of Michigan; Member of the Audit Committee of the Edward-Elmhurst Hospital |
James T. Bunch — 1942 Trustee | | 2000 | | Managing Member, Grumman Hill Group LLC (family office/private equity investments) Formerly: Founder, Green Manning & Bunch Ltd. (investment banking firm) (1988-2010); Executive Committee, United States Golf Association; and Chairman, Board of Governors, Western Golf Association | | 145 | | Chairman of the Board of Trustees, Evans Scholars Foundation; and Chairman of the Board, Denver Film Society |
Rodney F. Dammeyer — 1940 Trustee | | 2010 | | Chairman of CAC, LLC, (private company offering capital investment and management advisory services) Formerly: Prior to 2001, Managing Partner at Equity Group Corporate Investments; Prior to 1995, Chief Executive Officer of Itel Corporation (formerly Anixter International); Prior to 1985, experience includes Senior Vice President and Chief Financial Officer of Household International, Inc., Executive Vice President and Chief Financial Officer of Northwest Industries, Inc. and Partner of Arthur Andersen & Co.; From 1987 to 2010, Director/Trustee of investment companies in the Van Kampen Funds complex | | 145 | | Director of Quidel Corporation and Stericycle, Inc. |
Albert R. Dowden — 1941 Trustee | | 2003 | | Director of a number of public and private business corporations, including the Boss Group, Ltd. (private investment and management); Nature’s Sunshine Products, Inc. and Reich & Tang Funds (5 portfolios) (registered investment company) Formerly: Director, Homeowners of America Holding Corporation/Homeowners of America Insurance Company (property casualty company); Director, Continental Energy Services, LLC (oil and gas pipeline service); Director, CompuDyne Corporation (provider of product and services to the public security market) and Director, Annuity and Life Re (Holdings), Ltd. (reinsurance company); Director, President and Chief Executive Officer, Volvo Group North America, Inc.; Senior Vice President, AB Volvo; Director of various public and private corporations; Chairman, DHJ Media, Inc.; Director, Magellan Insurance Company; and Director, The Hertz Corporation, Genmar Corporation (boat manufacturer), National Media Corporation; Advisory Board of Rotary Power International (designer, manufacturer, and seller of rotary power engines); and Chairman, Cortland Trust, Inc. (registered investment company) | | 145 | | Director of: Nature’s Sunshine Products, Inc., Reich & Tang Funds, Homeowners of America Holding Corporation/ Homeowners of America Insurance Company, the Boss Group |
Jack M. Fields — 1952 Trustee | | 2003 | | Chief Executive Officer, Twenty First Century Group, Inc. (government affairs company); Owner and Chief Executive Officer, Dos Angeles Ranch, L.P. (cattle, hunting, corporate entertainment); and Discovery Global Education Fund (non-profit) Formerly: Chief Executive Officer, Texana Timber LP (sustainable forestry company); Director of Cross Timbers Quail Research Ranch (non-profit); and member of the U.S. House of Representatives | | 145 | | Insperity, Inc. (formerly known as Administaff) |
Prema Mathai-Davis — 1950 Trustee | | 2003 | | Retired. Formerly: Chief Executive Officer, YWCA of the U.S.A. | | 145 | | None |
Larry Soll — 1942 Trustee | | 1997 | | Retired. Formerly: Chairman, Chief Executive Officer and President, Synergen Corp. (a biotechnology company) | | 145 | | None |
Hugo F. Sonnenschein — 1940 Trustee | | 2010 | | President Emeritus and Honorary Trustee of the University of Chicago and the Adam Smith Distinguished Service Professor in the Department of Economics at the University of Chicago. Prior to 2000, President of the University of Chicago | | 145 | | Trustee of the University of Rochester and a member of its investment committee; Member of the National Academy of Sciences and the American Philosophical Society; Fellow of the American Academy of Arts and Sciences |
Raymond Stickel, Jr. — 1944 Trustee | | 2005 | | Retired. Formerly: Director, Mainstay VP Series Funds, Inc. (25 portfolios) and Partner, Deloitte & Touche | | 145 | | None |
T-2 Invesco Diversified Dividend Fund
Trustees and Officers—(continued)
| | | | | | | | |
Name, Year of Birth and
Position(s) Held with the Trust | | Trustee and/
or Officer Since | | Principal Occupation(s)
During Past 5 Years | | Number of Funds in Fund Complex Overseen by Trustee | | Other Directorship(s)
Held by Trustee During
Past 5 Years |
| Independent Trustees—(continued) |
Suzanne H. Woolsey — 1941 Trustee | | 2014 | | Chief Executive Officer of Woolsey Partners LLC | | 145 | | Emeritus Chair of the Board of Trustees of the Institute for Defense Analyses; Trustee of Colorado College; Trustee of California Institute of Technology; Prior to 2014, Director of Fluor Corp.; Prior to 2010, Trustee of the German Marshall Fund of the United States; Prior to 2010 Trustee of the Rocky Mountain Institute |
| Other Officers | | | | | | | | |
Russell C. Burk — 1958 Senior Vice President and Senior Officer | | 2005 | | Senior Vice President and Senior Officer, The Invesco Funds | | N/A | | N/A |
John M. Zerr — 1962 Senior Vice President, Chief Legal Officer and Secretary | | 2006 | | Director, Senior Vice President, Secretary and General Counsel, Invesco Management Group, Inc. (formerly known as Invesco Aim Management Group, Inc.) and Van Kampen Exchange Corp.; Senior Vice President, Invesco Advisers, Inc. (formerly known as Invesco Institutional (N.A.), Inc.) (registered investment adviser); Senior Vice President and Secretary, Invesco Distributors, Inc. (formerly known as Invesco Aim Distributors, Inc.); Director, Vice President and Secretary, Invesco Investment Services, Inc. (formerly known as Invesco Aim Investment Services, Inc.) and IVZ Distributors, Inc. (formerly known as INVESCO Distributors, Inc.); Director and Vice President, INVESCO Funds Group, Inc.; Senior Vice President, Chief Legal Officer and Secretary, The Invesco Funds; Managing Director, Invesco PowerShares Capital Management LLC; Director, Secretary and General Counsel, Invesco Investment Advisers LLC (formerly known as Van Kampen Asset Management); Secretary and General Counsel, Invesco Capital Markets, Inc. (formerly known as Van Kampen Funds Inc.) and Chief Legal Officer, PowerShares Exchange-Traded Fund Trust, PowerShares Exchange-Traded Fund Trust II, PowerShares India Exchange-Traded Fund Trust, PowerShares Actively Managed Exchange-Traded Fund Trust, and PowerShares Actively Managed Exchange-Traded Commodity Fund Trust Formerly: Director and Vice President, Van Kampen Advisors Inc.; Director, Vice President, Secretary and General Counsel, Van Kampen Investor Services Inc.; Director, Invesco Distributors, Inc. (formerly known as Invesco Aim Distributors, Inc.); Director, Senior Vice President, General Counsel and Secretary, Invesco Aim Advisers, Inc. and Van Kampen Investments Inc.; Director, Vice President and Secretary, Fund Management Company; Director, Senior Vice President, Secretary, General Counsel and Vice President, Invesco Aim Capital Management, Inc.; Chief Operating Officer and General Counsel, Liberty Ridge Capital, Inc. (an investment adviser); Vice President and Secretary, PBHG Funds (an investment company) and PBHG Insurance Series Fund (an investment company); Chief Operating Officer, General Counsel and Secretary, Old Mutual Investment Partners (a broker-dealer); General Counsel and Secretary, Old Mutual Fund Services (an administrator) and Old Mutual Shareholder Services (a shareholder servicing center); Executive Vice President, General Counsel and Secretary, Old Mutual Capital, Inc. (an investment adviser); and Vice President and Secretary, Old Mutual Advisors Funds (an investment company) | | N/A | | N/A |
Sheri Morris — 1964 Vice President, Treasurer and Principal Financial Officer | | 2003 | | Vice President, Treasurer and Principal Financial Officer, The Invesco Funds; Vice President, Invesco Advisers, Inc. (formerly known as Invesco Institutional (N.A.), Inc.) (registered investment adviser); and Vice President, PowerShares Exchange-Traded Fund Trust, PowerShares Exchange-Traded Fund Trust II, PowerShares India Exchange-Traded Fund Trust, PowerShares Actively Managed Exchange-Traded Fund Trust, and PowerShares Actively Managed Exchange-Traded Commodity Fund Trust Formerly: Vice President, Invesco Aim Advisers, Inc., Invesco Aim Capital Management, Inc. and Invesco Aim Private Asset Management, Inc.; Assistant Vice President and Assistant Treasurer, The Invesco Funds and Assistant Vice President, Invesco Advisers, Inc., Invesco Aim Capital Management, Inc. and Invesco Aim Private Asset Management, Inc.; and Treasurer, PowerShares Exchange-Traded Fund Trust, PowerShares Exchange-Traded Fund Trust II, PowerShares India Exchange-Traded Fund Trust and PowerShares Actively Managed Exchange-Traded Fund Trust | | N/A | | N/A |
T-3 Invesco Diversified Dividend Fund
Trustees and Officers—(continued)
| | | | | | | | |
Name, Year of Birth and
Position(s) Held with the Trust | | Trustee and/
or Officer Since | | Principal Occupation(s)
During Past 5 Years | | Number of Funds in Fund Complex Overseen by Trustee | | Other Directorship(s)
Held by Trustee During
Past 5 Years |
| Other Officers—(continued) | | | | | | | | |
Karen Dunn Kelley — 1960 Vice President | | 2003 | | Senior Managing Director, Investments, Invesco Ltd.; Director, Co-President, Co-Chief Executive Officer, and Co-Chairman, Invesco Advisers, Inc. (formerly known as Invesco Institutional (N.A.), Inc.) (registered investment adviser); Chairman, Invesco Senior Secured Management, Inc.; Senior Vice President, Invesco Management Group, Inc. (formerly known as Invesco Aim Management Group, Inc.); Executive Vice President, Invesco Distributors, Inc. (formerly known as Invesco Aim Distributors, Inc.); Director, Invesco Mortgage Capital Inc. and Invesco Management Company Limited; Vice President, The Invesco Funds (other than AIM Treasurer’s Series Trust (Invesco Treasurer’s Series Trust), Short-Term Investments Trust and Invesco Management Trust); and President and Principal Executive Officer, The Invesco Funds (AIM Treasurer’s Series Trust (Invesco Treasurer’s Series Trust), Short-Term Investments Trust and Invesco Management Trust only) Formerly: Director and President, INVESCO Asset Management (Bermuda) Ltd., Director, INVESCO Global Asset Management Limited and INVESCO Management S.A.; Senior Vice President, Van Kampen Investments Inc. and Invesco Advisers, Inc. (formerly known as Invesco Institutional (N.A.), Inc.) (registered investment adviser); Vice President, Invesco Advisers, Inc. (formerly known as Invesco Institutional (N.A.), Inc.); Director of Cash Management and Senior Vice President, Invesco Advisers, Inc. and Invesco Aim Capital Management, Inc.; Director and President, Fund Management Company; Chief Cash Management Officer, Director of Cash Management, Senior Vice President, and Managing Director, Invesco Aim Capital Management, Inc.; Director of Cash Management, Senior Vice President, and Vice President, Invesco Advisers, Inc. and The Invesco Funds (AIM Treasurer’s Series Trust (Invesco Treasurer’s Series Trust), and Short-Term Investments Trust only) | | N/A | | N/A |
Crissie M. Wisdom — 1969 Anti-Money Laundering Compliance Officer | | 2013 | | Anti-Money Laundering Compliance Officer, Invesco Advisers, Inc. (formerly known as Invesco Institutional (N.A.), Inc.) (registered investment adviser), Invesco Capital Markets, Inc. (formerly known as Van Kampen Funds Inc.), Invesco Distributors, Inc., Invesco Investment Services, Inc., Invesco Management Group, Inc., Van Kampen Exchange Corp., The Invesco Funds, and PowerShares Exchange-Traded Fund Trust, PowerShares Exchange-Traded Fund Trust II, PowerShares India Exchange-Traded Fund Trust, PowerShares Actively Managed Exchange-Traded Fund Trust and PowerShares Actively Managed Exchange-Traded Commodity Fund Trust; Anti-Money Laundering Compliance Officer and Bank Secrecy Act Officer, INVESCO National Trust Company and Invesco Trust Company; and Fraud Prevention Manager and Controls and Risk Analysis Manager for Invesco Investment Services, Inc.. | | N/A | | N/A |
Lisa O. Brinkley — 1959 Chief Compliance Officer | | 2015 | | Senior Vice President and Chief Compliance Officer, Invesco Advisers, Inc. (registered investment adviser) (formerly known as Invesco Institutional (N.A., Inc.); and Chief Compliance Officer, The Invesco Funds Formerly: Global Assurance Officer, Invesco Ltd. and Vice President, The Invesco Funds; Chief Compliance Officer, Invesco Distributors, Inc. (formerly known as Invesco Aim Distributors, Inc.), Invesco Investment Services, Inc.(formerly known as Invesco Aim Investment Services, Inc.) and Van Kampen Investor Services Inc.; Senior Vice President, Invesco Management Group, Inc.; Senior Vice President and Chief Compliance Officer, Invesco Advisers, Inc. and The Invesco Funds; Vice President and Chief Compliance Officer, Invesco Aim Capital Management, Inc. and Invesco Distributors, Inc.; Vice President, Invesco Investment Services, Inc. and Fund Management Company. | | N/A | | N/A |
The Statement of Additional Information of the Trust includes additional information about the Fund’s Trustees and is available upon request, without charge, by calling 1.800.959.4246. Please refer to the Fund’s prospectus for information on the Fund’s sub-advisers.
| | | | | | |
Office of the Fund 11 Greenway Plaza, Suite 1000 Houston, TX 77046-1173 | | Investment Adviser Invesco Advisers, Inc. 1555 Peachtree Street, N.E. Atlanta, GA 30309 | | Distributor Invesco Distributors, Inc. 11 Greenway Plaza, Suite 1000 Houston, TX 77046-1173 | | Auditors PricewaterhouseCoopers LLP 1000 Louisiana Street, Suite 5800 Houston, TX 77002-5678 |
| | | |
| | | | | | |
Counsel to the Fund Stradley Ronon Stevens & Young, LLP 2005 Market Street, Suite 2600 Philadelphia, PA 19103-7018 | | Counsel to the Independent Trustees Goodwin Procter LLP 901 New York Avenue, N.W. Washington, D.C. 20001 | | Transfer Agent Invesco Investment Services, Inc. 11 Greenway Plaza, Suite 1000 Houston, TX 77046-1173 | | Custodian State Street Bank and Trust Company 225 Franklin Street Boston, MA 02110-2801 |
T-4 Invesco Diversified Dividend Fund

Invesco mailing information
Send general correspondence to Invesco Investment Services, Inc., P.O. Box 219078, Kansas City, MO 64121-9078.
Important notice regarding delivery of security holder documents
To reduce Fund expenses, only one copy of most shareholder documents may be mailed to shareholders with multiple accounts at the same address (Householding). Mailing of your shareholder documents may be householded indefinitely unless you instruct us otherwise. If you do not want the mailing of these documents to be combined with those for other members of your household, please contact Invesco Investment Services, Inc. at 800 959 4246 or contact your financial institution. We will begin sending you individual copies for each account within 30 days after receiving your request.
Fund holdings and proxy voting information
The Fund provides a complete list of its holdings four times in each fiscal year, at the quarter ends. For the second and fourth quarters, the lists appear in the Fund’s semiannual and annual reports to shareholders. For the first and third quarters, the Fund files the lists with the Securities and Exchange Commission (SEC) on Form N-Q. The most recent list of portfolio holdings is available at invesco.com/completeqtrholdings. Shareholders can also look up the Fund’s Forms N-Q on the SEC website at sec.gov. Copies of the Fund’s Forms N-Q may be reviewed and copied at the SEC Public Reference Room in Washington, D.C. You can obtain information on the operation of the Public Reference Room, including information about duplicating fee charges, by calling 202 551 8090 or 800 732 0330, or by electronic request at the following email address: publicinfo@sec.gov. The SEC file numbers for the Fund are shown below.
A description of the policies and procedures that the Fund uses to determine how to vote proxies relating to portfolio securities is available without charge, upon request, from our Client Services department at 800 959 4246 or at invesco.com/proxyguidelines. The information is also available on the SEC website, sec.gov.
| | |
Information regarding how the Fund voted proxies related to its portfolio securities during the most recent 12-month period ended June 30 is available at invesco.com/proxysearch. The information is also available on the SEC website, sec.gov. Invesco Advisers, Inc. is an investment adviser; it provides investment advisory services to individual and institutional clients and does not sell securities. Invesco Distributors, Inc. is the US distributor for Invesco Ltd.’s retail mutual funds, exchange-traded funds and institutional money market funds. Both are wholly owned, indirect subsidiaries of Invesco Ltd. | |  |
| | | | |
| SEC file numbers: 811-01424 and 002-25469 | | DDI-AR-1 | | Invesco Distributors, Inc. |
| | | | |
| | |
 | | Annual Report to Shareholders | | October 31, 2015 |
| | |
| | Invesco Summit Fund |
| | Nasdaq: |
| | A: ASMMX n B: BSMMX n C: CSMMX n P: SMMIX n S: SMMSX n Y: ASMYX n R5: SMITX |

Letters to Shareholders
| | |

Philip Taylor | | Dear Shareholders: This annual report includes information about your Fund, including performance data and a complete list of its investments as of the close of the reporting period. Inside is a discussion of how your Fund was managed and the factors that affected its performance during the reporting period. I hope you find this report of interest. The US economy expanded and unemployment declined throughout the reporting period. Continuing low energy prices benefited consumers, but a strong US dollar crimped corporate profits. The US Federal Reserve signaled that it was increasingly likely to raise interest rates, based on generally positive economic data, but uncertainty remained about when it might act. Overseas, the story was much different. Low energy prices hurt the economies of some oil-producing nations, such as Brazil and Russia. During the reporting period, the European |
| Central Bank as well as central banks in China and Japan – among other countries – either instituted or maintained extraordinarily accommodative monetary policies in response to economic weakness. |
Investor uncertainty, such as we saw for much of the reporting period – and market volatility, such as we saw at the end of the reporting period – are unfortunate facts of life when it comes to investing. Some investors use these things as excuses to delay saving and investing for their long-term financial goals. That’s why Invesco encourages investors to work with a professional financial adviser who can stress the importance of starting to save and invest early and the importance of adhering to a disciplined investment plan – when times are good and when they’re uncertain. A financial adviser who knows your unique financial situation, investment goals and risk tolerance can be an invaluable partner as you seek to achieve your financial goals. He or she can offer a long-term perspective when markets are volatile and time-tested advice and guidance when your financial situation or investment goals change.
Timely information when and where you want it
Invesco’s efforts to help investors achieve their financial objectives include providing individual investors and financial professionals with timely information about the markets, the economy and investing – whenever and wherever they want it.
Our website, invesco.com/us, offers a wide range of market insights and investment perspectives. On the website, you’ll find detailed information about our funds, including prices, performance, holdings and portfolio manager commentaries. You can access information about your account by completing a simple, secure online registration. Click on the “Need to register” link in the “Account Access” box on our homepage to get started.
Invesco’s mobile apps for iPhone® and iPad® (both available free from the App StoreSM) allow you to obtain the same detailed information, monitor your account and create customizable watch lists. Also, they allow you to access investment insights from our investment leaders, market strategists, economists and retirement experts. You can sign up to be alerted when new commentary is added, and you can watch portfolio manager videos and have instant access to Invesco news and updates wherever you may be.
In addition to the resources accessible on our website and through our mobile app, you can obtain timely updates to help you stay informed about the markets, the economy and investing by connecting with Invesco on Twitter, LinkedIn or Facebook. You can access our blog at blog.invesco.us.com. Our goal is to provide you the information you want, when and where you want it.
Have questions?
For questions about your account, feel free to contact an Invesco client services representative at 800 959 4246. For Invesco-related questions or comments, please email me directly at phil@invesco.com.
All of us at Invesco look forward to serving your investment management needs for many years to come. Thank you for investing with us.
Sincerely,

Philip Taylor
Senior Managing Director, Invesco Ltd.
iPhone and iPad are trademarks of Apple Inc., registered in the US and other countries. App Store is a service mark of Apple Inc. Invesco Distributors, Inc. is not affiliated with Apple Inc.
2 Invesco Summit Fund
| | |

Bruce Crockett | | Dear Fellow Shareholders: Among the many important lessons I’ve learned in more than 40 years in a variety of business endeavors is the value of a trusted advocate. As independent chair of the Invesco Funds Board, I can assure you that the members of the Board are strong advocates for the interests of investors in Invesco’s mutual funds. We work hard to represent your interests through oversight of the quality of the investment management services your funds receive and other matters important to your investment, including but not limited to: n Ensuring that Invesco offers a diverse lineup of mutual funds that your financial adviser can use to strive to meet your financial needs as your investment goals change over time. n Monitoring how the portfolio management teams of the Invesco funds are performing in light of changing economic and market conditions. |
| n | | Assessing each portfolio management team’s investment performance within the context of the investment strategy described in the fund’s prospectus. |
| n | | Monitoring for potential conflicts of interests that may impact the nature of the services that your funds receive. |
We believe one of the most important services we provide our fund shareholders is the annual review of the funds’ advisory and sub-advisory contracts with Invesco Advisers and its affiliates. This review is required by the Investment Company Act of 1940 and focuses on the nature and quality of the services Invesco provides as the adviser to the Invesco funds and the reasonableness of the fees that it charges for those services. Each year, we spend months carefully reviewing information received from Invesco and a variety of independent sources, such as performance and fee data prepared by Lipper Inc., an independent, third-party firm widely recognized as a leader in its field. We also meet with our independent legal counsel and other independent advisers to review and help us assess the information that we have received. Our goal is to assure that you receive quality investment management services for a reasonable fee.
I trust the measures outlined above provide assurance that you have a worthy advocate when it comes to choosing the Invesco Funds.
As always, please contact me at bruce@brucecrockett.com with any questions or concerns you may have. On behalf of the Board, we look forward to continuing to represent your interests and serving your needs.
Sincerely,

Bruce L. Crockett
Independent Chair
Invesco Funds Board of Trustees
3 Invesco Summit Fund
Management’s Discussion of Fund Performance
Performance summary
For the fiscal year ended October 31, 2015, Class A shares of Invesco Summit Fund (the Fund), at net asset value (NAV), underperformed the Fund’s style-specific benchmark, the Russell 1000 Growth Index.
Your Fund’s long-term performance appears later in this report.
Fund vs. Indexes
Total returns, 10/31/14 to 10/31/15, at net asset value (NAV). Performance shown does not include applicable contingent deferred sales charges (CDSC) or front-end sales charges, which would have reduced performance.
| | | | |
Class A Shares | | | 8.86 | % |
Class B Shares | | | 8.06 | |
Class C Shares | | | 8.02 | |
Class P Shares | | | 9.03 | |
Class S Shares | | | 8.90 | |
Class Y Shares | | | 9.20 | |
Class R5 Shares | | | 9.24 | |
S&P 500 Index▼ (Broad Market Index) | | | 5.20 | |
Russell 1000 Growth Index▼ (Style-Specific Index) | | | 9.18 | |
Lipper Multi-Cap Growth Funds Indexn (Peer Group Index) | | | 5.63 | |
Source(s): ▼FactSet Research Systems Inc.; nLipper Inc.
Market conditions and your Fund
The US economy improved slowly, but steadily, during the fiscal year ended October 31, 2015 – although the health of individual economic sectors varied dramatically. The headline story was the continued slowdown in energy markets, as oil prices plummeted when too much supply overwhelmed slowing global demand. However, the more subtle story, which drove the economy forward during the fiscal year, was the improved position of the US consumer.
As the reporting period began in late 2014, economic growth appeared to be stronger in the US than in the rest of the world. US equity markets were recovering from the initial crash of oil prices when OPEC added additional uncertainty by deciding to maintain high production despite low prices and slowing global growth. In this environment, commodity-
based economies and most currencies underperformed those of the US. The continued strengthening of the US consumer led US equity markets higher through the spring. Continued low interest rates, the increasing availability of credit from lenders and an improving employment picture all contributed to higher consumer confidence. This strength also helped the markets overcome fears that Greece and the eurozone would fail to reach an agreement on a financial bailout plan. In the summer of 2015, however, US equity markets moved sharply lower. A significant downturn in China’s financial markets and weak global economic growth led the US Federal Reserve to delay raising interest rates, which, in turn, increased investor uncertainty and market volatility. In October, however, US markets rallied, recovering from their earlier decline and finishing higher for the fiscal year.
In this market environment, the Fund had positive returns at NAV, but it underperformed its style-specific index. The Fund outperformed its style-specific index in a number of sectors, most notably the consumer staples, consumer discretionary and information technology (IT) sectors. This was offset by relative underperformance in other sectors, including the energy, health care and industrials sectors.
The Fund outperformed its style-specific index by the widest margin in the consumer staples sector driven by positive stock selection. Within the sector, Kroger was a solid contributor to Fund performance as it outperformed competitors and consistently reported better-than-expected financial results. In recent years, the company re-invested significantly in its stores, service and technology, leading to a virtuous cycle of better results. The company also positioned itself to participate in online shopping with click and collect services. Monster Beverage was also a key contributor to Fund results, benefiting from the sizeable investment of a new strategic partner, which increased its profit margins and created significant distribution advantages.
The consumer discretionary sector was the strongest sector of the market during the fiscal year, and the Fund’s relative overweight exposure contributed to the Fund’s outperformance in this sector. Solid stock selection also contributed to Fund results, including investments in cruise lines, where low fuel costs and the strengthening US consumer led to improved pricing and bookings throughout the fiscal year. Royal Caribbean Cruises saw bookings reach their highest rates since before the financial crisis, and reported faster-than-expected growth from China, representing an attractively expanding market for the company. Carni-
| | | | |
By sector | | | % of total net assets | |
| | | | |
| Information Technology | | | 31.9 | % |
| Consumer Discretionary | | | 21.6 | |
| Health Care | | | 18.7 | |
| Consumer Staples | | | 7.7 | |
| Industrials | | | 7.4 | |
| Financials | | | 5.6 | |
| Telecommunication Services | | | 2.8 | |
| Energy | | | 1.8 | |
| Materials | | | 1.6 | |
Money Market Funds Plus Other Assets Less Liabilities | | | 0.9 | |
| | | | | | | | | |
Top 10 Equity Holdings* |
| | | | % of total net assets | | |
| | | | | | | | | |
| 1. | | Apple Inc. | | | | 5.1 | % |
| 2. | | Facebook Inc.-Class A | | | | 4.7 | |
| 3. | | Alphabet Inc.-Class C | | | | 4.5 | |
| 4. | | Amazon.com, Inc. | | | | 3.8 | |
| 5. | | Visa Inc.-Class A | | | | 3.5 | |
| 6. | | Gilead Sciences, Inc. | | | | 3.1 | |
| 7. | | Allergan PLC | | | | 3.0 | |
| 8. | | salesforce.com, inc. | | | | 2.9 | |
| 9. | | Celgene Corp. | | | | 2.8 | |
10. | | Lowe’s Cos., Inc. | | | | 2.3 | |
| | | | | |
Total Net Assets | | | | $1.9 billion | |
| |
| Total Number of Holdings* | | | | 91 | |
The Fund’s holdings are subject to change, and there is no assurance that the Fund will continue to hold any particular security.
* Excluding money market fund holdings.
Data presented here are as of October 31, 2015.
4 Invesco Summit Fund
val also contributed to Fund results as its bookings continued to improve and the company put past operational missteps behind it. Amazon.com contributed to Fund results as it reported expanding profitability in major business segments, and the company’s stock more than doubled during the fiscal year.
The Fund also outperformed in the IT sector due to both stock selection decisions and an overweight position versus its style-specific benchmark. Facebook was a key contributor to Fund results as the company continued to outperform expectations for mobile advertising and also reduced the outlook for future expenditures. Palo Alto Networks, which provides next-generation firewall and data threat protection to businesses, was another contributor to Fund results. Palo Alto Networks benefited from recent high profile security breaches, which led companies to invest heavily in security solutions.
Some of this outperformance was offset by the effect of other low-performing sectors. Most notably, energy was the worst-performing sector of the market, and the Fund’s modest overweight exposure to energy stocks was a headwind to Fund performance. As the imbalance of oil supply and demand evolved over the year, Halliburton, an oilfield services company, detracted from Fund results. We sold our position in Halliburton during the fiscal year. Whiting Petroleum was another detractor from Fund results as the company’s oil reserves are located primarily in the US Bakken shale formation, where transportation and production costs represent additional hurdles. We sold our position in Whiting Petroleum during the fiscal year. Fund holding Devon Energy has a more diversified geography of energy resources and we held it throughout the fiscal year, although it also detracted from Fund results.
In the health care sector, stock selection was a drag on relative performance. Biogen was a detractor from Fund results as the company faced foreign exchange headwinds and some challenges to its multiple sclerosis treatment. Gilead Sciences was also a large holding for the Fund that underperformed, remaining relatively flat over the fiscal year. The company’s late 2013 launch of a breakthrough treatment for hepatitis C has been a blockbuster success, leading to consistently better-than-expected financial results. However, investor sentiment seemed to focus less on the current success, and more on the uncertainty of what will be the next growth driver for the company.
Another area of challenge for the Fund was performance in the industrials sector. Stock selection early in the reporting period hurt, especially certain holdings that were expecting to benefit from building infrastructure to transport, refine and transform US hydrocarbon resources. As the price of oil plummeted, many of the projects for these companies were delayed or canceled, and the stocks fell significantly. We sold Jacobs Engineering Group, Fluor and Flowserve during the reporting period. As the fiscal year progressed, the Fund’s underweight exposure to industrials stocks was beneficial, though the Fund underperformed its benchmark in the industrials sector.
As we’ve discussed, the Fund, at NAV, had positive returns during the reporting period. We would like to caution investors against making investment decisions based on short-term performance. Thank you for your commitment to Invesco Summit Fund and for sharing our long-term investment horizon.
The views and opinions expressed in management’s discussion of Fund performance are those of Invesco Advisers, Inc. These views and opinions are subject to change at any time based on factors such as market and economic conditions. These views and opinions may not be relied upon as investment advice or recommendations, or as an offer for a particular security. The information is not a complete analysis of every aspect of any market, country, industry, security or the Fund. Statements of fact are from sources considered reliable, but Invesco Advisers, Inc. makes no representation or warranty as to their completeness or accuracy. Although historical performance is no guarantee of future results, these insights may help you understand our investment management philosophy.
See important Fund and, if applicable, index disclosures later in this report.
| | |
 | | Erik Voss Chartered Financial Analyst, Portfolio Manager, is lead manager of Invesco Summit Fund. He |
| joined Invesco in 2010. Mr. Voss earned a BS in mathematics and an MS in finance from the University of Wisconsin. |
| | |
 | | Ido Cohen Portfolio Manager, is manager of Invesco Summit Fund. He joined Invesco in 2010. Mr. Cohen |
| earned a BS in economics from The Wharton School of the University of Pennsylvania. |
5 Invesco Summit Fund
Your Fund’s Long-Term Performance
Results of a $10,000 Investment – Oldest Share Class(es)
Fund and index data from 10/31/05
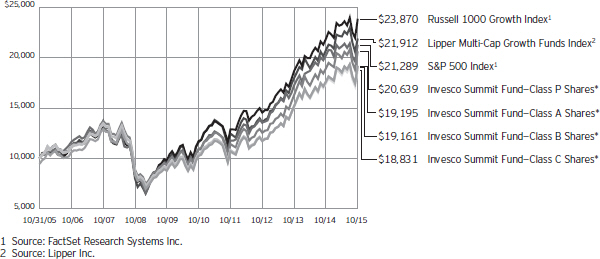
| * | The Fund’s oldest share class (Class P) does not have a sales charge, therefore, the second-oldest share classes (Class A, Class B and Class C) are also included in the chart. |
Past performance cannot guarantee comparable future results.
The data shown in the chart include reinvested distributions, applicable sales charges and Fund expenses including management fees. Results for Class B shares are calculated as if a hypothetical shareholder had liquidated his entire investment in the Fund at the close of the reporting period and paid the contingent deferred sales charges, if applicable. Index results include reinvested dividends, but they do not reflect sales charges. Performance of the peer group, if applicable, reflects fund expenses and management fees; performance of a market index does not. Performance shown in the chart and table(s) does not reflect deduction of taxes a shareholder would pay on Fund distributions or sale of Fund shares.
6 Invesco Summit Fund
| | |
| Average Annual Total Returns |
| | |
As of 10/31/15, including maximum applicable sales charges |
| | | | |
| |
| Class A Shares | | | | |
| Inception (10/31/05) | | | 6.74 | % |
| 10 Years | | | 6.74 | |
| 5 Years | | | 12.08 | |
| 1 Year | | | 2.89 | |
| |
| Class B Shares | | | | |
| Inception (10/31/05) | | | 6.72 | % |
| 10 Years | | | 6.72 | |
| 5 Years | | | 12.28 | |
| 1 Year | | | 3.40 | |
| |
| Class C Shares | | | | |
| Inception (10/31/05) | | | 6.53 | % |
| 10 Years | | | 6.53 | |
| 5 Years | | | 12.52 | |
| 1 Year | | | 7.09 | |
| |
| Class P Shares | | | | |
| Inception (11/01/82) | | | 9.29 | % |
| 10 Years | | | 7.52 | |
| 5 Years | | | 13.54 | |
| 1 Year | | | 9.03 | |
| |
| Class S Shares | | | | |
| 10 Years | | | 7.41 | % |
| 5 Years | | | 13.47 | |
| 1 Year | | | 8.90 | |
| |
| Class Y Shares | | | | |
| 10 Years | | | 7.53 | % |
| 5 Years | | | 13.67 | |
| 1 Year | | | 9.20 | |
| |
| Class R5 Shares | | | | |
| 10 Years | | | 7.63 | % |
| 5 Years | | | 13.76 | |
| 1 Year | | | 9.24 | |
Class S shares incepted on September 25, 2009. Performance shown prior to that date is that of Class A shares and includes the 12b-1 fees applicable to Class A shares.
Class Y shares incepted on October 3, 2008. Performance shown prior to that date is that of Class A shares and includes the 12b-1 fees applicable to Class A shares.
Class R5 shares incepted on October 3, 2008. Performance shown prior to that date is that of Class A shares and includes the 12b-1 fees applicable to Class A shares.
The performance data quoted represent past performance and cannot guarantee comparable future results; current performance may be lower or higher. Please visit invesco.com/performance for the
| | |
| Average Annual Total Returns |
| | |
| As of 9/30/15, the most recent calendar quarter end, including maximum applicable sales charges |
| | | | |
| |
| Class A Shares | | | | |
| Inception (10/31/05) | | | 5.80 | % |
| 5 Years | | | 11.11 | |
| 1 Year | | | -3.80 | |
| |
| Class B Shares | | | | |
| Inception (10/31/05) | | | 5.78 | % |
| 5 Years | | | 11.29 | |
| 1 Year | | | -3.28 | |
| |
| Class C Shares | | | | |
| Inception (10/31/05) | | | 5.60 | % |
| 5 Years | | | 11.52 | |
| 1 Year | | | 0.21 | |
| |
| Class P Shares | | | | |
| Inception (11/01/82) | | | 9.00 | % |
| 10 Years | | | 6.26 | |
| 5 Years | | | 12.56 | |
| 1 Year | | | 2.00 | |
| |
| Class S Shares | | | | |
| Inception | | | 6.47 | % |
| 5 Years | | | 12.47 | |
| 1 Year | | | 1.94 | |
| |
| Class Y Shares | | | | |
| Inception | | | 6.59 | % |
| 5 Years | | | 12.68 | |
| 1 Year | | | 2.13 | |
| |
| Class R5 Shares | | | | |
| Inception | | | 6.68 | % |
| 5 Years | | | 12.76 | |
| 1 Year | | | 2.18 | |
most recent month-end performance. Performance figures reflect reinvested distributions, changes in net asset value and the effect of the maximum sales charge unless otherwise stated. Investment return and principal value will fluctuate so that you may have a gain or loss when you sell shares.
The total annual Fund operating expense ratio set forth in the most recent Fund prospectus as of the date of this report for Class A, Class B, Class C, Class P, Class S, Class Y and Class R5 shares was 1.05%, 1.80%, 1.80%, 0.90%, 0.95%, 0.80% and 0.69%, respectively. The expense ratios presented above may vary from the expense ratios presented in other sections of this report that are based on expenses incurred during the period covered by this report.
Class A share performance reflects the maximum 5.50% sales charge, and Class B and Class C share performance reflects the applicable contingent deferred sales charge (CDSC) for the period involved. The CDSC on Class B shares declines from 5% beginning at the time of purchase to 0% at the beginning of the seventh year. The CDSC on Class C shares is 1% for the first year after purchase. Class P, Class S, Class Y and Class R5 shares do not have a front-end sales charge or contingent deferred sales charge (CDSC); therefore, returns shown are at net asset value.
The performance numbers shown do not reflect the creation and sales charges and other fees assessed by the AIM Summit Investors Plans, which were dissolved effective December 8, 2006.
The performance of the Fund’s share classes will differ primarily due to different sales charge structures and class expenses.
Fund performance reflects any applicable fee waivers and/or expense reimbursements. Had the adviser not waived fees and/or reimbursed expenses currently or in the past, returns would have been lower. See current prospectus for more information.
7 Invesco Summit Fund
Invesco Summit Fund’s investment objective is long-term growth of capital.
| n | | Unless otherwise stated, information presented in this report is as of October 31, 2015, and is based on total net assets. |
| n | | Unless otherwise noted, all data provided by Invesco. |
| n | | To access your Fund’s reports/prospectus, visit invesco.com/fundreports. |
About share classes
| n | | Class B shares may not be purchased for new or additional investments. Please see the prospectus for more information. |
| n | | Class P shares, Class S shares and Class Y shares are available only to certain investors. Please see the prospectus for more information. |
| n | | Class R5 shares are primarily intended for employer sponsored retirement and benefit plans that meet certain standards and for institutional investors. Please see the prospectus for more information. |
Principal risks of investing in the Fund
| n | | Foreign securities risk. The Fund’s foreign investments may be affected by changes in a foreign country’s exchange rates, political and social instability, changes in economic or taxation policies, difficulties when enforcing obligations, decreased liquidity, and increased volatility. Foreign companies may be subject to less regulation resulting in less publicly available information about the companies. |
| n | | Growth investing risk. Growth stocks tend to be more expensive relative to their earnings or assets compared with other types of stock. As a result they tend to be more sensitive to changes in their earnings and can be more volatile. |
| n | | Management risk. The investment techniques and risk analysis used by the Fund’s portfolio managers may not produce the desired results. |
| n | | Market risk. The prices of and the income generated by the Fund’s securities may decline in response to, among other things, investor sentiment, general economic and market conditions, regional or global instability, and currency and interest rate fluctuations. |
| n | | Small- and mid-capitalization risks. Stocks of small- and mid-sized companies tend to be more vulnerable to adverse developments and may have little or no operating history or track record of success, and limited product lines, markets, management and financial resources. The securities of small- and mid-sized companies may be more volatile due to less market interest and less publicly available information about the issuer. They also may be illiquid or restricted as to resale, or may trade less frequently and in smaller volumes, all of which may cause difficulty when establishing or closing a position at a desirable price. |
About indexes used in this report
| n | | The S&P 500® Index is an unmanaged index considered representative of the US stock market. |
| n | | The Russell 1000® Growth Index is an unmanaged index considered representative of large-cap growth stocks. The Russell 1000 Growth Index is a trademark/service mark of the Frank Russell Co. Russell® is a trademark of the Frank Russell Co. |
| n | | The Lipper Multi-Cap Growth Funds Index is an unmanaged index considered representative of multicap growth funds tracked by Lipper. |
| n | | The Fund is not managed to track the performance of any particular index, including the index(es) described here, and consequently, the performance of the Fund may deviate significantly from the performance of the index(es). |
| n | | A direct investment cannot be made in an index. Unless otherwise indicated, index results include reinvested dividends, and they do not reflect sales charges. Performance of the peer group, if applicable, reflects fund expenses; performance of a market index does not. |
Other information
| n | | The returns shown in management’s discussion of Fund performance are based on net asset values (NAVs) calculated for shareholder transactions. Generally accepted accounting principles require adjustments to be made to the net assets of the Fund at period end for financial reporting purposes, and as such, the NAVs for shareholder transactions and the returns based on those NAVs may differ from the NAVs and returns reported in the Financial Highlights. |
| n | | Industry classifications used in this report are generally according to the Global Industry Classification Standard, which was developed by and is the exclusive property and a service mark of MSCI Inc. and Standard & Poor’s. |
| | |
This report must be accompanied or preceded by a currently effective Fund prospectus, which contains more complete information, including sales charges and expenses. Investors should read it carefully before investing. | | |
| | | |
| NOT FDIC INSURED | MAY LOSE VALUE | NO BANK GUARANTEE | | |
8 Invesco Summit Fund
Schedule of Investments(a)
October 31, 2015
| | | | | | | | |
| | | Shares | | | Value | |
Common Stocks & Other Equity Interests–99.11% | |
| Advertising–0.91% | |
Interpublic Group of Cos., Inc. (The) | | | 750,241 | | | $ | 17,203,026 | |
|
| Aerospace & Defense–1.63% | |
Honeywell International Inc. | | | 169,756 | | | | 17,532,400 | |
Northrop Grumman Corp. | | | 70,502 | | | | 13,236,750 | |
| | | | | | | | 30,769,150 | |
|
| Agricultural Products–0.24% | |
Archer-Daniels-Midland Co. | | | 99,717 | | | | 4,553,078 | |
|
| Air Freight & Logistics–0.39% | |
FedEx Corp. | | | 23,600 | | | | 3,682,780 | |
United Parcel Service, Inc.–Class B | | | 34,759 | | | | 3,580,872 | |
| | | | | | | | 7,263,652 | |
|
| Airlines–0.99% | |
Delta Air Lines, Inc. | | | 365,004 | | | | 18,556,803 | |
|
| Application Software–2.87% | |
Monitise PLC (United Kingdom)(b) | | | 1,703,644 | | | | 75,386 | |
salesforce.com, inc.(b) | | | 695,420 | | | | 54,041,088 | |
| | | | | | | | 54,116,474 | |
|
| Automotive Retail–0.25% | |
Advance Auto Parts, Inc. | | | 23,765 | | | | 4,715,689 | |
|
| Biotechnology–10.93% | |
Alexion Pharmaceuticals, Inc.(b) | | | 56,423 | | | | 9,930,448 | |
Alkermes PLC(b) | | | 477,266 | | | | 34,324,971 | |
Amgen Inc. | | | 117,485 | | | | 18,583,777 | |
Biogen Inc.(b) | | | 45,647 | | | | 13,260,910 | |
Celgene Corp.(b) | | | 432,670 | | | | 53,092,936 | |
Gilead Sciences, Inc. | | | 540,306 | | | | 58,423,288 | |
Vertex Pharmaceuticals Inc.(b) | | | 146,490 | | | | 18,273,162 | |
| | | | | | | | 205,889,492 | |
|
| Cable & Satellite–3.03% | |
Comcast Corp.–Class A | | | 59,048 | | | | 3,697,586 | |
DISH Network Corp.–Class A(b) | | | 468,662 | | | | 29,511,646 | |
Time Warner Cable Inc. | | | 125,953 | | | | 23,855,498 | |
| | | | | | | | 57,064,730 | |
|
| Communications Equipment–1.31% | |
Cisco Systems, Inc. | | | 540,764 | | | | 15,601,041 | |
Palo Alto Networks, Inc.(b) | | | 56,740 | | | | 9,135,140 | |
| | | | | | | | 24,736,181 | |
|
| Computer & Electronics Retail–0.96% | |
GameStop Corp.–Class A(c) | | | 390,540 | | | | 17,992,178 | |
|
| Construction Materials–0.24% | |
Vulcan Materials Co. | | | 46,995 | | | | 4,538,777 | |
| | | | | | | | |
| | | Shares | | | Value | |
| Consumer Electronics–1.95% | |
Harman International Industries, Inc. | | | 131,717 | | | $ | 14,483,601 | |
Sony Corp. (Japan) | | | 783,400 | | | | 22,217,718 | |
| | | | | | | | 36,701,319 | |
|
| Consumer Finance–0.19% | |
Capital One Financial Corp. | | | 46,313 | | | | 3,654,096 | |
|
| Data Processing & Outsourced Services–5.15% | |
First Data Corp.–Class A(b)(c) | | | 917,547 | | | | 14,533,944 | |
MasterCard, Inc.–Class A | | | 161,229 | | | | 15,960,059 | |
Visa Inc.–Class A | | | 856,512 | | | | 66,448,201 | |
| | | | | | | | 96,942,204 | |
|
| Diversified Support Services–0.90% | |
Mobile Mini, Inc. | | | 492,970 | | | | 16,879,293 | |
|
| Drug Retail–0.74% | |
CVS Health Corp. | | | 140,773 | | | | 13,905,557 | |
|
| Electrical Components & Equipment–1.33% | |
AMETEK, Inc. | | | 458,226 | | | | 25,119,949 | |
|
| Environmental & Facilities Services–0.66% | |
Waste Connections, Inc. | | | 226,882 | | | | 12,360,531 | |
|
| Fertilizers & Agricultural Chemicals–0.98% | |
Monsanto Co. | | | 198,787 | | | | 18,530,924 | |
|
| Food Retail–1.45% | |
Kroger Co. (The) | | | 720,069 | | | | 27,218,608 | |
|
| Health Care Equipment–1.28% | |
Boston Scientific Corp.(b) | | | 814,327 | | | | 14,885,898 | |
Medtronic PLC | | | 124,398 | | | | 9,195,500 | |
| | | | | | | | 24,081,398 | |
|
| Health Care Facilities–0.64% | |
HCA Holdings, Inc.(b) | | | 174,701 | | | | 12,017,682 | |
|
| Home Entertainment Software–1.19% | |
Electronic Arts Inc.(b) | | | 204,295 | | | | 14,723,541 | |
Take-Two Interactive Software, Inc.(b) | | | 231,170 | | | | 7,674,844 | |
| | | | | | | | 22,398,385 | |
|
| Home Improvement Retail–2.29% | |
Lowe’s Cos., Inc. | | | 584,477 | | | | 43,151,937 | |
|
| Homebuilding–0.87% | |
Lennar Corp.–Class A | | | 325,253 | | | | 16,285,418 | |
|
| Hotels, Resorts & Cruise Lines–2.99% | |
Carnival Corp. | | | 537,396 | | | | 29,062,376 | |
Norwegian Cruise Line Holdings Ltd.(b) | | | 87,610 | | | | 5,573,748 | |
Royal Caribbean Cruises Ltd. | | | 220,053 | | | | 21,642,212 | |
| | | | | | | | 56,278,336 | |
See accompanying Notes to Financial Statements which are an integral part of the financial statements.
9 Invesco Summit Fund
| | | | | | | | |
| | | Shares | | | Value | |
| Household Appliances–1.02% | |
Whirlpool Corp. | | | 119,824 | | | $ | 19,188,615 | |
|
| Industrial Conglomerates–0.61% | |
Danaher Corp. | | | 123,672 | | | | 11,539,834 | |
|
| Industrial Gases–0.41% | |
Praxair, Inc. | | | 69,696 | | | | 7,742,529 | |
|
| Integrated Telecommunication Services–0.99% | |
Koninklijke KPN N.V. (Netherlands) | | | 5,112,154 | | | | 18,722,065 | |
|
| Internet Retail–6.28% | |
Amazon.com, Inc.(b) | | | 113,343 | | | | 70,941,384 | |
Netflix Inc.(b) | | | 132,366 | | | | 14,345,827 | |
Priceline Group Inc. (The)(b) | | | 22,716 | | | | 33,034,516 | |
| | | | | | | | 118,321,727 | |
|
| Internet Software & Services–11.96% | |
Alibaba Group Holding Ltd.–ADR
(China)(b) | | | 183,873 | | | | 15,414,073 | |
Alphabet Inc.–Class A(b) | | | 21,717 | | | | 16,013,899 | |
Alphabet Inc.–Class C(b) | | | 120,334 | | | | 85,534,610 | |
Baidu, Inc.–ADR (China)(b) | | | 16,778 | | | | 3,145,372 | |
Facebook Inc.–Class A(b) | | | 861,763 | | | | 87,873,973 | |
LinkedIn Corp.–Class A(b) | | | 71,755 | | | | 17,283,627 | |
| | | | | | | | 225,265,554 | |
|
| Investment Banking & Brokerage–2.45% | |
Charles Schwab Corp. (The) | | | 1,125,252 | | | | 34,342,691 | |
Lazard Ltd.–Class A | | | 252,881 | | | | 11,713,448 | |
| | | | | | | | 46,056,139 | |
|
| Leisure Products–0.52% | |
Brunswick Corp. | | | 182,332 | | | | 9,811,285 | |
|
| Life Sciences Tools & Services–0.48% | |
Thermo Fisher Scientific, Inc. | | | 69,760 | | | | 9,123,213 | |
|
| Managed Health Care–0.66% | |
UnitedHealth Group Inc. | | | 105,655 | | | | 12,444,046 | |
|
| Oil & Gas Exploration & Production–1.81% | |
Cimarex Energy Co. | | | 101,132 | | | | 11,939,644 | |
Devon Energy Corp. | | | 260,909 | | | | 10,939,915 | |
Laredo Petroleum Inc.(b)(c) | | | 91,717 | | | | 1,052,911 | |
Pioneer Natural Resources Co. | | | 74,588 | | | | 10,228,998 | |
| | | | | | | | 34,161,468 | |
|
| Packaged Foods & Meats–3.48% | |
Blue Buffalo Pet Products, Inc.(b)(c) | | | 477,626 | | | | 8,568,611 | |
Mead Johnson Nutrition Co. | | | 69,005 | | | | 5,658,410 | |
Mondelez International Inc.–Class A | | | 617,019 | | | | 28,481,597 | |
Tyson Foods, Inc.–Class A | | | 515,386 | | | | 22,862,523 | |
| | | | | | | | 65,571,141 | |
|
| Personal Products–0.39% | |
Estee Lauder Cos. Inc. (The)–Class A | | | 91,543 | | | | 7,365,550 | |
| | | | | | | | |
| | | Shares | | | Value | |
| Pharmaceuticals–4.71% | |
Allergan PLC(b) | | | 180,759 | | | $ | 55,758,729 | |
Bristol-Myers Squibb Co. | | | 261,398 | | | | 17,239,198 | |
Eli Lilly and Co. | | | 191,659 | | | | 15,633,625 | |
| | | | | | | | 88,631,552 | |
|
| Regional Banks–1.02% | |
First Republic Bank | | | 294,555 | | | | 19,237,387 | |
|
| Restaurants–0.54% | |
Papa John’s International, Inc. | | | 71,444 | | | | 5,013,225 | |
Texas Roadhouse, Inc. | | | 148,857 | | | | 5,113,238 | |
| | | | | | | | 10,126,463 | |
|
| Semiconductors–2.83% | |
Avago Technologies Ltd. (Singapore) | | | 149,274 | | | | 18,380,108 | |
NXP Semiconductors N.V. (Netherlands)(b) | | | 339,676 | | | | 26,613,615 | |
ON Semiconductor Corp.(b) | | | 424,596 | | | | 4,670,556 | |
Skyworks Solutions, Inc. | | | 47,343 | | | | 3,656,773 | |
| | | | | | | | 53,321,052 | |
|
| Soft Drinks–1.41% | |
Monster Beverage Corp.(b) | | | 195,001 | | | | 26,582,536 | |
|
| Specialized Finance–1.90% | |
Intercontinental Exchange, Inc. | | | 60,410 | | | | 15,247,484 | |
McGraw Hill Financial, Inc. | | | 222,296 | | | | 20,593,501 | |
| | | | | | | | 35,840,985 | |
|
| Systems Software–1.45% | |
ServiceNow, Inc.(b) | | | 333,916 | | | | 27,264,241 | |
|
| Technology Hardware, Storage & Peripherals–5.08% | |
Apple Inc. | | | 799,863 | | | | 95,583,629 | |
|
| Trucking–0.93% | |
Old Dominion Freight Line, Inc.(b) | | | 281,890 | | | | 17,460,267 | |
|
| Wireless Telecommunication Services–1.82% | |
SBA Communications Corp.–Class A(b) | | | 91,962 | | | | 10,945,318 | |
Sprint Corp.(b)(c) | | | 4,910,000 | | | | 23,224,300 | |
| | | | | | | | 34,169,618 | |
Total Common Stocks & Other Equity Interests
(Cost $1,242,375,424) | | | | 1,866,455,763 | |
| |
Money Market Funds–1.20% | | | | | |
Liquid Assets Portfolio–Institutional Class, 0.16%(d) | | | 11,305,359 | | | | 11,305,359 | |
Premier Portfolio–Institutional Class, 0.12%(d) | | | 11,305,359 | | | | 11,305,359 | |
Total Money Market Funds
(Cost $22,610,718) | | | | 22,610,718 | |
TOTAL INVESTMENTS (excluding investments purchased with cash collateral from securities on loan)–100.31%
(Cost $1,264,986,142) | | | | 1,889,066,481 | |
See accompanying Notes to Financial Statements which are an integral part of the financial statements.
10 Invesco Summit Fund
| | | | | | | | |
| | | Shares | | | Value | |
Investments Purchased with Cash Collateral from Securities on Loan | | | | | |
Money Market Funds–2.57% | |
Liquid Assets Portfolio–Institutional Class 0.16% (Cost $48,340,305)(d)(e) | | | 48,340,305 | | | $ | 48,340,305 | |
TOTAL INVESTMENTS–102.88%
(Cost $1,313,326,447) | | | | 1,937,406,786 | |
OTHER ASSETS LESS LIABILITIES–(2.88)% | | | | (54,170,074 | ) |
NET ASSETS–100.00% | | | $ | 1,883,236,712 | |
Investment Abbreviations:
| | |
| ADR | | – American Depositary Receipt |
Notes to Schedule of Investments:
| (a) | Industry and/or sector classifications used in this report are generally according to the Global Industry Classification Standard, which was developed by and is the exclusive property and a service mark of MSCI Inc. and Standard & Poor’s. |
| (b) | Non-income producing security. |
| (c) | All or a portion of this security was out on loan at October 31, 2015. |
| (d) | The money market fund and the Fund are affiliated by having the same investment adviser. The rate shown is the 7-day SEC standardized yield as of October 31, 2015. |
| (e) | The security has been segregated to satisfy the commitment to return the cash collateral received in securities lending transactions upon the borrower’s return of the securities loaned. See Note 1I. |
See accompanying Notes to Financial Statements which are an integral part of the financial statements.
11 Invesco Summit Fund
Statement of Assets and Liabilities
October 31, 2015
| | | | |
Assets: | |
Investments, at value (Cost $1,242,375,424)* | | $ | 1,866,455,763 | |
Investments in affiliated money market funds, at value and cost | | | 70,951,023 | |
Total investments, at value (Cost $1,313,326,447) | | | 1,937,406,786 | |
Foreign currencies, at value (Cost $1,296) | | | 1,290 | |
Receivable for: | | | | |
Investments sold | | | 6,039,380 | |
Fund shares sold | | | 426,965 | |
Dividends | | | 570,462 | |
Investment for trustee deferred compensation and retirement plans | | | 377,209 | |
Other assets | | | 54,582 | |
Total assets | | | 1,944,876,674 | |
|
Liabilities: | |
Payable for: | | | | |
Investments purchased | | | 11,477,721 | |
Fund shares reacquired | | | 912,555 | |
Collateral upon return of securities loaned | | | 48,340,305 | |
Accrued fees to affiliates | | | 434,083 | |
Accrued trustees’ and officers’ fees and benefits | | | 3,137 | |
Accrued other operating expenses | | | 39,277 | |
Trustee deferred compensation and retirement plans | | | 432,884 | |
Total liabilities | | | 61,639,962 | |
Net assets applicable to shares outstanding | | $ | 1,883,236,712 | |
|
Net assets consist of: | |
Shares of beneficial interest | | $ | 1,141,930,332 | |
Undistributed net investment income (loss) | | | (873,002 | ) |
Undistributed net realized gain | | | 118,100,340 | |
Net unrealized appreciation | | | 624,079,042 | |
| | | $ | 1,883,236,712 | |
| | | | |
Net Assets: | |
Class A | | $ | 50,348,526 | |
Class B | | $ | 566,162 | |
Class C | | $ | 4,855,219 | |
Class P | | $ | 1,821,733,154 | |
Class S | | $ | 3,545,698 | |
Class Y | | $ | 2,170,323 | |
Class R5 | | $ | 17,630 | |
|
Shares outstanding, $0.001 par value per share,
with an unlimited number of shares authorized: | |
Class A | | | 2,862,484 | |
Class B | | | 34,241 | |
Class C | | | 294,462 | |
Class P | | | 102,650,287 | |
Class S | | | 200,972 | |
Class Y | | | 122,653 | |
Class R5 | | | 993 | |
Class A: | | | | |
Net asset value per share | | $ | 17.59 | |
Maximum offering price per share | | | | |
(Net asset value of $17.59 ¸ 94.50%) | | $ | 18.61 | |
Class B: | | | | |
Net asset value and offering price per share | | $ | 16.53 | |
Class C: | | | | |
Net asset value and offering price per share | | $ | 16.49 | |
Class P: | | | | |
Net asset value and offering price per share | | $ | 17.75 | |
Class S: | | | | |
Net asset value and offering price per share | | $ | 17.64 | |
Class Y: | | | | |
Net asset value and offering price per share | | $ | 17.69 | |
Class R5: | | | | |
Net asset value and offering price per share | | $ | 17.75 | |
| * | At October 31, 2015, securities with an aggregate value of $47,185,370 were on loan to brokers. |
See accompanying Notes to Financial Statements which are an integral part of the financial statements.
12 Invesco Summit Fund
Statement of Operations
For the year ended October 31, 2015
| | | | |
Investment income: | |
Dividends (net of foreign withholding taxes of $102,355) | | $ | 16,188,634 | |
Dividends from affiliated money market funds (includes securities lending income of $444,725) | | | 454,818 | |
Total investment income | | | 16,643,452 | |
| |
Expenses: | | | | |
Advisory fees | | | 12,024,696 | |
Administrative services fees | | | 425,694 | |
Custodian fees | | | 49,316 | |
Distribution fees: | | | | |
Class A | | | 98,164 | |
Class B | | | 6,206 | |
Class C | | | 33,527 | |
Class P | | | 1,841,179 | |
Class S | | | 5,428 | |
Transfer agent fees — A, B, C, P, S and Y | | | 2,165,437 | |
Transfer agent fees — R5 | | | 6 | |
Trustees’ and officers’ fees and benefits | | | 54,772 | |
Other | | | 232,251 | |
Total expenses | | | 16,936,676 | |
Less: Fees waived and expense offset arrangement(s) | | | (29,508 | ) |
Net expenses | | | 16,907,168 | |
Net investment income (loss) | | | (263,716 | ) |
| |
Realized and unrealized gain from: | | | | |
Net realized gain (loss) from: | | | | |
Investment securities (includes net gains from securities sold to affiliates of $158,523) | | | 119,367,171 | |
Foreign currencies | | | (182,759 | ) |
| | | | 119,184,412 | |
Change in net unrealized appreciation of: | | | | |
Investment securities | | | 43,367,070 | |
Foreign currencies | | | 215,682 | |
| | | | 43,582,752 | |
Net realized and unrealized gain | | | 162,767,164 | |
Net increase in net assets resulting from operations | | $ | 162,503,448 | |
See accompanying Notes to Financial Statements which are an integral part of the financial statements.
13 Invesco Summit Fund
Statement of Changes in Net Assets
For the years ended October 31, 2015 and 2014
| | | | | | | | |
| | | 2015 | | | 2014 | |
Operations: | | | | | |
Net investment income (loss) | | $ | (263,716 | ) | | $ | (549,100 | ) |
Net realized gain | | | 119,184,412 | | | | 240,922,412 | |
Change in net unrealized appreciation | | | 43,582,752 | | | | 34,969,674 | |
Net increase in net assets resulting from operations | | | 162,503,448 | | | | 275,342,986 | |
| | |
Distributions to shareholders from net investment income: | | | | | | | | |
Class A | | | — | | | | (35,891 | ) |
Class P | | | — | | | | (4,580,015 | ) |
Class S | | | — | | | | (9,735 | ) |
Class Y | | | — | | | | (1,411 | ) |
Class R5 | | | — | | | | (529 | ) |
Total distributions from net investment income | | | — | | | | (4,627,581 | ) |
| | |
Distributions to shareholders from net realized gains: | | | | | | | | |
Class A | | | (4,071,647 | ) | | | (506,568 | ) |
Class B | | | (84,373 | ) | | | (17,246 | ) |
Class C | | | (321,880 | ) | | | (47,705 | ) |
Class P | | | (235,797,666 | ) | | | (35,952,753 | ) |
Class S | | | (470,346 | ) | | | (90,593 | ) |
Class Y | | | (94,950 | ) | | | (8,411 | ) |
Class R5 | | | (70,504 | ) | | | (2,353 | ) |
Total distributions from net realized gains | | | (240,911,366 | ) | | | (36,625,629 | ) |
| | |
Share transactions–net: | | | | | | | | |
Class A | | | 21,041,427 | | | | 4,192,343 | |
Class B | | | (74,538 | ) | | | (246,218 | ) |
Class C | | | 2,667,529 | | | | (55,933 | ) |
Class P | | | 69,026,441 | | | | (146,691,555 | ) |
Class S | | | 19,882 | | | | (1,330,081 | ) |
Class Y | | | 1,452,748 | | | | 192,807 | |
Class R5 | | | (469,005 | ) | | | 394,341 | |
Net increase (decrease) in net assets resulting from share transactions | | | 93,664,484 | | | | (143,544,296 | ) |
Net increase in net assets | | | 15,256,566 | | | | 90,545,480 | |
| | |
Net assets: | | | | | | | | |
Beginning of year | | | 1,867,980,146 | | | | 1,777,434,666 | |
End of year (includes undistributed net investment income (loss) of $(873,002) and $(426,476), respectively) | | $ | 1,883,236,712 | | | $ | 1,867,980,146 | |
Notes to Financial Statements
October 31, 2015
NOTE 1—Significant Accounting Policies
Invesco Summit Fund (the “Fund”) is a series portfolio of AIM Equity Funds (Invesco Equity Funds) (the “Trust”). The Trust is a Delaware statutory trust registered under the Investment Company Act of 1940, as amended (the “1940 Act”), as an open-end series management investment company consisting of three separate portfolios, each authorized to issue an unlimited number of shares of beneficial interest. The assets, liabilities and operations of each portfolio are accounted for separately. Information presented in these financial statements pertains only to the Fund. Matters affecting each portfolio or class will be voted on exclusively by the shareholders of such portfolio or class.
The Fund’s investment objective is long-term growth of capital.
The Fund currently consists of seven different classes of shares: Class A, Class B, Class C, Class P, Class S, Class Y and Class R5. Class P shares are not sold to members of the general public. Only shareholders who had accounts in the AIM Summit Investors Plans I and AIM Summit Investors Plans II at the close of business on December 8, 2006, may continue to purchase Class P shares as described in the Fund’s prospectus. Class A shares are sold with a front-end sales charge unless certain waiver criteria are met and under certain circumstances load waiver shares may be subject to
14 Invesco Summit Fund
contingent deferred sales charges (“CDSC”). Class C shares are sold with a CDSC. Class P, Class S, Class Y and Class R5 shares are sold at net asset value. Effective November 30, 2010, new or additional investments in Class B shares are no longer permitted. Existing shareholders of Class B shares may continue to reinvest dividends and capital gains distributions in Class B shares until they convert to Class A shares. Also, shareholders in Class B shares will be able to exchange those shares for Class B shares of other Invesco Funds offering such shares until they convert to Class A shares. Generally, Class B shares will automatically convert to Class A shares on or about the month-end, which is at least eight years after the date of purchase. Redemption of Class B shares prior to the conversion date will be subject to a CDSC.
The following is a summary of the significant accounting policies followed by the Fund in the preparation of its financial statements.
| A. | Security Valuations — Securities, including restricted securities, are valued according to the following policy. |
A security listed or traded on an exchange (except convertible securities) is valued at its last sales price or official closing price as of the close of the customary trading session on the exchange where the security is principally traded, or lacking any sales or official closing price on a particular day, the security may be valued at the closing bid price on that day. Securities traded in the over-the-counter market are valued based on prices furnished by independent pricing services or market makers. When such securities are valued by an independent pricing service they may be considered fair valued. Futures contracts are valued at the final settlement price set by an exchange on which they are principally traded. Listed options are valued at the mean between the last bid and asked prices from the exchange on which they are principally traded. Options not listed on an exchange are valued by an independent source at the mean between the last bid and asked prices. For purposes of determining net asset value (“NAV”) per share, futures and option contracts generally are valued 15 minutes after the close of the customary trading session of the New York Stock Exchange (“NYSE”).
Investments in open-end and closed-end registered investment companies that do not trade on an exchange are valued at the end-of-day net asset value per share. Investments in open-end and closed-end registered investment companies that trade on an exchange are valued at the last sales price or official closing price as of the close of the customary trading session on the exchange where the security is principally traded.
Debt obligations (including convertible securities) and unlisted equities are fair valued using an evaluated quote provided by an independent pricing service. Evaluated quotes provided by the pricing service may be determined without exclusive reliance on quoted prices, and may reflect appropriate factors such as institution-size trading in similar groups of securities, developments related to specific securities, dividend rate (for unlisted equities), yield (for debt obligations), quality, type of issue, coupon rate (for debt obligations), maturity (for debt obligations), individual trading characteristics and other market data. Debt obligations are subject to interest rate and credit risks. In addition, all debt obligations involve some risk of default with respect to interest and/or principal payments.
Foreign securities’ (including foreign exchange contracts) prices are converted into U.S. dollar amounts using the applicable exchange rates as of the close of the NYSE. If market quotations are available and reliable for foreign exchange-traded equity securities, the securities will be valued at the market quotations. Because trading hours for certain foreign securities end before the close of the NYSE, closing market quotations may become unreliable. If between the time trading ends on a particular security and the close of the customary trading session on the NYSE, events occur that the Adviser determines are significant and make the closing price unreliable, the Fund may fair value the security. If the event is likely to have affected the closing price of the security, the security will be valued at fair value in good faith using procedures approved by the Board of Trustees. Adjustments to closing prices to reflect fair value may also be based on a screening process of an independent pricing service to indicate the degree of certainty, based on historical data, that the closing price in the principal market where a foreign security trades is not the current value as of the close of the NYSE. Foreign securities’ prices meeting the approved degree of certainty that the price is not reflective of current value will be priced at the indication of fair value from the independent pricing service. Multiple factors may be considered by the independent pricing service in determining adjustments to reflect fair value and may include information relating to sector indices, American Depositary Receipts and domestic and foreign index futures. Foreign securities may have additional risks including exchange rate changes, potential for sharply devalued currencies and high inflation, political and economic upheaval, the relative lack of issuer information, relatively low market liquidity and the potential lack of strict financial and accounting controls and standards.
Securities for which market prices are not provided by any of the above methods may be valued based upon quotes furnished by independent sources. The last bid price may be used to value equity securities. The mean between the last bid and asked prices is used to value debt obligations, including corporate loans.
Securities for which market quotations are not readily available or became unreliable are valued at fair value as determined in good faith by or under the supervision of the Trust’s officers following procedures approved by the Board of Trustees. Issuer specific events, market trends, bid/asked quotes of brokers and information providers and other market data may be reviewed in the course of making a good faith determination of a security’s fair value.
The Fund may invest in securities that are subject to interest rate risk, meaning the risk that the prices will generally fall as interest rates rise and, conversely, the prices will generally rise as interest rates fall. Specific securities differ in their sensitivity to changes in interest rates depending on their individual characteristics. Changes in interest rates may result in increased market volatility, which may affect the value and/or liquidity of certain Fund investments.
Valuations change in response to many factors including the historical and prospective earnings of the issuer, the value of the issuer’s assets, general economic conditions, interest rates, investor perceptions and market liquidity. Because of the inherent uncertainties of valuation, the values reflected in the financial statements may materially differ from the value received upon actual sale of those investments.
| B. | Securities Transactions and Investment Income — Securities transactions are accounted for on a trade date basis. Realized gains or losses on sales are computed on the basis of specific identification of the securities sold. Interest income (net of withholding tax, if any) is recorded on the accrual basis from settlement date. Dividend income (net of withholding tax, if any) is recorded on the ex-dividend date. |
The Fund may periodically participate in litigation related to Fund investments. As such, the Fund may receive proceeds from litigation settlements. Any proceeds received are included in the Statement of Operations as realized gain (loss) for investments no longer held and as unrealized gain (loss) for investments still held.
Brokerage commissions and mark ups are considered transaction costs and are recorded as an increase to the cost basis of securities purchased and/or a reduction of proceeds on a sale of securities. Such transaction costs are included in the determination of net realized and unrealized gain (loss) from investment securities reported in the Statement of Operations and the Statement of Changes in Net Assets and the net realized and unrealized gains (losses) on securities per share in the Financial Highlights. Transaction costs are included in the calculation of the
15 Invesco Summit Fund
Fund’s net asset value and, accordingly, they reduce the Fund’s total returns. These transaction costs are not considered operating expenses and are not reflected in net investment income reported in the Statement of Operations and the Statement of Changes in Net Assets, or the net investment income per share and the ratios of expenses and net investment income reported in the Financial Highlights, nor are they limited by any expense limitation arrangements between the Fund and the investment adviser.
The Fund allocates income and realized and unrealized capital gains and losses to a class based on the relative net assets of each class.
| C. | Country Determination — For the purposes of making investment selection decisions and presentation in the Schedule of Investments, the investment adviser may determine the country in which an issuer is located and/or credit risk exposure based on various factors. These factors include the laws of the country under which the issuer is organized, where the issuer maintains a principal office, the country in which the issuer derives 50% or more of its total revenues and the country that has the primary market for the issuer’s securities, as well as other criteria. Among the other criteria that may be evaluated for making this determination are the country in which the issuer maintains 50% or more of its assets, the type of security, financial guarantees and enhancements, the nature of the collateral and the sponsor organization. Country of issuer and/or credit risk exposure has been determined to be the United States of America, unless otherwise noted. |
| D. | Distributions — Distributions from net investment income and net realized capital gain, if any, are generally declared and paid annually and recorded on the ex-dividend date. The Fund may elect to treat a portion of the proceeds from redemptions as distributions for federal income tax purposes. |
| E. | Federal Income Taxes — The Fund intends to comply with the requirements of Subchapter M of the Internal Revenue Code of 1986, as amended (the “Internal Revenue Code”), necessary to qualify as a regulated investment company and to distribute substantially all of the Fund’s taxable earnings to shareholders. As such, the Fund will not be subject to federal income taxes on otherwise taxable income (including net realized capital gain) that is distributed to shareholders. Therefore, no provision for federal income taxes is recorded in the financial statements. |
The Fund recognizes the tax benefits of uncertain tax positions only when the position is more likely than not to be sustained. Management has analyzed the Fund’s uncertain tax positions and concluded that no liability for unrecognized tax benefits should be recorded related to uncertain tax positions. Management is not aware of any tax positions for which it is reasonably possible that the total amounts of unrecognized tax benefits will change materially in the next 12 months.
The Fund files tax returns in the U.S. Federal jurisdiction and certain other jurisdictions. Generally, the Fund is subject to examinations by such taxing authorities for up to three years after the filing of the return for the tax period.
| F. | Expenses — Fees provided for under the Rule 12b-1 plan of a particular class of the Fund are charged to the operations of such class. Transfer agency fees and expenses and other shareholder recordkeeping fees and expenses attributable to Class R5 are charged to such class. Transfer agency fees and expenses and other shareholder recordkeeping fees and expenses relating to all other classes are allocated among those classes based on relative net assets. All other expenses are allocated among the classes based on relative net assets. |
| G. | Accounting Estimates — The preparation of financial statements in conformity with accounting principles generally accepted in the United States of America (“GAAP”) requires management to make estimates and assumptions that affect the reported amounts of assets and liabilities at the date of the financial statements and the reported amounts of revenues and expenses during the reporting period including estimates and assumptions related to taxation. Actual results could differ from those estimates by a significant amount. In addition, the Fund monitors for material events or transactions that may occur or become known after the period-end date and before the date the financial statements are released to print. |
| H. | Indemnifications — Under the Trust’s organizational documents, each Trustee, officer, employee or other agent of the Trust is indemnified against certain liabilities that may arise out of the performance of their duties to the Fund. Additionally, in the normal course of business, the Fund enters into contracts, including the Fund’s servicing agreements, that contain a variety of indemnification clauses. The Fund’s maximum exposure under these arrangements is unknown as this would involve future claims that may be made against the Fund that have not yet occurred. The risk of material loss as a result of such indemnification claims is considered remote. |
| I. | Securities Lending — The Fund may lend portfolio securities having a market value up to one-third of the Fund’s total assets. Such loans are secured by collateral equal to no less than the market value of the loaned securities determined daily by the securities lending provider. Such collateral will be cash or debt securities issued or guaranteed by the U.S. Government or any of its sponsored agencies. Cash collateral received in connection with these loans is invested in short-term money market instruments or affiliated money market funds and is shown as such on the Schedule of Investments. The Fund bears the risk of loss with respect to the investment of collateral. It is the Fund’s policy to obtain additional collateral from or return excess collateral to the borrower by the end of the next business day, following the valuation date of the securities loaned. Therefore, the value of the collateral held may be temporarily less than the value of the securities on loan. When loaning securities, the Fund retains certain benefits of owning the securities, including the economic equivalent of dividends or interest generated by the security. Lending securities entails a risk of loss to the Fund if, and to the extent that, the market value of the securities loaned were to increase and the borrower did not increase the collateral accordingly, and the borrower failed to return the securities. The securities loaned are subject to termination at the option of the borrower or the Fund. Upon termination, the borrower will return to the Fund the securities loaned and the Fund will return the collateral. Upon the failure of the borrower to return the securities, collateral may be liquidated and the securities may be purchased on the open market to replace the loaned securities. The Fund could experience delays and costs in gaining access to the collateral and the securities may lose value during the delay which could result in potential losses to the Fund. Some of these losses may be indemnified by the lending agent. The Fund bears the risk of any deficiency in the amount of the collateral available for return to the borrower due to any loss on the collateral invested. Dividends received on cash collateral investments for securities lending transactions, which are net of compensation to counterparties, is included in Dividends from affiliated money market funds on the Statement of Operations. The aggregate value of securities out on loan, if any, is shown as a footnote on the Statement of Assets and Liabilities. |
| J. | Foreign Currency Translations — Foreign currency is valued at the close of the NYSE based on quotations posted by banks and major currency dealers. Portfolio securities and other assets and liabilities denominated in foreign currencies are translated into U.S. dollar amounts at date of valuation. Purchases and sales of portfolio securities (net of foreign taxes withheld on disposition) and income items denominated in foreign currencies are translated into U.S. dollar amounts on the respective dates of such transactions. The Fund does not separately account for the portion of the results of operations resulting from changes in foreign exchange rates on investments and the fluctuations arising from changes in market prices of securities held. The combined results of changes in foreign exchange rates and the fluctuation of market prices on investments (net of estimated foreign tax withholding) are included with the net realized and unrealized gain or loss from investments in the |
16 Invesco Summit Fund
| | Statement of Operations. Reported net realized foreign currency gains or losses arise from (1) sales of foreign currencies, (2) currency gains or losses realized between the trade and settlement dates on securities transactions, and (3) the difference between the amounts of dividends, interest, and foreign withholding taxes recorded on the Fund’s books and the U.S. dollar equivalent of the amounts actually received or paid. Net unrealized foreign currency gains and losses arise from changes in the fair values of assets and liabilities, other than investments in securities at fiscal period end, resulting from changes in exchange rates. |
The Fund may invest in foreign securities, which may be subject to foreign taxes on income, gains on investments or currency repatriation, a portion of which may be recoverable. Foreign taxes, if any, are recorded based on the tax regulations and rates that exist in the foreign markets in which the Fund invests and are shown in the Statement of Operations.
| K. | Forward Foreign Currency Contracts — The Fund may engage in foreign currency transactions either on a spot (i.e. for prompt delivery and settlement) basis, or through forward foreign currency contracts, to manage or minimize currency or exchange rate risk. |
The Fund may also enter into forward foreign currency contracts for the purchase or sale of a security denominated in a foreign currency in order to “lock in” the U.S. dollar price of that security, or the Fund may also enter into forward foreign currency contracts that do not provide for physical settlement of the two currencies, but instead are settled by a single cash payment calculated as the difference between the agreed upon exchange rate and the spot rate at settlement based upon an agreed upon notional amount (non-deliverable forwards). The Fund will set aside liquid assets in an amount equal to daily mark-to-market obligation for forward foreign currency contracts.
A forward foreign currency contract is an obligation between two parties (“Counterparties”) to purchase or sell a specific currency for an agreed-upon price at a future date. The use of forward foreign currency contracts does not eliminate fluctuations in the price of the underlying securities the Fund owns or intends to acquire but establishes a rate of exchange in advance. Fluctuations in the value of these contracts are measured by the difference in the contract date and reporting date exchange rates and are recorded as unrealized appreciation (depreciation) until the contracts are closed. When the contracts are closed, realized gains (losses) are recorded. Realized and unrealized gains (losses) on the contracts are included in the Statement of Operations. The primary risks associated with forward foreign currency contracts include failure of the Counterparty to meet the terms of the contract and the value of the foreign currency changing unfavorably. These risks may be in excess of the amounts reflected in the Statement of Assets and Liabilities.
NOTE 2—Advisory Fees and Other Fees Paid to Affiliates
The Trust has entered into a master investment advisory agreement with Invesco Advisers, Inc. (the “Adviser” or “Invesco”). Under the terms of the investment advisory agreement, the Fund pays an advisory fee to the Adviser based on the annual rate of the Fund’s average daily net assets as follows:
| | | | | | |
| Average Daily Net Assets | | Rate |
First $10 million | | | 1 | .00% | | |
Next $140 million | | | 0 | .75% | | |
Over $150 million | | | 0 | .625% | | |
For the year ended October 31, 2015, the effective advisory fees incurred by the Fund was 0.64%.
Under the terms of a master sub-advisory agreement between the Adviser and each of Invesco Asset Management Deutschland GmbH, Invesco Asset Management Limited, Invesco Asset Management (Japan) Limited, Invesco Hong Kong Limited, Invesco Senior Secured Management, Inc. and Invesco Canada Ltd. (collectively, the “Affiliated Sub-Advisers”) the Adviser, not the Fund, may pay 40% of the fees paid to the Adviser to any such Affiliated Sub-Adviser(s) that provide(s) discretionary investment management services to the Fund based on the percentage of assets allocated to such Affiliated Sub-Adviser(s).
The Adviser has contractually agreed, through at least June 30, 2016, to waive advisory fees and/or reimburse expenses of all shares to the extent necessary to limit total annual fund operating expenses after fee waiver and/or expense reimbursement (excluding certain items discussed below) of Class A, Class B, Class C, Class P, Class S, Class Y and Class R5 shares to 2.00%, 2.75%, 2.75%, 1.85%, 1.90%, 1.75% and 1.75%, respectively, of average daily net assets. In determining the Adviser’s obligation to waive advisory fees and/or reimburse expenses, the following expenses are not taken into account, and could cause the total annual fund operating expenses after fee waiver and/or expense reimbursement to exceed the numbers reflected above: (1) interest; (2) taxes; (3) dividend expense on short sales; (4) extraordinary or non-routine items, including litigation expenses; and (5) expenses that the Fund has incurred but did not actually pay because of an expense offset arrangement. Unless Invesco continues the fee waiver agreement, it will terminate on June 30, 2016. The fee waiver agreement cannot be terminated during its term. The Adviser did not waiver fees and/or reimburse expenses during the period under this expense limitation.
Further, the Adviser has contractually agreed, through at least June 30, 2017, to waive the advisory fee payable by the Fund in an amount equal to 100% of the net advisory fees the Adviser receives from the affiliated money market funds on investments by the Fund of uninvested cash (excluding investments of cash collateral from securities lending) in such affiliated money market funds.
For the year ended October 31, 2015, the Adviser waived advisory fees of $17,422.
The Trust has entered into a master administrative services agreement with Invesco pursuant to which the Fund has agreed to pay Invesco for certain administrative costs incurred in providing accounting services to the Fund. For the year ended October 31, 2015, expenses incurred under the agreement are shown in the Statement of Operations as Administrative services fees.
The Trust has entered into a transfer agency and service agreement with Invesco Investment Services, Inc. (“IIS”) pursuant to which the Fund has agreed to pay IIS a fee for providing transfer agency and shareholder services to the Fund and reimburse IIS for certain expenses incurred by IIS in the course of providing such services. IIS may make payments to intermediaries that provide omnibus account services, sub-accounting services and/or networking services. All fees payable by IIS to intermediaries that provide omnibus account services or sub-accounting are charged back to the Fund, subject to certain limitations approved by the Trust’s Board of Trustees. For the year ended October 31, 2015, expenses incurred under the agreement are shown in the Statement of Operations as Transfer agent fees.
The Fund has entered into master distribution agreements with Invesco Distributors, Inc. (“IDI”) to serve as the distributor for the Class A, Class B, Class C, Class P, Class S, Class Y and Class R5 shares. The Fund has adopted plans pursuant to Rule 12b-1 under the 1940 Act with respect to the
17 Invesco Summit Fund
Fund’s Class A, Class B, Class C shares, Class P shares and Class S shares (collectively, the “Plans”). The Fund, pursuant to the Plans, pays IDI compensation at the annual rate of 0.25% of the Fund’s average daily net assets of Class A shares, 1.00% of the average daily net assets of Class B and Class C shares, 0.10% of the average daily net assets of Class P shares and 0.15% of the average daily net assets of Class S shares. Of the Plan payments, up to 0.25% of the average daily net assets of Class A, Class B and Class C shares, 0.10% of the average daily net assets of Class P shares and 0.15% of the average daily net assets of Class S shares may be paid to furnish continuing personal shareholder services to customers who purchase and own shares of such classes. Any amounts not paid as a service fee under the Plans would constitute an asset-based sales charge. Rules of the Financial Industry Regulatory Authority (“FINRA”) impose a cap on the total sales charges, including asset-based sales charges, that may be paid by any class of shares of the Fund. For the year ended October 31, 2015, expenses incurred under the Plans are shown in the Statement of Operations as Distribution fees.
Front-end sales commissions and CDSC (collectively, the “sales charges”) are not recorded as expenses of the Fund. Front-end sales commissions are deducted from proceeds from the sales of Fund shares prior to investment in Class A shares of the Fund. CDSC are deducted from redemption proceeds prior to remittance to the shareholder. During the year ended October 31, 2015, IDI advised the Fund that IDI retained $27,267 in front-end sales commissions from the sale of Class A shares and $0, $90 and $356 from Class A, Class B and Class C shares, respectively, for CDSC imposed on redemptions by shareholders.
For the year ended October 31, 2015, the Fund incurred $39,408 in brokerage commissions with Invesco Capital Markets, Inc., an affiliate of the Adviser and IDI, for portfolio transactions executed on behalf of the Fund.
Certain officers and trustees of the Trust are officers and directors of the Adviser, IIS and/or IDI.
NOTE 3—Additional Valuation Information
GAAP defines fair value as the price that would be received to sell an asset or paid to transfer a liability in an orderly transaction between market participants at the measurement date, under current market conditions. GAAP establishes a hierarchy that prioritizes the inputs to valuation methods, giving the highest priority to readily available unadjusted quoted prices in an active market for identical assets (Level 1) and the lowest priority to significant unobservable inputs (Level 3), generally when market prices are not readily available or are unreliable. Based on the valuation inputs, the securities or other investments are tiered into one of three levels. Changes in valuation methods may result in transfers in or out of an investment’s assigned level:
| | Level 1 — | Prices are determined using quoted prices in an active market for identical assets. |
| | Level 2 — | Prices are determined using other significant observable inputs. Observable inputs are inputs that other market participants may use in pricing a security. These may include quoted prices for similar securities, interest rates, prepayment speeds, credit risk, yield curves, loss severities, default rates, discount rates, volatilities and others. |
| | Level 3 — | Prices are determined using significant unobservable inputs. In situations where quoted prices or observable inputs are unavailable (for example, when there is little or no market activity for an investment at the end of the period), unobservable inputs may be used. Unobservable inputs reflect the Fund’s own assumptions about the factors market participants would use in determining fair value of the securities or instruments and would be based on the best available information. |
The following is a summary of the tiered valuation input levels, as of October 31, 2015. The level assigned to the securities valuations may not be an indication of the risk or liquidity associated with investing in those securities. Because of the inherent uncertainties of valuation, the values reflected in the financial statements may materially differ from the value received upon actual sale of those investments.
| | | | | | | | | | | | | | | | |
| | | Level 1 | | | Level 2 | | | Level 3 | | | Total | |
Equity Securities | | $ | 1,896,467,003 | | | $ | 40,939,783 | | | $ | — | | | $ | 1,937,406,786 | |
NOTE 4—Security Transactions with Affiliated Funds
The Fund is permitted to purchase or sell securities from or to certain other Invesco Funds under specified conditions outlined in procedures adopted by the Board of Trustees of the Trust. The procedures have been designed to ensure that any purchase or sale of securities by the Fund from or to another fund or portfolio that is or could be considered an affiliate by virtue of having a common investment adviser (or affiliated investment advisers), common Trustees and/or common officers complies with Rule 17a-7 of the 1940 Act. Further, as defined under the procedures, each transaction is effected at the current market price. Pursuant to these procedures, for the year ended October 31, 2015, the Fund engaged in securities sales of $2,080,884, which resulted in net realized gains of $158,523.
NOTE 5—Expense Offset Arrangement(s)
The expense offset arrangement is comprised of transfer agency credits which result from balances in demand deposit accounts used by the transfer agent for clearing shareholder transactions. For the year ended October 31, 2015, the Fund received credits from this arrangement, which resulted in the reduction of the Fund’s total expenses of $12,086.
NOTE 6—Trustees’ and Officers’ Fees and Benefits
Trustees’ and Officers’ Fees and Benefits include amounts accrued by the Fund to pay remuneration to certain Trustees and Officers of the Fund. Trustees have the option to defer compensation payable by the Fund, and Trustees’ and Officers’ Fees and Benefits also include amounts accrued by the Fund to fund such deferred compensation amounts. Those Trustees who defer compensation have the option to select various Invesco Funds in which their deferral accounts shall be deemed to be invested. Finally, certain current Trustees were eligible to participate in a retirement plan that provided for benefits to be paid upon retirement to Trustees over a period of time based on the number of years of service. The Fund may have certain former Trustees who also participate in a retirement plan and receive benefits under such plan. Trustees’ and Officers’ Fees and Benefits include amounts accrued by the Fund to fund such retirement benefits. Obligations under the deferred compensation and retirement plans represent unsecured claims against the general assets of the Fund.
18 Invesco Summit Fund
NOTE 7—Cash Balances
The Fund is permitted to temporarily carry a negative or overdrawn balance in its account with State Street Bank and Trust Company, the custodian bank. Such balances, if any at period end, are shown in the Statement of Assets and Liabilities under the payable caption Amount due custodian. To compensate the custodian bank for such overdrafts, the overdrawn Fund may either (1) leave funds as a compensating balance in the account so the custodian bank can be compensated by earning the additional interest; or (2) compensate by paying the custodian bank at a rate agreed upon by the custodian bank and Invesco, not to exceed the contractually agreed upon rate.
NOTE 8—Distributions to Shareholders and Tax Components of Net Assets
Tax Character of Distributions to Shareholders Paid During the Fiscal Years Ended October 31, 2015 and 2014:
| | | | | | | | |
| | | 2015 | | | 2014 | |
Ordinary income | | $ | 3,385,313 | | | $ | 4,627,581 | |
Long-term capital gain | | | 237,526,053 | | | | 36,625,629 | |
Total distributions | | $ | 240,911,366 | | | $ | 41,253,210 | |
Tax Components of Net Assets at Period-End:
| | | | |
| | | 2015 | |
Undistributed long-term gain | | $ | 120,260,658 | |
Net unrealized appreciation — investments | | | 621,920,355 | |
Net unrealized appreciation (depreciation) — other investments | | | (1,296 | ) |
Temporary book/tax differences | | | (435,359 | ) |
Late year ordinary loss deferral | | | (437,978 | ) |
Shares of beneficial interest | | | 1,141,930,332 | |
Total net assets | | $ | 1,883,236,712 | |
The difference between book-basis and tax-basis unrealized appreciation (depreciation) is due to differences in the timing of recognition of gains and losses on investments for tax and book purposes. The Fund’s net unrealized appreciation difference is attributable primarily to wash sales.
The temporary book/tax differences are a result of timing differences between book and tax recognition of income and/or expenses. The Fund’s temporary book/tax differences are the result of the trustee deferral of compensation and retirement plan benefits.
Capital loss carryforward is calculated and reported as of a specific date. Results of transactions and other activity after that date may affect the amount of capital loss carryforward actually available for the Fund to utilize. Capital losses generated in years beginning after December 22, 2010 can be carried forward for an unlimited period, whereas previous losses expire in eight tax years. Capital losses with an expiration period may not be used to offset capital gains until all net capital losses without an expiration date have been utilized. Capital loss carryforwards with no expiration date will retain their character as either short-term or long-term capital losses instead of as short-term capital losses as under prior law. The ability to utilize capital loss carryforwards in the future may be limited under the Internal Revenue Code and related regulations based on the results of future transactions.
The Fund does not have a capital loss carryforward as of October 31, 2015.
NOTE 9—Investment Securities
The aggregate amount of investment securities (other than short-term securities, U.S. Treasury obligations and money market funds, if any) purchased and sold by the Fund during the year ended October 31, 2015 was $911,172,142 and $1,063,629,153, respectively. Cost of investments on a tax basis includes the adjustments for financial reporting purposes as of the most recently completed federal income tax reporting period-end.
| | | | |
| Unrealized Appreciation (Depreciation) of Investment Securities on a Tax Basis | |
Aggregate unrealized appreciation of investment securities | | $ | 649,940,087 | |
Aggregate unrealized (depreciation) of investment securities | | | (28,019,732 | ) |
Net unrealized appreciation of investment securities | | $ | 621,920,355 | |
Cost of investments for tax purposes is $1,315,486,431.
NOTE 10—Reclassification of Permanent Differences
Primarily as a result of differing book/tax treatment of foreign currency transactions, on October 31, 2015, undistributed net investment income (loss) was decreased by $182,810 and undistributed net realized gain was increased by $182,810. This reclassification had no effect on the net assets of the Fund.
19 Invesco Summit Fund
NOTE 11—Share Information
| | | | | | | | | | | | | | | | |
| | | Summary of Share Activity | |
| | | Years ended October 31, | |
| | | 2015 | | | 2014 | |
| | | Shares | | | Amount | | | Shares | | | Amount | |
Sold: | | | | | | | | | | | | | | | | |
Class A | | | 1,757,047 | | | $ | 30,361,838 | | | | 1,177,487 | | | $ | 20,524,129 | |
Class B | | | 13,638 | | | | 224,162 | | | | 3,659 | | | | 61,363 | |
Class C | | | 214,287 | | | | 3,501,385 | | | | 34,485 | | | | 577,352 | |
Class P | | | 2,251,712 | | | | 39,207,435 | | | | 2,621,682 | | | | 45,934,057 | |
Class S | | | 6,272 | | | | 108,443 | | | | 8,074 | | | | 139,857 | |
Class Y | | | 140,739 | | | | 2,426,496 | | | | 930,516 | | | | 15,996,311 | |
Class R5 | | | — | | | | — | | | | 22,466 | | | | 402,467 | |
| | | | |
Issued as reinvestment of dividends: | | | | | | | | | | | | | | | | |
Class A | | | 241,711 | | | | 3,869,800 | | | | 31,280 | | | | 518,679 | |
Class B | | | 5,488 | | | | 83,204 | | | | 1,064 | | | | 16,940 | |
Class C | | | 20,722 | | | | 313,105 | | | | 2,968 | | | | 47,138 | |
Class P | | | 14,467,961 | | | | 233,512,895 | | | | 2,409,620 | | | | 40,168,567 | |
Class S | | | 29,305 | | | | 470,346 | | | | 6,044 | | | | 100,328 | |
Class Y | | | 3,855 | | | | 61,947 | | | | 211 | | | | 3,518 | |
Class R5 | | | 4,225 | | | | 68,080 | | | | 149 | | | | 2,471 | |
| | | | |
Automatic conversion of Class B shares to Class A shares: | | | | | | | | | | | | | | | | |
Class A | | | 14,613 | | | | 262,573 | | | | 7,145 | | | | 125,227 | |
Class B | | | (15,436 | ) | | | (262,573 | ) | | | (7,458 | ) | | | (125,227 | ) |
| | | | |
Reacquired: | | | | | | | | | | | | | | | | |
Class A | | | (782,405 | ) | | | (13,452,784 | ) | | | (988,306 | ) | | | (16,975,692 | ) |
Class B | | | (7,485 | ) | | | (119,331 | ) | | | (11,934 | ) | | | (199,294 | ) |
Class C | | | (72,365 | ) | | | (1,146,961 | ) | | | (40,602 | ) | | | (680,423 | ) |
Class P | | | (11,679,213 | ) | | | (203,693,889 | ) | | | (13,241,814 | ) | | | (232,794,179 | ) |
Class S | | | (32,103 | ) | | | (558,907 | ) | | | (89,938 | ) | | | (1,570,266 | ) |
Class Y | | | (59,387 | ) | | | (1,035,695 | ) | | | (924,531 | ) | | | (15,807,022 | ) |
Class R5 | | | (32,132 | ) | | | (537,085 | ) | | | (623 | ) | | | (10,597 | ) |
Net increase (decrease) in share activity | | | 6,491,049 | | | $ | 93,664,484 | | | | (8,048,356 | ) | | $ | (143,544,296 | ) |
20 Invesco Summit Fund
NOTE 12—Financial Highlights
The following schedule presents financial highlights for a share of the Fund outstanding throughout the periods indicated.
| | | | | | | | | | | | | | | | | | | | | | | | | | | | | | | | | | | | | | | | | | | | | | | | | | | | | | | | |
| | | Net asset
value,
beginning
of period | | | Net
investment
income
(loss)(a) | | | Net gains
on securities
(both
realized and
unrealized) | | | Total from
investment
operations | | | Dividends
from net
investment
income | | | Distributions
from net
realized
gains | | | Total
distributions | | | Net asset
value, end
of period | | | Total
return(b) | | | Net assets,
end of period
(000’s omitted) | | | Ratio of
expenses
to average
net assets
with fee waivers
and/or expenses
absorbed | | | Ratio of
expenses
to average net
assets without
fee waivers
and/or expenses
absorbed | | | Ratio of net
investment
income (loss)
to average
net assets | | | Portfolio
turnover(c) | |
Class A | |
Year ended 10/31/15 | | $ | 18.62 | | | $ | (0.03 | ) | | $ | 1.44 | | | $ | 1.41 | | | $ | — | | | $ | (2.44 | ) | | $ | (2.44 | ) | | $ | 17.59 | | | | 8.86 | % | | $ | 50,349 | | | | 1.04 | %(d) | | | 1.04 | %(d) | | | (0.16 | )%(d) | | | 49 | % |
Year ended 10/31/14 | | | 16.40 | | | | (0.03 | ) | | | 2.62 | | | | 2.59 | | | | (0.03 | ) | | | (0.34 | ) | | | (0.37 | ) | | | 18.62 | | | | 16.06 | | | | 30,382 | | | | 1.05 | | | | 1.05 | | | | (0.18 | ) | | | 52 | |
Year ended 10/31/13 | | | 12.67 | | | | 0.03 | | | | 3.72 | | | | 3.75 | | | | (0.02 | ) | | | — | | | | (0.02 | ) | | | 16.40 | | | | 29.68 | | | | 23,025 | | | | 1.06 | | | | 1.06 | | | | 0.20 | | | | 49 | |
Year ended 10/31/12 | | | 11.56 | | | | 0.01 | | | | 1.10 | | | | 1.11 | | | | (0.00 | ) | | | — | | | | (0.00 | ) | | | 12.67 | | | | 9.62 | | | | 22,712 | | | | 1.08 | | | | 1.08 | | | | 0.09 | | | | 36 | |
Year ended 10/31/11 | | | 11.09 | | | | 0.00 | | | | 0.47 | | | | 0.47 | | | | (0.00 | ) | | | — | | | | (0.00 | ) | | | 11.56 | | | | 4.25 | | | | 17,763 | | | | 1.06 | | | | 1.07 | | | | 0.00 | | | | 59 | |
Class B | |
Year ended 10/31/15 | | | 17.77 | | | | (0.15 | ) | | | 1.35 | | | | 1.20 | | | | — | | | | (2.44 | ) | | | (2.44 | ) | | | 16.53 | | | | 7.20 | | | | 566 | | | | 1.79 | (d) | | | 1.79 | (d) | | | (0.91 | )(d) | | | 49 | |
Year ended 10/31/14 | | | 15.76 | | | | (0.15 | ) | | | 2.50 | | | | 2.35 | | | | — | | | | (0.34 | ) | | | (0.34 | ) | | | 17.77 | | | | 15.19 | | | | 676 | | | | 1.80 | | | | 1.80 | | | | (0.93 | ) | | | 52 | |
Year ended 10/31/13 | | | 12.25 | | | | (0.08 | ) | | | 3.59 | | | | 3.51 | | | | — | | | | — | | | | — | | | | 15.76 | | | | 28.65 | | | | 831 | | | | 1.81 | | | | 1.81 | | | | (0.55 | ) | | | 49 | |
Year ended 10/31/12 | | | 11.24 | | | | (0.08 | ) | | | 1.09 | | | | 1.01 | | | | — | | | | — | | | | — | | | | 12.25 | | | | 8.99 | | | | 913 | | | | 1.83 | | | | 1.83 | | | | (0.66 | ) | | | 36 | |
Year ended 10/31/11 | | | 10.87 | | | | (0.09 | ) | | | 0.46 | | | | 0.37 | | | | — | | | | — | | | | — | | | | 11.24 | | | | 3.40 | | | | 1,085 | | | | 1.81 | | | | 1.82 | | | | (0.75 | ) | | | 59 | |
Class C | |
Year ended 10/31/15 | | | 17.73 | | | | (0.15 | ) | | | 1.35 | | | | 1.20 | | | | — | | | | (2.44 | ) | | | (2.44 | ) | | | 16.49 | | | | 8.02 | | | | 4,855 | | | | 1.79 | (d) | | | 1.79 | (d) | | | (0.91 | )(d) | | | 49 | |
Year ended 10/31/14 | | | 15.73 | | | | (0.16 | ) | | | 2.50 | | | | 2.34 | | | | — | | | | (0.34 | ) | | | (0.34 | ) | | | 17.73 | | | | 15.15 | | | | 2,337 | | | | 1.80 | | | | 1.80 | | | | (0.93 | ) | | | 52 | |
Year ended 10/31/13 | | | 12.22 | | | | (0.08 | ) | | | 3.59 | | | | 3.51 | | | | — | | | | — | | | | — | | | | 15.73 | | | | 28.72 | | | | 2,122 | | | | 1.81 | | | | 1.81 | | | | (0.55 | ) | | | 49 | |
Year ended 10/31/12 | | | 11.23 | | | | (0.08 | ) | | | 1.07 | | | | 0.99 | | | | — | | | | — | | | | — | | | | 12.22 | | | | 8.82 | | | | 1,577 | | | | 1.83 | | | | 1.83 | | | | (0.66 | ) | | | 36 | |
Year ended 10/31/11 | | | 10.85 | | | | (0.09 | ) | | | 0.47 | | | | 0.38 | | | | — | | | | — | | | | — | | | | 11.23 | | | | 3.50 | | | | 1,968 | | | | 1.81 | | | | 1.82 | | | | (0.75 | ) | | | 59 | |
Class P | |
Year ended 10/31/15 | | | 18.74 | | | | (0.00 | ) | | | 1.45 | | | | 1.45 | | | | — | | | | (2.44 | ) | | | (2.44 | ) | | | 17.75 | | | | 9.03 | | | | 1,821,733 | | | | 0.89 | (d) | | | 0.89 | (d) | | | (0.01 | )(d) | | | 49 | |
Year ended 10/31/14 | | | 16.50 | | | | (0.01 | ) | | | 2.63 | | | | 2.62 | | | | (0.04 | ) | | | (0.34 | ) | | | (0.38 | ) | | | 18.74 | | | | 16.22 | | | | 1,829,660 | | | | 0.90 | | | | 0.90 | | | | (0.03 | ) | | | 52 | |
Year ended 10/31/13 | | | 12.75 | | | | 0.05 | | | | 3.74 | | | | 3.79 | | | | (0.04 | ) | | | — | | | | (0.04 | ) | | | 16.50 | | | | 29.84 | | | | 1,746,339 | | | | 0.91 | | | | 0.91 | | | | 0.35 | | | | 49 | |
Year ended 10/31/12 | | | 11.63 | | | | 0.03 | | | | 1.11 | | | | 1.14 | | | | (0.02 | ) | | | — | | | | (0.02 | ) | | | 12.75 | | | | 9.80 | | | | 1,518,577 | | | | 0.93 | | | | 0.93 | | | | 0.24 | | | | 36 | |
Year ended 10/31/11 | | | 11.15 | | | | 0.02 | | | | 0.48 | | | | 0.50 | | | | (0.02 | ) | | | — | | | | (0.02 | ) | | | 11.63 | | | | 4.46 | | | | 1,545,006 | | | | 0.91 | | | | 0.92 | | | | 0.15 | | | | 59 | |
Class S | |
Year ended 10/31/15 | | | 18.66 | | | | (0.01 | ) | | | 1.43 | | | | 1.42 | | | | — | | | | (2.44 | ) | | | (2.44 | ) | | | 17.64 | | | | 8.90 | | | | 3,546 | | | | 0.94 | (d) | | | 0.94 | (d) | | | (0.06 | )(d) | | | 49 | |
Year ended 10/31/14 | | | 16.43 | | | | (0.01 | ) | | | 2.62 | | | | 2.61 | | | | (0.04 | ) | | | (0.34 | ) | | | (0.38 | ) | | | 18.66 | | | | 16.18 | | | | 3,685 | | | | 0.95 | | | | 0.95 | | | | (0.08 | ) | | | 52 | |
Year ended 10/31/13 | | | 12.70 | | | | 0.04 | | | | 3.73 | | | | 3.77 | | | | (0.04 | ) | | | — | | | | (0.04 | ) | | | 16.43 | | | | 29.74 | | | | 4,490 | | | | 0.96 | | | | 0.96 | | | | 0.30 | | | | 49 | |
Year ended 10/31/12 | | | 11.58 | | | | 0.02 | | | | 1.12 | | | | 1.14 | | | | (0.02 | ) | | | — | | | | (0.02 | ) | | | 12.70 | | | | 9.82 | | | | 3,896 | | | | 0.98 | | | | 0.98 | | | | 0.19 | | | | 36 | |
Year ended 10/31/11 | | | 11.11 | | | | 0.01 | | | | 0.47 | | | | 0.48 | | | | (0.01 | ) | | | — | | | | (0.01 | ) | | | 11.58 | | | | 4.36 | | | | 4,078 | | | | 0.96 | | | | 0.97 | | | | 0.10 | | | | 59 | |
Class Y | |
Year ended 10/31/15 | | | 18.67 | | | | 0.02 | | | | 1.44 | | | | 1.46 | | | | — | | | | (2.44 | ) | | | (2.44 | ) | | | 17.69 | | | | 9.13 | | | | 2,170 | | | | 0.79 | (d) | | | 0.79 | (d) | | | 0.09 | (d) | | | 49 | |
Year ended 10/31/14 | | | 16.45 | | | | 0.01 | | | | 2.61 | | | | 2.62 | | | | (0.06 | ) | | | (0.34 | ) | | | (0.40 | ) | | | 18.67 | | | | 16.23 | | | | 699 | | | | 0.80 | | | | 0.80 | | | | 0.07 | | | | 52 | |
Year ended 10/31/13 | | | 12.72 | | | | 0.06 | | | | 3.73 | | | | 3.79 | | | | (0.06 | ) | | | — | | | | (0.06 | ) | | | 16.45 | | | | 29.90 | | | | 514 | | | | 0.81 | | | | 0.81 | | | | 0.45 | | | | 49 | |
Year ended 10/31/12 | | | 11.58 | | | | 0.04 | | | | 1.13 | | | | 1.17 | | | | (0.03 | ) | | | — | | | | (0.03 | ) | | | 12.72 | | | | 10.14 | | | | 479 | | | | 0.83 | | | | 0.83 | | | | 0.34 | | | | 36 | |
Year ended 10/31/11 | | | 11.11 | | | | 0.03 | | | | 0.47 | | | | 0.50 | | | | (0.03 | ) | | | — | | | | (0.03 | ) | | | 11.58 | | | | 4.48 | | | | 1,186 | | | | 0.81 | | | | 0.82 | | | | 0.25 | | | | 59 | |
Class R5 | |
Year ended 10/31/15 | | | 18.71 | | | | 0.04 | | | | 1.44 | | | | 1.48 | | | | — | | | | (2.44 | ) | | | (2.44 | ) | | | 17.75 | | | | 9.24 | | | | 18 | | | | 0.68 | (d) | | | 0.68 | (d) | | | 0.20 | (d) | | | 49 | |
Year ended 10/31/14 | | | 16.46 | | | | 0.03 | | | | 2.63 | | | | 2.66 | | | | (0.07 | ) | | | (0.34 | ) | | | (0.41 | ) | | | 18.71 | | | | 16.50 | | | | 541 | | | | 0.69 | | | | 0.69 | | | | 0.18 | | | | 52 | |
Year ended 10/31/13 | | | 12.73 | | | | 0.08 | | | | 3.72 | | | | 3.80 | | | | (0.07 | ) | | | — | | | | (0.07 | ) | | | 16.46 | | | | 30.05 | | | | 114 | | | | 0.71 | | | | 0.71 | | | | 0.55 | | | | 49 | |
Year ended 10/31/12 | | | 11.60 | | | | 0.06 | | | | 1.11 | | | | 1.17 | | | | (0.04 | ) | | | — | | | | (0.04 | ) | | | 12.73 | | | | 10.12 | | | | 123 | | | | 0.72 | | | | 0.72 | | | | 0.45 | | | | 36 | |
Year ended 10/31/11 | | | 11.14 | | | | 0.04 | | | | 0.47 | | | | 0.51 | | | | (0.05 | ) | | | — | | | | (0.05 | ) | | | 11.60 | | | | 4.54 | | | | 77 | | | | 0.74 | | | | 0.75 | | | | 0.32 | | | | 59 | |
| (a) | Calculated using average shares outstanding. |
| (b) | Includes adjustments in accordance with accounting principles generally accepted in the United States of America and as such, the net asset value for financial reporting purposes and the returns based upon those net asset values may differ from the net asset value and returns for shareholder transactions. Does not include sales charges and is not annualized for periods less than one year, if applicable. |
| (c) | Portfolio turnover is calculated at the fund level and is not annualized for periods less than one year, if applicable. |
| (d) | Ratios are based on average daily net assets (000’s omitted) of $39,266, $621, $3,353, $1,841,179, $3,619, $1,824 and $91 for Class A, Class B, Class C, Class P, Class S, Class Y and Class R5 shares, respectively. |
21 Invesco Summit Fund
Report of Independent Registered Public Accounting Firm
To the Board of Trustees of AIM Equity Funds (Invesco Equity Funds) and Shareholders of Invesco Summit Fund:
In our opinion, the accompanying statement of assets and liabilities, including the schedule of investments, and the related statements of operations and of changes in net assets and the financial highlights present fairly, in all material respects, the financial position of Invesco Summit Fund (one of the funds constituting AIM Equity Funds (Invesco Equity Funds), hereafter referred to as the “Fund”) at October 31, 2015, the results of its operations for the year then ended, the changes in its net assets for each of the two years in the period then ended and the financial highlights for each of the five years in the period then ended, in conformity with accounting principles generally accepted in the United States of America. These financial statements and financial highlights (hereafter referred to as “financial statements”) are the responsibility of the Fund’s management. Our responsibility is to express an opinion on these financial statements based on our audits. We conducted our audits of these financial statements in accordance with the standards of the Public Company Accounting Oversight Board (United States). Those standards require that we plan and perform the audit to obtain reasonable assurance about whether the financial statements are free of material misstatement. An audit includes examining, on a test basis, evidence supporting the amounts and disclosures in the financial statements, assessing the accounting principles used and significant estimates made by management, and evaluating the overall financial statement presentation. We believe that our audits, which included confirmation of securities at October 31, 2015 by correspondence with the custodian and brokers, and the application of alternative auditing procedures where confirmations of security purchases have not been received, provide a reasonable basis for our opinion.
PRICEWATERHOUSECOOPERS LLP
December 23, 2015
Houston, Texas
22 Invesco Summit Fund
Calculating your ongoing Fund expenses
Example
As a shareholder of the Fund, you incur two types of costs: (1) transaction costs, which may include sales charges (loads) on purchase payments or contingent deferred sales charges on redemptions, if any; and (2) ongoing costs, including management fees, distribution and/or service (12b-1) fees, and other Fund expenses. This example is intended to help you understand your ongoing costs (in dollars) of investing in the Fund and to compare these costs with ongoing costs of investing in other mutual funds. The example is based on an investment of $1,000 invested at the beginning of the period and held for the entire period May 1, 2015 through October 31, 2015.
Actual expenses
The table below provides information about actual account values and actual expenses. You may use the information in this table, together with the amount you invested, to estimate the expenses that you paid over the period. Simply divide your account value by $1,000 (for example, an $8,600 account value divided by $1,000 = 8.6), then multiply the result by the number in the table under the heading entitled “Actual Expenses Paid During Period” to estimate the expenses you paid on your account during this period.
Hypothetical example for comparison purposes
The table below also provides information about hypothetical account values and hypothetical expenses based on the Fund’s actual expense ratio and an assumed rate of return of 5% per year before expenses, which is not the Fund’s actual return.
The hypothetical account values and expenses may not be used to estimate the actual ending account balance or expenses you paid for the period. You may use this information to compare the ongoing costs of investing in the Fund and other funds. To do so, compare this 5% hypothetical example with the 5% hypothetical examples that appear in the shareholder reports of the other funds.
Please note that the expenses shown in the table are meant to highlight your ongoing costs only and do not reflect any transaction costs, such as sales charges (loads) on purchase payments or contingent deferred sales charges on redemptions, if any. Therefore, the hypothetical information is useful in comparing ongoing costs only, and will not help you determine the relative total costs of owning different funds. In addition, if these transaction costs were included, your costs would have been higher.
| | | | | | | | | | | | | | | | | | | | | | | | |
| Class | | Beginning
Account Value
(05/01/15) | | | ACTUAL | | | HYPOTHETICAL
(5% annual return before
expenses) | | | Annualized
Expense
Ratio | |
| | | Ending
Account Value
(10/31/15)1 | | | Expenses
Paid During
Period2 | | | Ending
Account Value
(10/31/15) | | | Expenses
Paid During
Period2 | | |
| A | | $ | 1,000.00 | | | $ | 1,034.70 | | | $ | 5.33 | | | $ | 1,019.96 | | | $ | 5.30 | | | | 1.04 | % |
| B | | | 1,000.00 | | | | 1,030.50 | | | | 9.16 | | | | 1,016.18 | | | | 9.10 | | | | 1.79 | |
| C | | | 1,000.00 | | | | 1,030.60 | | | | 9.16 | | | | 1,016.18 | | | | 9.10 | | | | 1.79 | |
| P | | | 1,000.00 | | | | 1,035.00 | | | | 4.57 | | | | 1,020.72 | | | | 4.53 | | | | 0.89 | |
| S | | | 1,000.00 | | | | 1,034.60 | | | | 4.82 | | | | 1,020.47 | | | | 4.79 | | | | 0.94 | |
| Y | | | 1,000.00 | | | | 1,035.70 | | | | 4.05 | | | | 1,021.22 | | | | 4.02 | | | | 0.79 | |
| R5 | | | 1,000.00 | | | | 1,036.20 | | | | 3.80 | | | | 1,021.48 | | | | 3.77 | | | | 0.74 | |
| 1 | The actual ending account value is based on the actual total return of the Fund for the period May 1, 2015 through October 31, 2015, after actual expenses and will differ from the hypothetical ending account value which is based on the Fund’s expense ratio and a hypothetical annual return of 5% before expenses. |
| 2 | Expenses are equal to the Fund’s annualized expense ratio as indicated above multiplied by the average account value over the period, multiplied by 184/365 to reflect the most recent fiscal half year. |
23 Invesco Summit Fund
Approval of Investment Advisory and Sub-Advisory Contracts
The Board of Trustees (the Board) of AIM Equity Funds (Invesco Equity Funds) is required under the Investment Company Act of 1940, as amended, to approve annually the renewal of Invesco Summit Fund’s (the Fund) investment advisory agreements. During contract renewal meetings held on June 9-10, 2015, the Board as a whole, and the disinterested or “independent” Trustees, who comprise over 75% of the Board, voting separately, approved the continuance for the Fund of the Master Investment Advisory Agreement with Invesco Advisers, Inc. (Invesco Advisers and the investment advisory agreement) and the Master Intergroup Sub-Advisory Contract for Mutual Funds with Invesco Asset Management Deutschland GmbH, Invesco Asset Management Limited, Invesco Asset Management (Japan) Limited, Invesco Hong Kong Limited, Invesco Senior Secured Management, Inc. and Invesco Canada Ltd. (collectively, the Affiliated Sub-Advisers and the sub-advisory contracts) for another year, effective July 1, 2015.
In evaluating the fairness and reasonableness of compensation under the Fund’s investment advisory agreement and sub-advisory contracts, the Board considered, among other things, the factors discussed below. The Board determined that continuation of the Fund’s investment advisory agreement and the sub-advisory contracts is in the best interest of the Fund and its shareholders and that the compensation payable to Invesco Advisers and the Affiliated Sub-Advisers under the agreements is fair and reasonable.
The Board’s Fund Evaluation Process
The Board’s Investments Committee has established three Sub-Committees, each of which is primarily responsible for overseeing the performance and investment management services provided by Invesco Advisers and the Affiliated Sub-Advisers to a number of the funds advised by Invesco Advisers (the Invesco Funds). The Sub-Committees meet throughout the year to review the performance of their assigned Invesco Funds, including reviewing materials prepared under the direction of the independent Senior Officer, an officer of the Invesco Funds who reports directly to the independent Trustees. Over the course of each year, the Sub-Committees meet with portfolio managers for their assigned Invesco Funds and other members of management to review the performance, investment objective(s), policies, strategies, limitations and investment risks of these funds. The Board had the benefit of reports from the Sub-Committees and Investments Committee throughout the year in considering approval of the continuance of each Invesco Fund’s investment advisory agreement and sub-advisory contracts for another year.
During the contract renewal process, the Board receives comparative performance and
fee data regarding the Invesco Funds prepared by Invesco Advisers and Lipper Inc. (Lipper), an independent provider of investment company data. The Board also receives a report and this independent written evaluation from the Senior Officer. The Senior Officer’s evaluation is prepared as part of his responsibility to manage the process by which the Invesco Funds’ proposed management fees are negotiated during the annual contract renewal process to ensure they are negotiated in a manner that is at arms’ length and reasonable. In addition to meetings with Invesco Advisers and fund counsel, the independent Trustees also discuss the continuance of the investment advisory agreement and sub-advisory contracts in separate sessions with the Senior Officer and with independent legal counsel.
The Trustees recognized that the advisory fee rates for the Invesco Funds are, in many cases, the result of years of review and negotiation. The Trustees’ deliberations and conclusions in a particular year may be based in part on their deliberations and conclusions regarding these arrangements throughout the year and in prior years. The Trustees’ review and conclusions are based on the comprehensive consideration of all information presented to them and are not the result of any single determinative factor. Moreover, one Trustee may have weighed a particular piece of information or factor differently than another Trustee.
The discussion below is a summary of the Senior Officer’s independent written evaluation with respect to the Fund’s investment advisory agreement as well as a discussion of the material factors and related conclusions that formed the basis for the Board’s approval of the Fund’s investment advisory agreement and sub-advisory contracts. Unless otherwise stated, this information is current as of June 10, 2015, and does not reflect consideration of factors that became known to the Board after that date.
Factors and Conclusions and Summary of Independent Written Fee Evaluation
| A. | Nature, Extent and Quality of Services Provided by Invesco Advisers and the Affiliated Sub-Advisers |
The Board reviewed the advisory services provided to the Fund by Invesco Advisers under the Fund’s investment advisory agreement, the performance of Invesco Advisers in providing these services, and the credentials and experience of the officers and employees of Invesco Advisers who provide these services, including the Fund’s portfolio manager or managers. The Board’s review of the qualifications of Invesco Advisers to provide advisory services included the Board’s consideration of Invesco Advisers’ investment process oversight, independent credit analysis and investment risk management. The Board
also considered non-advisory services that Invesco Advisers and its affiliates provide to the Invesco Funds such as various back office support functions, equity and fixed income trading operations, internal audit, distribution, valuation and legal and compliance.
In determining whether to continue the Fund’s investment advisory agreement, the Board considered the benefits of reapproving an existing relationship and the greater uncertainty that may be associated with entering into a new relationship. The Board concluded that the nature, extent and quality of the services provided to the Fund by Invesco Advisers are appropriate and satisfactory and consistent with the terms of the Fund’s investment advisory agreement.
The Board reviewed the services that may be provided by the Affiliated Sub-Advisers under the sub-advisory contracts and the credentials and experience of the officers and employees of the Affiliated Sub-Advisers who provide these services. The Board noted that the Affiliated Sub-Advisers have offices and personnel that are located in financial centers around the world. As a result, the Affiliated Sub-Advisers can provide research and investment analysis on the markets and economies of various countries in which the Fund may invest, make recommendations regarding securities and assist with security trades. The Board concluded that the sub-advisory contracts benefit the Fund and its shareholders by permitting Invesco Advisers to use the resources and talents of the Affiliated Sub-Advisers in managing the Fund. The Board concluded that the nature, extent and quality of the services that may be provided by the Affiliated Sub-Advisers are appropriate and satisfactory and consistent with the terms of the Fund’s sub-advisory contracts.
The Board considered Fund performance as a relevant factor in considering whether to approve the investment advisory agreement. The Board did not view Fund performance as a relevant factor in considering whether to approve the sub-advisory contracts for the Fund, as no Affiliated Sub-Adviser currently manages assets of the Fund.
The Board compared the Fund’s performance during the past one, three and five calendar years to the performance of funds in the Lipper performance universe and against the Lipper Multi-Cap Growth Funds Index. The Board noted that performance of Class P shares of the Fund was in the third quintile of its performance universe for the one year period, the second quintile for the three year period and the fourth quintile for the five year period (the first quintile being the best performing funds and the fifth quintile being the worst performing funds). The Board noted that performance of Class P shares of the Fund was below the performance of the Index for the one, three and five year
24 Invesco Summit Fund
periods. Invesco Advisers noted that the Fund is repositioning to be less conservative, but its trend driven process remains susceptible to challenging environments. The Trustees also reviewed more recent Fund performance and this review did not change their conclusions.
| C. | Advisory and Sub-Advisory Fees |
The Board compared the Fund’s contractual management fee rate to the contractual management fee rates of funds in the Fund’s Lipper expense group at a common asset level. The Board noted that the contractual management fee rate for Class P shares of the Fund was below the median contractual management fee rate of funds in its expense group. The Board noted that the term “contractual management fee” may include both advisory and certain administrative services fees, but that Lipper does not provide information on a fund by fund basis as to what is included. The Board noted that Invesco Advisers does not charge the Invesco Funds for the administrative services included in the term as defined by Lipper. The Board also reviewed the methodology used by Lipper in providing expense group information, which includes using each fund’s contractual management fee schedule (including any applicable breakpoints) as reported in the most recent prospectus or statement of additional information for each fund in the expense group.
The Board noted that Invesco Advisers and the Affiliated Sub-Advisers do not manage other mutual funds or client accounts with investment strategies comparable to those of the Fund.
The Board also considered the services that may be provided by the Affiliated Sub-Advisers pursuant to the sub-advisory contracts, as well as the fees payable by Invesco Advisers to the Affiliated Sub-Advisers pursuant to the sub-advisory contracts. The Board also noted that the sub-advisory fees are not paid directly by the Fund, but rather, are payable by Invesco Advisers to the Affiliated Sub-Advisers.
| D. | Economies of Scale and Breakpoints |
The Board considered the extent to which there are economies of scale in the provision of advisory services to the Fund. The Board also considered whether the Fund benefits from economies of scale through contractual breakpoints in the Fund’s advisory fee schedule. The Board also noted that the Fund shares directly in economies of scale through lower fees charged by third party service providers based on the combined size of the Invesco Funds and other clients advised by Invesco Advisers.
| E. | Profitability and Financial Resources |
The Board reviewed information from Invesco Advisers concerning the costs of the advisory and other services that Invesco Advisers and its affiliates provide to the Fund and the Invesco Funds and the profitability of Invesco Advisers and its affiliates in providing these services. The Board received information from Invesco Advisers about the methodology used to prepare the profitability information. The Board noted that Invesco Advisers continues to
operate at a net profit from services Invesco Advisers and its affiliates provide to the Invesco Funds and the Fund. The Board did not deem the level of profits realized by Invesco Advisers and its affiliates from providing services to the Fund to be excessive given the nature, quality and extent of the services provided. The Board received and accepted information from Invesco Advisers demonstrating that Invesco Advisers and each Affiliated Sub-Adviser are financially sound and have the resources necessary to perform their obligations under the investment advisory agreement and sub-advisory contracts.
| F. | Collateral Benefits to Invesco Advisers and its Affiliates |
The Board considered various other benefits received by Invesco Advisers and its affiliates from the relationship with the Fund, including the fees received for providing transfer agency and distribution services to the Fund. The Board considered comparative information regarding fees charged for these services, including information provided by Lipper and other independent sources. The Board considered the performance of Invesco Advisers and its affiliates in providing these services and the organizational structure employed to provide these services. The Board also considered that these services are provided to the Fund pursuant to written contracts that are reviewed and approved on an annual basis by the Board; and that the services are required for the operation of the Fund.
The Board considered the benefits realized by Invesco Advisers and the Affiliated Sub-Advisers as a result of portfolio brokerage transactions executed through “soft dollar” arrangements. The Board noted that soft dollar arrangements shift the payment obligation for research services from Invesco Advisers and the Affiliated Sub-Advisers to the Invesco Funds and that the research received may be used with other clients of Invesco Advisers and may reduce Invesco Advisers’ and the Affiliated Sub-Advisers’ expenses. The Board also considered that it receives periodic reports from the Chief Compliance Officer of the Invesco Funds demonstrating that these arrangements are consistent with regulatory requirements. The Board did not deem the soft dollar arrangements to be inappropriate.
The Board considered that the Fund’s uninvested cash and cash collateral from any securities lending arrangements may be invested in money market funds advised by Invesco Advisers pursuant to procedures approved by the Board. The Board noted that Invesco Advisers receives advisory fees from these affiliated money market funds attributable to such investments, although Invesco Advisers has contractually agreed to waive through varying periods the advisory fees payable by the Invesco Funds with respect to investments in the affiliated money market funds. The waiver is in an amount equal to 100% of the net advisory fee Invesco Advisers receives from the affiliated money market funds with respect to the Fund’s investment in the
affiliated money market funds of uninvested cash, but not cash collateral. The Board concluded that the amount of advisory fees received by Invesco Advisors from the Fund’s investment of cash collateral from any securities lending arrangements in the affiliated money market funds is fair and reasonable.
The Board also considered the Fund may use an affiliated broker to execute certain trades for the Fund to, among other things, control information leakage, and were advised that such trades would be executed in compliance with rules under the Investment Company Act of 1940, as amended, and consistent with best execution obligations.
25 Invesco Summit Fund
Tax Information
Form 1099-DIV, Form 1042-S and other year-end tax information provide shareholders with actual calendar year amounts that should be included in their tax returns. Shareholders should consult their tax advisors.
The following distribution information is being provided as required by the Internal Revenue Code or to meet a specific state’s requirement.
The Fund designates the following amounts or, if subsequently determined to be different, the maximum amount allowable for its fiscal year ended October 31, 2015:
| | | | |
Federal and State Income Tax | |
Long-Term Capital Gain Distributions | | $ | 237,526,053 | |
Qualified Dividend Income* | | | 100 | % |
Corporate Dividends Received Deduction* | | | 100 | % |
U.S. Treasury Obligations* | | | 0 | % |
| | * | The above percentages are based on ordinary income dividends paid to shareholders during the Fund’s fiscal year. |
| | | | |
Non-Resident Alien Shareholders | |
Qualified Short-Term Gains | | $ | 3,385,313 | |
26 Invesco Summit Fund
Trustees and Officers
The address of each trustee and officer is AIM Equity Funds (Invesco Equity Funds) (the “Trust”), 11 Greenway Plaza, Suite 1000, Houston, Texas 77046-1173. The trustees serve for the life of the Trust, subject to their earlier death, incapacitation, resignation, retirement or removal as more specifically provided in the Trust’s organizational documents. Each officer serves for a one year term or until their successors are elected and qualified. Column two below includes length of time served with predecessor entities, if any.
| | | | | | | | |
Name, Year of Birth and
Position(s) Held with the Trust | | Trustee and/
or Officer Since | | Principal Occupation(s)
During Past 5 Years | | Number of Funds in Fund Complex Overseen by Trustee | | Other Directorship(s)
Held by Trustee During Past 5 Years |
| Interested Persons | | | | | | | | |
| Martin L. Flanagan1 — 1960 Trustee | | 2007 | | Executive Director, Chief Executive Officer and President, Invesco Ltd. (ultimate parent of Invesco and a global investment management firm); Advisor to the Board, Invesco Advisers, Inc. (formerly known as Invesco Institutional (N.A.), Inc.); Trustee, The Invesco Funds; Vice Chair, Investment Company Institute; and Member of Executive Board, SMU Cox School of Business Formerly: Chairman and Chief Executive Officer, Invesco Advisers, Inc. (registered investment adviser); Director, Chairman, Chief Executive Officer and President, IVZ Inc. (holding company), INVESCO Group Services, Inc. (service provider) and Invesco North American Holdings, Inc. (holding company); Director, Chief Executive Officer and President, Invesco Holding Company Limited (parent of Invesco and a global investment management firm); Director, Invesco Ltd.; Chairman, Investment Company Institute and President, Co-Chief Executive Officer, Co-President, Chief Operating Officer and Chief Financial Officer, Franklin Resources, Inc. (global investment management organization). | | 145 | | None |
Philip A. Taylor2 — 1954 Trustee, President and Principal Executive Officer | | 2006 | | Head of North American Retail and Senior Managing Director, Invesco Ltd.; Director, Co-Chairman, Co-President and Co-Chief Executive Officer, Invesco Advisers, Inc. (formerly known as Invesco Institutional (N.A.), Inc.) (registered investment adviser); Director, Chairman, Chief Executive Officer and President, Invesco Management Group, Inc. (formerly known as Invesco Aim Management Group, Inc.) (financial services holding company); Director and President, INVESCO Funds Group, Inc. (registered investment adviser and registered transfer agent); Director and Chairman, Invesco Investment Services, Inc. (formerly known as Invesco Aim Investment Services, Inc.) (registered transfer agent) and IVZ Distributors, Inc. (formerly known as INVESCO Distributors, Inc.) (registered broker dealer); Chief Executive Officer, Invesco Corporate Class Inc. (corporate mutual fund company) Director, Chairman and Chief Executive Officer, Invesco Canada Ltd. (formerly known as Invesco Trimark Ltd./Invesco Trimark Ltèe) (registered investment adviser and registered transfer agent); Trustee, President and Principal Executive Officer, The Invesco Funds (other than AIM Treasurer’s Series Trust (Invesco Treasurer’s Series Trust), Short-Term Investments Trust and Invesco Management Trust); Trustee and Executive Vice President, The Invesco Funds (AIM Treasurer’s Series Trust (Invesco Treasurer’s Series Trust), Short-Term Investments Trust and Invesco Management Trust only); Director, Invesco Investment Advisers LLC (formerly known as Van Kampen Asset Management); Director, Chief Executive Officer and President, Van Kampen Exchange Corp. Formerly: Director, President and Chairman, Invesco Inc. (holding company), Invesco Canada Holdings Inc. (holding company), Trimark Investments Ltd./Placements Trimark Ltèe and Invesco Financial Services Ltd/Services Financiers Invesco Ltèe; Chief Executive Officer, Invesco Canada Fund Inc (corporate mutual fund company); Director and Chairman, Van Kampen Investor Services Inc.; Director, Chief Executive Officer and President, 1371 Preferred Inc. (holding company) and Van Kampen Investments Inc.; Director and President, AIM GP Canada Inc. (general partner for limited partnerships) and Van Kampen Advisors, Inc.; Director and Chief Executive Officer, Invesco Trimark Dealer Inc. (registered broker dealer); Director, Invesco Distributors, Inc. (formerly known as Invesco Aim Distributors, Inc.) (registered broker dealer); Manager, Invesco PowerShares Capital Management LLC; Director, Chief Executive Officer and President, Invesco Advisers, Inc.; Director, Chairman, Chief Executive Officer and President, Invesco Aim Capital Management, Inc.; President, Invesco Trimark Dealer Inc. and Invesco Trimark Ltd./Invesco Trimark Ltèe; Director and President, AIM Trimark Corporate Class Inc. and AIM Trimark Canada Fund Inc.; Senior Managing Director, Invesco Holding Company Limited; Director and Chairman, Fund Management Company (former registered broker dealer); President and Principal Executive Officer, The Invesco Funds (AIM Treasurer’s Series Trust (Invesco Treasurer’s Series Trust), and Short-Term Investments Trust only); President, AIM Trimark Global Fund Inc. and AIM Trimark Canada Fund Inc.. | | 145 | | None |
| 1 | Mr. Flanagan is considered an interested person (within the meaning of Section 2(a)(19) of the 1940 Act) of the Trust because he is an officer of the Adviser to the Trust, and an officer and a director of Invesco Ltd., ultimate parent of the Adviser. |
| 2 | Mr. Taylor is considered an interested person (within the meaning of Section 2(a)(19) of the 1940 Act) of the Trust because he is an officer and a director of the Adviser. |
T-1 Invesco Summit Fund
Trustees and Officers—(continued)
| | | | | | | | |
Name, Year of Birth and
Position(s) Held with the Trust | | Trustee and/
or Officer Since | | Principal Occupation(s)
During Past 5 Years | | Number of Funds in Fund Complex Overseen by Trustee | | Other Directorship(s)
Held by Trustee During
Past 5 Years |
| Independent Trustees | | | | | | | | |
Bruce L. Crockett — 1944 Trustee and Chair | | 2003 | | Chairman, Crockett Technologies Associates (technology consulting company) Formerly: Director, Captaris (unified messaging provider); Director, President and Chief Executive Officer, COMSAT Corporation; Chairman, Board of Governors of INTELSAT (international communications company); ACE Limited (insurance company); Independent Directors Council and Investment Company Institute | | 145 | | ALPS (Attorneys Liability Protection Society) (insurance company) and Globe Specialty Metals, Inc. (metallurgical company) |
David C. Arch — 1945 Trustee | | 2010 | | Chairman of Blistex Inc., a consumer health care products manufacturer | | 145 | | Board member of the Illinois Manufacturers’ Association; Member of the Board of Visitors, Institute for the Humanities, University of Michigan; Member of the Audit Committee of the Edward-Elmhurst Hospital |
James T. Bunch — 1942 Trustee | | 2000 | | Managing Member, Grumman Hill Group LLC (family office/private equity investments) Formerly: Founder, Green Manning & Bunch Ltd. (investment banking firm) (1988-2010); Executive Committee, United States Golf Association; and Chairman, Board of Governors, Western Golf Association | | 145 | | Chairman of the Board of Trustees, Evans Scholars Foundation; and Chairman of the Board, Denver Film Society |
Rodney F. Dammeyer — 1940 Trustee | | 2010 | | Chairman of CAC, LLC, (private company offering capital investment and management advisory services) Formerly: Prior to 2001, Managing Partner at Equity Group Corporate Investments; Prior to 1995, Chief Executive Officer of Itel Corporation (formerly Anixter International); Prior to 1985, experience includes Senior Vice President and Chief Financial Officer of Household International, Inc., Executive Vice President and Chief Financial Officer of Northwest Industries, Inc. and Partner of Arthur Andersen & Co.; From 1987 to 2010, Director/Trustee of investment companies in the Van Kampen Funds complex | | 145 | | Director of Quidel Corporation and Stericycle, Inc. |
Albert R. Dowden — 1941 Trustee | | 2003 | | Director of a number of public and private business corporations, including the Boss Group, Ltd. (private investment and management); Nature���s Sunshine Products, Inc. and Reich & Tang Funds (5 portfolios) (registered investment company) Formerly: Director, Homeowners of America Holding Corporation/Homeowners of America Insurance Company (property casualty company); Director, Continental Energy Services, LLC (oil and gas pipeline service); Director, CompuDyne Corporation (provider of product and services to the public security market) and Director, Annuity and Life Re (Holdings), Ltd. (reinsurance company); Director, President and Chief Executive Officer, Volvo Group North America, Inc.; Senior Vice President, AB Volvo; Director of various public and private corporations; Chairman, DHJ Media, Inc.; Director, Magellan Insurance Company; and Director, The Hertz Corporation, Genmar Corporation (boat manufacturer), National Media Corporation; Advisory Board of Rotary Power International (designer, manufacturer, and seller of rotary power engines); and Chairman, Cortland Trust, Inc. (registered investment company) | | 145 | | Director of: Nature’s Sunshine Products, Inc., Reich & Tang Funds, Homeowners of America Holding Corporation/ Homeowners of America Insurance Company, the Boss Group |
Jack M. Fields — 1952 Trustee | | 2003 | | Chief Executive Officer, Twenty First Century Group, Inc. (government affairs company); Owner and Chief Executive Officer, Dos Angeles Ranch, L.P. (cattle, hunting, corporate entertainment); and Discovery Global Education Fund (non-profit) Formerly: Chief Executive Officer, Texana Timber LP (sustainable forestry company); Director of Cross Timbers Quail Research Ranch (non-profit); and member of the U.S. House of Representatives | | 145 | | Insperity, Inc. (formerly known as Administaff) |
Prema Mathai-Davis — 1950 Trustee | | 2003 | | Retired. Formerly: Chief Executive Officer, YWCA of the U.S.A. | | 145 | | None |
Larry Soll — 1942 Trustee | | 1997 | | Retired. Formerly: Chairman, Chief Executive Officer and President, Synergen Corp. (a biotechnology company) | | 145 | | None |
Hugo F. Sonnenschein — 1940 Trustee | | 2010 | | President Emeritus and Honorary Trustee of the University of Chicago and the Adam Smith Distinguished Service Professor in the Department of Economics at the University of Chicago. Prior to 2000, President of the University of Chicago | | 145 | | Trustee of the University of Rochester and a member of its investment committee; Member of the National Academy of Sciences and the American Philosophical Society; Fellow of the American Academy of Arts and Sciences |
Raymond Stickel, Jr. — 1944 Trustee | | 2005 | | Retired. Formerly: Director, Mainstay VP Series Funds, Inc. (25 portfolios) and Partner, Deloitte & Touche | | 145 | | None |
T-2 Invesco Summit Fund
Trustees and Officers—(continued)
| | | | | | | | |
Name, Year of Birth and
Position(s) Held with the Trust | | Trustee and/
or Officer Since | | Principal Occupation(s)
During Past 5 Years | | Number of Funds in Fund Complex Overseen by Trustee | | Other Directorship(s)
Held by Trustee During
Past 5 Years |
| Independent Trustees—(continued) |
Suzanne H. Woolsey — 1941 Trustee | | 2014 | | Chief Executive Officer of Woolsey Partners LLC | | 145 | | Emeritus Chair of the Board of Trustees of the Institute for Defense Analyses; Trustee of Colorado College; Trustee of California Institute of Technology; Prior to 2014, Director of Fluor Corp.; Prior to 2010, Trustee of the German Marshall Fund of the United States; Prior to 2010 Trustee of the Rocky Mountain Institute |
| Other Officers | | | | | | | | |
Russell C. Burk — 1958 Senior Vice President and Senior Officer | | 2005 | | Senior Vice President and Senior Officer, The Invesco Funds | | N/A | | N/A |
John M. Zerr — 1962 Senior Vice President, Chief Legal Officer and Secretary | | 2006 | | Director, Senior Vice President, Secretary and General Counsel, Invesco Management Group, Inc. (formerly known as Invesco Aim Management Group, Inc.) and Van Kampen Exchange Corp.; Senior Vice President, Invesco Advisers, Inc. (formerly known as Invesco Institutional (N.A.), Inc.) (registered investment adviser); Senior Vice President and Secretary, Invesco Distributors, Inc. (formerly known as Invesco Aim Distributors, Inc.); Director, Vice President and Secretary, Invesco Investment Services, Inc. (formerly known as Invesco Aim Investment Services, Inc.) and IVZ Distributors, Inc. (formerly known as INVESCO Distributors, Inc.); Director and Vice President, INVESCO Funds Group, Inc.; Senior Vice President, Chief Legal Officer and Secretary, The Invesco Funds; Managing Director, Invesco PowerShares Capital Management LLC; Director, Secretary and General Counsel, Invesco Investment Advisers LLC (formerly known as Van Kampen Asset Management); Secretary and General Counsel, Invesco Capital Markets, Inc. (formerly known as Van Kampen Funds Inc.) and Chief Legal Officer, PowerShares Exchange-Traded Fund Trust, PowerShares Exchange-Traded Fund Trust II, PowerShares India Exchange-Traded Fund Trust, PowerShares Actively Managed Exchange-Traded Fund Trust, and PowerShares Actively Managed Exchange-Traded Commodity Fund Trust Formerly: Director and Vice President, Van Kampen Advisors Inc.; Director, Vice President, Secretary and General Counsel, Van Kampen Investor Services Inc.; Director, Invesco Distributors, Inc. (formerly known as Invesco Aim Distributors, Inc.); Director, Senior Vice President, General Counsel and Secretary, Invesco Aim Advisers, Inc. and Van Kampen Investments Inc.; Director, Vice President and Secretary, Fund Management Company; Director, Senior Vice President, Secretary, General Counsel and Vice President, Invesco Aim Capital Management, Inc.; Chief Operating Officer and General Counsel, Liberty Ridge Capital, Inc. (an investment adviser); Vice President and Secretary, PBHG Funds (an investment company) and PBHG Insurance Series Fund (an investment company); Chief Operating Officer, General Counsel and Secretary, Old Mutual Investment Partners (a broker-dealer); General Counsel and Secretary, Old Mutual Fund Services (an administrator) and Old Mutual Shareholder Services (a shareholder servicing center); Executive Vice President, General Counsel and Secretary, Old Mutual Capital, Inc. (an investment adviser); and Vice President and Secretary, Old Mutual Advisors Funds (an investment company) | | N/A | | N/A |
Sheri Morris — 1964 Vice President, Treasurer and Principal Financial Officer | | 2003 | | Vice President, Treasurer and Principal Financial Officer, The Invesco Funds; Vice President, Invesco Advisers, Inc. (formerly known as Invesco Institutional (N.A.), Inc.) (registered investment adviser); and Vice President, PowerShares Exchange-Traded Fund Trust, PowerShares Exchange-Traded Fund Trust II, PowerShares India Exchange-Traded Fund Trust, PowerShares Actively Managed Exchange-Traded Fund Trust, and PowerShares Actively Managed Exchange-Traded Commodity Fund Trust Formerly: Vice President, Invesco Aim Advisers, Inc., Invesco Aim Capital Management, Inc. and Invesco Aim Private Asset Management, Inc.; Assistant Vice President and Assistant Treasurer, The Invesco Funds and Assistant Vice President, Invesco Advisers, Inc., Invesco Aim Capital Management, Inc. and Invesco Aim Private Asset Management, Inc.; and Treasurer, PowerShares Exchange-Traded Fund Trust, PowerShares Exchange-Traded Fund Trust II, PowerShares India Exchange-Traded Fund Trust and PowerShares Actively Managed Exchange-Traded Fund Trust | | N/A | | N/A |
T-3 Invesco Summit Fund
Trustees and Officers—(continued)
| | | | | | | | |
Name, Year of Birth and
Position(s) Held with the Trust | | Trustee and/
or Officer Since | | Principal Occupation(s)
During Past 5 Years | | Number of Funds in Fund Complex Overseen by Trustee | | Other Directorship(s)
Held by Trustee During
Past 5 Years |
| Other Officers—(continued) | | | | | | | | |
Karen Dunn Kelley — 1960 Vice President | | 2003 | | Senior Managing Director, Investments, Invesco Ltd.; Director, Co-President, Co-Chief Executive Officer, and Co-Chairman, Invesco Advisers, Inc. (formerly known as Invesco Institutional (N.A.), Inc.) (registered investment adviser); Chairman, Invesco Senior Secured Management, Inc.; Senior Vice President, Invesco Management Group, Inc. (formerly known as Invesco Aim Management Group, Inc.); Executive Vice President, Invesco Distributors, Inc. (formerly known as Invesco Aim Distributors, Inc.); Director, Invesco Mortgage Capital Inc. and Invesco Management Company Limited; Vice President, The Invesco Funds (other than AIM Treasurer’s Series Trust (Invesco Treasurer’s Series Trust), Short-Term Investments Trust and Invesco Management Trust); and President and Principal Executive Officer, The Invesco Funds (AIM Treasurer’s Series Trust (Invesco Treasurer’s Series Trust), Short-Term Investments Trust and Invesco Management Trust only) Formerly: Director and President, INVESCO Asset Management (Bermuda) Ltd., Director, INVESCO Global Asset Management Limited and INVESCO Management S.A.; Senior Vice President, Van Kampen Investments Inc. and Invesco Advisers, Inc. (formerly known as Invesco Institutional (N.A.), Inc.) (registered investment adviser); Vice President, Invesco Advisers, Inc. (formerly known as Invesco Institutional (N.A.), Inc.); Director of Cash Management and Senior Vice President, Invesco Advisers, Inc. and Invesco Aim Capital Management, Inc.; Director and President, Fund Management Company; Chief Cash Management Officer, Director of Cash Management, Senior Vice President, and Managing Director, Invesco Aim Capital Management, Inc.; Director of Cash Management, Senior Vice President, and Vice President, Invesco Advisers, Inc. and The Invesco Funds (AIM Treasurer’s Series Trust (Invesco Treasurer’s Series Trust), and Short-Term Investments Trust only) | | N/A | | N/A |
Crissie M. Wisdom — 1969 Anti-Money Laundering Compliance Officer | | 2013 | | Anti-Money Laundering Compliance Officer, Invesco Advisers, Inc. (formerly known as Invesco Institutional (N.A.), Inc.) (registered investment adviser), Invesco Capital Markets, Inc. (formerly known as Van Kampen Funds Inc.), Invesco Distributors, Inc., Invesco Investment Services, Inc., Invesco Management Group, Inc., Van Kampen Exchange Corp., The Invesco Funds, and PowerShares Exchange-Traded Fund Trust, PowerShares Exchange-Traded Fund Trust II, PowerShares India Exchange-Traded Fund Trust, PowerShares Actively Managed Exchange-Traded Fund Trust and PowerShares Actively Managed Exchange-Traded Commodity Fund Trust; Anti-Money Laundering Compliance Officer and Bank Secrecy Act Officer, INVESCO National Trust Company and Invesco Trust Company; and Fraud Prevention Manager and Controls and Risk Analysis Manager for Invesco Investment Services, Inc.. | | N/A | | N/A |
Lisa O. Brinkley — 1959 Chief Compliance Officer | | 2015 | | Senior Vice President and Chief Compliance Officer, Invesco Advisers, Inc. (registered investment adviser) (formerly known as Invesco Institutional (N.A., Inc.); and Chief Compliance Officer, The Invesco Funds Formerly: Global Assurance Officer, Invesco Ltd. and Vice President, The Invesco Funds; Chief Compliance Officer, Invesco Distributors, Inc. (formerly known as Invesco Aim Distributors, Inc.), Invesco Investment Services, Inc.(formerly known as Invesco Aim Investment Services, Inc.) and Van Kampen Investor Services Inc.; Senior Vice President, Invesco Management Group, Inc.; Senior Vice President and Chief Compliance Officer, Invesco Advisers, Inc. and The Invesco Funds; Vice President and Chief Compliance Officer, Invesco Aim Capital Management, Inc. and Invesco Distributors, Inc.; Vice President, Invesco Investment Services, Inc. and Fund Management Company. | | N/A | | N/A |
The Statement of Additional Information of the Trust includes additional information about the Fund’s Trustees and is available upon request, without charge, by calling 1.800.959.4246. Please refer to the Fund’s prospectus for information on the Fund’s sub-advisers.
| | | | | | |
Office of the Fund 11 Greenway Plaza, Suite 1000 Houston, TX 77046-1173 | | Investment Adviser Invesco Advisers, Inc. 1555 Peachtree Street, N.E. Atlanta, GA 30309 | | Distributor Invesco Distributors, Inc. 11 Greenway Plaza, Suite 1000 Houston, TX 77046-1173 | | Auditors PricewaterhouseCoopers LLP 1000 Louisiana Street, Suite 5800 Houston, TX 77002-5678 |
| | | |
| | | | | | |
Counsel to the Fund Stradley Ronon Stevens & Young, LLP 2005 Market Street, Suite 2600 Philadelphia, PA 19103-7018 | | Counsel to the Independent Trustees Goodwin Procter LLP 901 New York Avenue, N.W. Washington, D.C. 20001 | | Transfer Agent Invesco Investment Services, Inc. 11 Greenway Plaza, Suite 1000 Houston, TX 77046-1173 | | Custodian State Street Bank and Trust Company 225 Franklin Street Boston, MA 02110-2801 |
T-4 Invesco Summit Fund

Invesco mailing information
Send general correspondence to Invesco Investment Services, Inc., P.O. Box 219078, Kansas City, MO 64121-9078.
Important notice regarding delivery of security holder documents
To reduce Fund expenses, only one copy of most shareholder documents may be mailed to shareholders with multiple accounts at the same address (Householding). Mailing of your shareholder documents may be householded indefinitely unless you instruct us otherwise. If you do not want the mailing of these documents to be combined with those for other members of your household, please contact Invesco Investment Services, Inc. at 800 959 4246 or contact your financial institution. We will begin sending you individual copies for each account within 30 days after receiving your request.
Fund holdings and proxy voting information
The Fund provides a complete list of its holdings four times in each fiscal year, at the quarter ends. For the second and fourth quarters, the lists appear in the Fund’s semiannual and annual reports to shareholders. For the first and third quarters, the Fund files the lists with the Securities and Exchange Commission (SEC) on Form N-Q. The most recent list of portfolio holdings is available at invesco.com/completeqtrholdings. Shareholders can also look up the Fund’s Forms N-Q on the SEC website at sec.gov. Copies of the Fund’s Forms N-Q may be reviewed and copied at the SEC Public Reference Room in Washington, D.C. You can obtain information on the operation of the Public Reference Room, including information about duplicating fee charges, by calling 202 551 8090 or 800 732 0330, or by electronic request at the following email address: publicinfo@sec.gov. The SEC file numbers for the Fund are shown below.
A description of the policies and procedures that the Fund uses to determine how to vote proxies relating to portfolio securities is available without charge, upon request, from our Client Services department at 800 959 4246 or at invesco.com/proxyguidelines. The information is also available on the SEC website, sec.gov.
| | |
Information regarding how the Fund voted proxies related to its portfolio securities during the most recent 12-month period ended June 30 is available at invesco.com/proxysearch. The information is also available on the SEC website, sec.gov. Invesco Advisers, Inc. is an investment adviser; it provides investment advisory services to individual and institutional clients and does not sell securities. Invesco Distributors, Inc. is the US distributor for Invesco Ltd.’s retail mutual funds, exchange-traded funds and institutional money market funds. Both are wholly owned, indirect subsidiaries of Invesco Ltd. | |  |
| | | | |
| SEC file numbers: 811-01424 and 002-25469 | | SUM-AR-1 | | Invesco Distributors, Inc. |
ITEM 2. CODE OF ETHICS.
There were no amendments to the Code of Ethics (the “Code”) that applies to the Registrant’s Principal Executive Officer (“PEO”) and Principal Financial Officer (“PFO”) during the period covered by the report. The Registrant did not grant any waivers, including implicit waivers, from any provisions of the Code to the PEO or PFO during the period covered by this report.
ITEM 3. AUDIT COMMITTEE FINANCIAL EXPERT.
The Board of Trustees has determined that the Registrant has at least one audit committee financial expert serving on its Audit Committee. The Audit Committee financial expert is Raymond Stickel, Jr. Mr. Stickel is “independent” within the meaning of that term as used in Form N-CSR.
ITEM 4. PRINCIPAL ACCOUNTANT FEES AND SERVICES.
(a) to (d)
Fees Billed by PWC Related to the Registrant
PWC billed the Registrant aggregate fees for services rendered to the Registrant for the last two fiscal years as follows:
| | | | | | | | |
| | | Fees Billed for Services Rendered to the Registrant for fiscal year end 2015 | | (e)(2) Percentage of Fees Billed Applicable to Non-Audit Services Provided for fiscal year end 2015 Pursuant to Waiver of Pre-Approval Requirement(1) | | Fees Billed for Services Rendered to the Registrant for fiscal year end 2014 | | (e)(2) Percentage of Fees Billed Applicable to Non-Audit Services Provided for fiscal year end 2014 Pursuant to Waiver of Pre-Approval Requirement(1) |
| | | | |
Audit Fees | | $ 84,875 | | N/A | | $ 82,400 | | N/A |
Audit-Related Fees | | $ 0 | | 0% | | $ 0 | | 0% |
Tax Fees(2) | | $ 29,975 | | 0% | | $ 24,400 | | 0% |
All Other Fees | | $ 0 | | 0% | | $ 0 | | 0% |
Total Fees | | $114,850 | | 0% | | $106,800 | | 0% |
| | | | | | | | | | |
(g) PWC billed the Registrant aggregate non-audit fees of $29,975 for the fiscal year ended 2015, and $24,400 for the fiscal year ended 2014, for non-audit services rendered to the Registrant. | | |
| | | | |
|
|
(1) With respect to the provision of non-audit services, the pre-approval requirement is waived pursuant to a de minimis exception if (i) such services were not recognized as non-audit services by the Registrant at the time of engagement, (ii) the aggregate amount of all such services provided is no more than 5% of the aggregate audit and non-audit fees paid by the Registrant to PWC during a fiscal year; and (iii) such services are promptly brought to the attention of the Registrant’s Audit Committee and approved by the Registrant’s Audit Committee prior to the completion of the audit. |
|
(2) Tax fees for the fiscal year end 2015 include fees billed for reviewing tax returns. Tax fees for the fiscal year end 2014 includes fees billed for reviewing tax returns. |
Fees Billed by PWC Related to Invesco and Invesco Affiliates
PWC billed Invesco Advisers, Inc. (“Invesco”), the Registrant’s adviser, and any entity controlling, controlled by or under common control with Invesco that provides ongoing services to the Registrant (“Invesco Affiliates”) aggregate fees for pre-approved non-audit services rendered to Invesco and Invesco Affiliates for the last two fiscal years as follows:
| | | | | | | | |
| | | Fees Billed for Non- Audit Services Rendered to Invesco and Invesco Affiliates for fiscal year end 2015 That Were Required to be Pre-Approved by the Registrant’s Audit Committee | | (e)(2) Percentage of Fees Billed Applicable to Non-Audit Services Provided for fiscal year end 2015 Pursuant to Waiver of Pre- Approval Requirement(1) | | Fees Billed for Non- Audit Services Rendered to Invesco and Invesco Affiliates for fiscal year end 2014 That Were Required to be Pre-Approved by the Registrant’s Audit Committee | | (e)(2) Percentage of Fees Billed Applicable to Non-Audit Services Provided for fiscal year end 2014 Pursuant to Waiver of Pre- Approval Requirement(1) |
| | | | |
Audit-Related Fees | | $ 574,000 | | 0% | | $574,000 | | 0% |
Tax Fees | | $ 0 | | 0% | | $ 0 | | 0% |
All Other Fees | | $3,750,000 | | 0% | | $ 0 | | 0% |
Total Fees(2) | | $4,324,000 | | 0% | | $574,000 | | 0% |
| | | | |
|
|
|
(1) With respect to the provision of non-audit services, the pre-approval requirement is waived pursuant to a de minimis exception if (i) such services were not recognized as non-audit services by the Registrant at the time of engagement, (ii) the aggregate amount of all such services provided is no more than 5% of the aggregate audit and non-audit fees paid by the Registrant, Invesco and Invesco Affiliates to PWC during a fiscal year; and (iii) such services are promptly brought to the attention of the Registrant’s Audit Committee and approved by the Registrant’s Audit Committee prior to the completion of the audit. |
|
(2) Audit-Related fees for the year end 2015 include fees billed related to reviewing controls at a service organization. Audit-Related fees for the year end 2014 include fees billed related to reviewing controls at a service organization. |
|
(g) Including the fees for services not required to be pre-approved by the registrant’s audit committee, PWC billed Invesco and Invesco Affiliates aggregate non-audit fees of $9,083,022 for the fiscal year ended 2015, and $2,939,346 for the fiscal year ended 2014, for non-audit services rendered to Invesco and Invesco Affiliates. |
|
(h) The Audit Committee also has considered whether the provision of non-audit services that were rendered to Invesco and Invesco Affiliates that were not required to be pre-approved pursuant to SEC regulations, if any, is compatible with maintaining PWC’s independence. To the extent that such services were provided, the Audit Committee determined that the provision of such services is compatible with PWC maintaining independence with respect to the Registrant. |
|
(f) Not applicable. |
(e)(1)
PRE-APPROVAL OF AUDIT AND NON-AUDIT SERVICES
POLICIES AND PROCEDURES
As adopted by the Audit Committees of
the Invesco Funds (the “Funds”)
Last Amended May 4, 2010
Statement of Principles
Under the Sarbanes-Oxley Act of 2002 and rules adopted by the Securities and Exchange Commission (“SEC”) (“Rules”), the Audit Committees of the Funds’ (the “Audit Committees”) Board of Trustees (the “Board”) are responsible for the appointment, compensation and oversight of the work of independent accountants (an “Auditor”). As part of this responsibility and to assure that the Auditor’s independence is not impaired, the Audit Committees pre-approve the audit and non-audit services provided to the Funds by each Auditor, as well as all non-audit services provided by the Auditor to the Funds’ investment adviser and to affiliates of the adviser that provide ongoing services to the Funds (“Service Affiliates”) if the services directly impact the Funds’ operations or financial reporting. The SEC Rules also specify the types of services that an Auditor may not provide to its audit client. The following policies and procedures comply with the requirements for pre-approval and provide a mechanism by which management of the Funds may request and secure pre-approval of audit and non-audit services in an orderly manner with minimal disruption to normal business operations.
Proposed services either may be pre-approved without consideration of specific case-by-case services by the Audit Committees (“general pre-approval”) or require the specific pre-approval of the Audit Committees (“specific pre-approval”). As set forth in these policies and procedures, unless a type of service has received general pre-approval, it will require specific pre-approval by the Audit Committees. Additionally, any fees exceeding 110% of estimated pre-approved fee levels provided at the time the service was pre-approved will also require specific approval by the Audit Committees before payment is made. The Audit Committees will also consider the impact of additional fees on the Auditor’s independence when determining whether to approve any additional fees for previously pre-approved services.
The Audit Committees will annually review and generally pre-approve the services that may be provided by each Auditor without obtaining specific pre-approval from the Audit Committee generally on an annual basis. The term of any general pre-approval runs from the date of such pre-approval through September 30th of the following year, unless the Audit Committees consider a different period and state otherwise. The Audit Committees will add to or subtract from the list of general pre-approved services from time to time, based on subsequent determinations.
The purpose of these policies and procedures is to set forth the guidelines to assist the Audit Committees in fulfilling their responsibilities.
Delegation
The Audit Committees may from time to time delegate pre-approval authority to one or more of its members who are Independent Trustees. All decisions to pre-approve a service by a delegated member shall be reported to the Audit Committees at the next quarterly meeting.
Audit Services
The annual audit services engagement terms will be subject to specific pre-approval of the Audit Committees. Audit services include the annual financial statement audit and other procedures such as tax provision work that is required to be performed by the independent auditor to be able to form an opinion on the Funds’ financial statements. The Audit Committees will obtain, review and consider sufficient information concerning the proposed Auditor to make a reasonable evaluation of the Auditor’s qualifications and independence.
In addition to the annual Audit services engagement, the Audit Committees may grant either general or specific pre-approval of other audit services, which are those services that only the independent auditor
reasonably can provide. Other Audit services may include services such as issuing consents for the inclusion of audited financial statements with SEC registration statements, periodic reports and other documents filed with the SEC or other documents issued in connection with securities offerings.
Non-Audit Services
The Audit Committees may provide either general or specific pre-approval of any non-audit services to the Funds and its Service Affiliates if the Audit Committees believe that the provision of the service will not impair the independence of the Auditor, is consistent with the SEC’s Rules on auditor independence, and otherwise conforms to the Audit Committees’ general principles and policies as set forth herein.
Audit-Related Services
“Audit-related services” are assurance and related services that are reasonably related to the performance of the audit or review of the Fund’s financial statements or that are traditionally performed by the independent auditor. Audit-related services include, among others, accounting consultations related to accounting, financial reporting or disclosure matters not classified as “Audit services”; assistance with understanding and implementing new accounting and financial reporting guidance from rulemaking authorities; and agreed-upon procedures related to mergers, compliance with ratings agency requirements and interfund lending activities.
Tax Services
“Tax services” include, but are not limited to, the review and signing of the Funds’ federal tax returns, the review of required distributions by the Funds and consultations regarding tax matters such as the tax treatment of new investments or the impact of new regulations. The Audit Committees will scrutinize carefully the retention of the Auditor in connection with a transaction initially recommended by the Auditor, the major business purpose of which may be tax avoidance or the tax treatment of which may not be supported in the Internal Revenue Code and related regulations. The Audit Committees will consult with the Funds’ Treasurer (or his or her designee) and may consult with outside counsel or advisors as necessary to ensure the consistency of Tax services rendered by the Auditor with the foregoing policy.
No Auditor shall represent any Fund or any Service Affiliate before a tax court, district court or federal court of claims.
Under rules adopted by the Public Company Accounting Oversight Board and approved by the SEC, in connection with seeking Audit Committees’ pre-approval of permissible Tax services, the Auditor shall:
| | 1. | Describe in writing to the Audit Committees, which writing may be in the form of the proposed engagement letter: |
| | a. | The scope of the service, the fee structure for the engagement, and any side letter or amendment to the engagement letter, or any other agreement between the Auditor and the Fund, relating to the service; and |
| | b. | Any compensation arrangement or other agreement, such as a referral agreement, a referral fee or fee-sharing arrangement, between the Auditor and any person (other than the Fund) with respect to the promoting, marketing, or recommending of a transaction covered by the service; |
| | 2. | Discuss with the Audit Committees the potential effects of the services on the independence of the Auditor; and |
| | 3. | Document the substance of its discussion with the Audit Committees. |
All Other Auditor Services
The Audit Committees may pre-approve non-audit services classified as “All other services” that are not categorically prohibited by the SEC, as listed in Exhibit 1 to this policy.
Pre-Approval Fee Levels or Established Amounts
Pre-approval of estimated fees or established amounts for services to be provided by the Auditor under general or specific pre-approval policies will be set periodically by the Audit Committees. Any proposed fees exceeding 110% of the maximum estimated pre-approved fees or established amounts for pre-approved audit and non-audit services will be reported to the Audit Committees at the quarterly Audit Committees meeting and will require specific approval by the Audit Committees before payment is made. The Audit Committees will always factor in the overall relationship of fees for audit and non-audit services in determining whether to pre-approve any such services and in determining whether to approve any additional fees exceeding 110% of the maximum pre-approved fees or established amounts for previously pre-approved services.
Procedures
Generally on an annual basis, Invesco Advisers, Inc. (“Invesco”) will submit to the Audit Committees for general pre-approval, a list of non-audit services that the Funds or Service Affiliates of the Funds may request from the Auditor. The list will describe the non-audit services in reasonable detail and will include an estimated range of fees and such other information as the Audit Committee may request.
Each request for services to be provided by the Auditor under the general pre-approval of the Audit Committees will be submitted to the Funds’ Treasurer (or his or her designee) and must include a detailed description of the services to be rendered. The Treasurer or his or her designee will ensure that such services are included within the list of services that have received the general pre-approval of the Audit Committees. The Audit Committees will be informed at the next quarterly scheduled Audit Committees meeting of any such services for which the Auditor rendered an invoice and whether such services and fees had been pre-approved and if so, by what means.
Each request to provide services that require specific approval by the Audit Committees shall be submitted to the Audit Committees jointly by the Fund’s Treasurer or his or her designee and the Auditor, and must include a joint statement that, in their view, such request is consistent with the policies and procedures and the SEC Rules.
Each request to provide tax services under either the general or specific pre-approval of the Audit Committees will describe in writing: (i) the scope of the service, the fee structure for the engagement, and any side letter or amendment to the engagement letter, or any other agreement between the Auditor and the audit client, relating to the service; and (ii) any compensation arrangement or other agreement between the Auditor and any person (other than the audit client) with respect to the promoting, marketing, or recommending of a transaction covered by the service. The Auditor will discuss with the Audit Committees the potential effects of the services on the Auditor’s independence and will document the substance of the discussion.
Non-audit services pursuant to the de minimis exception provided by the SEC Rules will be promptly brought to the attention of the Audit Committees for approval, including documentation that each of the conditions for this exception, as set forth in the SEC Rules, has been satisfied.
On at least an annual basis, the Auditor will prepare a summary of all the services provided to any entity in the investment company complex as defined in section 2-01(f)(14) of Regulation S-X in sufficient detail as to the nature of the engagement and the fees associated with those services.
The Audit Committees have designated the Funds’ Treasurer to monitor the performance of all services provided by the Auditor and to ensure such services are in compliance with these policies and procedures. The Funds’ Treasurer will report to the Audit Committees on a periodic basis as to the results of such monitoring. Both the Funds’ Treasurer and management of Invesco will immediately report to the chairman of the Audit Committees any breach of these policies and procedures that comes to the attention of the Funds’ Treasurer or senior management of Invesco.
Exhibit 1 to Pre-Approval of Audit and Non-Audit Services Policies and Procedures
Conditionally Prohibited Non-Audit Services (not prohibited if the Fund can reasonably conclude that the results of the service would not be subject to audit procedures in connection with the audit of the Fund’s financial statements)
| | • | Bookkeeping or other services related to the accounting records or financial statements of the audit client |
| | • | Financial information systems design and implementation |
| | • | Appraisal or valuation services, fairness opinions, or contribution-in-kind reports |
| | • | Internal audit outsourcing services |
Categorically Prohibited Non-Audit Services
| | • | Broker-dealer, investment adviser, or investment banking services |
| | • | Expert services unrelated to the audit |
| | • | Any service or product provided for a contingent fee or a commission |
| | • | Services related to marketing, planning, or opining in favor of the tax treatment of confidential transactions or aggressive tax position transactions, a significant purpose of which is tax avoidance |
| | • | Tax services for persons in financial reporting oversight roles at the Fund |
| | • | Any other service that the Public Company Oversight Board determines by regulation is impermissible. |
| ITEM 5. | AUDIT COMMITTEE OF LISTED REGISTRANTS. |
Not applicable.
| ITEM 6. | SCHEDULE OF INVESTMENTS. |
Investments in securities of unaffiliated issuers is included as part of the reports to stockholders filed under Item 1 of this Form.
| ITEM 7. | DISCLOSURE OF PROXY VOTING POLICIES AND PROCEDURES FOR CLOSED-END MANAGEMENT INVESTMENT COMPANIES. |
Not applicable.
| ITEM 8. | PORTFOLIO MANAGERS OF CLOSED-END MANAGEMENT COMPANIES. |
Not applicable.
| ITEM 9. | PURCHASES OF EQUITY SECURITIES BY CLOSED-END MANAGEMENT INVESTMENT COMPANY AND AFFILIATED PURCHASERS. |
Not applicable.
| ITEM 10. | SUBMISSION OF MATTERS TO A VOTE OF SECURITY HOLDERS. |
None
| ITEM 11. | CONTROLS AND PROCEDURES. |
| (a) | As of November 20, 2015, an evaluation was performed under the supervision and with the participation of the officers of the Registrant, including the PEO and PFO, to assess the effectiveness of the Registrant’s disclosure controls and procedures, as that term is defined in Rule 30a-3(c) under the Investment Company Act of 1940 (the “Act”), as amended. Based on that evaluation, the Registrant’s officers, including the PEO and PFO, concluded that, as of November 20, 2015, the Registrant’s disclosure controls and procedures were reasonably designed to ensure: (1) that information required to be disclosed by the Registrant on Form N-CSR is recorded, processed, summarized and reported within the time periods specified by the rules and forms of the Securities and Exchange Commission; and (2) that material information relating to the Registrant is made known to the PEO and PFO as appropriate to allow timely decisions regarding required disclosure. |
| (b) | There have been no changes in the Registrant’s internal control over financial reporting (as defined in Rule 30a-3(d) under the Act) that occurred during the second fiscal quarter of the period covered by this report that have materially affected, or are reasonably likely to materially affect, the Registrant’s internal control over financial reporting. |
| 12(a) (2) | Certifications of principal executive officer and principal financial officer as required by Rule 30a-2(a) under the Investment Company Act of 1940. |
| 12(b) | Certifications of principal executive officer and principal financial officer as required by Rule 30a-2(b) under the Investment Company Act of 1940. |
SIGNATURES
Pursuant to the requirements of the Securities Exchange Act of 1934 and the Investment Company Act of 1940, the Registrant has duly caused this report to be signed on its behalf by the undersigned, thereunto duly authorized.
Registrant: AIM Equity Funds (Invesco Equity Funds)
| | |
| By: | | /s/ Philip A. Taylor |
| | Philip A. Taylor |
| | Principal Executive Officer |
| |
| Date: | | January 8, 2016 |
Pursuant to the requirements of the Securities and Exchange Act of 1934 and the Investment Company Act of 1940, this report has been signed below by the following persons on behalf of the Registrant and in the capacities and on the dates indicated.
| | |
| By: | | /s/ Philip A. Taylor |
| | Philip A. Taylor |
| | Principal Executive Officer |
| |
| Date: | | January 8, 2016 |
| | |
| By: | | /s/ Sheri Morris |
| | Sheri Morris |
| | Principal Executive Officer |
| |
| Date: | | January 8, 2016 |
EXHIBIT INDEX
| | |
| 12(a) (1) | | Code of Ethics. |
| |
| 12(a) (2) | | Certifications of principal executive officer and principal financial officer as required by Rule 30a-2(a) under the Investment Company Act of 1940. |
| |
| 12(a) (3) | | Not applicable. |
| |
| 12(b) | | Certifications of principal executive officer and principal financial officer as required by Rule 30a-2(b) under the Investment Company Act of 1940. |