| | | | |
| | | | OMB APPROVAL |
| | | | OMB Number: 3235-0570 Expires: August 31, 2020 Estimated average burden hours per response: 20.6 |
UNITED STATES
SECURITIES AND EXCHANGE COMMISSION
Washington, D.C. 20549
FORM N-CSR
CERTIFIED SHAREHOLDER REPORT OF REGISTERED
MANAGEMENT INVESTMENT COMPANIES
| | |
| Investment Company Act file number | | 811-01424 |
|
AIM Equity Funds (Invesco Equity Funds) |
| (Exact name of registrant as specified in charter) |
|
11 Greenway Plaza, Suite 1000 Houston, Texas 77046 |
| (Address of principal executive offices) (Zip code) |
|
Sheri Morris 11 Greenway Plaza, Suite 1000 Houston, Texas 77046 |
| (Name and address of agent for service) |
|
|
| Registrant’s telephone number, including area code: (713) 626-1919 |
|
| Date of fiscal year end: 10/31 |
|
| Date of reporting period: 10/31/17 |
Item 1. Report to Stockholders.
Letters to Shareholders
| | | | |

Philip Taylor | | | | Dear Shareholders: This annual report includes information about your Fund, including performance data and a complete list of its investments as of the close of the reporting period. Inside is a discussion of how your Fund was managed and the factors that affected its performance during the reporting period. American voters went to the polls just days after the start of the reporting period, and their decisions quickly affected markets. The US stock market rallied strongly after the election, with major market indexes rising, and setting record highs, throughout the reporting period. Generally positive economic data, strong corporate earnings and hope for tax and regulatory reform contributed to the rally. US and global bond markets, as well as emerging market equities, sold off immediately following the election – with the US bond market eventually recovering most of its losses. Overseas, economic data were mixed, prompting the European Central Bank and central |
banks in China and Japan, among other countries, to maintain extraordinarily accommodative monetary policies. Citing positive economic trends – specifically, realized and expected labor market conditions and inflation – the US Federal Reserve raised interest rates three times during the reporting period: first in December 2016, and then again in March and June 2017. Health care and tax reform proved to be more difficult than expected to enact, with little progress achieved by the end of the reporting period.
Short-term market volatility can prompt some investors to abandon their investment plans – and can cause others to settle for whatever returns the market has to offer. The investment professionals at Invesco, in contrast, invest with high conviction. This means that, no matter the asset class or the strategy, each investment team has a passion to exceed. We want to help investors achieve better outcomes, such as seeking higher returns, helping mitigate risk and generating income. Of course, investing with high conviction can’t guarantee a profit or ensure success; no investment strategy can. To learn more about how we invest with high conviction, visit invesco.com/HighConviction.
You, too, can invest with high conviction by maintaining a long-term investment perspective and by working with your financial adviser on a regular basis. During periods of short-term market volatility or uncertainty, your financial adviser can keep you focused on your long-term investment goals – a new home, a child’s college education or a secure retirement. He or she also can share research about the economy, the markets and individual investment options.
Visit our website for more information on your investments
Our website, invesco.com/us, offers a wide range of market insights and investment perspectives. On the website, you’ll find detailed information about our funds, including performance, holdings and portfolio manager commentaries. You can access information about your account by completing a simple, secure online registration. To do so, select “Log In” on the right side of the homepage, and then select “Register for Individual Account Access.”
In addition to the resources accessible on our website and through our mobile app, you can obtain timely updates to help you stay informed about the markets and the economy by connecting with Invesco on Twitter, LinkedIn or Facebook. You can access our blog at blog.invesco.us.com. Our goal is to provide you the information you want, when and where you want it.
Finally, I’m pleased to share with you Invesco’s commitment to both the Principles for Responsible Investment and to considering environmental, social and governance issues in our robust investment process. I invite you to learn more at invesco.com/esg.
Have questions?
For questions about your account, contact an Invesco client services representative at 800 959 4246. For Invesco-related questions or comments, please email me directly at phil@invesco.com.
All of us at Invesco look forward to serving your investment management needs. Thank you for investing with us.
Sincerely,

Philip Taylor
Senior Managing Director, Invesco Ltd.
| | | | | | |

Bruce Crockett | | | | | | Dear Fellow Shareholders: Among the many important lessons I’ve learned in more than 40 years in a variety of business endeavors is the value of a trusted advocate. As independent chair of the Invesco Funds Board, I can assure you that the members of the Board are strong advocates for the interests of investors in Invesco’s mutual funds. We work hard to represent your interests through oversight of the quality of the investment management services your funds receive and other matters important to your investment, including but not limited to: |
| | | | | | ∎ Ensuring that Invesco offers a diverse lineup of mutual funds that your financial adviser can use to strive to meet your financial needs as your investment goals change over time. |
| | | | | | ∎ Monitoring how the portfolio management teams of the Invesco funds are performing in light of changing economic and market conditions. |
| ∎ | | Assessing each portfolio management team’s investment performance within the context of the investment strategy described in the fund’s prospectus. |
| ∎ | | Monitoring for potential conflicts of interests that may impact the nature of the services that your funds receive. |
We believe one of the most important services we provide our fund shareholders is the annual review of the funds’ advisory and sub-advisory contracts with Invesco Advisers and its affiliates. This review is required by the Investment Company Act of 1940 and focuses on the nature and quality of the services Invesco provides as the adviser to the Invesco funds and the reasonableness of the fees that it charges for those services. Each year, we spend months carefully reviewing information received from Invesco and a variety of independent sources, such as performance and fee data prepared by Lipper, Inc. (a subsidiary of Broadridge Financial Solutions, Inc.), an independent, third-party firm widely recognized as a leader in its field. We also meet with our independent legal counsel and other independent advisers to review and help us assess the information that we have received. Our goal is to assure that you receive quality investment management services for a reasonable fee.
I trust the measures outlined above provide assurance that you have a worthy advocate when it comes to choosing the Invesco Funds.
As always, please contact me at bruce@brucecrockett.com with any questions or concerns you may have. On behalf of the Board, we look forward to continuing to represent your interests and serving your needs.
Sincerely,

Bruce L. Crockett
Independent Chair
Invesco Funds Board of Trustees
Management’s Discussion of Fund Performance
Performance summary
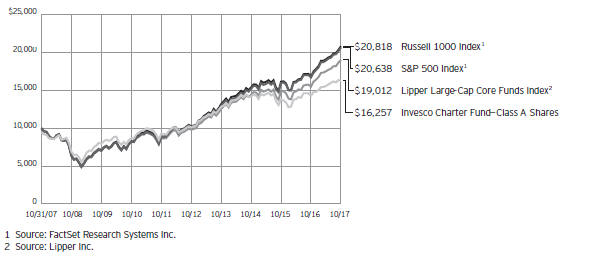
For the fiscal year ended October 31, 2017, Class A shares of Invesco Charter Fund (the Fund), at net asset value (NAV), underperformed the Russell 1000 Index, the Fund’s style-specific benchmark.
Your Fund’s long-term performance appears later in this report.
Fund vs. Indexes
Total returns, 10/31/16 to 10/31/17, at net asset value (NAV). Performance shown does not include applicable contingent deferred sales charges (CDSC) or front-end sales charges, which would have reduced performance.
| | | | | |
| Class A Shares | | | | 13.83 | % |
| Class B Shares | | | | 12.96 | |
| Class C Shares | | | | 12.98 | |
| Class R Shares | | | | 13.53 | |
| Class S Shares | | | | 13.94 | |
| Class Y Shares | | | | 14.13 | |
| Class R5 Shares | | | | 14.19 | |
| Class R6 Shares | | | | 14.27 | |
| S&P 500 Index▼ (Broad Market Index) | | | | 23.63 | |
| Russell 1000 Index▼ (Style-Specific Index) | | | | 23.67 | |
| Lipper Large Cap Core Funds Index∎ (Peer Group Index) | | | | 22.74 | |
Source(s): ▼FactSet Research Systems Inc.; ∎Lipper Inc. | | | | | |
Market conditions and your Fund
Despite highly destructive hurricanes that threatened to derail a years-long recovery, the US economy continued to expand throughout the fiscal year ended October 31, 2017. Gross domestic product (GDP) – the value of all goods and services produced in the US – grew by 1.8% in the fourth quarter of 2016, by 1.2% in the first quarter and by 3.1% in the second quarter of 2017.1 Inflation remained subdued even as the labor market continued to strengthen. Unemployment continued its multi-year decline, hitting just 4.2% in September – a 16-year low.2
Given signs of an improving economy, the US Federal Reserve (the Fed) raised interest rates three times during the reporting period, most recently in June 2017.3 The Fed pledged that “realized and expected economic conditions
relative to its objectives of maximum employment and 2 percent inflation” will guide its future actions. At the close of the reporting period, Fed policy remained accommodative, and the fed funds target rate stood at a range of 1.00% to 1.25% – up 75 basis points for the reporting period.3 (A basis point is 0.01%.)
Despite the Fed’s actions, major US stock market indexes repeatedly hit all-time highs throughout the reporting period. The stock market rally began immediately following the outcome of the US presidential election in November 2016, based on investors’ hopes for reduced regulation, lowered corporate and personal tax rates and increased infrastructure spending. The stock market rally continued throughout the reporting period, fueled by generally positive economic data, strong corporate earnings and improved consumer
confidence – even as the prospect for health care and tax reform faded somewhat.
During the fiscal year, stock selection in the consumer staples sector was the largest contributor to the Fund’s performance relative to its style-specific benchmark, as was underweight exposure to the sector. Stock selection in the telecommunication services sector also added to the Fund’s performance. The largest detractors from the Fund’s performance included the Fund’s cash position, as well as stock selection in the health care, information technology (IT) and energy sectors.
The largest individual contributor to the Fund’s performance was Progressive. During the fiscal year, the company reported better-than-expected earnings and total revenue gains across its personal lines segment. American Express also benefited from strong revenue and earnings growth. In addition, Cognizant Technology Solutions advanced due to consistently upbeat revenue growth across its primary business units, as well as stronger performance overseas during the fiscal year.
The largest individual detractor from the Fund’s performance was Range Resources, a natural gas company, which saw its stock price weaken due to declining gas prices. We sold our position in Range Resources during the reporting period. Shares of semiconductor company Qualcomm suffered after it was sued by Apple (not a Fund holding), one of its biggest customers, for unfair business practices. Also detracting from the Fund’s performance for the reporting period was Allergan, which fell amid criticism following a controversial patent agreement.
Finally, the Fund’s conservative positioning and allocation to cash hampered
| | | | | |
| Portfolio Composition | | |
| By sector | | | | % of total net assets | |
| | | | | |
| |
| Information Technology | | | | 20.1 | % |
| Consumer Discretionary | | | | 18.7 | |
| Financials | | | | 16.4 | |
| Health Care | | | | 14.0 | |
| Industrials | | | | 9.3 | |
| Energy | | | | 4.4 | |
| Consumer Staples | | | | 1.7 | |
| Materials | | | | 1.3 | |
| Utilities | | | | 1.2 | |
| Telecommunication Services | | | | 1.0 | |
| Real Estate | | | | 0.8 | |
Money Market Funds Plus Other Assets Less Liabilities | | | | 11.1 | |
| | | | | |
| Top 10 Equity Holdings* | | |
| % of total net assets |
| | | | | |
| |
| 1. Alphabet Inc.-Class C | | | | 3.2 | % |
2. Cognizant Technology Solutions Corp.-Class A | | | | 3.1 | |
| 3. AIA Group Ltd. | | | | 2.9 | |
| 4. Oracle Corp. | | | | 2.8 | |
| 5. Stanley Black & Decker Inc. | | | | 2.5 | |
| 6. Comcast Corp.-Class A | | | | 2.5 | |
| 7. American Express Co. | | | | 2.5 | |
| 8. Delphi Automotive PLC | | | | 2.5 | |
9. Taiwan Semiconductor Manufacturing Co. Ltd. | | | | 2.4 | |
| 10. Thermo Fisher Scientific, Inc. | | | | 2.1 | |
| | | | | |
Total Net Assets | | | $ | 3.8 billion | |
| |
Total Number of Holdings* | | | | 54 | |
The Fund’s holdings are subject to change, and there is no assurance that the Fund will continue to hold any particular security.
*Excluding money market fund holdings.
Data presented here are as of October 31, 2017.
its performance during the fiscal year. We have been active in deploying cash during periods of market volatility but continue to be selective due to valuations.
During the reporting period, the Fund’s largest overweight position relative to its style-specific benchmark was in the consumer discretionary sector. The Fund also had slight overweight position in the financials sector. Our underweight positions were in the consumer staples, energy, health care, industrials, information technology, materials, real estate, telecommunication services and utilities sectors.
Following our mandate as a conservative cornerstone for our clients’ portfolios, we continue to focus on high quality companies with attractive valuations and strong future growth prospects.
We thank you for your continued investment in Invesco Charter Fund.
| 1 | Source: Bureau of Economic Analysis |
| 2 | Sources: Bureau of Labor Statistics, Bloomberg |
| 3 | Source: US Federal Reserve |
The views and opinions expressed in management’s discussion of Fund performance are those of Invesco Advisers, Inc. These views and opinions are subject to change at any time based on factors such as market and economic conditions. These views and opinions may not be relied upon as investment advice or recommendations, or as an offer for a particular security. The information is not a complete analysis of every aspect of any market, country, industry, security or the Fund. Statements of fact are from sources considered reliable, but Invesco Advisers, Inc. makes no representation or warranty as to their completeness or accuracy. Although historical performance is no guarantee of future results, these insights may help you understand our investment management philosophy.
See important Fund and, if applicable, index disclosures later in this report.
| | |
 | | Ronald Sloan Chartered Financial Analyst, Portfolio Manager and Co-Chief Investment Officer of |
| Invesco’s Global Core Equity Team, is lead manager of Invesco Charter Fund. He joined Invesco in 1998. Mr. Sloan earned a BS in business administration and an MBA from the University of Missouri. |
| |
 | | Brian Nelson Chartered Financial Analyst, Portfolio Manager, is manager of Invesco Charter Fund. He |
| joined Invesco in 2004. Mr. Nelson earned a BA from the University of California, Santa Barbara. |
Your Fund’s Long-Term Performance
Results of a $10,000 Investment – Oldest Share Class(es)
Fund and index data from 10/31/07
Past performance cannot guarantee comparable future results
The data shown in the chart include re-invested distributions, applicable sales charges and Fund expenses including
management fees. Index results include reinvested dividends, but they do not reflect sales charges. Performance of the peer group, if applicable, reflects fund expenses and management fees; performance
of a market index does not. Performance shown in the chart and table(s) does not reflect deduction of taxes a shareholder would pay on Fund distributions or sale of Fund shares.
| | | | | |
Average Annual Total Returns |
| As of 10/31/17, including maximum applicable sales charges |
|
| | | | | |
| |
| Class A Shares | | | | | |
| Inception (11/26/68) | | | | 10.49 | % |
| 10 Years | | | | 4.98 | |
| 5 Years | | | | 8.72 | |
| 1 Year | | | | 7.54 | |
| |
| Class B Shares | | | | | |
| Inception (6/26/95) | | | | 7.13 | % |
| 10 Years | | | | 4.95 | |
| 5 Years | | | | 8.83 | |
| 1 Year | | | | 7.96 | |
| |
| Class C Shares | | | | | |
| Inception (8/4/97) | | | | 4.70 | % |
| 10 Years | | | | 4.79 | |
| 5 Years | | | | 9.12 | |
| 1 Year | | | | 11.98 | |
| |
| Class R Shares | | | | | |
| Inception (6/3/02) | | | | 6.62 | % |
| 10 Years | | | | 5.31 | |
| 5 Years | | | | 9.66 | |
| 1 Year | | | | 13.53 | |
| |
| Class S Shares | | | | | |
| 10 Years | | | | 5.66 | % |
| 5 Years | | | | 10.06 | |
| 1 Year | | | | 13.94 | |
| |
| Class Y Shares | | | | | |
| 10 Years | | | | 5.82 | % |
| 5 Years | | | | 10.22 | |
| 1 Year | | | | 14.13 | |
| |
| Class R5 Shares | | | | | |
| Inception (7/30/91) | | | | 8.26 | % |
| 10 Years | | | | 5.98 | |
| 5 Years | | | | 10.31 | |
| 1 Year | | | | 14.19 | |
| |
| Class R6 Shares | | | | | |
| 10 Years | | | | 5.80 | % |
| 5 Years | | | | 10.41 | |
| 1 Year | | | | 14.27 | |
Class S shares incepted on September 25, 2009. Performance shown prior to that date is that of Class A shares and includes the 12b-1 fees applicable to Class A shares.
Class Y shares incepted on October 3, 2008. Performance shown prior to that date is that of Class A shares and includes the 12b-1 fees applicable to Class A shares.
Class R6 shares incepted on September 24, 2012. Performance shown prior to that date is that of Class A shares and includes the 12b-1 fees applicable to Class A shares.
The performance data quoted represent
| | | | | |
Average Annual Total Returns | |
| As of 9/30/17, the most recent calendar quarter end, including maximum applicable sales charges | | | | | |
| | | | | |
| |
| Class A Shares | | | | | |
| Inception (11/26/68) | | | | 10.52 | % |
| 10 Years | | | | 5.23 | |
| 5 Years | | | | 8.60 | |
| 1 Year | | | | 5.66 | |
| |
| Class B Shares | | | | | |
| Inception (6/26/95) | | | | 7.19 | % |
| 10 Years | | | | 5.20 | |
| 5 Years | | | | 8.71 | |
| 1 Year | | | | 5.90 | |
| |
| Class C Shares | | | | | |
| Inception (8/4/97) | | | | 4.75 | % |
| 10 Years | | | | 5.04 | |
| 5 Years | | | | 9.02 | |
| 1 Year | | | | 9.99 | |
| |
| Class R Shares | | | | | |
| Inception (6/3/02) | | | | 6.70 | % |
| 10 Years | | | | 5.56 | |
| 5 Years | | | | 9.57 | |
| 1 Year | | | | 11.49 | |
| |
| Class S Shares | | | | | |
| 10 Years | | | | 5.91 | % |
| 5 Years | | | | 9.94 | |
| 1 Year | | | | 11.86 | |
| |
| Class Y Shares | | | | | |
| 10 Years | | | | 6.06 | % |
| 5 Years | | | | 10.12 | |
| 1 Year | | | | 12.05 | |
| |
| Class R5 Shares | | | | | |
| Inception (7/30/91) | | | | 8.31 | % |
| 10 Years | | | | 6.23 | |
| 5 Years | | | | 10.20 | |
| 1 Year | | | | 12.18 | |
| |
| Class R6 Shares | | | | | |
| 10 Years | | | | 6.05 | % |
| 5 Years | | | | 10.30 | |
| 1 Year | | | | 12.26 | |
past performance and cannot guarantee comparable future results; current performance may be lower or higher. Please visit invesco.com/performance for the most recent month-end performance. Performance figures reflect reinvested distributions, changes in net asset value and the effect of the maximum sales charge unless otherwise stated. Investment return and principal value will fluctuate so that you may have a gain or loss when you sell shares.
The net annual Fund operating expense ratio set forth in the most recent Fund prospectus as of the date of this
report for Class A, Class B, Class C, Class R, Class S, Class Y, Class R5 and Class R6 shares was 1.12%, 1.87%, 1.87%, 1.37%, 1.02%, 0.87%, 0.76% and 0.69%, respectively.1 The total annual Fund operating expense ratio set forth in the most recent Fund prospectus as of the date of this report for Class A, Class B, Class C, Class R, Class S, Class Y, Class R5 and Class R6 shares was 1.13%, 1.88%, 1.88%, 1.38%, 1.03%, 0.88%, 0.77% and 0.70%, respectively. The expense ratios presented above may vary from the expense ratios presented in other sections of this report that are based on expenses incurred during the period covered by this report.
Class A share performance reflects the maximum 5.50% sales charge, and Class B and Class C share performance reflects the applicable contingent deferred sales charge (CDSC) for the period involved. The CDSC on Class B shares declines from 5% beginning at the time of purchase to 0% at the beginning of the seventh year. The CDSC on Class C shares is 1% for the first year after purchase. Class R, Class S, Class Y, Class R5 and Class R6 shares do not have a front-end sales charge or a CDSC; therefore, performance is at net asset value.
The performance of the Fund’s share classes will differ primarily due to different sales charge structures and class expenses.
Fund performance reflects any applicable fee waivers and/or expense reimbursements. Had the adviser not waived fees and/or reimbursed expenses currently or in the past, returns would have been lower. See current prospectus for more information.
| 1 | Total annual Fund operating expenses after any contractual fee waivers and/or expense reimbursements by the adviser in effect through at least June 30, 2019. See current prospectus for more information. |
Invesco Charter Fund’s investment objective is long-term growth of capital.
| ∎ | | Unless otherwise stated, information presented in this report is as of October 31, 2017, and is based on total net assets. |
| ∎ | | Unless otherwise noted, all data provided by Invesco. |
| ∎ | | To access your Fund’s reports/prospectus, visit invesco.com/fundreports. |
About share classes
| ∎ | | Class B shares may not be purchased for new or additional investments. Please see the prospectus for more information. |
| ∎ | | Class R shares are generally available only to employee benefit plans. Please see the prospectus for more information. |
| ∎ | | Class S shares and Class Y shares are available only to certain investors. Please see the prospectus for more information. |
| ∎ | | Class R5 shares and Class R6 shares are available for use by retirement plans that meet certain standards and for institutional investors. Class R6 shares are also available through intermediaries that have established an agreement with Invesco Distributors, Inc. to make such shares available for use in retail omnibus accounts. Please see the prospectus for more information. |
Principal risks of investing in the Fund
| ∎ | | Cash/cash equivalents risk. In rising markets, holding cash or cash equivalents will negatively affect the Fund’s performance relative to its benchmark. |
| ∎ | | Debt Securities Risk. The prices of debt securities held by the Fund will be affected by changes in interest rates, the creditworthiness of the issuer and other factors. An increase in prevailing interest rates typically causes the value of existing debt securities to fall and often has a greater impact on longer-duration debt securities and higher quality debt securities. Falling interest rates will cause the Fund to reinvest the proceeds of debt securities that have been repaid by the issuer at lower interest rates. Falling interest rates may also reduce the Fund’s distributable income because interest payments on floating rate debt instruments held by the Fund will decline. The Fund could lose money on investments in debt securities if the issuer or borrower fails to meet its obligations to make interest payments |
| | and/or to repay principal in a timely manner. Changes in an issuer’s financial strength, the market’s perception of such strength or in the credit rating of the issuer or the security may affect the value of debt securities. The Adviser’s credit analysis may fail to anticipate such changes, which could result in buying a debt security at an inopportune time or failing to sell a debt security in advance of a price decline or other credit event. |
| ∎ | | Derivatives risk. The value of a derivative instrument depends largely on (and is derived from) the value of an underlying security, currency, commodity, interest rate, index or other asset (each referred to as an underlying asset). In addition to risks relating to the underlying assets, the use of derivatives may include other, possibly greater, risks, including counterparty, leverage and liquidity risks. Counterparty risk is the risk that the counterparty to the derivative contract will default on its obligation to pay the Fund the amount owed or otherwise perform under the derivative contract. Derivatives create leverage risk because they do not require payment up front equal to the economic exposure created by owning the derivative. As a result, an adverse change in the value of the underlying asset could result in the Fund sustaining a loss that is substantially greater than the amount invested in the derivative, which may make the Fund’s returns more volatile and increase the risk of loss. Derivative instruments may also be less liquid than more traditional investments and the Fund may be unable to sell or close out its derivative positions at a desirable time or price. This risk may be more acute under adverse market conditions, during which the Fund may be most in need of liquidating its derivative positions. Derivatives may also be harder to value, less tax efficient and subject to changing government regulation that could impact the Fund’s ability to use certain derivatives or their |
| | | cost. Also, derivatives used for hedging or to gain or limit exposure to a particular market segment may not provide the expected benefits, particularly during adverse market conditions. |
| ∎ | | Foreign securities risk. The Fund’s foreign investments may be adversely affected by political and social instability, changes in economic or taxation policies, difficulty in enforcing obligations, decreased liquidity or increased volatility. Foreign investments also involve the risk of the possible seizure, nationalization or expropriation of the issuer or foreign deposits (in which the Fund could lose its entire investments in a certain market) and the possible adoption of foreign governmental restrictions such as exchange controls. Unless the Fund has hedged its foreign securities risk, foreign securities risk also involves the risk of negative foreign currency rate fluctuations, which may cause the value of securities denominated in such foreign currency (or other instruments through which the Fund has exposure to foreign currencies) to decline in value. Currency exchange rates may fluctuate significantly over short periods of time. Currency hedging strategies, if used, are not always successful. |
| ∎ | | Management risk. The Fund is actively managed and depends heavily on the Adviser’s judgment about markets, interest rates or the attractiveness, relative values, liquidity, or potential appreciation of particular investments made for the Fund’s portfolio. The Fund could experience losses if these judgments prove to be incorrect. Additionally, legislative, regulatory, or tax developments may adversely affect management of the Fund and, therefore, the ability of the Fund to achieve its investment objective. |
| ∎ | | Market risk. The market values of the Fund’s investments, and therefore the value of the Fund’s shares, will go up and down, sometimes rapidly or unpredictably. Market risk may affect a single issuer, industry or section of the economy, or it may affect the market as a whole. Individual stock prices tend to go up and down more dramatically than those of certain other types of investments, such as bonds. During a general downturn in the financial |
|
This report must be accompanied or preceded by a currently effective Fund prospectus, which contains more complete information, including sales charges and expenses. Investors should read it carefully before investing. |
|
|
| NOT FDIC INSURED | MAY LOSE VALUE | NO BANK GUARANTEE |
| | markets, multiple asset classes may decline in value. When markets perform well, there can be no assurance that specific investments held by the Fund will rise in value. |
| ∎ | | Small- and mid-capitalization companies risks. Small- and mid-capitalization companies tend to be more vulnerable to changing market conditions, may have little or no operating history or track record of success, and may have more limited product lines and markets, less experienced management and fewer financial resources than larger companies. These companies’ securities may be more volatile and less liquid than those of more established companies, and their returns may vary, sometimes significantly, from the overall securities market. |
About indexes used in this report
| ∎ | | The S&P 500® Index is an unmanaged index considered representative of the US stock market. |
| ∎ | | The Russell 1000® Index is an unmanaged index considered representative of large-cap stocks. The Russell 1000 Index is a trademark/service mark of the Frank Russell Co. Russell® is a trademark of the Frank Russell Co. |
| ∎ | | The Lipper Large Cap Core Funds Index is an unmanaged index considered representative of large-cap core funds tracked by Lipper. |
| ∎ | | The Fund is not managed to track the performance of any particular index, including the index(es) described here, and consequently, the performance of the Fund may deviate significantly from the performance of the index(es). |
| ∎ | | A direct investment cannot be made in an index. Unless otherwise indicated, index results include reinvested dividends, and they do not reflect sales charges. Performance of the peer group, if applicable, reflects fund expenses; performance of a market index does not. |
Other information
| ∎ | | The returns shown in management’s discussion of Fund performance are based on net asset values (NAVs) calculated for shareholder transactions. Generally accepted accounting principles require adjustments to be made to the net assets of the Fund at period end for financial reporting purposes, and as such, the NAVs for shareholder transactions and the returns based on those NAVs may differ from the NAVs and returns reported in the Financial Highlights. |
| ∎ | | Industry classifications used in this report are generally according to the Global Industry Classification Standard, which was developed by and is the exclusive property and a service mark of MSCI Inc. and Standard & Poor’s. |
Schedule of Investments(a)
October 31, 2017
| | | | | | | | |
| | | Shares | | | Value | |
Common Stocks & Other Equity Interests–88.85% | |
| Advertising–1.21% | |
Publicis Groupe S.A. (France) | | | 701,687 | | | $ | 45,741,435 | |
|
| Aerospace & Defense–3.01% | |
General Dynamics Corp. | | | 281,346 | | | | 57,107,611 | |
United Technologies Corp. | | | 471,752 | | | | 56,497,020 | |
| | | | | | | | 113,604,631 | |
|
| Air Freight & Logistics–1.14% | |
United Parcel Service, Inc.–Class B | | | 365,678 | | | | 42,978,135 | |
|
| Apparel, Accessories & Luxury Goods–2.79% | |
Hanesbrands, Inc. | | | 1,625,888 | | | | 36,582,480 | |
LVMH Moet Hennessy Louis Vuitton S.E. (France) | | | 229,261 | | | | 68,395,638 | |
| | | | | | | | 104,978,118 | |
|
| Asset Management & Custody Banks–1.10% | |
Northern Trust Corp. | | | 441,366 | | | | 41,276,548 | |
|
| Auto Parts & Equipment–2.50% | |
Delphi Automotive PLC | | | 949,140 | | | | 94,325,533 | |
|
| Biotechnology–6.01% | |
Biogen Inc.(b) | | | 231,829 | | | | 72,251,826 | |
BioMarin Pharmaceutical Inc.(b) | | | 285,324 | | | | 23,422,247 | |
Celgene Corp.(b) | | | 755,377 | | | | 76,270,416 | |
Shire PLC–ADR | | | 370,209 | | | | 54,653,955 | |
| | | | | | | | 226,598,444 | |
|
| Cable & Satellite–2.51% | |
Comcast Corp.–Class A | | | 2,626,674 | | | | 94,639,064 | |
|
| Casinos & Gaming–1.17% | |
Wynn Resorts Ltd. | | | 297,930 | | | | 43,941,696 | |
|
| Consumer Finance–2.51% | |
American Express Co. | | | 988,927 | | | | 94,462,307 | |
|
| Data Processing & Outsourced Services–1.28% | |
Mastercard Inc.–Class A | | | 323,060 | | | | 48,061,636 | |
|
| Distillers & Vintners–1.76% | |
Diageo PLC (United Kingdom) | | | 1,936,229 | | | | 66,154,067 | |
|
| Diversified Banks–2.93% | |
Svenska Handelsbanken AB–Class A (Sweden) | | | 3,435,774 | | | | 49,178,413 | |
U.S. Bancorp | | | 1,126,268 | | | | 61,246,454 | |
| | | | | | | | 110,424,867 | |
|
| Electric Utilities–1.19% | |
Duke Energy Corp. | | | 508,588 | | | | 44,913,406 | |
|
| Electronic Manufacturing Services–1.61% | |
TE Connectivity Ltd. | | | 666,737 | | | | 60,653,065 | |
| | | | | | | | |
| | | Shares | | | Value | |
| Footwear–1.29% | |
NIKE, Inc.–Class B | | | 887,252 | | | $ | 48,789,987 | |
|
| General Merchandise Stores–1.18% | |
Dollar General Corp. | | | 551,257 | | | | 44,563,616 | |
|
| Health Care Facilities–1.53% | |
HCA Healthcare, Inc.(b) | | | 762,761 | | | | 57,702,870 | |
|
| Health Care Supplies–1.36% | |
Dentsply Sirona Inc. | | | 837,538 | | | | 51,148,446 | |
|
| Home Improvement Retail–1.86% | |
Home Depot, Inc. (The) | | | 423,729 | | | | 70,245,794 | |
|
| Household Appliances–1.00% | |
Whirlpool Corp. | | | 230,475 | | | | 37,781,767 | |
|
| Housewares & Specialties–1.60% | |
Newell Brands, Inc. | | | 1,474,143 | | | | 60,115,552 | |
|
| Industrial Conglomerates–1.40% | |
Siemens AG (Germany) | | | 369,162 | | | | 52,679,510 | |
|
| Industrial Gases–1.32% | |
Air Liquide S.A. (France) | | | 390,392 | | | | 49,706,103 | |
|
| Industrial Machinery–3.72% | |
Illinois Tool Works Inc. | | | 291,791 | | | | 45,671,127 | |
Stanley Black & Decker Inc. | | | 586,302 | | | | 94,717,088 | |
| | | | | | | | 140,388,215 | |
|
| Insurance Brokers–1.73% | |
Marsh & McLennan Cos., Inc. | | | 807,374 | | | | 65,340,778 | |
|
| Integrated Oil & Gas–1.62% | |
Suncor Energy, Inc. (Canada) | | | 1,801,230 | | | | 61,169,771 | |
|
| Internet & Direct Marketing Retail–1.55% | |
Priceline Group Inc. (The)(b) | | | 30,626 | | | | 58,555,687 | |
|
| Internet Software & Services–4.91% | |
Alphabet Inc.–Class C(b) | | | 119,035 | | | | 121,015,742 | |
eBay Inc.(b) | | | 1,702,829 | | | | 64,094,484 | |
| | | | | | | | 185,110,226 | |
|
| IT Consulting & Other Services–3.08% | |
Cognizant Technology Solutions Corp.–
Class A | | | 1,533,104 | | | | 116,009,980 | |
|
| Life & Health Insurance–2.87% | |
AIA Group Ltd. (Hong Kong) | | | 14,373,200 | | | | 108,148,132 | |
|
| Life Sciences Tools & Services–2.06% | |
Thermo Fisher Scientific, Inc. | | | 399,635 | | | | 77,461,252 | |
|
| Multi-Sector Holdings–2.02% | |
Berkshire Hathaway Inc.–Class A(b) | | | 272 | | | | 76,287,840 | |
See accompanying Notes to Financial Statements which are an integral part of the financial statements.
10 Invesco Charter Fund
| | | | | | | | |
| | | Shares | | | Value | |
| Oil & Gas Equipment & Services–1.25% | |
Halliburton Co. | | | 1,101,780 | | | $ | 47,090,077 | |
|
| Oil & Gas Exploration & Production–1.51% | |
Concho Resources Inc.(b) | | | 424,341 | | | | 56,950,806 | |
|
| Pharmaceuticals–3.01% | |
Allergan PLC | | | 360,529 | | | | 63,896,555 | |
Merck & Co., Inc. | | | 901,659 | | | | 49,672,394 | |
| | | | | | | | 113,568,949 | |
|
| Property & Casualty Insurance–1.85% | |
Progressive Corp. (The) | | | 1,431,658 | | | | 69,650,162 | |
|
| Regional Banks–1.38% | |
First Republic Bank | | | 533,714 | | | | 51,983,744 | |
|
| Retail REIT’s–0.80% | |
GGP Inc. | | | 1,555,929 | | | | 30,278,378 | |
|
| Semiconductors–4.72% | |
Analog Devices, Inc. | | | 474,834 | | | | 43,352,344 | |
QUALCOMM Inc. | | | 848,898 | | | | 43,302,287 | |
Taiwan Semiconductor Manufacturing Co. Ltd. (Taiwan) | | | 11,294,019 | | | | 91,213,202 | |
| | | | | | | | 177,867,833 | |
| | | | | | | | |
| | | Shares | | | Value | |
| Systems Software–4.55% | |
Microsoft Corp. | | | 793,721 | | | $ | 66,021,713 | |
Oracle Corp. | | | 2,073,123 | | | | 105,521,960 | |
| | | | | | | | 171,543,673 | |
|
| Wireless Telecommunication Services–0.96% | |
Vodafone Group PLC–ADR (United Kingdom) | | | 1,248,837 | | | | 36,191,296 | |
Total Common Stocks & Other Equity Interests
(Cost $2,429,731,139) | | | | 3,349,083,396 | |
| |
Money Market Funds–10.93% | | | | | |
Invesco Government & Agency Portfolio–Institutional Class, 0.95%(c) | | | 247,163,734 | | | | 247,163,734 | |
Invesco Treasury Portfolio–Institutional Class, 0.94%(c) | | | 164,775,822 | | | | 164,775,822 | |
Total Money Market Funds
(Cost $411,939,556) | | | | 411,939,556 | |
TOTAL INVESTMENTS IN SECURITIES–99.78%
(Cost $2,841,670,695) | | | | 3,761,022,952 | |
OTHER ASSETS LESS LIABILITIES–0.22% | | | | 8,241,320 | |
NET ASSETS–100.00% | | | $ | 3,769,264,272 | |
Investment Abbreviations:
| | |
| ADR | | – American Depositary Receipt |
| REIT | | – Real Estate Investment Trust |
Notes to Schedule of Investments:
| (a) | Industry and/or sector classifications used in this report are generally according to the Global Industry Classification Standard, which was developed by and is the exclusive property and a service mark of MSCI Inc. and Standard & Poor’s. |
| (b) | Non-income producing security. |
| (c) | The money market fund and the Fund are affiliated by having the same investment adviser. The rate shown is the 7-day SEC standardized yield as of October 31, 2017. |
See accompanying Notes to Financial Statements which are an integral part of the financial statements.
11 Invesco Charter Fund
Statement of Assets and Liabilities
October 31, 2017
| | | | |
Assets: | |
Investments in securities, at value (Cost $2,429,731,139) | | $ | 3,349,083,396 | |
Investments in affiliated money market funds, at value and cost | | | 411,939,556 | |
Foreign currencies, at value (Cost $10,385,236) | | | 10,550,734 | |
Receivable for: | | | | |
Investments sold | | | 528,195 | |
Fund shares sold | | | 509,626 | |
Dividends | | | 2,013,803 | |
Investment for trustee deferred compensation and retirement plans | | | 1,804,254 | |
Other assets | | | 95,541 | |
Total assets | | | 3,776,525,105 | |
|
Liabilities: | |
Payable for: | | | | |
Fund shares reacquired | | | 2,978,943 | |
Accrued fees to affiliates | | | 2,254,018 | |
Accrued trustees’ and officers’ fees and benefits | | | 6,075 | |
Accrued other operating expenses | | | 25,276 | |
Trustee deferred compensation and retirement plans | | | 1,996,521 | |
Total liabilities | | | 7,260,833 | |
Net assets applicable to shares outstanding | | $ | 3,769,264,272 | |
|
Net assets consist of: | |
Shares of beneficial interest | | $ | 2,617,454,668 | |
Undistributed net investment income | | | 16,839,398 | |
Undistributed net realized gain | | | 215,474,449 | |
Net unrealized appreciation | | | 919,495,757 | |
| | | $ | 3,769,264,272 | |
| | | | |
Net Assets: | |
Class A | | $ | 3,363,072,923 | |
Class B | | $ | 12,493,822 | |
Class C | | $ | 167,072,678 | |
Class R | | $ | 30,186,705 | |
Class S | | $ | 19,028,400 | |
Class Y | | $ | 129,284,793 | |
Class R5 | | $ | 29,835,372 | |
Class R6 | | $ | 18,289,579 | |
|
Shares outstanding, no par value,
with an unlimited number of shares authorized: | |
Class A | | | 179,391,753 | |
Class B | | | 710,822 | |
Class C | | | 9,465,440 | |
Class R | | | 1,626,992 | |
Class S | | | 1,014,250 | |
Class Y | | | 6,862,143 | |
Class R5 | | | 1,524,008 | |
Class R6 | | | 934,250 | |
Class A: | | | | |
Net asset value per share | | $ | 18.75 | |
Maximum offering price per share | | | | |
(Net asset value of $18.75 ¸ 94.50%) | | $ | 19.84 | |
Class B: | | | | |
Net asset value and offering price per share | | $ | 17.58 | |
Class C: | | | | |
Net asset value and offering price per share | | $ | 17.65 | |
Class R: | | | | |
Net asset value and offering price per share | | $ | 18.55 | |
Class S: | | | | |
Net asset value and offering price per share | | $ | 18.76 | |
Class Y: | | | | |
Net asset value and offering price per share | | $ | 18.84 | |
Class R5: | | | | |
Net asset value and offering price per share | | $ | 19.58 | |
Class R6: | | | | |
Net asset value and offering price per share | | $ | 19.58 | |
See accompanying Notes to Financial Statements which are an integral part of the financial statements.
12 Invesco Charter Fund
Statement of Operations
For the year ended October 31, 2017
| | | | |
Investment income: | |
Dividends (net of foreign withholding taxes of $1,571,447) | | $ | 59,483,269 | |
Dividends from affiliated money market funds | | | 2,762,951 | |
Total investment income | | | 62,246,220 | |
| |
Expenses: | | | | |
Advisory fees | | | 24,127,945 | |
Administrative services fees | | | 601,722 | |
Custodian fees | | | 231,053 | |
Distribution fees: | | | | |
Class A | | | 8,637,424 | |
Class B | | | 200,922 | |
Class C | | | 1,861,891 | |
Class R | | | 168,106 | |
Class S | | | 28,579 | |
Transfer agent fees — A, B, C, R, S and Y | | | 6,869,820 | |
Transfer agent fees — R5 | | | 35,174 | |
Transfer agent fees — R6 | | | 1,698 | |
Trustees’ and officers’ fees and benefits | | | 95,173 | |
Registration and filing fees | | | 178,092 | |
Reports to shareholders | | | 1,105,426 | |
Professional services fees | | | 67,489 | |
Other | | | 64,776 | |
Total expenses | | | 44,275,290 | |
Less: Fees waived and expense offset arrangement(s) | | | (576,745 | ) |
Net expenses | | | 43,698,545 | |
Net investment income | | | 18,547,675 | |
| |
Realized and unrealized gain from: | | | | |
Net realized gain from: | | | | |
Investment securities (includes net gains (losses) from securities sold to affiliates of $(577,325)) | | | 237,243,898 | |
Foreign currencies | | | 241,964 | |
| | | | 237,485,862 | |
Change in net unrealized appreciation of: | | | | |
Investment securities | | | 249,500,636 | |
Foreign currencies | | | 217,432 | |
| | | | 249,718,068 | |
Net realized and unrealized gain | | | 487,203,930 | |
Net increase in net assets resulting from operations | | $ | 505,751,605 | |
See accompanying Notes to Financial Statements which are an integral part of the financial statements.
13 Invesco Charter Fund
Statement of Changes in Net Assets
For the years ended October 31, 2017 and 2016
| | | | | | | | |
| | | 2017 | | | 2016 | |
Operations: | | | | | |
Net investment income | | $ | 18,547,675 | | | $ | 35,185,443 | |
Net realized gain | | | 237,485,862 | | | | 380,414,262 | |
Change in net unrealized appreciation (depreciation) | | | 249,718,068 | | | | (293,152,839 | ) |
Net increase in net assets resulting from operations | | | 505,751,605 | | | | 122,446,866 | |
| | |
Distributions to shareholders from net investment income: | | | | | | | | |
Class A | | | (30,633,877 | ) | | | (40,042,458 | ) |
Class B | | | (22,307 | ) | | | (101,578 | ) |
Class C | | | (165,647 | ) | | | (516,916 | ) |
Class R | | | (212,669 | ) | | | (336,604 | ) |
Class S | | | (181,181 | ) | | | (222,679 | ) |
Class Y | | | (1,150,067 | ) | | | (2,354,903 | ) |
Class R5 | | | (463,957 | ) | | | (1,147,498 | ) |
Class R6 | | | (40,672 | ) | | | (1,886,883 | ) |
Total distributions from net investment income | | | (32,870,377 | ) | | | (46,609,519 | ) |
| | |
Distributions to shareholders from net realized gains: | | | | | | | | |
Class A | | | (329,859,254 | ) | | | (428,206,831 | ) |
Class B | | | (2,669,783 | ) | | | (5,446,571 | ) |
Class C | | | (19,825,289 | ) | | | (27,716,876 | ) |
Class R | | | (3,292,840 | ) | | | (4,925,504 | ) |
Class S | | | (1,746,058 | ) | | | (2,152,527 | ) |
Class Y | | | (9,572,906 | ) | | | (19,900,365 | ) |
Class R5 | | | (3,507,497 | ) | | | (8,997,994 | ) |
Class R6 | | | (290,493 | ) | | | (13,770,029 | ) |
Total distributions from net realized gains | | | (370,764,120 | ) | | | (511,116,697 | ) |
| | |
Share transactions–net: | | | | | | | | |
Class A | | | (195,241,082 | ) | | | (49,993,523 | ) |
Class B | | | (15,347,934 | ) | | | (15,153,462 | ) |
Class C | | | (36,929,723 | ) | | | (16,283,874 | ) |
Class R | | | (6,325,944 | ) | | | (4,284,253 | ) |
Class S | | | 132,278 | | | | 822,416 | |
Class Y | | | 21,372,829 | | | | (63,518,983 | ) |
Class R5 | | | (9,692,424 | ) | | | (64,238,142 | ) |
Class R6 | | | 15,232,725 | | | | (98,538,831 | ) |
Net increase (decrease) in net assets resulting from share transactions | | | (226,799,275 | ) | | | (311,188,652 | ) |
Net increase (decrease) in net assets | | | (124,682,167 | ) | | | (746,468,002 | ) |
| | |
Net assets: | | | | | | | | |
Beginning of year | | | 3,893,946,439 | | | | 4,640,414,441 | |
End of year (includes undistributed net investment income of $16,839,398 and $30,952,356, respectively) | | $ | 3,769,264,272 | | | $ | 3,893,946,439 | |
Notes to Financial Statements
October 31, 2017
NOTE 1—Significant Accounting Policies
Invesco Charter Fund (the “Fund”) is a series portfolio of AIM Equity Funds (Invesco Equity Funds) (the “Trust”). The Trust is a Delaware statutory trust registered under the Investment Company Act of 1940, as amended (the “1940 Act”), as an open-end series management investment company consisting of three separate portfolios, each authorized to issue an unlimited number of shares of beneficial interest. The assets, liabilities and operations of each portfolio are accounted for separately. Information presented in these financial statements pertains only to the Fund. Matters affecting each portfolio or class will be voted on exclusively by the shareholders of such portfolio or class.
14 Invesco Charter Fund
The Fund’s investment objective is long-term growth of capital.
The Fund currently consists of eight different classes of shares: Class A, Class B, Class C, Class R, Class S, Class Y, Class R5 and Class R6. Class Y shares are available only to certain investors. Class A shares are sold with a front-end sales charge unless certain waiver criteria are met and under certain circumstances load waived shares may be subject to contingent deferred sales charges (“CDSC”). Class C shares are sold with a CDSC. Class R, Class S, Class Y, Class R5 and Class R6 shares are sold at net asset value. Effective November 30, 2010, new or additional investments in Class B shares are no longer permitted. Existing shareholders of Class B shares may continue to reinvest dividends and capital gains distributions in Class B shares until they convert to Class A shares. Also, shareholders in Class B shares will be able to exchange those shares for Class B shares of other Invesco Funds offering such shares until they convert to Class A shares. Generally, Class B shares will automatically convert to Class A shares on or about the month-end, which is at least eight years after the date of purchase. Redemption of Class B shares prior to the conversion date will be subject to a CDSC.
The Fund is an investment company and accordingly follows the investment company accounting and reporting guidance in accordance with Financial Accounting Standards Board Accounting Standards Codification Topic 946, Financial Services — Investment Companies.
The following is a summary of the significant accounting policies followed by the Fund in the preparation of its financial statements.
| A. | Security Valuations — Securities, including restricted securities, are valued according to the following policy. |
A security listed or traded on an exchange (except convertible securities) is valued at its last sales price or official closing price as of the close of the customary trading session on the exchange where the security is principally traded, or lacking any sales or official closing price on a particular day, the security may be valued at the closing bid price on that day. Securities traded in the over-the-counter market are valued based on prices furnished by independent pricing services or market makers. When such securities are valued by an independent pricing service they may be considered fair valued. Futures contracts are valued at the final settlement price set by an exchange on which they are principally traded. Listed options are valued at the mean between the last bid and asked prices from the exchange on which they are principally traded. Options not listed on an exchange are valued by an independent source at the mean between the last bid and asked prices. For purposes of determining net asset value (“NAV”) per share, futures and option contracts generally are valued 15 minutes after the close of the customary trading session of the New York Stock Exchange (“NYSE”).
Investments in open-end and closed-end registered investment companies that do not trade on an exchange are valued at the end-of-day net asset value per share. Investments in open-end and closed-end registered investment companies that trade on an exchange are valued at the last sales price or official closing price as of the close of the customary trading session on the exchange where the security is principally traded.
Debt obligations (including convertible securities) and unlisted equities are fair valued using an evaluated quote provided by an independent pricing service. Evaluated quotes provided by the pricing service may be determined without exclusive reliance on quoted prices, and may reflect appropriate factors such as institution-size trading in similar groups of securities, developments related to specific securities, dividend rate (for unlisted equities), yield (for debt obligations), quality, type of issue, coupon rate (for debt obligations), maturity (for debt obligations), individual trading characteristics and other market data. Pricing services generally value debt obligations assuming orderly transactions of institutional round lot size, but a fund may hold or transact in the same securities in smaller, odd lot sizes. Odd lots often trade at lower prices than institutional round lots. Debt obligations are subject to interest rate and credit risks. In addition, all debt obligations involve some risk of default with respect to interest and/or principal payments.
Foreign securities’ (including foreign exchange contracts) prices are converted into U.S. dollar amounts using the applicable exchange rates as of the close of the NYSE. If market quotations are available and reliable for foreign exchange-traded equity securities, the securities will be valued at the market quotations. Because trading hours for certain foreign securities end before the close of the NYSE, closing market quotations may become unreliable. If between the time trading ends on a particular security and the close of the customary trading session on the NYSE, events occur that the investment adviser determines are significant and make the closing price unreliable, the Fund may fair value the security. If the event is likely to have affected the closing price of the security, the security will be valued at fair value in good faith using procedures approved by the Board of Trustees. Adjustments to closing prices to reflect fair value may also be based on a screening process of an independent pricing service to indicate the degree of certainty, based on historical data, that the closing price in the principal market where a foreign security trades is not the current value as of the close of the NYSE. Foreign securities’ prices meeting the approved degree of certainty that the price is not reflective of current value will be priced at the indication of fair value from the independent pricing service. Multiple factors may be considered by the independent pricing service in determining adjustments to reflect fair value and may include information relating to sector indices, American Depositary Receipts and domestic and foreign index futures. Foreign securities may have additional risks including exchange rate changes, potential for sharply devalued currencies and high inflation, political and economic upheaval, the relative lack of issuer information, relatively low market liquidity and the potential lack of strict financial and accounting controls and standards.
Securities for which market prices are not provided by any of the above methods may be valued based upon quotes furnished by independent sources. The last bid price may be used to value equity securities. The mean between the last bid and asked prices is used to value debt obligations, including corporate loans.
Securities for which market quotations are not readily available or became unreliable are valued at fair value as determined in good faith by or under the supervision of the Trust’s officers following procedures approved by the Board of Trustees. Issuer specific events, market trends, bid/asked quotes of brokers and information providers and other market data may be reviewed in the course of making a good faith determination of a security’s fair value.
The Fund may invest in securities that are subject to interest rate risk, meaning the risk that the prices will generally fall as interest rates rise and, conversely, the prices will generally rise as interest rates fall. Specific securities differ in their sensitivity to changes in interest rates depending on their individual characteristics. Changes in interest rates may result in increased market volatility, which may affect the value and/or liquidity of certain Fund investments.
Valuations change in response to many factors including the historical and prospective earnings of the issuer, the value of the issuer’s assets, general economic conditions, interest rates, investor perceptions and market liquidity. Because of the inherent uncertainties of valuation, the values reflected in the financial statements may materially differ from the value received upon actual sale of those investments.
15 Invesco Charter Fund
| B. | Securities Transactions and Investment Income — Securities transactions are accounted for on a trade date basis. Realized gains or losses on sales are computed on the basis of specific identification of the securities sold. Interest income (net of withholding tax, if any) is recorded on the accrual basis from settlement date. Dividend income (net of withholding tax, if any) is recorded on the ex-dividend date. |
The Fund may periodically participate in litigation related to Fund investments. As such, the Fund may receive proceeds from litigation settlements. Any proceeds received are included in the Statement of Operations as realized gain (loss) for investments no longer held and as unrealized gain (loss) for investments still held.
Brokerage commissions and mark ups are considered transaction costs and are recorded as an increase to the cost basis of securities purchased and/or a reduction of proceeds on a sale of securities. Such transaction costs are included in the determination of net realized and unrealized gain (loss) from investment securities reported in the Statement of Operations and the Statement of Changes in Net Assets and the net realized and unrealized gains (losses) on securities per share in the Financial Highlights. Transaction costs are included in the calculation of the Fund’s net asset value and, accordingly, they reduce the Fund’s total returns. These transaction costs are not considered operating expenses and are not reflected in net investment income reported in the Statement of Operations and the Statement of Changes in Net Assets, or the net investment income per share and the ratios of expenses and net investment income reported in the Financial Highlights, nor are they limited by any expense limitation arrangements between the Fund and the investment adviser.
The Fund allocates income and realized and unrealized capital gains and losses to a class based on the relative net assets of each class.
| C. | Country Determination — For the purposes of making investment selection decisions and presentation in the Schedule of Investments, the investment adviser may determine the country in which an issuer is located and/or credit risk exposure based on various factors. These factors include the laws of the country under which the issuer is organized, where the issuer maintains a principal office, the country in which the issuer derives 50% or more of its total revenues and the country that has the primary market for the issuer’s securities, as well as other criteria. Among the other criteria that may be evaluated for making this determination are the country in which the issuer maintains 50% or more of its assets, the type of security, financial guarantees and enhancements, the nature of the collateral and the sponsor organization. Country of issuer and/or credit risk exposure has been determined to be the United States of America, unless otherwise noted. |
| D. | Distributions — Distributions from net investment income and net realized capital gain, if any, are generally declared and paid annually and recorded on the ex-dividend date. The Fund may elect to treat a portion of the proceeds from redemptions as distributions for federal income tax purposes. |
| E. | Federal Income Taxes — The Fund intends to comply with the requirements of Subchapter M of the Internal Revenue Code of 1986, as amended (the “Internal Revenue Code”), necessary to qualify as a regulated investment company and to distribute substantially all of the Fund’s taxable earnings to shareholders. As such, the Fund will not be subject to federal income taxes on otherwise taxable income (including net realized capital gain) that is distributed to shareholders. Therefore, no provision for federal income taxes is recorded in the financial statements. |
The Fund recognizes the tax benefits of uncertain tax positions only when the position is more likely than not to be sustained. Management has analyzed the Fund’s uncertain tax positions and concluded that no liability for unrecognized tax benefits should be recorded related to uncertain tax positions. Management is not aware of any tax positions for which it is reasonably possible that the total amounts of unrecognized tax benefits will change materially in the next 12 months.
The Fund files tax returns in the U.S. Federal jurisdiction and certain other jurisdictions. Generally, the Fund is subject to examinations by such taxing authorities for up to three years after the filing of the return for the tax period.
| F. | Expenses — Fees provided for under the Rule 12b-1 plan of a particular class of the Fund are charged to the operations of such class. Transfer agency fees and expenses and other shareholder recordkeeping fees and expenses attributable to Class R5 and Class R6 are allocated to each share class based on relative net assets. Sub-accounting fees attributable to Class R5 are charged to the operations of the class. Transfer agency fees and expenses and other shareholder recordkeeping fees and expenses relating to all other classes are allocated among those classes based on relative net assets. All other expenses are allocated among the classes based on relative net assets. |
| G. | Accounting Estimates — The preparation of financial statements in conformity with accounting principles generally accepted in the United States of America (“GAAP”) requires management to make estimates and assumptions that affect the reported amounts of assets and liabilities at the date of the financial statements and the reported amounts of revenues and expenses during the reporting period including estimates and assumptions related to taxation. Actual results could differ from those estimates by a significant amount. In addition, the Fund monitors for material events or transactions that may occur or become known after the period-end date and before the date the financial statements are released to print. |
| H. | Indemnifications — Under the Trust’s organizational documents, each Trustee, officer, employee or other agent of the Trust is indemnified against certain liabilities that may arise out of the performance of their duties to the Fund. Additionally, in the normal course of business, the Fund enters into contracts, including the Fund’s servicing agreements, that contain a variety of indemnification clauses. The Fund’s maximum exposure under these arrangements is unknown as this would involve future claims that may be made against the Fund that have not yet occurred. The risk of material loss as a result of such indemnification claims is considered remote. |
| I. | Foreign Currency Translations — Foreign currency is valued at the close of the NYSE based on quotations posted by banks and major currency dealers. Portfolio securities and other assets and liabilities denominated in foreign currencies are translated into U.S. dollar amounts at date of valuation. Purchases and sales of portfolio securities (net of foreign taxes withheld on disposition) and income items denominated in foreign currencies are translated into U.S. dollar amounts on the respective dates of such transactions. The Fund does not separately account for the portion of the results of operations resulting from changes in foreign exchange rates on investments and the fluctuations arising from changes in market prices of securities held. The combined results of changes in foreign exchange rates and the fluctuation of market prices on investments (net of estimated foreign tax withholding) are included with the net realized and unrealized gain or loss from investments in the Statement of Operations. Reported net realized foreign currency gains or losses arise from (1) sales of foreign currencies, (2) currency gains or losses realized between the trade and settlement dates on securities transactions, and (3) the difference between the amounts of dividends, interest, and foreign withholding taxes recorded on the Fund’s books and the U.S. dollar equivalent of the amounts actually received or paid. Net unrealized foreign currency gains and losses arise from changes in the fair values of assets and liabilities, other than investments in securities at fiscal period end, resulting from changes in exchange rates. |
16 Invesco Charter Fund
The Fund may invest in foreign securities, which may be subject to foreign taxes on income, gains on investments or currency repatriation, a portion of which may be recoverable. Foreign taxes, if any, are recorded based on the tax regulations and rates that exist in the foreign markets in which the Fund invests and are shown in the Statement of Operations.
| J. | Forward Foreign Currency Contracts — The Fund may engage in foreign currency transactions either on a spot (i.e. for prompt delivery and settlement) basis, or through forward foreign currency contracts, to manage or minimize currency or exchange rate risk. |
The Fund may also enter into forward foreign currency contracts for the purchase or sale of a security denominated in a foreign currency in order to “lock in” the U.S. dollar price of that security, or the Fund may also enter into forward foreign currency contracts that do not provide for physical settlement of the two currencies, but instead are settled by a single cash payment calculated as the difference between the agreed upon exchange rate and the spot rate at settlement based upon an agreed upon notional amount (non-deliverable forwards). The Fund will set aside liquid assets in an amount equal to the daily mark-to-market obligation for forward foreign currency contracts.
A forward foreign currency contract is an obligation between two parties (“Counterparties”) to purchase or sell a specific currency for an agreed-upon price at a future date. The use of forward foreign currency contracts does not eliminate fluctuations in the price of the underlying securities the Fund owns or intends to acquire but establishes a rate of exchange in advance. Fluctuations in the value of these contracts are measured by the difference in the contract date and reporting date exchange rates and are recorded as unrealized appreciation (depreciation) until the contracts are closed. When the contracts are closed, realized gains (losses) are recorded. Realized and unrealized gains (losses) on the contracts are included in the Statement of Operations. The primary risks associated with forward foreign currency contracts include failure of the Counterparty to meet the terms of the contract and the value of the foreign currency changing unfavorably. These risks may be in excess of the amounts reflected in the Statement of Assets and Liabilities.
NOTE 2—Advisory Fees and Other Fees Paid to Affiliates
The Trust has entered into a master investment advisory agreement with Invesco Advisers, Inc. (the “Adviser” or “Invesco”). Under the terms of the investment advisory agreement, the Fund accrues daily and pays monthly an advisory fee to the Adviser based on the annual rate of the Fund’s average daily net assets as follows:
| | | | | | | | |
| Average Daily Net Assets | | Rate | |
First $250 million | | | 0 | .695% | | | | |
Next $4.05 billion | | | 0 | .615% | | | | |
Next $3.9 billion | | | 0 | .57% | | | | |
Next $1.8 billion | | | 0 | .545% | | | | |
Over $10 billion | | | 0 | .52% | | | | |
For the year ended October 31, 2017, the effective advisory fees incurred by the Fund was 0.62%.
Under the terms of a master sub-advisory agreement between the Adviser and each of Invesco Asset Management Deutschland GmbH, Invesco Asset Management Limited, Invesco Asset Management (Japan) Limited, Invesco Hong Kong Limited, Invesco Senior Secured Management, Inc. and Invesco Canada Ltd. (collectively, the “Affiliated Sub-Advisers”) the Adviser, not the Fund, will pay 40% of the fees paid to the Adviser to any such Affiliated Sub-Adviser(s) that provide(s) discretionary investment management services to the Fund based on the percentage of assets allocated to such Affiliated Sub-Adviser(s).
The Adviser has contractually agreed, through at least June 30, 2018, to waive advisory fees and/or reimburse expenses of all shares to the extent necessary to limit total annual fund operating expenses after fee waiver and/or expense reimbursement (excluding certain items discussed below) of Class A, Class B, Class C, Class R, Class S, Class Y, Class R5 and Class R6 shares to 2.00%, 2.75%, 2.75%, 2.25%, 1.90%, 1.75%, 1.75% and 1.75%, respectively, of average daily net assets (the “expense limits”). In determining the Adviser’s obligation to waive advisory fees and/or reimburse expenses, the following expenses are not taken into account, and could cause the total annual fund operating expenses after fee waiver and/or expense reimbursement to exceed the numbers reflected above: (1) interest; (2) taxes; (3) dividend expense on short sales; (4) extraordinary or non-routine items, including litigation expenses; and (5) expenses that the Fund has incurred but did not actually pay because of an expense offset arrangement. Unless Invesco continues the fee waiver agreement, it will terminate on June 30, 2018. During its term, the fee waiver agreement cannot be terminated or amended to increase the expense limits or reduce the advisory fee waiver without approval of the Board of Trustees. The Adviser did not waive fees and/or reimburse expenses during the period under these expense limits.
Further, the Adviser has contractually agreed, through at least June 30, 2019, to waive the advisory fee payable by the Fund in an amount equal to 100% of the net advisory fees the Adviser receives from the affiliated money market funds on investments by the Fund of uninvested cash in such affiliated money market funds.
For the year ended October 31, 2017, the Adviser waived advisory fees of $490,073.
The Trust has entered into a master administrative services agreement with Invesco pursuant to which the Fund has agreed to pay Invesco for certain administrative costs incurred in providing accounting services to the Fund. For the year ended October 31, 2017, expenses incurred under the agreement are shown in the Statement of Operations as Administrative services fees.
The Trust has entered into a transfer agency and service agreement with Invesco Investment Services, Inc. (“IIS”) pursuant to which the Fund has agreed to pay IIS a fee for providing transfer agency and shareholder services to the Fund and reimburse IIS for certain expenses incurred by IIS in the course of providing such services. IIS may make payments to intermediaries that provide omnibus account services, sub-accounting services and/or networking services. All fees payable by IIS to intermediaries that provide omnibus account services or sub-accounting services are charged back to the Fund, subject to certain limitations approved by the Trust’s Board of Trustees. For the year ended October 31, 2017, expenses incurred under the agreement are shown in the Statement of Operations as Transfer agent fees.
The Trust has entered into master distribution agreements with Invesco Distributors, Inc. (“IDI”) to serve as the distributor for the Class A, Class B, Class C, Class R, Class S, Class Y, Class R5 and Class R6 shares of the Fund. The Trust has adopted plans pursuant to Rule 12b-1 under the 1940 Act with respect to the Fund’s Class A, Class B, Class C, Class R and Class S shares (collectively, the “Plans”). The Fund, pursuant to the Plans, pays IDI compensation at the annual rate of 0.25% of the Fund’s average daily net assets of Class A shares, 1.00% of the average daily net assets of Class B
17 Invesco Charter Fund
and Class C shares, 0.50% of the average daily net assets of Class R shares and 0.15% of the average daily net assets of Class S shares. The fees are accrued daily and paid monthly. Of the Plan payments, up to 0.25% of the average daily net assets of Class A, Class B, Class C and Class R shares and 0.15% of the average daily net assets of Class S shares may be paid to furnish continuing personal shareholder services to customers who purchase and own shares of such classes. Any amounts not paid as a service fee under the Plans would constitute an asset-based sales charge. Rules of the Financial Industry Regulatory Authority (“FINRA”) impose a cap on the total sales charges, including asset-based sales charges, that may be paid by any class of shares of the Fund. For the year ended October 31, 2017, expenses incurred under the Plans are shown in the Statement of Operations as Distribution fees.
Front-end sales commissions and CDSC (collectively, the “sales charges”) are not recorded as expenses of the Fund. Front-end sales commissions are deducted from proceeds from the sales of Fund shares prior to investment in Class A shares of the Fund. CDSC are deducted from redemption proceeds prior to remittance to the shareholder. During the year ended October 31, 2017, IDI advised the Fund that IDI retained $157,034 in front-end sales commissions from the sale of Class A shares and $7,431, $409 and $4,594 from Class A, Class B and Class C shares, respectively, for CDSC imposed on redemptions by shareholders.
For the year ended October 31, 2017, the Fund incurred $2,783 in brokerage commissions with Invesco Capital Markets, Inc., an affiliate of the Adviser and IDI, for portfolio transactions executed on behalf of the Fund.
Certain officers and trustees of the Trust are officers and directors of the Adviser, IIS and/or IDI.
NOTE 3—Additional Valuation Information
GAAP defines fair value as the price that would be received to sell an asset or paid to transfer a liability in an orderly transaction between market participants at the measurement date, under current market conditions. GAAP establishes a hierarchy that prioritizes the inputs to valuation methods, giving the highest priority to readily available unadjusted quoted prices in an active market for identical assets (Level 1) and the lowest priority to significant unobservable inputs (Level 3), generally when market prices are not readily available or are unreliable. Based on the valuation inputs, the securities or other investments are tiered into one of three levels. Changes in valuation methods may result in transfers in or out of an investment’s assigned level:
| | Level 1 — | Prices are determined using quoted prices in an active market for identical assets. |
| | Level 2 — | Prices are determined using other significant observable inputs. Observable inputs are inputs that other market participants may use in pricing a security. These may include quoted prices for similar securities, interest rates, prepayment speeds, credit risk, yield curves, loss severities, default rates, discount rates, volatilities and others. |
| | Level 3 — | Prices are determined using significant unobservable inputs. In situations where quoted prices or observable inputs are unavailable (for example, when there is little or no market activity for an investment at the end of the period), unobservable inputs may be used. Unobservable inputs reflect the Fund’s own assumptions about the factors market participants would use in determining fair value of the securities or instruments and would be based on the best available information. |
The following is a summary of the tiered valuation input levels, as of October 31, 2017. The level assigned to the securities valuations may not be an indication of the risk or liquidity associated with investing in those securities. Because of the inherent uncertainties of valuation, the values reflected in the financial statements may materially differ from the value received upon actual sale of those investments.
The Fund’s policy is to recognize transfers in and out of the valuation levels as of the end of the reporting period. During the year ended October 31, 2017, there were transfers from Level 1 to Level 2 of $91,213,202 and from Level 2 to Level 1 of $66,154,067, due to foreign fair value adjustments.
| | | | | | | | | | | | | | | | |
| | | Level 1 | | | Level 2 | | | Level 3 | | | Total | |
Common Stocks & Other Equity Interests | | $ | 3,208,691,781 | | | $ | 140,391,615 | | | $ | — | | | $ | 3,349,083,396 | |
Money Market Funds | | | 411,939,556 | | | | — | | | | — | | | | 411,939,556 | |
Total Investments | | $ | 3,620,631,337 | | | $ | 140,391,615 | | | $ | — | | | $ | 3,761,022,952 | |
NOTE 4—Security Transactions with Affiliated Funds
The Fund is permitted to purchase or sell securities from or to certain other Invesco Funds under specified conditions outlined in procedures adopted by the Board of Trustees of the Trust. The procedures have been designed to ensure that any purchase or sale of securities by the Fund from or to another fund or portfolio that is or could be considered an affiliate by virtue of having a common investment adviser (or affiliated investment advisers), common Trustees and/or common officers complies with Rule 17a-7 of the 1940 Act. Further, as defined under the procedures, each transaction is effected at the current market price. Pursuant to these procedures, for the year ended October 31, 2017, the Fund engaged in securities purchases of $4,643,302 and securities sales of $616,244, which resulted in net realized gains (losses) of $(577,325).
NOTE 5—Expense Offset Arrangement(s)
The expense offset arrangement is comprised of transfer agency credits which result from balances in demand deposit accounts used by the transfer agent for clearing shareholder transactions. For the year ended October 31, 2017, the Fund received credits from this arrangement, which resulted in the reduction of the Fund’s total expenses of $86,672.
18 Invesco Charter Fund
NOTE 6—Trustees’ and Officers’ Fees and Benefits
Trustees’ and Officers’ Fees and Benefits include amounts accrued by the Fund to pay remuneration to certain Trustees and Officers of the Fund. Trustees have the option to defer compensation payable by the Fund, and Trustees’ and Officers’ Fees and Benefits also include amounts accrued by the Fund to fund such deferred compensation amounts. Those Trustees who defer compensation have the option to select various Invesco Funds in which their deferral accounts shall be deemed to be invested. Finally, certain current Trustees were eligible to participate in a retirement plan that provided for benefits to be paid upon retirement to Trustees over a period of time based on the number of years of service. The Fund may have certain former Trustees who also participate in a retirement plan and receive benefits under such plan. Trustees’ and Officers’ Fees and Benefits include amounts accrued by the Fund to fund such retirement benefits. Obligations under the deferred compensation and retirement plans represent unsecured claims against the general assets of the Fund.
NOTE 7—Cash Balances
The Fund is permitted to temporarily carry a negative or overdrawn balance in its account with State Street Bank and Trust Company, the custodian bank. Such balances, if any at period-end, are shown in the Statement of Assets and Liabilities under the payable caption Amount due custodian. To compensate the custodian bank for such overdrafts, the overdrawn Fund may either (1) leave funds as a compensating balance in the account so the custodian bank can be compensated by earning the additional interest; or (2) compensate by paying the custodian bank at a rate agreed upon by the custodian bank and Invesco, not to exceed the contractually agreed upon rate.
NOTE 8—Distributions to Shareholders and Tax Components of Net Assets
Tax Character of Distributions to Shareholders Paid During the Fiscal Years Ended October 31, 2017 and 2016:
| | | | | | | | |
| | | 2017 | | | 2016 | |
Ordinary income | | $ | 38,353,715 | | | $ | 46,609,519 | |
Long-term capital gain | | | 365,280,782 | | | | 511,116,697 | |
Total distributions | | $ | 403,634,497 | | | $ | 557,726,216 | |
Tax Components of Net Assets at Period-End:
| | | | |
| | | 2017 | |
Undistributed ordinary income | | $ | 18,694,838 | |
Undistributed long-term gain | | | 227,841,943 | |
Net unrealized appreciation — investments | | | 916,250,212 | |
Net unrealized appreciation — other | | | 143,500 | |
Temporary book/tax differences | | | (1,855,440 | ) |
Capital loss carryforward | | | (9,265,449 | ) |
Shares of beneficial interest | | | 2,617,454,668 | |
Total net assets | | $ | 3,769,264,272 | |
The difference between book-basis and tax-basis unrealized appreciation (depreciation) is due to differences in the timing of recognition of gains and losses on investments for tax and book purposes. The Fund’s net unrealized appreciation difference is attributable primarily to wash sales.
The temporary book/tax differences are a result of timing differences between book and tax recognition of income and/or expenses. The Fund’s temporary book/tax differences are the result of the trustee deferral of compensation and retirement plan benefits.
Capital loss carryforward is calculated and reported as of a specific date. Results of transactions and other activity after that date may affect the amount of capital loss carryforward actually available for the Fund to utilize. Capital losses generated in years beginning after December 22, 2010 can be carried forward for an unlimited period, whereas previous losses expire in eight tax years. Capital losses with an expiration period may not be used to offset capital gains until all net capital losses without an expiration date have been utilized. Capital loss carryforwards with no expiration date will retain their character as either short-term or long-term capital losses instead of as short-term capital losses as under prior law. The ability to utilize capital loss carryforwards in the future may be limited under the Internal Revenue Code and related regulations based on the results of future transactions.
The Fund has a capital loss carryforward as of October 31, 2017, which expires as follows:
| | | | | | | | | | | | |
| Capital Loss Carryforward* | |
| Expiration | | Short-Term | | | Long-Term | | | Total | |
October 31, 2018 | | $ | 9,265,449 | | | $ | — | | | $ | 9,265,449 | |
| * | Capital loss carryforward as of the date listed above is reduced for limitations, if any, to the extent required by the Internal Revenue Code and may be further limited depending upon a variety of factors, including the realization of net unrealized gains or losses as of the date of any reorganization. |
19 Invesco Charter Fund
NOTE 9—Investment Transactions
The aggregate amount of investment securities (other than short-term securities, U.S. Treasury obligations and money market funds, if any) purchased and sold by the Fund during the year ended October 31, 2017 was $1,044,271,466 and $1,556,008,997, respectively. Cost of investments, including any derivatives, on a tax basis includes the adjustments for financial reporting purposes as of the most recently completed federal income tax reporting period-end.
| | | | |
| Unrealized Appreciation (Depreciation) of Investments on a Tax Basis | |
Aggregate unrealized appreciation of investments | | $ | 1,023,931,972 | |
Aggregate unrealized (depreciation) of investments | | | (107,681,760 | ) |
Net unrealized appreciation of investments | | $ | 916,250,212 | |
Cost of investments for tax purposes is $2,844,772,740.
NOTE 10—Reclassification of Permanent Differences
Primarily as a result of differing book/tax treatment of distributions, partnerships and foreign currency transactions, on October 31, 2017, undistributed net investment income was increased by $209,744, undistributed net realized gain was decreased by $209,359 and shares of beneficial interest was decreased by $385. This reclassification had no effect on the net assets of the Fund.
20 Invesco Charter Fund
NOTE 11—Share Information
| | | | | | | | | | | | | | | | |
| | | Summary of Share Activity | |
| | | Years ended October 31, | |
| | | 2017(a) | | | 2016 | |
| | | Shares | | | Amount | | | Shares | | | Amount | |
Sold: | | | | | | | | | | | | | | | | |
Class A | | | 4,569,205 | | | $ | 82,741,213 | | | | 5,334,229 | | | $ | 94,685,694 | |
Class B | | | 24,867 | | | | 422,361 | | | | 27,826 | | | | 468,455 | |
Class C | | | 436,199 | | | | 7,444,011 | | | | 701,037 | | | | 11,808,469 | |
Class R | | | 303,397 | | | | 5,418,192 | | | | 368,052 | | | | 6,559,975 | |
Class S | | | 36,177 | | | | 651,636 | | | | 37,290 | | | | 673,670 | |
Class Y | | | 6,641,648 | | | | 119,752,597 | | | | 3,193,027 | | | | 58,366,827 | |
Class R5 | | | 164,547 | | | | 3,105,751 | | | | 568,624 | | | | 10,445,497 | |
Class R6 | | | 946,512 | | | | 18,478,115 | | | | 231,849 | | | | 4,451,467 | |
| | | | |
Issued as reinvestment of dividends: | | | | | | | | | | | | | | | | |
Class A | | | 20,317,114 | | | | 352,501,925 | | | | 25,760,253 | | | | 434,833,073 | |
Class B | | | 163,588 | | | | 2,679,564 | | | | 334,842 | | | | 5,364,162 | |
Class C | | | 1,186,808 | | | | 19,511,118 | | | | 1,631,764 | | | | 26,222,439 | |
Class R | | | 203,583 | | | | 3,503,660 | | | | 314,013 | | | | 5,259,713 | |
Class S | | | 111,080 | | | | 1,927,239 | | | | 139,733 | | | | 2,357,300 | |
Class Y | | | 580,352 | | | | 10,098,134 | | | | 1,057,284 | | | | 17,889,253 | |
Class R5 | | | 219,408 | | | | 3,964,698 | | | | 576,673 | | | | 10,091,783 | |
Class R6 | | | 18,273 | | | | 330,017 | | | | 895,192 | | | | 15,656,912 | |
| | | | |
Automatic conversion of Class B shares to Class A shares: | | | | | | | | | | | | | | | | |
Class A | | | 801,175 | | | | 14,494,313 | | | | 849,593 | | | | 15,165,383 | |
Class B | | | (851,102 | ) | | | (14,494,313 | ) | | | (897,893 | ) | | | (15,165,383 | ) |
| | | | |
Reacquired: | | | | | | | | | | | | | | | | |
Class A | | | (35,709,531 | ) | | | (644,978,533 | ) | | | (33,114,867 | ) | | | (594,677,673 | ) |
Class B | | | (232,862 | ) | | | (3,955,546 | ) | | | (342,950 | ) | | | (5,820,696 | ) |
Class C | | | (3,732,740 | ) | | | (63,884,852 | ) | | | (3,181,030 | ) | | | (54,314,782 | ) |
Class R | | | (846,331 | ) | | | (15,247,796 | ) | | | (906,761 | ) | | | (16,103,941 | ) |
Class S | | | (135,278 | ) | | | (2,446,597 | ) | | | (125,808 | ) | | | (2,208,554 | ) |
Class Y | | | (5,915,191 | ) | | | (108,477,902 | ) | | | (7,665,882 | ) | | | (139,775,063 | ) |
Class R5 | | | (890,881 | ) | | | (16,762,873 | ) | | | (4,388,890 | ) | | | (84,775,422 | ) |
Class R6 | | | (185,291 | ) | | | (3,575,407 | ) | | | (6,959,527 | ) | | | (118,647,210 | ) |
Net increase (decrease) in share activity | | | (11,775,274 | ) | | $ | (226,799,275 | ) | | | (15,562,327 | ) | | $ | (311,188,652 | ) |
| (a) | There are entities that are record owners of more than 5% of the outstanding shares of the Fund and in the aggregate own 40% of the outstanding shares of the Fund. IDI has an agreement with these entities to sell Fund shares. The Fund, Invesco and/or Invesco affiliates may make payments to these entities, which are considered to be related to the Fund, for providing services to the Fund, Invesco and/or Invesco affiliates including but not limited to services such as securities brokerage, distribution, third party record keeping and account servicing. The Fund has no knowledge as to whether all or any portion of the shares owned of record by these entities are also owned beneficially. |
21 Invesco Charter Fund
NOTE 12—Financial Highlights
The following schedule presents financial highlights for a share of the Fund outstanding throughout the periods indicated.
| | | | | | | | | | | | | | | | | | | | | | | | | | | | | | | | | | | | | | | | | | | | | | | | | | | | | | | | |
| | | Net asset
value,
beginning
of period | | | Net
investment
income
(loss)(a) | | | Net gains
(losses)
on securities
(both
realized and
unrealized) | | | Total from
investment
operations | | | Dividends
from net
investment
income | | | Distributions
from net
realized
gains | | | Total
distributions | | | Net asset
value, end
of period | | | Total
return(b) | | | Net assets,
end of period
(000’s omitted) | | | Ratio of
expenses
to average
net assets
with fee waivers
and/or expenses
absorbed | | | Ratio of
expenses
to average net
assets without
fee waivers
and/or expenses
absorbed | | | Ratio of net
investment
income (loss)
to average
net assets | | | Portfolio
turnover(c) | |
Class A | |
Year ended 10/31/17 | | $ | 18.31 | | | $ | 0.09 | | | $ | 2.29 | | | $ | 2.38 | | | $ | (0.17 | ) | | $ | (1.77 | ) | | $ | (1.94 | ) | | $ | 18.75 | | | | 13.83 | % | | $ | 3,363,073 | | | | 1.10 | %(d) | | | 1.11 | %(d) | | | 0.50 | %(d) | | | 30 | % |
Year ended 10/31/16 | | | 20.30 | | | | 0.16 | | | | 0.34 | | | | 0.50 | | | | (0.21 | ) | | | (2.28 | ) | | | (2.49 | ) | | | 18.31 | | | | 3.54 | | | | 3,467,887 | | | | 1.11 | | | | 1.12 | | | | 0.88 | | | | 28 | |
Year ended 10/31/15 | | | 23.28 | | | | 0.19 | | | | (0.74 | ) | | | (0.55 | ) | | | (0.13 | ) | | | (2.30 | ) | | | (2.43 | ) | | | 20.30 | | | | (2.53 | ) | | | 3,869,488 | | | | 1.07 | | | | 1.08 | | | | 0.89 | | | | 47 | |
Year ended 10/31/14 | | | 22.22 | | | | 0.12 | | | | 2.09 | | | | 2.21 | | | | (0.20 | ) | | | (0.95 | ) | | | (1.15 | ) | | | 23.28 | | | | 10.48 | | | | 4,517,960 | | | | 1.05 | | | | 1.07 | | | | 0.53 | | | | 23 | |
Year ended 10/31/13 | | | 17.73 | | | | 0.19 | | | | 4.49 | | | | 4.68 | | | | (0.19 | ) | | | — | | | | (0.19 | ) | | | 22.22 | | | | 26.63 | | | | 4,529,846 | | | | 1.05 | | | | 1.07 | | | | 0.94 | | | | 35 | |
Class B | |
Year ended 10/31/17 | | | 17.26 | | | | (0.04 | ) | | | 2.15 | | | | 2.11 | | | | (0.02 | ) | | | (1.77 | ) | | | (1.79 | ) | | | 17.58 | | | | 12.96 | | | | 12,494 | | | | 1.85 | (d) | | | 1.86 | (d) | | | (0.25 | )(d) | | | 30 | |
Year ended 10/31/16 | | | 19.24 | | | | 0.02 | | | | 0.32 | | | | 0.34 | | | | (0.04 | ) | | | (2.28 | ) | | | (2.32 | ) | | | 17.26 | | | | 2.74 | | | | 27,731 | | | | 1.86 | | | | 1.87 | | | | 0.13 | | | | 28 | |
Year ended 10/31/15 | | | 22.21 | | | | 0.03 | | | | (0.70 | ) | | | (0.67 | ) | | | — | | | | (2.30 | ) | | | (2.30 | ) | | | 19.24 | | | | (3.22 | ) | | | 47,808 | | | | 1.82 | | | | 1.83 | | | | 0.14 | | | | 47 | |
Year ended 10/31/14 | | | 21.25 | | | | (0.05 | ) | | | 2.00 | | | | 1.95 | | | | (0.04 | ) | | | (0.95 | ) | | | (0.99 | ) | | | 22.21 | | | | 9.62 | | | | 78,125 | | | | 1.80 | | | | 1.82 | | | | (0.22 | ) | | | 23 | |
Year ended 10/31/13 | | | 16.96 | | | | 0.04 | | | | 4.30 | | | | 4.34 | | | | (0.05 | ) | | | — | | | | (0.05 | ) | | | 21.25 | | | | 25.63 | | | | 108,696 | | | | 1.80 | | | | 1.82 | | | | 0.19 | | | | 35 | |
Class C | |
Year ended 10/31/17 | | | 17.32 | | | | (0.04 | ) | | | 2.16 | | | | 2.12 | | | | (0.02 | ) | | | (1.77 | ) | | | (1.79 | ) | | | 17.65 | | | | 12.98 | | | | 167,073 | | | | 1.85 | (d) | | | 1.86 | (d) | | | (0.25 | )(d) | | | 30 | |
Year ended 10/31/16 | | | 19.30 | | | | 0.02 | | | | 0.32 | | | | 0.34 | | | | (0.04 | ) | | | (2.28 | ) | | | (2.32 | ) | | | 17.32 | | | | 2.73 | | | | 200,499 | | | | 1.86 | | | | 1.87 | | | | 0.13 | | | | 28 | |
Year ended 10/31/15 | | | 22.27 | | | | 0.03 | | | | (0.70 | ) | | | (0.67 | ) | | | — | | | | (2.30 | ) | | | (2.30 | ) | | | 19.30 | | | | (3.22 | ) | | | 239,765 | | | | 1.82 | | | | 1.83 | | | | 0.14 | | | | 47 | |
Year ended 10/31/14 | | | 21.30 | | | | (0.05 | ) | | | 2.01 | | | | 1.96 | | | | (0.04 | ) | | | (0.95 | ) | | | (0.99 | ) | | | 22.27 | | | | 9.64 | | | | 282,091 | | | | 1.80 | | | | 1.82 | | | | (0.22 | ) | | | 23 | |
Year ended 10/31/13 | | | 17.00 | | | | 0.04 | | | | 4.31 | | | | 4.35 | | | | (0.05 | ) | | | — | | | | (0.05 | ) | | | 21.30 | | | | 25.63 | | | | 283,655 | | | | 1.80 | | | | 1.82 | | | | 0.19 | | | | 35 | |
Class R | |
Year ended 10/31/17 | | | 18.13 | | | | 0.05 | | | | 2.26 | | | | 2.31 | | | | (0.12 | ) | | | (1.77 | ) | | | (1.89 | ) | | | 18.55 | | | | 13.53 | | | | 30,187 | | | | 1.35 | (d) | | | 1.36 | (d) | | | 0.25 | (d) | | | 30 | |
Year ended 10/31/16 | | | 20.12 | | | | 0.11 | | | | 0.34 | | | | 0.45 | | | | (0.16 | ) | | | (2.28 | ) | | | (2.44 | ) | | | 18.13 | | | | 3.24 | | | | 35,654 | | | | 1.36 | | | | 1.37 | | | | 0.63 | | | | 28 | |
Year ended 10/31/15 | | | 23.07 | | | | 0.13 | | | | (0.72 | ) | | | (0.59 | ) | | | (0.06 | ) | | | (2.30 | ) | | | (2.36 | ) | | | 20.12 | | | | (2.72 | ) | | | 44,079 | | | | 1.32 | | | | 1.33 | | | | 0.64 | | | | 47 | |
Year ended 10/31/14 | | | 22.03 | | | | 0.06 | | | | 2.07 | | | | 2.13 | | | | (0.14 | ) | | | (0.95 | ) | | | (1.09 | ) | | | 23.07 | | | | 10.19 | | | | 67,910 | | | | 1.30 | | | | 1.32 | | | | 0.28 | | | | 23 | |
Year ended 10/31/13 | | | 17.59 | | | | 0.14 | | | | 4.44 | | | | 4.58 | | | | (0.14 | ) | | | — | | | | (0.14 | ) | | | 22.03 | | | | 26.23 | | | | 77,769 | | | | 1.30 | | | | 1.32 | | | | 0.69 | | | | 35 | |
Class S | |
Year ended 10/31/17 | | | 18.32 | | | | 0.11 | | | | 2.28 | | | | 2.39 | | | | (0.18 | ) | | | (1.77 | ) | | | (1.95 | ) | | | 18.76 | | | | 13.94 | | | | 19,028 | | | | 1.00 | (d) | | | 1.01 | (d) | | | 0.60 | (d) | | | 30 | |
Year ended 10/31/16 | | | 20.32 | | | | 0.18 | | | | 0.34 | | | | 0.52 | | | | (0.24 | ) | | | (2.28 | ) | | | (2.52 | ) | | | 18.32 | | | | 3.63 | | | | 18,364 | | | | 1.01 | | | | 1.02 | | | | 0.98 | | | | 28 | |
Year ended 10/31/15 | | | 23.30 | | | | 0.21 | | | | (0.74 | ) | | | (0.53 | ) | | | (0.15 | ) | | | (2.30 | ) | | | (2.45 | ) | | | 20.32 | | | | (2.42 | ) | | | 19,329 | | | | 0.97 | | | | 0.98 | | | | 0.99 | | | | 47 | |
Year ended 10/31/14 | | | 22.24 | | | | 0.14 | | | | 2.09 | | | | 2.23 | | | | (0.22 | ) | | | (0.95 | ) | | | (1.17 | ) | | | 23.30 | | | | 10.57 | | | | 23,137 | | | | 0.95 | | | | 0.97 | | | | 0.63 | | | | 23 | |
Year ended 10/31/13 | | | 17.75 | | | | 0.21 | | | | 4.48 | | | | 4.69 | | | | (0.20 | ) | | | — | | | | (0.20 | ) | | | 22.24 | | | | 26.73 | | | | 24,014 | | | | 0.95 | | | | 0.97 | | | | 1.04 | | | | 35 | |
Class Y | |
Year ended 10/31/17 | | | 18.39 | | | | 0.14 | | | | 2.29 | | | | 2.43 | | | | (0.21 | ) | | | (1.77 | ) | | | (1.98 | ) | | | 18.84 | | | | 14.13 | | | | 129,285 | | | | 0.85 | (d) | | | 0.86 | (d) | | | 0.75 | (d) | | | 30 | |
Year ended 10/31/16 | | | 20.40 | | | | 0.20 | | | | 0.34 | | | | 0.54 | | | | (0.27 | ) | | | (2.28 | ) | | | (2.55 | ) | | | 18.39 | | | | 3.76 | | | | 102,182 | | | | 0.86 | | | | 0.87 | | | | 1.13 | | | | 28 | |
Year ended 10/31/15 | | | 23.38 | | | | 0.25 | | | | (0.75 | ) | | | (0.50 | ) | | | (0.18 | ) | | | (2.30 | ) | | | (2.48 | ) | | | 20.40 | | | | (2.24 | ) | | | 183,005 | | | | 0.82 | | | | 0.83 | | | | 1.14 | | | | 47 | |
Year ended 10/31/14 | | | 22.31 | | | | 0.18 | | | | 2.09 | | | | 2.27 | | | | (0.25 | ) | | | (0.95 | ) | | | (1.20 | ) | | | 23.38 | | | | 10.75 | | | | 479,371 | | | | 0.80 | | | | 0.82 | | | | 0.78 | | | | 23 | |
Year ended 10/31/13 | | | 17.81 | | | | 0.24 | | | | 4.49 | | | | 4.73 | | | | (0.23 | ) | | | — | | | | (0.23 | ) | | | 22.31 | | | | 26.89 | | | | 469,066 | | | | 0.80 | | | | 0.82 | | | | 1.19 | | | | 35 | |
Class R5 | |
Year ended 10/31/17 | | | 19.05 | | | | 0.16 | | | | 2.38 | | | | 2.54 | | | | (0.24 | ) | | | (1.77 | ) | | | (2.01 | ) | | | 19.58 | | | | 14.19 | | | | 29,835 | | | | 0.77 | (d) | | | 0.78 | (d) | | | 0.83 | (d) | | | 30 | |
Year ended 10/31/16 | | | 21.03 | | | | 0.23 | | | | 0.36 | | | | 0.59 | | | | (0.29 | ) | | | (2.28 | ) | | | (2.57 | ) | | | 19.05 | | | | 3.92 | | | | 38,682 | | | | 0.75 | | | | 0.76 | | | | 1.24 | | | | 28 | |
Year ended 10/31/15 | | | 24.04 | | | | 0.27 | | | | (0.78 | ) | | | (0.51 | ) | | | (0.20 | ) | | | (2.30 | ) | | | (2.50 | ) | | | 21.03 | | | | (2.22 | ) | | | 110,943 | | | | 0.73 | | | | 0.74 | | | | 1.23 | | | | 47 | |
Year ended 10/31/14 | | | 22.90 | | | | 0.20 | | | | 2.16 | | | | 2.36 | | | | (0.27 | ) | | | (0.95 | ) | | | (1.22 | ) | | | 24.04 | | | | 10.87 | | | | 414,713 | | | | 0.72 | | | | 0.74 | | | | 0.86 | | | | 23 | |
Year ended 10/31/13 | | | 18.29 | | | | 0.26 | | | | 4.61 | | | | 4.87 | | | | (0.26 | ) | | | — | | | | (0.26 | ) | | | 22.90 | | | | 26.99 | | | | 413,033 | | | | 0.72 | | | | 0.74 | | | | 1.27 | | | | 35 | |
Class R6 | |
Year ended 10/31/17 | | | 19.05 | | | | 0.17 | | | | 2.38 | | | | 2.55 | | | | (0.25 | ) | | | (1.77 | ) | | | (2.02 | ) | | | 19.58 | | | | 14.27 | | | | 18,290 | | | | 0.69 | (d) | | | 0.70 | (d) | | | 0.91 | (d) | | | 30 | |
Year ended 10/31/16 | | | 21.04 | | | | 0.24 | | | | 0.36 | | | | 0.60 | | | | (0.31 | ) | | | (2.28 | ) | | | (2.59 | ) | | | 19.05 | | | | 3.99 | | | | 2,948 | | | | 0.68 | | | | 0.69 | | | | 1.31 | | | | 28 | |
Year ended 10/31/15 | | | 24.05 | | | | 0.29 | | | | (0.77 | ) | | | (0.48 | ) | | | (0.23 | ) | | | (2.30 | ) | | | (2.53 | ) | | | 21.04 | | | | (2.12 | ) | | | 125,997 | | | | 0.64 | | | | 0.65 | | | | 1.32 | | | | 47 | |
Year ended 10/31/14 | | | 22.91 | | | | 0.22 | | | | 2.16 | | | | 2.38 | | | | (0.29 | ) | | | (0.95 | ) | | | (1.24 | ) | | | 24.05 | | | | 10.96 | | | | 135,294 | | | | 0.63 | | | | 0.65 | | | | 0.95 | | | | 23 | |
Year ended 10/31/13 | | | 18.29 | | | | 0.28 | | | | 4.62 | | | | 4.90 | | | | (0.28 | ) | | | — | | | | (0.28 | ) | | | 22.91 | | | | 27.15 | | | | 130,764 | | | | 0.63 | | | | 0.65 | | | | 1.36 | | | | 35 | |
| (a) | Calculated using average shares outstanding. |
| (b) | Includes adjustments in accordance with accounting principles generally accepted in the United States of America and as such, the net asset value for financial reporting purposes and the returns based upon those net asset values may differ from the net asset value and returns for shareholder transactions. Does not include sales charges and is not annualized for periods less than one year, if applicable. |
| (c) | Portfolio turnover is calculated at the fund level and is not annualized for periods less than one year, if applicable. |
| (d) | Ratios are based on average daily net assets (000’s omitted) of $3,454,970, $20,092, $186,189, $33,621, $19,052, $134,592, $35,009 and $7,197 for Class A, Class B, Class C, Class R, Class S, Class Y, Class R5 and Class R6 shares, respectively. |
NOTE 13—Subsequent Event
On December 1, 2017, the Fund’s Board of Trustees approved the early conversion of the remaining assets in the Fund’s Class B shares into Class A shares to occur on or about January 26, 2018. At the close of business on or about January 26, 2018, (the “Conversion Date”) all outstanding Class B shares of the Fund will be converted to Class A shares of the Fund, which is prior to the date the Class B shares would normally be converted to Class A shares. Once the conversion is completed, Class B shares will be closed and become inactive. No contingent deferred sales charges will be payable in connection with this early conversion. The conversion of the Fund’s Class B shares into Class A shares on the Conversion Date is not expected to be a taxable event for federal income tax purposes, and should not result in the recognition of gain or loss by converting shareholders, although each shareholder should consult with his or her own tax adviser.
22 Invesco Charter Fund
Report of Independent Registered Public Accounting Firm
To the Board of Trustees of AIM Equity Funds (Invesco Equity Funds)
and Shareholders of Invesco Charter Fund:
In our opinion, the accompanying statement of assets and liabilities, including the schedule of investments, and the related statements of operations and of changes in net assets and the financial highlights present fairly, in all material respects, the financial position of Invesco Charter Fund (one of the portfolios constituting the AIM Equity Funds (Invesco Equity Funds), hereafter referred to as the “Fund”) as of October 31, 2017, the results of its operations for the year then ended, the changes in its net assets for each of the two years in the period then ended and the financial highlights for each of the five years in the period then ended, in conformity with accounting principles generally accepted in the United States of America. These financial statements and financial highlights (hereafter referred to as “financial statements”) are the responsibility of the Fund’s management. Our responsibility is to express an opinion on these financial statements based on our audits. We conducted our audits of these financial statements in accordance with the standards of the Public Company Accounting Oversight Board (United States). Those standards require that we plan and perform the audit to obtain reasonable assurance about whether the financial statements are free of material misstatement. An audit includes examining, on a test basis, evidence supporting the amounts and disclosures in the financial statements, assessing the accounting principles used and significant estimates made by management, and evaluating the overall financial statement presentation. We believe that our audits, which included confirmation of securities as of October 31, 2017 by correspondence with the custodian, transfer agent and brokers, and when replies were not received from brokers, we performed other auditing procedures, provide a reasonable basis for our opinion.
PricewaterhouseCoopers LLP
Houston, Texas
December 21, 2017
23 Invesco Charter Fund
Calculating your ongoing Fund expenses
Example
As a shareholder of the Fund, you incur two types of costs: (1) transaction costs, which may include sales charges (loads) on purchase payments or contingent deferred sales charges on redemptions, if any; and (2) ongoing costs, including management fees, distribution and/or service (12b-1) fees, and other Fund expenses. This example is intended to help you understand your ongoing costs (in dollars) of investing in the Fund and to compare these costs with ongoing costs of investing in other mutual funds. The example is based on an investment of $1,000 invested at the beginning of the period and held for the entire period May 1, 2017 through October 31, 2017.
Actual expenses
The table below provides information about actual account values and actual expenses. You may use the information in this table, together with the amount you invested, to estimate the expenses that you paid over the period. Simply divide your account value by $1,000 (for example, an $8,600 account value divided by $1,000 = 8.6), then multiply the result by the number in the table under the heading entitled “Actual Expenses Paid During Period” to estimate the expenses you paid on your account during this period.
Hypothetical example for comparison purposes
The table below also provides information about hypothetical account values and hypothetical expenses based on the Fund’s actual expense ratio and an assumed rate of return of 5% per year before expenses, which is not the Fund’s actual return.
The hypothetical account values and expenses may not be used to estimate the actual ending account balance or expenses you paid for the period. You may use this information to compare the ongoing costs of investing in the Fund and other funds. To do so, compare this 5% hypothetical example with the 5% hypothetical examples that appear in the shareholder reports of the other funds.
Please note that the expenses shown in the table are meant to highlight your ongoing costs only and do not reflect any transaction costs, such as sales charges (loads) on purchase payments or contingent deferred sales charges on redemptions, if any. Therefore, the hypothetical information is useful in comparing ongoing costs only, and will not help you determine the relative total costs of owning different funds. In addition, if these transaction costs were included, your costs would have been higher.
| | | | | | | | | | | | | | | | | | | | | | | | |
| Class | | Beginning
Account Value
(05/01/17) | | | ACTUAL | | | HYPOTHETICAL
(5% annual return before expenses) | | | Annualized
Expense
Ratio | |
| | | Ending
Account Value
(10/31/17)1 | | | Expenses
Paid During
Period2 | | | Ending
Account Value
(10/31/17) | | | Expenses
Paid During
Period2 | | |
| A | | $ | 1,000.00 | | | $ | 1,044.00 | | | $ | 5.56 | | | $ | 1,019.76 | | | $ | 5.50 | | | | 1.08 | % |
| B | | | 1,000.00 | | | | 1,039.60 | | | | 9.41 | | | | 1,015.98 | | | | 9.30 | | | | 1.83 | |
| C | | | 1,000.00 | | | | 1,039.50 | | | | 9.41 | | | | 1,015.98 | | | | 9.30 | | | | 1.83 | |
| R | | | 1,000.00 | | | | 1,042.10 | | | | 6.85 | | | | 1,018.50 | | | | 6.77 | | | | 1.33 | |
| S | | | 1,000.00 | | | | 1,044.00 | | | | 5.05 | | | | 1,020.27 | | | | 4.99 | | | | 0.98 | |
| Y | | | 1,000.00 | | | | 1,044.90 | | | | 4.28 | | | | 1,021.02 | | | | 4.23 | | | | 0.83 | |
| R5 | | | 1,000.00 | | | | 1,045.40 | | | | 3.87 | | | | 1,021.42 | | | | 3.82 | | | | 0.75 | |
| R6 | | | 1,000.00 | | | | 1,045.90 | | | | 3.51 | | | | 1,021.78 | | | | 3.47 | | | | 0.68 | |
| 1 | The actual ending account value is based on the actual total return of the Fund for the period May 1, 2017 through October 31, 2017, after actual expenses and will differ from the hypothetical ending account value which is based on the Fund’s expense ratio and a hypothetical annual return of 5% before expenses. |
| 2 | Expenses are equal to the Fund’s annualized expense ratio as indicated above multiplied by the average account value over the period, multiplied by 184/365 to reflect the most recent fiscal half year. |
24 Invesco Charter Fund
Approval of Investment Advisory and Sub-Advisory Contracts
The Board of Trustees (the Board) of AIM Equity Funds (Invesco Equity Funds) is required under the Investment Company Act of 1940, as amended, to approve annually the renewal of Invesco Charter Fund’s (the Fund) investment advisory agreements. During contract renewal meetings held on June 12-13, 2017, the Board as a whole, and the disinterested or “independent” Trustees, who comprise over 75% of the Board, voting separately, approved the continuance for the Fund of the Master Investment Advisory Agreement with Invesco Advisers, Inc. (Invesco Advisers and the investment advisory agreement) and the Master Intergroup Sub-Advisory Contract for Mutual Funds with Invesco Asset Management Deutschland GmbH, Invesco Asset Management Limited, Invesco Asset Management (Japan) Limited, Invesco Hong Kong Limited, Invesco Senior Secured Management, Inc. and Invesco Canada Ltd (collectively, the Affiliated Sub-Advisers and the sub-advisory contracts) for another year, effective July 1, 2017.
In evaluating the fairness and reasonableness of compensation under the Fund’s investment advisory agreement and sub-advisory contracts, the Board considered, among other things, the factors discussed below. The Board determined that continuation of the Fund’s investment advisory agreement and the sub-advisory contracts is in the best interest of the Fund and its shareholders and that the compensation payable to Invesco Advisers and the Affiliated Sub-Advisers under the agreements is fair and reasonable.
The Board’s Fund Evaluation Process
The Board’s Investments Committee has established three Sub-Committees, which meet throughout the year to review the performance of funds advised by Invesco Advisers (the Invesco Funds). Over the course of each year, the Sub-Committees meet with portfolio managers for their assigned Invesco Funds and other members of management to review the performance, investment objective(s), policies, strategies, limitations and investment risks of these funds. The Board had the benefit of reports from the Sub-Committees and Investments Committee throughout the year in considering approval of the continuance of each Invesco Fund’s investment advisory agreement and sub-advisory contracts for another year.
During the contract renewal process, the Board receives comparative performance and fee data regarding the Invesco Funds prepared by Invesco Advisers and Broadridge Financial Solutions, Inc. (Broadridge), an independent provider of investment company data. The Board also receives an independent written evaluation from the Senior Officer, an officer of the Invesco Funds who reports directly to the independent Trustees. The Senior Officer’s evaluation is prepared as part of his
responsibility to manage the process by which the Invesco Funds’ proposed management fees are negotiated during the annual contract renewal process to ensure they are negotiated in a manner that is at arms’ length and reasonable. In addition to meetings with Invesco Advisers and fund counsel, the independent Trustees also discuss the continuance of the investment advisory agreement and sub-advisory contracts in separate sessions with the Senior Officer and with independent legal counsel.
The Trustees recognized that the advisory fee rates for the Invesco Funds are, in most cases, the result of years of review and negotiation. The Trustees’ deliberations and conclusions in a particular year may be based in part on their deliberations and conclusions regarding these arrangements throughout the year and in prior years. The Trustees’ review and conclusions are based on the comprehensive consideration of all information presented to them and are not the result of any single determinative factor. Moreover, one Trustee may have weighed a particular piece of information or factor differently than another Trustee.
The discussion below is a summary of the Senior Officer’s independent written evaluation with respect to the Fund’s investment advisory agreement as well as a discussion of the material factors and related conclusions that formed the basis for the Board’s approval of the Fund’s investment advisory agreement and sub-advisory contracts. This information is current as of June 13, 2017, and does not reflect consideration of factors that became known to the Board after that date.
Factors and Conclusions and Summary of Independent Written Fee Evaluation
| A. | Nature, Extent and Quality of Services Provided by Invesco Advisers and the Affiliated Sub-Advisers |
The Board reviewed the advisory services provided to the Fund by Invesco Advisers under the Fund’s investment advisory agreement, the performance of Invesco Advisers in providing these services, and the credentials and experience of the officers and employees of Invesco Advisers who provide these services, including the Fund’s portfolio manager or managers. The Board’s review included consideration of Invesco Advisers’ investment process oversight, credit analysis and investment risk management. The Board also considered non-advisory services that Invesco Advisers and its affiliates provide to the Invesco Funds such as various back office support functions, trading operations, internal audit, valuation and legal and compliance.
In determining whether to continue the Fund’s investment advisory agreement, the Board considered the benefits of reapproving an existing relationship as contrasted with the
greater uncertainty that may be associated with entering into a new relationship. The Board concluded that the nature, extent and quality of the services provided to the Fund by Invesco Advisers are appropriate and satisfactory.
The Board reviewed the services that may be provided by the Affiliated Sub-Advisers under the sub-advisory contracts and the credentials and experience of the officers and employees of the Affiliated Sub-Advisers who provide these services. The Board noted that the Affiliated Sub-Advisers have offices and personnel that are located in financial centers around the world. As a result, the Board noted that the Affiliated Sub-Advisers can provide research and investment analysis on the markets and economies of various countries in which the Fund may invest, make recommendations regarding securities and assist with security trades. The Board concluded that the sub-advisory contracts may benefit the Fund and its shareholders by permitting Invesco Advisers to use the resources and talents of the Affiliated Sub-Advisers in managing the Fund. The Board concluded that the nature, extent and quality of the services that may be provided by the Affiliated Sub-Advisers are appropriate and satisfactory.
| B. | Fund Investment Performance |
The Board considered Fund investment performance as a relevant factor in considering whether to approve the investment advisory agreement. The Board did not view Fund performance as a relevant factor in considering whether to approve the sub-advisory contracts for the Fund, as no Affiliated Sub-Adviser currently manages assets of the Fund.
The Board compared the Fund’s investment performance during the past one, three and five calendar years to the performance of funds in the Broadridge performance universe and against the Lipper Large-Cap Core Funds Index. The Board noted that performance of Class A shares of the Fund was in the third quintile of its performance universe for the one year period and the fifth quintile for the three and five year periods (the first quintile being the best performing funds and the fifth quintile being the worst performing funds). The Board noted that performance of Class A shares of the Fund was below the performance of the Index for the one, three and five year periods. The Trustees also reviewed more recent Fund performance and this review did not change their conclusions.
| C. | Advisory and Sub-Advisory Fees |
The Board compared the Fund’s contractual management fee rate to the contractual management fee rates of funds in the Fund’s Broadridge expense group at a common asset level. The Board noted that the contractual management fee rate for Class A shares of the Fund was above the median contractual management fee rate of funds in its expense group. The Board noted that the term
25 Invesco Charter Fund
“contractual management fee” for funds in the expense group may include both advisory and certain administrative services fees, but that Broadridge does not provide information on a fund by fund basis as to what is included. The Board noted that Invesco Advisers does not separately charge the Invesco Funds for the administrative services included in the term as defined by Broadridge. The Board also reviewed the methodology used by Broadridge in providing expense group information, which includes using each fund’s contractual management fee schedule (including any applicable breakpoints) as reported in the most recent prospectus or statement of additional information for each fund in the expense group.
The Board also compared the Fund’s effective advisory fee rate (the advisory fee rate after advisory fee waivers and before other expense limitations/waivers) to the effective advisory fee rates of other mutual funds advised by Invesco Advisers and its affiliates with investment strategies comparable to those of the Fund, based on asset balances as of December 31, 2016. The Board noted that the Fund’s rate was above the rate of one mutual fund advised by Invesco Advisers using a similar investment process.
The Board also considered the fees charged by Invesco Advisers and the Affiliated Sub-Advisers to other client accounts with investment strategies comparable to those of the Fund. The Board noted that Invesco Advisers or the Affiliated Sub-Advisers may charge lower fees to large institutional clients. Invesco Advisers reviewed with the Board the significantly greater scope of services it provides to the Invesco Funds relative to certain other types of client accounts. These additional services include provision of administrative services, officers and office space, oversight of service providers, preparation of annual registration statement updates and financial information and regulatory compliance under the Investment Company Act of 1940, as amended.
Invesco Advisers also reviewed generally the higher frequency of shareholder purchases and redemptions in the Invesco Funds relative to the flow of assets for other client accounts. Invesco Advisers advised the Board that advance notice of redemptions is often provided to Invesco Advisers by institutional clients. The Board did note that sub-advisory fee rates charged by the Affiliated Sub-Advisers to manage the Invesco Funds and to manage other client accounts tended to be more comparable, reflecting a similar scope of services.
The Board also considered the services that may be provided by the Affiliated Sub-Advisers pursuant to the sub-advisory contracts, as well as the fees payable by Invesco Advisers to the Affiliated Sub-Advisers pursuant to the sub-advisory contracts. The Board also noted that the sub-advisory fees are not paid directly by the Fund, but rather, are payable by Invesco Advisers to the Affiliated Sub-Advisers.
| D. | Economies of Scale and Breakpoints |
The Board considered the extent to which there are economies of scale in the provision of advisory services to the Fund. The Board also considered that the Fund benefits from economies of scale through contractual breakpoints in the Fund’s advisory fee schedule. The Board noted that the Fund shares directly in economies of scale through lower fees charged by third party service providers based on the combined size of the Invesco Funds advised by Invesco Advisers.
| E. | Profitability and Financial Resources |
The Board reviewed information from Invesco Advisers concerning the costs of the advisory and other services that Invesco Advisers and its affiliates provide to the Fund and the Invesco Funds and the profitability of Invesco Advisers and its affiliates in providing these services. The Board noted that Invesco Advisers continues to operate at a net profit from services Invesco Advisers and its affiliates provide to the Invesco Funds and the Fund. The Board did not deem the level of profits realized by Invesco Advisers and its affiliates from providing services to the Fund to be excessive given the nature, quality and extent of the services provided. The Board received and accepted information from Invesco Advisers demonstrating that Invesco Advisers and each Affiliated Sub-Adviser are financially sound and have the resources necessary to perform their obligations under the investment advisory agreement and sub-advisory contracts.
| F. | Collateral Benefits to Invesco Advisers and its Affiliates |
The Board considered various other benefits received by Invesco Advisers and its affiliates from the relationship with the Fund, including the fees received for providing transfer agency and distribution services to the Fund. The Board considered comparative information regarding fees charged for these services, including information provided by Broadridge and other independent sources. The Board considered the performance of Invesco Advisers and its affiliates in providing these services and the organizational structure employed to provide these services. The Board also considered that these services are provided to the Fund pursuant to written contracts that are reviewed and approved on an annual basis by the Board; and that the services are required for the operation of the Fund.
The Board considered the benefits realized by Invesco Advisers and the Affiliated Sub-Advisers as a result of portfolio brokerage transactions executed through “soft dollar” arrangements. The Board also noted how the Fund’s rate compared to the effective sub-adviser fee rate of one fund sub-advised by Invesco Advisers. The Board also considered that it receives periodic reports from the Chief Compliance Officer of the Invesco Funds demonstrating that these arrangements are consistent with regulatory requirements. The Board did not deem the soft dollar arrangements to be inappropriate.
The Board considered that the Fund’s uninvested cash and cash collateral from any securities lending arrangements may be invested in money market funds advised by Invesco Advisers pursuant to procedures approved by the Board. The Board noted that Invesco Advisers receives advisory fees from these affiliated money market funds attributable to such investments, although Invesco Advisers has contractually agreed to waive through varying periods the advisory fees payable by the Invesco Funds with respect to certain investments in the affiliated money market funds. The waiver is in an amount equal to 100% of the net advisory fee Invesco Advisers receives from the affiliated money market funds with respect to the Fund’s investment in the affiliated money market funds of uninvested cash, but not cash collateral. The Board concluded that the amount of advisory fees received by Invesco Advisers from the Fund’s investment of cash collateral from any securities lending arrangements in the affiliated money market funds is fair and reasonable.
The Board also considered that the Fund may use an affiliated broker to execute certain trades for the Fund to, among other things, control information leakage, and was advised that such trades would be executed in compliance with rules under the federal securities laws and consistent with best execution obligations.
26 Invesco Charter Fund
Tax Information
Form 1099-DIV, Form 1042-S and other year-end tax information provide shareholders with actual calendar year amounts that should be included in their tax returns. Shareholders should consult their tax advisors.
The following distribution information is being provided as required by the Internal Revenue Code or to meet a specific state’s requirement.
The Fund designates the following amounts or, if subsequently determined to be different, the maximum amount allowable for its fiscal year ended October 31, 2017:
| | | | |
Federal and State Income Tax | |
Long-Term Capital Gain Distributions | | $ | 365,280,782 | |
Qualified Dividend Income* | | | 100 | % |
Corporate Dividends Received Deduction* | | | 100 | % |
U.S. Treasury Obligations* | | | 0 | % |
| | * | The above percentages are based on ordinary income dividends paid to shareholders during the Fund’s fiscal year. |
| | | | |
Non-Resident Alien Shareholders | |
Qualified Short-Term Gains | | $ | 5,067,614 | |
27 Invesco Charter Fund
Trustees and Officers
The address of each trustee and officer is AIM Equity Funds (Invesco Equity Funds) (the “Trust”), 11 Greenway Plaza, Suite 1000, Houston, Texas 77046-1173. The trustees serve for the life of the Trust, subject to their earlier death, incapacitation, resignation, retirement or removal as more specifically provided in the Trust’s organizational documents. Each officer serves for a one year term or until their successors are elected and qualified. Column two below includes length of time served with predecessor entities, if any.
| | | | | | | | |
Name, Year of Birth and
Position(s) Held with the Trust | | Trustee and/
or Officer Since | | Principal Occupation(s)
During Past 5 Years | | Number of
Funds in Fund
Complex
Overseen by
Trustee | | Other Directorship(s)
Held by Trustee During
Past 5 Years |
| Interested Persons | | | | | | | | |
| Martin L. Flanagan1 — 1960 Trustee | | 2007 | | Executive Director, Chief Executive Officer and President, Invesco Ltd. (ultimate parent of Invesco and a global investment management firm); Trustee, The Invesco Funds; Vice Chair, Investment Company Institute; and Member of Executive Board, SMU Cox School of Business Formerly: Advisor to the Board, Invesco Advisers, Inc. (formerly known as Invesco Institutional (N.A.), Inc.); Chairman and Chief Executive Officer, Invesco Advisers, Inc. (registered investment adviser); Director, Chairman, Chief Executive Officer and President, Invesco Holding Company (US), Inc. (formerly IVZ Inc.) (holding company), Invesco Group Services, Inc. (service provider) and Invesco North American Holdings, Inc. (holding company); Director, Chief Executive Officer and President, Invesco Holding Company Limited (parent of Invesco and a global investment management firm); Director, Invesco Ltd.; Chairman, Investment Company Institute and President, Co-Chief Executive Officer, Co-President, Chief Operating Officer and Chief Financial Officer, Franklin Resources, Inc. (global investment management organization) | | 158 | | None |
| Philip A. Taylor2 — 1954 Trustee and Senior Vice President | | 2006 | | Head of the Americas and Senior Managing Director, Invesco Ltd.; Director, Invesco Advisers, Inc. (formerly known as Invesco Institutional (N.A.), Inc.) (registered investment adviser); Director, Chairman, Chief Executive Officer and President, Invesco Management Group, Inc. (formerly known as Invesco Aim Management Group, Inc.) (financial services holding company); Director and Chairman, Invesco Investment Services, Inc. (formerly known as Invesco Aim Investment Services, Inc.) (registered transfer agent); Chief Executive Officer, Invesco Corporate Class Inc. (corporate mutual fund company); Director, Chairman and Chief Executive Officer, Invesco Canada Ltd. (formerly known as Invesco Trimark Ltd./Invesco Trimark Ltèe) (registered investment adviser and registered transfer agent); Trustee and Senior Vice President, The Invesco Funds; Director, Invesco Investment Advisers LLC (formerly known as Van Kampen Asset Management). Formerly: Co-Chairman, Co-President and Co-Chief Executive Officer, Invesco Advisers, Inc. (formerly known as Invesco Institutional (N.A.), Inc.) (registered investment adviser); Director, Chief Executive Officer and President, Van Kampen Exchange Corp; President and Principal Executive Officer, The Invesco Funds (other than AIM Treasurer’s Series Trust (Invesco Treasurer’s Series Trust), Short-Term Investments Trust and Invesco Management Trust); Executive Vice President, The Invesco Funds (AIM Treasurer’s Series Trust (Invesco Treasurer’s Series Trust), Short-Term Investments Trust and Invesco Management Trust only); Director and President, INVESCO Funds Group, Inc. (registered investment adviser and registered transfer agent); Director and Chairman, IVZ Distributors, Inc. (formerly known as INVESCO Distributors, Inc.) (registered broker dealer); Director, President and Chairman, Invesco Inc. (holding company), Invesco Canada Holdings Inc. (holding company), Trimark Investments Ltd./Placements Trimark Ltèe and Invesco Financial Services Ltd/Services Financiers Invesco Ltèe; Chief Executive Officer, Invesco Canada Fund Inc. (corporate mutual fund company); Director and Chairman, Van Kampen Investor Services Inc.; Director, Chief Executive Officer and President, 1371 Preferred Inc. (holding company) and Van Kampen Investments Inc.; Director and President, AIM GP Canada Inc. (general partner for limited partnerships) and Van Kampen Advisors, Inc.; Director and Chief Executive Officer, Invesco Trimark Dealer Inc. (registered broker dealer); Director, Invesco Distributors, Inc. (formerly known as Invesco Aim Distributors, Inc.) (registered broker dealer); Manager, Invesco PowerShares Capital Management LLC; Director, Chief Executive Officer and President, Invesco Advisers, Inc.; Director, Chairman, Chief Executive Officer and President, Invesco Aim Capital Management, Inc.; President, Invesco Trimark Dealer Inc. and Invesco Trimark Ltd./Invesco Trimark Ltèe; Director and President, AIM Trimark Corporate Class Inc. and AIM Trimark Canada Fund Inc.; Senior Managing Director, Invesco Holding Company Limited; Director and Chairman, Fund Management Company (former registered broker dealer); President and Principal Executive Officer, The Invesco Funds (AIM Treasurer’s Series Trust (Invesco Treasurer’s Series Trust), and Short-Term Investments Trust only); President, AIM Trimark Global Fund Inc. and AIM Trimark Canada Fund Inc. | | 158 | | None |
| 1 | Mr. Flanagan is considered an interested person (within the meaning of Section 2(a)(19) of the 1940 Act) of the Trust because he is an officer of the Adviser to the Trust, and an officer and a director of Invesco Ltd., ultimate parent of the Adviser. |
| 2 | Mr. Taylor is considered an interested person (within the meaning of Section 2(a)(19) of the 1940 Act) of the Trust because he is an officer and a director of the Adviser. |
T-1 Invesco Charter Fund
Trustees and Officers—(continued)
| | | | | | | | |
Name, Year of Birth and
Position(s) Held with the Trust | | Trustee and/
or Officer Since | | Principal Occupation(s)
During Past 5 Years | | Number of
Funds in Fund
Complex
Overseen by
Trustee | | Other Directorship(s)
Held by Trustee During
Past 5 Years |
| Independent Trustees | | | | | | | | |
Bruce L. Crockett — 1944 Trustee and Chair | | 1993 | | Chairman, Crockett Technologies Associates (technology consulting company) Formerly: Director, Captaris (unified messaging provider); Director, President and Chief Executive Officer, COMSAT Corporation; Chairman, Board of Governors of INTELSAT (international communications company); ACE Limited (insurance company); Independent Directors Council and Investment Company Institute: Member of the Audit Committee, Investment Company Institute; Member of the Executive Committee and Chair of the Governance Committee, Independent Directors Council | | 158 | | Director and Chairman of the Audit Committee, ALPS (Attorneys Liability Protection Society) (insurance company); Director and Member of the Audit Committee, Ferroglobe PLC (metallurgical company) |
David C. Arch — 1945 Trustee | | 2010 | | Chairman of Blistex Inc. (consumer health care products manufacturer); Member, World Presidents’ Organization | | 158 | | Board member of the Illinois Manufacturers’ Association |
James T. Bunch — 1942 Trustee | | 2003 | | Managing Member, Grumman Hill Group LLC (family office/private equity investments) Formerly: Chairman of the Board, Denver Film Society; Chairman of the Board of Trustees, Evans Scholarship Foundation; Chairman, Board of Governors, Western Golf Association | | 158 | | Trustee, Evans Scholarship Foundation |
Jack M. Fields — 1952 Trustee | | 1997 | | Chief Executive Officer, Twenty First Century Group, Inc. (government affairs company); and Discovery Learning Alliance (non-profit) Formerly: Owner and Chief Executive Officer, Dos Angeles Ranch L.P. (cattle, hunting, corporate entertainment); Director, Insperity, Inc. (formerly known as Administaff) (human resources provider); Chief Executive Officer, Texana Timber LP (sustainable forestry company); Director of Cross Timbers Quail Research Ranch (non-profit); and member of the U.S. House of Representatives | | 158 | | None |
Cynthia Hostetler — 1962 Trustee | | 2017 | | Non-Executive Director and Trustee of a number of public and private business corporations Formerly: Head of Investment Funds and Private Equity, Overseas Private Investment Corporation; President, First Manhattan Bancorporation, Inc.; Attorney, Simpson Thacher & Bartlett LLP | | 158 | | Vulcan Materials Company (construction materials company); Trilinc Global Impact Fund; Aberdeen Investment Funds (4 portfolios); Artio Global Investment LLC (mutual fund complex); Edgen Group, Inc. (specialized energy and infrastructure products distributor) |
Eli Jones — 1961 Trustee | | 2016 | | Professor and Dean, Mays Business School — Texas A&M University Formerly: Professor and Dean, Walton College of Business, University of Arkansas and E.J. Ourso College of Business, Louisiana State University; Director, Arvest Bank | | 158 | | Insperity, Inc. (formerly known as Administaff) (human resources provider) |
Prema Mathai-Davis — 1950 Trustee | | 1998 | | Retired. Formerly: Chief Executive Officer, YWCA of the U.S.A. | | 158 | | None |
Teresa M. Ressel — 1962 Trustee | | 2017 | | Non-executive director and trustee of a number of public and private business corporations Formerly: Chief Financial Officer, Olayan America, The Olayan Group (international investor/commercial/industrial); Chief Executive Officer, UBS Securities LLC; Group Chief Operating Officer, Americas, UBS AG; Assistant Secretary for Management & Budget and CFO, US Department of the Treasury; Chief Compliance Officer, Kaiser Permanente (healthcare consortium); Program Manager, Hewlett-Packard; Nuclear Engineering, General Dynamics Corporation (aerospace and defense company) | | 158 | | Atlantic Power Corporation (power generation company); ON Semiconductor Corp. (semiconductor supplier) |
Larry Soll — 1942 Trustee | | 2003 | | Retired. Formerly: Chairman, Chief Executive Officer and President, Synergen Corp. (a biotechnology company) | | 158 | | None |
Ann Barnett Stern — 1957 Trustee | | 2017 | | President and Chief Executive Officer, Houston Endowment Inc. (private philanthropic institution) Formerly: Executive Vice President and General Counsel, Texas Children’s Hospital; Attorney, Beck, Redden and Secrest, LLP; Business Law Instructor, University of St. Thomas; Attorney, Andrews & Kurth LLP | | 158 | | Federal Reserve Bank of Dallas |
Raymond Stickel, Jr. — 1944 Trustee | | 2005 | | Retired. Formerly: Director, Mainstay VP Series Funds, Inc. (25 portfolios); Partner, Deloitte & Touche | | 158 | | None |
Robert C. Troccoli — 1949 Trustee | | 2016 | | Adjunct Professor, University of Denver — Daniels College of Business Formerly: Senior Partner, KPMG LLP | | 158 | | None |
T-2 Invesco Charter Fund
Trustees and Officers—(continued)
| | | | | | | | |
Name, Year of Birth and
Position(s) Held with the Trust | | Trustee and/
or Officer Since | | Principal Occupation(s)
During Past 5 Years | | Number of
Funds in Fund
Complex
Overseen by
Trustee | | Other Directorship(s)
Held by Trustee During
Past 5 Years |
| Independent Trustees—(continued) |
Christopher L. Wilson — 1957 Trustee | | 2017 | | Managing Partner, CT2, LLC (investing and consulting firm) Formerly: President/Chief Executive Officer, Columbia Funds, Bank of America Corporation; President/Chief Executive Officer, CDC IXIS Asset Management Services, Inc.; Principal & Director of Operations, Scudder Funds, Scudder, Stevens & Clark, Inc.; Assistant Vice President, Fidelity Investments | | 158 | | TD Asset Management USA Inc. (mutual fund complex) (22 portfolios); ISO New England, Inc. (non-profit organization managing regional electricity market) |
| Other Officers | | | | | | | | |
Sheri Morris — 1964 President, Principal Executive Officer and Treasurer | | 1999 | | President, Principal Executive Officer and Treasurer, The Invesco Funds; Vice President, Invesco Advisers, Inc. (formerly known as Invesco Institutional (N.A.), Inc.) (registered investment adviser); and Vice President, PowerShares Exchange-Traded Fund Trust, PowerShares Exchange-Traded Fund Trust II, PowerShares India Exchange-Traded Fund Trust, PowerShares Actively Managed Exchange-Traded Fund Trust and PowerShares Actively Managed Exchange-Traded Commodity Fund Trust Formerly: Vice President and Principal Financial Officer, The Invesco Funds; Vice President, Invesco Aim Advisers, Inc., Invesco Aim Capital Management, Inc. and Invesco Aim Private Asset Management, Inc.; Assistant Vice President and Assistant Treasurer, The Invesco Funds and Assistant Vice President, Invesco Advisers, Inc., Invesco Aim Capital Management, Inc. and Invesco Aim Private Asset Management, Inc.; and Treasurer, PowerShares Exchange-Traded Fund Trust, PowerShares Exchange-Traded Fund Trust II, PowerShares India Exchange-Traded Fund Trust and PowerShares Actively Managed Exchange-Traded Fund Trust | | N/A | | N/A |
Russell C. Burk — 1958 Senior Vice President and Senior Officer | | 2005 | | Senior Vice President and Senior Officer, The Invesco Funds | | N/A | | N/A |
John M. Zerr — 1962 Senior Vice President, Chief Legal Officer and Secretary | | 2006 | | Director, Senior Vice President, Secretary and General Counsel, Invesco Management Group, Inc. (formerly known as Invesco AIM Management Group, Inc.); Senior Vice President, Invesco Advisers, Inc. (formerly known as Invesco Institutional (N.A.), Inc.) (registered investment adviser); Senior Vice President and Secretary, Invesco Distributors, Inc. (formerly known as Invesco AIM Distributors, Inc.); Director, Vice President and Secretary, Invesco Investment Services, Inc. (formerly known as Invesco AIM Investment Services, Inc.) Senior Vice President, Chief Legal Officer and Secretary, The Invesco Funds; Managing Director, Invesco PowerShares Capital Management LLC; Director, Secretary and General Counsel, Invesco Investment Advisers LLC (formerly known as Van Kampen Asset Management); Secretary and General Counsel, Invesco Capital Markets, Inc. (formerly known as Van Kampen Funds Inc.) and Chief Legal Officer, PowerShares Exchange-Traded Fund Trust, PowerShares Exchange-Traded Fund Trust II, PowerShares India Exchange-Traded Fund Trust, PowerShares Actively Managed Exchange-Traded Fund Trust and PowerShares Actively Managed Exchange-Traded Commodity Fund Trust; Manager and Secretary, Invesco Indexing LLC Formerly: Director, Secretary, General Counsel and Senior Vice President, Van Kampen Exchange Corp.; Director, Vice President and Secretary, IVZ Distributors, Inc. (formerly known as INVESCO Distributors, Inc.); Director and Vice President, INVESCO Funds Group, Inc.; Director and Vice President, Van Kampen Advisors Inc.; Director, Vice President, Secretary and General Counsel, Van Kampen Investor Services Inc.; Director, Invesco Distributors, Inc. (formerly known as Invesco AIM Distributors, Inc.); Director, Senior Vice President, General Counsel and Secretary, Invesco AIM Advisers, Inc. and Van Kampen Investments Inc.; Director, Vice President and Secretary, Fund Management Company; Director, Senior Vice President, Secretary, General Counsel and Vice President, Invesco AIM Capital Management, Inc.; Chief Operating Officer and General Counsel, Liberty Ridge Capital, Inc. (an investment adviser); Vice President and Secretary, PBHG Funds (an investment company) and PBHG Insurance Series Fund (an investment company); Chief Operating Officer, General Counsel and Secretary, Old Mutual Investment Partners (a broker-dealer); General Counsel and Secretary, Old Mutual Fund Services (an administrator) and Old Mutual Shareholder Services (a shareholder servicing center); Executive Vice President, General Counsel and Secretary, Old Mutual Capital, Inc. (an investment adviser); and Vice President and Secretary, Old Mutual Advisors Funds (an investment company) | | N/A | | N/A |
Gregory G. McGreevey — 1962 Senior Vice President | | 2012 | | Senior Managing Director, Invesco Ltd.; Director, Chairman, President, and Chief Executive Officer, Invesco Advisers, Inc. (formerly known as Invesco Institutional (N.A.), Inc.) (registered investment adviser); Senior Vice President, Invesco Management Group, Inc.; Director, Invesco Mortgage Capital, Inc. and Invesco Senior Secured Management, Inc.; and Senior Vice President, The Invesco Funds Formerly: Assistant Vice President, The Invesco Funds | | N/A | | N/A |
T-3 Invesco Charter Fund
Trustees and Officers—(continued)
| | | | | | | | |
Name, Year of Birth and
Position(s) Held with the Trust | | Trustee and/
or Officer Since | | Principal Occupation(s)
During Past 5 Years | | Number of
Funds in Fund
Complex
Overseen by
Trustee | | Other Directorship(s)
Held by Trustee During
Past 5 Years |
| Other Officers—(continued) | | | | | | | | |
Kelli Gallegos — 1970 Vice President, Principal Financial Officer and Assistant Treasurer | | 2008 | | Vice President, Principal Financial Officer and Assistant Treasurer, The Invesco Funds; Assistant Treasurer, Invesco PowerShares Capital Management LLC, PowerShares Exchange-Traded Fund Trust, PowerShares Exchange-Traded Fund Trust II, PowerShares India Exchange-Traded Fund Trust, PowerShares Actively Managed Exchange-Traded Fund Trust and PowerShares Actively Managed Exchange-Traded Commodity Fund Trust Formerly: Assistant Vice President, The Invesco Funds | | N/A | | N/A |
Tracy Sullivan — 1962 Vice President, Chief Tax Officer and Assistant Treasurer | | 2008 | | Vice President, Chief Tax Officer and Assistant Treasurer, The Invesco Funds; Assistant Treasurer, Invesco PowerShares Capital Management LLC, PowerShares Exchange-Traded Fund Trust, PowerShares Exchange-Traded Fund Trust II, PowerShares India Exchange-Traded Fund Trust, PowerShares Actively Managed Exchange-Traded Fund Trust and PowerShares Actively Managed Exchange-Traded Commodity Fund Trust Formerly: Assistant Vice President, The Invesco Funds | | N/A | | N/A |
Crissie M. Wisdom — 1969 Anti-Money Laundering Compliance Officer | | 2013 | | Anti-Money Laundering Compliance Officer, Invesco Advisers, Inc. (formerly known as Invesco Institutional (N.A.), Inc.) (registered investment adviser), Invesco Capital Markets, Inc. (formerly known as Van Kampen Funds Inc.), Invesco Distributors, Inc., Invesco Investment Services, Inc., Invesco Management Group, Inc., The Invesco Funds, and PowerShares Exchange-Traded Fund Trust, PowerShares Exchange-Traded Fund Trust II, PowerShares India Exchange-Traded Fund Trust, PowerShares Actively Managed Exchange-Traded Fund Trust and PowerShares Actively Managed Exchange-Traded Commodity Fund Trust; Anti-Money Laundering Compliance Officer and Bank Secrecy Act Officer, INVESCO National Trust Company and Invesco Trust Company; and Fraud Prevention Manager and Controls and Risk Analysis Manager for Invesco Investment Services, Inc. Formerly: Anti-Money Laundering Compliance Officer, Van Kampen Exchange Corp. | | N/A | | N/A |
Robert R. Leveille — 1969 Chief Compliance Officer | | 2016 | | Chief Compliance Officer, Invesco Advisers, Inc. (registered investment adviser); and Chief Compliance Officer, The Invesco Funds Formerly: Chief Compliance Officer, Putnam Investments and the Putnam Funds | | N/A | | N/A |
The Statement of Additional Information of the Trust includes additional information about the Fund’s Trustees and is available upon request, without charge, by calling 1.800.959.4246. Please refer to the Fund’s Statement of Additional Information for information on the Fund’s sub-advisers.
| | | | | | |
Office of the Fund 11 Greenway Plaza, Suite 1000 Houston, TX 77046-1173 | | Investment Adviser Invesco Advisers, Inc. 1555 Peachtree Street, N.E. Atlanta, GA 30309 | | Distributor Invesco Distributors, Inc. 11 Greenway Plaza, Suite 1000 Houston, TX 77046-1173 | | Auditors PricewaterhouseCoopers LLP 1000 Louisiana Street, Suite 5800 Houston, TX 77002-5678 |
| | | |
| | | | | | |
Counsel to the Fund Stradley Ronon Stevens & Young, LLP 2005 Market Street, Suite 2600 Philadelphia, PA 19103-7018 | | Counsel to the Independent Trustees Goodwin Procter LLP 901 New York Avenue, N.W. Washington, D.C. 20001 | | Transfer Agent Invesco Investment Services, Inc. 11 Greenway Plaza, Suite 1000 Houston, TX 77046-1173 | | Custodian State Street Bank and Trust Company 225 Franklin Street Boston, MA 02110-2801 |
T-4 Invesco Charter Fund
Explore High-Conviction Investing with Invesco

Go paperless with eDelivery
Visit invesco.com/edelivery to enjoy the convenience and security of anytime electronic access to your investment documents.
With eDelivery, you can elect to have any or all of the following materials delivered straight to your inbox to download, save and print from your own computer:
| ∎ | | Fund reports and prospectuses |
Invesco mailing information
Send general correspondence to Invesco Investment Services, Inc., P.O. Box 219078, Kansas City, MO 64121-9078.
Important notice regarding delivery of security holder documents
To reduce Fund expenses, only one copy of most shareholder documents may be mailed to shareholders with multiple accounts at the same address (Householding). Mailing of your shareholder documents may be householded indefinitely unless you instruct us otherwise. If you do not want the mailing of these documents to be combined with those for other members of your household, please contact Invesco Investment Services, Inc. at 800 959 4246 or contact your financial institution. We will begin sending you individual copies for each account within 30 days after receiving your request.
Fund holdings and proxy voting information
The Fund provides a complete list of its holdings four times in each fiscal year, at the quarter ends. For the second and fourth quarters, the lists appear in the Fund’s semiannual and annual reports to shareholders. For the first and third quarters, the Fund files the lists with the Securities and Exchange Commission (SEC) on Form N-Q. The most recent list of portfolio holdings is available at invesco.com/completeqtrholdings. Shareholders can also look up the Fund’s Forms N-Q on the SEC website at sec.gov. Copies of the Fund’s Forms N-Q may be reviewed and copied at the SEC Public Reference Room in Washington, D.C. You can obtain information on the operation of the Public Reference Room, including information about duplicating fee charges, by calling 202 551 8090 or 800 732 0330, or by electronic request at the following email address: publicinfo@sec.gov. The SEC file numbers for the Fund are shown below.
A description of the policies and procedures that the Fund uses to determine how to vote proxies relating to portfolio securities is available without charge, upon request, from our Client Services department at 800 959 4246 or at invesco.com/proxyguidelines. The information is also available on the SEC website, sec.gov.
| | |
Information regarding how the Fund voted proxies related to its portfolio securities during the most recent 12-month period ended June 30 is available at invesco.com/proxysearch. The information is also available on the SEC website, sec.gov. Invesco Advisers, Inc. is an investment adviser; it provides investment advisory services to individual and institutional clients and does not sell securities. Invesco Distributors, Inc. is the US distributor for Invesco Ltd.’s retail mutual funds, exchange-traded funds and institutional money market funds. Both are wholly owned, indirect subsidiaries of Invesco Ltd. | |  |
| | | | | | | | |
| SEC file numbers: 811-01424 and 002-25469 | | Invesco Distributors, Inc. | | CHT-AR-1 | | 12112017 | | 1247 |
Letters to Shareholders
| | | | |

Philip Taylor | | | | Dear Shareholders: This annual report includes information about your Fund, including performance data and a complete list of its investments as of the close of the reporting period. Inside is a discussion of how your Fund was managed and the factors that affected its performance during the reporting period. American voters went to the polls just days after the start of the reporting period, and their decisions quickly affected markets. The US stock market rallied strongly after the election, with major market indexes rising, and setting record highs, throughout the reporting period. Generally positive economic data, strong corporate earnings and hope for tax and regulatory reform contributed to the rally. US and global bond markets, as well as emerging market equities, sold off immediately following the election – with the US bond market |
eventually recovering most of its losses. Overseas, economic data were mixed, prompting the European Central Bank and central banks in China and Japan, among other countries, to maintain extraordinarily accommodative monetary policies. Citing positive economic trends – specifically, realized and expected labor market conditions and inflation – the US Federal Reserve raised interest rates three times during the reporting period: first in December 2016, and then again in March and June 2017. Health care and tax reform proved to be more difficult than expected to enact, with little progress achieved by the end of the reporting period.
Short-term market volatility can prompt some investors to abandon their investment plans – and can cause others to settle for whatever returns the market has to offer. The investment professionals at Invesco, in contrast, invest with high conviction. This means that, no matter the asset class or the strategy, each investment team has a passion to exceed. We want to help investors achieve better outcomes, such as seeking higher returns, helping mitigate risk and generating income. Of course, investing with high conviction can’t guarantee a profit or ensure success; no investment strategy can. To learn more about how we invest with high conviction, visit invesco.com/HighConviction.
You, too, can invest with high conviction by maintaining a long-term investment perspective and by working with your financial adviser on a regular basis. During periods of short-term market volatility or uncertainty, your financial adviser can keep you focused on your long-term investment goals – a new home, a child’s college education or a secure retirement. He or she also can share research about the economy, the markets and individual investment options.
Visit our website for more information on your investments
Our website, invesco.com/us, offers a wide range of market insights and investment perspectives. On the website, you’ll find detailed information about our funds, including performance, holdings and portfolio manager commentaries. You can access information about your account by completing a simple, secure online registration. To do so, select “Log In” on the right side of the homepage, and then select “Register for Individual Account Access.”
In addition to the resources accessible on our website and through our mobile app, you can obtain timely updates to help you stay informed about the markets and the economy by connecting with Invesco on Twitter, LinkedIn or Facebook. You can access our blog at blog.invesco.us.com. Our goal is to provide you the information you want, when and where you want it.
Finally, I’m pleased to share with you Invesco’s commitment to both the Principles for Responsible Investment and to considering environmental, social and governance issues in our robust investment process. I invite you to learn more at invesco.com/esg.
Have questions?
For questions about your account, contact an Invesco client services representative at 800 959 4246. For Invesco-related questions or comments, please email me directly at phil@invesco.com.
All of us at Invesco look forward to serving your investment management needs. Thank you for investing with us.
Sincerely,

Philip Taylor
Senior Managing Director, Invesco Ltd.
|
| 2 Invesco Diversified Dividend Fund |
| | | | |

Bruce Crockett | | | | Dear Fellow Shareholders: Among the many important lessons I’ve learned in more than 40 years in a variety of business endeavors is the value of a trusted advocate. As independent chair of the Invesco Funds Board, I can assure you that the members of the Board are strong advocates for the interests of investors in Invesco’s mutual funds. We work hard to represent your interests through oversight of the quality of the investment management services your funds receive and other matters important to your investment, including but not limited to: ∎ Ensuring that Invesco offers a diverse lineup of mutual funds that your financial adviser can use to strive to meet your financial needs as your investment goals change over time. ∎ Monitoring how the portfolio management teams of the Invesco funds are performing in light of changing economic and market conditions. |
| ∎ | | Assessing each portfolio management team’s investment performance within the context of the investment strategy described in the fund’s prospectus. |
| ∎ | | Monitoring for potential conflicts of interests that may impact the nature of the services that your funds receive. |
We believe one of the most important services we provide our fund shareholders is the annual review of the funds’ advisory and sub-advisory contracts with Invesco Advisers and its affiliates. This review is required by the Investment Company Act of 1940 and focuses on the nature and quality of the services Invesco provides as the adviser to the Invesco funds and the reasonableness of the fees that it charges for those services. Each year, we spend months carefully reviewing information received from Invesco and a variety of independent sources, such as performance and fee data prepared by Lipper, Inc. (a subsidiary of Broadridge Financial Solutions, Inc.), an independent, third-party firm widely recognized as a leader in its field. We also meet with our independent legal counsel and other independent advisers to review and help us assess the information that we have received. Our goal is to assure that you receive quality investment management services for a reasonable fee.
I trust the measures outlined above provide assurance that you have a worthy advocate when it comes to choosing the Invesco Funds.
As always, please contact me at bruce@brucecrockett.com with any questions or concerns you may have. On behalf of the Board, we look forward to continuing to represent your interests and serving your needs.
Sincerely,

Bruce L. Crockett
Independent Chair
Invesco Funds Board of Trustees
|
| 3 Invesco Diversified Dividend Fund |
Management’s Discussion of Fund Performance
Performance summary
For the fiscal year ended October 31, 2017, Class A shares of Invesco Diversified Dividend Fund (the Fund), at net asset value (NAV), underperformed the Russell 1000 Value Index, the Fund’s style-specific benchmark.
Your Fund’s long-term performance appears later in this report.
Fund vs. Indexes
Total returns, 10/31/16 to 10/31/17, at net asset value (NAV). Performance shown does not include applicable contingent deferred sales charges (CDSC) or front-end sales charges, which would have reduced performance.
| | | | | |
| Class A Shares | | | | 11.65 | % |
| Class B Shares | | | | 10.83 | |
| Class C Shares | | | | 10.84 | |
| Class R Shares | | | | 11.40 | |
| Class Y Shares | | | | 11.93 | |
| Investor Class Shares | | | | 11.69 | |
| Class R5 Shares | | | | 11.99 | |
| Class R6 Shares | | | | 12.15 | |
| S&P 500 Index▼ (Broad Market Index) | | | | 23.63 | |
| Russell 1000 Value Index▼ (Style-Specific Index) | | | | 17.78 | |
| Lipper Large-Cap Value Funds Index∎ (Peer Group Index) | | | | 20.67 | |
Source(s): ▼FactSet Research Systems Inc.; ∎Lipper Inc.
Market conditions and your Fund
The US economy continued to expand throughout the fiscal year ended October 31, 2017. This improvement led the US Federal Reserve (the Fed) to raise interest rates three times during the reporting period, most recently in June 2017.1 At the close of the reporting period, Fed policy remained accommodative, and the fed funds target rate upper bound was 1.25% – up 75 basis points for the reporting period.1 (A basis point is 0.01%.)
Despite the Fed’s actions, major US stock market indexes repeatedly hit all-time highs throughout the reporting period. The stock market rally began immediately following the outcome of the US presidential election in November 2016, based on investors’ hopes for reduced regulation, lowered corporate and personal tax rates and increased infrastructure spending. The stock market
rally continued throughout the reporting period, fueled by generally positive economic data, strong corporate earnings and improved consumer confidence.
Within the S&P 500 Index, information technology (IT) and financials were the best-performing sectors for the fiscal year, while telecommunication services, energy and consumer staples were the worst-performing sectors. It is important to view the market’s performance within the context of a full market cycle. This cycle, which began in June 2009, is one of the longest expansions on record with one of the largest bull markets, despite a historically low recovery in revenue versus previous cycle troughs.2 In this environment, we remained focused on our assessment of each investment’s risk reward profile.
During the reporting period, our total return approach continued to emphasize long-term capital appreciation, current
income and capital preservation. We believe the Fund may serve as an equity foundation within a well-diversified asset allocation strategy, complementing more aggressive and cyclical investments. We look for dividend-paying companies with strong profitability, solid balance sheets and capital allocation policies that support sustained or increasing dividends and share repurchases. We perform extensive fundamental research, incorporating both financial statement analysis and an assessment of the potential reward relative to the downside risk, to determine a fair valuation over our two- to three-year investment horizon for each stock. We believe this process may provide a valuable combination of dividend income, price appreciation and capital preservation. We also maintain a rigorous sell discipline and consider selling or reducing shares in stocks that no longer meet our investment criteria.
During the fiscal year, holdings in the financials sector were the largest contributors to the Fund’s performance. American Express, Hartford Financial Services and Zions Bancorp were the top three contributors. Shares of American Express rose as the company’s co-branded card business stabilized amid a backdrop of technological and competitive industry changes. The company also showed strong top-line growth as it executed on its strategy to expand lending into the small and medium market channels. The company’s long-term CEO also announced his retirement, putting an end to an overhang on the stock over succession plans. Hartford’s stock price appreciated following an expansion in earnings within its property and casualty operations, management’s renewed focus on improving underwriting results within the company’s personal auto lines operation, as well as a favorable state regulatory ruling concerning the company’s ability to
| | | | | |
| By sector | | % of total net assets |
| | | | | |
Consumer Staples | | | | 19.7 | % |
| Utilities | | | | 16.4 | |
| Financials | | | | 13.8 | |
| Industrials | | | | 8.4 | |
| Consumer Discretionary | | | | 6.9 | |
| Energy | | | | 6.8 | |
| Health Care | | | | 5.9 | |
| Telecommunication Services | | | | 5.1 | |
| Materials | | | | 2.3 | |
| Real Estate | | | | 1.6 | |
| Information Technology | | | | 0.9 | |
Money Market Funds Plus Other Assets Less Liabilities | | | | 12.2 | |
| | | | | |
| Top 10 Equity Holdings* | | |
| | | % of total net assets |
| | | | | |
| 1. General Mills, Inc. | | | | 2.9 | % |
2. Hartford Financial Services Group, Inc. (The) | | | | 2.8 | |
| 3. PPL Corp. | | | | 2.8 | |
| 4. Coca-Cola Co. (The) | | | | 2.7 | |
| 5. Exelon Corp. | | | | 2.7 | |
| 6. AT&T Inc. | | | | 2.6 | |
| 7. Suncor Energy, Inc. | | | | 2.2 | |
| 8. TOTAL S.A. | | | | 2.0 | |
| 9. Entergy Corp. | | | | 2.0 | |
| 10. Dominion Energy, Inc. | | | | 2.0 | |
| | | | | |
Total Net Assets | | | $ | 23.8 billion | |
| |
Total Number of Holdings* | | | | 70 | |
The Fund’s holdings are subject to change, and there is no assurance that the Fund will continue to hold any particular security.
*Excluding money market fund holdings.
Data presented here are as of October 31, 2017.
|
| 4 Invesco Diversified Dividend Fund |
potentially divest non-core businesses. Zions reported higher earnings as loan growth increased from strength in residential mortgages and moderate growth in commercial loans. The company also saw improved profitability through continued efficiency initiatives. Concerns about the company’s energy loan portfolio abated, benefiting its asset quality and stock price. In addition, Zion’s regulatory capital and liquidity levels remained high.
Within the consumer staples sector, General Mills was the largest detractor from the Fund’s performance. The company saw weaker revenue trends driven by declines in its yogurt, and meals and baking categories. Management is focused on increasing innovation in yogurt and building on its organics and naturals platform to reinvigorate growth.
Telecommunication services sector holding BT Group was also a large detractor from the Fund’s performance. The company’s stock price declined due to losses within its global services business, as well as the loss of several key public service contracts in the UK. During the reporting period, the company faced regulatory uncertainty regarding independence of its infrastructure unit and pricing regulation of its products.
Within the Fund’s style-specific benchmark, financials, materials and IT were the best-performing sectors, while telecommunication services, energy and consumer staples were the worst-performing sectors during the fiscal year. The Fund’s overweight position in the consumer staples sector detracted from its performance versus the style-specific index. The Fund’s underweight positions in the financials and IT sectors also detracted from the Fund’s relative performance, as did the Fund’s unusually large cash position in a rising market environment. While the Fund’s cash position was higher than normal for much of the fiscal year, it did decrease and end the reporting period closer to normal levels. Strong stock selection and underweight position in the energy sector helped the Fund’s relative performance.
The Fund has successfully navigated multiple market cycles over its history with a consistent long-term mandate to emphasize capital appreciation, current income and capital preservation.
It has been our privilege to oversee Invesco Diversified Dividend Fund, and we thank you for your continued investment.
| 1 | Source: US Federal Reserve |
| 2 | Sources: National Bureau of Economic Research, Ned Davis Research and FactSet Research Systems Inc. |
The views and opinions expressed in management’s discussion of Fund performance are those of Invesco Advisers, Inc. These views and opinions are subject to change at any time based on factors such as market and economic conditions. These views and opinions may not be relied upon as investment advice or recommendations, or as an offer for a particular security. The information is not a complete analysis of every aspect of any market, country, industry, security or the Fund. Statements of fact are from sources considered reliable, but Invesco Advisers, Inc. makes no representation or warranty as to their completeness or accuracy. Although historical performance is no guarantee of future results, these insights may help you understand our investment management philosophy.
See important Fund and, if applicable, index disclosures later in this report.
| | |
 | | Meggan Walsh Chartered Financial Analyst, Portfolio Manager and Head of Invesco’s Dividend Value Team, is lead |
| manager of Invesco Diversified Dividend Fund. She joined Invesco in 1991. Ms. Walsh earned a BS in finance from the University of Maryland and an MBA from Loyola University Maryland. |
| | |
 | | Robert Botard Chartered Financial Analyst, Portfolio Manager, is manager of Invesco Diversified Dividend Fund. He joined Invesco in 1993. |
| Mr. Botard earned a BBA in finance and a BBA in international business from The University of Texas at Austin. He also earned a Master of International Management degree from the Thunderbird School of Global Management. |
| | |
 | | Kristina Bradshaw Chartered Financial Analyst, Portfolio Manager, is manager of Invesco Diversified Dividend Fund. She joined Invesco in 2006. |
| Ms. Bradshaw earned a BBA with honors from The University of Texas at Austin and an MBA from Stanford University’s Graduate School of Business. |
| | |
 | | Chris McMeans Chartered Financial Analyst, Portfolio Manager is manager of Invesco Diversified Dividend Fund. He joined Invesco in 2008. |
| Mr. McMeans earned a BA in economics from The University of Texas at Austin and an MBA with honors from the University of Houston. |
|
| 5 Invesco Diversified Dividend Fund |
Your Fund’s Long-Term Performance
Results of a $10,000 Investment – Oldest Share Class(es)
Fund and index data from 10/31/07
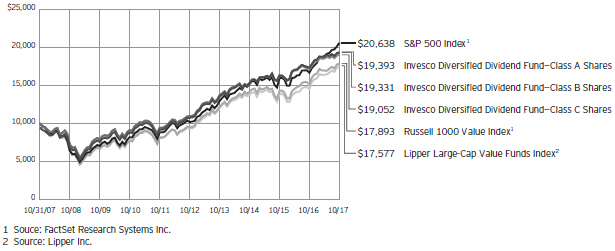
Past performance cannot guarantee comparable future results.
The data shown in the chart include reinvested distributions, applicable sales charges Fund expenses including management fees. Results for Class B shares are calculated as if a hypothetical
shareholder had liquidated his entire investment in the Fund at the close of the reporting period and paid the contingent deferred sales charges, if applicable. Index results include reinvested dividends, but they do not reflect sales charges. Performance of the peer group,
if applicable, reflects fund expenses and management fees; performance of a market index does not. Performance shown in the chart and table(s) does not reflect deduction of taxes a shareholder would pay on Fund distributions or sale of Fund shares.
|
| 6 Invesco Diversified Dividend Fund |
| | | | |
Average Annual Total Returns | |
As of 10/31/17, including maximum applicable sales charges | |
| |
| Class A Shares | | | | |
| Inception (12/31/01) | | | 7.54 | % |
| 10 Years | | | 6.85 | |
| 5 Years | | | 11.27 | |
| 1 Year | | | 5.49 | |
| |
| Class B Shares | | | | |
| Inception (12/31/01) | | | 7.56 | % |
| 10 Years | | | 6.81 | |
| 5 Years | | | 11.43 | |
| 1 Year | | | 5.83 | |
| |
| Class C Shares | | | | |
| Inception (12/31/01) | | | 7.15 | % |
| 10 Years | | | 6.66 | |
| 5 Years | | | 11.70 | |
| 1 Year | | | 9.84 | |
| |
| Class R Shares | | | | |
| Inception (10/25/05) | | | 8.22 | % |
| 10 Years | | | 7.21 | |
| 5 Years | | | 12.25 | |
| 1 Year | | | 11.40 | |
| |
| Class Y Shares | | | | |
| 10 Years | | | 7.70 | % |
| 5 Years | | | 12.81 | |
| 1 Year | | | 11.93 | |
| |
| Investor Class Shares | | | | |
| Inception (7/15/05) | | | 8.05 | % |
| 10 Years | | | 7.51 | |
| 5 Years | | | 12.57 | |
| 1 Year | | | 11.69 | |
| |
| Class R5 Shares | | | | |
| Inception (10/25/05) | | | 8.83 | % |
| 10 Years | | | 7.82 | |
| 5 Years | | | 12.87 | |
| 1 Year | | | 11.99 | |
| |
| Class R6 Shares | | | | |
| 10 Years | | | 7.67 | % |
| 5 Years | | | 12.99 | |
| 1 Year | | | 12.15 | |
Class Y shares incepted on October 3, 2008. Performance shown prior to that date is that of Class A shares and includes the 12b-1 fees applicable to Class A shares.
Class R6 shares incepted on September 24, 2012. Performance shown prior to that date is that of Class A shares and includes the 12b-1 fees applicable to Class A shares.
The performance data quoted represent past performance and cannot guarantee comparable future results; current performance may be lower or higher. Please visit invesco.com/performance
| | | | |
Average Annual Total Returns | |
As of 9/30/17, the most recent calendar quarter end, including maximum applicable sales
charges | |
| |
| Class A Shares | | | | |
| Inception (12/31/01) | | | 7.54 | % |
| 10 Years | | | 6.83 | |
| 5 Years | | | 11.26 | |
| 1 Year | | | 4.29 | |
| |
| Class B Shares | | | | |
| Inception (12/31/01) | | | 7.56 | % |
| 10 Years | | | 6.81 | |
| 5 Years | | | 11.42 | |
| 1 Year | | | 4.51 | |
| |
| Class C Shares | | | | |
| Inception (12/31/01) | | | 7.15 | % |
| 10 Years | | | 6.65 | |
| 5 Years | | | 11.66 | |
| 1 Year | | | 8.46 | |
| |
| Class R Shares | | | | |
| Inception (10/25/05) | | | 8.23 | % |
| 10 Years | | | 7.20 | |
| 5 Years | | | 12.25 | |
| 1 Year | | | 10.10 | |
| |
| Class Y Shares | | | | |
| 10 Years | | | 7.69 | % |
| 5 Years | | | 12.81 | |
| 1 Year | | | 10.61 | |
| |
| Investor Class Shares | | | | |
| Inception (7/15/05) | | | 8.06 | % |
| 10 Years | | | 7.50 | |
| 5 Years | | | 12.56 | |
| 1 Year | | | 10.38 | |
| |
| Class R5 Shares | | | | |
| Inception (10/25/05) | | | 8.84 | % |
| 10 Years | | | 7.81 | |
| 5 Years | | | 12.86 | |
| 1 Year | | | 10.68 | |
| |
| Class R6 Shares | | | | |
| 10 Years | | | 7.65 | % |
| 5 Years | | | 12.96 | |
| 1 Year | | | 10.78 | |
for the most recent month-end performance. Performance figures reflect reinvested distributions, changes in net asset value and the effect of the maximum sales charge unless otherwise stated. Investment return and principal value will fluctuate so that you may have a gain or loss when you sell shares.
The net annual Fund operating expense ratio set forth in the most recent Fund prospectus as of the date of this report for Class A, Class B, Class C, Class R, Class Y, Investor Class, Class R5 and Class R6 shares was 0.82%,
1.57%, 1.57%, 1.07%, 0.57%, 0.78%, 0.52% and 0.42%, respectively.1 The total annual Fund operating expense ratio set forth in the most recent Fund prospectus as of the date of this report for Class A, Class B, Class C, Class R Class Y, Investor Class, Class R5 and Class R6 shares was 0.84%, 1.59%, 1.59%, 1.09%, 0.59%, 0.80%, 0.54% and 0.44%, respectively. The expense ratios presented above may vary from the expense ratios presented in other sections of this report that are based on expenses incurred during the period covered by this report.
Class A share performance reflects the maximum 5.50% sales charge, and Class B and Class C share performance reflects the applicable contingent deferred sales charge (CDSC) for the period involved. The CDSC on Class B shares declines from 5% beginning at the time of purchase to 0% at the be-ginning of the seventh year. The CDSC on Class C shares is 1% for the first year after purchase. Class R, Class Y, Investor Class, Class R5 and Class R6 shares do not have a front-end sales charge or a CDSC; therefore, performance is at net asset value.
The performance of the Fund’s share classes will differ primarily due to different sales charge structures and class expenses.
Fund performance reflects any applicable fee waivers and/or expense reimbursements. Had the adviser not waived fees and/or reimbursed expenses currently or in the past, returns would have been lower. See current prospectus for more information.
| 1 | Total annual Fund operating expenses after any contractual fee waivers and/or expense reimbursements by the adviser in effect through at least June 30, 2019. See current prospectus for more information. |
|
| 7 Invesco Diversified Dividend Fund |
Invesco Diversified Dividend Fund’s investment objective is long-term growth of capital and, secondarily, current income.
| ∎ | | Unless otherwise stated, information presented in this report is as of October 31, 2017, and is based on total net assets. |
| ∎ | | Unless otherwise noted, all data provided by Invesco. |
| ∎ | | To access your Fund’s reports/prospectus, visit invesco.com/fundreports. |
About share classes
| ∎ | | Class B shares may not be purchased for new or additional investments. Please see the prospectus for more information. |
| ∎ | | Class R shares are generally available only to employer sponsored retirement and benefit plans. Please see the prospectus for more information. |
| ∎ | | Class Y shares and Investor Class shares are available only to certain investors. Please see the prospectus for more information. |
| ∎ | | Class R5 shares and Class R6 shares are available for use by retirement plans that meet certain standards and for institutional investors. Class R6 shares are also available through intermediaries that have established an agreement with Invesco Distributors, Inc. to make such shares available for use in retail omnibus accounts. Please see the prospectus for more information. |
Principal risks of investing in the Fund
| ∎ | | Foreign securities risk. The Fund’s foreign investments may be adversely affected by political and social instability, changes in economic or taxation policies, difficulty in enforcing obligations, decreased liquidity or increased volatility. Foreign investments also involve the risk of the possible seizure, nationalization or expropriation of the issuer or foreign deposits (in which the Fund could lose its entire investments in a certain market) and the possible adoption of foreign governmental restrictions such as exchange controls. Unless the Fund has hedged its foreign securities risk, foreign securities risk also involves the risk of negative foreign currency rate fluctuations, which may cause the value of securities denominated in such foreign currency (or other instruments through which the Fund has exposure to foreign currencies) to decline in value. Currency exchange rates may fluctuate significantly |
| | | over short periods of time. Currency hedging strategies, if used, are not always successful. |
| ∎ | | Management risk. The Fund is actively managed and depends heavily on the Adviser’s judgment about markets, interest rates or the attractiveness, relative values, liquidity, or potential appreciation of particular investments made for the Fund’s portfolio. The Fund could experience losses if these judgments prove to be incorrect. Additionally, legislative, regulatory, or tax developments may adversely affect management of the Fund and, therefore, the ability of the Fund to achieve its investment objective. |
| ∎ | | Market risk. The market values of the Fund’s investments, and therefore the value of the Fund’s shares, will go up and down, sometimes rapidly or unpredictably. Market risk may affect a single issuer, industry or section of the economy, or it may affect the market as a whole. Individual stock prices tend to go up and down more dramatically than those of certain other types of investments, such as bonds. During a general downturn in the financial markets, multiple asset classes may decline in value. When markets perform well, there can be no assurance that specific investments held by the Fund will rise in value. |
| ∎ | | Value investing style risk. A value investing style subjects the Fund to the risk that the valuations never improve or that the returns on value equity securities are less than returns on other styles of investing or the overall stock market. |
About indexes used in this report
| ∎ | | The S&P 500® Index is an unmanaged index considered representative of the US stock market. |
| ∎ | | The Russell 1000® Value Index is an unmanaged index considered representative of large-cap value stocks. The Russell 1000 Value Index is a trademark/service mark of the Frank Russell Co. Russell® is a trademark of the Frank Russell Co. |
| ∎ | | The Lipper Large-Cap Value Funds Index is an unmanaged index considered representative of large-cap value funds tracked by Lipper. |
| ∎ | | The Fund is not managed to track the performance of any particular index, including the index(es) described here, and consequently, the performance of the Fund may deviate significantly from the performance of the index(es). |
| ∎ | | A direct investment cannot be made in an index. Unless otherwise indicated, index results include reinvested dividends, and they do not reflect sales charges. Performance of the peer group, if applicable, reflects fund expenses; performance of a market index does not. |
Other information
| ∎ | | The returns shown in management’s discussion of Fund performance are based on net asset values (NAVs) calculated for shareholder transactions. Generally accepted accounting principles require adjustments to be made to the net assets of the Fund at period end for financial reporting purposes, and as such, the NAVs for shareholder transactions and the returns based on those NAVs may differ from the NAVs and returns reported in the Financial Highlights. |
| ∎ | | Industry classifications used in this report are generally according to the Global Industry Classification Standard, which was developed by and is the exclusive property and a service mark of MSCI Inc. and Standard & Poor’s. |
|
This report must be accompanied or preceded by a currently effective Fund prospectus, which contains more complete information, including sales charges and expenses. Investors should read it carefully before investing. |
|
|
| NOT FDIC INSURED | MAY LOSE VALUE | NO BANK GUARANTEE |
|
| 8 Invesco Diversified Dividend Fund |
Schedule of Investments(a)
October 31, 2017
| | | | | | | | |
| | | Shares | | | Value | |
Common Stocks & Other Equity Interests–87.83% | |
| Aerospace & Defense–1.74% | |
General Dynamics Corp. | | | 1,319,381 | | | $ | 267,807,955 | |
Raytheon Co. | | | 815,787 | | | | 147,004,818 | |
| | | | | 414,812,773 | |
|
| Air Freight & Logistics–1.23% | |
United Parcel Service, Inc.–Class B | | | 2,495,588 | | | | 293,306,458 | |
| | |
| Apparel Retail–0.69% | | | | | | | | |
TJX Cos., Inc. (The) | | | 2,345,756 | | | | 163,733,769 | |
|
| Apparel, Accessories & Luxury Goods–0.84% | |
Columbia Sportswear Co. | | | 1,388,853 | | | | 86,636,650 | |
Tapestry, Inc. | | | 2,741,614 | | | | 112,269,093 | |
| | | | | 198,905,743 | |
|
| Asset Management & Custody Banks–0.94% | |
Federated Investors, Inc.–Class B | | | 3,998,788 | | | | 124,242,343 | |
Legg Mason, Inc. | | | 2,623,031 | | | | 100,147,324 | |
| | | | | 224,389,667 | |
|
| Brewers–1.54% | |
Heineken N.V. (Netherlands) | | | 3,772,794 | | | | 367,679,654 | |
|
| Consumer Finance–1.76% | |
American Express Co. | | | 4,382,919 | | | | 418,656,423 | |
|
| Data Processing & Outsourced Services–0.92% | |
Automatic Data Processing, Inc. | | | 1,893,467 | | | | 220,134,473 | |
|
| Drug Retail–0.84% | |
Walgreens Boots Alliance, Inc. | | | 3,025,145 | | | | 200,476,359 | |
|
| Electric Utilities–11.56% | |
American Electric Power Co., Inc. | | | 4,778,425 | | | | 355,562,604 | |
Duke Energy Corp. | | | 4,313,392 | | | | 380,915,648 | |
Entergy Corp. | | | 5,531,589 | | | | 477,154,867 | |
Exelon Corp. | | | 15,899,927 | | | | 639,336,065 | |
PPL Corp. | | | 17,654,917 | | | | 663,118,682 | |
SSE PLC (United Kingdom) | | | 12,938,128 | | | | 237,524,468 | |
| | | | | 2,753,612,334 | |
|
| Electrical Components & Equipment–2.62% | |
ABB Ltd. (Switzerland) | | | 11,297,425 | | | | 295,653,424 | |
Emerson Electric Co. | | | 5,077,995 | | | | 327,327,557 | |
| | | | | 622,980,981 | |
|
| Food Distributors–1.29% | |
Sysco Corp. | | | 5,516,540 | | | | 306,829,955 | |
|
| General Merchandise Stores–1.67% | |
Target Corp. | | | 6,757,334 | | | | 398,952,999 | |
|
| Health Care Equipment–0.78% | |
Stryker Corp. | | | 1,193,719 | | | | 184,871,261 | |
| | | | | | | | |
| | | Shares | | | Value | |
| Hotels, Resorts & Cruise Lines–0.53% | |
Accor S.A. (France) | | | 2,523,210 | | | $ | 125,904,373 | |
|
| Household Products–3.16% | |
Kimberly-Clark Corp. | | | 2,662,730 | | | | 299,583,752 | |
Procter & Gamble Co. (The) | | | 5,255,638 | | | | 453,771,785 | |
| | | | | 753,355,537 | |
|
| Housewares & Specialties–0.55% | |
Newell Brands, Inc. | | | 3,238,815 | | | | 132,078,876 | |
|
| Human Resource & Employment Services–0.54% | |
Robert Half International, Inc. | | | 2,477,549 | | | | 128,262,712 | |
|
| Industrial Conglomerates–0.18% | |
Siemens AG (Germany) | | | 293,059 | | | | 41,819,593 | |
|
| Industrial Machinery–2.10% | |
Flowserve Corp.(b) | | | 7,512,040 | | | | 331,055,603 | |
Pentair PLC (United Kingdom) | | | 2,392,531 | | | | 168,577,734 | |
| | | | | 499,633,337 | |
|
| Integrated Oil & Gas–5.01% | |
Royal Dutch Shell PLC–Class B (United Kingdom) | | | 5,683,775 | | | | 182,967,919 | |
Suncor Energy, Inc. (Canada) | | | 15,422,400 | | | | 523,603,689 | |
TOTAL S.A. (France) | | | 8,746,675 | | | | 487,747,512 | |
| | | | | 1,194,319,120 | |
|
| Integrated Telecommunication Services–5.10% | |
AT&T Inc. | | | 18,303,357 | | | | 615,907,963 | |
BT Group PLC (United Kingdom) | | | 82,493,968 | | | | 285,249,721 | |
Deutsche Telekom AG (Germany) | | | 17,239,901 | | | | 314,094,377 | |
| | | | | 1,215,252,061 | |
|
| Motorcycle Manufacturers–1.05% | |
Harley-Davidson, Inc. | | | 5,263,542 | | | | 249,176,078 | |
|
| Movies & Entertainment–0.88% | |
Time Warner Inc. | | | 2,127,874 | | | | 209,148,735 | |
|
| Multi-Line Insurance–2.83% | |
Hartford Financial Services Group, Inc. (The) | | | 12,256,855 | | | | 674,739,868 | |
|
| Multi-Utilities–4.86% | |
Consolidated Edison, Inc. | | | 4,595,299 | | | | 395,425,479 | |
Dominion Energy, Inc. | | | 5,872,555 | | | | 476,499,113 | |
Sempra Energy | | | 2,421,182 | | | | 284,488,885 | |
| | | | | 1,156,413,477 | |
|
| Oil & Gas Equipment & Services–0.23% | |
Baker Hughes, a GE Co. | | | 1,716,916 | | | | 53,962,670 | |
|
| Oil & Gas Exploration & Production–1.54% | |
ConocoPhillips | | | 7,158,652 | | | | 366,165,050 | |
See accompanying Notes to Financial Statements which are an integral part of the financial statements.
9 Invesco Diversified Dividend Fund
| | | | | | | | |
| | | Shares | | | Value | |
| Packaged Foods & Meats–7.41% | |
Campbell Soup Co. | | | 6,324,540 | | | $ | 299,593,460 | |
Danone S.A. (France) | | | 1,965,033 | | | | 160,555,155 | |
General Mills, Inc. | | | 13,370,983 | | | | 694,221,438 | |
Kraft Heinz Co. (The) | | | 4,060,155 | | | | 313,971,786 | |
Mondelez International, Inc.–Class A | | | 7,171,554 | | | | 297,117,482 | |
| | | | | 1,765,459,321 | |
|
| Paper Packaging–2.29% | |
Avery Dennison Corp. | | | 1,215,284 | | | | 129,026,702 | |
International Paper Co. | | | 5,236,518 | | | | 299,895,386 | |
Sonoco Products Co. | | | 2,264,695 | | | | 117,288,554 | |
| | | | | 546,210,642 | |
|
| Personal Products–0.78% | |
L’Oreal S.A. (France) | | | 835,132 | | | | 185,862,088 | |
|
| Pharmaceuticals–5.15% | |
Bayer AG (Germany) | | | 1,833,697 | | | | 239,511,352 | |
Bristol-Myers Squibb Co. | | | 7,003,419 | | | | 431,830,815 | |
Eli Lilly and Co. | | | 4,274,574 | | | | 350,258,594 | |
Johnson & Johnson | | | 1,467,509 | | | | 204,585,430 | |
| | | | | 1,226,186,191 | |
|
| Property & Casualty Insurance–0.97% | |
Travelers Cos., Inc. (The) | | | 1,746,496 | | | | 231,323,395 | |
|
| Regional Banks–7.31% | |
Cullen/Frost Bankers, Inc. | | | 1,626,972 | | | | 160,256,742 | |
Fifth Third Bancorp | | | 9,751,225 | | | | 281,810,402 | |
KeyCorp | | | 12,069,575 | | | | 220,269,744 | |
M&T Bank Corp. | | | 2,404,392 | | | | 400,980,454 | |
| | | | | | | | |
| | | Shares | | | Value | |
| Regional Banks–(continued) | |
PNC Financial Services Group, Inc. (The) | | | 2,238,830 | | | $ | 306,249,556 | |
Zions Bancorp. | | | 7,990,117 | | | | 371,220,836 | |
| | | | | 1,740,787,734 | |
|
| Restaurants–0.71% | |
Darden Restaurants, Inc. | | | 2,049,866 | | | | 168,642,476 | |
|
| Soft Drinks–2.68% | |
Coca-Cola Co. (The) | | | 13,909,040 | | | | 639,537,659 | |
|
| Specialized REIT’s–1.59% | |
Weyerhaeuser Co. | | | 10,542,405 | | | | 378,577,764 | |
|
| Tobacco–1.96% | |
Altria Group, Inc. | | | 2,640,117 | | | | 169,548,314 | |
Philip Morris International Inc. | | | 2,850,249 | | | | 298,250,055 | |
| | | | | 467,798,369 | |
Total Common Stocks & Other Equity Interests
(Cost $16,224,353,620) | | | | 20,919,959,975 | |
|
Money Market Funds–12.22% | |
Invesco Government & Agency Portfolio–Institutional Class, 0.95%(c) | | | 1,746,351,642 | | | | 1,746,351,642 | |
Invesco Treasury Portfolio– Institutional Class, 0.94%(c) | | | 1,164,234,429 | | | | 1,164,234,429 | |
Total Money Market Funds
(Cost $2,910,586,071) | | | | | | | 2,910,586,071 | |
TOTAL INVESTMENTS IN
SECURITIES–100.05%
(Cost $19,134,939,691) | | | | 23,830,546,046 | |
OTHER ASSETS LESS LIABILITIES–(0.05)% | | | | (11,301,729 | ) |
NET ASSETS–100.00% | | | | | | $ | 23,819,244,317 | |
Investment Abbreviations:
| | |
| REIT | | – Real Estate Investment Trust |
Notes to Schedule of Investments:
| (a) | Industry and/or sector classifications used in this report are generally according to the Global Industry Classification Standard, which was developed by and is the exclusive property and a service mark of MSCI Inc. and Standard & Poor’s. |
| (b) | Affiliated company during the period. The Investment Company Act of 1940 defines an “affiliated person” as an issuance in which a fund holds 5% or more of the outstanding voting securities. The Fund has not owned enough of the outstanding voting securities of the issuer to have control (as defined in the Investment Company Act of 1940) of that issuer. The value of this security as of October 31, 2017 represented 1.39% of the Fund’s Net Assets. See Note 5. |
| (c) | The money market fund and the Fund are affiliated by having the same investment adviser. The rate shown is the 7-day SEC standardized yield as of October 31, 2017. |
See accompanying Notes to Financial Statements which are an integral part of the financial statements.
10 Invesco Diversified Dividend Fund
| | | | | | | | | | | | | | | | | | | | | | |
| Open Forward Foreign Currency Contracts | |
Settlement
Date | | Counterparty | | Contract to | | | Unrealized
Appreciation
(Depreciation) | |
| | | Deliver | | | Receive | | |
| 11/17/2017 | | Citigroup Global Markets Inc. | | | CAD | | | | 108,815,368 | | | | USD | | | | 88,724,576 | | | $ | 4,364,405 | |
| 11/17/2017 | | Citigroup Global Markets Inc. | | | EUR | | | | 188,270,775 | | | | USD | | | | 226,199,975 | | | | 6,682,672 | |
| 11/17/2017 | | Goldman Sachs International | | | CAD | | | | 108,815,368 | | | | USD | | | | 88,703,529 | | | | 4,343,358 | |
| 11/17/2017 | | Goldman Sachs International | | | EUR | | | | 191,022,784 | | | | USD | | | | 229,513,383 | | | | 6,787,331 | |
| 11/17/2017 | | Merrill Lynch International | | | CAD | | | | 108,815,368 | | | | USD | | | | 88,673,241 | | | | 4,313,071 | |
| 11/17/2017 | | Merrill Lynch International | | | EUR | | | | 213,687,286 | | | | USD | | | | 255,902,447 | | | | 6,750,358 | |
| 11/17/2017 | | State Street Bank and Trust Co. | | | EUR | | | | 216,167,337 | | | | USD | | | | 259,459,642 | | | | 7,415,898 | |
| Subtotal | | | | | | | | | | | | | | | | | | | | | 40,657,093 | |
| 11/17/2017 | | Citigroup Global Markets Inc. | | | USD | | | | 1,924,239 | | | | CAD | | | | 2,411,820 | | | | (54,452 | ) |
| 11/17/2017 | | Goldman Sachs International | | | USD | | | | 1,655,911 | | | | CAD | | | | 2,041,639 | | | | (73,111 | ) |
| 11/17/2017 | | State Street Bank and Trust Co. | | | USD | | | | 4,663,078 | | | | EUR | | | | 3,942,163 | | | | (66,651 | ) |
| Subtotal | | | | | | | | | | | | | | | | | | | | | (194,214 | ) |
Total Forward Foreign Currency Contracts — Currency Risk | | | | | | | | | | | | | | | $ | 40,462,879 | |
Abbreviations:
| | |
| CAD | | – Canadian Dollar |
| EUR | | – Euro |
| USD | | – United States Dollar |
See accompanying Notes to Financial Statements which are an integral part of the financial statements.
11 Invesco Diversified Dividend Fund
Statement of Assets and Liabilities
October 31, 2017
| | | | |
Assets: | |
Investments in securities, at value (Cost $15,895,830,759) | | $ | 20,588,904,372 | |
Investments in affiliates, at value (Cost $3,239,108,932) | | | 3,241,641,674 | |
Other investments: | | | | |
Unrealized appreciation on forward foreign currency contracts outstanding | | | 40,657,093 | |
Foreign currencies, at value (Cost $335,682) | | | 418,877 | |
Receivable for: | | | | |
Investments sold | | | 42,021,067 | |
Fund shares sold | | | 32,312,905 | |
Dividends | | | 35,584,850 | |
Investment for trustee deferred compensation and retirement plans | | | 791,633 | |
Other assets | | | 410,545 | |
Total assets | | | 23,982,743,016 | |
|
Liabilities: | |
Other investments: | | | | |
Unrealized depreciation on forward foreign currency contracts outstanding | | | 194,214 | |
Payable for: | | | | |
Investments purchased | | | 117,989,576 | |
Fund shares reacquired | | | 36,040,648 | |
Accrued fees to affiliates | | | 8,102,494 | |
Accrued trustees’ and officers’ fees and benefits | | | 29,875 | |
Accrued other operating expenses | | | 142,116 | |
Trustee deferred compensation and retirement plans | | | 999,776 | |
Total liabilities | | | 163,498,699 | |
Net assets applicable to shares outstanding | | $ | 23,819,244,317 | |
|
Net assets consist of: | |
Shares of beneficial interest | | $ | 18,849,182,518 | |
Undistributed net investment income | | | 96,932,291 | |
Undistributed net realized gain | | | 137,234,475 | |
Net unrealized appreciation | | | 4,735,895,033 | |
| | | $ | 23,819,244,317 | |
| | | | |
Net Assets: | | | | |
Class A | | $ | 6,029,664,193 | |
Class B | | $ | 9,091,765 | |
Class C | | $ | 840,124,892 | |
Class R | | $ | 358,417,692 | |
Class Y | | $ | 4,278,325,142 | |
Investor Class | | $ | 2,113,750,364 | |
Class R5 | | $ | 3,845,847,952 | |
Class R6 | | $ | 6,344,022,317 | |
|
Shares outstanding, no par value,
with an unlimited number of shares authorized: | |
Class A | | | 298,820,740 | |
Class B | | | 455,865 | |
Class C | | | 42,174,962 | |
Class R | | | 17,707,027 | |
Class Y | | | 211,797,117 | |
Investor Class | | | 104,830,514 | |
Class R5 | | | 190,557,894 | |
Class R6 | | | 314,287,884 | |
Class A: | | | | |
Net asset value per share | | $ | 20.18 | |
Maximum offering price per share | | | | |
(Net asset value of $20.18 ¸ 94.50%) | | $ | 21.35 | |
Class B: | | | | |
Net asset value and offering price per share | | $ | 19.94 | |
Class C: | | | | |
Net asset value and offering price per share | | $ | 19.92 | |
Class R: | | | | |
Net asset value and offering price per share | | $ | 20.24 | |
Class Y: | | | | |
Net asset value and offering price per share | | $ | 20.20 | |
Investor Class: | | | | |
Net asset value and offering price per share | | $ | 20.16 | |
Class R5: | | | | |
Net asset value and offering price per share | | $ | 20.18 | |
Class R6: | | | | |
Net asset value and offering price per share | | $ | 20.19 | |
See accompanying Notes to Financial Statements which are an integral part of the financial statements.
12 Invesco Diversified Dividend Fund
Statement of Operations
For the year ended October 31, 2017
| | | | |
Investment income: | |
Dividends (net of foreign withholding taxes of $8,441,718) | | $ | 565,816,987 | |
Dividends from affiliates | | | 28,503,913 | |
Total investment income | | | 594,320,900 | |
| |
Expenses: | | | | |
Advisory fees | | | 85,422,458 | |
Administrative services fees | | | 1,156,978 | |
Custodian fees | | | 735,459 | |
Distribution fees: | | | | |
Class A | | | 15,422,467 | |
Class B | | | 130,283 | |
Class C | | | 8,527,619 | |
Class R | | | 1,518,057 | |
Investor Class | | | 4,390,728 | |
Transfer agent fees — A, B, C, R, Y and Investor | | | 22,893,339 | |
Transfer agent fees — R5 | | | 3,817,498 | |
Transfer agent fees — R6 | | | 142,112 | |
Trustees’ and officers’ fees and benefits | | | 328,870 | |
Registration and filing fees | | | 846,820 | |
Reports to shareholders | | | 3,131,520 | |
Professional services fees | | | 225,099 | |
Other | | | 239,158 | |
Total expenses | | | 148,928,465 | |
Less: Fees waived and expense offset arrangement(s) | | | (4,158,149 | ) |
Net expenses | | | 144,770,316 | |
Net investment income | | | 449,550,584 | |
| |
Realized and unrealized gain (loss) from: | | | | |
Net realized gain (loss) from: | | | | |
Investment securities | | | 229,948,391 | |
Foreign currencies | | | (704,756 | ) |
Forward foreign currency contracts | | | (65,805,540 | ) |
| | | | 163,438,095 | |
Change in net unrealized appreciation (depreciation) of: | | | | |
Investment securities | | | 1,734,729,683 | |
Foreign currencies | | | (68,766 | ) |
Forward foreign currency contracts | | | 26,168,084 | |
| | | | 1,760,829,001 | |
Net realized and unrealized gain | | | 1,924,267,096 | |
Net increase in net assets resulting from operations | | $ | 2,373,817,680 | |
See accompanying Notes to Financial Statements which are an integral part of the financial statements.
13 Invesco Diversified Dividend Fund
Statement of Changes in Net Assets
For the years ended October 31, 2017 and 2016
| | | | | | | | |
| | | 2017 | | | 2016 | |
Operations: | | | | | | | | |
Net investment income | | $ | 449,550,584 | | | $ | 281,720,602 | |
Net realized gain | | | 163,438,095 | | | | 489,070,361 | |
Change in net unrealized appreciation | | | 1,760,829,001 | | | | 120,872,570 | |
Net increase in net assets resulting from operations | | | 2,373,817,680 | | | | 891,663,533 | |
| | |
Distributions to shareholders from net investment income: | | | | | | | | |
Class A | | | (104,371,576 | ) | | | (87,597,660 | ) |
Class B | | | (127,541 | ) | | | (186,213 | ) |
Class C | | | (8,002,015 | ) | | | (5,342,554 | ) |
Class R | | | (4,314,212 | ) | | | (2,826,974 | ) |
Class Y | | | (98,168,591 | ) | | | (38,800,678 | ) |
Investor Class | | | (37,353,627 | ) | | | (35,300,336 | ) |
Class R5 | | | (75,226,213 | ) | | | (55,949,846 | ) |
Class R6 | | | (81,891,302 | ) | | | (29,669,892 | ) |
Total distributions from net investment income | | | (409,455,077 | ) | | | (255,674,153 | ) |
| | |
Distributions to shareholders from net realized gains: | | | | | | | | |
Class A | | | (151,389,232 | ) | | | (187,921,659 | ) |
Class B | | | (388,597 | ) | | | (884,906 | ) |
Class C | | | (20,020,835 | ) | | | (18,558,267 | ) |
Class R | | | (6,235,896 | ) | | | (8,075,563 | ) |
Class Y | | | (102,046,387 | ) | | | (46,717,282 | ) |
Investor Class | | | (52,848,731 | ) | | | (78,259,112 | ) |
Class R5 | | | (87,151,961 | ) | | | (96,137,321 | ) |
Class R6 | | | (68,937,644 | ) | | | (33,943,581 | ) |
Total distributions from net realized gains | | | (489,019,283 | ) | | | (470,497,691 | ) |
| | |
Share transactions-net: | | | | | | | | |
Class A | | | (387,579,942 | ) | | | 1,217,893,699 | |
Class B | | | (8,203,248 | ) | | | (6,485,243 | ) |
Class C | | | 4,014,291 | | | | 328,459,436 | |
Class R | | | 101,239,116 | | | | 33,543,725 | |
Class Y | | | 303,448,708 | | | | 2,439,382,508 | |
Investor Class | | | (150,451,618 | ) | | | 101,759,931 | |
Class R5 | | | 176,556,635 | | | | 990,438,812 | |
Class R6 | | | 3,470,617,666 | | | | 1,759,334,300 | |
Net increase in net assets resulting from share transactions | | | 3,509,641,608 | | | | 6,864,327,168 | |
Net increase in net assets | | | 4,984,984,928 | | | | 7,029,818,857 | |
| | |
Net assets: | | | | | | | | |
Beginning of year | | | 18,834,259,389 | | | | 11,804,440,532 | |
End of year (includes undistributed net investment income of $96,932,291 and $57,541,540, respectively) | | $ | 23,819,244,317 | | | $ | 18,834,259,389 | |
Notes to Financial Statements
October 31, 2017
NOTE 1—Significant Accounting Policies
Invesco Diversified Dividend Fund (the “Fund”) is a series portfolio of AIM Equity Funds (Invesco Equity Funds) (the “Trust”). The Trust is a Delaware statutory trust registered under the Investment Company Act of 1940, as amended (the “1940 Act”), as an open-end series management investment company consisting of three separate portfolios, each authorized to issue an unlimited number of shares of beneficial interest. The assets, liabilities and operations of each portfolio are accounted for separately. Information presented in these financial statements pertains only to the Fund. Matters affecting each portfolio or class will be voted on exclusively by the shareholders of such portfolio or class.
14 Invesco Diversified Dividend Fund
The Fund’s investment objective is long-term growth of capital and, secondarily, current income.
The Fund currently consists of eight different classes of shares: Class A, Class B, Class C, Class R, Class Y, Investor Class, Class R5 and Class R6. Class Y and Investor Class shares are available only to certain investors. Class A shares are sold with a front-end sales charge unless certain waiver criteria are met and under certain circumstances load waived shares may be subject to contingent deferred sales charges (“CDSC”). Class C shares are sold with a CDSC. Class R, Class Y, Investor Class, Class R5 and Class R6 shares are sold at net asset value. Effective November 30, 2010, new or additional investments in Class B shares are no longer permitted. Existing shareholders of Class B shares may continue to reinvest dividends and capital gains distributions in Class B shares until they convert to Class A shares. Also, shareholders in Class B shares will be able to exchange those shares for Class B shares of other Invesco Funds offering such shares until they convert to Class A shares. Generally, Class B shares will automatically convert to Class A shares on or about the month-end, which is at least eight years after the date of purchase. Redemption of Class B shares prior to the conversion date will be subject to a CDSC.
The Fund is an investment company and accordingly follows the investment company accounting and reporting guidance in accordance with Financial Accounting Standards Board Accounting Standards Codification Topic 946, Financial Services — Investment Companies.
The following is a summary of the significant accounting policies followed by the Fund in the preparation of its financial statements.
| A. | Security Valuations — Securities, including restricted securities, are valued according to the following policy. |
A security listed or traded on an exchange (except convertible securities) is valued at its last sales price or official closing price as of the close of the customary trading session on the exchange where the security is principally traded, or lacking any sales or official closing price on a particular day, the security may be valued at the closing bid price on that day. Securities traded in the over-the-counter market are valued based on prices furnished by independent pricing services or market makers. When such securities are valued by an independent pricing service they may be considered fair valued. Futures contracts are valued at the final settlement price set by an exchange on which they are principally traded. Listed options are valued at the mean between the last bid and asked prices from the exchange on which they are principally traded. Options not listed on an exchange are valued by an independent source at the mean between the last bid and asked prices. For purposes of determining net asset value (“NAV”) per share, futures and option contracts generally are valued 15 minutes after the close of the customary trading session of the New York Stock Exchange (“NYSE”).
Investments in open-end and closed-end registered investment companies that do not trade on an exchange are valued at the end-of-day net asset value per share. Investments in open-end and closed-end registered investment companies that trade on an exchange are valued at the last sales price or official closing price as of the close of the customary trading session on the exchange where the security is principally traded.
Debt obligations (including convertible securities) and unlisted equities are fair valued using an evaluated quote provided by an independent pricing service. Evaluated quotes provided by the pricing service may be determined without exclusive reliance on quoted prices, and may reflect appropriate factors such as institution-size trading in similar groups of securities, developments related to specific securities, dividend rate (for unlisted equities), yield (for debt obligations), quality, type of issue, coupon rate (for debt obligations), maturity (for debt obligations), individual trading characteristics and other market data. Pricing services generally value debt obligations assuming orderly transactions of institutional round lot size, but a fund may hold or transact in the same securities in smaller, odd lot sizes. Odd lots often trade at lower prices than institutional round lots. Debt obligations are subject to interest rate and credit risks. In addition, all debt obligations involve some risk of default with respect to interest and/or principal payments.
Foreign securities’ (including foreign exchange contracts) prices are converted into U.S. dollar amounts using the applicable exchange rates as of the close of the NYSE. If market quotations are available and reliable for foreign exchange-traded equity securities, the securities will be valued at the market quotations. Because trading hours for certain foreign securities end before the close of the NYSE, closing market quotations may become unreliable. If between the time trading ends on a particular security and the close of the customary trading session on the NYSE, events occur that the investment adviser determines are significant and make the closing price unreliable, the Fund may fair value the security. If the event is likely to have affected the closing price of the security, the security will be valued at fair value in good faith using procedures approved by the Board of Trustees. Adjustments to closing prices to reflect fair value may also be based on a screening process of an independent pricing service to indicate the degree of certainty, based on historical data, that the closing price in the principal market where a foreign security trades is not the current value as of the close of the NYSE. Foreign securities’ prices meeting the approved degree of certainty that the price is not reflective of current value will be priced at the indication of fair value from the independent pricing service. Multiple factors may be considered by the independent pricing service in determining adjustments to reflect fair value and may include information relating to sector indices, American Depositary Receipts and domestic and foreign index futures. Foreign securities may have additional risks including exchange rate changes, potential for sharply devalued currencies and high inflation, political and economic upheaval, the relative lack of issuer information, relatively low market liquidity and the potential lack of strict financial and accounting controls and standards.
Securities for which market prices are not provided by any of the above methods may be valued based upon quotes furnished by independent sources. The last bid price may be used to value equity securities. The mean between the last bid and asked prices is used to value debt obligations, including corporate loans.
Securities for which market quotations are not readily available or became unreliable are valued at fair value as determined in good faith by or under the supervision of the Trust’s officers following procedures approved by the Board of Trustees. Issuer specific events, market trends, bid/asked quotes of brokers and information providers and other market data may be reviewed in the course of making a good faith determination of a security’s fair value.
The Fund may invest in securities that are subject to interest rate risk, meaning the risk that the prices will generally fall as interest rates rise and, conversely, the prices will generally rise as interest rates fall. Specific securities differ in their sensitivity to changes in interest rates depending on their individual characteristics. Changes in interest rates may result in increased market volatility, which may affect the value and/or liquidity of certain Fund investments.
Valuations change in response to many factors including the historical and prospective earnings of the issuer, the value of the issuer’s assets, general economic conditions, interest rates, investor perceptions and market liquidity. Because of the inherent uncertainties of valuation, the values reflected in the financial statements may materially differ from the value received upon actual sale of those investments.
| B. | Securities Transactions and Investment Income — Securities transactions are accounted for on a trade date basis. Realized gains or losses on sales are computed on the basis of specific identification of the securities sold. Interest income (net of withholding tax, if any) is recorded on the accrual basis from settlement date. Dividend income (net of withholding tax, if any) is recorded on the ex-dividend date. |
15 Invesco Diversified Dividend Fund
The Fund may periodically participate in litigation related to Fund investments. As such, the Fund may receive proceeds from litigation settlements. Any proceeds received are included in the Statement of Operations as realized gain (loss) for investments no longer held and as unrealized gain (loss) for investments still held.
Brokerage commissions and mark ups are considered transaction costs and are recorded as an increase to the cost basis of securities purchased and/or a reduction of proceeds on a sale of securities. Such transaction costs are included in the determination of net realized and unrealized gain (loss) from investment securities reported in the Statement of Operations and the Statement of Changes in Net Assets and the net realized and unrealized gains (losses) on securities per share in the Financial Highlights. Transaction costs are included in the calculation of the Fund’s net asset value and, accordingly, they reduce the Fund’s total returns. These transaction costs are not considered operating expenses and are not reflected in net investment income reported in the Statement of Operations and the Statement of Changes in Net Assets, or the net investment income per share and the ratios of expenses and net investment income reported in the Financial Highlights, nor are they limited by any expense limitation arrangements between the Fund and the investment adviser.
The Fund allocates income and realized and unrealized capital gains and losses to a class based on the relative net assets of each class.
| C. | Country Determination — For the purposes of making investment selection decisions and presentation in the Schedule of Investments, the investment adviser may determine the country in which an issuer is located and/or credit risk exposure based on various factors. These factors include the laws of the country under which the issuer is organized, where the issuer maintains a principal office, the country in which the issuer derives 50% or more of its total revenues and the country that has the primary market for the issuer’s securities, as well as other criteria. Among the other criteria that may be evaluated for making this determination are the country in which the issuer maintains 50% or more of its assets, the type of security, financial guarantees and enhancements, the nature of the collateral and the sponsor organization. Country of issuer and/or credit risk exposure has been determined to be the United States of America, unless otherwise noted. |
| D. | Distributions — Distributions from net investment income, if any, are declared and paid quarterly and are recorded on the ex-dividend date. Distributions from net realized capital gain, if any, are generally declared and paid annually and recorded on the ex-dividend date. The Fund may elect to treat a portion of the proceeds from redemptions as distributions for federal income tax purposes. |
| E. | Federal Income Taxes — The Fund intends to comply with the requirements of Subchapter M of the Internal Revenue Code of 1986, as amended (the “Internal Revenue Code”), necessary to qualify as a regulated investment company and to distribute substantially all of the Fund’s taxable earnings to shareholders. As such, the Fund will not be subject to federal income taxes on otherwise taxable income (including net realized capital gain) that is distributed to shareholders. Therefore, no provision for federal income taxes is recorded in the financial statements. |
The Fund recognizes the tax benefits of uncertain tax positions only when the position is more likely than not to be sustained. Management has analyzed the Fund’s uncertain tax positions and concluded that no liability for unrecognized tax benefits should be recorded related to uncertain tax positions. Management is not aware of any tax positions for which it is reasonably possible that the total amounts of unrecognized tax benefits will change materially in the next 12 months.
The Fund files tax returns in the U.S. Federal jurisdiction and certain other jurisdictions. Generally, the Fund is subject to examinations by such taxing authorities for up to three years after the filing of the return for the tax period.
| F. | Expenses — Fees provided for under the Rule 12b-1 plan of a particular class of the Fund are charged to the operations of such class. Transfer agency fees and expenses and other shareholder recordkeeping fees and expenses attributable to Class R5 and Class R6 are allocated to each share class based on relative net assets. Sub-accounting fees attributable to Class R5 are charged to the operations of the class. Transfer agency fees and expenses and other shareholder recordkeeping fees and expenses relating to all other classes are allocated among those classes based on relative net assets. All other expenses are allocated among the classes based on relative net assets. |
| G. | Accounting Estimates — The preparation of financial statements in conformity with accounting principles generally accepted in the United States of America (“GAAP”) requires management to make estimates and assumptions that affect the reported amounts of assets and liabilities at the date of the financial statements and the reported amounts of revenues and expenses during the reporting period including estimates and assumptions related to taxation. Actual results could differ from those estimates by a significant amount. In addition, the Fund monitors for material events or transactions that may occur or become known after the period-end date and before the date the financial statements are released to print. |
| H. | Indemnifications — Under the Trust’s organizational documents, each Trustee, officer, employee or other agent of the Trust is indemnified against certain liabilities that may arise out of the performance of their duties to the Fund. Additionally, in the normal course of business, the Fund enters into contracts, including the Fund’s servicing agreements, that contain a variety of indemnification clauses. The Fund’s maximum exposure under these arrangements is unknown as this would involve future claims that may be made against the Fund that have not yet occurred. The risk of material loss as a result of such indemnification claims is considered remote. |
| I. | Foreign Currency Translations — Foreign currency is valued at the close of the NYSE based on quotations posted by banks and major currency dealers. Portfolio securities and other assets and liabilities denominated in foreign currencies are translated into U.S. dollar amounts at date of valuation. Purchases and sales of portfolio securities (net of foreign taxes withheld on disposition) and income items denominated in foreign currencies are translated into U.S. dollar amounts on the respective dates of such transactions. The Fund does not separately account for the portion of the results of operations resulting from changes in foreign exchange rates on investments and the fluctuations arising from changes in market prices of securities held. The combined results of changes in foreign exchange rates and the fluctuation of market prices on investments (net of estimated foreign tax withholding) are included with the net realized and unrealized gain or loss from investments in the Statement of Operations. Reported net realized foreign currency gains or losses arise from (1) sales of foreign currencies, (2) currency gains or losses realized between the trade and settlement dates on securities transactions, and (3) the difference between the amounts of dividends, interest, and foreign withholding taxes recorded on the Fund’s books and the U.S. dollar equivalent of the amounts actually received or paid. Net unrealized foreign currency gains and losses arise from changes in the fair values of assets and liabilities, other than investments in securities at fiscal period end, resulting from changes in exchange rates. |
The Fund may invest in foreign securities, which may be subject to foreign taxes on income, gains on investments or currency repatriation, a portion of which may be recoverable. Foreign taxes, if any, are recorded based on the tax regulations and rates that exist in the foreign markets in which the Fund invests and are shown in the Statement of Operations.
16 Invesco Diversified Dividend Fund
| J. | Forward Foreign Currency Contracts — The Fund may engage in foreign currency transactions either on a spot (i.e. for prompt delivery and settlement) basis, or through forward foreign currency contracts, to manage or minimize currency or exchange rate risk. |
The Fund may also enter into forward foreign currency contracts for the purchase or sale of a security denominated in a foreign currency in order to “lock in” the U.S. dollar price of that security, or the Fund may also enter into forward foreign currency contracts that do not provide for physical settlement of the two currencies, but instead are settled by a single cash payment calculated as the difference between the agreed upon exchange rate and the spot rate at settlement based upon an agreed upon notional amount (non-deliverable forwards). The Fund will set aside liquid assets in an amount equal to the daily mark-to-market obligation for forward foreign currency contracts.
A forward foreign currency contract is an obligation between two parties (“Counterparties”) to purchase or sell a specific currency for an agreed-upon price at a future date. The use of forward foreign currency contracts does not eliminate fluctuations in the price of the underlying securities the Fund owns or intends to acquire but establishes a rate of exchange in advance. Fluctuations in the value of these contracts are measured by the difference in the contract date and reporting date exchange rates and are recorded as unrealized appreciation (depreciation) until the contracts are closed. When the contracts are closed, realized gains (losses) are recorded. Realized and unrealized gains (losses) on the contracts are included in the Statement of Operations. The primary risks associated with forward foreign currency contracts include failure of the Counterparty to meet the terms of the contract and the value of the foreign currency changing unfavorably. These risks may be in excess of the amounts reflected in the Statement of Assets and Liabilities.
NOTE 2—Advisory Fees and Other Fees Paid to Affiliates
The Trust has entered into a master investment advisory agreement with Invesco Advisers, Inc. (the “Adviser” or “Invesco”). Under the terms of the investment advisory agreement, the Fund accrues daily and pays monthly an advisory fee to the Adviser based on the annual rate of the Fund’s average daily net assets as follows:
| | | | | | | | |
| Average Daily Net Assets | | Rate | |
First $350 million | | | 0 | .60% | | | | |
Next $350 million | | | 0 | .55% | | | | |
Next $1.3 billion | | | 0 | .50% | | | | |
Next $2 billion | | | 0 | .45% | | | | |
Next $2 billion | | | 0 | .40% | | | | |
Next $2 billion | | | 0 | .375% | | | | |
Over $8 billion | | | 0 | .35% | | | | |
For the year ended October 31, 2017, the effective advisory fees incurred by the Fund was 0.38%.
Under the terms of a master sub-advisory agreement between the Adviser and each of Invesco Asset Management Deutschland GmbH, Invesco Asset Management Limited, Invesco Asset Management (Japan) Limited, Invesco Hong Kong Limited, Invesco Senior Secured Management, Inc. and Invesco Canada Ltd. (collectively, the “Affiliated Sub-Advisers”) the Adviser, not the Fund, will pay 40% of the fees paid to the Adviser to any such Affiliated Sub-Adviser(s) that provide(s) discretionary investment management services to the Fund based on the percentage of assets allocated to such Affiliated Sub-Adviser(s).
The Adviser has contractually agreed, through at least June 30, 2018, to waive advisory fees and/or reimburse expenses of all shares to the extent necessary to limit total annual fund operating expenses after fee waiver and/or expense reimbursement (excluding certain items discussed below) of Class A, Class B, Class C, Class R, Class Y, Investor Class, Class R5 and Class R6 shares to 2.00%, 2.75%, 2.75%, 2.25%, 1.75%, 2.00%, 1.75% and 1.75%, respectively, of average daily net assets (the “expense limits”). In determining the Adviser’s obligation to waive advisory fees and/or reimburse expenses, the following expenses are not taken into account, and could cause the total annual fund operating expenses after fee waiver and/or expense reimbursement to exceed the numbers reflected above: (1) interest; (2) taxes; (3) dividend expense on short sales; (4) extraordinary or non-routine items, including litigation expenses; and (5) expenses that the Fund has incurred but did not actually pay because of an expense offset arrangement. Unless Invesco continues the fee waiver agreement, it will terminate on June 30, 2018. During its term, the fee waiver agreement cannot be terminated or amended to increase the expense limits or reduce the advisory fee waiver without approval of the Board of Trustees. The Adviser did not waive fees and/or reimburse expenses during the period under these expense limits.
Further, the Adviser has contractually agreed, through at least June 30, 2019, to waive the advisory fee payable by the Fund in an amount equal to 100% of the net advisory fees the Adviser receives from the affiliated money market funds on investments by the Fund of uninvested cash in such affiliated money market funds.
For the year ended October 31, 2017, the Adviser waived advisory fees of $4,097,896.
The Trust has entered into a master administrative services agreement with Invesco pursuant to which the Fund has agreed to pay Invesco for certain administrative costs incurred in providing accounting services to the Fund. For the year ended October 31, 2017, expenses incurred under the agreement are shown in the Statement of Operations as Administrative services fees.
The Trust has entered into a transfer agency and service agreement with Invesco Investment Services, Inc. (“IIS”) pursuant to which the Fund has agreed to pay IIS a fee for providing transfer agency and shareholder services to the Fund and reimburse IIS for certain expenses incurred by IIS in the course of providing such services. IIS may make payments to intermediaries that provide omnibus account services, sub-accounting services and/or networking services. All fees payable by IIS to intermediaries that provide omnibus account services or sub-accounting services are charged back to the Fund, subject to certain limitations approved by the Trust’s Board of Trustees. For the year ended October 31, 2017, expenses incurred under the agreement are shown in the Statement of Operations as Transfer agent fees.
The Trust has entered into master distribution agreements with Invesco Distributors, Inc. (“IDI”) to serve as the distributor for the Class A, Class B, Class C, Class R, Class Y, Investor Class, Class R5 and Class R6 shares of the Fund. The Trust has adopted plans pursuant to Rule 12b-1 under the 1940 Act with respect to the Fund’s Class A, Class B, Class C, Class R and Investor Class shares (collectively, the “Plans”). The Fund, pursuant to the Plans, pays IDI compensation at the annual rate of 0.25% of the Fund’s average daily net assets of Class A shares, 1.00% of the average daily net
17 Invesco Diversified Dividend Fund
assets of Class B and Class C shares and 0.50% of the average daily net assets of Class R shares. The Fund, pursuant to the Investor Class Plan, reimburses IDI for its allocated share of expenses incurred pursuant to the Investor Class Plan for the period, up to a maximum annual rate of 0.25% of the average daily net assets of Investor Class shares. The fees are accrued daily and paid monthly. Of the Plan payments, up to 0.25% of the average daily net assets of each class of shares may be paid to furnish continuing personal shareholder services to customers who purchase and own shares of such classes. Any amounts not paid as a service fee under the Plans would constitute an asset-based sales charge. Rules of the Financial Industry Regulatory Authority (“FINRA”) impose a cap on the total sales charges, including asset-based sales charges, that may be paid by any class of shares of the Fund. For the year ended October 31, 2017, expenses incurred under the Plans are shown in the Statement of Operations as Distribution fees.
Front-end sales commissions and CDSC (collectively, the “sales charges”) are not recorded as expenses of the Fund. Front-end sales commissions are deducted from proceeds from the sales of Fund shares prior to investment in Class A shares of the Fund. CDSC are deducted from redemption proceeds prior to remittance to the shareholder. During the year ended October 31, 2017, IDI advised the Fund that IDI retained $1,595,391 in front-end sales commissions from the sale of Class A shares and $148,346, $862 and $175,234 from Class A, Class B and Class C shares, respectively, for CDSC imposed on redemptions by shareholders.
For the year ended October 31, 2017, the Fund incurred $861 in brokerage commissions with Invesco Capital Markets, Inc., an affiliate of the Adviser and IDI, for portfolio transactions executed on behalf of the Fund.
Certain officers and trustees of the Trust are officers and directors of the Adviser, IIS and/or IDI.
NOTE 3—Additional Valuation Information
GAAP defines fair value as the price that would be received to sell an asset or paid to transfer a liability in an orderly transaction between market participants at the measurement date, under current market conditions. GAAP establishes a hierarchy that prioritizes the inputs to valuation methods, giving the highest priority to readily available unadjusted quoted prices in an active market for identical assets (Level 1) and the lowest priority to significant unobservable inputs (Level 3), generally when market prices are not readily available or are unreliable. Based on the valuation inputs, the securities or other investments are tiered into one of three levels. Changes in valuation methods may result in transfers in or out of an investment’s assigned level:
| | Level 1 — | Prices are determined using quoted prices in an active market for identical assets. |
| | Level 2 — | Prices are determined using other significant observable inputs. Observable inputs are inputs that other market participants may use in pricing a security. These may include quoted prices for similar securities, interest rates, prepayment speeds, credit risk, yield curves, loss severities, default rates, discount rates, volatilities and others. |
| | Level 3 — | Prices are determined using significant unobservable inputs. In situations where quoted prices or observable inputs are unavailable (for example, when there is little or no market activity for an investment at the end of the period), unobservable inputs may be used. Unobservable inputs reflect the Fund’s own assumptions about the factors market participants would use in determining fair value of the securities or instruments and would be based on the best available information. |
The following is a summary of the tiered valuation input levels, as of October 31, 2017. The level assigned to the securities valuations may not be an indication of the risk or liquidity associated with investing in those securities. Because of the inherent uncertainties of valuation, the values reflected in the financial statements may materially differ from the value received upon actual sale of those investments.
The Fund’s policy is to recognize transfers in and out of the valuation levels as of the end of the reporting period. During the year ended October 31, 2017, there were transfers from Level 2 to Level 1 of $1,140,676,887, due to foreign fair value adjustments.
| | | | | | | | | | | | | | | | |
| | | Level 1 | | | Level 2 | | | Level 3 | | | Total | |
Common Stocks & Other Equity Interests | | $ | 20,201,827,280 | | | $ | 718,132,695 | | | $ | — | | | $ | 20,919,959,975 | |
Money Market Funds | | | 2,910,586,071 | | | | — | | | | — | | | | 2,910,586,071 | |
| | | | 23,112,413,351 | | | | 718,132,695 | | | | — | | | | 23,830,546,046 | |
Forward Foreign Currency Contracts* | | | — | | | | 40,462,879 | | | | — | | | | 40,462,879 | |
Total Investments | | $ | 23,112,413,351 | | | $ | 758,595,574 | | | $ | — | | | $ | 23,871,008,925 | |
| * | Unrealized appreciation. |
NOTE 4—Derivative Investments
The Fund may enter into an International Swaps and Derivatives Association Master Agreement (“ISDA Master Agreement”) under which a Fund may trade OTC derivatives. An OTC transaction entered into under an ISDA Master Agreement typically involves a collateral posting arrangement, payment netting provisions and close-out netting provisions. These netting provisions allow for reduction of credit risk through netting of contractual obligations. The enforceability of the netting provisions of the ISDA Master Agreement depends on the governing law of the ISDA Master Agreement, among other factors.
For financial reporting purposes, the Fund does not offset OTC derivative assets or liabilities that are subject to ISDA Master Agreements in the Statement of Assets and Liabilities.
18 Invesco Diversified Dividend Fund
Value of Derivative Investments at Period–End
The table below summarizes the value of the Fund’s derivative investments, detailed by primary risk exposure, held as of October 31, 2017:
| | | | |
| | | Value | |
| Derivative Assets | | Currency Risk | |
Unrealized appreciation on forward foreign currency contracts outstanding | | $ | 40,657,093 | |
Derivatives not subject to master netting agreements | | | — | |
Total Derivative Assets subject to master netting agreements | | $ | 40,657,093 | |
| |
| | | Value | |
| Derivative Liabilities | | Currency Risk | |
Unrealized depreciation on forward foreign currency contracts outstanding | | $ | (194,214 | ) |
Derivatives not subject to master netting agreements | | | — | |
Total Derivative Liabilities subject to master netting agreements | | $ | (194,214 | ) |
Offsetting Assets and Liabilities
The table below reflects the Fund’s exposure to Counterparties subject to either an ISDA Master Agreement or other agreement for OTC derivative transactions as of October 31, 2017.
| | | | | | | | | | | | | | | | | | | | | | | | |
| | | Financial
Derivative
Assets | | | Financial
Derivative
Liabilities | | | | | | Collateral
(Received)/Pledged | | | | |
| Counterparty | | Forward Foreign
Currency Contracts | | | Forward Foreign
Currency Contracts | | | Net Value of
Derivatives | | | Non-Cash | | | Cash | | | Net
Amount | |
Citigroup Global Markets Inc. | | $ | 11,047,077 | | | $ | (54,452 | ) | | $ | 10,992,625 | | | $ | — | | | $ | — | | | $ | 10,992,625 | |
Goldman Sachs International | | | 11,130,689 | | | | (73,111 | ) | | | 11,057,578 | | | | — | | | | — | | | | 11,057,578 | |
Merrill Lynch International | | | 11,063,429 | | | | — | | | | 11,063,429 | | | | — | | | | — | | | | 11,063,429 | |
State Street Bank & Trust Co. | | | 7,415,898 | | | | (66,651 | ) | | | 7,349,247 | | | | — | | | | — | | | | 7,349,247 | |
Total | | $ | 40,657,093 | | | $ | (194,214 | ) | | $ | 40,462,879 | | | | — | | | | — | | | $ | 40,462,879 | |
Effect of Derivative Investments for the year ended October 31, 2017
The table below summarizes the gains (losses) on derivative investments, detailed by primary risk exposure, recognized in earnings during the period:
| | | | |
| | | Location of
Gain (Loss)
on Statement
of Operations | |
| | Currency Risk | |
Realized Gain (Loss): | | | | |
Forward foreign currency contracts | | $ | (65,805,540 | ) |
Change in Net Unrealized Appreciation: | | | | |
Forward foreign currency contracts | | | 26,168,084 | |
Total | | $ | (39,637,456 | ) |
The table below summarizes the average notional value of forward foreign currency contracts outstanding during the period.
| | | | |
| | | Forward Foreign Currency
Contracts | |
Average notional value | | $ | 932,585,393 | |
NOTE 5—Investments in Other Affiliates
The 1940 Act defines an “affiliated person” as an issuance in which a fund holds 5% or more of the outstanding voting securities. The Fund has not owned enough of the outstanding voting securities of the issuer to have control (as defined in the 1940 Act) of that issuer. The following is a summary of the investments in other affiliates (excluding affiliated money market funds) for the year ended October 31, 2017.
| | | | | | | | | | | | | | | | | | | | | | | | | | | | |
| | | Value 10/31/16 | | | Purchases
at Cost | | | Proceeds
from Sales | | | Change in
Unrealized
Appreciation | | | Realized
Gain | | | Value 10/31/17 | | | Dividend
Income | |
Flowserve Corp. | | $ | 243,325,101 | | | $ | 80,528,736 | | | $ | — | | | $ | 7,201,766 | | | $ | — | | | $ | 331,055,603 | | | $ | 5,265,041 | |
NOTE 6—Expense Offset Arrangement(s)
The expense offset arrangement is comprised of transfer agency credits which result from balances in demand deposit accounts used by the transfer agent for clearing shareholder transactions. For the year ended October 31, 2017, the Fund received credits from this arrangement, which resulted in the reduction of the Fund’s total expenses of $60,253.
19 Invesco Diversified Dividend Fund
NOTE 7—Trustees’ and Officers’ Fees and Benefits
Trustees’ and Officers’ Fees and Benefits include amounts accrued by the Fund to pay remuneration to certain Trustees and Officers of the Fund. Trustees have the option to defer compensation payable by the Fund, and Trustees’ and Officers’ Fees and Benefits also include amounts accrued by the Fund to fund such deferred compensation amounts. Those Trustees who defer compensation have the option to select various Invesco Funds in which their deferral accounts shall be deemed to be invested. Finally, certain current Trustees were eligible to participate in a retirement plan that provided for benefits to be paid upon retirement to Trustees over a period of time based on the number of years of service. The Fund may have certain former Trustees who also participate in a retirement plan and receive benefits under such plan. Trustees’ and Officers’ Fees and Benefits include amounts accrued by the Fund to fund such retirement benefits. Obligations under the deferred compensation and retirement plans represent unsecured claims against the general assets of the Fund.
NOTE 8—Cash Balances
The Fund is permitted to temporarily carry a negative or overdrawn balance in its account with State Street Bank and Trust Company, the custodian bank. Such balances, if any at period-end, are shown in the Statement of Assets and Liabilities under the payable caption Amount due custodian. To compensate the custodian bank for such overdrafts, the overdrawn Fund may either (1) leave funds as a compensating balance in the account so the custodian bank can be compensated by earning the additional interest; or (2) compensate by paying the custodian bank at a rate agreed upon by the custodian bank and Invesco, not to exceed the contractually agreed upon rate.
NOTE 9—Distributions to Shareholders and Tax Components of Net Assets
Tax Character of Distributions to Shareholders Paid During the Fiscal Years Ended October 31, 2017 and 2016:
| | | | | | | | |
| | | 2017 | | | 2016 | |
Ordinary income | | $ | 409,455,077 | | | $ | 267,023,011 | |
Long-term capital gain | | | 489,019,283 | | | | 459,148,833 | |
Total distributions | | $ | 898,474,360 | | | $ | 726,171,844 | |
Tax Components of Net Assets at Period-End:
| | | | |
| | | 2017 | |
Undistributed ordinary income | | $ | 105,276,934 | |
Undistributed long-term gain | | | 170,862,617 | |
Net unrealized appreciation — investments | | | 4,695,026,788 | |
Net unrealized appreciation (depreciation) — foreign currencies | | | (174,202 | ) |
Temporary book/tax differences | | | (930,338 | ) |
Shares of beneficial interest | | | 18,849,182,518 | |
Total net assets | | $ | 23,819,244,317 | |
The difference between book-basis and tax-basis unrealized appreciation (depreciation) is due to differences in the timing of recognition of gains and losses on investments for tax and book purposes. The Fund’s net unrealized appreciation (depreciation) difference is attributable primarily to forward foreign currency contracts and wash sales.
The temporary book/tax differences are a result of timing differences between book and tax recognition of income and/or expenses. The Fund’s temporary book/tax differences are the result of the trustee deferral of compensation and retirement plan benefits.
Capital loss carryforward is calculated and reported as of a specific date. Results of transactions and other activity after that date may affect the amount of capital loss carryforward actually available for the Fund to utilize. Capital losses generated in years beginning after December 22, 2010 can be carried forward for an unlimited period, whereas previous losses expire in eight tax years. Capital losses with an expiration period may not be used to offset capital gains until all net capital losses without an expiration date have been utilized. Capital loss carryforwards with no expiration date will retain their character as either short-term or long-term capital losses instead of as short-term capital losses as under prior law. The ability to utilize capital loss carryforwards in the future may be limited under the Internal Revenue Code and related regulations based on the results of future transactions.
The Fund does not have a capital loss carryforward as of October 31, 2017.
NOTE 10—Investment Transactions
The aggregate amount of investment securities (other than short-term securities, U.S. Treasury obligations and money market funds, if any) purchased and sold by the Fund during the year ended October 31, 2017 was $4,904,489,197 and $1,520,904,785, respectively. Cost of investments, including any derivatives, on a tax basis includes the adjustments for financial reporting purposes as of the most recently completed federal income tax reporting period-end.
| | | | |
| Unrealized Appreciation (Depreciation) of Investments on a Tax Basis | | | |
Aggregate unrealized appreciation of investments | | $ | 4,892,518,905 | |
Aggregate unrealized (depreciation) of investments | | | (197,492,117 | ) |
Net unrealized appreciation of investments | | $ | 4,695,026,788 | |
Cost of investments for tax purposes is $19,175,982,137.
20 Invesco Diversified Dividend Fund
NOTE 11—Reclassification of Permanent Differences
Primarily as a result of differing book/tax treatment of foreign currency transactions, on October 31, 2017, undistributed net investment income was decrease by $704,756 and undistributed net realized gain was increased by $704,756. This reclassification had no effect on the net assets of the Fund.
NOTE 12—Share Information
| | | | | | | | | | | | | | | | |
| | | Summary of Share Activity | |
| | | Years ended October 31, | |
| | | 2017(a) | | | 2016 | |
| | | Shares | | | Amount | | | Shares | | | Amount | |
Sold: | | | | | | | | | | | | | | | | |
Class A | | | 74,830,049 | | | $ | 1,469,085,962 | | | | 108,979,405 | | | $ | 2,005,788,792 | |
Class B | | | 53,228 | | | | 1,029,356 | | | | 151,159 | | | | 2,737,031 | |
Class C | | | 12,129,887 | | | | 235,075,117 | | | | 23,552,942 | | | | 427,973,231 | |
Class R | | | 9,917,689 | | | | 196,514,334 | | | | 6,720,938 | | | | 124,503,593 | |
Class Y | | | 214,593,938 | | | | 4,224,691,102 | | | | 167,451,174 | | | | 3,100,807,223 | |
Investor Class | | | 5,057,606 | | | | 99,030,821 | | | | 13,026,207 | | | | 240,459,190 | |
Class R5 | | | 50,291,041 | | | | 985,430,188 | | | | 70,801,603 | | | | 1,300,534,108 | |
Class R6 | | | 203,344,265 | | | | 4,030,093,052 | | | | 106,486,741 | | | | 1,989,408,864 | |
| | | | |
Issued as reinvestment of dividends: | | | | | | | | | | | | | | | | |
Class A | | | 12,344,710 | | | | 240,902,638 | | | | 13,066,538 | | | | 230,265,852 | |
Class B | | | 25,244 | | | | 485,276 | | | | 58,325 | | | | 1,007,338 | |
Class C | | | 1,345,778 | | | | 25,875,317 | | | | 1,259,068 | | | | 21,799,540 | |
Class R | | | 538,188 | | | | 10,541,545 | | | | 616,089 | | | | 10,841,357 | |
Class Y | | | 8,930,366 | | | | 174,828,820 | | | | 4,198,659 | | | | 74,674,258 | |
Investor Class | | | 4,310,879 | | | | 84,051,057 | | | | 6,012,378 | | | | 105,660,767 | |
Class R5 | | | 7,966,357 | | | | 155,655,406 | | | | 7,939,892 | | | | 140,140,576 | |
Class R6 | | | 7,642,194 | | | | 149,715,670 | | | | 3,528,232 | | | | 62,800,636 | |
| | | | |
Automatic conversion of Class B shares to Class A shares: | | | | | | | | | | | | | | | | |
Class A | | | 343,370 | | | | 6,781,802 | | | | 327,801 | | | | 6,042,821 | |
Class B | | | (347,375 | ) | | | (6,781,802 | ) | | | (331,527 | ) | | | (6,042,821 | ) |
| | | | |
Reacquired: | | | | | | | | | | | | | | | | |
Class A | | | (106,628,670 | ) | | | (2,104,350,344 | ) | | | (55,515,159 | ) | | | (1,024,203,766 | ) |
Class B | | | (151,421 | ) | | | (2,936,078 | ) | | | (231,547 | ) | | | (4,186,791 | ) |
Class C | | | (13,191,725 | ) | | | (256,936,143 | ) | | | (6,658,102 | ) | | | (121,313,335 | ) |
Class R | | | (5,332,458 | ) | | | (105,816,763 | ) | | | (5,633,746 | ) | | | (101,801,225 | ) |
Class Y | | | (206,476,128 | ) | | | (4,096,071,214 | ) | | | (39,830,247 | ) | | | (736,098,973 | ) |
Investor Class | | | (16,949,114 | ) | | | (333,533,496 | ) | | | (13,325,518 | ) | | | (244,360,026 | ) |
Class R5 | | | (48,840,360 | ) | | | (964,528,959 | ) | | | (24,574,635 | ) | | | (450,235,872 | ) |
Class R6 | | | (35,840,069 | ) | | | (709,191,056 | ) | | | (16,074,584 | ) | | | (292,875,200 | ) |
Net increase in share activity | | | 179,907,469 | | | $ | 3,509,641,608 | | | | 372,002,086 | | | $ | 6,864,327,168 | |
| (a) | There are entities that are record owners of more than 5% of the outstanding shares of the Fund and in the aggregate own 46% of the outstanding shares of the Fund. IDI has an agreement with these entities to sell Fund shares. The Fund, Invesco and/or Invesco affiliates may make payments to these entities, which are considered to be related to the Fund, for providing services to the Fund, Invesco and/or Invesco affiliates including but not limited to services such as securities brokerage, distribution, third party record keeping and account servicing. The Fund has no knowledge as to whether all or any portion of the shares owned of record by these entities are also owned beneficially. |
21 Invesco Diversified Dividend Fund
NOTE 13—Financial Highlights
The following schedule presents financial highlights for a share of the Fund outstanding throughout the periods indicated.
| | | | | | | | | | | | | | | | | | | | | | | | | | | | | | | | | | | | | | | | | | | | | | | | | | | | | | | | |
| | | Net asset
value,
beginning
of period | | | Net
investment
income(a) | | | Net gains
on securities
(both
realized and
unrealized) | | | Total from
investment
operations | | | Dividends
from net
investment
income | | | Distributions
from net
realized
gains | | | Total
distributions | | | Net asset
value, end
of period | | | Total
return(b) | | | Net assets,
end of period
(000’s omitted) | | | Ratio of
expenses
to average
net assets
with fee waivers
and/or expenses
absorbed | | | Ratio of
expenses
to average net
assets without
fee waivers
and/or expenses
absorbed | | | Ratio of net
investment
income
to average
net assets | | | Portfolio
turnover(c) | |
Class A | | | | | | | | | | | | | | | | | | | | | | | | | | | | | | | | | | | | | | | | | | | | | | | | | | | | | | | | |
Year ended 10/31/17 | | $ | 18.83 | | | $ | 0.37 | | | $ | 1.79 | | | $ | 2.16 | | | $ | (0.34 | ) | | $ | (0.47 | ) | | $ | (0.81 | ) | | $ | 20.18 | | | | 11.65 | % | | $ | 6,029,664 | | | | 0.80 | %(d) | | | 0.82 | %(d) | | | 1.85 | %(d) | | | 8 | % |
Year ended 10/31/16 | | | 18.78 | | | | 0.33 | | | | 0.76 | | | | 1.09 | | | | (0.31 | ) | | | (0.73 | ) | | | (1.04 | ) | | | 18.83 | | | | 6.27 | | | | 5,985,548 | | | | 0.80 | | | | 0.82 | | | | 1.79 | | | | 11 | |
Year ended 10/31/15 | | | 18.17 | | | | 0.30 | | | | 0.95 | | | | 1.25 | | | | (0.28 | ) | | | (0.36 | ) | | | (0.64 | ) | | | 18.78 | | | | 7.09 | | | | 4,715,635 | | | | 0.82 | | | | 0.83 | | | | 1.63 | | | | 11 | |
Year ended 10/31/14 | | | 16.52 | | | | 0.28 | | | | 1.78 | | | | 2.06 | | | | (0.25 | ) | | | (0.16 | ) | | | (0.41 | ) | | | 18.17 | | | | 12.68 | | | | 4,206,935 | | | | 0.83 | | | | 0.84 | | | | 1.59 | | | | 6 | |
Year ended 10/31/13 | | | 13.54 | | | | 0.25 | | | | 3.20 | | | | 3.45 | | | | (0.26 | ) | | | (0.21 | ) | | | (0.47 | ) | | | 16.52 | | | | 26.07 | | | | 3,700,473 | | | | 0.86 | | | | 0.87 | | | | 1.65 | | | | 9 | |
Class B | | | | | | | | | | | | | | | | | | | | | | | | | | | | | | | | | | | | | | | | | | | | | | | | | | | | | | | | |
Year ended 10/31/17 | | | 18.61 | | | | 0.21 | | | | 1.78 | | | | 1.99 | | | | (0.19 | ) | | | (0.47 | ) | | | (0.66 | ) | | | 19.94 | | | | 10.83 | | | | 9,092 | | | | 1.55 | (d) | | | 1.57 | (d) | | | 1.10 | (d) | | | 8 | |
Year ended 10/31/16 | | | 18.58 | | | | 0.19 | | | | 0.74 | | | | 0.93 | | | | (0.17 | ) | | | (0.73 | ) | | | (0.90 | ) | | | 18.61 | | | | 5.41 | | | | 16,309 | | | | 1.55 | | | | 1.57 | | | | 1.04 | | | | 11 | |
Year ended 10/31/15 | | | 17.97 | | | | 0.16 | | | | 0.95 | | | | 1.11 | | | | (0.14 | ) | | | (0.36 | ) | | | (0.50 | ) | | | 18.58 | | | | 6.35 | | | | 22,845 | | | | 1.57 | | | | 1.58 | | | | 0.88 | | | | 11 | |
Year ended 10/31/14 | | | 16.35 | | | | 0.14 | | | | 1.76 | | | | 1.90 | | | | (0.12 | ) | | | (0.16 | ) | | | (0.28 | ) | | | 17.97 | | | | 11.77 | | | | 29,691 | | | | 1.58 | | | | 1.59 | | | | 0.84 | | | | 6 | |
Year ended 10/31/13 | | | 13.40 | | | | 0.13 | | | | 3.17 | | | | 3.30 | | | | (0.14 | ) | | | (0.21 | ) | | | (0.35 | ) | | | 16.35 | | | | 25.16 | | | | 35,912 | | | | 1.61 | | | | 1.62 | | | | 0.90 | | | | 9 | |
Class C | | | | | | | | | | | | | | | | | | | | | | | | | | | | | | | | | | | | | | | | | | | | | | | | | | | | | | | | |
Year ended 10/31/17 | | | 18.59 | | | | 0.21 | | | | 1.77 | | | | 1.98 | | | | (0.18 | ) | | | (0.47 | ) | | | (0.65 | ) | | | 19.92 | | | | 10.84 | | | | 840,125 | | | | 1.55 | (d) | | | 1.57 | (d) | | | 1.10 | (d) | | | 8 | |
Year ended 10/31/16 | | | 18.56 | | | | 0.19 | | | | 0.74 | | | | 0.93 | | | | (0.17 | ) | | | (0.73 | ) | | | (0.90 | ) | | | 18.59 | | | | 5.41 | | | | 778,829 | | | | 1.55 | | | | 1.57 | | | | 1.04 | | | | 11 | |
Year ended 10/31/15 | | | 17.95 | | | | 0.16 | | | | 0.95 | | | | 1.11 | | | | (0.14 | ) | | | (0.36 | ) | | | (0.50 | ) | | | 18.56 | | | | 6.36 | | | | 440,482 | | | | 1.57 | | | | 1.58 | | | | 0.88 | | | | 11 | |
Year ended 10/31/14 | | | 16.33 | | | | 0.14 | | | | 1.76 | | | | 1.90 | | | | (0.12 | ) | | | (0.16 | ) | | | (0.28 | ) | | | 17.95 | | | | 11.79 | | | | 348,340 | | | | 1.58 | | | | 1.59 | | | | 0.84 | | | | 6 | |
Year ended 10/31/13 | | | 13.38 | | | | 0.13 | | | | 3.17 | | | | 3.30 | | | | (0.14 | ) | | | (0.21 | ) | | | (0.35 | ) | | | 16.33 | | | | 25.19 | | | | 276,653 | | | | 1.61 | | | | 1.62 | | | | 0.90 | | | | 9 | |
Class R | | | | | | | | | | | | | | | | | | | | | | | | | | | | | | | | | | | | | | | | | | | | | | | | | | | | | | | | |
Year ended 10/31/17 | | | 18.88 | | | | 0.32 | | | | 1.80 | | | | 2.12 | | | | (0.29 | ) | | | (0.47 | ) | | | (0.76 | ) | | | 20.24 | | | | 11.40 | | | | 358,418 | | | | 1.05 | (d) | | | 1.07 | (d) | | | 1.60 | (d) | | | 8 | |
Year ended 10/31/16 | | | 18.84 | | | | 0.28 | | | | 0.75 | | | | 1.03 | | | | (0.26 | ) | | | (0.73 | ) | | | (0.99 | ) | | | 18.88 | | | | 5.93 | | | | 237,638 | | | | 1.05 | | | | 1.07 | | | | 1.54 | | | | 11 | |
Year ended 10/31/15 | | | 18.22 | | | | 0.26 | | | | 0.96 | | | | 1.22 | | | | (0.24 | ) | | | (0.36 | ) | | | (0.60 | ) | | | 18.84 | | | | 6.87 | | | | 204,956 | | | | 1.07 | | | | 1.08 | | | | 1.38 | | | | 11 | |
Year ended 10/31/14 | | | 16.57 | | | | 0.23 | | | | 1.79 | | | | 2.02 | | | | (0.21 | ) | | | (0.16 | ) | | | (0.37 | ) | | | 18.22 | | | | 12.36 | | | | 138,078 | | | | 1.08 | | | | 1.09 | | | | 1.34 | | | | 6 | |
Year ended 10/31/13 | | | 13.58 | | | | 0.22 | | | | 3.20 | | | | 3.42 | | | | (0.22 | ) | | | (0.21 | ) | | | (0.43 | ) | | | 16.57 | | | | 25.77 | | | | 109,444 | | | | 1.11 | | | | 1.12 | | | | 1.40 | | | | 9 | |
Class Y | | | | | | | | | | | | | | | | | | | | | | | | | | | | | | | | | | | | | | | | | | | | | | | | | | | | | | | | |
Year ended 10/31/17 | | | 18.85 | | | | 0.42 | | | | 1.79 | | | | 2.21 | | | | (0.39 | ) | | | (0.47 | ) | | | (0.86 | ) | | | 20.20 | | | | 11.93 | | | | 4,278,325 | | | | 0.55 | (d) | | | 0.57 | (d) | | | 2.10 | (d) | | | 8 | |
Year ended 10/31/16 | | | 18.80 | | | | 0.38 | | | | 0.75 | | | | 1.13 | | | | (0.35 | ) | | | (0.73 | ) | | | (1.08 | ) | | | 18.85 | | | | 6.53 | | | | 3,670,662 | | | | 0.55 | | | | 0.57 | | | | 2.04 | | | | 11 | |
Year ended 10/31/15 | | | 18.19 | | | | 0.35 | | | | 0.95 | | | | 1.30 | | | | (0.33 | ) | | | (0.36 | ) | | | (0.69 | ) | | | 18.80 | | | | 7.36 | | | | 1,183,312 | | | | 0.57 | | | | 0.58 | | | | 1.88 | | | | 11 | |
Year ended 10/31/14 | | | 16.54 | | | | 0.32 | | | | 1.79 | | | | 2.11 | | | | (0.30 | ) | | | (0.16 | ) | | | (0.46 | ) | | | 18.19 | | | | 12.95 | | | | 841,750 | | | | 0.58 | | | | 0.59 | | | | 1.84 | | | | 6 | |
Year ended 10/31/13 | | | 13.56 | | | | 0.29 | | | | 3.19 | | | | 3.48 | | | | (0.29 | ) | | | (0.21 | ) | | | (0.50 | ) | | | 16.54 | | | | 26.35 | | | | 485,248 | | | | 0.61 | | | | 0.62 | | | | 1.90 | | | | 9 | |
Investor Class | | | | | | | | | | | | | | | | | | | | | | | | | | | | | | | | | | | | | | | | | | | | | | | | | | | | | | | | |
Year ended 10/31/17 | | | 18.81 | | | | 0.37 | | | | 1.79 | | | | 2.16 | | | | (0.34 | ) | | | (0.47 | ) | | | (0.81 | ) | | | 20.16 | | | | 11.69 | (e) | | | 2,113,750 | | | | 0.75 | (d)(e) | | | 0.77 | (d)(e) | | | 1.90 | (d)(e) | | | 8 | |
Year ended 10/31/16 | | | 18.77 | | | | 0.33 | | | | 0.76 | | | | 1.09 | | | | (0.32 | ) | | | (0.73 | ) | | | (1.05 | ) | | | 18.81 | | | | 6.29 | (e) | | | 2,114,404 | | | | 0.76 | (e) | | | 0.78 | (e) | | | 1.83 | (e) | | | 11 | |
Year ended 10/31/15 | | | 18.16 | | | | 0.31 | | | | 0.96 | | | | 1.27 | | | | (0.30 | ) | | | (0.36 | ) | | | (0.66 | ) | | | 18.77 | | | | 7.16 | (e) | | | 2,002,938 | | | | 0.80 | (e) | | | 0.81 | (e) | | | 1.65 | (e) | | | 11 | |
Year ended 10/31/14 | | | 16.51 | | | | 0.29 | | | | 1.78 | | | | 2.07 | | | | (0.26 | ) | | | (0.16 | ) | | | (0.42 | ) | | | 18.16 | | | | 12.70 | (e) | | | 1,972,400 | | | | 0.76 | (e) | | | 0.77 | (e) | | | 1.66 | (e) | | | 6 | |
Year ended 10/31/13 | | | 13.53 | | | | 0.25 | | | | 3.20 | | | | 3.45 | | | | (0.26 | ) | | | (0.21 | ) | | | (0.47 | ) | | | 16.51 | | | | 26.11 | | | | 1,910,866 | | | | 0.86 | | | | 0.87 | | | | 1.64 | | | | 9 | |
Class R5 | | | | | | | | | | | | | | | | | | | | | | | | | | | | | | | | | | | | | | | | | | | | | | | | | | | | | | | | |
Year ended 10/31/17 | | | 18.83 | | | | 0.43 | | | | 1.79 | | | | 2.22 | | | | (0.40 | ) | | | (0.47 | ) | | | (0.87 | ) | | | 20.18 | | | | 11.99 | | | | 3,845,848 | | | | 0.49 | (d) | | | 0.51 | (d) | | | 2.16 | (d) | | | 8 | |
Year ended 10/31/16 | | | 18.78 | | | | 0.39 | | | | 0.76 | | | | 1.15 | | | | (0.37 | ) | | | (0.73 | ) | | | (1.10 | ) | | | 18.83 | | | | 6.59 | | | | 3,410,571 | | | | 0.50 | | | | 0.52 | | | | 2.09 | | | | 11 | |
Year ended 10/31/15 | | | 18.17 | | | | 0.36 | | | | 0.95 | | | | 1.31 | | | | (0.34 | ) | | | (0.36 | ) | | | (0.70 | ) | | | 18.78 | | | | 7.41 | | | | 2,385,096 | | | | 0.53 | | | | 0.54 | | | | 1.92 | | | | 11 | |
Year ended 10/31/14 | | | 16.52 | | | | 0.33 | | | | 1.78 | | | | 2.11 | | | | (0.30 | ) | | | (0.16 | ) | | | (0.46 | ) | | | 18.17 | | | | 12.99 | | | | 1,947,461 | | | | 0.54 | | | | 0.55 | | | | 1.88 | | | | 6 | |
Year ended 10/31/13 | | | 13.54 | | | | 0.29 | | | | 3.20 | | | | 3.49 | | | | (0.30 | ) | | | (0.21 | ) | | | (0.51 | ) | | | 16.52 | | | | 26.47 | | | | 1,408,407 | | | | 0.57 | | | | 0.58 | | | | 1.94 | | | | 9 | |
Class R6 | | | | | | | | | | | | | | | | | | | | | | | | | | | | | | | | | | | | | | | | | | | | | | | | | | | | | | | | |
Year ended 10/31/17 | | | 18.83 | | | | 0.45 | | | | 1.79 | | | | 2.24 | | | | (0.41 | ) | | | (0.47 | ) | | | (0.88 | ) | | | 20.19 | | | | 12.15 | | | | 6,344,022 | | | | 0.39 | (d) | | | 0.41 | (d) | | | 2.26 | (d) | | | 8 | |
Year ended 10/31/16 | | | 18.79 | | | | 0.41 | | | | 0.74 | | | | 1.15 | | | | (0.38 | ) | | | (0.73 | ) | | | (1.11 | ) | | | 18.83 | | | | 6.63 | | | | 2,620,298 | | | | 0.40 | | | | 0.42 | | | | 2.19 | | | | 11 | |
Year ended 10/31/15 | | | 18.17 | | | | 0.37 | | | | 0.97 | | | | 1.34 | | | | (0.36 | ) | | | (0.36 | ) | | | (0.72 | ) | | | 18.79 | | | | 7.57 | | | | 849,176 | | | | 0.43 | | | | 0.44 | | | | 2.02 | | | | 11 | |
Year ended 10/31/14 | | | 16.52 | | | | 0.35 | | | | 1.78 | | | | 2.13 | | | | (0.32 | ) | | | (0.16 | ) | | | (0.48 | ) | | | 18.17 | | | | 13.10 | | | | 937,485 | | | | 0.44 | | | | 0.45 | | | | 1.98 | | | | 6 | |
Year ended 10/31/13 | | | 13.54 | | | | 0.31 | | | | 3.19 | | | | 3.50 | | | | (0.31 | ) | | | (0.21 | ) | | | (0.52 | ) | | | 16.52 | | | | 26.56 | | | | 535,077 | | | | 0.48 | | | | 0.49 | | | | 2.03 | | | | 9 | |
| (a) | Calculated using average shares outstanding. |
| (b) | Includes adjustments in accordance with accounting principles generally accepted in the United States of America and as such, the net asset value for financial reporting purposes and the returns based upon those net asset values may differ from the net asset value and returns for shareholder transactions. Does not include sales charges and is not annualized for periods less than one year, if applicable. |
| (c) | Portfolio turnover is calculated at the fund level and is not annualized for periods less than one year, if applicable. |
| (d) | Ratios are based on average daily net assets (000’s omitted) of $6,168,987, $13,028, $852,762, $303,611, $5,062,000, $2,165,646, $3,818,614 and $4,014,625 for Class A, Class B, Class C, Class R, Class Y, Investor Class, Class R5 and Class R6 shares, respectively. |
| (e) | The total return, ratio of expenses to average net assets and ratio of net investment income to average net assets reflect actual 12b-1 fees 0.20%, 0.21%, 0.23% and 0.18% for the years ended October 31, 2017, 2016, 2015 and 2014, respectively. |
NOTE 14—Subsequent Event
On December 1, 2017, the Fund’s Board of Trustees approved the early conversion of the remaining assets in the Fund’s Class B shares into Class A shares to occur on or about January 26, 2018. At the close of business on or about January 26, 2018, (the “Conversion Date”) all outstanding Class B shares of the Fund will be converted to Class A shares of the Fund, which is prior to the date the Class B shares would normally be converted to Class A shares. Once the conversion is completed, Class B shares will be closed and become inactive. No contingent deferred sales charges will be payable in connection with this early conversion. The conversion of the Fund’s Class B shares into Class A shares on the Conversion Date is not expected to be a taxable event for federal income tax purposes, and should not result in the recognition of gain or loss by converting shareholders, although each shareholder should consult with his or her own tax adviser.
22 Invesco Diversified Dividend Fund
Report of Independent Registered Public Accounting Firm
To the Board of Trustees of AIM Equity Funds (Invesco Equity Funds)
and Shareholders of Invesco Diversified Dividend Fund:
In our opinion, the accompanying statement of assets and liabilities, including the schedule of investments, and the related statements of operations and of changes in net assets and the financial highlights present fairly, in all material respects, the financial position of Invesco Diversified Dividend Fund (one of the portfolios constituting the AIM Equity Funds (Invesco Equity Funds), hereafter referred to as the “Fund”) as of October 31, 2017, the results of its operations for the year then ended, the changes in its net assets for each of the two years in the period then ended and the financial highlights for each of the five years in the period then ended, in conformity with accounting principles generally accepted in the United States of America. These financial statements and financial highlights (hereafter referred to as “financial statements”) are the responsibility of the Fund’s management. Our responsibility is to express an opinion on these financial statements based on our audits. We conducted our audits of these financial statements in accordance with the standards of the Public Company Accounting Oversight Board (United States). Those standards require that we plan and perform the audit to obtain reasonable assurance about whether the financial statements are free of material misstatement. An audit includes examining, on a test basis, evidence supporting the amounts and disclosures in the financial statements, assessing the accounting principles used and significant estimates made by management, and evaluating the overall financial statement presentation. We believe that our audits, which included confirmation of securities as of October 31, 2017 by correspondence with the custodian, transfer agent and brokers, and when replies were not received from brokers, we performed other auditing procedures, provide a reasonable basis for our opinion.
PricewaterhouseCoopers LLP
Houston, Texas
December 21, 2017
23 Invesco Diversified Dividend Fund
Calculating your ongoing Fund expenses
Example
As a shareholder of the Fund, you incur two types of costs: (1) transaction costs, which may include sales charges (loads) on purchase payments or contingent deferred sales charges on redemptions, if any; and (2) ongoing costs, including management fees, distribution and/or service (12b-1) fees, and other Fund expenses. This example is intended to help you understand your ongoing costs (in dollars) of investing in the Fund and to compare these costs with ongoing costs of investing in other mutual funds. The example is based on an investment of $1,000 invested at the beginning of the period and held for the entire period May 1, 2017 through October 31, 2017.
Actual expenses
The table below provides information about actual account values and actual expenses. You may use the information in this table, together with the amount you invested, to estimate the expenses that you paid over the period. Simply divide your account value by $1,000 (for example, an $8,600 account value divided by $1,000 = 8.6), then multiply the result by the number in the table under the heading entitled “Actual Expenses Paid During Period” to estimate the expenses you paid on your account during this period.
Hypothetical example for comparison purposes
The table below also provides information about hypothetical account values and hypothetical expenses based on the Fund’s actual expense ratio and an assumed rate of return of 5% per year before expenses, which is not the Fund’s actual return.
The hypothetical account values and expenses may not be used to estimate the actual ending account balance or expenses you paid for the period. You may use this information to compare the ongoing costs of investing in the Fund and other funds. To do so, compare this 5% hypothetical example with the 5% hypothetical examples that appear in the shareholder reports of the other funds.
Please note that the expenses shown in the table are meant to highlight your ongoing costs only and do not reflect any transaction costs, such as sales charges (loads) on purchase payments or contingent deferred sales charges on redemptions, if any. Therefore, the hypothetical information is useful in comparing ongoing costs only, and will not help you determine the relative total costs of owning different funds. In addition, if these transaction costs were included, your costs would have been higher.
| | | | | | | | | | | | | | | | | | | | | | | | |
| Class | | Beginning
Account Value
(05/01/17) | | | ACTUAL | | | HYPOTHETICAL (5% annual return before
expenses) | | | Annualized
Expense
Ratio | |
| | | Ending
Account Value
(10/31/17)1 | | | Expenses
Paid During
Period2 | | | Ending
Account Value
(10/31/17) | | | Expenses
Paid During
Period2 | | |
| A | | $ | 1,000.00 | | | $ | 1,030.30 | | | $ | 4.09 | | | $ | 1,021.17 | | | $ | 4.08 | | | | 0.80 | % |
| B | | | 1,000.00 | | | | 1,026.20 | | | | 7.92 | | | | 1,017.39 | | | | 7.88 | | | | 1.55 | |
| C | | | 1,000.00 | | | | 1,026.20 | | | | 7.92 | | | | 1,017.39 | | | | 7.88 | | | | 1.55 | |
| R | | | 1,000.00 | | | | 1,029.00 | | | | 5.37 | | | | 1,019.91 | | | | 5.35 | | | | 1.05 | |
| Y | | | 1,000.00 | | | | 1,031.60 | | | | 2.82 | | | | 1,022.43 | | | | 2.80 | | | | 0.55 | |
| Investor | | | 1,000.00 | | | | 1,030.50 | | | | 3.94 | | | | 1,021.32 | | | | 3.92 | | | | 0.77 | |
| R5 | | | 1,000.00 | | | | 1,031.80 | | | | 2.51 | | | | 1,022.74 | | | | 2.50 | | | | 0.49 | |
| R6 | | | 1,000.00 | | | | 1,032.90 | | | | 2.05 | | | | 1,023.19 | | | | 2.04 | | | | 0.40 | |
| 1 | The actual ending account value is based on the actual total return of the Fund for the period May 1, 2017 through October 31, 2017, after actual expenses and will differ from the hypothetical ending account value which is based on the Fund’s expense ratio and a hypothetical annual return of 5% before expenses. |
| 2 | Expenses are equal to the Fund’s annualized expense ratio as indicated above multiplied by the average account value over the period, multiplied by 184/365 to reflect the most recent fiscal half year. |
24 Invesco Diversified Dividend Fund
Approval of Investment Advisory and Sub-Advisory Contracts
The Board of Trustees (the Board) of AIM Equity Funds (Invesco Equity Funds) is required under the Investment Company Act of 1940, as amended, to approve annually the renewal of Invesco Diversified Dividend Fund’s (the Fund) investment advisory agreements. During contract renewal meetings held on June 12-13, 2017, the Board as a whole, and the disinterested or “independent” Trustees, who comprise over 75% of the Board, voting separately, approved the continuance for the Fund of the Master Investment Advisory Agreement with Invesco Advisers, Inc. (Invesco Advisers and the investment advisory agreement) and the Master Intergroup Sub-Advisory Contract for Mutual Funds with Invesco Asset Management Deutschland GmbH, Invesco Asset Management Limited, Invesco Asset Management (Japan) Limited, Invesco Hong Kong Limited, Invesco Senior Secured Management, Inc. and Invesco Canada Ltd. (collectively, the Affiliated Sub-Advisers and the sub-advisory contracts) for another year, effective July 1, 2017.
In evaluating the fairness and reasonableness of compensation under the Fund’s investment advisory agreement and sub-advisory contracts, the Board considered, among other things, the factors discussed below. The Board determined that continuation of the Fund’s investment advisory agreement and the sub-advisory contracts is in the best interest of the Fund and its shareholders and that the compensation payable to Invesco Advisers and the Affiliated Sub-Advisers under the agreements is fair and reasonable.
The Board’s Fund Evaluation Process
The Board’s Investments Committee has established three Sub-Committees, which meet throughout the year to review the performance of funds advised by Invesco Advisers (the Invesco Funds). Over the course of each year, the Sub-Committees meet with portfolio managers for their assigned Invesco Funds and other members of management to review the performance, investment objective(s), policies, strategies, limitations and investment risks of these funds. The Board had the benefit of reports from the Sub-Committees and Investments Committee throughout the year in considering approval of the continuance of each Invesco Fund’s investment advisory agreement and sub-advisory contracts for another year.
During the contract renewal process, the Board receives comparative performance and fee data regarding the Invesco Funds prepared by Invesco Advisers and Broadridge Financial Solutions, Inc. (Broadridge), an independent provider of investment company data. The Board also receives an independent written evaluation from the Senior Officer, an officer of the Invesco Funds who reports directly to the independent Trustees. The Senior Officer’s
evaluation is prepared as part of his responsibility to manage the process by which the Invesco Funds’ proposed management fees are negotiated during the annual contract renewal process to ensure they are negotiated in a manner that is at arms’ length and reasonable. In addition to meetings with Invesco Advisers and fund counsel, the independent Trustees also discuss the continuance of the investment advisory agreement and sub-advisory contracts in separate sessions with the Senior Officer and with independent legal counsel.
The Trustees recognized that the advisory fee rates for the Invesco Funds are, in most cases, the result of years of review and negotiation. The Trustees’ deliberations and conclusions in a particular year may be based in part on their deliberations and conclusions regarding these arrangements throughout the year and in prior years. The Trustees’ review and conclusions are based on the comprehensive consideration of all information presented to them and are not the result of any single determinative factor. Moreover, one Trustee may have weighed a particular piece of information or factor differently than another Trustee.
The discussion below is a summary of the Senior Officer’s independent written evaluation with respect to the Fund’s investment advisory agreement as well as a discussion of the material factors and related conclusions that formed the basis for the Board’s approval of the Fund’s investment advisory agreement and sub-advisory contracts. This information is current as of June 13, 2017, and does not reflect consideration of factors that became known to the Board after that date.
Factors and Conclusions and Summary of Independent Written Fee Evaluation
| A. | Nature, Extent and Quality of Services Provided by Invesco Advisers and the Affiliated Sub-Advisers |
The Board reviewed the advisory services provided to the Fund by Invesco Advisers under the Fund’s investment advisory agreement, the performance of Invesco Advisers in providing these services, and the credentials and experience of the officers and employees of Invesco Advisers who provide these services, including the Fund’s portfolio manager or managers. The Board’s review included consideration of Invesco Advisers’ investment process oversight, credit analysis and investment risk management. The Board also considered non-advisory services that Invesco Advisers and its affiliates provide to the Invesco Funds such as various back office support functions, trading operations, internal audit, valuation and legal and compliance.
In determining whether to continue the Fund’s investment advisory agreement, the Board considered the benefits of reapproving an
existing relationship as contrasted with the greater uncertainty that may be associated with entering into a new relationship. The Board concluded that the nature, extent and quality of the services provided to the Fund by Invesco Advisers are appropriate and satisfactory.
The Board reviewed the services that may be provided by the Affiliated Sub-Advisers under the sub-advisory contracts and the credentials and experience of the officers and employees of the Affiliated Sub-Advisers who provide these services. The Board noted that the Affiliated Sub-Advisers have offices and personnel that are located in financial centers around the world. As a result, the Board noted that the Affiliated Sub-Advisers can provide research and investment analysis on the markets and economies of various countries in which the Fund may invest, make recommendations regarding securities and assist with security trades. The Board concluded that the sub-advisory contracts may benefit the Fund and its shareholders by permitting Invesco Advisers to use the resources and talents of the Affiliated Sub-Advisers in managing the Fund. The Board concluded that the nature, extent and quality of the services that may be provided by the Affiliated Sub-Advisers are appropriate and satisfactory.
| B. | Fund Investment Performance |
The Board considered Fund investment performance as a relevant factor in considering whether to approve the investment advisory agreement. The Board did not view Fund performance as a relevant factor in considering whether to approve the sub-advisory contracts for the Fund, as no Affiliated Sub-Adviser currently manages assets of the Fund.
The Board compared the Fund’s investment performance over multiple time periods ending December 31, 2016 to the performance of funds in the Broadridge performance universe and against the Lipper Large-Cap Value Funds Index. The Board noted that performance of Class A shares of the Fund was in the third quintile of its performance universe for the one year period and the first quintile for the three and five year periods (the first quintile being the best performing funds and the fifth quintile being the worst performing funds). The Board noted that performance of Class A shares of the Fund was below the performance of the Index for the one year period and above the performance of the Index for the three and five year periods. The Trustees also reviewed more recent Fund performance and this review did not change their conclusions.
| C. | Advisory and Sub-Advisory Fees |
The Board compared the Fund’s contractual management fee rate to the contractual management fee rates of funds in the Fund’s Broadridge expense group at a common asset level. The Board noted that the contractual management fee rate for Class A shares of the
25 Invesco Diversified Dividend Fund
Fund was below the median contractual management fee rate of funds in its expense group. The Board noted that the term “contractual management fee” for funds in the expense group may include both advisory and certain administrative services fees, but that Broadridge does not provide information on a fund by fund basis as to what is included. The Board noted that Invesco Advisers does not separately charge the Invesco Funds for the administrative services included in the term as defined by Broadridge. The Board also reviewed the methodology used by Broadridge in providing expense group information, which includes using each fund’s contractual management fee schedule (including any applicable breakpoints) as reported in the most recent prospectus or statement of additional information for each fund in the expense group.
The Board also compared the Fund’s effective advisory fee rate (the advisory fee rate after advisory fee waivers and before other expense limitations/waivers) to the effective advisory fee rates of other mutual funds advised by Invesco Advisers and its affiliates with investment strategies comparable to those of the Fund, based on asset balances as of December 31, 2016. The Board noted that the Fund’s rate was below the rate of one mutual fund and below the rate of an offshore fund advised by Invesco Advisers using a similar investment process.
The Board also considered the fees charged by Invesco Advisers and the Affiliated Sub-Advisers to other client accounts with investment strategies comparable to those of the Fund. The Board noted that Invesco Advisers or the Affiliated Sub-Advisers may charge lower fees to large institutional clients. Invesco Advisers reviewed with the Board the significantly greater scope of services it provides to the Invesco Funds relative to certain other types of client accounts. These additional services include provision of administrative services, officers and office space, oversight of service providers, preparation of annual registration statement updates and financial information and regulatory compliance under the Investment Company Act of 1940, as amended.
Invesco Advisers also reviewed generally the higher frequency of shareholder purchases and redemptions in the Invesco Funds relative to the flow of assets for other client accounts. Invesco Advisers advised the Board that advance notice of redemptions is often provided to Invesco Advisers by institutional clients. The Board did note that sub-advisory fee rates charged by the Affiliated Sub-Advisers to manage the Invesco Funds and to manage other client accounts tended to be more comparable, reflecting a similar scope of services.
The Board also considered the services that may be provided by the Affiliated Sub-Advisers pursuant to the sub-advisory contracts, as well as the fees payable by Invesco Advisers to the Affiliated Sub-Advisers pursuant to the sub-advisory contracts. The Board also noted
that the sub-advisory fees are not paid directly by the Fund, but rather, are payable by Invesco Advisers to the Affiliated Sub-Advisers.
| D. | Economies of Scale and Breakpoints |
The Board considered the extent to which there are economies of scale in the provision of advisory services to the Fund. The Board also considered that the Fund benefits from economies of scale through contractual breakpoints in the Fund’s advisory fee schedule. The Board noted that the Fund shares directly in economies of scale through lower fees charged by third party service providers based on the combined size of the Invesco Funds advised by Invesco Advisers.
| E. | Profitability and Financial Resources |
The Board reviewed information from Invesco Advisers concerning the costs of the advisory and other services that Invesco Advisers and its affiliates provide to the Fund and the Invesco Funds and the profitability of Invesco Advisers and its affiliates in providing these services. The Board noted that Invesco Advisers continues to operate at a net profit from services Invesco Advisers and its affiliates provide to the Invesco Funds and the Fund. The Board did not deem the level of profits realized by Invesco Advisers and its affiliates from providing services to the Fund to be excessive given the nature, quality and extent of the services provided. The Board received and accepted information from Invesco Advisers demonstrating that Invesco Advisers and each Affiliated Sub-Adviser are financially sound and have the resources necessary to perform their obligations under the investment advisory agreement and sub-advisory contracts.
| F. | Collateral Benefits to Invesco Advisers and its Affiliates |
The Board considered various other benefits received by Invesco Advisers and its affiliates from the relationship with the Fund, including the fees received for providing transfer agency and distribution services to the Fund. The Board considered comparative information regarding fees charged for these services, including information provided by Broadridge and other independent sources. The Board considered the performance of Invesco Advisers and its affiliates in providing these services and the organizational structure employed to provide these services. The Board also considered that these services are provided to the Fund pursuant to written contracts that are reviewed and approved on an annual basis by the Board; and that the services are required for the operation of the Fund.
The Board considered the benefits realized by Invesco Advisers and the Affiliated Sub-Advisers as a result of portfolio brokerage transactions executed through “soft dollar” arrangements. The Board noted that soft dollar arrangements may result in the Fund bearing costs to purchase research that may be used by Invesco Advisers or the Affiliated Sub-Advisers with other clients and may reduce Invesco Advisers’ or the Affiliated Sub-Advisers’ expenses. The Board also considered that it receives periodic reports from the Chief Compliance Officer of the
Invesco Funds demonstrating that these arrangements are consistent with regulatory requirements. The Board did not deem the soft dollar arrangements to be inappropriate.
The Board considered that the Fund’s uninvested cash and cash collateral from any securities lending arrangements may be invested in money market funds advised by Invesco Advisers pursuant to procedures approved by the Board. The Board noted that Invesco Advisers receives advisory fees from these affiliated money market funds attributable to such investments, although Invesco Advisers has contractually agreed to waive through varying periods the advisory fees payable by the Invesco Funds with respect to certain investments in the affiliated money market funds. The waiver is in an amount equal to 100% of the net advisory fee Invesco Advisers receives from the affiliated money market funds with respect to the Fund’s investment in the affiliated money market funds of uninvested cash, but not cash collateral. The Board concluded that the amount of advisory fees received by Invesco Advisers from the Fund’s investment of cash collateral from any securities lending arrangements in the affiliated money market funds is fair and reasonable.
The Board also considered that the Fund may use an affiliated broker to execute certain trades for the Fund to, among other things, control information leakage, and was advised that such trades would be executed in compliance with rules under the federal securities laws and consistent with best execution obligations.
26 Invesco Diversified Dividend Fund
Tax Information
Form 1099-DIV, Form 1042-S and other year–end tax information provide shareholders with actual calendar year amounts that should be included in their tax returns. Shareholders should consult their tax advisors.
The following distribution information is being provided as required by the Internal Revenue Code or to meet a specific state’s requirement.
The Fund designates the following amounts or, if subsequently determined to be different, the maximum amount allowable for its fiscal year ended October 31, 2017:
| | | | |
Federal and State Income Tax | |
Long-Term Capital Gain Distributions | | $ | 489,019,283 | |
Qualified Dividend Income* | | | 100 | % |
Corporate Dividends Received Deduction* | | | 100 | % |
U.S. Treasury Obligations* | | | 0 | % |
| | * | The above percentages are based on ordinary income dividends paid to shareholders during the Fund’s fiscal year. |
27 Invesco Diversified Dividend Fund
Trustees and Officers
The address of each trustee and officer is AIM Equity Funds (Invesco Equity Funds) (the “Trust”), 11 Greenway Plaza, Suite 1000, Houston, Texas 77046-1173. The trustees serve for the life of the Trust, subject to their earlier death, incapacitation, resignation, retirement or removal as more specifically provided in the Trust’s organizational documents. Each officer serves for a one year term or until their successors are elected and qualified. Column two below includes length of time served with predecessor entities, if any.
| | | | | | | | |
Name, Year of Birth and
Position(s) Held with the Trust | | Trustee and/
or Officer Since | | Principal Occupation(s)
During Past 5 Years | | Number of
Funds in Fund
Complex
Overseen by
Trustee | | Other Directorship(s)
Held by Trustee During
Past 5 Years |
| Interested Persons | | | | | | | | |
| Martin L. Flanagan1 — 1960 Trustee | | 2007 | | Executive Director, Chief Executive Officer and President, Invesco Ltd. (ultimate parent of Invesco and a global investment management firm); Trustee, The Invesco Funds; Vice Chair, Investment Company Institute; and Member of Executive Board, SMU Cox School of Business Formerly: Advisor to the Board, Invesco Advisers, Inc. (formerly known as Invesco Institutional (N.A.), Inc.); Chairman and Chief Executive Officer, Invesco Advisers, Inc. (registered investment adviser); Director, Chairman, Chief Executive Officer and President, Invesco Holding Company (US), Inc. (formerly IVZ Inc.) (holding company), Invesco Group Services, Inc. (service provider) and Invesco North American Holdings, Inc. (holding company); Director, Chief Executive Officer and President, Invesco Holding Company Limited (parent of Invesco and a global investment management firm); Director, Invesco Ltd.; Chairman, Investment Company Institute and President, Co-Chief Executive Officer, Co-President, Chief Operating Officer and Chief Financial Officer, Franklin Resources, Inc. (global investment management organization) | | 158 | | None |
| Philip A. Taylor2 — 1954 Trustee and Senior Vice President | | 2006 | | Head of the Americas and Senior Managing Director, Invesco Ltd.; Director, Invesco Advisers, Inc. (formerly known as Invesco Institutional (N.A.), Inc.) (registered investment adviser); Director, Chairman, Chief Executive Officer and President, Invesco Management Group, Inc. (formerly known as Invesco Aim Management Group, Inc.) (financial services holding company); Director and Chairman, Invesco Investment Services, Inc. (formerly known as Invesco Aim Investment Services, Inc.) (registered transfer agent); Chief Executive Officer, Invesco Corporate Class Inc. (corporate mutual fund company); Director, Chairman and Chief Executive Officer, Invesco Canada Ltd. (formerly known as Invesco Trimark Ltd./Invesco Trimark Ltèe) (registered investment adviser and registered transfer agent); Trustee and Senior Vice President, The Invesco Funds; Director, Invesco Investment Advisers LLC (formerly known as Van Kampen Asset Management). Formerly: Co-Chairman, Co-President and Co-Chief Executive Officer, Invesco Advisers, Inc. (formerly known as Invesco Institutional (N.A.), Inc.) (registered investment adviser); Director, Chief Executive Officer and President, Van Kampen Exchange Corp; President and Principal Executive Officer, The Invesco Funds (other than AIM Treasurer’s Series Trust (Invesco Treasurer’s Series Trust), Short-Term Investments Trust and Invesco Management Trust); Executive Vice President, The Invesco Funds (AIM Treasurer’s Series Trust (Invesco Treasurer’s Series Trust), Short-Term Investments Trust and Invesco Management Trust only); Director and President, INVESCO Funds Group, Inc. (registered investment adviser and registered transfer agent); Director and Chairman, IVZ Distributors, Inc. (formerly known as INVESCO Distributors, Inc.) (registered broker dealer); Director, President and Chairman, Invesco Inc. (holding company), Invesco Canada Holdings Inc. (holding company), Trimark Investments Ltd./Placements Trimark Ltèe and Invesco Financial Services Ltd/Services Financiers Invesco Ltèe; Chief Executive Officer, Invesco Canada Fund Inc. (corporate mutual fund company); Director and Chairman, Van Kampen Investor Services Inc.; Director, Chief Executive Officer and President, 1371 Preferred Inc. (holding company) and Van Kampen Investments Inc.; Director and President, AIM GP Canada Inc. (general partner for limited partnerships) and Van Kampen Advisors, Inc.; Director and Chief Executive Officer, Invesco Trimark Dealer Inc. (registered broker dealer); Director, Invesco Distributors, Inc. (formerly known as Invesco Aim Distributors, Inc.) (registered broker dealer); Manager, Invesco PowerShares Capital Management LLC; Director, Chief Executive Officer and President, Invesco Advisers, Inc.; Director, Chairman, Chief Executive Officer and President, Invesco Aim Capital Management, Inc.; President, Invesco Trimark Dealer Inc. and Invesco Trimark Ltd./Invesco Trimark Ltèe; Director and President, AIM Trimark Corporate Class Inc. and AIM Trimark Canada Fund Inc.; Senior Managing Director, Invesco Holding Company Limited; Director and Chairman, Fund Management Company (former registered broker dealer); President and Principal Executive Officer, The Invesco Funds (AIM Treasurer’s Series Trust (Invesco Treasurer’s Series Trust), and Short-Term Investments Trust only); President, AIM Trimark Global Fund Inc. and AIM Trimark Canada Fund Inc. | | 158 | | None |
| 1 | Mr. Flanagan is considered an interested person (within the meaning of Section 2(a)(19) of the 1940 Act) of the Trust because he is an officer of the Adviser to the Trust, and an officer and a director of Invesco Ltd., ultimate parent of the Adviser. |
| 2 | Mr. Taylor is considered an interested person (within the meaning of Section 2(a)(19) of the 1940 Act) of the Trust because he is an officer and a director of the Adviser. |
T-1 Invesco Diversified Dividend Fund
Trustees and Officers—(continued)
| | | | | | | | |
Name, Year of Birth and
Position(s) Held with the Trust | | Trustee and/
or Officer Since | | Principal Occupation(s)
During Past 5 Years | | Number of
Funds in Fund
Complex
Overseen by
Trustee | | Other Directorship(s)
Held by Trustee During
Past 5 Years |
| Independent Trustees | | | | | | | | |
Bruce L. Crockett — 1944 Trustee and Chair | | 1993 | | Chairman, Crockett Technologies Associates (technology consulting company) Formerly: Director, Captaris (unified messaging provider); Director, President and Chief Executive Officer, COMSAT Corporation; Chairman, Board of Governors of INTELSAT (international communications company); ACE Limited (insurance company); Independent Directors Council and Investment Company Institute: Member of the Audit Committee, Investment Company Institute; Member of the Executive Committee and Chair of the Governance Committee, Independent Directors Council | | 158 | | Director and Chairman of the Audit Committee, ALPS (Attorneys Liability Protection Society) (insurance company); Director and Member of the Audit Committee, Ferroglobe PLC (metallurgical company) |
David C. Arch — 1945 Trustee | | 2010 | | Chairman of Blistex Inc. (consumer health care products manufacturer); Member, World Presidents’ Organization | | 158 | | Board member of the Illinois Manufacturers’ Association |
James T. Bunch — 1942 Trustee | | 2003 | | Managing Member, Grumman Hill Group LLC (family office/private equity investments) Formerly: Chairman of the Board, Denver Film Society; Chairman of the Board of Trustees, Evans Scholarship Foundation; Chairman, Board of Governors, Western Golf Association | | 158 | | Trustee, Evans Scholarship Foundation |
Jack M. Fields — 1952 Trustee | | 1997 | | Chief Executive Officer, Twenty First Century Group, Inc. (government affairs company); and Discovery Learning Alliance (non-profit) Formerly: Owner and Chief Executive Officer, Dos Angeles Ranch L.P. (cattle, hunting, corporate entertainment); Director, Insperity, Inc. (formerly known as Administaff) (human resources provider); Chief Executive Officer, Texana Timber LP (sustainable forestry company); Director of Cross Timbers Quail Research Ranch (non-profit); and member of the U.S. House of Representatives | | 158 | | None |
Cynthia Hostetler — 1962 Trustee | | 2017 | | Non-Executive Director and Trustee of a number of public and private business corporations Formerly: Head of Investment Funds and Private Equity, Overseas Private Investment Corporation; President, First Manhattan Bancorporation, Inc.; Attorney, Simpson Thacher & Bartlett LLP | | 158 | | Vulcan Materials Company (construction materials company); Trilinc Global Impact Fund; Aberdeen Investment Funds (4 portfolios); Artio Global Investment LLC (mutual fund complex); Edgen Group, Inc. (specialized energy and infrastructure products distributor) |
Eli Jones — 1961 Trustee | | 2016 | | Professor and Dean, Mays Business School — Texas A&M University Formerly: Professor and Dean, Walton College of Business, University of Arkansas and E.J. Ourso College of Business, Louisiana State University; Director, Arvest Bank | | 158 | | Insperity, Inc. (formerly known as Administaff) (human resources provider) |
Prema Mathai-Davis — 1950 Trustee | | 1998 | | Retired. Formerly: Chief Executive Officer, YWCA of the U.S.A. | | 158 | | None |
Teresa M. Ressel — 1962 Trustee | | 2017 | | Non-executive director and trustee of a number of public and private business corporations Formerly: Chief Financial Officer, Olayan America, The Olayan Group (international investor/commercial/industrial); Chief Executive Officer, UBS Securities LLC; Group Chief Operating Officer, Americas, UBS AG; Assistant Secretary for Management & Budget and CFO, US Department of the Treasury; Chief Compliance Officer, Kaiser Permanente (healthcare consortium); Program Manager, Hewlett-Packard; Nuclear Engineering, General Dynamics Corporation (aerospace and defense company) | | 158 | | Atlantic Power Corporation (power generation company); ON Semiconductor Corp. (semiconductor supplier) |
Larry Soll — 1942 Trustee | | 2003 | | Retired. Formerly: Chairman, Chief Executive Officer and President, Synergen Corp. (a biotechnology company) | | 158 | | None |
Ann Barnett Stern — 1957 Trustee | | 2017 | | President and Chief Executive Officer, Houston Endowment Inc. (private philanthropic institution) Formerly: Executive Vice President and General Counsel, Texas Children’s Hospital; Attorney, Beck, Redden and Secrest, LLP; Business Law Instructor, University of St. Thomas; Attorney, Andrews & Kurth LLP | | 158 | | Federal Reserve Bank of Dallas |
Raymond Stickel, Jr. — 1944 Trustee | | 2005 | | Retired. Formerly: Director, Mainstay VP Series Funds, Inc. (25 portfolios); Partner, Deloitte & Touche | | 158 | | None |
Robert C. Troccoli — 1949 Trustee | | 2016 | | Adjunct Professor, University of Denver — Daniels College of Business Formerly: Senior Partner, KPMG LLP | | 158 | | None |
T-2 Invesco Diversified Dividend Fund
Trustees and Officers—(continued)
| | | | | | | | |
Name, Year of Birth and
Position(s) Held with the Trust | | Trustee and/
or Officer Since | | Principal Occupation(s)
During Past 5 Years | | Number of
Funds in Fund
Complex
Overseen by
Trustee | | Other Directorship(s)
Held by Trustee During
Past 5 Years |
| Independent Trustees—(continued) |
Christopher L. Wilson — 1957 Trustee | | 2017 | | Managing Partner, CT2, LLC (investing and consulting firm) Formerly: President/Chief Executive Officer, Columbia Funds, Bank of America Corporation; President/Chief Executive Officer, CDC IXIS Asset Management Services, Inc.; Principal & Director of Operations, Scudder Funds, Scudder, Stevens & Clark, Inc.; Assistant Vice President, Fidelity Investments | | 158 | | TD Asset Management USA Inc. (mutual fund complex) (22 portfolios); ISO New England, Inc. (non-profit organization managing regional electricity market) |
| Other Officers | | | | | | | | |
Sheri Morris — 1964 President, Principal Executive Officer and Treasurer | | 1999 | | President, Principal Executive Officer and Treasurer, The Invesco Funds; Vice President, Invesco Advisers, Inc. (formerly known as Invesco Institutional (N.A.), Inc.) (registered investment adviser); and Vice President, PowerShares Exchange-Traded Fund Trust, PowerShares Exchange-Traded Fund Trust II, PowerShares India Exchange-Traded Fund Trust, PowerShares Actively Managed Exchange-Traded Fund Trust and PowerShares Actively Managed Exchange-Traded Commodity Fund Trust Formerly: Vice President and Principal Financial Officer, The Invesco Funds; Vice President, Invesco Aim Advisers, Inc., Invesco Aim Capital Management, Inc. and Invesco Aim Private Asset Management, Inc.; Assistant Vice President and Assistant Treasurer, The Invesco Funds and Assistant Vice President, Invesco Advisers, Inc., Invesco Aim Capital Management, Inc. and Invesco Aim Private Asset Management, Inc.; and Treasurer, PowerShares Exchange-Traded Fund Trust, PowerShares Exchange-Traded Fund Trust II, PowerShares India Exchange-Traded Fund Trust and PowerShares Actively Managed Exchange-Traded Fund Trust | | N/A | | N/A |
Russell C. Burk — 1958 Senior Vice President and Senior Officer | | 2005 | | Senior Vice President and Senior Officer, The Invesco Funds | | N/A | | N/A |
John M. Zerr — 1962 Senior Vice President, Chief Legal Officer and Secretary | | 2006 | | Director, Senior Vice President, Secretary and General Counsel, Invesco Management Group, Inc. (formerly known as Invesco AIM Management Group, Inc.); Senior Vice President, Invesco Advisers, Inc. (formerly known as Invesco Institutional (N.A.), Inc.) (registered investment adviser); Senior Vice President and Secretary, Invesco Distributors, Inc. (formerly known as Invesco AIM Distributors, Inc.); Director, Vice President and Secretary, Invesco Investment Services, Inc. (formerly known as Invesco AIM Investment Services, Inc.) Senior Vice President, Chief Legal Officer and Secretary, The Invesco Funds; Managing Director, Invesco PowerShares Capital Management LLC; Director, Secretary and General Counsel, Invesco Investment Advisers LLC (formerly known as Van Kampen Asset Management); Secretary and General Counsel, Invesco Capital Markets, Inc. (formerly known as Van Kampen Funds Inc.) and Chief Legal Officer, PowerShares Exchange-Traded Fund Trust, PowerShares Exchange-Traded Fund Trust II, PowerShares India Exchange-Traded Fund Trust, PowerShares Actively Managed Exchange-Traded Fund Trust and PowerShares Actively Managed Exchange-Traded Commodity Fund Trust; Manager and Secretary, Invesco Indexing LLC Formerly: Director, Secretary, General Counsel and Senior Vice President, Van Kampen Exchange Corp.; Director, Vice President and Secretary, IVZ Distributors, Inc. (formerly known as INVESCO Distributors, Inc.); Director and Vice President, INVESCO Funds Group, Inc.; Director and Vice President, Van Kampen Advisors Inc.; Director, Vice President, Secretary and General Counsel, Van Kampen Investor Services Inc.; Director, Invesco Distributors, Inc. (formerly known as Invesco AIM Distributors, Inc.); Director, Senior Vice President, General Counsel and Secretary, Invesco AIM Advisers, Inc. and Van Kampen Investments Inc.; Director, Vice President and Secretary, Fund Management Company; Director, Senior Vice President, Secretary, General Counsel and Vice President, Invesco AIM Capital Management, Inc.; Chief Operating Officer and General Counsel, Liberty Ridge Capital, Inc. (an investment adviser); Vice President and Secretary, PBHG Funds (an investment company) and PBHG Insurance Series Fund (an investment company); Chief Operating Officer, General Counsel and Secretary, Old Mutual Investment Partners (a broker-dealer); General Counsel and Secretary, Old Mutual Fund Services (an administrator) and Old Mutual Shareholder Services (a shareholder servicing center); Executive Vice President, General Counsel and Secretary, Old Mutual Capital, Inc. (an investment adviser); and Vice President and Secretary, Old Mutual Advisors Funds (an investment company) | | N/A | | N/A |
Gregory G. McGreevey — 1962 Senior Vice President | | 2012 | | Senior Managing Director, Invesco Ltd.; Director, Chairman, President, and Chief Executive Officer, Invesco Advisers, Inc. (formerly known as Invesco Institutional (N.A.), Inc.) (registered investment adviser); Senior Vice President, Invesco Management Group, Inc.; Director, Invesco Mortgage Capital, Inc. and Invesco Senior Secured Management, Inc.; and Senior Vice President, The Invesco Funds Formerly: Assistant Vice President, The Invesco Funds | | N/A | | N/A |
T-3 Invesco Diversified Dividend Fund
Trustees and Officers—(continued)
| | | | | | | | |
Name, Year of Birth and
Position(s) Held with the Trust | | Trustee and/
or Officer Since | | Principal Occupation(s)
During Past 5 Years | | Number of
Funds in Fund
Complex
Overseen by
Trustee | | Other Directorship(s)
Held by Trustee During
Past 5 Years |
| Other Officers—(continued) | | | | | | | | |
Kelli Gallegos — 1970 Vice President, Principal Financial Officer and Assistant Treasurer | | 2008 | | Vice President, Principal Financial Officer and Assistant Treasurer, The Invesco Funds; Assistant Treasurer, Invesco PowerShares Capital Management LLC, PowerShares Exchange-Traded Fund Trust, PowerShares Exchange-Traded Fund Trust II, PowerShares India Exchange-Traded Fund Trust, PowerShares Actively Managed Exchange-Traded Fund Trust and PowerShares Actively Managed Exchange-Traded Commodity Fund Trust Formerly: Assistant Vice President, The Invesco Funds | | N/A | | N/A |
Tracy Sullivan — 1962 Vice President, Chief Tax Officer and Assistant Treasurer | | 2008 | | Vice President, Chief Tax Officer and Assistant Treasurer, The Invesco Funds; Assistant Treasurer, Invesco PowerShares Capital Management LLC, PowerShares Exchange-Traded Fund Trust, PowerShares Exchange-Traded Fund Trust II, PowerShares India Exchange-Traded Fund Trust, PowerShares Actively Managed Exchange-Traded Fund Trust and PowerShares Actively Managed Exchange-Traded Commodity Fund Trust Formerly: Assistant Vice President, The Invesco Funds | | N/A | | N/A |
Crissie M. Wisdom — 1969 Anti-Money Laundering Compliance Officer | | 2013 | | Anti-Money Laundering Compliance Officer, Invesco Advisers, Inc. (formerly known as Invesco Institutional (N.A.), Inc.) (registered investment adviser), Invesco Capital Markets, Inc. (formerly known as Van Kampen Funds Inc.), Invesco Distributors, Inc., Invesco Investment Services, Inc., Invesco Management Group, Inc., The Invesco Funds, and PowerShares Exchange-Traded Fund Trust, PowerShares Exchange-Traded Fund Trust II, PowerShares India Exchange-Traded Fund Trust, PowerShares Actively Managed Exchange-Traded Fund Trust and PowerShares Actively Managed Exchange-Traded Commodity Fund Trust; Anti-Money Laundering Compliance Officer and Bank Secrecy Act Officer, INVESCO National Trust Company and Invesco Trust Company; and Fraud Prevention Manager and Controls and Risk Analysis Manager for Invesco Investment Services, Inc. Formerly: Anti-Money Laundering Compliance Officer, Van Kampen Exchange Corp. | | N/A | | N/A |
Robert R. Leveille — 1969 Chief Compliance Officer | | 2016 | | Chief Compliance Officer, Invesco Advisers, Inc. (registered investment adviser); and Chief Compliance Officer, The Invesco Funds Formerly: Chief Compliance Officer, Putnam Investments and the Putnam Funds | | N/A | | N/A |
The Statement of Additional Information of the Trust includes additional information about the Fund’s Trustees and is available upon request, without charge, by calling 1.800.959.4246. Please refer to the Fund’s Statement of Additional Information for information on the Fund’s sub-advisers.
| | | | | | |
Office of the Fund 11 Greenway Plaza, Suite 1000 Houston, TX 77046-1173 | | Investment Adviser Invesco Advisers, Inc. 1555 Peachtree Street, N.E. Atlanta, GA 30309 | | Distributor Invesco Distributors, Inc. 11 Greenway Plaza, Suite 1000 Houston, TX 77046-1173 | | Auditors PricewaterhouseCoopers LLP 1000 Louisiana Street, Suite 5800 Houston, TX 77002-5678 |
| | | |
| | | | | | |
Counsel to the Fund Stradley Ronon Stevens & Young, LLP 2005 Market Street, Suite 2600 Philadelphia, PA 19103-7018 | | Counsel to the Independent Trustees Goodwin Procter LLP 901 New York Avenue, N.W. Washington, D.C. 20001 | | Transfer Agent Invesco Investment Services, Inc. 11 Greenway Plaza, Suite 1000 Houston, TX 77046-1173 | | Custodian State Street Bank and Trust Company 225 Franklin Street Boston, MA 02110-2801 |
T-4 Invesco Diversified Dividend Fund
Explore High-Conviction Investing with Invesco

Go paperless with eDelivery
Visit invesco.com/edelivery to enjoy the convenience and security of anytime electronic access to your investment documents.
With eDelivery, you can elect to have any or all of the following materials delivered straight to your inbox to download, save and print from your own computer:
| ∎ | | Fund reports and prospectuses |
Invesco mailing information
Send general correspondence to Invesco Investment Services, Inc., P.O. Box 219078, Kansas City, MO 64121-9078.
Important notice regarding delivery of security holder documents
To reduce Fund expenses, only one copy of most shareholder documents may be mailed to shareholders with multiple accounts at the same address (Householding). Mailing of your shareholder documents may be householded indefinitely unless you instruct us otherwise. If you do not want the mailing of these documents to be combined with those for other members of your household, please contact Invesco Investment Services, Inc. at 800 959 4246 or contact your financial institution. We will begin sending you individual copies for each account within 30 days after receiving your request.
Fund holdings and proxy voting information
The Fund provides a complete list of its holdings four times in each fiscal year, at the quarter ends. For the second and fourth quarters, the lists appear in the Fund’s semiannual and annual reports to shareholders. For the first and third quarters, the Fund files the lists with the Securities and Exchange Commission (SEC) on Form N-Q. The most recent list of portfolio holdings is available at invesco.com/completeqtrholdings. Shareholders can also look up the Fund’s Forms N-Q on the SEC website at sec.gov. Copies of the Fund’s Forms N-Q may be reviewed and copied at the SEC Public Reference Room in Washington, D.C. You can obtain information on the operation of the Public Reference Room, including information about duplicating fee charges, by calling 202 551 8090 or 800 732 0330, or by electronic request at the following email address: publicinfo@sec.gov. The SEC file numbers for the Fund are shown below.
A description of the policies and procedures that the Fund uses to determine how to vote proxies relating to portfolio securities is available without charge, upon request, from our Client Services department at 800 959 4246 or at invesco.com/proxyguidelines. The information is also available on the SEC website, sec.gov.
| | |
Information regarding how the Fund voted proxies related to its portfolio securities during the most recent 12-month period ended June 30 is available at invesco.com/proxysearch. The information is also available on the SEC website, sec.gov. Invesco Advisers, Inc. is an investment adviser; it provides investment advisory services to individual and institutional clients and does not sell securities. Invesco Distributors, Inc. is the US distributor for Invesco Ltd.’s retail mutual funds, exchange-traded funds and institutional money market funds. Both are wholly owned, indirect subsidiaries of Invesco Ltd. | |  |
| | | | |
| SEC file numbers: 811-01424 and 002-25469 | | Invesco Distributors, Inc. | | DDI-AR-1 12112017 1446 |

Letters to Shareholders
| | | | |

Philip Taylor | | | | Dear Shareholders: This annual report includes information about your Fund, including performance data and a complete list of its investments as of the close of the reporting period. Inside is a discussion of how your Fund was managed and the factors that affected its performance during the reporting period. American voters went to the polls just days after the start of the reporting period, and their decisions quickly affected markets. The US stock market rallied strongly after the election, with major market indexes rising, and setting record highs, throughout the reporting period. Generally positive economic data, strong corporate earnings and hope for tax and regulatory reform contributed to the rally. US and global bond markets, as well as emerging market equities, sold off immediately following the election – with the US bond market eventually recovering most of its losses. Overseas, economic data were mixed, prompting the |
European Central Bank and central banks in China and Japan, among other countries, to maintain extraordinarily accommodative monetary policies. Citing positive economic trends – specifically, realized and expected labor market conditions and inflation – the US Federal Reserve raised interest rates three times during the reporting period: first in December 2016, and then again in March and June 2017. Health care and tax reform proved to be more difficult than expected to enact, with little progress achieved by the end of the reporting period.
Short-term market volatility can prompt some investors to abandon their investment plans – and can cause others to settle for whatever returns the market has to offer. The investment professionals at Invesco, in contrast, invest with high conviction. This means that, no matter the asset class or the strategy, each investment team has a passion to exceed. We want to help investors achieve better outcomes, such as seeking higher returns, helping mitigate risk and generating income. Of course, investing with high conviction can’t guarantee a profit or ensure success; no investment strategy can. To learn more about how we invest with high conviction, visit invesco.com/HighConviction.
You, too, can invest with high conviction by maintaining a long-term investment perspective and by working with your financial adviser on a regular basis. During periods of short-term market volatility or uncertainty, your financial adviser can keep you focused on your long-term investment goals – a new home, a child’s college education or a secure retirement. He or she also can share research about the economy, the markets and individual investment options.
Visit our website for more information on your investments
Our website, invesco.com/us, offers a wide range of market insights and investment perspectives. On the website, you’ll find detailed information about our funds, including performance, holdings and portfolio manager commentaries. You can access information about your account by completing a simple, secure online registration. To do so, select “Log In” on the right side of the homepage, and then select “Register for Individual Account Access.”
In addition to the resources accessible on our website and through our mobile app, you can obtain timely updates to help you stay informed about the markets and the economy by connecting with Invesco on Twitter, LinkedIn or Facebook. You can access our blog at blog.invesco.us.com. Our goal is to provide you the information you want, when and where you want it.
Finally, I’m pleased to share with you Invesco’s commitment to both the Principles for Responsible Investment and to considering environmental, social and governance issues in our robust investment process. I invite you to learn more at invesco.com/esg.
Have questions?
For questions about your account, contact an Invesco client services representative at 800 959 4246. For Invesco-related questions or comments, please email me directly at phil@invesco.com.
All of us at Invesco look forward to serving your investment management needs. Thank you for investing with us.
Sincerely,

Philip Taylor
Senior Managing Director, Invesco Ltd.
| | | | | | |

Bruce Crockett | | | | Dear Fellow Shareholders: Among the many important lessons I’ve learned in more than 40 years in a variety of business endeavors is the value of a trusted advocate. As independent chair of the Invesco Funds Board, I can assure you that the members of the Board are strong advocates for the interests of investors in Invesco’s mutual funds. We work hard to represent your interests through oversight of the quality of the investment management services your funds receive and other matters important to your investment, including but not limited to: |
| | | | ∎ | | Ensuring that Invesco offers a diverse lineup of mutual funds that your financial adviser can use to strive to meet your financial needs as your investment goals change over time. |
| | | | ∎ | | Monitoring how the portfolio management teams of the Invesco funds are performing in light of changing economic and market conditions. |
| ∎ | | Assessing each portfolio management team’s investment performance within the context of the investment strategy described in the fund’s prospectus. |
| ∎ | | Monitoring for potential conflicts of interests that may impact the nature of the services that your funds receive. |
We believe one of the most important services we provide our fund shareholders is the annual review of the funds’ advisory and sub-advisory contracts with Invesco Advisers and its affiliates. This review is required by the Investment Company Act of 1940 and focuses on the nature and quality of the services Invesco provides as the adviser to the Invesco funds and the reasonableness of the fees that it charges for those services. Each year, we spend months carefully reviewing information received from Invesco and a variety of independent sources, such as performance and fee data prepared by Lipper, Inc. (a subsidiary of Broadridge Financial Solutions, Inc.), an independent, third-party firm widely recognized as a leader in its field. We also meet with our independent legal counsel and other independent advisers to review and help us assess the information that we have received. Our goal is to assure that you receive quality investment management services for a reasonable fee.
I trust the measures outlined above provide assurance that you have a worthy advocate when it comes to choosing the Invesco Funds.
As always, please contact me at bruce@brucecrockett.com with any questions or concerns you may have. On behalf of the Board, we look forward to continuing to represent your interests and serving your needs.
Sincerely,

Bruce L. Crockett
Independent Chair
Invesco Funds Board of Trustees
Management’s Discussion of Fund Performance
Performance summary
For the fiscal year ended October 31, 2017, Class A shares of Invesco Summit Fund (the Fund), at net asset value (NAV), underperformed the Russell 1000 Growth Index, the Fund’s style-specific benchmark.
Your Fund’s long-term performance appears later in this report.
Fund vs. Indexes
Total returns, 10/31/16 to 10/31/17, at net asset value (NAV). Performance shown does not include applicable contingent deferred sales charges (CDSC) or front-end sales charges, which would have reduced performance.
| | | | | |
| Class A Shares | | | | 29.20 | % |
| Class B Shares | | | | 28.21 | |
| Class C Shares | | | | 28.15 | |
| Class P Shares | | | | 29.32 | |
| Class S Shares | | | | 29.29 | |
| Class Y Shares | | | | 29.46 | |
| Class R5 Shares | | | | 29.56 | |
| Class R6 Shares* | | | | 29.36 | |
| S&P 500 Index▼ (Broad Market Index) | | | | 23.63 | |
| Russell 1000 Growth Index▼ (Style-Specific Index) | | | | 29.71 | |
| Lipper Multi-Cap Growth Funds Index∎ (Peer Group Index) | | | | 28.87 | |
Source(s): ▼FactSet Research Systems Inc.; ∎Lipper Inc. | | | | | |
| *Class R6 shares incepted on April 4, 2017. See page 7 for more information. | | | | | |
Market conditions and your Fund
Despite highly destructive hurricanes that threatened to derail a years-long recovery, the US economy continued to expand throughout the fiscal year ended October 31, 2017. Gross domestic product (GDP) – the value of all goods and services produced in the US – grew by 1.8% in the fourth quarter of 2016, and by 1.2% in the first quarter of 2017 and by 3.1% in the second quarter of 2017.1 Inflation remained subdued even as the labor market continued to strengthen. Unemployment continued its multiyear decline, hitting just 4.2% in September – a 16-year low.2
Given signs of an improving economy, the US Federal Reserve (the Fed) raised interest rates three times during the reporting period, most recently in June 2017.3 The Fed pledged that “realized and expected economic conditions
relative to its objectives of maximum employment and 2 percent inflation” will guide its future actions. At the close of the reporting period, Fed policy remained accommodative, and the fed funds target rate stood at a range of 1.00% to 1.25% – up 75 basis points for the reporting period.3 (A basis point is 0.01%.)
Despite the Fed’s actions, major US stock market indexes repeatedly hit alltime highs throughout the reporting period. The stock market rally began immediately following the outcome of the US presidential election in November 2016, based on investors’ hopes for reduced regulation, lowered corporate and personal tax rates and increased infrastructure spending. The stock market rally continued throughout the reporting period, fueled by generally positive economic data, strong corporate earnings and improved consumer
confidence – even as the prospect for health care and tax reform faded somewhat.
In this market environment, the Fund had double-digit positive returns at NAV and performed in line with its style-specific index. On the positive side, relative performance was driven by Fund exposure to the information technology (IT), consumer discretionary and consumer staples sectors. In contrast, underperformance in the health care, energy and telecommunication services sectors detracted from relative returns.
The Fund outperformed its style-specific index by the widest margin in the IT sector, driven by positive stock selection in and overweight exposure to the sector. Video game developer Take-Two Interactive Software posted a strong return and led Fund performance for the reporting period. The company benefited from renewed interest in the company’s “Grand Theft Auto” game, as consumer demand for new downloadable content (DLC) was better than expected. Take-Two was also helped by anticipation for expected new releases in 2018, including, “Red Dead Redemption 2,” “NBA 2K18,” a new title in the Borderlands series and, potentially an NBA 2K eSports league. Alibaba Group, an e-commerce company based in China, was also a leading contributor to relative performance. Alibaba was helped by strength in its core retail segment, driven by increased video and social interaction on the Alibaba platform.
Solid stock selection in the consumer discretionary sector also contributed to the Fund’s relative performance. Retail and e-commerce giant Amazon.com was a leading contributor to Fund performance during the reporting period. After a short pause in the second half of 2016, the company’s stock price rose throughout the reporting period on better-than-expected
| | | | | |
Portfolio Composition | |
By sector | | | | % of total net assets | |
| | | | | |
| |
Information Technology | | | | 45.3 | % |
Consumer Discretionary | | | | 20.7 | |
Health Care | | | | 11.9 | |
Industrials | | | | 7.3 | |
Consumer Staples | | | | 5.8 | |
Financials | | | | 3.2 | |
Materials | | | | 2.0 | |
Energy | | | | 1.4 | |
| Telecommunication Services | | | | 1.2 | |
Real Estate | | | | 0.9 | |
| Money Market Funds Plus Other Assets Less Liabilities | | | | 0.3 | |
| | | | | | |
| Top 10 Equity Holdings* | |
| | % of total net assets | |
| | |
| 1. | | Alphabet Inc.-Class C | | | 6.7 | % |
| 2. | | Amazon.com, Inc. | | | 6.1 | |
| 3. | | Facebook, Inc.-Class A | | | 6.0 | |
| 4. | | Visa Inc.-Class A | | | 4.5 | |
| 5. | | Apple Inc. | | | 4.1 | |
| 6. | | UnitedHealth Group Inc. | | | 2.9 | |
| 7. | | Alibaba Group Holding Ltd.-ADR | | | 2.9 | |
| 8. | | Electronic Arts Inc. | | | 2.7 | |
| 9. | | Take-Two Interactive Software, Inc. | | | 2.5 | |
| 10. | | Activision Blizzard, Inc. | | | 2.4 | |
| | | | | |
Total Net Assets | | | $ | 2.1 billion | |
| |
Total Number of Holdings* | | | | 90 | |
The Fund’s holdings are subject to change, and there is no assurance that the Fund will continue to hold any particular security.
*Excluding money market fund holdings.
Data presented here are as of October 31, 2017.
quarterly results as Amazon continued to take market share in the retail space. The acquisition of Whole Foods also aided the company’s performance. Royal Caribbean Cruises also contributed to performance within the sector. The stock price rose during the fiscal year as cruise bookings and pricing were trending ahead of expectations. The company’s 2018 outlook was also positive, with bookings coming in ahead of expectations. Investors have been generally positive on cruise lines, as many believe the industry has some protection from Amazon.
Stock selection in and underweight exposure to the consumer staples sector contributed to relative Fund performance as well. Underweight exposure to the sector was beneficial as consumer staples was one of the weaker-performing sectors within the style-specific index during the reporting period due to what many investors believed were extended valuations and slow global economic growth. The leading contributor to performance in the consumer staples sector was Lamb Weston, a global supplier of french fries to restaurants and retailers. We added the company in January of this year due to its significant market share in the industry. Lamb Weston has since produced better-than-expected quarterly results and acted as a contributor to Fund performance.
Some of the Fund’s outperformance was offset by the impact of other low-performing sectors. Stock selection in and underweight exposure to the health care sector was a detractor from relative Fund results. Pharmaceutical giant Allergan was the leading detractor in the sector. The company was negatively affected by uncertainty around potential generic competition for its dry eye drug Restasis. Amgen, a biotechnology company, was also a notable detractor from relative performance during the reporting period. The stock declined after the company issued concerning guidance surrounding the durability of its legacy franchises.
Overweight exposure to the energy sector was also a detractor from relative performance. The energy sector was the worst-performing sector in the style-specific index during the reporting period as crude prices declined on concerns over increasing US energy supplies and fears that the OPEC cuts enacted in November 2016 would not be continued after June 2017. Despite OPEC members eventually agreeing to extend the cuts in May of this year that are expected to last through
March 2018, the sector still has yet to fully recover. The Fund’s holdings were not immune to the decline in the sector, as Newfield Exploration and Halliburton were two of the largest detractors from both absolute and relative performance during the reporting period.
We think the traditional business cycle recovery has not fully materialized, as results over the last several years have been mixed, depending on which sector we evaluate. However, it is possible that this is just a very slow normalization, and we believe is some evidence we may yet see a more classic recovery and reacceleration in growth. Given this scenario, we are seeking opportunities in companies that are taking market share within their respective industries. Though we anticipate a possible slowdown in the economy, we continue to prudently balance the Fund between dynamic growth opportunities and more durable growth opportunities.
Thank you for your investment in Invesco Summit Fund and for sharing our long-term investment horizon.
| 1 | Source: Bureau of Economic Analysis |
| 2 | Sources: Bureau of Labor Statistics, Bloomberg |
| 3 | Source: US Federal Reserve |
The views and opinions expressed in management’s discussion of Fund performance are those of Invesco Advisers, Inc. These views and opinions are subject to change at any time based on factors such as market and economic conditions. These views and opinions may not be relied upon as investment advice or recommendations, or as an offer for a particular security. The information is not a complete analysis of every aspect of any market, country, industry, security or the Fund. Statements of fact are from sources considered reliable, but Invesco Advisers, Inc. makes no representation or warranty as to their completeness or accuracy. Although historical performance is no guarantee of future results, these insights may help you understand our investment management philosophy.
See important Fund and, if applicable, index disclosures later in this report.
| | |
 | | Erik Voss Chartered Financial Analyst, Portfolio Manager, is lead manager of Invesco Summit Fund. He joined Invesco |
| in 2010. Mr. Voss earned a BS in mathematics and an MS in finance from the University of Wisconsin. |
| | |
 | | Ido Cohen Portfolio Manager, is manager of Invesco Summit Fund. He joined Invesco in 2010. Mr. Cohen earned a BS in |
| economics from The Wharton School of the University of Pennsylvania. |
Your Fund’s Long-Term Performance
Results of a $10,000 Investment – Oldest Share Class(es)
Fund and index data from 10/31/07
Past performance cannot guarantee comparable future results.
The data shown in the chart include reinvested distributions, applicable sales charges and Fund expenses including management fees. Results for Class B shares are calculated as if a hypothetical
shareholder had liquidated his entire investment in the Fund at the close of the reporting period and paid the contingent deferred sales charges, if applicable. Index results include reinvested dividends, but they do not reflect sales charges. Performance of the peer group,
if applicable, reflects fund expenses and management fees; performance of a market index does not. Performance shown in the chart and table(s) does not reflect deduction of taxes a shareholder would pay on Fund distributions or sale of Fund shares.
| | | | |
Average Annual Total Returns | |
As of 10/31/17, including maximum applicable sales charges | |
| |
| Class A Shares | | | | |
| Inception (10/31/05) | | | 7.94 | % |
| 10 Years | | | 6.23 | |
| 5 Years | | | 15.06 | |
| 1 Year | | | 22.12 | |
| |
| Class B Shares | | | | |
| Inception (10/31/05) | | | 7.92 | % |
| 10 Years | | | 6.22 | |
| 5 Years | | | 15.25 | |
| 1 Year | | | 23.21 | |
| |
| Class C Shares | | | | |
| Inception (10/31/05) | | | 7.63 | % |
| 10 Years | | | 6.03 | |
| 5 Years | | | 15.48 | |
| 1 Year | | | 27.15 | |
| |
| Class P Shares | | | | |
| Inception (11/1/82) | | | 9.57 | % |
| 10 Years | | | 7.00 | |
| 5 Years | | | 16.53 | |
| 1 Year | | | 29.32 | |
| |
| Class S Shares | | | | |
| 10 Years | | | 6.93 | % |
| 5 Years | | | 16.46 | |
| 1 Year | | | 29.29 | |
| |
| Class Y Shares | | | | |
| 10 Years | | | 7.08 | % |
| 5 Years | | | 16.62 | |
| 1 Year | | | 29.46 | |
| |
| Class R5 Shares | | | | |
| 10 Years | | | 7.18 | % |
| 5 Years | | | 16.74 | |
| 1 Year | | | 29.56 | |
| |
| Class R6 Shares | | | | |
| 10 Years | | | 6.85 | % |
| 5 Years | | | 16.40 | |
| 1 Year | | | 29.36 | |
Class S shares incepted on September 25, 2009. Performance shown prior to that date is that of Class A shares and includes the 12b-1 fees applicable to Class A shares.
Class Y shares incepted on October 3, 2008. Performance shown prior to that date is that of Class A shares and includes the 12b-1 fees applicable to Class A shares.
Class R5 shares incepted on October 3, 2008. Performance shown prior to that date is that of Class A shares and includes the 12b-1 fees applicable to Class A shares.
| | | | |
Average Annual Total Returns | |
As of 9/30/17, the most recent calendar quarter end, including maximum applicable sales charges | |
| |
| Class A Shares | | | | |
| Inception (10/31/05) | | | 7.74 | % |
| 10 Years | | | 6.21 | |
| 5 Years | | | 13.74 | |
| 1 Year | | | 16.27 | |
| |
| Class B Shares | | | | |
| Inception (10/31/05) | | | 7.72 | % |
| 10 Years | | | 6.19 | |
| 5 Years | | | 13.92 | |
| 1 Year | | | 17.10 | |
| |
| Class C Shares | | | | |
| Inception (10/31/05) | | | 7.44 | % |
| 10 Years | | | 6.01 | |
| 5 Years | | | 14.18 | |
| 1 Year | | | 21.11 | |
| |
| Class P Shares | | | | |
| Inception (11/1/82) | | | 9.50 | % |
| 10 Years | | | 6.97 | |
| 5 Years | | | 15.20 | |
| 1 Year | | | 23.20 | |
| |
| Class S Shares | | | | |
| 10 Years | | | 6.91 | % |
| 5 Years | | | 15.15 | |
| 1 Year | | | 23.18 | |
| |
| Class Y Shares | | | | |
| 10 Years | | | 7.05 | % |
| 5 Years | | | 15.30 | |
| 1 Year | | | 23.32 | |
| |
| Class R5 Shares | | | | |
| 10 Years | | | 7.15 | % |
| 5 Years | | | 15.41 | |
| 1 Year | | | 23.30 | |
| |
| Class R6 Shares | | | | |
| 10 Years | | | 6.83 | % |
| 5 Years | | | 15.07 | |
| 1 Year | | | 23.21 | |
Class R6 shares incepted on April 4, 2017. Performance shown prior to that date is that of Class A shares and includes the 12b-1 fees applicable to Class A shares.
The performance data quoted represent past performance and cannot guarantee comparable future results; current performance may be lower or higher. Please visit invesco.com/performance for the most recent month-end performance. Performance figures reflect reinvested distributions, changes in net asset value and the effect of the maximum sales charge unless otherwise
stated. Investment return and principal value will fluctuate so that you may have a gain or loss when you sell shares.
The total annual Fund operating expense ratio set forth in the most recent Fund prospectus as of the date of this report for Class A, Class B, Class C, Class P, Class S, Class Y, Class R5 and Class R6 shares was 1.05%, 1.80%, 1.80%, 0.90%,0.95%, 0.80%, 0.74% and 0.73%, respectively. The expense ratios presented above may vary from the expense ratios presented in other sections of this report that are based on expenses incurred during the period covered by this report.
Class A share performance reflects the maximum 5.50% sales charge, and Class B and Class C share performance reflects the applicable contingent deferred sales charge (CDSC) for the period involved. The CDSC on Class B shares declines from 5% beginning at the time of purchase to 0% at the beginning of the seventh year. The CDSC on Class C shares is 1% for the first year after purchase. Class P, Class S, Class Y, Class R5 and Class R6 shares do not have a front-end sales charge or contingent deferred sales charge (CDSC); therefore, returns shown are at net asset value.
The performance numbers shown do not reflect the creation and sales charges and other fees assessed by the AIM Summit Investors Plans, which were dissolved effective December 8, 2006.
The performance of the Fund’s share classes will differ primarily due to different sales charge structures and class expenses.
Fund performance reflects any applicable fee waivers and/or expense reimbursements. Had the adviser not waived fees and/or reimbursed expenses currently or in the past, returns would have been lower. See current prospectus for more information.
Invesco Summit Fund’s investment objective is long-term growth of capital.
| ∎ | | Unless otherwise stated, information presented in this report is as of October 31, 2017, and is based on total net assets. |
| ∎ | | Unless otherwise noted, all data provided by Invesco. |
| ∎ | | To access your Fund’s reports/prospectus, visit invesco.com/fundreports. |
About share classes
| ∎ | | Class B shares may not be purchased for new or additional investments. Please see the prospectus for more information. |
| ∎ | | Class P shares, Class S shares and Class Y shares are available only to certain investors. Please see the prospectus for more information. |
| ∎ | | Class R5 shares and Class R6 shares are available for use by retirement plans that meet certain standards and for institutional investors. Class R6 shares are also available through intermediaries that have established an agreement with Invesco Distributors, Inc. to make such shares available for use in retail omnibus accounts. Please see the prospectus for more information. |
Principal risks of investing in the Fund
| ∎ | | Foreign securities risk. The Fund’s foreign investments may be adversely affected by political and social instability, changes in economic or taxation policies, difficulty in enforcing obligations, decreased liquidity or increased volatility. Foreign investments also involve the risk of the possible seizure, nationalization or expropriation of the issuer or foreign deposits (in which the Fund could lose its entire investments in a certain market) and the possible adoption of foreign governmental restrictions such as exchange controls. Unless the Fund has hedged its foreign securities risk, foreign securities risk also involves the risk of negative foreign currency rate fluctuations, which may cause the value of securities denominated in such foreign currency (or other instruments through which the Fund has exposure to foreign currencies) to decline in value. Currency exchange rates may fluctuate significantly over short periods of time. Currency hedging strategies, if used, are not always successful. |
| ∎ | | Growth investing risk. Growth stocks tend to be more expensive relative to the issuing company’s earnings or assets |
| | compared with other types of stock. As a result, they tend to be more sensitive to changes in, or investors’ expectations of, the issuing company’s earnings and can be more volatile. |
| ∎ | | Management risk. The Fund is actively managed and depends heavily on the Adviser’s judgment about markets, interest rates or the attractiveness, relative values, liquidity, or potential appreciation of particular investments made for the Fund’s portfolio. The Fund could experience losses if these judgments prove to be incorrect. Additionally, legislative, regulatory, or tax developments may adversely affect management of the Fund and, therefore, the ability of the Fund to achieve its investment objective. |
| ∎ | | Market risk. The market values of the Fund’s investments, and therefore the value of the Fund’s shares, will go up and down, sometimes rapidly or unpredictably. Market risk may affect a single issuer, industry or section of the economy, or it may affect the market as a whole. Individual stock prices tend to go up and down more dramatically than those of certain other types of investments, such as bonds. During a general downturn in the financial markets, multiple asset classes may decline in value. When markets perform well, there can be no assurance that specific investments held by the Fund will rise in value. |
| ∎ | | Sector focus risk. The Fund may from time to time invest a significant amount of its assets (i.e. over 25%) in one market sector or group of related industries. In this event, the Fund’s performance will depend to a greater extent on the overall condition of the sector or group of industries and there is increased risk that the Fund will lose significant value if conditions adversely affect that sector or group of industries. |
| ∎ | | Small- and mid-capitalization companies risks. Small- and mid-capitalization companies tend to be more vulnerable to changing market conditions, may have little or no operating history or track record of success, and may have |
| | more limited product lines and markets, less experienced management and fewer financial resources than larger companies. These companies’ securities may be more volatile and less liquid than those of more established companies, and their returns may vary, sometimes significantly, from the overall securities market. |
About indexes used in this report
| ∎ | | The S&P 500® Index is an unmanaged index considered representative of the US stock market. |
| ∎ | | The Russell 1000® Growth Index is an unmanaged index considered representative of large-cap growth stocks. The Russell 1000 Growth Index is a trademark/service mark of the Frank Russell Co. Russell® is a trademark of the Frank Russell Co. |
| ∎ | | The Lipper Multi-Cap Growth Funds Index is an unmanaged index considered representative of multicap growth funds tracked by Lipper. |
| ∎ | | The Fund is not managed to track the performance of any particular index, including the index(es) described here, and consequently, the performance of the Fund may deviate significantly from the performance of the index(es). |
| ∎ | | A direct investment cannot be made in an index. Unless otherwise indicated, index results include reinvested dividends, and they do not reflect sales charges. Performance of the peer group, if applicable, reflects fund expenses; performance of a market index does not. |
Other information
| ∎ | | The returns shown in management’s discussion of Fund performance are based on net asset values (NAVs) calculated for shareholder transactions. Generally accepted accounting principles require adjustments to be made to the net assets of the Fund at period end for financial reporting purposes, and as such, the NAVs for shareholder transactions and the returns based on those NAVs may differ from the NAVs and returns reported in the Financial Highlights. |
| ∎ | | Industry classifications used in this report are generally according to the Global Industry Classification Standard, which was developed by and is the exclusive property and a service mark of MSCI Inc. and Standard & Poor’s. |
| | |
This report must be accompanied or preceded by a currently effective Fund prospectus, which contains more complete information, including sales charges and expenses. Investors should read it carefully before investing. | | |
| | |
| NOT FDIC INSURED | MAY LOSE VALUE | NO BANK GUARANTEE | |
Schedule of Investments(a)
October 31, 2017
| | | | | | | | |
| | | Shares | | | Value | |
Common Stocks & Other Equity Interests–99.72% | |
| Aerospace & Defense–3.35% | |
Northrop Grumman Corp. | | | 57,617 | | | $ | 17,027,552 | |
Raytheon Co. | | | 156,002 | | | | 28,111,561 | |
Teledyne Technologies Inc.(b) | | | 158,144 | | | | 26,878,154 | |
| | | | | | | | 72,017,267 | |
|
| Airlines–0.56% | |
Alaska Air Group, Inc. | | | 181,912 | | | | 12,011,649 | |
|
| Application Software–1.80% | |
salesforce.com, inc.(b) | | | 377,385 | | | | 38,621,581 | |
|
| Biotechnology–4.07% | |
Alexion Pharmaceuticals, Inc.(b) | | | 225,201 | | | | 26,947,552 | |
Amgen Inc. | | | 28,071 | | | | 4,918,601 | |
Celgene Corp.(b) | | | 461,122 | | | | 46,559,488 | |
Incyte Corp.(b) | | | 80,401 | | | | 9,105,413 | |
| | | | | | | | 87,531,054 | |
|
| Cable & Satellite–3.26% | |
Altice USA, Inc.–Class A(b)(c) | | | 353,640 | | | | 8,374,195 | |
Charter Communications, Inc.–Class A(b) | | | 80,715 | | | | 26,972,532 | |
Comcast Corp.–Class A | | | 267,907 | | | | 9,652,689 | |
DISH Network Corp.–Class A(b) | | | 517,844 | | | | 25,136,148 | |
| | | | | | | | 70,135,564 | |
|
| Coal & Consumable Fuels–0.57% | |
Peabody Energy Corp.(b) | | | 396,232 | | | | 12,239,606 | |
|
| Commodity Chemicals–0.63% | |
Westlake Chemical Corp. | | | 158,418 | | | | 13,451,272 | |
|
| Consumer Electronics–1.86% | |
Sony Corp. (Japan) | | | 920,400 | | | | 40,073,319 | |
|
| Data Processing & Outsourced Services–6.05% | |
Mastercard Inc.–Class A | | | 141,197 | | | | 21,005,878 | |
Vantiv, Inc.–Class A(b) | | | 176,581 | | | | 12,360,670 | |
Visa Inc.–Class A | | | 879,195 | | | | 96,693,866 | |
| | | | | | | | 130,060,414 | |
|
| Diversified Banks–0.43% | |
Bank of America Corp. | | | 339,649 | | | | 9,302,986 | |
|
| Electronic Equipment & Instruments–0.62% | |
Keysight Technologies, Inc.(b) | | | 299,726 | | | | 13,388,760 | |
|
| Environmental & Facilities Services–1.51% | |
Waste Connections, Inc. (Canada) | | | 213,032 | | | | 15,054,971 | |
Waste Management, Inc. | | | 212,044 | | | | 17,423,656 | |
| | | | | | | | 32,478,627 | |
|
| Financial Exchanges & Data–1.42% | |
Intercontinental Exchange, Inc. | | | 310,765 | | | | 20,541,566 | |
| | | | | | | | |
| | | Shares | | | Value | |
| Financial Exchanges & Data–(continued) | |
London Stock Exchange Group PLC (United Kingdom) | | | 141,068 | | | $ | 7,047,916 | |
S&P Global Inc. | | | 18,898 | | | | 2,956,970 | |
| | | | | | | | 30,546,452 | |
|
| Health Care Equipment–1.56% | |
Boston Scientific Corp.(b) | | | 666,982 | | | | 18,768,873 | |
Intuitive Surgical, Inc.(b) | | | 39,066 | | | | 14,663,814 | |
| | | | | | | | 33,432,687 | |
|
| Home Entertainment Software–9.42% | |
Activision Blizzard, Inc. | | | 793,268 | | | | 51,951,121 | |
Electronic Arts Inc.(b) | | | 483,533 | | | | 57,830,547 | |
Nintendo Co., Ltd. (Japan) | | | 100,900 | | | | 39,303,645 | |
Take-Two Interactive Software, Inc.(b) | | | 482,911 | | | | 53,434,102 | |
| | | | | | | | 202,519,415 | |
|
| Home Improvement Retail–3.31% | |
Home Depot, Inc. (The) | | | 177,458 | | | | 29,418,987 | |
Lowe’s Cos., Inc. | | | 520,491 | | | | 41,613,256 | |
| | | | | | | | 71,032,243 | |
|
| Hotels, Resorts & Cruise Lines–2.56% | |
Norwegian Cruise Line Holdings Ltd.(b) | | | 623,363 | | | | 34,752,487 | |
Royal Caribbean Cruises Ltd. | | | 163,310 | | | | 20,212,879 | |
| | | | | | | | 54,965,366 | |
|
| Housewares & Specialties–0.62% | |
Newell Brands, Inc. | | | 325,260 | | | | 13,264,103 | |
|
| Industrial Gases–0.36% | |
Praxair, Inc. | | | 52,380 | | | | 7,653,766 | |
|
| Industrial Machinery–0.44% | |
Stanley Black & Decker Inc. | | | 58,653 | | | | 9,475,392 | |
|
| Internet & Direct Marketing Retail–7.88% | |
Amazon.com, Inc.(b) | | | 118,569 | | | | 131,051,944 | |
Netflix Inc.(b) | | | 38,042 | | | | 7,472,590 | |
Priceline Group Inc. (The)(b) | | | 16,113 | | | | 30,807,412 | |
| | | | | | | | 169,331,946 | |
|
| Internet Software & Services–16.61% | |
Alibaba Group Holding Ltd.–ADR (China)(b) | | | 331,772 | | | | 61,341,325 | |
Alphabet Inc.–Class A(b) | | | 10,830 | | | | 11,187,823 | |
Alphabet Inc.–Class C(b) | | | 142,541 | | | | 144,912,882 | |
Facebook, Inc.–Class A(b) | | | 715,941 | | | | 128,912,337 | |
Sea Ltd.–ADR (Singapore)(b)(c) | | | 698,416 | | | | 10,532,113 | |
| | | | | | | | 356,886,480 | |
|
| Investment Banking & Brokerage–1.10% | |
Charles Schwab Corp. (The) | | | 23,440 | | | | 1,051,049 | |
E*TRADE Financial Corp.(b) | | | 434,730 | | | | 18,949,881 | |
Lazard Ltd.–Class A | | | 74,170 | | | | 3,526,042 | |
| | | | | 23,526,972 | |
See accompanying Notes to Financial Statements which are an integral part of the financial statements.
9 Invesco Summit Fund
| | | | | | | | |
| | | Shares | | | Value | |
| Life Sciences Tools & Services–1.07% | |
PRA Health Sciences, Inc.(b) | | | 125,220 | | | $ | 10,196,665 | |
Thermo Fisher Scientific, Inc. | | | 65,647 | | | | 12,724,358 | |
| | | | | 22,921,023 | |
|
| Managed Health Care–2.86% | |
UnitedHealth Group Inc. | | | 292,455 | | | | 61,479,890 | |
|
| Movies & Entertainment–0.40% | |
IMAX Corp.(b) | | | 358,095 | | | | 8,683,804 | |
|
| Oil & Gas Equipment & Services–0.01% | |
Halliburton Co. | | | 5,049 | | | | 215,794 | |
|
| Oil & Gas Exploration & Production–0.77% | |
Cimarex Energy Co. | | | 41,611 | | | | 4,865,574 | |
Newfield Exploration Co.(b) | | | 72,048 | | | | 2,218,358 | |
Parsley Energy, Inc.–Class A(b) | | | 347,053 | | | | 9,231,610 | |
Pioneer Natural Resources Co. | | | 1,472 | | | | 220,314 | |
| | | | | 16,535,856 | |
|
| Packaged Foods & Meats–4.76% | |
Blue Buffalo Pet Products, Inc.(b) | | | 460,672 | | | | 13,327,241 | |
Lamb Weston Holdings, Inc. | | | 302,230 | | | | 15,410,708 | |
Marine Harvest ASA (Norway) | | | 1,036,566 | | | | 20,240,721 | |
Mondelez International, Inc.–Class A | | | 329,087 | | | | 13,634,074 | |
Pinnacle Foods Inc. | | | 128,184 | | | | 6,975,773 | |
Tyson Foods, Inc.–Class A | | | 448,076 | | | | 32,669,221 | |
| | | | | 102,257,738 | |
|
| Personal Products–0.26% | |
Estee Lauder Cos. Inc. (The)–Class A | | | 20,703 | | | | 2,314,803 | |
Unilever N.V. (United Kingdom) | | | 54,417 | | | | 3,163,496 | |
| | | | | 5,478,299 | |
|
| Pharmaceuticals–2.33% | |
Allergan PLC | | | 140,857 | | | | 24,964,086 | |
Zoetis Inc. | | | 394,865 | | | | 25,200,284 | |
| | | | | 50,164,370 | |
|
| Regional Banks–0.29% | |
SVB Financial Group(b) | | | 28,856 | | | | 6,327,544 | |
|
| Research & Consulting Services–0.21% | |
Equifax Inc. | | | 42,492 | | | | 4,611,657 | |
|
| Restaurants–0.13% | |
Papa John’s International, Inc. | | | 39,881 | | | | 2,713,902 | |
|
| Semiconductor Equipment–0.63% | |
Applied Materials, Inc. | | | 106,259 | | | | 5,996,195 | |
ASML Holding N.V.–New York Shares (Netherlands) | | | 42,132 | | | | 7,615,359 | |
| | | | | 13,611,554 | |
|
| Semiconductors–3.98% | |
Broadcom Ltd. | | | 193,294 | | | | 51,012,219 | |
Integrated Device Technology, Inc.(b) | | | 843,999 | | | | 26,223,049 | |
| | | | | | | | |
| | | Shares | | | Value | |
| Semiconductors–(continued) | |
NVIDIA Corp. | | | 39,991 | | | $ | 8,270,539 | |
| | | | | 85,505,807 | |
|
| Soft Drinks–0.76% | |
Monster Beverage Corp.(b) | | | 274,151 | | | | 15,881,567 | |
PepsiCo, Inc. | | | 3,803 | | | | 419,205 | |
| | | | | 16,300,772 | |
|
| Specialized Consumer Services–0.49% | |
Service Corp. International | | | 299,499 | | | | 10,620,235 | |
|
| Specialized REIT’s–0.87% | |
Crown Castle International Corp. | | | 102,790 | | | | 11,006,753 | |
SBA Communications Corp.–Class A(b) | | | 49,449 | | | | 7,772,394 | |
| | | | | 18,779,147 | |
|
| Specialty Chemicals–1.04% | |
Sherwin-Williams Co. (The) | | | 56,372 | | | | 22,275,396 | |
|
| Specialty Stores–0.20% | |
National Vision Holdings, Inc.(b) | | | 148,553 | | | | 4,278,326 | |
|
| Systems Software–2.13% | |
Microsoft Corp. | | | 439,244 | | | | 36,536,316 | |
ServiceNow, Inc.(b) | | | 72,225 | | | | 9,127,073 | |
| | | | | 45,663,389 | |
|
| Technology Hardware, Storage & Peripherals–4.08% | |
Apple Inc. | | | 519,167 | | | | 87,759,990 | |
|
| Trading Companies & Distributors–1.27% | |
Watsco, Inc. | | | 164,038 | | | | 27,323,810 | |
|
| Wireless Telecommunication Services–1.19% | |
Sprint Corp.(b) | | | 3,594,179 | | | | 23,505,930 | |
T-Mobile US, Inc.(b) | | | 34,897 | | | | 2,085,794 | |
| | | | | 25,591,724 | |
Total Common Stocks & Other Equity Interests
(Cost $1,186,838,204) | | | | 2,143,046,948 | |
|
Money Market Funds–0.03% | |
Invesco Government & Agency Portfolio–Institutional
Class, 0.95%(d) | | | 355,676 | | | | 355,676 | |
Invesco Treasury Portfolio–Institutional Class, 0.94%(d) | | | 237,118 | | | | 237,118 | |
Total Money Market Funds
(Cost $592,794) | | | | 592,794 | |
TOTAL INVESTMENTS IN SECURITIES (excluding investments purchased with cash collateral from securities on loan)–99.75%
(Cost $1,187,430,998) | | | | 2,143,639,742 | |
See accompanying Notes to Financial Statements which are an integral part of the financial statements.
10 Invesco Summit Fund
| | | | | | | | |
| | | Shares | | | Value | |
Money Market Fund–0.46% | |
Invesco Government & Agency Portfolio– Institutional Class, 0.95%
(Cost $9,909,467)(d)(e) | | | 9,909,467 | | | $ | 9,909,467 | |
TOTAL INVESTMENTS IN SECURITIES–100.21%
(Cost $1,197,340,465) | | | | 2,153,549,209 | |
OTHER ASSETS LESS LIABILITIES–(0.21)% | | | | (4,503,870 | ) |
NET ASSETS–100.00% | | | $ | 2,149,045,339 | |
Investment Abbreviations:
| | |
| ADR | | – American Depositary Receipt |
| REIT | | – Real Estate Investment Trust |
Notes to Schedule of Investments:
| (a) | Industry and/or sector classifications used in this report are generally according to the Global Industry Classification Standard, which was developed by and is the exclusive property and a service mark of MSCI Inc. and Standard & Poor’s. |
| (b) | Non-income producing security. |
| (c) | All or a portion of this security was out on loan at October 31, 2017. |
| (d) | The money market fund and the Fund are affiliated by having the same investment adviser. The rate shown is the 7-day SEC standardized yield as of October 31, 2017. |
| (e) | The security has been segregated to satisfy the commitment to return the cash collateral received in securities lending transactions upon the borrower’s return of the securities loaned. See Note 1I. |
See accompanying Notes to Financial Statements which are an integral part of the financial statements.
11 Invesco Summit Fund
Statement of Assets and Liabilities
October 31, 2017
| | | | |
Assets: | |
Investments in securities, at value (Cost $1,186,838,204)* | | $ | 2,143,046,948 | |
Investments in affiliated money market funds, at value and cost | | | 10,502,261 | |
Receivable for: | | | | |
Investments sold | | | 5,318,659 | |
Fund shares sold | | | 415,868 | |
Dividends | | | 475,889 | |
Investment for trustee deferred compensation and retirement plans | | | 422,919 | |
Other assets | | | 93,846 | |
Total assets | | | 2,160,276,390 | |
|
Liabilities: | |
Payable for: | | | | |
Collateral upon return of securities loaned | | | 9,909,467 | |
Fund shares reacquired | | | 290,039 | |
Accrued fees to affiliates | | | 534,766 | |
Accrued trustees’ and officers’ fees and benefits | | | 4,839 | |
Accrued other operating expenses | | | 21,971 | |
Trustee deferred compensation and retirement plans | | | 469,969 | |
Total liabilities | | | 11,231,051 | |
Net assets applicable to shares outstanding | | $ | 2,149,045,339 | |
|
Net assets consist of: | |
Shares of beneficial interest | | $ | 1,119,832,965 | |
Undistributed net investment income | | | (204,399 | ) |
Undistributed net realized gain | | | 73,209,615 | |
Net unrealized appreciation | | | 956,207,158 | |
| | | $ | 2,149,045,339 | |
| | | | |
Net Assets: | | | | |
Class A | | $ | 77,519,135 | |
Class B | | $ | 347,085 | |
Class C | | $ | 9,324,602 | |
Class P | | $ | 2,044,420,856 | |
Class S | | $ | 3,521,093 | |
Class Y | | $ | 13,880,685 | |
Class R5 | | $ | 20,282 | |
Class R6 | | $ | 11,601 | |
|
Shares outstanding, no par value,
with an unlimited number of shares authorized: | |
Class A | | | 3,849,923 | |
Class B | | | 18,789 | |
Class C | | | 506,386 | |
Class P | | | 100,259,350 | |
Class S | | | 173,926 | |
Class Y | | | 682,340 | |
Class R5 | | | 993 | |
Class R6 | | | 568 | |
Class A: | | | | |
Net asset value per share | | $ | 20.14 | |
Maximum offering price per share | | | | |
(Net asset value of $20.14 ¸ 94.50%) | | $ | 21.31 | |
Class B: | | | | |
Net asset value and offering price per share | | $ | 18.47 | |
Class C: | | | | |
Net asset value and offering price per share | | $ | 18.41 | |
Class P: | | | | |
Net asset value and offering price per share | | $ | 20.39 | |
Class S: | | | | |
Net asset value and offering price per share | | $ | 20.24 | |
Class Y: | | | | |
Net asset value and offering price per share | | $ | 20.34 | |
Class R5: | | | | |
Net asset value and offering price per share | | $ | 20.42 | |
Class R6: | | | | |
Net asset value and offering price per share | | $ | 20.42 | |
| * | At October 31, 2017, securities with an aggregate value of $7,942,854 were on loan to brokers. |
See accompanying Notes to Financial Statements which are an integral part of the financial statements.
12 Invesco Summit Fund
Statement of Operations
For the year ended October 31, 2017
| | | | |
Investment income: | |
Dividends (net of foreign withholding taxes of $102,147) | | $ | 17,784,601 | |
Dividends from affiliated money market funds (includes securities lending income of $36,411) | | | 65,642 | |
Total investment income | | | 17,850,243 | |
| |
Expenses: | | | | |
Advisory fees | | | 12,425,454 | |
Administrative services fees | | | 436,920 | |
Custodian fees | | | 69,122 | |
Distribution fees: | | | | |
Class A | | | 151,447 | |
Class B | | | 3,384 | |
Class C | | | 65,641 | |
Class P | | | 1,875,233 | |
Class S | | | 5,161 | |
Transfer agent fees — A, B, C, P, S and Y | | | 2,120,164 | |
Transfer agent fees — R5 | | | 13 | |
Transfer agent fees — R6 | | | 5 | |
Trustees’ and officers’ fees and benefits | | | 51,953 | |
Registration and filing fees | | | 120,988 | |
Reports to shareholders | | | 205,943 | |
Professional services fees | | | 63,119 | |
Other | | | 38,915 | |
Total expenses | | | 17,633,462 | |
Less: Fees waived and expense offset arrangement(s) | | | (54,224 | ) |
Net expenses | | | 17,579,238 | |
Net investment income | | | 271,005 | |
| |
Realized and unrealized gain from: | | | | |
Net realized gain from: | | | | |
Investment securities (includes net gains (losses) from securities sold to affiliates of $(47,186)) | | | 75,431,586 | |
Foreign currencies | | | 15,698 | |
| | | | 75,447,284 | |
Change in net unrealized appreciation of: | | | | |
Investment securities | | | 426,300,052 | |
Foreign currencies | | | 3,243 | |
| | | | 426,303,295 | |
Net realized and unrealized gain | | | 501,750,579 | |
Net increase in net assets resulting from operations | | $ | 502,021,584 | |
See accompanying Notes to Financial Statements which are an integral part of the financial statements.
13 Invesco Summit Fund
Statement of Changes in Net Assets
For the years ended October 31, 2017 and 2016
| | | | | | | | |
| | | 2017 | | | 2016 | |
Operations: | | | | | | | | |
Net investment income | | $ | 271,005 | | | $ | 1,605,230 | |
Net realized gain | | | 75,447,284 | | | | 104,976,732 | |
Change in net unrealized appreciation (depreciation) | | | 426,303,295 | | | | (94,175,179 | ) |
Net increase in net assets resulting from operations | | | 502,021,584 | | | | 12,406,783 | |
| | |
Distributions to shareholders from net investment income: | | | | | | | | |
Class P | | | (1,095,288 | ) | | | — | |
Class S | | | (455 | ) | | | — | |
Class Y | | | (6,596 | ) | | | — | |
Class R5 | | | (38 | ) | | | — | |
Total distributions from net investment income | | | (1,102,377 | ) | | | — | |
| | |
Distributions to shareholders from net realized gains: | | | | | | | | |
Class A | | | (3,020,626 | ) | | | (3,614,176 | ) |
Class B | | | (17,091 | ) | | | (41,771 | ) |
Class C | | | (305,415 | ) | | | (383,143 | ) |
Class P | | | (101,344,615 | ) | | | (115,878,847 | ) |
Class S | | | (189,501 | ) | | | (227,949 | ) |
Class Y | | | (238,831 | ) | | | (155,911 | ) |
Class R5 | | | (993 | ) | | | (1,127 | ) |
Total distributions from net realized gains | | | (105,117,072 | ) | | | (120,302,924 | ) |
| | |
Share transactions–net: | | | | | | | | |
Class A | | | 14,871,919 | | | | 3,485,315 | |
Class B | | | 3,229 | | | | (227,529 | ) |
Class C | | | 3,074,179 | | | | 644,565 | |
Class P | | | (44,084,588 | ) | | | (9,421,646 | ) |
Class S | | | (334,883 | ) | | | (151,816 | ) |
Class Y | | | 8,572,792 | | | | 1,461,091 | |
Class R6 | | | 10,005 | | | | — | |
Net increase (decrease) in net assets resulting from share transactions | | | (17,887,347 | ) | | | (4,210,020 | ) |
Net increase (decrease) in net assets | | | 377,914,788 | | | | (112,106,161 | ) |
| | |
Net assets: | | | | | | | | |
Beginning of year | | | 1,771,130,551 | | | | 1,883,236,712 | |
End of year (includes undistributed net investment income of $(204,399) and $613,834, respectively) | | $ | 2,149,045,339 | | | $ | 1,771,130,551 | |
Notes to Financial Statements
October 31, 2017
NOTE 1—Significant Accounting Policies
Invesco Summit Fund (the “Fund”) is a series portfolio of AIM Equity Funds (Invesco Equity Funds) (the “Trust”). The Trust is a Delaware statutory trust registered under the Investment Company Act of 1940, as amended (the “1940 Act”), as an open-end series management investment company consisting of three separate portfolios, each authorized to issue an unlimited number of shares of beneficial interest. The assets, liabilities and operations of each portfolio are accounted for separately. Information presented in these financial statements pertains only to the Fund. Matters affecting each portfolio or class will be voted on exclusively by the shareholders of such portfolio or class.
The Fund’s investment objective is long-term growth of capital.
The Fund currently consists of eight different classes of shares: Class A, Class B, Class C, Class P, Class S, Class Y, Class R5 and Class R6. On April 4, 2017, the Fund began offering Class R6 shares. Class P shares are not sold to members of the general public. Only shareholders who had accounts in the AIM Summit Investors Plans I and AIM Summit Investors Plans II at the close of business on December 8, 2006, may continue to purchase Class P shares as described in the Fund’s prospectus. Class Y shares are available only to certain investors. Class A shares are sold with a front-end sales charge unless certain waiver criteria are met and under certain circumstances load waiver shares may be subject to contingent deferred sales charges (“CDSC”). Class C shares are sold with a CDSC. Class P, Class S, Class Y, Class R5 and Class R6 shares are sold at net asset
14 Invesco Summit Fund
value. Effective November 30, 2010, new or additional investments in Class B shares are no longer permitted. Existing shareholders of Class B shares may continue to reinvest dividends and capital gains distributions in Class B shares until they convert to Class A shares. Also, shareholders in Class B shares will be able to exchange those shares for Class B shares of other Invesco Funds offering such shares until they convert to Class A shares. Generally, Class B shares will automatically convert to Class A shares on or about the month-end, which is at least eight years after the date of purchase. Redemption of Class B shares prior to the conversion date will be subject to a CDSC.
The Fund is an investment company and accordingly follows the investment company accounting and reporting guidance in accordance with Financial Accounting Standards Board Accounting Standards Codification Topic 946, Financial Services — Investment Companies.
The following is a summary of the significant accounting policies followed by the Fund in the preparation of its financial statements.
| A. | Security Valuations — Securities, including restricted securities, are valued according to the following policy. |
A security listed or traded on an exchange (except convertible securities) is valued at its last sales price or official closing price as of the close of the customary trading session on the exchange where the security is principally traded, or lacking any sales or official closing price on a particular day, the security may be valued at the closing bid price on that day. Securities traded in the over-the-counter market are valued based on prices furnished by independent pricing services or market makers. When such securities are valued by an independent pricing service they may be considered fair valued. Futures contracts are valued at the final settlement price set by an exchange on which they are principally traded. Listed options are valued at the mean between the last bid and asked prices from the exchange on which they are principally traded. Options not listed on an exchange are valued by an independent source at the mean between the last bid and asked prices. For purposes of determining net asset value (“NAV”) per share, futures and option contracts generally are valued 15 minutes after the close of the customary trading session of the New York Stock Exchange (“NYSE”).
Investments in open-end and closed-end registered investment companies that do not trade on an exchange are valued at the end-of-day net asset value per share. Investments in open-end and closed-end registered investment companies that trade on an exchange are valued at the last sales price or official closing price as of the close of the customary trading session on the exchange where the security is principally traded.
Debt obligations (including convertible securities) and unlisted equities are fair valued using an evaluated quote provided by an independent pricing service. Evaluated quotes provided by the pricing service may be determined without exclusive reliance on quoted prices, and may reflect appropriate factors such as institution-size trading in similar groups of securities, developments related to specific securities, dividend rate (for unlisted equities), yield (for debt obligations), quality, type of issue, coupon rate (for debt obligations), maturity (for debt obligations), individual trading characteristics and other market data. Pricing services generally value debt obligations assuming orderly transactions of institutional round lot size, but a fund may hold or transact in the same securities in smaller, odd lot sizes. Odd lots often trade at lower prices than institutional round lots. Debt obligations are subject to interest rate and credit risks. In addition, all debt obligations involve some risk of default with respect to interest and/or principal payments.
Foreign securities’ (including foreign exchange contracts) prices are converted into U.S. dollar amounts using the applicable exchange rates as of the close of the NYSE. If market quotations are available and reliable for foreign exchange-traded equity securities, the securities will be valued at the market quotations. Because trading hours for certain foreign securities end before the close of the NYSE, closing market quotations may become unreliable. If between the time trading ends on a particular security and the close of the customary trading session on the NYSE, events occur that the investment adviser determines are significant and make the closing price unreliable, the Fund may fair value the security. If the event is likely to have affected the closing price of the security, the security will be valued at fair value in good faith using procedures approved by the Board of Trustees. Adjustments to closing prices to reflect fair value may also be based on a screening process of an independent pricing service to indicate the degree of certainty, based on historical data, that the closing price in the principal market where a foreign security trades is not the current value as of the close of the NYSE. Foreign securities’ prices meeting the approved degree of certainty that the price is not reflective of current value will be priced at the indication of fair value from the independent pricing service. Multiple factors may be considered by the independent pricing service in determining adjustments to reflect fair value and may include information relating to sector indices, American Depositary Receipts and domestic and foreign index futures. Foreign securities may have additional risks including exchange rate changes, potential for sharply devalued currencies and high inflation, political and economic upheaval, the relative lack of issuer information, relatively low market liquidity and the potential lack of strict financial and accounting controls and standards.
Securities for which market prices are not provided by any of the above methods may be valued based upon quotes furnished by independent sources. The last bid price may be used to value equity securities. The mean between the last bid and asked prices is used to value debt obligations, including corporate loans.
Securities for which market quotations are not readily available or became unreliable are valued at fair value as determined in good faith by or under the supervision of the Trust’s officers following procedures approved by the Board of Trustees. Issuer specific events, market trends, bid/asked quotes of brokers and information providers and other market data may be reviewed in the course of making a good faith determination of a security’s fair value.
The Fund may invest in securities that are subject to interest rate risk, meaning the risk that the prices will generally fall as interest rates rise and, conversely, the prices will generally rise as interest rates fall. Specific securities differ in their sensitivity to changes in interest rates depending on their individual characteristics. Changes in interest rates may result in increased market volatility, which may affect the value and/or liquidity of certain Fund investments.
Valuations change in response to many factors including the historical and prospective earnings of the issuer, the value of the issuer’s assets, general economic conditions, interest rates, investor perceptions and market liquidity. Because of the inherent uncertainties of valuation, the values reflected in the financial statements may materially differ from the value received upon actual sale of those investments.
| B. | Securities Transactions and Investment Income — Securities transactions are accounted for on a trade date basis. Realized gains or losses on sales are computed on the basis of specific identification of the securities sold. Interest income (net of withholding tax, if any) is recorded on the accrual basis from settlement date. Dividend income (net of withholding tax, if any) is recorded on the ex-dividend date. |
The Fund may periodically participate in litigation related to Fund investments. As such, the Fund may receive proceeds from litigation settlements. Any proceeds received are included in the Statement of Operations as realized gain (loss) for investments no longer held and as unrealized gain (loss) for investments still held.
15 Invesco Summit Fund
Brokerage commissions and mark ups are considered transaction costs and are recorded as an increase to the cost basis of securities purchased and/or a reduction of proceeds on a sale of securities. Such transaction costs are included in the determination of net realized and unrealized gain (loss) from investment securities reported in the Statement of Operations and the Statement of Changes in Net Assets and the net realized and unrealized gains (losses) on securities per share in the Financial Highlights. Transaction costs are included in the calculation of the Fund’s net asset value and, accordingly, they reduce the Fund’s total returns. These transaction costs are not considered operating expenses and are not reflected in net investment income reported in the Statement of Operations and the Statement of Changes in Net Assets, or the net investment income per share and the ratios of expenses and net investment income reported in the Financial Highlights, nor are they limited by any expense limitation arrangements between the Fund and the investment adviser.
The Fund allocates income and realized and unrealized capital gains and losses to a class based on the relative net assets of each class.
| C. | Country Determination — For the purposes of making investment selection decisions and presentation in the Schedule of Investments, the investment adviser may determine the country in which an issuer is located and/or credit risk exposure based on various factors. These factors include the laws of the country under which the issuer is organized, where the issuer maintains a principal office, the country in which the issuer derives 50% or more of its total revenues and the country that has the primary market for the issuer’s securities, as well as other criteria. Among the other criteria that may be evaluated for making this determination are the country in which the issuer maintains 50% or more of its assets, the type of security, financial guarantees and enhancements, the nature of the collateral and the sponsor organization. Country of issuer and/or credit risk exposure has been determined to be the United States of America, unless otherwise noted. |
| D. | Distributions — Distributions from net investment income and net realized capital gain, if any, are generally declared and paid annually and recorded on the ex-dividend date. The Fund may elect to treat a portion of the proceeds from redemptions as distributions for federal income tax purposes. |
| E. | Federal Income Taxes — The Fund intends to comply with the requirements of Subchapter M of the Internal Revenue Code of 1986, as amended (the “Internal Revenue Code”), necessary to qualify as a regulated investment company and to distribute substantially all of the Fund’s taxable earnings to shareholders. As such, the Fund will not be subject to federal income taxes on otherwise taxable income (including net realized capital gain) that is distributed to shareholders. Therefore, no provision for federal income taxes is recorded in the financial statements. |
The Fund recognizes the tax benefits of uncertain tax positions only when the position is more likely than not to be sustained. Management has analyzed the Fund’s uncertain tax positions and concluded that no liability for unrecognized tax benefits should be recorded related to uncertain tax positions. Management is not aware of any tax positions for which it is reasonably possible that the total amounts of unrecognized tax benefits will change materially in the next 12 months.
The Fund files tax returns in the U.S. Federal jurisdiction and certain other jurisdictions. Generally, the Fund is subject to examinations by such taxing authorities for up to three years after the filing of the return for the tax period.
| F. | Expenses — Fees provided for under the Rule 12b-1 plan of a particular class of the Fund are charged to the operations of such class. Transfer agency fees and expenses and other shareholder recordkeeping fees and expenses attributable to Class R5 and Class R6 are allocated to each share class based on relative net assets. Sub-accounting fees attributable to Class R5 are charged to the operations of the class. Transfer agency fees and expenses and other shareholder recordkeeping fees and expenses relating to all other classes are allocated among those classes based on relative net assets. All other expenses are allocated among the classes based on relative net assets. |
| G. | Accounting Estimates — The preparation of financial statements in conformity with accounting principles generally accepted in the United States of America (“GAAP”) requires management to make estimates and assumptions that affect the reported amounts of assets and liabilities at the date of the financial statements and the reported amounts of revenues and expenses during the reporting period including estimates and assumptions related to taxation. Actual results could differ from those estimates by a significant amount. In addition, the Fund monitors for material events or transactions that may occur or become known after the period-end date and before the date the financial statements are released to print. |
| H. | Indemnifications — Under the Trust’s organizational documents, each Trustee, officer, employee or other agent of the Trust is indemnified against certain liabilities that may arise out of the performance of their duties to the Fund. Additionally, in the normal course of business, the Fund enters into contracts, including the Fund’s servicing agreements, that contain a variety of indemnification clauses. The Fund’s maximum exposure under these arrangements is unknown as this would involve future claims that may be made against the Fund that have not yet occurred. The risk of material loss as a result of such indemnification claims is considered remote. |
| I. | Securities Lending — The Fund may lend portfolio securities having a market value up to one-third of the Fund’s total assets. Such loans are secured by collateral equal to no less than the market value of the loaned securities determined daily by the securities lending provider. Such collateral will be cash or debt securities issued or guaranteed by the U.S. Government or any of its sponsored agencies. Cash collateral received in connection with these loans is invested in short-term money market instruments or affiliated money market funds and is shown as such on the Schedule of Investments. The Fund bears the risk of loss with respect to the investment of collateral. It is the Fund’s policy to obtain additional collateral from or return excess collateral to the borrower by the end of the next business day, following the valuation date of the securities loaned. Therefore, the value of the collateral held may be temporarily less than the value of the securities on loan. When loaning securities, the Fund retains certain benefits of owning the securities, including the economic equivalent of dividends or interest generated by the security. Lending securities entails a risk of loss to the Fund if, and to the extent that, the market value of the securities loaned were to increase and the borrower did not increase the collateral accordingly, and the borrower failed to return the securities. The securities loaned are subject to termination at the option of the borrower or the Fund. Upon termination, the borrower will return to the Fund the securities loaned and the Fund will return the collateral. Upon the failure of the borrower to return the securities, collateral may be liquidated and the securities may be purchased on the open market to replace the loaned securities. The Fund could experience delays and costs in gaining access to the collateral and the securities may lose value during the delay which could result in potential losses to the Fund. Some of these losses may be indemnified by the lending agent. The Fund bears the risk of any deficiency in the amount of the collateral available for return to the borrower due to any loss on the collateral invested. Dividends received on cash collateral investments for securities lending transactions, which are net of compensation to counterparties, are included in Dividends from affiliated money market funds on the Statement of Operations. The aggregate value of securities out on loan, if any, is shown as a footnote on the Statement of Assets and Liabilities. |
16 Invesco Summit Fund
| J. | Foreign Currency Translations — Foreign currency is valued at the close of the NYSE based on quotations posted by banks and major currency dealers. Portfolio securities and other assets and liabilities denominated in foreign currencies are translated into U.S. dollar amounts at date of valuation. Purchases and sales of portfolio securities (net of foreign taxes withheld on disposition) and income items denominated in foreign currencies are translated into U.S. dollar amounts on the respective dates of such transactions. The Fund does not separately account for the portion of the results of operations resulting from changes in foreign exchange rates on investments and the fluctuations arising from changes in market prices of securities held. The combined results of changes in foreign exchange rates and the fluctuation of market prices on investments (net of estimated foreign tax withholding) are included with the net realized and unrealized gain or loss from investments in the Statement of Operations. Reported net realized foreign currency gains or losses arise from (1) sales of foreign currencies, (2) currency gains or losses realized between the trade and settlement dates on securities transactions, and (3) the difference between the amounts of dividends, interest, and foreign withholding taxes recorded on the Fund’s books and the U.S. dollar equivalent of the amounts actually received or paid. Net unrealized foreign currency gains and losses arise from changes in the fair values of assets and liabilities, other than investments in securities at fiscal period end, resulting from changes in exchange rates. |
The Fund may invest in foreign securities, which may be subject to foreign taxes on income, gains on investments or currency repatriation, a portion of which may be recoverable. Foreign taxes, if any, are recorded based on the tax regulations and rates that exist in the foreign markets in which the Fund invests and are shown in the Statement of Operations.
| K. | Forward Foreign Currency Contracts — The Fund may engage in foreign currency transactions either on a spot (i.e. for prompt delivery and settlement) basis, or through forward foreign currency contracts, to manage or minimize currency or exchange rate risk. |
The Fund may also enter into forward foreign currency contracts for the purchase or sale of a security denominated in a foreign currency in order to “lock in” the U.S. dollar price of that security, or the Fund may also enter into forward foreign currency contracts that do not provide for physical settlement of the two currencies, but instead are settled by a single cash payment calculated as the difference between the agreed upon exchange rate and the spot rate at settlement based upon an agreed upon notional amount (non-deliverable forwards). The Fund will set aside liquid assets in an amount equal to the daily mark-to-market obligation for forward foreign currency contracts.
A forward foreign currency contract is an obligation between two parties (“Counterparties”) to purchase or sell a specific currency for an agreed-upon price at a future date. The use of forward foreign currency contracts does not eliminate fluctuations in the price of the underlying securities the Fund owns or intends to acquire but establishes a rate of exchange in advance. Fluctuations in the value of these contracts are measured by the difference in the contract date and reporting date exchange rates and are recorded as unrealized appreciation (depreciation) until the contracts are closed. When the contracts are closed, realized gains (losses) are recorded. Realized and unrealized gains (losses) on the contracts are included in the Statement of Operations. The primary risks associated with forward foreign currency contracts include failure of the Counterparty to meet the terms of the contract and the value of the foreign currency changing unfavorably. These risks may be in excess of the amounts reflected in the Statement of Assets and Liabilities.
NOTE 2—Advisory Fees and Other Fees Paid to Affiliates
The Trust has entered into a master investment advisory agreement with Invesco Advisers, Inc. (the “Adviser” or “Invesco”). Under the terms of the investment advisory agreement, the Fund accrues daily and pays monthly an advisory fee to the Adviser based on the annual rate of the Fund’s average daily net assets as follows:
| | | | | | | | |
| Average Daily Net Assets | | Rate | |
First $10 million | | | 1 | .00% | | | | |
Next $140 million | | | 0 | .75% | | | | |
Over $150 million | | | 0 | .625% | | | | |
For the year ended October 31, 2017, the effective advisory fees incurred by the Fund was 0.64%.
Under the terms of a master sub-advisory agreement between the Adviser and each of Invesco Asset Management Deutschland GmbH, Invesco Asset Management Limited, Invesco Asset Management (Japan) Limited, Invesco Hong Kong Limited, Invesco Senior Secured Management, Inc. and Invesco Canada Ltd. (collectively, the “Affiliated Sub-Advisers”) the Adviser, not the Fund, will pay 40% of the fees paid to the Adviser to any such Affiliated Sub-Adviser(s) that provide(s) discretionary investment management services to the Fund based on the percentage of assets allocated to such Affiliated Sub-Adviser(s).
The Adviser has contractually agreed, through at least June 30, 2018, to waive advisory fees and/or reimburse expenses of all shares to the extent necessary to limit total annual fund operating expenses after fee waiver and/or expense reimbursement (excluding certain items discussed below) of Class A, Class B, Class C, Class P, Class S, Class Y, Class R5 and Class R6 shares to 2.00%, 2.75%, 2.75%, 1.85%, 1.90%, 1.75%, 1.75% and 1.75%, respectively, of average daily net assets (the “expense limits”). In determining the Adviser’s obligation to waive advisory fees and/or reimburse expenses, the following expenses are not taken into account, and could cause the total annual fund operating expenses after fee waiver and/or expense reimbursement to exceed the numbers reflected above: (1) interest; (2) taxes; (3) dividend expense on short sales; (4) extraordinary or non-routine items, including litigation expenses; and (5) expenses that the Fund has incurred but did not actually pay because of an expense offset arrangement. Unless Invesco continues the fee waiver agreement, it will terminate on June 30, 2018. During its term, the fee waiver agreement cannot be terminated or amended to increase the expense limits or reduce the advisory fee waiver without approval of the Board of Trustees. The Adviser did not waive fees and/or reimburse expenses during the period under these expense limits.
Further, the Adviser has contractually agreed, through at least June 30, 2019, to waive the advisory fee payable by the Fund in an amount equal to 100% of the net advisory fees the Adviser receives from the affiliated money market funds on investments by the Fund of uninvested cash (excluding investments of cash collateral from securities lending) in such affiliated money market funds.
For the year ended October 31, 2017, the Adviser waived advisory fees of $8,615.
The Trust has entered into a master administrative services agreement with Invesco pursuant to which the Fund has agreed to pay Invesco for certain administrative costs incurred in providing accounting services to the Fund. For the year ended October 31, 2017, expenses incurred under the agreement are shown in the Statement of Operations as Administrative services fees.
17 Invesco Summit Fund
The Trust has entered into a transfer agency and service agreement with Invesco Investment Services, Inc. (“IIS”) pursuant to which the Fund has agreed to pay IIS a fee for providing transfer agency and shareholder services to the Fund and reimburse IIS for certain expenses incurred by IIS in the course of providing such services. IIS may make payments to intermediaries that provide omnibus account services, sub-accounting services and/or networking services. All fees payable by IIS to intermediaries that provide omnibus account services or sub-accounting services are charged back to the Fund, subject to certain limitations approved by the Trust’s Board of Trustees. For the year ended October 31, 2017, expenses incurred under the agreement are shown in the Statement of Operations as Transfer agent fees.
The Fund has entered into master distribution agreements with Invesco Distributors, Inc. (“IDI”) to serve as the distributor for the Class A, Class B, Class C, Class P, Class S, Class Y, Class R5 and Class R6 shares. The Fund has adopted plans pursuant to Rule 12b-1 under the 1940 Act with respect to the Fund’s Class A, Class B, Class C shares, Class P shares and Class S shares (collectively, the “Plans”). The Fund, pursuant to the Plans, pays IDI compensation at the annual rate of 0.25% of the Fund’s average daily net assets of Class A shares, 1.00% of the average daily net assets of Class B and Class C shares, 0.10% of the average daily net assets of Class P shares and 0.15% of the average daily net assets of Class S shares. The fees are accrued daily and paid monthly. Of the Plan payments, up to 0.25% of the average daily net assets of Class A, Class B and Class C shares, 0.10% of the average daily net assets of Class P shares and 0.15% of the average daily net assets of Class S shares may be paid to furnish continuing personal shareholder services to customers who purchase and own shares of such classes. Any amounts not paid as a service fee under the Plans would constitute an asset-based sales charge. Rules of the Financial Industry Regulatory Authority (“FINRA”) impose a cap on the total sales charges, including asset-based sales charges, that may be paid by any class of shares of the Fund. For the year ended October 31, 2017, expenses incurred under the Plans are shown in the Statement of Operations as Distribution fees.
Front-end sales commissions and CDSC (collectively, the “sales charges”) are not recorded as expenses of the Fund. Front-end sales commissions are deducted from proceeds from the sales of Fund shares prior to investment in Class A shares of the Fund. CDSC are deducted from redemption proceeds prior to remittance to the shareholder. During the year ended October 31, 2017, IDI advised the Fund that IDI retained $48,341 in front-end sales commissions from the sale of Class A shares and $1,098, $37 and $64 from Class A, Class B and Class C shares, respectively, for CDSC imposed on redemptions by shareholders.
For the year ended October 31, 2017, the Fund incurred $15,605 in brokerage commissions with Invesco Capital Markets, Inc., an affiliate of the Adviser and IDI, for portfolio transactions executed on behalf of the Fund.
Certain officers and trustees of the Trust are officers and directors of the Adviser, IIS and/or IDI.
NOTE 3—Additional Valuation Information
GAAP defines fair value as the price that would be received to sell an asset or paid to transfer a liability in an orderly transaction between market participants at the measurement date, under current market conditions. GAAP establishes a hierarchy that prioritizes the inputs to valuation methods, giving the highest priority to readily available unadjusted quoted prices in an active market for identical assets (Level 1) and the lowest priority to significant unobservable inputs (Level 3), generally when market prices are not readily available or are unreliable. Based on the valuation inputs, the securities or other investments are tiered into one of three levels. Changes in valuation methods may result in transfers in or out of an investment’s assigned level:
| | Level 1 — | Prices are determined using quoted prices in an active market for identical assets. |
| | Level 2 — | Prices are determined using other significant observable inputs. Observable inputs are inputs that other market participants may use in pricing a security. These may include quoted prices for similar securities, interest rates, prepayment speeds, credit risk, yield curves, loss severities, default rates, discount rates, volatilities and others. |
| | Level 3 — | Prices are determined using significant unobservable inputs. In situations where quoted prices or observable inputs are unavailable (for example, when there is little or no market activity for an investment at the end of the period), unobservable inputs may be used. Unobservable inputs reflect the Fund’s own assumptions about the factors market participants would use in determining fair value of the securities or instruments and would be based on the best available information. |
The following is a summary of the tiered valuation input levels, as of October 31, 2017. The level assigned to the securities valuations may not be an indication of the risk or liquidity associated with investing in those securities. Because of the inherent uncertainties of valuation, the values reflected in the financial statements may materially differ from the value received upon actual sale of those investments.
The Fund’s policy is to recognize transfers in and out of the valuation levels as of the end of the reporting period.
During the year ended October 31, 2017, there were no material transfers between valuation levels.
| | | | | | | | | | | | | | | | |
| | | Level 1 | | | Level 2 | | | Level 3 | | | Total | |
Common Stocks & Other Equity Interests | | $ | 2,063,669,984 | | | $ | 79,376,964 | | | $ | — | | | $ | 2,143,046,948 | |
Money Market Funds | | | 10,502,261 | | | | — | | | | — | | | | 10,502,261 | |
Total Investments | | $ | 2,074,172,245 | | | $ | 79,376,964 | | | $ | — | | | $ | 2,153,549,209 | |
NOTE 4—Security Transactions with Affiliated Funds
The Fund is permitted to purchase or sell securities from or to certain other Invesco Funds under specified conditions outlined in procedures adopted by the Board of Trustees of the Trust. The procedures have been designed to ensure that any purchase or sale of securities by the Fund from or to another fund or portfolio that is or could be considered an affiliate by virtue of having a common investment adviser (or affiliated investment advisers), common Trustees and/or common officers complies with Rule 17a-7 of the 1940 Act. Further, as defined under the procedures, each transaction is effected at the current market price. Pursuant to these procedures, for the year ended October 31, 2017, the Fund engaged in securities sales of $2,620,089, which resulted in net realized gains (losses) of $(47,186).
18 Invesco Summit Fund
NOTE 5—Expense Offset Arrangement(s)
The expense offset arrangement is comprised of transfer agency credits which result from balances in demand deposit accounts used by the transfer agent for clearing shareholder transactions. For the year ended October 31, 2017, the Fund received credits from this arrangement, which resulted in the reduction of the Fund’s total expenses of $45,609.
NOTE 6—Trustees’ and Officers’ Fees and Benefits
Trustees’ and Officers’ Fees and Benefits include amounts accrued by the Fund to pay remuneration to certain Trustees and Officers of the Fund. Trustees have the option to defer compensation payable by the Fund, and Trustees’ and Officers’ Fees and Benefits also include amounts accrued by the Fund to fund such deferred compensation amounts. Those Trustees who defer compensation have the option to select various Invesco Funds in which their deferral accounts shall be deemed to be invested. Finally, certain current Trustees were eligible to participate in a retirement plan that provided for benefits to be paid upon retirement to Trustees over a period of time based on the number of years of service. The Fund may have certain former Trustees who also participate in a retirement plan and receive benefits under such plan. Trustees’ and Officers’ Fees and Benefits include amounts accrued by the Fund to fund such retirement benefits. Obligations under the deferred compensation and retirement plans represent unsecured claims against the general assets of the Fund.
NOTE 7—Cash Balances
The Fund is permitted to temporarily carry a negative or overdrawn balance in its account with State Street Bank and Trust Company, the custodian bank. Such balances, if any at period-end, are shown in the Statement of Assets and Liabilities under the payable caption Amount due custodian. To compensate the custodian bank for such overdrafts, the overdrawn Fund may either (1) leave funds as a compensating balance in the account so the custodian bank can be compensated by earning the additional interest; or (2) compensate by paying the custodian bank at a rate agreed upon by the custodian bank and Invesco, not to exceed the contractually agreed upon rate.
NOTE 8—Distributions to Shareholders and Tax Components of Net Assets
Tax Character of Distributions to Shareholders Paid During the Fiscal Years Ended October 31, 2017 and 2016:
| | | | | | | | |
| | | 2017 | | | 2016 | |
Ordinary income | | $ | 1,102,377 | | | $ | — | |
Long-term capital gain | | | 105,117,072 | | | | 120,302,924 | |
Total distributions | | $ | 106,219,449 | | | $ | 120,302,924 | |
Tax Components of Net Assets at Period-End:
| | | | |
| | | 2017 | |
Undistributed ordinary income | | $ | 5,888,472 | |
Undistributed long-term gain | | | 72,869,226 | |
Net unrealized appreciation — investments | | | 950,892,470 | |
Net unrealized appreciation (depreciation) — foreign currencies | | | (1,586 | ) |
Temporary book/tax differences | | | (436,208 | ) |
Shares of beneficial interest | | | 1,119,832,965 | |
Total net assets | | $ | 2,149,045,339 | |
The difference between book-basis and tax-basis unrealized appreciation (depreciation) is due to differences in the timing of recognition of gains and losses on investments for tax and book purposes. The Fund’s net unrealized appreciation (depreciation) difference is attributable primarily to wash sales.
The temporary book/tax differences are a result of timing differences between book and tax recognition of income and/or expenses. The Fund’s temporary book/tax differences are the result of the trustee deferral of compensation and retirement plan benefits.
Capital loss carryforward is calculated and reported as of a specific date. Results of transactions and other activity after that date may affect the amount of capital loss carryforward actually available for the Fund to utilize. Capital losses generated in years beginning after December 22, 2010 can be carried forward for an unlimited period, whereas previous losses expire in eight tax years. Capital losses with an expiration period may not be used to offset capital gains until all net capital losses without an expiration date have been utilized. Capital loss carryforwards with no expiration date will retain their character as either short-term or long-term capital losses instead of as short-term capital losses as under prior law. The ability to utilize capital loss carryforwards in the future may be limited under the Internal Revenue Code and related regulations based on the results of future transactions.
The Fund does not have a capital loss carryforward as of October 31, 2017.
19 Invesco Summit Fund
NOTE 9—Investment Transactions
The aggregate amount of investment securities (other than short-term securities, U.S. Treasury obligations and money market funds, if any) purchased and sold by the Fund during the year ended October 31, 2017 was $604,422,578 and $682,080,356, respectively. Cost of investments, including any derivatives, on a tax basis includes the adjustments for financial reporting purposes as of the most recently completed federal income tax reporting period-end.
| | | | |
| Unrealized Appreciation (Depreciation) of Investments on a Tax Basis | |
Aggregate unrealized appreciation of investments | | $ | 974,066,785 | |
Aggregate unrealized (depreciation) of investments | | | (23,174,315 | ) |
Net unrealized appreciation of investments | | $ | 950,892,470 | |
Cost of investments for tax purposes is $1,202,656,739.
NOTE 10—Reclassification of Permanent Differences
Primarily as a result of differing book/tax treatment of foreign currency transactions and partnerships, on October 31, 2017, undistributed net investment income was increased by $13,139 and undistributed net realized gain was decreased by $13,139. This reclassification had no effect on the net assets of the Fund.
NOTE 11—Share Information
| | | | | | | | | | | | | | | | |
| | | Summary of Share Activity | |
| | | Years ended October 31, | |
| | | 2017 | | | 2016 | |
| | | Shares | | | Amount | | | Shares | | | Amount | |
Sold: | | | | | | | | | | | | | | | | |
Class A | | | 1,616,698 | | | $ | 29,365,182 | | | | 1,586,776 | | | $ | 25,588,835 | |
Class B | | | 14,112 | | | | 224,817 | | | | 8,187 | | | | 126,342 | |
Class C | | | 377,457 | | | | 6,417,661 | | | | 209,372 | | | | 3,205,647 | |
Class P | | | 1,741,281 | | | | 31,130,630 | | | | 2,250,146 | | | | 36,399,297 | |
Class S | | | 4,783 | | | | 84,978 | | | | 9,453 | | | | 154,193 | |
Class Y | | | 633,118 | | | | 11,532,147 | | | | 425,083 | | | | 6,711,110 | |
Class R6(a) | | | 568 | | | | 10,005 | | | | — | | | | — | |
| | | | |
Issued as reinvestment of dividends: | | | | | | | | | | | | | | | | |
Class A | | | 173,488 | | | | 2,779,270 | | | | 205,393 | | | | 3,292,454 | |
Class B | | | 1,135 | | | | 16,791 | | | | 2,679 | | | | 40,164 | |
Class C | | | 19,988 | | | | 294,614 | | | | 24,777 | | | | 370,418 | |
Class P | | | 6,231,181 | | | | 100,945,132 | | | | 7,072,427 | | | | 114,502,599 | |
Class S | | | 11,806 | | | | 189,951 | | | | 14,167 | | | | 227,949 | |
Class Y | | | 14,223 | | | | 229,700 | | | | 8,724 | | | | 140,813 | |
| | | | |
Automatic conversion of Class B shares to Class A shares: | | | | | | | | | | | | | | | | |
Class A | | | 10,175 | | | | 178,740 | | | | 13,153 | | | | 209,023 | |
Class B | | | (11,042 | ) | | | (178,740 | ) | | | (14,108 | ) | | | (209,023 | ) |
| | | | |
Reacquired: | | | | | | | | | | | | | | | | |
Class A | | | (982,545 | ) | | | (17,451,273 | ) | | | (1,635,699 | ) | | | (25,604,997 | ) |
Class B | | | (3,617 | ) | | | (59,639 | ) | | | (12,798 | ) | | | (185,012 | ) |
Class C | | | (217,575 | ) | | | (3,638,096 | ) | | | (202,095 | ) | | | (2,931,500 | ) |
Class P | | | (9,754,579 | ) | | | (176,160,350 | ) | | | (9,931,393 | ) | | | (160,323,542 | ) |
Class S | | | (32,871 | ) | | | (609,812 | ) | | | (34,384 | ) | | | (533,958 | ) |
Class Y | | | (179,003 | ) | | | (3,189,055 | ) | | | (342,458 | ) | | | (5,390,832 | ) |
Net increase (decrease) in share activity | | | (331,219 | ) | | $ | (17,887,347 | ) | | | (342,598 | ) | | $ | (4,210,020 | ) |
| (a) | Commencement date April 4, 2017. |
20 Invesco Summit Fund
NOTE 12—Financial Highlights
The following schedule presents financial highlights for a share of the Fund outstanding throughout the periods indicated.
| | | | | | | | | | | | | | | | | | | | | | | | | | | | | | | | | | | | | | | | | | | | | | | | | | | | | | | | |
| | | Net asset
value,
beginning
of period | | | Net
investment
income
(loss)(a) | | | Net gains
on securities
(both
realized and
unrealized) | | | Total from
investment
operations | | | Dividends
from net
investment
income | | | Distributions
from net
realized
gains | | | Total
distributions | | | Net asset
value, end
of period | | | Total
return(b) | | | Net assets,
end of period
(000’s omitted) | | | Ratio of
expenses
to average
net assets
with fee waivers
and/or expenses
absorbed | | | Ratio of
expenses
to average net
assets without
fee waivers
and/or expenses
absorbed | | | Ratio of net
investment
income (loss)
to average
net assets | | | Portfolio
turnover(c) | |
Class A | | | | | | | | | | | | | | | | | | | | | | | | | | | | | | | | | | | | | | | | | | | | | | | | | | | | | | | | |
Year ended 10/31/17 | | $ | 16.56 | | | $ | (0.02 | ) | | $ | 4.60 | | | $ | 4.58 | | | $ | — | | | $ | (1.00 | ) | | $ | (1.00 | ) | | $ | 20.14 | | | | 29.20 | % | | $ | 77,519 | | | | 1.04 | %(d) | | | 1.04 | %(d) | | | (0.13 | )%(d) | | | 31 | % |
Year ended 10/31/16 | | | 17.59 | | | | (0.01 | ) | | | 0.11 | | | | 0.10 | | | | — | | | | (1.13 | ) | | | (1.13 | ) | | | 16.56 | | | | 0.81 | | | | 50,217 | | | | 1.05 | | | | 1.05 | | | | (0.05 | ) | | | 47 | |
Year ended 10/31/15 | | | 18.62 | | | | (0.03 | ) | | | 1.44 | | | | 1.41 | | | | — | | | | (2.44 | ) | | | (2.44 | ) | | | 17.59 | | | | 8.86 | | | | 50,349 | | | | 1.04 | | | | 1.04 | | | | (0.16 | ) | | | 49 | |
Year ended 10/31/14 | | | 16.40 | | | | (0.03 | ) | | | 2.62 | | | | 2.59 | | | | (0.03 | ) | | | (0.34 | ) | | | (0.37 | ) | | | 18.62 | | | | 16.06 | | | | 30,382 | | | | 1.05 | | | | 1.05 | | | | (0.18 | ) | | | 52 | |
Year ended 10/31/13 | | | 12.67 | | | | 0.03 | | | | 3.72 | | | | 3.75 | | | | (0.02 | ) | | | — | | | | (0.02 | ) | | | 16.40 | | | | 29.68 | | | | 23,025 | | | | 1.06 | | | | 1.06 | | | | 0.20 | | | | 49 | |
Class B | | | | | | | | | | | | | | | | | | | | | | | | | | | | | | | | | | | | | | | | | | | | | | | | | | | | | | | | |
Year ended 10/31/17 | | | 15.38 | | | | (0.14 | ) | | | 4.23 | | | | 4.09 | | | | — | | | | (1.00 | ) | | | (1.00 | ) | | | 18.47 | | | | 28.21 | | | | 347 | | | | 1.79 | (d) | | | 1.79 | (d) | | | (0.88 | )(d) | | | 31 | |
Year ended 10/31/16 | | | 16.53 | | | | (0.12 | ) | | | 0.10 | | | | (0.02 | ) | | | — | | | | (1.13 | ) | | | (1.13 | ) | | | 15.38 | | | | 0.09 | | | | 280 | | | | 1.80 | | | | 1.80 | | | | (0.80 | ) | | | 47 | |
Year ended 10/31/15 | | | 17.77 | | | | (0.15 | ) | | | 1.35 | | | | 1.20 | | | | — | | | | (2.44 | ) | | | (2.44 | ) | | | 16.53 | | | | 7.20 | | | | 566 | | | | 1.79 | | | | 1.79 | | | | (0.91 | ) | | | 49 | |
Year ended 10/31/14 | | | 15.76 | | | | (0.15 | ) | | | 2.50 | | | | 2.35 | | | | — | | | | (0.34 | ) | | | (0.34 | ) | | | 17.77 | | | | 15.19 | | | | 676 | | | | 1.80 | | | | 1.80 | | | | (0.93 | ) | | | 52 | |
Year ended 10/31/13 | | | 12.25 | | | | (0.08 | ) | | | 3.59 | | | | 3.51 | | | | — | | | | — | | | | — | | | | 15.76 | | | | 28.65 | | | | 831 | | | | 1.81 | | | | 1.81 | | | | (0.55 | ) | | | 49 | |
Class C | | | | | | | | | | | | | | | | | | | | | | | | | | | | | | | | | | | | | | | | | | | | | | | | | | | | | | | | |
Year ended 10/31/17 | | | 15.34 | | | | (0.15 | ) | | | 4.22 | | | | 4.07 | | | | — | | | | (1.00 | ) | | | (1.00 | ) | | | 18.41 | | | | 28.15 | | | | 9,325 | | | | 1.79 | (d) | | | 1.79 | (d) | | | (0.88 | )(d) | | | 31 | |
Year ended 10/31/16 | | | 16.49 | | | | (0.12 | ) | | | 0.10 | | | | (0.02 | ) | | | — | | | | (1.13 | ) | | | (1.13 | ) | | | 15.34 | | | | 0.09 | | | | 5,008 | | | | 1.80 | | | | 1.80 | | | | (0.80 | ) | | | 47 | |
Year ended 10/31/15 | | | 17.73 | | | | (0.15 | ) | | | 1.35 | | | | 1.20 | | | | — | | | | (2.44 | ) | | | (2.44 | ) | | | 16.49 | | | | 8.02 | | | | 4,855 | | | | 1.79 | | | | 1.79 | | | | (0.91 | ) | | | 49 | |
Year ended 10/31/14 | | | 15.73 | | | | (0.16 | ) | | | 2.50 | | | | 2.34 | | | | — | | | | (0.34 | ) | | | (0.34 | ) | | | 17.73 | | | | 15.15 | | | | 2,337 | | | | 1.80 | | | | 1.80 | | | | (0.93 | ) | | | 52 | |
Year ended 10/31/13 | | | 12.22 | | | | (0.08 | ) | | | 3.59 | | | | 3.51 | | | | — | | | | — | | | | — | | | | 15.73 | | | | 28.72 | | | | 2,122 | | | | 1.81 | | | | 1.81 | | | | (0.55 | ) | | | 49 | |
Class P | | | | | | | | | | | | | | | | |
Year ended 10/31/17 | | | 16.75 | | | | 0.00 | | | | 4.65 | | | | 4.65 | | | | (0.01 | ) | | | (1.00 | ) | | | (1.01 | ) | | | 20.39 | | | | 29.32 | | | | 2,044,421 | | | | 0.89 | (d) | | | 0.89 | (d) | | | 0.02 | (d) | | | 31 | |
Year ended 10/31/16 | | | 17.75 | | | | 0.02 | | | | 0.11 | | | | 0.13 | | | | — | | | | (1.13 | ) | | | (1.13 | ) | | | 16.75 | | | | 0.98 | | | | 1,708,869 | | | | 0.90 | | | | 0.90 | | | | 0.10 | | | | 47 | |
Year ended 10/31/15 | | | 18.74 | | | | (0.00 | ) | | | 1.45 | | | | 1.45 | | | | — | | | | (2.44 | ) | | | (2.44 | ) | | | 17.75 | | | | 9.03 | | | | 1,821,733 | | | | 0.89 | | | | 0.89 | | | | (0.01 | ) | | | 49 | |
Year ended 10/31/14 | | | 16.50 | | | | (0.01 | ) | | | 2.63 | | | | 2.62 | | | | (0.04 | ) | | | (0.34 | ) | | | (0.38 | ) | | | 18.74 | | | | 16.22 | | | | 1,829,660 | | | | 0.90 | | | | 0.90 | | | | (0.03 | ) | | | 52 | |
Year ended 10/31/13 | | | 12.75 | | | | 0.05 | | | | 3.74 | | | | 3.79 | | | | (0.04 | ) | | | — | | | | (0.04 | ) | | | 16.50 | | | | 29.84 | | | | 1,746,339 | | | | 0.91 | | | | 0.91 | | | | 0.35 | | | | 49 | |
Class S | | | | | | | | | | | | | | | | | | | | | | | | | | | | | | | | | | | | | | | | | | | | | | | | | | | | | | | | |
Year ended 10/31/17 | | | 16.63 | | | | (0.01 | ) | | | 4.62 | | | | 4.61 | | | | (0.00 | ) | | | (1.00 | ) | | | (1.00 | ) | | | 20.24 | | | | 29.29 | | | | 3,521 | | | | 0.94 | (d) | | | 0.94 | (d) | | | (0.03 | )(d) | | | 31 | |
Year ended 10/31/16 | | | 17.64 | | | | 0.01 | | | | 0.11 | | | | 0.12 | | | | — | | | | (1.13 | ) | | | (1.13 | ) | | | 16.63 | | | | 0.92 | | | | 3,164 | | | | 0.95 | | | | 0.95 | | | | 0.05 | | | | 47 | |
Year ended 10/31/15 | | | 18.66 | | | | (0.01 | ) | | | 1.43 | | | | 1.42 | | | | — | | | | (2.44 | ) | | | (2.44 | ) | | | 17.64 | | | | 8.90 | | | | 3,546 | | | | 0.94 | | | | 0.94 | | | | (0.06 | ) | | | 49 | |
Year ended 10/31/14 | | | 16.43 | | | | (0.01 | ) | | | 2.62 | | | | 2.61 | | | | (0.04 | ) | | | (0.34 | ) | | | (0.38 | ) | | | 18.66 | | | | 16.18 | | | | 3,685 | | | | 0.95 | | | | 0.95 | | | | (0.08 | ) | | | 52 | |
Year ended 10/31/13 | | | 12.70 | | | | 0.04 | | | | 3.73 | | | | 3.77 | | | | (0.04 | ) | | | — | | | | (0.04 | ) | | | 16.43 | | | | 29.74 | | | | 4,490 | | | | 0.96 | | | | 0.96 | | | | 0.30 | | | | 49 | |
Class Y | | | | | | | | | | | | | | | | | | | | | | | | | | | | | | | | | | | | | | | | | | | | | | | | | | | | | | | | |
Year ended 10/31/17 | | | 16.71 | | | | 0.02 | | | | 4.64 | | | | 4.66 | | | | (0.03 | ) | | | (1.00 | ) | | | (1.03 | ) | | | 20.34 | | | | 29.46 | | | | 13,881 | | | | 0.79 | (d) | | | 0.79 | (d) | | | 0.12 | (d) | | | 31 | |
Year ended 10/31/16 | | | 17.69 | | | | 0.03 | | | | 0.12 | | | | 0.15 | | | | — | | | | (1.13 | ) | | | (1.13 | ) | | | 16.71 | | | | 1.10 | | | | 3,576 | | | | 0.80 | | | | 0.80 | | | | 0.20 | | | | 47 | |
Year ended 10/31/15 | | | 18.67 | | | | 0.02 | | | | 1.44 | | | | 1.46 | | | | — | | | | (2.44 | ) | | | (2.44 | ) | | | 17.69 | | | | 9.13 | | | | 2,170 | | | | 0.79 | | | | 0.79 | | | | 0.09 | | | | 49 | |
Year ended 10/31/14 | | | 16.45 | | | | 0.01 | | | | 2.61 | | | | 2.62 | | | | (0.06 | ) | | | (0.34 | ) | | | (0.40 | ) | | | 18.67 | | | | 16.23 | | | | 699 | | | | 0.80 | | | | 0.80 | | | | 0.07 | | | | 52 | |
Year ended 10/31/13 | | | 12.72 | | | | 0.06 | | | | 3.73 | | | | 3.79 | | | | (0.06 | ) | | | — | | | | (0.06 | ) | | | 16.45 | | | | 29.90 | | | | 514 | | | | 0.81 | | | | 0.81 | | | | 0.45 | | | | 49 | |
Class R5 | | | | | | | | | | | | | | | | | | | | | | | | | | | | | | | | | | | | | | | | | | | | | | | | | | | | | | | | |
Year ended 10/31/17 | | | 16.77 | | | | 0.03 | | | | 4.66 | | | | 4.69 | | | | (0.04 | ) | | | (1.00 | ) | | | (1.04 | ) | | | 20.42 | | | | 29.56 | | | | 20 | | | | 0.76 | (d) | | | 0.76 | (d) | | | 0.15 | (d) | | | 31 | |
Year ended 10/31/16 | | | 17.75 | | | | 0.04 | | | | 0.11 | | | | 0.15 | | | | — | | | | (1.13 | ) | | | (1.13 | ) | | | 16.77 | | | | 1.10 | | | | 17 | | | | 0.74 | | | | 0.74 | | | | 0.26 | | | | 47 | |
Year ended 10/31/15 | | | 18.71 | | | | 0.04 | | | | 1.44 | | | | 1.48 | | | | — | | | | (2.44 | ) | | | (2.44 | ) | | | 17.75 | | | | 9.24 | | | | 18 | | | | 0.68 | | | | 0.68 | | | | 0.20 | | | | 49 | |
Year ended 10/31/14 | | | 16.46 | | | | 0.03 | | | | 2.63 | | | | 2.66 | | | | (0.07 | ) | | | (0.34 | ) | | | (0.41 | ) | | | 18.71 | | | | 16.50 | | | | 541 | | | | 0.69 | | | | 0.69 | | | | 0.18 | | | | 52 | |
Year ended 10/31/13 | | | 12.73 | | | | 0.08 | | | | 3.72 | | | | 3.80 | | | | (0.07 | ) | | | — | | | | (0.07 | ) | | | 16.46 | | | | 30.05 | | | | 114 | | | | 0.71 | | | | 0.71 | | | | 0.55 | | | | 49 | |
Class R6 | | | | | | | | | | | | | | | | | | | | | | | | | | | | | | | | | | | | | | | | | | | | | | | | | | | | | | | | |
Year ended 10/31/17(e) | | | 17.61 | | | | 0.01 | | | | 2.80 | | | | 2.81 | | | | — | | | | — | | | | — | | | | 20.42 | | | | 15.96 | | | | 12 | | | | 0.77 | (d)(f) | | | 0.77 | (d)(f) | | | 0.14 | (d)(f) | | | 31 | |
| (a) | Calculated using average shares outstanding. |
| (b) | Includes adjustments in accordance with accounting principles generally accepted in the United States of America and as such, the net asset value for financial reporting purposes and the returns based upon those net asset values may differ from the net asset value and returns for shareholder transactions. Does not include sales charges and is not annualized for periods less than one year, if applicable. |
| (c) | Portfolio turnover is calculated at the fund level and is not annualized for periods less than one year, if applicable. |
| (d) | Ratios are based on average daily net assets (000’s omitted) of $60,579, $338, $6,564, $1,875,233, $3,441, $7,894, $18 and $11 for Class A, Class B, Class C, Class P, Class S Class Y, Class R5 and Class R6 shares, respectively. |
| (e) | Commencement date of April 4, 2017. |
21 Invesco Summit Fund
Note 13—Subsequent Event
On December 1, 2017, the Fund’s Board of Trustees approved the early conversion of the remaining assets in the Fund’s Class B shares into Class A shares to occur on or about January 26, 2018. At the close of business on or about January 26, 2018, (the “Conversion Date”) all outstanding Class B shares of the Fund will be converted to Class A shares of the Fund, which is prior to the date the Class B shares would normally be converted to Class A shares. Once the conversion is completed, Class B shares will be closed and become inactive. No contingent deferred sales charges will be payable in connection with this early conversion. The conversion of the Fund’s Class B shares into Class A shares on the Conversion Date is not expected to be a taxable event for federal income tax purposes, and should not result in the recognition of gain or loss by converting shareholders, although each shareholder should consult with his or her own tax adviser.
22 Invesco Summit Fund
Report of Independent Registered Public Accounting Firm
To the Board of Trustees of AIM Equity Funds (Invesco Equity Funds)
and Shareholders of Invesco Summit Fund:
In our opinion, the accompanying statement of assets and liabilities, including the schedule of investments, and the related statements of operations and of changes in net assets and the financial highlights present fairly, in all material respects, the financial position of Invesco Summit Fund (one of the portfolios constituting the AIM Equity Funds (Invesco Equity Funds), hereafter referred to as the “Fund”) as of October 31, 2017, the results of its operations for the year then ended, the changes in its net assets for each of the two years in the period then ended and the financial highlights for each of the periods indicated therein, in conformity with accounting principles generally accepted in the United States of America. These financial statements and financial highlights (hereafter referred to as “financial statements”) are the responsibility of the Fund’s management. Our responsibility is to express an opinion on these financial statements based on our audits. We conducted our audits of these financial statements in accordance with the standards of the Public Company Accounting Oversight Board (United States). Those standards require that we plan and perform the audit to obtain reasonable assurance about whether the financial statements are free of material misstatement. An audit includes examining, on a test basis, evidence supporting the amounts and disclosures in the financial statements, assessing the accounting principles used and significant estimates made by management, and evaluating the overall financial statement presentation. We believe that our audits, which included confirmation of securities as of October 31, 2017 by correspondence with the custodian, transfer agent and brokers, and when replies were not received from brokers, we performed other auditing procedures, provide a reasonable basis for our opinion.
PricewaterhouseCoopers LLP
Houston, Texas
December 21, 2017
23 Invesco Summit Fund
Calculating your ongoing Fund expenses
Example
As a shareholder of the Fund, you incur two types of costs: (1) transaction costs, which may include sales charges (loads) on purchase payments or contingent deferred sales charges on redemptions, if any; and (2) ongoing costs, including management fees, distribution and/or service (12b-1) fees, and other Fund expenses. This example is intended to help you understand your ongoing costs (in dollars) of investing in the Fund and to compare these costs with ongoing costs of investing in other mutual funds. The example is based on an investment of $1,000 invested at the beginning of the period and held for the entire period May 1, 2017 through October 31, 2017.
Actual expenses
The table below provides information about actual account values and actual expenses. You may use the information in this table, together with the amount you invested, to estimate the expenses that you paid over the period. Simply divide your account value by $1,000 (for example, an $8,600 account value divided by $1,000 = 8.6), then multiply the result by the number in the table under the heading entitled “Actual Expenses Paid During Period” to estimate the expenses you paid on your account during this period.
Hypothetical example for comparison purposes
The table below also provides information about hypothetical account values and hypothetical expenses based on the Fund’s actual expense ratio and an assumed rate of return of 5% per year before expenses, which is not the Fund’s actual return.
The hypothetical account values and expenses may not be used to estimate the actual ending account balance or expenses you paid for the period. You may use this information to compare the ongoing costs of investing in the Fund and other funds. To do so, compare this 5% hypothetical example with the 5% hypothetical examples that appear in the shareholder reports of the other funds.
Please note that the expenses shown in the table are meant to highlight your ongoing costs only and do not reflect any transaction costs, such as sales charges (loads) on purchase payments or contingent deferred sales charges on redemptions, if any. Therefore, the hypothetical information is useful in comparing ongoing costs only, and will not help you determine the relative total costs of owning different funds. In addition, if these transaction costs were included, your costs would have been higher.
| | | | | | | | | | | | | | | | | | | | | | | | |
| Class | | Beginning
Account Value
(05/01/17) | | | ACTUAL | | | HYPOTHETICAL (5% annual return before
expenses) | | | Annualized
Expense
Ratio | |
| | | Ending
Account Value
(10/31/17)1 | | | Expenses
Paid During
Period2 | | | Ending
Account Value
(10/31/17) | | | Expenses
Paid During
Period2 | | |
A | | $ | 1,000.00 | | | $ | 1,127.00 | | | $ | 5.58 | | | $ | 1,019.96 | | | $ | 5.30 | | | | 1.04 | % |
B | | | 1,000.00 | | | | 1,122.10 | | | | 9.57 | | | | 1,016.18 | | | | 9.10 | | | | 1.79 | |
C | | | 1,000.00 | | | | 1,121.90 | | | | 9.57 | | | | 1,016.18 | | | | 9.10 | | | | 1.79 | |
P | | | 1,000.00 | | | | 1,127.10 | | | | 4.77 | | | | 1,020.72 | | | | 4.53 | | | | 0.89 | |
S | | | 1,000.00 | | | | 1,126.90 | | | | 5.04 | | | | 1,020.47 | | | | 4.79 | | | | 0.94 | |
Y | | | 1,000.00 | | | | 1,128.10 | | | | 4.24 | | | | 1,021.22 | | | | 4.02 | | | | 0.79 | |
R5 | | | 1,000.00 | | | | 1,128.20 | | | | 4.02 | | | | 1,021.42 | | | | 3.82 | | | | 0.75 | |
R6 | | | 1,000.00 | | | | 1,128.20 | | | | 4.08 | | | | 1,021.37 | | | | 3.87 | | | | 0.76 | |
| 1 | The actual ending account value is based on the actual total return of the Fund for the period May 1, 2017 through October 31, 2017, after actual expenses and will differ from the hypothetical ending account value which is based on the Fund’s expense ratio and a hypothetical annual return of 5% before expenses. |
| 2 | Expenses are equal to the Fund’s annualized expense ratio as indicated above multiplied by the average account value over the period, multiplied by 184/365 to reflect the most recent fiscal half year. |
24 Invesco Summit Fund
Approval of Investment Advisory and Sub-Advisory Contracts
The Board of Trustees (the Board) of AIM Equity Funds (Invesco Equity Funds) is required under the Investment Company Act of 1940, as amended, to approve annually the renewal of Invesco Summit Fund’s (the Fund) investment advisory agreements. During contract renewal meetings held on June 12-13, 2017, the Board as a whole, and the disinterested or “independent” Trustees, who comprise over 75% of the Board, voting separately, approved the continuance for the Fund of the Master Investment Advisory Agreement with Invesco Advisers, Inc. (Invesco Advisers and the investment advisory agreement) and the Master Intergroup Sub-Advisory Contract for Mutual Funds with Invesco Asset Management Deutschland GmbH, Invesco Asset Management Limited, Invesco Asset Management (Japan) Limited, Invesco Hong Kong Limited, Invesco Senior Secured Management, Inc. and Invesco Canada Ltd. (collectively, the Affiliated Sub-Advisers and the sub-advisory contracts) for another year, effective July 1, 2017.
In evaluating the fairness and reasonableness of compensation under the Fund’s investment advisory agreement and sub-advisory contracts, the Board considered, among other things, the factors discussed below. The Board determined that continuation of the Fund’s investment advisory agreement and the sub-advisory contracts is in the best interest of the Fund and its shareholders and that the compensation payable to Invesco Advisers and the Affiliated Sub-Advisers under the agreements is fair and reasonable.
The Board’s Fund Evaluation Process
The Board’s Investments Committee has established three Sub-Committees, which meet throughout the year to review the performance of funds advised by Invesco Advisers (the Invesco Funds). Over the course of each year, the Sub-Committees meet with portfolio managers for their assigned Invesco Funds and other members of management to review the performance, investment objective(s), policies, strategies, limitations and investment risks of these funds. The Board had the benefit of reports from the Sub-Committees and Investments Committee throughout the year in considering approval of the continuance of each Invesco Fund’s investment advisory agreement and sub-advisory contracts for another year.
During the contract renewal process, the Board receives comparative performance and fee data regarding the Invesco Funds prepared by Invesco Advisers and Broadridge Financial Solutions, Inc. (Broadridge), an independent provider of investment company data. The Board also receives an independent written evaluation from the Senior Officer, an officer of the Invesco Funds who reports directly to the independent Trustees. The Senior Officer’s evaluation is prepared as part of his
responsibility to manage the process by which the Invesco Funds’ proposed management fees are negotiated during the annual contract renewal process to ensure they are negotiated in a manner that is at arms’ length and reasonable. In addition to meetings with Invesco Advisers and fund counsel, the independent Trustees also discuss the continuance of the investment advisory agreement and sub-advisory contracts in separate sessions with the Senior Officer and with independent legal counsel.
The Trustees recognized that the advisory fee rates for the Invesco Funds are, in most cases, the result of years of review and negotiation. The Trustees’ deliberations and conclusions in a particular year may be based in part on their deliberations and conclusions regarding these arrangements throughout the year and in prior years. The Trustees’ review and conclusions are based on the comprehensive consideration of all information presented to them and are not the result of any single determinative factor. Moreover, one Trustee may have weighed a particular piece of information or factor differently than another Trustee.
The discussion below is a summary of the Senior Officer’s independent written evaluation with respect to the Fund’s investment advisory agreement as well as a discussion of the material factors and related conclusions that formed the basis for the Board’s approval of the Fund’s investment advisory agreement and sub-advisory contracts. This information is current as of June 13, 2017, and does not reflect consideration of factors that became known to the Board after that date.
Factors and Conclusions and Summary of Independent Written Fee Evaluation
| A. | Nature, Extent and Quality of Services Provided by Invesco Advisers and the Affiliated Sub-Advisers |
The Board reviewed the advisory services provided to the Fund by Invesco Advisers under the Fund’s investment advisory agreement, the performance of Invesco Advisers in providing these services, and the credentials and experience of the officers and employees of Invesco Advisers who provide these services, including the Fund’s portfolio manager or managers. The Board’s review included consideration of Invesco Advisers’ investment process oversight, credit analysis and investment risk management. The Board also considered non-advisory services that Invesco Advisers and its affiliates provide to the Invesco Funds such as various back office support functions, trading operations, internal audit, valuation and legal and compliance.
In determining whether to continue the Fund’s investment advisory agreement, the Board considered the benefits of reapproving an existing relationship as contrasted with the
greater uncertainty that may be associated with entering into a new relationship. The Board concluded that the nature, extent and quality of the services provided to the Fund by Invesco Advisers are appropriate and satisfactory.
The Board reviewed the services that may be provided by the Affiliated Sub-Advisers under the sub-advisory contracts and the credentials and experience of the officers and employees of the Affiliated Sub-Advisers who provide these services. The Board noted that the Affiliated Sub-Advisers have offices and personnel that are located in financial centers around the world. As a result, the Board noted that the Affiliated Sub-Advisers can provide research and investment analysis on the markets and economies of various countries in which the Fund may invest, make recommendations regarding securities and assist with security trades. The Board concluded that the sub-advisory contracts may benefit the Fund and its shareholders by permitting Invesco Advisers to use the resources and talents of the Affiliated Sub-Advisers in managing the Fund. The Board concluded that the nature, extent and quality of the services that may be provided by the Affiliated Sub-Advisers are appropriate and satisfactory.
| B. | Fund Investment Performance |
The Board considered Fund investment performance as a relevant factor in considering whether to approve the investment advisory agreement. The Board did not view Fund performance as a relevant factor in considering whether to approve the sub-advisory contracts for the Fund, as no Affiliated Sub-Adviser currently manages assets of the Fund.
The Board compared the Fund’s investment performance over multiple time periods ending December 31, 2016 to the performance of funds in the Broadridge performance universe and against the Lipper Multi-Cap Growth Funds Index. The Board noted that performance of Class A shares of the Fund was in the third quintile of its performance universe for the one and three year periods and the second quintile for the five year period (the first quintile being the best performing funds and the fifth quintile being the worst performing funds). The Board noted that performance of Class A shares of the Fund was below the performance of the Index for the one year period and above the performance of the Index for the three and five year periods. The Trustees also reviewed more recent Fund performance and this review did not change their conclusions.
| C. | Advisory and Sub-Advisory Fees |
The Board compared the Fund’s contractual management fee rate to the contractual management fee rates of funds in the Fund’s Broadridge expense group at a common asset level. The Board noted that the contractual management fee rate for Class A shares of the Fund was below the median contractual
25 Invesco Summit Fund
management fee rate of funds in its expense group. The Board noted that the term “contractual management fee” for funds in the expense group may include both advisory and certain administrative services fees, but that Broadridge does not provide information on a fund by fund basis as to what is included. The Board noted that Invesco Advisers does not separately charge the Invesco Funds for the administrative services included in the term as defined by Broadridge. The Board also reviewed the methodology used by Broadridge in providing expense group information, which includes using each fund’s contractual management fee schedule (including any applicable breakpoints) as reported in the most recent prospectus or statement of additional information for each fund in the expense group.
The Board noted that Invesco Advisers and the Affiliated Sub-Advisers do not manage other mutual funds or client accounts with investment strategies comparable to those of the Fund.
The Board also considered the services that may be provided by the Affiliated Sub-Advisers pursuant to the sub-advisory contracts, as well as the fees payable by Invesco Advisers to the Affiliated Sub-Advisers pursuant to the sub-advisory contracts. The Board also noted that the sub-advisory fees are not paid directly by the Fund, but rather, are payable by Invesco Advisers to the Affiliated Sub-Advisers.
| D. | Economies of Scale and Breakpoints |
The Board considered the extent to which there are economies of scale in the provision of advisory services to the Fund. The Board also considered that the Fund benefits from economies of scale through contractual breakpoints in the Fund’s advisory fee schedule. The Board noted that the Fund shares directly in economies of scale through lower fees charged by third party service providers based on the combined size of the Invesco Funds advised by Invesco Advisers.
| E. | Profitability and Financial Resources |
The Board reviewed information from Invesco Advisers concerning the costs of the advisory and other services that Invesco Advisers and its affiliates provide to the Fund and the Invesco Funds and the profitability of Invesco Advisers and its affiliates in providing these services. The Board noted that Invesco Advisers continues to operate at a net profit from services Invesco Advisers and its affiliates provide to the Invesco Funds and the Fund. The Board did not deem the level of profits realized by Invesco Advisers and its affiliates from providing services to the Fund to be excessive given the nature, quality and extent of the services provided. The Board received and accepted information from Invesco Advisers demonstrating that Invesco Advisers and each Affiliated Sub-Adviser are financially sound and have the resources necessary to perform their obligations under the investment advisory agreement and sub-advisory contracts.
| F. | Collateral Benefits to Invesco Advisers and its Affiliates |
The Board considered various other benefits received by Invesco Advisers and its affiliates
from the relationship with the Fund, including the fees received for providing transfer agency and distribution services to the Fund. The Board considered comparative information regarding fees charged for these services, including information provided by Broadridge and other independent sources. The Board considered the performance of Invesco Advisers and its affiliates in providing these services and the organizational structure employed to provide these services. The Board also considered that these services are provided to the Fund pursuant to written contracts that are reviewed and approved on an annual basis by the Board; and that the services are required for the operation of the Fund.
The Board considered the benefits realized by Invesco Advisers and the Affiliated Sub-Advisers as a result of portfolio brokerage transactions executed through “soft dollar” arrangements. The Board noted that soft dollar arrangements may result in the Fund bearing costs to purchase research that may be used by Invesco Advisers or the Affiliated Sub-Advisers with other clients and may reduce Invesco Adviser’s or the Affiliated Sub-Adviser’s expenses. The Board also considered that it receives periodic reports from the Chief Compliance Officer of the Invesco Funds demonstrating that these arrangements are consistent with regulatory requirements. The Board did not deem the soft dollar arrangements to be inappropriate.
The Board considered that the Fund’s uninvested cash and cash collateral from any securities lending arrangements may be invested in money market funds advised by Invesco Advisers pursuant to procedures approved by the Board. The Board noted that Invesco Advisers receives advisory fees from these affiliated money market funds attributable to such investments, although Invesco Advisers has contractually agreed to waive through varying periods the advisory fees payable by the Invesco Funds with respect to certain investments in the affiliated money market funds. The waiver is in an amount equal to 100% of the net advisory fee Invesco Advisers receives from the affiliated money market funds with respect to the Fund’s investment in the affiliated money market funds of uninvested cash, but not cash collateral. The Board concluded that the amount of advisory fees received by Invesco Advisers from the Fund’s investment of cash collateral from any securities lending arrangements in the affiliated money market funds is fair and reasonable.
The Board also considered that the Fund may use an affiliated broker to execute certain trades for the Fund to, among other things, control information leakage, and was advised that such trades would be executed in compliance with rules under the federal securities laws and consistent with best execution obligations.
26 Invesco Summit Fund
Tax Information
Form 1099-DIV, Form 1042-S and other year-end tax information provide shareholders with actual calendar year amounts that should be included in their tax returns. Shareholders should consult their tax advisors.
The following distribution information is being provided as required by the Internal Revenue Code or to meet a specific state’s requirement.
The Fund designates the following amounts or, if subsequently determined to be different, the maximum amount allowable for its fiscal year ended October 31, 2017:
| | | | |
Federal and State Income Tax | |
Long-Term Capital Gain Distributions | | $ | 105,117,072 | |
Qualified Dividend Income* | | | 100 | % |
Corporate Dividends Received Deduction* | | | 100 | % |
U.S. Treasury Obligations* | | | 0 | % |
| | * | The above percentages are based on ordinary income dividends paid to shareholders during the Fund’s fiscal year. |
27 Invesco Summit Fund
Trustees and Officers
The address of each trustee and officer is AIM Equity Funds (Invesco Equity Funds) (the “Trust”), 11 Greenway Plaza, Suite 1000, Houston, Texas 77046-1173. The trustees serve for the life of the Trust, subject to their earlier death, incapacitation, resignation, retirement or removal as more specifically provided in the Trust’s organizational documents. Each officer serves for a one year term or until their successors are elected and qualified. Column two below includes length of time served with predecessor entities, if any.
| | | | | | | | |
Name, Year of Birth and
Position(s) Held with the Trust | | Trustee and/
or Officer Since | | Principal Occupation(s)
During Past 5 Years | | Number of
Funds in Fund
Complex
Overseen by
Trustee | | Other Directorship(s)
Held by Trustee During
Past 5 Years |
| Interested Persons | | | | | | | | |
| Martin L. Flanagan1 — 1960 Trustee | | 2007 | | Executive Director, Chief Executive Officer and President, Invesco Ltd. (ultimate parent of Invesco and a global investment management firm); Trustee, The Invesco Funds; Vice Chair, Investment Company Institute; and Member of Executive Board, SMU Cox School of Business Formerly: Advisor to the Board, Invesco Advisers, Inc. (formerly known as Invesco Institutional (N.A.), Inc.); Chairman and Chief Executive Officer, Invesco Advisers, Inc. (registered investment adviser); Director, Chairman, Chief Executive Officer and President, Invesco Holding Company (US), Inc. (formerly IVZ Inc.) (holding company), Invesco Group Services, Inc. (service provider) and Invesco North American Holdings, Inc. (holding company); Director, Chief Executive Officer and President, Invesco Holding Company Limited (parent of Invesco and a global investment management firm); Director, Invesco Ltd.; Chairman, Investment Company Institute and President, Co-Chief Executive Officer, Co-President, Chief Operating Officer and Chief Financial Officer, Franklin Resources, Inc. (global investment management organization) | | 158 | | None |
| Philip A. Taylor2 — 1954 Trustee and Senior Vice President | | 2006 | | Head of the Americas and Senior Managing Director, Invesco Ltd.; Director, Invesco Advisers, Inc. (formerly known as Invesco Institutional (N.A.), Inc.) (registered investment adviser); Director, Chairman, Chief Executive Officer and President, Invesco Management Group, Inc. (formerly known as Invesco Aim Management Group, Inc.) (financial services holding company); Director and Chairman, Invesco Investment Services, Inc. (formerly known as Invesco Aim Investment Services, Inc.) (registered transfer agent); Chief Executive Officer, Invesco Corporate Class Inc. (corporate mutual fund company); Director, Chairman and Chief Executive Officer, Invesco Canada Ltd. (formerly known as Invesco Trimark Ltd./Invesco Trimark Ltèe) (registered investment adviser and registered transfer agent); Trustee and Senior Vice President, The Invesco Funds; Director, Invesco Investment Advisers LLC (formerly known as Van Kampen Asset Management). Formerly: Co-Chairman, Co-President and Co-Chief Executive Officer, Invesco Advisers, Inc. (formerly known as Invesco Institutional (N.A.), Inc.) (registered investment adviser); Director, Chief Executive Officer and President, Van Kampen Exchange Corp; President and Principal Executive Officer, The Invesco Funds (other than AIM Treasurer’s Series Trust (Invesco Treasurer’s Series Trust), Short-Term Investments Trust and Invesco Management Trust); Executive Vice President, The Invesco Funds (AIM Treasurer’s Series Trust (Invesco Treasurer’s Series Trust), Short-Term Investments Trust and Invesco Management Trust only); Director and President, INVESCO Funds Group, Inc. (registered investment adviser and registered transfer agent); Director and Chairman, IVZ Distributors, Inc. (formerly known as INVESCO Distributors, Inc.) (registered broker dealer); Director, President and Chairman, Invesco Inc. (holding company), Invesco Canada Holdings Inc. (holding company), Trimark Investments Ltd./Placements Trimark Ltèe and Invesco Financial Services Ltd/Services Financiers Invesco Ltèe; Chief Executive Officer, Invesco Canada Fund Inc. (corporate mutual fund company); Director and Chairman, Van Kampen Investor Services Inc.; Director, Chief Executive Officer and President, 1371 Preferred Inc. (holding company) and Van Kampen Investments Inc.; Director and President, AIM GP Canada Inc. (general partner for limited partnerships) and Van Kampen Advisors, Inc.; Director and Chief Executive Officer, Invesco Trimark Dealer Inc. (registered broker dealer); Director, Invesco Distributors, Inc. (formerly known as Invesco Aim Distributors, Inc.) (registered broker dealer); Manager, Invesco PowerShares Capital Management LLC; Director, Chief Executive Officer and President, Invesco Advisers, Inc.; Director, Chairman, Chief Executive Officer and President, Invesco Aim Capital Management, Inc.; President, Invesco Trimark Dealer Inc. and Invesco Trimark Ltd./Invesco Trimark Ltèe; Director and President, AIM Trimark Corporate Class Inc. and AIM Trimark Canada Fund Inc.; Senior Managing Director, Invesco Holding Company Limited; Director and Chairman, Fund Management Company (former registered broker dealer); President and Principal Executive Officer, The Invesco Funds (AIM Treasurer’s Series Trust (Invesco Treasurer’s Series Trust), and Short-Term Investments Trust only); President, AIM Trimark Global Fund Inc. and AIM Trimark Canada Fund Inc. | | 158 | | None |
| 1 | Mr. Flanagan is considered an interested person (within the meaning of Section 2(a)(19) of the 1940 Act) of the Trust because he is an officer of the Adviser to the Trust, and an officer and a director of Invesco Ltd., ultimate parent of the Adviser. |
| 2 | Mr. Taylor is considered an interested person (within the meaning of Section 2(a)(19) of the 1940 Act) of the Trust because he is an officer and a director of the Adviser. |
T-1 Invesco Summit Fund
Trustees and Officers—(continued)
| | | | | | | | |
Name, Year of Birth and
Position(s) Held with the Trust | | Trustee and/
or Officer Since | | Principal Occupation(s)
During Past 5 Years | | Number of
Funds in Fund
Complex
Overseen by
Trustee | | Other Directorship(s)
Held by Trustee During
Past 5 Years |
| Independent Trustees | | | | | | | | |
Bruce L. Crockett — 1944 Trustee and Chair | | 1993 | | Chairman, Crockett Technologies Associates (technology consulting company) Formerly: Director, Captaris (unified messaging provider); Director, President and Chief Executive Officer, COMSAT Corporation; Chairman, Board of Governors of INTELSAT (international communications company); ACE Limited (insurance company); Independent Directors Council and Investment Company Institute: Member of the Audit Committee, Investment Company Institute; Member of the Executive Committee and Chair of the Governance Committee, Independent Directors Council | | 158 | | Director and Chairman of the Audit Committee, ALPS (Attorneys Liability Protection Society) (insurance company); Director and Member of the Audit Committee, Ferroglobe PLC (metallurgical company) |
David C. Arch — 1945 Trustee | | 2010 | | Chairman of Blistex Inc. (consumer health care products manufacturer); Member, World Presidents’ Organization | | 158 | | Board member of the Illinois Manufacturers’ Association |
James T. Bunch — 1942 Trustee | | 2003 | | Managing Member, Grumman Hill Group LLC (family office/private equity investments) Formerly: Chairman of the Board, Denver Film Society; Chairman of the Board of Trustees, Evans Scholarship Foundation; Chairman, Board of Governors, Western Golf Association | | 158 | | Trustee, Evans Scholarship Foundation |
Jack M. Fields — 1952 Trustee | | 1997 | | Chief Executive Officer, Twenty First Century Group, Inc. (government affairs company); and Discovery Learning Alliance (non-profit) Formerly: Owner and Chief Executive Officer, Dos Angeles Ranch L.P. (cattle, hunting, corporate entertainment); Director, Insperity, Inc. (formerly known as Administaff) (human resources provider); Chief Executive Officer, Texana Timber LP (sustainable forestry company); Director of Cross Timbers Quail Research Ranch (non-profit); and member of the U.S. House of Representatives | | 158 | | None |
Cynthia Hostetler — 1962 Trustee | | 2017 | | Non-Executive Director and Trustee of a number of public and private business corporations Formerly: Head of Investment Funds and Private Equity, Overseas Private Investment Corporation; President, First Manhattan Bancorporation, Inc.; Attorney, Simpson Thacher & Bartlett LLP | | 158 | | Vulcan Materials Company (construction materials company); Trilinc Global Impact Fund; Aberdeen Investment Funds (4 portfolios); Artio Global Investment LLC (mutual fund complex); Edgen Group, Inc. (specialized energy and infrastructure products distributor) |
Eli Jones — 1961 Trustee | | 2016 | | Professor and Dean, Mays Business School — Texas A&M University Formerly: Professor and Dean, Walton College of Business, University of Arkansas and E.J. Ourso College of Business, Louisiana State University; Director, Arvest Bank | | 158 | | Insperity, Inc. (formerly known as Administaff) (human resources provider) |
Prema Mathai-Davis — 1950 Trustee | | 1998 | | Retired. Formerly: Chief Executive Officer, YWCA of the U.S.A. | | 158 | | None |
Teresa M. Ressel — 1962 Trustee | | 2017 | | Non-executive director and trustee of a number of public and private business corporations Formerly: Chief Financial Officer, Olayan America, The Olayan Group (international investor/commercial/industrial); Chief Executive Officer, UBS Securities LLC; Group Chief Operating Officer, Americas, UBS AG; Assistant Secretary for Management & Budget and CFO, US Department of the Treasury; Chief Compliance Officer, Kaiser Permanente (healthcare consortium); Program Manager, Hewlett-Packard; Nuclear Engineering, General Dynamics Corporation (aerospace and defense company) | | 158 | | Atlantic Power Corporation (power generation company); ON Semiconductor Corp. (semiconductor supplier) |
Larry Soll — 1942 Trustee | | 2003 | | Retired. Formerly: Chairman, Chief Executive Officer and President, Synergen Corp. (a biotechnology company) | | 158 | | None |
Ann Barnett Stern — 1957 Trustee | | 2017 | | President and Chief Executive Officer, Houston Endowment Inc. (private philanthropic institution) Formerly: Executive Vice President and General Counsel, Texas Children’s Hospital; Attorney, Beck, Redden and Secrest, LLP; Business Law Instructor, University of St. Thomas; Attorney, Andrews & Kurth LLP | | 158 | | Federal Reserve Bank of Dallas |
Raymond Stickel, Jr. — 1944 Trustee | | 2005 | | Retired. Formerly: Director, Mainstay VP Series Funds, Inc. (25 portfolios); Partner, Deloitte & Touche | | 158 | | None |
Robert C. Troccoli — 1949 Trustee | | 2016 | | Adjunct Professor, University of Denver — Daniels College of Business Formerly: Senior Partner, KPMG LLP | | 158 | | None |
T-2 Invesco Summit Fund
Trustees and Officers—(continued)
| | | | | | | | |
Name, Year of Birth and
Position(s) Held with the Trust | | Trustee and/
or Officer Since | | Principal Occupation(s)
During Past 5 Years | | Number of
Funds in Fund
Complex
Overseen by
Trustee | | Other Directorship(s)
Held by Trustee During
Past 5 Years |
| Independent Trustees—(continued) |
Christopher L. Wilson — 1957 Trustee | | 2017 | | Managing Partner, CT2, LLC (investing and consulting firm) Formerly: President/Chief Executive Officer, Columbia Funds, Bank of America Corporation; President/Chief Executive Officer, CDC IXIS Asset Management Services, Inc.; Principal & Director of Operations, Scudder Funds, Scudder, Stevens & Clark, Inc.; Assistant Vice President, Fidelity Investments | | 158 | | TD Asset Management USA Inc. (mutual fund complex) (22 portfolios); ISO New England, Inc. (non-profit organization managing regional electricity market) |
| Other Officers | | | | | | | | |
Sheri Morris — 1964 President, Principal Executive Officer and Treasurer | | 1999 | | President, Principal Executive Officer and Treasurer, The Invesco Funds; Vice President, Invesco Advisers, Inc. (formerly known as Invesco Institutional (N.A.), Inc.) (registered investment adviser); and Vice President, PowerShares Exchange-Traded Fund Trust, PowerShares Exchange-Traded Fund Trust II, PowerShares India Exchange-Traded Fund Trust, PowerShares Actively Managed Exchange-Traded Fund Trust and PowerShares Actively Managed Exchange-Traded Commodity Fund Trust Formerly: Vice President and Principal Financial Officer, The Invesco Funds; Vice President, Invesco Aim Advisers, Inc., Invesco Aim Capital Management, Inc. and Invesco Aim Private Asset Management, Inc.; Assistant Vice President and Assistant Treasurer, The Invesco Funds and Assistant Vice President, Invesco Advisers, Inc., Invesco Aim Capital Management, Inc. and Invesco Aim Private Asset Management, Inc.; and Treasurer, PowerShares Exchange-Traded Fund Trust, PowerShares Exchange-Traded Fund Trust II, PowerShares India Exchange-Traded Fund Trust and PowerShares Actively Managed Exchange-Traded Fund Trust | | N/A | | N/A |
Russell C. Burk — 1958 Senior Vice President and Senior Officer | | 2005 | | Senior Vice President and Senior Officer, The Invesco Funds | | N/A | | N/A |
John M. Zerr — 1962 Senior Vice President, Chief Legal Officer and Secretary | | 2006 | | Director, Senior Vice President, Secretary and General Counsel, Invesco Management Group, Inc. (formerly known as Invesco AIM Management Group, Inc.); Senior Vice President, Invesco Advisers, Inc. (formerly known as Invesco Institutional (N.A.), Inc.) (registered investment adviser); Senior Vice President and Secretary, Invesco Distributors, Inc. (formerly known as Invesco AIM Distributors, Inc.); Director, Vice President and Secretary, Invesco Investment Services, Inc. (formerly known as Invesco AIM Investment Services, Inc.) Senior Vice President, Chief Legal Officer and Secretary, The Invesco Funds; Managing Director, Invesco PowerShares Capital Management LLC; Director, Secretary and General Counsel, Invesco Investment Advisers LLC (formerly known as Van Kampen Asset Management); Secretary and General Counsel, Invesco Capital Markets, Inc. (formerly known as Van Kampen Funds Inc.) and Chief Legal Officer, PowerShares Exchange-Traded Fund Trust, PowerShares Exchange-Traded Fund Trust II, PowerShares India Exchange-Traded Fund Trust, PowerShares Actively Managed Exchange-Traded Fund Trust and PowerShares Actively Managed Exchange-Traded Commodity Fund Trust; Manager and Secretary, Invesco Indexing LLC Formerly: Director, Secretary, General Counsel and Senior Vice President, Van Kampen Exchange Corp.; Director, Vice President and Secretary, IVZ Distributors, Inc. (formerly known as INVESCO Distributors, Inc.); Director and Vice President, INVESCO Funds Group, Inc.; Director and Vice President, Van Kampen Advisors Inc.; Director, Vice President, Secretary and General Counsel, Van Kampen Investor Services Inc.; Director, Invesco Distributors, Inc. (formerly known as Invesco AIM Distributors, Inc.); Director, Senior Vice President, General Counsel and Secretary, Invesco AIM Advisers, Inc. and Van Kampen Investments Inc.; Director, Vice President and Secretary, Fund Management Company; Director, Senior Vice President, Secretary, General Counsel and Vice President, Invesco AIM Capital Management, Inc.; Chief Operating Officer and General Counsel, Liberty Ridge Capital, Inc. (an investment adviser); Vice President and Secretary, PBHG Funds (an investment company) and PBHG Insurance Series Fund (an investment company); Chief Operating Officer, General Counsel and Secretary, Old Mutual Investment Partners (a broker-dealer); General Counsel and Secretary, Old Mutual Fund Services (an administrator) and Old Mutual Shareholder Services (a shareholder servicing center); Executive Vice President, General Counsel and Secretary, Old Mutual Capital, Inc. (an investment adviser); and Vice President and Secretary, Old Mutual Advisors Funds (an investment company) | | N/A | | N/A |
Gregory G. McGreevey — 1962 Senior Vice President | | 2012 | | Senior Managing Director, Invesco Ltd.; Director, Chairman, President, and Chief Executive Officer, Invesco Advisers, Inc. (formerly known as Invesco Institutional (N.A.), Inc.) (registered investment adviser); Senior Vice President, Invesco Management Group, Inc.; Director, Invesco Mortgage Capital, Inc. and Invesco Senior Secured Management, Inc.; and Senior Vice President, The Invesco Funds Formerly: Assistant Vice President, The Invesco Funds | | N/A | | N/A |
T-3 Invesco Summit Fund
Trustees and Officers—(continued)
| | | | | | | | |
Name, Year of Birth and
Position(s) Held with the Trust | | Trustee and/
or Officer Since | | Principal Occupation(s)
During Past 5 Years | | Number of
Funds in Fund
Complex
Overseen by
Trustee | | Other Directorship(s)
Held by Trustee During
Past 5 Years |
| Other Officers—(continued) | | | | | | | | |
Kelli Gallegos — 1970 Vice President, Principal Financial Officer and Assistant Treasurer | | 2008 | | Vice President, Principal Financial Officer and Assistant Treasurer, The Invesco Funds; Assistant Treasurer, Invesco PowerShares Capital Management LLC, PowerShares Exchange-Traded Fund Trust, PowerShares Exchange-Traded Fund Trust II, PowerShares India Exchange-Traded Fund Trust, PowerShares Actively Managed Exchange-Traded Fund Trust and PowerShares Actively Managed Exchange-Traded Commodity Fund Trust Formerly: Assistant Vice President, The Invesco Funds | | N/A | | N/A |
Tracy Sullivan — 1962 Vice President, Chief Tax Officer and Assistant Treasurer | | 2008 | | Vice President, Chief Tax Officer and Assistant Treasurer, The Invesco Funds; Assistant Treasurer, Invesco PowerShares Capital Management LLC, PowerShares Exchange-Traded Fund Trust, PowerShares Exchange-Traded Fund Trust II, PowerShares India Exchange-Traded Fund Trust, PowerShares Actively Managed Exchange-Traded Fund Trust and PowerShares Actively Managed Exchange-Traded Commodity Fund Trust Formerly: Assistant Vice President, The Invesco Funds | | N/A | | N/A |
Crissie M. Wisdom — 1969 Anti-Money Laundering Compliance Officer | | 2013 | | Anti-Money Laundering Compliance Officer, Invesco Advisers, Inc. (formerly known as Invesco Institutional (N.A.), Inc.) (registered investment adviser), Invesco Capital Markets, Inc. (formerly known as Van Kampen Funds Inc.), Invesco Distributors, Inc., Invesco Investment Services, Inc., Invesco Management Group, Inc., The Invesco Funds, and PowerShares Exchange-Traded Fund Trust, PowerShares Exchange-Traded Fund Trust II, PowerShares India Exchange-Traded Fund Trust, PowerShares Actively Managed Exchange-Traded Fund Trust and PowerShares Actively Managed Exchange-Traded Commodity Fund Trust; Anti-Money Laundering Compliance Officer and Bank Secrecy Act Officer, INVESCO National Trust Company and Invesco Trust Company; and Fraud Prevention Manager and Controls and Risk Analysis Manager for Invesco Investment Services, Inc. Formerly: Anti-Money Laundering Compliance Officer, Van Kampen Exchange Corp. | | N/A | | N/A |
Robert R. Leveille — 1969 Chief Compliance Officer | | 2016 | | Chief Compliance Officer, Invesco Advisers, Inc. (registered investment adviser); and Chief Compliance Officer, The Invesco Funds Formerly: Chief Compliance Officer, Putnam Investments and the Putnam Funds | | N/A | | N/A |
The Statement of Additional Information of the Trust includes additional information about the Fund’s Trustees and is available upon request, without charge, by calling 1.800.959.4246. Please refer to the Fund’s Statement of Additional Information for information on the Fund’s sub-advisers.
| | | | | | |
Office of the Fund 11 Greenway Plaza, Suite 1000 Houston, TX 77046-1173 | | Investment Adviser Invesco Advisers, Inc. 1555 Peachtree Street, N.E. Atlanta, GA 30309 | | Distributor Invesco Distributors, Inc. 11 Greenway Plaza, Suite 1000 Houston, TX 77046-1173 | | Auditors PricewaterhouseCoopers LLP 1000 Louisiana Street, Suite 5800 Houston, TX 77002-5678 |
| | | |
| | | | | | |
Counsel to the Fund Stradley Ronon Stevens & Young, LLP 2005 Market Street, Suite 2600 Philadelphia, PA 19103-7018 | | Counsel to the Independent Trustees Goodwin Procter LLP 901 New York Avenue, N.W. Washington, D.C. 20001 | | Transfer Agent Invesco Investment Services, Inc. 11 Greenway Plaza, Suite 1000 Houston, TX 77046-1173 | | Custodian State Street Bank and Trust Company 225 Franklin Street Boston, MA 02110-2801 |
T-4 Invesco Summit Fund
Explore High-Conviction Investing with Invesco

Go paperless with eDelivery
Visit invesco.com/edelivery to enjoy the convenience and security of anytime electronic access to your investment documents.
With eDelivery, you can elect to have any or all of the following materials delivered straight to your inbox to download, save and print from your own computer:
| ∎ | | Fund reports and prospectuses |
Invesco mailing information
Send general correspondence to Invesco Investment Services, Inc., P.O. Box 219078, Kansas City, MO 64121-9078.
Important notice regarding delivery of security holder documents
To reduce Fund expenses, only one copy of most shareholder documents may be mailed to shareholders with multiple accounts at the same address (Householding). Mailing of your shareholder documents may be householded indefinitely unless you instruct us otherwise. If you do not want the mailing of these documents to be combined with those for other members of your household, please contact Invesco Investment Services, Inc. at 800 959 4246 or contact your financial institution. We will begin sending you individual copies for each account within 30 days after receiving your request.
Fund holdings and proxy voting information
The Fund provides a complete list of its holdings four times in each fiscal year, at the quarter ends. For the second and fourth quarters, the lists appear in the Fund’s semiannual and annual reports to shareholders. For the first and third quarters, the Fund files the lists with the Securities and Exchange Commission (SEC) on Form N-Q. The most recent list of portfolio holdings is available at invesco.com/completeqtrholdings. Shareholders can also look up the Fund’s Forms N-Q on the SEC website at sec.gov. Copies of the Fund’s Forms N-Q may be reviewed and copied at the SEC Public Reference Room in Washington, D.C. You can obtain information on the operation of the Public Reference Room, including information about duplicating fee charges, by calling 202 551 8090 or 800 732 0330, or by electronic request at the following email address: publicinfo@sec.gov. The SEC file numbers for the Fund are shown below.
A description of the policies and procedures that the Fund uses to determine how to vote proxies relating to portfolio securities is available without charge, upon request, from our Client Services department at 800 959 4246 or at invesco.com/proxyguidelines. The information is also available on the SEC website, sec.gov.
| | |
Information regarding how the Fund voted proxies related to its portfolio securities during the most recent 12-month period ended June 30 is available at invesco.com/proxysearch. The information is also available on the SEC website, sec.gov. Invesco Advisers, Inc. is an investment adviser; it provides investment advisory services to individual and institutional clients and does not sell securities. Invesco Distributors, Inc. is the US distributor for Invesco Ltd.’s retail mutual funds, exchange-traded funds and institutional money market funds. Both are wholly owned, indirect subsidiaries of Invesco Ltd. | |  |
| | | | | | | | |
| SEC file numbers: 811-01424 and 002-25469 | | Invesco Distributors, Inc. | | SUM-AR-1 | | 12132017 | | 1016 |
There were no amendments to the Code of Ethics (the “Code”) that applies to the Registrant’s Principal Executive Officer (“PEO”) and Principal Financial Officer (“PFO”) during the period covered by the report. The Registrant did not grant any waivers, including implicit waivers, from any provisions of the Code to the PEO or PFO during the period covered by this report.
| ITEM 3. | AUDIT COMMITTEE FINANCIAL EXPERT. |
The Board of Trustees has determined that the Registrant has at least one audit committee financial expert serving on its Audit Committee. The Audit Committee financial expert is Raymond Stickel, Jr. Mr. Stickel is “independent” within the meaning of that term as used in Form N-CSR.
| ITEM 4. | PRINCIPAL ACCOUNTANT FEES AND SERVICES. |
PricewaterhouseCoopers LLP informed the Trust that it has identified an issue related to its independence under Rule 2-01(c)(1)(ii)(A) of Regulation S-X (referred to as the Loan Rule). The Loan Rule prohibits accounting firms, such as PricewaterhouseCoopers LLP, from being deemed independent if they have certain financial relationships with their audit clients or certain affiliates of those clients. The Trust is required under various securities laws to have its financial statements audited by an independent accounting firm.
The Loan Rule specifically provides that an accounting firm would not be independent if it or certain affiliates and covered persons receives a loan from a lender that is a record or beneficial owner of more than ten percent of an audit client’s equity securities (referred to as a “more than ten percent owner”). For purposes of the Loan Rule, audit clients include the Funds as well as all registered investment companies advised by the Adviser and its affiliates, including other subsidiaries of the Adviser’s parent company, Invesco Ltd. (collectively, the Invesco Fund Complex). PricewaterhouseCoopers LLP informed the Trust it and certain affiliates and covered persons have relationships with lenders who hold, as record owner, more than ten percent of the shares of certain funds within the Invesco Fund Complex, which may implicate the Loan Rule.
On June 20, 2016, the SEC Staff issued a “no-action” letter to another mutual fund complex (see Fidelity Management & Research Company et al., No-Action Letter) related to the audit independence issue described above. In that letter, the SEC confirmed that it would not recommend enforcement action against a fund that relied on audit services performed by an audit firm that was not in compliance with the Loan Rule in certain specified circumstances. In connection with prior independence determinations, PricewaterhouseCoopers LLP communicated, as contemplated by the no-action letter, that it believes that it remains objective and impartial and that a reasonable investor possessing all the facts would conclude that PricewaterhouseCoopers LLP is able to exhibit the requisite objectivity and impartiality to report on the Funds’ financial statements as the independent registered public accounting firm. PricewaterhouseCoopers LLP also represented that it has complied with PCAOB Rule 3526(b)(1) and (2), which are conditions to the Funds relying on the no action letter, and affirmed that it is an independent accountant within the meaning of PCAOB Rule 3520. Therefore, the Adviser, the Funds and PricewaterhouseCoopers LLP concluded that PricewaterhouseCoopers LLP could continue as the Funds’ independent registered public accounting firm. The Invesco Fund Complex relied upon the no-action letter in reaching this conclusion.
If in the future the independence of PricewaterhouseCoopers LLP is called into question under the Loan Rule by circumstances that are not addressed in the SEC’s no-action letter, the Funds will need to take other action in order for the Funds’ filings with the SEC containing financial statements to be deemed compliant with applicable securities laws. Such additional actions could result in additional costs, impair the ability of the Funds to issue new shares or have other material adverse effects on the Funds. The SEC no-action relief was initially set to expire 18 months from issuance but has been extended by the SEC without an expiration date, except that the no-action letter will be withdrawn upon the effectiveness of any amendments to the Loan Rule designed to address the concerns expressed in the letter.
(a) to (d)
Fees Billed by PWC Related to the Registrant
PWC billed the Registrant aggregate fees for services rendered to the Registrant for the last two fiscal years as follows:
| | | | |
| | | Fees Billed for
Services Rendered to
the Registrant for
fiscal year end 2017 | | Fees Billed for
Services Rendered to
the Registrant for
fiscal year end 2016 |
Audit Fees | | $ 88,275 | | $ 84,875 |
Audit-Related Fees(1) | | $ 1,500 | | $ 0 |
Tax Fees(2) | | $ 46,402 | | $ 25,225 |
All Other Fees | | $ 0 | | $ 0 |
Total Fees | | $ 136,177 | | $ 110,100 |
(g) PWC billed the Registrant aggregate non-audit fees of $47,902 for the fiscal year ended 2017, and $25,225 for the fiscal year ended 2016, for non-audit services rendered to the Registrant.
| | (1) | Audit-Related fees for the fiscal year end 2017 include fees billed for reviewing regulatory filings. |
| | (2) | Tax fees for the fiscal year end October 31, 2017 includes fees billed for reviewing tax returns and/or services related to tax compliance. Tax fees for fiscal year end October 31, 2016 includes fees billed for reviewing tax returns and/or services related to tax compliance. |
Fees Billed by PWC Related to Invesco and Invesco Affiliates
PWC billed Invesco Advisers, Inc. (“Invesco”), the Registrant’s adviser, and any entity controlling, controlled by or under common control with Invesco that provides ongoing services to the Registrant (“Invesco Affiliates”) aggregate fees for pre-approved non-audit services rendered to Invesco and Invesco Affiliates for the last two fiscal years as follows:
| | | | |
| | | Fees Billed for Non-
Audit Services
Rendered to Invesco
and Invesco Affiliates
for fiscal year end
2017 That Were
Required
to be Pre-Approved
by the Registrant’s
Audit Committee | | Fees Billed for Non-
Audit Services
Rendered to Invesco
and Invesco Affiliates
for fiscal year end
2016 That Were
Required
to be Pre-Approved
by the Registrant’s
Audit Committee |
Audit-Related Fees | | $ 662,000 | | $ 635,000 |
Tax Fees | | $ 0 | | $ 0 |
All Other Fees | | $ 1,245,000 | | $ 2,193,000 |
Total Fees(1) | | $ 1,907,000 | | $ 2,828,000 |
| (1) | Audit-Related fees for the year end 2017 include fees billed related to reviewing controls at a service organization. Audit-Related fees for the year end 2016 include fees billed related to reviewing controls at a service organization. |
All other fees for the year end 2017 include fees billed related to the assessments for certain of the company’s risk management tools, current state analysis against regulatory requirements and identification of structural and organizational alternatives, informed by industry practices, for certain of the company’s administrative activities and functions All other fees for the year end 2016 include fees billed related to the identification of structural and organizational alternatives, informed by industry practices, for certain of the company’s administrative activities and functions.
(e)(2) There were no amounts that were pre-approved by the Audit Committee pursuant to the de minimis exception under Rule 2-01 of Regulation S-X.
(g) Including the fees for services not required to be pre-approved by the registrant’s audit committee, PWC billed Invesco and Invesco Affiliates aggregate non-audit fees of $4,890,000 for the fiscal year ended October 31, 2017, and $5,032,000 for the fiscal year ended October 31, 2016, for non-audit services rendered to Invesco and Invesco Affiliates.
PWC provided audit services to the Investment Company complex of approximately $22 million.
(h) The Audit Committee also has considered whether the provision of non-audit services that were rendered to Invesco and Invesco Affiliates that were not required to be pre-approved pursuant to SEC regulations, if any, is compatible with maintaining PWC’s independence.
(f) Not applicable.
(e)(1)
PRE-APPROVAL OF AUDIT AND NON-AUDIT SERVICES
POLICIES AND PROCEDURES
As adopted by the Audit Committees
of the Invesco Funds (the “Funds”)
Last Amended March 29, 2017
| | I. | Statement of Principles |
The Audit Committees (the “Audit Committee”) of the Boards of Trustees of the Funds (the “Board”) have adopted these policies and procedures (the “Procedures”) with respect to the pre-approval of audit and non-audit services to be provided by the Funds’ independent auditor (the “Auditor”) to the Funds, and to the Funds’ investment adviser(s) and any entity controlling, controlled by, or under common control with the investment adviser(s) that provides ongoing services to the Funds (collectively, “Service Affiliates”).
Under Section 202 of the Sarbanes-Oxley Act of 2002, all audit and non-audit services provided to the Funds by the Auditor must be preapproved by the Audit Committee. Rule 2-01 of Regulation S-X requires that the Audit Committee also pre-approve a Service Affiliate’s engagement of the Auditor for non-audit services if the engagement relates directly to the operations and financial reporting of the Funds (a “Service Affiliate’s Covered Engagement”).
These Procedures set forth the procedures and the conditions pursuant to which the Audit Committee may pre-approve audit and non-audit services for the Funds and a Service Affiliate’s Covered Engagement pursuant to rules and regulations of the Securities and Exchange Commission (“SEC”) and other organizations and regulatory bodies applicable to the Funds (“Applicable Rules”).1 They address both general pre-approvals without consideration of specific case-by-case services (“general pre-approvals”) and pre-approvals on a case-by-case basis (“specific pre-approvals”). Any services requiring pre-approval that are not within the scope of general pre-approvals hereunder are subject to specific pre-approval. These Procedures also address the delegation by the Audit Committee of pre-approval authority to the Audit Committee Chair or Vice Chair.
| | II. | Pre-Approval of Fund Audit Services |
The annual Fund audit services engagement, including terms and fees, is subject to specific pre-approval by the Audit Committee. Audit services include the annual financial statement audit and other procedures required to be performed by an independent auditor to be able to form an opinion on the Funds’ financial statements. The Audit Committee will receive, review and consider sufficient information concerning a proposed Fund audit engagement to make a reasonable evaluation of the Auditor’s qualifications and independence. The Audit Committee will oversee the Fund audit services engagement as necessary, including approving any changes in terms, audit scope, conditions and fees.
In addition to approving the Fund audit services engagement at least annually and specifically approving any changes, the Audit Committee may generally or specifically pre-approve engagements for other audit services, which are those services that only an independent auditor reasonably can provide. Other audit services may include services associated with SEC registration statements, periodic reports and other documents filed with the SEC.
1 Applicable Rules include, for example, New York Stock Exchange (“NYSE”) rules applicable to closed-end funds managed by Invesco and listed on NYSE.
| | III. | General and Specific Pre-Approval of Non-Audit Fund Services |
The Audit Committee will consider, at least annually, the list of General Pre-Approved Non-Audit Services which list may be terminated or modified at any time by the Audit Committee. To inform the Audit Committee’s review and approval of General Pre-Approved Non-Audit Services, the Funds’ Treasurer (or his or her designee) and Auditor shall provide such information regarding independence or other matters as the Audit Committee may request.
Any services or fee ranges that are not within the scope of General Pre-Approved Non-Audit Services have not received general pre-approval and require specific pre-approval. Each request for specific pre-approval by the Audit Committee for services to be provided by the Auditor to the Funds must be submitted to the Audit Committee by the Funds’ Treasurer (or his or her designee) and must include detailed information about the services to be provided, the fees or fee ranges to be charged, and other relevant information sufficient to allow the Audit Committee to consider whether to pre-approve such engagement, including evaluating whether the provision of such services will impair the independence of the Auditor and is otherwise consistent with Applicable Rules.
| | IV. | Non-Audit Service Types |
The Audit Committee may provide either general or specific pre-approval of audit-related, tax or other services, each as described in more detail below.
“Audit-related services” are assurance and related services that are reasonably related to the performance of the audit or review of the Fund’s financial statements or that are traditionally performed by an independent auditor. Audit-related services include, among others, accounting consultations related to accounting, financial reporting or disclosure matters not classified as “Audit services”; assistance with understanding and implementing new accounting and financial reporting guidance from rulemaking authorities; services related to mergers, acquisitions or dispositions; compliance with ratings agency requirements and interfund lending activities; and assistance with internal control reporting requirements.
“Tax services” include, but are not limited to, the review and signing of the Funds’ federal tax returns, the review of required distributions by the Funds and consultations regarding tax matters such as the tax treatment of new investments or the impact of new regulations. The Audit Committee will not approve proposed services of the Auditor which the Audit Committee believes are to be provided in connection with a service or transaction initially recommended by the Auditor, the sole business purpose of which may be tax avoidance and the tax treatment of which may not be supported in the Internal Revenue Code and related regulations. The Audit Committee will consult with the Funds’ Treasurer (or his or her designee) and may consult with outside counsel or advisers as necessary to ensure the consistency of tax services rendered by the Auditor with the foregoing policy. The Auditor shall not represent any Fund or any Service Affiliate before a tax court, district court or federal court of claims.
Each request to provide tax services under either the general or specific pre-approval of the Audit Committee will include a description from the Auditor in writing of (i) the scope of the service, the fee structure for the engagement, and any side letter or other amendment to the engagement letter, or any other agreement (whether oral, written, or otherwise) between the Auditor and the Funds, relating to the service; and (ii) any compensation arrangement or other agreement, such as a referral agreement, a referral fee or fee-sharing arrangement, between the Auditor (or an affiliate of the Auditor) and any person (other than the Funds or Service Affiliates receiving the services) with respect to the promoting, marketing, or recommending of a transaction covered by the service. The Auditor will also discuss with
the Audit Committee the potential effects of the services on the independence of the Auditor, and document the substance of its discussion with the Audit Committee.
The Audit Committee may pre-approve other non-audit services so long as the Audit Committee believes that the service will not impair the independence of the Auditor. Appendix I includes a list of services that the Auditor is prohibited from performing by the SEC rules. Appendix I also includes a list of services that would impair the Auditor’s independence unless the Audit Committee reasonably concludes that the results of the services will not be subject to audit procedures during an audit of the Funds’ financial statements.
| | V. | Pre-Approval of Service Affiliate’s Covered Engagements |
Rule 2-01 of Regulation S-X requires that the Audit Committee pre-approve a Service Affiliate’s engagement of the Auditor for non-audit services if the engagement relates directly to the operations and financial reporting of the Funds, defined above as a “Service Affiliate’s Covered Engagement”.
The Audit Committee may provide either general or specific pre-approval of any Service Affiliate’s Covered Engagement, including for audit-related, tax or other services, as described above, if the Audit Committee believes that the provision of the services to a Service Affiliate will not impair the independence of the Auditor with respect to the Funds. Any Service Affiliate’s Covered Engagements that are not within the scope of General Pre-Approved Non-Audit Services have not received general pre-approval and require specific pre-approval.
Each request for specific pre-approval by the Audit Committee of a Service Affiliate’s Covered Engagement must be submitted to the Audit Committee by the Funds’ Treasurer (or his or her designee) and must include detailed information about the services to be provided, the fees or fee ranges to be charged, a description of the current status of the pre-approval process involving other audit committees in the Invesco investment company complex (as defined in Rule 2-201 of Regulation S-X) with respect to the proposed engagement, and other relevant information sufficient to allow the Audit Committee to consider whether the provision of such services will impair the independence of the Auditor from the Funds. Additionally, the Funds’ Treasurer (or his or her designee) and the Auditor will provide the Audit Committee with a statement that the proposed engagement requires pre-approval by the Audit Committee, the proposed engagement, in their view, will not impair the independence of the Auditor and is consistent with Applicable Rules, and the description of the proposed engagement provided to the Audit Committee is consistent with that presented to or approved by the Invesco audit committee.
Information about all Service Affiliate engagements of the Auditor for non-audit services, whether or not subject to pre-approval by the Audit Committee, shall be provided to the Audit Committee at least quarterly, to allow the Audit Committee to consider whether the provision of such services is compatible with maintaining the Auditor’s independence from the Funds. The Funds’ Treasurer and Auditor shall provide the Audit Committee with sufficiently detailed information about the scope of services provided and the fees for such services, to ensure that the Audit Committee can adequately consider whether the provision of such services is compatible with maintaining the Auditor’s independence from the Funds.
| | VI. | Pre-Approved Fee Levels or Established Amounts |
Pre-approved fee levels or ranges for audit and non-audit services to be provided by the Auditor to the Funds, and for a Service Affiliate’s Covered Engagement, under general pre-approval or specific pre-approval will be set periodically by the Audit Committee. Any proposed fees exceeding 110% of the maximum pre-approved fee levels or ranges for such services or engagements will be promptly presented
to the Audit Committee and will require specific pre-approval by the Audit Committee before payment of any additional fees is made.
The Audit Committee hereby delegates, subject to the dollar limitations set forth below, specific authority to its Chair, or in his or her absence, Vice Chair, to pre-approve audit and non-audit services proposed to be provided by the Auditor to the Funds and/or a Service Affiliate’s Covered Engagement, between Audit Committee meetings. Such delegation does not preclude the Chair or Vice Chair from declining, on a case by case basis, to exercise his or her delegated authority and instead convening the Audit Committee to consider and pre-approve any proposed services or engagements.
Notwithstanding the foregoing, the Audit Committee must pre-approve: (a) any non-audit services to be provided to the Funds for which the fees are estimated to exceed $500,000; (b) any Service Affiliate’s Covered Engagement for which the fees are estimated to exceed $500,000; or (c) any cost increase to any previously approved service or engagement that exceeds the greater of $250,000 or 50% of the previously approved fees up to a maximum increase of $500,000.
| | VIII. | Compliance with Procedures |
Notwithstanding anything herein to the contrary, failure to pre-approve any services or engagements that are not required to be pre-approved pursuant to the de minimis exception provided for in Rule 2-01(c)(7)(i)(C) of Regulation S-X shall not constitute a violation of these Procedures. The Audit Committee has designated the Funds’ Treasurer to ensure services and engagements are pre-approved in compliance with these Procedures. The Funds’ Treasurer will immediately report to the Chair of the Audit Committee, or the Vice Chair in his or her absence, any breach of these Procedures that comes to the attention of the Funds’ Treasurer or any services or engagements that are not required to be pre-approved pursuant to the de minimis exception provided for in Rule 2-01(c)(7)(i)(C) of Regulation S-X.
On at least an annual basis, the Auditor will provide the Audit Committee with a summary of all non-audit services provided to any entity in the investment company complex (as defined in section 2-01(f)(14) of Regulation S-X, including the Funds and Service Affiliates) that were not pre-approved, including the nature of services provided and the associated fees.
| | IX. | Amendments to Procedures |
All material amendments to these Procedures must be approved in advance by the Audit Committee. Non-material amendments to these Procedures may be made by the Legal and Compliance Departments and will be reported to the Audit Committee at the next regularly scheduled meeting of the Audit Committee.
Appendix I
Non-Audit Services That May Impair the Auditor’s Independence
The Auditor is not independent if, at any point during the audit and professional engagement, the Auditor provides the following non-audit services:
| | • | | Broker-dealer, investment adviser, or investment banking services ; |
| | • | | Expert services unrelated to the audit; |
| | • | | Any service or product provided for a contingent fee or a commission; |
| | • | | Services related to marketing, planning, or opining in favor of the tax treatment of confidential transactions or aggressive tax position transactions, a significant purpose of which is tax avoidance; |
| | • | | Tax services for persons in financial reporting oversight roles at the Fund; and |
| | • | | Any other service that the Public Company Oversight Board determines by regulation is impermissible. |
An Auditor is not independent if, at any point during the audit and professional engagement, the Auditor provides the following non-audit services unless it is reasonable to conclude that the results of the services will not be subject to audit procedures during an audit of the Funds’ financial statements:
| | • | | Bookkeeping or other services related to the accounting records or financial statements of the audit client; |
| | • | | Financial information systems design and implementation; |
| | • | | Appraisal or valuation services, fairness opinions, or contribution-in-kind reports; |
| | • | | Actuarial services; and |
| | • | | Internal audit outsourcing services. |
| ITEM 5. | AUDIT COMMITTEE OF LISTED REGISTRANTS. |
Not applicable.
| ITEM 6. | SCHEDULE OF INVESTMENTS. |
Investments in securities of unaffiliated issuers is included as part of the reports to stockholders filed under Item 1 of this Form.
| ITEM 7. | DISCLOSURE OF PROXY VOTING POLICIES AND PROCEDURES FOR CLOSED-END MANAGEMENT INVESTMENT COMPANIES. |
Not applicable.
| ITEM 8. | PORTFOLIO MANAGERS OF CLOSED-END MANAGEMENT COMPANIES. |
Not applicable.
| ITEM 9. | PURCHASES OF EQUITY SECURITIES BY CLOSED-END MANAGEMENT INVESTMENT COMPANY AND AFFILIATED PURCHASERS. |
Not applicable.
| ITEM 10. | SUBMISSION OF MATTERS TO A VOTE OF SECURITY HOLDERS. |
None
| ITEM 11. | CONTROLS AND PROCEDURES. |
| (a) | As of November 17, 2017, an evaluation was performed under the supervision and with the participation of the officers of the Registrant, including the PEO and PFO, to assess the effectiveness of the Registrant’s disclosure controls and procedures, as that term is defined in Rule 30a-3(c) under the Investment Company Act of 1940 (the “Act”), as amended. Based on that evaluation, the Registrant’s officers, including the PEO and PFO, concluded that, as of November 17, 2017, the Registrant’s disclosure controls and procedures were reasonably designed to ensure: (1) that information required to be disclosed by the Registrant on Form N-CSR is recorded, processed, summarized and reported within the time periods specified by the rules and forms of the Securities and Exchange Commission; and (2) that material information relating to the Registrant is made known to the PEO and PFO as appropriate to allow timely decisions regarding required disclosure. |
| (b) | There have been no changes in the Registrant’s internal control over financial reporting (as defined in Rule 30a-3(d) under the Act) that occurred during the second fiscal quarter of the period covered by this report that have materially affected, or are reasonably likely to materially affect, the Registrant’s internal control over financial reporting. |
| ITEM 12. | DISCLOSURE OF SECURITIES LENDING ACTIVITIES FOR CLOSED-END MANAGEMENT INVESTMENT COMPANIES. |
Not applicable.
| 13(a) (2) | Certifications of principal executive officer and principal financial officer as required by Rule 30a-2(a) under the Investment Company Act of 1940. |
SIGNATURES
Pursuant to the requirements of the Securities Exchange Act of 1934 and the Investment Company Act of 1940, the Registrant has duly caused this report to be signed on its behalf by the undersigned, thereunto duly authorized.
Registrant: AIM Equity Funds (Invesco Equity Funds)
| | |
| By: | | /s/ Sheri Morris |
| | Sheri Morris |
| | Principal Executive Officer |
| |
| Date: | | January 8, 2018 |
Pursuant to the requirements of the Securities and Exchange Act of 1934 and the Investment Company Act of 1940, this report has been signed below by the following persons on behalf of the Registrant and in the capacities and on the dates indicated.
| | |
| By: | | /s/ Sheri Morris |
| | Sheri Morris |
| | Principal Executive Officer |
| |
| Date: | | January 8, 2018 |
| | |
| By: | | /s/ Kelli Gallegos |
| | Kelli Gallegos |
| | Principal Financial Officer |
| |
| Date: | | January 8, 2018 |
EXHIBIT INDEX
| | |
| 12(a) (1) | | Code of Ethics. |
| |
| 12(a) (2) | | Certifications of principal executive officer and principal financial officer as required by Rule 30a-2(a) under the Investment Company Act of 1940. |
| |
| 12(a) (3) | | Not applicable. |
| |
| 12(b) | | Certifications of principal executive officer and principal financial officer as required by Rule 30a-2(b) under the Investment Company Act of 1940. |