UNITED STATES
SECURITIES AND EXCHANGE COMMISSION
Washington, D.C. 20549
FORM N-CSR
CERTIFIED SHAREHOLDER REPORT OF REGISTERED
MANAGEMENT INVESTMENT COMPANIES
Investment Company Act file number 811-01424
AIM Equity Funds (Invesco Equity Funds)
(Exact name of registrant as specified in charter)
11 Greenway Plaza, Suite 1000 Houston, Texas 77046
(Address of principal executive offices) (Zip code)
Sheri Morris 11 Greenway Plaza, Suite 1000 Houston, Texas 77046
(Name and address of agent for service)
Registrant’s telephone number, including area code: (713) 626-1919
Date of fiscal year end: 10/31
Date of reporting period: 10/31/18
Item 1. Report to Stockholders.
| | | | | | |
| | | | |
 | | Annual Report to Shareholders | | October 31, 2018 | | |
| | | | |
| | Invesco Charter Fund | | |
| | Nasdaq: | | |
| | A: CHTRX ∎ C: CHTCX ∎ R: CHRRX ∎ S: CHRSX ∎ Y: CHTYX ∎ R5: CHTVX ∎ R6: CHFTX | | |

Letters to Shareholders
| | |

Philip Taylor | | Dear Shareholders: This annual report includes information about your Fund, including performance data and a complete list of its investments as of the close of the reporting period. Inside is a discussion of how your Fund was managed and the factors that affected its performance during the reporting period. Throughout the reporting period, US economic data remained positive. Robust corporate profits, strong retail sales and unemployment rates near generational lows helped drive US markets to new all-time records multiple times during the reporting period. Against this backdrop, the US Federal Reserve raised the federal funds rate four times during the reporting period. Market volatility, largely non-existent in 2017, returned in 2018. Markets sold off first in |
February and again sharply in October, amid rising interest rates, concerns about potential trade wars and heightened geo- political tensions. Despite the volatility, US equity markets were largely positive for the reporting period and fared better than international markets. Emerging markets were particularly hard hit due to a strong US dollar. During the October sell-off, investors retreated to more defensive areas of the market and to US Treasuries. The broader bond market declined during the reporting period due to the increase in US Treasury yields and widening credit spreads. As the year progresses, we’ll see how the interplay of economic data, interest rates, geopolitics and a host of other factors affect US and overseas equity and fixed income markets.
Short-term market volatility can prompt some investors to abandon their investment plans – and can cause others to settle for whatever returns the market has to offer. The investment professionals at Invesco, in contrast, invest with high conviction. This means that, no matter the asset class or the strategy, each investment team has a passion to exceed. We want to help investors achieve better outcomes, such as seeking higher returns, helping mitigate risk and generating income. Of course, investing with high conviction can’t guarantee a profit or ensure success; no investment strategy can. To learn more about how we invest with high conviction, visit invesco.com/HighConviction.
You, too, can invest with high conviction by maintaining a long-term investment perspective and by working with your financial adviser on a regular basis. During periods of short-term market volatility or uncertainty, your financial adviser can keep you focused on your long-term investment goals – a new home, a child’s college education or a secure retirement. He or she also can share research about the economy, the markets and individual investment options.
Visit our website for more information on your investments
Our website, invesco.com/us, offers a wide range of market insights and investment perspectives. On the website, you’ll find detailed information about our funds, including performance, holdings and portfolio manager commentaries. You can access information about your account by completing a simple, secure online registration. To do so, select “Log In” on the right side of the homepage, and then select “Register for Individual Account Access.”
In addition to the resources accessible on our website and through our mobile app, you can obtain timely updates to help you stay informed about the markets and the economy by connecting with Invesco on Twitter, LinkedIn or Facebook. You can access our blog at blog.invesco.us.com. Our goal is to provide you the information you want, when and where you want it.
Finally, I’m pleased to share with you Invesco’s commitment to both the Principles for Responsible Investment and to considering environmental, social and governance issues in our robust investment process. I invite you to learn more at invesco.com/esg.
Have questions?
For questions about your account, contact an Invesco client services representative at 800 959 4246. For Invesco-related questions or comments, please email me directly at phil@invesco.com.
All of us at Invesco look forward to serving your investment management needs. Thank you for investing with us.
Sincerely,

Philip Taylor
Senior Managing Director, Invesco Ltd.
| | | | |

Bruce Crockett | | Dear Fellow Shareholders: Among the many important lessons I’ve learned in more than 40 years in a variety of business endeavors is the value of a trusted advocate. As independent chair of the Invesco Funds Board, I can assure you that the members of the Board are strong advocates for the interests of investors in Invesco’s mutual funds. We work hard to represent your interests through oversight of the quality of the investment management services your funds receive and other matters important to your investment, including but not limited to: |
| | ∎ | | Ensuring that Invesco offers a diverse lineup of mutual funds that your financial adviser can use to strive to meet your financial needs as your investment goals change over time. |
| | ∎ | | Monitoring how the portfolio management teams of the Invesco funds are performing in light of changing economic and market conditions. |
| ∎ | | Assessing each portfolio management team’s investment performance within the context of the investment strategy described in the fund’s prospectus. |
| ∎ | | Monitoring for potential conflicts of interests that may impact the nature of the services that your funds receive. |
We believe one of the most important services we provide our fund shareholders is the annual review of the funds’ advisory and sub-advisory contracts with Invesco Advisers and its affiliates. This review is required by the Investment Company Act of 1940 and focuses on the nature and quality of the services Invesco provides as the adviser to the Invesco funds and the reasonableness of the fees that it charges for those services. Each year, we spend months carefully reviewing information received from Invesco and a variety of independent sources, such as performance and fee data prepared by Lipper, Inc. (a subsidiary of Broadridge Financial Solutions, Inc.), an independent, third-party firm widely recognized as a leader in its field. We also meet with our independent legal counsel and other independent advisers to review and help us assess the information that we have received. Our goal is to assure that you receive quality investment management services for a reasonable fee.
I trust the measures outlined above provide assurance that you have a worthy advocate when it comes to choosing the Invesco Funds.
As always, please contact me at bruce@brucecrockett.com with any questions or concerns you may have. On behalf of the Board, we look forward to continuing to represent your interests and serving your needs.
Sincerely,

Bruce L. Crockett
Independent Chair
Invesco Funds Board of Trustees
Management’s Discussion of Fund Performance
| | | | |
| |
Performance summary For the fiscal year ended October 31, 2018, Class A shares of Invesco Charter Fund (the Fund), at net asset value (NAV), underperformed the Russell 1000 Index, the Fund’s style-specific benchmark. Your Fund’s long-term performance appears later in this report. | |
| |
Fund vs. Indexes | |
Total returns, 10/31/17 to 10/31/18, at net asset value (NAV). Performance shown does not include applicable contingent deferred sales charges (CDSC) or front-end sales charges, which would have reduced performance. | | | | |
| |
Class A Shares | | | -0.04 | % |
Class C Shares | | | -0.80 | |
Class R Shares | | | -0.24 | |
Class S Shares | | | 0.07 | |
Class Y Shares | | | 0.23 | |
Class R5 Shares | | | 0.25 | |
Class R6 Shares | | | 0.34 | |
S&P 500 Indexq (Broad Market Index) | | | 7.35 | |
Russell 1000 Indexq (Style-Specific Index) | | | 6.98 | |
Lipper Large Cap Core Funds Index⬛ (Peer Group Index) | | | 6.19 | |
Source(s): qFactSet Research Systems Inc.; ⬛Lipper Inc. | | | | |
Market conditions and your Fund
The fiscal year proved to be an increasingly volatile time for US equities. The fiscal year began in the final months of 2017 with several major US stock market indexes repeatedly reaching new highs amid strong corporate profits, the prospect of tax reform legislation and exceedingly low stock market volatility.
Stock market euphoria continued in January 2018 as US equity markets steadily moved higher. Investors remained enthused about the passage of the Tax Cuts and Jobs Act signed into law in late December 2017, which significantly cut corporate tax rates. However, in February 2018, volatility returned to the US stock and bond markets. Worries about how rising interest rates might affect economic growth, concerns about a potential trade war and heightened geopolitical tensions, caused the US stock
markets to pull back and volatility to increase.
US equity markets generally recovered in the second quarter of 2018 as strong US retail sales and low unemployment buoyed markets. Throughout the summer, US equities moved higher as corporate profits surged. Several US equity indexes reached new highs despite potential headwinds including trade tensions, tariff announcements and contagion concerns over a Turkish currency crisis. After a relatively quiet summer, market volatility markedly rose in the final month of the fiscal year. US equity markets suffered a sharp sell-off in October 2018 amid rising interest rates and concerns that higher inflation could mean a more restrictive monetary policy. In this environment, investors fled to more defensive areas of the market and to US Treasuries.
Given signs of a strong economy, the US Federal Reserve raised interest rates four times during the fiscal year: in December 2017 and in March, June and September 2018.1 In contrast, the European Central Bank and central banks in several other countries maintained extraordinarily accommodative monetary policies.
During the fiscal year, stock selection in the financials sector was the largest contributor to the Fund’s performance relative to its style-specific benchmark. Stock selection in the materials sector also added to the Fund’s performance. The largest detractors from the Fund’s performance included stock selection in the consumer discretionary, information technology (IT), health care and industrials sectors.
The largest individual contributor to the Fund’s performance versus its style-specific benchmark during the fiscal year was HCA Healthcare. The stock performed well despite concerns that it could not meet, much less exceed, management’s initial guidance for the fiscal year. Investors also appeared to be more confident in the company’s outlook for 2019.
Progressive was a solid contributor to the Fund’s performance relative to its style-specific benchmark during the fiscal year. The US-based auto and home insurance company has market-leading distribution, underwriting and risk management capabilities. During the fiscal year, management was able to execute its strategic priorities to expand distribution, increase value propositions and open new-end markets, which delivered continuous double-digit, top-line growth with stable to improving margins.
Another top contributor to the Fund’s relative performance was Microsoft. During the fiscal year, the company repeatedly delivered better-than-expected
| | | | |
| | |
Portfolio Composition | | | | |
By sector % of total net assets | |
| |
Financials | | | 18.8% | |
Health Care | | | 16.3 | |
Communication Services | | | 14.8 | |
Consumer Discretionary | | | 12.9 | |
Industrials | | | 12.6 | |
Information Technology | | | 12.1 | |
Energy | | | 5.7 | |
Consumer Staples | | | 3.3 | |
Utilities | | | 1.9 | |
| Money Market Funds Plus Other Assets Less Liabilities | | | 1.6 | |
| | |
| |
Top 10 Equity Holdings* |
| % of total net assets |
| |
1. Alphabet Inc.-Class C | | 4.8% |
2. Microsoft Corp. | | 3.4 |
3. Facebook, Inc.-Class A | | 3.3 |
4. American Express Co. | | 3.3 |
5. Comcast Corp.-Class A | | 3.1 |
6. Thermo Fisher Scientific, Inc. | | 2.9 |
7. U.S. Bancorp | | 2.7 |
8. UnitedHealth Group Inc. | | 2.5 |
9. Mastercard Inc.-Class A | | 2.3 |
10. PepsiCo, Inc. | | 2.2 |
| | | | |
| | |
Total Net Assets | | $ | 3.3 billion | |
| |
Total Number of Holdings* | | | 57 | |
The Fund’s holdings are subject to change, and there is no assurance that the Fund will continue to hold any particular security.
*Excluding money market fund holdings.
Data presented here are as of October 31, 2018.
results and revenue that was above consensus due to strong momentum in the business and excellent execution.
During the fiscal year, the largest individual detractor from the Fund’s performance versus its style-specific benchmark was Dentsply Sirona. The dental equipment provider’s stock price declined due to management changes, distributor issues, missed earnings and lowered estimates for the calendar year. We exited our position in the company before the close of the fiscal year. Facebook was another key detractor from the Fund’s relative performance. The company’s stock price was volatile during the fiscal year due to disappointing earnings guidance reported by the company. In addition, eBay was a drag on the Fund’s relative performance. The company suffered from a decline in sales momentum due to strong competition. We exited our position in the company before the close of the fiscal year.
Finally, the Fund’s allocation to cash was also a slight detractor from the Fund’s performance relative to the style-specific benchmark over the fiscal year.
At the close of the fiscal year, the Fund’s largest overweight position relative to its style-specific benchmark was in the consumer discretionary sector. The Fund also held slight overweight positions in the financials, health care and industrials sectors. Our underweight positions were in the consumer staples and IT sectors.
Following our mandate as a core investment for our clients’ portfolios, we continue to focus mitigating risk and providing investors with a high-conviction investment strategy focused on bottom-up company research.
We thank you for your continued investment in Invesco Charter Fund.
1 Source: US Federal Reserve
The views and opinions expressed in management’s discussion of Fund performance are those of Invesco Advisers, Inc. These views and opinions are subject to change at any time based on factors such as market and economic conditions. These views and opinions may not be relied upon as investment advice or recommendations, or as an offer for a particular security. The information is not a complete analysis of every aspect of any market, country, industry, security or the Fund. Statements of fact are from sources considered reliable, but Invesco Advisers, Inc. makes no representation or warranty as to their completeness or accuracy. Although historical performance is no guarantee of future results, these insights may help you understand our investment management philosophy.
See important Fund and, if applicable, index disclosures later in this report.
| | |
 | | Ronald Sloan Chartered Financial Analyst, Portfolio Manager and Co-Chief Investment Officer of Invesco’s Global Core |
| Equity Team, is lead manager of Invesco Charter Fund. He joined Invesco in 1998. Mr. Sloan earned a BS in business administration and an MBA from the University of Missouri. |
Effective November 9, 2018, after the close of the fiscal year, Brian Nelson left the management team. |
5 Invesco Charter Fund
Your Fund’s Long-Term Performance
Results of a $10,000 Investment – Oldest Share Class(es)
Fund and index data from 10/31/08
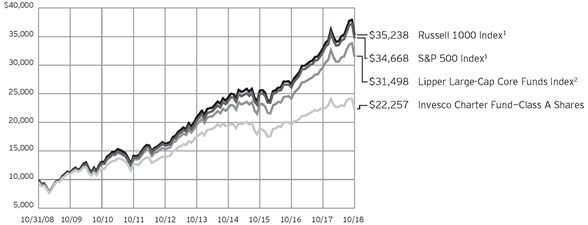
1 Source: FactSet Research Systems Inc.
2 Source: Lipper Inc.
Past performance cannot guarantee comparable future results
The data shown in the chart include reinvested distributions, applicable sales charges and
Fund expenses including
management fees. Index results include reinvested dividends, but they do not reflect sales charges. Performance of the peer group, if applicable, reflects fund expenses and management fees; performance
of a market index does not. Performance shown in the chart and table(s) does not reflect deduction of taxes a shareholder would pay on Fund distributions or sale of Fund shares.
| | | | |
| |
Average Annual Total Returns | |
As of 10/31/18, including maximum applicable sales charges | |
| |
Class A Shares | | | | |
Inception (11/26/68) | | | 10.27 | % |
10 Years | | | 8.33 | |
5 Years | | | 3.70 | |
1 Year | | | -5.53 | |
| |
Class C Shares | | | | |
Inception (8/4/97) | | | 4.43 | % |
10 Years | | | 8.13 | |
5 Years | | | 4.09 | |
1 Year | | | -1.72 | |
| |
Class R Shares | | | | |
Inception (6/3/02) | | | 6.19 | % |
10 Years | | | 8.68 | |
5 Years | | | 4.62 | |
1 Year | | | -0.24 | |
| |
Class S Shares | | | | |
10 Years | | | 9.05 | % |
5 Years | | | 4.98 | |
1 Year | | | 0.07 | |
| |
Class Y Shares | | | | |
Inception (10/3/08) | | | 7.94 | % |
10 Years | | | 9.22 | |
5 Years | | | 5.14 | |
1 Year | | | 0.23 | |
| |
Class R5 Shares | | | | |
Inception (7/30/91) | | | 7.95 | % |
10 Years | | | 9.35 | |
5 Years | | | 5.22 | |
1 Year | | | 0.25 | |
| |
Class R6 Shares | | | | |
10 Years | | | 9.22 | % |
5 Years | | | 5.31 | |
1 Year | | | 0.34 | |
Class S shares incepted on September 25, 2009. Performance shown prior to that date is that of Class A shares and includes the 12b-1 fees applicable to Class A shares.
Class Y shares incepted on October 3, 2008. Performance shown prior to that date is that of Class A shares and includes the 12b-1 fees applicable to Class A shares.
Class R6 shares incepted on September 24, 2012. Performance shown prior to that date is that of Class A shares and includes the 12b-1 fees applicable to Class A shares.
The performance data quoted represent past performance and cannot guarantee comparable future results; current performance may be lower or higher. Please visit
| | | | |
| |
Average Annual Total Returns | |
As of 9/30/18, the most recent calendar quarter end, including maximum applicable sales charges | |
| |
Class A Shares | | | | |
Inception (11/26/68) | | | 10.46 | % |
10 Years | | | 7.47 | |
5 Years | | | 6.07 | |
1 Year | | | 1.78 | |
| |
Class C Shares | | | | |
Inception (8/4/97) | | | 4.85 | % |
10 Years | | | 7.27 | |
5 Years | | | 6.48 | |
1 Year | | | 5.89 | |
| |
Class R Shares | | | | |
Inception (6/3/02) | | | 6.75 | % |
10 Years | | | 7.81 | |
5 Years | | | 7.02 | |
1 Year | | | 7.47 | |
| |
Class S Shares | | | | |
10 Years | | | 8.18 | % |
5 Years | | | 7.39 | |
1 Year | | | 7.83 | |
| |
Class Y Shares | | | | |
10 Years | | | 8.35 | % |
5 Years | | | 7.56 | |
1 Year | | | 7.97 | |
| |
Class R5 Shares | | | | |
Inception (7/30/91) | | | 8.30 | % |
10 Years | | | 8.48 | |
5 Years | | | 7.64 | |
1 Year | | | 8.06 | |
| |
Class R6 Shares | | | | |
10 Years | | | 8.35 | % |
5 Years | | | 7.72 | |
1 Year | | | 8.10 | |
invesco.com/performance for the most recent month-end performance. Performance figures reflect reinvested distributions, changes in net asset value and the effect of the maximum sales charge unless otherwise stated. Investment return and principal value will fluctuate so that you may have a gain or loss when you sell shares.
The net annual Fund operating expense ratio set forth in the most recent Fund prospectus as of the date of this report for Class A, Class C, Class R, Class S, Class Y, Class R5 and Class R6 shares was 1.12%, 1.87%, 1.37%, 1.02%, 0.87%, 0.79% and 0.71%, respectively.1 The total annual Fund operating expense ratio set forth in the most recent Fund prospectus as of the date of this report for Class A, Class C, Class R, Class S, Class Y, Class R5 and
Class R6 shares was 1.13%, 1.88%, 1.38%, 1.03%, 0.88%, 0.80% and 0.72%, respectively. The expense ratios presented above may vary from the expense ratios presented in other sections of this report that are based on expenses incurred during the period covered by this report.
Class A share performance reflects the maximum 5.50% sales charge, and Class C share performance reflects the applicable contingent deferred sales charge (CDSC) for the period involved. The CDSC on Class C shares is 1% for the first year after purchase. Class R, Class S, Class Y, Class R5 and Class R6 shares do not have a front-end sales charge or a CDSC; therefore, performance is at net asset value.
The performance of the Fund’s share classes will differ primarily due to different sales charge structures and class expenses.
Fund performance reflects any applicable fee waivers and/or expense reimbursements. Had the adviser not waived fees and/or reimbursed expenses currently or in the past, returns would have been lower. See current prospectus for more information.
| 1 | Total annual Fund operating expenses after any contractual fee waivers and/or expense reimbursements by the adviser in effect through at least June 30, 2020. See current prospectus for more information. |
7 Invesco Charter Fund
Invesco Charter Fund’s investment objective is long-term growth of capital.
| ∎ | | Unless otherwise stated, information presented in this report is as of October 31, 2018, and is based on total net assets. |
| ∎ | | Unless otherwise noted, all data provided by Invesco. |
| ∎ | | To access your Fund’s reports/prospectus, visit invesco.com/fundreports. |
About share classes
| ∎ | | Class R shares are generally available only to employee benefit plans. Please see the prospectus for more information. |
| ∎ | | Class S shares and Class Y shares are available only to certain investors. Please see the prospectus for more information. |
| ∎ | | Class R5 shares and Class R6 shares are available for use by retirement plans that meet certain standards and for institutional investors. Class R6 shares are also available through intermediaries that have established an agreement with Invesco Distributors, Inc. to make such shares available for use in retail omnibus accounts. Please see the prospectus for more information. |
Principal risks of investing in the Fund
| ∎ | | Cash/cash equivalents risk. In rising markets, holding cash or cash equivalents will negatively affect the Fund’s performance relative to its benchmark. |
∎ Debt securities risk. The prices of debt securities held by the Fund will be affected by changes in interest rates, the creditworthiness of the issuer and other factors. An increase in prevailing interest rates typically causes the value of existing debt securities to fall and often has a greater impact on longer-duration debt securities and higher quality debt securities. Falling interest rates will cause the Fund to reinvest the proceeds of debt securities that have been repaid by the issuer at lower interest rates. Falling interest rates may also reduce the Fund’s distributable income because interest payments on floating rate debt instruments held by the Fund will decline. The Fund could lose money on investments in debt securities if the issuer or borrower fails to meet its obligations to make interest payments and/or to repay principal in a timely manner. Changes in an issuer’s financial strength, the market’s perception of such strength or in the credit rating of the issuer or the
| | security may affect the value of debt securities. The Adviser’s credit analysis may fail to anticipate such changes, which could result in buying a debt security at an inopportune time or failing to sell a debt security in advance of a price decline or other credit event. |
∎ Derivatives risk. The value of a derivative instrument depends largely on (and is derived from) the value of an underlying security, currency, commodity, interest rate, index or other asset (each referred to as an underlying asset). In addition to risks relating to the underlying assets, the use of derivatives may include other, possibly greater, risks, including counterparty, leverage and liquidity risks. Counterparty risk is the risk that the counterparty to the derivative contract will default on its obligation to pay the Fund the amount owed or otherwise perform under the derivative contract. Derivatives create leverage risk because they do not require payment up front equal to the economic exposure created by owning the derivative. As a result, an adverse change in the value of the underlying asset could result in the Fund sustaining a loss that is substantially greater than the amount invested in the derivative, which may make the Fund’s returns more volatile and increase the risk of loss. Derivative instruments may also be less liquid than more traditional investments and the Fund may be unable to sell or close out its derivative positions at a desirable time or price. This risk may be more acute under adverse market conditions, during which the Fund may be most in need of liquidating its derivative positions. Derivatives may also be harder to value, less tax efficient and subject to changing government regulation that could impact the Fund’s ability to use certain derivatives or their cost. Also, derivatives used for hedging or to gain or limit exposure to a particular market segment may not provide the expected benefits, particularly during adverse market conditions.
This report must be accompanied or preceded by a currently effective Fund prospectus, which contains more complete information, including sales charges and expenses. Investors should read it carefully before investing.
NOT FDIC INSURED | MAY LOSE VALUE | NO BANK GUARANTEE
| ∎ | | Foreign securities risk. The Fund’s foreign investments may be adversely affected by political and social instability, changes in economic or taxation policies, difficulty in enforcing obligations, decreased liquidity or increased volatility. Foreign investments also involve the risk of the possible seizure, nationalization or expropriation of the issuer or foreign deposits (in which the Fund could lose its entire investments in a certain market) and the possible adoption of foreign governmental restrictions such as exchange controls. Unless the Fund has hedged its foreign securities risk, foreign securities risk also involves the risk of negative foreign currency rate fluctuations, which may cause the value of securities denominated in such foreign currency (or other instruments through which the Fund has exposure to foreign currencies) to decline in value. Currency exchange rates may fluctuate significantly over short periods of time. Currency hedging strategies, if used, are not always successful. |
| ∎ | | Management risk. The Fund is actively managed and depends heavily on the Adviser’s judgment about markets, interest rates or the attractiveness, relative values, liquidity, or potential appreciation of particular investments made for the Fund’s portfolio. The Fund could experience losses if these judgments prove to be incorrect. Additionally, legislative, regulatory, or tax developments may adversely affect management of the Fund and, therefore, the ability of the Fund to achieve its investment objective. |
∎ Market risk. The market values of the Fund’s investments, and therefore the value of the Fund’s shares, will go up and down, sometimes rapidly or unpredictably. Market risk may affect a single issuer, industry or section of the economy, or it may affect the market as a whole. Individual stock prices tend to go up and down more dramatically than those of certain other types of investments, such as bonds. During a general downturn in the financial markets, multiple asset classes may decline in value. When markets perform well, there can be no assurance that specific investments held by the Fund will rise in value.
| ∎ | | Small- and mid-capitalization companies risks. Small- and mid-capitalization companies tend to be more vulnerable to changing market conditions, may have little or no operating history or track record of success, and may have more limited product lines and markets, less experienced management and fewer financial resources than larger companies. These companies’ securities may be more volatile and less liquid than those of more established companies, and their returns may vary, sometimes significantly, from the overall securities market. |
About indexes used in this report
| ∎ | | The S&P 500® Index is an unmanaged index considered representative of the US stock market. |
| ∎ | | The Russell 1000® Index is an unmanaged index considered representative of large-cap stocks. The Russell 1000 Index is a trademark/service mark of the Frank Russell Co. Russell® is a trademark of the Frank Russell Co. |
| ∎ | | The Lipper Large Cap Core Funds Index is an unmanaged index considered representative of large-cap core funds tracked by Lipper. |
| ∎ | | The Fund is not managed to track the performance of any particular index, including the index(es) described here, and consequently, the performance of the Fund may deviate significantly from the performance of the index(es). |
| ∎ | | A direct investment cannot be made in an index. Unless otherwise indicated, index results include reinvested dividends, and they do not reflect sales charges. Performance of the peer group, if applicable, reflects fund expenses; performance of a market index does not. |
Other information
| ∎ | | The returns shown in management’s discussion of Fund performance are based on net asset values (NAVs) calculated for shareholder transactions. Generally accepted accounting principles require adjustments to be made to the net assets of the Fund at period end for financial reporting purposes, and as such, the NAVs for shareholder transactions and the returns based on those NAVs may differ from the NAVs and returns reported in the Financial Highlights. |
| ∎ | | Industry classifications used in this report are generally according to the Global Industry Classification Standard, which was developed by and is the exclusive property and a service mark of MSCI Inc. and Standard & Poor’s. |
9 Invesco Charter Fund
Schedule of Investments(a)
October 31, 2018
| | | | | | | | |
| | | Shares | | | Value | |
Common Stocks & Other Equity Interests–98.37% | |
| Aerospace & Defense–2.78% | |
General Dynamics Corp. | | | 185,949 | | | $ | 32,091,078 | |
United Technologies Corp. | | | 471,752 | | | | 58,596,316 | |
| | | | | | | | 90,687,394 | |
|
| Air Freight & Logistics–1.48% | |
FedEx Corp. | | | 218,644 | | | | 48,176,019 | |
|
| Airlines–1.26% | |
Delta Air Lines, Inc. | | | 749,798 | | | | 41,036,445 | |
|
| Asset Management & Custody Banks–1.29% | |
BlackRock, Inc. | | | 101,868 | | | | 41,910,533 | |
|
| Auto Parts & Equipment–0.96% | |
Aptiv PLC | | | 408,883 | | | | 31,402,214 | |
|
| Biotechnology–4.57% | |
Biogen Inc.(b) | | | 194,803 | | | | 59,272,709 | |
BioMarin Pharmaceutical Inc.(b) | | | 285,324 | | | | 26,298,313 | |
Celgene Corp.(b) | | | 469,732 | | | | 33,632,811 | |
Vertex Pharmaceuticals Inc.(b) | | | 176,032 | | | | 29,830,383 | |
| | | | | | | | 149,034,216 | |
|
| Cable & Satellite–3.07% | |
Comcast Corp.–Class A | | | 2,626,674 | | | | 100,181,346 | |
|
| Casinos & Gaming–1.04% | |
Wynn Resorts Ltd. | | | 338,031 | | | | 34,005,919 | |
|
| Consumer Finance–3.12% | |
American Express Co. | | | 988,927 | | | | 101,592,471 | |
|
| Data Processing & Outsourced Services–2.28% | |
Mastercard Inc.–Class A | | | 374,950 | | | | 74,116,366 | |
|
| Distillers & Vintners–1.04% | |
Diageo PLC (United Kingdom) | | | 983,483 | | | | 34,015,889 | |
|
| Diversified Banks–4.02% | |
Toronto-Dominion Bank (The) (Canada) | | | 799,010 | | | | 44,325,041 | |
U.S. Bancorp | | | 1,658,634 | | | | 86,696,799 | |
| | | | | | | | 131,021,840 | |
|
| Footwear–2.04% | |
NIKE, Inc.–Class B | | | 887,252 | | | | 66,579,390 | |
|
| General Merchandise Stores–1.88% | |
Dollar General Corp. | | | 551,257 | | | | 61,399,005 | |
|
| Health Care Equipment–2.16% | |
Medtronic PLC | | | 355,905 | | | | 31,967,387 | |
Zimmer Biomet Holdings, Inc. | | | 338,265 | | | | 38,423,521 | |
| | | | | | | | 70,390,908 | |
|
| Health Care Facilities–1.89% | |
HCA Healthcare, Inc. | | | 459,866 | | | | 61,405,907 | |
| | | | | | | | |
| | | Shares | | | Value | |
| Home Improvement Retail–1.35% | |
Home Depot, Inc. (The) | | | 249,285 | | | $ | 43,844,246 | |
|
| Homebuilding–0.49% | |
D.R. Horton, Inc. | | | 444,567 | | | | 15,986,629 | |
|
| Hotels, Resorts & Cruise Lines–2.01% | |
Carnival Corp. | | | 1,170,443 | | | | 65,591,626 | |
|
| Industrial Conglomerates–2.89% | |
Honeywell International Inc. | | | 357,697 | | | | 51,801,683 | |
Siemens AG (Germany) | | | 369,162 | | | | 42,532,333 | |
| | | | | | | | 94,334,016 | |
|
| Industrial Machinery–3.13% | |
Parker-Hannifin Corp. | | | 363,138 | | | | 55,062,615 | |
Stanley Black & Decker Inc. | | | 404,190 | | | | 47,096,219 | |
| | | | | | | | 102,158,834 | |
|
| Insurance Brokers–2.10% | |
Marsh & McLennan Cos., Inc. | | | 807,374 | | | | 68,424,946 | |
|
| Integrated Oil & Gas–3.86% | |
Chevron Corp. | | | 567,616 | | | | 63,374,326 | |
Suncor Energy, Inc. (Canada) | | | 1,878,251 | | | | 62,564,541 | |
| | | | | | | | 125,938,867 | |
|
| Integrated Telecommunication Services–2.01% | |
Verizon Communications Inc. | | | 1,144,724 | | | | 65,352,293 | |
|
| Interactive Home Entertainment–1.54% | |
Activision Blizzard, Inc. | | | 725,451 | | | | 50,092,392 | |
|
| Interactive Media & Services–8.19% | |
Alphabet Inc.–Class C(b) | | | 146,779 | | | | 158,047,224 | |
Facebook, Inc.–Class A(b) | | | 718,119 | | | | 109,003,283 | |
| | | | | | | | 267,050,507 | |
|
| Internet & Direct Marketing Retail–3.15% | |
Alibaba Group Holding Ltd.–ADR (China)(b) | | | 225,495 | | | | 32,083,428 | |
Booking Holdings Inc.(b) | | | 37,653 | | | | 70,583,561 | |
| | | | | | | | 102,666,989 | |
|
| IT Consulting & Other Services–1.98% | |
Cognizant Technology Solutions Corp.–Class A | | | 691,323 | | | | 47,722,027 | |
EPAM Systems, Inc.(b) | | | 141,505 | | | | 16,905,602 | |
| | | | | | | | 64,627,629 | |
|
| Life Sciences Tools & Services–2.86% | |
Thermo Fisher Scientific, Inc. | | | 399,635 | | | | 93,374,718 | |
|
| Managed Health Care–2.46% | |
UnitedHealth Group Inc. | | | 306,202 | | | | 80,025,893 | |
|
| Multi-Sector Holdings–1.04% | |
Berkshire Hathaway Inc.–Class A(b) | | | 110 | | | | 33,847,550 | |
See accompanying Notes to Financial Statements which are an integral part of the financial statements.
10 Invesco Charter Fund
| | | | | | | | |
| | | Shares | | | Value | |
| Multi-Utilities–1.94% | |
WEC Energy Group, Inc. | | | 924,896 | | | $ | 63,262,886 | |
|
| Oil & Gas Exploration & Production–1.81% | |
Concho Resources Inc.(b) | | | 424,341 | | | | 59,021,590 | |
|
| Pharmaceuticals–2.33% | |
Allergan PLC | | | 290,056 | | | | 45,831,748 | |
Novo Nordisk A/S–Class B (Denmark) | | | 699,522 | | | | 30,212,034 | |
| | | | | | | | 76,043,782 | |
|
| Property & Casualty Insurance–3.49% | |
Chubb Ltd. | | | 341,422 | | | | 42,647,022 | |
Progressive Corp. (The) | | | 1,021,443 | | | | 71,194,577 | |
| | | | | | | | 113,841,599 | |
|
| Railroads–1.06% | |
Norfolk Southern Corp. | | | 204,925 | | | | 34,392,563 | |
|
| Regional Banks–3.77% | |
First Republic Bank | | | 744,741 | | | | 67,763,984 | |
PNC Financial Services Group, Inc. (The) | | | 429,701 | | | | 55,212,281 | |
| | | | | | | | 122,976,265 | |
|
| Semiconductors–2.81% | |
Analog Devices, Inc. | | | 643,567 | | | | 53,872,994 | |
QUALCOMM Inc. | | | 601,808 | | | | 37,847,705 | |
| | | | | | | | 91,720,699 | |
| | | | | | | | |
| | | Shares | | | Value | |
| Soft Drinks–2.20% | |
PepsiCo, Inc. | | | 639,021 | | | $ | 71,813,180 | |
|
| Systems Software–5.02% | |
Microsoft Corp. | | | 1,032,009 | | | | 110,228,882 | |
Oracle Corp. | | | 1,091,142 | | | | 53,291,375 | |
| | | | | | | | 163,520,257 | |
Total Common Stocks & Other Equity Interests
(Cost $2,593,146,966) | | | | 3,206,865,818 | |
|
Money Market Funds–2.86% | |
Invesco Government & Agency Portfolio–Institutional Class, 2.08%(c) | | | 32,571,412 | | | | 32,571,412 | |
Invesco Liquid Assets Portfolio–Institutional Class, 2.27%(c) | | | 23,270,431 | | | | 23,275,085 | |
Invesco Treasury Portfolio–Institutional Class, 2.09%(c) | | | 37,224,472 | | | | 37,224,472 | |
Total Money Market Funds
(Cost $93,070,113) | | | | 93,070,969 | |
TOTAL INVESTMENTS IN SECURITIES–101.23%
(Cost $2,686,217,079) | | | | 3,299,936,787 | |
OTHER ASSETS LESS LIABILITIES–(1.23)% | | | | (39,978,865 | ) |
NET ASSETS–100.00% | | | $ | 3,259,957,922 | |
Investment Abbreviations:
| | |
| ADR | | – American Depositary Receipt |
Notes to Schedule of Investments:
| (a) | Industry and/or sector classifications used in this report are generally according to the Global Industry Classification Standard, which was developed by and is the exclusive property and a service mark of MSCI Inc. and Standard & Poor’s. |
| (b) | Non-income producing security. |
| (c) | The money market fund and the Fund are affiliated by having the same investment adviser. The rate shown is the 7-day SEC standardized yield as of October 31, 2018. |
See accompanying Notes to Financial Statements which are an integral part of the financial statements.
11 Invesco Charter Fund
Statement of Assets and Liabilities
October 31, 2018
| | | | |
Assets: | | | | |
Investments in securities, at value (Cost $2,593,146,966) | | $ | 3,206,865,818 | |
Investments in affiliated money market funds, at value
(Cost $93,070,113) | | | 93,070,969 | |
Foreign currencies, at value (Cost $348,006) | | | 346,855 | |
Receivable for: | | | | |
Investments sold | | | 34,609,513 | |
Dividends | | | 3,232,363 | |
Fund shares sold | | | 411,056 | |
Investment for trustee deferred compensation and retirement plans | | | 1,633,001 | |
Other assets | | | 17,492 | |
Total assets | | | 3,340,187,067 | |
| |
Liabilities: | | | | |
Payable for: | | | | |
Investments purchased | | | 72,611,525 | |
Fund shares reacquired | | | 3,717,939 | |
Accrued fees to affiliates | | | 1,819,364 | |
Accrued trustees’ and officers’ fees and benefits | | | 5,290 | |
Accrued other operating expenses | | | 269,282 | |
Trustee deferred compensation and retirement plans | | | 1,805,745 | |
Total liabilities | | | 80,229,145 | |
Net assets applicable to shares outstanding | | $ | 3,259,957,922 | |
| |
Net assets consist of: | | | | |
Shares of beneficial interest | | $ | 2,336,350,521 | |
Distributable earnings | | | 923,607,401 | |
| | | $ | 3,259,957,922 | |
| | | | |
Net Assets: | |
Class A | | $ | 2,951,278,534 | |
Class C | | $ | 133,804,207 | |
Class R | | $ | 23,250,922 | |
Class S | | $ | 17,317,210 | |
Class Y | | $ | 101,885,292 | |
Class R5 | | $ | 12,017,761 | |
Class R6 | | $ | 20,403,996 | |
|
Shares outstanding, no par value,
with an unlimited number of shares authorized: | |
Class A | | | 168,471,165 | |
Class C | | | 8,162,392 | |
Class R | | | 1,341,242 | |
Class S | | | 987,862 | |
Class Y | | | 5,786,641 | |
Class R5 | | | 655,122 | |
Class R6 | | | 1,112,519 | |
Class A: | | | | |
Net asset value per share | | $ | 17.52 | |
Maximum offering price per share | | | | |
(Net asset value of $17.52 ¸ 94.50%) | | $ | 18.54 | |
Class C: | | | | |
Net asset value and offering price per share | | $ | 16.39 | |
Class R: | | | | |
Net asset value and offering price per share | | $ | 17.34 | |
Class S: | | | | |
Net asset value and offering price per share | | $ | 17.53 | |
Class Y: | | | | |
Net asset value and offering price per share | | $ | 17.61 | |
Class R5: | | | | |
Net asset value and offering price per share | | $ | 18.34 | |
Class R6: | | | | |
Net asset value and offering price per share | | $ | 18.34 | |
See accompanying Notes to Financial Statements which are an integral part of the financial statements.
12 Invesco Charter Fund
Statement of Operations
For the year ended October 31, 2018
| | | | |
Investment income: | | | | |
Dividends (net of foreign withholding taxes of $1,015,199) | | $ | 46,997,013 | |
Dividends from affiliated money market funds | | | 4,476,873 | |
Total investment income | | | 51,473,886 | |
| |
Expenses: | | | | |
Advisory fees | | | 22,521,966 | |
Administrative services fees | | | 590,079 | |
Custodian fees | | | 317,206 | |
Distribution fees: | | | | |
Class A | | | 8,177,409 | |
Class B | | | 27,899 | |
Class C | | | 1,560,539 | |
Class R | | | 136,580 | |
Class S | | | 28,401 | |
Transfer agent fees — A, B, C, R, S and Y | | | 5,831,858 | |
Transfer agent fees — R5 | | | 16,615 | |
Transfer agent fees — R6 | | | 6,678 | |
Trustees’ and officers’ fees and benefits | | | 71,037 | |
Registration and filing fees | | | 148,743 | |
Reports to shareholders | | | 420,700 | |
Professional services fees | | | 169,976 | |
Other | | | 82,066 | |
Total expenses | | | 40,107,752 | |
Less: Fees waived and expense offset arrangement(s) | | | (463,406 | ) |
Net expenses | | | 39,644,346 | |
Net investment income | | | 11,829,540 | |
| |
Realized and unrealized gain (loss) from: | | | | |
Net realized gain from: | | | | |
Investment securities (includes net gains (losses) from securities sold to affiliates of $(55,935)) | | | 312,151,363 | |
Foreign currencies | | | 309,181 | |
| | | | 312,460,544 | |
Change in net unrealized appreciation (depreciation) of: | | | | |
Investment securities | | | (305,632,549 | ) |
Foreign currencies | | | (194,968 | ) |
| | | | (305,827,517 | ) |
Net realized and unrealized gain | | | 6,633,027 | |
Net increase in net assets resulting from operations | | $ | 18,462,567 | |
See accompanying Notes to Financial Statements which are an integral part of the financial statements.
13 Invesco Charter Fund
Statement of Changes in Net Assets
For the years ended October 31, 2018 and 2017
| | | | | | | | |
| | | 2018 | | | 2017 | |
Operations: | | | | | | | | |
Net investment income | | $ | 11,829,540 | | | $ | 18,547,675 | |
Net realized gain | | | 312,460,544 | | | | 237,485,862 | |
Change in net unrealized appreciation (depreciation) | | | (305,827,517 | ) | | | 249,718,068 | |
Net increase in net assets resulting from operations | | | 18,462,567 | | | | 505,751,605 | |
| | |
Distributions to shareholders from distributable earnings(1): | | | | | | | | |
Class A | | | (220,440,781 | ) | | | (360,493,131 | ) |
Class B | | | (751,285 | ) | | | (2,692,090 | ) |
Class C | | | (10,627,614 | ) | | | (19,990,936 | ) |
Class R | | | (1,810,151 | ) | | | (3,505,509 | ) |
Class S | | | (1,275,165 | ) | | | (1,927,239 | ) |
Class Y | | | (8,540,377 | ) | | | (10,722,973 | ) |
Class R5 | | | (1,952,783 | ) | | | (3,971,454 | ) |
Class R6 | | | (1,266,614 | ) | | | (331,165 | ) |
Total distributions from distributable earnings | | | (246,664,770 | ) | | | (403,634,497 | ) |
| | |
Share transactions-net: | | | | | | | | |
Class A | | | (206,489,185 | ) | | | (195,241,082 | ) |
Class B | | | (12,744,633 | ) | | | (15,347,934 | ) |
Class C | | | (22,815,713 | ) | | | (36,929,723 | ) |
Class R | | | (5,255,412 | ) | | | (6,325,944 | ) |
Class S | | | (523,015 | ) | | | 132,278 | |
Class Y | | | (20,054,996 | ) | | | 21,372,829 | |
Class R5 | | | (16,618,011 | ) | | | (9,692,424 | ) |
Class R6 | | | 3,396,818 | | | | 15,232,725 | |
Net increase (decrease) in net assets resulting from share transactions | | | (281,104,147 | ) | | | (226,799,275 | ) |
Net increase (decrease) in net assets | | | (509,306,350 | ) | | | (124,682,167 | ) |
| | |
Net assets: | | | | | | | | |
Beginning of year | | | 3,769,264,272 | | | | 3,893,946,439 | |
End of year | | $ | 3,259,957,922 | | | $ | 3,769,264,272 | |
| (1) | For the year ended October 31, 2017, distributions to shareholders from distributable earnings consisted of distributions from net investment income and distributions from net realized gains. The Securities and Exchange Commission eliminated the requirement to disclose the distribution components separately. For the year ended October 31, 2017, distributions from net investment income were $30,633,877, $22,307, $165,647, $212,669, $181,181, $1,150,067, $463,957, and $40,672 and distributions from net realized gains were $329,859,254, $2,669,783, $19,825,289, $3,292,840, $1,746,058, $9,572,906, $3,507,497 and $290,493 for Class A, Class B, Class C, Class R, Class S, Class Y, Class R5 and Class R6 shares, respectively. |
Notes to Financial Statements
October 31, 2018
NOTE 1—Significant Accounting Policies
Invesco Charter Fund (the “Fund”) is a series portfolio of AIM Equity Funds (Invesco Equity Funds) (the “Trust”). The Trust is a Delaware statutory trust registered under the Investment Company Act of 1940, as amended (the “1940 Act”), as an open-end series management investment company authorized to issue an unlimited number of shares of beneficial interest. Information presented in these financial statements pertains only to the Fund. Matters affecting the Fund or each class will be voted on exclusively by the shareholders of the Fund or each class.
The Fund’s investment objective is long-term growth of capital.
The Fund currently consists of seven different classes of shares: Class A, Class C, Class R, Class S, Class Y, Class R5 and Class R6. Class Y shares are available only to certain investors. Class A shares are sold with a front-end sales charge unless certain waiver criteria are met. Under certain circumstances, load waived shares may be subject to contingent deferred sales charges (“CDSC”). Class C shares are sold with a CDSC. Class R, Class S, Class Y, Class R5 and Class R6 shares are sold at net asset value. Effective November 30, 2010, new or additional investments in Class B shares are no longer permitted. Existing shareholders of Class B shares were permitted to continue to reinvest dividends and capital gains distributions in Class B shares until their conversion to Class A shares. Also, shareholders in Class B shares were able to exchange those shares for Class B shares of other Invesco Funds offering such shares until they converted to Class A shares. Generally, Class B shares automatically converted to Class A shares on or about the month-end, which was at least eight years after the date of purchase. Redemptions of Class B shares prior to the conversion date were
14 Invesco Charter Fund
subject to a CDSC. Effective January 26, 2018, all of the Fund’s outstanding Class B shares were converted to Class A shares, in advance of their normally scheduled conversion. No CDSC was paid in connection with this early conversion.
The Fund is an investment company and accordingly follows the investment company accounting and reporting guidance in accordance with Financial Accounting Standards Board Accounting Standards Codification Topic 946, Financial Services — Investment Companies.
The following is a summary of the significant accounting policies followed by the Fund in the preparation of its financial statements.
| A. | Security Valuations — Securities, including restricted securities, are valued according to the following policy. |
A security listed or traded on an exchange (except convertible securities) is valued at its last sales price or official closing price as of the close of the customary trading session on the exchange where the security is principally traded, or lacking any sales or official closing price on a particular day, the security may be valued at the closing bid price on that day. Securities traded in the over-the-counter market are valued based on prices furnished by independent pricing services or market makers. When such securities are valued by an independent pricing service they may be considered fair valued. Futures contracts are valued at the final settlement price set by an exchange on which they are principally traded. Listed options are valued at the mean between the last bid and asked prices from the exchange on which they are principally traded. Options not listed on an exchange are valued by an independent source at the mean between the last bid and asked prices. For purposes of determining net asset value (“NAV”) per share, futures and option contracts generally are valued 15 minutes after the close of the customary trading session of the New York Stock Exchange (“NYSE”).
Investments in open-end and closed-end registered investment companies that do not trade on an exchange are valued at the end-of-day net asset value per share. Investments in open-end and closed-end registered investment companies that trade on an exchange are valued at the last sales price or official closing price as of the close of the customary trading session on the exchange where the security is principally traded.
Debt obligations (including convertible securities) and unlisted equities are fair valued using an evaluated quote provided by an independent pricing service. Evaluated quotes provided by the pricing service may be determined without exclusive reliance on quoted prices, and may reflect appropriate factors such as institution-size trading in similar groups of securities, developments related to specific securities, dividend rate (for unlisted equities), yield (for debt obligations), quality, type of issue, coupon rate (for debt obligations), maturity (for debt obligations), individual trading characteristics and other market data. Pricing services generally value debt obligations assuming orderly transactions of institutional round lot size, but a fund may hold or transact in the same securities in smaller, odd lot sizes. Odd lots often trade at lower prices than institutional round lots. Debt obligations are subject to interest rate and credit risks. In addition, all debt obligations involve some risk of default with respect to interest and/or principal payments.
Foreign securities’ (including foreign exchange contracts) prices are converted into U.S. dollar amounts using the applicable exchange rates as of the close of the NYSE. If market quotations are available and reliable for foreign exchange-traded equity securities, the securities will be valued at the market quotations. Because trading hours for certain foreign securities end before the close of the NYSE, closing market quotations may become unreliable. If between the time trading ends on a particular security and the close of the customary trading session on the NYSE, events occur that the investment adviser determines are significant and make the closing price unreliable, the Fund may fair value the security. If the event is likely to have affected the closing price of the security, the security will be valued at fair value in good faith using procedures approved by the Board of Trustees. Adjustments to closing prices to reflect fair value may also be based on a screening process of an independent pricing service to indicate the degree of certainty, based on historical data, that the closing price in the principal market where a foreign security trades is not the current value as of the close of the NYSE. Foreign securities’ prices meeting the approved degree of certainty that the price is not reflective of current value will be priced at the indication of fair value from the independent pricing service. Multiple factors may be considered by the independent pricing service in determining adjustments to reflect fair value and may include information relating to sector indices, American Depositary Receipts and domestic and foreign index futures. Foreign securities may have additional risks including exchange rate changes, potential for sharply devalued currencies and high inflation, political and economic upheaval, the relative lack of issuer information, relatively low market liquidity and the potential lack of strict financial and accounting controls and standards.
Securities for which market prices are not provided by any of the above methods may be valued based upon quotes furnished by independent sources. The last bid price may be used to value equity securities. The mean between the last bid and asked prices is used to value debt obligations, including corporate loans.
Securities for which market quotations are not readily available or became unreliable are valued at fair value as determined in good faith by or under the supervision of the Trust’s officers following procedures approved by the Board of Trustees. Issuer specific events, market trends, bid/asked quotes of brokers and information providers and other market data may be reviewed in the course of making a good faith determination of a security’s fair value.
The Fund may invest in securities that are subject to interest rate risk, meaning the risk that the prices will generally fall as interest rates rise and, conversely, the prices will generally rise as interest rates fall. Specific securities differ in their sensitivity to changes in interest rates depending on their individual characteristics. Changes in interest rates may result in increased market volatility, which may affect the value and/or liquidity of certain Fund investments.
Valuations change in response to many factors including the historical and prospective earnings of the issuer, the value of the issuer’s assets, general economic conditions, interest rates, investor perceptions and market liquidity. Because of the inherent uncertainties of valuation, the values reflected in the financial statements may materially differ from the value received upon actual sale of those investments.
| B. | Securities Transactions and Investment Income — Securities transactions are accounted for on a trade date basis. Realized gains or losses on sales are computed on the basis of specific identification of the securities sold. Interest income (net of withholding tax, if any) is recorded on the accrual basis from settlement date. Dividend income (net of withholding tax, if any) is recorded on the ex-dividend date. |
The Fund may periodically participate in litigation related to Fund investments. As such, the Fund may receive proceeds from litigation settlements. Any proceeds received are included in the Statement of Operations as realized gain (loss) for investments no longer held and as unrealized gain (loss) for investments still held.
Brokerage commissions and mark ups are considered transaction costs and are recorded as an increase to the cost basis of securities purchased and/or a reduction of proceeds on a sale of securities. Such transaction costs are included in the determination of net realized and unrealized gain (loss) from investment securities reported in the Statement of Operations and the Statement of Changes in Net Assets and the net realized and unrealized gains (losses) on securities per share in the Financial Highlights. Transaction costs are included in the calculation of the
15 Invesco Charter Fund
Fund’s net asset value and, accordingly, they reduce the Fund’s total returns. These transaction costs are not considered operating expenses and are not reflected in net investment income reported in the Statement of Operations and the Statement of Changes in Net Assets, or the net investment income per share and the ratios of expenses and net investment income reported in the Financial Highlights, nor are they limited by any expense limitation arrangements between the Fund and the investment adviser.
The Fund allocates income and realized and unrealized capital gains and losses to a class based on the relative net assets of each class.
| C. | Country Determination — For the purposes of making investment selection decisions and presentation in the Schedule of Investments, the investment adviser may determine the country in which an issuer is located and/or credit risk exposure based on various factors. These factors include the laws of the country under which the issuer is organized, where the issuer maintains a principal office, the country in which the issuer derives 50% or more of its total revenues and the country that has the primary market for the issuer’s securities, as well as other criteria. Among the other criteria that may be evaluated for making this determination are the country in which the issuer maintains 50% or more of its assets, the type of security, financial guarantees and enhancements, the nature of the collateral and the sponsor organization. Country of issuer and/or credit risk exposure has been determined to be the United States of America, unless otherwise noted. |
| D. | Distributions — Distributions from net investment income and net realized capital gain, if any, are generally declared and paid annually and recorded on the ex-dividend date. The Fund may elect to treat a portion of the proceeds from redemptions as distributions for federal income tax purposes. |
| E. | Federal Income Taxes — The Fund intends to comply with the requirements of Subchapter M of the Internal Revenue Code of 1986, as amended (the “Internal Revenue Code”), necessary to qualify as a regulated investment company and to distribute substantially all of the Fund’s taxable earnings to shareholders. As such, the Fund will not be subject to federal income taxes on otherwise taxable income (including net realized capital gain) that is distributed to shareholders. Therefore, no provision for federal income taxes is recorded in the financial statements. |
The Fund recognizes the tax benefits of uncertain tax positions only when the position is more likely than not to be sustained. Management has analyzed the Fund’s uncertain tax positions and concluded that no liability for unrecognized tax benefits should be recorded related to uncertain tax positions. Management is not aware of any tax positions for which it is reasonably possible that the total amounts of unrecognized tax benefits will change materially in the next 12 months.
The Fund files tax returns in the U.S. Federal jurisdiction and certain other jurisdictions. Generally, the Fund is subject to examinations by such taxing authorities for up to three years after the filing of the return for the tax period.
| F. | Expenses — Fees provided for under the Rule 12b-1 plan of a particular class of the Fund are charged to the operations of such class. Transfer agency fees and expenses and other shareholder recordkeeping fees and expenses attributable to Class R5 and Class R6 are allocated to each share class based on relative net assets. Sub-accounting fees attributable to Class R5 are charged to the operations of the class. Transfer agency fees and expenses and other shareholder recordkeeping fees and expenses relating to all other classes are allocated among those classes based on relative net assets. All other expenses are allocated among the classes based on relative net assets. |
| G. | Accounting Estimates — The preparation of financial statements in conformity with accounting principles generally accepted in the United States of America (“GAAP”) requires management to make estimates and assumptions that affect the reported amounts of assets and liabilities at the date of the financial statements and the reported amounts of revenues and expenses during the reporting period including estimates and assumptions related to taxation. Actual results could differ from those estimates by a significant amount. In addition, the Fund monitors for material events or transactions that may occur or become known after the period-end date and before the date the financial statements are released to print. |
| H. | Indemnifications — Under the Trust’s organizational documents, each Trustee, officer, employee or other agent of the Trust is indemnified against certain liabilities that may arise out of the performance of their duties to the Fund. Additionally, in the normal course of business, the Fund enters into contracts, including the Fund’s servicing agreements, that contain a variety of indemnification clauses. The Fund’s maximum exposure under these arrangements is unknown as this would involve future claims that may be made against the Fund that have not yet occurred. The risk of material loss as a result of such indemnification claims is considered remote. |
| I. | Foreign Currency Translations — Foreign currency is valued at the close of the NYSE based on quotations posted by banks and major currency dealers. Portfolio securities and other assets and liabilities denominated in foreign currencies are translated into U.S. dollar amounts at the date of valuation. Purchases and sales of portfolio securities (net of foreign taxes withheld on disposition) and income items denominated in foreign currencies are translated into U.S. dollar amounts on the respective dates of such transactions. The Fund does not separately account for the portion of the results of operations resulting from changes in foreign exchange rates on investments and the fluctuations arising from changes in market prices of securities held. The combined results of changes in foreign exchange rates and the fluctuation of market prices on investments (net of estimated foreign tax withholding) are included with the net realized and unrealized gain or loss from investments in the Statement of Operations. Reported net realized foreign currency gains or losses arise from (1) sales of foreign currencies, (2) currency gains or losses realized between the trade and settlement dates on securities transactions, and (3) the difference between the amounts of dividends, interest, and foreign withholding taxes recorded on the Fund’s books and the U.S. dollar equivalent of the amounts actually received or paid. Net unrealized foreign currency gains and losses arise from changes in the fair values of assets and liabilities, other than investments in securities at fiscal period end, resulting from changes in exchange rates. |
The Fund may invest in foreign securities, which may be subject to foreign taxes on income, gains on investments or currency repatriation, a portion of which may be recoverable. Foreign taxes, if any, are recorded based on the tax regulations and rates that exist in the foreign markets in which the Fund invests and are shown in the Statement of Operations.
| J. | Forward Foreign Currency Contracts — The Fund may engage in foreign currency transactions either on a spot (i.e. for prompt delivery and settlement) basis, or through forward foreign currency contracts, to manage or minimize currency or exchange rate risk. |
The Fund may also enter into forward foreign currency contracts for the purchase or sale of a security denominated in a foreign currency in order to “lock in” the U.S. dollar price of that security, or the Fund may also enter into forward foreign currency contracts that do not provide for physical settlement of the two currencies, but instead are settled by a single cash payment calculated as the difference between the agreed upon exchange rate and the spot rate at settlement based upon an agreed upon notional amount (non-deliverable forwards). The Fund will set aside liquid assets in an amount equal to the daily mark-to-market obligation for forward foreign currency contracts.
16 Invesco Charter Fund
A forward foreign currency contract is an obligation between two parties (“Counterparties”) to purchase or sell a specific currency for an agreed-upon price at a future date. The use of forward foreign currency contracts does not eliminate fluctuations in the price of the underlying securities the Fund owns or intends to acquire but establishes a rate of exchange in advance. Fluctuations in the value of these contracts are measured by the difference in the contract date and reporting date exchange rates and are recorded as unrealized appreciation (depreciation) until the contracts are closed. When the contracts are closed, realized gains (losses) are recorded. Realized and unrealized gains (losses) on the contracts are included in the Statement of Operations. The primary risks associated with forward foreign currency contracts include failure of the Counterparty to meet the terms of the contract and the value of the foreign currency changing unfavorably. These risks may be in excess of the amounts reflected in the Statement of Assets and Liabilities.
NOTE 2—Advisory Fees and Other Fees Paid to Affiliates
The Trust has entered into a master investment advisory agreement with Invesco Advisers, Inc. (the “Adviser” or “Invesco”). Under the terms of the investment advisory agreement, the Fund accrues daily and pays monthly an advisory fee to the Adviser based on the annual rate of the Fund’s average daily net assets as follows:
| | | | | | | | |
| Average Daily Net Assets | | Rate | |
First $250 million | | | 0 | .695% | | | | |
Next $4.05 billion | | | 0 | .615% | | | | |
Next $3.9 billion | | | 0 | .57% | | | | |
Next $1.8 billion | | | 0 | .545% | | | | |
Over $10 billion | | | 0 | .52% | | | | |
For the year ended October 31, 2018, the effective advisory fees incurred by the Fund was 0.62%.
Under the terms of a master sub-advisory agreement between the Adviser and each of Invesco Asset Management Deutschland GmbH, Invesco Asset Management Limited, Invesco Asset Management (Japan) Limited, Invesco Hong Kong Limited, Invesco Senior Secured Management, Inc. and Invesco Canada Ltd. (collectively, the “Affiliated Sub-Advisers”) the Adviser, not the Fund, will pay 40% of the fees paid to the Adviser to any such Affiliated Sub-Adviser(s) that provide(s) discretionary investment management services to the Fund based on the percentage of assets allocated to such Affiliated Sub-Adviser(s).
The Adviser has contractually agreed, through at least June 30, 2019, to waive advisory fees and/or reimburse expenses of all shares to the extent necessary to limit total annual fund operating expenses after fee waiver and/or expense reimbursement (excluding certain items discussed below) of Class A, Class C, Class R, Class S, Class Y, Class R5 and Class R6 shares to 2.00%, 2.75%, 2.25%, 1.90%, 1.75%, 1.75% and 1.75%, respectively, of average daily net assets (the “expense limits”). Prior to their conversion to Class A shares, the expense limit for Class B was 2.75% of average daily net assets. In determining the Adviser’s obligation to waive advisory fees and/or reimburse expenses, the following expenses are not taken into account, and could cause the total annual fund operating expenses after fee waiver and/or expense reimbursement to exceed the numbers reflected above: (1) interest; (2) taxes; (3) dividend expense on short sales; (4) extraordinary or non-routine items, including litigation expenses; and (5) expenses that the Fund has incurred but did not actually pay because of an expense offset arrangement. Unless Invesco continues the fee waiver agreement, it will terminate on June 30, 2019. During its term, the fee waiver agreement cannot be terminated or amended to increase the expense limits or reduce the advisory fee waiver without approval of the Board of Trustees. The Adviser did not waive fees and/or reimburse expenses during the period under these expense limits.
Further, the Adviser has contractually agreed, through at least June 30, 2020, to waive the advisory fee payable by the Fund in an amount equal to 100% of the net advisory fees the Adviser receives from the affiliated money market funds on investments by the Fund of uninvested cash in such affiliated money market funds.
For the year ended October 31, 2018, the Adviser waived advisory fees of $373,926.
The Trust has entered into a master administrative services agreement with Invesco pursuant to which the Fund has agreed to pay Invesco for certain administrative costs incurred in providing accounting services to the Fund. For the year ended October 31, 2018, expenses incurred under the agreement are shown in the Statement of Operations as Administrative services fees.
The Trust has entered into a transfer agency and service agreement with Invesco Investment Services, Inc. (“IIS”) pursuant to which the Fund has agreed to pay IIS a fee for providing transfer agency and shareholder services to the Fund and reimburse IIS for certain expenses incurred by IIS in the course of providing such services. IIS may make payments to intermediaries that provide omnibus account services, sub-accounting services and/or networking services. All fees payable by IIS to intermediaries that provide omnibus account services or sub-accounting services are charged back to the Fund, subject to certain limitations approved by the Trust’s Board of Trustees. For the year ended October 31, 2018, expenses incurred under the agreement are shown in the Statement of Operations as Transfer agent fees.
The Trust has entered into master distribution agreements with Invesco Distributors, Inc. (“IDI”) to serve as the distributor for the Class A, Class C, Class R, Class S, Class Y, Class R5 and Class R6 shares of the Fund. The Trust has adopted plans pursuant to Rule 12b-1 under the 1940 Act with respect to the Fund’s Class A, Class C, Class R and Class S shares (collectively, the “Plans”). The Fund, pursuant to the Plans, pays IDI compensation at the annual rate of 0.25% of the Fund’s average daily net assets of Class A shares, 1.00% of the average daily net assets of Class C shares, 0.50% of the average daily net assets of Class R shares and 0.15% of the average daily net assets of Class S shares. Prior to their conversion to Class A shares, the Fund paid an annual rate of 1.00% of the average daily net assets of Class B shares. The fees are accrued daily and paid monthly. Of the Plan payments, up to 0.25% of the average daily net assets of Class A, Class C and Class R shares and 0.15% of the average daily net assets of Class S shares may be paid to furnish continuing personal shareholder services to customers who purchase and own shares of such classes. Any amounts not paid as a service fee under the Plans would constitute an asset-based sales charge. Rules of the Financial Industry Regulatory Authority (“FINRA”) impose a cap on the total sales charges, including asset-based sales charges, that may be paid by any class of shares of the Fund. For the year ended October 31, 2018, expenses incurred under the Plans are shown in the Statement of Operations as Distribution fees.
Front-end sales commissions and CDSC (collectively, the “sales charges”) are not recorded as expenses of the Fund. Front-end sales commissions are deducted from proceeds from the sales of Fund shares prior to investment in Class A shares of the Fund. CDSC are deducted from redemption
17 Invesco Charter Fund
proceeds prior to remittance to the shareholder. During the year ended October 31, 2018, IDI advised the Fund that IDI retained $153,308 in front-end sales commissions from the sale of Class A shares and $5,814 and $2,738 from Class A and Class C shares, respectively, for CDSC imposed on redemptions by shareholders.
For the year ended October 31, 2018, the Fund incurred $2,599 in brokerage commissions with Invesco Capital Markets, Inc., an affiliate of the Adviser and IDI, for portfolio transactions executed on behalf of the Fund.
Certain officers and trustees of the Trust are officers and directors of the Adviser, IIS and/or IDI.
NOTE 3—Additional Valuation Information
GAAP defines fair value as the price that would be received to sell an asset or paid to transfer a liability in an orderly transaction between market participants at the measurement date, under current market conditions. GAAP establishes a hierarchy that prioritizes the inputs to valuation methods, giving the highest priority to readily available unadjusted quoted prices in an active market for identical assets (Level 1) and the lowest priority to significant unobservable inputs (Level 3), generally when market prices are not readily available or are unreliable. Based on the valuation inputs, the securities or other investments are tiered into one of three levels. Changes in valuation methods may result in transfers in or out of an investment’s assigned level:
| | Level 1 — | Prices are determined using quoted prices in an active market for identical assets. |
| | Level 2 — | Prices are determined using other significant observable inputs. Observable inputs are inputs that other market participants may use in pricing a security. These may include quoted prices for similar securities, interest rates, prepayment speeds, credit risk, yield curves, loss severities, default rates, discount rates, volatilities and others. |
| | Level 3 — | Prices are determined using significant unobservable inputs. In situations where quoted prices or observable inputs are unavailable (for example, when there is little or no market activity for an investment at the end of the period), unobservable inputs may be used. Unobservable inputs reflect the Fund’s own assumptions about the factors market participants would use in determining fair value of the securities or instruments and would be based on the best available information. |
The following is a summary of the tiered valuation input levels, as of October 31, 2018. The level assigned to the securities valuations may not be an indication of the risk or liquidity associated with investing in those securities. Because of the inherent uncertainties of valuation, the values reflected in the financial statements may materially differ from the value received upon actual sale of those investments.
| | | | | | | | | | | | | | | | |
| | | Level 1 | | | Level 2 | | | Level 3 | | | Total | |
Investments in Securities | | | | | | | | | | | | | | | | |
Common Stocks & Other Equity Interests | | $ | 3,142,637,895 | | | $ | 64,227,923 | | | $ | — | | | $ | 3,206,865,818 | |
Money Market Funds | | | 93,070,969 | | | | — | | | | — | | | | 93,070,969 | |
Total Investments | | $ | 3,235,708,864 | | | $ | 64,227,923 | | | $ | — | | | $ | 3,299,936,787 | |
NOTE 4—Security Transactions with Affiliated Funds
The Fund is permitted to purchase or sell securities from or to certain other Invesco Funds under specified conditions outlined in procedures adopted by the Board of Trustees of the Trust. The procedures have been designed to ensure that any purchase or sale of securities by the Fund from or to another fund or portfolio that is or could be considered an affiliate by virtue of having a common investment adviser (or affiliated investment advisers), common Trustees and/or common officers complies with Rule 17a-7 of the 1940 Act. Further, as defined under the procedures, each transaction is effected at the current market price. Pursuant to these procedures, for the year ended October 31, 2018, the Fund engaged in securities sales of $926,570, which resulted in net realized gains (losses) of $(55,935).
NOTE 5—Expense Offset Arrangement(s)
The expense offset arrangement is comprised of transfer agency credits which result from balances in demand deposit accounts used by the transfer agent for clearing shareholder transactions. For the year ended October 31, 2018, the Fund received credits from this arrangement, which resulted in the reduction of the Fund’s total expenses of $89,480.
NOTE 6—Trustees’ and Officers’ Fees and Benefits
Trustees’ and Officers’ Fees and Benefits include amounts accrued by the Fund to pay remuneration to certain Trustees and Officers of the Fund. Trustees have the option to defer compensation payable by the Fund, and Trustees’ and Officers’ Fees and Benefits also include amounts accrued by the Fund to fund such deferred compensation amounts. Those Trustees who defer compensation have the option to select various Invesco Funds in which their deferral accounts shall be deemed to be invested. Finally, certain current Trustees were eligible to participate in a retirement plan that provided for benefits to be paid upon retirement to Trustees over a period of time based on the number of years of service. The Fund may have certain former Trustees who also participate in a retirement plan and receive benefits under such plan. Trustees’ and Officers’ Fees and Benefits include amounts accrued by the Fund to fund such retirement benefits. Obligations under the deferred compensation and retirement plans represent unsecured claims against the general assets of the Fund.
NOTE 7—Cash Balances
The Fund is permitted to temporarily carry a negative or overdrawn balance in its account with State Street Bank and Trust Company, the custodian bank. Such balances, if any at period-end, are shown in the Statement of Assets and Liabilities under the payable caption Amount due custodian. To compensate the custodian bank for such overdrafts, the overdrawn Fund may either (1) leave funds as a compensating balance in the account so the custodian bank can be compensated by earning the additional interest; or (2) compensate by paying the custodian bank at a rate agreed upon by the custodian bank and Invesco, not to exceed the contractually agreed upon rate.
18 Invesco Charter Fund
NOTE 8—Distributions to Shareholders and Tax Components of Net Assets
Tax Character of Distributions to Shareholders Paid During the Fiscal Years Ended October 31, 2018 and 2017:
| | | | | | | | |
| | | 2018 | | | 2017 | |
Ordinary income | | $ | 18,753,597 | | | $ | 38,353,715 | |
Long-term capital gain | | | 227,911,173 | | | | 365,280,782 | |
Total distributions | | $ | 246,664,770 | | | $ | 403,634,497 | |
Tax Components of Net Assets at Period-End:
| | | | |
| | | 2018 | |
Undistributed ordinary income | | $ | 11,943,170 | |
Undistributed long-term gain | | | 302,817,614 | |
Net unrealized appreciation — investments | | | 610,616,734 | |
Net unrealized appreciation (depreciation) — foreign currencies | | | (51,468 | ) |
Temporary book/tax differences | | | (1,718,649 | ) |
Shares of beneficial interest | | | 2,336,350,521 | |
Total net assets | | $ | 3,259,957,922 | |
The difference between book-basis and tax-basis unrealized appreciation (depreciation) is due to differences in the timing of recognition of gains and losses on investments for tax and book purposes. The Fund’s net unrealized appreciation difference is attributable primarily to wash sales.
The temporary book/tax differences are a result of timing differences between book and tax recognition of income and/or expenses. The Fund’s temporary book/tax differences are the result of the trustee deferral of compensation and retirement plan benefits.
Capital loss carryforward is calculated and reported as of a specific date. Results of transactions and other activity after that date may affect the amount of capital loss carryforward actually available for the Fund to utilize. Capital losses generated in years beginning after December 22, 2010 can be carried forward for an unlimited period, whereas previous losses expire in eight tax years. Capital losses with an expiration period may not be used to offset capital gains until all net capital losses without an expiration date have been utilized. Capital loss carryforwards with no expiration date will retain their character as either short-term or long-term capital losses instead of as short-term capital losses as under prior law. The ability to utilize capital loss carryforwards in the future may be limited under the Internal Revenue Code and related regulations based on the results of future transactions.
The Fund does not have a capital loss carryforward as of October 31, 2018.
NOTE 9—Investment Transactions
The aggregate amount of investment securities (other than short-term securities, U.S. Treasury obligations and money market funds, if any) purchased and sold by the Fund during the year ended October 31, 2018 was $1,531,325,903 and $1,678,144,525, respectively. Cost of investments, including any derivatives, on a tax basis includes the adjustments for financial reporting purposes as of the most recently completed federal income tax reporting period-end.
| | | | |
| Unrealized Appreciation (Depreciation) of Investments on a Tax Basis | |
Aggregate unrealized appreciation of investments | | $ | 764,391,443 | |
Aggregate unrealized (depreciation) of investments | | | (153,774,709 | ) |
Net unrealized appreciation of investments | | $ | 610,616,734 | |
Cost of investments for tax purposes is $2,689,320,053.
NOTE 10—Reclassification of Permanent Differences
Primarily as a result of differing book/tax treatment of foreign currency transactions, on October 31, 2018, undistributed net investment income was increased by $309,181 and undistributed net realized gain was decreased by $309,181. This reclassification had no effect on the net assets or the distributable earnings of the Fund.
19 Invesco Charter Fund
NOTE 11—Share Information
| | | | | | | | | | | | | | | | |
| | | Summary of Share Activity | |
| | | Years ended October 31, | |
| | | 2018(a) | | | 2017 | |
| | | Shares | | | Amount | | | Shares | | | Amount | |
Sold: | | | | | | | | | | | | | | | | |
Class A | | | 3,170,069 | | | $ | 58,228,262 | | | | 4,569,205 | | | $ | 82,741,213 | |
Class B(b) | | | 1,210 | | | | 21,625 | | | | 24,867 | | | | 422,361 | |
Class C | | | 330,129 | | | | 5,708,817 | | | | 436,199 | | | | 7,444,011 | |
Class R | | | 212,312 | | | | 3,840,617 | | | | 303,397 | | | | 5,418,192 | |
Class S | | | 26,948 | | | | 496,453 | | | | 36,177 | | | | 651,636 | |
Class Y | | | 1,744,023 | | | | 32,297,466 | | | | 6,641,648 | | | | 119,752,597 | |
Class R5 | | | 47,307 | | | | 818,104 | | | | 164,547 | | | | 3,105,751 | |
Class R6 | | | 615,081 | | | | 11,837,302 | | | | 946,512 | | | | 18,478,115 | |
| | | | |
Issued as reinvestment of dividends: | | | | | | | | | | | | | | | | |
Class A | | | 11,640,076 | | | | 208,473,736 | | | | 20,317,114 | | | | 352,501,925 | |
Class B(b) | | | 42,636 | | | | 715,869 | | | | 163,588 | | | | 2,679,564 | |
Class C | | | 604,288 | | | | 10,194,340 | | | | 1,186,808 | | | | 19,511,118 | |
Class R | | | 101,923 | | | | 1,810,151 | | | | 203,583 | | | | 3,503,660 | |
Class S | | | 71,238 | | | | 1,275,165 | | | | 111,080 | | | | 1,927,239 | |
Class Y | | | 344,635 | | | | 6,189,638 | | | | 580,352 | | | | 10,098,134 | |
Class R5 | | | 104,095 | | | | 1,946,586 | | | | 219,408 | | | | 3,964,698 | |
Class R6 | | | 66,133 | | | | 1,235,374 | | | | 18,273 | | | | 330,017 | |
| | | | |
Conversion of Class B shares to Class A shares:(c) | | | | | | | | | | | | | | | | |
Class A | | | 628,757 | | | | 12,059,566 | | | | 801,175 | | | | 14,494,313 | |
Class B | | | (614,926 | ) | | | (12,059,566 | ) | | | (851,102 | ) | | | (14,494,313 | ) |
| | | | |
Reacquired: | | | | | | | | | | | | | | | | |
Class A | | | (26,359,490 | ) | | | (485,250,749 | ) | | | (35,709,531 | ) | | | (644,978,533 | ) |
Class B(b) | | | (139,742 | ) | | | (1,422,561 | ) | | | (232,862 | ) | | | (3,955,546 | ) |
Class C | | | (2,237,465 | ) | | | (38,718,870 | ) | | | (3,732,740 | ) | | | (63,884,852 | ) |
Class R | | | (599,985 | ) | | | (10,906,180 | ) | | | (846,331 | ) | | | (15,247,796 | ) |
Class S | | | (124,574 | ) | | | (2,294,633 | ) | | | (135,278 | ) | | | (2,446,597 | ) |
Class Y | | | (3,164,160 | ) | | | (58,542,100 | ) | | | (5,915,191 | ) | | | (108,477,902 | ) |
Class R5 | | | (1,020,288 | ) | | | (19,382,701 | ) | | | (890,881 | ) | | | (16,762,873 | ) |
Class R6 | | | (502,945 | ) | | | (9,675,858 | ) | | | (185,291 | ) | | | (3,575,407 | ) |
Net increase (decrease) in share activity | | | (15,012,715 | ) | | $ | (281,104,147 | ) | | | (11,775,274 | ) | | $ | (226,799,275 | ) |
| (a) | There are entities that are record owners of more than 5% of the outstanding shares of the Fund and in the aggregate own 38% of the outstanding shares of the Fund. IDI has an agreement with these entities to sell Fund shares. The Fund, Invesco and/or Invesco affiliates may make payments to these entities, which are considered to be related to the Fund, for providing services to the Fund, Invesco and/or Invesco affiliates including but not limited to services such as securities brokerage, distribution, third party record keeping and account servicing. The Fund has no knowledge as to whether all or any portion of the shares owned of record by these entities are also owned beneficially. |
| (b) | Class B shares activity for the period November 1, 2017 through January 26, 2018 (date of conversion). |
| (c) | Effective as of the close of business January 26, 2018, all outstanding Class B shares were converted to Class A shares. |
20 Invesco Charter Fund
NOTE 12—Financial Highlights
The following schedule presents financial highlights for a share of the Fund outstanding throughout the periods indicated.
| | | | | | | | | | | | | | | | | | | | | | | | | | | | | | | | | | | | | | | | | | | | | | | | | | | | | | | | |
| | | Net asset
value,
beginning
of period | | | Net
investment
income
(loss)(a) | | | Net gains
(losses)
on securities
(both
realized and
unrealized) | | | Total from
investment
operations | | | Dividends
from net
investment
income | | | Distributions
from net
realized
gains | | | Total
distributions | | | Net asset
value, end
of period | | | Total
return(b) | | | Net assets,
end of period
(000’s omitted) | | | Ratio of
expenses
to average
net assets
with fee waivers
and/or expenses
absorbed | | | Ratio of
expenses
to average net
assets without
fee waivers
and/or expenses
absorbed | | | Ratio of net
investment
income (loss)
to average
net assets | | | Portfolio
turnover(c) | |
Class A | |
Year ended 10/31/18 | | $ | 18.75 | | | $ | 0.06 | | | $ | (0.04 | ) | | $ | 0.02 | | | $ | (0.10 | ) | | $ | (1.15 | ) | | $ | (1.25 | ) | | $ | 17.52 | | | | (0.04 | )% | | $ | 2,951,279 | | | | 1.07 | %(d) | | | 1.08 | %(d) | | | 0.35 | %(d) | | | 46 | % |
Year ended 10/31/17 | | | 18.31 | | | | 0.09 | | | | 2.29 | | | | 2.38 | | | | (0.17 | ) | | | (1.77 | ) | | | (1.94 | ) | | | 18.75 | | | | 13.83 | | | | 3,363,073 | | | | 1.10 | | | | 1.11 | | | | 0.50 | | | | 30 | |
Year ended 10/31/16 | | | 20.30 | | | | 0.16 | | | | 0.34 | | | | 0.50 | | | | (0.21 | ) | | | (2.28 | ) | | | (2.49 | ) | | | 18.31 | | | | 3.54 | | | | 3,467,887 | | | | 1.11 | | | | 1.12 | | | | 0.88 | | | | 28 | |
Year ended 10/31/15 | | | 23.28 | | | | 0.19 | | | | (0.74 | ) | | | (0.55 | ) | | | (0.13 | ) | | | (2.30 | ) | | | (2.43 | ) | | | 20.30 | | | | (2.53 | ) | | | 3,869,488 | | | | 1.07 | | | | 1.08 | | | | 0.89 | | | | 47 | |
Year ended 10/31/14 | | | 22.22 | | | | 0.12 | | | | 2.09 | | | | 2.21 | | | | (0.20 | ) | | | (0.95 | ) | | | (1.15 | ) | | | 23.28 | | | | 10.48 | | | | 4,517,960 | | | | 1.05 | | | | 1.07 | | | | 0.53 | | | | 23 | |
Class B | |
Year ended 10/31/18(e) | | | 17.58 | | | | (0.02 | ) | | | 1.56 | | | | 1.54 | | | | — | | | | (1.15 | ) | | | (1.15 | ) | | | 17.97 | | | | 9.23 | | | | — | | | | 1.82 | (d)(f) | | | 1.83 | (d)(f) | | | (0.40 | )(d)(f) | | | 46 | |
Year ended 10/31/17 | | | 17.26 | | | | (0.04 | ) | | | 2.15 | | | | 2.11 | | | | (0.02 | ) | | | (1.77 | ) | | | (1.79 | ) | | | 17.58 | | | | 12.96 | | | | 12,494 | | | | 1.85 | | | | 1.86 | | | | (0.25 | ) | | | 30 | |
Year ended 10/31/16 | | | 19.24 | | | | 0.02 | | | | 0.32 | | | | 0.34 | | | | (0.04 | ) | | | (2.28 | ) | | | (2.32 | ) | | | 17.26 | | | | 2.74 | | | | 27,731 | | | | 1.86 | | | | 1.87 | | | | 0.13 | | | | 28 | |
Year ended 10/31/15 | | | 22.21 | | | | 0.03 | | | | (0.70 | ) | | | (0.67 | ) | | | — | | | | (2.30 | ) | | | (2.30 | ) | | | 19.24 | | | | (3.22 | ) | | | 47,808 | | | | 1.82 | | | | 1.83 | | | | 0.14 | | | | 47 | |
Year ended 10/31/14 | | | 21.25 | | | | (0.05 | ) | | | 2.00 | | | | 1.95 | | | | (0.04 | ) | | | (0.95 | ) | | | (0.99 | ) | | | 22.21 | | | | 9.62 | | | | 78,125 | | | | 1.80 | | | | 1.82 | | | | (0.22 | ) | | | 23 | |
Class C | |
Year ended 10/31/18 | | | 17.65 | | | | (0.07 | ) | | | (0.04 | ) | | | (0.11 | ) | | | — | | | | (1.15 | ) | | | (1.15 | ) | | | 16.39 | | | | (0.80 | ) | | | 133,804 | | | | 1.82 | (d) | | | 1.83 | (d) | | | (0.40 | )(d) | | | 46 | |
Year ended 10/31/17 | | | 17.32 | | | | (0.04 | ) | | | 2.16 | | | | 2.12 | | | | (0.02 | ) | | | (1.77 | ) | | | (1.79 | ) | | | 17.65 | | | | 12.98 | | | | 167,073 | | | | 1.85 | | | | 1.86 | | | | (0.25 | ) | | | 30 | |
Year ended 10/31/16 | | | 19.30 | | | | 0.02 | | | | 0.32 | | | | 0.34 | | | | (0.04 | ) | | | (2.28 | ) | | | (2.32 | ) | | | 17.32 | | | | 2.73 | | | | 200,499 | | | | 1.86 | | | | 1.87 | | | | 0.13 | | | | 28 | |
Year ended 10/31/15 | | | 22.27 | | | | 0.03 | | | | (0.70 | ) | | | (0.67 | ) | | | — | | | | (2.30 | ) | | | (2.30 | ) | | | 19.30 | | | | (3.22 | ) | | | 239,765 | | | | 1.82 | | | | 1.83 | | | | 0.14 | | | | 47 | |
Year ended 10/31/14 | | | 21.30 | | | | (0.05 | ) | | | 2.01 | | | | 1.96 | | | | (0.04 | ) | | | (0.95 | ) | | | (0.99 | ) | | | 22.27 | | | | 9.64 | | | | 282,091 | | | | 1.80 | | | | 1.82 | | | | (0.22 | ) | | | 23 | |
Class R | |
Year ended 10/31/18 | | | 18.55 | | | | 0.02 | | | | (0.04 | ) | | | (0.02 | ) | | | (0.04 | ) | | | (1.15 | ) | | | (1.19 | ) | | | 17.34 | | | | (0.24 | ) | | | 23,251 | | | | 1.32 | (d) | | | 1.33 | (d) | | | 0.10 | (d) | | | 46 | |
Year ended 10/31/17 | | | 18.13 | | | | 0.05 | | | | 2.26 | | | | 2.31 | | | | (0.12 | ) | | | (1.77 | ) | | | (1.89 | ) | | | 18.55 | | | | 13.53 | | | | 30,187 | | | | 1.35 | | | | 1.36 | | | | 0.25 | | | | 30 | |
Year ended 10/31/16 | | | 20.12 | | | | 0.11 | | | | 0.34 | | | | 0.45 | | | | (0.16 | ) | | | (2.28 | ) | | | (2.44 | ) | | | 18.13 | | | | 3.24 | | | | 35,654 | | | | 1.36 | | | | 1.37 | | | | 0.63 | | | | 28 | |
Year ended 10/31/15 | | | 23.07 | | | | 0.13 | | | | (0.72 | ) | | | (0.59 | ) | | | (0.06 | ) | | | (2.30 | ) | | | (2.36 | ) | | | 20.12 | | | | (2.72 | ) | | | 44,079 | | | | 1.32 | | | | 1.33 | | | | 0.64 | | | | 47 | |
Year ended 10/31/14 | | | 22.03 | | | | 0.06 | | | | 2.07 | | | | 2.13 | | | | (0.14 | ) | | | (0.95 | ) | | | (1.09 | ) | | | 23.07 | | | | 10.19 | | | | 67,910 | | | | 1.30 | | | | 1.32 | | | | 0.28 | | | | 23 | |
Class S | |
Year ended 10/31/18 | | | 18.76 | | | | 0.08 | | | | (0.04 | ) | | | 0.04 | | | | (0.12 | ) | | | (1.15 | ) | | | (1.27 | ) | | | 17.53 | | | | 0.07 | | | | 17.317 | | | | 0.97 | (d) | | | 0.98 | (d) | | | 0.45 | (d) | | | 46 | |
Year ended 10/31/17 | | | 18.32 | | | | 0.11 | | | | 2.28 | | | | 2.39 | | | | (0.18 | ) | | | (1.77 | ) | | | (1.95 | ) | | | 18.76 | | | | 13.94 | | | | 19,028 | | | | 1.00 | | | | 1.01 | | | | 0.60 | | | | 30 | |
Year ended 10/31/16 | | | 20.32 | | | | 0.18 | | | | 0.34 | | | | 0.52 | | | | (0.24 | ) | | | (2.28 | ) | | | (2.52 | ) | | | 18.32 | | | | 3.63 | | | | 18,364 | | | | 1.01 | | | | 1.02 | | | | 0.98 | | | | 28 | |
Year ended 10/31/15 | | | 23.30 | | | | 0.21 | | | | (0.74 | ) | | | (0.53 | ) | | | (0.15 | ) | | | (2.30 | ) | | | (2.45 | ) | | | 20.32 | | | | (2.42 | ) | | | 19,329 | | | | 0.97 | | | | 0.98 | | | | 0.99 | | | | 47 | |
Year ended 10/31/14 | | | 22.24 | | | | 0.14 | | | | 2.09 | | | | 2.23 | | | | (0.22 | ) | | | (0.95 | ) | | | (1.17 | ) | | | 23.30 | | | | 10.57 | | | | 23,137 | | | | 0.95 | | | | 0.97 | | | | 0.63 | | | | 23 | |
Class Y | |
Year ended 10/31/18 | | | 18.84 | | | | 0.11 | | | | (0.04 | ) | | | 0.07 | | | | (0.15 | ) | | | (1.15 | ) | | | (1.30 | ) | | | 17.61 | | | | 0.23 | | | | 101,885 | | | | 0.82 | (d) | | | 0.83 | (d) | | | 0.60 | (d) | | | 46 | |
Year ended 10/31/17 | | | 18.39 | | | | 0.14 | | | | 2.29 | | | | 2.43 | | | | (0.21 | ) | | | (1.77 | ) | | | (1.98 | ) | | | 18.84 | | | | 14.13 | | | | 129,285 | | | | 0.85 | | | | 0.86 | | | | 0.75 | | | | 30 | |
Year ended 10/31/16 | | | 20.40 | | | | 0.20 | | | | 0.34 | | | | 0.54 | | | | (0.27 | ) | | | (2.28 | ) | | | (2.55 | ) | | | 18.39 | | | | 3.76 | | | | 102,182 | | | | 0.86 | | | | 0.87 | | | | 1.13 | | | | 28 | |
Year ended 10/31/15 | | | 23.38 | | | | 0.25 | | | | (0.75 | ) | | | (0.50 | ) | | | (0.18 | ) | | | (2.30 | ) | | | (2.48 | ) | | | 20.40 | | | | (2.24 | ) | | | 183,005 | | | | 0.82 | | | | 0.83 | | | | 1.14 | | | | 47 | |
Year ended 10/31/14 | | | 22.31 | | | | 0.18 | | | | 2.09 | | | | 2.27 | | | | (0.25 | ) | | | (0.95 | ) | | | (1.20 | ) | | | 23.38 | | | | 10.75 | | | | 479,371 | | | | 0.80 | | | | 0.82 | | | | 0.78 | | | | 23 | |
Class R5 | |
Year ended 10/31/18 | | | 19.58 | | | | 0.13 | | | | (0.06 | ) | | | 0.07 | | | | (0.16 | ) | | | (1.15 | ) | | | (1.31 | ) | | | 18.34 | | | | 0.25 | | | | 12,018 | | | | 0.76 | (d) | | | 0.77 | (d) | | | 0.66 | (d) | | | 46 | |
Year ended 10/31/17 | | | 19.05 | | | | 0.16 | | | | 2.38 | | | | 2.54 | | | | (0.24 | ) | | | (1.77 | ) | | | (2.01 | ) | | | 19.58 | | | | 14.19 | | | | 29,835 | | | | 0.77 | | | | 0.78 | | | | 0.83 | | | | 30 | |
Year ended 10/31/16 | | | 21.03 | | | | 0.23 | | | | 0.36 | | | | 0.59 | | | | (0.29 | ) | | | (2.28 | ) | | | (2.57 | ) | | | 19.05 | | | | 3.92 | | | | 38,682 | | | | 0.75 | | | | 0.76 | | | | 1.24 | | | | 28 | |
Year ended 10/31/15 | | | 24.04 | | | | 0.27 | | | | (0.78 | ) | | | (0.51 | ) | | | (0.20 | ) | | | (2.30 | ) | | | (2.50 | ) | | | 21.03 | | | | (2.22 | ) | | | 110,943 | | | | 0.73 | | | | 0.74 | | | | 1.23 | | | | 47 | |
Year ended 10/31/14 | | | 22.90 | | | | 0.20 | | | | 2.16 | | | | 2.36 | | | | (0.27 | ) | | | (0.95 | ) | | | (1.22 | ) | | | 24.04 | | | | 10.87 | | | | 414,713 | | | | 0.72 | | | | 0.74 | | | | 0.86 | | | | 23 | |
Class R6 | |
Year ended 10/31/18 | | | 19.58 | | | | 0.14 | | | | (0.05 | ) | | | 0.09 | | | | (0.18 | ) | | | (1.15 | ) | | | (1.33 | ) | | | 18.34 | | | | 0.34 | | | | 20,404 | | | | 0.69 | (d) | | | 0.70 | (d) | | | 0.73 | (d) | | | 46 | |
Year ended 10/31/17 | | | 19.05 | | | | 0.17 | | | | 2.38 | | | | 2.55 | | | | (0.25 | ) | | | (1.77 | ) | | | (2.02 | ) | | | 19.58 | | | | 14.27 | | | | 18,290 | | | | 0.69 | | | | 0.70 | | | | 0.91 | | | | 30 | |
Year ended 10/31/16 | | | 21.04 | | | | 0.24 | | | | 0.36 | | | | 0.60 | | | | (0.31 | ) | | | (2.28 | ) | | | (2.59 | ) | | | 19.05 | | | | 3.99 | | | | 2,948 | | | | 0.68 | | | | 0.69 | | | | 1.31 | | | | 28 | |
Year ended 10/31/15 | | | 24.05 | | | | 0.29 | | | | (0.77 | ) | | | (0.48 | ) | | | (0.23 | ) | | | (2.30 | ) | | | (2.53 | ) | | | 21.04 | | | | (2.12 | ) | | | 125,997 | | | | 0.64 | | | | 0.65 | | | | 1.32 | | | | 47 | |
Year ended 10/31/14 | | | 22.91 | | | | 0.22 | | | | 2.16 | | | | 2.38 | | | | (0.29 | ) | | | (0.95 | ) | | | (1.24 | ) | | | 24.05 | | | | 10.96 | | | | 135,294 | | | | 0.63 | | | | 0.65 | | | | 0.95 | | | | 23 | |
| (a) | Calculated using average shares outstanding. |
| (b) | Includes adjustments in accordance with accounting principles generally accepted in the United States of America and as such, the net asset value for financial reporting purposes and the returns based upon those net asset values may differ from the net asset value and returns for shareholder transactions. Does not include sales charges and is not annualized for periods less than one year, if applicable. |
| (c) | Portfolio turnover is calculated at the fund level and is not annualized for periods less than one year, if applicable. |
| (d) | Ratios are based on average daily net assets (000’s omitted) of $3,270,950, $11,719, $156,054, $27,316, $18,934, $115,643, $16,459 and $21,439 for Class A, Class B, Class C, Class R, Class S, Class Y, Class R5 and Class R6 shares, respectively. |
| (e) | Reflects activity for the period November 1, 2017 through January 26, 2018 (date of conversion). |
21 Invesco Charter Fund
Report of Independent Registered Public Accounting Firm
To the Board of Trustees of AIM Equity Funds (Invesco Equity Funds)
and Shareholders of Invesco Charter Fund:
Opinion on the Financial Statements
We have audited the accompanying statement of assets and liabilities, including the schedule of investments, of Invesco Charter Fund (one of the funds constituting AIM Equity Funds (Invesco Equity Funds), hereafter referred to as the “Fund”) as of October 31, 2018, the related statement of operations for the year ended October 31, 2018, the statement of changes in net assets for each of the two years in the period ended October 31, 2018, including the related notes, and the financial highlights for each of the periods indicated therein (collectively referred to as the financial statements). In our opinion, the financial statements present fairly, in all material respects, the financial position of the Fund as of October 31, 2018, the results of its operations for the year then ended, the changes in its net assets for each of the two years in the period ended October 31, 2018 and the financial highlights for each of the periods indicated therein in conformity with accounting principles generally accepted in the United States of America.
Basis for Opinion
These financial statements are the responsibility of the Fund’s management. Our responsibility is to express an opinion on the Fund’s financial statements based on our audits. We are a public accounting firm registered with the Public Company Accounting Oversight Board (United States) (PCAOB) and are required to be independent with respect to the Fund in accordance with the U.S. federal securities laws and the applicable rules and regulations of the Securities and Exchange Commission and the PCAOB.
We conducted our audits of these financial statements in accordance with the standards of the PCAOB. Those standards require that we plan and perform the audit to obtain reasonable assurance about whether the financial statements are free of material misstatement, whether due to error or fraud.
Our audits included performing procedures to assess the risks of material misstatement of the financial statements, whether due to error or fraud, and performing procedures that respond to those risks. Such procedures included examining, on a test basis, evidence regarding the amounts and disclosures in the financial statements. Our audits also included evaluating the accounting principles used and significant estimates made by management, as well as evaluating the overall presentation of the financial statements. Our procedures included confirmation of securities owned as of October 31, 2018 by correspondence with the custodian, transfer agent and brokers; when replies were not received from brokers, we performed other auditing procedures. We believe that our audits provide a reasonable basis for our opinion.
PricewaterhouseCoopers LLP
Houston, TX
December 28, 2018
We have served as the auditor of one or more of the investment companies in the Invesco group of investment companies since at least 1995. We have not been able to determine the specific year we began serving as auditor.
22 Invesco Charter Fund
Calculating your ongoing Fund expenses
Example
As a shareholder of the Fund, you incur two types of costs: (1) transaction costs, which may include sales charges (loads) on purchase payments or contingent deferred sales charges on redemptions, if any; and (2) ongoing costs, including management fees, distribution and/or service (12b-1) fees, and other Fund expenses. This example is intended to help you understand your ongoing costs (in dollars) of investing in the Fund and to compare these costs with ongoing costs of investing in other mutual funds. The example is based on an investment of $1,000 invested at the beginning of the period and held for the entire period May 1, 2018 through October 31, 2018.
Actual expenses
The table below provides information about actual account values and actual expenses. You may use the information in this table, together with the amount you invested, to estimate the expenses that you paid over the period. Simply divide your account value by $1,000 (for example, an $8,600 account value divided by $1,000 = 8.6), then multiply the result by the number in the table under the heading entitled “Actual Expenses Paid During Period” to estimate the expenses you paid on your account during this period.
Hypothetical example for comparison purposes
The table below also provides information about hypothetical account values and hypothetical expenses based on the Fund’s actual expense ratio and an assumed rate of return of 5% per year before expenses, which is not the Fund’s actual return.
The hypothetical account values and expenses may not be used to estimate the actual ending account balance or expenses you paid for the period. You may use this information to compare the ongoing costs of investing in the Fund and other funds. To do so, compare this 5% hypothetical example with the 5% hypothetical examples that appear in the shareholder reports of the other funds.
Please note that the expenses shown in the table are meant to highlight your ongoing costs only and do not reflect any transaction costs, such as sales charges (loads) on purchase payments or contingent deferred sales charges on redemptions, if any. Therefore, the hypothetical information is useful in comparing ongoing costs only, and will not help you determine the relative total costs of owning different funds. In addition, if these transaction costs were included, your costs would have been higher.
| | | | | | | | | | | | | | | | | | | | | | | | |
Class | | Beginning
Account Value
(05/01/18) | | | ACTUAL | | | HYPOTHETICAL
(5% annual return before
expenses) | | | Annualized
Expense Ratio | |
| | Ending
Account Value
(10/31/18)1 | | | Expenses
Paid During
Period2 | | | Ending
Account Value
(10/31/18) | | | Expenses
Paid During
Period2 | |
| A | | $ | 1,000.00 | | | $ | 980.40 | | | $ | 5.29 | | | $ | 1,019.86 | | | $ | 5.40 | | | | 1.06 | % |
| C | | | 1,000.00 | | | | 976.20 | | | | 9.02 | | | | 1,016.08 | | | | 9.20 | | | | 1.81 | |
| R | | | 1,000.00 | | | | 979.10 | | | | 6.53 | | | | 1,018.60 | | | | 6.67 | | | | 1.31 | |
| S | | | 1,000.00 | | | | 980.40 | | | | 4.79 | | | | 1,020.37 | | | | 4.89 | | | | 0.96 | |
| Y | | | 1,000.00 | | | | 981.60 | | | | 4.05 | | | | 1,021.12 | | | | 4.13 | | | | 0.81 | |
| R5 | | | 1,000.00 | | | | 981.30 | | | | 3.70 | | | | 1,021.48 | | | | 3.77 | | | | 0.74 | |
| R6 | | | 1,000.00 | | | | 981.80 | | | | 3.40 | | | | 1,021.78 | | | | 3.47 | | | | 0.68 | |
| 1 | The actual ending account value is based on the actual total return of the Fund for the period May 1, 2018 through October 31, 2018, after actual expenses and will differ from the hypothetical ending account value which is based on the Fund’s expense ratio and a hypothetical annual return of 5% before expenses. |
| 2 | Expenses are equal to the Fund’s annualized expense ratio as indicated above multiplied by the average account value over the period, multiplied by 184/365 to reflect the most recent fiscal half year. |
23 Invesco Charter Fund
Approval of Investment Advisory and Sub-Advisory Contracts
At meetings held on June 5-6, 2018, the Board of Trustees (the Board or the Trustees) of AIM Equity Funds (Invesco Equity Funds) as a whole, and the independent Trustees, who comprise over 75% of the Board, voting separately, approved the continuance of the Invesco Charter Fund’s (the Fund) Master Investment Advisory Agreement with Invesco Advisers, Inc. (Invesco Advisers and the investment advisory agreement) and the Master Intergroup Sub-Advisory Contract for Mutual Funds with Invesco Asset Management Deutschland GmbH, Invesco Asset Management Limited, Invesco Asset Management (Japan) Limited, Invesco Hong Kong Limited, Invesco Senior Secured Management, Inc. and Invesco Canada Ltd (collectively, the Affiliated Sub-Advisers and the sub-advisory contracts) for another year, effective July 1, 2018. After evaluating the factors discussed below, among others, the Board approved the renewal of the Fund’s investment advisory agreement and the sub-advisory contracts and determined that the compensation payable by the Fund to Invesco Advisers and by Invesco Advisers to the Affiliated Sub-Advisers is fair and reasonable.
The Board’s Evaluation Process
The Board’s Investments Committee has established three Sub-Committees, which meet throughout the year to review the performance of funds advised by Invesco Advisers (the Invesco Funds). Over the course of each year, the Sub-Committees meet with portfolio managers for their assigned Invesco Funds and other members of management to review detailed information about investment performance and portfolio attributes of these funds. The Board took into account evaluations and reports that it received from the Investments Committee and Sub-Committees, as well as the information provided to such committees and the Board throughout the year, in considering whether to approve each Invesco Fund’s investment advisory agreement and sub-advisory contracts.
As part of the contract renewal process, the Board reviews and considers information provided in response to detailed requests for information submitted to management by the independent Trustees with assistance from legal counsel to the independent Trustees. The Board receives comparative investment performance and fee data regarding the Invesco Funds prepared by Invesco Advisers and Broadridge Financial Solutions, Inc. (Broadridge), an independent mutual fund data provider. The Board also receives an independent written evaluation from the Senior Officer, an officer of the Invesco Funds who reports directly to the independent Trustees. The Senior Officer’s evaluation is prepared as part of his responsibility to manage the process by which the Invesco Funds’ proposed management fees
are negotiated during the annual contract renewal process to ensure they are negotiated in a manner that is at arms’ length and reasonable. In addition to meetings with Invesco Advisers and fund counsel throughout the year, the independent Trustees also discuss the continuance of the investment advisory agreement and sub-advisory contracts in separate sessions with the Senior Officer and with independent legal counsel.
The discussion below is a summary of the Senior Officer’s independent written evaluation with respect to the Fund’s investment advisory agreement, as well as a discussion of the material factors and related conclusions that formed the basis for the Board’s approval of the Fund’s investment advisory agreement and sub-advisory contracts. The Trustees’ review and conclusions are based on the comprehensive consideration of all information presented to them during the course of the year and in prior years and are not the result of any single determinative factor. Moreover, one Trustee may have weighed a particular piece of information or factor differently than another Trustee. This information is current as of June 6, 2018.
Factors and Conclusions and Summary of Independent Written Fee Evaluation
| A. | Nature, Extent and Quality of Services Provided by Invesco Advisers and the Affiliated Sub-Advisers |
The Board reviewed the nature, extent and quality of the advisory services provided to the Fund by Invesco Advisers under the Fund’s investment advisory agreement, and the credentials and experience of the officers and employees of Invesco Advisers who provide these services, including the Fund’s portfolio manager(s). The Board’s review included consideration of Invesco Advisers’ investment process oversight and structure, credit analysis and investment risk management. The Board also considered non-advisory services that Invesco Advisers and its affiliates provide to the Invesco Funds such as various back office support functions, third party oversight, internal audit, valuation, portfolio trading and legal and compliance. The Board also reviewed and considered the benefits to shareholders of investing in a fund that is part of the Invesco family of funds under the umbrella of Invesco Ltd., Invesco Advisers’ parent company, and noted Invesco Ltd.’s depth and experience in conducting an investment management business, as well as its commitment of financial and other resources to such business. The Board concluded that the nature, extent and quality of the services provided to the Fund by Invesco Advisers are appropriate and satisfactory.
The Board reviewed the services that may be provided by the Affiliated Sub-Advisers under
the sub-advisory contracts and the credentials and experience of the officers and employees of the Affiliated Sub-Advisers who provide these services. The Board noted the Affiliated Sub-Advisers’ expertise with respect to certain asset classes and that the Affiliated Sub-Advisers have offices and personnel that are located in financial centers around the world. As a result, the Board noted that the Affiliated Sub-Advisers can provide research and investment analysis on the markets and economies of various countries in which the Fund may invest, make recommendations regarding securities and assist with security trades. The Board concluded that the sub-advisory contracts may benefit the Fund and its shareholders by permitting Invesco Advisers to use the resources and talents of the Affiliated Sub-Advisers in managing the Fund. The Board concluded that the nature, extent and quality of the services that may be provided by the Affiliated Sub-Advisers are appropriate and satisfactory.
| B. | Fund Investment Performance |
The Board considered Fund investment performance as a relevant factor in considering whether to approve the investment advisory agreement. The Board did not view Fund investment performance as a relevant factor in considering whether to approve the sub-advisory contracts for the Fund, as no Affiliated Sub-Adviser currently manages assets of the Fund.
The Board compared the Fund’s investment performance over multiple time periods ending December 31, 2017 to the performance of funds in the Broadridge performance universe and against the Lipper Large-Cap Core Funds Index. The Board noted that performance of Class A shares of the Fund was in the fifth quintile for the one, three and five year periods (the first quintile being the best performing funds and the fifth quintile being the worst performing funds). The Board noted that performance of Class A shares of the Fund was below the performance of the Index for the one, three and five year periods. The Board noted that the Fund’s defensive positioning, including its underweight exposure to certain securities and sectors and its cash position, contributed to the Fund’s relative underperformance. The Trustees also reviewed more recent Fund performance and this review did not change their conclusions.
| C. | Advisory and Sub-Advisory Fees and Fund Expenses |
The Board compared the Fund’s contractual management fee rate to the contractual management fee rates of funds in the Fund’s Broadridge expense group. The Board noted that the contractual management fee rate for Class A shares of the Fund was above the median contractual management fee rate of funds in its expense group. The Board noted
24 Invesco Charter Fund
that the term “contractual management fee” for funds in the expense group may include both advisory and certain non-portfolio management administrative services fees, but that Broadridge does not provide information on a fund by fund basis as to what is included. The Board also reviewed the methodology used by Broadridge in providing expense group information, which includes using each fund’s contractual management fee schedule (including any applicable breakpoints) as reported in the most recent prospectus or statement of additional information for each fund in the expense group. The Board also considered comparative information regarding the Fund’s total expense ratio and its various components. The Board noted that the Fund’s actual and contractual management fees were in the fourth quintile and its total expense ratio was in the fifth quintile of its expense group and discussed with management reasons for such relative actual and contractual management fees and total expenses.
The Board noted that Invesco Advisers has contractually agreed to waive fees and/or limit expenses of the Fund in an amount necessary to limit total annual operating expenses to a specified percentage of average daily net assets for each class of the Fund.
The Board also considered the fees charged by Invesco Advisers and the Affiliated Sub-Advisers to other similarly managed client accounts. The Board noted that Invesco Advisers or the Affiliated Sub-Advisers may charge lower fees to large institutional clients. Invesco Advisers reviewed with the Board differences in the scope of services it provides to the Invesco Funds relative to certain other types of client accounts, including management of cash flows as a result of redemptions and purchases, necessary infrastructure such as officers, office space, technology, legal and distribution, oversight of service providers, costs and business risks associated with launching new funds and sponsoring and maintaining the product line, preparation of annual registration statement updates and financial information and compliance with federal and state laws and regulations.
The Board also considered the services that may be provided by the Affiliated Sub-Advisers pursuant to the sub-advisory contracts, as well as the fees payable by Invesco Advisers to the Affiliated Sub-Advisers pursuant to the sub-advisory contracts.
| D. | Economies of Scale and Breakpoints |
The Board considered the extent to which there may be economies of scale in the provision of advisory services to the Fund. The Board also considered that the Fund benefits from economies of scale through contractual breakpoints in the Fund’s advisory fee schedule, which generally operate to reduce the Fund’s expense ratio as it grows in size. The Board noted that the Fund shares directly in economies of scale through lower fees charged by third party service providers based on the combined size of the Invesco Funds. The Board
noted that the Fund may also benefit from economies of scale through initial fee setting, fee waivers and expense reimbursements.
| E. | Profitability and Financial Resources |
The Board reviewed information from Invesco Advisers concerning the costs of the advisory and other services that Invesco Advisers and its affiliates provide to the Fund and the Invesco Funds and the profitability of Invesco Advisers and its affiliates in providing these services. The Board considered the methodology used for calculating profitability and noted the periodic review of such methodology by an independent consultant. The Board noted that Invesco Advisers continues to operate at a net profit from services Invesco Advisers and its affiliates provide to the Invesco Funds and the Fund. The Board did not deem the level of profits realized by Invesco Advisers and its affiliates from providing services to the Fund to be excessive given the nature, extent and quality of the services provided. The Board received information from Invesco Advisers demonstrating that Invesco Advisers and the Affiliated Sub-Advisers are financially sound and have the resources necessary to perform their obligations under the investment advisory agreement and sub-advisory contracts.
| F. | Collateral Benefits to Invesco Advisers and its Affiliates |
The Board considered various other benefits received by Invesco Advisers and its affiliates from the relationship with the Fund, including the fees received for providing administrative, transfer agency and distribution services to the Fund. The Board considered comparative information regarding fees charged for these services, including information provided by Broadridge and other independent sources. The Board considered the performance of Invesco Advisers and its affiliates in providing these services and the organizational structure employed to provide these services. The Board also considered that these services are provided to the Fund pursuant to written contracts that are reviewed and approved on an annual basis by the Board; and that the services are required for the operation of the Fund.
The Board considered the benefits realized by Invesco Advisers and the Affiliated Sub-Advisers as a result of portfolio brokerage transactions executed through “soft dollar” arrangements. The Board noted that soft dollar arrangements may result in the Fund bearing costs to purchase research that may be used by Invesco Advisers or the Affiliated Sub-Advisers with other clients and may reduce Invesco Advisers’ or the Affiliated Sub-Advisers’ expenses. The Board also considered that it receives periodic reports from Invesco representing that these arrangements are consistent with regulatory requirements. The Board did not deem the soft dollar arrangements to be inappropriate.
The Board considered that the Fund’s uninvested cash and cash collateral from any securities lending arrangements may be invested in money market funds advised by Invesco Advisers pursuant to procedures
approved by the Board. The Board noted that Invesco Advisers receives advisory fees from these affiliated money market funds attributable to such investments, although Invesco Advisers has contractually agreed to waive through varying periods the advisory fees payable by the Invesco Funds with respect to certain investments in the affiliated money market funds. The waiver is in an amount equal to 100% of the net advisory fee Invesco Advisers receives from the affiliated money market funds with respect to the Fund’s investment in the affiliated money market funds of uninvested cash, but not cash collateral. The Board concluded that the amount of advisory fees received by Invesco Advisers from the Fund’s investment of cash collateral from any securities lending arrangements in the affiliated money market funds is fair and reasonable.
The Board also considered that an affiliated broker receives commissions for executing certain trades for the Fund. Invesco Advisers and the Affiliated Sub-Advisers use the affiliated broker to, among other things, control order routing and minimize information leakage, and the Board was advised that such trades are executed in compliance with rules under the federal securities laws and consistent with best execution obligations.
25 Invesco Charter Fund
Tax Information
Form 1099-DIV, Form 1042-S and other year-end tax information provide shareholders with actual calendar year amounts that should be included in their tax returns. Shareholders should consult their tax advisors.
The following distribution information is being provided as required by the Internal Revenue Code or to meet a specific state’s requirement.
The Fund designates the following amounts or, if subsequently determined to be different, the maximum amount allowable for its fiscal year ended October 31, 2018:
| | | | |
Federal and State Income Tax | |
Long-Term Capital Gain Distributions | | $ | 227,911,173 | |
Qualified Dividend Income* | | | 100 | % |
Corporate Dividends Received Deduction* | | | 100 | % |
U.S. Treasury Obligations* | | | 0 | % |
| | * | The above percentages are based on ordinary income dividends paid to shareholders during the Fund’s fiscal year. |
26 Invesco Charter Fund
Trustees and Officers
The address of each trustee and officer is AIM Equity Funds (Invesco Equity Funds) (the “Trust”), 11 Greenway Plaza, Suite 1000, Houston, Texas 77046-1173. The trustees serve for the life of the Trust, subject to their earlier death, incapacitation, resignation, retirement or removal as more specifically provided in the Trust’s organizational documents. Each officer serves for a one year term or until their successors are elected and qualified. Column two below includes length of time served with predecessor entities, if any.
| | | | | | | | |
Name, Year of Birth and Position(s) Held with the Trust | | Trustee and/
or Officer Since | | Principal Occupation(s)
During Past 5 Years | | Number of
Funds in Fund Complex Overseen by Trustee | | Other Directorship(s)
Held by Trustee During Past 5 Years |
| Interested Persons | | | | | | | | |
| Martin L. Flanagan1 — 1960 Trustee | | 2007 | | Executive Director, Chief Executive Officer and President, Invesco Ltd. (ultimate parent of Invesco and a global investment management firm); Trustee, The Invesco Funds; Vice Chair, Investment Company Institute; and Member of Executive Board, SMU Cox School of Business Formerly: Advisor to the Board, Invesco Advisers, Inc. (formerly known as Invesco Institutional (N.A.), Inc.); Chairman and Chief Executive Officer, Invesco Advisers, Inc. (registered investment adviser); Director, Chairman, Chief Executive Officer and President, Invesco Holding Company (US), Inc. (formerly IVZ Inc.) (holding company), Invesco Group Services, Inc. (service provider) and Invesco North American Holdings, Inc. (holding company); Director, Chief Executive Officer and President, Invesco Holding Company Limited (parent of Invesco and a global investment management firm); Director, Invesco Ltd.; Chairman, Investment Company Institute and President, Co-Chief Executive Officer, Co-President, Chief Operating Officer and Chief Financial Officer, Franklin Resources, Inc. (global investment management organization) | | 158 | | None |
Philip A. Taylor2 — 1954 Trustee and Senior Vice President | | 2006 | | Head of the Americas and Senior Managing Director, Invesco Ltd.; Director, Invesco Advisers, Inc. (formerly known as Invesco Institutional (N.A.), Inc.) (registered investment adviser); Director and Chairman, Invesco Investment Services, Inc. (formerly known as Invesco AIM Investment Services, Inc.) (registered transfer agent); Chief Executive Officer, Invesco Corporate Class Inc. (corporate mutual fund company); Director, Chairman and Chief Executive Officer, Invesco Canada Ltd. (formerly known as Invesco Trimark Ltd./Invesco Trimark Ltèe) (registered investment adviser and registered transfer agent); Trustee and Senior Vice President, The Invesco Funds; Director, Invesco Investment Advisers LLC (formerly known as Van Kampen Asset Management) Formerly: Director, Chairman, Chief Executive Officer and President, Invesco Management Group, Inc. (formerly known as Invesco AIM Management Group, Inc.) (financial services holding company); Co-Chairman, Co-President and Co-Chief Executive Officer, Invesco Advisers, Inc. (formerly known as Invesco Institutional (N.A.), Inc.) (registered investment adviser); Director, Chief Executive Officer and President, Van Kampen Exchange Corp; President and Principal Executive Officer, The Invesco Funds (other than AIM Treasurer’s Series Trust (Invesco Treasurer’s Series Trust), Short-Term Investments Trust and Invesco Management Trust); Executive Vice President, The Invesco Funds (AIM Treasurer’s Series Trust (Invesco Treasurer’s Series Trust), Short-Term Investments Trust and Invesco Management Trust only); Director and President, INVESCO Funds Group, Inc. (registered investment adviser and registered transfer agent); Director and Chairman, IVZ Distributors, Inc. (formerly known as INVESCO Distributors, Inc.) (registered broker dealer); Director, President and Chairman, Invesco Inc. (holding company), Invesco Canada Holdings Inc. (holding company), Trimark Investments Ltd./Placements Trimark Ltèe and Invesco Financial Services Ltd/Services Financiers Invesco Ltèe; Chief Executive Officer, Invesco Canada Fund Inc. (corporate mutual fund company); Director and Chairman, Van Kampen Investor Services Inc.; Director, Chief Executive Officer and President, 1371 Preferred Inc. (holding company) and Van Kampen Investments Inc.; Director and President, AIM GP Canada Inc. (general partner for limited partnerships) and Van Kampen Advisors, Inc.; Director and Chief Executive Officer, Invesco Trimark Dealer Inc. (registered broker dealer); Director, Invesco Distributors, Inc. (formerly known as Invesco AIM Distributors, Inc.) (registered broker dealer); Manager, Invesco Capital Management LLC; Director, Chief Executive Officer and President, Invesco Advisers, Inc.; Director, Chairman, Chief Executive Officer and President, Invesco AIM Capital Management, Inc.; President, Invesco Trimark Dealer Inc. and Invesco Trimark Ltd./Invesco Trimark Ltèe; Director and President, AIM Trimark Corporate Class Inc. and AIM Trimark Canada Fund Inc.; Senior Managing Director, Invesco Holding Company Limited; Director and Chairman, Fund Management Company (former registered broker dealer); President and Principal Executive Officer, The Invesco Funds (AIM Treasurer’s Series Trust (Invesco Treasurer’s Series Trust), and Short-Term Investments Trust only); President, AIM Trimark Global Fund Inc. and AIM Trimark Canada Fund Inc. | | 158 | | None |
| 1 | Mr. Flanagan is considered an interested person (within the meaning of Section 2(a)(19) of the 1940 Act) of the Trust because he is an officer of the Adviser to the Trust, and an officer and a director of Invesco Ltd., ultimate parent of the Adviser. |
| 2 | Mr. Taylor is considered an interested person (within the meaning of Section 2(a)(19) of the 1940 Act) of the Trust because he is an officer and a director of the Adviser. |
T-1 Invesco Charter Fund
Trustees and Officers—(continued)
| | | | | | | | |
Name, Year of Birth and Position(s) Held with the Trust | | Trustee and/
or Officer Since | | Principal Occupation(s)
During Past 5 Years | | Number of
Funds in Fund Complex Overseen by Trustee | | Other Directorship(s)
Held by Trustee During Past 5 Years |
| Independent Trustees | | | | | | | | |
Bruce L. Crockett — 1944 Trustee and Chair | | 1993 | | Chairman, Crockett Technologies Associates (technology consulting company) Formerly: Director, Captaris (unified messaging provider); Director, President and Chief Executive Officer, COMSAT Corporation; Chairman, Board of Governors of INTELSAT (international communications company); ACE Limited (insurance company); Independent Directors Council and Investment Company Institute: Member of the Audit Committee, Investment Company Institute; Member of the Executive Committee and Chair of the Governance Committee, Independent Directors Council | | 158 | | Director and Chairman of the Audit Committee, ALPS (Attorneys Liability Protection Society) (insurance company); Director and Member of the Audit Committee and Compensation Committee, Ferroglobe PLC (metallurgical company) |
David C. Arch — 1945 Trustee | | 2010 | | Chairman of Blistex Inc. (consumer health care products manufacturer); Member, World Presidents’ Organization | | 158 | | Board member of the Illinois Manufacturers’ Association |
Jack M. Fields — 1952 Trustee | | 1997 | | Chief Executive Officer, Twenty First Century Group, Inc. (government affairs company); and Chairman, Discovery Learning Alliance (non-profit) Formerly: Owner and Chief Executive Officer, Dos Angeles Ranch L.P. (cattle, hunting, corporate entertainment); Director, Insperity, Inc. (formerly known as Administaff) (human resources provider); Chief Executive Officer, Texana Timber LP (sustainable forestry company); Director of Cross Timbers Quail Research Ranch (non-profit); and member of the U.S. House of Representatives | | 158 | | None |
Cynthia Hostetler — 1962 Trustee | | 2017 | | Non-Executive Director and Trustee of a number of public and private business corporations Formerly: Director, Aberdeen Investment Funds (4 portfolios); Head of Investment Funds and Private Equity, Overseas Private Investment Corporation; President, First Manhattan Bancorporation, Inc.; Attorney, Simpson Thacher & Bartlett LLP | | 158 | | Vulcan Materials Company (construction materials company); Trilinc Global Impact Fund; Artio Global Investment LLC (mutual fund complex); Edgen Group, Inc. (specialized energy and infrastructure products distributor) |
Eli Jones — 1961 Trustee | | 2016 | | Professor and Dean, Mays Business School — Texas A&M University Formerly: Professor and Dean, Walton College of Business, University of Arkansas and E.J. Ourso College of Business, Louisiana State University; Director, Arvest Bank | | 158 | | Insperity, Inc. (formerly known as Administaff) (human resources provider) |
Prema Mathai-Davis — 1950 Trustee | | 1998 | | Retired | | 158 | | None |
Teresa M. Ressel — 1962 Trustee | | 2017 | | Non-executive director and trustee of a number of public and private business corporations Formerly: Chief Financial Officer, Olayan America, The Olayan Group (international investor/commercial/industrial); Chief Executive Officer, UBS Securities LLC; Group Chief Operating Officer, Americas, UBS AG; Assistant Secretary for Management & Budget and CFO, US Department of the Treasury | | 158 | | Atlantic Power Corporation (power generation company); ON Semiconductor Corp. (semiconductor supplier) |
Ann Barnett Stern — 1957 Trustee | | 2017 | | President and Chief Executive Officer, Houston Endowment Inc. (private philanthropic institution) Formerly: Executive Vice President and General Counsel, Texas Children’s Hospital; Attorney, Beck, Redden and Secrest, LLP; Business Law Instructor, University of St. Thomas; Attorney, Andrews & Kurth LLP | | 158 | | Federal Reserve Bank of Dallas |
Raymond Stickel, Jr. — 1944 Trustee | | 2005 | | Retired Formerly: Director, Mainstay VP Series Funds, Inc. (25 portfolios); Partner, Deloitte & Touche | | 158 | | None |
Robert C. Troccoli — 1949 Trustee | | 2016 | | Adjunct Professor, University of Denver — Daniels College of Business Formerly: Senior Partner, KPMG LLP | | 158 | | None |
Christopher L. Wilson — 1957 Trustee | | 2017 | | Non-executive director and trustee of a number of public and private business corporations Formerly: Director, TD Asset Management USA Inc. (mutual fund complex) (22 portfolios); Managing Partner, CT2, LLC (investing and consulting firm); President/Chief Executive Officer, Columbia Funds, Bank of America Corporation; President/Chief Executive Officer, CDC IXIS Asset Management Services, Inc.; Principal & Director of Operations, Scudder Funds, Scudder, Stevens & Clark, Inc.; Assistant Vice President, Fidelity Investments | | 158 | | ISO New England, Inc. (non-profit organization managing regional electricity market) |
T-2 Invesco Charter Fund
Trustees and Officers—(continued)
| | | | | | | | |
Name, Year of Birth and Position(s) Held with the Trust | | Trustee and/
or Officer Since | | Principal Occupation(s)
During Past 5 Years | | Number of
Funds in Fund Complex Overseen by Trustee | | Other Directorship(s)
Held by Trustee During Past 5 Years |
| Other Officers | | | | | | | | |
Sheri Morris — 1964 President, Principal Executive Officer and Treasurer | | 1999 | | President, Principal Executive Officer and Treasurer, The Invesco Funds; Vice President, Invesco Advisers, Inc. (formerly known as Invesco Institutional (N.A.), Inc.) (registered investment adviser); and Vice President, Invesco Exchange-Traded Fund Trust, Invesco Exchange-Traded Fund Trust II, Invesco India Exchange-Traded Fund Trust, Invesco Actively Managed Exchange-Traded Fund Trust, Invesco Actively Managed Exchange-Traded Commodity Fund Trust and Invesco Exchange-Traded Self-Indexed Fund Trust Formerly: Vice President and Principal Financial Officer, The Invesco Funds; Vice President, Invesco AIM Advisers, Inc., Invesco AIM Capital Management, Inc. and Invesco AIM Private Asset Management, Inc.; Assistant Vice President and Assistant Treasurer, The Invesco Funds and Assistant Vice President, Invesco Advisers, Inc., Invesco AIM Capital Management, Inc. and Invesco AIM Private Asset Management, Inc.; and Treasurer, Invesco Exchange-Traded Fund Trust, Invesco Exchange-Traded Fund Trust II, Invesco India Exchange-Traded Fund Trust and Invesco Actively Managed Exchange-Traded Fund Trust | | N/A | | N/A |
Russell C. Burk — 1958 Senior Vice President and Senior Officer | | 2005 | | Senior Vice President and Senior Officer, The Invesco Funds | | N/A | | N/A |
Jeffrey H. Kupor — 1968 Senior Vice President, Chief Legal Officer and Secretary | | 2018 | | Senior Vice President and Secretary, Invesco Advisers, Inc. (formerly known as Invesco Institutional (N.A.), Inc.) (registered investment adviser); Senior Vice President and Secretary, Invesco Distributors, Inc. (formerly known as Invesco AIM Distributors, Inc.); Vice President and Secretary, Invesco Investment Services, Inc. (formerly known as Invesco AIM Investment Services, Inc.) Senior Vice President, Chief Legal Officer and Secretary, The Invesco Funds; Secretary and General Counsel, Invesco Investment Advisers LLC (formerly known as Van Kampen Asset Management); Secretary and General Counsel, Invesco Capital Markets, Inc. (formerly known as Van Kampen Funds Inc.) and Chief Legal Officer, Invesco Exchange-Traded Fund Trust, Invesco Exchange-Traded Fund Trust II, Invesco India Exchange-Traded Fund Trust, Invesco Actively Managed Exchange-Traded Fund Trust, Invesco Actively Managed Exchange-Traded Commodity Fund Trust and Invesco Exchange-Traded Self-Indexed Fund Trust; Secretary, Invesco Indexing LLC; Secretary and General Counsel, INVESCO Private Capital Investments, Inc.; Secretary, W.L. Ross & Co., LLC; Secretary and Vice President, Jemstep, Inc. Formerly: Senior Vice President, Secretary and General Counsel, Invesco Management Group, Inc. (formerly known as Invesco AIM Management Group, Inc.); Assistant Secretary, INVESCO Asset Management (Bermuda) Ltd.; Secretary and General Counsel, Invesco Private Capital, Inc.; Assistant Secretary and General Counsel, INVESCO Realty, Inc.; Secretary and General Counsel, Invesco Senior Secured Management, Inc.; and Secretary, Sovereign G./P. Holdings Inc. | | N/A | | N/A |
John M. Zerr — 1962 Senior Vice President | | 2006 | | Chief Operating Officer of the Americas; Senior Vice President, Invesco Advisers, Inc. (formerly known as Invesco Institutional (N.A.), Inc.) (registered investment adviser); Senior Vice President, Invesco Distributors, Inc. (formerly known as Invesco AIM Distributors, Inc.); Director and Vice President, Invesco Investment Services, Inc. (formerly known as Invesco AIM Investment Services, Inc.) Senior Vice President, The Invesco Funds; Managing Director, Invesco Capital Management LLC; Director, Invesco Investment Advisers LLC (formerly known as Van Kampen Asset Management); Senior Vice President, Invesco Capital Markets, Inc. (formerly known as Van Kampen Funds Inc.); Manager, Invesco Indexing LLC Formerly: Director and Senior Vice President, Invesco Management Group, Inc. (formerly known as Invesco AIM Management Group, Inc.); Secretary and General Counsel, Invesco Management Group, Inc. (formerly known as Invesco AIM Management Group, Inc.); Secretary, Invesco Investment Services, Inc. (formerly known as Invesco AIM Investment Services, Inc.); Chief Legal Officer and Secretary, The Invesco Funds; Secretary and General Counsel, Invesco Investment Advisers LLC (formerly known as Van Kampen Asset Management); Secretary and General Counsel, Invesco Capital Markets, Inc. (formerly known as Van Kampen Funds Inc.); Chief Legal Officer, Invesco Exchange-Traded Fund Trust, Invesco Exchange-Traded Fund Trust II, Invesco India Exchange-Traded Fund Trust, Invesco Actively Managed Exchange-Traded Fund Trust, Invesco Actively Managed Exchange-Traded Commodity Fund Trust and Invesco Exchange-Traded Self-Indexed Fund Trust; Secretary, Invesco Indexing LLC; Director, Secretary, General Counsel and Senior Vice President, Van Kampen Exchange Corp.; Director, Vice President and Secretary, IVZ Distributors, Inc. (formerly known as INVESCO Distributors, Inc.); Director and Vice President, INVESCO Funds Group, Inc.; Director and Vice President, Van Kampen Advisors Inc.; Director, Vice President, Secretary and General Counsel, Van Kampen Investor Services Inc.; Director and Secretary, Invesco Distributors, Inc. (formerly known as Invesco AIM Distributors, Inc.); Director, Senior Vice President, General Counsel and Secretary, Invesco AIM Advisers, Inc. and Van Kampen Investments Inc.; Director, Vice President and Secretary, Fund Management Company; Director, Senior Vice President, Secretary, General Counsel and Vice President, Invesco AIM Capital Management, Inc.; Chief Operating Officer and General Counsel, Liberty Ridge Capital, Inc. (an investment adviser) | | N/A | | N/A |
T-3 Invesco Charter Fund
Trustees and Officers—(continued)
| | | | | | | | |
Name, Year of Birth and Position(s) Held with the Trust | | Trustee and/
or Officer Since | | Principal Occupation(s)
During Past 5 Years | | Number of
Funds in Fund Complex Overseen by Trustee | | Other Directorship(s)
Held by Trustee During Past 5 Years |
| Other Officers—(continued) | | | | | | | | |
Gregory G. McGreevey — 1962 Senior Vice President | | 2012 | | Senior Managing Director, Invesco Ltd.; Director, Chairman, President, and Chief Executive Officer, Invesco Advisers, Inc. (formerly known as Invesco Institutional (N.A.), Inc.) (registered investment adviser); Director, Invesco Mortgage Capital, Inc. and Invesco Senior Secured Management, Inc.; and Senior Vice President, The Invesco Funds Formerly: Senior Vice President, Invesco Management Group, Inc. and Invesco Advisers, Inc.; Assistant Vice President, The Invesco Funds | | N/A | | N/A |
Kelli Gallegos — 1970 Vice President, Principal Financial Officer and Assistant Treasurer | | 2008 | | Vice President and Treasurer, Invesco Exchange-Traded Fund Trust, Invesco Exchange-Traded Fund Trust II, Invesco India Exchange-Traded Fund Trust, Invesco Actively Managed Exchange-Traded Fund Trust, Invesco Actively Managed Exchange-Traded Commodity Fund Trust and Invesco Exchange-Traded Self-Indexed Fund Trust; Vice President, Principal Financial Officer and Assistant Treasurer, The Invesco Funds; Principal Financial and Accounting Officer — Pooled Investments, Invesco Capital Management LLC Formerly: Assistant Treasurer, Invesco Exchange-Traded Fund Trust, Invesco Exchange-Traded Fund Trust II, Invesco India Exchange-Traded Fund Trust, Invesco Actively Managed Exchange-Traded Fund Trust, Invesco Actively Managed Exchange-Traded Commodity Fund Trust and Invesco Exchange-Traded Self-Indexed Fund Trust; Assistant Treasurer, Invesco Capital Management LLC; Assistant Vice President, The Invesco Funds | | N/A | | N/A |
Tracy Sullivan — 1962 Vice President, Chief Tax Officer and Assistant Treasurer | | 2008 | | Vice President, Chief Tax Officer and Assistant Treasurer, The Invesco Funds; Assistant Treasurer, Invesco Capital Management LLC, Invesco Exchange-Traded Fund Trust, Invesco Exchange-Traded Fund Trust II, Invesco India Exchange-Traded Fund Trust, Invesco Actively Managed Exchange-Traded Fund Trust, Invesco Actively Managed Exchange-Traded Commodity Fund Trust and Invesco Exchange-Traded Self-Indexed Fund Trust Formerly: Assistant Vice President, The Invesco Funds | | N/A | | N/A |
Crissie M. Wisdom — 1969 Anti-Money Laundering Compliance Officer | | 2013 | | Anti-Money Laundering Compliance Officer, Invesco Advisers, Inc. (formerly known as Invesco Institutional (N.A.), Inc.) (registered investment adviser), Invesco Capital Markets, Inc. (formerly known as Van Kampen Funds Inc.), Invesco Distributors, Inc., Invesco Investment Services, Inc., The Invesco Funds, and Invesco Exchange-Traded Fund Trust, Invesco Exchange-Traded Fund Trust II, Invesco India Exchange-Traded Fund Trust, Invesco Actively Managed Exchange-Traded Fund Trust, Invesco Actively Managed Exchange-Traded Commodity Fund Trust and Invesco Exchange-Traded Self-Indexed Fund Trust; Anti-Money Laundering Compliance Officer and Bank Secrecy Act Officer, INVESCO National Trust Company and Invesco Trust Company; and Fraud Prevention Manager and Controls and Risk Analysis Manager for Invesco Investment Services, Inc. Formerly: Anti-Money Laundering Compliance Officer, Van Kampen Exchange Corp. and Invesco Management Group, Inc. | | N/A | | N/A |
Robert R. Leveille — 1969 Chief Compliance Officer | | 2016 | | Chief Compliance Officer, Invesco Advisers, Inc. (registered investment adviser); and Chief Compliance Officer, The Invesco Funds Formerly: Chief Compliance Officer, Putnam Investments and the Putnam Funds | | N/A | | N/A |
The Statement of Additional Information of the Trust includes additional information about the Fund’s Trustees and is available upon request, without charge, by calling 1.800.959.4246. Please refer to the Fund’s Statement of Additional Information for information on the Fund’s sub-advisers.
| | | | | | |
Office of the Fund 11 Greenway Plaza, Suite 1000 Houston, TX 77046-1173 | | Investment Adviser Invesco Advisers, Inc. 1555 Peachtree Street, N.E. Atlanta, GA 30309 | | Distributor Invesco Distributors, Inc. 11 Greenway Plaza, Suite 1000 Houston, TX 77046-1173 | | Auditors PricewaterhouseCoopers LLP 1000 Louisiana Street, Suite 5800 Houston, TX 77002-5021 |
| | | |
| | | | | | |
Counsel to the Fund Stradley Ronon Stevens & Young, LLP 2005 Market Street, Suite 2600 Philadelphia, PA 19103-7018 | | Counsel to the Independent Trustees Goodwin Procter LLP 901 New York Avenue, N.W. Washington, D.C. 20001 | | Transfer Agent Invesco Investment Services, Inc. 11 Greenway Plaza, Suite 1000 Houston, TX 77046-1173 | | Custodian State Street Bank and Trust Company 225 Franklin Street Boston, MA 02110-2801 |
T-4 Invesco Charter Fund
Explore High-Conviction Investing with Invesco

Go paperless with eDelivery
Visit invesco.com/edelivery to enjoy the convenience and security of anytime electronic access to your investment documents.
With eDelivery, you can elect to have any or all of the following materials delivered straight to your inbox to download, save and print from your own computer:
| ∎ | | Fund reports and prospectuses |
Invesco mailing information
Send general correspondence to Invesco Investment Services, Inc., P.O. Box 219078, Kansas City, MO 64121-9078.
Important notice regarding delivery of security holder documents
To reduce Fund expenses, only one copy of most shareholder documents may be mailed to shareholders with multiple accounts at the same address (Householding). Mailing of your shareholder documents may be householded indefinitely unless you instruct us otherwise. If you do not want the mailing of these documents to be combined with those for other members of your household, please contact Invesco Investment Services, Inc. at 800 959 4246 or contact your financial institution. We will begin sending you individual copies for each account within 30 days after receiving your request.
Fund holdings and proxy voting information
The Fund provides a complete list of its holdings four times in each fiscal year, at the quarter ends. For the second and fourth quarters, the lists appear in the Fund’s semiannual and annual reports to shareholders. For the first and third quarters, the Fund files the lists with the Securities and Exchange Commission (SEC) on Form N-Q (or any successor Form). The most recent list of portfolio holdings is available at invesco.com/completeqtrholdings. Shareholders can also look up the Fund’s Forms N-Q (or any successor Form) on the SEC website at sec.gov. The SEC file numbers for the Fund are shown below.
A description of the policies and procedures that the Fund uses to determine how to vote proxies relating to portfolio securities is available without charge, upon request, from our Client Services department at 800 959 4246 or at invesco.com/proxyguidelines. The information is also available on the SEC website, sec.gov.
| | |
Information regarding how the Fund voted proxies related to its portfolio securities during the most recent 12-month period ended June 30 is available at invesco.com/proxysearch. The information is also available on the SEC website, sec.gov. Invesco Advisers, Inc. is an investment adviser; it provides investment advisory services to individual and institutional clients and does not sell securities. Invesco Distributors, Inc. is the US distributor for Invesco Ltd.’s retail mutual funds, exchange-traded funds and institutional money market funds. Both are wholly owned, indirect subsidiaries of Invesco Ltd. | |  |
| | | | | | | | |
| SEC file numbers: 811-01424 and 002-25469 | | Invesco Distributors, Inc. | | CHT-AR-1 | | 12172018 | | 0858 |
| | | | |
| | |
 | | Annual Report to Shareholders | | October 31, 2018 |
| | |
| | Invesco Diversified Dividend Fund |
| | Nasdaq: |
| | A: LCEAX ∎ C: LCEVX ∎ R: DDFRX ∎ Y: LCEYX ∎ Investor: LCEIX ∎ R5: DDFIX ∎ R6: LCEFX |

Letters to Shareholders
| | |

Philip Taylor | | Dear Shareholders: This annual report includes information about your Fund, including performance data and a complete list of its investments as of the close of the reporting period. Inside is a discussion of how your Fund was managed and the factors that affected its performance during the reporting period. Throughout the reporting period, US economic data remained positive. Robust corporate profits, strong retail sales and unemployment rates near generational lows helped drive US markets to new all-time records multiple times during the reporting period. Against this backdrop, the US Federal Reserve raised the federal funds rate four times during the reporting period. Market volatility, largely non-existent in 2017, returned in 2018. Markets sold off first in February and again sharply in October, amid rising interest rates, concerns about potential trade wars and heightened geopolitical tensions. Despite the volatility, US equity markets were largely positive |
for the reporting period and fared better than international markets. Emerging markets were particularly hard hit due to a strong US dollar. During the October sell-off, investors retreated to more defensive areas of the market and to US Treasuries. The broader bond market declined during the reporting period due to the increase in US Treasury yields and widening credit spreads. As the year progresses, we’ll see how the interplay of economic data, interest rates, geopolitics and a host of other factors affect US and overseas equity and fixed income markets.
Short-term market volatility can prompt some investors to abandon their investment plans – and can cause others to settle for whatever returns the market has to offer. The investment professionals at Invesco, in contrast, invest with high conviction. This means that, no matter the asset class or the strategy, each investment team has a passion to exceed. We want to help investors achieve better outcomes, such as seeking higher returns, helping mitigate risk and generating income. Of course, investing with high conviction can’t guarantee a profit or ensure success; no investment strategy can. To learn more about how we invest with high conviction, visit invesco.com/HighConviction.
You, too, can invest with high conviction by maintaining a long-term investment perspective and by working with your financial adviser on a regular basis. During periods of short-term market volatility or uncertainty, your financial adviser can keep you focused on your long-term investment goals – a new home, a child’s college education or a secure retirement. He or she also can share research about the economy, the markets and individual investment options.
Visit our website for more information on your investments
Our website, invesco.com/us, offers a wide range of market insights and investment perspectives. On the website, you’ll find detailed information about our funds, including performance, holdings and portfolio manager commentaries. You can access information about your account by completing a simple, secure online registration. To do so, select “Log In” on the right side of the homepage, and then select “Register for Individual Account Access.”
In addition to the resources accessible on our website and through our mobile app, you can obtain timely updates to help you stay informed about the markets and the economy by connecting with Invesco on Twitter, LinkedIn or Facebook. You can access our blog at blog.invesco.us.com. Our goal is to provide you the information you want, when and where you want it.
Finally, I’m pleased to share with you Invesco’s commitment to both the Principles for Responsible Investment and to considering environmental, social and governance issues in our robust investment process. I invite you to learn more at invesco.com/esg.
Have questions?
For questions about your account, contact an Invesco client services representative at 800 959 4246. For Invesco-related questions or comments, please email me directly at phil@invesco.com.
All of us at Invesco look forward to serving your investment management needs. Thank you for investing with us.
Sincerely,

Philip Taylor
Senior Managing Director, Invesco Ltd.
| | |
| 2 | | Invesco Diversified Dividend Fund |
| | | | |

Bruce Crockett | | Dear Fellow Shareholders: Among the many important lessons I’ve learned in more than 40 years in a variety of business endeavors is the value of a trusted advocate. As independent chair of the Invesco Funds Board, I can assure you that the members of the Board are strong advocates for the interests of investors in Invesco’s mutual funds. We work hard to represent your interests through oversight of the quality of the investment management services your funds receive and other matters important to your investment, including but not limited to: |
| | ∎ | | Ensuring that Invesco offers a diverse lineup of mutual funds that your financial adviser can use to strive to meet your financial needs as your investment goals change over time. |
| | ∎ | | Monitoring how the portfolio management teams of the Invesco funds are performing in light of changing economic and market conditions. |
| ∎ | | Assessing each portfolio management team’s investment performance within the context of the investment strategy described in the fund’s prospectus. |
| ∎ | | Monitoring for potential conflicts of interests that may impact the nature of the services that your funds receive. |
We believe one of the most important services we provide our fund shareholders is the annual review of the funds’ advisory and sub-advisory contracts with Invesco Advisers and its affiliates. This review is required by the Investment Company Act of 1940 and focuses on the nature and quality of the services Invesco provides as the adviser to the Invesco funds and the reasonableness of the fees that it charges for those services. Each year, we spend months carefully reviewing information received from Invesco and a variety of independent sources, such as performance and fee data prepared by Lipper, Inc. (a subsidiary of Broadridge Financial Solutions, Inc.), an independent, third-party firm widely recognized as a leader in its field. We also meet with our independent legal counsel and other independent advisers to review and help us assess the information that we have received. Our goal is to assure that you receive quality investment management services for a reasonable fee.
I trust the measures outlined above provide assurance that you have a worthy advocate when it comes to choosing the Invesco Funds.
As always, please contact me at bruce@brucecrockett.com with any questions or concerns you may have. On behalf of the Board, we look forward to continuing to represent your interests and serving your needs.
Sincerely,

Bruce L. Crockett
Independent Chair
Invesco Funds Board of Trustees
| | |
| 3 | | Invesco Diversified Dividend Fund |
Management’s Discussion of Fund Performance
| | | | | | | | |
| | |
Performance summary For the fiscal year ended October 31, 2018, Class A shares of Invesco Diversified Dividend Fund (the Fund), at net asset value (NAV), underperformed the Russell 1000 Value Index, the Fund’s style-specific benchmark. Your Fund’s long-term performance appears later in this report. | | | | | |
| | | |
Fund vs. Indexes | | | | | | | | |
Total returns, 10/31/17 to 10/31/18, at net asset value (NAV). Performance shown does not include applicable contingent deferred sales charges (CDSC) or front-end sales charges, which would have reduced performance. | | | | | |
| | |
Class A Shares | | | -0.28 | % | | | | |
Class C Shares | | | -1.01 | | | | | |
Class R Shares | | | -0.52 | | | | | |
Class Y Shares | | | -0.03 | | | | | |
Investor Class Shares | | | -0.19 | | | | | |
Class R5 Shares | | | 0.02 | | | | | |
Class R6 Shares | | | 0.07 | | | | | |
S&P 500 Indexq (Broad Market Index) | | | 7.35 | | | | | |
Russell 1000 Value Indexq (Style-Specific Index) | | | 3.03 | | | | | |
Lipper Large-Cap Value Funds Index⬛ (Peer Group Index) | | | 4.10 | | | | | |
| | | |
Source(s): qFactSet Research Systems Inc.; ⬛Lipper Inc. | | | | | | | | |
Market conditions and your Fund
The fiscal year proved to be an increasingly volatile time for US equities. The fiscal year began in the final months of 2017 with several major US stock market indexes repeatedly reaching new highs amid strong corporate profits, the prospect of tax reform legislation and exceedingly low stock market volatility.
Stock market euphoria continued in January 2018 as US equity markets steadily moved higher. Investors remained enthused about the passage of the Tax Cuts and Jobs Act signed into law in late December 2017, which significantly cut corporate tax rates. However, in February 2018, volatility returned to the US stock and bond markets. Worries about how rising interest rates might affect economic growth, concerns about a potential trade war and heightened geopolitical tensions, caused the US stock
markets to pull back and volatility to increase.
US equity markets generally recovered in the second quarter of 2018 as strong US retail sales and low unemployment buoyed markets. Throughout the summer, US equities moved higher as corporate profits surged. Several US equity indexes reached new highs despite potential headwinds including trade tensions, tariff announcements and contagion concerns over a Turkish currency crisis. After a relatively quiet summer, market volatility markedly rose in the final month of the fiscal year. US equity markets suffered a sharp sell-off in October 2018 amid rising interest rates and concerns that higher inflation could mean a more restrictive monetary policy.
Within the S&P 500 Index, information technology (IT) and consumer discretionary were the best-performing sectors for
the fiscal year, while materials, industrials and utilities were the worst-performing sectors. It is important to view the market’s performance within the context of a full market cycle. This cycle, which began in June 2009, is one of the longest expansions on record with one of the largest bull markets, despite a historically low recovery in revenue versus previous cycle troughs.1 In this environment, we remain focused on our assessment of each investment’s risk-reward profile.
During the fiscal year, the Fund’s management discipline remained unchanged. Our total return approach continued to emphasize long-term capital appreciation, current income and capital preservation. We believe the Fund may serve as an equity foundation within a well-diversified asset allocation strategy, complementing more aggressive and cyclical investments. We look for dividend-paying companies with strong profitability, solid balance sheets and capital allocation policies that support sustained or increasing dividends and share repurchases. We perform extensive fundamental research, incorporating both financial statement analysis and an assessment of the potential reward relative to the downside risk, to determine a fair valuation over our two- to three-year investment horizon for each stock. We believe this process may provide a valuable combination of dividend income, price appreciation and capital preservation. We also maintain a rigorous sell discipline and consider selling or reducing shares in stocks that no longer meet our investment criteria.
Within the Fund’s style-specific benchmark, communication services and health care were the best-performing sectors, while materials and industrials were the worst-performing sectors during the fiscal year. The Fund’s underweight exposure to the health care sector detracted the most
| | | | | | |
Portfolio Composition | |
| By sector | | % of total net assets | |
| |
Consumer Staples | | | 22.2% | |
Utilities | | | 17.1 | |
Financials | | | 13.2 | |
Industrials | | | 8.9 | |
Health Care | | | | | 8.2 | |
Energy | | | 7.3 | |
| Communication Services | | | 6.0 | |
| Consumer Discretionary | | | 5.4 | |
Materials | | | 3.2 | |
| Information Technology | | | 1.3 | |
Real Estate | | | 1.2 | |
Money Market Funds Plus Other Assets Less Liabilities | | | 6.0 | |
| | | | | | |
Top 10 Equity Holdings* | |
| | % of total net assets | |
| | |
1. | | AT&T Inc. | | | 3.2% | |
2. | | Coca-Cola Co. (The) | | | 3.1 | |
3. | | General Mills, Inc. | | | 2.9 | |
4. | | Exelon Corp. | | | 2.6 | |
5. | | Hartford Financial Services Group, Inc. (The) | | | 2.5 | |
6. | | Entergy Corp. | | | 2.4 | |
7. | | Procter & Gamble Co. (The) | | | 2.4 | |
8. | | PPl Corp. | | | 2.3 | |
9. | | Eli Lilly and Co. | | | 2.2 | |
10. | | Dominion Energy, Inc. | | | 2.2 | |
| | | | |
Total Net Assets | | $ | 20.2 billion | |
| |
| Total Number of Holdings* | | | 70 | |
The Fund’s holdings are subject to change, and there is no assurance that the Fund will continue to hold any particular security.
*Excluding money market fund holdings.
Data presented here are as of October 31, 2018.
| | |
| 4 | | Invesco Diversified Dividend Fund |
from relative performance versus the style-specific index. The Fund’s overweight exposure to the consumer staples and utilities sectors also detracted from relative performance, as did stock selection in the communication services sector. Stock selection in the consumer discretionary sector contributed the most to the Fund’s relative performance. Stock selection in the energy and industrials sectors also helped the Fund’s relative performance.
During the fiscal year, holdings in the consumer discretionary sector were the largest contributors to the Fund’s performance. General merchandise store Target was the largest contributor. Shares of Target rose as earnings increased from an acceleration of same store sales, which was partially driven by higher e-commerce revenues. Oil and gas producer ConocoPhillips was also one of the largest contributors to performance. The company’s execution on its new capital allocation strategy, which included debt reduction and increased dividend payout and stock buybacks, exceeded investor expectations. Pharmaceutical company Eli Lilly also performed well during the fiscal year as its new drug pipeline demonstrated consistent success in such areas as diabetes and oncology.
The German pharmaceutical and chemical conglomerate Bayer was the largest detractor from Fund performance. During the fiscal year, Bayer completed the acquisition of agricultural chemicals company Monsanto. Bayer’s stock declined following a trial ruling against Monsanto. The case involved the alleged toxicity of glyphosate, an herbicide marketed as Roundup. Timber and forest products REIT Weyerhaeuser was also a detractor from the Fund’s performance. Despite lumber prices that were higher than the previous year, the stock declined on signs of slowing housing starts in the US. Additionally, trade tensions and a 5% tariff on logs implemented by China weighed on shares. PPL was also a large detractor. The regulated electric and gas utility serves more than 10 million customers in both the US and the UK. Shares underperformed on concerns that continuing uncertainty and political turmoil could lead to lower regulated returns for the company.
The Fund used currency forward contracts for the purpose of hedging currency exposure of some of the non-US-based companies held in the portfolio and not for speculative purposes or leverage. The use of currency forward contracts had a very small positive impact on the Fund’s performance during the fiscal year.
The Fund has successfully navigated multiple market cycles during its 15-plus year history with a consistent long-term mandate to emphasize capital appreciation, current income and capital preservation over a full market cycle.
It has been our privilege to oversee Invesco Diversified Dividend Fund, and we thank you for your continued investment.
| 1 | Sources: National Bureau of Economic Research, Ned Davis Research and FactSet Research Systems Inc. |
The views and opinions expressed in management’s discussion of Fund performance are those of Invesco Advisers, Inc. These views and opinions are subject to change at any time based on factors such as market and economic conditions. These views and opinions may not be relied upon as investment advice or recommendations, or as an offer for a particular security. The information is not a complete analysis of every aspect of any market, country, industry, security or the Fund. Statements of fact are from sources considered reliable, but Invesco Advisers, Inc. makes no representation or warranty as to their completeness or accuracy. Although historical performance is no guarantee of future results, these insights may help you understand our investment management philosophy.
See important Fund and, if applicable, index disclosures later in this report.
| | |
| |
 | | Meggan Walsh Chartered Financial Analyst, Portfolio Manager and Head of Invesco’s Dividend Value Team, is lead |
| manager of Invesco Diversified Dividend Fund. She joined Invesco in 1991. Ms. Walsh earned a BS in finance from the University of Maryland and an MBA from Loyola University Maryland. |
| |
 | | Robert Botard Chartered Financial Analyst, Portfolio Manager, is manager of Invesco Diversified Dividend Fund. |
| He joined Invesco in 1993. Mr. Botard earned a BBA in finance and a BBA in international business from The University of Texas at Austin. He also earned a Master of International Management degree from the Thunderbird School of Global Management. |
| |
 | | Kristina Bradshaw Chartered Financial Analyst, Portfolio Manager, is manager of Invesco Diversified Dividend Fund. |
| She joined Invesco in 2006. Ms. Bradshaw earned a BBA with honors from The University of Texas at Austin and an MBA from Stanford University’s Graduate School of Business. |
| | |
| |
 | | Chris McMeans Chartered Financial Analyst, Portfolio Manager is manager of Invesco Diversified Dividend Fund. |
| He joined Invesco in 2008. Mr. McMeans earned a BA in economics from The University of Texas at Austin and an MBA with honors from the University of Houston. |
5 Invesco Diversified Dividend Fund
Your Fund’s Long-Term Performance
Results of a $10,000 Investment – Oldest Share Class(es)
Fund and index data from 10/31/08
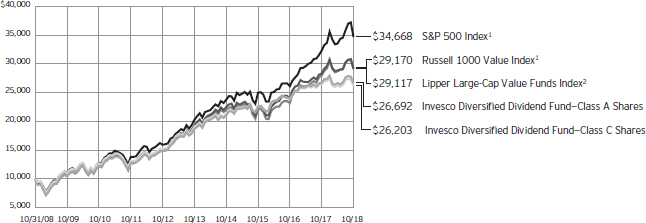
1 Source: FactSet Research Systems Inc.
2 Source: Lipper Inc.
Past performance cannot guarantee comparable future results.
The data shown in the chart include reinvested distributions, applicable sales charges Fund expenses including management
fees. Index results include reinvested dividends, but they do not reflect sales charges. Performance of the peer group, if applicable, reflects fund expenses and management fees; performance
of a market index does not. Performance shown in the chart and table(s) does not reflect deduction of taxes a shareholder would pay on Fund distributions or sale of Fund shares.
| | |
| 6 | | Invesco Diversified Dividend Fund |
| | | | |
| |
Average Annual Total Returns | |
As of 10/31/18, including maximum applicable sales charges | |
| |
Class A Shares | | | | |
Inception (12/31/01) | | | 7.06 | % |
10 Years | | | 10.32 | |
5 Years | | | 6.18 | |
1 Year | | | -5.75 | |
| |
Class C Shares | | | | |
Inception (12/31/01) | | | 6.65 | % |
10 Years | | | 10.11 | |
5 Years | | | 6.58 | |
1 Year | | | -1.98 | |
| |
Class R Shares | | | | |
Inception (10/25/05) | | | 7.52 | % |
10 Years | | | 10.69 | |
5 Years | | | 7.11 | |
1 Year | | | -0.52 | |
| |
Class Y Shares | | | | |
Inception (10/3/08) | | | 9.61 | % |
10 Years | | | 11.23 | |
5 Years | | | 7.65 | |
1 Year | | | -0.03 | |
| |
Investor Class Shares | | | | |
Inception (7/15/05) | | | 7.41 | % |
10 Years | | | 11.00 | |
5 Years | | | 7.43 | |
1 Year | | | -0.19 | |
| |
Class R5 Shares | | | | |
Inception (10/25/05) | | | 8.12 | % |
10 Years | | | 11.30 | |
5 Years | | | 7.70 | |
1 Year | | | 0.02 | |
| |
Class R6 Shares | | | | |
10 Years | | | 11.20 | % |
5 Years | | | 7.80 | |
1 Year | | | 0.07 | |
Class Y shares incepted on October 3, 2008. Performance shown prior to that date is that of Class A shares and includes the 12b-1 fees applicable to Class A shares.
Class R6 shares incepted on September 24, 2012. Performance shown prior to that date is that of Class A shares and includes the 12b-1 fees applicable to Class A shares.
The performance data quoted represent past performance and cannot guarantee comparable future results; current performance may be lower or higher. Please visit invesco.com/performance for the most recent month-end performance. Performance figures reflect reinvested distributions, changes in net asset value and the effect of the maximum
| | | | |
| |
Average Annual Total Returns | |
As of 9/30/18, the most recent calendar quarter end, including maximum applicable sales charges | |
| |
Class A Shares | | | | |
Inception (12/31/01) | | | 7.35 | % |
10 Years | | | 8.80 | |
5 Years | | | 7.99 | |
1 Year | | | -1.38 | |
| |
Class C Shares | | | | |
Inception (12/31/01) | | | 6.94 | % |
10 Years | | | 8.60 | |
5 Years | | | 8.40 | |
1 Year | | | 2.62 | |
| |
Class R Shares | | | | |
Inception (10/25/05) | | | 7.91 | % |
10 Years | | | 9.17 | |
5 Years | | | 8.95 | |
1 Year | | | 4.10 | |
| |
Class Y Shares | | | | |
10 Years | | | 9.70 | % |
5 Years | | | 9.48 | |
1 Year | | | 4.63 | |
| |
Investor Class Shares | | | | |
Inception (7/15/05) | | | 7.78 | % |
10 Years | | | 9.47 | |
5 Years | | | 9.27 | |
1 Year | | | 4.46 | |
| |
Class R5 Shares | | | | |
Inception (10/25/05) | | | 8.51 | % |
10 Years | | | 9.78 | |
5 Years | | | 9.54 | |
1 Year | | | 4.69 | |
| |
Class R6 Shares | | | | |
10 Years | | | 9.67 | % |
5 Years | | | 9.65 | |
1 Year | | | 4.79 | |
sales charge unless otherwise stated. Investment return and principal value will fluctuate so that you may have a gain or loss when you sell shares.
The net annual Fund operating expense ratio set forth in the most recent Fund prospectus as of the date of this report for Class A, Class C, Class R, Class Y, Investor Class, Class R5 and Class R6 shares was 0.83%, 1.58%, 1.08%, 0.58%, 0.78%, 0.52% and 0.42%, respectively.1 The total annual Fund operating expense ratio set forth in the most recent Fund prospectus as of the date of this report for Class A, Class C, Class R, Class Y, Investor Class, Class R5 and Class R6 shares was 0.85%, 1.60%, 1.10%, 0.60%, 0.80%, 0.54% and 0.44%, respectively. The expense ratios presented above may vary from the expense ratios
presented in other sections of this report that are based on expenses incurred during the period covered by this report.
Class A share performance reflects the maximum 5.50% sales charge, and Class C share performance reflects the applicable contingent deferred sales charge (CDSC) for the period involved. The CDSC on Class C shares is 1% for the first year after purchase. Class R, Class Y, Investor Class, Class R5 and Class R6 shares do not have a front-end sales charge or a CDSC; therefore, performance is at net asset value.
The performance of the Fund’s share classes will differ primarily due to different sales charge structures and class expenses.
Fund performance reflects any applicable fee waivers and/or expense reimbursements. Had the adviser not waived fees and/or reimbursed expenses currently or in the past, returns would have been lower. See current prospectus for more information.
| 1 | Total annual Fund operating expenses after any contractual fee waivers and/or expense reimbursements by the adviser in effect through at least June 30, 2020. See current prospectus for more information. |
7 Invesco Diversified Dividend Fund
Invesco Diversified Dividend Fund’s investment objective is long-term growth of capital and, secondarily, current income.
| ∎ | | Unless otherwise stated, information presented in this report is as of October 31, 2018, and is based on total net assets. |
| ∎ | | Unless otherwise noted, all data provided by Invesco. |
| ∎ | | To access your Fund’s reports/prospectus, visit invesco.com/fundreports. |
About share classes
| ∎ | | Class R shares are generally available only to employer sponsored retirement and benefit plans. Please see the prospectus for more information. |
| ∎ | | Class Y shares and Investor Class shares are available only to certain investors. Please see the prospectus for more information. |
| ∎ | | Class R5 shares and Class R6 shares are available for use by retirement plans that meet certain standards and for institutional investors. Class R6 shares are also available through intermediaries that have established an agreement with Invesco Distributors, Inc. to make such shares available for use in retail omnibus accounts. Please see the prospectus for more information. |
Principal risks of investing in the Fund
| ∎ | | Foreign securities risk. The Fund’s foreign investments may be adversely affected by political and social instability, changes in economic or taxation policies, difficulty in enforcing obligations, decreased liquidity or increased volatility. Foreign investments also involve the risk of the possible seizure, nationalization or expropriation of the issuer or foreign deposits (in which the Fund could lose its entire investments in a certain market) and the possible adoption of foreign governmental restrictions such as exchange controls. Unless the Fund has hedged its foreign currency risk, foreign securities risk also involves the risk of negative foreign currency rate fluctuations, which may cause the value of securities denominated in such foreign currency (or other instruments through which the Fund has exposure to foreign currencies) to decline in value. Currency exchange rates may fluctuate significantly over short periods of time. Currency hedging strategies, if used, are not always successful. |
| ∎ | | Management risk. The Fund is actively managed and depends heavily on the Adviser’s judgment about markets, interest rates or the attractiveness, relative values, liquidity, or potential appreciation of particular investments made for the Fund’s portfolio. The Fund could experience losses if these judgments prove to be incorrect. Additionally, legislative, regulatory, or tax developments may adversely affect management of the Fund and, therefore, the ability of the Fund to achieve its investment objective. |
| ∎ | | Market risk. The market values of the Fund’s investments, and therefore the value of the Fund’s shares, will go up and down, sometimes rapidly or unpredictably. Market risk may affect a single issuer, industry or section of the economy, or it may affect the market as a whole. Individual stock prices tend to go up and down more dramatically than those of certain other types of investments, such as bonds. During a general downturn in the financial markets, multiple asset classes may decline in value. When markets perform well, there can be no assurance that specific investments held by the Fund will rise in value. |
| ∎ | | Value investing style risk. A value investing style subjects the Fund to the risk that the valuations never improve or that the returns on value equity securities are less than returns on other styles of investing or the overall stock market. |
About indexes used in this report
| ∎ | | The S&P 500® Index is an unmanaged index considered representative of the US stock market. |
| ∎ | | The Russell 1000® Value Index is an unmanaged index considered representative of large-cap value stocks. The Russell 1000 Value Index is a trademark/service mark of the Frank Russell Co. Russell® is a trademark of the Frank Russell Co. |
This report must be accompanied or preceded by a currently effective Fund prospectus, which contains more complete information, including sales charges and expenses. Investors should read it carefully before investing.
NOT FDIC INSURED | MAY LOSE VALUE | NO BANK GUARANTEE
| ∎ | | The Lipper Large-Cap Value Funds Index is an unmanaged index considered representative of large-cap value funds tracked by Lipper. |
| ∎ | | The Fund is not managed to track the performance of any particular index, including the index(es) described here, and consequently, the performance of the Fund may deviate significantly from the performance of the index(es). |
| ∎ | | A direct investment cannot be made in an index. Unless otherwise indicated, index results include reinvested dividends, and they do not reflect sales charges. Performance of the peer group, if applicable, reflects fund expenses; performance of a market index does not. |
Other information
| ∎ | | The returns shown in management’s discussion of Fund performance are based on net asset values (NAVs) calculated for shareholder transactions. Generally accepted accounting principles require adjustments to be made to the net assets of the Fund at period end for financial reporting purposes, and as such, the NAVs for shareholder transactions and the returns based on those NAVs may differ from the NAVs and returns reported in the Financial Highlights. |
| ∎ | | Industry classifications used in this report are generally according to the Global Industry Classification Standard, which was developed by and is the exclusive property and a service mark of MSCI Inc. and Standard & Poor’s. |
| | |
| 8 | | Invesco Diversified Dividend Fund |
Schedule of Investments(a)
October 31, 2018
| | | | | | | | |
| | | Shares | | | Value | |
Common Stocks & Other Equity Interests–94.06% | |
| Aerospace & Defense–1.51% | |
General Dynamics Corp. | | | 1,261,452 | | | $ | 217,701,386 | |
Raytheon Co. | | | 501,368 | | | | 87,759,455 | |
| | | | | | | | 305,460,841 | |
|
| Air Freight & Logistics–1.16% | |
United Parcel Service, Inc.–Class B | | | 2,200,024 | | | | 234,390,557 | |
|
| Apparel Retail–1.38% | |
TJX Cos., Inc. (The) | | | 2,546,041 | | | | 279,758,985 | |
|
| Apparel, Accessories & Luxury Goods–0.72% | |
Columbia Sportswear Co. | | | 1,295,071 | | | | 116,919,010 | |
Tapestry, Inc. | | | 681,026 | | | | 28,814,210 | |
| | | | | | | | 145,733,220 | |
|
| Asset Management & Custody Banks–0.52% | |
Federated Investors, Inc.–Class B | | | 4,286,169 | | | | 105,739,789 | |
|
| Brewers–1.67% | |
Heineken N.V. (Netherlands) | | | 3,744,938 | | | | 337,639,743 | |
|
| Construction Machinery & Heavy Trucks–0.61% | |
Cummins Inc. | | | 896,998 | | | | 122,610,657 | |
|
| Consumer Finance–1.78% | |
American Express Co. | | | 3,497,135 | | | | 359,260,678 | |
|
| Data Processing & Outsourced Services–1.35% | |
Automatic Data Processing, Inc. | | | 1,889,654 | | | | 272,261,348 | |
|
| Diversified Chemicals–0.21% | |
BASF SE (Germany) | | | 537,356 | | | | 41,405,538 | |
|
| Electric Utilities–11.60% | |
American Electric Power Co., Inc. | | | 4,493,774 | | | | 329,663,261 | |
Duke Energy Corp. | | | 3,732,141 | | | | 308,386,811 | |
Entergy Corp. | | | 5,840,810 | | | | 490,335,999 | |
Exelon Corp. | | | 12,052,702 | | | | 528,028,874 | |
PPL Corp. | | | 15,527,605 | | | | 472,039,192 | |
SSE PLC (United Kingdom) | | | 14,752,478 | | | | 215,248,337 | |
| | | | | | | | 2,343,702,474 | |
|
| Electrical Components & Equipment–2.36% | |
ABB Ltd. (Switzerland) | | | 10,805,805 | | | | 217,229,050 | |
Emerson Electric Co. | | | 3,055,782 | | | | 207,426,482 | |
nVent Electric PLC (United Kingdom) | | | 2,107,413 | | | | 51,463,026 | |
| | | | | | | | 476,118,558 | |
|
| Fertilizers & Agricultural Chemicals–0.79% | |
Nutrien Ltd. (Canada) | | | 3,000,270 | | | | 158,827,769 | |
|
| Food Distributors–1.56% | |
Sysco Corp. | | | 4,429,167 | | | | 315,932,482 | |
|
| General Merchandise Stores–1.61% | |
Target Corp. | | | 3,883,068 | | | | 324,740,977 | |
| | | | | | | | |
| | | Shares | | | Value | |
| Health Care Equipment–0.55% | |
Stryker Corp. | | | 687,226 | | | $ | 111,481,802 | |
|
| Household Products–3.97% | |
Kimberly-Clark Corp. | | | 3,084,354 | | | | 321,698,122 | |
Procter & Gamble Co. (The) | | | 5,406,466 | | | | 479,445,405 | |
| | | | | | | | 801,143,527 | |
|
| Industrial Conglomerates–0.98% | |
Siemens AG (Germany) | | | 1,725,722 | | | | 198,825,942 | |
|
| Industrial Machinery–2.29% | |
Flowserve Corp.(b) | | | 7,968,262 | | | | 365,743,226 | |
Pentair PLC (United Kingdom) | | | 2,412,674 | | | | 96,868,861 | |
| | | | | | | | 462,612,087 | |
|
| Integrated Oil & Gas–4.55% | |
Royal Dutch Shell PLC–Class B (United Kingdom) | | | 4,098,005 | | | | 133,429,733 | |
Suncor Energy, Inc. (Canada) | | | 10,449,206 | | | | 350,516,113 | |
TOTAL S.A. (France) | | | 7,410,127 | | | | 434,894,398 | |
| | | | | | | | 918,840,244 | |
|
| Integrated Telecommunication Services–5.95% | |
AT&T Inc. | | | 20,932,761 | | | | 642,217,108 | |
BT Group PLC (United Kingdom) | | | 89,325,699 | | | | 274,650,692 | |
Deutsche Telekom AG (Germany) | | | 17,424,415 | | | | 286,069,981 | |
| | | | | | | | 1,202,937,781 | |
|
| Motorcycle Manufacturers–1.07% | |
Harley-Davidson, Inc. | | | 5,663,460 | | | | 216,457,441 | |
|
| Multi-Line Insurance–2.51% | |
Hartford Financial Services Group, Inc. (The) | | | 11,178,221 | | | | 507,714,798 | |
|
| Multi-Utilities–5.51% | |
Consolidated Edison, Inc. | | | 4,501,350 | | | | 342,102,600 | |
Dominion Energy, Inc. | | | 6,175,322 | | | | 441,041,497 | |
Sempra Energy | | | 2,992,194 | | | | 329,500,403 | |
| | | | | | | | 1,112,644,500 | |
|
| Oil & Gas Equipment & Services–0.83% | |
Baker Hughes, a GE Co. | | | 6,298,998 | | | | 168,120,257 | |
|
| Oil & Gas Exploration & Production–1.93% | |
ConocoPhillips | | | 5,569,991 | | | | 389,342,371 | |
|
| Packaged Foods & Meats–8.77% | |
Campbell Soup Co. | | | 8,031,979 | | | | 300,476,334 | |
Danone S.A. (France) | | | 2,341,231 | | | | 165,949,400 | |
General Mills, Inc. | | | 13,145,242 | | | | 575,761,600 | |
Kraft Heinz Co. (The) | | | 4,060,155 | | | | 223,186,720 | |
Mondelez International, Inc.–Class A | | | 7,171,554 | | | | 301,061,837 | |
Nestle S.A. (Switzerland) | | | 2,438,500 | | | | 205,659,596 | |
| | | | | | | | 1,772,095,487 | |
See accompanying Notes to Financial Statements which are an integral part of the financial statements.
9 Invesco Diversified Dividend Fund
| | | | | | | | |
| | | Shares | | | Value | |
| Paper Packaging–2.17% | |
Avery Dennison Corp. | | | 978,776 | | | $ | 88,794,559 | |
International Paper Co. | | | 4,697,852 | | | | 213,094,567 | |
Sonoco Products Co. | | | 2,493,702 | | | | 136,106,255 | |
| | | | | | | | 437,995,381 | |
|
| Personal Products–1.25% | |
L’Oreal S.A. (France) | | | 1,123,302 | | | | 253,062,140 | |
|
| Pharmaceuticals–7.64% | |
Bayer AG (Germany) | | | 2,662,411 | | | | 204,396,063 | |
Bristol-Myers Squibb Co. | | | 6,499,980 | | | | 328,508,989 | |
Eli Lilly and Co. | | | 4,136,189 | | | | 448,528,335 | |
Johnson & Johnson | | | 1,569,772 | | | | 219,752,382 | |
Merck & Co., Inc. | | | 4,642,678 | | | | 341,747,528 | |
| | | | | | | | 1,542,933,297 | |
|
| Property & Casualty Insurance–1.44% | |
Travelers Cos., Inc. (The) | | | 2,329,439 | | | | 291,482,702 | |
|
| Regional Banks–6.97% | |
Cullen/Frost Bankers, Inc. | | | 1,298,297 | | | | 127,129,242 | |
Fifth Third Bancorp | | | 6,600,580 | | | | 178,149,654 | |
KeyCorp | | | 7,954,913 | | | | 144,461,220 | |
M&T Bank Corp. | | | 2,411,795 | | | | 398,935,011 | |
PNC Financial Services Group, Inc. (The) | | | 1,886,675 | | | | 242,418,871 | |
Zions Bancorp., N.A. | | | 6,724,028 | | | | 316,365,518 | |
| | | | | | | | 1,407,459,516 | |
|
| Restaurants–0.64% | |
Darden Restaurants, Inc. | | | 1,206,691 | | | | 128,572,926 | |
| | | | | | | | |
| | | Shares | | | Value | |
| Soft Drinks–3.10% | |
Coca-Cola Co. (The) | | | 13,073,910 | | | $ | 625,978,811 | |
|
| Specialized REITs–1.21% | |
Weyerhaeuser Co. | | | 9,195,054 | | | | 244,864,288 | |
|
| Tobacco–1.90% | |
Altria Group, Inc. | | | 2,810,408 | | | | 182,788,936 | |
Philip Morris International Inc. | | | 2,275,763 | | | | 200,426,448 | |
| | | | | | | | 383,215,384 | |
Total Common Stocks & Other Equity Interests
(Cost $15,715,039,287) | | | | 19,001,364,298 | |
|
Money Market Funds–5.83% | |
Invesco Government & Agency
Portfolio–Institutional Class, 2.08%(c) | | | 412,320,999 | | | | 412,320,999 | |
Invesco Liquid Assets Portfolio–Institutional Class, 2.27%(c) | | | 294,517,154 | | | | 294,576,058 | |
Invesco Treasury Portfolio–Institutional Class, 2.09%(c) | | | 471,223,999 | | | | 471,223,999 | |
Total Money Market Funds
(Cost $1,178,088,348) | | | | 1,178,121,056 | |
TOTAL INVESTMENTS IN SECURITIES–99.89%
(Cost $16,893,127,635) | | | | 20,179,485,354 | |
OTHER ASSETS LESS LIABILITIES–0.11% | | | | 22,060,367 | |
NET ASSETS–100.00% | | | $ | 20,201,545,721 | |
Investment Abbreviations:
| | |
| REIT | | – Real Estate Investment Trust |
Notes to Schedule of Investments:
| (a) | Industry and/or sector classifications used in this report are generally according to the Global Industry Classification Standard, which was developed by and is the exclusive property and a service mark of MSCI Inc. and Standard & Poor’s. |
| (b) | Affiliated company during the period. The Investment Company Act of 1940 defines an "affiliated person" as an issuance in which a fund holds 5% or more of the outstanding voting securities. The Fund has not owned enough of the outstanding voting securities of the issuer to have control (as defined in the Investment Company Act of 1940) of that issuer. The value of this security as of October 31, 2018 represented 1.81% of the Fund’s Net Assets. See Note 5. |
| (c) | The money market fund and the Fund are affiliated by having the same investment adviser. The rate shown is the 7-day SEC standardized yield as of October 31, 2018. |
| | | | | | | | | | | | | | | | | | | | | | |
| Open Forward Foreign Currency Contracts | |
Settlement
Date | | Counterparty | | Contract to | | | Unrealized
Appreciation
(Depreciation) | |
| | Deliver | | | Receive | |
| 12/14/2018 | | Bank of America, N.A. | | | EUR | | | | 254,940,956 | | | | USD | | | | 296,701,815 | | | $ | 6,889,119 | |
| 12/14/2018 | | J.P. Morgan Chase Bank N.A. | | | EUR | | | | 252,630,301 | | | | USD | | | | 294,013,531 | | | | 6,827,550 | |
| 12/14/2018 | | State Street Bank and Trust Co. | | | EUR | | | | 254,940,957 | | | | USD | | | | 296,621,509 | | | | 6,808,813 | |
Subtotal — Appreciation | | | | | | | | | | | | | | | | | | | 20,525,482 | |
| 12/14/2018 | | Bank of America, N.A. | | | USD | | | | 21,219,329 | | | | EUR | | | | 18,583,648 | | | | (93,744 | ) |
Subtotal — Depreciation | | | | | | | | | | | | | | | | | | | (93,744 | ) |
Total Forward Foreign Currency Contracts — Currency Risk | | | | | | | | | | | | | | | | | | $ | 20,431,738 | |
Abbreviations:
| | |
| EUR | | – Euro |
| USD | | – U.S. Dollar |
See accompanying Notes to Financial Statements which are an integral part of the financial statements.
10 Invesco Diversified Dividend Fund
Statement of Assets and Liabilities
October 31, 2018
| | | | |
Assets: | | | | |
Investments in securities, at value (Cost $15,368,012,380) | | $ | 18,635,621,072 | |
Investments in affiliates, at value (Cost $1,525,115,255) | | | 1,543,864,282 | |
Other investments: | | | | |
Unrealized appreciation on forward foreign currency contracts outstanding | | | 20,525,482 | |
Foreign currencies, at value (Cost $821) | | | 16,557 | |
Receivable for: | | | | |
Investments sold | | | 30,684,243 | |
Dividends | | | 39,083,745 | |
Fund shares sold | | | 10,454,775 | |
Fund expenses absorbed | | | 6,859 | |
Investment for trustee deferred compensation and retirement plans | | | 711,674 | |
Other assets | | | 154,616 | |
Total assets | | | 20,281,123,305 | |
| |
Liabilities: | | | | |
Other investments: | | | | |
Unrealized depreciation on forward foreign currency contracts outstanding | | | 93,744 | |
Payable for: | | | | |
Investments purchased | | | 22,155,742 | |
Fund shares reacquired | | | 48,838,252 | |
Accrued fees to affiliates | | | 6,701,172 | |
Accrued trustees’ and officers’ fees and benefits | | | 24,988 | |
Accrued other operating expenses | | | 839,715 | |
Trustee deferred compensation and retirement plans | | | 923,971 | |
Total liabilities | | | 79,577,584 | |
Net assets applicable to shares outstanding | | $ | 20,201,545,721 | |
| |
Net assets consist of: | | | | |
Shares of beneficial interest | | $ | 15,912,288,799 | |
Distributable earnings | | | 4,289,256,922 | |
| | | $ | 20,201,545,721 | |
| | | | |
Net Assets: | | | | |
Class A | | $ | 4,979,892,677 | |
Class C | | $ | 634,394,494 | |
Class R | | $ | 306,070,208 | |
Class Y | | $ | 2,844,687,641 | |
Investor Class | | $ | 1,815,420,552 | |
Class R5 | | $ | 3,715,585,689 | |
Class R6 | | $ | 5,905,494,460 | |
|
Shares outstanding, no par value,
with an unlimited number of shares authorized: | |
Class A | | | 254,763,095 | |
Class C | | | 32,877,264 | |
Class R | | | 15,608,637 | |
Class Y | | | 145,369,386 | |
Investor Class | | | 92,927,452 | |
Class R5 | | | 190,063,664 | |
Class R6 | | | 302,035,909 | |
Class A: | | | | |
Net asset value per share | | $ | 19.55 | |
Maximum offering price per share | | | | |
(Net asset value of $19.55 ¸ 94.50%) | | $ | 20.69 | |
Class C: | | | | |
Net asset value and offering price per share | | $ | 19.30 | |
Class R: | | | | |
Net asset value and offering price per share | | $ | 19.61 | |
Class Y: | | | | |
Net asset value and offering price per share | | $ | 19.57 | |
Investor Class: | | | | |
Net asset value and offering price per share | | $ | 19.54 | |
Class R5: | | | | |
Net asset value and offering price per share | | $ | 19.55 | |
Class R6: | | | | |
Net asset value and offering price per share | | $ | 19.55 | |
See accompanying Notes to Financial Statements which are an integral part of the financial statements.
11 Invesco Diversified Dividend Fund
Statement of Operations
For the year ended October 31, 2018
| | | | |
Investment income: | | | | |
Dividends (net of foreign withholding taxes of $12,978,764) | | $ | 638,935,748 | |
Dividends from affiliates | | | 37,264,326 | |
Total investment income | | | 676,200,074 | |
| |
Expenses: | | | | |
Advisory fees | | | 86,910,039 | |
Administrative services fees | | | 1,165,921 | |
Custodian fees | | | 1,063,237 | |
Distribution fees: | | | | |
Class A | | | 14,032,731 | |
Class B | | | 19,901 | |
Class C | | | 7,514,057 | |
Class R | | | 1,713,747 | |
Investor Class | | | 3,845,061 | |
Transfer agent fees — A, B, C, R, Y and Investor | | | 18,001,841 | |
Transfer agent fees — R5 | | | 3,970,261 | |
Transfer agent fees — R6 | | | 453,199 | |
Trustees’ and officers’ fees and benefits | | | 339,222 | |
Registration and filing fees | | | 617,938 | |
Reports to shareholders | | | 1,712,281 | |
Professional services fees | | | 388,041 | |
Other | | | 530,484 | |
Total expenses | | | 142,277,961 | |
Less: Fees waived and expense offset arrangement(s) | | | (2,560,780 | ) |
Net expenses | | | 139,717,181 | |
Net investment income | | | 536,482,893 | |
| |
Realized and unrealized gain (loss) from: | | | | |
Net realized gain (loss) from: | | | | |
Investment securities | | | 859,108,041 | |
Foreign currencies | | | (1,827,285 | ) |
Forward foreign currency contracts | | | 60,628,875 | |
| | | | 917,909,631 | |
Change in net unrealized appreciation (depreciation) of: | | | | |
Investment securities | | | (1,409,248,636 | ) |
Foreign currencies | | | (15,999 | ) |
Forward foreign currency contracts | | | (20,031,141 | ) |
| | | | (1,429,295,776 | ) |
Net realized and unrealized gain (loss) | | | (511,386,145 | ) |
Net increase in net assets resulting from operations | | $ | 25,096,748 | |
See accompanying Notes to Financial Statements which are an integral part of the financial statements.
12 Invesco Diversified Dividend Fund
Statement of Changes in Net Assets
For the years ended October 31, 2018 and 2017
| | | | | | | | |
| | | 2018 | | | 2017 | |
Operations: | | | | | | | | |
Net investment income | | $ | 536,482,893 | | | $ | 449,550,584 | |
Net realized gain | | | 917,909,631 | | | | 163,438,095 | |
Change in net unrealized appreciation (depreciation) | | | (1,429,295,776 | ) | | | 1,760,829,001 | |
Net increase in net assets resulting from operations | | | 25,096,748 | | | | 2,373,817,680 | |
| | |
Distributions to shareholders from distributable earnings(1): | | | | | | | | |
Class A | | | (164,774,412 | ) | | | (255,760,808 | ) |
Class B | | | (101,750 | ) | | | (516,138 | ) |
Class C | | | (16,786,350 | ) | | | (28,022,850 | ) |
Class R | | | (9,233,576 | ) | | | (10,550,108 | ) |
Class Y | | | (118,691,198 | ) | | | (200,214,978 | ) |
Investor Class | | | (58,326,262 | ) | | | (90,202,358 | ) |
Class R5 | | | (124,983,876 | ) | | | (162,378,174 | ) |
Class R6 | | | (213,238,919 | ) | | | (150,828,946 | ) |
Total distributions from distributable earnings | | | (706,136,343 | ) | | | (898,474,360 | ) |
| | |
Share transactions–net: | | | | | | | | |
Class A | | | (884,267,650 | ) | | | (387,579,942 | ) |
Class B | | | (9,425,590 | ) | | | (8,203,248 | ) |
Class C | | | (183,579,211 | ) | | | 4,014,291 | |
Class R | | | (42,483,297 | ) | | | 101,239,116 | |
Class Y | | | (1,327,883,943 | ) | | | 303,448,708 | |
Investor Class | | | (240,151,819 | ) | | | (150,451,618 | ) |
Class R5 | | | (29,888,681 | ) | | | 176,556,635 | |
Class R6 | | | (218,978,810 | ) | | | 3,470,617,666 | |
Net increase (decrease) in net assets resulting from share transactions | | | (2,936,659,001 | ) | | | 3,509,641,608 | |
Net increase (decrease) in net assets | | | (3,617,698,596 | ) | | | 4,984,984,928 | |
| | |
Net assets: | | | | | | | | |
Beginning of year | | | 23,819,244,317 | | | | 18,834,259,389 | |
End of year | | $ | 20,201,545,721 | | | $ | 23,819,244,317 | |
| (1) | For the year ended October 31, 2017, distributions to shareholders from distributable earnings consisted of distributions from net investment income and distributions from net realized gains. The Securities and Exchange Commission eliminated the requirement to disclose the distribution components separately. For the year ended October 31, 2017, distributions from net investment income were $104,371,576, $127,541, $8,002,015, $4,314,212, $98,168,591, $37,353,627, $75,226,213 and $81,891,302 and distributions from net realized gains were $151,389,232, $388,597, $20,020,835, $6,235,896, $102,046,387, $52,848,731, $87,151,961 and $68,937,644 for Class A, Class B, Class C, Class R, Class Y, Investor Class, Class R5 and Class R6 shares, respectively. |
Notes to Financial Statements
October 31, 2018
NOTE 1—Significant Accounting Policies
Invesco Diversified Dividend Fund (the “Fund”) is a series portfolio of AIM Equity Funds (Invesco Equity Funds) (the “Trust”). The Trust is a Delaware statutory trust registered under the Investment Company Act of 1940, as amended (the “1940 Act”), as an open-end series management investment company authorized to issue an unlimited number of shares of beneficial interest. Information presented in these financial statements pertains only to the Fund. Matters affecting the Fund or each class will be voted on exclusively by the shareholders of the Fund or each class.
The Fund’s investment objective is long-term growth of capital and, secondarily, current income.
The Fund currently consists of seven different classes of shares: Class A, Class C, Class R, Class Y, Investor Class, Class R5 and Class R6. Class Y and Investor Class shares are available only to certain investors. Class A shares are sold with a front-end sales charge unless certain waiver criteria are met. Under certain circumstances, load waived shares may be subject to contingent deferred sales charges (“CDSC”). Class C shares are sold with a CDSC. Class R, Class Y, Investor Class, Class R5 and Class R6 shares are sold at net asset value. Effective November 30, 2010, new or additional investments in Class B shares are no longer permitted. Existing shareholders of Class B shares were permitted to continue to reinvest dividends and capital gains distributions in Class B shares until their conversion to Class A shares. Also, shareholders in Class B shares were able to exchange those
13 Invesco Diversified Dividend Fund
shares for Class B shares of other Invesco Funds offering such shares until they converted to Class A shares. Generally, Class B shares automatically converted to Class A shares on or about the month-end, which was at least eight years after the date of purchase. Redemptions of Class B shares prior to the conversion date were subject to a CDSC. Effective January 26, 2018, all of the Fund’s outstanding Class B shares were converted to Class A shares, in advance of their normally scheduled conversion. No CDSC was paid in connection with this early conversion.
The Fund is an investment company and accordingly follows the investment company accounting and reporting guidance in accordance with Financial Accounting Standards Board Accounting Standards Codification Topic 946, Financial Services — Investment Companies.
The following is a summary of the significant accounting policies followed by the Fund in the preparation of its financial statements.
| A. | Security Valuations — Securities, including restricted securities, are valued according to the following policy. |
A security listed or traded on an exchange (except convertible securities) is valued at its last sales price or official closing price as of the close of the customary trading session on the exchange where the security is principally traded, or lacking any sales or official closing price on a particular day, the security may be valued at the closing bid price on that day. Securities traded in the over-the-counter market are valued based on prices furnished by independent pricing services or market makers. When such securities are valued by an independent pricing service they may be considered fair valued. Futures contracts are valued at the final settlement price set by an exchange on which they are principally traded. Listed options are valued at the mean between the last bid and asked prices from the exchange on which they are principally traded. Options not listed on an exchange are valued by an independent source at the mean between the last bid and asked prices. For purposes of determining net asset value (“NAV”) per share, futures and option contracts generally are valued 15 minutes after the close of the customary trading session of the New York Stock Exchange (“NYSE”).
Investments in open-end and closed-end registered investment companies that do not trade on an exchange are valued at the end-of-day net asset value per share. Investments in open-end and closed-end registered investment companies that trade on an exchange are valued at the last sales price or official closing price as of the close of the customary trading session on the exchange where the security is principally traded.
Debt obligations (including convertible securities) and unlisted equities are fair valued using an evaluated quote provided by an independent pricing service. Evaluated quotes provided by the pricing service may be determined without exclusive reliance on quoted prices, and may reflect appropriate factors such as institution-size trading in similar groups of securities, developments related to specific securities, dividend rate (for unlisted equities), yield (for debt obligations), quality, type of issue, coupon rate (for debt obligations), maturity (for debt obligations), individual trading characteristics and other market data. Pricing services generally value debt obligations assuming orderly transactions of institutional round lot size, but a fund may hold or transact in the same securities in smaller, odd lot sizes. Odd lots often trade at lower prices than institutional round lots. Debt obligations are subject to interest rate and credit risks. In addition, all debt obligations involve some risk of default with respect to interest and/or principal payments.
Foreign securities’ (including foreign exchange contracts) prices are converted into U.S. dollar amounts using the applicable exchange rates as of the close of the NYSE. If market quotations are available and reliable for foreign exchange-traded equity securities, the securities will be valued at the market quotations. Because trading hours for certain foreign securities end before the close of the NYSE, closing market quotations may become unreliable. If between the time trading ends on a particular security and the close of the customary trading session on the NYSE, events occur that the investment adviser determines are significant and make the closing price unreliable, the Fund may fair value the security. If the event is likely to have affected the closing price of the security, the security will be valued at fair value in good faith using procedures approved by the Board of Trustees. Adjustments to closing prices to reflect fair value may also be based on a screening process of an independent pricing service to indicate the degree of certainty, based on historical data, that the closing price in the principal market where a foreign security trades is not the current value as of the close of the NYSE. Foreign securities’ prices meeting the approved degree of certainty that the price is not reflective of current value will be priced at the indication of fair value from the independent pricing service. Multiple factors may be considered by the independent pricing service in determining adjustments to reflect fair value and may include information relating to sector indices, American Depositary Receipts and domestic and foreign index futures. Foreign securities may have additional risks including exchange rate changes, potential for sharply devalued currencies and high inflation, political and economic upheaval, the relative lack of issuer information, relatively low market liquidity and the potential lack of strict financial and accounting controls and standards.
Securities for which market prices are not provided by any of the above methods may be valued based upon quotes furnished by independent sources. The last bid price may be used to value equity securities. The mean between the last bid and asked prices is used to value debt obligations, including corporate loans.
Securities for which market quotations are not readily available or became unreliable are valued at fair value as determined in good faith by or under the supervision of the Trust’s officers following procedures approved by the Board of Trustees. Issuer specific events, market trends, bid/asked quotes of brokers and information providers and other market data may be reviewed in the course of making a good faith determination of a security’s fair value.
The Fund may invest in securities that are subject to interest rate risk, meaning the risk that the prices will generally fall as interest rates rise and, conversely, the prices will generally rise as interest rates fall. Specific securities differ in their sensitivity to changes in interest rates depending on their individual characteristics. Changes in interest rates may result in increased market volatility, which may affect the value and/or liquidity of certain Fund investments.
Valuations change in response to many factors including the historical and prospective earnings of the issuer, the value of the issuer’s assets, general economic conditions, interest rates, investor perceptions and market liquidity. Because of the inherent uncertainties of valuation, the values reflected in the financial statements may materially differ from the value received upon actual sale of those investments.
| B. | Securities Transactions and Investment Income — Securities transactions are accounted for on a trade date basis. Realized gains or losses on sales are computed on the basis of specific identification of the securities sold. Interest income (net of withholding tax, if any) is recorded on the accrual basis from settlement date. Dividend income (net of withholding tax, if any) is recorded on the ex-dividend date. |
The Fund may periodically participate in litigation related to Fund investments. As such, the Fund may receive proceeds from litigation settlements. Any proceeds received are included in the Statement of Operations as realized gain (loss) for investments no longer held and as unrealized gain (loss) for investments still held.
Brokerage commissions and mark ups are considered transaction costs and are recorded as an increase to the cost basis of securities purchased and/or a reduction of proceeds on a sale of securities. Such transaction costs are included in the determination of net realized and
14 Invesco Diversified Dividend Fund
unrealized gain (loss) from investment securities reported in the Statement of Operations and the Statement of Changes in Net Assets and the net realized and unrealized gains (losses) on securities per share in the Financial Highlights. Transaction costs are included in the calculation of the Fund’s net asset value and, accordingly, they reduce the Fund’s total returns. These transaction costs are not considered operating expenses and are not reflected in net investment income reported in the Statement of Operations and the Statement of Changes in Net Assets, or the net investment income per share and the ratios of expenses and net investment income reported in the Financial Highlights, nor are they limited by any expense limitation arrangements between the Fund and the investment adviser.
The Fund allocates income and realized and unrealized capital gains and losses to a class based on the relative net assets of each class.
| C. | Country Determination — For the purposes of making investment selection decisions and presentation in the Schedule of Investments, the investment adviser may determine the country in which an issuer is located and/or credit risk exposure based on various factors. These factors include the laws of the country under which the issuer is organized, where the issuer maintains a principal office, the country in which the issuer derives 50% or more of its total revenues and the country that has the primary market for the issuer’s securities, as well as other criteria. Among the other criteria that may be evaluated for making this determination are the country in which the issuer maintains 50% or more of its assets, the type of security, financial guarantees and enhancements, the nature of the collateral and the sponsor organization. Country of issuer and/or credit risk exposure has been determined to be the United States of America, unless otherwise noted. |
| D. | Distributions — Distributions from net investment income, if any, are declared and paid quarterly and are recorded on the ex-dividend date. Distributions from net realized capital gain, if any, are generally declared and paid annually and recorded on the ex-dividend date. The Fund may elect to treat a portion of the proceeds from redemptions as distributions for federal income tax purposes. |
| E. | Federal Income Taxes — The Fund intends to comply with the requirements of Subchapter M of the Internal Revenue Code of 1986, as amended (the “Internal Revenue Code”), necessary to qualify as a regulated investment company and to distribute substantially all of the Fund’s taxable earnings to shareholders. As such, the Fund will not be subject to federal income taxes on otherwise taxable income (including net realized capital gain) that is distributed to shareholders. Therefore, no provision for federal income taxes is recorded in the financial statements. |
The Fund recognizes the tax benefits of uncertain tax positions only when the position is more likely than not to be sustained. Management has analyzed the Fund’s uncertain tax positions and concluded that no liability for unrecognized tax benefits should be recorded related to uncertain tax positions. Management is not aware of any tax positions for which it is reasonably possible that the total amounts of unrecognized tax benefits will change materially in the next 12 months.
The Fund files tax returns in the U.S. Federal jurisdiction and certain other jurisdictions. Generally, the Fund is subject to examinations by such taxing authorities for up to three years after the filing of the return for the tax period.
| F. | Expenses — Fees provided for under the Rule 12b-1 plan of a particular class of the Fund are charged to the operations of such class. Transfer agency fees and expenses and other shareholder recordkeeping fees and expenses attributable to Class R5 and Class R6 are allocated to each share class based on relative net assets. Sub-accounting fees attributable to Class R5 are charged to the operations of the class. Transfer agency fees and expenses and other shareholder recordkeeping fees and expenses relating to all other classes are allocated among those classes based on relative net assets. All other expenses are allocated among the classes based on relative net assets. |
| G. | Accounting Estimates — The preparation of financial statements in conformity with accounting principles generally accepted in the United States of America (“GAAP”) requires management to make estimates and assumptions that affect the reported amounts of assets and liabilities at the date of the financial statements and the reported amounts of revenues and expenses during the reporting period including estimates and assumptions related to taxation. Actual results could differ from those estimates by a significant amount. In addition, the Fund monitors for material events or transactions that may occur or become known after the period-end date and before the date the financial statements are released to print. |
| H. | Indemnifications — Under the Trust’s organizational documents, each Trustee, officer, employee or other agent of the Trust is indemnified against certain liabilities that may arise out of the performance of their duties to the Fund. Additionally, in the normal course of business, the Fund enters into contracts, including the Fund’s servicing agreements, that contain a variety of indemnification clauses. The Fund’s maximum exposure under these arrangements is unknown as this would involve future claims that may be made against the Fund that have not yet occurred. The risk of material loss as a result of such indemnification claims is considered remote. |
| I. | Foreign Currency Translations — Foreign currency is valued at the close of the NYSE based on quotations posted by banks and major currency dealers. Portfolio securities and other assets and liabilities denominated in foreign currencies are translated into U.S. dollar amounts at the date of valuation. Purchases and sales of portfolio securities (net of foreign taxes withheld on disposition) and income items denominated in foreign currencies are translated into U.S. dollar amounts on the respective dates of such transactions. The Fund does not separately account for the portion of the results of operations resulting from changes in foreign exchange rates on investments and the fluctuations arising from changes in market prices of securities held. The combined results of changes in foreign exchange rates and the fluctuation of market prices on investments (net of estimated foreign tax withholding) are included with the net realized and unrealized gain or loss from investments in the Statement of Operations. Reported net realized foreign currency gains or losses arise from (1) sales of foreign currencies, (2) currency gains or losses realized between the trade and settlement dates on securities transactions, and (3) the difference between the amounts of dividends, interest, and foreign withholding taxes recorded on the Fund’s books and the U.S. dollar equivalent of the amounts actually received or paid. Net unrealized foreign currency gains and losses arise from changes in the fair values of assets and liabilities, other than investments in securities at fiscal period end, resulting from changes in exchange rates. |
The Fund may invest in foreign securities, which may be subject to foreign taxes on income, gains on investments or currency repatriation, a portion of which may be recoverable. Foreign taxes, if any, are recorded based on the tax regulations and rates that exist in the foreign markets in which the Fund invests and are shown in the Statement of Operations.
| J. | Forward Foreign Currency Contracts — The Fund may engage in foreign currency transactions either on a spot (i.e. for prompt delivery and settlement) basis, or through forward foreign currency contracts, to manage or minimize currency or exchange rate risk. |
The Fund may also enter into forward foreign currency contracts for the purchase or sale of a security denominated in a foreign currency in order to “lock in” the U.S. dollar price of that security, or the Fund may also enter into forward foreign currency contracts that do not provide for physical settlement of the two currencies, but instead are settled by a single cash payment calculated as the difference between the agreed upon
15 Invesco Diversified Dividend Fund
exchange rate and the spot rate at settlement based upon an agreed upon notional amount (non-deliverable forwards). The Fund will set aside liquid assets in an amount equal to the daily mark-to-market obligation for forward foreign currency contracts.
A forward foreign currency contract is an obligation between two parties (“Counterparties”) to purchase or sell a specific currency for an agreed-upon price at a future date. The use of forward foreign currency contracts does not eliminate fluctuations in the price of the underlying securities the Fund owns or intends to acquire but establishes a rate of exchange in advance. Fluctuations in the value of these contracts are measured by the difference in the contract date and reporting date exchange rates and are recorded as unrealized appreciation (depreciation) until the contracts are closed. When the contracts are closed, realized gains (losses) are recorded. Realized and unrealized gains (losses) on the contracts are included in the Statement of Operations. The primary risks associated with forward foreign currency contracts include failure of the Counterparty to meet the terms of the contract and the value of the foreign currency changing unfavorably. These risks may be in excess of the amounts reflected in the Statement of Assets and Liabilities.
NOTE 2—Advisory Fees and Other Fees Paid to Affiliates
The Trust has entered into a master investment advisory agreement with Invesco Advisers, Inc. (the “Adviser” or “Invesco”). Under the terms of the investment advisory agreement, the Fund accrues daily and pays monthly an advisory fee to the Adviser based on the annual rate of the Fund’s average daily net assets as follows:
| | | | | | | | |
| Average Daily Net Assets | | Rate | |
First $350 million | | | 0 | .60% | | | | |
Next $350 million | | | 0 | .55% | | | | |
Next $1.3 billion | | | 0 | .50% | | | | |
Next $2 billion | | | 0 | .45% | | | | |
Next $2 billion | | | 0 | .40% | | | | |
Next $2 billion | | | 0 | .375% | | | | |
Over $8 billion | | | 0 | .35% | | | | |
For the year ended October 31, 2018, the effective advisory fees incurred by the Fund was 0.38%.
Under the terms of a master sub-advisory agreement between the Adviser and each of Invesco Asset Management Deutschland GmbH, Invesco Asset Management Limited, Invesco Asset Management (Japan) Limited, Invesco Hong Kong Limited, Invesco Senior Secured Management, Inc. and Invesco Canada Ltd. (collectively, the “Affiliated Sub-Advisers”) the Adviser, not the Fund, will pay 40% of the fees paid to the Adviser to any such Affiliated Sub-Adviser(s) that provide(s) discretionary investment management services to the Fund based on the percentage of assets allocated to such Affiliated Sub-Adviser(s).
The Adviser has contractually agreed, through at least June 30, 2019, to waive advisory fees and/or reimburse expenses of all shares to the extent necessary to limit total annual fund operating expenses after fee waiver and/or expense reimbursement (excluding certain items discussed below) of Class A, Class C, Class R, Class Y, Investor Class, Class R5 and Class R6 shares to 2.00%, 2.75%, 2.25%, 1.75%, 2.00%, 1.75% and 1.75%, respectively, of average daily net assets (the “expense limits”). Prior to their conversion to Class A shares, the expense limit for Class B shares was 2.75% of average daily net assets. In determining the Adviser’s obligation to waive advisory fees and/or reimburse expenses, the following expenses are not taken into account, and could cause the total annual fund operating expenses after fee waiver and/or expense reimbursement to exceed the numbers reflected above: (1) interest; (2) taxes; (3) dividend expense on short sales; (4) extraordinary or non-routine items, including litigation expenses; and (5) expenses that the Fund has incurred but did not actually pay because of an expense offset arrangement. Unless Invesco continues the fee waiver agreement, it will terminate on June 30, 2019. During its term, the fee waiver agreement cannot be terminated or amended to increase the expense limits or reduce the advisory fee waiver without approval of the Board of Trustees. The Adviser did not waive fees and/or reimburse expenses during the period under these expense limits.
Further, the Adviser has contractually agreed, through at least June 30, 2020, to waive the advisory fee payable by the Fund in an amount equal to 100% of the net advisory fees the Adviser receives from the affiliated money market funds on investments by the Fund of uninvested cash in such affiliated money market funds.
For the year ended October 31, 2018, the Adviser waived advisory fees of $2,497,172.
The Trust has entered into a master administrative services agreement with Invesco pursuant to which the Fund has agreed to pay Invesco for certain administrative costs incurred in providing accounting services to the Fund. For the year ended October 31, 2018, expenses incurred under the agreement are shown in the Statement of Operations as Administrative services fees.
The Trust has entered into a transfer agency and service agreement with Invesco Investment Services, Inc. (“IIS”) pursuant to which the Fund has agreed to pay IIS a fee for providing transfer agency and shareholder services to the Fund and reimburse IIS for certain expenses incurred by IIS in the course of providing such services. IIS may make payments to intermediaries that provide omnibus account services, sub-accounting services and/or networking services. All fees payable by IIS to intermediaries that provide omnibus account services or sub-accounting services are charged back to the Fund, subject to certain limitations approved by the Trust’s Board of Trustees. For the year ended October 31, 2018, expenses incurred under the agreement are shown in the Statement of Operations as Transfer agent fees.
The Trust has entered into master distribution agreements with Invesco Distributors, Inc. (“IDI”) to serve as the distributor for the Class A, Class C, Class R, Class Y, Investor Class, Class R5 and Class R6 shares of the Fund. The Trust has adopted plans pursuant to Rule 12b-1 under the 1940 Act with respect to the Fund’s Class A, Class C, Class R and Investor Class shares (collectively, the “Plans”). The Fund, pursuant to the Plans, pays IDI compensation at the annual rate of 0.25% of the Fund’s average daily net assets of Class A shares, 1.00% of the average daily net assets of Class C shares and 0.50% of the average daily net assets of Class R shares. The Fund, pursuant to the Investor Class Plan, reimburses IDI for its allocated share of expenses incurred pursuant to the Investor Class Plan for the period, up to a maximum annual rate of 0.25% of the average daily net assets of Investor Class shares. Prior to their conversion to Class A shares, the Fund paid an annual rate of 1.00% of the average daily net assets of Class B shares. The fees are accrued daily and paid monthly. Of the Plan payments, up to 0.25% of the average daily net assets of each class of shares may
16 Invesco Diversified Dividend Fund
be paid to furnish continuing personal shareholder services to customers who purchase and own shares of such classes. Any amounts not paid as a service fee under the Plans would constitute an asset-based sales charge. Rules of the Financial Industry Regulatory Authority (“FINRA”) impose a cap on the total sales charges, including asset-based sales charges, that may be paid by any class of shares of the Fund. For the year ended October 31, 2018, expenses incurred under the Plans are shown in the Statement of Operations as Distribution fees.
Front-end sales commissions and CDSC (collectively, the “sales charges”) are not recorded as expenses of the Fund. Front-end sales commissions are deducted from proceeds from the sales of Fund shares prior to investment in Class A shares of the Fund. CDSC are deducted from redemption proceeds prior to remittance to the shareholder. During the year ended October 31, 2018, IDI advised the Fund that IDI retained $719,425 in front-end sales commissions from the sale of Class A shares and $102,274 and $65,281 from Class A and Class C shares, respectively, for CDSC imposed on redemptions by shareholders.
For the year ended October 31, 2018, the Fund incurred $4,197 in brokerage commissions with Invesco Capital Markets, Inc., an affiliate of the Adviser and IDI, for portfolio transactions executed on behalf of the Fund.
Certain officers and trustees of the Trust are officers and directors of the Adviser, IIS and/or IDI.
NOTE 3—Additional Valuation Information
GAAP defines fair value as the price that would be received to sell an asset or paid to transfer a liability in an orderly transaction between market participants at the measurement date, under current market conditions. GAAP establishes a hierarchy that prioritizes the inputs to valuation methods, giving the highest priority to readily available unadjusted quoted prices in an active market for identical assets (Level 1) and the lowest priority to significant unobservable inputs (Level 3), generally when market prices are not readily available or are unreliable. Based on the valuation inputs, the securities or other investments are tiered into one of three levels. Changes in valuation methods may result in transfers in or out of an investment’s assigned level:
| | Level 1 — | Prices are determined using quoted prices in an active market for identical assets. |
| | Level 2 — | Prices are determined using other significant observable inputs. Observable inputs are inputs that other market participants may use in pricing a security. These may include quoted prices for similar securities, interest rates, prepayment speeds, credit risk, yield curves, loss severities, default rates, discount rates, volatilities and others. |
| | Level 3 — | Prices are determined using significant unobservable inputs. In situations where quoted prices or observable inputs are unavailable (for example, when there is little or no market activity for an investment at the end of the period), unobservable inputs may be used. Unobservable inputs reflect the Fund’s own assumptions about the factors market participants would use in determining fair value of the securities or instruments and would be based on the best available information. |
The following is a summary of the tiered valuation input levels, as of October 31, 2018. The level assigned to the securities valuations may not be an indication of the risk or liquidity associated with investing in those securities. Because of the inherent uncertainties of valuation, the values reflected in the financial statements may materially differ from the value received upon actual sale of those investments.
| | | | | | | | | | | | | | | | |
| | | Level 1 | | | Level 2 | | | Level 3 | | | Total | |
Investments in Securities | | | | | | | | | | | | | | | | |
Common Stocks & Other Equity Interests | | $ | 18,010,151,521 | | | $ | 991,212,777 | | | $ | — | | | $ | 19,001,364,298 | |
Money Market Funds | | | 1,178,121,056 | | | | — | | | | — | | | | 1,178,121,056 | |
Total Investments in Securities | | | 19,188,272,577 | | | | 991,212,777 | | | | — | | | | 20,179,485,354 | |
Other Investments — Assets* | | | | | | | | | | | | | | | | |
Forward Foreign Currency Contracts | | | — | | | | 20,525,482 | | | | — | | | | 20,525,482 | |
Other Investments — Liabilities* | | | | | | | | | | | | | | | | |
Forward Foreign Currency Contracts | | | — | | | | (93,744 | ) | | | — | | | | (93,744 | ) |
Total Other Investments | | | — | | | | 20,431,738 | | | | — | | | | 20,431,738 | |
Total Investments | | $ | 19,188,272,577 | | | $ | 1,011,644,515 | | | $ | — | | | $ | 20,199,917,092 | |
| * | Unrealized appreciation (depreciation). |
NOTE 4—Derivative Investments
The Fund may enter into an International Swaps and Derivatives Association Master Agreement (“ISDA Master Agreement”) under which a fund may trade OTC derivatives. An OTC transaction entered into under an ISDA Master Agreement typically involves a collateral posting arrangement, payment netting provisions and close-out netting provisions. These netting provisions allow for reduction of credit risk through netting of contractual obligations. The enforceability of the netting provisions of the ISDA Master Agreement depends on the governing law of the ISDA Master Agreement, among other factors.
For financial reporting purposes, the Fund does not offset OTC derivative assets or liabilities that are subject to ISDA Master Agreements in the Statement of Assets and Liabilities.
17 Invesco Diversified Dividend Fund
Value of Derivative Investments at Period-End
The table below summarizes the value of the Fund’s derivative investments, detailed by primary risk exposure, held as of October 31, 2018:
| | | | |
| | | Value | |
| Derivative Assets | | Currency Risk | |
Unrealized appreciation on forward foreign currency contracts outstanding | | $ | 20,525,482 | |
Derivatives not subject to master netting agreements | | | — | |
Total Derivative Assets subject to master netting agreements | | $ | 20,525,482 | |
| |
| | | Value | |
| Derivative Liabilities | | Currency Risk | |
Unrealized depreciation on forward foreign currency contracts outstanding | | $ | (93,744 | ) |
Derivatives not subject to master netting agreements | | | — | |
Total Derivative Liabilities subject to master netting agreements | | $ | (93,744 | ) |
Offsetting Assets and Liabilities
The table below reflects the Fund’s exposure to Counterparties subject to either an ISDA Master Agreement or other agreement for OTC derivative transactions as of October 31, 2018.
| | | | | | | | | | | | | | | | | | | | | | | | |
| | | Financial
Derivative
Assets | | | Financial
Derivative
Liabilities | | | | | | Collateral (Received)/Pledged | | | | |
| Counterparty | | Forward Foreign Currency
Contracts | | | Forward Foreign Currency Contracts | | | Net Value of Derivatives | | | Non-Cash | | | Cash | | | Net
Amount | |
Bank of America, N.A. | | $ | 6,889,119 | | | $ | (93,744 | ) | | $ | 6,795,375 | | | $ | — | | | $ | — | | | $ | 6,795,375 | |
J.P. Morgan Chase Bank N.A. | | | 6,827,550 | | | | — | | | | 6,827,550 | | | | — | | | | — | | | | 6,827,550 | |
State Street Bank and Trust Co. | | | 6,808,813 | | | | — | | | | 6,808,813 | | | | — | | | | — | | | | 6,808,813 | |
Total | | $ | 20,525,482 | | | $ | (93,744 | ) | | $ | 20,431,738 | | | $ | — | | | $ | — | | | $ | 20,431,738 | |
Effect of Derivative Investments for the year ended October 31, 2018
The table below summarizes the gains (losses) on derivative investments, detailed by primary risk exposure, recognized in earnings during the period:
| | | | |
| | | Location of Gain (Loss) on
Statement of Operations | |
| | | Currency Risk | |
Realized Gain: | | | | |
Forward foreign currency contracts | | $ | 60,628,875 | |
Change in Net Unrealized Appreciation (Depreciation): | | | | |
Forward foreign currency contracts | | | (20,031,141 | ) |
Total | | $ | 40,597,734 | |
The table below summarizes the average notional value of forward foreign currency contracts outstanding during the period.
| | | | |
| | | Forward
Foreign Currency
Contracts | |
Average notional value | | $ | 1,025,615,531 | |
NOTE 5—Investments in Other Affiliates
The 1940 Act defines an “affiliated person” as an issuance in which a fund holds 5% or more of the outstanding voting securities. The Fund has not owned enough of the outstanding voting securities of the issuer to have control (as defined in the 1940 Act) of that issuer. The following is a summary of the investments in other affiliates (excluding affiliated money market funds) for the year ended October 31, 2018.
| | | | | | | | | | | | | | | | | | | | | | | | | | | | |
| | | Value 10/31/17 | | | Purchases
at Cost | | | Proceeds
from Sales | | | Change in
Unrealized
Appreciation | | | Realized
Gain (Loss) | | | Value
10/31/18 | | | Dividend
Income | |
Flowserve Corp. | | $ | 331,055,603 | | | $ | 18,504,046 | | | $ | — | | | $ | 16,183,577 | | | $ | — | | | $ | 365,743,226 | | | $ | 5,994,301 | |
NOTE 6—Expense Offset Arrangement(s)
The expense offset arrangement is comprised of transfer agency credits which result from balances in demand deposit accounts used by the transfer agent for clearing shareholder transactions. For the year ended October 31, 2018, the Fund received credits from this arrangement, which resulted in the reduction of the Fund’s total expenses of $63,608.
18 Invesco Diversified Dividend Fund
NOTE 7—Trustees’ and Officers’ Fees and Benefits
Trustees’ and Officers’ Fees and Benefits include amounts accrued by the Fund to pay remuneration to certain Trustees and Officers of the Fund. Trustees have the option to defer compensation payable by the Fund, and Trustees’ and Officers’ Fees and Benefits also include amounts accrued by the Fund to fund such deferred compensation amounts. Those Trustees who defer compensation have the option to select various Invesco Funds in which their deferral accounts shall be deemed to be invested. Finally, certain current Trustees were eligible to participate in a retirement plan that provided for benefits to be paid upon retirement to Trustees over a period of time based on the number of years of service. The Fund may have certain former Trustees who also participate in a retirement plan and receive benefits under such plan. Trustees’ and Officers’ Fees and Benefits include amounts accrued by the Fund to fund such retirement benefits. Obligations under the deferred compensation and retirement plans represent unsecured claims against the general assets of the Fund.
NOTE 8—Cash Balances
The Fund is permitted to temporarily carry a negative or overdrawn balance in its account with State Street Bank and Trust Company, the custodian bank. Such balances, if any at period-end, are shown in the Statement of Assets and Liabilities under the payable caption Amount due custodian. To compensate the custodian bank for such overdrafts, the overdrawn Fund may either (1) leave funds as a compensating balance in the account so the custodian bank can be compensated by earning the additional interest; or (2) compensate by paying the custodian bank at a rate agreed upon by the custodian bank and Invesco, not to exceed the contractually agreed upon rate.
NOTE 9—Distributions to Shareholders and Tax Components of Net Assets
Tax Character of Distributions to Shareholders Paid During the Fiscal Years Ended October 31, 2018 and 2017:
| | | | | | | | |
| | | 2018 | | | 2017 | |
Ordinary income | | $ | 535,039,424 | | | $ | 409,455,077 | |
Long-term capital gain | | | 171,096,919 | | | | 489,019,283 | |
Total distributions | | $ | 706,136,343 | | | $ | 898,474,360 | |
Tax Components of Net Assets at Period-End:
| | | | |
| | | 2018 | |
Undistributed ordinary income | | $ | 104,990,764 | |
Undistributed long-term gain | | | 900,360,552 | |
Net unrealized appreciation — investments | | | 3,284,978,516 | |
Net unrealized appreciation (depreciation) — foreign currencies | | | (190,200 | ) |
Temporary book/tax differences | | | (882,710 | ) |
Shares of beneficial interest | | | 15,912,288,799 | |
Total net assets | | $ | 20,201,545,721 | |
The difference between book-basis and tax-basis unrealized appreciation (depreciation) is due to differences in the timing of recognition of gains and losses on investments for tax and book purposes. The Fund’s net unrealized appreciation difference is attributable primarily to forward foreign currency contracts.
The temporary book/tax differences are a result of timing differences between book and tax recognition of income and/or expenses. The Fund’s temporary book/tax differences are the result of the trustee deferral of compensation and retirement plan benefits.
Capital loss carryforward is calculated and reported as of a specific date. Results of transactions and other activity after that date may affect the amount of capital loss carryforward actually available for the Fund to utilize. Capital losses generated in years beginning after December 22, 2010 can be carried forward for an unlimited period, whereas previous losses expire in eight tax years. Capital losses with an expiration period may not be used to offset capital gains until all net capital losses without an expiration date have been utilized. Capital loss carryforwards with no expiration date will retain their character as either short-term or long-term capital losses instead of as short-term capital losses as under prior law. The ability to utilize capital loss carryforwards in the future may be limited under the Internal Revenue Code and related regulations based on the results of future transactions.
The Fund does not have a capital loss carryforward as of October 31, 2018.
NOTE 10—Investment Transactions
The aggregate amount of investment securities (other than short-term securities, U.S. Treasury obligations and money market funds, if any) purchased and sold by the Fund during the year ended October 31, 2018 was $2,046,660,732 and $3,293,880,008, respectively. Cost of investments, including any derivatives, on a tax basis includes the adjustments for financial reporting purposes as of the most recently completed federal income tax reporting period-end.
| | | | |
| Unrealized Appreciation (Depreciation) of Investments on a Tax Basis | |
Aggregate unrealized appreciation of investments | | $ | 4,007,013,869 | |
Aggregate unrealized (depreciation) of investments | | | (722,035,353 | ) |
Net unrealized appreciation of investments | | $ | 3,284,978,516 | |
Cost of investments for tax purposes is $16,914,938,576.
19 Invesco Diversified Dividend Fund
NOTE 11—Reclassification of Permanent Differences
Primarily as a result of differing book/tax treatment of foreign currency transactions, on October 31, 2018, undistributed net investment income was decreased by $1,778,115, undistributed net realized gain was increased by $2,012,833 and shares of beneficial interest was decreased by $234,718. This reclassification had no effect on the net assets of the Fund.
NOTE 12—Share Information
| | | | | | | | | | | | | | | | |
| | | Summary of Share Activity | |
| | | Years ended October 31, | |
| | | 2018(a) | | | 2017 | |
| | | Shares | | | Amount | | | Shares | | | Amount | |
Sold: | | | | | | | | | | | | | | | | |
Class A | | | 28,924,893 | | | $ | 580,423,086 | | | | 74,830,049 | | | $ | 1,469,085,962 | |
Class B(b) | | | 6,148 | | | | 124,354 | | | | 53,228 | | | | 1,029,356 | |
Class C | | | 3,686,590 | | | | 73,250,992 | | | | 12,129,887 | | | | 235,075,117 | |
Class R | | | 3,552,739 | | | | 71,570,802 | | | | 9,917,689 | | | | 196,514,334 | |
Class Y | | | 46,011,505 | | | | 929,419,492 | | | | 214,593,938 | | | | 4,224,691,102 | |
Investor Class | | | 2,089,174 | | | | 41,892,838 | | | | 5,057,606 | | | | 99,030,821 | |
Class R5 | | | 48,399,623 | | | | 956,945,773 | | | | 50,291,041 | | | | 985,430,188 | |
Class R6 | | | 92,419,916 | | | | 1,862,795,671 | | | | 203,344,265 | | | | 4,030,093,052 | |
| | | | |
Issued as reinvestment of dividends: | | | | | | | | | | | | | | | | |
Class A | | | 7,738,483 | | | | 155,261,455 | | | | 12,344,710 | | | | 240,902,638 | |
Class B(b) | | | 4,758 | | | | 95,535 | | | | 25,244 | | | | 485,276 | |
Class C | | | 765,384 | | | | 15,214,465 | | | | 1,345,778 | | | | 25,875,317 | |
Class R | | | 458,168 | | | | 9,229,628 | | | | 538,188 | | | | 10,541,545 | |
Class Y | | | 4,846,794 | | | | 97,341,228 | | | | 8,930,366 | | | | 174,828,820 | |
Investor Class | | | 2,694,174 | | | | 54,011,105 | | | | 4,310,879 | | | | 84,051,057 | |
Class R5 | | | 6,097,457 | | | | 122,210,853 | | | | 7,966,357 | | | | 155,655,406 | |
Class R6 | | | 10,519,733 | | | | 210,727,661 | | | | 7,642,194 | | | | 149,715,670 | |
| | | | |
Conversion of Class B shares to Class A shares:(c) | | | | | | | | | | | | | | | | |
Class A | | | 335,663 | | | | 7,082,493 | | | | 343,370 | | | | 6,781,802 | |
Class B | | | (340,970 | ) | | | (7,082,493 | ) | | | (347,375 | ) | | | (6,781,802 | ) |
| | | | |
Reacquired: | | | | | | | | | | | | | | | | |
Class A | | | (81,056,684 | ) | | | (1,627,034,684 | ) | | | (106,628,670 | ) | | | (2,104,350,344 | ) |
Class B(b) | | | (125,801 | ) | | | (2,562,986 | ) | | | (151,421 | ) | | | (2,936,078 | ) |
Class C | | | (13,749,672 | ) | | | (272,044,668 | ) | | | (13,191,725 | ) | | | (256,936,143 | ) |
Class R | | | (6,109,297 | ) | | | (123,283,727 | ) | | | (5,332,458 | ) | | | (105,816,763 | ) |
Class Y | | | (117,286,030 | ) | | | (2,354,644,663 | ) | | | (206,476,128 | ) | | | (4,096,071,214 | ) |
Investor Class | | | (16,686,410 | ) | | | (336,055,762 | ) | | | (16,949,114 | ) | | | (333,533,496 | ) |
Class R5 | | | (54,991,310 | ) | | | (1,109,045,307 | ) | | | (48,840,360 | ) | | | (964,528,959 | ) |
Class R6 | | | (115,191,624 | ) | | | (2,292,502,142 | ) | | | (35,840,069 | ) | | | (709,191,056 | ) |
Net increase (decrease) in share activity | | | (146,986,596 | ) | | $ | (2,936,659,001 | ) | | | 179,907,469 | | | $ | 3,509,641,608 | |
| (a) | There are entities that are record owners of more than 5% of the outstanding shares of the Fund and in the aggregate own 43% of the outstanding shares of the Fund. IDI has an agreement with these entities to sell Fund shares. The Fund, Invesco and/or Invesco affiliates may make payments to these entities, which are considered to be related to the Fund, for providing services to the Fund, Invesco and/or Invesco affiliates including but not limited to services such as securities brokerage, distribution, third party record keeping and account servicing. The Fund has no knowledge as to whether all or any portion of the shares owned of record by these entities are also owned beneficially. |
| (b) | Class B shares activity for the period November 1, 2017 through January 26, 2018 (date of conversion). |
| (c) | Effective as of close of business January 26, 2018, all outstanding Class B shares were converted to Class A shares. |
20 Invesco Diversified Dividend Fund
NOTE 13—Financial Highlights
The following schedule presents financial highlights for a share of the Fund outstanding throughout the periods indicated.
| | | | | | | | | | | | | | | | | | | | | | | | | | | | | | | | | | | | | | | | | | | | | | | | | | | | | | | | |
| | | Net asset
value,
beginning
of period | | | Net
investment
income(a) | | | Net gains
(losses)
on securities
(both
realized and
unrealized) | | | Total from
investment
operations | | | Dividends
from net
investment
income | | | Distributions
from net
realized
gains | | | Total
distributions | | | Net asset
value, end
of period | | | Total
return(b) | | | Net assets,
end of period
(000’s omitted) | | | Ratio of
expenses
to average
net assets
with fee waivers
and/or expenses
absorbed | | | Ratio of
expenses
to average net
assets without
fee waivers
and/or expenses
absorbed | | | Ratio of net
investment
income
to average
net assets | | | Portfolio
turnover(c) | |
Class A | | | | | | | | | | | | | | | | | | | | | | | | | | | | | | | | | | | | | | | | | | | | | | | | | | | | | | | | |
Year ended 10/31/18 | | $ | 20.18 | | | $ | 0.44 | | | $ | (0.49 | ) | | $ | (0.05 | ) | | $ | (0.43 | ) | | $ | (0.15 | ) | | $ | (0.58 | ) | | $ | 19.55 | | | | (0.28 | )% | | $ | 4,979,893 | | | | 0.79 | %(d) | | | 0.80 | %(d) | | | 2.17 | %(d) | | | 10 | % |
Year ended 10/31/17 | | | 18.83 | | | | 0.37 | | | | 1.79 | | | | 2.16 | | | | (0.34 | ) | | | (0.47 | ) | | | (0.81 | ) | | | 20.18 | | | | 11.65 | | | | 6,029,664 | | | | 0.80 | | | | 0.82 | | | | 1.85 | | | | 8 | |
Year ended 10/31/16 | | | 18.78 | | | | 0.33 | | | | 0.76 | | | | 1.09 | | | | (0.31 | ) | | | (0.73 | ) | | | (1.04 | ) | | | 18.83 | | | | 6.27 | | | | 5,985,548 | | | | 0.80 | | | | 0.82 | | | | 1.79 | | | | 11 | |
Year ended 10/31/15 | | | 18.17 | | | | 0.30 | | | | 0.95 | | | | 1.25 | | | | (0.28 | ) | | | (0.36 | ) | | | (0.64 | ) | | | 18.78 | | | | 7.09 | | | | 4,715,635 | | | | 0.82 | | | | 0.83 | | | | 1.63 | | | | 11 | |
Year ended 10/31/14 | | | 16.52 | | | | 0.28 | | | | 1.78 | | | | 2.06 | | | | (0.25 | ) | | | (0.16 | ) | | | (0.41 | ) | | | 18.17 | | | | 12.68 | | | | 4,206,935 | | | | 0.83 | | | | 0.84 | | | | 1.59 | | | | 6 | |
Class B | | | | | | | | | | | | | | | | | | | | | | | | | | | | | | | | | | | | | | | | | | | | | | | | | | | | | | | | |
Year ended 10/31/18(e) | | | 19.94 | | | | 0.07 | | | | 1.05 | | | | 1.12 | | | | (0.09 | ) | | | (0.15 | ) | | | (0.24 | ) | | | 20.82 | | | | 5.70 | | | | — | | | | 1.54 | (d)(f) | | | 1.55 | (d)(f) | | | 1.42 | (d)(f) | | | 10 | |
Year ended 10/31/17 | | | 18.61 | | | | 0.21 | | | | 1.78 | | | | 1.99 | | | | (0.19 | ) | | | (0.47 | ) | | | (0.66 | ) | | | 19.94 | | | | 10.83 | | | | 9,092 | | | | 1.55 | | | | 1.57 | | | | 1.10 | | | | 8 | |
Year ended 10/31/16 | | | 18.58 | | | | 0.19 | | | | 0.74 | | | | 0.93 | | | | (0.17 | ) | | | (0.73 | ) | | | (0.90 | ) | | | 18.61 | | | | 5.41 | | | | 16,309 | | | | 1.55 | | | | 1.57 | | | | 1.04 | | | | 11 | |
Year ended 10/31/15 | | | 17.97 | | | | 0.16 | | | | 0.95 | | | | 1.11 | | | | (0.14 | ) | | | (0.36 | ) | | | (0.50 | ) | | | 18.58 | | | | 6.35 | | | | 22,845 | | | | 1.57 | | | | 1.58 | | | | 0.88 | | | | 11 | |
Year ended 10/31/14 | | | 16.35 | | | | 0.14 | | | | 1.76 | | | | 1.90 | | | | (0.12 | ) | | | (0.16 | ) | | | (0.28 | ) | | | 17.97 | | | | 11.77 | | | | 29,691 | | | | 1.58 | | | | 1.59 | | | | 0.84 | | | | 6 | |
Class C | | | | | | | | | | | | | | | | | | | | | | | | | | | | | | | | | | | | | | | | | | | | | | | | | | | | | | | | |
Year ended 10/31/18 | | | 19.92 | | | | 0.28 | | | | (0.47 | ) | | | (0.19 | ) | | | (0.28 | ) | | | (0.15 | ) | | | (0.43 | ) | | | 19.30 | | | | (1.01 | ) | | | 634,394 | | | | 1.54 | (d) | | | 1.55 | (d) | | | 1.42 | (d) | | | 10 | |
Year ended 10/31/17 | | | 18.59 | | | | 0.21 | | | | 1.77 | | | | 1.98 | | | | (0.18 | ) | | | (0.47 | ) | | | (0.65 | ) | | | 19.92 | | | | 10.84 | | | | 840,125 | | | | 1.55 | | | | 1.57 | | | | 1.10 | | | | 8 | |
Year ended 10/31/16 | | | 18.56 | | | | 0.19 | | | | 0.74 | | | | 0.93 | | | | (0.17 | ) | | | (0.73 | ) | | | (0.90 | ) | | | 18.59 | | | | 5.41 | | | | 778,829 | | | | 1.55 | | | | 1.57 | | | | 1.04 | | | | 11 | |
Year ended 10/31/15 | | | 17.95 | | | | 0.16 | | | | 0.95 | | | | 1.11 | | | | (0.14 | ) | | | (0.36 | ) | | | (0.50 | ) | | | 18.56 | | | | 6.36 | | | | 440,482 | | | | 1.57 | | | | 1.58 | | | | 0.88 | | | | 11 | |
Year ended 10/31/14 | | | 16.33 | | | | 0.14 | | | | 1.76 | | | | 1.90 | | | | (0.12 | ) | | | (0.16 | ) | | | (0.28 | ) | | | 17.95 | | | | 11.79 | | | | 348,340 | | | | 1.58 | | | | 1.59 | | | | 0.84 | | | | 6 | |
Class R | | | | | | | | | | | | | | | | | | | | | | | | | | | | | | | | | | | | | | | | | | | | | | | | | | | | | | | | |
Year ended 10/31/18 | | | 20.24 | | | | 0.39 | | | | (0.49 | ) | | | (0.10 | ) | | | (0.38 | ) | | | (0.15 | ) | | | (0.53 | ) | | | 19.61 | | | | (0.52 | ) | | | 306,070 | | | | 1.04 | (d) | | | 1.05 | (d) | | | 1.92 | (d) | | | 10 | |
Year ended 10/31/17 | | | 18.88 | | | | 0.32 | | | | 1.80 | | | | 2.12 | | | | (0.29 | ) | | | (0.47 | ) | | | (0.76 | ) | | | 20.24 | | | | 11.40 | | | | 358,418 | | | | 1.05 | | | | 1.07 | | | | 1.60 | | | | 8 | |
Year ended 10/31/16 | | | 18.84 | | | | 0.28 | | | | 0.75 | | | | 1.03 | | | | (0.26 | ) | | | (0.73 | ) | | | (0.99 | ) | | | 18.88 | | | | 5.93 | | | | 237,638 | | | | 1.05 | | | | 1.07 | | | | 1.54 | | | | 11 | |
Year ended 10/31/15 | | | 18.22 | | | | 0.26 | | | | 0.96 | | | | 1.22 | | | | (0.24 | ) | | | (0.36 | ) | | | (0.60 | ) | | | 18.84 | | | | 6.87 | | | | 204,956 | | | | 1.07 | | | | 1.08 | | | | 1.38 | | | | 11 | |
Year ended 10/31/14 | | | 16.57 | | | | 0.23 | | | | 1.79 | | | | 2.02 | | | | (0.21 | ) | | | (0.16 | ) | | | (0.37 | ) | | | 18.22 | | | | 12.36 | | | | 138,078 | | | | 1.08 | | | | 1.09 | | | | 1.34 | | | | 6 | |
Class Y | | | | | | | | | | | | | | | | | | | | | | | | | | | | | | | | | | | | | | | | | | | | | | | | | | | | | | | | |
Year ended 10/31/18 | | | 20.20 | | | | 0.49 | | | | (0.49 | ) | | | 0.00 | | | | (0.48 | ) | | | (0.15 | ) | | | (0.63 | ) | | | 19.57 | | | | (0.03 | ) | | | 2,844,688 | | | | 0.54 | (d) | | | 0.55 | (d) | | | 2.42 | (d) | | | 10 | |
Year ended 10/31/17 | | | 18.85 | | | | 0.42 | | | | 1.79 | | | | 2.21 | | | | (0.39 | ) | | | (0.47 | ) | | | (0.86 | ) | | | 20.20 | | | | 11.93 | | | | 4,278,325 | | | | 0.55 | | | | 0.57 | | | | 2.10 | | | | 8 | |
Year ended 10/31/16 | | | 18.80 | | | | 0.38 | | | | 0.75 | | | | 1.13 | | | | (0.35 | ) | | | (0.73 | ) | | | (1.08 | ) | | | 18.85 | | | | 6.53 | | | | 3,670,662 | | | | 0.55 | | | | 0.57 | | | | 2.04 | | | | 11 | |
Year ended 10/31/15 | | | 18.19 | | | | 0.35 | | | | 0.95 | | | | 1.30 | | | | (0.33 | ) | | | (0.36 | ) | | | (0.69 | ) | | | 18.80 | | | | 7.36 | | | | 1,183,312 | | | | 0.57 | | | | 0.58 | | | | 1.88 | | | | 11 | |
Year ended 10/31/14 | | | 16.54 | | | | 0.32 | | | | 1.79 | | | | 2.11 | | | | (0.30 | ) | | | (0.16 | ) | | | (0.46 | ) | | | 18.19 | | | | 12.95 | | | | 841,750 | | | | 0.58 | | | | 0.59 | | | | 1.84 | | | | 6 | |
Investor Class | | | | | | | | | | | | | | | | | | | | | | | | | | | | | | | | | | | | | | | | | | | | | | | | | | | | | | | | |
Year ended 10/31/18 | | | 20.16 | | | | 0.45 | | | | (0.48 | ) | | | (0.03 | ) | | | (0.44 | ) | | | (0.15 | ) | | | (0.59 | ) | | | 19.54 | | | | (0.19 | )(g) | | | 1,815,421 | | | | 0.74 | (d)(g) | | | 0.75 | (d)(g) | | | 2.22 | (d)(g) | | | 10 | |
Year ended 10/31/17 | | | 18.81 | | | | 0.37 | | | | 1.79 | | | | 2.16 | | | | (0.34 | ) | | | (0.47 | ) | | | (0.81 | ) | | | 20.16 | | | | 11.69 | (g) | | | 2,113,750 | | | | 0.75 | (g) | | | 0.77 | (g) | | | 1.90 | (g) | | | 8 | |
Year ended 10/31/16 | | | 18.77 | | | | 0.33 | | | | 0.76 | | | | 1.09 | | | | (0.32 | ) | | | (0.73 | ) | | | (1.05 | ) | | | 18.81 | | | | 6.29 | (g) | | | 2,114,404 | | | | 0.76 | (g) | | | 0.78 | (g) | | | 1.83 | (g) | | | 11 | |
Year ended 10/31/15 | | | 18.16 | | | | 0.31 | | | | 0.96 | | | | 1.27 | | | | (0.30 | ) | | | (0.36 | ) | | | (0.66 | ) | | | 18.77 | | | | 7.16 | (g) | | | 2,002,938 | | | | 0.80 | (g) | | | 0.81 | (g) | | | 1.65 | (g) | | | 11 | |
Year ended 10/31/14 | | | 16.51 | | | | 0.29 | | | | 1.78 | | | | 2.07 | | | | (0.26 | ) | | | (0.16 | ) | | | (0.42 | ) | | | 18.16 | | | | 12.70 | (g) | | | 1,972,400 | | | | 0.76 | (g) | | | 0.77 | (g) | | | 1.66 | (g) | | | 6 | |
Class R5 | | | | | | | | | | | | | | | | | | | | | | | | | | | | | | | | | | | | | | | | | | | | | | | | | | | | | | | | |
Year ended 10/31/18 | | | 20.18 | | | | 0.50 | | | | (0.49 | ) | | | 0.01 | | | | (0.49 | ) | | | (0.15 | ) | | | (0.64 | ) | | | 19.55 | | | | 0.02 | | | | 3,715,586 | | | | 0.50 | (d) | | | 0.51 | (d) | | | 2.46 | (d) | | | 10 | |
Year ended 10/31/17 | | | 18.83 | | | | 0.43 | | | | 1.79 | | | | 2.22 | | | | (0.40 | ) | | | (0.47 | ) | | | (0.87 | ) | | | 20.18 | | | | 11.99 | | | | 3,845,848 | | | | 0.49 | | | | 0.51 | | | | 2.16 | | | | 8 | |
Year ended 10/31/16 | | | 18.78 | | | | 0.39 | | | | 0.76 | | | | 1.15 | | | | (0.37 | ) | | | (0.73 | ) | | | (1.10 | ) | | | 18.83 | | | | 6.59 | | | | 3,410,571 | | | | 0.50 | | | | 0.52 | | | | 2.09 | | | | 11 | |
Year ended 10/31/15 | | | 18.17 | | | | 0.36 | | | | 0.95 | | | | 1.31 | | | | (0.34 | ) | | | (0.36 | ) | | | (0.70 | ) | | | 18.78 | | | | 7.41 | | | | 2,385,096 | | | | 0.53 | | | | 0.54 | | | | 1.92 | | | | 11 | |
Year ended 10/31/14 | | | 16.52 | | | | 0.33 | | | | 1.78 | | | | 2.11 | | | | (0.30 | ) | | | (0.16 | ) | | | (0.46 | ) | | | 18.17 | | | | 12.99 | | | | 1,947,461 | | | | 0.54 | | | | 0.55 | | | | 1.88 | | | | 6 | |
Class R6 | | | | | | | | | | | | | | | | | | | | | | | | | | | | | | | | | | | | | | | | | | | | | | | | | | | | | | | | |
Year ended 10/31/18 | | | 20.19 | | | | 0.51 | | | | (0.49 | ) | | | 0.02 | | | | (0.51 | ) | | | (0.15 | ) | | | (0.66 | ) | | | 19.55 | | | | 0.07 | | | | 5,905,494 | | | | 0.40 | (d) | | | 0.41 | (d) | | | 2.56 | (d) | | | 10 | |
Year ended 10/31/17 | | | 18.83 | | | | 0.45 | | | | 1.79 | | | | 2.24 | | | | (0.41 | ) | | | (0.47 | ) | | | (0.88 | ) | | | 20.19 | | | | 12.15 | | | | 6,344,022 | | | | 0.39 | | | | 0.41 | | | | 2.26 | | | | 8 | |
Year ended 10/31/16 | | | 18.79 | | | | 0.41 | | | | 0.74 | | | | 1.15 | | | | (0.38 | ) | | | (0.73 | ) | | | (1.11 | ) | | | 18.83 | | | | 6.63 | | | | 2,620,298 | | | | 0.40 | | | | 0.42 | | | | 2.19 | | | | 11 | |
Year ended 10/31/15 | | | 18.17 | | | | 0.37 | | | | 0.97 | | | | 1.34 | | | | (0.36 | ) | | | (0.36 | ) | | | (0.72 | ) | | | 18.79 | | | | 7.57 | | | | 849,176 | | | | 0.43 | | | | 0.44 | | | | 2.02 | | | | 11 | |
Year ended 10/31/14 | | | 16.52 | | | | 0.35 | | | | 1.78 | | | | 2.13 | | | | (0.32 | ) | | | (0.16 | ) | | | (0.48 | ) | | | 18.17 | | | | 13.10 | | | | 937,485 | | | | 0.44 | | | | 0.45 | | | | 1.98 | | | | 6 | |
| (a) | Calculated using average shares outstanding. |
| (b) | Includes adjustments in accordance with accounting principles generally accepted in the United States of America and as such, the net asset value for financial reporting purposes and the returns based upon those net asset values may differ from the net asset value and returns for shareholder transactions. Does not include sales charges and is not annualized for periods less than one year, if applicable. |
| (c) | Portfolio turnover is calculated at the fund level and is not annualized for periods less than one year, if applicable. |
| (d) | Ratios are based on average daily net assets (000’s omitted) of $5,613,083, $8,359, $751,406, $342,749, $3,606,831, $1,970,427, $3,969,096 and $6,568,713 for Class A, Class B, Class C, Class R, Class Y, Investor Class, Class R5 and Class R6 shares, respectively. |
| (e) | Reflects activity for the period November 1, 2017 through January 26, 2018 (date of conversion). |
| (g) | The total return, ratio of expenses to average net assets and ratio of net investment income to average net assets reflect actual 12b-1 fees of 0.20%, 0.20%, 0.21%, 0.23% and 0.18% for the years ended October 31, 2018, 2017, 2016, 2015 and 2014, respectively. |
21 Invesco Diversified Dividend Fund
Report of Independent Registered Public Accounting Firm
To the Board of Trustees of AIM Equity Funds (Invesco Equity Funds)
and Shareholders of Invesco Diversified Dividend Fund:
Opinion on the Financial Statements
We have audited the accompanying statement of assets and liabilities, including the schedule of investments, of Invesco Diversified Dividend Fund (one of the funds constituting AIM Equity Funds (Invesco Equity Funds), hereafter referred to as the “Fund”) as of October 31, 2018, the related statement of operations for the year ended October 31, 2018, the statement of changes in net assets for each of the two years in the period ended October 31, 2018, including the related notes, and the financial highlights for each of the periods indicated therein (collectively referred to as the financial statements). In our opinion, the financial statements present fairly, in all material respects, the financial position of the Fund as of October 31, 2018, the results of its operations for the year then ended, the changes in its net assets for each of the two years in the period ended October 31, 2018 and the financial highlights for each of the periods indicated therein in conformity with accounting principles generally accepted in the United States of America.
Basis for Opinion
These financial statements are the responsibility of the Fund’s management. Our responsibility is to express an opinion on the Fund’s financial statements based on our audits. We are a public accounting firm registered with the Public Company Accounting Oversight Board (United States) (PCAOB) and are required to be independent with respect to the Fund in accordance with the U.S. federal securities laws and the applicable rules and regulations of the Securities and Exchange Commission and the PCAOB.
We conducted our audits of these financial statements in accordance with the standards of the PCAOB. Those standards require that we plan and perform the audit to obtain reasonable assurance about whether the financial statements are free of material misstatement, whether due to error or fraud.
Our audits included performing procedures to assess the risks of material misstatement of the financial statements, whether due to error or fraud, and performing procedures that respond to those risks. Such procedures included examining, on a test basis, evidence regarding the amounts and disclosures in the financial statements. Our audits also included evaluating the accounting principles used and significant estimates made by management, as well as evaluating the overall presentation of the financial statements. Our procedures included confirmation of securities owned as of October 31, 2018 by correspondence with the custodian, transfer agent and brokers; when replies were not received from brokers, we performed other auditing procedures. We believe that our audits provide a reasonable basis for our opinion.
PricewaterhouseCoopers LLP
Houston, TX
December 28, 2018
We have served as the auditor of one or more of the investment companies in the Invesco group of investment companies since at least 1995. We have not been able to determine the specific year we began serving as auditor.
22 Invesco Diversified Dividend Fund
Calculating your ongoing Fund expenses
Example
As a shareholder of the Fund, you incur two types of costs: (1) transaction costs, which may include sales charges (loads) on purchase payments or contingent deferred sales charges on redemptions, if any; and (2) ongoing costs, including management fees, distribution and/or service (12b-1) fees, and other Fund expenses. This example is intended to help you understand your ongoing costs (in dollars) of investing in the Fund and to compare these costs with ongoing costs of investing in other mutual funds. The example is based on an investment of $1,000 invested at the beginning of the period and held for the entire period May 1, 2018 through October 31, 2018.
Actual expenses
The table below provides information about actual account values and actual expenses. You may use the information in this table, together with the amount you invested, to estimate the expenses that you paid over the period. Simply divide your account value by $1,000 (for example, an $8,600 account value divided by $1,000 = 8.6), then multiply the result by the number in the table under the heading entitled “Actual Expenses Paid During Period” to estimate the expenses you paid on your account during this period.
Hypothetical example for comparison purposes
The table below also provides information about hypothetical account values and hypothetical expenses based on the Fund’s actual expense ratio and an assumed rate of return of 5% per year before expenses, which is not the Fund’s actual return.
The hypothetical account values and expenses may not be used to estimate the actual ending account balance or expenses you paid for the period. You may use this information to compare the ongoing costs of investing in the Fund and other funds. To do so, compare this 5% hypothetical example with the 5% hypothetical examples that appear in the shareholder reports of the other funds.
Please note that the expenses shown in the table are meant to highlight your ongoing costs only and do not reflect any transaction costs, such as sales charges (loads) on purchase payments or contingent deferred sales charges on redemptions, if any. Therefore, the hypothetical information is useful in comparing ongoing costs only, and will not help you determine the relative total costs of owning different funds. In addition, if these transaction costs were included, your costs would have been higher.
| | | | | | | | | | | | | | | | | | | | | | | | |
| Class | | Beginning
Account Value
(05/01/18) | | | ACTUAL | | | HYPOTHETICAL (5% annual return before
expenses) | | | Annualized
Expense
Ratio | |
| | Ending
Account Value
(10/31/18)1 | | | Expenses
Paid During
Period2 | | | Ending
Account Value
(10/31/18) | | | Expenses
Paid During
Period2 | |
A | | $ | 1,000.00 | | | $ | 1,001.40 | | | $ | 3.99 | | | $ | 1,021.22 | | | $ | 4.02 | | | | 0.79 | % |
C | | | 1,000.00 | | | | 998.00 | | | | 7.76 | | | | 1,017.44 | | | | 7.83 | | | | 1.54 | |
R | | | 1,000.00 | | | | 1,000.10 | | | | 5.24 | | | | 1,019.96 | | | | 5.30 | | | | 1.04 | |
Y | | | 1,000.00 | | | | 1,002.60 | | | | 2.73 | | | | 1,022.48 | | | | 2.75 | | | | 0.54 | |
Investor | | | 1,000.00 | | | | 1,002.10 | | | | 3.48 | | | | 1,021.73 | | | | 3.52 | | | | 0.69 | |
R5 | | | 1,000.00 | | | | 1,002.90 | | | | 2.52 | | | | 1,022.68 | | | | 2.55 | | | | 0.50 | |
| R6 | | | 1,000.00 | | | | 1,003.30 | | | | 2.07 | | | | 1,023.14 | | | | 2.09 | | | | 0.41 | |
| 1 | The actual ending account value is based on the actual total return of the Fund for the period May 1, 2018 through October 31, 2018, after actual expenses and will differ from the hypothetical ending account value which is based on the Fund’s expense ratio and a hypothetical annual return of 5% before expenses. |
| 2 | Expenses are equal to the Fund’s annualized expense ratio as indicated above multiplied by the average account value over the period, multiplied by 184/365 to reflect the most recent fiscal half year. |
23 Invesco Diversified Dividend Fund
Approval of Investment Advisory and Sub-Advisory Contracts
At meetings held on June 5-6, 2018, the Board of Trustees (the Board or the Trustees) of AIM Equity Funds (Invesco Equity Funds) as a whole, and the independent Trustees, who comprise over 75% of the Board, voting separately, approved the continuance of the Invesco Diversified Dividend Fund’s (the Fund) Master Investment Advisory Agreement with Invesco Advisers, Inc. (Invesco Advisers and the investment advisory agreement) and the Master Intergroup Sub-Advisory Contract for Mutual Funds with Invesco Asset Management Deutschland GmbH, Invesco Asset Management Limited, Invesco Asset Management (Japan) Limited, Invesco Hong Kong Limited, Invesco Senior Secured Management, Inc. and Invesco Canada Ltd. (collectively, the Affiliated Sub-Advisers and the sub-advisory contracts) for another year, effective July 1, 2018. After evaluating the factors discussed below, among others, the Board approved the renewal of the Fund’s investment advisory agreement and the sub-advisory contracts and determined that the compensation payable by the Fund to Invesco Advisers and by Invesco Advisers to the Affiliated Sub-Advisers is fair and reasonable.
The Board’s Evaluation Process
The Board’s Investments Committee has established three Sub-Committees, which meet throughout the year to review the performance of funds advised by Invesco Advisers (the Invesco Funds). Over the course of each year, the Sub-Committees meet with portfolio managers for their assigned Invesco Funds and other members of management to review detailed information about investment performance and portfolio attributes of these funds. The Board took into account evaluations and reports that it received from the Investments Committee and Sub-Committees, as well as the information provided to such committees and the Board throughout the year, in considering whether to approve each Invesco Fund’s investment advisory agreement and sub-advisory contracts.
As part of the contract renewal process, the Board reviews and considers information provided in response to detailed requests for information submitted to management by the independent Trustees with assistance from legal counsel to the independent Trustees. The Board receives comparative investment performance and fee data regarding the Invesco Funds prepared by Invesco Advisers and Broadridge Financial Solutions, Inc. (Broadridge), an independent mutual fund data provider. The Board also receives an independent written evaluation from the Senior Officer, an officer of the Invesco Funds who reports directly to the independent Trustees. The Senior Officer’s evaluation is prepared as part of his responsibility to manage the process by which the Invesco Funds’ proposed management fees
are negotiated during the annual contract renewal process to ensure they are negotiated in a manner that is at arms’ length and reasonable. In addition to meetings with Invesco Advisers and fund counsel throughout the year, the independent Trustees also discuss the continuance of the investment advisory agreement and sub-advisory contracts in separate sessions with the Senior Officer and with independent legal counsel.
The discussion below is a summary of the Senior Officer’s independent written evaluation with respect to the Fund’s investment advisory agreement, as well as a discussion of the material factors and related conclusions that formed the basis for the Board’s approval of the Fund’s investment advisory agreement and sub-advisory contracts. The Trustees’ review and conclusions are based on the comprehensive consideration of all information presented to them during the course of the year and in prior years and are not the result of any single determinative factor. Moreover, one Trustee may have weighed a particular piece of information or factor differently than another Trustee. This information is current as of June 6, 2018.
Factors and Conclusions and Summary of Independent Written Fee Evaluation
| A. | Nature, Extent and Quality of Services Provided by Invesco Advisers and the Affiliated Sub-Advisers |
The Board reviewed the nature, extent and quality of the advisory services provided to the Fund by Invesco Advisers under the Fund’s investment advisory agreement, and the credentials and experience of the officers and employees of Invesco Advisers who provide these services, including the Fund’s portfolio manager(s). The Board’s review included consideration of Invesco Advisers’ investment process oversight and structure, credit analysis and investment risk management. The Board also considered non-advisory services that Invesco Advisers and its affiliates provide to the Invesco Funds such as various back office support functions, third party oversight, internal audit, valuation, portfolio trading and legal and compliance. The Board also reviewed and considered the benefits to shareholders of investing in a fund that is part of the Invesco family of funds under the umbrella of Invesco Ltd., Invesco Advisers’ parent company, and noted Invesco Ltd.’s depth and experience in conducting an investment management business, as well as its commitment of financial and other resources to such business. The Board concluded that the nature, extent and quality of the services provided to the Fund by Invesco Advisers are appropriate and satisfactory.
The Board reviewed the services that may be provided by the Affiliated Sub-Advisers under
the sub-advisory contracts and the credentials and experience of the officers and employees of the Affiliated Sub-Advisers who provide these services. The Board noted the Affiliated Sub-Advisers’ expertise with respect to certain asset classes and that the Affiliated Sub-Advisers have offices and personnel that are located in financial centers around the world. As a result, the Board noted that the Affiliated Sub-Advisers can provide research and investment analysis on the markets and economies of various countries in which the Fund may invest, make recommendations regarding securities and assist with security trades. The Board concluded that the sub-advisory contracts may benefit the Fund and its shareholders by permitting Invesco Advisers to use the resources and talents of the Affiliated Sub-Advisers in managing the Fund. The Board concluded that the nature, extent and quality of the services that may be provided by the Affiliated Sub-Advisers are appropriate and satisfactory.
| B. | Fund Investment Performance |
The Board considered Fund investment performance as a relevant factor in considering whether to approve the investment advisory agreement. The Board did not view Fund investment performance as a relevant factor in considering whether to approve the sub-advisory contracts for the Fund, as no Affiliated Sub-Adviser currently manages assets of the Fund.
The Board compared the Fund’s investment performance over multiple time periods ending December 31, 2017 to the performance of funds in the Broadridge performance universe and against the Lipper Large-Cap Value Funds Index. The Board noted that performance of Class A shares of the Fund was in the fifth quintile of its performance universe for the one year period and the fourth quintile for the three and five year periods (the first quintile being the best performing funds and the fifth quintile being the worst performing funds). The Board noted that performance of Class A shares of the Fund was below the performance of the Index for the one, three and five year periods. The Board noted that the Fund’s overweight exposure to certain defensive sectors and underweight exposure to certain cyclically-oriented sectors, as well as its cash position, negatively impacted performance. The Trustees also reviewed more recent Fund performance and this review did not change their conclusions.
| C. | Advisory and Sub-Advisory Fees and Fund Expenses |
The Board compared the Fund’s contractual management fee rate to the contractual management fee rates of funds in the Fund’s Broadridge expense group. The Board noted that the contractual management fee rate for Class A shares of the Fund was below the
24 Invesco Diversified Dividend Fund
median contractual management fee rate of funds in its expense group. The Board noted that the term “contractual management fee” for funds in the expense group may include both advisory and certain non-portfolio management administrative services fees, but that Broadridge does not provide information on a fund by fund basis as to what is included. The Board also reviewed the methodology used by Broadridge in providing expense group information, which includes using each fund’s contractual management fee schedule (including any applicable breakpoints) as reported in the most recent prospectus or statement of additional information for each fund in the expense group. The Board also considered comparative information regarding the Fund’s total expense ratio and its various components.
The Board noted that Invesco Advisers has contractually agreed to waive fees and/or limit expenses of the Fund in an amount necessary to limit total annual operating expenses to a specified percentage of average daily net assets for each class of the Fund.
The Board also considered the fees charged by Invesco Advisers and the Affiliated Sub-Advisers to other similarly managed client accounts. The Board noted that Invesco Advisers or the Affiliated Sub-Advisers may charge lower fees to large institutional clients. Invesco Advisers reviewed with the Board differences in the scope of services it provides to the Invesco Funds relative to certain other types of client accounts, including management of cash flows as a result of redemptions and purchases, necessary infrastructure such as officers, office space, technology, legal and distribution, oversight of service providers, costs and business risks associated with launching new funds and sponsoring and maintaining the product line, preparation of annual registration statement updates and financial information and compliance with federal and state laws and regulations.
The Board also compared the Fund’s effective advisory fee rate (the advisory fee rate after advisory fee waivers and before other expense limitations/waivers) to the effective advisory fee rates of other similarly managed third-party mutual funds advised or sub-advised by Invesco Advisers and its affiliates, based on asset balances as of December 31, 2017.
The Board also considered the services that may be provided by the Affiliated Sub-Advisers pursuant to the sub-advisory contracts, as well as the fees payable by Invesco Advisers to the Affiliated Sub-Advisers pursuant to the sub-advisory contracts.
| D. | Economies of Scale and Breakpoints |
The Board considered the extent to which there may be economies of scale in the provision of advisory services to the Fund. The Board also considered that the Fund benefits from economies of scale through contractual breakpoints in the Fund’s advisory fee schedule, which generally operate to reduce the Fund’s
expense ratio as it grows in size. The Board noted that the Fund shares directly in economies of scale through lower fees charged by third party service providers based on the combined size of the Invesco Funds. The Board noted that the Fund may also benefit from economies of scale through initial fee setting, fee waivers and expense reimbursements.
| E. | Profitability and Financial Resources |
The Board reviewed information from Invesco Advisers concerning the costs of the advisory and other services that Invesco Advisers and its affiliates provide to the Fund and the Invesco Funds and the profitability of Invesco Advisers and its affiliates in providing these services. The Board considered the methodology used for calculating profitability and noted the periodic review of such methodology by an independent consultant. The Board noted that Invesco Advisers continues to operate at a net profit from services Invesco Advisers and its affiliates provide to the Invesco Funds and the Fund. The Board did not deem the level of profits realized by Invesco Advisers and its affiliates from providing services to the Fund to be excessive given the nature, extent and quality of the services provided. The Board received information from Invesco Advisers demonstrating that Invesco Advisers and the Affiliated Sub-Advisers are financially sound and have the resources necessary to perform their obligations under the investment advisory agreement and sub-advisory contracts.
| F. | Collateral Benefits to Invesco Advisers and its Affiliates |
The Board considered various other benefits received by Invesco Advisers and its affiliates from the relationship with the Fund, including the fees received for providing administrative, transfer agency and distribution services to the Fund. The Board considered comparative information regarding fees charged for these services, including information provided by Broadridge and other independent sources. The Board considered the performance of Invesco Advisers and its affiliates in providing these services and the organizational structure employed to provide these services. The Board also considered that these services are provided to the Fund pursuant to written contracts that are reviewed and approved on an annual basis by the Board; and that the services are required for the operation of the Fund.
The Board considered the benefits realized by Invesco Advisers and the Affiliated Sub-Advisers as a result of portfolio brokerage transactions executed through “soft dollar” arrangements. The Board noted that soft dollar arrangements may result in the Fund bearing costs to purchase research that may be used by Invesco Advisers or the Affiliated Sub-Advisers with other clients and may reduce Invesco Advisers’ or the Affiliated Sub-Advisers’ expenses. The Board also considered that it receives periodic reports from Invesco representing that these arrangements are consistent with regulatory
requirements. The Board did not deem the soft dollar arrangements to be inappropriate.
The Board considered that the Fund’s uninvested cash and cash collateral from any securities lending arrangements may be invested in money market funds advised by Invesco Advisers pursuant to procedures approved by the Board. The Board noted that Invesco Advisers receives advisory fees from these affiliated money market funds attributable to such investments, although Invesco Advisers has contractually agreed to waive through varying periods the advisory fees payable by the Invesco Funds with respect to certain investments in the affiliated money market funds. The waiver is in an amount equal to 100% of the net advisory fee Invesco Advisers receives from the affiliated money market funds with respect to the Fund’s investment in the affiliated money market funds of uninvested cash, but not cash collateral. The Board concluded that the amount of advisory fees received by Invesco Advisers from the Fund’s investment of cash collateral from any securities lending arrangements in the affiliated money market funds is fair and reasonable.
The Board also considered that an affiliated broker receives commissions for executing certain trades for the Fund. Invesco Advisers and the Affiliated Sub-Advisers use the affiliated broker to, among other things, control order routing and minimize information leakage, and the Board was advised that such trades are executed in compliance with rules under the federal securities laws and consistent with best execution obligations.
25 Invesco Diversified Dividend Fund
Tax Information
Form 1099-DIV, Form 1042-S and other year-end tax information provide shareholders with actual calendar year amounts that should be included in their tax returns. Shareholders should consult their tax advisors.
The following distribution information is being provided as required by the Internal Revenue Code or to meet a specific state’s requirement.
The Fund designates the following amounts or, if subsequently determined to be different, the maximum amount allowable for its fiscal year ended October 31, 2018:
| | | | |
Federal and State Income Tax | |
Long-Term Capital Gain Distributions | | $ | 171,096,919 | |
Qualified Dividend Income* | | | 100.00 | % |
Corporate Dividends Received Deduction* | | | 95.56 | % |
U.S. Treasury Obligations* | | | 0.00 | % |
| | * | The above percentages are based on ordinary income dividends paid to shareholders during the Fund’s fiscal year. |
26 Invesco Diversified Dividend Fund
Trustees and Officers
The address of each trustee and officer is AIM Equity Funds (Invesco Equity Funds) (the “Trust”), 11 Greenway Plaza, Suite 1000, Houston, Texas 77046-1173. The trustees serve for the life of the Trust, subject to their earlier death, incapacitation, resignation, retirement or removal as more specifically provided in the Trust’s organizational documents. Each officer serves for a one year term or until their successors are elected and qualified. Column two below includes length of time served with predecessor entities, if any.
| | | | | | | | |
Name, Year of Birth and Position(s) Held with the Trust | | Trustee and/
or Officer Since | | Principal Occupation(s)
During Past 5 Years | | Number of
Funds in Fund Complex Overseen by Trustee | | Other Directorship(s)
Held by Trustee During Past 5 Years |
| Interested Persons | | | | | | | | |
| Martin L. Flanagan1 — 1960 Trustee | | 2007 | | Executive Director, Chief Executive Officer and President, Invesco Ltd. (ultimate parent of Invesco and a global investment management firm); Trustee, The Invesco Funds; Vice Chair, Investment Company Institute; and Member of Executive Board, SMU Cox School of Business Formerly: Advisor to the Board, Invesco Advisers, Inc. (formerly known as Invesco Institutional (N.A.), Inc.); Chairman and Chief Executive Officer, Invesco Advisers, Inc. (registered investment adviser); Director, Chairman, Chief Executive Officer and President, Invesco Holding Company (US), Inc. (formerly IVZ Inc.) (holding company), Invesco Group Services, Inc. (service provider) and Invesco North American Holdings, Inc. (holding company); Director, Chief Executive Officer and President, Invesco Holding Company Limited (parent of Invesco and a global investment management firm); Director, Invesco Ltd.; Chairman, Investment Company Institute and President, Co-Chief Executive Officer, Co-President, Chief Operating Officer and Chief Financial Officer, Franklin Resources, Inc. (global investment management organization) | | 158 | | None |
Philip A. Taylor2 — 1954 Trustee and Senior Vice President | | 2006 | | Head of the Americas and Senior Managing Director, Invesco Ltd.; Director, Invesco Advisers, Inc. (formerly known as Invesco Institutional (N.A.), Inc.) (registered investment adviser); Director and Chairman, Invesco Investment Services, Inc. (formerly known as Invesco AIM Investment Services, Inc.) (registered transfer agent); Chief Executive Officer, Invesco Corporate Class Inc. (corporate mutual fund company); Director, Chairman and Chief Executive Officer, Invesco Canada Ltd. (formerly known as Invesco Trimark Ltd./Invesco Trimark Ltèe) (registered investment adviser and registered transfer agent); Trustee and Senior Vice President, The Invesco Funds; Director, Invesco Investment Advisers LLC (formerly known as Van Kampen Asset Management) Formerly: Director, Chairman, Chief Executive Officer and President, Invesco Management Group, Inc. (formerly known as Invesco AIM Management Group, Inc.) (financial services holding company); Co-Chairman, Co-President and Co-Chief Executive Officer, Invesco Advisers, Inc. (formerly known as Invesco Institutional (N.A.), Inc.) (registered investment adviser); Director, Chief Executive Officer and President, Van Kampen Exchange Corp; President and Principal Executive Officer, The Invesco Funds (other than AIM Treasurer’s Series Trust (Invesco Treasurer’s Series Trust), Short-Term Investments Trust and Invesco Management Trust); Executive Vice President, The Invesco Funds (AIM Treasurer’s Series Trust (Invesco Treasurer’s Series Trust), Short-Term Investments Trust and Invesco Management Trust only); Director and President, INVESCO Funds Group, Inc. (registered investment adviser and registered transfer agent); Director and Chairman, IVZ Distributors, Inc. (formerly known as INVESCO Distributors, Inc.) (registered broker dealer); Director, President and Chairman, Invesco Inc. (holding company), Invesco Canada Holdings Inc. (holding company), Trimark Investments Ltd./Placements Trimark Ltèe and Invesco Financial Services Ltd/Services Financiers Invesco Ltèe; Chief Executive Officer, Invesco Canada Fund Inc. (corporate mutual fund company); Director and Chairman, Van Kampen Investor Services Inc.; Director, Chief Executive Officer and President, 1371 Preferred Inc. (holding company) and Van Kampen Investments Inc.; Director and President, AIM GP Canada Inc. (general partner for limited partnerships) and Van Kampen Advisors, Inc.; Director and Chief Executive Officer, Invesco Trimark Dealer Inc. (registered broker dealer); Director, Invesco Distributors, Inc. (formerly known as Invesco AIM Distributors, Inc.) (registered broker dealer); Manager, Invesco Capital Management LLC; Director, Chief Executive Officer and President, Invesco Advisers, Inc.; Director, Chairman, Chief Executive Officer and President, Invesco AIM Capital Management, Inc.; President, Invesco Trimark Dealer Inc. and Invesco Trimark Ltd./Invesco Trimark Ltèe; Director and President, AIM Trimark Corporate Class Inc. and AIM Trimark Canada Fund Inc.; Senior Managing Director, Invesco Holding Company Limited; Director and Chairman, Fund Management Company (former registered broker dealer); President and Principal Executive Officer, The Invesco Funds (AIM Treasurer’s Series Trust (Invesco Treasurer’s Series Trust), and Short-Term Investments Trust only); President, AIM Trimark Global Fund Inc. and AIM Trimark Canada Fund Inc. | | 158 | | None |
| 1 | Mr. Flanagan is considered an interested person (within the meaning of Section 2(a)(19) of the 1940 Act) of the Trust because he is an officer of the Adviser to the Trust, and an officer and a director of Invesco Ltd., ultimate parent of the Adviser. |
| 2 | Mr. Taylor is considered an interested person (within the meaning of Section 2(a)(19) of the 1940 Act) of the Trust because he is an officer and a director of the Adviser. |
T-1 Invesco Diversified Dividend Fund
Trustees and Officers—(continued)
| | | | | | | | |
Name, Year of Birth and Position(s) Held with the Trust | | Trustee and/
or Officer Since | | Principal Occupation(s)
During Past 5 Years | | Number of
Funds in Fund Complex Overseen by Trustee | | Other Directorship(s)
Held by Trustee During Past 5 Years |
| Independent Trustees | | | | | | | | |
Bruce L. Crockett — 1944 Trustee and Chair | | 1993 | | Chairman, Crockett Technologies Associates (technology consulting company) Formerly: Director, Captaris (unified messaging provider); Director, President and Chief Executive Officer, COMSAT Corporation; Chairman, Board of Governors of INTELSAT (international communications company); ACE Limited (insurance company); Independent Directors Council and Investment Company Institute: Member of the Audit Committee, Investment Company Institute; Member of the Executive Committee and Chair of the Governance Committee, Independent Directors Council | | 158 | | Director and Chairman of the Audit Committee, ALPS (Attorneys Liability Protection Society) (insurance company); Director and Member of the Audit Committee and Compensation Committee, Ferroglobe PLC (metallurgical company) |
David C. Arch — 1945 Trustee | | 2010 | | Chairman of Blistex Inc. (consumer health care products manufacturer); Member, World Presidents’ Organization | | 158 | | Board member of the Illinois Manufacturers’ Association |
Jack M. Fields — 1952 Trustee | | 1997 | | Chief Executive Officer, Twenty First Century Group, Inc. (government affairs company); and Chairman, Discovery Learning Alliance (non-profit) Formerly: Owner and Chief Executive Officer, Dos Angeles Ranch L.P. (cattle, hunting, corporate entertainment); Director, Insperity, Inc. (formerly known as Administaff) (human resources provider); Chief Executive Officer, Texana Timber LP (sustainable forestry company); Director of Cross Timbers Quail Research Ranch (non-profit); and member of the U.S. House of Representatives | | 158 | | None |
Cynthia Hostetler — 1962 Trustee | | 2017 | | Non-Executive Director and Trustee of a number of public and private business corporations Formerly: Director, Aberdeen Investment Funds (4 portfolios); Head of Investment Funds and Private Equity, Overseas Private Investment Corporation; President, First Manhattan Bancorporation, Inc.; Attorney, Simpson Thacher & Bartlett LLP | | 158 | | Vulcan Materials Company (construction materials company); Trilinc Global Impact Fund; Artio Global Investment LLC (mutual fund complex); Edgen Group, Inc. (specialized energy and infrastructure products distributor) |
Eli Jones — 1961 Trustee | | 2016 | | Professor and Dean, Mays Business School — Texas A&M University Formerly: Professor and Dean, Walton College of Business, University of Arkansas and E.J. Ourso College of Business, Louisiana State University; Director, Arvest Bank | | 158 | | Insperity, Inc. (formerly known as Administaff) (human resources provider) |
Prema Mathai-Davis — 1950 Trustee | | 1998 | | Retired | | 158 | | None |
Teresa M. Ressel — 1962 Trustee | | 2017 | | Non-executive director and trustee of a number of public and private business corporations Formerly: Chief Financial Officer, Olayan America, The Olayan Group (international investor/commercial/industrial); Chief Executive Officer, UBS Securities LLC; Group Chief Operating Officer, Americas, UBS AG; Assistant Secretary for Management & Budget and CFO, US Department of the Treasury | | 158 | | Atlantic Power Corporation (power generation company); ON Semiconductor Corp. (semiconductor supplier) |
Ann Barnett Stern — 1957 Trustee | | 2017 | | President and Chief Executive Officer, Houston Endowment Inc. (private philanthropic institution) Formerly: Executive Vice President and General Counsel, Texas Children’s Hospital; Attorney, Beck, Redden and Secrest, LLP; Business Law Instructor, University of St. Thomas; Attorney, Andrews & Kurth LLP | | 158 | | Federal Reserve Bank of Dallas |
Raymond Stickel, Jr. — 1944 Trustee | | 2005 | | Retired Formerly: Director, Mainstay VP Series Funds, Inc. (25 portfolios); Partner, Deloitte & Touche | | 158 | | None |
Robert C. Troccoli — 1949 Trustee | | 2016 | | Adjunct Professor, University of Denver — Daniels College of Business Formerly: Senior Partner, KPMG LLP | | 158 | | None |
Christopher L. Wilson — 1957 Trustee | | 2017 | | Non-executive director and trustee of a number of public and private business corporations Formerly: Director, TD Asset Management USA Inc. (mutual fund complex) (22 portfolios); Managing Partner, CT2, LLC (investing and consulting firm); President/Chief Executive Officer, Columbia Funds, Bank of America Corporation; President/Chief Executive Officer, CDC IXIS Asset Management Services, Inc.; Principal & Director of Operations, Scudder Funds, Scudder, Stevens & Clark, Inc.; Assistant Vice President, Fidelity Investments | | 158 | | ISO New England, Inc. (non-profit organization managing regional electricity market) |
T-2 Invesco Diversified Dividend Fund
Trustees and Officers—(continued)
| | | | | | | | |
Name, Year of Birth and Position(s) Held with the Trust | | Trustee and/
or Officer Since | | Principal Occupation(s)
During Past 5 Years | | Number of
Funds in Fund Complex Overseen by Trustee | | Other Directorship(s)
Held by Trustee During Past 5 Years |
| Other Officers | | | | | | | | |
Sheri Morris — 1964 President, Principal Executive Officer and Treasurer | | 1999 | | President, Principal Executive Officer and Treasurer, The Invesco Funds; Vice President, Invesco Advisers, Inc. (formerly known as Invesco Institutional (N.A.), Inc.) (registered investment adviser); and Vice President, Invesco Exchange-Traded Fund Trust, Invesco Exchange-Traded Fund Trust II, Invesco India Exchange-Traded Fund Trust, Invesco Actively Managed Exchange-Traded Fund Trust, Invesco Actively Managed Exchange-Traded Commodity Fund Trust and Invesco Exchange-Traded Self-Indexed Fund Trust Formerly: Vice President and Principal Financial Officer, The Invesco Funds; Vice President, Invesco AIM Advisers, Inc., Invesco AIM Capital Management, Inc. and Invesco AIM Private Asset Management, Inc.; Assistant Vice President and Assistant Treasurer, The Invesco Funds and Assistant Vice President, Invesco Advisers, Inc., Invesco AIM Capital Management, Inc. and Invesco AIM Private Asset Management, Inc.; and Treasurer, Invesco Exchange-Traded Fund Trust, Invesco Exchange-Traded Fund Trust II, Invesco India Exchange-Traded Fund Trust and Invesco Actively Managed Exchange-Traded Fund Trust | | N/A | | N/A |
Russell C. Burk — 1958 Senior Vice President and Senior Officer | | 2005 | | Senior Vice President and Senior Officer, The Invesco Funds | | N/A | | N/A |
Jeffrey H. Kupor — 1968 Senior Vice President, Chief Legal Officer and Secretary | | 2018 | | Senior Vice President and Secretary, Invesco Advisers, Inc. (formerly known as Invesco Institutional (N.A.), Inc.) (registered investment adviser); Senior Vice President and Secretary, Invesco Distributors, Inc. (formerly known as Invesco AIM Distributors, Inc.); Vice President and Secretary, Invesco Investment Services, Inc. (formerly known as Invesco AIM Investment Services, Inc.) Senior Vice President, Chief Legal Officer and Secretary, The Invesco Funds; Secretary and General Counsel, Invesco Investment Advisers LLC (formerly known as Van Kampen Asset Management); Secretary and General Counsel, Invesco Capital Markets, Inc. (formerly known as Van Kampen Funds Inc.) and Chief Legal Officer, Invesco Exchange-Traded Fund Trust, Invesco Exchange-Traded Fund Trust II, Invesco India Exchange-Traded Fund Trust, Invesco Actively Managed Exchange-Traded Fund Trust, Invesco Actively Managed Exchange-Traded Commodity Fund Trust and Invesco Exchange-Traded Self-Indexed Fund Trust; Secretary, Invesco Indexing LLC; Secretary and General Counsel, INVESCO Private Capital Investments, Inc.; Secretary, W.L. Ross & Co., LLC; Secretary and Vice President, Jemstep, Inc. Formerly: Senior Vice President, Secretary and General Counsel, Invesco Management Group, Inc. (formerly known as Invesco AIM Management Group, Inc.); Assistant Secretary, INVESCO Asset Management (Bermuda) Ltd.; Secretary and General Counsel, Invesco Private Capital, Inc.; Assistant Secretary and General Counsel, INVESCO Realty, Inc.; Secretary and General Counsel, Invesco Senior Secured Management, Inc.; and Secretary, Sovereign G./P. Holdings Inc. | | N/A | | N/A |
John M. Zerr — 1962 Senior Vice President | | 2006 | | Chief Operating Officer of the Americas; Senior Vice President, Invesco Advisers, Inc. (formerly known as Invesco Institutional (N.A.), Inc.) (registered investment adviser); Senior Vice President, Invesco Distributors, Inc. (formerly known as Invesco AIM Distributors, Inc.); Director and Vice President, Invesco Investment Services, Inc. (formerly known as Invesco AIM Investment Services, Inc.) Senior Vice President, The Invesco Funds; Managing Director, Invesco Capital Management LLC; Director, Invesco Investment Advisers LLC (formerly known as Van Kampen Asset Management); Senior Vice President, Invesco Capital Markets, Inc. (formerly known as Van Kampen Funds Inc.); Manager, Invesco Indexing LLC Formerly: Director and Senior Vice President, Invesco Management Group, Inc. (formerly known as Invesco AIM Management Group, Inc.); Secretary and General Counsel, Invesco Management Group, Inc. (formerly known as Invesco AIM Management Group, Inc.); Secretary, Invesco Investment Services, Inc. (formerly known as Invesco AIM Investment Services, Inc.); Chief Legal Officer and Secretary, The Invesco Funds; Secretary and General Counsel, Invesco Investment Advisers LLC (formerly known as Van Kampen Asset Management); Secretary and General Counsel, Invesco Capital Markets, Inc. (formerly known as Van Kampen Funds Inc.); Chief Legal Officer, Invesco Exchange-Traded Fund Trust, Invesco Exchange-Traded Fund Trust II, Invesco India Exchange-Traded Fund Trust, Invesco Actively Managed Exchange-Traded Fund Trust, Invesco Actively Managed Exchange-Traded Commodity Fund Trust and Invesco Exchange-Traded Self-Indexed Fund Trust; Secretary, Invesco Indexing LLC; Director, Secretary, General Counsel and Senior Vice President, Van Kampen Exchange Corp.; Director, Vice President and Secretary, IVZ Distributors, Inc. (formerly known as INVESCO Distributors, Inc.); Director and Vice President, INVESCO Funds Group, Inc.; Director and Vice President, Van Kampen Advisors Inc.; Director, Vice President, Secretary and General Counsel, Van Kampen Investor Services Inc.; Director and Secretary, Invesco Distributors, Inc. (formerly known as Invesco AIM Distributors, Inc.); Director, Senior Vice President, General Counsel and Secretary, Invesco AIM Advisers, Inc. and Van Kampen Investments Inc.; Director, Vice President and Secretary, Fund Management Company; Director, Senior Vice President, Secretary, General Counsel and Vice President, Invesco AIM Capital Management, Inc.; Chief Operating Officer and General Counsel, Liberty Ridge Capital, Inc. (an investment adviser) | | N/A | | N/A |
T-3 Invesco Diversified Dividend Fund
Trustees and Officers—(continued)
| | | | | | | | |
Name, Year of Birth and Position(s) Held with the Trust | | Trustee and/
or Officer Since | | Principal Occupation(s)
During Past 5 Years | | Number of
Funds in Fund Complex Overseen by Trustee | | Other Directorship(s)
Held by Trustee During Past 5 Years |
| Other Officers—(continued) | | | | | | | | |
Gregory G. McGreevey — 1962 Senior Vice President | | 2012 | | Senior Managing Director, Invesco Ltd.; Director, Chairman, President, and Chief Executive Officer, Invesco Advisers, Inc. (formerly known as Invesco Institutional (N.A.), Inc.) (registered investment adviser); Director, Invesco Mortgage Capital, Inc. and Invesco Senior Secured Management, Inc.; and Senior Vice President, The Invesco Funds Formerly: Senior Vice President, Invesco Management Group, Inc. and Invesco Advisers, Inc.; Assistant Vice President, The Invesco Funds | | N/A | | N/A |
Kelli Gallegos — 1970 Vice President, Principal Financial Officer and Assistant Treasurer | | 2008 | | Vice President and Treasurer, Invesco Exchange-Traded Fund Trust, Invesco Exchange-Traded Fund Trust II, Invesco India Exchange-Traded Fund Trust, Invesco Actively Managed Exchange-Traded Fund Trust, Invesco Actively Managed Exchange-Traded Commodity Fund Trust and Invesco Exchange-Traded Self-Indexed Fund Trust; Vice President, Principal Financial Officer and Assistant Treasurer, The Invesco Funds; Principal Financial and Accounting Officer — Pooled Investments, Invesco Capital Management LLC Formerly: Assistant Treasurer, Invesco Exchange-Traded Fund Trust, Invesco Exchange-Traded Fund Trust II, Invesco India Exchange-Traded Fund Trust, Invesco Actively Managed Exchange-Traded Fund Trust, Invesco Actively Managed Exchange-Traded Commodity Fund Trust and Invesco Exchange-Traded Self-Indexed Fund Trust; Assistant Treasurer, Invesco Capital Management LLC; Assistant Vice President, The Invesco Funds | | N/A | | N/A |
Tracy Sullivan — 1962 Vice President, Chief Tax Officer and Assistant Treasurer | | 2008 | | Vice President, Chief Tax Officer and Assistant Treasurer, The Invesco Funds; Assistant Treasurer, Invesco Capital Management LLC, Invesco Exchange-Traded Fund Trust, Invesco Exchange-Traded Fund Trust II, Invesco India Exchange-Traded Fund Trust, Invesco Actively Managed Exchange-Traded Fund Trust, Invesco Actively Managed Exchange-Traded Commodity Fund Trust and Invesco Exchange-Traded Self-Indexed Fund Trust Formerly: Assistant Vice President, The Invesco Funds | | N/A | | N/A |
Crissie M. Wisdom — 1969 Anti-Money Laundering Compliance Officer | | 2013 | | Anti-Money Laundering Compliance Officer, Invesco Advisers, Inc. (formerly known as Invesco Institutional (N.A.), Inc.) (registered investment adviser), Invesco Capital Markets, Inc. (formerly known as Van Kampen Funds Inc.), Invesco Distributors, Inc., Invesco Investment Services, Inc., The Invesco Funds, and Invesco Exchange-Traded Fund Trust, Invesco Exchange-Traded Fund Trust II, Invesco India Exchange-Traded Fund Trust, Invesco Actively Managed Exchange-Traded Fund Trust, Invesco Actively Managed Exchange-Traded Commodity Fund Trust and Invesco Exchange-Traded Self-Indexed Fund Trust; Anti-Money Laundering Compliance Officer and Bank Secrecy Act Officer, INVESCO National Trust Company and Invesco Trust Company; and Fraud Prevention Manager and Controls and Risk Analysis Manager for Invesco Investment Services, Inc. Formerly: Anti-Money Laundering Compliance Officer, Van Kampen Exchange Corp. and Invesco Management Group, Inc. | | N/A | | N/A |
Robert R. Leveille — 1969 Chief Compliance Officer | | 2016 | | Chief Compliance Officer, Invesco Advisers, Inc. (registered investment adviser); and Chief Compliance Officer, The Invesco Funds Formerly: Chief Compliance Officer, Putnam Investments and the Putnam Funds | | N/A | | N/A |
The Statement of Additional Information of the Trust includes additional information about the Fund’s Trustees and is available upon request, without charge, by calling 1.800.959.4246. Please refer to the Fund’s Statement of Additional Information for information on the Fund’s sub-advisers.
| | | | | | |
Office of the Fund 11 Greenway Plaza, Suite 1000 Houston, TX 77046-1173 | | Investment Adviser Invesco Advisers, Inc. 1555 Peachtree Street, N.E. Atlanta, GA 30309 | | Distributor Invesco Distributors, Inc. 11 Greenway Plaza, Suite 1000 Houston, TX 77046-1173 | | Auditors PricewaterhouseCoopers LLP 1000 Louisiana Street, Suite 5800 Houston, TX 77002-5021 |
| | | |
| | | | | | |
Counsel to the Fund Stradley Ronon Stevens & Young, LLP 2005 Market Street, Suite 2600 Philadelphia, PA 19103-7018 | | Counsel to the Independent Trustees Goodwin Procter LLP 901 New York Avenue, N.W. Washington, D.C. 20001 | | Transfer Agent Invesco Investment Services, Inc. 11 Greenway Plaza, Suite 1000 Houston, TX 77046-1173 | | Custodian State Street Bank and Trust Company 225 Franklin Street Boston, MA 02110-2801 |
T-4 Invesco Diversified Dividend Fund
Explore High-Conviction Investing with Invesco

Go paperless with eDelivery
Visit invesco.com/edelivery to enjoy the convenience and security of anytime electronic access to your investment documents.
With eDelivery, you can elect to have any or all of the following materials delivered straight to your inbox to download, save and print from your own computer:
∎ Fund reports and prospectuses
∎ Quarterly statements
∎ Daily confirmations
∎ Tax forms
Invesco mailing information
Send general correspondence to Invesco Investment Services, Inc., P.O. Box 219078, Kansas City, MO 64121-9078.
Important notice regarding delivery of security holder documents
To reduce Fund expenses, only one copy of most shareholder documents may be mailed to shareholders with multiple accounts at the same address (Householding). Mailing of your shareholder documents may be householded indefinitely unless you instruct us otherwise. If you do not want the mailing of these documents to be combined with those for other members of your household, please contact Invesco Investment Services, Inc. at 800 959 4246 or contact your financial institution. We will begin sending you individual copies for each account within 30 days after receiving your request.
Fund holdings and proxy voting information
The Fund provides a complete list of its holdings four times in each fiscal year, at the quarter ends. For the second and fourth quarters, the lists appear in the Fund’s semiannual and annual reports to shareholders. For the first and third quarters, the Fund files the lists with the Securities and Exchange Commission (SEC) on Form N-Q (or any successor Form). The most recent list of portfolio holdings is available at invesco.com/completeqtrholdings. Shareholders can also look up the Fund’s Forms N-Q (or any successor Form) on the SEC website at sec.gov. The SEC file numbers for the Fund are shown below.
A description of the policies and procedures that the Fund uses to determine how to vote proxies relating to portfolio securities is available without charge, upon request, from our Client Services department at 800 959 4246 or at invesco.com/proxyguidelines. The information is also available on the SEC website, sec.gov.
| | |
Information regarding how the Fund voted proxies related to its portfolio securities during the most recent 12-month period ended June 30 is available at invesco.com/proxysearch. The information is also available on the SEC website, sec.gov. Invesco Advisers, Inc. is an investment adviser; it provides investment advisory services to individual and institutional clients and does not sell securities. Invesco Distributors, Inc. is the US distributor for Invesco Ltd.’s retail mutual funds, exchange-traded funds and institutional money market funds. Both are wholly owned, indirect subsidiaries of Invesco Ltd. | |  |
| | | | | | | | |
| SEC file numbers: 811-01424 and 002-25469 | | Invesco Distributors, Inc. | | DDI-AR-1 | | 12212018 | | 1143 |
| | | | | | |
| | | | |

| | Annual Report to Shareholders | | October 31, 2018 | | |
| | | | |
| | Invesco Summit Fund | | |
| | Nasdaq: | | |
| | A: ASMMX ∎ C: CSMMX ∎ P: SMMIX ∎ S: SMMSX ∎ Y: ASMYX ∎ R5: SMITX ∎ R6: SMISX | | |

Letters to Shareholders
| | |

Philip Taylor | | Dear Shareholders: This annual report includes information about your Fund, including performance data and a complete list of its investments as of the close of the reporting period. Inside is a discussion of how your Fund was managed and the factors that affected its performance during the reporting period. Throughout the reporting period, US economic data remained positive. Robust corporate profits, strong retail sales and unemployment rates near generational lows helped drive US markets to new all-time records multiple times during the reporting period. Against this backdrop, the US Federal Reserve raised the federal funds rate four times during the reporting period. Market volatility, largely non-existent in 2017, returned in 2018. Markets sold off first in February and again sharply in October, amid rising interest rates, concerns about potential trade wars and heightened geopolitical tensions. Despite the volatility, US equity markets were largely positive |
for the reporting period and fared better than international markets. Emerging markets were particularly hard hit due to a strong US dollar. During the October sell-off, investors retreated to more defensive areas of the market and to US Treasuries. The broader bond market declined during the reporting period due to the increase in US Treasury yields and widening credit spreads. As the year progresses, we’ll see how the interplay of economic data, interest rates, geopolitics and a host of other factors affect US and overseas equity and fixed income markets.
Short-term market volatility can prompt some investors to abandon their investment plans – and can cause others to settle for whatever returns the market has to offer. The investment professionals at Invesco, in contrast, invest with high conviction. This means that, no matter the asset class or the strategy, each investment team has a passion to exceed. We want to help investors achieve better outcomes, such as seeking higher returns, helping mitigate risk and generating income. Of course, investing with high conviction can’t guarantee a profit or ensure success; no investment strategy can. To learn more about how we invest with high conviction, visit invesco.com/HighConviction.
You, too, can invest with high conviction by maintaining a long-term investment perspective and by working with your financial adviser on a regular basis. During periods of short-term market volatility or uncertainty, your financial adviser can keep you focused on your long-term investment goals – a new home, a child’s college education or a secure retirement. He or she also can share research about the economy, the markets and individual investment options.
Visit our website for more information on your investments
Our website, invesco.com/us, offers a wide range of market insights and investment perspectives. On the website, you’ll find detailed information about our funds, including performance, holdings and portfolio manager commentaries. You can access information about your account by completing a simple, secure online registration. To do so, select “Log In” on the right side of the homepage, and then select “Register for Individual Account Access.”
In addition to the resources accessible on our website and through our mobile app, you can obtain timely updates to help you stay informed about the markets and the economy by connecting with Invesco on Twitter, LinkedIn or Facebook. You can access our blog at blog.invesco.us.com. Our goal is to provide you the information you want, when and where you want it.
Finally, I’m pleased to share with you Invesco’s commitment to both the Principles for Responsible Investment and to considering environmental, social and governance issues in our robust investment process. I invite you to learn more at invesco.com/esg.
Have questions?
For questions about your account, contact an Invesco client services representative at 800 959 4246. For Invesco-related questions or comments, please email me directly at phil@invesco.com.
All of us at Invesco look forward to serving your investment management needs. Thank you for investing with us.
Sincerely,

Philip Taylor
Senior Managing Director, Invesco Ltd.
| | | | |

Bruce Crockett | | Dear Fellow Shareholders: Among the many important lessons I’ve learned in more than 40 years in a variety of business endeavors is the value of a trusted advocate. As independent chair of the Invesco Funds Board, I can assure you that the members of the Board are strong advocates for the interests of investors in Invesco’s mutual funds. We work hard to represent your interests through oversight of the quality of the investment management services your funds receive and other matters important to your investment, including but not limited to: |
| | ∎ | | Ensuring that Invesco offers a diverse lineup of mutual funds that your financial adviser can use to strive to meet your financial needs as your investment goals change over time. |
| | ∎ | | Monitoring how the portfolio management teams of the Invesco funds are performing in light of changing economic and market conditions. |
| ∎ | | Assessing each portfolio management team’s investment performance within the context of the investment strategy described in the fund’s prospectus. |
| ∎ | | Monitoring for potential conflicts of interests that may impact the nature of the services that your funds receive. |
We believe one of the most important services we provide our fund shareholders is the annual review of the funds’ advisory and sub-advisory contracts with Invesco Advisers and its affiliates. This review is required by the Investment Company Act of 1940 and focuses on the nature and quality of the services Invesco provides as the adviser to the Invesco funds and the reasonableness of the fees that it charges for those services. Each year, we spend months carefully reviewing information received from Invesco and a variety of independent sources, such as performance and fee data prepared by Lipper, Inc. (a subsidiary of Broadridge Financial Solutions, Inc.), an independent, third-party firm widely recognized as a leader in its field. We also meet with our independent legal counsel and other independent advisers to review and help us assess the information that we have received. Our goal is to assure that you receive quality investment management services for a reasonable fee.
I trust the measures outlined above provide assurance that you have a worthy advocate when it comes to choosing the Invesco Funds.
As always, please contact me at bruce@brucecrockett.com with any questions or concerns you may have. On behalf of the Board, we look forward to continuing to represent your interests and serving your needs.
Sincerely,

Bruce L. Crockett
Independent Chair
Invesco Funds Board of Trustees
Management’s Discussion of Fund Performance
| | | | | | |
| | |
Performance summary For the fiscal year ended October 31, 2018, Class A shares of Invesco Summit Fund (the Fund), at net asset value (NAV), underperformed the Russell 1000 Growth Index, the Fund’s style-specific benchmark. Your Fund’s long-term performance appears later in this report. | | | | |
| | | |
Fund vs. Indexes | | | | | | |
Total returns, 10/31/17 to 10/31/18, at net asset value (NAV). Performance shown does not include applicable contingent deferred sales charges (CDSC) or front-end sales charges, which would have reduced performance. | | | | |
| | |
Class A Shares | | 6.95% | | | | |
Class C Shares | | 6.22 | | | | |
Class P Shares | | 7.13 | | | | |
Class S Shares | | 7.12 | | | | |
Class Y Shares | | 7.25 | | | | |
Class R5 Shares | | 7.30 | | | | |
Class R6 Shares | | 7.29 | | | | |
S&P 500 Indexq (Broad Market Index) | | 7.35 | | | | |
Russell 1000 Growth Indexq (Style-Specific Index) | | 10.71 | | | | |
Lipper Multi-Cap Growth Funds Index⬛ (Peer Group Index) | | 7.14 | | | | |
Source(s): qFactSet Research Systems Inc.; ⬛Lipper Inc. | | | | | | |
Market conditions and your Fund
The fiscal year proved to be an increasingly volatile time for US equities. The fiscal year began in the final months of 2017 with several major US stock market indexes repeatedly reaching new highs amid strong corporate profits, the prospect of tax reform legislation and exceedingly low stock market volatility.
Stock market euphoria continued in January 2018 as US equity markets steadily moved higher. Investors remained enthused about the passage of the Tax Cuts and Jobs Act signed into law in late December 2017, which significantly cut corporate tax rates. However, in February 2018, volatility returned to US stock and bond markets. Worries about how rising interest rates might affect economic growth, concerns about a potential trade war and heightened geopolitical tensions, caused the US stock markets to pull back and volatility to increase.
US equity markets generally recovered in the second quarter of 2018 as strong US retail sales and low unemployment buoyed markets. Throughout the summer, US equities moved higher as corporate profits surged. Several US equity indexes reached new highs despite potential headwinds including trade tensions, tariff announcements and contagion concerns over a Turkish currency crisis. After a relatively quiet summer, market volatility markedly rose in the final month of the fiscal year. US equity markets suffered a sharp sell-off in October 2018 amid rising interest rates and concerns that higher inflation could mean a more restrictive monetary policy. In this environment, investors fled to more defensive areas of the market and to US treasuries.
Given signs of a strong economy, the US Federal Reserve raised interest rates four times during the fiscal year: in December 2017 and in March, June and September 2018.1 In contrast, the
European Central Bank and central banks in several other countries maintained extraordinarily accommodative monetary policies.
In this market environment, the Fund produced a positive return at NAV, but underperformed the Russell 1000 Growth Index, its style-specific benchmark, for the fiscal year. Both stock selection in and an underweight allocation to the health care and materials sectors were leading contributors to relative performance. In contrast, Fund holdings and an overweight allocation to the communication services sector was the leading detractor from relative return. Additionally, Fund holdings in the consumer discretionary sector underperformed relative to the style-specific index and detracted from Fund performance.
The leading individual contributor to Fund performance during the fiscal year was consumer discretionary sector constituent, Amazon.com. The retail and e-commerce giant reported solid quarterly results with better revenue growth and improving profit margins across all segments. The strong results show that Amazon had success growing its higher margin categories, including its cloud computing service, Amazon Web Services (AWS).
Stock selection in the information technology sector was also a contributor to relative return during the fiscal year. Although we held an underweight position in this sector relative to the Russell 1000 Growth index, we had overweight exposure to the payments industry as long-term secular drivers remained strong. On an absolute basis, leading contributions to portfolio returns came from Visa, Apple and Mastercard. Visa and Mastercard both experienced strong purchase volume growth, which helped to drive revenue expansion. As the payment industry continued to transform, we saw
| | | | |
Portfolio Composition | |
By sector | | | % of total net assets | |
| |
Information Technology | | | 23.7% | |
| Communications Services | | | 22.0 | |
| Consumer Discretionary | | | 20.1 | |
Health Care | | | 15.0 | |
Industrials | | | 7.2 | |
Consumer Staples | | | 4.4 | |
Energy | | | 2.9 | |
Financials | | | 2.4 | |
Materials | | | 1.6 | |
Real Estate | | | 0.5 | |
| Money Market Funds Plus Other Assets Less Liabilities | | | 0.2 | |
| | | | | | |
Top 10 Equity Holdings* | |
| | % of total net assets | |
| | |
1. | | Amazon.com, Inc. | | | 8.6% | |
2. | | Alphabet Inc.-Class C | | | 6.7 | |
3. | | Visa Inc.-Class A | | | 4.5 | |
4. | | Facebook, Inc.-Class A | | | 4.1 | |
5. | | UnitedHealth Group Inc. | | | 3.6 | |
6. | | Apple Inc. | | | 3.3 | |
7. | | Microsoft Corp. | | | 2.8 | |
8. | | salesforce.com, inc. | | | 2.7 | |
9. | | Take-Two Interactive Software, Inc. | | | 2.4 | |
10. | | Activision Blizzard, Inc. | | | 2.3 | |
| | | | |
Total Net Assets | | $ | 2.2 billion | |
| |
| Total Number of Holdings* | | | 93 | |
The Fund’s holdings are subject to change, and there is no assurance that the Fund will continue to hold any particular security.
*Excluding money market fund holdings.
Data presented here are as of October 31, 2018.
opportunities for both companies to expand their total addressable markets. Despite Apple being a leading contributor on an absolute basis, our underweight position in the company detracted from performance relative to the style-specific index. The tech giant reported solid earnings and services growth, which helped the company maintain positive momentum and profitability. The majority of Apple’s revenue comes from iPhone sales, which have been growing in the low single digits. The company is executing very well, despite a slowing global handset market, and we expect that continued innovation will allow it to also leverage its 1 billion plus installed base of iOS devices to offer additional services.
Communication services sector holdings Facebook and Nintendo were leading detractors from absolute Fund returns during the fiscal year. Facebook experienced headwinds due to fallout from a data scandal, which revealed that the personal data of millions of Facebook profiles had been harvested without consent and used for political purposes. Following the revelation, Facebook provided guidance for slower-than-expected revenue growth resulting from foreign exchange concerns, changes to their user engagement interface from ‘Feed’ to ‘Stories’, which have lower monetization opportunities, and increased investment in privacy controls and growth initiatives, such as artificial intelligence, augmented reality and content acquisition.
Another leading detractor from Fund performance in the communication services sector was Nintendo. The consumer electronics and video game company experienced a lull in its content cycle. The 2018 release of Nintendo Labo, a gaming and construction toy platform, was less successful than the company had expected and led to slower console sales. We believe this lull is temporary and generally remain bullish on the video game space given numerous positive long-term drivers such as a strong console cycle, growing libraries of downloadable content, global smartphone growth, increasing mobile processing power, the rise of eSports, and the potential for new virtual and augmented reality peripherals.
Within the consumer discretionary sector Alibaba Group and Norwegian Cruise Line were among the leading detractors from Fund returns on an absolute basis. Neither of these companies are holdings in the Russell 1000 Growth Index. Alibaba Group has come under pressure due to China’s foreign exchange moves and
fears of an impact from the ongoing trade negotiations between the US and China. We believe shifting consumer behavior trends towards e-commerce platforms like Alibaba could continue for a number of years and potentially accelerate. Norwegian Cruise Line’s pricing continued to exceed expectations, but was offset by investor concerns about the stronger US dollar and higher fuel prices. Momentum from cruise bookings has been strong with fears around Caribbean capacity growth fading due to a mild hurricane season thus far.
At the close of the fiscal year, we saw continued potential for positive US equity returns, but slowing economic growth may mean more frequent downhills – and more investors losing their way – than during the market’s climb of recent years. Observing the weight of the evidence, we believe we have moved into a late-cycle environment. We are seeking opportunities in companies that can gain market share from technology-enabled advantages in their business model and in consumer behavior and not relying on choosing growth versus value or small-cap versus large-cap. We will work to avoid companies that have simply been buoyed in recent years by the expanding economic environment. In such an environment, it is our view that true growth will likely become an even scarcer commodity, and thus we believe the market will continue to favor companies that can produce growth and compound earnings in spite of the economic cycle.
Thank you for your investment in Invesco Summit Fund and for sharing our long-term investment horizon.
1 Source: US Federal Reserve
The views and opinions expressed in management’s discussion of Fund performance are those of Invesco Advisers, Inc. These views and opinions are subject to change at any time based on factors such as market and economic conditions. These views and opinions may not be relied upon as investment advice or recommendations, or as an offer for a particular security. The information is not a complete analysis of every aspect of any market, country, industry, security or the Fund. Statements of fact are from sources considered reliable, but Invesco Advisers, Inc. makes no representation or warranty as to their completeness or accuracy. Although historical performance is no guarantee of future results, these insights may help you understand our investment management philosophy.
See important Fund and, if applicable, index disclosures later in this report.
| | |

| | Erik Voss Chartered Financial Analyst, Portfolio Manager, is lead manager of Invesco Summit Fund. He joined |
| Invesco in 2010. Mr. Voss earned a BS in mathematics and an MS in finance from the University of Wisconsin. |
| |

| | Ido Cohen Portfolio Manager, is manager of Invesco Summit Fund. He joined Invesco in 2010. Mr. Cohen |
| earned a BS in economics from The Wharton School of the University of Pennsylvania. |
5 Invesco Summit Fund
Your Fund’s Long-Term Performance
Results of a $10,000 Investment – Oldest Share Class(es)
Fund and index data from 10/31/08
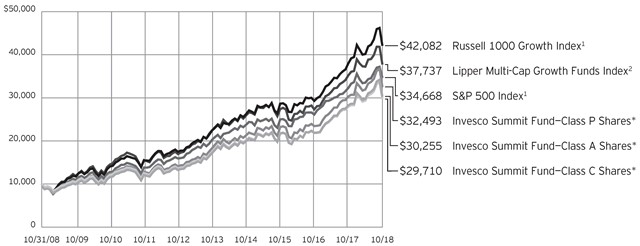
1 Source: FactSet Research Systems Inc.
2 Source: Lipper Inc.
| * | The Fund’s oldest share class (Class P) does not have a sales charge; therefore, the second-oldest share classes with a sales charge (Class A and Class C) are also included in the chart. |
Past performance cannot guarantee comparable future results.
The data shown in the chart include reinvested distributions, applicable sales charges and Fund expenses including management fees. Performance of the peer group, if applicable, reflects fund expenses
and management fees; performance of a market index does not. Performance shown in the chart and table(s) does not reflect deduction of taxes a shareholder would pay on Fund distributions or sale of Fund shares.
| | | | |
| |
Average Annual Total Returns | |
As of 10/31/18, including maximum applicable sales charges | |
| |
Class A Shares | | | | |
Inception (10/31/05) | | | 7.86 | % |
10 Years | | | 11.71 | |
5 Years | | | 10.72 | |
1 Year | | | 1.08 | |
| |
Class C Shares | | | | |
Inception (10/31/05) | | | 7.52 | % |
10 Years | | | 11.50 | |
5 Years | | | 11.13 | |
1 Year | | | 5.22 | |
| |
Class P Shares | | | | |
Inception (11/1/82) | | | 9.50 | % |
10 Years | | | 12.51 | |
5 Years | | | 12.13 | |
1 Year | | | 7.13 | |
| |
Class S Shares | | | | |
10 Years | | | 12.45 | % |
5 Years | | | 12.08 | |
1 Year | | | 7.12 | |
| |
Class Y Shares | | | | |
Inception (10/3/08) | | | 11.27 | % |
10 Years | | | 12.62 | |
5 Years | | | 12.23 | |
1 Year | | | 7.25 | |
| |
Class R5 Shares | | | | |
Inception (10/3/08) | | | 11.38 | % |
10 Years | | | 12.74 | |
5 Years | | | 12.33 | |
1 Year | | | 7.30 | |
| |
Class R6 Shares | | | | |
10 Years | | | 12.39 | % |
5 Years | | | 12.07 | |
1 Year | | | 7.29 | |
Class S shares incepted on September 25, 2009. Performance shown prior to that date is that of Class A shares and includes the 12b-1 fees applicable to Class A shares.
Class Y shares incepted on October 3, 2008. Performance shown prior to that date is that of Class A shares and includes the 12b-1 fees applicable to Class A shares.
Class R5 shares incepted on October 3, 2008. Performance shown prior to that date is that of Class A shares and includes the 12b-1 fees applicable to Class A shares.
Class R6 shares incepted on April 4, 2017. Performance shown prior to that date is that of Class A shares and includes the 12b-1 fees applicable to Class A shares.
| | | | |
| |
Average Annual Total Returns | |
As of 9/30/18, the most recent calendar quarter end, including maximum applicable sales charges | |
| |
Class A Shares | | | | |
Inception (10/31/05) | | | 8.94 | % |
10 Years | | | 11.01 | |
5 Years | | | 14.45 | |
1 Year | | | 17.54 | |
| |
Class C Shares | | | | |
Inception (10/31/05) | | | 8.60 | % |
10 Years | | | 10.81 | |
5 Years | | | 14.88 | |
1 Year | | | 22.43 | |
| |
Class P Shares | | | | |
Inception (11/1/82) | | | 9.90 | % |
10 Years | | | 11.82 | |
5 Years | | | 15.92 | |
1 Year | | | 24.55 | |
| |
Class S Shares | | | | |
10 Years | | | 11.76 | % |
5 Years | | | 15.87 | |
1 Year | | | 24.50 | |
| |
Class Y Shares | | | | |
10 Years | | | 11.92 | % |
5 Years | | | 16.02 | |
1 Year | | | 24.68 | |
| |
Class R5 Shares | | | | |
10 Years | | | 12.04 | % |
5 Years | | | 16.12 | |
1 Year | | | 24.78 | |
| |
Class R6 Shares | | | | |
10 Years | | | 11.69 | % |
5 Years | | | 15.84 | |
1 Year | | | 24.70 | |
The performance data quoted represent past performance and cannot guarantee comparable future results; current performance may be lower or higher. Please visit invesco.com/performance for the most recent month-end performance. Performance figures reflect reinvested distributions, changes in net asset value and the effect of the maximum sales charge unless otherwise stated. Investment return and principal value will fluctuate so that you may have a gain or loss when you sell shares.
The total annual Fund operating expense ratio set forth in the most recent Fund prospectus as of the date of this report for Class A, Class C, Class P, Class S, Class Y, Class R5 and Class R6 shares was 1.04%, 1.79%, 0.89%, 0.94%, 0.79%, 0.76% and 0.76%, respectively. The expense ratios presented above may vary from the expense
ratios presented in other sections of this report that are based on expenses incurred during the period covered by this report.
Class A share performance reflects the maximum 5.50% sales charge, and Class C share performance reflects the applicable contingent deferred sales charge (CDSC) for the period involved. The CDSC on Class C shares is 1% for the first year after purchase. Class P, Class S, Class Y, Class R5 and Class R6 shares do not have a front-end sales charge or contingent deferred sales charge (CDSC); therefore, returns shown are at net asset value.
The performance numbers shown do not reflect the creation and sales charges and other fees assessed by the AIM Summit Investors Plans, which were dissolved effective December 8, 2006.
The performance of the Fund’s share classes will differ primarily due to different sales charge structures and class expenses.
Fund performance reflects any applicable fee waivers and/or expense reimbursements. Had the adviser not waived fees and/or reimbursed expenses currently or in the past, returns would have been lower. See current prospectus for more information.
7 Invesco Summit Fund
Invesco Summit Fund’s investment objective is long-term growth of capital.
| ∎ | | Unless otherwise stated, information presented in this report is as of October 31, 2018, and is based on total net assets. |
| ∎ | | Unless otherwise noted, all data provided by Invesco. |
| ∎ | | To access your Fund’s reports/prospectus, visit invesco.com/fundreports. |
About share classes
| ∎ | | Class P shares, Class S shares and Class Y shares are available only to certain investors. Please see the prospectus for more information. |
| ∎ | | Class R5 shares and Class R6 shares are available for use by retirement plans that meet certain standards and for institutional investors. Class R6 shares are also available through intermediaries that have established an agreement with Invesco Distributors, Inc. to make such shares available for use in retail omnibus accounts. Please see the prospectus for more information. |
Principal risks of investing in the Fund
| ∎ | | Foreign securities risk. The Fund’s foreign investments may be adversely affected by political and social instability, changes in economic or taxation policies, difficulty in enforcing obligations, decreased liquidity or increased volatility. Foreign investments also involve the risk of the possible seizure, nationalization or expropriation of the issuer or foreign deposits (in which the Fund could lose its entire investments in a certain market) and the possible adoption of foreign governmental restrictions such as exchange controls. Unless the Fund has hedged its foreign securities risk, foreign securities risk also involves the risk of negative foreign currency rate fluctuations, which may cause the value of securities denominated in such foreign currency (or other instruments through which the Fund has exposure to foreign currencies) to decline in value. Currency exchange rates may fluctuate significantly over short periods of time. Currency hedging strategies, if used, are not always successful. |
| ∎ | | Growth investing risk. Growth stocks tend to be more expensive relative to the issuing company’s earnings or assets compared with other types of stock. As a result, they tend to be more sensitive to changes in, or investors’ expectations of, the issuing company’s earnings and |
| ∎ | | Management risk. The Fund is actively managed and depends heavily on the Adviser’s judgment about markets, interest rates or the attractiveness, relative values, liquidity, or potential appreciation of particular investments made for the Fund’s portfolio. The Fund could experience losses if these judgments prove to be incorrect. Additionally, legislative, regulatory, or tax developments may adversely affect management of the Fund and, therefore, the ability of the Fund to achieve its investment objective. |
| ∎ | | Market risk. The market values of the Fund’s investments, and therefore the value of the Fund’s shares, will go up and down, sometimes rapidly or unpredictably. Market risk may affect a single issuer, industry or section of the economy, or it may affect the market as a whole. Individual stock prices tend to go up and down more dramatically than those of certain other types of investments, such as bonds. During a general downturn in the financial markets, multiple asset classes may decline in value. When markets perform well, there can be no assurance that specific investments held by the Fund will rise in value. |
| ∎ | | Sector focus risk. The Fund may from time to time invest a significant amount of its assets (i.e. over 25%) in one market sector or group of related industries. In this event, the Fund’s performance will depend to a greater extent on the overall condition of the sector or group of industries and there is increased risk that the Fund will lose significant value if conditions adversely affect that sector or group of industries. |
| ∎ | | Small- and mid-capitalization companies risks. Small- and mid-capitalization companies tend to be more vulnerable to changing market conditions, may have little or no operating history or track record of success, and may have more limited product lines and markets, less experienced management and fewer financial resources than larger companies. These companies’ |
This report must be accompanied or preceded by a currently effective Fund prospectus, which contains more complete information, including sales charges and expenses. Investors should read it carefully before investing.
NOT FDIC INSURED | MAY LOSE VALUE | NO BANK GUARANTEE
| | securities may be more volatile and less liquid than those of more established companies, and their returns may vary, sometimes significantly, from the overall securities market. |
About indexes used in this report
| ∎ | | The S&P 500® Index is an unmanaged index considered representative of the US stock market. |
| ∎ | | The Russell 1000® Growth Index is an unmanaged index considered representative of large-cap growth stocks. The Russell 1000 Growth Index is a trademark/service mark of the Frank Russell Co. Russell® is a trademark of the Frank Russell Co. |
| ∎ | | The Lipper Multi-Cap Growth Funds Index is an unmanaged index considered representative of multi-cap growth funds tracked by Lipper. |
| ∎ | | The Fund is not managed to track the performance of any particular index, including the index(es) described here, and consequently, the performance of the Fund may deviate significantly from the performance of the index(es). |
| ∎ | | A direct investment cannot be made in an index. Unless otherwise indicated, index results include reinvested dividends, and they do not reflect sales charges. Performance of the peer group, if applicable, reflects fund expenses; performance of a market index does not. |
Other information
| ∎ | | The returns shown in management’s discussion of Fund performance are based on net asset values (NAVs) calculated for shareholder transactions. Generally accepted accounting principles require adjustments to be made to the net assets of the Fund at period end for financial reporting purposes, and as such, the NAVs for shareholder transactions and the returns based on those NAVs may differ from the NAVs and returns reported in the Financial Highlights. |
| ∎ | | Industry classifications used in this report are generally according to the Global Industry Classification Standard, which was developed by and is the exclusive property and a service mark of MSCI Inc. and Standard & Poor’s. |
Schedule of Investments(a)
October 31, 2018
| | | | | | | | |
| | | Shares | | | Value | |
Common Stocks & Other Equity Interests–99.84% | |
| Aerospace & Defense–2.97% | |
Airbus S.E. (France) | | | 142,752 | | | $ | 15,733,660 | |
Northrop Grumman Corp.(b) | | | 43,760 | | | | 11,462,932 | |
Raytheon Co. | | | 83,683 | | | | 14,647,872 | |
Teledyne Technologies Inc.(b) | | | 104,553 | | | | 23,135,488 | |
| | | | | | | | 64,979,952 | |
|
| Agricultural & Farm Machinery–0.08% | |
Deere & Co. | | | 13,549 | | | | 1,835,077 | |
|
| Application Software–3.21% | |
salesforce.com, inc.(b) | | | 422,353 | | | | 57,963,726 | |
Trade Desk, Inc. (The)–Class A(b) | | | 98,644 | | | | 12,187,466 | |
| | | | | | | | 70,151,192 | |
|
| Asset Management & Custody Banks–0.21% | |
Ares Management, L.P. | | | 237,213 | | | | 4,651,747 | |
|
| Automotive Retail–0.19% | |
Camping World Holdings, Inc.–Class A(c) | | | 245,557 | | | | 4,211,303 | |
|
| Biotechnology–1.08% | |
Alexion Pharmaceuticals, Inc. | | | 93,766 | | | | 10,508,356 | |
Celgene Corp.(b) | | | 183,327 | | | | 13,126,213 | |
| | | | | | | | 23,634,569 | |
|
| Cable & Satellite–1.64% | |
Altice USA, Inc.–Class A | | | 731,747 | | | | 11,934,793 | |
Charter Communications, Inc.–Class A(b) | | | 51,200 | | | | 16,402,944 | |
DISH Network Corp.–Class A(b) | | | 244,077 | | | | 7,502,927 | |
| | | | | | | | 35,840,664 | |
|
| Commodity Chemicals–0.70% | |
Westlake Chemical Corp.(b) | | | 214,242 | | | | 15,275,455 | |
|
| Communications Equipment–0.32% | |
Palo Alto Networks, Inc.(b) | | | 38,373 | | | | 7,023,794 | |
|
| Consumer Electronics–1.70% | |
Sony Corp. (Japan) | | | 688,400 | | | | 37,049,760 | |
|
| Data Processing & Outsourced Services–9.36% | |
Mastercard Inc.–Class A | | | 252,025 | | | | 49,817,782 | |
PayPal Holdings, Inc. | | | 316,874 | | | | 26,677,622 | |
Visa Inc.–Class A | | | 705,346 | | | | 97,231,946 | |
Worldpay, Inc.–Class A(b) | | | 334,307 | | | | 30,702,755 | |
| | | | | | | | 204,430,105 | |
|
| Diversified Support Services–0.72% | |
Cintas Corp.(b) | | | 86,425 | | | | 15,718,115 | |
|
| Electronic Equipment & Instruments–0.98% | |
Keysight Technologies, Inc.(b) | | | 373,172 | | | | 21,300,658 | |
| | | | | | | | |
| | | Shares | | | Value | |
| Environmental & Facilities Services–1.83% | |
Casella Waste Systems, Inc.–Class A | | | 104,640 | | | $ | 3,407,078 | |
Clean Harbors, Inc. | | | 172,265 | | | | 11,720,911 | |
Waste Connections, Inc. | | | 110,343 | | | | 8,434,619 | |
Waste Management, Inc. | | | 182,485 | | | | 16,326,933 | |
| | | | | | | | 39,889,541 | |
|
| Financial Exchanges & Data–1.22% | |
Intercontinental Exchange, Inc. | | | 250,804 | | | | 19,321,940 | |
London Stock Exchange Group PLC (United Kingdom) | | | 110,616 | | | | 6,095,999 | |
S&P Global Inc. | | | 6,198 | | | | 1,130,019 | |
| | | | | | | | 26,547,958 | |
|
| General Merchandise Stores–0.15% | |
Dollar General Corp. | | | 28,728 | | | | 3,199,725 | |
|
| Health Care Equipment–3.57% | |
Baxter International Inc. | | | 155,257 | | | | 9,705,115 | |
Boston Scientific Corp.(b) | | | 816,172 | | | | 29,496,456 | |
Intuitive Surgical, Inc.(b) | | | 54,297 | | | | 28,298,511 | |
Teleflex Inc. | | | 43,942 | | | | 10,578,597 | |
| | | | | | | | 78,078,679 | |
|
| Home Improvement Retail–3.38% | |
Home Depot, Inc. (The) | | | 149,026 | | | | 26,210,693 | |
Lowe’s Cos., Inc. | | | 500,490 | | | | 47,656,658 | |
| | | | | | | | 73,867,351 | |
|
| Hotels, Resorts & Cruise Lines–1.97% | |
Norwegian Cruise Line Holdings Ltd.(b) | | | 733,991 | | | | 32,346,983 | |
Royal Caribbean Cruises Ltd. | | | 102,755 | | | | 10,761,531 | |
| | | | | | | | 43,108,514 | |
|
| Industrial Gases–0.16% | |
Linde PLC (United Kingdom) | | | 21,252 | | | | 3,516,568 | |
|
| Industrial Machinery–0.90% | |
Stanley Black & Decker Inc. | | | 169,106 | | | | 19,704,231 | |
|
| Interactive Home Entertainment–7.80% | |
Activision Blizzard, Inc. | | | 734,327 | | | | 50,705,279 | |
Electronic Arts Inc.(b) | | | 278,210 | | | | 25,311,546 | |
Nintendo Co., Ltd. (Japan) | | | 103,900 | | | | 32,209,264 | |
Sea Ltd.–ADR (Thailand)(b) | | | 819,889 | | | | 10,699,552 | |
Take-Two Interactive Software, Inc.(b) | | | 398,768 | | | | 51,389,232 | |
| | | | | | | | 170,314,873 | |
|
| Interactive Media & Services–11.15% | |
Alphabet Inc.–Class A(b) | | | 7,303 | | | | 7,964,506 | |
Alphabet Inc.–Class C(b) | | | 136,723 | | | | 147,219,225 | |
Facebook, Inc.–Class A(b) | | | 582,918 | | | | 88,481,123 | |
| | | | | | | | 243,664,854 | |
See accompanying Notes to Financial Statements which are an integral part of the financial statements.
9 Invesco Summit Fund
| | | | | | | | |
| | | Shares | | | Value | |
| Internet & Direct Marketing Retail–11.45% | |
Alibaba Group Holding Ltd.–ADR (China)(b) | | | 319,046 | | | $ | 45,393,865 | |
Amazon.com, Inc. | | | 117,816 | | | | 188,271,146 | |
Booking Holdings Inc.(b) | | | 8,809 | | | | 16,513,175 | |
| | | | | | | | 250,178,186 | |
|
| Investment Banking & Brokerage–0.47% | |
E*TRADE Financial Corp. | | | 207,987 | | | | 10,278,717 | |
|
| Leisure Facilities–0.63% | |
Six Flags Entertainment Corp. | | | 254,451 | | | | 13,704,731 | |
|
| Life Sciences Tools & Services–3.82% | |
Illumina, Inc.(b) | | | 122,192 | | | | 38,020,041 | |
PRA Health Sciences, Inc.(b) | | | 240,049 | | | | 23,253,547 | |
Thermo Fisher Scientific, Inc. | | | 95,351 | | | | 22,278,761 | |
| | | | | | | | 83,552,349 | |
|
| Managed Health Care–4.44% | |
Humana Inc. | | | 58,381 | | | | 18,705,856 | |
UnitedHealth Group Inc. | | | 299,859 | | | | 78,368,150 | |
| | | | | | | | 97,074,006 | |
|
| Movies & Entertainment–1.38% | |
IMAX Corp.(b) | | | 401,577 | | | | 7,774,531 | |
Netflix, Inc.(b) | | | 38,042 | | | | 11,480,315 | |
Vivendi S.A. (France) | | | 450,245 | | | | 10,882,763 | |
| | | | | | | | 30,137,609 | |
|
| Oil & Gas Exploration & Production–1.72% | |
Extraction Oil & Gas Inc. | | | 606,407 | | | | 4,845,192 | |
Noble Energy, Inc. | | | 384,112 | | | | 9,545,183 | |
Parsley Energy, Inc.–Class A(b) | | | 177,093 | | | | 4,147,518 | |
Viper Energy Partners L.P. | | | 528,262 | | | | 18,996,302 | |
| | | | | | | | 37,534,195 | |
|
| Oil & Gas Refining & Marketing–1.18% | |
Marathon Petroleum Corp. | | | 181,292 | | | | 12,772,021 | |
PBF Energy Inc.–Class A | | | 310,646 | | | | 13,000,535 | |
| | | | | | | | 25,772,556 | |
|
| Packaged Foods & Meats–4.32% | |
Lamb Weston Holdings, Inc. | | | 156,018 | | | | 12,194,367 | |
Marine Harvest ASA (Norway) | | | 768,757 | | | | 18,603,814 | |
Mondelez International, Inc.–Class A | | | 723,324 | | | | 30,365,141 | |
Tyson Foods, Inc.–Class A(b) | | | 552,377 | | | | 33,098,430 | |
| | | | | | | | 94,261,752 | |
|
| Pharmaceuticals–2.14% | |
Allergan PLC | | | 63,362 | | | | 10,011,830 | |
Elanco Animal Health Inc.(c) | | | 347,620 | | | | 10,595,457 | |
Zoetis Inc. | | | 289,959 | | | | 26,139,804 | |
| | | | | | | | 46,747,091 | |
|
| Railroads–0.45% | |
Kansas City Southern | | | 95,827 | | | | 9,770,521 | |
| | | | | | | | |
| | | Shares | | | Value | |
| Regional Banks–0.53% | |
SVB Financial Group(b) | | | 48,540 | | | $ | 11,515,144 | |
|
| Restaurants–0.11% | |
Texas Roadhouse, Inc. | | | 40,901 | | | | 2,472,874 | |
|
| Semiconductor Equipment–0.98% | |
Applied Materials, Inc. | | | 289,002 | | | | 9,502,386 | |
ASML Holding N.V.–New York Shares (Netherlands) | | | 69,565 | | | | 11,990,223 | |
| | | | | | | | 21,492,609 | |
|
| Semiconductors–2.28% | |
Broadcom Inc. | | | 34,963 | | | | 7,813,881 | |
Integrated Device Technology, Inc.(b) | | | 309,201 | | | | 14,473,699 | |
NVIDIA Corp. | | | 66,809 | | | | 14,085,341 | |
Semtech Corp.(b) | | | 300,566 | | | | 13,507,436 | |
| | | | | | | | 49,880,357 | |
|
| Soft Drinks–0.10% | |
Monster Beverage Corp.(b) | | | 40,421 | | | | 2,136,250 | |
|
| Specialized Consumer Services–0.51% | |
Service Corp. International | | | 270,168 | | | | 11,203,867 | |
|
| Specialized REITs–0.50% | |
Crown Castle International Corp. | | | 43,285 | | | | 4,706,811 | |
SBA Communications Corp.–Class A(b) | | | 38,167 | | | | 6,189,542 | |
| | | | | | | | 10,896,353 | |
|
| Specialty Chemicals–0.71% | |
Sherwin-Williams Co. (The) | | | 39,336 | | | | 15,477,536 | |
|
| Systems Software–3.30% | |
Microsoft Corp. | | | 567,746 | | | | 60,640,950 | |
ServiceNow, Inc.(b) | | | 62,948 | | | | 11,396,106 | |
| | | | | | | | 72,037,056 | |
|
| Technology Hardware, Storage & Peripherals–3.30% | |
Apple Inc. | | | 329,835 | | | | 72,187,688 | |
|
| Trading Companies & Distributors–0.23% | |
Watsco, Inc. | | | 34,491 | | | | 5,110,876 | |
Total Common Stocks & Other Equity Interests
(Cost $1,288,040,351) | | | | 2,181,417,008 | |
|
Money Market Funds–0.42% | |
Invesco Government & Agency
Portfolio–Institutional Class, 2.08%(d) | | | 3,215,493 | | | | 3,215,493 | |
Invesco Liquid Assets Portfolio–Institutional Class, 2.27%(d) | | | 2,296,122 | | | | 2,296,581 | |
Invesco Treasury Portfolio–Institutional Class, 2.09%(d) | | | 3,674,850 | | | | 3,674,850 | |
Total Money Market Funds
(Cost $9,186,924) | | | | 9,186,924 | |
TOTAL INVESTMENTS IN SECURITIES (excluding investments purchased with cash collateral from securities on loan)–100.26%
(Cost $1,297,227,275) | | | | 2,190,603,932 | |
See accompanying Notes to Financial Statements which are an integral part of the financial statements.
10 Invesco Summit Fund
| | | | | | | | |
| | | Shares | | | Value | |
Investments Purchased with Cash Collateral from Securities on Loan | | | | | |
Money Market Funds–0.52% | |
Invesco Government & Agency
Portfolio–Institutional Class, 2.08% (Cost $11,468,170)(d)(e) | | | 11,468,170 | | | $ | 11,468,170 | |
TOTAL INVESTMENTS IN SECURITIES–100.78%
(Cost $1,308,695,445) | | | | 2,202,072,102 | |
OTHER ASSETS LESS LIABILITIES–(0.78)% | | | | (17,146,501 | ) |
NET ASSETS–100.00% | | | $ | 2,184,925,601 | |
Investment Abbreviations:
| | |
| ADR | | – American Depositary Receipt |
| REIT | | – Real Estate Investment Trust |
Notes to Schedule of Investments:
| (a) | Industry and/or sector classifications used in this report are generally according to the Global Industry Classification Standard, which was developed by and is the exclusive property and a service mark of MSCI Inc. and Standard & Poor’s. |
| (b) | Non-income producing security. |
| (c) | All or a portion of this security was out on loan at October 31, 2018. |
| (d) | The money market fund and the Fund are affiliated by having the same investment adviser. The rate shown is the 7-day SEC standardized yield as of October 31, 2018. |
| (e) | The security has been segregated to satisfy the commitment to return the cash collateral received in securities lending transactions upon the borrower’s return of the securities loaned. See Note 1I. |
See accompanying Notes to Financial Statements which are an integral part of the financial statements.
11 Invesco Summit Fund
Statement of Assets and Liabilities
October 31, 2018
| | | | |
Assets: | | | | |
Investments in securities, at value (Cost $1,288,040,351) | | $ | 2,181,417,008 | |
Investments in affiliated money market funds, at value and cost | | | 20,655,094 | |
Foreign currencies, at value (Cost $520) | | | 508 | |
Receivable for: | | | | |
Investments sold | | | 15,222,231 | |
Dividends and interest | | | 709,631 | |
Fund shares sold | | | 702,365 | |
Fund expenses absorbed | | | 7,326 | |
Investment for trustee deferred compensation and retirement plans | | | 386,211 | |
Other assets | | | 78,201 | |
Total assets | | | 2,219,178,575 | |
| |
Liabilities: | | | | |
Payable for: | | | | |
Investments purchased | | | 20,813,600 | |
Fund shares repurchased | | | 882,237 | |
Accrued foreign taxes | | | 24,833 | |
Collateral upon return of securities loaned | | | 11,468,170 | |
Accrued fees to affiliates | | | 517,578 | |
Accrued trustees’ and officers’ fees and benefits | | | 3,951 | |
Accrued other operating expenses | | | 112,083 | |
Trustee deferred compensation and retirement plans | | | 430,522 | |
Total liabilities | | | 34,252,974 | |
Net assets applicable to shares outstanding | | $ | 2,184,925,601 | |
| |
Net assets consist of: | | | | |
Shares of beneficial interest | | $ | 1,078,749,230 | |
Distributable earnings | | | 1,106,176,371 | |
| | | $ | 2,184,925,601 | |
| | | | |
Net assets: | | | | |
Class A | | $ | 114,570,131 | |
Class C | | $ | 16,791,535 | |
Class P | | $ | 2,024,210,848 | |
Class S | | $ | 3,405,244 | |
Class Y | | $ | 14,817,850 | |
Class R5 | | $ | 73,170 | |
Class R6 | | $ | 11,056,823 | |
|
Shares outstanding, no par value,
with an unlimited number of shares authorized: | |
Class A | | | 5,521,949 | |
Class C | | | 894,788 | |
Class P | | | 96,152,140 | |
Class S | | | 163,031 | |
Class Y | | | 705,674 | |
Class R5 | | | 3,470 | |
Class R6 | | | 524,248 | |
Class A: | | | | |
Net asset value per share | | $ | 20.75 | |
Maximum offering price per share | | | | |
(Net asset value of $20.75 ¸ 94.50%) | | $ | 21.96 | |
Class C: | | | | |
Net asset value and offering price per share | | $ | 18.77 | |
Class P: | | | | |
Net asset value and offering price per share | | $ | 21.05 | |
Class S: | | | | |
Net asset value and offering price per share | | $ | 20.89 | |
Class Y: | | | | |
Net asset value and offering price per share | | $ | 21.00 | |
Class R5: | | | | |
Net asset value and offering price per share | | $ | 21.09 | |
Class R6: | | | | |
Net asset value and offering price per share | | $ | 21.09 | |
| * | At October 31, 2018, securities with an aggregate value of $11,234,389 were on loan to brokers. |
See accompanying Notes to Financial Statements which are an integral part of the financial statements.
12 Invesco Summit Fund
Statement of Operations
For the year ended October 31, 2018
| | | | |
Investment income: | | | | |
Dividends (net of foreign withholding taxes of $404,770) | | $ | 17,626,104 | |
Dividends from affiliated money market funds (includes securities lending income of $77,777) | | | 148,226 | |
Total investment income | | | 17,774,330 | |
| |
Expenses: | | | | |
Advisory fees | | | 14,520,939 | |
Administrative services fees | | | 478,807 | |
Custodian fees | | | 100,553 | |
Distribution fees: | | | | |
Class A | | | 246,595 | |
Class B | | | 837 | |
Class C | | | 138,299 | |
Class P | | | 2,150,720 | |
Class S | | | 5,457 | |
Transfer agent fees — A, B, C, P, S and Y | | | 2,146,862 | |
Transfer agent fees — R5 | | | 17 | |
Transfer agent fees — R6 | | | 3,451 | |
Trustees’ and officers’ fees and benefits | | | 50,975 | |
Registration and filing fees | | | 129,064 | |
Reports to shareholders | | | 72,697 | |
Professional services fees | | | 111,081 | |
Other | | | 52,344 | |
Total expenses | | | 20,208,698 | |
Less: Fees waived and expense offset arrangement(s) | | | (53,948 | ) |
Net expenses | | | 20,154,750 | |
Net investment income (loss) | | | (2,380,420 | ) |
| |
Realized and unrealized gain (loss) from: | | | | |
Net realized gain (loss) from: | | | | |
Investment securities | | | 221,163,721 | |
Foreign currencies | | | (135,725 | ) |
| | | | 221,027,996 | |
Change in net unrealized appreciation (depreciation) of: | | | | |
Investment securities | | | (62,832,087 | ) |
Foreign currencies | | | 777 | |
| | | | (62,831,310 | ) |
Net realized and unrealized gain | | | 158,196,686 | |
Net increase in net assets resulting from operations | | $ | 155,816,266 | |
See accompanying Notes to Financial Statements which are an integral part of the financial statements.
13 Invesco Summit Fund
Statement of Changes in Net Assets
For the years ended October 31, 2018 and 2017
| | | | | | | | |
| | | 2018 | | | 2017 | |
Operations: | | | | | | | | |
Net investment income (loss) | | $ | (2,380,420 | ) | | $ | 271,005 | |
Net realized gain | | | 221,027,996 | | | | 75,447,284 | |
Change in net unrealized appreciation (depreciation) | | | (62,831,310 | ) | | | 426,303,295 | |
Net increase in net assets resulting from operations | | | 155,816,266 | | | | 502,021,584 | |
| | |
Distributions to shareholders from distributable earnings(1): | | | | | | | | |
Class A | | | (2,989,383 | ) | | | (3,020,626 | ) |
Class B | | | (13,801 | ) | | | (17,091 | ) |
Class C | | | (469,794 | ) | | | (305,415 | ) |
Class P | | | (74,612,584 | ) | | | (102,439,903 | ) |
Class S | | | (128,917 | ) | | | (189,956 | ) |
Class Y | | | (636,582 | ) | | | (245,427 | ) |
Class R5 | | | (769 | ) | | | (1,031 | ) |
Class R6 | | | (439 | ) | | | — | |
Total distributions from distributable earnings | | | (78,852,269 | ) | | | (106,219,449 | ) |
| | |
Share transactions–net: | | | | | | | | |
Class A | | | 35,805,441 | | | | 14,871,919 | |
Class B | | | (369,921 | ) | | | 3,229 | |
Class C | | | 7,522,064 | | | | 3,074,179 | |
Class P | | | (95,477,221 | ) | | | (44,084,588 | ) |
Class S | | | (247,728 | ) | | | (334,883 | ) |
Class Y | | | 261,843 | | | | 8,572,792 | |
Class R5 | | | 55,373 | | | | — | |
Class R6 | | | 11,366,414 | | | | 10,005 | |
Net increase (decrease) in net assets resulting from share transactions | | | (41,083,735 | ) | | | (17,887,347 | ) |
Net increase in net assets | | | 35,880,262 | | | | 377,914,788 | |
| | |
Net assets: | | | | | | | | |
Beginning of year | | | 2,149,045,339 | | | | 1,771,130,551 | |
End of year | | $ | 2,184,925,601 | | | $ | 2,149,045,339 | |
| (1) | For the year ended October 31, 2017, distributions to shareholders from distributable earnings consisted of distributions from net investment income and distributions from net realized gains. The Securities and Exchange Commission eliminated the requirement to disclose the distribution components separately, except for tax return of capital. For the year ended October 31, 2017, distributions from net investment income were $1,095,288, $455, $6,596 and $38 for Class P, Class S, Class Y and Class R5 shares, respectively, and distributions from net realized gains were $3,020,626, $17,091, $305,415, $101,344,615, $189,501, $238,831 and $993 for Class A, Class B, Class C, Class P, Class S, Class Y and Class R5 shares, respectively. |
Notes to Financial Statements
October 31, 2018
NOTE 1—Significant Accounting Policies
Invesco Summit Fund (the “Fund”) is a series portfolio of AIM Equity Funds (Invesco Equity Funds) (the “Trust”). The Trust is a Delaware statutory trust registered under the Investment Company Act of 1940, as amended (the “1940 Act”), as an open-end series management investment company authorized to issue an unlimited number of shares of beneficial interest. Information presented in these financial statements pertains only to the Fund. Matters affecting the Fund or each class will be voted on exclusively by the shareholders of the Fund or each class.
The Fund’s investment objective is long-term growth of capital.
The Fund currently consists of seven different classes of shares: Class A, Class C, Class P, Class S, Class Y, Class R5 and Class R6. Class P shares are not sold to members of the general public. Only shareholders who had accounts in the AIM Summit Investors Plans I and AIM Summit Investors Plans II at the close of business on December 8, 2006, may continue to purchase Class P shares as described in the Fund’s prospectus. Class Y shares are available only to certain investors. Class A shares are sold with a front-end sales charge unless certain waiver criteria are met. Under certain circumstances, load waiver shares may be subject to contingent deferred sales charges (“CDSC”). Class C shares are sold with a CDSC. Class P, Class S, Class Y, Class R5 and Class R6 shares are sold at net asset value. Effective November 30, 2010, new or additional investments in Class B shares are no longer permitted. Existing shareholders of Class B shares were permitted to continue to reinvest dividends and capital gains distributions in Class B shares until their conversion to Class A shares. Also, shareholders in Class B shares were able to exchange those shares for Class B shares of other
14 Invesco Summit Fund
Invesco Funds offering such shares until they converted to Class A shares. Generally, Class B shares automatically converted to Class A shares on or about the month-end, which was at least eight years after the date of purchase. Redemptions of Class B shares prior to the conversion date were subject to a CDSC. Effective January 26, 2018, all of the Fund’s outstanding Class B shares were converted to Class A shares, in advance of their normally scheduled conversion. No CDSC was paid in connection with this early conversion.
The Fund is an investment company and accordingly follows the investment company accounting and reporting guidance in accordance with Financial Accounting Standards Board Accounting Standards Codification Topic 946, Financial Services — Investment Companies.
The following is a summary of the significant accounting policies followed by the Fund in the preparation of its financial statements.
| A. | Security Valuations — Securities, including restricted securities, are valued according to the following policy. |
A security listed or traded on an exchange (except convertible securities) is valued at its last sales price or official closing price as of the close of the customary trading session on the exchange where the security is principally traded, or lacking any sales or official closing price on a particular day, the security may be valued at the closing bid price on that day. Securities traded in the over-the-counter market are valued based on prices furnished by independent pricing services or market makers. When such securities are valued by an independent pricing service they may be considered fair valued. Futures contracts are valued at the final settlement price set by an exchange on which they are principally traded. Listed options are valued at the mean between the last bid and asked prices from the exchange on which they are principally traded. Options not listed on an exchange are valued by an independent source at the mean between the last bid and asked prices. For purposes of determining net asset value (“NAV”) per share, futures and option contracts generally are valued 15 minutes after the close of the customary trading session of the New York Stock Exchange (“NYSE”).
Investments in open-end and closed-end registered investment companies that do not trade on an exchange are valued at the end-of-day net asset value per share. Investments in open-end and closed-end registered investment companies that trade on an exchange are valued at the last sales price or official closing price as of the close of the customary trading session on the exchange where the security is principally traded.
Debt obligations (including convertible securities) and unlisted equities are fair valued using an evaluated quote provided by an independent pricing service. Evaluated quotes provided by the pricing service may be determined without exclusive reliance on quoted prices, and may reflect appropriate factors such as institution-size trading in similar groups of securities, developments related to specific securities, dividend rate (for unlisted equities), yield (for debt obligations), quality, type of issue, coupon rate (for debt obligations), maturity (for debt obligations), individual trading characteristics and other market data. Pricing services generally value debt obligations assuming orderly transactions of institutional round lot size, but a fund may hold or transact in the same securities in smaller, odd lot sizes. Odd lots often trade at lower prices than institutional round lots. Debt obligations are subject to interest rate and credit risks. In addition, all debt obligations involve some risk of default with respect to interest and/or principal payments.
Foreign securities’ (including foreign exchange contracts) prices are converted into U.S. dollar amounts using the applicable exchange rates as of the close of the NYSE. If market quotations are available and reliable for foreign exchange-traded equity securities, the securities will be valued at the market quotations. Because trading hours for certain foreign securities end before the close of the NYSE, closing market quotations may become unreliable. If between the time trading ends on a particular security and the close of the customary trading session on the NYSE, events occur that the investment adviser determines are significant and make the closing price unreliable, the Fund may fair value the security. If the event is likely to have affected the closing price of the security, the security will be valued at fair value in good faith using procedures approved by the Board of Trustees. Adjustments to closing prices to reflect fair value may also be based on a screening process of an independent pricing service to indicate the degree of certainty, based on historical data, that the closing price in the principal market where a foreign security trades is not the current value as of the close of the NYSE. Foreign securities’ prices meeting the approved degree of certainty that the price is not reflective of current value will be priced at the indication of fair value from the independent pricing service. Multiple factors may be considered by the independent pricing service in determining adjustments to reflect fair value and may include information relating to sector indices, American Depositary Receipts and domestic and foreign index futures. Foreign securities may have additional risks including exchange rate changes, potential for sharply devalued currencies and high inflation, political and economic upheaval, the relative lack of issuer information, relatively low market liquidity and the potential lack of strict financial and accounting controls and standards.
Securities for which market prices are not provided by any of the above methods may be valued based upon quotes furnished by independent sources. The last bid price may be used to value equity securities. The mean between the last bid and asked prices is used to value debt obligations, including corporate loans.
Securities for which market quotations are not readily available or became unreliable are valued at fair value as determined in good faith by or under the supervision of the Trust’s officers following procedures approved by the Board of Trustees. Issuer specific events, market trends, bid/asked quotes of brokers and information providers and other market data may be reviewed in the course of making a good faith determination of a security’s fair value.
The Fund may invest in securities that are subject to interest rate risk, meaning the risk that the prices will generally fall as interest rates rise and, conversely, the prices will generally rise as interest rates fall. Specific securities differ in their sensitivity to changes in interest rates depending on their individual characteristics. Changes in interest rates may result in increased market volatility, which may affect the value and/or liquidity of certain Fund investments.
Valuations change in response to many factors including the historical and prospective earnings of the issuer, the value of the issuer’s assets, general economic conditions, interest rates, investor perceptions and market liquidity. Because of the inherent uncertainties of valuation, the values reflected in the financial statements may materially differ from the value received upon actual sale of those investments.
| B. | Securities Transactions and Investment Income — Securities transactions are accounted for on a trade date basis. Realized gains or losses on sales are computed on the basis of specific identification of the securities sold. Interest income (net of withholding tax, if any) is recorded on the accrual basis from settlement date. Dividend income (net of withholding tax, if any) is recorded on the ex-dividend date. |
The Fund may periodically participate in litigation related to Fund investments. As such, the Fund may receive proceeds from litigation settlements. Any proceeds received are included in the Statement of Operations as realized gain (loss) for investments no longer held and as unrealized gain (loss) for investments still held.
Brokerage commissions and mark ups are considered transaction costs and are recorded as an increase to the cost basis of securities purchased and/or a reduction of proceeds on a sale of securities. Such transaction costs are included in the determination of net realized and
15 Invesco Summit Fund
unrealized gain (loss) from investment securities reported in the Statement of Operations and the Statement of Changes in Net Assets and the net realized and unrealized gains (losses) on securities per share in the Financial Highlights. Transaction costs are included in the calculation of the Fund’s net asset value and, accordingly, they reduce the Fund’s total returns. These transaction costs are not considered operating expenses and are not reflected in net investment income reported in the Statement of Operations and the Statement of Changes in Net Assets, or the net investment income per share and the ratios of expenses and net investment income reported in the Financial Highlights, nor are they limited by any expense limitation arrangements between the Fund and the investment adviser.
The Fund allocates income and realized and unrealized capital gains and losses to a class based on the relative net assets of each class.
| C. | Country Determination — For the purposes of making investment selection decisions and presentation in the Schedule of Investments, the investment adviser may determine the country in which an issuer is located and/or credit risk exposure based on various factors. These factors include the laws of the country under which the issuer is organized, where the issuer maintains a principal office, the country in which the issuer derives 50% or more of its total revenues and the country that has the primary market for the issuer’s securities, as well as other criteria. Among the other criteria that may be evaluated for making this determination are the country in which the issuer maintains 50% or more of its assets, the type of security, financial guarantees and enhancements, the nature of the collateral and the sponsor organization. Country of issuer and/or credit risk exposure has been determined to be the United States of America, unless otherwise noted. |
| D. | Distributions — Distributions from net investment income and net realized capital gain, if any, are generally declared and paid annually and recorded on the ex-dividend date. The Fund may elect to treat a portion of the proceeds from redemptions as distributions for federal income tax purposes. |
| E. | Federal Income Taxes — The Fund intends to comply with the requirements of Subchapter M of the Internal Revenue Code of 1986, as amended (the “Internal Revenue Code”), necessary to qualify as a regulated investment company and to distribute substantially all of the Fund’s taxable earnings to shareholders. As such, the Fund will not be subject to federal income taxes on otherwise taxable income (including net realized capital gain) that is distributed to shareholders. Therefore, no provision for federal income taxes is recorded in the financial statements. |
The Fund recognizes the tax benefits of uncertain tax positions only when the position is more likely than not to be sustained. Management has analyzed the Fund’s uncertain tax positions and concluded that no liability for unrecognized tax benefits should be recorded related to uncertain tax positions. Management is not aware of any tax positions for which it is reasonably possible that the total amounts of unrecognized tax benefits will change materially in the next 12 months.
The Fund files tax returns in the U.S. Federal jurisdiction and certain other jurisdictions. Generally, the Fund is subject to examinations by such taxing authorities for up to three years after the filing of the return for the tax period.
| F. | Expenses — Fees provided for under the Rule 12b-1 plan of a particular class of the Fund are charged to the operations of such class. Transfer agency fees and expenses and other shareholder recordkeeping fees and expenses attributable to Class R5 and Class R6 are allocated to each share class based on relative net assets. Sub-accounting fees attributable to Class R5 are charged to the operations of the class. Transfer agency fees and expenses and other shareholder recordkeeping fees and expenses relating to all other classes are allocated among those classes based on relative net assets. All other expenses are allocated among the classes based on relative net assets. |
| G. | Accounting Estimates — The preparation of financial statements in conformity with accounting principles generally accepted in the United States of America (“GAAP”) requires management to make estimates and assumptions that affect the reported amounts of assets and liabilities at the date of the financial statements and the reported amounts of revenues and expenses during the reporting period including estimates and assumptions related to taxation. Actual results could differ from those estimates by a significant amount. In addition, the Fund monitors for material events or transactions that may occur or become known after the period-end date and before the date the financial statements are released to print. |
| H. | Indemnifications — Under the Trust’s organizational documents, each Trustee, officer, employee or other agent of the Trust is indemnified against certain liabilities that may arise out of the performance of their duties to the Fund. Additionally, in the normal course of business, the Fund enters into contracts, including the Fund’s servicing agreements, that contain a variety of indemnification clauses. The Fund’s maximum exposure under these arrangements is unknown as this would involve future claims that may be made against the Fund that have not yet occurred. The risk of material loss as a result of such indemnification claims is considered remote. |
| I. | Securities Lending — The Fund may lend portfolio securities having a market value up to one-third of the Fund’s total assets. Such loans are secured by collateral equal to no less than the market value of the loaned securities determined daily by the securities lending provider. Such collateral will be cash or debt securities issued or guaranteed by the U.S. Government or any of its sponsored agencies. Cash collateral received in connection with these loans is invested in short-term money market instruments or affiliated money market funds and is shown as such on the Schedule of Investments. The Fund bears the risk of loss with respect to the investment of collateral. It is the Fund’s policy to obtain additional collateral from or return excess collateral to the borrower by the end of the next business day, following the valuation date of the securities loaned. Therefore, the value of the collateral held may be temporarily less than the value of the securities on loan. When loaning securities, the Fund retains certain benefits of owning the securities, including the economic equivalent of dividends or interest generated by the security. Lending securities entails a risk of loss to the Fund if, and to the extent that, the market value of the securities loaned were to increase and the borrower did not increase the collateral accordingly, and the borrower failed to return the securities. The securities loaned are subject to termination at the option of the borrower or the Fund. Upon termination, the borrower will return to the Fund the securities loaned and the Fund will return the collateral. Upon the failure of the borrower to return the securities, collateral may be liquidated and the securities may be purchased on the open market to replace the loaned securities. The Fund could experience delays and costs in gaining access to the collateral and the securities may lose value during the delay which could result in potential losses to the Fund. Some of these losses may be indemnified by the lending agent. The Fund bears the risk of any deficiency in the amount of the collateral available for return to the borrower due to any loss on the collateral invested. Dividends received on cash collateral investments for securities lending transactions, which are net of compensation to counterparties, are included in Dividends from affiliated money market funds on the Statement of Operations. The aggregate value of securities out on loan, if any, is shown as a footnote on the Statement of Assets and Liabilities. |
| J. | Foreign Currency Translations — Foreign currency is valued at the close of the NYSE based on quotations posted by banks and major currency dealers. Portfolio securities and other assets and liabilities denominated in foreign currencies are translated into U.S. dollar amounts at the date of valuation. Purchases and sales of portfolio securities (net of foreign taxes withheld on disposition) and income items denominated in |
16 Invesco Summit Fund
| | foreign currencies are translated into U.S. dollar amounts on the respective dates of such transactions. The Fund does not separately account for the portion of the results of operations resulting from changes in foreign exchange rates on investments and the fluctuations arising from changes in market prices of securities held. The combined results of changes in foreign exchange rates and the fluctuation of market prices on investments (net of estimated foreign tax withholding) are included with the net realized and unrealized gain or loss from investments in the Statement of Operations. Reported net realized foreign currency gains or losses arise from (1) sales of foreign currencies, (2) currency gains or losses realized between the trade and settlement dates on securities transactions, and (3) the difference between the amounts of dividends, interest, and foreign withholding taxes recorded on the Fund’s books and the U.S. dollar equivalent of the amounts actually received or paid. Net unrealized foreign currency gains and losses arise from changes in the fair values of assets and liabilities, other than investments in securities at fiscal period end, resulting from changes in exchange rates. |
The Fund may invest in foreign securities, which may be subject to foreign taxes on income, gains on investments or currency repatriation, a portion of which may be recoverable. Foreign taxes, if any, are recorded based on the tax regulations and rates that exist in the foreign markets in which the Fund invests and are shown in the Statement of Operations.
| K. | Forward Foreign Currency Contracts — The Fund may engage in foreign currency transactions either on a spot (i.e. for prompt delivery and settlement) basis, or through forward foreign currency contracts, to manage or minimize currency or exchange rate risk. |
The Fund may also enter into forward foreign currency contracts for the purchase or sale of a security denominated in a foreign currency in order to “lock in” the U.S. dollar price of that security, or the Fund may also enter into forward foreign currency contracts that do not provide for physical settlement of the two currencies, but instead are settled by a single cash payment calculated as the difference between the agreed upon exchange rate and the spot rate at settlement based upon an agreed upon notional amount (non-deliverable forwards). The Fund will set aside liquid assets in an amount equal to the daily mark-to-market obligation for forward foreign currency contracts.
A forward foreign currency contract is an obligation between two parties (“Counterparties”) to purchase or sell a specific currency for an agreed-upon price at a future date. The use of forward foreign currency contracts does not eliminate fluctuations in the price of the underlying securities the Fund owns or intends to acquire but establishes a rate of exchange in advance. Fluctuations in the value of these contracts are measured by the difference in the contract date and reporting date exchange rates and are recorded as unrealized appreciation (depreciation) until the contracts are closed. When the contracts are closed, realized gains (losses) are recorded. Realized and unrealized gains (losses) on the contracts are included in the Statement of Operations. The primary risks associated with forward foreign currency contracts include failure of the Counterparty to meet the terms of the contract and the value of the foreign currency changing unfavorably. These risks may be in excess of the amounts reflected in the Statement of Assets and Liabilities.
NOTE 2—Advisory Fees and Other Fees Paid to Affiliates
The Trust has entered into a master investment advisory agreement with Invesco Advisers, Inc. (the “Adviser” or “Invesco”). Under the terms of the investment advisory agreement, the Fund accrues daily and pays monthly an advisory fee to the Adviser based on the annual rate of the Fund’s average daily net assets as follows:
| | | | | | | | |
| Average Daily Net Assets | | Rate | |
First $10 million | | | 1 | .00% | | | | |
Next $140 million | | | 0 | .75% | | | | |
Over $150 million | | | 0 | .625% | | | | |
For the year ended October 31, 2018, the effective advisory fees incurred by the Fund was 0.63%.
Under the terms of a master sub-advisory agreement between the Adviser and each of Invesco Asset Management Deutschland GmbH, Invesco Asset Management Limited, Invesco Asset Management (Japan) Limited, Invesco Hong Kong Limited, Invesco Senior Secured Management, Inc. and Invesco Canada Ltd. (collectively, the “Affiliated Sub-Advisers”) the Adviser, not the Fund, will pay 40% of the fees paid to the Adviser to any such Affiliated Sub-Adviser(s) that provide(s) discretionary investment management services to the Fund based on the percentage of assets allocated to such Affiliated Sub-Adviser(s).
The Adviser has contractually agreed, through at least June 30, 2019, to waive advisory fees and/or reimburse expenses of all shares to the extent necessary to limit total annual fund operating expenses after fee waiver and/or expense reimbursement (excluding certain items discussed below) of Class A, Class C, Class P, Class S, Class Y, Class R5 and Class R6 shares to 2.00%, 2.75%, 1.85%, 1.90%, 1.75%, 1.75% and 1.75%, respectively, of average daily net assets (the “expense limits”). Prior to their conversion to Class A shares, the expense limit for Class B was 2.75% of average daily net assets. In determining the Adviser’s obligation to waive advisory fees and/or reimburse expenses, the following expenses are not taken into account, and could cause the total annual fund operating expenses after fee waiver and/or expense reimbursement to exceed the numbers reflected above: (1) interest; (2) taxes; (3) dividend expense on short sales; (4) extraordinary or non-routine items, including litigation expenses; and (5) expenses that the Fund has incurred but did not actually pay because of an expense offset arrangement. Unless Invesco continues the fee waiver agreement, it will terminate on June 30, 2019. During its term, the fee waiver agreement cannot be terminated or amended to increase the expense limits or reduce the advisory fee waiver without approval of the Board of Trustees. The Adviser did not waive fees and/or reimburse expenses during the period under these expense limits.
Further, the Adviser has contractually agreed, through at least June 30, 2020, to waive the advisory fee payable by the Fund in an amount equal to 100% of the net advisory fees the Adviser receives from the affiliated money market funds on investments by the Fund of uninvested cash (excluding investments of cash collateral from securities lending) in such affiliated money market funds.
For the year ended October 31, 2018, the Adviser waived advisory fees of $4,167.
The Trust has entered into a master administrative services agreement with Invesco pursuant to which the Fund has agreed to pay Invesco for certain administrative costs incurred in providing accounting services to the Fund. For the year ended October 31, 2018, expenses incurred under the agreement are shown in the Statement of Operations as Administrative services fees.
The Trust has entered into a transfer agency and service agreement with Invesco Investment Services, Inc. (“IIS”) pursuant to which the Fund has agreed to pay IIS a fee for providing transfer agency and shareholder services to the Fund and reimburse IIS for certain expenses incurred by IIS in the
17 Invesco Summit Fund
course of providing such services. IIS may make payments to intermediaries that provide omnibus account services, sub-accounting services and/or networking services. All fees payable by IIS to intermediaries that provide omnibus account services or sub-accounting services are charged back to the Fund, subject to certain limitations approved by the Trust’s Board of Trustees. For the year ended October 31, 2018, expenses incurred under the agreement are shown in the Statement of Operations as Transfer agent fees.
The Fund has entered into master distribution agreements with Invesco Distributors, Inc. (“IDI”) to serve as the distributor for the Class A, Class C, Class P, Class S, Class Y, Class R5 and Class R6 shares. The Fund has adopted plans pursuant to Rule 12b-1 under the 1940 Act with respect to the Fund’s Class A, Class C shares, Class P shares and Class S shares (collectively, the “Plans”). The Fund, pursuant to the Plans, pays IDI compensation at the annual rate of 0.25% of the Fund’s average daily net assets of Class A shares, 1.00% of the average daily net assets of Class C shares, 0.10% of the average daily net assets of Class P shares and 0.15% of the average daily net assets of Class S shares. Prior to their conversion to Class A shares, the Fund paid an annual rate of 1.00% of the average daily net assets of Class B shares. The fees are accrued daily and paid monthly. Of the Plan payments, up to 0.25% of the average daily net assets of Class A, Class B and Class C shares, 0.10% of the average daily net assets of Class P shares and 0.15% of the average daily net assets of Class S shares may be paid to furnish continuing personal shareholder services to customers who purchase and own shares of such classes. Any amounts not paid as a service fee under the Plans would constitute an asset-based sales charge. Rules of the Financial Industry Regulatory Authority (“FINRA”) impose a cap on the total sales charges, including asset-based sales charges, that may be paid by any class of shares of the Fund. For the year ended October 31, 2018, expenses incurred under the Plans are shown in the Statement of Operations as Distribution fees.
Front-end sales commissions and CDSC (collectively, the “sales charges”) are not recorded as expenses of the Fund. Front-end sales commissions are deducted from proceeds from the sales of Fund shares prior to investment in Class A shares of the Fund. CDSC are deducted from redemption proceeds prior to remittance to the shareholder. During the year ended October 31, 2018, IDI advised the Fund that IDI retained $85,650 in front-end sales commissions from the sale of Class A shares and $335 and $471 from Class A and Class C shares, respectively, for CDSC imposed on redemptions by shareholders.
For the year ended October 31, 2018, the Fund incurred $22,358 in brokerage commissions with Invesco Capital Markets, Inc., an affiliate of the Adviser and IDI, for portfolio transactions executed on behalf of the Fund.
Certain officers and trustees of the Trust are officers and directors of the Adviser, IIS and/or IDI.
NOTE 3—Additional Valuation Information
GAAP defines fair value as the price that would be received to sell an asset or paid to transfer a liability in an orderly transaction between market participants at the measurement date, under current market conditions. GAAP establishes a hierarchy that prioritizes the inputs to valuation methods, giving the highest priority to readily available unadjusted quoted prices in an active market for identical assets (Level 1) and the lowest priority to significant unobservable inputs (Level 3), generally when market prices are not readily available or are unreliable. Based on the valuation inputs, the securities or other investments are tiered into one of three levels. Changes in valuation methods may result in transfers in or out of an investment’s assigned level:
| | Level 1 — | Prices are determined using quoted prices in an active market for identical assets. |
| | Level 2 — | Prices are determined using other significant observable inputs. Observable inputs are inputs that other market participants may use in pricing a security. These may include quoted prices for similar securities, interest rates, prepayment speeds, credit risk, yield curves, loss severities, default rates, discount rates, volatilities and others. |
| | Level 3 — | Prices are determined using significant unobservable inputs. In situations where quoted prices or observable inputs are unavailable (for example, when there is little or no market activity for an investment at the end of the period), unobservable inputs may be used. Unobservable inputs reflect the Fund’s own assumptions about the factors market participants would use in determining fair value of the securities or instruments and would be based on the best available information. |
The following is a summary of the tiered valuation input levels, as of October 31, 2018. The level assigned to the securities valuations may not be an indication of the risk or liquidity associated with investing in those securities. Because of the inherent uncertainties of valuation, the values reflected in the financial statements may materially differ from the value received upon actual sale of those investments.
| | | | | | | | | | | | | | | | |
| | | Level 1 | | | Level 2 | | | Level 3 | | | Total | |
Investments in Securities | | | | | | | | | | | | | | | | |
Common Stocks & Other Equity Interests | | $ | 2,090,328,325 | | | $ | 91,088,683 | | | $ | — | | | $ | 2,181,417,008 | |
Money Market Funds | | | 20,655,094 | | | | — | | | | — | | | | 20,655,094 | |
Total Investments | | $ | 2,110,983,419 | | | $ | 91,088,683 | | | $ | — | | | $ | 2,202,072,102 | |
NOTE 4—Expense Offset Arrangement(s)
The expense offset arrangement is comprised of transfer agency credits which result from balances in demand deposit accounts used by the transfer agent for clearing shareholder transactions. For the year ended October 31, 2018, the Fund received credits from this arrangement, which resulted in the reduction of the Fund’s total expenses of $49,781.
NOTE 5—Trustees’ and Officers’ Fees and Benefits
Trustees’ and Officers’ Fees and Benefits include amounts accrued by the Fund to pay remuneration to certain Trustees and Officers of the Fund. Trustees have the option to defer compensation payable by the Fund, and Trustees’ and Officers’ Fees and Benefits also include amounts accrued by the Fund to fund such deferred compensation amounts. Those Trustees who defer compensation have the option to select various Invesco Funds in which their deferral accounts shall be deemed to be invested. Finally, certain current Trustees were eligible to participate in a retirement plan that provided for benefits to be paid upon retirement to Trustees over a period of time based on the number of years of service. The Fund may have certain former Trustees who also participate in a retirement plan and receive benefits under such plan. Trustees’ and Officers’ Fees and Benefits include amounts accrued by the Fund to fund such retirement benefits. Obligations under the deferred compensation and retirement plans represent unsecured claims against the general assets of the Fund.
18 Invesco Summit Fund
NOTE 6—Cash Balances
The Fund is permitted to temporarily carry a negative or overdrawn balance in its account with State Street Bank and Trust Company, the custodian bank. Such balances, if any at period-end, are shown in the Statement of Assets and Liabilities under the payable caption Amount due custodian. To compensate the custodian bank for such overdrafts, the overdrawn Fund may either (1) leave funds as a compensating balance in the account so the custodian bank can be compensated by earning the additional interest; or (2) compensate by paying the custodian bank at a rate agreed upon by the custodian bank and Invesco, not to exceed the contractually agreed upon rate.
NOTE 7—Distributions to Shareholders and Tax Components of Net Assets
Tax Character of Distributions to Shareholders Paid During the Fiscal Years Ended October 31, 2018 and 2017:
| | | | | | | | |
| | | 2018 | | | 2017 | |
Ordinary income | | $ | 5,946,634 | | | $ | 1,102,377 | |
Long-term capital gain | | | 72,905,635 | | | | 105,117,072 | |
Total distributions | | $ | 78,852,269 | | | $ | 106,219,449 | |
Tax Components of Net Assets at Period-End:
| | | | |
| | | 2018 | |
Undistributed ordinary income | | $ | 497,262 | |
Undistributed long-term gain | | | 216,942,380 | |
Net unrealized appreciation — investments | | | 889,146,154 | |
Net unrealized appreciation (depreciation) — foreign currencies | | | (809 | ) |
Temporary book/tax differences | | | (408,616 | ) |
Shares of beneficial interest | | | 1,078,749,230 | |
Total net assets | | $ | 2,184,925,601 | |
The difference between book-basis and tax-basis unrealized appreciation (depreciation) is due to differences in the timing of recognition of gains and losses on investments for tax and book purposes. The Fund’s net unrealized appreciation difference is attributable primarily to wash sales.
The temporary book/tax differences are a result of timing differences between book and tax recognition of income and/or expenses. The Fund’s temporary book/tax differences are the result of the trustee deferral of compensation and retirement plan benefits.
Capital loss carryforward is calculated and reported as of a specific date. Results of transactions and other activity after that date may affect the amount of capital loss carryforward actually available for the Fund to utilize. Capital losses generated in years beginning after December 22, 2010 can be carried forward for an unlimited period, whereas previous losses expire in eight tax years. Capital losses with an expiration period may not be used to offset capital gains until all net capital losses without an expiration date have been utilized. Capital loss carryforwards with no expiration date will retain their character as either short-term or long-term capital losses instead of as short-term capital losses as under prior law. The ability to utilize capital loss carryforwards in the future may be limited under the Internal Revenue Code and related regulations based on the results of future transactions.
The Fund does not have a capital loss carryforward as of October 31, 2018.
NOTE 8—Investment Transactions
The aggregate amount of investment securities (other than short-term securities, U.S. Treasury obligations and money market funds, if any) purchased and sold by the Fund during the year ended October 31, 2018 was $794,391,269 and $912,204,064, respectively. Cost of investments, including any derivatives, on a tax basis includes the adjustments for financial reporting purposes as of the most recently completed federal income tax reporting period-end.
| | | | |
| Unrealized Appreciation (Depreciation) of Investments on a Tax Basis | |
Aggregate unrealized appreciation of investments | | $ | 930,232,250 | |
Aggregate unrealized (depreciation) of investments | | | (41,086,096 | ) |
Net unrealized appreciation of investments | | $ | 889,146,154 | |
Cost of investments for tax purposes is $1,312,925,948.
NOTE 9—Reclassification of Permanent Differences
Primarily as a result of differing book/tax treatment of operating losses, on October 31, 2018, undistributed net investment income (loss) was increased by $2,422,624 and undistributed net realized gain was decreased by $2,422,624. This reclassification had no effect on the net assets or the distributable earnings of the Fund.
19 Invesco Summit Fund
NOTE 10—Share Information
| | | | | | | | | | | | | | | | |
| | | Summary of Share Activity | |
| | | Years ended October 31, | |
| | | 2018 | | | 2017 | |
| | | Shares | | | Amount | | | Shares | | | Amount | |
Sold: | | | | | | | | | | | | | | | | |
Class A | | | 2,747,684 | | | $ | 58,734,837 | | | | 1,616,698 | | | $ | 29,365,182 | |
Class B(a) | | | 796 | | | | 14,719 | | | | 14,112 | | | | 224,817 | |
Class C | | | 645,661 | | | | 12,462,679 | | | | 377,457 | | | | 6,417,661 | |
Class P | | | 1,343,366 | | | | 28,723,804 | | | | 1,741,281 | | | | 31,130,630 | |
Class S | | | 3,893 | | | | 83,837 | | | | 4,783 | | | | 84,978 | |
Class Y | | | 600,267 | | | | 12,700,327 | | | | 633,118 | | | | 11,532,147 | |
Class R5 | | | 2,500 | | | | 55,861 | | | | — | | | | — | |
Class R6(b) | | | 611,749 | | | | 13,282,861 | | | | 568 | | | | 10,005 | |
| | | | |
Issued as reinvestment of dividends: | | | | | | | | | | | | | | | | |
Class A | | | 147,603 | | | | 2,894,554 | | | | 173,488 | | | | 2,779,270 | |
Class B(a) | | | 758 | | | | 13,577 | | | | 1,135 | | | | 16,791 | |
Class C | | | 25,759 | | | | 460,049 | | | | 19,988 | | | | 294,614 | |
Class P | | | 3,694,772 | | | | 73,415,062 | | | | 6,231,181 | | | | 100,945,132 | |
Class S | | | 6,502 | | | | 128,288 | | | | 11,806 | | | | 189,951 | |
Class Y | | | 30,410 | | | | 602,431 | | | | 14,223 | | | | 229,700 | |
| | | | |
Conversion of Class B shares to Class A shares:(c) | | | | | | | | | | | | | | | | |
Class A | | | 16,457 | | | | 354,658 | | | | 10,175 | | | | 178,740 | |
Class B | | | (18,081 | ) | | | (354,658 | ) | | | (11,042 | ) | | | (178,740 | ) |
| | | | |
Reacquired: | | | | | | | | | | | | | | | | |
Class A | | | (1,239,718 | ) | | | (26,178,608 | ) | | | (982,545 | ) | | | (17,451,273 | ) |
Class B(a) | | | (2,262 | ) | | | (43,559 | ) | | | (3,617 | ) | | | (59,639 | ) |
Class C | | | (283,018 | ) | | | (5,400,664 | ) | | | (217,575 | ) | | | (3,638,096 | ) |
Class P | | | (9,145,348 | ) | | | (197,616,087 | ) | | | (9,754,579 | ) | | | (176,160,350 | ) |
Class S | | | (21,290 | ) | | | (459,853 | ) | | | (32,871 | ) | | | (609,812 | ) |
Class Y | | | (607,343 | ) | | | (13,040,915 | ) | | | (179,003 | ) | | | (3,189,055 | ) |
Class R5 | | | (23 | ) | | | (488 | ) | | | — | | | | — | |
Class R6 | | | (88,069 | ) | | | (1,916,447 | ) | | | — | | | | — | |
Net increase(decrease) in share activity | | | (1,526,975 | ) | | $ | (41,083,735 | ) | | | (331,219 | ) | | $ | (17,887,347 | ) |
| (a) | Class B shares activity for the period November 1, 2017 through January 26, 2018 (date of conversion). |
| (b) | Commencement date of April 4, 2017. |
| (c) | Effective as of the close of business January 26, 2018, all outstanding Class B shares were converted to Class A shares. |
20 Invesco Summit Fund
NOTE 11—Financial Highlights
The following schedule presents financial highlights for a share of the Fund outstanding throughout the periods indicated.
| | | | | | | | | | | | | | | | | | | | | | | | | | | | | | | | | | | | | | | | | | | | | | | | | | | | | | | | |
| | | Net asset
value,
beginning
of period | | | Net
investment
income
(loss)(a) | | | Net gains
on securities
(both
realized and
unrealized) | | | Total from
investment
operations | | | Dividends
from net
investment
income | | | Distributions
from net
realized
gains | | | Total
distributions | | | Net asset
value, end
of period | | | Total
return(b) | | | Net assets, end of period
(000’s omitted) | | | Ratio of
expenses
to average net assets
with fee waivers
and/or expenses
absorbed | | | Ratio of
expenses
to average net
assets without
fee waivers
and/or expenses
absorbed | | | Ratio of net
investment
income (loss)
to average
net assets | | | Portfolio
turnover(c) | |
Class A | | | | | | | | | | | | | | | | | | | | | | | | | | | | | | | | | | | | | | | | | | | | | | | | | | | | | | | | |
Year ended 10/31/18 | | $ | 20.14 | | | $ | (0.05 | ) | | $ | 1.41 | | | $ | 1.36 | | | $ | — | | | $ | (0.75 | ) | | $ | (0.75 | ) | | $ | 20.75 | | | | 6.95 | % | | $ | 114,570 | | | | 1.02 | %(d) | | | 1.02 | %(d) | | | (0.24 | )%(d) | | | 35 | % |
Year ended 10/31/17 | | | 16.56 | | | | (0.02 | ) | | | 4.60 | | | | 4.58 | | | | — | | | | (1.00 | ) | | | (1.00 | ) | | | 20.14 | | | | 29.20 | | | | 77,519 | | | | 1.04 | | | | 1.04 | | | | (0.13 | ) | | | 31 | |
Year ended 10/31/16 | | | 17.59 | | | | (0.01 | ) | | | 0.11 | | | | 0.10 | | | | — | | | | (1.13 | ) | | | (1.13 | ) | | | 16.56 | | | | 0.81 | | | | 50,217 | | | | 1.05 | | | | 1.05 | | | | (0.05 | ) | | | 47 | |
Year ended 10/31/15 | | | 18.62 | | | | (0.03 | ) | | | 1.44 | | | | 1.41 | | | | — | | | | (2.44 | ) | | | (2.44 | ) | | | 17.59 | | | | 8.86 | | | | 50,349 | | | | 1.04 | | | | 1.04 | | | | (0.16 | ) | | | 49 | |
Year ended 10/31/14 | | | 16.40 | | | | (0.03 | ) | | | 2.62 | | | | 2.59 | | | | (0.03 | ) | | | (0.34 | ) | | | (0.37 | ) | | | 18.62 | | | | 16.06 | | | | 30,382 | | | | 1.05 | | | | 1.05 | | | | (0.18 | ) | | | 52 | |
Class B | | | | | | | | | | | | | | | | | | | | | | | | | | | | | | | | | | | | | | | | | | | | | | | | | | | | | | | | |
Year ended 10/31/18(e) | | | 18.47 | | | | (0.04 | ) | | | 1.99 | | | | 1.95 | | | | — | | | | (0.75 | ) | | | (0.75 | ) | | | 19.67 | | | | 10.94 | | | | — | | | | 1.77 | (d)(g) | | | 1.77 | (d)(g) | | | (0.99 | )(d)(g) | | | 35 | |
Year ended 10/31/17 | | | 15.38 | | | | (0.14 | ) | | | 4.23 | | | | 4.09 | | | | — | | | | (1.00 | ) | | | (1.00 | ) | | | 18.47 | | | | 28.21 | | | | 347 | | | | 1.79 | | | | 1.79 | | | | (0.88 | ) | | | 31 | |
Year ended 10/31/16 | | | 16.53 | | | | (0.12 | ) | | | 0.10 | | | | (0.02 | ) | | | — | | | | (1.13 | ) | | | (1.13 | ) | | | 15.38 | | | | 0.09 | | | | 280 | | | | 1.80 | | | | 1.80 | | | | (0.80 | ) | | | 47 | |
Year ended 10/31/15 | | | 17.77 | | | | (0.15 | ) | | | 1.35 | | | | 1.20 | | | | — | | | | (2.44 | ) | | | (2.44 | ) | | | 16.53 | | | | 7.20 | | | | 566 | | | | 1.79 | | | | 1.79 | | | | (0.91 | ) | | | 49 | |
Year ended 10/31/14 | | | 15.76 | | | | (0.15 | ) | | | 2.50 | | | | 2.35 | | | | — | | | | (0.34 | ) | | | (0.34 | ) | | | 17.77 | | | | 15.19 | | | | 676 | | | | 1.80 | | | | 1.80 | | | | (0.93 | ) | | | 52 | |
Class C | | | | | | | | | | | | | | | | | | | | | | | | | | | | | | | | | | | | | | | | | | | | | | | | | | | | | | | | |
Year ended 10/31/18 | | | 18.41 | | | | (0.19 | ) | | | 1.30 | | | | 1.11 | | | | — | | | | (0.75 | ) | | | (0.75 | ) | | | 18.77 | | | | 6.22 | | | | 16,792 | | | | 1.77 | (d) | | | 1.77 | (d) | | | (0.99 | )(d) | | | 35 | |
Year ended 10/31/17 | | | 15.34 | | | | (0.15 | ) | | | 4.22 | | | | 4.07 | | | | — | | | | (1.00 | ) | | | (1.00 | ) | | | 18.41 | | | | 28.15 | | | | 9,325 | | | | 1.79 | | | | 1.79 | | | | (0.88 | ) | | | 31 | |
Year ended 10/31/16 | | | 16.49 | | | | (0.12 | ) | | | 0.10 | | | | (0.02 | ) | | | — | | | | (1.13 | ) | | | (1.13 | ) | | | 15.34 | | | | 0.09 | | | | 5,008 | | | | 1.80 | | | | 1.80 | | | | (0.80 | ) | | | 47 | |
Year ended 10/31/15 | | | 17.73 | | | | (0.15 | ) | | | 1.35 | | | | 1.20 | | | | — | | | | (2.44 | ) | | | (2.44 | ) | | | 16.49 | | | | 8.02 | | | | 4,855 | | | | 1.79 | | | | 1.79 | | | | (0.91 | ) | | | 49 | |
Year ended 10/31/14 | | | 15.73 | | | | (0.16 | ) | | | 2.50 | | | | 2.34 | | | | — | | | | (0.34 | ) | | | (0.34 | ) | | | 17.73 | | | | 15.15 | | | | 2,337 | | | | 1.80 | | | | 1.80 | | | | (0.93 | ) | | | 52 | |
Class P | | | | | | | | | | | | | | | | | | | | | | | | | | | | | | | | | | | | | | | | | | | | | | | | | | | | | | | | |
Year ended 10/31/18 | | | 20.39 | | | | (0.02 | ) | | | 1.43 | | | | 1.41 | | | | (0.00 | ) | | | (0.75 | ) | | | (0.75 | ) | | | 21.05 | | | | 7.13 | | | | 2,024,211 | | | | 0.87 | (d) | | | 0.87 | (d) | | | (0.09 | )(d) | | | 35 | |
Year ended 10/31/17 | | | 16.75 | | | | 0.00 | | | | 4.65 | | | | 4.65 | | | | (0.01 | ) | | | (1.00 | ) | | | (1.01 | ) | | | 20.39 | | | | 29.32 | | | | 2,044,421 | | | | 0.89 | | | | 0.89 | | | | 0.02 | | | | 31 | |
Year ended 10/31/16 | | | 17.75 | | | | 0.02 | | | | 0.11 | | | | 0.13 | | | | — | | | | (1.13 | ) | | | (1.13 | ) | | | 16.75 | | | | 0.98 | | | | 1,708,869 | | | | 0.90 | | | | 0.90 | | | | 0.10 | | | | 47 | |
Year ended 10/31/15 | | | 18.74 | | | | (0.00 | ) | | | 1.45 | | | | 1.45 | | | | — | | | | (2.44 | ) | | | (2.44 | ) | | | 17.75 | | | | 9.03 | | | | 1,821,733 | | | | 0.89 | | | | 0.89 | | | | (0.01 | ) | | | 49 | |
Year ended 10/31/14 | | | 16.50 | | | | (0.01 | ) | | | 2.63 | | | | 2.62 | | | | (0.04 | ) | | | (0.34 | ) | | | (0.38 | ) | | | 18.74 | | | | 16.22 | | | | 1,829,660 | | | | 0.90 | | | | 0.90 | | | | (0.03 | ) | | | 52 | |
Class S | | | | | | | | | | | | | | | | | | | | | | | | | | | | | | | | | | | | | | | | | | | | | | | | | | | | | | | | |
Year ended 10/31/18 | | | 20.24 | | | | (0.03 | ) | | | 1.43 | | | | 1.40 | | | | — | | | | (0.75 | ) | | | (0.75 | ) | | | 20.89 | | | | 7.12 | | | | 3,405 | | | | 0.92 | (d) | | | 0.92 | (d) | | | (0.14 | )(d) | | | 35 | |
Year ended 10/31/17 | | | 16.63 | | | | (0.01 | ) | | | 4.62 | | | | 4.61 | | | | (0.00 | ) | | | (1.00 | ) | | | (1.00 | ) | | | 20.24 | | | | 29.29 | | | | 3,521 | | | | 0.94 | | | | 0.94 | | | | (0.03 | ) | | | 31 | |
Year ended 10/31/16 | | | 17.64 | | | | 0.01 | | | | 0.11 | | | | 0.12 | | | | — | | | | (1.13 | ) | | | (1.13 | ) | | | 16.63 | | | | 0.92 | | | | 3,164 | | | | 0.95 | | | | 0.95 | | | | 0.05 | | | | 47 | |
Year ended 10/31/15 | | | 18.66 | | | | (0.01 | ) | | | 1.43 | | | | 1.42 | | | | — | | | | (2.44 | ) | | | (2.44 | ) | | | 17.64 | | | | 8.90 | | | | 3,546 | | | | 0.94 | | | | 0.94 | | | | (0.06 | ) | | | 49 | |
Year ended 10/31/14 | | | 16.43 | | | | (0.01 | ) | | | 2.62 | | | | 2.61 | | | | (0.04 | ) | | | (0.34 | ) | | | (0.38 | ) | | | 18.66 | | | | 16.18 | | | | 3,685 | | | | 0.95 | | | | 0.95 | | | | (0.08 | ) | | | 52 | |
Class Y | | | | | | | | | | | | | | | | | | | | | | | | | | | | | | | | | | | | | | | | | | | | | | | | | | | | | | | | |
Year ended 10/31/18 | | | 20.34 | | | | 0.00 | | | | 1.43 | | | | 1.43 | | | | (0.02 | ) | | | (0.75 | ) | | | (0.77 | ) | | | 21.00 | | | | 7.25 | | | | 14,818 | | | | 0.77 | (d) | | | 0.77 | (d) | | | 0.01 | (d) | | | 35 | |
Year ended 10/31/17 | | | 16.71 | | | | 0.02 | | | | 4.64 | | | | 4.66 | | | | (0.03 | ) | | | (1.00 | ) | | | (1.03 | ) | | | 20.34 | | | | 29.46 | | | | 13,881 | | | | 0.79 | | | | 0.79 | | | | 0.12 | | | | 31 | |
Year ended 10/31/16 | | | 17.69 | | | | 0.03 | | | | 0.12 | | | | 0.15 | | �� | | — | | | | (1.13 | ) | | | (1.13 | ) | | | 16.71 | | | | 1.10 | | | | 3,576 | | | | 0.80 | | | | 0.80 | | | | 0.20 | | | | 47 | |
Year ended 10/31/15 | | | 18.67 | | | | 0.02 | | | | 1.44 | | | | 1.46 | | | | — | | | | (2.44 | ) | | | (2.44 | ) | | | 17.69 | | | | 9.13 | | | | 2,170 | | | | 0.79 | | | | 0.79 | | | | 0.09 | | | | 49 | |
Year ended 10/31/14 | | | 16.45 | | | | 0.01 | | | | 2.61 | | | | 2.62 | | | | (0.06 | ) | | | (0.34 | ) | | | (0.40 | ) | | | 18.67 | | | | 16.23 | | | | 699 | | | | 0.80 | | | | 0.80 | | | | 0.07 | | | | 52 | |
Class R5 | | | | | | | | | | | | | | | | | | | | | | | | | | | | | | | | | | | | | | | | | | | | | | | | | | | | | | | | |
Year ended 10/31/18 | | | 20.42 | | | | 0.01 | | | | 1.43 | | | | 1.44 | | | | (0.02 | ) | | | (0.75 | ) | | | (0.77 | ) | | | 21.09 | | | | 7.30 | | | | 73 | | | | 0.72 | (d) | | | 0.72 | (d) | | | 0.06 | (d) | | | 35 | |
Year ended 10/31/17 | | | 16.77 | | | | 0.03 | | | | 4.66 | | | | 4.69 | | | | (0.04 | ) | | | (1.00 | ) | | | (1.04 | ) | | | 20.42 | | | | 29.56 | | | | 20 | | | | 0.76 | | | | 0.76 | | | | 0.15 | | | | 31 | |
Year ended 10/31/16 | | | 17.75 | | | | 0.04 | | | | 0.11 | | | | 0.15 | | | | — | | | | (1.13 | ) | | | (1.13 | ) | | | 16.77 | | | | 1.10 | | | | 17 | | | | 0.74 | | | | 0.74 | | | | 0.26 | | | | 47 | |
Year ended 10/31/15 | | | 18.71 | | | | 0.04 | | | | 1.44 | | | | 1.48 | | | | — | | | | (2.44 | ) | | | (2.44 | ) | | | 17.75 | | | | 9.24 | | | | 18 | | | | 0.68 | | | | 0.68 | | | | 0.20 | | | | 49 | |
Year ended 10/31/14 | | | 16.46 | | | | 0.03 | | | | 2.63 | | | | 2.66 | | | | (0.07 | ) | | | (0.34 | ) | | | (0.41 | ) | | | 18.71 | | | | 16.50 | | | | 541 | | | | 0.69 | | | | 0.69 | | | | 0.18 | | | | 52 | |
Class R6 | | | | | | | | | | | | | | | | | | | | | | | | | | | | | | | | | | | | | | | | | | | | | | | | | | | | | | | | |
Year ended 10/31/18 | | | 20.42 | | | | 0.01 | | | | 1.43 | | | | 1.44 | | | | (0.02 | ) | | | (0.75 | ) | | | (0.77 | ) | | | 21.09 | | | | 7.29 | | | | 11,057 | | | | 0.72 | (d) | | | 0.72 | (d) | | | 0.06 | (d) | | | 35 | |
Year ended 10/31/17(f) | | | 17.61 | | | | 0.01 | | | | 2.80 | | | | 2.81 | | | | — | | | | — | | | | — | | | | 20.42 | | | | 15.96 | | | | 12 | | | | 0.77 | (g) | | | 0.77 | (g) | | | 0.14 | (g) | | | 31 | |
| (a) | Calculated using average shares outstanding. |
| (b) | Includes adjustments in accordance with accounting principles generally accepted in the United States of America and, as such, the net asset value for financial reporting purposes and returns based upon those net asset values may differ from the net asset value and returns for shareholder transactions. Does not include sales charges and not annualized for periods less than one year, if applicable. |
| (c) | Portfolio turnover is calculated at the fund level and is not annualized for periods less than one year, if applicable. |
| (d) | Ratios are based on average daily net assets (000’s omitted) of $98,637, $351, $13,830, $2,150,720, $3,638, $14,216, $40 and $8,184 for Class A, Class B, Class C, Class P, Class S, Class Y, Class R5 and Class R6 shares, respectively. |
| (e) | Reflects activity for the period November 1, 2017 through January 26, 2018 (the date of conversion). |
| (f) | Commencement date of April 4, 2017. |
21 Invesco Summit Fund
Report of Independent Registered Public Accounting Firm
To the Board of Trustees of AIM Equity Funds (Invesco Equity Funds)
and Shareholders of Invesco Summit Fund:
Opinion on the Financial Statements
We have audited the accompanying statement of assets and liabilities, including the schedule of investments, of Invesco Summit Fund (one of the funds constituting AIM Equity Funds (Invesco Equity Funds), hereafter referred to as the “Fund”) as of October 31, 2018, the related statement of operations for the year ended October 31, 2018, the statement of changes in net assets for each of the two years in the period ended October 31, 2018, including the related notes, and the financial highlights for each of the periods indicated therein (collectively referred to as the financial statements). In our opinion, the financial statements present fairly, in all material respects, the financial position of the Fund as of October 31, 2018, the results of its operations for the year then ended, the changes in its net assets for each of the two years in the period ended October 31, 2018 and the financial highlights for each of the periods indicated therein in conformity with accounting principles generally accepted in the United States of America.
Basis for Opinion
These financial statements are the responsibility of the Fund’s management. Our responsibility is to express an opinion on the Fund’s financial statements based on our audits. We are a public accounting firm registered with the Public Company Accounting Oversight Board (United States) (PCAOB) and are required to be independent with respect to the Fund in accordance with the U.S. federal securities laws and the applicable rules and regulations of the Securities and Exchange Commission and the PCAOB.
We conducted our audits of these financial statements in accordance with the standards of the PCAOB. Those standards require that we plan and perform the audit to obtain reasonable assurance about whether the financial statements are free of material misstatement, whether due to error or fraud.
Our audits included performing procedures to assess the risks of material misstatement of the financial statements, whether due to error or fraud, and performing procedures that respond to those risks. Such procedures included examining, on a test basis, evidence regarding the amounts and disclosures in the financial statements. Our audits also included evaluating the accounting principles used and significant estimates made by management, as well as evaluating the overall presentation of the financial statements. Our procedures included confirmation of securities owned as of October 31, 2018 by correspondence with the custodian, transfer agent and brokers; when replies were not received from brokers, we performed other auditing procedures. We believe that our audits provide a reasonable basis for our opinion.
PricewaterhouseCoopers LLP
Houston, TX
December 28, 2018
We have served as the auditor of one or more of the investment companies in the Invesco group of investment companies since at least 1995. We have not been able to determine the specific year we began serving as auditor.
22 Invesco Summit Fund
Calculating your ongoing Fund expenses
Example
As a shareholder of the Fund, you incur two types of costs: (1) transaction costs, which may include sales charges (loads) on purchase payments or contingent deferred sales charges on redemptions, if any; and (2) ongoing costs, including management fees, distribution and/or service (12b-1) fees, and other Fund expenses. This example is intended to help you understand your ongoing costs (in dollars) of investing in the Fund and to compare these costs with ongoing costs of investing in other mutual funds. The example is based on an investment of $1,000 invested at the beginning of the period and held for the entire period May 1, 2018 through October 31, 2018.
Actual expenses
The table below provides information about actual account values and actual expenses. You may use the information in this table, together with the amount you invested, to estimate the expenses that you paid over the period. Simply divide your account value by $1,000 (for example, an $8,600 account value divided by $1,000 = 8.6), then multiply the result by the number in the table under the heading entitled “Actual Expenses Paid During Period” to estimate the expenses you paid on your account during this period.
Hypothetical example for comparison purposes
The table below also provides information about hypothetical account values and hypothetical expenses based on the Fund’s actual expense ratio and an assumed rate of return of 5% per year before expenses, which is not the Fund’s actual return.
The hypothetical account values and expenses may not be used to estimate the actual ending account balance or expenses you paid for the period. You may use this information to compare the ongoing costs of investing in the Fund and other funds. To do so, compare this 5% hypothetical example with the 5% hypothetical examples that appear in the shareholder reports of the other funds.
Please note that the expenses shown in the table are meant to highlight your ongoing costs only and do not reflect any transaction costs, such as sales charges (loads) on purchase payments or contingent deferred sales charges on redemptions, if any. Therefore, the hypothetical information is useful in comparing ongoing costs only, and will not help you determine the relative total costs of owning different funds. In addition, if these transaction costs were included, your costs would have been higher.
| | | | | | | | | | | | | | | | | | | | | | | | |
Class | | Beginning
Account Value
(05/01/18) | | | ACTUAL | | | HYPOTHETICAL
(5% annual return before
expenses) | | | Annualized
Expense Ratio | |
| | Ending
Account Value
(10/31/18)1 | | | Expenses
Paid During
Period2 | | | Ending
Account Value
(10/31/18) | | | Expenses
Paid During
Period2 | |
A | | $ | 1,000.00 | | | $ | 1,016.20 | | | $ | 5.18 | | | $ | 1,020.06 | | | $ | 5.19 | | | | 1.02 | % |
C | | | 1,000.00 | | | | 1,012.40 | | | | 8.98 | | | | 1,016.28 | | | | 9.00 | | | | 1.77 | |
P | | | 1,000.00 | | | | 1,016.90 | | | | 4.42 | | | | 1,020.82 | | | | 4.43 | | | | 0.87 | |
S | | | 1,000.00 | | | | 1,016.50 | | | | 4.68 | | | | 1,020.57 | | | | 4.69 | | | | 0.92 | |
Y | | | 1,000.00 | | | | 1,017.50 | | | | 3.92 | | | | 1,021.32 | | | | 3.92 | | | | 0.77 | |
R5 | | | 1,000.00 | | | | 1,017.90 | | | | 3.71 | | | | 1,021.53 | | | | 3.72 | | | | 0.73 | |
R6 | | | 1,000.00 | | | | 1,017.40 | | | | 3.71 | | | | 1,021.53 | | | | 3.72 | | | | 0.73 | |
| 1 | The actual ending account value is based on the actual total return of the Fund for the period May 1, 2018 through October 31, 2018, after actual expenses and will differ from the hypothetical ending account value which is based on the Fund’s expense ratio and a hypothetical annual return of 5% before expenses. |
| 2 | Expenses are equal to the Fund’s annualized expense ratio as indicated above multiplied by the average account value over the period, multiplied by 184/365 to reflect the most recent fiscal half year. |
23 Invesco Summit Fund
Approval of Investment Advisory and Sub-Advisory Contracts
At meetings held on June 5-6, 2018, the Board of Trustees (the Board or the Trustees) of AIM Equity Funds (Invesco Equity Funds) as a whole, and the independent Trustees, who comprise over 75% of the Board, voting separately, approved the continuance of the Invesco Summit Fund’s (the Fund) Master Investment Advisory Agreement with Invesco Advisers, Inc. (Invesco Advisers and the investment advisory agreement) and the Master Intergroup Sub-Advisory Contract for Mutual Funds with Invesco Asset Management Deutschland GmbH, Invesco Asset Management Limited, Invesco Asset Management (Japan) Limited, Invesco Hong Kong Limited, Invesco Senior Secured Management, Inc. and Invesco Canada Ltd. (collectively, the Affiliated Sub-Advisers and the sub-advisory contracts) for another year, effective July 1, 2018. After evaluating the factors discussed below, among others, the Board approved the renewal of the Fund’s investment advisory agreement and the sub-advisory contracts and determined that the compensation payable by the Fund to Invesco Advisers and by Invesco Advisers to the Affiliated Sub-Advisers is fair and reasonable.
The Board’s Evaluation Process
The Board’s Investments Committee has established three Sub-Committees, which meet throughout the year to review the performance of funds advised by Invesco Advisers (the Invesco Funds). Over the course of each year, the Sub-Committees meet with portfolio managers for their assigned Invesco Funds and other members of management to review detailed information about investment performance and portfolio attributes of these funds. The Board took into account evaluations and reports that it received from the Investments Committee and Sub-Committees, as well as the information provided to such committees and the Board throughout the year, in considering whether to approve each Invesco Fund’s investment advisory agreement and sub-advisory contracts.
As part of the contract renewal process, the Board reviews and considers information provided in response to detailed requests for information submitted to management by the independent Trustees with assistance from legal counsel to the independent Trustees. The Board receives comparative investment performance and fee data regarding the Invesco Funds prepared by Invesco Advisers and Broadridge Financial Solutions, Inc. (Broadridge), an independent mutual fund data provider. The Board also receives an independent written evaluation from the Senior Officer, an officer of the Invesco Funds who reports directly to the independent Trustees. The Senior Officer’s evaluation is prepared as part of his responsibility to manage the process by which the Invesco Funds’ proposed management fees
are negotiated during the annual contract renewal process to ensure they are negotiated in a manner that is at arms’ length and reasonable. In addition to meetings with Invesco Advisers and fund counsel throughout the year, the independent Trustees also discuss the continuance of the investment advisory agreement and sub-advisory contracts in separate sessions with the Senior Officer and with independent legal counsel.
The discussion below is a summary of the Senior Officer’s independent written evaluation with respect to the Fund’s investment advisory agreement, as well as a discussion of the material factors and related conclusions that formed the basis for the Board’s approval of the Fund’s investment advisory agreement and sub-advisory contracts. The Trustees’ review and conclusions are based on the comprehensive consideration of all information presented to them during the course of the year and in prior years and are not the result of any single determinative factor. Moreover, one Trustee may have weighed a particular piece of information or factor differently than another Trustee. This information is current as of June 6, 2018.
Factors and Conclusions and Summary of Independent Written Fee Evaluation
| A. | Nature, Extent and Quality of Services Provided by Invesco Advisers and the Affiliated Sub-Advisers |
The Board reviewed the nature, extent and quality of the advisory services provided to the Fund by Invesco Advisers under the Fund’s investment advisory agreement, and the credentials and experience of the officers and employees of Invesco Advisers who provide these services, including the Fund’s portfolio manager(s). The Board’s review included consideration of Invesco Advisers’ investment process oversight and structure, credit analysis and investment risk management. The Board also considered non-advisory services that Invesco Advisers and its affiliates provide to the Invesco Funds such as various back office support functions, third party oversight, internal audit, valuation, portfolio trading and legal and compliance. The Board also reviewed and considered the benefits to shareholders of investing in a fund that is part of the Invesco family of funds under the umbrella of Invesco Ltd., Invesco Advisers’ parent company, and noted Invesco Ltd.’s depth and experience in conducting an investment management business, as well as its commitment of financial and other resources to such business. The Board concluded that the nature, extent and quality of the services provided to the Fund by Invesco Advisers are appropriate and satisfactory.
The Board reviewed the services that may be provided by the Affiliated Sub-Advisers under
the sub-advisory contracts and the credentials and experience of the officers and employees of the Affiliated Sub-Advisers who provide these services. The Board noted the Affiliated Sub-Advisers’ expertise with respect to certain asset classes and that the Affiliated Sub-Advisers have offices and personnel that are located in financial centers around the world. As a result, the Board noted that the Affiliated Sub-Advisers can provide research and investment analysis on the markets and economies of various countries in which the Fund may invest, make recommendations regarding securities and assist with security trades. The Board concluded that the sub-advisory contracts may benefit the Fund and its shareholders by permitting Invesco Advisers to use the resources and talents of the Affiliated Sub-Advisers in managing the Fund. The Board concluded that the nature, extent and quality of the services that may be provided by the Affiliated Sub-Advisers are appropriate and satisfactory.
| B. | Fund Investment Performance |
The Board considered Fund investment performance as a relevant factor in considering whether to approve the investment advisory agreement. The Board did not view Fund investment performance as a relevant factor in considering whether to approve the sub-advisory contracts for the Fund, as no Affiliated Sub-Adviser currently manages assets of the Fund.
The Board compared the Fund’s investment performance over multiple time periods ending December 31, 2017 to the performance of funds in the Broadridge performance universe and against the Lipper Multi-Cap Growth Funds Index. The Board noted that performance of Class A shares of the Fund was in the third quintile of its performance universe for the one year period and the second quintile for the three and five year periods (the first quintile being the best performing funds and the fifth quintile being the worst performing funds). The Board noted that performance of Class A shares of the Fund was reasonably comparable to the performance of the Index for the one and five year periods, and above the performance of the Index for the three year period. The Trustees also reviewed more recent Fund performance and this review did not change their conclusions.
| C. | Advisory and Sub-Advisory Fees and Fund Expenses |
The Board compared the Fund’s contractual management fee rate to the contractual management fee rates of funds in the Fund’s Broadridge expense group. The Board noted that the contractual management fee rate for Class A shares of the Fund was below the median contractual management fee rate of funds in its expense group. The Board noted that the term “contractual management fee” for funds in the expense group may include both
24 Invesco Summit Fund
advisory and certain non-portfolio management administrative services fees, but that Broadridge does not provide information on a fund by fund basis as to what is included. The Board also reviewed the methodology used by Broadridge in providing expense group information, which includes using each fund’s contractual management fee schedule (including any applicable breakpoints) as reported in the most recent prospectus or statement of additional information for each fund in the expense group. The Board also considered comparative information regarding the Fund’s total expense ratio and its various components.
The Board noted that Invesco Advisers has contractually agreed to waive fees and/or limit expenses of the Fund in an amount necessary to limit total annual operating expenses to a specified percentage of average daily net assets for each class of the Fund.
The Board noted that Invesco Advisers and the Affiliated Sub-Advisers do not manage other similarly managed mutual funds or client accounts.
The Board also considered the services that may be provided by the Affiliated Sub-Advisers pursuant to the sub-advisory contracts, as well as the fees payable by Invesco Advisers to the Affiliated Sub-Advisers pursuant to the sub-advisory contracts.
| D. | Economies of Scale and Breakpoints |
The Board considered the extent to which there may be economies of scale in the provision of advisory services to the Fund. The Board also considered that the Fund benefits from economies of scale through contractual breakpoints in the Fund’s advisory fee schedule, which generally operate to reduce the Fund’s expense ratio as it grows in size. The Board noted that the Fund shares directly in economies of scale through lower fees charged by third party service providers based on the combined size of the Invesco Funds. The Board noted that the Fund may also benefit from economies of scale through initial fee setting, fee waivers and expense reimbursements.
| E. | Profitability and Financial Resources |
The Board reviewed information from Invesco Advisers concerning the costs of the advisory and other services that Invesco Advisers and its affiliates provide to the Fund and the Invesco Funds and the profitability of Invesco Advisers and its affiliates in providing these services. The Board considered the methodology used for calculating profitability and noted the periodic review of such methodology by an independent consultant. The Board noted that Invesco Advisers continues to operate at a net profit from services Invesco Advisers and its affiliates provide to the Invesco Funds and the Fund. The Board did not deem the level of profits realized by Invesco Advisers and its affiliates from providing services to the Fund to be excessive given the nature, extent and quality of the services provided. The Board received information from Invesco Advisers
demonstrating that Invesco Advisers and the Affiliated Sub-Advisers are financially sound and have the resources necessary to perform their obligations under the investment advisory agreement and sub-advisory contracts.
| F. | Collateral Benefits to Invesco Advisers and its Affiliates |
The Board considered various other benefits received by Invesco Advisers and its affiliates from the relationship with the Fund, including the fees received for providing administrative, transfer agency and distribution services to the Fund. The Board considered comparative information regarding fees charged for these services, including information provided by Broadridge and other independent sources. The Board considered the performance of Invesco Advisers and its affiliates in providing these services and the organizational structure employed to provide these services. The Board also considered that these services are provided to the Fund pursuant to written contracts that are reviewed and approved on an annual basis by the Board; and that the services are required for the operation of the Fund.
The Board considered the benefits realized by Invesco Advisers and the Affiliated Sub-Advisers as a result of portfolio brokerage transactions executed through “soft dollar” arrangements. The Board noted that soft dollar arrangements may result in the Fund bearing costs to purchase research that may be used by Invesco Advisers or the Affiliated Sub-Advisers with other clients and may reduce Invesco Advisers’ or the Affiliated Sub-Advisers’ expenses. The Board also considered that it receives periodic reports from Invesco representing that these arrangements are consistent with regulatory requirements. The Board did not deem the soft dollar arrangements to be inappropriate.
The Board considered that the Fund’s uninvested cash and cash collateral from any securities lending arrangements may be invested in money market funds advised by Invesco Advisers pursuant to procedures approved by the Board. The Board noted that Invesco Advisers receives advisory fees from these affiliated money market funds attributable to such investments, although Invesco Advisers has contractually agreed to waive through varying periods the advisory fees payable by the Invesco Funds with respect to certain investments in the affiliated money market funds. The waiver is in an amount equal to 100% of the net advisory fee Invesco Advisers receives from the affiliated money market funds with respect to the Fund’s investment in the affiliated money market funds of uninvested cash, but not cash collateral. The Board concluded that the amount of advisory fees received by Invesco Advisers from the Fund’s investment of cash collateral from any securities lending arrangements in the affiliated money market funds is fair and reasonable.
The Board also considered that an affiliated broker receives commissions for executing certain trades for the Fund. Invesco Advisers and the Affiliated Sub-Advisers use the affiliated
broker to, among other things, control order routing and minimize information leakage, and the Board was advised that such trades are executed in compliance with rules under the federal securities laws and consistent with best execution obligations.
25 Invesco Summit Fund
Tax Information
Form 1099-DIV, Form 1042-S and other year-end tax information provide shareholders with actual calendar year amounts that should be included in their tax returns. Shareholders should consult their tax advisors.
The following distribution information is being provided as required by the Internal Revenue Code or to meet a specific state’s requirement.
The Fund designates the following amounts or, if subsequently determined to be different, the maximum amount allowable for its fiscal year ended October 31, 2018:
| | | | |
Federal and State Income Tax | |
Long-Term Capital Gain Distributions | | $ | 72,905,635 | |
Qualified Dividend Income* | | | 100 | % |
Corporate Dividends Received Deduction* | | | 100 | % |
U.S. Treasury Obligations* | | | 0 | % |
| | * | The above percentages are based on ordinary income dividends paid to shareholders during the Fund’s fiscal year. |
26 Invesco Summit Fund
Trustees and Officers
The address of each trustee and officer is AIM Equity Funds (Invesco Equity Funds) (the “Trust”), 11 Greenway Plaza, Suite 1000, Houston, Texas 77046-1173. The trustees serve for the life of the Trust, subject to their earlier death, incapacitation, resignation, retirement or removal as more specifically provided in the Trust’s organizational documents. Each officer serves for a one year term or until their successors are elected and qualified. Column two below includes length of time served with predecessor entities, if any.
| | | | | | | | |
Name, Year of Birth and Position(s) Held with the Trust | | Trustee and/
or Officer Since | | Principal Occupation(s)
During Past 5 Years | | Number of
Funds in Fund Complex Overseen by Trustee | | Other Directorship(s)
Held by Trustee During Past 5 Years |
| Interested Persons | | | | | | | | |
| Martin L. Flanagan1 — 1960 Trustee | | 2007 | | Executive Director, Chief Executive Officer and President, Invesco Ltd. (ultimate parent of Invesco and a global investment management firm); Trustee, The Invesco Funds; Vice Chair, Investment Company Institute; and Member of Executive Board, SMU Cox School of Business Formerly: Advisor to the Board, Invesco Advisers, Inc. (formerly known as Invesco Institutional (N.A.), Inc.); Chairman and Chief Executive Officer, Invesco Advisers, Inc. (registered investment adviser); Director, Chairman, Chief Executive Officer and President, Invesco Holding Company (US), Inc. (formerly IVZ Inc.) (holding company), Invesco Group Services, Inc. (service provider) and Invesco North American Holdings, Inc. (holding company); Director, Chief Executive Officer and President, Invesco Holding Company Limited (parent of Invesco and a global investment management firm); Director, Invesco Ltd.; Chairman, Investment Company Institute and President, Co-Chief Executive Officer, Co-President, Chief Operating Officer and Chief Financial Officer, Franklin Resources, Inc. (global investment management organization) | | 158 | | None |
Philip A. Taylor2 — 1954 Trustee and Senior Vice President | | 2006 | | Head of the Americas and Senior Managing Director, Invesco Ltd.; Director, Invesco Advisers, Inc. (formerly known as Invesco Institutional (N.A.), Inc.) (registered investment adviser); Director and Chairman, Invesco Investment Services, Inc. (formerly known as Invesco AIM Investment Services, Inc.) (registered transfer agent); Chief Executive Officer, Invesco Corporate Class Inc. (corporate mutual fund company); Director, Chairman and Chief Executive Officer, Invesco Canada Ltd. (formerly known as Invesco Trimark Ltd./Invesco Trimark Ltèe) (registered investment adviser and registered transfer agent); Trustee and Senior Vice President, The Invesco Funds; Director, Invesco Investment Advisers LLC (formerly known as Van Kampen Asset Management) Formerly: Director, Chairman, Chief Executive Officer and President, Invesco Management Group, Inc. (formerly known as Invesco AIM Management Group, Inc.) (financial services holding company); Co-Chairman, Co-President and Co-Chief Executive Officer, Invesco Advisers, Inc. (formerly known as Invesco Institutional (N.A.), Inc.) (registered investment adviser); Director, Chief Executive Officer and President, Van Kampen Exchange Corp; President and Principal Executive Officer, The Invesco Funds (other than AIM Treasurer’s Series Trust (Invesco Treasurer’s Series Trust), Short-Term Investments Trust and Invesco Management Trust); Executive Vice President, The Invesco Funds (AIM Treasurer’s Series Trust (Invesco Treasurer’s Series Trust), Short-Term Investments Trust and Invesco Management Trust only); Director and President, INVESCO Funds Group, Inc. (registered investment adviser and registered transfer agent); Director and Chairman, IVZ Distributors, Inc. (formerly known as INVESCO Distributors, Inc.) (registered broker dealer); Director, President and Chairman, Invesco Inc. (holding company), Invesco Canada Holdings Inc. (holding company), Trimark Investments Ltd./Placements Trimark Ltèe and Invesco Financial Services Ltd/Services Financiers Invesco Ltèe; Chief Executive Officer, Invesco Canada Fund Inc. (corporate mutual fund company); Director and Chairman, Van Kampen Investor Services Inc.; Director, Chief Executive Officer and President, 1371 Preferred Inc. (holding company) and Van Kampen Investments Inc.; Director and President, AIM GP Canada Inc. (general partner for limited partnerships) and Van Kampen Advisors, Inc.; Director and Chief Executive Officer, Invesco Trimark Dealer Inc. (registered broker dealer); Director, Invesco Distributors, Inc. (formerly known as Invesco AIM Distributors, Inc.) (registered broker dealer); Manager, Invesco Capital Management LLC; Director, Chief Executive Officer and President, Invesco Advisers, Inc.; Director, Chairman, Chief Executive Officer and President, Invesco AIM Capital Management, Inc.; President, Invesco Trimark Dealer Inc. and Invesco Trimark Ltd./Invesco Trimark Ltèe; Director and President, AIM Trimark Corporate Class Inc. and AIM Trimark Canada Fund Inc.; Senior Managing Director, Invesco Holding Company Limited; Director and Chairman, Fund Management Company (former registered broker dealer); President and Principal Executive Officer, The Invesco Funds (AIM Treasurer’s Series Trust (Invesco Treasurer’s Series Trust), and Short-Term Investments Trust only); President, AIM Trimark Global Fund Inc. and AIM Trimark Canada Fund Inc. | | 158 | | None |
| 1 | Mr. Flanagan is considered an interested person (within the meaning of Section 2(a)(19) of the 1940 Act) of the Trust because he is an officer of the Adviser to the Trust, and an officer and a director of Invesco Ltd., ultimate parent of the Adviser. |
| 2 | Mr. Taylor is considered an interested person (within the meaning of Section 2(a)(19) of the 1940 Act) of the Trust because he is an officer and a director of the Adviser. |
T-1 Invesco Summit Fund
Trustees and Officers—(continued)
| | | | | | | | |
Name, Year of Birth and Position(s) Held with the Trust | | Trustee and/
or Officer Since | | Principal Occupation(s)
During Past 5 Years | | Number of
Funds in Fund Complex Overseen by Trustee | | Other Directorship(s)
Held by Trustee During Past 5 Years |
| Independent Trustees | | | | | | | | |
Bruce L. Crockett — 1944 Trustee and Chair | | 1993 | | Chairman, Crockett Technologies Associates (technology consulting company) Formerly: Director, Captaris (unified messaging provider); Director, President and Chief Executive Officer, COMSAT Corporation; Chairman, Board of Governors of INTELSAT (international communications company); ACE Limited (insurance company); Independent Directors Council and Investment Company Institute: Member of the Audit Committee, Investment Company Institute; Member of the Executive Committee and Chair of the Governance Committee, Independent Directors Council | | 158 | | Director and Chairman of the Audit Committee, ALPS (Attorneys Liability Protection Society) (insurance company); Director and Member of the Audit Committee and Compensation Committee, Ferroglobe PLC (metallurgical company) |
David C. Arch — 1945 Trustee | | 2010 | | Chairman of Blistex Inc. (consumer health care products manufacturer); Member, World Presidents’ Organization | | 158 | | Board member of the Illinois Manufacturers’ Association |
Jack M. Fields — 1952 Trustee | | 1997 | | Chief Executive Officer, Twenty First Century Group, Inc. (government affairs company); and Chairman, Discovery Learning Alliance (non-profit) Formerly: Owner and Chief Executive Officer, Dos Angeles Ranch L.P. (cattle, hunting, corporate entertainment); Director, Insperity, Inc. (formerly known as Administaff) (human resources provider); Chief Executive Officer, Texana Timber LP (sustainable forestry company); Director of Cross Timbers Quail Research Ranch (non-profit); and member of the U.S. House of Representatives | | 158 | | None |
Cynthia Hostetler — 1962 Trustee | | 2017 | | Non-Executive Director and Trustee of a number of public and private business corporations Formerly: Director, Aberdeen Investment Funds (4 portfolios); Head of Investment Funds and Private Equity, Overseas Private Investment Corporation; President, First Manhattan Bancorporation, Inc.; Attorney, Simpson Thacher & Bartlett LLP | | 158 | | Vulcan Materials Company (construction materials company); Trilinc Global Impact Fund; Artio Global Investment LLC (mutual fund complex); Edgen Group, Inc. (specialized energy and infrastructure products distributor) |
Eli Jones — 1961 Trustee | | 2016 | | Professor and Dean, Mays Business School — Texas A&M University Formerly: Professor and Dean, Walton College of Business, University of Arkansas and E.J. Ourso College of Business, Louisiana State University; Director, Arvest Bank | | 158 | | Insperity, Inc. (formerly known as Administaff) (human resources provider) |
Prema Mathai-Davis — 1950 Trustee | | 1998 | | Retired | | 158 | | None |
Teresa M. Ressel — 1962 Trustee | | 2017 | | Non-executive director and trustee of a number of public and private business corporations Formerly: Chief Financial Officer, Olayan America, The Olayan Group (international investor/commercial/industrial); Chief Executive Officer, UBS Securities LLC; Group Chief Operating Officer, Americas, UBS AG; Assistant Secretary for Management & Budget and CFO, US Department of the Treasury | | 158 | | Atlantic Power Corporation (power generation company); ON Semiconductor Corp. (semiconductor supplier) |
Ann Barnett Stern — 1957 Trustee | | 2017 | | President and Chief Executive Officer, Houston Endowment Inc. (private philanthropic institution) Formerly: Executive Vice President and General Counsel, Texas Children’s Hospital; Attorney, Beck, Redden and Secrest, LLP; Business Law Instructor, University of St. Thomas; Attorney, Andrews & Kurth LLP | | 158 | | Federal Reserve Bank of Dallas |
Raymond Stickel, Jr. — 1944 Trustee | | 2005 | | Retired Formerly: Director, Mainstay VP Series Funds, Inc. (25 portfolios); Partner, Deloitte & Touche | | 158 | | None |
Robert C. Troccoli — 1949 Trustee | | 2016 | | Adjunct Professor, University of Denver — Daniels College of Business Formerly: Senior Partner, KPMG LLP | | 158 | | None |
Christopher L. Wilson — 1957 Trustee | | 2017 | | Non-executive director and trustee of a number of public and private business corporations Formerly: Director, TD Asset Management USA Inc. (mutual fund complex) (22 portfolios); Managing Partner, CT2, LLC (investing and consulting firm); President/Chief Executive Officer, Columbia Funds, Bank of America Corporation; President/Chief Executive Officer, CDC IXIS Asset Management Services, Inc.; Principal & Director of Operations, Scudder Funds, Scudder, Stevens & Clark, Inc.; Assistant Vice President, Fidelity Investments | | 158 | | ISO New England, Inc. (non-profit organization managing regional electricity market) |
T-2 Invesco Summit Fund
Trustees and Officers—(continued)
| | | | | | | | |
Name, Year of Birth and Position(s) Held with the Trust | | Trustee and/
or Officer Since | | Principal Occupation(s)
During Past 5 Years | | Number of
Funds in Fund Complex Overseen by Trustee | | Other Directorship(s)
Held by Trustee During Past 5 Years |
| Other Officers | | | | | | | | |
Sheri Morris — 1964 President, Principal Executive Officer and Treasurer | | 1999 | | President, Principal Executive Officer and Treasurer, The Invesco Funds; Vice President, Invesco Advisers, Inc. (formerly known as Invesco Institutional (N.A.), Inc.) (registered investment adviser); and Vice President, Invesco Exchange-Traded Fund Trust, Invesco Exchange-Traded Fund Trust II, Invesco India Exchange-Traded Fund Trust, Invesco Actively Managed Exchange-Traded Fund Trust, Invesco Actively Managed Exchange-Traded Commodity Fund Trust and Invesco Exchange-Traded Self-Indexed Fund Trust Formerly: Vice President and Principal Financial Officer, The Invesco Funds; Vice President, Invesco AIM Advisers, Inc., Invesco AIM Capital Management, Inc. and Invesco AIM Private Asset Management, Inc.; Assistant Vice President and Assistant Treasurer, The Invesco Funds and Assistant Vice President, Invesco Advisers, Inc., Invesco AIM Capital Management, Inc. and Invesco AIM Private Asset Management, Inc.; and Treasurer, Invesco Exchange-Traded Fund Trust, Invesco Exchange-Traded Fund Trust II, Invesco India Exchange-Traded Fund Trust and Invesco Actively Managed Exchange-Traded Fund Trust | | N/A | | N/A |
Russell C. Burk — 1958 Senior Vice President and Senior Officer | | 2005 | | Senior Vice President and Senior Officer, The Invesco Funds | | N/A | | N/A |
Jeffrey H. Kupor — 1968 Senior Vice President, Chief Legal Officer and Secretary | | 2018 | | Senior Vice President and Secretary, Invesco Advisers, Inc. (formerly known as Invesco Institutional (N.A.), Inc.) (registered investment adviser); Senior Vice President and Secretary, Invesco Distributors, Inc. (formerly known as Invesco AIM Distributors, Inc.); Vice President and Secretary, Invesco Investment Services, Inc. (formerly known as Invesco AIM Investment Services, Inc.) Senior Vice President, Chief Legal Officer and Secretary, The Invesco Funds; Secretary and General Counsel, Invesco Investment Advisers LLC (formerly known as Van Kampen Asset Management); Secretary and General Counsel, Invesco Capital Markets, Inc. (formerly known as Van Kampen Funds Inc.) and Chief Legal Officer, Invesco Exchange-Traded Fund Trust, Invesco Exchange-Traded Fund Trust II, Invesco India Exchange-Traded Fund Trust, Invesco Actively Managed Exchange-Traded Fund Trust, Invesco Actively Managed Exchange-Traded Commodity Fund Trust and Invesco Exchange-Traded Self-Indexed Fund Trust; Secretary, Invesco Indexing LLC; Secretary and General Counsel, INVESCO Private Capital Investments, Inc.; Secretary, W.L. Ross & Co., LLC; Secretary and Vice President, Jemstep, Inc. Formerly: Senior Vice President, Secretary and General Counsel, Invesco Management Group, Inc. (formerly known as Invesco AIM Management Group, Inc.); Assistant Secretary, INVESCO Asset Management (Bermuda) Ltd.; Secretary and General Counsel, Invesco Private Capital, Inc.; Assistant Secretary and General Counsel, INVESCO Realty, Inc.; Secretary and General Counsel, Invesco Senior Secured Management, Inc.; and Secretary, Sovereign G./P. Holdings Inc. | | N/A | | N/A |
John M. Zerr — 1962 Senior Vice President | | 2006 | | Chief Operating Officer of the Americas; Senior Vice President, Invesco Advisers, Inc. (formerly known as Invesco Institutional (N.A.), Inc.) (registered investment adviser); Senior Vice President, Invesco Distributors, Inc. (formerly known as Invesco AIM Distributors, Inc.); Director and Vice President, Invesco Investment Services, Inc. (formerly known as Invesco AIM Investment Services, Inc.) Senior Vice President, The Invesco Funds; Managing Director, Invesco Capital Management LLC; Director, Invesco Investment Advisers LLC (formerly known as Van Kampen Asset Management); Senior Vice President, Invesco Capital Markets, Inc. (formerly known as Van Kampen Funds Inc.); Manager, Invesco Indexing LLC Formerly: Director and Senior Vice President, Invesco Management Group, Inc. (formerly known as Invesco AIM Management Group, Inc.); Secretary and General Counsel, Invesco Management Group, Inc. (formerly known as Invesco AIM Management Group, Inc.); Secretary, Invesco Investment Services, Inc. (formerly known as Invesco AIM Investment Services, Inc.); Chief Legal Officer and Secretary, The Invesco Funds; Secretary and General Counsel, Invesco Investment Advisers LLC (formerly known as Van Kampen Asset Management); Secretary and General Counsel, Invesco Capital Markets, Inc. (formerly known as Van Kampen Funds Inc.); Chief Legal Officer, Invesco Exchange-Traded Fund Trust, Invesco Exchange-Traded Fund Trust II, Invesco India Exchange-Traded Fund Trust, Invesco Actively Managed Exchange-Traded Fund Trust, Invesco Actively Managed Exchange-Traded Commodity Fund Trust and Invesco Exchange-Traded Self-Indexed Fund Trust; Secretary, Invesco Indexing LLC; Director, Secretary, General Counsel and Senior Vice President, Van Kampen Exchange Corp.; Director, Vice President and Secretary, IVZ Distributors, Inc. (formerly known as INVESCO Distributors, Inc.); Director and Vice President, INVESCO Funds Group, Inc.; Director and Vice President, Van Kampen Advisors Inc.; Director, Vice President, Secretary and General Counsel, Van Kampen Investor Services Inc.; Director and Secretary, Invesco Distributors, Inc. (formerly known as Invesco AIM Distributors, Inc.); Director, Senior Vice President, General Counsel and Secretary, Invesco AIM Advisers, Inc. and Van Kampen Investments Inc.; Director, Vice President and Secretary, Fund Management Company; Director, Senior Vice President, Secretary, General Counsel and Vice President, Invesco AIM Capital Management, Inc.; Chief Operating Officer and General Counsel, Liberty Ridge Capital, Inc. (an investment adviser) | | N/A | | N/A |
T-3 Invesco Summit Fund
Trustees and Officers—(continued)
| | | | | | | | |
Name, Year of Birth and Position(s) Held with the Trust | | Trustee and/
or Officer Since | | Principal Occupation(s)
During Past 5 Years | | Number of
Funds in Fund Complex Overseen by Trustee | | Other Directorship(s)
Held by Trustee During Past 5 Years |
| Other Officers—(continued) | | | | | | | | |
Gregory G. McGreevey — 1962 Senior Vice President | | 2012 | | Senior Managing Director, Invesco Ltd.; Director, Chairman, President, and Chief Executive Officer, Invesco Advisers, Inc. (formerly known as Invesco Institutional (N.A.), Inc.) (registered investment adviser); Director, Invesco Mortgage Capital, Inc. and Invesco Senior Secured Management, Inc.; and Senior Vice President, The Invesco Funds Formerly: Senior Vice President, Invesco Management Group, Inc. and Invesco Advisers, Inc.; Assistant Vice President, The Invesco Funds | | N/A | | N/A |
Kelli Gallegos — 1970 Vice President, Principal Financial Officer and Assistant Treasurer | | 2008 | | Vice President and Treasurer, Invesco Exchange-Traded Fund Trust, Invesco Exchange-Traded Fund Trust II, Invesco India Exchange-Traded Fund Trust, Invesco Actively Managed Exchange-Traded Fund Trust, Invesco Actively Managed Exchange-Traded Commodity Fund Trust and Invesco Exchange-Traded Self-Indexed Fund Trust; Vice President, Principal Financial Officer and Assistant Treasurer, The Invesco Funds; Principal Financial and Accounting Officer — Pooled Investments, Invesco Capital Management LLC Formerly: Assistant Treasurer, Invesco Exchange-Traded Fund Trust, Invesco Exchange-Traded Fund Trust II, Invesco India Exchange-Traded Fund Trust, Invesco Actively Managed Exchange-Traded Fund Trust, Invesco Actively Managed Exchange-Traded Commodity Fund Trust and Invesco Exchange-Traded Self-Indexed Fund Trust; Assistant Treasurer, Invesco Capital Management LLC; Assistant Vice President, The Invesco Funds | | N/A | | N/A |
Tracy Sullivan — 1962 Vice President, Chief Tax Officer and Assistant Treasurer | | 2008 | | Vice President, Chief Tax Officer and Assistant Treasurer, The Invesco Funds; Assistant Treasurer, Invesco Capital Management LLC, Invesco Exchange-Traded Fund Trust, Invesco Exchange-Traded Fund Trust II, Invesco India Exchange-Traded Fund Trust, Invesco Actively Managed Exchange-Traded Fund Trust, Invesco Actively Managed Exchange-Traded Commodity Fund Trust and Invesco Exchange-Traded Self-Indexed Fund Trust Formerly: Assistant Vice President, The Invesco Funds | | N/A | | N/A |
Crissie M. Wisdom — 1969 Anti-Money Laundering Compliance Officer | | 2013 | | Anti-Money Laundering Compliance Officer, Invesco Advisers, Inc. (formerly known as Invesco Institutional (N.A.), Inc.) (registered investment adviser), Invesco Capital Markets, Inc. (formerly known as Van Kampen Funds Inc.), Invesco Distributors, Inc., Invesco Investment Services, Inc., The Invesco Funds, and Invesco Exchange-Traded Fund Trust, Invesco Exchange-Traded Fund Trust II, Invesco India Exchange-Traded Fund Trust, Invesco Actively Managed Exchange-Traded Fund Trust, Invesco Actively Managed Exchange-Traded Commodity Fund Trust and Invesco Exchange-Traded Self-Indexed Fund Trust; Anti-Money Laundering Compliance Officer and Bank Secrecy Act Officer, INVESCO National Trust Company and Invesco Trust Company; and Fraud Prevention Manager and Controls and Risk Analysis Manager for Invesco Investment Services, Inc. Formerly: Anti-Money Laundering Compliance Officer, Van Kampen Exchange Corp. and Invesco Management Group, Inc. | | N/A | | N/A |
Robert R. Leveille — 1969 Chief Compliance Officer | | 2016 | | Chief Compliance Officer, Invesco Advisers, Inc. (registered investment adviser); and Chief Compliance Officer, The Invesco Funds Formerly: Chief Compliance Officer, Putnam Investments and the Putnam Funds | | N/A | | N/A |
The Statement of Additional Information of the Trust includes additional information about the Fund’s Trustees and is available upon request, without charge, by calling 1.800.959.4246. Please refer to the Fund’s Statement of Additional Information for information on the Fund’s sub-advisers.
| | | | | | |
Office of the Fund 11 Greenway Plaza, Suite 1000 Houston, TX 77046-1173 | | Investment Adviser Invesco Advisers, Inc. 1555 Peachtree Street, N.E. Atlanta, GA 30309 | | Distributor Invesco Distributors, Inc. 11 Greenway Plaza, Suite 1000 Houston, TX 77046-1173 | | Auditors PricewaterhouseCoopers LLP 1000 Louisiana Street, Suite 5800 Houston, TX 77002-5021 |
| | | |
| | | | | | |
Counsel to the Fund Stradley Ronon Stevens & Young, LLP 2005 Market Street, Suite 2600 Philadelphia, PA 19103-7018 | | Counsel to the Independent Trustees Goodwin Procter LLP 901 New York Avenue, N.W. Washington, D.C. 20001 | | Transfer Agent Invesco Investment Services, Inc. 11 Greenway Plaza, Suite 1000 Houston, TX 77046-1173 | | Custodian State Street Bank and Trust Company 225 Franklin Street Boston, MA 02110-2801 |
T-4 Invesco Summit Fund
Explore High-Conviction Investing with Invesco

Go paperless with eDelivery
Visit invesco.com/edelivery to enjoy the convenience and security of anytime electronic access to your investment documents.
With eDelivery, you can elect to have any or all of the following materials delivered straight to your inbox to download, save and print from your own computer:
∎ Fund reports and prospectuses
∎ Quarterly statements
∎ Daily confirmations
∎ Tax forms
Invesco mailing information
Send general correspondence to Invesco Investment Services, Inc., P.O. Box 219078, Kansas City, MO 64121-9078.
Important notice regarding delivery of security holder documents
To reduce Fund expenses, only one copy of most shareholder documents may be mailed to shareholders with multiple accounts at the same address (Householding). Mailing of your shareholder documents may be householded indefinitely unless you instruct us otherwise. If you do not want the mailing of these documents to be combined with those for other members of your household, please contact Invesco Investment Services, Inc. at 800 959 4246 or contact your financial institution. We will begin sending you individual copies for each account within 30 days after receiving your request.
Fund holdings and proxy voting information
The Fund provides a complete list of its holdings four times in each fiscal year, at the quarter ends. For the second and fourth quarters, the lists appear in the Fund’s semiannual and annual reports to shareholders. For the first and third quarters, the Fund files the lists with the Securities and Exchange Commission (SEC) on Form N-Q (or any successor Form). The most recent list of portfolio holdings is available at invesco.com/completeqtrholdings. Shareholders can also look up the Fund’s Forms N-Q (or any successor Form) on the SEC website at sec.gov. The SEC file numbers for the Fund are shown below.
A description of the policies and procedures that the Fund uses to determine how to vote proxies relating to portfolio securities is available without charge, upon request, from our Client Services department at 800 959 4246 or at invesco.com/proxyguidelines. The information is also available on the SEC website, sec.gov.
| | |
| Information regarding how the Fund voted proxies related to its portfolio securities during the most recent 12-month period ended June 30 is available at invesco.com/proxysearch. The information is also available on the SEC website, sec.gov. | |  |
| Invesco Advisers, Inc. is an investment adviser; it provides investment advisory services to individual and institutional clients and does not sell securities. Invesco Distributors, Inc. is the US distributor for Invesco Ltd.’s retail mutual funds, exchange-traded funds and institutional money market funds. Both are wholly owned, indirect subsidiaries of Invesco Ltd. |
| | | | | | | | |
| SEC file numbers: 811-01424 and 002-25469 | | Invesco Distributors, Inc. | | SUM-AR-1 | | 12172018 | | 1228 |
On May 2, 2018, the Board of Trustees of the Invesco Funds amended the Code of Ethics (the “Code”) that applies to the Registrant’s Principal Executive Officer (“PEO”) and Principal Financial Officer (“PFO”) during the period covered by the report. The Registrant did not grant any waivers, including implicit waivers, from any provisions of the Code to the PEO or PFO during the period covered by this report.
| ITEM 3. | AUDIT COMMITTEE FINANCIAL EXPERT. |
The Board of Trustees has determined that the Registrant has at least one audit committee financial expert serving on its Audit Committee. The Audit Committee financial experts are David C. Arch, Bruce L. Crockett, Cynthia Hostetler, Teresa M. Ressel, Raymond Stickel, Jr. and Robert C. Troccoli. David C. Arch, Bruce L. Crockett, Cynthia Hostetler, Teresa M. Ressel, Raymond Stickel, Jr. and Robert Troccoli are “independent” within the meaning of that term as used in Form N-CSR.
| ITEM 4. | PRINCIPAL ACCOUNTANT FEES AND SERVICES. |
PricewaterhouseCoopers LLP (“PwC”) informed the Trust that it has identified an issue related to its independence under Rule 2-01(c)(1)(ii)(A) of Regulation S-X (referred to as the Loan Rule). The Loan Rule prohibits accounting firms, such as PricewaterhouseCoopers LLP, from being deemed independent if they have certain financial relationships with their audit clients or certain affiliates of those clients. The Trust is required under various securities laws to have its financial statements audited by an independent accounting firm.
The Loan Rule specifically provides that an accounting firm would not be independent if it or certain affiliates and covered persons receives a loan from a lender that is a record or beneficial owner of more than ten percent of an audit client’s equity securities (referred to as a “more than ten percent owner”). For purposes of the Loan Rule, audit clients include the Funds as well as all registered investment companies advised by the Adviser and its affiliates, including other subsidiaries of the Adviser’s parent company, Invesco Ltd. (collectively, the Invesco Fund Complex). PricewaterhouseCoopers LLP informed the Trust it and certain affiliates and covered persons have relationships with lenders who hold, as record owner, more than ten percent of the shares of certain funds within the Invesco Fund Complex.
On June 20, 2016, the SEC Staff issued a “no-action” letter to another mutual fund complex (see Fidelity Management & Research Company et al., No-Action Letter) related to the audit independence issue described above. In that letter, the SEC confirmed that it would not recommend enforcement action against a fund that relied on audit services performed by an audit firm that was not in compliance with the Loan Rule in certain specified circumstances. On May 2, 2018, the SEC proposed amendments to the Loan Rule that, if adopted as proposed, would address many of the issues that led to issuance of the no-action letter. In connection with prior independence determinations, PricewaterhouseCoopers LLP communicated, as contemplated by the no-action letter, that it believes that it remains objective and impartial and that a reasonable investor possessing all the facts would conclude that PricewaterhouseCoopers LLP is able to exhibit the requisite objectivity and impartiality to report on the Funds’ financial statements as the independent registered public accounting firm. PricewaterhouseCoopers LLP also represented that it has complied with PCAOB Rule 3526(b)(1) and (2), which are conditions to the Funds relying on the no action letter, and affirmed that it is an independent accountant within the meaning of PCAOB Rule 3520. Therefore, the Adviser, the Funds and PricewaterhouseCoopers LLP concluded that PricewaterhouseCoopers LLP could continue as the Funds’ independent registered public accounting firm. The Invesco Fund Complex relied upon the no-action letter in reaching this conclusion.
If in the future the independence of PricewaterhouseCoopers LLP is called into question under the Loan Rule by circumstances that are not addressed in the SEC’s no-action letter, the Funds will need to take other action in order for the Funds’ filings with the SEC containing financial statements to be deemed compliant with applicable securities laws. Such additional actions could result in additional costs, impair the ability of the Funds to issue new shares or have other material adverse effects on the Funds. The SEC no-action relief was initially set to expire 18 months from issuance but has been extended by the SEC without an expiration date, except that the no-action letter will be withdrawn upon the effectiveness of any amendments to the Loan Rule designed to address the concerns expressed in the letter.
PwC advised the Registrant’s Audit Committee that PwC had identified two matters for consideration under the SEC’s auditor independence rules. PwC stated that a PwC manager and a PwC Senior Manager each held financial interests in investment companies within the Invesco Fund complex that were inconsistent with the requirements of Rule 2-01(c)(1) of Regulation S-X.
PwC advised the Audit Committee that it believes its objectivity and impartiality had not been adversely affected by these matters as they related to the audit of the Registrant. In reaching this conclusion, PwC noted, among other things, that during the time of its audit, the engagement team was not aware of the investments, neither individual was in the chain of command of the audit or the audit partners of Invesco or the affiliate of the Registrant, the services each individual provided were not relied upon by the audit engagement team with respect to the audit of the affiliate of the Registrant and the investments were not material to the net worth of either individual or their immediate family members.
(a) to (d)
Fees Billed by PwC Related to the Registrant
PwC billed the Registrant aggregate fees for services rendered to the Registrant for the last two fiscal years as follows:
| | | | | | | | |
| | | Fees Billed for
Services Rendered to
the Registrant for
fiscal year end 2018 | | | Fees Billed for
Services Rendered to
the Registrant for
fiscal year end 2017 | |
Audit Fees | | $ | 101,075 | | | $ | 88,275 | |
Audit-Related Fees(1) | | $ | 0 | | | $ | 1,500 | |
Tax Fees(2) | | $ | 60,193 | | | $ | 46,402 | |
All Other Fees | | $ | 0 | | | $ | 0 | |
| | | | | | | | |
Total Fees | | $ | 161,268 | | | $ | 136,177 | |
(g) PwC billed the Registrant aggregate non-audit fees of $60,193 for the fiscal year ended 2018, and $47,902 for the fiscal year ended 2017, for non-audit services rendered to the Registrant.
| (1) | Audit-Related Fees for the fiscal year end 2017 include fees billed for reviewing regulatory filings. |
| (2) | Tax Fees for the fiscal year end October 31, 2018 includes fees billed for reviewing tax returns and/or services related to tax compliance. Tax Fees for fiscal year end October 31, 2017 includes fees billed for reviewing tax returns and/or services related to tax compliance. |
Fees Billed by PwC Related to Invesco and Invesco Affiliates
PwC billed Invesco Advisers, Inc. (“Invesco”), the Registrant’s adviser, and any entity controlling, controlled by or under common control with Invesco that provides ongoing services to the
Registrant (“Invesco Affiliates”) aggregate fees for pre-approved non-audit services rendered to Invesco and Invesco Affiliates for the last two fiscal years as follows:
| | | | | | | | |
| | | Fees Billed for Non-Audit
Services Rendered to Invesco
and Invesco Affiliates for
fiscal year end 2018 That
Were Required
to be Pre-Approved
by the Registrant’s
Audit Committee | | | Fees Billed for Non-Audit
Services Rendered to Invesco
and Invesco Affiliates for
fiscal year end 2017 That
Were Required
to be Pre-Approved
by the Registrant’s
Audit Committee | |
Audit-Related Fees(1) | | $ | 662,000 | | | $ | 662,000 | |
Tax Fees | | $ | 0 | | | $ | 0 | |
All Other Fees(2) | | $ | 0 | | | $ | 1,245,000 | |
| | | | | | | | |
Total Fees | | $ | 662,000 | | | $ | 1,907,000 | |
| (1) | Audit-Related Fees for the year end 2018 include fees billed related to reviewing controls at a service organization. Audit-Related Fees for the year end 2017 include fees billed related to reviewing controls at a service organization. |
| (2) | All Other Fees for the year end 2017 include fees billed related to the assessments for certain of the company’s risk management tools, current state analysis against regulatory requirements and identification of structural and organizational alternatives, informed by industry practices, for certain of the company’s administrative activities and functions |
(e)(2) There were no amounts that were pre-approved by the Audit Committee pursuant to the de minimis exception under Rule 2-01 of Regulation S-X.
(g) Including the fees for services not required to be pre-approved by the registrant’s audit committee, PwC billed Invesco and Invesco Affiliates aggregate non-audit fees of $3,639,000 for the fiscal year ended October 31, 2018, and $4,890,000 for the fiscal year ended October 31, 2017, for non-audit services rendered to Invesco and Invesco Affiliates.
PwC provided audit services to the Investment Company complex of approximately $24 million.
(h) The Audit Committee also has considered whether the provision of non-audit services that were rendered to Invesco and Invesco Affiliates that were not required to be pre-approved pursuant to SEC regulations, if any, is compatible with maintaining PwC’s independence.
(e)(1)
PRE-APPROVAL OF AUDIT AND NON-AUDIT SERVICES
POLICIES AND PROCEDURES
As adopted by the Audit Committees
of the Invesco Funds (the “Funds”)
Last Amended March 29, 2017
I. Statement of Principles
The Audit Committees (the “Audit Committee”) of the Boards of Trustees of the Funds (the “Board”) have adopted these policies and procedures (the “Procedures”) with respect to the pre-approval of audit
and non-audit services to be provided by the Funds’ independent auditor (the “Auditor”) to the Funds, and to the Funds’ investment adviser(s) and any entity controlling, controlled by, or under common control with the investment adviser(s) that provides ongoing services to the Funds (collectively, “Service Affiliates”).
Under Section 202 of the Sarbanes-Oxley Act of 2002, all audit and non-audit services provided to the Funds by the Auditor must be preapproved by the Audit Committee. Rule 2-01 of Regulation S-X requires that the Audit Committee also pre-approve a Service Affiliate’s engagement of the Auditor for non-audit services if the engagement relates directly to the operations and financial reporting of the Funds (a “Service Affiliate’s Covered Engagement”).
These Procedures set forth the procedures and the conditions pursuant to which the Audit Committee may pre-approve audit and non-audit services for the Funds and a Service Affiliate’s Covered Engagement pursuant to rules and regulations of the Securities and Exchange Commission (“SEC”) and other organizations and regulatory bodies applicable to the Funds (“Applicable Rules”).1 They address both general pre-approvals without consideration of specific case-by-case services (“general pre-approvals”) and pre-approvals on a case-by-case basis (“specific pre-approvals”). Any services requiring pre-approval that are not within the scope of general pre-approvals hereunder are subject to specific pre-approval. These Procedures also address the delegation by the Audit Committee of pre-approval authority to the Audit Committee Chair or Vice Chair.
II. Pre-Approval of Fund Audit Services
The annual Fund audit services engagement, including terms and fees, is subject to specific pre-approval by the Audit Committee. Audit services include the annual financial statement audit and other procedures required to be performed by an independent auditor to be able to form an opinion on the Funds’ financial statements. The Audit Committee will receive, review and consider sufficient information concerning a proposed Fund audit engagement to make a reasonable evaluation of the Auditor’s qualifications and independence. The Audit Committee will oversee the Fund audit services engagement as necessary, including approving any changes in terms, audit scope, conditions and fees.
In addition to approving the Fund audit services engagement at least annually and specifically approving any changes, the Audit Committee may generally or specifically pre-approve engagements for other audit services, which are those services that only an independent auditor reasonably can provide. Other audit services may include services associated with SEC registration statements, periodic reports and other documents filed with the SEC.
III. General and Specific Pre-Approval of Non-Audit Fund Services
The Audit Committee will consider, at least annually, the list of General Pre-Approved Non-Audit Services which list may be terminated or modified at any time by the Audit Committee. To inform the Audit Committee’s review and approval of General Pre-Approved Non-Audit Services, the Funds’ Treasurer (or his or her designee) and Auditor shall provide such information regarding independence or other matters as the Audit Committee may request.
Any services or fee ranges that are not within the scope of General Pre-Approved Non-Audit Services have not received general pre-approval and require specific pre-approval. Each request for specific pre-approval by the Audit Committee for services to be provided by the Auditor to the Funds must be submitted to the Audit Committee by the Funds’ Treasurer (or his or her designee) and must include detailed information about the services to be provided, the fees or fee ranges to be charged, and other relevant information sufficient to allow the Audit Committee to consider whether to pre-approve such
| 1 | Applicable Rules include, for example, New York Stock Exchange (“NYSE”) rules applicable to closed-end funds managed by Invesco and listed on NYSE. |
engagement, including evaluating whether the provision of such services will impair the independence of the Auditor and is otherwise consistent with Applicable Rules.
IV. Non-Audit Service Types
The Audit Committee may provide either general or specific pre-approval of audit-related, tax or other services, each as described in more detail below.
a. Audit-Related Services
“Audit-related services” are assurance and related services that are reasonably related to the performance of the audit or review of the Fund’s financial statements or that are traditionally performed by an independent auditor. Audit-related services include, among others, accounting consultations related to accounting, financial reporting or disclosure matters not classified as “Audit services”; assistance with understanding and implementing new accounting and financial reporting guidance from rulemaking authorities; services related to mergers, acquisitions or dispositions; compliance with ratings agency requirements and interfund lending activities; and assistance with internal control reporting requirements.
b. Tax Services
“Tax services” include, but are not limited to, the review and signing of the Funds’ federal tax returns, the review of required distributions by the Funds and consultations regarding tax matters such as the tax treatment of new investments or the impact of new regulations. The Audit Committee will not approve proposed services of the Auditor which the Audit Committee believes are to be provided in connection with a service or transaction initially recommended by the Auditor, the sole business purpose of which may be tax avoidance and the tax treatment of which may not be supported in the Internal Revenue Code and related regulations. The Audit Committee will consult with the Funds’ Treasurer (or his or her designee) and may consult with outside counsel or advisers as necessary to ensure the consistency of tax services rendered by the Auditor with the foregoing policy. The Auditor shall not represent any Fund or any Service Affiliate before a tax court, district court or federal court of claims.
Each request to provide tax services under either the general or specific pre-approval of the Audit Committee will include a description from the Auditor in writing of (i) the scope of the service, the fee structure for the engagement, and any side letter or other amendment to the engagement letter, or any other agreement (whether oral, written, or otherwise) between the Auditor and the Funds, relating to the service; and (ii) any compensation arrangement or other agreement, such as a referral agreement, a referral fee or fee-sharing arrangement, between the Auditor (or an affiliate of the Auditor) and any person (other than the Funds or Service Affiliates receiving the services) with respect to the promoting, marketing, or recommending of a transaction covered by the service. The Auditor will also discuss with the Audit Committee the potential effects of the services on the independence of the Auditor, and document the substance of its discussion with the Audit Committee.
c. Other Services
The Audit Committee may pre-approve other non-audit services so long as the Audit Committee believes that the service will not impair the independence of the Auditor. Appendix I includes a list of services that the Auditor is prohibited from performing by the SEC rules. Appendix I also includes a list of services that would impair the Auditor’s independence unless the Audit Committee reasonably concludes that the results of the services will not be subject to audit procedures during an audit of the Funds’ financial statements.
V. Pre-Approval of Service Affiliate’s Covered Engagements
Rule 2-01 of Regulation S-X requires that the Audit Committee pre-approve a Service Affiliate’s engagement of the Auditor for non-audit services if the engagement relates directly to the operations and financial reporting of the Funds, defined above as a “Service Affiliate’s Covered Engagement”.
The Audit Committee may provide either general or specific pre-approval of any Service Affiliate’s Covered Engagement, including for audit-related, tax or other services, as described above, if the Audit Committee believes that the provision of the services to a Service Affiliate will not impair the independence of the Auditor with respect to the Funds. Any Service Affiliate’s Covered Engagements that are not within the scope of General Pre-Approved Non-Audit Services have not received general pre-approval and require specific pre-approval.
Each request for specific pre-approval by the Audit Committee of a Service Affiliate’s Covered Engagement must be submitted to the Audit Committee by the Funds’ Treasurer (or his or her designee) and must include detailed information about the services to be provided, the fees or fee ranges to be charged, a description of the current status of the pre-approval process involving other audit committees in the Invesco investment company complex (as defined in Rule 2-201 of Regulation S-X) with respect to the proposed engagement, and other relevant information sufficient to allow the Audit Committee to consider whether the provision of such services will impair the independence of the Auditor from the Funds. Additionally, the Funds’ Treasurer (or his or her designee) and the Auditor will provide the Audit Committee with a statement that the proposed engagement requires pre-approval by the Audit Committee, the proposed engagement, in their view, will not impair the independence of the Auditor and is consistent with Applicable Rules, and the description of the proposed engagement provided to the Audit Committee is consistent with that presented to or approved by the Invesco audit committee.
Information about all Service Affiliate engagements of the Auditor for non-audit services, whether or not subject to pre-approval by the Audit Committee, shall be provided to the Audit Committee at least quarterly, to allow the Audit Committee to consider whether the provision of such services is compatible with maintaining the Auditor’s independence from the Funds. The Funds’ Treasurer and Auditor shall provide the Audit Committee with sufficiently detailed information about the scope of services provided and the fees for such services, to ensure that the Audit Committee can adequately consider whether the provision of such services is compatible with maintaining the Auditor’s independence from the Funds.
VI. Pre-Approved Fee Levels or Established Amounts
Pre-approved fee levels or ranges for audit and non-audit services to be provided by the Auditor to the Funds, and for a Service Affiliate’s Covered Engagement, under general pre-approval or specific pre-approval will be set periodically by the Audit Committee. Any proposed fees exceeding 110% of the maximum pre-approved fee levels or ranges for such services or engagements will be promptly presented to the Audit Committee and will require specific pre-approval by the Audit Committee before payment of any additional fees is made.
VII. Delegation
The Audit Committee hereby delegates, subject to the dollar limitations set forth below, specific authority to its Chair, or in his or her absence, Vice Chair, to pre-approve audit and non-audit services proposed to be provided by the Auditor to the Funds and/or a Service Affiliate’s Covered Engagement, between Audit Committee meetings. Such delegation does not preclude the Chair or Vice Chair from declining, on a case by case basis, to exercise his or her delegated authority and instead convening the Audit Committee to consider and pre-approve any proposed services or engagements.
Notwithstanding the foregoing, the Audit Committee must pre-approve: (a) any non-audit services to be provided to the Funds for which the fees are estimated to exceed $500,000; (b) any Service Affiliate’s
Covered Engagement for which the fees are estimated to exceed $500,000; or (c) any cost increase to any previously approved service or engagement that exceeds the greater of $250,000 or 50% of the previously approved fees up to a maximum increase of $500,000.
VIII. Compliance with Procedures
Notwithstanding anything herein to the contrary, failure to pre-approve any services or engagements that are not required to be pre-approved pursuant to the de minimis exception provided for in Rule 2-01(c)(7)(i)(C) of Regulation S-X shall not constitute a violation of these Procedures. The Audit Committee has designated the Funds’ Treasurer to ensure services and engagements are pre-approved in compliance with these Procedures. The Funds’ Treasurer will immediately report to the Chair of the Audit Committee, or the Vice Chair in his or her absence, any breach of these Procedures that comes to the attention of the Funds’ Treasurer or any services or engagements that are not required to be pre-approved pursuant to the de minimis exception provided for in Rule 2-01(c)(7)(i)(C) of Regulation S-X.
On at least an annual basis, the Auditor will provide the Audit Committee with a summary of all non-audit services provided to any entity in the investment company complex (as defined in section 2-01(f)(14) of Regulation S-X, including the Funds and Service Affiliates) that were not pre-approved, including the nature of services provided and the associated fees.
IX. Amendments to Procedures
All material amendments to these Procedures must be approved in advance by the Audit Committee. Non-material amendments to these Procedures may be made by the Legal and Compliance Departments and will be reported to the Audit Committee at the next regularly scheduled meeting of the Audit Committee.
Appendix I
Non-Audit Services That May Impair the Auditor’s Independence
The Auditor is not independent if, at any point during the audit and professional engagement, the Auditor provides the following non-audit services:
| | • | | Broker-dealer, investment adviser, or investment banking services ; |
| | • | | Expert services unrelated to the audit; |
| | • | | Any service or product provided for a contingent fee or a commission; |
| | • | | Services related to marketing, planning, or opining in favor of the tax treatment of confidential transactions or aggressive tax position transactions, a significant purpose of which is tax avoidance; |
| | • | | Tax services for persons in financial reporting oversight roles at the Fund; and |
| | • | | Any other service that the Public Company Oversight Board determines by regulation is impermissible. |
An Auditor is not independent if, at any point during the audit and professional engagement, the Auditor provides the following non-audit services unless it is reasonable to conclude that the results of the services will not be subject to audit procedures during an audit of the Funds’ financial statements:
| | • | | Bookkeeping or other services related to the accounting records or financial statements of the audit client; |
| | • | | Financial information systems design and implementation; |
| | • | | Appraisal or valuation services, fairness opinions, or contribution-in-kind reports; |
| | • | | Actuarial services; and |
| | • | | Internal audit outsourcing services. |
| ITEM 5. | AUDIT COMMITTEE OF LISTED REGISTRANTS. |
Not applicable.
| ITEM 6. | SCHEDULE OF INVESTMENTS. |
Investments in securities of unaffiliated issuers is included as part of the reports to stockholders filed under Item 1 of this Form.
| ITEM 7. | DISCLOSURE OF PROXY VOTING POLICIES AND PROCEDURES FOR CLOSED-END MANAGEMENT INVESTMENT COMPANIES. |
Not applicable.
| ITEM 8. | PORTFOLIO MANAGERS OF CLOSED-END MANAGEMENT COMPANIES. |
Not applicable.
| ITEM 9. | PURCHASES OF EQUITY SECURITIES BY CLOSED-END MANAGEMENT INVESTMENT COMPANY AND AFFILIATED PURCHASERS. |
Not applicable.
| ITEM 10. | SUBMISSION OF MATTERS TO A VOTE OF SECURITY HOLDERS. |
None
| ITEM 11. | CONTROLS AND PROCEDURES. |
| (a) | As of December 20, 2018, an evaluation was performed under the supervision and with the participation of the officers of the Registrant, including the PEO and PFO, to assess the effectiveness of the Registrant’s disclosure controls and procedures, as that term is defined in Rule 30a-3(c) under the Investment Company Act of 1940 (the “Act”), as amended. Based on that evaluation, the Registrant’s officers, including the PEO and PFO, concluded that, as of December 20, 2018, the Registrant’s disclosure controls and procedures were reasonably designed to ensure: (1) that information required to be disclosed by the Registrant on Form N-CSR is recorded, processed, summarized and reported within the time periods specified by the rules and forms of the Securities and Exchange Commission; and (2) that material information relating to the Registrant is made known to the PEO and PFO as appropriate to allow timely decisions regarding required disclosure. |
| (b) | There have been no changes in the Registrant’s internal control over financial reporting (as defined in Rule 30a-3(d) under the Act) that occurred during the second fiscal quarter of the period covered by this report that have materially affected, or are reasonably likely to materially affect, the Registrant’s internal control over financial reporting. |
| ITEM 12. | DISCLOSURE OF SECURITIES LENDING ACTIVITIES FOR CLOSED-END MANAGEMENT INVESTMENT COMPANIES. |
Not applicable.
| 13(a) (2) | Certifications of principal executive officer and principal financial officer as required by Rule 30a-2(a) under the Investment Company Act of 1940. |
| 13(b) | Certifications of principal executive officer and principal financial officer as required by Rule 30a-2(b) under the Investment Company Act of 1940. |
SIGNATURES
Pursuant to the requirements of the Securities Exchange Act of 1934 and the Investment Company Act of 1940, the Registrant has duly caused this report to be signed on its behalf by the undersigned, thereunto duly authorized.
Registrant: AIM Equity Funds (Invesco Equity Funds)
| | |
| By: | | /s/ Sheri Morris |
| | Sheri Morris |
| | Principal Executive Officer |
| |
| Date: | | January 4, 2019 |
Pursuant to the requirements of the Securities and Exchange Act of 1934 and the Investment Company Act of 1940, this report has been signed below by the following persons on behalf of the Registrant and in the capacities and on the dates indicated.
| | |
| By: | | /s/ Sheri Morris |
| | Sheri Morris |
| | Principal Executive Officer |
| |
| Date: | | January 4, 2019 |
| | |
| By: | | /s/ Kelli Gallegos |
| | Kelli Gallegos |
| | Principal Financial Officer |
| |
| Date: | | January 4, 2019 |
EXHIBIT INDEX
| | |
| 13(a) (1) | | Code of Ethics. |
| |
| 13(a) (2) | | Certifications of principal executive officer and principal financial officer as required by Rule 30a-2(a) under the Investment Company Act of 1940. |
| |
| 13(a) (3) | | Not applicable. |
| |
| 13(a) (4) | | Not applicable. |