UNITED STATES
SECURITIES AND EXCHANGE COMMISSION
WASHINGTON, D.C. 20549
FORMN-CSR
CERTIFIED SHAREHOLDER REPORT OF REGISTERED MANAGEMENT
INVESTMENT COMPANIES
Investment Company Act file number811-01424
AIM Equity Funds (Invesco Equity Funds)
(Exact name of registrant as specified in charter)
11 Greenway Plaza, Suite 1000 Houston, Texas 77046
(Address of principal executive offices) (Zip code)
Sheri Morris
11 Greenway Plaza, Suite 1000
Houston, Texas 77046
(Name and address of agent for service)
Registrant’s telephone number, including area code:(713)626-1919
Date of fiscal year end:April 30
Date of reporting period:4/30/2019
Item 1. Reports to Stockholders.
| | | | | | |
 | | Annual Report | | 4/30/2019 | | |
| | | | |
| | | | | | |
| | | | | | |
| | | | | | |
| | | | | | |
| | | | | | |
|
| Invesco |
| Oppenheimer |
| Dividend |
| Opportunity Fund* |
|
| Beginning on January 1, 2021, as permitted by regulations adopted by the Securities and Exchange Commission, paper copies of the Fund’s shareholder reports will no longer be sent by mail, unless you specifically request paper copies of the reports from the Fund. Instead, the reports will be made available on the Fund’s website, and you will be notified by mail each time a report is posted and provided with a website link to access the report. |
|
| If you already elected to receive shareholder reports electronically, you will not be affected by this change and you need not take any action. You may elect to receive shareholder reports and other communications from the Fund electronically by contacting your financial intermediary (such as a broker-dealer or bank) or, if you are a direct investor, by enrolling at invesco.com/edelivery. |
|
| You may elect to receive all future reports in paper free of charge. If you invest through a financial intermediary, you can contact your financial intermediary to request that you continue to receive paper copies of your shareholder reports. If you invest directly with the Fund, you can call 800 959 4246 to let the Fund know you wish to continue receiving paper copies of your shareholder reports. Your election to receive reports in paper will apply to all funds held with your financial intermediary or all funds held with the fund complex if you invest directly with the Fund. |
|
| *Prior to the close of business on May 24, 2019, the Fund’s name was Oppenheimer Dividend Opportunity Fund. See Important Update on the following page for more information. |
Important Update
On October 18, 2018, Massachusetts Mutual Life Insurance Company, an indirect corporate parent of OppenheimerFunds, Inc. and its subsidiaries OFI Global Asset Management, Inc., OFI SteelPath, Inc. and OFI Advisors, LLC, announced that it had entered into an agreement whereby Invesco Ltd., a global investment management company would acquire OppenheimerFunds and its subsidiaries (together “OppenheimerFunds”). After the close of business on May 24, 2019 Invesco Ltd. completed the acquisition of OppenheimerFunds. This Fund was included in that acquisition and as of that date, became part of the Invesco family of funds. Please visit oppenheimerfunds.com for more information or call Invesco’s Client Services team at800-959-4246.
Table of Contents
Class A Shares
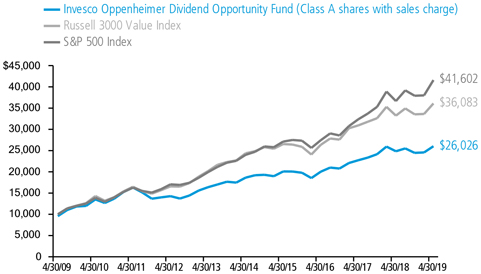
AVERAGE ANNUAL TOTAL RETURNS AT 4/30/19
| | | | | | | | | | | | | | | | |
| | | Class A Shares of the Fund | | | | | | | |
| | | Without Sales Charge | | | With Sales Charge | | | Russell 3000 Value Index | | | S&P 500 Index | |
| 1-Year | | | 4.78% | | | | -1.24% | | | | 8.58% | | | | 13.49% | |
| 5-Year | | | 6.91 | | | | 5.66 | | | | 8.17 | | | | 11.63 | |
| 10-Year | | | 10.69 | | | | 10.04 | | | | 13.69 | | | | 15.32 | |
Performance data quoted represents past performance, which does not guarantee future results.The investment return and principal value of an investment inthe Fund will fluctuate so that an investor’s shares, when redeemed, may be worth more or less than their original cost. Fund returns include changes in share price, reinvested distributions, and a 5.75% maximum applicable sales charge except where “without sales charge” is indicated. Current performance may be lower or higher than the performance quoted. Returns do not consider capital gains or income taxes on an individual’s investment. Returns for periods of less than one year are cumulative and not annualized. For performance data current to the most recentmonth-end, visit oppenheimerfunds.com or call 1.800.CALL OPP (225.5677). See Fund prospectuses and summary prospectuses for more information on share classes, sales charges and new fee agreements, if any.
3 INVESCO OPPENHEIMER DIVIDEND OPPORTUNITY FUND
Fund Performance Discussion
The Fund’s Class A shares (without sales charge) produced a return of 4.78% during theone-year period ended April 30, 2019. In comparison, the Russell 3000 Value Index (the “Index”) returned 8.58% during the same period. The Fund’s underperformance relative to the Index stemmed from weaker relative stock selection in the Industrials, Communications Services, and Financials sectors. The Fund outperformed the Index within the Energy, Information Technology, and Consumer Staples sectors due to stock selection. Our overweight position in Energy also detracted from performance.
MARKET OVERVIEW
During the reporting period, investors endured a significant drawdown in late 2018 only to witness an almost complete rebound in the first quarter of 2019. During the fourth quarter, the Index declined 12%, with most of the pain felt in the market’s December sell off. Data emerged that suggested the US economy may be slowing even as the Federal Reserve maintained its stance of modestly tighter monetary policy, and fears of a continued trade conflict remained at
the front of investors’ minds. Economically sensitive sectors such as Energy, Materials, Industrials and Consumer Discretionary all underperformed the Index.
After the first of the year, however, equity markets rebounded strongly as it became increasingly clear that the Federal Reserve’s stance pivoted towards neutrality, and global economic indicators showed signs of
COMPARISON OF CHANGE IN VALUE OF $10,000 HYPOTHETICAL INVESTMENTS IN:
4 INVESCO OPPENHEIMER DIVIDEND OPPORTUNITY FUND
improvement. The Index gained over 15% into the end of the reporting period, with economically sensitive sectors such as Information Technology, Financials, and Industrials all outperforming.
FUND REVIEW
Top performing holdings this reporting period included Microsoft, Cisco Systems, and Merck & Co.
Microsoft continued to generate strong revenue growth from Azure, its cloud-based software offering, which helped drive better than expected margin expansion. As a result, shares gained over 40% during the reporting period.
Shares of Cisco were up over 30% for the reporting period, as the networking company continues to execute on its strategy of shifting towards providing software and services in addition to networking equipment. The firm’s move towards a subscription based revenue model has been well received by investors.
Pharmaceutical manufacturer Merck benefitted from strong growth in its key oncology drug Keytruda and robust growth outside of the US. In addition, the company continues to focus on prudent capital deployment, allocating excess capital to its dividend and share repurchase programs.
Detractors from performance included Weatherford International, Suncor Energy, and Intesa Sanpaolo.
Weatherford, a provider of global oilfield services, is in the process of restructuring its balance sheet and progress in its asset sales and debt reduction came at a slower rate than anticipated.
Canadian oil sands producer Suncor’s shares were weak both due to lower oil prices and a mandatory production cut announced in early December for the Canadian province of Alberta.
Intesa Sanpaolo SpA engages in the provision of financial products and banking services in Italy. The company’s shares suffered losses after political turmoil in Italy sparked government bond selloffs.
STRATEGY & OUTLOOK
The strong performance in early 2019 was driven primarily by multiple expansion, and the broad equity market has largely recouped the losses sustained in the fourth quarter. Current market multiples are once again largely in line with recent historical averages. In our view, it is unlikely that multiples will continue to expand unless underlying corporate profits rebound. We believe that fundamentals will drive equity returns through the remainder of 2019.
As always, while many investors focus on a short-term view when considering potential investments, the Fund utilizesin-depth fundamental research to identify companies that we believe are poised for an unanticipated acceleration in return
5 INVESCO OPPENHEIMER DIVIDEND OPPORTUNITY FUND
on invested capital over a multi-year time horizon. We believe this longer-term approach provides a more comprehensive outlook of potential investments by focusing on all three financial statements – income statement, balance sheet and statement of cash flows – and helps us uncover companies whose generation and use of free cash flow we deem as yet to be fully reflected in the current stock price.
| | |
 | |  |
| | Laton Spahr, CFA |
| | Portfolio Manager |
Effective June 21, 2019, after the close of the fiscal year, the Portfolio Management team changed to Meggan Walsh (lead manager), Robert Botard, Kristina Bradshaw and Chris McMeans.
6 INVESCO OPPENHEIMER DIVIDEND OPPORTUNITY FUND
Top Holdings and Allocations
TOP TEN COMMON STOCK HOLDINGS
| | |
| AT&T, Inc. | | 3.4% |
| Cisco Systems, Inc. | | 3.4 |
| BP plc, Sponsored ADR | | 3.0 |
| Citigroup, Inc. | | 3.0 |
| Microsoft Corp. | | 2.8 |
| Prudential Financial, Inc. | | 2.8 |
| Philip Morris International, Inc. | | 2.4 |
| Verizon Communications, Inc. | | 2.4 |
| Suncor Energy, Inc. | | 2.3 |
| Coca-Cola Co. (The) | | 2.1 |
Portfolio holdings and allocations are subject to change. Percentages are as of April 30, 2019, and are based on net assets.
TOP TEN COMMON STOCK INDUSTRIES
| | |
| Oil, Gas & Consumable Fuels | | 12.8% |
| Commercial Banks | | 9.3 |
| Pharmaceuticals | | 7.5 |
| Diversified Telecommunication Services | | 7.1 |
| Electric Utilities | | 4.4 |
| Real Estate Investment Trusts (REITs) | | 4.2 |
| Communications Equipment | | 3.8 |
| Beverages | | 3.5 |
| Semiconductors & Semiconductor Equipment | | 3.3 |
| Capital Markets | | 2.9 |
Portfolio holdings and allocations are subject to change. Percentages are as of April 30, 2019, and are based on net assets.
SECTOR ALLOCATION
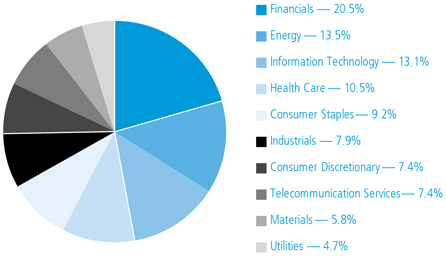
Portfolio holdings and allocations are subject to change. Percentages are as of April 30, 2019, and are based on the total market value of common stocks.
For more current Fund holdings, please visit oppenheimerfunds.com.
7 INVESCO OPPENHEIMER DIVIDEND OPPORTUNITY FUND
Share Class Performance
AVERAGE ANNUAL TOTAL RETURNS WITHOUT SALES CHARGE AS OF 4/30/19
| | | | | | | | |
| | | Inception Date | | 1-Year | | 5-Year | | 10-Year |
| Class A (OSVAX) | | 11/26/02 | | 4.78% | | 6.91% | | 10.69% |
| Class C (OSCVX) | | 2/27/04 | | 4.05 | | 6.12 | | 9.84 |
| Class I1 (OSVIX) | | 8/28/14 | | 5.23 | | 6.772 | | N/A |
| Class R (OSVNX) | | 2/27/04 | | 4.54 | | 6.65 | | 10.41 |
| Class Y (OSVYX) | | 2/27/04 | | 5.05 | | 7.18 | | 11.07 |
|
AVERAGE ANNUAL TOTAL RETURNS WITH SALES CHARGE AS OF 4/30/19 |
| | | Inception Date | | 1-Year | | 5-Year | | 10-Year |
| Class A (OSVAX) | | 11/26/02 | | -1.24% | | 5.66% | | 10.04% |
| Class C (OSCVX) | | 2/27/04 | | 3.05 | | 6.12 | | 9.84 |
| Class I1 (OSVIX) | | 8/28/14 | | 5.23 | | 6.772 | | N/A |
| Class R (OSVNX) | | 2/27/04 | | 4.54 | | 6.65 | | 10.41 |
| Class Y (OSVYX) | | 2/27/04 | | 5.05 | | 7.18 | | 11.07 |
1. Pursuant to the closing of the transaction described in the Notes to Financial Statements, after the close of business on May 24, 2019, Class I shares were reorganized as Class R6 shares.
2. Shows performance since inception.
Performance data quoted represents past performance, which does not guarantee future results.The investment return and principal value of an investmentin the Fund will fluctuate so that an investor’s shares, when redeemed, may be worth more or less than their original cost. Current performance may be lower or higher than the performance quoted. Returns do not consider capital gains or income taxes on an individual’s investment. For performance data current to the most recentmonth-end, visit oppenheimerfunds.com or call 1.800. CALL OPP (225.5677). Fund returns include changes in share price, reinvested distributions, and the applicable sales charge: for Class A shares, the current maximum initial sales charge of 5.75% and for Class C shares, the contingent deferred sales charge of 1% for the1-year period. There is no sales charge for Class I, Class R and Class Y shares. Returns for periods of less than one year are cumulative and not annualized. See Fund prospectuses and summary prospectuses for more information on share classes, sales charges and new fee agreements, if any.
The Fund’s performance is compared to the Russell 3000 Value Index and the S&P 500 Index. The Russell 3000 Value Index measures the performance of the broad value segment of the U.S. equity universe. It includes those Russell 3000 companies with lowerprice-to-book ratios and lower forecasted growth values. The S&P 500 Index is a capitalization-weighted index of 500 stocks intended to be a representative sample of leading companies in leading industries within the U.S. economy. The indices are unmanaged and cannot be purchased directly by investors. While index comparisons may be useful to provide a benchmark for the Fund’s performance, it must be noted that the Fund’s investments are not limited to the investments comprising the indices. Index performance includes reinvestment of income, but does not reflect transaction costs, fees, expenses or taxes. Index performance is shown for illustrative
8 INVESCO OPPENHEIMER DIVIDEND OPPORTUNITY FUND
purposes only as a benchmark for the Fund’s performance, and does not predict or depict performance of the Fund. The Fund’s performance reflects the effects of the Fund’s business and operating expenses.
The Fund’s investment strategy and focus can change over time. The mention of specific fund holdings does not constitute a recommendation by OppenheimerFunds, Inc. or its affiliates.
The views in the Fund Performance Discussion represent the opinions of this Fund’s portfolio manager(s) and are not intended as investment advice or to predict or depict the performance of any investment. These views are as of the close of business on April 30, 2019, and are subject to change based on subsequent developments. The Fund’s portfolio and strategies are subject to change.
Before investing in any of the Invesco Oppenheimer funds, investors should carefully consider a fund’s investment objectives, risks, charges and expenses. Fund prospectuses and summary prospectuses contain this and other information about the funds, and may be obtained by asking your financial advisor, visiting oppenheimerfunds.com, or calling 1.800.CALL OPP (225.5677). Read prospectuses and summary prospectuses carefully before investing.
Shares of Invesco Oppenheimer funds are not deposits or obligations of any bank, are not guaranteed by any bank, are not insured by the FDIC or any other agency, and involve investment risks, including the possible loss of the principal amount invested.
9 INVESCO OPPENHEIMER DIVIDEND OPPORTUNITY FUND
Fund Expenses
Fund Expenses.As a shareholder of the Fund, you incur two types of costs: (1) transactioncosts, which may include sales charges (loads) on purchase payments and/or contingent deferred sales charges on redemptions; and (2) ongoing costs, including management fees; distribution and service fees; and other Fund expenses. These examples are intended to help you understand your ongoing costs (in dollars) of investing in the Fund and to compare these costs with the ongoing costs of investing in other mutual funds.
The examples are based on an investment of $1,000.00 invested at the beginning of the period and held for the entire6-month period ended April 30, 2019.
Actual Expenses.The first section of the table provides information about actual accountvalues and actual expenses. You may use the information in this section for the class of shares you hold, together with the amount you invested, to estimate the expense that you paid over the period. Simply divide your account value by $1,000.00 (for example, an $8,600.00 account value divided by $1,000.00 = 8.60), then multiply the result by the number in the first section under the heading entitled “Expenses Paid During 6 Months Ended April 30, 2019” to estimate the expenses you paid on your account during this period.
Hypothetical Example for Comparison Purposes.The second section of the tableprovides information about hypothetical account values and hypothetical expenses based on the Fund’s actual expense ratio for each class of shares, and an assumed rate of return of 5% per year for each class before expenses, which is not the Fund’s actual return. The hypothetical account values and expenses may not be used to estimate the actual ending account balance or expenses you paid for the period. You may use this information to compare the ongoing costs of investing in the Fund and other funds. To do so, compare this 5% hypothetical example for the class of shares you hold with the 5% hypothetical examples that appear in the shareholder reports of the other funds.
Please note that the expenses shown in the table are meant to highlight your ongoing costs only and do not reflect any transactional costs, such asfront-end or contingent deferred sales charges (loads). Therefore, the “hypothetical” section of the table is useful in comparing ongoing costs only, and will not help you determine the relative total costs of owning different funds. In addition, if these transactional costs were included, your costs would have been higher.
10 INVESCO OPPENHEIMER DIVIDEND OPPORTUNITY FUND
| | | | | | |
| Actual | | Beginning Account Value November 1, 2018 | | Ending Account Value April 30, 2019 | | Expenses Paid During 6 Months Ended April 30, 2019 |
| Class A | | $ 1,000.00 | | $ 1,063.80 | | $ 5.85 |
| Class C | | 1,000.00 | | 1,060.00 | | 9.70 |
| Class I | | 1,000.00 | | 1,066.10 | | 3.75 |
| Class R | | 1,000.00 | | 1,062.30 | | 7.18 |
| Class Y | | 1,000.00 | | 1,064.80 | | 4.62 |
| | | |
| Hypothetical | | | | | | |
| (5% return before expenses) | | | | | | |
| Class A | | 1,000.00 | | 1,019.14 | | 5.72 |
| Class C | | 1,000.00 | | 1,015.42 | | 9.49 |
| Class I | | 1,000.00 | | 1,021.17 | | 3.66 |
| Class R | | 1,000.00 | | 1,017.85 | | 7.03 |
| Class Y | | 1,000.00 | | 1,020.33 | | 4.52 |
Expenses are equal to the Fund’s annualized expense ratio for that class, multiplied by the average account value over the period, multiplied by 181/365 (to reflect theone-half year period). Those annualized expense ratios, excluding indirect expenses from affiliated funds, based on the6-month period ended April 30, 2019 are as follows:
| | |
| Class | | Expense Ratios |
| Class A | | 1.14% |
| Class C | | 1.89 |
| Class I | | 0.73 |
| Class R | | 1.40 |
| Class Y | | 0.90 |
The expense ratios reflect voluntary and/or contractual waivers and/or reimbursements of expenses by the Fund’s Manager. Some of these undertakings may be modified or terminated at any time, as indicated in the Fund’s prospectus. The “Financial Highlights” tables in the Fund’s financial statements, included in this report, also show the gross expense ratios, without such waivers or reimbursements and reduction to custodian expenses, if applicable.
11 INVESCO OPPENHEIMER DIVIDEND OPPORTUNITY FUND
STATEMENT OF INVESTMENTSApril 30, 2019
| | | | | | | | |
| | | Shares | | | Value | |
| Common Stocks—95.1% | | | | | |
| Consumer Discretionary—7.0% | | | | | |
| Auto Components—0.5% | | | | | |
Valeo SA | | | 37,470 | | | $ | 1,369,140 | |
| Automobiles—2.2% | | | | | | | | |
| General Motors Co. | | | 115,030 | | | | 4,480,419 | |
| Subaru Corp. | | | 55,100 | | | | 1,340,560 | |
| | | | | | | | |
| | | | | | | 5,820,979 | |
| Entertainment—0.7% | | | | | | | | |
Nintendo Co. Ltd. | | | 5,600 | | | | 1,920,333 | |
| Hotels, Restaurants & Leisure—0.6% | |
McDonald’s Corp. | | | 7,800 | | | | 1,541,046 | |
| Household Durables—0.2% | | | | | |
Newell Brands, Inc. | | | 36,000 | | | | 517,680 | |
| Multiline Retail—2.0% | | | | | | | | |
Target Corp. | | | 67,610 | | | | 5,234,366 | |
| Specialty Retail—0.8% | | | | | | | | |
Lowe’s Cos., Inc. | | | 17,810 | | | | 2,015,024 | |
| Consumer Staples—8.8% | | | | | |
| Beverages—3.5% | | | | | | | | |
| Coca-Cola Co. (The) | | | 113,350 | | | | 5,560,951 | |
| Coca-Cola European Partners plc | | | 67,190 | | | | 3,600,712 | |
| | | | | | | | |
| | | | | | | 9,161,663 | |
| Food & Staples Retailing—0.8% | | | | | |
Walmart, Inc. | | | 21,260 | | | | 2,186,378 | |
| Household Products—2.1% | | | | | |
Procter & Gamble Co. (The) | | | 52,070 | | | | 5,544,414 | |
| Tobacco—2.4% | | | | | | | | |
Philip Morris International, Inc. | | | 72,010 | | | | 6,233,186 | |
| Energy—12.8% | | | | | | | | |
| Energy Equipment & Services—0.0% | |
Weatherford International plc1 | | | 146,415 | | | | 81,012 | |
| Oil, Gas & Consumable Fuels—12.8% | |
| Anadarko Petroleum Corp. | | | 54,020 | | | | 3,935,357 | |
| BP plc, Sponsored ADR | | | 182,634 | | | | 7,986,585 | |
| Chevron Corp. | | | 41,078 | | | | 4,931,825 | |
| Enbridge, Inc. | | | 30,827 | | | | 1,138,749 | |
| Marathon Petroleum Corp. | | | 30,000 | | | | 1,826,100 | |
| | | | | | | | |
| | | Shares | | | Value | |
| Oil, Gas & Consumable Fuels (Continued) | |
| Royal Dutch Shell plc, Cl. A, Sponsored ADR | | | 42,742 | | | $ | 2,715,399 | |
| Ship Finance International Ltd. | | | 248,900 | | | | 3,175,964 | |
| Suncor Energy, Inc. | | | 181,030 | | | | 5,973,990 | |
| Targa Resources Corp. | | | 48,540 | | | | 1,948,881 | |
| | | | | | | | |
| | | | | | | 33,632,850 | |
| Financials—19.5% | | | | | | | | |
| Capital Markets—2.9% | | | | | |
| Apollo Global Management LLC, Cl. A2 | | | 38,573 | | | | 1,260,951 | |
| Ares Management Corp., Cl. A | | | 125,749 | | | | 3,074,563 | |
| Charles Schwab Corp. (The) | | | 39,490 | | | | 1,807,852 | |
| Moelis & Co., Cl. A | | | 35,490 | | | | 1,453,316 | |
| | | | | | | | |
| | | | | | | 7,596,682 | |
| Commercial Banks—9.3% | | | | | |
| Banco Comercial Portugues SA, Cl. R1 | | | 4,612,651 | | | | 1,295,679 | |
| BB&T Corp. | | | 56,600 | | | | 2,897,920 | |
| Citigroup, Inc. | | | 110,470 | | | | 7,810,229 | |
| Intesa Sanpaolo SpA | | | 454,111 | | | | 1,190,081 | |
| JPMorgan Chase & Co. | | | 9,920 | | | | 1,151,216 | |
| M&T Bank Corp. | | | 15,670 | | | | 2,664,997 | |
| Regions Financial Corp. | | | 253,520 | | | | 3,937,166 | |
| Zions Bancorp NA | | | 68,400 | | | | 3,374,172 | |
| | | | | | | | |
| | | | | | | 24,321,460 | |
| Consumer Finance—0.3% | | | | | |
Navient Corp. | | | 63,415 | | | | 856,737 | |
| Insurance—2.8% | | | | | | | | |
| Prudential Financial, Inc. | | | 70,060 | | | | 7,406,042 | |
| Real Estate Investment Trusts (REITs)—4.2% | |
| Crown Castle International Corp. | | | 20,700 | | | | 2,603,646 | |
| Equity Residential | | | 59,730 | | | | 4,564,567 | |
| HCP, Inc. | | | 45,850 | | | | 1,365,413 | |
| Park Hotels & Resorts, Inc. | | | 77,590 | | | | 2,489,087 | |
| | | | | | | | |
| | | | | | | 11,022,713 | |
12 INVESCO OPPENHEIMER DIVIDEND OPPORTUNITY FUND
STATEMENT OF INVESTMENTSContinued
| | | | | | | | |
| | | Shares | | | Value | |
| Health Care—10.0% | | | | | | | | |
| Biotechnology—1.0% | | | | | | | | |
Gilead Sciences, Inc. | | | 38,000 | | | $ | 2,471,520 | |
| Health Care Equipment & Supplies—1.0% | |
| Alcon, Inc.1 | | | 7,534 | | | | 438,479 | |
| Medtronic plc | | | 25,420 | | | | 2,257,550 | |
| | | | | | | | |
| | | | | | | | 2,696,029 | |
| Health Care Providers & Services—0.5% | |
| UnitedHealth Group, Inc. | | | 5,950 | | | | 1,386,766 | |
| Pharmaceuticals—7.5% | | | | | | | | |
| AstraZeneca plc, Sponsored ADR | | | 100,380 | | | | 3,780,311 | |
| Bayer AG | | | 21,000 | | | | 1,395,715 | |
| GlaxoSmithKline plc, Sponsored ADR | | | 30,000 | | | | 1,233,900 | |
| Merck & Co., Inc. | | | 67,810 | | | | 5,337,325 | |
| Novartis AG, Sponsored ADR | | | 32,770 | | | | 2,694,677 | |
| Pfizer, Inc. | | | 128,540 | | | | 5,220,010 | |
| | | | | | | | |
| | | | | | | | 19,661,938 | |
| Industrials—7.6% | | | | | | | | |
| Aerospace & Defense—2.1% | | | | | |
| Lockheed Martin Corp. | | | 16,080 | | | | 5,359,946 | |
| Airlines—0.5% | | | | | | | | |
| International Consolidated Airlines Group SA | | | 185,450 | | | | 1,310,750 | |
| Electrical Equipment—1.6% | | | | | |
| ABB Ltd.1 | | | 83,257 | | | | 1,713,818 | |
| Eaton Corp. plc | | | 31,090 | | | | 2,574,874 | |
| | | | | | | | |
| | | | | | | | 4,288,692 | |
| Industrial Conglomerates—0.7% | |
| Siemens AG | | | 15,979 | | | | 1,916,561 | |
| Machinery—0.9% | | | | | | | | |
| Caterpillar, Inc. | | | 16,850 | | | | 2,349,227 | |
| Trading Companies & Distributors—1.8% | |
| ITOCHU Corp. | | | 256,400 | | | | 4,619,721 | |
| Information Technology—12.4% | |
| Communications Equipment—3.8% | | | | | |
| Cisco Systems, Inc. | | | 159,310 | | | | 8,913,394 | |
| Nokia OYJ, Sponsored ADR | | | 231,924 | | | | 1,224,559 | |
| | | | | | | | |
| | | | | | | 10,137,953 | |
| | | | | | | | |
| | | Shares | | | Value | |
| Electronic Equipment, Instruments, & Components—0.9% | |
| Corning, Inc. | | | 73,060 | | | $ | 2,326,961 | |
| IT Services—1.4% | | | | | | | | |
| International Business Machines Corp. | | | 13,590 | | | | 1,906,270 | |
| Mastercard, Inc., Cl. A | | | 6,930 | | | | 1,761,883 | |
| | | | | | | | |
| | | | | | | | 3,668,153 | |
| Semiconductors & Semiconductor Equipment—3.3% | |
| Broadcom, Inc. | | | 4,110 | | | | 1,308,624 | |
| Lam Research Corp. | | | 4,050 | | | | 840,091 | |
| QUALCOMM, Inc. | | | 22,890 | | | | 1,971,516 | |
| Taiwan Semiconductor Manufacturing Co. Ltd., Sponsored ADR | | | 28,540 | | | | 1,250,623 | |
| Texas Instruments, Inc. | | | 27,340 | | | | 3,221,472 | |
| | | | | | | | |
| | | | | | | | 8,592,326 | |
| Software—2.8% | | | | | | | | |
| Microsoft Corp. | | | 57,300 | | | | 7,483,380 | |
| Technology Hardware, Storage & Peripherals—0.2% | |
| Western Digital Corp. | | | 9,170 | | | | 468,770 | |
| Materials—5.5% | | | | | | | | |
| Chemicals—2.6% | | | | | | | | |
| Dow, Inc.1 | | | 32,240 | | | | 1,828,975 | |
| DowDuPont, Inc. | | | 86,510 | | | | 3,326,309 | |
| Nissan Chemical Corp. | | | 39,582 | | | | 1,747,316 | |
| | | | | | | | |
| | | | | | | | 6,902,600 | |
| Containers & Packaging—0.5% | | | | | |
| International Paper Co. | | | 29,760 | | | | 1,393,066 | |
| Metals & Mining—2.4% | | | | | |
| Alumina Ltd. | | | 1,435,090 | | | | 2,268,821 | |
| Anglo American plc | | | 93,260 | | | | 2,426,989 | |
| BHP Group Ltd., Sponsored ADR | | | 14,450 | | | | 765,128 | |
| Warrior Met Coal, Inc. | | | 25,000 | | | | 775,000 | |
| | | | | | | | |
| | | | | | | 6,235,938 | |
13 INVESCO OPPENHEIMER DIVIDEND OPPORTUNITY FUND
STATEMENT OF INVESTMENTSContinued
| | | | | | | | |
| | | Shares | | | Value |
| Telecommunication Services—7.1% | |
| Diversified Telecommunication Services—7.1% | |
| AT&T, Inc. | | | 292,910 | | | $ | 9,068,493 | |
| BT Group plc, Cl. A | | | 613,830 | | | | 1,834,038 | |
| Nippon Telegraph & Telephone Corp. | | | 36,900 | | | | 1,532,087 | |
| Verizon Communications, Inc. | | | 108,240 | | | | 6,190,246 | |
| | | | | | | | |
| | | | | | | | 18,624,864 | |
| Utilities—4.4% | | | | | | | | |
| Electric Utilities—4.4% | | | | | | | | |
| Duke Energy Corp. | | | 16,540 | | | | 1,507,125 | |
| Edison International | | | 34,740 | | | | 2,215,370 | |
| Entergy Corp. | | | 28,670 | | | | 2,778,123 | |
| Iberdrola SA | | | 214,783 | | | | 1,952,428 | |
| NextEra Energy, Inc. | | | 13,177 | | | | 2,562,136 | |
| PPL Corp. | | | 20,000 | | | | 624,200 | |
| | | | | | | | |
| | | | | | | 11,639,382 | |
| | | | | | | | |
Total Common Stocks (Cost $217,588,446) | | | | | | | 249,996,248 | |
| | | | | | | | |
| | | Shares | | | Value | |
| Preferred Stocks—1.1% | |
| Belden, Inc., 6.75% Cv. | | | 17,000 | | | $ | 1,276,530 | |
| Danaher Corp., 4.75% Cv., Series A1 | | | 1,600 | | | | 1,685,600 | |
| | | | | | | | |
Total Preferred Stocks (Cost $3,362,353) | | | | | | | 2,962,130 | |
| | |
| | | | | | | | |
| Investment Company—3.0% | |
Invesco Oppenheimer Institutional Government Money Market Fund, Cl. E, 2.42%3,4 (Cost $7,830,471) | | | 7,830,471 | | | | 7,830,471 | |
| Total Investments, at Value (Cost $228,781,270) | | | 99.2% | | | | 260,788,849 | |
| Net Other Assets (Liabilities) | | | 0.8 | | | | 2,202,472 | |
| Net Assets | | | 100.0% | | | $ | 262,991,321 | |
| | | | | | | | |
Footnotes to Statement of Investments
1.Non-income producing security.
2.Security is a Master Limited Partnership.
3.Rate shown is the7-day yield at period end.
4. Is or was an affiliate, as defined in the Investment Company Act of 1940, as amended, at or during the reporting period, by virtue of the Fund owning at least 5% of the voting securities of the issuer or as a result of the Fund and the issuer having the same investment adviser. Transactions during the reporting period in which the issuer was an affiliate are as follows:
| | | | | | | | | | | | | | | | |
| | | Shares
April 30, 2018 | | | Gross
Additions | | | Gross
Reductions | | | Shares
April 30, 2019 | |
| Investment Company | | | | | | | | | | | | | | | | |
| Invesco Oppenheimer Institutional Government Money Market Fund, Cl. Ea | | | 5,592,483 | | | | 86,992,719 | | | | 84,754,731 | | | | 7,830,471 | |
| | | | | | | | | | | | | | | | |
| | | Value | | | Income | | | Realized
Gain (Loss) | | | Change in
Unrealized
Gain (Loss) | |
| Investment Company | | | | | | | | | | | | | | | | |
| Invesco Oppenheimer Institutional Government Money Market Fund, Cl. Ea | | $ | 7,830,471 | | | $ | 203,216 | | | $ | — | | | $ | — | |
a.Prior to May 24, 2019, this fund was named Oppenheimer Institutional Government Money Market Fund.
14 INVESCO OPPENHEIMER DIVIDEND OPPORTUNITY FUND
STATEMENT OF INVESTMENTSContinued
Footnotes to Statement of Investments (Continued)
| | | | | | | | | | | | | | | | | | | | | | |
| Forward Currency Exchange Contracts as of April 30, 2019 | | | | | | | | | | | | | | |
Counter -party | | Settlement
Month(s) | | Currency
Purchased (000’s) | | Currency Sold
(000’s) | | Unrealized
Appreciation | | | Unrealized
Depreciation | |
| BOA | | 05/2019 | | | USD | | | 3,745 | | | EUR | | | 3,270 | | $ | 70,841 | | | $ | — | |
| CITNA-B | | 07/2019 | | | USD | | | 4,017 | | | GBP | | | 3,090 | | | — | | | | 30,760 | |
| CITNA-B | | 07/2019 | | | USD | | | 8,192 | | | JPY | | | 903,500 | | | 34,393 | | | | — | |
| Total Unrealized Appreciation and Depreciation | | | | | | | | | | | $ | 105,234 | | | $ | 30,760 | |
| | | | | | | | | | | | | | | | | | | | | | |
| | |
| Glossary: | | |
| Counterparty Abbreviations |
| BOA | | Bank of America NA |
| CITNA-B | | Citibank NA |
|
| Currency abbreviations indicate amounts reporting in currencies |
| EUR | | Euro |
| GBP | | British Pound Sterling |
| JPY | | Japanese Yen |
See accompanying Notes to Financial Statements.
15 INVESCO OPPENHEIMER DIVIDEND OPPORTUNITY FUND
STATEMENT OF ASSETS AND LIABILITIESApril 30, 2019
| | | | |
| Assets | | | | |
| |
| Investments, at value—see accompanying statement of investments: | | | | |
| Unaffiliated companies (cost $220,950,799) | | $ | 252,958,378 | |
| Affiliated companies (cost $7,830,471) | | | 7,830,471 | |
| | | | |
| | | | 260,788,849 | |
| Cash | | | 250,026 | |
| Cash—foreign currencies (cost $35,210) | | | 35,210 | |
| Unrealized appreciation on forward currency exchange contracts | | | 105,234 | |
| Receivables and other assets: | | | | |
| Investments sold | | | 1,782,828 | |
| Dividends | | | 733,303 | |
| Shares of beneficial interest sold | | | 130,417 | |
| Other | | | 22,903 | |
| | | | |
| Total assets | | | 263,848,770 | |
| | | | | |
| Liabilities | | | | |
| |
| Unrealized depreciation on forward currency exchange contracts | | | 30,760 | |
| Payables and other liabilities: | | | | |
| Shares of beneficial interest redeemed | | | 668,461 | |
| Distribution and service plan fees | | | 50,223 | |
| Trustees’ compensation | | | 24,775 | |
| Shareholder communications | | | 9,025 | |
| Other | | | 74,205 | |
| | | | |
| Total liabilities | | | 857,449 | |
| | | | |
| Net Assets | | $ | 262,991,321 | |
| | | | |
| | | | |
| Composition of Net Assets | | | | |
| Par value of shares of beneficial interest | | $ | 11,117 | |
| Additionalpaid-in capital | | | 228,447,201 | |
| Total distributable earnings | | | 34,533,003 | |
| | | | |
| Net Assets | | $ | 262,991,321 | |
| | | | |
| | | | |
16 INVESCO OPPENHEIMER DIVIDEND OPPORTUNITY FUND
STATEMENT OF ASSETS AND LIABILITIESContinued
| | | | |
| Net Asset Value Per Share | | | | |
| |
| Class A Shares: | | | | |
| |
| Net asset value and redemption price per share (based on net assets of $182,465,883 and 7,653,782 shares of beneficial interest outstanding) | | | $23.84 | |
| |
| Maximum offering price per share (net asset value plus sales charge of 5.75% of offering price) | | | $25.29 | |
| |
| Class C Shares: | | | | |
| |
| Net asset value, redemption price (excludes applicable contingent deferred sales charge) and offering price per share (based on net assets of $48,562,551 and 2,115,472 shares of beneficial interest outstanding) | | | $22.96 | |
| |
| Class I Shares: | | | | |
| |
| Net asset value, redemption price and offering price per share (based on net assets of $4,283,064 and 179,813 shares of beneficial interest outstanding) | | | $23.82 | |
| |
| Class R Shares: | | | | |
| |
| Net asset value, redemption price (excludes applicable contingent deferred sales charge) and offering price per share (based on net assets of $14,587,039 and 618,564 shares of beneficial interest outstanding) | | | $23.58 | |
| |
| Class Y Shares: | | | | |
| |
| Net asset value, redemption price and offering price per share (based on net assets of $13,092,784 and 549,841 shares of beneficial interest outstanding) | | | $23.81 | |
See accompanying Notes to Financial Statements.
17 INVESCO OPPENHEIMER DIVIDEND OPPORTUNITY FUND
STATEMENT
OF OPERATIONSFor the Year Ended April 30, 2019
| | | | |
| Investment Income | | | | |
| Dividends: | | | | |
| Unaffiliated companies (net of foreign withholding taxes of $241,569) | | $ | 9,513,313 | |
| Affiliated companies | | | 203,216 | |
| Interest | | | 8,701 | |
| Total investment income | | | 9,725,230 | |
| | | | |
| Expenses | | | | |
| Management fees | | | 1,673,993 | |
| Distribution and service plan fees: | | | | |
| Class A | | | 431,770 | |
| Class B1 | | | 97 | |
| Class C | | | 480,615 | |
| Class R | | | 68,060 | |
| Transfer and shareholder servicing agent fees: | | | | |
| Class A | | | 348,641 | |
| Class B1 | | | 20 | |
| Class C | | | 94,285 | |
| Class I | | | 1,041 | |
| Class R | | | 26,948 | |
| Class Y | | | 25,534 | |
| Shareholder communications: | | | | |
| Class A | | | 17,885 | |
| Class B1 | | | 38 | |
| Class C | | | 4,131 | |
| Class I | | | 21 | |
| Class R | | | 1,427 | |
| Class Y | | | 791 | |
| Custodian fees and expenses | | | 26,664 | |
| Borrowing fees | | | 7,398 | |
| Trustees’ compensation | | | 3,795 | |
| Other | | | 86,015 | |
| Total expenses | | | 3,299,169 | |
| Less waivers and reimbursements of expenses | | | (9,608 | ) |
| Net expenses | | | 3,289,561 | |
| | | | |
| Net Investment Income | | | 6,435,669 | |
18 INVESCO OPPENHEIMER DIVIDEND OPPORTUNITY FUND
STATEMENT
OF OPERATIONSContinued
| | | | |
| Realized and Unrealized Gain (Loss) | | | | |
| Net realized gain (loss) on: | | | | |
| Investment transactions in unaffiliated companies | | $ | 6,110,727 | |
| Foreign currency transactions | | | (18,108 | ) |
| Forward currency exchange contracts | | | 2,603,242 | |
| | | | |
| Net realized gain | | | 8,695,861 | |
| Net change in unrealized appreciation/(depreciation) on: | | | | |
| Investment transactions in unaffiliated companies | | | (2,419,669 | ) |
| Translation of assets and liabilities denominated in foreign currencies | | | (539 | ) |
| Forward currency exchange contracts | | | (641,811 | ) |
| | | | |
| Net change in unrealized appreciation/(depreciation) | | | (3,062,019 | ) |
| | | | |
| Net Increase in Net Assets Resulting from Operations | | $ | 12,069,511 | |
| | | | |
1.Effective June 1, 2018, all Class B shares converted to Class A shares.
See accompanying Notes to Financial Statements.
19 INVESCO OPPENHEIMER DIVIDEND OPPORTUNITY FUND
STATEMENTS OF CHANGES IN NET ASSETS
| | | | | | | | |
| | | Year Ended
April 30, 2019 | | Year Ended
April 30, 20181 |
| Operations | | | | | | | | |
| Net investment income | | $ | 6,435,669 | | | $ | 6,155,875 | |
| Net realized gain | | | 8,695,861 | | | | 6,166,014 | |
| Net change in unrealized appreciation/(depreciation) | | | (3,062,019 | ) | | | 10,607,284 | |
| | | | |
| Net increase in net assets resulting from operations | | | 12,069,511 | | | | 22,929,173 | |
| | | | | | | | |
| Dividends and/or Distributions to Shareholders | | | | | | | | |
| Dividends and distributions declared: | | | | | | | | |
| Class A | | | (7,323,476 | ) | | | (4,245,093 | ) |
| Class B2 | | | — | | | | (11,377 | ) |
| Class C | | | (1,695,827 | ) | | | (863,438 | ) |
| Class I | | | (154,077 | ) | | | (78,524 | ) |
| Class R | | | (544,465 | ) | | | (290,761 | ) |
| Class Y | | | (652,463 | ) | | | (357,252 | ) |
| | | | |
| Total dividends and distributions declared | | | (10,370,308 | ) | | | (5,846,445 | ) |
| | | | | | | | |
| Beneficial Interest Transactions | | | | | | | | |
| Net increase (decrease) in net assets resulting from beneficial interest transactions: | | | | | | | | |
| Class A | | | (2,827,555 | ) | | | (10,179,660 | ) |
| Class B2 | | | (189,787 | ) | | | (1,273,123 | ) |
| Class C | | | (2,880,434 | ) | | | (4,161,544 | ) |
| Class I | | | 1,060,082 | | | | 391,304 | |
| Class R | | | 761,714 | | | | (496,266 | ) |
| Class Y | | | 115,118 | | | | 1,388,178 | |
| | | | |
| Total beneficial interest transactions | | | (3,960,862 | ) | | | (14,331,111 | ) |
| | | | | | | | |
| Net Assets | | | | | | | | |
| Total increase (decrease) | | | (2,261,659 | ) | | | 2,751,617 | |
| Beginning of period | | | 265,252,980 | | | | 262,501,363 | |
| | | | |
| End of period | | $ | 262,991,321 | | | $ | 265,252,980 | |
| | | | |
1.Prior period amounts have been conformed to current year presentation. See Notes to Financial Statements,
Note 2 – New Accounting Pronouncements for further details.
2.Effective June 1, 2018, all Class B shares converted to Class A shares.
See accompanying Notes to Financial Statements.
20 INVESCO OPPENHEIMER DIVIDEND OPPORTUNITY FUND
FINANCIAL HIGHLIGHTS
| | | | | | | | | | | | | | | | | | | | |
| Class A | | Year Ended April 30, 2019 | | | Year Ended April 30, 2018 | | | Year Ended April 30, 2017 | | | Year Ended April 29, 20161 | | | Year Ended April 30, 2015 | |
| Per Share Operating Data | | | | | | | | | | | | | | | | | | | | |
| Net asset value, beginning of period | | | $23.72 | | | | $22.23 | | | | $20.19 | | | | $20.78 | | | | $19.79 | |
| Income (loss) from investment operations: | | | | | | | | | | | | | | | | | | | | |
| Net investment income2 | | | 0.62 | | | | 0.57 | | | | 0.51 | | | | 0.54 | | | | 0.53 | |
| Net realized and unrealized gain (loss) | | | 0.47 | | | | 1.46 | | | | 2.16 | | | | (0.62) | | | | 1.01 | |
| Total from investment operations | | | 1.09 | | | | 2.03 | | | | 2.67 | | | | (0.08) | | | | 1.54 | |
| Dividends and/or distributions to shareholders: | | | | | | | | | | | | | | | | | | | | |
| Dividends from net investment income | | | (0.57) | | | | (0.54) | | | | (0.63) | | | | (0.51) | | | | (0.55) | |
| Distributions from net realized gain | | | (0.40) | | | | 0.00 | | | | 0.00 | | | | 0.00 | | | | 0.00 | |
| Total dividends and/or distributions to shareholders | | | (0.97) | | | | (0.54) | | | | (0.63) | | | | (0.51) | | | | (0.55) | |
| Net asset value, end of period | | | $23.84 | | | | $23.72 | | | | $22.23 | | | | $20.19 | | | | $20.78 | |
| | | | | | | | | | | | | | | | | | | | |
| | | | | | | | | | | | | | | | | | | | |
| Total Return, at Net Asset Value3 | | | 4.78% | | | | 9.28% | | | | 13.40% | | | | (0.25)% | | | | 7.86% | |
| | | | | | | | | | | | | | | | | | | | |
| Ratios/Supplemental Data | | | | | | | | | | | | | | | | | | | | |
| Net assets, end of period (in thousands) | | | $182,466 | | | | $183,818 | | | | $182,226 | | | | $150,192 | | | | $140,697 | |
| Average net assets (in thousands) | | | $178,814 | | | | $182,822 | | | | $167,839 | | | | $138,687 | | | | $138,051 | |
| Ratios to average net assets:4 | | | | | | | | | | | | | | | | | | | | |
| Net investment income | | | 2.64% | | | | 2.46% | | | | 2.38% | | | | 2.72% | | | | 2.64% | |
| Expenses excluding specific expenses listed below | | | 1.14% | | | | 1.15% | | | | 1.16% | | | | 1.16% | | | | 1.15% | |
| Interest and fees from borrowings | | | 0.00%5 | | | | 0.00%5 | | | | 0.00%5 | | | | 0.00%5 | | | | 0.00% | |
| Total expenses6 | | | 1.14% | | | | 1.15% | | | | 1.16% | | | | 1.16% | | | | 1.15% | |
| Expenses after payments, waivers and/or reimbursements and reduction to custodian expenses | | | 1.14%7 | | | | 1.14% | | | | 1.15% | | | | 1.16%7 | | | | 1.15%7 | |
| Portfolio turnover rate | | | 51% | | | | 63% | | | | 64% | | | | 47% | | | | 46% | |
1.Represents the last business day of the Fund’s reporting period.
2.Per share amounts calculated based on the average shares outstanding during the period.
3. Assumes an initial investment on the business day before the first day of the fiscal period, with all dividends and distributions reinvested in additional shares on the reinvestment date, and redemption at the net asset value calculated on the last business day of the fiscal period. Sales charges are not reflected in the total returns. Total returns are not annualized for periods less than one full year. Returns do not reflect the deduction of taxes that a shareholder would pay on fund distributions or the redemption of fund shares.
4.Annualized for periods less than one full year.
5.Less than 0.005%.
6.Total expenses including indirect expenses from affiliated fund fees and expenses were as follows:
| | | | | | | | |
| | Year Ended April 30, 2019 | | | 1.14 | % | | |
| | Year Ended April 30, 2018 | | | 1.15 | % | | |
| | Year Ended April 30, 2017 | | | 1.16 | % | | |
| | Year Ended April 29, 2016 | | | 1.16 | % | | |
| | Year Ended April 30, 2015 | | | 1.15 | % | | |
7.Waiver was less than 0.005%.
See accompanying Notes to Financial Statements.
21 INVESCO OPPENHEIMER DIVIDEND OPPORTUNITY FUND
FINANCIAL HIGHLIGHTSContinued
| | | | | | | | | | |
| Class C | | Year Ended
April 30,
2019 | | Year Ended April 30,
2018 | | Year Ended April 30, 2017 | | Year Ended April 29, 20161 | | Year Ended April 30,
2015 |
| Per Share Operating Data |
| Net asset value, beginning of period | | $22.88 | | $21.46 | | $19.52 | | $20.11 | | $19.17 |
| Income (loss) from investment operations: | | | | | | | | | | |
| Net investment income2 | | 0.43 | | 0.38 | | 0.34 | | 0.38 | | 0.37 |
| Net realized and unrealized gain (loss) | | 0.45 | | 1.42 | | 2.09 | | (0.60) | | 0.97 |
| Total from investment operations | | 0.88 | | 1.80 | | 2.43 | | (0.22) | | 1.34 |
| Dividends and/or distributions to shareholders: | | | | | | | | | | |
| Dividends from net investment income | | (0.40) | | (0.38) | | (0.49) | | (0.37) | | (0.40) |
| Distributions from net realized gain | | (0.40) | | 0.00 | | 0.00 | | 0.00 | | 0.00 |
| Total dividends and/or distributions to shareholders | | (0.80) | | (0.38) | | (0.49) | | (0.37) | | (0.40) |
| Net asset value, end of period | | $22.96 | | $22.88 | | $21.46 | | $19.52 | | $20.11 |
| | |
| | |
| Total Return, at Net Asset Value3 | | 4.05% | | 8.44% | | 12.59% | | (1.05)% | | 7.08% |
| | | | | | | | | | |
| |
| Ratios/Supplemental Data |
| Net assets, end of period (in thousands) | | $48,562 | | $51,171 | | $52,082 | | $43,138 | | $42,892 |
| Average net assets (in thousands) | | $48,345 | | $51,243 | | $48,317 | | $41,327 | | $41,408 |
| Ratios to average net assets:4 | | | | | | | | | | |
| Net investment income | | 1.88% | | 1.71% | | 1.64% | | 1.99% | | 1.89% |
| Expenses excluding specific expenses listed below | | 1.90% | | 1.89% | | 1.90% | | 1.90% | | 1.90% |
| Interest and fees from borrowings | | 0.00%5 | | 0.00%5 | | 0.00%5 | | 0.00%5 | | 0.00% |
| Total expenses6 | | 1.90% | | 1.89% | | 1.90% | | 1.90% | | 1.90% |
| Expenses after payments, waivers and/or reimbursements and reduction to custodian expenses | | 1.90%7 | | 1.88% | | 1.89% | | 1.90%7 | | 1.90%7 |
| Portfolio turnover rate | | 51% | | 63% | | 64% | | 47% | | 46% |
1.Represents the last business day of the Fund’s reporting period.
2.Per share amounts calculated based on the average shares outstanding during the period.
3. Assumes an initial investment on the business day before the first day of the fiscal period, with all dividends and distributions reinvested in additional shares on the reinvestment date, and redemption at the net asset value calculated on the last business day of the fiscal period. Sales charges are not reflected in the total returns. Total returns are not annualized for periods less than one full year. Returns do not reflect the deduction of taxes that a shareholder would pay on fund distributions or the redemption of fund shares.
4.Annualized for periods less than one full year.
5.Less than 0.005%.
6.Total expenses including indirect expenses from affiliated fund fees and expenses were as follows:
| | | | | | | | |
| | Year Ended April 30, 2019 | | | 1.90 | % | | |
| | Year Ended April 30, 2018 | | | 1.89 | % | | |
| | Year Ended April 30, 2017 | | | 1.90 | % | | |
| | Year Ended April 29, 2016 | | | 1.90 | % | | |
| | Year Ended April 30, 2015 | | | 1.90 | % | | |
7.Waiver was less than 0.005%.
See accompanying Notes to Financial Statements.
22 INVESCO OPPENHEIMER DIVIDEND OPPORTUNITY FUND
FINANCIAL HIGHLIGHTSContinued
| | | | | | | | | | | | | | | | | | | | |
| Class I | | Year Ended April 30, 2019 | | | Year Ended April 30, 2018 | | | Year Ended April 30, 2017 | | | Year Ended April 29, 20161 | | | Period Ended April 30, 20152 | |
| Per Share Operating Data | |
| Net asset value, beginning of period | | | $23.70 | | | | $22.21 | | | | $20.18 | | | | $20.76 | | | | $20.61 | |
| Income (loss) from investment operations: | | | | | | | | | | | | | | | | | | | | |
| Net investment income3 | | | 0.71 | | | | 0.67 | | | | 0.66 | | | | 0.66 | | | | 0.39 | |
| Net realized and unrealized gain (loss) | | | 0.48 | | | | 1.46 | | | | 2.10 | | | | (0.64) | | | | 0.22 | |
| Total from investment operations | | | 1.19 | | | | 2.13 | | | | 2.76 | | | | 0.02 | | | | 0.61 | |
| Dividends and/or distributions to shareholders: | | | | | | | | | | | | | | | | | | | | |
| Dividends from net investment income | | | (0.67) | | | | (0.64) | | | | (0.73) | | | | (0.60) | | | | (0.46) | |
| Distributions from net realized gain | | | (0.40) | | | | 0.00 | | | | 0.00 | | | | 0.00 | | | | 0.00 | |
| Total dividends and/or distributions to shareholders | | | (1.07) | | | | (0.64) | | | | (0.73) | | | | (0.60) | | | | (0.46) | |
| Net asset value, end of period | | | $23.82 | | | | $23.70 | | | | $22.21 | | | | $20.18 | | | | $20.76 | |
| | | | |
| | | | | | | | | | | | | | | | | | | | | |
| Total Return, at Net Asset Value4 | | | 5.23% | | | | 9.76% | | | | 13.91% | | | | 0.20% | | | | 3.02% | |
| | | | | | | | | | | | | | | | | | | | |
| |
| Ratios/Supplemental Data | |
| Net assets, end of period (in thousands) | | | $4,283 | | | | $3,140 | | | | $2,572 | | | | $15 | | | | $10 | |
| Average net assets (in thousands) | | | $3,477 | | | | $2,844 | | | | $548 | | | | $15 | | | | $10 | |
| Ratios to average net assets:5 | | | | | | | | | | | | | | | | | | | | |
| Net investment income | | | 3.05% | | | | 2.88% | | | | 3.02% | | | | 3.35% | | | | 2.86% | |
| Expenses excluding specific expenses listed below | | | 0.73% | | | | 0.71% | | | | 0.71% | | | | 0.70% | | | | 0.69% | |
| Interest and fees from borrowings | | | 0.00%6 | | | | 0.00%6 | | | | 0.00%6 | | | | 0.00%6 | | | | 0.00% | |
| Total expenses7 | | | 0.73% | | | | 0.71% | | | | 0.71% | | | | 0.70% | | | | 0.69% | |
| Expenses after payments, waivers and/or reimbursements and reduction to custodian expenses | | | 0.73%8 | | | | 0.71%8 | | | | 0.70% | | | | 0.70%8 | | | | 0.69%8 | |
| Portfolio turnover rate | | | 51% | | | | 63% | | | | 64% | | | | 47% | | | | 46% | |
23 INVESCO OPPENHEIMER DIVIDEND OPPORTUNITY FUND
FINANCIAL HIGHLIGHTSContinued
1.Represents the last business day of the Fund’s reporting period.
2.For the period from August 28, 2014 (inception of offering) to April 30, 2015.
3.Per share amounts calculated based on the average shares outstanding during the period.
4. Assumes an initial investment on the business day before the first day of the fiscal period, with all dividends and distributions reinvested in additional shares on the reinvestment date, and redemption at the net asset value calculated on the last business day of the fiscal period. Sales charges are not reflected in the total returns. Total returns are not annualized for periods less than one full year. Returns do not reflect the deduction of taxes that a shareholder would pay on fund distributions or the redemption of fund shares.
5.Annualized for periods less than one full year.
6.Less than 0.005%.
7.Total expenses including indirect expenses from affiliated fund fees and expenses were as follows:
| | | | | | | | |
| | Year Ended April 30, 2019 | | | 0.73 | % | | |
| | Year Ended April 30, 2018 | | | 0.71 | % | | |
| | Year Ended April 30, 2017 | | | 0.71 | % | | |
| | Year Ended April 29, 2016 | | | 0.70 | % | | |
| | Period Ended April 30, 2015 | | | 0.69 | % | | |
8.Waiver was less than 0.005%.
See accompanying Notes to Financial Statements.
24 INVESCO OPPENHEIMER DIVIDEND OPPORTUNITY FUND
FINANCIAL HIGHLIGHTSContinued
| | | | | | | | | | | | | | | | | | | | |
| Class R | | Year Ended
April 30,
2019 | | Year Ended
April 30,
2018 | | | Year Ended
April 30,
2017 | | | Year Ended
April 29,
20161 | | | Year Ended April 30,
2015 | |
| Per Share Operating Data | |
| Net asset value, beginning of period | | | $23.48 | | | | $22.01 | | | | $20.00 | | | | $20.59 | | | | $19.61 | |
| Income (loss) from investment operations: | | | | | | | | | | | | | | | | | | | | |
| Net investment income2 | | | 0.55 | | | | 0.51 | | | | 0.45 | | | | 0.49 | | | | 0.48 | |
| Net realized and unrealized gain (loss) | | | 0.46 | | | | 1.45 | | | | 2.14 | | | | (0.61) | | | | 1.00 | |
| Total from investment operations | | | 1.01 | | | | 1.96 | | | | 2.59 | | | | (0.12) | | | | 1.48 | |
| Dividends and/or distributions to shareholders: | | | | | | | | | | | | | | | | | | | | |
| Dividends from net investment income | | | (0.51) | | | | (0.49) | | | | (0.58) | | | | (0.47) | | | | (0.50) | |
| Distributions from net realized gain | | | (0.40) | | | | 0.00 | | | | 0.00 | | | | 0.00 | | | | 0.00 | |
| Total dividends and/or distributions to shareholders | | | (0.91) | | | | (0.49) | | | | (0.58) | | | | (0.47) | | | | (0.50) | |
| Net asset value, end of period | | | $23.58 | | | | $23.48 | | | | $22.01 | | | | $20.00 | | | | $20.59 | |
| | | | |
| | | | | | | | | | | | | | | | | | | | |
| Total Return, at Net Asset Value3 | | | 4.54% | | | | 8.98% | | | | 13.17% | | | | (0.55)% | | | | 7.61% | |
| | | | | | | | | | | | | | | | | | | | |
| |
| Ratios/Supplemental Data | |
| Net assets, end of period (in thousands) | | | $14,587 | | | | $13,736 | | | | $13,332 | | | | $9,837 | | | | $9,051 | |
| Average net assets (in thousands) | | | $13,824 | | | | $13,745 | | | | $11,603 | | | | $8,890 | | | | $9,492 | |
| Ratios to average net assets:4 | | | | | | | | | | | | | | | | | | | | |
| Net investment income | | | 2.38% | | | | 2.22% | | | | 2.13% | | | | 2.49% | | | | 2.41% | |
| Expenses excluding specific expenses listed below | | | 1.40% | | | | 1.38% | | | | 1.40% | | | | 1.40% | | | | 1.40% | |
| Interest and fees from borrowings | | | 0.00%5 | | | | 0.00%5 | | | | 0.00%5 | | | | 0.00%5 | | | | 0.00% | |
| Total expenses6 | | | 1.40% | | | | 1.38% | | | | 1.40% | | | | 1.40% | | | | 1.40% | |
| Expenses after payments, waivers and/or reimbursements and reduction to custodian expenses | | | 1.40%7 | | | | 1.37% | | | | 1.39% | | | | 1.40%7 | | | | 1.40%7 | |
| Portfolio turnover rate | | | 51% | | | | 63% | | | | 64% | | | | 47% | | | | 46% | |
1.Represents the last business day of the Fund’s reporting period.
2.Per share amounts calculated based on the average shares outstanding during the period.
3. Assumes an initial investment on the business day before the first day of the fiscal period, with all dividends and distributions reinvested in additional shares on the reinvestment date, and redemption at the net asset value calculated on the last business day of the fiscal period. Sales charges are not reflected in the total returns. Total returns are not annualized for periods less than one full year. Returns do not reflect the deduction of taxes that a shareholder would pay on fund distributions or the redemption of fund shares.
4.Annualized for periods less than one full year.
5.Less than 0.005%.
6.Total expenses including indirect expenses from affiliated fund fees and expenses were as follows:
| | | | | | | | |
| | Year Ended April 30, 2019 | | | 1.40 | % | | |
| | Year Ended April 30, 2018 | | | 1.38 | % | | |
| | Year Ended April 30, 2017 | | | 1.40 | % | | |
| | Year Ended April 29, 2016 | | | 1.40 | % | | |
| | Year Ended April 30, 2015 | | | 1.40 | % | | |
7.Waiver was less than 0.005%.
See accompanying Notes to Financial Statements.
25 INVESCO OPPENHEIMER DIVIDEND OPPORTUNITY FUND
FINANCIAL HIGHLIGHTSContinued
| | | | | | | | | | | | | | | | | | | | |
| Class Y | | Year Ended April 30, 2019 | | Year Ended April 30, 2018 | | | Year Ended
April 30,
2017 | | | Year Ended April 29, 20161 | | | Year Ended April 30, 2015 | |
| Per Share Operating Data | |
| Net asset value, beginning of period | | | $23.70 | | | | $22.21 | | | | $20.17 | | | | $20.76 | | | | $19.77 | |
| Income (loss) from investment operations: | | | | | | | | | | | | | | | | | | | | |
| Net investment income2 | | | 0.67 | | | | 0.63 | | | | 0.55 | | | | 0.59 | | | | 0.58 | |
| Net realized and unrealized gain (loss) | | | 0.47 | | | | 1.46 | | | | 2.18 | | | | (0.62) | | | | 1.01 | |
| Total from investment operations | | | 1.14 | | | | 2.09 | | | | 2.73 | | | | (0.03) | | | | 1.59 | |
| Dividends and/or distributions to shareholders: | | | | | | | | | | | | | | | | | | | | |
| Dividends from net investment income | | | (0.63) | | | | (0.60) | | | | (0.69) | | | | (0.56) | | | | (0.60) | |
| Distributions from net realized gain | | | (0.40) | | | | 0.00 | | | | 0.00 | | | | 0.00 | | | | 0.00 | |
| Total dividends and/or distributions to shareholders | | | (1.03) | | | | (0.60) | | | | (0.69) | | | | (0.56) | | | | (0.60) | |
| Net asset value, end of period | | | $23.81 | | | | $23.70 | | | | $22.21 | | | | $20.17 | | | | $20.76 | |
| | | | |
| | | | | | | | | | | | | | | | | | | | |
| Total Return, at Net Asset Value3 | | | 5.05% | | | | 9.52% | | | | 13.70% | | | | (0.04)% | | | | 8.15% | |
| | | | | | | | | | | | | | | | | | | | |
| |
| Ratios/Supplemental Data | |
| Net assets, end of period (in thousands) | | | $13,093 | | | | $13,199 | | | | $10,891 | | | | $5,777 | | | | $11,949 | |
| Average net assets (in thousands) | | | $13,093 | | | | $13,806 | | | | $7,845 | | | | $7,642 | | | | $10,315 | |
| Ratios to average net assets:4 | | | | | | | | | | | | | | | | | | | | |
| Net investment income | | | 2.88% | | | | 2.71% | | | | 2.58% | | | | 2.99% | | | | 2.87% | |
| Expenses excluding specific expenses listed below | | | 0.90% | | | | 0.90% | | | | 0.91% | | | | 0.91% | | | | 0.90% | |
| Interest and fees from borrowings | | | 0.00%5 | | | | 0.00%5 | | | | 0.00%5 | | | | 0.00%5 | | | | 0.00% | |
| Total expenses6 | | | 0.90% | | | | 0.90% | | | | 0.91% | | | | 0.91% | | | | 0.90% | |
| Expenses after payments, waivers and/or reimbursements and reduction to custodian expenses | | | 0.90%7 | | | | 0.89% | | | | 0.90% | | | | 0.91%7 | | | | 0.90%7 | |
| Portfolio turnover rate | | | 51% | | | | 63% | | | | 64% | | | | 47% | | | | 46% | |
1.Represents the last business day of the Fund’s reporting period.
2.Per share amounts calculated based on the average shares outstanding during the period.
3. Assumes an initial investment on the business day before the first day of the fiscal period, with all dividends and distributions reinvested in additional shares on the reinvestment date, and redemption at the net asset value calculated on the last business day of the fiscal period. Sales charges are not reflected in the total returns. Total returns are not annualized for periods less than one full year. Returns do not reflect the deduction of taxes that a shareholder would pay on fund distributions or the redemption of fund shares.
4.Annualized for periods less than one full year.
5.Less than 0.005%.
6.Total expenses including indirect expenses from affiliated fund fees and expenses were as follows:
| | | | | | | | |
| | Year Ended April 30, 2019 | | | 0.90 | % | | |
| | Year Ended April 30, 2018 | | | 0.90 | % | | |
| | Year Ended April 30, 2017 | | | 0.91 | % | | |
| | Year Ended April 29, 2016 | | | 0.91 | % | | |
| | Year Ended April 30, 2015 | | | 0.90 | % | | |
7.Waiver was less than 0.005%.
See accompanying Notes to Financial Statements.
26 INVESCO OPPENHEIMER DIVIDEND OPPORTUNITY FUND
NOTES TO FINANCIAL STATEMENTSApril 30, 2019
1. Organization
Oppenheimer Dividend Opportunity Fund* (the “Fund”) is a diversifiedopen-end management investment company registered under the Investment Company Act of 1940 (“1940 Act”), as amended. The Fund’s investment objective is to seek total return. The Fund’s investment adviser is OFI Global Asset Management, Inc. (“OFI Global” or the “Manager”), a wholly-owned subsidiary of OppenheimerFunds, Inc. (“OFI” or the“Sub-Adviser”). The Manager has entered into asub-advisory agreement with OFI.
The Fund offers Class A, Class C, Class I, Class R and Class Y shares, and previously offered Class B shares for new purchase through June 29, 2012. Subsequent to that date, no new purchases of Class B shares were permitted. Reinvestment of dividend and/or capital gain distributions and exchanges of Class B shares into and from other Oppenheimer funds were permitted through May 31, 2018. Effective June 1, 2018 (the “Conversion Date”), all Class B shares converted to Class A shares. Class A shares are sold at their offering price, which is normally net asset value plus afront-end sales charge. Class C and Class R shares are sold, and Class B shares were sold, without afront-end sales charge but may be subject to a contingent deferred sales charge (“CDSC”). Class R shares are sold only through retirement plans. Retirement plans that offer Class R shares may impose charges on those accounts. Class I and Class Y shares are sold to certain institutional investors or intermediaries without either afront-end sales charge or a CDSC, however, the intermediaries may impose charges on their accountholders who beneficially own Class I and Class Y shares. All classes of shares have identical rights and voting privileges with respect to the Fund in general and exclusive voting rights on matters that affect that class alone. Earnings, net assets and net asset value per share may differ due to each class having its own expenses, such as transfer and shareholder servicing agent fees and shareholder communications, directly attributable to that class. Class A, C and R shares have, and Class B shares had, separate distribution and/or service plans under which they pay, and Class B shares paid, fees. Class I and Class Y shares do not pay such fees. Previously issued Class B shares automatically converted to Class A shares 72 months after the date of purchase.
The following is a summary of significant accounting policies followed in the Fund’s preparation of financial statements in accordance with accounting principles generally accepted in the United States (“U.S. GAAP”).
2. Significant Accounting Policies
Security Valuation.All investments in securities are recorded at their estimated fair value, asdescribed in Note 3.
Foreign Currency Translation.The books and records of the Fund are maintained in U.S.dollars. Any foreign currency amounts are translated into U.S. dollars on the following basis:
* Effective after the close of business on May 24, 2019, the Fund was reorganized as Invesco Oppenheimer Dividend Opportunity Fund, a series portfolio of AIM Equity Funds (Invesco Equity Funds).
27 INVESCO OPPENHEIMER DIVIDEND OPPORTUNITY FUND
NOTES TO FINANCIAL STATEMENTSContinued
2. Significant Accounting Policies (Continued)
(1) Value of investment securities, other assets and liabilities — at the exchange rates prevailing at market close as described in Note 3.
(2) Purchases and sales of investment securities, income and expenses — at the rates of exchange prevailing on the respective dates of such transactions.
Although the net assets and the values are presented at the foreign exchange rates at market close, the Fund does not isolate the portion of the results of operations resulting from changes in foreign exchange rates on investments from the fluctuations arising from changes in prices of securities held. Such fluctuations are included with the net realized and unrealized gains or losses from investments shown in the Statement of Operations.
For securities, which are subject to foreign withholding tax upon disposition, realized and unrealized gains or losses on such securities are recorded net of foreign withholding tax.
Reported net realized foreign exchange gains or losses arise from sales of foreign currencies, currency gains or losses realized between the trade and settlement dates on securities transactions, the difference between the amounts of dividends, interest, and foreign withholding tax reclaims recorded on the Fund’s books, and the U.S. dollar equivalent of
the amounts actually received or paid. Net unrealized foreign exchange gains and losses arise from changes in the value of assets and liabilities other than investments in securities, resulting from changes in the exchange rate.
Allocation of Income, Expenses, Gains and Losses.Income, expenses (other than thoseattributable to a specific class), gains and losses are allocated on a daily basis to each class of shares based upon the relative proportion of net assets represented by such class. Operating expenses directly attributable to a specific class are charged against the operations of that class.
Dividends and Distributions to Shareholders.Dividends and distributions toshareholders, which are determined in accordance with income tax regulations and may differ from U.S. GAAP, are recorded on theex-dividend date. Income distributions, if any, are declared and paid quarterly. Capital gain distributions, if any, are declared and paid annually or at other times as determined necessary by the Manager.
Investment Income.Dividend income is recorded on the ex-dividend date or uponex-dividend notification in the case of certain foreign dividends where theex-dividend date may have passed.Non-cash dividends included in dividend income, if any, are recorded at the fair value of the securities received. Withholding taxes on foreign dividends, if any, and capital gains taxes on foreign investments, if any, have been provided for in accordance with the Fund’s understanding of the applicable tax rules and regulations. Interest income, if any, is recognized on an accrual basis. Discount and premium, which are included in interest income on the Statement of Operations, are amortized or accreted daily.
Return of Capital Estimates.Distributions received from the Fund’s investments in MasterLimited Partnerships (MLPs) and Real Estate Investments Trusts (REITs), generally are
28 INVESCO OPPENHEIMER DIVIDEND OPPORTUNITY FUND
NOTES TO FINANCIAL STATEMENTSContinued
2. Significant Accounting Policies (Continued)
comprised of income and return of capital. Any return of capital estimates in excess of cost basis are classified as realized gain. The Fund records investment income and return of capital based on estimates. Such estimates are based on historical information available from each MLP, REIT and other industry sources. These estimates may subsequently be revised based on information received from MLPs and REITs after their tax reporting periods are concluded.
Custodian Fees.“Custodian fees and expenses” in the Statement of Operations may includeinterest expense incurred by the Fund on any cash overdrafts of its custodian account during the period. Such cash overdrafts may result from the effects of failed trades in portfolio securities and from cash outflows resulting from unanticipated shareholder redemption activity. The Fund pays interest to its custodian on such cash overdraft at a rate equal to the Prime Rate plus 0.35%. The “Reduction to custodian expenses” line item, if applicable, represents earnings on cash balances maintained by the Fund during the period. Such interest expense and other custodian fees may be paid with these earnings.
Security Transactions.Security transactions are recorded on the trade date. Realized gainsand losses on securities sold are determined on the basis of identified cost.
Indemnifications.The Fund’s organizational documents provide current and former Trusteesand officers with a limited indemnification against liabilities arising in connection with the performance of their duties to the Fund. In the normal course of business, the Fund may also enter into contracts that provide general indemnifications. The Fund’s maximum exposure under these arrangements is unknown as this would be dependent on future claims that may be made against the Fund. The risk of material loss from such claims is considered remote.
Federal Taxes.The Fund intends to comply with provisions of the Internal Revenue Codeapplicable to regulated investment companies and to distribute substantially all of its investment company taxable income, including any net realized gain on investments not offset by capital loss carryforwards, if any, to shareholders. Therefore, no federal income or excise tax provision is required. The Fund files income tax returns in U.S. federal and applicable state jurisdictions. The statute of limitations on the Fund’s tax return filings generally remains open for the three preceding fiscal reporting period ends. The Fund has analyzed its tax positions for the fiscal year ended April 30, 2019, including open tax years, and does not believe there are any uncertain tax positions requiring recognition in the Fund’s financial statements.
The tax components of capital shown in the following table represent distribution requirements the Fund must satisfy under the income tax regulations, losses the Fund may be able to offset against income and gains realized in future years and unrealized appreciation or depreciation of securities and other investments for federal income tax purposes.
29 INVESCO OPPENHEIMER DIVIDEND OPPORTUNITY FUND
NOTES TO FINANCIAL STATEMENTSContinued
2. Significant Accounting Policies (Continued)
| | | | | | | | | | | | |
Undistributed Net Investment Income | | Undistributed Long-Term Gain | | | Accumulated Loss Carryforward1,2 | | | Net Unrealized Appreciation Based on cost of Securities and
Other Investments for Federal Income Tax Purposes | |
| $217,543 | | | $3,046,956 | | | | $— | | | | $31,300,369 | |
1.During the reporting period, the Fund did not utilize any capital loss carryforward.
2. During the previous reporting period, the Fund utilized $8,327,694 of capital loss carryforward to offset capital gains realized in that fiscal year.
Net investment income (loss) and net realized gain (loss) may differ for financial statement and tax purposes. The character of dividends and distributions made during the fiscal year from net investment income or net realized gains are determined in accordance with federal income tax requirements, which may differ from the character of net investment income or net realized gains presented in those financial statements in accordance with U.S. GAAP. Also, due to timing of dividends and distributions, the fiscal year in which amounts are distributed may differ from the fiscal year in which the income or net realized gain was recorded by the Fund.
Accordingly, the following amounts have been reclassified for the reporting period. Net assets of the Fund were unaffected by the reclassifications.
| | | | |
Increase toPaid-in Capital | | Reduction to Accumulated Net Earnings3 | |
| $343,777 | | | $343,777 | |
3.$343,765, all of which was long-term capital gain, was distributed in connection with Fund share redemptions.
The tax character of distributions paid during the reporting periods:
| | | | | | | | |
| | | Year Ended
April 30, 2019 | | | Year Ended April 30, 2018 |
| Distributions paid from: | | | | | | | | |
| Ordinary income | | $ | 6,343,243 | | | $ | 5,846,445 | |
| Long-term capital gain | | | 4,027,065 | | | | — | |
| | | | |
| Total | | $ | 10,370,308 | | | $ | 5,846,445 | |
| | | | |
The aggregate cost of securities and other investments and the composition of unrealized appreciation and depreciation of securities and other investments for federal income tax purposes at period end are noted in the following table. The primary difference between book and tax appreciation or depreciation of securities and other investments, if applicable, is attributable to the tax deferral of losses or tax realization of financial statement unrealized gain or loss.
30 INVESCO OPPENHEIMER DIVIDEND OPPORTUNITY FUND
NOTES TO FINANCIAL STATEMENTSContinued
2. Significant Accounting Policies (Continued)
| | | | |
| Federal tax cost of securities | | $ | 229,483,831 | |
| Federal tax cost of other investments | | | 74,474 | |
| | | | |
| Total federal tax cost | | $ | 229,558,305 | |
| | | | |
| |
| Gross unrealized appreciation | | $ | 37,568,162 | |
| Gross unrealized depreciation | | | (6,267,793 | ) |
| | | | |
| Net unrealized appreciation | | $ | 31,300,369 | |
| | | | |
Use of Estimates.The preparation of financial statements in conformity with U.S. GAAPrequires management to make estimates and assumptions that affect the reported amounts of assets and liabilities and disclosure of contingent assets and liabilities at the date of the financial statements and the reported amounts of increases and decreases in net assets from operations during the reporting period. Actual results could differ from those estimates.
New Accounting Pronouncements.In March 2017, Financial Accounting Standards Board(“FASB”) issued Accounting Standards Update (“ASU”), ASU2017-08. This provides guidance related to the amortization period for certain purchased callable debt securities held at a premium. The ASU is effective for annual periods beginning after December 15, 2018, and interim periods within those annual periods. The Manager has evaluated the impacts of these changes on the financial statements and there are no material impacts.
During August 2018, the Securities and Exchange Commission (the “SEC”) issued Final Rule ReleaseNo. 33-10532 (the “Rule”), Disclosure Update and Simplification. The rule amends certain financial statement disclosure requirements to conform to U.S. GAAP. The amendments to Rule6-04.17 of RegulationS-X (balance sheet) remove the requirement to separately state the book basis components of net assets: undistributed (over-distribution of) net investment income (“UNII”), accumulated undistributed net realized gains (losses), and net unrealized appreciation (depreciation) at the balance sheet date. Instead, consistent with U.S. GAAP, funds will be required to disclose total distributable earnings. The amendments to Rule6-09 of RegulationS-X (statement of changes in net assets) remove the requirement to separately state the sources of distributions paid. Instead, consistent with U.S. GAAP, funds will be required to disclose the total amount of distributions paid, except that any tax return of capital must be separately disclosed. The amendments also remove the requirement to parenthetically state the book basis amount of UNII on the statement of changes in net assets. The requirements of the Rule were effective November 5, 2018, and the Fund’s Statement of Assets and Liabilities and Statement of Changes in Net Assets for the current reporting period have been modified accordingly. In addition, certain amounts within the Fund’s Statement of Changes in Net Assets for the prior fiscal period have been modified to conform to the Rule.
3. Securities Valuation
The Fund calculates the net asset value of its shares as of 4:00 P.M. Eastern Time, on each day the New York Stock Exchange (the “Exchange” or “NYSE”) is open for trading, except in the case of a scheduled early closing of the Exchange, in which case the Fund will calculate net
31 INVESCO OPPENHEIMER DIVIDEND OPPORTUNITY FUND
NOTES TO FINANCIAL STATEMENTSContinued
3. Securities Valuation (Continued)
asset value of the shares as of the scheduled early closing time of the Exchange.
The Fund’s Board has adopted procedures for the valuation of the Fund’s securities and has delegated theday-to-day responsibility for valuation determinations under those procedures to the Manager. The Manager has established a Valuation Committee which is responsible for determining a fair valuation for any security for which market quotations are not readily available. The Valuation Committee’s fair valuation determinations are subject to review, approval and ratification by the Fund’s Board at least quarterly or more frequently, if necessary.
Valuation Methods and Inputs
Securities are valued primarily using unadjusted quoted market prices, when available, as supplied by third party pricing services or broker-dealers.
The following methodologies are used to determine the market value or the fair value of the types of securities described below:
Equity securities traded on a securities exchange (including exchange-traded derivatives other than futures and futures options) are valued based on the official closing price on the principal exchange on which the security is traded, as identified by the Manager, prior to the time when the Fund’s assets are valued. If the official closing price is unavailable, the security is valued at the last sale price on the principal exchange on which it is traded, or if no sales occurred, the security is valued at the mean between the quoted bid and asked prices.Over-the-counter equity securities are valued at the last published sale price, or if no sales occurred, at the mean between the quoted bid and asked prices. Events occurring after the close of trading on foreign exchanges may result in adjustments to the valuation of foreign securities to more accurately reflect their fair value as of the time when the Fund’s assets are valued.
Shares of a registered investment company that are not traded on an exchange are valued at that investment company’s net asset value per share.
Forward foreign currency exchange contracts are valued utilizing current and forward currency rates obtained from third party pricing services. When the settlement date of a contract is an interim date for which a quotation is not available, interpolated values are derived using the nearest dated forward currency rate.
Securities for which market quotations are not readily available, or when a significant event has occurred that would materially affect the value of the security, are fair valued either (i) by a standardized fair valuation methodology applicable to the security type or the significant event as previously approved by the Valuation Committee and the Fund’s Board or (ii) as determined in good faith by the Manager’s Valuation Committee. The Valuation Committee considers all relevant facts that are reasonably available, through either public information or information available to the Manager, when determining the fair value of a security. Those standardized fair valuation methodologies include, but are not limited to, valuing securities at the last sale price or initially at cost and subsequently adjusting the value based on: changes in company specific fundamentals, changes in an appropriate securities index, or changes in the value of similar securities which may be further adjusted for any discounts related to security-specific resale restrictions. When possible, such methodologies use observable
32 INVESCO OPPENHEIMER DIVIDEND OPPORTUNITY FUND
NOTES TO FINANCIAL STATEMENTSContinued
3. Securities Valuation (Continued)
market inputs such as unadjusted quoted prices of similar securities, observable interest rates, currency rates and yield curves. The methodologies used for valuing securities are not necessarily an indication of the risks associated with investing in those securities nor can it be assured that the Fund can obtain the fair value assigned to a security if it were to sell the security.
Classifications
Each investment asset or liability of the Fund is assigned a level at measurement date based on the significance and source of the inputs to its valuation. Various data inputs may be used in determining the value of each of the Fund’s investments as of the reporting period end.
These data inputs are categorized in the following hierarchy under applicable financial accounting standards:
1) Level1-unadjusted quoted prices in active markets for identical assets or liabilities (including securities actively traded on a securities exchange)
2) Level2-inputs other than unadjusted quoted prices that are observable for the asset or liability (such as unadjusted quoted prices for similar assets and market corroborated inputs such as interest rates, prepayment speeds, credit risks, etc.)
3) Level3-significant unobservable inputs (including the Manager’s own judgments about assumptions that market participants would use in pricing the asset or liability).
The inputs used for valuing securities are not necessarily an indication of the risks associated with investing in those securities.
The Fund classifies each of its investments in investment companies which are publicly offered as Level 1. Investment companies that are not publicly offered, if any, are classified as Level 2 in the fair value hierarchy.
The table below categorizes amounts that are included in the Fund’s Statement of Assets and Liabilities at period end based on valuation input level:
| | | | | | | | | | | | | | | | |
| | | Level 1— Unadjusted Quoted Prices | | | Level 2—
Other Significant Observable Inputs | | | Level 3—
Significant
Unobservable
Inputs | | | Value | |
| Assets Table | | | | | | | | | | | | | | | | |
| Investments, at Value: | | | | | | | | | | | | | | | | |
| Common Stocks | | | | | | | | | | | | | | | | |
Consumer Discretionary | | $ | 13,788,535 | | | $ | 4,630,033 | | | $ | — | | | $ | 18,418,568 | |
Consumer Staples | | | 23,125,641 | | | | — | | | | — | | | | 23,125,641 | |
Energy | | | 33,713,862 | | | | — | | | | — | | | | 33,713,862 | |
Financials | | | 48,717,874 | | | | 2,485,760 | | | | — | | | | 51,203,634 | |
Health Care | | | 24,820,538 | | | | 1,395,715 | | | | — | | | | 26,216,253 | |
Industrials | | | 10,284,047 | | | | 9,560,850 | | | | — | | | | 19,844,897 | |
Information Technology | | | 32,677,543 | | | | — | | | | — | | | | 32,677,543 | |
Materials | | | 8,088,478 | | | | 6,443,126 | | | | — | | | | 14,531,604 | |
Telecommunication Services | | | 15,258,739 | | | | 3,366,125 | | | | — | | | | 18,624,864 | |
Utilities | | | 9,686,954 | | | | 1,952,428 | | | | — | | | | 11,639,382 | |
33 INVESCO OPPENHEIMER DIVIDEND OPPORTUNITY FUND
NOTES TO FINANCIAL STATEMENTSContinued
3. Securities Valuation (Continued)
| | | | | | | | | | | | | | | | |
| | | Level 1—
Unadjusted Quoted Prices | | Level 2— Other Significant
Observable Inputs | | | Level 3—
Significant Unobservable Inputs | | | Value | |
| Common Stocks (Continued) | | | | | | | | | | | | | | | | |
| Preferred Stocks | | $ | 2,962,130 | | | $ | — | | | $ | — | | | $ | 2,962,130 | |
| Investment Company | | | 7,830,471 | | | | — | | | | — | | | | 7,830,471 | |
| | | | |
| Total Investments, at Value | | | 230,954,812 | | | | 29,834,037 | | | | — | | | | 260,788,849 | |
| Other Financial Instruments: | | | | | | | | | | | | | | | | |
| Forward currency exchange contracts | | | — | | | | 105,234 | | | | — | | | | 105,234 | |
| | | | |
| Total Assets | | $ | 230,954,812 | | | $ | 29,939,271 | | | $ | — | | | $ | 260,894,083 | |
| | | | |
| | | | |
| Liabilities Table | | | | | | | | | | | | | | | | |
| Other Financial Instruments: | | | | | | | | | | | | | | | | |
| Forward currency exchange contracts | | $ | — | | | $ | (30,760 | ) | | $ | — | | | $ | (30,760 | ) |
| | | | |
| Total Liabilities | | $ | — | | | $ | (30,760 | ) | | $ | — | | | $ | (30,760 | ) |
| | | | |
Forward currency exchange contracts and futures contracts, if any, are reported at their unrealized appreciation/depreciation at measurement date, which represents the change in the contract’s value from trade date. All additional assets and liabilities included in the above table are reported at their market value at measurement date.
For the reporting period, there were no transfers between levels.
4. Investments and Risks
Investments in Affiliated Funds.The Fund is permitted to invest in other mutual fundsadvised by the Manager (“Affiliated Funds”). Affiliated Funds are management investment companies registered under the 1940 Act, as amended. The Manager is the investment adviser of, and theSub-Adviser provides investment and related advisory services to, the Affiliated Funds. When applicable, the Fund’s investments in Affiliated Funds are included in the Statement of Investments. Shares of Affiliated Funds are valued at their net asset value per share. As a shareholder, the Fund is subject to its proportional share of the Affiliated Funds’ expenses, including their management fee. The Manager will waive fees and/or reimburse Fund expenses in an amount equal to the indirect management fees incurred through the Fund’s investment in the Affiliated Funds.
Each of the Affiliated Funds in which the Fund invests has its own investment risks, and those risks can affect the value of the Fund’s investments and therefore the value of the Fund’s shares. To the extent that the Fund invests more of its assets in one Affiliated Fund than in another, the Fund will have greater exposure to the risks of that Affiliated Fund.
Investments in Money Market Instruments.The Fund is permitted to invest its freecash balances in money market instruments to provide liquidity or for defensive purposes. The Fund may invest in money market instruments by investing in Class E shares of Invesco Oppenheimer Institutional Government Money Market Fund (“IGMMF”), which is an Affiliated Fund. IGMMF is regulated as a money market fund under the 1940 Act, as amended. The
34 INVESCO OPPENHEIMER DIVIDEND OPPORTUNITY FUND
NOTES TO FINANCIAL STATEMENTSContinued
4. Investments and Risks (Continued)
Fund may also invest in money market instruments directly or in other affiliated or unaffiliated money market funds.
Master Limited Partnerships (“MLPs”).MLPs issue common units that represent anequity ownership interest in a partnership and provide limited voting rights. MLP common units are registered with the Securities and Exchange Commission (“SEC”), and are freely tradable on securities exchanges such as the NYSE and the NASDAQ Stock Market (“NASDAQ”), or in theover-the-counter (“OTC”) market. An MLP consists of one or more general partners, who conduct the business, and one or more limited partners, who contribute capital. MLP common unit holders have a limited role in the partnership’s operations and management. The Fund, as a limited partner, normally would not be liable for the debts of the MLP beyond the amounts the Fund has contributed, but would not be shielded to the same extent that a shareholder of a corporation would be. In certain circumstances creditors of an MLP would have the right to seek return of capital distributed to a limited partner. This right of an MLP’s creditors would continue after the Fund sold its investment in the MLP.
Equity Security Risk.Stocks and other equity securities fluctuate in price. The value of the Fund’s portfolio may be affected by changes in the equity markets generally. Equity markets may experience significant short-term volatility and may fall sharply at times. Different markets may behave differently from each other and U.S. equity markets may move in the opposite direction from one or more foreign stock markets. Adverse events in any part of the equity or fixed-income markets may have unexpected negative effects on other market segments.
The prices of individual equity securities generally do not all move in the same direction at the same time and a variety of factors can affect the price of a particular company’s securities. These factors may include, but are not limited to, poor earnings reports, a loss of customers, litigation against the company, general unfavorable performance of the company’s sector or industry, or changes in government regulations affecting the company or its industry.
5. Market Risk Factors
The Fund’s investments in securities and/or financial derivatives may expose the Fund to various market risk factors:
Commodity Risk.Commodity risk relates to the change in value of commodities orcommodity indexes as they relate to increases or decreases in the commodities market. Commodities are physical assets that have tangible properties. Examples of these types of assets are crude oil, heating oil, metals, livestock, and agricultural products.
Credit Risk.Credit risk relates to the ability of the issuer of debt to meet interest andprincipal payments, or both, as they come due. In general, lower-grade, higher-yield debt securities are subject to credit risk to a greater extent than lower-yield, higher-quality securities.
Equity Risk.Equity risk relates to the change in value of equity securities as they relate toincreases or decreases in the general market.
35 INVESCO OPPENHEIMER DIVIDEND OPPORTUNITY FUND
NOTES TO FINANCIAL STATEMENTSContinued
5. Market Risk Factors (Continued)
Foreign Exchange Rate Risk.Foreign exchange rate risk relates to the change in theU.S. dollar value of a security held that is denominated in a foreign currency. The U.S. dollar value of a foreign currency denominated security will decrease as the dollar appreciates against the currency, while the U.S. dollar value will increase as the dollar depreciates against the currency.
Interest Rate Risk.Interest rate risk refers to the fluctuations in value of fixed-incomesecurities resulting from the inverse relationship between price and yield. For example, an increase in general interest rates will tend to reduce the market value of already issued fixed-income investments, and a decline in general interest rates will tend to increase their value. In addition, debt securities with longer maturities, which tend to have higher yields, are subject to potentially greater fluctuations in value from changes in interest rates than obligations with shorter maturities.
Volatility Risk.Volatility risk refers to the magnitude of the movement, but not thedirection of the movement, in a financial instrument’s price over a defined time period. Large increases or decreases in a financial instrument’s price over a relative time period typically indicate greater volatility risk, while small increases or decreases in its price typically indicate lower volatility risk.
6. Use of Derivatives
The Fund’s investment objective not only permits the Fund to purchase investment securities, it also allows the Fund to enter into various types of derivatives contracts, including, but not limited to, futures contracts, forward currency exchange contracts, credit default swaps, interest rate swaps, total return swaps, variance swaps and purchased and written options. In doing so, the Fund will employ strategies in differing combinations to permit it to increase, decrease, or change the level or types of exposure to market risk factors. These instruments may allow the Fund to pursue its objectives more quickly and efficiently than if it were to make direct purchases or sales of securities capable of effecting a similar response to market factors. Such contracts may be entered into through a bilateralover-the-counter (“OTC”) transaction, or through a securities or futures exchange and cleared through a clearinghouse.
Derivatives may have little or no initial cash investment relative to their market value exposure and therefore can produce significant gains or losses in excess of their cost due to changes in the market risk factors and the overall market. This use of embedded leverage allows the Fund to increase its market value exposure relative to its net assets and can substantially increase the volatility of the Fund’s performance. In instances where the Fund is using derivatives to decrease, or hedge, exposures to market risk factors for securities held by the Fund, there are also risks that those derivatives may not perform as expected resulting in losses for the combined or hedged positions. Some derivatives have the potential for unlimited loss, regardless of the size of the Fund’s initial investment.
Additional associated risks from investing in derivatives also exist and potentially could have significant effects on the valuation of the derivative and the Fund. Typically, the associated risks are not the risks that the Fund is attempting to increase or decrease exposure
36 INVESCO OPPENHEIMER DIVIDEND OPPORTUNITY FUND
NOTES TO FINANCIAL STATEMENTSContinued
6. Use of Derivatives (Continued)
to, per its investment objectives, but are the additional risks from investing in derivatives. Examples of these associated risks are liquidity risk, which is the risk that the Fund will not be able to sell the derivative in the open market in a timely manner, and counterparty credit risk, which is the risk that the counterparty will not fulfill its obligation to the Fund.
The Fund’s actual exposures to these market risk factors and associated risks during the period are discussed in further detail, by derivative type, below.
Forward Currency Exchange Contracts
The Fund may enter into forward currency exchange contracts (“forward contracts”) for the purchase or sale of a foreign currency at a negotiated rate at a future date. Such contracts are traded in the OTC inter-bank currency dealer market.
Forward contracts are reported on a schedule following the Statement of Investments. The unrealized appreciation (depreciation) is reported in the Statement of Assets and Liabilities as a receivable (or payable) and in the Statement of Operations within the change in unrealized appreciation (depreciation). At contract close, the difference between the original cost of the contract and the value at the close date is recorded as a realized gain (loss) in the Statement of Operations.
The Fund may enter into forward foreign currency exchange contracts in order to decrease exposure to foreign exchange rate risk associated with either specific transactions or portfolio instruments or to increase exposure to foreign exchange rate risk.
During the reporting period, the Fund had daily average contract amounts on forward contracts to buy and sell of $783,133 and $27,574,608, respectively.
Additional associated risk to the Fund includes counterparty credit risk. Counterparty credit risk arises from the possibility that the counterparty to a forward contract will default and fail to perform its obligations to the Fund.
Counterparty Credit Risk.Derivative positions are subject to the risk that the counterpartywill not fulfill its obligation to the Fund. The Fund intends to enter into derivative transactions with counterparties that the Manager believes to be creditworthy at the time of the transaction.
The Fund’s risk of loss from counterparty credit risk on OTC derivatives is generally limited to the aggregate unrealized gain netted against any collateral held by the Fund. For OTC options purchased, the Fund bears the risk of loss of the amount of the premiums paid plus the positive change in market values net of any collateral held by the Fund should the counterparty fail to perform under the contracts. Options written by the Fund do not typically give rise to counterparty credit risk, as options written generally obligate the Fund and not the counterparty to perform.
To reduce counterparty risk with respect to OTC transactions, the Fund has entered into master netting arrangements, established within the Fund’s International Swap and Derivatives Association, Inc. (“ISDA”) master agreements, which allow the Fund to make (or to have an entitlement to receive) a single net payment in the event of default(close-out netting) for outstanding payables and receivables with respect to certain OTC positions in swaps,
37 INVESCO OPPENHEIMER DIVIDEND OPPORTUNITY FUND
NOTES TO FINANCIAL STATEMENTSContinued
6. Use of Derivatives (Continued)
options, swaptions, and forward currency exchange contracts for each individual counterparty. In addition, the Fund may require that certain counterparties post cash and/or securities in collateral accounts to cover their net payment obligations for those derivative contracts subject to ISDA master agreements. If the counterparty fails to perform under these contracts and agreements, the cash and/or securities will be made available to the Fund.
ISDA master agreements include credit related contingent features which allow counterparties to OTC derivatives to terminate derivative contracts prior to maturity in the event that, for example, the Fund’s net assets decline by a stated percentage or the Fund fails to meet the terms of its ISDA master agreements, which would cause the Fund to accelerate payment of any net liability owed to the counterparty.
For financial reporting purposes, the Fund does not offset derivative assets and derivative liabilities that are subject to netting arrangements in the Statement of Assets and Liabilities. Bankruptcy or insolvency laws of a particular jurisdiction may impose restrictions on or prohibitions against the right of offset in bankruptcy, insolvency or other events.
The Fund’s risk of loss from counterparty credit risk on exchange-traded derivatives cleared through a clearinghouse and for centrally cleared swaps is generally considered lower than as compared to OTC derivatives. However, counterparty credit risk exists with respect to initial and variation margin deposited/paid by the Fund that is held in futures commission merchant, broker and/or clearinghouse accounts for such exchange-traded derivatives and for centrally cleared swaps.
With respect to centrally cleared swaps, such transactions will be submitted for clearing, and if cleared, will be held in accounts at futures commission merchants or brokers that are members of clearinghouses. While brokers, futures commission merchants and clearinghouses are required to segregate customer margin from their own assets, in the event that a broker, futures commission merchant or clearinghouse becomes insolvent or goes into bankruptcy and at that time there is a shortfall in the aggregate amount of margin held by the broker, futures commission merchant or clearinghouse for all its customers, U.S. bankruptcy laws will typically allocate that shortfall on apro-rata basis across all the broker’s, futures commission merchant’s or clearinghouse’s customers, potentially resulting in losses to the Fund.
There is the risk that a broker, futures commission merchant or clearinghouse will decline to clear a transaction on the Fund’s behalf, and the Fund may be required to pay a termination fee to the executing broker with whom the Fund initially enters into the transaction. Clearinghouses may also be permitted to terminate centrally cleared swaps at any time. The Fund is also subject to the risk that the broker or futures commission merchant will improperly use the Fund’s assets deposited/paid as initial or variation margin to satisfy payment obligations of another customer. In the event of a default by another customer of the broker or futures commission merchant, the Fund might not receive its variation margin payments from the clearinghouse, due to the manner in which variation margin payments are aggregated for all customers of the broker/futures commission merchant.
Collateral and margin requirements differ by type of derivative. Margin requirements are established by the broker, futures commission merchant or clearinghouse for exchange-traded and cleared derivatives, including centrally cleared swaps. Brokers, futures commission
38 INVESCO OPPENHEIMER DIVIDEND OPPORTUNITY FUND
NOTES TO FINANCIAL STATEMENTSContinued
6. Use of Derivatives (Continued)
merchants and clearinghouses can ask for margin in excess of the regulatory minimum, or increase the margin amount, in certain circumstances.
Collateral terms are contract specific for OTC derivatives. For derivatives traded under an ISDA master agreement, the collateral requirements are typically calculated by netting the mark to market amount for each transaction under such agreement and comparing that amount to the value of any collateral currently pledged by the Fund or the counterparty.
For financial reporting purposes, cash collateral that has been pledged to cover obligations of the Fund, if any, is reported separately on the Statement of Assets and Liabilities as cash pledged as collateral.Non-cash collateral pledged by the Fund, if any, is noted in the Statement of Investments. Generally, the amount of collateral due from or to a party must exceed a minimum transfer amount threshold (e.g., $250,000) before a transfer has to be made. To the extent amounts due to the Fund from its counterparties are not fully collateralized, contractually or otherwise, the Fund bears the risk of loss from counterparty nonperformance.
The following table presents by counterparty the Fund’s OTC derivative assets net of the related collateral pledged by the Fund at period end:
| | | | | | | | | | | | | | | | | | | | |
| | | | | Gross Amounts Not Offset in the Statement of
Assets & Liabilities | | | | |
| Counterparty | | Gross Amounts
Not Offset in the Statement of Assets & Liabilities* | | Financial
Instruments
Available for
Offset | | | Financial Instruments Collateral Received** | | | Cash Collateral
Received** | | | Net Amount | |
| Bank of America NA | | $ | 70,841 | | | $ | – | | | $ | – | | | $ | – | | | $ | 70,841 | |
| Citibank NA | | | 34,393 | | | | (30,760 | ) | | | – | | | | – | | | | 3,633 | |
| | | | |
| | $ | 105,234 | | | $ | (30,760 | ) | | $ | – | | | $ | – | | | $ | 74,474 | |
| | | | |
*OTC derivatives are reported gross on the Statement of Assets and Liabilities. Exchange traded options and marginrelated to centrally cleared swaps and futures, if any, are excluded from these reported amounts.
**Reported collateral posted for the benefit of the Fund within this table is limited to the net outstanding amountdue from an individual counterparty. The collateral posted for the benefit of the Fund may exceed these amounts.
The following table presents by counterparty the Fund’s OTC derivative liabilities net of the related collateral pledged by the Fund at period end:
39 INVESCO OPPENHEIMER DIVIDEND OPPORTUNITY FUND
NOTES TO FINANCIAL STATEMENTSContinued
6. Use of Derivatives (Continued)
| | | | | | | | | | | | | | | | | | | | |
| | | | | | Gross Amounts Not Offset in the Statement of
Assets & Liabilities | | | | |
| Counterparty | | Gross Amounts
Not Offset in the Statement of Assets &
Liabilities* | | | Financial
Instruments
Available for
Offset | | | Financial
Instruments
Collateral
Pledged** | | | Cash Collateral
Pledged** | | | Net Amount | |
| Citibank NA | | $ | (30,760) | | | $ | 30,760 | | | $ | – | | | $ | – | | | $ | – | |
| | | | |
| | $ | (30,760) | | | $ | 30,760 | | | $ | – | | | $ | – | | | $ | – | |
| | | | |
*OTC derivatives are reported gross on the Statement of Assets and Liabilities. Exchange traded options and marginrelated to centrally cleared swaps and futures, if any, are excluded from these reported amounts.
**Reported collateral pledged within this table is limited to the net outstanding amount due from the Fund. Thesecurities pledged as collateral by the Fund as reported on the Statement of Investments may exceed these amounts.
The following table presents the valuations of derivative instruments by risk exposure as reported within the Statement of Assets and Liabilities at period end:
| | | | | | | | | | | | |
| | | Asset Derivatives | | | Liability Derivatives | |
Derivatives Not Accounted for as Hedging Instruments | | Statement of Assets and Liabilities Location | | Value | | | Statement of Assets and Liabilities Location | | Value | |
| Forward currency exchange contracts | | Unrealized appreciation on foreign currency exchange contracts | | $ | 105,234 | | | Unrealized depreciation on foreign currency exchange contracts | | $ | 30,760 | |
The effect of derivative instruments on the Statement of Operations is as follows:
| | | | |
| Amount of Realized Gain or (Loss) Recognized on Derivatives | |
Derivatives Not Accounted for as Hedging Instruments | | Forward
currency
exchange
contracts | |
| Forward currency exchange contracts | | $ | 2,603,242 | |
|
| Amount of Change in Unrealized Gain or (Loss) Recognized on Derivatives | |
Derivatives Not Accounted for as Hedging Instruments | | Forward
currency
exchange
contracts | |
| Forward currency exchange contracts | | $ | (641,811 | ) |
7. Shares of Beneficial Interest
The Fund has authorized an unlimited number of $0.001 par value shares of beneficial interest of each class. Transactions in shares of beneficial interest were as follows:
40 INVESCO OPPENHEIMER DIVIDEND OPPORTUNITY FUND
NOTES TO FINANCIAL STATEMENTSContinued
7. Shares of Beneficial Interest (Continued)
| | | | | | | | | | | | | | | | | | | | |
| | | Year Ended April 30, 2019 | | | | | | Year Ended April 30, 2018 | |
| | | Shares | | | Amount | | | | | | Shares | | | Amount | |
| Class A | | | | | | | | | | | | | | | | | | | | |
| Sold1 | | | 1,097,058 | | | $ | 25,113,877 | | | | | | | | 994,492 | | | $ | 23,231,201 | |
| Dividends and/or distributions reinvested | | | 314,995 | | | | 7,196,512 | | | | | | | | 180,657 | | | | 4,167,752 | |
| Redeemed | | | (1,506,970 | ) | | | (35,137,944 | ) | | | | | | | (1,623,601 | ) | | | (37,578,613 | ) |
| | | | | | | | | | | | | | | | | | | | |
| Net decrease | | | (94,917 | ) | | $ | (2,827,555 | ) | | | | | | | (448,452 | ) | | $ | (10,179,660 | ) |
| | | | | | | | | | | | | | | | | | | | |
| | | | | |
| | | | | | | | | | | | | | | | | | | | | |
| Class B | | | | | | | | | | | | | | | | | | | | |
| Sold | | | 12 | | | $ | 288 | | | | | | | | 1,139 | | | $ | 25,338 | |
| Dividends and/or distributions reinvested | | | — | | | | — | | | | | | | | 508 | | | | 11,248 | |
| Redeemed1 | | | (8,215 | ) | | | (190,075 | ) | | | | | | | (58,343 | ) | | | (1,309,709 | ) |
| | | | | | | | | | | | | | | | | | | | |
| Net decrease | | | (8,203 | ) | | $ | (189,787 | ) | | | | | | | (56,696 | ) | | $ | (1,273,123 | ) |
| | | | | | | | | | | | | | | | | | | | |
| | | | | |
| | | | | | | | | | | | | | | | | | | | | |
| Class C | | | | | | | | | | | | | | | | | | | | |
| Sold | | | 332,567 | | | $ | 7,378,009 | | | | | | | | 349,670 | | | $ | 7,891,787 | |
| Dividends and/or distributions reinvested | | | 76,417 | | | | 1,676,180 | | | | | | | | 38,007 | | | | 846,560 | |
| Redeemed | | | (529,945 | ) | | | (11,934,623 | ) | | | | | | | (577,803 | ) | | | (12,899,891 | ) |
| | | | | | | | | | | | | | | | | | | | |
| Net decrease | | | (120,961 | ) | | $ | (2,880,434 | ) | | | | | | | (190,126 | ) | | $ | (4,161,544 | ) |
| | | | | | | | | | | | | | | | | | | | |
| | | | | |
| | | | | | | | | | | | | | | | | | | | | |
| Class I | | | | | | | | | | | | | | | | | | | | |
| Sold | | | 61,064 | | | $ | 1,383,725 | | | | | | | | 34,373 | | | $ | 805,152 | |
| Dividends and/or distributions reinvested | | | 6,738 | | | | 153,999 | | | | | | | | 3,391 | | | | 78,213 | |
| Redeemed | | | (20,458 | ) | | | (477,642 | ) | | | | | | | (21,098 | ) | | | (492,061 | ) |
| | | | | | | | | | | | | | | | | | | | |
| Net increase | | | 47,344 | | | $ | 1,060,082 | | | | | | | | 16,666 | | | $ | 391,304 | |
| | | | | | | | | | | | | | | | | | | | |
| | | | | |
| | | | | | | | | | | | | | | | | | | | | |
| Class R | | | | | | | | | | | | | | | | | | | | |
| Sold | | | 139,146 | | | $ | 3,211,330 | | | | | | | | 135,277 | | | $ | 3,129,143 | |
| Dividends and/or distributions reinvested | | | 23,337 | | | | 526,971 | | | | | | | | 12,091 | | | | 276,111 | |
| Redeemed | | | (128,921 | ) | | | (2,976,587 | ) | | | | | | | (168,100 | ) | | | (3,901,520 | ) |
| | | | | | | | | | | | | | | | | | | | |
| Net increase (decrease) | | | 33,562 | | | $ | 761,714 | | | | | | | | (20,732 | ) | | $ | (496,266 | ) |
| | | | | | | | | | | | | | | | | | | | |
| | | | | |
| | | | | | | | | | | | | | | | | | | | | |
| Class Y | | | | | | | | | | | | | | | | | | | | |
| Sold | | | 329,447 | | | $ | 7,780,313 | | | | | | | | 308,374 | | | $ | 7,058,724 | |
| Dividends and/or distributions reinvested | | | 26,958 | | | | 612,686 | | | | | | | | 12,598 | | | | 290,399 | |
| Redeemed | | | (363,534 | ) | | | (8,277,881 | ) | | | | | | | (254,386 | ) | | | (5,960,945 | ) |
| | | | | | | | | | | | | | | | | | | | |
| Net increase (decrease) | | | (7,129 | ) | | $ | 115,118 | | | | | | | | 66,586 | | | $ | 1,388,178 | |
| | | | | | | | | | | | | | | | | | | | |
1.All outstanding Class B shares converted to Class A shares on June 1, 2018.
| 8. | Purchases and Sales of Securities |
The aggregate cost of purchases and proceeds from sales of securities, other than short-term obligations and investments in IGMMF, for the reporting period were as follows:
41 INVESCO OPPENHEIMER DIVIDEND OPPORTUNITY FUND
NOTES TO FINANCIAL STATEMENTSContinued
8. Purchases and Sales of Securities (Continued)
| | | | | | | | | | | | |
| | | Purchases | | | | | | Sales | |
| Investment securities | | $ | 126,249,505 | | | | | | | $ | 134,369,922 | |
9. Fees and Other Transactions with Affiliates
Management Fees.Under the investment advisory agreement, the Fund pays the Managera management fee based on the daily net assets of the Fund at an annual rate as shown in the following table:
| | |
| Fee Schedule | | |
| Up to $500 million | | 0.65% |
| Next $500 million | | 0.63 |
| Next $4 billion | | 0.60 |
| Over $5 billion | | 0.58 |
The Fund’s effective management fee for the reporting period was 0.65% of average annual net assets before any applicable waivers.
Sub-Adviser Fees.The Manager has retained theSub-Adviser to provide theday-to-dayportfolio management of the Fund. Under theSub-Advisory Agreement, the Manager pays theSub-Adviser an annual fee in monthly installments, equal to a percentage of the investment management fee collected by the Manager from the Fund, which shall be calculated after any investment management fee waivers. The fee paid to theSub-Adviser is paid by the Manager, not by the Fund.
Transfer Agent Fees.OFI Global (the “Transfer Agent”) serves as the transfer andshareholder servicing agent for the Fund. The Fund pays the Transfer Agent a fee based on annual net assets, which shall be calculated after any applicable fee waivers. Fees incurred and average net assets for each class with respect to these services are detailed in the Statement of Operations and Financial Highlights, respectively.
Sub-Transfer Agent Fees.The Transfer Agent has retained Shareholder Services, Inc., awholly-owned subsidiary of OFI (the“Sub-Transfer Agent”), to provide theday-to-day transfer agent and shareholder servicing of the Fund. Under theSub-Transfer Agency Agreement, the Transfer Agent pays theSub-Transfer Agent an annual fee in monthly installments, equal to a percentage of the transfer agent fee collected by the Transfer Agent from the Fund, which shall be calculated after any applicable fee waivers. The fee paid to theSub-Transfer Agent is paid by the Transfer Agent, not by the Fund.
Trustees’ Compensation.The Fund has adopted an unfunded retirement plan (the “Plan”)for the Fund’s Independent Trustees. Benefits are based on years of service and fees paid to each Trustee during their period of service. The Plan was frozen with respect to adding new participants effective December 31, 2006 (the “Freeze Date”) and existing Plan Participants as of the Freeze Date will continue to receive accrued benefits under the Plan. Active Independent Trustees as of the Freeze Date have each elected a distribution method with
42 INVESCO OPPENHEIMER DIVIDEND OPPORTUNITY FUND
NOTES TO FINANCIAL STATEMENTSContinued
9. Fees and Other Transactions with Affiliates (Continued)
respect to their benefits under the Plan.
During the reporting period, the Fund’s projected benefit obligations, payments to retired Trustees and accumulated liability were as follows:
| | | | |
| Projected Benefit Obligations Increased | | $ | — | |
| Payments Made to Retired Trustees | | | 1,220 | |
| Accumulated Liability as of April 30, 2019 | | | 10,364 | |
The Fund’s Board of Trustees (“Board”) has adopted a compensation deferral plan for Independent Trustees that enables Trustees to elect to defer receipt of all or a portion of the annual compensation they are entitled to receive from the Fund. For purposes of determining the amount owed to the Trustee under the plan, deferred amounts are treated as though equal dollar amounts had been invested in shares of the Fund or in other Oppenheimer funds selected by the Trustee. The Fund purchases shares of the funds selected for deferral by the Trustee in amounts equal to his or her deemed investment, resulting in a Fund asset equal to the deferred compensation liability. Such assets are included as a component of “Other” within the asset section of the Statement of Assets and Liabilities. Deferral of Trustees’ fees under the plan will not affect the net assets of the Fund and will not materially affect the Fund’s assets, liabilities or net investment income per share. Amounts will be deferred until distributed in accordance with the compensation deferral plan.
Distribution and Service Plan(12b-1) Fees.Under its General Distributor’s Agreementwith the Fund, OppenheimerFunds Distributor, Inc. (the “Distributor”) acts as the Fund’s principal underwriter in the continuous public offering of the Fund’s classes of shares.
Service Plan for Class A Shares.The Fund has adopted a Service Plan (the “Plan”)for Class A shares pursuant to Rule12b-1 under the 1940 Act. Under the Plan, the Fund reimburses the Distributor for a portion of its costs incurred for services provided to accounts that hold Class A shares. Reimbursement is made periodically at an annual rate of up to 0.25% of the daily net assets of Class A shares of the Fund. The Distributor currently uses all of those fees to pay dealers, brokers, banks and other financial institutions periodically for providing personal service and maintenance of accounts of their customers that hold Class A shares. Any unreimbursed expenses the Distributor incurs with respect to Class A shares in any fiscal year cannot be recovered in subsequent periods. Fees incurred by the Fund under the Plan are detailed in the Statement of Operations.
Distribution and Service Plans for Class B, Class C and Class R Shares.The Fund hasadopted Distribution and Service Plans (the “Plans”) for Class C and Class R shares, and had previously adopted a similar plan for Class B shares, pursuant to Rule12b-1 under the 1940 Act to compensate the Distributor for distributing those share classes, maintaining accounts and providing shareholder services. Under the Plans, the Fund pays the Distributor an annual asset-based sales charge of 0.75% on Class C shares’ daily net assets and 0.25% on Class
43 INVESCO OPPENHEIMER DIVIDEND OPPORTUNITY FUND
NOTES TO FINANCIAL STATEMENTSContinued
9. Fees and Other Transactions with Affiliates (Continued)
R shares’ daily net assets. The Fund paid the Distributor an annual asset-based sales charge of 0.75% on Class B shares prior to their Conversion Date. The Fund also pays a service fee under the Plans at an annual rate of 0.25% of daily net assets and previously paid this fee for Class B prior to their Conversion Date. The Plans continue in effect from year to year only if the Fund’s Board of Trustees votes annually to approve their continuance at an in person meeting called for that purpose. Fees incurred by the Fund under the Plans are detailed in the Statement of Operations.
Sales Charges.Front-end sales charges and CDSC do not represent expenses of theFund. They are deducted from the proceeds of sales of Fund shares prior to investment or from redemption proceeds prior to remittance, as applicable. The sales charges retained by the Distributor from the sale of shares and the CDSC retained by the Distributor on the redemption of shares is shown in the following table for the period indicated.
| | | | | | | | | | | | | | | | | | | | |
| Year Ended | | Class A
Front-End
Sales Charges
Retained by
Distributor | | | Class A
Contingent
Deferred
Sales Charges
Retained by
Distributor | | | Class B
Contingent
Deferred
Sales Charges
Retained by
Distributor1 | | | Class C
Contingent
Deferred
Sales Charges
Retained by
Distributor | | | Class R
Contingent
Deferred
Sales Charges
Retained by
Distributor | |
| April 30, 2019 | | | $68,756 | | | | $— | | | | $4 | | | | $3,254 | | | | $— | |
1.Effective June 1, 2018, all Class B shares converted to Class A shares.
Waivers and Reimbursements of Expenses.The Manager will waive fees and/orreimburse Fund expenses in an amount equal to the indirect management fees incurred through the Fund’s investment in IGMMF. During the reporting period, the Manager waived fees and/or reimbursed the Fund $9,608 for IGMMF management fees.
10. Borrowings and Other Financing
Joint Credit Facility.A number of mutual funds managed by the Manager participate in a$1.95 billion revolving credit facility (the “Facility”) intended to provide short-term financing, if necessary, subject to certain restrictions in connection with atypical redemption activity. Expenses and fees related to the Facility are paid by the participating funds and are disclosed separately or as other expenses on the Statement of Operations. The Fund did not utilize the Facility during the reporting period.
11. Subsequent Event
Effective after the close of business on May 24, 2019, Invesco Ltd., an independent global investment management company, completed its acquisition of MassMutual asset management affiliate OppenheimerFunds, Inc. and its subsidiaries (the “Transaction”). In connection with the Transaction, the Fund’s Board of Trustees (the “Board”) approved that the Fund be transitioned to the Invesco mutual fund platform by transferring the assets and
44 INVESCO OPPENHEIMER DIVIDEND OPPORTUNITY FUND
NOTES TO FINANCIAL STATEMENTSContinued
11. Subsequent Event (Continued)
liabilities of the Fund to a newly formed fund (the “Acquiring Fund”), advised by an affiliate of Invesco Ltd., that has the same investment objectives and substantially similar principal investment strategies and risks as the Fund (the “Reorganization”). The Reorganization was accounted for as atax-free reorganization for federal income tax purposes. Following the Reorganization, the accounting books and records of the Fund became the accounting books and records of the Acquiring Fund. On April 12, 2019, the Reorganization was approved by the shareholders of the Fund at a special meeting of shareholders.
The Reorganization was completed after the close of business on May 24, 2019 at which time shareholders of the Fund received shares of the Acquiring Fund in exchange for their shares of the Fund. Also after the close of business on May 24, 2019, the Fund’s former Class I shares were reorganized as Class R6 shares and the Fund began offering Class R5 shares. Effective May 28, 2019, Invesco Advisers, Inc. has contractually agreed to waive advisory fees and/or reimburse expenses to limit total annual operating expenses after fee waiver and/or expense reimbursement (excluding certain items discussed in the Fund’s statement of additional information) of Class A, Class C, Class R, Class Y, Class R5 and Class R6 shares to 1.14%, 1.88%, 1.37%, 0.88%, 0.76% and 0.71%, respectively, of the Acquiring Fund’s average daily net assets. This waiver and/or expense reimbursement cannot be terminated until May 28, 2021 without approval of the Board.
The Acquiring Fund has entered into an investment advisory agreement with Invesco Advisers, Inc., a master administrative services agreement with Invesco Advisers, Inc., a transfer agency agreement with Invesco Investment Services, Inc., and a distribution agreement with Invesco Distributors, Inc. In addition, Invesco Advisers, Inc. has entered into a mastersub-advisory agreement with each of Invesco Asset Management Deutschland GmbH, Invesco Asset Management Limited, Invesco Asset Management (Japan) Limited, Invesco Hong Kong Limited, Invesco Senior Secured Management, Inc. and Invesco Canada Ltd. and separatesub-advisory agreements with Invesco Capital Management LLC, Invesco Asset Management (India) Private Limited and OppenheimerFunds, Inc.
45 INVESCO OPPENHEIMER DIVIDEND OPPORTUNITY FUND
REPORT OF INDEPENDENT REGISTERED PUBLIC ACCOUNTING FIRM
To the Shareholders and Board of Trustees
AIM Equity Funds (Invesco Equity Funds):
Opinion on the Financial Statements
We have audited the accompanying statement of assets and liabilities of Invesco Oppenheimer Dividend Opportunity Fund, a series of AIM Equity Funds (Invesco Equity Funds), (the “Fund”), formerly known as Oppenheimer Dividend Opportunity Fund, including the statement of investments, as of April 30, 2019, the related statement of operations for the year then ended, the statements of changes in net assets for each of the years in thetwo-year period then ended, and the related notes (collectively, the “financial statements”) and the financial highlights for each of the years in the five-year period then ended. In our opinion, the financial statements and financial highlights present fairly, in all material respects, the financial position of the Fund as of April 30, 2019, the results of its operations for the year then ended, the changes in its net assets for each of the years in thetwo-year period then ended, and the financial highlights for each of the years in the five-year period then ended, in conformity with U.S. generally accepted accounting principles.
Basis for Opinion
These financial statements and financial highlights are the responsibility of the Fund’s management. Our responsibility is to express an opinion on these financial statements and financial highlights based on our audits. We are a public accounting firm registered with the Public Company Accounting Oversight Board (United States) (“PCAOB”) and are required to be independent with respect to the Fund in accordance with the U.S. federal securities laws and the applicable rules and regulations of the Securities and Exchange Commission and the PCAOB.
We conducted our audits in accordance with the standards of the PCAOB. Those standards require that we plan and perform the audit to obtain reasonable assurance about whether the financial statements and financial highlights are free of material misstatement, whether due to error or fraud. Our audits included performing procedures to assess the risks of material misstatement of the financial statements and financial highlights, whether due to error or fraud, and performing procedures that respond to those risks. Such procedures included examining, on a test basis, evidence regarding the amounts and disclosures in the financial statements and financial highlights. Such procedures also included confirmation of securities owned as of April 30, 2019, by correspondence with the custodian, brokers and the transfer agent, or by other appropriate auditing procedures. Our audits also included evaluating the accounting principles used and significant estimates made by management, as well as evaluating the overall presentation of the financial statements and financial highlights. We believe that our audits provide a reasonable basis for our opinion.
KPMGLLP
We have not been able to determine the specific year that we began serving as the auditor of one or more Invesco Oppenheimer Funds investment companies, however we are aware that we have served as the auditor of one or more Invesco Oppenheimer Funds investment companies since at least 1969.
Denver, Colorado
June 25, 2019
46 INVESCO OPPENHEIMER DIVIDEND OPPORTUNITY FUND
FEDERAL INCOME TAX INFORMATIONUnaudited
In early 2019, if applicable, shareholders of record received information regarding all dividends and distributions paid to them by the Fund during calendar year 2018.
Capital gain distributions of $0.36443 per share were paid to Class A, Class C, Class I, Class R and Class Y shareholders, respectively, on December 10, 2018. Whether received in stock or in cash, the capital gain distribution should be treated by shareholders as a gain from the sale of the capital assets held for more than one year (long-term capital gains).
Dividends, if any, paid by the Fund during the reporting period which are not designated as capital gain distributions should be multiplied by the maximum amount allowable but not less than 89.02% to arrive at the amount eligible for the corporate dividend-received deduction.
A portion, if any, of the dividends paid by the Fund during the reporting period which are not designated as capital gain distributions are eligible for lower individual income tax rates to the extent that the Fund has received qualified dividend income as stipulated by recent tax legislation. The maximum amount allowable but not less than $8,710,679 of the Fund’s fiscal year taxable income may be eligible for the lower individual income tax rates. In early 2019, shareholders of record received information regarding the percentage of distributions that are eligible for lower individual income tax rates.
Recent tax legislation allows a regulated investment company to designate distributions not designated as capital gain distributions, as either interest related dividends or short-term capital gain dividends, both of which are exempt from the U.S. withholding tax applicable to non U.S. taxpayers. For the reporting period, the maximum amount allowable but not less than $140,008 of the ordinary distributions to be paid by the Fund qualifies as an interest related dividend.
The foregoing information is presented to assist shareholders in reporting distributions received from the Fund to the Internal Revenue Service. Because of the complexity of the federal regulations which may affect your individual tax return and the many variations in state and local tax regulations, we recommend that you consult your tax advisor for specific guidance.
47 INVESCO OPPENHEIMER DIVIDEND OPPORTUNITY FUND
PORTFOLIO PROXY VOTING POLICIES AND GUIDELINES;
UPDATES TO STATEMENT OF INVESTMENTSUnaudited
Go paperless with eDelivery
Visit invesco.com/edelivery to enjoy the convenience and security of anytime electronic access to your investment documents.
With eDelivery, you can elect to have any or all of the following materials delivered straight to your inbox to download, save and print from your own computer:
● Fund reports and prospectuses
● Quarterly statements
● Daily confirmations
● Tax forms
Invesco mailing information
Send general correspondence to Invesco Investment Services, Inc., P.O. Box 219078, Kansas City, MO 64121-9078.
Important notice regarding delivery of security holder documents
To reduce Fund expenses, only one copy of most shareholder documents may be mailed to shareholders with multiple accounts at the same address (Householding). Mailing of your shareholder documents may be householded indefinitely unless you instruct us otherwise. If you do not want the mailing of these documents to be combined with those for other members of your household, please contact Invesco Investment Services, Inc. at 800 959 4246 or contact your financial institution. We will begin sending you individual copies for each account within 30 days after receiving your request.
Fund holdings and proxy voting information
The Fund provides a complete list of its holdings four times in each fiscal year, at the quarter ends. For the second and fourth quarters, the lists appear in the Fund’s semiannual and annual reports to shareholders. For the first and third quarters, the Fund files the lists with the Securities and Exchange Commission (SEC) on FormN-Q (or any successor Form). The most recent list of portfolio holdings is available at invesco.com/completeqtrholdings. Shareholders can also look up the Fund’s FormsN-Q (or any successor Form) on the SEC website at sec.gov.
A description of the policies and procedures that the Fund uses to determine how to vote proxies relating to portfolio securities is available without charge, upon request, from our Client Services department at 800 959 4246 or at invesco.com/proxyguidelines. The information is also available on the SEC website, sec.gov.
Information regarding how the Fund voted proxies related to its portfolio securities during the most recent12-month period ended June 30 is available at invesco.com/proxysearch. The information is also available on the SEC website, sec.gov.
Invesco Advisers, Inc. is an investment adviser; it provides investment advisory services to individual and institutional clients and does not sell securities. Invesco Distributors, Inc. is the US distributor for Invesco Ltd.’s retail mutual funds, exchange-traded funds and institutional money market funds. Both are wholly owned, indirect subsidiaries of Invesco Ltd.
48 INVESCO OPPENHEIMER DIVIDEND OPPORTUNITY FUND
DISTRIBUTION SOURCESUnaudited
For any distribution that took place over the last six months of the Fund’s reporting period, the table below details on aper-share basis the percentage of the Fund’s total distribution payment amount that was derived from the following sources: net income, net profit from the sale of securities, and other capital sources. Other capital sources represent a return of capital. A return of capital may occur, for example, when some or all of the money that you invested in the Fund is paid back to you. A return of capital distribution does not necessarily reflect the Fund’s investment performance and should not be confused with “yield” or “income.” You should not draw any conclusions about the Fund’s investment performance from the amounts of these distributions. This information is based upon income and capital gains using generally accepted accounting principles as of the date of each distribution. If the Fund (or an underlying fund in which the Fund invests) invests in real estate investment trusts (REITs) and/or master limited partnerships (MLPs), the percentages attributed to each category are estimated using historical information because the character of the amounts received from the REITs and/or MLPs in which the Fund (or underlying fund) invests is unknown until after the end of the calendar year. Because the Fund is actively managed, the relative amount of the Fund’s total distributions derived from various sources over the calendar year may change. Please note that this information should not be used for tax reporting purposes as the tax character of distributable income may differ from the amounts used for this notification. You will receive IRS tax forms in the first quarter of each calendar year detailing the actual amount of the taxable andnon-taxable portion of distributions paid to you during the tax year.
For the most current information, please go to oppenheimerfunds.com. Select your Fund, and scroll down to the ‘Dividends’ table under ‘Analytics’.
| | | | | | | | | | | | | | | | |
| Fund Name | | Pay
Date | | | Net Income | | | Net Profit from Sale | | | Other Capital Sources | |
| Invesco Oppenheimer Dividend Opportunity Fund | | | 12/10/18 | | | | 19.7% | | | | 72.1% | | | | 8.2% | |
49 INVESCO OPPENHEIMER DIVIDEND OPPORTUNITY FUND
SHAREHOLDER PROXYUnaudited
A Special Meeting (“Meeting”) of Shareholders of Invesco Oppenheimer Dividend Opportunity Fund was held on April 12, 2019. The Meeting was held for the following purpose:
(1) Approval of an Agreement and Plan of Reorganization that provides for the reorganization of Oppenheimer Dividend Opportunity Fund into Invesco Oppenheimer Dividend Opportunity Fund.
The results of the voting on the above matter was as follows:
| | | | | | | | | | | | | | | | |
| Matter | | Votes For | | | Votes Against | | | Votes Abstain | | | Broker Non-Votes | |
| (1) Approval of an Agreement and Plan of Reorganization | | | 5,199,913 | | | | 399,089 | | | | 381,221 | | | | 0 | |
50 INVESCO OPPENHEIMER DIVIDEND OPPORTUNITY FUND
TRUSTEES AND OFFICERSUnaudited
The address of each trustee and officer is AIM Equity Funds (Invesco Equity Funds) (the “Trust”), 11 Greenway Plaza, Suite 1000, Houston, Texas 77046-1173. The trustees serve for the life of the Trust, subject to their earlier death, incapacitation, resignation, retirement or removal as more specifically provided in the Trust’s organizational documents. Each officer serves for a one year term or until their successors are elected and qualified. Column two below includes length of time served with predecessor entities, if any.
Information below is as of May 25, 2019.
| | | | | | | | |
Name, Year of Birth and Position(s) Held with the Trust | | Trustee
and/or
Officer
Since | | Principal Occupation(s) During Past 5 Years | | Number of Funds in Fund Complex Overseen by Trustee | | Other Directorship(s) Held by Trustee During Past 5 Years |
| | | | | |
INTERESTED PERSONS | | | | | | | | |
| | | | | |
Martin L. Flanagan 1 — 1960 Trustee and Vice Chair | | 2007 | | Executive Director, Chief Executive Officer and President, Invesco Ltd. (ultimate parent of Invesco and a global investment management firm); Trustee and Vice Chair, The Invesco Funds; Vice Chair, Investment Company Institute; and Member of Executive Board, SMU Cox School of Business | | 241 | | None |
| | | | | |
| | | | | Formerly: Advisor to the Board, Invesco Advisers, Inc. (formerly known as Invesco Institutional (N.A.), Inc.); Chairman and Chief Executive Officer, Invesco Advisers, Inc. (registered investment adviser); Director, Chairman, Chief Executive Officer and President, Invesco Holding Company (US), Inc. (formerly IVZ Inc.) (holding company), Invesco Group Services, Inc. (service provider) and Invesco North American Holdings, Inc. (holding company); Director, Chief Executive Officer and President, Invesco Holding Company Limited (parent of Invesco and a global investment management firm); Director, Invesco Ltd.; Chairman, Investment Company Institute and President,Co-Chief Executive Officer,Co-President, Chief Operating Officer and Chief Financial Officer, Franklin Resources, Inc. (global investment management organization) | | | | |
| | | | | |
Philip A. Taylor2 — 1954 Trustee | | 2006 | | Vice Chair, Invesco Ltd.; Director, Invesco Canada Ltd. (formerly known as Invesco Trimark Ltd./Invesco Trimark Ltèe) (registered investment adviser and registered transfer agent); Trustee, The Invesco Funds | | 241 | | None |
| | | | | |
| | | | | Formerly: Head of the Americas and Senior Managing Director, Invesco Ltd.; Director, Invesco Advisers, Inc. (formerly known as Invesco Institutional (N.A.), Inc.) (registered | | | | |
| |
1 Mr. Flanagan is considered an interested person (within the meaning of Section 2(a)(19) of the 1940 Act) of the Trust because he is an officer of the Adviser to the Trust, and an officer and a director of Invesco Ltd., ultimate parent of the Adviser. |
| |
2 Mr. Taylor is considered an interested person (within the meaning of Section 2(a)(19) of the 1940 Act) of the Trust because he is an officer and a director of the Adviser. |
51 INVESCO OPPENHEIMER DIVIDEND OPPORTUNITY FUND
TRUSTEES AND OFFICERSUnaudited / Continued
| | | | | | | | |
Name, Year of Birth and Position(s) Held with the Trust | | Trustee
and/or
Officer
Since | | Principal Occupation(s) During Past 5 Years | | Number of Funds in Fund Complex Overseen by Trustee | | Other Directorship(s) Held by Trustee During Past 5 Years |
| | | | | |
INTERESTED PERSONS (CONTINUED) | | | | | | | | |
| | | | | |
| Philip A. Taylor (Continued) | | | | investment adviser); Director and Chairman, Invesco Investment Services, Inc. (formerly known as Invesco AIM Investment Services, Inc.) (registered transfer agent); Chief Executive Officer, Invesco Corporate Class Inc. (corporate mutual fund company); Chairman and Chief Executive Officer, Invesco Canada Ltd. (formerly known as Invesco Trimark Ltd./ Invesco Trimark Ltèe) (registered investment adviser and registered transfer agent); Senior Vice President, The Invesco Funds; Director, Invesco Investment Advisers LLC (formerly known as Van Kampen Asset Management); Director, Chairman, Chief Executive Officer and President, Invesco Management Group, Inc. (formerly known as Invesco AIM Management Group, Inc.) (financial services holding company);Co-Chairman,Co-President andCo-Chief Executive Officer, Invesco Advisers, Inc. (formerly known as Invesco Institutional (N.A.), Inc.) (registered investment adviser); Director, Chief Executive Officer and President, Van Kampen Exchange Corp; President and Principal Executive Officer, The Invesco Funds (other than AIM Treasurer’s Series Trust (Invesco Treasurer’s Series Trust), Short-Term Investments Trust and Invesco Management Trust); Executive Vice President, The Invesco Funds (AIM Treasurer’s Series Trust (Invesco Treasurer’s Series Trust), Short-Term Investments Trust and Invesco Management Trust only); Director and President, INVESCO Funds Group, Inc. (registered investment adviser and registered transfer agent); Director and Chairman, IVZ Distributors, Inc. (formerly known as INVESCO Distributors, Inc.) (registered broker dealer); Director, President and Chairman, Invesco Inc. (holding company), Invesco Canada Holdings Inc. (holding company), Trimark Investments Ltd./ Placements Trimark Ltèe and Invesco Financial Services Ltd/Services Financiers Invesco Ltèe; Chief Executive Officer, Invesco Canada Fund Inc. (corporate mutual fund company); Director and Chairman, Van Kampen Investor Services Inc.; Director, Chief Executive Officer and President, 1371 Preferred Inc. (holding company) and Van Kampen Investments Inc.; Director and President, AIM GP Canada Inc. | | | | |
52 INVESCO OPPENHEIMER DIVIDEND OPPORTUNITY FUND
TRUSTEES AND OFFICERSUnaudited / Continued
| | | | | | | | |
Name, Year of Birth and Position(s) Held with the Trust | | Trustee
and/or
Officer
Since | | Principal Occupation(s) During Past 5 Years | | Number of Funds in Fund Complex Overseen by Trustee | | Other Directorship(s) Held by Trustee During Past 5 Years |
| | | | | |
INTERESTED PERSONS (CONTINUED) | | | | | | | | |
| | | | | |
| Philip A. Taylor (Continued) | | | | (general partner for limited partnerships) and Van Kampen Advisors, Inc.; Director and Chief Executive Officer, Invesco Trimark Dealer Inc. (registered broker dealer); Director, Invesco Distributors, Inc. (formerly known as Invesco AIM Distributors, Inc.) (registered broker dealer); Manager, Invesco Capital Management LLC; Director, Chief Executive Officer and President, Invesco Advisers, Inc.; Director, Chairman, Chief Executive Officer and President, Invesco AIM Capital Management, Inc.; President, Invesco Trimark Dealer Inc. and Invesco Trimark Ltd./Invesco Trimark Ltèe; Director and President, AIM Trimark Corporate Class Inc. and AIM Trimark Canada Fund Inc.; Senior Managing Director, Invesco Holding Company Limited; Director and Chairman, Fund Management Company (former registered broker dealer); President and Principal Executive Officer, The Invesco Funds (AIM Treasurer’s Series Trust (Invesco Treasurer’s Series Trust), and Short-Term Investments Trust only); President, AIM Trimark Global Fund Inc. and AIM Trimark Canada Fund Inc. | | | | |
53 INVESCO OPPENHEIMER DIVIDEND OPPORTUNITY FUND
TRUSTEES AND OFFICERSUnaudited / Continued
| | | | | | | | |
Name, Year of Birth and Position(s) Held with the Trust | | Trustee
and/or
Officer
Since | | Principal Occupation(s) During Past 5 Years | | Number of Funds in Fund Complex Overseen by Trustee | | Other Directorship(s) Held by Trustee During Past 5 Years |
| | | | | |
INDEPENDENT TRUSTEES | | | | | | | | |
| | | | | |
| | | | | |
Bruce L. Crockett – 1944 Trustee and Chair | | 2003 | | Chairman, Crockett Technologies Associates (technology consulting company) Formerly: Director, Captaris (unified messaging provider); Director, President and Chief Executive Officer, COMSAT Corporation; Chairman, Board of Governors of INTELSAT (international communications company); ACE Limited (insurance company); Independent Directors Council and Investment Company Institute: Member of the Audit Committee, Investment Company Institute; Member of the Executive Committee and Chair of the Governance Committee, Independent Directors Council | | 241 | | Director and Chairman of the Audit Committee, ALPS (Attorneys Liability Protection Society) (insurance company); Director and Member of the Audit Committee and Compensation Committee, Ferroglobe PLC (metallurgical company) |
| | | | | |
David C. Arch – 1945 Trustee | | 2010 | | Chairman of Blistex Inc. (consumer health care products manufacturer); Member, World Presidents’ Organization | | 241 | | Board member of the Illinois Manufacturers’ Association |
| | | | | |
Beth Ann Brown3– 1968 Trustee | | 2019 | | Independent Consultant Formerly: Head of Intermediary Distribution, Managing Director, Strategic Relations, Managing Director, Head of National Accounts; Senior Vice President, National Account Manager and Senior Vice President, Key Account Manager, Columbia Management Investment Advisers LLC; Vice President, Key Account Manager, Liberty Funds Distributor, Inc.; and Trustee of certain Oppenheimer Funds | | 225 | | Director, Board of Directors of Caron Engineering Inc.; Advisor, Board of Advisors of Caron Engineering Inc.; President and Director, of Acton Shapleigh Youth Conservation Corps (non -profit); and Vice President and Director of Grahamtastic Connection (non- profit) |
| | | | | |
Jack M. Fields – 1952 Trustee | | 2003 | | Chief Executive Officer, Twenty First Century Group, Inc. (government affairs company); and Chairman, Discovery Learning Alliance(non-profit) | | 241 | | None |
| | | | | |
| | | | | Formerly: Owner and Chief Executive Officer, Dos Angeles Ranch L.P. (cattle, hunting, corporate entertainment); Director, Insperity, Inc. (formerly known as Administaff) (human resources provider); Chief Executive Officer, Texana Timber LP (sustainable forestry | | | | |
| |
3 Mss. Brown and Krentzman and Messrs. Motley, Vandivort and Vaughn were appointed as Trustees of the Trust effective June 10, 2019. |
54 INVESCO OPPENHEIMER DIVIDEND OPPORTUNITY FUND
TRUSTEES AND OFFICERSUnaudited / Continued
| | | | | | | | |
Name, Year of Birth and Position(s) Held with the Trust | | Trustee
and/or
Officer
Since | | Principal Occupation(s) During Past 5 Years | | Number of Funds in Fund Complex Overseen by Trustee | | Other Directorship(s) Held by Trustee During Past 5 Years |
| | | | | |
INDEPENDENT TRUSTEES (CONTINUED) | | | | | | | | |
| | | | | |
| | | | | |
| Jack M. Fields (Continued) | | | | company); Director of Cross Timbers Quail Research Ranch(non-profit); and member of the U.S. House of Representatives | | | | |
| | | | | |
Cynthia Hostetler —1962 Trustee | | 2017 | | Non-Executive Director and Trustee of a number of public and private business corporations Formerly: Director, Aberdeen Investment Funds (4 portfolios); Head of Investment Funds and Private Equity, Overseas Private Investment Corporation; President, First Manhattan Bancorporation, Inc.; Attorney, Simpson Thacher & Bartlett LLP | | 241 | | Vulcan Materials Company (construction materials company); Trilinc Global Impact Fund; Genesee & Wyoming, Inc. (railroads); Artio Global Investment LLC (mutual fund complex); Edgen Group, Inc. (specialized energy and infrastructure products distributor); Investment Company Institute (professional organization); Independent Directors Council (professional organization) |
| | | | | |
Eli Jones – 1961 Trustee | | 2016 | | Professor and Dean, Mays Business School - Texas A&M University Formerly: Professor and Dean, Walton College of Business, University of Arkansas and E.J. Ourso College of Business, Louisiana State University; Director, Arvest Bank | | 241 | | Insperity, Inc. (formerly known as Administaff) (human resources provider) |
| | | | | |
Elizabeth Krentzman3– 1959 Trustee | | 2019 | | Formerly, Principal and Chief Regulatory Advisor for Asset Management Services and U.S. Mutual Fund Leader of Deloitte & Touche LLP; General Counsel of the Investment Company Institute (trade association); National Director of the Investment Management Regulatory Consulting Practice, Principal, Director and Senior Manager of Deloitte & Touche LLP; Assistant Director of the Division of Investment Management - Office of Disclosure and Investment Adviser Regulation of the U.S. Securities and Exchange Commission and various positions with the Division of Investment Management – Office of Regulatory Policy of the U.S. Securities and Exchange Commission; Associate at Ropes & Gray LLP.; Advisory Board Member of the | | 225 | | Trustee of the University of Florida National Board Foundation and Audit Committee Member; Member of the Cartica Funds Board of Directors (private investment funds); Member of the University of Florida Law Center Association, Inc. Board of Trustees and Audit Committee Member |
55 INVESCO OPPENHEIMER DIVIDEND OPPORTUNITY FUND
TRUSTEES AND OFFICERSUnaudited / Continued
| | | | | | | | |
Name, Year of Birth and Position(s) Held with the Trust | | Trustee
and/or
Officer
Since | | Principal Occupation(s) During Past 5 Years | | Number of Funds in Fund Complex Overseen by Trustee | | Other Directorship(s) Held by Trustee During Past 5 Years |
| | | | | |
| INDEPENDENT TRUSTEES (CONTINUED) | | | | | | | | |
| | | | | |
Elizabeth Krentzman (Continued) | | | | Securities and Exchange Commission Historical Society; and Trustee of certain Oppenheimer Funds | | | | |
Anthony J. LaCava, Jr. – 1956 Trustee | | 2019 | | Formerly: Director and Member of the Audit Committee, Blue Hills Bank and Managing Partner, KPMG LLP | | 241 | | Chairman of the Audit Committee, Blue Hills Bank; Chairman of the Business Advisory Council, Bentley University; Chairman of the Audit and Finance Committee and Nominating Committee, KPMG LLP |
Prema Mathai-Davis – 1950 Trustee | | 2003 | | Retired Co-Owner & Partner of Quantalytics Research, LLC, (a FinTech Investment Research Platform for the Self-Directed Investor) | | 241 | | None |
Joel W. Motley3– 1952 Trustee | | 2019 | | Director of Office of Finance Federal Home Loan Bank; Member of the Vestry of Trinity Wall Street; Managing Director of Carmona Motley Hoffman Inc. (privately held financial advisor); Member of the Finance and Budget Committee of the Council on Foreign Relations, Member of the Investment Committee and Board of Human Rights Watch and Member of the Investment Committee and Board of Historic Hudson Valley. Formerly, Managing Director of Public Capital Advisors, LLC (privately held financial advisor); Managing Director of Carmona Motley Hoffman, Inc. (privately held financial advisor); Trustee of certain Oppenheimer Funds; and Director of Columbia Equity Financial Corp. (privately held financial advisor) | | 225 | | Director of Greenwall Foundation; Member of Board and Investment Committee of The Greenwall Foundation; Director of Southern Africa Legal Services Foundation; Board Member and Investment Committee Member of Pulitzer Center for Crisis Reporting(non-profit journalism) |
Teresa M. Ressel — 1962 Trustee | | 2017 | | Non-executive director and trustee of a number of public and private business corporations Formerly: Chief Financial Officer, Olayan America, The Olayan Group (international investor/commercial/industrial); Chief Executive Officer, UBS Securities LLC; Group Chief Operating Officer, Americas, UBS AG; Assistant Secretary for Management & Budget and CFO, US Department of the Treasury | | 241 | | Atlantic Power Corporation (power generation company); ON Semiconductor Corp. (semiconductor supplier) |
56 INVESCO OPPENHEIMER DIVIDEND OPPORTUNITY FUND
TRUSTEES AND OFFICERSUnaudited / Continued
| | | | | | | | |
Name, Year of Birth and Position(s) Held with the Trust | | Trustee
and/or
Officer
Since | | Principal Occupation(s) During Past 5 Years | | Number of Funds in Fund Complex Overseen by Trustee | | Other Directorship(s) Held by Trustee During Past 5 Years |
| | | | | |
| INDEPENDENT TRUSTEES (CONTINUED) | | | | | | | | |
| | | | | |
Ann Barnett Stern – 1957 Trustee | | 2017 | | President and Chief Executive Officer, Houston Endowment Inc. (private philanthropic institution) | | 241 | | Federal Reserve Bank of Dallas |
| | | | | |
| | | | | Formerly: Executive Vice President and General Counsel, Texas Children’s Hospital; Attorney, Beck, Redden and Secrest, LLP; Business Law Instructor, University of St. Thomas; Attorney, Andrews & Kurth LLP | | | | |
| | | | | |
Raymond Stickel, Jr. – 1944 Trustee | | 2005 | | Retired Formerly: Director, Mainstay VP Series Funds, Inc. (25 portfolios); Partner, Deloitte & Touche | | 241 | | None |
| | | | | |
Robert C. Troccoli – 1949 Trustee | | 2016 | | Adjunct Professor, University of Denver – Daniels College of Business Formerly: Senior Partner, KPMG LLP | | 241 | | None |
| | | | | |
Daniel S. Vandivort3–1954 Trustee | | 2019 | | Treasurer, Chairman of the Audit and Finance Committee, and Trustee, Board of Trustees, Huntington Disease Foundation of America; and President, Flyway Advisory Services LLC (consulting and property management). Formerly: Trustee and Governance Chair, Board of Trustees (New York), Oppenheimer Funds | | 225 | | Chairman and Lead Independent Director, Chairman of the Audit Committee, and Director, Board of Directors, Value Line Funds |
James D. Vaughn3– 1945 Trustee | | 2019 | | Retired Formerly: Managing Partner, Deloitte & Touche LLP; Trustee and Chairman of the Audit Committee, Schroder Funds; Board Member, Mile High United Way, Boys and Girls Clubs, Boy Scouts, Colorado Business Committee for the Arts, Economic Club of Colorado and Metro Denver Network; and Trustee of certain Oppenheimer Funds | | 225 | | Board member and Chairman of Audit Committee of AMG National Trust Bank; Trustee and Investment Committee member, University of South Dakota Foundation; Board member, Audit Committee Member and past Board Chair, Junior Achievement |
| | | | | |
Christopher L. Wilson – 1957 Trustee | | 2017 | | Non-executive director and trustee of a number of public and private business corporations Formerly: Director, TD Asset Management USA Inc. (mutual fund complex) (22 portfolios); | | | | ISO New England, Inc.(non-profit organization managing regional electricity market) |
57 INVESCO OPPENHEIMER DIVIDEND OPPORTUNITY FUND
TRUSTEES AND OFFICERSUnaudited / Continued
| | | | | | | | |
Name, Year of Birth and Position(s) Held with the Trust | | Trustee
and/or
Officer
Since | | Principal Occupation(s) During Past 5 Years | | Number of Funds in Fund Complex Overseen by Trustee | | Other Directorship(s) Held by Trustee During Past 5 Years |
| | | | | |
| INDEPENDENT TRUSTEES (CONTINUED) | | | | | | | | |
| | | | | |
Christopher L. Wilson (Continued) | | | | Managing Partner, CT2, LLC (investing and consulting firm); President/Chief Executive Officer, Columbia Funds, Bank of America Corporation; President/Chief Executive Officer, CDC IXIS Asset Management Services, Inc.; Principal & Director of Operations, Scudder Funds, Scudder, Stevens & Clark, Inc.; Assistant Vice President, Fidelity Investments | | | | |
58 INVESCO OPPENHEIMER DIVIDEND OPPORTUNITY FUND
TRUSTEES AND OFFICERSUnaudited / Continued
| | | | | | | | |
Name, Year of Birth and Position(s) Held with the Trust | | Trustee
and/or
Officer
Since | | Principal Occupation(s) During Past 5 Years | | Number of Funds in Fund Complex Overseen by Trustee | | Other Directorship(s) Held by Trustee During Past 5 Years |
| | | | | |
OTHER OFFICERS | | | | | | | | |
| | | | | |
| | | | | |
Sheri Morris — 1964 President, Principal Executive Officer and Treasurer | | 2003 | | President, Principal Executive Officer and Treasurer, The Invesco Funds; Vice President, Invesco Advisers, Inc. (formerly known as Invesco Institutional (N.A.), Inc.) (registered investment adviser); and Vice President, Invesco Exchange-Traded Fund Trust, Invesco Exchange-Traded Fund Trust II, Invesco India Exchange-Traded Fund Trust, Invesco Actively Managed Exchange-Traded Fund Trust, Invesco Actively Managed Exchange-Traded Commodity Fund Trust and Invesco Exchange- Traded Self-Indexed Fund Trust | | N/A | | N/A |
| | | | | |
| | | | | Formerly: Vice President and Principal Financial Officer, The Invesco Funds; Vice President, Invesco AIM Advisers, Inc., Invesco AIM Capital Management, Inc. and Invesco AIM Private Asset Management, Inc.; Assistant Vice President and Assistant Treasurer, The Invesco Funds and Assistant Vice President, Invesco Advisers, Inc., Invesco AIM Capital Management, Inc. and Invesco AIM Private Asset Management, Inc.; and Treasurer, Invesco Exchange-Traded Fund Trust, Invesco Exchange-Traded Fund Trust II, Invesco India Exchange-Traded Fund Trust and Invesco Actively Managed Exchange-Traded Fund Trust | | | | |
| | | | | |
Russell C. Burk — 1958 Senior Vice President and Senior Officer | | 2005 | | Senior Vice President and Senior Officer, The Invesco Funds | | N/A | | N/A |
| | | | | |
Jeffrey H. Kupor – 1968 Senior Vice President, Chief Legal Officer and Secretary | | 2018 | | Head of Legal of the Americas, Invesco Ltd.; Senior Vice President and Secretary, Invesco Advisers, Inc. (formerly known as Invesco Institutional (N.A.), Inc.) (registered investment adviser); Senior Vice President and Secretary, Invesco Distributors, Inc. (formerly known as Invesco AIM Distributors, Inc.); Vice President and Secretary, Invesco Investment Services, Inc. (formerly known as Invesco AIM Investment Services, Inc.) Senior Vice President, Chief Legal Officer and Secretary, The Invesco Funds; Secretary and General Counsel, Invesco Investment Advisers LLC (formerly known as Van Kampen Asset Management); Secretary and General Counsel, Invesco Capital Markets, Inc. (formerly known as Van Kampen Funds Inc.) and Chief Legal Officer, Invesco Exchange-Traded Fund Trust, Invesco Exchange-Traded Fund Trust II, Invesco | | N/A | | N/A |
59 INVESCO OPPENHEIMER DIVIDEND OPPORTUNITY FUND
TRUSTEES AND OFFICERSUnaudited / Continued
| | | | | | | | |
Name, Year of Birth and Position(s) Held with the Trust | | Trustee
and/or
Officer
Since | | Principal Occupation(s) During Past 5 Years | | Number of Funds in Fund Complex Overseen by Trustee | | Other Directorship(s) Held by Trustee During Past 5 Years |
| | | | | |
OTHER OFFICERS (CONTINUED) | | | | | | | | |
| | | | | |
| Jeffrey H. Kupor (Continued) | | | | India Exchange-Traded Fund Trust, Invesco Actively Managed Exchange-Traded Fund Trust, Invesco Actively Managed Exchange- Traded Commodity Fund Trust and Invesco Exchange-Traded Self-Indexed Fund Trust; Secretary, Invesco Indexing LLC; Secretary, W.L. Ross & Co., LLC; Secretary and Vice President, Jemstep, Inc. | | | | |
| | | | | |
| | | | | Formerly: Head of Legal, Worldwide Institutional, Invesco Ltd.; Secretary and General Counsel, INVESCO Private Capital Investments, Inc.; Senior Vice President, Secretary and General Counsel, Invesco Management Group, Inc. (formerly known as Invesco AIM Management Group, Inc.); Assistant Secretary, INVESCO Asset Management (Bermuda) Ltd.; Secretary and General Counsel, Invesco Private Capital, Inc.; Assistant Secretary and General Counsel, INVESCO Realty, Inc.; Secretary and General Counsel, Invesco Senior Secured Management, Inc.; and Secretary, Sovereign G./P. Holdings Inc. | | | | |
| | | | | |
Andrew R. Schlossberg – 1974 Senior Vice President | | 2019 | | Head of the Americas and Senior Managing Director, Invesco Ltd.; Director and Senior Vice President, Invesco Advisers, Inc. (formerly known as Invesco Institutional (N.A.), Inc.) (registered investment adviser); Director and Chairman, Invesco Investment Services, Inc. (formerly known as Invesco AIM Investment Services, Inc.) (registered transfer agent); Senior Vice President, The Invesco Funds; Director, Invesco Investment Advisers LLC (formerly known as Van Kampen Asset Management) and Invesco UK Limited; Director, President and Chairman, Invesco Insurance Agency, Inc.; Director and Chief Executive, Invesco Asset Management Limited and Invesco Fund Managers Limited | | N/A | | N/A |
| | | | | |
| | | | | Formerly: Assistant Vice President, The Invesco Funds; Senior Vice President, Invesco Advisers, Inc. (formerly known as Invesco Institutional (N.A.), Inc.) (registered investment adviser); Director and Chief Executive, Invesco Administration Services Limited and Invesco Global Investment Funds Limited; Director, Invesco Distributors, Inc.; Head of EMEA, | | | | |
60 INVESCO OPPENHEIMER DIVIDEND OPPORTUNITY FUND
TRUSTEES AND OFFICERSUnaudited / Continued
| | | | | | | | |
Name, Year of Birth and Position(s) Held with the Trust | | Trustee
and/or
Officer
Since | | Principal Occupation(s) During Past 5 Years | | Number of Funds in Fund Complex Overseen by Trustee | | Other Directorship(s) Held by Trustee During Past 5 Years |
| | | | | |
OTHER OFFICERS (CONTINUED) | | | | | | | | |
| | | | | |
Andrew R. Schlossberg (Continued) | | | | Invesco Ltd.; President, Invesco Actively Managed Exchange-Traded Commodity Fund Trust, Invesco Actively Managed Exchange- Traded Fund Trust, Invesco Exchange-Traded Fund Trust, Invesco Exchange-Traded Fund Trust II and Invesco India Exchange-Traded Fund Trust; Managing Director and Principal Executive Officer, Invesco Capital Management LLC | | | | |
| | | | | |
John M. Zerr — 1962 Senior Vice President | | 2006 | | Chief Operating Officer of the Americas; Senior Vice President, Invesco Advisers, Inc. (formerly known as Invesco Institutional (N.A.), Inc.) (registered investment adviser); Senior Vice President, Invesco Distributors, Inc. (formerly known as Invesco AIM Distributors, Inc.); Director and Vice President, Invesco Investment Services, Inc. (formerly known as Invesco AIM Investment Services, Inc.) Senior Vice President, The Invesco Funds; Managing Director, Invesco Capital Management LLC; Director, Invesco Investment Advisers LLC (formerly known as Van Kampen Asset Management); Senior Vice President, Invesco Capital Markets, Inc. (formerly known as Van Kampen Funds Inc.); Manager, Invesco Indexing LLC; Invesco Canada Funds Advisory Board Member; Director, President Chief Executive Officer, Invesco Corporate Class Inc. (corporate mutual fund company); and Director, Chairman, President and Chief Executive Officer, Invesco Canada Ltd. (formerly known as Invesco Trimark Ltd./ Invesco Trimark Ltèe) (registered investment adviser and registered transfer agent) | | N/A | | N/A |
| | | | | |
| | | | | Formerly: Director and Senior Vice President, Invesco Management Group, Inc. (formerly known as Invesco AIM Management Group, Inc.); Secretary and General Counsel, Invesco Management Group, Inc. (formerly known as Invesco AIM Management Group, Inc.); Secretary, Invesco Investment Services, Inc. (formerly known as Invesco AIM Investment Services, Inc.); Chief Legal Officer and Secretary, The Invesco Funds; Secretary and General Counsel, Invesco Investment Advisers LLC (formerly known as Van Kampen Asset | | | | |
61 INVESCO OPPENHEIMER DIVIDEND OPPORTUNITY FUND
TRUSTEES AND OFFICERSUnaudited / Continued
| | | | | | | | |
Name, Year of Birth and Position(s) Held with the Trust | | Trustee
and/or
Officer
Since | | Principal Occupation(s) During Past 5 Years | | Number of Funds in Fund Complex Overseen by Trustee | | Other Directorship(s) Held by Trustee During Past 5 Years |
| | | | | |
OTHER OFFICERS (CONTINUED) | | | | | | | | |
| John M. Zerr (Continued) | | | | Management); Secretary and General Counsel, Invesco Capital Markets, Inc. (formerly known as Van Kampen Funds Inc.); Chief Legal Officer, Invesco Exchange-Traded Fund Trust, Invesco Exchange-Traded Fund Trust II, Invesco India Exchange-Traded Fund Trust, Invesco Actively Managed Exchange-Traded Fund Trust, Invesco Actively Managed Exchange- Traded Commodity Fund Trust and Invesco Exchange-Traded Self-Indexed Fund Trust; Secretary, Invesco Indexing LLC; Director, Secretary, General Counsel and Senior Vice President, Van Kampen Exchange Corp.; Director, Vice President and Secretary, IVZ Distributors, Inc. (formerly known as INVESCO Distributors, Inc.); Director and Vice President, INVESCO Funds Group, Inc.; Director and Vice President, Van Kampen Advisors Inc.; Director, Vice President, Secretary and General Counsel, Van Kampen Investor Services Inc.; Director and Secretary, Invesco Distributors, Inc. (formerly known as Invesco AIM Distributors, Inc.); Director, Senior Vice President, General Counsel and Secretary, Invesco AIM Advisers, Inc. and Van Kampen Investments Inc.; Director, Vice President and Secretary, Fund Management Company; Director, Senior Vice President, Secretary, General Counsel and Vice President, Invesco AIM Capital Management, Inc.; Chief Operating Officer and General Counsel, Liberty Ridge Capital, Inc. (an investment adviser) | | | | |
| | | | | |
Gregory G. McGreevey - 1962 Senior Vice President | | 2012 | | Senior Managing Director, Invesco Ltd.; Director, Chairman, President, and Chief Executive Officer, Invesco Advisers, Inc. (formerly known as Invesco Institutional (N.A.), Inc.) (registered investment adviser); Director, Invesco Mortgage Capital, Inc. and Invesco Senior Secured Management, Inc.; and Senior Vice President, The Invesco Funds | | N/A | | N/A |
| | | | | |
| | | | | Formerly: Senior Vice President, Invesco Management Group, Inc. and Invesco Advisers, Inc.; Assistant Vice President, The Invesco Funds | | | | |
62 INVESCO OPPENHEIMER DIVIDEND OPPORTUNITY FUND
TRUSTEES AND OFFICERSUnaudited / Continued
| | | | | | | | |
Name, Year of Birth and Position(s) Held with the Trust | | Trustee
and/or
Officer
Since | | Principal Occupation(s) During Past 5 Years | | Number of Funds in Fund Complex Overseen by Trustee | | Other Directorship(s) Held by Trustee During Past 5 Years |
| | | | | |
OTHER OFFICERS (CONTINUED) | | | | | | | | |
| | | | | |
| | | | | |
Kelli Gallegos – 1970 Vice President, Principal Financial Officer and Assistant Treasurer | | 2008 | | Vice President and Treasurer, Invesco Exchange-Traded Fund Trust, Invesco Exchange-Traded Fund Trust II, Invesco India Exchange-Traded Fund Trust, Invesco Actively Managed Exchange-Traded Fund Trust, Invesco Actively Managed Exchange-Traded Commodity Fund Trust and Invesco Exchange- Traded Self-Indexed Fund Trust; Vice President, Principal Financial Officer and Assistant Treasurer, The Invesco Funds; Principal Financial and Accounting Officer – Pooled Investments, Invesco Capital Management LLC | | N/A | | N/A |
| | | | | |
| | | | | Formerly: Assistant Treasurer, Invesco Exchange-Traded Fund Trust, Invesco Exchange-Traded Fund Trust II, Invesco India Exchange-Traded Fund Trust, Invesco Actively Managed Exchange-Traded Fund Trust, Invesco Actively Managed Exchange-Traded Commodity Fund Trust and Invesco Exchange- Traded Self-Indexed Fund Trust; Assistant Treasurer, Invesco Capital Management LLC; Assistant Vice President, The Invesco Funds | | | | |
| | | | | |
Crissie M. Wisdom – 1969 Anti-Money Laundering Compliance Officer | | 2013 | | Anti-Money Laundering Compliance Officer, Invesco Advisers, Inc. (formerly known as Invesco Institutional (N.A.), Inc.) (registered investment adviser), Invesco Capital Markets, Inc. (formerly known as Van Kampen Funds Inc.), Invesco Distributors, Inc., Invesco Investment Services, Inc., The Invesco Funds, and Invesco Exchange-Traded Fund Trust, Invesco Exchange-Traded Fund Trust II, Invesco India Exchange-Traded Fund Trust, Invesco Actively Managed Exchange-Traded Fund Trust, Invesco Actively Managed Exchange- Traded Commodity Fund Trust and Invesco Exchange-Traded Self-Indexed Fund Trust; Anti-Money Laundering Compliance Officer and Bank Secrecy Act Officer, INVESCO National Trust Company and Invesco Trust Company; and Fraud Prevention Manager and Controls and Risk Analysis Manager for Invesco Investment Services, Inc. | | N/A | | N/A |
| | | | | |
| | | | | Formerly: Anti-Money Laundering Compliance Officer, Van Kampen Exchange Corp. and Invesco Management Group, Inc. | | | | |
63 INVESCO OPPENHEIMER DIVIDEND OPPORTUNITY FUND
TRUSTEES AND OFFICERSUnaudited / Continued
| | | | | | | | |
Name, Year of Birth and Position(s) Held with the Trust | | Trustee
and/or
Officer
Since | | Principal Occupation(s) During Past 5 Years | | Number of Funds in Fund Complex Overseen by Trustee | | Other Directorship(s) Held by Trustee During Past 5 Years |
| | | | | |
OTHER OFFICERS (CONTINUED) | | | | | | | | |
| | | | | |
| | | | | |
Robert R. Leveille – 1969 Chief Compliance Officer | | 2016 | | Chief Compliance Officer, Invesco Advisers, Inc. (registered investment adviser); and Chief Compliance Officer, The Invesco Funds | | N/A | | N/A |
| | | | | |
| | | | | Formerly: Chief Compliance Officer, Putnam Investments and the Putnam Funds | | | | |
The Statement of Additional Information of the Trust includes additional information about the Fund’s Trustees and is available upon request, without charge, by calling 1.800.959.4246. Please refer to the Fund’s Statement of Additional Information for information on the Fund’ssub-advisers.
| | | | | | |
| Office of the Fund | | Investment Adviser | | Distributor | | Auditors |
| 11 Greenway Plaza, Suite 1000 | | Invesco Advisers, Inc. | | Invesco Distributors, Inc. | | KPMG LLP |
| Houston, TX 77046-1173 | | 1555 Peachtree Street, N.E. | | 11 Greenway Plaza, | | 1225 17th Street, |
| | Atlanta, GA 30309 | | Suite 1000 | | Suite 800 |
| | | | Houston, TX | | Denver, CO 80202 |
| | | | 77046-1173 | | |
| Counsel to the Fund | | Counsel to the | | Transfer Agent | | Custodian |
| Stradley Ronon Stevens & | | Independent Trustees | | Invesco Investment | | State Street Bank and |
| Young, LLP | | Goodwin Procter LLP | | Services, Inc. | | Trust Company |
| 2005 Market Street, Suite 2600 | | 901 New York Avenue, N.W. | | 11 Greenway Plaza, | | 225 Franklin Street |
| Philadelphia, PA 19103-7018 | | Washington, D.C. 20001 | | Suite 1000 | | Boston, MA 02110-2801 |
| | | | Houston, TX | | |
| | | | 77046-1173 | | |
64 INVESCO OPPENHEIMER DIVIDEND OPPORTUNITY FUND
Invesco recognizes the importance of protecting your personal and financial information when you visit our website located atwww.invesco.com (the “Website”). The following information is designed to help you understand the information collection practices at this Website. We will not sell, share or rent your personally identifiable information to others in contravention of this Privacy Policy. When we refer to ourselves as “we” or “Invesco” in this Privacy Policy, we mean our entire company including our affiliates, such as subsidiaries.
By visiting this Website, you are accepting the practices described in this Privacy Policy. If you do not agree to this policy, you may not use this Website. This Privacy Policy is subject to change without notice, from time to time in our sole discretion. You acknowledge that by accessing the Website after we have posted changes to this Privacy Policy, you are agreeing to this Privacy Policy as modified. Please review the Terms of Use1 to learn of other terms and conditions applicable to your use of the Website.
Please note that this Privacy Policy is not an exclusive statement of our privacy principles across all products and services. Other privacy principles or policies may apply depending on the products or services you obtain from Invesco, or the jurisdiction in which you transact with Invesco.
This Privacy Policy was last updated on May 6, 2018.
Information We Collect and Use
We collect personal information you choose to submit to the Website in order to process transactions requested by you and meet our contractual obligations. For example, you can choose to provide your name, contact information, social security number, or tax identification number in connection with accessing your account, or you can choose to provide your personal information when you fill out a secure account question form. Any information collected about you from the Website can, from time to time, be associated with other identifying information we have about you.
In addition, we may gather information about you automatically through your use of the Website, e.g. your IP address, how you navigate the Website, the organization from which you are accessing the Website, and the websites that you access before and after you visit the Website.
When you access the Website, we may also collect information such as unique device identifiers, your screen resolution and other device settings, information about your location, and analytical information about how you use the device from which you are viewing the Website. Where applicable, we may ask your permission before collecting certain information, such as precise geolocation information.
From time to time, we use or augment the personal information we have about you with information obtained from third parties. For example, we use third party information to confirm contact or financial information or to better understand your interests by associating demographic information from third parties with the information you have provided.
How We Use Personal Information
We use your personal information to respond to your inquiries and provide the products and services you request. We also use your information from time to time to deliver the content and services we believe
1NTD
65 INVESCO OPPENHEIMER DIVIDEND OPPORTUNITY FUND
| | |
| | INVESCO’S PRIVACY NOTICEContinued |
you will find the most relevant and to provide customer service and support.
We also use the information you provide to further develop and improve our products and services. We aggregate and/orde-identify data about visitors to the Website for various business purposes including product and service development and improvement activities.
How We Share Personal Information
We collaborate with other companies and individuals to perform services for us and on our behalf and we collaborate with our affiliates, other companies and individuals with respect to particular products or services (“Providers”). Examples of Providers include data analysis firms, customer service and support providers, email and SMS vendors, andweb-hosting and development companies. Some Providers collect information for us or on our behalf on our Website. These Providers can be provided with access to personal information needed to perform their functions.
We reserve the right to disclose your personal information as required by law, when we believe disclosure is necessary to comply with a regulatory requirement, judicial proceeding, court order or legal process served on us, to protect the safety, rights or property of our customers, the public or Invesco or to enforce the Terms of Use.
If we sell or transfer a business unit (such as a subsidiary) or an asset (such as a website) to another company, we will share your personal information with such company. You will receive notice of such an event and the new entity will inform you of any changes to the practices in this Privacy Policy. If the new entity wishes to make additional use of your information, you have the right to decline such use at that time.
We occasionally disclose aggregate orde-identified data that is not personally identifiable with third parties.
Cookies and Other Tools
Invesco and its Providers collect information about you by using cookies, tracking pixels and other technologies. We use this information to better understand, customize and improve user experience with our websites, services and offerings as well as to manage our advertising. For example, we use web analytics services that use these technologies to gather information to help us understand how visitors engage with and navigate our Website, e.g., how and when pages in a site are visited and by how many visitors. We are also able to offer our visitors a more customized, relevant experience on our sites using these technologies by delivering content and functionality based on your preferences and interests.
Depending on their purpose, some cookies will only operate for the length of a single browsing session, while others have a longer life span to ensure that they fulfill their longer-term purposes. Your web browser can be set to allow you to control whether you will accept cookies or reject cookies, to notify you each time a cookie is sent to your browser, or to delete cookies that have already been set. If your browser is set to reject cookies, certain aspects of the Website that are cookie-enabled will not recognize you when you return to the website, and some Website functionality may be lost. The “Help” section of your browser may tell you how to prevent your browser from accepting cookies. To find out more about cookies, visitwww.aboutcookies.org.
66 INVESCO OPPENHEIMER DIVIDEND OPPORTUNITY FUND
| | |
| | INVESCO’S PRIVACY NOTICEContinued |
Security
No data transmission over the internet can be 100% secure, so Invesco cannot ensure or warrant the security of any information you submit to us on this Website. However, Invesco seeks to protect your personal information from unauthorized access or use when you transact business on our Website using technical, administrative and procedural measures. Invesco makes no representation as to the reasonableness, efficacy, or appropriateness of the measures we use to safeguard such information.
Users are responsible for maintaining the secrecy of their own passwords. If you have reason to believe that your interaction with us is no longer secure (for example, if you feel that the security of any account you might have with us has been compromised), please immediately notify us by contacting us as specified below.
Transfer of Data to Other Countries
Any information you provide to Invesco through use of the Website may be stored and processed, transferred between and accessed from the United States, Canada and other countries which do not guarantee the same level of protection of personal information as the one in which you reside. However, Invesco will handle your personal information in accordance with this Privacy Policy regardless of where your personal information is stored/accessed.
Children’s Privacy
We are committed to protecting the privacy of children. We do not knowingly collect personal information from children under the age of 18. If you are under the age of 18, do not provide us with any personal information.
Contact Us
Please contact us if you have any questions or concerns about your personal information or require assistance in managing your choices.
Invesco Ltd.
1555 Peachtree St. NE
Atlanta, GA 30309
By phone:
(404)439-3236
By fax:
(404)962-8288
By email:
Anne.Gerry@invesco.com
Please update your account information by logging in or contact us by email or telephone as specified above to update your account information whenever such information ceases to be complete or accurate.
You may also contact us to:
67 INVESCO OPPENHEIMER DIVIDEND OPPORTUNITY FUND
| | |
| | INVESCO’S PRIVACY NOTICEContinued |
| | ● | | Request that we amend, rectify, delete or update the personal data we hold about you; |
| | ● | | Where possible (e.g. in relation to marketing) amend or update your choices around processing; |
| | ● | | Request a copy of personal data held by us. |
Disclaimer
Where the Website contains links to third-party websites/content/services that are not owned or controlled by Invesco, Invesco is not responsible for how these properties operate or treat your personal information so we recommend that you read the privacy policies and terms associated with these third party properties carefully.
68 INVESCO OPPENHEIMER DIVIDEND OPPORTUNITY FUND
THIS PAGE INTENTIONALLY LEFT BLANK.
THIS PAGE INTENTIONALLY LEFT BLANK.
THIS PAGE INTENTIONALLY LEFT BLANK.
| | |
Explore High-Conviction Investing with Invesco 
| | |
| |
| Go paperless with eDelivery | | |
Visit invesco.com/edelivery to enjoy the convenience and security of anytime electronic access to your investment documents. | | |
| |
| With eDelivery, you can elect to have any or all of the following materials delivered straight to your inbox to download, save and print from your own computer: | | |
| |
∎ Fund reports and prospectuses ∎ Quarterly statements | | |
∎ Daily confirmations ∎ Tax forms | | |
| | |
| Invesco mailing information | | |
| |
| Send general correspondence to Invesco Investment Services, Inc., P.O. Box 219078, Kansas City, MO 64121-9078. | | |
| | | | | | | | |
| | |  | |
| | |
Invesco Distributors, Inc. | | | O-DOPP-AR-1 | | | | 06242019 | |
Item 2. Code of Ethics.
There were no amendments to the Code of Ethics (the “Code”) that applies to the Registrant’s Principal Executive Officer (“PEO”) and Principal Financial Officer (“PFO”) during the period covered by the report. The Registrant did not grant any waivers, including implicit waivers, from any provisions of the Code to the PEO or PFO during the period covered by this report.
Item 3. Audit Committee Financial Expert.
The Board of Trustees has determined that the Registrant has at least one audit committee financial expert serving on its Audit Committee. The Audit Committee financial experts are David C. Arch, Bruce L. Crockett, Cynthia Hostetler, Elizabeth Krentzman, Anthony J. LaCava, Jr., Teresa M. Ressel, Raymond Stickel, Jr., Robert C. Troccoli and James Vaughn. David C. Arch, Bruce L. Crockett, Cynthia Hostetler, Elizabeth Krentzman, Anthony J. LaCava, Jr., Teresa M. Ressel, Raymond Stickel, Jr., Robert Troccoli and James Vaughn are “independent” within the meaning of that term as used in FormN-CSR
Item 4. Principal Accountant Fees and Services.
The following information relates to the series funds of the Registrant that are covered by this Report and includes information pertaining to principal accountant fees and services rendered to such funds for the two most recently completed fiscal years or, if shorter, since a fund’s commencement of operations.
The principal accountant for the audit of the fund’s annual financial statements billed $28,600 in fiscal 2019 and $27,900 in fiscal 2018.
The principal accountant for the audit of the fund’s annual financial statements billed $4,191 in fiscal 2019 and $3,500 in fiscal 2018.
The principal accountant for the audit of the fund’s annual financial statements billed $87,586 in fiscal 2019 and $476,361 in fiscal 2018 to the fund’s investment adviser or any entity controlling, controlled by, or under common control with the adviser that provided ongoing services to the fund.
Such services included: Internal control reviews, GIPS attestation procedures, custody audits and additional audit services
The principal accountant for the audit of the fund’s annual financial statements billed $2,849 in fiscal 2019 and no such fees in fiscal 2018.
The principal accountant for the audit of the fund’s annual financial statements billed $481,085 in fiscal 2019 and $669,599 in fiscal 2018 to the fund’s investment adviser or any entity controlling, controlled by, or under common control with the adviser that provided ongoing services to the fund.
Such services included: tax compliance, tax planning and tax advice. Tax compliance generally involved preparation of original and amended tax returns, claims for a refund and tax payment-planning services. Tax planning and tax advice included assistance with tax audits and appeals, tax advice related to mergers and acquisitions and requests for rulings or technical advice from taxing authorities.
The principal accountant for the audit of the fund’s annual financial statements billed no such fees in fiscal 2019 and no such fees in fiscal 2018.
The principal accountant for the audit of the fund’s annual financial statements billed no such fees in fiscal 2019 and no such fees in fiscal 2018 to the fund’s investment adviser or any entity controlling, controlled by, or under common control with the adviser that provided ongoing services to the fund.
Such fees would have included the cost to the principal accountant of attending audit committee meetings and consultations regarding the fund’s retirement plan with respect to its Trustees.
| (e) | (1) During its regularly scheduled periodic meetings, the fund’s audit committeepre-approved all audit, audit-related, tax and other services to be provided by the principal accountants of the fund. |
The audit committee had delegatedpre-approval authority to its committee chair for any subsequent new engagements that arose between regularly scheduled meeting dates provided that any suchpre-approvals were presented to the audit committee at its next regularly scheduled meeting.
Under applicable laws,pre-approval ofnon-audit services may be waived provided that: 1) the aggregate amount of all such services provided constitutes no more than five percent of the total amount of fees paid by the registrant to its principal accountant during the fiscal year in which services are provided 2) such services were not recognized by the registrant at the time of engagement asnon-audit services and 3) such services are promptly brought to the attention of the audit committee of the registrant and approved prior to the completion of the audit.
(2) 0%
| (f) | Not applicable as less than 50%. |
| (g) | The principal accountant for the audit of the fund’s annual financial statements billed $575,711 in fiscal 2019 and $1,149,460 in fiscal 2018 to the fund and the fund’s investment adviser or any entity controlling, controlled by, or under common control with the adviser that provided ongoing services to the fund related tonon-audit fees. Those billings did not include any prohibitednon-audit services as defined by the Securities Exchange Act of 1934. |
| (h) | The fund’s audit committee had considered whether the provision ofnon-audit services that were rendered to the fund’s investment adviser, and any entity controlling, controlled by, or under common control with the investment adviser that provided ongoing services to the fund that were notpre-approved pursuant to paragraph (c)(7)(ii) of Rule2-01 of RegulationS-X were compatible with maintaining the principal accountant’s independence. No such services were rendered. |
Item 5. Audit Committee of Listed Registrants
Not applicable.
Item 6. Schedule of Investments.
a) Not applicable. The complete schedule of investments is included in Item 1 of this FormN-CSR.
b) Not applicable.
Item 7. Disclosure of Proxy Voting Policies and Procedures forClosed-End Management Investment Companies.
Not applicable.
Item 8. Portfolio Managers ofClosed-End Management Investment Companies.
Not applicable.
Item 9. Purchases of Equity Securities byClosed-End Management Investment Company and Affiliated Purchasers.
Not applicable.
Item 10. Submission of Matters to a Vote of Security Holders.
None
Item 11. Controls and Procedures.
| | (a) | As of June 18, 2019, an evaluation was performed under the supervision and with the participation of the officers of the Registrant, including the PEO and PFO, to assess the effectiveness of the Registrant’s disclosure controls and procedures, as that term is defined in Rule30a-3(c) under the Investment Company Act of 1940 (the “Act”), as amended. Based on that evaluation, the Registrant’s officers, including the PEO and PFO, concluded that, as of June 18, 2019, the Registrant’s disclosure controls and procedures were reasonably designed to ensure: (1) that information required to be disclosed by the Registrant on FormN-CSR is recorded, processed, summarized and reported within the time periods specified by the rules and forms of the Securities and Exchange Commission; and (2) that material information relating to the Registrant is made known to the PEO and PFO as appropriate to allow timely decisions regarding required disclosure. |
| (b) | There have been no changes in the Registrant’s internal control over financial reporting (as defined in Rule30a-3(d) under the Act) that occurred during the second fiscal quarter of the period covered by this report that have materially affected, or are reasonably likely to materially affect, the Registrant’s internal control over financial reporting. |
Item 12. Disclosure of Securities Lending Activities forClosed-End Management Investment Companies.
Not applicable.
Item 13. Exhibits.
| | |
| 13(a) (1) | | Code of Ethics |
| |
| 13(a) (2) | | Certifications of principal executive officer and principal financial officer as required by Rule30a-2(a) under the Investment Company Act of 1940. |
| |
| 13(a) (3) | | Not applicable. |
| |
| 13(a) (4) | | Not applicable. |
| |
| 13(b) | | Certifications of principal executive officer and principal financial officer as required by Rule30a-2(b) under the Investment Company Act of 1940. |
SIGNATURES
Pursuant to the requirements of the Securities Exchange Act of 1934 and the Investment Company Act of 1940, the registrant has duly caused this report to be signed on its behalf by the undersigned, thereunto duly authorized.
| | |
AIM Equity Funds (Invesco Equity Funds) |
By: | | /s/ Sheri Morris |
| | Sheri Morris |
| | Principal Executive Officer |
Date: | | July 5, 2019 |
Pursuant to the requirements of the Securities Exchange Act of 1934 and the Investment Company Act of 1940, this report has been signed below by the following persons on behalf of the registrant and in the capacities and on the dates indicated.
| | |
By: | | /s/ Sheri Morris |
| | Sheri Morris |
| | Principal Executive Officer |
Date: | | July 5, 2019 |
| |
By: | | /s/ Kelli Gallegos |
| | Kelli Gallegos |
| | Principal Financial Officer |
Date: | | July 5, 2019 |