UNITED STATES
SECURITIES AND EXCHANGE COMMISSION
Washington, D.C. 20549
FORM N-CSR
CERTIFIED SHAREHOLDER REPORT
OF
REGISTERED MANAGEMENT INVESTMENT COMPANIES
| | |
| Investment Company Act file number: | 811-01766 |
Name of Registrant: | Vanguard Wellesley Income Fund |
Address of Registrant: | P.O. Box 2600 |
| | Valley Forge, PA 19482 |
Name and address of agent for service: | Anne E. Robinson, Esquire |
| | P.O. Box 876 |
| | Valley Forge, PA 19482 |
Registrant’s telephone number, including area code: (610) 669-1000 |
Date of fiscal year end: September 30 |
Date of reporting period: October 1, 2015 – September 30, 2016 |
Item 1: Reports to Shareholders |

Annual Report | September 30, 2016
Vanguard Wellesley® Income Fund
A new format, unwavering commitment
As you begin reading this report, you’ll notice that we’ve made some improvements to the opening sections—based on feedback from you, our clients.
Page 1 starts with a new ”Your Fund’s Performance at a Glance,” a concise, handy summary of how your fund performed during the period.
In the renamed ”Chairman’s Perspective,” Bill McNabb will focus on enduring principles and investment insights.
We’ve modified some tables, and eliminated some redundancy, but we haven’t removed any information.
At Vanguard, we’re always looking for better ways to communicate and to help you make sound investment decisions. Thank you for entrusting your assets to us.
| |
| Contents | |
| Your Fund’s Performance at a Glance. | 1 |
| Chairman’s Perspective. | 3 |
| Advisor’s Report. | 6 |
| Fund Profile. | 10 |
| Performance Summary. | 12 |
| Financial Statements. | 14 |
| Your Fund’s After-Tax Returns. | 35 |
| About Your Fund’s Expenses. | 36 |
| Trustees Approve Advisory Arrangement. | 38 |
| Glossary. | 40 |
Please note: The opinions expressed in this report are just that—informed opinions. They should not be considered promises or advice.
Also, please keep in mind that the information and opinions cover the period through the date on the front of this report. Of course, the
risks of investing in your fund are spelled out in the prospectus.
See the Glossary for definitions of investment terms used in this report.
About the cover: No matter what language you speak, Vanguard has one consistent message and set of principles. Our primary
focus is on you, our clients. We conduct our business with integrity as a faithful steward of your assets. This message is shown
translated into seven languages, reflecting our expanding global presence.
Your Fund’s Performance at a Glance
• For the 12 months ended September 30, 2016, Vanguard Wellesley Income Fund
returned 11.58% for Investor Shares. Its return was slightly ahead of the return of its
benchmark index and notably above the average return of its peer group.
• The fund allocates 60% to 65% of its assets to investment-grade bonds. Its fixed
income portfolio returned 7.27% compared with the 7.15% return of its benchmark.
• The advisor’s selections within investment-grade industrial and financial bonds
contributed most to the fund’s relative performance.
• The fund’s stock portfolio, which represents about 35% to 40% of its assets, returned
19.57%, slightly more than the 18.89% return of its benchmark.
• Energy, consumer discretionary, and industrial stocks added most to relative
performance.
• Over the decade ended September 30, 2016, the fund’s average annual return
surpassed that of its benchmark and its peers.
| |
| Total Returns: Fiscal Year Ended September 30, 2016 | |
| | Total |
| | Returns |
| Vanguard Wellesley Income Fund | |
| Investor Shares | 11.58% |
| Admiral™ Shares | 11.64 |
| Wellesley Income Composite Index | 11.25 |
| Mixed-Asset Target Allocation Conservative Funds Average | 7.21 |
For a benchmark description, see the Glossary.
Mixed-Asset Target Allocation Conservative Funds Average: Derived from data provided by Lipper, a Thomson Reuters Company.
Admiral Shares carry lower expenses and are available to investors who meet certain account-balance requirements.
1
| |
| Total Returns: Ten Years Ended September 30, 2016 | |
| | Average |
| | Annual Return |
| Wellesley Income Fund Investor Shares | 7.10% |
| Wellesley Income Composite Index | 6.41 |
| Mixed-Asset Target Allocation Conservative Funds Average | 4.06 |
For a benchmark description, see the Glossary.
Mixed-Asset Target Allocation Conservative Funds Average: Derived from data provided by Lipper, a Thomson Reuters Company.
The figures shown represent past performance, which is not a guarantee of future results. (Current performance may be
lower or higher than the performance data cited. For performance data current to the most recent month-end, visit our
website at vanguard.com/performance.) Note, too, that both investment returns and principal value can fluctuate widely, so
an investor’s shares, when sold, could be worth more or less than their original cost.
| | | |
| Expense Ratios | | | |
| Your Fund Compared With Its Peer Group | | | |
| | Investor | Admiral | Peer Group |
| | Shares | Shares | Average |
| Wellesley Income Fund | 0.23% | 0.16% | 0.83% |
The fund expense ratios shown are from the prospectus dated January 26, 2016, and represent estimated costs for the current fiscal year. For
the fiscal year ended September 30, 2016, the fund’s expense ratios were 0.22% for Investor Shares and 0.15% for Admiral Shares. The
peer-group expense ratio is derived from data provided by Lipper, a Thomson Reuters Company, and captures information through year-end
2015.
Peer group: Mixed-Asset Target Allocation Conservative Funds.
2
Chairman’s Perspective

Bill McNabb
Chairman and Chief Executive Officer
Dear Shareholder,
If you think you’ve had reason to feel uneasy about the investment environment lately, you’re not imagining things. In just the past few months, we’ve seen economic uncertainty, intense political polarization, and super-low bond yields. Yet at the same time, the stock market kept pushing higher.
In this confusing and sometimes contradictory climate, you may be asking yourself a question that I hear often: How do I make sense of all this, keep investing, and still get a good night’s sleep?
As with any problem, there are multiple ways to go at it. But there’s one approach in particular that is simple, straightforward, and nearly foolproof: Save more money. Not only can saving more give you a greater sense of control over your investment plan, it can help compensate for long-term returns that, in our estimation, could fall short of historical averages.
I love the way one of our investment pros put it. Fran Kinniry this summer told The Wall Street Journal, “Investing is always a partnership between you and the markets.” He explained that the markets carried more than their fair share of the weight for a couple of decades, through the 1990s, providing outsized returns that made the investor’s half of the partnership relatively light work. “But now you are going to have to be the majority partner.”
Sobering? Sure. Hopeless? Definitely not.
3
Over the 12 months since last September, U.S. stocks returned 15%, though the rise has not been a one-way ticket straight up. International markets have also posted strong returns, but lower than those of the broad U.S. market. The decision by United Kingdom voters in June to exit the European Union came as a surprise but caused market heartburn for only a few days.
In fixed income, yields remained extremely low—about 1.60% on the 10-year U.S. Treasury note at the end of September, after dipping below 1.40% over the summer. And bond yields in some international markets were negative.
Even this relatively small window of time illustrates a truism of the financial markets: There will always be segments that perform well and others that don’t. Saving more saves you from trying to control the uncontrollable—how economies and the markets perform. And it keeps you in control of one of the most vital parts of your investment program.
Although the “save more” logic is easy to grasp, it’s not always easy to follow. Bills, illness, the loss of a job—these can affect any of us.
But whatever our circumstances, figuring out how to save more is worth the effort. It requires that we make difficult decisions to forgo some consumption today to increase the likelihood of consuming (or consuming more) in the future. This is the very heart of investing. Sacrifices are never fun, so consider carrying them out systematically and in doses that you
| | | |
| Market Barometer | | | |
| | Average Annual Total Returns |
| | Periods Ended September 30, 2016 |
| | One | Three | Five |
| | Year | Years | Years |
| Stocks | | | |
| Russell 1000 Index (Large-caps) | 14.93% | 10.78% | 16.41% |
| Russell 2000 Index (Small-caps) | 15.47 | 6.71 | 15.82 |
| Russell 3000 Index (Broad U.S. market) | 14.96 | 10.44 | 16.36 |
| FTSE All-World ex US Index (International) | 9.62 | 0.71 | 6.50 |
| |
| Bonds | | | |
| Bloomberg Barclays U.S. Aggregate Bond Index | | | |
| (Broad taxable market) | 5.19% | 4.03% | 3.08% |
| Bloomberg Barclays Municipal Bond Index | | | |
| (Broad tax-exempt market) | 5.58 | 5.54 | 4.48 |
| Citigroup Three-Month U.S. Treasury Bill Index | 0.20 | 0.06 | 0.06 |
| |
| CPI | | | |
| Consumer Price Index | 1.46% | 1.03% | 1.25% |
4
can be comfortable with—for instance, gradually getting up to the max in your IRA, or adding a percentage point or so to the amount you stash in your employer’s retirement plan. As a point of reference, we generally suggest that investors strive for a retirement savings rate of 12%–15%, including any employer contributions.
If you need more convincing about the wisdom of the “save more” course of action, it might be helpful to examine your alternatives. This list is by no means exhaustive, but it hits on a few of the big ones, and none are without risk.
• Reach for yield. With yields so low on
many types of bonds, it’s tempting to find
the corners of the fixed income market
where payouts are juicier. But with the
juice comes considerable risk. You need
to be aware that you’d be taking on more
risk—and how much more.
• Go all-in on a hot-performing asset
class or fund. By now, you know better
than that, right?
• Sit tight. This approach isn’t a
terrible idea; it’s better than panicking
and deciding to just “do something,”
particularly if that means changing your
approach in response to the market’s
movements.
Here’s the inescapably challenging part of your partnership with the markets: In the short run, your “partner” is fickle, emotional, and wildly unpredictable. But in the long run, your partner is mostly rational and extremely helpful.
The best way to minimize your vulnerability to the market’s mood swings, and to maximize the benefit of your partner’s longer-term strengths, is to expect less and save more. Maybe the markets will deliver better-than-expected returns. Maybe they’ll be consistent with our more modest expectations. In either case, a higher savings rate can help put you in a better position to reach your goals.
As always, thank you for investing with Vanguard.
Sincerely,

F. William McNabb III
Chairman and Chief Executive Officer
October 18, 2016
5
Advisor’s Report
Vanguard Wellesley Income Fund returned 11.58% for Investor Shares and 11.64% for Admiral Shares for the fiscal year ended September 30, 2016. The composite benchmark, which is weighted 65% Bloomberg Barclays U.S. Credit A or Better Bond Index and 35% FTSE High Dividend Yield Index, returned 11.25%.
The investment environment
Stock markets in the United States and abroad climbed higher during the fiscal year. The S&P 500 Index returned 15.43%, the MSCI World Index returned 12.02%, and the MSCI EAFE Index returned 6.52%. In the United States, value stocks outperformed their growth counterparts, as the Russell 1000 Value Index returned 16.20% and the Russell 1000 Growth Index returned 13.76%.
The broad fixed income markets also ended the period with gains. The Bloomberg Barclays U.S. Aggregate Bond Index returned 5.19%. The higher-quality corporate bond market performed better than the broader fixed income market, returning 7.15% as measured by the Bloomberg Barclays U.S. Credit A or Better Bond Index. The yield on the 10-year U.S. Treasury note rose in November and December but declined in early 2016, reaching a low of 1.37% in July. Rates ended the period at 1.60%, compared with 2.05% a year ago.
Investors experienced a choppy 12 months highlighted by divergent central bank actions, global uncertainty about the health of China’s economy, oil price fluctuations, and the United Kingdom’s unexpected decision to leave the European Union. The much-anticipated monetary-policy divergence materialized in late 2015 when the European Central Bank (ECB) and the Bank of Japan (BOJ) announced additional policy easing, while the U.S. Federal Reserve initiated its well-telegraphed liftoff in December.
The start of 2016 was volatile as Chinese stocks plunged in early January, sparking global “risk-off” trading. U.S. stocks moved in virtual lockstep with the price of oil at the start of 2016 as fears of a recession weighed on investors’ minds. Markets surged in the second half of the quarter as solid economic data, stabilization in oil prices, and accommodative Fed comments helped calm investors’ early jitters. However, June brought fresh concerns largely because of the Brexit vote to leave the European Union.
Despite a negative initial market reaction, U.S. stocks staged an impressive comeback to continue their climb higher and keep the seven-year-old bull market intact. The third quarter of 2016 was relatively uneventful, as markets climbed higher amid subsiding Brexit fears and expectations for continued accommodative monetary policy from central banks around the globe. At its September meeting, the Fed decided to leave interest rates unchanged as Fed Chair Janet Yellen indicated that the case for a rate increase had strengthened but not enough to warrant a move.
6
The fund’s successes
Both the equity and fixed income portions of the fund generated positive returns and finished ahead of their respective benchmarks, the FTSE High Dividend Yield Index and the Bloomberg Barclays U.S. Credit A or Better Bond Index.
The stock portfolio’s relative outperformance was driven by strong security selection in the energy, industrial, and consumer staples sectors, as well as an underweight allocation to the consumer discretionary sector. On an individual stock basis, our positions in Bristol-Myers Squibb, TransCanada, and Eaton were the top contributors to relative performance. We were able to sell our position in Bristol-Myers Squibb and capture profits before the stock’s decline later in the period. Our avoidance of poorly performing benchmark constituent Eli Lilly also aided relative performance.
In the fixed income sleeve, selection among corporates was favorable, particularly within industrials and financials. An underweight to noncorporate credit, particularly our avoidance of supranationals, also helped. Our out-of-benchmark allocation to asset-backed securities, particularly collateralized loan obligations, helped relative performance.
The fund’s shortfalls
In the equity portfolio, security selection in utilities, financials, materials, and telecommunication services detracted from relative performance, as did an underweight to information technology, one of the benchmark’s best-performing sectors during the period. Our avoidance of AT&T and our positions in Wells Fargo, Novartis, and M&T Bank also hurt relative performance.
On the fixed income side, our duration positioning detracted. Although our short duration posture helped as rates rose at the end of 2015, it hurt in the first quarter of 2016 after the sharp rate decline.
We subsequently shifted our duration posture closer to the benchmark duration. However, in September, we once again took a short duration position relative to the benchmark.
The fund’s positioning
We are cautiously positive about the U.S. credit markets. The economic and credit cycles look to be tiring, but the powerful flood of global capital into our bond market—and credit in particular—shows no sign of abating. Low and negative yields in other major economic zones are still driving capital flows toward the higher yields and safety of the U.S. markets. Although our credit selections will remain thematic and well-researched, we expect investment-grade corporate bond returns to be attractive.
We do anticipate an increase in volatility as the markets become less complacent about the Fed’s intentions and as the U.S. election approaches. In this market context, we are focused on identifying solid company-specific investment catalysts and mispriced individual securities, rather than investing based
7
on broad themes. We remain disciplined in our application of our investment process, which enables us to create a balanced portfolio that we believe should perform well in a variety of environments.
Predicting rates has been a challenge given the influence of global macro factors. While we favor being short-duration, we are limiting our duration strategies to a narrow band because of the uncertainties facing the market. We anticipate a flatter yield curve and remain overweight the long end of the U.S. bond market as our inflation expectations, the primary driver of long-term interest rates, remain subdued. Our outlook is not without uncertainty, however. We cannot recall a period when global forces were as important to the U.S. economy and policies as they are today, so we are mindful of global events.
Additionally, the Fed appears reluctant to cause market volatility, potentially throwing the economy off its low-growth trajectory. In the end, we feel the Fed will not be able to avoid this outcome as it is on the threshold of meeting its dual objectives of low unemployment and modest inflation. Our immediate concern is that so many financial assets are correlated to interest rates (and priced for low interest rates) that higher interest rates could be the primary driver of all returns in the near term. In that environment, our exposure to U.S. Treasuries should help to buffer the fund’s bond holdings.
On the equity side, we believe the investment environment is somewhat precarious, with diverging developed- and emerging-market trends and uncertainties about central bank policies. China’s economy is moving from rapid to more moderate growth; the extent of the slowdown is still unknown. Europe struggled at the beginning of 2016, and the ECB continues to expand monetary policies and move interest rates into negative territory. Markets have had mixed reactions and experienced volatility in recent months. Japan also had a rocky start to 2016 as the BOJ surprised investors with the decision to implement negative interest rates.
The United States is in the seventh year of expansion and its third-longest economic recovery. Core inflation is starting to tick up, unemployment is low, and wages have been accelerating. It remains to be seen how the Fed’s experiment with quantitative easing will play out amid global uncertainty and the actions of other central banks. Against this backdrop, the consumer continues to be resilient.
Although our base case remains one of moderate U.S. GDP growth, we are wary of a potential downturn after a long run of moderate growth. We are mindful of higher risks and continue to focus on companies that can sustain or increase their dividend payments in a lower-growth environment.
8
At the end of the period, the equity portfolio’s largest overweighted sectors were energy, health care, and financials. The biggest underweights were in consumer discretionary, information technology, and telecommunication services. Over the past 12 months, we initiated new equity positions in Union Pacific, TransCanada, and Royal Dutch Shell. We also added to our Philip Morris International holdings. We eliminated Sysco, Bristol-Myers Squibb, and Texas Instruments and trimmed our positions in Waste Management and Analog Devices.
Respectfully,
John C. Keogh, Senior Managing Director
and Fixed Income Portfolio Manager
W. Michael Reckmeyer, III, CFA
Senior Managing Director and
Equity Portfolio Manager
Wellington Management Company llp
October 25, 2016
9
Wellesley Income Fund
Fund Profile
As of September 30, 2016
| | |
| Share-Class Characteristics | |
| | Investor | Admiral |
| | Shares | Shares |
| Ticker Symbol | VWINX | VWIAX |
| Expense Ratio1 | 0.23% | 0.16% |
| 30-Day SEC Yield | 2.46% | 2.54% |
| | | |
| Equity and Portfolio Characteristics | |
| | | FTSE High | DJ |
| | | Dividend | U.S. Total |
| | | Yield | Market |
| | Fund | Index | FA Index |
| Number of Stocks | 60 | 414 | 3,850 |
| Median Market Cap $150.8B | $108.8B | $51.8B |
| Price/Earnings Ratio | 22.1x | 20.7x | 23.7x |
| Price/Book Ratio | 2.7x | 2.7x | 2.8x |
| Return on Equity | 17.7% | 17.7% | 16.6% |
| Earnings Growth | | | |
| Rate | 0.2% | 1.0% | 7.6% |
| Dividend Yield | 3.3% | 3.2% | 2.0% |
| Foreign Holdings | 6.2% | 0.0% | 0.0% |
| Turnover Rate | 31% | — | — |
| Short-Term Reserves | 1.5% | — | — |
| | | |
| Fixed Income Characteristics | |
| |
| | | Bloomberg | |
| | | Barclays | Bloomberg |
| | | Credit | Barclays |
| | | A or Better | Aggregate |
| | Fund | Index Bond | Index |
| |
| Number of Bonds | 942 | 3,418 | 9,908 |
| |
| Yield to Maturity | | | |
| (before expenses) | 2.3% | 2.3% | 2.0% |
| |
| Average Coupon | 3.5% | 3.5% | 3.1% |
| |
| Average Duration | 6.7 years | 7.1 years | 5.5 years |
| |
| Average Effective | | | |
| Maturity | 9.7 years | 10.0 years | 7.7 years |
| | |
| Total Fund Volatility Measures | |
| | | DJ |
| | Wellesley | U.S. Total |
| | Composite | Market |
| | Index | FA Index |
| R-Squared | 0.97 | 0.66 |
| Beta | 1.01 | 0.32 |
| These measures show the degree and timing of the fund’s fluctuations compared with the indexes over 36 months. |
| | |
| Ten Largest Stocks (% of equity portfolio) | |
| Microsoft Corp. | Systems Software | 4.9% |
| Merck & Co. Inc. | Pharmaceuticals | 3.7 |
| Johnson & Johnson | Pharmaceuticals | 3.7 |
| Philip Morris | | |
| International Inc. | Tobacco | 3.6 |
| JPMorgan Chase & Co. | Diversified Banks | 3.4 |
| Wells Fargo & Co. | Diversified Banks | 3.4 |
| Cisco Systems Inc. | Communications | |
| | Equipment | 3.3 |
| Pfizer Inc. | Pharmaceuticals | 3.3 |
| General Electric Co. | Industrial | |
| | Conglomerates | 3.0 |
| Verizon Communications Integrated | |
| Inc. | Telecommunication | |
| | Services | 2.9 |
| Top Ten | | 35.2% |
| Top Ten as % of Total Net Assets | 12.6% |
| The holdings listed exclude any temporary cash investments and equity index products. |
Fund Asset Allocation

1 The expense ratios shown are from the prospectus dated January 26, 2016, and represent estimated costs for the current fiscal year. For the fiscal
year ended September 30, 2016, the expense ratios were 0.22% for Investor Shares and 0.15% for Admiral Shares.
10
Wellesley Income Fund
| |
| Distribution by Credit Quality (% of fixed | |
| income portfolio) | |
| U.S. Government | 17.8% |
| Aaa | 6.0 |
| Aa | 14.9 |
| A | 41.7 |
| Baa | 19.6 |
Credit-quality ratings are obtained from Barclays and are from Moody's, Fitch, and S&P. When ratings from all three agencies are
used, the median rating is shown. When ratings from two of the agencies are used, the lower rating for each issue is shown. "Not
Rated" is used to classify securities for which a rating is not available. Not rated securities include a fund's investment in
Vanguard Market Liquidity Fund or Vanguard Municipal Cash Management Fund, each of which invests in high-quality money
market instruments and may serve as a cash management vehicle for the Vanguard funds, trusts, and accounts. For more information
about these ratings, see the Glossary entry for Credit Quality.
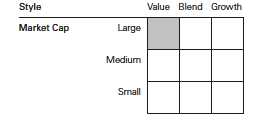
Equity Investment Focus
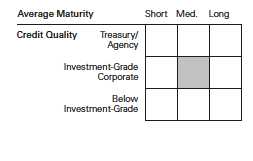
Fixed Income Investment Focus
| | | |
| Sector Diversification (% of equity exposure) |
| | | FTSE High | DJ |
| | | Dividend | U.S. Total |
| | | Yield | Market |
| | Fund | Index | FA Index |
| Consumer | | | |
| Discretionary | 1.7% | 5.8% | 12.8% |
| Consumer Staples | 14.5 | 14.6 | 8.7 |
| Energy | 14.0 | 10.6 | 6.7 |
| Financials | 13.8 | 13.2 | 13.3 |
| Health Care | 14.2 | 11.4 | 14.2 |
| Industrials | 11.7 | 11.5 | 10.3 |
| Information | | | |
| Technology | 13.8 | 15.6 | 20.7 |
| Materials | 3.4 | 3.5 | 3.3 |
| Real Estate | 0.0 | 0.0 | 4.3 |
| Telecommunication | | | |
| Services | 4.3 | 5.6 | 2.4 |
| Utilities | 8.6 | 8.2 | 3.3 |
| |
| Sector Diversification (% of fixed income | |
| portfolio) | |
| Asset-Backed | 3.9% |
| Commercial Mortgage-Backed | 0.4 |
| Finance | 25.4 |
| Foreign | 4.4 |
| Government Mortgage-Backed | 1.3 |
| Industrial | 37.4 |
| Treasury/Agency | 16.2 |
| Utilities | 6.5 |
| Other | 4.5 |
The agency and mortgage-backed securities sectors may include issues from government-sponsored enterprises; such issues are
generally not backed by the full faith and credit of the U.S. government.
Wellesley Income Fund
Performance Summary
All of the returns in this report represent past performance, which is not a guarantee of future results that may be achieved by the fund. (Current performance may be lower or higher than the performance data cited. For performance data current to the most recent month-end, visit our website at vanguard.com/performance.) Note, too, that both investment returns and principal value can fluctuate widely, so an investor’s shares, when sold, could be worth more or less than their original cost. The returns shown do not reflect taxes that a shareholder would pay on fund distributions or on the sale of fund shares.
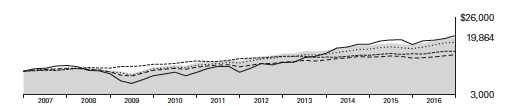
Cumulative Performance: September 30, 2006, Through September 30, 2016
Initial Investment of $10,000
| | | | | |
| | | Average Annual Total Returns | |
| | | Periods Ended September 30, 2016 | |
| |
| | | | | | Final Value |
| | | One | Five | Ten | of a $10,000 |
| | | Year | Years | Years | Investment |
| | Wellesley Income Fund Investor | | | | |
| | Shares | 11.58% | 8.70% | 7.10% | $19,864 |
| |
| •••••••• | Wellesley Income Composite Index | 11.25 | 8.44 | 6.41 | 18,609 |
| |
| – – – – | Mixed-Asset Target Allocation | | | | |
| | Conservative Funds Average | 7.21 | 5.67 | 4.06 | 14,884 |
| | Bloomberg Barclays U.S. Aggregate | | | | |
| - - - - - - | Bond Index | 5.19 | 3.08 | 4.79 | 15,965 |
| | Dow Jones U.S. Total Stock Market | | | | |
| | Float Adjusted Index | 14.93 | 16.30 | 7.49 | 20,592 |
For a benchmark description, see the Glossary.
Mixed-Asset Target Allocation Conservative Funds Average: Derived from data provided by Lipper, a Thomson Reuters Company.
| | | | |
| | | | | Final Value |
| | One | Five | Ten | of a $50,000 |
| | Year | Years | Years | Investment |
| Wellesley Income Fund Admiral Shares | 11.64% | 8.78% | 7.19% | $100,102 |
| Wellesley Income Composite Index | 11.25 | 8.44 | 6.41 | 93,045 |
| Bloomberg Barclays U.S. Aggregate Bond | | | | |
| Index | 5.19 | 3.08 | 4.79 | 79,825 |
| Dow Jones U.S. Total Stock Market Float | | | | |
| Adjusted Index | 14.93 | 16.30 | 7.49 | 102,961 |
| See Financial Highlights for dividend and capital gains information. |
12
Wellesley Income Fund
Fiscal-Year Total Returns (%): September 30, 2006, Through September 30, 2016
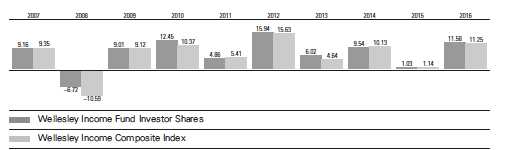
For a benchmark description, see the Glossary.
13
Wellesley Income Fund
Financial Statements
Statement of Net Assets—Investments Summary
As of September 30, 2016
This Statement summarizes the fund’s holdings by asset type. Details are reported for each of the fund’s 50 largest individual holdings and for investments that, in total for any issuer, represent more than 1% of the fund’s net assets. The total value of smaller holdings is reported as a single amount within each category.
The fund reports a complete list of its holdings in regulatory filings four times in each fiscal year, at the quarter-ends. For the second and fourth fiscal quarters, the complete listing of the fund’s holdings is available electronically on vanguard.com and on the Securities and Exchange Commission’s website (sec.gov), or you can have it mailed to you without charge by calling 800-662-7447. For the first and third fiscal quarters, the fund files the lists with the SEC on Form N-Q. Shareholders can look up the fund’s Forms N-Q on the SEC’s website. Forms N-Q may also be reviewed and copied at the SEC’s Public Reference Room (see the back cover of this report for further information).
| | | | | | |
| | | | | Face | Market | Percentage |
| | | | Maturity | Amount | Value• | of Net |
| | | Coupon | Date | ($000) | ($000) | Assets |
| U.S. Government and Agency Obligations | | | | |
| U.S. Government Securities | | | | | | |
| 1 United States Treasury Note/Bond | 1.750% | 9/30/19 | 665,000 | 681,519 | 1.4% |
| United States Treasury Note/Bond | 1.375% | 9/30/18 | 662,270 | 669,721 | 1.3% |
| United States Treasury Note/Bond | 1.000% | 9/15/17 | 629,315 | 631,278 | 1.3% |
| United States Treasury Note/Bond | 3.375% | 5/15/44 | 322,125 | 394,200 | 0.8% |
| United States Treasury Note/Bond | 2.000% | 2/15/25 | 350,870 | 363,533 | 0.7% |
| United States Treasury Note/Bond | 0.625% | 7/31/17 | 298,000 | 298,000 | 0.6% |
| United States Treasury Note/Bond | 1.625% | 6/30/20 | 258,195 | 263,844 | 0.5% |
| United States Treasury Note/Bond | 2.875% | 5/15/43 | 203,565 | 227,325 | 0.5% |
| United States Treasury Note/Bond | 0.875% | 3/31/18 | 217,000 | 217,441 | 0.4% |
| United States Treasury | | | | | | |
| Note/Bond | 0.500%–3.625% | 12/31/16–2/15/46 | 1,073,489 | 1,112,609 | 2.2% |
| | | | | | 4,859,470 | 9.7% |
| |
| Agency Notes † | | | | | 77,191 | 0.2% |
| |
| Conventional Mortgage-Backed Securities † | | | 425,451 | 0.9% |
| |
| Nonconventional Mortgage-Backed Securities † | | | 110,705 | 0.2% |
| Total U.S. Government and Agency Obligations (Cost $5,253,268) | | 5,472,817 | 11.0% |
| 2Asset-Backed/Commercial Mortgage-Backed Securities (Cost $1,199,036) † | 1,207,603 | 2.4% |
| Corporate Bonds | | | | | | |
| Finance | | | | | | |
| Banking | | | | | | |
| Bank One Corp. | | 7.750% | 7/15/25 | 25,000 | 32,099 | 0.1% |
| Bear Stearns Cos. LLC | | 7.250% | 2/1/18 | 14,860 | 15,958 | 0.0% |
| Goldman Sachs Group Inc. | 2.600%–7.500% | 1/18/18–10/21/45 | 486,415 | 546,931 | 1.1% |
| JPMorgan Chase & Co. | 2.000%–6.300% | 8/15/17–6/1/45 | 498,530 | 548,338 | 1.1% |
| Morgan Stanley | 1.875%–7.300% | 1/9/17–1/27/45 | 539,165 | 581,763 | 1.1% |
| Wachovia Corp. | 5.750%–6.605% | 2/1/18–10/1/25 | 24,500 | 28,346 | 0.1% |
14
| | | | | |
| Wellesley Income Fund | | | | | |
| |
| |
| |
| | | | Face | Market | Percentage |
| | | Maturity | Amount | Value• | of Net |
| | Coupon | Date | ($000) | ($000) | Assets |
| Wells Fargo & Co. | 2.150%–5.625% | 12/11/17–6/14/46 | 519,305 | 548,671 | 1.1% |
| 2 Banking—Other † | | | | 3,722,516 | 7.5% |
| Brokerage † | | | | 7,364 | 0.0% |
| Finance Companies | | | | | |
| GE Capital International | | | | | |
| Funding Co. | 4.418% | 11/15/35 | 201,814 | 227,654 | 0.5% |
| GE Capital International | | | | | |
| Funding Co. | 2.342%–3.373% | 11/15/20–11/15/25 | 117,660 | 124,170 | 0.2% |
| |
| 2 Insurance † | | | | 1,197,307 | 2.4% |
| 2 Other Finance † | | | | 30,795 | 0.1% |
| 2 Real Estate Investment Trusts † | | | 157,473 | 0.3% |
| | | | | 7,769,385 | 15.6% |
| Industrial | | | | | |
| 2 Basic Industry † | | | | 194,704 | 0.4% |
| Capital Goods | | | | | |
| General Electric Capital | | | | | |
| Corp. | 3.100%–6.875% | 2/11/21–1/10/39 | 103,860 | 131,763 | 0.2% |
| General Electric Co. | 2.700%–4.500% | 10/9/22–3/11/44 | 30,665 | 33,279 | 0.1% |
| 2 Capital Goods—Other † | | | | 787,110 | 1.6% |
| Communication | | | | | |
| Verizon | | | | | |
| Communications Inc. | 3.450%–6.550% | 3/15/21–9/15/43 | 279,580 | 339,177 | 0.7% |
| 2 Communication—Other † | | | | 1,470,624 | 2.9% |
| 2 Consumer Cyclical † | | | | 1,516,648 | 3.0% |
| Consumer Noncyclical | | | | | |
| Anheuser-Busch InBev | | | | | |
| Finance Inc. | 3.300%–4.900% | 2/1/23–2/1/46 | 387,920 | 442,372 | 0.9% |
| Anheuser-Busch InBev | | | | | |
| Worldwide Inc. | 2.500%–7.750% | 1/15/19–7/15/42 | 125,851 | 138,054 | 0.3% |
| Johnson & Johnson | 2.450%–6.730% | 11/15/23–3/1/26 | 93,000 | 100,286 | 0.2% |
| Merck & Co. Inc. | 2.350%–4.150% | 1/15/21–5/18/43 | 136,880 | 146,148 | 0.3% |
| Merck Sharp & Dohme | | | | | |
| Corp. | 5.000% | 6/30/19 | 18,000 | 19,809 | 0.0% |
| Pfizer Inc. | 3.000%–6.200% | 3/15/19–6/15/23 | 54,040 | 59,007 | 0.1% |
| Philip Morris International | | | | | |
| Inc. | 1.875%–4.875% | 3/26/20–11/10/44 | 164,030 | 173,255 | 0.4% |
| Wyeth LLC | 5.950% | 4/1/37 | 15,000 | 20,106 | 0.0% |
| 2 Consumer Noncyclical—Other † | | | 2,737,268 | 5.5% |
| Energy | | | | | |
| Chevron Corp. | 2.355%–3.191% | 12/5/22–6/24/23 | 75,750 | 80,431 | 0.2% |
| Dominion Gas Holdings LLC | 3.550% | 11/1/23 | 14,085 | 14,834 | 0.0% |
| Exxon Mobil Corp. | 2.222%–4.114% | 3/1/21–3/1/46 | 41,620 | 43,888 | 0.1% |
| Texaco Capital Inc. | 8.625% | 4/1/32 | 25,000 | 37,601 | 0.1% |
| 2 Energy—Other † | | | | 1,415,063 | 2.8% |
| 2 Other Industrial † | | | | 71,091 | 0.2% |
| Technology | | | | | |
| Cisco Systems Inc. | 2.200%–4.450% | 1/15/20–3/4/21 | 114,205 | 118,733 | 0.3% |
| Intel Corp. | 3.300%–4.100% | 10/1/21–5/19/46 | 57,755 | 61,921 | 0.1% |
| Microsoft Corp. | 2.375%–4.500% | 10/1/20–8/8/46 | 330,740 | 348,712 | 0.7% |
| Technology—Other † | | | | 603,321 | 1.2% |
| 2 Transportation † | | | | 310,302 | 0.6% |
| | | | | 11,415,507 | 22.9% |
15
| | | | | |
| Wellesley Income Fund | | | | | |
| |
| |
| |
| | | | Face | Market | Percentage |
| | | Maturity | Amount | Value• | of Net |
| | Coupon | Date | ($000) | ($000) | Assets |
| Utilities | | | | | |
| Electric | | | | | |
| 3 Dominion Resources Inc. | 2.962%–4.450% | 7/1/19–12/1/24 | 70,880 | 75,871 | 0.2% |
| Duke Energy Carolinas LLC | 3.900%–6.100% | 1/15/18–9/30/42 | 57,520 | 65,345 | 0.1% |
| Duke Energy Corp. | 1.625%–4.800% | 11/15/16–9/1/46 | 139,660 | 144,280 | 0.3% |
| Duke Energy Progress LLC | 2.800%–6.300% | 5/15/22–8/15/45 | 63,820 | 70,343 | 0.1% |
| Progress Energy Inc. | 3.150% | 4/1/22 | 20,800 | 21,767 | 0.1% |
| Virginia Electric & Power | | | | | |
| Co. | 5.950%–6.000% | 9/15/17–5/15/37 | 59,435 | 64,713 | 0.1% |
| 2 Electric—Other † | | | | 1,357,505 | 2.7% |
| 2 Natural Gas † | | | | 179,270 | 0.3% |
| | | | | 1,979,094 | 3.9% |
| Total Corporate Bonds (Cost $19,722,824) | | | 21,163,986 | 42.4% |
| 2Sovereign Bonds (U.S. Dollar-Denominated) (Cost $1,381,120) † | | 1,422,452 | 2.9% |
| Taxable Municipal Bonds (Cost $1,119,773) † | | | 1,391,321 | 2.8% |
| |
| | | | Shares | | |
| Common Stocks | | | | | |
| Consumer Discretionary | | | | | |
| McDonald’s Corp. | | | 2,703,790 | 311,909 | 0.6% |
| |
| Consumer Staples | | | | | |
| Philip Morris International Inc. | | 6,631,860 | 644,749 | 1.3% |
| Kraft Heinz Co. | | | 4,255,286 | 380,891 | 0.8% |
| British American Tobacco plc | | | 5,637,221 | 360,517 | 0.7% |
| Coca-Cola Co. | | | 7,383,760 | 312,481 | 0.6% |
| Altria Group Inc. | | | 3,504,640 | 221,598 | 0.4% |
| PepsiCo Inc. | | | 1,972,770 | 214,578 | 0.4% |
| Consumer Staples—Other † | | | | 484,904 | 1.0% |
| | | | | 2,619,718 | 5.2% |
| Energy | | | | | |
| Exxon Mobil Corp. | | | 5,292,010 | 461,887 | 0.9% |
| Chevron Corp. | | | 4,332,340 | 445,884 | 0.9% |
| Suncor Energy Inc. | | | 12,439,320 | 345,564 | 0.7% |
| Occidental Petroleum Corp. | | | 4,590,270 | 334,723 | 0.7% |
| ^ TransCanada Corp. | | | 4,876,020 | 231,583 | 0.5% |
| Phillips 66 | | | 2,537,730 | 204,414 | 0.4% |
| Energy—Other † | | | | 500,776 | 1.0% |
| | | | | 2,524,831 | 5.1% |
| Financials | | | | | |
| JPMorgan Chase & Co. | | | 9,212,680 | 613,472 | 1.2% |
| Wells Fargo & Co. | | | 13,720,112 | 607,526 | 1.2% |
| BlackRock Inc. | | | 915,480 | 331,825 | 0.7% |
| Chubb Ltd. | | | 1,994,143 | 250,564 | 0.5% |
| MetLife Inc. | | | 4,906,280 | 217,986 | 0.5% |
| Financials—Other † | | | | 465,268 | 0.9% |
| | | | | 2,486,641 | 5.0% |
| Health Care | | | | | |
| Merck & Co. Inc. | | | 10,614,970 | 662,480 | 1.3% |
| Johnson & Johnson | | | 5,603,630 | 661,957 | 1.3% |
| Pfizer Inc. | | | 17,470,847 | 591,737 | 1.2% |
16
| | | | |
| Wellesley Income Fund | | | | |
| |
| |
| |
| | | | Market | Percentage |
| | | | Value• | of Net |
| | | Shares | ($000) | Assets |
| ^ AstraZeneca plc ADR | | 7,629,640 | 250,710 | 0.5% |
| Novartis AG | | 2,919,307 | 229,578 | 0.5% |
| Health Care—Other † | | | 175,942 | 0.4% |
| | | | 2,572,404 | 5.2% |
| Industrials | | | | |
| General Electric Co. | | 18,474,270 | 547,208 | 1.1% |
| Eaton Corp. plc | | 5,752,630 | 378,005 | 0.8% |
| Union Pacific Corp. | | 3,226,840 | 314,714 | 0.6% |
| Lockheed Martin Corp. | | 918,990 | 220,300 | 0.4% |
| 3M Co. | | 1,160,830 | 204,573 | 0.4% |
| Industrials—Other † | | | 457,985 | 0.9% |
| | | | 2,122,785 | 4.2% |
| Information Technology | | | | |
| Microsoft Corp. | | 15,263,120 | 879,156 | 1.8% |
| Cisco Systems Inc. | | 18,774,760 | 595,535 | 1.2% |
| Intel Corp. | | 13,500,550 | 509,646 | 1.0% |
| Analog Devices Inc. | | 4,019,397 | 259,050 | 0.5% |
| Information Technology—Other † | | | 244,805 | 0.5% |
| | | | 2,488,192 | 5.0% |
| Materials | | | | |
| Dow Chemical Co. | | 5,163,190 | 267,608 | 0.5% |
| Materials—Other † | | | 341,320 | 0.7% |
| | | | 608,928 | 1.2% |
| Telecommunication Services | | | | |
| Verizon Communications Inc. | | 10,003,326 | 519,973 | 1.1% |
| BCE Inc. | | 5,612,180 | 259,188 | 0.5% |
| | | | 779,161 | 1.6% |
| Utilities | | | | |
| Dominion Resources Inc. | | 6,085,370 | 451,960 | 0.9% |
| Xcel Energy Inc. | | 6,311,960 | 259,674 | 0.5% |
| Duke Energy Corp. | | 3,199,620 | 256,098 | 0.5% |
| Eversource Energy | | 4,052,250 | 219,551 | 0.5% |
| National Grid plc | | 14,669,406 | 207,326 | 0.4% |
| Utilities—Other † | | | 154,867 | 0.3% |
| | | | 1,549,476 | 3.1% |
| Total Common Stocks (Cost $13,395,843) | | | 18,064,045 | 36.2% |
| |
| | Coupon | | | |
| Temporary Cash Investments | | | | |
| Money Market Fund | | | | |
| 4,5 Vanguard Market Liquidity Fund | 0.640% | 3,809 | 380,962 | 0.8% |
17
| | | | | |
| Wellesley Income Fund | | | | | |
| |
| |
| |
| | | | Face | Market | Percentage |
| | | Maturity | Amount | Value• | of Net |
| | Coupon | Date | ($000) | ($000) | Assets |
| Repurchase Agreements | | | | | |
| Bank of America Securities, LLC | | | | | |
| (Dated 9/30/16, Repurchase Value | | | | | |
| $75,203,000, collateralized by | | | | | |
| Federal Home Loan Mortgage | | | | | |
| Corp. 0.000%–3.500%, | | | | | |
| 2/1/43–7/1/46, with a value | | | | | |
| of $76,704,000) | 0.490% | 10/3/16 | 75,200 | 75,200 | 0.2% |
| Deutsche Bank Securities, Inc. | | | | | |
| (Dated 9/30/16, Repurchase Value | | | | | |
| $57,302,000, collateralized by U.S. | | | | | |
| Treasury Note/Bond 2.125%, | | | | | |
| 5/15/25, with a value of | | | | | |
| $58,446,000) | 0.510% | 10/3/16 | 57,300 | 57,300 | 0.1% |
| HSBC Bank USA (Dated 9/30/16, | | | | | |
| Repurchase Value $110,504,000, | | | | | |
| collateralized by Federal National | | | | | |
| Mortgage Assn. 3.500%, | | | | | |
| 12/1/42–9/1/46, with a value | | | | | |
| of $112,713,000) | 0.470% | 10/3/16 | 110,500 | 110,500 | 0.2% |
| RBC Capital Markets LLC (Dated | | | | | |
| 9/30/16, Repurchase Value | | | | | |
| $80,903,000, collateralized by | | | | | |
| Federal National Mortgage Assn. | | | | | |
| 2.418%–6.000%, 9/1/26–7/1/46, | | | | | |
| and Federal Home Loan Mortgage | | | | | |
| Corp. 4.000%, 5/1/44, with a value | | | | | |
| of $82,518,000) | 0.460% | 10/3/16 | 80,900 | 80,900 | 0.2% |
| RBS Securities, Inc. (Dated | | | | | |
| 9/30/16, Repurchase Value | | | | | |
| $3,300,000, collateralized by | | | | | |
| U.S. Treasury Note/Bond 0.500%, | | | | | |
| 1/31/17, with a value of | | | | | |
| $3,370,000) | 0.470% | 10/3/16 | 3,300 | 3,300 | 0.0% |
| | | | | 327,200 | 0.7% |
| U.S. Government and Agency Obligations | | | | |
| United States Treasury Bill | 0.353% | 12/15/16 | 125,000 | 124,950 | 0.3% |
| U.S. Government and Agency | | | | | |
| Obligations—Other † | | | | 285,938 | 0.5% |
| | | | | 410,888 | 0.8% |
| Total Temporary Cash Investments (Cost $1,118,979) | | | 1,119,050 | 2.3% |
| Total Investments (Cost $43,190,843) | | | | 49,841,274 | 100.0% |
18
| | |
| Wellesley Income Fund | | |
| |
| |
| |
| | | Percentage |
| | Amount | of Net |
| | ($000) | Assets |
| Other Assets and Liabilities | | |
| Other Assets | | |
| Investment in Vanguard | 3,813 | |
| Receivables for Investment Securities Sold | 372,181 | |
| Receivables for Accrued Income | 288,199 | |
| Receivables for Capital Shares Issued | 37,658 | |
| Other Assets6 | 13,750 | |
| Total Other Assets | 715,601 | 1.4% |
| Liabilities | | |
| Payables for Investment Securities Purchased | (233,129) | |
| Collateral for Securities on Loan | (380,925) | |
| Payables for Capital Shares Redeemed | (27,172) | |
| Payables to Vanguard | (55,644) | |
| Other Liabilities | (7,505) | |
| Total Liabilities | (704,375) | (1.4%) |
| Net Assets | 49,852,500 | 100.0% |
19
Wellesley Income Fund
| |
| At September 30, 2016, net assets consisted of: | |
| | Amount |
| | ($000) |
| Paid-in Capital | 42,963,987 |
| Undistributed Net Investment Income | 27,078 |
| Accumulated Net Realized Gains | 211,960 |
| Unrealized Appreciation (Depreciation) | |
| Investment Securities | 6,650,431 |
| Futures Contracts | (585) |
| Forward Currency Contracts | (88) |
| Foreign Currencies | (283) |
| Net Assets | 49,852,500 |
| |
| |
| Investor Shares—Net Assets | |
| Applicable to 542,428,327 outstanding $.001 par value shares of | |
| beneficial interest (unlimited authorization) | 14,174,821 |
| Net Asset Value Per Share—Investor Shares | $26.13 |
| |
| |
| Admiral Shares—Net Assets | |
| Applicable to 563,615,577 outstanding $.001 par value shares of | |
| beneficial interest (unlimited authorization) | 35,677,679 |
| Net Asset Value Per Share—Admiral Shares | $63.30 |
• See Note A in Notes to Financial Statements.
^ Includes partial security positions on loan to broker-dealers. The total value of securities on loan is $367,042,000.
† Represents the aggregate value, by category, of securities that are not among the 50 largest holdings and, in total for any issuer, represent
1% or less of net assets.
1 Securities with a value of $236,000 have been segregated as collateral for certain open To Be Announced (TBA) transactions.
2 Certain of the fund’s securities are exempt from registration under Rule 144A of the Securities Act of 1933. Such securities may be sold in
transactions exempt from registration, normally to qualified institutional buyers. At September 30, 2016, the aggregate value of these
securities was $4,173,373,000, representing 8.4% of net assets.
3 Adjustable-rate security.
4 Affiliated money market fund available only to Vanguard funds and certain trusts and accounts managed by Vanguard. Rate shown is the
7-day yield.
5 Includes $380,925,000 of collateral received for securities on loan.
6 Cash of $7,037,000 has been segregated as initial margin for open futures contracts.
ADR—American Depositary Receipt.
See accompanying Notes, which are an integral part of the Financial Statements.
20
Wellesley Income Fund
Statement of Operations
| |
| | Year Ended |
| | September 30, 2016 |
| | ($000) |
| Investment Income | |
| Income | |
| Dividends1 | 545,891 |
| Interest | 881,915 |
| Securities Lending—Net | 4,819 |
| Total Income | 1,432,625 |
| Expenses | |
| Investment Advisory Fees—Note B | |
| Basic Fee | 23,988 |
| Performance Adjustment | 51 |
| The Vanguard Group—Note C | |
| Management and Administrative—Investor Shares | 18,640 |
| Management and Administrative—Admiral Shares | 28,214 |
| Marketing and Distribution—Investor Shares | 2,817 |
| Marketing and Distribution—Admiral Shares | 2,579 |
| Custodian Fees | 371 |
| Auditing Fees | 34 |
| Shareholders’ Reports—Investor Shares | 239 |
| Shareholders’ Reports—Admiral Shares | 178 |
| Trustees’ Fees and Expenses | 54 |
| Total Expenses | 77,165 |
| Net Investment Income | 1,355,460 |
| Realized Net Gain (Loss) | |
| Investment Securities Sold2 | 495,319 |
| Futures Contracts | (39,010) |
| Swap Contracts | (153) |
| Foreign Currencies and Forward Currency Contracts | (4,169) |
| Realized Net Gain (Loss) | 451,987 |
| Change in Unrealized Appreciation (Depreciation) | |
| Investment Securities | 2,987,245 |
| Futures Contracts | 10,018 |
| Swap Contracts | 132 |
| Foreign Currencies and Forward Currency Contracts | 51 |
| Change in Unrealized Appreciation (Depreciation) | 2,997,446 |
| Net Increase (Decrease) in Net Assets Resulting from Operations | 4,804,893 |
| 1 Dividends are net of foreign withholding taxes of $7,108,000. |
| 2 Realized net gain (loss) from an affiliated company of the fund was $32,000. |
See accompanying Notes, which are an integral part of the Financial Statements.
21
Wellesley Income Fund
Statement of Changes in Net Assets
| | |
| | Year Ended September 30, |
| | 2016 | 2015 |
| | ($000) | ($000) |
| Increase (Decrease) in Net Assets | | |
| Operations | | |
| Net Investment Income | 1,355,460 | 1,226,968 |
| Realized Net Gain (Loss) | 451,987 | 1,023,246 |
| Change in Unrealized Appreciation (Depreciation) | 2,997,446 | (1,833,583) |
| Net Increase (Decrease) in Net Assets Resulting from Operations | 4,804,893 | 416,631 |
| Distributions | | |
| Net Investment Income | | |
| Investor Shares | (377,189) | (363,028) |
| Admiral Shares | (947,720) | (866,602) |
| Realized Capital Gain1 | | |
| Investor Shares | (287,414) | (212,146) |
| Admiral Shares | (695,059) | (484,421) |
| Total Distributions | (2,307,382) | (1,926,197) |
| Capital Share Transactions | | |
| Investor Shares | 1,823,397 | 234,117 |
| Admiral Shares | 5,831,697 | 1,989,823 |
| Net Increase (Decrease) from Capital Share Transactions | 7,655,094 | 2,223,940 |
| Total Increase (Decrease) | 10,152,605 | 714,374 |
| Net Assets | | |
| Beginning of Period | 39,699,895 | 38,985,521 |
| End of Period2 | 49,852,500 | 39,699,895 |
| 1 Includes fiscal 2016 and 2015 short-term gain distributions totaling $24,043,000 and $35,445,000, respectively. Short-term gain distributions are treated as ordinary income dividends for tax purposes. |
| 2 Net Assets—End of Period includes undistributed (overdistributed) net investment income of $27,078,000 and ($2,266,000). |
See accompanying Notes, which are an integral part of the Financial Statements.
22
Wellesley Income Fund
Financial Highlights
| | | | | |
| Investor Shares | | | | | |
| |
| For a Share Outstanding | Year Ended September 30, |
| Throughout Each Period | 2016 | 2015 | 2014 | 2013 | 2012 |
| Net Asset Value, Beginning of Period | $24.71 | $25.65 | $24.82 | $24.47 | $21.82 |
| Investment Operations | | | | | |
| Net Investment Income | .761 | .760 | .811 | .752 | .787 |
| Net Realized and Unrealized Gain (Loss) | | | | | |
| on Investments | 2.014 | (.487) | 1.491 | .688 | 2.648 |
| Total from Investment Operations | 2.775 | .273 | 2.302 | 1.440 | 3.435 |
| Distributions | | | | | |
| Dividends from Net Investment Income | (.746) | (.761) | (.793) | (.755) | (.785) |
| Distributions from Realized Capital Gains | (. 609) | (. 452) | (. 679) | (. 335) | — |
| Total Distributions | (1.355) | (1.213) | (1.472) | (1.090) | (.785) |
| Net Asset Value, End of Period | $26.13 | $24.71 | $25.65 | $24.82 | $24.47 |
| |
| Total Return1 | 11.58% | 1.03% | 9.54% | 6.02% | 15.94% |
| |
| Ratios/Supplemental Data | | | | | |
| Net Assets, End of Period (Millions) | $14,175 | $11,617 | $11,830 | $11,431 | $11,916 |
| Ratio of Total Expenses to Average Net Assets2 | 0.22% | 0.23% | 0.25% | 0.25% | 0.25% |
| Ratio of Net Investment Income to | | | | | |
| Average Net Assets | 3.02% | 2.96% | 3.19% | 3.03% | 3.39% |
| Portfolio Turnover Rate | 31%3 | 59%3 | 109%3 | 36%3 | 33%3 |
1 Total returns do not include account service fees that may have applied in the periods shown. Fund prospectuses provide information about any applicable account service fees.
2 Includes performance-based investment advisory fee increases (decreases) of 0.00%, 0.00%, 0.01%, 0.00%, and 0.01%.
3 Includes 15%, 18%, 23%, 3%, and 26% attributable to mortgage-dollar-roll activity.
See accompanying Notes, which are an integral part of the Financial Statements.
23
Wellesley Income Fund
Financial Highlights
| | | | | |
| Admiral Shares | | | | | |
| |
| For a Share Outstanding | Year Ended September 30, |
| Throughout Each Period | 2016 | 2015 | 2014 | 2013 | 2012 |
| Net Asset Value, Beginning of Period | $59.87 | $62.14 | $60.12 | $59.29 | $52.86 |
| Investment Operations | | | | | |
| Net Investment Income | 1.887 | 1.884 | 2.010 | 1.867 | 1.949 |
| Net Realized and Unrealized Gain (Loss) | | | | | |
| on Investments | 4.868 | (1.171) | 3.623 | 1.646 | 6.425 |
| Total from Investment Operations | 6.755 | .713 | 5.633 | 3.513 | 8.374 |
| Distributions | | | | | |
| Dividends from Net Investment Income | (1.850) | (1.888) | (1.967) | (1.871) | (1.944) |
| Distributions from Realized Capital Gains | (1.475) | (1.095) | (1.646) | (.812) | — |
| Total Distributions | (3.325) | (2.983) | (3.613) | (2.683) | (1.944) |
| Net Asset Value, End of Period | $63.30 | $59.87 | $62.14 | $60.12 | $59.29 |
| |
| Total Return1 | 11.64% | 1.11% | 9.64% | 6.06% | 16.04% |
| |
| Ratios/Supplemental Data | | | | | |
| Net Assets, End of Period (Millions) | $35,678 | $28,083 | $27,156 | $22,705 | $20,561 |
| Ratio of Total Expenses to Average Net Assets2 | 0.15% | 0.16% | 0.18% | 0.18% | 0.18% |
| Ratio of Net Investment Income to | | | | | |
| Average Net Assets | 3.09% | 3.03% | 3.26% | 3.10% | 3.46% |
| Portfolio Turnover Rate | 31%3 | 59%3 | 109%3 | 36%3 | 33%3 |
1 Total returns do not include account service fees that may have applied in the periods shown. Fund prospectuses provide information about any applicable account service fees.
2 Includes performance-based investment advisory fee increases (decreases) of 0.00%, 0.00%, 0.01%, 0.00%, and 0.01%.
3 Includes 15%, 18%, 23%, 3%, and 26% attributable to mortgage-dollar-roll activity.
See accompanying Notes, which are an integral part of the Financial Statements.
24
Wellesley Income Fund
Notes to Financial Statements
Vanguard Wellesley Income Fund is registered under the Investment Company Act of 1940 as an open-end investment company, or mutual fund. Certain of the fund’s investments are in corporate debt instruments; the issuers’ abilities to meet their obligations may be affected by economic developments in their respective industries. The fund offers two classes of shares: Investor Shares and Admiral Shares. Investor Shares are available to any investor who meets the fund’s minimum purchase requirements. Admiral Shares are designed for investors who meet certain administrative, service, and account-size criteria.
A. The following significant accounting policies conform to generally accepted accounting principles for U.S. investment companies. The fund consistently follows such policies in preparing its financial statements.
1. Security Valuation: Securities are valued as of the close of trading on the New York Stock Exchange (generally 4 p.m., Eastern time) on the valuation date. Equity securities are valued at the latest quoted sales prices or official closing prices taken from the primary market in which each security trades; such securities not traded on the valuation date are valued at the mean of the latest quoted bid and asked prices. Bonds and temporary cash investments acquired over 60 days to maturity are valued using the latest bid prices or using valuations based on a matrix system (which considers such factors as security prices, yields, maturities, and ratings), both as furnished by independent pricing services. Structured debt securities, including mortgages and asset-backed securities, are valued using the latest bid prices or using valuations based on a matrix system that considers such factors as issuer, tranche, nominal or option-adjusted spreads, weighted average coupon, weighted average maturity, credit enhancements, and collateral. Investments in Vanguard Market Liquidity Fund are valued at that fund’s net asset value. Other temporary cash investments are valued at amortized cost, which approximates market value. Securities for which market quotations are not readily available, or whose values have been affected by events occurring before the fund’s pricing time but after the close of the securities’ primary markets, are valued at their fair values calculated according to procedures adopted by the board of trustees. These procedures include obtaining quotations from an independent pricing service, monitoring news to identify significant market- or security-specific events, and evaluating changes in the values of foreign market proxies (for example, ADRs, futures contracts, or exchange-traded funds), between the time the foreign markets close and the fund’s pricing time. When fair-value pricing is employed, the prices of securities used by a fund to calculate its net asset value may differ from quoted or published prices for the same securities.
2. Foreign Currency: Securities and other assets and liabilities denominated in foreign currencies are translated into U.S. dollars using exchange rates obtained from an independent third party as of the fund’s pricing time on the valuation date. Realized gains (losses) and unrealized appreciation (depreciation) on investment securities include the effects of changes in exchange rates since the securities were purchased, combined with the effects of changes in security prices. Fluctuations in the value of other assets and liabilities resulting from changes in exchange rates are recorded as unrealized foreign currency gains (losses) until the assets or liabilities are settled in cash, at which time they are recorded as realized foreign currency gains (losses).
3. Futures Contracts: The fund uses futures contracts to invest in fixed income asset classes with greater efficiency and lower cost than is possible through direct investment, to add value when these instruments are attractively priced, or to adjust sensitivity to changes in interest rates. The primary risks associated with the use of futures contracts are imperfect correlation between changes in market values of bonds held by the fund and the prices of futures contracts, and the possibility of an illiquid market. Counterparty risk involving futures is mitigated because a regulated clearinghouse is the counterparty instead of the clearing broker. To further mitigate counterparty risk, the fund trades
25
Wellesley Income Fund
futures contracts on an exchange, monitors the financial strength of its clearing brokers and clearinghouse, and has entered into clearing agreements with its clearing brokers. The clearinghouse imposes initial margin requirements to secure the fund’s performance and requires daily settlement of variation margin representing changes in the market value of each contract.
Futures contracts are valued at their quoted daily settlement prices. The aggregate settlement values of the contracts are not recorded in the Statement of Net Assets. Fluctuations in the value of the contracts are recorded in the Statement of Net Assets as an asset (liability) and in the Statement of Operations as unrealized appreciation (depreciation) until the contracts are closed, when they are recorded as realized futures gains (losses).
4. Forward Currency Contracts: The fund enters into forward currency contracts to protect the value of securities and related receivables and payables against changes in future foreign exchange rates. The fund’s risks in using these contracts include movement in the values of the foreign currencies relative to the U.S. dollar and the ability of the counterparties to fulfill their obligations under the contracts. The fund mitigates its counterparty risk by entering into forward currency contracts only with a diverse group of prequalified counterparties, monitoring their financial strength, entering into master netting arrangements with its counterparties, and requiring its counterparties to transfer collateral as security for their performance. In the absence of a default, the collateral pledged or received by the fund cannot be repledged, resold or rehypothecated. The master netting arrangements provide that, in the event of a counterparty’s default (including bankruptcy), the fund may terminate the forward currency contracts, determine the net amount owed by either party in accordance with its master netting arrangements, and sell or retain any collateral held up to the net amount owed to the fund under the master netting arrangements. The forward currency contracts contain provisions whereby a counterparty may terminate open contracts if the fund’s net assets decline below a certain level, triggering a payment by the fund if the fund is in a net liability position at the time of the termination. The payment amount would be reduced by any collateral the fund has pledged. Any assets pledged as collateral for open contracts are noted in the Statement of Net Assets. The value of collateral received or pledged is compared daily to the value of the forward currency contracts exposure with each counterparty, and any difference, if in excess of a specified minimum transfer amount, is adjusted and settled within two business days.
Forward currency contracts are valued at their quoted daily prices obtained from an independent third party, adjusted for currency risk based on the expiration date of each contract. The notional amounts of the contracts are not recorded in the Statement of Net Assets. Fluctuations in the value of the contracts are recorded in the Statement of Net Assets as an asset (liability) and in the Statement of Operations as unrealized appreciation (depreciation) until the contracts are closed, when they are recorded as realized forward currency contract gains (losses).
During the year ended September 30, 2016, the fund’s average investments in long and short futures contracts represented 1% and 3% of net assets, respectively, based on the average of aggregate settlement values at each quarter-end during the period. The fund’s average investment in forward currency contracts represented less than 1% of net assets, based on the average of notional amounts at each quarter-end during the period.
5. Swap Contracts: The fund invests in credit default swaps to adjust the overall credit risk of the fund or to actively overweight or underweight credit risk to a specific issuer or group of issuers. The fund may sell credit protection through credit default swaps to simulate investments in long positions that are either unavailable or considered to be less attractively priced in the bond market. The fund may purchase credit protection through credit default swaps to reduce credit exposure to a given issuer or
26
Wellesley Income Fund
issuers. Under the terms of the swaps, an up-front payment may be exchanged between the seller and buyer. In addition, the seller of the credit protection receives a periodic payment of premium from the buyer that is a fixed percentage applied to a notional amount. If, for example, the reference entity is subject to a credit event (such as bankruptcy, failure to pay, or obligation acceleration) during the term of the swap, the seller agrees to either physically settle or cash settle the swap contract. If the swap is physically settled, the seller agrees to pay the buyer an amount equal to the notional amount and take delivery of a debt instrument of the reference issuer with a par amount equal to such notional amount. If the swap is cash settled, the seller agrees to pay the buyer the difference between the notional amount and the final price for the relevant debt instrument, as determined either in a market auction or pursuant to a pre-agreed-upon valuation procedure.
The notional amounts of swap contracts are not recorded in the Statement of Net Assets. Swaps are valued daily based on market quotations received from independent pricing services or recognized dealers and the change in value is recorded in the Statement of Net Assets as an asset (liability) and in the Statement of Operations as unrealized appreciation (depreciation) until the seller of credit protection is required to take delivery (or, in a cash settled swap, pay the settlement amount determined) upon occurrence of a credit event, periodic payments are made, or the swap terminates, at which time realized gain (loss) is recorded. The net premium to be received or paid by the fund under swap contracts is accrued daily and recorded as realized gain (loss) over the life of the contract.
The primary risk associated with selling credit protection is that, upon the occurrence of a defined credit event, the market value of the debt instrument received by the fund (or, in a cash settled swap, the debt instruments used to determine the settlement payment by the fund) will be significantly less than the amount paid by the fund and, in a physically settled swap, the fund may receive an illiquid debt instrument. A risk associated with all types of swaps is the possibility that a counterparty may default on its obligation to pay net amounts due to the fund. The fund’s maximum amount subject to counterparty risk is the unrealized appreciation on the swap contract. The fund mitigates its counterparty risk by entering into swaps only with a diverse group of prequalified counterparties, monitoring their financial strength, entering into master netting arrangements with its counterparties, and requiring its counterparties to transfer collateral as security for their performance. In the absence of a default, the collateral pledged or received by the fund cannot be repledged, resold or rehypothecated. In the event of a counterparty’s default (including bankruptcy), the fund may terminate any swap contracts with that counterparty, determine the net amount owed by either party in accordance with its master netting arrangements, and sell or retain any collateral held up to the net amount owed to the fund under the master netting arrangements. The swap contracts contain provisions whereby a counterparty may terminate open contracts if the fund’s net assets decline below a certain level, triggering a payment by the fund if the fund is in a net liability position at the time of the termination. The payment amount would be reduced by any collateral the fund has pledged. Any securities pledged as collateral for open contracts are noted in the Statement of Net Assets. The value of collateral received or pledged is compared daily to the value of the swap contracts exposure with each counterparty, and any difference, if in excess of a specified minimum transfer amount, is adjusted and settled within two business days.
During the year ended September 30, 2016, the fund’s average amounts of investments in credit protection sold and credit protection purchased each represented less than 1% of net assets, based on the average of notional amounts at each quarter-end during the period.
6. To Be Announced (TBA) Transactions: A TBA transaction is an agreement to buy or sell mortgage-backed securities with agreed-upon characteristics (face amount, coupon, maturity) for settlement at a future date. The fund may be a seller of TBA transactions to reduce its exposure to the mortgage-
27
Wellesley Income Fund
backed securities market or in order to sell mortgage-backed securities it owns under delayed-delivery arrangements. When the fund is a buyer of TBA transactions, it maintains cash or short-term investments in an amount sufficient to meet the purchase price at the settlement date of the TBA transaction. The primary risk associated with TBA transactions is that a counterparty may default on its obligations. The fund mitigates its counterparty risk by, among other things, performing a credit analysis of counterparties, allocating transactions among numerous counterparties, and monitoring its exposure to each counterparty. The fund may also enter into a Master Securities Forward Transaction Agreement (MSFTA) with certain counterparties and require them to transfer collateral as security for their performance. In the absence of a default, the collateral pledged or received by the fund cannot be repledged, resold or rehypothecated. Under an MSFTA, upon a counterparty default (including bankruptcy), the fund may terminate any TBA transactions with that counterparty, determine the net amount owed by either party in accordance with its master netting arrangements, and sell or retain any collateral held up to the net amount owed to the fund under the master netting arrangements.
7. Mortgage Dollar Rolls: The fund enters into mortgage-dollar-roll transactions, in which the fund sells mortgage-backed securities to a dealer and simultaneously agrees to purchase similar securities in the future at a predetermined price. The proceeds of the securities sold in mortgage-dollar-roll transactions are typically invested in high-quality short-term fixed income securities. The fund forgoes principal and interest paid on the securities sold, and is compensated by interest earned on the proceeds of the sale and by a lower price on the securities to be repurchased. The fund has also entered into mortgage-dollar-roll transactions in which the fund buys mortgage-backed securities from a dealer pursuant to a TBA transaction and simultaneously agrees to sell similar securities in the future at a predetermined price. The securities bought in mortgage-dollar-roll transactions are used to cover an open TBA sell position. The fund continues to earn interest on mortgage-backed security pools already held and receives a lower price on the securities to be sold in the future. The fund accounts for mortgage-dollar-roll transactions as purchases and sales; as such, these transactions may increase the fund’s portfolio turnover rate. Amounts to be received or paid in connection with open mortgage dollar rolls are included in Receivables for Investment Securities Sold (Other Assets) or Payables for Investment Securities Purchased (Liabilities) in the Statement of Net Assets.
8. Repurchase Agreements: The fund enters into repurchase agreements with institutional counterparties. Securities pledged as collateral to the fund under repurchase agreements are held by a custodian bank until the agreements mature, and in the absence of a default, such collateral cannot be repledged, resold, or rehypothecated. Each agreement requires that the market value of the collateral be sufficient to cover payments of interest and principal. The fund further mitigates its counterparty risk by entering into repurchase agreements only with a diverse group of prequalified counterparties, monitoring their financial strength, and entering into master repurchase agreements with its counterparties. The master repurchase agreements provide that, in the event of a counterparty’s default (including bankruptcy), the fund may terminate any repurchase agreements with that counterparty, determine the net amount owed, and sell or retain the collateral up to the net amount owed to the fund. Such action may be subject to legal proceedings, which may delay or limit the disposition of collateral.
9. Federal Income Taxes: The fund intends to continue to qualify as a regulated investment company and distribute all of its taxable income. Management has analyzed the fund’s tax positions taken for all open federal income tax years (September 30, 2013–2016), and has concluded that no provision for federal income tax is required in the fund’s financial statements.
10. Distributions: Distributions to shareholders are recorded on the ex-dividend date.
28
Wellesley Income Fund
11. Securities Lending: To earn additional income, the fund lends its securities to qualified institutional borrowers. Security loans are subject to termination by the fund at any time, and are required to be secured at all times by collateral in an amount at least equal to the market value of securities loaned. Daily market fluctuations could cause the value of loaned securities to be more or less than the value of the collateral received. When this occurs, the collateral is adjusted and settled on the next business day. The fund further mitigates its counterparty risk by entering into securities lending transactions only with a diverse group of prequalified counterparties, monitoring their financial strength, and entering into master securities lending agreements with its counterparties. The master securities lending agreements provide that, in the event of a counterparty’s default (including bankruptcy), the fund may terminate any loans with that borrower, determine the net amount owed, and sell or retain the collateral up to the net amount owed to the fund; however, such actions may be subject to legal proceedings. While collateral mitigates counterparty risk, in the absence of a default the fund may experience delays and costs in recovering the securities loaned. The fund invests cash collateral received in Vanguard Market Liquidity Fund, and records a liability in the Statement of Net Assets for the return of the collateral, during the period the securities are on loan. Securities lending income represents fees charged to borrowers plus income earned on invested cash collateral, less expenses associated with the loan. During the term of the loan, the fund is entitled to all distributions made on or in respect of the loaned securities.
12. Credit Facility: The fund and certain other funds managed by The Vanguard Group (“Vanguard”) participate in a $3.1 billion committed credit facility provided by a syndicate of lenders pursuant to a credit agreement that may be renewed annually; each fund is individually liable for its borrowings, if any, under the credit facility. Borrowings may be utilized for temporary and emergency purposes, and are subject to the fund’s regulatory and contractual borrowing restrictions. The participating funds are charged administrative fees and an annual commitment fee of 0.10% of the undrawn amount of the facility; these fees are allocated to the funds based on a method approved by the fund’s board of trustees and included in Management and Administrative expenses on the fund’s Statement of Operations. Any borrowings under this facility bear interest at a rate based upon the higher of the one-month London Interbank Offered Rate, federal funds effective rate, or overnight bank funding rate plus an agreed-upon spread.
The fund had no borrowings outstanding at September 30, 2016, or at any time during the period then ended.
13. Other: Dividend income is recorded on the ex-dividend date. Interest income is accrued daily. Premiums and discounts on debt securities purchased are amortized and accreted, respectively, to interest income over the lives of the respective securities. Security transactions are accounted for on the date securities are bought or sold. Costs used to determine realized gains (losses) on the sale of investment securities are those of the specific securities sold.
Each class of shares has equal rights as to assets and earnings, except that each class separately bears certain class-specific expenses related to maintenance of shareholder accounts (included in Management and Administrative expenses) and shareholder reporting. Marketing and distribution expenses are allocated to each class of shares based on a method approved by the board of trustees. Income, other non-class-specific expenses, and gains and losses on investments are allocated to each class of shares based on its relative net assets.
B. Wellington Management Company LLP provides investment advisory services to the fund for a fee calculated at an annual percentage rate of average net assets. The basic fee is subject to quarterly adjustments based on the fund’s performance for the preceding three years relative to a combined
29
Wellesley Income Fund
index comprising the Bloomberg Barclays U.S. Credit A or Better Bond Index and the FTSE High Dividend Yield Index. For the year ended September 30, 2016, the investment advisory fee represented an effective annual basic rate of 0.05% of the fund’s average net assets before an increase of $51,000 (0.00%) based on performance.
C. In accordance with the terms of a fund’s Service Agreement (the “FSA”) between Vanguard and the fund, Vanguard furnishes to the fund corporate management, administrative, marketing, distribution and cash management services at Vanguard’s cost of operations (as defined by the FSA). These costs of operations are allocated to the fund based on methods and guidelines approved by the board of trustees. Vanguard does not require reimbursement in the current period for certain costs of operations (such as deferred compensation/benefits and risk/insurance costs); the fund’s liability for these costs of operations is included in Payables to Vanguard on the Statement of Net Assets.
Upon the request of Vanguard, the fund may invest up to 0.40% of its net assets as capital in Vanguard. At September 30, 2016, the fund had contributed to Vanguard capital in the amount of $3,813,000, representing 0.01% of the fund’s net assets and 1.53% of Vanguard’s capitalization. The fund’s trustees and officers are also directors and employees, respectively, of Vanguard.
D. Various inputs may be used to determine the value of the fund’s investments. These inputs are summarized in three broad levels for financial statement purposes. The inputs or methodologies used to value securities are not necessarily an indication of the risk associated with investing in those securities.
Level 1—Quoted prices in active markets for identical securities.
Level 2—Other significant observable inputs (including quoted prices for similar securities, interest rates, prepayment speeds, credit risk, etc.).
Level 3—Significant unobservable inputs (including the fund’s own assumptions used to determine the fair value of investments).
The following table summarizes the market value of the fund’s investments as of September 30, 2016, based on the inputs used to value them:
| | | |
| | Level 1 | Level 2 | Level 3 |
| Investments | ($000) | ($000) | ($000) |
| U.S. Government and Agency Obligations | — | 5,472,817 | — |
| Asset-Backed/Commercial Mortgage-Backed Securities | — | 1,207,603 | — |
| Corporate Bonds | — | 21,163,986 | — |
| Sovereign Bonds | — | 1,422,452 | — |
| Taxable Municipal Bonds | — | 1,391,321 | — |
| Common Stocks | 16,919,108 | 1,144,937 | — |
| Temporary Cash Investments | 380,962 | 738,088 | — |
| Futures Contracts—Assets1 | 2,150 | — | — |
| Futures Contracts—Liabilities1 | (592) | — | — |
| Forward Currency Contracts—Assets | — | 1,017 | — |
| Forward Currency Contracts—Liabilities | — | (1,105) | — |
| Total | 17,301,628 | 32,541,116 | — |
| 1 Represents variation margin on the last day of the reporting period. |
30
Wellesley Income Fund
E. At September 30, 2016, the fair values of derivatives were reflected in the Statement of Net Assets as follows:
| | | | |
| | Interest Rate | Currency | Credit | |
| | Contracts | Contracts | Contracts | Total |
| Statement of Net Assets Caption | ($000) | ($000) | ($000) | ($000) |
| Other Assets | 2,150 | 1,017 | — | 3,167 |
| Liabilities | (592) | (1,105) | — | (1,697) |
Realized net gain (loss) and the change in unrealized appreciation (depreciation) on derivatives for the year ended September 30, 2016, were:
| | | | |
| | Interest Rate | Currency | Credit | |
| | Contracts | Contracts | Contracts | Total |
| Realized Net Gain (Loss) on Derivatives | ($000) | ($000) | ($000) | ($000) |
| Futures Contracts | (39,010) | — | — | (39,010) |
| Swap Contracts | — | — | (153) | (153) |
| Forward Currency Contracts | — | (3,043) | — | (3,043) |
| Realized Net Gain (Loss) on Derivatives | (39,010) | (3,043) | (153) | (42,206) |
| |
| Change in Unrealized Appreciation (Depreciation) on Derivatives | | | |
| Futures Contracts | 10,018 | — | — | 10,018 |
| Swap Contracts | — | — | 132 | 132 |
| Forward Currency Contracts | — | (88) | — | (88) |
| Change in Unrealized Appreciation | | | | |
| (Depreciation) on Derivatives | 10,018 | (88) | 132 | 10,062 |
At September 30, 2016, the aggregate settlement value of open futures contracts and the related unrealized appreciation (depreciation) were:
| | | | |
| | | | ($000) |
| | | | Aggregate | |
| | | Number of | Settlement | Unrealized |
| | | Long (Short) | Value | Appreciation |
| Futures Contracts | Expiration | Contracts | Long (Short) | (Depreciation) |
| 5-Year U.S. Treasury Note | December 2016 | (10,194) | (1,238,730) | (404) |
| 10-Year U.S. Treasury Note | December 2016 | 1,404 | 184,099 | (181) |
| | | | | (585) |
Unrealized appreciation (depreciation) on open futures contracts is required to be treated as realized gain (loss) for tax purposes.
31
Wellesley Income Fund
At September 30, 2016, the fund had open forward currency contracts to receive and deliver currencies as follows. Unrealized appreciation (depreciation) on open forward currency contracts is treated as ordinary income for tax purposes.
| | | | | | |
| | | | | | | Unrealized |
| | Contract | | | | | Appreciation |
| | Settlement | Contract Amount (000) | (Depreciation) |
| Counterparty | Date | | Receive | | Deliver | ($000) |
| Goldman Sachs International | 11/28/16 | USD | 76,900 | JPY | 7,700,000 | 781 |
| Citibank, N.A. | 11/14/16 | USD | 77,200 | JPY | 7,800,000 | 135 |
| J.P. Morgan Securities, Inc. | 1/3/17 | USD | 78,037 | GBP | 60,000 | 101 |
| Citibank, N.A. | 10/11/16 | USD | 73,335 | JPY | 7,530,000 | (956) |
| J.P. Morgan Securities, Inc. | 12/12/16 | USD | 68,423 | JPY | 6,930,000 | (141) |
| Citibank, N.A. | 12/12/16 | USD | 9,589 | JPY | 970,000 | (8) |
| | | | | | | (88) |
| GBR—British pound. |
| JPY—Japanese yen. |
| USD—U.S. dollar. |
F. Distributions are determined on a tax basis and may differ from net investment income and realized capital gains for financial reporting purposes. Differences may be permanent or temporary. Permanent differences are reclassified among capital accounts in the financial statements to reflect their tax character. Temporary differences arise when certain items of income, expense, gain, or loss are recognized in different periods for financial statement and tax purposes. These differences will reverse at some time in the future. Differences in classification may also result from the treatment of short-term gains as ordinary income for tax purposes.
During the year ended September 30, 2016, the fund realized net foreign currency losses of $1,126,000, which decreased distributable net income for tax purposes; accordingly, such losses have been reclassified from accumulated net realized gains to undistributed net investment income.
The fund used a tax accounting practice to treat a portion of the price of capital shares redeemed during the year as distributions from realized capital gains. Accordingly, the fund has reclassified $43,282,000 from accumulated net realized gains to paid-in capital.
Realized and unrealized gains (losses) on certain of the fund’s swap contracts are treated as ordinary income (loss) for tax purposes; the effect on the fund’s income dividends to shareholders is offset by a change in principal return. Realized losses of $81,000 on swap contracts have been reclassified from accumulated net realized gains to undistributed net investment income.
For tax purposes, at September 30, 2016, the fund had $79,372,000 of ordinary income and $283,603,000 of long-term capital gains available for distribution.
At September 30, 2016, the cost of investment securities for tax purposes was $43,268,952,000. Net unrealized appreciation of investment securities for tax purposes was $6,572,322,000, consisting of unrealized gains of $6,713,732,000 on securities that had risen in value since their purchase and $141,410,000 in unrealized losses on securities that had fallen in value since their purchase.
32
Wellesley Income Fund
G. During the year ended September 30, 2016, the fund purchased $9,460,439,000 of investment securities and sold $3,447,571,000 of investment securities, other than U.S. government securities and temporary cash investments. Purchases and sales of U.S. government securities were $9,974,240,000 and $9,876,731,000, respectively.
H. Capital share transactions for each class of shares were:
| | | | |
| | Year Ended September 30, |
| | 2016 | 2015 |
| | Amount | Shares | Amount | Shares |
| | ($000) | (000) | ($000) | (000) |
| Investor Shares | | | | |
| Issued | 4,057,945 | 159,483 | 2,790,645 | 108,693 |
| Issued in Lieu of Cash Distributions | 617,931 | 24,749 | 533,871 | 21,110 |
| Redeemed | (2,852,479) | (111,845) | (3,090,399) | (120,906) |
| Net Increase (Decrease)—Investor Shares | 1,823,397 | 72,387 | 234,117 | 8,897 |
| Admiral Shares | | | | |
| Issued | 7,759,727 | 125,566 | 4,879,493 | 78,584 |
| Issued in Lieu of Cash Distributions | 1,453,985 | 24,026 | 1,195,682 | 19,521 |
| Redeemed | (3,382,015) | (55,064) | (4,085,352) | (65,999) |
| Net Increase (Decrease)—Admiral Shares | 5,831,697 | 94,528 | 1,989,823 | 32,106 |
I. Management has determined that no material events or transactions occurred subsequent to September 30, 2016, that would require recognition or disclosure in these financial statements.
33
Report of Independent Registered
Public Accounting Firm
To the Board of Trustees and Shareholders of Vanguard Wellesley Income Fund:
In our opinion, the accompanying statement of net assets—investments summary and the related statements of operations and of changes in net assets and the financial highlights present fairly, in all material respects, the financial position of Vanguard Wellesley Income Fund (the “Fund”) at September 30, 2016, the results of its operations for the year then ended, the changes in its net assets for each of the two years in the period then ended, and the financial highlights for each of the five years in the period then ended, in conformity with accounting principles generally accepted in the United States of America. These financial statements and financial highlights (hereafter referred to as “financial statements”) are the responsibility of the Fund’s management. Our responsibility is to express an opinion on these financial statements based on our audits. We conducted our audits of these financial statements in accordance with the standards of the Public Company Accounting Oversight Board (United States). Those standards require that we plan and perform the audit to obtain reasonable assurance about whether the financial statements are free of material misstatement. An audit includes examining, on a test basis, evidence supporting the amounts and disclosures in the financial statements, assessing the accounting principles used and significant estimates made by management, and evaluating the overall financial statement presentation.
We believe that our audits, which included confirmation of securities at September 30, 2016 by correspondence with the custodian and brokers and by agreement to the underlying ownership records of the transfer agent, provide a reasonable basis for our opinion.
/s/PricewaterhouseCoopers LLP
Philadelphia, Pennsylvania
November 15, 2016

Special 2016 tax information (unaudited) for Vanguard Wellesley Income Fund
This information for the fiscal year ended September 30, 2016, is included pursuant to provisions
of the Internal Revenue Code.
The fund distributed $1,000,920,000 as capital gain dividends (20% rate gain distributions) to
shareholders during the fiscal year.
For nonresident alien shareholders, 100% of short-term capital gain dividends distributed by the fund
are qualified short-term capital gains.
The fund distributed $500,735,000 of qualified dividend income to shareholders during the fiscal year.
For corporate shareholders, 32.1% of investment income (dividend income plus short-term gains, if
any) qualifies for the dividends-received deduction.
34
Your Fund’s After-Tax Returns
This table presents returns for your fund both before and after taxes. The after-tax returns are shown in two ways: (1) assuming that an investor owned the fund during the entire period and paid taxes on the fund’s distributions, and (2) assuming that an investor paid taxes on the fund’s distributions and sold all shares at the end of each period.
Calculations are based on the highest individual federal income tax and capital gains tax rates in effect at the times of the distributions and the hypothetical sales. State and local taxes were not considered. After-tax returns reflect any qualified dividend income, using actual prior-year figures and estimates for 2016. (In the example, returns after the sale of fund shares may be higher than those assuming no sale. This occurs when the sale would have produced a capital loss. The calculation assumes that the investor received a tax deduction for the loss.)
The table shows returns for Investor Shares only; returns for other share classes will differ. Please note that your actual after-tax returns will depend on your tax situation and may differ from those shown. Also note that if you own the fund in a tax-deferred account, such as an individual retirement account or a 401(k) plan, this information does not apply to you. Such accounts are not subject to current taxes.
Finally, keep in mind that a fund’s performance—whether before or after taxes—does not guarantee future results.
Average Annual Total Returns: Wellesley Income Fund Investor Shares
Periods Ended September 30, 2016
| | | |
| | One | Five | Ten |
| | Year | Years | Years |
| Returns Before Taxes | 11.58% | 8.70% | 7.10% |
| Returns After Taxes on Distributions | 9.76 | 7.18 | 5.60 |
| Returns After Taxes on Distributions and Sale of Fund Shares | 7.19 | 6.41 | 5.21 |
35
About Your Fund’s Expenses
As a shareholder of the fund, you incur ongoing costs, which include costs for portfolio management, administrative services, and shareholder reports (like this one), among others. Operating expenses, which are deducted from a fund’s gross income, directly reduce the investment return of the fund.
A fund’s expenses are expressed as a percentage of its average net assets. This figure is known as the expense ratio. The following examples are intended to help you understand the ongoing costs (in dollars) of investing in your fund and to compare these costs with those of other mutual funds. The examples are based on an investment of $1,000 made at the beginning of the period shown and held for the entire period.
The accompanying table illustrates your fund’s costs in two ways:
• Based on actual fund return. This section helps you to estimate the actual expenses that you paid over the period. The ”Ending Account Value“ shown is derived from the fund‘s actual return, and the third column shows the dollar amount that would have been paid by an investor who started with $1,000 in the fund. You may use the information here, together with the amount you invested, to estimate the expenses that you paid over the period.
To do so, simply divide your account value by $1,000 (for example, an $8,600 account value divided by $1,000 = 8.6), then multiply the result by the number given for your fund under the heading ”Expenses Paid During Period.“
• Based on hypothetical 5% yearly return. This section is intended to help you compare your fund‘s costs with those of other mutual funds. It assumes that the fund had a yearly return of 5% before expenses, but that the expense ratio is unchanged. In this case—because the return used is not the fund’s actual return—the results do not apply to your investment. The example is useful in making comparisons because the Securities and Exchange Commission requires all mutual funds to calculate expenses based on a 5% return. You can assess your fund’s costs by comparing this hypothetical example with the hypothetical examples that appear in shareholder reports of other funds.
Note that the expenses shown in the table are meant to highlight and help you compare ongoing costs only and do not reflect transaction costs incurred by the fund for buying and selling securities. Further, the expenses do not include any purchase, redemption, or account service fees described in the fund prospectus. If such fees were applied to your account, your costs would be higher. Your fund does not carry a “sales load.”
The calculations assume no shares were bought or sold during the period. Your actual costs may have been higher or lower, depending on the amount of your investment and the timing of any purchases or redemptions.
You can find more information about the fund’s expenses, including annual expense ratios, in the Financial Statements section of this report. For additional information on operating expenses and other shareholder costs, please refer to your fund’s current prospectus.
36
| | | |
| Six Months Ended September 30, 2016 | | | |
| | Beginning | Ending | Expenses |
| | Account Value | Account Value | Paid During |
| Wellesley Income Fund | 3/31/2016 | 9/30/2016 | Period |
| Based on Actual Fund Return | | | |
| Investor Shares | $1,000.00 | $1,048.18 | $1.18 |
| Admiral Shares | 1,000.00 | 1,048.47 | 0.82 |
| Based on Hypothetical 5% Yearly Return | | | |
| Investor Shares | $1,000.00 | $1,023.85 | $1.16 |
| Admiral Shares | 1,000.00 | 1,024.20 | 0.81 |
The calculations are based on expenses incurred in the most recent six-month period. The fund’s annualized six-month expense ratios for that
period are 0.23% for Investor Shares and 0.16% for Admiral Shares. The dollar amounts shown as “Expenses Paid” are equal to the
annualized expense ratio multiplied by the average account value over the period, multiplied by the number of days in the most recent
six-month period, then divided by the number of days in the most recent 12-month period (183/366).
37
Trustees Approve Advisory Arrangement
The board of trustees of Vanguard Wellesley Income Fund has renewed the fund’s investment advisory arrangement with Wellington Management Company LLP (Wellington Management). The board determined that renewing the fund’s advisory arrangement was in the best interests of the fund and its shareholders.
The board based its decision upon an evaluation of the advisor’s investment staff, portfolio management process, and performance. This evaluation included information provided to the board by Vanguard’s Portfolio Review Department, which is responsible for fund and advisor oversight and product management. The Portfolio Review Department met regularly with the advisors and made monthly presentations to the board during the fiscal year directing the board’s focus to relevant information and topics.
The board, or an investment committee made up of board members, also received information throughout the year during advisor presentations. For each advisor presentation, the board was provided with letters and reports that included information about, among other things, the advisory firm and the advisor’s assessment of the investment environment, portfolio performance, and portfolio characteristics.
In addition, the board received monthly reports, which included a Market and Economic Report, a Fund Dashboard Monthly Summary, and a Fund Performance Report.
Prior to their meeting, the trustees were provided with a memo and materials that summarized the information they received over the course of the year. They also considered the factors discussed below, among others. However, no single factor determined whether the board approved the arrangement. Rather, it was the totality of the circumstances that drove the board’s decision.
Nature, extent, and quality of services
The board reviewed the quality of the fund’s investment management services over both the short and long term, and took into account the organizational depth and stability of the advisor. The board considered that Wellington Management, founded in 1928, is among the nation’s oldest and most respected institutional managers. The firm has advised the fund since its inception in 1970. The board also noted that the senior portfolio managers of the fund each have over two decades of investment industry experience. For the equity portion of the fund, Wellington Management seeks to invest in large-capitalization companies with an attractive dividend yield relative to the market, below-average valuations, and stable or improving businesses. For the fixed income portion, the firm utilizes fundamental research to invest in investment-grade debt.
The board concluded that the advisor’s experience, stability, depth, and performance, among other factors, warranted continuation of the advisory arrangement.
Investment performance
The board considered the short- and long-term performance of the fund, including any periods of outperformance or underperformance compared with a relevant benchmark index and peer group. The board concluded that the performance was such that the advisory arrangement should continue. Information about the fund’s most recent performance can be found in the Performance Summary section of this report.
38
Cost
The board concluded that the fund’s expense ratio was well below the average expense ratio charged by funds in its peer group and that the fund’s advisory fee rate was also well below its peer-group average. Information about the fund’s expenses appears in the About Your Fund’s Expenses section of this report as well as in the Financial Statements section, which also includes information about the fund’s advisory fee rate.
The board did not consider profitability of Wellington Management in determining whether to approve the advisory fee, because Wellington Management is independent of Vanguard, and the advisory fee is the result of arm’s-length negotiations.
The benefit of economies of scale
The board concluded that the fund’s shareholders benefit from economies of scale because of the breakpoints in the fund’s advisory fee schedule. The breakpoints reduce the effective rate of the fee as the fund’s assets increase.
The board will consider whether to renew the advisory arrangement again after a one-year period.
39
Glossary
30-Day SEC Yield. A fund’s 30-day SEC yield is derived using a formula specified by the U.S. Securities and Exchange Commission. Under the formula, data related to the fund’s security holdings in the previous 30 days are used to calculate the fund’s hypothetical net income for that period, which is then annualized and divided by the fund’s estimated average net assets over the calculation period. For the purposes of this calculation, a security’s income is based on its current market yield to maturity (for bonds), its actual income (for asset-backed securities), or its projected dividend yield (for stocks). Because the SEC yield represents hypothetical annualized income, it will differ—at times significantly—from the fund’s actual experience. As a result, the fund’s income distributions may be higher or lower than implied by the SEC yield.
Average Coupon. The average interest rate paid on the fixed income securities held by a fund. It is expressed as a percentage of face value.
Average Duration. An estimate of how much the value of the bonds held by a fund will fluctuate in response to a change in interest rates. To see how the value could change, multiply the average duration by the change in rates. If interest rates rise by 1 percentage point, the value of the bonds in a fund with an average duration of five years would decline by about 5%. If rates decrease by a percentage point, the value would rise by 5%.
Average Effective Maturity. The average length of time until fixed income securities held by a fund reach maturity and are repaid, taking into consideration the possibility that the issuer may call the bond before its maturity date. The figure reflects the proportion of fund assets represented by each security; it also reflects any futures contracts held. In general, the longer the average effective maturity, the more a fund’s share price will fluctuate in response to changes in market interest rates.
Beta. A measure of the magnitude of a fund’s past share-price fluctuations in relation to the ups and downs of a given market index. The index is assigned a beta of 1.00. Compared with a given index, a fund with a beta of 1.20 typically would have seen its share price rise or fall by 12% when the index rose or fell by 10%. For this report, beta is based on returns over the past 36 months for both the fund and the index. Note that a fund’s beta should be reviewed in conjunction with its R-squared (see definition). The lower the R-squared, the less correlation there is between the fund and the index, and the less reliable beta is as an indicator of volatility.
Credit Quality. Credit-quality ratings are measured on a scale that generally ranges from AAA (highest) to D (lowest). U.S. Treasury, U.S. Agency, and U.S. Agency mortgage-backed securities appear under “U.S. Government.” Credit-quality ratings are obtained from Barclays and are from Moody’s, Fitch, and S&P. When ratings from all three agencies are used, the median rating is shown. When ratings from two of the agencies are used, the lower rating for each issue is shown. “Not Rated” is used to classify securities for which a rating is not available. Not rated securities include a fund’s investment in Vanguard Market Liquidity Fund or Vanguard Municipal Cash Management Fund, each of which invests in high-quality money market instruments and may serve as a cash management vehicle for the Vanguard funds, trusts, and accounts.
Dividend Yield. The current, annualized rate of dividends paid on a share of stock, divided by its current share price. For a fund, the weighted average yield for stocks it holds. The index yield is based on the current annualized rate of dividends paid on stocks in the index.
40
Earnings Growth Rate. The average annual rate of growth in earnings over the past five years for the stocks now in a fund.
Equity Exposure. A measure that reflects a fund’s investments in stocks and stock futures. Any holdings in short-term reserves are excluded.
Expense Ratio. A fund’s total annual operating expenses expressed as a percentage of the fund’s average net assets. The expense ratio includes management and administrative expenses, but does not include the transaction costs of buying and selling portfolio securities.
Foreign Holdings. The percentage of a fund represented by securities or depositary receipts of companies based outside the United States.
Inception Date. The date on which the assets of a fund (or one of its share classes) are first invested in accordance with the fund’s investment objective. For funds with a subscription period, the inception date is the day after that period ends. Investment performance is measured from the inception date.
Median Market Cap. An indicator of the size of companies in which a fund invests; the midpoint of market capitalization (market price x shares outstanding) of a fund’s stocks, weighted by the proportion of the fund’s assets invested in each stock. Stocks representing half of the fund’s assets have market capitalizations above the median, and the rest are below it.
Price/Book Ratio. The share price of a stock divided by its net worth, or book value, per share. For a fund, the weighted average price/book ratio of the stocks it holds.
Price/Earnings Ratio. The ratio of a stock’s current price to its per-share earnings over the past year. For a fund, the weighted average P/E of the stocks it holds. P/E is an indicator of market expectations about corporate prospects; the higher the P/E, the greater the expectations for a company’s future growth.
R-Squared. A measure of how much of a fund’s past returns can be explained by the returns from the market in general, as measured by a given index. If a fund’s total returns were precisely synchronized with an index’s returns, its R-squared would be 1.00. If the fund’s returns bore no relationship to the index’s returns, its R-squared would be 0. For this report, R-squared is based on returns over the past 36 months for both the fund and the index.
Return on Equity. The annual average rate of return generated by a company during the past five years for each dollar of shareholder’s equity (net income divided by shareholder’s equity). For a fund, the weighted average return on equity for the companies whose stocks it holds.
Short-Term Reserves. The percentage of a fund invested in highly liquid, short-term securities that can be readily converted to cash.
Turnover Rate. An indication of the fund’s trading activity. Funds with high turnover rates incur higher transaction costs and may be more likely to distribute capital gains (which may be taxable to investors). The turnover rate excludes in-kind transactions, which have minimal impact on costs.
Yield to Maturity. The rate of return an investor would receive if the fixed income securities held by a fund were held to their maturity dates.
41
Benchmark Information
Wellesley Income Composite Index: Weighted 65% bonds and 35% stocks. For bonds: Lehman U.S. Long Credit AA or Better Bond Index through March 31, 2000, and Bloomberg Barclays U.S. Credit A or Better Bond Index thereafter. For stocks: 26% S&P 500/Barra Value Index and 9% S&P Utilities Index through June 30, 1996, when the utilities component was split into the S&P Utilities Index (4.5%) and the S&P Telephone Index (4.5%); as of January 1, 2002, the S&P Telephone Index was replaced by the S&P Integrated Telecommunication Services Index; as of July 1, 2006, the S&P 500/Barra Value Index was replaced by the S&P 500/Citigroup Value Index; as of August 1, 2007, the three stock indexes were replaced by the FTSE High Dividend Yield Index.
42
This page intentionally left blank.
The People Who Govern Your Fund
The trustees of your mutual fund are there to see that the fund is operated and managed in your best interests since, as a shareholder, you are a part owner of the fund. Your fund’s trustees also serve on the board of directors of The Vanguard Group, Inc., which is owned by the Vanguard funds and provides services to them on an at-cost basis.
A majority of Vanguard’s board members are independent, meaning that they have no affiliation with Vanguard or the funds they oversee, apart from the sizable personal investments they have made as private individuals. The independent board members have distinguished backgrounds in business, academia, and public service. Each of the trustees and executive officers oversees 198 Vanguard funds.
The following table provides information for each trustee and executive officer of the fund. The mailing address of the trustees and officers is P.O. Box 876, Valley Forge, PA 19482. More information about the trustees is in the Statement of Additional Information, which can be obtained, without charge, by contacting Vanguard at 800-662-7447, or online at vanguard.com.
|
| InterestedTrustee1 |
| F. William McNabb III |
| Born 1957. Trustee Since July 2009. Chairman of |
| the Board. Principal Occupation(s) During the Past |
| Five Years and Other Experience: Chairman of the |
| Board of The Vanguard Group, Inc., and of each of |
| the investment companies served by The Vanguard |
| Group, since January 2010; Director of The Vanguard |
| Group since 2008; Chief Executive Officer and |
| President of The Vanguard Group, and of each of |
| the investment companies served by The Vanguard |
| Group, since 2008; Director of Vanguard Marketing |
| Corporation; Managing Director of The Vanguard |
| Group (1995–2008). |
| |
| IndependentTrustees |
| Emerson U. Fullwood |
| Born 1948. Trustee Since January 2008. Principal |
| Occupation(s) During the Past Five Years and Other |
| Experience: Executive Chief Staff and Marketing |
| Officer for North America and Corporate Vice President |
| (retired 2008) of Xerox Corporation (document manage- |
| ment products and services); Executive in Residence |
| and 2009–2010 Distinguished Minett Professor at |
| the Rochester Institute of Technology; Lead Director |
| of SPX FLOW, Inc. (multi-industry manufacturing); |
| Director of the United Way of Rochester, the University |
| of Rochester Medical Center, Monroe Community |
| College Foundation, North Carolina A&T University, |
| and Roberts Wesleyan College. |
|
| Rajiv L. Gupta |
| Born 1945. Trustee Since December 2001.2 Principal |
| Occupation(s) During the Past Five Years and Other |
| Experience: Chairman and Chief Executive Officer |
| (retired 2009) and President (2006–2008) of |
| Rohm and Haas Co. (chemicals); Director of Tyco |
| International plc (diversified manufacturing and |
| services), HP Inc. (printer and personal computer |
| manufacturing), and Delphi Automotive plc |
| (automotive components); Senior Advisor at |
| New Mountain Capital. |
Amy Gutmann |
| Born 1949. Trustee Since June 2006. Principal |
| Occupation(s) During the Past Five Years and |
| Other Experience: President of the University of |
| Pennsylvania; Christopher H. Browne Distinguished |
| Professor of Political Science, School of Arts and |
| Sciences, and Professor of Communication, Annenberg |
| School for Communication, with secondary faculty |
| appointments in the Department of Philosophy, School |
| of Arts and Sciences, and at the Graduate School of |
| Education, University of Pennsylvania; Trustee of the |
| National Constitution Center; Chair of the Presidential |
| Commission for the Study of Bioethical Issues. |
JoAnn Heffernan Heisen |
| Born 1950. Trustee Since July 1998. Principal |
| Occupation(s) During the Past Five Years and |
| Other Experience: Corporate Vice President and |
| Chief Global Diversity Officer (retired 2008) and |
| Member of the Executive Committee (1997–2008) |
| of Johnson & Johnson (pharmaceuticals/medical |
| devices/consumer products); Director of Skytop |
| Lodge Corporation (hotels) and the Robert Wood |
| Johnson Foundation; Member of the Advisory |
| Board of the Institute for Women’s Leadership |
| at Rutgers University. |
|
| F. Joseph Loughrey |
| Born 1949. Trustee Since October 2009. Principal |
| Occupation(s) During the Past Five Years and Other |
| Experience: President and Chief Operating Officer |
| (retired 2009) of Cummins Inc. (industrial machinery); |
| Chairman of the Board of Hillenbrand, Inc. (specialized |
| consumer services), and of Oxfam America; Director |
| of SKF AB (industrial machinery), Hyster-Yale Materials |
| Handling, Inc. (forklift trucks), the Lumina Foundation |
| for Education, and the V Foundation for Cancer |
| Research; Member of the Advisory Council for the |
| College of Arts and Letters and of the Advisory Board |
| to the Kellogg Institute for International Studies, both |
| at the University of Notre Dame. |
Mark Loughridge |
| Born 1953. Trustee Since March 2012. Principal |
| Occupation(s) During the Past Five Years and Other |
| Experience: Senior Vice President and Chief Financial |
| Officer (retired 2013) at IBM (information technology |
| services); Fiduciary Member of IBM’s Retirement Plan |
| Committee (2004–2013); Director of the Dow Chemical |
| Company; Member of the Council on Chicago Booth. |
Scott C. Malpass |
| Born 1962. Trustee Since March 2012. Principal |
| Occupation(s) During the Past Five Years and Other |
| Experience: Chief Investment Officer and Vice |
| President at the University of Notre Dame; Assistant |
| Professor of Finance at the Mendoza College of |
| Business at Notre Dame; Member of the Notre Dame |
| 403(b) Investment Committee, the Board of Advisors |
| for Spruceview Capital Partners, and the Investment |
| Advisory Committee of Major League Baseball; Board |
| Member of TIFF Advisory Services, Inc., and Catholic |
| Investment Services, Inc. (investment advisors). |
André F. Perold |
| Born 1952. Trustee Since December 2004. Principal |
| Occupation(s) During the Past Five Years and Other |
| Experience: George Gund Professor of Finance and |
| Banking, Emeritus at the Harvard Business School |
| (retired 2011); Chief Investment Officer and Managing |
| Partner of HighVista Strategies LLC (private investment |
| firm); Director of Rand Merchant Bank; Overseer of |
| the Museum of Fine Arts Boston. |
Peter F. Volanakis |
| Born 1955. Trustee Since July 2009. Principal |
| Occupation(s) During the Past Five Years and |
| Other Experience: President and Chief Operating |
| Officer (retired 2010) of Corning Incorporated |
| (communications equipment); Chairman of the |
| Board of Trustees of Colby-Sawyer College; |
| Member of the Advisory Board of the Norris |
| Cotton Cancer Center. |
| |
| Executive Officers | |
| Glenn Booraem | |
| Born 1967. Treasurer Since May 2015. Principal |
| Occupation(s) During the Past Five Years and |
| Other Experience: Principal of The Vanguard Group, |
| Inc.; Treasurer of each of the investment companies |
| served by The Vanguard Group; Controller of each of |
| the investment companies served by The Vanguard |
| Group (2010–2015); Assistant Controller of each of |
| the investment companies served by The Vanguard |
| Group (2001–2010). | |
Thomas J. Higgins | |
| Born 1957. Chief Financial Officer Since September |
| 2008. Principal Occupation(s) During the Past Five |
| Years and Other Experience: Principal of The Vanguard |
| Group, Inc.; Chief Financial Officer of each of the |
| investment companies served by The Vanguard Group; |
| Treasurer of each of the investment companies served |
| by The Vanguard Group (1998–2008). |
Peter Mahoney | |
| Born 1974. Controller Since May 2015. Principal |
| Occupation(s) During the Past Five Years and Other |
| Experience: Head of Global Fund Accounting at The |
| Vanguard Group, Inc.; Controller of each of the invest- |
| ment companies served by The Vanguard Group; |
| Head of International Fund Services at The Vanguard |
| Group (2008–2014). | |
Anne E. Robinson | |
| Born 1970. Secretary Since September 2016. Principal |
| Occupation(s) During the Past Five Years and Other |
| Experience: Managing Director of The Vanguard Group, |
| Inc.; General Counsel of The Vanguard Group; Secretary |
| of The Vanguard Group and of each of the investment |
| companies served by The Vanguard Group; Director |
| and Senior Vice President of Vanguard Marketing |
| Corporation; Managing Director and General Counsel |
| of Global Cards and Consumer Services at Citigroup |
| (2014–2016); Counsel at American Express (2003–2014). |
| |
| Vanguard Senior ManagementTeam |
| Mortimer J. Buckley | James M. Norris |
| Kathleen C. Gubanich | Thomas M. Rampulla |
| Martha G. King | Glenn W. Reed |
| John T. Marcante | Karin A. Risi |
| Chris D. McIsaac | Michael Rollings |
| |
| Chairman Emeritus and Senior Advisor |
| John J. Brennan | |
| Chairman, 1996–2009 | |
| Chief Executive Officer and President, 1996–2008 |
| |
| Founder | |
| John C. Bogle | |
| Chairman and Chief Executive Officer, 1974–1996 |
1 Mr. McNabb is considered an “interested person,” as defined in the Investment Company Act of 1940, because he is an officer of the Vanguard funds.
2 December 2002 for Vanguard Equity Income Fund, the Vanguard Municipal Bond Funds, and the Vanguard State Tax-Exempt Funds.
|  |
| | P.O. Box 2600 |
| | Valley Forge, PA 19482-2600 |
| |
| |
| |
| Connect with Vanguard® > vanguard.com | |
| |
| |
| |
| Fund Information > 800-662-7447 | CFA® is a registered trademark owned by CFA Institute. |
| Direct Investor Account Services > 800-662-2739 | |
| Institutional Investor Services > 800-523-1036 | |
| Text Telephone for People | |
| Who Are Deaf or Hard of Hearing> 800-749-7273 | |
| |
| This material may be used in conjunction | |
| with the offering of shares of any Vanguard | |
| fund only if preceded or accompanied by | |
| the fund’s current prospectus. | |
| |
| All comparative mutual fund data are from Lipper, a | |
| Thomson Reuters Company, or Morningstar, Inc., unless | |
| otherwise noted. | |
| |
| You can obtain a free copy of Vanguard’s proxy voting | |
| guidelines by visiting vanguard.com/proxyreporting or by | |
| calling Vanguard at 800-662-2739. The guidelines are | |
| also available from the SEC’s website, sec.gov. In | |
| addition, you may obtain a free report on how your fund | |
| voted the proxies for securities it owned during the 12 | |
| months ended June 30. To get the report, visit either | |
| vanguard.com/proxyreporting or sec.gov. | |
| |
| You can review and copy information about your fund at | |
| the SEC’s Public Reference Room in Washington, D.C. To | |
| find out more about this public service, call the SEC at | |
| 202-551-8090. Information about your fund is also | |
| available on the SEC’s website, and you can receive | |
| copies of this information, for a fee, by sending a | |
| request in either of two ways: via email addressed to | |
| publicinfo@sec.gov or via regular mail addressed to the | |
| Public Reference Section, Securities and Exchange | |
| Commission, Washington, DC 20549-1520. | |
| |
| | © 2016 The Vanguard Group, Inc. |
| | All rights reserved. |
| | Vanguard Marketing Corporation, Distributor. |
| |
| | Q270 112016 |
Item 2: Code of Ethics. The Registrant has adopted a code of ethics that applies to the Registrant’s principal executive officer, principal financial officer, principal accounting officer or controller or persons performing similar functions. The Code of Ethics was amended during the reporting period covered by this report to make certain technical, non-material changes.
Item 3: Audit Committee Financial Expert. All members of the Audit Committee have been determined by the Registrant’s Board of Trustees to be Audit Committee Financial Experts and to be independent: Rajiv L. Gupta, JoAnn Heffernan Heisen, F. Joseph Loughrey, Mark Loughridge, and Peter F. Volanakis.
Item 4: Principal Accountant Fees and Services.
(a) Audit Fees.
Audit Fees of the Registrant
Fiscal Year Ended September 30, 2016: $34,000
Fiscal Year Ended September 30, 2015: $33,000
Aggregate Audit Fees of Registered Investment Companies in the Vanguard Group.
Fiscal Year Ended September 30, 2016: $9,629,849
Fiscal Year Ended September 30, 2015: $7,000,200
Includes fees billed in connection with audits of the Registrant, other registered investment companies in the Vanguard complex, The Vanguard Group, Inc. and Vanguard Marketing Corporation.
(b) Audit-Related Fees.
Fiscal Year Ended September 30, 2016: $2,717,627
Fiscal Year Ended September 30, 2015: $2,899,096
Includes fees billed in connection with assurance and related services provided to the Registrant, other registered investment companies in the Vanguard complex, The Vanguard Group, Inc., and Vanguard Marketing Corporation.
(c) Tax Fees.
Fiscal Year Ended September 30, 2016: $254,050
Fiscal Year Ended September 30, 2015: $353,389
Includes fees billed in connection with tax compliance, planning, and advice services provided to the Registrant, other registered investment companies in the Vanguard complex, The Vanguard Group, Inc., and Vanguard Marketing Corporation.
(d) All Other Fees.
Fiscal Year Ended September 30, 2016: $214,225
Fiscal Year Ended September 30, 2015: $202,313
Includes fees billed for services related to tax reported information provided to the Registrant, other registered investment companies in the Vanguard complex, The Vanguard Group, Inc., and Vanguard Marketing Corporation.
(e) (1) Pre-Approval Policies. The policy of the Registrant’s Audit Committee is to consider and, if appropriate, approve before the principal accountant is engaged for such services, all specific audit and non-audit services provided to: the Registrant, other registered investment companies in the Vanguard complex, The Vanguard Group, Inc., and entities controlled by The Vanguard Group, Inc. that provide ongoing services to the Registrant. In making a determination, the Audit Committee considers whether the services are consistent with maintaining the principal accountant’s independence.
In the event of a contingency situation in which the principal accountant is needed to provide services in between scheduled Audit Committee meetings, the Chairman of the Audit Committee would be called on to consider and, if appropriate, pre-approve audit or permitted non-audit services in an amount sufficient to complete services through the next Audit Committee meeting, and to determine if such services would be consistent with maintaining the accountant’s independence. At the next scheduled Audit Committee meeting, services and fees would be presented to the Audit Committee for formal consideration, and, if appropriate, approval by the entire Audit Committee. The Audit Committee would again consider whether such services and fees are consistent with maintaining the principal accountant’s independence.
The Registrant’s Audit Committee is informed at least annually of all audit and non-audit services provided by the principal accountant to the Vanguard complex, whether such services are provided to: the Registrant, other registered investment companies in the Vanguard complex, The Vanguard Group, Inc., or other entities controlled by The Vanguard Group, Inc. that provide ongoing services to the Registrant.
(2) No percentage of the principal accountant’s fees or services were approved pursuant to the waiver provision of paragraph (c)(7)(i)(C) of Rule 2-01 of Regulation S-X.
(f) For the most recent fiscal year, over 50% of the hours worked under the principal accountant’s engagement were not performed by persons other than full-time, permanent employees of the principal accountant.
(g) Aggregate Non-Audit Fees.
Fiscal Year Ended September 30, 2016: $468,275
Fiscal Year Ended September 30, 2015: $555,702
Includes fees billed for non-audit services provided to the Registrant, other registered investment companies in the Vanguard complex, The Vanguard Group, Inc., and Vanguard Marketing Corporation.
(h) For the most recent fiscal year, the Audit Committee has determined that the provision of all non-audit services was consistent with maintaining the principal accountant’s independence.
Item 5: Audit Committee of Listed Registrants.
Not Applicable.
Item 6: Investments.
Vanguard® Wellesley Income Fund
Schedule of Investments
September 30, 2016
| | | | | |
| | | | | Face | Market |
| | | | Maturity | Amount | Value |
| | | Coupon | Date | ($000) | ($000) |
| |
| U.S. Government and Agency Obligations (11.0%) | | | | |
| U.S. Government Securities (9.7%) | | | | |
| | United States Treasury Note/Bond | 0.625% | 12/31/16 | 140,120 | 140,207 |
| | United States Treasury Note/Bond | 0.875% | 1/31/17 | 44,979 | 45,050 |
| | United States Treasury Note/Bond | 0.500% | 2/28/17 | 11,000 | 11,003 |
| | United States Treasury Note/Bond | 0.500% | 3/31/17 | 113,300 | 113,300 |
| | United States Treasury Note/Bond | 0.625% | 7/31/17 | 298,000 | 298,000 |
| | United States Treasury Note/Bond | 1.000% | 9/15/17 | 629,315 | 631,278 |
| | United States Treasury Note/Bond | 0.750% | 10/31/17 | 74,500 | 74,546 |
| | United States Treasury Note/Bond | 0.875% | 3/31/18 | 217,000 | 217,441 |
| | United States Treasury Note/Bond | 0.750% | 4/30/18 | 45,000 | 45,007 |
| | United States Treasury Note/Bond | 1.375% | 9/30/18 | 662,270 | 669,721 |
| 1 | United States Treasury Note/Bond | 1.750% | 9/30/19 | 665,000 | 681,519 |
| | United States Treasury Note/Bond | 1.625% | 6/30/20 | 258,195 | 263,844 |
| | United States Treasury Note/Bond | 1.250% | 3/31/21 | 162,000 | 162,860 |
| | United States Treasury Note/Bond | 2.000% | 2/15/25 | 350,870 | 363,533 |
| | United States Treasury Note/Bond | 2.000% | 8/15/25 | 109,605 | 113,493 |
| | United States Treasury Note/Bond | 2.250% | 11/15/25 | 5,685 | 6,005 |
| | United States Treasury Note/Bond | 1.625% | 2/15/26 | 105,000 | 105,263 |
| | United States Treasury Note/Bond | 2.875% | 5/15/43 | 203,565 | 227,325 |
| | United States Treasury Note/Bond | 3.625% | 2/15/44 | 99,150 | 126,633 |
| | United States Treasury Note/Bond | 3.375% | 5/15/44 | 322,125 | 394,200 |
| | United States Treasury Note/Bond | 2.500% | 2/15/46 | 163,150 | 169,242 |
| | | | | | 4,859,470 |
| Agency Bonds and Notes (0.2%) | | | | |
| | Private Export Funding Corp. | 2.250% | 12/15/17 | 51,055 | 51,870 |
| 2 | Tennessee Valley Authority | 4.625% | 9/15/60 | 19,800 | 25,321 |
| | | | | | 77,191 |
| Conventional Mortgage-Backed Securities (0.9%) | | | | |
| 3,4 | Fannie Mae Pool | 2.500% | 8/1/27–10/1/28 | 8,039 | 8,350 |
| 3,4 | Fannie Mae Pool | 3.000% | 10/1/46 | 100,000 | 104,007 |
| 3,4 | Fannie Mae Pool | 4.500% | 10/1/29–10/1/46 | 242,265 | 267,049 |
| 3,4 | Freddie Mac Gold Pool | 4.000% | 7/1/33 | 5 | 6 |
| 3,4 | Freddie Mac Gold Pool | 4.500% | 4/1/33–10/1/46 | 36,604 | 40,909 |
| 3 | Ginnie Mae I Pool | 6.000% | 6/15/31–7/15/35 | 55 | 63 |
| 3 | Ginnie Mae I Pool | 6.500% | 4/15/32–9/15/38 | 4,452 | 5,067 |
| | | | | | 425,451 |
| Nonconventional Mortgage-Backed Securities (0.2%) | | | | |
| 3,4 | Fannie Mae REMICS | 3.500% | 4/25/31 | 6,910 | 7,381 |
| 3,4 | Fannie Mae REMICS | 4.000% | 9/25/29–5/25/31 | 13,201 | 14,287 |
| 3,4 | Freddie Mac REMICS | 3.500% | 3/15/31 | 4,095 | 4,382 |
| 3,4 | Freddie Mac REMICS | 4.000% | 12/15/30–4/15/31 | 77,206 | 84,655 |
| |
| | | | | | 110,705 |
| |
| Total U.S. Government and Agency Obligations (Cost $5,253,268) | | | | 5,472,817 |
| |
| Asset-Backed/Commercial Mortgage-Backed Securities (2.4%) | �� | | | |
| 3 | Ally Master Owner Trust Series 2012-4 | 1.720% | 7/15/19 | 25,000 | 25,120 |
| 3 | Ally Master Owner Trust Series 2012-5 | 1.540% | 9/15/19 | 95,780 | 96,132 |
| 3 | Ally Master Owner Trust Series 2014-5 | 1.600% | 10/15/19 | 117,745 | 118,267 |
| 5 | American Tower Trust I | 1.551% | 3/15/18 | 13,530 | 13,497 |
| 5 | American Tower Trust I | 3.070% | 3/15/23 | 32,900 | 34,277 |
| 3,5,6 | Apidos CDO | 2.179% | 4/17/26 | 39,850 | 39,942 |
| 3,5,6 | ARES CLO Ltd. | 2.199% | 4/17/26 | 39,670 | 39,764 |
| 3,5,6 | Atlas Senior Loan Fund Ltd. | 2.220% | 10/15/26 | 12,360 | 12,420 |
| 3,5,6 | Atlas Senior Loan Fund V Ltd. | 2.229% | 7/16/26 | 9,890 | 9,926 |
| 3,5,6 | Babson CLO Ltd. | 2.186% | 7/20/25 | 4,555 | 4,565 |
| 3,5,6 | Cent CLO | 2.224% | 7/27/26 | 13,260 | 13,238 |
| 3,5,6 | Cent CLO 20 Ltd. | 2.194% | 1/25/26 | 40,000 | 39,993 |
| 3,5,6 | Cent CLO 22 Ltd. | 2.268% | 11/7/26 | 30,200 | 30,183 |
| 3,5,6 | CIFC Funding Ltd. | 2.179% | 4/18/25 | 38,255 | 38,349 |
| 3 | COMM 2012-CCRE2 Mortgage Trust | 3.147% | 8/15/45 | 16,040 | 17,091 |
| 3,5,6 | Dryden Senior Loan Fund | 2.029% | 4/18/26 | 37,710 | 37,688 |
1
Vanguard® Wellesley Income Fund
Schedule of Investments
September 30, 2016
| | | | | |
| | | | | Face | Market |
| | | | Maturity | Amount | Value |
| | | Coupon | Date | ($000) | ($000) |
| 3,5 | First Investors Auto Owner Trust 2013-2 | 1.230% | 3/15/19 | 240 | 240 |
| 3,5 | Ford Credit Floorplan Master Owner Trust A | 2.090% | 3/15/22 | 10,250 | 10,432 |
| 3 | Ford Credit Floorplan Master Owner Trust A Series | | | | |
| | 2012-2 | 1.920% | 1/15/19 | 27,005 | 27,078 |
| 3,5 | Hilton USA Trust 2013-HLT | 2.662% | 11/5/30 | 37,815 | 37,832 |
| 3,5,6 | ING Investment Management Co. | 2.179% | 4/18/26 | 37,635 | 37,716 |
| 3,6 | LB-UBS Commercial Mortgage Trust 2008-C1 | 6.287% | 4/15/41 | 19,015 | 19,864 |
| 3,5,6 | Limerock CLO | 2.179% | 4/18/26 | 43,000 | 42,968 |
| 3,5,6 | Madison Park Funding XII Ltd. | 2.138% | 1/19/25 | 24,975 | 25,117 |
| 3,5,6 | Madison Park Funding XIII Ltd. | 2.196% | 7/20/26 | 29,375 | 29,453 |
| 3,5 | OBP Depositor LLC Trust 2010-OBP | 4.646% | 7/15/45 | 23,260 | 25,304 |
| 3,5 | OneMain Financial Issuance Trust 2016-1A | 3.660% | 2/20/29 | 12,215 | 12,524 |
| 3,5 | OneMain Financial Issuance Trust 2016-2 | 4.100% | 3/20/28 | 23,305 | 23,987 |
| 3,5,6 | OZLM VI Ltd. | 2.229% | 4/17/26 | 30,910 | 31,033 |
| 3 | Santander Drive Auto Receivables Trust 2013-2 | 2.570% | 3/15/19 | 15,610 | 15,780 |
| 3 | Santander Drive Auto Receivables Trust 2014-2 | 2.330% | 11/15/19 | 9,665 | 9,740 |
| 5 | SBA Tower Trust | 2.898% | 10/15/19 | 37,250 | 37,706 |
| 3,5,6 | Seneca Park CLO Ltd. | 2.159% | 7/17/26 | 21,705 | 21,748 |
| 3,5,6 | SFAVE Commercial Mortgage Securities Trust 2015- | | | | |
| | 5AVE | 4.144% | 1/5/43 | 22,000 | 23,171 |
| 3,5,6 | Shackleton CLO Ltd. | 2.159% | 7/17/26 | 20,985 | 20,923 |
| 3,5 | Springleaf Funding Trust | 2.410% | 12/15/22 | 18,959 | 18,972 |
| 3,5 | Springleaf Funding Trust | 3.160% | 11/15/24 | 43,060 | 43,562 |
| 3,5 | Springleaf Funding Trust 2015-B | 3.480% | 5/15/28 | 19,420 | 19,287 |
| 3,5 | Springleaf Mortgage Loan Trust 2013-1A | 2.310% | 6/25/58 | 7,480 | 7,477 |
| 3,5,6 | Symphony CLO XIV Ltd. | 2.153% | 7/14/26 | 36,945 | 37,049 |
| 3,5,6 | Thacher Park CLO Ltd. | 2.166% | 10/20/26 | 16,115 | 16,131 |
| 3 | Utility Debt Securitization Authority Series 2013T | 3.435% | 12/15/25 | 6,775 | 7,296 |
| 3 | Volkswagen Auto Loan Enhanced Trust 2014-1 | 1.450% | 9/21/20 | 16,897 | 16,921 |
| 3 | Volkswagen Auto Loan Enhanced Trust 2014-2 | 0.950% | 4/22/19 | 11,955 | 11,931 |
| 3,5,6 | Voya CLO 2014-2 Ltd. | 2.129% | 7/17/26 | 5,905 | 5,909 |
| |
| Total Asset-Backed/Commercial Mortgage-Backed Securities (Cost $1,199,036) | | | 1,207,603 |
| |
| Corporate Bonds (42.4%) | | | | |
| Finance (15.6%) | | | | |
| | Banking (12.1%) | | | | |
| | American Express Co. | 6.150% | 8/28/17 | 35,000 | 36,474 |
| | American Express Credit Corp. | 2.375% | 3/24/17 | 35,650 | 35,866 |
| | American Express Credit Corp. | 2.250% | 8/15/19 | 24,000 | 24,488 |
| | Bank of America Corp. | 5.625% | 10/14/16 | 22,500 | 22,523 |
| | Bank of America Corp. | 6.875% | 4/25/18 | 32,000 | 34,506 |
| | Bank of America Corp. | 5.650% | 5/1/18 | 60,090 | 63,739 |
| | Bank of America Corp. | 5.625% | 7/1/20 | 28,825 | 32,355 |
| | Bank of America Corp. | 5.875% | 1/5/21 | 10,285 | 11,768 |
| | Bank of America Corp. | 5.000% | 5/13/21 | 35,910 | 40,099 |
| | Bank of America Corp. | 3.300% | 1/11/23 | 18,875 | 19,570 |
| | Bank of America Corp. | 4.100% | 7/24/23 | 47,670 | 51,581 |
| | Bank of America Corp. | 4.125% | 1/22/24 | 7,500 | 8,137 |
| | Bank of America Corp. | 4.000% | 1/22/25 | 26,225 | 27,146 |
| | Bank of America Corp. | 6.110% | 1/29/37 | 30,000 | 36,617 |
| | Bank of America Corp. | 5.875% | 2/7/42 | 8,770 | 11,459 |
| | Bank of America Corp. | 5.000% | 1/21/44 | 24,180 | 28,400 |
| | Bank of America Corp. | 4.875% | 4/1/44 | 7,820 | 9,086 |
| | Bank of Montreal | 2.500% | 1/11/17 | 71,580 | 71,834 |
| | Bank of Montreal | 2.375% | 1/25/19 | 29,000 | 29,552 |
| | Bank of New York Mellon Corp. | 5.450% | 5/15/19 | 49,465 | 54,529 |
| | Bank of New York Mellon Corp. | 2.150% | 2/24/20 | 49,755 | 50,596 |
| | Bank of New York Mellon Corp. | 3.000% | 2/24/25 | 22,710 | 23,743 |
| | Bank of Nova Scotia | 2.550% | 1/12/17 | 31,000 | 31,130 |
| | Bank of Nova Scotia | 2.450% | 3/22/21 | 39,905 | 40,925 |
| | Bank of Nova Scotia | 2.800% | 7/21/21 | 58,100 | 60,591 |
| 5 | Bank of Tokyo-Mitsubishi UFJ Ltd. | 1.700% | 3/5/18 | 44,350 | 44,402 |
| | Bank One Corp. | 7.750% | 7/15/25 | 25,000 | 32,099 |
2
Vanguard® Wellesley Income Fund
Schedule of Investments
September 30, 2016
| | | | |
| | | | Face | Market |
| | | Maturity | Amount | Value |
| | Coupon | Date | ($000) | ($000) |
| 5 Banque Federative du Credit Mutuel SA | 2.750% | 10/15/20 | 37,820 | 39,149 |
| 5 Barclays Bank plc | 6.050% | 12/4/17 | 27,600 | 28,805 |
| Barclays Bank plc | 5.140% | 10/14/20 | 7,935 | 8,605 |
| BB&T Corp. | 1.600% | 8/15/17 | 19,775 | 19,831 |
| BB&T Corp. | 5.250% | 11/1/19 | 19,000 | 20,956 |
| Bear Stearns Cos. LLC | 7.250% | 2/1/18 | 14,860 | 15,958 |
| BNP Paribas SA | 2.400% | 12/12/18 | 11,000 | 11,177 |
| BNP Paribas SA | 3.250% | 3/3/23 | 6,750 | 7,090 |
| BPCE SA | 2.500% | 12/10/18 | 15,570 | 15,860 |
| BPCE SA | 2.500% | 7/15/19 | 42,100 | 42,974 |
| BPCE SA | 4.000% | 4/15/24 | 25,885 | 28,463 |
| 5 BPCE SA | 5.150% | 7/21/24 | 37,185 | 39,389 |
| Capital One Financial Corp. | 4.750% | 7/15/21 | 36,165 | 40,039 |
| Capital One Financial Corp. | 3.750% | 4/24/24 | 60,945 | 64,742 |
| Capital One Financial Corp. | 3.200% | 2/5/25 | 12,500 | 12,722 |
| Capital One Financial Corp. | 4.200% | 10/29/25 | 9,715 | 10,141 |
| Citigroup Inc. | 1.750% | 5/1/18 | 13,000 | 13,014 |
| Citigroup Inc. | 2.500% | 9/26/18 | 31,000 | 31,481 |
| Citigroup Inc. | 2.550% | 4/8/19 | 30,000 | 30,601 |
| Citigroup Inc. | 2.500% | 7/29/19 | 29,565 | 30,163 |
| Citigroup Inc. | 2.400% | 2/18/20 | 87,550 | 88,586 |
| Citigroup Inc. | 4.500% | 1/14/22 | 30,140 | 33,250 |
| Citigroup Inc. | 4.125% | 7/25/28 | 45,085 | 46,044 |
| Citigroup Inc. | 6.625% | 6/15/32 | 9,000 | 11,113 |
| Citigroup Inc. | 8.125% | 7/15/39 | 1,883 | 2,971 |
| Citigroup Inc. | 5.875% | 1/30/42 | 7,460 | 9,576 |
| Citigroup Inc. | 4.950% | 11/7/43 | 7,000 | 7,981 |
| Citigroup Inc. | 5.300% | 5/6/44 | 15,745 | 17,672 |
| Compass Bank | 2.750% | 9/29/19 | 12,250 | 12,219 |
| Cooperatieve Rabobank UA | 2.250% | 1/14/19 | 44,660 | 45,375 |
| 5 Credit Agricole SA | 2.500% | 4/15/19 | 45,420 | 46,258 |
| Credit Suisse | 5.300% | 8/13/19 | 9,000 | 9,867 |
| Credit Suisse AG | 1.750% | 1/29/18 | 25,940 | 25,930 |
| Credit Suisse AG | 2.300% | 5/28/19 | 18,975 | 19,224 |
| Credit Suisse AG | 3.000% | 10/29/21 | 53,710 | 55,123 |
| Credit Suisse AG | 3.625% | 9/9/24 | 3,955 | 4,126 |
| Credit Suisse Group Funding Guernsey Ltd. | 3.125% | 12/10/20 | 25,000 | 25,317 |
| Credit Suisse Group Funding Guernsey Ltd. | 3.800% | 9/15/22 | 45,685 | 46,693 |
| Credit Suisse Group Funding Guernsey Ltd. | 3.750% | 3/26/25 | 57,400 | 57,202 |
| 5 Danske Bank A/S | 2.000% | 9/8/21 | 41,970 | 41,870 |
| Deutsche Bank AG | 1.875% | 2/13/18 | 8,730 | 8,576 |
| Deutsche Bank AG | 2.500% | 2/13/19 | 12,005 | 11,661 |
| 5 DNB Bank ASA | 2.375% | 6/2/21 | 42,450 | 43,191 |
| Fifth Third Bank | 2.875% | 10/1/21 | 8,780 | 9,184 |
| Fifth Third Bank | 3.850% | 3/15/26 | 29,295 | 31,235 |
| Goldman Sachs Group Inc. | 5.950% | 1/18/18 | 24,190 | 25,521 |
| Goldman Sachs Group Inc. | 2.900% | 7/19/18 | 55,000 | 56,247 |
| Goldman Sachs Group Inc. | 7.500% | 2/15/19 | 20,790 | 23,496 |
| Goldman Sachs Group Inc. | 5.375% | 3/15/20 | 24,305 | 26,898 |
| Goldman Sachs Group Inc. | 2.600% | 4/23/20 | 11,900 | 12,096 |
| Goldman Sachs Group Inc. | 6.000% | 6/15/20 | 23,755 | 27,008 |
| Goldman Sachs Group Inc. | 2.875% | 2/25/21 | 25,990 | 26,660 |
| Goldman Sachs Group Inc. | 2.625% | 4/25/21 | 9,270 | 9,426 |
| Goldman Sachs Group Inc. | 5.250% | 7/27/21 | 70,165 | 79,318 |
| Goldman Sachs Group Inc. | 5.750% | 1/24/22 | 67,095 | 77,770 |
| Goldman Sachs Group Inc. | 3.625% | 1/22/23 | 7,715 | 8,154 |
| Goldman Sachs Group Inc. | 3.500% | 1/23/25 | 16,660 | 17,245 |
| Goldman Sachs Group Inc. | 4.250% | 10/21/25 | 13,000 | 13,660 |
| Goldman Sachs Group Inc. | 6.125% | 2/15/33 | 20,000 | 25,235 |
| Goldman Sachs Group Inc. | 6.450% | 5/1/36 | 25,000 | 30,965 |
| Goldman Sachs Group Inc. | 6.250% | 2/1/41 | 35,790 | 46,906 |
| Goldman Sachs Group Inc. | 4.800% | 7/8/44 | 19,895 | 22,443 |
| Goldman Sachs Group Inc. | 4.750% | 10/21/45 | 15,895 | 17,883 |
| 5 HSBC Bank plc | 4.750% | 1/19/21 | 42,960 | 47,473 |
3
Vanguard® Wellesley Income Fund
Schedule of Investments
September 30, 2016
| | | | |
| | | | Face | Market |
| | | Maturity | Amount | Value |
| | Coupon | Date | ($000) | ($000) |
| HSBC Bank USA NA | 5.875% | 11/1/34 | 21,000 | 25,426 |
| HSBC Holdings plc | 3.400% | 3/8/21 | 50,000 | 51,744 |
| HSBC Holdings plc | 4.000% | 3/30/22 | 10,870 | 11,603 |
| HSBC Holdings plc | 3.600% | 5/25/23 | 56,130 | 58,047 |
| HSBC Holdings plc | 7.625% | 5/17/32 | 15,800 | 21,536 |
| HSBC Holdings plc | 6.500% | 5/2/36 | 22,000 | 27,891 |
| HSBC Holdings plc | 6.100% | 1/14/42 | 43,680 | 58,111 |
| HSBC Holdings plc | 5.250% | 3/14/44 | 5,795 | 6,557 |
| HSBC USA Inc. | 1.625% | 1/16/18 | 35,910 | 35,917 |
| HSBC USA Inc. | 2.350% | 3/5/20 | 58,195 | 58,701 |
| HSBC USA Inc. | 3.500% | 6/23/24 | 26,200 | 27,375 |
| Huntington Bancshares Inc. | 3.150% | 3/14/21 | 26,950 | 27,768 |
| Huntington National Bank | 1.700% | 2/26/18 | 15,000 | 15,035 |
| Huntington National Bank | 2.200% | 4/1/19 | 17,850 | 18,032 |
| Huntington National Bank | 2.400% | 4/1/20 | 36,530 | 36,928 |
| 5 ING Bank NV | 3.750% | 3/7/17 | 35,000 | 35,357 |
| 5 ING Bank NV | 1.800% | 3/16/18 | 51,425 | 51,618 |
| JPMorgan Chase & Co. | 2.000% | 8/15/17 | 10,025 | 10,081 |
| JPMorgan Chase & Co. | 6.300% | 4/23/19 | 68,310 | 75,972 |
| JPMorgan Chase & Co. | 2.550% | 3/1/21 | 26,000 | 26,452 |
| JPMorgan Chase & Co. | 4.625% | 5/10/21 | 14,000 | 15,480 |
| JPMorgan Chase & Co. | 4.350% | 8/15/21 | 33,285 | 36,559 |
| JPMorgan Chase & Co. | 4.500% | 1/24/22 | 18,260 | 20,173 |
| JPMorgan Chase & Co. | 3.250% | 9/23/22 | 22,380 | 23,476 |
| JPMorgan Chase & Co. | 3.375% | 5/1/23 | 36,370 | 37,269 |
| JPMorgan Chase & Co. | 3.875% | 2/1/24 | 11,200 | 12,047 |
| JPMorgan Chase & Co. | 3.900% | 7/15/25 | 11,560 | 12,480 |
| JPMorgan Chase & Co. | 3.300% | 4/1/26 | 26,730 | 27,616 |
| JPMorgan Chase & Co. | 2.950% | 10/1/26 | 75,000 | 74,821 |
| JPMorgan Chase & Co. | 4.125% | 12/15/26 | 24,400 | 26,047 |
| JPMorgan Chase & Co. | 4.250% | 10/1/27 | 9,275 | 9,986 |
| JPMorgan Chase & Co. | 5.600% | 7/15/41 | 70,000 | 89,853 |
| JPMorgan Chase & Co. | 5.400% | 1/6/42 | 16,235 | 20,369 |
| JPMorgan Chase & Co. | 5.625% | 8/16/43 | 13,500 | 16,335 |
| JPMorgan Chase & Co. | 4.950% | 6/1/45 | 12,000 | 13,322 |
| KeyBank NA | 2.350% | 3/8/19 | 30,000 | 30,561 |
| 5 Macquarie Bank Ltd. | 2.400% | 1/21/20 | 10,195 | 10,311 |
| Manufacturers & Traders Trust Co. | 2.100% | 2/6/20 | 14,540 | 14,669 |
| Manufacturers & Traders Trust Co. | 2.900% | 2/6/25 | 20,085 | 20,643 |
| Morgan Stanley | 5.450% | 1/9/17 | 15,000 | 15,165 |
| Morgan Stanley | 1.875% | 1/5/18 | 9,470 | 9,514 |
| Morgan Stanley | 6.625% | 4/1/18 | 25,000 | 26,819 |
| Morgan Stanley | 2.125% | 4/25/18 | 104,400 | 105,241 |
| Morgan Stanley | 2.500% | 1/24/19 | 43,200 | 44,006 |
| Morgan Stanley | 7.300% | 5/13/19 | 53,955 | 61,355 |
| Morgan Stanley | 2.375% | 7/23/19 | 35,000 | 35,566 |
| Morgan Stanley | 5.500% | 7/24/20 | 15,000 | 16,816 |
| Morgan Stanley | 5.750% | 1/25/21 | 13,900 | 15,846 |
| Morgan Stanley | 2.500% | 4/21/21 | 30,630 | 30,926 |
| Morgan Stanley | 3.750% | 2/25/23 | 23,000 | 24,411 |
| Morgan Stanley | 3.875% | 4/29/24 | 22,050 | 23,504 |
| Morgan Stanley | 4.000% | 7/23/25 | 20,805 | 22,323 |
| Morgan Stanley | 3.125% | 7/27/26 | 36,950 | 37,189 |
| Morgan Stanley | 4.350% | 9/8/26 | 15,000 | 15,960 |
| Morgan Stanley | 7.250% | 4/1/32 | 51,100 | 70,723 |
| Morgan Stanley | 4.300% | 1/27/45 | 24,705 | 26,399 |
| National City Bank | 5.800% | 6/7/17 | 50,000 | 51,419 |
| 5 Nationwide Building Society | 2.350% | 1/21/20 | 22,720 | 22,928 |
| Northern Trust Corp. | 3.450% | 11/4/20 | 10,285 | 10,960 |
| PNC Bank NA | 5.250% | 1/15/17 | 16,000 | 16,181 |
| PNC Bank NA | 3.300% | 10/30/24 | 14,645 | 15,554 |
| PNC Bank NA | 2.950% | 2/23/25 | 34,775 | 35,797 |
| PNC Financial Services Group Inc. | 3.900% | 4/29/24 | 40,150 | 43,148 |
| Royal Bank of Canada | 2.500% | 1/19/21 | 24,750 | 25,721 |
4
Vanguard® Wellesley Income Fund
Schedule of Investments
September 30, 2016
| | | | |
| | | | Face | Market |
| | | Maturity | Amount | Value |
| | Coupon | Date | ($000) | ($000) |
| Santander Bank NA | 2.000% | 1/12/18 | 21,075 | 21,097 |
| Santander Bank NA | 8.750% | 5/30/18 | 5,225 | 5,740 |
| Santander Holdings USA Inc. | 2.700% | 5/24/19 | 28,100 | 28,436 |
| Santander Holdings USA Inc. | 2.650% | 4/17/20 | 19,225 | 19,367 |
| Santander Issuances SAU | 5.179% | 11/19/25 | 24,800 | 25,361 |
| Santander UK plc | 2.500% | 3/14/19 | 79,400 | 80,568 |
| 5 Skandinaviska Enskilda Banken AB | 2.450% | 5/27/20 | 50,900 | 51,988 |
| State Street Corp. | 5.375% | 4/30/17 | 55,500 | 56,879 |
| SunTrust Bank | 3.300% | 5/15/26 | 11,955 | 12,184 |
| SunTrust Banks Inc. | 2.900% | 3/3/21 | 34,300 | 35,693 |
| Svenska Handelsbanken AB | 2.875% | 4/4/17 | 57,000 | 57,499 |
| Svenska Handelsbanken AB | 1.875% | 9/7/21 | 37,750 | 37,528 |
| Synchrony Financial | 2.600% | 1/15/19 | 17,915 | 18,121 |
| Synchrony Financial | 3.000% | 8/15/19 | 8,570 | 8,766 |
| Synchrony Financial | 2.700% | 2/3/20 | 12,580 | 12,734 |
| 5 UBS Group Funding Jersey Ltd. | 2.950% | 9/24/20 | 36,710 | 37,581 |
| 5 UBS Group Funding Jersey Ltd. | 3.000% | 4/15/21 | 58,970 | 60,579 |
| 5 UBS Group Funding Jersey Ltd. | 2.650% | 2/1/22 | 46,000 | 45,884 |
| US Bancorp | 3.700% | 1/30/24 | 39,005 | 42,725 |
| US Bancorp | 2.375% | 7/22/26 | 45,000 | 44,213 |
| Wachovia Corp. | 5.750% | 2/1/18 | 9,500 | 10,037 |
| Wachovia Corp. | 6.605% | 10/1/25 | 15,000 | 18,309 |
| Wells Fargo & Co. | 5.625% | 12/11/17 | 47,000 | 49,305 |
| Wells Fargo & Co. | 2.150% | 1/30/20 | 38,370 | 38,634 |
| Wells Fargo & Co. | 3.000% | 1/22/21 | 27,580 | 28,600 |
| Wells Fargo & Co. | 4.600% | 4/1/21 | 40,000 | 44,272 |
| Wells Fargo & Co. | 3.500% | 3/8/22 | 54,840 | 58,193 |
| Wells Fargo & Co. | 3.450% | 2/13/23 | 49,865 | 51,451 |
| Wells Fargo & Co. | 4.480% | 1/16/24 | 34,444 | 37,878 |
| Wells Fargo & Co. | 3.000% | 2/19/25 | 28,660 | 29,004 |
| Wells Fargo & Co. | 3.550% | 9/29/25 | 27,170 | 28,695 |
| Wells Fargo & Co. | 3.000% | 4/22/26 | 36,830 | 37,234 |
| Wells Fargo & Co. | 4.100% | 6/3/26 | 33,000 | 34,894 |
| Wells Fargo & Co. | 5.606% | 1/15/44 | 28,551 | 34,197 |
| Wells Fargo & Co. | 4.650% | 11/4/44 | 20,735 | 21,706 |
| Wells Fargo & Co. | 4.900% | 11/17/45 | 16,060 | 17,739 |
| Wells Fargo & Co. | 4.400% | 6/14/46 | 36,200 | 36,869 |
| Brokerage (0.0%) | | | | |
| Ameriprise Financial Inc. | 5.300% | 3/15/20 | 6,625 | 7,364 |
| |
| Finance Companies (0.7%) | | | | |
| GE Capital International Funding Co. | 2.342% | 11/15/20 | 58,112 | 59,693 |
| GE Capital International Funding Co. | 3.373% | 11/15/25 | 59,548 | 64,477 |
| GE Capital International Funding Co. | 4.418% | 11/15/35 | 201,814 | 227,654 |
| Insurance (2.4%) | | | | |
| Aetna Inc. | 1.750% | 5/15/17 | 2,966 | 2,976 |
| Aetna Inc. | 3.950% | 9/1/20 | 4,860 | 5,229 |
| Aetna Inc. | 2.800% | 6/15/23 | 19,685 | 20,159 |
| Aetna Inc. | 3.200% | 6/15/26 | 43,190 | 43,918 |
| Aetna Inc. | 4.250% | 6/15/36 | 27,050 | 28,100 |
| Anthem Inc. | 2.300% | 7/15/18 | 12,045 | 12,207 |
| Anthem Inc. | 3.700% | 8/15/21 | 25,635 | 27,466 |
| Anthem Inc. | 3.125% | 5/15/22 | 30,450 | 31,692 |
| Anthem Inc. | 3.300% | 1/15/23 | 20,000 | 20,974 |
| Anthem Inc. | 4.650% | 8/15/44 | 8,832 | 9,613 |
| Berkshire Hathaway Finance Corp. | 5.400% | 5/15/18 | 32,000 | 34,133 |
| Berkshire Hathaway Inc. | 2.750% | 3/15/23 | 36,055 | 37,399 |
| Berkshire Hathaway Inc. | 3.125% | 3/15/26 | 23,645 | 24,865 |
| Chubb INA Holdings Inc. | 5.700% | 2/15/17 | 15,000 | 15,248 |
| Chubb INA Holdings Inc. | 5.900% | 6/15/19 | 15,000 | 16,723 |
| Chubb INA Holdings Inc. | 2.300% | 11/3/20 | 5,235 | 5,374 |
| Chubb INA Holdings Inc. | 3.350% | 5/15/24 | 20,340 | 21,738 |
| Chubb INA Holdings Inc. | 3.350% | 5/3/26 | 12,280 | 13,155 |
5
Vanguard® Wellesley Income Fund
Schedule of Investments
September 30, 2016
| | | | |
| | | | Face | Market |
| | | Maturity | Amount | Value |
| | Coupon | Date | ($000) | ($000) |
| Chubb INA Holdings Inc. | 4.350% | 11/3/45 | 24,795 | 28,552 |
| Cigna Corp. | 3.250% | 4/15/25 | 43,165 | 44,570 |
| CNA Financial Corp. | 3.950% | 5/15/24 | 4,335 | 4,578 |
| 5 Five Corners Funding Trust | 4.419% | 11/15/23 | 5,320 | 5,748 |
| 5 Guardian Life Global Funding | 2.000% | 4/26/21 | 12,825 | 12,940 |
| Hartford Financial Services Group Inc. | 5.500% | 10/15/16 | 16,665 | 16,683 |
| 5 Liberty Mutual Group Inc. | 4.250% | 6/15/23 | 11,825 | 12,791 |
| 5 Liberty Mutual Insurance Co. | 8.500% | 5/15/25 | 21,665 | 27,762 |
| Loews Corp. | 2.625% | 5/15/23 | 14,100 | 14,251 |
| 5 MassMutual Global Funding II | 2.100% | 8/2/18 | 45,015 | 45,713 |
| 5 MassMutual Global Funding II | 2.350% | 4/9/19 | 22,000 | 22,492 |
| 5 MassMutual Global Funding II | 2.000% | 4/15/21 | 42,188 | 42,406 |
| MetLife Inc. | 1.903% | 12/15/17 | 7,340 | 7,379 |
| MetLife Inc. | 3.600% | 4/10/24 | 28,000 | 29,707 |
| MetLife Inc. | 4.125% | 8/13/42 | 5,300 | 5,276 |
| MetLife Inc. | 4.875% | 11/13/43 | 17,500 | 19,449 |
| 5 Metropolitan Life Global Funding I | 1.500% | 1/10/18 | 35,550 | 35,644 |
| 5 Metropolitan Life Global Funding I | 1.875% | 6/22/18 | 16,315 | 16,454 |
| 5 Metropolitan Life Insurance Co. | 7.800% | 11/1/25 | 25,000 | 32,729 |
| 5 New York Life Global Funding | 1.650% | 5/15/17 | 53,000 | 53,174 |
| 5 New York Life Insurance Co. | 5.875% | 5/15/33 | 44,785 | 55,374 |
| Prudential Financial Inc. | 4.500% | 11/15/20 | 24,055 | 26,522 |
| 5 QBE Insurance Group Ltd. | 2.400% | 5/1/18 | 8,185 | 8,255 |
| 5 Teachers Insurance & Annuity Assn. of America | 4.900% | 9/15/44 | 11,990 | 13,504 |
| Travelers Cos. Inc. | 5.800% | 5/15/18 | 8,690 | 9,313 |
| Travelers Cos. Inc. | 5.900% | 6/2/19 | 9,400 | 10,492 |
| UnitedHealth Group Inc. | 6.000% | 2/15/18 | 22,000 | 23,403 |
| UnitedHealth Group Inc. | 3.875% | 10/15/20 | 6,786 | 7,346 |
| UnitedHealth Group Inc. | 2.875% | 3/15/22 | 2,346 | 2,457 |
| UnitedHealth Group Inc. | 2.875% | 3/15/23 | 12,000 | 12,515 |
| UnitedHealth Group Inc. | 3.100% | 3/15/26 | 14,220 | 14,863 |
| UnitedHealth Group Inc. | 4.625% | 7/15/35 | 31,295 | 36,422 |
| UnitedHealth Group Inc. | 6.625% | 11/15/37 | 20,000 | 28,616 |
| UnitedHealth Group Inc. | 4.625% | 11/15/41 | 36,010 | 41,790 |
| UnitedHealth Group Inc. | 4.250% | 3/15/43 | 31,000 | 34,284 |
| UnitedHealth Group Inc. | 4.750% | 7/15/45 | 19,035 | 22,884 |
| Other Finance (0.1%) | | | | |
| 5 LeasePlan Corp. NV | 2.875% | 1/22/19 | 30,515 | 30,795 |
| |
| Real Estate Investment Trusts (0.3%) | | | | |
| AvalonBay Communities Inc. | 3.625% | 10/1/20 | 17,315 | 18,385 |
| Duke Realty LP | 6.500% | 1/15/18 | 4,819 | 5,125 |
| HCP Inc. | 6.000% | 1/30/17 | 20,000 | 20,291 |
| Liberty Property LP | 6.625% | 10/1/17 | 10,096 | 10,574 |
| Realty Income Corp. | 5.750% | 1/15/21 | 8,675 | 9,893 |
| Simon Property Group LP | 4.375% | 3/1/21 | 22,000 | 24,325 |
| Simon Property Group LP | 4.125% | 12/1/21 | 12,946 | 14,244 |
| Simon Property Group LP | 3.300% | 1/15/26 | 23,500 | 24,812 |
| 5 WEA Finance LLC / Westfield UK & Europe Finance plc | 1.750% | 9/15/17 | 11,670 | 11,689 |
| 5 WEA Finance LLC / Westfield UK & Europe Finance plc | 2.700% | 9/17/19 | 17,715 | 18,135 |
| | | | | 7,769,385 |
| Industrial (22.9%) | | | | |
| Basic Industry (0.4%) | | | | |
| 5 Air Liquide Finance SA | 2.250% | 9/27/23 | 21,000 | 21,085 |
| 5 Air Liquide Finance SA | 2.500% | 9/27/26 | 16,815 | 16,922 |
| BHP Billiton Finance USA Ltd. | 3.850% | 9/30/23 | 38,275 | 41,756 |
| CF Industries Inc. | 7.125% | 5/1/20 | 19,379 | 22,310 |
| CF Industries Inc. | 5.375% | 3/15/44 | 28,635 | 28,334 |
| LyondellBasell Industries NV | 4.625% | 2/26/55 | 28,625 | 28,052 |
| Monsanto Co. | 4.700% | 7/15/64 | 7,025 | 6,718 |
| Monsanto Finance Canada Co. | 5.500% | 7/30/35 | 15,000 | 17,223 |
| Rio Tinto Finance USA plc | 3.500% | 3/22/22 | 11,445 | 12,304 |
6
Vanguard® Wellesley Income Fund
Schedule of Investments
September 30, 2016
| | | | |
| | | | Face | Market |
| | | Maturity | Amount | Value |
| | Coupon | Date | ($000) | ($000) |
| Capital Goods (1.9%) | | | | |
| 3M Co. | 6.375% | 2/15/28 | 20,825 | 28,569 |
| 5 BAE Systems Holdings Inc. | 2.850% | 12/15/20 | 5,020 | 5,130 |
| 5 BAE Systems Holdings Inc. | 3.800% | 10/7/24 | 26,068 | 27,567 |
| 5 BAE Systems Holdings Inc. | 3.850% | 12/15/25 | 39,838 | 42,067 |
| Caterpillar Financial Services Corp. | 2.625% | 3/1/23 | 39,500 | 40,265 |
| Caterpillar Inc. | 3.900% | 5/27/21 | 32,880 | 35,951 |
| Caterpillar Inc. | 2.600% | 6/26/22 | 9,575 | 9,929 |
| Caterpillar Inc. | 3.400% | 5/15/24 | 19,475 | 21,008 |
| Caterpillar Inc. | 5.200% | 5/27/41 | 19,770 | 24,540 |
| Caterpillar Inc. | 3.803% | 8/15/42 | 20,469 | 21,028 |
| Caterpillar Inc. | 4.300% | 5/15/44 | 7,885 | 8,810 |
| Deere & Co. | 4.375% | 10/16/19 | 13,090 | 14,254 |
| Eaton Corp. | 5.300% | 3/15/17 | 20,000 | 20,356 |
| Eaton Corp. | 6.500% | 6/1/25 | 10,000 | 12,208 |
| General Dynamics Corp. | 3.875% | 7/15/21 | 9,950 | 10,913 |
| General Electric Capital Corp. | 5.300% | 2/11/21 | 1,806 | 2,072 |
| General Electric Capital Corp. | 4.650% | 10/17/21 | 18,610 | 21,204 |
| General Electric Capital Corp. | 3.150% | 9/7/22 | 16,706 | 17,827 |
| General Electric Capital Corp. | 3.100% | 1/9/23 | 6,094 | 6,473 |
| General Electric Capital Corp. | 6.750% | 3/15/32 | 9,962 | 13,985 |
| General Electric Capital Corp. | 6.150% | 8/7/37 | 13,205 | 18,269 |
| General Electric Capital Corp. | 5.875% | 1/14/38 | 27,573 | 37,019 |
| General Electric Capital Corp. | 6.875% | 1/10/39 | 9,904 | 14,914 |
| General Electric Co. | 2.700% | 10/9/22 | 14,000 | 14,557 |
| General Electric Co. | 4.125% | 10/9/42 | 7,940 | 8,684 |
| General Electric Co. | 4.500% | 3/11/44 | 8,725 | 10,038 |
| Honeywell International Inc. | 4.250% | 3/1/21 | 29,484 | 32,895 |
| Illinois Tool Works Inc. | 3.500% | 3/1/24 | 42,775 | 46,869 |
| John Deere Capital Corp. | 2.000% | 1/13/17 | 53,000 | 53,159 |
| John Deere Capital Corp. | 2.800% | 1/27/23 | 8,000 | 8,330 |
| John Deere Capital Corp. | 3.350% | 6/12/24 | 9,000 | 9,663 |
| 5 LafargeHolcim Finance US LLC | 4.750% | 9/22/46 | 14,970 | 15,400 |
| Lockheed Martin Corp. | 2.500% | 11/23/20 | 12,340 | 12,740 |
| Lockheed Martin Corp. | 2.900% | 3/1/25 | 26,840 | 27,695 |
| Lockheed Martin Corp. | 4.500% | 5/15/36 | 6,715 | 7,704 |
| Lockheed Martin Corp. | 4.700% | 5/15/46 | 16,650 | 19,835 |
| Parker-Hannifin Corp. | 4.450% | 11/21/44 | 14,290 | 16,996 |
| Raytheon Co. | 3.125% | 10/15/20 | 10,000 | 10,607 |
| 5 Siemens Financieringsmaatschappij NV | 5.750% | 10/17/16 | 45,820 | 45,896 |
| 5 Siemens Financieringsmaatschappij NV | 2.900% | 5/27/22 | 25,650 | 26,867 |
| 5 Siemens Financieringsmaatschappij NV | 4.400% | 5/27/45 | 40,495 | 47,146 |
| United Technologies Corp. | 4.500% | 4/15/20 | 24,170 | 26,718 |
| United Technologies Corp. | 3.100% | 6/1/22 | 10,095 | 10,846 |
| United Technologies Corp. | 4.500% | 6/1/42 | 38,885 | 45,149 |
| Communication (3.6%) | | | | |
| 21st Century Fox America Inc. | 4.500% | 2/15/21 | 4,650 | 5,151 |
| 21st Century Fox America Inc. | 6.200% | 12/15/34 | 11,000 | 13,926 |
| America Movil SAB de CV | 3.125% | 7/16/22 | 66,820 | 68,759 |
| America Movil SAB de CV | 6.125% | 3/30/40 | 27,680 | 33,350 |
| American Tower Corp. | 3.450% | 9/15/21 | 23,985 | 25,227 |
| American Tower Corp. | 4.700% | 3/15/22 | 2,905 | 3,229 |
| AT&T Inc. | 1.400% | 12/1/17 | 15,595 | 15,620 |
| AT&T Inc. | 1.750% | 1/15/18 | 21,060 | 21,156 |
| AT&T Inc. | 2.300% | 3/11/19 | 20,145 | 20,504 |
| AT&T Inc. | 5.200% | 3/15/20 | 10,125 | 11,218 |
| AT&T Inc. | 4.600% | 2/15/21 | 4,900 | 5,375 |
| AT&T Inc. | 5.000% | 3/1/21 | 10,000 | 11,185 |
| AT&T Inc. | 3.875% | 8/15/21 | 20,000 | 21,599 |
| AT&T Inc. | 4.750% | 5/15/46 | 23,075 | 24,133 |
| 5 AT&T Inc. | 4.500% | 3/9/48 | 32,292 | 32,513 |
| CBS Corp. | 4.300% | 2/15/21 | 22,710 | 24,688 |
| Comcast Corp. | 3.600% | 3/1/24 | 15,490 | 16,922 |
7
Vanguard® Wellesley Income Fund
Schedule of Investments
September 30, 2016
| | | | |
| | | | Face | Market |
| | | Maturity | Amount | Value |
| | Coupon | Date | ($000) | ($000) |
| Comcast Corp. | 3.150% | 3/1/26 | 15,280 | 16,150 |
| Comcast Corp. | 4.250% | 1/15/33 | 15,060 | 16,731 |
| Comcast Corp. | 4.200% | 8/15/34 | 18,620 | 20,551 |
| Comcast Corp. | 4.400% | 8/15/35 | 22,290 | 25,177 |
| Comcast Corp. | 6.450% | 3/15/37 | 20,000 | 27,595 |
| Comcast Corp. | 6.950% | 8/15/37 | 45,000 | 65,631 |
| Comcast Corp. | 4.650% | 7/15/42 | 7,260 | 8,400 |
| Comcast Corp. | 4.500% | 1/15/43 | 20,000 | 22,604 |
| Comcast Corp. | 4.750% | 3/1/44 | 16,635 | 19,566 |
| Comcast Corp. | 4.600% | 8/15/45 | 26,430 | 30,579 |
| 5 COX Communications Inc. | 5.875% | 12/1/16 | 40,000 | 40,294 |
| 5 Cox Communications Inc. | 4.800% | 2/1/35 | 58,525 | 58,035 |
| Crown Castle International Corp. | 3.700% | 6/15/26 | 19,465 | 20,339 |
| Deutsche Telekom International Finance BV | 8.750% | 6/15/30 | 30,000 | 46,765 |
| Discovery Communications LLC | 5.625% | 8/15/19 | 7,635 | 8,369 |
| Discovery Communications LLC | 5.050% | 6/1/20 | 13,365 | 14,634 |
| Grupo Televisa SAB | 6.625% | 1/15/40 | 13,805 | 15,792 |
| Grupo Televisa SAB | 5.000% | 5/13/45 | 5,925 | 5,657 |
| Grupo Televisa SAB | 6.125% | 1/31/46 | 13,475 | 14,971 |
| 5 GTP Acquisition Partners I LLC | 2.350% | 6/15/20 | 18,745 | 18,753 |
| Michigan Bell Telephone Co. | 7.850% | 1/15/22 | 23,750 | 28,886 |
| 5 NBCUniversal Enterprise Inc. | 1.662% | 4/15/18 | 47,135 | 47,401 |
| 5 NBCUniversal Enterprise Inc. | 1.974% | 4/15/19 | 84,070 | 85,285 |
| NBCUniversal Media LLC | 4.375% | 4/1/21 | 26,000 | 28,929 |
| Omnicom Group Inc. | 3.600% | 4/15/26 | 22,925 | 24,237 |
| Orange SA | 9.000% | 3/1/31 | 54,566 | 87,057 |
| 5 SBA Tower Trust | 2.933% | 12/15/17 | 28,850 | 28,952 |
| 5 Sky plc | 2.625% | 9/16/19 | 30,550 | 30,932 |
| 5 Sky plc | 3.125% | 11/26/22 | 7,000 | 7,101 |
| 5 Sky plc | 3.750% | 9/16/24 | 35,911 | 37,912 |
| Time Warner Cable Inc. | 5.850% | 5/1/17 | 70,000 | 71,753 |
| Time Warner Cable Inc. | 8.750% | 2/14/19 | 915 | 1,055 |
| Time Warner Cable Inc. | 8.250% | 4/1/19 | 11,944 | 13,751 |
| Time Warner Entertainment Co. LP | 8.375% | 3/15/23 | 3,215 | 4,179 |
| Time Warner Inc. | 4.750% | 3/29/21 | 13,000 | 14,559 |
| Time Warner Inc. | 6.250% | 3/29/41 | 8,000 | 10,349 |
| Verizon Communications Inc. | 3.450% | 3/15/21 | 15,585 | 16,607 |
| Verizon Communications Inc. | 3.500% | 11/1/21 | 78,905 | 84,805 |
| Verizon Communications Inc. | 6.400% | 9/15/33 | 62,160 | 80,669 |
| Verizon Communications Inc. | 6.400% | 2/15/38 | 23,000 | 29,860 |
| Verizon Communications Inc. | 4.750% | 11/1/41 | 28,730 | 31,310 |
| Verizon Communications Inc. | 6.550% | 9/15/43 | 71,200 | 95,926 |
| Viacom Inc. | 5.625% | 9/15/19 | 10,000 | 10,932 |
| Vodafone Group plc | 1.250% | 9/26/17 | 37,000 | 36,901 |
| Vodafone Group plc | 5.450% | 6/10/19 | 26,000 | 28,507 |
| Walt Disney Co. | 4.125% | 6/1/44 | 18,320 | 20,798 |
| Consumer Cyclical (3.0%) | | | | |
| Alibaba Group Holding Ltd. | 2.500% | 11/28/19 | 10,480 | 10,607 |
| Alibaba Group Holding Ltd. | 3.125% | 11/28/21 | 2,035 | 2,114 |
| Amazon.com Inc. | 2.500% | 11/29/22 | 31,600 | 32,557 |
| Amazon.com Inc. | 4.800% | 12/5/34 | 55,880 | 65,756 |
| Amazon.com Inc. | 4.950% | 12/5/44 | 17,920 | 21,965 |
| 5 American Honda Finance Corp. | 1.500% | 9/11/17 | 15,750 | 15,800 |
| 5 American Honda Finance Corp. | 1.600% | 2/16/18 | 14,340 | 14,433 |
| American Honda Finance Corp. | 2.125% | 10/10/18 | 29,535 | 30,036 |
| American Honda Finance Corp. | 2.300% | 9/9/26 | 17,135 | 17,048 |
| AutoZone Inc. | 4.000% | 11/15/20 | 25,000 | 26,877 |
| AutoZone Inc. | 3.700% | 4/15/22 | 12,752 | 13,650 |
| AutoZone Inc. | 3.125% | 7/15/23 | 22,000 | 22,799 |
| 5 BMW US Capital LLC | 2.000% | 4/11/21 | 19,815 | 19,865 |
| 5 BMW US Capital LLC | 2.250% | 9/15/23 | 93,000 | 93,250 |
| 5 BMW US Capital LLC | 2.800% | 4/11/26 | 9,530 | 9,719 |
| CVS Health Corp. | 2.750% | 12/1/22 | 20,000 | 20,589 |
8
Vanguard® Wellesley Income Fund
Schedule of Investments
September 30, 2016
| | | | | |
| | | | | Face | Market |
| | | | Maturity | Amount | Value |
| | | Coupon | Date | ($000) | ($000) |
| | CVS Health Corp. | 4.875% | 7/20/35 | 18,205 | 21,356 |
| | CVS Health Corp. | 5.125% | 7/20/45 | 42,460 | 51,752 |
| 3,5 | CVS Pass-Through Trust | 5.926% | 1/10/34 | 14,537 | 17,217 |
| 5 | Daimler Finance North America LLC | 2.250% | 7/31/19 | 58,255 | 59,033 |
| 5 | Daimler Finance North America LLC | 2.450% | 5/18/20 | 2,260 | 2,308 |
| 5 | Daimler Finance North America LLC | 2.000% | 7/6/21 | 60,000 | 59,933 |
| 5 | Daimler Finance North America LLC | 3.875% | 9/15/21 | 3,270 | 3,550 |
| | eBay Inc. | 1.350% | 7/15/17 | 10,960 | 10,969 |
| | Ford Motor Credit Co. LLC | 2.375% | 3/12/19 | 56,800 | 57,466 |
| | Ford Motor Credit Co. LLC | 3.157% | 8/4/20 | 31,000 | 31,951 |
| 5 | Harley-Davidson Financial Services Inc. | 2.700% | 3/15/17 | 12,122 | 12,213 |
| | Home Depot Inc. | 4.400% | 4/1/21 | 12,300 | 13,693 |
| | Home Depot Inc. | 2.700% | 4/1/23 | 24,715 | 25,720 |
| | Home Depot Inc. | 4.400% | 3/15/45 | 22,390 | 26,005 |
| | Johnson Controls Inc. | 5.000% | 3/30/20 | 29,000 | 31,563 |
| | Johnson Controls Inc. | 3.750% | 12/1/21 | 25,000 | 26,936 |
| | Lowe's Cos. Inc. | 6.650% | 9/15/37 | 5,000 | 7,212 |
| | Lowe's Cos. Inc. | 5.800% | 4/15/40 | 10,280 | 13,615 |
| | Marriott International Inc. | 2.300% | 1/15/22 | 44,000 | 44,338 |
| | McDonald's Corp. | 3.500% | 7/15/20 | 21,760 | 23,167 |
| | McDonald's Corp. | 2.625% | 1/15/22 | 10,175 | 10,520 |
| | McDonald's Corp. | 3.250% | 6/10/24 | 4,400 | 4,751 |
| 5 | Nissan Motor Acceptance Corp. | 1.950% | 9/12/17 | 42,355 | 42,520 |
| 5 | Nissan Motor Acceptance Corp. | 1.800% | 3/15/18 | 38,400 | 38,614 |
| 5 | Nissan Motor Acceptance Corp. | 2.650% | 9/26/18 | 17,180 | 17,530 |
| | PACCAR Financial Corp. | 1.600% | 3/15/17 | 34,687 | 34,803 |
| | Target Corp. | 5.375% | 5/1/17 | 5,000 | 5,126 |
| | Target Corp. | 6.000% | 1/15/18 | 16,500 | 17,521 |
| | Target Corp. | 2.900% | 1/15/22 | 11,850 | 12,494 |
| | Toyota Motor Credit Corp. | 2.050% | 1/12/17 | 26,000 | 26,081 |
| | Toyota Motor Credit Corp. | 1.750% | 5/22/17 | 22,000 | 22,099 |
| | Toyota Motor Credit Corp. | 1.250% | 10/5/17 | 34,150 | 34,181 |
| 5 | Volkswagen Group of America Finance LLC | 2.450% | 11/20/19 | 13,860 | 13,981 |
| | Wal-Mart Stores Inc. | 3.625% | 7/8/20 | 75,000 | 81,275 |
| | Wal-Mart Stores Inc. | 3.250% | 10/25/20 | 6,290 | 6,769 |
| | Wal-Mart Stores Inc. | 4.250% | 4/15/21 | 15,000 | 16,824 |
| | Wal-Mart Stores Inc. | 2.550% | 4/11/23 | 44,450 | 46,164 |
| | Wal-Mart Stores Inc. | 5.625% | 4/15/41 | 52,780 | 72,114 |
| | Wal-Mart Stores Inc. | 4.750% | 10/2/43 | 20,300 | 25,202 |
| | Wal-Mart Stores Inc. | 4.300% | 4/22/44 | 16,995 | 19,921 |
| | Walgreens Boots Alliance Inc. | 2.600% | 6/1/21 | 10,845 | 11,096 |
| | Consumer Noncyclical (7.7%) | | | | |
| | AbbVie Inc. | 1.750% | 11/6/17 | 28,485 | 28,571 |
| | Actavis Funding SCS | 3.000% | 3/12/20 | 32,675 | 33,739 |
| | Actavis Funding SCS | 3.450% | 3/15/22 | 45,660 | 47,717 |
| | Actavis Funding SCS | 3.800% | 3/15/25 | 4,510 | 4,775 |
| | Actavis Funding SCS | 4.550% | 3/15/35 | 8,745 | 9,335 |
| | Actavis Funding SCS | 4.850% | 6/15/44 | 14,075 | 15,529 |
| | Altria Group Inc. | 4.750% | 5/5/21 | 40,806 | 46,050 |
| | Altria Group Inc. | 2.850% | 8/9/22 | 11,835 | 12,357 |
| | Altria Group Inc. | 4.500% | 5/2/43 | 10,105 | 11,448 |
| | Amgen Inc. | 3.625% | 5/22/24 | 38,185 | 40,938 |
| | Amgen Inc. | 5.150% | 11/15/41 | 27,515 | 31,550 |
| | Anheuser-Busch InBev Finance Inc. | 3.300% | 2/1/23 | 63,200 | 66,639 |
| | Anheuser-Busch InBev Finance Inc. | 3.650% | 2/1/26 | 57,035 | 61,094 |
| | Anheuser-Busch InBev Finance Inc. | 4.700% | 2/1/36 | 130,310 | 150,156 |
| | Anheuser-Busch InBev Finance Inc. | 4.900% | 2/1/46 | 137,375 | 164,483 |
| | Anheuser-Busch InBev Worldwide Inc. | 7.750% | 1/15/19 | 6,635 | 7,547 |
| | Anheuser-Busch InBev Worldwide Inc. | 6.875% | 11/15/19 | 8,300 | 9,643 |
| | Anheuser-Busch InBev Worldwide Inc. | 5.375% | 1/15/20 | 81,200 | 90,715 |
| | Anheuser-Busch InBev Worldwide Inc. | 4.375% | 2/15/21 | 800 | 879 |
| | Anheuser-Busch InBev Worldwide Inc. | 2.500% | 7/15/22 | 9,836 | 10,030 |
| | Anheuser-Busch InBev Worldwide Inc. | 3.750% | 7/15/42 | 19,080 | 19,240 |
9
Vanguard® Wellesley Income Fund
Schedule of Investments
September 30, 2016
| | | | | |
| | | | | Face | Market |
| | | | Maturity | Amount | Value |
| | | Coupon | Date | ($000) | ($000) |
| | AstraZeneca plc | 5.900% | 9/15/17 | 50,000 | 52,124 |
| | AstraZeneca plc | 1.950% | 9/18/19 | 12,435 | 12,603 |
| | AstraZeneca plc | 2.375% | 11/16/20 | 37,225 | 38,098 |
| | AstraZeneca plc | 3.375% | 11/16/25 | 27,755 | 29,635 |
| | AstraZeneca plc | 4.375% | 11/16/45 | 25,305 | 28,004 |
| 3,5,6 | Avery Point IV CLO Ltd. | 2.234% | 4/25/26 | 36,540 | 36,658 |
| 5 | BAT International Finance plc | 2.750% | 6/15/20 | 17,600 | 18,239 |
| 5 | BAT International Finance plc | 3.250% | 6/7/22 | 50,880 | 54,057 |
| 5 | BAT International Finance plc | 3.500% | 6/15/22 | 7,440 | 7,981 |
| 5 | BAT International Finance plc | 3.950% | 6/15/25 | 15,000 | 16,618 |
| 5 | Bayer US Finance LLC | 2.375% | 10/8/19 | 6,140 | 6,232 |
| 5 | Bayer US Finance LLC | 3.000% | 10/8/21 | 38,730 | 40,295 |
| 5 | Bayer US Finance LLC | 3.375% | 10/8/24 | 9,425 | 9,744 |
| | Becton Dickinson & Co. | 1.750% | 11/8/16 | 19,145 | 19,157 |
| | Bestfoods | 6.625% | 4/15/28 | 25,000 | 35,126 |
| | Biogen Inc. | 2.900% | 9/15/20 | 17,465 | 18,176 |
| | Bristol-Myers Squibb Co. | 3.250% | 11/1/23 | 16,630 | 18,181 |
| | Cardinal Health Inc. | 1.700% | 3/15/18 | 2,401 | 2,409 |
| | Cardinal Health Inc. | 2.400% | 11/15/19 | 22,090 | 22,543 |
| | Cardinal Health Inc. | 3.200% | 3/15/23 | 11,650 | 12,255 |
| | Cardinal Health Inc. | 3.500% | 11/15/24 | 20,020 | 21,348 |
| | Cardinal Health Inc. | 4.500% | 11/15/44 | 23,250 | 25,707 |
| 5 | Cargill Inc. | 6.000% | 11/27/17 | 7,000 | 7,368 |
| 5 | Cargill Inc. | 4.760% | 11/23/45 | 83,304 | 97,822 |
| | Catholic Health Initiatives Colorado GO | 1.600% | 11/1/17 | 1,935 | 1,938 |
| | Catholic Health Initiatives Colorado GO | 2.950% | 11/1/22 | 17,856 | 18,070 |
| 3 | Catholic Health Initiatives Colorado GO | 4.350% | 11/1/42 | 30,010 | 30,059 |
| | Celgene Corp. | 2.250% | 5/15/19 | 5,145 | 5,237 |
| | Celgene Corp. | 3.550% | 8/15/22 | 15,160 | 16,104 |
| | Celgene Corp. | 3.625% | 5/15/24 | 11,980 | 12,613 |
| | Celgene Corp. | 5.000% | 8/15/45 | 25,000 | 28,014 |
| | Coca-Cola Enterprises Inc. | 3.500% | 9/15/20 | 4,600 | 4,874 |
| | Coca-Cola Enterprises Inc. | 4.500% | 9/1/21 | 14,785 | 16,412 |
| | Coca-Cola Femsa SAB de CV | 2.375% | 11/26/18 | 25,332 | 25,559 |
| | Coca-Cola Femsa SAB de CV | 3.875% | 11/26/23 | 28,000 | 30,127 |
| | Colgate-Palmolive Co. | 2.950% | 11/1/20 | 25,000 | 26,575 |
| | Diageo Capital plc | 2.625% | 4/29/23 | 42,580 | 43,900 |
| | Diageo Investment Corp. | 2.875% | 5/11/22 | 17,245 | 18,086 |
| | Dignity Health California GO | 2.637% | 11/1/19 | 4,480 | 4,597 |
| | Dignity Health California GO | 3.812% | 11/1/24 | 9,060 | 9,747 |
| | Eli Lilly & Co. | 3.700% | 3/1/45 | 20,040 | 21,475 |
| 5 | EMD Finance LLC | 2.400% | 3/19/20 | 1,100 | 1,119 |
| 5 | EMD Finance LLC | 2.950% | 3/19/22 | 19,640 | 20,255 |
| 5 | EMD Finance LLC | 3.250% | 3/19/25 | 39,545 | 40,762 |
| | Express Scripts Holding Co. | 2.250% | 6/15/19 | 14,030 | 14,228 |
| 5 | Forest Laboratories Inc. | 4.875% | 2/15/21 | 7,125 | 7,909 |
| 5 | Forest Laboratories LLC | 5.000% | 12/15/21 | 23,725 | 26,631 |
| | General Mills Inc. | 5.650% | 2/15/19 | 6,850 | 7,510 |
| 6 | General Mills Inc. | 6.390% | 2/5/23 | 50,000 | 59,464 |
| | Gilead Sciences Inc. | 2.550% | 9/1/20 | 15,245 | 15,747 |
| | Gilead Sciences Inc. | 2.500% | 9/1/23 | 26,390 | 26,628 |
| | Gilead Sciences Inc. | 3.700% | 4/1/24 | 21,420 | 23,047 |
| | Gilead Sciences Inc. | 3.500% | 2/1/25 | 28,575 | 30,273 |
| | Gilead Sciences Inc. | 4.500% | 2/1/45 | 50,807 | 54,022 |
| | GlaxoSmithKline Capital Inc. | 2.800% | 3/18/23 | 25,750 | 26,963 |
| | GlaxoSmithKline Capital Inc. | 5.375% | 4/15/34 | 16,055 | 20,158 |
| | GlaxoSmithKline Capital plc | 2.850% | 5/8/22 | 51,595 | 54,114 |
| 5 | Imperial Tobacco Finance plc | 3.750% | 7/21/22 | 29,995 | 31,844 |
| | Johnson & Johnson | 6.730% | 11/15/23 | 15,000 | 19,953 |
| | Johnson & Johnson | 2.450% | 3/1/26 | 78,000 | 80,333 |
| | Kaiser Foundation Hospitals | 3.500% | 4/1/22 | 19,815 | 21,241 |
| | Kaiser Foundation Hospitals | 4.875% | 4/1/42 | 12,710 | 15,891 |
| | Kimberly-Clark Corp. | 6.250% | 7/15/18 | 25,000 | 27,219 |
| | Kraft Foods Group Inc. | 2.250% | 6/5/17 | 10,085 | 10,148 |
10
Vanguard® Wellesley Income Fund
Schedule of Investments
September 30, 2016
| | | | |
| | | | Face | Market |
| | | Maturity | Amount | Value |
| | Coupon | Date | ($000) | ($000) |
| Kraft Heinz Foods Co. | 5.000% | 7/15/35 | 7,370 | 8,507 |
| Kraft Heinz Foods Co. | 4.375% | 6/1/46 | 24,920 | 26,448 |
| 3 Mayo Clinic | 4.128% | 11/15/52 | 11,465 | 13,070 |
| McKesson Corp. | 2.700% | 12/15/22 | 7,010 | 7,149 |
| McKesson Corp. | 2.850% | 3/15/23 | 6,840 | 6,999 |
| McKesson Corp. | 3.796% | 3/15/24 | 9,525 | 10,320 |
| Medtronic Inc. | 1.375% | 4/1/18 | 16,225 | 16,270 |
| Medtronic Inc. | 2.500% | 3/15/20 | 25,335 | 26,196 |
| Medtronic Inc. | 3.150% | 3/15/22 | 46,380 | 49,279 |
| Medtronic Inc. | 3.625% | 3/15/24 | 7,510 | 8,156 |
| Medtronic Inc. | 3.500% | 3/15/25 | 62,791 | 67,703 |
| Medtronic Inc. | 4.375% | 3/15/35 | 21,968 | 24,952 |
| Memorial Sloan-Kettering Cancer Center New York GO | 5.000% | 7/1/42 | 11,505 | 14,578 |
| Memorial Sloan-Kettering Cancer Center New York GO | 4.125% | 7/1/52 | 6,535 | 7,237 |
| Memorial Sloan-Kettering Cancer Center New York GO | 4.200% | 7/1/55 | 10,430 | 11,663 |
| Merck & Co. Inc. | 3.875% | 1/15/21 | 30,000 | 32,688 |
| Merck & Co. Inc. | 2.350% | 2/10/22 | 24,825 | 25,499 |
| Merck & Co. Inc. | 2.800% | 5/18/23 | 15,650 | 16,405 |
| Merck & Co. Inc. | 2.750% | 2/10/25 | 38,000 | 39,327 |
| Merck & Co. Inc. | 4.150% | 5/18/43 | 28,405 | 32,229 |
| Merck Sharp & Dohme Corp. | 5.000% | 6/30/19 | 18,000 | 19,809 |
| Molson Coors Brewing Co. | 3.500% | 5/1/22 | 14,905 | 15,944 |
| Molson Coors Brewing Co. | 5.000% | 5/1/42 | 5,710 | 6,610 |
| New York & Presbyterian Hospital | 4.024% | 8/1/45 | 22,955 | 25,043 |
| Novartis Capital Corp. | 3.400% | 5/6/24 | 13,425 | 14,704 |
| Novartis Capital Corp. | 4.400% | 5/6/44 | 21,485 | 25,380 |
| Partners Healthcare System Massachusetts GO | 3.443% | 7/1/21 | 2,000 | 2,121 |
| PepsiCo Inc. | 3.125% | 11/1/20 | 48,610 | 51,591 |
| PepsiCo Inc. | 4.000% | 3/5/42 | 35,200 | 38,339 |
| Pfizer Inc. | 6.200% | 3/15/19 | 28,600 | 31,829 |
| Pfizer Inc. | 3.000% | 6/15/23 | 25,440 | 27,178 |
| Philip Morris International Inc. | 4.500% | 3/26/20 | 25,000 | 27,437 |
| Philip Morris International Inc. | 1.875% | 2/25/21 | 43,455 | 43,858 |
| Philip Morris International Inc. | 4.125% | 5/17/21 | 15,705 | 17,393 |
| Philip Morris International Inc. | 2.500% | 8/22/22 | 13,250 | 13,605 |
| Philip Morris International Inc. | 2.625% | 3/6/23 | 23,000 | 23,641 |
| Philip Morris International Inc. | 3.875% | 8/21/42 | 22,785 | 23,720 |
| Philip Morris International Inc. | 4.875% | 11/15/43 | 5,835 | 7,026 |
| Philip Morris International Inc. | 4.250% | 11/10/44 | 15,000 | 16,575 |
| 3 Procter & Gamble - Esop | 9.360% | 1/1/21 | 11,459 | 13,493 |
| Procter & Gamble Co. | 6.450% | 1/15/26 | 25,000 | 33,578 |
| Procter & Gamble Co. | 5.550% | 3/5/37 | 25,000 | 34,967 |
| Providence St. Joseph Health Obligated Group | 2.746% | 10/1/26 | 18,290 | 18,527 |
| 3 Providence St. Joseph Health Obligated Group | 3.744% | 10/1/47 | 11,430 | 11,803 |
| 5 Roche Holdings Inc. | 2.875% | 9/29/21 | 26,150 | 27,478 |
| 5 SABMiller Holdings Inc. | 2.450% | 1/15/17 | 15,100 | 15,148 |
| 5 SABMiller Holdings Inc. | 3.750% | 1/15/22 | 4,310 | 4,674 |
| 5 SABMiller Holdings Inc. | 4.950% | 1/15/42 | 5,700 | 6,677 |
| 5 SABMiller plc | 6.500% | 7/15/18 | 30,000 | 32,606 |
| Sanofi | 4.000% | 3/29/21 | 36,275 | 40,052 |
| 5 Sigma Alimentos SA de CV | 4.125% | 5/2/26 | 27,145 | 27,223 |
| Teva Pharmaceutical Finance Netherlands III BV | 2.800% | 7/21/23 | 36,645 | 36,717 |
| Teva Pharmaceutical Finance Netherlands III BV | 3.150% | 10/1/26 | 8,895 | 8,941 |
| Teva Pharmaceutical Finance Netherlands III BV | 4.100% | 10/1/46 | 8,575 | 8,553 |
| The Kroger Co. | 2.200% | 1/15/17 | 22,780 | 22,848 |
| The Kroger Co. | 3.300% | 1/15/21 | 13,605 | 14,370 |
| The Kroger Co. | 3.850% | 8/1/23 | 5,055 | 5,488 |
| The Kroger Co. | 3.875% | 10/15/46 | 28,920 | 29,104 |
| Thermo Fisher Scientific Inc. | 1.850% | 1/15/18 | 18,975 | 19,090 |
| Unilever Capital Corp. | 4.250% | 2/10/21 | 78,185 | 86,723 |
| Wyeth LLC | 5.950% | 4/1/37 | 15,000 | 20,106 |
| Energy (3.2%) | | | | |
| 5 BG Energy Capital plc | 2.875% | 10/15/16 | 26,655 | 26,668 |
11
Vanguard® Wellesley Income Fund
Schedule of Investments
September 30, 2016
| | | | |
| | | | Face | Market |
| | | Maturity | Amount | Value |
| | Coupon | Date | ($000) | ($000) |
| 5 BG Energy Capital plc | 4.000% | 10/15/21 | 17,070 | 18,626 |
| BP Capital Markets plc | 2.248% | 11/1/16 | 34,545 | 34,579 |
| BP Capital Markets plc | 4.750% | 3/10/19 | 18,140 | 19,528 |
| BP Capital Markets plc | 2.315% | 2/13/20 | 3,760 | 3,836 |
| BP Capital Markets plc | 4.500% | 10/1/20 | 28,000 | 30,745 |
| BP Capital Markets plc | 4.742% | 3/11/21 | 10,000 | 11,198 |
| BP Capital Markets plc | 3.062% | 3/17/22 | 35,770 | 37,468 |
| BP Capital Markets plc | 3.245% | 5/6/22 | 10,000 | 10,549 |
| BP Capital Markets plc | 2.500% | 11/6/22 | 8,000 | 8,075 |
| BP Capital Markets plc | 3.994% | 9/26/23 | 13,130 | 14,328 |
| BP Capital Markets plc | 3.814% | 2/10/24 | 38,000 | 40,966 |
| BP Capital Markets plc | 3.506% | 3/17/25 | 41,710 | 44,241 |
| Chevron Corp. | 2.355% | 12/5/22 | 6,000 | 6,107 |
| Chevron Corp. | 3.191% | 6/24/23 | 69,750 | 74,324 |
| ConocoPhillips | 5.750% | 2/1/19 | 6,365 | 6,925 |
| ConocoPhillips | 6.000% | 1/15/20 | 3,115 | 3,512 |
| ConocoPhillips | 7.000% | 3/30/29 | 11,500 | 14,102 |
| ConocoPhillips Canada Funding Co. I | 5.625% | 10/15/16 | 15,000 | 15,018 |
| ConocoPhillips Co. | 4.200% | 3/15/21 | 17,925 | 19,376 |
| ConocoPhillips Co. | 2.875% | 11/15/21 | 21,951 | 22,498 |
| ConocoPhillips Co. | 3.350% | 11/15/24 | 10,275 | 10,534 |
| ConocoPhillips Co. | 3.350% | 5/15/25 | 24,815 | 25,379 |
| ConocoPhillips Co. | 4.950% | 3/15/26 | 12,710 | 14,347 |
| ConocoPhillips Co. | 4.300% | 11/15/44 | 48,640 | 49,687 |
| Devon Energy Corp. | 3.250% | 5/15/22 | 15,905 | 15,772 |
| Devon Energy Corp. | 5.600% | 7/15/41 | 8,690 | 8,784 |
| Devon Energy Corp. | 5.000% | 6/15/45 | 11,535 | 11,227 |
| Dominion Gas Holdings LLC | 3.550% | 11/1/23 | 14,085 | 14,834 |
| Enterprise Products Operating LLC | 4.900% | 5/15/46 | 5,000 | 5,267 |
| EOG Resources Inc. | 5.625% | 6/1/19 | 16,285 | 17,817 |
| Exxon Mobil Corp. | 2.222% | 3/1/21 | 12,735 | 13,002 |
| Exxon Mobil Corp. | 2.726% | 3/1/23 | 10,710 | 11,098 |
| Exxon Mobil Corp. | 3.043% | 3/1/26 | 7,330 | 7,682 |
| Exxon Mobil Corp. | 4.114% | 3/1/46 | 10,845 | 12,106 |
| Halliburton Co. | 3.500% | 8/1/23 | 67,975 | 70,065 |
| Noble Energy Inc. | 4.150% | 12/15/21 | 14,890 | 15,837 |
| Occidental Petroleum Corp. | 4.100% | 2/1/21 | 27,466 | 29,837 |
| Occidental Petroleum Corp. | 2.700% | 2/15/23 | 9,250 | 9,430 |
| Occidental Petroleum Corp. | 3.400% | 4/15/26 | 33,675 | 35,621 |
| Occidental Petroleum Corp. | 4.400% | 4/15/46 | 35,145 | 38,741 |
| Phillips 66 | 4.300% | 4/1/22 | 30,000 | 32,972 |
| Phillips 66 | 4.875% | 11/15/44 | 8,855 | 9,861 |
| 5 Schlumberger Holdings Corp. | 3.000% | 12/21/20 | 25,500 | 26,551 |
| 5 Schlumberger Investment SA | 2.400% | 8/1/22 | 20,765 | 21,082 |
| Shell International Finance BV | 4.375% | 3/25/20 | 16,000 | 17,476 |
| Shell International Finance BV | 2.250% | 11/10/20 | 49,900 | 50,781 |
| Shell International Finance BV | 3.250% | 5/11/25 | 28,680 | 30,271 |
| Shell International Finance BV | 4.125% | 5/11/35 | 38,475 | 41,258 |
| Shell International Finance BV | 5.500% | 3/25/40 | 10,795 | 13,229 |
| Shell International Finance BV | 4.375% | 5/11/45 | 95,725 | 103,373 |
| Suncor Energy Inc. | 6.100% | 6/1/18 | 13,825 | 14,807 |
| Suncor Energy Inc. | 3.600% | 12/1/24 | 19,505 | 20,363 |
| Suncor Energy Inc. | 5.950% | 12/1/34 | 13,000 | 15,760 |
| Sunoco Logistics Partners Operations LP | 4.400% | 4/1/21 | 25,945 | 27,838 |
| Texaco Capital Inc. | 8.625% | 4/1/32 | 25,000 | 37,601 |
| Total Capital International SA | 1.550% | 6/28/17 | 38,435 | 38,528 |
| Total Capital International SA | 2.700% | 1/25/23 | 32,714 | 33,754 |
| Total Capital International SA | 3.750% | 4/10/24 | 50,000 | 55,020 |
| TransCanada PipeLines Ltd. | 3.800% | 10/1/20 | 30,875 | 33,043 |
| TransCanada PipeLines Ltd. | 2.500% | 8/1/22 | 21,165 | 21,278 |
| TransCanada PipeLines Ltd. | 4.875% | 1/15/26 | 58,060 | 67,235 |
| Other Industrial (0.2%) | | | | |
| George Washington University | 3.545% | 9/15/46 | 10,000 | 9,865 |
12
Vanguard® Wellesley Income Fund
Schedule of Investments
September 30, 2016
| | | | |
| | | | Face | Market |
| | | Maturity | Amount | Value |
| | Coupon | Date | ($000) | ($000) |
| 5 Hutchison Whampoa International 09/19 Ltd. | 5.750% | 9/11/19 | 12,000 | 13,377 |
| 5 Hutchison Whampoa International 11 Ltd. | 3.500% | 1/13/17 | 19,660 | 19,783 |
| 3 Johns Hopkins University Maryland GO | 4.083% | 7/1/53 | 24,695 | 28,066 |
| Technology (2.3%) | | | | |
| Apple Inc. | 2.850% | 5/6/21 | 34,300 | 36,150 |
| Apple Inc. | 2.850% | 2/23/23 | 43,845 | 46,127 |
| Apple Inc. | 3.450% | 5/6/24 | 31,140 | 33,714 |
| Apple Inc. | 2.450% | 8/4/26 | 37,850 | 37,692 |
| Apple Inc. | 3.850% | 5/4/43 | 15,275 | 15,611 |
| Apple Inc. | 4.450% | 5/6/44 | 4,035 | 4,511 |
| Apple Inc. | 3.850% | 8/4/46 | 36,510 | 37,167 |
| Cisco Systems Inc. | 4.450% | 1/15/20 | 25,000 | 27,346 |
| Cisco Systems Inc. | 2.200% | 2/28/21 | 78,505 | 80,145 |
| Cisco Systems Inc. | 2.900% | 3/4/21 | 10,700 | 11,242 |
| Intel Corp. | 3.300% | 10/1/21 | 10,000 | 10,740 |
| Intel Corp. | 4.100% | 5/19/46 | 47,755 | 51,181 |
| International Business Machines Corp. | 5.700% | 9/14/17 | 41,710 | 43,527 |
| International Business Machines Corp. | 3.375% | 8/1/23 | 61,300 | 65,928 |
| International Business Machines Corp. | 3.625% | 2/12/24 | 22,800 | 24,836 |
| International Business Machines Corp. | 7.000% | 10/30/25 | 25,000 | 33,986 |
| Microsoft Corp. | 3.000% | 10/1/20 | 10,000 | 10,629 |
| Microsoft Corp. | 2.375% | 2/12/22 | 19,865 | 20,420 |
| Microsoft Corp. | 3.625% | 12/15/23 | 13,500 | 14,841 |
| Microsoft Corp. | 2.700% | 2/12/25 | 23,890 | 24,708 |
| Microsoft Corp. | 3.125% | 11/3/25 | 26,300 | 27,984 |
| Microsoft Corp. | 2.400% | 8/8/26 | 52,640 | 52,787 |
| Microsoft Corp. | 3.450% | 8/8/36 | 53,965 | 54,984 |
| Microsoft Corp. | 4.500% | 10/1/40 | 18,210 | 20,863 |
| Microsoft Corp. | 4.450% | 11/3/45 | 61,885 | 70,358 |
| Microsoft Corp. | 3.700% | 8/8/46 | 50,485 | 51,138 |
| Oracle Corp. | 5.000% | 7/8/19 | 35,000 | 38,416 |
| Oracle Corp. | 1.900% | 9/15/21 | 70,285 | 70,433 |
| Oracle Corp. | 2.500% | 5/15/22 | 38,860 | 39,773 |
| Oracle Corp. | 2.400% | 9/15/23 | 63,535 | 63,783 |
| Oracle Corp. | 2.950% | 5/15/25 | 11,300 | 11,667 |
| Transportation (0.6%) | | | | |
| Burlington Northern Santa Fe LLC | 3.050% | 3/15/22 | 7,235 | 7,631 |
| 5 ERAC USA Finance LLC | 6.375% | 10/15/17 | 36,290 | 38,084 |
| 5 ERAC USA Finance LLC | 2.350% | 10/15/19 | 12,165 | 12,350 |
| 5 ERAC USA Finance LLC | 4.500% | 8/16/21 | 10,270 | 11,391 |
| 5 ERAC USA Finance LLC | 3.300% | 10/15/22 | 745 | 781 |
| 5 ERAC USA Finance LLC | 7.000% | 10/15/37 | 3,775 | 5,155 |
| 5 ERAC USA Finance LLC | 5.625% | 3/15/42 | 31,000 | 37,513 |
| FedEx Corp. | 2.700% | 4/15/23 | 15,810 | 16,242 |
| FedEx Corp. | 4.900% | 1/15/34 | 25,040 | 28,679 |
| FedEx Corp. | 3.875% | 8/1/42 | 4,505 | 4,487 |
| FedEx Corp. | 5.100% | 1/15/44 | 26,055 | 30,936 |
| FedEx Corp. | 4.550% | 4/1/46 | 14,460 | 16,074 |
| Kansas City Southern | 4.950% | 8/15/45 | 28,170 | 32,100 |
| Ryder System Inc. | 2.500% | 3/1/18 | 32,000 | 32,422 |
| United Parcel Service Inc. | 2.450% | 10/1/22 | 17,095 | 17,758 |
| United Parcel Service Inc. | 4.875% | 11/15/40 | 14,810 | 18,699 |
| | | | | 11,415,507 |
| Utilities (3.9%) | | | | |
| Electric (3.6%) | | | | |
| Alabama Power Co. | 5.550% | 2/1/17 | 11,765 | 11,929 |
| Alabama Power Co. | 3.750% | 3/1/45 | 20,255 | 21,053 |
| Ameren Illinois Co. | 2.700% | 9/1/22 | 58,000 | 60,334 |
| Baltimore Gas & Electric Co. | 5.900% | 10/1/16 | 15,000 | 15,000 |
| Baltimore Gas & Electric Co. | 2.800% | 8/15/22 | 26,250 | 27,369 |
| Baltimore Gas & Electric Co. | 2.400% | 8/15/26 | 20,945 | 20,803 |
| Berkshire Hathaway Energy Co. | 6.125% | 4/1/36 | 10,063 | 13,398 |
| Berkshire Hathaway Energy Co. | 6.500% | 9/15/37 | 65,165 | 89,616 |
13
Vanguard® Wellesley Income Fund
Schedule of Investments
September 30, 2016
| | | | |
| | | | Face | Market |
| | | Maturity | Amount | Value |
| | Coupon | Date | ($000) | ($000) |
| Commonwealth Edison Co. | 4.350% | 11/15/45 | 6,815 | 7,787 |
| Consolidated Edison Co. of New York Inc. | 5.850% | 3/15/36 | 9,500 | 12,300 |
| Consolidated Edison Co. of New York Inc. | 6.300% | 8/15/37 | 50,000 | 68,083 |
| Consolidated Edison Co. of New York Inc. | 4.500% | 12/1/45 | 30,855 | 35,546 |
| Delmarva Power & Light Co. | 3.500% | 11/15/23 | 9,550 | 10,338 |
| 6 Dominion Resources Inc. | 2.962% | 7/1/19 | 17,030 | 17,478 |
| Dominion Resources Inc. | 4.450% | 3/15/21 | 30,000 | 33,185 |
| Dominion Resources Inc. | 3.625% | 12/1/24 | 23,850 | 25,208 |
| Duke Energy Carolinas LLC | 5.250% | 1/15/18 | 20,980 | 22,057 |
| Duke Energy Carolinas LLC | 3.900% | 6/15/21 | 11,045 | 12,077 |
| Duke Energy Carolinas LLC | 6.100% | 6/1/37 | 13,915 | 18,516 |
| Duke Energy Carolinas LLC | 4.250% | 12/15/41 | 6,375 | 7,103 |
| Duke Energy Carolinas LLC | 4.000% | 9/30/42 | 5,205 | 5,592 |
| Duke Energy Corp. | 2.150% | 11/15/16 | 35,000 | 35,042 |
| Duke Energy Corp. | 1.625% | 8/15/17 | 34,840 | 34,943 |
| Duke Energy Corp. | 2.650% | 9/1/26 | 17,480 | 17,138 |
| Duke Energy Corp. | 4.800% | 12/15/45 | 37,600 | 42,829 |
| Duke Energy Corp. | 3.750% | 9/1/46 | 14,740 | 14,328 |
| Duke Energy Progress Llc | 2.800% | 5/15/22 | 20,140 | 21,183 |
| Duke Energy Progress LLC | 6.300% | 4/1/38 | 1,625 | 2,269 |
| Duke Energy Progress LLC | 4.200% | 8/15/45 | 42,055 | 46,891 |
| Entergy Corp. | 2.950% | 9/1/26 | 22,080 | 22,083 |
| Eversource Energy | 4.500% | 11/15/19 | 1,880 | 2,041 |
| Eversource Energy | 3.150% | 1/15/25 | 6,775 | 7,031 |
| Florida Power & Light Co. | 6.200% | 6/1/36 | 22,452 | 30,939 |
| Florida Power & Light Co. | 5.250% | 2/1/41 | 29,745 | 38,226 |
| Florida Power & Light Co. | 4.125% | 2/1/42 | 20,000 | 22,524 |
| 5 Fortis Inc. | 3.055% | 10/4/26 | 28,865 | 28,759 |
| Georgia Power Co. | 5.700% | 6/1/17 | 50,000 | 51,355 |
| Georgia Power Co. | 5.950% | 2/1/39 | 30,476 | 39,680 |
| Georgia Power Co. | 5.400% | 6/1/40 | 10,136 | 12,490 |
| Georgia Power Co. | 4.750% | 9/1/40 | 6,105 | 7,011 |
| Georgia Power Co. | 4.300% | 3/15/42 | 47,540 | 51,892 |
| MidAmerican Energy Co. | 5.750% | 11/1/35 | 9,925 | 12,933 |
| MidAmerican Energy Co. | 4.250% | 5/1/46 | 13,105 | 14,988 |
| Mississippi Power Co. | 4.250% | 3/15/42 | 20,000 | 18,759 |
| National Rural Utilities Cooperative Finance Corp. | 3.050% | 2/15/22 | 13,800 | 14,515 |
| National Rural Utilities Cooperative Finance Corp. | 2.850% | 1/27/25 | 32,210 | 33,523 |
| NextEra Energy Capital Holdings Inc. | 2.700% | 9/15/19 | 30,500 | 31,363 |
| Oklahoma Gas & Electric Co. | 6.500% | 4/15/28 | 10,000 | 12,664 |
| Oncor Electric Delivery Co. LLC | 4.100% | 6/1/22 | 13,935 | 15,402 |
| Oncor Electric Delivery Co. LLC | 2.950% | 4/1/25 | 14,266 | 14,868 |
| Oncor Electric Delivery Co. LLC | 5.250% | 9/30/40 | 11,325 | 14,333 |
| Oncor Electric Delivery Co. LLC | 4.550% | 12/1/41 | 1,025 | 1,198 |
| Pacific Gas & Electric Co. | 4.250% | 5/15/21 | 8,335 | 9,182 |
| Pacific Gas & Electric Co. | 2.450% | 8/15/22 | 45,000 | 46,178 |
| Pacific Gas & Electric Co. | 3.750% | 8/15/42 | 35,460 | 36,536 |
| PacifiCorp | 2.950% | 6/1/23 | 14,835 | 15,588 |
| PacifiCorp | 5.750% | 4/1/37 | 11,135 | 14,605 |
| Potomac Electric Power Co. | 6.500% | 11/15/37 | 8,000 | 11,353 |
| PPL Electric Utilities Corp. | 2.500% | 9/1/22 | 12,830 | 13,161 |
| PPL Electric Utilities Corp. | 6.250% | 5/15/39 | 2,675 | 3,730 |
| Progress Energy Inc. | 3.150% | 4/1/22 | 20,800 | 21,767 |
| Public Service Electric & Gas Co. | 3.500% | 8/15/20 | 10,000 | 10,695 |
| Puget Sound Energy Inc. | 4.434% | 11/15/41 | 19,880 | 22,754 |
| South Carolina Electric & Gas Co. | 6.050% | 1/15/38 | 8,355 | 11,053 |
| South Carolina Electric & Gas Co. | 4.350% | 2/1/42 | 29,880 | 32,695 |
| South Carolina Electric & Gas Co. | 4.100% | 6/15/46 | 18,810 | 20,126 |
| South Carolina Electric & Gas Co. | 5.100% | 6/1/65 | 19,550 | 23,004 |
| Southern California Edison Co. | 5.500% | 8/15/18 | 31,730 | 34,247 |
| Southern California Edison Co. | 3.875% | 6/1/21 | 24,860 | 27,229 |
| Southern California Edison Co. | 2.400% | 2/1/22 | 8,270 | 8,514 |
| Southern California Edison Co. | 4.500% | 9/1/40 | 5,150 | 6,008 |
| Southern California Edison Co. | 3.600% | 2/1/45 | 8,160 | 8,548 |
14
Vanguard® Wellesley Income Fund
Schedule of Investments
September 30, 2016
| | | | | |
| | | | | Face | Market |
| | | | Maturity | Amount | Value |
| | | Coupon | Date | ($000) | ($000) |
| | Southern Co. | 2.950% | 7/1/23 | 44,985 | 46,461 |
| | Southwestern Electric Power Co. | 2.750% | 10/1/26 | 25,000 | 24,875 |
| | Tampa Electric Co. | 2.600% | 9/15/22 | 20,205 | 20,796 |
| | Virginia Electric & Power Co. | 5.950% | 9/15/17 | 50,000 | 52,118 |
| | Virginia Electric & Power Co. | 6.000% | 5/15/37 | 9,435 | 12,595 |
| | Wisconsin Electric Power Co. | 5.700% | 12/1/36 | 13,825 | 18,034 |
| | Natural Gas (0.3%) | | | | |
| 5 | KeySpan Gas East Corp. | 2.742% | 8/15/26 | 37,580 | 38,047 |
| 5 | KeySpan Gas East Corp. | 5.819% | 4/1/41 | 5,060 | 6,546 |
| | NiSource Finance Corp. | 6.400% | 3/15/18 | 19,895 | 21,248 |
| | Nisource Finance Corp. | 5.250% | 2/15/43 | 13,546 | 16,142 |
| | NiSource Finance Corp. | 4.800% | 2/15/44 | 8,500 | 9,626 |
| | Sempra Energy | 2.850% | 11/15/20 | 11,900 | 12,319 |
| | Sempra Energy | 6.000% | 10/15/39 | 35,849 | 45,880 |
| | Southern California Gas Co. | 2.600% | 6/15/26 | 28,885 | 29,462 |
| |
| | | | | | 1,979,094 |
| |
| Total Corporate Bonds (Cost $19,722,824) | | | | 21,163,986 |
| |
| Sovereign Bonds (U.S. Dollar-Denominated) (2.9%) | | | | |
| 5 | Abu Dhabi National Energy Co. PJSC | 5.875% | 10/27/16 | 10,000 | 10,011 |
| 5 | CDP Financial Inc. | 4.400% | 11/25/19 | 22,000 | 24,012 |
| 5 | Electricite de France SA | 4.600% | 1/27/20 | 31,972 | 34,792 |
| 5 | Electricite de France SA | 4.875% | 1/22/44 | 2,910 | 3,139 |
| 5 | Electricite de France SA | 4.950% | 10/13/45 | 12,500 | 13,602 |
| 3,5 | Electricite de France SA | 5.250% | 1/29/49 | 17,185 | 16,863 |
| 3,5 | Electricite de France SA | 5.625% | 12/29/49 | 10,640 | 10,440 |
| | Export-Import Bank of Korea | 1.750% | 5/26/19 | 70,100 | 70,569 |
| | Japan Treasury Discount Bill | 0.000% | 10/11/16 | 7,530,000 | 74,193 |
| | Japan Treasury Discount Bill | 0.000% | 11/14/16 | 7,800,000 | 77,019 |
| | Japan Treasury Discount Bill | 0.000% | 11/28/16 | 7,700,000 | 75,957 |
| | Japan Treasury Discount Bill | 0.000% | 12/12/16 | 7,900,000 | 77,950 |
| | Korea Development Bank | 2.875% | 8/22/18 | 32,285 | 33,141 |
| | Korea Development Bank | 2.500% | 3/11/20 | 62,550 | 64,273 |
| 5 | Petroleos Mexicanos | 5.500% | 2/4/19 | 10,825 | 11,427 |
| | Province of New Brunswick | 5.200% | 2/21/17 | 30,000 | 30,476 |
| | Province of Ontario | 4.400% | 4/14/20 | 48,000 | 52,848 |
| | Province of Ontario | 2.500% | 4/27/26 | 100,400 | 103,793 |
| | Quebec | 2.500% | 4/20/26 | 134,755 | 138,125 |
| 5 | Sinopec Group Overseas Development 2015 Ltd. | 2.500% | 4/28/20 | 51,685 | 52,551 |
| 5 | Sinopec Group Overseas Development 2015 Ltd. | 3.250% | 4/28/25 | 51,685 | 52,819 |
| 5 | Sinopec Group Overseas Development 2016 Ltd. | 3.500% | 5/3/26 | 28,000 | 29,068 |
| 5 | State Grid Overseas Investment 2014 Ltd. | 2.750% | 5/7/19 | 41,455 | 42,637 |
| | Statoil ASA | 3.125% | 8/17/17 | 33,000 | 33,532 |
| | Statoil ASA | 5.250% | 4/15/19 | 8,895 | 9,722 |
| | Statoil ASA | 2.250% | 11/8/19 | 16,095 | 16,404 |
| | Statoil ASA | 2.900% | 11/8/20 | 22,450 | 23,491 |
| | Statoil ASA | 2.750% | 11/10/21 | 31,091 | 32,460 |
| | Statoil ASA | 2.450% | 1/17/23 | 10,840 | 11,025 |
| | Statoil ASA | 2.650% | 1/15/24 | 10,105 | 10,356 |
| | Statoil ASA | 3.700% | 3/1/24 | 20,035 | 21,881 |
| | Statoil ASA | 3.250% | 11/10/24 | 22,425 | 23,875 |
| 5 | Temasek Financial I Ltd. | 2.375% | 1/23/23 | 39,070 | 39,964 |
| | United Kingdom Treasury Bill | 0.000% | 1/3/17 | 60,000 | 77,862 |
| | United Mexican States | 3.500% | 1/21/21 | 11,250 | 11,960 |
| | United Mexican States | 3.600% | 1/30/25 | 9,855 | 10,215 |
| |
| Total Sovereign Bonds (Cost $1,381,120) | | | | 1,422,452 |
| |
| Taxable Municipal Bonds (2.8%) | | | | |
| | Bay Area Toll Authority California Toll Bridge Revenue | | | | |
| | (San Francisco Bay Area) | 6.263% | 4/1/49 | 33,860 | 51,543 |
| | Bay Area Toll Authority California Toll Bridge Revenue | | | | |
| | (San Francisco Bay Area) | 7.043% | 4/1/50 | 22,775 | 36,599 |
15
Vanguard® Wellesley Income Fund
Schedule of Investments
September 30, 2016
| | | | |
| | | | Face | Market |
| | | Maturity | Amount | Value |
| | Coupon | Date | ($000) | ($000) |
| California GO | 5.700% | 11/1/21 | 15,655 | 18,509 |
| California GO | 7.550% | 4/1/39 | 45,525 | 72,710 |
| California GO | 7.300% | 10/1/39 | 4,460 | 6,798 |
| California GO | 7.625% | 3/1/40 | 2,345 | 3,732 |
| California GO | 7.600% | 11/1/40 | 47,525 | 77,326 |
| Chicago IL Metropolitan Water Reclamation District GO | 5.720% | 12/1/38 | 4,445 | 5,715 |
| Chicago IL O'Hare International Airport Revenue | 6.845% | 1/1/38 | 14,590 | 16,460 |
| Chicago IL O'Hare International Airport Revenue | 6.395% | 1/1/40 | 13,390 | 19,388 |
| Chicago IL Transit Authority Transfer Tax Receipts | | | | |
| Revenue | 6.899% | 12/1/40 | 12,640 | 16,756 |
| Chicago Transit Authority | 6.899% | 12/1/40 | 24,650 | 32,570 |
| Dallas TX Area Rapid Transit Revenue | 5.999% | 12/1/44 | 22,485 | 32,632 |
| District of Columbia Income Tax Revenue | 5.591% | 12/1/34 | 6,480 | 8,499 |
| Duke University North Carolina Revenue | 5.850% | 4/1/37 | 62,165 | 86,365 |
| Georgia Municipal Electric Power Authority Revenue | 6.637% | 4/1/57 | 42,526 | 57,752 |
| Houston TX GO | 6.290% | 3/1/32 | 21,830 | 27,670 |
| Illinois GO | 5.100% | 6/1/33 | 50,105 | 48,218 |
| Illinois Toll Highway Authority Revenue | 6.184% | 1/1/34 | 16,525 | 22,107 |
| Kansas Development Finance Authority Revenue | 4.927% | 4/15/45 | 47,000 | 53,483 |
| Los Angeles CA Community College District GO | 6.750% | 8/1/49 | 12,915 | 20,563 |
| Los Angeles CA Department of Water & Power | | | | |
| Revenue | 6.574% | 7/1/45 | 28,590 | 43,709 |
| Los Angeles CA Unified School District GO | 5.750% | 7/1/34 | 30,000 | 39,967 |
| Louisville & Jefferson County KY Metropolitan Sewer | | | | |
| District Sewer & Drainage System Revenue | 6.250% | 5/15/43 | 11,000 | 15,687 |
| Maryland Transportation Authority Facilities Projects | | | | |
| Revenue | 5.888% | 7/1/43 | 12,005 | 16,443 |
| Massachusetts School Building Authority Dedicated | | | | |
| Sales Tax Revenue | 5.715% | 8/15/39 | 15,000 | 20,679 |
| New Jersey Turnpike Authority Revenue | 7.414% | 1/1/40 | 28,975 | 45,470 |
| New Jersey Turnpike Authority Revenue | 7.102% | 1/1/41 | 2,000 | 3,050 |
| New York City NY Municipal Water Finance Authority | | | | |
| Water & Sewer System Revenue | 5.790% | 6/15/41 | 1,805 | 2,042 |
| New York City NY Municipal Water Finance Authority | | | | |
| Water & Sewer System Revenue | 5.882% | 6/15/44 | 12,820 | 18,572 |
| New York Metropolitan Transportation Authority | | | | |
| Revenue | 6.814% | 11/15/40 | 5,600 | 8,118 |
| New York Metropolitan Transportation Authority | | | | |
| Revenue (Dedicated Tax Fund) | 7.336% | 11/15/39 | 2,430 | 3,867 |
| New York Metropolitan Transportation Authority | | | | |
| Revenue (Dedicated Tax Fund) | 6.089% | 11/15/40 | 16,940 | 23,294 |
| New York State Thruway Authority Revenue | 5.883% | 4/1/30 | 29,670 | 37,645 |
| North Texas Tollway Authority System Revenue | 6.718% | 1/1/49 | 31,790 | 49,605 |
| Oregon Department of Transportation Highway User | | | | |
| Tax Revenue | 5.834% | 11/15/34 | 14,510 | 19,873 |
| Oregon School Boards Association GO | 4.759% | 6/30/28 | 15,000 | 17,615 |
| Port Authority of New York & New Jersey Revenue | 5.859% | 12/1/24 | 9,605 | 12,172 |
| Port Authority of New York & New Jersey Revenue | 6.040% | 12/1/29 | 5,665 | 7,630 |
| Port Authority of New York & New Jersey Revenue | 4.458% | 10/1/62 | 58,000 | 67,014 |
| Port Authority of New York & New Jersey Revenue | 4.810% | 10/15/65 | 10,910 | 13,291 |
| Princeton University New Jersey GO | 5.700% | 3/1/39 | 13,020 | 18,944 |
| San Antonio TX Electric & Gas Systems Revenue | 5.985% | 2/1/39 | 6,175 | 8,686 |
| Texas Transportation Commission Revenue | 5.178% | 4/1/30 | 12,275 | 15,652 |
| University of California | 3.931% | 5/15/45 | 18,275 | 19,562 |
| University of California Regents Medical Center | | | | |
| Revenue | 6.548% | 5/15/48 | 16,165 | 23,189 |
| University of California Regents Medical Center | | | | |
| Revenue | 6.583% | 5/15/49 | 20,890 | 29,984 |
| University of California Revenue | 4.601% | 5/15/31 | 19,390 | 22,652 |
| University of California Revenue | 5.770% | 5/15/43 | 23,675 | 31,853 |
| University of California Revenue | 4.765% | 5/15/44 | 4,740 | 5,195 |
| Utah GO | 3.289% | 7/1/20 | 21,900 | 23,449 |
16
Vanguard® Wellesley Income Fund
Schedule of Investments
September 30, 2016
| | | | |
| | | | Face | Market |
| | | Maturity | Amount | Value |
| | Coupon | Date | ($000) | ($000) |
| 7 Wisconsin GO | 5.700% | 5/1/26 | 9,000 | 11,017 |
| |
| Total Taxable Municipal Bonds (Cost $1,119,773) | | | | 1,391,321 |
| |
| |
| | | | Shares | |
| |
| Common Stocks (36.2%) | | | | |
| Consumer Discretionary (0.6%) | | | | |
| McDonald's Corp. | | | 2,703,790 | 311,909 |
| |
| Consumer Staples (5.2%) | | | | |
| Philip Morris International Inc. | | | 6,631,860 | 644,749 |
| Kraft Heinz Co. | | | 4,255,286 | 380,891 |
| British American Tobacco plc | | | 5,637,221 | 360,517 |
| Coca-Cola Co. | | | 7,383,760 | 312,481 |
| Altria Group Inc. | | | 3,504,640 | 221,598 |
| PepsiCo Inc. | | | 1,972,770 | 214,578 |
| Procter & Gamble Co. | | | 1,939,880 | 174,104 |
| ^ Diageo plc ADR | | | 1,247,260 | 144,732 |
| Unilever NV | | | 1,950,290 | 89,908 |
| Kimberly-Clark Corp. | | | 603,770 | 76,160 |
| | | | | 2,619,718 |
| Energy (5.1%) | | | | |
| Exxon Mobil Corp. | | | 5,292,010 | 461,887 |
| Chevron Corp. | | | 4,332,340 | 445,884 |
| Suncor Energy Inc. | | | 12,439,320 | 345,564 |
| Occidental Petroleum Corp. | | | 4,590,270 | 334,723 |
| ^ TransCanada Corp. | | | 4,876,020 | 231,583 |
| Phillips 66 | | | 2,537,730 | 204,414 |
| Enbridge Inc. | | | 3,940,490 | 174,288 |
| Royal Dutch Shell plc Class B | | | 6,612,670 | 171,574 |
| Marathon Petroleum Corp. | | | 3,816,550 | 154,914 |
| | | | | 2,524,831 |
| Financials (5.0%) | | | | |
| JPMorgan Chase & Co. | | | 9,212,680 | 613,472 |
| Wells Fargo & Co. | | | 13,720,112 | 607,526 |
| BlackRock Inc. | | | 915,480 | 331,825 |
| Chubb Ltd. | | | 1,994,143 | 250,564 |
| MetLife Inc. | | | 4,906,280 | 217,986 |
| M&T Bank Corp. | | | 1,588,930 | 184,475 |
| Thomson Reuters Corp. | | | 4,182,690 | 173,080 |
| National Bank of Canada | | | 3,037,700 | 107,713 |
| | | | | 2,486,641 |
| Health Care (5.2%) | | | | |
| Merck & Co. Inc. | | | 10,614,970 | 662,480 |
| Johnson & Johnson | | | 5,603,630 | 661,957 |
| Pfizer Inc. | | | 17,470,847 | 591,737 |
| ^ AstraZeneca plc ADR | | | 7,629,640 | 250,710 |
| Novartis AG | | | 2,919,307 | 229,578 |
| Roche Holding AG | | | 710,198 | 175,942 |
| | | | | 2,572,404 |
| Industrials (4.2%) | | | | |
| General Electric Co. | | | 18,474,270 | 547,208 |
| Eaton Corp. plc | | | 5,752,630 | 378,005 |
| Union Pacific Corp. | | | 3,226,840 | 314,714 |
| Lockheed Martin Corp. | | | 918,990 | 220,300 |
| 3M Co. | | | 1,160,830 | 204,573 |
| Caterpillar Inc. | | | 2,270,800 | 201,579 |
| United Parcel Service Inc. Class B | | | 1,433,030 | 156,716 |
| Waste Management Inc. | | | 1,563,510 | 99,690 |
| | | | | 2,122,785 |
17
Vanguard® Wellesley Income Fund
Schedule of Investments
September 30, 2016
| | | | |
| | | | | Market |
| | | | | Value |
| | | | Shares | ($000) |
| Information Technology (5.0%) | | | | |
| Microsoft Corp. | | | 15,263,120 | 879,156 |
| Cisco Systems Inc. | | | 18,774,760 | 595,535 |
| Intel Corp. | | | 13,500,550 | 509,646 |
| Analog Devices Inc. | | | 4,019,397 | 259,050 |
| Maxim Integrated Products Inc. | | | 4,165,770 | 166,339 |
| International Business Machines Corp. | | | 493,960 | 78,466 |
| | | | | 2,488,192 |
| Materials (1.2%) | | | | |
| Dow Chemical Co. | | | 5,163,190 | 267,608 |
| ^ Agrium Inc. | | | 2,027,479 | 183,872 |
| International Paper Co. | | | 1,947,210 | 93,427 |
| Nucor Corp. | | | 1,294,650 | 64,021 |
| | | | | 608,928 |
| Telecommunication Services (1.6%) | | | | |
| Verizon Communications Inc. | | | 10,003,326 | 519,973 |
| BCE Inc. | | | 5,612,180 | 259,188 |
| | | | | 779,161 |
| Utilities (3.1%) | | | | |
| Dominion Resources Inc. | | | 6,085,370 | 451,960 |
| Xcel Energy Inc. | | | 6,311,960 | 259,674 |
| Duke Energy Corp. | | | 3,199,620 | 256,098 |
| Eversource Energy | | | 4,052,250 | 219,551 |
| National Grid plc | | | 14,669,406 | 207,326 |
| NextEra Energy Inc. | | | 1,266,080 | 154,867 |
| |
| | | | | 1,549,476 |
| |
| Total Common Stocks (Cost $13,395,843) | | | | 18,064,045 |
| |
| |
| | Coupon | | | |
| |
| Temporary Cash Investments (2.3%) | | | | |
| Money Market Fund (0.8%) | | | | |
| 8,9 Vanguard Market Liquidity Fund | 0.640% | | 3,809 | 380,962 |
| |
| |
| | | | Face | |
| | | Maturity | Amount | |
| | | Date | ($000) | |
| Repurchase Agreements (0.7%) | | | | |
| Bank of America Securities, LLC (Dated 9/30/16, | | | | |
| Repurchase Value $75,203,000, collateralized by | | | | |
| Federal Home Loan Mortgage Corp. 0.000%-3.500%, | | | | |
| 2/1/43-7/1/46, with a value of $76,704,000) | 0.490% | 10/3/16 | 75,200 | 75,200 |
| Deutsche Bank Securities, Inc. (Dated 9/30/16, | | | | |
| Repurchase Value $57,302,000, collateralized by U.S. | | | | |
| Treasury Note/Bond 2.125%, 3/15/25, with a value of | | | | |
| $58,446,000) | 0.510% | 10/3/16 | 57,300 | 57,300 |
| HSBC Bank USA (Dated 9/30/16, Repurchase Value | | | | |
| $110,504,000, collateralized by Federal National | | | | |
| Mortgage Assn. 3.500%, 12/1/42-9/1/46, with a value | | | | |
| of $112,713,000) | 0.470% | 10/3/16 | 110,500 | 110,500 |
| RBC Capital Markets LLC (Dated 9/30/16, Repurchase | | | | |
| Value $80,903,000, collateralized by Federal National | | | | |
| Mortgage Assn. 2.418%-6.000%, 9/1/26-7/1/46, and | | | | |
| Federal Home Loan Mortgage Corp. 4.000%, 5/1/44, | | | | |
| with a value of $82,518,000) | 0.460% | 10/3/16 | 80,900 | 80,900 |
18
Vanguard® Wellesley Income Fund
Schedule of Investments
September 30, 2016
| | | | | |
| | | | | Face | Market |
| | | | Maturity | Amount | Value |
| | | Coupon | Date | ($000) | ($000) |
| | RBS Securities, Inc. (Dated 9/30/16, Repurchase Value | | | | |
| | $3,300,000, collateralized by U.S. Treasury | | | | |
| | Note/Bond 0.500%, 1/31/17, with a value of | | | | |
| | $3,370,000) | 0.470% | 10/3/16 | 3,300 | 3,300 |
| | | | | | 327,200 |
| U.S. Government and Agency Obligations (0.8%) | | | | |
| 2 | Federal Home Loan Bank Discount Notes | 0.295% | 11/7/16 | 50,000 | 49,987 |
| 2 | Federal Home Loan Bank Discount Notes | 0.330% | 11/18/16 | 121,650 | 121,607 |
| 2 | Federal Home Loan Bank Discount Notes | 0.340% | 11/23/16 | 25,000 | 24,990 |
| 2 | Federal Home Loan Bank Discount Notes | 0.345% | 12/2/16 | 39,400 | 39,380 |
| 2 | Federal Home Loan Bank Discount Notes | 0.340% | 12/6/16 | 50,000 | 49,974 |
| | United States Treasury Bill | 0.353% | 12/15/16 | 125,000 | 124,950 |
| |
| | | | | | 410,888 |
| |
| Total Temporary Cash Investments (Cost $1,118,979) | | | | 1,119,050 |
| |
| Total Investments (100.0%) (Cost $43,190,843) | | | | 49,841,274 |
| Other Assets and Liabilities—Net (0.0%)9,10 | | | | 11,226 |
| |
| Net Assets (100%) | | | | 49,852,500 |
^ Includes partial security positions on loan to broker-dealers. The total value of securities on loan is $367,042,000.
1 Securities with a value of $236,000 have been segregated as collateral for certain open To Be Announced (TBA) transactions.
2 The issuer operates under a congressional charter; its securities are generally neither guaranteed by the U.S. Treasury nor backed by the full
faith and credit of the U.S. government.
3 The average or expected maturity is shorter than the final maturity shown because of the possibility of interim principal payments and
prepayments or the possibility of the issue being called.
4 The issuer was placed under federal conservatorship in September 2008; since that time, its daily operations have been managed by the Federal
Housing Finance Agency and it receives capital from the U.S. Treasury, as needed to maintain a positive net worth, in exchange for senior
preferred stock.
5 Security exempt from registration under Rule 144A of the Securities Act of 1933. Such securities may be sold in transactions exempt from
registration, normally to qualified institutional buyers. At September 30, 2016, the aggregate value of these securities was $4,173,373,000,
representing 8.4% of net assets.
6 Adjustable-rate security.
7 Scheduled principal and interest payments are guaranteed by AGM (Assured Guaranty Municipal Corporation).
8 Affiliated money market fund available only to Vanguard funds and certain trusts and accounts managed by Vanguard. Rate shown is the 7-day
yield.
9 Includes $380,925,000 of collateral received for securities on loan.
10 Cash of $7,037,000 has been segregated as initial margin for open futures contracts.
ADR—American Depositary Receipt.
GO—General Obligation Bond.
19
© 2016 The Vanguard Group, Inc.
All rights reserved.
Vanguard Marketing Corporation, Distributor.
SNA270_112016

Report of Independent Registered Public Accounting Firm
To the Board of Trustees and Shareholders of Vanguard Wellesley Income Fund:
In our opinion, the accompanying statement of net assets – investments summary and the related statements of operations and of changes in net assets and the financial highlights (included in Item 1 of this Form N-CSR) and the schedule of investments (included in Item 6 of this Form N-CSR) present fairly, in all material respects, the financial position of Vanguard Wellesley Income Fund (the "Fund") at September 30, 2016, the results of its operations for the year then ended, the changes in its net assets for each of the two years in the period then ended, and the financial highlights for each of the five years in the period then ended, in conformity with accounting principles generally accepted in the United States of America. These financial statements, financial highlights, and schedule of investments (hereafter referred to as "financial statements") are the responsibility of the Fund's management. Our responsibility is to express an opinion on these financial statements based on our audits. We conducted our audits of these financial statements in accordance with the standards of the Public Company Accounting Oversight Board (United States). Those standards require that we plan and perform the audit to obtain reasonable assurance about whether the financial statements are free of material misstatement. An audit includes examining, on a test basis, evidence supporting the amounts and disclosures in the financial statements, assessing the accounting principles used and significant estimates made by management, and evaluating the overall financial statement presentation. We believe that our audits, which included confirmation of securities at September 30, 2016 by correspondence with the custodian and brokers and by agreement to the underlying ownership records of the transfer agent, provide a reasonable basis for our opinion.

November 15, 2016
PricewaterhouseCoopers LLP, Two Commerce Square, Suite 1800, 2001 Market Street, Philadelphia, PA 19103-7042
T: (267) 330 3000, F: (267) 330 3300, www.pwc.com/us
Item 7: Disclosure of Proxy Voting Policies and Procedures for Closed-End Management
Investment Companies.
Not Applicable.
Item 8: Portfolio Managers of Closed-End Management Investment Companies.
Not Applicable.
Item 9: Purchase of Equity Securities by Closed-End Management Investment Company and
Affiliated Purchasers.
Not Applicable.
Item 10: Submission of Matters to a Vote of Security Holders.
Not Applicable.
Item 11: Controls and Procedures.
(a) Disclosure Controls and Procedures. The Principal Executive and Financial Officers concluded that the Registrant’s Disclosure Controls and Procedures are effective based on their evaluation of the Disclosure Controls and Procedures as of a date within 90 days of the filing date of this report.
(b) Internal Control Over Financial Reporting. There were no significant changes in Registrant’s Internal Control Over Financial Reporting or in other factors that could significantly affect this control subsequent to the date of the evaluation, including any corrective actions with regard to significant deficiencies and material weaknesses.
Item 12: Exhibits.
(a) Code of Ethics.
(b) Certifications.
Pursuant to the requirements of the Securities Exchange Act of 1934 and the Investment Company Act of 1940, the registrant has duly caused this report to be signed on its behalf by the undersigned, thereunto duly authorized.
| |
| | VANGUARD WELLESLEY INCOME FUND |
| |
| |
| BY: | /s/ F. WILLIAM MCNABB III* |
| | F. WILLIAM MCNABB III |
| | CHIEF EXECUTIVE OFFICER |
| |
| Date: November 17, 2016 |
Pursuant to the requirements of the Securities Exchange Act of 1934 and the Investment Company Act of 1940, this report has been signed below by the following persons on behalf of the registrant and in the capacities and on the dates indicated.
| |
| | VANGUARD WELLESLEY INCOME FUND |
| |
| BY: | /s/ F. WILLIAM MCNABB III* |
| | F. WILLIAM MCNABB III |
| | CHIEF EXECUTIVE OFFICER |
Date: November 17, 2016 |
| VANGUARD WELLESLEY INCOME FUND |
| |
| BY: | /s/ THOMAS J. HIGGINS* |
| | THOMAS J. HIGGINS |
| | CHIEF FINANCIAL OFFICER |
Date: November 17, 2016 |
* By: /s/ Anne E. Robinson
Anne E. Robinson, pursuant to a Power of Attorney filed on October 4, 2016 see file Number
33-32548, Incorporated by Reference.