UNITED STATES
SECURITIES AND EXCHANGE COMMISSION
Washington, D.C. 20549
FORM N-CSR
CERTIFIED SHAREHOLDER REPORT OF
REGISTERED MANAGEMENT INVESTMENT COMPANIES
Investment Company Act file number: 811-01766
| |
| Name of Registrant: | Vanguard Wellesley Income Fund |
| Address of Registrant: | P.O. Box 2600 |
| | Valley Forge, PA 19482 |
| |
| Name and address of agent for service: | Anne E. Robinson, Esquire |
| | P.O. Box 876 |
| | Valley Forge, PA 19482 |
Registrant’s telephone number, including area code: (610) 669-1000
Date of fiscal year end: September 30 Date of reporting period: October 1, 2017 – September 30, 2018
Item 1: Reports to Shareholders
Vanguard’s Principles for Investing Success
We want to give you the best chance of investment success. These principles, grounded in Vanguard’s research and experience, can put you on the right path.
Goals. Create clear, appropriate investment goals.
Balance. Develop a suitable asset allocation using broadly diversified funds. Cost. Minimize cost.
Discipline. Maintain perspective and long-term discipline.
A single theme unites these principles: Focus on the things you can control.
We believe there is no wiser course for any investor.
| |
| Contents | |
| Your Fund’s Performance at a Glance. | 1 |
| CEO’s Perspective. | 3 |
| Advisor’s Report. | 5 |
| Fund Profile. | 9 |
| Performance Summary. | 11 |
| Financial Statements. | 13 |
| Your Fund’s After-Tax Returns. | 35 |
| About Your Fund’s Expenses. | 36 |
| Trustees Approve Advisory Arrangement. | 38 |
| Glossary. | 40 |
Please note: The opinions expressed in this report are just that—informed opinions. They should not be considered promises or advice. Also, please keep in mind that the information and opinions cover the period through the date on the front of this report. Of course, the risks of investing in your fund are spelled out in the prospectus.
See the Glossary for definitions of investment terms used in this report.
Your Fund’s Performance at a Glance
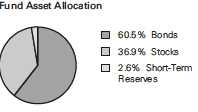
• Vanguard Wellesley Income Fund returned 3.28% for Investor Shares and 3.38% for Admiral Shares for the 12 months ended September 30, 2018. It outperformed its benchmark, the Wellesley Income Composite Index, as well as the average return for its mixed-asset target allocation conservative fund peers.
• The fund allocates 60% to 65% of its assets to investment-grade bonds. The fixed income portfolio’s absolute returns were negative but surpassed those of its benchmark, the Bloomberg Barclays U.S. Credit A or Better Bond Index (–1.31%). The advisor’s security selection within industrial bonds, as well as the portfolio’s duration stance and its yield-curve positioning, drove much of the outperformance.
• The fund’s stock portfolio, which represents 35% to 40% of its assets, trailed its benchmark, the FTSE High Dividend Yield Index (+10.75%). The advisor’s selections within consumer staples and energy detracted most from relative performance, while sector allocations were generally positive.
| |
| Total Returns: Fiscal Year Ended September 30, 2018 | |
| | Total |
| | Returns |
| Vanguard Wellesley Income Fund | |
| Investor Shares | 3.28% |
| Admiral™ Shares | 3.38 |
| Wellesley Income Composite Index | 2.84 |
| Mixed-Asset Target Allocation Conservative Funds Average | 2.51 |
For a benchmark description, see the Glossary.
Mixed-Asset Target Allocation Conservative Funds Average: Derived from data provided by Lipper, a Thomson Reuters Company.
Admiral Shares carry lower expenses and are available to investors who meet certain account-balance requirements.
| |
| Total Returns: Ten Years Ended September 30, 2018 | |
| | Average |
| | Annual Return |
| Wellesley Income Fund Investor Shares | 7.91% |
| Wellesley Income Composite Index | 7.58 |
| Mixed-Asset Target Allocation Conservative Funds Average | 5.19 |
| For a benchmark description, see the Glossary. | |
Mixed-Asset Target Allocation Conservative Funds Average: Derived from data provided by Lipper, a Thomson Reuters Company.
The figures shown represent past performance, which is not a guarantee of future results. (Current performance may be lower or higher than the performance data cited. For performance data current to the most recent month-end, visit our website at vanguard.com/performance.) Note, too, that both investment returns and principal value can fluctuate widely, so an investor’s shares, when sold, could be worth more or less than their original cost.
1
| | | |
| Expense Ratios | | | |
| Your Fund Compared With Its Peer Group | | | |
| | Investor | Admiral | Peer Group |
| | Shares | Shares | Average |
| Wellesley Income Fund | 0.22% | 0.15% | 0.76% |
The fund expense ratios shown are from the prospectus dated January 26, 2018, and represent estimated costs for the current fiscal year. For the fiscal year ended September 30, 2018, the fund’s expense ratios were 0.23% for Investor Shares and 0.16% for Admiral Shares. The peer-group expense ratio is derived from data provided by Lipper, a Thomson Reuters Company, and captures information through year-end 2017.
Peer group: Mixed-Asset Target Allocation Conservative Funds.
2
CEO’s Perspective

Tim Buckley
President and Chief Executive Officer
Dear Shareholder,
Over the years, I’ve found that prudent investors exhibit a common trait: discipline. No matter how the markets move or what new investing fad hits the headlines, those who stay focused on their goals and tune out the noise are set up for long-term success.
The prime gateway to investing is saving, and you don’t usually become a saver without a healthy dose of discipline. Savers make the decision to sock away part of their income, which means spending less and delaying gratification, no matter how difficult that may be.
Of course, disciplined investing extends beyond diligent saving. The financial markets, in the short term especially, are unpredictable; I have yet to meet the investor who can time them perfectly. It takes discipline to resist the urge to go all-in when markets are frothy or to retreat when things look bleak.
Staying put with your investments is one strategy for handling volatility. Another, rebalancing, requires even more discipline because it means steering your money away from strong performers and toward poorer performers.
Patience—a form of discipline—is also the friend of long-term investors. Higher returns are the potential reward for weathering the market’s turbulence and uncertainty.
3
We have been enjoying one of the longest bull markets in history, but it won’t continue forever. Prepare yourself now for how you will react when volatility comes back. Don’t panic. Don’t chase returns or look for answers outside the asset classes you trust. And be sure to rebalance periodically, even when there’s turmoil.
Whether you’re a master of self-control, get a boost from technology, or work with a professional advisor, know that discipline
is necessary to get the most out of your investment portfolio. And know that Vanguard is with you for the entire ride.
Thank you for your continued loyalty.

Mortimer J. Buckley
President and Chief Executive Officer
October 18, 2018
| | | |
| Market Barometer | | | |
| | | Average Annual Total Returns |
| | Periods Ended September 30, 2018 |
| | One Year | Three Years | Five Years |
| Stocks | | | |
| Russell 1000 Index (Large-caps) | 17.76% | 17.07% | 13.67% |
| Russell 2000 Index (Small-caps) | 15.24 | 17.12 | 11.07 |
| Russell 3000 Index (Broad U.S. market) | 17.58 | 17.07 | 13.46 |
| FTSE All-World ex US Index (International) | 2.13 | 10.18 | 4.51 |
| |
| Bonds | | | |
| Bloomberg Barclays U.S. Aggregate Bond Index | | | |
| (Broad taxable market) | -1.22% | 1.31% | 2.16% |
| Bloomberg Barclays Municipal Bond Index | | | |
| (Broad tax-exempt market) | 0.35 | 2.24 | 3.54 |
| FTSE Three-Month U. S. Treasury Bill Index | 1.57 | 0.80 | 0.48 |
| |
| CPI | | | |
| Consumer Price Index | 2.28% | 1.99% | 1.52% |
4
Advisor’s Report
For the 12 months ended September 30, 2018, Vanguard Wellesley Income Fund returned 3.28% for Investor Shares and 3.38% for the lower-cost Admiral Shares. The composite benchmark, which is weighted 65% Bloomberg Barclays U.S. Credit A or Better Bond Index and 35% FTSE High Dividend Yield Index, returned 2.84%.
The investment environment
The global economy ended 2017 on a strong note, supported by low unemployment rates, high consumer and business confidence, and optimism around tax-law changes. Healthy corporate and economic fundamentals boosted the U.S. equity market. The U.S. Federal Reserve raised interest rates in December and projected at least three more increases in 2018. Shorter-term U.S. Treasury yields rose in anticipation of tax cuts and Fed balance-sheet contraction, but the 30-year yield fell amid a weak inflation outlook.
In February, the U.S. equity markets declined for the first time since late 2015. The sharp correction appeared to be the result of investor concern about inflation and global trade. President Trump imposed tariffs on steel and aluminum and announced further plans to impose tariffs on billions of dollars of goods from China. Treasury yields dipped temporarily in response to trade-war concerns and adverse regulation in the technology sector. As expected, the Fed raised interest rates in March.
By midyear, U.S. equity markets had rebounded, boosted by the positive effects of tax cuts and greater capital expenditures. Nevertheless, we remained wary of the modest acceleration in inflation, slowly rising interest rates, and deceleration in housing affordability. Energy prices rose, which was good news for producers but weighed on consumer sentiment. Fears of a global trade war mounted as President Trump levied additional tariffs on Chinese imports and threatened to impose tariffs on European auto manufacturers. Greater inflationary pressures balanced higher political uncertainty. U.S. investment-grade corporate bonds posted negative excess returns as credit spreads widened. The Fed increased rates again in June, as expected.
As of this writing, the U.S. stock market was in the longest bull market in its history. More than 80% of domestic public companies reported exceeding their most recent earnings forecasts. The Fed presented an upbeat assessment of the economy, downplaying the effects of trade tensions and raising rates for the third time in 2018. U.S. investment-grade corporate credit experienced a mixed third quarter, responding favorably to a strong U.S. economy but also pressured by mounting trade concerns.
For the 12 months, the Standard & Poor’s 500 Index returned 17.91%, the MSCI World Index returned 11.84%, and the MSCI EAFE Index returned 2.74%. Within
5
the United States, growth continued to outperform value, as the Russell 1000 Growth Index returned 26.30% and the Russell 1000 Value Index returned 9.45%. The fund’s equity benchmark, the FTSE High Dividend Yield Index, returned 10.75%.
On the fixed income side, the Bloomberg Barclays U.S. Aggregate Bond Index returned –1.22%. The higher-quality corporate bond market experienced slightly weaker performance, returning –1.31% as measured by the Bloomberg Barclays U.S. Credit A or Better Bond Index. The yield of the 10-year U.S. Treasury note closed at 3.06%, up from 2.33% 12 months earlier.
The fund’s successes
The fixed income portfolio outperformed the Bloomberg Barclays U.S. Credit A or Better Bond Index, helped by security selection and duration and yield-curve positioning. Our selection within investment-grade corporate bonds, particularly industrials, drove positive relative performance. Our security selection among taxable municipal bonds and out-of-benchmark allocation to asset-backed securities also helped returns. Our short duration posture remained beneficial.
Within the equity portfolio, our overweight allocations to energy and health care and our underweight allocation to industrials contributed to performance. Security
selection among industrials, health care, and information technology also boosted returns. Among individual stocks, our decision to sell out of General Electric, which tumbled more than 30% during the period, was the strongest relative contributor. Our positions in Union-Pacific and Cisco Systems, as well as our avoidance of AT&T, also helped.
The fund’s shortfalls
The fixed income portfolio outperformed its benchmark but produced negative absolute returns. This was not attributable to any particular positioning or security selection but rather to challenges in the broader corporate credit markets as short-term Treasury yields rose, credit spreads widened, and investors grew concerned about global trade.
The stock portfolio underperformed its equity benchmark, pulled down by security selection in consumer staples and energy. Our underweighting of the strong-performing information technology sector weighed on returns. Our holdings in Philip Morris International and British American Tobacco detracted, as did our decision not to own benchmark constituent Boeing. We also eliminated Microsoft at the end of March because of insufficient yield and because the stock reached our target price. Microsoft continued to appreciate after that, which hurt our relative performance, but the index ultimately dropped the company in June.
6
The fund’s positioning
Broadly speaking, global economic fundamentals continue to look healthy, and we’re seeing strong signs of prosperity translate to corporate performance. Central banks are unwinding accommodative monetary policies, and we anticipate a measured approach to rate normalization. Inflation pressure remains muted for now, but we are watching carefully for any deterioration in data, particularly with unemployment levels in the U.S. at historic lows, as wage growth pressure could push up inflation.
A key topic that remains top of mind is the potential escalation of trade tensions between the United States and the rest of the world. Although there’s been some progress, the overall situation remains in flux and it’s tough to draw definitive conclusions at this stage. The main questions on investors’ minds are how much this could damage global economic growth and whether we’re headed toward an all-out trade war. While the direct cost of trade restrictions announced so far is low, should the situation deteriorate, trade retaliation and the effects of disruption to the global supply chain and inflation could cause financial conditions to tighten meaningfully.
In the fixed income portfolio, we are underweight in duration across the U.S. yield curve, particularly the short end, as we expect the Fed to continue to raise short-term interest rates. While we are
underweight in corporate credit relative to the all-credit benchmark, we expect our significant positioning there to benefit from the continued tailwinds from tax reform, deregulation, and fiscal stimulus.
Overall, we feel valuations largely reflect a comfort with synchronized global economic growth and stable credit fundamentals. On an industry basis, the fixed income portfolio maintains an out-of-benchmark allocation to U.S. government bonds, namely Treasury bills. We believe government yields will continue to rise in response to both an increase in Treasury borrowing and a reduction in the Fed’s asset purchases. Within corporate credit, we are overweight utilities and favor financials because of their attractive valuations and high credit quality. We also have a small out-of-benchmark allocation to securitized sectors such as asset-backed securities and mortgages, given their favorable valuations compared with other areas of corporate credit.
On the equity side, solid fundamentals remain in place. Job growth has driven the unemployment rate below 4%, and the strong employment backdrop supported robust retail sales through the summer and has kept consumer confidence near all-time highs. Tax cuts boosted consumer spending and corporate earnings growth, leading to strong business confidence and high levels of capital spending. Inflation ticked up modestly to 2.4%, but it remains near the Fed’s targeted level.
7
Outside the United States, a weaker macroeconomic backdrop contributed to softer equity markets. In response to the announced tariffs, which may result in increased inflationary pressure and manufacturing dislocations, we are monitoring supply chain impacts in the technology, industrial, and consumer sectors. We are also mindful of the overall impact the tariffs may have on global economic growth.
During the period, the equity portfolio’s net buys were largest within health care and telecommunication services; its net sales were largest within industrials and consumer discretionary. Although we believe that fundamentals within the United States remain constructive in the near term, we did reduce our cyclical exposure over the course of 2018. This reduction was primarily the result of our bottom-up security selection process, but the shift also aligns with our desire to provide the equity portfolio with some downside protection as we move further along in the economic cycle.
We ended the period most overweight in the health care, energy, and utilities sectors and most underweight in consumer discretionary, industrials, and information technology. Notable purchases within the equity portfolio include Comcast, Medtronic, Crown Castle International, Travelers, and Schlumberger. Notable eliminations include VF, Marathon Petroleum, and Altria. We also trimmed our position in Wells Fargo meaningfully because of company-specific risks associated with the multiple investigations into company practices.
John C. Keogh
Senior Managing Director and
Fixed Income Portfolio Manager
Michael E. Stack, CFA
Senior Managing Director and
Fixed Income Portfolio Manager
Loren L. Moran, CFA
Managing Director and
Fixed Income Portfolio Manager
W. Michael Reckmeyer, III, CFA
Senior Managing Director and
Equity Portfolio Manager
Wellington Management Company llp
October 10, 2018
8
Wellesley Income Fund
Fund Profile
As of September 30, 2018
Share-Class Characteristics
| | | | |
| | | Investor | Admiral |
| | | Shares | Shares |
| Ticker Symbol | | VWINX | VWIAX |
| Expense Ratio1 | | 0.22% | 0.15% |
| 30-Day SEC Yield | | 3.27% | 3.34% |
| |
| Equity and Portfolio Characteristics | |
| | | | FTSE High | DJ |
| | | | Dividend | U.S. Total |
| | | | Yield | Market |
| | | Fund | Index | FA Index |
| Number of Stocks | | 72 | 399 | 3,825 |
| Median Market Cap $115.2B | $105.8B | $73.9B |
| Price/Earnings Ratio | | 16.6x | 16.8x | 21.0x |
| Price/Book Ratio | | 2.5x | 2.5x | 3.1x |
| Return on Equity | | 13.3% | 15.4% | 14.9% |
| Earnings Growth Rate | 2.6% | 3.4% | 8.5% |
| Dividend Yield | | 3.0% | 3.1% | 1.7% |
| Foreign Holdings | | 5.9% | 0.0% | 0.0% |
| Turnover Rate | | 36% | — | — |
| Short-Term Reserves | 2.6% | — | — |
| |
| Fixed Income Characteristics | |
| | | Bloomberg | |
| | | | Barclays | Bloomberg |
| | | | Credit | Barclays |
| | | A or Better | Aggregate |
| | | Fund | Index Bond Index |
| Number of Bonds | | 1,033 | 3,264 | 10,112 |
| Yield to Maturity | | | | |
| (before expenses) | | 3.7% | 3.7% | 3.5% |
| Average Coupon | | 3.5% | 3.5% | 3.2% |
| Average Duration | 6.4 years | 6.7 years | 6.0 years |
| Average Effective | | | | |
| Maturity | 9.3 years | 9.7 years | 8.4 years |
| | | |
| Total Fund Volatility Measures | | |
| | | | DJ |
| | Wellesley | U.S. Total |
| | Composite | | Market |
| | Index | | FA Index |
| R-Squared | 0.97 | | 0.52 |
| Beta | 1.05 | | 0.32 |
| These measures show the degree and timing of the fund’s |
| fluctuations compared with the indexes over 36 months. | |
| |
| Ten Largest Stocks (% of equity portfolio) |
| JPMorgan Chase & Co. | Diversified Banks | 4.6% |
| Johnson & Johnson | Pharmaceuticals | 3.5 |
| Cisco Systems Inc. | Communications | |
| | Equipment | | 3.4 |
| Pfizer Inc. | Pharmaceuticals | 3.4 |
| Verizon Communications Integrated | | |
| Inc. | Telecommunication | |
| | Services | | 3.4 |
| Suncor Energy Inc. | Integrated Oil & Gas | 2.5 |
| Philip Morris | | | |
| International Inc. | Tobacco | | 2.5 |
| Chevron Corp. | Integrated Oil & Gas | 2.5 |
| Eli Lilly & Co. | Pharmaceuticals | 2.4 |
| Exxon Mobil Corp. | Integrated Oil & Gas | 2.2 |
| Top Ten | | | 30.4% |
| Top Ten as % of Total Net Assets | | 11.4% |
| The holdings listed exclude any temporary cash investments and equity index products. |
1 The expense ratios shown are from the prospectus dated January 26, 2018, and represent estimated costs for the current fiscal year. For the fiscal year ended September 30, 2018, the expense ratios were 0.23% for Investor Shares and 0.16% for Admiral Shares.
9
Wellesley Income Fund
| |
| Sector Diversification (% of equity exposure) |
| | Fund |
| Consumer Discretionary | 4.6% |
| Consumer Staples | 12.4 |
| Energy | 13.1 |
| Financials | 14.6 |
| Health Care | 18.1 |
| Industrials | 8.3 |
| Information Technology | 9.7 |
| Materials | 4.5 |
| Real Estate | 1.4 |
| Telecommunication Services | 4.2 |
| Utilities | 9.1 |
Sector categories are based on the Global Industry Classification Standard (“GICS”), except for the “Other” category (if applicable), which includes securities that have not been provided a GICS classification as of the effective reporting period.
| |
| Sector Diversification (% of fixed income | |
| portfolio) | |
| Asset-Backed | 3.8% |
| Commercial Mortgage-Backed | 0.6 |
| Finance | 29.5 |
| Foreign | 5.3 |
| Government Mortgage-Backed | 1.8 |
| Industrial | 33.4 |
| Treasury/Agency | 12.5 |
| Utilities | 8.2 |
| Other | 4.9 |
The agency and mortgage-backed securities sectors may include issues from government-sponsored enterprises; such issues are generally not backed by the full faith and credit of the U.S. government.
| |
| Distribution by Credit Quality (% of fixed | |
| income portfolio) | |
| U.S. Government | 14.6% |
| Aaa | 7.3 |
| Aa | 14.2 |
| A | 44.2 |
| Baa | 19.6 |
| Ba | 0.1 |
Credit-quality ratings are obtained from Barclays and are from Moody's, Fitch, and S&P. When ratings from all three agencies are used, the median rating is shown. When ratings from two of the agencies are used, the lower rating for each issue is shown. "Not Rated" is used to classify securities for which a rating is not available. Not rated securities include a fund's investment in Vanguard Market Liquidity Fund or Vanguard Municipal Cash Management Fund, each of which invests in high-quality money market instruments and may serve as a cash management vehicle for the Vanguard funds, trusts, and accounts. For more information about these ratings, see the Glossary entry for Credit Quality.
10
Wellesley Income Fund
Performance Summary
All of the returns in this report represent past performance, which is not a guarantee of future results that may be achieved by the fund. (Current performance may be lower or higher than the performance data cited. For performance data current to the most recent month-end, visit our website at vanguard.com/performance.) Note, too, that both investment returns and principal value can fluctuate widely, so an investor’s shares, when sold, could be worth more or less than their original cost. The returns shown do not reflect taxes that a shareholder would pay on fund distributions or on the sale of fund shares.
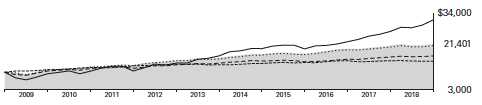
Cumulative Performance: September 30, 2008, Through September 30, 2018
Initial Investment of $10,000
| | | | |
| | Average Annual Total Returns | |
| | Periods Ended September 30, 2018 | |
| |
| | | | | Final Value |
| | One | Five | Ten | of a $10,000 |
| | Year | Years | Years | Investment |
| |
| Wellesley Income Fund*Investor | | | | |
| Shares | 3.28% | 6.26% | 7.91% | $21,401 |
| |
| Wellesley Income Composite Index | 2.84 | 6.21 | 7.58 | 20,764 |
| |
| Mixed-Asset Target Allocation | | | | |
| Conservative Funds Average | 2.51 | 3.96 | 5.19 | 16,579 |
| |
| Bloomberg Barclays U.S. Aggregate | | | | |
| Bond Index | -1.22 | 2.16 | 3.77 | 14,482 |
| Dow Jones U.S. Total Stock Market | | | | |
| Float Adjusted Index | 17.58 | 13.42 | 12.05 | 31,191 |
For a benchmark description, see the Glossary.
Mixed-Asset Target Allocation Conservative Funds Average: Derived from data provided by Lipper, a Thomson Reuters Company.
| | | | |
| | | | | Final Value |
| | One | Five | Ten | of a $50,000 |
| | Year | Years | Years | Investment |
| Wellesley Income Fund Admiral Shares | 3.38% | 6.34% | 7.99% | $107,800 |
| Wellesley Income Composite Index | 2.84 | 6.21 | 7.58 | 103,819 |
| Bloomberg Barclays U.S. Aggregate | | | | |
| Bond Index | -1.22 | 2.16 | 3.77 | 72,412 |
| Dow Jones U.S. Total Stock Market | | | | |
| Float Adjusted Index | 17.58 | 13.42 | 12.05 | 155,955 |
See Financial Highlights for dividend and capital gains information.
11
Wellesley Income Fund
Fiscal-Year Total Returns (%): September 30, 2008, Through September 30, 2018
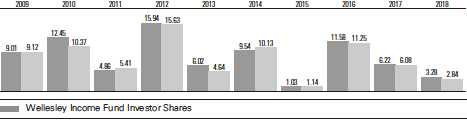
Wellesley Income Composite Index
For a benchmark description, see the Glossary.
12
Wellesley Income Fund
Financial Statements
Statement of Net Assets—Investments Summary
As of September 30, 2018
This Statement summarizes the fund’s holdings by asset type. Details are reported for each of the fund’s 50 largest individual holdings and for investments that, in total for any issuer, represent more than 1% of the fund’s net assets. The total value of smaller holdings is reported as a single amount within each category.
The fund reports a complete list of its holdings in regulatory filings four times in each fiscal year, at the quarter-ends. For the second and fourth fiscal quarters, the complete listing of the fund’s holdings is available electronically on vanguard.com and on the Securities and Exchange Commission’s website (sec.gov), or you can have it mailed to you without charge by calling 800-662-7447. For the first and third fiscal quarters, the fund files the lists with the SEC on Form N-Q. Shareholders can look up the fund’s Forms N-Q on the SEC’s website. Forms N-Q may also be reviewed and copied at the SEC’s Public Reference Room (see the back cover of this report for further information).
| | | | | | | |
| | | | | | Face | Market | Percentage |
| | | | | Maturity | Amount | Value • | of Net |
| | | | Coupon | Date | ($000) | ($000) | Assets |
| U. S. Government and Agency Obligations | | | | |
| U. S. Government Securities | | | | | |
| | United States Treasury Inflation | | | | | |
| | Indexed Bonds | | 0.750% | 7/15/28 | 328,600 | 324,893 | 0.6% |
| 1 | United States Treasury Note/Bond | 2.250% | 2/29/20 | 788,010 | 782,588 | 1.5% |
| 2 | United States Treasury Note/Bond | 2.125% | 12/31/22 | 520,400 | 503,570 | 1.0% |
| | United States Treasury Note/Bond | 2.250% | 3/31/20 | 337,000 | 334,526 | 0.6% |
| | United States Treasury Note/Bond | 3.375% | 5/15/44 | 322,125 | 332,040 | 0.6% |
| | United States Treasury Note/Bond | 2.250% | 11/15/27 | 302,780 | 283,429 | 0.5% |
| | United States Treasury Note/Bond | 1.625% | 6/30/20 | 280,795 | 275,224 | 0.5% |
| | United States Treasury | | | | | |
| | Note/Bond | 1.250%–3.625% | 2/15/20–5/15/48 | 975,212 | 943,912 | 1.8% |
| | U.S. Government Securities—Other † | | | 171,180 | 0.3% |
| | | | | | | 3,951,362 | 7.4% |
| |
| Agency Notes † | | | | | 22,989 | 0.0% |
| |
| Conventional Mortgage-Backed Securities | | | | |
| 3,4,5 Fannie Mae Pool | 2.500%–4.500% | 8/1/27–10/1/48 | 582,132 | 570,648 | 1.1% |
| | Conventional Mortgage-Backed Securities—Other † | | 3,195 | 0.0% |
| | | | | | | 573,843 | 1.1% |
| Nonconventional Mortgage-Backed Securities | | | |
| §,3,4 Fannie Mae REMICS 3.500%–4.000% 9/25/29–10/25/56 | 78,827 | 78,837 | 0.2% |
| | Nonconventional Mortgage-Backed Securities—Other † | | 119,564 | 0.2% |
| | | | | | | 198,401 | 0.4% |
| Total U.S. Government and Agency Obligations (Cost $4,813,971) | | 4,746,595 | 8.9% |
| §,6Asset-Backed/Commercial Mortgage-Backed Securities (Cost $1,220,639) † | 1,209,268 | 2.3% |
13
Wellesley Income Fund
| | | | | |
| | | | Face | Market | Percentage |
| | | Maturity | Amount | Value • | of Net |
| | Coupon | Date | ($000) | ($000) | Assets |
| Corporate Bonds | | | | | |
| Finance | | | | | |
| Banking | | | | | |
| Bank One Corp. | 7.750% | 7/15/25 | 25,000 | 29,553 | 0.1% |
| 4 Goldman Sachs Group | | | | | |
| Inc. | 2.625%– 6.250% | 2/25/21–10/21/45 | 591,235 | 594,597 | 1.1% |
| 4 JPMorgan Chase & Co. | 2.550%– 6.300% | 4/23/19–11/15/48 | 648,505 | 644,351 | 1.2% |
| 4 Morgan Stanley | 2.375%–7.300% | 1/24/19–1/27/45 | 567,155 | 572,616 | 1.1% |
| Wachovia Corp. | 6.605% | 10/1/25 | 15,000 | 16,674 | 0.0% |
| Wells Fargo & Co. | 2.150%–5.606% | 1/30/20–12/7/46 | 530,230 | 524,731 | 1.0% |
| 6 Banking—Other † | | | | 5,408,894 | 10.1% |
| Brokerage † | | | | 25,650 | 0.0% |
| Finance Companies † | | | | 197,282 | 0.4% |
| 6 Insurance † | | | | 1,203,903 | 2.3% |
| 6 Other Finance † | | | | 48,845 | 0.2% |
| 6 Real Estate Investment Trusts † | | | 167,959 | 0.3% |
| | | | | 9,435,055 | 17.8% |
| Industrial | | | | | |
| 6 Basic Industry † | | | | 74,712 | 0.1% |
| 6 Capital Goods † | | | | 837,477 | 1.6% |
| Communication | | | | | |
| Comcast Corp. | 2.350%–4.750% | 2/1/24–11/1/52 | 431,771 | 409,721 | 0.8% |
| 6 NBCUniversal Enterprise | | | | | |
| Inc. | 1.974% | 4/15/19 | 84,070 | 83,697 | 0.1% |
| NBCUniversal Media | | | | | |
| LLC | 4.375%–4.450% | 4/1/21–1/15/43 | 36,639 | 36,768 | 0.1% |
| Verizon Communications | | | | | |
| Inc. | 3.450%–5.012% | 3/15/21–3/15/55 | 282,461 | 283,622 | 0.5% |
| 6 Communication—Other † | | | | 711,830 | 1.3% |
| 6 Consumer Cyclical † | | | | 1,341,172 | 2.5% |
| Consumer Noncyclical | | | | | |
| Johnson & Johnson | 2.450%– 6.730% | 11/15/23–3/1/26 | 93,000 | 90,130 | 0.2% |
| Medtronic Inc. | 2.500%–4.375% | 3/15/20–3/15/35 | 178,634 | 178,324 | 0.3% |
| Pfizer Inc. | 3.000%–4.100% | 6/15/23–9/15/38 | 106,555 | 104,986 | 0.2% |
| Philip Morris | | | | | |
| International Inc. | 1.875%–4.875% | 3/26/20–11/10/44 | 175,695 | 170,024 | 0.3% |
| Wyeth LLC | 5.950% | 4/1/37 | 15,000 | 18,093 | 0.0% |
| 6 Consumer Noncyclical—Other † | | | 3,062,125 | 5.8% |
| Energy | | | | | |
| Chevron Corp. | 2.355%–3.191% | 12/5/22– 6/24/23 | 75,750 | 74,972 | 0.1% |
| Suncor Energy Inc. | 3.600%–5.950% | 12/1/24–12/1/34 | 32,505 | 34,196 | 0.1% |
| Texaco Capital Inc. | 8.625% | 4/1/32 | 25,000 | 34,868 | 0.1% |
| 6 Energy—Other † | | | | 917,747 | 1.7% |
| 6 Other Industrial † | | | | 159,298 | 0.3% |
| Technology | | | | | |
| Cisco Systems Inc. | 2.500% | 9/20/26 | 15,921 | 14,724 | 0.0% |
| 6 Technology—Other † | | | | 1,774,567 | 3.4% |
| 6 Transportation † | | | | 239,928 | 0.5% |
| | | | | 10,652,981 | 20.0% |
14
| | | |
| Wellesley Income Fund | | | |
| |
| |
| |
| | | Market | Percentage |
| | | Value• | of Net |
| | | ($000) | Assets |
| Utilities | | | |
| 6 Electric † | | 2,311,448 | 4.3% |
| 6 Natural Gas † | | 262,366 | 0.5% |
| Other Utility † | | 46,727 | 0.1% |
| | | 2,620,541 | 4.9% |
| Total Corporate Bonds (Cost $23,007,624) | | 22,708,577 | 42.7% |
| 6Sovereign Bonds (Cost $1,720,335) † | | 1,688,390 | 3.2% |
| Taxable Municipal Bonds (Cost $1,428,933) † | | 1,572,459 | 3.0% |
| |
| | Shares | | |
| Common Stocks | | | |
| Consumer Discretionary | | | |
| Comcast Corp. Class A | 11,662,133 | 412,956 | 0.8% |
| McDonald’s Corp. | 1,321,658 | 221,100 | 0.4% |
| Consumer Discretionary—Other † | | 286,374 | 0.5% |
| | | 920,430 | 1.7% |
| Consumer Staples | | | |
| Philip Morris International Inc. | 6,187,171 | 504,502 | 1.0% |
| Unilever NV | 7,149,302 | 397,144 | 0.8% |
| Coca-Cola Co. | 7,410,851 | 342,307 | 0.6% |
| Procter & Gamble Co. | 2,963,537 | 246,655 | 0.5% |
| PepsiCo Inc. | 2,034,338 | 227,439 | 0.4% |
| Consumer Staples—Other † | | 751,531 | 1.4% |
| | | 2,469,578 | 4.7% |
| Energy | | | |
| Suncor Energy Inc. | 13,052,243 | 504,991 | 1.0% |
| Chevron Corp. | 4,082,926 | 499,260 | 0.9% |
| Exxon Mobil Corp. | 5,260,011 | 447,206 | 0.8% |
| ^ TransCanada Corp. | 6,107,253 | 247,099 | 0.5% |
| Canadian Natural Resources Ltd. | 6,599,591 | 215,543 | 0.4% |
| Energy—Other † | | 703,360 | 1.3% |
| | | 2,617,459 | 4.9% |
| Financials | | | |
| JPMorgan Chase & Co. | 8,118,222 | 916,060 | 1.7% |
| Wells Fargo & Co. | 7,544,642 | 396,546 | 0.8% |
| MetLife Inc. | 7,804,253 | 364,615 | 0.7% |
| Financials—Other † | | 1,229,136 | 2.3% |
| | | 2,906,357 | 5.5% |
| Health Care | | | |
| Johnson & Johnson | 5,109,959 | 706,043 | 1.4% |
| Pfizer Inc. | 15,222,727 | 670,866 | 1.3% |
| Eli Lilly & Co. | 4,509,809 | 483,948 | 0.9% |
| Merck & Co. Inc. | 5,377,406 | 381,473 | 0.7% |
| Medtronic plc | 3,835,616 | 377,310 | 0.7% |
| Bristol-Myers Squibb Co. | 4,427,504 | 274,859 | 0.5% |
| Novartis AG | 3,189,761 | 274,570 | 0.5% |
| Koninklijke Philips NV | 4,719,831 | 215,139 | 0.4% |
| Roche Holding AG | 886,810 | 214,444 | 0.4% |
| | | 3,598,652 | 6.8% |
15
| | | | | |
| Wellesley Income Fund | | | | | |
| |
| |
| |
| | | | | Market | Percentage |
| | | | | Value• | of Net |
| | | | Shares | ($000) | Assets |
| Industrials | | | | | |
| Union Pacific Corp. | | | 2,008,628 | 327,065 | 0.6% |
| Eaton Corp. plc | | | 3,649,221 | 316,497 | 0.6% |
| Lockheed Martin Corp. | | | 896,270 | 310,074 | 0.6% |
| Caterpillar Inc. | | | 1,855,166 | 282,894 | 0.5% |
| 3M Co. | | | 1,050,759 | 221,405 | 0.4% |
| Industrials—Other † | | | | 192,431 | 0.4% |
| | | | | 1,650,366 | 3.1% |
| Information Technology | | | | | |
| Cisco Systems Inc. | | | 13,805,946 | 671,659 | 1.3% |
| Intel Corp. | | | 9,067,452 | 428,800 | 0.8% |
| Analog Devices Inc. | | | 3,951,328 | 365,340 | 0.7% |
| QUALCOMM Inc. | | | 3,245,326 | 233,761 | 0.4% |
| Information Technology—Other † | | | 232,608 | 0.4% |
| | | | | 1,932,168 | 3.6% |
| Materials | | | | | |
| DowDuPont Inc. | | | 6,932,472 | 445,827 | 0.8% |
| Materials—Other † | | | | 458,343 | 0.9% |
| | | | | 904,170 | 1.7% |
| Real Estate | | | | | |
| Crown Castle International Corp. | | 2,490,418 | 277,258 | 0.5% |
| |
| Telecommunication Services | | | | | |
| Verizon Communications Inc. | | | 12,535,730 | 669,282 | 1.3% |
| Telecommunication Services—Other † | | | 169,643 | 0.3% |
| | | | | 838,925 | 1.6% |
| Utilities | | | | | |
| Dominion Energy Inc. | | | 4,316,311 | 303,350 | 0.6% |
| NextEra Energy Inc. | | | 1,498,423 | 251,136 | 0.5% |
| Eversource Energy | | | 4,053,157 | 249,026 | 0.4% |
| Duke Energy Corp. | | | 2,787,844 | 223,083 | 0.4% |
| Sempra Energy | | | 1,847,207 | 210,120 | 0.4% |
| Utilities—Other † | | | | 576,344 | 1.1% |
| | | | | 1,813,059 | 3.4% |
| Total Common Stocks (Cost $14,461,074) | | | 19,928,422 | 37.5% |
| |
| | | Coupon | | | |
| Temporary Cash Investments | | | | | |
| Money Market Fund | | | | | |
| 7,8 Vanguard Market Liquidity Fund | 2.209% | 1,813,594 | 181,360 | 0.3% |
| |
| | | | Face | | |
| | | Maturity | Amount | | |
| | Coupon | Date | ($000) | | |
| Repurchase Agreements | | | | | |
| Bank of America Securities, LLC | | | | |
| (Dated 9/28/18, Repurchase | | | | | |
| Value $16,403,000, collateralized | | | | |
| by Federal Farm Credit Bank, | | | | |
| 2.480%, 10/19/29, with a value | | | | |
| of $16,728,000) | 2.270% | 10/1/18 | 16,400 | 16,400 | 0.0% |
16
Wellesley Income Fund
| | | | | |
| | | | Face | Market | Percentage |
| | | Maturity | Amount | Value • | of Net |
| | Coupon | Date | ($000) | ($000) | Assets |
| Deutsche Bank Securities, Inc. | | | | | |
| (Dated 9/28/18, Repurchase | | | | | |
| Value $10,302,000, collateralized | | | | | |
| by Federal Farm Credit Bank, | | | | | |
| 2.035%, 7/9/20, with a value | | | | | |
| of $10,506,000) | 2.250% | 10/1/18 | 10,300 | 10,300 | 0.0% |
| HSBC Bank USA (Dated 9/28/18, | | | | | |
| Repurchase Value $85,516,000, | | | | | |
| collateralized by U. S. Treasury | | | | | |
| Bill 0.000%, 11/1/18–11/8/18, | | | | | |
| and U.S. Treasury Note/Bond, | | | | | |
| 2.125%, 5/15/25, with a value | | | | | |
| of $87,210,000) | 2.230% | 10/1/18 | 85,500 | 85,500 | 0.2% |
| HSBC Bank USA (Dated 9/28/18, | | | | | |
| Repurchase Value $20,504,000, | | | | | |
| collateralized by Federal Home | | | | | |
| Loan Mortgage Corp., 3.000%– | | | | | |
| 6.000%, 1/1/23–9/1/48, and | | | | | |
| Federal National Mortgage Assn., | | | | | |
| 5.000%–5.500%, 3/1/33–3/1/41, | | | | | |
| with a value of $20,910,000) | 2.240% | 10/1/18 | 20,500 | 20,500 | 0.1% |
| JP Morgan Securities LLC | | | | | |
| (Dated 9/28/18, Repurchase | | | | | |
| Value $165,131,000, collateralized | | | | | |
| by U. S. Treasury Note/Bond, | | | | | |
| 1.625%, 5/15/26, with a value | | | | | |
| of $168,402,000) | 2.220% | 10/1/18 | 165,100 | 165,100 | 0.3% |
| Natixis (Dated 9/28/18, | | | | | |
| Repurchase Value $175,033,000, | | | | | |
| collateralized by U. S. Treasury | | | | | |
| Note/Bond, 1.500%–3.375%, | | | | | |
| 7/31/20–4/15/32, with a value | | | | | |
| of $178,500,000) | 2.230% | 10/1/18 | 175,000 | 175,000 | 0.3% |
| Nomura International plc | | | | | |
| (Dated 9/28/18, Repurchase | | | | | |
| Value $70,013,000, collateralized | | | | | |
| by U. S. Treasury Note/Bond, | | | | | |
| 1.625%–3.125%, 5/31/25– | | | | | |
| 11/15/41, with a value of | | | | | |
| $71,400,000) | 2.250% | 10/1/18 | 70,000 | 70,000 | 0.1% |
| RBC Capital Markets LLC | | | | | |
| (Dated 9/28/18, Repurchase | | | | | |
| Value $17,103,000, collateralized | | | | | |
| by Federal Home Loan Mortgage | | | | | |
| Corp., 4.000%, 9/1/48, and | | | | | |
| Federal National Mortgage Assn., | | | | | |
| 2.360%–3.040%, 12/1/22– | | | | | |
| 11/1/26, with a value of | | | | | |
| $17,443,000) | 2.230% | 10/1/18 | 17,100 | 17,100 | 0.1% |
17
Wellesley Income Fund
| | | | | |
| | | | Face | Market | Percentage |
| | | Maturity | Amount | Value • | of Net |
| | Coupon | Date | ($000) | ($000) | Assets |
| RBS Securities, Inc. | | | | | |
| (Dated 9/28/18, Repurchase | | | | |
| Value $272,351,000, collateralized | | | | |
| by U. S. Treasury Note/Bond | | | | |
| 3.375%, 11/15/19, with a value | | | | |
| of $277,746,000) | 2.240% | 10/1/18 | 272,300 | 272,300 | 0.5% |
| | | | | 832,200 | 1.6% |
| U. S. Government and Agency Obligations | | | | |
| United States Treasury | | | | | |
| Bill | 1.972%–1.973% | 10/25/18 | 198,100 | 197,824 | 0.4% |
| United States Treasury | | | | | |
| Bill | 2.545%–2.548% | 9/12/19 | 353,000 | 344,553 | 0.6% |
| | | | | 542,377 | 1.0% |
| Total Temporary Cash Investments (Cost $1,555,973) | | | 1,555,937 | 2.9% |
| Total Investments (Cost $48,208,549) | | | 53,409,648 | 100.5% |
| | |
| | Amount | |
| | ($000) | |
| Other Assets and Liabilities | | |
| Other Assets | | |
| Investment in Vanguard | 2,717 | |
| Receivables for Investment Securities Sold | 115,353 | |
| Receivables for Accrued Income | 312,724 | |
| Receivables for Capital Shares Issued | 20,426 | |
| Variation Margin Receivable—Futures Contracts | 1,149 | |
| Unrealized Appreciation—Forward Currency Contracts | 2,633 | |
| Other Assets | 10,952 | |
| Total Other Assets | 465,954 | 0.9% |
| Liabilities | | |
| Payables for Investment Securities Purchased | (455,792) | |
| Collateral for Securities on Loan | (181,351) | |
| Payables to Investment Advisor | (7,752) | |
| Payables for Capital Shares Redeemed | (33,809) | |
| Payables for Distributions | (1) | |
| Payables to Vanguard | (40,425) | |
| Variation Margin Payable—Futures Contracts | (454) | |
| Unrealized Depreciation—Forward Currency Contracts | (162) | |
| Other Liabilities | (1,874) | |
| Total Liabilities | (721,620) | (1.4%) |
| Net Assets | 53,153,982 | 100.0% |
18
Wellesley Income Fund
| |
| | Amount |
| | ($000) |
| Paid-in Capital | 45,936,605 |
| Undistributed Net Investment Income | 9,743 |
| Accumulated Net Realized Gains | 1,989,520 |
| Unrealized Appreciation (Depreciation) | |
| Investment Securities | 5,201,099 |
| Futures Contracts | 14,676 |
| Forward Currency Contracts | 2,471 |
| Foreign Currencies | (132) |
| Net Assets | 53,153,982 |
| |
| |
| Investor Shares—Net Assets | |
| Applicable to 469,044,106 outstanding $.001 par value shares of | |
| beneficial interest (unlimited authorization) | 12,397,630 |
| Net Asset Value Per Share—Investor Shares | $26.43 |
| |
| |
| Admiral Shares—Net Assets | |
| Applicable to 636,542,622 outstanding $.001 par value shares of | |
| beneficial interest (unlimited authorization) | 40,756,352 |
| Net Asset Value Per Share—Admiral Shares | $64.03 |
At September 30, 2018, net assets consisted of:
• See Note A in Notes to Financial Statements.
§ Security value determined using significant unobservable inputs.
^ Includes partial security positions on loan to broker-dealers. The total value of securities on loan is $172,277,000.
† Represents the aggregate value, by category, of securities that are not among the 50 largest holdings and, in total for any issuer, represent 1% or less of net assets.
1 Securities with a value of $808,000 have been segregated as collateral for certain open To Be Announced (TBA) transactions. 2 Securities with a value of $13,720,000 have been segregated as initial margin for open futures contracts.
3 The issuer was placed under federal conservatorship in September 2008; since that time, its daily operations have been managed by the Federal Housing Finance Agency and it receives capital from the U.S. Treasury, as needed to maintain a positive net worth, in exchange for senior preferred stock.
4 The average or expected maturity is shorter than the final maturity shown because of the possibility of interim principal payments and prepayments or the possibility of the issue being called.
5 Includes securities purchased on a when-issued or delayed-delivery basis for which the fund has not taken delivery as of September 30, 2018.
6 Certain of the fund’s securities are exempt from registration under Rule 144A of the Securities Act of 1933. Such securities may be sold in transactions exempt from registration, normally to qualified institutional buyers. At September 30, 2018, the aggregate value of these securities was $5,980,511,000, representing 11.3% of net assets.
7 Affiliated money market fund available only to Vanguard funds and certain trusts and accounts managed by Vanguard. Rate shown is the 7-day yield.
8 Includes $181,351,000 of collateral received for securities on loan.
REMICS—Real Estate Mortgage Investment Conduits.
19
Wellesley Income Fund
| | | | |
| Derivative Financial Instruments Outstanding as of Period End | | |
| Futures Contracts | | | | |
| | | | | ($000) |
| | | | | Value and |
| | | Number of | | Unrealized |
| | | Long (Short) | Notional | Appreciation |
| | Expiration | Contracts | Amount | (Depreciation) |
| Long Futures Contracts | | | | |
| 5-Year U.S. Treasury Note | December 2018 | 9,060 | 1,019,038 | (7,299) |
| |
| Short Futures Contracts | | | | |
| 2-Year U.S. Treasury Note | December 2018 | (4,437) | (935,029) | 2,487 |
| 10-Year U.S. Treasury Note | December 2018 | (7,861) | (933,739) | 9,179 |
| Ultra Long U.S. Treasury Bond | December 2018 | (1,902) | (293,443) | 10,309 |
| | | | | 21,975 |
| | | | | 14,676 |
| | | | | | |
| Forward Currency Contracts | | | | | | |
| | | | | | | Unrealized |
| | Contract | | | | | Appreciation |
| | | | Contract Amount (000) | |
| | Settlement | | | | | (Depreciation) |
| Counterparty | Date | | Receive | | Deliver | ($000) |
| J.P. Morgan Chase Bank, N.A. | 1/9/19 | USD | 163,834 | JPY | 18,440,450 | 106 |
| Citibank, N.A. | 10/29/18 | USD | 82,886 | JPY | 9,150,000 | 2,180 |
| J.P. Morgan Chase Bank, N.A. | 10/29/18 | USD | 41,050 | JPY | 4,627,000 | 238 |
| Citibank, N.A. | 10/22/18 | USD | 37,725 | CAD | 48,700 | 2 |
| UBS AG | 10/10/18 | USD | 25,750 | CAD | 33,460 | (161) |
| Citibank, N.A. | 10/22/18 | USD | 18,860 | CAD | 24,350 | (1) |
| Citibank, N.A. | 10/19/18 | USD | 18,834 | CAD | 24,300 | 12 |
| Goldman Sachs International | 10/16/18 | USD | 18,826 | CAD | 24,300 | 7 |
| Credit Suisse International | 10/17/18 | USD | 18,826 | CAD | 24,300 | 6 |
| Barclays Bank plc | 10/15/18 | USD | 18,824 | CAD | 24,300 | 5 |
| Goldman Sachs International | 10/15/18 | USD | 12,942 | JPY | 1,460,000 | 77 |
| | | | | | | 2,471 |
| CAD—Canadian dollar. | | | | | | |
| JPY—Japanese yen. | | | | | | |
| USD—U.S. dollar. | | | | | | |
At September 30, 2018, a counterparty had deposited in a segregated account securities with a value of $1,825,000 in connection with open forward currency contracts.
See accompanying Notes, which are an integral part of the Financial Statements.
20
| |
| Wellesley Income Fund | |
| |
| |
| Statement of Operations | |
| |
| | Year Ended |
| | September 30, 2018 |
| | ($000) |
| Investment Income | |
| Income | |
| Dividends1 | 616,713 |
| Interest | 1,098,088 |
| Securities Lending—Net | 1,446 |
| Total Income | 1,716,247 |
| Expenses | |
| Investment Advisory Fees—Note B | |
| Basic Fee | 29,260 |
| Performance Adjustment | 2,529 |
| The Vanguard Group—Note C | |
| Management and Administrative—Investor Shares | 19,949 |
| Management and Administrative—Admiral Shares | 37,800 |
| Marketing and Distribution—Investor Shares | 2,244 |
| Marketing and Distribution—Admiral Shares | 2,402 |
| Custodian Fees | 268 |
| Auditing Fees | 33 |
| Shareholders’ Reports and Proxy—Investor Shares | 348 |
| Shareholders’ Reports and Proxy—Admiral Shares | 442 |
| Trustees’ Fees and Expenses | 84 |
| Total Expenses | 95,359 |
| Net Investment Income | 1,620,888 |
| Realized Net Gain (Loss) | |
| Investment Securities Sold 2 | 2,382,165 |
| Futures Contracts | 80,739 |
| Forward Currency Contracts | (4,427) |
| Foreign Currencies | 5,313 |
| Realized Net Gain (Loss) | 2,463,790 |
| Change in Unrealized Appreciation (Depreciation) | |
| Investment Securities 2 | (2,323,374) |
| Futures Contracts | 4,797 |
| Forward Currency Contracts | (897) |
| Foreign Currencies | (844) |
| Change in Unrealized Appreciation (Depreciation) | (2,320,318) |
| Net Increase (Decrease) in Net Assets Resulting from Operations | 1,764,360 |
1 Dividends are net of foreign withholding taxes of $13,872,000.
2 Realized net gain (loss) and change in unrealized appreciation (depreciation) from an affiliated company of the fund were ($54,000) and ($4,000), respectively. Purchases and sales are for temporary cash investment purposes.
See accompanying Notes, which are an integral part of the Financial Statements.
21
Wellesley Income Fund
Statement of Changes in Net Assets
| | |
| | Year Ended September 30, |
| | 2018 | 2017 |
| | ($000) | ($000) |
| Increase (Decrease) in Net Assets | | |
| Operations | | |
| Net Investment Income | 1,620,888 | 1,541,537 |
| Realized Net Gain (Loss) | 2,463,790 | 734,142 |
| Change in Unrealized Appreciation (Depreciation) | (2,320,318) | 888,957 |
| Net Increase (Decrease) in Net Assets Resulting from Operations | 1,764,360 | 3,164,636 |
| Distributions | | |
| Net Investment Income | | |
| Investor Shares | (389,576) | (420,839) |
| Admiral Shares | (1,236,857) | (1,142,767) |
| Realized Capital Gain1 | | |
| Investor Shares | (158,569) | (144,472) |
| Admiral Shares | (472,158) | (370,403) |
| Total Distributions | (2,257,160) | (2,078,481) |
| Capital Share Transactions | | |
| Investor Shares | (1,702,663) | (241,853) |
| Admiral Shares | 1,154,836 | 3,497,807 |
| Net Increase (Decrease) from Capital Share Transactions | (547,827) | 3,255,954 |
| Total Increase (Decrease) | (1,040,627) | 4,342,109 |
| Net Assets | | |
| Beginning of Period | 54,194,609 | 49,852,500 |
| End of Period2 | 53,153,982 | 54,194,609 |
| 1 Includes fiscal 2018 and 2017 short-term gain distributions totaling $50,213,000 and $18,019,000, respectively. Short-term gain |
| distributions are treated as ordinary income dividends for tax purposes. | | |
| 2 Net Assets—End of Period includes undistributed (overdistributed) net investment income of $9,743,000 and $1,334,000. |
See accompanying Notes, which are an integral part of the Financial Statements.
22
Wellesley Income Fund
Financial Highlights
| | | | | |
| Investor Shares | | | | | |
| |
| For a Share Outstanding | | | Year Ended September 30, |
| Throughout Each Period | 2018 | 2017 | 2016 | 2015 | 2014 |
| Net Asset Value, Beginning of Period | $26.66 | $26.13 | $24.71 | $25.65 | $24.82 |
| Investment Operations | | | | | |
| Net Investment Income | .7791 | .7691 | .761 | .760 | .811 |
| Net Realized and Unrealized Gain (Loss) | | | | | |
| on Investments | .086 | .810 | 2.014 | (.487) | 1.491 |
| Total from Investment Operations | .865 | 1.579 | 2.775 | .273 | 2.302 |
| Distributions | | | | | |
| Dividends from Net Investment Income | (.786) | (.780) | (.746) | (.761) | (.793) |
| Distributions from Realized Capital Gains | (.309) | (.269) | (.609) | (.452) | (.679) |
| Total Distributions | (1.095) | (1.049) | (1.355) | (1.213) | (1.472) |
| Net Asset Value, End of Period | $26.43 | $26.66 | $26.13 | $24.71 | $25.65 |
| |
| Total Return2 | 3.28% | 6.22% | 11.58% | 1.03% | 9.54% |
| |
| Ratios/Supplemental Data | | | | | |
| Net Assets, End of Period (Millions) | $12,398 | $14,220 | $14,175 | $11,617 | $11,830 |
| Ratio of Total Expenses to Average Net Assets3 | 0.23% | 0.22% | 0.22% | 0.23% | 0.25% |
| Ratio of Net Investment Income to | | | | | |
| Average Net Assets | 2.93% | 2.95% | 3.02% | 2.96% | 3.19% |
| Portfolio Turnover Rate4 | 36% | 22% | 31% | 59% | 109% |
1 Calculated based on average shares outstanding.
2 Total returns do not include account service fees that may have applied in the periods shown. Fund prospectuses provide information
about any applicable account service fees.
3 Includes performance-based investment advisory fee increases (decreases) of 0.00%, (0.00%), 0.00%, 0.00%, and 0.01%.
4 Includes 4%, 1%, 15%, 18%, and 23% attributable to mortgage-dollar-roll activity.
See accompanying Notes, which are an integral part of the Financial Statements.
23
Wellesley Income Fund
Financial Highlights
| | | | | |
| Admiral Shares | | | | | |
| |
| For a Share Outstanding | | | Year Ended September 30, |
| Throughout Each Period | 2018 | 2017 | 2016 | 2015 | 2014 |
| Net Asset Value, Beginning of Period | $64.57 | $63.30 | $59.87 | $62.14 | $60.12 |
| Investment Operations | | | | | |
| Net Investment Income | 1. 9341 | 1.9081 | 1.887 | 1.884 | 2.010 |
| Net Realized and Unrealized Gain (Loss) | | | | | |
| on Investments | .226 | 1.945 | 4.868 | (1.171) | 3.623 |
| Total from Investment Operations | 2.160 | 3.853 | 6.755 | .713 | 5.633 |
| Distributions | | | | | |
| Dividends from Net Investment Income | (1.951) | (1.932) | (1.850) | (1.888) | (1.967) |
| Distributions from Realized Capital Gains | (.749) | (.651) | (1.475) | (1.095) | (1.646) |
| Total Distributions | (2.700) | (2.583) | (3.325) | (2.983) | (3.613) |
| Net Asset Value, End of Period | $64.03 | $64.57 | $63.30 | $59.87 | $62.14 |
| |
| Total Return2 | 3.38% | 6.27% | 11.64% | 1.11% | 9.64% |
| |
| Ratios/Supplemental Data | | | | | |
| Net Assets, End of Period (Millions) | $40,756 | $39,974 | $35,678 | $28,083 | $27,156 |
| Ratio of Total Expenses to Average Net Assets3 | 0.16% | 0.15% | 0.15% | 0.16% | 0.18% |
| Ratio of Net Investment Income to | | | | | |
| Average Net Assets | 3.00% | 3.02% | 3.09% | 3.03% | 3.26% |
| Portfolio Turnover Rate4 | 36% | 22% | 31% | 59% | 109% |
1 Calculated based on average shares outstanding.
2 Total returns do not include account service fees that may have applied in the periods shown. Fund prospectuses provide information about any applicable account service fees.
3 Includes performance-based investment advisory fee increases (decreases) of 0.00%, (0.00%), 0.00%, 0.00%, and 0.01%.
4 Includes 4%, 1%, 15%, 18%, and 23% attributable to mortgage-dollar-roll activity.
See accompanying Notes, which are an integral part of the Financial Statements
24
Wellesley Income Fund
Notes to Financial Statements
Vanguard Wellesley Income Fund is registered under the Investment Company Act of 1940 as an open-end investment company, or mutual fund. Certain of the fund’s investments are in corporate debt instruments; the issuers’ abilities to meet their obligations may be affected by economic developments in their respective industries. The fund offers two classes of shares: Investor Shares and Admiral Shares. Investor Shares are available to any investor who meets the fund’s minimum purchase requirements. Admiral Shares are designed for investors who meet certain administrative, service, and account-size criteria.
A. The following significant accounting policies conform to generally accepted accounting principles for U.S. investment companies. The fund consistently follows such policies in preparing its financial statements.
1. Security Valuation: Securities are valued as of the close of trading on the New York Stock Exchange (generally 4 p.m., Eastern time) on the valuation date. Equity securities are valued at the latest quoted sales prices or official closing prices taken from the primary market in which each security trades; such securities not traded on the valuation date are valued at the mean of the latest quoted bid and asked prices. Bonds and temporary cash investments are valued using the latest bid prices or using valuations based on a matrix system (which considers such factors as security prices, yields, maturities, and ratings), both as furnished by independent pricing services. Structured debt securities, including mortgages and asset-backed securities, are valued using the latest bid prices or using valuations based on a matrix system that considers such factors as issuer, tranche, nominal or option-adjusted spreads, weighted average coupon, weighted average maturity, credit enhancements, and collateral. Investments in Vanguard Market Liquidity Fund are valued at that fund’s net asset value. Securities for which market quotations are not readily available, or whose values have been affected by events occurring before the fund’s pricing time but after the close of the securities’ primary markets, are valued at their fair values calculated according to procedures adopted by the board of trustees. These procedures include obtaining quotations from an independent pricing service, monitoring news to identify significant market-or security-specific events, and evaluating changes in the values of foreign market proxies (for example, ADRs, futures contracts, or exchange-traded funds), between the time the foreign markets close and the fund’s pricing time. When fair-value pricing is employed, the prices of securities used by a fund to calculate its net asset value may differ from quoted or published prices for the same securities.
2. Foreign Currency: Securities and other assets and liabilities denominated in foreign currencies are translated into U.S. dollars using exchange rates obtained from an independent third party as of the fund’s pricing time on the valuation date. Realized gains (losses) and unrealized appreciation (depreciation) on investment securities include the effects of changes in exchange rates since the securities were purchased, combined with the effects of changes in security prices. Fluctuations in the value of other assets and liabilities resulting from changes in exchange rates are recorded as unrealized foreign currency gains (losses) until the assets or liabilities are settled in cash, at which time they are recorded as realized foreign currency gains (losses).
3. Futures Contracts: The fund uses futures contracts to invest in fixed income asset classes with greater efficiency and lower cost than is possible through direct investment, to add value when these instruments are attractively priced, or to adjust sensitivity to changes in interest rates. The primary risks associated with the use of futures contracts are imperfect correlation between changes
25
Wellesley Income Fund
in market values of bonds held by the fund and the prices of futures contracts, and the possibility of an illiquid market. Counterparty risk involving futures is mitigated because a regulated clearinghouse is the counterparty instead of the clearing broker. To further mitigate counterparty risk, the fund trades futures contracts on an exchange, monitors the financial strength of its clearing brokers and clearinghouse, and has entered into clearing agreements with its clearing brokers. The clearinghouse imposes initial margin requirements to secure the fund’s performance and requires daily settlement of variation margin representing changes in the market value of each contract. Any assets pledged as initial margin for open contracts are noted in the Statement of Net Assets.
Futures contracts are valued at their quoted daily settlement prices. The notional amounts of the contracts are not recorded in the Statement of Net Assets. Fluctuations in the value of the contracts are recorded in the Statement of Net Assets as an asset (liability) and in the Statement of Operations as unrealized appreciation (depreciation) until the contracts are closed, when they are recorded as realized futures gains (losses).
During the year ended September 30, 2018, the fund’s average investments in long and short futures contracts represented less than 1% and 3% of net assets, respectively, based on the average of the notional amounts at each quarter-end during the period.
4. Forward Currency Contracts: The fund enters into forward currency contracts to protect the value of securities and related receivables and payables against changes in future foreign exchange rates. The fund’s risks in using these contracts include movement in the values of the foreign currencies relative to the U.S. dollar and the ability of the counterparties to fulfill their obligations under the contracts. The fund mitigates its counterparty risk by entering into forward currency contracts only with a diverse group of prequalified counterparties, monitoring their financial strength, entering into master netting arrangements with its counterparties, and requiring its counterparties to transfer collateral as security for their performance. In the absence of a default, the collateral pledged or received by the fund cannot be repledged, resold, or rehypothecated.
The master netting arrangements provide that, in the event of a counterparty’s default (including bankruptcy), the fund may terminate the forward currency contracts, determine the net amount owed by either party in accordance with its master netting arrangements, and sell or retain any collateral held up to the net amount owed to the fund under the master netting arrangements. The forward currency contracts contain provisions whereby a counterparty may terminate open contracts if the fund’s net assets decline below a certain level, triggering a payment by the fund if the fund is in a net liability position at the time of the termination. The payment amount would be reduced by any collateral the fund has pledged. Any assets pledged as collateral for open contracts are noted in the Statement of Net Assets. The value of collateral received or pledged is compared daily to the value of the forward currency contracts exposure with each counterparty, and any difference, if in excess of a specified minimum transfer amount, is adjusted and settled within two business days.
Forward currency contracts are valued at their quoted daily prices obtained from an independent third party, adjusted for currency risk based on the expiration date of each contract. The notional amounts of the contracts are not recorded in the Statement of Net Assets. Fluctuations in the value of the contracts are recorded in the Statement of Net Assets as an asset (liability) and in the Statement of Operations as unrealized appreciation (depreciation) until the contracts are closed, when they are recorded as realized forward currency contract gains (losses).
26
Wellesley Income Fund
During the year ended September 30, 2018, the fund’s average investment in forward currency contracts represented 1% of net assets, based on the average of notional amounts at each quarter-end during the period.
5. To Be Announced (TBA) Transactions: A TBA transaction is an agreement to buy or sell mortgage-backed securities with agreed-upon characteristics (face amount, coupon, maturity) for settlement at a future date. The fund may be a seller of TBA transactions to reduce its exposure to the mortgage-backed securities market or in order to sell mortgage-backed securities it owns under delayed-delivery arrangements. When the fund is a buyer of TBA transactions, it maintains cash or short-term investments in an amount sufficient to meet the purchase price at the settlement date of the TBA transaction. The primary risk associated with TBA transactions is that a counterparty may default on its obligations. The fund mitigates its counterparty risk by, among other things, performing a credit analysis of counterparties, allocating transactions among numerous counterparties, and monitoring its exposure to each counterparty. The fund may also enter into a Master Securities Forward Transaction Agreement (MSFTA) with certain counterparties and require them to transfer collateral as security for their performance. In the absence of a default, the collateral pledged or received by the fund cannot be repledged, resold, or rehypothecated. Under an MSFTA, upon a counterparty default (including bankruptcy), the fund may terminate any TBA transactions with that counterparty, determine the net amount owed by either party in accordance with its master netting arrangements, and sell or retain any collateral held up to the net amount owed to the fund under the master netting arrangements.
6. Mortgage Dollar Rolls: The fund enters into mortgage-dollar-roll transactions, in which the fund sells mortgage-backed securities to a dealer and simultaneously agrees to purchase similar securities in the future at a predetermined price. The proceeds of the securities sold in mortgage-dollar-roll transactions are typically invested in high-quality short-term fixed income securities. The fund forgoes principal and interest paid on the securities sold, and is compensated by interest earned on the proceeds of the sale and by a lower price on the securities to be repurchased. The fund has also entered into mortgage-dollar-roll transactions in which the fund buys mortgage-backed securities from a dealer pursuant to a TBA transaction and simultaneously agrees to sell similar securities in the future at a predetermined price. The securities bought in mortgage-dollar-roll transactions are used to cover an open TBA sell position. The fund continues to earn interest on mortgage-backed security pools already held and receives a lower price on the securities to be sold in the future.
The fund accounts for mortgage-dollar-roll transactions as purchases and sales; as such, these transactions may increase the fund’s portfolio turnover rate. Amounts to be received or paid in connection with open mortgage dollar rolls are included in Receivables for Investment Securities Sold or Payables for Investment Securities Purchased in the Statement of Net Assets.
7. Repurchase Agreements: The fund enters into repurchase agreements with institutional counterparties. Securities pledged as collateral to the fund under repurchase agreements are held by a custodian bank until the agreements mature, and in the absence of a default, such collateral cannot be repledged, resold, or rehypothecated. Each agreement requires that the market value of the collateral be sufficient to cover payments of interest and principal. The fund further mitigates its counterparty risk by entering into repurchase agreements only with a diverse group of prequalified counterparties, monitoring their financial strength, and entering into master repurchase agreements with its counterparties. The master repurchase agreements provide that, in the event of a counterparty’s default (including bankruptcy), the fund may terminate any repurchase agreements
27
Wellesley Income Fund
with that counterparty, determine the net amount owed, and sell or retain the collateral up to the net amount owed to the fund. Such action may be subject to legal proceedings, which may delay or limit the disposition of collateral.
8. Federal Income Taxes: The fund intends to continue to qualify as a regulated investment company and distribute all of its taxable income. Management has analyzed the fund’s tax positions taken for all open federal income tax years (September 30, 2015–2018), and has concluded that no provision for federal income tax is required in the fund’s financial statements.
9. Distributions: Distributions to shareholders are recorded on the ex-dividend date. Distributions are determined on a tax basis and may differ from net investment income and realized capital gains for financial reporting purposes.
10. Securities Lending: To earn additional income, the fund lends its securities to qualified institutional borrowers. Security loans are subject to termination by the fund at any time, and are required to be secured at all times by collateral in an amount at least equal to the market value of securities loaned. Daily market fluctuations could cause the value of loaned securities to be more or less than the value of the collateral received. When this occurs, the collateral is adjusted and settled before the opening of the market on the next business day. The fund further mitigates its counterparty risk by entering into securities lending transactions only with a diverse group of prequalified counterparties, monitoring their financial strength, and entering into master securities lending agreements with its counterparties. The master securities lending agreements provide that, in the event of a counterparty’s default (including bankruptcy), the fund may terminate any loans with that borrower, determine the net amount owed, and sell or retain the collateral up to the net amount owed to the fund; however, such actions may be subject to legal proceedings. While collateral mitigates counterparty risk, in the event of a default, the fund may experience delays and costs in recovering the securities loaned. The fund invests cash collateral received in Vanguard Market Liquidity Fund, and records a liability in the Statement of Net Assets for the return of the collateral, during the period the securities are on loan. Securities lending income represents fees charged to borrowers plus income earned on invested cash collateral, less expenses associated with the loan. During the term of the loan, the fund is entitled to all distributions made on or in respect of the loaned securities.
11. Credit Facility: The fund and certain other funds managed by The Vanguard Group (“Vanguard”) participate in a $3.1 billion committed credit facility provided by a syndicate of lenders pursuant to a credit agreement that may be renewed annually; each fund is individually liable for its borrowings, if any, under the credit facility. Borrowings may be utilized for temporary and emergency purposes, and are subject to the fund’s regulatory and contractual borrowing restrictions. The participating funds are charged administrative fees and an annual commitment fee of 0.10% of the undrawn amount of the facility; these fees are allocated to the funds based on a method approved by the fund’s board of trustees and included in Management and Administrative expenses on the fund’s Statement of Operations. Any borrowings under this facility bear interest at a rate based upon the higher of the one-month London Interbank Offered Rate, federal funds effective rate, or overnight bank funding rate plus an agreed-upon spread.
The fund had no borrowings outstanding at September 30, 2018, or at any time during the period then ended.
28
Wellesley Income Fund
12. Other: Dividend income is recorded on the ex-dividend date. Interest income includes income distributions received from Vanguard Market Liquidity Fund and is accrued daily. Premiums and discounts on debt securities purchased are amortized and accreted, respectively, to interest income over the lives of the respective securities. Security transactions are accounted for on the date securities are bought or sold. Costs used to determine realized gains (losses) on the sale of investment securities are those of the specific securities sold.
Each class of shares has equal rights as to assets and earnings, except that each class separately bears certain class-specific expenses related to maintenance of shareholder accounts (included in Management and Administrative expenses), shareholder reporting, and the proxy. Marketing and distribution expenses are allocated to each class of shares based on a method approved by the board of trustees. Income, other non-class-specific expenses, and gains and losses on investments are allocated to each class of shares based on its relative net assets.
B. Wellington Management Company LLP provides investment advisory services to the fund for a fee calculated at an annual percentage rate of average net assets. The basic fee is subject to quarterly adjustments based on the fund’s performance for the preceding three years relative to a combined index comprising the Bloomberg Barclays U.S. Credit A or Better Bond Index and the FTSE High Dividend Yield Index. For the year ended September 30, 2018, the investment advisory fee represented an effective annual basic rate of 0.05% of the fund’s average net assets before an increase of $2,529,000 (0.00%) based on performance.
C. In accordance with the terms of a Funds’ Service Agreement (the “FSA”) between Vanguard and the fund, Vanguard furnishes to the fund corporate management, administrative, marketing, and distribution services at Vanguard’s cost of operations (as defined by the FSA). These costs of operations are allocated to the fund based on methods and guidelines approved by the board of trustees. Vanguard does not require reimbursement in the current period for certain costs of operations (such as deferred compensation/benefits and risk/insurance costs); the fund’s liability for these costs of operations is included in Payables to Vanguard on the Statement of Net Assets. All other costs of operations payable to Vanguard are generally settled twice a month.
Upon the request of Vanguard, the fund may invest up to 0.40% of its net assets as capital in Vanguard. At September 30, 2018, the fund had contributed to Vanguard capital in the amount of $2,717,000, representing 0.01% of the fund’s net assets and 1.09% of Vanguard’s capitalization. The fund’s trustees and officers are also directors and employees, respectively, of Vanguard.
D. Various inputs may be used to determine the value of the fund’s investments. These inputs are summarized in three broad levels for financial statement purposes. The inputs or methodologies used to value securities are not necessarily an indication of the risk associated with investing in those securities.
Level 1—Quoted prices in active markets for identical securities.
Level 2—Other significant observable inputs (including quoted prices for similar securities, interest rates, prepayment speeds, credit risk, etc.).
Level 3—Significant unobservable inputs (including the fund’s own assumptions used to determine the fair value of investments). Any investments valued with significant unobservable inputs are noted on the Statement of Net Assets.
29
Wellesley Income Fund
The following table summarizes the market value of the fund’s investments as of September 30, 2018, based on the inputs used to value them:
| | | |
| | Level 1 | Level 2 | Level 3 |
| Investments | ($000) | ($000) | ($000) |
| U.S. Government and Agency Obligations | — | 4,702,665 | 43,930 |
| Asset-Backed/Commercial Mortgage-Backed Securities | — | 1,204,002 | 5,266 |
| Corporate Bonds | — | 22,708,577 | — |
| Sovereign Bonds | — | 1,688,390 | — |
| Taxable Municipal Bonds | — | 1,572,459 | — |
| Common Stocks | 18,629,861 | 1,298,561 | — |
| Temporary Cash Investments | 181,360 | 1,374,577 | — |
| Futures Contracts—Assets1 | 1,149 | — | — |
| Futures Contracts—Liabilities1 | (454) | — | — |
| Forward Currency Contracts—Assets | — | 2,633 | — |
| Forward Currency Contracts—Liabilities | — | (162) | — |
| Total | 18,811,916 | 34,551,702 | 49,196 |
| 1 Represents variation margin on the last day of the reporting period. | | | |
E. At September 30, 2018, the fair values of derivatives were reflected in the Statement of Net Assets as follows:
| | | |
| | Interest Rate | Currency | |
| | Contracts | Contracts | Total |
| Statement of Net Assets Caption | ($000) | ($000) | ($000) |
| Variation Margin Receivable—Futures Contracts | 1,149 | — | 1,149 |
| Unrealized Appreciation—Forward Currency Contracts | — | 2,633 | 2,633 |
| Total Assets | 1,149 | 2,633 | 3,782 |
| |
| Variation Margin Payable—Futures Contracts | (454) | — | (454) |
| Unrealized Depreciation—Forward Currency Contracts | — | (162) | (162) |
| Total Liabilities | (454) | (162) | (616) |
30
Wellesley Income Fund
Realized net gain (loss) and the change in unrealized appreciation (depreciation) on derivatives for the year ended September 30, 2018, were:
| | | |
| | Interest Rate | Currency | |
| | Contracts | Contracts | Total |
| Realized Net Gain (Loss) on Derivatives | ($000) | ($000) | ($000) |
| Futures Contracts | 80,739 | — | 80,739 |
| Forward Currency Contracts | — | (4,427) | (4,427) |
| Realized Net Gain (Loss) on Derivatives | 80,739 | (4,427) | 76,312 |
| |
| Change in Unrealized Appreciation (Depreciation) on Derivatives | | |
| Futures Contracts | 4,797 | — | 4,797 |
| Forward Currency Contracts | — | (897) | (897) |
| Change in Unrealized Appreciation (Depreciation) | | | |
| on Derivatives | 4,797 | (897) | 3,900 |
F. Permanent differences between book-basis and tax-basis components of net assets are reclassified among capital accounts in the financial statements to reflect their tax character. These reclassifications have no effect on net assets or net asset value per share. As of period end, the following permanent differences primarily attributable to the accounting for foreign currency transactions and distributions in connection with fund share redemptions were reclassified to the following accounts:
| |
| | Amount |
| | ($000) |
| Paid-in Capital | 211,701 |
| Undistributed (Overdistributed) Net Investment Income | 13,954 |
| Accumulated Net Realized Gains (Losses) | (225,655) |
Temporary differences between book-basis and tax-basis components of accumulated net earnings (losses) arise when certain items of income, gain, or loss are recognized in different periods for financial statement and tax purposes; these differences will reverse at some time in the future. The differences are primarily related to the tax deferral of losses on wash sales and straddles, and the realization of unrealized gains or losses on certain futures contracts and forward currency contracts. As of period end, the tax-basis components of accumulated net earnings (losses) are detailed in the table as follows:
| |
| | Amount |
| | ($000) |
| Undistributed Ordinary Income | 36,545 |
| Undistributed Long-Term Gains | 2,048,926 |
| Capital Loss Carryforwards (Non-expiring) | — |
| Net Unrealized Gains (Losses) | 5,169,440 |
31
Wellesley Income Fund
As of September 30, 2018, gross unrealized appreciation and depreciation for investments and derivatives based on cost for U.S. federal income tax purposes were as follows:
| |
| | Amount |
| | ($000) |
| Tax Cost | 48,240,076 |
| Gross Unrealized Appreciation | 6,012,801 |
| Gross Unrealized Depreciation | (843,229) |
| Net Unrealized Appreciation (Depreciation) | 5,169,572 |
G. During the year ended September 30, 2018, the fund purchased $10,955,688,000 of investment securities and sold $12,429,532,000 of investment securities, other than U.S. government securities and temporary cash investments. Purchases and sales of U.S. government securities were $7,816,946,000 and $7,622,393,000, respectively.
| | | | |
| H. Capital share transactions for each class of shares were: | | | |
| | | | Year Ended September 30, |
| | | 2018 | | 2017 |
| | Amount | Shares | Amount | Shares |
| | ($000) | (000) | ($000) | (000) |
| Investor Shares | | | | |
| Issued | 2,106,829 | 78,984 | 3,085,240 | 118,728 |
| Issued in Lieu of Cash Distributions | 504,998 | 18,982 | 522,732 | 20,191 |
| Redeemed | (4,314,490) | (162,392) | (3,849,825) | (147,877) |
| Net Increase (Decrease)—Investor Shares | (1,702,663) | (64,426) | (241,853) | (8,958) |
| Admiral Shares | | | | |
| Issued | 6,483,472 | 100,463 | 7,345,886 | 116,509 |
| Issued in Lieu of Cash Distributions | 1,500,891 | 23,296 | 1,331,117 | 21,212 |
| Redeemed | (6,829,527) | (106,266) | (5,179,196) | (82,287) |
| Net Increase (Decrease)—Admiral Shares | 1,154,836 | 17,493 | 3,497,807 | 55,434 |
I. Management has determined that no events or transactions occurred subsequent to September 30, 2018, that would require recognition or disclosure in these financial statements.
32
Report of Independent Registered Public Accounting Firm
To the Board of Trustees and Shareholders of Vanguard Wellesley Income Fund
Opinion on the Financial Statements
We have audited the accompanying statement of net assets—investments summary of Vanguard Wellesley Income Fund (the “Fund”) as of September 30, 2018, the related statement of operations for the year ended September 30, 2018, the statement of changes in net assets for each of the two years in the period ended September 30, 2018, including the related notes, and the financial highlights for each of the five years in the period ended September 30, 2018 (collectively referred to as the “financial statements”). In our opinion, the financial statements present fairly, in all material respects, the financial position of the Fund as of September 30, 2018, the results of its operations for the year then ended, the changes in its net assets for each of the two years in the period ended September 30, 2018 and the financial highlights for each of the five years in the period ended September 30, 2018 in conformity with accounting principles generally accepted in the United States of America.
Basis for Opinion
These financial statements are the responsibility of the Fund’s management. Our responsibility is to express an opinion on the Fund’s financial statements based on our audits. We are a public accounting firm registered with the Public Company Accounting Oversight Board (United States) (“PCAOB”) and are required to be independent with respect to the Fund in accordance with the U.S. federal securities laws and the applicable rules and regulations of the Securities and Exchange Commission and the PCAOB.
We conducted our audits of these financial statements in accordance with the standards of the PCAOB. Those standards require that we plan and perform the audit to obtain reasonable assurance about whether the financial statements are free of material misstatement, whether due to error or fraud.
Our audits included performing procedures to assess the risks of material misstatement of the financial statements, whether due to error or fraud, and performing procedures that respond to those risks. Such procedures included examining, on a test basis, evidence regarding the amounts and disclosures in the financial statements. Our audits also included evaluating the accounting principles used and significant estimates made by management, as well as evaluating the overall presentation of the financial statements. Our procedures included confirmation of securities owned as of September 30, 2018 by correspondence with the custodians and brokers and by agreement to the underlying ownership records of the transfer agent; when replies were not received from brokers, we performed other auditing procedures. We believe that our audits provide a reasonable basis for our opinion.
/s/PricewaterhouseCoopers LLP
Philadelphia, Pennsylvania
November 15, 2018
We have served as the auditor of one or more investment companies in The Vanguard Group of Funds since 1975.
33
Special 2018 tax information (unaudited) for Vanguard Wellesley Income Fund
This information for the fiscal year ended September 30, 2018, is included pursuant to provisions of the Internal Revenue Code.
The fund distributed $791,847,000 as capital gain dividends (20% rate gain distributions) to shareholders during the fiscal year.
For nonresident alien shareholders, 100% of short-term capital gain dividends distributed by the fund are qualified short-term capital gains.
The fund distributed $599,033,000 of qualified dividend income to shareholders during the fiscal year.
For corporate shareholders, 32.0% of investment income (dividend income plus short-term gains, if any) qualifies for the dividends-received deduction.
34
Your Fund’s After-Tax Returns
This table presents returns for your fund both before and after taxes. The after-tax returns are shown in two ways: (1) assuming that an investor owned the fund during the entire period and paid taxes on the fund’s distributions, and (2) assuming that an investor paid taxes on the fund’s distributions and sold all shares at the end of each period.
Calculations are based on the highest individual federal income tax and capital gains tax rates in effect at the times of the distributions and the hypothetical sales. State and local taxes were not considered. After-tax returns reflect any qualified dividend income, using actual prior-year figures and estimates for 2018. (In the example, returns after the sale of fund shares may be higher than those assuming no sale. This occurs when the sale would have produced a capital loss. The calculation assumes that the investor received a tax deduction for the loss.)
The table shows returns for Investor Shares only; returns for other share classes will differ. Please note that your actual after-tax returns will depend on your tax situation and may differ from those shown. Also note that if you own the fund in a tax-deferred account, such as an individual retirement account or a 401(k) plan, this information does not apply to you. Such accounts are not subject to current taxes.
Finally, keep in mind that a fund’s performance—whether before or after taxes—does not guarantee future results.
| | | |
| Average Annual Total Returns: Wellesley Income Fund Investor Shares | | |
| Periods Ended September 30, 2018 | | | |
| | One | Five | Ten |
| | Year | Years | Years |
| Returns Before Taxes | 3.28% | 6.26% | 7.91% |
| Returns After Taxes on Distributions | 1.93 | 4.66 | 6.46 |
| Returns After Taxes on Distributions and Sale of Fund Shares | 2.28 | 4.38 | 5.90 |
35
About Your Fund’s Expenses
As a shareholder of the fund, you incur ongoing costs, which include costs for portfolio management, administrative services, and shareholder reports (like this one), among others. Operating expenses, which are deducted from a fund’s gross income, directly reduce the investment return of the fund.
A fund’s expenses are expressed as a percentage of its average net assets. This figure is known as the expense ratio. The following examples are intended to help you understand the ongoing costs (in dollars) of investing in your fund and to compare these costs with those of other mutual funds. The examples are based on an investment of $1,000 made at the beginning of the period shown and held for the entire period.
The accompanying table illustrates your fund’s costs in two ways:
• Based on actual fund return. This section helps you to estimate the actual expenses that you paid over the period. The ”Ending Account Value“ shown is derived from the fund‘s actual return, and the third column shows the dollar amount that would have been paid by an investor who started with $1,000 in the fund. You may use the information here, together with the amount you invested, to estimate the expenses that you paid over the period.
To do so, simply divide your account value by $1,000 (for example, an $8,600 account value divided by $1,000 = 8.6), then multiply the result by the number given for your fund under the heading ”Expenses Paid During Period.“
• Based on hypothetical 5% yearly return. This section is intended to help you compare your fund‘s costs with those of other mutual funds. It assumes that the fund had a yearly return of 5% before expenses, but that the expense ratio is unchanged. In this case—because the return used is not the fund’s actual return—the results do not apply to your investment. The example is useful in making comparisons because the Securities and Exchange Commission requires all mutual funds to calculate expenses based on a 5% return. You can assess your fund’s costs by comparing this hypothetical example with the hypothetical examples that appear in shareholder reports of other funds.
Note that the expenses shown in the table are meant to highlight and help you compare ongoing costs only and do not reflect transaction costs incurred by the fund for buying and selling securities. Further, the expenses do not include any purchase, redemption, or account service fees described in the fund prospectus. If such fees were applied to your account, your costs would be higher. Your fund does not carry a “sales load.”
The calculations assume no shares were bought or sold during the period. Your actual costs may have been higher or lower, depending on the amount of your investment and the timing of any purchases or redemptions.
You can find more information about the fund’s expenses, including annual expense ratios, in the Financial Statements section of this report. For additional information on operating expenses and other shareholder costs, please refer to your fund’s current prospectus.
36
| | | |
| Six Months Ended September 30, 2018 | | | |
| | Beginning | Ending | Expenses |
| | Account Value | Account Value | Paid During |
| Wellesley Income Fund | 3/31/2018 | 9/30/2018 | Period |
| Based on Actual Fund Return | | | |
| Investor Shares | $1,000.00 | $1,027.03 | $1.17 |
| Admiral Shares | 1,000.00 | 1,027.63 | 0.81 |
| Based on Hypothetical 5% Yearly Return | | | |
| Investor Shares | $1,000.00 | $1,023.92 | $1.17 |
| Admiral Shares | 1,000.00 | 1,024.27 | 0.81 |
The calculations are based on expenses incurred in the most recent six-month period. The fund’s annualized six-month expense ratios for that period are 0.23% for Investor Shares and 0.16% for Admiral Shares. The dollar amounts shown as “Expenses Paid” are equal to the annualized expense ratio multiplied by the average account value over the period, multiplied by the number of days in the most recent six-month period, then divided by the number of days in the most recent 12-month period (183/365).
37
Trustees Approve Advisory Arrangement
The board of trustees of Vanguard Wellesley Income Fund has renewed the fund’s investment advisory arrangement with Wellington Management Company LLP (Wellington Management). The board determined that renewing the fund’s advisory arrangement was in the best interests of the fund and its shareholders.
The board based its decision upon an evaluation of the advisor’s investment staff, portfolio management process, and performance. This evaluation included information provided to the board by Vanguard’s Portfolio Review Department, which is responsible for fund and advisor oversight and product management. The Portfolio Review Department met regularly with the advisor and made monthly presentations to the board during the fiscal year that directed the board’s focus to relevant information and topics.
The board, or an investment committee made up of board members, also received information throughout the year during advisor presentations. For each advisor presentation, the board was provided with letters and reports that included information about, among other things, the advisory firm and the advisor’s assessment of the investment environment, portfolio performance, and portfolio characteristics.
In addition, the board received monthly reports, which included a Market and Economic Report, a Fund Dashboard Monthly Summary, and a Fund Performance Report.
Prior to their meeting, the trustees were provided with a memo and materials that summarized the information they received over the course of the year. They also considered the factors discussed below, among others. However, no single factor determined whether the board approved the arrangement. Rather, it was the totality of the circumstances that drove the board’s decision.
Nature, extent, and quality of services
The board reviewed the quality of the fund’s investment management services over both the short and long term, and took into account the organizational depth and stability of the advisor. The board considered that Wellington Management, founded in 1928, is among the nation’s oldest and most respected institutional managers. The fund seeks long-term growth of income, a high and sustainable level of current income, and moderate long-term capital appreciation by investing in high-quality bonds and stocks. Asset allocation changes are made gradually in response to changes in relative valuations between asset classes. For the equity portion of the fund, Wellington Management seeks to invest in large-capitalization companies with an attractive dividend yield relative to the market, below-average valuations, and stable or improving businesses. For the fixed income portion, the advisor utilizes fundamental research to invest in investment-grade debt. Wellington Management has advised the fund since its inception in 1970.
The board concluded that the advisor’s experience, stability, depth, and performance, among other factors, warranted continuation of the advisory arrangement.
Investment performance
The board considered the short- and long-term performance of the fund, including any periods of outperformance or underperformance compared with a relevant benchmark index and peer group. The board concluded that the performance was such that the advisory arrangement should continue. Information about the fund’s most recent performance can be found in the Performance Summary section of this report.
38
Cost
The board concluded that the fund’s expense ratio was well below the average expense ratio charged by funds in its peer group and that the fund’s advisory fee rate was also well below its peer-group average. Information about the fund’s expense ratio appears in the About Your Fund’s Expenses section of this report as well as in the Financial Statements section, which also includes information about the fund’s advisory fee rate.
The board did not consider the profitability of Wellington Management in determining whether to approve the advisory fee, because Wellington Management is independent of Vanguard and the advisory fee is the result of arm’s-length negotiations.
The benefit of economies of scale
The board concluded that the fund’s shareholders benefit from economies of scale because of the breakpoints in the fund’s advisory fee schedule. The breakpoints reduce the effective rate of the fee as the fund’s assets increase.
The board will consider whether to renew the advisory arrangement again after a one-year period.
39
Glossary
30-Day SEC Yield. A fund’s 30-day SEC yield is derived using a formula specified by the U.S. Securities and Exchange Commission. Under the formula, data related to the fund’s security holdings in the previous 30 days are used to calculate the fund’s hypothetical net income for that period, which is then annualized and divided by the fund’s estimated average net assets over the calculation period. For the purposes of this calculation, a security’s income is based on its current market yield to maturity (for bonds), its actual income (for asset-backed securities), or its projected dividend yield (for stocks). Because the SEC yield represents hypothetical annualized income, it will differ—at times significantly—from the fund’s actual experience. As a result, the fund’s income distributions may be higher or lower than implied by the SEC yield.
Average Coupon. The average interest rate paid on the fixed income securities held by a fund. It is expressed as a percentage of face value.
Average Duration. An estimate of how much the value of the bonds held by a fund will fluctuate in response to a change in interest rates. To see how the value could change, multiply the average duration by the change in rates. If interest rates rise by 1 percentage point, the value of the bonds in a fund with an average duration of five years would decline by about 5%. If rates decrease by a percentage point, the value would rise by 5%.
Average Effective Maturity. The average length of time until fixed income securities held by a fund reach maturity and are repaid, taking into consideration the possibility that the issuer may call the bond before its maturity date. The figure reflects the proportion of fund assets represented by each security; it also reflects any futures contracts held. In general, the longer the average effective maturity, the more a fund’s share price will fluctuate in response to changes in market interest rates.
Beta. A measure of the magnitude of a fund’s past share-price fluctuations in relation to the ups and downs of a given market index. The index is assigned a beta of 1.00. Compared with a given index, a fund with a beta of 1.20 typically would have seen its share price rise or fall by 12% when the index rose or fell by 10%. For this report, beta is based on returns over the past 36 months for both the fund and the index. Note that a fund’s beta should be reviewed in conjunction with its R-squared (see definition). The lower the R-squared, the less correlation there is between the fund and the index, and the less reliable beta is as an indicator of volatility.
Credit Quality. Credit-quality ratings are measured on a scale that generally ranges from AAA (highest) to D (lowest). U.S. Treasury, U.S. Agency, and U.S. Agency mortgage-backed securities appear under “U.S. Government.” Credit-quality ratings are obtained from Barclays and are from Moody’s, Fitch, and S&P. When ratings from all three agencies are used, the median rating is shown. When ratings from two of the agencies are used, the lower rating for each issue is shown. “Not Rated” is used to classify securities for which a rating is not available. Not rated securities include a fund’s investment in Vanguard Market Liquidity Fund or Vanguard Municipal Cash Management Fund, each of which invests in high-quality money market instruments and may serve as a cash management vehicle for the Vanguard funds, trusts, and accounts.
Dividend Yield. The current, annualized rate of dividends paid on a share of stock, divided by its current share price. For a fund, the weighted average yield for stocks it holds. The index yield is based on the current annualized rate of dividends paid on stocks in the index.
40
Earnings Growth Rate. The average annual rate of growth in earnings over the past five years for the stocks now in a fund.
Equity Exposure. A measure that reflects a fund’s investments in stocks and stock futures. Any holdings in short-term reserves are excluded.
Expense Ratio. A fund’s total annual operating expenses expressed as a percentage of the fund’s average net assets. The expense ratio includes management and administrative expenses, but does not include the transaction costs of buying and selling portfolio securities.
Foreign Holdings. The percentage of a fund represented by securities or depositary receipts of companies based outside the United States.
Inception Date. The date on which the assets of a fund (or one of its share classes) are first invested in accordance with the fund’s investment objective. For funds with a subscription period, the inception date is the day after that period ends. Investment performance is measured from the inception date.
Median Market Cap. An indicator of the size of companies in which a fund invests; the midpoint of market capitalization (market price x shares outstanding) of a fund’s stocks, weighted by the proportion of the fund’s assets invested in each stock. Stocks representing half of the fund’s assets have market capitalizations above the median, and the rest are below it.
Price/Book Ratio. The share price of a stock divided by its net worth, or book value, per share. For a fund, the weighted average price/book ratio of the stocks it holds.
Price/Earnings Ratio. The ratio of a stock’s current price to its per-share earnings over the past year. For a fund, the weighted average P/E of the stocks it holds. P/E is an indicator of market expectations about corporate prospects; the higher the P/E, the greater the expectations for a company’s future growth.
R-Squared. A measure of how much of a fund’s past returns can be explained by the returns from the market in general, as measured by a given index. If a fund’s total returns were precisely synchronized with an index’s returns, its R-squared would be 1.00. If the fund’s returns bore no relationship to the index’s returns, its R-squared would be 0. For this report, R-squared is based on returns over the past 36 months for both the fund and the index.
Return on Equity. The annual average rate of return generated by a company during the past five years for each dollar of shareholder’s equity (net income divided by shareholder’s equity). For a fund, the weighted average return on equity for the companies whose stocks it holds.
Short-Term Reserves. The percentage of a fund invested in highly liquid, short-term securities that can be readily converted to cash.
Turnover Rate. An indication of the fund’s trading activity. Funds with high turnover rates incur higher transaction costs and may be more likely to distribute capital gains (which may be taxable to investors). The turnover rate excludes in-kind transactions, which have minimal impact on costs.
41
Yield to Maturity. The rate of return an investor would receive if the fixed income securities held by a fund were held to their maturity dates.
Benchmark Information
Wellesley Income Composite Index: Weighted 65% bonds and 35% stocks. For bonds: Lehman U.S. Long Credit AA or Better Bond Index through March 31, 2000, and Bloomberg Barclays U.S. Credit A or Better Bond Index thereafter. For stocks: 26% S&P 500/Barra Value Index and 9% S&P Utilities Index through June 30, 1996, when the utilities component was split into the S&P Utilities Index (4.5%) and the S&P Telephone Index (4.5%); as of January 1, 2002, the S&P Telephone Index was replaced by the S&P Integrated Telecommunication Services Index; as of July 1, 2006, the S&P 500/Barra Value Index was replaced by the S&P 500/Citigroup Value Index; as of August 1, 2007, the three stock indexes were replaced by the FTSE High Dividend Yield Index.
42
The Global Industry Classification Standard (“GICS”) was developed by and is the exclusive property and a service mark of MSCI Inc. (“MSCI”) and Standard and Poor’s, a division of McGraw-Hill Companies, Inc. (“S&P”), and is licensed for use by Vanguard. Neither MSCI, S&P nor any third party involved in making or compiling the GICS or any GICS classification makes any express or implied warranties or representations with respect to such standard or classification (or the results to be obtained by the use thereof), and all such parties hereby expressly disclaim all warranties of originality, accuracy, completeness, merchantability or fitness for a particular purpose with respect to any such standard or classification. Without limiting any of the foregoing, in no event shall MSCI, S&P, any of its affiliates or any third party involved in making or compiling the GICS or any GICS classification have any liability for any direct, indirect, special, punitive, consequential or any other damages (including lost profits) even if notified of the possibility of such damages.
BLOOMBERG is a trademark and service mark of Bloomberg Finance L.P. BARCLAYS is a trademark and service mark of Barclays Bank Plc, used under license. Bloomberg Finance L.P. and its affiliates, including Bloomberg Index Services Limited (BISL) (collectively, Bloomberg), or Bloomberg’s licensors, own all proprietary rights in the Bloomberg Barclays U.S. Credit A or Better Bond Index (Index or Bloomberg Barclays Index).
Neither Barclays Bank Plc, Barclays Capital Inc., or any affiliate (collectively Barclays) or Bloomberg is the issuer or producer of the Wellesley Income Fund and neither Bloomberg nor Barclays has any responsibilities, obligations or duties to investors in the Wellesley Income Fund. The Index is licensed for use by The Vanguard Group, Inc. (Vanguard) as the sponsor of the Wellesley Income Fund. Bloomberg and Barclays’ only relationship with Vanguard in respect of the Index is the licensing of the Index, which is determined, composed and calculated by BISL, or any successor thereto, without regard to the Issuer or the Wellesley Income Fund or the owners of the Wellesley Income Fund.
Additionally, Vanguard may for itself execute transaction(s) with Barclays in or relating to the Index in connection with the Wellesley Income Fund. Investors acquire the Wellesley Income Fund from Vanguard and investors neither acquire any interest in the Index nor enter into any relationship of any kind whatsoever with Bloomberg or Barclays upon making an investment in the Wellesley Income Fund. The Wellesley Income Fund is not sponsored, endorsed, sold or promoted by Bloomberg or Barclays. Neither Bloomberg nor Barclays makes any representation or warranty, express or implied regarding the advisability of investing in the Wellesley Income Fund or the advisability of investing in securities generally or the ability of the Index to track corresponding or relative market performance. Neither Bloomberg nor Barclays has passed on the legality or suitability of the Wellesley Income Fund with respect to any person or entity. Neither Bloomberg nor Barclays is responsible for and has not participated in the determination of the timing of, prices at, or quantities of the Wellesley Income Fund to be issued. Neither Bloomberg nor Barclays has any obligation to take the needs of the Issuer or the owners of the Wellesley Income Fund or any other third party into consideration in determining, composing or calculating the Index. Neither Bloomberg nor Barclays has any obligation or liability in connection with administration, marketing or trading of the Wellesley Income Fund.
43
The licensing agreement between Bloomberg and Barclays is solely for the benefit of Bloomberg and Barclays and not for the benefit of the owners of the Wellesley Income Fund, investors or other third parties. In addition, the licensing agreement between Vanguard and Bloomberg is solely for the benefit of Vanguard and Bloomberg and not for the benefit of the owners of the Wellesley Income Fund, investors or other third parties.
NEITHER BLOOMBERG NOR BARCLAYS SHALL HAVE ANY LIABILITY TO THE ISSUER, INVESTORS OR TO OTHER THIRD PARTIES FOR THE QUALITY, ACCURACY AND/OR COMPLETENESS OF THE BLOOMBERG BARCLAYS INDEX OR ANY DATA INCLUDED THEREIN OR FOR INTERRUPTIONS IN THE DELIVERY OF THE BLOOMBERG BARCLAYS INDEX. NEITHER BLOOMBERG NOR BARCLAYS MAKES ANY WARRANTY, EXPRESS OR IMPLIED, AS TO RESULTS TO BE OBTAINED BY THE ISSUER, THE INVESTORS OR ANY OTHER PERSON OR ENTITY FROM THE USE OF THE BLOOMBERG BARCLAYS INDEX OR ANY DATA INCLUDED THEREIN. NEITHER BLOOMBERG NOR BARCLAYS MAKES ANY EXPRESS OR IMPLIED WARRANTIES, AND EACH HEREBY EXPRESSLY DISCLAIMS ALL WARRANTIES OF MERCHANTABILITY OR FITNESS FOR A PARTICULAR PURPOSE OR USE WITH RESPECT TO THE BLOOMBERG BARCLAYS INDEX OR ANY DATA INCLUDED THEREIN. BLOOMBERG RESERVES THE RIGHT TO CHANGE THE METHODS OF CALCULATION OR PUBLICATION, OR
TO CEASE THE CALCULATION OR PUBLICATION OF THE BLOOMBERG BARCLAYS INDEX, AND NEITHER BLOOMBERG NOR BARCLAYS SHALL BE LIABLE FOR ANY MISCALCULATION OF OR ANY INCORRECT, DELAYED OR INTERRUPTED PUBLICATION WITH RESPECT TO THE BLOOMBERG BARCLAYS INDEX. NEITHER BLOOMBERG NOR BARCLAYS SHALL BE LIABLE FOR ANY DAMAGES, INCLUDING, WITHOUT LIMITATION, ANY SPECIAL, INDIRECT OR CONSEQUENTIAL DAMAGES, OR ANY LOST PROFITS AND EVEN IF ADVISED OF THE POSSIBILITY OF SUCH, RESULTING FROM THE USE OF THE BLOOMBERG BARCLAYS INDEX OR ANY DATA INCLUDED THEREIN OR WITH RESPECT TO THE WELLESLEY INCOME FUND.
None of the information supplied by Bloomberg or Barclays and used in this publication may be reproduced in any manner without the prior written permission of both Bloomberg and Barclays Capital, the investment banking division of Barclays Bank Plc. Barclays Bank Plc is registered in England No. 1026167. Registered office 1 Churchill Place London E14 5HP.
© 2018 Bloomberg. Used with Permission.
Source: Bloomberg Index Services Limited. Copyright 2018, Bloomberg. All rights reserved.
44
This page intentionally left blank.
This page intentionally left blank.
This page intentionally left blank.
This page intentionally left blank.
This page intentionally left blank.
This page intentionally left blank.
The People Who Govern Your Fund
The trustees of your mutual fund are there to see that the fund is operated and managed in your best interests since, as a shareholder, you are a part owner of the fund. Your fund’s trustees also serve on the board of directors of The Vanguard Group, Inc., which is owned by the Vanguard funds and provides services to them on an at-cost basis.
A majority of Vanguard’s board members are independent, meaning that they have no affiliation with Vanguard or the funds they oversee, apart from the sizable personal investments they have made as private individuals. The independent board members have distinguished backgrounds in business, academia, and public service. Each of the trustees and executive officers oversees 211 Vanguard funds.
Information for each trustee and executive officer of the fund appears below. The mailing address of the trustees and officers is P.O. Box 876, Valley Forge, PA 19482. More information about the trustees is in the Statement of Additional Information, which can be obtained, without charge, by contacting Vanguard at 800-662-7447, or online at vanguard.com.
Interested Trustees1
F. William McNabb III
Born in 1957. Trustee since July 2009. Principal occupation(s) during the past five years and other experience: chairman of the board (January 2010–present) of Vanguard and of each of the investment companies served by Vanguard, trustee (2009–present) of each of the investment companies served by Vanguard, and director (2008–present) of Vanguard. Chief executive officer and president (2008–2017) of Vanguard and each of the investment companies served by Vanguard, managing director (1995–2008) of Vanguard, and director (1997–2018) of Vanguard Marketing Corporation. Director (2018–present) of UnitedHealth Group.
Mortimer J. Buckley
Born in 1969. Trustee since January 2018. Principal occupation(s) during the past five years and other experience: chief executive officer (January 2018–present) of Vanguard; chief executive officer, president, and trustee (January 2018–present) of each of the investment companies served by Vanguard; president and director (2017–present) of Vanguard; and president (February 2018–present) of Vanguard Marketing Corporation. Chief investment officer (2013–2017), managing director (2002–2017), head of the Retail Investor Group (2006–2012), and chief information officer (2001–2006) of Vanguard. Chairman of the board (2011–2017) of the Children’s Hospital of Philadelphia.
Independent Trustees
Emerson U. Fullwood
Born in 1948. Trustee since January 2008. Principal occupation(s) during the past five years and other experience: executive chief staff and marketing officer for North America and corporate vice president (retired 2008) of Xerox Corporation (document management products and services). Former president of the Worldwide Channels Group, Latin America, and Worldwide Customer Service and executive chief staff officer of Developing Markets of Xerox. Executive in residence and 2009–2010 Distinguished Minett Professor at the Rochester Institute of Technology. Lead director of SPX FLOW, Inc. (multi-industry manufacturing). Director of the University of Rochester Medical Center, the Monroe Community College Foundation, the United Way of Rochester, North Carolina A&T University, and Roberts Wesleyan College. Trustee of the University of Rochester.
Amy Gutmann
Born in 1949. Trustee since June 2006. Principal occupation(s) during the past five years and other experience: president (2004–present) of the University of Pennsylvania. Christopher H. Browne Distinguished Professor of Political Science, School of Arts and Sciences, and professor of communication, Annenberg School for Communication, with secondary faculty appointments in the Department of Philosophy, School of Arts and Sciences, and at the Graduate School of Education, University of Pennsylvania. Trustee of the National Constitution Center.
1 Mr. McNabb and Mr. Buckley are considered “interested persons,” as defined in the Investment Company Act of 1940, because they are officers of the Vanguard funds.
JoAnn Heffernan Heisen
Born in 1950. Trustee since July 1998. Principal occupation(s) during the past five years and other experience: corporate vice president of Johnson & Johnson (pharmaceuticals/medical devices/consumer products) and member of its executive committee (1997–2008). Chief global diversity officer (retired 2008), vice president and chief information officer (1997–2006), controller (1995–1997), treasurer (1991–1995), and assistant treasurer (1989–1991) of Johnson & Johnson. Director of Skytop Lodge Corporation (hotels) and the Robert Wood Johnson Foundation. Member of the advisory board of the Institute for Women’s Leadership at Rutgers University.
F. Joseph Loughrey
Born in 1949. Trustee since October 2009. Principal occupation(s) during the past five years and other experience: president and chief operating officer (retired 2009) and vice chairman of the board (2008–2009) of Cummins Inc. (industrial machinery). Chairman of the board of Hillenbrand, Inc. (specialized consumer services), Oxfam America, and the Lumina Foundation for Education. Director of the V Foundation for Cancer Research. Member of the advisory council for the College of Arts and Letters and chair of the advisory board to the Kellogg Institute for International Studies, both at the University of Notre Dame.
Mark Loughridge
Born in 1953. Trustee since March 2012. Principal occupation(s) during the past five years and other experience: senior vice president and chief financial officer (retired 2013) of IBM (information technology services). Fiduciary member of IBM’s Retirement Plan Committee (2004–2013), senior vice president and general manager (2002–2004) of IBM Global Financing, vice president and controller (1998–2002) of IBM, and a variety of other prior management roles at IBM. Member of the Council on Chicago Booth.
Scott C. Malpass
Born in 1962. Trustee since March 2012. Principal occupation(s) during the past five years and other experience: chief investment officer (1989–present) and vice president (1996–present) of the University of Notre Dame. Assistant professor of finance at the Mendoza College of Business, University of Notre Dame, and member of the Notre Dame 403(b) Investment Committee. Chairman of the board of TIFF Advisory Services, Inc. Member of the board of Catholic Investment Services, Inc. (investment advisors), the board of advisors for Spruceview Capital Partners, and the board of superintendence of the Institute for the Works of Religion.
Deanna Mulligan
Born in 1963. Trustee since January 2018. Principal occupation(s) during the past five years and other experience: president (2010–present) and chief executive officer (2011–present) of The Guardian Life Insurance Company of America. Chief operating officer (2010–2011) and executive vice president (2008–2010) of Individual Life and Disability of The Guardian Life Insurance Company of America. Member of the board of The Guardian Life Insurance Company of America, the American Council of Life Insurers, the Partnership for New York City (business leadership), and the Committee Encouraging Corporate Philanthropy. Trustee of the Economic Club of New York and the Bruce Museum (arts and science). Member of the Advisory Council for the Stanford Graduate School of Business.
André F. Perold
Born in 1952. Trustee since December 2004. Principal occupation(s) during the past five years and other experience: George Gund Professor of Finance and Banking, Emeritus at the Harvard Business School (retired 2011). Chief investment officer and co-managing partner of HighVista Strategies LLC (private investment firm). Overseer of the Museum of Fine Arts Boston.
Sarah Bloom Raskin
Born in 1961. Trustee since January 2018. Principal occupation(s) during the past five years and other experience: deputy secretary (2014–2017) of the United States Department of the Treasury. Governor (2010–2014) of the Federal Reserve Board. Commissioner (2007–2010) of financial regulation for the State of Maryland. Member of the board of directors (2012–2014) of Neighborhood Reinvestment Corporation. Director of i(x) Investments, LLC.
Peter F. Volanakis
Born in 1955. Trustee since July 2009. Principal occupation(s) during the past five years and other experience: president and chief operating officer (retired 2010) of Corning Incorporated (communications equipment) and director of Corning Incorporated (2000–2010) and Dow Corning (2001–2010). Director (2012) of SPX Corporation (multi-industry manufacturing). Overseer of the Amos Tuck School of Business Administration, Dartmouth College (2001–2013). Chairman of the board of trustees of Colby-Sawyer College. Member of the Board of Hypertherm Inc. (industrial cutting systems, software, and consumables).
Executive Officers
Glenn Booraem
Born in 1967. Principal occupation(s) during the past five years and other experience: principal of Vanguard. Investment stewardship officer (2017–present), treasurer (2015–2017), controller (2010–2015), and assistant controller (2001–2010) of each of the investment companies served by Vanguard.
Christine M. Buchanan
Born in 1970. Principal occupation(s) during the past five years and other experience: principal of Vanguard and global head of Fund Administration at Vanguard. Treasurer (2017–present) of each of the investment companies served by Vanguard. Partner (2005–2017) at KPMG LLP (audit, tax, and advisory services).
Brian Dvorak
Born in 1973. Principal occupation(s) during the past five years and other experience: principal of Vanguard. Chief compliance officer (2017–present) of Vanguard and each of the investment companies served by Vanguard. Assistant vice president (2017–present) of Vanguard Marketing Corporation. Vice president and director of Enterprise Risk Management (2011–2013) at Oppenheimer Funds, Inc.
Thomas J. Higgins
Born in 1957. Principal occupation(s) during the past five years and other experience: principal of Vanguard. Chief financial officer (2008–present) and treasurer (1998–2008) of each of the investment companies served by Vanguard.
Peter Mahoney
Born in 1974. Principal occupation(s) during the past five years and other experience: principal of Vanguard. Controller (2015–present) of each of the investment companies served by Vanguard. Head of International Fund Services (2008–2014) at Vanguard.
Anne E. Robinson
Born in 1970. Principal occupation(s) during the past five years and other experience: general counsel (2016–present) of Vanguard. Secretary (2016–present) of Vanguard and of each of the investment companies served by Vanguard. Managing director (2016–present) of Vanguard. Director and senior vice president (2016–2018) of Vanguard Marketing Corporation. Managing director and general counsel of Global Cards and Consumer Services (2014–2016) at Citigroup. Counsel (2003–2014) at American Express.
Michael Rollings
Born in 1963. Principal occupation(s) during the past five years and other experience: finance director (2017–present) and treasurer (2017) of each of the investment companies served by Vanguard. Managing director (2016–present) of Vanguard. Chief financial officer (2016–present) of Vanguard. Director (2016–present) of Vanguard Marketing Corporation. Executive vice president and chief financial officer (2006–2016) of MassMutual Financial Group.
| |
| Vanguard Senior Management Team |
| |
| Joseph Brennan | Chris D. McIsaac |
| Mortimer J. Buckley | James M. Norris |
| Gregory Davis | Thomas M. Rampulla |
| John James | Karin A. Risi |
| Martha G. King | Anne E. Robinson |
| John T. Marcante | Michael Rollings |
Chairman Emeritus and Senior Advisor
John J. Brennan
Chairman, 1996–2009
Chief Executive Officer and President, 1996–2008
Founder
John C. Bogle
Chairman and Chief Executive Officer, 1974–1996
|  |
| | P.O. Box 2600 |
| | Valley Forge, PA 19482-2600 |
| |
| |
| |
| Connect with Vanguard® > vanguard.com |
| |
| |
| |
| Fund Information > 800-662-7447 | CFA® is a registered trademark owned by CFA Institute |
| Direct Investor Account Services > 800-662-2739 |
| Institutional Investor Services > 800-523-1036 |
| Text Telephone for People | |
| Who Are Deaf or Hard of Hearing > 800-749-7273 |
| |
| This material may be used in conjunction |
| with the offering of shares of any Vanguard |
| fund only if preceded or accompanied by |
| the fund’s current prospectus. | |
| |
| All comparative mutual fund data are from Lipper, a |
| Thomson Reuters Company, or Morningstar, Inc., unless |
| otherwise noted. | |
| |
| You can obtain a free copy of Vanguard’s proxy voting |
| guidelines by visiting vanguard.com/proxyreporting or by |
| calling Vanguard at 800-662-2739. The guidelines are |
| also available from the SEC’s website, sec.gov. In |
| addition, you may obtain a free report on how your fund |
| voted the proxies for securities it owned during the 12 |
| months ended June 30. To get the report, visit either |
| vanguard.com/proxyreporting or sec.gov. |
| |
| You can review and copy information about your fund at |
| the SEC’s Public Reference Room in Washington, D.C. To |
| find out more about this public service, call the SEC at |
| 202-551-8090. Information about your fund is also |
| available on the SEC’s website, and you can receive |
| copies of this information, for a fee, by sending a |
| request in either of two ways: via email addressed to |
| publicinfo@sec.gov or via regular mail addressed to the |
| Public Reference Section, Securities and Exchange |
| Commission, Washington, DC 20549-1520. |
| | © 2018 The Vanguard Group, Inc. |
| | All rights reserved. |
| | Vanguard Marketing Corporation, Distributor. |
| |
| | Q270 112018 |
Item 2: Code of Ethics. The Registrant has adopted a code of ethics that applies to the Registrant’s principal executive officer, principal financial officer, principal accounting officer or controller or persons performing similar functions. The Code of Ethics was amended during the reporting period covered by this report to make certain technical, non-material changes.
Item 3: Audit Committee Financial Expert. All members of the Audit Committee have been determined by the Registrant’s Board of Trustees to be Audit Committee Financial Experts and to be independent: JoAnn Heffernan Heisen, F. Joseph Loughrey, Mark Loughridge, Sarah Bloom Raskin, and Peter F. Volanakis.
Item 4: Principal Accountant Fees and Services.
(a) Audit Fees.
Audit Fees of the Registrant
Fiscal Year Ended September 30, 2018: $33,000
Fiscal Year Ended September 30, 2017: $35,000
Aggregate Audit Fees of Registered Investment Companies in the Vanguard Group.
Fiscal Year Ended September 30, 2018: $9,734,277
Fiscal Year Ended September 30, 2017: $8,424,459
Includes fees billed in connection with audits of the Registrant, other registered investment companies in the Vanguard complex, The Vanguard Group, Inc. and Vanguard Marketing Corporation.
(b) Audit-Related Fees.
Fiscal Year Ended September 30, 2018: $5,581,336
Fiscal Year Ended September 30, 2017: $3,194,093
Includes fees billed in connection with assurance and related services provided to the Registrant, other registered investment companies in the Vanguard complex, The Vanguard Group, Inc., and Vanguard Marketing Corporation.
(c) Tax Fees.
Fiscal Year Ended September 30, 2018: $347,985
Fiscal Year Ended September 30, 2017: $274,313
Includes fees billed in connection with tax compliance, planning, and advice services provided to the Registrant, other registered investment companies in the Vanguard complex, The Vanguard Group, Inc., and Vanguard Marketing Corporation.
(d) All Other Fees.
Fiscal Year Ended September 30, 2018: $0
Fiscal Year Ended September 30, 2017: $0
Includes fees billed for services related to tax reported information provided to the Registrant, other registered investment companies in the Vanguard complex, The Vanguard Group, Inc., and Vanguard Marketing Corporation.
(e) (1) Pre-Approval Policies. The policy of the Registrant’s Audit Committee is to consider and, if appropriate, approve before the principal accountant is engaged for such services, all specific audit and non-audit services provided to: the Registrant, other registered investment companies in the Vanguard complex, The Vanguard Group, Inc., and entities controlled by The Vanguard Group, Inc. that provide ongoing services to the Registrant. In making a determination, the Audit Committee considers whether the services are consistent with maintaining the principal accountant’s independence.
In the event of a contingency situation in which the principal accountant is needed to provide services in between scheduled Audit Committee meetings, the Chairman of the Audit Committee would be called on to consider and, if appropriate, pre-approve audit or permitted non-audit services in an amount sufficient to complete services through the next Audit Committee meeting, and to determine if such services would be consistent with maintaining the accountant’s independence. At the next scheduled Audit Committee meeting, services and fees would be presented to the Audit Committee for formal consideration, and, if appropriate, approval by the entire Audit Committee. The Audit Committee would again consider whether such services and fees are consistent with maintaining the principal accountant’s independence.
The Registrant’s Audit Committee is informed at least annually of all audit and non-audit services provided by the principal accountant to the Vanguard complex, whether such services are provided to: the Registrant, other registered investment companies in the Vanguard complex, The Vanguard Group, Inc., or other entities controlled by The Vanguard Group, Inc. that provide ongoing services to the Registrant.
(2) No percentage of the principal accountant’s fees or services were approved pursuant to the waiver provision of paragraph (c)(7)(i)(C) of Rule 2-01 of Regulation S-X.
(f) For the most recent fiscal year, over 50% of the hours worked under the principal accountant’s engagement were not performed by persons other than full-time, permanent employees of the principal accountant.
(g) Aggregate Non-Audit Fees.
Fiscal Year Ended September 30, 2018: $347,985
Fiscal Year Ended September 30, 2017: $274,313
Includes fees billed for non-audit services provided to the Registrant, other registered investment companies in the Vanguard complex, The Vanguard Group, Inc., and Vanguard Marketing Corporation.
(h) For the most recent fiscal year, the Audit Committee has determined that the provision of all non-audit services was consistent with maintaining the principal accountant’s independence.
Item 5: Audit Committee of Listed Registrants.
The Registrant is a listed issuer as defined in rule 10A-3 under the Securities Exchange Act of 1934 (“Exchange Act”). The Registrant has a separately-designated standing audit committee established in accordance with Section 3(a)(58)(A) of the Exchange Act. The Registrant’s audit committee members are: JoAnn Heffernan Heisen, F. Joseph Loughrey, Mark Loughridge, Sarah Bloom Raskin, and Peter F. Volanakis.
Item 6: Investments.
| | | | | |
| Vanguard® Wellesley Income Fund | | | | |
| Schedule of Investments | | | | |
| September 30, 2018 | | | | |
| |
| | | | | Face | Market |
| | | | Maturity | Amount | Value |
| | | Coupon | Date | ($000) | ($000) |
| |
| U.S. Government and Agency Obligations (8.9%) | | | | |
| U.S. Government Securities (7.4%) | | | | |
| | United States Treasury Inflation Indexed Bonds | 0.750% | 7/15/28 | 328,600 | 324,893 |
| | United States Treasury Note/Bond | 1.375% | 2/15/20 | 15,725 | 15,438 |
| 1 | United States Treasury Note/Bond | 2.250% | 2/29/20 | 788,010 | 782,588 |
| | United States Treasury Note/Bond | 2.250% | 3/31/20 | 337,000 | 334,526 |
| | United States Treasury Note/Bond | 1.625% | 6/30/20 | 280,795 | 275,224 |
| | United States Treasury Note/Bond | 1.250% | 3/31/21 | 43,000 | 41,347 |
| 2 | United States Treasury Note/Bond | 2.125% | 12/31/22 | 520,400 | 503,570 |
| | United States Treasury Note/Bond | 2.500% | 3/31/23 | 65,000 | 63,801 |
| | United States Treasury Note/Bond | 2.625% | 6/30/23 | 203,585 | 200,723 |
| | United States Treasury Note/Bond | 2.000% | 2/15/25 | 160,450 | 151,149 |
| | United States Treasury Note/Bond | 2.000% | 8/15/25 | 19,780 | 18,541 |
| | United States Treasury Note/Bond | 2.250% | 11/15/27 | 302,780 | 283,429 |
| | United States Treasury Note/Bond | 2.750% | 2/15/28 | 67,280 | 65,619 |
| | United States Treasury Note/Bond | 2.875% | 5/15/28 | 48,985 | 48,250 |
| | United States Treasury Note/Bond | 2.875% | 5/15/43 | 203,565 | 192,402 |
| | United States Treasury Note/Bond | 3.625% | 2/15/44 | 63,950 | 68,677 |
| | United States Treasury Note/Bond | 3.375% | 5/15/44 | 322,125 | 332,040 |
| | United States Treasury Note/Bond | 2.875% | 11/15/46 | 27,995 | 26,320 |
| | United States Treasury Note/Bond | 2.750% | 8/15/47 | 40,000 | 36,619 |
| | United States Treasury Note/Bond | 2.750% | 11/15/47 | 8,142 | 7,452 |
| | United States Treasury Note/Bond | 3.000% | 2/15/48 | 3,090 | 2,973 |
| | United States Treasury Note/Bond | 3.125% | 5/15/48 | 4,665 | 4,601 |
| | United States Treasury Strip Principal | 0.000% | 5/15/47 | 179,000 | 71,879 |
| | United States Treasury Strip Principal | 0.000% | 8/15/47 | 249,325 | 99,301 |
| | | | | | 3,951,362 |
| Agency Notes (0.0%) | | | | |
| 3 | Tennessee Valley Authority | 4.625% | 9/15/60 | 19,800 | 22,989 |
| |
| Conventional Mortgage-Backed Securities (1.1%) | | | | |
| 4,5 | Fannie Mae Pool | 2.500% | 8/1/27–10/1/28 | 5,339 | 5,166 |
| 4,5 | Fannie Mae Pool | 3.000% | 10/1/46 | 85,810 | 82,137 |
| 4,5,6 | Fannie Mae Pool | 3.500% | 12/1/47–10/1/48 | 490,983 | 483,345 |
| 4,5 | Freddie Mac Gold Pool | 4.000% | 7/1/33 | 4 | 4 |
| 4 | Ginnie Mae I Pool | 6.000% | 6/15/31–7/15/35 | 37 | 42 |
| 4 | Ginnie Mae I Pool | 6.500% | 4/15/32–9/15/38 | 2,908 | 3,149 |
| | | | | | 573,843 |
| Nonconventional Mortgage-Backed Securities (0.4%) | | | | |
| §,4,5 | Fannie Mae REMICS | 3.500% | 4/25/31–10/25/56 | 65,626 | 65,348 |
| 4,5 | Fannie Mae REMICS | 4.000% | 9/25/29–5/25/31 | 13,201 | 13,489 |
| 4,5 | Freddie Mac REMICS | 3.000% | 5/15/46 | 40,972 | 40,155 |
| 4,5 | Freddie Mac REMICS | 3.500% | 3/15/31 | 4,095 | 4,118 |
| 4,5 | Freddie Mac REMICS | 4.000% | 12/15/30–4/15/31 | 73,405 | 75,291 |
| |
| | | | | | 198,401 |
| |
| Total U.S. Government and Agency Obligations (Cost $4,813,971) | | | | 4,746,595 |
| Asset-Backed/Commercial Mortgage-Backed Securities (2.3%) | | | | |
| 4,7 | American Express Credit Account Master Trust | 2.950% | 3/15/23 | 51,000 | 50,551 |
| 7 | American Tower Trust I | 3.070% | 3/15/23 | 32,900 | 32,102 |
| 4 | AmeriCredit Automobile Receivables Trust 2016-3 | 2.240% | 4/8/22 | 12,670 | 12,486 |
| 4,7,8 | Apidos CLO XVII | 3.646% | 4/17/26 | 25,531 | 25,538 |
| 4,7,8 | Ares XXIX CLO Ltd. | 3.526% | 4/17/26 | 27,133 | 27,136 |
| 4,7,8 | Atlas Senior Loan Fund X Ltd. | 3.429% | 1/15/31 | 7,405 | 7,365 |
| 4,7,8 | Avery Point IV CLO Ltd. | 3.435% | 4/25/26 | 31,602 | 31,600 |
| 4,7,8 | Babson CLO Ltd. 2014-I | 3.498% | 7/20/25 | 4,555 | 4,555 |
| 7 | Bank of Montreal | 2.500% | 1/11/22 | 122,300 | 119,197 |
| 4,7,9 | CARDS II Trust | 2.528% | 4/18/22 | 18,300 | 18,311 |
| 4 | CarMax Auto Owner Trust | 2.300% | 5/15/19 | 6,471 | 6,471 |
| 4,7,8 | Cent CLO 20 Ltd. | 3.435% | 1/25/26 | 35,181 | 35,179 |
| 4,7,8 | Cent CLO 22 Ltd. | 3.753% | 11/7/26 | 29,995 | 30,021 |
| 4,7 | Chesapeake Funding II LLC 2018-1 | 3.040% | 4/15/30 | 45,725 | 45,556 |
| |
| |
| |
| |
| 1 |
Vanguard® Wellesley Income Fund
Schedule of Investments
September 30, 2018
| | | | | |
| | | | | Face | Market |
| | | | Maturity | Amount | Value |
| | | Coupon | Date | ($000) | ($000) |
| 4,7 | Chesapeake Funding II LLC 2018-2A | 1.990% | 5/15/29 | 7,732 | 7,655 |
| 4 | COMM 2012-CCRE2 Mortgage Trust | 3.147% | 8/15/45 | 16,040 | 15,887 |
| 7 | DNB Boligkreditt AS | 2.500% | 3/28/22 | 24,355 | 23,674 |
| 4,7 | Enterprise Fleet Financing LLC | 2.150% | 3/20/19 | 11,196 | 11,188 |
| 4,7 | Enterprise Fleet Financing LLC Series 2017-1 | 2.130% | 7/20/22 | 4,924 | 4,895 |
| 4,7 | Enterprise Fleet Financing LLC Series 2018-1 | 2.870% | 10/20/23 | 30,060 | 29,983 |
| 4,7 | Exeter Automobile Receivables Trust 2018-3 | 2.900% | 1/18/22 | 12,153 | 12,147 |
| 4 | Ford Credit Auto Lease Trust 2018-A | 2.300% | 5/15/19 | 10,151 | 10,152 |
| 4,7 | Ford Credit Floorplan Master Owner Trust A | 2.090% | 3/15/22 | 10,250 | 10,098 |
| 4 | GM Financial Consumer Automobile Receivables Trust | 2.300% | 4/16/19 | 2,403 | 2,404 |
| 4,7 | Golden Credit Card Trust | 1.980% | 4/15/22 | 10,000 | 9,825 |
| 4,7 | Hyundai Auto Lease Securitization Trust 2018-A | 1.950% | 3/15/19 | 84 | 84 |
| 4,7 | Hyundai Auto Lease Securitization Trust 2018-A | 2.550% | 8/17/20 | 21,310 | 21,280 |
| 4 | John Deere Owner Trust 2018 | 1.950% | 3/15/19 | 7,748 | 7,745 |
| 4,7,8 | Madison Park Funding XII Ltd. | 3.607% | 7/20/26 | 29,853 | 29,860 |
| 4,7,8 | Madison Park Funding XIII Ltd. | 3.292% | 4/19/30 | 34,150 | 34,101 |
| 4,7,9 | Master Credit Card Trust II Series 2018-1A | 2.672% | 7/22/24 | 36,965 | 36,877 |
| 4,7,9 | Mercedes-Benz Master Owner Trust 2016-B | 2.858% | 5/17/21 | 13,575 | 13,615 |
| 7 | National Australia Bank Ltd. | 2.400% | 12/7/21 | 75,600 | 73,309 |
| 4,7 | OBP Depositor LLC Trust 2010-OBP | 4.646% | 7/15/45 | 23,260 | 23,628 |
| 4,7 | OneMain Direct Auto Receivables Trust | 3.430% | 12/16/24 | 35,475 | 35,430 |
| 4,7 | OneMain Direct Auto Receivables Trust 2017-2 | 2.310% | 12/14/21 | 27,630 | 27,478 |
| 4,7 | OneMain Financial Issuance Trust 2016-1A | 3.660% | 2/20/29 | 12,215 | 12,253 |
| 4,7 | OneMain Financial Issuance Trust 2016-2 | 4.100% | 3/20/28 | 10,528 | 10,584 |
| 4,7 | OneMain Financial Issuance Trust 2017-1 | 2.370% | 9/14/32 | 12,784 | 12,539 |
| §,4,7 | Prestige Auto Receivables Trust | 2.528% | 10/15/19 | 5,266 | 5,266 |
| 4 | Santander Drive Auto Receivables Trust 2018-2 | 2.350% | 4/15/19 | 515 | 515 |
| 4,7 | Securitized Term Auto Receivables Trust 2018-1 | 2.400% | 4/25/19 | 10,520 | 10,521 |
| 4,7,8 | Seneca Park CLO Ltd. 2014-1 | 3.456% | 7/17/26 | 21,705 | 21,705 |
| 4,7,10 SFAVE Commercial Mortgage Securities Trust 2015- | | | | |
| | 5AVE | 4.144% | 1/5/43 | 22,000 | 20,886 |
| 4,7 | Sofi Consumer Loan Program 2018-2 Trust | 2.930% | 4/26/27 | 20,055 | 20,012 |
| 4,7 | Springleaf Funding Trust | 3.160% | 11/15/24 | 18,191 | 18,193 |
| 4,7 | Springleaf Funding Trust 2015-B | 3.480% | 5/15/28 | 19,420 | 19,391 |
| 4,7,8 | Symphony CLO XIV Ltd. | 3.619% | 7/14/26 | 36,945 | 36,953 |
| 4,7,8 | Thacher Park CLO Ltd. | 3.508% | 10/20/26 | 16,115 | 16,124 |
| 7 | Toronto-Dominion Bank | 2.500% | 1/18/22 | 77,500 | 75,429 |
| 4 | Utility Debt Securitization Authority Series 2013T | 3.435% | 12/15/25 | 6,775 | 6,776 |
| 4,7 | Vantage Data Centers Issuer, LLC 2018-1A | 4.072% | 2/16/43 | 18,059 | 18,109 |
| 4,7,8 | Voya CLO 2014-1 Ltd. | 3.323% | 4/18/31 | 16,725 | 16,629 |
| |
| Total Asset-Backed/Commercial Mortgage-Backed Securities (Cost $1,220,639) | | | 1,209,268 |
| |
| Corporate Bonds (42.7%) | | | | |
| Finance (17.8%) | | | | |
| | Banking (14.6%) | | | | |
| 7 | ABN AMRO Bank NV | 2.450% | 6/4/20 | 20,406 | 20,095 |
| | American Express Credit Corp. | 2.250% | 8/15/19 | 24,000 | 23,842 |
| | American Express Credit Corp. | 2.700% | 3/3/22 | 83,055 | 80,757 |
| | Banco Santander SA | 3.125% | 2/23/23 | 28,600 | 27,118 |
| | Banco Santander SA | 3.848% | 4/12/23 | 17,000 | 16,607 |
| | Bank of America Corp. | 3.300% | 1/11/23 | 18,875 | 18,611 |
| 4 | Bank of America Corp. | 2.816% | 7/21/23 | 60,600 | 58,515 |
| | Bank of America Corp. | 4.100% | 7/24/23 | 47,670 | 48,448 |
| | Bank of America Corp. | 3.004% | 12/20/23 | 42,652 | 41,265 |
| | Bank of America Corp. | 4.125% | 1/22/24 | 7,500 | 7,621 |
| | Bank of America Corp. | 4.000% | 1/22/25 | 26,225 | 25,887 |
| 4 | Bank of America Corp. | 3.593% | 7/21/28 | 37,995 | 36,166 |
| | Bank of America Corp. | 3.419% | 12/20/28 | 48,603 | 45,605 |
| 4 | Bank of America Corp. | 4.271% | 7/23/29 | 72,640 | 72,275 |
| | Bank of America Corp. | 6.110% | 1/29/37 | 30,000 | 34,564 |
| | Bank of America Corp. | 5.875% | 2/7/42 | 8,770 | 10,336 |
| | Bank of America Corp. | 5.000% | 1/21/44 | 24,180 | 25,777 |
| | Bank of Montreal | 2.375% | 1/25/19 | 29,000 | 28,978 |
2
Vanguard® Wellesley Income Fund
Schedule of Investments
September 30, 2018
| | | | | |
| | | | | Face | Market |
| | | | Maturity | Amount | Value |
| | | Coupon | Date | ($000) | ($000) |
| | Bank of Montreal | 3.100% | 4/13/21 | 46,940 | 46,794 |
| | Bank of New York Mellon Corp. | 5.450% | 5/15/19 | 49,465 | 50,299 |
| | Bank of New York Mellon Corp. | 2.150% | 2/24/20 | 49,755 | 49,215 |
| | Bank of New York Mellon Corp. | 2.200% | 8/16/23 | 32,698 | 30,647 |
| 8 | Bank of New York Mellon Corp. | 3.389% | 10/30/23 | 43,060 | 43,876 |
| | Bank of New York Mellon Corp. | 3.000% | 2/24/25 | 22,710 | 21,757 |
| 11 | Bank of Nova Scotia | 0.000% | 10/17/18 | 24,300 | 18,799 |
| 11 | Bank of Nova Scotia | 0.000% | 10/17/18 | 24,300 | 18,798 |
| 11 | Bank of Nova Scotia | 0.000% | 10/17/18 | 24,300 | 18,798 |
| 11 | Bank of Nova Scotia | 0.000% | 10/19/18 | 24,300 | 18,796 |
| | Bank of Nova Scotia | 2.450% | 3/22/21 | 39,905 | 39,010 |
| | Bank of Nova Scotia | 2.800% | 7/21/21 | 58,100 | 57,154 |
| | Bank One Corp. | 7.750% | 7/15/25 | 25,000 | 29,553 |
| 7 | Banque Federative du Credit Mutuel SA | 2.750% | 10/15/20 | 37,820 | 37,192 |
| | Barclays Bank plc | 5.140% | 10/14/20 | 7,935 | 8,127 |
| 8 | Barclays plc | 3.695% | 5/16/24 | 36,710 | 36,444 |
| | BB&T Corp. | 5.250% | 11/1/19 | 19,000 | 19,445 |
| | BB&T Corp. | 3.200% | 9/3/21 | 25,210 | 25,102 |
| | BB&T Corp. | 3.700% | 6/5/25 | 48,000 | 47,712 |
| | BNP Paribas SA | 2.400% | 12/12/18 | 11,000 | 10,999 |
| 7 | BNP Paribas SA | 2.950% | 5/23/22 | 4,365 | 4,216 |
| | BNP Paribas SA | 3.250% | 3/3/23 | 4,190 | 4,109 |
| 7 | BNP Paribas SA | 3.800% | 1/10/24 | 76,490 | 74,890 |
| 7 | BNP Paribas SA | 3.375% | 1/9/25 | 61,070 | 57,783 |
| 7 | BNP Paribas SA | 3.500% | 11/16/27 | 82,370 | 75,657 |
| 7 | BNP Paribas SA | 4.400% | 8/14/28 | 57,800 | 56,602 |
| | BPCE SA | 2.500% | 12/10/18 | 15,570 | 15,569 |
| | BPCE SA | 2.500% | 7/15/19 | 42,100 | 41,978 |
| 7 | BPCE SA | 5.700% | 10/22/23 | 10,670 | 11,117 |
| | BPCE SA | 4.000% | 4/15/24 | 25,885 | 26,043 |
| 7 | BPCE SA | 5.150% | 7/21/24 | 37,185 | 37,767 |
| 7 | BPCE SA | 3.500% | 10/23/27 | 64,900 | 58,966 |
| | Branch Banking & Trust Co. | 2.625% | 1/15/22 | 61,500 | 59,944 |
| 8 | Canadian Imperial Bank of Commerce | 3.054% | 6/16/22 | 57,790 | 58,295 |
| | Capital One Financial Corp. | 2.500% | 5/12/20 | 27,000 | 26,659 |
| | Capital One Financial Corp. | 4.750% | 7/15/21 | 36,165 | 37,372 |
| | Capital One Financial Corp. | 3.750% | 4/24/24 | 60,945 | 59,877 |
| | Capital One Financial Corp. | 3.200% | 2/5/25 | 9,055 | 8,529 |
| | Citibank NA | 3.050% | 5/1/20 | 67,750 | 67,583 |
| | Citigroup Inc. | 2.550% | 4/8/19 | 30,000 | 29,998 |
| | Citigroup Inc. | 2.500% | 7/29/19 | 29,565 | 29,476 |
| | Citigroup Inc. | 2.400% | 2/18/20 | 87,550 | 86,646 |
| | Citigroup Inc. | 4.500% | 1/14/22 | 30,140 | 30,948 |
| | Citigroup Inc. | 4.125% | 7/25/28 | 45,085 | 43,532 |
| 4 | Citigroup Inc. | 3.520% | 10/27/28 | 72,260 | 67,939 |
| | Citigroup Inc. | 6.625% | 6/15/32 | 9,000 | 10,621 |
| 4 | Citigroup Inc. | 3.878% | 1/24/39 | 37,225 | 34,225 |
| | Citigroup Inc. | 8.125% | 7/15/39 | 1,883 | 2,708 |
| | Citigroup Inc. | 5.875% | 1/30/42 | 7,460 | 8,662 |
| | Citigroup Inc. | 5.300% | 5/6/44 | 12,142 | 12,705 |
| | Citigroup Inc. | 4.750% | 5/18/46 | 15,410 | 15,068 |
| | Citigroup Inc. | 4.650% | 7/23/48 | 40,465 | 41,006 |
| | Commonwealth Bank of Australia | 2.300% | 3/12/20 | 21,255 | 20,948 |
| | Compass Bank | 2.750% | 9/29/19 | 12,250 | 12,218 |
| | Cooperatieve Rabobank UA | 2.250% | 1/14/19 | 44,660 | 44,620 |
| 7 | Credit Agricole SA | 2.500% | 4/15/19 | 45,420 | 45,340 |
| 7,8 | Credit Agricole SA | 3.362% | 4/24/23 | 16,500 | 16,520 |
| 7 | Credit Agricole SA | 3.750% | 4/24/23 | 31,690 | 31,082 |
| 7 | Credit Agricole SA | 3.250% | 10/4/24 | 30,590 | 28,757 |
| | Credit Suisse AG | 2.300% | 5/28/19 | 18,975 | 18,917 |
| | Credit Suisse AG | 5.300% | 8/13/19 | 9,000 | 9,166 |
| | Credit Suisse AG | 3.000% | 10/29/21 | 53,710 | 52,916 |
| | Credit Suisse AG | 3.625% | 9/9/24 | 3,955 | 3,899 |
| 7 | Credit Suisse Group AG | 3.574% | 1/9/23 | 40,835 | 39,990 |
3
Vanguard® Wellesley Income Fund
Schedule of Investments
September 30, 2018
| | | | | |
| | | | | Face | Market |
| | | | Maturity | Amount | Value |
| | | Coupon | Date | ($000) | ($000) |
| 7,8 | Credit Suisse Group AG | 3.574% | 6/12/24 | 24,825 | 24,886 |
| 4,7 | Credit Suisse Group AG | 4.207% | 6/12/24 | 12,285 | 12,243 |
| 4,7 | Credit Suisse Group AG | 3.869% | 1/12/29 | 11,050 | 10,370 |
| | Credit Suisse Group Funding Guernsey Ltd. | 3.125% | 12/10/20 | 25,000 | 24,796 |
| | Credit Suisse Group Funding Guernsey Ltd. | 3.800% | 9/15/22 | 45,685 | 45,409 |
| | Credit Suisse Group Funding Guernsey Ltd. | 3.750% | 3/26/25 | 57,400 | 55,241 |
| 7 | Danske Bank A/S | 2.000% | 9/8/21 | 41,970 | 39,698 |
| 7 | Danske Bank A/S | 3.875% | 9/12/23 | 45,515 | 44,688 |
| | Deutsche Bank AG | 2.500% | 2/13/19 | 12,005 | 11,978 |
| | Deutsche Bank AG | 2.700% | 7/13/20 | 24,575 | 24,021 |
| | Deutsche Bank AG | 3.150% | 1/22/21 | 51,760 | 50,450 |
| | Deutsche Bank AG | 4.250% | 10/14/21 | 45,940 | 45,768 |
| 7 | DNB Bank ASA | 2.375% | 6/2/21 | 42,450 | 41,166 |
| | Fifth Third Bank | 2.875% | 10/1/21 | 8,780 | 8,615 |
| | Fifth Third Bank | 3.850% | 3/15/26 | 29,295 | 28,546 |
| | Goldman Sachs Group Inc. | 2.875% | 2/25/21 | 25,990 | 25,631 |
| | Goldman Sachs Group Inc. | 2.625% | 4/25/21 | 9,270 | 9,072 |
| | Goldman Sachs Group Inc. | 5.250% | 7/27/21 | 70,165 | 73,372 |
| | Goldman Sachs Group Inc. | 5.750% | 1/24/22 | 67,095 | 71,372 |
| 4 | Goldman Sachs Group Inc. | 2.876% | 10/31/22 | 65,405 | 63,782 |
| | Goldman Sachs Group Inc. | 3.625% | 1/22/23 | 7,715 | 7,675 |
| | Goldman Sachs Group Inc. | 3.500% | 1/23/25 | 16,660 | 16,141 |
| 4 | Goldman Sachs Group Inc. | 3.272% | 9/29/25 | 44,260 | 42,296 |
| | Goldman Sachs Group Inc. | 4.250% | 10/21/25 | 13,000 | 12,872 |
| | Goldman Sachs Group Inc. | 3.500% | 11/16/26 | 48,000 | 45,567 |
| | Goldman Sachs Group Inc. | 3.850% | 1/26/27 | 36,525 | 35,524 |
| 4 | Goldman Sachs Group Inc. | 3.691% | 6/5/28 | 14,525 | 13,805 |
| 4 | Goldman Sachs Group Inc. | 3.814% | 4/23/29 | 46,055 | 43,814 |
| 4 | Goldman Sachs Group Inc. | 4.223% | 5/1/29 | 54,990 | 54,176 |
| | Goldman Sachs Group Inc. | 6.250% | 2/1/41 | 35,790 | 43,144 |
| | Goldman Sachs Group Inc. | 4.800% | 7/8/44 | 19,895 | 20,284 |
| | Goldman Sachs Group Inc. | 4.750% | 10/21/45 | 15,895 | 16,070 |
| 7 | HSBC Bank plc | 4.750% | 1/19/21 | 42,960 | 44,131 |
| | HSBC Bank USA NA | 5.875% | 11/1/34 | 21,000 | 23,769 |
| | HSBC Holdings plc | 3.400% | 3/8/21 | 50,000 | 49,868 |
| | HSBC Holdings plc | 4.000% | 3/30/22 | 10,870 | 10,988 |
| 4 | HSBC Holdings plc | 3.262% | 3/13/23 | 25,625 | 25,084 |
| | HSBC Holdings plc | 3.600% | 5/25/23 | 56,130 | 55,545 |
| 8 | HSBC Holdings plc | 3.322% | 5/18/24 | 26,495 | 26,423 |
| | HSBC Holdings plc | 3.900% | 5/25/26 | 7,915 | 7,658 |
| 4 | HSBC Holdings plc | 4.041% | 3/13/28 | 27,520 | 26,514 |
| 4 | HSBC Holdings plc | 4.583% | 6/19/29 | 40,190 | 40,185 |
| | HSBC Holdings plc | 7.625% | 5/17/32 | 15,800 | 19,694 |
| | HSBC Holdings plc | 6.500% | 5/2/36 | 22,000 | 25,920 |
| | HSBC Holdings plc | 6.100% | 1/14/42 | 43,680 | 52,080 |
| | HSBC Holdings plc | 5.250% | 3/14/44 | 5,795 | 6,021 |
| | HSBC USA Inc. | 2.350% | 3/5/20 | 93,430 | 92,408 |
| | HSBC USA Inc. | 3.500% | 6/23/24 | 18,355 | 17,902 |
| | Huntington Bancshares Inc. | 3.150% | 3/14/21 | 26,950 | 26,705 |
| | Huntington National Bank | 2.200% | 4/1/19 | 17,850 | 17,809 |
| | Huntington National Bank | 2.400% | 4/1/20 | 36,530 | 36,043 |
| | ING Groep NV | 3.150% | 3/29/22 | 13,170 | 12,852 |
| | ING Groep NV | 3.950% | 3/29/27 | 33,605 | 32,304 |
| 12 | Japan Treasury Discount Bill | 0.000% | 1/9/19 | 18,440,450 | 163,338 |
| | JPMorgan Chase & Co. | 6.300% | 4/23/19 | 68,310 | 69,663 |
| | JPMorgan Chase & Co. | 2.550% | 3/1/21 | 26,000 | 25,525 |
| | JPMorgan Chase & Co. | 4.625% | 5/10/21 | 14,000 | 14,438 |
| | JPMorgan Chase & Co. | 4.350% | 8/15/21 | 33,285 | 34,104 |
| | JPMorgan Chase & Co. | 4.500% | 1/24/22 | 18,260 | 18,822 |
| | JPMorgan Chase & Co. | 3.250% | 9/23/22 | 22,380 | 22,186 |
| | JPMorgan Chase & Co. | 3.375% | 5/1/23 | 36,370 | 35,597 |
| | JPMorgan Chase & Co. | 3.875% | 2/1/24 | 11,200 | 11,275 |
| | JPMorgan Chase & Co. | 3.900% | 7/15/25 | 11,560 | 11,536 |
| | JPMorgan Chase & Co. | 3.300% | 4/1/26 | 26,730 | 25,606 |
4
Vanguard® Wellesley Income Fund
Schedule of Investments
September 30, 2018
| | | | | |
| | | | | Face | Market |
| | | | Maturity | Amount | Value |
| | | Coupon | Date | ($000) | ($000) |
| | JPMorgan Chase & Co. | 2.950% | 10/1/26 | 75,000 | 69,588 |
| | JPMorgan Chase & Co. | 4.125% | 12/15/26 | 24,400 | 24,133 |
| | JPMorgan Chase & Co. | 4.250% | 10/1/27 | 9,275 | 9,204 |
| | JPMorgan Chase & Co. | 5.600% | 7/15/41 | 70,000 | 80,277 |
| | JPMorgan Chase & Co. | 5.400% | 1/6/42 | 16,235 | 18,184 |
| | JPMorgan Chase & Co. | 5.625% | 8/16/43 | 13,500 | 15,240 |
| | JPMorgan Chase & Co. | 4.950% | 6/1/45 | 12,000 | 12,552 |
| 4 | JPMorgan Chase & Co. | 3.964% | 11/15/48 | 160,000 | 146,421 |
| | KeyBank NA | 2.350% | 3/8/19 | 30,000 | 29,968 |
| 7 | Macquarie Bank Ltd. | 2.400% | 1/21/20 | 10,195 | 10,086 |
| 4,7 | Macquarie Group Ltd. | 4.150% | 3/27/24 | 50,725 | 50,281 |
| | Manufacturers & Traders Trust Co. | 2.100% | 2/6/20 | 14,540 | 14,352 |
| | Manufacturers & Traders Trust Co. | 2.900% | 2/6/25 | 20,085 | 19,124 |
| | Morgan Stanley | 2.500% | 1/24/19 | 43,200 | 43,177 |
| | Morgan Stanley | 7.300% | 5/13/19 | 53,955 | 55,410 |
| | Morgan Stanley | 2.375% | 7/23/19 | 35,000 | 34,859 |
| | Morgan Stanley | 5.500% | 7/24/20 | 15,000 | 15,561 |
| | Morgan Stanley | 5.750% | 1/25/21 | 13,900 | 14,604 |
| | Morgan Stanley | 2.500% | 4/21/21 | 30,630 | 29,902 |
| | Morgan Stanley | 2.625% | 11/17/21 | 30,200 | 29,362 |
| | Morgan Stanley | 2.750% | 5/19/22 | 63,830 | 61,881 |
| | Morgan Stanley | 3.750% | 2/25/23 | 23,000 | 22,995 |
| | Morgan Stanley | 3.875% | 4/29/24 | 22,050 | 21,951 |
| | Morgan Stanley | 4.000% | 7/23/25 | 20,805 | 20,640 |
| | Morgan Stanley | 3.125% | 7/27/26 | 36,950 | 34,409 |
| | Morgan Stanley | 4.350% | 9/8/26 | 15,000 | 14,877 |
| | Morgan Stanley | 3.625% | 1/20/27 | 31,000 | 29,669 |
| 4 | Morgan Stanley | 3.772% | 1/24/29 | 56,830 | 54,571 |
| | Morgan Stanley | 7.250% | 4/1/32 | 51,100 | 64,939 |
| | Morgan Stanley | 4.300% | 1/27/45 | 24,705 | 23,809 |
| 7 | NBK SPC Ltd. | 2.750% | 5/30/22 | 56,875 | 54,783 |
| | PNC Bank NA | 3.300% | 10/30/24 | 14,645 | 14,293 |
| | PNC Bank NA | 2.950% | 2/23/25 | 34,775 | 33,180 |
| | PNC Bank NA | 3.100% | 10/25/27 | 42,485 | 39,992 |
| | PNC Bank NA | 3.250% | 1/22/28 | 60,960 | 58,149 |
| | PNC Financial Services Group Inc. | 3.900% | 4/29/24 | 40,150 | 39,881 |
| 11 | Royal Bank of Canada | 0.000% | 10/22/18 | 73,050 | 56,497 |
| | Royal Bank of Canada | 2.500% | 1/19/21 | 24,750 | 24,345 |
| | Royal Bank of Canada | 2.750% | 2/1/22 | 44,630 | 43,742 |
| | Santander Holdings USA Inc. | 2.650% | 4/17/20 | 19,225 | 19,021 |
| | Santander Holdings USA Inc. | 3.700% | 3/28/22 | 28,405 | 27,997 |
| | Santander Holdings USA Inc. | 3.400% | 1/18/23 | 26,105 | 25,156 |
| | Santander UK plc | 2.500% | 3/14/19 | 79,400 | 79,356 |
| 7 | Skandinaviska Enskilda Banken AB | 2.450% | 5/27/20 | 50,900 | 50,190 |
| 7 | Societe Generale SA | 3.250% | 1/12/22 | 55,070 | 53,735 |
| 4 | State Street Corp. | 2.653% | 5/15/23 | 31,280 | 30,298 |
| | SunTrust Bank | 3.300% | 5/15/26 | 11,955 | 11,264 |
| | SunTrust Banks Inc. | 2.900% | 3/3/21 | 34,300 | 33,849 |
| | Svenska Handelsbanken AB | 1.875% | 9/7/21 | 37,750 | 36,103 |
| | Synchrony Bank | 3.650% | 5/24/21 | 46,290 | 45,908 |
| | Synchrony Financial | 2.600% | 1/15/19 | 17,915 | 17,901 |
| | Synchrony Financial | 3.000% | 8/15/19 | 8,570 | 8,557 |
| | Synchrony Financial | 2.700% | 2/3/20 | 12,580 | 12,435 |
| | Toronto-Dominion Bank | 2.500% | 12/14/20 | 97,700 | 96,046 |
| 7 | UBS AG | 2.200% | 6/8/20 | 27,590 | 27,091 |
| 7 | UBS AG | 4.500% | 6/26/48 | 32,955 | 34,177 |
| 7 | UBS Group Funding Jersey Ltd. | 2.950% | 9/24/20 | 36,710 | 36,332 |
| 7 | UBS Group Funding Jersey Ltd. | 3.000% | 4/15/21 | 58,970 | 57,989 |
| 7 | UBS Group Funding Jersey Ltd. | 2.650% | 2/1/22 | 46,000 | 44,364 |
| | US Bancorp | 2.625% | 1/24/22 | 47,510 | 46,445 |
| | US Bancorp | 3.700% | 1/30/24 | 39,005 | 39,238 |
| | US Bancorp | 2.375% | 7/22/26 | 45,000 | 40,749 |
| | Wachovia Corp. | 6.605% | 10/1/25 | 15,000 | 16,674 |
| | Wells Fargo & Co. | 2.150% | 1/30/20 | 38,370 | 37,923 |
5
Vanguard® Wellesley Income Fund
Schedule of Investments
September 30, 2018
| | | | |
| | | | Face | Market |
| | | Maturity | Amount | Value |
| | Coupon | Date | ($000) | ($000) |
| Wells Fargo & Co. | 3.000% | 1/22/21 | 27,580 | 27,354 |
| Wells Fargo & Co. | 4.600% | 4/1/21 | 40,000 | 41,139 |
| Wells Fargo & Co. | 3.500% | 3/8/22 | 54,840 | 54,760 |
| Wells Fargo & Co. | 3.069% | 1/24/23 | 10,465 | 10,198 |
| Wells Fargo & Co. | 3.450% | 2/13/23 | 39,400 | 38,577 |
| Wells Fargo & Co. | 4.480% | 1/16/24 | 34,444 | 35,231 |
| Wells Fargo & Co. | 3.000% | 2/19/25 | 28,660 | 27,146 |
| Wells Fargo & Co. | 3.550% | 9/29/25 | 27,170 | 26,473 |
| Wells Fargo & Co. | 3.000% | 4/22/26 | 36,830 | 34,143 |
| Wells Fargo & Co. | 4.100% | 6/3/26 | 45,700 | 45,036 |
| Wells Fargo & Co. | 3.000% | 10/23/26 | 6,435 | 5,960 |
| Wells Fargo & Co. | 5.606% | 1/15/44 | 28,551 | 31,732 |
| Wells Fargo & Co. | 4.650% | 11/4/44 | 20,735 | 20,313 |
| Wells Fargo & Co. | 4.900% | 11/17/45 | 16,060 | 16,284 |
| Wells Fargo & Co. | 4.400% | 6/14/46 | 36,200 | 33,955 |
| Wells Fargo & Co. | 4.750% | 12/7/46 | 38,790 | 38,507 |
| Westpac Banking Corp. | 2.300% | 5/26/20 | 22,948 | 22,610 |
| Brokerage (0.0%) | | | | |
| Ameriprise Financial Inc. | 5.300% | 3/15/20 | 6,625 | 6,824 |
| Charles Schwab Corp. | 3.200% | 3/2/27 | 19,790 | 18,826 |
| Finance Companies (0.4%) | | | | |
| GE Capital International Funding Co. Unlimited Co. | 4.418% | 11/15/35 | 209,754 | 197,282 |
| |
| Insurance (2.3%) | | | | |
| Aetna Inc. | 2.800% | 6/15/23 | 32,080 | 30,741 |
| 7 AIG Global Funding | 2.700% | 12/15/21 | 41,815 | 40,607 |
| Anthem Inc. | 3.700% | 8/15/21 | 25,635 | 25,790 |
| Anthem Inc. | 3.300% | 1/15/23 | 20,000 | 19,672 |
| Anthem Inc. | 3.650% | 12/1/27 | 13,150 | 12,514 |
| Anthem Inc. | 4.101% | 3/1/28 | 42,145 | 41,535 |
| Anthem Inc. | 4.650% | 8/15/44 | 14,857 | 14,639 |
| Anthem Inc. | 4.375% | 12/1/47 | 15,905 | 15,020 |
| Berkshire Hathaway Inc. | 2.750% | 3/15/23 | 36,055 | 35,100 |
| Berkshire Hathaway Inc. | 3.125% | 3/15/26 | 23,645 | 22,746 |
| Chubb INA Holdings Inc. | 5.900% | 6/15/19 | 15,000 | 15,276 |
| Chubb INA Holdings Inc. | 2.300% | 11/3/20 | 5,235 | 5,138 |
| Chubb INA Holdings Inc. | 3.350% | 5/15/24 | 20,340 | 19,967 |
| Chubb INA Holdings Inc. | 3.350% | 5/3/26 | 12,280 | 11,931 |
| Chubb INA Holdings Inc. | 4.350% | 11/3/45 | 24,795 | 25,187 |
| Cigna Corp. | 3.250% | 4/15/25 | 30,765 | 29,052 |
| 7 Five Corners Funding Trust | 4.419% | 11/15/23 | 5,320 | 5,450 |
| 7 Guardian Life Global Funding | 2.000% | 4/26/21 | 12,825 | 12,408 |
| 7 Jackson National Life Global Funding | 3.250% | 1/30/24 | 48,955 | 47,537 |
| 7 Liberty Mutual Group Inc. | 4.250% | 6/15/23 | 11,825 | 11,912 |
| 7 Liberty Mutual Insurance Co. | 8.500% | 5/15/25 | 21,665 | 26,352 |
| Loews Corp. | 2.625% | 5/15/23 | 14,100 | 13,493 |
| 7 MassMutual Global Funding II | 2.350% | 4/9/19 | 22,000 | 21,921 |
| 7 MassMutual Global Funding II | 2.000% | 4/15/21 | 42,188 | 40,858 |
| MetLife Inc. | 3.600% | 4/10/24 | 28,000 | 28,050 |
| MetLife Inc. | 4.125% | 8/13/42 | 5,300 | 5,018 |
| MetLife Inc. | 4.875% | 11/13/43 | 17,500 | 18,346 |
| 7 Metropolitan Life Global Funding I | 2.650% | 4/8/22 | 14,005 | 13,562 |
| 7 Metropolitan Life Global Funding I | 3.450% | 12/18/26 | 29,970 | 29,083 |
| 7 Metropolitan Life Global Funding I | 3.000% | 9/19/27 | 43,250 | 40,193 |
| 7 Metropolitan Life Insurance Co. | 7.800% | 11/1/25 | 25,000 | 30,116 |
| 7 New York Life Global Funding | 2.900% | 1/17/24 | 58,670 | 56,582 |
| 7 New York Life Insurance Co. | 5.875% | 5/15/33 | 44,785 | 53,405 |
| 7 Northwestern Mutual Life Insurance Co. | 3.850% | 9/30/47 | 24,098 | 21,762 |
| Prudential Financial Inc. | 4.500% | 11/15/20 | 24,055 | 24,654 |
| 7 Teachers Insurance & Annuity Assn. of America | 4.900% | 9/15/44 | 21,990 | 23,398 |
| 7 Teachers Insurance & Annuity Assn. of America | 4.270% | 5/15/47 | 42,865 | 41,286 |
| Travelers Cos. Inc. | 5.900% | 6/2/19 | 9,400 | 9,567 |
| UnitedHealth Group Inc. | 3.875% | 10/15/20 | 6,786 | 6,873 |
6
Vanguard® Wellesley Income Fund
Schedule of Investments
September 30, 2018
| | | | |
| | | | Face | Market |
| | | Maturity | Amount | Value |
| | Coupon | Date | ($000) | ($000) |
| UnitedHealth Group Inc. | 2.875% | 3/15/22 | 2,346 | 2,305 |
| UnitedHealth Group Inc. | 2.875% | 3/15/23 | 12,000 | 11,685 |
| UnitedHealth Group Inc. | 3.100% | 3/15/26 | 14,220 | 13,611 |
| UnitedHealth Group Inc. | 3.850% | 6/15/28 | 34,260 | 34,359 |
| UnitedHealth Group Inc. | 4.625% | 7/15/35 | 22,950 | 24,516 |
| UnitedHealth Group Inc. | 6.625% | 11/15/37 | 20,000 | 26,019 |
| UnitedHealth Group Inc. | 4.625% | 11/15/41 | 36,010 | 37,425 |
| UnitedHealth Group Inc. | 4.250% | 3/15/43 | 31,000 | 30,954 |
| UnitedHealth Group Inc. | 4.750% | 7/15/45 | 19,035 | 20,420 |
| UnitedHealth Group Inc. | 4.200% | 1/15/47 | 8,345 | 8,236 |
| UnitedHealth Group Inc. | 4.250% | 6/15/48 | 47,700 | 47,632 |
| Other Finance (0.2%) | | | | |
| 7 GTP Acquisition Partners I LLC | 2.350% | 6/15/20 | 18,745 | 18,351 |
| 7 LeasePlan Corp. NV | 2.875% | 1/22/19 | 30,515 | 30,494 |
| |
| Real Estate Investment Trusts (0.3%) | | | | |
| AvalonBay Communities Inc. | 3.625% | 10/1/20 | 17,315 | 17,379 |
| Boston Properties LP | 3.125% | 9/1/23 | 13,520 | 13,146 |
| Boston Properties LP | 3.800% | 2/1/24 | 1,780 | 1,768 |
| Realty Income Corp. | 5.750% | 1/15/21 | 8,675 | 9,068 |
| Simon Property Group LP | 4.375% | 3/1/21 | 22,000 | 22,522 |
| Simon Property Group LP | 4.125% | 12/1/21 | 12,946 | 13,204 |
| Simon Property Group LP | 3.750% | 2/1/24 | 6,645 | 6,643 |
| Simon Property Group LP | 3.375% | 10/1/24 | 20,470 | 20,044 |
| 7 WEA Finance LLC | 4.125% | 9/20/28 | 20,815 | 20,632 |
| 7 WEA Finance LLC | 4.625% | 9/20/48 | 26,575 | 25,971 |
| 7 WEA Finance LLC / Westfield UK & Europe Finance plc | 2.700% | 9/17/19 | 17,715 | 17,582 |
| | | | | 9,435,055 |
| Industrial (20.0%) | | | | |
| Basic Industry (0.1%) | | | | |
| 7 Air Liquide Finance SA | 2.250% | 9/27/23 | 21,000 | 19,733 |
| 7 Air Liquide Finance SA | 2.500% | 9/27/26 | 16,815 | 15,328 |
| International Paper Co. | 4.350% | 8/15/48 | 43,570 | 39,651 |
| Capital Goods (1.6%) | | | | |
| 7 BAE Systems Holdings Inc. | 2.850% | 12/15/20 | 5,020 | 4,950 |
| 7 BAE Systems Holdings Inc. | 3.800% | 10/7/24 | 26,068 | 25,729 |
| 7 BAE Systems Holdings Inc. | 3.850% | 12/15/25 | 29,838 | 29,473 |
| Boeing Co. | 5.875% | 2/15/40 | 5,000 | 6,174 |
| Caterpillar Financial Services Corp. | 2.625% | 3/1/23 | 39,500 | 38,150 |
| Caterpillar Inc. | 3.900% | 5/27/21 | 32,880 | 33,449 |
| Caterpillar Inc. | 2.600% | 6/26/22 | 9,575 | 9,323 |
| Caterpillar Inc. | 3.400% | 5/15/24 | 19,475 | 19,439 |
| Caterpillar Inc. | 5.200% | 5/27/41 | 19,770 | 22,546 |
| Deere & Co. | 4.375% | 10/16/19 | 13,090 | 13,296 |
| Eaton Corp. | 6.500% | 6/1/25 | 10,000 | 11,272 |
| General Dynamics Corp. | 2.875% | 5/11/20 | 54,940 | 54,804 |
| General Dynamics Corp. | 3.875% | 7/15/21 | 9,950 | 10,097 |
| General Electric Co. | 2.700% | 10/9/22 | 14,000 | 13,524 |
| General Electric Co. | 3.100% | 1/9/23 | 6,094 | 5,963 |
| Honeywell International Inc. | 4.250% | 3/1/21 | 29,484 | 30,292 |
| Illinois Tool Works Inc. | 3.500% | 3/1/24 | 42,775 | 43,077 |
| John Deere Capital Corp. | 2.800% | 1/27/23 | 8,000 | 7,778 |
| John Deere Capital Corp. | 3.350% | 6/12/24 | 9,000 | 8,860 |
| John Deere Capital Corp. | 3.450% | 3/13/25 | 43,560 | 43,051 |
| Johnson Controls International plc | 5.000% | 3/30/20 | 29,000 | 29,588 |
| Johnson Controls International plc | 3.750% | 12/1/21 | 25,000 | 25,078 |
| Lockheed Martin Corp. | 2.500% | 11/23/20 | 12,340 | 12,169 |
| Lockheed Martin Corp. | 2.900% | 3/1/25 | 26,840 | 25,573 |
| Lockheed Martin Corp. | 4.500% | 5/15/36 | 6,715 | 6,972 |
| Lockheed Martin Corp. | 4.700% | 5/15/46 | 12,041 | 12,835 |
| Lockheed Martin Corp. | 4.090% | 9/15/52 | 4,609 | 4,382 |
| Parker-Hannifin Corp. | 4.450% | 11/21/44 | 14,290 | 14,601 |
7
Vanguard® Wellesley Income Fund
Schedule of Investments
September 30, 2018
| | | | | |
| | | | | Face | Market |
| | | | Maturity | Amount | Value |
| | | Coupon | Date | ($000) | ($000) |
| | Raytheon Co. | 3.125% | 10/15/20 | 10,000 | 9,991 |
| 7 | Siemens Financieringsmaatschappij NV | 2.900% | 5/27/22 | 60,840 | 59,523 |
| 7 | Siemens Financieringsmaatschappij NV | 3.125% | 3/16/24 | 62,200 | 60,339 |
| 7 | Siemens Financieringsmaatschappij NV | 4.400% | 5/27/45 | 40,495 | 41,599 |
| | United Technologies Corp. | 4.500% | 4/15/20 | 24,170 | 24,622 |
| | United Technologies Corp. | 3.100% | 6/1/22 | 10,095 | 9,928 |
| | United Technologies Corp. | 4.450% | 11/16/38 | 9,050 | 8,943 |
| | United Technologies Corp. | 4.500% | 6/1/42 | 55,694 | 54,973 |
| | United Technologies Corp. | 3.750% | 11/1/46 | 5,891 | 5,114 |
| | Communication (2.8%) | | | | |
| | 21st Century Fox America Inc. | 4.500% | 2/15/21 | 4,650 | 4,783 |
| | 21st Century Fox America Inc. | 6.200% | 12/15/34 | 11,000 | 13,569 |
| | America Movil SAB de CV | 3.125% | 7/16/22 | 66,820 | 65,433 |
| | America Movil SAB de CV | 6.125% | 3/30/40 | 10,010 | 11,734 |
| | American Tower Corp. | 3.450% | 9/15/21 | 23,985 | 23,890 |
| | American Tower Corp. | 4.700% | 3/15/22 | 2,905 | 2,999 |
| | American Tower Corp. | 5.000% | 2/15/24 | 23,881 | 24,946 |
| | American Tower Corp. | 4.400% | 2/15/26 | 7,300 | 7,303 |
| | AT&T Inc. | 5.200% | 3/15/20 | 10,125 | 10,427 |
| | AT&T Inc. | 2.450% | 6/30/20 | 17,525 | 17,282 |
| | AT&T Inc. | 4.600% | 2/15/21 | 4,900 | 5,022 |
| | AT&T Inc. | 5.000% | 3/1/21 | 10,000 | 10,329 |
| | AT&T Inc. | 3.875% | 8/15/21 | 20,000 | 20,195 |
| 7 | AT&T Inc. | 7.850% | 1/15/22 | 23,750 | 26,471 |
| | CBS Corp. | 4.300% | 2/15/21 | 22,710 | 23,050 |
| | Comcast Corp. | 3.000% | 2/1/24 | 51,960 | 50,052 |
| | Comcast Corp. | 3.600% | 3/1/24 | 60,515 | 59,792 |
| | Comcast Corp. | 3.375% | 2/15/25 | 2,565 | 2,474 |
| | Comcast Corp. | 3.150% | 3/1/26 | 15,280 | 14,412 |
| | Comcast Corp. | 2.350% | 1/15/27 | 19,840 | 17,442 |
| | Comcast Corp. | 4.250% | 1/15/33 | 15,060 | 14,737 |
| | Comcast Corp. | 4.200% | 8/15/34 | 25,155 | 24,171 |
| | Comcast Corp. | 4.400% | 8/15/35 | 32,657 | 31,941 |
| | Comcast Corp. | 4.650% | 7/15/42 | 7,260 | 7,179 |
| | Comcast Corp. | 4.500% | 1/15/43 | 20,000 | 19,288 |
| | Comcast Corp. | 4.750% | 3/1/44 | 28,710 | 28,549 |
| | Comcast Corp. | 4.600% | 8/15/45 | 46,358 | 45,181 |
| | Comcast Corp. | 3.969% | 11/1/47 | 40,576 | 35,968 |
| | Comcast Corp. | 4.000% | 3/1/48 | 17,415 | 15,615 |
| | Comcast Corp. | 3.999% | 11/1/49 | 26,848 | 23,916 |
| | Comcast Corp. | 4.049% | 11/1/52 | 21,572 | 19,004 |
| 7 | Cox Communications Inc. | 4.800% | 2/1/35 | 58,525 | 54,238 |
| 7 | Cox Communications Inc. | 6.450% | 12/1/36 | 1,575 | 1,723 |
| 7 | Cox Communications Inc. | 4.600% | 8/15/47 | 3,325 | 3,104 |
| | Crown Castle International Corp. | 3.650% | 9/1/27 | 10,385 | 9,725 |
| | Crown Castle International Corp. | 3.800% | 2/15/28 | 8,575 | 8,130 |
| | Discovery Communications LLC | 5.625% | 8/15/19 | 4,675 | 4,776 |
| 7 | NBCUniversal Enterprise Inc. | 1.974% | 4/15/19 | 84,070 | 83,697 |
| | NBCUniversal Media LLC | 4.375% | 4/1/21 | 26,000 | 26,613 |
| | NBCUniversal Media LLC | 4.450% | 1/15/43 | 10,639 | 10,155 |
| | Orange SA | 9.000% | 3/1/31 | 54,566 | 77,183 |
| 7 | SK Telecom Co. Ltd. | 3.750% | 4/16/23 | 12,220 | 12,098 |
| 7 | Sky plc | 2.625% | 9/16/19 | 30,550 | 30,340 |
| 7 | Sky plc | 3.750% | 9/16/24 | 42,911 | 42,653 |
| 4,7 | Sprint Spectrum Co LLC / Sprint Spectrum Co II LLC / | | | | |
| | Sprint Spectrum Co III LLC | 4.738% | 3/20/25 | 46,800 | 46,779 |
| | Time Warner Cable LLC | 8.750% | 2/14/19 | 915 | 934 |
| | Time Warner Cable LLC | 8.250% | 4/1/19 | 11,944 | 12,250 |
| | Time Warner Entertainment Co. LP | 8.375% | 3/15/23 | 3,215 | 3,734 |
| | Time Warner Inc. | 4.750% | 3/29/21 | 13,000 | 13,392 |
| | Time Warner Inc. | 3.600% | 7/15/25 | 22,963 | 21,994 |
| | Verizon Communications Inc. | 3.450% | 3/15/21 | 15,585 | 15,642 |
| | Verizon Communications Inc. | 3.500% | 11/1/21 | 78,905 | 79,172 |
8
Vanguard® Wellesley Income
Fund Schedule of Investments
September 30, 2018
| | | | | |
| | | | | Face | Market |
| | | | Maturity | Amount | Value |
| | | Coupon | Date | ($000) | ($000) |
| | Verizon Communications Inc. | 4.812% | 3/15/39 | 67,074 | 67,438 |
| | Verizon Communications Inc. | 4.750% | 11/1/41 | 28,730 | 28,215 |
| | Verizon Communications Inc. | 5.012% | 4/15/49 | 79,842 | 81,505 |
| | Verizon Communications Inc. | 4.672% | 3/15/55 | 12,325 | 11,650 |
| | Viacom Inc. | 5.625% | 9/15/19 | 10,000 | 10,245 |
| | Vodafone Group plc | 3.750% | 1/16/24 | 33,185 | 32,811 |
| | Vodafone Group plc | 4.125% | 5/30/25 | 9,800 | 9,755 |
| | Vodafone Group plc | 5.000% | 5/30/38 | 1,890 | 1,871 |
| | Vodafone Group plc | 5.250% | 5/30/48 | 28,355 | 28,438 |
| | Walt Disney Co. | 4.125% | 6/1/44 | 18,320 | 18,224 |
| | Consumer Cyclical (2.5%) | | | | |
| | Alibaba Group Holding Ltd. | 2.500% | 11/28/19 | 10,480 | 10,427 |
| | Alibaba Group Holding Ltd. | 3.125% | 11/28/21 | 2,035 | 2,009 |
| | Alibaba Group Holding Ltd. | 3.600% | 11/28/24 | 45,610 | 44,812 |
| | Alibaba Group Holding Ltd. | 3.400% | 12/6/27 | 60,380 | 56,319 |
| | Amazon.com Inc. | 2.500% | 11/29/22 | 31,600 | 30,605 |
| | Amazon.com Inc. | 2.800% | 8/22/24 | 26,740 | 25,798 |
| | Amazon.com Inc. | 4.800% | 12/5/34 | 55,880 | 60,954 |
| | Amazon.com Inc. | 4.950% | 12/5/44 | 17,920 | 20,102 |
| | Amazon.com Inc. | 4.250% | 8/22/57 | 52,165 | 51,771 |
| | American Honda Finance Corp. | 2.125% | 10/10/18 | 29,535 | 29,532 |
| | American Honda Finance Corp. | 2.300% | 9/9/26 | 17,135 | 15,450 |
| | AutoZone Inc. | 4.000% | 11/15/20 | 25,000 | 25,353 |
| | AutoZone Inc. | 3.700% | 4/15/22 | 12,752 | 12,800 |
| 7 | BMW US Capital LLC | 2.000% | 4/11/21 | 19,815 | 19,171 |
| 7 | BMW US Capital LLC | 2.250% | 9/15/23 | 93,000 | 86,683 |
| 7 | BMW US Capital LLC | 2.800% | 4/11/26 | 5,395 | 5,010 |
| 4,7 | CVS Pass-Through Trust | 5.926% | 1/10/34 | 13,514 | 14,405 |
| 7 | Daimler Finance North America LLC | 2.250% | 7/31/19 | 58,255 | 57,852 |
| 7 | Daimler Finance North America LLC | 2.450% | 5/18/20 | 8,005 | 7,892 |
| 7 | Daimler Finance North America LLC | 2.300% | 2/12/21 | 34,630 | 33,718 |
| 7 | Daimler Finance North America LLC | 2.000% | 7/6/21 | 60,000 | 57,572 |
| 7 | Daimler Finance North America LLC | 3.875% | 9/15/21 | 3,270 | 3,296 |
| 7 | Daimler Finance North America LLC | 3.250% | 8/1/24 | 3,970 | 3,821 |
| | Ford Motor Credit Co. LLC | 2.375% | 3/12/19 | 56,800 | 56,656 |
| | Ford Motor Credit Co. LLC | 3.157% | 8/4/20 | 23,890 | 23,669 |
| | General Motors Financial Co. Inc. | 3.550% | 4/9/21 | 16,525 | 16,485 |
| | General Motors Financial Co. Inc. | 3.950% | 4/13/24 | 58,730 | 57,149 |
| | Home Depot Inc. | 2.700% | 4/1/23 | 24,715 | 24,074 |
| | Home Depot Inc. | 4.400% | 3/15/45 | 22,390 | 23,290 |
| 7 | Hyundai Capital America | 2.550% | 4/3/20 | 29,410 | 28,924 |
| 7,8 | Hyundai Capital America | 3.261% | 7/8/21 | 50,500 | 50,607 |
| | Lowe's Cos. Inc. | 3.100% | 5/3/27 | 115,000 | 109,441 |
| | Marriott International Inc. | 2.300% | 1/15/22 | 44,000 | 42,180 |
| | McDonald's Corp. | 3.500% | 7/15/20 | 21,760 | 21,867 |
| | McDonald's Corp. | 2.625% | 1/15/22 | 10,175 | 9,905 |
| | McDonald's Corp. | 3.250% | 6/10/24 | 4,400 | 4,293 |
| | McDonald's Corp. | 4.875% | 12/9/45 | 22,775 | 23,776 |
| | Starbucks Corp. | 4.500% | 11/15/48 | 35,130 | 34,226 |
| | Target Corp. | 2.900% | 1/15/22 | 11,850 | 11,759 |
| 7 | Volkswagen Group of America Finance LLC | 2.450% | 11/20/19 | 13,860 | 13,724 |
| | Walmart Inc. | 2.550% | 4/11/23 | 44,450 | 43,048 |
| | Walmart Inc. | 3.550% | 6/26/25 | 56,485 | 56,807 |
| | Walmart Inc. | 3.625% | 12/15/47 | 14,950 | 13,940 |
| | Consumer Noncyclical (6.8%) | | | | |
| | Allergan Funding SCS | 3.450% | 3/15/22 | 23,785 | 23,635 |
| | Allergan Funding SCS | 3.800% | 3/15/25 | 12,825 | 12,558 |
| | Allergan Funding SCS | 4.550% | 3/15/35 | 10,885 | 10,574 |
| | Allergan Funding SCS | 4.850% | 6/15/44 | 14,075 | 13,854 |
| | Altria Group Inc. | 4.750% | 5/5/21 | 40,806 | 42,229 |
| | Altria Group Inc. | 2.850% | 8/9/22 | 11,835 | 11,566 |
| | Altria Group Inc. | 4.500% | 5/2/43 | 10,105 | 9,656 |
| | Altria Group Inc. | 3.875% | 9/16/46 | 22,625 | 19,801 |
9
Vanguard® Wellesley Income Fund
Schedule of Investments
September 30, 2018
| | | | |
| | | | Face | Market |
| | | Maturity | Amount | Value |
| | Coupon | Date | ($000) | ($000) |
| Amgen Inc. | 3.625% | 5/22/24 | 38,185 | 38,162 |
| Amgen Inc. | 5.150% | 11/15/41 | 27,515 | 29,148 |
| Amgen Inc. | 4.663% | 6/15/51 | 9,875 | 9,765 |
| Anheuser-Busch InBev Finance Inc. | 3.300% | 2/1/23 | 63,200 | 62,404 |
| Anheuser-Busch InBev Finance Inc. | 3.650% | 2/1/26 | 57,035 | 55,408 |
| Anheuser-Busch InBev Finance Inc. | 4.700% | 2/1/36 | 129,785 | 129,779 |
| Anheuser-Busch InBev Finance Inc. | 4.900% | 2/1/46 | 137,375 | 138,401 |
| Anheuser-Busch InBev Worldwide Inc. | 6.875% | 11/15/19 | 8,300 | 8,635 |
| Anheuser-Busch InBev Worldwide Inc. | 4.375% | 2/15/21 | 800 | 820 |
| Anheuser-Busch InBev Worldwide Inc. | 3.750% | 1/15/22 | 4,310 | 4,348 |
| Anheuser-Busch InBev Worldwide Inc. | 2.500% | 7/15/22 | 9,836 | 9,491 |
| Anheuser-Busch InBev Worldwide Inc. | 4.375% | 4/15/38 | 23,185 | 22,315 |
| Anheuser-Busch InBev Worldwide Inc. | 4.950% | 1/15/42 | 5,700 | 5,811 |
| Anheuser-Busch InBev Worldwide Inc. | 3.750% | 7/15/42 | 19,080 | 16,500 |
| Anheuser-Busch InBev Worldwide Inc. | 4.600% | 4/15/48 | 14,500 | 14,022 |
| Ascension Health | 3.945% | 11/15/46 | 14,675 | 14,202 |
| 4 Ascension Health | 4.847% | 11/15/53 | 2,165 | 2,377 |
| AstraZeneca plc | 1.950% | 9/18/19 | 12,435 | 12,323 |
| AstraZeneca plc | 2.375% | 11/16/20 | 37,225 | 36,695 |
| AstraZeneca plc | 3.375% | 11/16/25 | 27,755 | 26,782 |
| AstraZeneca plc | 4.000% | 1/17/29 | 33,295 | 32,796 |
| 7 BAT Capital Corp. | 3.557% | 8/15/27 | 60,340 | 56,089 |
| 7 Bayer US Finance II LLC | 4.250% | 12/15/25 | 35,355 | 34,984 |
| 7 Bayer US Finance II LLC | 5.500% | 7/30/35 | 15,000 | 15,314 |
| 7 Bayer US Finance LLC | 2.375% | 10/8/19 | 6,140 | 6,074 |
| 7 Bayer US Finance LLC | 3.000% | 10/8/21 | 38,730 | 37,948 |
| Biogen Inc. | 2.900% | 9/15/20 | 17,465 | 17,333 |
| Cardinal Health Inc. | 2.400% | 11/15/19 | 22,090 | 21,903 |
| Cardinal Health Inc. | 3.200% | 3/15/23 | 11,650 | 11,312 |
| Cardinal Health Inc. | 3.079% | 6/15/24 | 16,720 | 15,797 |
| Cardinal Health Inc. | 3.500% | 11/15/24 | 20,020 | 19,201 |
| Cardinal Health Inc. | 4.500% | 11/15/44 | 23,250 | 20,816 |
| 7 Cargill Inc. | 4.760% | 11/23/45 | 57,879 | 63,394 |
| Catholic Health Initiatives Colorado GO | 2.950% | 11/1/22 | 36,807 | 35,518 |
| Catholic Health Initiatives Colorado GO | 4.200% | 8/1/23 | 11,695 | 11,850 |
| 4 Catholic Health Initiatives Colorado GO | 4.350% | 11/1/42 | 20,970 | 19,089 |
| Celgene Corp. | 2.250% | 5/15/19 | 5,145 | 5,125 |
| Celgene Corp. | 3.550% | 8/15/22 | 15,160 | 15,102 |
| Celgene Corp. | 3.625% | 5/15/24 | 11,980 | 11,799 |
| Celgene Corp. | 5.000% | 8/15/45 | 25,000 | 24,707 |
| Coca-Cola Co. | 4.500% | 9/1/21 | 14,785 | 15,022 |
| Coca-Cola European Partners plc | 3.500% | 9/15/20 | 4,600 | 4,594 |
| Coca-Cola Femsa SAB de CV | 2.375% | 11/26/18 | 11,134 | 11,104 |
| Coca-Cola Femsa SAB de CV | 3.875% | 11/26/23 | 28,000 | 27,920 |
| Colgate-Palmolive Co. | 2.950% | 11/1/20 | 25,000 | 24,883 |
| Constellation Brands Inc. | 2.700% | 5/9/22 | 2,400 | 2,315 |
| CVS Health Corp. | 2.750% | 12/1/22 | 20,000 | 19,298 |
| CVS Health Corp. | 4.875% | 7/20/35 | 18,205 | 18,301 |
| CVS Health Corp. | 5.125% | 7/20/45 | 42,620 | 43,722 |
| CVS Health Corp. | 5.050% | 3/25/48 | 22,175 | 22,627 |
| 7 Danone SA | 2.589% | 11/2/23 | 10,000 | 9,419 |
| 7 Danone SA | 2.947% | 11/2/26 | 40,000 | 36,724 |
| Diageo Capital plc | 2.625% | 4/29/23 | 42,580 | 41,234 |
| Diageo Investment Corp. | 2.875% | 5/11/22 | 17,245 | 16,919 |
| Dignity Health California GO | 2.637% | 11/1/19 | 4,480 | 4,452 |
| Dignity Health California GO | 3.812% | 11/1/24 | 18,560 | 18,426 |
| Eli Lilly & Co. | 3.700% | 3/1/45 | 20,040 | 18,877 |
| 7 EMD Finance LLC | 2.400% | 3/19/20 | 1,100 | 1,085 |
| 7 EMD Finance LLC | 2.950% | 3/19/22 | 19,640 | 19,167 |
| Express Scripts Holding Co. | 2.250% | 6/15/19 | 14,030 | 13,966 |
| 7 Forest Laboratories Inc. | 4.875% | 2/15/21 | 3,312 | 3,403 |
| 7 Forest Laboratories LLC | 5.000% | 12/15/21 | 23,725 | 24,580 |
| General Mills Inc. | 5.650% | 2/15/19 | 6,850 | 6,917 |
| Gilead Sciences Inc. | 2.550% | 9/1/20 | 15,245 | 15,084 |
10
Vanguard® Wellesley Income Fund
Schedule of Investments
September 30, 2018
| | | | |
| | | Maturity | Amount | Value |
| | Coupon | Date | ($000) | ($000) |
| Gilead Sciences Inc. | 2.500% | 9/1/23 | 26,390 | 25,201 |
| Gilead Sciences Inc. | 3.700% | 4/1/24 | 21,420 | 21,477 |
| Gilead Sciences Inc. | 3.500% | 2/1/25 | 28,575 | 28,058 |
| Gilead Sciences Inc. | 4.500% | 2/1/45 | 55,782 | 55,439 |
| Gilead Sciences Inc. | 4.750% | 3/1/46 | 13,200 | 13,506 |
| GlaxoSmithKline Capital Inc. | 2.800% | 3/18/23 | 25,750 | 25,109 |
| GlaxoSmithKline Capital Inc. | 5.375% | 4/15/34 | 16,055 | 18,410 |
| GlaxoSmithKline Capital plc | 2.850% | 5/8/22 | 51,595 | 50,424 |
| 7 Halfmoon Parent Inc. | 4.375% | 10/15/28 | 18,115 | 18,014 |
| 7 Halfmoon Parent Inc. | 4.800% | 8/15/38 | 25,725 | 25,699 |
| 7 Halfmoon Parent Inc. | 4.900% | 12/15/48 | 25,850 | 25,851 |
| 7 Imperial Tobacco Finance plc | 3.750% | 7/21/22 | 58,995 | 58,649 |
| Johnson & Johnson | 6.730% | 11/15/23 | 15,000 | 17,408 |
| Johnson & Johnson | 2.450% | 3/1/26 | 78,000 | 72,722 |
| Kaiser Foundation Hospitals | 3.500% | 4/1/22 | 19,815 | 19,837 |
| Kaiser Foundation Hospitals | 3.150% | 5/1/27 | 18,190 | 17,377 |
| Kaiser Foundation Hospitals | 4.875% | 4/1/42 | 12,710 | 14,044 |
| Kraft Heinz Foods Co. | 3.000% | 6/1/26 | 31,320 | 28,504 |
| Kraft Heinz Foods Co. | 5.000% | 7/15/35 | 7,370 | 7,279 |
| Kraft Heinz Foods Co. | 4.375% | 6/1/46 | 59,110 | 51,917 |
| Kroger Co. | 3.300% | 1/15/21 | 13,605 | 13,553 |
| Kroger Co. | 3.850% | 8/1/23 | 5,055 | 5,060 |
| 4 Mayo Clinic | 4.128% | 11/15/52 | 11,465 | 11,400 |
| McKesson Corp. | 2.700% | 12/15/22 | 7,010 | 6,711 |
| McKesson Corp. | 2.850% | 3/15/23 | 6,840 | 6,545 |
| McKesson Corp. | 3.796% | 3/15/24 | 9,525 | 9,451 |
| Medtronic Inc. | 2.500% | 3/15/20 | 25,335 | 25,148 |
| Medtronic Inc. | 3.150% | 3/15/22 | 61,030 | 60,642 |
| Medtronic Inc. | 3.625% | 3/15/24 | 7,510 | 7,547 |
| Medtronic Inc. | 3.500% | 3/15/25 | 62,791 | 62,275 |
| Medtronic Inc. | 4.375% | 3/15/35 | 21,968 | 22,712 |
| Memorial Sloan-Kettering Cancer Center New York GO | 5.000% | 7/1/42 | 11,505 | 13,048 |
| Memorial Sloan-Kettering Cancer Center New York GO | 4.125% | 7/1/52 | 7,820 | 7,701 |
| Memorial Sloan-Kettering Cancer Center New York GO | 4.200% | 7/1/55 | 5,940 | 5,885 |
| Merck & Co. Inc. | 2.350% | 2/10/22 | 24,825 | 24,153 |
| Merck & Co. Inc. | 2.800% | 5/18/23 | 15,650 | 15,332 |
| Merck & Co. Inc. | 2.750% | 2/10/25 | 38,000 | 36,485 |
| Merck & Co. Inc. | 4.150% | 5/18/43 | 28,405 | 28,933 |
| Merck Sharp & Dohme Corp. | 5.000% | 6/30/19 | 18,000 | 18,318 |
| Molson Coors Brewing Co. | 3.500% | 5/1/22 | 14,905 | 14,793 |
| Mylan NV | 3.950% | 6/15/26 | 32,630 | 30,812 |
| New York & Presbyterian Hospital | 4.024% | 8/1/45 | 22,955 | 22,452 |
| Novartis Capital Corp. | 3.400% | 5/6/24 | 13,425 | 13,436 |
| Novartis Capital Corp. | 4.400% | 5/6/44 | 21,485 | 22,818 |
| Partners Healthcare System Massachusetts GO | 3.443% | 7/1/21 | 2,000 | 2,003 |
| PepsiCo Inc. | 2.375% | 10/6/26 | 72,545 | 66,199 |
| PepsiCo Inc. | 4.000% | 3/5/42 | 35,200 | 34,725 |
| PepsiCo Inc. | 3.450% | 10/6/46 | 45,740 | 41,097 |
| Pfizer Inc. | 3.000% | 6/15/23 | 25,440 | 25,114 |
| Pfizer Inc. | 3.000% | 12/15/26 | 28,400 | 27,230 |
| Pfizer Inc. | 4.100% | 9/15/38 | 52,715 | 52,642 |
| Philip Morris International Inc. | 4.500% | 3/26/20 | 25,000 | 25,477 |
| Philip Morris International Inc. | 1.875% | 2/25/21 | 43,455 | 42,035 |
| Philip Morris International Inc. | 4.125% | 5/17/21 | 15,705 | 16,019 |
| Philip Morris International Inc. | 2.500% | 8/22/22 | 13,250 | 12,778 |
| Philip Morris International Inc. | 2.625% | 3/6/23 | 23,000 | 22,075 |
| Philip Morris International Inc. | 4.500% | 3/20/42 | 11,665 | 11,306 |
| Philip Morris International Inc. | 3.875% | 8/21/42 | 22,785 | 20,260 |
| Philip Morris International Inc. | 4.875% | 11/15/43 | 5,835 | 5,951 |
| Philip Morris International Inc. | 4.250% | 11/10/44 | 15,000 | 14,123 |
| 4 Procter & Gamble - Esop | 9.360% | 1/1/21 | 6,965 | 7,457 |
| Providence St. Joseph Health Obligated Group | 2.746% | 10/1/26 | 18,290 | 16,859 |
| 4 Providence St. Joseph Health Obligated Group | 3.930% | 10/1/48 | 12,030 | 11,314 |
| 7 Roche Holdings Inc. | 2.875% | 9/29/21 | 26,150 | 25,914 |
11
Vanguard® Wellesley Income Fund
Schedule of Investments
September 30, 2018
| | | | |
| | | | Face | Market |
| | | Maturity | Amount | Value |
| | Coupon | Date | ($000) | ($000) |
| 7 Roche Holdings Inc. | 2.375% | 1/28/27 | 61,570 | 55,797 |
| Sanofi | 4.000% | 3/29/21 | 36,275 | 36,953 |
| 7 Sigma Alimentos SA de CV | 4.125% | 5/2/26 | 24,660 | 23,483 |
| 7 South Carolina Electric & Gas Co. | 2.750% | 6/15/20 | 17,600 | 17,422 |
| 7 South Carolina Electric & Gas Co. | 3.250% | 6/7/22 | 50,880 | 49,676 |
| 7 South Carolina Electric & Gas Co. | 3.500% | 6/15/22 | 7,440 | 7,364 |
| 7 South Carolina Electric & Gas Co. | 3.950% | 6/15/25 | 15,000 | 14,650 |
| SSM Health Care Corp. | 3.823% | 6/1/27 | 35,390 | 35,004 |
| Stanford Health Care | 3.795% | 11/15/48 | 8,555 | 8,092 |
| Teva Pharmaceutical Finance Co. BV | 3.650% | 11/10/21 | 6,765 | 6,561 |
| Teva Pharmaceutical Finance Netherlands III BV | 2.800% | 7/21/23 | 36,645 | 32,508 |
| Unilever Capital Corp. | 4.250% | 2/10/21 | 78,185 | 79,915 |
| Wyeth LLC | 5.950% | 4/1/37 | 15,000 | 18,093 |
| Energy (2.0%) | | | | |
| 7 BG Energy Capital plc | 4.000% | 10/15/21 | 17,070 | 17,302 |
| BP Capital Markets plc | 4.750% | 3/10/19 | 18,140 | 18,308 |
| BP Capital Markets plc | 2.315% | 2/13/20 | 3,760 | 3,725 |
| BP Capital Markets plc | 4.500% | 10/1/20 | 28,000 | 28,697 |
| BP Capital Markets plc | 4.742% | 3/11/21 | 10,000 | 10,348 |
| BP Capital Markets plc | 3.062% | 3/17/22 | 35,770 | 35,314 |
| BP Capital Markets plc | 3.245% | 5/6/22 | 10,000 | 9,922 |
| BP Capital Markets plc | 2.500% | 11/6/22 | 8,000 | 7,728 |
| BP Capital Markets plc | 3.994% | 9/26/23 | 13,130 | 13,368 |
| BP Capital Markets plc | 3.814% | 2/10/24 | 38,000 | 38,366 |
| BP Capital Markets plc | 3.506% | 3/17/25 | 41,710 | 41,122 |
| Chevron Corp. | 2.355% | 12/5/22 | 6,000 | 5,754 |
| Chevron Corp. | 3.191% | 6/24/23 | 69,750 | 69,218 |
| ConocoPhillips | 7.000% | 3/30/29 | 11,500 | 13,901 |
| ConocoPhillips Co. | 4.950% | 3/15/26 | 12,710 | 13,716 |
| Dominion Energy Gas Holdings LLC | 3.550% | 11/1/23 | 14,085 | 13,888 |
| Dominion Energy Gas Holdings LLC | 4.800% | 11/1/43 | 14,190 | 14,155 |
| Dominion Energy Gas Holdings LLC | 4.600% | 12/15/44 | 7,003 | 6,901 |
| Enterprise Products Operating LLC | 4.900% | 5/15/46 | 5,000 | 5,147 |
| Enterprise Products Operating LLC | 4.250% | 2/15/48 | 23,475 | 21,913 |
| EOG Resources Inc. | 5.625% | 6/1/19 | 16,285 | 16,584 |
| Exxon Mobil Corp. | 2.222% | 3/1/21 | 12,735 | 12,448 |
| Exxon Mobil Corp. | 2.726% | 3/1/23 | 10,710 | 10,486 |
| Exxon Mobil Corp. | 3.043% | 3/1/26 | 7,330 | 7,077 |
| Exxon Mobil Corp. | 4.114% | 3/1/46 | 10,845 | 10,943 |
| Noble Energy Inc. | 4.150% | 12/15/21 | 14,890 | 15,070 |
| Occidental Petroleum Corp. | 4.100% | 2/1/21 | 27,466 | 27,909 |
| Occidental Petroleum Corp. | 2.700% | 2/15/23 | 9,250 | 8,947 |
| Occidental Petroleum Corp. | 3.400% | 4/15/26 | 13,540 | 13,245 |
| Phillips 66 | 4.300% | 4/1/22 | 30,000 | 30,778 |
| 7 Schlumberger Holdings Corp. | 3.000% | 12/21/20 | 25,500 | 25,315 |
| 7 Schlumberger Investment SA | 2.400% | 8/1/22 | 20,765 | 19,898 |
| Shell International Finance BV | 3.250% | 5/11/25 | 28,680 | 28,104 |
| Shell International Finance BV | 4.125% | 5/11/35 | 40,575 | 40,997 |
| Shell International Finance BV | 5.500% | 3/25/40 | 10,795 | 12,687 |
| Shell International Finance BV | 4.375% | 5/11/45 | 95,725 | 98,264 |
| Suncor Energy Inc. | 3.600% | 12/1/24 | 19,505 | 19,304 |
| Suncor Energy Inc. | 5.950% | 12/1/34 | 13,000 | 14,892 |
| Sunoco Logistics Partners Operations LP | 4.400% | 4/1/21 | 25,945 | 26,366 |
| Texaco Capital Inc. | 8.625% | 4/1/32 | 25,000 | 34,868 |
| Total Capital International SA | 2.700% | 1/25/23 | 32,714 | 31,758 |
| Total Capital International SA | 3.750% | 4/10/24 | 50,000 | 50,413 |
| TransCanada PipeLines Ltd. | 7.125% | 1/15/19 | 4,800 | 4,854 |
| TransCanada PipeLines Ltd. | 3.800% | 10/1/20 | 30,875 | 31,145 |
| TransCanada PipeLines Ltd. | 2.500% | 8/1/22 | 21,165 | 20,268 |
| TransCanada PipeLines Ltd. | 4.875% | 1/15/26 | 58,060 | 60,370 |
| Other Industrial (0.3%) | | | | |
| George Washington University District of Columbia GO | 3.545% | 9/15/46 | 10,000 | 8,959 |
| 7 Hutchison Whampoa International 09/19 Ltd. | 5.750% | 9/11/19 | 12,000 | 12,284 |
12
Vanguard® Wellesley Income Fund
Schedule of Investments
September 30, 2018
| | | | | |
| | | | | Face | Market |
| | | | Maturity | Amount | Value |
| | | Coupon | Date | ($000) | ($000) |
| 4 | Johns Hopkins University Maryland GO | 4.083% | 7/1/53 | 24,695 | 23,969 |
| 7 | SBA Tower Trust | 3.168% | 4/11/22 | 49,780 | 48,820 |
| 7 | SBA Tower Trust | 3.448% | 3/15/23 | 28,730 | 28,306 |
| 4,7 | SBA Tower Trust | 2.898% | 10/15/44 | 37,250 | 36,960 |
| | Technology (3.4%) | | | | |
| | Apple Inc. | 2.850% | 2/23/23 | 43,845 | 43,033 |
| | Apple Inc. | 3.000% | 2/9/24 | 22,750 | 22,290 |
| | Apple Inc. | 3.450% | 5/6/24 | 31,140 | 31,130 |
| | Apple Inc. | 2.850% | 5/11/24 | 45,635 | 44,189 |
| | Apple Inc. | 2.750% | 1/13/25 | 21,615 | 20,715 |
| | Apple Inc. | 3.250% | 2/23/26 | 38,220 | 37,324 |
| | Apple Inc. | 2.450% | 8/4/26 | 55,182 | 50,795 |
| | Apple Inc. | 3.350% | 2/9/27 | 56,435 | 55,090 |
| | Apple Inc. | 3.200% | 5/11/27 | 39,750 | 38,313 |
| | Apple Inc. | 2.900% | 9/12/27 | 83,420 | 78,597 |
| | Apple Inc. | 3.850% | 5/4/43 | 15,275 | 14,641 |
| | Apple Inc. | 4.450% | 5/6/44 | 4,035 | 4,231 |
| | Apple Inc. | 3.850% | 8/4/46 | 36,510 | 34,885 |
| | Applied Materials Inc. | 3.300% | 4/1/27 | 32,395 | 31,083 |
| | Broadcom Corp. / Broadcom Cayman Finance Ltd. | 3.625% | 1/15/24 | 36,975 | 35,947 |
| | Cisco Systems Inc. | 2.500% | 9/20/26 | 15,921 | 14,724 |
| | Intel Corp. | 2.875% | 5/11/24 | 29,825 | 28,918 |
| | Intel Corp. | 4.100% | 5/19/46 | 47,755 | 47,227 |
| | International Business Machines Corp. | 3.375% | 8/1/23 | 61,300 | 61,350 |
| | International Business Machines Corp. | 3.625% | 2/12/24 | 22,800 | 22,875 |
| | International Business Machines Corp. | 7.000% | 10/30/25 | 25,000 | 29,916 |
| | Microsoft Corp. | 2.375% | 2/12/22 | 19,865 | 19,374 |
| | Microsoft Corp. | 3.625% | 12/15/23 | 13,500 | 13,717 |
| | Microsoft Corp. | 2.875% | 2/6/24 | 61,625 | 60,243 |
| | Microsoft Corp. | 2.700% | 2/12/25 | 23,890 | 22,882 |
| | Microsoft Corp. | 3.125% | 11/3/25 | 26,300 | 25,679 |
| | Microsoft Corp. | 2.400% | 8/8/26 | 64,501 | 59,357 |
| | Microsoft Corp. | 3.450% | 8/8/36 | 53,965 | 51,330 |
| | Microsoft Corp. | 4.100% | 2/6/37 | 45,435 | 46,918 |
| | Microsoft Corp. | 4.500% | 10/1/40 | 18,210 | 19,534 |
| | Microsoft Corp. | 4.450% | 11/3/45 | 61,885 | 66,251 |
| | Microsoft Corp. | 3.700% | 8/8/46 | 50,485 | 48,281 |
| | Microsoft Corp. | 4.250% | 2/6/47 | 61,800 | 64,834 |
| | Oracle Corp. | 5.000% | 7/8/19 | 35,000 | 35,586 |
| | Oracle Corp. | 1.900% | 9/15/21 | 70,285 | 67,839 |
| | Oracle Corp. | 2.500% | 5/15/22 | 38,860 | 37,799 |
| | Oracle Corp. | 2.400% | 9/15/23 | 63,535 | 60,532 |
| | Oracle Corp. | 2.950% | 11/15/24 | 80,105 | 77,197 |
| | Oracle Corp. | 2.950% | 5/15/25 | 11,300 | 10,836 |
| | Oracle Corp. | 3.250% | 11/15/27 | 112,120 | 107,789 |
| | Oracle Corp. | 4.000% | 11/15/47 | 32,260 | 30,609 |
| | QUALCOMM Inc. | 2.600% | 1/30/23 | 26,140 | 25,104 |
| | QUALCOMM Inc. | 2.900% | 5/20/24 | 38,055 | 36,339 |
| 7 | Tencent Holdings Ltd. | 3.595% | 1/19/28 | 57,625 | 53,988 |
| | Transportation (0.5%) | | | | |
| | Burlington Northern Santa Fe LLC | 3.050% | 3/15/22 | 7,235 | 7,152 |
| | Burlington Northern Santa Fe LLC | 3.250% | 6/15/27 | 17,530 | 17,095 |
| | CSX Corp. | 4.300% | 3/1/48 | 16,635 | 16,209 |
| 7 | ERAC USA Finance LLC | 2.350% | 10/15/19 | 12,165 | 12,032 |
| 7 | ERAC USA Finance LLC | 4.500% | 8/16/21 | 10,270 | 10,499 |
| 7 | ERAC USA Finance LLC | 3.300% | 10/15/22 | 745 | 731 |
| 7 | ERAC USA Finance LLC | 7.000% | 10/15/37 | 3,775 | 4,680 |
| 7 | ERAC USA Finance LLC | 5.625% | 3/15/42 | 31,000 | 33,703 |
| | FedEx Corp. | 2.700% | 4/15/23 | 15,810 | 15,113 |
| | FedEx Corp. | 5.100% | 1/15/44 | 26,055 | 26,965 |
| | Kansas City Southern | 4.950% | 8/15/45 | 13,845 | 13,787 |
| 7 | Penske Truck Leasing Co. LP / PTL Finance Corp. | 3.950% | 3/10/25 | 53,520 | 52,228 |
| 4 | United Airlines 2018-1 Class B Pass Through Trust | 4.600% | 3/1/26 | 7,850 | 7,795 |
13
Vanguard® Wellesley Income Fund
Schedule of Investments
September 30, 2018
| | | | | |
| | | | | Face | Market |
| | | | Maturity | Amount | Value |
| | | Coupon | Date | ($000) | ($000) |
| | United Parcel Service Inc. | 2.450% | 10/1/22 | 17,095 | 16,514 |
| | United Parcel Service Inc. | 4.875% | 11/15/40 | 4,925 | 5,425 |
| | | | | | 10,652,981 |
| Utilities (4.9%) | | | | |
| | Electric (4.3%) | | | | |
| | Alabama Power Co. | 5.200% | 6/1/41 | 3,365 | 3,599 |
| | Alabama Power Co. | 4.100% | 1/15/42 | 5,595 | 5,299 |
| | Alabama Power Co. | 3.750% | 3/1/45 | 20,255 | 18,605 |
| | Alabama Power Co. | 4.300% | 7/15/48 | 27,790 | 27,796 |
| | Ameren Illinois Co. | 2.700% | 9/1/22 | 58,000 | 56,386 |
| | Ameren Illinois Co. | 3.800% | 5/15/28 | 22,365 | 22,447 |
| | Ameren Illinois Co. | 3.700% | 12/1/47 | 5,085 | 4,701 |
| | Baltimore Gas & Electric Co. | 2.800% | 8/15/22 | 26,250 | 25,519 |
| | Baltimore Gas & Electric Co. | 2.400% | 8/15/26 | 20,945 | 18,881 |
| | Berkshire Hathaway Energy Co. | 6.125% | 4/1/36 | 32,917 | 39,849 |
| | Berkshire Hathaway Energy Co. | 5.150% | 11/15/43 | 10,725 | 11,708 |
| | Commonwealth Edison Co. | 2.950% | 8/15/27 | 23,275 | 21,774 |
| | Commonwealth Edison Co. | 4.350% | 11/15/45 | 6,815 | 6,872 |
| | Commonwealth Edison Co. | 3.650% | 6/15/46 | 6,420 | 5,818 |
| | Commonwealth Edison Co. | 4.000% | 3/1/48 | 17,900 | 17,216 |
| | Consolidated Edison Co. of New York Inc. | 5.850% | 3/15/36 | 9,500 | 11,195 |
| | Consolidated Edison Co. of New York Inc. | 6.300% | 8/15/37 | 45,000 | 56,026 |
| | Consolidated Edison Co. of New York Inc. | 4.500% | 12/1/45 | 30,855 | 31,546 |
| | Consolidated Edison Co. of New York Inc. | 3.850% | 6/15/46 | 2,752 | 2,558 |
| | Consolidated Edison Co. of New York Inc. | 4.625% | 12/1/54 | 24,915 | 25,124 |
| | Consolidated Edison Co. of New York Inc. | 4.500% | 5/15/58 | 24,475 | 24,170 |
| | Delmarva Power & Light Co. | 3.500% | 11/15/23 | 9,550 | 9,498 |
| 10 | Dominion Energy Inc. | 2.962% | 7/1/19 | 17,030 | 17,013 |
| | Dominion Energy Inc. | 2.579% | 7/1/20 | 12,040 | 11,873 |
| | Dominion Energy Inc. | 4.450% | 3/15/21 | 30,000 | 30,520 |
| | Dominion Energy Inc. | 3.625% | 12/1/24 | 23,850 | 23,331 |
| | DTE Energy Co. | 3.800% | 3/15/27 | 19,405 | 18,947 |
| | Duke Energy Carolinas LLC | 3.900% | 6/15/21 | 11,045 | 11,214 |
| | Duke Energy Carolinas LLC | 6.000% | 12/1/28 | 5,000 | 5,790 |
| | Duke Energy Carolinas LLC | 6.100% | 6/1/37 | 13,915 | 16,870 |
| | Duke Energy Carolinas LLC | 6.050% | 4/15/38 | 4,000 | 4,933 |
| | Duke Energy Carolinas LLC | 4.250% | 12/15/41 | 6,375 | 6,368 |
| | Duke Energy Carolinas LLC | 4.000% | 9/30/42 | 5,205 | 5,028 |
| | Duke Energy Carolinas LLC | 3.700% | 12/1/47 | 17,220 | 15,623 |
| | Duke Energy Corp. | 2.650% | 9/1/26 | 17,480 | 15,844 |
| | Duke Energy Corp. | 4.800% | 12/15/45 | 37,600 | 38,539 |
| | Duke Energy Corp. | 3.750% | 9/1/46 | 14,740 | 12,999 |
| | Duke Energy Progress LLC | 2.800% | 5/15/22 | 20,140 | 19,747 |
| | Duke Energy Progress LLC | 6.300% | 4/1/38 | 1,625 | 2,022 |
| | Duke Energy Progress LLC | 4.100% | 3/15/43 | 6,221 | 6,101 |
| | Duke Energy Progress LLC | 4.200% | 8/15/45 | 61,923 | 61,065 |
| | Entergy Corp. | 2.950% | 9/1/26 | 7,085 | 6,506 |
| | Entergy Louisiana LLC | 3.120% | 9/1/27 | 10,065 | 9,483 |
| | Eversource Energy | 4.500% | 11/15/19 | 1,880 | 1,906 |
| | Eversource Energy | 2.900% | 10/1/24 | 25,155 | 23,854 |
| | Eversource Energy | 3.150% | 1/15/25 | 6,775 | 6,507 |
| | Eversource Energy | 3.300% | 1/15/28 | 14,490 | 13,662 |
| | Florida Power & Light Co. | 6.200% | 6/1/36 | 12,452 | 15,399 |
| | Florida Power & Light Co. | 5.950% | 2/1/38 | 10,000 | 12,259 |
| | Florida Power & Light Co. | 5.690% | 3/1/40 | 4,994 | 5,985 |
| | Florida Power & Light Co. | 5.250% | 2/1/41 | 29,745 | 34,066 |
| | Florida Power & Light Co. | 4.125% | 2/1/42 | 20,000 | 20,023 |
| | Florida Power & Light Co. | 3.700% | 12/1/47 | 27,690 | 25,778 |
| | Fortis Inc. | 3.055% | 10/4/26 | 44,365 | 40,703 |
| | Georgia Power Co. | 4.750% | 9/1/40 | 22,910 | 23,137 |
| | Georgia Power Co. | 4.300% | 3/15/42 | 46,232 | 43,764 |
| | Indiana Michigan Power Co. | 4.250% | 8/15/48 | 14,590 | 14,423 |
| 7 | Massachusetts Electric Co. | 5.900% | 11/15/39 | 21,895 | 26,087 |
14
Vanguard® Wellesley Income Fund
Schedule of Investments
September 30, 2018
| | | | |
| | | | Face | Market |
| | | Maturity | Amount | Value |
| | Coupon | Date | ($000) | ($000) |
| MidAmerican Energy Co. | 5.750% | 11/1/35 | 9,925 | 11,724 |
| MidAmerican Energy Co. | 4.250% | 5/1/46 | 14,675 | 14,753 |
| 7 Monongahela Power Co. | 4.100% | 4/15/24 | 11,000 | 11,187 |
| National Rural Utilities Cooperative Finance Corp. | 3.050% | 2/15/22 | 13,800 | 13,644 |
| National Rural Utilities Cooperative Finance Corp. | 2.950% | 2/7/24 | 15,355 | 14,790 |
| National Rural Utilities Cooperative Finance Corp. | 2.850% | 1/27/25 | 32,210 | 30,637 |
| NextEra Energy Capital Holdings Inc. | 2.700% | 9/15/19 | 30,500 | 30,414 |
| NextEra Energy Capital Holdings Inc. | 3.550% | 5/1/27 | 32,950 | 31,617 |
| Oglethorpe Power Corp. | 5.950% | 11/1/39 | 5,145 | 6,031 |
| Oglethorpe Power Corp. | 4.550% | 6/1/44 | 1,835 | 1,806 |
| Oglethorpe Power Corp. | 4.250% | 4/1/46 | 20,029 | 18,394 |
| Oglethorpe Power Corp. | 5.250% | 9/1/50 | 17,225 | 18,492 |
| Oklahoma Gas & Electric Co. | 6.500% | 4/15/28 | 10,000 | 11,559 |
| Oncor Electric Delivery Co. LLC | 4.100% | 6/1/22 | 13,935 | 14,226 |
| Oncor Electric Delivery Co. LLC | 2.950% | 4/1/25 | 31,858 | 30,589 |
| Oncor Electric Delivery Co. LLC | 5.250% | 9/30/40 | 11,325 | 12,903 |
| Oncor Electric Delivery Co. LLC | 4.550% | 12/1/41 | 3,275 | 3,455 |
| Pacific Gas & Electric Co. | 4.250% | 5/15/21 | 8,335 | 8,431 |
| Pacific Gas & Electric Co. | 2.450% | 8/15/22 | 45,000 | 42,729 |
| Pacific Gas & Electric Co. | 2.950% | 3/1/26 | 4,875 | 4,434 |
| Pacific Gas & Electric Co. | 6.050% | 3/1/34 | 5,165 | 5,814 |
| Pacific Gas & Electric Co. | 5.800% | 3/1/37 | 40,866 | 45,407 |
| Pacific Gas & Electric Co. | 6.350% | 2/15/38 | 2,435 | 2,844 |
| Pacific Gas & Electric Co. | 6.250% | 3/1/39 | 13,940 | 16,022 |
| Pacific Gas & Electric Co. | 5.400% | 1/15/40 | 71,295 | 75,997 |
| Pacific Gas & Electric Co. | 3.750% | 8/15/42 | 35,460 | 30,305 |
| Pacific Gas & Electric Co. | 5.125% | 11/15/43 | 11,370 | 11,623 |
| Pacific Gas & Electric Co. | 4.750% | 2/15/44 | 11,720 | 11,421 |
| Pacific Gas & Electric Co. | 4.300% | 3/15/45 | 2,525 | 2,313 |
| Pacific Gas & Electric Co. | 4.000% | 12/1/46 | 9,835 | 8,562 |
| Pacific Gas & Electric Co. | 3.950% | 12/1/47 | 9,092 | 7,913 |
| PacifiCorp | 2.950% | 6/1/23 | 14,835 | 14,483 |
| PacifiCorp | 3.600% | 4/1/24 | 20,000 | 19,925 |
| PacifiCorp | 3.350% | 7/1/25 | 15,354 | 14,978 |
| PacifiCorp | 5.750% | 4/1/37 | 14,188 | 16,861 |
| Potomac Electric Power Co. | 3.050% | 4/1/22 | 4,235 | 4,134 |
| Potomac Electric Power Co. | 6.500% | 11/15/37 | 8,000 | 10,122 |
| PPL Electric Utilities Corp. | 2.500% | 9/1/22 | 12,830 | 12,348 |
| PPL Electric Utilities Corp. | 6.250% | 5/15/39 | 2,675 | 3,363 |
| Progress Energy Inc. | 3.150% | 4/1/22 | 20,800 | 20,471 |
| Public Service Electric & Gas Co. | 3.500% | 8/15/20 | 10,000 | 10,037 |
| Puget Sound Energy Inc. | 4.434% | 11/15/41 | 19,880 | 20,039 |
| Sierra Pacific Power Co. | 2.600% | 5/1/26 | 8,027 | 7,376 |
| South Carolina Electric & Gas Co. | 3.500% | 8/15/21 | 22,030 | 21,962 |
| South Carolina Electric & Gas Co. | 4.250% | 8/15/28 | 24,205 | 24,043 |
| South Carolina Electric & Gas Co. | 6.625% | 2/1/32 | 2,482 | 2,912 |
| South Carolina Electric & Gas Co. | 5.300% | 5/15/33 | 1,446 | 1,519 |
| South Carolina Electric & Gas Co. | 6.050% | 1/15/38 | 23,085 | 26,070 |
| South Carolina Electric & Gas Co. | 5.450% | 2/1/41 | 9,627 | 10,290 |
| South Carolina Electric & Gas Co. | 4.350% | 2/1/42 | 32,530 | 31,116 |
| South Carolina Electric & Gas Co. | 4.600% | 6/15/43 | 6,830 | 6,773 |
| South Carolina Electric & Gas Co. | 4.100% | 6/15/46 | 11,210 | 10,375 |
| South Carolina Electric & Gas Co. | 4.500% | 6/1/64 | 3,490 | 3,197 |
| South Carolina Electric & Gas Co. | 5.100% | 6/1/65 | 25,065 | 25,121 |
| Southern California Edison Co. | 3.875% | 6/1/21 | 24,860 | 25,074 |
| Southern California Edison Co. | 2.400% | 2/1/22 | 8,270 | 7,959 |
| Southern California Edison Co. | 3.700% | 8/1/25 | 3,225 | 3,207 |
| Southern California Edison Co. | 5.750% | 4/1/35 | 5,000 | 5,724 |
| Southern California Edison Co. | 6.050% | 3/15/39 | 1,995 | 2,383 |
| Southern California Edison Co. | 4.500% | 9/1/40 | 5,150 | 5,202 |
| Southern California Edison Co. | 4.050% | 3/15/42 | 15,788 | 14,969 |
| Southern California Edison Co. | 3.900% | 3/15/43 | 8,782 | 8,107 |
| Southern California Edison Co. | 4.650% | 10/1/43 | 16,770 | 17,306 |
| Southern California Edison Co. | 3.600% | 2/1/45 | 8,160 | 7,245 |
15
Vanguard® Wellesley Income Fund
Schedule of Investments
September 30, 2018
| | | | | |
| | | | | Face | Market |
| | | | Maturity | Amount | Value |
| | | Coupon | Date | ($000) | ($000) |
| | Southern California Edison Co. | 4.000% | 4/1/47 | 257 | 240 |
| | Southern California Edison Co. | 4.125% | 3/1/48 | 64,754 | 61,848 |
| | Southern Co. | 2.950% | 7/1/23 | 44,985 | 43,117 |
| | Southwestern Electric Power Co. | 2.750% | 10/1/26 | 15,000 | 13,714 |
| | Southwestern Electric Power Co. | 6.200% | 3/15/40 | 9,800 | 11,629 |
| | Southwestern Public Service Co. | 3.700% | 8/15/47 | 3,790 | 3,482 |
| | Tampa Electric Co. | 2.600% | 9/15/22 | 20,205 | 19,419 |
| | Virginia Electric & Power Co. | 3.500% | 3/15/27 | 40,765 | 39,848 |
| | Virginia Electric & Power Co. | 6.000% | 5/15/37 | 9,435 | 11,384 |
| | Wisconsin Electric Power Co. | 5.700% | 12/1/36 | 13,825 | 16,289 |
| | Xcel Energy Inc. | 3.350% | 12/1/26 | 33,370 | 31,795 |
| | Natural Gas (0.5%) | | | | |
| 7 | Boston Gas Co. | 3.150% | 8/1/27 | 8,010 | 7,551 |
| 7 | Brooklyn Union Gas Co. | 4.273% | 3/15/48 | 63,125 | 62,443 |
| | CenterPoint Energy Resources Corp. | 4.500% | 1/15/21 | 3,800 | 3,866 |
| | CenterPoint Energy Resources Corp. | 6.625% | 11/1/37 | 4,406 | 5,373 |
| 7 | Infraestructura Energetica Nova SAB de CV | 4.875% | 1/14/48 | 16,735 | 14,464 |
| 7 | KeySpan Gas East Corp. | 2.742% | 8/15/26 | 37,580 | 34,573 |
| 7 | KeySpan Gas East Corp. | 5.819% | 4/1/41 | 5,060 | 6,016 |
| | NiSource Finance Corp. | 6.250% | 12/15/40 | 10,000 | 11,594 |
| | Nisource Finance Corp. | 5.250% | 2/15/43 | 13,546 | 14,381 |
| | NiSource Finance Corp. | 4.800% | 2/15/44 | 8,500 | 8,591 |
| | Sempra Energy | 2.850% | 11/15/20 | 11,900 | 11,750 |
| | Sempra Energy | 2.875% | 10/1/22 | 14,066 | 13,640 |
| | Sempra Energy | 6.000% | 10/15/39 | 36,184 | 41,543 |
| | Southern California Gas Co. | 2.600% | 6/15/26 | 28,885 | 26,581 |
| | Other Utility (0.1%) | | | | |
| | American Water Capital Corp. | 2.950% | 9/1/27 | 20,245 | 18,866 |
| | American Water Capital Corp. | 4.200% | 9/1/48 | 28,425 | 27,861 |
| |
| | | | | | 2,620,541 |
| |
| Total Corporate Bonds (Cost $23,007,624) | | | | 22,708,577 |
| |
| Sovereign Bonds (3.2%) | | | | |
| 7 | CDP Financial Inc. | 4.400% | 11/25/19 | 22,000 | 22,351 |
| 7 | Electricite de France SA | 4.600% | 1/27/20 | 31,972 | 32,568 |
| 7 | Electricite de France SA | 4.875% | 9/21/38 | 81,600 | 79,662 |
| 7 | Electricite de France SA | 4.875% | 1/22/44 | 2,910 | 2,810 |
| 7 | Electricite de France SA | 4.950% | 10/13/45 | 12,500 | 12,179 |
| | Equinor ASA | 2.250% | 11/8/19 | 16,095 | 15,974 |
| | Equinor ASA | 2.900% | 11/8/20 | 22,450 | 22,335 |
| | Equinor ASA | 2.750% | 11/10/21 | 31,091 | 30,623 |
| | Equinor ASA | 2.450% | 1/17/23 | 10,840 | 10,438 |
| | Equinor ASA | 2.650% | 1/15/24 | 10,105 | 9,686 |
| | Equinor ASA | 3.700% | 3/1/24 | 20,035 | 20,185 |
| | Equinor ASA | 3.250% | 11/10/24 | 22,425 | 22,027 |
| | Export-Import Bank of Korea | 1.750% | 5/26/19 | 70,100 | 69,576 |
| 13 | Japan Bank for International Cooperation | 2.250% | 2/24/20 | 53,298 | 52,760 |
| 13 | Japan Bank for International Cooperation | 2.125% | 6/1/20 | 21,888 | 21,529 |
| 13 | Japan Bank for International Cooperation | 2.125% | 7/21/20 | 40,500 | 39,789 |
| 12 | Japan Treasury Discount Bill | 0.000% | 10/15/18 | 1,460,000 | 12,855 |
| 12 | Japan Treasury Discount Bill | 0.000% | 10/29/18 | 13,777,000 | 121,203 |
| 7 | Kingdom of Saudi Arabia | 2.375% | 10/26/21 | 31,570 | 30,463 |
| 7 | Kingdom of Saudi Arabia | 2.875% | 3/4/23 | 49,100 | 47,390 |
| 7 | Kingdom of Saudi Arabia | 4.000% | 4/17/25 | 45,170 | 45,211 |
| | Korea Development Bank | 2.500% | 3/11/20 | 62,550 | 61,589 |
| 7 | Petroleos Mexicanos | 6.350% | 2/12/48 | 34,590 | 31,648 |
| 11 | Province of British Columbia | 0.000% | 10/10/18 | 33,460 | 25,893 |
| | Province of Ontario | 4.400% | 4/14/20 | 48,000 | 48,954 |
| | Province of Ontario | 2.500% | 4/27/26 | 100,400 | 94,196 |
| | Province of Quebec | 2.500% | 4/20/26 | 134,755 | 126,964 |
| 7 | Sinopec Group Overseas Development 2015 Ltd. | 2.500% | 4/28/20 | 51,685 | 50,774 |
| 7 | Sinopec Group Overseas Development 2015 Ltd. | 3.250% | 4/28/25 | 51,685 | 48,595 |
16
Vanguard® Wellesley Income Fund
Schedule of Investments
September 30, 2018
| | | | | |
| | | | | Face | Market |
| | | | Maturity | Amount | Value |
| | | Coupon | Date | ($000) | ($000) |
| 7 | Sinopec Group Overseas Development 2016 Ltd. | 3.500% | 5/3/26 | 28,000 | 26,538 |
| 7 | Sinopec Group Overseas Development 2017 Ltd. | 3.000% | 4/12/22 | 31,520 | 30,689 |
| 7 | State Grid Overseas Investment 2014 Ltd. | 2.750% | 5/7/19 | 41,455 | 41,351 |
| 7 | State Grid Overseas Investment 2016 Ltd. | 2.750% | 5/4/22 | 63,500 | 61,434 |
| 7 | State Grid Overseas Investment 2016 Ltd. | 3.500% | 5/4/27 | 29,070 | 27,728 |
| 7 | State of Kuwait | 2.750% | 3/20/22 | 4,315 | 4,212 |
| 7 | State of Qatar | 5.250% | 1/20/20 | 53,470 | 54,870 |
| 7 | State of Qatar | 2.375% | 6/2/21 | 55,255 | 53,735 |
| 7 | State of Qatar | 3.875% | 4/23/23 | 72,530 | 73,068 |
| 7 | State of Qatar | 5.103% | 4/23/48 | 30,000 | 31,145 |
| 7 | Temasek Financial I Ltd. | 2.375% | 1/23/23 | 39,070 | 37,439 |
| 7 | Temasek Financial I Ltd. | 3.625% | 8/1/28 | 36,135 | 35,954 |
| |
| Total Sovereign Bonds (Cost $1,720,335) | | | | 1,688,390 |
| |
| Taxable Municipal Bonds (3.0%) | | | | |
| | Bay Area Toll Authority California Toll Bridge Revenue | | | | |
| | (San Francisco Bay Area) | 6.263% | 4/1/49 | 27,625 | 37,689 |
| | Bay Area Toll Authority California Toll Bridge Revenue | | | | |
| | (San Francisco Bay Area) | 7.043% | 4/1/50 | 28,955 | 42,417 |
| | California GO | 5.700% | 11/1/21 | 15,655 | 16,863 |
| | California GO | 7.500% | 4/1/34 | 5,845 | 8,082 |
| | California GO | 7.550% | 4/1/39 | 32,345 | 47,210 |
| | California GO | 7.300% | 10/1/39 | 4,460 | 6,227 |
| | California GO | 7.350% | 11/1/39 | 61,000 | 85,668 |
| | California GO | 7.625% | 3/1/40 | 1,035 | 1,507 |
| | California GO | 7.600% | 11/1/40 | 42,545 | 63,232 |
| | Chicago IL Metropolitan Water Reclamation District GO | 5.720% | 12/1/38 | 4,445 | 5,366 |
| | Chicago IL O'Hare International Airport Revenue | 6.845% | 1/1/38 | 14,590 | 15,162 |
| | Chicago IL O'Hare International Airport Revenue | 6.395% | 1/1/40 | 13,390 | 17,201 |
| | Chicago IL Transit Authority Sales Tax Receipts | | | | |
| | Revenue | 6.200% | 12/1/40 | 1,790 | 2,167 |
| | Chicago IL Transit Authority Sales Tax Receipts | | | | |
| | Revenue | 6.899% | 12/1/40 | 24,650 | 31,333 |
| | Chicago IL Transit Authority Transfer Tax Receipts | | | | |
| | Revenue | 6.899% | 12/1/40 | 59,990 | 76,254 |
| | Dallas TX Area Rapid Transit Revenue | 5.999% | 12/1/44 | 22,485 | 29,015 |
| | District of Columbia Income Tax Revenue | 5.591% | 12/1/34 | 6,480 | 7,461 |
| | Duke University North Carolina Revenue | 5.850% | 4/1/37 | 62,165 | 77,434 |
| | Georgia Municipal Electric Power Authority Revenue | 6.637% | 4/1/57 | 52,038 | 61,383 |
| | Georgia Municipal Electric Power Authority Revenue | 6.655% | 4/1/57 | 6,950 | 8,226 |
| | Houston TX GO | 6.290% | 3/1/32 | 16,050 | 18,457 |
| | Illinois GO | 5.100% | 6/1/33 | 45,890 | 44,043 |
| | Illinois Toll Highway Authority Revenue | 6.184% | 1/1/34 | 16,525 | 20,305 |
| | Kansas Development Finance Authority Revenue | 4.927% | 4/15/45 | 44,540 | 47,844 |
| | Los Angeles CA Community College District GO | 6.750% | 8/1/49 | 12,915 | 18,667 |
| | Los Angeles CA Department of Water & Power | | | | |
| | Revenue | 6.574% | 7/1/45 | 28,590 | 39,316 |
| | Los Angeles CA Unified School District GO | 5.750% | 7/1/34 | 30,000 | 35,485 |
| | Louisville & Jefferson County KY Metropolitan Sewer | | | | |
| | District Sewer & Drainage System Revenue | 6.250% | 5/15/43 | 11,000 | 14,337 |
| | Maryland Transportation Authority Facilities Projects | | | | |
| | Revenue | 5.888% | 7/1/43 | 12,005 | 14,915 |
| | Massachusetts School Building Authority Dedicated | | | | |
| | Sales Tax Revenue | 5.715% | 8/15/39 | 15,000 | 17,896 |
| | Municipal Electric Authority of Georgia | 4.430% | 1/1/22 | 7,795 | 7,969 |
| | New Jersey Turnpike Authority Revenue | 7.414% | 1/1/40 | 28,975 | 41,457 |
| | New Jersey Turnpike Authority Revenue | 7.102% | 1/1/41 | 2,000 | 2,756 |
| | New York City NY Municipal Water Finance Authority | | | | |
| | Water & Sewer System Revenue | 5.790% | 6/15/41 | 1,805 | 1,876 |
| | New York City NY Municipal Water Finance Authority | | | | |
| | Water & Sewer System Revenue | 5.882% | 6/15/44 | 12,820 | 16,263 |
| | New York Metropolitan Transportation Authority | | | | |
| | Revenue | 6.814% | 11/15/40 | 5,600 | 7,384 |
17
Vanguard® Wellesley Income Fund
Schedule of Investments
September 30, 2018
| | | | | |
| | | | | Face | Market |
| | | | Maturity | Amount | Value |
| | | Coupon | Date | ($000) | ($000) |
| | New York Metropolitan Transportation Authority | | | | |
| | Revenue (Dedicated Tax Fund) | 7.336% | 11/15/39 | 2,430 | 3,465 |
| | New York Metropolitan Transportation Authority | | | | |
| | Revenue (Dedicated Tax Fund) | 6.089% | 11/15/40 | 16,940 | 21,067 |
| | New York State Thruway Authority Revenue | 5.883% | 4/1/30 | 29,670 | 34,429 |
| | New York State Urban Development Corp. Revenue | 2.100% | 3/15/22 | 113,235 | 110,951 |
| | North Texas Tollway Authority System Revenue | 6.718% | 1/1/49 | 31,790 | 44,680 |
| | Oregon Department of Transportation Highway User | | | | |
| | Tax Revenue | 5.834% | 11/15/34 | 14,510 | 17,537 |
| 14 | Oregon School Boards Association GO | 4.759% | 6/30/28 | 15,000 | 15,838 |
| | Port Authority of New York & New Jersey Revenue | 5.859% | 12/1/24 | 9,605 | 10,880 |
| | Port Authority of New York & New Jersey Revenue | 6.040% | 12/1/29 | 5,665 | 6,741 |
| | Port Authority of New York & New Jersey Revenue | 4.458% | 10/1/62 | 58,000 | 60,104 |
| | Port Authority of New York & New Jersey Revenue | 4.810% | 10/15/65 | 10,910 | 11,908 |
| | Princeton University New Jersey GO | 5.700% | 3/1/39 | 13,020 | 16,067 |
| | Regents of the University of California Revenue | 3.063% | 7/1/25 | 49,360 | 47,904 |
| | San Antonio TX Electric & Gas Systems Revenue | 5.985% | 2/1/39 | 6,175 | 7,848 |
| | Texas Transportation Commission Revenue | 5.178% | 4/1/30 | 12,275 | 13,809 |
| | University of California Regents Medical Center | | | | |
| | Revenue | 6.548% | 5/15/48 | 20,485 | 26,826 |
| | University of California Regents Medical Center | | | | |
| | Revenue | 6.583% | 5/15/49 | 18,160 | 23,807 |
| | University of California Revenue | 4.601% | 5/15/31 | 19,390 | 20,560 |
| | University of California Revenue | 5.770% | 5/15/43 | 23,675 | 28,684 |
| | University of California Revenue | 4.765% | 5/15/44 | 4,740 | 4,982 |
| | University of California Revenue | 3.931% | 5/15/45 | 18,275 | 17,669 |
| | Wisconsin Annual Appropriation Revenue | 3.954% | 5/1/36 | 28,325 | 27,977 |
| 15 | Wisconsin GO | 5.700% | 5/1/26 | 9,000 | 9,859 |
| |
| Total Taxable Municipal Bonds (Cost $1,428,933) | | | | 1,572,459 |
| | |
| | Shares | |
| |
| Common Stocks (37.5%) | | |
| Consumer Discretionary (1.7%) | | |
| Comcast Corp. Class A | 11,662,133 | 412,956 |
| McDonald's Corp. | 1,321,658 | 221,100 |
| Home Depot Inc. | 949,496 | 196,688 |
| Cie Generale des Etablissements Michelin SCA | 751,408 | 89,686 |
| | | 920,430 |
| Consumer Staples (4.7%) | | |
| Philip Morris International Inc. | 6,187,171 | 504,502 |
| Unilever NV | 7,149,302 | 397,144 |
| Coca-Cola Co. | 7,410,851 | 342,307 |
| Procter & Gamble Co. | 2,963,537 | 246,655 |
| PepsiCo Inc. | 2,034,338 | 227,439 |
| Kraft Heinz Co. | 3,373,133 | 185,893 |
| Nestle SA | 1,902,819 | 158,384 |
| British American Tobacco plc | 3,301,264 | 153,908 |
| Mondelez International Inc. Class A | 3,257,838 | 139,957 |
| Sysco Corp. | 1,547,976 | 113,389 |
| | | 2,469,578 |
| Energy (4.9%) | | |
| Suncor Energy Inc. | 13,052,243 | 504,991 |
| Chevron Corp. | 4,082,926 | 499,260 |
| Exxon Mobil Corp. | 5,260,011 | 447,206 |
| ^ TransCanada Corp. | 6,107,253 | 247,099 |
| Canadian Natural Resources Ltd. | 6,599,591 | 215,543 |
| Kinder Morgan Inc. | 11,546,950 | 204,727 |
| Occidental Petroleum Corp. | 2,361,462 | 194,041 |
| Schlumberger Ltd. | 3,088,291 | 188,139 |
18
Vanguard® Wellesley Income Fund
Schedule of Investments
September 30, 2018
| | |
| | | Market |
| | | Value |
| | Shares | ($000) |
| Phillips 66 | 1,033,117 | 116,453 |
| | | 2,617,459 |
| Financials (5.5%) | | |
| JPMorgan Chase & Co. | 8,118,222 | 916,060 |
| Wells Fargo & Co. | 7,544,642 | 396,546 |
| MetLife Inc. | 7,804,253 | 364,615 |
| Travelers Cos. Inc. | 1,612,418 | 209,147 |
| Chubb Ltd. | 1,366,928 | 182,676 |
| BB&T Corp. | 3,724,499 | 180,787 |
| M&T Bank Corp. | 1,036,806 | 170,596 |
| American International Group Inc. | 3,096,803 | 164,874 |
| PNC Financial Services Group Inc. | 1,110,760 | 151,275 |
| Bank of Nova Scotia | 1,441,931 | 85,982 |
| BlackRock Inc. | 177,792 | 83,799 |
| | | 2,906,357 |
| Health Care (6.8%) | | |
| Johnson & Johnson | 5,109,959 | 706,043 |
| Pfizer Inc. | 15,222,727 | 670,866 |
| Eli Lilly & Co. | 4,509,809 | 483,948 |
| Merck & Co. Inc. | 5,377,406 | 381,473 |
| Medtronic plc | 3,835,616 | 377,310 |
| Bristol-Myers Squibb Co. | 4,427,504 | 274,859 |
| Novartis AG | 3,189,761 | 274,570 |
| Koninklijke Philips NV | 4,719,831 | 215,139 |
| Roche Holding AG | 886,810 | 214,444 |
| | | 3,598,652 |
| Industrials (3.1%) | | |
| Union Pacific Corp. | 2,008,628 | 327,065 |
| Eaton Corp. plc | 3,649,221 | 316,497 |
| Lockheed Martin Corp. | 896,270 | 310,074 |
| Caterpillar Inc. | 1,855,166 | 282,894 |
| 3M Co. | 1,050,759 | 221,405 |
| BAE Systems plc | 23,467,082 | 192,431 |
| | | 1,650,366 |
| Information Technology (3.6%) | | |
| Cisco Systems Inc. | 13,805,946 | 671,659 |
| Intel Corp. | 9,067,452 | 428,800 |
| Analog Devices Inc. | 3,951,328 | 365,340 |
| QUALCOMM Inc. | 3,245,326 | 233,761 |
| Maxim Integrated Products Inc. | 3,037,349 | 171,276 |
| Broadcom Inc. | 168,304 | 41,526 |
| KLA-Tencor Corp. | 194,734 | 19,806 |
| | | 1,932,168 |
| Materials (1.7%) | | |
| DowDuPont Inc. | 6,932,472 | 445,827 |
| ^ Nutrien Ltd. | 3,531,160 | 203,748 |
| International Paper Co. | 3,559,729 | 174,961 |
| LyondellBasell Industries NV Class A | 776,840 | 79,634 |
| | | 904,170 |
| Real Estate (0.5%) | | |
| Crown Castle International Corp. | 2,490,418 | 277,258 |
| |
| Telecommunication Services (1.6%) | | |
| Verizon Communications Inc. | 12,535,730 | 669,282 |
| BCE Inc. | 4,187,256 | 169,643 |
| | | 838,925 |
| Utilities (3.4%) | | |
| Dominion Energy Inc. | 4,316,311 | 303,350 |
| NextEra Energy Inc. | 1,498,423 | 251,136 |
| Eversource Energy | 4,053,157 | 249,026 |
| Duke Energy Corp. | 2,787,844 | 223,083 |
| Sempra Energy | 1,847,207 | 210,120 |
| American Electric Power Co. Inc. | 2,939,942 | 208,383 |
19
Vanguard® Wellesley Income Fund
Schedule of Investments
September 30, 2018
| | | |
| | | | Market |
| | | | Value |
| | | Shares | ($000) |
| Xcel Energy Inc. | | 3,314,893 | 156,496 |
| Exelon Corp. | | 3,089,112 | 134,871 |
| Edison International | | 1,131,711 | 76,594 |
| |
| | | | 1,813,059 |
| |
| Total Common Stocks (Cost $14,461,074) | | | 19,928,422 |
| |
| |
| | Coupon | | |
| Temporary Cash Investments (2.9%) | | | |
| Money Market Fund (0.3%) | | | |
| 16,17 Vanguard Market Liquidity Fund | 2.209% | 1,813,594 | 181,360 |
| | | | |
| | | | Face | |
| | | Maturity | Amount | |
| | | Date | ($000) | |
| Repurchase Agreements (1.6%) | | | | |
| Bank of America Securities, LLC (Dated 9/28/18, | | | | |
| Repurchase Value $16,403,000, collateralized by | | | | |
| Federal Farm Credit Bank, 2.480%, 10/19/29, with a | | | | |
| value of $16,728,000) | 2.270% | 10/1/18 | 16,400 | 16,400 |
| Deutsche Bank Securities, Inc. (Dated 9/28/18, | | | | |
| Repurchase Value $10,302,000, collateralized by | | | | |
| Federal Farm Credit Bank, 2.035%, 7/9/20, with a | | | | |
| value of $10,506,000) | 2.250% | 10/1/18 | 10,300 | 10,300 |
| HSBC Bank USA (Dated 9/28/18, Repurchase Value | | | | |
| $85,516,000, collateralized by U.S. Treasury Bill | | | | |
| 0.000%, 11/1/18-11/8/18, and U.S. Treasury | | | | |
| Note/Bond, 2.125%, 5/15/25, with a value of | | | | |
| $87,210,000) | 2.230% | 10/1/18 | 85,500 | 85,500 |
| HSBC Bank USA (Dated 9/28/18, Repurchase Value | | | | |
| $20,504,000, collateralized by Federal Home Loan | | | | |
| Mortgage Corp., 3.000%-6.000%, 1/1/23-9/1/48, and | | | | |
| Federal National Mortgage Assn., 5.000%-5.500%, | | | | |
| 3/1/33-3/1/41, with a value of $20,910,000) | 2.240% | 10/1/18 | 20,500 | 20,500 |
| JP Morgan Securities LLC (Dated 9/28/18, Repurchase | | | | |
| Value $165,131,000, collateralized by U.S. Treasury | | | | |
| Note/Bond, 1.625%, 5/15/26, with a value of | | | | |
| $168,402,000) | 2.220% | 10/1/18 | 165,100 | 165,100 |
| Natixis (Dated 9/28/18, Repurchase Value | | | | |
| $175,033,000, collateralized by U.S. Treasury | | | | |
| Note/Bond, 1.500%-3.375%, 7/31/20-4/15/32, with a | | | | |
| value of $178,500,000) | 2.230% | 10/1/18 | 175,000 | 175,000 |
| Nomura International plc (Dated 9/28/18, Repurchase | | | | |
| Value $70,013,000, collateralized by U.S. Treasury | | | | |
| Note/Bond, 1.625%-3.125%, 5/31/25-11/15/41, with a | | | | |
| value of $71,400,000) | 2.250% | 10/1/18 | 70,000 | 70,000 |
| RBC Capital Markets LLC (Dated 9/28/18, Repurchase | | | | |
| Value $17,103,000, collateralized by Federal Home | | | | |
| Loan Mortgage Corp., 4.000%, 9/1/48, and Federal | | | | |
| National Mortgage Assn., 2.360%-3.040%, 12/1/22- | | | | |
| 11/1/26, with a value of $17,443,000) | 2.230% | 10/1/18 | 17,100 | 17,100 |
| RBS Securities, Inc. (Dated 9/28/18, Repurchase Value | | | | |
| 272,351,000, collateralized by U.S. Treasury | | | | |
| Note/Bond 3.375%, 11/15/19, with a value of | | | | |
| $277,746,000) | 2.240% | 10/1/18 | 272,300 | 272,300 |
| | | | | 832,200 |
20
Vanguard® Wellesley Income Fund
Schedule of Investments
September 30, 2018
| | | | |
| | | | Face | Market |
| | | Maturity | Amount | Value |
| | Coupon | Date | ($000) | ($000) |
| U.S. Government and Agency Obligations (1.0%) | | | | |
| United States Treasury Bill | 1.972% | 10/25/18 | 198,100 | 197,824 |
| United States Treasury Bill | 2.545% | 9/12/19 | 353,000 | 344,553 |
| | | | | 542,377 |
| Total Temporary Cash Investments (Cost $1,555,973) | | | | 1,555,937 |
| Total Investments (100.5%) (Cost $48,208,549) | | | | 53,409,648 |
| Other Assets and Liabilities—Net (-0.5%) | | | | (255,666) |
| Net Assets (100%) | | | | 53,153,982 |
§ Security value determined using significant unobservable inputs.
^ Includes partial security positions on loan to broker-dealers. The total value of securities on loan is $172,277,000.
1 Securities with a value of $808,000 have been segregated as collateral for certain open To Be Announced (TBA) transactions.
2 Securities with a value of $1,372,000 have been segregated as initial margin for open futures contracts.
3 The issuer operates under a congressional charter; its securities are generally neither guaranteed by the U.S. Treasury nor backed by the full faith and credit of the U.S. government.
4 The average or expected maturity is shorter than the final maturity shown because of the possibility of interim principal payments and prepayments or the possibility of the issue being called.
5 The issuer was placed under federal conservatorship in September 2008; since that time, its daily operations have been managed by the Federal Housing Finance Agency and it receives capital from the U.S. Treasury, as needed to maintain a positive net worth, in exchange for senior preferred stock.
6 Includes securities purchased on a when-issued or delayed-delivery basis for which the fund has not taken delivery as of September 30, 2018.
7 Security exempt from registration under Rule 144A of the Securities Act of 1933. Such securities may be sold in transactions exempt from registration, normally to qualified institutional buyers. At September 30, 2018, the aggregate value of these securities was $5,980,511,000, representing 11.3% of net assets.
8 Adjustable-rate security based upon 3-month USD LIBOR plus spread.
9 Adjustable-rate security based upon 1-month USD LIBOR plus spread.
10 Adjustable-rate security.
11 Face amount denominated in Canadian dollars.
12 Face amount denominated in Japanese yen.
13 Guaranteed by the Government of Japan.
14 Scheduled principal and interest payments are guaranteed by AMBAC (Ambac Assurance Corporation).
15 Scheduled principal and interest payments are guaranteed by AGM (Assured Guaranty Municipal Corporation).
16 Affiliated money market fund available only to Vanguard funds and certain trusts and accounts managed by Vanguard. Rate shown is the 7-day yield.
17 Includes $181,351,000 of collateral received for securities on loan. GO—General Obligation Bond.
REMICs—Real Estate Mortgage Investment Conduits.
21
© 2018 The Vanguard Group, Inc.
All rights reserved.
Vanguard Marketing Corporation, Distributor.
SNA270 112018

Report of Independent Registered Public Accounting Firm
To the Board of Trustees and Shareholders of Vanguard Wellesley Income Fund
Opinion on the Financial Statements
We have audited the accompanying statement of net assets—investments summary of Vanguard Wellesley Income Fund (the "Fund”) as of September 30, 2018, the related statement of operations for the year ended September 30, 2018, the statement of changes in net assets for each of the two years in the period ended September 30, 2018, including the related notes, and the financial highlights for each of the five years in the period ended September 30, 2018 (included in Item 1 of this Form N-CSR) and the schedule of investments (included in Item 6 of this Form N-CSR) as of September 30, 2018 (collectively referred to as the “financial statements”). In our opinion, the financial statements present fairly, in all material respects, the financial position of the Fund as of September 30, 2018, the results of its operations for the year then ended, the changes in its net assets for each of the two years in the period ended September 30, 2018 and the financial highlights for each of the five years in the period ended September 30, 2018 in conformity with accounting principles generally accepted in the United States of America.
Basis for Opinion
These financial statements are the responsibility of the Fund’s management. Our responsibility is to express an opinion on the Fund’s financial statements based on our audits. We are a public accounting firm registered with the Public Company Accounting Oversight Board (United States) (“PCAOB”) and are required to be independent with respect to the Fund in accordance with the U.S. federal securities laws and the applicable rules and regulations of the Securities and Exchange Commission and the PCAOB.
We conducted our audits of these financial statements in accordance with the standards of the PCAOB. Those standards require that we plan and perform the audit to obtain reasonable assurance about whether the financial statements are free of material misstatement, whether due to error or fraud.
Our audits included performing procedures to assess the risks of material misstatement of the financial statements, whether due to error or fraud, and performing procedures that respond to those risks. Such procedures included examining, on a test basis, evidence regarding the amounts and disclosures in the financial statements. Our audits also included evaluating the accounting principles used and significant estimates made by management, as well as evaluating the overall presentation of the financial statements. Our procedures included confirmation of securities owned as of September 30, 2018 by correspondence with the custodians and brokers and by agreement to the underlying ownership records of the transfer agent; when replies were not received from brokers, we performed other auditing procedures. We believe that our audits provide a reasonable basis for our opinion.

November 15, 2018
We have served as the auditor of one or more investment companies in The Vanguard Group of Funds since 1975.
PricewaterhouseCoopers LLP, Two Commerce Square, Suite 1800, 2001 Market Street, Philadelphia, PA 19103-7042
T: (267) 330 3000, F: (267) 330 3300, www.pwc.com/us
Item 7: Disclosure of Proxy Voting Policies and Procedures for Closed-End Management Investment
Companies.
Not Applicable.
Item 8: Portfolio Managers of Closed-End Management Investment Companies.
Not Applicable.
Item 9: Purchase of Equity Securities by Closed-End Management Investment Company and
Affiliated Purchasers.
Not Applicable.
Item 10: Submission of Matters to a Vote of Security Holders.
Not Applicable.
Item 11: Controls and Procedures.
(a) Disclosure Controls and Procedures. The Principal Executive and Financial Officers concluded that the Registrant’s Disclosure Controls and Procedures are effective based on their evaluation of the Disclosure Controls and Procedures as of a date within 90 days of the filing date of this report.
(b) Internal Control Over Financial Reporting. There were no significant changes in Registrant’s Internal Control Over Financial Reporting or in other factors that could significantly affect this control subsequent to the date of the evaluation, including any corrective actions with regard to significant deficiencies and material weaknesses.
Item 12: Disclosure of Securities Lending Activities for Closed-End Management
Investment Companies.
Not Applicable.
Item 13: Exhibits.
(a) Code of Ethics.
(b) Certifications.
Pursuant to the requirements of the Securities Exchange Act of 1934 and the Investment Company Act of 1940, the registrant has duly caused this report to be signed on its behalf by the undersigned, thereunto duly authorized.
| |
| | VANGUARD WELLESLEY INCOME FUND |
BY: | /s/ MORTIMER J. BUCKLEY* |
|
| MORTIMER J. BUCKLEY |
| CHIEF EXECUTIVE OFFICER |
| |
| Date: November 16, 2018 |
Pursuant to the requirements of the Securities Exchange Act of 1934 and the Investment Company Act of 1940, this report has been signed below by the following persons on behalf of the registrant and in the capacities and on the dates indicated.
| |
| | VANGUARD WELLESLEY INCOME FUND |
| |
| BY: | /s/ MORTIMER J. BUCKLEY * |
| | MORTIMER J. BUCKLEY |
| | CHIEF EXECUTIVE OFFICER |
Date: November 16, 2018 |
| VANGUARD WELLESLEY INCOME FUND |
| |
| BY: | /s/ THOMAS J. HIGGINS* |
| | THOMAS J. HIGGINS |
| | CHIEF FINANCIAL OFFICER |
| Date: November 16, 2018 |
* By: /s/ Anne E. Robinson
Anne E. Robinson, pursuant to a Power of Attorney filed on January 18, 2018 see file Number
33-32216, Incorporated by Reference.