UNITED STATES
SECURITIES AND EXCHANGE COMMISSION
Washington, D.C. 20549
FORM N-CSR
CERTIFIED SHAREHOLDER REPORT
OF
REGISTERED MANAGEMENT INVESTMENT COMPANIES
Investment Company Act file number: 811-00121
Name of Registrant: Vanguard Wellington Fund
Address of Registrant:
P.O. Box 2600
Valley Forge, PA 19482
Name and address of agent for service:
Heidi Stam, Esquire
P.O. Box 876
Valley Forge, PA 19482
Registrant’s telephone number, including area code: (610) 669-1000
Date of fiscal year end: November 30
Date of reporting period: December 1, 2012 – November 30, 2013
Item 1: Reports to Shareholders
![]()
Annual Report | November 30, 2013
Vanguard Wellington™ Fund

Vanguard’s Principles for Investing Success
We want to give you the best chance of investment success. These principles, grounded in Vanguard’s research and experience, can put you on the right path.
Goals. Create clear, appropriate investment goals.
Balance. Develop a suitable asset allocation using broadly diversified funds. Cost. Minimize cost.
Discipline. Maintain perspective and long-term discipline.
A single theme unites these principles: Focus on the things you can control.
We believe there is no wiser course for any investor.
| Contents | |
| Your Fund’s Total Returns. | 1 |
| Chairman’s Letter. | 2 |
| Advisor’s Report. | 7 |
| Fund Profile. | 11 |
| Performance Summary. | 13 |
| Financial Statements. | 15 |
| Your Fund’s After-Tax Returns. | 36 |
| About Your Fund’s Expenses. | 37 |
| Trustees Approve Advisory Arrangement. | 39 |
| Glossary. | 40 |
Please note: The opinions expressed in this report are just that—informed opinions. They should not be considered promises or advice.
Also, please keep in mind that the information and opinions cover the period through the date on the front of this report. Of course, the risks of investing in your fund are spelled out in the prospectus.
See the Glossary for definitions of investment terms used in this report.
About the cover: The ship's wheel represents leadership and guidance, essential qualities in navigating difficult seas.
This one is a replica based on an 18th-century British vessel. The HMS Vanguard, another ship of that era, served as the flagship for Admiral Horatio Nelson when he defeated a French fleet at the Battle of the Nile.
Your Fund’s Total Returns
| Fiscal Year Ended November 30, 2013 | |
| Total | |
| Returns | |
| Vanguard Wellington Fund | |
| Investor Shares | 18.85% |
| Admiral™ Shares | 18.91 |
| Wellington Composite Index | 18.16 |
| Mixed-Asset Target Allocation Growth Funds Average | 18.56 |
For a benchmark description, see the Glossary.
Mixed-Asset Target Allocation Growth Funds Average: Derived from data provided by Lipper, a Thomson Reuters Company.
Admiral Shares carry lower expenses and are available to investors who meet certain account-balance requirements.
| Your Fund’s Performance at a Glance | ||||
| November 30, 2012, Through November 30, 2013 | ||||
| Distributions Per Share | ||||
| Starting | Ending | |||
| Share | Share | Income | Capital | |
| Price | Price | Dividends | Gains | |
| Vanguard Wellington Fund | ||||
| Investor Shares | $34.29 | $39.17 | $0.958 | $0.441 |
| Admiral Shares | 59.24 | 67.65 | 1.703 | 0.762 |
1

Chairman’s Letter
Dear Shareholder,
For the fiscal year ended November 30, 2013, Vanguard Wellington Fund returned almost 19%. The fund’s returns were slightly ahead of the return of its benchmark, the Wellington Composite Index, as well as the average return of peer funds.
Buoyed by the stock market’s robust performance, the equity portion of your fund posted gains in all ten market sectors for the period. Stocks in the financial, health care, and industrial sectors added most to returns.
The fund’s fixed income portfolio, on the other hand, finished the period in negative territory. When I wrote to you a year ago, I noted that we were anticipating a more challenging environment for bond investors, and that’s certainly what we’ve encountered in recent months.
On November 30, the fund’s 30-day SEC yield was 2.23% for Investor Shares and 2.31% for Admiral Shares, compared with 2.33% for Investor Shares and 2.41% for Admiral Shares a year earlier.
Despite some jolts, U.S. stocks notched an impressive 12-month gain
U.S. stocks powered to a return of about 32% for the 12 months ended November 30, despite encountering a few bumps along the way.
2
Uncertainty surrounding Federal Reserve policy contributed to market declines in June and August. But stocks bounced back in September when, to the surprise of some investors, the Fed announced it had no immediate plans to scale back its stimulative bond-buying program. (In mid-December, the Fed ended several months of speculation by announcing that it would begin scaling back bond purchases in January 2014.) Corporate profit growth, though not robust, was generally solid during the fiscal year.
International stocks returned about 18% in aggregate. While the developed markets of Europe and the Pacific region performed well for the period, gains were modest for emerging-market stocks.
Bond prices fell as yields rose over the period’s second half
Bonds, which held onto slight gains through the first five months of the fiscal year, retreated in May. For the full period, the broad U.S. taxable bond market returned –1.61%. The yield of the 10-year Treasury note closed at 2.74%, up from 1.61% at the end of November 2012. (Bond yields and prices move in opposite directions.) Municipal bonds returned –3.51%.
International bond markets (as measured by the Barclays Global Aggregate Index ex USD) returned –2.93%. Returns of money market funds and savings accounts continued to be restrained by the Fed’s 0%–0.25% target for short-term interest rates.
| Market Barometer | |||
| Average Annual Total Returns | |||
| Periods Ended November 30, 2013 | |||
| One | Three | Five | |
| Year | Years | Years | |
| Stocks | |||
| Russell 1000 Index (Large-caps) | 30.96% | 17.78% | 18.33% |
| Russell 2000 Index (Small-caps) | 40.99 | 17.89 | 20.97 |
| Russell 3000 Index (Broad U.S. market) | 31.71 | 17.78 | 18.54 |
| MSCI All Country World Index ex USA (International) | 18.24 | 7.50 | 13.87 |
| Bonds | |||
| Barclays U.S. Aggregate Bond Index (Broad taxable market) | -1.61% | 3.09% | 5.33% |
| Barclays Municipal Bond Index (Broad tax-exempt market) | -3.51 | 4.23 | 6.26 |
| Citigroup Three-Month U.S. Treasury Bill Index | 0.05 | 0.07 | 0.10 |
| CPI | |||
| Consumer Price Index | 1.24% | 2.13% | 1.87% |
3
The bond market’s downturn, coupled with the upswing in stocks, provides an occasion for investors to review their portfolio’s asset allocation. In a powerful stock market rally, a portfolio’s mix of stocks and bonds can drift away from its target allocation, as Fran Kinniry, a principal in our Investment Strategy Group, recently reminded clients in an article on our website.
“Buying stocks now may actually run counter to what many prudent investors should be doing,” he noted. “If you have an equity-heavy portfolio, you will most likely need to direct new cash flows to bond mutual funds, or sell stock mutual funds to maintain your target asset allocation.”
Diverging stock and bond results highlight the wisdom of balance
At Vanguard, we believe strongly in the benefits of balance and diversification. The Wellington Fund—which began operations in 1929, making it the nation’s oldest balanced fund— epitomizes these investment virtues. The fund is broadly diversified, with about 100 stocks and more than 600 bonds across all market sectors. In strong markets, like the one we’ve experienced in recent months, the equity portion of the fund can offer investors the opportunity for long-term growth. When stock prices fall, the fund’s bond portfolio can help provide a cushion.
| Expense Ratios | |||
| Your Fund Compared With Its Peer Group | |||
| Investor | Admiral | Peer Group | |
| Shares | Shares | Average | |
| Wellington Fund | 0.25% | 0.17% | 1.02% |
The fund expense ratios shown are from the prospectus dated March 27, 2013, and represent estimated costs for the current fiscal year. For the fiscal year ended November 30, 2013, the fund’s expense ratios were 0.26% for Investor Shares and 0.18% for Admiral Shares. The peer-group expense ratio is derived from data provided by Lipper, a Thomson Reuters Company, and captures information through year-end 2012.
Peer group: Mixed-Asset Target Allocation Growth Funds.
4
For the latest 12-month period, the fund’s stock portfolio returned about 31%, a hair above the return of its equity benchmark, the S&P 500 Index, which returned just over 30%. As I mentioned, financial, health care, and industrial stocks were key contributors to the fund’s performance. Together, these three sectors added more than 18 percentage points to the portfolio’s total return.
The advisor’s choices in financials and technology helped the fund most compared with the benchmark. Within financials, the advisor’s selections among insurance companies gave the fund an edge over the index, while in technology, less exposure to poorer performing computer hardware companies provided a comparative boost.
The bond market, as I mentioned, was unsettled during the period by what were perceived as mixed signals from the Fed about when it might start scaling back its bond-buying program. In this environment, the fund’s fixed income holdings returned –1.59%, slightly better than the benchmark, the Barclays U.S. Credit A or Better Bond Index, which returned –1.83%. At the beginning of the fiscal period, the fund’s advisor shortened the portfolio’s average duration, a measure of its sensitivity to changes in interest rates, which gave it a slight boost relative to the index.
For more on the fund’s positioning during the fiscal year, please see the Advisor’s Report that follows this letter.
| Total Returns | |
| Ten Years Ended November 30, 2013 | |
| Average | |
| Annual Return | |
| Wellington Fund Investor Shares | 8.46% |
| Wellington Composite Index | 6.96 |
| Mixed-Asset Target Allocation Growth Funds Average | 6.03 |
For a benchmark description, see the Glossary.
Mixed-Asset Target Allocation Growth Funds Average: Derived from data provided by Lipper, a Thomson Reuters Company.
The figures shown represent past performance, which is not a guarantee of future results. (Current performance may be lower or higher than the performance data cited. For performance data current to the most recent month-end, visit our website at vanguard.com/performance.) Note, too, that both investment returns and principal value can fluctuate widely, so an investor’s shares, when sold, could be worth more or less than their original cost.
5
Your fund has delivered excellent long-term results
For the decade ended November 30, Vanguard Wellington Fund posted an average annual return of 8.46%, higher than that of both its index (6.96%) and its peer group (6.03%), as well as the broad U.S. stock market (8.09%).
This performance is especially impressive when you consider the extreme volatility that the fund had to contend with during the ten-year period, which included the worst global recession since the Great Depression.
The fund’s admirable track record is a credit to the experience and talent of its advisor, Wellington Management Company, llp, which has managed the fund since its inception.
The power of compounding can put time on your side
The purpose of my annual letter to you is, of course, to report on how your fund fared over the past year. But while it’s important to be aware of how your fund is doing in the latest market environment, short-term performance isn’t what matters most.
The focus on the preceding 12 months shouldn’t distract investors from the long-term commitment they need to help themselves be successful.
To be sure, there are many aspects of investing success that you can’t influence, overall market performance being the obvious example. But you can control how long you invest, and that’s important because it allows you to harness the power of compounding—the snowball effect that occurs when your earnings generate even more earnings. As Benjamin Franklin said, “Money makes money.”
A simple example illustrates the benefits of compounding that can potentially result from investing and then reinvesting your money over the long haul, putting time on your side. Suppose that you were able to put away $10,000 and earn 6% a year (keep in mind that this is hypothetical, and that actual returns would likely be different and a lot less predictable).
If you keep reinvesting the earnings (again, assuming a hypothetical return of 6% each year), after 10 years your investment will have grown to just under $18,000. But if you were able to invest that $10,000 for 30 years, your investment would grow to more than $57,000.
Compounding can make a real difference in your account balance over time, particularly when combined with Vanguard’s low expense ratios—which allow you to keep more of the return on your investment.
As always, thank you for entrusting your assets to Vanguard.
Sincerely,

F. William McNabb III
Chairman and Chief Executive Officer
December 19, 2013
6
Advisor’s Report
Vanguard Wellington Fund returned nearly 19% for the 12 months ended November 30, 2013. The fund outperformed the peer group of mixed-asset target allocation growth funds and finished slightly ahead of the Wellington Composite Index, which is weighted 65% in large-capitalization stocks and 35% in high-quality (as determined by independent credit-rating agencies) corporate bonds. The fund’s equity and fixed income portfolios both contributed to the outperformance as each finished ahead of its benchmark component.
Investment environment
Stocks rose sharply during the course of the fund’s fiscal year. The S&P 500 Index, the benchmark for the stock portion of the fund, returned just over 30%. Favorable global liquidity dynamics and accommodative monetary policy from central banks boosted shares in the United States and throughout many developed markets in other parts of the world. Emerging-market equity returns were more muted.
The bond market declined during the period. Low yields did not generate enough income to offset the declines in most fixed income security prices. The benchmark for the bond portion of the fund, the Barclays U.S. Credit A or Better Bond Index, returned –1.83%, largely because of rising interest rates.
Our successes
The equity portion of the fund outper- formed the S&P 500 Index through a favorable combination of both security selection and sector allocation. The fund benefited from greater-than-market exposure to health care, one of the strongest equity sectors during the period (although individual stock selection in the sector detracted from relative performance). The fund’s underweight allocation to information technology, a sector that lagged during the period, also boosted relative returns.
Stock selection was strongest in financials; our positions in Prudential Financial, JPMorgan Chase, and Wells Fargo were among the key relative contributors in that sector. Our less-than-market-weight allocation to Apple was the top relative contributor to the fund’s performance.
Other individual stock positions that helped performance included Cardinal Health, AT&T, FedEx, Microsoft, Comcast, and Pfizer.
Wells Fargo shares rose on better-than-expected earnings and the market’s positive outlook for bank results in an environment of rising interest rates. The shares trade at an attractive normalized earnings multiple and should benefit from an improving economy, market share gains, and cost savings. Wells Fargo was our largest absolute contributor during the period; it was the fund’s largest equity position at the close of the period.
7
We believe that Prudential Financial, an insurance services firm, has an attractive mix across both its individual life segment and its asset management business, which benefited from strong inflows. The stock rallied on strong and improved quality of earnings, driven by rising stock markets and higher long-term interest rates. We continue to like this holding; management appears to have made it a priority to increase the dividend, which we expect to be underpinned by both growing earnings and an increasing payout ratio.
Cardinal Health is a global pharmaceutical distributor. The stock has rebounded since the company lost its Walgreens business to AmerisourceBergen in mid-March. Investors bid up shares after the firm posted a 25% year-over-year quarterly profit jump and hiked its earnings forecast for next year. The company’s renewal of its CVS Caremark distribution contract reduced investor fear that increasing industry competition would lead to pricing pressure. We expect that Cardinal will benefit over the longer term from the implementation of the Affordable Care Act, which should lead to expanded insurance coverage and increased demand for pharmaceuticals. Shortly after the close of the period, Cardinal and CVS announced a joint venture that will become the largest purchaser of generic drugs. We expect the deal to be beneficial to shareholders of both firms.
In the fixed income portion of the fund, our shorter duration bias helped relative returns as interest rates rose. Security selection among industrial issuers was strong, particularly communications and technology bonds; we participated in the $49 billion record bond issuance by Verizon, which performed very well afterward. We remain underweighted in AT&T bonds. Security selection within certain noncorporate credit sectors—including supranational, local agency, and local authority bonds—also aided relative performance. This poorly defined group includes our long-duration taxable municipal bonds, which performed well as fiscal conditions improved for many states with the slowly improving economy. Our underweight allocation to corporate bonds also contributed to relative returns.
Our shortfalls
While the fixed income portion of the fund did its job in outpacing its reference benchmark, the fund’s bonds delivered a modestly negative return in absolute terms, as bond prices and interest rates move inversely.
In the equity portfolio, stock selection within the energy sector and, as mentioned earlier, health care, detracted from relative performance. Individual detractors in the equity portfolio included Goldcorp, IBM, and Exelon.
8
Goldcorp, a senior gold producer with assets in North, Central, and South America, saw its shares plummet along with the sudden and steep drop in gold commodity prices. Fundamentals surprised us on the downside.
IBM, the global technology and business services provider, saw its shares decline modestly. Slowing global growth, combined with sluggish hardware sales, led to a disappointing performance during the period. We continue to view IBM as an attractive investment over the longer term and maintain a position. We believe the company has the ability to increase earnings in the high-single-digit range and view the valuation as attractive.
Equity portfolio changes
We established a number of new equity positions in the fund over the course of the year, including Verizon, EMC, Boeing, and Apple.
Verizon provides communications, information, and entertainment products and services to consumers, businesses, and government agencies worldwide. The company is well positioned competitively in the U.S. market, with the best brand strength, highest consumer loyalty, and broadest deployment of LTE wireless services. We expect that Verizon’s purchase of Vodafone’s stake in Verizon Wireless will accelerate earnings growth over the next few years.
We eliminated positions in AT&T, Air Products & Chemicals, General Mills, and Baker Hughes. We exited our position in AT&T, which represented our largest sale during the period, to establish the new position in Verizon, as we believe that Verizon is better positioned for future growth.
The fund’s positioning
We continue to look for moderate growth in the global economy. We are encouraged by the recent data out of Europe, which suggest that perhaps the continent’s economy has stabilized. The United States continues to improve, albeit at moderate growth rates. Continued momentum in housing and auto sales and sustained growth in the oil shale industry should benefit the economy. It is worth noting that we do not see as much upside in the equity market today as we did a couple of years ago.
From a sector perspective, the fund’s equity positioning remains fairly similar to this time last year. We continue to have an overweight position in financials, particularly large-cap U.S. banks. The strengthening housing market should provide a boost for the group, and rising interest rates should prove beneficial for longer-term profitability. We have also increased our exposure to insurance companies as many of them should also benefit from rising rates. We are focusing on high-quality financial institutions with solid balance sheets, strong management teams, and attractive valuations.
9
We also have a meaningfully overweight position in health care, where we are targeting stocks that offer stable cash flows and high yields, and trade at attractive valuations. We favor large-cap pharmaceutical stocks. We believe many of these companies have solid pipelines that are underappreciated by investors.
The portfolio remains underweighted in information technology, consumer discretionary, and consumer staples stocks. Many consumer staples stocks are at historically high valuations compared to where they typically trade, and we are having a difficult time finding value. Our underweight allocation to Apple narrowed during the period as we bought more shares subsequent to initiating a small position.
We continue to search diligently for attractively valued companies with strong operating characteristics. We are particularly interested in stocks where business fundamentals are poised to improve.
As always, an above-average dividend is central to our stock selection process. Our discipline is focused on identifying industries with favorable supply-and-demand dynamics and, ultimately, the best stocks within those industries. We are positioned in companies that should benefit from global growth over time, though we remain cautious about the near term.
Bond prices may decline further, depending on how investors react to the Fed’s decision to begin tapering its extraordinary purchases of Treasuries and agency mortgage-backed securities, starting in January. We closed the period with a shorter-than-benchmark duration posture to mitigate bond principal losses that would be likely to result in a rising-rate environment.
Edward P. Bousa, CFA, Senior Vice President and Equity Portfolio Manager
John C. Keogh, Senior Vice President and Fixed Income Portfolio Manager Wellington Management Company, llp December 19, 2013
10
Wellington Fund
Fund Profile
As of November 30, 2013
| Share-Class Characteristics | |||
| Investor | Admiral | ||
| Shares | Shares | ||
| Ticker Symbol | VWELX | VWENX | |
| Expense Ratio1 | 0.25% | 0.17% | |
| 30-Day SEC Yield | 2.23% | 2.31% | |
| Equity and Portfolio Characteristics | |||
| DJ U.S. | |||
| Total | |||
| Market | |||
| S&P 500 | FA | ||
| Fund | Index | Index | |
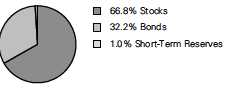
| Number of Stocks | 102 | 500 | 3,595 |
| Median Market Cap | $80.0B | $67.5B | $43.9B |
| Price/Earnings Ratio | 17.2x | 18.6x | 20.1x |
| Price/Book Ratio | 2.2x | 2.6x | 2.6x |
| Return on Equity | 17.1% | 17.9% | 16.5% |
| Earnings Growth | |||
| Rate | 9.9% | 10.9% | 11.1% |
| Dividend Yield | 2.5% | 2.0% | 1.8% |
| Foreign Holdings | 9.2% | 0.0% | 0.0% |
| Turnover Rate | 35% | — | — |
| Short-Term Reserves | 1.0% | — | — |
| Fixed Income Characteristics | |||
| Barclays | Barclays | ||
| Credit A | Aggregate | ||
| or Better | Bond | ||
| Fund | Index | Index | |
| Number of Bonds | 677 | 2,937 | 8,625 |
| Yield to Maturity | |||
| (before expenses) | 2.7% | 2.6% | 2.3% |
| Average Coupon | 4.1% | 3.9% | 3.3% |
| Average Duration | 5.8 years | 6.3 years | 5.6 years |
| Average Effective | |||
| Maturity | 8.5 years | 9.1 years | 7.5 years |
| Total Fund Volatility Measures | DJ U.S. | |
| Wellington | Total | |
| Composite | Market | |
| Index | FA Index | |
| R-Squared | 0.98 | 0.96 |
| Beta | 0.99 | 0.62 |
These measures show the degree and timing of the fund’s fluctuations compared with the indexes over 36 months.
Ten Largest Stocks (% of equity portfolio)
| Wells Fargo & Co. | Diversified Banks | 3.3% |
| Merck & Co. Inc. | Pharmaceuticals | 2.6 |
| JPMorgan Chase & Co. | Diversified Financial | |
| Services | 2.6 | |
| Exxon Mobil Corp. | Integrated Oil & Gas | 2.5 |
| Microsoft Corp. | Systems Software | 2.5 |
| Verizon Communications Integrated | ||
| Inc. | Telecommunication | |
| Services | 2.3 | |
| Comcast Corp. | Cable & Satellite | 2.2 |
| Chevron Corp. | Integrated Oil & Gas | 2.0 |
| Johnson & Johnson | Pharmaceuticals | 1.9 |
| ACE Ltd. | Integrated Oil & Gas | 1.9 |
| Top Ten | 23.8% | |
| Top Ten as % of Total Net Assets | 15.8% | |
The holdings listed exclude any temporary cash investments and equity index products.
Fund Asset Allocation
1 The expense ratios shown are from the prospectus dated March 27, 2013, and represent estimated costs for the current fiscal year. For the fiscal year ended November 30, 2013, the expense ratios were 0.26% for Investor Shares and 0.18% for Admiral Shares.
11
Wellington Fund
Sector Diversification (% of equity exposure)
| DJ U.S. | |||
| Total | |||
| S&P 500 | Market | ||
| Fund | Index FA Index | ||
| Consumer | |||
| Discretionary | 8.4% | 12.6% | 13.4% |
| Consumer Staples | 8.2 | 10.1 | 8.7 |
| Energy | 10.8 | 10.3 | 9.4 |
| Financials | 20.7 | 16.3 | 17.4 |
| Health Care | 17.6 | 13.2 | 12.8 |
| Industrials | 14.2 | 10.8 | 11.6 |
| Information | |||
| Technology | 13.0 | 17.9 | 17.8 |
| Materials | 1.6 | 3.4 | 3.8 |
| Telecommunication | |||
| Services | 2.3 | 2.4 | 2.1 |
| Utilities | 3.2 | 3.0 | 3.0 |
| Sector Diversification (% of fixed income | |||
| portfolio) | |||
| Asset-Backed | 2.5% | ||
| Commercial Mortgage-Backed | 0.6 | ||
| Finance | 27.2 | ||
| Foreign | 2.4 | ||
| Government Mortgage-Backed | 8.5 | ||
| Industrial | 35.9 | ||
| Treasury/Agency | 12.2 | ||
| Utilities | 6.1 | ||
| Other | 4.6 | ||
The agency and mortgage-backed securities sectors may include issues from government-sponsored enterprises; such issues are generally not backed by the full faith and credit of the U.S. government.
| Distribution by Credit Quality (% of fixed | |
| income portfolio) | |
| U.S. Government | 21.0% |
| Aaa | 4.6 |
| Aa | 14.1 |
| A | 42.2 |
| Baa | 18.1 |
For information about these ratings, see the Glossary entry for Credit Quality.
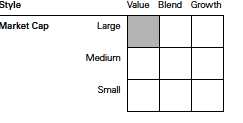
Equity Investment Focus
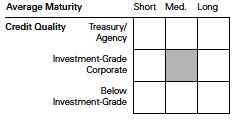
Fixed Income Investment Focus
12
Wellington Fund
Performance Summary
All of the returns in this report represent past performance, which is not a guarantee of future results that may be achieved by the fund. (Current performance may be lower or higher than the performance data cited. For performance data current to the most recent month-end, visit our website at vanguard.com/performance.) Note, too, that both investment returns and principal value can fluctuate widely, so an investor’s shares, when sold, could be worth more or less than their original cost. The returns shown do not reflect taxes that a shareholder would pay on fund distributions or on the sale of fund shares.
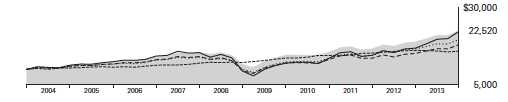
Cumulative Performance: November 30, 2003, Through November 30, 2013
Initial Investment of $10,000
| Average Annual Total Returns | |||||
| Periods Ended November 30, 2013 | |||||
| Final Value | |||||
| One | Five | Ten | of a $10,000 | ||
| Year | Years | Years | Investment | ||
| Wellington Fund Investor Shares | 18.85% | 14.19% | 8.46% | $22,520 | |
| •••••••• | Wellington Composite Index | 18.16 | 14.42 | 6.96 | 19,603 |
| – – – – | Mixed-Asset Target Allocation Growth | ||||
| Funds Average | 18.56 | 13.49 | 6.03 | 17,963 | |
| - - - - - - | Barclays U.S. Aggregate Bond Index | -1.61 | 5.33 | 4.71 | 15,847 |
| Dow Jones U.S. Total Stock Market | |||||
| Float Adjusted Index | 31.64 | 18.65 | 8.29 | 22,175 | |
For a benchmark description, see the Glossary.
Mixed-Asset Target Allocation Growth Funds Average: Derived from data provided by Lipper, a Thomson Reuters Company.
| Final Value | ||||
| One | Five | Ten | of a $50,000 | |
| Year | Years | Years | Investment | |
| Wellington Fund Admiral Shares | 18.91% | 14.28% | 8.57% | $113,762 |
| Wellington Composite Index | 18.16 | 14.42 | 6.96 | 98,017 |
| Barclays U.S. Aggregate Bond Index | -1.61 | 5.33 | 4.71 | 79,237 |
| Dow Jones U.S. Total Stock Market Float | ||||
| Adjusted Index | 31.64 | 18.65 | 8.29 | 110,874 |
| See Financial Highlights for dividend and capital gains information. |
13
Wellington Fund
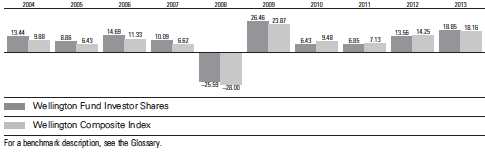
Fiscal-Year Total Returns (%): November 30, 2003, Through November 30, 2013
Average Annual Total Returns: Periods Ended September 30, 2013
This table presents returns through the latest calendar quarter—rather than through the end of the fiscal period.
Securities and Exchange Commission rules require that we provide this information.
| Ten Years | ||||||
| Inception Date | One Year | Five Years | Income | Capital | Total | |
| Investor Shares | 7/1/1929 | 13.65% | 9.77% | 3.26% | 5.16% | 8.42% |
| Admiral Shares | 5/14/2001 | 13.73 | 9.87 | 3.38 | 5.16 | 8.54 |
14
Wellington Fund
Financial Statements
Statement of Net Assets—Investments Summary
As of November 30, 2013
This Statement summarizes the fund’s holdings by asset type. Details are reported for each of the fund’s 50 largest individual holdings and for investments that, in total for any issuer, represent more than 1% of the fund’s net assets. The total value of smaller holdings is reported as a single amount within each category.
The fund reports a complete list of its holdings in regulatory filings four times in each fiscal year, at the quarter-ends. For the second and fourth fiscal quarters, the complete listing of the fund’s holdings is available electronically on vanguard.com and on the Securities and Exchange Commission’s website (sec.gov), or you can have it mailed to you without charge by calling 800-662-7447. For the first and third fiscal quarters, the fund files the lists with the SEC on Form N-Q. Shareholders can look up the fund’s Forms N-Q on the SEC’s website. Forms N-Q may also be reviewed and copied at the SEC’s Public Reference Room (see the back cover of this report for further information).
| Market | Percentage | ||
| Value | of Net | ||
| Shares | ($000) | Assets | |
| Common Stocks | |||
| Consumer Discretionary | |||
| Comcast Corp. Class A | 23,059,160 | 1,149,960 | 1.5% |
| Time Warner Inc. | 11,666,810 | 766,626 | 1.0% |
| Ford Motor Co. | 38,588,880 | 659,098 | 0.8% |
| Lowe’s Cos. Inc. | 13,637,020 | 647,486 | 0.8% |
| Walt Disney Co. | 6,640,746 | 468,438 | 0.6% |
| Consumer Discretionary—Other † | 663,849 | 0.8% | |
| 4,355,457 | 5.5% | ||
| Consumer Staples | |||
| CVS Caremark Corp. | 12,664,140 | 847,991 | 1.1% |
| Procter & Gamble Co. | 7,449,265 | 627,377 | 0.8% |
| Philip Morris International Inc. | 5,999,300 | 513,180 | 0.6% |
| Consumer Staples—Other † | 2,297,262 | 2.9% | |
| 4,285,810 | 5.4% | ||
| Energy | |||
| Exxon Mobil Corp. | 14,055,384 | 1,313,897 | 1.6% |
| Chevron Corp. | 8,323,220 | 1,019,095 | 1.3% |
| BP plc ADR | 16,882,610 | 793,651 | 1.0% |
| Anadarko Petroleum Corp. | 7,718,910 | 685,594 | 0.9% |
| Energy—Other † | 1,805,502 | 2.3% | |
| 5,617,739 | 7.1% | ||
| Financials | |||
| Wells Fargo & Co. | 38,971,017 | 1,715,504 | 2.2% |
| JPMorgan Chase & Co. | 23,549,396 | 1,347,496 | 1.7% |
| ACE Ltd. | 9,602,460 | 986,941 | 1.2% |
| Prudential Financial Inc. | 10,734,120 | 952,761 | 1.2% |
| PNC Financial Services Group Inc. | 9,691,400 | 745,753 | 0.9% |
| BlackRock Inc. | 2,120,040 | 641,842 | 0.8% |
15
| Wellington Fund | |||
| Market | Percentage | ||
| Value | of Net | ||
| Shares | ($000) | Assets | |
| Citigroup Inc. | 10,092,510 | 534,096 | 0.7% |
| Bank of America Corp. | 23,040,500 | 364,501 | 0.4% |
| Financials—Other † | 3,537,609 | 4.5% | |
| 10,826,503 | 13.6% | ||
| Health Care | |||
| Merck & Co. Inc. | 27,713,952 | 1,380,986 | 1.7% |
| Johnson & Johnson | 10,672,450 | 1,010,254 | 1.3% |
| Pfizer Inc. | 29,075,738 | 922,573 | 1.2% |
| Roche Holding AG | 2,888,356 | 805,635 | 1.0% |
| Eli Lilly & Co. | 14,137,500 | 709,985 | 0.9% |
| Cardinal Health Inc. | 10,836,500 | 700,038 | 0.9% |
| Medtronic Inc. | 12,018,800 | 688,918 | 0.9% |
| AstraZeneca plc ADR | 11,923,460 | 681,903 | 0.8% |
| UnitedHealth Group Inc. | 7,364,590 | 548,515 | 0.7% |
| Bristol-Myers Squibb Co. | 9,370,690 | 481,466 | 0.6% |
| Health Care—Other † | 1,279,362 | 1.6% | |
| 9,209,635 | 11.6% | ||
| Industrials | |||
| General Electric Co. | 31,794,200 | 847,634 | 1.1% |
| United Parcel Service Inc. Class B | 7,052,170 | 722,001 | 0.9% |
| FedEx Corp. | 4,977,520 | 690,382 | 0.9% |
| Siemens AG | 4,856,830 | 641,071 | 0.8% |
| Honeywell International Inc. | 6,957,170 | 615,779 | 0.8% |
| Industrials—Other † | 3,906,072 | 4.9% | |
| 7,422,939 | 9.4% | ||
| Information Technology | |||
| Microsoft Corp. | 34,323,220 | 1,308,744 | 1.6% |
| Intel Corp. | 28,718,860 | 684,658 | 0.9% |
| International Business Machines Corp. | 3,785,390 | 680,159 | 0.9% |
| Texas Instruments Inc. | 15,240,172 | 655,328 | 0.8% |
| Apple Inc. | 1,125,100 | 625,634 | 0.8% |
| Accenture plc Class A | 7,837,210 | 607,149 | 0.8% |
| * eBay Inc. | 11,883,590 | 600,359 | 0.8% |
| Cisco Systems Inc. | 22,930,170 | 487,266 | 0.6% |
| Information Technology—Other † | 1,143,091 | 1.4% | |
| 6,792,388 | 8.6% | ||
| Materials | |||
| Dow Chemical Co. | 18,115,900 | 707,607 | 0.9% |
| Materials—Other † | 130,856 | 0.2% | |
| 838,463 | 1.1% | ||
| Telecommunication Services | |||
| Verizon Communications Inc. | 24,258,590 | 1,203,711 | 1.5% |
| Utilities | |||
| NextEra Energy Inc. | 7,459,900 | 631,033 | 0.8% |
| Dominion Resources Inc. | 9,581,400 | 621,929 | 0.8% |
| Utilities—Other † | 418,520 | 0.5% | |
| 1,671,482 | 2.1% | ||
| Total Common Stocks (Cost $34,143,619) | 52,224,127 | 65.9% | |
16
| Wellington Fund | ||||||
| Face | Market | Percentage | ||||
| Maturity | Amount | Value | of Net | |||
| Coupon | Date | ($000) | ($000) | Assets | ||
| U.S. Government and Agency Obligations | ||||||
| U.S. Government Securities | ||||||
| United States Treasury | ||||||
| Note/Bond | 1.375% | 9/30/18 | 950,000 | 952,821 | 1.2% | |
| 1 | United States Treasury | |||||
| Note/Bond | 1.500% | 6/30/16 | 506,905 | 521,002 | 0.7% | |
| United States Treasury | ||||||
| Note/Bond | 2.875% | 5/15/43 | 569,275 | 472,498 | 0.6% | |
| 1 | United States Treasury | |||||
| Note/Bond | 0.125%–2.750% | 4/30/15–2/15/19 | 1,132,965 | 1,131,298 | 1.4% | |
| 3,077,619 | 3.9% | |||||
| Conventional Mortgage-Backed Securities | ||||||
| 2,3 | Freddie Mac Gold Pool | 4.500% | 12/1/43 | 677,750 | 721,594 | 0.9% |
| 2,3 | Freddie Mac Gold Pool | 4.500%–5.500% | 9/1/22–12/1/43 | 638,415 | 687,006 | 0.9% |
| Conventional Mortgage-Backed Securities—Other † | 737,380 | 0.9% | ||||
| 2,145,980 | 2.7% | |||||
| Nonconventional Mortgage-Backed Securities | ||||||
| 2,3 | Freddie Mac REMICS | 3.500%–4.000% | 12/15/30–4/15/31 | 114,446 | 117,159 | 0.2% |
| Nonconventional Mortgage-Backed Securities—Other † | 28,801 | 0.0% | ||||
| 145,960 | 0.2% | |||||
| Total U.S. Government and Agency Obligations (Cost $5,351,451) | 5,369,559 | 6.8% | ||||
| Asset-Backed/Commercial Mortgage-Backed Securities | ||||||
| 3 | Banc of America Commercial | |||||
| Mortgage Trust 2006-2 | 5.923% | 5/10/45 | 14,695 | 16,111 | 0.0% | |
| 3 | Banc of America Commercial | |||||
| Mortgage Trust 2006-5 | 5.414% | 9/10/47 | 17,671 | 19,265 | 0.0% | |
| 3 | Bear Stearns Commercial | |||||
| Mortgage Securities | ||||||
| Trust 2006-PWR13 | 5.540% | 9/11/41 | 23,000 | 25,164 | 0.1% | |
| 3 | Merrill Lynch Mortgage | |||||
| Trust 2006-C1 | 5.866% | 5/12/39 | 12,660 | 13,634 | 0.0% | |
| 4 | Asset-Backed/Commercial | |||||
| Mortgage-Backed Securities—Other † | 557,287 | 0.7% | ||||
| Total Asset-Backed/Commercial Mortgage-Backed Securities (Cost $629,937) | 631,461 | 0.8% | ||||
| Corporate Bonds | ||||||
| Finance | ||||||
| Banking | ||||||
| Bank of America Corp. | 3.300%–6.000% | 9/1/17–2/7/42 | 184,980 | 206,028 | 0.3% | |
| Bank of America NA | 5.300%–6.000% | 3/15/17–10/15/36 | 98,000 | 110,140 | 0.2% | |
| Bear Stearns Cos. LLC | 6.400%–7.250% | 10/2/17–2/1/18 | 25,150 | 29,951 | 0.0% | |
| Citigroup Inc. | 1.750%–8.500% | 12/15/15–11/7/43 | 449,578 | 499,186 | 0.6% | |
| JPMorgan Chase & Co. | 3.250%–6.300% | 9/15/14–8/16/43 | 417,621 | 452,135 | 0.6% | |
| Merrill Lynch & Co. Inc. | 6.050%–6.875% | 5/16/16–4/25/18 | 133,000 | 151,667 | 0.2% | |
| National City Corp. | 6.875% | 5/15/19 | 13,950 | 16,770 | 0.0% | |
| PNC Bank NA | 4.200%–4.875% | 9/21/17–11/1/25 | 66,650 | 72,082 | 0.1% | |
| 3 | PNC Financial | |||||
| Services Group Inc. | 4.459% | 5/29/49 | 19,193 | 19,193 | 0.0% | |
| Wells Fargo & Co. | 2.150%–5.625% | 10/1/14–1/15/44 | 446,772 | 456,017 | 0.6% | |
| 4 | Banking—Other † | 2,884,076 | 3.6% | |||
17
| Wellington Fund | |||||
| Face | Market | Percentage | |||
| Maturity | Amount | Value | of Net | ||
| Coupon | Date | ($000) | ($000) | Assets | |
| Brokerage † | 13,193 | 0.0% | |||
| Finance Companies (0.6%) | |||||
| General Electric | |||||
| Capital Corp. | 3.100%–6.875% | 1/7/21–1/10/39 | 416,731 | 453,778 | 0.6% |
| Insurance | |||||
| ACE Capital Trust II | 9.700% | 4/1/30 | 20,000 | 28,575 | 0.0% |
| ACE INA Holdings Inc. | 2.600%–5.800% | 11/23/15–3/15/18 | 51,360 | 58,170 | 0.1% |
| Prudential Financial Inc. | 2.300%–5.100% | 4/1/14–11/15/20 | 109,605 | 114,184 | 0.2% |
| 4 Insurance—Other † | 1,061,023 | 1.3% | |||
| 4 Real Estate Investment Trusts † | 239,115 | 0.3% | |||
| 6,865,283 | 8.7% | ||||
| Industrial | |||||
| Basic Industry † | 271,735 | 0.3% | |||
| Capital Goods | |||||
| General Electric Co. | 2.700%–5.250% | 12/6/17–10/9/42 | 49,420 | 48,947 | 0.1% |
| 4 Capital Goods—Other † | 571,185 | 0.7% | |||
| Communication | |||||
| Cellco Partnership/Verizon | |||||
| Wireless Capital LLC | 8.500% | 11/15/18 | 21,000 | 27,007 | 0.0% |
| Comcast Corp. | 2.850%–6.500% | 5/15/18–1/15/43 | 145,900 | 141,694 | 0.2% |
| 4 NBCUniversal | |||||
| Enterprise Inc. | 1.662%–1.974% | 4/15/18–4/15/19 | 156,250 | 154,468 | 0.2% |
| NBCUniversal Media LLC | 4.375% | 4/1/21 | 23,900 | 25,613 | 0.0% |
| Verizon | |||||
| Communications Inc. | 3.500%–7.750% | 4/1/17–9/15/43 | 409,390 | 455,789 | 0.6% |
| 4 Communication—Other † | 1,078,699 | 1.4% | |||
| Consumer Cyclical | |||||
| CVS Caremark Corp. | 2.750%–5.750% | 9/15/14–12/1/22 | 87,953 | 86,994 | 0.1% |
| Time Warner Cos. Inc. | 6.950%–7.570% | 2/1/24–1/15/28 | 40,000 | 48,954 | 0.1% |
| Time Warner Inc. | 4.750%–4.875% | 3/15/20–3/29/21 | 22,000 | 24,021 | 0.0% |
| 4 Consumer Cyclical—Other † | 1,444,989 | 1.8% | |||
| Consumer Noncyclical | |||||
| Johnson & Johnson | 5.150% | 7/15/18 | 14,800 | 17,155 | 0.0% |
| Merck & Co. Inc. | 1.300%–6.550% | 5/18/18–5/18/43 | 120,535 | 117,566 | 0.2% |
| Pfizer Inc. | 3.000% | 6/15/23 | 70,000 | 66,875 | 0.1% |
| 4 Roche Holdings Inc. | 6.000% | 3/1/19 | 12,984 | 15,461 | 0.0% |
| Wyeth LLC | 5.950% | 4/1/37 | 25,000 | 29,257 | 0.0% |
| 4 Consumer Noncyclical—Other † | 2,666,908 | 3.4% | |||
| Energy | |||||
| BP Capital Markets plc | 1.846%–4.750% | 10/1/15–9/26/23 | 181,765 | 187,396 | 0.2% |
| Chevron Corp. | 3.191% | 6/24/23 | 49,470 | 48,173 | 0.1% |
| 4 Energy—Other † | 594,504 | 0.8% | |||
| 4 Other Industrial † | 30,057 | 0.0% | |||
| Technology | |||||
| International Business | |||||
| Machines Corp. | 1.250%–8.375% | 1/5/16–11/29/32 | 194,611 | 207,857 | 0.3% |
| Microsoft Corp. | 4.000% | 2/8/21 | 16,000 | 17,169 | 0.0% |
| Technology—Other † | 280,340 | 0.3% | |||
| 4 Transportation † | 397,112 | 0.5% | |||
| 9,055,925 | 11.4% | ||||
18
| Wellington Fund | |||||
| Face | Market | Percentage | |||
| Maturity | Amount | Value | of Net | ||
| Coupon | Date | ($000) | ($000) | Assets | |
| Utilities | |||||
| Electric † | 1,270,101 | 1.6% | |||
| 4 Natural Gas † | 223,542 | 0.2% | |||
| Other Utility † | 42,213 | 0.1% | |||
| 1,535,856 | 1.9% | ||||
| Total Corporate Bonds (Cost $16,649,119) | 17,457,064 | 22.0% | |||
| 2Sovereign Bonds (U.S. Dollar-Denominated) (Cost $563,158) † | 597,971 | 0.7% | |||
| Taxable Municipal Bonds (Cost $1,037,341) † | 1,158,198 | 1.5% | |||
| Temporary Cash Investments | |||||
| Repurchase Agreements | |||||
| Bank of America Securities, LLC | |||||
| (Dated 11/29/13, Repurchase Value | |||||
| $19,400,000, collateralized by | |||||
| U.S. Treasury Bill 0.000%, 2/13/14, | |||||
| with a value of $19,788,000) | 0.080% | 12/2/13 | 19,400 | 19,400 | 0.0% |
| Bank of Montreal (Dated 11/29/13, | |||||
| Repurchase Value $150,001,000, | |||||
| collateralized by Federal National | |||||
| Mortgage Assn. 2.000%–4.500%, | |||||
| 2/1/27–11/1/43, Government | |||||
| National Mortgage Assn. | |||||
| 3.500%–6.000%, 6/20/34–3/20/43, | |||||
| and U.S. Treasury Note/Bond | |||||
| 0.625%, 5/31/17, with a value | |||||
| of $153,000,000) | 0.070% | 12/2/13 | 150,000 | 150,000 | 0.2% |
| Citigroup Global Markets Inc. | |||||
| (Dated 11/29/13, Repurchase Value | |||||
| $107,101,000, collateralized by | |||||
| U.S. Treasury Note/Bond | |||||
| 0.750%–10.625%, 8/15/15–5/15/22, | |||||
| with a value of $109,242,000) | 0.070% | 12/2/13 | 107,100 | 107,100 | 0.1% |
| Deutsche Bank Securities, Inc. | |||||
| (Dated 11/29/13, Repurchase Value | |||||
| $190,101,000, collateralized by | |||||
| Federal Home Loan Mortgage Corp. | |||||
| 3.500%–4.500%, 4/1/25–8/1/43, | |||||
| Federal National Mortgage Assn. | |||||
| 3.000%–6.000%, 8/1/27–11/1/43, | |||||
| and Government National | |||||
| Mortgage Assn. 2.280%–5.000%, | |||||
| 7/15/37–5/15/48, with a value | |||||
| of $193,902,000) | 0.090% | 12/2/13 | 190,100 | 190,100 | 0.2% |
| HSBC Bank USA (Dated 11/29/13, | |||||
| Repurchase Value $89,201,000, | |||||
| collateralized by Federal National | |||||
| Mortgage Assn. 3.000%, | |||||
| 4/1/43–6/1/43, with a value of | |||||
| $90,985,000) | 0.090% | 12/2/13 | 89,200 | 89,200 | 0.1% |
19
| Wellington Fund | |||||
| Face | Market | Percentage | |||
| Maturity | Amount | Value• | of Net | ||
| Coupon | Date | ($000) | ($000) | Assets | |
| RBC Capital Markets LLC | |||||
| (Dated 11/29/13, Repurchase | |||||
| Value $128,301,000, collateralized | |||||
| by Federal Home Loan Mortgage | |||||
| Corp. 2.794%, 12/1/41, and | |||||
| Federal National Mortgage Assn. | |||||
| 2.506%–4.000%, 3/1/41–11/1/43, | |||||
| with a value of $130,866,000) | 0.090% | 12/2/13 | 128,300 | 128,300 | 0.2% |
| RBS Securities, Inc. (Dated 11/29/13, | |||||
| Repurchase Value $36,100,000, | |||||
| collateralized by U.S. Treasury | |||||
| Note/Bond 3.000%, 2/28/17, | |||||
| with a value of $36,826,000) | 0.070% | 12/2/13 | 36,100 | 36,100 | 0.1% |
| TD Securities (USA) LLC | |||||
| (Dated 11/29/13, Repurchase Value | |||||
| $79,700,000, collateralized by | |||||
| Federal Home Loan Mortgage Corp. | |||||
| 0.120%–3.000%, 5/27/14–1/1/43, | |||||
| and Government National | |||||
| Mortgage Assn. 2.500%, 8/20/43, | |||||
| with a value of $81,294,000) | 0.070% | 12/2/13 | 79,700 | 79,700 | 0.1% |
| 799,900 | 1.0% | ||||
| Total Temporary Cash Investments (Cost $799,900) | 799,900 | 1.0% | |||
| Total Investments (Cost $59,174,525) | 78,238,280 | 98.7% | |||
| Other Assets and Liabilities | |||||
| Other Assets5 | 2,281,283 | 3.0% | |||
| Liabilities | (1,229,952) | (1.7%) | |||
| 1,051,331 | 1.3% | ||||
| Net Assets | 79,289,611 | 100.0% | |||
20
| Wellington Fund | |
| At November 30, 2013, net assets consisted of: | |
| Amount | |
| ($000) | |
| Paid-in Capital | 56,875,045 |
| Undistributed Net Investment Income | 296,405 |
| Accumulated Net Realized Gains | 3,046,510 |
| Unrealized Appreciation (Depreciation) | |
| Investment Securities | 19,063,755 |
| Futures Contracts | 5,648 |
| Swap Contracts | 2,121 |
| Foreign Currencies | 127 |
| Net Assets | 79,289,611 |
| Investor Shares—Net Assets | |
| Applicable to 688,784,260 outstanding $.001 par value shares of | |
| beneficial interest (unlimited authorization) | 26,978,364 |
| Net Asset Value Per Share—Investor Shares | $39.17 |
| Admiral Shares—Net Assets | |
| Applicable to 773,208,157 outstanding $.001 par value shares of | |
| beneficial interest (unlimited authorization) | 52,311,247 |
| Net Asset Value Per Share—Admiral Shares | $67.65 |
See Note A in Notes to Financial Statements.
* Non-income-producing security.
† Represents the aggregate value, by category, of securities that are not among the 50 largest holdings and, in total for any issuer, represent 1% or less of net assets.
1 Securities with a value of $5,784,000 have been segregated as collateral for open swap contracts.
2 The issuer was placed under federal conservatorship in September 2008; since that time, its daily operations have been managed by the Federal Housing Finance Agency and it receives capital from the U.S. Treasury, as needed to maintain a positive net worth, in exchange for senior preferred stock.
3 The average or expected maturity is shorter than the final maturity shown because of the possibility of interim principal payments and prepayments or the possibility of the issue being called.
4 Certain of the fund’s securities are exempt from registration under Rule 144A of the Securities Act of 1933. Such securities may be sold in transactions exempt from registration, normally to qualified institutional buyers. At November 30, 2013, the aggregate value of these securities was $2,777,441,000, representing 3.5% of net assets.
5 Cash of $35,196,000 has been segregated as initial margin for open futures contracts.
ADR—American Depositary Receipt.
See accompanying Notes, which are an integral part of the Financial Statements.
21
| Wellington Fund | |
| Statement of Operations | |
| Year Ended | |
| November 30, 2013 | |
| ($000) | |
| Investment Income | |
| Income | |
| Dividends1 | 1,243,702 |
| Interest | 826,609 |
| Securities Lending | 3,629 |
| Total Income | 2,073,940 |
| Expenses | |
| Investment Advisory Fees—Note B | |
| Basic Fee | 48,956 |
| Performance Adjustment | (3,074) |
| The Vanguard Group—Note C | |
| Management and Administrative—Investor Shares | 48,679 |
| Management and Administrative—Admiral Shares | 45,164 |
| Marketing and Distribution—Investor Shares | 5,336 |
| Marketing and Distribution—Admiral Shares | 7,510 |
| Custodian Fees | 668 |
| Auditing Fees | 33 |
| Shareholders’ Reports—Investor Shares | 324 |
| Shareholders’ Reports—Admiral Shares | 216 |
| Trustees’ Fees and Expenses | 184 |
| Total Expenses | 153,996 |
| Net Investment Income | 1,919,944 |
| Realized Net Gain (Loss) | |
| Investment Securities Sold | 3,352,214 |
| Futures Contracts | 6,221 |
| Swap Contracts | 1,285 |
| Foreign Currencies | (979) |
| Realized Net Gain (Loss) | 3,358,741 |
| Change in Unrealized Appreciation (Depreciation) | |
| Investment Securities | 7,113,811 |
| Futures Contracts | 5,648 |
| Swap Contracts | 1,649 |
| Foreign Currencies | 316 |
| Change in Unrealized Appreciation (Depreciation) | 7,121,424 |
| Net Increase (Decrease) in Net Assets Resulting from Operations | 12,400,109 |
| 1 Dividends are net of foreign withholding taxes of $14,606,000. | |
| See accompanying Notes, which are an integral part of the Financial Statements. | |
22
| Wellington Fund | ||
| Statement of Changes in Net Assets | ||
| Year Ended November 30, | ||
| 2013 | 2012 | |
| ($000) | ($000) | |
| Increase (Decrease) in Net Assets | ||
| Operations | ||
| Net Investment Income | 1,919,944 | 1,791,273 |
| Realized Net Gain (Loss) | 3,358,741 | 954,546 |
| Change in Unrealized Appreciation (Depreciation) | 7,121,424 | 4,843,575 |
| Net Increase (Decrease) in Net Assets Resulting from Operations | 12,400,109 | 7,589,394 |
| Distributions | ||
| Net Investment Income | ||
| Investor Shares | (725,993) | (764,768) |
| Admiral Shares | (1,175,953) | (992,538) |
| Realized Capital Gain1 | ||
| Investor Shares | (342,707) | — |
| Admiral Shares | (484,884) | — |
| Total Distributions | (2,729,537) | (1,757,306) |
| Capital Share Transactions | ||
| Investor Shares | (3,405,616) | (1,626,720) |
| Admiral Shares | 8,659,551 | 5,369,681 |
| Net Increase (Decrease) from Capital Share Transactions | 5,253,935 | 3,742,961 |
| Total Increase (Decrease) | 14,924,507 | 9,575,049 |
| Net Assets | ||
| Beginning of Period | 64,365,104 | 54,790,055 |
| End of Period2 | 79,289,611 | 64,365,104 |
1 Includes fiscal 2013 short-term gain distributions totaling $152,007,000. Short-term gain distributions are treated as ordinary income dividends for tax purposes.
2 Net Assets—End of Period includes undistributed net investment income of $296,405,000 and $278,863,000.
See accompanying Notes, which are an integral part of the Financial Statements.
23
| Wellington Fund | |||||
| Financial Highlights | |||||
| Investor Shares | |||||
| For a Share Outstanding | Year Ended November 30, | ||||
| Throughout Each Period | 2013 | 2012 | 2011 | 2010 | 2009 |
| Net Asset Value, Beginning of Period | $34.29 | $31.08 | $29.94 | $28.99 | $23.79 |
| Investment Operations | |||||
| Net Investment Income | .955 | .959 | .929 | .868 | .909 |
| Net Realized and Unrealized Gain (Loss) | |||||
| on Investments | 5.324 | 3.201 | 1.115 | .960 | 5.217 |
| Total from Investment Operations | 6.279 | 4.160 | 2.044 | 1.828 | 6.126 |
| Distributions | |||||
| Dividends from Net Investment Income | (.958) | (.950) | (.904) | (.878) | (.926) |
| Distributions from Realized Capital Gains | (.441) | — | — | — | — |
| Total Distributions | (1.399) | (.950) | (.904) | (.878) | (.926) |
| Net Asset Value, End of Period | $39.17 | $34.29 | $31.08 | $29.94 | $28.99 |
| Total Return1 | 18.85% | 13.56% | 6.85% | 6.43% | 26.46% |
| Ratios/Supplemental Data | |||||
| Net Assets, End of Period (Millions) | $26,978 | $26,716 | $25,743 | $26,717 | $28,114 |
| Ratio of Total Expenses to | |||||
| Average Net Assets2 | 0.26% | 0.25% | 0.27% | 0.30% | 0.34% |
| Ratio of Net Investment Income to | |||||
| Average Net Assets | 2.61% | 2.91% | 2.95% | 2.97% | 3.59% |
| Portfolio Turnover Rate | 35%3 | 31%3 | 38%3 | 35% | 28% |
1 Total returns do not include account service fees that may have applied in the periods shown. Fund prospectuses provide information about any applicable account service fees.
2 Includes performance-based investment advisory fee increases (decreases) of 0.00%, (0.02%), 0.00%, 0.01%, and 0.02%.
3 Includes 5%, 15%, and 9% attributable to mortgage-dollar-roll activity.
See accompanying Notes, which are an integral part of the Financial Statements.
24
| Wellington Fund | |||||
| Financial Highlights | |||||
| Admiral Shares | |||||
| For a Share Outstanding | Year Ended November 30, | ||||
| Throughout Each Period | 2013 | 2012 | 2011 | 2010 | 2009 |
| Net Asset Value, Beginning of Period | $59.24 | $53.68 | $51.71 | $50.07 | $41.10 |
| Investment Operations | |||||
| Net Investment Income | 1.700 | 1.703 | 1.645 | 1.542 | 1.619 |
| Net Realized and Unrealized Gain (Loss) | |||||
| on Investments | 9.175 | 5.544 | 1.930 | 1.658 | 8.999 |
| Total from Investment Operations | 10.875 | 7.247 | 3.575 | 3.200 | 10.618 |
| Distributions | |||||
| Dividends from Net Investment Income | (1.703) | (1.687) | (1.605) | (1.560) | (1.648) |
| Distributions from Realized Capital Gains | (.762) | — | — | — | — |
| Total Distributions | (2.465) | (1.687) | (1.605) | (1.560) | (1.648) |
| Net Asset Value, End of Period | $67.65 | $59.24 | $53.68 | $51.71 | $50.07 |
| Total Return | 18.91% | 13.69% | 6.94% | 6.52% | 26.57% |
| Ratios/Supplemental Data | |||||
| Net Assets, End of Period (Millions) | $52,311 | $37,649 | $29,048 | $24,623 | $19,211 |
| Ratio of Total Expenses to | |||||
| Average Net Assets1 | 0.18% | 0.17% | 0.19% | 0.22% | 0.23% |
| Ratio of Net Investment Income to | |||||
| Average Net Assets | 2.69% | 2.99% | 3.03% | 3.05% | 3.70% |
| Portfolio Turnover Rate | 35%2 | 31%2 | 38%2 | 35% | 28% |
1 Includes performance-based investment advisory fee increases (decreases) of 0.00%, (0.02%), 0.00%, 0.01%, and 0.02%.
2 Includes 5%, 15%, and 9% attributable to mortgage-dollar-roll activity.
See accompanying Notes, which are an integral part of the Financial Statements.
25
Wellington Fund
Notes to Financial Statements
Vanguard Wellington Fund is registered under the Investment Company Act of 1940 as an open-end investment company, or mutual fund. Certain of the fund’s investments are in corporate debt instruments; the issuers’ abilities to meet their obligations may be affected by economic developments in their respective industries. The fund offers two classes of shares: Investor Shares and Admiral Shares. Investor Shares are available to any investor who meets the fund’s minimum purchase requirements. Admiral Shares are designed for investors who meet certain administrative, service, and account-size criteria.
A. The following significant accounting policies conform to generally accepted accounting principles for U.S. mutual funds. The fund consistently follows such policies in preparing its financial statements.
1. Security Valuation: Securities are valued as of the close of trading on the New York Stock Exchange (generally 4 p.m., Eastern time) on the valuation date. Equity securities are valued at the latest quoted sales prices or official closing prices taken from the primary market in which each security trades; such securities not traded on the valuation date are valued at the mean of the latest quoted bid and asked prices. Bonds, and temporary cash investments acquired over 60 days to maturity, are valued using the latest bid prices or using valuations based on a matrix system (which considers such factors as security prices, yields, maturities, and ratings), both as furnished by independent pricing services. Structured debt securities, including mortgages and asset-backed securities, are valued using the latest bid prices or using valuations based on a matrix system that considers such factors as issuer, tranche, nominal or option-adjusted spreads, weighted average coupon, weighted average maturity, credit enhancements, and collateral. Investments in Vanguard Market Liquidity Fund are valued at that fund’s net asset value. Other temporary cash investments are valued at amortized cost, which approximates market value. Securities for which market quotations are not readily available, or whose values have been affected by events occurring before the fund’s pricing time but after the close of the securities’ primary markets, are valued at their fair values calculated according to procedures adopted by the board of trustees. These procedures include obtaining quotations from an independent pricing service, monitoring news to identify significant market- or security-specific events, and evaluating changes in the values of foreign market proxies (for example, ADRs, futures contracts, or exchange-traded funds), between the time the foreign markets close and the fund’s pricing time. When fair-value pricing is employed, the prices of securities used by a fund to calculate its net asset value may differ from quoted or published prices for the same securities.
2. Foreign Currency: Securities and other assets and liabilities denominated in foreign currencies are translated into U.S. dollars using exchange rates obtained from an independent third party as of the fund’s pricing time on the valuation date. Realized gains (losses) and unrealized appreciation (depreciation) on investment securities include the effects of changes in exchange rates since the securities were purchased, combined with the effects of changes in security prices. Fluctuations in the value of other assets and liabilities resulting from changes in exchange rates are recorded as unrealized foreign currency gains (losses) until the assets or liabilities are settled in cash, at which time they are recorded as realized foreign currency gains (losses).
26
Wellington Fund
3. Futures Contracts: The fund may use futures contracts to invest in fixed income asset classes with greater efficiency and lower cost than is possible through direct investment, to add value when these instruments are attractively priced, or to adjust sensitivity to changes in interest rates. The primary risks associated with the use of futures contracts are imperfect correlation between changes in market values of bonds held by the fund and the prices of futures contracts, and the possibility of an illiquid market. Counterparty risk involving futures is mitigated because a regulated clearinghouse is the counterparty instead of the clearing broker. To further mitigate counterparty risk, the fund trades futures contracts on an exchange, monitors the financial strength of its clearing brokers and clearinghouse, and has entered into clearing agreements with its clearing brokers. The clearinghouse imposes initial margin requirements to secure the fund’s performance and requires daily settlement of variation margin representing changes in the market value of each contract.
Futures contracts are valued at their quoted daily settlement prices. The aggregate notional amounts of the contracts are not recorded in the Statement of Net Assets. Fluctuations in the value of the contracts are recorded in the Statement of Net Assets as an asset (liability) and in the Statement of Operations as unrealized appreciation (depreciation) until the contracts are closed, when they are recorded as realized futures gains (losses).
During the year ended November 30, 2013, the fund’s average investments in long and short futures contracts represented 0% and 1% of net assets, respectively, based on quarterly average aggregate settlement values.
4. Swap Contracts: The fund may invest in credit default swaps to adjust the overall credit risk of the fund or to actively overweight or underweight credit risk to a specific issuer or group of issuers. The fund may sell credit protection through credit default swaps to simulate investments in long positions that are either unavailable or considered to be less attractively priced in the bond market. The fund may purchase credit protection through credit default swaps to reduce credit exposure to a given issuer or issuers. Under the terms of the swaps, an up-front payment may be exchanged between the seller and buyer. In addition, the seller of the credit protection receives a periodic payment of premium from the buyer that is a fixed percentage applied to a notional amount. If, for example, the reference entity is subject to a credit event (such as bankruptcy, failure to pay, or obligation acceleration) during the term of the swap, the seller agrees to either physically settle or cash settle the swap contract. If the swap is physically settled, the seller agrees to pay the buyer an amount equal to the notional amount and take delivery of a debt instrument of the reference issuer with a par amount equal to such notional amount. If the swap is cash settled, the seller agrees to pay the buyer the difference between the notional amount and the final price for the relevant debt instrument, as determined either in a market auction or pursuant to a pre-agreed-upon valuation procedure.
The notional amounts of swap contracts are not recorded in the Statement of Net Assets. Swaps are valued daily based on market quotations received from independent pricing services or recognized dealers and the change in value is recorded as unrealized appreciation (depreciation) until the seller of credit protection is required to take delivery (or, in a cash settled swap, pay the settlement amount
27
Wellington Fund
determined) upon occurrence of a credit event, periodic payments are made, or the swap terminates, at which time realized gain (loss) is recorded. The net premium to be received or paid by the fund under swap contracts is accrued daily and recorded as realized gain (loss) over the life of the contract.
The primary risk associated with selling credit protection is that, upon the occurrence of a defined credit event, the market value of the debt instrument received by the fund (or, in a cash settled swap, the debt instruments used to determine the settlement payment by the fund) will be significantly less than the amount paid by the fund and, in a physically settled swap, the fund may receive an illiquid debt instrument. A risk associated with all types of swaps is the possibility that a counterparty may default on its obligation to pay net amounts due to the fund. The fund’s maximum amount subject to counterparty risk is the unrealized appreciation on the swap contract. The fund mitigates its counter-party risk by entering into swaps only with a diverse group of pre-qualified counterparties, monitoring their financial strength, entering into master netting arrangements with its counterparties, and requiring its counterparties to transfer collateral as security for their performance. In the event of a counterparty’s default (including bankruptcy), the fund may terminate any swap contracts with that counterparty, determine the net amount owed by either party in accordance with its master netting arrangements, and sell or retain any collateral held up to the net amount owed to the fund under the master netting arrangements. The swap contracts contain provisions whereby a counterparty may terminate open contracts if the fund’s net assets decline below a certain level, triggering a payment by the fund if the fund is in a net liability position at the time of the termination. The payment amount would be reduced by any collateral the fund has pledged. Any securities pledged as collateral for open contracts are noted in the Statement of Net Assets. The value of collateral received or pledged is compared daily to the value of the swap contracts exposure with each counterparty, and any difference, if in excess of a specified minimum transfer amount, is adjusted and settled within two business days.
During the year ended November 30, 2013, the fund’s average amounts of credit protection sold represented less than 1% of net assets, based on quarterly average notional amounts
5. To Be Announced (TBA) Transactions: A TBA transaction is an agreement to buy or sell mortgage-backed securities with agreed-upon characteristics (face amount, coupon, maturity) for settlement at a future date. The fund may enter into TBA sells to reduce its exposure to the mortgage-backed securities market or in order to dispose of mortgage-backed securities it owns under delayed-delivery arrangements. For TBA purchases, the fund maintains cash or short-term investments until settlement date in an amount sufficient to meet the purchase price.
6. Mortgage Dollar Rolls: The fund enters into mortgage-dollar-roll transactions, in which the fund sells mortgage-backed securities to a dealer and simultaneously agrees to purchase similar securities in the future at a predetermined price. The proceeds of the securities sold in mortgage-dollar-roll transactions are typically invested in high-quality short-term fixed income securities. The fund forgoes principal and interest paid on the securities sold, and is compensated by interest earned on the proceeds of the sale and by a lower price on the securities to be repurchased. The fund has also
28
Wellington Fund
entered into mortgage-dollar-roll transactions in which the fund buys mortgage-backed securities from a dealer pursuant to a TBA transaction and simultaneously agrees to sell similar securities in the future at a predetermined price. The securities bought in mortgage-dollar-roll transactions are used to cover an open TBA sell position. The fund continues to earn interest on mortgage-backed security pools already held and receives a lower price on the securities to be sold in the future. The fund accounts for mortgage-dollar-roll transactions as purchases and sales; as such, these transactions may increase the fund’s portfolio turnover rate. Amounts to be received or paid in connection with open mortgage dollar rolls are included in Receivables for Investment Securities Sold (Other Assets) or Payables for Investment Securities Purchased (Liabilities) in the Statement of Net Assets. The primary risk associated with mortgage dollar rolls is that a counterparty will default on its obligations. This risk is mitigated by, among other things, performing a credit analysis of counterparties, allocating transactions among numerous counterparties, and monitoring exposure to each counterparty.
7. Repurchase Agreements: The fund may enter into repurchase agreements with institutional counterparties. Securities pledged as collateral to the fund under repurchase agreements are held by a custodian bank until the agreements mature. Each agreement requires that the market value of the collateral be sufficient to cover payments of interest and principal. The fund further mitigates its counterparty risk by entering into repurchase agreements only with a diverse group of prequalified counterparties, monitoring their financial strength, and entering into master repurchase agreements with its counterparties. The master repurchase agreements provide that, in the event of a counter-party’s default (including bankruptcy), the fund may terminate any repurchase agreements with that counterparty, determine the net amount owed, and sell or retain the collateral up to the net amount owed to the fund. Such action may be subject to legal proceedings, which may delay or limit the disposition of collateral.
8. Federal Income Taxes: The fund intends to continue to qualify as a regulated investment company and distribute all of its taxable income. Management has analyzed the fund’s tax positions taken for all open federal income tax years (November 30, 2010–2013) and has concluded that no provision for federal income tax is required in the fund’s financial statements.
9. Distributions: Distributions to shareholders are recorded on the ex-dividend date.
10. Securities Lending: To earn additional income, the fund may lend its securities to qualified institutional borrowers. Security loans are required to be secured at all times by collateral in an amount at least equal to the market value of securities loaned. Daily market fluctuations could cause the value of loaned securities to be more or less than the value of the collateral received. When this occurs, the collateral is adjusted and settled on the next business day. The fund further mitigates its counterparty risk by entering into securities lending transactions only with a diverse group of prequalified counterparties, monitoring their financial strength, and entering into master securities lending agreements with its counterparties. The master securities lending agreements provide that, in the event of a counterparty’s default (including bankruptcy), the fund may terminate any loans with that borrower, determine the net amount owed, and sell or retain the collateral up to the net amount owed to the fund; however, such actions may be subject to legal proceedings. While collateral
29
Wellington Fund
mitigates counterparty risk, in the absence of a default the fund may experience delays and costs in recovering the securities loaned. The fund invests cash collateral received in Vanguard Market Liquidity Fund, and records a liability for the return of the collateral, during the period the securities are on loan. Securities lending income represents fees charged to borrowers plus income earned on invested cash collateral, less expenses associated with the loan.
11. Other: Dividend income is recorded on the ex-dividend date. Interest income is accrued daily. Premiums and discounts on debt securities purchased are amortized and accreted, respectively, to interest income over the lives of the respective securities. Security transactions are accounted for on the date securities are bought or sold. Costs used to determine realized gains (losses) on the sale of investment securities are those of the specific securities sold.
Each class of shares has equal rights as to assets and earnings, except that each class separately bears certain class-specific expenses related to maintenance of shareholder accounts (included in Management and Administrative expenses) and shareholder reporting. Marketing and distribution expenses are allocated to each class of shares based on a method approved by the board of trustees. Income, other non-class-specific expenses, and gains and losses on investments are allocated to each class of shares based on its relative net assets.
B. Wellington Management Company, LLP, provides investment advisory services to the fund for a fee calculated at an annual percentage rate of average net assets. The basic fee is subject to quarterly adjustments based on the fund’s performance for the preceding three years relative to the combined index comprising the S&P 500 Index and the Barclays Capital U.S. Credit A or Better Bond Index. For the year ended November 30, 2013, the investment advisory fee represented an effective annual basic rate of 0.07% of the fund’s average net assets before a decrease of $3,074,000 (0.00%) based on performance.
C. The Vanguard Group furnishes at cost corporate management, administrative, marketing, and distribution services. The costs of such services are allocated to the fund under methods approved by the board of trustees. The fund has committed to provide up to 0.40% of its net assets in capital contributions to Vanguard. At November 30, 2013, the fund had contributed capital of $8,867,000 to Vanguard (included in Other Assets), representing 0.01% of the fund’s net assets and 3.55% of Vanguard’s capitalization. The fund’s trustees and officers are also directors and officers of Vanguard.
D. Various inputs may be used to determine the value of the fund’s investments. These inputs are summarized in three broad levels for financial statement purposes. The inputs or methodologies used to value securities are not necessarily an indication of the risk associated with investing in those securities.
Level 1—Quoted prices in active markets for identical securities.
Level 2—Other significant observable inputs (including quoted prices for similar securities, interest rates, prepayment speeds, credit risk, etc.).
Level 3—Significant unobservable inputs (including the fund’s own assumptions used to determine the fair value of investments).
30
Wellington Fund
The following table summarizes the market value of the fund’s investments as of November 30, 2013, based on the inputs used to value them:
| Level 1 | Level 2 | Level 3 | |
| Investments | ($000) | ($000) | ($000) |
| U.S. Government and Agency Obligations | — | 5,369,559 | — |
| Asset-Backed/Commercial Mortgage-Backed Securities | — | 631,461 | — |
| Corporate Bonds | — | 17,457,064 | — |
| Sovereign Bonds | — | 597,971 | — |
| Taxable Municipal Bonds | — | 1,158,198 | — |
| Common Stocks | 48,615,548 | 3,608,579 | — |
| Temporary Cash Investments | — | 799,900 | — |
| Futures Contracts—Assets1 | 2,555 | — | — |
| Futures Contracts—Liabilities1 | (24) | — | — |
| Swap Contracts—Assets | — | 2,121 | — |
| Total | 48,618,079 | 29,624,853 | — |
| 1 Represents variation margin on the last day of the reporting period. |
E. At November 30, 2013, the fair values of derivatives were reflected in the Statement of Net Assets as follows:
| Interest Rate | Credit | ||
| Contracts | Contracts | Total | |
| Statement of Net Assets Caption | ($000) | ($000) | ($000) |
| Other Assets | 2,555 | 2,121 | 4,676 |
| Liabilities | (24) | — | (24) |
Realized net gain (loss) and the change in unrealized appreciation (depreciation) on derivatives for the year ended November 30, 2013, were:
| Interest Rate | Credit | ||
| Contracts | Contracts | Total | |
| Realized Net Gain (Loss) on Derivatives | ($000) | ($000) | ($000) |
| Futures Contracts | 6,221 | — | 6,221 |
| Swap Contracts | — | 1,285 | 1,285 |
| Realized Net Gain (Loss) on Derivatives | 6,221 | 1,285 | 7,506 |
| Change in Unrealized Appreciation (Depreciation) on Derivatives | |||
| Futures Contracts | 5,648 | — | 5,648 |
| Swap Contracts | — | 1,649 | 1,649 |
| Change in Unrealized Appreciation (Depreciation) on Derivatives | 5,648 | 1,649 | 7,297 |
31
Wellington Fund
At November 30, 2013, the aggregate settlement value of open futures contracts and the related unrealized appreciation (depreciation) were:
| ($000) | ||||
| Aggregate | ||||
| Number of | Settlement | Unrealized | ||
| Long (Short) | Value | Appreciation | ||
| Futures Contracts | Expiration | Contracts | Long (Short) | (Depreciation) |
| 10-Year U.S. Treasury Note | March 2014 | (23,361) | (2,928,885) | 5,796 |
| Ultra Long U.S. Treasury Bond | March 2014 | (193) | (26,851) | (148) |
| 5,648 |
Unrealized appreciation (depreciation) on open futures contracts is required to be treated as realized gain (loss) for tax purposes.
| At November 30, 2013, the fund had the following open swap contracts: | ||||||
| Credit Default Swaps | ||||||
| Remaining | ||||||
| Up-Front | Periodic | |||||
| Fee | Premium | Unrealized | ||||
| Notional | Received | Received | Appreciation | |||
| Termination | Amount | (Paid) | (Paid) | (Depreciation) | ||
| Reference Entity | Date | Counterparty1 | ($000) | ($000) | (%) | ($000) |
| Credit Protection Sold/Moody’s Rating | ||||||
| CMBX.NA.AAA 6/A32 | 5/11/63 | DBAG | 13,900 | 549 | 0.500 | 88 |
| CMBX.NA.AAA 6/A32 | 5/11/63 | MSCS | 13,205 | 575 | 0.500 | 136 |
| CMBX.NA.AAA 6/A32 | 5/11/63 | UBSAG | 13,010 | 478 | 0.500 | 46 |
| CMBX.NA.AAA 6/A32 | 5/11/63 | GSI | 13,900 | 587 | 0.500 | 125 |
| CMBX.NA.AAA 6/A32 | 5/11/63 | DBAG | 13,900 | 536 | 0.500 | 75 |
| CMBX.NA.AAA 6/A32 | 5/11/63 | CSFBI | 13,110 | 630 | 0.500 | 195 |
| CMBX.NA.AAA 6/A32 | 5/11/63 | DBAG | 12,950 | 616 | 0.500 | 186 |
| CMBX.NA.AAA 6/A32 | 5/11/63 | DBAG | 25,900 | 1,252 | 0.500 | 392 |
| CMBX.NA.AAA 6/A32 | 5/11/63 | MSCS | 24,970 | 1,187 | 0.500 | 358 |
| CMBX.NA.AAA 6/A32 | 5/11/63 | CSFBI | 26,315 | 1,258 | 0.500 | 384 |
| CMBX.NA.AAA 6/A32 | 5/11/63 | MSCS | 13,205 | 575 | 0.500 | 136 |
| 184,365 | 2,121 | |||||
1 CSFBI—Credit Suisse First Boston International.
DBAG—Deutsche Bank AG.
GSI—Goldman Sachs International.
MSCS—Morgan Stanley Capital Services LLC.
UBSAG—UBS AG.
2 CMBX NA—North American Commercial Mortgage-Backed Index.
32
Wellington Fund
The notional amount represents the maximum potential amount the fund could be required to pay as a seller of credit protection if the reference entity was subject to a credit event.
F. Distributions are determined on a tax basis and may differ from net investment income and realized capital gains for financial reporting purposes. Differences may be permanent or temporary. Permanent differences are reclassified among capital accounts in the financial statements to reflect their tax character. Temporary differences arise when certain items of income, expense, gain, or loss are recognized in different periods for financial statement and tax purposes. These differences will reverse at some time in the future. Differences in classification may also result from the treatment of short-term gains as ordinary income for tax purposes.
During the year ended November 30, 2013, the fund realized net foreign currency losses of $979,000, which decreased distributable net income for tax purposes; accordingly, such losses have been reclassified from accumulated net realized gains to undistributed net investment income.
Realized and unrealized gains (losses) on certain of the fund’s swap contracts are treated as ordinary income (loss) for tax purposes; the effect on the fund’s income dividends to shareholders is offset by a change in principal return. Realized gains of $523,000 on swap contracts have been reclassified from accumulated net realized gains to undistributed net investment income.
The fund used a tax accounting practice to treat a portion of the price of capital shares redeemed during the year as distributions from realized capital gains. Accordingly, the fund has reclassified $263,928,000 from accumulated net realized gains to paid-in capital.
For tax purposes, at November 30, 2013, the fund had $858,376,000 of ordinary income and $2,649,232,000 of long-term capital gains available for distribution.
At November 30, 2013, the cost of investment securities for tax purposes was $59,234,140,000. Net unrealized appreciation of investment securities for tax purposes was $19,004,140,000, consisting of unrealized gains of $19,345,460,000 on securities that had risen in value since their purchase and $341,320,000 in unrealized losses on securities that had fallen in value since their purchase.
G. During the year ended November 30, 2013, the fund purchased $18,264,819,000 of investment securities and sold $16,169,194,000 of investment securities, other than U.S. government securities and temporary cash investments. Purchases and sales of U.S. government securities were $9,299,310,000 and $8,261,989,000, respectively.
33
Wellington Fund
| H. Capital share transactions for each class of shares were: | ||||
| Year Ended November 30, | ||||
| 2013 | 2012 | |||
| Amount | Shares | Amount | Shares | |
| ($000) | (000) | ($000) | (000) | |
| Investor Shares | ||||
| Issued | 3,551,065 | 98,175 | 3,928,943 | 119,032 |
| Issued in Lieu of Cash Distributions | 1,037,876 | 29,677 | 740,932 | 22,626 |
| Redeemed | (7,994,557) | (218,082) | (6,296,595) | (190,990) |
| Net Increase (Decrease)—Investor Shares | (3,405,616) | (90,230) | (1,626,720) | (49,332) |
| Admiral Shares | ||||
| Issued | 12,106,200 | 191,046 | 8,262,787 | 144,837 |
| Issued in Lieu of Cash Distributions | 1,548,758 | 25,530 | 917,357 | 16,193 |
| Redeemed | (4,995,407) | (78,941) | (3,810,463) | (66,592) |
| Net Increase (Decrease) —Admiral Shares | 8,659,551 | 137,635 | 5,369,681 | 94,438 |
I. Management has determined that no material events or transactions occurred subsequent to November 30, 2013, that would require recognition or disclosure in these financial statements.
34
Report of Independent Registered Public Accounting Firm
To the Trustees and Shareholders of Vanguard Wellington Fund:
In our opinion, the accompanying statement of net assets—investments summary and the related statements of operations and of changes in net assets and the financial highlights present fairly, in all material respects, the financial position of Vanguard Wellington Fund (the “Fund”) at November 30, 2013, the results of its operations for the year then ended, the changes in its net assets for each of the two years in the period then ended, and the financial highlights for each of the five years in the period then ended, in conformity with accounting principles generally accepted in the United States of America. These financial statements and financial highlights (hereafter referred to as “financial statements”) are the responsibility of the Fund’s management; our responsibility is to express an opinion on these financial statements based on our audits. We conducted our audits of these financial statements in accordance with the standards of the Public Company Accounting Oversight Board (United States). Those standards require that we plan and perform the audit to obtain reasonable assurance about whether the financial statements are free of material misstatement. An audit includes examining, on a test basis, evidence supporting the amounts and disclosures in the financial statements, assessing the accounting principles used and significant estimates made by management, and evaluating the overall financial statement presentation. We believe that our audits, which included confirmation of securities at November 30, 2013 by correspondence with the custodians and brokers, provide a reasonable basis for our opinion.
PricewaterhouseCoopers LLP
Philadelphia, Pennsylvania
January 15, 2014
Special 2013 tax information (unaudited) for Vanguard Wellington Fund
This information for the fiscal year ended November 30, 2013, is included pursuant to provisions of the Internal Revenue Code.
The fund distributed $900,323,000 as capital gain dividends (from net long-term capital gains) to shareholders during the fiscal year.
The fund distributed $1,174,234,000 of qualified dividend income to shareholders during the fiscal year.
For corporate shareholders, 42.1% of investment income (dividend income plus short-term gains, if any) qualifies for the dividends-received deduction.
35
Your Fund’s After-Tax Returns
This table presents returns for your fund both before and after taxes. The after-tax returns are shown in two ways: (1) assuming that an investor owned the fund during the entire period and paid taxes on the fund’s distributions, and (2) assuming that an investor paid taxes on the fund’s distributions and sold all shares at the end of each period.
Calculations are based on the highest individual federal income tax and capital gains tax rates in effect at the times of the distributions and the hypothetical sales. State and local taxes were not considered. After-tax returns reflect any qualified dividend income, using actual prior-year figures and estimates for 2013. (In the example, returns after the sale of fund shares may be higher than those assuming no sale. This occurs when the sale would have produced a capital loss. The calculation assumes that the investor received a tax deduction for the loss.)
The table shows returns for one share class only; returns for other share classes will differ. Please note that your actual after-tax returns will depend on your tax situation and may differ from those shown. Also note that if you own the fund in a tax-deferred account, such as an individual retirement account or a 401(k) plan, this information does not apply to you. Such accounts are not subject to current taxes.
Finally, keep in mind that a fund’s performance—whether before or after taxes—does not guarantee future results.
Average Annual Total Returns: Wellington Fund Investor Shares
Periods Ended November 30, 2013
| One | Five | Ten | |
| Year | Years | Years | |
| Returns Before Taxes | 18.85% | 14.19% | 8.46% |
| Returns After Taxes on Distributions | 17.67 | 13.26 | 7.34 |
| Returns After Taxes on Distributions and Sale of Fund Shares | 11.33 | 11.16 | 6.63 |
36
About Your Fund’s Expenses
As a shareholder of the fund, you incur ongoing costs, which include costs for portfolio management, administrative services, and shareholder reports (like this one), among others. Operating expenses, which are deducted from a fund’s gross income, directly reduce the investment return of the fund.
A fund’s expenses are expressed as a percentage of its average net assets. This figure is known as the expense ratio. The following examples are intended to help you understand the ongoing costs (in dollars) of investing in your fund and to compare these costs with those of other mutual funds. The examples are based on an investment of $1,000 made at the beginning of the period shown and held for the entire period.
The accompanying table illustrates your fund’s costs in two ways:
• Based on actual fund return. This section helps you to estimate the actual expenses that you paid over the period. The ”Ending Account Value“ shown is derived from the fund‘s actual return, and the third column shows the dollar amount that would have been paid by an investor who started with $1,000 in the fund. You may use the information here, together with the amount you invested, to estimate the expenses that you paid over the period.
To do so, simply divide your account value by $1,000 (for example, an $8,600 account value divided by $1,000 = 8.6), then multiply the result by the number given for your fund under the heading ”Expenses Paid During Period. "
Based on hypothetical 5% yearly return. This section is intended to help you compare your fund‘s costs with those of other mutual funds. It assumes that the fund had a yearly return of 5% before expenses, but that the expense ratio is unchanged. In this case—because the return used is not the fund’s actual return—the results do not apply to your investment. The example is useful in making comparisons because the Securities and Exchange Commission requires all mutual funds to calculate expenses based on a 5% return. You can assess your fund’s costs by comparing this hypothetical example with the hypothetical examples that appear in shareholder reports of other funds.
Note that the expenses shown in the table are meant to highlight and help you compare ongoing costs only and do not reflect transaction costs incurred by the fund for buying and selling securities. Further, the expenses do not include any purchase, redemption, or account service fees described in the fund prospectus. If such fees were applied to your account, your costs would be higher. Your fund does not carry a “sales load.”
The calculations assume no shares were bought or sold during the period. Your actual costs may have been higher or lower, depending on the amount of your investment and the timing of any purchases or redemptions.
You can find more information about the fund’s expenses, including annual expense ratios, in the Financial Statements section of this report. For additional information on operating expenses and other shareholder costs, please refer to your fund’s current prospectus.
37
| Six Months Ended November 30, 2013 | |||
| Beginning | Ending | Expenses | |
| Account Value | Account Value | Paid During | |
| Wellington Fund | 5/31/2013 | 11/30/2013 | Period |
| Based on Actual Fund Return | |||
| Investor Shares | $1,000.00 | $1,070.15 | $1.35 |
| Admiral Shares | 1,000.00 | 1,070.29 | 0.93 |
| Based on Hypothetical 5% Yearly Return | |||
| Investor Shares | $1,000.00 | $1,023.76 | $1.32 |
| Admiral Shares | 1,000.00 | 1,024.17 | 0.91 |
The calculations are based on expenses incurred in the most recent six-month period. The fund’s annualized six-month expense ratios for that period are 0.26% for Investor Shares and 0.18% for Admiral Shares. The dollar amounts shown as “Expenses Paid” are equal to the annualized expense ratio multiplied by the average account value over the period, multiplied by the number of days in the most recent six-month period, then divided by the number of days in the most recent 12-month period.
38
Trustees Approve Advisory Arrangement
The board of trustees of Vanguard Wellington Fund has renewed the fund’s investment advisory arrangement and approved an amended investment advisory agreement with Wellington Management Company, LLP (Wellington Management), effective December 1, 2013. The amended agreement contains a new base fee schedule, including revised breakpoints; however, other terms of the existing agreement have not changed. The board determined that renewing the fund’s advisory arrangement and amending the fee schedule was in the best interests of the fund and its shareholders.
The board based its decision upon an evaluation of the advisor’s investment staff, portfolio management process, and performance. The trustees considered the factors discussed below, among others. However, no single factor determined whether the board approved the arrangement. Rather, it was the totality of the circumstances that drove the board’s decision.
Nature, extent, and quality of services
The board considered the quality of the fund’s investment management services over both the short and long term, and took into account the organizational depth and stability of the advisor. The board noted that Wellington Management, founded in 1928, is among the nation’s oldest and most respected institutional managers. The firm has advised the fund since its inception in 1929. The board also noted that the senior portfolio managers of the fund each have over two decades of investment industry experience. The firm and the fund’s management team have depth and stability. The managers are backed by well-tenured teams of equity and fixed income research analysts who conduct detailed fundamental analysis of their respective industries and companies. The board noted that the new fee arrangement would help Wellington Management to continue to attract and retain top investment talent, and thereby support enhanced organizational depth and stability, which would benefit the fund and its shareholders.
The board concluded that the advisor’s experience, stability, depth, and performance, among other factors, warranted approval of the advisory arrangement.
Investment performance
The board considered the short- and long-term performance of the fund, including any periods of outperformance or underperformance relative to a benchmark index and peer group. The board concluded that the performance was such that the advisory arrangement should continue. Information about the fund’s most recent performance can be found in the Performance Summary section of this report.
Cost
The board concluded that the fund’s expense ratio was well below the average expense ratio charged by funds in its peer group and that the fund’s advisory fee rate was also well below its peer-group average. Information about the fund’s expenses appears in the About Your Fund’s Expenses section of this report as well as in the Financial Statements section, which also includes information about the advisory fee rate.
The board did not consider profitability of Wellington Management in determining whether to approve the advisory fee, because Wellington Management is independent of Vanguard, and the advisory fee is the result of arm’s-length negotiations.
The benefit of economies of scale
The board concluded that the fund’s shareholders benefit from economies of scale because of the breakpoints in the fund’s advisory fee schedule. The breakpoints reduce the effective rate of the fee as the fund’s assets increase.
The board will consider whether to renew the advisory arrangement again after a one-year period.
39
Glossary
30-Day SEC Yield. A fund’s 30-day SEC yield is derived using a formula specified by the U.S. Securities and Exchange Commission. Under the formula, data related to the fund’s security holdings in the previous 30 days are used to calculate the fund’s hypothetical net income for that period, which is then annualized and divided by the fund’s estimated average net assets over the calculation period. For the purposes of this calculation, a security’s income is based on its current market yield to maturity (for bonds), its actual income (for asset-backed securities), or its projected dividend yield (for stocks). Because the SEC yield represents hypothetical annualized income, it will differ—at times significantly—from the fund’s actual experience. As a result, the fund’s income distributions may be higher or lower than implied by the SEC yield.
Average Coupon. The average interest rate paid on the fixed income securities held by a fund. It is expressed as a percentage of face value.
Average Duration. An estimate of how much the value of the bonds held by a fund will fluctuate in response to a change in interest rates. To see how the value could change, multiply the average duration by the change in rates. If interest rates rise by 1 percentage point, the value of the bonds in a fund with an average duration of five years would decline by about 5%. If rates decrease by a percentage point, the value would rise by 5%.
Average Effective Maturity. The average length of time until fixed income securities held by a fund reach maturity and are repaid, taking into consideration the possibility that the issuer may call the bond before its maturity date. The figure reflects the proportion of fund assets represented by each security; it also reflects any futures contracts held. In general, the longer the average effective maturity, the more a fund’s share price will fluctuate in response to changes in market interest rates.
Beta. A measure of the magnitude of a fund’s past share-price fluctuations in relation to the ups and downs of a given market index. The index is assigned a beta of 1.00. Compared with a given index, a fund with a beta of 1.20 typically would have seen its share price rise or fall by 12% when the index rose or fell by 10%. For this report, beta is based on returns over the past 36 months for both the fund and the index. Note that a fund’s beta should be reviewed in conjunction with its R-squared (see definition). The lower the R-squared, the less correlation there is between the fund and the index, and the less reliable beta is as an indicator of volatility.
Credit Quality. Credit-quality ratings are measured on a scale that generally ranges from AAA (highest) to D (lowest). “Not Rated” is used to classify securities for which a rating is not available. U.S. Treasury, U.S. Agency, and U.S. Agency mortgage-backed securities appear under “U.S. Government.” For this report, credit-quality ratings are obtained from Moody’s and S&P, and the higher rating for each issue is used.
Dividend Yield. The current, annualized rate of dividends paid on a share of stock, divided by its current share price. For a fund, the weighted average yield for stocks it holds. The index yield is based on the current annualized rate of dividends paid on stocks in the index.
Earnings Growth Rate. The average annual rate of growth in earnings over the past five years for the stocks now in a fund.
Equity Exposure. A measure that reflects a fund’s investments in stocks and stock futures. Any holdings in short-term reserves are excluded.
40
Expense Ratio. A fund’s total annual operating expenses expressed as a percentage of the fund’s average net assets. The expense ratio includes management and administrative expenses, but does not include the transaction costs of buying and selling portfolio securities.
Foreign Holdings. The percentage of a fund represented by securities or depositary receipts of companies based outside the United States.
Inception Date. The date on which the assets of a fund (or one of its share classes) are first invested in accordance with the fund’s investment objective. For funds with a subscription period, the inception date is the day after that period ends. Investment performance is measured from the inception date.
Median Market Cap. An indicator of the size of companies in which a fund invests; the midpoint of market capitalization (market price x shares outstanding) of a fund’s stocks, weighted by the proportion of the fund’s assets invested in each stock. Stocks representing half of the fund’s assets have market capitalizations above the median, and the rest are below it.
Price/Book Ratio. The share price of a stock divided by its net worth, or book value, per share. For a fund, the weighted average price/book ratio of the stocks it holds.
Price/Earnings Ratio. The ratio of a stock’s current price to its per-share earnings over the past year. For a fund, the weighted average P/E of the stocks it holds. P/E is an indicator of market expectations about corporate prospects; the higher the P/E, the greater the expectations for a company’s future growth.
R-Squared. A measure of how much of a fund’s past returns can be explained by the returns from the market in general, as measured by a given index. If a fund’s total returns were precisely synchronized with an index’s returns, its R-squared would be 1.00. If the fund’s returns bore no relationship to the index’s returns, its R-squared would be 0. For this report, R-squared is based on returns over the past 36 months for both the fund and the index.
Return on Equity. The annual average rate of return generated by a company during the past five years for each dollar of shareholder’s equity (net income divided by shareholder’s equity). For a fund, the weighted average return on equity for the companies whose stocks it holds.
Short-Term Reserves. The percentage of a fund invested in highly liquid, short-term securities that can be readily converted to cash.
Turnover Rate. An indication of the fund’s trading activity. Funds with high turnover rates incur higher transaction costs and may be more likely to distribute capital gains (which may be taxable to investors). The turnover rate excludes in-kind transactions, which have minimal impact on costs.
Yield to Maturity. The rate of return an investor would receive if the fixed income securities held by a fund were held to their maturity dates.
41
Benchmark Information
Wellington Composite Index: 65% S&P 500 Index and 35% Lehman U.S. Long Credit AA or Better Bond Index through February 29, 2000; 65% S&P 500 Index and 35% Barclays U.S. Credit A or Better Bond Index thereafter.
42
This page intentionally left blank.
The People Who Govern Your Fund
The trustees of your mutual fund are there to see that the fund is operated and managed in your best interests since, as a shareholder, you are a part owner of the fund. Your fund’s trustees also serve on the board of directors of The Vanguard Group, Inc., which is owned by the Vanguard funds and provides services to them on an at-cost basis.
A majority of Vanguard’s board members are independent, meaning that they have no affiliation with Vanguard or the funds they oversee, apart from the sizable personal investments they have made as private individuals. The independent board members have distinguished backgrounds in business, academia, and public service. Each of the trustees and executive officers oversees 181 Vanguard funds.
The following table provides information for each trustee and executive officer of the fund. More information about the trustees is in the Statement of Additional Information, which can be obtained, without charge, by contacting Vanguard at 800-662-7447, or online at vanguard.com.
| InterestedTrustee1 | and Delphi Automotive LLP (automotive components); |
| Senior Advisor at New Mountain Capital; Trustee of | |
| F. William McNabb III | The Conference Board. |
| Born 1957. Trustee Since July 2009. Chairman of the | |
| Board. Principal Occupation(s) During the Past Five | Amy Gutmann |
| Years: Chairman of the Board of The Vanguard Group, | Born 1949. Trustee Since June 2006. Principal |
| Inc., and of each of the investment companies served | Occupation(s) During the Past Five Years: President |
| by The Vanguard Group, since January 2010; Director | of the University of Pennsylvania; Christopher H. |
| of The Vanguard Group since 2008; Chief Executive | Browne Distinguished Professor of Political Science |
| Officer and President of The Vanguard Group and of | in the School of Arts and Sciences with secondary |
| each of the investment companies served by The | appointments at the Annenberg School for |
| Vanguard Group since 2008; Director of Vanguard | Communication and the Graduate School of Education |
| Marketing Corporation; Managing Director of The | of the University of Pennsylvania; Member of the |
| Vanguard Group (1995–2008). | National Commission on the Humanities and Social |
| Sciences; Trustee of Carnegie Corporation of New | |
| York and of the National Constitution Center; Chair | |
| IndependentTrustees | of the U.S. Presidential Commission for the Study |
| of Bioethical Issues. | |
| Emerson U. Fullwood | |
| Born 1948. Trustee Since January 2008. Principal | |
| Occupation(s) During the Past Five Years: Executive | JoAnn Heffernan Heisen |
| Chief Staff and Marketing Officer for North America | Born 1950. Trustee Since July 1998. Principal |
| and Corporate Vice President (retired 2008) of Xerox | Occupation(s) During the Past Five Years: Corporate |
| Corporation (document management products and | Vice President and Chief Global Diversity Officer |
| services); Executive in Residence and 2010 | (retired 2008) and Member of the Executive |
| Distinguished Minett Professor at the Rochester | Committee (1997–2008) of Johnson & Johnson |
| Institute of Technology; Director of SPX Corporation | (pharmaceuticals/medical devices/consumer |
| (multi-industry manufacturing), the United Way of | products); Director of Skytop Lodge Corporation |
| Rochester, Amerigroup Corporation (managed health | (hotels), the University Medical Center at Princeton, |
| care), the University of Rochester Medical Center, | the Robert Wood Johnson Foundation, and the Center |
| Monroe Community College Foundation, and North | for Talent Innovation; Member of the Advisory Board |
| Carolina A&T University. | of the Maxwell School of Citizenship and Public Affairs |
| at Syracuse University. | |
| Rajiv L. Gupta | |
| Born 1945. Trustee Since December 2001.2 | F. Joseph Loughrey |
| Principal Occupation(s) During the Past Five Years: | Born 1949. Trustee Since October 2009. Principal |
| Chairman and Chief Executive Officer (retired 2009) | Occupation(s) During the Past Five Years: President |
| and President (2006–2008) of Rohm and Haas Co. | and Chief Operating Officer (retired 2009) of Cummins |
| (chemicals); Director of Tyco International, Ltd. | Inc. (industrial machinery); Chairman of the Board of |
| (diversified manufacturing and services), Hewlett- | Hillenbrand, Inc. (specialized consumer services) and |
| Packard Co. (electronic computer manufacturing), | of Oxfam America; Director of SKF AB (industrial |
| machinery), Hyster-Yale Materials Handling, Inc. | Executive Officers | |
| (forklift trucks), and the Lumina Foundation for | ||
| Education; Member of the Advisory Council for the | Glenn Booraem | |
| College of Arts and Letters and of the Advisory Board | Born 1967. Controller Since July 2010. Principal | |
| to the Kellogg Institute for International Studies, both | Occupation(s) During the Past Five Years: Principal | |
| at the University of Notre Dame. | of The Vanguard Group, Inc.; Controller of each of | |
| the investment companies served by The Vanguard | ||
| Mark Loughridge | Group; Assistant Controller of each of the investment | |
| Born 1953. Trustee Since March 2012. Principal | companies served by The Vanguard Group (2001–2010). | |
| Occupation(s) During the Past Five Years: Senior Vice | ||
| President and Chief Financial Officer at IBM (information | Thomas J. Higgins | |
| technology services); Fiduciary Member of IBM’s | Born 1957. Chief Financial Officer Since September | |
| Retirement Plan Committee. | 2008. Principal Occupation(s) During the Past Five | |
| Years: Principal of The Vanguard Group, Inc.; Chief | ||
| Scott C. Malpass | Financial Officer of each of the investment companies | |
| Born 1962. Trustee Since March 2012. Principal | served by The Vanguard Group; Treasurer of each of | |
| Occupation(s) During the Past Five Years: Chief | the investment companies served by The Vanguard | |
| Investment Officer and Vice President at the University | Group (1998–2008). | |
| of Notre Dame; Assistant Professor of Finance at the | ||
| Mendoza College of Business at Notre Dame; Member | Kathryn J. Hyatt | |
| of the Notre Dame 403(b) Investment Committee; | Born 1955. Treasurer Since November 2008. Principal | |
| Director of TIFF Advisory Services, Inc. (investment | Occupation(s) During the Past Five Years: Principal of | |
| advisor); Member of the Investment Advisory | The Vanguard Group, Inc.; Treasurer of each of the | |
| Committees of the Financial Industry Regulatory | investment companies served by The Vanguard | |
| Authority (FINRA) and of Major League Baseball. | Group; Assistant Treasurer of each of the investment | |
| companies served by The Vanguard Group (1988–2008). | ||
| André F. Perold | ||
| Born 1952. Trustee Since December 2004. Principal | Heidi Stam | |
| Occupation(s) During the Past Five Years: George | Born 1956. Secretary Since July 2005. Principal | |
| Gund Professor of Finance and Banking at the Harvard | Occupation(s) During the Past Five Years: Managing | |
| Business School (retired 2011); Chief Investment | Director of The Vanguard Group, Inc.; General Counsel | |
| Officer and Managing Partner of HighVista Strategies | of The Vanguard Group; Secretary of The Vanguard | |
| LLC (private investment firm); Director of Rand | Group and of each of the investment companies | |
| Merchant Bank; Overseer of the Museum of Fine | served by The Vanguard Group; Director and Senior | |
| Arts Boston. | Vice President of Vanguard Marketing Corporation. | |
| Alfred M. Rankin, Jr. | ||
| Vanguard Senior ManagementTeam | ||
| Born 1941. Trustee Since January 1993. Principal | ||
| Occupation(s) During the Past Five Years: Chairman, | Mortimer J. Buckley | Chris D. McIsaac |
| President, and Chief Executive Officer of NACCO | Kathleen C. Gubanich | Michael S. Miller |
| Industries, Inc. (housewares/lignite) and of Hyster-Yale | Paul A. Heller | James M. Norris |
| Materials Handling, Inc. (forklift trucks); Director of | Martha G. King | Glenn W. Reed |
| the National Association of Manufacturers; Chairman | John T. Marcante | |
| of the Board of University Hospitals of Cleveland; | ||
| Advisory Chairman of the Board of The Cleveland | ||
| Museum of Art. | Chairman Emeritus and Senior Advisor | |
| John J. Brennan | ||
| Peter F. Volanakis | Chairman, 1996–2009 | |
| Born 1955. Trustee Since July 2009. Principal | Chief Executive Officer and President, 1996–2008 | |
| Occupation(s) During the Past Five Years: President | ||
| and Chief Operating Officer (retired 2010) of Corning | ||
| Incorporated (communications equipment); Director | Founder | |
| of SPX Corporation (multi-industry manufacturing); | ||
| Overseer of the Amos Tuck School of Business | John C. Bogle | |
| Administration at Dartmouth College; Advisor to the | Chairman and Chief Executive Officer, 1974–1996 | |
| Norris Cotton Cancer Center. | ||
1 Mr. McNabb is considered an “interested person,” as defined in the Investment Company Act of 1940, because he is an officer of the Vanguard funds.
2 December 2002 for Vanguard Equity Income Fund, Vanguard Growth Equity Fund, the Vanguard Municipal Bond Funds, and the Vanguard State Tax-Exempt Funds.
 | |
| P.O. Box 2600 | |
| Valley Forge, PA 19482-2600 |
Connect with Vanguard® > vanguard.com
| Fund Information > 800-662-7447 | CFA® is a trademark owned by CFA Institute. |
| Direct Investor Account Services > 800-662-2739 | |
| Institutional Investor Services > 800-523-1036 | |
| Text Telephone for People | |
| With Hearing Impairment > 800-749-7273 | |
| This material may be used in conjunction | |
| with the offering of shares of any Vanguard | |
| fund only if preceded or accompanied by | |
| the fund’s current prospectus. | |
| All comparative mutual fund data are from Lipper, a | |
| Thomson Reuters Company, or Morningstar, Inc., unless | |
| otherwise noted. | |
| You can obtain a free copy of Vanguard’s proxy voting | |
| guidelines by visiting vanguard.com/proxyreporting or by | |
| calling Vanguard at 800-662-2739. The guidelines are | |
| also available from the SEC’s website, sec.gov. In | |
| addition, you may obtain a free report on how your fund | |
| voted the proxies for securities it owned during the 12 | |
| months ended June 30. To get the report, visit either | |
| vanguard.com/proxyreporting or sec.gov. | |
| You can review and copy information about your fund at | |
| the SEC’s Public Reference Room in Washington, D.C. To | |
| find out more about this public service, call the SEC at | |
| 202-551-8090. Information about your fund is also | |
| available on the SEC’s website, and you can receive | |
| copies of this information, for a fee, by sending a | |
| request in either of two ways: via e-mail addressed to | |
| publicinfo@sec.gov or via regular mail addressed to the | |
| Public Reference Section, Securities and Exchange | |
| Commission, Washington, DC 20549-1520. | |
| © 2014 The Vanguard Group, Inc. | |
| All rights reserved. | |
| Vanguard Marketing Corporation, Distributor. | |
| Q210 012014 | |
Item 2: Code of Ethics. The Registrant has adopted a code of ethics that applies to the Registrant’s principal executive officer, principal financial officer, principal accounting officer or controller or persons performing similar functions. The Code of Ethics was amended during the reporting period covered by this report to make certain technical, non-material changes.
Item 3: Audit Committee Financial Expert. The following members of the Audit Committee have been determined by the Registrant’s Board of Trustees to be Audit Committee Financial Experts serving on its Audit Committee, and to be independent: Rajiv L. Gupta, Amy Gutmann, JoAnn Heffernan Heisen, F. Joseph Loughrey, Mark Loughridge, Scott C. Malpass, André F. Perold, and Alfred M. Rankin, Jr.
Item 4: Principal Accountant Fees and Services.
(a) Audit Fees.
Audit Fees of the Registrant
Fiscal Year Ended November 30, 2013: $33,000
Fiscal Year Ended November 30, 2012: $33,000
Aggregate Audit Fees of Registered Investment Companies in the Vanguard Group.
Fiscal Year Ended November 30, 2013: $5,714,113
Fiscal Year Ended November 30, 2012: $4,809,780
Includes fees billed in connection with audits of the Registrant and other registered investment companies in the Vanguard complex. Also includes fees billed in connection with audits of The Vanguard Group, Inc. and Vanguard Marketing Corporation for Fiscal Year Ended November 30, 2013.
(b) Audit-Related Fees.
Fiscal Year Ended November 30, 2013: $1,552,950
Fiscal Year Ended November 30, 2012: $1,812,565
Includes fees billed in connection with assurance and related services provided to the Registrant, other registered investment companies in the Vanguard complex, The Vanguard Group, Inc., and Vanguard Marketing Corporation.
(c) Tax Fees.
Fiscal Year Ended November 30, 2013: $110,000
Fiscal Year Ended November 30, 2012: $490,518
Includes fees billed in connection with tax compliance, planning, and advice services provided to the Registrant, other registered investment companies in the Vanguard complex, The Vanguard Group, Inc., and Vanguard Marketing Corporation. Also includes fees billed in connection with certain tax services related to audits of the Registrant and other registered investment companies in the Vanguard complex for Fiscal Year Ended November 30, 2012.
(d) All Other Fees.
Fiscal Year Ended November 30, 2013: $132,000
Fiscal Year Ended November 30, 2012: $16,000
Includes fees billed for services related to tax reported information provided to the Registrant, other registered investment companies in the Vanguard complex, The Vanguard Group, Inc., and Vanguard Marketing Corporation.
(e) (1) Pre-Approval Policies. The policy of the Registrant’s Audit Committee is to consider and, if appropriate, approve before the principal accountant is engaged for such services, all specific audit and non-audit services provided to: the Registrant, other registered investment companies in the Vanguard complex, The Vanguard Group, Inc., and entities controlled by The Vanguard Group, Inc. that provide ongoing services to the Registrant. In making a determination, the Audit Committee considers whether the services are consistent with maintaining the principal accountant’s independence.
In the event of a contingency situation in which the principal accountant is needed to provide services in between scheduled Audit Committee meetings, the Chairman of the Audit Committee would be called on to consider and, if appropriate, pre-approve audit or permitted non-audit services in an amount sufficient to complete services through the next Audit Committee meeting, and to determine if such services would be consistent with maintaining the accountant’s independence. At the next scheduled Audit Committee meeting, services and fees would be presented to the Audit Committee for formal consideration, and, if appropriate, approval by the entire Audit Committee. The Audit Committee would again consider whether such services and fees are consistent with maintaining the principal accountant’s independence.
The Registrant’s Audit Committee is informed at least annually of all audit and non-audit services provided by the principal accountant to the Vanguard complex, whether such services are provided to: the Registrant, other registered investment companies in the Vanguard complex, The Vanguard Group, Inc., or other entities controlled by The Vanguard Group, Inc. that provide ongoing services to the Registrant.
(2) No percentage of the principal accountant’s fees or services were approved pursuant to the waiver provision of paragraph (c)(7)(i)(C) of Rule 2-01 of Regulation S-X.
(f) For the most recent fiscal year, over 50% of the hours worked under the principal accountant’s engagement were not performed by persons other than full-time, permanent employees of the principal accountant.
(g) Aggregate Non-Audit Fees.
Fiscal Year Ended November 30, 2013: $242,000
Fiscal Year Ended November 30, 2012: $506,518
Includes fees billed for non-audit services provided to the Registrant, other registered investment companies in the Vanguard complex, The Vanguard Group, Inc., and Vanguard Marketing Corporation.
(h) For the most recent fiscal year, the Audit Committee has determined that the provision of all non-audit services was consistent with maintaining the principal accountant’s independence.
Item 5: Audit Committee of Listed Registrants.
Not Applicable.
Item 6: Investments.
| Vanguard® Wellington Fund | ||
| Schedule of Investments | ||
| November 30, 2013 | ||
| Market | ||
| Value | ||
| Shares | ($000) | |
| Common Stocks (65.9%) | ||
| Consumer Discretionary (5.5%) | ||
| Comcast Corp. Class A | 23,059,160 | 1,149,960 |
| Time Warner Inc. | 11,666,810 | 766,626 |
| Ford Motor Co. | 38,588,880 | 659,098 |
| Lowe's Cos. Inc. | 13,637,020 | 647,486 |
| Walt Disney Co. | 6,640,746 | 468,438 |
| Volkswagen AG Prior Pfd. | 1,575,500 | 417,489 |
| Target Corp. | 3,853,590 | 246,360 |
| 4,355,457 | ||
| Consumer Staples (5.4%) | ||
| CVS Caremark Corp. | 12,664,140 | 847,991 |
| Procter & Gamble Co. | 7,449,265 | 627,377 |
| Philip Morris International Inc. | 5,999,300 | 513,180 |
| Unilever NV | 11,199,000 | 439,673 |
| Wal-Mart Stores Inc. | 5,258,300 | 425,975 |
| Kraft Foods Group Inc. | 6,794,200 | 360,908 |
| Walgreen Co. | 5,271,430 | 312,068 |
| Diageo plc | 9,606,361 | 306,043 |
| Archer-Daniels-Midland Co. | 4,194,900 | 168,845 |
| Anheuser-Busch InBev NV ADR | 1,403,000 | 143,260 |
| Mondelez International Inc. Class A | 3,077,000 | 103,172 |
| Diageo plc ADR | 292,300 | 37,318 |
| 4,285,810 | ||
| Energy (7.1%) | ||
| Exxon Mobil Corp. | 14,055,384 | 1,313,897 |
| Chevron Corp. | 8,323,220 | 1,019,095 |
| BP plc ADR | 16,882,610 | 793,651 |
| Anadarko Petroleum Corp. | 7,718,910 | 685,594 |
| BG Group plc | 22,198,607 | 452,768 |
| Schlumberger Ltd. | 3,780,390 | 334,262 |
| Phillips 66 | 4,452,481 | 309,937 |
| Suncor Energy Inc. | 8,320,420 | 288,552 |
| Occidental Petroleum Corp. | 2,373,310 | 225,370 |
| Halliburton Co. | 3,694,250 | 194,613 |
| 5,617,739 | ||
| Financials (13.6%) | ||
| Wells Fargo & Co. | 38,971,017 | 1,715,504 |
| JPMorgan Chase & Co. | 23,549,396 | 1,347,496 |
| ACE Ltd. | 9,602,460 | 986,941 |
| Prudential Financial Inc. | 10,734,120 | 952,761 |
| PNC Financial Services Group Inc. | 9,691,400 | 745,753 |
| BlackRock Inc. | 2,120,040 | 641,842 |
| Citigroup Inc. | 10,092,510 | 534,096 |
| US Bancorp | 9,868,800 | 387,054 |
| Bank of America Corp. | 23,040,500 | 364,501 |
| Marsh & McLennan Cos. Inc. | 7,559,100 | 358,679 |
| Mitsubishi UFJ Financial Group Inc. | 48,325,000 | 312,108 |
| MetLife Inc. | 5,783,285 | 301,830 |
| HSBC Holdings plc ADR | 5,179,500 | 290,570 |
| Standard Chartered plc | 11,457,321 | 270,999 |
| UBS AG | 14,141,834 | 268,695 |
| Aflac Inc. | 3,857,480 | 256,021 |
| Morgan Stanley | 7,414,800 | 232,083 |
| American International Group Inc. | 3,539,100 | 176,070 |
| State Street Corp. | 2,408,227 | 174,861 |
| * Bank of Nova Scotia | 2,517,300 | 154,990 |
| Chubb Corp. | 1,487,050 | 143,426 |
| Hartford Financial Services Group Inc. | 3,495,472 | 124,544 |
| Vornado Realty Trust | 974,400 | 85,679 |
| 10,826,503 | ||
| Health Care (11.6%) | ||
| Merck & Co. Inc. | 27,713,952 | 1,380,986 |
1
| Vanguard® Wellington Fund | ||
| Schedule of Investments | ||
| November 30, 2013 | ||
| Market | ||
| Value | ||
| Shares | ($000) | |
| Johnson & Johnson | 10,672,450 | 1,010,254 |
| Pfizer Inc. | 29,075,738 | 922,573 |
| Roche Holding AG | 2,888,356 | 805,635 |
| Eli Lilly & Co. | 14,137,500 | 709,985 |
| Cardinal Health Inc. | 10,836,500 | 700,038 |
| Medtronic Inc. | 12,018,800 | 688,918 |
| AstraZeneca plc ADR | 11,923,460 | 681,903 |
| UnitedHealth Group Inc. | 7,364,590 | 548,515 |
| Bristol-Myers Squibb Co. | 9,370,690 | 481,466 |
| Teva Pharmaceutical Industries Ltd. ADR | 10,401,700 | 423,973 |
| Zoetis Inc. | 9,256,196 | 288,330 |
| * Gilead Sciences Inc. | 2,934,900 | 219,560 |
| * Celgene Corp. | 1,092,400 | 176,718 |
| AmerisourceBergen Corp. Class A | 2,421,400 | 170,781 |
| 9,209,635 | ||
| Industrials (9.4%) | ||
| General Electric Co. | 31,794,200 | 847,634 |
| United Parcel Service Inc. Class B | 7,052,170 | 722,001 |
| FedEx Corp. | 4,977,520 | 690,382 |
| Siemens AG | 4,856,830 | 641,071 |
| Honeywell International Inc. | 6,957,170 | 615,779 |
| Raytheon Co. | 5,171,830 | 458,638 |
| Boeing Co. | 3,312,650 | 444,723 |
| United Technologies Corp. | 3,985,000 | 441,777 |
| Deere & Co. | 4,922,460 | 414,668 |
| Schneider Electric SA | 4,823,181 | 408,114 |
| Eaton Corp. plc | 5,478,600 | 398,075 |
| CSX Corp. | 14,363,840 | 391,702 |
| Union Pacific Corp. | 1,852,460 | 300,173 |
| General Dynamics Corp. | 2,731,465 | 250,366 |
| Emerson Electric Co. | 3,540,470 | 237,176 |
| Caterpillar Inc. | 1,899,050 | 160,660 |
| 7,422,939 | ||
| Information Technology (8.6%) | ||
| Microsoft Corp. | 34,323,220 | 1,308,744 |
| Intel Corp. | 28,718,860 | 684,658 |
| International Business Machines Corp. | 3,785,390 | 680,159 |
| Texas Instruments Inc. | 15,240,172 | 655,328 |
| Apple Inc. | 1,125,100 | 625,634 |
| Accenture plc Class A | 7,837,210 | 607,149 |
| * eBay Inc. | 11,883,590 | 600,359 |
| Cisco Systems Inc. | 22,930,170 | 487,266 |
| EMC Corp. | 19,040,260 | 454,110 |
| Oracle Corp. | 11,473,050 | 404,884 |
| Automatic Data Processing Inc. | 2,075,170 | 166,055 |
| QUALCOMM Inc. | 1,604,268 | 118,042 |
| 6,792,388 | ||
| Materials (1.1%) | ||
| Dow Chemical Co. | 18,115,900 | 707,607 |
| Goldcorp Inc. | 5,826,160 | 130,856 |
| 838,463 | ||
| Telecommunication Services (1.5%) | ||
| Verizon Communications Inc. | 24,258,590 | 1,203,711 |
| Utilities (2.1%) | ||
| NextEra Energy Inc. | 7,459,900 | 631,033 |
| Dominion Resources Inc. | 9,581,400 | 621,929 |
| Exelon Corp. | 10,513,964 | 282,931 |
| Duke Energy Corp. | 1,938,100 | 135,589 |
| 1,671,482 | ||
| Total Common Stocks (Cost $34,143,619) | 52,224,127 | |
2
| Vanguard® Wellington Fund | |||||
| Schedule of Investments | |||||
| November 30, 2013 | |||||
| Face | Market | ||||
| Maturity | Amount | Value | |||
| Coupon | Date | ($000) | ($000) | ||
| U.S. Government and Agency Obligations (6.8%) | |||||
| U.S. Government Securities (3.9%) | |||||
| 1 | United States Treasury Note/Bond | 0.125% | 4/30/15 | 351,900 | 351,516 |
| United States Treasury Note/Bond | 0.250% | 5/31/15 | 141,400 | 141,488 | |
| United States Treasury Note/Bond | 0.375% | 6/30/15 | 147,150 | 147,494 | |
| 1 | United States Treasury Note/Bond | 1.500% | 6/30/16 | 506,905 | 521,002 |
| United States Treasury Note/Bond | 0.875% | 1/31/17 | 12,165 | 12,252 | |
| United States Treasury Note/Bond | 0.750% | 10/31/17 | 230,000 | 228,096 | |
| United States Treasury Note/Bond | 1.000% | 5/31/18 | 220,000 | 218,110 | |
| United States Treasury Note/Bond | 1.375% | 9/30/18 | 950,000 | 952,821 | |
| United States Treasury Note/Bond | 2.750% | 2/15/19 | 30,350 | 32,342 | |
| United States Treasury Note/Bond | 2.875% | 5/15/43 | 569,275 | 472,498 | |
| 3,077,619 | |||||
| Conventional Mortgage-Backed Securities (2.7%) | |||||
| 2,3 | Freddie Mac Gold Pool | 4.500% | 6/1/23–12/1/43 | 1,656,984 | 1,767,077 |
| 2,3 | Freddie Mac Gold Pool | 5.000% | 1/1/33–12/1/43 | 155,174 | 167,839 |
| 2,3 | Freddie Mac Gold Pool | 5.500% | 9/1/22–12/1/43 | 120,463 | 131,071 |
| 3 | Ginnie Mae I Pool | 4.000% | 7/15/39–12/1/43 | 43,378 | 45,806 |
| 3 | Ginnie Mae I Pool | 5.000% | 12/15/32–12/1/43 | 25,986 | 28,569 |
| 3 | Ginnie Mae I Pool | 7.000% | 11/15/31–11/15/33 | 4,868 | 5,597 |
| 3 | Ginnie Mae I Pool | 8.000% | 6/15/17 | 21 | 21 |
| 2,145,980 | |||||
| Nonconventional Mortgage-Backed Securities (0.2%) | |||||
| 2,3 | Fannie Mae REMICS | 3.500% | 4/25/31 | 9,730 | 9,490 |
| 2,3 | Fannie Mae REMICS | 4.000% | 9/25/29–5/25/31 | 18,581 | 19,311 |
| 2,3 | Freddie Mac REMICS | 3.500% | 3/15/31 | 5,760 | 5,628 |
| 2,3 | Freddie Mac REMICS | 4.000% | 12/15/30–4/15/31 | 108,686 | 111,531 |
| 145,960 | |||||
| Total U.S. Government and Agency Obligations (Cost $5,351,451) | 5,369,559 | ||||
| Asset-Backed/Commercial Mortgage-Backed Securities (0.8%) | |||||
| 3 | Ally Auto Receivables Trust 2010-4 | 1.350% | 12/15/15 | 7,043 | 7,091 |
| 3 | Ally Master Owner Trust Series 2011-1 | 2.150% | 1/15/16 | 44,666 | 44,748 |
| 3 | Ally Master Owner Trust Series 2012-5 | 1.540% | 9/15/19 | 105,755 | 105,804 |
| 3 | AmeriCredit Automobile Receivables Trust 2011-3 | 1.170% | 1/8/16 | 3,209 | 3,214 |
| 3,4 | Avis Budget Rental Car Funding AESOP LLC 2010-4A | 2.090% | 4/20/15 | 46,896 | 47,059 |
| 3,4 | Avis Budget Rental Car Funding AESOP LLC 2010-5A | 3.150% | 3/20/17 | 12,000 | 12,402 |
| 3 | Banc of America Commercial Mortgage Trust 2006-2 | 5.923% | 5/10/45 | 14,695 | 16,111 |
| 3 | Banc of America Commercial Mortgage Trust 2006-5 | 5.414% | 9/10/47 | 17,671 | 19,265 |
| 3 | Bear Stearns Commercial Mortgage Securities Trust | ||||
| 2006-PWR13 | 5.540% | 9/11/41 | 23,000 | 25,164 | |
| 3 | COMM 2006-C7 Mortgage Trust | 5.944% | 6/10/46 | 22,400 | 24,443 |
| 3 | COMM 2012-CCRE2 Mortgage Trust | 3.147% | 8/15/45 | 18,085 | 17,698 |
| 3 | Credit Suisse Commercial Mortgage Trust Series 2006- | ||||
| C4 | 5.467% | 9/15/39 | 13,549 | 14,827 | |
| 3,4 | First Investors Auto Owner Trust 2013-2 | 1.230% | 3/15/19 | 20,485 | 20,543 |
| 3,5 | Ford Credit Floorplan Master Owner Trust A | 2.120% | 2/15/16 | 25,390 | 25,475 |
| 3,4 | Ford Credit Floorplan Master Owner Trust A Series | ||||
| 2010-3 | 4.200% | 2/15/17 | 16,270 | 16,920 | |
| 3 | Ford Credit Floorplan Master Owner Trust A Series | ||||
| 2012-2 | 1.920% | 1/15/19 | 30,861 | 31,551 | |
| 3,4 | Hertz Vehicle Financing LLC 2011-1A | 2.200% | 3/25/16 | 36,320 | 36,809 |
| 3,4 | Hilton USA Trust 2013-HLT | 2.662% | 11/5/30 | 45,820 | 45,820 |
| 3,4 | HLSS Servicer Advance Receivables Backed Notes | 1.495% | 1/16/46 | 7,850 | 7,902 |
| 3,4 | HLSS Servicer Advance Receivables Backed Notes | 2.289% | 1/15/48 | 11,385 | 11,268 |
3
| Vanguard® Wellington Fund | |||||
| Schedule of Investments | |||||
| November 30, 2013 | |||||
| Face | Market | ||||
| Maturity | Amount | Value | |||
| Coupon | Date | ($000) | ($000) | ||
| 3 | LB-UBS Commercial Mortgage Trust 2006-C4 | 6.055% | 6/15/38 | 9,976 | 11,007 |
| 3,5 | LB-UBS Commercial Mortgage Trust 2008-C1 | 6.320% | 4/15/41 | 29,465 | 34,124 |
| 3 | Merrill Lynch Mortgage Trust 2006-C1 | 5.866% | 5/12/39 | 12,660 | 13,634 |
| 3,4 | MMAF Equipment Finance LLC 2012-A | 2.570% | 6/9/33 | 8,570 | 8,660 |
| 3 | Morgan Stanley Capital I Trust 2005-HQ6 | 4.989% | 8/13/42 | 11,699 | 12,290 |
| 3 | Santander Drive Auto Receivables Trust 2011-1 | 2.350% | 11/16/15 | 9,512 | 9,617 |
| 3,4 | Springleaf Mortgage Loan Trust 2013-1A | 2.310% | 6/25/58 | 8,330 | 8,015 |
| Total Asset-Backed/Commercial Mortgage-Backed Securities (Cost $629,937) | 631,461 | ||||
| Corporate Bonds (22.0%) | |||||
| Finance (8.7%) | |||||
| Banking (6.2%) | |||||
| American Express Centurion Bank | 6.000% | 9/13/17 | 20,000 | 23,217 | |
| American Express Co. | 1.550% | 5/22/18 | 62,130 | 61,223 | |
| American Express Credit Corp. | 2.750% | 9/15/15 | 10,000 | 10,372 | |
| American Express Credit Corp. | 2.375% | 3/24/17 | 71,985 | 74,736 | |
| American Express Credit Corp. | 2.125% | 7/27/18 | 49,605 | 50,204 | |
| Bank of America Corp. | 6.000% | 9/1/17 | 69,725 | 79,804 | |
| Bank of America Corp. | 5.750% | 12/1/17 | 30,000 | 34,330 | |
| Bank of America Corp. | 5.625% | 7/1/20 | 4,550 | 5,186 | |
| Bank of America Corp. | 5.875% | 1/5/21 | 40,000 | 46,060 | |
| Bank of America Corp. | 3.300% | 1/11/23 | 24,005 | 22,739 | |
| Bank of America Corp. | 4.100% | 7/24/23 | 6,735 | 6,742 | |
| Bank of America Corp. | 5.875% | 2/7/42 | 9,965 | 11,167 | |
| Bank of America NA | 5.300% | 3/15/17 | 68,000 | 75,795 | |
| Bank of America NA | 6.000% | 10/15/36 | 30,000 | 34,345 | |
| Bank of Montreal | 1.300% | 7/15/16 | 34,200 | 34,561 | |
| Bank of Montreal | 2.500% | 1/11/17 | 79,535 | 82,471 | |
| Bank of New York Mellon Corp. | 4.950% | 3/15/15 | 58,655 | 61,800 | |
| Bank of Nova Scotia | 3.400% | 1/22/15 | 82,000 | 84,793 | |
| Bank of Nova Scotia | 2.050% | 10/30/18 | 64,150 | 64,139 | |
| Barclays Bank plc | 2.375% | 1/13/14 | 53,000 | 53,120 | |
| 4 | Barclays Bank plc | 6.050% | 12/4/17 | 15,500 | 17,386 |
| Barclays Bank plc | 5.125% | 1/8/20 | 18,095 | 20,226 | |
| Barclays Bank plc | 5.140% | 10/14/20 | 11,905 | 12,641 | |
| BB&T Corp. | 3.200% | 3/15/16 | 34,000 | 35,777 | |
| BB&T Corp. | 4.900% | 6/30/17 | 8,045 | 8,892 | |
| BB&T Corp. | 5.250% | 11/1/19 | 8,000 | 9,017 | |
| Bear Stearns Cos. LLC | 6.400% | 10/2/17 | 8,765 | 10,203 | |
| Bear Stearns Cos. LLC | 7.250% | 2/1/18 | 16,385 | 19,748 | |
| BNP Paribas SA | 3.250% | 3/3/23 | 12,270 | 11,677 | |
| BNY Mellon NA | 4.750% | 12/15/14 | 4,750 | 4,944 | |
| Canadian Imperial Bank of Commerce | 2.350% | 12/11/15 | 56,000 | 57,833 | |
| Capital One Bank USA NA | 2.150% | 11/21/18 | 45,055 | 45,071 | |
| Capital One Financial Corp. | 2.150% | 3/23/15 | 27,380 | 27,860 | |
| Capital One Financial Corp. | 3.150% | 7/15/16 | 10,000 | 10,476 | |
| Capital One Financial Corp. | 5.250% | 2/21/17 | 3,580 | 3,940 | |
| Capital One Financial Corp. | 4.750% | 7/15/21 | 18,835 | 20,141 | |
| Citigroup Inc. | 4.587% | 12/15/15 | 23,975 | 25,672 | |
| Citigroup Inc. | 3.953% | 6/15/16 | 41,322 | 44,127 | |
| Citigroup Inc. | 5.850% | 8/2/16 | 30,000 | 33,542 | |
| Citigroup Inc. | 4.450% | 1/10/17 | 35,670 | 38,911 | |
| Citigroup Inc. | 6.125% | 11/21/17 | 64,960 | 75,547 | |
| Citigroup Inc. | 1.750% | 5/1/18 | 25,000 | 24,735 | |
| Citigroup Inc. | 6.125% | 5/15/18 | 9,500 | 11,097 | |
| Citigroup Inc. | 2.500% | 9/26/18 | 18,000 | 18,268 | |
| Citigroup Inc. | 8.500% | 5/22/19 | 34,000 | 44,176 | |
| Citigroup Inc. | 5.375% | 8/9/20 | 32,616 | 36,963 | |
| Citigroup Inc. | 4.500% | 1/14/22 | 33,920 | 36,010 | |
| Citigroup Inc. | 6.625% | 6/15/32 | 45,000 | 49,803 | |
| Citigroup Inc. | 6.125% | 8/25/36 | 30,000 | 31,548 | |
| Citigroup Inc. | 8.125% | 7/15/39 | 8,325 | 11,651 | |
| Citigroup Inc. | 5.875% | 1/30/42 | 1,290 | 1,444 | |
4
| Vanguard® Wellington Fund | ||||
| Schedule of Investments | ||||
| November 30, 2013 | ||||
| Face | Market | |||
| Maturity | Amount | Value | ||
| Coupon | Date | ($000) | ($000) | |
| Citigroup Inc. | 4.950% | 11/7/43 | 16,000 | 15,692 |
| 4 Cooperatieve Centrale Raiffeisen-Boerenleenbank BA | 3.200% | 3/11/15 | 52,000 | 53,489 |
| 4 Credit Agricole SA | 3.500% | 4/13/15 | 50,000 | 51,665 |
| Credit Suisse | 2.200% | 1/14/14 | 41,000 | 41,093 |
| Credit Suisse | 5.500% | 5/1/14 | 30,000 | 30,623 |
| Deutsche Bank Financial LLC | 5.375% | 3/2/15 | 59,215 | 62,202 |
| Goldman Sachs Group Inc. | 5.350% | 1/15/16 | 58,000 | 63,136 |
| Goldman Sachs Group Inc. | 5.625% | 1/15/17 | 40,000 | 44,250 |
| Goldman Sachs Group Inc. | 5.950% | 1/18/18 | 44,000 | 50,388 |
| Goldman Sachs Group Inc. | 6.000% | 6/15/20 | 11,090 | 12,803 |
| Goldman Sachs Group Inc. | 5.250% | 7/27/21 | 56,720 | 62,343 |
| Goldman Sachs Group Inc. | 5.750% | 1/24/22 | 40,725 | 45,945 |
| Goldman Sachs Group Inc. | 3.625% | 1/22/23 | 63,920 | 62,117 |
| Goldman Sachs Group Inc. | 6.450% | 5/1/36 | 50,000 | 53,355 |
| Goldman Sachs Group Inc. | 6.750% | 10/1/37 | 43,995 | 48,889 |
| Goldman Sachs Group Inc. | 6.250% | 2/1/41 | 35,320 | 40,591 |
| 4 HSBC Bank plc | 2.000% | 1/19/14 | 9,820 | 9,835 |
| 4 HSBC Bank plc | 3.500% | 6/28/15 | 17,937 | 18,754 |
| 4 HSBC Bank plc | 4.750% | 1/19/21 | 62,040 | 67,971 |
| HSBC Bank USA NA | 4.625% | 4/1/14 | 19,710 | 19,987 |
| HSBC Holdings plc | 4.000% | 3/30/22 | 72,455 | 74,597 |
| HSBC Holdings plc | 6.500% | 5/2/36 | 25,000 | 29,658 |
| HSBC Holdings plc | 6.100% | 1/14/42 | 40,665 | 49,036 |
| HSBC USA Inc. | 1.625% | 1/16/18 | 39,500 | 39,286 |
| HSBC USA Inc. | 2.625% | 9/24/18 | 20,000 | 20,605 |
| 4 ING Bank NV | 3.750% | 3/7/17 | 23,000 | 24,403 |
| JPMorgan Chase & Co. | 5.125% | 9/15/14 | 14,550 | 15,061 |
| JPMorgan Chase & Co. | 5.250% | 5/1/15 | 40,000 | 42,340 |
| JPMorgan Chase & Co. | 6.000% | 1/15/18 | 57,000 | 66,101 |
| JPMorgan Chase & Co. | 6.300% | 4/23/19 | 10,340 | 12,267 |
| JPMorgan Chase & Co. | 4.950% | 3/25/20 | 55,000 | 61,199 |
| JPMorgan Chase & Co. | 4.350% | 8/15/21 | 41,386 | 43,952 |
| JPMorgan Chase & Co. | 4.500% | 1/24/22 | 44,780 | 47,385 |
| JPMorgan Chase & Co. | 3.250% | 9/23/22 | 18,645 | 17,794 |
| JPMorgan Chase & Co. | 3.375% | 5/1/23 | 5,785 | 5,384 |
| JPMorgan Chase & Co. | 5.600% | 7/15/41 | 96,000 | 105,093 |
| JPMorgan Chase & Co. | 5.400% | 1/6/42 | 18,035 | 19,157 |
| JPMorgan Chase & Co. | 5.625% | 8/16/43 | 16,100 | 16,402 |
| Mellon Funding Corp. | 5.000% | 12/1/14 | 30,000 | 31,296 |
| Merrill Lynch & Co. Inc. | 6.050% | 5/16/16 | 70,000 | 77,240 |
| Merrill Lynch & Co. Inc. | 6.400% | 8/28/17 | 23,000 | 26,719 |
| Merrill Lynch & Co. Inc. | 6.875% | 4/25/18 | 40,000 | 47,708 |
| Morgan Stanley | 7.070% | 2/10/14 | 17,500 | 17,637 |
| Morgan Stanley | 4.750% | 4/1/14 | 70,000 | 70,938 |
| Morgan Stanley | 6.000% | 5/13/14 | 7,835 | 8,022 |
| Morgan Stanley | 6.000% | 4/28/15 | 44,000 | 47,003 |
| Morgan Stanley | 3.800% | 4/29/16 | 9,470 | 10,014 |
| Morgan Stanley | 5.450% | 1/9/17 | 70,000 | 77,993 |
| Morgan Stanley | 2.125% | 4/25/18 | 52,125 | 51,935 |
| Morgan Stanley | 5.625% | 9/23/19 | 24,355 | 27,900 |
| Morgan Stanley | 5.750% | 1/25/21 | 79,825 | 90,996 |
| Morgan Stanley | 6.250% | 8/9/26 | 20,000 | 23,046 |
| National City Corp. | 6.875% | 5/15/19 | 13,950 | 16,770 |
| 4 Nordea Bank AB | 2.125% | 1/14/14 | 39,500 | 39,583 |
| 4 Nordea Bank AB | 3.700% | 11/13/14 | 22,880 | 23,589 |
| Northern Trust Corp. | 3.450% | 11/4/20 | 9,000 | 9,391 |
| PNC Bank NA | 4.875% | 9/21/17 | 50,000 | 55,535 |
| PNC Bank NA | 4.200% | 11/1/25 | 16,650 | 16,547 |
| 3 PNC Financial Services Group Inc. | 4.459% | 5/29/49 | 19,193 | 19,193 |
| 4 Standard Chartered plc | 3.850% | 4/27/15 | 14,990 | 15,587 |
| State Street Corp. | 5.375% | 4/30/17 | 76,315 | 86,334 |
| 4 Svenska Handelsbanken AB | 4.875% | 6/10/14 | 56,000 | 57,270 |
| Svenska Handelsbanken AB | 2.875% | 4/4/17 | 40,000 | 41,898 |
| UBS AG | 3.875% | 1/15/15 | 29,052 | 30,115 |
5
| Vanguard® Wellington Fund | ||||
| Schedule of Investments | ||||
| November 30, 2013 | ||||
| Face | Market | |||
| Maturity | Amount | Value | ||
| Coupon | Date | ($000) | ($000) | |
| UBS AG | 5.875% | 7/15/16 | 50,000 | 55,585 |
| UBS AG | 4.875% | 8/4/20 | 8,000 | 8,938 |
| US Bancorp | 2.875% | 11/20/14 | 32,000 | 32,795 |
| US Bancorp | 1.650% | 5/15/17 | 32,000 | 32,374 |
| US Bank NA | 6.300% | 2/4/14 | 30,000 | 30,299 |
| Wells Fargo & Co. | 3.750% | 10/1/14 | 28,000 | 28,768 |
| Wells Fargo & Co. | 3.625% | 4/15/15 | 2,200 | 2,292 |
| Wells Fargo & Co. | 3.676% | 6/15/16 | 19,000 | 20,321 |
| Wells Fargo & Co. | 2.625% | 12/15/16 | 53,000 | 55,499 |
| Wells Fargo & Co. | 5.625% | 12/11/17 | 31,150 | 36,088 |
| Wells Fargo & Co. | 2.150% | 1/15/19 | 91,150 | 91,846 |
| Wells Fargo & Co. | 3.500% | 3/8/22 | 72,215 | 72,800 |
| Wells Fargo & Co. | 3.450% | 2/13/23 | 35,620 | 33,635 |
| Wells Fargo & Co. | 4.480% | 1/16/24 | 46,156 | 45,835 |
| 4 Wells Fargo & Co. | 5.606% | 1/15/44 | 68,281 | 68,933 |
| Brokerage (0.0%) | ||||
| Ameriprise Financial Inc. | 5.300% | 3/15/20 | 11,590 | 13,193 |
| Finance Companies (0.6%) | ||||
| General Electric Capital Corp. | 4.625% | 1/7/21 | 78,930 | 86,768 |
| General Electric Capital Corp. | 5.300% | 2/11/21 | 30,850 | 34,378 |
| General Electric Capital Corp. | 3.150% | 9/7/22 | 119,030 | 115,589 |
| General Electric Capital Corp. | 3.100% | 1/9/23 | 19,460 | 18,570 |
| General Electric Capital Corp. | 6.750% | 3/15/32 | 30,000 | 37,040 |
| General Electric Capital Corp. | 6.150% | 8/7/37 | 46,100 | 53,578 |
| General Electric Capital Corp. | 5.875% | 1/14/38 | 66,921 | 75,620 |
| General Electric Capital Corp. | 6.875% | 1/10/39 | 25,440 | 32,235 |
| Insurance (1.6%) | ||||
| ACE Capital Trust II | 9.700% | 4/1/30 | 20,000 | 28,575 |
| ACE INA Holdings Inc. | 2.600% | 11/23/15 | 11,000 | 11,392 |
| ACE INA Holdings Inc. | 5.800% | 3/15/18 | 40,360 | 46,778 |
| Aetna Inc. | 1.750% | 5/15/17 | 2,636 | 2,660 |
| Aetna Inc. | 6.500% | 9/15/18 | 11,460 | 13,683 |
| Allstate Corp. | 5.000% | 8/15/14 | 10,000 | 10,314 |
| 3 Allstate Corp. | 6.125% | 5/15/67 | 30,000 | 31,200 |
| 3 Allstate Corp. | 6.500% | 5/15/67 | 20,000 | 20,900 |
| American International Group Inc. | 4.125% | 2/15/24 | 18,450 | 18,647 |
| Chubb Corp. | 6.000% | 5/11/37 | 50,000 | 59,128 |
| 4 Farmers Exchange Capital | 7.050% | 7/15/28 | 25,000 | 29,990 |
| 4 Five Corners Funding Trust | 4.419% | 11/15/23 | 42,330 | 42,576 |
| Hartford Financial Services Group Inc. | 4.750% | 3/1/14 | 15,000 | 15,139 |
| 4 Jackson National Life Insurance Co. | 8.150% | 3/15/27 | 39,480 | 47,184 |
| 4 Liberty Mutual Group Inc. | 4.250% | 6/15/23 | 14,330 | 14,113 |
| 4 Liberty Mutual Insurance Co. | 7.875% | 10/15/26 | 31,210 | 37,348 |
| Loews Corp. | 2.625% | 5/15/23 | 21,720 | 19,716 |
| 4 MassMutual Global Funding II | 2.875% | 4/21/14 | 11,390 | 11,499 |
| 4 MassMutual Global Funding II | 2.100% | 8/2/18 | 46,890 | 47,134 |
| MetLife Inc. | 4.125% | 8/13/42 | 5,565 | 4,915 |
| MetLife Inc. | 4.875% | 11/13/43 | 31,425 | 30,983 |
| 4 Metropolitan Life Global Funding I | 5.125% | 6/10/14 | 8,000 | 8,186 |
| 4 Metropolitan Life Global Funding I | 1.500% | 1/10/18 | 50,360 | 49,721 |
| 4 Metropolitan Life Global Funding I | 1.875% | 6/22/18 | 12,690 | 12,604 |
| 4 Metropolitan Life Insurance Co. | 7.700% | 11/1/15 | 51,000 | 56,238 |
| 4 New York Life Global Funding | 1.650% | 5/15/17 | 44,000 | 44,321 |
| 4 New York Life Insurance Co. | 5.875% | 5/15/33 | 55,395 | 60,537 |
| Prudential Financial Inc. | 4.750% | 4/1/14 | 28,700 | 29,098 |
| Prudential Financial Inc. | 5.100% | 9/20/14 | 10,000 | 10,357 |
| Prudential Financial Inc. | 3.000% | 5/12/16 | 11,995 | 12,577 |
| Prudential Financial Inc. | 2.300% | 8/15/18 | 24,545 | 24,860 |
| Prudential Financial Inc. | 4.500% | 11/15/20 | 34,365 | 37,292 |
| 4 QBE Insurance Group Ltd. | 2.400% | 5/1/18 | 9,160 | 8,956 |
| Torchmark Corp. | 7.875% | 5/15/23 | 45,000 | 57,114 |
| Travelers Cos. Inc. | 5.800% | 5/15/18 | 32,500 | 37,938 |
6
| Vanguard® Wellington Fund | ||||
| Schedule of Investments | ||||
| November 30, 2013 | ||||
| Face | Market | |||
| Maturity | Amount | Value | ||
| Coupon | Date | ($000) | ($000) | |
| UnitedHealth Group Inc. | 6.000% | 6/15/17 | 9,500 | 10,992 |
| UnitedHealth Group Inc. | 6.000% | 2/15/18 | 26,300 | 30,824 |
| UnitedHealth Group Inc. | 3.875% | 10/15/20 | 27,960 | 29,687 |
| UnitedHealth Group Inc. | 2.875% | 3/15/22 | 4,696 | 4,517 |
| UnitedHealth Group Inc. | 2.875% | 3/15/23 | 16,000 | 15,072 |
| UnitedHealth Group Inc. | 4.250% | 3/15/43 | 67,400 | 60,374 |
| WellPoint Inc. | 2.300% | 7/15/18 | 15,110 | 15,148 |
| WellPoint Inc. | 4.350% | 8/15/20 | 10,000 | 10,647 |
| WellPoint Inc. | 3.125% | 5/15/22 | 53,740 | 50,854 |
| WellPoint Inc. | 3.300% | 1/15/23 | 42,468 | 40,164 |
| Real Estate Investment Trusts (0.3%) | ||||
| AvalonBay Communities Inc. | 3.625% | 10/1/20 | 20,780 | 21,322 |
| Duke Realty LP | 6.500% | 1/15/18 | 8,755 | 10,111 |
| HCP Inc. | 3.750% | 2/1/16 | 7,950 | 8,370 |
| Realty Income Corp. | 6.750% | 8/15/19 | 21,075 | 25,109 |
| Realty Income Corp. | 4.650% | 8/1/23 | 25,010 | 25,523 |
| Simon Property Group LP | 5.100% | 6/15/15 | 50,000 | 53,419 |
| Simon Property Group LP | 6.100% | 5/1/16 | 49,050 | 54,539 |
| 4 WEA Finance LLC | 7.125% | 4/15/18 | 34,000 | 40,722 |
| 6,865,283 | ||||
| Industrial (11.4%) | ||||
| Basic Industry (0.3%) | ||||
| BHP Billiton Finance USA Ltd. | 7.250% | 3/1/16 | 15,000 | 17,109 |
| BHP Billiton Finance USA Ltd. | 3.850% | 9/30/23 | 45,970 | 46,357 |
| EI du Pont de Nemours & Co. | 2.750% | 4/1/16 | 54,000 | 56,663 |
| Rio Tinto Alcan Inc. | 7.250% | 3/15/31 | 21,273 | 26,243 |
| Rio Tinto Finance USA Ltd. | 6.500% | 7/15/18 | 37,000 | 44,190 |
| Rio Tinto Finance USA plc | 2.000% | 3/22/17 | 8,095 | 8,219 |
| Rio Tinto Finance USA plc | 2.250% | 12/14/18 | 50,200 | 50,451 |
| Rio Tinto Finance USA plc | 3.500% | 3/22/22 | 17,000 | 16,644 |
| 3 Rohm and Haas Holdings Ltd. | 9.800% | 4/15/20 | 4,875 | 5,859 |
| Capital Goods (0.8%) | ||||
| 3M Co. | 6.375% | 2/15/28 | 24,990 | 31,227 |
| Boeing Co. | 8.625% | 11/15/31 | 9,460 | 13,483 |
| Caterpillar Financial Services Corp. | 1.625% | 6/1/17 | 25,220 | 25,462 |
| Caterpillar Financial Services Corp. | 2.625% | 3/1/23 | 63,500 | 58,496 |
| Caterpillar Inc. | 3.900% | 5/27/21 | 51,914 | 54,539 |
| Caterpillar Inc. | 2.600% | 6/26/22 | 11,345 | 10,662 |
| Caterpillar Inc. | 3.803% | 8/15/42 | 13,960 | 11,754 |
| Deere & Co. | 7.125% | 3/3/31 | 17,500 | 22,462 |
| General Dynamics Corp. | 3.875% | 7/15/21 | 14,925 | 15,615 |
| General Electric Co. | 5.250% | 12/6/17 | 11,685 | 13,391 |
| General Electric Co. | 2.700% | 10/9/22 | 29,000 | 27,553 |
| General Electric Co. | 4.125% | 10/9/42 | 8,735 | 8,003 |
| Honeywell International Inc. | 4.250% | 3/1/21 | 40,681 | 44,198 |
| John Deere Capital Corp. | 2.250% | 4/17/19 | 28,125 | 28,449 |
| John Deere Capital Corp. | 1.700% | 1/15/20 | 21,935 | 20,767 |
| 4 Siemens Financieringsmaatschappij NV | 5.750% | 10/17/16 | 89,650 | 101,609 |
| United Technologies Corp. | 1.800% | 6/1/17 | 21,785 | 22,236 |
| United Technologies Corp. | 3.100% | 6/1/22 | 7,010 | 6,914 |
| United Technologies Corp. | 7.500% | 9/15/29 | 19,230 | 25,603 |
| United Technologies Corp. | 6.050% | 6/1/36 | 20,325 | 23,903 |
| United Technologies Corp. | 6.125% | 7/15/38 | 45,000 | 53,806 |
| Communication (2.4%) | ||||
| 21st Century Fox America Inc. | 4.500% | 2/15/21 | 14,500 | 15,658 |
| 21st Century Fox America Inc. | 3.000% | 9/15/22 | 11,891 | 11,257 |
| 4 21st Century Fox America Inc. | 4.000% | 10/1/23 | 4,505 | 4,510 |
| 21st Century Fox America Inc. | 6.150% | 2/15/41 | 33,265 | 36,667 |
| America Movil SAB de CV | 3.125% | 7/16/22 | 84,600 | 78,923 |
| America Movil SAB de CV | 4.375% | 7/16/42 | 20,430 | 17,104 |
| 4 American Tower Trust I | 1.551% | 3/15/18 | 14,885 | 14,625 |
| 4 American Tower Trust I | 3.070% | 3/15/23 | 18,175 | 17,073 |
7
| Vanguard® Wellington Fund | ||||
| Schedule of Investments | ||||
| November 30, 2013 | ||||
| Face | Market | |||
| Maturity | Amount | Value | ||
| Coupon | Date | ($000) | ($000) | |
| AT&T Inc. | 5.100% | 9/15/14 | 30,160 | 31,233 |
| AT&T Inc. | 2.950% | 5/15/16 | 23,655 | 24,720 |
| AT&T Inc. | 1.600% | 2/15/17 | 38,000 | 38,234 |
| AT&T Inc. | 1.400% | 12/1/17 | 24,000 | 23,621 |
| AT&T Inc. | 5.600% | 5/15/18 | 44,000 | 50,967 |
| AT&T Inc. | 4.450% | 5/15/21 | 10,000 | 10,500 |
| AT&T Inc. | 6.450% | 6/15/34 | 73,115 | 81,158 |
| AT&T Inc. | 6.800% | 5/15/36 | 11,305 | 12,766 |
| AT&T Inc. | 6.500% | 9/1/37 | 9,675 | 10,693 |
| AT&T Inc. | 6.550% | 2/15/39 | 15,265 | 16,975 |
| BellSouth Corp. | 5.200% | 9/15/14 | 20,000 | 20,711 |
| BellSouth Corp. | 6.550% | 6/15/34 | 32,225 | 34,917 |
| CBS Corp. | 4.300% | 2/15/21 | 27,830 | 28,793 |
| Cellco Partnership / Verizon Wireless Capital LLC | 8.500% | 11/15/18 | 21,000 | 27,007 |
| Comcast Corp. | 5.700% | 5/15/18 | 20,000 | 23,178 |
| Comcast Corp. | 2.850% | 1/15/23 | 9,760 | 9,147 |
| Comcast Corp. | 4.250% | 1/15/33 | 42,890 | 39,576 |
| Comcast Corp. | 5.650% | 6/15/35 | 4,725 | 5,084 |
| Comcast Corp. | 6.500% | 11/15/35 | 4,720 | 5,412 |
| Comcast Corp. | 6.400% | 5/15/38 | 4,320 | 4,957 |
| Comcast Corp. | 4.650% | 7/15/42 | 37,485 | 34,349 |
| Comcast Corp. | 4.500% | 1/15/43 | 22,000 | 19,991 |
| 4 COX Communications Inc. | 4.700% | 12/15/42 | 5,775 | 4,841 |
| 4 COX Communications Inc. | 4.500% | 6/30/43 | 33,530 | 27,335 |
| 4 Deutsche Telekom International Finance BV | 2.250% | 3/6/17 | 15,785 | 16,133 |
| 4 Deutsche Telekom International Finance BV | 4.875% | 3/6/42 | 27,715 | 26,495 |
| DIRECTV Holdings LLC / DIRECTV Financing Co. Inc. | 3.125% | 2/15/16 | 7,665 | 7,991 |
| DIRECTV Holdings LLC / DIRECTV Financing Co. Inc. | 3.500% | 3/1/16 | 31,150 | 32,779 |
| DIRECTV Holdings LLC / DIRECTV Financing Co. Inc. | 1.750% | 1/15/18 | 18,320 | 18,031 |
| DIRECTV Holdings LLC / DIRECTV Financing Co. Inc. | 5.200% | 3/15/20 | 20,000 | 21,543 |
| DIRECTV Holdings LLC / DIRECTV Financing Co. Inc. | 4.600% | 2/15/21 | 5,000 | 5,127 |
| DIRECTV Holdings LLC / DIRECTV Financing Co. Inc. | 6.000% | 8/15/40 | 10,000 | 9,694 |
| DIRECTV Holdings LLC / DIRECTV Financing Co. Inc. | 6.375% | 3/1/41 | 27,190 | 27,573 |
| Discovery Communications LLC | 5.625% | 8/15/19 | 10,635 | 12,241 |
| Discovery Communications LLC | 5.050% | 6/1/20 | 8,365 | 9,278 |
| Discovery Communications LLC | 3.250% | 4/1/23 | 5,440 | 5,126 |
| Discovery Communications LLC | 4.950% | 5/15/42 | 4,175 | 3,923 |
| Discovery Communications LLC | 4.875% | 4/1/43 | 7,615 | 7,108 |
| Grupo Televisa SAB | 6.625% | 1/15/40 | 25,090 | 27,167 |
| 4 NBCUniversal Enterprise Inc. | 1.662% | 4/15/18 | 56,135 | 55,805 |
| 4 NBCUniversal Enterprise Inc. | 1.974% | 4/15/19 | 100,115 | 98,663 |
| NBCUniversal Media LLC | 4.375% | 4/1/21 | 23,900 | 25,613 |
| Orange SA | 4.125% | 9/14/21 | 60,990 | 62,285 |
| 4 SBA Tower Trust | 2.933% | 12/15/17 | 33,310 | 33,456 |
| Time Warner Cable Inc. | 5.850% | 5/1/17 | 34,980 | 38,577 |
| Time Warner Cable Inc. | 5.875% | 11/15/40 | 21,600 | 18,405 |
| Time Warner Cable Inc. | 5.500% | 9/1/41 | 18,000 | 14,498 |
| Time Warner Cable Inc. | 4.500% | 9/15/42 | 28,800 | 21,148 |
| Verizon Communications Inc. | 5.500% | 4/1/17 | 25,000 | 28,142 |
| Verizon Communications Inc. | 4.500% | 9/15/20 | 95,525 | 102,277 |
| Verizon Communications Inc. | 3.500% | 11/1/21 | 5,495 | 5,433 |
| Verizon Communications Inc. | 7.750% | 12/1/30 | 56,410 | 70,627 |
| Verizon Communications Inc. | 6.400% | 9/15/33 | 79,665 | 88,588 |
| Verizon Communications Inc. | 5.850% | 9/15/35 | 49,525 | 51,991 |
| Verizon Communications Inc. | 6.900% | 4/15/38 | 9,710 | 11,254 |
| Verizon Communications Inc. | 4.750% | 11/1/41 | 11,880 | 10,780 |
| Verizon Communications Inc. | 6.550% | 9/15/43 | 76,180 | 86,697 |
| Vodafone Group plc | 5.000% | 12/16/13 | 10,000 | 10,015 |
| Vodafone Group plc | 2.500% | 9/26/22 | 41,355 | 36,825 |
| Consumer Cyclical (2.0%) | ||||
| Amazon.com Inc. | 2.500% | 11/29/22 | 34,760 | 31,630 |
| 4 American Honda Finance Corp. | 1.500% | 9/11/17 | 18,760 | 18,697 |
| 4 American Honda Finance Corp. | 1.600% | 2/16/18 | 30,845 | 30,519 |
8
| Vanguard® Wellington Fund | ||||
| Schedule of Investments | ||||
| November 30, 2013 | ||||
| Face | Market | |||
| Maturity | Amount | Value | ||
| Coupon | Date | ($000) | ($000) | |
| American Honda Finance Corp. | 2.125% | 10/10/18 | 45,655 | 46,039 |
| AutoZone Inc. | 3.700% | 4/15/22 | 46,136 | 45,203 |
| AutoZone Inc. | 3.125% | 7/15/23 | 33,000 | 30,472 |
| CVS Caremark Corp. | 4.875% | 9/15/14 | 25,200 | 26,064 |
| CVS Caremark Corp. | 5.750% | 6/1/17 | 12,753 | 14,594 |
| CVS Caremark Corp. | 2.750% | 12/1/22 | 50,000 | 46,336 |
| 4 Daimler Finance North America LLC | 2.375% | 8/1/18 | 35,000 | 35,343 |
| 4 Daimler Finance North America LLC | 2.250% | 7/31/19 | 69,485 | 68,307 |
| Daimler Finance North America LLC | 8.500% | 1/18/31 | 33,000 | 47,905 |
| eBay Inc. | 1.350% | 7/15/17 | 12,580 | 12,614 |
| eBay Inc. | 2.600% | 7/15/22 | 20,130 | 18,698 |
| Ford Motor Credit Co. LLC | 1.500% | 1/17/17 | 33,780 | 33,773 |
| Home Depot Inc. | 2.250% | 9/10/18 | 39,555 | 40,360 |
| Home Depot Inc. | 3.950% | 9/15/20 | 16,000 | 17,204 |
| Home Depot Inc. | 2.700% | 4/1/23 | 31,170 | 29,090 |
| 4 Hyundai Capital America | 1.625% | 10/2/15 | 14,955 | 14,987 |
| Johnson Controls Inc. | 7.125% | 7/15/17 | 36,300 | 43,002 |
| Lowe's Cos. Inc. | 6.875% | 2/15/28 | 5,790 | 7,223 |
| Lowe's Cos. Inc. | 6.500% | 3/15/29 | 39,900 | 47,107 |
| Lowe's Cos. Inc. | 5.500% | 10/15/35 | 20,000 | 21,249 |
| Lowe's Cos. Inc. | 6.650% | 9/15/37 | 25,905 | 31,539 |
| McDonald's Corp. | 1.875% | 5/29/19 | 16,685 | 16,584 |
| McDonald's Corp. | 2.625% | 1/15/22 | 7,805 | 7,499 |
| 4 Nissan Motor Acceptance Corp. | 1.950% | 9/12/17 | 44,895 | 44,939 |
| 4 Nissan Motor Acceptance Corp. | 1.800% | 3/15/18 | 46,400 | 45,884 |
| 4 Nissan Motor Acceptance Corp. | 2.650% | 9/26/18 | 24,990 | 25,360 |
| PACCAR Financial Corp. | 1.600% | 3/15/17 | 39,311 | 39,622 |
| Target Corp. | 5.875% | 7/15/16 | 20,000 | 22,704 |
| Target Corp. | 2.900% | 1/15/22 | 27,000 | 26,206 |
| Time Warner Cos. Inc. | 7.570% | 2/1/24 | 20,000 | 24,782 |
| Time Warner Cos. Inc. | 6.950% | 1/15/28 | 20,000 | 24,172 |
| Time Warner Inc. | 4.875% | 3/15/20 | 14,000 | 15,411 |
| Time Warner Inc. | 4.750% | 3/29/21 | 8,000 | 8,610 |
| Toyota Motor Credit Corp. | 2.800% | 1/11/16 | 42,517 | 44,423 |
| Toyota Motor Credit Corp. | 1.750% | 5/22/17 | 47,000 | 47,567 |
| Toyota Motor Credit Corp. | 1.250% | 10/5/17 | 35,945 | 35,701 |
| Viacom Inc. | 6.125% | 10/5/17 | 7,500 | 8,633 |
| Viacom Inc. | 3.250% | 3/15/23 | 19,020 | 17,801 |
| Viacom Inc. | 4.875% | 6/15/43 | 25,080 | 22,683 |
| 4 Volkswagen International Finance NV | 1.625% | 3/22/15 | 83,250 | 84,218 |
| Wal-Mart Stores Inc. | 3.250% | 10/25/20 | 25,754 | 26,547 |
| Wal-Mart Stores Inc. | 4.250% | 4/15/21 | 29,000 | 31,586 |
| Wal-Mart Stores Inc. | 2.550% | 4/11/23 | 69,450 | 64,402 |
| Wal-Mart Stores Inc. | 5.625% | 4/15/41 | 112,595 | 127,670 |
| Walt Disney Co. | 5.625% | 9/15/16 | 30,000 | 33,999 |
| Consumer Noncyclical (3.7%) | ||||
| AbbVie Inc. | 1.750% | 11/6/17 | 31,160 | 31,370 |
| AbbVie Inc. | 2.000% | 11/6/18 | 37,390 | 37,368 |
| Altria Group Inc. | 4.750% | 5/5/21 | 23,376 | 25,118 |
| Altria Group Inc. | 2.850% | 8/9/22 | 31,700 | 29,254 |
| Altria Group Inc. | 4.500% | 5/2/43 | 52,500 | 46,093 |
| AmerisourceBergen Corp. | 3.500% | 11/15/21 | 12,320 | 12,314 |
| Amgen Inc. | 2.300% | 6/15/16 | 25,340 | 26,219 |
| Amgen Inc. | 3.875% | 11/15/21 | 33,315 | 34,160 |
| Amgen Inc. | 5.150% | 11/15/41 | 61,000 | 59,884 |
| Anheuser-Busch Cos. LLC | 5.000% | 3/1/19 | 15,000 | 16,987 |
| Anheuser-Busch Cos. LLC | 6.500% | 1/1/28 | 19,550 | 23,534 |
| Anheuser-Busch InBev Worldwide Inc. | 5.375% | 1/15/20 | 12,830 | 14,778 |
| Anheuser-Busch InBev Worldwide Inc. | 4.375% | 2/15/21 | 36,000 | 38,948 |
| Anheuser-Busch InBev Worldwide Inc. | 2.500% | 7/15/22 | 133,296 | 123,301 |
| Anheuser-Busch InBev Worldwide Inc. | 3.750% | 7/15/42 | 4,720 | 4,054 |
| 3 Ascension Health Alliance | 4.847% | 11/15/53 | 44,750 | 43,403 |
| AstraZeneca plc | 1.950% | 9/18/19 | 43,465 | 42,832 |
9
| Vanguard® Wellington Fund | ||||
| Schedule of Investments | ||||
| November 30, 2013 | ||||
| Face | Market | |||
| Maturity | Amount | Value | ||
| Coupon | Date | ($000) | ($000) | |
| AstraZeneca plc | 6.450% | 9/15/37 | 23,385 | 28,196 |
| 4 BAT International Finance plc | 3.250% | 6/7/22 | 58,280 | 57,063 |
| Baxter International Inc. | 5.900% | 9/1/16 | 12,498 | 14,186 |
| Bristol-Myers Squibb Co. | 3.250% | 11/1/23 | 40,790 | 39,521 |
| Cardinal Health Inc. | 1.700% | 3/15/18 | 2,585 | 2,554 |
| Cardinal Health Inc. | 3.200% | 3/15/23 | 13,035 | 12,256 |
| 4 Cargill Inc. | 6.000% | 11/27/17 | 25,000 | 29,024 |
| 4 Cargill Inc. | 4.307% | 5/14/21 | 60,532 | 64,048 |
| 4 Cargill Inc. | 6.875% | 5/1/28 | 19,355 | 22,750 |
| 4 Cargill Inc. | 6.125% | 4/19/34 | 28,980 | 31,761 |
| Catholic Health Initiatives | 2.600% | 8/1/18 | 9,745 | 9,868 |
| Catholic Health Initiatives Colorado GO | 1.600% | 11/1/17 | 2,140 | 2,099 |
| 3 Catholic Health Initiatives Colorado GO | 4.350% | 11/1/42 | 40,735 | 36,072 |
| Coca-Cola Co. | 5.350% | 11/15/17 | 85,000 | 98,018 |
| Coca-Cola Co. | 3.300% | 9/1/21 | 10,075 | 10,257 |
| Coca-Cola Enterprises Inc. | 3.500% | 9/15/20 | 9,900 | 10,076 |
| Coca-Cola Enterprises Inc. | 4.500% | 9/1/21 | 8,430 | 8,923 |
| Coca-Cola Femsa SAB de CV | 2.375% | 11/26/18 | 30,936 | 30,934 |
| Coca-Cola Femsa SAB de CV | 3.875% | 11/26/23 | 34,200 | 33,940 |
| Coca-Cola HBC Finance BV | 5.500% | 9/17/15 | 17,440 | 18,676 |
| Colgate-Palmolive Co. | 7.600% | 5/19/25 | 13,920 | 18,664 |
| ConAgra Foods Inc. | 1.900% | 1/25/18 | 9,090 | 9,042 |
| ConAgra Foods Inc. | 3.200% | 1/25/23 | 7,690 | 7,163 |
| Diageo Capital plc | 2.625% | 4/29/23 | 48,310 | 44,411 |
| Diageo Investment Corp. | 2.875% | 5/11/22 | 26,991 | 25,928 |
| Dr Pepper Snapple Group Inc. | 2.000% | 1/15/20 | 7,850 | 7,514 |
| Dr Pepper Snapple Group Inc. | 2.700% | 11/15/22 | 7,905 | 7,258 |
| Express Scripts Holding Co. | 2.650% | 2/15/17 | 43,711 | 45,340 |
| Express Scripts Holding Co. | 4.750% | 11/15/21 | 23,400 | 24,951 |
| 5 General Mills Inc. | 6.390% | 2/5/23 | 50,000 | 58,200 |
| General Mills Inc. | 4.150% | 2/15/43 | 20,280 | 18,174 |
| GlaxoSmithKline Capital Inc. | 2.800% | 3/18/23 | 36,160 | 34,066 |
| GlaxoSmithKline Capital Inc. | 5.375% | 4/15/34 | 45,000 | 49,102 |
| GlaxoSmithKline Capital plc | 1.500% | 5/8/17 | 36,755 | 37,146 |
| GlaxoSmithKline Capital plc | 2.850% | 5/8/22 | 28,930 | 27,759 |
| 4 Heineken NV | 1.400% | 10/1/17 | 8,150 | 8,083 |
| 4 Heineken NV | 2.750% | 4/1/23 | 25,450 | 23,205 |
| 4 Heineken NV | 4.000% | 10/1/42 | 1,390 | 1,176 |
| Hershey Co. | 4.850% | 8/15/15 | 9,620 | 10,314 |
| 4 Japan Tobacco Inc. | 2.100% | 7/23/18 | 22,200 | 22,404 |
| Johnson & Johnson | 5.150% | 7/15/18 | 14,800 | 17,155 |
| Kaiser Foundation Hospitals | 3.500% | 4/1/22 | 11,731 | 11,395 |
| Kaiser Foundation Hospitals | 4.875% | 4/1/42 | 13,205 | 12,655 |
| Kellogg Co. | 4.000% | 12/15/20 | 57,000 | 59,864 |
| Kraft Foods Group Inc. | 2.250% | 6/5/17 | 11,390 | 11,664 |
| Kraft Foods Group Inc. | 3.500% | 6/6/22 | 40,490 | 39,769 |
| Kraft Foods Group Inc. | 5.000% | 6/4/42 | 12,505 | 12,216 |
| Kroger Co. | 3.850% | 8/1/23 | 10,770 | 10,593 |
| McKesson Corp. | 3.250% | 3/1/16 | 6,650 | 6,981 |
| McKesson Corp. | 2.700% | 12/15/22 | 7,710 | 7,036 |
| McKesson Corp. | 2.850% | 3/15/23 | 7,620 | 7,009 |
| Medtronic Inc. | 4.750% | 9/15/15 | 20,000 | 21,525 |
| Medtronic Inc. | 1.375% | 4/1/18 | 13,520 | 13,370 |
| Memorial Sloan-Kettering Cancer Center New York GO | 4.125% | 7/1/52 | 11,055 | 9,235 |
| Merck & Co. Inc. | 1.300% | 5/18/18 | 33,670 | 33,177 |
| Merck & Co. Inc. | 2.800% | 5/18/23 | 54,775 | 51,641 |
| Merck & Co. Inc. | 6.550% | 9/15/37 | 10,000 | 12,538 |
| Merck & Co. Inc. | 4.150% | 5/18/43 | 22,090 | 20,210 |
| Molson Coors Brewing Co. | 2.000% | 5/1/17 | 1,180 | 1,197 |
| Molson Coors Brewing Co. | 3.500% | 5/1/22 | 16,525 | 16,386 |
| Molson Coors Brewing Co. | 5.000% | 5/1/42 | 14,965 | 14,554 |
| Mondelez International Inc. | 5.375% | 2/10/20 | 43,800 | 49,507 |
| Partners Healthcare System Massachusetts GO | 3.443% | 7/1/21 | 1,950 | 1,957 |
| Pepsi Bottling Group Inc. | 7.000% | 3/1/29 | 10,000 | 12,651 |
10
| Vanguard® Wellington Fund | ||||
| Schedule of Investments | ||||
| November 30, 2013 | ||||
| Face | Market | |||
| Maturity | Amount | Value | ||
| Coupon | Date | ($000) | ($000) | |
| PepsiCo Inc. | 3.100% | 1/15/15 | 38,800 | 39,921 |
| PepsiCo Inc. | 2.750% | 3/1/23 | 45,000 | 41,791 |
| PepsiCo Inc. | 4.000% | 3/5/42 | 51,391 | 44,881 |
| Pfizer Inc. | 3.000% | 6/15/23 | 70,000 | 66,875 |
| Philip Morris International Inc. | 4.500% | 3/26/20 | 8,250 | 9,023 |
| Philip Morris International Inc. | 4.125% | 5/17/21 | 43,025 | 45,218 |
| Philip Morris International Inc. | 2.500% | 8/22/22 | 21,645 | 19,852 |
| Philip Morris International Inc. | 2.625% | 3/6/23 | 46,850 | 42,841 |
| 3 Procter & Gamble - Esop | 9.360% | 1/1/21 | 40,912 | 51,946 |
| 4 Roche Holdings Inc. | 6.000% | 3/1/19 | 12,984 | 15,461 |
| 4 SABMiller Holdings Inc. | 2.450% | 1/15/17 | 11,400 | 11,819 |
| 4 SABMiller Holdings Inc. | 3.750% | 1/15/22 | 2,390 | 2,419 |
| 4 SABMiller Holdings Inc. | 4.950% | 1/15/42 | 4,100 | 4,096 |
| 4 SABMiller plc | 6.500% | 7/1/16 | 50,000 | 56,535 |
| Sanofi | 4.000% | 3/29/21 | 44,090 | 46,650 |
| St. Jude Medical Inc. | 2.500% | 1/15/16 | 24,840 | 25,607 |
| 4 Tesco plc | 5.500% | 11/15/17 | 50,000 | 56,040 |
| Thermo Fisher Scientific Inc. | 3.250% | 11/20/14 | 9,385 | 9,604 |
| Thermo Fisher Scientific Inc. | 3.200% | 5/1/15 | 10,355 | 10,687 |
| Thermo Fisher Scientific Inc. | 3.200% | 3/1/16 | 11,405 | 11,921 |
| Thermo Fisher Scientific Inc. | 1.850% | 1/15/18 | 20,495 | 20,380 |
| Unilever Capital Corp. | 4.250% | 2/10/21 | 95,235 | 103,089 |
| Wyeth LLC | 5.950% | 4/1/37 | 25,000 | 29,257 |
| Zeneca Wilmington Inc. | 7.000% | 11/15/23 | 29,000 | 36,145 |
| Zoetis Inc. | 3.250% | 2/1/23 | 3,475 | 3,273 |
| Zoetis Inc. | 4.700% | 2/1/43 | 4,170 | 3,867 |
| Energy (1.1%) | ||||
| Apache Finance Canada Corp. | 7.750% | 12/15/29 | 19,910 | 25,962 |
| 4 BG Energy Capital plc | 4.000% | 10/15/21 | 9,700 | 10,006 |
| BP Capital Markets plc | 3.125% | 10/1/15 | 16,000 | 16,770 |
| BP Capital Markets plc | 3.200% | 3/11/16 | 33,000 | 34,777 |
| BP Capital Markets plc | 1.846% | 5/5/17 | 25,000 | 25,453 |
| BP Capital Markets plc | 4.750% | 3/10/19 | 27,215 | 30,731 |
| BP Capital Markets plc | 4.500% | 10/1/20 | 16,000 | 17,433 |
| BP Capital Markets plc | 3.245% | 5/6/22 | 35,000 | 34,288 |
| BP Capital Markets plc | 2.500% | 11/6/22 | 22,000 | 20,236 |
| BP Capital Markets plc | 3.994% | 9/26/23 | 7,550 | 7,708 |
| Chevron Corp. | 3.191% | 6/24/23 | 49,470 | 48,173 |
| ConocoPhillips | 5.200% | 5/15/18 | 80,000 | 91,676 |
| EOG Resources Inc. | 5.625% | 6/1/19 | 16,100 | 18,863 |
| Halliburton Co. | 3.500% | 8/1/23 | 70,500 | 69,326 |
| 4 Motiva Enterprises LLC | 5.750% | 1/15/20 | 5,065 | 5,854 |
| Occidental Petroleum Corp. | 4.100% | 2/1/21 | 39,240 | 41,569 |
| Occidental Petroleum Corp. | 2.700% | 2/15/23 | 21,000 | 19,443 |
| 4 Schlumberger Investment SA | 2.400% | 8/1/22 | 23,925 | 22,081 |
| Schlumberger Investment SA | 3.650% | 12/1/23 | 44,520 | 44,682 |
| Shell International Finance BV | 3.250% | 9/22/15 | 29,575 | 31,044 |
| Shell International Finance BV | 4.375% | 3/25/20 | 38,000 | 41,723 |
| Shell International Finance BV | 2.250% | 1/6/23 | 34,000 | 30,774 |
| Suncor Energy Inc. | 5.950% | 12/1/34 | 20,700 | 22,542 |
| Total Capital International SA | 1.550% | 6/28/17 | 44,415 | 44,890 |
| Total Capital International SA | 2.700% | 1/25/23 | 33,630 | 31,349 |
| Total Capital SA | 2.125% | 8/10/18 | 42,000 | 42,720 |
| Other Industrial (0.0%) | ||||
| 4 Hutchison Whampoa International 11 Ltd. | 3.500% | 1/13/17 | 6,145 | 6,461 |
| 3 Johns Hopkins University Maryland GO | 4.083% | 7/1/53 | 26,970 | 23,596 |
| Technology (0.6%) | ||||
| Apple Inc. | 2.400% | 5/3/23 | 48,685 | 44,104 |
| Apple Inc. | 3.850% | 5/4/43 | 17,000 | 14,197 |
| Cisco Systems Inc. | 4.450% | 1/15/20 | 40,000 | 43,928 |
| EMC Corp. | 1.875% | 6/1/18 | 20,000 | 20,037 |
| EMC Corp. | 2.650% | 6/1/20 | 20,000 | 19,722 |
| EMC Corp. | 3.375% | 6/1/23 | 20,000 | 19,552 |
11
| Vanguard® Wellington Fund | ||||
| Schedule of Investments | ||||
| November 30, 2013 | ||||
| Face | Market | |||
| Maturity | Amount | Value | ||
| Coupon | Date | ($000) | ($000) | |
| Hewlett-Packard Co. | 3.750% | 12/1/20 | 71,300 | 71,316 |
| Hewlett-Packard Co. | 4.300% | 6/1/21 | 26,000 | 26,422 |
| International Business Machines Corp. | 2.000% | 1/5/16 | 40,400 | 41,596 |
| International Business Machines Corp. | 1.950% | 7/22/16 | 23,211 | 23,973 |
| International Business Machines Corp. | 1.250% | 2/6/17 | 10,075 | 10,137 |
| International Business Machines Corp. | 8.375% | 11/1/19 | 25,000 | 33,276 |
| International Business Machines Corp. | 3.375% | 8/1/23 | 70,925 | 69,538 |
| International Business Machines Corp. | 5.875% | 11/29/32 | 25,000 | 29,337 |
| Microsoft Corp. | 4.000% | 2/8/21 | 16,000 | 17,169 |
| Oracle Corp. | 6.125% | 7/8/39 | 18,000 | 21,062 |
| Transportation (0.5%) | ||||
| Burlington Northern Santa Fe LLC | 3.050% | 3/15/22 | 7,595 | 7,258 |
| Burlington Northern Santa Fe LLC | 3.000% | 3/15/23 | 15,182 | 14,175 |
| Burlington Northern Santa Fe LLC | 3.850% | 9/1/23 | 68,200 | 67,942 |
| 3 Continental Airlines 2007-1 Class A Pass Through Trust | 5.983% | 4/19/22 | 27,059 | 29,359 |
| 4 ERAC USA Finance LLC | 2.250% | 1/10/14 | 5,890 | 5,901 |
| 4 ERAC USA Finance LLC | 5.900% | 11/15/15 | 19,500 | 21,237 |
| 4 ERAC USA Finance LLC | 2.750% | 3/15/17 | 6,795 | 6,993 |
| 4 ERAC USA Finance LLC | 4.500% | 8/16/21 | 9,295 | 9,717 |
| 4 ERAC USA Finance LLC | 3.300% | 10/15/22 | 2,115 | 1,998 |
| 4 ERAC USA Finance LLC | 7.000% | 10/15/37 | 26,175 | 30,904 |
| 4 ERAC USA Finance LLC | 5.625% | 3/15/42 | 10,000 | 10,083 |
| 3 Federal Express Corp. 1998 Pass Through Trust | 6.720% | 1/15/22 | 27,510 | 32,121 |
| FedEx Corp. | 2.625% | 8/1/22 | 5,385 | 4,953 |
| FedEx Corp. | 2.700% | 4/15/23 | 23,430 | 21,456 |
| FedEx Corp. | 3.875% | 8/1/42 | 5,095 | 4,216 |
| FedEx Corp. | 4.100% | 4/15/43 | 20,500 | 17,574 |
| Kansas City Southern de Mexico SA de CV | 2.350% | 5/15/20 | 4,260 | 4,041 |
| Southwest Airlines Co. | 5.750% | 12/15/16 | 32,500 | 36,474 |
| 3 Southwest Airlines Co. 1993-A Pass Through Trust | 7.540% | 6/29/15 | 11,841 | 12,435 |
| 3 Southwest Airlines Co. 2007-1 Pass Through Trust | 6.150% | 2/1/24 | 18,580 | 21,367 |
| United Parcel Service Inc. | 1.125% | 10/1/17 | 4,680 | 4,668 |
| United Parcel Service Inc. | 2.450% | 10/1/22 | 17,950 | 16,742 |
| United Parcel Service Inc. | 4.875% | 11/15/40 | 14,815 | 15,498 |
| 9,055,925 | ||||
| Utilities (1.9%) | ||||
| Electric (1.6%) | ||||
| Alabama Power Co. | 5.550% | 2/1/17 | 17,650 | 19,654 |
| Alabama Power Co. | 5.700% | 2/15/33 | 15,000 | 16,749 |
| Ameren Illinois Co. | 6.125% | 12/15/28 | 54,000 | 62,568 |
| Commonwealth Edison Co. | 5.950% | 8/15/16 | 23,120 | 26,025 |
| Connecticut Light & Power Co. | 5.650% | 5/1/18 | 13,655 | 15,878 |
| Consolidated Edison Co. of New York Inc. | 5.500% | 9/15/16 | 20,930 | 23,506 |
| Consolidated Edison Co. of New York Inc. | 5.300% | 12/1/16 | 25,505 | 28,754 |
| Consolidated Edison Co. of New York Inc. | 7.125% | 12/1/18 | 11,278 | 13,991 |
| Dominion Resources Inc. | 5.200% | 8/15/19 | 19,250 | 21,859 |
| Duke Energy Carolinas LLC | 5.250% | 1/15/18 | 9,000 | 10,310 |
| Duke Energy Carolinas LLC | 5.100% | 4/15/18 | 18,235 | 20,846 |
| Duke Energy Carolinas LLC | 3.900% | 6/15/21 | 50,025 | 52,879 |
| Duke Energy Florida Inc. | 6.350% | 9/15/37 | 8,000 | 9,857 |
| Duke Energy Florida Inc. | 6.400% | 6/15/38 | 27,055 | 33,821 |
| Duke Energy Progress Inc. | 6.300% | 4/1/38 | 14,705 | 18,054 |
| Florida Power & Light Co. | 5.650% | 2/1/35 | 50,000 | 56,208 |
| Florida Power & Light Co. | 4.950% | 6/1/35 | 10,000 | 10,579 |
| Florida Power & Light Co. | 5.650% | 2/1/37 | 5,000 | 5,731 |
| Florida Power & Light Co. | 5.950% | 2/1/38 | 39,215 | 46,022 |
| Georgia Power Co. | 5.400% | 6/1/18 | 38,660 | 44,204 |
| Georgia Power Co. | 4.300% | 3/15/42 | 23,145 | 20,881 |
| MidAmerican Energy Holdings Co. | 6.125% | 4/1/36 | 25,000 | 28,118 |
| National Rural Utilities Cooperative Finance Corp. | 3.875% | 9/16/15 | 24,125 | 25,509 |
| National Rural Utilities Cooperative Finance Corp. | 5.450% | 2/1/18 | 60,000 | 68,677 |
| Northern States Power Co. | 6.250% | 6/1/36 | 50,000 | 60,802 |
| NSTAR LLC | 4.500% | 11/15/19 | 3,535 | 3,913 |
12
| Vanguard® Wellington Fund | |||||
| Schedule of Investments | |||||
| November 30, 2013 | |||||
| Face | Market | ||||
| Maturity | Amount | Value | |||
| Coupon | Date | ($000) | ($000) | ||
| Pacific Gas & Electric Co. | 4.250% | 5/15/21 | 11,365 | 11,983 | |
| Pacific Gas & Electric Co. | 3.850% | 11/15/23 | 17,950 | 17,911 | |
| Pacific Gas & Electric Co. | 5.125% | 11/15/43 | 11,255 | 11,479 | |
| PacifiCorp | 2.950% | 6/1/23 | 29,675 | 28,260 | |
| PacifiCorp | 5.900% | 8/15/34 | 12,500 | 13,947 | |
| PacifiCorp | 6.250% | 10/15/37 | 36,635 | 44,039 | |
| Peco Energy Co. | 5.350% | 3/1/18 | 20,545 | 23,626 | |
| Potomac Electric Power Co. | 6.500% | 11/15/37 | 25,000 | 31,783 | |
| Public Service Electric & Gas Co. | 5.300% | 5/1/18 | 25,100 | 28,827 | |
| San Diego Gas & Electric Co. | 6.000% | 6/1/26 | 3,600 | 4,379 | |
| Sierra Pacific Power Co. | 3.375% | 8/15/23 | 34,040 | 33,345 | |
| South Carolina Electric & Gas Co. | 5.800% | 1/15/33 | 9,000 | 9,990 | |
| South Carolina Electric & Gas Co. | 6.050% | 1/15/38 | 34,000 | 39,677 | |
| Southern California Edison Co. | 6.000% | 1/15/34 | 7,695 | 9,081 | |
| Southern California Edison Co. | 5.550% | 1/15/37 | 50,475 | 56,362 | |
| Southern California Edison Co. | 5.950% | 2/1/38 | 40,000 | 46,879 | |
| Southern Co. | 2.450% | 9/1/18 | 9,395 | 9,589 | |
| Virginia Electric & Power Co. | 2.750% | 3/15/23 | 34,540 | 32,590 | |
| Wisconsin Electric Power Co. | 5.700% | 12/1/36 | 17,280 | 19,573 | |
| Wisconsin Public Service Corp. | 6.080% | 12/1/28 | 45,000 | 51,386 | |
| Natural Gas (0.2%) | |||||
| AGL Capital Corp. | 6.375% | 7/15/16 | 25,815 | 29,085 | |
| 4 | DCP Midstream LLC | 6.450% | 11/3/36 | 30,325 | 31,223 |
| 4 | Dominion Gas Holdings LLC | 3.550% | 11/1/23 | 21,445 | 21,029 |
| National Grid plc | 6.300% | 8/1/16 | 30,000 | 33,973 | |
| Plains All American Pipeline LP / PAA Finance Corp. | 3.850% | 10/15/23 | 60,000 | 58,994 | |
| TransCanada PipeLines Ltd. | 3.800% | 10/1/20 | 47,125 | 49,238 | |
| Other Utility (0.1%) | |||||
| UGI Utilities Inc. | 5.753% | 9/30/16 | 37,590 | 42,213 | |
| 1,535,856 | |||||
| Total Corporate Bonds (Cost $16,649,119) | 17,457,064 | ||||
| Sovereign Bonds (U.S. Dollar-Denominated) (0.7%) | |||||
| 4 | Abu Dhabi National Energy Co. | 5.875% | 10/27/16 | 41,140 | 45,650 |
| 4 | CDP Financial Inc. | 4.400% | 11/25/19 | 40,000 | 44,730 |
| 4 | Electricite de France SA | 4.600% | 1/27/20 | 50,000 | 54,823 |
| 3,4 | Electricite de France SA | 5.250% | 1/29/49 | 22,485 | 22,159 |
| 4 | Gazprom Neft OAO Via GPN Capital SA | 4.375% | 9/19/22 | 22,000 | 20,224 |
| International Bank for Reconstruction & Development | 4.750% | 2/15/35 | 40,000 | 43,817 | |
| Japan Finance Organization for Municipalities | 4.625% | 4/21/15 | 7,800 | 8,239 | |
| Korea Finance Corp. | 2.875% | 8/22/18 | 37,605 | 38,310 | |
| Oesterreichische Kontrollbank AG | 4.500% | 3/9/15 | 10,500 | 11,059 | |
| Province of Ontario | 4.500% | 2/3/15 | 12,270 | 12,865 | |
| Province of Ontario | 4.000% | 10/7/19 | 56,415 | 61,879 | |
| Province of Ontario | 4.400% | 4/14/20 | 50,000 | 55,247 | |
| Quebec | 5.125% | 11/14/16 | 50,000 | 56,218 | |
| 4 | Ras Laffan Liquefied Natural Gas Co. Ltd. III | 5.500% | 9/30/14 | 14,985 | 15,512 |
| Republic of South Africa | 6.500% | 6/2/14 | 21,900 | 22,451 | |
| Statoil ASA | 2.900% | 11/8/20 | 43,280 | 43,607 | |
| 4 | Temasek Financial I Ltd. | 2.375% | 1/23/23 | 45,150 | 41,181 |
| Total Sovereign Bonds (Cost $563,158) | 597,971 | ||||
| Taxable Municipal Bonds (1.5%) | |||||
| Atlanta GA Downtown Development Authority | |||||
| Revenue | 6.875% | 2/1/21 | 9,770 | 11,426 | |
| Bay Area Toll Authority California Toll Bridge Revenue | |||||
| (San Francisco Bay Area) | 6.263% | 4/1/49 | 40,000 | 49,697 | |
| California GO | 5.700% | 11/1/21 | 16,840 | 19,358 | |
| California GO | 7.550% | 4/1/39 | 13,375 | 18,053 | |
| California GO | 7.300% | 10/1/39 | 4,280 | 5,579 | |
| California GO | 7.600% | 11/1/40 | 23,935 | 32,686 | |
13
| Vanguard® Wellington Fund | ||||
| Schedule of Investments | ||||
| November 30, 2013 | ||||
| Face | Market | |||
| Maturity | Amount | Value | ||
| Coupon | Date | ($000) | ($000) | |
| Chicago IL Metropolitan Water Reclamation District GO | 5.720% | 12/1/38 | 8,545 | 9,379 |
| Chicago IL O'Hare International Airport Revenue | 6.845% | 1/1/38 | 21,280 | 22,406 |
| Chicago IL O'Hare International Airport Revenue | 6.395% | 1/1/40 | 8,970 | 10,115 |
| Dallas TX Area Rapid Transit Revenue | 5.999% | 12/1/44 | 29,925 | 36,576 |
| Georgia Municipal Electric Power Authority Revenue | 6.637% | 4/1/57 | 26,580 | 28,769 |
| Grand Parkway Transportation Corp. | 5.184% | 10/1/42 | 40,435 | 41,933 |
| Houston TX GO | 6.290% | 3/1/32 | 25,000 | 28,542 |
| Illinois GO | 5.100% | 6/1/33 | 3,145 | 2,887 |
| Illinois Toll Highway Authority Revenue | 6.184% | 1/1/34 | 29,200 | 33,875 |
| 6 Kansas Development Finance Authority Revenue | ||||
| (Public Employees Retirement System) | 5.501% | 5/1/34 | 50,000 | 52,040 |
| Los Angeles CA Department of Water & Power | ||||
| Revenue | 6.008% | 7/1/39 | 15,645 | 17,754 |
| Los Angeles CA Unified School District GO | 5.750% | 7/1/34 | 55,325 | 61,761 |
| Louisville & Jefferson County KY Metropolitan Sewer | ||||
| District Revenue | 6.250% | 5/15/43 | 19,000 | 22,270 |
| Maryland Transportation Authority Facilities Projects | ||||
| Revenue | 5.888% | 7/1/43 | 21,685 | 23,890 |
| Massachusetts School Building Authority Dedicated | ||||
| Sales Tax Revenue | 5.715% | 8/15/39 | 22,105 | 25,504 |
| New Jersey Turnpike Authority Revenue | 7.414% | 1/1/40 | 35,285 | 47,840 |
| New Jersey Turnpike Authority Revenue | 7.102% | 1/1/41 | 4,000 | 5,232 |
| New York City NY Municipal Water Finance Authority | ||||
| Water & Sewer System Revenue | 5.790% | 6/15/41 | 2,030 | 2,147 |
| New York City NY Municipal Water Finance Authority | ||||
| Water & Sewer System Revenue | 5.882% | 6/15/44 | 15,950 | 18,845 |
| New York Metropolitan Transportation Authority | ||||
| Revenue | 6.814% | 11/15/40 | 4,000 | 4,850 |
| New York Metropolitan Transportation Authority | ||||
| Revenue (Dedicated Tax Fund) | 7.336% | 11/15/39 | 10,860 | 14,545 |
| New York Metropolitan Transportation Authority | ||||
| Revenue (Dedicated Tax Fund) | 6.089% | 11/15/40 | 5,235 | 6,071 |
| North Texas Tollway Authority System Revenue | 6.718% | 1/1/49 | 61,100 | 73,487 |
| Oregon Department of Transportation Highway User | ||||
| Tax Revenue | 5.834% | 11/15/34 | 25,930 | 30,281 |
| Oregon GO | 5.902% | 8/1/38 | 19,510 | 20,752 |
| 6 Oregon School Boards Association GO | 5.528% | 6/30/28 | 50,000 | 54,606 |
| Port Authority of New York & New Jersey Revenue | 5.859% | 12/1/24 | 12,735 | 14,666 |
| Port Authority of New York & New Jersey Revenue | 6.040% | 12/1/29 | 10,455 | 12,154 |
| Port Authority of New York & New Jersey Revenue | 4.458% | 10/1/62 | 53,000 | 46,873 |
| President & Fellows of Harvard College Massachusetts | ||||
| GO | 6.300% | 10/1/37 | 50,675 | 56,883 |
| San Antonio TX Electric & Gas Systems Revenue | 5.985% | 2/1/39 | 11,890 | 14,370 |
| Stanford University | 6.875% | 2/1/24 | 34,745 | 44,605 |
| Stanford University | 7.650% | 6/15/26 | 29,000 | 40,061 |
| University of California Regents General Revenue | 4.601% | 5/15/31 | 21,975 | 22,271 |
| University of California Regents Medical Center | ||||
| Revenue | 6.548% | 5/15/48 | 14,820 | 17,517 |
| University of California Regents Medical Center | ||||
| Revenue | 6.583% | 5/15/49 | 23,785 | 28,201 |
| University of California Revenue | 5.770% | 5/15/43 | 24,325 | 27,441 |
| Total Taxable Municipal Bonds (Cost $1,037,341) | 1,158,198 | |||
14
| Vanguard® Wellington Fund | ||||
| Schedule of Investments | ||||
| November 30, 2013 | ||||
| Face | Market | |||
| Maturity | Amount | Value | ||
| Coupon | Date | ($000) | ($000) | |
| Temporary Cash Investments (1.0%) | ||||
| Repurchase Agreements (1.0%) | ||||
| Bank of America Securities, LLC (Dated 11/29/13, | ||||
| Repurchase Value $19,400,000, collateralized by U.S. | ||||
| Treasury Bill 0.000%, 2/13/14, with a value of | ||||
| $19,788,000) | 0.080% | 12/2/13 | 19,400 | 19,400 |
| Bank of Montreal (Dated 11/29/13, Repurchase Value | ||||
| $150,001,000, collateralized by Federal National | ||||
| Mortgage Assn. 2.000%-4.500%, 2/1/27-11/1/43, | ||||
| Government National Mortgage Assn. 3.500%- | ||||
| 6.000%, 6/20/34-3/20/43, and U.S. Treasury | ||||
| Note/Bond 0.625%, 5/31/17, with a value of | ||||
| $153,000,000) | 0.070% | 12/2/13 | 150,000 | 150,000 |
| Citigroup Global Markets Inc. (Dated 11/29/13, | ||||
| Repurchase Value $107,101,000, collateralized by | ||||
| U.S. Treasury Note/Bond 0.750%-10.625%, 8/15/15- | ||||
| 5/15/22, with a value of $109,242,000) | 0.070% | 12/2/13 | 107,100 | 107,100 |
| Deutsche Bank Securities, Inc. (Dated 11/29/13, | ||||
| Repurchase Value $190,101,000, collateralized by | ||||
| Federal Home Loan Mortgage Corp. 3.500%-4.500%, | ||||
| 4/1/25-8/1/43, Federal National Mortgage Assn. | ||||
| 3.000%-6.000%, 8/1/27-11/1/43, and Government | ||||
| National Mortgage Assn. 2.280%-5.000%, 7/15/37- | ||||
| 5/15/48, with a value of $193,902,000) | 0.090% | 12/2/13 | 190,100 | 190,100 |
| HSBC Bank USA (Dated 11/29/13, Repurchase Value | ||||
| $89,201,000, collateralized by Federal National | ||||
| Mortgage Assn. 3.000%, 4/1/43-6/1/43, with a value | ||||
| of $90,985,000) | 0.090% | 12/2/13 | 89,200 | 89,200 |
| RBC Capital Markets LLC (Dated 11/29/13, Repurchase | ||||
| Value $128,301,000, collateralized by Federal Home | ||||
| Loan Mortgage Corp. 2.794%, 12/1/41, and Federal | ||||
| National Mortgage Assn. 2.506%-4.000%, 3/1/41- | ||||
| 11/1/43, with a value of $130,866,000) | 0.090% | 12/2/13 | 128,300 | 128,300 |
| RBS Securities, Inc. (Dated 11/29/13, Repurchase Value | ||||
| $36,100,000, collateralized by U.S. Treasury | ||||
| Note/Bond 3.000%, 2/28/17, with a value of | ||||
| $36,826,000) | 0.070% | 12/2/13 | 36,100 | 36,100 |
| TD Securities (USA) LLC (Dated 11/29/13, Repurchase | ||||
| Value $79,700,000, collateralized by Federal Home | ||||
| Loan Mortgage Corp. 0.120%-3.000%, 5/27/14- | ||||
| 1/1/43, and Government National Mortgage Assn. | ||||
| 2.500%, 8/20/43, with a value of $81,294,000) | 0.070% | 12/2/13 | 79,700 | 79,700 |
| 799,900 | ||||
| Total Temporary Cash Investments (Cost $799,900) | 799,900 | |||
| Total Investments (98.7%) (Cost $59,174,525) | 78,238,280 | |||
| Other Assets and Liabilities—Net (1.3%)7 | 1,051,331 | |||
| Net Assets (100%) | 79,289,611 | |||
* Non-income-producing security.
1 Securities with a value of $5,784,000 have been segregated as collateral for open swap contracts.
2 The issuer was placed under federal conservatorship in September 2008; since that time, its daily operations have been managed by the Federal Housing Finance Agency and it receives capital from the U.S. Treasury, as needed to maintain a positive net worth, in exchange for senior preferred stock.
3 The average or expected maturity is shorter than the final maturity shown because of the possibility of interim principal payments and prepayments or the possibility of the issue being called.
15
Vanguard® Wellington Fund
Schedule of Investments
November 30, 2013
4 Security exempt from registration under Rule 144A of the Securities Act of 1933. Such securities may be sold in transactions exempt from registration, normally to qualified institutional buyers. At November 30, 2013, the aggregate value of these securities was $2,777,441,000, representing 3.5% of net assets.
5 Adjustable-rate security.
6 Scheduled principal and interest payments are guaranteed by AGM (Assured Guaranty Municipal Corporation).
7 Cash of $35,196,000 has been segregated as initial margin for open futures contracts.
ADR—American Depositary Receipt.
GO—General Obligation Bond.
REMIC—Real Estate Mortgage Investment Conduit.
16
This page intentionally left blank.
17
© 2013 The Vanguard Group, Inc. All rights reserved.
Vanguard Marketing Corporation, Distributor.
SNA210_022014
Report of Independent Registered Public Accounting Firm
To the Trustees and Shareholders of Vanguard Wellington Fund:
We have audited, in accordance with the standards of the Public Company Accounting Oversight Board (United States), the financial statements of Vanguard Wellington Fund (the “Fund") as of November 30, 2013 and for the year then ended and have issued our unqualified report thereon dated January 13, 2014 (which report and financial statements are included in Item 1 of this Certified Shareholder Report on Form N-CSR). Our audit included an audit of the Fund's schedule of investments as of November 30, 2013 appearing in Item 6 of this Form N-CSR. This schedule of investments is the responsibility of the Fund's management. Our responsibility is to express an opinion on the schedule of investments based on our audit.
In our opinion, the schedule of investments referred to above, when read in conjunction with the financial statements of the Fund referred to above, presents fairly, in all material respects, the information set forth therein.
/s/PricewaterhouseCoopers LLP
Philadelphia, PA
January 13, 2014
Item 7: Disclosure of Proxy Voting Policies and Procedures for Closed-End Management Investment Companies.
Not Applicable.
Item 8: Portfolio Managers of Closed-End Management Investment Companies.
Not Applicable.
Item 9: Purchase of Equity Securities by Closed-End Management Investment Company and Affiliated Purchasers.
Not Applicable.
Item 10: Submission of Matters to a Vote of Security Holders.
Not Applicable.
Item 11: Controls and Procedures.
(a) Disclosure Controls and Procedures. The Principal Executive and Financial Officers concluded that the Registrant’s Disclosure Controls and Procedures are effective based on their evaluation of the Disclosure Controls and Procedures as of a date within 90 days of the filing date of this report.
(b) Internal Control Over Financial Reporting. There were no significant changes in Registrant’s Internal Control Over Financial Reporting or in other factors that could significantly affect this control subsequent to the date of the evaluation, including any corrective actions with regard to significant deficiencies and material weaknesses.
Item 12: Exhibits.
(a) Code of Ethics.
(b) Certifications.
Pursuant to the requirements of the Securities Exchange Act of 1934 and the Investment Company Act of 1940, the registrant has duly caused this report to be signed on its behalf by the undersigned, thereunto duly authorized.
| VANGUARD WELLINGTON FUND | |
| By: | /s/ F. WILLIAM MCNABB III* |
| F. WILLIAM MCNABB III | |
| CHIEF EXECUTIVE OFFICER | |
| Date: January 21, 2014 | |
Pursuant to the requirements of the Securities Exchange Act of 1934 and the Investment Company Act of 1940, this report has been signed below by the following persons on behalf of the registrant and in the capacities and on the dates indicated.
| VANGUARD WELLINGTON FUND | |
| By: | /s/ F. WILLIAM MCNABB III* |
| F. WILLIAM MCNABB III | |
| CHIEF EXECUTIVE OFFICER | |
| Date: January 21, 2014 | |
| VANGUARD WELLINGTON FUND | |
| By: | /s/ THOMAS J. HIGGINS* |
| THOMAS J. HIGGINS | |
| CHIEF FINANCIAL OFFICER | |
| Date: January 21, 2014 | |
* By: /s/ Heidi Stam
Heidi Stam, pursuant to a Power of Attorney filed on March 27, 2012 see file Number
2-11444, Incorporated by Reference.