UNITED STATES
SECURITIES AND EXCHANGE COMMISSION
Washington, D.C. 20549
FORM N-CSR
CERTIFIED SHAREHOLDER REPORT
OF
REGISTERED MANAGEMENT INVESTMENT COMPANIES
Investment Company Act file number: 811-121
Name of Registrant: Vanguard Wellington Fund
Address of Registrant:
P.O. Box 2600
Valley Forge, PA 19482
Name and address of agent for service:
Heidi Stam, Esquire
P.O. Box 876
Valley Forge, PA 19482
Registrant’s telephone number, including area code: (610) 669-1000
Date of fiscal year end: November 30
Date of reporting period: December 1, 2010 – November 30, 2011
Item 1: Reports to Shareholders
| Annual Report | November 30, 2011 |
| Vanguard WellingtonTM Fund |
> For the fiscal year ended November 30, 2011, Vanguard Wellington Fund returned almost 7%, slightly behind its composite index benchmark and significantly ahead of its peer group.
> Strong stock choices in the energy and information technology sectors helped the fund’s overall performance, but sizable holdings in the troubled U.S. financial sector restrained results.
> Wellington outperformed its comparative standards for the decade ended November 30, 2011.
| Contents | |
| Your Fund’s Total Returns. | 1 |
| Chairman’s Letter. | 2 |
| Advisor’s Report. | 8 |
| Fund Profile. | 12 |
| Performance Summary. | 14 |
| Financial Statements. | 16 |
| Your Fund’s After-Tax Returns. | 33 |
| About Your Fund’s Expenses. | 34 |
| Trustees Approve Advisory Agreement. | 36 |
| Glossary. | 37 |
Please note: The opinions expressed in this report are just that—informed opinions. They should not be considered promises or advice. Also, please keep in mind that the information and opinions cover the period through the date on the front of this report. Of course, the risks of investing in your fund are spelled out in the prospectus.
See the Glossary for definitions of investment terms used in this report.
About the cover: Vanguard was named for the HMS Vanguard, flagship of British Admiral Horatio Nelson. A ship—whose performance and safety depend on the work of all hands—has served as a fitting metaphor for the Vanguard crew as we strive to help clients reach their financial goals.
Your Fund’s Total Returns
| Fiscal Year Ended November 30, 2011 | |
| Total | |
| Returns | |
| Vanguard Wellington Fund | |
| Investor Shares | 6.85% |
| Admiral™ Shares | 6.94 |
| Wellington Composite Index | 7.13 |
| Mixed-Asset Target Allocation Growth Funds Average | 3.12 |
Wellington Composite Index: 65% S&P 500 Index and 35% Lehman U.S. Long Credit AA or Better Bond Index through February 29, 2000; 65% S&P 500 Index and 35% Barclays Capital U.S. Credit A or Better Bond Index thereafter.
Mixed-Asset Target Allocation Growth Funds Average: Derived from data provided by Lipper Inc.
Admiral Shares carry lower expenses and are available to investors who meet certain account-balance requirements.
| Your Fund’s Performance at a Glance | ||||
| November 30, 2010 , Through November 30, 2011 | ||||
| Distributions Per Share | ||||
| Starting | Ending | Income | Capital | |
| Share Price | Share Price | Dividends | Gains | |
| Vanguard Wellington Fund | ||||
| Investor Shares | $29.94 | $31.08 | $0.904 | $0.000 |
| Admiral Shares | 51.71 | 53.68 | 1.605 | 0.000 |
1

Chairman’s Letter
Dear Shareholder,
Vanguard Wellington Fund delivered a solid performance during a fiscal year that was marked by jagged but ultimately positive stock and bond market returns. For the 12 months ended November 30, 2011, Wellington returned close to 7%, a shade worse than the result of the unmanaged Wellington Composite Index but significantly better than the average result of peer funds.
While the fund’s stocks produced double-digit returns in five of the ten industry sectors, results were disappointing in financials and consumer discretionary. Income from dividend-paying stocks and investment-grade bonds, as well as some price appreciation in the stock and bond portfolios, boosted the fund’s returns.
On November 30, the fund’s 30-day SEC yield was 2.74% for Investor Shares and 2.82% for Admiral Shares, up from 2.47% for Investor Shares and 2.55% for Admiral Shares six months ago, in part because companies with healthy balance sheets have nudged dividends higher.
A tumultuous path to unremarkable returns
The broad U.S. stock market produced a single-digit gain for the 12 months ended November 30. International stocks recorded a single-digit loss. On the way to these unremarkable returns, however, global stock markets traced dramatic highs and lows.
2
Stock prices surged through the first half of the period, as the U.S. economy seemed to be grinding into gear. But investor optimism waned in the second half, as Europe’s sovereign-debt crisis took center stage and political gridlock led to high-stakes brinkmanship over a bill to raise the U.S. debt ceiling. The drama prompted Standard & Poor’s to downgrade the U.S. credit rating, a shock that reverberated through global financial markets. (Vanguard’s confidence in the full faith and credit of the U.S. Treasury remains unshaken.)
U.S. stocks tumbled through the summer, then rebounded in the period’s final months. International stock markets traced similar trajectories before finishing the year with a negative return.
Despite modest yields, bonds produced strong returns
Stock market volatility helped generate enthusiasm for the relative stability of bonds. The broad taxable investment-grade bond market returned 5.52% as anxious investors bid up bond prices, driving already low yields lower still. At the start of the year, the yield of the 10-year U.S. Treasury note, a benchmark for longer-term interest rates, stood at 2.80%. At the end, the note yielded just 2.07%. As yields decline, of course, so do the prospective returns available from these interest-bearing investments. Municipal bonds also performed strongly.
| Market Barometer | |||
| Average Annual Total Returns | |||
| Periods Ended November 30, 2011 | |||
| One | Three | Five | |
| Year | Years | Years | |
| Stocks | |||
| Russell 1000 Index (Large-caps) | 7.38% | 15.10% | 0.07% |
| Russell 2000 Index (Small-caps) | 2.75 | 17.56 | 0.09 |
| Dow Jones U.S. Total Stock Market Index | 6.57 | 15.67 | 0.36 |
| MSCI All Country World Index ex USA (International) | -5.90 | 13.19 | -2.11 |
| Bonds | |||
| Barclays Capital U.S. Aggregate Bond Index (Broad | |||
| taxable market) | 5.52% | 7.69% | 6.14% |
| Barclays Capital Municipal Bond Index (Broad | |||
| tax-exempt market) | 6.53 | 8.41 | 4.75 |
| Citigroup Three-Month U.S. Treasury Bill Index | 0.09 | 0.12 | 1.44 |
| CPI | |||
| Consumer Price Index | 3.39% | 2.12% | 2.34% |
3
The returns on money market instruments hovered near 0%, consistent with the Federal Reserve Board’s target for short-term interest rates.
Fund’s stocks, bonds deliver steady performance
Vanguard Wellington Fund is designed to be an all-weather portfolio, striking a balance between the long-term growth potential of stocks and the relative stability of high-quality bonds. Although Wellington’s value-oriented approach to the stock market didn’t provide an advantage during a period when growth stocks outperformed their value counterparts, the fund’s bond holdings held up well, providing the diversification and income for which the fund has become known.
Wellington’s stock holdings, which represented, on average, about two-thirds of its assets, returned about 7% for the fiscal year. The fund’s equity benchmark, the Standard & Poor’s 500 Index, returned closer to 8%.
The energy sector contributed the most to performance as political turmoil in North Africa and the Middle East fed fears of oil shortages and drove up crude prices. Wellington’s energy holdings rose nearly 19%, thanks mainly to the performance of several of the major integrated oil and gas firms. The fund also benefited from the advisor’s astute selections within the sector.
| Expense Ratios | |||
| Your Fund Compared With Its Peer Group | |||
| Investor | Admiral | Peer Group | |
| Shares | Shares | Average | |
| Wellington Fund | 0.30% | 0.22% | 1.04% |
The fund expense ratios shown are from the prospectus dated March 25, 2011, and represent estimated costs for the current fiscal year. For the fiscal year ended November 30, 2011, the fund’s expense ratios were 0.27% for Investor Shares and 0.19% for Admiral Shares. The peer-group expense ratio is derived from data provided by Lipper Inc. and captures information through year-end 2010.
Peer group: Mixed-Asset Target Allocation Growth Funds.
4
Strong stock selection was also evident in the information technology sector, with several IT services companies, which generate recurring revenue, driving returns. A few software and communications equipment firms also provided a lift. Another source of strength was the health care sector. Major pharmaceutical companies did particularly well, as nervous investors flocked to perceived safe havens and growing global sales helped offset increased competition from generics.
The fund’s weakest spots were the financial and consumer discretionary sectors. Wellington’s financial stocks, which represent the fund’s largest sector weighting, returned about –9%; the fund was also hurt by having more exposure to this troubled sector than the benchmark
did. Giant diversified financial services companies and investment banks were affected by regulatory pressures, mortgage-related problems, and Europe’s debt crisis. Stock selection was the culprit in the consumer discretionary sector, where the fund’s automobile and specialty retailer holdings muted returns.
Wellington’s fixed income portfolio, which represented, on average, about one-third of the fund’s assets, returned more than 5%, a bit higher than the return of its fixed income benchmark, the Barclays Capital U.S. Credit A or Better Bond Index. The fund benefited from its low exposure to sovereign bonds—dollar-denominated bonds issued by foreign countries—and from a rise in bond prices brought on by falling interest rates.
| Total Returns | |
| Ten Years Ended November 30, 2011 | |
| Average | |
| Annual Return | |
| Wellington Fund Investor Shares | 6.08% |
| Wellington Composite Index | 4.16 |
| Mixed-Asset Target Allocation Growth Funds Average | 3.40 |
Wellington Composite Index: 65% S&P 500 Index and 35% Lehman U.S. Long Credit AA or Better Bond Index through February 29, 2000; 65% S&P 500 Index and 35% Barclays Capital U.S. Credit A or Better Bond Index thereafter.
Mixed-Asset Target Allocation Growth Funds Average: Derived from data provided by Lipper Inc.
The figures shown represent past performance, which is not a guarantee of future results. (Current performance may be lower or higher than the performance data cited. For performance data current to the most recent month-end, visit our website at vanguard.com/performance.) Note, too, that both investment returns and principal value can fluctuate widely, so an investor’s shares, when sold, could be worth more or less than their original cost.
5
For more on the fund’s positioning during the fiscal year, please see the Advisor’s Report that follows this letter.
During a volatile decade, the fund found success
At Vanguard, we believe strongly in the value of diversification and focusing on the long term when it comes to investing, and Wellington Fund is a touchstone for both those principles. Since the fund began operations in 1929, it has weathered depressions, wars, and every conceivable market condition to deliver exemplary long-term performance for shareholders.
The last decade has been one of the market’s most trying. It began more than a year into the extended dot-com bust and featured five straight years of gains before the financial crisis sent investors reeling again. In these difficult conditions, the fund’s average annual return for the ten-year period was more than double that of the all-stock Standard & Poor’s 500 Index (2.91%). It was also significantly better than the average annual returns for the unmanaged Wellington Composite Index and the fund’s peer group.
Wellington Management Company, llp, the fund’s advisor, has a record of identifying reasonably valued stocks and investment-grade bonds and adeptly rebalancing the asset classes to produce a relatively consistent risk profile over time. The fund’s low costs have helped it maintain a notable advantage over its peers and allowed shareholders to keep more of the returns.
Proven principles for a lifetime of investing
The financial markets charted a zigzag course over the past fiscal year. Stocks and bonds each exhibited strength for months at a time, followed by similar periods of weakness and volatility. The two asset classes rarely moved in tandem, and the different sectors within the asset classes also performed independently. The volatile performance underscored the reality that even the most knowledgeable and skilled experts don’t know where the markets are headed next, or which areas will lead and which will lag.
Recent Vanguard research continues to show why diversification is important in the face of the market’s unpredictability. One surprising finding: Over the past 85 years, a hypothetical portfolio made up of 50% stocks and 50% bonds would have produced statistically equivalent returns whether the U.S. economy was in or out of recession. (The commentary, Recessions and balanced portfolio returns, can be found on vanguard.com.)
Vanguard’s view is that shareholders are best served by taking a balanced, long-term approach and not making investment decisions based on short-term fluctuations. This means diversifying within and across asset classes, paying attention to costs, and creating a portfolio that is tailored to your goals, time horizon, and risk tolerance. As I noted earlier, Vanguard Wellington Fund embodies these core investing principles. We believe that the fund,
6
which has served investors for more than 80 years, can play an important role in a well-designed investment plan.
Thank you for entrusting your assets to Vanguard.
Sincerely,

F. William McNabb III
Chairman and Chief Executive Officer
December 9, 2011
7
Advisor’s Report
Vanguard Wellington Fund’s Investor Shares returned 6.85% for the fiscal year ended November 30, 2011. Our performance trailed the 7.13% return of the composite index, which is weighted 65% in large-cap stocks and 35% in high-quality corporate bonds, but surpassed the 3.12% average return of mixed-asset target growth funds.
Investment environment
The fiscal period was extremely volatile in the capital markets as concern about the health of the global economy increased. While stock markets abroad declined, U.S. stocks gained 7.83%, as measured by the S&P 500 Index.
Investors’ risk appetite dropped later in the period as negative sentiment began to weigh more heavily upon market participants. The absence of decisive leadership regarding the U.S. debt ceiling unnerved markets, as did the deepening European debt crisis. In equities there was a flight to the perceived safety of consumer staples.
Bonds recorded positive total returns for the year, and we expect that credit markets will continue to perform well on the strength of corporate credit fundamentals. However, we remain vigilant toward risk factors that could alter our favorable outlook. The outcome
| Equity Portfolio Changes | |
| Fiscal Year Ended November 30, 2011 | |
| Additions | Comments |
| Microsoft | We increased our position in Microsoft, as we see an extremely |
| attractive risk-to-reward ratio at current valuations. The price of | |
| the stock suggests market participants do not have particularly | |
| high expectations, yet earnings growth at the company remains | |
| strong, driven in part by businesses’ cyclical computer upgrades. | |
| Cash-flow generation is solid and may be underappreciated by | |
| the market as well. In our view, the upside potential of this stock | |
| more than adequately compensates investors for the downside | |
| risks they bear. | |
| Walt Disney | We found a compelling entry point in terms of valuation and |
| initiated a position in Disney. We foresee strong earnings increases | |
| driven by accelerating revenue growth at ESPN, a theme-parks | |
| recovery, and a strong, long-term creative cycle driving studio and | |
| consumer products growth. | |
| Deletions | Comments |
| News Corporation | We sold News Corporation during the period. Our decision was |
| based upon concern about management’s ability to execute | |
| effectively and avoid distraction following the phone-hacking | |
| scandal. | |
| Marathon Oil | This large U.S. refining and oil exploration company announced it |
| would split refining and oil production into two companies, news | |
| that led to a significant rally in the stock. We sold our position as | |
| it reached our fair-value target. | |
8
of the current European crisis is unclear, and many other risks to bonds exist as well, including the threat of rising global inflation.
In a typical economic cycle, a prolonged period of slow growth would lead to underperformance by corporate bonds as a result of companies’ struggles with slower demand, higher inventories, and lower earnings. The current cycle has been different, however, because many businesses responded early and aggressively to the slowdown by cutting costs, including labor, to meet reduced demand. As a result, balance sheets and credit quality are in good shape, and the corporate bond sector, where we focus our fixed income investments, has held up well.
Our successes
Strong stock selection within the information technology sector aided the fund’s performance relative to its equity benchmark. Our energy stocks also did well, and our overweighting of the energy sector as a whole further supported relative returns. The holdings that contributed most to relative performance included Accenture, IBM, and Chevron. The portfolio also benefited by not holding shares of poorly performing Citigroup.
Accenture is a management consulting, technology services, and outsourcing company that operates globally. The stock was boosted by solid earnings results that outpaced consensus estimates, driven by a broad-based recovery in demand with faster bookings-to-revenue conversion and expectations for continued growth. IBM was our top contributor not only relative to the benchmark but on an absolute basis. The market responded favorably as the company showed signs of strong organic growth and used its robust free cash flow to repurchase shares. IBM is making steady progress toward its 2015 goal of doubling earnings.
Shares of Chevron also contributed to the portfolio’s overall gain. Compared with its peers, the company is well-positioned in terms of its leverage to oil and the depth and quality of its upstream production portfolio. Chevron has made prudent acreage purchases and has completed its downstream waste disposal and restructuring initiatives.
The fund’s fixed income portfolio beat its benchmark thanks to favorable sector allocation decisions and yield-curve flattening strategies. An underweight allocation to banking-sector bonds, as well as to sovereign and other foreign issuers, aided performance. Relative to the yield curve, our underweighting of bonds with durations of 2 to 3 years, combined with a similarly modest overweighting of bonds with 10- to 20-year durations, was beneficial. Long-term interest rates declined more than shorter-term rates during the period as investors sought yield and the Federal Reserve commenced its Operation Twist to push longer-maturity yields lower.
9
Our shortfalls
Although the fund’s bonds did their job of dampening the volatility caused by the equity markets, we were disappointed that the stock portfolio itself did not provide more protection in this environment of extreme fear. The fund’s equity portfolio finished behind the S&P 500 Index.
Stock selection within the consumer discretionary sector detracted from relative results, as did our overweighting of the financial sector.
An underweighting of the consumer staples sector also hindered performance. Many of the sector’s high-quality, defensively oriented stocks were already on the upper end of our valuation range, and we were therefore reluctant to increase our exposure to them. In our view, such stocks went from being fully valued to being overvalued during the period as market participants bid up shares perceived as relatively safe. We made a conscious decision not to chase these stocks as they rose, which restrained the portfolio’s return in this relatively brief period.
Among individual stock holdings, Staples, MetLife, and UBS were notable detractors from performance compared with the benchmark. Not owning Apple also hindered relative results.
Shares of Staples, a leading supplier of office products, have suffered as investors evaluate the potential impact of growing tablet usage on the market for office products. The company has also been hurt by stubbornly high unemployment among consumers and a lack of popular Apple products in its stores. We reduced our exposure to Staples during the period.
The stock of MetLife, a major life insurance and financial services company, fell along with shares of similar firms owing to concerns related to the European debt predicament. We took advantage of the decline to add to our MetLife position.
For UBS, poor trading results combined with a glaring $2.3 billion loss from a rogue trader sent shares lower. We trimmed our position as our patience for a turnaround of the company began to wear thin. In absolute terms, our largest single detractor was Bank of America. The company’s losses tied to Countrywide were greater than we expected, and we reduced our position as litigation risk escalated.
In the fixed income portfolio, security selection in the technology sector detracted from relative results. Our choice of bonds within the communications sector also hindered performance. An overweighting of bonds rated below A as a group was hurtful, though security selection within that group was strong.
The fund’s positioning
Looking forward, we see good valuations in many high-quality, defensively oriented stocks outside of the consumer staples sector. We have been buying when we find those attractive valuations accompanied by good balance sheets and
10
generous dividend yields. Ford, Dow Chemical, and Raytheon are a few examples.
Although financials were a key culprit in recent periods’ underperformance, we own high-quality financial services companies that are poised to take market share from their more troubled peers in this challenging environment. At the fiscal year-end, the fund’s equity portfolio was overweighted in the health care, financial, and energy sectors and underweighted in the information technology, consumer staples, and consumer discretionary sectors.
In comparison with our fixed income benchmark, the bond portfolio remains close to neutral with respect to overall duration, while we maintain our curve-
flattening positions. We remain largely invested in corporate bonds, but we also hold Treasuries, which tend to provide some degree of protection when the economy takes an unexpected turn for the worse. We also have a large out-of-benchmark position in agency mortgage-backed securities that offer attractive yields and superior liquidity relative to corporate bonds.
Edward P. Bousa, CFA,
Senior Vice President and Equity Portfolio Manager
John C. Keogh, Senior Vice President and Fixed Income Portfolio Manager
Wellington Management Company, llp
December 16, 2011
11
Wellington Fund
Fund Profile
As of November 30, 2011
| Share-Class Characteristics | ||
| Investor | Admiral | |
| Shares | Shares | |
| Ticker Symbol | VWELX | VWENX |
| Expense Ratio1 | 0.30% | 0.22% |
| 30-Day SEC Yield | 2.74% | 2.82% |
| Equity Characteristics | |||
| DJ | |||
| U.S. Total | |||
| S&P 500 | Market | ||
| Fund | Index | Index | |
| Number of Stocks | 99 | 500 | 3,745 |
| Median Market Cap | $61.2B | $49.9B | $30.9B |
| Price/Earnings Ratio | 12.4x | 13.9x | 14.9x |
| Price/Book Ratio | 1.7x | 2.1x | 2.1x |
| Return on Equity | 20.1% | 20.6% | 19.0% |
| Earnings Growth Rate | 4.1% | 7.3% | 7.2% |
| Dividend Yield | 2.9% | 2.2% | 2.0% |
| Foreign Holdings | 14.8% | 0.0% | 0.0% |
| Turnover Rate | 38% | — | — |
| Short-Term Reserves | 1.8% | — | — |
| Fixed Income Characteristics | |||
| Barclays | |||
| Credit | |||
| A or | Barclays | ||
| Better | Aggregate | ||
| Fund | Index | Bond Index | |
| Number of Bonds | 482 | 2,644 | 7,799 |
| Yield to Maturity | |||
| (before expenses) | 3.4% | 3.3% | 2.4% |
| Average Coupon | 4.6% | 4.7% | 4.0% |
| Average Duration | 5.9 years | 6.4 years | 5.0 years |
| Average Effective | |||
| Maturity | 9.5 years | 9.7 years | 7.2 years |
| Total Fund Volatility Measures | ||
| DJ | ||
| Wellington | U.S. Total | |
| Composite | Market | |
| Index | Index | |
| R-Squared | 0.98 | 0.93 |
| Beta | 0.96 | 0.62 |
These measures show the degree and timing of the fund’s fluctuations compared with the indexes over 36 months.
| Ten Largest Stocks (% of equity portfolio) | ||
| Exxon Mobil Corp. | Integrated Oil & | |
| Gas | 3.9% | |
| AT&T Inc. | Integrated | |
| Telecommunication | ||
| Services | 3.6 | |
| Chevron Corp. | Integrated Oil & | |
| Gas | 3.0 | |
| Pfizer Inc. | Pharmaceuticals | 2.7 |
| Wells Fargo & Co. | Diversified Banks | 2.6 |
| International Business | IT Consulting & | |
| Machines Corp. | Other Services | 2.6 |
| Microsoft Corp. | Systems Software | 2.5 |
| Merck & Co. Inc. | Pharmaceuticals | 2.2 |
| Eli Lilly & Co. | Pharmaceuticals | 1.8 |
| JPMorgan Chase & Co. | Diversified Financial | |
| Services | 1.8 | |
| Top Ten | 26.7% | |
| Top Ten as % of Total Net Assets | 17.7% | |
The holdings listed exclude any temporary cash investments and equity index products.
Fund Asset Allocation

1 The expense ratios shown are from the prospectus dated March 25, 2011, and represent estimated costs for the current fiscal year. For the fiscal year ended November 30, 2011, the expense ratios were 0.27% for Investor Shares and 0.19% for Admiral Shares.
12
Wellington Fund
| Sector Diversification (% of equity exposure) | |||
| DJ | |||
| U.S. Total | |||
| S&P 500 | Market | ||
| Fund | Index | Index | |
| Consumer | |||
| Discretionary | 8.4% | 10.6% | 11.6% |
| Consumer Staples | 8.5 | 11.4 | 9.9 |
| Energy | 14.3 | 12.5 | 11.6 |
| Financials | 15.9 | 13.4 | 14.7 |
| Health Care | 15.4 | 11.6 | 11.7 |
| Industrials | 11.1 | 10.7 | 11.0 |
| Information | |||
| Technology | 14.4 | 19.4 | 18.8 |
| Materials | 4.0 | 3.6 | 4.1 |
| Telecommunication | |||
| Services | 3.6 | 3.1 | 2.8 |
| Utilities | 4.4 | 3.7 | 3.8 |
| Sector Diversification (% of fixed income | |
| portfolio) | |
| Asset-Backed | 3.0% |
| Commercial Mortgage-Backed | 0.9 |
| Finance | 32.2 |
| Foreign | 2.9 |
| Government Mortgage-Backed | 10.2 |
| Industrial | 30.2 |
| Treasury/Agency | 5.6 |
| Utilities | 8.9 |
| Other | 6.1 |
The agency and mortgage-backed securities sectors may include issues from government-sponsored enterprises; such issues are not backed by the full faith and credit of the U.S. government.
| Distribution by Credit Quality (% of fixed | |
| income portfolio) | |
| U.S. Government | 16.5% |
| Aaa | 3.9 |
| Aa | 19.1 |
| A | 43.7 |
| Baa | 11.2 |
| Not Rated | 5.6 |
For information about these ratings, see the Glossary entry for Credit Quality.
Equity Investment Focus
Fixed Income Investment Focus

13
Wellington Fund
Performance Summary
All of the returns in this report represent past performance, which is not a guarantee of future results that may be achieved by the fund. (Current performance may be lower or higher than the performance data cited. For performance data current to the most recent month-end, visit our website at vanguard.com/performance.) Note, too, that both investment returns and principal value can fluctuate widely, so an investor’s shares, when sold, could be worth more or less than their original cost. The returns shown do not reflect taxes that a shareholder would pay on fund distributions or on the sale of fund shares.
Cumulative Performance: November 30, 2001, Through November 30, 2011
Initial Investment of $10,000

| Average Annual Total Returns | ||||
| Periods Ended November 30, 2011 | ||||
| Final Value | ||||
| One | Five | Ten | of a $10,000 | |
| Year | Years | Years | Investment | |
| Wellington Fund Investor Shares | 6.85% | 3.33% | 6.08% | $18,040 |
| Dow Jones U.S. Total Stock Market | ||||
| Index | 6.57 | 0.36 | 4.01 | 14,815 |
| Barclays Capital U.S. Aggregate Bond | ||||
| Index | 5.52 | 6.14 | 5.59 | 17,235 |
| Wellington Composite Index | 7.13 | 2.21 | 4.16 | 15,037 |
| Mixed-Asset Target Allocation Growth | ||||
| Funds Average | 3.12 | 0.72 | 3.40 | 13,977 |
Wellington Composite Index: 65% S&P 500 Index and 35% Lehman U.S. Long Credit AA or Better Bond Index through February 29, 2000; 65% S&P 500 Index and 35% Barclays Capital U.S. Credit A or Better Bond Index thereafter.
Mixed-Asset Target Allocation Growth Funds Average: Derived from data provided by Lipper Inc.
See Financial Highlights for dividend and capital gains information.
14
Wellington Fund
| Average Annual Total Returns | ||||
| Periods Ended November 30, 2011 | ||||
| Final Value | ||||
| One | Five | Ten | of a $50,000 | |
| Year | Years | Years | Investment | |
| Wellington Fund Admiral Shares | 6.94% | 3.43% | 6.20% | $91,213 |
| Dow Jones U.S. Total Stock Market Index | 6.57 | 0.36 | 4.01 | 74,073 |
| Barclays Capital U.S. Aggregate Bond | ||||
| Index | 5.52 | 6.14 | 5.59 | 86,173 |
| Wellington Composite Index | 7.13 | 2.21 | 4.16 | 75,187 |
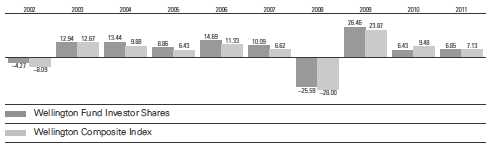
Fiscal-Year Total Returns (%): November 30, 2001, Through November 30, 2011
Average Annual Total Returns: Periods Ended September 30, 2011
This table presents returns through the latest calendar quarter—rather than through the end of the fiscal period.
Securities and Exchange Commission rules require that we provide this information.
| Ten Years | ||||||
| Inception Date | One Year | Five Years | Income | Capital | Total | |
| Investor Shares | 7/1/1929 | 1.48% | 2.93% | 3.27% | 2.77% | 6.04% |
| Admiral Shares | 5/14/2001 | 1.55 | 3.03 | 3.39 | 2.77 | 6.16 |
15
Wellington Fund
Financial Statements
Statement of Net Assets—Investments Summary
As of November 30, 2011
This Statement summarizes the fund’s holdings by asset type. Details are reported for each of the fund’s 50 largest individual holdings and for investments that, in total for any issuer, represent more than 1% of the fund’s net assets. The total value of smaller holdings is reported as a single amount within each category.
The fund reports a complete list of its holdings in regulatory filings four times in each fiscal year, at the quarter-ends. For the second and fourth fiscal quarters, the complete listing of the fund’s holdings is available electronically on vanguard.com and on the Securities and Exchange Commission’s website (sec.gov), or you can have it mailed to you without charge by calling 800-662-7447. For the first and third fiscal quarters, the fund files the lists with the SEC on Form N-Q. Shareholders can look up the fund’s Forms N-Q on the SEC’s website. Forms N-Q may also be reviewed and copied at the SEC’s Public Reference Room (see the back cover of this report for further information).
| Market | Percentage | ||
| Value | of Net | ||
| Shares | ($000) | Assets | |
| Common Stocks | |||
| Consumer Discretionary | |||
| Comcast Corp. Class A | 27,149,300 | 615,475 | 1.1% |
| Walt Disney Co. | 12,590,900 | 451,384 | 0.8% |
| Target Corp. | 7,545,500 | 397,648 | 0.7% |
| Consumer Discretionary—Other † | 1,549,210 | 2.9% | |
| 3,013,717 | 5.5% | ||
| Consumer Staples | |||
| Philip Morris International Inc. | 7,692,400 | 586,469 | 1.1% |
| Procter & Gamble Co. | 9,012,475 | 581,935 | 1.0% |
| PepsiCo Inc. | 8,677,400 | 555,354 | 1.0% |
| Consumer Staples—Other † | 1,333,056 | 2.4% | |
| 3,056,814 | 5.5% | ||
| Energy | |||
| Exxon Mobil Corp. | 17,623,864 | 1,417,664 | 2.6% |
| Chevron Corp. | 10,550,000 | 1,084,751 | 2.0% |
| Anadarko Petroleum Corp. | 7,737,300 | 628,810 | 1.1% |
| Occidental Petroleum Corp. | 3,765,100 | 372,368 | 0.7% |
| Total SA ADR | 6,944,300 | 359,298 | 0.6% |
| Baker Hughes Inc. | 5,891,100 | 321,713 | 0.6% |
| Energy—Other † | 965,134 | 1.8% | |
| 5,149,738 | 9.4% | ||
| Financials | |||
| Wells Fargo & Co. | 36,494,517 | 943,748 | 1.7% |
| JPMorgan Chase & Co. | 20,480,776 | 634,290 | 1.2% |
| ACE Ltd. | 6,664,800 | 463,404 | 0.8% |
| MetLife Inc. | 12,738,005 | 400,992 | 0.7% |
| PNC Financial Services Group Inc. | 7,302,800 | 395,885 | 0.7% |
| BlackRock Inc. | 1,839,100 | 316,399 | 0.6% |
| Goldman Sachs Group Inc. | 2,804,400 | 268,830 | 0.5% |
| Financials—Other † | 2,333,980 | 4.3% | |
| 5,757,528 | 10.5% |
16
Wellington Fund
| Market | Percentage | ||
| Value | of Net | ||
| Shares | ($000) | Assets | |
| Health Care | |||
| Pfizer Inc. | 47,834,641 | 960,041 | 1.8% |
| Merck & Co. Inc. | 22,072,152 | 789,080 | 1.4% |
| Eli Lilly & Co. | 17,194,900 | 650,827 | 1.2% |
| Johnson & Johnson | 9,263,200 | 599,514 | 1.1% |
| Medtronic Inc. | 13,432,900 | 489,361 | 0.9% |
| AstraZeneca plc ADR | 8,871,100 | 407,893 | 0.7% |
| Cardinal Health Inc. | 9,506,200 | 403,633 | 0.7% |
| Health Care—Other † | 1,239,343 | 2.3% | |
| 5,539,692 | 10.1% | ||
| Industrials | |||
| United Parcel Service Inc. Class B | 6,840,600 | 490,813 | 0.9% |
| General Electric Co. | 29,557,200 | 470,255 | 0.9% |
| Honeywell International Inc. | 7,313,400 | 396,021 | 0.7% |
| Deere & Co. | 4,739,100 | 375,574 | 0.7% |
| Waste Management Inc. | 10,935,400 | 342,278 | 0.6% |
| Siemens AG | 3,348,951 | 338,913 | 0.6% |
| FedEx Corp. | 3,907,100 | 324,602 | 0.6% |
| Industrials—Other † | 1,253,172 | 2.3% | |
| 3,991,628 | 7.3% | ||
| Information Technology | |||
| International Business Machines Corp. | 4,899,100 | 921,031 | 1.7% |
| Microsoft Corp. | 35,481,900 | 907,627 | 1.7% |
| Texas Instruments Inc. | 16,303,200 | 490,726 | 0.9% |
| Intel Corp. | 19,606,800 | 488,406 | 0.9% |
| Oracle Corp. | 12,583,600 | 394,496 | 0.7% |
| Cisco Systems Inc. | 21,003,400 | 391,503 | 0.7% |
| Automatic Data Processing Inc. | 7,086,500 | 362,049 | 0.7% |
| * eBay Inc. | 11,800,300 | 349,171 | 0.6% |
| Qualcomm Inc. | 6,017,800 | 329,776 | 0.6% |
| Information Technology—Other † | 561,872 | 1.0% | |
| 5,196,657 | 9.5% | ||
| Materials | |||
| Dow Chemical Co. | 15,528,400 | 430,292 | 0.8% |
| Air Products & Chemicals Inc. | 4,008,200 | 335,687 | 0.6% |
| Materials—Other † | 659,013 | 1.2% | |
| 1,424,992 | 2.6% | ||
| Telecommunication Services | |||
| AT&T Inc. | 45,247,785 | 1,311,281 | 2.4% |
| Utilities | |||
| Dominion Resources Inc. | 9,253,100 | 477,645 | 0.9% |
| NextEra Energy Inc. | 7,752,300 | 429,787 | 0.8% |
| Exelon Corp. | 7,822,674 | 346,623 | 0.6% |
| PG&E Corp. | 8,342,600 | 324,027 | 0.6% |
| 1,578,082 | 2.9% | ||
| Total Common Stocks (Cost $30,059,264) | 36,020,129 | 65.7% | |
17
Wellington Fund
| Face | Market | Percentage | ||||
| Maturity | Amount | Value | of Net | |||
| Coupon | Date | ($000) | ($000) | Assets | ||
| U.S. Government and Agency Obligations | ||||||
| U.S. Government Securities | ||||||
| United States Treasury | ||||||
| Note/Bond | 1.500% | 6/30/16 | 675,700 | 695,126 | 1.2% | |
| United States Treasury | ||||||
| Note/Bond | 0.125%–4.375% | 9/30/13–5/15/41 | 243,000 | 270,653 | 0.5% | |
| 965,779 | 1.7% | |||||
| Agency Notes † | 13,740 | 0.0% | ||||
| Conventional Mortgage-Backed Securities | ||||||
| 1,2,3 Freddie Mac Gold Pool | 3.500%–4.000% | 8/1/13–11/1/41 | 1,725,692 | 1,787,048 | 3.3% | |
| Conventional | ||||||
| Mortgage-Backed | ||||||
| Securities—Other † | 8,109 | 0.0% | ||||
| 1,795,157 | 3.3% | |||||
| Nonconventional Mortgage-Backed Securities | ||||||
| 1,2 | Freddie Mac REMICS | 3.500%–4.000% | 12/15/30-4/15/31 | 114,446 | 121,626 | 0.2% |
| Nonconventional | ||||||
| Mortgage-Backed | ||||||
| Securities—Other † | 29,694 | 0.1% | ||||
| 151,320 | 0.3% | |||||
| Total U.S. Government and Agency Obligations (Cost $2,814,476) | 2,925,996 | 5.3% | ||||
| Asset-Backed/Commercial Mortgage-Backed Securities | ||||||
| 2 | GE Capital Commercial | |||||
| Mortgage Corp. | 5.145% | 7/10/37 | 15,640 | 16,282 | 0.0% | |
| 2 | GE Capital Credit Card Master | |||||
| Note Trust | 3.800% | 11/15/17 | 32,000 | 34,201 | 0.1% | |
| 4 | Asset-Backed/Commercial | |||||
| Mortgage-Backed | ||||||
| Securities—Other † | 478,165 | 0.9% | ||||
| Total Asset-Backed/Commercial Mortgage-Backed Securities (Cost $525,335) | 528,648 | 1.0% | ||||
| Corporate Bonds | ||||||
| Finance | ||||||
| Banking | ||||||
| Bear Stearns Cos. LLC | 6.400%–7.250% | 10/2/17–2/1/18 | 25,150 | 28,292 | 0.1% | |
| Golden West Financial Corp. | 4.750% | 10/1/12 | 10,000 | 10,311 | 0.0% | |
| Goldman Sachs Group Inc. | 3.625%–6.750% | 5/1/14–2/1/41 | 348,091 | 332,313 | 0.6% | |
| 2 | JPMorgan Chase & Co. | 4.950%–7.900% | 9/15/14–12/29/49 | 339,861 | 357,500 | 0.6% |
| Wachovia Bank NA | 6.600% | 1/15/38 | 60,000 | 64,574 | 0.1% | |
| Wachovia Corp. | 5.250%–5.500% | 5/1/13–8/1/14 | 37,900 | 40,035 | 0.1% | |
| Wells Fargo & Co. | 3.625%–5.625% | 9/1/12–12/11/17 | 180,350 | 190,328 | 0.3% | |
| 4 | Banking—Other † | 3,024,412 | 5.5% | |||
| Brokerage † | 28,321 | 0.1% | ||||
| Finance Companies | ||||||
| General Electric | ||||||
| Capital Corp. | 2.950%–6.750% | 1/15/13–8/7/37 | 312,235 | 319,919 | 0.6% | |
| 4 | Finance Companies— | |||||
| Other † | 6,827 | 0.0% | ||||
18
Wellington Fund
| Face | Market | Percentage | |||
| Maturity | Amount | Value | of Net | ||
| Coupon | Date | ($000) | ($000) | Assets | |
| Insurance | |||||
| ACE Capital Trust II | 9.700% | 4/1/30 | 20,000 | 26,400 | 0.1% |
| ACE INA Holdings Inc. | 2.600%–5.800% | 11/23/15–3/15/18 | 51,360 | 57,214 | 0.1% |
| 4 Insurance—Other † | 845,127 | 1.5% | |||
| Other Finance † | 54,736 | 0.1% | |||
| 4 Real Estate Investment Trusts † | 272,711 | 0.5% | |||
| 5,659,020 | 10.3% | ||||
| Industrial | |||||
| 4 Basic Industry † | 181,011 | 0.3% | |||
| Capital Goods | |||||
| General Electric Co. | 5.250% | 12/6/17 | 41,685 | 46,897 | 0.1% |
| 4 Capital Goods—Other † | 446,160 | 0.8% | |||
| Communication | |||||
| AT&T Inc. | 2.950%–6.800% | 9/15/14–9/1/37 | 211,910 | 239,502 | 0.4% |
| BellSouth Corp. | 5.200%–6.550% | 9/15/14–11/15/34 | 64,220 | 72,174 | 0.1% |
| BellSouth | |||||
| Telecommunications Inc. | 7.000% | 12/1/95 | 27,600 | 32,452 | 0.1% |
| Comcast Corp. | 5.700% | 5/15/18 | 20,000 | 22,670 | 0.0% |
| NBCUniversal Media LLC | 4.375% | 4/1/21 | 23,900 | 24,354 | 0.1% |
| Communication—Other † | 697,898 | 1.3% | |||
| 4 Consumer Cyclical † | 839,947 | 1.6% | |||
| Consumer Noncyclical | |||||
| Johnson & Johnson | 2.150%–5.150% | 5/15/16–7/15/18 | 55,800 | 60,144 | 0.1% |
| Merck & Co. Inc. | 6.550% | 9/15/37 | 10,000 | 13,529 | 0.0% |
| Pepsi Bottling Group Inc. | 7.000% | 3/1/29 | 10,000 | 13,745 | 0.0% |
| PepsiCo Inc. | 3.100% | 1/15/15 | 38,800 | 41,009 | 0.1% |
| Pfizer Inc. | 5.350% | 3/15/15 | 33,000 | 37,367 | 0.1% |
| Philip Morris | |||||
| International Inc. | 4.125%–4.500% | 3/26/20–5/17/21 | 51,275 | 55,490 | 0.1% |
| 2 Procter & Gamble - Esop | 9.360% | 1/1/21 | 47,717 | 63,779 | 0.1% |
| Wyeth | 5.950% | 4/1/37 | 25,000 | 30,371 | 0.1% |
| 4 Consumer Noncyclical—Other † | 1,235,915 | 2.2% | |||
| 4 Energy † | 398,462 | 0.7% | |||
| 4 Other Industrial † | 52,490 | 0.1% | |||
| Technology | |||||
| International Business | |||||
| Machines Corp. | 1.950%–8.375% | 1/5/16–11/29/32 | 113,611 | 130,430 | 0.3% |
| Microsoft Corp. | 4.000% | 2/8/21 | 16,000 | 17,711 | 0.0% |
| Technology—Other † | 311,957 | 0.6% | |||
| 4 Transportation † | 234,246 | 0.4% | |||
| 5,299,710 | 9.7% | ||||
| Utilities | |||||
| Electric | |||||
| Florida Power & Light Co. | 4.950%–5.950% | 2/1/35–2/1/38 | 104,215 | 130,046 | 0.2% |
| 4 Electric—Other † | 1,154,810 | 2.1% | |||
| 4 Natural Gas † | 227,915 | 0.4% | |||
| Other Utility † | 43,438 | 0.1% | |||
| 1,556,209 | 2.8% | ||||
| Total Corporate Bonds (Cost $11,683,138) | 12,514,939 | 22.8% | |||
| 4Sovereign Bonds (U.S. Dollar-Denominated) (Cost $ 455,817) † | 504,139 | 0.9% | |||
| 4Taxable Municipal Bonds (Cost $ 919,633) † | 1,069,887 | 2.0% | |||
19
Wellington Fund
| Market | Percentage | ||||
| Maturity | Value | of Net | |||
| Coupon | Date | Shares | ($000) | Assets | |
| Temporary Cash Investments | |||||
| Money Market Fund | |||||
| 5,6 Vanguard Market Liquidity Fund | 0.135% | 16,328,400 | 16,328 | 0.0% | |
| Face | |||||
| Amount | |||||
| ($000) | |||||
| Repurchase Agreements | |||||
| Bank of America Securities, LLC | |||||
| (Dated 11/30/11, Repurchase | |||||
| Value $62,200,000, collateralized | |||||
| by Federal National Mortgage | |||||
| Assn. 3.500%–4.000%, | |||||
| 2/1/41–3/1/41) | 0.130% | 12/1/11 | 62,200 | 62,200 | 0.1% |
| Deutsche Bank Securities, Inc. | |||||
| (Dated 11/30/11, Repurchase | |||||
| Value $80,100,000, collateralized | |||||
| by Federal National Mortgage | |||||
| Assn. 5.000%–7.000%, | |||||
| 4/1/38–10/1/38) | 0.140% | 12/1/11 | 80,100 | 80,100 | 0.2% |
| HSBC Bank USA | |||||
| (Dated 11/30/11, Repurchase | |||||
| Value $437,502,000, collateralized | |||||
| by Federal Home Loan Mortgage | |||||
| Corp. 3.500%–7.500%, | |||||
| 4/1/16–12/1/41) | 0.140% | 12/1/11 | 437,500 | 437,500 | 0.8% |
| RBS Securities, Inc. | |||||
| (Dated 11/30/11, Repurchase | |||||
| Value $402,202,000, collateralized | |||||
| by Government National Mortgage | |||||
| Assn. 1.700%–6.000%, | |||||
| 5/20/37–10/20/61) | 0.140% | 12/1/11 | 402,200 | 402,200 | 0.7% |
| TD Bank Group | |||||
| (Dated 11/30/11, Repurchase | |||||
| Value $25,000,000, collateralized | |||||
| by U.S. Treasury Note 0.125%, | |||||
| 9/30/13) | 0.140% | 12/1/11 | 25,000 | 25,000 | 0.1% |
| 1,007,000 | 1.9% | ||||
| Total Temporary Cash Investments (Cost $1,023,328) | 1,023,328 | 1.9% | |||
| ^Total Investments (Cost $47,480,991) | 54,587,066 | 99.6% | |||
| Other Assets and Liabilities | |||||
| Other Assets7 | 524,987 | 1.0% | |||
| Liabilities6 | (321,998) | (0.6%) | |||
| 202,989 | 0.4% | ||||
| Net Assets | 54,790,055 | 100.0% | |||
20
Wellington Fund
| At November 30, 2011, net assets consisted of: | |
| Amount | |
| ($000) | |
| Paid-in Capital | 47,531,783 |
| Undistributed Net Investment Income | 244,473 |
| Accumulated Net Realized Losses | (92,853) |
| Unrealized Appreciation (Depreciation) | |
| Investment Securities | 7,106,075 |
| Futures Contracts | 595 |
| Foreign Currencies | (18) |
| Net Assets | 54,790,055 |
| Investor Shares—Net Assets | |
| Applicable to 828,346,336 outstanding $.001 par value shares of | |
| beneficial interest (unlimited authorization) | 25,742,544 |
| Net Asset Value Per Share—Investor Shares | $31.08 |
| Admiral Shares—Net Assets | |
| Applicable to 541,135,621 outstanding $.001 par value shares of | |
| beneficial interest (unlimited authorization) | 29,047,511 |
| Net Asset Value Per Share—Admiral Shares | $53.68 |
See Note A in Notes to Financial Statements.
* Non-income-producing security.
^ The total value of securities on loan is $15,729,000.
† Represents the aggregate value, by category, of securities that are not among the 50 largest holdings and, in total for any issuer, represent 1% or less of net assets.
1 The issuer is under federal conservatorship and is dependent upon the continued support of the U.S. Treasury to avoid receivership.
2 The average or expected maturity is shorter than the final maturity shown because of the possibility of interim principal payments and prepayments or the possibility of the issue being called.
3 Includes securities purchased on a when-issued or delayed-delivery basis for which the fund has not taken delivery as of November 30, 2011.
4 Certain of the fund’s securities are exempt from registration under Rule 144A of the Securities Act of 1933. Such securities may be sold in transactions exempt from registration, normally to qualified institutional buyers. At November 30, 2011, the aggregate value of these securities was $2,173,538,000, representing 4.0% of net assets.
5 Affiliated money market fund available only to Vanguard funds and certain trusts and accounts managed by Vanguard. Rate shown is the 7-day yield.
6 Includes $16,328,000 of collateral received for securities on loan.
7 Cash of $3,320,000 has been segregated as initial margin for open futures contracts.
ADR—American Depositary Receipt.
See accompanying Notes, which are an integral part of the Financial Statements.
21
Wellington Fund
| Statement of Operations | |
| Year Ended | |
| November 30, 2011 | |
| ($000) | |
| Investment Income | |
| Income | |
| Dividends1 | 972,222 |
| Interest | 798,893 |
| Security Lending | 11,127 |
| Total Income | 1,782,242 |
| Expenses | |
| Investment Advisory Fees—Note B | |
| Basic Fee | 38,030 |
| Performance Adjustment | 1,383 |
| The Vanguard Group—Note C | |
| Management and Administrative—Investor Shares | 46,430 |
| Management and Administrative—Admiral Shares | 27,866 |
| Marketing and Distribution—Investor Shares | 6,430 |
| Marketing and Distribution—Admiral Shares | 5,632 |
| Custodian Fees | 490 |
| Auditing Fees | 33 |
| Shareholders’ Reports—Investor Shares | 421 |
| Shareholders’ Reports—Admiral Shares | 123 |
| Trustees’ Fees and Expenses | 112 |
| Total Expenses | 126,950 |
| Net Investment Income | 1,655,292 |
| Realized Net Gain (Loss) | |
| Investment Securities Sold | 2,001,204 |
| Futures Contracts | (42,709) |
| Swap Contracts | 4,408 |
| Foreign Currencies | (1,029) |
| Realized Net Gain (Loss) | 1,961,874 |
| Change in Unrealized Appreciation (Depreciation) | |
| Investment Securities | (109,902) |
| Futures Contracts | 595 |
| Foreign Currencies | (6) |
| Change in Unrealized Appreciation (Depreciation) | (109,313) |
| Net Increase (Decrease) in Net Assets Resulting from Operations | 3,507,853 |
| 1 Dividends are net of foreign withholding taxes of $18,045,000. | |
See accompanying Notes, which are an integral part of the Financial Statements.
22
Wellington Fund
| Statement of Changes in Net Assets | ||
| Year Ended November 30, | ||
| 2011 | 2010 | |
| ($000) | ($000) | |
| Increase (Decrease) in Net Assets | ||
| Operations | ||
| Net Investment Income | 1,655,292 | 1,482,026 |
| Realized Net Gain (Loss) | 1,961,874 | 857,687 |
| Change in Unrealized Appreciation (Depreciation) | (109,313) | 731,677 |
| Net Increase (Decrease) in Net Assets Resulting from Operations | 3,507,853 | 3,071,390 |
| Distributions | ||
| Net Investment Income | ||
| Investor Shares | (772,854) | (859,061) |
| Admiral Shares | (834,384) | (629,966) |
| Realized Capital Gain | ||
| Investor Shares | — | — |
| Admiral Shares | — | — |
| Total Distributions | (1,607,238) | (1,489,027) |
| Capital Share Transactions | ||
| Investor Shares | (1,962,619) | (2,346,300) |
| Admiral Shares | 3,512,544 | 4,778,476 |
| Net Increase (Decrease) from Capital Share Transactions | 1,549,925 | 2,432,176 |
| Total Increase (Decrease) | 3,450,540 | 4,014,539 |
| Net Assets | ||
| Beginning of Period | 51,339,515 | 47,324,976 |
| End of Period1 | 54,790,055 | 51,339,515 |
| 1 Net Assets—End of Period includes undistributed net investment income of $244,473,000 and $194,785,000. | ||
See accompanying Notes, which are an integral part of the Financial Statements.
23
Wellington Fund
Financial Highlights
| Investor Shares | |||||
| For a Share Outstanding | Year Ended November 30, | ||||
| Throughout Each Period | 2011 | 2010 | 2009 | 2008 | 2007 |
| Net Asset Value, Beginning of Period | $29.94 | $28.99 | $23.79 | $34.56 | $33.76 |
| Investment Operations | |||||
| Net Investment Income | .929 | .868 | .909 | 1.037 | 1.059 |
| Net Realized and Unrealized Gain (Loss) | |||||
| on Investments | 1.115 | .960 | 5.217 | (9.289) | 2.172 |
| Total from Investment Operations | 2.044 | 1.828 | 6.126 | (8.252) | 3.231 |
| Distributions | |||||
| Dividends from Net Investment Income | (.904) | (.878) | (.926) | (1.094) | (1.030) |
| Distributions from Realized Capital Gains | — | — | — | (1.424) | (1.401) |
| Total Distributions | (.904) | (.878) | (.926) | (2.518) | (2.431) |
| Net Asset Value, End of Period | $31.08 | $29.94 | $28.99 | $23.79 | $34.56 |
| Total Return1 | 6.85% | 6.43% | 26.46% | -25.59% | 10.09% |
| Ratios/Supplemental Data | |||||
| Net Assets, End of Period (Millions) | $25,743 | $26,717 | $28,114 | $22,486 | $31,451 |
| Ratio of Total Expenses to | |||||
| Average Net Assets2 | 0.27% | 0.30% | 0.34% | 0.29% | 0.27% |
| Ratio of Net Investment Income to | |||||
| Average Net Assets | 2.95% | 2.97% | 3.59% | 3.44% | 3.14% |
| Portfolio Turnover Rate | 38%3 | 35% | 28% | 30% | 23% |
1 Total returns do not include account service fees that may have applied in the periods shown. Fund prospectuses provide information about any applicable account service fees.
2 Includes performance-based investment advisory fee increases (decreases) of 0.00%, 0.01%, 0.02%, 0.01%, and 0.01%.
3 Includes 9% that is attributable to mortgage-dollar-roll activity.
See accompanying Notes, which are an integral part of the Financial Statements.
24
Wellington Fund
Financial Highlights
| Admiral Shares | |||||
| For a Share Outstanding | Year Ended November 30, | ||||
| Throughout Each Period | 2011 | 2010 | 2009 | 2008 | 2007 |
| Net Asset Value, Beginning of Period | $51.71 | $50.07 | $41.10 | $59.71 | $58.32 |
| Investment Operations | |||||
| Net Investment Income | 1.645 | 1.542 | 1.619 | 1.848 | 1.894 |
| Net Realized and Unrealized Gain (Loss) | |||||
| on Investments | 1.930 | 1.658 | 8.999 | (16.048) | 3.762 |
| Total from Investment Operations | 3.575 | 3.200 | 10.618 | (14.200) | 5.656 |
| Distributions | |||||
| Dividends from Net Investment Income | (1.605) | (1.560) | (1.648) | (1.950) | (1.847) |
| Distributions from Realized Capital Gains | — | — | — | (2.460) | (2.419) |
| Total Distributions | (1.605) | (1.560) | (1.648) | (4.410) | (4.266) |
| Net Asset Value, End of Period | $53.68 | $51.71 | $50.07 | $41.10 | $59.71 |
| Total Return | 6.94% | 6.52% | 26.57% | -25.52% | 10.23% |
| Ratios/Supplemental Data | |||||
| Net Assets, End of Period (Millions) | $29,048 | $24,623 | $19,211 | $14,696 | $19,323 |
| Ratio of Total Expenses to | |||||
| Average Net Assets1 | 0.19% | 0.22% | 0.23% | 0.18% | 0.16% |
| Ratio of Net Investment Income to | |||||
| Average Net Assets | 3.03% | 3.05% | 3.70% | 3.55% | 3.25% |
| Portfolio Turnover Rate | 38%2 | 35% | 28% | 30% | 23% |
1 Includes performance-based investment advisory fee increases (decreases) of 0.00%, 0.01%, 0.02%, 0.01%, and 0.01%.
2 Includes 9% that is attributable to mortgage-dollar-roll activity.
See accompanying Notes, which are an integral part of the Financial Statements.
25
Wellington Fund
Notes to Financial Statements
Vanguard Wellington Fund is registered under the Investment Company Act of 1940 as an open-end investment company, or mutual fund. Certain of the fund’s investments are in corporate debt instruments; the issuers’ abilities to meet their obligations may be affected by economic developments in their respective industries. The fund offers two classes of shares: Investor Shares and Admiral Shares. Investor Shares are available to any investor who meets the fund’s minimum purchase requirements. Admiral Shares are designed for investors who meet certain administrative, service, and account-size criteria.
A. The following significant accounting policies conform to generally accepted accounting principles for U.S. mutual funds. The fund consistently follows such policies in preparing its financial statements.
1. Security Valuation: Securities are valued as of the close of trading on the New York Stock Exchange (generally 4 p.m., Eastern time) on the valuation date. Equity securities are valued at the latest quoted sales prices or official closing prices taken from the primary market in which each security trades; such securities not traded on the valuation date are valued at the mean of the latest quoted bid and asked prices. Bonds, and temporary cash investments acquired over 60 days to maturity, are valued using the latest bid prices or using valuations based on a matrix system (which considers such factors as security prices, yields, maturities, and ratings), both as furnished by independent pricing services. Investments in Vanguard Market Liquidity Fund are valued at that fund’s net asset value. Other temporary cash investments are valued at amortized cost, which approximates market value. Securities for which market quotations are not readily available, or whose values have been affected by events occurring before the fund’s pricing time but after the close of the securities’ primary markets, are valued at their fair values calculated according to procedures adopted by the board of trustees. These procedures include obtaining quotations from an independent pricing service, monitoring news to identify significant market- or security-specific events, and evaluating changes in the values of foreign market proxies (for example, ADRs, futures contracts, or exchange-traded funds), between the time the foreign markets close and the fund’s pricing time. When fair-value pricing is employed, the prices of securities used by a fund to calculate its net asset value may differ from quoted or published prices for the same securities.
2. Foreign Currency: Securities and other assets and liabilities denominated in foreign currencies are translated into U.S. dollars using exchange rates obtained from an independent third party as of the fund’s pricing time on the valuation date. Realized gains (losses) and unrealized appreciation (depreciation) on investment securities include the effects of changes in exchange rates since the securities were purchased, combined with the effects of changes in security prices. Fluctuations in the value of other assets and liabilities resulting from changes in exchange rates are recorded as unrealized foreign currency gains (losses) until the assets or liabilities are settled in cash, at which time they are recorded as realized foreign currency gains (losses).
3. Futures Contracts: The fund uses futures contracts to invest in fixed income asset classes with greater efficiency and lower cost than is possible through direct investment, to add value when these instruments are attractively priced, or to adjust sensitivity to changes in interest rates. The primary risks associated with the use of futures contracts are imperfect correlation between changes in market values of bonds held by the fund and the prices of futures contracts, and the possibility of an illiquid market.
26
Wellington Fund
Futures contracts are valued based upon their quoted daily settlement prices. The aggregate principal amounts of the contracts are not recorded in the Statement of Net Assets. Fluctuations in the value of the contracts are recorded in the Statement of Net Assets as an asset (liability) and in the Statement of Operations as unrealized appreciation (depreciation) until the contracts are closed, when they are recorded as realized futures gains (losses).
4. Swap Contracts: The fund may invest in credit default swaps to adjust the overall credit risk of the fund or to actively overweight or underweight credit risk to a specific issuer or group of issuers. The fund has sold credit protection through credit default swaps to simulate investments in long positions that are either unavailable or considered to be less attractively priced in the bond market. The fund has also purchased credit protection through credit default swaps to reduce credit exposure to a given issuer or issuers. Under the terms of the swaps, an up-front payment may be exchanged between the seller and buyer. In addition, the seller of the credit protection receives a periodic payment of premium from the buyer that is a fixed percentage applied to a notional principal amount. If, for example, the reference entity is subject to a credit event (such as bankruptcy, failure to pay, or obligation acceleration) during the term of the swap, the seller agrees to either physically settle or cash settle the swap contract. If the swap is physically settled, the seller agrees to pay the buyer an amount equal to the notional amount and take delivery of a debt instrument of the reference issuer with a par amount equal to such notional amount. If the swap is cash-settled, the seller agrees to pay the buyer the difference between the notional amount and the final price for the relevant debt instrument, as determined either in a market auction or pursuant to a pre-agreed-upon valuation procedure.
The notional amounts of swap contracts are not recorded in the Statement of Net Assets. Swaps are valued daily based on market quotations received from independent pricing services or recognized dealers and the change in value is recorded as unrealized appreciation (depreciation) until the seller of credit protection is required to take delivery (or, in a cash-settled swap, pay the settlement amount determined) upon occurrence of a credit event, periodic payments are made, or the swap terminates, at which time realized gain (loss) is recorded. The net premium to be received or paid by the fund under swap contracts is accrued daily and recorded as realized gain (loss) over the life of the contract.
The primary risk associated with selling credit protection is that, upon the occurrence of a defined credit event, the market value of the debt instrument received by the fund (or, in a cash-settled swap, the debt instruments used to determine the settlement payment by the fund) will be significantly less than the amount paid by the fund and, in a physically settled swap, the fund may receive an illiquid debt instrument. A risk for all types of swaps is that a counterparty will default on its obligation to pay net amounts due to the fund. The fund’s maximum risk of loss from counterparty credit risk is the amount of unrealized appreciation on the swap contract. This risk is mitigated by entering into swaps only with highly rated counterparties, by a master netting arrangement between the fund and the counterparty, and by the posting of collateral by the counterparty. The swap contracts contain provisions whereby a counterparty may terminate open contracts if the fund’s net assets decline below a certain level, triggering a payment by the fund if the fund is in a net liability position at the time of the termination. The payment amount would be reduced by any collateral the fund has posted. Any securities posted as collateral for open contracts are noted in the Statement of Net Assets.
The fund had no open swap contacts at November 30, 2011.
27
Wellington Fund
5. To Be Announced (TBA) Transactions: A TBA transaction is an agreement to buy or sell mortgage-backed securities with agreed-upon characteristics (face amount, coupon, maturity) for settlement at a future date. The fund may enter into TBA sells to reduce its exposure to the mortgage-backed securities market or in order to dispose of mortgage-backed securities it owns under delayed-delivery arrangements. For TBA purchases, the fund maintains cash or short-term investments until settlement date in an amount sufficient to meet the purchase price.
6. Mortgage Dollar Rolls: The fund enters into mortgage-dollar-roll transactions, in which the fund sells mortgage-backed securities to a dealer and simultaneously agrees to purchase similar securities in the future at a predetermined price. The proceeds of the securities sold in mortgage-dollar-roll transactions are typically invested in high-quality short-term fixed income securities. The fund forgoes principal and interest paid on the securities sold, and is compensated by interest earned on the proceeds of the sale and by a lower price on the securities to be repurchased. The fund has also entered into mortgage-dollar-roll transactions in which the fund buys mortgage-backed securities from a dealer pursuant to a TBA transaction and simultaneously agrees to sell similar securities in the future at a predetermined price. The securities bought in mortgage-dollar-roll transactions are used to cover an open TBA sell position. The fund continues to earn interest on mortgage-backed security pools already held and receives a lower price on the securities to be sold in the future. The fund accounts for mortgage-dollar-roll transactions as purchases and sales; as such, these transactions may increase the fund’s portfolio turnover rate. Amounts to be received or paid in connection with open mortgage dollar rolls are included in Receivables for Investment Securities Sold (Other Assets) or Payables for Investment Securities Purchased (Liabilities) in the Statement of Net Assets. The primary risk associated with mortgage dollar rolls is that a counterparty will default on its obligations. This risk is mitigated by entering into mortgage dollar rolls only with highly rated counterparties, allocating transactions among numerous counterparties, and monitoring exposure to each counterparty.
In April 2011, the Financial Accounting Standards Board adopted Accounting Standards Update (ASU) 2011-03, “Transfers and Servicing (Topic 860)—Reconsideration of Effective Control for Repurchase Agreements.” The ASU takes effect for periods beginning after December 15, 2011. Under the ASU, certain mortgage-dollar-roll transactions that previously would have been accounted for as purchases and sales may be accounted for as financing transactions. Treating these transactions as financing would have no impact on total return, but certain transactions that previously resulted in realized gains and losses would instead be reflected in net income and unrealized gains and losses. Management has concluded that purchase and sale treatment continues to be appropriate for the mortgage-dollar-roll arrangements entered into by the fund.
7. Repurchase Agreements: The fund may enter into repurchase agreements. Securities pledged as collateral for repurchase agreements are held by a custodian bank until the agreements mature. Each agreement requires that the market value of the collateral be sufficient to cover payments of interest and principal. In the event of default or bankruptcy by the other party to the agreement, the fund may sell or retain the collateral; however, such action may be subject to legal proceedings.
8. Federal Income Taxes: The fund intends to continue to qualify as a regulated investment company and distribute all of its taxable income. Management has analyzed the fund’s tax positions taken for all open federal income tax years (November 30, 2008–2011), and has concluded that no provision for federal income tax is required in the fund’s financial statements.
9. Distributions: Distributions to shareholders are recorded on the ex-dividend date.
28
Wellington Fund
10. Security Lending: The fund may lend its securities to qualified institutional borrowers to earn additional income. Security loans are required to be secured at all times by collateral at least equal to the market value of securities loaned. The fund invests cash collateral received in Vanguard Market Liquidity Fund, and records a liability for the return of the collateral, during the period the securities are on loan. Security lending income represents fees charged to borrowers plus income earned on investing cash collateral, less expenses associated with the loan.
11. Other: Dividend income is recorded on the ex-dividend date. Interest income is accrued daily. Premiums and discounts on debt securities purchased are amortized and accreted, respectively, to interest income over the lives of the respective securities. Security transactions are accounted for on the date securities are bought or sold. Costs used to determine realized gains (losses) on the sale of investment securities are those of the specific securities sold.
Each class of shares has equal rights as to assets and earnings, except that each class separately bears certain class-specific expenses related to maintenance of shareholder accounts (included in Management and Administrative expenses) and shareholder reporting. Marketing and distribution expenses are allocated to each class of shares based on a method approved by the board of trustees. Income, other non-class-specific expenses, and gains and losses on investments are allocated to each class of shares based on its relative net assets.
B. Wellington Management Company, LLP, provides investment advisory services to the fund for a fee calculated at an annual percentage rate of average net assets. The basic fee is subject to quarterly adjustments based on the fund’s performance for the preceding three years relative to the combined index comprising the S&P 500 Index and the Barclays Capital U.S. Credit A or Better Bond Index. For the year ended November 30, 2011, the investment advisory fee represented an effective annual basic rate of 0.07% of the fund’s average net assets before an increase of $1,383,000 (0.00%) based on performance.
C. The Vanguard Group furnishes at cost corporate management, administrative, marketing, and distribution services. The costs of such services are allocated to the fund under methods approved by the board of trustees. The fund has committed to provide up to 0.40% of its net assets in capital contributions to Vanguard. At November 30, 2011, the fund had contributed capital of $8,964,000 to Vanguard (included in Other Assets), representing 0.02% of the fund’s net assets and 3.59% of Vanguard’s capitalization. The fund’s trustees and officers are also directors and officers of Vanguard.
D. Various inputs may be used to determine the value of the fund’s investments. These inputs are summarized in three broad levels for financial statement purposes. The inputs or methodologies used to value securities are not necessarily an indication of the risk associated with investing in those securities.
Level 1—Quoted prices in active markets for identical securities.
Level 2—Other significant observable inputs (including quoted prices for similar securities, interest rates, prepayment speeds, credit risk, etc.).
Level 3—Significant unobservable inputs (including the fund’s own assumptions used to determine the fair value of investments).
29
Wellington Fund
The following table summarizes the market value of the fund’s investments as of November 30, 2011, based on the inputs used to value them:
| Level 1 | Level 2 | Level 3 | |
| Investments | ($000) | ($000) | ($000) |
| Common Stocks | 34,028,702 | 1,991,427 | — |
| U.S. Government and Agency Obligations | — | 2,925,996 | — |
| Asset-Backed/Commercial Mortgage-Backed Securities | — | 528,648 | — |
| Corporate Bonds | — | 12,514,939 | — |
| Sovereign Bonds | — | 504,139 | — |
| Taxable Municipal Bonds | — | 1,069,887 | — |
| Temporary Cash Investments | 16,328 | 1,007,000 | — |
| Futures Contracts—Assets1 | 811 | — | — |
| Total | 34,045,841 | 20,542,036 | — |
| 1 Represents variation margin on the last day of the reporting period. |
E. Realized net gain (loss) on derivatives for the year ended November 30, 2011, were:
| Interest Rate | Credit | ||
| Contracts | Contracts | Total | |
| Realized Net Gain (Loss) on Derivatives | ($000) | ($000) | ($000) |
| Futures Contracts | (42,709) | — | (42,709) |
| Swap Contracts | — | 4,408 | 4,408 |
| Realized Net Gain (Loss) on Derivatives | (42,709) | 4,408 | (38,301) |
At November 30, 2011, the aggregate settlement value of open futures contracts and the related unrealized appreciation (depreciation) were:
| ($000) | ||||
| Aggregate | ||||
| Number of | Settlement | Unrealized | ||
| Long (Short) | Value | Appreciation | ||
| Futures Contracts | Expiration | Contracts | Long (Short) | (Depreciation) |
| 10-Year U.S. Treasury Note | March 2012 | (2,075) | (268,388) | 595 |
Unrealized appreciation (depreciation) on open futures contracts is required to be treated as realized gain (loss) for tax purposes.
F. Distributions are determined on a tax basis and may differ from net investment income and realized capital gains for financial reporting purposes. Differences may be permanent or temporary. Permanent differences are reclassified among capital accounts in the financial statements to reflect their tax character. Temporary differences arise when certain items of income, expense, gain, or loss are recognized in different periods for financial statement and tax purposes; these differences will reverse at some time in the future. Differences in classification may also result from the treatment of short-term gains as ordinary income for tax purposes.
30
Wellington Fund
During the year ended November 30, 2011, the fund realized net foreign currency losses of $1,029,000, which decreased distributable net income for tax purposes; accordingly, such losses have been reclassified from accumulated net realized losses to undistributed net investment income.
Realized and unrealized gains (losses) on certain of the fund’s swap contracts are treated as ordinary income (loss) for tax purposes; the effect on the fund’s income dividends to shareholders is offset by a change in principal return. Realized gains of $2,663,000 on swap contracts have been reclassified from accumulated net realized losses to undistributed net investment income.
For tax purposes, at November 30, 2011, the fund had $333,775,000 of ordinary income available for distribution. The fund had available capital loss carryforwards totaling $35,883,000 to offset future net capital gains through November 30, 2017.
The fund had realized losses totaling $41,307,000 through November 30, 2011, which are deferred for tax purposes and reduce the amount of tax-basis unrealized appreciation on investment securities.
At November 30, 2011, the cost of investment securities for tax purposes was $47,540,580,000. Net unrealized appreciation of investment securities for tax purposes was $7,046,486,000, consisting of unrealized gains of $8,570,200,000 on securities that had risen in value since their purchase and $1,523,714,000 in unrealized losses on securities that had fallen in value since their purchase.
G. During the year ended November 30, 2011, the fund purchased $13,876,648,000 of investment securities and sold $12,585,133,000 of investment securities, other than U.S. government securities and temporary cash investments. Purchases and sales of U.S. government securities were $8,103,194,000 and $7,779,937,000, respectively.
H. Capital share transactions for each class of shares were:
| Year Ended November 30, | ||||
| 2011 | 2010 | |||
| Amount | Shares | Amount | Shares | |
| ($000) | (000) | ($000) | (000) | |
| Investor Shares | ||||
| Issued | 3,863,624 | 122,449 | 4,053,445 | 138,444 |
| Issued in Lieu of Cash Distributions | 751,643 | 24,136 | 832,812 | 28,659 |
| Redeemed | (6,577,886) | (210,620) | (7,232,557) | (244,648) |
| Net Increase (Decrease)—Investor Shares | (1,962,619) | (64,035) | (2,346,300) | (77,545) |
| Admiral Shares | ||||
| Issued | 6,312,591 | 116,559 | 6,523,387 | 127,011 |
| Issued in Lieu of Cash Distributions | 768,903 | 14,297 | 577,590 | 11,508 |
| Redeemed | (3,568,950) | (65,855) | (2,322,501) | (46,086) |
| Net Increase (Decrease)—Admiral Shares | 3,512,544 | 65,001 | 4,778,476 | 92,433 |
I. In preparing the financial statements as of November 30, 2011, management considered the impact of subsequent events for potential recognition or disclosure in these financial statements.
31
Report of Independent Registered Public Accounting Firm
To the Trustees and Shareholders of Vanguard Wellington Fund:
In our opinion, the accompanying statement of net assets--investments summary and the related statements of operations and of changes in net assets and the financial highlights present fairly, in all material respects, the financial position of Vanguard Wellington Fund (the “Fund”) at November 30, 2011, the results of its operations for the year then ended, the changes in its net assets for each of the two years in the period then ended and the financial highlights for each of the five years in the period then ended, in conformity with accounting principles generally accepted in the United States of America. These financial statements and financial highlights (hereafter referred to as “financial statements”) are the responsibility of the Fund’s management; our responsibility is to express an opinion on these financial statements based on our audits. We conducted our audits of these financial statements in accordance with the standards of the Public Company Accounting Oversight Board (United States). Those standards require that we plan and perform the audit to obtain reasonable assurance about whether the financial statements are free of material misstatement. An audit includes examining, on a test basis, evidence supporting the amounts and disclosures in the financial statements, assessing the accounting principles used and significant estimates made by management, and evaluating the overall financial statement presentation. We believe that our audits, which included confirmation of securities at November 30, 2011 by correspondence with the custodians and brokers and by agreement to the underlying ownership records of Vanguard Market Liquidity Fund, provide a reasonable basis for our opinion.
PricewaterhouseCoopers LLP
Philadelphia, Pennsylvania
January 11, 2012
| Special 2011 tax information (unaudited) for Vanguard Wellington Fund |
This information for the fiscal year ended November 30, 2011, is included pursuant to provisions of the Internal Revenue Code.
The fund distributed $874,016,000 of qualified dividend income to shareholders during the fiscal year.
For corporate shareholders, 46.7% of investment income (dividend income plus short-term gains, if any) qualifies for the dividends-received deduction.
32
Your Fund’s After-Tax Returns
This table presents returns for your fund both before and after taxes. The after-tax returns are shown in two ways: (1) assuming that an investor owned the fund during the entire period and paid taxes on the fund’s distributions, and (2) assuming that an investor paid taxes on the fund’s distributions and sold all shares at the end of each period.
Calculations are based on the highest individual federal income tax and capital gains tax rates in effect at the times of the distributions and the hypothetical sales. State and local taxes were not considered. After-tax returns reflect any qualified dividend income, using actual prior-year figures and estimates for 2011. (In the example, returns after the sale of fund shares may be higher than those assuming no sale. This occurs when the sale would have produced a capital loss. The calculation assumes that the investor received a tax deduction for the loss.)
The table shows returns for Investor Shares only; returns for other share classes will differ. Please note that your actual after-tax returns will depend on your tax situation and may differ from those shown. Also note that if you own the fund in a tax-deferred account, such as an individual retirement account or a 401(k) plan, this information does not apply to you. Such accounts are not subject to current taxes.
Finally, keep in mind that a fund’s performance—whether before or after taxes—does not guarantee future results.
| Average Annual Total Returns: Wellington Fund Investor Shares | |||
| Periods Ended November 30, 2011 | |||
| One | Five | Ten | |
| Year | Years | Years | |
| Returns Before Taxes | 6.85% | 3.33% | 6.08% |
| Returns After Taxes on Distributions | 6.11 | 2.21 | 4.86 |
| Returns After Taxes on Distributions and Sale of Fund Shares | 4.78 | 2.42 | 4.75 |
33
About Your Fund’s Expenses
As a shareholder of the fund, you incur ongoing costs, which include costs for portfolio management, administrative services, and shareholder reports (like this one), among others. Operating expenses, which are deducted from a fund’s gross income, directly reduce the investment return of the fund.
A fund’s expenses are expressed as a percentage of its average net assets. This figure is known as the expense ratio. The following examples are intended to help you understand the ongoing costs (in dollars) of investing in your fund and to compare these costs with those of other mutual funds. The examples are based on an investment of $1,000 made at the beginning of the period shown and held for the entire period.
The accompanying table illustrates your fund’s costs in two ways:
• Based on actual fund return. This section helps you to estimate the actual expenses that you paid over the period. The ”Ending Account Value“ shown is derived from the fund‘s actual return, and the third column shows the dollar amount that would have been paid by an investor who started with $1,000 in the fund. You may use the information here, together with the amount you invested, to estimate the expenses that you paid over the period.
To do so, simply divide your account value by $1,000 (for example, an $8,600 account value divided by $1,000 = 8.6), then multiply the result by the number given for your fund under the heading ”Expenses Paid During Period.“
• Based on hypothetical 5% yearly return. This section is intended to help you compare your fund‘s costs with those of other mutual funds. It assumes that the fund had a yearly return of 5% before expenses, but that the expense ratio is unchanged. In this case—because the return used is not the fund’s actual return—the results do not apply to your investment. The example is useful in making comparisons because the Securities and Exchange Commission requires all mutual funds to calculate expenses based on a 5% return. You can assess your fund’s costs by comparing this hypothetical example with the hypothetical examples that appear in shareholder reports of other funds.
Note that the expenses shown in the table are meant to highlight and help you compare ongoing costs only and do not reflect transaction costs incurred by the fund for buying and selling securities. Further, the expenses do not include any purchase, redemption, or account service fees described in the fund prospectus. If such fees were applied to your account, your costs would be higher. Your fund does not carry a “sales load.”
The calculations assume no shares were bought or sold during the period. Your actual costs may have been higher or lower, depending on the amount of your investment and the timing of any purchases or redemptions.
You can find more information about the fund’s expenses, including annual expense ratios, in the Financial Statements section of this report. For additional information on operating expenses and other shareholder costs, please refer to your fund’s current prospectus.
34
| Six Months Ended November 30, 2011 | |||
| Beginning | Ending | Expenses | |
| Account Value | Account Value | Paid During | |
| Wellington Fund | 5/31/2011 | 11/30/2011 | Period |
| Based on Actual Fund Return | |||
| Investor Shares | $1,000.00 | $958.92 | $1.23 |
| Admiral Shares | 1,000.00 | 959.28 | 0.83 |
| Based on Hypothetical 5% Yearly Return | |||
| Investor Shares | $1,000.00 | $1,023.82 | $1.27 |
| Admiral Shares | 1,000.00 | 1,024.22 | 0.86 |
The calculations are based on expenses incurred in the most recent six-month period. The fund’s annualized six-month expense ratios for that period are 0.25% for Investor Shares and 0.17% for Admiral Shares. The dollar amounts shown as “Expenses Paid” are equal to the annualized expense ratio multiplied by the average account value over the period, multiplied by the number of days in the most recent six-month period, then divided by the number of days in the most recent 12-month period.
35
Trustees Approve Advisory Agreement
The board of trustees of Vanguard Wellington Fund has renewed the fund’s investment advisory agreement with Wellington Management Company, LLP. The board determined that the retention of the advisor was in the best interests of the fund and its shareholders.
The board based its decision upon an evaluation of the advisor’s investment staff, portfolio management process, and performance. The trustees considered the factors discussed below, among others. However, no single factor determined whether the board approved the agreement. Rather, it was the totality of the circumstances that drove the board’s decision.
Nature, extent, and quality of services
The board considered the quality of the fund’s investment management over both the short and long term, and took into account the organizational depth and stability of the advisor. The board noted that Wellington Management, founded in 1928, is among the nation’s oldest and most respected institutional managers. The board also noted that the senior portfolio managers of the fund each have over two decades of investment industry experience. The firm and the fund’s management team have depth and stability. The managers are backed by well-tenured teams of equity and fixed income research analysts who conduct detailed fundamental analysis of their respective industries and companies. The firm has advised the fund since its inception in 1929.
The board concluded that the advisor’s experience, stability, depth, and performance, among other factors, warranted continuation of the advisory agreement.
Investment performance
The board considered the short- and long-term performance of the fund, including any periods of outperformance or underperformance of a relevant benchmark and peer group. The board concluded that the advisor has carried out the fund’s investment strategy in disciplined fashion, and that the performance results have allowed the fund to remain competitive versus its benchmark and peer group. Information about the fund’s most recent performance can be found in the Performance Summary section of this report.
Cost
The board concluded that the fund’s expense ratio was well below the average expense ratio charged by funds in its peer group and that the fund’s advisory fee rate was also well below its peer-group average. Information about the fund’s expenses appears in the About Your Fund’s Expenses section of this report as well as in the Financial Statements section, which also includes information about the advisory fee rate.
The board did not consider profitability of Wellington Management in determining whether to approve the advisory fee, because Wellington Management is independent of Vanguard, and the advisory fee is the result of arm’s-length negotiations.
The benefit of economies of scale
The board concluded that the fund’s shareholders benefit from economies of scale because of breakpoints in the fund’s advisory fee schedule. The breakpoints reduce the effective rate of the fee as the fund’s assets increase.
The board will consider whether to renew the advisory agreement again after a one-year period.
36
Glossary
30-Day SEC Yield. A fund’s 30-day SEC yield is derived using a formula specified by the U.S. Securities and Exchange Commission. Under the formula, data related to the fund’s security holdings in the previous 30 days are used to calculate the fund’s hypothetical net income for that period, which is then annualized and divided by the fund’s estimated average net assets over the calculation period. For the purposes of this calculation, a security’s income is based on its current market yield to maturity (for bonds), its actual income (for asset-backed securities), or its projected dividend yield (for stocks). Because the SEC yield represents hypothetical annualized income, it will differ—at times significantly—from the fund’s actual experience. As a result, the fund’s income distributions may be higher or lower than implied by the SEC yield.
Average Coupon. The average interest rate paid on the fixed income securities held by a fund. It is expressed as a percentage of face value.
Average Duration. An estimate of how much the value of the bonds held by a fund will fluctuate in response to a change in interest rates. To see how the value could change, multiply the average duration by the change in rates. If interest rates rise by 1 percentage point, the value of the bonds in a fund with an average duration of five years would decline by about 5%. If rates decrease by a percentage point, the value would rise by 5%.
Average Effective Maturity. The average length of time until fixed income securities held by a fund reach maturity and are repaid, taking into consideration the possibility that the issuer may call the bond before its maturity date. The figure reflects the proportion of fund assets represented by each security; it also reflects any futures contracts held. In general, the longer the average effective maturity, the more a fund’s share price will fluctuate in response to changes in market interest rates.
Beta. A measure of the magnitude of a fund’s past share-price fluctuations in relation to the ups and downs of a given market index. The index is assigned a beta of 1.00. Compared with a given index, a fund with a beta of 1.20 typically would have seen its share price rise or fall by 12% when the index rose or fell by 10%. For this report, beta is based on returns over the past 36 months for both the fund and the index. Note that a fund’s beta should be reviewed in conjunction with its R-squared (see definition). The lower the R-squared, the less correlation there is between the fund and the index, and the less reliable beta is as an indicator of volatility.
Credit Quality. Credit-quality ratings are measured on a scale that generally ranges from AAA (highest) to D (lowest). “Not Rated” is used to classify securities for which a rating is not available. U.S. Treasury, U.S. Agency, and U.S. Agency mortgage-backed securities appear under “U.S. Government.” For this report, credit-quality ratings are obtained from Moody’s and S&P, and the higher rating for each issue is used.
Dividend Yield. The current, annualized rate of dividends paid on a share of stock, divided by its current share price. For a fund, the weighted average yield for stocks it holds. The index yield is based on the current annualized rate of dividends paid on stocks in the index.
Earnings Growth Rate. The average annual rate of growth in earnings over the past five years for the stocks now in a fund.
Equity Exposure. A measure that reflects a fund’s investments in stocks and stock futures. Any holdings in short-term reserves are excluded.
37
Expense Ratio. A fund’s total annual operating expenses expressed as a percentage of the fund’s average net assets. The expense ratio includes management and administrative expenses, but does not include the transaction costs of buying and selling portfolio securities.
Foreign Holdings. The percentage of a fund represented by securities or depositary receipts of companies based outside the United States.
Inception Date. The date on which the assets of a fund (or one of its share classes) are first invested in accordance with the fund’s investment objective. For funds with a subscription period, the inception date is the day after that period ends. Investment performance is measured from the inception date.
Median Market Cap. An indicator of the size of companies in which a fund invests; the midpoint of market capitalization (market price x shares outstanding) of a fund’s stocks, weighted by the proportion of the fund’s assets invested in each stock. Stocks representing half of the fund’s assets have market capitalizations above the median, and the rest are below it.
Price/Book Ratio. The share price of a stock divided by its net worth, or book value, per share. For a fund, the weighted average price/book ratio of the stocks it holds.
Price/Earnings Ratio. The ratio of a stock’s current price to its per-share earnings over the past year. For a fund, the weighted average P/E of the stocks it holds. P/E is an indicator of market expectations about corporate prospects; the higher the P/E, the greater the expectations for a company’s future growth.
R-Squared. A measure of how much of a fund’s past returns can be explained by the returns from the market in general, as measured by a given index. If a fund’s total returns were precisely synchronized with an index’s returns, its R-squared would be 1.00. If the fund’s returns bore no relationship to the index’s returns, its R-squared would be 0. For this report, R-squared is based on returns over the past 36 months for both the fund and the index.
Return on Equity. The annual average rate of return generated by a company during the past five years for each dollar of shareholder’s equity (net income divided by shareholder’s equity). For a fund, the weighted average return on equity for the companies whose stocks it holds.
Short-Term Reserves. The percentage of a fund invested in highly liquid, short-term securities that can be readily converted to cash.
Turnover Rate. An indication of the fund’s trading activity. Funds with high turnover rates incur higher transaction costs and may be more likely to distribute capital gains (which may be taxable to investors). The turnover rate excludes in-kind transactions, which have minimal impact on costs.
Yield to Maturity. The rate of return an investor would receive if the fixed income securities held by a fund were held to their maturity dates.
38
This page intentionally left blank.
The People Who Govern Your Fund
The trustees of your mutual fund are there to see that the fund is operated and managed in your best interests since, as a shareholder, you are a part owner of the fund. Your fund’s trustees also serve on the board of directors of The Vanguard Group, Inc., which is owned by the Vanguard funds and provides services to them on an at-cost basis.
A majority of Vanguard’s board members are independent, meaning that they have no affiliation with Vanguard or the funds they oversee, apart from the sizable personal investments they have made as private individuals. The independent board members have distinguished backgrounds in business, academia, and public service. Each of the trustees and executive officers oversees 180 Vanguard funds.
The following table provides information for each trustee and executive officer of the fund. More information about the trustees is in the Statement of Additional Information, which can be obtained, without charge, by contacting Vanguard at 800-662-7447, or online at vanguard.com.
| Interested Trustee1 | and President (2006–2008) of Rohm and Haas Co. |
| (chemicals); Director of Tyco International, Ltd. | |
| F. William McNabb III | (diversified manufacturing and services) and Hewlett- |
| Born 1957. Trustee Since July 2009. Chairman of the | Packard Co. (electronic computer manufacturing); |
| Board. Principal Occupation(s) During the Past Five | Senior Advisor at New Mountain Capital; Trustee |
| Years: Chairman of the Board of The Vanguard Group, | of The Conference Board; Member of the Board of |
| Inc., and of each of the investment companies served | Managers of Delphi Automotive LLP (automotive |
| by The Vanguard Group, since January 2010; Director | components). |
| of The Vanguard Group since 2008; Chief Executive | |
| Officer and President of The Vanguard Group and of | Amy Gutmann |
| each of the investment companies served by The | Born 1949. Trustee Since June 2006. Principal |
| Vanguard Group since 2008; Director of Vanguard | Occupation(s) During the Past Five Years: President |
| Marketing Corporation; Managing Director of The | of the University of Pennsylvania; Christopher H. |
| Vanguard Group (1995–2008). | Browne Distinguished Professor of Political Science |
| in the School of Arts and Sciences with secondary | |
| appointments at the Annenberg School for Commu- | |
| Independent Trustees | nication and the Graduate School of Education |
| of the University of Pennsylvania; Director of | |
| Emerson U. Fullwood | Carnegie Corporation of New York, Schuylkill River |
| Born 1948. Trustee Since January 2008. Principal | Development Corporation, and Greater Philadelphia |
| Occupation(s) During the Past Five Years: Executive | Chamber of Commerce; Trustee of the National |
| Chief Staff and Marketing Officer for North America | Constitution Center; Chair of the Presidential |
| and Corporate Vice President (retired 2008) of Xerox | Commission for the Study of Bioethical Issues. |
| Corporation (document management products and | |
| services); Executive in Residence and 2010 | JoAnn Heffernan Heisen |
| Distinguished Minett Professor at the Rochester | Born 1950. Trustee Since July 1998. Principal |
| Institute of Technology; Director of SPX Corporation | Occupation(s) During the Past Five Years: Corporate |
| (multi-industry manufacturing), the United Way of | Vice President and Chief Global Diversity Officer |
| Rochester, Amerigroup Corporation (managed health | (retired 2008) and Member of the Executive |
| care), the University of Rochester Medical Center, | Committee (1997–2008) of Johnson & Johnson |
| Monroe Community College Foundation, and North | (pharmaceuticals/consumer products); Director of |
| Carolina A&T University. | Skytop Lodge Corporation (hotels), the University |
| Medical Center at Princeton, the Robert Wood | |
| Rajiv L. Gupta | Johnson Foundation, and the Center for Work Life |
| Born 1945. Trustee Since December 2001.2 | Policy; Member of the Advisory Board of the |
| Principal Occupation(s) During the Past Five Years: | Maxwell School of Citizenship and Public Affairs |
| Chairman and Chief Executive Officer (retired 2009) | at Syracuse University. |
| F. Joseph Loughrey | Thomas J. Higgins | |
| Born 1949. Trustee Since October 2009. Principal | Born 1957. Chief Financial Officer Since September | |
| Occupation(s) During the Past Five Years: President | 2008. Principal Occupation(s) During the Past Five | |
| and Chief Operating Officer (retired 2009) and Vice | Years: Principal of The Vanguard Group, Inc.; Chief | |
| Chairman of the Board (2008–2009) of Cummins Inc. | Financial Officer of each of the investment companies | |
| (industrial machinery); Director of SKF AB (industrial | served by The Vanguard Group since 2008; Treasurer | |
| machinery), Hillenbrand, Inc. (specialized consumer | of each of the investment companies served by The | |
| services), the Lumina Foundation for Education, and | Vanguard Group (1998–2008). | |
| Oxfam America; Chairman of the Advisory Council | ||
| for the College of Arts and Letters and Member | Kathryn J. Hyatt | |
| of the Advisory Board to the Kellogg Institute for | Born 1955. Treasurer Since November 2008. Principal | |
| International Studies at the University of Notre Dame. | Occupation(s) During the Past Five Years: Principal | |
| of The Vanguard Group, Inc.; Treasurer of each of | ||
| André F. Perold | the investment companies served by The Vanguard | |
| Born 1952. Trustee Since December 2004. Principal | Group since 2008; Assistant Treasurer of each of the | |
| Occupation(s) During the Past Five Years: George | investment companies served by The Vanguard Group | |
| Gund Professor of Finance and Banking at the Harvard | (1988–2008). | |
| Business School (retired July 2011); Chief Investment | ||
| Officer and co-Managing Partner of HighVista | Heidi Stam | |
| Strategies LLC (private investment firm); Director of | Born 1956. Secretary Since July 2005. Principal | |
| Rand Merchant Bank; Overseer of the Museum of | Occupation(s) During the Past Five Years: Managing | |
| Fine Arts Boston. | Director of The Vanguard Group, Inc., since 2006; | |
| General Counsel of The Vanguard Group since 2005; | ||
| Alfred M. Rankin, Jr. | Secretary of The Vanguard Group and of each of the | |
| Born 1941. Trustee Since January 1993. Principal | investment companies served by The Vanguard Group | |
| Occupation(s) During the Past Five Years: Chairman, | since 2005; Director and Senior Vice President of | |
| President, and Chief Executive Officer of NACCO | Vanguard Marketing Corporation since 2005; | |
| Industries, Inc. (forklift trucks/housewares/lignite); | Principal of The Vanguard Group (1997–2006). | |
| Director of Goodrich Corporation (industrial products/ | ||
| aircraft systems and services) and the National | ||
| Association of Manufacturers; Chairman of the | Vanguard Senior Management Team | |
| Federal Reserve Bank of Cleveland; Vice Chairman | ||
| of University Hospitals of Cleveland; President of | R. Gregory Barton | Chris D. McIsaac |
| the Board of The Cleveland Museum of Art. | Mortimer J. Buckley | Michael S. Miller |
| Kathleen C. Gubanich | James M. Norris | |
| Peter F. Volanakis | Paul A. Heller | Glenn W. Reed |
| Born 1955. Trustee Since July 2009. Principal | Martha G. King | George U. Sauter |
| Occupation(s) During the Past Five Years: President | ||
| and Chief Operating Officer (retired 2010) of Corning | ||
| Incorporated (communications equipment); Director of | Chairman Emeritus and Senior Advisor | |
| Corning Incorporated (2000–2010) and Dow Corning | ||
| (2001–2010); Overseer of the Amos Tuck School of | John J. Brennan | |
| Business Administration at Dartmouth College. | Chairman, 1996–2009 | |
| Chief Executive Officer and President, 1996–2008 | ||
| Executive Officers | ||
| Founder | ||
| Glenn Booraem | ||
| Born 1967. Controller Since July 2010. Principal | John C. Bogle | |
| Occupation(s) During the Past Five Years: Principal | Chairman and Chief Executive Officer, 1974–1996 | |
| of The Vanguard Group, Inc.; Controller of each of | ||
| the investment companies served by The Vanguard | ||
| Group since 2010; Assistant Controller of each of | ||
| the investment companies served by The Vanguard | ||
| Group (2001–2010). | ||
1 Mr. McNabb is considered an “interested person,” as defined in the Investment Company Act of 1940, because he is an officer of the Vanguard funds.
2 December 2002 for Vanguard Equity Income Fund, Vanguard Growth Equity Fund, the Vanguard Municipal Bond Funds, and the Vanguard State Tax-Exempt Funds.
 | |
| P.O. Box 2600 | |
| Valley Forge, PA 19482-2600 |
Connect with Vanguard® > vanguard.com
| Fund Information > 800-662-7447 | CFA® is a trademark owned by CFA Institute. |
| Direct Investor Account Services > 800-662-2739 | |
| Institutional Investor Services > 800-523-1036 | |
| Text Telephone for People | |
| With Hearing Impairment > 800-749-7273 | |
| This material may be used in conjunction | |
| with the offering of shares of any Vanguard | |
| fund only if preceded or accompanied by | |
| the fund’s current prospectus. | |
| All comparative mutual fund data are from Lipper Inc. or | |
| Morningstar, Inc., unless otherwise noted. | |
| You can obtain a free copy of Vanguard’s proxy voting | |
| guidelines by visiting vanguard.com/proxyreporting or by | |
| calling Vanguard at 800-662-2739. The guidelines are | |
| also available from the SEC’s website, sec.gov. In | |
| addition, you may obtain a free report on how your fund | |
| voted the proxies for securities it owned during the 12 | |
| months ended June 30. To get the report, visit either | |
| vanguard.com/proxyreporting or sec.gov. | |
| You can review and copy information about your fund at | |
| the SEC’s Public Reference Room in Washington, D.C. To | |
| find out more about this public service, call the SEC at | |
| 202-551-8090. Information about your fund is also | |
| available on the SEC’s website, and you can receive | |
| copies of this information, for a fee, by sending a | |
| request in either of two ways: via e-mail addressed to | |
| publicinfo@sec.gov or via regular mail addressed to the | |
| Public Reference Section, Securities and Exchange | |
| Commission, Washington, DC 20549-1520. | |
| © 2012 The Vanguard Group, Inc. | |
| All rights reserved. | |
| Vanguard Marketing Corporation, Distributor. | |
| Q210 012012 | |
| Vanguard® Wellington Fund | ||
| Schedule of Investments | ||
| November 30, 2011 | ||
| Market | ||
| Value | ||
| Shares | ($000) | |
| Common Stocks (65.7%) | ||
| Consumer Discretionary (5.5%) | ||
| Comcast Corp. Class A | 27,149,300 | 615,475 |
| Walt Disney Co. | 12,590,900 | 451,384 |
| Target Corp. | 7,545,500 | 397,648 |
| Time Warner Inc. | 8,991,000 | 313,067 |
| Johnson Controls Inc. | 9,874,400 | 310,846 |
| * Ford Motor Co. | 22,569,760 | 239,239 |
| Lowe's Cos. Inc. | 9,804,200 | 235,399 |
| Staples Inc. | 12,810,300 | 184,596 |
| Home Depot Inc. | 4,212,400 | 165,210 |
| Honda Motor Co. Ltd. ADR | 3,186,500 | 100,853 |
| 3,013,717 | ||
| Consumer Staples (5.5%) | ||
| Philip Morris International Inc. | 7,692,400 | 586,469 |
| Procter & Gamble Co. | 9,012,475 | 581,935 |
| PepsiCo Inc. | 8,677,400 | 555,354 |
| Unilever NV | 8,927,500 | 304,517 |
| Anheuser-Busch InBev NV | 5,087,489 | 304,217 |
| CVS Caremark Corp. | 7,750,600 | 301,033 |
| Coca-Cola Co. | 3,547,700 | 238,512 |
| Archer-Daniels-Midland Co. | 6,134,700 | 184,777 |
| 3,056,814 | ||
| Energy (9.4%) | ||
| Exxon Mobil Corp. | 17,623,864 | 1,417,664 |
| Chevron Corp. | 10,550,000 | 1,084,751 |
| Anadarko Petroleum Corp. | 7,737,300 | 628,810 |
| Occidental Petroleum Corp. | 3,765,100 | 372,368 |
| Total SA ADR | 6,944,300 | 359,298 |
| Baker Hughes Inc. | 5,891,100 | 321,713 |
| BG Group plc | 12,238,170 | 262,498 |
| ^ Encana Corp. (New York Shares) | 9,828,904 | 197,070 |
| BP plc ADR | 4,351,100 | 189,490 |
| Petroleo Brasileiro SA ADR | 6,748,600 | 182,145 |
| Cenovus Energy Inc. | 4,011,104 | 133,931 |
| 5,149,738 | ||
| Financials (10.5%) | ||
| Wells Fargo & Co. | 36,494,517 | 943,748 |
| JPMorgan Chase & Co. | 20,480,776 | 634,290 |
| ACE Ltd. | 6,664,800 | 463,404 |
| MetLife Inc. | 12,738,005 | 400,992 |
| PNC Financial Services Group Inc. | 7,302,800 | 395,885 |
| BlackRock Inc. | 1,839,100 | 316,399 |
| Goldman Sachs Group Inc. | 2,804,400 | 268,830 |
| Chubb Corp. | 3,959,800 | 267,049 |
| Standard Chartered plc | 11,860,041 | 258,206 |
| US Bancorp | 9,503,600 | 246,333 |
| Prudential Financial Inc. | 4,488,300 | 227,287 |
| Barclays plc | 56,693,000 | 163,319 |
| Bank of America Corp. | 29,864,500 | 162,463 |
| Swiss Re AG | 2,771,025 | 146,591 |
| HSBC Holdings plc ADR | 3,669,900 | 143,677 |
| * UBS AG | 11,093,934 | 138,341 |
| Mitsubishi UFJ Financial Group Inc. | 29,809,900 | 130,568 |
| Marsh & McLennan Cos. Inc. | 4,066,000 | 122,753 |
| Hartford Financial Services Group Inc. | 6,275,332 | 111,450 |
| Morgan Stanley | 7,360,600 | 108,863 |
| State Street Corp. | 2,700,627 | 107,080 |
| 5,757,528 | ||
| Health Care (10.1%) | ||
| Pfizer Inc. | 47,834,641 | 960,041 |
| Merck & Co. Inc. | 22,072,152 | 789,080 |
| Eli Lilly & Co. | 17,194,900 | 650,827 |
1
| Vanguard® Wellington Fund | ||
| Schedule of Investments | ||
| November 30, 2011 | ||
| Market | ||
| Value | ||
| Shares | ($000) | |
| Johnson & Johnson | 9,263,200 | 599,514 |
| Medtronic Inc. | 13,432,900 | 489,361 |
| AstraZeneca plc ADR | 8,871,100 | 407,893 |
| Cardinal Health Inc. | 9,506,200 | 403,633 |
| Teva Pharmaceutical Industries Ltd. ADR | 6,942,200 | 274,981 |
| Bristol-Myers Squibb Co. | 7,926,000 | 259,339 |
| UnitedHealth Group Inc. | 4,796,400 | 233,920 |
| * Celgene Corp. | 3,447,800 | 217,487 |
| Amgen Inc. | 2,632,100 | 152,425 |
| * Gilead Sciences Inc. | 2,539,300 | 101,191 |
| 5,539,692 | ||
| Industrials (7.3%) | ||
| United Parcel Service Inc. Class B | 6,840,600 | 490,813 |
| General Electric Co. | 29,557,200 | 470,255 |
| Honeywell International Inc. | 7,313,400 | 396,021 |
| Deere & Co. | 4,739,100 | 375,574 |
| Waste Management Inc. | 10,935,400 | 342,278 |
| Siemens AG | 3,348,951 | 338,913 |
| FedEx Corp. | 3,907,100 | 324,602 |
| General Dynamics Corp. | 4,407,300 | 291,146 |
| Raytheon Co. | 5,731,100 | 261,166 |
| Canadian National Railway Co. | 2,811,400 | 218,052 |
| Northrop Grumman Corp. | 3,226,800 | 184,153 |
| Schneider Electric SA | 2,953,364 | 167,941 |
| Emerson Electric Co. | 2,501,700 | 130,714 |
| 3,991,628 | ||
| Information Technology (9.5%) | ||
| International Business Machines Corp. | 4,899,100 | 921,031 |
| Microsoft Corp. | 35,481,900 | 907,627 |
| Texas Instruments Inc. | 16,303,200 | 490,726 |
| Intel Corp. | 19,606,800 | 488,406 |
| Oracle Corp. | 12,583,600 | 394,496 |
| Cisco Systems Inc. | 21,003,400 | 391,503 |
| Automatic Data Processing Inc. | 7,086,500 | 362,049 |
| * eBay Inc. | 11,800,300 | 349,171 |
| Qualcomm Inc. | 6,017,800 | 329,776 |
| Accenture plc Class A | 5,298,950 | 306,968 |
| Taiwan Semiconductor Manufacturing Co. Ltd. ADR | 13,102,885 | 169,289 |
| ^ SAP AG ADR | 1,427,875 | 85,615 |
| 5,196,657 | ||
| Materials (2.6%) | ||
| Dow Chemical Co. | 15,528,400 | 430,292 |
| Air Products & Chemicals Inc. | 4,008,200 | 335,687 |
| BASF SE | 3,000,164 | 219,173 |
| Kinross Gold Corp. | 12,843,400 | 179,422 |
| ^ CRH plc ADR | 8,101,900 | 155,151 |
| ArcelorMittal | 5,572,600 | 105,267 |
| 1,424,992 | ||
| Telecommunication Services (2.4%) | ||
| AT&T Inc. | 45,247,785 | 1,311,281 |
| Utilities (2.9%) | ||
| Dominion Resources Inc. | 9,253,100 | 477,645 |
| NextEra Energy Inc. | 7,752,300 | 429,787 |
| Exelon Corp. | 7,822,674 | 346,623 |
| PG&E Corp. | 8,342,600 | 324,027 |
| 1,578,082 | ||
| Total Common Stocks (Cost $30,059,264) | 36,020,129 | |
2
| Vanguard® Wellington Fund | |||||
| Schedule of Investments | |||||
| November 30, 2011 | |||||
| Face | Market | ||||
| Maturity | Amount | Value | |||
| Coupon | Date | ($000) | ($000) | ||
| U.S. Government and Agency Obligations (5.3%) | |||||
| U.S. Government Securities (1.7%) | |||||
| United States Treasury Note/Bond | 0.125% | 9/30/13 | 49,000 | 48,878 | |
| United States Treasury Note/Bond | 0.250% | 9/15/14 | 31,000 | 30,893 | |
| United States Treasury Note/Bond | 1.500% | 6/30/16 | 675,700 | 695,126 | |
| United States Treasury Note/Bond | 2.750% | 2/15/19 | 52,000 | 56,217 | |
| United States Treasury Note/Bond | 2.125% | 8/15/21 | 21,000 | 21,125 | |
| United States Treasury Note/Bond | 4.375% | 5/15/41 | 90,000 | 113,540 | |
| 965,779 | |||||
| Agency Notes (0.0%) | |||||
| 1 | PNC Funding Corp. | 2.300% | 6/22/12 | 13,590 | 13,740 |
| Conventional Mortgage-Backed Securities (3.3%) | |||||
| 2,3 | Freddie Mac Gold Pool | 3.500% | 10/1/40–11/1/41 | 469,738 | 478,606 |
| 2,3,4 | Freddie Mac Gold Pool | 4.000% | 8/1/13–11/1/41 | 1,255,954 | 1,308,442 |
| 2 | Ginnie Mae I Pool | 7.000% | 11/15/31–11/15/33 | 7,007 | 8,078 |
| 2 | Ginnie Mae I Pool | 8.000% | 6/15/17 | 31 | 31 |
| 1,795,157 | |||||
| Nonconventional Mortgage-Backed Securities (0.3%) | |||||
| 2,3 | Fannie Mae REMICS | 3.500% | 4/25/31 | 9,730 | 9,820 |
| 2,3 | Fannie Mae REMICS | 4.000% | 9/25/29–5/25/31 | 18,581 | 19,874 |
| 2,3 | Freddie Mac REMICS | 3.500% | 3/15/31 | 5,760 | 5,815 |
| 2,3 | Freddie Mac REMICS | 4.000% | 12/15/30–4/15/31 | 108,686 | 115,811 |
| 151,320 | |||||
| Total U.S. Government and Agency Obligations (Cost $2,814,476) | 2,925,996 | ||||
| Asset-Backed/Commercial Mortgage-Backed Securities (1.0%) | |||||
| 2 | Ally Auto Receivables Trust | 1.350% | 12/15/15 | 12,550 | 12,598 |
| 2,5 | Ally Master Owner Trust | 2.880% | 4/15/15 | 22,650 | 23,088 |
| 2 | Ally Master Owner Trust | 2.150% | 1/15/16 | 48,866 | 49,458 |
| 2 | AmeriCredit Automobile Receivables Trust | 1.170% | 1/8/16 | 10,765 | 10,727 |
| 2,5 | Avis Budget Rental Car Funding AESOP LLC | 2.090% | 4/20/15 | 56,275 | 56,752 |
| 2,5 | Avis Budget Rental Car Funding AESOP LLC | 3.150% | 3/20/17 | 12,000 | 12,524 |
| 2 | Credit Suisse First Boston Mortgage Securities Corp. | 4.597% | 3/15/35 | 30,600 | 31,289 |
| 2 | Credit Suisse First Boston Mortgage Securities Corp. | 5.183% | 11/15/36 | 5,341 | 5,456 |
| 2 | Ford Credit Floorplan Master Owner Trust | 1.500% | 9/15/15 | 13,350 | 13,340 |
| 2,6 | Ford Credit Floorplan Master Owner Trust | 2.120% | 2/15/16 | 25,390 | 25,699 |
| 2,5 | Ford Credit Floorplan Master Owner Trust | 4.200% | 2/15/17 | 16,270 | 17,449 |
| 2 | GE Capital Commercial Mortgage Corp. | 5.145% | 7/10/37 | 15,640 | 16,282 |
| 2 | GE Capital Credit Card Master Note Trust | 3.800% | 11/15/17 | 32,000 | 34,201 |
| 2,5 | Hertz Vehicle Financing LLC | 4.260% | 3/25/14 | 29,500 | 30,386 |
| 2,5 | Hertz Vehicle Financing LLC | 2.200% | 3/25/16 | 36,320 | 36,856 |
| 2 | JP Morgan Chase Commercial Mortgage Securities | ||||
| Corp. | 4.994% | 7/12/35 | 35,650 | 36,547 | |
| 2,5 | Marriott Vacation Club Owner Trust | 5.362% | 10/20/28 | 2,728 | 2,810 |
| 2 | Morgan Stanley Dean Witter Capital I | 5.080% | 9/15/37 | 19,361 | 19,788 |
| 2,5 | Santander Consumer Acquired Receivables Trust | 1.400% | 10/15/14 | 24,176 | 24,234 |
| 2,5 | Santander Drive Auto Receivables Trust | 1.830% | 11/17/14 | 27,420 | 27,496 |
| 2 | Santander Drive Auto Receivables Trust | 2.350% | 11/16/15 | 13,545 | 13,559 |
| 2 | World Omni Automobile Lease Securitization Trust | 1.490% | 10/15/14 | 27,925 | 28,109 |
| Total Asset-Backed/Commercial Mortgage-Backed Securities (Cost $525,335) | 528,648 | ||||
| Corporate Bonds (22.8%) | |||||
| Finance (10.3%) | |||||
| Banking (7.3%) | |||||
| American Express Bank FSB | 5.550% | 10/17/12 | 50,000 | 51,781 | |
| American Express Bank FSB | 5.500% | 4/16/13 | 15,000 | 15,690 | |
| American Express Credit Corp. | 5.875% | 5/2/13 | 44,000 | 46,350 | |
| American Express Credit Corp. | 2.750% | 9/15/15 | 10,000 | 9,914 | |
| 5 | ANZ National International Ltd. | 2.375% | 12/21/12 | 15,445 | 15,533 |
| 5 | ANZ National International Ltd./New Zealand | 6.200% | 7/19/13 | 18,960 | 20,222 |
| Bank of America Corp. | 6.000% | 9/1/17 | 84,725 | 78,427 | |
3
| Vanguard® Wellington Fund | |||||
| Schedule of Investments | |||||
| November 30, 2011 | |||||
| Face | Market | ||||
| Maturity | Amount | Value | |||
| Coupon | Date | ($000) | ($000) | ||
| Bank of America Corp. | 5.750% | 12/1/17 | 30,000 | 27,341 | |
| Bank of America NA | 5.300% | 3/15/17 | 68,000 | 59,996 | |
| Bank of America NA | 6.000% | 10/15/36 | 30,000 | 24,765 | |
| Bank of New York Mellon Corp. | 4.950% | 3/15/15 | 58,655 | 63,301 | |
| Bank of Nova Scotia | 3.400% | 1/22/15 | 82,000 | 86,023 | |
| Barclays Bank plc | 2.375% | 1/13/14 | 53,000 | 51,902 | |
| Barclays Bank plc | 5.000% | 9/22/16 | 15,570 | 15,854 | |
| 2,5 | Barclays Bank plc | 5.926% | 9/29/49 | 51,000 | 36,195 |
| BB&T Corp. | 3.200% | 3/15/16 | 34,000 | 35,210 | |
| BB&T Corp. | 4.900% | 6/30/17 | 8,045 | 8,644 | |
| BB&T Corp. | 5.250% | 11/1/19 | 8,000 | 8,730 | |
| Bear Stearns Cos. LLC | 6.400% | 10/2/17 | 8,765 | 9,506 | |
| Bear Stearns Cos. LLC | 7.250% | 2/1/18 | 16,385 | 18,786 | |
| BNY Mellon NA | 4.750% | 12/15/14 | 4,750 | 5,123 | |
| Canadian Imperial Bank of Commerce | 2.350% | 12/11/15 | 56,000 | 56,018 | |
| Capital One Bank USA NA | 6.500% | 6/13/13 | 20,705 | 21,932 | |
| Capital One Financial Corp. | 5.250% | 2/21/17 | 3,580 | 3,768 | |
| Citigroup Inc. | 5.300% | 10/17/12 | 50,000 | 50,765 | |
| Citigroup Inc. | 4.587% | 12/15/15 | 23,975 | 23,893 | |
| Citigroup Inc. | 3.953% | 6/15/16 | 41,322 | 40,537 | |
| Citigroup Inc. | 5.850% | 8/2/16 | 30,000 | 31,670 | |
| Citigroup Inc. | 6.125% | 11/21/17 | 64,960 | 67,767 | |
| Citigroup Inc. | 8.500% | 5/22/19 | 34,000 | 38,993 | |
| Citigroup Inc. | 5.375% | 8/9/20 | 14,700 | 14,697 | |
| Citigroup Inc. | 6.625% | 6/15/32 | 45,000 | 40,317 | |
| Citigroup Inc. | 6.125% | 8/25/36 | 30,000 | 25,337 | |
| Citigroup Inc. | 8.125% | 7/15/39 | 8,325 | 9,659 | |
| 5 | Cooperatieve Centrale Raiffeisen-Boerenleenbank | ||||
| BA/Netherlands | 3.200% | 3/11/15 | 52,000 | 54,330 | |
| 5 | Credit Agricole SA/London | 3.500% | 4/13/15 | 50,000 | 46,333 |
| Credit Suisse New York | 5.000% | 5/15/13 | 87,750 | 90,314 | |
| Credit Suisse New York | 2.200% | 1/14/14 | 41,000 | 40,415 | |
| Credit Suisse New York | 5.500% | 5/1/14 | 30,000 | 31,619 | |
| Credit Suisse New York | 5.400% | 1/14/20 | 40,000 | 36,510 | |
| Credit Suisse USA Inc. | 6.500% | 1/15/12 | 15,000 | 15,081 | |
| Deutsche Bank AG | 5.375% | 10/12/12 | 41,245 | 42,231 | |
| Deutsche Bank Financial LLC | 5.375% | 3/2/15 | 59,215 | 59,656 | |
| Golden West Financial Corp. | 4.750% | 10/1/12 | 10,000 | 10,311 | |
| Goldman Sachs Group Inc. | 6.000% | 5/1/14 | 40,000 | 41,083 | |
| Goldman Sachs Group Inc. | 5.350% | 1/15/16 | 70,000 | 70,020 | |
| Goldman Sachs Group Inc. | 3.625% | 2/7/16 | 7,111 | 6,754 | |
| Goldman Sachs Group Inc. | 5.625% | 1/15/17 | 40,000 | 39,087 | |
| Goldman Sachs Group Inc. | 5.950% | 1/18/18 | 44,000 | 43,516 | |
| Goldman Sachs Group Inc. | 6.000% | 6/15/20 | 5,000 | 4,874 | |
| Goldman Sachs Group Inc. | 5.250% | 7/27/21 | 12,665 | 11,733 | |
| Goldman Sachs Group Inc. | 6.450% | 5/1/36 | 50,000 | 44,021 | |
| Goldman Sachs Group Inc. | 6.750% | 10/1/37 | 43,995 | 39,212 | |
| Goldman Sachs Group Inc. | 6.250% | 2/1/41 | 35,320 | 32,013 | |
| 5 | HBOS plc | 6.000% | 11/1/33 | 48,880 | 29,891 |
| 5 | HSBC Bank plc | 2.000% | 1/19/14 | 38,000 | 37,896 |
| 5 | HSBC Bank plc | 3.500% | 6/28/15 | 17,937 | 18,122 |
| 5 | HSBC Bank plc | 4.750% | 1/19/21 | 62,040 | 62,631 |
| HSBC Bank USA NA | 4.625% | 4/1/14 | 19,710 | 20,265 | |
| HSBC Holdings plc | 6.500% | 5/2/36 | 25,000 | 23,846 | |
| HSBC Holdings plc | 6.100% | 1/14/42 | 54,000 | 56,597 | |
| 5 | ING Bank NV | 2.650% | 1/14/13 | 40,000 | 39,909 |
| 5 | ING Bank NV | 2.000% | 10/18/13 | 40,000 | 38,741 |
| JPMorgan Chase & Co. | 5.125% | 9/15/14 | 50,000 | 52,248 | |
| JPMorgan Chase & Co. | 5.250% | 5/1/15 | 40,000 | 41,939 | |
| JPMorgan Chase & Co. | 6.000% | 1/15/18 | 57,000 | 62,679 | |
| JPMorgan Chase & Co. | 6.300% | 4/23/19 | 10,340 | 11,343 | |
| JPMorgan Chase & Co. | 4.950% | 3/25/20 | 55,000 | 56,020 | |
| JPMorgan Chase & Co. | 5.600% | 7/15/41 | 96,000 | 100,174 | |
| 2 | JPMorgan Chase & Co. | 7.900% | 12/29/49 | 31,521 | 33,097 |
4
Vanguard® Wellington Fund
Schedule of Investments
November 30, 2011
| Face | Market | ||||
| Maturity | Amount | Value | |||
| Coupon | Date | ($000) | ($000) | ||
| Mellon Funding Corp. | 5.000% | 12/1/14 | 30,000 | 32,361 | |
| Merrill Lynch & Co. Inc. | 6.050% | 5/16/16 | 70,000 | 65,665 | |
| Merrill Lynch & Co. Inc. | 6.400% | 8/28/17 | 23,000 | 21,856 | |
| Merrill Lynch & Co. Inc. | 6.875% | 4/25/18 | 40,000 | 37,803 | |
| Merrill Lynch & Co. Inc. | 6.220% | 9/15/26 | 25,000 | 20,148 | |
| Morgan Stanley | 6.750% | 10/15/13 | 25,775 | 26,911 | |
| Morgan Stanley | 7.070% | 2/10/14 | 17,500 | 18,279 | |
| Morgan Stanley | 4.750% | 4/1/14 | 70,000 | 67,186 | |
| Morgan Stanley | 6.000% | 5/13/14 | 20,000 | 19,816 | |
| Morgan Stanley | 6.000% | 4/28/15 | 44,000 | 42,737 | |
| Morgan Stanley | 3.800% | 4/29/16 | 14,470 | 12,731 | |
| Morgan Stanley | 5.450% | 1/9/17 | 70,000 | 65,071 | |
| Morgan Stanley | 5.750% | 1/25/21 | 55,425 | 49,062 | |
| Morgan Stanley | 6.250% | 8/9/26 | 20,000 | 17,025 | |
| National City Corp. | 6.875% | 5/15/19 | 13,950 | 16,182 | |
| 5 | Nordea Bank AB | 2.125% | 1/14/14 | 39,500 | 39,212 |
| 5 | Nordea Bank AB | 3.700% | 11/13/14 | 22,880 | 23,326 |
| Northern Trust Co. | 4.600% | 2/1/13 | 5,925 | 6,168 | |
| Northern Trust Corp. | 5.200% | 11/9/12 | 34,940 | 36,399 | |
| Northern Trust Corp. | 3.450% | 11/4/20 | 9,000 | 9,098 | |
| Paribas | 6.950% | 7/22/13 | 40,000 | 40,922 | |
| PNC Bank NA | 4.875% | 9/21/17 | 50,000 | 52,582 | |
| 2 | PNC Financial Services Group Inc. | 8.250% | 5/31/49 | 44,000 | 44,000 |
| 5 | Societe Generale SA | 5.200% | 4/15/21 | 80,795 | 69,030 |
| 5 | Standard Chartered plc | 3.850% | 4/27/15 | 14,990 | 15,065 |
| State Street Corp. | 5.375% | 4/30/17 | 76,315 | 87,211 | |
| 5 | Svenska Handelsbanken AB | 4.875% | 6/10/14 | 56,000 | 59,176 |
| Toronto-Dominion Bank | 1.375% | 7/14/14 | 34,045 | 34,196 | |
| UBS AG | 3.875% | 1/15/15 | 50,000 | 49,285 | |
| UBS AG | 5.875% | 7/15/16 | 50,000 | 49,000 | |
| US Bancorp | 2.875% | 11/20/14 | 32,000 | 33,257 | |
| US Bank NA | 6.300% | 2/4/14 | 30,000 | 32,911 | |
| Wachovia Bank NA | 6.600% | 1/15/38 | 60,000 | 64,574 | |
| Wachovia Corp. | 5.500% | 5/1/13 | 35,000 | 36,971 | |
| Wachovia Corp. | 5.250% | 8/1/14 | 2,900 | 3,064 | |
| Wells Fargo & Co. | 5.125% | 9/1/12 | 10,000 | 10,289 | |
| Wells Fargo & Co. | 5.250% | 10/23/12 | 50,000 | 51,910 | |
| Wells Fargo & Co. | 4.625% | 4/15/14 | 15,000 | 15,536 | |
| Wells Fargo & Co. | 3.750% | 10/1/14 | 28,000 | 29,454 | |
| Wells Fargo & Co. | 3.625% | 4/15/15 | 2,200 | 2,284 | |
| Wells Fargo & Co. | 3.676% | 6/15/16 | 19,000 | 19,901 | |
| Wells Fargo & Co. | 5.125% | 9/15/16 | 25,000 | 26,188 | |
| Wells Fargo & Co. | 5.625% | 12/11/17 | 31,150 | 34,766 | |
| Brokerage (0.1%) | |||||
| Ameriprise Financial Inc. | 5.300% | 3/15/20 | 11,590 | 12,431 | |
| Charles Schwab Corp. | 4.950% | 6/1/14 | 14,750 | 15,890 | |
| Finance Companies (0.6%) | |||||
| General Electric Capital Corp. | 5.450% | 1/15/13 | 31,585 | 33,034 | |
| General Electric Capital Corp. | 2.950% | 5/9/16 | 25,000 | 25,060 | |
| General Electric Capital Corp. | 5.400% | 2/15/17 | 20,000 | 21,888 | |
| General Electric Capital Corp. | 5.625% | 9/15/17 | 20,000 | 21,886 | |
| General Electric Capital Corp. | 4.625% | 1/7/21 | 117,000 | 116,522 | |
| General Electric Capital Corp. | 5.300% | 2/11/21 | 30,850 | 31,774 | |
| General Electric Capital Corp. | 6.750% | 3/15/32 | 30,000 | 32,165 | |
| General Electric Capital Corp. | 6.150% | 8/7/37 | 37,800 | 37,590 | |
| 2,5 | US Trade Funding Corp. | 4.260% | 11/15/14 | 6,525 | 6,827 |
| Insurance (1.7%) | |||||
| ACE Capital Trust II | 9.700% | 4/1/30 | 20,000 | 26,400 | |
| ACE INA Holdings Inc. | 2.600% | 11/23/15 | 11,000 | 11,128 | |
| ACE INA Holdings Inc. | 5.800% | 3/15/18 | 40,360 | 46,086 | |
| Aetna Inc. | 6.500% | 9/15/18 | 11,460 | 13,770 | |
| Allstate Corp. | 5.000% | 8/15/14 | 10,000 | 10,934 | |
| 2 | Allstate Corp. | 6.500% | 5/15/57 | 20,000 | 18,000 |
5
| Vanguard® Wellington Fund | |||||
| Schedule of Investments | |||||
| November 30, 2011 | |||||
| Face | Market | ||||
| Maturity | Amount | Value | |||
| Coupon | Date | ($000) | ($000) | ||
| 2 | Allstate Corp. | 6.125% | 5/15/67 | 30,000 | 27,000 |
| Berkshire Hathaway Finance Corp. | 4.625% | 10/15/13 | 50,000 | 53,669 | |
| Chubb Corp. | 6.000% | 5/11/37 | 50,000 | 58,005 | |
| Cincinnati Financial Corp. | 6.920% | 5/15/28 | 14,800 | 15,868 | |
| 5 | Farmers Exchange Capital | 7.050% | 7/15/28 | 25,000 | 26,455 |
| Genworth Global Funding Trusts | 5.750% | 5/15/13 | 25,000 | 25,588 | |
| Hartford Financial Services Group Inc. | 4.625% | 7/15/13 | 9,000 | 9,230 | |
| Hartford Financial Services Group Inc. | 4.750% | 3/1/14 | 15,000 | 15,547 | |
| Hartford Financial Services Group Inc. | 6.000% | 1/15/19 | 4,845 | 4,934 | |
| 5 | Jackson National Life Insurance Co. | 8.150% | 3/15/27 | 39,480 | 47,787 |
| 5 | Liberty Mutual Insurance Co. | 7.875% | 10/15/26 | 31,210 | 35,096 |
| 5 | MassMutual Global Funding II | 2.875% | 4/21/14 | 11,390 | 11,646 |
| 5 | Metropolitan Life Global Funding I | 5.125% | 6/10/14 | 20,000 | 21,550 |
| 5 | Metropolitan Life Insurance Co. | 7.700% | 11/1/15 | 51,000 | 59,644 |
| 5 | New York Life Global Funding | 5.250% | 10/16/12 | 10,720 | 11,127 |
| 5 | New York Life Insurance Co. | 5.875% | 5/15/33 | 55,395 | 62,730 |
| Prudential Financial Inc. | 5.150% | 1/15/13 | 10,615 | 11,031 | |
| Prudential Financial Inc. | 4.750% | 4/1/14 | 28,700 | 30,346 | |
| Prudential Financial Inc. | 5.100% | 9/20/14 | 10,000 | 10,710 | |
| Prudential Financial Inc. | 3.000% | 5/12/16 | 11,995 | 11,798 | |
| Prudential Financial Inc. | 4.500% | 11/15/20 | 34,365 | 33,185 | |
| 5 | TIAA Global Markets Inc. | 5.125% | 10/10/12 | 46,100 | 47,693 |
| Torchmark Corp. | 7.875% | 5/15/23 | 45,000 | 52,810 | |
| Travelers Cos. Inc. | 5.800% | 5/15/18 | 32,500 | 37,528 | |
| UnitedHealth Group Inc. | 6.000% | 6/15/17 | 9,500 | 11,095 | |
| UnitedHealth Group Inc. | 6.000% | 2/15/18 | 26,300 | 30,669 | |
| UnitedHealth Group Inc. | 3.875% | 10/15/20 | 27,960 | 28,996 | |
| WellPoint Inc. | 4.350% | 8/15/20 | 10,000 | 10,686 | |
| Other Finance (0.1%) | |||||
| NYSE Euronext | 4.800% | 6/28/13 | 52,025 | 54,736 | |
| Real Estate Investment Trusts (0.5%) | |||||
| Duke Realty LP | 5.950% | 2/15/17 | 3,075 | 3,249 | |
| Duke Realty LP | 6.500% | 1/15/18 | 8,755 | 9,402 | |
| HCP Inc. | 3.750% | 2/1/16 | 7,950 | 7,993 | |
| Realty Income Corp. | 6.750% | 8/15/19 | 21,075 | 23,797 | |
| Simon Property Group LP | 5.100% | 6/15/15 | 50,000 | 54,330 | |
| Simon Property Group LP | 6.100% | 5/1/16 | 49,050 | 55,282 | |
| Simon Property Group LP | 6.125% | 5/30/18 | 10,000 | 11,327 | |
| 5 | WCI Finance LLC / WEA Finance LLC | 5.700% | 10/1/16 | 64,150 | 69,203 |
| 5 | WEA Finance LLC | 7.125% | 4/15/18 | 34,000 | 38,128 |
| 5,659,020 | |||||
| Industrial (9.7%) | |||||
| Basic Industry (0.3%) | |||||
| ArcelorMittal | 6.750% | 3/1/41 | 9,098 | 7,736 | |
| BHP Billiton Finance USA Ltd. | 7.250% | 3/1/16 | 15,000 | 18,279 | |
| EI du Pont de Nemours & Co. | 2.750% | 4/1/16 | 54,000 | 56,701 | |
| 2,5 | Pacific Beacon LLC | 5.379% | 7/15/26 | 8,801 | 9,595 |
| PPG Industries Inc. | 6.875% | 2/15/12 | 9,355 | 9,460 | |
| Rio Tinto Alcan Inc. | 7.250% | 3/15/31 | 21,273 | 27,801 | |
| Rio Tinto Finance USA Ltd. | 6.500% | 7/15/18 | 37,000 | 43,666 | |
| 2 | Rohm and Haas Holdings Ltd. | 9.800% | 4/15/20 | 6,375 | 7,773 |
| Capital Goods (0.9%) | |||||
| 3M Co. | 6.375% | 2/15/28 | 30,000 | 38,949 | |
| Boeing Co. | 8.625% | 11/15/31 | 9,460 | 14,270 | |
| Caterpillar Inc. | 3.900% | 5/27/21 | 42,840 | 45,645 | |
| Caterpillar Inc. | 7.300% | 5/1/31 | 10,000 | 14,041 | |
| Deere & Co. | 7.125% | 3/3/31 | 17,500 | 24,333 | |
| General Dynamics Corp. | 3.875% | 7/15/21 | 14,925 | 15,999 | |
| General Electric Co. | 5.250% | 12/6/17 | 41,685 | 46,897 | |
| Honeywell International Inc. | 4.250% | 3/1/21 | 40,681 | 45,078 | |
| Raytheon Co. | 1.625% | 10/15/15 | 35,210 | 35,097 | |
6
| Vanguard® Wellington Fund | ||||
| Schedule of Investments | ||||
| November 30, 2011 | ||||
| Face | Market | |||
| Maturity | Amount | Value | ||
| Coupon | Date | ($000) | ($000) | |
| 5 Siemens Financieringsmaatschappij NV | 5.750% | 10/17/16 | 89,650 | 104,299 |
| United Technologies Corp. | 7.500% | 9/15/29 | 19,230 | 26,742 |
| United Technologies Corp. | 6.050% | 6/1/36 | 20,325 | 24,913 |
| United Technologies Corp. | 6.125% | 7/15/38 | 45,000 | 56,794 |
| Communication (2.0%) | ||||
| AT&T Inc. | 5.100% | 9/15/14 | 40,160 | 44,284 |
| AT&T Inc. | 2.950% | 5/15/16 | 23,655 | 24,434 |
| AT&T Inc. | 5.600% | 5/15/18 | 44,000 | 50,526 |
| AT&T Inc. | 5.800% | 2/15/19 | 10,000 | 11,494 |
| AT&T Inc. | 6.450% | 6/15/34 | 73,115 | 83,709 |
| AT&T Inc. | 6.800% | 5/15/36 | 11,305 | 13,725 |
| AT&T Inc. | 6.500% | 9/1/37 | 9,675 | 11,330 |
| BellSouth Corp. | 5.200% | 9/15/14 | 20,000 | 22,050 |
| BellSouth Corp. | 6.550% | 6/15/34 | 32,225 | 36,898 |
| BellSouth Corp. | 6.000% | 11/15/34 | 11,995 | 13,226 |
| BellSouth Telecommunications Inc. | 7.000% | 12/1/95 | 27,600 | 32,452 |
| CBS Corp. | 4.300% | 2/15/21 | 27,830 | 27,813 |
| Cellco Partnership / Verizon Wireless Capital LLC | 5.550% | 2/1/14 | 28,000 | 30,501 |
| Cellco Partnership / Verizon Wireless Capital LLC | 8.500% | 11/15/18 | 21,000 | 27,916 |
| Comcast Corp. | 5.700% | 5/15/18 | 20,000 | 22,670 |
| DIRECTV Holdings LLC / DIRECTV Financing Co. Inc. | 3.125% | 2/15/16 | 7,665 | 7,735 |
| DIRECTV Holdings LLC / DIRECTV Financing Co. Inc. | 3.500% | 3/1/16 | 31,150 | 31,900 |
| DIRECTV Holdings LLC / DIRECTV Financing Co. Inc. | 5.200% | 3/15/20 | 20,000 | 20,947 |
| DIRECTV Holdings LLC / DIRECTV Financing Co. Inc. | 6.375% | 3/1/41 | 24,640 | 26,891 |
| Discovery Communications LLC | 5.625% | 8/15/19 | 10,635 | 11,876 |
| Discovery Communications LLC | 5.050% | 6/1/20 | 8,365 | 9,019 |
| France Telecom SA | 4.375% | 7/8/14 | 16,800 | 17,846 |
| Grupo Televisa SAB | 6.625% | 1/15/40 | 25,090 | 27,555 |
| NBCUniversal Media LLC | 4.375% | 4/1/21 | 23,900 | 24,354 |
| News America Inc. | 4.500% | 2/15/21 | 14,500 | 14,633 |
| News America Inc. | 6.150% | 2/15/41 | 33,265 | 35,247 |
| Telefonica Emisiones SAU | 3.992% | 2/16/16 | 34,790 | 32,906 |
| Time Warner Cable Inc. | 5.850% | 5/1/17 | 34,980 | 39,378 |
| Time Warner Cable Inc. | 6.750% | 6/15/39 | 29,985 | 34,439 |
| Verizon Communications Inc. | 4.350% | 2/15/13 | 15,530 | 16,182 |
| Verizon Communications Inc. | 5.500% | 4/1/17 | 25,000 | 28,770 |
| Verizon Communications Inc. | 5.850% | 9/15/35 | 49,525 | 57,026 |
| Verizon Communications Inc. | 6.900% | 4/15/38 | 9,710 | 12,350 |
| Verizon Communications Inc. | 4.750% | 11/1/41 | 11,880 | 11,905 |
| Verizon Global Funding Corp. | 7.750% | 12/1/30 | 56,410 | 75,064 |
| Verizon Maryland Inc. | 7.150% | 5/1/23 | 10,000 | 10,698 |
| Vodafone Group plc | 5.000% | 12/16/13 | 10,000 | 10,726 |
| Vodafone Group plc | 5.375% | 1/30/15 | 40,000 | 44,560 |
| Vodafone Group plc | 2.875% | 3/16/16 | 33,000 | 34,015 |
| Consumer Cyclical (1.6%) | ||||
| 5 American Honda Finance Corp. | 4.625% | 4/2/13 | 50,000 | 52,204 |
| CVS Caremark Corp. | 4.875% | 9/15/14 | 25,200 | 27,662 |
| CVS Caremark Corp. | 5.750% | 6/1/17 | 26,185 | 30,189 |
| Daimler Finance North America LLC | 6.500% | 11/15/13 | 49,855 | 54,314 |
| Daimler Finance North America LLC | 8.500% | 1/18/31 | 33,000 | 43,547 |
| Home Depot Inc. | 3.950% | 9/15/20 | 16,000 | 16,865 |
| Johnson Controls Inc. | 7.125% | 7/15/17 | 36,300 | 43,997 |
| Lowe's Cos. Inc. | 6.875% | 2/15/28 | 5,790 | 7,038 |
| Lowe's Cos. Inc. | 6.500% | 3/15/29 | 39,900 | 47,142 |
| Lowe's Cos. Inc. | 5.500% | 10/15/35 | 20,000 | 21,020 |
| Lowe's Cos. Inc. | 6.650% | 9/15/37 | 25,905 | 31,216 |
| Staples Inc. | 9.750% | 1/15/14 | 25,220 | 28,877 |
| Target Corp. | 5.875% | 7/15/16 | 20,000 | 23,589 |
| Time Warner Cos. Inc. | 7.570% | 2/1/24 | 20,000 | 25,041 |
| Time Warner Cos. Inc. | 6.950% | 1/15/28 | 20,000 | 24,312 |
| Time Warner Inc. | 4.875% | 3/15/20 | 14,000 | 14,889 |
| Toyota Motor Credit Corp. | 2.800% | 1/11/16 | 42,517 | 43,984 |
| Viacom Inc. | 6.125% | 10/5/17 | 7,500 | 8,606 |
7
Vanguard® Wellington Fund
Schedule of Investments
November 30, 2011
| Face | Market | |||
| Maturity | Amount | Value | ||
| Coupon | Date | ($000) | ($000) | |
| Wal-Mart Stores Inc. | 3.250% | 10/25/20 | 25,754 | 26,686 |
| Wal-Mart Stores Inc. | 4.250% | 4/15/21 | 29,000 | 32,550 |
| Wal-Mart Stores Inc. | 5.625% | 4/15/41 | 112,595 | 133,389 |
| Walt Disney Co. | 5.625% | 9/15/16 | 30,000 | 35,564 |
| Western Union Co. | 5.930% | 10/1/16 | 60,000 | 67,266 |
| Consumer Noncyclical (2.8%) | ||||
| Altria Group Inc. | 4.125% | 9/11/15 | 10,000 | 10,775 |
| Altria Group Inc. | 4.750% | 5/5/21 | 18,300 | 19,254 |
| Amgen Inc. | 2.300% | 6/15/16 | 25,340 | 24,901 |
| Amgen Inc. | 4.500% | 3/15/20 | 6,625 | 6,848 |
| Amgen Inc. | 5.150% | 11/15/41 | 36,000 | 34,686 |
| Anheuser-Busch Cos. LLC | 5.000% | 3/1/19 | 15,000 | 16,827 |
| Anheuser-Busch Cos. LLC | 6.500% | 1/1/28 | 19,550 | 23,520 |
| Anheuser-Busch InBev Worldwide Inc. | 5.375% | 1/15/20 | 12,830 | 14,743 |
| Anheuser-Busch InBev Worldwide Inc. | 4.375% | 2/15/21 | 36,000 | 39,294 |
| AstraZeneca plc | 6.450% | 9/15/37 | 23,385 | 30,117 |
| Baxter International Inc. | 5.900% | 9/1/16 | 12,498 | 14,841 |
| 5 Cargill Inc. | 6.000% | 11/27/17 | 25,000 | 29,365 |
| 5 Cargill Inc. | 4.307% | 5/14/21 | 60,532 | 64,898 |
| 5 Cargill Inc. | 6.875% | 5/1/28 | 19,355 | 25,186 |
| 5 Cargill Inc. | 6.125% | 4/19/34 | 28,980 | 34,762 |
| Coca-Cola Co. | 5.350% | 11/15/17 | 85,000 | 101,521 |
| 5 Coca-Cola Co. | 3.300% | 9/1/21 | 10,075 | 10,365 |
| Coca-Cola Enterprises Inc. | 3.500% | 9/15/20 | 9,900 | 10,120 |
| Coca-Cola Enterprises Inc. | 4.500% | 9/1/21 | 8,430 | 9,181 |
| Coca-Cola HBC Finance BV | 5.125% | 9/17/13 | 43,000 | 45,506 |
| Coca-Cola HBC Finance BV | 5.500% | 9/17/15 | 17,440 | 19,124 |
| Colgate-Palmolive Co. | 7.600% | 5/19/25 | 13,920 | 19,804 |
| Diageo Capital plc | 5.200% | 1/30/13 | 16,190 | 17,010 |
| Express Scripts Inc. | 6.250% | 6/15/14 | 14,670 | 16,020 |
| GlaxoSmithKline Capital Inc. | 5.375% | 4/15/34 | 45,000 | 52,311 |
| Hershey Co. | 4.850% | 8/15/15 | 9,620 | 10,774 |
| Johnson & Johnson | 2.150% | 5/15/16 | 41,000 | 42,538 |
| Johnson & Johnson | 5.150% | 7/15/18 | 14,800 | 17,606 |
| Kellogg Co. | 4.000% | 12/15/20 | 57,000 | 59,833 |
| Kimberly-Clark Corp. | 4.875% | 8/15/15 | 30,000 | 33,684 |
| Kraft Foods Inc. | 5.375% | 2/10/20 | 24,000 | 26,569 |
| McKesson Corp. | 3.250% | 3/1/16 | 6,650 | 7,014 |
| Medtronic Inc. | 4.750% | 9/15/15 | 20,000 | 22,434 |
| Merck & Co. Inc. | 6.550% | 9/15/37 | 10,000 | 13,529 |
| Pepsi Bottling Group Inc. | 7.000% | 3/1/29 | 10,000 | 13,745 |
| PepsiCo Inc. | 3.100% | 1/15/15 | 38,800 | 41,009 |
| Pfizer Inc. | 5.350% | 3/15/15 | 33,000 | 37,367 |
| Philip Morris International Inc. | 4.500% | 3/26/20 | 8,250 | 9,086 |
| Philip Morris International Inc. | 4.125% | 5/17/21 | 43,025 | 46,404 |
| 2 Procter & Gamble - Esop | 9.360% | 1/1/21 | 47,717 | 63,779 |
| 5 Roche Holdings Inc. | 6.000% | 3/1/19 | 14,250 | 17,159 |
| 5 SABMiller plc | 6.500% | 7/1/16 | 50,000 | 58,375 |
| Sanofi | 4.000% | 3/29/21 | 44,090 | 47,363 |
| St. Jude Medical Inc. | 2.500% | 1/15/16 | 24,840 | 25,447 |
| 5 Tesco plc | 5.500% | 11/15/17 | 50,000 | 57,815 |
| Thermo Fisher Scientific Inc. | 3.250% | 11/20/14 | 9,385 | 9,905 |
| Thermo Fisher Scientific Inc. | 3.200% | 5/1/15 | 10,355 | 10,940 |
| Thermo Fisher Scientific Inc. | 3.200% | 3/1/16 | 11,405 | 12,034 |
| Unilever Capital Corp. | 4.250% | 2/10/21 | 95,235 | 106,504 |
| Wyeth | 5.950% | 4/1/37 | 25,000 | 30,371 |
| Zeneca Wilmington Inc. | 7.000% | 11/15/23 | 29,000 | 39,086 |
| Energy (0.7%) | ||||
| Apache Finance Canada Corp. | 7.750% | 12/15/29 | 19,910 | 28,743 |
| BP Capital Markets plc | 3.125% | 10/1/15 | 16,000 | 16,539 |
| BP Capital Markets plc | 3.200% | 3/11/16 | 33,000 | 34,307 |
| BP Capital Markets plc | 4.750% | 3/10/19 | 27,215 | 29,854 |
| BP Capital Markets plc | 4.500% | 10/1/20 | 16,000 | 17,230 |
8
| Vanguard® Wellington Fund | ||||
| Schedule of Investments | ||||
| November 30, 2011 | ||||
| Face | Market | |||
| Maturity | Amount | Value | ||
| Coupon | Date | ($000) | ($000) | |
| ConocoPhillips | 5.200% | 5/15/18 | 80,000 | 91,517 |
| EOG Resources Inc. | 5.625% | 6/1/19 | 16,100 | 18,813 |
| 5 Motiva Enterprises LLC | 5.750% | 1/15/20 | 5,065 | 5,784 |
| Occidental Petroleum Corp. | 4.100% | 2/1/21 | 39,240 | 42,747 |
| Shell International Finance BV | 3.250% | 9/22/15 | 44,000 | 47,065 |
| Shell International Finance BV | 4.375% | 3/25/20 | 38,000 | 43,220 |
| Suncor Energy Inc. | 5.950% | 12/1/34 | 20,700 | 22,643 |
| Other Industrial (0.1%) | ||||
| 5 Hutchison Whampoa International 03/13 Ltd. | 6.500% | 2/13/13 | 50,000 | 52,490 |
| Technology (0.9%) | ||||
| Cisco Systems Inc. | 4.450% | 1/15/20 | 40,000 | 44,339 |
| Dell Inc. | 5.875% | 6/15/19 | 34,840 | 40,381 |
| Google Inc. | 2.125% | 5/19/16 | 27,365 | 28,161 |
| Hewlett-Packard Co. | 2.650% | 6/1/16 | 17,000 | 17,159 |
| Hewlett-Packard Co. | 5.500% | 3/1/18 | 29,135 | 32,587 |
| Hewlett-Packard Co. | 3.750% | 12/1/20 | 82,000 | 80,543 |
| Hewlett-Packard Co. | 4.300% | 6/1/21 | 26,000 | 26,452 |
| International Business Machines Corp. | 2.000% | 1/5/16 | 40,400 | 41,118 |
| International Business Machines Corp. | 1.950% | 7/22/16 | 23,211 | 23,521 |
| International Business Machines Corp. | 8.375% | 11/1/19 | 25,000 | 34,936 |
| International Business Machines Corp. | 5.875% | 11/29/32 | 25,000 | 30,855 |
| Intuit Inc. | 5.400% | 3/15/12 | 19,610 | 19,862 |
| Microsoft Corp. | 4.000% | 2/8/21 | 16,000 | 17,711 |
| Oracle Corp. | 6.125% | 7/8/39 | 18,000 | 22,473 |
| Transportation (0.4%) | ||||
| 2 Continental Airlines 2007-1 Class A Pass Through Trust | 5.983% | 4/19/22 | 29,246 | 30,270 |
| 5 ERAC USA Finance LLC | 2.250% | 1/10/14 | 5,890 | 5,920 |
| 5 ERAC USA Finance LLC | 5.900% | 11/15/15 | 19,500 | 21,904 |
| 5 ERAC USA Finance LLC | 4.500% | 8/16/21 | 9,295 | 9,249 |
| 5 ERAC USA Finance LLC | 7.000% | 10/15/37 | 26,175 | 30,657 |
| 2 Federal Express Corp. 1998 Pass Through Trust | 6.720% | 1/15/22 | 31,346 | 36,763 |
| Southwest Airlines Co. | 5.750% | 12/15/16 | 32,500 | 36,175 |
| 2 Southwest Airlines Co. 1993-A Pass Through Trust | 7.540% | 6/29/15 | 22,862 | 25,325 |
| 2 Southwest Airlines Co. 2007-1 Pass Through Trust | 6.150% | 8/1/22 | 20,419 | 21,440 |
| United Parcel Service Inc. | 4.875% | 11/15/40 | 14,815 | 16,543 |
| 5,299,710 | ||||
| Utilities (2.8%) | ||||
| Electric (2.3%) | ||||
| Alabama Power Co. | 5.550% | 2/1/17 | 17,650 | 20,571 |
| Alabama Power Co. | 5.700% | 2/15/33 | 15,000 | 18,491 |
| Ameren Illinois Co. | 6.125% | 12/15/28 | 54,000 | 58,621 |
| Carolina Power & Light Co. | 6.300% | 4/1/38 | 14,705 | 20,052 |
| Commonwealth Edison Co. | 5.950% | 8/15/16 | 23,120 | 26,875 |
| Connecticut Light & Power Co. | 5.650% | 5/1/18 | 13,655 | 16,266 |
| Consolidated Edison Co. of New York Inc. | 5.500% | 9/15/16 | 20,930 | 24,448 |
| Consolidated Edison Co. of New York Inc. | 5.300% | 12/1/16 | 25,505 | 29,599 |
| Consolidated Edison Co. of New York Inc. | 7.125% | 12/1/18 | 11,278 | 14,412 |
| Dominion Resources Inc. | 5.200% | 8/15/19 | 19,250 | 21,969 |
| Duke Energy Carolinas LLC | 5.250% | 1/15/18 | 9,000 | 10,516 |
| Duke Energy Carolinas LLC | 5.100% | 4/15/18 | 18,235 | 21,263 |
| Duke Energy Carolinas LLC | 3.900% | 6/15/21 | 50,025 | 53,903 |
| 5 EDP Finance BV | 5.375% | 11/2/12 | 40,745 | 39,821 |
| 5 Enel Finance International NV | 6.800% | 9/15/37 | 38,515 | 32,984 |
| Florida Power & Light Co. | 5.650% | 2/1/35 | 50,000 | 61,578 |
| Florida Power & Light Co. | 4.950% | 6/1/35 | 10,000 | 11,286 |
| Florida Power & Light Co. | 5.650% | 2/1/37 | 5,000 | 6,189 |
| Florida Power & Light Co. | 5.950% | 2/1/38 | 39,215 | 50,993 |
| Florida Power Corp. | 6.350% | 9/15/37 | 8,000 | 10,416 |
| Florida Power Corp. | 6.400% | 6/15/38 | 27,055 | 36,189 |
| Georgia Power Co. | 5.400% | 6/1/18 | 38,660 | 45,135 |
| Midamerican Energy Holdings Co. | 6.125% | 4/1/36 | 25,000 | 29,671 |
9
Vanguard® Wellington Fund
Schedule of Investments
November 30, 2011
| Face | Market | |||
| Maturity | Amount | Value | ||
| Coupon | Date | ($000) | ($000) | |
| National Rural Utilities Cooperative Finance Corp. | 3.875% | 9/16/15 | 24,125 | 26,028 |
| National Rural Utilities Cooperative Finance Corp. | 5.450% | 2/1/18 | 60,000 | 68,456 |
| Northern States Power Co. | 6.250% | 6/1/36 | 50,000 | 67,437 |
| NSTAR | 4.500% | 11/15/19 | 3,535 | 3,829 |
| Pacific Gas & Electric Co. | 4.250% | 5/15/21 | 11,365 | 12,168 |
| PacifiCorp | 5.900% | 8/15/34 | 12,500 | 15,436 |
| PacifiCorp | 6.250% | 10/15/37 | 36,635 | 46,093 |
| Peco Energy Co. | 5.350% | 3/1/18 | 20,545 | 24,010 |
| Potomac Electric Power Co. | 6.500% | 11/15/37 | 25,000 | 34,020 |
| PPL Energy Supply LLC | 6.200% | 5/15/16 | 13,573 | 15,133 |
| Public Service Electric & Gas Co. | 5.300% | 5/1/18 | 25,100 | 29,560 |
| San Diego Gas & Electric Co. | 6.000% | 6/1/26 | 3,600 | 4,522 |
| South Carolina Electric & Gas Co. | 5.800% | 1/15/33 | 9,000 | 10,857 |
| South Carolina Electric & Gas Co. | 6.050% | 1/15/38 | 34,000 | 42,887 |
| Southern California Edison Co. | 6.000% | 1/15/34 | 7,695 | 9,777 |
| Southern California Edison Co. | 5.550% | 1/15/37 | 50,475 | 62,130 |
| Southern California Edison Co. | 5.950% | 2/1/38 | 40,000 | 52,013 |
| Wisconsin Electric Power Co. | 4.500% | 5/15/13 | 21,565 | 22,645 |
| Wisconsin Electric Power Co. | 5.700% | 12/1/36 | 17,280 | 21,854 |
| Wisconsin Public Service Corp. | 6.080% | 12/1/28 | 45,000 | 54,753 |
| Natural Gas (0.4%) | ||||
| AGL Capital Corp. | 6.375% | 7/15/16 | 25,815 | 29,864 |
| British Transco Finance Inc. | 6.625% | 6/1/18 | 50,000 | 56,430 |
| 5 DCP Midstream LLC | 6.450% | 11/3/36 | 30,325 | 34,309 |
| KeySpan Corp. | 4.650% | 4/1/13 | 9,000 | 9,354 |
| National Grid plc | 6.300% | 8/1/16 | 30,000 | 34,494 |
| TransCanada PipeLines Ltd. | 3.800% | 10/1/20 | 47,125 | 49,355 |
| Wisconsin Gas LLC | 6.600% | 9/15/13 | 13,100 | 14,109 |
| Other Utility (0.1%) | ||||
| UGI Utilities Inc. | 5.753% | 9/30/16 | 37,590 | 43,438 |
| 1,556,209 | ||||
| Total Corporate Bonds (Cost $11,683,138) | 12,514,939 | |||
| Sovereign Bonds (U.S. Dollar-Denominated) (0.9%) | ||||
| 5 Abu Dhabi National Energy Co. | 5.875% | 10/27/16 | 41,140 | 45,018 |
| 5 Austria Government International Bond | 2.000% | 11/15/12 | 19,825 | 19,995 |
| 5 CDP Financial Inc. | 4.400% | 11/25/19 | 40,000 | 42,974 |
| 5 EDF SA | 4.600% | 1/27/20 | 50,000 | 50,915 |
| International Bank for Reconstruction & Development | 4.750% | 2/15/35 | 40,000 | 49,033 |
| Japan Finance Organization for Municipalities | 4.625% | 4/21/15 | 7,800 | 8,676 |
| Kreditanstalt fuer Wiederaufbau | 7.000% | 3/1/13 | 10,000 | 10,733 |
| Oesterreichische Kontrollbank AG | 4.500% | 3/9/15 | 10,500 | 11,647 |
| Province of Ontario | 4.500% | 2/3/15 | 35,000 | 38,708 |
| Province of Ontario | 4.000% | 10/7/19 | 56,415 | 61,855 |
| Province of Ontario | 4.400% | 4/14/20 | 50,000 | 56,200 |
| Quebec | 5.125% | 11/14/16 | 50,000 | 58,054 |
| 5 Ras Laffan Liquefied Natural Gas Co. Ltd. III | 5.500% | 9/30/14 | 14,985 | 15,959 |
| South Africa Government International Bond | 6.500% | 6/2/14 | 21,900 | 24,008 |
| Statoil ASA | 2.900% | 10/15/14 | 9,885 | 10,364 |
| Total Sovereign Bonds (Cost $455,817) | 504,139 | |||
| Taxable Municipal Bonds (2.0%) | ||||
| Atlanta GA Downtown Development Authority | ||||
| Revenue | 6.875% | 2/1/21 | 11,505 | 14,455 |
| Bay Area Toll Authority California Toll Bridge Revenue | ||||
| (San Francisco Bay Area) | 6.263% | 4/1/49 | 40,000 | 50,569 |
| Board of Trustees of The Leland Stanford Junior | ||||
| University | 6.875% | 2/1/24 | 34,745 | 46,944 |
| Board of Trustees of The Leland Stanford Junior | ||||
| University | 7.650% | 6/15/26 | 29,000 | 41,837 |
| California GO | 5.700% | 11/1/21 | 11,840 | 12,976 |
10
| Vanguard® Wellington Fund | |||||
| Schedule of Investments | |||||
| November 30, 2011 | |||||
| Face | Market | ||||
| Maturity | Amount | Value | |||
| Coupon | Date | ($000) | ($000) | ||
| California GO | 7.550% | 4/1/39 | 2,790 | 3,316 | |
| California GO | 7.300% | 10/1/39 | 4,280 | 5,067 | |
| California GO | 7.600% | 11/1/40 | 23,935 | 28,709 | |
| Chicago IL Metropolitan Water Reclamation District GO | 5.720% | 12/1/38 | 8,545 | 10,271 | |
| Chicago IL O'Hare International Airport Revenue | 6.845% | 1/1/38 | 21,280 | 23,127 | |
| Chicago IL O'Hare International Airport Revenue | 6.395% | 1/1/40 | 8,970 | 10,678 | |
| Dallas TX Area Rapid Transit Revenue | 5.999% | 12/1/44 | 29,925 | 38,339 | |
| Illinois GO | 5.365% | 3/1/17 | 805 | 844 | |
| Illinois GO | 5.665% | 3/1/18 | 22,735 | 23,848 | |
| Illinois GO | 5.877% | 3/1/19 | 23,750 | 25,135 | |
| Illinois GO | 5.100% | 6/1/33 | 3,145 | 2,812 | |
| Illinois Toll Highway Authority Revenue | 6.184% | 1/1/34 | 29,200 | 33,576 | |
| 7 | Kansas Development Finance Authority Revenue | ||||
| (Public Employees Retirement System) | 5.501% | 5/1/34 | 50,000 | 53,385 | |
| Los Angeles CA Department of Water & Power | |||||
| Revenue | 6.008% | 7/1/39 | 13,645 | 15,616 | |
| Los Angeles CA Unified School District GO | 5.750% | 7/1/34 | 55,325 | 61,453 | |
| Louisville & Jefferson County KY Metropolitan Sewer | |||||
| District Revenue | 6.250% | 5/15/43 | 19,000 | 23,128 | |
| Maryland Transportation Authority Facilities Projects | |||||
| Revenue | 5.888% | 7/1/43 | 21,685 | 26,775 | |
| Massachusetts Development Finance Agency Revenue | |||||
| (Harvard University) | 6.300% | 10/1/37 | 50,675 | 56,428 | |
| Massachusetts School Building Authority Dedicated | |||||
| Sales Tax Revenue | 5.715% | 8/15/39 | 22,105 | 26,293 | |
| Metropolitan New York Transportation Authority | |||||
| Revenue (Dedicated Tax Fund) | 7.336% | 11/15/39 | 10,860 | 15,053 | |
| Metropolitan New York Transportation Authority | |||||
| Revenue (Dedicated Tax Fund) | 6.089% | 11/15/40 | 5,235 | 6,248 | |
| New Jersey Turnpike Authority Revenue | 7.414% | 1/1/40 | 35,285 | 48,602 | |
| New Jersey Turnpike Authority Revenue | 7.102% | 1/1/41 | 4,000 | 5,370 | |
| New York City NY Municipal Water Finance Authority | |||||
| Water & Sewer System Revenue | 5.882% | 6/15/44 | 15,950 | 19,633 | |
| North Texas Tollway Authority System Revenue | 6.718% | 1/1/49 | 61,100 | 73,828 | |
| 2,5 | Ohana Military Communities LLC | 5.558% | 10/1/36 | 9,600 | 9,540 |
| 2,5 | Ohana Military Communities LLC | 5.780% | 10/1/36 | 16,360 | 16,903 |
| Oregon Department Transportation Highway Usertax | |||||
| Revenue | 5.834% | 11/15/34 | 25,930 | 31,610 | |
| Oregon GO | 5.902% | 8/1/38 | 19,510 | 22,659 | |
| 7 | Oregon School Boards Association GO | 5.528% | 6/30/28 | 50,000 | 54,825 |
| Port Authority of New York & New Jersey Revenue | 5.859% | 12/1/24 | 12,735 | 14,919 | |
| Port Authority of New York & New Jersey Revenue | 6.040% | 12/1/29 | 10,455 | 12,572 | |
| San Antonio TX Electric & Gas Systems Revenue | 5.985% | 2/1/39 | 11,890 | 14,750 | |
| South Carolina Public Service Authority Revenue | 6.454% | 1/1/50 | 11,700 | 15,607 | |
| University of California Regents Medical Center | |||||
| Revenue | 6.548% | 5/15/48 | 14,820 | 17,064 | |
| University of California Regents Medical Center | |||||
| Revenue | 6.583% | 5/15/49 | 23,785 | 27,550 | |
| University of California Revenue | 5.770% | 5/15/43 | 24,325 | 27,573 | |
| Total Taxable Municipal Bonds (Cost $919,633) | 1,069,887 | ||||
11
| Vanguard® Wellington Fund | ||||
| Schedule of Investments | ||||
| November 30, 2011 | ||||
| Market | ||||
| Value | ||||
| Coupon | Shares | ($000) | ||
| Temporary Cash Investments (1.9%) | ||||
| Money Market Fund (0.0%) | ||||
| 8,9 Vanguard Market Liquidity Fund | 0.135% | 16,328,400 | 16,328 | |
| Face | ||||
| Maturity | Amount | |||
| Date | ($000) | |||
| Repurchase Agreements (1.9%) | ||||
| Bank of America Securities, LLC (Dated 11/30/11, | ||||
| Repurchase Value $62,200,000, collateralized by | ||||
| Federal National Mortgage Assn. 3.500%-4.000%, | ||||
| 2/1/41-3/1/41) | 0.130% | 12/1/11 | 62,200 | 62,200 |
| Deutsche Bank Securities, Inc. (Dated 11/30/11, | ||||
| Repurchase Value $80,100,000, collateralized by | ||||
| Federal National Mortgage Assn. 5.000%-7.000%, | ||||
| 4/1/38-10/1/38) | 0.140% | 12/1/11 | 80,100 | 80,100 |
| HSBC Bank USA (Dated 11/30/11, Repurchase Value | ||||
| $437,502,000, collateralized by Federal Home Loan | ||||
| Mortgage Corp. 3.500%-7.500%, 4/1/16-12/1/41) | 0.140% | 12/1/11 | 437,500 | 437,500 |
| RBS Securities, Inc. (Dated 11/30/11, Repurchase Value | ||||
| $402,202,000, collateralized by Government National | ||||
| Mortgage Assn. 1.700%-6.000%, 5/20/37-10/20/61) | 0.140% | 12/1/11 | 402,200 | 402,200 |
| TD Bank Group (Dated 11/30/11, Repurchase Value | ||||
| $25,000,000, collateralized by U.S. Treasury Note | ||||
| 0.125%, 9/30/13) | 0.140% | 12/1/11 | 25,000 | 25,000 |
| 1,007,000 | ||||
| Total Temporary Cash Investments (Cost $1,023,328) | 1,023,328 | |||
| Total Investments (99.6%) (Cost $47,480,991) | 54,587,066 | |||
| Other Assets and Liabilities—Net (0.4%)9,10 | 202,989 | |||
| Net Assets (100%) | 54,790,055 | |||
* Non-income-producing security.
^ Part of security position is on loan to broker-dealers. The total value of securities on loan is $15,729,000.
1 Guaranteed by the Federal Deposit Insurance Corporation (FDIC) as part of the Temporary Liquidity Guarantee Program.
2 The average or expected maturity is shorter than the final maturity shown because of the possibility of interim principal payments and prepayments or the possibility of the issue being called.
3 The issuer is under federal conservatorship and is dependent upon the continued support of the U.S. Treasury to avoid receivership.
4 Includes securities purchased on a when-issued or delayed-delivery basis for which the fund has not taken delivery as of November 30, 2011.
5 Security exempt from registration under Rule 144A of the Securities Act of 1933. Such securities may be sold in transactions exempt from registration, normally to qualified institutional buyers. At November 30, 2011, the aggregate value of these securities was $2,173,538,000, representing 4.0% of net assets.
6 Adjustable-rate security.
7 Scheduled principal and interest payments are guaranteed by AGM (Assured Guaranty Municipal Corporation).
8 Affiliated money market fund available only to Vanguard funds and certain trusts and accounts managed by Vanguard. Rate shown is the 7-day yield.
9 Includes $16,328,000 of collateral received for securities on loan.
10 Cash of $3,320,000, has been segregated as initial margin for open futures contracts.
ADR—American Depositary Receipt.
GO—General Obligation Bond.
12
Report of Independent Registered Public Accounting Firm
To the Trustees and Shareholders of Vanguard Wellington Fund:
We have audited, in accordance with the standards of the Public Company Accounting Oversight Board (United States), the financial statements (not presented herein) of Vanguard Wellington Fund (the "Fund") as of November 30, 2011 and for the period then ended and have issued our unqualified report thereon dated January 11, 2012. Our audit included an audit of the Fund's schedule of investments as of November 30, 2011. This schedule of investments is the responsibility of the Fund's management. Our responsibility is to express an opinion on this schedule of investments based on our audit.
In our opinion, the accompanying schedule of investments referred to above, when read in conjunction with the financial statements of the Fund referred to above, present fairly, in all material respects, the information set forth therein.
January 11, 2012
13
| © 2012 The Vanguard Group. Inc. |
| All rights reserved. |
| Vanguard Marketing Corporation, Distributor. |
| SNA 210_012012 |
Item 2: Code of Ethics. The Registrant has adopted a code of ethics that applies to the Registrant’s principal executive officer, principal financial officer, principal accounting officer or controller or persons performing similar functions. The Code of Ethics was amended during the reporting period covered by this report to make certain technical, non-material changes.
Item 3: Audit Committee Financial Expert. The following members of the Audit Committee have been determined by the Registrant’s Board of Trustees to be Audit Committee Financial Experts serving on its Audit Committee, and to be independent: Charles D. Ellis, Rajiv L. Gupta, JoAnn Heffernan Heisen, André F. Perold, and Alfred M. Rankin, Jr.
Item 4: Principal Accountant Fees and Services.
(a) Audit Fees.
Audit Fees of the Registrant
Fiscal Year Ended November 30, 2011: $33,000
Fiscal Year Ended November 30, 2010: $31,000
Aggregate Audit Fees of Registered Investment Companies in the Vanguard Group.
Fiscal Year Ended November 30, 2011: $3,978,540
Fiscal Year Ended November 30, 2010: $3,607,060
(b) Audit-Related Fees.
Fiscal Year Ended November 30, 2011: $1,341,750
Fiscal Year Ended November 30, 2010: $791,350
Includes fees billed in connection with assurance and related services provided to the Registrant, The Vanguard Group, Inc., Vanguard Marketing Corporation, and other registered investment companies in the Vanguard Group.
(c) Tax Fees.
Fiscal Year Ended November 30, 2011: $373,830
Fiscal Year Ended November 30, 2010: $336,090
Includes fees billed in connection with tax compliance, planning and advice services provided to the Registrant, The Vanguard Group, Inc., Vanguard Marketing Corporation, and other registered investment companies in the Vanguard Group and related to income and excise taxes.
(d) All Other Fees.
Fiscal Year Ended November 30, 2011: $16,000
Fiscal Year Ended November 30, 2010: $16,000
Includes fees billed for services related to risk management and privacy matters. Services were provided to the Registrant, The Vanguard Group, Inc., Vanguard Marketing Corporation, and other registered investment companies in the Vanguard Group.
(e) (1) Pre-Approval Policies. The policy of the Registrant’s Audit Committee is to consider and, if appropriate, approve before the principal accountant is engaged for such services, all specific audit and non-audit services provided to: (1) the Registrant; (2) The Vanguard Group, Inc.; (3) other entities controlled by The Vanguard Group, Inc. that provide ongoing services to the Registrant; and (4) other registered investment companies in the Vanguard Group. In making a determination, the Audit Committee considers whether the services are consistent with maintaining the principal accountant’s independence.
In the event of a contingency situation in which the principal accountant is needed to provide services in between scheduled Audit Committee meetings, the Chairman of the Audit Committee would be called on to consider and, if appropriate, pre-approve audit or permitted non-audit services in an amount sufficient to complete services through the next Audit Committee meeting, and to determine if such services would be consistent with maintaining the accountant’s independence. At the next scheduled Audit Committee meeting, services and fees would be presented to the Audit Committee for formal consideration, and, if appropriate, approval by the entire Audit Committee. The Audit Committee would again consider whether such services and fees are consistent with maintaining the principal accountant’s independence.
The Registrant’s Audit Committee is informed at least annually of all audit and non-audit services provided by the principal accountant to the Vanguard complex, whether such services are provided to: (1) the Registrant; (2) The Vanguard Group, Inc.; (3) other entities controlled by The Vanguard Group, Inc. that provide ongoing services to the Registrant; or (4) other registered investment companies in the Vanguard Group.
(2) No percentage of the principal accountant’s fees or services were approved pursuant to the waiver provision of paragraph (c)(7)(i)(C) of Rule 2-01 of Regulation S-X.
(f) For the most recent fiscal year, over 50% of the hours worked under the principal accountant’s engagement were not performed by persons other than full-time, permanent employees of the principal accountant.
(g) Aggregate Non-Audit Fees.
Fiscal Year Ended November 30, 2011: $389,830
Fiscal Year Ended November 30, 2010: $352,090
Includes fees billed for non-audit services provided to the Registrant, The Vanguard Group, Inc., Vanguard Marketing Corporation, and other registered investment companies in the Vanguard Group.
(h) For the most recent fiscal year, the Audit Committee has determined that the provision of all non-audit services was consistent with maintaining the principal accountant’s independence.
Item 5: Audit Committee of Listed Registrants.
Not Applicable.
Item 6: Investments.
Not Applicable.
Item 7: Disclosure of Proxy Voting Policies and Procedures for Closed-End Management Investment Companies.
Not Applicable.
Item 8: Portfolio Managers of Closed-End Management Investment Companies.
Not Applicable.
Item 9: Purchase of Equity Securities by Closed-End Management Investment Company and Affiliated Purchasers.
Not Applicable.
Item 10: Submission of Matters to a Vote of Security Holders.
Not Applicable.
Item 11: Controls and Procedures.
(a) Disclosure Controls and Procedures. The Principal Executive and Financial Officers concluded that the Registrant's Disclosure Controls and Procedures are effective based on their evaluation of the Disclosure Controls and Procedures as of a date within 90 days of the filing date of this report.
(b) Internal Control Over Financial Reporting. There were no significant changes in Registrant’s Internal Control Over Financial Reporting or in other factors that could significantly affect this control subsequent to the date of the evaluation, including any corrective actions with regard to significant deficiencies and material weaknesses.
Item 12: Exhibits.
(a) Code of Ethics.
(b) Certifications.
Pursuant to the requirements of the Securities Exchange Act of 1934 and the Investment Company Act of 1940, the registrant has duly caused this report to be signed on its behalf by the undersigned, thereunto duly authorized.
| VANGUARD WELLINGTON FUND | |
| By: | /s/ F. WILLIAM MCNABB III* |
| F. WILLIAM MCNABB III | |
| CHIEF EXECUTIVE OFFICER | |
| Date: January 20, 2012 | |
Pursuant to the requirements of the Securities Exchange Act of 1934 and the Investment Company Act of 1940, this report has been signed below by the following persons on behalf of the registrant and in the capacities and on the dates indicated.
| VANGUARD WELLINGTON FUND | |
| By: | /s/ F. WILLIAM MCNABB III* |
| F. WILLIAM MCNABB III | |
| CHIEF EXECUTIVE OFFICER | |
| Date: January 20, 2012 | |
| VANGUARD WELLINGTON FUND | |
| By: | /s/ THOMAS J. HIGGINS* |
| THOMAS J. HIGGINS | |
| CHIEF FINANCIAL OFFICER | |
| Date: January 20, 2012 | |
* By: /s/ Heidi Stam
Heidi Stam, pursuant to a Power of Attorney filed on November 28, 2011 see file Number 33-23444,
Incorporated by Reference.