UNITED STATES
SECURITIES AND EXCHANGE COMMISSION
Washington, D.C. 20549
FORM N-CSR
CERTIFIED SHAREHOLDER REPORT
OF
REGISTERED MANAGEMENT INVESTMENT COMPANIES
| Investment Company Act file number: 811-121 | |
| Name of Registrant: Vanguard Wellington Fund | |
| Address of Registrant: P.O. Box 2600 | |
| Valley Forge, PA 19482 | |
| Name and address of agent for service: | |
| Heidi Stam, Esquire | |
| P.O. Box 876 | |
| Valley Forge, PA 19482 | |
| Registrant’s telephone number, including area code: (610) 669-1000 | |
| Date of fiscal year end: November 30 | |
| Date of reporting period: December 1, 2008 – November 30, 2009 | |
| Item 1: Reports to Shareholders | |
![]()
| Vanguard Wellington™ Fund |
| Annual Report |
| November 30, 2009 |

> For the fiscal year ended November 30, 2009, Vanguard Wellington Fund
returned about 26%, ahead of its composite index benchmark and in line with
the average return of its peer group.
> Wellington Fund benefited from superior stock selection in a handful of sectors,
most notably health care and materials. The fund’s bond holdings received a lift
from mortgage-backed securities.
> The fund’s average annual return of about 6% for Investor Shares for the ten
years ended November 30, 2009, exceeded the return of its composite index
benchmark and the average return of its peer group.
| Contents | |
| Your Fund’s Total Returns | 1 |
| President’s Letter | 2 |
| Advisor’s Report | 8 |
| Results of Proxy Voting | 12 |
| Fund Profile | 13 |
| Performance Summary | 15 |
| Financial Statements | 17 |
| Your Fund’s After-Tax Returns | 32 |
| About Your Fund’s Expenses | 33 |
| Trustees Approve Advisory Agreement | 35 |
| Glossary | 36 |
The figures shown represent past performance, which is not a guarantee of future results. (Current performance may be lower or higher than the performance data cited. For performance data current to the most recent month-end, visit our website at www.vanguard.com/performance.) Note, too, that both investment returns and principal value can fluctuate widely, so an investor’s shares, when sold, could be worth more or less than their original cost.
Please note: The opinions expressed in this report are just that—informed opinions. They should not be considered promises or advice.
Also, please keep in mind that the information and opinions cover the period through the date on the front of this report. Of course, the
risks of investing in your fund are spelled out in the prospectus.
Cover photograph: Veronica Coia.
Your Fund’s Total Returns
| Fiscal Year Ended November 30, 2009 | ||
| Ticker | Total | |
| Symbol | Returns | |
| Vanguard Wellington Fund | ||
| Investor Shares | VWELX | 26.46% |
| Admiral™ Shares1 | VWENX | 26.57 |
| Wellington Composite Index2 | 23.87 | |
| Mixed-Asset Target Allocation Growth Funds Average3 | 26.23 |
| Your Fund’s Performance at a Glance | ||||
| November 30, 2008–November 30, 2009 | ||||
| Distributions Per Share | ||||
| Starting | Ending | Income | Capital | |
| Share Price | Share Price | Dividends | Gains | |
| Vanguard Wellington Fund | ||||
| Investor Shares | $23.79 | $28.99 | $0.926 | $0.000 |
| Admiral Shares | 41.10 | 50.07 | 1.648 | 0.000 |
1 A lower-cost class of shares available to many longtime shareholders and to those with significant investments in the fund.
2 Weighted 65% Standard & Poor’s 500 Index and 35% Barclays Capital U.S. Credit A or Better Bond Index.
3 Derived from data provided by Lipper Inc.
1

President’s Letter
Dear Shareholder:
For the fiscal year that ended November 30, 2009, Vanguard Wellington Fund’s Investor Shares and Admiral Shares both returned about 26%, a strong performance driven by the stock market’s turnaround and the fund advisor’s expert stock selection. By comparison, the fund’s benchmark, the unmanaged Wellington Composite Index, returned about 24%.
While stocks in a variety of industries made solid contributions as markets rallied during the dramatic recovery, the fund’s health care and materials holdings were especially impressive. Wellington Management Company, the fund’s advisor, also made wise decisions in the consumer staples, energy, and industrial sectors.
All ten equity sectors in the fund had positive returns, and only the utilities and telecommunication services groups returned less than double digits. The fixed income portion of the fund also outperformed the fund’s fixed income benchmark.
If you hold the Wellington Fund in a taxable account, you may wish to review the section on the fund’s after-tax returns later in this report.
Stock markets worldwide produced double-digit returns
For the 12 months ended November 30, U.S. stocks posted significant gains, as the steep losses suffered during the first
2
few months were erased by the rally that began in March. The stock market’s rebound seemed to anticipate an improvement in the broader economy, which began to show signs of growth in the second half of the period.
The story was similar in many international markets: They collapsed in late 2008 and early 2009, then rebounded at a startling rate. The recovery was especially swift and powerful in emerging markets, many of which came out of the financial crisis in better fiscal and economic shape than their developed-market counterparts.
Despite the strong performance seen since March, the longer-term returns of most stock market indexes bear witness to the trials suffered by many investors in the not-
so-distant past. Over the past three years, for example, both U.S. and international stock indexes have declined. Five-year annualized returns for U.S. stocks as of November 30 were mostly positive, but far from impressive. Stock markets abroad fared better over this longer period, posting average annual returns of almost 7%.
For bonds, a period of panic was followed by robust returns
Volatility was also a theme in the fixed income market over the past 12 months. At the peak of the credit crisis in late 2008, investors shunned just about any security not issued by the U.S. Treasury. This stampede to quality led to the widest gap between the very low yields of Treasuries and the much higher yields of corporate bonds since the Great Depression.
| Market Barometer | |||
| Average Annual Total Returns | |||
| Periods Ended November 30, 2009 | |||
| One Year | Three Years | Five Years | |
| Stocks | |||
| Russell 1000 Index (Large-caps) | 27.38% | –5.71% | 1.02% |
| Russell 2000 Index (Small-caps) | 24.53 | –8.36 | –0.46 |
| Dow Jones U.S. Total Stock Market Index | 28.06 | –5.55 | 1.24 |
| MSCI All Country World Index ex USA (International) | 47.13 | –2.73 | 6.75 |
| Bonds | |||
| Barclays Capital U.S. Aggregate Bond Index | |||
| (Broad taxable market) | 11.63% | 6.40% | 5.49% |
| Barclays Capital Municipal Bond Index | 14.17 | 4.17 | 4.50 |
| Citigroup 3-Month Treasury Bill Index | 0.20 | 2.36 | 2.91 |
| CPI | |||
| Consumer Price Index | 1.84% | 2.40% | 2.52% |
3
In early spring, “green shoots” began to emerge—signs that aggressive fiscal and monetary policies were getting the global economy back on its feet. Investors’ appetite for risk returned to more normal levels and the demand for corporate bonds increased, raising their prices and bringing down their yields. For the 12 months ended November 30, taxable and municipal bonds each notched double-digit results, returning about 12% and 14%, respectively.
Shorter-term savings vehicles, including money market funds, didn’t fare as well. They became casualties of the Fed’s dramatic cuts in short-term interest rates, which were intended to nurse the economy, the markets, and banks back to health. In December 2008, the Fed
reduced its target for the federal funds rate, a benchmark for the interest rates paid by money market instruments and other very short-term securities, to between 0% and 0.25%. The target has stayed there ever since. After its meeting in early November, the Fed said it expected to maintain the target at this level “for an extended period.”
Stocks and bonds contribute to success
The Wellington Fund’s fiscal year began amid extreme volatility in the financial markets and the deepest recession since the 1930s. As the stock market skidded toward its bottom in March, however, investment opportunities arose. Wellington Management Company has distinguished itself over the years with its value-oriented
| Expense Ratios1 | |||
| Your Fund Compared With Its Peer Group | |||
| Mixed-Asset | |||
| Target Allocation | |||
| Investor | Admiral | Growth Funds | |
| Shares | Shares | Average | |
| Wellington Fund | 0.35% | 0.23% | 1.08% |
1 The fund expense ratios shown are from the prospectus dated March 20, 2009, and represent estimated costs for the current fiscal year
based on the fund’s net assets as of the prospectus date. For the fiscal year ended November 30, 2009, the fund’s expense ratios were
0.34% for Investor Shares and 0.23% for Admiral Shares. The peer group expense ratio is derived from data provided by Lipper Inc. and
captures information through year-end 2008.
4
approach, and its patience and expertise were rewarded as the market subsequently revived. Through its expert stock selection, it was able to find hidden gems in the bargain bin.
The fund’s stock holdings, which represented about two-thirds of its assets, on average, returned about 28% for the fiscal year. In comparison, the fund’s equity benchmark, the Standard & Poor’s 500 Index, returned about 25%.
Consolidations made a major difference in the health care sector on both an absolute basis and compared with the equity benchmark. Both Schering-Plough and Wyeth advanced significantly after receiving premium buyout offers and eventually merging with Merck and Pfizer,
respectively. The fund’s pharmaceutical holdings also benefited from strategic collaborations and new product approvals. Cost-cutting efforts and solid sales lifted the fund’s biotechnology stocks.
Strong stock choices also boosted the fund’s holdings in the materials sector. Metals and mining firms and chemical companies rose as worldwide demand for commodities increased. Global demand and signs of improvement in the economy also helped conglomerates and construction firms in the industrial sector.
Further strength came from the consumer staples sector, where the fund limited its exposure to weaker performers such as Procter & Gamble while holding sizable positions in better performers such as
| Total Returns | |
| Ten Years Ended November 30, 2009 | |
| Average | |
| Annual Return | |
| Wellington Fund Investor Shares | 6.20% |
| Wellington Composite Index | 2.15 |
| Mixed-Asset Target Allocation Growth Funds Average1 | 2.06 |
The figures shown represent past performance, which is not a guarantee of future results. (Current performance
may be lower or higher than the performance data cited. For performance data current to the most recent month-
end, visit our website at www.vanguard.com/performance.) Note, too, that both investment returns and principal
value can fluctuate widely, so an investor’s shares, when sold, could be worth more or less than their original cost.
1 Derived from data provided by Lipper Inc.
5
SABMiller, the global brewing company. Similarly perceptive decisions aided the fund in the energy sector, particularly among integrated oil and gas companies.
In contrast, although the fund’s holdings in information technology were among its best performers and made a significant contribution to total return, they didn’t keep up with those of the equity benchmark. The advisor’s preference for dividend-paying companies, which aren’t abundant in the IT universe, limited the fund’s exposure to some of the year’s top performers.
Wellington’s fixed income holdings, which represented about one-third of the fund’s assets, on average, returned about 23%, compared with less than 20% for its fixed income benchmark, the Barclays Capital U.S. Credit A or Better Bond Index. The fund’s exposure to mortgage-backed securities, which are not in the index, helped its results.
For more on the fund’s positioning during the fiscal year, please see the Advisor’s Report that follows this letter.
Through a volatile decade, the fund remains commendable
The Wellington Fund, which celebrated its 80th anniversary on July 1 and is the nation’s oldest balanced mutual fund, has endured every type of market condition and challenge since its inception in the months before the stock market crash of 1929. The fund has sought to maintain a balance of between 60% to 70% stocks and 30% to 40% bonds during its long history, and has performed admirably through the years.
The fund’s record during the past ten tumultuous years is one to be proud of. For the last decade, through the bursting of the tech-stock bubble in 2000 and the subprime-mortgage crisis of 2008, the Wellington Fund has recorded an average annual return of about 6%. Over the same period, the fund exceeded the average annual returns of the all-stock S&P 500 Index (–0.57%) and the unmanaged Wellington Composite Index (about 2%), as well as the average return of its peer group (about 2%).
6
Wellington Management Company has continued to build on its legacy of prudent management and strong performance with expert selection of reasonably valued stocks and investment-grade bonds. The fund’s ongoing cost advantage has also been a key to success, as you, the rightful owner, keep more of the fund’s returns.
Balanced approach stands the test of time
The financial markets, always unpredictable, have been especially chaotic during the past two years, underscoring how important it is for investors to take a long-term approach to portfolio management.
Vanguard encourages investors to select a diversified mix of stock, bond, and money market funds that fits their time horizon, risk tolerance, and goals. A balanced fund can help you do that, and can deliver performance that doesn’t trace the highest or lowest points of the market. We believe that the Wellington Fund, with its 80-year-strong commitment to diversification, low costs, and a long-term view, can serve an important role in a well-designed investment plan.
On another matter, I would like to inform you that on January 1, 2010, we will complete a leadership transition that began in March 2008. I will succeed Jack Brennan as chairman of Vanguard and each of the funds. Jack has agreed to serve as chairman emeritus and senior advisor.
Under Jack’s leadership, Vanguard has grown to become a preeminent firm in the mutual fund industry. Jack’s energy, his relentless pursuit of perfection, and his unwavering focus on always doing the right thing for our clients are evident in every facet of Vanguard policy today.
Thank you for your entrusting your assets to Vanguard.
Sincerely,

F. William McNabb III
President and Chief Executive Officer
December 10, 2009
7
Advisor’s Report
Vanguard Wellington Fund’s Investor Shares returned about 26% for the fiscal year ended November 30, 2009. The performance exceeded the return for the composite index, which is weighted 65% in large-capitalization stocks and 35% in high-quality corporate bonds, as well as the average return of mixed-asset target allocation growth funds.
The investment environment
Stocks gained just over 25%, as measured by the S&P 500 Index, for the 12-month period ended November 30, 2009. U.S. equities snapped back in November, rising for the eighth time in the past nine months. Markets closed modestly off their peak levels as news of debt problems in Dubai briefly sparked a rise in risk aversion toward the end of the period. While the news shook global markets, equity markets finished the period significantly higher than their March 2009 lows, with emerging markets continuing their dominance over developed markets as investors favored higher-risk assets.
Recent actions taken by banks and other financial services companies to increase their capital strength, in addition to the broader rally in equity prices, appear to have taken the risk of further severe economic decline off the table. However, the most recent economic news has been mixed. As consumers improve their balance sheets, confidence remains low amid a worsening unemployment rate and sluggish housing market.
The return of growth to the U.S. economy has been uneven and, for the most part, government-assisted, but the return of liquidity and risk appetite to the bond market has been nothing short of dramatic. Lower Treasury yields have allowed other borrowing costs to decline. Drops in mortgage rates, swap rates, and the cost of borrowing between banks (as represented by the London Interbank Offered Rate, or LIBOR) have provided relief for some mortgage and nonfinancial corporate borrowers. However, year-end profit-taking and fears that Dubai’s debt restructuring announcement would have negative systemic implications halted the advances of nongovernment fixed income markets toward the end of the period.
Our successes
Strong stock selection was the main driver of overall equity performance for the period. Select holdings in the health care, energy, materials, consumer staples, and industrials sectors added to results. Top absolute contributors during the period included IBM, Schering-Plough, JPMorgan Chase, Wells Fargo, and International Paper.
IBM’s solid earnings in a tough environment led to outperformance for the period. Schering-Plough’s stock price jumped significantly following news that it would combine with Merck as part of a reverse merger. JPMorgan Chase shares surged in May after the bank announced that it planned to repay the money it received under the Troubled Asset Relief Program (TARP) without raising capital. More
8
recently shares have benefited from improved earnings. We added to our holding in International Paper in April after the company strengthened its balance sheet through a debt refinancing. The company’s shares gained as earnings per share and cash flow generation were better than the market expected, further improving the company’s balance sheet. Wells Fargo benefited from a stock offering that helped secure the company’s financial position and focused investors’ attention on the company’s future earnings power.
The fund’s bond portfolio also performed well. Security selection within the corporate sector, particularly holdings in insurance and consumer cyclicals and noncyclicals, was the primary driver of outperformance for the period.
Our shortfalls
Within the equity portion of the fund, security selection in the information technology and telecommunication services sectors detracted modestly from results. Also detracting from returns were meaningfully underweighted positions to the information technology and consumer discretionary sectors and overweighted positions in the utilities and telecommunication services sectors. Absolute detractors for the period included Bank of America, Capital One, and General Electric.
Bank of America shares declined after the company posted its first quarterly loss of the year. Steeper consumer and commercial loan losses more than offset
a boost in revenue from Bank of America’s acquisition of Merrill Lynch and strong trading profits. Capital One saw a rapid escalation in credit card losses as a result of the economic slowdown. We eliminated our position early in the period. General Electric, the industrial and financial services giant, saw shares tumble on missed first-quarter earnings, concerns over the stability of its GE Capital finance unit, and the subsequent rating downgrade by both Moody’s and Standard & Poor’s. We reduced our exposure to GE, starting late in 2008, but not before the fund had borne the brunt of the share-price decline. Shares of General Electric gained more recently on news that the company was in talks to sell its stake in NBC Universal to Comcast (the companies announced that they had reached an agreement shortly after the close of the fiscal period).
Within fixed income, our U.S. Treasury holdings, which we maintain for potential liquidity needs, underperformed higher-risk assets during the period.
The fund’s positioning
We continue to search diligently for attractively valued companies with strong operating characteristics. We are particularly interested in the stocks of companies whose business fundamentals are poised to improve. As always, an above-average dividend is central to our stock selection process.
9
Our discipline is focused on identifying industries where the outlook for balance between supply and demand will be favorable. Health care, as a group, continues to be weak as government reform and an apparent rebound in global economic activity have led investors to seek returns elsewhere. This has presented opportunities to buy high-quality, cash-generative businesses at compelling valuations. Apathy among investors regarding consumer staples has given us an opportunity to buy leading global brands at very attractive valuations. At the end of the period, the fund was overweighted in the energy, health care, industrial, and financial sectors, and underweighted in the information technology and consumer sectors.
We believe the U.S. government’s fiscal and monetary policies are beginning to take hold, and we are positioning the fund’s bond portfolio for a bottoming in the economic contraction. With that, we should also see a bottoming in interest rates for this cycle and a continued appetite for non-Treasury bonds such as corporates and some mortgage-backed bonds.
Fixed income holdings in the fund continue to be of very high quality. We have greatly reduced our exposure to agency pass-through mortgage securities because valuations seem just short of fair and we see the looming end to the Federal Reserve’s buying program as a negative for this sector. We are rebuilding our liquidity position. With yield spreads between Treasuries and other types of issues greatly compressed in recent quarters, we are more inclined to hold short-duration Treasuries than cash in the liquidity positioning of the fund.
Edward P. Bousa, CFA, Senior Vice
President and Equity Manager
John C. Keogh, Senior Vice President and
Fixed Income Manager
Wellington Management Company, LLP
December 12, 2009
10
| Equity Portfolio Changes | |
| Year Ended November 30, 2009 | |
| Additions | Comments |
| Johnson & Johnson | We added a new position in this pharmaceuticals stock when |
| valuations were nearly at bottom. We think the challenges in the | |
| pharmaceuticals pipeline are well understood and the company’s | |
| broadly diversified health care platform offers powerful cross- | |
| division opportunities. | |
| Pfizer | We added a new position in this pharmaceuticals stock after Pfizer |
| announced its plan to merge with Wyeth. We feel the combined | |
| company will benefit from Pfizer’s global distribution platform. | |
| Deletions | Comments |
| Abbott Laboratories | We eliminated our position in Abbott as we expect increased |
| competition for its arthritis treatment to have a negative impact | |
| on earnings. | |
| Verizon Communications | We eliminated our position in Verizon because of our concerns |
| about management’s ability to effectively run the business, which | |
| is under pressure as a result of the impact the iPhone is having on Verizon Wireless. | |
11
Results of Proxy Voting
At a special meeting of shareholders on July 2, 2009, fund shareholders approved the following two proposals:
Proposal 1—Elect trustees for the fund.
The individuals listed in the table below were elected as trustees for the fund. All trustees with the exception of Messrs. McNabb and Volanakis (both of whom already served as directors of The Vanguard Group, Inc.) served as trustees to the fund prior to the shareholder meeting.
| Percentage | |||
| Trustee | For | Withheld | For |
| John J. Brennan | 893,642,808 | 29,337,599 | 96.8% |
| Charles D. Ellis | 889,560,026 | 33,420,381 | 96.4% |
| Emerson U. Fullwood | 890,219,195 | 32,761,211 | 96.5% |
| Rajiv L. Gupta | 891,747,761 | 31,232,646 | 96.6% |
| Amy Gutmann | 892,556,504 | 30,423,902 | 96.7% |
| JoAnn Heffernan Heisen | 892,285,256 | 30,695,151 | 96.7% |
| F. William McNabb III | 893,078,484 | 29,901,922 | 96.8% |
| André F. Perold | 890,448,946 | 32,531,461 | 96.5% |
| Alfred M. Rankin, Jr. | 892,392,947 | 30,587,459 | 96.7% |
| Peter F. Volanakis | 893,102,756 | 29,877,651 | 96.8% |
Proposal 2—Update and standardize the funds’ fundamental policies regarding:
(a) Purchasing and selling real estate.
(b) Issuing senior securities.
(c) Borrowing money.
(d) Making loans.
(e) Purchasing and selling commodities.
(f) Concentrating investments in a particular industry or group of industries.
(g) Eliminating outdated fundamental investment policies not required by law.
The revised fundamental policies are clearly stated and simple, yet comprehensive, making oversight and compliance more efficient than under the former policies. The revised fundamental policies will allow the funds to respond more quickly to regulatory and market changes, while avoiding the costs and delays associated with successive shareholder meetings.
| Broker | Percentage | ||||
| Vanguard Fund | For | Abstain | Against | Non-Votes | For |
| Wellington Fund | |||||
| 2a | 833,553,734 | 20,277,283 | 30,286,099 | 38,863,291 | 90.3% |
| 2b | 827,654,311 | 22,279,782 | 34,183,022 | 38,863,292 | 89.7% |
| 2c | 790,356,918 | 21,745,186 | 72,015,011 | 38,863,292 | 85.6% |
| 2d | 800,125,741 | 22,001,190 | 61,990,180 | 38,863,295 | 86.7% |
| 2e | 816,162,866 | 21,626,241 | 46,328,007 | 38,863,293 | 88.4% |
| 2f | 824,800,880 | 21,927,667 | 37,388,566 | 38,863,293 | 89.4% |
| 2g | 830,940,109 | 21,423,386 | 31,753,622 | 38,863,289 | 90.0% |
12
Wellington Fund
Fund Profile
As of November 30, 2009
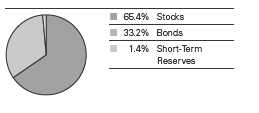
| Total Fund Characteristics | |
| Yield1 | |
| Investor Shares | 2.5% |
| Admiral Shares | 2.6% |
| Turnover Rate | 28% |
| Expense Ratio2 | |
| Investor Shares | 0.35% |
| Admiral Shares | 0.23% |
| Short-Term Reserves | 1.4% |
| Sector Diversification (% of equity exposure) | |||
| Comparative | Broad | ||
| Fund | Index3 | Index4 | |
| Consumer Discretionary | 5.8% | 9.4% | 10.1% |
| Consumer Staples | 9.5 | 11.7 | 10.1 |
| Energy | 15.8 | 12.0 | 11.3 |
| Financials | 16.6 | 14.5 | 16.1 |
| Health Care | 15.6 | 12.8 | 12.6 |
| Industrials | 12.4 | 10.4 | 10.6 |
| Information Technology | 11.8 | 18.9 | 18.6 |
| Materials | 4.3 | 3.6 | 4.0 |
| Telecommunication | |||
| Services | 3.7 | 3.1 | 2.9 |
| Utilities | 4.5 | 3.6 | 3.7 |
| Total Fund Volatility Measures5 | ||
| Fund Versus | Fund Versus | |
| Composite Index6 | Broad Index4 | |
| R-Squared | 0.98 | 0.93 |
| Beta | 0.94 | 0.64 |
| Ten Largest Stocks7 (% of equity exposure) | ||
| AT&T Inc. | integrated | |
| telecommunication | ||
| services | 3.7% | |
| Chevron Corp. | integrated oil | |
| and gas | 2.7 | |
| International Business | ||
| Machines Corp. | computer hardware | 2.7 |
| Merck & Co. Inc. | pharmaceuticals | 2.4 |
| Wells Fargo & Co. | diversified banks | 2.4 |
| Total SA ADR | integrated oil | |
| and gas | 2.4 | |
| Exxon Mobil Corp. | integrated oil | |
| and gas | 2.3 | |
| JPMorgan Chase & Co. | diversified | |
| financial services | 1.9 | |
| Pfizer Inc. | pharmaceuticals | 1.9 |
| Eli Lilly & Co. | pharmaceuticals | 1.9 |
| Top Ten | 24.3% | |
| Top Ten as % of Total Net Assets | 16.0% | |
Fund Asset Allocation
1 30-day SEC yield. See the Glossary.
2 The expense ratios shown are from the prospectus dated March 20, 2009, and represent estimated costs for the current fiscal year based
on the fund’s net assets as of the prospectus date. For the fiscal year ended November 30, 2009, the expense ratios were 0.34% for
Investor Shares and 0.23% for Admiral Shares.
3 S&P 500 Index.
4 Dow Jones U.S. Total Stock Market Index.
5 For an explanation of R-squared, beta, and other terms used here, see the Glossary.
6 Wellington Composite Index, weighted 65% S&P 500 Index and 35% Barclays Capital U.S. Credit A or Better Bond Index.
7 The holdings listed exclude any temporary cash investments and equity index products.
13
Wellington Fund
| Equity Characteristics | |||
| Comparative | Broad | ||
| Fund | Index1 | Index2 | |
| Number of Stocks | 103 | 500 | 4,289 |
| Median Market Cap | $53.8B | $44.1B | $30.5B |
| Price/Earnings Ratio | 19.0x | 29.2x | 34.2x |
| Price/Book Ratio | 2.0x | 2.2x | 2.1x |
| Dividend Yield | 2.6% | 2.0% | 1.8% |
| Return on Equity | 21.7% | 20.8% | 19.2% |
| Earnings Growth Rate | 6.5% | 8.5% | 8.3% |
| Foreign Holdings | 13.1% | 0.0% | 0.0% |
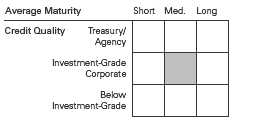
| Fixed Income Characteristics | |||
| Comparative | Broad | ||
| Fund | Index3 | Index4 | |
| Number of Bonds | 428 | 2,051 | 8,434 |
| Yield to Maturity | 3.8%5 | 3.8% | 3.2% |
| Average Coupon | 5.2% | 5.4% | 4.7% |
| Average Effective | |||
| Maturity | 9.3 years | 9.2 years | 6.4 years |
| Average Quality6 | A1 | Aa3 | Aa1 |
| Average Duration | 5.9 years | 6.0 years | 4.2 years |
| Sector Diversification7 | |
| (% of fixed income portfolio) | |
| Asset-Backed/Commercial Mortgage-Backed | 0.1% |
| Finance | 36.4 |
| Foreign | 4.5 |
| Government Mortgage-Backed | 0.1 |
| Industrial | 31.2 |
| Treasury/Agency | 14.4 |
| Utilities | 9.2 |
| Other | 4.1 |
| Distribution by Credit Quality6 | |
| (% of fixed income portfolio) | |
| Aaa | 17.8% |
| Aa | 20.3 |
| A | 47.9 |
| Baa | 12.5 |
| B | 0.0 |
| Other | 0.3 |
Equity Investment Focus

Fixed Income Investment Focus
1 S&P 500 Index.
2 Dow Jones U.S. Total Stock Market Index.
3 Barclays Capital U.S. Credit A or Better Bond Index.
4 Barclays Capital U.S. Aggregate Bond Index.
5 Before expenses.
6 Moody’s Investors Service.
7 The agency and mortgage-backed securities sectors may include issues from government-sponsored enterprises; such issues are not
backed by the full faith and credit of the U.S. government.
See the glossary of investment terms.
14
Wellington Fund
Performance Summary
All of the returns in this report represent past performance, which is not a guarantee of future results that may be achieved by the fund. (Current performance may be lower or higher than the performance data cited. For performance data current to the most recent month-end, visit our website at www.vanguard.com/performance.) Note, too, that both investment returns and principal value can fluctuate widely, so an investor’s shares, when sold, could be worth more or less than their original cost. The returns shown do not reflect taxes that a shareholder would pay on fund distributions or on the sale of fund shares.
Cumulative Performance: November 30, 1999–November 30, 2009
Initial Investment of $10,000
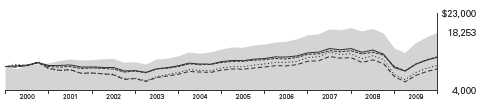
| Average Annual Total Returns | Final Value | |||
| Periods Ended November 30, 2009 | of a $10,000 | |||
| One Year | Five Years | Ten Years | Investment | |
| Wellington Fund Investor Shares1 | 26.46% | 5.28% | 6.20% | $18,253 |
| Dow Jones U.S. Total Stock Market Index | 28.06 | 1.24 | 0.27 | 10,278 |
| S&P 500 Index | 25.39 | 0.71 | –0.57 | 9,443 |
| Wellington Composite Index2 | 23.87 | 2.42 | 2.15 | 12,375 |
| Mixed-Asset Target Allocation | ||||
| Growth Funds Average3 | 26.23 | 1.86 | 2.06 | 12,266 |
| Final Value | ||||
| Since | of a $100,000 | |||
| One Year | Five Years | Inception4 | Investment | |
| Wellington Fund Admiral Shares | 26.57% | 5.40% | 5.65% | $159,951 |
| Dow Jones U.S. Total Stock Market Index | 28.06 | 1.24 | 1.44 | 112,985 |
| S&P 500 Index | 25.39 | 0.71 | 0.37 | 103,246 |
| Wellington Composite Index2 | 23.87 | 2.42 | 2.71 | 125,651 |
1 Total returns do not include the account service fee that may be applicable to certain accounts with balances below $10,000.
2 Weighted 65% S&P 500 Index and 35% Lehman U.S. Long Credit AA or Better Index through February 29, 2000; and 65% S&P 500 Index
and 35% Barclays Capital U.S. Credit A or Better Bond Index thereafter.
3 Derived from data provided by Lipper Inc.
4 Performance for the fund’s Admiral Shares and comparative standards is calculated since the Admiral Shares’ inception: May 14, 2001.
See Financial Highlights for dividend and capital gains information.
15
Wellington Fund
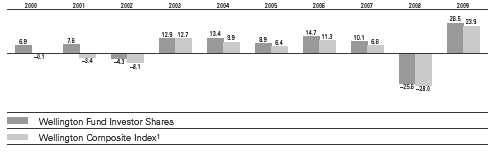
Fiscal-Year Total Returns (%): November 30, 1999–November 30, 2009
Average Annual Total Returns for periods ended September 30, 2009
This table presents average annual total returns through the latest calendar quarter—rather than through the end of the fiscal period. Securities and Exchange Commission rules require that we provide this information.
| Ten Years | ||||||
| Inception Date | One Year | Five Years | Capital | Income | Total | |
| Investor Shares2 | 7/1/1929 | 4.53% | 5.21% | 2.50% | 3.45% | 5.95% |
| Admiral Shares | 5/14/2001 | 4.66 | 5.34 | 1.793 | 3.473 | 5.263 |
1 Weighted 65% S&P 500 Index and 35% Lehman U.S. Long Credit AA or Better Index through February 29, 2000; and 65% S&P 500 Index
and 35% Barclays Capital U.S. Credit A or Better Bond Index thereafter.
2 Total returns do not include the account service fee that may be applicable to certain accounts with balances below $10,000.
3 Return since inception.
See Financial Highlights for dividend and capital gains information.
16
Wellington Fund
Financial Statements
Statement of Net Assets—Investments Summary
As of November 30, 2009
This Statement summarizes the fund’s holdings by asset type. Details are reported for each of the fund’s 50 largest individual holdings and for investments that, in total for any issuer, represent more than 1% of the fund’s net assets. The total value of smaller holdings is reported as a single amount within each category.
The fund reports a complete list of its holdings in regulatory filings four times in each fiscal year, at the quarter-ends. For the second and fourth fiscal quarters, the complete listing of the fund’s holdings is available electronically on Vanguard.com and on the Securities and Exchange Commission’s website (www.sec.gov), or you can have it mailed to you without charge by calling 800-662-7447. For the first and third fiscal quarters, the fund files the lists with the SEC on Form N-Q. Shareholders can look up the fund’s Forms N-Q on the SEC’s website. Forms N-Q may also be reviewed and copied at the SEC’s Public Reference Room (see the back cover of this report for further information).
| Market | Percentage | ||
| Value• | of Net | ||
| Shares | ($000) | Assets | |
| Common Stocks | |||
| Consumer Discretionary | |||
| Staples Inc. | 13,817,800 | 322,231 | 0.7% |
| Comcast Corp. Class A | 20,571,100 | 301,778 | 0.6% |
| Consumer Discretionary—Other † | 1,166,906 | 2.5% | |
| 1,790,915 | 3.8% | ||
| Consumer Staples | |||
| Wal-Mart Stores Inc. | 9,117,000 | 497,332 | 1.0% |
| Nestle SA ADR | 9,705,000 | 461,473 | 1.0% |
| Procter & Gamble Co. | 6,241,775 | 389,175 | 0.8% |
| Philip Morris International Inc. | 7,167,200 | 344,671 | 0.7% |
| PepsiCo Inc. | 5,317,400 | 330,848 | 0.7% |
| Kimberly-Clark Corp. | 4,687,600 | 309,241 | 0.7% |
| Consumer Staples—Other † | 595,385 | 1.3% | |
| 2,928,125 | 6.2% | ||
| Energy | |||
| Chevron Corp. | 10,810,200 | 843,628 | 1.8% |
| Total SA ADR | 11,662,500 | 725,291 | 1.5% |
| Exxon Mobil Corp. | 9,505,300 | 713,563 | 1.5% |
| BP PLC ADR | 6,844,000 | 391,340 | 0.8% |
| Anadarko Petroleum Corp. | 6,310,000 | 375,634 | 0.8% |
| XTO Energy Inc. | 8,587,500 | 364,454 | 0.8% |
| EnCana Corp. | 6,466,704 | 348,426 | 0.8% |
| Marathon Oil Corp. | 8,888,900 | 289,956 | 0.6% |
| Energy—Other † | 820,045 | 1.7% | |
| 4,872,337 | 10.3% | ||
| Financials | |||
| Wells Fargo & Co. | 26,490,717 | 742,800 | 1.6% |
| JPMorgan Chase & Co. | 14,032,276 | 596,231 | 1.3% |
| MetLife Inc. | 11,204,305 | 383,075 | 0.8% |
| ACE Ltd. | 7,131,300 | 347,366 | 0.7% |
| PNC Financial Services Group Inc. | 6,058,700 | 345,407 | 0.7% |
| Bank of America Corp. | 21,765,500 | 344,983 | 0.7% |
17
Wellington Fund
| Market | Percentage | ||
| Value• | of Net | ||
| Shares | ($000) | Assets | |
| Muenchener Rueckversicherungs AG | 1,818,553 | 285,328 | 0.6% |
| Goldman Sachs Group Inc. | 1,323,300 | 224,511 | 0.5% |
| Financials—Other † | 1,801,719 | 3.8% | |
| 5,071,420 | 10.7% | ||
| Health Care | |||
| Merck & Co. Inc. | 20,796,652 | 753,047 | 1.6% |
| Pfizer Inc. | 32,591,241 | 592,183 | 1.2% |
| Eli Lilly & Co. | 15,596,800 | 572,870 | 1.2% |
| Medtronic Inc. | 12,054,900 | 511,610 | 1.1% |
| Johnson & Johnson | 7,996,400 | 502,494 | 1.1% |
| Bristol-Myers Squibb Co. | 15,003,200 | 379,731 | 0.8% |
| ^ AstraZeneca PLC ADR | 7,465,100 | 334,660 | 0.7% |
| Teva Pharmaceutical Industries Ltd. ADR | 5,583,900 | 294,774 | 0.6% |
| Health Care—Other † | 856,565 | 1.8% | |
| 4,797,934 | 10.1% | ||
| Industrials | |||
| Deere & Co. | 9,285,000 | 496,840 | 1.0% |
| Siemens AG | 3,799,000 | 372,590 | 0.8% |
| Lockheed Martin Corp. | 4,351,000 | 336,028 | 0.7% |
| United Parcel Service Inc. Class B | 5,810,500 | 333,929 | 0.7% |
| Waste Management Inc. | 9,382,500 | 308,121 | 0.7% |
| General Electric Co. | 10,500,600 | 168,220 | 0.4% |
| Industrials—Other † | 1,816,207 | 3.8% | |
| 3,831,935 | 8.1% | ||
| Information Technology | |||
| International Business Machines Corp. | 6,637,000 | 838,585 | 1.8% |
| Microsoft Corp. | 16,502,300 | 485,333 | 1.0% |
| Accenture PLC Class A | 9,945,100 | 408,147 | 0.9% |
| Texas Instruments Inc. | 15,734,100 | 397,915 | 0.9% |
| Hewlett-Packard Co. | 6,049,000 | 296,764 | 0.6% |
| * Cisco Systems Inc. | 12,221,200 | 285,976 | 0.6% |
| Automatic Data Processing Inc. | 6,570,400 | 285,484 | 0.6% |
| Information Technology—Other † | 631,424 | 1.3% | |
| 3,629,628 | 7.7% | ||
| Materials † | 1,335,392 | 2.8% | |
| Telecommunication Services | |||
| AT&T Inc. | 42,283,285 | 1,139,112 | 2.4% |
| Utilities | |||
| Dominion Resources Inc. | 9,920,200 | 360,897 | 0.8% |
| FPL Group Inc. | 6,320,800 | 328,492 | 0.7% |
| Exelon Corp. | 6,790,800 | 327,181 | 0.7% |
| Utilities—Other † | 375,184 | 0.8% | |
| 1,391,754 | 3.0% | ||
| Total Common Stocks (Cost $24,941,462) | 30,788,552 | 65.1% | |
18
Wellington Fund
| Face | Market | Percentage | |||||
| Maturity | Amount | Value• | of Net | ||||
| Coupon | Date | ($000) | ($000) | Assets | |||
| U.S. Government and Agency Obligations | |||||||
| U.S. Government Securities | |||||||
| United States Treasury Note/Bond | 1.000% | 7/31/11 | 1,143,000 | 1,152,293 | 2.5% | ||
| United States Treasury Note/Bond | 1.000% | 9/30/11 | 525,000 | 528,937 | 1.1% | ||
| United States Treasury Note/Bond | 2.750% | 2/15/19 | 202,000 | 195,467 | 0.4% | ||
| 1,876,697 | 4.0% | ||||||
| Agency Bonds and Notes | |||||||
| 1 Bank of America Corp. | 3.125% | 6/15/12 | 50,000 | 52,461 | 0.1% | ||
| 1 General Electric Capital Corp. | 2.000%–3.000% | 12/9/11–9/28/12 | 98,985 | 101,957 | 0.2% | ||
| 1 John Deere Capital Corp. | 2.875% | 6/19/12 | 50,000 | 52,134 | 0.1% | ||
| 1 JPMorgan Chase & Co. | 3.125% | 12/1/11 | 25,000 | 26,117 | 0.1% | ||
| 1 PNC Funding Corp. | 2.300% | 6/22/12 | 13,590 | 14,010 | 0.0% | ||
| 1 Wells Fargo & Co. | 3.000% | 12/9/11 | 19,000 | 19,811 | 0.1% | ||
| Agency Bonds and Notes—Other † | 113,184 | 0.2% | |||||
| 379,674 | 0.8% | ||||||
| Conventional Mortgage-Backed Securities † | 10,975 | 0.0% | |||||
| Total U.S. Government and Agency Obligations (Cost $2,242,950) | 2,267,346 | 4.8% | |||||
| 2Asset-Backed/Commercial Mortgage-Backed Securities (Cost $19,945) † | 20,043 | 0.0% | |||||
| Corporate Bonds | |||||||
| Finance | |||||||
| Banking | |||||||
| BAC Capital Trust VI | 5.625% | 3/8/35 | 96,180 | 68,816 | 0.1% | ||
| Bank of America Corp. | 4.375% | 12/1/10 | 10,000 | 10,258 | 0.0% | ||
| Bank of America NA | 5.300%–6.000% | 3/15/17–10/15/36 | 98,000 | 96,027 | 0.2% | ||
| Bank One Corp. | 7.875% | 8/1/10 | 40,000 | 41,896 | 0.1% | ||
| Golden West Financial Corp. | 4.750% | 10/1/12 | 10,000 | 10,567 | 0.0% | ||
| Goldman Sachs Group Inc. | 5.000%–6.750% | 1/15/11–10/1/37 | 322,995 | 337,998 | 0.7% | ||
| 3 | JPMorgan Chase & Co. | 3.700%–7.900% | 2/1/11–12/29/49 | 264,636 | 278,028 | 0.6% | |
| Merrill Lynch & Co. Inc. | 5.770%–6.875% | 7/25/11–9/15/26 | 188,000 | 194,128 | 0.4% | ||
| National City Bank | |||||||
| of Pennsylvania | 7.250% | 10/21/11 | 20,000 | 21,509 | 0.1% | ||
| National City Bank | 7.250% | 7/15/10 | 25,000 | 25,643 | 0.1% | ||
| National City Corp. | 6.875% | 5/15/19 | 13,950 | 15,228 | 0.0% | ||
| PNC Bank NA | 4.875% | 9/21/17 | 50,000 | 48,833 | 0.1% | ||
| 3 | PNC Financial Services Group Inc. | 8.250% | 5/31/49 | 44,000 | 43,890 | 0.1% | |
| Wachovia Bank NA | 6.600% | 1/15/38 | 60,000 | 64,927 | 0.1% | ||
| Wachovia Corp. | 5.500% | 5/1/13 | 35,000 | 37,881 | 0.1% | ||
| Wells Fargo & Co. | 3.750%–6.375% | 8/1/11–9/15/16 | 143,000 | 150,417 | 0.3% | ||
| Wells Fargo Bank NA | 6.450% | 2/1/11 | 5,000 | 5,306 | 0.0% | ||
| 3 | Wells Fargo Capital XIII | 7.700% | 12/29/49 | 45,145 | 41,082 | 0.1% | |
| Wells Fargo Financial Inc. | 5.500% | 8/1/12 | 20,000 | 21,666 | 0.1% | ||
| 2 | Banking—Other † | 2,122,852 | 4.5% | ||||
| Brokerage † | 16,655 | 0.0% | |||||
| Finance Companies | |||||||
| General Electric Capital Corp. | 5.250%–6.750% | 2/22/11–8/7/37 | 252,200 | 265,275 | 0.5% | ||
| 2 | Finance Companies—Other † | 225,272 | 0.5% | ||||
| 2 | Insurance † | 1,236,194 | 2.6% | ||||
| Other Finance † | 55,544 | 0.1% | |||||
| 2 | Real Estate Investment Trusts † | 254,203 | 0.6% | ||||
| 5,690,095 | 12.0% | ||||||
19
Wellington Fund
| Face | Market | Percentage | ||||
| Maturity | Amount | Value• | of Net | |||
| Coupon | Date | ($000) | ($000) | Assets | ||
| Industrial | ||||||
| Basic Industry † | 154,291 | 0.3% | ||||
| Capital Goods | ||||||
| Deere & Co. | 7.125% | 3/3/31 | 17,500 | 21,552 | 0.0% | |
| General Electric Co. | 5.250% | 12/6/17 | 41,685 | 43,629 | 0.1% | |
| John Deere Capital Corp. | 5.100%–5.350% | 1/17/12–1/15/13 | 80,000 | 86,934 | 0.2% | |
| 2 | Capital Goods—Other † | 380,746 | 0.8% | |||
| Communication | ||||||
| AT&T Inc. | 5.100%–6.800% | 9/15/14–9/1/37 | 178,255 | 190,047 | 0.4% | |
| BellSouth Corp. | 5.200%–6.550% | 10/15/11–11/15/34 | 89,220 | 94,692 | 0.2% | |
| BellSouth Telecommunications Inc. | 7.000% | 12/1/95 | 27,600 | 27,831 | 0.1% | |
| 2 | Communication—Other † | 603,112 | 1.2% | |||
| Consumer Cyclical | ||||||
| Wal-Mart Stores Inc. | 5.250% | 9/1/35 | 18,000 | 18,136 | 0.1% | |
| 2 | Consumer Cyclical—Other † | 723,774 | 1.5% | |||
| Consumer Noncyclical | ||||||
| Eli Lilly & Co. | 6.000% | 3/15/12 | 45,000 | 49,810 | 0.1% | |
| Johnson & Johnson | 5.150% | 7/15/18 | 14,800 | 16,430 | 0.0% | |
| Medtronic Inc. | 4.375%–4.750% | 9/15/10–9/15/15 | 39,235 | 41,782 | 0.1% | |
| Merck & Co. Inc. | 5.125% | 11/15/11 | 69,000 | 74,668 | 0.1% | |
| Pfizer Inc. | 5.350% | 3/15/15 | 33,000 | 36,981 | 0.1% | |
| Wyeth | 6.950% | 3/15/11 | 30,000 | 32,376 | 0.1% | |
| 2 | Consumer Noncyclical—Other † | 1,272,529 | 2.7% | |||
| Energy † | 270,397 | 0.6% | ||||
| Other Industrial † | 66,021 | 0.2% | ||||
| Technology | ||||||
| IBM International Group Capital LLC | 5.050% | 10/22/12 | 50,000 | 55,001 | 0.1% | |
| International Business | ||||||
| Machines Corp. | 5.875%–8.375% | 11/1/19–11/29/32 | 50,000 | 60,575 | 0.1% | |
| Technology—Other † | 260,953 | 0.6% | ||||
| 2 | Transportation † | 293,048 | 0.6% | |||
| 4,875,315 | 10.3% | |||||
| Utilities | ||||||
| 2 | Electric † | 1,228,835 | 2.6% | |||
| 2 | Natural Gas † | 168,659 | 0.4% | |||
| Other Utility † | 39,004 | 0.1% | ||||
| 1,436,498 | 3.1% | |||||
| Total Corporate Bonds (Cost $11,439,661) | 12,001,908 | 25.4% | ||||
| 2Sovereign Bonds (U.S. Dollar-Denominated) (Cost $672,022) † | 709,177 | 1.5% | ||||
| 2Taxable Municipal Bonds (Cost $626,612) † | 639,754 | 1.3% | ||||
| Temporary Cash Investments | ||||||
| Repurchase Agreement | ||||||
| BNP Paribas Securities Corp. | ||||||
| (Dated 11/30/09, Repurchase | ||||||
| Value $655,203,000, collateralized | ||||||
| by Federal Home Loan Mortgage | ||||||
| Corp. 4.500%–8.000%, 11/1/16–1/1/39, | ||||||
| Federal National Mortgage Assn. | ||||||
| 3.500%–6.590%, 2/1/11–4/1/48, | ||||||
| and Government National | ||||||
| Mortgage Assn. 4.350%–5.500%, | ||||||
| 11/15/35 –12/15/49) | 0.160% | 12/1/09 | 655,200 | 655,200 | 1.4% | |
20
| Market | Percentage | |||
| Value• | of Net | |||
| Coupon | Shares | ($000) | Assets | |
| Money Market Fund | ||||
| 4,5Vanguard Market Liquidity Fund | 0.199% | 45,350,300 | 45,350 | 0.1% |
| Total Temporary Cash Investments (Cost $700,550) | 700,550 | 1.5% | ||
| Total Investments (Cost $40,643,202) | 47,127,330 | 99.6% | ||
| Other Assets and Liabilities | ||||
| Other Assets | 487,358 | 1.0% | ||
| Liabilities5 | (289,712) | (0.6%) | ||
| 197,646 | 0.4% | |||
| Net Assets | 47,324,976 | 100.0% | ||
| At November 30, 2009, net assets consisted of: | ||||
| Amount | ||||
| ($000) | ||||
| Paid-in Capital | 43,549,682 | |||
| Undistributed Net Investment Income | 201,646 | |||
| Accumulated Net Realized Losses | (2,910,640) | |||
| Unrealized Appreciation (Depreciation) | ||||
| Investment Securities | 6,484,128 | |||
| Foreign Currencies | 160 | |||
| Net Assets | 47,324,976 | |||
| Investor Shares—Net Assets | ||||
| Applicable to 969,926,954 outstanding $.001 par value shares of | ||||
| beneficial interest (unlimited authorization) | 28,113,513 | |||
| Net Asset Value Per Share—Investor Shares | $28.99 | |||
| Admiral Shares—Net Assets | ||||
| Applicable to 383,701,802 outstanding $.001 par value shares of | ||||
| beneficial interest (unlimited authorization) | 19,211,463 | |||
| Net Asset Value Per Share—Admiral Shares | $50.07 | |||
• See Note A in Notes to Financial Statements.
* Non-income-producing security.
^ Part of security position is on loan to broker-dealers. The total value of securities on loan is $43,256,000.
† Represents the aggregate value, by category, of securities that are not among the 50 largest holdings and, in total for any issuer,
represent 1% or less of net assets.
1 Guaranteed by the Federal Deposit Insurance Corporation (FDIC) as part of the Temporary Liquidity Guarantee Program.
2 Certain of the fund’s securities are exempt from registration under Rule 144A of the Securities Act of 1933. Such securities may be
sold in transactions exempt from registration, normally to qualified institutional buyers. At November 30, 2009, the aggregate value
of these securities was $1,817,288,000, representing 3.8% of net assets.
3 The average or expected maturity is shorter than the final maturity shown because of the possibility of interim principal payments and
prepayments or the possibility of the issue being called.
4 Affiliated money market fund available only to Vanguard funds and certain trusts and accounts managed by Vanguard. Rate shown is
the 7-day yield.
5 Includes $45,350,000 of collateral received for securities on loan.
ADR—American Depositary Receipt.
See accompanying Notes, which are an integral part of the Financial Statements.
21
Wellington Fund
Statement of Operations
| Year Ended | |
| November 30, 2009 | |
| ($000) | |
| Investment Income | |
| Income | |
| Dividends1 | 775,599 |
| Interest | 787,989 |
| Security Lending | 11,053 |
| Total Income | 1,574,641 |
| Expenses | |
| Investment Advisory Fees—Note B | |
| Basic Fee | 27,424 |
| Performance Adjustment | 6,887 |
| The Vanguard Group—Note C | |
| Management and Administrative—Investor Shares | 55,167 |
| Management and Administrative—Admiral Shares | 19,654 |
| Marketing and Distribution—Investor Shares | 5,879 |
| Marketing and Distribution—Admiral Shares | 3,713 |
| Custodian Fees | 227 |
| Auditing Fees | 28 |
| Shareholders’ Reports and Proxies—Investor Shares | 1,253 |
| Shareholders’ Reports and Proxies—Admiral Shares | 187 |
| Trustees’ Fees and Expenses | 75 |
| Total Expenses | 120,494 |
| Expenses Paid Indirectly | (502) |
| Net Expenses | 119,992 |
| Net Investment Income | 1,454,649 |
| Realized Net Gain (Loss) | |
| Investment Securities Sold | (2,314,957) |
| Futures Contracts | (5,710) |
| Swap Contracts | (8,042) |
| Foreign Currencies | 1,859 |
| Realized Net Gain (Loss) | (2,326,850) |
| Change in Unrealized Appreciation (Depreciation) | |
| Investment Securities | 10,569,403 |
| Swap Contracts | 1,133 |
| Foreign Currencies | (51) |
| Change in Unrealized Appreciation (Depreciation) | 10,570,485 |
| Net Increase (Decrease) in Net Assets Resulting from Operations | 9,698,284 |
1 Dividends are net of foreign withholding taxes of $21,552,000.
See accompanying Notes, which are an integral part of the Financial Statements.
22
Wellington Fund
Statement of Changes in Net Assets
| Year Ended November 30, | ||
| 2009 | 2008 | |
| ($000) | ($000) | |
| Increase (Decrease) in Net Assets | ||
| Operations | ||
| Net Investment Income | 1,454,649 | 1,643,901 |
| Realized Net Gain (Loss) | (2,326,850) | (588,530) |
| Change in Unrealized Appreciation (Depreciation) | 10,570,485 | (14,218,636) |
| Net Increase (Decrease) in Net Assets Resulting from Operations | 9,698,284 | (13,163,265) |
| Distributions | ||
| Net Investment Income | ||
| Investor Shares | (877,808) | (1,033,168) |
| Admiral Shares | (594,812) | (682,485) |
| Realized Capital Gain1 | ||
| Investor Shares | — | (1,290,892) |
| Admiral Shares | — | (799,806) |
| Total Distributions | (1,472,620) | (3,806,351) |
| Capital Share Transactions | ||
| Investor Shares | 678,727 | 1,340,936 |
| Admiral Shares | 1,239,126 | 2,035,690 |
| Net Increase (Decrease) from Capital Share Transactions | 1,917,853 | 3,376,626 |
| Total Increase (Decrease) | 10,143,517 | (13,592,990) |
| Net Assets | ||
| Beginning of Period | 37,181,459 | 50,774,449 |
| End of Period2 | 47,324,976 | 37,181,459 |
1 Includes fiscal 2008 short-term gain distributions totaling $174,714,000. Short-term gain distributions are treated as ordinary income
dividends for tax purposes.
2 Net Assets—End of Period includes undistributed net investment income of $201,646,000 and $219,849,000.
See accompanying Notes, which are an integral part of the Financial Statements.
23
Wellington Fund
Financial Highlights
| Investor Shares | |||||
| For a Share Outstanding | Year Ended November 30, | ||||
| Throughout Each Period | 2009 | 2008 | 2007 | 2006 | 2005 |
| Net Asset Value, Beginning of Period | $23.79 | $34.56 | $33.76 | $31.34 | $30.54 |
| Investment Operations | |||||
| Net Investment Income | .909 | 1.037 | 1.059 | .982 | .886 |
| Net Realized and Unrealized Gain (Loss) | |||||
| on Investments | 5.217 | (9.289) | 2.172 | 3.392 | 1.718 |
| Total from Investment Operations | 6.126 | (8.252) | 3.231 | 4.374 | 2.604 |
| Distributions | |||||
| Dividends from Net Investment Income | (.926) | (1.094) | (1.030) | (.980) | (.895) |
| Distributions from Realized Capital Gains | — | (1.424) | (1.401) | (.974) | (.909) |
| Total Distributions | (.926) | (2.518) | (2.431) | (1.954) | (1.804) |
| Net Asset Value, End of Period | $28.99 | $23.79 | $34.56 | $33.76 | $31.34 |
| Total Return1 | 26.46% | –25.59% | 10.09% | 14.69% | 8.86% |
| Ratios/Supplemental Data | |||||
| Net Assets, End of Period (Millions) | $28,114 | $22,486 | $31,451 | $29,318 | $26,074 |
| Ratio of Total Expenses to | |||||
| Average Net Assets2 | 0.34% | 0.29% | 0.27% | 0.30% | 0.29% |
| Ratio of Net Investment Income to | |||||
| Average Net Assets | 3.59% | 3.44% | 3.14% | 3.10% | 2.93% |
| Portfolio Turnover Rate | 28% | 30% | 23% | 25% | 24% |
1 Total returns do not include the account service fee that may be applicable to certain accounts with balances below $10,000.
2 Includes performance-based investment advisory fee increases (decreases) of 0.02%, 0.01%, 0.01%, 0.01%, and 0.01%.
See accompanying Notes, which are an integral part of the Financial Statements.
24
Wellington Fund
Financial Highlights
| Admiral Shares | |||||
| For a Share Outstanding | Year Ended November 30, | ||||
| Throughout Each Period | 2009 | 2008 | 2007 | 2006 | 2005 |
| Net Asset Value, Beginning of Period | $41.10 | $59.71 | $58.32 | $54.15 | $52.76 |
| Investment Operations | |||||
| Net Investment Income | 1.619 | 1.848 | 1.894 | 1.768 | 1.610 |
| Net Realized and Unrealized Gain (Loss) | |||||
| on Investments | 8.999 | (16.048) | 3.762 | 5.849 | 2.970 |
| Total from Investment Operations | 10.618 | (14.200) | 5.656 | 7.617 | 4.580 |
| Distributions | |||||
| Dividends from Net Investment Income | (1.648) | (1.950) | (1.847) | (1.765) | (1.620) |
| Distributions from Realized Capital Gains | — | (2.460) | (2.419) | (1.682) | (1.570) |
| Total Distributions | (1.648) | (4.410) | (4.266) | (3.447) | (3.190) |
| Net Asset Value, End of Period | $50.07 | $41.10 | $59.71 | $58.32 | $54.15 |
| Total Return | 26.57% | –25.52% | 10.23% | 14.82% | 9.02% |
| Ratios/Supplemental Data | |||||
| Net Assets, End of Period (Millions) | $19,211 | $14,696 | $19,323 | $15,851 | $12,503 |
| Ratio of Total Expenses to | |||||
| Average Net Assets1 | 0.23% | 0.18% | 0.16% | 0.17% | 0.15% |
| Ratio of Net Investment Income to | |||||
| Average Net Assets | 3.70% | 3.55% | 3.25% | 3.23% | 3.09% |
| Portfolio Turnover Rate | 28% | 30% | 23% | 25% | 24% |
1 Includes performance-based investment advisory fee increases (decreases) of 0.02%, 0.01%, 0.01%, 0.01%, and 0.01%.
See accompanying Notes, which are an integral part of the Financial Statements.
25
Wellington Fund
Notes to Financial Statements
Vanguard Wellington Fund is registered under the Investment Company Act of 1940 as an open-end investment company, or mutual fund. Certain of the fund’s investments are in corporate debt instruments; the issuers’ abilities to meet their obligations may be affected by economic developments in their respective industries. The fund offers two classes of shares: Investor Shares and Admiral Shares. Investor Shares are available to any investor who meets the fund’s minimum purchase requirements. Admiral Shares are designed for investors who meet certain administrative, service, tenure, and account-size criteria.
A. The following significant accounting policies conform to generally accepted accounting principles for U.S. mutual funds. The fund consistently follows such policies in preparing its financial statements.
1. Security Valuation: Securities are valued as of the close of trading on the New York Stock Exchange (generally 4 p.m., Eastern time) on the valuation date. Equity securities are valued at the latest quoted sales prices or official closing prices taken from the primary market in which each security trades; such securities not traded on the valuation date are valued at the mean of the latest quoted bid and asked prices. Bonds, and temporary cash investments acquired over 60 days to maturity, are valued using the latest bid prices or using valuations based on a matrix system (which considers such factors as security prices, yields, maturities, and ratings), both as furnished by independent pricing services. Investments in Vanguard Market Liquidity Fund are valued at that fund’s net asset value. Other temporary cash investments are valued at amortized cost, which approximates market value. Securities for which m arket quotations are not readily available, or whose values have been affected by events occurring before the fund’s pricing time but after the close of the securities’ primary markets, are valued at their fair values calculated according to procedures adopted by the board of trustees. These procedures include obtaining quotations from an independent pricing service, monitoring news to identify significant market- or security-specific events, and evaluating changes in the values of foreign market proxies (for example, ADRs, futures contracts, or exchange-traded funds), between the time the foreign markets close and the fund’s pricing time. When fair-value pricing is employed, the prices of securities used by a fund to calculate its net asset value may differ from quoted or published prices for the same securities.
2. Foreign Currency: Securities and other assets and liabilities denominated in foreign currencies are translated into U.S. dollars using exchange rates obtained from an independent third party as of the fund’s pricing time on the valuation date. Realized gains (losses) and unrealized appreciation (depreciation) on investment securities include the effects of changes in exchange rates since the securities were purchased, combined with the effects of changes in security prices. Fluctuations in the value of other assets and liabilities resulting from changes in exchange rates are recorded as unrealized foreign currency gains (losses) until the assets or liabilities are settled in cash, at which time they are recorded as realized foreign currency gains (losses).
3. Futures Contracts: The fund may use futures contracts to invest in fixed income asset classes with greater efficiency and lower cost than is possible through direct investment, to add value when these instruments are attractively priced, or to adjust sensitivity to changes in interest rates. The primary risks associated with the use of futures contracts are imperfect correlation between changes in market values of bonds held by the fund and the prices of futures contracts, and the possibility of an illiquid market.
Futures contracts are valued based upon their quoted daily settlement prices. The aggregate principal amounts of the contracts are not recorded in the Statement of Net Assets. Fluctuations in the value of the contracts are recorded in the Statement of Net Assets as an asset (liability) and in the Statement of Operations as unrealized appreciation (depreciation) until the contracts are closed, when they are recorded as realized futures gains (losses).
26
Wellington Fund
4. Swap Contracts: The fund may invest in credit default swaps to adjust the overall credit risk of the fund or to actively overweight or underweight credit risk to a specific bond issuer. The fund has purchased credit protection through credit default swaps to reduce credit exposure to a given issuer or issuers. Under the terms of the swaps, an upfront payment may be exchanged between the seller and buyer. In addition, the seller of the credit protection receives a periodic payment of premium from the buyer that is a fixed percentage applied to a notional principal amount. If the reference entity is subject to a credit event (such as bankruptcy, failure to pay, or obligation acceleration) during the term of the swap, the seller agrees to either physically settle or cash settle the swap contract. If the swap is physically settled, the seller agrees to pay the buyer the notional amount and take delivery of a debt ins trument of the reference issuer of the same notional par amount. If the swap is cash settled, the seller agrees to pay the buyer the difference between the notional amount and the final price for debt instruments of the relevant reference entity, as determined either in a market auction for credit default swaps of such reference entity or pursuant to a pre-agreed upon-valuation procedure.
The notional amounts of swap contracts are not recorded in the Statement of Net Assets. Swaps are valued daily and the change in value is recorded as unrealized appreciation (depreciation) until the seller of credit protection is required to take delivery (or, in a cash settled swap, pay the settlement amount determined) upon occurrence of a credit event, periodic payments are made, or the swap terminates, at which time realized gain (loss) is recorded. The net premium to be received or paid by the fund under swap contracts is accrued daily and recorded as realized gain (loss) over the life of the contract. A primary risk for all types of swaps is that a counterparty will default on its obligation to pay net amounts due to the fund. The fund’s maximum risk of loss from counterparty credit risk is the amount of unrealized appreciation on the swap contract. This risk is mitigated by entering into swaps only with highly rated counterparties, a master netting arrangement between the fund and the counterparty and by the posting of collateral by the counterparty. The swap contracts contain provisions whereby a counterparty may terminate open contracts if the fund’s net assets decline below a certain level, triggering a payment by the fund if the fund is in a net liability position at the time of the termination. The payment amount would be reduced by any collateral the fund has posted. Any securities posted as collateral for open contracts are noted in the Statement of Net Assets.
5. Repurchase Agreements: The fund may invest in repurchase agreements. Securities pledged as collateral for repurchase agreements are held by a custodian bank until the agreements mature. Each agreement requires that the market value of the collateral be sufficient to cover payments of interest and principal; however, in the event of default or bankruptcy by the other party to the agreement, retention of the collateral may be subject to legal proceedings.
6. Federal Income Taxes: The fund intends to continue to qualify as a regulated investment company and distribute all of its taxable income. Management has analyzed the fund’s tax positions taken for all open federal income tax years (November 30, 2006–2009), and has concluded that no provision for federal income tax is required in the fund’s financial statements.
7. Distributions: Distributions to shareholders are recorded on the ex-dividend date.
8. Security Lending: The fund may lend its securities to qualified institutional borrowers to earn additional income. Security loans are required to be secured at all times by collateral at least equal to the market value of securities loaned. The fund invests cash collateral received in Vanguard Market Liquidity Fund, and records a liability for the return of the collateral, during the period the securities are on loan. Security lending income represents the income earned on investing cash collateral, less expenses associated with the loan.
27
Wellington Fund
9. Other: Dividend income is recorded on the ex-dividend date. Interest income is accrued daily. Premiums and discounts on debt securities purchased are amortized and accreted, respectively, to interest income over the lives of the respective securities. Security transactions are accounted for on the date securities are bought or sold. Costs used to determine realized gains (losses) on the sale of investment securities are those of the specific securities sold.
Each class of shares has equal rights as to assets and earnings, except that each class separately bears certain class-specific expenses related to maintenance of shareholder accounts (included in Management and Administrative expenses), shareholder reporting, and proxies. Marketing and distribution expenses are allocated to each class of shares based on a method approved by the board of trustees. Income, other non-class-specific expenses, and gains and losses on investments are allocated to each class of shares based on its relative net assets.
B. Wellington Management Company, LLP, provides investment advisory services to the fund for a fee calculated at an annual percentage rate of average net assets. The basic fee is subject to quarterly adjustments based on the fund’s performance for the preceding three years relative to the combined index comprising the S&P 500 Index and Barclays Capital U.S. Credit A or Better Bond Index. For the year ended November 30, 2009, the investment advisory fee represented an effective annual basic rate of 0.07% of the fund’s average net assets before an increase of $6,887,000 (0.02%) based on performance.
C. The Vanguard Group furnishes at cost corporate management, administrative, marketing, and distribution services. The costs of such services are allocated to the fund under methods approved by the board of trustees. The fund has committed to provide up to 0.40% of its net assets in capital contributions to Vanguard. At November 30, 2009, the fund had contributed capital of $9,455,000 to Vanguard (included in Other Assets), representing 0.02% of the fund’s net assets and 3.78% of Vanguard’s capitalization. The fund’s trustees and officers are also directors and officers of Vanguard.
D. The fund has asked its investment advisor to direct certain security trades, subject to obtaining the best price and execution, to brokers who have agreed to rebate to the fund part of the commissions generated. Such rebates are used solely to reduce the fund’s management and administrative expenses. The fund’s custodian bank has also agreed to reduce its fees when the fund maintains cash on deposit in the non-interest-bearing custody account. For the year ended November 30, 2009, these arrangements reduced the fund’s management and administrative expenses by $493,000 and custodian fees by $9,000. The total expense reduction represented an effective annual rate of 0.00% of the fund’s average net assets.
E. Various inputs may be used to determine the value of the fund’s investments. These inputs are summarized in three broad levels for financial statement purposes. The inputs or methodologies used to value securities are not necessarily an indication of the risk associated with investing in those securities.
Level 1—Quoted prices in active markets for identical securities.
Level 2—Other significant observable inputs (including quoted prices for similar securities, interest rates, prepayment speeds, credit risk, etc.).
Level 3—Significant unobservable inputs (including the fund’s own assumptions used to determine the fair value of investments).
28
Wellington Fund
The following table summarizes the fund’s investments as of November 30, 2009, based on the inputs used to value them:
| Level 1 | Level 2 | Level 3 | |
| Investments | ($000) | ($000) | ($000) |
| Common Stocks | 29,567,241 | 1,221,311 | — |
| U.S. Government and Agency Obligations | — | 2,267,346 | — |
| Asset-Backed/Commercial Mortgage-Backed Securities | — | 20,043 | — |
| Corporate Bonds | — | 12,001,908 | — |
| Sovereign Bonds | — | 709,177 | — |
| Taxable Municipal Bonds | — | 639,754 | — |
| Temporary Cash Investments | 45,350 | 655,200 | — |
| Total | 29,612,591 | 17,514,739 | — |
F. Realized net gain (loss) and the change in unrealized appreciation (depreciation) on derivatives for the year ended November 30, 2009, were:
| Interest Rate | Credit | ||
| Contracts | Contracts | Total | |
| Realized Net Gain (Loss) on Derivatives | ($000) | ($000) | ($000) |
| Futures Contracts | (5,710) | — | (5,710) |
| Swap Contracts | — | (8,042) | (8,042) |
| Realized Net Gain (Loss) on Derivatives | (5,710) | (8,042) | (13,752) |
| Change in Unrealized Appreciation (Depreciation) on Derivatives | |||
| Futures Contracts | — | — | — |
| Swap Contracts | — | 1,133 | 1,133 |
| Change in Unrealized Appreciation (Depreciation) on Derivatives | — | 1,133 | 1,133 |
G. Distributions are determined on a tax basis and may differ from net investment income and realized capital gains for financial reporting purposes. Differences may be permanent or temporary. Permanent differences are reclassified among capital accounts in the financial statements to reflect their tax character. Temporary differences arise when certain items of income, expense, gain, or loss are recognized in different periods for financial statement and tax purposes; these differences will reverse at some time in the future. Differences in classification may also result from the treatment of short-term gains as ordinary income for tax purposes.
During the year ended November 30, 2009, the fund realized net foreign currency gains of $1,859,000, which increased distributable net income for tax purposes; accordingly, such gains have been reclassified from accumulated net realized losses to undistributed net investment income.
29
Wellington Fund
Realized and unrealized gains (losses) on certain of the fund’s swap contracts are treated as ordinary income (loss) for tax purposes; the effect on the fund’s income dividends to shareholders is offset by a change in principal return. Realized losses of $2,091,000 on swap contracts have been reclassified from accumulated net realized losses to undistributed net investment income.
For tax purposes, at November 30, 2009, the fund had $295,440,000 of ordinary income available for distribution. The fund had available capital loss carryforwards totaling $2,913,854,000 to offset future net capital gains of $585,859,000 through November 30, 2016, and $2,327,995,000 through November 30, 2017.
At November 30, 2009, the cost of investment securities for tax purposes was $40,643,202,000. Net unrealized appreciation of investment securities for tax purposes was $6,484,128,000, consisting of unrealized gains of $7,638,395,000 on securities that had risen in value since their purchase and $1,154,267,000 in unrealized losses on securities that had fallen in value since their purchase.
H. During the year ended November 30, 2009, the fund purchased $9,523,405,000 of investment securities and sold $9,383,100,000 of investment securities, other than U.S. government securities and temporary cash investments. Purchases and sales of U.S. government securities were $3,599,867,000 and $1,804,485,000, respectively.
I. Capital share transactions for each class of shares were:
| Year Ended November 30, | ||||
| 2009 | 2008 | |||
| Amount | Shares | Amount | Shares | |
| ($000) | (000) | ($000) | (000) | |
| Investor Shares | ||||
| Issued | 3,655,303 | 144,636 | 4,384,153 | 144,706 |
| Issued in Lieu of Cash Distributions | 849,915 | 34,192 | 2,262,448 | 71,317 |
| Redeemed | (3,826,491) | (153,943) | (5,305,665) | (180,912) |
| Net Increase (Decrease)—Investor Shares | 678,727 | 24,885 | 1,340,936 | 35,111 |
| Admiral Shares | ||||
| Issued | 2,941,896 | 66,378 | 3,429,156 | 65,145 |
| Issued in Lieu of Cash Distributions | 541,836 | 12,610 | 1,378,226 | 25,180 |
| Redeemed | (2,244,606) | (52,839) | (2,771,692) | (56,390) |
| Net Increase (Decrease)—Admiral Shares | 1,239,126 | 26,149 | 2,035,690 | 33,935 |
J. In preparing the financial statements as of November 30, 2009, management considered the impact of subsequent events occurring through January 11, 2010, for potential recognition or disclosure in these financial statements.
30
Report of Independent Registered
Public Accounting Firm
To the Trustees and Shareholders of Vanguard Wellington Fund:
In our opinion, the accompanying statement of net assets—investments summary and the related statements of operations and of changes in net assets and the financial highlights present fairly, in all material respects, the financial position of Vanguard Wellington Fund (the “Fund”) at November 30, 2009, the results of its operations for the year then ended, the changes in its net assets for each of the two years in the period then ended and the financial highlights for each of the five years in the period then ended, in conformity with accounting principles generally accepted in the United States of America. These financial statements and financial highlights (hereafter referred to as “financial statements”) are the responsibility of the Fund’s management; our responsibility is to express an opinion on these financial statements based on our audits. We conducted our audits of these financial statements in accordance with the standards of the Public Company Accounting Oversight Board (United States). Those standards require that we plan and perform the audit to obtain reasonable assurance about whether the financial statements are free of material misstatement. An audit includes examining, on a test basis, evidence supporting the amounts and disclosures in the financial statements, assessing the accounting principles used and significant estimates made by management, and evaluating the overall financial statement presentation. We believe that our audits, which included confirmation of securities at November 30, 2009 by correspondence with the custodians and brokers and by agreement to the underlying ownership records of Vanguard Market Liquidity Fund, provide a reasonable basis for our opinion.
PricewaterhouseCoopers LLP
Philadelphia, Pennsylvania
January 11, 2010

Special 2009 tax information (unaudited) for Vanguard Wellington Fund
This information for the fiscal year ended November 30, 2009, is included pursuant to provisions of
the Internal Revenue Code.
The fund distributed $674,051,000 of qualified dividend income to shareholders during the fiscal year.
For corporate shareholders, 39.8% of investment income (dividend income plus short-term gains,
if any) qualifies for the dividends-received deduction.
31
Your Fund’s After-Tax Returns
This table presents returns for your fund both before and after taxes. The after-tax returns are shown in two ways: (1) assuming that an investor owned the fund during the entire period and paid taxes on the fund’s distributions, and (2) assuming that an investor paid taxes on the fund’s distributions and sold all shares at the end of each period.
Calculations are based on the highest individual federal income tax and capital gains tax rates in effect at the times of the distributions and the hypothetical sales. State and local taxes were not considered. After-tax returns reflect any qualified dividend income, using actual prior-year figures and estimates for 2009. (In the example, returns after the sale of fund shares may be higher than those assuming no sale. This occurs when the sale would have produced a capital loss. The calculation assumes that the investor received a tax deduction for the loss.)
The table shows returns for Investor Shares only; returns for other share classes will differ. Please note that your actual after-tax returns will depend on your tax situation and may differ from those shown. Also note that if you own the fund in a tax-deferred account, such as an individual retirement account or a 401(k) plan, this information does not apply to you. Such accounts are not subject to current taxes.
Finally, keep in mind that a fund’s performance—whether before or after taxes—does not guarantee future results.
| Average Annual Total Returns: Wellington Fund Investor Shares1 | |||
| Periods Ended November 30, 2009 | |||
| One | Five | Ten | |
| Year | Years | Years | |
| Returns Before Taxes | 26.46% | 5.28% | 6.20% |
| Returns After Taxes on Distributions | 25.26 | 3.91 | 4.59 |
| Returns After Taxes on Distributions and Sale of Fund Shares | 17.44 | 4.08 | 4.62 |
1 Total returns do not include the account service fee that may be applicable to certain accounts with balances below $10,000.
32
About Your Fund’s Expenses
As a shareholder of the fund, you incur ongoing costs, which include costs for portfolio management, administrative services, and shareholder reports (like this one), among others. Operating expenses, which are deducted from a fund’s gross income, directly reduce the investment return of the fund.
A fund’s expenses are expressed as a percentage of its average net assets. This figure is known as the expense ratio. The following examples are intended to help you understand the ongoing costs (in dollars) of investing in your fund and to compare these costs with those of other mutual funds. The examples are based on an investment of $1,000 made at the beginning of the period shown and held for the entire period.
The accompanying table illustrates your fund’s costs in two ways:
• Based on actual fund return. This section helps you to estimate the actual expenses that you paid over the period. The ”Ending Account Value“ shown is derived from the fund‘s actual return, and the third column shows the dollar amount that would have been paid by an investor who started with $1,000 in the fund. You may use the information here, together with the amount you invested, to estimate the expenses that you paid over the period.
To do so, simply divide your account value by $1,000 (for example, an $8,600 account value divided by $1,000 = 8.6), then multiply the result by the number given for your fund under the heading ”Expenses Paid During Period.“
• Based on hypothetical 5% yearly return. This section is intended to help you compare your fund‘s costs with those of other mutual funds. It assumes that the fund had a yearly return of 5% before expenses, but that the expense ratio is unchanged. In this case—because the return used is not the fund’s actual return—the results do not apply to your investment. The example is useful in making comparisons because the Securities and Exchange Commission requires all mutual funds to calculate expenses based on a 5% return. You can assess your fund’s costs by comparing this hypothetical example with the hypothetical examples that appear in shareholder reports of other funds.
Note that the expenses shown in the table are meant to highlight and help you compare ongoing costs only and do not reflect transaction costs incurred by the fund for buying and selling securities. Further, the expenses do not include the account service fee described in the prospectus. If such a fee were applied to your account, your costs would be higher. Your fund does not charge transaction fees, such as purchase or redemption fees, nor does it carry a “sales load.”
The calculations assume no shares were bought or sold during the period. Your actual costs may have been higher or lower, depending on the amount of your investment and the timing of any purchases or redemptions.
You can find more information about the fund’s expenses, including annual expense ratios, in the Financial Statements section of this report. For additional information on operating expenses and other shareholder costs, please refer to your fund’s current prospectus.
33
| Six Months Ended November 30, 2009 | |||
| Beginning | Ending | Expenses | |
| Account Value | Account Value | Paid During | |
| Wellington Fund | 5/31/2009 | 11/30/2009 | Period1 |
| Based on Actual Fund Return | |||
| Investor Shares | $1,000.00 | $1,164.45 | $1.74 |
| Admiral Shares | 1,000.00 | 1,165.10 | 1.19 |
| Based on Hypothetical 5% Yearly Return | |||
| Investor Shares | $1,000.00 | $1,023.46 | $1.62 |
| Admiral Shares | 1,000.00 | 1,023.97 | 1.12 |
1 The calculations are based on expenses incurred in the most recent six-month period. The fund’s annualized six-month expense ratios for
that period are 0.32% for Investor Shares and 0.22% for Admiral Shares. The dollar amounts shown as “Expenses Paid” are equal to the
annualized expense ratio multiplied by the average account value over the period, multiplied by the number of days in the most recent
six-month period, then divided by the number of days in the most recent 12-month period.
34
Trustees Approve Advisory Agreement
The board of trustees of Vanguard Wellington Fund has renewed the fund’s investment advisory agreement with Wellington Management Company, LLP. The board determined that the retention of the advisor was in the best interests of the fund and its shareholders.
The board based its decision upon an evaluation of the advisor’s investment staff, portfolio management process, and performance. The trustees considered the factors discussed below, among others. However, no single factor determined whether the board approved the agreement. Rather, it was the totality of the circumstances that drove the board’s decision.
Nature, extent, and quality of services
The board considered the quality of the fund’s investment management over both the short and long term, and took into account the organizational depth and stability of the advisor. The board noted that Wellington Management, founded in 1928, is among the nation’s oldest and most respected institutional managers. The firm has advised the Wellington Fund since its inception in 1929. The two senior portfolio managers for the fund, Edward P. Bousa and John C. Keogh, each have over two decades of industry experience and are backed by well-tenured teams of equity and fixed income research analysts who conduct detailed fundamental analysis of their respective industries and companies. Wellington Management has seen a significant growth in assets in the past decade.
The board concluded that the advisor’s experience, stability, depth, and performance, among other factors, warranted continuation of the advisory agreement.
Investment performance
The board considered the short- and long-term performance of the fund, including any periods of outperformance or underperformance of a relevant benchmark and peer group. The board concluded that the advisor has carried out the fund’s investment strategy in disciplined fashion, and the performance results have been excellent. Information about the fund’s most recent performance can be found in the Performance Summary section of this report.
Cost
The board concluded that the fund’s expense ratio was well below the average expense ratio charged by funds in its peer group and that the fund’s advisory fee rate was also well below its peer-group average. Information about the fund’s expense ratio appears in the About Your Fund’s Expenses section of this report as well as in the Financial Statements section, which also includes information about the advisory fee rate.
The board did not consider profitability of Wellington Management in determining whether to approve the advisory fee, because Wellington Management is independent of Vanguard, and the advisory fee is the result of arm’s-length negotiations.
The benefit of economies of scale
The board concluded that the fund’s shareholders benefit from economies of scale because of breakpoints in the fund’s advisory fee schedule. The breakpoints reduce the effective rate of the fee as the fund’s assets increase.
The board will consider whether to renew the advisory agreement again after a one-year period.
35
Glossary
30-Day SEC Yield. A fund’s 30-day SEC yield is derived using a formula specified by the U.S. Securities and Exchange Commission. Under the formula, data related to the fund’s security holdings in the previous 30 days are used to calculate the fund’s hypothetical net income for that period, which is then annualized and divided by the fund’s estimated average net assets over the calculation period. For the purposes of this calculation, a security’s income is based on its current market yield to maturity (in the case of bonds) or its projected dividend yield (for stocks). Because the SEC yield represents hypothetical annualized income, it will differ—at times significantly—from the fund’s actual experience. As a result, the fund’s income distributions may be higher or lower than implied by the SEC yield.
Average Coupon. The average interest rate paid on the fixed income securities held by a fund. It is expressed as a percentage of face value.
Average Duration. An estimate of how much the value of the bonds held by a fund will fluctuate in response to a change in interest rates. To see how the value could change, multiply the average duration by the change in rates. If interest rates rise by 1 percentage point, the value of the bonds in a fund with an average duration of five years would decline by about 5%. If rates decrease by a percentage point, the value would rise by 5%.
Average Effective Maturity. The average length of time until fixed income securities held by a fund reach maturity and are repaid, taking into consideration the possibility that the issuer may call the bond before its maturity date. The figure reflects the proportion of fund assets represented by each security; it also reflects any futures contracts held. In general, the longer the average effective maturity, the more a fund’s share price will fluctuate in response to changes in market interest rates.
Average Quality. An indicator of credit risk, this figure is the average of the ratings assigned to a fund’s fixed income holdings by credit-rating agencies. The agencies make their judgment after appraising an issuer’s ability to meet its obligations. Quality is graded on a scale, with Aaa or AAA indicating the most creditworthy bond issuers. U.S. Treasury securities are considered to have the highest credit quality.
Beta. A measure of the magnitude of a fund’s past share-price fluctuations in relation to the ups and downs of a given market index. The index is assigned a beta of 1.00. Compared with a given index, a fund with a beta of 1.20 typically would have seen its share price rise or fall by 12% when the index rose or fell by 10%. For this report, beta is based on returns over the past 36 months for both the fund and the index. Note that a fund’s beta should be reviewed in conjunction with its R-squared (see definition). The lower the R-squared, the less correlation there is between the fund and the index, and the less reliable beta is as an indicator of volatility.
Dividend Yield. Dividend income earned by stocks, expressed as a percentage of the aggregate market value (or of net asset value, for a fund). The yield is determined by dividing the amount of the annual dividends by the aggregate value (or net asset value) at the end of the period. For a fund, the dividend yield is based solely on stock holdings and does not include any income produced by other investments.
Earnings Growth Rate. The average annual rate of growth in earnings over the past five years for the stocks now in a fund.
36
Equity Exposure. A measure that reflects a fund’s investments in stocks and stock futures. Any holdings in short-term reserves are excluded.
Expense Ratio. The percentage of a fund’s average net assets used to pay its annual administrative and advisory expenses. These expenses directly reduce returns to investors.
Foreign Holdings. The percentage of a fund represented by stocks or depositary receipts of companies based outside the United States.
Inception Date. The date on which the assets of a fund (or one of its share classes) are first invested in accordance with the fund’s investment objective. For funds with a subscription period, the inception date is the day after that period ends. Investment performance is measured from the inception date.
Median Market Cap. An indicator of the size of companies in which a fund invests; the midpoint of market capitalization (market price x shares outstanding) of a fund’s stocks, weighted by the proportion of the fund’s assets invested in each stock. Stocks representing half of the fund’s assets have market capitalizations above the median, and the rest are below it.
Price/Book Ratio. The share price of a stock divided by its net worth, or book value, per share. For a fund, the weighted average price/book ratio of the stocks it holds.
Price/Earnings Ratio. The ratio of a stock’s current price to its per-share earnings over the past year. For a fund, the weighted average P/E of the stocks it holds. P/E is an indicator of market expectations about corporate prospects; the higher the P/E, the greater the expectations for a company’s future growth.
R-Squared. A measure of how much of a fund’s past returns can be explained by the returns from the market in general, as measured by a given index. If a fund’s total returns were precisely synchronized with an index’s returns, its R-squared would be 1.00. If the fund’s returns bore no relationship to the index’s returns, its R-squared would be 0. For this report, R-squared is based on returns over the past 36 months for both the fund and the index.
Return on Equity. The annual average rate of return generated by a company during the past five years for each dollar of shareholder’s equity (net income divided by shareholder’s equity). For a fund, the weighted average return on equity for the companies whose stocks it holds.
Short-Term Reserves. The percentage of a fund invested in highly liquid, short-term securities that can be readily converted to cash.
Turnover Rate. An indication of the fund’s trading activity. Funds with high turnover rates incur higher transaction costs and may be more likely to distribute capital gains (which may be taxable to investors). The turnover rate excludes in-kind transactions, which have minimal impact on costs.
Yield to Maturity. The rate of return an investor would receive if the fixed income securities held by a fund were held to their maturity dates.
37
This page intentionally left blank.
This page intentionally left blank.
The People Who Govern Your Fund
The trustees of your mutual fund are there to see that the fund is operated and managed in your best interests since, as a shareholder, you are a part owner of the fund. Your fund’s trustees also serve on the board of directors of The Vanguard Group, Inc., which is owned by the Vanguard funds and provides services to them on an at-cost basis.
A majority of Vanguard’s board members are independent, meaning that they have no affiliation with Vanguard or the funds they oversee, apart from the sizable personal investments they have made as private individuals. The independent board members have distinguished backgrounds in business, academia, and public service. Each of the trustees and executive officers oversees 163 Vanguard funds.
The following table provides information for each trustee and executive officer of the fund. More information about the trustees is in the Statement of Additional Information, which can be obtained, without charge, by contacting Vanguard at 800-662-7447, or online at www.vanguard.com.
| Interested Trustees1 | Emerson U. Fullwood |
| Born 1948. Trustee Since January 2008. Principal | |
| John J. Brennan | Occupation(s) During the Past Five Years: Executive |
| Born 1954. Trustee Since May 1987. Chairman of | Chief Staff and Marketing Officer for North America |
| the Board. Principal Occupation(s) During the Past | and Corporate Vice President (retired 2008) of Xerox |
| Five Years: Chairman of the Board and Director/Trustee | Corporation (photocopiers and printers); Director of |
| of The Vanguard Group, Inc., and of each of the | SPX Corporation (multi-industry manufacturing), the |
| investment companies served by The Vanguard Group; | United Way of Rochester, the Boy Scouts of America, |
| Chief Executive Officer (1996–2008) and President | Amerigroup Corporation (direct health and medical |
| (1989–2008) of The Vanguard Group and of each of the | insurance carriers), and Monroe Community College |
| investment companies served by The Vanguard Group; | Foundation. |
| Chairman of the Financial Accounting Foundation; | |
| Governor of the Financial Industry Regulatory Authority | Rajiv L. Gupta |
| (FINRA); Director of United Way of Southeastern | Born 1945. Trustee Since December 2001.2 Principal |
| Pennsylvania. | Occupation(s) During the Past Five Years: Chairman |
| and Chief Executive Officer (retired 2009) and President | |
| F. William McNabb III | (2006–2008) of Rohm and Haas Co. (chemicals); Board |
| Born 1957. Trustee Since July 2009. Principal | Member of American Chemistry Council; Director of |
| Occupation(s) During the Past Five Years: Director of | Tyco International, Ltd. (diversified manufacturing and |
| The Vanguard Group, Inc., since 2008; Chief Executive | services) and Hewlett-Packard Co. (electronic computer |
| Officer and President of The Vanguard Group and of | manufacturing); Trustee of The Conference Board. |
| each of the investment companies served by The | |
| Vanguard Group since 2008; Director of Vanguard | Amy Gutmann |
| Marketing Corporation; Managing Director of The | Born 1949. Trustee Since June 2006. Principal |
| Vanguard Group (1995–2008). | Occupation(s) During the Past Five Years: President of |
| the University of Pennsylvania; Christopher H. Browne | |
| Distinguished Professor of Political Science in the School | |
| Independent Trustees | of Arts and Sciences with secondary appointments |
| at the Annenberg School for Communication and the | |
| Charles D. Ellis | Graduate School of Education of the University of |
| Born 1937. Trustee Since January 2001. Principal | Pennsylvania; Director of Carnegie Corporation of |
| Occupation(s) During the Past Five Years: Applecore | New York, Schuylkill River Development Corporation, |
| Partners (pro bono ventures in education); Senior | and Greater Philadelphia Chamber of Commerce; |
| Advisor to Greenwich Associates (international business | Trustee of the National Constitution Center. |
| strategy consulting); Successor Trustee of Yale University; | |
| Overseer of the Stern School of Business at New York | |
| University; Trustee of the Whitehead Institute for | |
| Biomedical Research. |
| JoAnn Heffernan Heisen | Executive Officers | |
| Born 1950. Trustee Since July 1998. Principal | ||
| Occupation(s) During the Past Five Years: Corporate | Thomas J. Higgins | |
| Vice President and Chief Global Diversity Officer since | Born 1957. Chief Financial Officer Since September | |
| 2006 (retired 2008) and Member of the Executive | 2008. Principal Occupation(s) During the Past Five | |
| Committee (retired 2008) of Johnson & Johnson | Years: Principal of The Vanguard Group, Inc.; Chief | |
| (pharmaceuticals/consumer products); Vice President | Financial Officer of each of the investment companies | |
| and Chief Information Officer of Johnson & Johnson | served by The Vanguard Group since 2008; Treasurer | |
| (1997–2005); Director of the University Medical Center | of each of the investment companies served by The | |
| at Princeton and Women’s Research and Education | Vanguard Group (1998–2008). | |
| Institute; Member of the Advisory Board of the Maxwell | ||
| School of Citizenship and Public Affairs at Syracuse | Kathryn J. Hyatt | |
| University. | Born 1955. Treasurer Since November 2008. Principal | |
| Occupation(s) During the Past Five Years: Principal of | ||
| F. Joseph Loughrey | The Vanguard Group, Inc.; Treasurer of each of the | |
| Born 1949. Trustee Since October 2009. Principal | investment companies served by The Vanguard | |
| Occupation(s) During the Past Five Years: President and | Group since 2008; Assistant Treasurer of each of the | |
| Chief Operating Officer since 2005 (retired 2009) and | investment companies served by The Vanguard Group | |
| Vice Chairman of the Board (2008–2009) of Cummins | (1988–2008). | |
| Inc. (industrial machinery); Director of SKF AB (industrial | ||
| machinery), Hillenbrand, Inc. (specialized consumer | Heidi Stam | |
| services), Sauer-Danfoss Inc. (machinery), the Lumina | Born 1956. Secretary Since July 2005. Principal | |
| Foundation for Education, and the Columbus Community | Occupation(s) During the Past Five Years: Managing | |
| Education Coalition; Chairman of the Advisory Council | Director of The Vanguard Group, Inc., since 2006; | |
| for the College of Arts and Letters at the University of | General Counsel of The Vanguard Group since 2005; | |
| Notre Dame. | Secretary of The Vanguard Group and of each of the | |
| investment companies served by The Vanguard Group | ||
| André F. Perold | since 2005; Director and Senior Vice President of | |
| Born 1952. Trustee Since December 2004. Principal | Vanguard Marketing Corporation since 2005; Principal | |
| Occupation(s) During the Past Five Years: George Gund | of The Vanguard Group (1997–2006). | |
| Professor of Finance and Banking, Harvard Business | ||
| School; Chair of the Investment Committee of HighVista | ||
| Strategies LLC (private investment firm). | Vanguard Senior Management Team | |
| Alfred M. Rankin, Jr. | R. Gregory Barton | Michael S. Miller |
| Born 1941. Trustee Since January 1993. Principal | Mortimer J. Buckley | James M. Norris |
| Occupation(s) During the Past Five Years: Chairman, | Kathleen C. Gubanich | Glenn W. Reed |
| President, and Chief Executive Officer of NACCO | Paul A. Heller | George U. Sauter |
| Industries, Inc. (forklift trucks/housewares/lignite); | ||
| Director of Goodrich Corporation (industrial products/ | ||
| aircraft systems and services); Deputy Chairman of | ||
| the Federal Reserve Bank of Cleveland; Trustee of | Founder | |
| University Hospitals of Cleveland, The Cleveland | John C. Bogle | |
| Museum of Art, and Case Western Reserve University. | Chairman and Chief Executive Officer, 1974–1996 | |
| Peter F. Volanakis | ||
| Born 1955. Trustee Since July 2009. Principal | ||
| Occupation(s) During the Past Five Years: President | ||
| since 2007 and Chief Operating Officer since 2005 | ||
| of Corning Incorporated (communications equipment); | ||
| President of Corning Technologies (2001–2005); Director | ||
| of Corning Incorporated and Dow Corning; Trustee of | ||
| the Corning Incorporated Foundation and the Corning | ||
| Museum of Glass; Overseer of the Amos Tuck School | ||
| of Business Administration at Dartmouth College. | ||
1 These individuals are considered “interested persons,” as defined in the Investment Company Act of 1940, because they are officers of the
Vanguard funds.
2 December 2002 for Vanguard Equity Income Fund, Vanguard Growth Equity Fund, the Vanguard Municipal Bond Funds, and the Vanguard
State Tax-Exempt Funds.

P.O. Box 2600
Valley Forge, PA 19482-2600
Connect with Vanguard® > www.vanguard.com
| Fund Information > 800-662-7447 | CFA® is a trademark owned by CFA Institute. |
| Direct Investor Account Services > 800-662-2739 | |
| Institutional Investor Services > 800-523-1036 | |
| Text Telephone for People | |
| With Hearing Impairment > 800-749-7273 | |
| This material may be used in conjunction | |
| with the offering of shares of any Vanguard | |
| fund only if preceded or accompanied by | |
| the fund’s current prospectus. | |
| All comparative mutual fund data are from Lipper Inc. or | |
| Morningstar, Inc., unless otherwise noted. | |
| You can obtain a free copy of Vanguard’s proxy voting | |
| guidelines by visiting our website, www.vanguard.com, | |
| and searching for “proxy voting guidelines,” or by calling | |
| Vanguard at 800-662-2739. The guidelines are also | |
| available from the SEC’s website, www.sec.gov. In | |
| addition, you may obtain a free report on how your fund | |
| voted the proxies for securities it owned during the 12 | |
| months ended June 30. To get the report, visit either | |
| www.vanguard.com or www.sec.gov. | |
| You can review and copy information about your fund at | |
| the SEC’s Public Reference Room in Washington, D.C. To | |
| find out more about this public service, call the SEC at | |
| 202-551-8090. Information about your fund is also | |
| available on the SEC’s website, and you can receive | |
| copies of this information, for a fee, by sending a | |
| request in either of two ways: via e-mail addressed to | © 2010 The Vanguard Group, Inc. |
| publicinfo@sec.gov or via regular mail addressed to the | All rights reserved. |
| Public Reference Section, Securities and Exchange | Vanguard Marketing Corporation, Distributor. |
| Commission, Washington, DC 20549-1520. | |
| Q210 012010 | |
Vanguard® Wellington™ Fund
Schedule of Investments
November 30, 2009
| Market | ||
| Value | ||
| Shares | ($000) | |
| Common Stocks (65.1%) | ||
| Consumer Discretionary (3.8%) | ||
| Staples Inc. | 13,817,800 | 322,231 |
| Comcast Corp. Class A | 20,571,100 | 301,778 |
| Walt Disney Co. | 8,937,600 | 270,094 |
| Time Warner Inc. | 8,783,200 | 269,820 |
| * Ford Motor Co. | 18,933,260 | 168,317 |
| Daimler AG | 3,015,783 | 153,594 |
| Honda Motor Co. Ltd. ADR | 3,499,500 | 108,449 |
| * Viacom Inc. Class B | 3,542,800 | 105,009 |
| Home Depot Inc. | 3,348,800 | 91,623 |
| 1,790,915 | ||
| Consumer Staples (6.2%) | ||
| Wal-Mart Stores Inc. | 9,117,000 | 497,332 |
| Nestle SA ADR | 9,705,000 | 461,473 |
| Procter & Gamble Co. | 6,241,775 | 389,175 |
| Philip Morris International Inc. | 7,167,200 | 344,671 |
| PepsiCo Inc. | 5,317,400 | 330,848 |
| Kimberly-Clark Corp. | 4,687,600 | 309,241 |
| Coca-Cola Co. | 3,547,600 | 202,923 |
| CVS Caremark Corp. | 4,293,200 | 133,132 |
| SABMiller PLC | 4,453,643 | 129,860 |
| Unilever NV | 4,202,200 | 129,470 |
| 2,928,125 | ||
| Energy (10.3%) | ||
| Chevron Corp. | 10,810,200 | 843,628 |
| Total SA ADR | 11,662,500 | 725,291 |
| Exxon Mobil Corp. | 9,505,300 | 713,563 |
| BP PLC ADR | 6,844,000 | 391,340 |
| Anadarko Petroleum Corp. | 6,310,000 | 375,634 |
| XTO Energy Inc. | 8,587,500 | 364,454 |
| EnCana Corp. | 6,466,704 | 348,426 |
| Marathon Oil Corp. | 8,888,900 | 289,956 |
| ConocoPhillips | 4,501,263 | 233,031 |
| Baker Hughes Inc. | 5,502,900 | 224,188 |
| Petroleo Brasileiro SA ADR | 2,646,900 | 135,733 |
| ENI SPA ADR | 2,452,900 | 122,007 |
| Schlumberger Ltd. | 1,644,800 | 105,086 |
| 4,872,337 | ||
| Financials (10.7%) | ||
| Wells Fargo & Co. | 26,490,717 | 742,800 |
| JPMorgan Chase & Co. | 14,032,276 | 596,231 |
| MetLife Inc. | 11,204,305 | 383,075 |
| ACE Ltd. | 7,131,300 | 347,366 |
| PNC Financial Services Group Inc. | 6,058,700 | 345,407 |
| Bank of America Corp. | 21,765,500 | 344,983 |
| Muenchener Rueckversicherungs AG | 1,818,553 | 285,328 |
| * UBS AG | 15,546,834 | 243,930 |
| US Bancorp | 9,379,800 | 226,335 |
| Goldman Sachs Group Inc. | 1,323,300 | 224,511 |
| State Street Corp. | 4,930,427 | 203,627 |
| Chubb Corp. | 3,940,100 | 197,557 |
| Toronto-Dominion Bank | 3,103,400 | 195,638 |
| HSBC Holdings PLC ADR | 2,493,700 | 147,153 |
| Morgan Stanley | 4,492,000 | 141,857 |
| Barclays PLC | 25,870,727 | 126,429 |
| Marsh & McLennan Cos. Inc. | 5,193,700 | 117,118 |
| SunTrust Banks Inc. | 4,876,818 | 115,239 |
| Travelers Cos. Inc. | 1,657,500 | 86,836 |
| 5,071,420 | ||
| Health Care (10.1%) | ||
| Merck & Co. Inc. | 20,796,652 | 753,047 |
| Pfizer Inc. | 32,591,241 | 592,183 |
1
Vanguard® Wellington Fund
Schedule of Investments
November 30, 2009
| Market | ||
| Value | ||
| Shares | ($000) | |
| Eli Lilly & Co. | 15,596,800 | 572,870 |
| Medtronic Inc. | 12,054,900 | 511,610 |
| Johnson & Johnson | 7,996,400 | 502,494 |
| Bristol-Myers Squibb Co. | 15,003,200 | 379,731 |
| ^ AstraZeneca PLC ADR | 7,465,100 | 334,660 |
| Teva Pharmaceutical Industries Ltd. ADR | 5,583,900 | 294,774 |
| UnitedHealth Group Inc. | 9,746,800 | 279,441 |
| Cardinal Health Inc. | 6,304,700 | 203,200 |
| Covidien PLC | 4,091,800 | 191,578 |
| * St Jude Medical Inc. | 2,583,500 | 94,840 |
| Sanofi-Aventis SA ADR | 2,305,203 | 87,506 |
| 4,797,934 | ||
| Industrials (8.1%) | ||
| Deere & Co. | 9,285,000 | 496,840 |
| Siemens AG | 3,799,000 | 372,590 |
| Lockheed Martin Corp. | 4,351,000 | 336,028 |
| United Parcel Service Inc. Class B | 5,810,500 | 333,929 |
| Waste Management Inc. | 9,382,500 | 308,121 |
| Honeywell International Inc. | 6,959,700 | 267,740 |
| FedEx Corp. | 3,163,700 | 267,175 |
| Illinois Tool Works Inc. | 5,239,900 | 254,869 |
| Canadian National Railway Co. | 4,691,500 | 246,773 |
| Parker Hannifin Corp. | 3,779,250 | 203,928 |
| Caterpillar Inc. | 3,143,700 | 183,561 |
| General Electric Co. | 10,500,600 | 168,220 |
| General Dynamics Corp. | 2,545,100 | 167,722 |
| Raytheon Co. | 2,964,200 | 152,745 |
| Mitsui & Co. Ltd. | 5,444,000 | 71,694 |
| 3,831,935 | ||
| Information Technology (7.7%) | ||
| International Business Machines Corp. | 6,637,000 | 838,585 |
| Microsoft Corp. | 16,502,300 | 485,333 |
| Accenture PLC Class A | 9,945,100 | 408,147 |
| Texas Instruments Inc. | 15,734,100 | 397,915 |
| Hewlett-Packard Co. | 6,049,000 | 296,764 |
| * Cisco Systems Inc. | 12,221,200 | 285,976 |
| Automatic Data Processing Inc. | 6,570,400 | 285,484 |
| Corning Inc. | 16,720,500 | 278,898 |
| Intel Corp. | 10,243,900 | 196,683 |
| Taiwan Semiconductor Manufacturing Co. Ltd. ADR | 14,999,385 | 155,843 |
| 3,629,628 | ||
| Materials (2.8%) | ||
| International Paper Co. | 10,656,900 | 271,218 |
| BHP Billiton Ltd. ADR | 3,340,000 | 251,502 |
| Syngenta AG ADR | 4,171,300 | 223,206 |
| BASF SE | 2,273,216 | 137,407 |
| Newmont Mining Corp. | 2,416,200 | 129,605 |
| Vale SA Class B ADR | 4,466,472 | 128,054 |
| * Xstrata PLC | 5,528,059 | 98,002 |
| Air Products & Chemicals Inc. | 1,162,400 | 96,398 |
| 1,335,392 | ||
| Telecommunication Services (2.4%) | ||
| AT&T Inc. | 42,283,285 | 1,139,112 |
| Utilities (3.0%) | ||
| Dominion Resources Inc. | 9,920,200 | 360,897 |
| FPL Group Inc. | 6,320,800 | 328,492 |
| Exelon Corp. | 6,790,800 | 327,181 |
| PG&E Corp. | 6,299,300 | 266,712 |
| Veolia Environnement ADR | 3,194,100 | 108,472 |
| 1,391,754 | ||
| Total Common Stocks (Cost $24,941,462) | 30,788,552 | |
2
Vanguard® Wellington Fund Schedule of Investments November 30, 2009
| Face | Market | ||||
| Maturity | Amount | Value | |||
| Coupon | Date | ($000) | ($000) | ||
| U.S. Government and Agency Obligations (4.8%) | |||||
| U.S. Government Securities (4.0%) | |||||
| United States Treasury Note/Bond | 1.000% | 7/31/11 | 1,143,000 | 1,152,293 | |
| United States Treasury Note/Bond | 1.000% | 9/30/11 | 525,000 | 528,937 | |
| United States Treasury Note/Bond | 2.750% | 2/15/19 | 202,000 | 195,467 | |
| 1,876,697 | |||||
| Agency Bonds and Notes (0.8%) | |||||
| 1 | Bank of America Corp. | 3.125% | 6/15/12 | 50,000 | 52,461 |
| 2 | Federal Home Loan Banks | 3.625% | 9/16/11 | 33,000 | 34,727 |
| 1 | General Electric Capital Corp. | 3.000% | 12/9/11 | 50,000 | 52,092 |
| 1 | General Electric Capital Corp. | 2.000% | 9/28/12 | 48,985 | 49,865 |
| 1 | HSBC USA Inc. | 3.125% | 12/16/11 | 50,000 | 52,269 |
| 1 | John Deere Capital Corp. | 2.875% | 6/19/12 | 50,000 | 52,134 |
| 1 | JPMorgan Chase & Co. | 3.125% | 12/1/11 | 25,000 | 26,117 |
| 1 | Morgan Stanley | 3.250% | 12/1/11 | 25,000 | 26,188 |
| 1 | PNC Funding Corp. | 2.300% | 6/22/12 | 13,590 | 14,010 |
| 1 | Wells Fargo & Co. | 3.000% | 12/9/11 | 19,000 | 19,811 |
| 379,674 | |||||
| Conventional Mortgage-Backed Securities (0.0%) | |||||
| 3 | Ginnie Mae I Pool | 7.000% | 11/15/31–11/15/33 | 9,958 | 10,933 |
| 3 | Ginnie Mae I Pool | 8.000% | 6/15/17 | 39 | 42 |
| 10,975 | |||||
| Total U.S. Government and Agency Obligations (Cost $2,242,950) | 2,267,346 | ||||
| Asset-Backed/Commercial Mortgage-Backed Securities (0.0%) | |||||
| 3 | AmeriCredit Automobile Receivables Trust | 3.930% | 10/6/11 | 3,187 | 3,186 |
| 3 | Daimler Chrysler Auto Trust | 4.980% | 2/8/11 | 1,673 | 1,677 |
| 3 | Household Automotive Trust | 5.280% | 9/17/11 | 7,841 | 7,902 |
| 3,4 | Marriott Vacation Club Owner Trust | 5.362% | 10/20/28 | 5,735 | 5,644 |
| 3 | UPFC Auto Receivables Trust | 5.490% | 5/15/12 | 1,604 | 1,634 |
| Total Asset-Backed/Commercial Mortgage-Backed Securities (Cost $19,945) | 20,043 | ||||
| Corporate Bonds (25.4%) | |||||
| Finance (12.0%) | |||||
| Banking (7.7%) | |||||
| American Express Bank FSB | 5.550% | 10/17/12 | 50,000 | 54,264 | |
| American Express Credit Corp. | 5.875% | 5/2/13 | 44,000 | 47,600 | |
| 4 | American Express Travel Related Services Co. Inc. | 5.250% | 11/21/11 | 35,000 | 36,786 |
| 4 | ANZ National International Ltd. | 6.200% | 7/19/13 | 38,890 | 42,783 |
| BAC Capital Trust VI | 5.625% | 3/8/35 | 96,180 | 68,816 | |
| Bank of America Corp. | 4.375% | 12/1/10 | 10,000 | 10,258 | |
| Bank of America NA | 5.300% | 3/15/17 | 68,000 | 66,778 | |
| Bank of America NA | 6.000% | 10/15/36 | 30,000 | 29,249 | |
| Bank of New York Mellon Corp. | 5.125% | 11/1/11 | 44,000 | 47,286 | |
| Bank of New York Mellon Corp. | 4.950% | 11/1/12 | 30,000 | 32,708 | |
| Bank of New York Mellon Corp. | 4.950% | 3/15/15 | 58,655 | 63,164 | |
| Bank One Corp. | 7.875% | 8/1/10 | 40,000 | 41,896 | |
| Banque Paribas | 6.950% | 7/22/13 | 40,000 | 44,904 | |
| Barclays Bank PLC | 5.000% | 9/22/16 | 15,570 | 16,128 | |
| 3,4 | Barclays Bank PLC | 5.926% | 12/15/49 | 51,000 | 36,720 |
| BB&T Corp. | 4.900% | 6/30/17 | 8,045 | 7,983 | |
| BB&T Corp. | 5.250% | 11/1/19 | 8,000 | 8,023 | |
| BNY Mellon NA | 4.750% | 12/15/14 | 4,750 | 5,147 | |
| 3,4 | BTMU Curacao Holdings NV | 4.760% | 7/21/15 | 47,895 | 48,113 |
| Capital One Bank USA NA | 6.500% | 6/13/13 | 20,705 | 22,318 | |
| Capital One Capital IV | 6.745% | 2/17/37 | 21,000 | 16,695 | |
| Citigroup Inc. | 4.625% | 8/3/10 | 19,400 | 19,808 | |
| Citigroup Inc. | 5.300% | 10/17/12 | 50,000 | 52,082 | |
| Citigroup Inc. | 5.850% | 8/2/16 | 30,000 | 30,224 | |
| Citigroup Inc. | 6.125% | 11/21/17 | 64,960 | 65,498 | |
| Citigroup Inc. | 8.500% | 5/22/19 | 34,000 | 38,694 | |
| Citigroup Inc. | 6.625% | 6/15/32 | 45,000 | 41,470 | |
3
Vanguard® Wellington Fund
Schedule of Investments
November 30, 2009
| Face | Market | |||
| Maturity | Amount | Value | ||
| Coupon | Date | ($000) | ($000) | |
| Citigroup Inc. | 6.125% | 8/25/36 | 30,000 | 25,593 |
| Citigroup Inc. | 8.125% | 7/15/39 | 8,325 | 9,161 |
| 4 Commonwealth Bank of Australia | 3.750% | 10/15/14 | 48,000 | 49,138 |
| Credit Suisse USA Inc. | 6.500% | 1/15/12 | 15,000 | 16,516 |
| Credit Suisse | 5.000% | 5/15/13 | 87,750 | 94,880 |
| Credit Suisse | 5.500% | 5/1/14 | 30,000 | 33,038 |
| Deutsche Bank AG | 5.375% | 10/12/12 | 41,245 | 45,207 |
| Deutsche Bank Financial LLC | 5.375% | 3/2/15 | 59,215 | 63,439 |
| Fifth Third Bank | 4.200% | 2/23/10 | 60,000 | 60,336 |
| Golden West Financial Corp. | 4.750% | 10/1/12 | 10,000 | 10,567 |
| Goldman Sachs Group Inc. | 5.000% | 1/15/11 | 15,000 | 15,645 |
| Goldman Sachs Group Inc. | 5.300% | 2/14/12 | 60,000 | 64,071 |
| Goldman Sachs Group Inc. | 5.350% | 1/15/16 | 70,000 | 73,942 |
| Goldman Sachs Group Inc. | 5.625% | 1/15/17 | 40,000 | 41,401 |
| Goldman Sachs Group Inc. | 5.950% | 1/18/18 | 44,000 | 47,392 |
| Goldman Sachs Group Inc. | 6.450% | 5/1/36 | 50,000 | 49,797 |
| Goldman Sachs Group Inc. | 6.750% | 10/1/37 | 43,995 | 45,750 |
| 4 HBOS PLC | 6.000% | 11/1/33 | 80,500 | 58,822 |
| HSBC Bank USA NA | 4.625% | 4/1/14 | 19,710 | 20,861 |
| HSBC Holdings PLC | 6.500% | 5/2/36 | 25,000 | 26,777 |
| JPMorgan Chase & Co. | 6.750% | 2/1/11 | 25,115 | 26,680 |
| JPMorgan Chase & Co. | 4.650% | 6/1/14 | 30,000 | 32,029 |
| JPMorgan Chase & Co. | 5.125% | 9/15/14 | 50,000 | 53,322 |
| JPMorgan Chase & Co. | 3.700% | 1/20/15 | 46,000 | 46,798 |
| JPMorgan Chase & Co. | 5.250% | 5/1/15 | 40,000 | 42,491 |
| JPMorgan Chase & Co. | 6.000% | 1/15/18 | 42,000 | 45,581 |
| 3 JPMorgan Chase & Co. | 7.900% | 12/29/49 | 31,521 | 31,127 |
| 1 KeyBank NA | 3.200% | 6/15/12 | 25,000 | 26,277 |
| Mellon Funding Corp. | 5.000% | 12/1/14 | 30,000 | 32,809 |
| Merrill Lynch & Co. Inc. | 5.770% | 7/25/11 | 30,000 | 31,884 |
| Merrill Lynch & Co. Inc. | 6.050% | 5/16/16 | 70,000 | 70,770 |
| Merrill Lynch & Co. Inc. | 6.400% | 8/28/17 | 23,000 | 24,151 |
| Merrill Lynch & Co. Inc. | 6.875% | 4/25/18 | 40,000 | 43,064 |
| Merrill Lynch & Co. Inc. | 6.220% | 9/15/26 | 25,000 | 24,259 |
| Morgan Stanley | 6.750% | 10/15/13 | 25,775 | 28,759 |
| Morgan Stanley | 7.070% | 2/10/14 | 17,500 | 18,461 |
| Morgan Stanley | 4.750% | 4/1/14 | 70,000 | 71,313 |
| Morgan Stanley | 6.000% | 5/13/14 | 20,000 | 21,699 |
| Morgan Stanley | 6.000% | 4/28/15 | 44,000 | 47,682 |
| Morgan Stanley | 5.450% | 1/9/17 | 70,000 | 71,976 |
| Morgan Stanley | 6.250% | 8/9/26 | 20,000 | 20,752 |
| National City Bank of Pennsylvania | 7.250% | 10/21/11 | 20,000 | 21,509 |
| National City Bank | 7.250% | 7/15/10 | 25,000 | 25,643 |
| National City Corp. | 6.875% | 5/15/19 | 13,950 | 15,228 |
| 4 Nordea Bank AB | 3.700% | 11/13/14 | 22,880 | 23,211 |
| Northern Trust Corp. | 4.600% | 2/1/13 | 5,925 | 6,365 |
| Northern Trust Corp. | 5.300% | 8/29/11 | 36,320 | 38,893 |
| Northern Trust Corp. | 5.200% | 11/9/12 | 34,940 | 38,524 |
| 4 Oversea-Chinese Banking Corp. Ltd. | 7.750% | 9/6/11 | 14,805 | 16,148 |
| PNC Bank NA | 4.875% | 9/21/17 | 50,000 | 48,833 |
| 3 PNC Financial Services Group Inc. | 8.250% | 5/31/49 | 44,000 | 43,890 |
| Royal Bank of Scotland Group PLC | 6.375% | 2/1/11 | 40,775 | 40,957 |
| Royal Bank of Scotland Group PLC | 5.000% | 10/1/14 | 9,700 | 8,521 |
| Royal Bank of Scotland Group PLC | 5.050% | 1/8/15 | 19,510 | 17,538 |
| Royal Bank of Scotland Group PLC | 4.700% | 7/3/18 | 10,000 | 7,421 |
| State Street Corp. | 5.375% | 4/30/17 | 76,315 | 80,763 |
| 1 SunTrust Bank | 3.000% | 11/16/11 | 25,000 | 26,033 |
| 4 Svenska Handelsbanken AB | 4.875% | 6/10/14 | 56,000 | 59,483 |
| UBS AG | 5.875% | 7/15/16 | 50,000 | 51,465 |
| US Bancorp | 2.875% | 11/20/14 | 32,000 | 32,156 |
| US Bank NA | 6.375% | 8/1/11 | 17,940 | 19,489 |
| US Bank NA | 6.300% | 2/4/14 | 30,000 | 33,991 |
| Wachovia Bank NA | 6.600% | 1/15/38 | 60,000 | 64,927 |
| Wachovia Corp. | 5.500% | 5/1/13 | 35,000 | 37,881 |
4
Vanguard® Wellington Fund
Schedule of Investments
November 30, 2009
| Face | Market | ||||
| Maturity | Amount | Value | |||
| Coupon | Date | ($000) | ($000) | ||
| Wells Fargo & Co. | 6.375% | 8/1/11 | 15,000 | 16,125 | |
| Wells Fargo & Co. | 5.125% | 9/1/12 | 10,000 | 10,676 | |
| Wells Fargo & Co. | 5.250% | 10/23/12 | 50,000 | 54,018 | |
| Wells Fargo & Co. | 4.950% | 10/16/13 | 15,000 | 15,803 | |
| Wells Fargo & Co. | 3.750% | 10/1/14 | 28,000 | 28,160 | |
| Wells Fargo & Co. | 5.125% | 9/15/16 | 25,000 | 25,635 | |
| Wells Fargo Bank NA | 6.450% | 2/1/11 | 5,000 | 5,306 | |
| 3 | Wells Fargo Capital XIII | 7.700% | 12/29/49 | 45,145 | 41,082 |
| Wells Fargo Financial Inc. | 5.500% | 8/1/12 | 20,000 | 21,666 | |
| Brokerage (0.0%) | |||||
| Ameriprise Financial Inc. | 5.350% | 11/15/10 | 659 | 684 | |
| Charles Schwab Corp. | 4.950% | 6/1/14 | 14,750 | 15,971 | |
| Finance Companies (1.0%) | |||||
| General Electric Capital Corp. | 6.125% | 2/22/11 | 19,400 | 20,487 | |
| General Electric Capital Corp. | 5.875% | 2/15/12 | 30,000 | 32,451 | |
| General Electric Capital Corp. | 6.000% | 6/15/12 | 15,000 | 16,259 | |
| General Electric Capital Corp. | 5.250% | 10/19/12 | 60,000 | 64,543 | |
| General Electric Capital Corp. | 5.450% | 1/15/13 | 40,000 | 43,135 | |
| General Electric Capital Corp. | 5.400% | 2/15/17 | 20,000 | 20,793 | |
| General Electric Capital Corp. | 6.750% | 3/15/32 | 30,000 | 31,227 | |
| General Electric Capital Corp. | 6.150% | 8/7/37 | 37,800 | 36,380 | |
| HSBC Finance Corp. | 5.700% | 6/1/11 | 19,230 | 20,193 | |
| HSBC Finance Corp. | 6.375% | 10/15/11 | 75,000 | 80,448 | |
| HSBC Finance Corp. | 5.500% | 1/19/16 | 25,000 | 26,541 | |
| International Lease Finance Corp. | 5.400% | 2/15/12 | 50,000 | 42,500 | |
| International Lease Finance Corp. | 5.300% | 5/1/12 | 50,000 | 41,750 | |
| 3,4 | US Trade Funding Corp. | 4.260% | 11/15/14 | 12,815 | 13,840 |
| Insurance (2.6%) | |||||
| ACE Capital Trust II | 9.700% | 4/1/30 | 20,000 | 22,849 | |
| ACE INA Holdings Inc. | 5.800% | 3/15/18 | 40,360 | 44,621 | |
| Aetna Inc. | 6.500% | 9/15/18 | 11,460 | 12,650 | |
| 4 | AIG SunAmerica Global Financing VI | 6.300% | 5/10/11 | 60,000 | 58,875 |
| Allstate Corp. | 5.000% | 8/15/14 | 10,000 | 10,739 | |
| 3 | Allstate Corp. | 6.125% | 5/15/37 | 30,000 | 25,385 |
| 3 | Allstate Corp. | 6.500% | 5/15/57 | 20,000 | 16,796 |
| American International Group Inc. | 4.700% | 10/1/10 | 34,400 | 34,056 | |
| Berkshire Hathaway Finance Corp. | 4.625% | 10/15/13 | 50,000 | 54,239 | |
| Chubb Corp. | 6.000% | 5/11/37 | 50,000 | 53,578 | |
| Cincinnati Financial Corp. | 6.920% | 5/15/28 | 20,000 | 19,548 | |
| 4 | Farmers Exchange Capital | 7.050% | 7/15/28 | 25,000 | 21,552 |
| Genworth Global Funding Trusts | 5.125% | 3/15/11 | 47,825 | 48,746 | |
| Genworth Global Funding Trusts | 5.750% | 5/15/13 | 25,000 | 25,375 | |
| Hartford Financial Services Group Inc. | 7.900% | 6/15/10 | 15,575 | 16,062 | |
| Hartford Financial Services Group Inc. | 4.625% | 7/15/13 | 9,000 | 9,061 | |
| Hartford Financial Services Group Inc. | 4.750% | 3/1/14 | 15,000 | 14,835 | |
| Hartford Financial Services Group Inc. | 6.000% | 1/15/19 | 44,000 | 43,564 | |
| Hartford Life Global Funding Trusts | 5.200% | 2/15/11 | 24,185 | 25,062 | |
| ING USA Global Funding Trust | 4.500% | 10/1/10 | 25,000 | 25,662 | |
| 4 | Jackson National Life Insurance Co. | 8.150% | 3/15/27 | 39,480 | 39,648 |
| 4 | Liberty Mutual Insurance Co. | 7.875% | 10/15/26 | 31,210 | 28,560 |
| 4 | MassMutual Global Funding II | 3.500% | 3/15/10 | 40,000 | 40,057 |
| Mercury General Corp. | 7.250% | 8/15/11 | 20,000 | 20,798 | |
| 4 | Metropolitan Life Global Funding I | 5.125% | 11/9/11 | 30,000 | 31,639 |
| 4 | Metropolitan Life Global Funding I | 5.125% | 6/10/14 | 20,000 | 21,374 |
| 4 | Metropolitan Life Insurance Co. | 7.700% | 11/1/15 | 51,000 | 57,943 |
| 4 | New York Life Global Funding | 5.250% | 10/16/12 | 20,720 | 22,555 |
| 4 | New York Life Insurance Co. | 5.875% | 5/15/33 | 55,395 | 51,558 |
| Principal Life Income Funding Trusts | 5.125% | 3/1/11 | 42,935 | 44,375 | |
| Protective Life Secured Trusts | 4.850% | 8/16/10 | 15,205 | 15,628 | |
| Prudential Financial Inc. | 5.800% | 6/15/12 | 25,080 | 26,588 | |
| Prudential Financial Inc. | 5.150% | 1/15/13 | 29,115 | 30,814 | |
| Prudential Financial Inc. | 4.750% | 4/1/14 | 28,700 | 29,639 | |
| Prudential Financial Inc. | 5.100% | 9/20/14 | 10,000 | 10,334 |
5
Vanguard® Wellington Fund
Schedule of Investments
November 30, 2009
| Face | Market | |||
| Maturity | Amount | Value | ||
| Coupon | Date | ($000) | ($000) | |
| 4 TIAA Global Markets Inc. | 5.125% | 10/10/12 | 46,100 | 50,000 |
| Torchmark Corp. | 7.875% | 5/15/23 | 45,000 | 46,712 |
| Travelers Cos. Inc. | 5.800% | 5/15/18 | 32,500 | 35,820 |
| UnitedHealth Group Inc. | 4.750% | 2/10/14 | 10,000 | 10,557 |
| UnitedHealth Group Inc. | 6.000% | 11/15/17 | 36,000 | 38,340 |
| Other Finance (0.1%) | ||||
| NYSE Euronext | 4.800% | 6/28/13 | 52,025 | 55,544 |
| Real Estate Investment Trusts (0.6%) | ||||
| ProLogis | 5.625% | 11/15/16 | 19,600 | 18,671 |
| Realty Income Corp. | 6.750% | 8/15/19 | 21,075 | 21,489 |
| Simon Property Group LP | 5.100% | 6/15/15 | 50,000 | 50,916 |
| Simon Property Group LP | 6.100% | 5/1/16 | 49,050 | 51,887 |
| Simon Property Group LP | 6.125% | 5/30/18 | 10,000 | 10,494 |
| 4 WEA Finance LLC | 7.125% | 4/15/18 | 34,000 | 36,502 |
| 4 WEA Finance LLC / WCI Finance LLC | 5.700% | 10/1/16 | 64,150 | 64,244 |
| 5,690,095 | ||||
| Industrial (10.3%) | ||||
| Basic Industry (0.3%) | ||||
| BHP Billiton Finance USA Ltd. | 4.800% | 4/15/13 | 15,000 | 16,249 |
| BHP Billiton Finance USA Ltd. | 7.250% | 3/1/16 | 15,000 | 17,495 |
| EI du Pont de Nemours & Co. | 4.750% | 11/15/12 | 17,560 | 19,170 |
| PPG Industries Inc. | 6.875% | 2/15/12 | 9,355 | 10,063 |
| Rio Tinto Alcan Inc. | 7.250% | 3/15/31 | 21,273 | 24,721 |
| Rio Tinto Finance USA Ltd. | 6.500% | 7/15/18 | 52,000 | 57,701 |
| 3 Rohm & Haas Holdings Ltd. | 9.800% | 4/15/20 | 7,875 | 8,892 |
| Capital Goods (1.1%) | ||||
| 3M Co. | 6.375% | 2/15/28 | 30,000 | 34,708 |
| Boeing Co. | 8.625% | 11/15/31 | 9,460 | 12,459 |
| Caterpillar Financial Services Corp. | 5.050% | 12/1/10 | 25,000 | 26,134 |
| Caterpillar Inc. | 7.300% | 5/1/31 | 10,000 | 12,355 |
| Deere & Co. | 7.125% | 3/3/31 | 17,500 | 21,552 |
| General Dynamics Corp. | 4.250% | 5/15/13 | 40,000 | 43,024 |
| General Electric Co. | 5.250% | 12/6/17 | 41,685 | 43,629 |
| 4 Hutchison Whampoa International 03/13 Ltd. | 6.500% | 2/13/13 | 50,000 | 55,179 |
| John Deere Capital Corp. | 5.350% | 1/17/12 | 40,000 | 43,340 |
| John Deere Capital Corp. | 5.100% | 1/15/13 | 40,000 | 43,594 |
| 4 Siemens Financieringsmaatschappij NV | 5.750% | 10/17/16 | 89,650 | 98,189 |
| United Technologies Corp. | 7.500% | 9/15/29 | 19,230 | 24,385 |
| United Technologies Corp. | 6.050% | 6/1/36 | 20,325 | 22,903 |
| United Technologies Corp. | 6.125% | 7/15/38 | 45,000 | 51,410 |
| Communication (1.9%) | ||||
| AT&T Inc. | 5.100% | 9/15/14 | 40,160 | 43,849 |
| AT&T Inc. | 5.600% | 5/15/18 | 44,000 | 47,234 |
| AT&T Inc. | 6.450% | 6/15/34 | 73,115 | 76,426 |
| AT&T Inc. | 6.800% | 5/15/36 | 11,305 | 12,271 |
| AT&T Inc. | 6.500% | 9/1/37 | 9,675 | 10,267 |
| BellSouth Corp. | 6.000% | 10/15/11 | 25,000 | 27,166 |
| BellSouth Corp. | 5.200% | 9/15/14 | 20,000 | 21,925 |
| BellSouth Corp. | 6.550% | 6/15/34 | 32,225 | 33,671 |
| BellSouth Corp. | 6.000% | 11/15/34 | 11,995 | 11,930 |
| BellSouth Telecommunications Inc. | 7.000% | 12/1/95 | 27,600 | 27,831 |
| Cellco Partnership / Verizon Wireless Capital LLC | 5.550% | 2/1/14 | 28,000 | 30,920 |
| Cellco Partnership / Verizon Wireless Capital LLC | 8.500% | 11/15/18 | 21,000 | 26,877 |
| Comcast Corp. | 5.700% | 5/15/18 | 48,500 | 51,854 |
| France Telecom SA | 7.750% | 3/1/11 | 50,000 | 54,032 |
| France Telecom SA | 4.375% | 7/8/14 | 16,800 | 17,859 |
| 4 Grupo Televisa SA | 6.625% | 1/15/40 | 25,090 | 25,141 |
| 4 News America Inc. | 5.650% | 8/15/20 | 14,505 | 15,342 |
| Telefonica Europe BV | 7.750% | 9/15/10 | 50,000 | 52,446 |
| Time Warner Cable Inc. | 5.850% | 5/1/17 | 34,980 | 37,362 |
| Time Warner Cable Inc. | 6.750% | 6/15/39 | 29,985 | 31,800 |
6
Vanguard® Wellington Fund
Schedule of Investments
November 30, 2009
| Face | Market | |||
| Maturity | Amount | Value | ||
| Coupon | Date | ($000) | ($000) | |
| Verizon Communications Inc. | 4.350% | 2/15/13 | 15,530 | 16,533 |
| Verizon Communications Inc. | 5.500% | 4/1/17 | 25,000 | 27,043 |
| Verizon Communications Inc. | 5.850% | 9/15/35 | 49,525 | 49,903 |
| Verizon Communications Inc. | 6.900% | 4/15/38 | 9,710 | 11,051 |
| Verizon Global Funding Corp. | 6.875% | 6/15/12 | 10,000 | 11,250 |
| Verizon Global Funding Corp. | 4.375% | 6/1/13 | 10,000 | 10,668 |
| Verizon Global Funding Corp. | 7.750% | 12/1/30 | 56,410 | 67,788 |
| Verizon Maryland Inc. | 7.150% | 5/1/23 | 10,000 | 10,536 |
| Vodafone Group PLC | 5.000% | 12/16/13 | 10,000 | 10,845 |
| Vodafone Group PLC | 5.375% | 1/30/15 | 40,000 | 43,862 |
| Consumer Cyclical (1.6%) | ||||
| 4 American Honda Finance Corp. | 4.625% | 4/2/13 | 50,000 | 51,960 |
| CVS Caremark Corp. | 4.875% | 9/15/14 | 35,000 | 37,948 |
| CVS Caremark Corp. | 5.750% | 6/1/17 | 16,285 | 17,569 |
| Daimler Finance North America LLC | 6.500% | 11/15/13 | 49,855 | 54,733 |
| Daimler Finance North America LLC | 8.500% | 1/18/31 | 33,000 | 40,980 |
| Home Depot Inc. | 4.625% | 8/15/10 | 12,000 | 12,306 |
| Johnson Controls Inc. | 7.125% | 7/15/17 | 36,300 | 40,893 |
| Kohl's Corp. | 6.000% | 1/15/33 | 15,500 | 15,899 |
| Lowe's Cos. Inc. | 6.875% | 2/15/28 | 5,790 | 6,701 |
| Lowe's Cos. Inc. | 6.500% | 3/15/29 | 39,900 | 44,623 |
| Lowe's Cos. Inc. | 5.500% | 10/15/35 | 20,000 | 20,010 |
| Lowe's Cos. Inc. | 6.650% | 9/15/37 | 25,905 | 30,551 |
| Staples Inc. | 9.750% | 1/15/14 | 25,220 | 30,846 |
| Target Corp. | 5.875% | 3/1/12 | 40,000 | 44,093 |
| Target Corp. | 5.125% | 1/15/13 | 24,025 | 26,169 |
| Target Corp. | 5.875% | 7/15/16 | 20,000 | 22,347 |
| Time Warner Cos. Inc. | 7.570% | 2/1/24 | 20,000 | 22,762 |
| Time Warner Cos. Inc. | 6.950% | 1/15/28 | 20,000 | 21,626 |
| Time Warner Inc. | 5.500% | 11/15/11 | 21,460 | 22,959 |
| Wal-Mart Stores Inc. | 5.250% | 9/1/35 | 18,000 | 18,136 |
| Walt Disney Co. | 6.375% | 3/1/12 | 20,000 | 22,046 |
| Walt Disney Co. | 4.700% | 12/1/12 | 33,500 | 36,568 |
| Walt Disney Co. | 5.625% | 9/15/16 | 30,000 | 33,437 |
| Western Union Co. | 5.930% | 10/1/16 | 60,000 | 66,748 |
| Consumer Noncyclical (3.2%) | ||||
| Abbott Laboratories | 4.350% | 3/15/14 | 30,500 | 32,942 |
| Anheuser-Busch Cos. Inc. | 5.000% | 3/1/19 | 15,000 | 15,245 |
| Anheuser-Busch Cos. Inc. | 6.500% | 1/1/28 | 19,550 | 20,627 |
| Anheuser-Busch Cos. Inc. | 6.800% | 8/20/32 | 20,000 | 21,926 |
| Archer-Daniels-Midland Co. | 7.000% | 2/1/31 | 20,130 | 22,981 |
| AstraZeneca PLC | 6.450% | 9/15/37 | 48,385 | 56,410 |
| Baxter International Inc. | 5.900% | 9/1/16 | 12,498 | 14,190 |
| 4 Cargill Inc. | 5.200% | 1/22/13 | 36,000 | 38,567 |
| 4 Cargill Inc. | 4.375% | 6/1/13 | 20,400 | 21,323 |
| 4 Cargill Inc. | 6.000% | 11/27/17 | 25,000 | 27,494 |
| 4 Cargill Inc. | 6.875% | 5/1/28 | 19,355 | 21,144 |
| 4 Cargill Inc. | 6.125% | 4/19/34 | 28,980 | 29,305 |
| Coca-Cola Co. | 5.350% | 11/15/17 | 85,000 | 94,407 |
| Coca-Cola Enterprises Inc. | 6.125% | 8/15/11 | 40,000 | 43,626 |
| Coca-Cola Enterprises Inc. | 7.000% | 10/1/26 | 10,075 | 12,160 |
| Coca-Cola HBC Finance BV | 5.125% | 9/17/13 | 43,000 | 46,618 |
| Coca-Cola HBC Finance BV | 5.500% | 9/17/15 | 17,440 | 19,627 |
| Colgate-Palmolive Co. | 7.600% | 5/19/25 | 13,920 | 17,845 |
| ConAgra Foods Inc. | 6.750% | 9/15/11 | 632 | 689 |
| Diageo Capital PLC | 5.200% | 1/30/13 | 50,590 | 54,954 |
| Eli Lilly & Co. | 6.000% | 3/15/12 | 45,000 | 49,810 |
| Express Scripts Inc. | 6.250% | 6/15/14 | 9,670 | 10,762 |
| GlaxoSmithKline Capital Inc. | 4.850% | 5/15/13 | 35,000 | 38,102 |
| GlaxoSmithKline Capital Inc. | 4.375% | 4/15/14 | 35,000 | 37,669 |
| GlaxoSmithKline Capital Inc. | 5.375% | 4/15/34 | 45,000 | 45,816 |
| Hershey Co. | 4.850% | 8/15/15 | 9,620 | 10,503 |
| Johnson & Johnson | 5.150% | 7/15/18 | 14,800 | 16,430 |
7
Vanguard® Wellington Fund
Schedule of Investments
November 30, 2009
| Face | Market | |||
| Maturity | Amount | Value | ||
| Coupon | Date | ($000) | ($000) | |
| Kimberly-Clark Corp. | 4.875% | 8/15/15 | 30,000 | 33,187 |
| Medtronic Inc. | 4.375% | 9/15/10 | 19,235 | 19,839 |
| Medtronic Inc. | 4.750% | 9/15/15 | 20,000 | 21,943 |
| Merck & Co. Inc. | 5.125% | 11/15/11 | 69,000 | 74,668 |
| Pepsi Bottling Group Inc. | 7.000% | 3/1/29 | 10,000 | 12,177 |
| PepsiCo Inc. | 5.150% | 5/15/12 | 50,000 | 54,427 |
| Pfizer Inc. | 5.350% | 3/15/15 | 33,000 | 36,981 |
| 3 Procter & Gamble - Esop | 9.360% | 1/1/21 | 53,343 | 68,365 |
| 4 SABMiller PLC | 6.500% | 7/1/16 | 50,000 | 56,688 |
| Schering-Plough Corp. | 5.300% | 12/1/13 | 39,000 | 43,728 |
| Schering-Plough Corp. | 6.550% | 9/15/37 | 10,000 | 11,928 |
| Sysco Corp. | 5.375% | 9/21/35 | 25,000 | 26,177 |
| 4 Tesco PLC | 5.500% | 11/15/17 | 50,000 | 54,381 |
| 4 Thermo Fisher Scientific Inc. | 3.250% | 11/18/14 | 9,385 | 9,527 |
| Unilever Capital Corp. | 7.125% | 11/1/10 | 77,000 | 81,681 |
| Unilever Capital Corp. | 5.900% | 11/15/32 | 27,000 | 29,894 |
| Wyeth | 6.950% | 3/15/11 | 30,000 | 32,376 |
| Zeneca Wilmington Inc. | 7.000% | 11/15/23 | 29,000 | 35,437 |
| Energy (0.6%) | ||||
| Apache Finance Canada Corp. | 7.750% | 12/15/29 | 19,910 | 25,445 |
| Conoco Funding Co. | 6.350% | 10/15/11 | 30,000 | 32,909 |
| ConocoPhillips | 9.375% | 2/15/11 | 20,000 | 21,894 |
| ConocoPhillips | 5.200% | 5/15/18 | 80,000 | 85,943 |
| EOG Resources Inc. | 5.625% | 6/1/19 | 16,100 | 17,923 |
| Shell International Finance BV | 3.250% | 9/22/15 | 44,000 | 45,221 |
| Statoil ASA | 2.900% | 10/15/14 | 19,885 | 20,367 |
| Suncor Energy Inc. | 5.950% | 12/1/34 | 20,700 | 20,695 |
| Other Industrial (0.2%) | ||||
| Dover Corp. | 6.500% | 2/15/11 | 26,518 | 28,307 |
| Snap-On Inc. | 6.250% | 8/15/11 | 34,990 | 37,714 |
| Technology (0.8%) | ||||
| Cisco Systems Inc. | 4.450% | 1/15/20 | 40,000 | 40,724 |
| Dell Inc. | 5.875% | 6/15/19 | 34,840 | 38,241 |
| Hewlett-Packard Co. | 5.250% | 3/1/12 | 75,000 | 81,501 |
| Hewlett-Packard Co. | 5.500% | 3/1/18 | 29,135 | 32,374 |
| IBM International Group Capital LLC | 5.050% | 10/22/12 | 50,000 | 55,001 |
| International Business Machines Corp. | 8.375% | 11/1/19 | 25,000 | 33,489 |
| International Business Machines Corp. | 5.875% | 11/29/32 | 25,000 | 27,086 |
| Intuit Inc. | 5.400% | 3/15/12 | 19,610 | 20,870 |
| Oracle Corp. | 4.950% | 4/15/13 | 25,020 | 27,401 |
| Oracle Corp. | 6.125% | 7/8/39 | 18,000 | 19,842 |
| Transportation (0.6%) | ||||
| 3 Continental Airlines Inc. | 5.983% | 4/19/22 | 31,465 | 30,128 |
| 4 ERAC USA Finance Co. | 5.800% | 10/15/12 | 12,835 | 13,506 |
| 4 ERAC USA Finance Co. | 5.600% | 5/1/15 | 6,960 | 7,166 |
| 4 ERAC USA Finance Co. | 5.900% | 11/15/15 | 19,500 | 20,424 |
| 4 ERAC USA Finance Co. | 7.000% | 10/15/37 | 26,175 | 25,418 |
| 3 Federal Express Corp. 1998 Pass Through Trust | 6.720% | 1/15/22 | 34,678 | 37,645 |
| Southwest Airlines Co. | 5.750% | 12/15/16 | 32,500 | 32,595 |
| 3 Southwest Airlines Co. 1993-A Pass Through Trust | 7.540% | 6/29/15 | 30,772 | 31,935 |
| 3 Southwest Airlines Co. 2007-1 Pass Through Trust | 6.150% | 8/1/22 | 22,568 | 22,860 |
| United Parcel Service Inc. | 4.500% | 1/15/13 | 66,475 | 71,371 |
| 4,875,315 | ||||
| Utilities (3.1%) | ||||
| Electric (2.6%) | ||||
| Alabama Power Co. | 4.850% | 12/15/12 | 42,330 | 46,182 |
| Alabama Power Co. | 5.550% | 2/1/17 | 17,650 | 19,172 |
| Alabama Power Co. | 5.700% | 2/15/33 | 15,000 | 15,811 |
| Carolina Power & Light Co. | 6.300% | 4/1/38 | 14,705 | 16,749 |
| Central Illinois Public Service Co. | 6.125% | 12/15/28 | 54,000 | 47,318 |
| Commonwealth Edison Co. | 5.950% | 8/15/16 | 23,120 | 25,667 |
| Connecticut Light & Power Co. | 5.650% | 5/1/18 | 13,655 | 14,992 |
8
Vanguard® Wellington Fund
Schedule of Investments
November 30, 2009
| Face | Market | |||
| Maturity | Amount | Value | ||
| Coupon | Date | ($000) | ($000) | |
| Consolidated Edison Co. of New York Inc. | 5.500% | 9/15/16 | 20,930 | 22,578 |
| Consolidated Edison Co. of New York Inc. | 5.300% | 12/1/16 | 25,505 | 27,104 |
| Duke Energy Carolinas LLC | 5.250% | 1/15/18 | 9,000 | 9,804 |
| Duke Energy Carolinas LLC | 5.100% | 4/15/18 | 18,235 | 19,578 |
| 4 EDP Finance BV | 5.375% | 11/2/12 | 40,745 | 44,430 |
| 4 Enel Finance International SA | 6.800% | 9/15/37 | 38,515 | 43,505 |
| Florida Power & Light Co. | 5.550% | 11/1/17 | 9,835 | 10,964 |
| Florida Power & Light Co. | 5.650% | 2/1/35 | 50,000 | 53,561 |
| Florida Power & Light Co. | 4.950% | 6/1/35 | 10,000 | 9,660 |
| Florida Power & Light Co. | 5.650% | 2/1/37 | 5,000 | 5,331 |
| Florida Power & Light Co. | 5.950% | 2/1/38 | 39,215 | 42,847 |
| Florida Power Corp. | 6.350% | 9/15/37 | 8,000 | 9,034 |
| Florida Power Corp. | 6.400% | 6/15/38 | 27,055 | 30,789 |
| Georgia Power Co. | 5.400% | 6/1/18 | 38,660 | 42,228 |
| 4 Iberdrola Finance Ireland Ltd. | 3.800% | 9/11/14 | 21,750 | 22,304 |
| Midamerican Energy Holdings Co. | 6.125% | 4/1/36 | 25,000 | 26,644 |
| National Rural Utilities Cooperative Finance Corp. | 3.875% | 9/16/15 | 24,125 | 25,018 |
| National Rural Utilities Cooperative Finance Corp. | 5.450% | 2/1/18 | 60,000 | 64,736 |
| Northern States Power Co. | 6.250% | 6/1/36 | 50,000 | 57,175 |
| NSTAR | 4.500% | 11/15/19 | 3,535 | 3,605 |
| PacifiCorp | 5.900% | 8/15/34 | 12,500 | 13,361 |
| PacifiCorp | 6.250% | 10/15/37 | 36,635 | 41,427 |
| Peco Energy Co. | 5.350% | 3/1/18 | 20,545 | 22,472 |
| Potomac Electric Power Co. | 6.500% | 11/15/37 | 25,000 | 29,178 |
| PPL Energy Supply LLC | 6.200% | 5/15/16 | 13,573 | 14,809 |
| Public Service Electric & Gas Co. | 5.300% | 5/1/18 | 25,100 | 27,313 |
| Public Service Electric & Gas Co. | 5.800% | 5/1/37 | 50,000 | 53,652 |
| San Diego Gas & Electric Co. | 6.000% | 6/1/26 | 3,600 | 3,941 |
| South Carolina Electric & Gas Co. | 5.800% | 1/15/33 | 9,000 | 9,543 |
| South Carolina Electric & Gas Co. | 6.050% | 1/15/38 | 34,000 | 37,747 |
| Southern California Edison Co. | 6.000% | 1/15/34 | 7,695 | 8,488 |
| Southern California Edison Co. | 5.550% | 1/15/37 | 50,475 | 52,710 |
| Southern California Edison Co. | 5.950% | 2/1/38 | 50,000 | 55,178 |
| Southern Co. | 5.300% | 1/15/12 | 13,300 | 14,333 |
| Wisconsin Electric Power Co. | 4.500% | 5/15/13 | 21,565 | 22,725 |
| Wisconsin Electric Power Co. | 5.700% | 12/1/36 | 17,280 | 18,160 |
| Wisconsin Public Service Corp. | 6.080% | 12/1/28 | 45,000 | 47,012 |
| Natural Gas (0.4%) | ||||
| AGL Capital Corp. | 6.375% | 7/15/16 | 25,815 | 28,475 |
| British Transco Finance Inc. | 6.625% | 6/1/18 | 50,000 | 55,963 |
| 4 DCP Midstream LLC | 6.450% | 11/3/36 | 30,325 | 27,331 |
| KeySpan Corp. | 4.650% | 4/1/13 | 9,000 | 9,388 |
| National Grid PLC | 6.300% | 8/1/16 | 30,000 | 33,181 |
| Wisconsin Gas LLC | 6.600% | 9/15/13 | 13,100 | 14,321 |
| Other Utility (0.1%) | ||||
| UGI Utilities Inc. | 5.753% | 9/30/16 | 37,590 | 39,004 |
| 1,436,498 | ||||
| Total Corporate Bonds (Cost $11,439,661) | 12,001,908 | |||
| Sovereign Bonds (U.S. Dollar-Denominated) (1.5%) | ||||
| 4 Abu Dhabi National Energy Co. | 5.875% | 10/27/16 | 47,180 | 46,476 |
| 4 CDP Financial Inc. | 4.400% | 11/25/19 | 40,000 | 40,508 |
| 4 Emirate of Abu Dhabi | 5.500% | 8/2/12 | 10,000 | 10,446 |
| Hydro Quebec | 6.300% | 5/11/11 | 40,000 | 43,128 |
| Inter-American Development Bank | 4.375% | 9/20/12 | 40,000 | 42,960 |
| International Bank for Reconstruction & Development | 4.750% | 2/15/35 | 40,000 | 39,696 |
| Italian Republic | 4.500% | 1/21/15 | 50,000 | 53,688 |
| Japan Finance Organization for Municipalities | 4.625% | 4/21/15 | 50,000 | 54,127 |
| Kreditanstalt fuer Wiederaufbau | 7.000% | 3/1/13 | 10,000 | 11,084 |
| Oesterreichische Kontrollbank AG | 4.500% | 3/9/15 | 50,000 | 53,741 |
| Province of British Columbia Canada | 4.300% | 5/30/13 | 40,000 | 42,865 |
| Province of Ontario Canada | 4.500% | 2/3/15 | 35,000 | 38,338 |
9
Vanguard® Wellington Fund
Schedule of Investments
November 30, 2009
| Face | Market | ||||
| Maturity | Amount | Value | |||
| Coupon | Date | ($000) | ($000) | ||
| Province of Ontario Canada | 4.000% | 10/7/19 | 56,415 | 56,676 | |
| Province of Quebec Canada | 4.875% | 5/5/14 | 25,000 | 27,242 | |
| Province of Quebec Canada | 5.125% | 11/14/16 | 50,000 | 56,036 | |
| 4 | Qatar Govt International Bond | 4.000% | 1/20/15 | 32,000 | 32,360 |
| 4 | Ras Laffan Liquefied Natural Gas Co. Ltd. III | 5.500% | 9/30/14 | 14,985 | 15,777 |
| 4 | Republic of Austria | 2.000% | 11/15/12 | 19,825 | 20,048 |
| South Africa Government International Bond | 6.500% | 6/2/14 | 21,900 | 23,981 | |
| Total Sovereign Bonds (Cost $672,022) | 709,177 | ||||
| Taxable Municipal Bonds (1.3%) | |||||
| Atlanta GA Downtown Dev. Auth. Rev. | 6.875% | 2/1/21 | 12,985 | 13,933 | |
| Bay Area Toll Auth. CA Toll Bridge Rev. | 6.263% | 4/1/49 | 40,000 | 40,663 | |
| Board of Trustees of The Leland Stanford Junior | |||||
| University | 6.875% | 2/1/24 | 34,745 | 41,895 | |
| Board of Trustees of The Leland Stanford Junior | |||||
| University | 7.650% | 6/15/26 | 29,000 | 33,819 | |
| California GO | 6.200% | 10/1/19 | 29,100 | 29,557 | |
| Chicago IL Metro. Water Reclamation Dist. GO | 5.720% | 12/1/38 | 8,545 | 9,047 | |
| Dallas TX Area Rapid Transit Rev. | 5.999% | 12/1/44 | 29,265 | 31,834 | |
| Illinois State Tollway Highway Auth. Toll Highway Rev. | 6.184% | 1/1/34 | 20,765 | 22,015 | |
| 5 | Kansas Dev. Finance Auth. Rev. (Public Employee | ||||
| Retirement System) | 5.501% | 5/1/34 | 50,000 | 49,816 | |
| Los Angeles CA Dept. of Water & Power Rev. | 6.008% | 7/1/39 | 13,645 | 13,735 | |
| Los Angeles CA USD GO | 5.750% | 7/1/34 | 55,325 | 53,555 | |
| New Jersey Turnpike Auth. Rev. | 7.414% | 1/1/40 | 29,885 | 35,832 | |
| North Texas Tollway Auth. Rev. | 6.718% | 1/1/49 | 43,000 | 47,234 | |
| 6 | Oakland CA Pension Obligation | 6.980% | 12/15/09 | 7,801 | 7,817 |
| 4,6 | Ohana Military Communities LLC | 5.558% | 10/1/36 | 9,600 | 7,395 |
| 4,6 | Ohana Military Communities LLC | 5.780% | 10/1/36 | 16,360 | 12,933 |
| Oregon GO | 5.528% | 6/30/28 | 50,000 | 49,986 | |
| Oregon GO | 5.902% | 8/1/38 | 19,510 | 19,460 | |
| 4 | Pacific Beacon LLC | 5.379% | 7/15/26 | 9,000 | 7,826 |
| Port Auth. of New York & New Jersey Rev. | 5.859% | 12/1/24 | 12,735 | 13,806 | |
| Port Auth. of New York & New Jersey Rev. | 6.040% | 12/1/29 | 7,450 | 7,786 | |
| President and Fellows of Harvard College | 6.300% | 10/1/37 | 50,675 | 53,739 | |
| San Antonio TX Electric & Gas Rev. | 5.985% | 2/1/39 | 10,895 | 11,710 | |
| Univ. of California Rev. | 5.770% | 5/15/43 | 23,825 | 24,361 | |
| Total Taxable Municipal Bonds (Cost $626,612) | 639,754 | ||||
| Temporary Cash Investments (1.5%) | |||||
| Repurchase Agreement (1.4%) | |||||
| BNP Paribas Securities Corp. | |||||
| (Dated 11/30/09, Repurchase Value $655,203,000, | |||||
| collateralized by Federal Home Loan Mortgage Corp. | |||||
| 4.500%-8.000%, 11/1/16-1/1/39, Federal National | |||||
| Mortgage Assn. 3.500%-6.590%, 2/1/11-4/1/48, and | |||||
| Government National Mortgage Assn. 4.350%- | |||||
| 5.500%, 11/15/35-12/15/49) | 0.160% | 12/1/09 | 655,200 | 655,200 | |
| Shares | |||||
| Money Market Fund (0.1%) | |||||
| 7,8 | Vanguard Market Liquidity Fund | 0.199% | 45,350,300 | 45,350 | |
| Total Temporary Cash Investments (Cost $700,550) | 700,550 | ||||
| Total Investments (99.6%) (Cost $40,643,202) | 47,127,330 | ||||
| Other Assets and Liabilities—Net (0.4%)8 | 197,646 | ||||
| Net Assets (100%) | 47,324,976 | ||||
10
Vanguard® Wellington Fund
Schedule of Investments
November 30, 2009
* Non-income-producing security.
^ Part of security position is on loan to broker-dealers. The total value of securities on loan is $43,256,000.
1 Guaranteed by the Federal Deposit Insurance Corporation (FDIC) as part of the Temporary Liquidity Guarantee Program.
2 The issuer operates under a congressional charter; its securities are not backed by the full faith and credit of the U.S. government.
3 The average or expected maturity is shorter than the final maturity shown because of the possibility of interim principal payments and
prepayments or the possibility of the issue being called.
4 Security exempt from registration under Rule 144A of the Securities Act of 1933. Such securities may be sold in transactions exempt from
registration, normally to qualified institutional buyers. At November 30, 2009, the aggregate value of these securities was $1,817,288,000,
representing 3.8% of net assets.
5 Scheduled principal and interest payments are guaranteed by FSA (Financial Security Association).
6 Scheduled principal and interest payments are guaranteed by Municipal Bond Insurance Association.
7 Affiliated money market fund available only to Vanguard funds and certain trusts and accounts managed by Vanguard. Rate shown is the 7-day
yield.
8 Includes $45,350,000 of collateral received for securities on loan.
ADR—American Depositary Receipt.
GO—General Obligation Bond.
USD—United School District.
11
Report of Independent Registered Public Accounting Firm
To the Trustees and Shareholders of Vanguard Wellington Fund:
We have audited, in accordance with the standards of the Public Company Accounting Oversight Board (United States), the financial statements (not presented herein) of Vanguard Wellington Fund (the “Fund”) as of November 30, 2009 and for the year then ended and have issued our unqualified report thereon dated January 11, 2010. Our audit included an audit of the Fund’s schedule of investments as of November 30, 2009. This schedule of investments is the responsibility of the Fund’s management. Our responsibility is to express an opinion on this schedule of investments based on our audit.
In our opinion, the accompanying schedule of investments referred to above, when read in conjunction with the financial statements of the Fund referred to above, presents fairly, in all material respects, the information set forth therein.
PricewaterhouseCoopers LLP
Philadelphia, PA
January 11, 2010
12
© 2010 Vanguard Group. Inc.
All rights reserved.
Vanguard Marketing Corporation, Distributor.
SNA210 012010
Item 2: Code of Ethics. The Registrant has adopted a code of ethics that applies to the Registrant’s principal executive officer, principal financial officer, principal accounting officer or controller or persons performing similar functions. The Code of Ethics was amended during the reporting period covered by this report to make certain technical, non-material changes.
Item 3: Audit Committee Financial Expert. The following members of the Audit Committee have been determined by the Registrant’s Board of Trustees to be Audit Committee Financial Experts serving on its Audit Committee, and to be independent: Charles D. Ellis, Rajiv L. Gupta, JoAnn Heffernan Heisen, André F. Perold, and Alfred M. Rankin, Jr.
Item 4: Principal Accountant Fees and Services.
(a) Audit Fees.
Audit Fees of the Registrant
Fiscal Year Ended November 30, 2009: $28,000
Fiscal Year Ended November 30, 2008: $33,000
Aggregate Audit Fees of Registered Investment Companies in the Vanguard Group.
Fiscal Year Ended November 30, 2009: $3,354,640
Fiscal Year Ended November 30, 2008: $3,055,590
(b) Audit-Related Fees.
Fiscal Year Ended November 30, 2009: $876,210
Fiscal Year Ended November 30, 2008: $626,240
Includes fees billed in connection with assurance and related services provided to the Registrant, The Vanguard Group, Inc., Vanguard Marketing Corporation, and other registered investment companies in the Vanguard Group.
(c) Tax Fees.
Fiscal Year Ended November 30, 2009: $423,070
Fiscal Year Ended November 30, 2008: $230,400
Includes fees billed in connection with tax compliance, planning and advice services provided to the Registrant, The Vanguard Group, Inc., Vanguard Marketing Corporation, and other registered investment companies in the Vanguard Group and related to income and excise taxes.
(d) All Other Fees.
Fiscal Year Ended November 30, 2009: $0
Fiscal Year Ended November 30, 2008: $0
Includes fees billed for services related to risk management and privacy matters. Services were provided to the Registrant, The Vanguard Group, Inc., Vanguard Marketing Corporation, and other registered investment companies in the Vanguard Group.
(e) (1) Pre-Approval Policies. The policy of the Registrant’s Audit Committee is to consider and, if appropriate, approve before the principal accountant is engaged for such services, all specific audit and non-audit services provided to: (1) the Registrant; (2) The Vanguard Group, Inc.; (3) other entities controlled by The Vanguard Group, Inc. that provide ongoing services to the Registrant; and (4) other registered investment companies in the Vanguard Group. In making a determination, the Audit Committee considers whether the services are consistent with maintaining the principal accountant’s independence.
In the event of a contingency situation in which the principal accountant is needed to provide services in between scheduled Audit Committee meetings, the Chairman of the Audit Committee would be called on to consider and, if appropriate, pre-approve audit or permitted non-audit services in an amount sufficient to complete services through the next Audit Committee meeting, and to determine if such services would be consistent with maintaining the accountant’s independence. At the next scheduled Audit Committee meeting, services and fees would be presented to the Audit Committee for formal consideration, and, if appropriate, approval by the entire Audit Committee. The Audit Committee would again consider whether such services and fees are consistent with maintaining the principal accountant’s independence.
The Registrant’s Audit Committee is informed at least annually of all audit and non-audit services provided by the principal accountant to the Vanguard complex, whether such services are provided to: (1) the Registrant; (2) The Vanguard Group, Inc.; (3) other entities controlled by The Vanguard Group, Inc. that provide ongoing services to the Registrant; or (4) other registered investment companies in the Vanguard Group.
(2) No percentage of the principal accountant’s fees or services were approved pursuant to the waiver provision of paragraph (c)(7)(i)(C) of Rule 2-01 of Regulation S-X.
(f) For the most recent fiscal year, over 50% of the hours worked under the principal accountant’s engagement were not performed by persons other than full-time, permanent employees of the principal accountant.
Doc#0216367
(g) Aggregate Non-Audit Fees.
Fiscal Year Ended November 30, 2009: $423,070
Fiscal Year Ended November 30, 2008: $230,400
Includes fees billed for non-audit services provided to the Registrant, The Vanguard Group, Inc., Vanguard Marketing Corporation, and other registered investment companies in the Vanguard Group.
(h) For the most recent fiscal year, the Audit Committee has determined that the provision of all non-audit services was consistent with maintaining the principal accountant’s independence.
Item 5: Not Applicable.
Item 6: Not Applicable.
Item 7: Not Applicable.
Item 8: Not Applicable.
Item 9: Not Applicable.
Item 10: Not Applicable.
Item 11: Controls and Procedures.
(a) Disclosure Controls and Procedures. The Principal Executive and Financial Officers concluded that the Registrant's Disclosure Controls and Procedures are effective based on their evaluation of the Disclosure Controls and Procedures as of a date within 90 days of the filing date of this report.
(b) Internal Control Over Financial Reporting. There were no significant changes in Registrant’s Internal Control Over Financial Reporting or in other factors that could significantly affect this control subsequent to the date of the evaluation, including any corrective actions with regard to significant deficiencies and material weaknesses.
Item 12: Exhibits.
(a) Code of Ethics.
(b) Certifications.
Pursuant to the requirements of the Securities Exchange Act of 1934 and the Investment Company Act of 1940, the registrant has duly caused this report to be signed on its behalf by the undersigned, thereunto duly authorized.
| VANGUARD WELLINGTON FUND | |
| BY: | /s/ F. WILLIAM MCNABB III* |
| F. WILLIAM MCNABB III | |
| CHIEF EXECUTIVE OFFICER | |
| Date: January 25, 2010 | |
Pursuant to the requirements of the Securities Exchange Act of 1934 and the Investment Company Act of 1940, this report has been signed below by the following persons on behalf of the registrant and in the capacities and on the dates indicated.
| VANGUARD WELLINGTON FUND | |
| BY: | /s/ F. WILLIAM MCNABB III* |
| F. WILLIAM MCNABB III | |
| CHIEF EXECUTIVE OFFICER | |
| Date: January 25, 2010 | |
| VANGUARD WELLINGTON FUND | |
| BY: | /s/ THOMAS J. HIGGINS* |
| THOMAS J. HIGGINS | |
| CHIEF FINANCIAL OFFICER | |
| Date: January 25, 2010 | |
* By: /s/ Heidi Stam
Heidi Stam, pursuant to a Power of Attorney filed on July 24, 2009, see file Number
2-88373, and a Power of Attorney filed on October 16, 2009, see File Number 2-52698,
both Incorporated by Reference.