UNITED STATES
SECURITIES AND EXCHANGE COMMISSION
Washington, D.C. 20549
FORM N-CSR
CERTIFIED SHAREHOLDER REPORT
OF
REGISTERED MANAGEMENT INVESTMENT COMPANIES
Investment Company Act file number: 811-121
Name of Registrant: Vanguard Wellington Fund
Address of Registrant: | P.O. Box 2600 |
| Valley Forge, PA 19482 |
Name and address of agent for service: | Heidi Stam, Esquire |
| P.O. Box 876 |
| Valley Forge, PA 19482 |
Registrant’s telephone number, including area code: (610) 669-1000
Date of fiscal year end: November 30
Date of reporting period: December 1, 2006–November 30, 2007
Item 1: Reports to Shareholders |
> Vanguard Wellington Fund returned more than 10% for the fiscal year ended November 30, 2007, significantly outperforming both its composite index benchmark and its peer group.
> The fund’s stock portfolio earned strong returns in energy, consumer staples, industrials, and materials—all beneficiaries of global growth. The fund’s fixed income portfolio performed well, in part because of its high credit quality.
> For the ten-year period ended November 30, 2007, the Wellington Fund’s Investor Shares returned an average of 8.6% per year, far surpassing the average return of funds in its peer group as well as the returns of its composite index benchmark and the all-stock Standard & Poor’s 500 Index.
Contents |
|
|
|
Your Fund’s Total Returns | 1 |
Chairman’s Letter | 2 |
Advisor’s Report | 5 |
Fund Profile | 8 |
Performance Summary | 14 |
Financial Statements | 16 |
Your Fund’s After-Tax Returns | 31 |
About Your Fund’s Expenses | 32 |
Trustees Approve Advisory Agreement | 34 |
Glossary | 35 |
Past performance is not a guarantee of future results. (Current performance may be lower or higher than the performance data cited. For performance data current to the most recent month-end, visit our website at www.vanguard.com/performance.) Note, too, that both investment returns and principal value can fluctuate widely, so an investor’s shares, when sold, could be worth more or less than their original cost.
Please note: The opinions expressed in this report are just that—informed opinions. They should not be considered promises or advice. Also, please keep in mind that the information and opinions cover the period through the date on the cover of this report. Of course, the risks of investing in your fund are spelled out in the prospectus.
Your Fund’s Total Returns
Fiscal Year Ended November 30, 2007 |
|
|
| Ticker | Total |
| Symbol | Returns |
Vanguard Wellington Fund |
|
|
Investor Shares | VWELX | 10.1% |
Admiral™ Shares1 | VWENX | 10.2 |
Wellington Composite Index2 |
| 6.6 |
Average Mixed-Asset Target Growth Fund3 |
| 8.0 |
Your Fund’s Performance at a Glance | ||||
November 30, 2006–November 30, 2007 | ||||
|
|
| Distributions Per Share | |
| Starting | Ending | Income | Capital |
| Share Price | Share Price | Dividends | Gains |
Vanguard Wellington Fund |
|
|
|
|
Investor Shares | $33.76 | $34.56 | $1.030 | $1.401 |
Admiral Shares | 58.32 | 59.71 | 1.847 | 2.419 |
1 A lower-cost class of shares available to many longtime shareholders and to those with significant investments in the fund.
2 Weighted 65% Standard & Poor’s 500 Index and 35% Lehman U.S. Credit A or Better Index.
3 Derived from data provided by Lipper Inc.
1

Chairman’s Letter
Dear Shareholder,
In a fiscal year in which growth stocks surged ahead of value stocks and fixed income markets faced major challenges, Vanguard Wellington Fund’s value-oriented, balanced investment approach delivered impressive results. Investor Shares returned 10.1% and the lower-cost Admiral Shares returned 10.2%, which exceeded the return of the fund’s composite index benchmark and the average return of peer funds.
Investors benefited from astute bottom-up stock selection by Wellington Management Company, LLP, the fund’s advisor, which identifies seemingly undervalued stocks with the potential for long-term capital appreciation. The biggest contributions to equity return came from energy, consumer staples, industrials, and materials companies with global reach—all beneficiaries of strong demand, especially in fast-growing emerging-market economies such as China and India.
Wellington’s fixed income portfolio withstood most of the ripple effect from the subprime mortgage crisis, largely because of the fund’s high-quality orientation, and ended the fiscal year in positive territory.
If you hold the Wellington Fund in a taxable account, you may wish to review our report on the fund’s after-tax returns on page 31.
2
A volatile stock market produced solid gains
Although the U.S. economy began to slow toward the end of the fiscal year, stocks produced solid returns for the 12 months. These gains came despite a recession in housing and intensified problems among subprime mortgage-loan lenders—problems that first erupted in midsummer and continued to rattle the financial markets for the remainder of the period. In November, the stock market was quite volatile, as crude oil prices hovered near historic highs while the U.S. dollar continued to lose ground against other major currencies.
The broad U.S. stock market returned 7.6% for the year. Returns from large-capitalization stocks far outpaced those of small-cap issues, and growth stocks outperformed their value-oriented counterparts.
International stocks continued to outperform domestic issues. Emerging-markets stocks did particularly well, followed by stocks in Europe and the Pacific regions—excluding Japan, where returns were slight. The dollar’s ongoing weakness further enhanced international markets’ gains for U.S.-based investors.
Federal Reserve rate cuts depressed short-term yields
Ongoing turmoil in the subprime lending market engendered a “flight to quality” that drove prices of U.S. Treasury bonds sharply higher, and as the bonds’ prices
Market Barometer |
|
|
|
| Average Annual Total Returns | ||
| Periods Ended November 30, 2007 | ||
| One Year | Three Years | Five Years |
Stocks |
|
|
|
Russell 1000 Index (Large-caps) | 7.8% | 10.6% | 12.3% |
Russell 2000 Index (Small-caps) | –1.2 | 7.9 | 14.9 |
Dow Jones Wilshire 5000 Index (Entire market) | 7.6 | 10.7 | 12.9 |
MSCI All Country World Index ex USA (International) | 22.5 | 22.7 | 24.1 |
|
|
|
|
|
|
|
|
Bonds |
|
|
|
Lehman U.S. Aggregate Bond Index (Broad taxable market) | 6.0% | 4.8% | 4.8% |
Lehman Municipal Bond Index | 2.7 | 4.2 | 4.7 |
Citigroup 3-Month Treasury Bill Index | 4.9 | 4.1 | 2.9 |
|
|
|
|
|
|
|
|
CPI |
|
|
|
Consumer Price Index | 4.3% | 3.2% | 3.0% |
3
rose, their yields fell. Declines in Treasury yields were steepest at the short end of the maturity spectrum.
The declines were prompted largely by the actions of the Federal Reserve Board, which cut its target for the federal funds rate on two separate occasions. (On December 11, 2007, after the end of the fiscal period, the central bank again lowered the target for short-term interest rates by 0.25 percentage point, to 4.25%.) The yield of the 3-month Treasury bill, which started the fiscal year at 5.02%, had dropped nearly 2 percentage points, to 3.15%, by the end of the period.
The broad taxable bond market returned 6.0% for the year. Returns from tax-exempt municipal bonds were lower, gaining 2.7%.
A strong showing in challenging markets
The Wellington Fund’s equity portfolio delivered an impressive 13.1% return for the fiscal year, beating its benchmark, the Standard & Poor’s 500 Index, by more than 5 percentage points. Even though growth stocks outperformed value stocks, your advisor found many strong performers among mid-to-large-capitalization companies that had been underappreciated by the market.
Four sectors contributed about three-quarters of the equity portfolio’s return—energy, consumer staples, industrials, and materials. Three of the fund’s top-ten holdings during the year were integrated oil and gas producers Chevron, ExxonMobil, and Total; they benefited from soaring oil prices, which touched record highs of almost $100 per barrel, and were among the largest contributors to return. Among the fund’s consumer-oriented holdings, leading performers that enjoyed strong global demand included Altria, Nestle, and Procter & Gamble.
Your advisor’s focus on identifying industries with a favorable outlook for the balance between supply and demand was most evident in the industrials and materials sectors. Deere & Co. (up 82% for the year) was a standout performer; demand for biofuels drove up corn and wheat prices significantly, leading to increased demand for farm equipment. Although the materials sector represented a small slice of the portfolio, the voracious appetite for base metals and commodities—particularly among booming emerging-market countries—produced exceptional returns for Alcoa and for international mining companies Companhia Vale do Rio Doce and Rio Tinto.
Weak spots were limited as the fund outperformed its S&P 500 equity benchmark in all sectors except information technology. While some tech opportunities were missed, International Business Machines was a notable winner; this top-ten holding enjoyed strong global demand for technology consulting and application management services. In financials, the fund’s below-benchmark exposure spared the portfolio some damage from this group’s negative returns in the wake of the weak housing market and mortgage meltdown.
4
The fund’s fixed income holdings, which averaged about 35% of the portfolio’s assets, returned 4.2% for the year. The benefit of falling interest rates in the second half of the fiscal year helped overcome our fixed income portfolio’s modest negative return for the first half, when interest rates were still climbing. The advisor’s decision to underweight corporate bonds—and the fund’s minimal exposure to subprime mortgage lenders, home builders, and mortgage insurers—was an advantage when credit markets began to unravel.
For more on the fund’s positioning during the fiscal year, please see the Advisor’s Report, which begins on page 5.
The enduring success of a balanced approach
The Wellington Fund has weathered many storms since its launch just a few months before the stock market crash of 1929. During the past ten years, for example, the markets have experienced the tech-stock bubble, its dramatic collapse, and the broad market’s subsequent recovery. Over this same period, a hypothetical initial investment of $10,000 in Wellington Fund’s Investor Shares would have grown to $22,872, significantly exceeding the comparable ending balance of $18,505 for the Wellington Composite Index and the
Expense Ratios1 |
|
|
|
Your fund compared with its peer group |
|
|
|
|
|
| Average |
|
|
| Mixed-Asset |
| Investor | Admiral | Target |
| Shares | Shares | Growth Fund |
Wellington Fund | 0.27% | 0.16% | 1.17% |
Total Returns |
|
Ten Years Ended November 30, 2007 |
|
| Average |
| Annual Return |
Wellington Fund Investor Shares | 8.6% |
Wellington Composite Index | 6.3 |
Average Mixed-Asset Target Growth Fund2 | 6.0 |
The figures shown represent past performance, which is not a guarantee of future results. (Current performance may be lower or higher than the performance data cited. For performance data current to the most recent month-end, visit our website at www.vanguard.com/performance.) Note, too, that both investment returns and principal value can fluctuate widely, so an investor’s shares, when sold, could be worth more or less than their original cost.
1 Fund expense ratios reflect the 12 months ended November 30, 2007. Peer-group expense ratio is derived from data provided by Lipper Inc. and captures information through year-end 2006.
2 Derived from data provided by Lipper Inc.
5
$17,938 that would have resulted from the average return among peer funds. Your fund’s 8.6% average annual return for the ten-year period also surpassed the 6.2% return of the all-stock Standard & Poor’s 500 Index. Given the fund’s significant bond holdings, this is an especially notable achievement, but not a result we should expect in all periods.
The Wellington Fund’s outstanding long-term track record is a testament to its disciplined and balanced asset allocation (60%–70% in reasonably valued stocks and 30%–40% in investment-grade bonds), combined with the advisor’s well-honed investment process and long-term perspective. Compared with its peers, the fund also enjoys a significant cost advantage. Maintaining this low-cost structure helps to put more of the fund’s returns into the hands of investors.
In volatile markets, diversification and a long-term view are key
Many investors were jolted by the sharp increase in market volatility in 2007. After soaring to record highs, many equity markets around the world declined more than 10%. Fixed income markets were roiled by the fallout from the subprime mortgage crisis. Market cycles are hard to predict with accuracy, which is why Vanguard always encourages shareholders to invest with a long-term view, to diversify within and across asset classes, and to pay attention to costs.
The Wellington Fund embodies many of these bedrock principles. It offers broad diversification across stock and bond markets, at a low cost, and a rebalancing strategy that keeps the portfolio’s risk profile consistent over time. These characteristics can help Wellington play a valuable role in a long-term portfolio consistent with your goals, risk tolerance, and time horizon.
Thank you for your entrusting your assets to Vanguard.
Sincerely,

John J. Brennan
Chairman and Chief Executive Officer
December 12, 2007
6
Advisor’s Report
Vanguard Wellington Fund Investor Shares returned 10.1% for the fiscal year ended November 30, 2007. (Admiral Shares returned 10.2%.) This performance exceeded both the 8.0% average return for peer funds and the 6.6% return for the benchmark composite index, which is weighted 65% in large-capitalization stocks and 35% in high-quality corporate bonds.
The investment environment
Stocks, as measured by the S&P 500 Index, advanced 7.7% during the 12 months ended November 30, 2007. Global equities continued their upward trend during the period, but the path to these gains was an erratic one as markets were buffeted by issues related to U.S. subprime mortgages beginning in July. Concerns regarding the state of the U.S. housing sector had loomed over financial markets for some time, but rising default rates and the failure of some key industry players sparked a crisis of confidence.
Market conditions in November were reminiscent of late August and early September, with a sharp decline in market liquidity. Continued anxiety among investors over mortgage-related write-downs resulted in a renewed flight to U.S. Treasuries and the under-performance of all spread sectors. Corporate bonds underperformed comparable Treasury securities during the period, with the debt of firms exposed to the mortgage market most adversely affected.
Equity Portfolio Changes | |
Year Ended November 30, 2007 | |
|
|
Additions | Comments |
ING | The company is well-positioned to deliver strong organic growth |
| in both the insurance and banking segments. |
Pepsi | We initiated a position based on valuation versus other consumer |
| products companies. |
Colgate Palmolive | We expect continued robust earnings growth driven by the |
| company’s strong position in emerging markets. |
|
|
|
|
Reductions | Comments |
Weyerhaeuser | We took profits and eliminated our holding as the company began |
| looking at alternative corporate structures. |
Alcoa | We reduced holdings on strength as the company benefited from |
| growing global demand. |
EMC | We took profits and eliminated our position after strong earnings |
| from the VMware unit. |
7
Our successes
Our strong equity performance was driven largely by stock selection in the materials, industrials, and consumer staples sectors, boosted by our overweighted stakes in the energy and materials sectors and underweighted position in financials. Top absolute contributors for the period included Deere & Co. (industrials), Exelon (utilities), and Companhia Vale do Rio Doce, or CVRD (materials). Shares of Deere & Co. surged on worldwide demand for tractors and combines as higher grain prices, increased ethanol demand, and rising farm income spurred farmers’ spending. Exelon shares gained on tightening power markets, rising commodity prices, and the upward repricing of legacy contracts. Since Exelon is primarily a carbon-free nuclear generator, it is well-positioned to benefit from the passage of U.S. carbon legislation, which we consider likely. CVRD shares rose on good volumes and strong prices for iron ore, which boosted profits. Continued global demand for steel should benefit CVRD, as the company is increasing production capacity to keep up with demand.
Several health care holdings, including Schering-Plough and Abbott Laboratories, also contributed positively. Schering-Plough’s stock price achieved solid gains on strong revenue growth and double-digit sales growth for many of the company’s top-selling products, especially within its cholesterol franchise. Schering-Plough remains a unique company in the pharmaceutical industry because of its combination of strong current earnings, long exclusivity, and an attractive drug development pipeline. Abbott Laboratories benefited from continued robust sales growth for Humira, a treatment for rheumatoid arthritis, which helped the company to post strong third-quarter operating earnings.
AT&T shares gained on solid wireless subscriber growth driven by its exclusive service contract for the Apple iPhone. The company also benefited from cost savings achieved as a result of recent mergers with SBC Communications and Cingular Wireless.
Within the fixed income portion of the fund, our allocation to government agency pass-through mortgage-backed securities and our security selection within the corporate sector contributed to results for the period. Notably, minimal credit exposure to the most troubled areas of the economy—subprime mortgage lenders, home builders, and mortgage insurers—supported returns during this period.
Our shortfalls
Our underweighted position and security selection within the information technology sector detracted modestly from results. Motorola shares fell amid the company’s declining handset advantage and lower-than-expected sales and operating earnings. We eliminated our position toward the end of March after we concluded that management turnover was materially delaying operational improvements. Nortel Networks shares declined on investor disappointment with revenue guidance. We continue to hold the stock, as we feel company management should be able to successfully implement its business transition plan over time. Other detractors included financials holdings Citigroup, MBIA, and Freddie Mac; all three stocks suffered from exposure to the U.S. subprime mortgage market.
8
On the fixed income side, we noticed a rise in leveraged buyout activity in late 2006 and early 2007, so we tread warily among corporate bonds to lower this unfriendly bondholder risk in the fund. Instead, we invested in highly rated (by us as well as the rating agencies) commercial mortgage-backed securities, which have underperformed corporate bonds so far in calendar year 2007. We continue to embrace this strategy, despite the recent underperformance.
The fund’s positioning
We continue to search diligently for attractively valued companies with strong operating characteristics. We are particularly interested in stocks for which business fundamentals are poised to improve. As always, an above-average dividend is central to our stock-selection process.
Our strategy is focused on identifying industries in which the outlook for supply/ demand balance will be favorable. For example, we remain overweighted in energy and agriculture as part of the themes we have followed in recent years. Water and natural gas should also perform well. Housing has proven to be weak, and we have maintained our underweighting to financials. Consumers continue to be vulnerable because of high oil prices and the mortgage-market turmoil. At the end of the fiscal year, the fund held overweighted positions in the energy, materials, and utilities sectors, and underweighted positions in the technology, financials, and consumer discretionary sectors.
Corporate bond valuations have returned to levels we consider attractive and we will be increasing our relative weighting in this sector of the bond market. We will be funding our purchases with sales of government agency pass-through mortgage-backed securities, which have outperformed this year.
Edward P. Bousa, CFA, Senior Vice
President and Equity Manager
John C. Keogh, Senior Vice President
and Fixed Income Manager
Wellington Management Company, LLP
December 12, 2007
9
Fund Profile
As of November 30, 2007
Total Fund Characteristics |
|
|
|
Yield |
|
Investor Shares | 3.0% |
Admiral Shares | 3.1% |
Turnover Rate | 23% |
Expense Ratio |
|
Investor Shares | 0.27% |
Admiral Shares | 0.16% |
Short-Term Reserves | 0.8% |
Sector Diversification (% of equity exposure) | |||
|
| Comparative | Broad |
| Fund | Index1 | Index2 |
Consumer Discretionary | 6.6% | 8.9% | 9.9% |
Consumer Staples | 12.1 | 10.3 | 8.9 |
Energy | 16.1 | 11.9 | 11.3 |
Financials | 15.5 | 18.3 | 18.9 |
Health Care | 11.4 | 12.3 | 12.2 |
Industrials | 12.0 | 11.6 | 11.8 |
Information Technology | 9.6 | 16.3 | 16.2 |
Materials | 5.7 | 3.3 | 3.8 |
Telecommunication Services | 5.0 | 3.5 | 3.2 |
Utilities | 6.0 | 3.6 | 3.8 |
Total Fund Volatility Measures3 | ||
| Fund Versus | Fund Versus |
| Composite Index4 | Broad Index2 |
R-Squared | 0.89 | 0.82 |
Beta | 0.92 | 0.55 |
10
Ten Largest Stocks5 (% of equity portfolio) |
| |
|
|
|
AT&T Inc. | integrated |
|
| telecommunication |
|
| services | 3.7% |
General Electric Co. | industrial |
|
| conglomerates | 2.9 |
Chevron Corp. | integrated oil |
|
| and gas | 2.6 |
Bank of America Corp. | diversified financial |
|
| services | 2.5 |
ExxonMobil Corp. | integrated oil |
|
| and gas | 2.4 |
Total SA ADR | integrated oil |
|
| and gas | 2.4 |
Exelon Corp. | electric utilities | 2.2 |
International Business |
|
|
Machines Corp. | computer hardware | 2.0 |
Deere & Co. | construction and |
|
| farm machinery |
|
| and heavy trucks | 2.0 |
Eli Lilly & Co. | pharmaceuticals | 1.9 |
Top Ten |
| 24.6% |
Top Ten as % of Total Net Assets | 16.1% | |
Fund Asset Allocation

1 S&P 500 Index.
2 Dow Jones Wilshire 5000 Index.
3 For an explanation of R-squared, beta, and other terms used here, see the Glossary on pages 35 and 36.
4 Wellington Composite Index, weighted 65% S&P 500 Index and 35% Lehman U.S. Credit A or Better Index.
5 “Ten Largest Stocks” excludes any temporary cash investments and equity index products.
11
Equity Characteristics |
|
|
|
|
| Comparative | Broad |
| Fund | Index1 | Index2 |
Number of Stocks | 111 | 500 | 4,851 |
Median Market Cap | $65.3B | $55.7B | $36.8B |
Price/Earnings Ratio | 15.0x | 16.9x | 17.7x |
Price/Book Ratio | 2.7x | 2.8x | 2.7x |
Dividend Yield | 2.2% | 1.9% | 1.8% |
Return on Equity | 20.7% | 20.2% | 19.1% |
Earnings Growth Rate | 20.7% | 20.7% | 20.5% |
Foreign Holdings | 12.6% | 0.0% | 0.0% |
Fixed Income Characteristics |
|
| |
|
| Comparative | Broad |
| Fund | Index3 | Index4 |
Number of Bonds | 513 | 1,954 | 9,242 |
Yield to Maturity | 5.4%5 | 5.2% | 4.9% |
Average Coupon | 5.7% | 5.7% | 5.4% |
Average Effective |
|
|
|
Maturity | 9.5 years | 9.4 years | 6.9 years |
Average Quality6 | Aa3 | Aa3 | Aa1 |
Average Duration | 6.0 years | 5.9 years | 4.4 years |
Sector Diversification7 |
|
(% of fixed income portfolio) |
|
|
|
Asset-Backed/Commercial Mortgage-Backed | 14.2% |
Finance | 34.9 |
Foreign | 6.0 |
Government Mortgage-Backed | 6.7 |
Industrial | 29.2 |
Treasury/Agency | 0.2 |
Utilities | 6.2 |
Other | 2.6 |
12
Distribution by Credit Quality6 |
|
(% of fixed income portfolio) |
|
|
|
Aaa | 25.4% |
Aa | 25.6 |
A | 35.1 |
Baa | 9.1 |
Ba | 0.0 |
B | 0.0 |
Other | 4.8 |
Equity Investment Focus
Fixed Income Investment Focus

1 S&P 500 Index.
2 Dow Jones Wilshire 5000 Index.
3 Lehman U.S. Credit A or Better Index.
4 Lehman U.S. Aggregate Bond Index.
5 Before expenses.
6 Moody’s Investors Service.
7 The agency and mortgage-backed securities sectors may include issues from government-sponsored enterprises; such issues are not backed by the full faith and credit of the U.S. government.
13
Performance Summary
All of the returns in this report represent past performance, which is not a guarantee of future results that may be achieved by the fund. (Current performance may be lower or higher than the performance data cited. For performance data current to the most recent month-end, visit our website at www.vanguard.com/performance.) Note, too, that both investment returns and principal value can fluctuate widely, so an investor’s shares, when sold, could be worth more or less than their original cost. The returns shown do not reflect taxes that a shareholder would pay on fund distributions or on the sale of fund shares.
Cumulative Performance: November 30, 1997–November 30, 2007
Initial Investment of $10,000
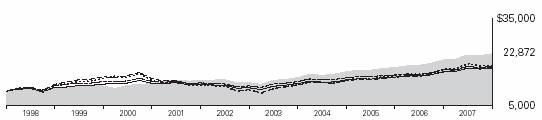
| Average Annual Total Returns | Final Value | ||
| Periods Ended November 30, 2007 | of a $10,000 | ||
| One Year | Five Years | Ten Years | Investment |
Wellington Fund Investor Shares1 | 10.09% | 11.98% | 8.63% | $22,872 |
Dow Jones Wilshire 5000 Index | 7.58 | 12.91 | 6.60 | 18,946 |
S&P 500 Index | 7.72 | 11.63 | 6.16 | 18,187 |
Wellington Composite Index2 | 6.62 | 9.36 | 6.35 | 18,505 |
Average Mixed-Asset Target Growth Fund3 | 7.95 | 9.96 | 6.02 | 17,938 |
|
|
|
| Final Value |
|
|
| Since | of a $100,000 |
| One Year | Five Years | Inception4 | Investment |
Wellington Fund Admiral Shares | 10.23% | 12.13% | 8.41% | $169,662 |
Dow Jones Wilshire 5000 Index | 7.58 | 12.91 | 5.76 | 144,262 |
S&P 500 Index | 7.72 | 11.63 | 4.45 | 133,009 |
Wellington Composite Index2 | 6.62 | 9.36 | 5.38 | 140,956 |
1 Total returns do not include the account service fee that may be applicable to certain accounts with balances below $10,000.
2 Weighted 65% S&P 500 Index and 35% Lehman U.S. Long Credit AA or Better Index through February 29, 2000; and 65% S&P 500 Index and 35% Lehman U.S. Credit A or Better Index thereafter.
3 Derived from data provided by Lipper Inc.
4 Performance for the fund’s Admiral Shares and comparative standards is calculated since the Admiral Shares’ inception: May 14, 2001.
14
Fiscal-Year Total Returns (%): November 30, 1997–November 30, 2007 | ||||
|
|
|
|
|
|
|
| Wellington Fund | Composite |
|
|
| Investor Shares | Index1 |
Fiscal | Capital | Income | Total | Total |
Year | Return | Return | Return | Return |
1998 | 9.6% | 4.2% | 13.8% | 20.1% |
1999 | –0.5 | 4.1 | 3.6 | 11.0 |
2000 | 2.6 | 4.3 | 6.9 | –0.1 |
2001 | 3.8 | 3.8 | 7.6 | –3.4 |
2002 | –7.4 | 3.1 | –4.3 | –8.1 |
2003 | 9.6 | 3.3 | 12.9 | 12.7 |
2004 | 10.3 | 3.1 | 13.4 | 9.9 |
2005 | 5.7 | 3.2 | 8.9 | 6.4 |
2006 | 11.2 | 3.5 | 14.7 | 11.3 |
2007 | 6.8 | 3.3 | 10.1 | 6.6 |
Average Annual Total Returns: Periods Ended September 30, 2007
This table presents average annual total returns through the latest calendar quarter—rather than through the end of the fiscal period. Securities and Exchange Commission rules require that we provide this information.
|
|
|
|
|
| Ten Years |
| Inception Date | One Year | Five Years | Capital | Income | Total |
Investor Shares2 | 7/1/1929 | 15.32% | 13.85% | 5.18% | 3.61% | 8.79% |
Admiral Shares | 5/14/2001 | 15.46 | 13.99 | 5.223 | 3.473 | 8.693 |
1 Weighted 65% S&P 500 Index and 35% Lehman U.S. Long Credit AA or Better Index through February 29, 2000; and 65% S&P 500 Index and 35% Lehman U.S. Credit A or Better Index thereafter.
2 Total returns do not include the account service fee that may be applicable to certain accounts with balances below $10,000.
3 Return since inception.
Note: See Financial Highlights tables on pages 24 and 25 for dividend and capital gains information.
15
Financial Statements
Statement of Net Assets—Investments Summary
As of November 30, 2007
This Statement summarizes the fund’s holdings by asset type (common stocks, bonds, etc.) and by industry sector. Details are reported for each of the fund’s 50 largest individual holdings and for investments that, in total for any issuer, represent more than 1% of the fund’s net assets. The total value of smaller holdings is reported as a single amount within each category.
The fund provides a complete list of its holdings four times in each fiscal year, at the quarter-ends. For the second and fourth fiscal quarters, the complete listing of the fund’s holdings is available electronically on Vanguard.com and on the Securities and Exchange Commission’s website (www.sec.gov), or you can have it mailed to you without charge by calling 800-662-7447. For the first and third fiscal quarters, the fund files the lists with the SEC on Form N-Q. Shareholders can look up the fund’s Forms N-Q on the SEC’s website. Forms N-Q may also be reviewed and copied at the SEC’s Public Reference Room (see the back cover of this report for further information).
|
|
| Market | Percentage |
|
|
| Value• | of Net |
|
| Shares | ($000) | Assets |
Common Stocks |
|
|
| |
Consumer Discretionary |
|
|
| |
* | Comcast Corp. Class A | 18,195,600 | 373,738 | 0.7% |
| McDonald’s Corp. | 6,216,100 | 363,455 | 0.7% |
† | Other—Consumer Discretionary |
| 1,435,663 | 2.9% |
|
|
| 2,172,856 | 4.3% |
Consumer Staples |
|
|
| |
| The Procter & Gamble Co. | 8,195,375 | 606,458 | 1.2% |
| Wal-Mart Stores, Inc. | 11,578,200 | 554,596 | 1.1% |
| Altria Group, Inc. | 6,206,800 | 481,399 | 0.9% |
| PepsiCo, Inc. | 5,979,500 | 461,498 | 0.9% |
| Nestle SA ADR | 3,505,300 | 419,059 | 0.8% |
| Colgate-Palmolive Co. | 4,291,600 | 343,671 | 0.7% |
| The Coca-Cola Co. | 4,753,100 | 295,167 | 0.6% |
† | Other—Consumer Staples |
| 836,804 | 1.7% |
|
|
| 3,998,652 | 7.9% |
Energy |
|
|
| |
| Chevron Corp. | 9,763,100 | 856,907 | 1.7% |
| ExxonMobil Corp. | 9,001,200 | 802,547 | 1.6% |
| Total SA ADR | 9,809,900 | 793,817 | 1.6% |
| ConocoPhillips Co. | 6,813,263 | 545,333 | 1.1% |
| EnCana Corp. | 7,231,304 | 471,842 | 0.9% |
| Royal Dutch Shell PLC ADR Class A | 5,108,810 | 416,010 | 0.8% |
| Schlumberger Ltd. | 3,255,800 | 304,254 | 0.6% |
| XTO Energy, Inc. | 4,790,000 | 296,118 | 0.6% |
† | Other—Energy |
| 828,267 | 1.5% |
|
|
| 5,315,095 | 10.4% |
Financials |
|
|
| |
| Bank of America Corp. | 17,663,999 | 814,840 | 1.6% |
| State Street Corp. | 5,742,300 | 458,752 | 0.9% |
| UBS AG (New York Shares) | 8,134,800 | 410,645 | 0.8% |
16
|
|
| Market | Percentage |
|
|
| Value• | of Net |
|
| Shares | ($000) | Assets |
American International Group, Inc. | 6,841,500 | 397,696 | 0.8% | |
ACE Ltd. | 6,205,900 | 371,299 | 0.7% | |
Citigroup, Inc. | 10,937,100 | 364,205 | 0.7% | |
Muenchener Rueckversicherungs-Gesellschaft AG (Registered) | 1,742,626 | 318,075 | 0.6% | |
ING Groep NV–Sponsored ADR | 7,469,500 | 289,667 | 0.6% | |
The Hartford Financial Services Group Inc. | 2,926,400 | 278,944 | 0.6% | |
† Other—Financials |
| 1,410,916 | 2.8% | |
|
| 5,115,039 | 10.1% | |
Health Care |
|
|
| |
Eli Lilly & Co. | 12,103,600 | 640,886 | 1.2% | |
Abbott Laboratories | 10,834,800 | 623,109 | 1.2% | |
Schering-Plough Corp. | 15,670,700 | 490,493 | 1.0% | |
Medtronic, Inc. | 9,505,700 | 483,365 | 1.0% | |
Bristol-Myers Squibb Co. | 14,225,200 | 421,493 | 0.8% | |
Wyeth | 7,177,000 | 352,391 | 0.7% | |
† Other—Health Care |
| 746,615 | 1.5% | |
|
| 3,758,352 | 7.4% | |
Industrials |
|
|
| |
General Electric Co. | 24,908,700 | 953,754 | 1.9% | |
Deere & Co. | 3,825,300 | 657,186 | 1.3% | |
Lockheed Martin Corp. | 3,015,000 | 333,670 | 0.7% | |
Waste Management, Inc. | 9,108,800 | 312,614 | 0.6% | |
Canadian National Railway Co. | 6,312,300 | 309,555 | 0.6% | |
United Parcel Service, Inc. | 3,707,300 | 273,154 | 0.5% | |
† Other—Industrials |
| 1,124,089 | 2.2% | |
|
| 3,964,022 | 7.8% | |
Information Technology |
|
|
| |
International Business Machines Corp. | 6,332,600 | 666,063 | 1.3% | |
Microsoft Corp. | 9,485,900 | 318,726 | 0.6% | |
Accenture Ltd. | 7,753,500 | 267,961 | 0.5% | |
† Other—Information Technology |
| 1,901,654 | 3.8% | |
|
| 3,154,404 | 6.2% | |
Materials |
|
|
| |
E.I. du Pont de Nemours & Co. | 7,598,800 | 350,685 | 0.7% | |
Syngenta AG ADR | 6,251,600 | 309,767 | 0.6% | |
International Paper Co. | 8,148,100 | 274,998 | 0.5% | |
† Other—Materials |
| 935,621 | 1.9% | |
|
| 1,871,071 | 3.7% | |
Telecommunication Services |
|
|
| |
AT&T Inc. | 32,067,385 | 1,225,295 | 2.4% | |
Verizon Communications Inc. | 8,178,400 | 353,389 | 0.7% | |
† Other—Telecommunications Services |
| 59,039 | 0.1% | |
|
| 1,637,723 | 3.2% | |
|
| 1,969,591 | 3.9% | |
17
|
|
| Market | Percentage |
|
|
| Value• | of Net |
|
| Shares | ($000) | Assets |
Utilities |
|
|
| |
Exelon Corp. | 9,011,400 | 730,554 | 1.4% | |
FPL Group, Inc. | 6,014,800 | 419,592 | 0.8% | |
Dominion Resources, Inc. | 6,881,800 | 325,027 | 0.7% | |
† Other—Utilities |
| 494,418 | 1.0% | |
Total Common Stocks ($22,944,879) |
| 32,956,805 | 64.9% | |
† Preferred Stock (Cost $31,185) |
| 31,871 | 0.1% | |
18
|
|
|
| Face | Market | Percentage |
|
|
| Maturity | Amount | Value• | of Net |
|
| Coupon | Date | ($000) | ($000) | Assets |
U.S. Government and Agency Obligations |
|
|
|
| ||
† | Agency Notes |
|
|
| 33,134 | 0.1% |
|
|
|
|
|
|
|
Mortgage-Backed Securities |
|
|
|
|
| |
| Conventional Mortgage-Backed Securities |
|
|
|
| |
1 | Government National |
|
|
|
|
|
| Mortgage Assn. | 5.000%–8.000% | 3/15/28-4/15/36 | 1,149,611 | 1,161,037 | 2.3% |
† | Other—Conventional |
|
|
|
|
|
| Mortgage-Backed Securities |
|
| 766 | 0.0% | |
| Nonconventional Mortgage-Backed Securities |
|
|
| ||
1 | Government National |
|
|
|
|
|
| Mortgage Assn. | 5.500% | 6/16/23 | 19,858 | 19,968 | 0.0% |
† | Other—Nonconventional |
|
|
|
|
|
| Mortgage-Backed Securities |
|
| 141,650 | 0.3% | |
|
|
|
|
| 1,323,421 | 2.6% |
Total U.S. Government and Agency Obligations (Cost $1,348,491) |
| 1,356,555 | 2.7% | |||
Corporate Bonds |
|
|
|
|
| |
† | Asset-Backed/Commercial Mortgage-Backed Securities | 2,275,078 | 4.5% | |||
|
|
|
|
|
|
|
Finance |
|
|
|
|
| |
| Banking |
|
|
|
|
|
| Bank of America Corp. | 4.375%–6.000% | 2/15/09–10/15/36 | 229,180 | 210,780 | 0.4% |
| Citicorp | 6.375% | 11/15/08 | 15,000 | 15,162 | 0.0% |
| Citigroup, Inc. | 4.625%–6.625% | 8/3/10–8/25/36 | 239,360 | 242,068 | 0.5% |
† | Other—Banking |
|
|
| 1,889,730 | 3.7% |
† | Brokerage |
|
|
| 912,196 | 1.8% |
| Finance Companies |
|
|
|
|
|
| General Electric |
|
|
|
|
|
| Capital Corp. | 5.250%–8.125% | 2/22/11–8/7/37 | 282,200 | 299,588 | 0.6% |
| International Lease |
|
|
|
|
|
| Finance Corp. | 5.300%–5.400% | 2/15/12–5/1/12 | 100,000 | 100,207 | 0.2% |
† | Other—Finance Companies |
|
|
| 506,819 | 1.0% |
| Insurance |
|
|
|
|
|
2 | AIG SunAmerica |
|
|
|
|
|
| Global Financing VI | 6.300% | 5/10/11 | 60,000 | 63,089 | 0.1% |
| American |
|
|
|
|
|
| International Group, Inc. | 4.700%–6.250 | 10/1/10–3/15/37 | 58,440 | 56,084 | 0.1% |
† | Other—Insurance |
|
|
| 1,405,425 | 2.8% |
† | Real Estate Investment Trusts |
|
| 245,385 | 0.5% | |
† | Finance—Other |
|
|
| 50,543 | 0.1% |
|
|
|
|
| 5,997,076 | 11.8% |
Industrial |
|
|
|
|
| |
† | Basic Industry |
|
|
| 286,530 | 0.6% |
| Capital Goods |
|
|
|
|
|
| Deere & Co. | 7.125% | 3/3/31 | 25,000 | 29,746 | 0.1% |
| General Electric Co. | 5.250% | 12/6/17 | 41,685 | 41,981 | 0.1% |
| John Deere Capital Corp. | 5.100%–5.350% | 1/17/12–1/15/13 | 80,000 | 81,707 | 0.2% |
† | Other—Capital Goods |
|
|
| 482,852 | 0.8% |
| Communications |
|
|
|
|
|
| AT&T Inc. | 4.125%–6.800% | 9/15/09–9/1/37 | 164,255 | 168,213 | 0.3% |
19
|
|
|
| Face | Market | Percentage |
|
|
| Maturity | Amount | Value• | of Net |
|
| Coupon | Date | ($000) | ($000) | Assets |
| BellSouth Corp. | 4.200%–6.550% | 9/15/09–11/15/34 | 99,220 | 101,819 | 0.2% |
| BellSouth |
|
|
|
|
|
| Telecommunications | 5.875%–7.000% | 1/15/09–12/1/95 | 42,600 | 44,234 | 0.1% |
| Chesapeake & |
|
|
|
|
|
| Potomac Telephone Co. | 7.150% | 5/1/23 | 10,000 | 10,569 | 0.0% |
| Verizon Communications Corp. | 5.500% | 4/1/17 | 50,000 | 50,621 | 0.1% |
| Verizon Global |
|
|
|
|
|
| Funding Corp. | 4.375%–7.750% | 6/15/12–9/15/35 | 116,525 | 124,652 | 0.2% |
† | Other—Communications |
|
|
| 308,613 | 0.7% |
| Consumer Cyclicals |
|
|
|
|
|
| Wal-Mart Stores, Inc. | 4.125%–6.875% | 8/10/09–9/1/35 | 70,000 | 67,929 | 0.1% |
† | Other—Consumer Cyclicals |
|
|
| 829,747 | 1.7% |
| Consumer Noncyclicals |
|
|
|
|
|
| Abbott Laboratories | 4.350%–5.600% | 5/15/11–3/15/14 | 45,500 | 44,984 | 0.1% |
| Eli Lilly & Co. | 6.000% | 3/15/12 | 45,000 | 48,197 | 0.1% |
| Medtronic Inc. | 4.375%–4.750% | 9/15/10–9/15/15 | 39,235 | 38,511 | 0.1% |
| Pepsi Bottling Group, Inc. | 7.000% | 3/1/29 | 10,000 | 11,538 | 0.0% |
2 | Pepsi Bottling Holdings Inc. | 5.625% | 2/17/09 | 40,000 | 40,783 | 0.1% |
| PepsiCo, Inc. | 4.650%–5.150% | 5/15/12–2/15/13 | 69,065 | 70,395 | 0.1% |
1 | Procter & Gamble Co. ESOP | 9.360% | 1/1/21 | 57,994 | 74,171 | 0.1% |
| Schering-Plough Corp. | 5.550%–6.550% | 12/1/13–9/15/37 | 49,000 | 50,090 | 0.1% |
† | Other—Consumer Noncyclicals |
|
|
| 1,236,594 | 2.5% |
| Energy |
|
|
|
|
|
| Conoco Funding Co. | 6.350% | 10/15/11 | 30,000 | 31,991 | 0.1% |
| Phillips Petroleum Co. | 9.375% | 2/15/11 | 20,000 | 23,114 | 0.0% |
† | Other—Energy |
|
|
| 83,495 | 0.2% |
| Technology |
|
|
|
|
|
| IBM International Group Capital | 5.050% | 10/22/12 | 50,000 | 50,671 | 0.1% |
| International Business |
|
|
|
|
|
| Machines Corp. | 5.875%–8.375% | 11/1/19–11/29/32 | 50,000 | 56,576 | 0.1% |
† | Other—Technology |
|
|
| 208,840 | 0.4% |
† | Transportation |
|
|
| 271,017 | 0.5% |
† | Industrial—Other |
|
|
| 65,429 | 0.1% |
|
|
|
|
| 5,035,609 | 9.9% |
Utilities |
|
|
|
|
| |
| Electric |
|
|
|
|
|
| Commonwealth Edison Co. | 5.950% | 8/15/16 | 23,120 | 23,624 | 0.1% |
| Exelon Generation Co. LLC | 6.950% | 6/15/11 | 50,000 | 52,708 | 0.1% |
† | Other—Electric |
|
|
| 815,840 | 1.6% |
† | Natural Gas |
|
|
| 143,646 | 0.3% |
† | Utilities—Other |
|
|
| 38,566 | 0.0% |
|
|
|
|
| 1,074,384 | 2.1% |
Total Corporate Bonds (Cost $14,305,243) |
|
| 14,382,147 | 28.3% | ||
† | Sovereign Bonds (U.S. Dollar-Denominated) (Cost $1,026,168) |
| 1,038,473 | 2.0% | ||
† | Taxable Municipal Bonds (Cost $425,837) |
|
| 447,779 | 0.9% | |
Temporary Cash Investments |
|
|
|
|
| |
Repurchase Agreement |
|
|
|
|
| |
BNP Paribas Securities Corp. (Dated 11/30/07, |
|
|
|
| ||
Repurchase Value $387,149,000, |
|
|
|
|
| |
collateralized by Federal Home Loan |
|
|
|
| ||
Mortgage Corp. 5.500%-6.500%, 11/1/37, |
|
|
|
| ||
Federal National Mortgage Assn. |
|
|
|
|
| |
5.500%–6.000%, 11/1/37) |
|
|
|
|
| |
(Cost $387,000) | 4.630% | 12/3/07 | 387,000 | 387,000 | 0.8% | |
Total Investments (Cost $40,468,803) |
|
|
| 50,600,630 | 99.7% | |
Other Assets and Liabilities |
|
|
|
|
| |
Other Assets—Note C |
|
|
| 564,217 | 1.1% | |
Liabilities |
|
|
| (390,398) | (0.8%) | |
|
|
|
| 173,819 | 0.3% | |
Net Assets |
|
|
| 50,774,449 | 100.0% | |
20
At November 30, 2007, net assets consisted of:3 |
|
| Amount |
| ($000) |
Paid-in Capital | 38,255,203 |
Undistributed Net Investment Income | 292,895 |
Accumulated Net Realized Gains | 2,093,912 |
Unrealized Appreciation |
|
Investment Securities | 10,131,827 |
Foreign Currencies | 612 |
Net Assets | 50,774,449 |
|
|
|
|
Investor Shares—Net Assets |
|
Applicable to 909,930,374 outstanding $.001 par value shares of |
|
beneficial interest (unlimited authorization) | 31,451,452 |
Net Asset Value Per Share—Investor Shares | $34.56 |
|
|
|
|
Admiral Shares—Net Assets |
|
Applicable to 323,618,348 outstanding $.001 par value shares of |
|
beneficial interest (unlimited authorization) | 19,322,997 |
Net Asset Value Per Share—Admiral Shares | $59.71 |
• See Note A in Notes to Financial Statements.
* Non-income-producing security.
† Represents the aggregate value, by category, of securities that are not among the 50 largest holdings and, in total for any issuer, represent 1% or less of net assets.
1 The average or expected maturity is shorter than the final maturity shown because of the possibility of interim principal payments and prepayments or the possibility of the issue being called.
2 Certain of the fund’s securities are exempt from registration under Rule 144A of the Securities Act of 1933. Such securities may be sold in transactions exempt from registration, normally to qualified institutional buyers. At November 30, 2007, the aggregate value of these securities was $1,905,799, representing 3.8% of net assets.
3 See Note E in Notes to Financial Statements for the tax-basis components of net assets.
ADR—American Depositary Receipt.
21
Statement of Operations
| Year Ended |
| November 30, 2007 |
| ($000) |
Investment Income |
|
Income |
|
Dividends1 | 748,458 |
Interest | 895,501 |
Security Lending | 6,314 |
Total Income | 1,650,273 |
Expenses |
|
Investment Advisory Fees—Note B |
|
Basic Fee | 23,637 |
Performance Adjustment | 4,163 |
The Vanguard Group—Note C |
|
Management and Administrative |
|
Investor Shares | 57,177 |
Admiral Shares | 14,565 |
Marketing and Distribution |
|
Investor Shares | 6,015 |
Admiral Shares | 2,888 |
Custodian Fees | 432 |
Auditing Fees | 24 |
Shareholders’ Reports |
|
Investor Shares | 567 |
Admiral Shares | 59 |
Trustees’ Fees and Expenses | 66 |
Total Expenses | 109,593 |
Expenses Paid Indirectly—Note D | (747) |
Net Expenses | 108,846 |
Net Investment Income | 1,541,427 |
Realized Net Gain (Loss) |
|
Investment Securities Sold | 2,212,879 |
Foreign Currencies | (423) |
Realized Net Gain (Loss) | 2,212,456 |
Change in Unrealized Appreciation (Depreciation) |
|
Investment Securities | 889,537 |
Foreign Currencies | 576 |
Change in Unrealized Appreciation (Depreciation) | 890,113 |
Net Increase (Decrease) in Net Assets Resulting from Operations | 4,643,996 |
1 Dividends are net of foreign withholding taxes of $19,332,000.
22
Statement of Changes in Net Assets
| Year Ended November 30, | |
| 2007 | 2006 |
| ($000) | ($000) |
Increase (Decrease) in Net Assets |
|
|
Operations |
|
|
Net Investment Income | 1,541,427 | 1,301,162 |
Realized Net Gain (Loss) | 2,212,456 | 2,008,324 |
Change in Unrealized Appreciation (Depreciation) | 890,113 | 2,438,104 |
Net Increase (Decrease) in Net Assets Resulting from Operations | 4,643,996 | 5,747,590 |
Distributions |
|
|
Net Investment Income |
|
|
Investor Shares | (925,794) | (838,099) |
Admiral Shares | (551,301) | (442,134) |
Realized Capital Gain1 |
|
|
Investor Shares | (1,219,716) | (811,700) |
Admiral Shares | (660,286) | (390,028) |
Total Distributions | (3,357,097) | (2,481,961) |
Capital Share Transactions—Note G |
|
|
Investor Shares | 1,339,575 | 1,104,904 |
Admiral Shares | 2,978,921 | 2,222,170 |
Net Increase (Decrease) from Capital Share Transactions | 4,318,496 | 3,327,074 |
Total Increase (Decrease) | 5,605,395 | 6,592,703 |
Net Assets |
|
|
Beginning of Period | 45,169,054 | 38,576,351 |
End of Period2 | 50,774,449 | 45,169,054 |
1 Includes fiscal 2007 and 2006 short-term gain distributions totaling $179,815,000 and $80,197,000, respectively. Short-term gain distributions are treated as ordinary income dividends for tax purposes.
2 Net Assets—End of Period includes undistributed net investment income of $292,895,000 and $228,986,000.
23
Financial Highlights
Investor Shares |
|
|
|
|
|
|
|
|
| ||
For a Share Outstanding | Year Ended November 30, | ||||
Throughout Each Period | 2007 | 2006 | 2005 | 2004 | 2003 |
Net Asset Value, Beginning of Period | $33.76 | $31.34 | $30.54 | $27.69 | $25.27 |
Investment Operations |
|
|
|
|
|
Net Investment Income | 1.059 | .982 | .886 | .865 | .77 |
Net Realized and Unrealized Gain (Loss) |
|
|
|
|
|
on Investments | 2.172 | 3.392 | 1.718 | 2.800 | 2.42 |
Total from Investment Operations | 3.231 | 4.374 | 2.604 | 3.665 | 3.19 |
Distributions |
|
|
|
|
|
Dividends from Net Investment Income | (1.030) | (.980) | (.895) | (.815) | (.77) |
Distributions from Realized Capital Gains | (1.401) | (.974) | (.909) | — | — |
Total Distributions | (2.431) | (1.954) | (1.804) | (.815) | (.77) |
Net Asset Value, End of Period | $34.56 | $33.76 | $31.34 | $30.54 | $27.69 |
|
|
|
|
|
|
|
|
|
|
|
|
Total Return1 | 10.09% | 14.69% | 8.86% | 13.44% | 12.94% |
|
|
|
|
|
|
|
|
|
|
|
|
Ratios/Supplemental Data |
|
|
|
|
|
Net Assets, End of Period (Millions) | $31,451 | $29,318 | $26,074 | $27,503 | $23,108 |
Ratio of Total Expenses to |
|
|
|
|
|
Average Net Assets2 | 0.27% | 0.30% | 0.29% | 0.31% | 0.36% |
Ratio of Net Investment Income to |
|
|
|
|
|
Average Net Assets | 3.14% | 3.10% | 2.93% | 2.99% | 3.00% |
Portfolio Turnover Rate | 23% | 25% | 24% | 24% | 28% |
1 Total returns do not include the account service fee that may be applicable to certain accounts with balances below $10,000.
2 Includes performance-based investment advisory fee increases (decreases) of 0.01%, 0.01%, 0.01%, 0.01%, and 0.01%.
24
Admiral Shares |
|
|
|
|
|
|
|
|
|
|
|
|
|
|
|
|
|
|
|
|
| ||
For a Share Outstanding | Year Ended November 30, | ||||
Throughout Each Period | 2007 | 2006 | 2005 | 2004 | 2003 |
Net Asset Value, Beginning of Period | $58.32 | $54.15 | $52.76 | $47.84 | $43.66 |
Investment Operations |
|
|
|
|
|
Net Investment Income | 1.894 | 1.768 | 1.61 | 1.561 | 1.383 |
Net Realized and Unrealized Gain (Loss) |
|
|
|
|
|
on Investments | 3.762 | 5.849 | 2.97 | 4.831 | 4.183 |
Total from Investment Operations | 5.656 | 7.617 | 4.58 | 6.392 | 5.566 |
Distributions |
|
|
|
|
|
Dividends from Net Investment Income | (1.847) | (1.765) | (1.62) | (1.472) | (1.386) |
Distributions from Realized Capital Gains | (2.419) | (1.682) | (1.57) | — | — |
Total Distributions | (4.266) | (3.447) | (3.19) | (1.472) | (1.386) |
Net Asset Value, End of Period | $59.71 | $58.32 | $54.15 | $52.76 | $47.84 |
|
|
|
|
|
|
|
|
|
|
|
|
Total Return | 10.23% | 14.82% | 9.02% | 13.57% | 13.09% |
|
|
|
|
|
|
|
|
|
|
|
|
Ratios/Supplemental Data |
|
|
|
|
|
Net Assets, End of Period (Millions) | $19,323 | $15,851 | $12,503 | $5,392 | $3,878 |
Ratio of Total Expenses to |
|
|
|
|
|
Average Net Assets1 | 0.16% | 0.17% | 0.15% | 0.17% | 0.23% |
Ratio of Net Investment Income to |
|
|
|
|
|
Average Net Assets | 3.25% | 3.23% | 3.09% | 3.13% | 3.12% |
Portfolio Turnover Rate | 23% | 25% | 24% | 24% | 28% |
1 Includes performance-based investment advisory fee increases (decreases) of 0.01%, 0.01%, 0.01%, 0.01%, and 0.01%. See accompanying Notes, which are an integral part of the Financial Statements.
25
Notes to Financial Statements
Vanguard Wellington Fund is registered under the Investment Company Act of 1940 as an open-end investment company, or mutual fund. The fund offers two classes of shares, Investor Shares and Admiral Shares. Investor Shares are available to any investor who meets the fund’s minimum purchase requirements. Admiral Shares are designed for investors who meet certain administrative, service, tenure, and account-size criteria. Certain of the fund’s investments are in corporate debt instruments; the issuers’ abilities to meet their obligations may be affected by economic developments in their respective industries.
A. The following significant accounting policies conform to generally accepted accounting principles for U.S. mutual funds. The fund consistently follows such policies in preparing its financial statements.
1. Security Valuation: Securities are valued as of the close of trading on the New York Stock Exchange (generally 4 p.m., Eastern time) on the valuation date. Equity securities are valued at the latest quoted sales prices or official closing prices taken from the primary market in which each security trades; such securities not traded on the valuation date are valued at the mean of the latest quoted bid and asked prices. Bonds, and temporary cash investments acquired over 60 days to maturity, are valued using the latest bid prices or using valuations based on a matrix system (which considers such factors as security prices, yields, maturities, and ratings), both as furnished by independent pricing services. Investments in Vanguard Market Liquidity Fund are valued at that fund’s net asset value. Other temporary cash investments are valued at amortized cost, which approximates market value. Securities for which market quotations are not readily available, or whose values have been affected by events occurring before the fund’s pricing time but after the close of the securities’ primary markets, are valued at their fair values calculated according to procedures adopted by the board of trustees. These procedures include obtaining quotations from an independent pricing service, monitoring news to identify significant market- or security-specific events, and evaluating changes in the values of foreign market proxies (for example, ADRs, futures contracts, or exchange-traded funds), between the time the foreign markets close and the fund’s pricing time. When fair-value pricing is employed, the prices of securities used by a fund to calculate its net asset value may differ from quoted or published prices for the same securities.
2. Foreign Currency: Securities and other assets and liabilities denominated in foreign currencies are translated into U.S. dollars using exchange rates obtained from an independent third party as of the fund’s pricing time on the valuation date. Realized gains (losses) and unrealized appreciation (depreciation) on investment securities include the effects of changes in exchange rates since the securities were purchased, combined with the effects of changes in security prices. Fluctuations in the value of other assets and liabilities resulting from changes in exchange rates are recorded as unrealized foreign currency gains (losses) until the assets or liabilities are settled in cash, at which time they are recorded as realized foreign currency gains (losses).
3. Repurchase Agreements: The fund may invest in repurchase agreements. Securities pledged as collateral for repurchase agreements are held by a custodian bank until the agreements mature. Each agreement requires that the market value of the collateral be sufficient to cover payments of interest and principal; however, in the event of default or bankruptcy by the other party to the agreement, retention of the collateral may be subject to legal proceedings.
4. Federal Income Taxes: The fund intends to continue to qualify as a regulated investment company and distribute all of its taxable income. Accordingly, no provision for federal income taxes is required in the financial statements.
26
5. Distributions: Distributions to shareholders are recorded on the ex-dividend date.
6. Security Lending: The fund may lend its securities to qualified institutional borrowers to earn additional income. Security loans are required to be secured at all times by collateral at least equal to the market value of securities loaned. The fund invests cash collateral received in Vanguard Market Liquidity Fund, and records a liability for the return of the collateral, during the period the securities are on loan. Security lending income represents the income earned on investing cash collateral, less expenses associated with the loan.
7. Other: Dividend income is recorded on the ex-dividend date. Interest income is accrued daily. Premiums and discounts on debt securities purchased are amortized and accreted, respectively, to interest income over the lives of the respective securities. Security transactions are accounted for on the date securities are bought or sold. Costs used to determine realized gains (losses) on the sale of investment securities are those of the specific securities sold.
Each class of shares has equal rights as to assets and earnings, except that each class separately bears certain class-specific expenses related to maintenance of shareholder accounts (included in Management and Administrative expenses) and shareholder reporting. Marketing and distribution expenses are allocated to each class of shares based on a method approved by the board of trustees. Income, other non-class-specific expenses, and gains and losses on investments are allocated to each class of shares based on its relative net assets.
B. Wellington Management Company, LLP, provides investment advisory services to the fund for a fee calculated at an annual percentage rate of average net assets. The basic fee is subject to quarterly adjustments based on the fund’s performance for the preceding three years relative to a combined index comprising the S&P 500 Index and the Lehman Brothers Credit A or Better Bond Index. For the year ended November 30, 2007, the investment advisory fee represented an effective annual basic rate of 0.05% of the fund’s average net assets before an increase of $4,163,000 (0.01%) based on performance.
C. The Vanguard Group furnishes at cost corporate management, administrative, marketing, and distribution services. The costs of such services are allocated to the fund under methods approved by the board of trustees. The fund has committed to provide up to 0.40% of its net assets in capital contributions to Vanguard. At November 30, 2007, the fund had contributed capital of $4,226,000 to Vanguard (included in Other Assets), representing 0.01% of the fund’s net assets and 4.22% of Vanguard’s capitalization. The fund’s trustees and officers are also directors and officers of Vanguard.
D. The fund has asked its investment advisor to direct certain security trades, subject to obtaining the best price and execution, to brokers who have agreed to rebate to the fund part of the commissions generated. Such rebates are used solely to reduce the fund’s management and administrative expenses. The fund’s custodian bank has also agreed to reduce its fees when the fund maintains cash on deposit in the non-interest-bearing custody account. For the year ended November 30, 2007, these arrangements reduced the fund’s management and administrative expenses by $590,000 and custodian fees by $157,000.
27
E. Distributions are determined on a tax basis and may differ from net investment income and realized capital gains for financial reporting purposes. Differences may be permanent or temporary. Permanent differences are reclassified among capital accounts in the financial statements to reflect their tax character. Temporary differences arise when certain items of income, expense, gain, or loss are recognized in different periods for financial statement and tax purposes; these differences will reverse at some time in the future. Differences in classification may also result from the treatment of short-term gains as ordinary income for tax purposes.
During the year ended November 30, 2007, the fund realized net foreign currency losses of $423,000, which decreased distributable net income for tax purposes; accordingly such losses have been reclassified from accumulated net realized gains to undistributed net investment income.
The fund used a tax accounting practice to treat a portion of the price of capital shares redeemed during the year as distributions from realized capital gains. Accordingly, the fund has reclassified $118,759,000 from accumulated net realized gains to paid-in capital.
For tax purposes, at November 30, 2007, the fund had $537,912,000 of ordinary income and $1,918,429,000 of long-term capital gains available for distribution.
At November 30, 2007, the cost of investment securities for tax purposes was $40,468,803,000. Net unrealized appreciation of investment securities for tax purposes was $10,131,827,000, consisting of unrealized gains of $10,782,201,000 on securities that had risen in value since their purchase and $650,374,000 in unrealized losses on securities that had fallen in value since their purchase.
F. During the year ended November 30, 2007, the fund purchased $12,749,164,000 of investment securities and sold $8,276,047,000 of investment securities, other than U.S. government securities and temporary cash investments. Purchases and sales of U.S. government securities were $1,009,880,000 and $2,756,188,000, respectively.
G. Capital share transactions for each class of shares were:
| Year Ended November 30, | ||||
|
| 2007 |
|
| 2006 |
| Amount | Shares |
| Amount | Shares |
| ($000) | (000) |
| ($000) | (000) |
Investor Shares |
|
|
|
|
|
Issued | 4,397,668 | 131,141 |
| 4,041,031 | 128,182 |
Issued in Lieu of Cash Distributions | 2,085,425 | 63,552 |
| 1,596,982 | 51,935 |
Redeemed | (5,143,518) | (153,255) |
| (4,533,109) | (143,551) |
Net Increase (Decrease)—Investor Shares | 1,339,575 | 41,438 |
| 1,104,904 | 36,566 |
Admiral Shares |
|
|
|
|
|
Issued | 3,762,459 | 64,899 |
| 2,912,397 | 53,262 |
Issued in Lieu of Cash Distributions | 1,125,382 | 19,841 |
| 768,878 | 14,470 |
Redeemed | (1,908,920) | (32,927) |
| (1,459,105) | (26,834) |
Net Increase (Decrease)—Admiral Shares | 2,978,921 | 51,813 |
| 2,222,170 | 40,898 |
28
H. In June 2006, the Financial Accounting Standards Board issued Interpretation No. 48 (“FIN 48”), “Accounting for Uncertainty in Income Taxes.” FIN 48 establishes the minimum threshold for recognizing, and a system for measuring, the benefits of tax-return positions in financial statements, and is effective for the fund’s fiscal year beginning December 1, 2007. Management has analyzed the fund’s tax positions taken on federal income tax returns for all open tax years (tax years ended November 30, 2004–2007) for purposes of implementing FIN 48, and has concluded that as of November 30, 2007, no provision for income tax would be required in the fund’s financial statements.
29
Report of Independent Registered
Public Accounting Firm
To the Trustees and Shareholders of Vanguard Wellington Fund:
In our opinion, the accompanying statement of net assets—investments summary and the related statements of operations and of changes in net assets and the financial highlights present fairly, in all material respects, the financial position of Vanguard Wellington Fund (the “Fund”) at November 30, 2007, the results of its operations for the year then ended, the changes in its net assets for each of the two years in the period then ended and the financial highlights for each of the five years in the period then ended, in conformity with accounting principles generally accepted in the United States of America. These financial statements and financial highlights (hereafter referred to as “financial statements”) are the responsibility of the Fund’s management; our responsibility is to express an opinion on these financial statements based on our audits. We conducted our audits of these financial statements in accordance with the standards of the Public Company Accounting Oversight Board (United States). Those standards require that we plan and perform the audit to obtain reasonable assurance about whether the financial statements are free of material misstatement. An audit includes examining, on a test basis, evidence supporting the amounts and disclosures in the financial statements, assessing the accounting principles used and significant estimates made by management, and evaluating the overall financial statement presentation. We believe that our audits, which included confirmation of securities at November 30, 2007 by correspondence with the custodians and broker, provide a reasonable basis for our opinion.
PricewaterhouseCoopers LLP
Philadelphia, Pennsylvania
January 11, 2008
Special 2007 tax information (unaudited) for Vanguard Wellington Fund
This information for the fiscal year ended November 30, 2007, is included pursuant to provisions of the Internal Revenue Code.
The fund distributed $1,809,059,000 as capital gain dividends (from net long-term capital gains) to shareholders during the fiscal year.
The fund distributed $663,577,000 of qualified dividend income to shareholders during the fiscal year.
For corporate shareholders, 32.9% of investment income (dividend income plus short-term gains, if any) qualifies for the dividends-received deduction.
30
Your Fund’s After-Tax Returns
This table presents returns for your fund both before and after taxes. The after-tax returns are shown in two ways: (1) assuming that an investor owned the fund during the entire period and paid taxes on the fund’s distributions, and (2) assuming that an investor paid taxes on the fund’s distributions and sold all shares at the end of each period.
Calculations are based on the highest individual federal income tax and capital gains tax rates in effect at the times of the distributions and the hypothetical sales. State and local taxes were not considered. After-tax returns reflect any qualified dividend income, using actual prior-year figures and estimates for 2007. (In the example, returns after the sale of fund shares may be higher than those assuming no sale. This occurs when the sale would have produced a capital loss. The calculation assumes that the investor received a tax deduction for the loss.)
The table shows returns for Investor Shares only; returns for other share classes will differ. Please note that your actual after-tax returns will depend on your tax situation and may differ from those shown. Also note that if you own the fund in a tax-deferred account, such as an individual retirement account or a 401(k) plan, this information does not apply to you. Such accounts are not subject to current taxes.
Finally, keep in mind that a fund’s performance—whether before or after taxes—does not guarantee future results.
Average Annual Total Returns: Wellington Fund Investor Shares1 | |||
Periods Ended November 30, 2007 |
|
|
|
| One | Five | Ten |
| Year | Years | Years |
Returns Before Taxes | 10.09% | 11.98% | 8.63% |
Returns After Taxes on Distributions | 8.47 | 10.74 | 6.61 |
Returns After Taxes on Distributions and Sale of Fund Shares | 7.53 | 9.91 | 6.40 |
1 Total returns do not include the account service fee that may be applicable to certain accounts with balances below $10,000.
31
About Your Fund’s Expenses
As a shareholder of the fund, you incur ongoing costs, which include costs for portfolio management, administrative services, and shareholder reports (like this one), among others. Operating expenses, which are deducted from a fund’s gross income, directly reduce the investment return of the fund.
A fund’s expenses are expressed as a percentage of its average net assets. This figure is known as the expense ratio. The following examples are intended to help you understand the ongoing costs (in dollars) of investing in your fund and to compare these costs with those of other mutual funds. The examples are based on an investment of $1,000 made at the beginning of the period shown and held for the entire period.
The table below illustrates your fund’s costs in two ways:
• Based on actual fund return. This section helps you to estimate the actual expenses that you paid over the period. The “Ending Account Value” shown is derived from the fund’s actual return, and the third column shows the dollar amount that would have been paid by an investor who started with $1,000 in the fund. You may use the information here, together with the amount you invested, to estimate the expenses that you paid over the period.
To do so, simply divide your account value by $1,000 (for example, an $8,600 account value divided by $1,000 = 8.6), then multiply the result by the number given for your fund under the heading “Expenses Paid During Period.”
• Based on hypothetical 5% yearly return. This section is intended to help you compare your fund’s costs with those of other mutual funds. It assumes that the fund had a yearly return of 5% before expenses, but that the expense ratio is unchanged. In this case—because the return used is not the fund’s actual return—the results do not apply to your investment. The example is useful in making comparisons because the Securities and Exchange Commission requires all mutual funds to calculate expenses based on a 5% return. You can assess your fund’s costs by comparing this hypothetical example with the hypothetical examples that appear in shareholder reports of other funds.
Six Months Ended November 30, 2007 |
|
|
|
| Beginning | Ending | Expenses |
| Account Value | Account Value | Paid During |
Wellington Fund | 5/31/2007 | 11/30/2007 | Period1 |
Based on Actual Fund Return |
|
|
|
Investor Shares | $1,000.00 | $1,017.94 | $1.21 |
Admiral Shares | 1,000.00 | 1,018.50 | 0.71 |
Based on Hypothetical 5% Yearly Return |
|
|
|
Investor Shares | $1,000.00 | $1,023.87 | $1.22 |
Admiral Shares | 1,000.00 | 1,024.37 | 0.71 |
1 The calculations are based on expenses incurred in the most recent six-month period. The fund’s annualized six-month expense ratios for that period are 0.24% for Investor Shares and 0.14% for Admiral Shares. The dollar amounts shown as “Expenses Paid” are equal to the annualized expense ratio multiplied by the average account value over the period, multiplied by the number of days in the most recent six-month period, then divided by the number of days in the most recent 12-month period.
32
Note that the expenses shown in the table are meant to highlight and help you compare ongoing costs only and do not reflect transaction costs incurred by the fund for buying and selling securities. Further, the expenses do not include the account service fee described in the prospectus. If such a fee were applied to your account, your costs would be higher. Your fund does not charge transaction fees, such as purchase or redemption fees, nor does it carry a “sales load.”
The calculations assume no shares were bought or sold during the period. Your actual costs may have been higher or lower, depending on the amount of your investment and the timing of any purchases or redemptions.
You can find more information about the fund’s expenses, including annual expense ratios, in the Financial Statements section of this report. For additional information on operating expenses and other shareholder costs, please refer to your fund’s current prospectus.
33
Trustees Approve Advisory Agreement
The board of trustees of Vanguard Wellington Fund has approved a new investment advisory agreement with Wellington Management Company, LLP . The board determined that the retention of Wellington Management was in the best interests of the fund and its shareholders.
The board based its decision upon an evaluation of the advisor’s investment staff, portfolio management process, and performance. The trustees considered the factors discussed below, among others. However, no single factor determined whether the board approved the agreement. Rather, it was the totality of the circumstances that drove the board’s decision.
Nature, extent, and quality of services
The board considered the quality of the fund’s investment management over both the short and long term and took into account the organizational depth and stability of the firm. The board noted that Wellington Management, founded in 1928, is among the nation’s oldest and most-respected institutional managers. The firm has advised the Wellington Fund since its inception in 1929.
The two senior portfolio managers for the fund, Edward P. Bousa and John C. Keogh, each have over two decades of industry experience and are backed by well-tenured teams of equity and fixed income research analysts who conduct detailed fundamental analysis of their respective industries and companies. Wellington Management has seen a significant growth in assets in the past decade.
The board concluded that Wellington Management has provided high-quality advisory services for the Wellington Fund and has demonstrated strong organizational depth and stability over both the short and long term. In addition, the board concluded that the asset-based advisory fee schedule should be adjusted to reflect the fair-market value of Wellington Management’s services, to support the firm’s ability to continue to attract and recruit top investment talent, and to enhance its organizational depth and stability. The new schedule is expected to impact the fund’s expense ratio by approximately 0.01%.
The board concluded that the advisor’s experience, stability, depth, and performance, among other factors, warranted the approval of the new advisory agreement.
Investment performance
The board considered the short- and long-term performance of the fund, including any periods of outperformance or underperformance of a relevant benchmark and peer group. The board concluded that the advisor has carried out the fund’s investment strategy in disciplined fashion, and the performance results have been excellent. Information about the fund’s most recent performance can be found in the Performance Summary section of this report.
Cost
The board concluded that the fund’s expense ratio, after the adjustment, is far below the average expense ratio charged by funds in its peer group. The board noted that the fund’s advisory fee rate is also well below the peer-group average. Information about the fund’s expense ratio appears in the About Your Fund’s Expenses section of this report as well as in the Financial Statements section, which also includes information about the advisory fee rate. The board did not consider profitability of Wellington Management in determining whether to approve the advisory fee, because Wellington Management is independent of Vanguard, and the advisory fee is the result of arm’s-length negotiations.
The benefit of economies of scale
The board concluded that the fund’s shareholders benefit from economies of scale because of breakpoints in the fund’s advisory fee schedule. The breakpoints reduce the effective rate of the fee as the fund’s assets increase.
The board will consider whether to renew the advisory agreement after a one-year period.
34
Glossary
Average Coupon. The average interest rate paid on the fixed income securities held by a fund. It is expressed as a percentage of face value.
Average Duration. An estimate of how much the value of the bonds held by a fund will fluctuate in response to a change in interest rates. To see how the value could change, multiply the average duration by the change in rates. If interest rates rise by 1 percentage point, the value of the bonds in a fund with an average duration of five years would decline by about 5%. If rates decrease by a percentage point, the value would rise by 5%.
Average Effective Maturity. The average length of time until fixed income securities held by a fund reach maturity and are repaid, taking into consideration the possibility that the issuer may call the bond before its maturity date. The figure reflects the proportion of fund assets represented by each security; it also reflects any futures contracts held. In general, the longer the average effective maturity, the more a fund’s share price will fluctuate in response to changes in market interest rates.
Average Quality. An indicator of credit risk, this figure is the average of the ratings assigned to a fund’s fixed income holdings by credit-rating agencies. The agencies make their judgment after appraising an issuer’s ability to meet its obligations. Quality is graded on a scale, with Aaa or AAA indicating the most creditworthy bond issuers. U.S. Treasury securities are considered to have the highest credit quality.
Beta. A measure of the magnitude of a fund’s past share-price fluctuations in relation to the ups and downs of a given market index. The index is assigned a beta of 1.00. Compared with a given index, a fund with a beta of 1.20 typically would have seen its share price rise or fall by 12% when the index rose or fell by 10%. A fund’s beta should be reviewed in conjunction with its R-squared (see definition below). The lower the R-squared, the less correlation there is between the fund and the index, and the less reliable beta is as an indicator of volatility.
Dividend Yield. The current, annualized rate of dividends paid on a share of stock, divided by its current share price. For a fund, the weighted average yield for stocks it holds. The index yield is based on the current annualized rate of dividends paid on stocks in the index.
Earnings Growth Rate. The average annual rate of growth in earnings over the past five years for the stocks now in a fund.
Equity Exposure. A measure that reflects a fund’s investments in stocks and stock futures. Any holdings in short-term reserves are excluded.
Expense Ratio. The percentage of a fund’s average net assets used to pay its annual administrative and advisory expenses. These expenses directly reduce returns to investors.
Foreign Holdings. The percentage of a fund represented by stocks or depositary receipts of companies based outside the United States.
Inception Date. The date on which the assets of a fund (or one of its share classes) are first invested in accordance with the fund’s investment objective. For funds with a subscription period, the inception date is the day after that period ends. Investment performance is measured from the inception date.
35
Median Market Cap. An indicator of the size of companies in which a fund invests; the midpoint of market capitalization (market price x shares outstanding) of a fund’s stocks, weighted by the proportion of the fund’s assets invested in each stock. Stocks representing half of the fund’s assets have market capitalizations above the median, and the rest are below it.
Price/Book Ratio. The share price of a stock divided by its net worth, or book value, per share. For a fund, the weighted average price/book ratio of the stocks it holds.
Price/Earnings Ratio. The ratio of a stock’s current price to its per-share earnings over the past year. For a fund, the weighted average P/E of the stocks it holds. P/E is an indicator of market expectations about corporate prospects; the higher the P/E, the greater the expectations for a company’s future growth.
R-Squared. A measure of how much of a fund’s past returns can be explained by the returns from the market in general, as measured by a given index. If a fund’s total returns were precisely synchronized with an index’s returns, its R-squared would be 1.00. If the fund’s returns bore no relationship to the index’s returns, its R-squared would be 0.
Return on Equity. The annual average rate of return generated by a company during the past five years for each dollar of shareholder’s equity (net income divided by shareholder’s equity). For a fund, the weighted average return on equity for the companies whose stocks it holds.
Short-Term Reserves. The percentage of a fund invested in highly liquid, short-term securities that can be readily converted to cash.
Turnover Rate. An indication of the fund’s trading activity. Funds with high turnover rates incur higher transaction costs and may be more likely to distribute capital gains (which may be taxable to investors). The turnover rate excludes in-kind transactions, which have minimal impact on costs.
Yield. A snapshot of a fund’s income from interest and dividends. The yield, expressed as a percentage of the fund’s net asset value, is based on income earned over the past 30 days and is annualized, or projected forward for the coming year.
Yield to Maturity. The rate of return an investor would receive if the fixed income securities held by a fund were held to their maturity dates.
36
The People Who Govern Your Fund
The trustees of your mutual fund are there to see that the fund is operated and managed in your best interests since, as a shareholder, you are a part owner of the fund. Your fund’s trustees also serve on the board of directors of The Vanguard Group, Inc., which is owned by the Vanguard funds and provides services to them on an at-cost basis.
A majority of Vanguard’s board members are independent, meaning that they have no affiliation with Vanguard or the funds they oversee, apart from the sizable personal investments they have made as private individuals.
Our independent board members bring distinguished backgrounds in business, academia, and public service to their task of working with Vanguard officers to establish the policies and oversee the activities of the funds. Among board members’ responsibilities are selecting investment advisors for the funds; monitoring fund operations, performance, and costs; reviewing contracts; nominating and selecting new trustees/directors; and electing Vanguard officers.
Each trustee serves a fund until its termination; or until the trustee’s retirement, resignation, or death; or otherwise as specified in the fund’s organizational documents. Any trustee may be removed at a shareholders’ meeting by a vote representing two-thirds of the net asset value of all shares of the fund together with shares of other Vanguard funds organized within the same trust. The table on these two pages shows information for each trustee and executive officer of the fund. The mailing address of the trustees and officers is P.O. Box 876, Valley Forge, PA 19482.
Chairman of the Board, Chief Executive Officer, and Trustee | |
|
|
John J. Brennan1 |
|
Born 1954 | Principal Occupation(s) During the Past Five Years: Chairman of the Board, Chief Executive |
Trustee since May 1987; | Officer, and Director/Trustee of The Vanguard Group, Inc., and of each of the investment |
Chairman of the Board and | companies served by The Vanguard Group. |
Chief Executive Officer |
|
148 Vanguard Funds Overseen |
|
|
|
Independent Trustees |
|
|
|
Charles D. Ellis |
|
Born 1937 | Principal Occupation(s) During the Past Five Years: Applecore Partners (pro bono ventures |
Trustee since January 2001 | in education); Senior Advisor to Greenwich Associates (international business strategy |
148 Vanguard Funds Overseen | consulting); Successor Trustee of Yale University; Overseer of the Stern School of Business |
| at New York University; Trustee of the Whitehead Institute for Biomedical Research. |
|
|
Rajiv L. Gupta |
|
Born 1945 | Principal Occupation(s) During the Past Five Years: Chairman, President, and |
Trustee since December 20012 | Chief Executive Officer of Rohm and Haas Co. (chemicals); Board Member of |
148 Vanguard Funds Overseen | the American Chemistry Council; Director of Tyco International, Ltd. (diversified |
| manufacturing and services) since 2005; Trustee of Drexel University and of the |
| Chemical Heritage Foundation. |
|
|
Amy Gutmann |
|
Born 1949 | Principal Occupation(s) During the Past Five Years: President of the University of |
Trustee since June 2006 | Pennsylvania since 2004; Professor in the School of Arts and Sciences, Annenberg School |
148 Vanguard Funds Overseen | for Communication, and Graduate School of Education of the University of Pennsylvania |
| since 2004; Provost (2001–2004) and Laurance S. Rockefeller Professor of Politics and |
| the University Center for Human Values (1990–2004), Princeton University; Director of |
| Carnegie Corporation of New York since 2005 and of Schuylkill River Development |
| Corporation and Greater Philadelphia Chamber of Commerce since 2004. |
|
|
JoAnn Heffernan Heisen |
|
Born 1950 | Principal Occupation(s) During the Past Five Years: Corporate Vice President and |
Trustee since July 1998 | Chief Global Diversity Officer since 2006, Vice President and Chief Information |
148 Vanguard Funds Overseen | Officer (1997–2005), and Member of the Executive Committee of Johnson & |
| Johnson (pharmaceuticals/consumer products); Director of the University Medical |
| Center at Princeton and Women’s Research and Education Institute. |
|
|
André F. Perold |
|
Born 1952 | Principal Occupation(s) During the Past Five Years: George Gund Professor of Finance |
Trustee since December 2004 | and Banking, Harvard Business School; Senior Associate Dean, Director of Faculty |
148 Vanguard Funds Overseen | Recruiting, and Chair of Finance Faculty, Harvard Business School; Director and Chairman |
| of UNX, Inc. (equities trading firm) since 2003; Chair of the Investment Committee of |
| HighVista Strategies LLC (private investment firm) since 2005. |
|
|
Alfred M. Rankin, Jr. |
|
Born 1941 | Principal Occupation(s) During the Past Five Years: Chairman, President, Chief Executive |
Trustee since January 1993 | Officer, and Director of NACCO Industries, Inc. (forklift trucks/housewares/lignite); Director |
148 Vanguard Funds Overseen | of Goodrich Corporation (industrial products/aircraft systems and services). |
|
|
|
|
J. Lawrence Wilson |
|
Born 1936 | Principal Occupation(s) During the Past Five Years: Retired Chairman and Chief Executive |
Trustee since April 1985 | Officer of Rohm and Haas Co. (chemicals); Director of Cummins Inc. (diesel engines) and |
148 Vanguard Funds Overseen | AmerisourceBergen Corp. (pharmaceutical distribution); Trustee of Vanderbilt University |
| and of Culver Educational Foundation. |
|
|
Executive Officers1 |
|
|
|
Thomas J. Higgins |
|
Born 1957 | Principal Occupation(s) During the Past Five Years: Principal of The Vanguard Group, Inc.; |
Treasurer since July 1998 | Treasurer of each of the investment companies served by The Vanguard Group. |
148 Vanguard Funds Overseen |
|
|
|
Heidi Stam |
|
Born 1956 | Principal Occupation(s) During the Past Five Years: Managing Director of The Vanguard |
Secretary since July 2005 | Group, Inc., since 2006; General Counsel of The Vanguard Group since 2005; Secretary of |
148 Vanguard Funds Overseen | The Vanguard Group, and of each of the investment companies served by The Vanguard |
| Group, since 2005; Principal of The Vanguard Group (1997–2006). |
Vanguard Senior Management Team |
|
| |
|
|
|
|
R. Gregory Barton | Kathleen C. Gubanich | F. William McNabb, III | Ralph K. Packard |
Mortimer J. Buckley | Paul A. Heller | Michael S. Miller | George U. Sauter |
Founder |
|
John C. Bogle |
Chairman and Chief Executive Officer, 1974–1996 |
1 Officers of the funds are “interested persons” as defined in the Investment Company Act of 1940.
2 December 2002 for Vanguard Equity Income Fund, Vanguard Growth Equity Fund, the Vanguard Municipal Bond Funds, and the Vanguard State Tax-Exempt Funds.
More information about the trustees is in the Statement of Additional Information, available from The Vanguard Group.

P.O. Box 2600
Valley Forge, PA 19482-2600
Connect with Vanguard® > www.vanguard.com
Fund Information > 800-662-7447 | Vanguard, Admiral, Connect with Vanguard, |
| Wellington, and the ship logo are trademarks of |
Direct Investor Account Services > 800-662-2739 | The Vanguard Group, Inc. |
|
|
Institutional Investor Services > 800-523-1036 |
|
| All other marks are the exclusive property of their |
Text Telephone for People | respective owners. |
With Hearing Impairment > 800-952-3335 |
|
| All comparative mutual fund data are from Lipper Inc. |
| or Morningstar, Inc., unless otherwise noted. |
|
|
| You can obtain a free copy of Vanguard’s proxy voting |
This material may be used in conjunction | guidelines by visiting our website, www.vanguard.com, |
with the offering of shares of any Vanguard | and searching for “proxy voting guidelines,” or by |
fund only if preceded or accompanied by | calling Vanguard at 800-662-2739. The guidelines are |
the fund’s current prospectus. | also available from the SEC’s website, www.sec.gov. |
| In addition, you may obtain a free report on how your |
| fund voted the proxies for securities it owned during |
| the 12 months ended June 30. To get the report, visit |
| either www.vanguard.com or www.sec.gov. |
|
|
| You can review and copy information about your fund |
| at the SEC’s Public Reference Room in Washington, D.C. |
| To find out more about this public service, call the SEC |
| at 202-551-8090. Information about your fund is also |
| available on the SEC’s website, and you can receive |
| copies of this information, for a fee, by sending a |
| request in either of two ways: via e-mail addressed to |
| publicinfo@sec.gov or via regular mail addressed to the |
| Public Reference Section, Securities and Exchange |
| Commission, Washington, DC 20549-0102. |
|
|
|
|
|
|
|
|
| © 2008 The Vanguard Group, Inc. |
| All rights reserved. |
| Vanguard Marketing Corporation, Distributor. |
|
|
| Q210 012008 |
Vanguard® Wellington Fund |
|
| |
Schedule of Investments |
|
| |
November 30, 2007 |
|
| |
|
|
| Market |
|
|
| Value |
|
| Shares | ($000) |
|
|
|
|
Common Stocks (64.9%) |
|
| |
Consumer Discretionary (4.3%) |
|
| |
* | Comcast Corp. Class A | 18,195,600 | 373,738 |
| McDonald’s Corp. | 6,216,100 | 363,455 |
| Time Warner, Inc. | 14,384,100 | 248,269 |
| Honda Motor Co., Ltd ADR | 6,388,000 | 219,811 |
| The Walt Disney Co. | 5,955,800 | 197,435 |
| Staples, Inc. | 8,232,900 | 195,120 |
* | Viacom Inc. Class B | 4,482,800 | 188,367 |
| NIKE, Inc. Class B | 2,220,700 | 145,789 |
| CBS Corp. | 5,093,100 | 139,704 |
| Home Depot, Inc. | 3,542,300 | 101,168 |
|
|
| 2,172,856 |
Consumer Staples (7.9%) |
|
| |
| The Procter & Gamble Co. | 8,195,375 | 606,458 |
| Wal-Mart Stores, Inc. | 11,578,200 | 554,596 |
| Altria Group, Inc. | 6,206,800 | 481,399 |
| PepsiCo, Inc. | 5,979,500 | 461,498 |
| Nestle SA ADR | 3,505,300 | 419,059 |
| Colgate-Palmolive Co. | 4,291,600 | 343,671 |
| The Coca-Cola Co. | 4,753,100 | 295,167 |
| Sysco Corp. | 7,166,900 | 232,996 |
| Kimberly-Clark Corp. | 3,322,000 | 231,909 |
| SABMiller PLC | 8,021,882 | 228,111 |
| British American Tobacco PLC | 1,942,540 | 75,446 |
| SABMiller PLC ADR | 1,261,800 | 36,245 |
| Walgreen Co. | 877,200 | 32,097 |
|
|
| 3,998,652 |
Energy (10.4%) |
|
| |
| Chevron Corp. | 9,763,100 | 856,907 |
| ExxonMobil Corp. | 9,001,200 | 802,547 |
| Total SA ADR | 9,809,900 | 793,817 |
| ConocoPhillips Co. | 6,813,263 | 545,333 |
| EnCana Corp. | 7,231,304 | 471,842 |
| Royal Dutch Shell PLC ADR Class A | 5,108,810 | 416,010 |
| Schlumberger Ltd. | 3,255,800 | 304,254 |
| XTO Energy, Inc. | 4,790,000 | 296,118 |
| Eni SpA ADR | 3,434,700 | 245,787 |
| Anadarko Petroleum Corp. | 4,256,800 | 240,935 |
| Petroleo Brasileiro SA ADR | 2,237,000 | 215,423 |
| Sasol Ltd. Sponsored ADR | 2,495,500 | 126,122 |
|
|
| 5,315,095 |
Financials (10.1%) |
|
| |
| Bank of America Corp. | 17,663,999 | 814,840 |
| State Street Corp. | 5,742,300 | 458,752 |
| UBS AG (New York Shares) | 8,134,800 | 410,645 |
| American International Group, Inc. | 6,841,500 | 397,696 |
1
| ACE Ltd. | 6,205,900 | 371,299 |
| Citigroup, Inc. | 10,937,100 | 364,205 |
| Muenchener Rueckversicherungs-Gesellschaft AG (Registered) | 1,742,626 | 318,075 |
| ING Groep NV - Sponsored ADR | 7,469,500 | 289,667 |
| The Hartford Financial Services Group Inc. | 2,926,400 | 278,944 |
| Wachovia Corp. | 5,741,000 | 246,863 |
| Prudential Financial, Inc. | 2,422,900 | 228,092 |
| PNC Financial Services Group | 2,673,700 | 195,741 |
| Merrill Lynch & Co., Inc. | 2,719,600 | 163,013 |
| MBIA, Inc. | 3,796,900 | 138,625 |
| Freddie Mac | 3,441,500 | 120,693 |
| Capital One Financial Corp. | 2,039,400 | 108,720 |
| JPMorgan Chase & Co. | 2,331,776 | 106,376 |
| Morgan Stanley | 1,949,800 | 102,793 |
|
|
| 5,115,039 |
Health Care (7.4%) |
|
| |
| Eli Lilly & Co. | 12,103,600 | 640,886 |
| Abbott Laboratories | 10,834,800 | 623,109 |
| Schering-Plough Corp. | 15,670,700 | 490,493 |
| Medtronic, Inc. | 9,505,700 | 483,365 |
| Bristol-Myers Squibb Co. | 14,225,200 | 421,493 |
| Wyeth | 7,177,000 | 352,391 |
| Teva Pharmaceutical Industries Ltd. Sponsored ADR | 5,854,900 | 261,304 |
| AstraZeneca Group PLC ADR | 4,576,900 | 216,853 |
| Sanofi-Aventis ADR | 4,460,303 | 211,686 |
| UCB SA | 1,194,111 | 56,772 |
|
|
| 3,758,352 |
Industrials (7.8%) |
|
| |
| General Electric Co. | 24,908,700 | 953,754 |
| Deere & Co. | 3,825,300 | 657,186 |
| Lockheed Martin Corp. | 3,015,000 | 333,670 |
| Waste Management, Inc. | 9,108,800 | 312,614 |
| Canadian National Railway Co. | 6,312,300 | 309,555 |
| United Parcel Service, Inc. | 3,707,300 | 273,154 |
| 3M Co. | 2,201,800 | 183,322 |
| Avery Dennison Corp. | 3,371,100 | 175,668 |
| General Dynamics Corp. | 1,862,400 | 165,344 |
| Parker Hannifin Corp. | 1,890,250 | 150,142 |
| FedEx Corp. | 1,315,200 | 129,508 |
| Illinois Tool Works, Inc. | 1,804,400 | 100,144 |
| Northrop Grumman Corp. | 1,078,279 | 84,958 |
| Emerson Electric Co. | 1,438,400 | 82,017 |
| Honeywell International Inc. | 935,827 | 52,986 |
|
|
| 3,964,022 |
Information Technology (6.2%) |
|
| |
| International Business Machines Corp. | 6,332,600 | 666,063 |
| Microsoft Corp. | 9,485,900 | 318,726 |
| Accenture Ltd. | 7,753,500 | 267,961 |
2
| Applied Materials, Inc. | 13,885,300 | 261,460 | |
| Texas Instruments, Inc. | 7,966,800 | 251,512 | |
| Automatic Data Processing, Inc. | 5,018,400 | 226,129 | |
| ASML Holding NV | 5,910,023 | 206,561 | |
| Hewlett-Packard Co. | 2,971,800 | 152,037 | |
| Keyence Corp. | 648,700 | 150,795 | |
* | Autodesk, Inc. | 3,011,900 | 141,830 | |
| Canon, Inc. | 2,475,511 | 130,576 | |
| QUALCOMM Inc. | 2,906,800 | 118,539 | |
| Intel Corp. | 3,516,200 | 91,702 | |
| ASML Holding NV (New York Shares) | 2,392,144 | 83,127 | |
* | Nortel Networks Corp. | 3,050,300 | 51,367 | |
| Maxim Integrated Products, Inc. | 1,553,200 | 36,019 | |
|
|
| 3,154,404 | |
Materials (3.7%) |
|
| ||
| E.I. du Pont de Nemours & Co. | 7,598,800 | 350,685 | |
| Syngenta AG ADR | 6,251,600 | 309,767 | |
| International Paper Co. | 8,148,100 | 274,998 | |
| Companhia Vale do Rio Doce ADR | 6,777,372 | 234,361 | |
| Alcoa Inc. | 6,252,500 | 227,403 | |
| Rohm & Haas Co. | 3,977,800 | 216,273 | |
| Air Products & Chemicals, Inc. | 1,428,000 | 141,429 | |
| Newmont Mining Corp. (Holding Co.) | 2,337,600 | 116,155 | |
|
|
| 1,871,071 | |
Telecommunication Services (3.2%) |
|
| ||
| AT&T Inc. | 32,067,385 | 1,225,295 | |
| Verizon Communications Inc. | 8,178,400 | 353,389 | |
| France Telecom SA | 1,557,879 | 59,039 | |
|
|
| 1,637,723 | |
Utilities (3.9%) |
|
| ||
| Exelon Corp. | 9,011,400 | 730,554 | |
| FPL Group, Inc. | 6,014,800 | 419,592 | |
| Dominion Resources, Inc. | 6,881,800 | 325,027 | |
| PG&E Corp. | 4,764,600 | 220,458 | |
| Veolia Environment ADR | 2,052,300 | 190,453 | |
| Progress Energy, Inc. | 1,710,500 | 83,507 | |
|
|
| 1,969,591 | |
|
|
|
| |
Total Common Stocks (Cost $22,944,879) |
| 32,956,805 | ||
Preferred Stock (0.1%) |
|
| ||
** | Federal Home Loan Mortgage Corp. 8.375% (Cost $31,185) | 1,247,400 | 31,871 | |
3
|
|
|
| Face | Market |
|
|
| Maturity | Amount | Value |
|
| Coupon | Date | ($000) | ($000) |
U.S. Government and Agency Obligations (2.7%) | |||||
Agency Notes (0.1%) |
|
|
|
| |
| Private Export Funding Corp. | 3.375% | 2/15/09 | 33,300 | 33,134 |
Mortgage-Backed Securities (2.6%) |
|
|
|
| |
| Conventional Mortgage-Backed Securities (2.3%) |
|
| ||
1,2 | Federal National Mortgage Assn. | 6.000% | 12/1/08-9/1/21 | 763 | 766 |
1 | Government National Mortgage Assn. | 5.000% | 1/15/30-12/15/35 | 362,821 | 360,985 |
1 | Government National Mortgage Assn. | 5.500% | 1/15/29-4/15/36 | 718,367 | 728,934 |
1 | Government National Mortgage Assn. | 6.000% | 3/15/28-1/15/33 | 37,113 | 38,340 |
1 | Government National Mortgage Assn. | 6.500% | 1/15/31-1/15/32 | 17,085 | 17,810 |
1 | Government National Mortgage Assn. | 7.000% | 11/15/31-11/15/33 | 14,178 | 14,919 |
1 | Government National Mortgage Assn. | 8.000% | 6/15/17 | 47 | 49 |
| Nonconventional Mortgage-Backed Securities (0.3%) |
|
| ||
1,2 | Federal Home Loan Mortgage Corp. | 4.000% | 3/15/19-9/15/19 | 68,295 | 62,883 |
1,2 | Federal National Mortgage Assn. | 4.000% | 2/25/19 | 19,895 | 18,322 |
1,2 | Federal National Mortgage Assn. | 4.517% | 5/1/13 | 17,518 | 17,522 |
1,2 | Federal National Mortgage Assn. | 4.890% | 1/1/14 | 24,749 | 25,101 |
1,2 | Federal National Mortgage Assn. | 5.014% | 2/1/13 | 17,456 | 17,822 |
1 | Government National Mortgage Assn. | 5.500% | 6/16/23 | 19,858 | 19,968 |
|
|
|
|
| 1,323,421 |
Total U.S. Government and Agency Obligations (Cost $1,348,491) |
|
|
| 1,356,555 | |
Corporate Bonds (28.3%) |
|
|
|
| |
Asset-Backed/Commercial |
|
|
|
| |
Mortgage-Backed Securities (4.5%) |
|
|
|
| |
1 | Adjustable Rate Mortgage Trust | 5.689% | 3/25/36 | 12,181 | 11,780 |
1 | Advanta Business Card Master Trust | 4.750% | 1/20/11 | 13,150 | 13,131 |
1,3 | Aesop Funding II LLC | 3.950% | 4/20/09 | 29,626 | 29,602 |
1,3 | American Mortgage Trust | 5.419% | 4/15/37 | 50,075 | 51,041 |
1 | Banc of America Commercial Mortgage, Inc. | 5.451% | 1/15/49 | 50,000 | 49,367 |
1 | Banc of America Commercial Mortgage, Inc. | 5.740% | 5/10/45 | 41,450 | 42,237 |
1 | Bank One Issuance Trust | 3.450% | 10/17/11 | 40,000 | 39,524 |
1 | Bank One Issuance Trust | 3.860% | 6/15/11 | 40,000 | 39,641 |
1 | Bear Stearns Commercial Mortgage Securities, Inc. | 5.610% | 11/15/33 | 17,250 | 17,876 |
1 | Bear Stearns Commercial Mortgage Securities, Inc. | 5.631% | 4/12/38 | 28,720 | 28,857 |
1 | Bear Stearns Commercial Mortgage Securities, Inc. | 5.243% | 12/11/38 | 23,425 | 21,995 |
4
1 | Bear Stearns Commercial Mortgage Securities, Inc. | 4.740% | 3/13/40 | 25,000 | 24,341 |
1 | Bear Stearns Commercial Mortgage Securities, Inc. | 4.674% | 6/11/41 | 20,960 | 20,019 |
1 | Bear Stearns Commercial Mortgage Securities, Inc. | 5.540% | 9/11/41 | 20,300 | 20,427 |
1 | Bear Stearns Commercial Mortgage Securities, Inc. | 5.582% | 9/11/41 | 20,750 | 20,004 |
1 | Bear Stearns Commercial Mortgage Securities, Inc. | 5.537% | 10/12/41 | 37,215 | 37,125 |
1 | Bear Stearns Commercial Mortgage Securities, Inc. | 4.825% | 11/11/41 | 49,980 | 48,000 |
1 | Bear Stearns Commercial Mortgage Securities, Inc. | 4.933% | 2/13/42 | 19,160 | 18,620 |
1 | Bear Stearns Commercial Mortgage Securities, Inc. | 4.871% | 9/11/42 | 24,700 | 23,834 |
1 | Bear Stearns Commercial Mortgage Securities, Inc. | 5.301% | 10/12/42 | 49,915 | 49,229 |
1 | Bear Stearns Commercial Mortgage Securities, Inc. | 5.331% | 2/11/44 | 40,630 | 39,800 |
1 | Bear Stearns Commercial Mortgage Securities, Inc. | 5.471% | 1/12/45 | 38,965 | 38,524 |
1 | California Infrastructure & Economic Development Bank |
|
|
|
|
| Special Purpose Trust SCE-1 | 6.420% | 12/26/09 | 3,493 | 3,494 |
1 | CarMax Auto Owner Trust | 4.910% | 1/18/11 | 21,520 | 21,556 |
1 | Chase Commercial Mortgage Securities Corp. | 6.390% | 11/18/30 | 23,259 | 23,501 |
1 | Chase Issuance Trust | 4.650% | 12/17/12 | 40,000 | 40,318 |
1 | Citigroup/Deutsche Bank Commercial Mortgage Trust | 5.225% | 7/15/44 | 44,400 | 44,152 |
1 | Commercial Mortgage Pass Through Certificates | 5.116% | 6/10/44 | 25,000 | 24,512 |
1 | Commercial Mortgage Pass-Through Certificates | 5.961% | 6/10/46 | 49,000 | 50,001 |
1 | Countrywide Home Loans | 6.000% | 5/25/37 | 20,198 | 20,321 |
1 | Credit Suisse Mortgage Capital Certificates | 5.467% | 9/15/39 | 39,605 | 39,623 |
1 | Credit Suisse Mortgage Capital Certificates | 5.609% | 2/15/39 | 50,000 | 50,137 |
1 | DaimlerChrysler Auto Trust | 4.980% | 2/8/11 | 18,435 | 18,418 |
1 | GS Mortgage Securities Corp. II | 5.396% | 8/10/38 | 25,100 | 24,980 |
1 | GS Mortgage Securities Corp. II | 4.751% | 7/10/39 | 20,000 | 19,213 |
1 | GS Mortgage Securities Corp. II | 5.560% | 11/10/39 | 15,000 | 14,997 |
1,4 | GSAMP Trust | 5.049% | 11/25/35 | 17,163 | 17,055 |
1 | GSR Mortgage Loan Trust | 5.790% | 5/25/47 | 45,558 | 44,976 |
1 | Greenwich Capital Commercial Funding Corp. | 4.915% | 1/5/36 | 47,700 | 46,666 |
1 | Greenwich Capital Commercial Funding Corp. | 5.317% | 6/10/36 | 25,535 | 25,367 |
1 | Greenwich Capital Commercial Funding Corp. | 5.224% | 4/10/37 | 10,000 | 9,865 |
1 | Greenwich Capital Commercial Funding Corp. | 5.444% | 3/10/39 | 50,095 | 49,962 |
1 | Greenwich Capital Commercial Funding Corp. | 4.799% | 8/10/42 | 48,375 | 46,289 |
1 | Honda Auto Receivables Owner Trust | 3.820% | 5/21/10 | 20,056 | 19,887 |
1 | Household Automotive Trust | 5.280% | 9/17/11 | 60,000 | 60,463 |
1,4 | JP Morgan Mortgage Acquisition Corp. | 4.899% | 5/25/37 | 16,640 | 15,676 |
1 | JPMorgan Chase Commercial Mortgage Securities | 4.899% | 1/12/37 | 25,440 | 24,542 |
1 | JPMorgan Chase Commercial Mortgage Securities | 5.344% | 12/15/44 | 50,000 | 49,668 |
1 | JPMorgan Chase Commercial Mortgage Securities | 6.065% | 4/15/45 | 12,655 | 13,002 |
1 | JPMorgan Chase Commercial Mortgage Securities | 5.440% | 6/12/47 | 50,000 | 49,356 |
1 | LB-UBS Commercial Mortgage Trust | 4.954% | 9/15/30 | 14,119 | 13,728 |
1 | LB-UBS Commerical Mortgage Trust | 6.462% | 3/15/31 | 18,325 | 19,536 |
1 | LB-UBS Commercial Mortgage Trust | 5.883% | 6/15/38 | 43,851 | 45,098 |
1 | LB-UBS Commercial Mortgage Trust | 5.347% | 11/15/38 | 50,000 | 49,258 |
1,3 | Marriott Vacation Club Owner Trust | 5.362% | 10/20/28 | 11,618 | 11,767 |
1 | Morgan Stanley Capital I | 5.984% | 8/12/41 | 50,000 | 51,561 |
1 | Morgan Stanley Capital I | 4.780% | 12/13/41 | 50,000 | 47,815 |
1 | Morgan Stanley Capital I | 5.230% | 9/15/42 | 16,905 | 16,688 |
1 | Morgan Stanley Capital I | 4.700% | 7/15/56 | 38,470 | 36,586 |
1 | Morgan Stanley Dean Witter Capital I | 4.740% | 11/13/36 | 26,000 | 25,691 |
1 | Morgan Stanley Dean Witter Capital I | 5.364% | 3/15/44 | 25,000 | 24,514 |
1 | Morgan Stanley Dean Witter Capital I | 5.514% | 11/12/49 | 27,043 | 26,846 |
1 | Morgan Stanley Dean Witter Capital II | 5.447% | 2/12/44 | 50,000 | 49,381 |
5
1 | Morgan Stanley Mortgage Loan Trust | 6.000% | 8/25/37 | 17,552 | 17,896 | ||
1 | Nissan Auto Lease Trust | 5.110% | 3/15/10 | 40,000 | 40,147 | ||
1 | Nomura Asset Securities Corp. | 6.690% | 3/15/30 | 13,000 | 13,952 | ||
1 | Nomura Asset Securities Corp. | 6.590% | 3/15/30 | 5,769 | 5,803 | ||
1 | PSE&G Transition Funding LLC | 6.450% | 3/15/13 | 10,000 | 10,486 | ||
1 | Sequoia Mortgage Trust | 5.822% | 2/20/47 | 69,975 | 70,342 | ||
1 | USAA Auto Owner Trust | 4.130% | 11/15/11 | 24,000 | 23,809 | ||
1 | WFS Financial Owner Trust | 3.930% | 2/17/12 | 25,216 | 25,083 | ||
1 | Wachovia Auto Owner Trust | 4.930% | 11/20/12 | 25,000 | 25,064 | ||
1 | Wachovia Bank Commercial Mortgage Trust | 5.118% | 7/15/42 | 25,000 | 24,499 | ||
1 | Wells Fargo Mortgage Backed Securities Trust | 6.028% | 9/25/36 | 37,064 | 37,394 | ||
1 | World Omni Auto Receivables Trust | 3.820% | 11/14/11 | 9,255 | 9,163 | ||
|
|
|
|
| 2,275,078 | ||
Finance (11.8%) |
|
|
|
|
| ||
| Banking (4.6%) |
|
|
|
|
| |
| BB&T Corp. | 5.250% | 11/1/19 | 8,000 | 7,693 |
| |
| BB&T Corp. | 4.900% | 6/30/17 | 8,045 | 7,604 |
| |
1,3 | BTMU Curacao Holdings NV | 4.760% | 7/21/15 | 47,895 | 48,174 |
| |
| Bank One Corp. | 7.875% | 8/1/10 | 15,000 | 16,210 |
| |
| Bank of America Corp. | 5.875% | 2/15/09 | 25,000 | 25,404 |
| |
| Bank of America Corp. | 4.375% | 12/1/10 | 10,000 | 9,974 |
| |
| Bank of America Corp. | 5.300% | 3/15/17 | 68,000 | 65,542 |
| |
| Bank of America Corp. | 5.625% | 3/8/35 | 96,180 | 81,119 |
| |
| Bank of America Corp. | 6.000% | 10/15/36 | 30,000 | 28,741 |
| |
| Bank of New York Mellon | 5.125% | 11/1/11 | 44,000 | 44,552 |
| |
| Bank of New York Mellon | 4.950% | 11/1/12 | 30,000 | 30,183 |
| |
| Bank of New York Mellon | 4.950% | 3/15/15 | 58,655 | 57,708 |
| |
3 | Barclays Bank PLC | 5.926% | 12/15/49 | 70,000 | 63,641 |
| |
| Citicorp | 6.375% | 11/15/08 | 15,000 | 15,162 |
| |
| Citigroup, Inc. | 4.625% | 8/3/10 | 19,400 | 19,339 |
| |
| Citigroup, Inc. | 6.125% | 11/21/17 | 64,960 | 67,044 |
| |
| Citigroup, Inc. | 5.300% | 10/17/12 | 50,000 | 50,686 |
| |
| Citigroup, Inc. | 5.850% | 8/2/16 | 30,000 | 30,469 |
| |
| Citigroup, Inc. | 6.625% | 6/15/32 | 45,000 | 45,866 |
| |
| Citigroup, Inc. | 6.125% | 8/25/36 | 30,000 | 28,664 |
| |
| Credit Suisse First Boston USA, Inc. | 4.700% | 6/1/09 | 45,000 | 45,004 |
| |
| Credit Suisse First Boston USA, Inc. | 6.500% | 1/15/12 | 15,000 | 15,988 |
| |
| Deutsche Bank AG London | 5.375% | 10/12/12 | 41,245 | 42,347 |
| |
| Deutsche Bank Financial LLC | 5.375% | 3/2/15 | 59,215 | 57,203 |
| |
| Fifth Third Bank | 4.200% | 2/23/10 | 60,000 | 59,549 |
| |
| Golden West Financial Corp. | 4.750% | 10/1/12 | 10,000 | 9,890 |
| |
3 | HBOS Treasury Services PLC | 6.000% | 11/1/33 | 80,500 | 81,479 |
| |
| HSBC Bank USA | 4.625% | 4/1/14 | 19,710 | 19,096 |
| |
| HSBC Holdings PLC | 6.500% | 5/2/36 | 25,000 | 23,553 |
| |
| Huntington National Bank | 4.900% | 1/15/14 | 16,375 | 16,113 |
| |
| Huntington National Bank | 5.500% | 2/15/16 | 16,000 | 16,169 |
| |
| JPMorgan Chase & Co. | 4.500% | 11/15/10 | 25,000 | 24,858 |
| |
| JPMorgan Chase & Co. | 6.750% | 2/1/11 | 25,115 | 26,234 |
| |
| JPMorgan Chase & Co. | 5.125% | 9/15/14 | 50,000 | 49,174 |
| |
| JPMorgan Chase & Co. | 5.250% | 5/1/15 | 40,000 | 38,998 |
| |
| Mellon Bank NA | 4.750% | 12/15/14 | 4,750 | 4,623 |
| |
| Mellon Funding Corp. | 5.000% | 12/1/14 | 30,000 | 29,108 |
| |
3 | Mizuho Finance (Cayman) | 5.790% | 4/15/14 | 50,000 | 51,067 |
| |
6
| National City Bank | 4.150% | 8/1/09 | 8,630 | 8,573 |
| National City Bank | 7.250% | 7/15/10 | 25,000 | 26,327 |
| National City Bank of Pennsylvania | 7.250% | 10/21/11 | 20,000 | 21,308 |
| National City Corp. | 3.200% | 4/1/08 | 10,000 | 9,925 |
| National City Corp. | 6.875% | 5/15/19 | 13,950 | 14,692 |
| Northern Trust Co. | 5.300% | 8/29/11 | 36,320 | 37,434 |
| Northern Trust Co. | 5.200% | 11/9/12 | 34,940 | 36,184 |
| Northern Trust Co. | 4.600% | 2/1/13 | 5,925 | 5,774 |
3 | Overseas Chinese Banking Corp. | 7.750% | 9/6/11 | 14,805 | 16,166 |
| PNC Bank NA | 4.875% | 9/21/17 | 50,000 | 46,690 |
| Paribas NY | 6.950% | 7/22/13 | 40,000 | 43,768 |
| Regions Bank | 6.450% | 6/26/37 | 26,000 | 26,145 |
| Royal Bank of Scotland Group PLC | 6.375% | 2/1/11 | 40,775 | 42,927 |
| Royal Bank of Scotland Group PLC | 5.000% | 10/1/14 | 9,700 | 9,379 |
| Royal Bank of Scotland Group PLC | 5.050% | 1/8/15 | 19,510 | 18,901 |
| Royal Bank of Scotland Group PLC | 4.700% | 7/3/18 | 10,000 | 9,126 |
3 | Santander U.S. Debt, S.A. Unipersonal | 4.750% | 10/21/08 | 47,100 | 47,570 |
| State Street Corp. | 5.375% | 4/30/17 | 76,315 | 76,909 |
| SunTrust Banks, Inc. | 4.250% | 10/15/09 | 9,680 | 9,717 |
| UBS AG | 5.875% | 7/15/16 | 60,000 | 62,829 |
| UFJ Finance Aruba AEC | 6.750% | 7/15/13 | 50,000 | 54,417 |
| US Bank NA | 6.375% | 8/1/11 | 17,940 | 19,056 |
| US Bank NA | 6.300% | 2/4/14 | 30,000 | 31,544 |
| Wachovia Bank NA | 4.375% | 8/15/08 | 15,000 | 14,892 |
| Wachovia Bank NA | 6.600% | 1/15/38 | 60,000 | 59,875 |
| Wachovia Corp. | 4.375% | 6/1/10 | 19,400 | 19,325 |
| Washington Mutual Bank | 6.875% | 6/15/11 | 15,000 | 14,136 |
| Washington Mutual Bank | 5.125% | 1/15/15 | 10,000 | 8,315 |
| Washington Mutual, Inc. | 5.250% | 9/15/17 | 27,005 | 21,530 |
| Wells Fargo & Co. | 6.375% | 8/1/11 | 15,000 | 15,804 |
| Wells Fargo & Co. | 5.125% | 9/1/12 | 10,000 | 10,099 |
| Wells Fargo & Co. | 5.250% | 10/23/12 | 50,000 | 51,719 |
| Wells Fargo & Co. | 4.950% | 10/16/13 | 15,000 | 14,614 |
| Wells Fargo & Co. | 5.125% | 9/15/16 | 25,000 | 24,153 |
| Wells Fargo Bank NA | 6.450% | 2/1/11 | 5,000 | 5,245 |
| Wells Fargo Financial | 5.500% | 8/1/12 | 20,000 | 20,776 |
| World Savings Bank, FSB | 4.500% | 6/15/09 | 14,845 | 14,842 |
| World Savings Bank, FSB | 4.125% | 12/15/09 | 33,045 | 32,826 |
| Brokerage (1.8%) |
|
|
|
|
| Ameriprise Financial Inc. | 5.350% | 11/15/10 | 22,605 | 22,868 |
| Dean Witter, Discover & Co. | 6.750% | 10/15/13 | 25,775 | 26,925 |
| Dean Witter, Discover & Co. | 7.070% | 2/10/14 | 17,500 | 18,484 |
| Goldman Sachs Group, Inc. | 5.000% | 1/15/11 | 30,000 | 30,362 |
| Goldman Sachs Group, Inc. | 5.300% | 2/14/12 | 75,000 | 76,382 |
| Goldman Sachs Group, Inc. | 5.350% | 1/15/16 | 70,000 | 69,010 |
| Goldman Sachs Group, Inc. | 5.625% | 1/15/17 | 40,000 | 39,596 |
| Goldman Sachs Group, Inc. | 6.450% | 5/1/36 | 50,000 | 47,764 |
| Lehman Brothers Holdings, Inc. | 5.250% | 2/6/12 | 25,000 | 24,871 |
| Lehman Brothers Holdings, Inc. | 6.000% | 7/19/12 | 50,000 | 50,704 |
| Lehman Brothers Holdings, Inc. | 5.500% | 4/4/16 | 50,000 | 48,128 |
| Lehman Brothers Holdings, Inc. | 5.750% | 1/3/17 | 25,000 | 24,079 |
| Lehman Brothers Holdings, Inc. | 6.875% | 7/17/37 | 50,000 | 49,359 |
| Merrill Lynch & Co., Inc. | 5.770% | 7/25/11 | 30,000 | 30,551 |
7
| Merrill Lynch & Co., Inc. | 6.050% | 5/16/16 | 70,000 | 69,595 |
| Merrill Lynch & Co., Inc. | 6.400% | 8/28/17 | 48,000 | 49,081 |
| Merrill Lynch & Co., Inc. | 6.220% | 9/15/26 | 25,000 | 23,329 |
| Merrill Lynch & Co., Inc. | 6.110% | 1/29/37 | 30,000 | 26,503 |
| Morgan Stanley Dean Witter | 4.000% | 1/15/10 | 10,000 | 9,847 |
| Morgan Stanley Dean Witter | 6.600% | 4/1/12 | 20,000 | 21,087 |
| Morgan Stanley Dean Witter | 4.750% | 4/1/14 | 70,000 | 65,664 |
| Morgan Stanley Dean Witter | 5.450% | 1/9/17 | 70,000 | 68,728 |
| Morgan Stanley Dean Witter | 6.250% | 8/9/26 | 20,000 | 19,279 |
| Finance Companies (1.8%) |
|
|
|
|
| American Express Bank, FSB | 5.550% | 10/17/12 | 50,000 | 52,119 |
| American Express Centurion Bank | 4.375% | 7/30/09 | 10,000 | 9,963 |
| American Express Co. | 4.750% | 6/17/09 | 20,000 | 20,082 |
| American Express Credit Corp. | 3.000% | 5/16/08 | 30,000 | 29,718 |
3 | American Express Travel | 5.250% | 11/21/11 | 35,000 | 35,489 |
| CIT Group, Inc. | 4.125% | 11/3/09 | 25,000 | 24,128 |
| CIT Group, Inc. | 7.625% | 11/30/12 | 27,660 | 28,426 |
| Capital One Bank | 6.500% | 6/13/13 | 20,705 | 20,650 |
| Capital One Capital IV | 6.745% | 2/17/37 | 33,000 | 25,929 |
| Capital One Financial | 5.700% | 9/15/11 | 31,150 | 30,164 |
| Countrywide Home Loan | 5.625% | 7/15/09 | 20,000 | 15,425 |
3 | FGIC Corp. | 6.000% | 1/15/34 | 14,635 | 10,347 |
| General Electric Capital Corp. | 6.125% | 2/22/11 | 19,400 | 20,328 |
| General Electric Capital Corp. | 5.875% | 2/15/12 | 30,000 | 31,421 |
| General Electric Capital Corp. | 8.125% | 5/15/12 | 30,000 | 34,041 |
| General Electric Capital Corp. | 6.000% | 6/15/12 | 15,000 | 15,807 |
| General Electric Capital Corp. | 5.250% | 10/19/12 | 60,000 | 61,582 |
| General Electric Capital Corp. | 5.450% | 1/15/13 | 40,000 | 41,333 |
| General Electric Capital Corp. | 5.400% | 2/15/17 | 20,000 | 20,334 |
| General Electric Capital Corp. | 6.750% | 3/15/32 | 30,000 | 34,339 |
| General Electric Capital Corp. | 6.150% | 8/7/37 | 37,800 | 40,403 |
| HSBC Finance Corp. | 5.700% | 6/1/11 | 19,230 | 19,406 |
| HSBC Finance Corp. | 6.375% | 10/15/11 | 75,000 | 76,940 |
| HSBC Finance Corp. | 5.500% | 1/19/16 | 25,000 | 24,856 |
| International Lease Finance Corp. | 5.400% | 2/15/12 | 50,000 | 50,224 |
| International Lease Finance Corp. | 5.300% | 5/1/12 | 50,000 | 49,983 |
| Norwest Financial, Inc. | 6.250% | 12/15/07 | 35,000 | 35,011 |
| Transamerica Financial Corp. | 6.400% | 9/15/08 | 29,265 | 29,579 |
1,3 | US Trade Funding Corp. | 4.260% | 11/15/14 | 18,160 | 18,587 |
| Insurance (3.0%) |
|
|
|
|
| ACE Capital Trust II | 9.700% | 4/1/30 | 20,000 | 25,095 |
3 | AIG SunAmerica Global Financing VI | 6.300% | 5/10/11 | 60,000 | 63,089 |
| Allstate Corp. | 7.200% | 12/1/09 | 40,000 | 42,329 |
| Allstate Corp. | 5.000% | 8/15/14 | 10,000 | 9,795 |
1 | Allstate Corp. | 6.125% | 5/15/37 | 30,000 | 29,362 |
1 | Allstate Corp. | 6.500% | 5/15/57 | 20,000 | 18,860 |
| Ambac, Inc. | 7.500% | 5/1/23 | 25,000 | 23,261 |
| American International Group, Inc. | 4.700% | 10/1/10 | 34,400 | 34,436 |
| American International Group, Inc. | 6.250% | 3/15/37 | 24,040 | 21,648 |
| Berkshire Hathaway Finance Corp. | 4.625% | 10/15/13 | 50,000 | 49,940 |
| Chubb Corp. | 6.000% | 5/11/37 | 50,000 | 48,435 |
8
| Cincinnati Financial Corp. | 6.920% | 5/15/28 | 20,000 | 21,540 |
3 | Farmers Exchange Capital | 7.050% | 7/15/28 | 25,000 | 25,388 |
3 | Frank Russell Co. | 5.625% | 1/15/09 | 30,000 | 30,421 |
| General Reinsurance Corp. | 9.000% | 9/12/09 | 32,000 | 34,664 |
| Genworth Financial, Inc. | 5.125% | 9/15/11 | 47,825 | 48,668 |
| Genworth Financial, Inc. | 5.750% | 5/15/13 | 25,000 | 26,178 |
1 | Genworth Financial, Inc. | 6.150% | 11/15/66 | 50,000 | 44,377 |
| Hartford Financial Services Group, Inc. | 7.900% | 6/15/10 | 35,000 | 37,763 |
| Hartford Financial Services Group, Inc. | 4.625% | 7/15/13 | 9,000 | 8,747 |
| Hartford Financial Services Group, Inc. | 4.750% | 3/1/14 | 15,000 | 14,699 |
| Hartford Life, Inc. | 5.200% | 2/15/11 | 24,185 | 24,640 |
| ING USA Global | 4.500% | 10/1/10 | 25,000 | 25,053 |
3 | Jackson National Life Insurance Co. | 8.150% | 3/15/27 | 39,480 | 49,057 |
| John Hancock Financial Services | 5.625% | 12/1/08 | 16,080 | 16,288 |
3 | Liberty Mutual Insurance Co. | 7.875% | 10/15/26 | 31,210 | 34,895 |
| Marsh & McLennan Cos., Inc. | 6.250% | 3/15/12 | 25,000 | 25,840 |
3 | MassMutual Global Funding II | 3.500% | 3/15/10 | 50,000 | 49,231 |
| Mercury General Corp. | 7.250% | 8/15/11 | 20,000 | 21,500 |
3 | MetLife Global Funding I | 4.500% | 5/5/10 | 20,000 | 20,172 |
3 | MetLife Global Funding I | 5.125% | 11/9/11 | 30,000 | 30,389 |
3 | Metropolitan Life Insurance Co. | 7.700% | 11/1/15 | 51,000 | 58,470 |
3 | New York Life Global Funding | 3.875% | 1/15/09 | 4,285 | 4,272 |
3 | New York Life Global Funding | 5.250% | 10/16/12 | 30,120 | 30,953 |
3 | New York Life Insurance | 5.875% | 5/15/33 | 55,395 | 55,889 |
3 | Pacific Life Global Funding | 3.750% | 1/15/09 | 38,415 | 38,199 |
| Principal Life Income Funding | 5.125% | 3/1/11 | 42,935 | 43,901 |
| Protective Life Secured Trust | 3.700% | 11/24/08 | 35,000 | 34,570 |
| Protective Life Secured Trust | 4.850% | 8/16/10 | 15,205 | 15,215 |
| Prudential Financial, Inc. | 5.800% | 6/15/12 | 25,080 | 25,978 |
| Prudential Financial, Inc. | 4.750% | 4/1/14 | 28,700 | 27,609 |
| Prudential Financial, Inc. | 5.100% | 9/20/14 | 10,000 | 9,793 |
3 | TIAA Global Markets | 5.125% | 10/10/12 | 46,100 | 47,022 |
| Torchmark Corp. | 7.875% | 5/15/23 | 45,000 | 54,144 |
| UnitedHealth Group, Inc. | 4.125% | 8/15/09 | 23,950 | 23,973 |
| UnitedHealth Group, Inc. | 4.750% | 2/10/14 | 10,000 | 9,531 |
3 | UnitedHealth Group, Inc. | 6.000% | 11/15/17 | 36,000 | 36,543 |
| XL Capital Ltd. | 6.500% | 1/15/12 | 50,000 | 52,776 |
| Real Estate Investment Trusts (0.5%) |
|
|
|
|
| ERP Operating LP | 5.375% | 8/1/16 | 9,675 | 9,272 |
| Kimco Realty Corp. | 5.783% | 3/15/16 | 4,750 | 4,782 |
| ProLogis | 5.625% | 11/15/16 | 35,600 | 35,369 |
| Realy Income Corp. | 6.750% | 8/15/19 | 31,515 | 32,758 |
| Simon Property Group Inc. | 5.100% | 6/15/15 | 50,000 | 47,689 |
| Simon Property Group Inc. | 6.100% | 5/1/16 | 35,000 | 35,507 |
| Simon Property Group Inc. | 5.875% | 3/1/17 | 20,000 | 19,923 |
3 | Westfield Group | 5.700% | 10/1/16 | 60,000 | 60,085 |
| Other (0.1%) |
|
|
|
|
3 | SovRisc BV | 4.625% | 10/31/08 | 50,000 | 50,543 |
|
|
|
|
| 5,997,076 |
Industrial (9.9%) |
|
|
|
| |
| Basic Industry (0.6%) |
|
|
|
|
| Alcan, Inc. | 4.500% | 5/15/13 | 20,000 | 19,382 |
| Alcan, Inc. | 7.250% | 3/15/31 | 21,273 | 24,591 |
| Alcoa, Inc. | 5.720% | 2/23/19 | 37,403 | 37,009 |
| Alcoa, Inc. | 5.870% | 2/23/22 | 12,597 | 12,302 |
| BHP Billiton Finance | 4.800% | 4/15/13 | 15,000 | 15,029 |
| BHP Finance USA Ltd. | 7.250% | 3/1/16 | 15,000 | 16,679 |
| Dow Chemical Co. | 6.125% | 2/1/11 | 19,000 | 19,728 |
9
| Dow Chemical Co. | 6.000% | 10/1/12 | 50,000 | 52,098 |
| E.I. du Pont de Nemours & Co. | 4.125% | 4/30/10 | 24,930 | 24,943 |
| E.I. du Pont de Nemours & Co. | 4.750% | 11/15/12 | 17,560 | 17,493 |
| PPG Industries, Inc. | 6.875% | 2/15/12 | 9,355 | 10,286 |
1 | Rohm & Haas Co. | 9.800% | 4/15/20 | 9,375 | 11,972 |
| Weyerhaeuser Co. | 7.375% | 3/15/32 | 25,000 | 25,018 |
| Capital Goods (1.2%) |
|
|
|
|
| Boeing Capital Corp. | 6.500% | 2/15/12 | 40,000 | 43,170 |
| Boeing Co. | 8.625% | 11/15/31 | 9,460 | 13,039 |
| Boeing Co. | 8.750% | 9/15/31 | 9,800 | 13,653 |
| Caterpillar Financial Services Corp. | 2.700% | 7/15/08 | 25,000 | 24,667 |
| Caterpillar Financial Services Corp. | 4.500% | 6/15/09 | 10,000 | 9,992 |
| Caterpillar Financial Services Corp. | 5.050% | 12/1/10 | 25,000 | 25,492 |
| Caterpillar, Inc. | 7.300% | 5/1/31 | 10,000 | 12,072 |
| Deere & Co. | 7.125% | 3/3/31 | 25,000 | 29,746 |
| General Dynamics Corp. | 4.250% | 5/15/13 | 40,000 | 39,129 |
| General Electric Co. | 5.250% | 12/6/17 | 41,685 | 41,981 |
| Honeywell International, Inc. | 7.500% | 3/1/10 | 41,000 | 43,750 |
3 | Hutchison Whampoa International Ltd. | 6.500% | 2/13/13 | 50,000 | 52,854 |
| John Deere Capital Corp. | 5.350% | 1/17/12 | 40,000 | 41,131 |
| John Deere Capital Corp. | 5.100% | 1/15/13 | 40,000 | 40,576 |
| Minnesota Mining & Manufacturing Corp. | 6.375% | 2/15/28 | 30,000 | 33,459 |
3 | Siemens Financieringsmat | 5.750% | 10/17/16 | 89,650 | 90,149 |
| United Technologies Corp. | 4.375% | 5/1/10 | 27,575 | 27,759 |
| United Technologies Corp. | 4.875% | 5/1/15 | 9,675 | 9,619 |
| United Technologies Corp. | 7.500% | 9/15/29 | 19,230 | 22,953 |
| United Technologies Corp. | 6.050% | 6/1/36 | 20,325 | 21,095 |
| Communications (1.6%) |
|
|
|
|
| AT&T Inc. | 4.125% | 9/15/09 | 30,000 | 29,842 |
| AT&T Inc. | 5.100% | 9/15/14 | 30,160 | 29,940 |
| AT&T Inc. | 6.450% | 6/15/34 | 73,115 | 75,504 |
| AT&T Inc. | 6.800% | 5/15/36 | 11,305 | 12,339 |
| AT&T Inc. | 6.500% | 9/1/37 | 19,675 | 20,588 |
| BellSouth Corp. | 4.200% | 9/15/09 | 10,000 | 9,948 |
| BellSouth Corp. | 6.000% | 10/15/11 | 25,000 | 26,398 |
| BellSouth Corp. | 5.200% | 9/15/14 | 20,000 | 19,933 |
| BellSouth Corp. | 6.550% | 6/15/34 | 32,225 | 33,652 |
| BellSouth Corp. | 6.000% | 11/15/34 | 11,995 | 11,888 |
| BellSouth Telecommunications | 5.875% | 1/15/09 | 15,000 | 15,218 |
| BellSouth Telecommunications | 7.000% | 12/1/95 | 27,600 | 29,016 |
| Chesapeake & Potomac Telephone Co. | 7.150% | 5/1/23 | 10,000 | 10,569 |
| Deutsche Telekom International Finance | 8.000% | 6/15/10 | 50,000 | 53,569 |
| France Telecom | 7.750% | 3/1/11 | 50,000 | 54,249 |
| New York Times Co. | 4.500% | 3/15/10 | 9,450 | 9,373 |
| Telefonica Europe BV | 7.750% | 9/15/10 | 50,000 | 54,075 |
| Time Warner Cable Inc. | 5.850% | 5/1/17 | 34,980 | 34,684 |
| Verizon Communications Corp. | 5.500% | 4/1/17 | 50,000 | 50,621 |
| Verizon Global Funding Corp. | 6.875% | 6/15/12 | 10,000 | 10,896 |
| Verizon Global Funding Corp. | 4.375% | 6/1/13 | 10,000 | 9,700 |
| Verizon Global Funding Corp. | 7.750% | 12/1/30 | 37,000 | 44,352 |
| Verizon Global Funding Corp. | 5.850% | 9/15/35 | 59,525 | 59,704 |
| Viacom Inc. | 7.700% | 7/30/10 | 40,000 | 42,628 |
| Vodafone AirTouch PLC | 7.750% | 2/15/10 | 10,000 | 10,583 |
| Vodafone Group PLC | 5.000% | 12/16/13 | 10,000 | 9,883 |
| Vodafone Group PLC | 5.375% | 1/30/15 | 40,000 | 39,569 |
| Consumer Cyclicals (1.8%) |
|
|
|
|
| CVS Caremark Corp. | 4.000% | 9/15/09 | 30,000 | 29,971 |
| CVS Corp. | 4.875% | 9/15/14 | 35,000 | 34,124 |
| CVS Corp. | 5.750% | 6/1/17 | 16,285 | 16,322 |
10
| DaimlerChrysler North America Holding Corp. | 5.750% | 9/8/11 | 55,145 | 56,470 |
| DaimlerChrysler North America Holding Corp. | 6.500% | 11/15/13 | 49,855 | 52,590 |
| DaimlerChrysler North America Holding Corp. | 8.500% | 1/18/31 | 33,000 | 41,834 |
| Federated Retail Holding | 5.900% | 12/1/16 | 16,842 | 15,815 |
3 | Harley-Davidson Inc. | 3.625% | 12/15/08 | 50,000 | 49,781 |
| Home Depot Inc. | 3.750% | 9/15/09 | 48,000 | 47,074 |
| Home Depot Inc. | 4.625% | 8/15/10 | 12,000 | 11,842 |
| Johnson Controls, Inc. | 7.125% | 7/15/17 | 36,300 | 41,154 |
| Kohl’s Corp. | 6.000% | 1/15/33 | 32,000 | 26,739 |
| Lowe’s Cos., Inc. | 8.250% | 6/1/10 | 12,870 | 14,157 |
| Lowe’s Cos., Inc. | 6.875% | 2/15/28 | 5,790 | 6,203 |
| Lowe’s Cos., Inc. | 6.500% | 3/15/29 | 39,900 | 41,121 |
| Lowe’s Cos., Inc. | 5.500% | 10/15/35 | 20,000 | 17,331 |
| Lowe’s Cos., Inc. | 6.650% | 9/15/37 | 25,905 | 25,844 |
| Target Corp. | 3.375% | 3/1/08 | 10,000 | 9,951 |
| Target Corp. | 5.875% | 3/1/12 | 40,000 | 41,477 |
| Target Corp. | 5.875% | 7/15/16 | 20,000 | 20,129 |
| The Walt Disney Co. | 6.375% | 3/1/12 | 20,000 | 21,290 |
| The Walt Disney Co. | 4.700% | 12/1/12 | 33,500 | 33,415 |
| The Walt Disney Co. | 5.625% | 9/15/16 | 30,000 | 31,277 |
| Time Warner, Inc. | 5.500% | 11/15/11 | 21,460 | 21,612 |
| Time Warner, Inc. | 7.570% | 2/1/24 | 20,000 | 21,336 |
| Time Warner, Inc. | 6.950% | 1/15/28 | 20,000 | 20,090 |
| Toyota Motor Credit Corp. | 4.250% | 3/15/10 | 20,000 | 20,305 |
| Wal-Mart Stores, Inc. | 6.875% | 8/10/09 | 12,000 | 12,512 |
| Wal-Mart Stores, Inc. | 4.125% | 2/15/11 | 40,000 | 39,685 |
| Wal-Mart Stores, Inc. | 5.250% | 9/1/35 | 18,000 | 15,732 |
| Western Union Co. | 5.930% | 10/1/16 | 60,000 | 60,493 |
| Consumer Noncyclicals (3.2%) |
|
|
|
|
| Abbott Laboratories | 5.600% | 5/15/11 | 15,000 | 15,492 |
| Abbott Laboratories | 4.350% | 3/15/14 | 30,500 | 29,492 |
| Anheuser-Busch Cos., Inc. | 5.000% | 3/1/19 | 15,000 | 14,378 |
| Anheuser-Busch Cos., Inc. | 6.500% | 1/1/28 | 19,550 | 20,782 |
| Anheuser-Busch Cos., Inc. | 6.800% | 8/20/32 | 20,000 | 22,164 |
| Archer-Daniels-Midland Co. | 7.000% | 2/1/31 | 20,130 | 22,746 |
| AstraZeneca PLC | 6.450% | 9/15/37 | 48,385 | 52,254 |
| Baxter International, Inc. | 5.900% | 9/1/16 | 12,498 | 13,107 |
| Bristol-Myers Squibb Co. | 5.875% | 11/15/36 | 60,000 | 59,566 |
3 | Cargill Inc. | 4.375% | 6/1/13 | 20,400 | 19,598 |
3 | Cargill Inc. | 6.000% | 11/27/17 | 25,000 | 25,059 |
3 | Cargill Inc. | 6.875% | 5/1/28 | 19,355 | 20,040 |
3 | Cargill Inc. | 6.125% | 4/19/34 | 28,980 | 27,415 |
| Clorox Co. | 4.200% | 1/15/10 | 55,770 | 55,103 |
| Coca-Cola Co. | 5.350% | 11/15/17 | 85,000 | 86,847 |
| Coca-Cola Enterprises Inc. | 6.125% | 8/15/11 | 40,000 | 42,441 |
| Coca-Cola Enterprises Inc. | 7.000% | 10/1/26 | 10,075 | 11,501 |
| Coca-Cola HBC Finance | 5.125% | 9/17/13 | 43,000 | 43,527 |
| Coca-Cola HBC Finance | 5.500% | 9/17/15 | 17,440 | 17,918 |
| Colgate-Palmolive Co. | 7.600% | 5/19/25 | 13,920 | 16,808 |
| ConAgra Foods, Inc. | 6.750% | 9/15/11 | 5,982 | 6,305 |
| ConAgra Foods, Inc. | 5.819% | 6/15/17 | 9,503 | 9,572 |
| Diageo Capital PLC | 3.375% | 3/20/08 | 10,000 | 9,950 |
| Diageo Capital PLC | 5.200% | 1/30/13 | 46,045 | 46,575 |
| Eli Lilly & Co. | 6.000% | 3/15/12 | 45,000 | 48,197 |
| Fortune Brands Inc. | 6.250% | 4/1/08 | 30,000 | 30,098 |
| Fortune Brands Inc. | 4.875% | 12/1/13 | 20,000 | 19,411 |
| GlaxoSmithKline Capital Inc. | 4.375% | 4/15/14 | 35,000 | 33,730 |
| GlaxoSmithKline Capital Inc. | 5.375% | 4/15/34 | 45,000 | 42,158 |
| Hershey Foods Corp. | 4.850% | 8/15/15 | 9,620 | 9,362 |
11
| Kimberly-Clark Corp. | 4.875% | 8/15/15 | 30,000 | 30,107 | |
| Kraft Foods, Inc. | 6.250% | 6/1/12 | 34,170 | 35,649 | |
| Medtronic Inc. | 4.375% | 9/15/10 | 19,235 | 19,266 | |
| Medtronic Inc. | 4.750% | 9/15/15 | 20,000 | 19,245 | |
| Merck & Co. | 5.125% | 11/15/11 | 69,000 | 71,734 | |
| Pepsi Bottling Group, Inc. | 7.000% | 3/1/29 | 10,000 | 11,538 | |
3 | Pepsi Bottling Holdings Inc. | 5.625% | 2/17/09 | 40,000 | 40,783 | |
| Pepsico, Inc. | 5.150% | 5/15/12 | 50,000 | 51,340 | |
| Pepsico, Inc. | 4.650% | 2/15/13 | 19,065 | 19,055 | |
1 | Procter & Gamble Co. ESOP | 9.360% | 1/1/21 | 57,994 | 74,171 | |
3 | SABMiller PLC | 6.500% | 7/1/16 | 50,000 | 53,774 | |
| Schering-Plough Corp. | 5.550% | 12/1/13 | 39,000 | 39,558 | |
| Schering-Plough Corp. | 6.550% | 9/15/37 | 10,000 | 10,532 | |
| Sysco Corp. | 5.375% | 9/21/35 | 25,000 | 23,321 | |
3 | Tesco PLC | 5.500% | 11/15/17 | 50,000 | 51,275 | |
| Unilever Capital Corp. | 7.125% | 11/1/10 | 77,000 | 83,364 | |
| Unilever Capital Corp. | 5.900% | 11/15/32 | 27,000 | 27,256 | |
| Warner-Lambert Co. | 6.000% | 1/15/08 | 16,000 | 16,009 | |
| Wyeth | 6.950% | 3/15/11 | 30,000 | 32,103 | |
| Zeneca Wilmington Inc. | 7.000% | 11/15/23 | 29,000 | 33,587 | |
| Energy (0.3%) |
|
|
|
| |
| Anadarko Petroleum Corp. | 3.250% | 5/1/08 | 15,000 | 14,836 | |
| Apache Finance Canada | 7.750% | 12/15/29 | 19,910 | 24,625 | |
| Conoco Funding Co. | 6.350% | 10/15/11 | 30,000 | 31,991 | |
| Phillips Petroleum Co. | 9.375% | 2/15/11 | 20,000 | 23,114 | |
| Suncor Energy, Inc. | 7.150% | 2/1/32 | 20,279 | 22,791 | |
| Suncor Energy, Inc. | 5.950% | 12/1/34 | 20,700 | 21,243 | |
| Technology (0.6%) |
|
|
|
| |
| Cisco Systems Inc. | 5.250% | 2/22/11 | 65,000 | 66,659 | |
| Hewlett-Packard Co. | 5.250% | 3/1/12 | 75,000 | 77,209 | |
| IBM International Group Capital | 5.050% | 10/22/12 | 50,000 | 50,671 | |
| International Business Machines Corp. | 8.375% | 11/1/19 | 25,000 | 31,321 | |
| International Business Machines Corp. | 5.875% | 11/29/32 | 25,000 | 25,255 | |
| Intuit Inc. | 5.400% | 3/15/12 | 19,610 | 19,954 | |
| Pitney Bowes Credit Corp. | 8.550% | 9/15/09 | 41,890 | 45,018 | |
| Transportation (0.5%) |
|
|
|
| |
1 | Continental Airlines, Inc. | 5.983% | 4/19/22 | 31,465 | 30,285 | |
3 | ERAC USA Finance Co. | 7.350% | 6/15/08 | 29,805 | 30,113 | |
3 | ERAC USA Finance Co. | 5.600% | 5/1/15 | 6,960 | 6,707 | |
3 | ERAC USA Finance Co. | 5.900% | 11/15/15 | 19,500 | 19,115 | |
3 | ERAC USA Finance Co. | 5.800% | 10/15/12 | 12,835 | 13,047 | |
3 | ERAC USA Finance Co. | 7.000% | 10/15/37 | 26,175 | 26,149 | |
1 | Federal Express Corp. | 6.720% | 1/15/22 | 37,872 | 40,354 | |
1 | Southwest Airlines Co. | 7.540% | 6/29/15 | 30,772 | 33,412 | |
| Southwest Airlines Co. | 5.750% | 12/15/16 | 46,500 | 46,602 | |
1 | Southwest Airlines Co. | 6.150% | 8/1/22 | 24,140 | 25,233 | |
| Industrial Other (0.1%) |
|
|
|
| |
| Dover Corp. | 6.500% | 2/15/11 | 26,518 | 28,217 | |
| Snap-On Inc. | 6.250% | 8/15/11 | 34,990 | 37,212 | |
|
|
|
|
| 5,035,609 | |
Utilities (2.1%) |
|
|
|
| ||
| Electric Utilities (1.8%) |
|
|
|
| |
| Alabama Power Co. | 5.550% | 2/1/17 | 17,650 | 18,045 | |
| Alabama Power Co. | 5.700% | 2/15/33 | 15,000 | 14,787 | |
| Carolina Power & Light Co. | 5.950% | 3/1/09 | 20,000 | 20,396 | |
| Central Illinois Public Service | 6.125% | 12/15/28 | 54,000 | 52,800 | |
| Commonwealth Edison Co. | 5.950% | 8/15/16 | 23,120 | 23,624 | |
| Consolidated Edison Co. of New York | 6.450% | 12/1/07 | 20,000 | 20,001 | |
| Consolidated Edison Co. of New York | 5.500% | 9/15/16 | 20,930 | 21,105 | |
12
| Consolidated Edison Co. of New York | 5.300% | 12/1/16 | 25,505 | 25,653 | |
| Consolidated Edison, Inc. | 3.625% | 8/1/08 | 20,000 | 19,821 | |
3 | EDP Finance BV | 5.375% | 11/2/12 | 40,745 | 41,743 | |
3 | Enel Finance International | 6.800% | 9/15/37 | 38,515 | 41,046 | |
| Exelon Generation Co. LLC | 6.950% | 6/15/11 | 50,000 | 52,708 | |
| Florida Power & Light Co. | 5.550% | 11/1/17 | 9,835 | 10,107 | |
| Florida Power & Light Co. | 5.650% | 2/1/35 | 40,000 | 39,142 | |
| Florida Power & Light Co. | 4.950% | 6/1/35 | 10,000 | 8,830 | |
| Florida Power & Light Co. | 5.650% | 2/1/37 | 5,000 | 4,890 | |
| Florida Power Corp. | 6.350% | 9/15/37 | 8,000 | 8,528 | |
| MidAmerican Energy Holdings Co. | 6.125% | 4/1/36 | 25,000 | 25,057 | |
| National Rural Utilities Cooperative Finance Corp. | 5.750% | 12/1/08 | 50,000 | 50,423 | |
| Northern States Power Co. | 6.250% | 6/1/36 | 50,000 | 52,634 | |
| PPL Energy Supply LLC | 6.200% | 5/15/16 | 30,000 | 29,750 | |
| PacifiCorp | 5.900% | 8/15/34 | 12,500 | 12,487 | |
| Public Service Electric & Gas | 4.000% | 11/1/08 | 40,500 | 40,133 | |
| Public Service Electric & Gas | 5.800% | 5/1/37 | 50,000 | 50,441 | |
| South Carolina Electric & Gas Co. | 5.800% | 1/15/33 | 9,000 | 9,219 | |
| Southern California Edison Co. | 6.000% | 1/15/34 | 7,695 | 7,851 | |
| Southern California Edison Co. | 5.550% | 1/15/37 | 43,225 | 41,435 | |
| Southern Co. | 5.300% | 1/15/12 | 13,300 | 13,561 | |
| Southwestern Electric Power | 5.550% | 1/15/17 | 30,000 | 29,644 | |
| Wisconsin Electric Power Co. | 4.500% | 5/15/13 | 21,565 | 21,403 | |
| Wisconsin Electric Power Co. | 5.700% | 12/1/36 | 17,280 | 16,903 | |
| Wisconsin Power & Light Co. | 7.625% | 3/1/10 | 20,000 | 21,527 | |
| Wisconsin Public Service | 6.080% | 12/1/28 | 45,000 | 46,478 | |
| Natural Gas (0.3%) |
|
|
|
| |
| British Transco Finance | 6.625% | 6/1/18 | 50,000 | 54,906 | |
3 | Duke Energy Field Services | 6.450% | 11/3/36 | 30,325 | 30,098 | |
| KeySpan Corp. | 4.650% | 4/1/13 | 9,000 | 8,933 | |
| National Grid PLC | 6.300% | 8/1/16 | 30,000 | 31,552 | |
| San Diego Gas & Electric | 6.000% | 6/1/26 | 3,600 | 3,678 | |
| Wisconsin Gas Co. | 6.600% | 9/15/13 | 13,100 | 14,479 | |
| Utilities Other (0.0%) |
|
|
|
| |
| UGI Utilities Inc. | 5.753% | 9/30/16 | 37,590 | 38,566 | |
|
|
|
|
| 1,074,384 | |
|
|
|
|
|
| |
Total Corporate Bonds (Cost $14,305,243) |
|
|
| 14,382,147 | ||
Sovereign Bonds (U.S. Dollar-Denominated) (2.0%) |
|
|
|
| ||
| African Development Bank | 4.500% | 1/15/09 | 50,000 | 50,648 | |
3 | Corporacion Nacional del Cobre | 6.150% | 10/24/36 | 25,000 | 24,938 | |
3 | Emirate of Abu Dhabi | 5.500% | 8/2/12 | 10,000 | 10,518 | |
| European Investment Bank | 4.000% | 3/3/10 | 40,000 | 40,409 | |
| Inter-American Development Bank | 7.375% | 1/15/10 | 40,000 | 42,757 | |
| Inter-American Development Bank | 4.375% | 9/20/12 | 40,000 | 40,895 | |
| International Bank for Reconstruction & Development | 4.750% | 2/15/35 | 40,000 | 39,326 | |
| Japan Bank International | 4.750% | 5/25/11 | 70,000 | 71,778 | |
| Japan Finance Corp. | 4.625% | 4/21/15 | 75,000 | 75,029 | |
| Kreditanstalt fur Wiederaufbau | 7.000% | 3/1/13 | 10,000 | 11,518 | |
| Landwirtschaftliche Rentenbank | 4.125% | 7/15/08 | 50,000 | 50,243 | |
| Oesterreichische Kontrollbank | 4.250% | 10/6/10 | 25,000 | 25,396 | |
| Oesterreichische Kontrollbank | 4.500% | 3/9/15 | 50,000 | 50,034 | |
| Province of British Columbia | 4.300% | 5/30/13 | 40,000 | 39,830 | |
| Province of Manitoba | 4.450% | 4/12/10 | 57,000 | 57,609 | |
| Province of Ontario | 4.375% | 2/15/13 | 40,000 | 40,869 | |
| Province of Ontario | 4.500% | 2/3/15 | 35,000 | 35,130 | |
13
| Province of Quebec | 4.875% | 5/5/14 | 25,000 | 26,100 | |
| Province of Quebec | 5.125% | 11/14/16 | 50,000 | 51,690 | |
| Quebec Hydro Electric | 6.300% | 5/11/11 | 40,000 | 42,926 | |
| Republic of Italy | 4.500% | 1/21/15 | 50,000 | 49,125 | |
| Republic of South Africa | 6.500% | 6/2/14 | 21,900 | 23,396 | |
| State of Israel | 5.500% | 11/9/16 | 30,000 | 31,557 | |
| Swedish Export Credit Corp. | 4.625% | 2/17/09 | 60,000 | 60,516 | |
3 | Taqa Abu Dhabi National Energy Co. | 5.875% | 10/27/16 | 47,180 | 46,236 | |
|
|
|
|
|
| |
Total Sovereign Bonds (Cost $1,026,168) |
|
|
| 1,038,473 | ||
Taxable Municipal Bonds (0.9%) |
|
|
|
| ||
| Atlanta GA Downtown Dev. Auth. Rev. | 6.875% | 2/1/21 | 12,985 | 14,683 | |
5 | Chelan County WA Public Util. Dist. | 7.100% | 6/1/08 | 12,000 | 12,158 | |
| Illinois (Taxable Pension) GO | 5.100% | 6/1/33 | 109,510 | 107,052 | |
6 | Kansas Dev. Finance Auth. Rev. (Public Employee |
|
|
|
| |
| Retirement System) | 5.501% | 5/1/34 | 50,000 | 51,396 | |
5 | Oakland CA Pension Obligation | 6.980% | 12/15/09 | 7,801 | 8,221 | |
3,5 | Ohana Military Communities LLC | 5.558% | 10/1/36 | 9,600 | 9,726 | |
3,5 | Ohana Military Communities LLC | 5.780% | 10/1/36 | 16,360 | 17,063 | |
| Oregon School Board Assn. | 5.528% | 6/30/28 | 50,000 | 51,549 | |
3 | Pacific Beacon LLC Naval Base | 5.379% | 7/15/26 | 9,000 | 9,024 | |
| President and Fellows of Harvard College | 6.300% | 10/1/37 | 50,675 | 54,831 | |
6 | Southern California Public Power Auth. | 6.930% | 5/15/17 | 30,000 | 34,688 | |
| Stanford Univ. California Rev. | 6.875% | 2/1/24 | 34,745 | 40,677 | |
| Stanford Univ. California Rev. | 7.650% | 6/15/26 | 29,000 | 36,711 | |
|
|
|
|
|
| |
Total Taxable Municipal Bonds (Cost $425,837) |
|
| 447,779 | |||
Temporary Cash Investments (0.8%) |
|
|
| |||
Repurchase Agreement |
|
|
| |||
| BNP Paribas Securities Corp. (Dated 11/30/07, |
|
|
|
| |
| Repurchase Value $387,149,000, |
|
|
| ||
| collateralized by Federal Home Loan Mortgage Corp. |
|
|
| ||
| 5.500%-6.500%, 11/1/37, Federal National Mortgage Assn. |
|
|
| ||
| 5.500%-6.000%, 11/1/37) (Cost $387,000) | 4.630% | 12/3/07 | 387,000 | 387,000 | |
Total Investments (99.7%) (Cost $40,468,803) |
|
|
| 50,600,630 | ||
Other Assets and Liabilities—Net (0.3%) |
|
|
| 173,819 | ||
Net Assets (100%) |
|
|
| 50,774,449 | ||
* Non-income-producing security.
** New issue that has not paid a dividend as of November 30, 2007.
1 The average or expected maturity is shorter than the final maturity shown because of the possibility of interim principal payments and prepayments or the possibility of the issue being called.
2 The issuer operates under a congressional charter; its securities are neither issued nor guaranteed by the U.S. government. If needed, access to additional funding from the U.S. Treasury (beyond the issuer’s line of credit) would require congressional action.
3 Security exempt from registration under Rule 144A of the Securities Act of 1933. Such securities may be sold in transactions exempt from registration, normally to qualified institutional buyers. At November 30, 2007, the aggregate value of these securities was $1,905,799,000, representing 3.8% of net assets.
4 Adjustable-rate note.
5 Scheduled principal and interest payments are guaranteed by MBIA (Municipal Bond Insurance Association).
6 Scheduled principal and interest payments are guaranteed by FSA (Financial Security Association).
ADR—American Depositary Receipt.
GO—General Obligation Bond.
14
Report of Independent Registered Public Accounting Firm
To the Trustees and Shareholders of Vanguard Wellington Fund:
We have audited, in accordance with the standards of the Public Company Accounting Oversight Board (United States), the financial statements (not presented herein) of Vanguard Wellington Fund (the “Fund”) as of November 30, 2007, and for the year then ended and have issued our unqualified report thereon dated January 11, 2008. Our audit included an audit of the Fund’s schedule of investments as of November 30, 2007. This schedule of investments is the responsibility of the Fund’s management. Our responsibility is to express an opinion on this schedule of investments based on our audit.
In our opinion, the accompanying schedule of investments referred to above, when read in conjunction with the financial statements of the Fund referred to above, presents fairly, in all material respects, the information set forth therein.
PricewaterhouseCoopers LLP January 11, 2008
15
Item 2: Code of Ethics. The Registrant has adopted a code of ethics that applies to the Registrant’s principal executive officer, principal financial officer, principal accounting officer or controller or persons performing similar functions. The Code of Ethics was amended during the reporting period covered by this report to make certain technical, non-material changes.
Item 3: Audit Committee Financial Expert. The following members of the Audit Committee have been determined by the Registrant’s Board of Trustees to be Audit Committee Financial Experts serving on its Audit Committee, and to be independent: Charles D. Ellis, Rajiv L. Gupta, JoAnn Heffernan Heisen, André F. Perold, Alfred M. Rankin, Jr., and J. Lawrence Wilson.
Item 4: Principal Accountant Fees and Services.
(a) Audit Fees.
Audit Fees of the Registrant
Fiscal Year Ended November 30, 2007: $24,000
Fiscal Year Ended November 30, 2006: $21,000
Aggregate Audit Fees of Registered Investment Companies in the Vanguard Group.
Fiscal Year Ended November 30, 2007: $2,835,320
Fiscal Year Ended November 30, 2006: $2,347,620
(b) Audit-Related Fees.
Fiscal Year Ended November 30, 2007: $630,400
Fiscal Year Ended November 30, 2006: $530,000
Includes fees billed in connection with assurance and related services provided to the Registrant, The Vanguard Group, Inc., Vanguard Marketing Corporation, and other registered investment companies in the Vanguard Group.
(c) Tax Fees.
Fiscal Year Ended November 30, 2007: $215,900
Fiscal Year Ended November 30, 2006: $101,300
Includes fees billed in connection with tax compliance, planning and advice services provided to the Registrant, The Vanguard Group, Inc., Vanguard Marketing Corporation, and other registered investment companies in the Vanguard Group and related to income and excise taxes.
(d) All Other Fees.
Fiscal Year Ended November 30, 2007: $0
Fiscal Year Ended November 30, 2006: $0
Includes fees billed for services related to risk management and privacy matters. Services were provided to the Registrant, The Vanguard Group, Inc., Vanguard Marketing Corporation, and other registered investment companies in the Vanguard Group.
(e) (1) Pre-Approval Policies. The policy of the Registrant’s Audit Committee is to consider and, if appropriate, approve before the principal accountant is engaged for such services, all specific audit and non-audit services provided to: (1) the Registrant; (2) The Vanguard Group, Inc.; (3) other entities controlled by The Vanguard Group, Inc. that provide ongoing services to the Registrant; and (4) other
registered investment companies in the Vanguard Group. In making a determination, the Audit Committee considers whether the services are consistent with maintaining the principal accountant’s independence.
In the event of a contingency situation in which the principal accountant is needed to provide services in between scheduled Audit Committee meetings, the Chairman of the Audit Committee would be called on to consider and, if appropriate, pre-approve audit or permitted non-audit services in an amount sufficient to complete services through the next Audit Committee meeting, and to determine if such services would be consistent with maintaining the accountant’s independence. At the next scheduled Audit Committee meeting, services and fees would be presented to the Audit Committee for formal consideration, and, if appropriate, approval by the entire Audit Committee. The Audit Committee would again consider whether such services and fees are consistent with maintaining the principal accountant’s independence.
The Registrant’s Audit Committee is informed at least annually of all audit and non-audit services provided by the principal accountant to the Vanguard complex, whether such services are provided to: (1) the Registrant; (2) The Vanguard Group, Inc.; (3) other entities controlled by The Vanguard Group, Inc. that provide ongoing services to the Registrant; or (4) other registered investment companies in the Vanguard Group.
(2) No percentage of the principal accountant’s fees or services were approved pursuant to the waiver provision of paragraph (c)(7)(i)(C) of Rule 2-01 of Regulation S-X.
(f) For the most recent fiscal year, over 50% of the hours worked under the principal accountant’s engagement were not performed by persons other than full-time, permanent employees of the principal accountant.
(g) Aggregate Non-Audit Fees.
Fiscal Year Ended November 30, 2007: $215,900
Fiscal Year Ended November 30, 2006: $101,300
Includes fees billed for non-audit services provided to the Registrant, The Vanguard Group, Inc., Vanguard Marketing Corporation, and other registered investment companies in the Vanguard Group.
(h) For the most recent fiscal year, the Audit Committee has determined that the provision of all non-audit services was consistent with maintaining the principal accountant’s independence.
Item 5: Not Applicable.
Item 6: Not Applicable.
Item 7: Not Applicable.
Item 8: Not Applicable.
Item 9: Not Applicable.
Item 10: Not Applicable.
Item 11: Controls and Procedures.
(a) Disclosure Controls and Procedures. The Principal Executive and Financial Officers concluded that the Registrant's Disclosure Controls and Procedures are effective based on their evaluation of the Disclosure Controls and Procedures as of a date within 90 days of the filing date of this report.
(b) Internal Control Over Financial Reporting. There were no significant changes in Registrant’s Internal Control Over Financial Reporting or in other factors that could significantly affect this control subsequent to the date of the evaluation, including any corrective actions with regard to significant deficiencies and material weaknesses.
Item 12: Exhibits.
(a) Code of Ethics.
(b) Certifications.
Pursuant to the requirements of the Securities Exchange Act of 1934 and the Investment Company Act of 1940, the registrant has duly caused this report to be signed on its behalf by the undersigned, thereunto duly authorized.
VANGUARD WELLINGTON FUND | |
BY: | (signature) |
| (HEIDI STAM) |
| JOHN J. BRENNAN* |
| CHIEF EXECUTIVE OFFICER |
Date: January 17, 2008
Pursuant to the requirements of the Securities Exchange Act of 1934 and the Investment Company Act of 1940, this report has been signed below by the following persons on behalf of the registrant and in the capacities and on the dates indicated.
VANGUARD WELLINGTON FUND | |
BY: | (signature) |
| (HEIDI STAM) |
| JOHN J. BRENNAN* |
| CHIEF EXECUTIVE OFFICER |
Date: January 17, 2008
VANGUARD WELLINGTON FUND | |
BY: | (signature) |
| (HEIDI STAM) |
| THOMAS J. HIGGINS* |
| TREASURER |
Date: January 17, 2008
*By Power of Attorney. Filed on January 18, 2008, see File Number 2-29601. Incorporated by Reference.