UNITED STATES
SECURITIES AND EXCHANGE COMMISSION
Washington, D.C. 20549
FORM N-CSR
CERTIFIED SHAREHOLDER REPORT
OF
REGISTERED MANAGEMENT COMPANY
| Investment Company Act file number: | 811-121 |
| Name of Registrant: | Vanguard Wellington Fund |
| Address of Registrant: | P.O. Box 2600 Valley Forge, PA 19482 |
| Name and address of agent for service: | Heidi Stam, Esquire P.O. Box 876 Valley Forge, PA 19482 |
Registrant’s telephone number, including area code: (610) 669-1000
| Date of fiscal year end: | November 30 |
| Date of reporting period: | December 1, 2005 - November 30, 2006 |
| Item 1: | Reports to Shareholders |
Vanguard® Wellington™ Fund |
|
|
|
|
|
|
|
> Annual Report |
|
|
|
|
|
|
|
November 30, 2006 |
|
|
|
|
|
|
|
|
|
|
|
|
|
|
|
|
|
|
|
|
|
|
|
|
|
|
|
|
|

> | Vanguard Wellington Fund’s Investor Shares returned 14.7% (Admiral Shares, 14.8%) for the 12 months ended November 30, 2006. The fund’s result easily topped both the gain of the index benchmark and the average return of peer funds. |
> | Within Wellington’s stock portfolio, the best-performing holdings were in the energy and industrials sectors. The fund’s fixed income portfolio performed respectably amid rising interest rates. |
> | The fund’s long-term record is strong, as it has surpassed the results of both its average peer and its benchmark. |
Contents |
|
|
|
Your Fund’s Total Returns | 1 |
Chairman’s Letter | 2 |
Advisor’s Report | 7 |
Fund Profile | 10 |
Performance Summary | 12 |
Financial Statements | 14 |
Your Fund’s After-Tax Returns | 35 |
About Your Fund’s Expenses | 36 |
Trustees Approve Advisory Agreement | 38 |
Glossary | 40 |
Please note: The opinions expressed in this report are just that—informed opinions. They should not be considered promises or advice. Also, please keep in mind that the information and opinions cover the period through the date on the cover of this report. Of course, the risks of investing in your fund are spelled out in the prospectus.
Your Fund’s Total Returns
Fiscal Year Ended November 30, 2006 |
|
| Total |
| Returns |
Vanguard Wellington Fund |
|
Investor Shares | 14.7% |
Admiral™ Shares1 | 14.8 |
Wellington Composite Index2 | 11.3 |
Average Mixed-Asset Target Growth Fund3 | 11.9 |
Your Fund’s Performance at a Glance |
|
|
|
|
November 30, 2005–November 30, 2006 |
|
|
|
|
|
|
| Distributions Per Share | |
| Starting | Ending | Income | Capital |
| Share Price | Share Price | Dividends | Gains |
Vanguard Wellington Fund |
|
|
|
|
Investor Shares | $31.34 | $33.76 | $0.980 | $0.974 |
Admiral Shares | 54.15 | 58.32 | 1.765 | 1.682 |
1 A lower-cost class of shares available to many longtime shareholders and to those with significant investments in the fund.
2 Weighted 65% Standard & Poor’s 500 Index and 35% Lehman Brothers Credit A or Better Index.
3 Derived from data provided by Lipper Inc.
1

Chairman’s Letter
Dear Shareholder,
During its 2006 fiscal year, Vanguard Wellington Fund benefited from yet another period of solid performance among large-capitalization value stocks. The Investor Shares returned 14.7%, well ahead of the result for the fund’s composite benchmark and the average return of peer funds. The Admiral Shares, which carry lower expenses, returned 14.8%.
While stocks in several sectors made important contributions, the fund’s holdings in the energy and industrials groups were particularly noteworthy. Wellington’s fixed income holdings held up well, despite a rising-rate environment. At the fiscal year-end on November 30, the yield of the fund’s Investor Shares was 2.9%, while the Admiral Shares yielded 3.0%.
If you hold the Wellington Fund in a taxable account, you may wish to review our report on after-tax returns on page 35.
Economic uncertainty didn’t stop a stock rally
Despite being caught in a crosscurrent of opinions on the economy, U.S. stocks more than held their own during the fund’s 2006 fiscal year. The housing market and automobile makers produced a drumbeat of bad news; however, corporate profits and job creation remained strong. Amid such mixed signals, stocks rose sharply beginning in mid-July. The broad market gained 14.7% for the year; in October, the
2
narrower Dow Jones Industrial Average broke through its January 2000 high—and kept going.
Small-capitalization stocks enjoyed an edge over large-cap stocks by a margin of roughly 3 percentage points. Among both small-cap and large-cap stocks, value-oriented stocks outperformed their growth-oriented counterparts by wide margins.
Investors in international stocks were rewarded by both a falling U.S. dollar and strong economic gains in Europe and emerging markets.
Weaker parts of the economy drew bond investors’ notice
In the first half of the fiscal year, the Federal Reserve Board continued to tighten monetary policy, raising its target for the federal funds rate five times through the end of June. Longer-term bond yields generally followed the upward trend until late summer, when they began to backslide. Weakness in the housing and manufacturing sectors persuaded bond investors that inflation was not a threat, prompting a rally (bond prices rose and yields fell).
The broad taxable bond market returned 5.9%. Municipal bonds did better still.
Market Barometer |
|
|
|
|
| Average Annual Total Returns | |
|
| Periods Ended November 30, 2006 | |
| One Year | Three Years | Five Years |
Stocks |
|
|
|
Russell 1000 Index (Large-caps) | 14.2% | 12.2% | 6.8% |
Russell 2000 Index (Small-caps) | 17.4 | 14.2 | 12.7 |
Dow Jones Wilshire 5000 Index (Entire market) | 14.7 | 12.8 | 7.8 |
MSCI All Country World Index ex USA (International) | 29.2 | 23.6 | 16.5 |
|
|
|
|
Bonds |
|
|
|
Lehman Aggregate Bond Index (Broad taxable market) | 5.9% | 4.2% | 5.0% |
Lehman Municipal Bond Index | 6.1 | 4.7 | 5.4 |
Citigroup 3-Month Treasury Bill Index | 4.7 | 2.9 | 2.3 |
|
|
|
|
CPI |
|
|
|
Consumer Price Index | 2.0% | 3.0% | 2.6% |
3
Fund’s stock holdings were strong across a variety of sectors
The fund’s stock holdings—made up of companies that advisor Wellington Management Company, LLP, deemed undervalued or out-of-favor when purchased—returned almost 20% over the 12 months. The three largest sectors in the stock portfolio were financials, energy, and industrials, which represented about 45% of the fund’s equity assets, on average, during the period.
The stock portfolio benefited all year from the burgeoning energy sector. Amid strong global energy demand, investors drove the prices of energy-related stocks higher. Wellington Management identified a number of strong performers, including giant integrated oil businesses such as Chevron, ExxonMobil, and Petróleo Brasileiro. Notable contributions also came from companies involved in exploration for new energy sources, including EnCana and XTO Energy.
The advisor’s stock selection was strong as well in the industrials sector, where high returns came from machinery makers and railroad freight haulers. Deere & Co., a farm equipment producer, and Parker Hannifin, which manufactures motion and control systems, posted impressive results, while railways took advantage of a favorable business environment to boost profits.
The advisor maintained relatively modest exposure to the health care sector, but nevertheless identified some excellent performers, primarily large pharmaceuticals companies such as Abbott Laboratories
Expense Ratios1 |
|
|
|
Your fund compared with its peer group |
|
|
|
|
|
| Average |
|
|
| Mixed-Asset |
| Investor | Admiral | Target |
| Shares | Shares | Growth Fund |
Wellington Fund | 0.30% | 0.17% | 1.23% |
1 Fund expense ratios reflect the 12 months ended November 30, 2006. Peer-group expense ratio is derived from data provided by Lipper Inc. and captures information through year-end 2005.
4
and AstraZeneca Group. Other smaller sectors that featured beneficial stock selection included consumer discretionary and consumer staples. Both were aided by the continued strength of consumer spending, despite the moderating growth in the U.S. economy.
Wellington’s fixed income portfolio—the roughly 35% of fund assets allocated primarily to investment-grade corporate and U.S. government bonds—returned about 5.9% for the period. This was slightly short of the 6.0% return for the Lehman Credit A or Better Index.
For more on the fund’s positioning during the fiscal year, please see the Advisor’s Report, which begins on page 7.
Over ten years, the fund has topped the S&P 500 Index
Over time, Wellington Fund’s balanced allocation of roughly 65% stocks and 35% bonds has provided an extremely competitive return while offering investors the benefits of broad diversification across asset classes. As the table below shows, a hypothetical initial investment of $10,000 made in the fund ten years ago would have grown to $24,639 as of November 30, easily surpassing the $19,440 ending balance for its average peer fund and the $21,113 result for the unmanaged Wellington Composite Index.
The fund’s 9.4% average annual return for the ten-year period also surpassed the 8.1% return of the all-stock Standard &
Total Returns |
|
|
Ten Years Ended November 30, 2006 |
|
|
| Average | Final Value of a $10,000 |
| Annual Return | Initial Investment |
Wellington Fund Investor Shares | 9.4% | $24,639 |
Wellington Composite Index | 7.8 | 21,113 |
Average Mixed-Asset Target Growth Fund | 6.9 | 19,440 |
The figures shown represent past performance, which is not a guarantee of future results. (Current performance may be lower
or higher than the performance data cited. For performance data current to the most recent month-end, visit our website at
www.vanguard.com.) Note, too, that both investment returns and principal value can fluctuate widely, so an investor’s shares,
when sold, could be worth more or less than their original cost.
5
Poor’s 500 Index. This is a noteworthy accomplishment for a fund with a sizable bond allocation. It affirms the benefit to shareholders of Wellington Management’s long experience in selecting reasonably valued stocks and investment-grade bonds, and in managing with a long-term perspective.
Beyond skilled management, another key in the fund’s long-term success has been its ongoing cost advantage over similar mutual funds. Such a cost advantage means that a larger share of the fund’s returns can be passed back to you, the rightful owner.
Staying balanced can support you through good and bad markets
As seasoned investors have learned over the years, the stock and bond markets can harbor many uncertainties. There is simply no way to know what will happen year by year, much less day to day. That’s why Vanguard suggests that the best way to prepare for long-term investing is to select a diversified mix of stock, bond, and money market mutual funds that fits your goals, time horizon, and risk tolerance.
Once you have made your initial decision, it is critical to stick with it, resisting the temptation to alter course. A balanced portfolio should never deliver the best (or worst) possible returns in the markets, but the ride should be less bumpy than one that encompasses a higher degree of risk. A balanced portfolio gives you the opportunity to participate in the rewards of each asset class, while offering some protection from the inevitable downturns.
The Wellington Fund, which by its nature has exemplified the values of balance and diversification for over 75 years, offers a simple solution that is appropriate for many investors. Together with other components of a thoughtful investment program, the fund’s time-tested strategy can play an important role in helping you move toward your financial goals.
Thank you for your ongoing confidence in Vanguard.
Sincerely,

John J. Brennan
Chairman and Chief Executive Officer
December 12, 2006
6
Advisor’s Report
Vanguard Wellington Fund Investor Shares returned 14.7% for the fiscal year ended November 30, 2006 (Admiral Shares returned 14.8%). This result exceeded both the 11.9% return for the average peer mutual fund and the 11.3% return for the Wellington Composite Index, which is weighted 65% in large-capitalization stocks and 35% in high-quality corporate bonds.
Investment environment
Stocks, as measured by the S&P 500 Index, advanced 14.2% during the period. Growth in global gross domestic product remained strong even as the U.S. housing market cooled. Oil and gas prices dropped from record highs, providing consumers with additional disposable income. The commodity markets struggled as relative geopolitical calm, milder U.S. weather, and higher oil and gas inventory levels caused prices to decline.
The Federal Reserve Board’s actions on interest rates have had a clear and cooling impact upon housing—the most overheated segment of the economy—while leaving ample, cheap liquidity for other segments to sustain overall economic growth. With inflationary concerns subsiding, the Fed has moved to the sidelines and is awaiting more information. The corporate bond sector performed well over the period, with positive absolute returns and positive excess returns over U.S. Treasuries. Other sectors of the bond market, such as mortgage- and asset-backed securities, also performed well.
Our successes
Our equity portfolio’s strong performance was driven largely by stock selection in the health care and industrials sectors, as well as by our underweighted position in the technology sector. The portfolio’s top
Equity Portfolio Changes |
|
Year Ended November 30, 2006 |
|
|
|
Additions | Comments |
Medtronic | We added this leading medical device company at an |
| attractive valuation. |
Wal-Mart Stores | We like the turnaround efforts of this major discount retailer. |
Muenchener Re | This reinsurance company should benefit from better pricing |
| and restructuring efforts. |
UPS | This leading air freight and logistics company should benefit from |
| strong international growth and low fuel exposure. |
|
|
Deletions |
|
Union Pacific | We took profits as the company reached full valuation. |
CSX | We took profits in the face of pricing headwinds. |
Fuji Photo Film | We took profits as the company reached full valuation and the |
| longer-term outlook declined. |
7
contributor for the period was AT&T. Shares of the company advanced during the 12 months because of strong margin growth at Cingular—AT&T and BellSouth’s wireless provider. AT&T also benefited from growing market share in the enterprise market, which serves larger businesses and government entities. We continue to have a positive outlook on AT&T, believing that the company should benefit from its merger with BellSouth, based on expected synergies gained from combining the firms’ wireless and wireline services, as well as from new technology within the sector.
Our long-term investment in railroad companies paid off nicely over the period. Canadian National Railway, CSX, and Union Pacific benefited from higher volumes and improved freight rates. Within the agricultural industry, shares of Deere & Co. advanced, as global food consumption and demand for fuel substitutes have increased. We believe that global demand for grains and biofuels will continue and that Deere is well positioned to benefit from that growth, based on higher corn prices and increased demand for tractors.
The performance of the fund’s fixed income portfolio was driven more by interest rate strategies than security selection during the fiscal period. Our positioning in anticipation of rising short-term interest rates was beneficial. We also successfully avoided most of the corporate bond issues that have been susceptible to leveraged buyouts, in which one company uses borrowed money (usually bonds) to buy another company.
Our shortfalls
Wellington Fund’s largest detractors for the period were select holdings in the telecommunication services and consumer discretionary sectors. Within telecom, wireless provider Sprint Nextel disappointed, as the company has struggled to match the branding and product offerings of its competitors. In the consumer discretionary sector, shares of media company Viacom were down as the stock was punished for a surprise change in management. We continued to build our position in Viacom based on a positive outlook for the company’s cable network business. Dollar General shares declined after the company reported lower-than-expected profits over the first half of its fiscal period. Dollar General’s management believed the company’s consumer base was negatively affected by higher gas prices and personal debt levels.
Within the fund’s fixed income portfolio, corporate bonds performed well. However, we found the corporate sector to be rather unattractive, given the narrow yield-spread advantage and rising event risk (i.e., takeover-related developments), and our decision to underweight corporate bonds was detrimental. Fortunately, the other sectors we moved into provided results comparable to those of corporate bonds, so our overall returns were unaffected by this strategy.
8
The fund’s positioning
We continue to search diligently for attractively valued companies with strong operating characteristics. We are particularly interested in stocks of companies whose business fundamentals are poised to improve. As always, holdings that provide above-average dividends are central in our search process.
Our discipline is focused on identifying industries with a favorable expected balance between supply and demand. For example, in the telecommunication services industry, consolidation has been favorable, and demand continues to grow nicely. We continue to find media stocks attractive, although they are closer to having fair valuations. Consumer discretionary spending remains the most vulnerable segment of the U.S. economy, because of the slowing housing market and rising debt levels, even as some relief has come in the form of lower energy prices. We also still favor the energy sector, although the risk/reward trade-off is not as favorable. At the end of the 12 months, the fund was overweighted in the energy, materials, utilities, and telecom sectors; it was underweighted in the information technology, financials, and consumer discretionary sectors.
In the fixed income market, we still find corporate bonds, particularly lower-quality investment-grade issues, unattractive. We continue to underweight the corporate sector in favor of mortgage- and asset-backed securities. The bond market is anticipating a significantly slower economy in 2007, including some degree of lower short-term interest rates. We are not overly concerned about economic growth, believing that the aggregate economy is healthy and that other sectors will pick up some of the slack created by the softer housing and auto sectors. We are not currently positioned for lower short-term rates. We continue to await wider yield spreads for corporate bonds.
Edward P. Bousa, CFA, Senior Vice
President and Equity Manager
John C. Keogh, Senior Vice
President and Fixed Income Manager
Wellington Management Company, LLP
December 18, 2006
9
Fund Profile
As of November 30, 2006
Total Fund Characteristics |
|
|
|
Yield |
|
Investor Shares | 2.9% |
Admiral Shares | 3.0% |
Turnover Rate | 25% |
Expense Ratio |
|
Investor Shares | 0.30% |
Admiral Shares | 0.17% |
Short-Term Reserves | 1% |
Sector Diversification (% of equity portfolio) | |||
|
| Comparative | Broad |
| Fund | Index1 | Index2 |
Consumer Discretionary | 8% | 10% | 12% |
Consumer Staples | 9 | 9 | 8 |
Energy | 14 | 10 | 10 |
Financials | 18 | 22 | 23 |
Health Care | 11 | 12 | 12 |
Industrials | 12 | 11 | 11 |
Information Technology | 10 | 16 | 15 |
Materials | 8 | 3 | 3 |
Telecommunication |
|
|
|
Services | 5 | 3 | 3 |
Utilities | 5 | 4 | 3 |
Total Fund Volatility Measures3 |
| |
| Fund Versus | Fund Versus |
| Composite Index4 | Broad Index2 |
R-Squared | 0.87 | 0.77 |
Beta | 0.98 | 0.58 |
Ten Largest Stocks5 (% of equity portfolio) |
| |
|
|
|
Bank of America Corp. | diversified financial |
|
| services | 3.3% |
General Electric Co. | industrial |
|
| conglomerate | 2.9 |
AT&T Inc. | integrated |
|
| telecommunication |
|
| services | 2.5 |
Citigroup, Inc. | diversified financial |
|
| services | 2.4 |
Chevron Corp. | integrated oil |
|
| and gas | 2.4 |
ExxonMobil Corp. | integrated oil |
|
| and gas | 2.4 |
Total SA ADR | integrated oil |
|
| and gas | 2.3 |
Exelon Corp. | electric utilities | 1.9 |
Altria Group, Inc. | tobacco | 1.8 |
International Business |
|
|
Machines Corp. | computer hardware | 1.8 |
Top Ten |
| 23.7% |
Top Ten as % of Total Net Assets | 15.4% | |
Fund Asset Allocation

1 S&P 500 Index.
2 Dow Jones Wilshire 5000 Index.
3 For an explanation of R-squared, beta, and other terms used here, see the Glossary on pages 40 and 41.
| 4 | Wellington Composite Index, weighted 65% S&P 500 Index and 35% Lehman Credit A or Better Index. |
5 “Ten Largest Stocks” excludes any temporary cash investments and equity index products.
10
Equity Characteristics |
|
|
|
|
| Comparative | Broad |
| Fund | Index1 | Index2 |
Number of Stocks | 108 | 500 | 4,955 |
Median Market Cap | $65.0B | $59.9B | $27.2B |
Price/Earnings Ratio | 15.7x | 16.7x | 17.6x |
Price/Book Ratio | 2.7x | 2.8x | 2.6x |
Dividend Yield | 2.2% | 1.8% | 1.6% |
Return on Equity | 18.9% | 19.1% | 15.3% |
Earnings Growth Rate | 17.6% | 19.4% | 15.6% |
Foreign Holdings | 9.6% | 0.0% | 1.1% |
Fixed Income Characteristics |
|
| |
|
| Comparative | Broad |
| Fund | Index3 | Index4 |
Number of Bonds | 423 | 1,883 | 7,086 |
Yield to Maturity | 5.2%5 | 5.2% | 5.2% |
Average Coupon | 5.7% | 5.6% | 5.4% |
Average Effective |
|
|
|
Maturity | 8.9 years | 9.0 years | 6.8 years |
Average Quality6 | Aa3 | Aa3 | Aa1 |
Average Duration | 5.9 years | 5.7 years | 4.4 years |
Sector Diversification7 |
|
(% of fixed income portfolio) |
|
|
|
Asset-Backed/Commercial Mortgage-Backed | 9% |
Finance | 30 |
Foreign | 7 |
Government Mortgage-Backed | 9 |
Industrials | 26 |
Treasury/Agency | 10 |
Utilities | 6 |
Other | 3 |
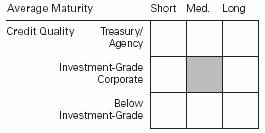
Distribution by Credit Quality6 |
|
(% of fixed income portfolio) |
|
|
|
Aaa | 34% |
Aa | 24 |
A | 30 |
Baa | 9 |
Ba | 0 |
B | 0 |
Not Rated | 3 |
Equity Investment Focus

Fixed Income Investment Focus
1 S&P 500 Index.
2 Dow Jones Wilshire 5000 Index.
3 Lehman Credit A or Better Index.
4 Lehman Aggregate Bond Index.
5 Before expenses.
6 Moody’s Investors Service.
7 The agency and mortgage-backed securities sectors may include issues from government-sponsored enterprises; such issues are not
backed by the full faith and credit of the U.S. government.
| 11 |
Performance Summary
All of the returns in this report represent past performance, which is not a guarantee of future results that may be achieved by the fund. (Current performance may be lower or higher than the performance data cited. For performance data current to the most recent month-end, visit our website at www.vanguard.com.) Note, too, that both investment returns and principal value can fluctuate widely, so an investor’s shares, when sold, could be worth more or less than their original cost. The returns shown do not reflect taxes that a shareholder would pay on fund distributions or on the sale of fund shares.
Cumulative Performance: November 30, 1996–November 30, 2006
Initial Investment of $10,000

| Average Annual Total Returns | Final Value | ||
| Periods Ended November 30, 2006 | of a $10,000 | ||
| One Year | Five Years | Ten Years | Investment |
Wellington Fund Investor Shares | 14.69% | 8.89% | 9.44% | $24,639 |
Dow Jones Wilshire 5000 Index | 14.68 | 7.79 | 8.42 | 22,447 |
S&P 500 Index | 14.23 | 6.08 | 8.05 | 21,698 |
Wellington Composite Index1 | 11.33 | 6.16 | 7.76 | 21,113 |
Average Mixed-Asset Target Growth Fund2 | 11.88 | 6.17 | 6.87 | 19,440 |
|
|
|
| Final Value |
|
|
| Since | of a $100,000 |
| One Year | Five Years | Inception3 | Investment |
Wellington Fund Admiral Shares | 14.82% | 9.03% | 8.08% | $153,911 |
Dow Jones Wilshire 5000 Index | 14.68 | 7.79 | 5.43 | 134,099 |
S&P 500 Index | 14.23 | 6.08 | 3.87 | 123,475 |
Wellington Composite Index1 | 11.33 | 6.16 | 5.16 | 132,206 |
1 Weighted 65% S&P 500 Index and 35% Lehman Long Credit AA or Better Index through February 29, 2000; and 65% S&P 500 Index and 35% Lehman Credit A or Better Index thereafter.
2 Derived from data provided by Lipper Inc.
3 May 14, 2001.
12
Fiscal-Year Total Returns (%): November 30, 1996–November 30, 2006 | ||||
|
|
|
|
|
| Wellington Fund | Composite | ||
| Investor Shares | Index1 | ||
Fiscal | Capital | Income | Total | Total |
Year | Return | Return | Return | Return |
1997 | 14.2% | 4.4% | 18.6% | 21.6% |
1998 | 9.6 | 4.2 | 13.8 | 20.1 |
1999 | –0.5 | 4.1 | 3.6 | 11.0 |
2000 | 2.6 | 4.3 | 6.9 | –0.1 |
2001 | 3.8 | 3.8 | 7.6 | –3.4 |
2002 | –7.4 | 3.1 | –4.3 | –8.1 |
2003 | 9.6 | 3.3 | 12.9 | 12.7 |
2004 | 10.3 | 3.1 | 13.4 | 9.9 |
2005 | 5.7 | 3.2 | 8.9 | 6.4 |
2006 | 11.2 | 3.5 | 14.7 | 11.3 |
Average Annual Total Returns: Periods Ended September 30, 2006
This table presents average annual total returns through the latest calendar quarter—rather than through the end of the fiscal period. Securities and Exchange Commission rules require that we provide this information.
|
|
|
|
|
| Ten Years |
| Inception Date | One Year | Five Years | Capital | Income | Total |
Investor Shares | 7/1/1929 | 10.39% | 9.25% | 6.19% | 3.72% | 9.91% |
Admiral Shares | 5/14/2001 | 10.50 | 9.38 | 4.032 | 3.452 | 7.482 |
1 Weighted 65% S&P 500 Index and 35% Lehman Long Credit AA or Better Index through February 29, 2000; and 65% S&P 500 Index and 35% Lehman Credit A or Better Index thereafter.
2 Return since inception.
Note: See Financial Highlights tables on pages 28 and 29 for dividend and capital gains information.
13
Financial Statements
Statement of Net Assets
As of November 30, 2006
The fund provides a complete list of its holdings four times in each fiscal year, at the quarter-ends. For the second and fourth fiscal quarters, the lists appear in the fund’s semiannual and annual reports to shareholders. For the first and third fiscal quarters, the fund files the lists with the Securities and Exchange Commission on Form N-Q. Shareholders can look up the fund’s Forms N-Q on the SEC’s website at www.sec.gov. Forms N-Q may also be reviewed and copied at the SEC’s Public Reference Room (see the back cover of this report for further information).
|
| Market |
|
| Value• |
| Shares | ($000) |
|
|
|
Common Stocks (65.0%) |
|
|
Consumer Discretionary (4.9%) |
|
|
* Comcast Corp. Class A | 10,076,600 | 407,699 |
McDonald’s Corp. | 9,613,000 | 403,458 |
Time Warner, Inc. | 14,379,100 | 289,595 |
The Walt Disney Co. | 5,373,400 | 177,591 |
* Viacom Inc. Class B | 4,482,800 | 168,150 |
CBS Corp. | 5,384,500 | 160,189 |
NIKE, Inc. Class B | 1,604,900 | 158,805 |
Limited Brands, Inc. | 4,122,300 | 130,636 |
Yum! Brands, Inc. | 2,108,100 | 128,995 |
Gannett Co., Inc. | 1,924,300 | 114,534 |
Genuine Parts Co. | 837,200 | 39,256 |
Home Depot, Inc. | 765,200 | 29,055 |
* Idearc Inc. | 385,960 | 10,629 |
|
| 2,218,592 |
Consumer Staples (6.0%) |
|
|
Altria Group, Inc. | 6,362,400 | 535,778 |
Wal-Mart Stores, Inc. | 10,987,900 | 506,542 |
The Coca-Cola Co. | 7,424,700 | 347,699 |
Kimberly-Clark Corp. | 4,808,600 | 319,628 |
Nestle SA ADR Reg | 3,505,300 | 311,796 |
The Procter & Gamble Co. | 3,403,275 | 213,692 |
Sysco Corp. | 5,943,000 | 213,057 |
SABMiller PLC | 7,536,539 | 158,005 |
Unilever NV ADR | 3,515,100 | 93,115 |
SABMiller PLC ADR | 1,261,800 | 26,687 |
|
| 2,725,999 |
Energy (9.4%) |
|
|
Chevron Corp. | 9,763,100 | 706,067 |
ExxonMobil Corp. | 9,095,200 | 698,602 |
Total SA ADR | 9,595,000 | 685,659 |
ConocoPhillips Co. | 6,589,263 | 443,457 |
Royal Dutch Shell PLC ADR |
|
|
Class A | 5,382,010 | 382,284 |
EnCana Corp. | 7,131,304 | 372,325 |
Schlumberger Ltd. | 3,987,700 | 273,078 |
XTO Energy, Inc. | 4,740,000 | 239,844 |
BP PLC ADR | 3,325,700 | 226,414 |
Petroleo Brasileiro ADR | 1,423,900 | 134,060 |
Sasol Ltd. Sponsored ADR | 1,764,400 | 62,195 |
|
| 4,223,985 |
Financials (11.9%) |
|
|
Bank of America Corp. | 17,750,699 | 955,875 |
Citigroup, Inc. | 14,313,300 | 709,797 |
UBS AG (New York Shares) | 7,843,600 | 472,341 |
Merrill Lynch & Co., Inc. | 4,474,700 | 391,223 |
American International |
|
|
Group, Inc. | 5,091,700 | 358,048 |
ACE Ltd. | 6,108,800 | 347,224 |
State Street Corp. | 5,540,600 | 344,237 |
Muenchener |
|
|
Rueckversicherungs- |
|
|
Gesellschaft |
|
|
AG (Registered) | 1,947,427 | 317,784 |
Freddie Mac | 4,024,900 | 270,312 |
MBIA, Inc. | 3,825,900 | 266,474 |
The Hartford Financial |
|
|
Services Group Inc. | 2,547,300 | 218,456 |
Prudential Financial, Inc. | 1,757,900 | 143,234 |
JPMorgan Chase & Co. | 3,011,776 | 139,385 |
PNC Financial |
|
|
Services Group | 1,949,800 | 137,831 |
MetLife, Inc. | 2,157,100 | 126,686 |
Westpac Banking |
|
|
Corp. Ltd. ADR | 1,068,500 | 102,576 |
Wachovia Corp. | 970,400 | 52,586 |
|
| 5,354,069 |
Health Care (7.1%) |
|
|
Abbott Laboratories | 11,426,800 | 533,174 |
Eli Lilly & Co. | 9,876,500 | 529,282 |
Medtronic, Inc. | 8,311,200 | 433,263 |
Schering-Plough Corp. | 17,379,100 | 382,514 |
Bristol-Myers Squibb Co. | 15,197,900 | 377,364 |
AstraZeneca Group |
|
|
PLC ADR | 4,968,200 | 287,609 |
Wyeth | 4,730,200 | 228,374 |
14
|
| Market |
|
| Value• |
| Shares | ($000) |
Teva Pharmaceutical |
|
|
Industries Ltd. |
|
|
Sponsored ADR | 5,466,500 | 175,256 |
Sanofi-Aventis ADR | 3,367,403 | 148,199 |
* Amgen, Inc. | 1,358,600 | 96,461 |
|
| 3,191,496 |
Industrials (7.5%) |
|
|
General Electric Co. | 24,011,000 | 847,108 |
Deere & Co. | 4,748,500 | 455,856 |
Canadian National Railway Co. | 9,638,800 | 453,698 |
Waste Management, Inc. | 8,396,000 | 307,378 |
Lockheed Martin Corp. | 2,913,600 | 263,535 |
United Parcel Service, Inc. | 3,051,000 | 237,734 |
Parker Hannifin Corp. | 2,778,500 | 231,949 |
Pitney Bowes, Inc. | 3,855,300 | 177,691 |
Avery Dennison Corp. | 2,494,800 | 168,324 |
3M Co. | 1,286,300 | 104,782 |
General Dynamics Corp. | 891,100 | 66,690 |
Emerson Electric Co. | 719,200 | 62,355 |
United Technologies Corp. | 454,300 | 29,316 |
|
| 3,406,416 |
Information Technology (6.2%) | ||
International Business |
|
|
Machines Corp. | 5,811,200 | 534,166 |
Microsoft Corp. | 17,166,600 | 503,496 |
Motorola, Inc. | 16,598,800 | 367,995 |
Accenture Ltd. | 8,937,200 | 301,184 |
* EMC Corp. | 14,025,700 | 183,877 |
Automatic Data |
|
|
Processing, Inc. | 3,371,500 | 162,607 |
KLA-Tencor Corp. | 2,983,000 | 154,132 |
Texas Instruments, Inc. | 4,807,300 | 142,056 |
Hewlett-Packard Co. | 3,457,500 | 136,433 |
First Data Corp. | 4,570,000 | 115,392 |
* Western Union Co. | 4,570,000 | 104,196 |
* Sun Microsystems, Inc. | 18,222,200 | 98,764 |
|
| 2,804,298 |
Materials (5.2%) |
|
|
Alcoa Inc. | 14,190,100 | 442,305 |
E.I. du Pont de |
|
|
Nemours & Co. | 8,222,800 | 385,896 |
Weyerhaeuser Co. | 5,652,300 | 365,591 |
International Paper Co. | 6,732,700 | 222,852 |
Rio Tinto PLC ADR | 875,500 | 187,874 |
Syngenta AG ADR | 4,920,700 | 173,258 |
Rohm & Haas Co. | 3,262,100 | 170,347 |
Cia Vale do Rio Doce ADR | 5,886,536 | 163,410 |
Air Products & |
|
|
Chemicals, Inc. | 1,683,000 | 116,363 |
Newmont Mining Corp. |
|
|
(Holding Co.) | 2,337,600 | 109,657 |
|
| 2,337,553 |
Telecommunication Services (3.4%) | ||
AT&T Inc. | 21,361,500 | 724,368 |
Verizon Communications Inc. | 7,719,200 | 269,709 |
Sprint Nextel Corp. | 9,309,100 | 181,621 |
BellSouth Corp. | 3,841,200 | 171,279 |
Deutsche Telekom AG ADR | 7,884,400 | 140,342 |
France Telecom SA ADR | 2,504,600 | 65,295 |
|
| 1,552,614 |
Utilities (3.4%) |
|
|
Exelon Corp. | 9,144,000 | 555,315 |
FPL Group, Inc. | 5,489,000 | 292,564 |
TXU Corp. | 4,742,500 | 272,172 |
Dominion Resources, Inc. | 2,442,800 | 197,232 |
Pinnacle West Capital Corp. | 2,602,900 | 128,427 |
Progress Energy, Inc. | 1,710,500 | 81,711 |
|
| 1,527,421 |
Total Common Stocks |
|
|
(Cost $20,328,145) |
| 29,342,443 |
15
|
|
|
| Face | Market |
|
|
| Maturity | Amount | Value• |
|
| Coupon | Date | ($000) | ($000) |
U.S. Government and Agency Obligations (6.7%) | |||||
U.S. Government Securities (2.7%) |
|
|
|
| |
| U.S. Treasury Bond | 5.250% | 2/15/29 | 284,975 | 308,574 |
| U.S. Treasury Note | 3.875% | 7/31/07 | 330,000 | 327,627 |
| U.S. Treasury Note | 5.000% | 8/15/11 | 186,000 | 190,708 |
| U.S. Treasury Note | 4.625% | 10/31/11 | 388,625 | 391,540 |
|
|
|
|
| 1,218,449 |
Agency Notes (0.6%) |
|
|
|
| |
1 | Federal Home Loan Mortgage Corp. | 4.000% | 8/17/07 | 50,000 | 49,598 |
1 | Federal Home Loan Mortgage Corp. | 3.500% | 9/15/07 | 50,000 | 49,364 |
1 | Federal National Mortgage Assn. | 3.250% | 11/15/07 | 100,000 | 98,353 |
| Private Export Funding Corp. | 5.750% | 1/15/08 | 40,385 | 40,704 |
| Private Export Funding Corp. | 3.375% | 2/15/09 | 33,300 | 32,251 |
|
|
|
|
| 270,270 |
Mortgage-Backed Securities (3.4%) |
|
|
|
| |
| Conventional Mortgage-Backed Securities (3.0%) | ||||
1,2 | Federal National Mortgage Assn. | 6.000% | 12/1/08–9/1/21 | 70,312 | 71,556 |
2 | Government National Mortgage Assn. | 5.000% | 1/15/30–12/15/35 | 412,618 | 406,396 |
2 | Government National Mortgage Assn. | 5.500% | 1/15/29–4/15/36 | 821,468 | 823,259 |
2 | Government National Mortgage Assn. | 6.000% | 3/15/28–1/15/33 | 43,890 | 44,679 |
2 | Government National Mortgage Assn. | 6.500% | 1/15/31–1/15/32 | 20,466 | 21,061 |
2 | Government National Mortgage Assn. | 7.000% | 11/15/31–11/15/33 | 17,566 | 18,180 |
2 | Government National Mortgage Assn. | 8.000% | 6/15/17 | 50 | 52 |
| Non-Conventional Mortgage-Backed Securities (0.4%) | ||||
1,2 | Federal Home Loan Mortgage Corp. | 4.000% | 3/15/19–9/15/19 | 68,295 | 62,859 |
1,2 | Federal National Mortgage Assn. | 4.000% | 2/25/19 | 19,895 | 18,339 |
1,2 | Federal National Mortgage Assn. | 5.013% | 2/1/13 | 18,528 | 18,567 |
1,2 | Federal National Mortgage Assn. | 4.517% | 5/1/13 | 18,193 | 17,801 |
1,2 | Federal National Mortgage Assn. | 4.884% | 1/1/14 | 34,994 | 34,890 |
2 | Government National Mortgage Assn. | 5.500% | 6/16/23 | 19,858 | 20,086 |
|
|
|
|
| 1,557,725 |
Total U.S. Government and Agency Obligations | |||||
(Cost $3,025,177) |
|
|
| 3,046,444 | |
Corporate Bonds (23.3%) |
|
|
|
| |
Asset-Backed/Commercial Mortgage-Backed Securities (2.8%) | |||||
2 | Adjustable Rate Mortgage Trust | 5.707% | 3/25/36 | 14,430 | 14,581 |
2 | Advanta Business Card Master Trust | 4.750% | 1/20/11 | 13,150 | 13,110 |
2,3 | Aesop Funding II LLC | 3.950% | 4/20/09 | 43,600 | 43,055 |
2 | Asset Securitization Corp. | 7.490% | 4/14/29 | 8,700 | 8,725 |
2 | Banc of America Commercial Mortgage Inc. | 5.930% | 5/10/45 | 41,450 | 43,519 |
2 | Bank One Issuance Trust | 3.860% | 6/15/11 | 40,000 | 39,303 |
2 | Bank One Issuance Trust | 3.450% | 10/17/11 | 40,000 | 38,854 |
2 | Bear Stearns Commercial Mortgage Securities, Inc. | 5.610% | 11/15/33 | 17,250 | 17,591 |
2 | Bear Stearns Commercial Mortgage Securities, Inc. | 5.633% | 4/12/38 | 28,720 | 29,699 |
2 | Bear Stearns Commercial Mortgage Securities, Inc. | 4.740% | 3/13/40 | 25,000 | 24,425 |
2 | Bear Stearns Commercial Mortgage Securities, Inc. | 5.537% | 10/12/41 | 16,700 | 17,257 |
2 | Bear Stearns Commercial Mortgage Securities, Inc. | 4.825% | 11/11/41 | 49,980 | 49,066 |
2 | Bear Stearns Commercial Mortgage Securities, Inc. | 4.933% | 2/13/42 | 19,160 | 18,911 |
2 | Bear Stearns Commercial Mortgage Securities, Inc. | 4.871% | 9/11/42 | 24,700 | 24,257 |
2 | California Infrastructure & Economic Development |
|
|
|
|
| Bank Special Purpose Trust SCE-1 | 6.420% | 12/26/09 | 16,110 | 16,203 |
2 | CarMax Auto Owner Trust | 4.910% | 1/18/11 | 21,520 | 21,555 |
2 | Caterpillar Financial Asset Trust | 3.130% | 1/26/09 | 1,724 | 1,704 |
2 | Chase Commercial Mortgage Securities Corp. | 6.390% | 11/18/30 | 24,281 | 24,648 |
16
|
|
|
| Face | Market |
|
|
| Maturity | Amount | Value• |
|
| Coupon | Date | ($000) | ($000) |
2 | Chase Issuance Trust | 4.650% | 12/17/12 | 40,000 | 39,868 |
2 | Chase Manhattan Auto Owner Trust | 2.570% | 2/16/10 | 14,456 | 14,320 |
2 | Commercial Mortgage Pass-Through Certificates | 5.116% | 6/10/44 | 25,000 | 24,980 |
2 | Commercial Mortgage Pass-Through Certificates | 5.962% | 6/10/46 | 49,000 | 51,547 |
2 | Credit Suisse Mortgage Capital Certificates | 5.467% | 9/15/39 | 39,605 | 40,572 |
2,3 | DLJ Mortgage Acceptance Corp. | 6.820% | 10/15/30 | 10,939 | 10,969 |
2 | Daimler Chrysler Auto Trust | 4.980% | 2/8/11 | 18,435 | 18,435 |
2 | GS Mortgage Securities Corp. II | 5.396% | 8/10/38 | 25,100 | 25,664 |
2 | Greenwich Capital Commercial Funding Corp. | 4.915% | 1/5/36 | 47,700 | 47,212 |
2 | Greenwich Capital Commercial Funding Corp. | 5.317% | 6/10/36 | 25,535 | 25,919 |
2 | Greenwich Capital Commercial Funding Corp. | 5.224% | 4/10/37 | 10,000 | 10,059 |
2 | Greenwich Capital Commercial Funding Corp. | 4.799% | 8/10/42 | 48,375 | 48,575 |
2 | Honda Auto Receivables Owner Trust | 3.820% | 5/21/10 | 21,677 | 21,337 |
2 | Household Automotive Trust | 5.280% | 9/17/11 | 60,000 | 60,680 |
2 | JPMorgan Chase Commercial Mortgage Securities | 4.899% | 1/12/37 | 24,040 | 23,683 |
2 | LB-UBS Commerical Mortgage Trust | 6.462% | 3/15/31 | 18,325 | 19,523 |
2,3 | Marriott Vacation Club Owner Trust | 5.362% | 10/20/28 | 19,310 | 19,405 |
2 | Morgan Stanley Capital I | 4.780% | 12/13/41 | 43,275 | 42,408 |
2 | Morgan Stanley Capital I | 5.230% | 9/15/42 | 16,905 | 16,989 |
2 | Morgan Stanley Capital I | 4.700% | 7/15/56 | 38,470 | 37,532 |
2 | Morgan Stanley Dean Witter Capital I | 4.740% | 11/13/36 | 26,000 | 25,531 |
2 | Nissan Auto Lease Trust | 5.110% | 3/15/10 | 40,000 | 40,050 |
2 | Nomura Asset Securities Corp. | 6.590% | 3/15/30 | 9,952 | 10,084 |
2 | Nomura Asset Securities Corp. | 6.690% | 3/15/30 | 13,000 | 13,829 |
2 | PSE&G Transition Funding LLC | 6.450% | 3/15/13 | 10,000 | 10,446 |
2 | USAA Auto Owner Trust | 2.670% | 10/15/10 | 5,000 | 4,934 |
2 | USAA Auto Owner Trust | 4.130% | 11/15/11 | 24,000 | 23,697 |
2 | WFS Financial Owner Trust | 3.930% | 2/17/12 | 37,445 | 37,046 |
2 | Wachovia Auto Owner Trust | 4.930% | 11/20/12 | 25,000 | 25,055 |
2 | Wachovia Bank Commercial Mortgage Trust | 5.118% | 7/15/42 | 25,000 | 24,965 |
2 | World Omni Auto Receivables Trust | 3.820% | 11/12/11 | 9,255 | 9,088 |
|
|
|
|
| 1,270,865 |
Finance (10.0%) |
|
|
|
| |
| Banking (4.1%) |
|
|
|
|
| BB&T Corp. | 4.900% | 6/30/17 | 8,045 | 7,818 |
| BB&T Corp. | 5.250% | 11/1/19 | 8,000 | 7,940 |
3 | BTM Curacao | 4.760% | 7/21/15 | 47,895 | 47,392 |
| Bank One Corp. | 7.875% | 8/1/10 | 15,000 | 16,427 |
| Bank of America Corp. | 4.375% | 12/1/10 | 10,000 | 9,822 |
| Bank of America Corp. | 5.625% | 3/8/35 | 46,180 | 44,791 |
| Bank of America Corp. | 6.000% | 10/15/36 | 30,000 | 31,807 |
| Bank of Montreal | 7.800% | 4/1/07 | 21,000 | 21,163 |
| Bank of New York Co., Inc. | 5.125% | 11/1/11 | 44,000 | 44,230 |
| Bank of New York Co., Inc. | 4.950% | 3/15/15 | 58,655 | 57,752 |
| BankAmerica Corp. | 5.875% | 2/15/09 | 25,000 | 25,520 |
3 | Barclays Bank PLC | 5.926% | 12/15/49 | 70,000 | 71,677 |
| Citicorp | 6.375% | 11/15/08 | 15,000 | 15,374 |
| Citigroup, Inc. | 4.625% | 8/3/10 | 19,400 | 19,214 |
| Citigroup, Inc. | 5.850% | 8/2/16 | 30,000 | 31,510 |
| Citigroup, Inc. | 6.625% | 6/15/32 | 45,000 | 51,473 |
| Citigroup, Inc. | 6.125% | 8/25/36 | 30,000 | 32,297 |
| Credit Suisse First Boston USA, Inc. | 4.700% | 6/1/09 | 45,000 | 44,781 |
| Credit Suisse First Boston USA, Inc. | 6.500% | 1/15/12 | 15,000 | 15,952 |
| Deutsche Bank Financial LLC | 5.375% | 3/2/15 | 43,715 | 44,219 |
| Fifth Third Bank | 4.200% | 2/23/10 | 60,000 | 58,686 |
| Golden West Financial Corp. | 4.750% | 10/1/12 | 10,000 | 9,853 |
3 | HBOS Treasury Services PLC | 6.000% | 11/1/33 | 80,500 | 84,449 |
17
|
|
|
| Face | Market |
|
|
| Maturity | Amount | Value• |
|
| Coupon | Date | ($000) | ($000) |
| HSBC Bank USA | 4.625% | 4/1/14 | 10,000 | 9,677 |
| Huntington National Bank | 4.900% | 1/15/14 | 16,375 | 15,934 |
| Huntington National Bank | 5.500% | 2/15/16 | 16,000 | 16,056 |
| JPMorgan Chase & Co. | 4.500% | 11/15/10 | 25,000 | 24,616 |
| JPMorgan Chase & Co. | 6.750% | 2/1/11 | 25,115 | 26,703 |
| JPMorgan Chase & Co. | 5.250% | 5/1/15 | 40,000 | 40,079 |
| Mellon Bank NA | 4.750% | 12/15/14 | 4,750 | 4,623 |
| Mellon Funding Corp. | 5.000% | 12/1/14 | 30,000 | 29,747 |
3 | Mizuho Finance (Cayman) | 5.790% | 4/15/14 | 50,000 | 51,351 |
| National City Bank | 4.150% | 8/1/09 | 8,630 | 8,451 |
| National City Bank | 7.250% | 7/15/10 | 25,000 | 26,706 |
| National City Bank of Pennsylvania | 7.250% | 10/21/11 | 20,000 | 21,914 |
| National City Corp. | 6.875% | 5/15/19 | 13,950 | 15,756 |
| National City Corp. | 3.200% | 4/1/08 | 10,000 | 9,753 |
| Northern Trust Co. | 5.300% | 8/29/11 | 36,320 | 36,755 |
| Northern Trust Co. | 4.600% | 2/1/13 | 5,925 | 5,785 |
3 | Overseas Chinese Banking Corp. | 7.750% | 9/6/11 | 14,805 | 16,439 |
| PNC Bank NA | 4.875% | 9/21/17 | 50,000 | 48,306 |
| Paribas NY | 6.950% | 7/22/13 | 40,000 | 44,187 |
| Royal Bank of Scotland Group PLC | 6.375% | 2/1/11 | 40,775 | 42,755 |
| Royal Bank of Scotland Group PLC | 5.000% | 10/1/14 | 9,700 | 9,625 |
| Royal Bank of Scotland Group PLC | 5.050% | 1/8/15 | 19,510 | 19,356 |
| Royal Bank of Scotland Group PLC | 4.700% | 7/3/18 | 10,000 | 9,527 |
3 | Santander U.S. Debt, S.A. Unipersonal | 4.750% | 10/21/08 | 47,100 | 46,939 |
| SunTrust Banks, Inc. | 4.250% | 10/15/09 | 9,680 | 9,503 |
| UBS AG | 5.875% | 7/15/16 | 60,000 | 62,891 |
| UFJ Finance Aruba AEC | 6.750% | 7/15/13 | 50,000 | 54,054 |
| US Bank NA | 4.125% | 3/17/08 | 50,000 | 49,434 |
| US Bank NA | 6.375% | 8/1/11 | 17,940 | 18,980 |
| US Bank NA | 6.300% | 2/4/14 | 30,000 | 32,154 |
| Wachovia Bank NA | 4.375% | 8/15/08 | 15,000 | 14,812 |
| Wachovia Corp. | 4.375% | 6/1/10 | 19,400 | 19,075 |
| Washington Mutual Bank | 6.875% | 6/15/11 | 15,000 | 16,013 |
| Washington Mutual Bank | 5.125% | 1/15/15 | 10,000 | 9,801 |
| Washington Mutual, Inc. | 5.250% | 9/15/17 | 52,005 | 51,244 |
| Wells Fargo & Co. | 6.375% | 8/1/11 | 15,000 | 15,832 |
| Wells Fargo & Co. | 5.125% | 9/1/12 | 10,000 | 10,055 |
| Wells Fargo & Co. | 4.950% | 10/16/13 | 15,000 | 14,853 |
| Wells Fargo & Co. | 5.125% | 9/15/16 | 25,000 | 24,874 |
| Wells Fargo Bank NA | 6.450% | 2/1/11 | 5,000 | 5,282 |
| Wells Fargo Financial | 5.500% | 8/1/12 | 20,000 | 20,445 |
| World Savings Bank, FSB | 4.500% | 6/15/09 | 14,845 | 14,684 |
| World Savings Bank, FSB | 4.125% | 12/15/09 | 33,045 | 32,314 |
|
|
|
|
|
|
| Brokerage (0.9%) |
|
|
|
|
| Ameriprise Financial Inc. | 5.350% | 11/15/10 | 22,605 | 22,826 |
| Dean Witter, Discover & Co. | 6.750% | 10/15/13 | 25,775 | 28,085 |
| Dean Witter, Discover & Co. | 7.070% | 2/10/14 | 17,500 | 19,362 |
| Goldman Sachs Group, Inc. | 5.000% | 1/15/11 | 30,000 | 30,030 |
| Goldman Sachs Group, Inc. | 5.350% | 1/15/16 | 70,000 | 70,096 |
| Lehman Brothers Holdings, Inc. | 5.500% | 4/4/16 | 50,000 | 50,835 |
| Merrill Lynch & Co., Inc. | 5.770% | 7/25/11 | 30,000 | 30,978 |
| Merrill Lynch & Co., Inc. | 6.050% | 5/16/16 | 70,000 | 73,807 |
| Morgan Stanley Dean Witter | 4.000% | 1/15/10 | 10,000 | 9,739 |
| Morgan Stanley Dean Witter | 6.600% | 4/1/12 | 20,000 | 21,369 |
| Morgan Stanley Dean Witter | 4.750% | 4/1/14 | 20,000 | 19,385 |
| Morgan Stanley Dean Witter | 6.250% | 8/9/26 | 20,000 | 21,604 |
18
|
|
|
| Face | Market |
|
|
| Maturity | Amount | Value• |
|
| Coupon | Date | ($000) | ($000) |
| Finance Companies (1.4%) |
|
|
|
|
| American Express Centurion Bank | 4.375% | 7/30/09 | 10,000 | 9,851 |
| American Express Co. | 4.750% | 6/17/09 | 20,000 | 19,910 |
| American Express Credit Corp. | 3.000% | 5/16/08 | 30,000 | 29,155 |
3 | American Express Travel | 5.250% | 11/21/11 | 35,000 | 35,268 |
| CIT Group, Inc. | 3.650% | 11/23/07 | 25,000 | 24,626 |
| CIT Group, Inc. | 4.125% | 11/3/09 | 25,000 | 24,373 |
| Capital One Bank | 6.500% | 6/13/13 | 20,705 | 22,083 |
| Capital One Financial | 5.700% | 9/15/11 | 31,150 | 31,835 |
| Countrywide Home Loan | 5.625% | 7/15/09 | 20,000 | 20,262 |
3 | FGIC Corp. | 6.000% | 1/15/34 | 14,635 | 15,005 |
| General Electric Capital Corp. | 6.125% | 2/22/11 | 19,400 | 20,246 |
| General Electric Capital Corp. | 8.125% | 5/15/12 | 30,000 | 34,308 |
| General Electric Capital Corp. | 6.000% | 6/15/12 | 15,000 | 15,707 |
| General Electric Capital Corp. | 5.450% | 1/15/13 | 40,000 | 40,893 |
| General Electric Capital Corp. | 6.750% | 3/15/32 | 30,000 | 35,533 |
| HSBC Finance Corp. | 5.700% | 6/1/11 | 19,230 | 19,732 |
| HSBC Finance Corp. | 6.375% | 10/15/11 | 75,000 | 79,222 |
| International Lease Finance Corp. | 5.400% | 2/15/12 | 50,000 | 50,583 |
| Norwest Financial, Inc. | 6.250% | 12/15/07 | 35,000 | 35,324 |
| Transamerica Financial Corp. | 6.400% | 9/15/08 | 29,265 | 29,796 |
2,3 | US Trade Funding Corp. | 4.260% | 11/15/14 | 20,670 | 20,255 |
|
|
|
|
|
|
| Insurance (3.1%) |
|
|
|
|
| ACE Capital Trust II | 9.700% | 4/1/30 | 20,000 | 28,272 |
3 | AIG SunAmerica Global Financing VI | 6.300% | 5/10/11 | 60,000 | 62,960 |
| Allstate Corp. | 5.000% | 8/15/14 | 10,000 | 9,886 |
| Allstate Corp. | 7.200% | 12/1/09 | 40,000 | 42,460 |
| Ambac, Inc. | 7.500% | 5/1/23 | 25,000 | 29,804 |
| American International Group, Inc. | 4.700% | 10/1/10 | 34,400 | 34,087 |
| Berkshire Hathaway Finance Corp. | 4.625% | 10/15/13 | 50,000 | 48,891 |
| Cincinnati Financial Corp. | 6.920% | 5/15/28 | 20,000 | 22,962 |
3 | Farmers Exchange Capital | 7.050% | 7/15/28 | 25,000 | 26,574 |
3 | Florida Windstorm Underwriters | 7.125% | 2/25/19 | 55,000 | 63,136 |
3 | Frank Russell Co. | 5.625% | 1/15/09 | 30,000 | 30,357 |
| General Reinsurance Corp. | 9.000% | 9/12/09 | 32,000 | 35,129 |
| Genworth Financial, Inc. | 5.125% | 3/15/11 | 47,825 | 48,008 |
| Genworth Financial, Inc. | 5.750% | 5/15/13 | 25,000 | 25,925 |
| Genworth Financial, Inc. | 6.150% | 11/15/66 | 50,000 | 50,815 |
| Hartford Financial Services Group, Inc. | 7.900% | 6/15/10 | 35,000 | 38,206 |
| Hartford Financial Services Group, Inc. | 4.750% | 3/1/14 | 15,000 | 14,605 |
| Hartford Life, Inc. | 5.200% | 2/15/11 | 24,185 | 24,298 |
| ING USA Global | 4.500% | 10/1/10 | 25,000 | 24,566 |
3 | Jackson National Life Insurance Co. | 8.150% | 3/15/27 | 39,480 | 50,104 |
| John Hancock Financial Services | 5.625% | 12/1/08 | 16,080 | 16,246 |
3 | Liberty Mutual Insurance Co. | 7.875% | 10/15/26 | 31,210 | 36,175 |
| Marsh & McLennan Cos., Inc. | 6.250% | 3/15/12 | 50,000 | 51,479 |
3 | MassMutual Global Funding II | 3.500% | 3/15/10 | 50,000 | 47,727 |
| Mercury General Corp. | 7.250% | 8/15/11 | 20,000 | 21,282 |
3 | MetLife Global Funding I | 4.500% | 5/5/10 | 20,000 | 19,687 |
3 | MetLife Global Funding I | 5.125% | 11/9/11 | 30,000 | 30,093 |
3 | Metropolitan Life Insurance Co. | 7.700% | 11/1/15 | 51,000 | 58,851 |
3 | New York Life Global Funding | 3.875% | 1/15/09 | 4,285 | 4,178 |
3 | New York Life Insurance | 5.875% | 5/15/33 | 55,395 | 58,647 |
3 | Pacific Life Global Funding | 3.750% | 1/15/09 | 38,415 | 37,425 |
| Principal Life Income Funding | 5.125% | 3/1/11 | 42,935 | 43,049 |
| Protective Life Secured Trust | 3.700% | 11/24/08 | 35,000 | 34,104 |
19
|
|
|
| Face | Market |
|
|
| Maturity | Amount | Value• |
|
| Coupon | Date | ($000) | ($000) |
| Protective Life Secured Trust | 4.850% | 8/16/10 | 15,205 | 15,113 |
| Prudential Financial, Inc. | 4.750% | 4/1/14 | 28,700 | 27,801 |
| Prudential Financial, Inc. | 5.100% | 9/20/14 | 10,000 | 9,904 |
| St. Paul Travelers Cos., Inc. | 5.750% | 3/15/07 | 20,000 | 20,014 |
| Torchmark Corp. | 7.875% | 5/15/23 | 45,000 | 54,043 |
| UnitedHealth Group, Inc. | 4.125% | 8/15/09 | 23,950 | 23,379 |
| UnitedHealth Group, Inc. | 4.750% | 2/10/14 | 10,000 | 9,727 |
| XL Capital Ltd. | 6.500% | 1/15/12 | 50,000 | 52,715 |
|
|
|
|
|
|
| Real Estate Investment Trusts (0.4%) |
|
|
|
|
| ERP Operating LP | 5.375% | 8/1/16 | 9,675 | 9,700 |
| Kimco Realty Corp. | 5.783% | 3/15/16 | 4,750 | 4,899 |
| ProLogis | 5.625% | 11/15/16 | 35,600 | 35,665 |
| Simon Property Group Inc. | 6.100% | 5/1/16 | 35,000 | 37,104 |
| Simon Property Group Inc. | 5.875% | 3/1/17 | 20,000 | 20,770 |
| Spieker Properties Corp. LP | 7.650% | 12/15/10 | 25,000 | 27,483 |
3 | Westfield Group | 5.700% | 10/1/16 | 60,000 | 60,759 |
|
|
|
|
|
|
| Other (0.1%) |
|
|
|
|
3 | SovRisc BV | 4.625% | 10/31/08 | 50,000 | 49,813 |
|
|
|
|
| 4,492,447 |
Industrials (8.5%) |
|
|
|
| |
| Basic Industry (0.6%) |
|
|
|
|
| Alcan, Inc. | 4.500% | 5/15/13 | 20,000 | 19,093 |
| Alcan, Inc. | 7.250% | 3/15/31 | 21,273 | 24,638 |
| Alcoa, Inc. | 7.375% | 8/1/10 | 40,000 | 43,006 |
| Alcoa, Inc. | 6.500% | 6/1/11 | 10,000 | 10,542 |
| BHP Billiton Finance | 4.800% | 4/15/13 | 15,000 | 14,725 |
| BHP Finance USA Ltd. | 7.250% | 3/1/16 | 15,000 | 17,125 |
| Dow Chemical Co. | 6.125% | 2/1/11 | 19,000 | 19,725 |
| Dow Chemical Co. | 6.000% | 10/1/12 | 25,000 | 26,029 |
| Dow Chemical Co. | 7.375% | 11/1/29 | 20,000 | 23,898 |
| E.I. du Pont de Nemours & Co. | 4.125% | 4/30/10 | 24,930 | 24,313 |
| E.I. du Pont de Nemours & Co. | 4.750% | 11/15/12 | 17,560 | 17,195 |
| PPG Industries, Inc. | 6.875% | 2/15/12 | 9,355 | 10,036 |
2 | Rohm & Haas Co. | 9.800% | 4/15/20 | 10,125 | 12,656 |
| Weyerhaeuser Co. | 7.375% | 3/15/32 | 25,000 | 26,183 |
|
|
|
|
|
|
| Capital Goods (1.1%) |
|
|
|
|
| Boeing Capital Corp. | 6.500% | 2/15/12 | 40,000 | 42,744 |
| Boeing Co. | 8.750% | 9/15/31 | 9,800 | 14,232 |
| Boeing Co. | 8.625% | 11/15/31 | 9,460 | 13,541 |
| Caterpillar Financial Services Corp. | 3.625% | 11/15/07 | 15,000 | 14,788 |
| Caterpillar Financial Services Corp. | 2.700% | 7/15/08 | 25,000 | 24,089 |
| Caterpillar Financial Services Corp. | 4.500% | 6/15/09 | 10,000 | 9,892 |
| Caterpillar, Inc. | 7.300% | 5/1/31 | 10,000 | 12,273 |
| Deere & Co. | 7.125% | 3/3/31 | 25,000 | 30,505 |
| General Dynamics Corp. | 4.250% | 5/15/13 | 40,000 | 38,300 |
| Honeywell International, Inc. | 7.500% | 3/1/10 | 41,000 | 44,076 |
3 | Hutchison Whampoa International Ltd. | 6.500% | 2/13/13 | 50,000 | 52,829 |
| John Deere Capital Corp. | 5.100% | 1/15/13 | 40,000 | 39,936 |
| Minnesota Mining & Manufacturing Corp. | 6.375% | 2/15/28 | 30,000 | 33,815 |
3 | Siemens Financieringsmat | 5.750% | 10/17/16 | 69,650 | 71,908 |
| United Technologies Corp. | 4.875% | 5/1/15 | 9,675 | 9,521 |
| United Technologies Corp. | 7.500% | 9/15/29 | 19,230 | 24,327 |
| United Technologies Corp. | 6.050% | 6/1/36 | 20,325 | 22,190 |
20
|
|
|
| Face | Market |
|
|
| Maturity | Amount | Value• |
|
| Coupon | Date | ($000) | ($000) |
| Communications (1.0%) |
|
|
|
|
| AT&T Inc. | 4.125% | 9/15/09 | 30,000 | 29,295 |
| BellSouth Corp. | 6.000% | 10/15/11 | 25,000 | 25,899 |
| BellSouth Corp. | 4.200% | 9/15/09 | 10,000 | 9,777 |
| BellSouth Telecommunications | 5.875% | 1/15/09 | 15,000 | 15,211 |
| CBS Corp. | 7.700% | 7/30/10 | 40,000 | 43,212 |
| Chesapeake & Potomac Telephone Co. | 7.150% | 5/1/23 | 10,000 | 10,762 |
| Deutsche Telekom International Finance | 8.000% | 6/15/10 | 50,000 | 54,710 |
| France Telecom | 7.750% | 3/1/11 | 50,000 | 55,083 |
| Gannett Co., Inc. | 5.500% | 4/1/07 | 19,250 | 19,247 |
| New York Times Co. | 4.500% | 3/15/10 | 9,450 | 9,218 |
| Southwestern Bell Telephone Co. | 7.600% | 4/26/07 | 7,000 | 7,054 |
| Telefonica Europe BV | 7.750% | 9/15/10 | 50,000 | 54,205 |
| Verizon Communications Corp. | 5.550% | 2/15/16 | 20,000 | 20,185 |
| Verizon Global Funding Corp. | 6.875% | 6/15/12 | 10,000 | 10,834 |
| Verizon Global Funding Corp. | 4.375% | 6/1/13 | 10,000 | 9,577 |
| Verizon Global Funding Corp. | 7.750% | 12/1/30 | 17,000 | 20,236 |
| Vodafone AirTouch PLC | 7.750% | 2/15/10 | 10,000 | 10,750 |
| Vodafone Group PLC | 5.000% | 12/16/13 | 10,000 | 9,808 |
| Vodafone Group PLC | 5.375% | 1/30/15 | 40,000 | 39,750 |
|
|
|
|
|
|
| Consumer Cyclicals (1.5%) |
|
|
|
|
| CVS Corp. | 4.000% | 9/15/09 | 40,000 | 38,871 |
| CVS Corp. | 4.875% | 9/15/14 | 35,000 | 33,972 |
| DaimlerChrysler North America Holding Corp. | 5.750% | 9/8/11 | 45,145 | 45,452 |
| DaimlerChrysler North America Holding Corp. | 6.500% | 11/15/13 | 4,855 | 5,052 |
| Federated Retail Holding | 5.900% | 12/1/16 | 16,842 | 17,070 |
3 | Harley-Davidson Inc. | 3.625% | 12/15/08 | 50,000 | 48,613 |
| Home Depot Inc. | 3.750% | 9/15/09 | 48,000 | 46,495 |
| Home Depot Inc. | 4.625% | 8/15/10 | 12,000 | 11,840 |
| Johnson Controls, Inc. | 7.125% | 7/15/17 | 36,300 | 40,404 |
| Kohl’s Corp. | 6.000% | 1/15/33 | 25,000 | 24,923 |
| Lowe’s Cos., Inc. | 8.250% | 6/1/10 | 12,870 | 14,184 |
| Lowe’s Cos., Inc. | 6.875% | 2/15/28 | 5,790 | 6,752 |
| Lowe’s Cos., Inc. | 6.500% | 3/15/29 | 39,900 | 44,528 |
| Target Corp. | 3.375% | 3/1/08 | 10,000 | 9,804 |
| Target Corp. | 5.875% | 3/1/12 | 40,000 | 41,611 |
| The Walt Disney Co. | 6.375% | 3/1/12 | 20,000 | 21,176 |
| The Walt Disney Co. | 5.625% | 9/15/16 | 30,000 | 30,757 |
| Time Warner, Inc. | 5.500% | 11/15/11 | 21,460 | 21,604 |
| Time Warner, Inc. | 7.570% | 2/1/24 | 20,000 | 22,474 |
| Time Warner, Inc. | 6.950% | 1/15/28 | 20,000 | 21,424 |
| Toyota Motor Credit Corp. | 5.500% | 12/15/08 | 50,000 | 50,493 |
| Toyota Motor Credit Corp. | 4.250% | 3/15/10 | 20,000 | 19,635 |
| Wal-Mart Stores, Inc. | 6.875% | 8/10/09 | 12,000 | 12,587 |
| Wal-Mart Stores, Inc. | 4.125% | 2/15/11 | 40,000 | 38,816 |
| Wal-Mart Stores, Inc. | 5.250% | 9/1/35 | 18,000 | 17,072 |
|
|
|
|
|
|
| Consumer Noncyclicals (3.0%) |
|
|
|
|
| Abbott Laboratories | 5.600% | 5/15/11 | 15,000 | 15,364 |
| Abbott Laboratories | 4.350% | 3/15/14 | 45,000 | 42,861 |
| Anheuser-Busch Cos., Inc. | 5.000% | 3/1/19 | 15,000 | 14,466 |
| Anheuser-Busch Cos., Inc. | 6.500% | 1/1/28 | 19,550 | 21,806 |
| Anheuser-Busch Cos., Inc. | 6.800% | 8/20/32 | 20,000 | 23,209 |
| Archer-Daniels-Midland Co. | 7.000% | 2/1/31 | 40,130 | 47,558 |
| Baxter International, Inc. | 5.900% | 9/1/16 | 12,498 | 13,061 |
| Bristol-Myers Squibb Co. | 5.875% | 11/15/36 | 60,000 | 61,126 |
21
|
|
|
| Face | Market |
|
|
| Maturity | Amount | Value• |
|
| Coupon | Date | ($000) | ($000) |
3 | Cargill Inc. | 6.875% | 5/1/28 | 19,355 | 21,982 |
3 | Cargill Inc. | 6.125% | 4/19/34 | 28,980 | 30,621 |
| Clorox Co. | 4.200% | 1/15/10 | 55,770 | 54,465 |
| Coca-Cola Enterprises Inc. | 6.125% | 8/15/11 | 40,000 | 41,888 |
| Coca-Cola Enterprises Inc. | 7.000% | 10/1/26 | 10,075 | 11,640 |
| Coca-Cola HBC Finance | 5.125% | 9/17/13 | 28,000 | 27,847 |
| Coca-Cola HBC Finance | 5.500% | 9/17/15 | 17,440 | 17,656 |
| Colgate-Palmolive Co. | 7.600% | 5/19/25 | 13,920 | 17,635 |
| ConAgra Foods, Inc. | 6.750% | 9/15/11 | 15,485 | 16,506 |
| Diageo Capital PLC | 3.500% | 11/19/07 | 40,000 | 39,360 |
| Diageo Capital PLC | 3.375% | 3/20/08 | 10,000 | 9,781 |
| Eli Lilly & Co. | 6.000% | 3/15/12 | 45,000 | 47,226 |
| Fortune Brands Inc. | 4.875% | 12/1/13 | 20,000 | 19,104 |
| Fortune Brands Inc. | 6.250% | 4/1/08 | 40,000 | 40,454 |
| GlaxoSmithKline Capital Inc. | 4.375% | 4/15/14 | 35,000 | 33,581 |
| GlaxoSmithKline Capital Inc. | 5.375% | 4/15/34 | 45,000 | 45,268 |
| Hershey Foods Corp. | 4.850% | 8/15/15 | 9,620 | 9,419 |
| Kimberly-Clark Corp. | 4.875% | 8/15/15 | 30,000 | 29,653 |
| Kimberly-Clark Corp. | 6.375% | 1/1/28 | 10,000 | 11,053 |
| Kraft Foods, Inc. | 6.250% | 6/1/12 | 27,170 | 28,517 |
| Medtronic Inc. | 4.375% | 9/15/10 | 19,235 | 18,818 |
| Medtronic Inc. | 4.750% | 9/15/15 | 20,000 | 19,302 |
| Merck & Co. | 5.125% | 11/15/11 | 69,000 | 69,394 |
3 | Pepsi Bottling Holdings Inc. | 5.625% | 2/17/09 | 40,000 | 40,561 |
| Pepsi Bottling Group, Inc. | 7.000% | 3/1/29 | 10,000 | 11,749 |
| Pharmacia Corp. | 6.600% | 12/1/28 | 12,000 | 14,007 |
2 | Procter & Gamble Co. ESOP | 9.360% | 1/1/21 | 60,008 | 76,024 |
3 | SABMiller PLC | 6.500% | 7/1/16 | 50,000 | 53,030 |
| Schering-Plough Corp. | 5.550% | 12/1/13 | 35,000 | 35,505 |
| Sysco Corp. | 5.375% | 9/21/35 | 25,000 | 24,574 |
| Unilever Capital Corp. | 7.125% | 11/1/10 | 37,000 | 39,685 |
| Unilever Capital Corp. | 5.900% | 11/15/32 | 27,000 | 28,089 |
| Warner-Lambert Co. | 6.000% | 1/15/08 | 16,000 | 16,170 |
3 | Western Union Co. | 5.930% | 10/1/16 | 60,000 | 61,247 |
| Wyeth | 6.950% | 3/15/11 | 30,000 | 32,079 |
| Zeneca Wilmington Inc. | 7.000% | 11/15/23 | 29,000 | 34,493 |
|
|
|
|
|
|
| Energy (0.5%) |
|
|
|
|
| Amoco Corp. | 6.500% | 8/1/07 | 25,000 | 25,193 |
| Anadarko Petroleum Corp. | 3.250% | 5/1/08 | 15,000 | 14,596 |
| Apache Finance Canada | 7.750% | 12/15/29 | 39,910 | 50,010 |
| ChevronTexaco Capital Co. | 3.500% | 9/17/07 | 27,190 | 26,838 |
| Conoco Funding Co. | 6.350% | 10/15/11 | 30,000 | 31,696 |
| Phillips Petroleum Co. | 9.375% | 2/15/11 | 20,000 | 23,106 |
| Suncor Energy, Inc. | 7.150% | 2/1/32 | 20,279 | 24,326 |
| Suncor Energy, Inc. | 5.950% | 12/1/34 | 20,700 | 21,800 |
|
|
|
|
|
|
| Technology (0.4%) |
|
|
|
|
| Cisco Systems Inc. | 5.250% | 2/22/11 | 65,000 | 65,747 |
| International Business Machines Corp. | 8.375% | 11/1/19 | 25,000 | 31,955 |
| International Business Machines Corp. | 5.875% | 11/29/32 | 25,000 | 26,421 |
| Pitney Bowes Credit Corp. | 8.550% | 9/15/09 | 41,890 | 45,742 |
|
|
|
|
|
|
| Transportation (0.2%) |
|
|
|
|
3 | ERAC USA Finance Co. | 7.350% | 6/15/08 | 21,805 | 22,394 |
2 | Federal Express Corp. | 6.720% | 1/15/22 | 39,469 | 42,488 |
2 | Southwest Airlines Co. | 7.540% | 6/29/15 | 30,772 | 33,975 |
22
|
|
|
| Face | Market |
|
|
| Maturity | Amount | Value• |
|
| Coupon | Date | ($000) | ($000) |
| Industrials Other (0.2%) |
|
|
|
|
| Dover Corp. | 6.500% | 2/15/11 | 13,808 | 14,532 |
2,3 | Ohana Military Communities LLC | 5.780% | 10/1/36 | 16,360 | 16,656 |
| Snap-On Inc. | 6.250% | 8/15/11 | 34,990 | 36,659 |
|
|
|
|
| 3,850,520 |
Utilities (2.0%) |
|
|
|
| |
| Electric (1.6%) |
|
|
|
|
^,3 | Abu Dhabi National Energy Co. | 5.875% | 10/27/16 | 22,180 | 22,707 |
| Alabama Power Co. | 2.800% | 12/1/06 | 23,090 | 23,090 |
| Alabama Power Co. | 5.700% | 2/15/33 | 15,000 | 15,343 |
| Carolina Power & Light Co. | 5.950% | 3/1/09 | 20,000 | 20,370 |
| Central Illinois Public Service | 6.125% | 12/15/28 | 54,000 | 54,403 |
| Commonwealth Edison Co. | 5.950% | 8/15/16 | 23,120 | 23,787 |
| Consolidated Edison Co. of New York | 6.450% | 12/1/07 | 20,000 | 20,230 |
| Consolidated Edison Co. of New York | 5.500% | 9/15/16 | 20,930 | 21,309 |
| Consolidated Edison Co. of New York | 5.300% | 12/1/16 | 25,505 | 25,622 |
| Consolidated Edison, Inc. | 3.625% | 8/1/08 | 20,000 | 19,530 |
| Exelon Generation Co. LLC | 6.950% | 6/15/11 | 45,000 | 47,874 |
| Florida Power & Light Co. | 4.950% | 6/1/35 | 10,000 | 9,250 |
| Florida Power & Light Co. | 5.650% | 2/1/35 | 40,000 | 41,008 |
| MidAmerican Energy Holdings Co. | 6.125% | 4/1/36 | 15,000 | 15,741 |
| National Rural Utilities Cooperative Finance Corp. | 5.750% | 12/1/08 | 50,000 | 50,540 |
| Northern States Power Co. | 6.250% | 6/1/36 | 50,000 | 55,419 |
| PPL Energy Supply LLC | 6.200% | 5/15/16 | 30,000 | 31,507 |
| PacifiCorp | 5.900% | 8/15/34 | 12,500 | 13,091 |
| Public Service Electric & Gas | 4.000% | 11/1/08 | 40,500 | 39,677 |
| South Carolina Electric & Gas Co. | 5.800% | 1/15/33 | 9,000 | 9,380 |
| Southern California Edison Co. | 6.000% | 1/15/34 | 7,695 | 8,162 |
| Southern Investments UK PLC | 6.800% | 12/1/06 | 35,000 | 35,001 |
| Wisconsin Electric Power Co. | 4.500% | 5/15/13 | 21,565 | 20,735 |
| Wisconsin Electric Power Co. | 5.700% | 12/1/36 | 17,280 | 17,853 |
| Wisconsin Power & Light Co. | 7.625% | 3/1/10 | 20,000 | 21,451 |
| Wisconsin Public Service | 6.080% | 12/1/28 | 45,000 | 47,931 |
|
|
|
|
|
|
| Natural Gas (0.3%) |
|
|
|
|
| British Transco Finance | 6.625% | 6/1/18 | 50,000 | 55,147 |
3 | Duke Energy Field Services | 6.450% | 11/3/36 | 30,325 | 32,240 |
| KeySpan Corp. | 4.650% | 4/1/13 | 9,000 | 8,661 |
| National Grid PLC | 6.300% | 8/1/16 | 30,000 | 31,547 |
| San Diego Gas & Electric | 6.000% | 6/1/26 | 3,600 | 3,830 |
| Wisconsin Gas Co. | 6.600% | 9/15/13 | 13,100 | 14,081 |
|
|
|
|
|
|
| Utilities Other (0.1%) |
|
|
|
|
| UGI Utilities Inc. | 5.753% | 9/30/16 | 37,590 | 38,015 |
|
|
|
|
| 894,532 |
Total Corporate Bonds (Cost $10,310,377) |
|
|
| 10,508,364 | |
Sovereign Bonds (U.S. Dollar-Denominated) (2.4%) |
|
|
|
| |
| African Development Bank | 4.500% | 1/15/09 | 50,000 | 49,758 |
3 | Corporacion Nacional del Cobre | 6.150% | 10/24/36 | 25,000 | 26,156 |
| European Investment Bank | 4.000% | 3/3/10 | 40,000 | 39,114 |
| Inter-American Development Bank | 5.375% | 11/18/08 | 19,400 | 19,713 |
| Inter-American Development Bank | 7.375% | 1/15/10 | 40,000 | 42,998 |
| Inter-American Development Bank | 4.375% | 9/20/12 | 40,000 | 39,107 |
| International Bank for Reconstruction & Development | 6.125% | 12/19/07 | 20,000 | 20,225 |
| International Bank for Reconstruction & Development | 5.750% | 2/6/08 | 19,400 | 19,613 |
23
|
|
|
| Face | Market |
|
|
| Maturity | Amount | Value• |
|
| Coupon | Date | ($000) | ($000) |
| International Bank for Reconstruction & Development | 4.750% | 2/15/35 | 40,000 | 38,771 |
| Japan Bank International | 4.750% | 5/25/11 | 70,000 | 69,684 |
| Japan Finance Corp. | 4.625% | 4/21/15 | 75,000 | 73,313 |
| Kreditanstalt fur Wiederaufbau | 4.750% | 1/24/07 | 15,000 | 14,996 |
| Kreditanstalt fur Wiederaufbau | 3.375% | 1/23/08 | 55,000 | 54,087 |
| Kreditanstalt fur Wiederaufbau | 7.000% | 3/1/13 | 10,000 | 11,167 |
| Landwirtschaftliche Rentenbank | 4.125% | 7/15/08 | 50,000 | 49,397 |
| Oesterreichische Kontrollbank | 4.250% | 10/6/10 | 25,000 | 24,619 |
| Oesterreichische Kontrollbank | 4.500% | 3/9/15 | 50,000 | 49,084 |
| Province of British Columbia | 4.300% | 5/30/13 | 40,000 | 39,027 |
| Province of Manitoba | 4.450% | 4/12/10 | 57,000 | 56,156 |
| Province of Ontario | 4.375% | 2/15/13 | 40,000 | 39,012 |
^ | Province of Ontario | 4.500% | 2/3/15 | 35,000 | 34,203 |
| Province of Quebec | 4.875% | 5/5/14 | 25,000 | 24,930 |
| Province of Quebec | 5.125% | 11/14/16 | 50,000 | 50,483 |
| Quebec Hydro Electric | 6.300% | 5/11/11 | 40,000 | 41,716 |
| Republic of Italy | 4.500% | 1/21/15 | 50,000 | 48,813 |
| Republic of South Africa | 6.500% | 6/2/14 | 21,900 | 23,187 |
| State of Israel | 5.500% | 11/9/16 | 30,000 | 30,295 |
| Swedish Export Credit Corp. | 4.625% | 2/17/09 | 60,000 | 59,667 |
Total Sovereign Bonds (Cost $1,102,003) |
|
|
| 1,089,291 | |
Taxable Municipal Bonds (0.8%) |
|
|
|
| |
| Atlanta GA Downtown Dev. Auth. Rev. | 6.875% | 2/1/21 | 12,985 | 14,624 |
4 | Chelan County WA Public Util. Dist. | 7.100% | 6/1/08 | 12,000 | 12,329 |
| Illinois (Taxable Pension) GO | 5.100% | 6/1/33 | 75,000 | 73,937 |
5 | Kansas Dev. Finance Auth. Rev. |
|
|
|
|
| (Public Employee Retirement System) | 5.501% | 5/1/34 | 50,000 | 51,830 |
4 | Oakland CA Pension Obligation | 6.980% | 12/15/09 | 7,801 | 8,238 |
| Oregon School Board Assn. | 5.528% | 6/30/28 | 50,000 | 51,600 |
| President and Fellows of Harvard College | 6.300% | 10/1/37 | 50,000 | 55,162 |
5 | Southern California Public Power Auth. | 6.930% | 5/15/17 | 30,000 | 34,617 |
| Stanford Univ. California Rev. | 6.875% | 2/1/24 | 34,745 | 41,210 |
| Stanford Univ. California Rev. | 7.650% | 6/15/26 | 29,000 | 37,383 |
Total Taxable Municipal Bonds (Cost $359,473) |
|
|
| 380,930 | |
24
|
| Face | Market |
|
| Amount | Value• |
|
| ($000) | ($000) |
Temporary Cash Investments (1.4%) |
| ||
Repurchase Agreement (1.2%) |
|
| |
| Bank America, 5.310%,12/1/06 |
| |
| (Dated 11/30/06, |
|
|
| Repurchase Value $546,181,000, |
| |
| collateralized by Federal |
|
|
| Home Loan Mortgage Corp. |
|
|
| 5.500%, 2/1/34 and Federal |
|
|
| National Mortgage Assn. |
|
|
| 5.000%, 7/1/35) | 546,100 | 546,100 |
Commercial Paper (0.1%) |
|
| |
| UBS Americas Inc. |
|
|
| 5.305%, 2/9/07 | 25,000 | 24,997 |
| Royal Bank of Canada |
|
|
| 5.290%, 2/5/07 | 30,000 | 29,996 |
|
|
| 54,993 |
U.S. Agency Obligation (0.0%) |
|
| |
1 | Federal National Mortgage Assn. |
| |
| 5.214%, 12/18/06 | 14,500 | 14,465 |
|
|
|
|
|
|
|
|
Money Market Fund (0.1%) |
|
| |
6 | Vanguard Market |
|
|
| Liquidity Fund, |
|
|
| 5.290%—Note G | 22,106,920 | 22,107 |
Total Temporary Cash Investments |
| ||
(Cost $637,672) |
| 637,665 | |
Total Investments (99.6%) |
|
| |
(Cost $35,762,847) |
| 45,005,137 | |
Other Assets and Liabilities (0.4%) |
| ||
| Other Assets—Note C |
| 348,086 |
| Liabilities—Note G |
| (184,169) |
|
|
| 163,917 |
Net Assets (100%) |
| 45,169,054 | |
At November 30, 2006, net assets consisted of:7 | |
| Amount |
| ($000) |
Paid-in Capital | 33,817,948 |
Undistributed Net Investment Income | 228,986 |
Accumulated Net Realized Gains | 1,879,794 |
Unrealized Appreciation |
|
Investment Securities | 9,242,290 |
Foreign Currencies | 36 |
Net Assets | 45,169,054 |
|
|
Investor Shares—Net Assets |
|
Applicable to 868,491,944 outstanding |
|
$.001 par value shares of beneficial |
|
interest (unlimited authorization) | 29,317,922 |
Net Asset Value Per Share— |
|
Investor Shares | $33.76 |
|
|
Admiral Shares—Net Assets |
|
Applicable to 271,805,167 outstanding |
|
$.001 par value shares of beneficial |
|
interest (unlimited authorization) | 15,851,132 |
Net Asset Value Per Share— |
|
Admiral Shares | $58.32 |
• See Note A in Notes to Financial Statements.
* Non-income-producing security.
^ Part of security position is on loan to broker-dealers. See Note G in Notes to Financial Statements
1 The issuer operates under a congressional charter; its securities are neither issued nor guaranteed by the U.S. government. If needed, access to additional funding from the U.S. Treasury (beyond the issuer’s line of credit) would require congressional action.
2 The average maturity is shorter than the final maturity shown due to scheduled interim principal payments and prepayments.
3 Security exempt from registration under Rule 144A of the Securities Act of 1933. Such securities may be sold in transactions exempt from registration, normally to qualified institutional buyers. At November 30, 2006, the aggregate value of these securities was $1,599,634,000, representing 3.5% of net assets.
4 Scheduled principal and interest payments are guaranteed by MBIA (Municipal Bond Insurance Association).
5 Scheduled principal and interest payments are guaranteed by FSA (Financial Security Association).
6 Affiliated money market fund available only to Vanguard funds and certain trusts and accounts managed by Vanguard. Rate shown is the 7-day yield.
7 See Note E in Notes to Financial Statements for the tax-basis components of net assets.
ADR—American Depositary Receipt.
CMO—Collateralized Mortgage Obligation.
GO—General Obligation Bond.
| 25 |
Statement of Operations
| Year Ended |
| November 30, 2006 |
| ($000) |
Investment Income |
|
Income |
|
Dividends1 | 656,301 |
Interest | 745,182 |
Security Lending | 4,098 |
Total Income | 1,405,581 |
Expenses |
|
Investment Advisory Fees—Note B |
|
Basic Fee | 17,827 |
Performance Adjustment | 4,433 |
The Vanguard Group—Note C |
|
Management and Administrative—Investor Shares | 60,548 |
Management and Administrative—Admiral Shares | 13,702 |
Marketing and Distribution—Investor Shares | 5,993 |
Marketing and Distribution—Admiral Shares | 2,348 |
Custodian Fees | 123 |
Auditing Fees | 21 |
Shareholders’ Reports—Investor Shares | 623 |
Shareholders’ Reports—Admiral Shares | 36 |
Trustees’ Fees and Expenses | 44 |
Total Expenses | 105,698 |
Expenses Paid Indirectly—Note D | (1,279) |
Net Expenses | 104,419 |
Net Investment Income | 1,301,162 |
Realized Net Gain (Loss) |
|
Investment Securities Sold | 2,008,603 |
Foreign Currencies | (279) |
Realized Net Gain (Loss) | 2,008,324 |
Change in Unrealized Appreciation (Depreciation) |
|
Investment Securities | 2,438,068 |
Foreign Currencies | 36 |
Change in Unrealized Appreciation (Depreciation) | 2,438,104 |
Net Increase (Decrease) in Net Assets Resulting from Operations | 5,747,590 |
1 Dividends are net of foreign withholding taxes of $14,195,000.
26
Statement of Changes in Net Assets
| Year Ended November 30, | |
| 2006 | 2005 |
| ($000) | ($000) |
Increase (Decrease) In Net Assets |
|
|
Operations |
|
|
Net Investment Income | 1,301,162 | 1,061,027 |
Realized Net Gain (Loss) | 2,008,324 | 1,270,014 |
Change in Unrealized Appreciation (Depreciation) | 2,438,104 | 722,504 |
Net Increase (Decrease) in Net Assets Resulting from Operations | 5,747,590 | 3,053,545 |
Distributions |
|
|
Net Investment Income |
|
|
Investor Shares | (838,099) | (821,748) |
Admiral Shares | (442,134) | (221,010) |
Realized Capital Gain1 |
|
|
Investor Shares | (811,700) | (821,687) |
Admiral Shares | (390,028) | (161,487) |
Total Distributions | (2,481,961) | (2,025,932) |
Capital Share Transactions—Note H |
|
|
Investor Shares | 1,104,904 | (2,171,481) |
Admiral Shares | 2,222,170 | 6,824,895 |
Net Increase (Decrease) from Capital Share Transactions | 3,327,074 | 4,653,414 |
Total Increase (Decrease) | 6,592,703 | 5,681,027 |
Net Assets |
|
|
Beginning of Period | 38,576,351 | 32,895,324 |
End of Period2 | 45,169,054 | 38,576,351 |
1 Includes fiscal 2006 and 2005 short-term gain distributions totaling $80,197,000 and $6,490,000, respectively. Short-term gain distributions are treated as ordinary income dividends for tax purposes.
2 Net Assets–End of Period includes undistributed net investment income of $228,986,000 and $208,336,000.
27
Financial Highlights
Wellington Fund Investor Shares |
|
|
|
|
|
|
|
|
|
|
|
For a Share Outstanding |
|
| Year Ended November 30, | ||
Throughout Each Period | 2006 | 2005 | 2004 | 2003 | 2002 |
Net Asset Value, Beginning of Period | $31.34 | $30.54 | $27.69 | $25.27 | $28.41 |
Investment Operations |
|
|
|
|
|
Net Investment Income | .982 | .886 | .865 | .77 | .837 |
Net Realized and Unrealized Gain (Loss) |
|
|
|
|
|
on Investments | 3.392 | 1.718 | 2.800 | 2.42 | (1.986) |
Total from Investment Operations | 4.374 | 2.604 | 3.665 | 3.19 | (1.149) |
Distributions |
|
|
|
|
|
Dividends from Net Investment Income | (.980) | (.895) | (.815) | (.77) | (.870) |
Distributions from Realized Capital Gains | (.974) | (.909) | — | — | (1.121) |
Total Distributions | (1.954) | (1.804) | (.815) | (.77) | (1.991) |
Net Asset Value, End of Period | $33.76 | $31.34 | $30.54 | $27.69 | $25.27 |
|
|
|
|
|
|
Total Return | 14.69% | 8.86% | 13.44% | 12.94% | –4.27% |
|
|
|
|
|
|
Ratios/Supplemental Data |
|
|
|
|
|
Net Assets, End of Period (Millions) | $29,318 | $26,074 | $27,503 | $23,108 | $20,007 |
Ratio of Total Expenses to |
|
|
|
|
|
Average Net Assets1 | 0.30% | 0.29% | 0.31% | 0.36% | 0.36% |
Ratio of Net Investment Income to |
|
|
|
|
|
Average Net Assets | 3.10% | 2.93% | 2.99% | 3.00% | 3.18% |
Portfolio Turnover Rate | 25% | 24% | 24% | 28% | 25% |
1 Includes performance-based investment advisory fee increases (decreases) of 0.01%, 0.01%, 0.01%, 0.01%, and 0.01%.
28
Wellington Fund Admiral Shares |
|
|
|
|
|
|
|
|
|
|
|
For a Share Outstanding |
|
| Year Ended November 30, | ||
Throughout Each Period | 2006 | 2005 | 2004 | 2003 | 2002 |
Net Asset Value, Beginning of Period | $54.15 | $52.76 | $47.84 | $43.66 | $49.08 |
Investment Operations |
|
|
|
|
|
Net Investment Income | 1.768 | 1.61 | 1.561 | 1.383 | 1.494 |
Net Realized and Unrealized Gain (Loss) |
|
|
|
|
|
on Investments | 5.849 | 2.97 | 4.831 | 4.183 | (3.425) |
Total from Investment Operations | 7.617 | 4.58 | 6.392 | 5.566 | (1.931) |
Distributions |
|
|
|
|
|
Dividends from Net Investment Income | (1.765) | (1.62) | (1.472) | (1.386) | (1.552) |
Distributions from Realized Capital Gains | (1.682) | (1.57) | — | — | (1.937) |
Total Distributions | (3.447) | (3.19) | (1.472) | (1.386) | (3.489) |
Net Asset Value, End of Period | $58.32 | $54.15 | $52.76 | $47.84 | $43.66 |
|
|
|
|
|
|
Total Return | 14.82% | 9.02% | 13.57% | 13.09% | –4.15% |
|
|
|
|
|
|
Ratios/Supplemental Data |
|
|
|
|
|
Net Assets, End of Period (Millions) | $15,851 | $12,503 | $5,392 | $3,878 | $2,922 |
Ratio of Total Expenses to |
|
|
|
|
|
Average Net Assets1 | 0.17% | 0.15% | 0.17% | 0.23% | 0.26% |
Ratio of Net Investment Income to |
|
|
|
|
|
Average Net Assets | 3.23% | 3.09% | 3.13% | 3.12% | 3.30% |
Portfolio Turnover Rate | 25% | 24% | 24% | 28% | 25% |
1 Includes performance-based investment advisory fee increases (decreases) of 0.01%, 0.01%, 0.01%, 0.01%, and 0.01%. See accompanying Notes, which are an integral part of the Financial Statements.
29
Notes to Financial Statements
Vanguard Wellington Fund is registered under the Investment Company Act of 1940 as an open-end investment company, or mutual fund. The fund offers two classes of shares, Investor Shares and Admiral Shares. Investor Shares are available to any investor who meets the fund’s minimum purchase requirements. Admiral Shares are designed for investors who meet certain administrative, servicing, tenure, and account-size criteria. Certain of the fund’s investments are in corporate debt instruments; the issuers’ abilities to meet their obligations may be affected by economic developments in their respective industries.
A. The following significant accounting policies conform to generally accepted accounting principles for U.S. mutual funds. The fund consistently follows such policies in preparing its financial statements.
1. Security Valuation: Securities are valued as of the close of trading on the New York Stock Exchange (generally 4:00 p.m. Eastern time) on the valuation date. Equity securities are valued at the latest quoted sales prices or official closing prices taken from the primary market in which each security trades; such securities not traded on the valuation date are valued at the mean of the latest quoted bid and asked prices. Bonds, and temporary cash investments acquired over 60 days to maturity, are valued using the latest bid prices or using valuations based on a matrix system (which considers such factors as security prices, yields, maturities, and ratings), both as furnished by independent pricing services. Investments in Vanguard Market Liquidity Fund are valued at that fund’s net asset value. Other temporary cash investments are valued at amortized cost, which approximates market value. Securities for which market quotations are not readily available, or whose values have been affected by events occurring before the fund’s pricing time but after the close of the securities’ primary markets, are valued at their fair values calculated according to procedures adopted by the board of trustees. These procedures include obtaining quotations from an independent pricing service, monitoring news to identify significant market- or security-specific events, and evaluating changes in the values of foreign market proxies (for example, ADRs, futures contracts, or exchange-traded funds), between the time the foreign markets close and the fund’s pricing time. When fair-value pricing is employed, the prices of securities used by a fund to calculate its net asset value may differ from quoted or published prices for the same securities.
2. Foreign Currency: Securities and other assets and liabilities denominated in foreign currencies are translated into U.S. dollars at the exchange rates on the valuation date as employed by Morgan Stanley Capital International (MSCI) in the calculation of its indexes. As part of the fund’s fair-value procedures, exchange rates may be adjusted if they change significantly before the fund’s pricing time but after the time at which the MSCI rates are determined (generally 11:00 a.m. Eastern time).
Realized gains (losses) and unrealized appreciation (depreciation) on investment securities include the effects of changes in exchange rates since the securities were purchased, combined with the effects of changes in security prices. Fluctuations in the value of other assets and liabilities resulting from changes in exchange rates are recorded as unrealized foreign currency gains (losses) until the asset or liability is settled in cash, when they are recorded as realized foreign currency gains (losses).
3. Repurchase Agreements: The fund may invest in repurchase agreements. Securities pledged as collateral for repurchase agreements are held by a custodian bank until the agreements mature. Each agreement requires that the market value of the collateral be sufficient to cover payments of interest and principal; however, in the event of default or bankruptcy by the other party to the agreement, retention of the collateral may be subject to legal proceedings.
30
4. Federal Income Taxes: The fund intends to continue to qualify as a regulated investment company and distribute all of its taxable income. Accordingly, no provision for federal income taxes is required in the financial statements.
5. Distributions: Distributions to shareholders are recorded on the ex-dividend date.
6. Security Lending: The fund may lend its securities to qualified institutional borrowers to earn additional income. Security loans are required to be secured at all times by collateral at least equal to the market value of securities loaned. The fund invests cash collateral received in Vanguard Market Liquidity Fund, and records a liability for the return of the collateral, during the period the securities are on loan. Security lending income represents the income earned on investing cash collateral, less expenses associated with the loan.
7. Other: Dividend income is recorded on the ex-dividend date. Interest income is accrued daily. Premiums and discounts on debt securities purchased are amortized and accreted, respectively, to interest income over the lives of the respective securities. Security transactions are accounted for on the date securities are bought or sold. Costs used to determine realized gains (losses) on the sale of investment securities are those of the specific securities sold.
Each class of shares has equal rights as to assets and earnings, except that each class separately bears certain class-specific expenses related to maintenance of shareholder accounts (included in Management and Administrative expenses) and shareholder reporting. Marketing and distribution expenses are allocated to each class of shares based on a method approved by the board of trustees. Income, other non-class-specific expenses, and gains and losses on investments are allocated to each class of shares based on its relative net assets.
B. Wellington Management Company, LLP, provides investment advisory services to the fund for a fee calculated at an annual percentage rate of average net assets. The basic fee is subject to quarterly adjustments based on the fund’s performance for the preceding three years relative to a combined index comprising the S&P 500 Index and the Lehman Brothers Credit A or Better Bond Index. For the year ended November 30, 2006, the investment advisory fee represented an effective annual basic rate of 0.04% of the fund’s average net assets before an increase of $4,433,000 (0.01%) based on performance.
C. The Vanguard Group furnishes at cost corporate management, administrative, marketing, and distribution services. The costs of such services are allocated to the fund under methods approved by the board of trustees. The fund has committed to provide up to 0.40% of its net assets in capital contributions to Vanguard. At November 30, 2006, the fund had contributed capital of $4,454,000 to Vanguard (included in Other Assets), representing 0.01% of the fund’s net assets and 4.45% of Vanguard’s capitalization. The fund’s trustees and officers are also directors and officers of Vanguard.
D. The fund has asked its investment advisor to direct certain security trades, subject to obtaining the best price and execution, to brokers who have agreed to rebate to the fund part of the commissions generated. Such rebates are used solely to reduce the fund’s management and administrative expenses. For the year ended November 30, 2006, these arrangements reduced the fund’s expenses by $1,279,000.
31
E. Distributions are determined on a tax basis and may differ from net investment income and realized capital gains for financial reporting purposes. Differences may be permanent or temporary. Permanent differences are reclassified among capital accounts in the financial statements to reflect their tax character. Temporary differences arise when certain items of income, expense, gain, or loss are recognized in different periods for financial statement and tax purposes; these differences will reverse at some time in the future. Differences in classification may also result from the treatment of short-term gains as ordinary income for tax purposes.
During the year ended November 30, 2006, the fund realized net foreign currency losses of $279,000, which decreased distributable net income for tax purposes; accordingly such losses have been reclassified from accumulated net realized gains to undistributed net investment income.
The fund used a tax accounting practice to treat a portion of the price of capital shares redeemed during the year as distributions from realized capital gains. Accordingly, the fund has reclassified $128,196,000 from accumulated net realized gains to paid-in capital.
For tax purposes, at November 30, 2006, the fund had $469,183,000 of ordinary income and $1,699,599,000 of long-term capital gains available for distribution.
At November 30, 2006, the cost of investment securities for tax purposes was $35,762,847,000. Net unrealized appreciation of investment securities for tax purposes was $9,242,290,000, consisting of unrealized gains of $9,512,233,000 on securities that had risen in value since their purchase and $269,943,000 in unrealized losses on securities that had fallen in value since their purchase.
F. During the year ended November 30, 2006, the fund purchased $9,965,085,000 of investment securities and sold $7,891,816,000 of investment securities, other than U.S. government securities and temporary cash investments. Purchases and sales of U.S. government securities were $2,505,240,000 and $2,093,499,000, respectively.
G. The market value of securities on loan to broker-dealers at November 30, 2006, was $21,693,000, for which the fund received cash collateral of $22,107,000.
H. Capital share transactions for each class of shares were:
| Year Ended November 30, | |||||
|
| 2006 |
|
| 2005 |
|
| Amount | Shares |
| Amount | Shares |
|
| ($000) | (000) |
| ($000) | (000) |
|
Investor Shares |
|
|
|
|
|
|
Issued | 4,041,031 | 128,182 |
| 4,995,907 | 164,483 |
|
Issued in Lieu of Cash Distributions | 1,596,982 | 51,935 |
| 1,574,878 | 52,243 |
|
Redeemed | (4,533,109) | (143,551) |
| (8,742,266) | (285,363) |
|
Net Increase (Decrease)—Investor Shares | 1,104,904 | 36,566 |
| (2,171,481) | (68,637) |
|
Admiral Shares |
|
|
|
|
|
|
Issued | 2,912,397 | 53,262 |
| 7,199,889 | 135,769 |
|
Issued in Lieu of Cash Distributions | 768,878 | 14,470 |
| 352,559 | 6,752 |
|
Redeemed | (1,459,105) | (26,834) |
| (727,553) | (13,809) |
|
Net Increase (Decrease)—Admiral Shares | 2,222,170 | 40,898 |
| 6,824,895 | 128,712 |
|
32
I. In June 2006, the Financial Accounting Standards Board issued Interpretation No. 48 (“FIN 48”), “Accounting for Uncertainty in Income Taxes.” FIN 48 establishes the minimum threshold for recognizing, and a system for measuring, the benefits of tax-return positions in financial statements. FIN 48 will be effective for the fund’s fiscal year beginning December 1, 2007. Management is in the process of analyzing the fund’s tax positions for purposes of implementing FIN 48; based on the analysis completed to date, management does not believe the adoption of FIN 48 will result in any material impact to the fund’s financial statements.
33
Report of Independent Registered
Public Accounting Firm
To the Trustees and Shareholders of Vanguard Wellington Fund:
In our opinion, the accompanying statement of net assets and the related statements of operations and of changes in net assets and the financial highlights present fairly, in all material respects, the financial position of Vanguard Wellington Fund (the “Fund”) at November 30, 2006, the results of its operations for the year then ended, the changes in its net assets for each of the two years in the period then ended and the financial highlights for each of the five years in the period then ended, in conformity with accounting principles generally accepted in the United States of America. These financial statements and financial highlights (hereafter referred to as “financial statements”) are the responsibility of the Fund’s management; our responsibility is to express an opinion on these financial statements based on our audits. We conducted our audits of these financial statements in accordance with the standards of the Public Company Accounting Oversight Board (United States). Those standards require that we plan and perform the audit to obtain reasonable assurance about whether the financial statements are free of material misstatement. An audit includes examining, on a test basis, evidence supporting the amounts and disclosures in the financial statements, assessing the accounting principles used and significant estimates made by management, and evaluating the overall financial statement presentation. We believe that our audits, which included confirmation of securities at November 30, 2006 by correspondence with the custodians and broker and by agreement to the underlying ownership records for Vanguard Market Liquidity Fund, provide a reasonable basis for our opinion.
PricewaterhouseCoopers LLP
Philadelphia, Pennsylvania
January 11, 2007
Special 2006 tax information (unaudited) for Vanguard Wellington Fund
This information for the fiscal year ended November 30, 2006, is included pursuant to provisions of the Internal Revenue Code.
The fund distributed $1,237,445,000 as capital gain dividends (from net long-term capital gains) to shareholders during the fiscal year.
The fund distributed $603,397,000 of qualified dividend income to shareholders during the fiscal year.
For corporate shareholders, 35.3% of investment income (dividend income plus short-term gains, if any) qualifies for the dividends-received deduction.
34
Your Fund’s After-Tax Returns
This table presents returns for your fund both before and after taxes. The after-tax returns are shown in two ways: (1) assuming that an investor owned the fund during the entire period and paid taxes on the fund’s distributions, and (2) assuming that an investor paid taxes on the fund’s distributions and sold all shares at the end of each period.
Calculations are based on the highest individual federal income tax and capital gains tax rates in effect at the times of the distributions and the hypothetical sales. State and local taxes were not considered. After-tax returns reflect any qualified dividend income, using actual prior-year figures and estimates for 2006. (In the example, returns after the sale of fund shares may be higher than those assuming no sale. This occurs when the sale would have produced a capital loss. The calculation assumes that the investor received a tax deduction for the loss.)
The table shows returns for Investor Shares only; returns for other share classes will differ. Please note that your actual after-tax returns will depend on your tax situation and may differ from those shown. Also note that if you own the fund in a tax-deferred account, such as an individual retirement account or a 401(k) plan, this information does not apply to you. Such accounts are not subject to current taxes.
Finally, keep in mind that a fund’s performance—whether before or after taxes—does not guarantee future results.
Average Annual Total Returns: Wellington Fund Investor Shares |
|
|
|
Periods Ended November 30, 2006 |
|
|
|
| One | Five | Ten |
| Year | Years | Years |
Returns Before Taxes | 14.69% | 8.89% | 9.44% |
Returns After Taxes on Distributions | 13.21 | 7.59 | 7.28 |
Returns After Taxes on Distributions and Sale of Fund Shares | 10.34 | 7.06 | 7.01 |
35
About Your Fund’s Expenses
As a shareholder of the fund, you incur ongoing costs, which include costs for portfolio management, administrative services, and shareholder reports (like this one), among others. Operating expenses, which are deducted from a fund’s gross income, directly reduce the investment return of the fund.
A fund’s expenses are expressed as a percentage of its average net assets. This figure is known as the expense ratio. The following examples are intended to help you understand the ongoing costs (in dollars) of investing in your fund and to compare these costs with those of other mutual funds. The examples are based on an investment of $1,000 made at the beginning of the period shown and held for the entire period.
The table below illustrates your fund’s costs in two ways:
• Based on actual fund return. This section helps you to estimate the actual expenses that you paid over the period. The “Ending Account Value” shown is derived from the fund’s actual return, and the third column shows the dollar amount that would have been paid by an investor who started with $1,000 in the fund. You may use the information here, together with the amount you invested, to estimate the expenses that you paid over the period.
To do so, simply divide your account value by $1,000 (for example, an $8,600 account value divided by $1,000 = 8.6), then multiply the result by the number given for your fund under the heading “Expenses Paid During Period.”
• Based on hypothetical 5% yearly return. This section is intended to help you compare your fund’s costs with those of other mutual funds. It assumes that the fund had a yearly return of 5% before expenses, but that the expense ratio is unchanged. In this case—because the return used is not the fund’s actual return—the results do not apply to your investment. The example is useful in making comparisons because the Securities and Exchange Commission requires all mutual funds to calculate expenses based on a 5% return. You can assess your fund’s costs by comparing this hypothetical example with the hypothetical examples that appear in shareholder reports of other funds.
Six Months Ended November 30, 2006 |
|
|
|
| Beginning | Ending | Expenses |
| Account Value | Account Value | Paid During |
Wellington Fund | 5/31/2006 | 11/30/2006 | Period1 |
Based on Actual Fund Return |
|
|
|
Investor Shares | $1,000.00 | $1,098.42 | $1.58 |
Admiral Shares | 1,000.00 | 1,099.35 | 0.89 |
Based on Hypothetical 5% Yearly Return |
|
|
|
Investor Shares | $1,000.00 | $1,023.56 | $1.52 |
Admiral Shares | 1,000.00 | 1,024.22 | 0.86 |
1 The calculations are based on expenses incurred in the most recent six-month period. The fund’s annualized six-month expense ratios for that period are 0.30% for Investor Shares and 0.17% for Admiral Shares. The dollar amounts shown as “Expenses Paid” are equal to the annualized expense ratio multiplied by the average account value over the period, multiplied by the number of days in the most recent six-month period, then divided by the number of days in the most recent 12-month period.
36
Note that the expenses shown in the table are meant to highlight and help you compare ongoing costs only and do not reflect any transactional costs or account maintenance fees. They do not include your fund’s low-balance fee, which is described in the prospectus. If this fee were applied to your account, your costs would be higher. Your fund does not charge transaction fees, such as purchase or redemption fees, nor does it carry a “sales load.”
The calculations assume no shares were bought or sold during the period. Your actual costs may have been higher or lower, depending on the amount of your investment and the timing of any purchases or redemptions.
You can find more information about the fund’s expenses, including annual expense ratios, in the Financial Statements section of this report. For additional information on operating expenses and other shareholder costs, please refer to the appropriate fund prospectus.
37
Trustees Approve Advisory Agreement
The board of trustees of Vanguard Wellington Fund has renewed the fund’s investment advisory agreement with Wellington Management Company, LLP. The board determined that the retention of Wellington Management was in the best interests of the fund and its shareholders.
The board based its decision upon an evaluation of the advisor’s investment staff, portfolio management process, and performance. The trustees considered the factors discussed below, among others. However, no single factor determined whether the board approved the amended agreement. Rather, it was the totality of the circumstances that drove the board’s decision.
Nature, extent, and quality of services
The board considered the quality of investment management of the fund over both the short and long term and the organizational depth and stability of the advisory firm. The board noted that Wellington Management, founded in 1928, is among the nation’s oldest and most-respected institutional managers. The firm has advised the Wellington Fund since its inception in 1929. The two senior portfolio managers for the fund each have over two decades of industry experience and are backed by well-tenured teams of equity and fixed income research analysts who conduct detailed fundamental analysis of their respective industries and companies. Wellington Management has seen a significant growth in assets in the past decade.
The board concluded that Wellington Management has provided high-quality advisory services for the Wellington Fund and has demonstrated strong organizational depth and stability over both the short and long term. In addition, the board concluded that the asset-based advisory fee schedule should be adjusted to reflect the fair-market value of Wellington Management’s services and the firm’s need to maintain an expanded portfolio management team to manage a large fund in the balanced fund segment. The new schedule is expected to impact the fund’s expense ratio by less than 0.01%.
The board also approved a change to the process for the quarterly calculation of Wellington’s asset-based advisory fee. The calculation will be based on the average daily net assets of the fund rather than the average month-end net assets.
The board concluded that the advisor’s experience, stability, depth, and performance, among other factors, warranted the amendment and continuation of the advisory agreement.
Investment performance
The board considered the short- and long-term performance of the fund, including any periods of outperformance or underperformance of a relevant benchmark and peer group. The board concluded that the fund’s short- and long-term performance has been consistently competitive versus the fund’s benchmark, the Wellington Composite Index. The board also concluded that short- and long-term performance has been outstanding versus the fund’s mixed-asset target growth peers, as defined by Lipper. Information about the fund’s performance, including some of the data considered by the board, can be found in the Performance Summary section of this report.
Cost
The board concluded that the fund’s expense ratio, after the adjustment, is far below the average expense ratio charged by funds in its peer group. The board noted that the fund’s advisory fee is also well below the peer-group average. Information about the fund’s expense ratio appears in the About Your Fund’s Expenses section of this report as well as in the Financial Statements section, which also
38
includes information about the advisory fee rate. The board did not consider profitability of Wellington Management in determining whether to approve the advisory fee, because Wellington Management is independent of Vanguard, and the advisory fee is the result of arm’s-length negotiations.
The benefit of economies of scale
The board concluded that the fund’s shareholders benefit from economies of scale because of breakpoints in the fund’s advisory fee schedule. The breakpoints reduce the effective rate of the fee as the fund’s assets increase.
The advisory agreement will continue for one year and is renewable by the fund’s board after that for successive one-year periods.
39
Glossary
Average Coupon. The average interest rate paid on the fixed income securities held by a fund. It is expressed as a percentage of face value.
Average Duration. An estimate of how much the value of the bonds held by a fund will fluctuate in response to a change in interest rates. To see how the value could change, multiply the average duration by the change in rates. If interest rates rise by 1 percentage point, the value of the bonds in a fund with an average duration of five years would decline by about 5%. If rates decrease by a percentage point, the value would rise by 5%.
Average Effective Maturity. The average length of time until fixed income securities held by a fund reach maturity and are repaid, taking into consideration the possibility that the issuer may call the bond before its maturity date. The figure reflects the proportion of fund assets represented by each security; it also reflects any futures contracts held. In general, the longer the average effective maturity, the more a fund’s share price will fluctuate in response to changes in market interest rates.
Average Quality. An indicator of credit risk, this figure is the average of the ratings assigned to a fund’s fixed income holdings by credit-rating agencies. The agencies make their judgment after appraising an issuer’s ability to meet its obligations. Quality is graded on a scale, with Aaa or AAA indicating the most creditworthy bond issuers. U.S. Treasury securities are considered to have the highest credit quality.
Beta. A measure of the magnitude of a fund’s past share-price fluctuations in relation to the ups and downs of a given market index. The index is assigned a beta of 1.00. Compared with a given index, a fund with a beta of 1.20 typically would have seen its share price rise or fall by 12% when the index rose or fell by 10%. A fund’s beta should be reviewed in conjunction with its R-squared (see definition below). The lower the R-squared, the less correlation there is between the fund and the index, and the less reliable beta is as an indicator of volatility.
Dividend Yield. The current, annualized rate of dividends paid on a share of stock, divided by its current share price. For a fund, the weighted average yield for stocks it holds. The index yield is based on the current annualized rate of dividends paid on stocks in the index.
Earnings Growth Rate. The average annual rate of growth in earnings over the past five years for the stocks now in a fund.
Expense Ratio. The percentage of a fund’s average net assets used to pay its annual administrative and advisory expenses. These expenses directly reduce returns to investors.
Foreign Holdings. The percentage of a fund represented by stocks or depositary receipts of companies based outside the United States.
Median Market Cap. An indicator of the size of companies in which a fund invests; the midpoint of market capitalization (market price x shares outstanding) of a fund’s stocks, weighted by the proportion of the fund’s assets invested in each stock. Stocks representing half of the fund’s assets have market capitalizations above the median, and the rest are below it.
Price/Book Ratio. The share price of a stock divided by its net worth, or book value, per share. For a fund, the weighted average price/book ratio of the stocks it holds.
40
Price/Earnings Ratio. The ratio of a stock’s current price to its per-share earnings over the past year. For a fund, the weighted average P/E of the stocks it holds. P/E is an indicator of market expectations about corporate prospects; the higher the P/E, the greater the expectations for a company’s future growth.
R-Squared. A measure of how much of a fund’s past returns can be explained by the returns from the market in general, as measured by a given index. If a fund’s total returns were precisely synchronized with an index’s returns, its R-squared would be 1.00. If the fund’s returns bore no relationship to the index’s returns, its R-squared would be 0.
Return on Equity. The annual average rate of return generated by a company during the past five years for each dollar of shareholder’s equity (net income divided by shareholder’s equity). For a fund, the weighted average return on equity for the companies whose stocks it holds.
Short-Term Reserves. The percentage of a fund invested in highly liquid, short-term securities that can be readily converted to cash.
Turnover Rate. An indication of the fund’s trading activity. Funds with high turnover rates incur higher transaction costs and may be more likely to distribute capital gains (which may be taxable to investors). The turnover rate excludes in-kind transactions, which have minimal impact on costs.
Yield. A snapshot of a fund’s income from interest and dividends. The yield, expressed as a percentage of the fund’s net asset value, is based on income earned over the past 30 days and is annualized, or projected forward for the coming year.
Yield to Maturity. The rate of return an investor would receive if the fixed income securities held by a fund were held to their maturity dates.
41
This page intentionally left blank.
This page intentionally left blank.
The People Who Govern Your Fund
The trustees of your mutual fund are there to see that the fund is operated and managed in your best interests since, as a shareholder, you are a part owner of the fund. Your fund’s trustees also serve on the board of directors of The Vanguard Group, Inc., which is owned by the Vanguard funds and provides services to them on an at-cost basis.
A majority of Vanguard’s board members are independent, meaning that they have no affiliation with Vanguard or the funds they oversee, apart from the sizable personal investments they have made as private individuals.
Our independent board members bring distinguished backgrounds in business, academia, and public service to their task of working with Vanguard officers to establish the policies and oversee the activities of the funds. Among board members’ responsibilities are selecting investment advisors for the funds; monitoring fund operations, performance, and costs; reviewing contracts; nominating and selecting new trustees/directors; and electing Vanguard officers.
Each trustee serves a fund until its termination; or until the trustee’s retirement, resignation, or death; or otherwise as specified in the fund’s organizational documents. Any trustee may be removed at a shareholders’ meeting by a vote representing two-thirds of the net asset value of all shares of the fund together with shares of other Vanguard funds organized within the same trust. The table on these two pages shows information for each trustee and executive officer of the fund. The mailing address of the trustees and officers is P.O. Box 876, Valley Forge, PA 19482.
Chairman of the Board, Chief Executive Officer, and Trustee | |
|
|
John J. Brennan1 |
|
Born 1954 | Principal Occupation(s) During the Past Five Years: Chairman of the Board, Chief Executive |
Trustee since May 1987; | Officer, and Director/Trustee of The Vanguard Group, Inc., and of each of the investment |
Chairman of the Board and | companies served by The Vanguard Group. |
Chief Executive Officer |
|
145 Vanguard Funds Overseen |
|
|
|
Independent Trustees |
|
|
|
Charles D. Ellis |
|
Born 1937 | Principal Occupation(s) During the Past Five Years: Applecore Partners (pro bono ventures |
Trustee since January 2001 | in education); Senior Advisor to Greenwich Associates (international business strategy |
145 Vanguard Funds Overseen | consulting); Successor Trustee of Yale University; Overseer of the Stern School of Business |
| at New York University; Trustee of the Whitehead Institute for Biomedical Research. |
|
|
Rajiv L. Gupta |
|
Born 1945 | Principal Occupation(s) During the Past Five Years: Chairman and Chief Executive Officer |
Trustee since December 20012 | of Rohm and Haas Co. (chemicals); Board Member of the American Chemistry Council; |
145 Vanguard Funds Overseen | Director of Tyco International, Ltd. (diversified manufacturing and services) since 2005; |
| Trustee of Drexel University and of the Chemical Heritage Foundation. |
|
|
Amy Gutmann |
|
Born 1949 | Principal Occupation(s) During the Past Five Years: President of the University of |
Trustee since June 2006 | Pennsylvania since 2004; Professor in the School of Arts and Sciences, Annenberg School |
145 Vanguard Funds Overseen | for Communication, and Graduate School of Education of the University of Pennsylvania |
| since 2004; Provost (2001–2004) and Laurance S. Rockefeller Professor of Politics and the |
| University Center for Human Values (1990–2004), Princeton University; Director of Carnegie |
| Corporation of New York since 2005 and of Schuylkill River Development Corporation and |
| Greater Philadelphia Chamber of Commerce since 2004. |
|
|
JoAnn Heffernan Heisen |
|
Born 1950 | Principal Occupation(s) During the Past Five Years: Corporate Vice President and Chief |
Trustee since July 1998 | Global Diversity Officer since 2006, Vice President and Chief Information Officer |
145 Vanguard Funds Overseen | (1997–2005), and Member of the Executive Committee of Johnson & Johnson |
| (pharmaceuticals/consumer products); Director of the University Medical Center |
| at Princeton and Women’s Research and Education Institute. |
|
|
André F. Perold |
|
Born 1952 | Principal Occupation(s) During the Past Five Years: George Gund Professor of Finance |
Trustee since December 2004 | and Banking, Harvard Business School; Senior Associate Dean, Director of Faculty |
145 Vanguard Funds Overseen | Recruiting, and Chair of Finance Faculty, Harvard Business School; Director and Chairman |
| of UNX, Inc. (equities trading firm) since 2003; Chair of the Investment Committee of |
| HighVista Strategies LLC (private investment firm) since 2005; Director of registered |
| investment companies advised by Merrill Lynch Investment Managers and affiliates |
| (1985–2004), Genbel Securities Limited (South African financial services firm) |
| (1999–2003), Gensec Bank (1999–2003), Sanlam, Ltd. (South African insurance |
| company) (2001–2003), and Stockback, Inc. (credit card firm) (2000–2002). |
|
|
Alfred M. Rankin, Jr. |
|
Born 1941 | Principal Occupation(s) During the Past Five Years: Chairman, President, Chief Executive |
Trustee since January 1993 | Officer, and Director of NACCO Industries, Inc. (forklift trucks/housewares/lignite); Director |
145 Vanguard Funds Overseen | of Goodrich Corporation (industrial products/aircraft systems and services). |
|
|
J. Lawrence Wilson |
|
Born 1936 | Principal Occupation(s) During the Past Five Years: Retired Chairman and Chief Executive |
Trustee since April 1985 | Officer of Rohm and Haas Co. (chemicals); Director of Cummins Inc. (diesel engines), |
145 Vanguard Funds Overseen | MeadWestvaco Corp. (packaging products), and AmerisourceBergen Corp. (pharmaceutical |
| distribution); Trustee of Vanderbilt University and of Culver Educational Foundation. |
|
|
Executive Officers1 |
|
|
|
Heidi Stam |
|
Born 1956 | Principal Occupation(s) During the Past Five Years: Managing Director of the Vanguard |
Secretary since July 2005 | Group, Inc., since 2006; General Counsel of The Vanguard Group since 2005; Secretary of |
145 Vanguard Funds Overseen | The Vanguard Group, and of each of the investment companies served by The Vanguard Group, |
| since 2005; Principal of The Vanguard Group (1997 - 2006). |
|
|
Thomas J. Higgins |
|
Born 1957 | Principal Occupation(s) During the Past Five Years: Principal of The Vanguard Group, Inc.; |
Treasurer since July 1998 | Treasurer of each of the investment companies served by The Vanguard Group. |
145 Vanguard Funds Overseen |
|
Vanguard Senior Management Team |
|
|
|
|
|
R. Gregory Barton | Kathleen C. Gubanich | Michael S. Miller |
Mortimer J. Buckley | Paul A. Heller | Ralph K. Packard |
James H. Gately | F. William McNabb, III | George U. Sauter |
|
|
|
Founder |
|
|
|
|
|
John C. Bogle |
|
|
Chairman and Chief Executive Officer, 1974–1996 |
| |
1 | Officers of the funds are “interested persons” as defined in the Investment Company Act of 1940. |
2 | December 2002 for Vanguard Equity Income Fund, Vanguard Growth Equity Fund, the Vanguard Municipal Bond Funds, and the Vanguard State Tax-Exempt Funds. |
More information about the trustees is in the Statement of Additional Information, available from The Vanguard Group.
|
|
|
|
| P.O. Box 2600 |
| Valley Forge, PA 19482-2600 |
|
|
|
|
|
|
|
|
|
|
|
|
|
|
Connect with Vanguard™ > www.vanguard.com | |
|
|
|
|
|
|
Fund Information > 800-662-7447 |
|
| Vanguard, Admiral, Connect with Vanguard, Wellington and the ship logo are |
Direct Investor Account Services > 800-662-2739 | trademarks of The Vanguard Group, Inc. |
|
|
Institutional Investor Services > 800-523-1036 |
|
| All other marks are the exclusive property of their |
Text Telephone > 800-952-3335 | respective owners. |
|
|
| All comparative mutual fund data are from Lipper Inc. |
| or Morningstar, Inc., unless otherwise noted. |
This material may be used in conjunction |
|
with the offering of shares of any Vanguard |
|
fund only if preceded or accompanied by | You can obtain a free copy of Vanguard’s proxy voting |
the fund’s current prospectus. | guidelines by visiting our website, www.vanguard.com, |
| and searching for “proxy voting guidelines,” or by calling |
| Vanguard at 800-662-2739. They are also available from |
| the SEC’s website, www.sec.gov. In addition, you may |
| obtain a free report on how your fund voted the proxies for |
| securities it owned during the 12 months ended June 30. |
| To get the report, visit either www.vanguard.com |
| or www.sec.gov. |
|
|
| You can review and copy information about your fund |
| at the SEC’s Public Reference Room in Washington, D.C. |
| To find out more about this public service, call the SEC |
| at 202-551-8090. Information about your fund is also |
| available on the SEC’s website, and you can receive |
| copies of this information, for a fee, by sending a |
| request in either of two ways: via e-mail addressed to |
| publicinfo@sec.gov or via regular mail addressed to the |
| Public Reference Section, Securities and Exchange |
| Commission, Washington, DC 20549-0102. |
|
|
|
|
|
|
| © 2007 The Vanguard Group, Inc. |
| All rights reserved. |
| Vanguard Marketing Corporation, Distributor. |
|
|
| Q210 012007 |
Item 2: Code of Ethics. The Registrant has adopted a code of ethics that applies to the Registrant's principal executive officer, principal financial officer, principal accounting officer or controller or persons performing similar functions. The Code of Ethics was amended during the reporting period covered by this report to make certain technical, non-material changes.
Item 3: Audit Committee Financial Expert. The following members of the Audit Committee have been determined by the Registrant’s Board of Trustees to be Audit Committee Financial Experts serving on its Audit Committee, and to be independent: Charles D. Ellis, Rajiv L. Gupta, JoAnn Heffernan Heisen, André F. Perold, Alfred M. Rankin, Jr., and J. Lawrence Wilson.
Item 4: Principal Accountant Fees and Services.
(a) Audit Fees.
Audit Fees of the Registrant
Fiscal Year Ended November 30, 2006: $21,000
Fiscal Year Ended November 30, 2005: $17,000
Aggregate Audit Fees of Registered Investment Companies in the Vanguard Group
Fiscal Year Ended November 30, 2006: $2,347,620
Fiscal Year Ended November 30, 2005: $2,152,740
(b) Audit-Related Fees.
Fiscal Year Ended November 30, 2006: $530,000
Fiscal Year Ended November 30, 2005: $382,200
Includes fees billed in connection with assurance and related services provided to the Registrant, The Vanguard Group, Inc., Vanguard Marketing Corporation, and other registered investment companies in the Vanguard Group.
(c) Tax Fees.
Fiscal Year Ended November 30, 2006: $101,300
Fiscal Year Ended November 30, 2005: $98,400
Includes fees billed in connection with tax compliance, planning and advice services provided to the Registrant, The Vanguard Group, Inc., Vanguard Marketing Corporation, and other registered investment companies in the Vanguard Group and related to income and excise taxes.
(d) All Other Fees.
Fiscal Year Ended November 30, 2006: $0
Fiscal Year Ended November 30, 2005: $0
Includes fees billed for services related to risk management and privacy matters. Services were provided to the Registrant, The Vanguard Group, Inc., Vanguard Marketing Corporation, and other registered investment companies in the Vanguard Group.
(e) (1) Pre-Approval Policies. The policy of the Registrant’s Audit Committee is to consider and, if appropriate, approve before the principal accountant is engaged for such services, all specific audit and non-audit services provided to: (1) the Registrant; (2) The Vanguard Group, Inc.; (3) other entities controlled by The Vanguard Group, Inc. that provide ongoing services to the Registrant; and (4) other registered investment companies in the Vanguard Group. In making a determination, the Audit Committee considers whether the services are consistent with maintaining the principal accountant’s independence.
In the event of a contingency situation in which the principal accountant is needed to provide services in between scheduled Audit Committee meetings, the Chairman of the Audit Committee would be called on to consider and, if appropriate, pre-approve audit or permitted non-audit services in an amount sufficient to complete services through the next Audit Committee meeting, and to determine if such services would be consistent with maintaining the accountant’s independence. At the next scheduled Audit Committee meeting, services and fees would be presented to the Audit Committee for formal consideration, and, if appropriate, approval by the entire Audit Committee. The Audit Committee would again consider whether such services and fees are consistent with maintaining the principal accountant’s independence.
The Registrant’s Audit Committee is informed at least annually of all audit and non-audit services provided by the principal accountant to the Vanguard complex, whether such services are provided to: (1) the Registrant; (2) The Vanguard Group, Inc.; (3) other entities controlled by The Vanguard Group, Inc. that provide ongoing services to the Registrant; or other registered investment companies in the Vanguard Group.
(2) No percentage of the principal accountant’s fees or services were approved pursuant to the waiver provision of paragraph (c)(7)(i)(C) of Rule 2-01 of Regulation S-X.
(f) For the most recent fiscal year, over 50% of the hours worked under the principal accountant’s engagement were not performed by persons other than full-time, permanent employees of the principal accountant.
(g) Aggregate Non-Audit Fees.
Fiscal Year Ended November 30, 2006: $101,300
Fiscal Year Ended November 30, 2005: $98,400
Includes fees billed for non-audit services provided to the Registrant, The Vanguard Group, Inc., Vanguard Marketing Corporation, and other registered investment companies in the Vanguard Group.
(h) For the most recent fiscal year, the Audit Committee has determined that the provision of all non-audit services was consistent with maintaining the principal accountant’s independence.
Item 5: Not applicable.
Item 6: Not applicable.
Item 7: Not applicable.
Item 8: Not applicable.
Item 9: Not applicable.
Item 10: Not applicable
Item 11: Controls and Procedures.
(a) Disclosure Controls and Procedures. The Principal Executive and Financial Officers concluded that the Registrant’s Disclosure Controls and Procedures are effective based on their evaluation of the Disclosure Controls and Procedures as of a date within 90 days of the filing date of this report.
(b) Internal Control Over Financial Reporting. There were no significant changes in Registrant’s internal control over financial reporting or in other factors that could significantly affect this control subsequent to the date of the evaluation, including any corrective actions with regard to significant deficiencies and material weaknesses.
Item 12: Exhibits.
(a) Code of Ethics.
(b) Certifications.
Pursuant to the requirements of the Securities Exchange Act of 1934 and the Investment Company Act of 1940, the registrant has duly caused this report to be signed on its behalf by the undersigned, thereunto duly authorized.
| VANGUARD WELLINGTON FUND | |
| BY: | (signature) |
| (HEIDI STAM) JOHN J. BRENNAN* CHIEF EXECUTIVE OFFICER |
| Date: | January 18, 2007 |
Pursuant to the requirements of the Securities Exchange Act of 1934 and the Investment Company Act of 1940, this report has been signed below by the following persons on behalf of the registrant and in the capacities and on the dates indicated.
| VANGUARD WELLINGTON FUND | |
| BY: | (signature) |
| (HEIDI STAM) JOHN J. BRENNAN* CHIEF EXECUTIVE OFFICER |
| Date: | January 18, 2007 |
| VANGUARD WELLINGTON FUND | |
| BY: | (signature) |
| (HEIDI STAM) THOMAS J. HIGGINS* TREASURER |
| Date: | January 18, 2007 |
* By Power of Attorney. See File Number 002-65955-99, filed on July 27, 2006. Incorporated by Reference.