UNITED STATES
SECURITIES AND EXCHANGE COMMISSION
Washington, D.C. 20549
FORM N-CSR
CERTIFIED SHAREHOLDER REPORT
OF
REGISTERED MANAGEMENT INVESTMENT COMPANIES
| | |
| Investment Company Act file number: 811-00121 |
Name of Registrant: | Vanguard Wellington Fund |
Address of Registrant: | P.O. Box 2600 |
| | Valley Forge, PA 19482 |
Name and address of agent for service: | Anne E. Robinson, Esquire |
| | P.O. Box 876 |
| | Valley Forge, PA 19482 |
Registrant’s telephone number, including area code: (610) 669-1000 |
Date of fiscal year end: November 30 | |
Date of reporting period: November 30, 2016 – May 31, 2017 |
Item 1: Reports to Shareholders | |

Semiannual Report | May 31, 2017
Vanguard Wellington™ Fund
A new format, unwavering commitment
As you begin reading this report, you’ll notice that we’ve made some improvements to the opening sections—based on feedback from you, our clients.
Page 1 starts with a new ”Your Fund’s Performance at a Glance,” a concise, handy summary of how your fund performed during the period.
In the renamed ”Chairman’s Perspective,” Bill McNabb will focus on enduring principles and investment insights.
We’ve modified some tables, and eliminated some redundancy, but we haven’t removed any information.
At Vanguard, we’re always looking for better ways to communicate and to help you make sound investment decisions. Thank you for entrusting your assets to us.
| |
| Contents | |
| Your Fund’s Performance at a Glance. | 1 |
| Chairman’s Perspective. | 2 |
| Advisor’s Report. | 6 |
| Fund Profile. | 10 |
| Performance Summary. | 12 |
| Financial Statements. | 13 |
| About Your Fund’s Expenses. | 32 |
| Glossary. | 34 |
Please note: The opinions expressed in this report are just that—informed opinions. They should not be considered promises or advice. Also, please keep in mind that the information and opinions cover the period through the date on the front of this report. Of course, the risks of investing in your fund are spelled out in the prospectus.
See the Glossary for definitions of investment terms used in this report.
About the cover: No matter what language you speak, Vanguard has one consistent message and set of principles. Our primary focus is on you, our clients. We conduct our business with integrity as a faithful steward of your assets. This message is shown translated into seven languages, reflecting our expanding global presence.
Your Fund’s Performance at a Glance
• For the six months ended May 31, 2017, Vanguard Wellington Fund returned more than 7%, lagging both its benchmark and the average return of its peers.
• The fund’s stock portfolio returned 10.55%, lagging the 10.81% return of its benchmark, the Standard & Poor’s 500 Index. Industrial, consumer staples, and real estate stocks contributed most to the portfolio’s performance relative to its benchmark. Information technology and financials detracted most from relative performance.
• The fixed income portfolio returned 3.22%, finishing slightly below the 3.27% return of its benchmark, the Bloomberg Barclays U.S. Credit A or Better Bond Index. The portfolio’s short duration and credit spread duration positioning hurt performance as rates fell and spreads tightened. Duration estimates how much a bond’s value fluctuates because of a change in interest rates. Credit spreads are the difference in yields between two bonds of similar maturity but different credit quality.
• Strong corporate bond selection helped offset some of the drag from the portfolio’s structural positioning.
Total Returns: Six Months Ended May 31, 2017
| |
| | Total |
| | Returns |
| Vanguard Wellington Fund | |
| Investor Shares | 7.67% |
| Admiral™ Shares | 7.73 |
| Wellington Composite Index | 8.12 |
| Mixed-Asset Target Allocation Growth Funds Average | 8.11 |
For a benchmark description, see the Glossary.
Mixed-Asset Target Allocation Growth Funds Average: Derived from data provided by Lipper, a Thomson Reuters Company.
Admiral Shares carry lower expenses and are available to investors who meet certain account-balance requirements.
| | | |
| Expense Ratios | | | |
| Your Fund Compared With Its Peer Group | | | |
| | Investor | Admiral | Peer Group |
| | Shares | Shares | Average |
| Wellington Fund | 0.25% | 0.16% | 0.92% |
The fund expense ratios shown are from the prospectus dated March 24, 2017, and represent estimated costs for the current fiscal year. For
the six months ended May 31, 2017, the fund’s annualized expense ratios were 0.25% for Investor Shares and 0.17% for Admiral Shares.
Peer-group expense ratios are derived from data provided by Lipper, a Thomson Reuters Company, and capture information through year-end
2016.
Peer group: Mixed-Asset Target Allocation Growth Funds.
1
Chairman’s Perspective

Bill McNabb
Chairman and Chief Executive Officer
Dear Shareholder,
At the end of May, we completed the latest round of expense ratio changes for our U.S.-based funds. The estimated savings for our investors during the six-month period was more than $300 million across our fund lineup—another record for us.1
That’s a remarkable amount, but it’s also business as usual here at Vanguard. After all, we’ve been cutting costs for investors for more than 40 years. Indeed, we’ve become so synonymous with driving down costs that when other investment companies lower their fees, the financial press often refers to it as the “Vanguard effect.”
To be sure, high costs persist in some areas of the industry. But the good news is, our 40-year campaign to lower costs seems to be approaching its mathematical limits, with some fund expenses now near zero not just at Vanguard but at other investment companies as well.
What makes investors successful?
While we’ll continue our drive for cost efficiency, we’ll also keep vigorously promoting our three other linchpin investment principles:
• Goals. Create clear, appropriate investment goals.
• Balance. Develop a suitable asset allocation using broadly diversified funds.
1 This figure represents cumulative net savings from expense ratio changes for all Vanguard fund share classes announced from December 2016
through May 2017. The estimated savings is the difference between prior and current expense ratios multiplied by average assets under
management (AUM). Average AUM is based on averaging one month’s daily average assets over the 12 months of each fund’s fiscal year.
2
• Discipline. Maintain perspective and long-term discipline.
Today, these tenets are more relevant than ever. They’re essential elements of our Personal Advisor Services recommendations, the model portfolios we develop for financial advisors, and our target-date funds.
We’re convinced that as investors increasingly adopt low-cost portfolios, focusing on goals, balance, and discipline could make the difference between achieving financial objectives and falling short.
Of course, there’s nothing new about our philosophy. And it seems simple enough. But unfortunately, we all have built-in behavioral biases that can make it hard to stick to the plan. We might, for example, allow natural inertia to keep us from rebalancing our portfolios to control risk, or we may become too wedded to an opinion or approach.
Lessons from the last crisis
Although it can be difficult at times to follow proven investing principles, it’s not impossible, even under the most challenging circumstances.
During the financial crisis of 2008–2009, various media outlets asked me whether our investors were pulling out of the
| | | |
| Market Barometer | | | |
| | | | Total Returns |
| | | Periods Ended May 31, 2017 |
| | Six | One | Five Years |
| | Months | Year | (Annualized) |
| Stocks | | | |
| Russell 1000 Index (Large-caps) | 10.55% | 17.48% | 15.37% |
| Russell 2000 Index (Small-caps) | 4.33 | 20.36 | 14.04 |
| Russell 3000 Index (Broad U.S. market) | 10.06 | 17.69 | 15.26 |
| FTSE All-World ex US Index (International) | 16.80 | 18.45 | 8.86 |
| |
| Bonds | | | |
| Bloomberg Barclays U.S. Aggregate Bond Index | | | |
| (Broad taxable market) | 2.52% | 1.58% | 2.24% |
| Bloomberg Barclays Municipal Bond Index | | | |
| (Broad tax-exempt market) | 5.16 | 1.46 | 3.31 |
| Citigroup Three-Month U.S. Treasury Bill Index | 0.26 | 0.41 | 0.12 |
| |
| CPI | | | |
| Consumer Price Index | 1.40% | 1.87% | 1.27% |
3
market and running for the hills. In actuality, we didn’t see that at Vanguard. Our clients were certainly nervous, and they contacted us more often. But for the most part, they didn’t engage in the excessive, panicked trading that can be so destructive to building wealth. Those who relied on financial advisors who follow our philosophy were wisely counseled to stay the course.
The accompanying chart shows the importance of patience and discipline. Investors who maintained a 60% stock/ 40% bond mix through the bear market were amply rewarded afterward, while those who fled stocks when they hit bottom were left far behind.
It’s not different this time
Today, nearly a decade after the global financial crisis, the world seems very different. Market indexes recently hit a series of all-time highs. With the wind at their backs and the increasing availability of low-cost funds, investors may be tempted to ask, “What could go wrong?” The answer is, “A lot.” Performance chasing and market-timing won’t be any more effective with low-cost funds than they are with high-cost funds.
| Reacting to volatility can hurt returns |
| Investors who kept a balanced portfolio through the 2008–2009 crash were rewarded |

| Notes: On October 31, 2007, close to the equity market’s peak, the value of a hypothetical 60/40 portfolio is set at 100. Subsequent returns |
| are calculated relative to this starting value of 100. It is assumed that all dividends and income are reinvested in the components of the |
| indexes. The initial allocation for the portfolios was 42% U.S. stocks, 18% international stocks, and 40% U.S. bonds. The rebalanced portfolio |
| is returned to this allocation every month-end. Returns for the U.S. stock allocation are based on the MSCI US Broad Market Index. Returns for |
| the international stock allocation are based on the MSCI All Country World Index ex USA. Returns for the bond allocation are based on the |
| Bloomberg Barclays U.S. Aggregate Bond Index. Returns for the cash allocation are based on the Citigroup 3-Month U.S. Treasury Bill Index. |
| Sources: Vanguard, using data provided by Thomson Reuters Datastream. |
4
Whether markets are sunny or stormy, investors need to stick to their investment plans, maintain balanced and diversified portfolios, and think long-term.
We strive to help investors follow the principles that lead to enduring success. I’d like to think that will be the real “Vanguard effect.”
As always, thank you for investing with Vanguard.
Sincerely,

F. William McNabb III
Chairman and Chief Executive Officer
June 14, 2017
5
Advisor’s Report
Vanguard Wellington Fund’s Investor Shares returned 7.67% for the six months ended May 31, 2017. The fund trailed the 8.11% average return of its peers. It also trailed the 8.12% return of its benchmark, the Wellington Composite Index, which is weighted 65% large-capitalization stocks (as measured by the Standard & Poor’s 500 Index) and 35% high-quality corporate bonds (as measured by the Bloomberg Barclays U.S. Credit A or Better Bond Index). The equity and fixed income portfolios both slightly underperformed their respective benchmarks.
Investment environment
Stock markets in the United States lagged those abroad: The S&P 500 Index returned 10.8%, the MSCI World Index returned 13.2%, and the MSCI EAFE Index returned 17.1%. U.S. equities rose steadily for the period, with less volatility than had been expected. The S&P 500 Index posted its sixth consecutive quarter of positive results.
The news continued to paint a promising picture of the U.S. economy, including multiyear lows in unemployment and healthy housing market trends. Stock prices have risen on the market’s anticipation that regulatory pressure will ease and lower corporate taxes could boost earnings. In the United States, large-cap growth stocks outperformed large-cap value stocks, as measured by the Russell 1000 Growth and Russell 1000 Value Indexes. The Federal Reserve, still following its policy of monetary tightening, raised interest rates again in March.
The broad fixed income markets rose during the period, and the Bloomberg Barclays U.S. Aggregate Bond Index returned 2.52% for the six months. The higher-quality credit market performed even better: The Bloomberg Barclays U.S. Credit A or Better Bond Index returned 3.27%. The yield on the 10-year U.S. Treasury note fell, beginning the period at 2.45% and ending at 2.21%.
Our successes
In the stock portfolio, security selection in the industrial and energy sectors contributed to relative results. Within industrials, our position in CSX helped, as did our avoidance of poorly performing benchmark constituent General Electric. In energy, our lack of benchmark constituent Schlumberger boosted performance. AstraZeneca, Unilever, and NextEra Energy were among the top relative contributors.
Shares of rail company CSX rose following Hunter Harrison’s appointment as the new CEO of the company. Harrison has a strong track record of improving profitability by cutting costs and streamlining operations, and investors appeared optimistic that he can do the same for CSX. The company has underperformed peers in recent years, and the new leadership should help improve operational efficiency and earnings.
In the fixed income portfolio, security selection within investment-grade corporates, particularly among industrial and financial issuers, helped results. Our holdings in the banking, consumer noncyclical, communications, and consumer cyclical subsectors were notable contributors to relative
6
performance. Our underweight to noncorporate credit, particularly supranational issuers, also aided performance.
Our shortfalls
In the stock portfolio, our selection was weakest in information technology, consumer discretionary, and telecommunication services. In terms of sector allocation, our underweight to information technology—especially benchmark constituent Apple—detracted from relative results. Apple’s stock price soared over the period, pushed up by the market’s anticipation of the launch of the iPhone 8 and a sector-wide recovery that has broadly supported Apple shares. Although we owned Apple because of its attractive valuation, our concerns about increasing competition over the very long term led us to remain underweight in the stock. We have trimmed our position now that valuation is less attractive.
In consumer discretionary, our lack of benchmark constituent Amazon.com and our position in L Brands hurt performance the most. Amazon shares surged on strong performance and rising expectations for both the company’s international expansion and its cloud business. Amazon is a strong business but does not fit our investment approach, as it lacks both yield and attractive valuation. L Brands, parent company of Bath & Body Works and Victoria’s Secret, declined on disappointing earnings results linked to challenges in Bath & Body Works and the intimate apparel subsector. The company’s inability to make forward progress in international expansion has been a disappointment; however, we continue to hold the name because of its valuation, yield, and international growth potential.
On the fixed income side, the portfolio’s credit spread duration and yield curve/ duration positioning detracted. The fund was underweight corporates relative to the all-credit benchmark as spreads tightened over the period. Our overweight to agency mortgage pass-throughs hurt relative performance. Within corporates, our security selection among utilities issuers also hindered performance.
The fund’s positioning
The fourth quarter of 2016 saw the change in the U.S. administration boost value stocks; the first five months of 2017, in contrast, reflected a shift back to growth-oriented equities. In the equity portfolio, we are typically underexposed to high-growth, non-yielding securities, which outperformed during the six-month period.
Disruption from technology has had far-reaching effects, touching autos, energy, distributors, media, consumer brands, and apparel. Within these sectors, price transparency has created headwinds for formerly cash-flow-heavy companies. For example, many businesses, such as distributors—which benefited from having an efficient and convenient platform to deliver products—now find it difficult to market high-margin products and maintain pricing power. Against this backdrop, we are positioning the portfolio to benefit from disruption by investing in companies that stand to benefit from disruption in their sector (Siemens and ABB, for example).
7
We are also looking for opportunities to take advantage of economic growth outside the United States.
In the equity portfolio, our largest overweights at the end of the period were in the financial, energy, and health care sectors, while our largest underweights were in the information technology, consumer discretionary, and real estate sectors. As always, these allocations are determined by a bottom-up analysis and are largely attributable to companies’ valuations.
We believe financial stocks remain undervalued, given their modest price-to-book ratios. The low equity returns of recent years have pushed down valuations in this sector, but banks continue to work aggressively to improve returns.
Energy equities have underperformed in the early part of this year. We still believe that supply and demand will normalize this sector. This has taken longer to occur than we expected, however, because the industry added back capacity too quickly after OPEC agreed to production cuts. We have chosen to invest in companies with longer-dated projects and assets. We believe that the more disciplined companies will benefit as the current oversupply abates, and that prices will rise in the medium to long term. We maintain high conviction in our overweight allocation to energy.
Over the last six months we have added new positions in Unilever, eBay, QUALCOMM, and ConocoPhillips. We eliminated our positions in EOG Resources, U.S. Bancorp, Coca-Cola, and Colgate-Palmolive.
With equity market performance as strong as it’s been since 2008–2009, it is not surprising that there are few areas in which valuations are attractive. Looking ahead, we expect to see solid growth; wages are beginning to improve, interest rates are rising, and the consumer appears healthy. Investors are concerned President Trump’s unpopularity will make adoption of market-friendly policies, such as tax reform and increased infrastructure spending, more challenging. Still, we believe Congress will feel compelled to accomplish some measure of reform in order to retain credibility leading up to midterm elections.
We continue to rely on our process and philosophy as we construct the portfolio and adjust our positioning. We remain focused on the significance of dividends, positive capital stewardship, and franchise value. We believe we have a solid portfolio of undervalued market leaders, companies in industries with improving supply/demand trends, and strong companies that are temporarily out of favor.
On the fixed income side, we are a bit surprised by the stability of longer-term interest rates in the face of higher short-term rates, the well-advertised plans by the Fed to reduce its holdings of Treasuries and mortgage securities, and the prospects of a debt-financed fiscal package intended to further stimulate growth. Offsetting these pressures, inflation remains persistently lower than most forecasts.
8
We remain biased toward higher short-term interest rates, given the strengthening labor markets and early signs of rising wage pressures. Aware of these powerful forces, we choose to limit our interest rate risk relative to the benchmark and to focus our higher-rate bias at the short end of the yield curve, where the Fed has the greatest influence on yield levels.
Despite the prolonged economic cycle and persistently good earnings from the corporate sector, we are viewing the credit cycle as mature, with most of the narrowing of spreads (corporate compared to Treasury) behind us. While we do not see any immediate catalyst for spreads to widen, we have begun to shift our credit risk posture lower.
We remain uninterested in the mortgage-backed-securities sector as these securities will be sold from the Fed’s portfolio, but we are finding securities in the asset-backed-securities sector that are good surrogates for short-maturity corporate bonds.
We anticipate increased volatility as much geopolitical uncertainty remains and the uncertainty over the fate of the Trump administration policies continues to be high, offering opportunities for surprise. In this context, we are focused on identifying solid company-specific investment catalysts and mispriced individual securities, rather than investing based on broad themes.
Predicting rates has been a challenge given the influence of global macro factors, and so we have been biased toward moving the portfolio to a more neutral duration posture. While we favor being short-duration, we are limiting our duration strategies to a narrow band because of the uncertainties facing the market. We anticipate a flatter yield curve, and our expectations for inflation, the primary driver of long-term interest rates, remain subdued.
We continue to be disciplined in our application of our investment process, which allows us to create a balanced portfolio that we believe should perform well in a variety of environments. We remain focused on long-term, low-turnover investing—features that we believe have served the fund’s shareholders well over time.
|
| Edward P. Bousa, CFA, Senior Managing Director |
| and Equity Portfolio Manager |
| |
| John C. Keogh, Senior Managing Director |
| and Fixed Income Portfolio Manager |
| |
| Loren L. Moran, CFA, Managing Director |
| and Fixed Income Portfolio Manager |
| |
| Michael E. Stack, CFA, Senior Managing Director |
| and Fixed Income Portfolio Manager |
| |
| Wellington Management Company llp |
| |
| June 19, 2017 |
9
Wellington Fund
| | |
| Fund Profile | | |
| As of May 31, 2017 | | |
| |
| Share-Class Characteristics | |
| | Investor | Admiral |
| | Shares | Shares |
| Ticker Symbol | VWELX | VWENX |
| Expense Ratio1 | 0.25% | 0.16% |
| 30-Day SEC Yield | 2.36% | 2.44% |
| | | |
| Equity and Portfolio Characteristics | |
| | | | DJ |
| | | | U.S. |
| | | | Total |
| | | | Market |
| | | S&P 500 | FA |
| | Fund | Index | Index |
| Number of Stocks | 102 | 505 | 3,770 |
| Median Market Cap | $88.9B | $87.6B | $60.0B |
| Price/Earnings Ratio | 21.3x | 24.1x | 27.5x |
| Price/Book Ratio | 2.3x | 3.0x | 2.8x |
| Return on Equity | 19.3% | 24.3% | 17.0% |
| Earnings Growth | | | |
| Rate | 4.9% | 7.9% | 9.9% |
| Dividend Yield | 2.5% | 1.9% | 1.8% |
| Foreign Holdings | 11.1% | 0.0% | 0.0% |
| Turnover Rate | | | |
| (Annualized) | 34% | — | — |
| Short-Term | | | |
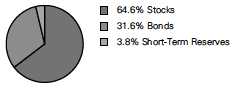
| Reserves | 3.8% | — | — |
| | | |
| Fixed Income Characteristics | |
| |
| | | Bloomberg | Bloomberg |
| | | Barclays | Barclays |
| | | Credit A or | Aggregate |
| | | Better | Bond |
| | Fund | Index | Index |
| |
| Number of Bonds | 861 | 3,088 | 9,295 |
| |
| Yield to Maturity | | | |
| (before expenses) | 2.7% | 2.7% | 2.5% |
| |
| Average Coupon | 3.5% | 3.4% | 3.1% |
| |
| Average Duration | 6.6 years | 6.9 years | 6.0 years |
| |
| Average Effective | | | |
| Maturity | 9.6 years | 9.7 years | 8.1 years |
| | |
| Total Fund Volatility Measures | |
| | | DJ |
| | Wellington | U.S. Total |
| | Composite | Market |
| | Index | FA Index |
| R-Squared | 0.97 | 0.94 |
| Beta | 1.00 | 0.64 |
| These measures show the degree and timing of the fund’s fluctuations compared with the indexes over 36 months. |
| |
| | |
| Ten Largest Stocks (% of equity portfolio) | |
| Microsoft Corp. | Systems Software | 3.4% |
| Comcast Corp. | Cable & Satellite | 2.9 |
| Alphabet Inc. | Internet Software & | |
| | Services | 2.8 |
| JPMorgan Chase & Co. | Diversified Banks | 2.6 |
| Chevron Corp. | Integrated Oil & Gas | 2.6 |
| Intel Corp. | Semiconductors | 2.5 |
| Bank of America Corp. | Diversified Banks | 2.5 |
| Apple Inc. | Technology | |
| | Hardware, Storage & | |
| | Peripherals | 2.4 |
| Chubb Ltd. | Property & Casualty | |
| | Insurance | 2.4 |
| Merck & Co. Inc. | Pharmaceuticals | 2.1 |
| Top Ten | | 26.2% |
| Top Ten as % of Total Net Assets | 16.8% |
| The holdings listed exclude any temporary cash investments and equity index products. |
| | |
Fund Asset Allocation
1 The expense ratios shown are from the prospectus dated March 24, 2017, and represent estimated costs for the current fiscal year. For the six
months ended May 31, 2017, the annualized expense ratios were 0.25% for Investor Shares and 0.17% for Admiral Shares.
10
Wellington Fund
| | | |
| Sector Diversification (% of equity exposure) |
| | | | DJ |
| | | | U.S. Total |
| | | S&P 500 | Market |
| | Fund | Index FA Index |
| Consumer | | | |
| Discretionary | 6.5% | 12.5% | 12.8% |
| Consumer Staples | 8.0 | 9.4 | 8.4 |
| Energy | 9.2 | 6.0 | 5.6 |
| Financials | 23.3 | 13.7 | 14.3 |
| Health Care | 16.0 | 13.9 | 13.4 |
| Industrials | 11.5 | 10.1 | 10.7 |
| Information | | | |
| Technology | 15.8 | 23.2 | 22.2 |
| Materials | 2.7 | 2.8 | 3.3 |
| Real Estate | 1.3 | 2.9 | 4.0 |
| Telecommunication | | | |
| Services | 1.6 | 2.2 | 2.0 |
| Utilities | 4.1 | 3.3 | 3.3 |
| |
| Sector Diversification (% of fixed income portfolio) | |
Asset-Backed | 3.7% |
| Commercial Mortgage-Backed | 0.5 |
| Finance | 26.1 |
| Foreign | 5.4 |
| Industrial | 34.4 |
| Treasury/Agency | 17.2 |
| Utilities | 6.6 |
| Other | 6.1 |
The agency and mortgage-backed securities sectors may include
issues from government-sponsored enterprises; such issues are
generally not backed by the full faith and credit of the U.S.
government.
| |
| Distribution by Credit Quality (% of fixed | |
| income portfolio) | |
| U.S. Government | 17.5% |
| Aaa | 6.1 |
| Aa | 14.6 |
| A | 43.6 |
| Baa | 18.2 |
Credit-quality ratings are obtained from Barclays and are from
Moody's, Fitch, and S&P. When ratings from all three agencies are
used, the median rating is shown. When ratings from two of the
agencies are used, the lower rating for each issue is shown. "Not
Rated" is used to classify securities for which a rating is not
available. Not rated securities include a fund's investment in
Vanguard Market Liquidity Fund or Vanguard Municipal Cash
Management Fund, each of which invests in high-quality money
market instruments and may serve as a cash management vehicle
for the Vanguard funds, trusts, and accounts. For more information
about these ratings, see the Glossary entry for Credit Quality.
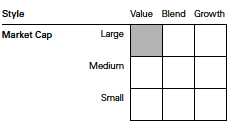
Equity Investment Focus
Fixed Income Investment Focus

11
Wellington Fund
Performance Summary
All of the returns in this report represent past performance, which is not a guarantee of future results that may be achieved by the fund. (Current performance may be lower or higher than the performance data cited. For performance data current to the most recent month-end, visit our website at vanguard.com/performance.) Note, too, that both investment returns and principal value can fluctuate widely, so an investor’s shares, when sold, could be worth more or less than their original cost. The returns shown do not reflect taxes that a shareholder would pay on fund distributions or on the sale of fund shares.
Fiscal-Year Total Returns (%): November 30, 2006, Through May 31, 2017

For a benchmark description, see the Glossary.
Note: For 2017, performance data reflect the six months ended May 31, 2017.
Average Annual Total Returns: Periods Ended March 31, 2017
This table presents returns through the latest calendar quarter—rather than through the end of the fiscal period.
Securities and Exchange Commission rules require that we provide this information.
| | | | | | |
| | | | | | | Ten Years |
| | Inception Date | One Year | Five Years | Income | Capital | Total |
| Investor Shares | 7/1/1929 | 12.67% | 9.58% | 3.08% | 4.05% | 7.13% |
| Admiral Shares | 5/14/2001 | 12.76 | 9.67 | 3.18 | 4.05 | 7.23 |
See Financial Highlights for dividend and capital gains information.
12
Wellington Fund
Financial Statements (unaudited)
Statement of Net Assets—Investments Summary
As of May 31, 2017
This Statement summarizes the fund’s holdings by asset type. Details are reported for each of the fund’s 50 largest individual holdings and for investments that, in total for any issuer, represent more than 1% of the fund’s net assets. The total value of smaller holdings is reported as a single amount within each category.
The fund reports a complete list of its holdings in regulatory filings four times in each fiscal year, at the quarter-ends. For the second and fourth fiscal quarters, the complete listing of the fund’s holdings is available electronically on vanguard.com and on the Securities and Exchange Commission’s website (sec.gov), or you can have it mailed to you without charge by calling 800-662-7447. For the first and third fiscal quarters, the fund files the lists with the SEC on Form N-Q. Shareholders can look up the fund’s Forms N-Q on the SEC’s website. Forms N-Q may also be reviewed and copied at the SEC’s Public Reference Room (see the back cover of this report for further information).
| | | |
| | | Market | Percentage |
| | | Value• | of Net |
| | Shares | ($000) | Assets |
| Common Stocks | | | |
| Consumer Discretionary | | | |
| Comcast Corp. Class A | 44,367,572 | 1,849,684 | 1.9% |
| Ford Motor Co. | 55,967,740 | 622,361 | 0.6% |
| Consumer Discretionary—Other † | | 1,702,823 | 1.7% |
| | | 4,174,868 | 4.2% |
| Consumer Staples | | | |
| PepsiCo Inc. | 8,111,080 | 947,942 | 0.9% |
| Unilever NV | 16,418,775 | 935,294 | 0.9% |
| Philip Morris International Inc. | 5,938,890 | 711,479 | 0.7% |
| Walgreens Boots Alliance Inc. | 8,286,890 | 671,404 | 0.7% |
| Diageo plc | 18,503,396 | 556,192 | 0.6% |
| Consumer Staples—Other † | | 1,357,528 | 1.4% |
| | | 5,179,839 | 5.2% |
| Energy | | | |
| Chevron Corp. | 16,071,775 | 1,663,107 | 1.7% |
| TOTAL SA | 17,575,369 | 928,477 | 0.9% |
| Exxon Mobil Corp. | 10,549,370 | 849,224 | 0.9% |
| Energy—Other † | | 2,518,975 | 2.5% |
| | | 5,959,783 | 6.0% |
| Financials | | | |
| JPMorgan Chase & Co. | 20,544,786 | 1,687,754 | 1.7% |
| Bank of America Corp. | 72,233,803 | 1,618,759 | 1.6% |
| Chubb Ltd. | 10,739,480 | 1,537,786 | 1.5% |
| Prudential Financial Inc. | 12,632,940 | 1,324,564 | 1.3% |
| Wells Fargo & Co. | 23,611,329 | 1,207,483 | 1.2% |
| PNC Financial Services Group Inc. | 9,088,945 | 1,078,858 | 1.1% |
| Marsh & McLennan Cos. Inc. | 9,031,920 | 700,516 | 0.7% |
| BlackRock Inc. | 1,432,886 | 586,394 | 0.6% |
| Northern Trust Corp. | 6,491,104 | 567,582 | 0.6% |
13
| | | |
| Wellington Fund | | | |
| |
| |
| |
| | | Market | Percentage |
| | | Value• | of Net |
| | Shares | ($000) | Assets |
| Mitsubishi UFJ Financial Group Inc. | 89,847,800 | 557,533 | 0.5% |
| Goldman Sachs Group Inc. | 2,439,985 | 515,471 | 0.5% |
| Financials—Other † | | 3,661,310 | 3.7% |
| | | 15,044,010 | 15.0% |
| Health Care | | | |
| Merck & Co. Inc. | 20,970,157 | 1,365,367 | 1.4% |
| Bristol-Myers Squibb Co. | 22,942,625 | 1,237,754 | 1.2% |
| ^ AstraZeneca plc ADR | 33,672,226 | 1,157,988 | 1.2% |
| Johnson & Johnson | 7,795,651 | 999,792 | 1.0% |
| Medtronic plc | 10,495,195 | 884,535 | 0.9% |
| Pfizer Inc. | 25,072,795 | 818,627 | 0.8% |
| Eli Lilly & Co. | 8,293,955 | 659,950 | 0.7% |
| UnitedHealth Group Inc. | 3,686,665 | 645,830 | 0.6% |
| Novartis AG | 7,812,592 | 639,345 | 0.6% |
| Cardinal Health Inc. | 8,389,300 | 623,241 | 0.6% |
| Health Care—Other † | | 1,316,296 | 1.3% |
| | | 10,348,725 | 10.3% |
| Industrials | | | |
| United Parcel Service Inc. Class B | 10,713,350 | 1,135,294 | 1.1% |
| Honeywell International Inc. | 5,813,105 | 773,085 | 0.8% |
| Lockheed Martin Corp. | 2,492,630 | 700,753 | 0.7% |
| Canadian National Railway Co. | 8,000,941 | 619,513 | 0.6% |
| Caterpillar Inc. | 5,673,111 | 598,116 | 0.6% |
| Industrials—Other † | | 3,588,092 | 3.6% |
| | | 7,414,853 | 7.4% |
| Information Technology | | | |
| Microsoft Corp. | 30,995,154 | 2,164,701 | 2.2% |
| * Alphabet Inc. Class A | 1,863,102 | 1,839,049 | 1.8% |
| Intel Corp. | 44,937,690 | 1,622,700 | 1.6% |
| Apple Inc. | 10,145,535 | 1,549,832 | 1.6% |
| Accenture plc Class A | 6,003,990 | 747,317 | 0.7% |
| Cisco Systems Inc. | 22,651,177 | 714,192 | 0.7% |
| Information Technology—Other † | | 1,569,169 | 1.6% |
| | | 10,206,960 | 10.2% |
| Materials | | | |
| Dow Chemical Co. | 10,656,830 | 660,297 | 0.7% |
| Materials—Other † | | 1,052,195 | 1.0% |
| | | 1,712,492 | 1.7% |
| Real Estate | | | |
| American Tower Corporation | 5,560,757 | 729,516 | 0.7% |
| Real Estate—Other † | | 110,847 | 0.1% |
| | | 840,363 | 0.8% |
| Telecommunication Services | | | |
| Verizon Communications Inc. | 21,384,050 | 997,352 | 1.0% |
| |
| Utilities | | | |
| NextEra Energy Inc. | 8,700,890 | 1,230,654 | 1.2% |
| Dominion Energy Inc. | 10,909,030 | 881,122 | 0.9% |
| Utilities—Other † | | 547,766 | 0.6% |
| | | 2,659,542 | 2.7% |
| Total Common Stocks (Cost $42,056,311) | | 64,538,787 | 64.5% |
14
| | | | | | | |
| Wellington Fund | | | | | | |
| |
| |
| |
| | | | | | Face | Market | Percentage |
| | | | | Maturity | Amount | Value• | of Net |
| | | | Coupon | Date | ($000) | ($000) | Assets |
| U.S. Government and Agency Obligations | | | | |
| U.S. Government Securities | | | | | | |
| 1 | United States Treasury Note/Bond 1.750% | 9/30/19 | 950,000 | 959,206 | 1.0% |
| 1 | United States Treasury Note/Bond 1.375% | 9/30/18 | 747,350 | 748,867 | 0.7% |
| | United States Treasury Note/Bond | 1.000% | 9/15/17 | 552,580 | 552,580 | 0.5% |
| 1,†† United States Treasury | | | | | | |
| | Note/Bond | 0.625%–3.375% | 6/30/17–2/15/47 | 3,185,651 | 3,161,596 | 3.2% |
| | | | | | | 5,422,249 | 5.4% |
| |
| Conventional Mortgage-Backed Securities † | | | 258,686 | 0.2% |
| |
| Nonconventional Mortgage-Backed Securities † | | | 151,802 | 0.2% |
| Total U.S. Government and Agency Obligations (Cost $5,744,075) | | 5,832,737 | 5.8% |
| 2Asset-Backed/Commercial Mortgage-Backed Securities (Cost $1,169,045) † | 1,172,371 | 1.2% |
| Corporate Bonds | | | | | | |
| Finance | | | | | | |
| | Banking | | | | | | |
| | Bank of America Corp. | 3.300%–6.875% | 8/28/17–4/1/44 | 330,688 | 348,793 | 0.4% |
| | Bear Stearns Cos. LLC | 6.400%–7.250% | 10/2/17–2/1/18 | 25,150 | 25,890 | 0.0% |
| | Goldman Sachs Group Inc. | 2.375%–6.750% | 1/18/18–10/21/45 | 505,100 | 562,021 | 0.6% |
| | JPMorgan Chase & Co. | 3.250%–6.300% | 1/15/18–6/1/45 | 496,021 | 543,138 | 0.5% |
| | National City Corp. | | 6.875% | 5/15/19 | 13,950 | 15,223 | 0.0% |
| | PNC Bank NA | 3.300%–4.875% | 9/21/17–11/1/25 | 84,845 | 87,063 | 0.1% |
| | PNC Financial Services | | | | | | |
| | Group Inc. | | 3.900% | 4/29/24 | 41,565 | 43,541 | 0.0% |
| | Wells Fargo & Co. | 2.150%–5.625% | 12/11/17–12/7/46 | 598,257 | 622,276 | 0.6% |
| 2 | Banking—Other † | | | | | 4,076,959 | 4.1% |
| | Brokerage † | | | | | 32,438 | 0.0% |
| | Finance Companies † | | | | | 372,924 | 0.4% |
| | Insurance | | | | | | |
| | ACE Capital Trust II | | 9.700% | 4/1/30 | 20,000 | 30,075 | 0.0% |
| | Chubb Corp. | | 6.000% | 5/11/37 | 50,000 | 64,395 | 0.1% |
| | Chubb INA Holdings Inc. | 2.300%–5.800% | 3/15/18–11/3/45 | 98,870 | 103,642 | 0.1% |
| 2 | Five Corners Funding Trust | | 4.419% | 11/15/23 | 5,935 | 6,388 | 0.0% |
| | Prudential Financial Inc. | 2.300%–4.500% | 8/15/18–11/15/20 | 48,910 | 50,853 | 0.1% |
| 2 | Insurance—Other † | | | | | 1,089,514 | 1.0% |
| 2 | Other Finance † | | | | | 24,764 | 0.0% |
| 2 | Real Estate Investment Trusts † | | | | 146,554 | 0.2% |
| | | | | | | 8,246,451 | 8.2% |
| Industrial | | | | | | |
| | Basic Industry † | | | | | 40,801 | 0.0% |
| 2 | Capital Goods † | | | | | 853,888 | 0.9% |
| | Communication | | | | | | |
| | Comcast Corp. | 2.350%–6.500% | 2/1/24–8/15/45 | 338,341 | 360,233 | 0.4% |
| 2 | NBCUniversal Enterprise | | | | | | |
| | Inc. | | 1.974% | 4/15/19 | 100,115 | 100,579 | 0.1% |
| | NBCUniversal Media LLC | 2.875%–4.375% | 4/1/21–1/15/23 | 33,660 | 35,851 | 0.0% |
| 2 | Verizon Communications | | | | | | |
| | Inc. | 3.500%–5.012% | 9/15/20–4/15/49 | 256,734 | 263,834 | 0.3% |
| 2 | Communication—Other † | | | | | 802,635 | 0.8% |
| 2 | Consumer Cyclical † | | | | | 1,431,288 | 1.4% |
15
| | | | | | |
| Wellington Fund | | | | | | |
| |
| |
| |
| | | | | Face | Market | Percentage |
| | | | Maturity | Amount | Value• | of Net |
| | | Coupon | Date | ($000) | ($000) | Assets |
| Consumer Noncyclical | | | | | | |
| AstraZeneca plc | 1.950%–6.450% | 9/18/19–11/16/45 | 110,170 | 120,171 | 0.1% |
| Medtronic Inc. | 1.375%–4.375% | 4/1/18–3/15/35 | 216,264 | 224,069 | 0.2% |
| Merck & Co. Inc. | 2.350%–6.550% | 2/10/22–5/18/43 | 164,715 | 171,159 | 0.2% |
| PepsiCo Inc. | 2.750%–4.000% | 3/1/23–3/5/42 | 81,191 | 82,367 | 0.1% |
| The Pepsi Bottling Group Inc. | 7.000% | 3/1/29 | 10,000 | 13,684 | 0.0% |
| Unilever Capital Corp. | | 4.250% | 2/10/21 | 95,235 | 102,233 | 0.1% |
| Zeneca Wilmington Inc. | | 7.000% | 11/15/23 | 29,000 | 36,091 | 0.1% |
| 2 Consumer Noncyclical—Other † | | | | 2,821,282 | 2.8% |
| Energy | | | | | | |
| Chevron Corp. | | 3.191% | 6/24/23 | 49,470 | 51,116 | 0.1% |
| Dominion Gas Holdings LLC | | 3.550% | 11/1/23 | 21,445 | 22,125 | 0.0% |
| Exxon Mobil Corp. | 2.222%–4.114% | 3/1/21–3/1/46 | 46,250 | 47,230 | 0.1% |
| Total Capital International SA 1.550%–3.750% | 6/28/17–4/10/24 | 122,425 | 125,283 | 0.1% |
| Total Capital SA | | 2.125% | 8/10/18 | 42,000 | 42,208 | 0.0% |
| 2 Energy—Other † | | | | | 1,279,164 | 1.3% |
| Other Industrial † | | | | | 28,566 | 0.0% |
| Technology | | | | | | |
| Apple Inc. | 2.450%–4.450% | 5/6/21–8/4/46 | 386,647 | 391,222 | 0.4% |
| Intel Corp. | 2.875%–4.100% | 5/11/24–5/19/46 | 81,000 | 82,370 | 0.1% |
| Microsoft Corp. | 2.375%–4.450% | 2/12/22–2/6/47 | 498,005 | 505,305 | 0.5% |
| 2 Technology—Other † | | | | | 459,024 | 0.4% |
| Transportation | | | | | | |
| United Parcel Service Inc. | 2.450%–4.875% | 10/1/22–11/15/40 | 32,765 | 35,404 | 0.1% |
| 2 Transportation—Other † | | | | | 334,822 | 0.3% |
| | | | | | 10,864,004 | 10.9% |
| Utilities | | | | | | |
| Electric | | | | | | |
| Dominion Energy Inc. | 2.579%–5.200% | 7/1/19–7/1/20 | 61,115 | 62,864 | 0.1% |
| Dominion Resources Inc. | | 3.625% | 12/1/24 | 29,400 | 30,092 | 0.0% |
| Florida Power & Light Co. | 4.950%–5.950% | 2/1/35–2/1/38 | 104,215 | 129,804 | 0.1% |
| NextEra Energy Capital | | | | | | |
| Holdings Inc. | | 3.550% | 5/1/27 | 32,275 | 32,738 | 0.0% |
| Virginia Electric & Power Co. | 2.750%–6.000% | 3/15/23–5/15/37 | 52,305 | 53,704 | 0.1% |
| 2 Electric—Other † | | | | | 1,705,122 | 1.7% |
| 2 Natural Gas † | | | | | 80,101 | 0.1% |
| | | | | | 2,094,425 | 2.1% |
| Total Corporate Bonds (Cost $20,136,530) | | | 21,204,880 | 21.2% |
| 2Sovereign Bonds (Cost $1,676,723) † | | | 1,711,773 | 1.7% |
| Taxable Municipal Bonds (Cost $1,693,019) † | | | 1,937,085 | 1.9% |
16
| | | | | |
| Wellington Fund | | | | | |
| |
| |
| |
| | | | | Market | Percentage |
| | | | | Value• | of Net |
| | Coupon | | Shares | ($000) | Assets |
| Temporary Cash Investments | | | | | |
| Money Market Fund | | | | | |
| 3,4 Vanguard Market Liquidity Fund | 1.040% | | 5,835 | 583,650 | 0.6% |
| |
| | | | Face | | |
| | | Maturity | Amount | | |
| | | Date | ($000) | | |
| Repurchase Agreements | | | | | |
| Bank of America Securities, LLC | | | | | |
| (Dated 5/31/17, Repurchase | | | | | |
| Value $36,401,000 collateralized | | | | | |
| by Federal Farm Credit Bank | | | | | |
| 1.740%-3.820%, 11/25/20-3/20/37, | | | | | |
| Federal Home Loan Bank | | | | | |
| 2.700%-3.470%, 3/14/31-9/8/36, | | | | | |
| with a value of $37,128,000) | 0.810% | 6/1/17 | 36,400 | 36,400 | 0.0% |
| Citigroup Global Markets Inc. | | | | | |
| (Dated 5/31/17, Repurchase | | | | | |
| Value $271,306,000 collateralized | | | | | |
| by U.S. Treasury Note/Bond | | | | | |
| 0.750%-3.125%, 9/30/18-5/15/21, | | | | | |
| with a value of $276,726,000) | 0.790% | 6/1/17 | 271,300 | 271,300 | 0.3% |
| Deutsche Bank Securities, Inc. | | | | | |
| (Dated 5/31/17, Repurchase Value | | | | | |
| $37,101,000 collateralized by U.S. | | | | | |
| Treasury Note/Bond 1.375%, | | | | | |
| 12/31/18, with a value of | | | | | |
| $37,842,000) | 0.810% | 6/1/17 | 37,100 | 37,100 | 0.0% |
| HSBC Bank USA (Dated 5/31/17, | | | | | |
| Repurchase Value $75,002,000 | | | | | |
| collateralized by U.S. Treasury | | | | | |
| Note/Bond 1.625%, 3/31/19, | | | | | |
| with a value of $76,503,000) | 0.770% | 6/1/17 | 75,000 | 75,000 | 0.1% |
| HSBC Bank USA (Dated 5/31/17, | | | | | |
| Repurchase Value $19,100,000 | | | | | |
| collateralized by Federal National | | | | | |
| Mortgage Assn. 4.000%, 5/1/47, | | | | | |
| with a value of $19,488,000) | 0.780% | 6/1/17 | 19,100 | 19,100 | 0.0% |
| RBC Capital Markets LLC | | | | | |
| (Dated 5/31/17, Repurchase Value | | | | | |
| $213,205,000 collateralized by | | | | | |
| Federal Home Loan Mortgage | | | | | |
| Corp. 2.459%-3.494%, | | | | | |
| 4/1/41-2/1/47, Federal National | | | | | |
| Mortgage Assn. 2.243%-6.000%, | | | | | |
| 4/1/22-5/1/47, Government National | | | | | |
| Mortgage Assn. 4.000%, | | | | | |
| 4/20/47, with a value of | | | | | |
| $217,464,000) | 0.790% | 6/1/17 | 213,200 | 213,200 | 0.2% |
17
| | | | | | |
| Wellington Fund | | | | | |
| |
| |
| |
| | | | | Face | Market | Percentage |
| | | | Maturity | Amount | Value• | of Net |
| | | Coupon | Date | ($000) | ($000) | Assets |
| | TD Securities (USA) LLC | | | | | |
| | (Dated 5/31/17, Repurchase Value | | | | | |
| | $446,710,000 collateralized by | | | | | |
| | Federal National Mortgage Assn. | | | | | |
| | 2.500%-4.500%, 11/1/25-5/1/46, | | | | | |
| | U.S. Treasury Note/Bond | | | | | |
| | 1.500%-2.875%, 10/31/19-5/15/43, | | | | | |
| | with a value of $455,634,000) | 0.790% | 6/1/17 | 446,700 | 446,700 | 0.4% |
| | Wells Fargo & Co. (Dated 5/31/17, | | | | | |
| | Repurchase Value $150,003,000 | | | | | |
| | collateralized by Federal Home | | | | | |
| | Loan Mortgage Corp. 3.500%, | | | | | |
| | 2/1/47, Federal National Mortgage | | | | | |
| | Assn. 3.500%, 2/1/47, with a | | | | | |
| | value of $153,000,000) | 0.820% | 6/1/17 | 150,000 | 150,000 | 0.2% |
| | | | | | 1,248,800 | 1.2% |
| |
| U.S. Government and Agency Obligations † | | | 99,958 | 0.1% |
| |
| Commercial Paper | | | | | |
| 5 | Apple Inc. | 0.821% | 6/16/17 | 145,588 | 145,534 | 0.1% |
| | Exxon Mobil Corp. | 0.831% | 6/2/17 | 114,000 | 113,994 | 0.1% |
| 5 | PepsiCo Inc. | 0.810% | 6/9/17–6/16/17 | 180,000 | 179,933 | 0.2% |
| | Commercial Paper—Other † | | | | 1,469,227 | 1.5% |
| | | | | | 1,908,688 | 1.9% |
| Total Temporary Cash Investments (Cost $3,841,158) | | 3,841,096 | 3.8% |
| Total Investments (Cost $76,316,861) | | | | 100,238,729 | 100.1% |
| Conventional Mortgage-Backed Securities – Sale Commitments | | | |
| 6,7 Freddie Mac Gold Pool | 3.000% | 6/1/47 | (249,200) | (250,212) | (0.2%) |
| Total Conventional Mortgage-Backed Securities – | | | | |
| Sale Commitments (Proceeds $247,448) | | | (250,212) | (0.2%) |
| |
| | | | | | Amount | |
| | | | | | ($000) | |
| Other Assets and Liabilities | | | | | |
| Other Assets | | | | | |
| Investment in Vanguard | | | | 6,662 | |
| Receivables for Investment Securities Sold | | | 634,449 | |
| Receivables for Accrued Income | | | | 470,792 | |
| Receivables for Capital Shares Issued | | | | 25,542 | |
| Other Assets8 | | | | 45,650 | |
| Total Other Assets | | | | 1,183,095 | 1.2% |
| Liabilities | | | | | |
| Payables for Investment Securities Purchased | | | (260,895) | |
| Payables to Investment Advisor | | | | (16,831) | |
| Collateral for Securities on Loan | | | | (583,515) | |
| Payables for Capital Shares Redeemed | | | | (110,125) | |
| Payables to Vanguard | | | | (121,729) | |
| Other Liabilities | | | | (6,913) | |
| Total Liabilities | | | | (1,100,008) | (1.1%) |
| Net Assets | | | | 100,071,604 | 100.0% |
18
| |
| Wellington Fund | |
| |
| |
| |
| At May 31, 2017, net assets consisted of: | |
| | Amount |
| | ($000) |
| Paid-in Capital | 73,719,454 |
| Undistributed Net Investment Income | 479,318 |
| Accumulated Net Realized Gains | 1,958,018 |
| Unrealized Appreciation (Depreciation) | |
| Investment Securities | 23,921,868 |
| Sale Commitments | (2,764) |
| Futures Contracts | (248) |
| Forward Currency Contracts | (4,651) |
| Foreign Currencies | 609 |
| Net Assets | 100,071,604 |
| |
| |
| Investor Shares—Net Assets | |
| Applicable to 475,593,019 outstanding $.001 par value shares of | |
| beneficial interest (unlimited authorization) | 19,472,291 |
| Net Asset Value Per Share—Investor Shares | $40.94 |
| |
| |
| Admiral Shares—Net Assets | |
| Applicable to 1,139,803,873 outstanding $.001 par value shares of | |
| beneficial interest (unlimited authorization) | 80,599,313 |
| Net Asset Value Per Share—Admiral Shares | $70.71 |
• See Note A in Notes to Financial Statements.
^ Includes partial security positions on loan to broker-dealers. The total value of securities on loan is $557,568,000.
* Non-income-producing security.
† Represents the aggregate value, by category, of securities that are not among the 50 largest holdings and, in total for any issuer,
represent 1% or less of net assets.
Securities with a value of $2,272,000 have been segregated as collateral for certain open To Be Announced (TBA) transactions.
1 Securities with a value of $4,729,000 have been segregated as collateral for open forward currency contracts.
2 Certain of the fund’s securities are exempt from registration under Rule 144A of the Securities Act of 1933. Such securities may be
sold in transactions exempt from registration, normally to qualified institutional buyers. At May 31, 2017, the aggregate value of
these securities was $4,549,665,000, representing 4.5% of net assets.
3 Includes $583,515,000 of collateral received for securities on loan.
4 Affiliated money market fund available only to Vanguard funds and certain trusts and accounts managed by Vanguard. Rate shown is
the 7-day yield.
5 Security exempt from registration under Section 4(2) of the Securities Act of 1933. Such securities may be sold in transactions
exempt from registration only to dealers in that program or other “accredited investors.” At May 31, 2017, the aggregate value of
these securities was $1,344,902,000, representing 1.3% of net assets.
6 The average or expected maturity is shorter than the final maturity shown because of the possibility of interim principal payments
and prepayments or the possibility of the issue being called.
7 The issuer was placed under federal conservatorship in September 2008; since that time, its daily operations have been managed by
the Federal Housing Finance Agency and it receives capital from the U.S. Treasury, as needed to maintain a positive net worth, in
exchange for senior preferred stock.
8 Cash of $2,767,000 has been segregated as initial margin for open futures contracts.
ADR—American Depositary Receipt.
See accompanying Notes, which are an integral part of the Financial Statements.
19
Wellington Fund
Statement of Operations
| |
| | Six Months Ended |
| | May 31, 2017 |
| | ($000) |
| Investment Income | |
| Income | |
| Dividends1 | 898,950 |
| Interest | 515,260 |
| Securities Lending—Net | 3,946 |
| Total Income | 1,418,156 |
| Expenses | |
| Investment Advisory Fees—Note B | |
| Basic Fee | 37,548 |
| Performance Adjustment | (3,703) |
| The Vanguard Group—Note C | |
| Management and Administrative—Investor Shares | 15,186 |
| Management and Administrative—Admiral Shares | 35,788 |
| Marketing and Distribution—Investor Shares | 1,484 |
| Marketing and Distribution—Admiral Shares | 2,214 |
| Custodian Fees | 500 |
| Shareholders’ Reports—Investor Shares | 526 |
| Shareholders’ Reports—Admiral Shares | 332 |
| Trustees’ Fees and Expenses | 66 |
| Total Expenses | 89,941 |
| Net Investment Income | 1,328,215 |
| Realized Net Gain (Loss) | |
| Investment Securities Sold2 | 2,051,492 |
| Futures Contracts | (11,950) |
| Foreign Currencies and Forward Currency Contracts | 4,416 |
| Realized Net Gain (Loss) | 2,043,958 |
| Change in Unrealized Appreciation (Depreciation) | |
| Investment Securities | 3,842,026 |
| Sale Commitments | (2,764) |
| Futures Contracts | 782 |
| Foreign Currencies and Forward Currency Contracts | (21,395) |
| Change in Unrealized Appreciation (Depreciation) | 3,818,649 |
| Net Increase (Decrease) in Net Assets Resulting from Operations | 7,190,822 |
1 Dividends are net of foreign withholding taxes of $27,365,000.
2 Realized net gain (loss) from an affiliated company of the fund was $9,000.
See accompanying Notes, which are an integral part of the Financial Statements.
20
| | |
| Wellington Fund | | |
| |
| |
| Statement of Changes in Net Assets | | |
| |
| | Six Months Ended | Year Ended |
| | May 31, | November 30, |
| | 2017 | 2016 |
| | ($000) | ($000) |
| Increase (Decrease) in Net Assets | | |
| Operations | | |
| Net Investment Income | 1,328,215 | 2,448,099 |
| Realized Net Gain (Loss) | 2,043,958 | 1,841,458 |
| Change in Unrealized Appreciation (Depreciation) | 3,818,649 | 1,994,762 |
| Net Increase (Decrease) in Net Assets Resulting from Operations | 7,190,822 | 6,284,319 |
| Distributions | | |
| Net Investment Income | | |
| Investor Shares | (245,401) | (511,759) |
| Admiral Shares | (1,011,589) | (1,912,446) |
| Realized Capital Gain1 | | |
| Investor Shares | (354,942) | (703,940) |
| Admiral Shares | (1,391,895) | (2,449,802) |
| Total Distributions | (3,003,827) | (5,577,947) |
| Capital Share Transactions | | |
| Investor Shares | (324,163) | (985,833) |
| Admiral Shares | 3,245,321 | 4,498,517 |
| Net Increase (Decrease) from Capital Share Transactions | 2,921,158 | 3,512,684 |
| Total Increase (Decrease) | 7,108,153 | 4,219,056 |
| Net Assets | | |
| Beginning of Period | 92,963,451 | 88,744,395 |
| End of Period2 | 100,071,604 | 92,963,451 |
1 Includes fiscal 2017 and 2016 short-term gain distributions totaling $175,633,000 and $145,313,000 respectively. Short-term gain
distributions are treated as ordinary income dividends for tax purposes.
2 Net Assets—End of Period includes undistributed (overdistributed) net investment income of $479,318,000 and $407,699,000.
See accompanying Notes, which are an integral part of the Financial Statements.
21
| | | | | | |
| Wellington Fund | | | | | | |
| |
| |
| Financial Highlights | | | | | | |
| |
| |
| Investor Shares | | | | | | |
| Six Months | | | | | |
| | Ended | | | | | |
| For a Share Outstanding | May 31, | | | Year Ended November 30, |
| Throughout Each Period | 2017 | 2016 | 2015 | 2014 | 2013 | 2012 |
| Net Asset Value, Beginning of Period | $39.23 | $39.00 | $41.02 | $39.17 | $34.29 | $31.08 |
| Investment Operations | | | | | | |
| Net Investment Income | .534 | 1.017 | 1.004 | 1.000 | .955 | .959 |
| Net Realized and Unrealized Gain (Loss) | | | | | | |
| on Investments | 2.422 | 1.616 | (.527) | 3.370 | 5.324 | 3.201 |
| Total from Investment Operations | 2.956 | 2.633 | .477 | 4.370 | 6.279 | 4.160 |
| Distributions | | | | | | |
| Dividends from Net Investment Income | (. 510) | (1.014) | (. 995) | (. 982) | (. 958) | (. 950) |
| Distributions from Realized Capital Gains | (.736) | (1.389) | (1.502) | (1.538) | (.441) | — |
| Total Distributions | (1.246) | (2.403) | (2.497) | (2.520) | (1.399) | (.950) |
| Net Asset Value, End of Period | $40.94 | $39.23 | $39.00 | $41.02 | $39.17 | $34.29 |
| |
| Total Return1 | 7.67% | 7.18% | 1.22% | 11.72% | 18.85% | 13.56% |
| |
| Ratios/Supplemental Data | | | | | | |
| Net Assets, End of Period (Millions) | $19,472 | $18,967 | $19,850 | $25,199 | $26,978 | $26,716 |
| Ratio of Total Expenses to | | | | | | |
| Average Net Assets2 | 0.25% | 0.25% | 0.26% | 0.26% | 0.26% | 0.25% |
| Ratio of Net Investment Income to | | | | | | |
| Average Net Assets | 2.67% | 2.68% | 2.55% | 2.54% | 2.61% | 2.91% |
| Portfolio Turnover Rate 3 | 34% | 31% | 39% | 71% | 35% | 31% |
The expense ratio, net investment income ratio, and turnover rate for the current period have been annualized.
1 Total returns do not include account service fees that may have applied in the periods shown. Fund prospectuses provide information about any applicable account service fees.
2 Includes performance-based investment advisory fee increases (decreases) of (0.01%), (0.01%), 0.00%, 0.00%, 0.00%, and (0.02%).
3 Includes 6%, 6%, 10%, 14%, 5%, and 15% attributable to mortgage-dollar-roll activity.
See accompanying Notes, which are an integral part of the Financial Statements.
22
| | | | | | |
| Wellington Fund | | | | | | |
| |
| |
| Financial Highlights | | | | | | |
| |
| |
| Admiral Shares | | | | | | |
| Six Months | | | | | |
| | Ended | | | | | |
| For a Share Outstanding | May 31, | | | Year Ended November 30, |
| Throughout Each Period | 2017 | 2016 | 2015 | 2014 | 2013 | 2012 |
| Net Asset Value, Beginning of Period | $67.75 | $67.36 | $70.85 | $67.65 | $59.24 | $53.68 |
| Investment Operations | | | | | | |
| Net Investment Income | .950 | 1.812 | 1.790 | 1.781 | 1.700 | 1.703 |
| Net Realized and Unrealized Gain (Loss) | | | | | | |
| on Investments | 4.190 | 2.784 | (.910) | 5.825 | 9.175 | 5.544 |
| Total from Investment Operations | 5.140 | 4.596 | .880 | 7.606 | 10.875 | 7.247 |
| Distributions | | | | | | |
| Dividends from Net Investment Income | (.909) | (1.807) | (1.776) | (1.750) | (1.703) | (1.687) |
| Distributions from Realized Capital Gains (1.271) | (2.399) | (2.594) | (2.656) | (.762) | — |
| Total Distributions | (2.180) | (4.206) | (4.370) | (4.406) | (2.465) | (1.687) |
| Net Asset Value, End of Period | $70.71 | $67.75 | $67.36 | $70.85 | $67.65 | $59.24 |
| |
| Total Return1 | 7.73% | 7.26% | 1.31% | 11.82% | 18.91% | 13.69% |
| |
| Ratios/Supplemental Data | | | | | | |
| Net Assets, End of Period (Millions) | $80,599 | $73,996 | $68,894 | $64,341 | $52,311 | $37,649 |
| Ratio of Total Expenses to | | | | | | |
| Average Net Assets2 | 0.17% | 0.16% | 0.18% | 0.18% | 0.18% | 0.17% |
| Ratio of Net Investment Income to | | | | | | |
| Average Net Assets | 2.75% | 2.77% | 2.63% | 2.62% | 2.69% | 2.99% |
| Portfolio Turnover Rate 3 | 34% | 31% | 39% | 71% | 35% | 31% |
The expense ratio, net investment income ratio, and turnover rate for the current period have been annualized.
1 Total returns do not include account service fees that may have applied in the periods shown. Fund prospectuses provide information about
any applicable account service fees.
2 Includes performance-based investment advisory fee increases (decreases) of (0.01%), (0.01%), 0.00%, 0.00%, 0.00%, and (0.02%).
3 Includes 6%, 6%, 10%, 14%, 5%, and 15% attributable to mortgage-dollar-roll activity.
See accompanying Notes, which are an integral part of the Financial Statements.
23
Wellington Fund
Notes to Financial Statements
Vanguard Wellington Fund is registered under the Investment Company Act of 1940 as an open-end investment company, or mutual fund. Certain of the fund’s investments are in corporate debt instruments; the issuers’ abilities to meet their obligations may be affected by economic developments in their respective industries. The fund offers two classes of shares: Investor Shares and Admiral Shares. Investor Shares are available to any investor who meets the fund’s minimum purchase requirements. Admiral Shares are designed for investors who meet certain administrative, service, and account-size criteria.
A. The following significant accounting policies conform to generally accepted accounting principles for U.S. investment companies. The fund consistently follows such policies in preparing its financial statements.
1. Security Valuation: Securities are valued as of the close of trading on the New York Stock Exchange (generally 4 p.m., Eastern time) on the valuation date. Equity securities are valued at the latest quoted sales prices or official closing prices taken from the primary market in which each security trades; such securities not traded on the valuation date are valued at the mean of the latest quoted bid and asked prices. Bonds and temporary cash investments are valued using the latest bid prices or using valuations based on a matrix system (which considers such factors as security prices, yields, maturities, and ratings), both as furnished by independent pricing services. Structured debt securities, including mortgages and asset-backed securities, are valued using the latest bid prices or using valuations based on a matrix system that considers such factors as issuer, tranche, nominal or option-adjusted spreads, weighted average coupon, weighted average maturity, credit enhancements, and collateral. Investments in Vanguard Market Liquidity Fund are valued at that fund’s net asset value. Securities for which market quotations are not readily available, or whose values have been affected by events occurring before the fund’s pricing time but after the close of the securities’ primary markets, are valued at their fair values calculated according to procedures adopted by the board of trustees. These procedures include obtaining quotations from an independent pricing service, monitoring news to identify significant market- or security-specific events, and evaluating changes in the values of foreign market proxies (for example, ADRs, futures contracts, or exchange-traded funds), between the time the foreign markets close and the fund’s pricing time. When fair-value pricing is employed, the prices of securities used by a fund to calculate its net asset value may differ from quoted or published prices for the same securities.
2. Foreign Currency: Securities and other assets and liabilities denominated in foreign currencies are translated into U.S. dollars using exchange rates obtained from an independent third party as of the fund’s pricing time on the valuation date. Realized gains (losses) and unrealized appreciation (depreciation) on investment securities include the effects of changes in exchange rates since the securities were purchased, combined with the effects of changes in security prices. Fluctuations in the value of other assets and liabilities resulting from changes in exchange rates are recorded as unrealized foreign currency gains (losses) until the assets or liabilities are settled in cash, at which time they are recorded as realized foreign currency gains (losses).
3. Futures Contracts: The fund uses futures contracts to invest in fixed income asset classes with greater efficiency and lower cost than is possible through direct investment, to add value when these instruments are attractively priced, or to adjust sensitivity to changes in interest rates. The primary risks associated with the use of futures contracts are imperfect correlation between changes in market values of bonds held by the fund and the prices of futures contracts, and the possibility of an illiquid market. Counterparty risk involving futures is mitigated because a regulated clearinghouse is the counterparty instead of the clearing broker. To further mitigate counterparty risk, the fund trades futures contracts on an exchange, monitors the financial strength of its clearing brokers and
24
Wellington Fund
clearinghouse, and has entered into clearing agreements with its clearing brokers. The clearinghouse imposes initial margin requirements to secure the fund’s performance and requires daily settlement of variation margin representing changes in the market value of each contract.
Futures contracts are valued at their quoted daily settlement prices. The aggregate settlement values of the contracts are not recorded in the Statement of Net Assets. Fluctuations in the value of the contracts are recorded in the Statement of Net Assets as an asset (liability) and in the Statement of Operations as unrealized appreciation (depreciation) until the contracts are closed, when they are recorded as realized futures gains (losses).
During the six months ended May 31, 2017, the fund’s average investments in long and short futures contracts represented less than 1% and 1% of net assets, respectively, based on the average of aggregate settlement values at each quarter-end during the period.
4. Forward Currency Contracts: The fund enters into forward currency contracts to protect the value of securities and related receivables and payables against changes in future foreign exchange rates. The fund’s risks in using these contracts include movement in the values of the foreign currencies relative to the U.S. dollar and the ability of the counterparties to fulfill their obligations under the contracts. The fund mitigates its counterparty risk by entering into forward currency contracts only with a diverse group of prequalified counterparties, monitoring their financial strength, entering into master netting arrangements with its counterparties, and requiring its counterparties to transfer collateral as security for their performance. In the absence of a default, the collateral pledged or received by the fund cannot be repledged, resold, or rehypothecated. The master netting arrangements provide that, in the event of a counterparty’s default (including bankruptcy), the fund may terminate the forward currency contracts, determine the net amount owed by either party in accordance with its master netting arrangements, and sell or retain any collateral held up to the net amount owed to the fund under the master netting arrangements. The forward currency contracts contain provisions whereby a counterparty may terminate open contracts if the fund’s net assets decline below a certain level, triggering a payment by the fund if the fund is in a net liability position at the time of the termination. The payment amount would be reduced by any collateral the fund has pledged. Any assets pledged as collateral for open contracts are noted in the Statement of Net Assets. The value of collateral received or pledged is compared daily to the value of the forward currency contracts exposure with each counterparty, and any difference, if in excess of a specified minimum transfer amount, is adjusted and settled within two business days.
Forward currency contracts are valued at their quoted daily prices obtained from an independent third party, adjusted for currency risk based on the expiration date of each contract. The notional amounts of the contracts are not recorded in the Statement of Net Assets. Fluctuations in the value of the contracts are recorded in the Statement of Net Assets as an asset (liability) and in the Statement of Operations as unrealized appreciation (depreciation) until the contracts are closed, when they are recorded as realized forward currency contract gains (losses).
During the six months ended May 31, 2017, the fund’s average investment in forward currency contracts represented less than 1% of net assets, based on the average of notional amounts at each quarter-end during the period.
5. To Be Announced (TBA) Transactions: A TBA transaction is an agreement to buy or sell mortgage-backed securities with agreed-upon characteristics (face amount, coupon, maturity) for settlement at a future date. The fund may be a seller of TBA transactions to reduce its exposure to the mortgage-backed securities market or in order to sell mortgage-backed securities it owns under delayed-delivery arrangements. When the fund is a buyer of TBA transactions, it maintains cash or short-term
25
Wellington Fund
investments in an amount sufficient to meet the purchase price at the settlement date of the TBA transaction. The primary risk associated with TBA transactions is that a counterparty may default on its obligations. The fund mitigates its counterparty risk by, among other things, performing a credit analysis of counterparties, allocating transactions among numerous counterparties, and monitoring its exposure to each counterparty. The fund may also enter into a Master Securities Forward Transaction Agreement (MSFTA) with certain counterparties and require them to transfer collateral as security for their performance. In the absence of a default, the collateral pledged or received by the fund cannot be repledged, resold, or rehypothecated. Under an MSFTA, upon a counterparty default (including bankruptcy), the fund may terminate any TBA transactions with that counterparty, determine the net amount owed by either party in accordance with its master netting arrangements, and sell or retain any collateral held up to the net amount owed to the fund under the master netting arrangements.
6. Mortgage Dollar Rolls: The fund enters into mortgage-dollar-roll transactions, in which the fund sells mortgage-backed securities to a dealer and simultaneously agrees to purchase similar securities in the future at a predetermined price. The proceeds of the securities sold in mortgage-dollar-roll transactions are typically invested in high-quality short-term fixed income securities. The fund forgoes principal and interest paid on the securities sold, and is compensated by interest earned on the proceeds of the sale and by a lower price on the securities to be repurchased. The fund has also entered into mortgage-dollar-roll transactions in which the fund buys mortgage-backed securities from a dealer pursuant to a TBA transaction and simultaneously agrees to sell similar securities in the future at a predetermined price. The securities bought in mortgage-dollar-roll transactions are used to cover an open TBA sell position. The fund continues to earn interest on mortgage-backed security pools already held and receives a lower price on the securities to be sold in the future.
The fund accounts for mortgage-dollar-roll transactions as purchases and sales; as such, these transactions may increase the fund’s portfolio turnover rate. Amounts to be received or paid in connection with open mortgage dollar rolls are included in Receivables for Investment Securities Sold or Payables for Investment Securities Purchased in the Statement of Net Assets.
7. Repurchase Agreements: The fund enters into repurchase agreements with institutional counterparties. Securities pledged as collateral to the fund under repurchase agreements are held by a custodian bank until the agreements mature, and in the absence of a default, such collateral cannot be repledged, resold, or rehypothecated. Each agreement requires that the market value of the collateral be sufficient to cover payments of interest and principal. The fund further mitigates its counterparty risk by entering into repurchase agreements only with a diverse group of prequalified counterparties, monitoring their financial strength, and entering into master repurchase agreements with its counterparties. The master repurchase agreements provide that, in the event of a counterparty’s default (including bankruptcy), the fund may terminate any repurchase agreements with that counterparty, determine the net amount owed, and sell or retain the collateral up to the net amount owed to the fund. Such action may be subject to legal proceedings, which may delay or limit the disposition of collateral.
8. Federal Income Taxes: The fund intends to continue to qualify as a regulated investment company and distribute all of its taxable income. Management has analyzed the fund’s tax positions taken for all open federal income tax years (November 30, 2013–2016), and for the period ended May 31, 2017, and has concluded that no provision for federal income tax is required in the fund’s financial statements.
9. Distributions: Distributions to shareholders are recorded on the ex-dividend date.
26
Wellington Fund
10. Securities Lending: To earn additional income, the fund lends its securities to qualified institutional borrowers. Security loans are subject to termination by the fund at any time, and are required to be secured at all times by collateral in an amount at least equal to the market value of securities loaned. Daily market fluctuations could cause the value of loaned securities to be more or less than the value of the collateral received. When this occurs, the collateral is adjusted and settled on the next business day. The fund further mitigates its counterparty risk by entering into securities lending transactions only with a diverse group of prequalified counterparties, monitoring their financial strength, and entering into master securities lending agreements with its counterparties. The master securities lending agreements provide that, in the event of a counterparty’s default (including bankruptcy), the fund may terminate any loans with that borrower, determine the net amount owed, and sell or retain the collateral up to the net amount owed to the fund; however, such actions may be subject to legal proceedings. While collateral mitigates counterparty risk, in the event of a default, the fund may experience delays and costs in recovering the securities loaned. The fund invests cash collateral received in Vanguard Market Liquidity Fund, and records a liability in the Statement of Net Assets for the return of the collateral, during the period the securities are on loan. Securities lending income represents fees charged to borrowers plus income earned on invested cash collateral, less expenses associated with the loan. During the term of the loan, the fund is entitled to all distributions made on or in respect of the loaned securities.
11. Credit Facility: The fund and certain other funds managed by The Vanguard Group (“Vanguard”) participate in a $3.1 billion committed credit facility provided by a syndicate of lenders pursuant to a credit agreement that may be renewed annually; each fund is individually liable for its borrowings, if any, under the credit facility. Borrowings may be utilized for temporary and emergency purposes, and are subject to the fund’s regulatory and contractual borrowing restrictions. The participating funds are charged administrative fees and an annual commitment fee of 0.10% of the undrawn amount of the facility; these fees are allocated to the funds based on a method approved by the fund’s board of trustees and included in Management and Administrative expenses on the fund’s Statement of Operations. Any borrowings under this facility bear interest at a rate based upon the higher of the one-month London Interbank Offered Rate, federal funds effective rate, or overnight bank funding rate plus an agreed-upon spread.
The fund had no borrowings outstanding at May 31, 2017, or at any time during the period then ended.
12. Other: Dividend income is recorded on the ex-dividend date. Interest income is accrued daily. Premiums and discounts on debt securities purchased are amortized and accreted, respectively, to interest income over the lives of the respective securities. Security transactions are accounted for on the date securities are bought or sold. Costs used to determine realized gains (losses) on the sale of investment securities are those of the specific securities sold.
Each class of shares has equal rights as to assets and earnings, except that each class separately bears certain class-specific expenses related to maintenance of shareholder accounts (included in Management and Administrative expenses) and shareholder reporting. Marketing and distribution expenses are allocated to each class of shares based on a method approved by the board of trustees. Income, other non-class-specific expenses, and gains and losses on investments are allocated to each class of shares based on its relative net assets.
B. Wellington Management Company LLP provides investment advisory services to the fund for a fee calculated at an annual percentage rate of average net assets. The basic fee is subject to quarterly adjustments based on the fund’s performance relative to the combined index comprising the S&P
27
Wellington Fund
500 Index and the Bloomberg Barclays U.S. Credit A or Better Bond Index for the preceding three years. For the six months ended May 31, 2017, the investment advisory fee represented an effective annual basic rate of 0.08% of the fund’s average net assets before a decrease of $3,703,000 (0.01%) based on performance.
C. In accordance with the terms of a Funds’ Service Agreement (the “FSA”) between Vanguard and the fund, Vanguard furnishes to the fund corporate management, administrative, marketing, distribution, and cash management services at Vanguard’s cost of operations (as defined by the FSA). These costs of operations are allocated to the fund based on methods and guidelines approved by the board of trustees. Vanguard does not require reimbursement in the current period for certain costs of operations (such as deferred compensation/benefits and risk/insurance costs); the fund’s liability for these costs of operations is included in Payables to Vanguard on the Statement of Net Assets.
Upon the request of Vanguard, the fund may invest up to 0.40% of its net assets as capital in Vanguard. At May 31, 2017, the fund had contributed to Vanguard capital in the amount of $6,662,000, representing 0.01% of the fund’s net assets and 2.66% of Vanguard’s capitalization. The fund’s trustees and officers are also directors and employees, respectively, of Vanguard.
D. Various inputs may be used to determine the value of the fund’s investments. These inputs are summarized in three broad levels for financial statement purposes. The inputs or methodologies used to value securities are not necessarily an indication of the risk associated with investing in those securities.
Level 1—Quoted prices in active markets for identical securities.
Level 2—Other significant observable inputs (including quoted prices for similar securities, interest
rates, prepayment speeds, credit risk, etc.).
Level 3—Significant unobservable inputs (including the fund’s own assumptions used to determine
the fair value of investments).
The following table summarizes the market value of the fund’s investments as of May 31, 2017, based on the inputs used to value them:
| | | |
| | Level 1 | Level 2 | Level 3 |
| Investments | ($000) | ($000) | ($000) |
| Common Stocks | 56,799,391 | 7,739,396 | — |
| U.S. Government and Agency Obligations | — | 5,832,737 | — |
| Asset-Backed/Commercial Mortgage-Backed Securities | — | 1,172,371 | — |
| Corporate Bonds | — | 21,204,880 | — |
| Sovereign Bonds | — | 1,711,773 | — |
| Taxable Municipal Bonds | — | 1,937,085 | — |
| Temporary Cash Investments | 583,650 | 3,257,446 | — |
| Conventional Mortgage-Backed Securities— | | | |
| Sale Commitments | — | (250,212) | — |
| Futures Contracts—Assets1 | 670 | — | — |
| Futures Contracts—Liabilities1 | (326) | — | — |
| Forward Currency Contracts—Liabilities | — | (4,651) | — |
| Total | 57,383,385 | 42,600,825 | — |
1 Represents variation margin on the last day of the reporting period.
28
Wellington Fund
E. At May 31, 2017, the fair values of derivatives were reflected in the Statement of Net Assets as follows:
| | | |
| | Interest Rate | Currency | |
| | Contracts | Contracts | Total |
| Statement of Net Assets Caption | ($000) | ($000) | ($000) |
| Other Assets | 670 | — | 670 |
| Other Liabilities | (326) | (4,651) | (4,977) |
Realized net gain (loss) and the change in unrealized appreciation (depreciation) on derivatives for the six months ended May 31, 2017, were:
| | | |
| Interest Rate | Currency | |
| | Contracts | Contracts | Total |
| Realized Net Gain (Loss) on Derivatives | ($000) | ($000) | ($000) |
| Futures Contracts | (11,950) | — | (11,950) |
| Forward Currency Contracts | — | 3,126 | 3,126 |
| Realized Net Gain (Loss) on Derivatives | (11,950) | 3,126 | (8,824) |
| |
| Change in Unrealized Appreciation (Depreciation) on Derivatives | | | |
| Futures Contracts | 782 | — | 782 |
| Forward Currency Contracts | — | (22,508) | (22,508) |
| Change in Unrealized Appreciation (Depreciation) on Derivatives | 782 | (22,508) | (21,726) |
At May 31, 2017, the aggregate settlement value of open futures contracts and the related unrealized appreciation (depreciation) were:
| | | | |
| | | | | ($000) |
| | | | Aggregate | |
| | | Number of | Settlement | Unrealized |
| | | Long (Short) | Value | Appreciation |
| Futures Contracts | Expiration | Contracts | Long (Short) | (Depreciation) |
| 5-Year U.S. Treasury Note | September 2017 | (6,119) | (723,954) | (1,298) |
| 2-Year U.S. Treasury Note | September 2017 | (2,493) | (539,696) | (43) |
| 10-Year U.S. Treasury Note | September 2017 | 4,060 | 512,765 | 1,093 |
| | | | | (248) |
Unrealized appreciation (depreciation) on open futures contracts is required to be treated as realized gain (loss) for tax purposes.
29
Wellington Fund
At May 31, 2017, the fund had open forward currency contracts to receive and deliver currencies as follows. Unrealized appreciation (depreciation) on open forward currency contracts is treated as realized gain (loss) for tax purposes.
| | | | | | |
| | Contract | | | | | Appreciation |
| | Settlement | | | Contract Amount (000) | (Depreciation) |
| Counterparty | Date | | Receive | | Deliver | ($000) |
| Citibank, N.A. | 8/28/17 | USD | 79,640 | JPY | 8,850,000 | (603) |
| Goldman Sachs International | 8/21/17 | USD | 80,104 | JPY | 8,900,000 | (565) |
| J.P. Morgan Securities LLC | 8/7/17 | USD | 78,871 | JPY | 8,900,000 | (1,741) |
| J.P. Morgan Securities LLC | 8/14/17 | USD | 78,899 | JPY | 8,900,000 | (1,742) |
| | | | | | | (4,651) |
JPY—Japanese yen.
USD—U.S. dollar.
F. Distributions are determined on a tax basis and may differ from net investment income and realized capital gains for financial reporting purposes. Differences may be permanent or temporary. Permanent differences are reclassified among capital accounts in the financial statements to reflect their tax character. Temporary differences arise when certain items of income, expense, gain, or loss are recognized in different periods for financial statement and tax purposes. These differences will reverse at some time in the future. Differences in classification may also result from the treatment of short-term gains as ordinary income for tax purposes. The fund’s tax-basis capital gains and losses are determined only at the end of each fiscal year.
During the six months ended May 31, 2017, the fund realized net foreign currency gains of $394,000, (including the foreign currency component on sales of foreign currency denominated bonds), which increased distributable net income for tax purposes; accordingly, such gains have been reclassified from accumulated net realized gains to undistributed net investment income.
At May 31, 2017, the cost of long security positions for tax purposes was $76,385,553,000. Net unrealized appreciation of long security positions for tax purposes was $23,853,176,000, consisting of unrealized gains of $24,416,671,000 on securities that had risen in value since their purchase and $563,495,000 in unrealized losses on securities that had fallen in value since their purchase. Tax basis net unrealized depreciation on sale commitments was $2,764,000, consisting entirely of unrealized losses on sale commitments that had risen in value since their sale.
G. During the six months ended May 31, 2017, the fund purchased $10,424,856,000 of investment securities and sold $10,794,782,000 of investment securities, other than U.S. government securities and temporary cash investments. Purchases and sales of U.S. government securities were $5,339,283,000 and $5,289,371,000, respectively.
30
Wellington Fund
| | | | |
| H. Capital share transactions for each class of shares were: | | | |
| | Six Months Ended | | Year Ended |
| | | May 31, 2017 | November 30, 2016 |
| | Amount | Shares | Amount | Shares |
| | ($000) | (000) | ($000) | (000) |
| Investor Shares | | | | |
| Issued | 1,254,966 | 31,381 | 1,845,683 | 48,907 |
| Issued in Lieu of Cash Distributions | 576,493 | 14,627 | 1,169,972 | 31,435 |
| Redeemed | (2,155,622) | (53,953) | (4,001,488) | (105,836) |
| Net Increase (Decrease)—Investor Shares | (324,163) | (7,945) | (985,833) | (25,494) |
| Admiral Shares | | | | |
| Issued | 4,660,257 | 67,530 | 7,081,561 | 108,533 |
| Issued in Lieu of Cash Distributions | 2,259,362 | 33,191 | 4,109,992 | 63,923 |
| Redeemed | (3,674,298) | (53,155) | (6,693,036) | (103,049) |
| Net Increase (Decrease)—Admiral Shares | 3,245,321 | 47,566 | 4,498,517 | 69,407 |
I. Management has determined that no material events or transactions occurred subsequent to May 31, 2017, that would require recognition or disclosure in these financial statements.
31
About Your Fund’s Expenses
As a shareholder of the fund, you incur ongoing costs, which include costs for portfolio management, administrative services, and shareholder reports (like this one), among others. Operating expenses, which are deducted from a fund’s gross income, directly reduce the investment return of the fund.
A fund’s expenses are expressed as a percentage of its average net assets. This figure is known as the expense ratio. The following examples are intended to help you understand the ongoing costs (in dollars) of investing in your fund and to compare these costs with those of other mutual funds. The examples are based on an investment of $1,000 made at the beginning of the period shown and held for the entire period.
The accompanying table illustrates your fund’s costs in two ways:
• Based on actual fund return. This section helps you to estimate the actual expenses that you paid over the period. The ”Ending Account Value“ shown is derived from the fund‘s actual return, and the third column shows the dollar amount that would have been paid by an investor who started with $1,000 in the fund. You may use the information here, together with the amount you invested, to estimate the expenses that you paid over the period.
To do so, simply divide your account value by $1,000 (for example, an $8,600 account value divided by $1,000 = 8.6), then multiply the result by the number given for your fund under the heading ”Expenses Paid During Period.“
• Based on hypothetical 5% yearly return. This section is intended to help you compare your fund‘s costs with those of other mutual funds. It assumes that the fund had a yearly return of 5% before expenses, but that the expense ratio is unchanged. In this case—because the return used is not the fund’s actual return—the results do not apply to your investment. The example is useful in making comparisons because the Securities and Exchange Commission requires all mutual funds to calculate expenses based on a 5% return. You can assess your fund’s costs by comparing this hypothetical example with the hypothetical examples that appear in shareholder reports of other funds.
Note that the expenses shown in the table are meant to highlight and help you compare ongoing costs only and do not reflect transaction costs incurred by the fund for buying and selling securities. Further, the expenses do not include any purchase, redemption, or account service fees described in the fund prospectus. If such fees were applied to your account, your costs would be higher. Your fund does not carry a “sales load.”
The calculations assume no shares were bought or sold during the period. Your actual costs may have been higher or lower, depending on the amount of your investment and the timing of any purchases or redemptions.
You can find more information about the fund’s expenses, including annual expense ratios, in the Financial Statements section of this report. For additional information on operating expenses and other shareholder costs, please refer to your fund’s current prospectus.
32
| | | |
| Six Months Ended May 31, 2017 | | | |
| | Beginning | Ending | Expenses |
| | Account Value | Account Value | Paid During |
| Wellington Fund | 11/30/2016 | 5/31/2017 | Period |
| Based on Actual Fund Return | | | |
| Investor Shares | $1,000.00 | $1,076.73 | $1.29 |
| Admiral Shares | 1,000.00 | 1,077.27 | 0.88 |
| Based on Hypothetical 5% Yearly Return | | | |
| Investor Shares | $1,000.00 | $1,023.68 | $1.26 |
| Admiral Shares | 1,000.00 | 1,024.08 | 0.86 |
The calculations are based on expenses incurred in the most recent six-month period. The fund’s annualized six-month expense ratios for that
period are 0.25% for Investor Shares and 0.17% for Admiral Shares. The dollar amounts shown as “Expenses Paid” are equal to the
annualized expense ratio multiplied by the average account value over the period, multiplied by the number of days in the most recent
six-month period, then divided by the number of days in the most recent 12-month period (182/365).
33
Glossary
30-Day SEC Yield. A fund’s 30-day SEC yield is derived using a formula specified by the U.S. Securities and Exchange Commission. Under the formula, data related to the fund’s security holdings in the previous 30 days are used to calculate the fund’s hypothetical net income for that period, which is then annualized and divided by the fund’s estimated average net assets over the calculation period. For the purposes of this calculation, a security’s income is based on its current market yield to maturity (for bonds), its actual income (for asset-backed securities), or its projected dividend yield (for stocks). Because the SEC yield represents hypothetical annualized income, it will differ—at times significantly—from the fund’s actual experience. As a result, the fund’s income distributions may be higher or lower than implied by the SEC yield.
Average Coupon. The average interest rate paid on the fixed income securities held by a fund. It is expressed as a percentage of face value.
Average Duration. An estimate of how much the value of the bonds held by a fund will fluctuate in response to a change in interest rates. To see how the value could change, multiply the average duration by the change in rates. If interest rates rise by 1 percentage point, the value of the bonds in a fund with an average duration of five years would decline by about 5%. If rates decrease by a percentage point, the value would rise by 5%.
Average Effective Maturity. The average length of time until fixed income securities held by a fund reach maturity and are repaid, taking into consideration the possibility that the issuer may call the bond before its maturity date. The figure reflects the proportion of fund assets represented by each security; it also reflects any futures contracts held. In general, the longer the average effective maturity, the more a fund’s share price will fluctuate in response to changes in market interest rates.
Beta. A measure of the magnitude of a fund’s past share-price fluctuations in relation to the ups and downs of a given market index. The index is assigned a beta of 1.00. Compared with a given index, a fund with a beta of 1.20 typically would have seen its share price rise or fall by 12% when the index rose or fell by 10%. For this report, beta is based on returns over the past 36 months for both the fund and the index. Note that a fund’s beta should be reviewed in conjunction with its R-squared (see definition). The lower the R-squared, the less correlation there is between the fund and the index, and the less reliable beta is as an indicator of volatility.
Credit Quality. Credit-quality ratings are measured on a scale that generally ranges from AAA (highest) to D (lowest). U.S. Treasury, U.S. Agency, and U.S. Agency mortgage-backed securities appear under “U.S. Government.” Credit-quality ratings are obtained from Barclays and are from Moody’s, Fitch, and S&P. When ratings from all three agencies are used, the median rating is shown. When ratings from two of the agencies are used, the lower rating for each issue is shown. “Not Rated” is used to classify securities for which a rating is not available. Not rated securities include a fund’s investment in Vanguard Market Liquidity Fund or Vanguard Municipal Cash Management Fund, each of which invests in high-quality money market instruments and may serve as a cash management vehicle for the Vanguard funds, trusts, and accounts.
Dividend Yield. The current, annualized rate of dividends paid on a share of stock, divided by its current share price. For a fund, the weighted average yield for stocks it holds. The index yield is based on the current annualized rate of dividends paid on stocks in the index.
34
Earnings Growth Rate. The average annual rate of growth in earnings over the past five years for the stocks now in a fund.
Equity Exposure. A measure that reflects a fund’s investments in stocks and stock futures. Any holdings in short-term reserves are excluded.
Expense Ratio. A fund’s total annual operating expenses expressed as a percentage of the fund’s average net assets. The expense ratio includes management and administrative expenses, but does not include the transaction costs of buying and selling portfolio securities.
Foreign Holdings. The percentage of a fund represented by securities or depositary receipts of companies based outside the United States.
Inception Date. The date on which the assets of a fund (or one of its share classes) are first invested in accordance with the fund’s investment objective. For funds with a subscription period, the inception date is the day after that period ends. Investment performance is measured from the inception date.
Median Market Cap. An indicator of the size of companies in which a fund invests; the midpoint of market capitalization (market price x shares outstanding) of a fund’s stocks, weighted by the proportion of the fund’s assets invested in each stock. Stocks representing half of the fund’s assets have market capitalizations above the median, and the rest are below it.
Price/Book Ratio. The share price of a stock divided by its net worth, or book value, per share. For a fund, the weighted average price/book ratio of the stocks it holds.
Price/Earnings Ratio. The ratio of a stock’s current price to its per-share earnings over the past year. For a fund, the weighted average P/E of the stocks it holds. P/E is an indicator of market expectations about corporate prospects; the higher the P/E, the greater the expectations for a company’s future growth.
R-Squared. A measure of how much of a fund’s past returns can be explained by the returns from the market in general, as measured by a given index. If a fund’s total returns were precisely synchronized with an index’s returns, its R-squared would be 1.00. If the fund’s returns bore no relationship to the index’s returns, its R-squared would be 0. For this report, R-squared is based on returns over the past 36 months for both the fund and the index.
Return on Equity. The annual average rate of return generated by a company during the past five years for each dollar of shareholder’s equity (net income divided by shareholder’s equity). For a fund, the weighted average return on equity for the companies whose stocks it holds.
Short-Term Reserves. The percentage of a fund invested in highly liquid, short-term securities that can be readily converted to cash.
Turnover Rate. An indication of the fund’s trading activity. Funds with high turnover rates incur higher transaction costs and may be more likely to distribute capital gains (which may be taxable to investors). The turnover rate excludes in-kind transactions, which have minimal impact on costs.
Yield to Maturity. The rate of return an investor would receive if the fixed income securities held by a fund were held to their maturity dates.
35
Benchmark Information
Wellington Composite Index: 65% S&P 500 Index and 35% Lehman U.S. Long Credit AA or Better Bond Index through February 29, 2000; 65% S&P 500 Index and 35% Bloomberg Barclays U.S.
Credit A or Better Bond Index thereafter.
36
The Global Industry Classification Standard (“GICS”) was developed by and is the exclusive property and a service mark of MSCI Inc. (“MSCI”) and Standard and Poor’s, a division of McGraw-Hill Companies, Inc. (“S&P”), and is licensed for use by Vanguard. Neither MSCI, S&P nor any third party involved in making or compiling the GICS or any GICS classification makes any express or implied warranties or representations with respect to such standard or classification (or the results to be obtained by the use thereof), and all such parties hereby expressly disclaim all warranties of originality, accuracy, completeness, merchantability or fitness for a particular purpose with respect to any such standard or classification. Without limiting any of the foregoing, in no event shall MSCI, S&P, any of its affiliates or any third party involved in making or compiling the GICS or any GICS classification have any liability for any direct, indirect, special, punitive, consequential or any other damages (including lost profits) even if notified of the possibility of such damages.
Vanguard Wellington Fund is not sponsored, endorsed, issued, sold or promoted by Barclays Risk Analytics and Index Solutions Limited or any of its affiliates (“Barclays”). Barclays makes no representation or warranty, express or implied, to the owners or purchasers of Vanguard Wellington Fund or any member of the public regarding the advisability of investing in securities generally or in Vanguard Wellington Fund particularly or the ability of the Bloomberg Barclays Index to track general bond market performance. Barclays has not passed on the legality or suitability of Vanguard Wellington Fund with respect to any person or entity. Barclays’ only relationship to Vanguard and Vanguard Wellington Fund is the licensing of the Bloomberg Barclays Index which is determined, composed and calculated by Barclays without regard to Vanguard or Vanguard Wellington Fund or any owners or purchasers of Vanguard Wellington Fund. Barclays has no obligation to take the needs of Vanguard, Vanguard Wellington Fund or the owners of Vanguard Wellington Fund into consideration in determining, composing or calculating the Barclays Index. Barclays is not responsible for and has not participated in the determination of the timing of, prices at, or quantities of Vanguard Wellington Fund to be issued. Barclays has no obligation or liability in connection with the administration, marketing or trading of Vanguard Wellington Fund.
BARCLAYS SHALL HAVE NO LIABILITY TO THIRD PARTIES FOR THE QUALITY, ACCURACY AND/OR COMPLETENESS OF THE INDEX OR ANY DATA INCLUDED THEREIN OR FOR INTERRUPTIONS IN THE DELIVERY OF THE INDEX. BARCLAYS MAKES NO WARRANTY, EXPRESS OR IMPLIED, AS TO RESULTS TO BE OBTAINED BY OWNERS OF THE WELLINGTON FUND OR ANY OTHER PERSON OR ENTITY FROM THE USE OF THE INDEX OR ANY DATA INCLUDED THEREIN IN CONNECTION WITH THE RIGHTS LICENSED HEREUNDER OR FOR ANY OTHER USE. BARCLAYS RESERVES THE RIGHT TO CHANGE THE METHODS OF CALCULATION OR PUBLICATION, OR TO CEASE THE CALCULATION OR PUBLICATION OF THE BLOOMBERG BARCLAYS U.S. CREDIT A OR BETTER BOND INDEX, AND BARCLAYS SHALL NOT BE LIABLE FOR ANY MISCALCULATION OF OR ANY INCORRECT, DELAYED OR INTERRUPTED PUBLICATION WITH RESPECT TO THE BLOOMBERG BARCLAYS U.S. CREDIT A OR BETTER BOND INDEX. BARCLAYS MAKES NO EXPRESS OR IMPLIED WARRANTIES, AND HEREBY EXPRESSLY DISCLAIMS ALL WARRANTIES OF MERCHANTABILITY OR FITNESS FOR A PARTICULAR PURPOSE OR USE WITH RESPECT TO THE INDEX OR ANY DATA INCLUDED THEREIN. BARCLAYS SHALL NOT BE LIABLE FOR ANY DAMAGES, INCLUDING, WITHOUT LIMITATION, ANY INDIRECT OR CONSEQUENTIAL DAMAGES RESULTING FROM THE USE OF THE INDEX OR ANY DATA INCLUDED THEREIN.
© 2017 Barclays. Used with Permission.
Source: Barclays Global Family of Indices. Copyright 2017, Barclays. All rights reserved.
37
This page intentionally left blank.
This page intentionally left blank.
The People Who Govern Your Fund
The trustees of your mutual fund are there to see that the fund is operated and managed in your best interests since, as a shareholder, you are a part owner of the fund. Your fund’s trustees also serve on the board of directors of The Vanguard Group, Inc., which is owned by the Vanguard funds and provides services to them on an at-cost basis.
A majority of Vanguard’s board members are independent, meaning that they have no affiliation with Vanguard or the funds they oversee, apart from the sizable personal investments they have made as private individuals. The independent board members have distinguished backgrounds in business, academia, and public service. Each of the trustees and executive officers oversees 197 Vanguard funds.
The following table provides information for each trustee and executive officer of the fund. The mailing address of the trustees and officers is P.O. Box 876, Valley Forge, PA 19482. More information about the trustees is in the Statement of Additional Information, which can be obtained, without charge, by contacting Vanguard at 800-662-7447, or online at vanguard.com.
Interested Trustee1
F. William McNabb III
Born 1957. Trustee Since July 2009. Chairman of the Board. Principal Occupation(s) During the Past Five Years and Other Experience: Chairman of the Board of The Vanguard Group, Inc., and of each of the investment companies served by The Vanguard Group, since January 2010; Director of The Vanguard Group since 2008; Chief Executive Officer and President of The Vanguard Group, and of each of the investment companies served by The Vanguard Group, since 2008; Director of Vanguard Marketing Corporation; Managing Director of The Vanguard Group (1995–2008).
Independent Trustees
Emerson U. Fullwood
Born 1948. Trustee Since January 2008. Principal Occupation(s) During the Past Five Years and Other Experience: Executive Chief Staff and Marketing Officer for North America and Corporate Vice President (retired 2008) of Xerox Corporation (document management products and services); Executive in Residence and 2009–2010 Distinguished Minett Professor at the Rochester Institute of Technology; Lead Director of SPX FLOW, Inc. (multi-industry manufacturing); Director of the United Way of Rochester, the University of Rochester Medical Center, Monroe Community College Foundation, North Carolina A&T University, and Roberts Wesleyan College; Trustee of the University of Rochester.
Rajiv L. Gupta
Born 1945. Trustee Since December 2001.2 Principal Occupation(s) During the Past Five Years and Other Experience: Chairman and Chief Executive Officer (retired 2009) and President (2006–2008) of Rohm and Haas Co. (chemicals); Director of Arconic Inc. (diversified manufacturer), HP Inc. (printer and personal computer manufacturing), and Delphi Automotive plc (automotive components); Senior Advisor at New Mountain Capital.
Amy Gutmann
Born 1949. Trustee Since June 2006. Principal Occupation(s) During the Past Five Years and Other Experience: President of the University of Pennsylvania; Christopher H. Browne Distinguished Professor of Political Science, School of Arts and Sciences, and Professor of Communication, Annenberg School for Communication, with secondary faculty appointments in the Department of Philosophy, School of Arts and Sciences, and at the Graduate School of Education, University of Pennsylvania; Trustee of the National Constitution Center.
JoAnn Heffernan Heisen
Born 1950. Trustee Since July 1998. Principal Occupation(s) During the Past Five Years and Other Experience: Corporate Vice President and Member of the Executive Committee (1997–2008), Chief Global Diversity Officer (retired 2008), Vice President and Chief Information Officer (1997–2006), Controller (1995–1997), Treasurer (1991–1995), and Assistant Treasurer (1989–1991) of Johnson & Johnson (pharmaceuticals/medical devices/consumer products); Director of Skytop Lodge Corporation (hotels) and the Robert Wood Johnson Foundation; Member of the Advisory Board of the Institute for Women’s Leadership at Rutgers University.
F. Joseph Loughrey
Born 1949. Trustee Since October 2009. Principal Occupation(s) During the Past Five Years and Other Experience: President and Chief Operating Officer (retired 2009) of Cummins Inc. (industrial machinery); Chairman of the Board of Hillenbrand, Inc. (specialized consumer services), Oxfam America, and the Lumina Foundation for Education; Director of SKF AB (industrial machinery), Hyster-Yale Materials Handling, Inc. (forklift trucks), and the V Foundation for Cancer
Research; Member of the Advisory Council for the College of Arts and Letters and Chair of the Advisory Board to the Kellogg Institute for International Studies, both at the University of Notre Dame.
Mark Loughridge
Born 1953. Trustee Since March 2012. Principal Occupation(s) During the Past Five Years and Other Experience: Senior Vice President and Chief Financial Officer (retired 2013) at IBM (information technology services); Fiduciary Member of IBM’s Retirement Plan Committee (2004–2013); Director of the Dow Chemical Company; Member of the Council on Chicago Booth.
Scott C. Malpass
Born 1962. Trustee Since March 2012. Principal Occupation(s) During the Past Five Years and Other Experience: Chief Investment Officer and Vice President at the University of Notre Dame; Assistant Professor of Finance at the Mendoza College of Business at Notre Dame; Member of the Notre Dame 403(b) Investment Committee, the Board of Advisors for Spruceview Capital Partners, and the Investment Advisory Committee of Major League Baseball; Board Member of TIFF Advisory Services, Inc., and Catholic Investment Services, Inc. (investment advisors); Member of the Board of Superintendence of the Institute for the Works of Religion.
André F. Perold
Born 1952. Trustee Since December 2004. Principal Occupation(s) During the Past Five Years and Other Experience: George Gund Professor of Finance and Banking, Emeritus at the Harvard Business School (retired 2011); Chief Investment Officer and Co-Managing Partner of HighVista Strategies LLC (private investment firm); Overseer of the Museum of Fine Arts Boston.
Peter F. Volanakis
Born 1955. Trustee Since July 2009. Principal Occupation(s) During the Past Five Years and Other Experience: President and Chief Operating Officer (retired 2010) of Corning Incorporated (communications equipment); Chairman of the Board of Trustees of Colby-Sawyer College; Member of the Board of Hypertherm, Inc. (industrial cutting systems, software, and consumables).
Executive Officers
Glenn Booraem
Born 1967. Investment Stewardship Officer Since February 2017. Principal Occupation(s) During the Past Five Years and Other Experience: Principal of The Vanguard Group, Inc.; Treasurer (2015–2017), Controller (2010–2015), and Assistant Controller (2001–2010) of each of the investment companies served by The Vanguard Group.
Thomas J. Higgins
Born 1957. Chief Financial Officer Since September 2008. Principal Occupation(s) During the Past Five Years and Other Experience: Principal of The Vanguard Group, Inc.; Chief Financial Officer of each of the investment companies served by The Vanguard Group; Treasurer of each of the investment companies served by The Vanguard Group (1998–2008).
Peter Mahoney
Born 1974. Controller Since May 2015. Principal Occupation(s) During the Past Five Years and Other Experience: Principal of The Vanguard Group, Inc.; Controller of each of the investment companies served by The Vanguard Group; Head of International Fund Services at The Vanguard Group (2008–2014).
Anne E. Robinson
Born 1970. Secretary Since September 2016. Principal Occupation(s) During the Past Five Years and Other Experience: Managing Director of The Vanguard Group, Inc.; General Counsel of The Vanguard Group; Secretary of The Vanguard Group and of each of the investment companies served by The Vanguard Group; Director and Senior Vice President of Vanguard Marketing Corporation; Managing Director and General Counsel of Global Cards and Consumer Services at Citigroup (2014–2016); Counsel at American Express (2003–2014).
Michael Rollings
Born 1963. Treasurer Since February 2017. Principal Occupation(s) During the Past Five Years and Other Experience: Managing Director of The Vanguard Group, Inc.; Treasurer of each of the investment companies served by The Vanguard Group; Executive Vice President and Chief Financial Officer of MassMutual Financial Group (2006–2016).
Vanguard Senior Management Team
| |
| Mortimer J. Buckley | James M. Norris |
| John James | Thomas M. Rampulla |
| Martha G. King | Glenn W. Reed |
| John T. Marcante | Karin A. Risi |
| Chris D. McIsaac | |
| |
| Chairman Emeritus and Senior Advisor |
| John J. Brennan | |
| Chairman, 1996–2009 | |
| Chief Executive Officer and President, 1996–2008 |
| |
| Founder | |
| John C. Bogle | |
| Chairman and Chief Executive Officer, 1974–1996 |
1 Mr. McNabb is considered an “interested person,” as defined in the Investment Company Act of 1940, because he is an officer of the Vanguard funds.
2 December 2002 for Vanguard Equity Income Fund, the Vanguard Municipal Bond Funds, and the Vanguard State Tax-Exempt Funds.
| |  |
| | | P.O. Box 2600 |
| | | Valley Forge, PA 19482-2600 |
| |
| |
| |
| Connect with Vanguard® > vanguard.com | |
| |
| |
| |
| Fund Information > 800-662-7447 | | CFA® is a registered trademark owned by CFA Institute. |
| Direct Investor Account Services > 800-662-2739 | |
| Institutional Investor Services > 800-523-1036 | |
| Text Telephone for People | | |
| Who Are Deaf or Hard of Hearing> 800-749-7273 | |
| |
| This material may be used in conjunction | |
| with the offering of shares of any Vanguard | |
| fund only if preceded or accompanied by | |
| the fund’s current prospectus. | |
| |
| All comparative mutual fund data are from Lipper, a | |
| Thomson Reuters Company, or Morningstar, Inc., unless | |
| otherwise noted. | | |
| |
| You can obtain a free copy of Vanguard’s proxy voting | |
| guidelines by visiting vanguard.com/proxyreporting or by | |
| calling Vanguard at 800-662-2739. The guidelines are | |
| also available from the SEC’s website, sec.gov. In | |
| addition, you may obtain a free report on how your fund | |
| voted the proxies for securities it owned during the 12 | |
| months ended June 30. To get the report, visit either | |
| vanguard.com/proxyreporting or sec.gov. | |
| |
| You can review and copy information about your fund at | |
| the SEC’s Public Reference Room in Washington, D.C. To | |
| find out more about this public service, call the SEC at | |
| 202-551-8090. Information about your fund is also | |
| available on the SEC’s website, and you can receive | |
| copies of this information, for a fee, by sending a | |
| request in either of two ways: via email addressed to | |
| publicinfo@sec.gov or via regular mail addressed to the | |
| Public Reference Section, Securities and Exchange | |
| Commission, Washington, DC 20549-1520. | |
| |
| | | © 2017 The Vanguard Group, Inc. |
| | | All rights reserved. |
| | | Vanguard Marketing Corporation, Distributor. |
| |
| | | Q212 072017 |
Item 2: Code of Ethics. The Registrant has adopted a code of ethics that applies to the Registrant’s principal executive officer, principal financial officer, principal accounting officer or controller or persons performing similar functions. The Code of Ethics was amended during the reporting period covered by this report to make certain technical, non-material changes.
Item 3: Audit Committee Financial Expert.
Not Applicable.
Item 4: Principal Accountant Fees and Services.
(a) Audit Fees.
Not Applicable.
Item 5: Audit Committee of Listed Registrants.
Not Applicable.
Item 6: Investments.
| | |
| Vanguard® Wellington Fund | | |
| Schedule of Investments | | |
| May 31, 2017 | | |
| |
| | | Market |
| | | Value |
| | Shares | ($000) |
| |
| Common Stocks (64.5%) | | |
| Consumer Discretionary (4.2%) | | |
| Comcast Corp. Class A | 44,367,572 | 1,849,684 |
| Ford Motor Co. | 55,967,740 | 622,361 |
| Twenty-First Century Fox Inc. Class A | 19,844,871 | 538,193 |
| Lowe's Cos. Inc. | 6,317,885 | 497,660 |
| Hilton Worldwide Holdings Inc. | 3,592,523 | 238,795 |
| L Brands Inc. | 4,205,300 | 216,994 |
| Bayerische Motoren Werke AG | 2,251,875 | 211,181 |
| | | 4,174,868 |
| Consumer Staples (5.2%) | | |
| PepsiCo Inc. | 8,111,080 | 947,942 |
| Unilever NV | 16,418,775 | 935,294 |
| Philip Morris International Inc. | 5,938,890 | 711,479 |
| Walgreens Boots Alliance Inc. | 8,286,890 | 671,404 |
| Diageo plc | 18,503,396 | 556,192 |
| Costco Wholesale Corp. | 2,775,990 | 500,872 |
| CVS Health Corp. | 6,168,160 | 473,900 |
| British American Tobacco plc | 3,105,050 | 222,145 |
| Mondelez International Inc. Class A | 3,447,325 | 160,611 |
| | | 5,179,839 |
| Energy (6.0%) | | |
| Chevron Corp. | 16,071,775 | 1,663,107 |
| TOTAL SA | 17,575,369 | 928,477 |
| Exxon Mobil Corp. | 10,549,370 | 849,224 |
| Suncor Energy Inc. | 16,992,240 | 531,837 |
| Anadarko Petroleum Corp. | 8,682,695 | 438,737 |
| ConocoPhillips | 7,405,000 | 330,930 |
| Hess Corp. | 6,238,750 | 286,296 |
| Royal Dutch Shell plc Class B | 9,352,574 | 258,904 |
| BP plc | 32,372,258 | 195,581 |
| Eni SPA | 11,986,854 | 190,533 |
| Halliburton Co. | 3,843,420 | 173,684 |
| Valero Energy Corp. | 1,829,725 | 112,473 |
| | | 5,959,783 |
| Financials (15.0%) | | |
| JPMorgan Chase & Co. | 20,544,786 | 1,687,754 |
| Bank of America Corp. | 72,233,803 | 1,618,759 |
| Chubb Ltd. | 10,739,480 | 1,537,786 |
| Prudential Financial Inc. | 12,632,940 | 1,324,564 |
| Wells Fargo & Co. | 23,611,329 | 1,207,483 |
| PNC Financial Services Group Inc. | 9,088,945 | 1,078,858 |
| Marsh & McLennan Cos. Inc. | 9,031,920 | 700,516 |
| BlackRock Inc. | 1,432,886 | 586,394 |
| Northern Trust Corp. | 6,491,104 | 567,582 |
| Mitsubishi UFJ Financial Group Inc. | 89,847,800 | 557,533 |
| Intercontinental Exchange Inc. | 8,906,895 | 536,106 |
| Citigroup Inc. | 8,602,808 | 520,814 |
| Goldman Sachs Group Inc. | 2,439,985 | 515,471 |
| MetLife Inc. | 9,337,584 | 472,388 |
| Bank of Nova Scotia | 7,217,200 | 407,700 |
| ^ BNP Paribas SA | 5,256,634 | 371,122 |
| Hartford Financial Services Group Inc. | 6,657,482 | 328,813 |
| American International Group Inc. | 4,356,477 | 277,203 |
| Zurich Insurance Group AG | 791,643 | 232,936 |
| UBS Group AG | 9,939,752 | 157,943 |
| Tokio Marine Holdings Inc. | 3,404,100 | 144,436 |
| ING Groep NV | 8,564,540 | 143,746 |
| Synchrony Financial | 2,138,766 | 57,426 |
| Capital One Financial Corp. | 138,807 | 10,677 |
| | | 15,044,010 |
1
| | | |
| Vanguard® Wellington Fund | | |
| Schedule of Investments | | |
| May 31, 2017 | | |
| |
| | | | Market |
| | | | Value |
| | | Shares | ($000) |
| Health Care (10.3%) | | |
| | Merck & Co. Inc. | 20,970,157 | 1,365,367 |
| | Bristol-Myers Squibb Co. | 22,942,625 | 1,237,754 |
| ^ | AstraZeneca plc ADR | 33,672,226 | 1,157,988 |
| | Johnson & Johnson | 7,795,651 | 999,792 |
| | Medtronic plc | 10,495,195 | 884,535 |
| | Pfizer Inc. | 25,072,795 | 818,627 |
| | Eli Lilly & Co. | 8,293,955 | 659,950 |
| | UnitedHealth Group Inc. | 3,686,665 | 645,830 |
| | Novartis AG | 7,812,592 | 639,345 |
| | Cardinal Health Inc. | 8,389,300 | 623,241 |
| * | HCA Healthcare Inc. | 4,028,710 | 329,992 |
| | Roche Holding AG | 1,085,261 | 297,957 |
| | McKesson Corp. | 1,537,370 | 250,730 |
| | Abbott Laboratories | 4,984,094 | 227,574 |
| * | Regeneron Pharmaceuticals Inc. | 457,550 | 210,043 |
| | | | 10,348,725 |
| Industrials (7.4%) | | |
| | United Parcel Service Inc. Class B | 10,713,350 | 1,135,294 |
| | Honeywell International Inc. | 5,813,105 | 773,085 |
| | Lockheed Martin Corp. | 2,492,630 | 700,753 |
| | Canadian National Railway Co. | 8,000,941 | 619,513 |
| | Caterpillar Inc. | 5,673,111 | 598,116 |
| | Eaton Corp. plc | 6,716,478 | 519,721 |
| | Airbus SE | 6,021,118 | 495,185 |
| | FedEx Corp. | 2,544,714 | 493,267 |
| ^ | ABB Ltd. ADR | 18,540,676 | 465,927 |
| | Siemens AG | 3,146,126 | 449,957 |
| | Schneider Electric SE | 5,233,933 | 403,261 |
| | Boeing Co. | 1,657,269 | 310,953 |
| | United Technologies Corp. | 2,128,250 | 258,114 |
| | CSX Corp. | 3,538,981 | 191,707 |
| | | | 7,414,853 |
| Information Technology (10.2%) | | |
| | Microsoft Corp. | 30,995,154 | 2,164,701 |
| * | Alphabet Inc. Class A | 1,863,102 | 1,839,049 |
| | Intel Corp. | 44,937,690 | 1,622,700 |
| | Apple Inc. | 10,145,535 | 1,549,832 |
| | Accenture plc Class A | 6,003,990 | 747,317 |
| | Cisco Systems Inc. | 22,651,177 | 714,192 |
| * | eBay Inc. | 15,575,615 | 534,244 |
| | QUALCOMM Inc. | 8,044,182 | 460,690 |
| | Texas Instruments Inc. | 4,236,526 | 349,471 |
| | International Business Machines Corp. | 1,472,606 | 224,764 |
| | | | 10,206,960 |
| Materials (1.7%) | | |
| | Dow Chemical Co. | 10,656,830 | 660,297 |
| | International Paper Co. | 8,851,010 | 468,041 |
| | Linde AG | 1,436,853 | 274,943 |
| | BHP Billiton plc | 15,264,793 | 230,668 |
| | Monsanto Co. | 668,904 | 78,543 |
| | | | 1,712,492 |
| Real Estate (0.8%) | | |
| | American Tower Corporation | 5,560,757 | 729,516 |
| | AvalonBay Communities Inc. | 579,626 | 110,847 |
| | | | 840,363 |
| |
| Telecommunication Services (1.0%) | | |
| | Verizon Communications Inc. | 21,384,050 | 997,352 |
2
| | | | | |
| Vanguard® Wellington Fund | | | | |
| Schedule of Investments | | | | |
| May 31, 2017 | | | | |
| |
| | | | | | Market |
| | | | | | Value |
| | | | | Shares | ($000) |
| Utilities (2.7%) | | | | |
| | NextEra Energy Inc. | | | 8,700,890 | 1,230,654 |
| | Dominion Energy Inc. | | | 10,909,030 | 881,122 |
| | Exelon Corp. | | | 15,085,814 | 547,766 |
| |
| | | | | | 2,659,542 |
| |
| Total Common Stocks (Cost $42,056,311) | | | | 64,538,787 |
| |
| | | | | Face | Market |
| | | | Maturity | Amount | Value |
| | | Coupon | Date | ($000) | ($000) |
| |
| U.S. Government and Agency Obligations (5.8%) | | | | |
| U.S. Government Securities (5.4%) | | | | |
| | United States Treasury Note/Bond | 0.750% | 6/30/17 | 148,620 | 148,596 |
| | United States Treasury Note/Bond | 0.625% | 7/31/17 | 368,000 | 367,772 |
| | United States Treasury Note/Bond | 1.000% | 9/15/17 | 552,580 | 552,580 |
| | United States Treasury Note/Bond | 0.750% | 10/31/17 | 83,700 | 83,582 |
| | United States Treasury Note/Bond | 0.875% | 3/31/18 | 30,000 | 29,920 |
| | United States Treasury Note/Bond | 0.750% | 4/30/18 | 45,000 | 44,817 |
| | United States Treasury Note/Bond | 1.000% | 5/31/18 | 220,000 | 219,553 |
| | United States Treasury Note/Bond | 0.750% | 8/31/18 | 65,000 | 64,624 |
| 1 | United States Treasury Note/Bond | 1.375% | 9/30/18 | 747,350 | 748,867 |
| 1 | United States Treasury Note/Bond | 1.750% | 9/30/19 | 950,000 | 959,206 |
| | United States Treasury Note/Bond | 1.375% | 2/15/20 | 231,935 | 231,826 |
| | United States Treasury Note/Bond | 1.375% | 2/29/20 | 62,000 | 61,942 |
| | United States Treasury Note/Bond | 1.625% | 6/30/20 | 67,210 | 67,514 |
| | United States Treasury Note/Bond | 1.250% | 3/31/21 | 52,000 | 51,301 |
| 1 | United States Treasury Note/Bond | 2.000% | 2/15/25 | 410,420 | 407,535 |
| | United States Treasury Note/Bond | 2.000% | 8/15/25 | 282,680 | 279,678 |
| | United States Treasury Note/Bond | 2.250% | 11/15/25 | 6,805 | 6,854 |
| | United States Treasury Note/Bond | 1.625% | 5/15/26 | 220,390 | 210,336 |
| | United States Treasury Note/Bond | 2.000% | 11/15/26 | 43,000 | 42,241 |
| 2 | United States Treasury Note/Bond | 2.875% | 5/15/43 | 275,732 | 276,766 |
| | United States Treasury Note/Bond | 3.375% | 5/15/44 | 149,670 | 164,520 |
| | United States Treasury Note/Bond | 2.500% | 2/15/46 | 50,745 | 46,939 |
| | United States Treasury Note/Bond | 2.250% | 8/15/46 | 166,764 | 145,762 |
| | United States Treasury Note/Bond | 2.875% | 11/15/46 | 64,975 | 64,944 |
| | United States Treasury Note/Bond | 3.000% | 2/15/47 | 141,005 | 144,574 |
| | | | | | 5,422,249 |
| Conventional Mortgage-Backed Securities (0.2%) | | | | |
| 3,4 | Fannie Mae Pool | 2.500% | 9/1/27–12/1/28 | 6,675 | 6,762 |
| 3,4 | Freddie Mac Gold Pool | 3.000% | 5/1/22–1/1/47 | 247,529 | 248,704 |
| 4 | Ginnie Mae I Pool | 7.000% | 11/15/31–11/15/33 | 2,725 | 3,220 |
| | | | | | 258,686 |
| Nonconventional Mortgage-Backed Securities (0.2%) | | | | |
| 3,4 | Fannie Mae REMICS | 3.500% | 4/25/31 | 9,730 | 10,193 |
| 3,4 | Fannie Mae REMICS | 4.000% | 9/25/29–5/25/31 | 18,581 | 19,806 |
| 3,4 | Freddie Mac REMICS | 3.500% | 3/15/31 | 5,760 | 6,036 |
| 3,4 | Freddie Mac REMICS | 4.000% | 12/15/30–4/15/31 | 107,841 | 115,767 |
| |
| | | | | | 151,802 |
| |
| Total U.S. Government and Agency Obligations (Cost $5,744,075) | | | | 5,832,737 |
| |
| Asset-Backed/Commercial Mortgage-Backed Securities (1.2%) | | | | |
| 5 | American Tower Trust I | 1.551% | 3/15/18 | 14,885 | 14,838 |
| 5 | American Tower Trust I | 3.070% | 3/15/23 | 43,000 | 43,410 |
| 4,5 | Apidos CLO XVII | 2.468% | 4/17/26 | 50,310 | 50,435 |
| 4,5 | Ares XXIX CLO Ltd. | 2.348% | 4/17/26 | 49,210 | 49,272 |
3
| | | | | |
| Vanguard® Wellington Fund | | | | |
| Schedule of Investments | | | | |
| May 31, 2017 | | | | |
| |
| | | | | Face | Market |
| | | | Maturity | Amount | Value |
| | | Coupon | Date | ($000) | ($000) |
| 4,5 | Atlas Senior Loan Fund VI Ltd. | 2.408% | 10/15/26 | 13,245 | 13,253 |
| 4,5 | Avery Point IV CLO Ltd. | 2.256% | 4/25/26 | 46,220 | 46,251 |
| 4,5 | Babson CLO Ltd. 2014-I | 2.306% | 7/20/25 | 5,660 | 5,663 |
| 4,5 | Bank of Montreal | 2.500% | 1/11/22 | 60,000 | 60,617 |
| 4,5 | BlueMountain CLO 2014-1 Ltd. | 2.430% | 4/30/26 | 29,055 | 29,129 |
| 4,5 | Cent CLO 20 Ltd. | 2.256% | 1/25/26 | 39,880 | 39,872 |
| 4,5 | Cent CLO 21 Ltd. | 2.380% | 7/27/26 | 24,170 | 23,984 |
| 4,5 | Cent CLO 22 Ltd. | 2.589% | 11/7/26 | 36,895 | 37,091 |
| 4,5 | CIFC Funding 2014 Ltd. | 2.208% | 4/18/25 | 47,325 | 47,349 |
| 4 | COMM 2012-CCRE2 Mortgage Trust | 3.147% | 8/15/45 | 18,085 | 18,702 |
| 4,5 | DNB Boligkreditt AS | 2.500% | 3/28/22 | 47,550 | 48,016 |
| 4,5 | Dryden XXXI Senior Loan Fund | 2.238% | 4/18/26 | 46,460 | 46,489 |
| 4,5 | Enterprise Fleet Financing LLC Series 2017-1 | 2.130% | 7/20/22 | 7,690 | 7,660 |
| 4,5 | GM Financial Consumer Automobile 2017-1 | 1.510% | 3/16/20 | 20,985 | 20,989 |
| 4 | LB-UBS Commercial Mortgage Trust 2008-C1 | 6.067% | 4/15/41 | 20,112 | 20,625 |
| 4,5 | Limerock CLO II Ltd. | 2.458% | 4/18/26 | 53,500 | 53,502 |
| 4,5 | Madison Park Funding XII Ltd. | 2.418% | 7/20/26 | 37,385 | 37,437 |
| 4,5 | Madison Park Funding XIII Ltd. | 1.988% | 1/19/25 | 30,660 | 30,680 |
| 4,5 | MMAF Equipment Finance LLC 2013-AA | 2.570% | 6/9/33 | 8,570 | 8,664 |
| 4,5 | MMAF Equipment Finance LLC 2017-A | 1.730% | 5/18/20 | 9,445 | 9,451 |
| 4 | Santander Drive Auto Receivables Trust 2013-2 | 2.570% | 3/15/19 | 19,690 | 19,761 |
| 4 | Santander Drive Auto Receivables Trust 2014-2 | 2.330% | 11/15/19 | 9,600 | 9,633 |
| 5 | SBA Tower Trust | 2.898% | 10/15/19 | 46,310 | 46,646 |
| 4,5 | Seneca Park CLO Ltd. 2014-1 | 2.278% | 7/17/26 | 27,340 | 27,340 |
| 4,5 | SFAVE Commercial Mortgage Securities Trust 2015- | | | | |
| | 5AVE | 4.144% | 1/5/43 | 27,300 | 27,684 |
| 4,5 | Shackleton 2014-VI CLO | 2.318% | 7/17/26 | 26,700 | 26,729 |
| 4,5 | Springleaf Funding Trust | 3.160% | 11/15/24 | 53,215 | 53,814 |
| 4,5 | Springleaf Funding Trust 2015-B | 3.480% | 5/15/28 | 23,420 | 23,921 |
| 4,5 | Symphony CLO XIV Ltd. | 2.435% | 7/14/26 | 46,405 | 46,468 |
| 4,5 | Thacher Park CLO Ltd. | 2.153% | 10/20/26 | 19,915 | 19,910 |
| 4,5 | Toronto-Dominion Bank | 2.500% | 1/18/22 | 76,400 | 77,088 |
| 4 | Utility Debt Securitization Authority Series 2013T | 3.435% | 12/15/25 | 8,625 | 8,991 |
| 4,5 | Voya CLO 2014-1 Ltd. | 2.488% | 4/18/26 | 20,980 | 21,007 |
| |
| Total Asset-Backed/Commercial Mortgage-Backed Securities (Cost $1,169,045) | | | 1,172,371 |
| |
| Corporate Bonds (21.2%) | | | | |
| Finance (8.2%) | | | | |
| | Banking (6.3%) | | | | |
| | American Express Centurion Bank | 6.000% | 9/13/17 | 20,000 | 20,246 |
| | American Express Co. | 1.550% | 5/22/18 | 62,130 | 62,016 |
| | American Express Credit Corp. | 2.125% | 7/27/18 | 49,605 | 49,851 |
| | American Express Credit Corp. | 2.250% | 8/15/19 | 30,200 | 30,383 |
| | American Express Credit Corp. | 2.700% | 3/3/22 | 54,990 | 55,495 |
| | Bank of America Corp. | 6.400% | 8/28/17 | 23,000 | 23,264 |
| | Bank of America Corp. | 6.000% | 9/1/17 | 69,725 | 70,492 |
| | Bank of America Corp. | 5.750% | 12/1/17 | 30,000 | 30,617 |
| | Bank of America Corp. | 6.875% | 4/25/18 | 40,000 | 41,769 |
| | Bank of America Corp. | 5.625% | 7/1/20 | 4,550 | 4,984 |
| | Bank of America Corp. | 5.875% | 1/5/21 | 40,000 | 44,611 |
| | Bank of America Corp. | 3.300% | 1/11/23 | 7,905 | 8,038 |
| | Bank of America Corp. | 4.125% | 1/22/24 | 16,100 | 17,004 |
| | Bank of America Corp. | 4.000% | 1/22/25 | 32,900 | 33,532 |
| | Bank of America Corp. | 3.500% | 4/19/26 | 10,000 | 10,024 |
| | Bank of America Corp. | 5.875% | 2/7/42 | 9,965 | 12,402 |
| | Bank of America Corp. | 5.000% | 1/21/44 | 39,433 | 44,169 |
| | Bank of America Corp. | 4.875% | 4/1/44 | 7,110 | 7,887 |
| | Bank of New York Mellon Corp. | 2.150% | 2/24/20 | 61,325 | 61,640 |
| | Bank of New York Mellon Corp. | 2.200% | 8/16/23 | 16,670 | 16,196 |
| | Bank of New York Mellon Corp. | 3.000% | 2/24/25 | 27,990 | 28,070 |
| | Bank of Nova Scotia | 2.050% | 10/30/18 | 64,150 | 64,513 |
| | Bank of Nova Scotia | 2.800% | 7/21/21 | 25,650 | 26,199 |
| 5 | Bank of Tokyo-Mitsubishi UFJ Ltd. | 1.700% | 3/5/18 | 54,260 | 54,264 |
4
| | | | | |
| Vanguard® Wellington Fund | | | | |
| Schedule of Investments | | | | |
| May 31, 2017 | | | | |
| |
| | | | | Face | Market |
| | | | Maturity | Amount | Value |
| | | Coupon | Date | ($000) | ($000) |
| 5 | Barclays Bank plc | 6.050% | 12/4/17 | 47,500 | 48,503 |
| | Barclays Bank plc | 5.140% | 10/14/20 | 11,905 | 12,817 |
| | Barclays plc | 3.684% | 1/10/23 | 29,605 | 30,374 |
| | BB&T Corp. | 4.900% | 6/30/17 | 8,045 | 8,063 |
| | BB&T Corp. | 5.250% | 11/1/19 | 8,000 | 8,580 |
| | BB&T Corp. | 2.750% | 4/1/22 | 61,300 | 62,210 |
| | Bear Stearns Cos. LLC | 6.400% | 10/2/17 | 8,765 | 8,907 |
| | Bear Stearns Cos. LLC | 7.250% | 2/1/18 | 16,385 | 16,983 |
| | BNP Paribas SA | 2.400% | 12/12/18 | 53,700 | 54,132 |
| 5 | BNP Paribas SA | 2.950% | 5/23/22 | 22,800 | 22,912 |
| | BNP Paribas SA | 3.250% | 3/3/23 | 12,270 | 12,605 |
| 5 | BNP Paribas SA | 3.800% | 1/10/24 | 44,775 | 46,285 |
| | BPCE SA | 2.500% | 12/10/18 | 18,325 | 18,464 |
| | BPCE SA | 2.500% | 7/15/19 | 53,100 | 53,372 |
| 5 | BPCE SA | 3.000% | 5/22/22 | 9,490 | 9,541 |
| | BPCE SA | 4.000% | 4/15/24 | 30,615 | 32,348 |
| 5 | BPCE SA | 5.150% | 7/21/24 | 43,790 | 46,582 |
| | Branch Banking & Trust Co. | 2.625% | 1/15/22 | 45,425 | 45,945 |
| | Capital One Bank USA NA | 2.150% | 11/21/18 | 45,055 | 45,111 |
| | Capital One Financial Corp. | 4.750% | 7/15/21 | 18,835 | 20,380 |
| | Capital One Financial Corp. | 3.750% | 4/24/24 | 55,460 | 56,854 |
| | Capital One Financial Corp. | 3.200% | 2/5/25 | 33,400 | 32,735 |
| | Capital One Financial Corp. | 4.200% | 10/29/25 | 11,740 | 11,966 |
| | Citigroup Inc. | 1.750% | 5/1/18 | 25,000 | 24,993 |
| | Citigroup Inc. | 2.500% | 9/26/18 | 18,000 | 18,136 |
| | Citigroup Inc. | 2.550% | 4/8/19 | 55,000 | 55,531 |
| | Citigroup Inc. | 2.500% | 7/29/19 | 37,530 | 37,857 |
| | Citigroup Inc. | 2.400% | 2/18/20 | 65,200 | 65,429 |
| | Citigroup Inc. | 4.500% | 1/14/22 | 33,920 | 36,515 |
| | Citigroup Inc. | 4.125% | 7/25/28 | 14,550 | 14,753 |
| | Citigroup Inc. | 6.625% | 6/15/32 | 45,000 | 55,878 |
| | Citigroup Inc. | 8.125% | 7/15/39 | 4,638 | 6,984 |
| | Compass Bank | 2.750% | 9/29/19 | 15,105 | 15,161 |
| | Cooperatieve Rabobank UA | 2.250% | 1/14/19 | 55,610 | 55,960 |
| 5 | Credit Agricole SA | 2.500% | 4/15/19 | 57,830 | 58,271 |
| | Credit Suisse AG | 1.750% | 1/29/18 | 32,250 | 32,282 |
| | Credit Suisse AG | 2.300% | 5/28/19 | 109,260 | 109,908 |
| | Credit Suisse AG | 3.000% | 10/29/21 | 18,325 | 18,672 |
| | Credit Suisse AG | 3.625% | 9/9/24 | 4,885 | 5,032 |
| 5 | Credit Suisse Group AG | 3.574% | 1/9/23 | 20,675 | 21,086 |
| | Credit Suisse Group Funding Guernsey Ltd. | 3.800% | 9/15/22 | 55,260 | 57,310 |
| | Credit Suisse Group Funding Guernsey Ltd. | 3.750% | 3/26/25 | 67,850 | 68,636 |
| | Deutsche Bank AG | 1.875% | 2/13/18 | 11,075 | 11,072 |
| | Deutsche Bank AG | 2.500% | 2/13/19 | 15,225 | 15,265 |
| | Deutsche Bank AG | 4.250% | 10/14/21 | 45,220 | 47,205 |
| | Fifth Third Bank | 2.875% | 10/1/21 | 10,345 | 10,570 |
| | Goldman Sachs Group Inc. | 5.950% | 1/18/18 | 44,000 | 45,137 |
| | Goldman Sachs Group Inc. | 2.375% | 1/22/18 | 22,200 | 22,300 |
| | Goldman Sachs Group Inc. | 5.375% | 3/15/20 | 30,790 | 33,327 |
| | Goldman Sachs Group Inc. | 2.600% | 4/23/20 | 25,750 | 25,982 |
| | Goldman Sachs Group Inc. | 6.000% | 6/15/20 | 11,090 | 12,254 |
| | Goldman Sachs Group Inc. | 5.250% | 7/27/21 | 56,720 | 62,560 |
| | Goldman Sachs Group Inc. | 5.750% | 1/24/22 | 40,725 | 46,023 |
| | Goldman Sachs Group Inc. | 3.000% | 4/26/22 | 30,275 | 30,644 |
| | Goldman Sachs Group Inc. | 3.625% | 1/22/23 | 35,320 | 36,582 |
| | Goldman Sachs Group Inc. | 3.500% | 1/23/25 | 17,545 | 17,723 |
| | Goldman Sachs Group Inc. | 3.850% | 1/26/27 | 17,980 | 18,316 |
| | Goldman Sachs Group Inc. | 6.450% | 5/1/36 | 50,000 | 62,230 |
| | Goldman Sachs Group Inc. | 6.750% | 10/1/37 | 43,995 | 56,103 |
| | Goldman Sachs Group Inc. | 6.250% | 2/1/41 | 35,320 | 45,588 |
| | Goldman Sachs Group Inc. | 4.800% | 7/8/44 | 30,675 | 33,412 |
| | Goldman Sachs Group Inc. | 4.750% | 10/21/45 | 12,715 | 13,840 |
| 5 | HSBC Bank plc | 4.750% | 1/19/21 | 62,040 | 67,060 |
| | HSBC Holdings plc | 3.400% | 3/8/21 | 33,270 | 34,297 |
5
| | | | | |
| Vanguard® Wellington Fund | | | | |
| Schedule of Investments | | | | |
| May 31, 2017 | | | | |
| |
| | | | | Face | Market |
| | | | Maturity | Amount | Value |
| | | Coupon | Date | ($000) | ($000) |
| | HSBC Holdings plc | 4.000% | 3/30/22 | 72,455 | 76,504 |
| | HSBC Holdings plc | 3.600% | 5/25/23 | 60,200 | 62,150 |
| | HSBC Holdings plc | 3.900% | 5/25/26 | 12,085 | 12,475 |
| | HSBC Holdings plc | 4.041% | 3/13/28 | 21,805 | 22,548 |
| | HSBC Holdings plc | 6.500% | 5/2/36 | 25,000 | 31,615 |
| | HSBC Holdings plc | 6.100% | 1/14/42 | 40,665 | 52,665 |
| | HSBC Holdings plc | 5.250% | 3/14/44 | 13,210 | 14,830 |
| | HSBC USA Inc. | 1.625% | 1/16/18 | 39,500 | 39,508 |
| | HSBC USA Inc. | 2.625% | 9/24/18 | 20,000 | 20,177 |
| | HSBC USA Inc. | 2.350% | 3/5/20 | 71,330 | 71,699 |
| | HSBC USA Inc. | 3.500% | 6/23/24 | 28,025 | 28,931 |
| | Huntington National Bank | 2.200% | 4/1/19 | 22,280 | 22,338 |
| | Huntington National Bank | 2.400% | 4/1/20 | 44,990 | 45,228 |
| 5 | ING Bank NV | 1.800% | 3/16/18 | 36,610 | 36,675 |
| | ING Groep NV | 3.150% | 3/29/22 | 12,955 | 13,197 |
| | ING Groep NV | 3.950% | 3/29/27 | 32,965 | 34,221 |
| | JPMorgan Chase & Co. | 6.000% | 1/15/18 | 57,000 | 58,513 |
| | JPMorgan Chase & Co. | 6.300% | 4/23/19 | 10,340 | 11,155 |
| | JPMorgan Chase & Co. | 4.950% | 3/25/20 | 55,000 | 59,130 |
| | JPMorgan Chase & Co. | 4.350% | 8/15/21 | 41,386 | 44,345 |
| | JPMorgan Chase & Co. | 4.500% | 1/24/22 | 44,780 | 48,428 |
| | JPMorgan Chase & Co. | 3.250% | 9/23/22 | 18,645 | 19,119 |
| | JPMorgan Chase & Co. | 3.375% | 5/1/23 | 27,610 | 28,029 |
| | JPMorgan Chase & Co. | 3.875% | 2/1/24 | 39,000 | 40,952 |
| | JPMorgan Chase & Co. | 3.900% | 7/15/25 | 13,870 | 14,500 |
| | JPMorgan Chase & Co. | 4.125% | 12/15/26 | 29,835 | 30,996 |
| | JPMorgan Chase & Co. | 4.250% | 10/1/27 | 13,420 | 14,039 |
| | JPMorgan Chase & Co. | 5.600% | 7/15/41 | 96,000 | 117,035 |
| | JPMorgan Chase & Co. | 5.400% | 1/6/42 | 18,035 | 21,480 |
| | JPMorgan Chase & Co. | 5.625% | 8/16/43 | 16,100 | 19,001 |
| | JPMorgan Chase & Co. | 4.950% | 6/1/45 | 15,000 | 16,416 |
| 5 | Macquarie Bank Ltd. | 2.400% | 1/21/20 | 12,610 | 12,659 |
| | Manufacturers & Traders Trust Co. | 2.100% | 2/6/20 | 17,870 | 17,909 |
| | Manufacturers & Traders Trust Co. | 2.900% | 2/6/25 | 24,685 | 24,503 |
| | Morgan Stanley | 1.875% | 1/5/18 | 9,470 | 9,484 |
| | Morgan Stanley | 2.125% | 4/25/18 | 52,125 | 52,300 |
| | Morgan Stanley | 2.500% | 1/24/19 | 100,000 | 100,746 |
| | Morgan Stanley | 5.625% | 9/23/19 | 24,355 | 26,213 |
| | Morgan Stanley | 5.750% | 1/25/21 | 79,825 | 88,817 |
| | Morgan Stanley | 2.500% | 4/21/21 | 21,815 | 21,741 |
| | Morgan Stanley | 2.625% | 11/17/21 | 30,000 | 29,979 |
| | Morgan Stanley | 2.750% | 5/19/22 | 63,420 | 63,415 |
| | Morgan Stanley | 3.875% | 4/29/24 | 97,010 | 101,168 |
| | Morgan Stanley | 3.700% | 10/23/24 | 29,050 | 29,963 |
| | Morgan Stanley | 4.000% | 7/23/25 | 29,455 | 30,726 |
| | Morgan Stanley | 3.125% | 7/27/26 | 11,435 | 11,077 |
| | Morgan Stanley | 6.250% | 8/9/26 | 20,000 | 24,113 |
| | Morgan Stanley | 3.625% | 1/20/27 | 64,000 | 64,345 |
| | Morgan Stanley | 4.300% | 1/27/45 | 18,360 | 18,650 |
| | National City Corp. | 6.875% | 5/15/19 | 13,950 | 15,223 |
| 5 | Nationwide Building Society | 2.350% | 1/21/20 | 28,075 | 28,142 |
| 5 | NBK SPC Ltd. | 2.750% | 5/30/22 | 63,930 | 63,610 |
| | Northern Trust Corp. | 3.450% | 11/4/20 | 9,000 | 9,394 |
| | PNC Bank NA | 4.875% | 9/21/17 | 50,000 | 50,487 |
| | PNC Bank NA | 3.300% | 10/30/24 | 18,195 | 18,654 |
| | PNC Bank NA | 4.200% | 11/1/25 | 16,650 | 17,922 |
| | PNC Financial Services Group Inc. | 3.900% | 4/29/24 | 41,565 | 43,541 |
| | Royal Bank of Canada | 2.750% | 2/1/22 | 43,960 | 44,841 |
| | Santander Holdings USA Inc. | 2.700% | 5/24/19 | 30,200 | 30,356 |
| | Santander Holdings USA Inc. | 2.650% | 4/17/20 | 23,185 | 23,163 |
| 5 | Santander Holdings USA Inc. | 3.700% | 3/28/22 | 26,000 | 26,247 |
| 5 | Skandinaviska Enskilda Banken AB | 2.450% | 5/27/20 | 61,300 | 61,695 |
| 5 | Societe Generale SA | 3.250% | 1/12/22 | 54,445 | 55,205 |
| | State Street Corp. | 2.653% | 5/15/23 | 30,770 | 30,980 |
6
| | | | | |
| Vanguard® Wellington Fund | | | | |
| Schedule of Investments | | | | |
| May 31, 2017 | | | | |
| |
| | | | | Face | Market |
| | | | Maturity | Amount | Value |
| | | Coupon | Date | ($000) | ($000) |
| | SunTrust Bank | 3.300% | 5/15/26 | 12,895 | 12,671 |
| | Synchrony Financial | 2.600% | 1/15/19 | 20,920 | 21,024 |
| | Synchrony Financial | 3.000% | 8/15/19 | 10,990 | 11,129 |
| | Synchrony Financial | 2.700% | 2/3/20 | 15,605 | 15,683 |
| | Toronto-Dominion Bank | 2.500% | 12/14/20 | 49,340 | 50,066 |
| | UBS AG | 1.800% | 3/26/18 | 34,055 | 34,092 |
| 5 | UBS Group Funding Jersey Ltd. | 2.950% | 9/24/20 | 44,570 | 45,293 |
| 5 | UBS Group Funding Jersey Ltd. | 3.000% | 4/15/21 | 5,130 | 5,210 |
| | US Bancorp | 2.625% | 1/24/22 | 46,910 | 47,490 |
| | US Bancorp | 3.700% | 1/30/24 | 52,500 | 55,584 |
| | Wells Fargo & Co. | 5.625% | 12/11/17 | 31,150 | 31,810 |
| | Wells Fargo & Co. | 2.150% | 1/15/19 | 91,150 | 91,606 |
| | Wells Fargo & Co. | 2.150% | 1/30/20 | 46,155 | 46,291 |
| | Wells Fargo & Co. | 3.000% | 1/22/21 | 26,735 | 27,372 |
| | Wells Fargo & Co. | 3.500% | 3/8/22 | 64,245 | 67,104 |
| | Wells Fargo & Co. | 3.450% | 2/13/23 | 61,885 | 63,521 |
| | Wells Fargo & Co. | 4.480% | 1/16/24 | 46,156 | 49,514 |
| | Wells Fargo & Co. | 3.550% | 9/29/25 | 32,170 | 32,825 |
| | Wells Fargo & Co. | 3.000% | 4/22/26 | 39,405 | 38,328 |
| | Wells Fargo & Co. | 5.606% | 1/15/44 | 68,281 | 80,367 |
| | Wells Fargo & Co. | 4.650% | 11/4/44 | 10,315 | 10,668 |
| | Wells Fargo & Co. | 4.900% | 11/17/45 | 19,160 | 20,567 |
| | Wells Fargo & Co. | 4.400% | 6/14/46 | 38,300 | 37,911 |
| | Wells Fargo & Co. | 4.750% | 12/7/46 | 23,150 | 24,392 |
| | Brokerage (0.0%) | | | | |
| | Ameriprise Financial Inc. | 5.300% | 3/15/20 | 11,590 | 12,573 |
| | Charles Schwab Corp. | 3.200% | 3/2/27 | 19,665 | 19,865 |
| | Finance Companies (0.4%) | | | | |
| | GE Capital International Funding Co. | 2.342% | 11/15/20 | 75,437 | 75,797 |
| | GE Capital International Funding Co. | 3.373% | 11/15/25 | 111,589 | 116,384 |
| | GE Capital International Funding Co. | 4.418% | 11/15/35 | 168,370 | 180,743 |
| | Insurance (1.3%) | | | | |
| | ACE Capital Trust II | 9.700% | 4/1/30 | 20,000 | 30,075 |
| | Aetna Inc. | 2.800% | 6/15/23 | 25,660 | 25,656 |
| | Anthem Inc. | 2.300% | 7/15/18 | 15,110 | 15,185 |
| | Anthem Inc. | 3.700% | 8/15/21 | 10,000 | 10,437 |
| | Anthem Inc. | 3.125% | 5/15/22 | 53,740 | 55,034 |
| | Anthem Inc. | 3.300% | 1/15/23 | 42,468 | 43,379 |
| | Anthem Inc. | 4.650% | 8/15/44 | 13,445 | 14,223 |
| | Chubb Corp. | 6.000% | 5/11/37 | 50,000 | 64,395 |
| | Chubb INA Holdings Inc. | 5.800% | 3/15/18 | 40,360 | 41,606 |
| | Chubb INA Holdings Inc. | 2.300% | 11/3/20 | 6,330 | 6,368 |
| | Chubb INA Holdings Inc. | 3.350% | 5/15/24 | 22,345 | 23,148 |
| | Chubb INA Holdings Inc. | 4.350% | 11/3/45 | 29,835 | 32,520 |
| | Cigna Corp. | 3.250% | 4/15/25 | 31,655 | 31,769 |
| | CNA Financial Corp. | 3.950% | 5/15/24 | 5,410 | 5,631 |
| 5 | Farmers Exchange Capital | 7.050% | 7/15/28 | 25,000 | 31,434 |
| 5 | Five Corners Funding Trust | 4.419% | 11/15/23 | 5,935 | 6,388 |
| 5 | Jackson National Life Global Funding | 3.250% | 1/30/24 | 24,070 | 24,493 |
| 5 | Jackson National Life Insurance Co. | 8.150% | 3/15/27 | 18,890 | 25,185 |
| 5 | Liberty Mutual Group Inc. | 4.250% | 6/15/23 | 14,330 | 15,382 |
| 5 | Liberty Mutual Insurance Co. | 7.875% | 10/15/26 | 31,210 | 40,354 |
| 5 | MassMutual Global Funding II | 2.100% | 8/2/18 | 46,890 | 47,181 |
| 5 | MassMutual Global Funding II | 2.350% | 4/9/19 | 28,000 | 28,239 |
| | MetLife Inc. | 1.903% | 12/15/17 | 9,010 | 9,018 |
| | MetLife Inc. | 3.600% | 4/10/24 | 35,035 | 36,820 |
| | MetLife Inc. | 4.125% | 8/13/42 | 5,565 | 5,606 |
| | MetLife Inc. | 4.875% | 11/13/43 | 20,820 | 23,523 |
| 5 | Metropolitan Life Global Funding I | 1.500% | 1/10/18 | 50,360 | 50,294 |
| 5 | Metropolitan Life Global Funding I | 1.875% | 6/22/18 | 12,690 | 12,721 |
| 5 | Metropolitan Life Global Funding I | 2.650% | 4/8/22 | 13,770 | 13,893 |
| 5 | Metropolitan Life Global Funding I | 3.450% | 12/18/26 | 23,660 | 24,304 |
| 5 | New York Life Global Funding | 2.900% | 1/17/24 | 29,050 | 29,440 |
7
| | | | | |
| Vanguard® Wellington Fund | | | | |
| Schedule of Investments | | | | |
| May 31, 2017 | | | | |
| |
| | | | | Face | Market |
| | | | Maturity | Amount | Value |
| | | Coupon | Date | ($000) | ($000) |
| 5 | New York Life Insurance Co. | 5.875% | 5/15/33 | 55,395 | 69,369 |
| | Prudential Financial Inc. | 2.300% | 8/15/18 | 24,545 | 24,696 |
| | Prudential Financial Inc. | 4.500% | 11/15/20 | 24,365 | 26,157 |
| 5 | QBE Insurance Group Ltd. | 2.400% | 5/1/18 | 9,160 | 9,182 |
| 5 | Teachers Insurance & Annuity Assn. of America | 4.900% | 9/15/44 | 14,830 | 16,512 |
| 5 | Teachers Insurance & Annuity Association of America | 4.270% | 5/15/47 | 42,390 | 43,254 |
| | Torchmark Corp. | 7.875% | 5/15/23 | 45,000 | 53,925 |
| | Travelers Cos. Inc. | 5.800% | 5/15/18 | 32,500 | 33,767 |
| | UnitedHealth Group Inc. | 6.000% | 6/15/17 | 9,500 | 9,512 |
| | UnitedHealth Group Inc. | 6.000% | 2/15/18 | 26,300 | 27,082 |
| | UnitedHealth Group Inc. | 3.875% | 10/15/20 | 27,960 | 29,490 |
| | UnitedHealth Group Inc. | 2.875% | 3/15/22 | 4,696 | 4,825 |
| | UnitedHealth Group Inc. | 2.875% | 3/15/23 | 16,000 | 16,301 |
| | UnitedHealth Group Inc. | 3.100% | 3/15/26 | 15,350 | 15,458 |
| | UnitedHealth Group Inc. | 4.625% | 7/15/35 | 32,330 | 35,990 |
| | UnitedHealth Group Inc. | 4.250% | 3/15/43 | 67,400 | 70,678 |
| | UnitedHealth Group Inc. | 4.750% | 7/15/45 | 30,995 | 34,968 |
| | Other Finance (0.0%) | | | | |
| 5 | LeasePlan Corp. NV | 2.875% | 1/22/19 | 24,670 | 24,764 |
| |
| | Real Estate Investment Trusts (0.2%) | | | | |
| | AvalonBay Communities Inc. | 3.625% | 10/1/20 | 20,780 | 21,632 |
| | Boston Properties LP | 3.125% | 9/1/23 | 13,275 | 13,434 |
| | Boston Properties LP | 3.800% | 2/1/24 | 1,750 | 1,816 |
| | Duke Realty LP | 6.500% | 1/15/18 | 8,160 | 8,415 |
| | Realty Income Corp. | 6.750% | 8/15/19 | 21,075 | 23,166 |
| | Realty Income Corp. | 4.650% | 8/1/23 | 25,010 | 27,205 |
| | Simon Property Group LP | 3.750% | 2/1/24 | 3,265 | 3,406 |
| | Simon Property Group LP | 3.375% | 10/1/24 | 10,055 | 10,229 |
| 5 | WEA Finance LLC / Westfield UK & Europe Finance plc | 1.750% | 9/15/17 | 14,730 | 14,728 |
| 5 | WEA Finance LLC / Westfield UK & Europe Finance plc | 2.700% | 9/17/19 | 22,360 | 22,523 |
| | | | | | 8,246,451 |
| Industrial (10.9%) | | | | |
| | Basic Industry (0.0%) | | | | |
| | BHP Billiton Finance USA Ltd. | 3.850% | 9/30/23 | 24,045 | 25,696 |
| | LyondellBasell Industries NV | 4.625% | 2/26/55 | 11,555 | 11,282 |
| | Rio Tinto Finance USA plc | 3.500% | 3/22/22 | 1,281 | 1,341 |
| | Rohm and Haas Holdings Ltd. | 9.800% | 4/15/20 | 2,250 | 2,482 |
| | Capital Goods (0.9%) | | | | |
| | 3M Co. | 6.375% | 2/15/28 | 24,990 | 32,501 |
| 5 | BAE Systems Holdings Inc. | 2.850% | 12/15/20 | 6,060 | 6,044 |
| 5 | BAE Systems Holdings Inc. | 3.850% | 12/15/25 | 11,010 | 11,399 |
| | Boeing Co. | 8.625% | 11/15/31 | 9,460 | 14,570 |
| | Caterpillar Financial Services Corp. | 2.625% | 3/1/23 | 53,000 | 53,146 |
| | Caterpillar Inc. | 3.900% | 5/27/21 | 46,914 | 50,077 |
| | Caterpillar Inc. | 2.600% | 6/26/22 | 11,345 | 11,494 |
| | Caterpillar Inc. | 3.400% | 5/15/24 | 14,200 | 14,837 |
| | Caterpillar Inc. | 3.803% | 8/15/42 | 13,960 | 13,826 |
| | Deere & Co. | 7.125% | 3/3/31 | 17,500 | 24,590 |
| | General Dynamics Corp. | 3.875% | 7/15/21 | 14,925 | 15,955 |
| | General Electric Capital Corp. | 4.625% | 1/7/21 | 22,598 | 24,664 |
| | General Electric Capital Corp. | 5.300% | 2/11/21 | 8,833 | 9,815 |
| | General Electric Capital Corp. | 3.150% | 9/7/22 | 34,079 | 35,534 |
| | General Electric Capital Corp. | 3.100% | 1/9/23 | 8,635 | 8,980 |
| | General Electric Capital Corp. | 6.150% | 8/7/37 | 2,093 | 2,758 |
| | General Electric Capital Corp. | 5.875% | 1/14/38 | 4,160 | 5,346 |
| | General Electric Co. | 2.700% | 10/9/22 | 9,965 | 10,183 |
| | General Electric Co. | 4.500% | 3/11/44 | 43,750 | 48,064 |
| | Honeywell International Inc. | 4.250% | 3/1/21 | 40,681 | 44,002 |
| | Illinois Tool Works Inc. | 3.500% | 3/1/24 | 52,955 | 55,889 |
| | John Deere Capital Corp. | 2.250% | 4/17/19 | 28,125 | 28,436 |
| | John Deere Capital Corp. | 1.700% | 1/15/20 | 21,935 | 21,875 |
8
| | | | | |
| Vanguard® Wellington Fund | | | | |
| Schedule of Investments | | | | |
| May 31, 2017 | | | | |
| |
| | | | | Face | Market |
| | | | Maturity | Amount | Value |
| | | Coupon | Date | ($000) | ($000) |
| | Lockheed Martin Corp. | 2.900% | 3/1/25 | 10,450 | 10,437 |
| | Lockheed Martin Corp. | 4.500% | 5/15/36 | 8,015 | 8,697 |
| | Lockheed Martin Corp. | 4.700% | 5/15/46 | 19,870 | 22,159 |
| | Parker-Hannifin Corp. | 4.450% | 11/21/44 | 17,735 | 19,393 |
| 5 | Siemens Financieringsmaatschappij NV | 2.900% | 5/27/22 | 39,625 | 40,508 |
| 5 | Siemens Financieringsmaatschappij NV | 3.125% | 3/16/24 | 61,400 | 62,541 |
| 5 | Siemens Financieringsmaatschappij NV | 4.400% | 5/27/45 | 34,365 | 36,725 |
| | United Technologies Corp. | 3.100% | 6/1/22 | 7,010 | 7,262 |
| | United Technologies Corp. | 7.500% | 9/15/29 | 19,230 | 27,405 |
| | United Technologies Corp. | 6.050% | 6/1/36 | 20,325 | 25,886 |
| | United Technologies Corp. | 6.125% | 7/15/38 | 37,300 | 48,890 |
| | Communication (1.6%) | | | | |
| | 21st Century Fox America Inc. | 3.000% | 9/15/22 | 11,891 | 12,116 |
| | America Movil SAB de CV | 3.125% | 7/16/22 | 84,600 | 86,292 |
| | America Movil SAB de CV | 6.125% | 3/30/40 | 7,380 | 8,971 |
| | American Tower Corp. | 3.450% | 9/15/21 | 30,665 | 31,797 |
| | American Tower Corp. | 5.000% | 2/15/24 | 7,655 | 8,446 |
| | AT&T Inc. | 1.400% | 12/1/17 | 18,715 | 18,712 |
| | AT&T Inc. | 5.600% | 5/15/18 | 44,000 | 45,609 |
| | AT&T Inc. | 5.200% | 3/15/20 | 10,120 | 10,929 |
| | AT&T Inc. | 2.450% | 6/30/20 | 12,000 | 12,048 |
| | AT&T Inc. | 4.600% | 2/15/21 | 5,000 | 5,346 |
| | AT&T Inc. | 4.450% | 5/15/21 | 10,000 | 10,680 |
| | AT&T Inc. | 4.500% | 3/9/48 | 24,959 | 23,035 |
| | CBS Corp. | 4.300% | 2/15/21 | 27,830 | 29,533 |
| | Comcast Corp. | 3.000% | 2/1/24 | 25,345 | 25,740 |
| | Comcast Corp. | 3.600% | 3/1/24 | 50,730 | 53,403 |
| | Comcast Corp. | 3.375% | 2/15/25 | 2,540 | 2,619 |
| | Comcast Corp. | 2.350% | 1/15/27 | 19,620 | 18,470 |
| | Comcast Corp. | 4.250% | 1/15/33 | 42,890 | 45,548 |
| | Comcast Corp. | 4.200% | 8/15/34 | 23,435 | 24,571 |
| | Comcast Corp. | 5.650% | 6/15/35 | 4,725 | 5,725 |
| | Comcast Corp. | 4.400% | 8/15/35 | 26,835 | 28,815 |
| | Comcast Corp. | 6.500% | 11/15/35 | 4,720 | 6,181 |
| | Comcast Corp. | 6.400% | 5/15/38 | 4,320 | 5,691 |
| | Comcast Corp. | 4.650% | 7/15/42 | 47,970 | 51,823 |
| | Comcast Corp. | 4.500% | 1/15/43 | 22,000 | 23,233 |
| | Comcast Corp. | 4.750% | 3/1/44 | 22,875 | 25,029 |
| | Comcast Corp. | 4.600% | 8/15/45 | 40,336 | 43,385 |
| 5 | Cox Communications Inc. | 4.800% | 2/1/35 | 30,000 | 28,748 |
| 5 | COX Communications Inc. | 6.450% | 12/1/36 | 5,850 | 6,239 |
| 5 | Deutsche Telekom International Finance BV | 3.600% | 1/19/27 | 35,925 | 36,561 |
| | Discovery Communications LLC | 5.625% | 8/15/19 | 6,511 | 6,995 |
| | Grupo Televisa SAB | 6.625% | 1/15/40 | 25,090 | 28,786 |
| | Grupo Televisa SAB | 5.000% | 5/13/45 | 6,100 | 5,869 |
| | Grupo Televisa SAB | 6.125% | 1/31/46 | 12,550 | 13,846 |
| 5 | GTP Acquisition Partners I LLC | 2.350% | 6/15/20 | 22,530 | 22,429 |
| 5 | NBCUniversal Enterprise Inc. | 1.974% | 4/15/19 | 100,115 | 100,579 |
| | NBCUniversal Media LLC | 4.375% | 4/1/21 | 23,900 | 25,902 |
| | NBCUniversal Media LLC | 2.875% | 1/15/23 | 9,760 | 9,949 |
| | Orange SA | 4.125% | 9/14/21 | 60,990 | 65,051 |
| | Orange SA | 9.000% | 3/1/31 | 20,280 | 30,894 |
| 5 | SBA Tower Trust | 3.168% | 4/15/22 | 48,960 | 49,303 |
| 5 | Sky plc | 2.625% | 9/16/19 | 38,021 | 38,259 |
| 5 | Sky plc | 3.750% | 9/16/24 | 45,046 | 46,323 |
| | Time Warner Cable LLC | 8.750% | 2/14/19 | 1,120 | 1,242 |
| | Time Warner Cable LLC | 8.250% | 4/1/19 | 14,433 | 16,006 |
| | Time Warner Cos. Inc. | 7.570% | 2/1/24 | 20,000 | 24,851 |
| | Time Warner Cos. Inc. | 6.950% | 1/15/28 | 20,000 | 25,103 |
| | Time Warner Entertainment Co. LP | 8.375% | 3/15/23 | 3,925 | 4,957 |
| | Time Warner Inc. | 4.875% | 3/15/20 | 14,000 | 15,005 |
| | Time Warner Inc. | 4.750% | 3/29/21 | 8,000 | 8,647 |
| | Verizon Communications Inc. | 4.500% | 9/15/20 | 95,525 | 102,324 |
9
| | | | | |
| Vanguard® Wellington Fund | | | | |
| Schedule of Investments | | | | |
| May 31, 2017 | | | | |
| |
| | | | | Face | Market |
| | | | Maturity | Amount | Value |
| | | Coupon | Date | ($000) | ($000) |
| | Verizon Communications Inc. | 3.500% | 11/1/21 | 5,495 | 5,703 |
| 5 | Verizon Communications Inc. | 4.812% | 3/15/39 | 85,963 | 86,522 |
| | Verizon Communications Inc. | 4.750% | 11/1/41 | 11,880 | 11,706 |
| | Verizon Communications Inc. | 4.862% | 8/21/46 | 36,117 | 35,832 |
| 5 | Verizon Communications Inc. | 5.012% | 4/15/49 | 21,754 | 21,747 |
| | Walt Disney Co. | 4.125% | 6/1/44 | 23,115 | 24,007 |
| | Consumer Cyclical (1.4%) | | | | |
| | Alibaba Group Holding Ltd. | 2.500% | 11/28/19 | 12,965 | 13,060 |
| | Alibaba Group Holding Ltd. | 3.125% | 11/28/21 | 2,515 | 2,558 |
| | Alibaba Group Holding Ltd. | 3.600% | 11/28/24 | 39,860 | 40,892 |
| | Amazon.com Inc. | 2.500% | 11/29/22 | 34,760 | 35,092 |
| | Amazon.com Inc. | 4.800% | 12/5/34 | 37,370 | 42,774 |
| | Amazon.com Inc. | 4.950% | 12/5/44 | 22,605 | 26,449 |
| 5 | American Honda Finance Corp. | 1.500% | 9/11/17 | 13,510 | 13,517 |
| 5 | American Honda Finance Corp. | 1.600% | 2/16/18 | 30,845 | 30,893 |
| | American Honda Finance Corp. | 2.125% | 10/10/18 | 45,655 | 45,977 |
| | AutoZone Inc. | 3.700% | 4/15/22 | 46,136 | 48,216 |
| | AutoZone Inc. | 3.125% | 7/15/23 | 33,000 | 33,314 |
| | AutoZone Inc. | 3.750% | 6/1/27 | 17,490 | 17,695 |
| 5 | BMW US Capital LLC | 2.000% | 4/11/21 | 21,300 | 21,099 |
| 5 | BMW US Capital LLC | 2.800% | 4/11/26 | 5,805 | 5,667 |
| | CVS Health Corp. | 2.750% | 12/1/22 | 40,255 | 40,391 |
| | CVS Health Corp. | 4.875% | 7/20/35 | 6,900 | 7,576 |
| | CVS Health Corp. | 5.125% | 7/20/45 | 51,085 | 57,717 |
| 5 | Daimler Finance North America LLC | 2.375% | 8/1/18 | 35,000 | 35,216 |
| 5 | Daimler Finance North America LLC | 2.250% | 7/31/19 | 73,100 | 73,366 |
| 5 | Daimler Finance North America LLC | 2.200% | 5/5/20 | 16,565 | 16,581 |
| 5 | Daimler Finance North America LLC | 2.450% | 5/18/20 | 2,740 | 2,760 |
| 5 | Daimler Finance North America LLC | 3.875% | 9/15/21 | 3,961 | 4,174 |
| 5 | Daimler Finance North America LLC | 3.250% | 8/1/24 | 5,870 | 5,957 |
| | Ford Motor Credit Co. LLC | 2.375% | 3/12/19 | 45,000 | 45,109 |
| | Ford Motor Credit Co. LLC | 3.157% | 8/4/20 | 26,655 | 27,050 |
| | General Motors Financial Co. Inc. | 3.950% | 4/13/24 | 62,350 | 62,480 |
| | Home Depot Inc. | 2.250% | 9/10/18 | 39,555 | 39,939 |
| | Home Depot Inc. | 2.700% | 4/1/23 | 31,170 | 31,771 |
| | Home Depot Inc. | 4.400% | 3/15/45 | 28,655 | 31,057 |
| 5 | Hyundai Capital America | 2.550% | 4/3/20 | 28,910 | 28,945 |
| | Lowe's Cos. Inc. | 3.100% | 5/3/27 | 68,700 | 68,827 |
| | Lowe's Cos. Inc. | 6.500% | 3/15/29 | 13,301 | 17,505 |
| | McDonald's Corp. | 2.625% | 1/15/22 | 7,805 | 7,883 |
| | McDonald's Corp. | 3.250% | 6/10/24 | 5,460 | 5,620 |
| | McDonald's Corp. | 4.875% | 12/9/45 | 9,940 | 10,974 |
| 5 | Nissan Motor Acceptance Corp. | 1.950% | 9/12/17 | 44,895 | 44,945 |
| 5 | Nissan Motor Acceptance Corp. | 1.800% | 3/15/18 | 46,400 | 46,431 |
| 5 | Nissan Motor Acceptance Corp. | 2.650% | 9/26/18 | 24,990 | 25,207 |
| | Toyota Motor Credit Corp. | 1.250% | 10/5/17 | 35,945 | 35,939 |
| 5 | Volkswagen Group of America Finance LLC | 2.450% | 11/20/19 | 16,935 | 17,018 |
| | Wal-Mart Stores Inc. | 3.250% | 10/25/20 | 25,754 | 26,911 |
| | Wal-Mart Stores Inc. | 4.250% | 4/15/21 | 29,000 | 31,510 |
| | Wal-Mart Stores Inc. | 2.550% | 4/11/23 | 38,325 | 38,944 |
| | Wal-Mart Stores Inc. | 5.625% | 4/15/41 | 112,595 | 144,169 |
| | Wal-Mart Stores Inc. | 4.300% | 4/22/44 | 20,480 | 22,113 |
| | Consumer Noncyclical (3.6%) | | | | |
| | Actavis Funding SCS | 3.000% | 3/12/20 | 37,430 | 38,243 |
| | Actavis Funding SCS | 3.450% | 3/15/22 | 37,195 | 38,423 |
| | Allergan Funding SCS | 4.550% | 3/15/35 | 14,265 | 14,748 |
| | Allergan Funding SCS | 4.850% | 6/15/44 | 18,000 | 19,085 |
| | Altria Group Inc. | 4.750% | 5/5/21 | 23,376 | 25,598 |
| | Altria Group Inc. | 2.850% | 8/9/22 | 18,810 | 19,115 |
| | Altria Group Inc. | 4.500% | 5/2/43 | 10,705 | 11,274 |
| | AmerisourceBergen Corp. | 3.500% | 11/15/21 | 12,320 | 12,828 |
| | Amgen Inc. | 3.875% | 11/15/21 | 13,315 | 14,084 |
| | Amgen Inc. | 5.150% | 11/15/41 | 36,380 | 40,250 |
10
| | | | | |
| Vanguard® Wellington Fund | | | | |
| Schedule of Investments | | | | |
| May 31, 2017 | | | | |
| |
| | | | | Face | Market |
| | | | Maturity | Amount | Value |
| | | Coupon | Date | ($000) | ($000) |
| | Amgen Inc. | 4.563% | 6/15/48 | 4,540 | 4,639 |
| | Anheuser-Busch Cos. LLC | 6.500% | 1/1/28 | 19,550 | 24,095 |
| | Anheuser-Busch InBev Finance Inc. | 3.300% | 2/1/23 | 75,400 | 77,624 |
| | Anheuser-Busch InBev Finance Inc. | 3.650% | 2/1/26 | 68,045 | 69,988 |
| | Anheuser-Busch InBev Finance Inc. | 4.700% | 2/1/36 | 133,300 | 145,062 |
| | Anheuser-Busch InBev Finance Inc. | 4.900% | 2/1/46 | 99,460 | 110,139 |
| | Anheuser-Busch InBev Worldwide Inc. | 3.750% | 1/15/22 | 2,390 | 2,534 |
| | Anheuser-Busch InBev Worldwide Inc. | 2.500% | 7/15/22 | 117,831 | 117,868 |
| | Anheuser-Busch InBev Worldwide Inc. | 4.950% | 1/15/42 | 4,100 | 4,540 |
| | Anheuser-Busch InBev Worldwide Inc. | 3.750% | 7/15/42 | 19,610 | 18,620 |
| | Ascension Health | 4.847% | 11/15/53 | 44,750 | 50,489 |
| | AstraZeneca plc | 1.950% | 9/18/19 | 12,065 | 12,080 |
| | AstraZeneca plc | 2.375% | 11/16/20 | 44,480 | 44,924 |
| | AstraZeneca plc | 6.450% | 9/15/37 | 23,385 | 31,172 |
| | AstraZeneca plc | 4.375% | 11/16/45 | 30,240 | 31,995 |
| 5 | BAT International Finance plc | 2.750% | 6/15/20 | 21,250 | 21,595 |
| 5 | BAT International Finance plc | 3.250% | 6/7/22 | 58,280 | 59,356 |
| 5 | BAT International Finance plc | 3.500% | 6/15/22 | 8,980 | 9,272 |
| 5 | Bayer US Finance LLC | 2.375% | 10/8/19 | 7,510 | 7,564 |
| 5 | Bayer US Finance LLC | 3.000% | 10/8/21 | 46,850 | 47,856 |
| | Biogen Inc. | 2.900% | 9/15/20 | 21,115 | 21,590 |
| | Boston Children's Hospital Corp. Revenue | 4.115% | 1/1/47 | 8,935 | 9,234 |
| | Cardinal Health Inc. | 2.400% | 11/15/19 | 27,350 | 27,539 |
| | Cardinal Health Inc. | 3.200% | 3/15/23 | 13,035 | 13,351 |
| | Cardinal Health Inc. | 3.500% | 11/15/24 | 24,705 | 25,377 |
| | Cardinal Health Inc. | 4.500% | 11/15/44 | 28,805 | 28,302 |
| 5 | Cargill Inc. | 4.307% | 5/14/21 | 60,532 | 65,124 |
| 5 | Cargill Inc. | 6.875% | 5/1/28 | 19,355 | 24,374 |
| 5 | Cargill Inc. | 4.760% | 11/23/45 | 28,190 | 31,797 |
| | Catholic Health Initiatives Colorado GO | 1.600% | 11/1/17 | 2,140 | 2,139 |
| | Catholic Health Initiatives Colorado GO | 2.600% | 8/1/18 | 9,745 | 9,813 |
| | Catholic Health Initiatives Colorado GO | 2.950% | 11/1/22 | 2,170 | 2,109 |
| | Catholic Health Initiatives Colorado GO | 4.200% | 8/1/23 | 2,980 | 3,056 |
| | Catholic Health Initiatives Colorado GO | 4.350% | 11/1/42 | 27,580 | 24,178 |
| | Celgene Corp. | 2.250% | 5/15/19 | 6,565 | 6,626 |
| | Celgene Corp. | 3.250% | 8/15/22 | 16,250 | 16,757 |
| | Celgene Corp. | 3.550% | 8/15/22 | 18,400 | 19,241 |
| | Coca-Cola Co. | 3.300% | 9/1/21 | 10,075 | 10,603 |
| | Coca-Cola Enterprises Inc. | 3.500% | 9/15/20 | 9,900 | 10,265 |
| | Coca-Cola Enterprises Inc. | 4.500% | 9/1/21 | 8,430 | 9,061 |
| | Coca-Cola Femsa SAB de CV | 2.375% | 11/26/18 | 30,936 | 31,005 |
| | Coca-Cola Femsa SAB de CV | 3.875% | 11/26/23 | 34,200 | 35,905 |
| | Colgate-Palmolive Co. | 7.600% | 5/19/25 | 13,920 | 18,092 |
| | Constellation Brands Inc. | 2.700% | 5/9/22 | 2,385 | 2,379 |
| | Diageo Capital plc | 2.625% | 4/29/23 | 48,310 | 48,476 |
| | Diageo Investment Corp. | 2.875% | 5/11/22 | 26,991 | 27,630 |
| | Dignity Health California GO | 2.637% | 11/1/19 | 5,595 | 5,627 |
| | Dignity Health California GO | 3.812% | 11/1/24 | 11,415 | 11,722 |
| | Eli Lilly & Co. | 3.700% | 3/1/45 | 24,450 | 24,021 |
| 5 | EMD Finance LLC | 2.950% | 3/19/22 | 23,660 | 24,155 |
| 5 | EMD Finance LLC | 3.250% | 3/19/25 | 47,000 | 47,232 |
| 5 | Forest Laboratories Inc. | 4.875% | 2/15/21 | 4,184 | 4,540 |
| | General Mills Inc. | 6.390% | 2/5/23 | 50,000 | 57,200 |
| | Gilead Sciences Inc. | 2.550% | 9/1/20 | 26,330 | 26,753 |
| | Gilead Sciences Inc. | 3.700% | 4/1/24 | 26,895 | 28,034 |
| | Gilead Sciences Inc. | 3.500% | 2/1/25 | 22,335 | 22,958 |
| | Gilead Sciences Inc. | 4.500% | 2/1/45 | 32,375 | 33,031 |
| | Gilead Sciences Inc. | 4.750% | 3/1/46 | 7,340 | 7,778 |
| | GlaxoSmithKline Capital Inc. | 2.800% | 3/18/23 | 31,740 | 32,227 |
| | GlaxoSmithKline Capital Inc. | 5.375% | 4/15/34 | 45,000 | 53,098 |
| | GlaxoSmithKline Capital plc | 2.850% | 5/8/22 | 28,930 | 29,690 |
| 5 | Imperial Tobacco Finance plc | 3.750% | 7/21/22 | 34,745 | 36,122 |
| 5 | Japan Tobacco Inc. | 2.100% | 7/23/18 | 22,200 | 22,254 |
| | Kaiser Foundation Hospitals | 3.500% | 4/1/22 | 20,786 | 21,837 |
11
| | | | | |
| Vanguard® Wellington Fund | | | | |
| Schedule of Investments | | | | |
| May 31, 2017 | | | | |
| |
| | | | | Face | Market |
| | | | Maturity | Amount | Value |
| | | Coupon | Date | ($000) | ($000) |
| | Kaiser Foundation Hospitals | 3.150% | 5/1/27 | 17,935 | 18,152 |
| | Kaiser Foundation Hospitals | 4.875% | 4/1/42 | 14,250 | 16,242 |
| | Kraft Heinz Foods Co. | 3.000% | 6/1/26 | 19,550 | 18,761 |
| | Kraft Heinz Foods Co. | 5.000% | 7/15/35 | 8,940 | 9,555 |
| | Kraft Heinz Foods Co. | 4.375% | 6/1/46 | 33,815 | 32,174 |
| | Kroger Co. | 4.450% | 2/1/47 | 45,875 | 45,778 |
| | McKesson Corp. | 2.700% | 12/15/22 | 7,710 | 7,693 |
| | McKesson Corp. | 2.850% | 3/15/23 | 7,620 | 7,614 |
| | McKesson Corp. | 4.883% | 3/15/44 | 26,111 | 28,071 |
| | Medtronic Inc. | 1.375% | 4/1/18 | 13,520 | 13,504 |
| | Medtronic Inc. | 2.500% | 3/15/20 | 34,350 | 34,900 |
| | Medtronic Inc. | 3.150% | 3/15/22 | 72,005 | 74,846 |
| | Medtronic Inc. | 3.625% | 3/15/24 | 10,350 | 10,940 |
| | Medtronic Inc. | 3.500% | 3/15/25 | 76,150 | 79,211 |
| | Medtronic Inc. | 4.375% | 3/15/35 | 9,889 | 10,668 |
| | Memorial Sloan-Kettering Cancer Center New York GO | 4.125% | 7/1/52 | 12,320 | 12,371 |
| | Memorial Sloan-Kettering Cancer Center New York GO | 4.200% | 7/1/55 | 15,150 | 15,492 |
| | Merck & Co. Inc. | 2.350% | 2/10/22 | 30,760 | 31,082 |
| | Merck & Co. Inc. | 2.800% | 5/18/23 | 54,775 | 56,004 |
| | Merck & Co. Inc. | 2.750% | 2/10/25 | 47,090 | 47,031 |
| | Merck & Co. Inc. | 6.550% | 9/15/37 | 10,000 | 13,806 |
| | Merck & Co. Inc. | 4.150% | 5/18/43 | 22,090 | 23,236 |
| | Molson Coors Brewing Co. | 3.500% | 5/1/22 | 16,525 | 17,234 |
| | Molson Coors Brewing Co. | 5.000% | 5/1/42 | 6,465 | 7,076 |
| | New York & Presbyterian Hospital | 4.024% | 8/1/45 | 28,410 | 28,415 |
| | Novartis Capital Corp. | 3.400% | 5/6/24 | 16,695 | 17,441 |
| | Novartis Capital Corp. | 4.400% | 5/6/44 | 25,896 | 28,420 |
| | Partners Healthcare System Massachusetts GO | 3.443% | 7/1/21 | 1,950 | 2,025 |
| | PepsiCo Inc. | 2.750% | 3/1/23 | 29,800 | 30,270 |
| | PepsiCo Inc. | 4.000% | 3/5/42 | 51,391 | 52,097 |
| | Pfizer Inc. | 3.000% | 6/15/23 | 47,025 | 48,644 |
| | Philip Morris International Inc. | 4.500% | 3/26/20 | 8,250 | 8,828 |
| | Philip Morris International Inc. | 4.125% | 5/17/21 | 43,025 | 45,985 |
| | Philip Morris International Inc. | 2.500% | 8/22/22 | 21,645 | 21,673 |
| | Philip Morris International Inc. | 2.625% | 3/6/23 | 46,850 | 46,828 |
| | Philip Morris International Inc. | 4.875% | 11/15/43 | 6,185 | 6,845 |
| | Procter & Gamble - Esop | 9.360% | 1/1/21 | 25,389 | 29,053 |
| 5 | Roche Holdings Inc. | 2.875% | 9/29/21 | 33,000 | 33,894 |
| | Sanofi | 4.000% | 3/29/21 | 44,090 | 47,141 |
| 5 | Sigma Alimentos SA de CV | 4.125% | 5/2/26 | 19,205 | 19,271 |
| | SSM Health Care Corp. | 3.823% | 6/1/27 | 42,700 | 43,936 |
| | Teva Pharmaceutical Finance Netherlands III BV | 2.800% | 7/21/23 | 37,215 | 36,063 |
| | Teva Pharmaceutical Finance Netherlands III BV | 3.150% | 10/1/26 | 9,045 | 8,513 |
| | Teva Pharmaceutical Finance Netherlands III BV | 4.100% | 10/1/46 | 32,010 | 28,180 |
| | The Kroger Co. | 3.850% | 8/1/23 | 10,770 | 11,322 |
| | The Kroger Co. | 4.000% | 2/1/24 | 22,290 | 23,504 |
| | The Pepsi Bottling Group Inc. | 7.000% | 3/1/29 | 10,000 | 13,684 |
| | Unilever Capital Corp. | 4.250% | 2/10/21 | 95,235 | 102,233 |
| | Wyeth LLC | 5.950% | 4/1/37 | 25,000 | 31,897 |
| | Zeneca Wilmington Inc. | 7.000% | 11/15/23 | 29,000 | 36,091 |
| | Energy (1.6%) | | | | |
| 5 | BG Energy Capital plc | 4.000% | 10/15/21 | 5,000 | 5,324 |
| | BP Capital Markets plc | 4.750% | 3/10/19 | 27,215 | 28,609 |
| | BP Capital Markets plc | 2.315% | 2/13/20 | 5,855 | 5,920 |
| | BP Capital Markets plc | 4.500% | 10/1/20 | 16,000 | 17,216 |
| | BP Capital Markets plc | 3.062% | 3/17/22 | 43,130 | 44,328 |
| | BP Capital Markets plc | 3.245% | 5/6/22 | 35,000 | 36,178 |
| | BP Capital Markets plc | 2.500% | 11/6/22 | 22,000 | 21,864 |
| | BP Capital Markets plc | 3.994% | 9/26/23 | 16,185 | 17,268 |
| | BP Capital Markets plc | 3.814% | 2/10/24 | 38,938 | 40,873 |
| | BP Capital Markets plc | 3.506% | 3/17/25 | 50,285 | 51,730 |
| | Chevron Corp. | 3.191% | 6/24/23 | 49,470 | 51,116 |
| | ConocoPhillips | 5.200% | 5/15/18 | 80,000 | 82,673 |
12
| | | | | |
| Vanguard® Wellington Fund | | | | |
| Schedule of Investments | | | | |
| May 31, 2017 | | | | |
| |
| | | | | Face | Market |
| | | | Maturity | Amount | Value |
| | | Coupon | Date | ($000) | ($000) |
| | ConocoPhillips | 5.750% | 2/1/19 | 7,510 | 7,993 |
| | ConocoPhillips | 6.000% | 1/15/20 | 3,680 | 4,062 |
| | ConocoPhillips Co. | 4.200% | 3/15/21 | 13,820 | 14,789 |
| | ConocoPhillips Co. | 2.875% | 11/15/21 | 12,755 | 13,045 |
| | ConocoPhillips Co. | 3.350% | 11/15/24 | 8,470 | 8,719 |
| | ConocoPhillips Co. | 3.350% | 5/15/25 | 9,440 | 9,680 |
| | ConocoPhillips Co. | 4.950% | 3/15/26 | 4,385 | 4,915 |
| | ConocoPhillips Co. | 4.300% | 11/15/44 | 60,450 | 61,402 |
| | Devon Energy Corp. | 3.250% | 5/15/22 | 18,600 | 18,801 |
| | Dominion Energy Gas Holdings LLC | 3.550% | 11/1/23 | 21,445 | 22,125 |
| | EOG Resources Inc. | 5.625% | 6/1/19 | 23,100 | 24,725 |
| | Exxon Mobil Corp. | 2.222% | 3/1/21 | 14,165 | 14,301 |
| | Exxon Mobil Corp. | 2.726% | 3/1/23 | 11,910 | 12,095 |
| | Exxon Mobil Corp. | 3.043% | 3/1/26 | 8,115 | 8,230 |
| | Exxon Mobil Corp. | 4.114% | 3/1/46 | 12,060 | 12,604 |
| | Halliburton Co. | 3.500% | 8/1/23 | 78,795 | 81,426 |
| | Noble Energy Inc. | 4.150% | 12/15/21 | 15,961 | 16,967 |
| | Occidental Petroleum Corp. | 4.100% | 2/1/21 | 39,240 | 41,725 |
| | Occidental Petroleum Corp. | 2.700% | 2/15/23 | 10,750 | 10,805 |
| | Occidental Petroleum Corp. | 3.400% | 4/15/26 | 28,910 | 29,469 |
| | Occidental Petroleum Corp. | 4.400% | 4/15/46 | 12,140 | 12,600 |
| | Phillips 66 | 4.875% | 11/15/44 | 10,800 | 11,483 |
| | Plains All American Pipeline LP / PAA Finance Corp. | 3.850% | 10/15/23 | 55,000 | 56,014 |
| 5 | Schlumberger Holdings Corp. | 3.000% | 12/21/20 | 30,755 | 31,478 |
| 5 | Schlumberger Investment SA | 2.400% | 8/1/22 | 23,925 | 23,763 |
| | Schlumberger Investment SA | 3.650% | 12/1/23 | 44,520 | 46,992 |
| | Shell International Finance BV | 4.375% | 3/25/20 | 28,875 | 30,856 |
| | Shell International Finance BV | 3.250% | 5/11/25 | 11,051 | 11,309 |
| | Shell International Finance BV | 2.875% | 5/10/26 | 16,320 | 16,189 |
| | Shell International Finance BV | 4.125% | 5/11/35 | 36,315 | 37,598 |
| | Shell International Finance BV | 5.500% | 3/25/40 | 12,990 | 15,580 |
| | Shell International Finance BV | 4.375% | 5/11/45 | 96,700 | 100,762 |
| | Suncor Energy Inc. | 5.950% | 12/1/34 | 20,700 | 24,754 |
| | Sunoco Logistics Partners Operations LP | 4.400% | 4/1/21 | 30,900 | 32,756 |
| | Total Capital International SA | 1.550% | 6/28/17 | 44,415 | 44,414 |
| | Total Capital International SA | 2.700% | 1/25/23 | 36,510 | 36,818 |
| | Total Capital International SA | 3.750% | 4/10/24 | 41,500 | 44,051 |
| | Total Capital SA | 2.125% | 8/10/18 | 42,000 | 42,208 |
| | TransCanada PipeLines Ltd. | 3.800% | 10/1/20 | 47,125 | 49,674 |
| | TransCanada PipeLines Ltd. | 4.875% | 1/15/26 | 47,256 | 53,027 |
| | Transcanada Trust | 5.300% | 3/15/77 | 23,255 | 23,823 |
| | Other Industrial (0.0%) | | | | |
| | Johns Hopkins University Maryland GO | 4.083% | 7/1/53 | 26,970 | 28,566 |
| |
| | Technology (1.4%) | | | | |
| | Apple Inc. | 2.850% | 5/6/21 | 44,000 | 45,380 |
| | Apple Inc. | 3.000% | 2/9/24 | 22,535 | 23,017 |
| | Apple Inc. | 3.450% | 5/6/24 | 39,950 | 41,757 |
| | Apple Inc. | 2.850% | 5/11/24 | 44,990 | 45,249 |
| | Apple Inc. | 3.250% | 2/23/26 | 37,631 | 38,556 |
| | Apple Inc. | 2.450% | 8/4/26 | 43,466 | 41,704 |
| | Apple Inc. | 3.350% | 2/9/27 | 55,925 | 57,235 |
| | Apple Inc. | 3.200% | 5/11/27 | 39,185 | 39,725 |
| | Apple Inc. | 3.850% | 5/4/43 | 17,000 | 16,827 |
| | Apple Inc. | 4.450% | 5/6/44 | 5,075 | 5,473 |
| | Apple Inc. | 3.850% | 8/4/46 | 36,890 | 36,299 |
| | Applied Materials Inc. | 3.300% | 4/1/27 | 31,840 | 32,489 |
| 5 | Broadcom Corp. / Broadcom Cayman Finance Ltd. | 3.625% | 1/15/24 | 54,015 | 55,028 |
| | Cisco Systems Inc. | 4.450% | 1/15/20 | 24,095 | 25,732 |
| | Cisco Systems Inc. | 2.900% | 3/4/21 | 13,350 | 13,809 |
| | Cisco Systems Inc. | 2.500% | 9/20/26 | 15,676 | 15,096 |
| | Intel Corp. | 2.875% | 5/11/24 | 29,395 | 29,641 |
| | Intel Corp. | 4.100% | 5/19/46 | 51,605 | 52,729 |
13
| | | | | |
| Vanguard® Wellington Fund | | | | |
| Schedule of Investments | | | | |
| May 31, 2017 | | | | |
| |
| | | | | Face | Market |
| | | | Maturity | Amount | Value |
| | | Coupon | Date | ($000) | ($000) |
| | International Business Machines Corp. | 8.375% | 11/1/19 | 25,000 | 28,860 |
| | International Business Machines Corp. | 3.375% | 8/1/23 | 70,925 | 74,100 |
| | International Business Machines Corp. | 3.625% | 2/12/24 | 35,000 | 36,709 |
| | International Business Machines Corp. | 5.875% | 11/29/32 | 20,240 | 26,095 |
| | Microsoft Corp. | 2.375% | 2/12/22 | 24,670 | 25,023 |
| | Microsoft Corp. | 3.625% | 12/15/23 | 16,000 | 17,045 |
| | Microsoft Corp. | 2.875% | 2/6/24 | 70,885 | 72,036 |
| | Microsoft Corp. | 3.125% | 11/3/25 | 31,615 | 32,361 |
| | Microsoft Corp. | 2.400% | 8/8/26 | 53,545 | 51,409 |
| | Microsoft Corp. | 3.500% | 2/12/35 | 23,520 | 23,450 |
| | Microsoft Corp. | 3.450% | 8/8/36 | 65,320 | 63,769 |
| | Microsoft Corp. | 4.100% | 2/6/37 | 45,385 | 48,280 |
| | Microsoft Corp. | 4.450% | 11/3/45 | 14,250 | 15,556 |
| | Microsoft Corp. | 3.700% | 8/8/46 | 61,115 | 59,278 |
| | Microsoft Corp. | 4.250% | 2/6/47 | 91,700 | 97,098 |
| | Oracle Corp. | 2.500% | 5/15/22 | 46,930 | 47,512 |
| | Oracle Corp. | 2.950% | 5/15/25 | 13,635 | 13,666 |
| | QUALCOMM Inc. | 2.600% | 1/30/23 | 26,010 | 26,059 |
| | QUALCOMM Inc. | 2.900% | 5/20/24 | 31,285 | 31,172 |
| | QUALCOMM Inc. | 3.250% | 5/20/27 | 32,775 | 32,697 |
| | Transportation (0.4%) | | | | |
| | Burlington Northern Santa Fe LLC | 3.050% | 3/15/22 | 7,595 | 7,867 |
| | Burlington Northern Santa Fe LLC | 3.000% | 3/15/23 | 21,397 | 22,058 |
| | Burlington Northern Santa Fe LLC | 3.850% | 9/1/23 | 20,891 | 22,469 |
| | Burlington Northern Santa Fe LLC | 3.250% | 6/15/27 | 12,315 | 12,667 |
| | Continental Airlines 2007-1 Class A Pass Through Trust | 5.983% | 10/19/23 | 23,178 | 25,554 |
| 5 | ERAC USA Finance LLC | 2.350% | 10/15/19 | 27,135 | 27,230 |
| 5 | ERAC USA Finance LLC | 4.500% | 8/16/21 | 9,295 | 9,934 |
| 5 | ERAC USA Finance LLC | 7.000% | 10/15/37 | 32,995 | 41,621 |
| 5 | ERAC USA Finance LLC | 5.625% | 3/15/42 | 10,000 | 11,037 |
| | Federal Express Corp. 1998 Pass Through Trust | 6.720% | 1/15/22 | 19,790 | 21,698 |
| | FedEx Corp. | 2.700% | 4/15/23 | 23,430 | 23,438 |
| | FedEx Corp. | 4.900% | 1/15/34 | 10,610 | 11,689 |
| | FedEx Corp. | 3.875% | 8/1/42 | 5,095 | 4,754 |
| | FedEx Corp. | 4.100% | 4/15/43 | 20,500 | 19,824 |
| | FedEx Corp. | 5.100% | 1/15/44 | 18,015 | 19,882 |
| | Kansas City Southern | 4.950% | 8/15/45 | 33,985 | 36,172 |
| | Southwest Airlines Co. 2007-1 Pass Through Trust | 6.150% | 2/1/24 | 15,372 | 16,928 |
| | United Parcel Service Inc. | 2.450% | 10/1/22 | 17,950 | 18,189 |
| | United Parcel Service Inc. | 4.875% | 11/15/40 | 14,815 | 17,215 |
| | | | | | 10,864,004 |
| Utilities (2.1%) | | | | |
| | Electric (2.0%) | | | | |
| | Alabama Power Co. | 5.700% | 2/15/33 | 15,000 | 17,795 |
| | Alabama Power Co. | 3.750% | 3/1/45 | 24,430 | 23,800 |
| | Ameren Illinois Co. | 6.125% | 12/15/28 | 54,000 | 65,304 |
| | Berkshire Hathaway Energy Co. | 6.125% | 4/1/36 | 43,116 | 54,882 |
| | Berkshire Hathaway Energy Co. | 6.500% | 9/15/37 | 10,301 | 13,746 |
| | Commonwealth Edison Co. | 4.350% | 11/15/45 | 8,130 | 8,722 |
| | Connecticut Light & Power Co. | 5.650% | 5/1/18 | 13,655 | 14,156 |
| | Consolidated Edison Co. of New York Inc. | 7.125% | 12/1/18 | 11,278 | 12,163 |
| | Consolidated Edison Co. of New York Inc. | 4.500% | 12/1/45 | 36,735 | 40,303 |
| | Consolidated Edison Co. of New York Inc. | 4.625% | 12/1/54 | 51,625 | 56,448 |
| | Delmarva Power & Light Co. | 3.500% | 11/15/23 | 11,816 | 12,399 |
| | Dominion Energy Inc. | 2.962% | 7/1/19 | 18,210 | 18,482 |
| | Dominion Energy Inc. | 2.579% | 7/1/20 | 23,655 | 23,846 |
| | Dominion Energy Inc. | 3.625% | 12/1/24 | 29,400 | 30,092 |
| | Dominion Resources Inc. | 5.200% | 8/15/19 | 19,250 | 20,536 |
| | DTE Energy Co. | 3.800% | 3/15/27 | 9,550 | 9,835 |
| | Duke Energy Carolinas LLC | 5.250% | 1/15/18 | 9,000 | 9,200 |
| | Duke Energy Carolinas LLC | 5.100% | 4/15/18 | 18,235 | 18,805 |
| | Duke Energy Carolinas LLC | 3.900% | 6/15/21 | 50,025 | 53,362 |
| | Duke Energy Corp. | 2.650% | 9/1/26 | 11,775 | 11,207 |
14
| | | | | |
| Vanguard® Wellington Fund | | | | |
| Schedule of Investments | | | | |
| May 31, 2017 | | | | |
| |
| | | | | Face | Market |
| | | | Maturity | Amount | Value |
| | | Coupon | Date | ($000) | ($000) |
| | Duke Energy Corp. | 4.800% | 12/15/45 | 44,700 | 48,565 |
| | Duke Energy Corp. | 3.750% | 9/1/46 | 9,940 | 9,330 |
| | Duke Energy Florida LLC | 6.350% | 9/15/37 | 8,000 | 10,647 |
| | Duke Energy Florida LLC | 6.400% | 6/15/38 | 27,055 | 36,782 |
| | Duke Energy Progress LLC | 6.300% | 4/1/38 | 14,705 | 19,527 |
| | Duke Energy Progress LLC | 4.200% | 8/15/45 | 32,825 | 34,426 |
| | Entergy Louisiana LLC | 3.120% | 9/1/27 | 14,935 | 15,016 |
| | Eversource Energy | 4.500% | 11/15/19 | 3,535 | 3,743 |
| | Eversource Energy | 3.150% | 1/15/25 | 5,025 | 5,056 |
| | Florida Power & Light Co. | 5.650% | 2/1/35 | 50,000 | 61,359 |
| | Florida Power & Light Co. | 4.950% | 6/1/35 | 10,000 | 11,631 |
| | Florida Power & Light Co. | 5.650% | 2/1/37 | 5,000 | 6,288 |
| | Florida Power & Light Co. | 5.950% | 2/1/38 | 39,215 | 50,526 |
| 5 | Fortis Inc. | 3.055% | 10/4/26 | 28,565 | 27,631 |
| | Georgia Power Co. | 5.400% | 6/1/18 | 38,660 | 40,056 |
| | Georgia Power Co. | 3.250% | 3/30/27 | 15,475 | 15,464 |
| | Georgia Power Co. | 5.950% | 2/1/39 | 16,822 | 20,645 |
| | Georgia Power Co. | 4.750% | 9/1/40 | 9,893 | 10,478 |
| | Georgia Power Co. | 4.300% | 3/15/42 | 30,375 | 30,732 |
| | Great Plains Energy Inc. | 3.150% | 4/1/22 | 11,860 | 12,061 |
| | Great Plains Energy Inc. | 3.900% | 4/1/27 | 9,870 | 10,000 |
| 5 | Massachusetts Electric Co. | 5.900% | 11/15/39 | 21,565 | 26,777 |
| | MidAmerican Energy Co. | 4.250% | 5/1/46 | 3,925 | 4,181 |
| | National Rural Utilities Cooperative Finance Corp. | 5.450% | 2/1/18 | 60,000 | 61,470 |
| | National Rural Utilities Cooperative Finance Corp. | 2.950% | 2/7/24 | 15,255 | 15,424 |
| | National Rural Utilities Cooperative Finance Corp. | 2.850% | 1/27/25 | 40,345 | 40,241 |
| | NextEra Energy Capital Holdings Inc. | 3.550% | 5/1/27 | 32,275 | 32,738 |
| | Northern States Power Co. | 6.250% | 6/1/36 | 50,000 | 65,558 |
| | Oglethorpe Power Corp. | 5.950% | 11/1/39 | 6,075 | 7,242 |
| | Oglethorpe Power Corp. | 5.250% | 9/1/50 | 6,450 | 6,904 |
| | Pacific Gas & Electric Co. | 4.250% | 5/15/21 | 11,365 | 12,147 |
| | Pacific Gas & Electric Co. | 3.850% | 11/15/23 | 17,950 | 19,118 |
| | Pacific Gas & Electric Co. | 3.750% | 2/15/24 | 12,250 | 12,972 |
| | Pacific Gas & Electric Co. | 5.125% | 11/15/43 | 11,255 | 13,387 |
| | PacifiCorp | 2.950% | 6/1/23 | 29,675 | 30,308 |
| | PacifiCorp | 5.900% | 8/15/34 | 12,500 | 15,169 |
| | PacifiCorp | 6.250% | 10/15/37 | 36,635 | 48,390 |
| | PECO Energy Co. | 5.350% | 3/1/18 | 20,545 | 21,105 |
| | Potomac Electric Power Co. | 6.500% | 11/15/37 | 25,000 | 34,055 |
| | Public Service Electric & Gas Co. | 5.300% | 5/1/18 | 25,100 | 25,968 |
| | San Diego Gas & Electric Co. | 6.000% | 6/1/26 | 3,600 | 4,383 |
| | Sierra Pacific Power Co. | 3.375% | 8/15/23 | 34,040 | 35,201 |
| | South Carolina Electric & Gas Co. | 5.800% | 1/15/33 | 9,000 | 10,323 |
| | South Carolina Electric & Gas Co. | 6.050% | 1/15/38 | 44,155 | 53,467 |
| | South Carolina Electric & Gas Co. | 5.450% | 2/1/41 | 650 | 745 |
| | South Carolina Electric & Gas Co. | 4.350% | 2/1/42 | 2,745 | 2,756 |
| | South Carolina Electric & Gas Co. | 4.600% | 6/15/43 | 2,170 | 2,236 |
| | South Carolina Electric & Gas Co. | 4.100% | 6/15/46 | 19,800 | 19,138 |
| | South Carolina Electric & Gas Co. | 5.100% | 6/1/65 | 29,850 | 32,588 |
| | Southern California Edison Co. | 2.400% | 2/1/22 | 4,295 | 4,314 |
| | Southern California Edison Co. | 6.000% | 1/15/34 | 7,695 | 9,763 |
| | Southern California Edison Co. | 5.550% | 1/15/37 | 50,475 | 61,795 |
| | Southern California Edison Co. | 5.950% | 2/1/38 | 40,000 | 51,604 |
| | Southern California Edison Co. | 3.600% | 2/1/45 | 3,560 | 3,461 |
| | Southern Co. | 2.450% | 9/1/18 | 9,395 | 9,467 |
| | Southern Co. | 2.950% | 7/1/23 | 48,400 | 48,235 |
| | Southern Co. | 3.250% | 7/1/26 | 30,885 | 30,317 |
| | Southern Co. | 4.400% | 7/1/46 | 15,635 | 15,558 |
| | Virginia Electric & Power Co. | 2.750% | 3/15/23 | 34,540 | 34,887 |
| | Virginia Electric & Power Co. | 3.500% | 3/15/27 | 16,025 | 16,605 |
| | Virginia Electric & Power Co. | 6.000% | 5/15/37 | 1,740 | 2,212 |
| | Wisconsin Electric Power Co. | 5.700% | 12/1/36 | 17,280 | 21,443 |
| | Wisconsin Public Service Corp. | 6.080% | 12/1/28 | 45,000 | 55,626 |
15
| | | | | |
| Vanguard® Wellington Fund | | | | |
| Schedule of Investments | | | | |
| May 31, 2017 | | | | |
| |
| | | | | Face | Market |
| | | | Maturity | Amount | Value |
| | | Coupon | Date | ($000) | ($000) |
| | Natural Gas (0.1%) | | | | |
| 5 | KeySpan Gas East Corp. | 2.742% | 8/15/26 | 25,345 | 24,627 |
| | Nisource Finance Corp. | 5.250% | 2/15/43 | 14,588 | 16,600 |
| | NiSource Finance Corp. | 4.800% | 2/15/44 | 10,370 | 11,218 |
| | Sempra Energy | 2.875% | 10/1/22 | 27,530 | 27,656 |
| |
| | | | | | 2,094,425 |
| |
| Total Corporate Bonds (Cost $20,136,530) | | | | 21,204,880 |
| |
| Sovereign Bonds (1.7%) | | | | |
| 5 | CDP Financial Inc. | 4.400% | 11/25/19 | 40,000 | 42,324 |
| 5 | Electricite de France SA | 4.600% | 1/27/20 | 50,000 | 53,061 |
| 5 | Electricite de France SA | 4.875% | 1/22/44 | 1,775 | 1,824 |
| 5 | Electricite de France SA | 4.950% | 10/13/45 | 15,100 | 15,735 |
| | Export-Import Bank of Korea | 1.750% | 5/26/19 | 75,100 | 74,616 |
| | International Bank for Reconstruction & Development | 4.750% | 2/15/35 | 40,000 | 49,992 |
| | Japan Bank for International Cooperation | 2.250% | 2/24/20 | 52,670 | 52,829 |
| | Japan Bank for International Cooperation | 2.125% | 6/1/20 | 32,682 | 32,720 |
| 6 | Japan Treasury Discount Bill | 0.000% | 8/7/17 | 8,900,000 | 80,379 |
| 6 | Japan Treasury Discount Bill | 0.000% | 8/14/17 | 8,900,000 | 80,381 |
| 6 | Japan Treasury Discount Bill | 0.000% | 8/21/17 | 8,900,000 | 80,384 |
| 6 | Japan Treasury Discount Bill | 0.000% | 8/28/17 | 8,850,000 | 79,934 |
| 5 | Kingdom of Saudi Arabia | 2.375% | 10/26/21 | 31,330 | 30,970 |
| | Korea Development Bank | 2.875% | 8/22/18 | 37,605 | 38,027 |
| | Korea Development Bank | 2.500% | 3/11/20 | 78,800 | 79,019 |
| 5 | Kuwait | 2.750% | 3/20/22 | 4,255 | 4,298 |
| | Petroleos Mexicanos | 5.500% | 2/4/19 | 13,315 | 13,967 |
| | Province of Ontario | 4.000% | 10/7/19 | 56,415 | 59,112 |
| | Province of Ontario | 4.400% | 4/14/20 | 50,000 | 53,296 |
| | Province of Ontario | 2.500% | 4/27/26 | 40,160 | 39,849 |
| | Province of Quebec | 2.500% | 4/20/26 | 145,430 | 143,849 |
| 5 | Sinopec Group Overseas Development 2015 Ltd. | 2.500% | 4/28/20 | 62,500 | 62,648 |
| 5 | Sinopec Group Overseas Development 2015 Ltd. | 3.250% | 4/28/25 | 62,500 | 61,778 |
| 5 | Sinopec Group Overseas Development 2017 Ltd. | 3.000% | 4/12/22 | 31,000 | 31,274 |
| 5 | State Grid Overseas Investment 2014 Ltd. | 2.750% | 5/7/19 | 51,455 | 51,960 |
| 5 | State Grid Overseas Investment 2016 Ltd. | 2.750% | 5/4/22 | 62,480 | 62,328 |
| 5 | State Grid Overseas Investment 2016 Ltd. | 3.500% | 5/4/27 | 28,630 | 28,610 |
| | Statoil ASA | 2.250% | 11/8/19 | 22,515 | 22,650 |
| | Statoil ASA | 2.900% | 11/8/20 | 57,210 | 58,632 |
| | Statoil ASA | 2.750% | 11/10/21 | 32,860 | 33,433 |
| | Statoil ASA | 2.450% | 1/17/23 | 15,017 | 14,937 |
| | Statoil ASA | 2.650% | 1/15/24 | 14,000 | 13,892 |
| | Statoil ASA | 3.700% | 3/1/24 | 25,320 | 26,697 |
| | Statoil ASA | 3.250% | 11/10/24 | 29,975 | 30,756 |
| 5 | Temasek Financial I Ltd. | 2.375% | 1/23/23 | 45,150 | 44,757 |
| | United Mexican States | 3.500% | 1/21/21 | 13,956 | 14,524 |
| | United Mexican States | 4.150% | 3/28/27 | 35,579 | 36,684 |
| | United Mexican States | 4.750% | 3/8/44 | 9,750 | 9,647 |
| |
| Total Sovereign Bonds (Cost $1,676,723) | | | | 1,711,773 |
| |
| Taxable Municipal Bonds (1.9%) | | | | |
| | Atlanta GA Downtown Development Authority | | | | |
| | Revenue | 6.875% | 2/1/21 | 5,520 | 6,196 |
| | Bay Area Toll Authority California Toll Bridge Revenue | | | | |
| | (San Francisco Bay Area) | 6.263% | 4/1/49 | 33,765 | 47,760 |
| | Bay Area Toll Authority California Toll Bridge Revenue | | | | |
| | (San Francisco Bay Area) | 7.043% | 4/1/50 | 33,915 | 50,265 |
| | California GO | 5.700% | 11/1/21 | 16,840 | 19,200 |
| | California GO | 7.550% | 4/1/39 | 43,215 | 65,162 |
| | California GO | 7.300% | 10/1/39 | 11,800 | 17,002 |
| | California GO | 7.350% | 11/1/39 | 66,875 | 96,703 |
| | California GO | 7.625% | 3/1/40 | 3,510 | 5,273 |
| | California GO | 7.600% | 11/1/40 | 34,800 | 53,373 |
16
| | | | |
| Vanguard® Wellington Fund | | | | |
| Schedule of Investments | | | | |
| May 31, 2017 | | | | |
| |
| | | | Face | Market |
| | | Maturity | Amount | Value |
| | Coupon | Date | ($000) | ($000) |
| Chicago IL Metropolitan Water Reclamation District GO | 5.720% | 12/1/38 | 8,545 | 10,396 |
| Chicago IL O'Hare International Airport Revenue | 6.845% | 1/1/38 | 25,680 | 28,468 |
| Chicago IL O'Hare International Airport Revenue | 6.395% | 1/1/40 | 8,970 | 12,031 |
| Chicago IL Transit Authority Transfer Tax Receipts | | | | |
| Revenue | 6.899% | 12/1/40 | 29,855 | 37,954 |
| Chicago Transit Authority | 6.899% | 12/1/40 | 54,480 | 69,259 |
| Dallas TX Area Rapid Transit Revenue | 5.999% | 12/1/44 | 29,925 | 39,707 |
| Georgia Municipal Electric Power Authority Revenue | 6.637% | 4/1/57 | 51,675 | 62,074 |
| Grand Parkway Transportation Corp. Texas System Toll | | | | |
| Revenue | 5.184% | 10/1/42 | 40,435 | 48,200 |
| Houston TX GO | 6.290% | 3/1/32 | 23,255 | 27,714 |
| Illinois Finance Authority | 4.545% | 10/1/18 | 29,580 | 30,507 |
| Illinois GO | 5.100% | 6/1/33 | 61,950 | 55,840 |
| Illinois Toll Highway Authority Revenue | 6.184% | 1/1/34 | 29,200 | 37,433 |
| Kansas Development Finance Authority Revenue | 4.927% | 4/15/45 | 10,155 | 10,922 |
| Kansas Development Finance Authority Revenue | | | | |
| (Public Employees Retirement System) | 5.501% | 5/1/34 | 50,000 | 57,794 |
| Los Angeles CA Community College District GO | 6.750% | 8/1/49 | 13,625 | 20,397 |
| Los Angeles CA Unified School District GO | 5.750% | 7/1/34 | 55,325 | 69,374 |
| Louisville & Jefferson County KY Metropolitan Sewer | | | | |
| District Sewer & Drainage System Revenue | 6.250% | 5/15/43 | 19,000 | 25,003 |
| Maryland Transportation Authority Facilities Projects | | | | |
| Revenue | 5.888% | 7/1/43 | 21,685 | 28,211 |
| Massachusetts School Building Authority Dedicated | | | | |
| Sales Tax Revenue | 5.715% | 8/15/39 | 22,105 | 27,988 |
| New Jersey Turnpike Authority Revenue | 7.414% | 1/1/40 | 35,285 | 51,920 |
| New Jersey Turnpike Authority Revenue | 7.102% | 1/1/41 | 4,000 | 5,711 |
| New York City NY Municipal Water Finance Authority | | | | |
| Water & Sewer System Revenue | 5.790% | 6/15/41 | 2,030 | 2,233 |
| New York City NY Municipal Water Finance Authority | | | | |
| Water & Sewer System Revenue | 5.882% | 6/15/44 | 16,995 | 22,858 |
| New York Metropolitan Transportation Authority | | | | |
| Revenue | 6.814% | 11/15/40 | 4,000 | 5,478 |
| New York Metropolitan Transportation Authority | | | | |
| Revenue (Dedicated Tax Fund) | 7.336% | 11/15/39 | 10,860 | 16,292 |
| New York Metropolitan Transportation Authority | | | | |
| Revenue (Dedicated Tax Fund) | 6.089% | 11/15/40 | 16,085 | 20,904 |
| New York State Urban Development Corp. Revenue | 2.100% | 3/15/22 | 135,865 | 135,938 |
| North Texas Tollway Authority System Revenue | 6.718% | 1/1/49 | 61,100 | 88,212 |
| Oregon Department of Transportation Highway User | | | | |
| Tax Revenue | 5.834% | 11/15/34 | 25,930 | 33,386 |
| Oregon GO | 5.902% | 8/1/38 | 19,510 | 24,865 |
| Oregon School Boards Association GO | 5.528% | 6/30/28 | 50,000 | 58,233 |
| Port Authority of New York & New Jersey Revenue | 5.859% | 12/1/24 | 12,735 | 15,366 |
| Port Authority of New York & New Jersey Revenue | 6.040% | 12/1/29 | 10,455 | 13,357 |
| Port Authority of New York & New Jersey Revenue | 4.458% | 10/1/62 | 53,000 | 56,964 |
| Port Authority of New York & New Jersey Revenue | 4.810% | 10/15/65 | 21,985 | 24,952 |
| Regents of the University of California Revenue | 3.063% | 7/1/25 | 49,360 | 49,915 |
| San Antonio TX Electric & Gas Systems Revenue | 5.985% | 2/1/39 | 11,890 | 15,381 |
| Stanford University | 6.875% | 2/1/24 | 34,745 | 43,387 |
| Stanford University | 7.650% | 6/15/26 | 29,000 | 40,101 |
| University of California | 3.931% | 5/15/45 | 22,370 | 22,628 |
| University of California Regents Medical Center | | | | |
| Revenue | 6.548% | 5/15/48 | 18,650 | 25,118 |
| University of California Regents Medical Center | | | | |
| Revenue | 6.583% | 5/15/49 | 31,110 | 41,945 |
| University of California Revenue | 4.601% | 5/15/31 | 21,975 | 24,458 |
| University of California Revenue | 5.770% | 5/15/43 | 24,325 | 30,940 |
| University of California Revenue | 4.765% | 5/15/44 | 5,980 | 6,337 |
| |
| Total Taxable Municipal Bonds (Cost $1,693,019) | | | | 1,937,085 |
17
| | | | | |
| Vanguard® Wellington Fund | | | | |
| Schedule of Investments | | | | |
| May 31, 2017 | | | | |
| |
| | | | | | Market |
| | | | | | Value |
| | | Coupon | | Shares | ($000) |
| Temporary Cash Investments (3.8%) | | | | |
| Money Market Fund (0.6%) | | | | |
| 8,9 | Market Liquidity Fund | 1.040% | | 5,835 | 583,650 |
| |
| | | | | Face | |
| | | | Maturity | Amount | |
| | | | Date | ($000) | |
| Repurchase Agreements (1.2%) | | | | |
| | Bank of America Securities, LLC(Dated 5/31/17, | | | | |
| | Repurchase Value $36,401,000 collateralized by | | | | |
| | Federal Farm Credit Bank 1.740%-3.820%, 11/20/20- | | | | |
| | 3/20/37, Federal Home Loan Bank 2.700%-3.470%, | | | | |
| | 3/14/31-9/8/36, with a value of $37,128,000) | 0.810% | 6/1/17 | 36,400 | 36,400 |
| | Citigroup Global Markets Inc.(Dated 5/31/17, | | | | |
| | Repurchase Value $36,401,000 collateralized by U.S. | | | | |
| | Treasury Note/Bond 0.750%-3.125%, 9/30/18- | | | | |
| | 5/15/21, with a value of $276,726,000) | 0.790% | 6/1/17 | 271,300 | 271,300 |
| | Deutsche Bank Securities, Inc.(Dated 5/31/17, | | | | |
| | Repurchase Value $37,101,000 collateralized by U.S. | | | | |
| | Treasury Note/Bond 1.375%, 12/31/18, with a value | | | | |
| | of $37,842,000) | 0.810% | 6/1/17 | 37,100 | 37,100 |
| | HSBC Bank USA(Dated 5/31/17, Repurchase Value | | | | |
| | $75,002,000 collateralized by U.S. Treasury | | | | |
| | Note/Bond 1.625%, 3/31/19, with a value of | | | | |
| | $76,503,000) | 0.770% | 6/1/17 | 75,000 | 75,000 |
| | HSBC Bank USA(Dated 5/31/17, Repurchase Value | | | | |
| | $19,100,000 collateralized by Federal National | | | | |
| | Mortgage Assn. 4.000%, 5/1/47, with a value of | | | | |
| | $19,488,000) | 0.780% | 6/1/17 | 19,100 | 19,100 |
| | RBC Capital Markets LLC(Dated 5/31/17, Repurchase | | | | |
| | Value $213,205,000 collateralized by Federal Home | | | | |
| | Loan Mortgage Corp. 2.494%-3.494%, 4/1/41-2/1/47, | | | | |
| | Federal National Mortgage Assn. 2.243%-6.000%, | | | | |
| | 4/1/22-5/1/47, Government National Mortgage Assn. | | | | |
| | 4.000%, 4/20/47, with a value of $217,464,000) | 0.790% | 6/1/17 | 213,200 | 213,200 |
| | TD Securities (USA) LLC(Dated 5/31/17, Repurchase | | | | |
| | Value $446,710,000 collateralized by Federal National | | | | |
| | Mortgage Assn. 2.500%-4.500%, 11/1/25-5/1/46, | | | | |
| | U.S. Treasury Note/Bond 1.500%-2.875%, 10/31/19- | | | | |
| | 5/15/43, with a value of $455,634,000) | 0.790% | 6/1/17 | 446,700 | 446,700 |
| | Wells Fargo & Co.(Dated 5/31/17, Repurchase Value | | | | |
| | $150,003,000 collateralized by Federal Home Loan | | | | |
| | Mortgage Corp. 3.500%, 2/1/47, Federal National | | | | |
| | Mortgage Assn. 3.500%, 2/1/47, with a value of | | | | |
| | $153,000,000) | 0.820% | 6/1/17 | 150,000 | 150,000 |
| | | | | | 1,248,800 |
| U.S. Government and Agency Obligations (0.1%) | | | | |
| 7 | Federal Home Loan Bank Discount Notes | 0.771% | 6/14/17 | 35,000 | 34,990 |
| 7 | Federal Home Loan Bank Discount Notes | 0.781% | 6/23/17 | 65,000 | 64,968 |
| | | | | | 99,958 |
| Commercial Paper (1.9%) | | | | |
| | Abbey National North | 0.911% | 6/21/17 | 100,000 | 99,944 |
| 10 | Apple Inc. | 0.821% | 6/16/17 | 145,588 | 145,534 |
| | Bank of Tokyo-Mitsubishi UFJ Ltd. | | | | |
| | (New York Branch) | 0.951% | 6/16/17 | 100,000 | 99,957 |
| 10 | BK Nederlandse Gemeenten | 0.971% | 6/28/17 | 250,000 | 249,795 |
| | BNP Paribas (New York Branch) | 0.921% | 6/20/17 | 150,000 | 149,920 |
18
| | | | | |
| Vanguard® Wellington Fund | | | | |
| Schedule of Investments | | | | |
| May 31, 2017 | | | | |
| |
| |
| | | | | | Market |
| | | | Maturity | | Value |
| | | Coupon | Date | Shares | ($000) |
| 10 | BPCE SA | 0.921% | 6/20/17 | 150,000 | 149,922 |
| 10 | Canadian Imperial Holdings Inc. | 0.911% | 6/29/17 | 100,000 | 99,919 |
| | Credit Agricole CIB (New York) | 0.921% | 6/2/17 | 50,000 | 49,997 |
| | Credit Agricole CIB (New York) | 0.910% | 6/20/17 | 50,000 | 49,974 |
| 10 | DNB Bank ASA | 0.921% | 6/21/17 | 150,000 | 149,916 |
| | Exxon Mobil Corp. | 0.831% | 6/2/17 | 114,000 | 113,994 |
| 10 | KFW | 0.921% | 6/22/17 | 100,000 | 99,942 |
| 10 | PepsiCo Inc. | 0.810% | 6/9/17 | 50,000 | 49,989 |
| 10 | PepsiCo Inc. | 0.810% | 6/16/17 | 130,000 | 129,944 |
| 10 | Societe Generale SA | 0.900% | 6/20/17 | 50,000 | 49,975 |
| 10 | Wal-Mart Stores, Inc. | 0.831% | 6/5/17 | 73,000 | 72,991 |
| 10 | Wal-Mart Stores, Inc. | 0.820% | 6/7/17 | 147,000 | 146,975 |
| |
| | | | | | 1,908,688 |
| |
| Total Temporary Cash Investments (Cost $3,841,158) | | | | 3,841,096 |
| Total Investments (100.1%) (Cost $76,316,861) | | | | 100,238,729 |
| Conventional Mortgage-Backed Securities – Sale Commitments (-0.2%) | | | |
| 3,4 Freddie Mac Gold Pool | 3.000% | 6/1/47 | (249,200) | (250,212) |
| |
| Total Conventional Mortgage-Backed Securities – Sale Commitments (Proceeds $247,448) | | | (250,212) |
| Other Assets and Liabilities—Net (0.1%) | | | | 83,087 |
| |
| Net Assets (100%) | | | | 100,071,604 |
^ Includes partial security positions on loan to broker-dealers. The total value of securities on loan is $557,568,000.
* Non-income-producing security.
1 Securities with a value of $4,729,000 have been segregated as collateral for open forward currency contracts.
2 Securities with a value of $2,272,000 have been segregated as collateral for certain open To Be Announced (TBA) transactions.
3 The issuer was placed under federal conservatorship in September 2008; since that time, its daily operations have been managed by the Federal
Housing Finance Agency and it receives capital from the U.S. Treasury, as needed to maintain a positive net worth, in exchange for senior
preferred stock.
4 The average or expected maturity is shorter than the final maturity shown because of the possibility of interim principal payments and
prepayments or the possibility of the issue being called.
5 Security exempt from registration under Rule 144A of the Securities Act of 1933. Such securities may be sold in transactions exempt from
registration, normally to qualified institutional buyers. At May 31, 2017, the aggregate value of these securities was $4,549,665,000,
representing 4.5% of net assets.
6 Face amount denominated in Japanese yen.
7 The issuer operates under a congressional charter; its securities are generally neither guaranteed by the U.S. Treasury nor backed by the full
faith and credit of the U.S. government.
8 Affiliated money market fund available only to Vanguard funds and certain trusts and accounts managed by Vanguard. Rate shown is the 7-day
yield.
9 Includes $583,515,000 of collateral received for securities on loan.
10 Security exempt from registration under Section 4(2) of the Securities Act of 1933. Such securities may be sold in transactions exempt from
registration only to dealers in that program or other "accredited investors." At May 31, 2017, the aggregate value of these securities was
$1,344,902,000, representing 1.3% of net assets.
ADR—American Depositary Receipt.
GO—General Obligation Bond.
19
© 2017 The Vanguard Group, Inc. All rights reserved.
Vanguard Marketing Corporation, Distributor.
SNA212 072017
Item 7: Disclosure of Proxy Voting Policies and Procedures for Closed-End Management
Investment Companies.
Not Applicable.
Item 8: Portfolio Managers of Closed-End Management Investment Companies.
Not Applicable.
Item 9: Purchase of Equity Securities by Closed-End Management Investment Company and
Affiliated Purchasers.
Not Applicable.
Item 10: Submission of Matters to a Vote of Security Holders.
Not Applicable.
Item 11: Controls and Procedures.
(a) Disclosure Controls and Procedures. The Principal Executive and Financial Officers concluded that the Registrant’s Disclosure Controls and Procedures are effective based on their evaluation of the Disclosure Controls and Procedures as of a date within 90 days of the filing date of this report.
(b) Internal Control Over Financial Reporting. There were no significant changes in Registrant’s Internal Control Over Financial Reporting or in other factors that could significantly affect this control subsequent to the date of the evaluation, including any corrective actions with regard to significant deficiencies and material weaknesses.
Item 12: Exhibits.
(a) Certifications.
Pursuant to the requirements of the Securities Exchange Act of 1934 and the Investment
Company Act of 1940, the registrant has duly caused this report to be signed on its behalf by
the undersigned, thereunto duly authorized.
| |
| | VANGUARD WELLINGTON FUND |
| |
| |
| BY: | /s/ F. WILLIAM MCNABB III* |
| | F. WILLIAM MCNABB III |
| | CHIEF EXECUTIVE OFFICER |
| |
| Date: July 18, 2017 |
Pursuant to the requirements of the Securities Exchange Act of 1934 and the Investment Company Act of 1940, this report has been signed below by the following persons on behalf of the registrant and in the capacities and on the dates indicated.
| |
| | VANGUARD WELLINGTON FUND |
|
| BY: | /s/ F. WILLIAM MCNABB III* |
| | F. WILLIAM MCNABB III |
| | CHIEF EXECUTIVE OFFICER |
Date: July 18, 2017 |
| VANGUARD WELLINGTON FUND |
|
| BY: | /s/ THOMAS J. HIGGINS* |
| THOMAS J. HIGGINS |
| | CHIEF FINANCIAL OFFICER |
Date: July 18, 2017 |
* By: /s/ Anne E. Robinson
Anne E. Robinson, pursuant to a Power of Attorney filed on October 4, 2016 see file Number
33-32548, Incorporated by Reference.