UNITED STATES
SECURITIES AND EXCHANGE COMMISSION
Washington, D.C. 20549
FORM N-CSR
CERTIFIED SHAREHOLDER REPORT
OF
REGISTERED MANAGEMENT INVESTMENT COMPANIES
| | |
| Investment Company Act file number: | 811-00121 |
Name of Registrant: | Vanguard Wellington Fund |
Address of Registrant: | P.O. Box 2600 |
| | Valley Forge, PA 19482 |
Name and address of agent for service: | Anne E. Robinson, Esquire |
| | P.O. Box 876 |
| | Valley Forge, PA 19482 |
Registrant’s telephone number, including area code: (610) 669-1000 |
Date of fiscal year end: November 30 |
Date of reporting period: December 1, 2017—May 31, 2018 |
Item 1: Reports to Shareholders |

Semiannual Report | May 31, 2018
Vanguard Wellington™ Fund
Vanguard’s Principles for Investing Success
We want to give you the best chance of investment success. These principles, grounded in Vanguard’s research and experience, can put you on the right path.
Goals. Create clear, appropriate investment goals.
Balance. Develop a suitable asset allocation using broadly diversified funds.
Cost. Minimize cost.
Discipline. Maintain perspective and long-term discipline.
A single theme unites these principles: Focus on the things you can control.
We believe there is no wiser course for any investor.
| |
| Contents | |
| Your Fund’s Performance at a Glance. | 1 |
| CEO’s Perspective. | 2 |
| Advisor’s Report. | 4 |
| Fund Profile. | 8 |
| Performance Summary. | 10 |
| Financial Statements. | 11 |
| About Your Fund’s Expenses. | 31 |
| Glossary. | 33 |
Please note: The opinions expressed in this report are just that—informed opinions. They should not be considered promises
or advice. Also, please keep in mind that the information and opinions cover the period through the date on the front of this
report. Of course, the risks of investing in your fund are spelled out in the prospectus.
See the Glossary for definitions of investment terms used in this report.
About the cover: Nautical images have been part of Vanguard’s rich heritage since its start in 1975. For an
incoming ship, a lighthouse offers a beacon and safe path to shore. You can similarly depend on Vanguard to put
you first––and light the way––as you strive to meet your financial goals. Our client focus and low costs,
stemming from our unique ownership structure, assure that your interests are paramount.
Your Fund’s Performance at a Glance
• For the six months ended May 31, 2018, Vanguard Wellington Fund returned about a quarter of a percentage point, lagging both the return of its benchmark and the average return of its peers.
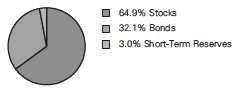
• The broadly diversified fund has about 65% of its assets invested in stocks and 35% in bonds.
• The fund’s stock portfolio returned 1.00%, lagging the 3.16% return of its benchmark, the Standard & Poor’s 500 Index. Consumer staples, materials, energy, industrial, and real estate stocks contributed positively to the portfolio’s performance relative to its benchmark. Financial, consumer discretionary, information technology, telecommunication services, and health care stocks detracted from relative performance.
• The fixed income portfolio returned –1.18%, finishing above the –1.62% return of its benchmark, the Bloomberg Barclays U.S. Credit A or Better Bond Index. The portfolio benefited on a relative basis from strong corporate bond selection, particularly within industrials, but was held back somewhat by its positioning in other credits.
| |
| Total Returns: Six Months Ended May 31, 2018 | |
| | Total |
| | Returns |
| Vanguard Wellington Fund | |
| Investor Shares | 0.22% |
| Admiral™ Shares | 0.26 |
| Wellington Composite Index | 1.53 |
| Mixed-Asset Target Allocation Growth Funds Average | 1.33 |
For a benchmark description, see the Glossary.
Mixed-Asset Target Allocation Growth Funds Average: Derived from data provided by Lipper, a Thomson Reuters Company.
Admiral Shares carry lower expenses and are available to investors who meet certain account-balance requirements.
| | | |
| Expense Ratios | | | |
| Your Fund Compared With Its Peer Group | | | |
| | Investor | Admiral | Peer Group |
| | Shares | Shares | Average |
| Wellington Fund | 0.25% | 0.17% | 0.84% |
The fund expense ratios shown are from the prospectus dated March 27, 2018, and represent estimated costs for the current fiscal year.
For the six months ended May 31, 2018, the fund’s annualized expense ratios were 0.25% for Investor Shares and 0.17% for Admiral
Shares. Peer-group expense ratios are derived from data provided by Lipper, a Thomson Reuters Company, and capture information
through year-end 2017.
Peer group: Mixed-Asset Target Allocation Growth Funds.
1
CEO’s Perspective

Tim Buckley
President and Chief Executive Officer
Dear Shareholder,
I feel extremely fortunate to have the chance to lead a company filled with people who come to work every day passionate about Vanguard’s core purpose: to take a stand for all investors, to treat them fairly, and to give them the best chance for investment success.
When I joined Vanguard in 1991, I found a mission-driven team focused on improving lives—helping people retire more comfortably, put their children through college, and achieve financial security. I also found a company with purpose in an industry ripe for improvement.
It was clear, even early in my career, that the cards were stacked against most investors. Hidden fees, performance-chasing, and poor advice were relentlessly eroding investors’ dreams.
We knew Vanguard could be different and, as a result, could make a real difference. We have lowered the costs of investing for our shareholders significantly. And we’re proud of the performance of our funds.
Vanguard is built for Vanguard investors—we focus solely on you, our fund shareholders. Everything we do is designed to give our clients the best chance for investment success. In my role as CEO, I’ll keep this priority
2
front and center. We’re proud of what we’ve achieved, but we’re even more excited about what’s to come.
Steady, time-tested guidance
Our guidance for investors, as always, is to stay the course, tune out the hyperbolic headlines, and focus on your goals and what you can control, such as costs and how much you save. This time-tested advice has served our clients well over the decades.
Regardless of how the markets perform in the short term, I’m incredibly optimistic about the future for our investors. We have a dedicated team serving you, and we will never stop striving to make
Vanguard the best place for you to invest through our high-quality funds and services, advice and guidance to help you meet your financial goals, and an experience that makes you feel good about entrusting us with your hard-earned savings.
Thank you for your continued loyalty.
Sincerely,

Mortimer J. Buckley
President and Chief Executive Officer
June 12, 2018
| | | |
| Market Barometer | | | |
| | Total Returns |
| | Periods Ended May 31, 2018 |
| | Six | One | Five Years |
| | Months | Year | (Annualized) |
| Stocks | | | |
| Russell 1000 Index (Large-caps) | 3.33% | 14.60% | 12.91% |
| Russell 2000 Index (Small-caps) | 6.47 | 20.76 | 12.18 |
| Russell 3000 Index (Broad U.S. market) | 3.57 | 15.06 | 12.85 |
| FTSE All-World ex US Index (International) | 0.36 | 9.62 | 5.84 |
| |
| Bonds | | | |
| Bloomberg Barclays U.S. Aggregate Bond Index | | | |
| (Broad taxable market) | -1.04% | -0.37% | 1.98% |
| Bloomberg Barclays Municipal Bond Index | | | |
| (Broad tax-exempt market) | 0.71 | 1.11 | 2.92 |
| Citigroup Three-Month U.S. Treasury Bill Index | 0.73 | 1.24 | 0.35 |
| |
| CPI | | | |
| Consumer Price Index | 1.99% | 2.80% | 1.55% |
3
Advisor’s Report
Vanguard Wellington Fund’s Investor Shares returned 0.22% for the six months ended May 31, 2018. The fund trailed the 1.33% average return of its peers. It also trailed the 1.53% return of its benchmark, the Wellington Composite Index, which is weighted 65% large-capitalization stocks (as measured by the Standard & Poor’s 500 Index) and 35% high-quality corporate bonds (as measured by the Bloomberg Barclays U.S. Credit A or Better Bond Index). The equity portfolio underperformed its benchmark, while the fixed income portfolio outperformed its benchmark.
Investment environment
Stock markets in the United States outperformed those abroad: The S&P 500 Index returned 3.16%, while the MSCI World Index returned 2.16% and the MSCI EAFE Index returned 0.03%.
The U.S. economy continues to present a promising picture that includes multiyear lows in unemployment and healthy housing market trends. But patches of market volatility arose during the period that were likely triggered by investors’ concern about lofty equity valuations and the potential upside risks to inflation, bond yields, and Federal Reserve policy. In the United States, large-capitalization growth stocks outperformed large-cap value stocks, as measured by the Russell 1000 Growth and Russell 1000 Value Indexes. The Fed, still following its policy of monetary tightening, raised interest rates again in March. (It did so again in June, after the close of the period under review.)
The broad fixed income markets fell during the period. The Bloomberg Barclays U.S. Aggregate Bond Index returned –1.04% for the six months. The higher-quality credit market performed worse: The Bloomberg Barclays U.S. Credit A or Better Bond Index returned –1.62%. The yield on the 10-year U.S. Treasury note rose, beginning the period at 2.41% and ending at 2.83%.
Our successes
In the stock portfolio, security selection in the consumer staples and materials sectors aided relative results. Within consumer staples, our avoidance of poorly performing benchmark constituents Procter & Gamble and Altria Group helped. In materials, our position in BHP Billiton and the elimination of our position in DowDuPont also boosted performance. In terms of sector allocation, our overweighting of energy and underweighting of real estate contributed to relative results.
Among individual stocks, our holdings in Intel, ConocoPhillips, and AstraZeneca were among the top relative contributors for the period.
Chipmaker Intel gained during the period after it seemed to resolve a security defect in its products that had come to light late in 2017. The design flaw, though broad in scope, appears to have been patched with no material impact on revenues. We remain enthusiastic about the growth prospects for Intel relative to its price and we continue to hold the stock.
4
In the fixed income portfolio, our overweighting of taxable municipals and security selection within investment-grade corporates, particularly among industrial issuers, contributed to relative performance. Security selection in the communications and consumer cyclical subsectors notably contributed. Our short duration/yield curve positioning was also a positive driver of performance. An out-of-benchmark allocation to Japanese treasury bills also aided relative performance.
Our shortfalls
In the stock portfolio, our selection was weakest in financials and consumer discretionary. Our underweighting of information technology—especially benchmark constituent Apple—detracted from relative results. Apple’s stock price benefited from strong results during the period. Although we owned Apple because of its attractive valuation, our concerns about projected sales for the iPhone X and increasing competition over the long term led us to remain underweighted in the stock. We have trimmed our position now that valuation is less attractive.
In financials, insurance was particularly weak as investors feared an increase in competition from Amazon.com’s potential entry into the industry. Also toward the end of the period, yields suffered globally from the political instability surrounding Italian elections and the formation of a new government coalition between the anti-establishment Five Star Movement and the far-right League. Despite short-term negative sentiment, we remain positive on financials as the sector remains one of the most attractive on a relative price/earnings basis.
In consumer discretionary, our lack of holdings in benchmark constituents Amazon and Netflix, as well as our position in Comcast, hurt performance most. Amazon outperformed based on strong results and what we view as potentially excessive optimism about the trajectory and predictability of future profitability. Netflix continues to benefit from global subscription growth, but we believe the valuation reflects lofty expectations about the company’s ability to maintain its growth rate. Both Amazon and Netflix are high in price/earnings and are non-yielders; we feel that they do not currently match our investment philosophy and objectives.
Cable provider Comcast lagged because of concerns about its proposed acquisition of Sky, the Europe-based satellite media provider. Other factors in Comcast’s underperformance were the competitive environment and potential degradation of profitability with the disruption of linear TV viewing and the attractiveness of bundled services. Despite concerns, we continue to hold the stock as we feel that Comcast offers strong fundamentals and attractive upside potential.
On the fixed income side, our underweighting of noncorporate credit, specifically supranationals, detracted from relative performance. Among the subsectors within investment-grade
5
corporates, our overweighting of communications and underweighting of technology also hurt relative performance.
The fund’s positioning
The greatest overweightings in our equity portfolio at the end of the period were in the financial, energy, and telecommunication services sectors. We continue to believe that many stocks in the financial and energy sectors offer among the most compelling combinations of fundamental strength and attractive valuation. We believe that financial stocks remain broadly undervalued, given modest price/book ratios. The low equity returns of recent years have pushed down valuations in this sector, but banks continue to work aggressively to improve returns.
Although oil prices have moved higher, we have not seen a commensurate recovery in share prices for energy equities. We attribute this lag to skepticism about supply discipline. Our energy positions are concentrated among companies we believe have exercised production discipline in the past and exhibit a combination of responsible balance sheet management and moderate valuations that we believe provide downside protection.
Our greatest underweightings were in the information technology, consumer discretionary, and consumer staples sectors—areas of the market in which we are challenged to find ideas that fit our investment style and valuation discipline. Where possible, we invest in companies that are capitalizing on disruptive
technologies or have declined excessively because of the perception of competitive challenges that the companies are able to overcome.
The market volatility we experienced over the period created several buying opportunities, which caused us to initiate more new positions and to exit more positions than we typically would. Over the six months, we added new positions in Simon Property Group, Halliburton, Sysco, TJX, AT&T, Home Depot, and Walmart. We eliminated positions in Johnson & Johnson, ExxonMobil, Goldman Sachs, Wells Fargo, and Walgreens Boots.
Looking ahead, we expect to see solid growth; wages are beginning to improve, interest rates are rising, and the consumer appears healthy.
We continue to rely on our process and philosophy as we construct the portfolio and adjust our positioning. We remain focused on the significance of dividends, positive capital stewardship, and franchise value. We believe we have a solid portfolio of undervalued market leaders, companies in industries with improving supply/demand trends, and strong companies that are temporarily out of favor.
On the fixed income side, we are a bit surprised by the stability of longer-term interest rates in the face of higher short-term rates, the Fed’s well-advertised plans to reduce its holdings of Treasuries and mortgage securities, and the prospects of
6
a debt-financed fiscal package intended to further stimulate growth. Offsetting these pressures, inflation remains persistently lower than most forecasts. We remain biased toward higher short-term interest rates, given the strengthening labor markets and early signs of rising wage pressures. We choose to limit our interest rate risk relative to the benchmark and to focus our higher-rate bias at the short end of the yield curve, where the Fed has the greatest influence on yields.
Credit remains the main investment focus of the portfolio and, while we are somewhat uneasy about investment-grade credit risk, we continue to find opportunities amid recent volatility and underperformance. U.S. investment-grade corporates have underperformed this year because of increased volatility, weaker overseas demand, and continued headline risk.
We have maintained our preference for adding risk in the financial and utilities sectors, which we view as attractively valued and likely to outperform when the cycle turns. Within the financial sector, we have traditionally favored the large-cap U.S. banks, given strong capitalization and exposure to tailwinds from robust housing markets and a stable consumer.
Despite the prolonged economic cycle and persistently good earnings from the corporate sector, we view the credit cycle as mature, with most of the narrowing of spreads (corporate compared with Treasury) behind us.
We continue to be disciplined in our application of our investment process, which allows us to create a balanced portfolio that we believe should perform well in a variety of environments. We remain focused on long-term, low-turnover investing—features that we believe have served the fund’s shareholders well over time.
Edward P. Bousa, CFA, Senior Managing
Director and Equity Portfolio Manager
John C. Keogh, Senior Managing Director
and Fixed Income Portfolio Manager
Loren L. Moran, CFA, Managing Director
and Fixed Income Portfolio Manager
Michael E. Stack, CFA, Senior Managing
Director and Fixed Income Portfolio
Manager
Wellington Management Company llp
June 15, 2018
7
Wellington Fund
Fund Profile
As of May 31, 2018
| | |
| Share-Class Characteristics | |
| | Investor | Admiral |
| | Shares | Shares |
| Ticker Symbol | VWELX | VWENX |
| Expense Ratio1 | 0.25% | 0.17% |
| 30-Day SEC Yield | 2.69% | 2.77% |
| | | |
| Equity and Portfolio Characteristics | |
| | | | DJ |
| | | | U.S. Total |
| | | S&P 500 | Market |
| | Fund | Index | FA Index |
| Number of Stocks | 101 | 505 | 3,742 |
| Median Market | | | |
| Cap | $93.9B | $101.8B | $65.1B |
| Price/Earnings | | | |
| Ratio | 16.2x | 21.0x | 20.8x |
| Price/Book Ratio | 2.3x | 3.2x | 2.1x |
| Return on Equity | 14.2% | 16.1% | 15.0% |
| Earnings Growth | | | |
| Rate | 6.4% | 7.5% | 7.9% |
| Dividend Yield | 2.6% | 1.9% | 1.8% |
| Foreign Holdings | 12.6% | 0.0% | 0.0% |
| Turnover Rate | | | |
| (Annualized) | 38% | — | — |
| Short-Term | | | |
| Reserves | 3.0% | — | — |
| | | |
| Fixed Income Characteristics | |
| |
| | | Bloomberg | Bloomberg |
| | | Barclays | Barclays |
| | | Credit A or | Aggregate |
| | | Better | Bond |
| | Fund | Index | Index |
| |
| Number of Bonds | 945 | 3,281 | 9,917 |
| |
| Yield to Maturity | | | |
| (before expenses) | 3.5% | 3.5% | 3.2% |
| |
| Average Coupon | 3.5% | 3.4% | 3.1% |
| |
| Average Duration | 6.5 years | 6.8 years | 6.0 years |
| |
| Average Effective | | | |
| Maturity | 9.3 years | 9.8 years | 8.4 years |
| | |
| Total Fund Volatility Measures | |
| | | DJ |
| | Wellington | U.S. Total |
| | Composite | Market |
| | Index | FA Index |
| R-Squared | 0.95 | 0.93 |
| Beta | 1.00 | 0.66 |
| These measures show the degree and timing of the fund’s |
| fluctuations compared with the indexes over 36 months. |
| | |
| Ten Largest Stocks (% of equity portfolio) | |
| Microsoft Corp. | Systems Software | 4.1% |
| JPMorgan Chase & Co. | Diversified Banks | 3.4 |
| Bank of America Corp. | Diversified Banks | 3.3 |
| Verizon Communications Telecommunication | |
| Inc. | Services | 3.0 |
| Alphabet Inc. | Internet Software & | |
| | Services | 2.8 |
| Chevron Corp. | Integrated Oil & Gas | 2.7 |
| Intel Corp. | Semiconductors | 2.7 |
| Comcast Corp. | Cable & Satellite | 2.0 |
| Chubb Ltd. | Property & Casualty | |
| | Insurance | 2.0 |
| Prudential Financial Inc. | Life & Health | |
| | Insurance | 1.9 |
| Top Ten | | 27.9% |
| Top Ten as % of Total Net Assets | 18.1% |
| The holdings listed exclude any temporary cash investments and equity index products. |
Fund Asset Allocation
1 The expense ratios shown are from the prospectus dated March 27, 2018, and represent estimated costs for the current fiscal year. For
the six months ended May 31, 2018, the annualized expense ratios were 0.25% for Investor Shares and 0.17% for Admiral Shares.
8
Wellington Fund
| | | |
| Sector Diversification (% of equity exposure) |
| | | | DJ |
| | | | U.S. Total |
| | | S&P 500 | Market |
| | Fund | Index | FA Index |
| Consumer | | | |
| Discretionary | 6.3% | 12.9% | 13.1% |
| Consumer Staples | 5.9 | 6.7 | 6.0 |
| Energy | 9.3 | 6.3 | 6.0 |
| Financials | 23.2 | 14.2 | 14.6 |
| Health Care | 14.2 | 13.9 | 13.5 |
| Industrials | 10.7 | 9.9 | 10.6 |
| Information | | | |
| Technology | 17.3 | 26.0 | 24.8 |
| Materials | 3.4 | 2.8 | 3.3 |
| Real Estate | 2.0 | 2.7 | 3.7 |
| Telecommunication | | | |
| Services | 3.4 | 1.8 | 1.6 |
| Utilities | 4.3 | 2.8 | 2.8 |
Sector categories are based on the Global Industry Classification
Standard (“GICS”), except for the “Other” category (if applicable),
which includes securities that have not been provided a GICS
classification as of the effective reporting period.
| |
| Sector Diversification (% of fixed income | |
| portfolio) | |
| Asset-Backed | 5.3% |
| Commercial Mortgage-Backed | 0.4 |
| Finance | 25.5 |
| Foreign | 5.8 |
| Government Mortgage-Backed | 2.0 |
| Industrial | 30.9 |
| Treasury/Agency | 17.3 |
| Utilities | 7.3 |
| Other | 5.5 |
The agency and mortgage-backed securities sectors may include
issues from government-sponsored enterprises; such issues are
generally not backed by the full faith and credit of the U.S.
government.
| |
| Distribution by Credit Quality (% of fixed | |
| income portfolio) | |
| U.S. Government | 19.9% |
| Aaa | 6.0 |
| Aa | 13.2 |
| A | 44.0 |
| Baa | 16.8 |
| Ba | 0.1 |
Credit-quality ratings are obtained from Barclays and are from
Moody's, Fitch, and S&P. When ratings from all three agencies are
used, the median rating is shown. When ratings from two of the
agencies are used, the lower rating for each issue is shown. "Not
Rated" is used to classify securities for which a rating is not
available. Not rated securities include a fund's investment in
Vanguard Market Liquidity Fund or Vanguard Municipal Cash
Management Fund, each of which invests in high-quality money
market instruments and may serve as a cash management vehicle
for the Vanguard funds, trusts, and accounts. For more information
about these ratings, see the Glossary entry for Credit Quality.
Equity Investment Focus

Fixed Income Investment Focus

9
Wellington Fund
Performance Summary
All of the returns in this report represent past performance, which is not a guarantee of future results that may be achieved by the fund. (Current performance may be lower or higher than the performance data cited. For performance data current to the most recent month-end, visit our website at vanguard.com/performance.) Note, too, that both investment returns and principal value can fluctuate widely, so an investor’s shares, when sold, could be worth more or less than their original cost. The returns shown do not reflect taxes that a shareholder would pay on fund distributions or on the sale of fund shares.
Fiscal-Year Total Returns (%): November 30, 2007, Through May 31, 2018

For a benchmark description, see the Glossary.
Note: For 2018, performance data reflect the six months ended May 31, 2018.
Average Annual Total Returns: Periods Ended March 31, 2018
This table presents returns through the latest calendar quarter—rather than through the end of the fiscal period.
Securities and Exchange Commission rules require that we provide this information.
| | | | | | |
| | | | | Ten Years |
| | Inception Date | One Year | Five Years | Income | Capital | Total |
| Investor Shares | 7/1/1929 | 8.82% | 8.94% | 3.01% | 4.72% | 7.73% |
| Admiral Shares | 5/14/2001 | 8.90 | 9.03 | 3.10 | 4.72 | 7.82 |
See Financial Highlights for dividend and capital gains information.
10
Wellington Fund
Financial Statements (unaudited)
Statement of Net Assets—Investments Summary
As of May 31, 2018
This Statement summarizes the fund’s holdings by asset type. Details are reported for each of the fund’s 50 largest individual holdings and for investments that, in total for any issuer, represent more than 1% of the fund’s net assets. The total value of smaller holdings is reported as a single amount within each category.
The fund reports a complete list of its holdings in regulatory filings four times in each fiscal year, at the quarter-ends. For the second and fourth fiscal quarters, the complete listing of the fund’s holdings is available electronically on vanguard.com and on the Securities and Exchange Commission’s website (sec.gov), or you can have it mailed to you without charge by calling 800-662-7447. For the first and third fiscal quarters, the fund files the lists with the SEC on Form N-Q. Shareholders can look up the fund’s Forms N-Q on the SEC’s website. Forms N-Q may also be reviewed and copied at the SEC’s Public Reference Room (see the back cover of this report for further information).
| | | |
| | | Market | Percentage |
| | | Value• | of Net |
| | Shares | ($000) | Assets |
| Common Stocks | | | |
| Consumer Discretionary | | | |
| Comcast Corp. Class A | 43,726,638 | 1,363,396 | 1.3% |
| Consumer Discretionary—Other † | | 2,912,795 | 2.8% |
| | | 4,276,191 | 4.1% |
| Consumer Staples | | | |
| PepsiCo Inc. | 8,367,417 | 838,834 | 0.8% |
| Unilever NV | 13,628,051 | 760,025 | 0.7% |
| Consumer Staples—Other † | | 2,382,329 | 2.3% |
| | | 3,981,188 | 3.8% |
| Energy | | | |
| Chevron Corp. | 14,882,886 | 1,849,943 | 1.8% |
| TOTAL SA | 18,407,775 | 1,119,087 | 1.1% |
| ConocoPhillips | 13,132,802 | 885,020 | 0.9% |
| Suncor Energy Inc. | 19,600,424 | 780,631 | 0.8% |
| BP plc | 73,432,456 | 561,632 | 0.5% |
| Energy—Other † | | 1,085,301 | 1.0% |
| | | 6,281,614 | 6.1% |
| Financials | | | |
| JPMorgan Chase & Co. | 21,337,032 | 2,283,276 | 2.2% |
| Bank of America Corp. | 75,654,951 | 2,197,020 | 2.1% |
| Chubb Ltd. | 10,329,478 | 1,349,960 | 1.3% |
| Prudential Financial Inc. | 13,231,263 | 1,281,316 | 1.2% |
| PNC Financial Services Group Inc. | 8,525,423 | 1,222,631 | 1.2% |
| Northern Trust Corp. | 7,535,860 | 772,576 | 0.7% |
| Intercontinental Exchange Inc. | 10,107,857 | 716,546 | 0.7% |
| American International Group Inc. | 12,927,605 | 682,448 | 0.7% |
| BlackRock Inc. | 1,245,095 | 665,167 | 0.6% |
| Citigroup Inc. | 9,605,252 | 640,574 | 0.6% |
11
Wellington Fund
| | | | |
| | | | Market | Percentage |
| | | | Value• | of Net |
| | | Shares | ($000) | Assets |
| Mitsubishi UFJ Financial Group Inc. | | 4,103,100 | 567,274 | 0.6% |
| Financials—Other † | | | 3,279,995 | 3.2% |
| | | | 15,658,783 | 15.1% |
| Health Care | | | | |
| Bristol-Myers Squibb Co. | | 24,029,236 | 1,264,418 | 1.2% |
| ^ AstraZeneca plc ADR | | 34,070,454 | 1,261,629 | 1.2% |
| Medtronic plc | | 11,797,542 | 1,018,364 | 1.0% |
| Pfizer Inc. | | 25,881,943 | 929,938 | 0.9% |
| Merck & Co. Inc. | | 15,460,795 | 920,381 | 0.9% |
| UnitedHealth Group Inc. | | 3,800,444 | 917,845 | 0.9% |
| CVS Health Corp. | | 10,493,933 | 665,210 | 0.6% |
| Eli Lilly & Co. | | 7,668,951 | 652,168 | 0.6% |
| Novartis AG | | 8,424,043 | 626,267 | 0.6% |
| Health Care—Other † | | | 1,312,357 | 1.3% |
| | | | 9,568,577 | 9.2% |
| Industrials | | | | |
| United Parcel Service Inc. Class B | | 9,517,164 | 1,105,133 | 1.1% |
| Union Pacific Corp. | | 4,814,825 | 687,364 | 0.7% |
| Schneider Electric SE | | 7,191,204 | 621,647 | 0.6% |
| Caterpillar Inc. | | 3,990,176 | 606,148 | 0.6% |
| Industrials—Other † | | | 4,172,157 | 4.0% |
| | | | 7,192,449 | 7.0% |
| Information Technology | | | | |
| Microsoft Corp. | | 27,863,831 | 2,754,061 | 2.7% |
| * Alphabet Inc. Class A | | 1,691,379 | 1,860,517 | 1.8% |
| Intel Corp. | | 32,811,103 | 1,811,173 | 1.7% |
| Cisco Systems Inc. | | 21,652,645 | 924,785 | 0.9% |
| Apple Inc. | | 4,862,457 | 908,647 | 0.9% |
| Texas Instruments Inc. | | 5,164,261 | 577,932 | 0.6% |
| HP Inc. | | 26,164,428 | 576,402 | 0.6% |
| * eBay Inc. | | 15,224,646 | 574,274 | 0.5% |
| Information Technology—Other † | | | 1,675,321 | 1.6% |
| | | | 11,663,112 | 11.3% |
| Materials | | | | |
| BHP Billiton plc | | 28,585,282 | 657,263 | 0.6% |
| International Paper Co. | | 11,362,866 | 607,913 | 0.6% |
| Materials—Other † | | | 1,013,476 | 1.0% |
| | | | 2,278,652 | 2.2% |
| Real Estate | | | | |
| American Tower Corp. | | 5,324,704 | 736,779 | 0.7% |
| Simon Property Group Inc. | | 3,881,024 | 621,818 | 0.6% |
| | | | 1,358,597 | 1.3% |
| Telecommunication Services | | | | |
| Verizon Communications Inc. | | 42,550,768 | 2,028,395 | 2.0% |
| Telecommunication Services—Other † | | | 298,834 | 0.3% |
| | | | 2,327,229 | 2.3% |
| Utilities | | | | |
| NextEra Energy Inc. | | 7,037,666 | 1,166,915 | 1.1% |
| Dominion Energy Inc. | | 12,426,114 | 797,632 | 0.8% |
| Exelon Corp. | | 15,800,310 | 653,975 | 0.6% |
| Utilities—Other † | | | 266,135 | 0.3% |
| | | | 2,884,657 | 2.8% |
| Total Common Stocks (Cost $44,871,487) | | | 67,471,049 | 65.2% |
| 12 |
Wellington Fund
| | | | | | |
| | | | | Face | Market | Percentage |
| | | | Maturity | Amount | Value • | of Net |
| | | Coupon | Date | ($000) | ($000) | Assets |
| U. S. Government and Agency Obligations | | | | |
| U. S. Government Securities | | | | |
| | United States Treasury | | | | | |
| | Note/Bond | 2.250% | 2/29/20 | 1,496,000 | 1,492,021 | 1.4% |
| 1 | United States Treasury | | | | | |
| | Note/Bond | 1.250%–3.375% | 9/30/19–5/15/48 | 4,232,382 | 4,112,417 | 4.0% |
| | U.S. Government Securities—Other † | | | 155,477 | 0.2% |
| | | | | | 5,759,915 | 5.6% |
| |
| Conventional Mortgage-Backed Securities † | | | 678,044 | 0.6% |
| |
| Nonconventional Mortgage-Backed Securities † | | 144,972 | 0.1% |
| Total U.S. Government and Agency Obligations (Cost $6,614,088) | | 6,582,931 | 6.3% |
| 2Asset-Backed/Commercial Mortgage-Backed Securities (Cost $1,890,784) † | 1,884,003 | 1.8% |
| Corporate Bonds | | | | | |
| Finance | | | | | |
| | Banking | | | | | |
| 3 | Bank of America Corp. | 2.816%–5.875% | 1/11/23–1/21/44 | 272,619 | 271,714 | 0.3% |
| | Citibank NA | 3.050% | 5/1/20 | 67,400 | 67,418 | 0.1% |
| 3 | Citigroup Inc. | 2.400%–8.125% | 9/26/18–5/18/46 | 398,473 | 400,721 | 0.4% |
| 3 | JPMorgan Chase & Co. | 3.250%– 6.300% | 4/23/19–11/15/48 | 598,621 | 610,087 | 0.6% |
| | National City Corp. | 6.875% | 5/15/19 | 13,950 | 14,475 | 0.0% |
| | PNC Bank NA | 3.100%–4.200% | 10/30/24–1/22/28 | 137,285 | 132,426 | 0.1% |
| | PNC Financial Services | | | | | |
| | Group Inc. | 3.900% | 4/29/24 | 41,565 | 41,612 | 0.0% |
| 2 | Banking—Other † | | | | 5,424,946 | 5.2% |
| | Brokerage † | | | | 30,987 | 0.0% |
| | Finance Companies † | | | | 161,009 | 0.2% |
| | Insurance | | | | | |
| | ACE Capital Trust II | 9.700% | 4/1/30 | 20,000 | 28,600 | 0.0% |
| | Chubb Corp. | 6.000% | 5/11/37 | 50,000 | 61,820 | 0.1% |
| | Chubb INA Holdings Inc. 2.300%–4.350% | 11/3/20–11/3/45 | 58,510 | 59,002 | 0.1% |
| 2 | Five Corners | | | | | |
| | Funding Trust | 4.419% | 11/15/23 | 5,935 | 6,120 | 0.0% |
| | Prudential Financial Inc. | 2.300%–4.500% | 8/15/18–11/15/20 | 48,910 | 49,776 | 0.0% |
| | UnitedHealth Group Inc. | 2.875%–4.750% | 10/15/20–1/15/47 | 194,731 | 198,284 | 0.2% |
| 2 | Insurance—Other † | | | | 816,962 | 0.8% |
| 2 | Other Finance † | | | | 24,632 | 0.0% |
| 2 | Real Estate Investment Trusts † | | | 96,920 | 0.1% |
| | | | | | 8,497,511 | 8.2% |
| Industrial | | | | | |
| | Basic Industry † | | | | 26,498 | 0.0% |
| 2 | Capital Goods † | | | | 728,835 | 0.7% |
| | Communication | | | | | |
| | Comcast Corp. | 2.350%– 6.500% | 2/1/24–11/1/52 | 405,126 | 390,233 | 0.4% |
| 2 | NBCUniversal Enterprise | | | | | |
| | Inc. | 1.974% | 4/15/19 | 100,115 | 99,406 | 0.1% |
| | NBCUniversal Media LLC 2.875%–4.450% | 4/1/21–1/15/43 | 44,030 | 44,043 | 0.0% |
| | Verizon Communications | | | | | |
| | Inc. | 3.500%–5.012% | 11/1/21–4/15/49 | 161,209 | 156,914 | 0.2% |
| 2 | Communication—Other † | | | | 717,438 | 0.7% |
| 2 | Consumer Cyclical † | | | | 1,086,468 | 1.1% |
| |
| |
| 13 |
Wellington Fund
| | | | | | |
| | | | | Face | Market | Percentage |
| | | | Maturity | Amount | Value • | of Net |
| | | Coupon | Date | ($000) | ($000) | Assets |
| | Consumer Noncyclical | | | | | |
| | AstraZeneca plc | 1.950%– 6.450% | 9/18/19–9/15/37 | 79,930 | 85,284 | 0.1% |
| | Medtronic Inc. | 2.500%–4.375% | 3/15/20–3/15/35 | 202,744 | 202,723 | 0.2% |
| | Merck & Co. Inc. | 2.350%–4.150% | 2/10/22–5/18/43 | 154,715 | 151,701 | 0.1% |
| | Zeneca Wilmington Inc. | 7.000% | 11/15/23 | 29,000 | 33,994 | 0.0% |
| 2 | Consumer Noncyclical—Other † | | | 3,052,409 | 3.0% |
| | Energy | | | | | |
| | Chevron Corp. | 3.191% | 6/24/23 | 49,470 | 49,107 | 0.1% |
| | Total Capital International | | | | | |
| | SA | 2.700%–3.750% | 1/25/23–4/10/24 | 78,010 | 77,631 | 0.1% |
| | Total Capital SA | 2.125% | 8/10/18 | 42,000 | 41,983 | 0.0% |
| 2 | Energy—Other † | | | | 1,153,001 | 1.1% |
| 2 | Other Industrial † | | | | 26,933 | 0.0% |
| | Technology | | | | | |
| | Apple Inc. | 2.450%–4.450% | 5/6/21–8/4/46 | 463,497 | 450,546 | 0.4% |
| | Intel Corp. | 2.875%–4.100% | 5/11/24–5/19/46 | 81,000 | 80,830 | 0.1% |
| | Microsoft Corp. | 2.375%–4.450% | 2/12/22–2/6/47 | 498,005 | 496,068 | 0.5% |
| 2 | Technology—Other † | | | | 668,121 | 0.6% |
| | Transportation | | | | | |
| | United Parcel Service Inc. | 2.450%–4.875% | 10/1/22–11/15/40 | 22,875 | 22,846 | 0.0% |
| 2 | Transportation—Other † | | | | 363,033 | 0.4% |
| | | | | | 10,206,045 | 9.9% |
| Utilities | | | | | |
| | Electric | | | | | |
| | Florida Power & Light Co. | 3.700%–5.950% | 2/1/35–12/1/47 | 125,585 | 148,309 | 0.2% |
| | NextEra Energy | | | | | |
| | Capital Holdings Inc. | 3.550% | 5/1/27 | 32,275 | 30,930 | 0.0% |
| 2 | Electric—Other † | | | | 1,996,519 | 1.9% |
| 2 | Natural Gas † | | | | 223,509 | 0.2% |
| 2 | Other Utility † | | | | 23,906 | 0.0% |
| | | | | | 2,423,173 | 2.3% |
| Total Corporate Bonds (Cost $21,005,031) | | | 21,126,729 | 20.4% |
| 2Sovereign Bonds (Cost $ 1,949,501) † | | | 1,930,922 | 1.9% |
| Taxable Municipal Bonds (Cost $ 1,601,109) † | | | 1,828,746 | 1.8% |
| |
| | | | | Shares | | |
| Temporary Cash Investments | | | | |
| Money Market Fund | | | | | |
| 4,5 | Vanguard Market Liquidity Fund 1.961% | | 3,685 | 368,537 | 0.3% |
14
Wellington Fund
| | | | | | |
| | | | | Face | Market | Percentage |
| | | | Maturity | Amount | Value • | of Net |
| | Coupon | | Date | ($000) | ($000) | Assets |
| Repurchase Agreements | | | | | | |
| Bank of America Securities, | | | | | | |
| LLC (Dated 5/31/18, Repurchase | | | | | | |
| Value $18,301,000, collateralized | | | | | | |
| by Federal Home Loan Mortgage | | | | | | |
| Corp. 2.349%– 6.000%, | | | | | | |
| 11/1/22–12/1/47, Federal Farm | | | | | | |
| Credit Bank 3.140%, 4/18/36 | | | | | | |
| with a value of $18,667,000) | 1.790% | | 6/1/18 | 18,300 | 18,300 | 0.0% |
| Citigroup Global Markets Inc. | | | | | | |
| (Dated 5/31/18, Repurchase | | | | | | |
| Value $292,214,000, collateralized | | | | | | |
| by U. S. Treasury Note/Bond | | | | | | |
| 2.000%–3.750%, 5/31/24–8/15/41, | | | | | |
| with a value of $298,044,000) | 1.770% | | 6/1/18 | 292,200 | 292,200 | 0.3% |
| Deutsche Bank Securities, Inc. | | | | | | |
| (Dated 5/31/18, Repurchase Value | | | | | | |
| $18,101,000, collateralized by | | | | | | |
| U.S. Treasury Note/Bond | | | | | | |
| 2.000%–3.750%, | | | | | | |
| 11/15/26–11/15/43, with a | | | | | | |
| value of $18,462,000) | 1.790% | | 6/1/18 | 18,100 | 18,100 | 0.0% |
| HSBC Bank USA (Dated 5/31/18, | | | | | | |
| Repurchase Value $112,106,000, | | | | | | |
| collateralized by U. S Treasury | | | | | | |
| Note/Bond 1.250%, | | | | | | |
| 3/31/19–3/31/21, | | | | | | |
| with a value of $114,344,000) | 1.780% | | 6/1/18 | 112,100 | 112,100 | 0.1% |
| HSBC Bank USA (Dated 5/31/18, | | | | | | |
| Repurchase Value $59,903,000, | | | | | | |
| collateralized by Federal National | | | | | | |
| Mortgage Assn. 3.500%, 1/1/47, | | | | | | |
| with a value of $61,103,000) | 1.790% | | 6/1/18 | 59,900 | 59,900 | 0.1% |
| RBC Capital Markets LLC | | | | | | |
| (Dated 5/31/18, Repurchase | | | | | | |
| Value $223,111,000, collateralized | | | | | | |
| by Federal National | | | | | | |
| Mortgage Assn. 2.183%–6.000%, | | | | | | |
| 4/1/19–5/1/48, Federal Home Loan | | | | | | |
| Mortgage Corp. 3.000%–4.000%, | | | | | | |
| 4/1/38–5/1/48, with a value of | | | | | | |
| $227,562,000) | 1.780% | | 6/1/18 | 223,100 | 223,100 | 0.2% |
| TD Securities (USA) LLC | | | | | | |
| (Dated 5/31/18, Repurchase | | | | | | |
| Value $243,912,000, collateralized | | | | | | |
| by Federal National | | | | | | |
| Mortgage Assn. 3.500%–4.000%, | | | | | | |
| 5/1/47–9/1/47, Federal Home | | | | | | |
| Loan Mortgage Corp. 4.000%, | | | | | | |
| 11/1/47, with a value of | | | | | | |
| $248,778,000) | 1.780% | | 6/1/18 | 243,900 | 243,900 | 0.2% |
| |
| |
| |
| |
| 15 |
Wellington Fund
| | | | | |
| | | | Face | Market | Percentage |
| | | Maturity | Amount | Value • | of Net |
| | Coupon | Date | ($000) | ($000) | Assets |
| Wells Fargo & Co. (Dated 5/31/18, | | | | | |
| Repurchase Value $475,024,000, | | | | | |
| collateralized by Federal National | | | | | |
| Mortgage Assn. 2.000%– 6.500%, | | | | |
| 11/1/19– 6/1/48, Federal Home | | | | | |
| Loan Mortgage Corp. | | | | | |
| 3.000%–5.000%, 7/1/23–5/1/48, | | | | | |
| with a value of $484,500,000) | 1.790% | 6/1/18 | 475,000 | 475,000 | 0.5% |
| | | | | 1,442,600 | 1.4% |
| |
| Commercial Paper | | | | | |
| 6 Chevron Corp. | 1.793% | | 100,000 | 99,881 | 0.1% |
| 6 Commercial Paper—Other † | | | | 1,550,883 | 1.5% |
| | | | | 1,650,764 | 1.6% |
| Total Temporary Cash Investments (Cost $3,461,664) | | | 3,461,901 | 3.3% |
| Total Investments (Cost $81,393,664) | | | 104,286,281 | 100.7% |
| | |
| | Amount | |
| | ($000) | |
| Other Assets and Liabilities | | |
| Other Assets | | |
| Investment in Vanguard | 5,580 | |
| Receivables for Investment Securities Sold | 373,585 | |
| Receivables for Accrued Income | 494,923 | |
| Receivables for Capital Shares Issued | 20,712 | |
| Variation Margin Receivable—Futures Contracts | 85 | |
| Unrealized Appreciation—Forward Currency Contracts | 1,717 | |
| Other Assets7 | 34,058 | |
| Total Other Assets | 930,660 | 0.9% |
| Liabilities | | |
| Payables for Investment Securities Purchased | (1,136,067) | |
| Payables to Investment Advisor | (17,951) | |
| Collateral for Securities on Loan | (368,467) | |
| Payables for Capital Shares Redeemed | (31,266) | |
| Payables to Vanguard | (108,423) | |
| Variation Margin Payable—Futures Contracts | (1,907) | |
| Unrealized Depreciation—Forward Currency Contracts | (302) | |
| Total Liabilities | (1,664,383) | (1.6%) |
| Net Assets | 103,552,558 | 100.0% |
16
Wellington Fund
| |
| At May 31, 2018, net assets consisted of: | |
| | Amount |
| | ($000) |
| Paid-in Capital | 76,403,733 |
| Undistributed Net Investment Income | 596,973 |
| Accumulated Net Realized Gains | 3,669,646 |
| Unrealized Appreciation (Depreciation) | |
| Investment Securities | 22,892,617 |
| Futures Contracts | (10,893) |
| Forward Currency Contracts | 1,415 |
| Foreign Currencies | (933) |
| Net Assets | 103,552,558 |
| |
| |
| Investor Shares—Net Assets | |
| Applicable to 423,158,645 outstanding $.001 par value shares of | |
| beneficial interest (unlimited authorization) | 17,504,836 |
| Net Asset Value Per Share—Investor Shares | $41.37 |
| |
| |
| Admiral Shares—Net Assets | |
| Applicable to 1,204,386,690 outstanding $.001 par value shares of | |
| beneficial interest (unlimited authorization) | 86,047,722 |
| Net Asset Value Per Share—Admiral Shares | $71.45 |
• See Note A in Notes to Financial Statements.
^ Includes partial security positions on loan to broker-dealers. The total value of securities on loan is $341,135,000.
* Non-income-producing security.
† Represents the aggregate value, by category, of securities that are not among the 50 largest holdings and, in total for any issuer,
represent 1% or less of net assets.
1 Securities with a value of $443,000 have been segregated as collateral for open forward currency contracts.
2 Certain of the fund’s securities are exempt from registration under Rule 144A of the Securities Act of 1933. Such securities may be
sold in transactions exempt from registration, normally to qualified institutional buyers. At May 31, 2018, the aggregate value of
these securities was $5,440,935,000, representing 5.3% of net assets.
3 The average or expected maturity is shorter than the final maturity shown because of the possibility of interim principal payments
and prepayments or the possibility of the issue being called.
4 Includes $368,467,000 of collateral received for securities on loan.
5 Affiliated money market fund available only to Vanguard funds and certain trusts and accounts managed by Vanguard. Rate shown
is the 7-day yield.
6 Security exempt from registration under Section 4(2) of the Securities Act of 1933. Such securities may be sold in transactions
exempt from registration only to dealers in that program or other “accredited investors.” At May 31, 2018, the value of these
securities was $1,475,953,000, representing 1.4% of net assets.
7 Cash of $6,821,000 has been segregated as initial margin for open futures contracts.
ADR—American Depositary Receipt.
17
Wellington Fund
| | | | |
| Derivative Financial Instruments Outstanding as of Period End | | |
| Futures Contracts | | | | |
| | | | | ($000) |
| | | | | Value and |
| | | Number of | | Unrealized |
| | | Long (Short) | Notional | Appreciation |
| | Expiration | Contracts | Amount | (Depreciation) |
| Long Futures Contracts | | | | |
| 5-Year U.S. Treasury Note | September 2018 | 925 | 105,349 | 475 |
| |
| Short Futures Contracts | | | | |
| 2-Year U.S. Treasury Note | September 2018 | (2,247) | (476,891) | (1,196) |
| Ultra Long U.S. Treasury Bond | September 2018 | (2,109) | (336,386) | (8,441) |
| 10-Year U.S. Treasury Note | September 2018 | (1,373) | (165,361) | (1,731) |
| | | | | (11,368) |
| | | | | (10,893) |
Unrealized appreciation (depreciation) on open futures contracts is required to be treated as realized gain (loss) for tax purposes.
| | | | | | |
| Forward Currency Contracts | | | | | | |
| | | | | | | Unrealized |
| | Contract | | | | | Appreciation |
| | Settlement | Contract Amount (000) | (Depreciation) |
| Counterparty | Date | | Receive | | Deliver | ($000) |
| Barclays Bank plc | 7/30/18 | USD | 83,747 | JPY | 9,104,000 | (302) |
| J.P. Morgan Securities LLC | 7/17/18 | USD | 84,349 | JPY | 9,000,000 | 1,335 |
| UBS AG | 7/23/18 | USD | 83,430 | JPY | 9,000,000 | 382 |
| | | | | | | 1,415 |
| JPY—Japanese yen. |
| USD—U.S. dollar. |
Unrealized appreciation (depreciation) on open forward currency contracts is treated as realized gain (loss) for tax purposes.
At May 31, 2018, the counterparties had deposited in segregated accounts securities with a value of $3,200,000 in connection with open forward currency contracts.
See accompanying Notes, which are an integral part of the Financial Statements.
18
Wellington Fund
Statement of Operations
| |
| | Six Months Ended |
| | May 31, 2018 |
| | ($000) |
| Investment Income | |
| Income | |
| Dividends1 | 956,571 |
| Interest 2 | 565,726 |
| Securities Lending—Net | 3,393 |
| Total Income | 1,525,690 |
| Expenses | |
| Investment Advisory Fees—Note B | |
| Basic Fee | 40,442 |
| Performance Adjustment | (3,208) |
| The Vanguard Group—Note C | |
| Management and Administrative—Investor Shares | 14,676 |
| Management and Administrative—Admiral Shares | 40,873 |
| Marketing and Distribution—Investor Shares | 1,319 |
| Marketing and Distribution—Admiral Shares | 2,001 |
| Custodian Fees | 286 |
| Shareholders’ Reports and Proxy—Investor Shares | 141 |
| Shareholders’ Reports and Proxy—Admiral Shares | 181 |
| Trustees’ Fees and Expenses | 76 |
| Total Expenses | 96,787 |
| Net Investment Income | 1,428,903 |
| Realized Net Gain (Loss) | |
| Investment Securities Sold 2 | 3,733,585 |
| Futures Contracts | 50,978 |
| Forward Currency Contracts | (24,551) |
| Foreign Currencies | 3,848 |
| Realized Net Gain (Loss) | 3,763,860 |
| Change in Unrealized Appreciation (Depreciation) | |
| Investment Securities 2 | (4,895,540) |
| Futures Contracts | (16,918) |
| Forward Currency Contracts | (1,748) |
| Foreign Currencies | (2,067) |
| Change in Unrealized Appreciation (Depreciation) | (4,916,273) |
| Net Increase (Decrease) in Net Assets Resulting from Operations | 276,490 |
1 Dividends are net of foreign withholding taxes of $26,434,000.
2 Interest income, realized net gain (loss), and change in unrealized appreciation (depreciation) from an affiliated company of the fund
were $0, ($48,000), and $39,000, respectively. Purchases and sales are for temporary cash investment purposes.
See accompanying Notes, which are an integral part of the Financial Statements.
19
Wellington Fund
Statement of Changes in Net Assets
| | |
| | Six Months Ended | Year Ended |
| | May 31, | November 30, |
| | 2018 | 2017 |
| | ($000) | ($000) |
| Increase (Decrease) in Net Assets | | |
| Operations | | |
| Net Investment Income | 1,428,903 | 2,558,234 |
| Realized Net Gain (Loss) | 3,763,860 | 4,352,244 |
| Change in Unrealized Appreciation (Depreciation) | (4,916,273) | 7,702,314 |
| Net Increase (Decrease) in Net Assets Resulting from Operations | 276,490 | 14,612,792 |
| Distributions | | |
| Net Investment Income | | |
| Investor Shares | (216,456) | (485,955) |
| Admiral Shares | (1,067,902) | (2,072,768) |
| Realized Capital Gain1 | | |
| Investor Shares | (714,085) | (354,943) |
| Admiral Shares | (3,377,383) | (1,391,895) |
| Total Distributions | (5,375,826) | (4,305,561) |
| Capital Share Transactions | | |
| Investor Shares | (32,333) | (2,487,650) |
| Admiral Shares | 3,126,363 | 4,774,832 |
| Net Increase (Decrease) from Capital Share Transactions | 3,094,030 | 2,287,182 |
| Total Increase (Decrease) | (2,005,306) | 12,594,413 |
| Net Assets | | |
| Beginning of Period | 105,557,864 | 92,963,451 |
| End of Period2 | 103,552,558 | 105,557,864 |
1 Includes fiscal 2018 and 2017 short-term gain distributions totaling $488,251,000 and $175,705,000, respectively. Short-term gain
distributions are treated as ordinary income dividends for tax purposes.
2 Net Assets—End of Period includes undistributed (overdistributed) net investment income of $596,973,000 and $421,452,000.
See accompanying Notes, which are an integral part of the Financial Statements.
20
Wellington Fund
Financial Highlights
| | | | | | |
| Investor Shares | | | | | | |
| Six Months | | | | | |
| | Ended | | | | | |
| For a Share Outstanding | May 31, | Year Ended November 30, |
| Throughout Each Period | 2018 | 2017 | 2016 | 2015 | 2014 | 2013 |
| Net Asset Value, Beginning of Period | $43.45 | $39.23 | $39.00 | $41.02 | $39.17 | $34.29 |
| Investment Operations | | | | | | |
| Net Investment Income | 0.5561 | 1.0211 | 1.017 | 1.004 | 1.000 | .955 |
| Net Realized and Unrealized Gain (Loss) | | | | | | |
| on Investments | (.440) | 4.965 | 1.616 | (.527) | 3.370 | 5.324 |
| Total from Investment Operations | .116 | 5.986 | 2.633 | .477 | 4.370 | 6.279 |
| Distributions | | | | | | |
| Dividends from Net Investment Income | (0.508) | (1.030) | (1.014) | (.995) | (.982) | (.958) |
| Distributions from Realized Capital Gains | (1.688) | (.736) | (1.389) | (1.502) | (1.538) | (.441) |
| Total Distributions | (2.196) | (1.766) | (2.403) | (2.497) | (2.520) | (1.399) |
| Net Asset Value, End of Period | $41.37 | $43.45 | $39.23 | $39.00 | $41.02 | $39.17 |
| |
| Total Return2 | 0.22% | 15.72% | 7.18% | 1.22% | 11.72% | 18.85% |
| |
| Ratios/Supplemental Data | | | | | | |
| Net Assets, End of Period (Millions) | $17,505 | $18,422 | $18,967 | $19,850 | $25,199 | $26,978 |
| Ratio of Total Expenses to | | | | | | |
| Average Net Assets3 | 0.25% | 0.25% | 0.25% | 0.26% | 0.26% | 0.26% |
| Ratio of Net Investment Income to | | | | | | |
| Average Net Assets | 2.66% | 2.50% | 2.68% | 2.55% | 2.54% | 2.61% |
| Portfolio Turnover Rate 4 | 38% | 30% | 31% | 39% | 71% | 35% |
The expense ratio, net investment income ratio, and turnover rate for the current period have been annualized.
1 Calculated based on average shares outstanding.
2 Total returns do not include account service fees that may have applied in the periods shown. Fund prospectuses provide information
about any applicable account service fees.
3 Includes performance-based investment advisory fee increases (decreases) of (0.01%), (0.01%), (0.01%), 0.00%, 0.00%, and 0.00%.
4 Includes 2%, 4%, 6%, 10%, 14%, and 5% attributable to mortgage-dollar-roll activity.
See accompanying Notes, which are an integral part of the Financial Statements.
21
Wellington Fund
Financial Highlights
| | | | | | |
| Admiral Shares | | | | | | |
| Six Months | | | | | |
| | Ended | | | | | |
| For a Share Outstanding | May 31, | Year Ended November 30, |
| Throughout Each Period | 2018 | 2017 | 2016 | 2015 | 2014 | 2013 |
| Net Asset Value, Beginning of Period | $75.04 | $67.75 | $67.36 | $70.85 | $67.65 | $59.24 |
| Investment Operations | | | | | | |
| Net Investment Income | . 9911 | 1.8241 | 1.812 | 1.790 | 1.781 | 1.700 |
| Net Realized and Unrealized Gain (Loss) | | | | | | |
| on Investments | (.760) | 8.572 | 2.784 | (.910) | 5.825 | 9.175 |
| Total from Investment Operations | .231 | 10.396 | 4.596 | .880 | 7.606 | 10.875 |
| Distributions | | | | | | |
| Dividends from Net Investment Income | (.906) | (1.836) | (1.807) | (1.776) | (1.750) | (1.703) |
| Distributions from Realized Capital Gains | (2.915) | (1.270) | (2.399) | (2.594) | (2.656) | (.762) |
| Total Distributions | (3.821) | (3.106) | (4.206) | (4.370) | (4.406) | (2.465) |
| Net Asset Value, End of Period | $71.45 | $75.04 | $67.75 | $67.36 | $70.85 | $67.65 |
| |
| Total Return2 | 0.26% | 15.81% | 7.26% | 1.31% | 11.82% | 18.91% |
| |
| Ratios/Supplemental Data | | | | | | |
| Net Assets, End of Period (Millions) | $86,048 | $87,136 | $73,996 | $68,894 | $64,341 | $52,311 |
| Ratio of Total Expenses to | | | | | | |
| Average Net Assets3 | 0.17% | 0.17% | 0.16% | 0.18% | 0.18% | 0.18% |
| Ratio of Net Investment Income to | | | | | | |
| Average Net Assets | 2.74% | 2.58% | 2.77% | 2.63% | 2.62% | 2.69% |
| Portfolio Turnover Rate 4 | 38% | 30% | 31% | 39% | 71% | 35% |
The expense ratio, net investment income ratio, and turnover rate for the current period have been annualized.
1 Calculated based on average shares outstanding.
2 Total returns do not include account service fees that may have applied in the periods shown. Fund prospectuses provide information
about any applicable account service fees.
3 Includes performance-based investment advisory fee increases (decreases) of (0.01%), (0.01%), (0.01%), 0.00%, 0.00%, and 0.00%.
4 Includes 2%, 4%, 6%, 10%, 14%, and 5% attributable to mortgage-dollar-roll activity.
See accompanying Notes, which are an integral part of the Financial Statements.
22
Wellington Fund
Notes to Financial Statements
Vanguard Wellington Fund is registered under the Investment Company Act of 1940 as an open-end investment company, or mutual fund. Certain of the fund’s investments are in corporate debt instruments; the issuers’ abilities to meet their obligations may be affected by economic developments in their respective industries. The fund offers two classes of shares: Investor Shares and Admiral Shares. Investor Shares are available to any investor who meets the fund’s minimum purchase requirements. Admiral Shares are designed for investors who meet certain administrative, service, and account-size criteria.
A. The following significant accounting policies conform to generally accepted accounting principles for U.S. investment companies. The fund consistently follows such policies in preparing its financial statements.
1. Security Valuation: Securities are valued as of the close of trading on the New York Stock Exchange (generally 4 p.m., Eastern time) on the valuation date. Equity securities are valued at the latest quoted sales prices or official closing prices taken from the primary market in which each security trades; such securities not traded on the valuation date are valued at the mean of the latest quoted bid and asked prices. Bonds and temporary cash investments are valued using the latest bid prices or using valuations based on a matrix system (which considers such factors as security prices, yields, maturities, and ratings), both as furnished by independent pricing services. Structured debt securities, including mortgages and asset-backed securities, are valued using the latest bid prices or using valuations based on a matrix system that considers such factors as issuer, tranche, nominal or option-adjusted spreads, weighted average coupon, weighted average maturity, credit enhancements, and collateral. Investments in Vanguard Market Liquidity Fund are valued at that fund’s net asset value. Securities for which market quotations are not readily available, or whose values have been affected by events occurring before the fund’s pricing time but after the close of the securities’ primary markets, are valued at their fair values calculated according to procedures adopted by the board of trustees. These procedures include obtaining quotations from an independent pricing service, monitoring news to identify significant market- or security-specific events, and evaluating changes in the values of foreign market proxies (for example, ADRs, futures contracts, or exchange-traded funds), between the time the foreign markets close and the fund’s pricing time. When fair-value pricing is employed, the prices of securities used by a fund to calculate its net asset value may differ from quoted or published prices for the same securities.
2. Foreign Currency: Securities and other assets and liabilities denominated in foreign currencies are translated into U.S. dollars using exchange rates obtained from an independent third party as of the fund’s pricing time on the valuation date. Realized gains (losses) and unrealized appreciation (depreciation) on investment securities include the effects of changes in exchange rates since the securities were purchased, combined with the effects of changes in security prices. Fluctuations in the value of other assets and liabilities resulting from changes in exchange rates are recorded as unrealized foreign currency gains (losses) until the assets or liabilities are settled in cash, at which time they are recorded as realized foreign currency gains (losses).
3. Futures Contracts: The fund uses futures contracts to invest in fixed income asset classes with greater efficiency and lower cost than is possible through direct investment, to add value when these instruments are attractively priced, or to adjust sensitivity to changes in interest rates. The primary risks associated with the use of futures contracts are imperfect correlation between changes in market values of bonds held by the fund and the prices of futures contracts, and the possibility of an illiquid market. Counterparty risk involving futures is mitigated because a regulated clearinghouse is
23
Wellington Fund
the counterparty instead of the clearing broker. To further mitigate counterparty risk, the fund trades futures contracts on an exchange, monitors the financial strength of its clearing brokers and clearinghouse, and has entered into clearing agreements with its clearing brokers. The clearinghouse imposes initial margin requirements to secure the fund’s performance and requires daily settlement of variation margin representing changes in the market value of each contract.
Futures contracts are valued at their quoted daily settlement prices. The notional amounts of the contracts are not recorded in the Statement of Net Assets. Fluctuations in the value of the contracts are recorded in the Statement of Net Assets as an asset (liability) and in the Statement of Operations as unrealized appreciation (depreciation) until the contracts are closed, when they are recorded as realized futures gains (losses).
During the six months ended May 31, 2018, the fund’s average investments in long and short futures contracts represented less than 1% and 1% of net assets, respectively, based on the average of the notional amounts at each quarter-end during the period.
4. Forward Currency Contracts: The fund enters into forward currency contracts to protect the value of securities and related receivables and payables against changes in future foreign exchange rates. The fund’s risks in using these contracts include movement in the values of the foreign currencies relative to the U.S. dollar and the ability of the counterparties to fulfill their obligations under the contracts. The fund mitigates its counterparty risk by entering into forward currency contracts only with a diverse group of prequalified counterparties, monitoring their financial strength, entering into master netting arrangements with its counterparties, and requiring its counterparties to transfer collateral as security for their performance. In the absence of a default, the collateral pledged or received by the fund cannot be repledged, resold, or rehypothecated. The master netting arrangements provide that, in the event of a counterparty’s default (including bankruptcy), the fund may terminate the forward currency contracts, determine the net amount owed by either party in accordance with its master netting arrangements, and sell or retain any collateral held up to the net amount owed to the fund under the master netting arrangements. The forward currency contracts contain provisions whereby a counterparty may terminate open contracts if the fund’s net assets decline below a certain level, triggering a payment by the fund if the fund is in a net liability position at the time of the termination. The payment amount would be reduced by any collateral the fund has pledged. Any assets pledged as collateral for open contracts are noted in the Statement of Net Assets. The value of collateral received or pledged is compared daily to the value of the forward currency contracts exposure with each counterparty, and any difference, if in excess of a specified minimum transfer amount, is adjusted and settled within two business days.
Forward currency contracts are valued at their quoted daily prices obtained from an independent third party, adjusted for currency risk based on the expiration date of each contract. The notional amounts of the contracts are not recorded in the Statement of Net Assets. Fluctuations in the value of the contracts are recorded in the Statement of Net Assets as an asset (liability) and in the Statement of Operations as unrealized appreciation (depreciation) until the contracts are closed, when they are recorded as realized forward currency contract gains (losses).
During the six months ended May 31, 2018, the fund’s average investment in forward currency contracts represented less than 1% of net assets, based on the average of notional amounts at each quarter-end during the period.
24
Wellington Fund
5. To Be Announced (TBA) Transactions: A TBA transaction is an agreement to buy or sell mortgage-backed securities with agreed-upon characteristics (face amount, coupon, maturity) for settlement at a future date. The fund may be a seller of TBA transactions to reduce its exposure to the mortgage-backed securities market or in order to sell mortgage-backed securities it owns under delayed-delivery arrangements. When the fund is a buyer of TBA transactions, it maintains cash or short-term investments in an amount sufficient to meet the purchase price at the settlement date of the TBA transaction. The primary risk associated with TBA transactions is that a counterparty may default on its obligations. The fund mitigates its counterparty risk by, among other things, performing a credit analysis of counterparties, allocating transactions among numerous counterparties, and monitoring its exposure to each counterparty. The fund may also enter into a Master Securities Forward Transaction Agreement (MSFTA) with certain counterparties and require them to transfer collateral as security for their performance. In the absence of a default, the collateral pledged or received by the fund cannot be repledged, resold, or rehypothecated. Under an MSFTA, upon a counterparty default (including bankruptcy), the fund may terminate any TBA transactions with that counterparty, determine the net amount owed by either party in accordance with its master netting arrangements, and sell or retain any collateral held up to the net amount owed to the fund under the master netting arrangements.
6. Mortgage Dollar Rolls: The fund enters into mortgage-dollar-roll transactions, in which the fund sells mortgage-backed securities to a dealer and simultaneously agrees to purchase similar securities in the future at a predetermined price. The proceeds of the securities sold in mortgage-dollar-roll transactions are typically invested in high-quality short-term fixed income securities. The fund forgoes principal and interest paid on the securities sold, and is compensated by interest earned on the proceeds of the sale and by a lower price on the securities to be repurchased. The fund has also entered into mortgage-dollar-roll transactions in which the fund buys mortgage-backed securities from a dealer pursuant to a TBA transaction and simultaneously agrees to sell similar securities in the future at a predetermined price. The securities bought in mortgage-dollar-roll transactions are used to cover an open TBA sell position. The fund continues to earn interest on mortgage-backed security pools already held and receives a lower price on the securities to be sold in the future. The fund accounts for mortgage-dollar-roll transactions as purchases and sales; as such, these transactions may increase the fund’s portfolio turnover rate. Amounts to be received or paid in connection with open mortgage dollar rolls are included in Receivables for Investment Securities Sold or Payables for Investment Securities Purchased in the Statement of Net Assets.
7. Repurchase Agreements: The fund enters into repurchase agreements with institutional counterparties. Securities pledged as collateral to the fund under repurchase agreements are held by a custodian bank until the agreements mature, and in the absence of a default, such collateral cannot be repledged, resold, or rehypothecated. Each agreement requires that the market value of the collateral be sufficient to cover payments of interest and principal. The fund further mitigates its counterparty risk by entering into repurchase agreements only with a diverse group of prequalified counterparties, monitoring their financial strength, and entering into master repurchase agreements with its counterparties. The master repurchase agreements provide that, in the event of a counterparty’s default (including bankruptcy), the fund may terminate any repurchase agreements with that counterparty, determine the net amount owed, and sell or retain the collateral up to the net amount owed to the fund. Such action may be subject to legal proceedings, which may delay or limit the disposition of collateral.
25
Wellington Fund
8. Federal Income Taxes: The fund intends to continue to qualify as a regulated investment company and distribute all of its taxable income. Management has analyzed the fund’s tax positions taken for all open federal income tax years (November 30, 2014–2017), and for the period ended May 31, 2018, and has concluded that no provision for federal income tax is required in the fund’s financial statements.
9. Distributions: Distributions to shareholders are recorded on the ex-dividend date.
10. Securities Lending: To earn additional income, the fund lends its securities to qualified institutional borrowers. Security loans are subject to termination by the fund at any time, and are required to be secured at all times by collateral in an amount at least equal to the market value of securities loaned. Daily market fluctuations could cause the value of loaned securities to be more or less than the value of the collateral received. When this occurs, the collateral is adjusted and settled before the opening of the market on the next business day. The fund further mitigates its counterparty risk by entering into securities lending transactions only with a diverse group of prequalified counterparties, monitoring their financial strength, and entering into master securities lending agreements with its counterparties. The master securities lending agreements provide that, in the event of a counterparty’s default (including bankruptcy), the fund may terminate any loans with that borrower, determine the net amount owed, and sell or retain the collateral up to the net amount owed to the fund; however, such actions may be subject to legal proceedings. While collateral mitigates counterparty risk, in the event of a default, the fund may experience delays and costs in recovering the securities loaned. The fund invests cash collateral received in Vanguard Market Liquidity Fund, and records a liability in the Statement of Net Assets for the return of the collateral, during the period the securities are on loan. Securities lending income represents fees charged to borrowers plus income earned on invested cash collateral, less expenses associated with the loan. During the term of the loan, the fund is entitled to all distributions made on or in respect of the loaned securities.
11. Credit Facility: The fund and certain other funds managed by The Vanguard Group (“Vanguard”) participate in a $3.1 billion committed credit facility provided by a syndicate of lenders pursuant to a credit agreement that may be renewed annually; each fund is individually liable for its borrowings, if any, under the credit facility. Borrowings may be utilized for temporary and emergency purposes, and are subject to the fund’s regulatory and contractual borrowing restrictions. The participating funds are charged administrative fees and an annual commitment fee of 0.10% of the undrawn amount of the facility; these fees are allocated to the funds based on a method approved by the fund’s board of trustees and included in Management and Administrative expenses on the fund’s Statement of Operations. Any borrowings under this facility bear interest at a rate based upon the higher of the one-month London Interbank Offered Rate, federal funds effective rate, or overnight bank funding rate plus an agreed-upon spread.
The fund had no borrowings outstanding at May 31, 2018, or at any time during the period then ended.
12. Other: Dividend income is recorded on the ex-dividend date. Interest income is accrued daily. Premiums and discounts on debt securities purchased are amortized and accreted, respectively, to interest income over the lives of the respective securities. Security transactions are accounted for on the date securities are bought or sold. Costs used to determine realized gains (losses) on the sale of investment securities are those of the specific securities sold.
26
Wellington Fund
Each class of shares has equal rights as to assets and earnings, except that each class separately bears certain class-specific expenses related to maintenance of shareholder accounts (included in Management and Administrative expenses), shareholder reporting, and the proxy. Marketing and distribution expenses are allocated to each class of shares based on a method approved by the board of trustees. Income, other non-class-specific expenses, and gains and losses on investments are allocated to each class of shares based on its relative net assets.
B. Wellington Management Company LLP provides investment advisory services to the fund for a fee calculated at an annual percentage rate of average net assets. The basic fee is subject to quarterly adjustments based on the fund’s performance relative to the combined index comprising the S&P 500 Index and the Bloomberg Barclays U.S. Credit A or Better Bond Index for the preceding three years. For the six months ended May 31, 2018, the investment advisory fee represented an effective annual basic rate of 0.08% of the fund’s average net assets before a decrease of $3,208,000 (0.01%) based on performance.
C. In accordance with the terms of a Funds’ Service Agreement (the “FSA”) between Vanguard and the fund, Vanguard furnishes to the fund corporate management, administrative, marketing, distribution, and cash management services at Vanguard’s cost of operations (as defined by the FSA). These costs of operations are allocated to the fund based on methods and guidelines approved by the board of trustees. Vanguard does not require reimbursement in the current period for certain costs of operations (such as deferred compensation/benefits and risk/insurance costs); the fund’s liability for these costs of operations is included in Payables to Vanguard on the Statement of Net Assets.
Upon the request of Vanguard, the fund may invest up to 0.40% of its net assets as capital in Vanguard. At May 31, 2018, the fund had contributed to Vanguard capital in the amount of $5,580,000, representing 0.01% of the fund’s net assets and 2.23% of Vanguard’s capitalization. The fund’s trustees and officers are also directors and employees, respectively, of Vanguard.
D. Various inputs may be used to determine the value of the fund’s investments. These inputs are summarized in three broad levels for financial statement purposes. The inputs or methodologies used to value securities are not necessarily an indication of the risk associated with investing in those securities.
Level 1—Quoted prices in active markets for identical securities.
Level 2—Other significant observable inputs (including quoted prices for similar securities, interest rates, prepayment speeds, credit risk, etc.).
Level 3—Significant unobservable inputs (including the fund’s own assumptions used to determine
the fair value of investments). Any investments valued with significant unobservable inputs are
noted on the Statement of Net Assets.
27
Wellington Fund
The following table summarizes the market value of the fund’s investments as of May 31, 2018, based on the inputs used to value them:
| | | |
| | Level 1 | Level 2 | Level 3 |
| Investments | ($000) | ($000) | ($000) |
| Common Stocks | 58,379,752 | 9,091,297 | — |
| U.S. Government and Agency Obligations | — | 6,582,931 | — |
| Asset-Backed/Commercial Mortgage-Backed Securities | — | 1,884,003 | — |
| Corporate Bonds | — | 21,126,729 | — |
| Sovereign Bonds | — | 1,930,922 | — |
| Taxable Municipal Bonds | — | 1,828,746 | — |
| Temporary Cash Investments | 368,537 | 3,093,364 | — |
| Futures Contracts—Assets1 | 85 | — | — |
| Futures Contracts—Liabilities1 | (1,907) | — | — |
| Forward Currency Contracts—Assets | — | 1,717 | — |
| Forward Currency Contracts—Liabilities | — | (302) | — |
| Total | 58,746,467 | 45,539,407 | — |
| 1 Represents variation margin on the last day of the reporting period. |
E. At May 31, 2018, the fair values of derivatives were reflected in the Statement of Net Assets as follows:
| | | |
| | Interest Rate | Currency | |
| | Contracts | Contracts | Total |
| Statement of Net Assets Caption | ($000) | ($000) | ($000) |
| Variation Margin Receivable—Futures Contracts | 85 | — | 85 |
| Unrealized Appreciation—Forward Currency Contracts | — | 1,717 | 1,717 |
| Total Assets | 85 | 1,717 | 1,802 |
| |
| Variation Margin Payable—Futures Contracts | (1,907) | — | (1,907) |
| Unrealized Depreciation—Forward Currency Contracts | — | (302) | (302) |
| Total Liabilities | (1,907) | (302) | (2,209) |
28
Wellington Fund
Realized net gain (loss) and the change in unrealized appreciation (depreciation) on derivatives for the six months ended May 31, 2018, were:
| | | |
| Interest Rate | Currency | |
| | Contracts | Contracts | Total |
| Realized Net Gain (Loss) on Derivatives | ($000) | ($000) | ($000) |
| Futures Contracts | 50,978 | — | 50,978 |
| Forward Currency Contracts | — | (24,551) | (24,551) |
| Realized Net Gain (Loss) on Derivatives | 50,978 | (24,551) | 26,427 |
| |
| Change in Unrealized Appreciation (Depreciation) on Derivatives | | | |
| Futures Contracts | (16,918) | — | (16,918) |
| Forward Currency Contracts | — | (1,748) | (1,748) |
| Change in Unrealized Appreciation (Depreciation) on Derivatives | (16,918) | (1,748) | (18,666) |
F. Distributions are determined on a tax basis and may differ from net investment income and realized capital gains for financial reporting purposes. Differences may be permanent or temporary. Permanent differences are reclassified among capital accounts in the financial statements to reflect their tax character. Temporary differences arise when certain items of income, expense, gain, or loss are recognized in different periods for financial statement and tax purposes. These differences will reverse at some time in the future. Differences in classification may also result from the treatment of short-term gains as ordinary income for tax purposes. The fund’s tax-basis capital gains and losses are determined only at the end of each fiscal year.
At May 31, 2018, the cost of investment securities for tax purposes was $81,447,742,000. Net unrealized appreciation of investment securities for tax purposes was $22,838,539,000, consisting of unrealized gains of $23,905,854,000 on securities that had risen in value since their purchase and $1,067,315,000 in unrealized losses on securities that had fallen in value since their purchase.
G. During the six months ended May 31, 2018, the fund purchased $12,178,344,000 of investment securities and sold $13,162,704,000 of investment securities, other than U.S. government securities and temporary cash investments. Purchases and sales of U.S. government securities were $7,466,546,000 and $6,166,124,000, respectively.
29
Wellington Fund
H. Capital share transactions for each class of shares were:
| | | | |
| | Six Months Ended | Year Ended |
| | May 31, 2018 | November 30, 2017 |
| | Amount | Shares | Amount | Shares |
| | ($000) | (000) | ($000) | (000) |
| Investor Shares | | | | |
| Issued | 955,080 | 22,638 | 2,111,512 | 51,862 |
| Issued in Lieu of Cash Distributions | 891,265 | 21,248 | 806,153 | 20,179 |
| Redeemed | (1,878,678) | (44,709) | (5,405,315) | (131,597) |
| Net Increase (Decrease)—Investor Shares | (32,333) | (823) | (2,487,650) | (59,556) |
| Admiral Shares | | | | |
| Issued | 3,742,043 | 51,553 | 9,371,661 | 132,764 |
| Issued in Lieu of Cash Distributions | 4,176,426 | 57,654 | 3,246,596 | 47,007 |
| Redeemed | (4,792,106) | (65,953) | (7,843,425) | (110,876) |
| Net Increase (Decrease)—Admiral Shares | 3,126,363 | 43,254 | 4,774,832 | 68,895 |
I. Management has determined that no events or transactions occurred subsequent to May 31, 2018, that would require recognition or disclosure in these financial statements.
30
About Your Fund’s Expenses
As a shareholder of the fund, you incur ongoing costs, which include costs for portfolio management, administrative services, and shareholder reports (like this one), among others. Operating expenses, which are deducted from a fund’s gross income, directly reduce the investment return of the fund.
A fund’s expenses are expressed as a percentage of its average net assets. This figure is known as the expense ratio. The following examples are intended to help you understand the ongoing costs (in dollars) of investing in your fund and to compare these costs with those of other mutual funds. The examples are based on an investment of $1,000 made at the beginning of the period shown and held for the entire period.
The accompanying table illustrates your fund’s costs in two ways:
• Based on actual fund return. This section helps you to estimate the actual expenses that you paid over the period. The ”Ending Account Value“ shown is derived from the fund‘s actual return, and the third column shows the dollar amount that would have been paid by an investor who started with $1,000 in the fund. You may use the information here, together with the amount you invested, to estimate the expenses that you paid over the period.
To do so, simply divide your account value by $1,000 (for example, an $8,600 account value divided by $1,000 = 8.6), then multiply the result by the number given for your fund under the heading ”Expenses Paid During Period.“
• Based on hypothetical 5% yearly return. This section is intended to help you compare your fund‘s costs with those of other mutual funds. It assumes that the fund had a yearly return of 5% before expenses, but that the expense ratio is unchanged. In this case—because the return used is not the fund’s actual return—the results do not apply to your investment. The example is useful in making comparisons because the Securities and Exchange Commission requires all mutual funds to calculate expenses based on a 5% return. You can assess your fund’s costs by comparing this hypothetical example with the hypothetical examples that appear in shareholder reports of other funds.
Note that the expenses shown in the table are meant to highlight and help you compare ongoing costs only and do not reflect transaction costs incurred by the fund for buying and selling securities. Further, the expenses do not include any purchase, redemption, or account service fees described in the fund prospectus. If such fees were applied to your account, your costs would be higher. Your fund does not carry a “sales load.”
The calculations assume no shares were bought or sold during the period. Your actual costs may have been higher or lower, depending on the amount of your investment and the timing of any purchases or redemptions.
You can find more information about the fund’s expenses, including annual expense ratios, in the Financial Statements section of this report. For additional information on operating expenses and other shareholder costs, please refer to your fund’s current prospectus.
31
| | | |
| Six Months Ended May 31, 2018 | | | |
| | Beginning | Ending | Expenses |
| | Account Value | Account Value | Paid During |
| Wellington Fund | 11/30/2017 | 5/31/2018 | Period |
| Based on Actual Fund Return | | | |
| Investor Shares | $1,000.00 | $1,002.22 | $1.25 |
| Admiral Shares | 1,000.00 | 1,002.65 | 0.85 |
| Based on Hypothetical 5% Yearly Return | | | |
| Investor Shares | $1,000.00 | $1,023.68 | $1.26 |
| Admiral Shares | 1,000.00 | 1,024.08 | 0.86 |
The calculations are based on expenses incurred in the most recent six-month period. The fund’s annualized six-month expense ratios for
that period are 0.25% for Investor Shares and 0.17% for Admiral Shares. The dollar amounts shown as “Expenses Paid” are equal to the
annualized expense ratio multiplied by the average account value over the period, multiplied by the number of days in the most recent
six-month period, then divided by the number of days in the most recent 12-month period (182/365).
32
Glossary
30-Day SEC Yield. A fund’s 30-day SEC yield is derived using a formula specified by the U.S. Securities and Exchange Commission. Under the formula, data related to the fund’s security holdings in the previous 30 days are used to calculate the fund’s hypothetical net income for that period, which is then annualized and divided by the fund’s estimated average net assets over the calculation period. For the purposes of this calculation, a security’s income is based on its current market yield to maturity (for bonds), its actual income (for asset-backed securities), or its projected dividend yield (for stocks). Because the SEC yield represents hypothetical annualized income, it will differ—at times significantly—from the fund’s actual experience. As a result, the fund’s income distributions may be higher or lower than implied by the SEC yield.
Average Coupon. The average interest rate paid on the fixed income securities held by a fund. It is expressed as a percentage of face value.
Average Duration. An estimate of how much the value of the bonds held by a fund will fluctuate in response to a change in interest rates. To see how the value could change, multiply the average duration by the change in rates. If interest rates rise by 1 percentage point, the value of the bonds in a fund with an average duration of five years would decline by about 5%. If rates decrease by a percentage point, the value would rise by 5%.
Average Effective Maturity. The average length of time until fixed income securities held by a fund reach maturity and are repaid, taking into consideration the possibility that the issuer may call the bond before its maturity date. The figure reflects the proportion of fund assets represented by each security; it also reflects any futures contracts held. In general, the longer the average effective maturity, the more a fund’s share price will fluctuate in response to changes in market interest rates.
Beta. A measure of the magnitude of a fund’s past share-price fluctuations in relation to the ups and downs of a given market index. The index is assigned a beta of 1.00. Compared with a given index, a fund with a beta of 1.20 typically would have seen its share price rise or fall by 12% when the index rose or fell by 10%. For this report, beta is based on returns over the past 36 months for both the fund and the index. Note that a fund’s beta should be reviewed in conjunction with its R-squared (see definition). The lower the R-squared, the less correlation there is between the fund and the index, and the less reliable beta is as an indicator of volatility.
Credit Quality. Credit-quality ratings are measured on a scale that generally ranges from AAA (highest) to D (lowest). U.S. Treasury, U.S. Agency, and U.S. Agency mortgage-backed securities appear under “U.S. Government.” Credit-quality ratings are obtained from Barclays and are from Moody’s, Fitch, and S&P. When ratings from all three agencies are used, the median rating is shown. When ratings from two of the agencies are used, the lower rating for each issue is shown. “Not Rated” is used to classify securities for which a rating is not available. Not rated securities include a fund’s investment in Vanguard Market Liquidity Fund or Vanguard Municipal Cash Management Fund, each of which invests in high-quality money market instruments and may serve as a cash management vehicle for the Vanguard funds, trusts, and accounts.
Dividend Yield. The current, annualized rate of dividends paid on a share of stock, divided by its current share price. For a fund, the weighted average yield for stocks it holds. The index yield is based on the current annualized rate of dividends paid on stocks in the index.
33
Earnings Growth Rate. The average annual rate of growth in earnings over the past five years for the stocks now in a fund.
Equity Exposure. A measure that reflects a fund’s investments in stocks and stock futures. Any holdings in short-term reserves are excluded.
Expense Ratio. A fund’s total annual operating expenses expressed as a percentage of the fund’s average net assets. The expense ratio includes management and administrative expenses, but does not include the transaction costs of buying and selling portfolio securities.
Foreign Holdings. The percentage of a fund represented by securities or depositary receipts of companies based outside the United States.
Inception Date. The date on which the assets of a fund (or one of its share classes) are first invested in accordance with the fund’s investment objective. For funds with a subscription period, the inception date is the day after that period ends. Investment performance is measured from the inception date.
Median Market Cap. An indicator of the size of companies in which a fund invests; the midpoint of market capitalization (market price x shares outstanding) of a fund’s stocks, weighted by the proportion of the fund’s assets invested in each stock. Stocks representing half of the fund’s assets have market capitalizations above the median, and the rest are below it.
Price/Book Ratio. The share price of a stock divided by its net worth, or book value, per share. For a fund, the weighted average price/book ratio of the stocks it holds.
Price/Earnings Ratio. The ratio of a stock’s current price to its per-share earnings over the past year. For a fund, the weighted average P/E of the stocks it holds. P/E is an indicator of market expectations about corporate prospects; the higher the P/E, the greater the expectations for a company’s future growth.
R-Squared. A measure of how much of a fund’s past returns can be explained by the returns from the market in general, as measured by a given index. If a fund’s total returns were precisely synchronized with an index’s returns, its R-squared would be 1.00. If the fund’s returns bore no relationship to the index’s returns, its R-squared would be 0. For this report, R-squared is based on returns over the past 36 months for both the fund and the index.
Return on Equity. The annual average rate of return generated by a company during the past five years for each dollar of shareholder’s equity (net income divided by shareholder’s equity). For a fund, the weighted average return on equity for the companies whose stocks it holds.
Short-Term Reserves. The percentage of a fund invested in highly liquid, short-term securities that can be readily converted to cash.
Turnover Rate. An indication of the fund’s trading activity. Funds with high turnover rates incur higher transaction costs and may be more likely to distribute capital gains (which may be taxable to investors). The turnover rate excludes in-kind transactions, which have minimal impact on costs.
34
Yield to Maturity. The rate of return an investor would receive if the fixed income securities held by a fund were held to their maturity dates.
Benchmark Information
Wellington Composite Index: 65% S&P 500 Index and 35% Lehman U.S. Long Credit AA or Better Bond Index through February 29, 2000; 65% S&P 500 Index and 35% Bloomberg Barclays U.S. Credit A or Better Bond Index thereafter.
35
The Global Industry Classification Standard (“GICS”) was developed by and is the exclusive property and a service mark
of MSCI Inc. (“MSCI”) and Standard and Poor’s, a division of McGraw-Hill Companies, Inc. (“S&P”), and is licensed for use
by Vanguard. Neither MSCI, S&P nor any third party involved in making or compiling the GICS or any GICS classification
makes any express or implied warranties or representations with respect to such standard or classification (or the results
to be obtained by the use thereof), and all such parties hereby expressly disclaim all warranties of originality, accuracy,
completeness, merchantability or fitness for a particular purpose with respect to any such standard or classification.
Without limiting any of the foregoing, in no event shall MSCI, S&P, any of its affiliates or any third party involved in
making or compiling the GICS or any GICS classification have any liability for any direct, indirect, special, punitive,
consequential or any other damages (including lost profits) even if notified of the possibility of such damages.
BLOOMBERG is a trademark and service mark of Bloomberg Finance L.P. BARCLAYS is a trademark and service mark
of Barclays Bank Plc, used under license. Bloomberg Finance L.P. and its affiliates, including Bloomberg Index Services
Limited (BISL) (collectively, Bloomberg), or Bloomberg’s licensors, own all proprietary rights in the Bloomberg Barclays
U.S. Credit A or Better Bond Index (Index or Bloomberg Barclays Index).
Neither Barclays Bank Plc, Barclays Capital Inc., or any affiliate (collectively Barclays) or Bloomberg is the issuer or
producer of the Wellington Fund and neither Bloomberg nor Barclays has any responsibilities, obligations or duties to
investors in the Wellington Fund. The Index is licensed for use by The Vanguard Group, Inc. (Vanguard) as the sponsor
of the Wellington Fund. Bloomberg and Barclays’ only relationship with Vanguard in respect of the Index is the licensing
of the Index, which is determined, composed and calculated by BISL, or any successor thereto, without regard to the
Issuer or the Wellington Fund or the owners of the Wellington Fund.
Additionally, Vanguard may for itself execute transaction(s) with Barclays in or relating to the Index in connection with
the Wellington Fund. Investors acquire the Wellington Fund from Vanguard and investors neither acquire any interest in
the Index nor enter into any relationship of any kind whatsoever with Bloomberg or Barclays upon making an investment in
the Wellington Fund. The Wellington Fund is not sponsored, endorsed, sold or promoted by Bloomberg or Barclays. Neither
Bloomberg nor Barclays makes any representation or warranty, express or implied regarding the advisability of investing in
the Wellington Fund or the advisability of investing in securities generally or the ability of the Index to track corresponding
or relative market performance. Neither Bloomberg nor Barclays has passed on the legality or suitability of the Wellington
Fund with respect to any person or entity. Neither Bloomberg nor Barclays is responsible for and has not participated in the
determination of the timing of, prices at, or quantities of the Wellington Fund to be issued. Neither Bloomberg nor Barclays
has any obligation to take the needs of the Issuer or the owners of the Wellington Fund or any other third party into
consideration in determining, composing or calculating the Index. Neither Bloomberg nor Barclays has any obligation
or liability in connection with administration, marketing or trading of the Wellington Fund.
36
The licensing agreement between Bloomberg and Barclays is solely for the benefit of Bloomberg and Barclays and not
for the benefit of the owners of the Wellington Fund, investors or other third parties. In addition, the licensing agreement
between Vanguard and Bloomberg is solely for the benefit of Vanguard and Bloomberg and not for the benefit of the
owners of the Wellington Fund, investors or other third parties.
NEITHER BLOOMBERG NOR BARCLAYS SHALL HAVE ANY LIABILITY TO THE ISSUER, INVESTORS OR TO OTHER THIRD
PARTIES FOR THE QUALITY, ACCURACY AND/OR COMPLETENESS OF THE BLOOMBERG BARCLAYS INDEX OR ANY
DATA INCLUDED THEREIN OR FOR INTERRUPTIONS IN THE DELIVERY OF THE BLOOMBERG BARCLAYS INDEX. NEITHER
BLOOMBERG NOR BARCLAYS MAKES ANY WARRANTY, EXPRESS OR IMPLIED, AS TO RESULTS TO BE OBTAINED BY
THE ISSUER, THE INVESTORS OR ANY OTHER PERSON OR ENTITY FROM THE USE OF THE BLOOMBERG BARCLAYS
INDEX OR ANY DATA INCLUDED THEREIN. NEITHER BLOOMBERG NOR BARCLAYS MAKES ANY EXPRESS OR IMPLIED
WARRANTIES, AND EACH HEREBY EXPRESSLY DISCLAIMS ALL WARRANTIES OF MERCHANTABILITY OR FITNESS FOR
A PARTICULAR PURPOSE OR USE WITH RESPECT TO THE BLOOMBERG BARCLAYS INDEX OR ANY DATA INCLUDED
THEREIN. BLOOMBERG RESERVES THE RIGHT TO CHANGE THE METHODS OF CALCULATION OR PUBLICATION, OR
TO CEASE THE CALCULATION OR PUBLICATION OF THE BLOOMBERG BARCLAYS INDEX, AND NEITHER BLOOMBERG
NOR BARCLAYS SHALL BE LIABLE FOR ANY MISCALCULATION OF OR ANY INCORRECT, DELAYED OR INTERRUPTED
PUBLICATION WITH RESPECT TO ANY OF THE BLOOMBERG BARCLAYS INDEX. NEITHER BLOOMBERG NOR
BARCLAYS SHALL BE LIABLE FOR ANY DAMAGES, INCLUDING, WITHOUT LIMITATION, ANY SPECIAL, INDIRECT
OR CONSEQUENTIAL DAMAGES, OR ANY LOST PROFITS AND EVEN IF ADVISED OF THE POSSIBILITY OF SUCH,
RESULTING FROM THE USE OF THE BLOOMBERG BARCLAYS INDEX OR ANY DATA INCLUDED THEREIN OR WITH
RESPECT TO THE WELLINGTON FUND.
None of the information supplied by Bloomberg or Barclays and used in this publication may be reproduced in any manner
without the prior written permission of both Bloomberg and Barclays Capital, the investment banking division of Barclays
Bank Plc. Barclays Bank Plc is registered in England No. 1026167. Registered office 1 Churchill Place London E14 5HP.
© 2018 Bloomberg. Used with Permission.
Source: Bloomberg Index Services Limited. Copyright 2018, Bloomberg. All rights reserved.
37
This page intentionally left blank.
The People Who Govern Your Fund
The trustees of your mutual fund are there to see that the fund is operated and managed in your best interests since, as a shareholder, you are a part owner of the fund. Your fund’s trustees also serve on the board of directors of The Vanguard Group, Inc., which is owned by the Vanguard funds and provides services to them on an at-cost basis.
A majority of Vanguard’s board members are independent, meaning that they have no affiliation with Vanguard or the funds they oversee, apart from the sizable personal investments they have made as private individuals. The independent board members have distinguished backgrounds in business, academia, and public service. Each of the trustees and executive officers oversees 208 Vanguard funds.
Information for each trustee and executive officer of the fund appears below. The mailing address of the trustees and officers is P.O. Box 876, Valley Forge, PA 19482. More information about the trustees is in the Statement of Additional Information, which can be obtained, without charge, by contacting Vanguard at 800-662-7447, or online at vanguard.com.
Interested Trustees1
F. William McNabb III
Born in 1957. Trustee since July 2009. Principal occupation(s) during the past five years and other experience: chairman of the board (January 2010–present) of Vanguard and of each of the investment companies served by Vanguard, trustee (2009–present) of each of the investment companies served by Vanguard, and director (2008–present) of Vanguard. Chief executive officer and president (2008–2017) of Vanguard and each of the investment companies served by Vanguard, managing director (1995–2008) of Vanguard, and director (1997–2018) of Vanguard Marketing Corporation. Director (2018–present) of UnitedHealth Group.
Mortimer J. Buckley
Born in 1969. Trustee since January 2018. Principal occupation(s) during the past five years and other experience: chief executive officer (January 2018–present) of Vanguard; chief executive officer, president, and trustee (January 2018–present) of each of the investment companies served by Vanguard; president and director (2017–present) of Vanguard; and president (February 2018–present) of Vanguard Marketing Corporation. Chief investment officer (2013–2017), managing director (2002–2017), head of the Retail Investor Group (2006–2012), and chief information officer (2001–2006) of Vanguard. Chairman of the board (2011–2017) of the Children’s Hospital of Philadelphia.
Independent Trustees
Emerson U. Fullwood
Born in 1948. Trustee since January 2008. Principal occupation(s) during the past five years and other experience: executive chief staff and marketing officer for North America and corporate vice president (retired 2008) of Xerox Corporation (document management products and services). Former president of the Worldwide Channels Group, Latin America, and Worldwide Customer Service and executive chief staff officer of Developing Markets of Xerox. Executive in residence and 2009–2010 Distinguished Minett Professor at the Rochester Institute of Technology. Lead director of SPX FLOW, Inc. (multi-industry manufacturing). Director of the University of Rochester Medical Center, the Monroe Community College Foundation, the United Way of Rochester, North Carolina A&T University, and Roberts Wesleyan College. Trustee of the University of Rochester.
Amy Gutmann
Born in 1949. Trustee since June 2006. Principal occupation(s) during the past five years and other experience: president (2004–present) of the University of Pennsylvania. Christopher H. Browne Distinguished Professor of Political Science, School of Arts and Sciences, and professor of communication, Annenberg School for Communication, with secondary faculty appointments in the Department of Philosophy, School of Arts and Sciences, and at the Graduate School of Education, University of Pennsylvania. Trustee of the National Constitution Center.
1 Mr. McNabb and Mr. Buckley are considered “interested persons,” as defined in the Investment Company Act of 1940, because they are officers of the Vanguard funds.
JoAnn Heffernan Heisen
Born in 1950. Trustee since July 1998. Principal occupation(s) during the past five years and other experience: corporate vice president of Johnson & Johnson (pharmaceuticals/medical devices/consumer products) and member of its executive committee (1997–2008). Chief global diversity officer (retired 2008), vice president and chief information officer (1997–2006), controller (1995–1997), treasurer (1991–1995), and assistant treasurer (1989–1991) of Johnson & Johnson. Director of Skytop Lodge Corporation (hotels) and the Robert Wood Johnson Foundation. Member of the advisory board of the Institute for Women’s Leadership at Rutgers University.
F. Joseph Loughrey
Born in 1949. Trustee since October 2009. Principal occupation(s) during the past five years and other experience: president and chief operating officer (retired 2009) and vice chairman of the board (2008–2009) of Cummins Inc. (industrial machinery). Chairman of the board of Hillenbrand, Inc. (specialized consumer services), Oxfam America, and the Lumina Foundation for Education. Director of the V Foundation for Cancer Research. Member of the advisory council for the College of Arts and Letters and chair of the advisory board to the Kellogg Institute for International Studies, both at the University of Notre Dame.
Mark Loughridge
Born in 1953. Trustee since March 2012. Principal occupation(s) during the past five years and other experience: senior vice president and chief financial officer (retired 2013) of IBM (information technology services). Fiduciary member of IBM’s Retirement Plan Committee (2004–2013), senior vice president and general manager (2002–2004) of IBM Global Financing, vice president and controller (1998–2002) of IBM, and a variety of other prior management roles at IBM. Member of the Council on Chicago Booth.
Scott C. Malpass
Born in 1962. Trustee since March 2012. Principal occupation(s) during the past five years and other experience: chief investment officer (1989–present) and vice president (1996–present) of the University of Notre Dame. Assistant professor of finance at the Mendoza College of Business, University of Notre Dame, and member of the Notre Dame 403(b) Investment Committee. Chairman of the board of TIFF Advisory Services, Inc. Member of the board of Catholic Investment Services, Inc. (investment advisors), the board of advisors for Spruceview Capital Partners, and the board of superintendence of the Institute for the Works of Religion.
Deanna Mulligan
Born in 1963. Trustee since January 2018. Principal occupation(s) during the past five years and other experience: president (2010–present) and chief executive officer (2011–present) of The Guardian Life Insurance Company of America. Chief operating officer (2010–2011) and executive vice president (2008–2010) of Individual Life and Disability of The Guardian Life Insurance Company of America. Member of the board of The Guardian Life Insurance Company of America, the American Council of Life Insurers, the Partnership for New York City (business leadership), and the Committee Encouraging Corporate Philanthropy. Trustee of the Economic Club of New York and the Bruce Museum (arts and science). Member of the Advisory Council for the Stanford Graduate School of Business.
André F. Perold
Born in 1952. Trustee since December 2004. Principal occupation(s) during the past five years and other experience: George Gund Professor of Finance and Banking, Emeritus at the Harvard Business School (retired 2011). Chief investment officer and co-managing partner of HighVista Strategies LLC (private investment firm). Overseer of the Museum of Fine Arts Boston.
Sarah Bloom Raskin
Born in 1961. Trustee since January 2018. Principal occupation(s) during the past five years and other experience: deputy secretary (2014–2017) of the United States Department of the Treasury. Governor (2010–2014) of the Federal Reserve Board. Commissioner (2007–2010) of financial regulation for the State of Maryland. Member of the board of directors (2012–2014) of Neighborhood Reinvestment Corporation. Director of i(x) Investments, LLC.
Peter F. Volanakis
Born in 1955. Trustee since July 2009. Principal occupation(s) during the past five years and other experience: president and chief operating officer (retired 2010) of Corning Incorporated (communications equipment) and director of Corning Incorporated (2000–2010) and Dow Corning (2001–2010). Director (2012) of SPX Corporation (multi-industry manufacturing). Overseer of the Amos Tuck School of Business Administration, Dartmouth College (2001–2013). Chairman of the board of trustees of Colby-Sawyer College. Member of the Board of Hypertherm Inc. (industrial cutting systems, software, and consumables).
Executive Officers
Glenn Booraem
Born in 1967. Principal occupation(s) during the past five years and other experience: principal of Vanguard. Investment stewardship officer (2017–present), treasurer (2015–2017), controller (2010–2015), and assistant controller (2001–2010) of each of the investment companies served by Vanguard.
Christine M. Buchanan
Born in 1970. Principal occupation(s) during the past five years and other experience: principal of Vanguard and global head of Fund Administration at Vanguard. Treasurer (2017–present) of each of the investment companies served by Vanguard. Partner (2005–2017) at KPMG LLP (audit, tax, and advisory services).
Brian Dvorak
Born in 1973. Principal occupation(s) during the past five years and other experience: principal of Vanguard. Chief compliance officer (2017–present) of Vanguard and each of the investment companies served by Vanguard. Assistant vice president (2017–present) of Vanguard Marketing Corporation. Vice president and director of Enterprise Risk Management (2011–2013) at Oppenheimer Funds, Inc.
Thomas J. Higgins
Born in 1957. Principal occupation(s) during the past five years and other experience: principal of Vanguard. Chief financial officer (2008–present) and treasurer (1998–2008) of each of the investment companies served by Vanguard.
Peter Mahoney
Born in 1974. Principal occupation(s) during the past five years and other experience: principal of Vanguard. Controller (2015–present) of each of the investment companies served by Vanguard. Head of International Fund Services (2008–2014) at Vanguard.
Anne E. Robinson
Born in 1970. Principal occupation(s) during the past five years and other experience: general counsel (2016–present) of Vanguard. Secretary (2016–present) of Vanguard and of each of the investment companies served by Vanguard. Managing director (2016–present) of Vanguard. Director and senior vice president (2016–2018) of Vanguard Marketing Corporation. Managing director and general counsel of Global Cards and Consumer Services (2014–2016) at Citigroup. Counsel (2003–2014) at American Express.
Michael Rollings
Born in 1963. Principal occupation(s) during the past five years and other experience: finance director (2017–present) and treasurer (2017) of each of the investment companies served by Vanguard. Managing director (2016–present) of Vanguard. Chief financial officer (2016–present) of Vanguard. Director (2016–present) of Vanguard Marketing Corporation. Executive vice president and chief financial officer (2006–2016) of MassMutual Financial Group.
| |
| Vanguard Senior Management Team |
| |
| Mortimer J. Buckley | James M. Norris |
| Gregory Davis | Thomas M. Rampulla |
| John James | Karin A. Risi |
| Martha G. King | Anne E. Robinson |
| John T. Marcante | Michael Rollings |
| Chris D. McIsaac | |
| |
| |
| Chairman Emeritus and Senior Advisor |
| |
| John J. Brennan | |
| Chairman, 1996–2009 | |
| Chief Executive Officer and President, 1996–2008 |
| |
| |
| Founder | |
| |
| John C. Bogle | |
| Chairman and Chief Executive Officer, 1974–1996 |
|  |
| | P.O. Box 2600 |
| | Valley Forge, PA 19482-2600 |
| |
| |
| |
| Connect with Vanguard® > vanguard.com |
| |
| |
| |
| Fund Information > 800-662-7447 | CFA® is a registered trademark owned by CFA Institute. |
| Direct Investor Account Services > 800-662-2739 |
| Institutional Investor Services > 800-523-1036 |
| Text Telephone for People | |
| Who Are Deaf or Hard of Hearing > 800-749-7273 |
| |
| This material may be used in conjunction |
| with the offering of shares of any Vanguard |
| fund only if preceded or accompanied by |
| the fund’s current prospectus. | |
| |
| All comparative mutual fund data are from Lipper, a |
| Thomson Reuters Company, or Morningstar, Inc., unless |
| otherwise noted. | |
| |
| You can obtain a free copy of Vanguard’s proxy voting |
| guidelines by visiting vanguard.com/proxyreporting or by |
| calling Vanguard at 800-662-2739. The guidelines are |
| also available from the SEC’s website, sec.gov. In |
| addition, you may obtain a free report on how your fund |
| voted the proxies for securities it owned during the 12 |
| months ended June 30. To get the report, visit either |
| vanguard.com/proxyreporting or sec.gov. |
| |
| You can review and copy information about your fund at |
| the SEC’s Public Reference Room in Washington, D.C. To |
| find out more about this public service, call the SEC at |
| 202-551-8090. Information about your fund is also |
| available on the SEC’s website, and you can receive |
| copies of this information, for a fee, by sending a |
| request in either of two ways: via email addressed to |
| publicinfo@sec.gov or via regular mail addressed to the |
| Public Reference Section, Securities and Exchange |
| Commission, Washington, DC 20549-1520. |
| | © 2018 The Vanguard Group, Inc. |
| | All rights reserved. |
| | Vanguard Marketing Corporation, Distributor. |
| |
| | Q212 072018 |

Semiannual Report | May 31, 2018
Vanguard U.S. Factor ETFs
Vanguard U.S. Liquidity Factor ETF
Vanguard U.S. Minimum Volatility ETF
Vanguard U.S. Momentum Factor ETF
Vanguard U.S. Multifactor ETF
Vanguard U.S. Quality Factor ETF
Vanguard U.S. Value Factor ETF
Vanguard’s Principles for Investing Success
We want to give you the best chance of investment success. These principles, grounded in Vanguard’s research and experience, can put you on the right path.
Goals. Create clear, appropriate investment goals.
Balance. Develop a suitable asset allocation using broadly diversified funds.
Cost. Minimize cost.
Discipline. Maintain perspective and long-term discipline.
A single theme unites these principles: Focus on the things you can control.
We believe there is no wiser course for any investor.
| |
| Contents | |
| Your Fund’s Performance at a Glance. | 1 |
| CEO’s Perspective. | 4 |
| Advisor’s Report. | 6 |
| U.S. Liquidity Factor ETF. | 9 |
| U.S. Minimum Volatility ETF. | 27 |
| U.S. Momentum Factor ETF. | 39 |
| U.S. Multifactor ETF. | 56 |
| U.S. Quality Factor ETF. | 72 |
| U.S. Value Factor ETF. | 87 |
| About Your Fund’s Expenses. | 105 |
| Trustees Approve Advisory Arrangements. | 107 |
| Glossary. | 108 |
Please note: The opinions expressed in this report are just that—informed opinions. They should not be considered promises
or advice. Also, please keep in mind that the information and opinions cover the period through the date on the front of this
report. Of course, the risks of investing in your fund are spelled out in the prospectus.
See the Glossary for definitions of investment terms used in this report.
About the cover: Nautical images have been part of Vanguard’s rich heritage since its start in 1975. For an
incoming ship, a lighthouse offers a beacon and safe path to shore. You can similarly depend on Vanguard to put
you first––and light the way––as you strive to meet your financial goals. Our client focus and low costs,
stemming from our unique ownership structure, assure that your interests are paramount.
Your Fund’s Performance at a Glance
• From their February 13, 2018, inception through May 31, 2018, Vanguard’s six U.S. Factor ETFs provided returns ranging from about 4% to more than 8%. All six ETFs outperformed their benchmark, the Russell 3000 Index.
• The U.S. Factor ETFs seek to provide long-term capital appreciation by investing in stocks that have lower or higher measures of certain factors relative to the broad U.S. equity market.
• Vanguard U.S. Momentum Factor ETF did best among the group, returning 8.35% based on net asset value, as stocks identified as attractive from a momentum standpoint outperformed.
• Vanguard U.S. Value Factor ETF advanced the least, returning 4.12% based on net asset value. In terms of relative performance, both strong selection in and an overweighting of energy contributed most, while an underweighting of technology and weak selection in consumer discretionary detracted.
| |
| Total Returns: Period Ended May 31, 2018 | |
| | Since Inception |
| Vanguard U.S. Liquidity Factor ETF (Inception: 2/13/2018) | |
| Market Price | 7.23% |
| Net Asset Value | 7.19 |
| Russell 3000 Index | 3.10 |
| Multi-Cap Core Funds Average | 0.62 |
| Multi-Cap Core Funds Average: Derived from data provided by Lipper, a Thomson Reuters Company, and captures information from |
| February 28, 2018, through May 31, 2018. | |
| |
| Vanguard U.S. Minimum Volatility ETF (Inception: 2/13/2018) | |
| Market Price | 7.05% |
| Net Asset Value | 6.99 |
| Russell 3000 Index | 3.10 |
| Multi-Cap Core Funds Average | 0.62 |
| Multi-Cap Core Funds Average: Derived from data provided by Lipper, a Thomson Reuters Company, and captures information from |
| February 28, 2018, through May 31, 2018. | |
| |
| Vanguard U.S. Momentum Factor ETF (Inception: 2/13/2018) | |
| Market Price | 8.39% |
| Net Asset Value | 8.35 |
| Russell 3000 Index | 3.10 |
| Multi-Cap Core Funds Average | 0.62 |
| Multi-Cap Core Funds Average: Derived from data provided by Lipper, a Thomson Reuters Company, and captures information from |
| February 28, 2018, through May 31, 2018. | |
1
| |
| | Since Inception |
| Vanguard U.S. Multifactor ETF (Inception: 2/13/2018) | |
| Market Price | 5.91% |
| Net Asset Value | 5.85 |
| Russell 3000 Index | 3.10 |
| Multi-Cap Core Funds Average | 0.62 |
| Multi-Cap Core Funds Average: Derived from data provided by Lipper, a Thomson Reuters Company, and captures information from |
| February 28, 2018, through May 31, 2018. | |
| |
| Vanguard U.S. Quality Factor ETF (Inception: 2/13/2018) | |
| Market Price | 7.23% |
| Net Asset Value | 7.17 |
| Russell 3000 Index | 3.10 |
| Multi-Cap Core Funds Average | 0.62 |
| Multi-Cap Core Funds Average: Derived from data provided by Lipper, a Thomson Reuters Company, and captures information from |
| February 28, 2018, through May 31, 2018. | |
| |
| Vanguard U.S. Value Factor ETF (Inception: 2/13/2018) | |
| Market Price | 4.17% |
| Net Asset Value | 4.12 |
| Russell 3000 Index | 3.10 |
| Multi-Cap Core Funds Average | 0.62 |
| Multi-Cap Core Funds Average: Derived from data provided by Lipper, a Thomson Reuters Company, and captures information from |
| February 28, 2018, through May 31, 2018. | |
The Vanguard ETF® Shares shown are traded on the Cboe BZX Exchange and are available only through brokers. The table provides ETF returns based on both the Cboe BZX market price and the net asset value for a share.
The market price is determined by the midpoint of the bid-offer spread as of the closing time of the New York Stock Exchange (generally 4 p.m., Eastern time). The net asset value is also determined as of the NYSE closing time. For more information about how the ETF Shares' market prices have compared with their net asset value, visit vanguard.com, select your ETF, and then select the Price and Performance tab. The ETF premium/discount analysis there shows the percentages of days on which the ETF Shares' market price was above or below the NAV.
2
| | |
| Expense Ratios | | |
| Your Fund Compared With Its Peer Group | | |
| | ETF | Peer Group |
| | Shares | Average |
| U.S. Liquidity Factor ETF | 0.13% | 1.11% |
| U.S. Minimum Volatility ETF | 0.13 | 1.11 |
| U.S. Momentum Factor ETF | 0.13 | 1.17 |
| U.S. Multifactor ETF | 0.18 | 1.11 |
| U.S. Quality Factor ETF | 0.13 | 1.11 |
| U.S. Value Factor ETF | 0.13 | 1.06 |
The fund expense ratios shown are from the prospectus dated February 13, 2018, and represent estimated costs for the current fiscal year.
For the period from inception through May 31, 2018, the funds’ annualized expense ratios were: 0.13% for the U.S. Liquidity Factor ETF,
0.13% for the U.S. Minimum Volatility ETF, 0.13% for the U.S. Momentum Factor ETF, 0.18% for the U.S. Multifactor ETF, 0.13% for the
U.S. Quality Factor ETF, and 0.13% for the U.S. Value Factor ETF. Peer-group expense ratios are derived from data provided by Lipper, a
Thomson Reuters Company, and capture information through year-end 2017.
Peer group: Multi-Cap Core Funds.
3
CEO’s Perspective

Tim Buckley
President and Chief Executive Officer
Dear Shareholder,
I feel extremely fortunate to have the chance to lead a company filled with people who come to work every day passionate about Vanguard’s core purpose: to take a stand for all investors, to treat them fairly, and to give them the best chance for investment success.
When I joined Vanguard in 1991, I found a mission-driven team focused on improving lives—helping people retire more comfortably, put their children through college, and achieve financial security. I also found a company with purpose in an industry ripe for improvement.
It was clear, even early in my career, that the cards were stacked against most investors. Hidden fees, performance-chasing, and poor advice were relentlessly eroding investors’ dreams.
We knew Vanguard could be different and, as a result, could make a real difference. We have lowered the costs of investing for our shareholders significantly. And we’re proud of the performance of our funds.
Vanguard is built for Vanguard investors—we focus solely on you, our fund shareholders. Everything we do is designed to give our clients the best chance for investment success. In my role as CEO, I’ll keep this priority
4
front and center. We’re proud of what we’ve achieved, but we’re even more excited about what’s to come.
Steady, time-tested guidance
Our guidance for investors, as always, is to stay the course, tune out the hyperbolic headlines, and focus on your goals and what you can control, such as costs and how much you save. This time-tested advice has served our clients well over the decades.
Regardless of how the markets perform in the short term, I’m incredibly optimistic about the future for our investors. We have a dedicated team serving you, and we will never stop striving to make
Vanguard the best place for you to invest through our high-quality funds and services, advice and guidance to help you meet your financial goals, and an experience that makes you feel good about entrusting us with your hard-earned savings.
Thank you for your continued loyalty.
Sincerely,

Mortimer J. Buckley
President and Chief Executive Officer
June 12, 2018
| | | |
| Market Barometer | | | |
| | Total Returns |
| | Periods Ended May 31, 2018 |
| | Six | One | Five Years |
| | Months | Year | (Annualized) |
| Stocks | | | |
| Russell 1000 Index (Large-caps) | 3.33% | 14.60% | 12.91% |
| Russell 2000 Index (Small-caps) | 6.47 | 20.76 | 12.18 |
| Russell 3000 Index (Broad U.S. market) | 3.57 | 15.06 | 12.85 |
| FTSE All-World ex US Index (International) | 0.36 | 9.62 | 5.84 |
| |
| Bonds | | | |
| Bloomberg Barclays U.S. Aggregate Bond Index | | | |
| (Broad taxable market) | -1.04% | -0.37% | 1.98% |
| Bloomberg Barclays Municipal Bond Index | | | |
| (Broad tax-exempt market) | 0.71 | 1.11 | 2.92 |
| Citigroup Three-Month U.S. Treasury Bill Index | 0.73 | 1.24 | 0.35 |
| |
| CPI | | | |
| Consumer Price Index | 1.99% | 2.80% | 1.55% |
5
Advisor’s Report
From their February 13, 2018, inception through May 31, 2018, Vanguard’s six U.S. Factor ETFs posted returns ranging from about 4% to more than 8%. They outperformed the 3.10% return of their benchmark, the Russell 3000 Index, for the period.
The objective of each U.S. Factor ETF is to create a portfolio that has broad exposure to large-, mid-, and small-capitalization U.S. equities and that has the potential for long-term capital appreciation, subject to rules-based screens as follows:
• Vanguard U.S. Liquidity Factor ETF seeks exposure to stocks with lower measures of trading liquidity, such as daily trading volume and its effect on the security’s price.
• Vanguard U.S. Minimum Volatility ETF seeks exposure to stocks with the potential to generate lower volatility relative to the broad U.S. equity market.
• Vanguard U.S. Momentum Factor ETF seeks exposure to stocks with relatively strong recent performance, as identified by measures such as performance over different periods.
• Vanguard U.S. Multifactor ETF seeks exposure to stocks with relatively strong recent performance, strong fundamentals, and low prices relative to fundamentals.
• Vanguard U.S. Quality Factor ETF seeks exposure to stocks with strong fundamentals as identified by measures such as profitability, earnings, and balance-sheet strength.
• Vanguard U.S. Value Factor ETF seeks exposure to stocks with lower prices relative to fundamental measures of value such as book/price and earnings/ price ratios.
The investment environment
The broad U.S. equity market advanced for the period, with small-cap stocks outperforming large-caps and growth stocks outperforming value stocks. Volatility returned after an unusually long period of calm as markets reacted to recently enacted U.S. tax cuts, trade-war jitters, and perceived inflation risks.
The Federal Reserve, under new Chair Jerome Powell, raised the federal funds target rate in March by a quarter percentage point and began signaling that it could speed up its timetable for subsequent increases. (In June, after the close of the period covered in this report, the Fed raised the rate another quarter point, to 1.75%–2%, and signaled that it could raise the rate twice more in 2018 and at least three times in 2019.)
U.S. gross domestic product grew at an annual rate of 2.2% in the first quarter of 2018, a decrease from the previous quarter’s 2.9%. Nonresidential fixed investment, personal consumption, exports, and private inventory investment boosted growth, as did government spending at the federal, state, and local levels. Imports, however, slowed.
6
Small-cap companies tended to be better-positioned to benefit from the recent U.S. tax-law changes than large-caps, which can spread their tax liabilities globally. Small-caps also are likely to have less international exposure and thus be less affected by trade friction.
The outperformance of growth stocks was most pronounced within large-caps, with big information technology companies showing the strongest overall momentum Across the market-cap spectrum, the energy and technology sectors performed best. Health care did well within small-caps.
Financial services disappointed, despite expectations for rising interest rates. Market commentators have attributed this to slow loan growth.
The funds’ successes and shortfalls
Exposure to small-cap stocks drove the positive returns for all six ETFs.
Sector exposure affected the funds differently based on the factors each seeks to emphasize:
• The U.S. Liquidity Factor ETF posted positive returns in all but one sector. The lone exception, consumer staples, was nevertheless a net contributor to relative performance because of underweighting. Selection in health care and financial services most helped relative returns; an underweight allocation to technology detracted.
• The U.S. Minimum Volatility ETF experienced about 30% less annualized volatility for the period than its benchmark, the Russell 3000 Index. The index was up 3.10% over the period, but given larger bouts of volatility, the fund was able to catch more of the upside.
• The U.S. Momentum Factor ETF benefited most from our selection in health care and from both our overweight allocation to and selection in the high-performing technology sector. An underweight allocation to and selection within the low-performing financial services sector also bolstered relative returns.
• The U.S. Multifactor ETF drew the biggest contributions from the quality and momentum factors, with value factors helping to a lesser extent. The consumer staples and consumer discretionary sectors were the most significant relative contributors.
• The U.S. Quality Factor ETF benefited from overweight allocations to and selection within health care and technology; an underweight allocation to the high-performing energy sector detracted.
• The U.S. Value Factor ETF most benefited from an overweighting of energy, though an underweight allocation to the outperforming technology sector hurt.
We expect our approach to portfolio construction to produce long-term capital appreciation that reflects the factors emphasized by each of the U.S. Factor
7
portfolios. Not all periods will produce such favorable results across each factor. However, we believe that focusing on the risk-adjusted returns of each portfolio relative to its targeted factors and the benchmark will serve investors well over time.
We thank you for your investment and look forward to serving you in the period ahead.
Antonio Picca, Portfolio Manager
Liqian Ren, Portfolio Manager
Quantitative Equity Group
June 20, 2018
8
U.S. Liquidity Factor ETF
Fund Profile
As of May 31, 2018
| | |
| Portfolio Characteristics | | |
| | | Russell |
| | | 3000 |
| | Fund | Index |
| Number of Stocks | 922 | 2,941 |
| Median Market Cap | $4.9B | $66.7B |
| Price/Earnings Ratio | 20.5x | 20.8x |
| Price/Book Ratio | 2.3x | 3.0x |
| Return on Equity | 10.2% | 15.0% |
| Earnings Growth | | |
| Rate | 8.1% | 7.9% |
| Dividend Yield | 1.5% | 1.8% |
| Foreign Holdings | 0.6% | 0.0% |
| Turnover Rate | | |
| (Annualized) | 18% | — |
| Ticker Symbol | VFLQ | — |
| Expense Ratio1 | 0.13% | — |
| 30-Day SEC Yield | 1.42% | — |
| Short-Term Reserves | 0.5% | — |
| | |
| Sector Diversification (% of equity exposure) |
| | | Russell |
| | | 3000 |
| | Fund | Index |
| Consumer Discretionary | 9.5% | 14.3% |
| Consumer Staples | 3.7 | 5.3 |
| Energy | 3.8 | 6.0 |
| Financial Services | 34.7 | 21.1 |
| Health Care | 12.4 | 13.2 |
| Materials & Processing | 7.9 | 3.8 |
| Other | 0.7 | 0.0 |
| Producer Durables | 14.9 | 10.8 |
| Technology | 6.8 | 21.0 |
| Utilities | 5.6 | 4.5 |
Sector categories are based on the Russell Global Sectors (“RGS”),
except for the “Other” category (if applicable), which includes
securities that have not been provided a RGS classification as of
the effective reporting period.
| | |
| Ten Largest Holdings (% of total net assets) |
| Ecolab Inc. | Chemicals: | |
| | Diversified | 0.8% |
| Fiserv Inc. | Financial Data & | |
| | Systems | 0.7 |
| Sirius XM Holdings Inc. | Radio & TV | |
| | Broadcasters | 0.7 |
| Monster Beverage Corp. Beverage: Soft | |
| | Drinks | 0.7 |
| Stryker Corp. | Medical & Dental | |
| | Instruments & | |
| | Supplies | 0.7 |
| Southern Copper Corp. | Copper | 0.7 |
| Phillips 66 | Oil: Refining & | |
| | Marketing | 0.6 |
| Sysco Corp. | Foods | 0.6 |
| S&P Global Inc. | Financial Data & | |
| | Systems | 0.6 |
| Marsh & McLennan | | |
| Cos. Inc. | Insurance: Multi-Line | 0.6 |
| Top Ten | | 6.7% |
The holdings listed exclude any temporary cash investments and
equity index products.
1 The expense ratio shown is from the prospectus dated February 13, 2018, and represents estimated costs for the current fiscal year. For
the period from inception through May 31, 2018, the annualized expense ratio was 0.13%.
9
U.S. Liquidity Factor ETF
Performance Summary
All of the returns in this report represent past performance, which is not a guarantee of future results that may be achieved by the fund. (Current performance may be lower or higher than the performance data cited. For performance data current to the most recent month-end, visit our website at vanguard.com/performance.) Note, too, that both investment returns and principal value can fluctuate widely, so an investor’s shares, when sold, could be worth more or less than their original cost. The returns shown do not reflect taxes that a shareholder would pay on fund distributions or on the sale of fund shares.
Fiscal-Period Total Returns (%): February 13, 2018, Through May 31, 2018
Total Returns: Period Ended March 31, 2018
This table presents returns through the latest calendar quarter—rather than through the end of the fiscal period.
Securities and Exchange Commission rules require that we provide this information.
| | |
| | Inception | Since |
| | Date | Inception |
| ETF Shares | 2/13/2018 | |
| Market Price | | 2.19% |
| Net Asset Value | | 2.15 |
See Financial Highlights for dividend and capital gains information.
10
U.S. Liquidity Factor ETF
Financial Statements (unaudited)
Statement of Net Assets
As of May 31, 2018
The fund reports a complete list of its holdings in regulatory filings four times in each fiscal year, at the quarter-ends. For the second and fourth fiscal quarters, the lists appear in the fund’s semiannual and annual reports to shareholders. For the first and third fiscal quarters, the fund files the lists with the Securities and Exchange Commission on Form N-Q. Shareholders can look up the fund’s Forms N-Q on the SEC’s website at sec.gov. Forms N-Q may also be reviewed and copied at the SEC’s Public Reference Room (see the back cover of this report for further information).
| | | |
| | | | Market |
| | | | Value• |
| | Shares | ($000) |
| Common Stocks (99.4%) | | |
| Consumer Discretionary (9.5%) | | |
| | Sirius XM Holdings Inc. | 7,575 | 54 |
| | Las Vegas Sands Corp. | 617 | 50 |
| | VF Corp. | 337 | 27 |
| | Carnival Corp. | 335 | 21 |
| | Emerald Expositions Events | | |
| | Inc. | 778 | 16 |
| | Columbia Sportswear Co. | 153 | 13 |
| * | Grand Canyon Education Inc. | 118 | 13 |
| * | Liberty Media Corp-Liberty | | |
| | SiriusXM Class C | 282 | 13 |
| | Choice Hotels International Inc. | 154 | 12 |
| * | Bright Horizons Family | | |
| | Solutions Inc. | 115 | 12 |
| | Penske Automotive Group Inc. | 241 | 12 |
| * | Hilton Grand Vacations Inc. | 256 | 10 |
| | AMERCO | 30 | 10 |
| * | Career Education Corp. | 615 | 9 |
| | Pool Corp. | 64 | 9 |
| | News Corp. Class A | 604 | 9 |
| | Marcus Corp. | 286 | 9 |
| | Johnson Outdoors Inc. Class A | 115 | 9 |
| | Cable One Inc. | 13 | 8 |
| | Inter Parfums Inc. | 158 | 8 |
| | HealthStream Inc. | 299 | 8 |
| * | Regis Corp. | 470 | 8 |
| | Churchill Downs Inc. | 27 | 8 |
| * | Stoneridge Inc. | 256 | 8 |
| * | Golden Entertainment Inc. | 262 | 8 |
| | National Presto Industries Inc. | 69 | 8 |
| | Movado Group Inc. | 154 | 8 |
| * | America’s Car-Mart Inc. | 121 | 8 |
| * | Lands’ End Inc. | 381 | 7 |
| | Citi Trends Inc. | 246 | 7 |
| * | Liberty Media Corp-Liberty | | |
| | Braves | 295 | 7 |
| * | Floor & Decor Holdings Inc. | | |
| | Class A | 153 | 7 |
| | | |
| | Haverty Furniture Cos. Inc. | 348 | 7 |
| | Hooker Furniture Corp. | 182 | 7 |
| * | Scientific Games Corp. | 114 | 7 |
| * | K12 Inc. | 416 | 7 |
| | Tower International Inc. | 227 | 7 |
| * | QuinStreet Inc. | 484 | 7 |
| * | American Public Education Inc. | 155 | 7 |
| | International Game | | |
| | Technology plc | 261 | 7 |
| | Acushnet Holdings Corp. | 272 | 6 |
| | Superior Industries | | |
| | International Inc. | 364 | 6 |
| * | ServiceMaster Global | | |
| | Holdings Inc. | 111 | 6 |
| * | FTD Cos. Inc. | 1,095 | 6 |
| * | Cavco Industries Inc. | 30 | 6 |
| * | Bridgepoint Education Inc. | | |
| | Class A | 862 | 6 |
| | Service Corp. International | 157 | 6 |
| * | Cimpress NV | 41 | 6 |
| * | Revlon Inc. Class A | 325 | 6 |
| * | MCBC Holdings Inc. | 188 | 6 |
| * | Care.com Inc. | 267 | 6 |
| | Carriage Services Inc. Class A | 220 | 6 |
| * | Barnes & Noble Education Inc. | 863 | 5 |
| | Marriott Vacations Worldwide | | |
| | Corp. | 45 | 5 |
| * | Belmond Ltd. Class A | 451 | 5 |
| * | WideOpenWest Inc. | 605 | 5 |
| * | Visteon Corp. | 42 | 5 |
| * | Carrols Restaurant Group Inc. | 402 | 5 |
| * | Denny’s Corp. | 326 | 5 |
| | Gentex Corp. | 206 | 5 |
| * | Liberty Media Corp-Liberty | | |
| | Formula One | 156 | 5 |
| * | At Home Group Inc. | 139 | 5 |
| * | Madison Square Garden Co. | | |
| | Class A | 18 | 5 |
| | Standard Motor Products Inc. | 104 | 5 |
11
U.S. Liquidity Factor ETF
| | | |
| | | | Market |
| | | | Value• |
| | Shares | ($000) |
| * | Quotient Technology Inc. | 348 | 5 |
| | Scholastic Corp. | 99 | 4 |
| * | Vera Bradley Inc. | 382 | 4 |
| | Viad Corp. | 82 | 4 |
| | Ruth’s Hospitality Group Inc. | 161 | 4 |
| * | Gentherm Inc. | 120 | 4 |
| * | Chuy’s Holdings Inc. | 144 | 4 |
| | Cato Corp. Class A | 184 | 4 |
| * | El Pollo Loco Holdings Inc. | 395 | 4 |
| * | Motorcar Parts of America Inc. | 195 | 4 |
| | Texas Roadhouse Inc. Class A | 67 | 4 |
| * | Potbelly Corp. | 310 | 4 |
| | KAR Auction Services Inc. | 77 | 4 |
| | Extended Stay America Inc. | 193 | 4 |
| | New Media Investment Group | | |
| | Inc. | 232 | 4 |
| * | Biglari Holdings Inc. Class B | 18 | 4 |
| * | Universal Electronics Inc. | 129 | 4 |
| * | Central Garden & Pet Co. | | |
| | Class A | 100 | 4 |
| | Matthews International Corp. | | |
| | Class A | 69 | 4 |
| | Sonic Automotive Inc. Class A | 178 | 4 |
| * | Duluth Holdings Inc. | 217 | 4 |
| * | Sportsman’s Warehouse | | |
| | Holdings Inc. | 718 | 4 |
| * | Del Taco Restaurants Inc. | 304 | 4 |
| * | Liberty Broadband Corp. | 53 | 4 |
| * | Monarch Casino & Resort Inc. | 81 | 4 |
| | Garmin Ltd. | 60 | 4 |
| * | Party City Holdco Inc. | 245 | 4 |
| | Aramark | 92 | 4 |
| | International Speedway Corp. | | |
| | Class A | 84 | 3 |
| * | Hovnanian Enterprises Inc. | | |
| | Class A | 1,909 | 3 |
| | Dana Inc. | 152 | 3 |
| * | MDC Partners Inc. Class A | 798 | 3 |
| | Cinemark Holdings Inc. | 98 | 3 |
| | Entravision Communications | | |
| | Corp. Class A | 803 | 3 |
| * | Bojangles’ Inc. | 206 | 3 |
| * | LKQ Corp. | 94 | 3 |
| * | Del Frisco’s Restaurant | | |
| | Group Inc. | 220 | 3 |
| | Shoe Carnival Inc. | 89 | 3 |
| * | Michaels Cos. Inc. | 152 | 3 |
| * | Boot Barn Holdings Inc. | 112 | 3 |
| * | Eros International plc | 155 | 2 |
| * | Drive Shack Inc. | 310 | 2 |
| * | Iconix Brand Group Inc. | 2,921 | 2 |
| * | GCI Liberty Inc. Class A | 40 | 2 |
| * | Biglari Holdings Inc. | 1 | 1 |
| | | | 762 |
| | | |
| Consumer Staples (3.7%) | | |
| * | Monster Beverage Corp. | 1,040 | 53 |
| | Sysco Corp. | 787 | 51 |
| | Kraft Heinz Co. | 336 | 19 |
| | Lancaster Colony Corp. | 128 | 16 |
| | Colgate-Palmolive Co. | 227 | 14 |
| | Kimberly-Clark Corp. | 128 | 13 |
| | General Mills Inc. | 229 | 10 |
| * | Primo Water Corp. | 530 | 9 |
| | Flowers Foods Inc. | 443 | 9 |
| * | Chefs’ Warehouse Inc. | 314 | 9 |
| | National Beverage Corp. | 88 | 8 |
| * | Freshpet Inc. | 362 | 8 |
| | Weis Markets Inc. | 148 | 8 |
| * | Farmer Brothers Co. | 257 | 8 |
| * | Pilgrim’s Pride Corp. | 371 | 7 |
| | Ingles Markets Inc. Class A | 204 | 6 |
| | Brown-Forman Corp. Class B | 101 | 6 |
| | Lamb Weston Holdings Inc. | 87 | 6 |
| | Tootsie Roll Industries Inc. | 188 | 6 |
| | Andersons Inc. | 162 | 5 |
| | Nu Skin Enterprises Inc. | | |
| | Class A | 54 | 5 |
| | WD-40 Co. | 31 | 4 |
| | SpartanNash Co. | 159 | 4 |
| | PepsiCo Inc. | 33 | 3 |
| | Ingredion Inc. | 29 | 3 |
| * | Edgewell Personal Care Co. | 73 | 3 |
| * | Smart & Final Stores Inc. | 524 | 2 |
| | | | 295 |
| Energy (3.8%) | | |
| | Phillips 66 | 440 | 51 |
| * | EP Energy Corp. Class A | 16,874 | 49 |
| | Kinder Morgan Inc. | 1,015 | 17 |
| * | Penn Virginia Corp. | 192 | 13 |
| * | Pioneer Energy Services | | |
| | Corp. | 2,258 | 12 |
| | Marathon Petroleum Corp. | 154 | 12 |
| | EOG Resources Inc. | 103 | 12 |
| * | Clean Energy Fuels Corp. | 3,648 | 12 |
| * | Centennial Resource | | |
| | Development Inc. Class A | 529 | 9 |
| * | TPI Composites Inc. | 325 | 9 |
| * | Energy XXI Gulf Coast Inc. | 1,127 | 8 |
| * | Mammoth Energy Services | | |
| | Inc. | 219 | 8 |
| * | Abraxas Petroleum Corp. | 2,597 | 7 |
| * | NCS Multistage Holdings Inc. | 433 | 7 |
| | Anadarko Petroleum Corp. | 86 | 6 |
| | RPC Inc. | 356 | 6 |
| * | Tellurian Inc. | 506 | 6 |
| | Valvoline Inc. | 273 | 6 |
| * | Newpark Resources Inc. | 466 | 5 |
| * | TETRA Technologies Inc. | 1,141 | 5 |
12
U.S. Liquidity Factor ETF
| | | |
| | | | Market |
| | | | Value• |
| | Shares | ($000) |
| * | Matrix Service Co. | 243 | 5 |
| | Frank’s International NV | 611 | 4 |
| * | WildHorse Resource | | |
| | Development Corp. | 158 | 4 |
| * | Par Pacific Holdings Inc. | 235 | 4 |
| * | Exterran Corp. | 136 | 4 |
| * | REX American Resources | | |
| | Corp. | 48 | 4 |
| | TerraForm Power Inc. | | |
| | Class A | 327 | 4 |
| * | Pacific Ethanol Inc. | 1,048 | 4 |
| * | SandRidge Energy Inc. | 227 | 3 |
| | Archrock Inc. | 252 | 3 |
| * | Bonanza Creek Energy Inc. | 67 | 2 |
| * | Renewable Energy Group Inc. | 130 | 2 |
| * | Ring Energy Inc. | 135 | 2 |
| * | Jagged Peak Energy Inc. | 142 | 2 |
| | | | 307 |
| Financial Services (34.5%) | | |
| * | Fiserv Inc. | 778 | 56 |
| | S&P Global Inc. | 259 | 51 |
| | Marsh & McLennan Cos. Inc. | 624 | 50 |
| | Prologis Inc. | 770 | 50 |
| | Progressive Corp. | 746 | 46 |
| | Fidelity National Information | | |
| | Services Inc. | 452 | 46 |
| | Public Storage | 213 | 45 |
| | Aon plc | 313 | 44 |
| | Intercontinental Exchange Inc. | 608 | 43 |
| | CME Group Inc. | 261 | 43 |
| | Moody’s Corp. | 248 | 42 |
| | State Street Corp. | 437 | 42 |
| | Aflac Inc. | 926 | 42 |
| | TD Ameritrade Holding Corp. | 682 | 40 |
| | BlackRock Inc. | 68 | 36 |
| | Prudential Financial Inc. | 353 | 34 |
| | Capital One Financial Corp. | 363 | 34 |
| | Chubb Ltd. | 252 | 33 |
| | BB&T Corp. | 616 | 32 |
| | Bank of New York Mellon | | |
| | Corp. | 522 | 29 |
| | Allstate Corp. | 277 | 26 |
| | American National Insurance | | |
| | Co. | 216 | 26 |
| | SunTrust Banks Inc. | 318 | 21 |
| | Commerce Bancshares Inc. | 286 | 18 |
| | BOK Financial Corp. | 181 | 18 |
| | Hospitality Properties Trust | 611 | 18 |
| | PS Business Parks Inc. | 143 | 18 |
| | Bank of Hawaii Corp. | 203 | 17 |
| | TFS Financial Corp. | 1,075 | 17 |
| | Morningstar Inc. | 137 | 16 |
| | Travelers Cos. Inc. | 126 | 16 |
| | Erie Indemnity Co. Class A | 136 | 15 |
| | Rayonier Inc. | 376 | 15 |
| | | | |
| | Ryman Hospitality Properties | | |
| | Inc. | | 171 | 14 |
| | First Citizens BancShares Inc. | | |
| | Class A | | 30 | 13 |
| | First Hawaiian Inc. | | 450 | 13 |
| * | Enstar Group Ltd. | | 64 | 13 |
| * | Fair Isaac Corp. | | 70 | 13 |
| | Equinix Inc. | | 32 | 13 |
| | White Mountains Insurance | | |
| | Group Ltd. | | 14 | 13 |
| | UMB Financial Corp. | | 163 | 13 |
| * | CoreLogic Inc. | | 234 | 12 |
| | PNC Financial Services Group | | |
| | Inc. | | 85 | 12 |
| | Chemical Financial Corp. | | 217 | 12 |
| * | Equity Commonwealth | | 390 | 12 |
| | United Financial Bancorp Inc. | 693 | 12 |
| | Paramount Group Inc. | | 801 | 12 |
| | Hanover Insurance Group Inc. | 99 | 12 |
| | CNA Financial Corp. | | 255 | 12 |
| | WP Carey Inc. | | 177 | 12 |
| | 1st Source Corp. | | 221 | 12 |
| | Apple Hospitality REIT Inc. | 590 | 11 |
| | Santander Consumer USA | | |
| | Holdings Inc. | | 626 | 11 |
| | Bryn Mawr Bank Corp. | | 238 | 11 |
| | Associated Banc-Corp | | 402 | 11 |
| | American Tower Corp. | | 80 | 11 |
| * | Howard Hughes Corp. | | 87 | 11 |
| | Charles Schwab Corp. | | 197 | 11 |
| * | On Deck Capital Inc. | 1,636 | 11 |
| | WR Berkley Corp. | | 141 | 11 |
| | American Express Co. | | 109 | 11 |
| | Brown & Brown Inc. | | 384 | 11 |
| | Home BancShares Inc. | | 443 | 10 |
| | First Industrial Realty Trust Inc. | 308 | 10 |
| | Stifel Financial Corp. | | 172 | 10 |
| | Douglas Emmett Inc. | | 261 | 10 |
| | Primerica Inc. | | 102 | 10 |
| | Sun Communities Inc. | | 97 | 9 |
| | Highwoods Properties Inc. | 195 | 9 |
| | Weingarten Realty Investors | 315 | 9 |
| | Alleghany Corp. | | 16 | 9 |
| | Broadridge Financial Solutions | | |
| | Inc. | | 79 | 9 |
| | United Fire Group Inc. | | 170 | 9 |
| | Liberty Property Trust | | 205 | 9 |
| | Equity LifeStyle Properties Inc. | 99 | 9 |
| | Senior Housing Properties | | |
| | Trust | | 503 | 9 |
| | OFG Bancorp | | 628 | 9 |
| | Umpqua Holdings Corp. | | 376 | 9 |
| | Wintrust Financial Corp. | | 96 | 9 |
| | Urstadt Biddle Properties Inc. | | |
| | Class A | | 403 | 9 |
13
U.S. Liquidity Factor ETF
| | | |
| | | | Market |
| | | | Value• |
| | Shares | ($000) |
| | Pinnacle Financial Partners Inc. | 131 | 9 |
| | American Campus | | |
| | Communities Inc. | 219 | 9 |
| * | Markel Corp. | 8 | 9 |
| | Eaton Vance Corp. | 163 | 9 |
| | Hancock Whitney Corp. | 172 | 9 |
| | Live Oak Bancshares Inc. | 292 | 9 |
| | BGC Partners Inc. Class A | 749 | 9 |
| | CNO Financial Group Inc. | 427 | 9 |
| | First American Financial Corp. | 164 | 9 |
| | US Bancorp | 169 | 8 |
| * | TriState Capital Holdings Inc. | 328 | 8 |
| | BancFirst Corp. | 141 | 8 |
| | Healthcare Realty Trust Inc. | 309 | 8 |
| | MetLife Inc. | 183 | 8 |
| * | Western Alliance Bancorp | 139 | 8 |
| | S&T Bancorp Inc. | 184 | 8 |
| | Nelnet Inc. Class A | 135 | 8 |
| | United Insurance Holdings | | |
| | Corp. | 400 | 8 |
| | First Bancorp | 197 | 8 |
| | Popular Inc. | 179 | 8 |
| | Carolina Financial Corp. | 185 | 8 |
| | Synovus Financial Corp. | 149 | 8 |
| * | Veritex Holdings Inc. | 262 | 8 |
| | Jones Lang LaSalle Inc. | 49 | 8 |
| | Forest City Realty Trust Inc. | | |
| | Class A | 393 | 8 |
| | Fidelity Southern Corp. | 325 | 8 |
| | Park National Corp. | 68 | 8 |
| | FB Financial Corp. | 190 | 8 |
| | Kilroy Realty Corp. | 102 | 8 |
| | Webster Financial Corp. | 121 | 8 |
| | Alexander’s Inc. | 20 | 8 |
| | SEI Investments Co. | 121 | 8 |
| | TriCo Bancshares | 198 | 8 |
| | Prosperity Bancshares Inc. | 106 | 8 |
| | Investors Real Estate Trust | 1,378 | 8 |
| | Tompkins Financial Corp. | 91 | 8 |
| | Beneficial Bancorp Inc. | 467 | 8 |
| | TrustCo Bank Corp. | 877 | 8 |
| * | Euronet Worldwide Inc. | 91 | 8 |
| | Univest Corp. of Pennsylvania | 261 | 8 |
| | American Financial Group Inc. | 69 | 8 |
| * | Marcus & Millichap Inc. | 202 | 8 |
| * | Franklin Financial Network Inc. | 207 | 8 |
| | Lakeland Bancorp Inc. | 376 | 8 |
| * | Triumph Bancorp Inc. | 184 | 8 |
| | Old Republic International | | |
| | Corp. | 360 | 8 |
| * | Bancorp Inc. | 665 | 8 |
| | UMH Properties Inc. | 508 | 7 |
| | National Western Life Group | | |
| | Inc. Class A | 24 | 7 |
| | | |
| | United Bankshares Inc. | 204 | 7 |
| * | HRG Group Inc. | 579 | 7 |
| | Tier REIT Inc. | 334 | 7 |
| | Kinsale Capital Group Inc. | 138 | 7 |
| * | INTL. FCStone Inc. | 145 | 7 |
| | Diamond Hill Investment | | |
| | Group Inc. | 37 | 7 |
| | National Bank Holdings Corp. | | |
| | Class A | 186 | 7 |
| | MarketAxess Holdings Inc. | 33 | 7 |
| * | SLM Corp. | 616 | 7 |
| | National General Holdings | | |
| | Corp. | 253 | 7 |
| | Sunstone Hotel Investors Inc. | 398 | 7 |
| | BankUnited Inc. | 164 | 7 |
| | Hudson Pacific Properties Inc. | 194 | 7 |
| | Dime Community Bancshares | | |
| | Inc. | 336 | 7 |
| | Federal Agricultural Mortgage | | |
| | Corp. | 73 | 7 |
| * | eHealth Inc. | 317 | 7 |
| | Cincinnati Financial Corp. | 97 | 7 |
| | NorthStar Realty Europe Corp. | 479 | 7 |
| | Lazard Ltd. Class A | 130 | 7 |
| * | Enova International Inc. | 199 | 7 |
| | First Busey Corp. | 207 | 7 |
| | Safety Insurance Group Inc. | 77 | 7 |
| * | Essent Group Ltd. | 193 | 7 |
| | OceanFirst Financial Corp. | 224 | 7 |
| | Lakeland Financial Corp. | 134 | 7 |
| | Meridian Bancorp Inc. | 332 | 6 |
| | Universal Health Realty | | |
| | Income Trust | 104 | 6 |
| | Heritage Financial Corp. | 200 | 6 |
| | City Holding Co. | 86 | 6 |
| | WesBanco Inc. | 137 | 6 |
| | Radian Group Inc. | 401 | 6 |
| | Cullen/Frost Bankers Inc. | 55 | 6 |
| | Torchmark Corp. | 74 | 6 |
| | InfraREIT Inc. | 293 | 6 |
| | LPL Financial Holdings Inc. | 91 | 6 |
| | Ashford Hospitality Trust Inc. | 849 | 6 |
| | Jack Henry & Associates Inc. | 50 | 6 |
| | Southside Bancshares Inc. | 183 | 6 |
| | Gaming and Leisure Properties | | |
| | Inc. | 178 | 6 |
| | Navigators Group Inc. | 106 | 6 |
| | ConnectOne Bancorp Inc. | 237 | 6 |
| | MSCI Inc. Class A | 38 | 6 |
| | WSFS Financial Corp. | 118 | 6 |
| | Sandy Spring Bancorp Inc. | 145 | 6 |
| | EPR Properties | 98 | 6 |
| | NBT Bancorp Inc. | 156 | 6 |
| | PJT Partners Inc. | 107 | 6 |
14
U.S. Liquidity Factor ETF
| | | |
| | | | Market |
| | | | Value• |
| | Shares | ($000) |
| | Loews Corp. | 121 | 6 |
| * | Braemar Hotels & Resorts Inc. | 537 | 6 |
| | Community Healthcare Trust | | |
| | Inc. | 213 | 6 |
| * | Jefferies Financial Group Inc. | 267 | 6 |
| | Reinsurance Group of America | | |
| | Inc. Class A | 39 | 6 |
| | Oritani Financial Corp. | 362 | 6 |
| | Farmland Partners Inc. | 666 | 6 |
| | Heartland Financial USA Inc. | 103 | 6 |
| | Towne Bank | 177 | 6 |
| | Midland States Bancorp Inc. | 171 | 6 |
| | Axis Capital Holdings Ltd. | 97 | 6 |
| * | Greenlight Capital Re Ltd. | | |
| | Class A | 385 | 6 |
| | Provident Financial Services | | |
| | Inc. | 196 | 5 |
| | Employers Holdings Inc. | 138 | 5 |
| | PacWest Bancorp | 102 | 5 |
| | Uniti Group Inc. | 253 | 5 |
| | Banco Latinoamericano de | | |
| | Comercio Exterior SA | 199 | 5 |
| | Iron Mountain Inc. | 159 | 5 |
| | Assured Guaranty Ltd. | 149 | 5 |
| | Central Pacific Financial Corp. | 179 | 5 |
| | Green Bancorp Inc. | 231 | 5 |
| * | Arch Capital Group Ltd. | 66 | 5 |
| | Simon Property Group Inc. | 32 | 5 |
| | Cedar Realty Trust Inc. | 1,159 | 5 |
| | Cousins Properties Inc. | 532 | 5 |
| | Crown Castle International | | |
| | Corp. | 48 | 5 |
| | Hanmi Financial Corp. | 166 | 5 |
| | ServisFirst Bancshares Inc. | 118 | 5 |
| | Boston Private Financial | | |
| | Holdings Inc. | 286 | 5 |
| | Investors Bancorp Inc. | 361 | 5 |
| | FNF Group | 129 | 5 |
| | Independent Bank Corp. | 60 | 5 |
| * | St. Joe Co. | 262 | 5 |
| * | Seacoast Banking Corp. of | | |
| | Florida | 149 | 5 |
| | Maiden Holdings Ltd. | 529 | 5 |
| | RMR Group Inc. Class A | 61 | 5 |
| | Enterprise Financial Services | | |
| | Corp. | 84 | 5 |
| | IBERIABANK Corp. | 57 | 5 |
| * | Flagstar Bancorp Inc. | 128 | 4 |
| | East West Bancorp Inc. | 64 | 4 |
| | Lamar Advertising Co. Class A | 64 | 4 |
| | Bluerock Residential Growth | | |
| | REIT Inc. Class A | 498 | 4 |
| | Investment Technology Group | | |
| | Inc. | 200 | 4 |
| | | |
| | Life Storage Inc. | 47 | 4 |
| | Preferred Bank | 68 | 4 |
| | Park Hotels & Resorts Inc. | 134 | 4 |
| | UDR Inc. | 118 | 4 |
| | First Financial Bankshares Inc. | 81 | 4 |
| | Cohen & Steers Inc. | 109 | 4 |
| | STORE Capital Corp. | 158 | 4 |
| | Jernigan Capital Inc. | 214 | 4 |
| | Renasant Corp. | 88 | 4 |
| | Peapack Gladstone Financial | | |
| | Corp. | 122 | 4 |
| | Dun & Bradstreet Corp. | 34 | 4 |
| | RE/MAX Holdings Inc. Class A | 80 | 4 |
| | First Financial Bancorp | 132 | 4 |
| | Selective Insurance Group Inc. | 73 | 4 |
| | Independent Bank Group Inc. | 55 | 4 |
| | First Commonwealth Financial | | |
| | Corp. | 263 | 4 |
| | Westamerica Bancorporation | 72 | 4 |
| | Franklin Street Properties | | |
| | Corp. | 532 | 4 |
| | Brookline Bancorp Inc. | 226 | 4 |
| | Union Bankshares Corp. | 100 | 4 |
| | National Retail Properties Inc. | 99 | 4 |
| | Getty Realty Corp. | 156 | 4 |
| | Horace Mann Educators Corp. | 92 | 4 |
| | International Bancshares Corp. | 94 | 4 |
| | Raymond James Financial Inc. | 42 | 4 |
| | CorEnergy Infrastructure Trust | | |
| | Inc. | 112 | 4 |
| | Kearny Financial Corp. | 278 | 4 |
| | Assurant Inc. | 43 | 4 |
| | First Merchants Corp. | 88 | 4 |
| | Opus Bank | 135 | 4 |
| | Medical Properties Trust Inc. | 294 | 4 |
| * | Texas Capital Bancshares Inc. | 41 | 4 |
| | Sterling Bancorp | 159 | 4 |
| * | PennyMac Financial Services | | |
| | Inc. Class A | 194 | 4 |
| * | MGIC Investment Corp. | 374 | 4 |
| | AMERISAFE Inc. | 65 | 4 |
| | Select Income REIT | 179 | 4 |
| | American Homes 4 Rent | | |
| | Class A | 194 | 4 |
| | Monmouth Real Estate | | |
| | Investment Corp. | 248 | 4 |
| | Gladstone Commercial Corp. | 203 | 4 |
| | Apartment Investment & | | |
| | Management Co. | 93 | 4 |
| * | Customers Bancorp Inc. | 125 | 4 |
| | CVB Financial Corp. | 163 | 4 |
| | Arthur J Gallagher & Co. | 57 | 4 |
| | Capitol Federal Financial Inc. | 286 | 4 |
| | Navient Corp. | 272 | 4 |
15
U.S. Liquidity Factor ETF
| | | |
| | | | Market |
| | | | Value• |
| | Shares | ($000) |
| | Cadence BanCorp Class A | 128 | 4 |
| | Heritage Insurance Holdings | | |
| | Inc. | 214 | 4 |
| | Healthcare Trust of America | | |
| | Inc. Class A | 140 | 4 |
| | Legg Mason Inc. | 96 | 4 |
| | FNB Corp. | 270 | 4 |
| | RenaissanceRe Holdings Ltd. | 29 | 4 |
| | Hilltop Holdings Inc. | 149 | 3 |
| * | EZCORP Inc. Class A | 278 | 3 |
| | Taubman Centers Inc. | 63 | 3 |
| | Principal Financial Group Inc. | 60 | 3 |
| | Piper Jaffray Cos. | 42 | 3 |
| * | Trupanion Inc. | 96 | 3 |
| | Unum Group | 75 | 3 |
| | Kemper Corp. | 37 | 3 |
| | GAIN Capital Holdings Inc. | 342 | 3 |
| | Colony NorthStar Inc. Class A | 435 | 3 |
| | CoBiz Financial Inc. | 109 | 2 |
| | Universal Insurance Holdings | | |
| | Inc. | 68 | 2 |
| * | Everi Holdings Inc. | 291 | 2 |
| * | Zillow Group Inc. | 34 | 2 |
| | Realogy Holdings Corp. | 78 | 2 |
| | CatchMark Timber Trust Inc. | | |
| | Class A | 136 | 2 |
| | HFF Inc. Class A | 51 | 2 |
| | Cathay General Bancorp | 40 | 2 |
| | Valley National Bancorp | 125 | 2 |
| | | | 2,776 |
| Health Care (12.3%) | | |
| | Stryker Corp. | 305 | 53 |
| * | Illumina Inc. | 159 | 43 |
| | Baxter International Inc. | 590 | 42 |
| * | Boston Scientific Corp. | 1,372 | 42 |
| | Zoetis Inc. | 455 | 38 |
| | HCA Healthcare Inc. | 314 | 32 |
| | Danaher Corp. | 259 | 26 |
| | Thermo Fisher Scientific Inc. | 108 | 22 |
| * | Vertex Pharmaceuticals Inc. | 118 | 18 |
| | Eli Lilly & Co. | 197 | 17 |
| * | ICU Medical Inc. | 46 | 13 |
| | Chemed Corp. | 41 | 13 |
| | Bio-Techne Corp. | 87 | 13 |
| * | Cotiviti Holdings Inc. | 373 | 13 |
| | Cantel Medical Corp. | 115 | 13 |
| * | Penumbra Inc. | 77 | 12 |
| | Bruker Corp. | 405 | 12 |
| | Abbott Laboratories | 188 | 12 |
| * | Xencor Inc. | 276 | 11 |
| * | QIAGEN NV | 299 | 11 |
| * | CryoLife Inc. | 394 | 11 |
| * | Triple-S Management Corp. | | |
| | Class B | 288 | 11 |
| | | |
| * | NeoGenomics Inc. | 908 | 11 |
| * | Karyopharm Therapeutics Inc. | 566 | 11 |
| * | Sientra Inc. | 549 | 10 |
| * | Integra LifeSciences Holdings | | |
| | Corp. | 148 | 10 |
| * | AtriCure Inc. | 379 | 9 |
| * | NanoString Technologies Inc. | 666 | 9 |
| | West Pharmaceutical | | |
| | Services Inc. | 91 | 8 |
| * | Catalyst Pharmaceuticals Inc. | 2,166 | 8 |
| * | Ra Pharmaceuticals Inc. | 1,188 | 8 |
| * | WaVe Life Sciences Ltd. | 176 | 8 |
| * | Aduro Biotech Inc. | 912 | 8 |
| * | Selecta Biosciences Inc. | 660 | 8 |
| | STERIS plc | 76 | 8 |
| | Ensign Group Inc. | 215 | 8 |
| * | Alexion Pharmaceuticals Inc. | 67 | 8 |
| | Atrion Corp. | 13 | 8 |
| * | GenMark Diagnostics Inc. | 1,009 | 7 |
| | Luminex Corp. | 256 | 7 |
| * | Genomic Health Inc. | 181 | 7 |
| | US Physical Therapy Inc. | 76 | 7 |
| * | Stemline Therapeutics Inc. | 351 | 7 |
| * | Aratana Therapeutics Inc. | 1,319 | 7 |
| * | Assembly Biosciences Inc. | 159 | 7 |
| * | Catalent Inc. | 171 | 7 |
| * | G1 Therapeutics Inc. | 155 | 7 |
| * | Fate Therapeutics Inc. | 605 | 7 |
| * | Reata Pharmaceuticals Inc. | | |
| | Class A | 184 | 7 |
| | Phibro Animal Health Corp. | | |
| | Class A | 144 | 7 |
| * | Syros Pharmaceuticals Inc. | 523 | 6 |
| * | Providence Service Corp. | 89 | 6 |
| * | Quality Systems Inc. | 360 | 6 |
| * | FibroGen Inc. | 115 | 6 |
| * | American Renal Associates | | |
| | Holdings Inc. | 417 | 6 |
| | Computer Programs & | | |
| | Systems Inc. | 184 | 6 |
| | National HealthCare Corp. | 90 | 6 |
| * | Medidata Solutions Inc. | 77 | 6 |
| * | Invitae Corp. | 799 | 6 |
| * | AngioDynamics Inc. | 279 | 6 |
| * | Cross Country Healthcare Inc. | 472 | 6 |
| * | Bio-Rad Laboratories Inc. | | |
| | Class A | 20 | 6 |
| | PerkinElmer Inc. | 76 | 6 |
| * | Alkermes plc | 119 | 6 |
| * | Teligent Inc. | 1,956 | 5 |
| * | Cerus Corp. | 823 | 5 |
| * | Antares Pharma Inc. | 2,076 | 5 |
| * | RadNet Inc. | 420 | 5 |
| * | BioScrip Inc. | 2,001 | 5 |
16
U.S. Liquidity Factor ETF
| | | |
| | | | Market |
| | | | Value• |
| | Shares | ($000) |
| * | Tabula Rasa HealthCare Inc. | 96 | 5 |
| * | Surgery Partners Inc. | 315 | 5 |
| | Encompass Health Corp. | 78 | 5 |
| * | Seattle Genetics Inc. | 82 | 5 |
| * | Endologix Inc. | 884 | 5 |
| | Hill-Rom Holdings Inc. | 53 | 5 |
| * | Charles River Laboratories | | |
| | International Inc. | 44 | 5 |
| * | Madrigal Pharmaceuticals Inc. | 17 | 5 |
| * | Medpace Holdings Inc. | 107 | 5 |
| * | Pacific Biosciences of | | |
| | California Inc. | 1,777 | 4 |
| * | PRA Health Sciences Inc. | 52 | 4 |
| | Meridian Bioscience Inc. | 298 | 4 |
| * | AxoGen Inc. | 86 | 4 |
| | ResMed Inc. | 41 | 4 |
| * | Audentes Therapeutics Inc. | 111 | 4 |
| | CONMED Corp. | 61 | 4 |
| | Teleflex Inc. | 15 | 4 |
| | Medtronic plc | 46 | 4 |
| * | Amphastar Pharmaceuticals | | |
| | Inc. | 249 | 4 |
| * | Syndax Pharmaceuticals Inc. | 440 | 4 |
| * | Theravance Biopharma Inc. | 157 | 4 |
| * | Concert Pharmaceuticals Inc. | 182 | 4 |
| * | Rigel Pharmaceuticals Inc. | 1,125 | 4 |
| * | Capital Senior Living Corp. | 328 | 4 |
| * | Kura Oncology Inc. | 204 | 3 |
| * | Ardelyx Inc. | 849 | 3 |
| * | Accuray Inc. | 765 | 3 |
| * | ViewRay Inc. | 464 | 3 |
| * | Jounce Therapeutics Inc. | 295 | 3 |
| * | Neogen Corp. | 43 | 3 |
| * | Iovance Biotherapeutics Inc. | 222 | 3 |
| | Merrimack Pharmaceuticals | | |
| | Inc. | 366 | 3 |
| * | MacroGenics Inc. | 139 | 3 |
| * | Retrophin Inc. | 112 | 3 |
| * | Accelerate Diagnostics Inc. | 153 | 3 |
| * | Conatus Pharmaceuticals Inc. | 722 | 3 |
| * | Voyager Therapeutics Inc. | 155 | 3 |
| * | PDL BioPharma Inc. | 1,019 | 3 |
| * | Tetraphase Pharmaceuticals | | |
| | Inc. | 709 | 3 |
| * | Anika Therapeutics Inc. | 64 | 3 |
| * | Pieris Pharmaceuticals Inc. | 453 | 3 |
| * | Advaxis Inc. | 1,388 | 3 |
| * | ACADIA Pharmaceuticals Inc. | 130 | 2 |
| * | ABIOMED Inc. | 6 | 2 |
| * | Tactile Systems Technology | | |
| | Inc. | 46 | 2 |
| * | CytomX Therapeutics Inc. | 84 | 2 |
| | Melinta Therapeutics Inc. | 300 | 2 |
| | LeMaitre Vascular Inc. | 56 | 2 |
| | | |
| * | Agenus Inc. | 562 | 2 |
| * | Revance Therapeutics Inc. | 63 | 2 |
| * | Neos Therapeutics Inc. | 220 | 1 |
| * | Celldex Therapeutics Inc. | 1,534 | 1 |
| | | | 988 |
| Materials & Processing (7.8%) | | |
| | Ecolab Inc. | 433 | 62 |
| | Southern Copper Corp. | 1,082 | 53 |
| | Praxair Inc. | 235 | 37 |
| | PPG Industries Inc. | 339 | 34 |
| | Air Products & Chemicals Inc. | 156 | 25 |
| | LyondellBasell Industries NV | | |
| | Class A | 172 | 19 |
| * | Unifi Inc. | 481 | 15 |
| | Sherwin-Williams Co. | 35 | 13 |
| | Versum Materials Inc. | 319 | 13 |
| | NewMarket Corp. | 31 | 12 |
| | AptarGroup Inc. | 127 | 12 |
| * | Klondex Mines Ltd. | 4,847 | 12 |
| | Silgan Holdings Inc. | 429 | 12 |
| | Sensient Technologies Corp. | 173 | 12 |
| | PolyOne Corp. | 275 | 11 |
| | Cabot Corp. | 173 | 10 |
| * | Univar Inc. | 379 | 10 |
| * | Ryerson Holding Corp. | 827 | 10 |
| | Valmont Industries Inc. | 69 | 10 |
| | Sonoco Products Co. | 188 | 10 |
| | Griffon Corp. | 404 | 9 |
| | Chase Corp. | 74 | 9 |
| | Hexcel Corp. | 109 | 8 |
| * | Foundation Building Materials | | |
| | Inc. | 501 | 8 |
| * | JELD-WEN Holding Inc. | 273 | 7 |
| * | Platform Specialty Products | | |
| | Corp. | 605 | 7 |
| | Reliance Steel & Aluminum | | |
| | Co. | 75 | 7 |
| | Gold Resource Corp. | 1,081 | 7 |
| | Global Brass & Copper | | |
| | Holdings Inc. | 214 | 7 |
| * | Veritiv Corp. | 201 | 7 |
| | Haynes International Inc. | 150 | 6 |
| | Materion Corp. | 113 | 6 |
| | Tahoe Resources Inc. | 1,173 | 6 |
| * | Owens-Illinois Inc. | 322 | 6 |
| | Quanex Building Products | | |
| | Corp. | 355 | 6 |
| | PH Glatfelter Co. | 320 | 6 |
| | Timken Co. | 112 | 5 |
| * | Beacon Roofing Supply Inc. | 120 | 5 |
| | Balchem Corp. | 52 | 5 |
| * | Verso Corp. | 241 | 5 |
| * | Intrepid Potash Inc. | 1,087 | 5 |
| | RPM International Inc. | 98 | 5 |
17
U.S. Liquidity Factor ETF
| | | |
| | | | Market |
| | | | Value• |
| | Shares | ($000) |
| | Mueller Industries Inc. | 160 | 5 |
| | NN Inc. | 216 | 5 |
| * | Armstrong Flooring Inc. | 355 | 5 |
| | Innospec Inc. | 58 | 4 |
| | AAON Inc. | 144 | 4 |
| * | PGT Innovations Inc. | 206 | 4 |
| | Advanced Drainage Systems | | |
| | Inc. | 147 | 4 |
| | Comfort Systems USA Inc. | 90 | 4 |
| | Innophos Holdings Inc. | 88 | 4 |
| | Westlake Chemical Corp. | 36 | 4 |
| | Royal Gold Inc. | 46 | 4 |
| * | Koppers Holdings Inc. | 102 | 4 |
| | Insteel Industries Inc. | 130 | 4 |
| | Quaker Chemical Corp. | 26 | 4 |
| | Schweitzer-Mauduit | | |
| | International Inc. | 90 | 4 |
| | Stepan Co. | 54 | 4 |
| | Olympic Steel Inc. | 168 | 4 |
| | Bemis Co. Inc. | 89 | 4 |
| | Neenah Inc. | 44 | 4 |
| | Scotts Miracle-Gro Co. | 41 | 3 |
| | International Flavors & | | |
| | Fragrances Inc. | 27 | 3 |
| | Caesarstone Ltd. | 171 | 3 |
| * | LSB Industries Inc. | 518 | 3 |
| * | Clearwater Paper Corp. | 109 | 3 |
| | Aceto Corp. | 494 | 1 |
| | | | 629 |
| Other (0.7%) | | |
| | TE Connectivity Ltd. | 533 | 50 |
| | Janus Henderson Group plc | 265 | 8 |
| | | | 58 |
| Producer Durables (14.9%) | | |
| | Illinois Tool Works Inc. | 336 | 48 |
| | Waste Management Inc. | 551 | 46 |
| | Eaton Corp. plc | 419 | 32 |
| | Norfolk Southern Corp. | 207 | 31 |
| | Johnson Controls | | |
| | International plc | 908 | 30 |
| | Emerson Electric Co. | 423 | 30 |
| | Systemax Inc. | 653 | 22 |
| * | Gardner Denver Holdings Inc. | 624 | 21 |
| | Accenture plc Class A | 131 | 20 |
| | General Dynamics Corp. | 101 | 20 |
| | Northrop Grumman Corp. | 59 | 19 |
| | Donaldson Co. Inc. | 378 | 18 |
| * | Teledyne Technologies Inc. | 62 | 12 |
| * | Keysight Technologies Inc. | 206 | 12 |
| | Barnes Group Inc. | 203 | 12 |
| | Rollins Inc. | 236 | 12 |
| | Regal Beloit Corp. | 145 | 12 |
| | Curtiss-Wright Corp. | 88 | 11 |
| | | |
| | Heidrick & Struggles | | |
| | International Inc. | 283 | 11 |
| * | NV5 Global Inc. | 165 | 10 |
| | Woodward Inc. | 135 | 10 |
| | Littelfuse Inc. | 46 | 10 |
| * | Zebra Technologies Corp. | 65 | 10 |
| | National Instruments Corp. | 239 | 10 |
| | Graco Inc. | 219 | 10 |
| | Deluxe Corp. | 148 | 10 |
| | McGrath RentCorp | 151 | 10 |
| | Kforce Inc. | 290 | 10 |
| | ITT Inc. | 186 | 10 |
| | EMCOR Group Inc. | 125 | 9 |
| | Landstar System Inc. | 83 | 9 |
| * | Navistar International Corp. | 248 | 9 |
| | MAXIMUS Inc. | 151 | 9 |
| | Crane Co. | 110 | 9 |
| | Barrett Business Services Inc. | 105 | 9 |
| | Mesa Laboratories Inc. | 56 | 9 |
| | IDEX Corp. | 64 | 9 |
| | Frontline Ltd. | 1,536 | 9 |
| * | Colfax Corp. | 282 | 9 |
| * | Engility Holdings Inc. | 274 | 9 |
| * | CBIZ Inc. | 417 | 9 |
| * | Genesee & Wyoming Inc. | | |
| | Class A | 110 | 9 |
| * | Kirby Corp. | 94 | 9 |
| | Douglas Dynamics Inc. | 174 | 8 |
| | US Ecology Inc. | 132 | 8 |
| | Genpact Ltd. | 264 | 8 |
| * | AECOM | 228 | 8 |
| * | DXP Enterprises Inc. | 192 | 7 |
| * | Covenant Transportation | | |
| | Group Inc. Class A | 247 | 7 |
| | Lincoln Electric Holdings Inc. | 82 | 7 |
| | Healthcare Services Group Inc. | 203 | 7 |
| * | International Seaways Inc. | 348 | 7 |
| * | Vectrus Inc. | 226 | 7 |
| * | Copart Inc. | 132 | 7 |
| * | Trimble Inc. | 216 | 7 |
| | Essendant Inc. | 508 | 7 |
| | Air Lease Corp. Class A | 158 | 7 |
| | TTEC Holdings Inc. | 198 | 7 |
| * | Thermon Group Holdings Inc. | 303 | 7 |
| | Hackett Group Inc. | 429 | 7 |
| | Encore Wire Corp. | 142 | 7 |
| * | InnerWorkings Inc. | 781 | 7 |
| | Marten Transport Ltd. | 299 | 7 |
| | BWX Technologies Inc. | 102 | 7 |
| | Nordson Corp. | 54 | 7 |
| | American Railcar Industries | | |
| | Inc. | 163 | 7 |
| | Spartan Motors Inc. | 422 | 7 |
18
U.S. Liquidity Factor ETF
| | | |
| | | | Market |
| | | | Value• |
| | Shares | ($000) |
| | Booz Allen Hamilton Holding | | |
| | Corp. Class A | 144 | 6 |
| | Columbus McKinnon Corp. | 156 | 6 |
| * | TriMas Corp. | 225 | 6 |
| * | MYR Group Inc. | 162 | 6 |
| | Standex International Corp. | 63 | 6 |
| | Brink’s Co. | 79 | 6 |
| * | Titan Machinery Inc. | 336 | 6 |
| | ICF International Inc. | 86 | 6 |
| * | Textainer Group Holdings Ltd. | 357 | 6 |
| | John Bean Technologies Corp. | 68 | 6 |
| * | Willdan Group Inc. | 208 | 6 |
| | Toro Co. | 100 | 6 |
| * | Energy Recovery Inc. | 692 | 6 |
| | Titan International Inc. | 482 | 6 |
| * | FARO Technologies Inc. | 102 | 5 |
| * | Lydall Inc. | 130 | 5 |
| | Raven Industries Inc. | 144 | 5 |
| * | Daseke Inc. | 565 | 5 |
| | Hubbell Inc. Class B | 49 | 5 |
| * | Conduent Inc. | 267 | 5 |
| | Kelly Services Inc. Class A | 225 | 5 |
| | Raytheon Co. | 24 | 5 |
| | Exponent Inc. | 51 | 5 |
| | Trinity Industries Inc. | 144 | 5 |
| | MTS Systems Corp. | 94 | 5 |
| | FLIR Systems Inc. | 91 | 5 |
| | Old Dominion Freight Line Inc. | 31 | 5 |
| | Tennant Co. | 61 | 5 |
| | Hyster-Yale Materials Handling | | |
| | Inc. | 71 | 5 |
| | Lockheed Martin Corp. | 15 | 5 |
| * | Navigant Consulting Inc. | 191 | 5 |
| * | CoStar Group Inc. | 12 | 5 |
| * | Aegion Corp. Class A | 178 | 5 |
| * | SEACOR Holdings Inc. | 87 | 5 |
| * | Commercial Vehicle Group Inc. | 573 | 5 |
| * | ASGN Inc. | 59 | 5 |
| | Mobile Mini Inc. | 99 | 5 |
| | UniFirst Corp. | 25 | 4 |
| | Federal Signal Corp. | 184 | 4 |
| | Robert Half International Inc. | 69 | 4 |
| * | Sykes Enterprises Inc. | 156 | 4 |
| | Costamare Inc. | 592 | 4 |
| | Franklin Electric Co. Inc. | 92 | 4 |
| | ACCO Brands Corp. | 328 | 4 |
| | ESCO Technologies Inc. | 75 | 4 |
| * | Casella Waste Systems Inc. | | |
| | Class A | 174 | 4 |
| * | Aqua Metals Inc. | 1,177 | 4 |
| * | Wesco Aircraft Holdings Inc. | 355 | 4 |
| | Primoris Services Corp. | 151 | 4 |
| | Kadant Inc. | 40 | 4 |
| | Brady Corp. Class A | 100 | 4 |
| | | |
| | CIRCOR International Inc. | 81 | 4 |
| | Badger Meter Inc. | 89 | 4 |
| * | MasTec Inc. | 82 | 4 |
| | Jacobs Engineering Group Inc. | 59 | 4 |
| | AO Smith Corp. | 60 | 4 |
| | Copa Holdings SA Class A | 34 | 4 |
| * | Huron Consulting Group Inc. | 93 | 4 |
| | Multi-Color Corp. | 54 | 4 |
| | AZZ Inc. | 86 | 4 |
| * | Sterling Construction Co. Inc. | 291 | 4 |
| | Matson Inc. | 107 | 4 |
| | Carlisle Cos. Inc. | 34 | 4 |
| * | SP Plus Corp. | 101 | 4 |
| | Aircastle Ltd. | 170 | 4 |
| | Albany International Corp. | 59 | 4 |
| | Scorpio Bulkers Inc. | 490 | 4 |
| | Moog Inc. Class A | 44 | 4 |
| | GasLog Ltd. | 199 | 4 |
| | Quad/Graphics Inc. | 180 | 4 |
| | AGCO Corp. | 54 | 3 |
| | Sun Hydraulics Corp. | 69 | 3 |
| | Alamo Group Inc. | 36 | 3 |
| * | Astronics Corp. | 94 | 3 |
| | Altra Industrial Motion Corp. | 80 | 3 |
| | Kennametal Inc. | 87 | 3 |
| | Briggs & Stratton Corp. | 167 | 3 |
| * | Modine Manufacturing Co. | 159 | 3 |
| * | SPX Corp. | 78 | 3 |
| * | Harsco Corp. | 106 | 3 |
| | Cubic Corp. | 36 | 2 |
| | Pentair plc | 55 | 2 |
| | LSC Communications Inc. | 189 | 2 |
| * | SPX FLOW Inc. | 50 | 2 |
| * | CAI International Inc. | 86 | 2 |
| * | Advanced Disposal Services | | |
| | Inc. | 79 | 2 |
| * | nVent Electric plc | 55 | 1 |
| | Teekay Tankers Ltd. Class A | 1,304 | 1 |
| * | Hudson Technologies Inc. | 629 | 1 |
| | | | 1,193 |
| Technology (6.7%) | | |
| | HP Inc. | 1,278 | 28 |
| | Intuit Inc. | 125 | 25 |
| | Hewlett Packard Enterprise | | |
| | Co. | 1,479 | 23 |
| | Pegasystems Inc. | 256 | 16 |
| * | RealPage Inc. | 217 | 13 |
| * | CACI International Inc. Class A | 73 | 12 |
| * | Silicon Laboratories Inc. | 106 | 11 |
| * | VASCO Data Security | | |
| | International Inc. | 507 | 11 |
| * | EPAM Systems Inc. | 88 | 11 |
| | Entegris Inc. | 304 | 11 |
19
U.S. Liquidity Factor ETF
| | | |
| | | | Market |
| | | | Value• |
| | | Shares | ($000) |
| | Dolby Laboratories Inc. | | |
| | Class A | 166 | 10 |
| * | Tyler Technologies Inc. | 45 | 10 |
| * | Aspen Technology Inc. | 108 | 10 |
| | Blackbaud Inc. | 103 | 10 |
| * | Loral Space & | | |
| | Communications Inc. | 261 | 10 |
| * | USA Technologies Inc. | 734 | 10 |
| | SYNNEX Corp. | 92 | 10 |
| * | Perficient Inc. | 362 | 9 |
| * | Ubiquiti Networks Inc. | 109 | 9 |
| * | Limelight Networks Inc. | 1,816 | 9 |
| | Monolithic Power Systems | | |
| | Inc. | 66 | 9 |
| * | Guidewire Software Inc. | 93 | 9 |
| * | Workiva Inc. | 308 | 8 |
| * | ScanSource Inc. | 202 | 8 |
| * | Endurance International | | |
| | Group Holdings Inc. | 865 | 8 |
| * | Harmonic Inc. | 1,993 | 8 |
| * | Ribbon Communications Inc. | 1,247 | 8 |
| * | Digimarc Corp. | 242 | 7 |
| * | KeyW Holding Corp. | 721 | 7 |
| * | PCM Inc. | 536 | 7 |
| * | ViaSat Inc. | 104 | 7 |
| | AVX Corp. | 417 | 6 |
| * | Atlassian Corp. plc Class A | 99 | 6 |
| | SS&C Technologies Holdings | | |
| | Inc. | 124 | 6 |
| * | Arrow Electronics Inc. | 85 | 6 |
| * | Nanometrics Inc. | 144 | 6 |
| * | MobileIron Inc. | 1,338 | 6 |
| * | Upland Software Inc. | 160 | 6 |
| | CDW Corp. | 71 | 6 |
| * | Presidio Inc. | 399 | 5 |
| * | Rubicon Project Inc. | 2,238 | 5 |
| * | ARRIS International plc | 204 | 5 |
| * | Benefitfocus Inc. | 153 | 5 |
| * | Rapid7 Inc. | 161 | 5 |
| * | LivePerson Inc. | 260 | 5 |
| * | Rudolph Technologies Inc. | 150 | 5 |
| * | Yext Inc. | 318 | 5 |
| * | Paycom Software Inc. | 46 | 5 |
| * | PDF Solutions Inc. | 371 | 5 |
| * | ePlus Inc. | 51 | 5 |
| | Amdocs Ltd. | 68 | 5 |
| * | EMCORE Corp. | 886 | 5 |
| | Science Applications | | |
| | International Corp. | 51 | 5 |
| * | Appfolio Inc. | 76 | 4 |
| * | Mitek Systems Inc. | 515 | 4 |
| * | A10 Networks Inc. | 685 | 4 |
| * | Integrated Device Technology | |
| | Inc. | 130 | 4 |
| | | |
| * | Photronics Inc. | 487 | 4 |
| | Cohu Inc. | 174 | 4 |
| | MKS Instruments Inc. | 37 | 4 |
| * | PROS Holdings Inc. | 115 | 4 |
| | Comtech Telecommunications | | |
| | Corp. | 123 | 4 |
| * | Vocera Communications Inc. | 142 | 4 |
| * | Immersion Corp. | 250 | 4 |
| * | Model N Inc. | 209 | 4 |
| | Leidos Holdings Inc. | 62 | 4 |
| * | Lattice Semiconductor Corp. | 622 | 4 |
| | Avnet Inc. | 92 | 3 |
| * | Tech Data Corp. | 40 | 3 |
| * | AXT Inc. | 471 | 3 |
| | Internap Corp. | 298 | 3 |
| * | Nuance Communications Inc. | 227 | 3 |
| * | Web.com Group Inc. | 124 | 2 |
| * | Diodes Inc. | 70 | 2 |
| | Monotype Imaging Holdings | | |
| | Inc. | 92 | 2 |
| | | | 539 |
| Utilities (5.5%) | | |
| | Sempra Energy | 251 | 27 |
| | American Electric Power Co. | | |
| | Inc. | 373 | 25 |
| | Exelon Corp. | 590 | 24 |
| * | T-Mobile US Inc. | 421 | 23 |
| * | Intelsat SA | 1,149 | 21 |
| | Dominion Energy Inc. | 295 | 19 |
| | ONE Gas Inc. | 244 | 18 |
| | Duke Energy Corp. | 225 | 17 |
| | NextEra Energy Inc. | 87 | 14 |
| | New Jersey Resources Corp. | 320 | 14 |
| | Spire Inc. | 192 | 14 |
| | Avangrid Inc. | 252 | 13 |
| | IDACORP Inc. | 140 | 13 |
| | ALLETE Inc. | 168 | 13 |
| | Hawaiian Electric Industries | | |
| | Inc. | 365 | 13 |
| | Southwest Gas Holdings Inc. | 165 | 12 |
| | Aqua America Inc. | 348 | 12 |
| | MDU Resources Group Inc. | 425 | 12 |
| | Atmos Energy Corp. | 116 | 10 |
| | UGI Corp. | 198 | 10 |
| | j2 Global Inc. | 99 | 8 |
| | Unitil Corp. | 169 | 8 |
| | SJW Group | 126 | 8 |
| * | United States Cellular Corp. | 205 | 7 |
| | Otter Tail Corp. | 147 | 7 |
| | Chesapeake Utilities Corp. | 85 | 7 |
| | OGE Energy Corp. | 192 | 7 |
| | Portland General Electric Co. | 156 | 7 |
| | Black Hills Corp. | 112 | 7 |
| | Southern Co. | 137 | 6 |
20
U.S. Liquidity Factor ETF
| | | |
| | | | Market |
| | | | Value• |
| | | Shares | ($000) |
| | Westar Energy Inc. Class A | 108 | 6 |
| | Shenandoah | | |
| | Telecommunications Co. | 182 | 6 |
| * | Vistra Energy Corp. | 229 | 6 |
| | ATN International Inc. | 88 | 5 |
| | MGE Energy Inc. | 79 | 5 |
| * | Globalstar Inc. | 8,018 | 4 |
| | California Water Service | | |
| | Group | 97 | 4 |
| | Spark Energy Inc. Class A | 377 | 4 |
| | IDT Corp. Class B | 765 | 4 |
| * | Cincinnati Bell Inc. | 245 | 3 |
| | Alliant Energy Corp. | 44 | 2 |
| | | | 445 |
| Total Common Stocks | | |
| (Cost $7,519) | | 7,992 |
| Temporary Cash Investment (0.5%) | |
| Money Market Fund (0.5%) | | |
| 1 | Vanguard Market Liquidity Fund, | |
| | 1.961% (Cost $37) | 368 | 37 |
| Total Investments (99.9%) | | |
| (Cost $7,556) | | 8,029 |
| |
| | | | Amount |
| | | | ($000) |
| Other Assets and Liabilities (0.1%) | |
| Other Assets | | |
| Investment in Vanguard | | 1 |
| Receivables for Accrued Income | | 10 |
| Total Other Assets | | 11 |
| Liabilities | | |
| Payables to Vanguard | | (1) |
| Total Liabilities | | (1) |
| Net Assets (100%) | | |
| Applicable to 100,000 outstanding | |
| $.001 par value shares of beneficial | |
| interest (unlimited authorization) | 8,039 |
| Net Asset Value Per Share | | $80.39 |
| |
| At May 31, 2018, net assets consisted of: | |
| | Amount |
| | ($000) |
| Paid-in Capital | 7,500 |
| Undistributed Net Investment Income | 40 |
| Accumulated Net Realized Gains | 26 |
| Unrealized Appreciation (Depreciation) | 473 |
| Net Assets | 8,039 |
• See Note A in Notes to Financial Statements.
* Non-income-producing security.
1 Affiliated money market fund available only to Vanguard funds
and certain trusts and accounts managed by Vanguard. Rate
shown is the 7-day yield.
REIT—Real Estate Investment Trust.
See accompanying Notes, which are an integral part of the Financial Statements.
21
U.S. Liquidity Factor ETF
Statement of Operations
| |
| | February13,20181 to |
| | May 31, 2018 |
| | ($000) |
| Investment Income | |
| Income | |
| Dividends | 43 |
| Interest 2 | — |
| Total Income | 43 |
| Expenses | |
| The Vanguard Group—Note B | |
| Management and Administrative | — |
| Marketing and Distribution | — |
| Custodian Fees | 2 |
| Shareholders’ Reports | 1 |
| Total Expenses | 3 |
| Net Investment Income | 40 |
| Realized Net Gain (Loss) on Investment Securities Sold2 | 26 |
| Change in Unrealized Appreciation (Depreciation)2 | 473 |
| Net Increase (Decrease) in Net Assets Resulting from Operations | 539 |
1 Inception.
2 Interest income, realized net gain (loss), and change in unrealized appreciation (depreciation) from an affiliated company of the fund
were each less than $1,000. Purchases and sales are for temporary cash investment purposes.
See accompanying Notes, which are an integral part of the Financial Statements.
22
U.S. Liquidity Factor ETF
Statement of Changes in Net Assets
| |
| | February13,20181 to |
| | May 31, 2018 |
| | ($000) |
| Increase (Decrease) in Net Assets | |
| Operations | |
| Net Investment Income | 40 |
| Realized Net Gain (Loss) | 26 |
| Change in Unrealized Appreciation (Depreciation) | 473 |
| Net Increase (Decrease) in Net Assets Resulting from Operations | 539 |
| Distributions | |
| Net Investment Income | — |
| Realized Capital Gain | — |
| Total Distributions | — |
| Capital Share Transactions | |
| Issued | 7,500 |
| Issued in Lieu of Cash Distributions | — |
| Redeemed | — |
| Net Increase (Decrease) from Capital Share Transactions | 7,500 |
| Total Increase (Decrease) | 8,039 |
| Net Assets | |
| Beginning of Period | — |
| End of Period2 | 8,039 |
| 1 Inception. |
| 2 Net Assets—End of Period includes undistributed (overdistributed) net investment income of $40,000. |
See accompanying Notes, which are an integral part of the Financial Statements.
23
|
| U.S. Liquidity Factor ETF |
Financial Highlights
| |
| | February 13, 20181 to |
| For a Share Outstanding Throughout the Period | May 31, 2018 |
| Net Asset Value, Beginning of Period | $75.00 |
| Investment Operations | |
| Net Investment Income2 | .400 |
| Net Realized and Unrealized Gain (Loss) on Investments | 4.990 |
| Total from Investment Operations | 5.390 |
| Distributions | |
| Dividends from Net Investment Income | — |
| Distributions from Realized Capital Gains | — |
| Total Distributions | — |
| Net Asset Value, End of Period | $80.39 |
| |
| Total Return | 7.19% |
| |
| Ratios/Supplemental Data | |
| Net Assets, End of Period (Millions) | $8 |
| Ratio of Total Expenses to Average Net Assets | 0.13%3 |
| Ratio of Net Investment Income to Average Net Assets | 1.67%3 |
| Portfolio Turnover Rate | 18%3 |
| 1 Inception. |
| 2 Calculated based on average shares outstanding. |
| 3 Annualized. |
See accompanying Notes, which are an integral part of the Financial Statements.
24
U.S. Liquidity Factor ETF
Notes to Financial Statements
Vanguard U.S. Liquidity Factor ETF is registered under the Investment Company Act of 1940 as an open-end investment company, or mutual fund. ETF Shares are listed for trading on Cboe BZX Exchange; they can be purchased and sold through a broker.
A. The following significant accounting policies conform to generally accepted accounting principles for U.S. investment companies. The fund consistently follows such policies in preparing its financial statements.
1. Security Valuation: Securities are valued as of the close of trading on the New York Stock Exchange (generally 4 p.m., Eastern time) on the valuation date. Equity securities are valued at the latest quoted sales prices or official closing prices taken from the primary market in which each security trades; such securities not traded on the valuation date are valued at the mean of the latest quoted bid and asked prices. Securities for which market quotations are not readily available, or whose values have been materially affected by events occurring before the fund’s pricing time but after the close of the securities’ primary markets, are valued by methods deemed by the board of trustees to represent fair value. Investments in Vanguard Market Liquidity Fund are valued at that fund’s net asset value.
2. Federal Income Taxes: The fund intends to qualify as a regulated investment company and distribute all of its taxable income. Management has analyzed the fund’s tax positions taken for the period ended May 31, 2018, and has concluded that no provision for federal income tax is required in the fund’s financial statements.
3. Distributions: Distributions to shareholders are recorded on the ex-dividend date.
4. Other: Dividend income is recorded on the ex-dividend date. Interest income includes income distributions received from Vanguard Market Liquidity Fund and is accrued daily. Security transactions are accounted for on the date securities are bought or sold. Costs used to determine realized gains (losses) on the sale of investment securities are those of the specific securities sold.
B. In accordance with the terms of a Funds’ Service Agreement (the “FSA”) between Vanguard and the fund, Vanguard furnishes to the fund investment advisory, corporate management, administrative, marketing, and distribution services at Vanguard’s cost of operations (as defined by the FSA). These costs of operations are allocated to the fund based on methods and guidelines approved by the board of trustees, and generally settled twice a month.
Upon the request of Vanguard, the fund may invest up to 0.40% of its net assets as capital in Vanguard. At May 31, 2018, the fund had contributed to Vanguard capital in the amount of $1,000, representing 0.01% of the fund’s net assets and 0.00% of Vanguard’s capitalization. The fund’s trustees and officers are also directors and employees, respectively, of Vanguard.
C. Various inputs may be used to determine the value of the fund’s investments. These inputs are summarized in three broad levels for financial statement purposes. The inputs or methodologies used to value securities are not necessarily an indication of the risk associated with investing in those securities.
Level 1—Quoted prices in active markets for identical securities.
Level 2—Other significant observable inputs (including quoted prices for similar securities, interest rates, prepayment speeds, credit risk, etc.).
Level 3—Significant unobservable inputs (including the fund’s own assumptions used to determine
the fair value of investments). Any investments valued with significant unobservable inputs are
noted on the Statement of Net Assets.
25
U.S. Liquidity Factor ETF
At May 31, 2018, 100% of the market value of the fund’s investments was determined based on Level 1 inputs.
D. Distributions are determined on a tax basis and may differ from net investment income and realized capital gains for financial reporting purposes. Differences may be permanent or temporary. Permanent differences are reclassified among capital accounts in the financial statements to reflect their tax character. Temporary differences arise when certain items of income, expense, gain, or loss are recognized in different periods for financial statement and tax purposes. These differences will reverse at some time in the future. Differences in classification may also result from the treatment of short-term gains as ordinary income for tax purposes. The fund’s tax-basis capital gains and losses are determined only at the end of each fiscal year.
At May 31, 2018, the cost of investment securities for tax purposes was $7,556,000. Net unrealized appreciation of investment securities for tax purposes was $473,000, consisting of unrealized gains of $697,000 on securities that had risen in value since their purchase and $224,000 in unrealized losses on securities that had fallen in value since their purchase.
E. During the period ended May 31, 2018, the fund purchased $8,057,000 of investment securities and sold $564,000 of investment securities, other than temporary cash investments.
F. Capital shares issued and redeemed were:
| |
| | February 13, 20181 to |
| | May 31, 2018 |
| | Shares |
| | (000) |
| Issued | 100 |
| Issued in Lieu of Cash Distributions | — |
| Redeemed | — |
| Net Increase (Decrease) in Shares Outstanding | 100 |
| 1 Inception. |
At May 31, 2018, one shareholder was the record or beneficial owner of 61% of the fund’s net assets. If the shareholder were to redeem its investment in the fund, the redemption might result in an increase in the fund’s expense ratio.
G. Management has determined that no events or transactions occurred subsequent to May 31, 2018, that would require recognition or disclosure in these financial statements.
26
U.S. Minimum Volatility ETF
Fund Profile
As of May 31, 2018
| | |
| Portfolio Characteristics | | |
| | | Russell |
| | | 3000 |
| | Fund | Index |
| Number of Stocks | 164 | 2,941 |
| Median Market Cap | $9.6B | $66.7B |
| Price/Earnings Ratio | 19.9x | 20.8x |
| Price/Book Ratio | 2.3x | 3.0x |
| Return on Equity | 11.3% | 15.0% |
| Earnings Growth | | |
| Rate | 3.5% | 7.9% |
| Dividend Yield | 2.5% | 1.8% |
| Foreign Holdings | 0.0% | 0.0% |
| Turnover Rate | | |
| (Annualized) | 2% | — |
| Ticker Symbol | VFMV | — |
| Expense Ratio1 | 0.13% | — |
| 30-Day SEC Yield | 2.47% | — |
| Short-Term Reserves | -0.1% | — |
| | |
| Sector Diversification (% of equity exposure) |
| | | Russell |
| | | 3000 |
| | Fund | Index |
| Consumer Discretionary | 18.1% | 14.3% |
| Consumer Staples | 8.5 | 5.3 |
| Energy | 6.8 | 6.0 |
| Financial Services | 22.0 | 21.1 |
| Health Care | 10.8 | 13.2 |
| Materials & Processing | 2.2 | 3.8 |
| Producer Durables | 7.9 | 10.8 |
| Technology | 16.3 | 21.0 |
| Utilities | 7.4 | 4.5 |
Sector categories are based on the Russell Global Sectors (“RGS”),
except for the “Other” category (if applicable), which includes
securities that have not been provided a RGS classification as of
the effective reporting period.
| | |
| Ten Largest Holdings (% of total net assets) |
| Vector Group Ltd. | Tobacco | 1.5% |
| Phillips 66 | Oil: Refining & | |
| | Marketing | 1.5 |
| Progressive Corp. | Insurance: | |
| | Property-Casualty | 1.3 |
| Dollar General Corp. | Diversified Retail | 1.2 |
| Genpact Ltd. | Back Office Support | |
| | HR & Consulting | 1.2 |
| White Mountains | Insurance: | |
| Insurance Group Ltd. | Property-Casualty | 1.2 |
| Ecolab Inc. | Chemicals: | |
| | Diversified | 1.2 |
| Estee Lauder Cos. Inc. | Cosmetics | 1.2 |
| Starwood Property Trust | | |
| Inc. | Mortgage REITs | 1.2 |
| Chevron Corp. | Oil: Integrated | 1.2 |
| Top Ten | | 12.7% |
| The holdings listed exclude any temporary cash investments and equity index products. |
1 The expense ratio shown is from the prospectus dated February 13, 2018, and represents estimated costs for the current fiscal year. For
the period from inception through May 31, 2018, the annualized expense ratio was 0.13%.
27
U.S. Minimum Volatility ETF
Performance Summary
All of the returns in this report represent past performance, which is not a guarantee of future results that may be achieved by the fund. (Current performance may be lower or higher than the performance data cited. For performance data current to the most recent month-end, visit our website at vanguard.com/performance.) Note, too, that both investment returns and principal value can fluctuate widely, so an investor’s shares, when sold, could be worth more or less than their original cost. The returns shown do not reflect taxes that a shareholder would pay on fund distributions or on the sale of fund shares.
Fiscal-Period Total Returns (%): February 13, 2018, Through May 31, 2018

Total Returns: Period Ended March 31, 2018
This table presents returns through the latest calendar quarter—rather than through the end of the fiscal period.
Securities and Exchange Commission rules require that we provide this information.
| | |
| | Inception | Since |
| | Date | Inception |
| ETF Shares | 2/13/2018 | |
| Market Price | | 3.48% |
| Net Asset Value | | 3.41 |
See Financial Highlights for dividend and capital gains information.
28
U.S. Minimum Volatility ETF
Financial Statements (unaudited)
Statement of Net Assets
As of May 31, 2018
The fund reports a complete list of its holdings in regulatory filings four times in each fiscal year, at the quarter-ends. For the second and fourth fiscal quarters, the lists appear in the fund’s semiannual and annual reports to shareholders. For the first and third fiscal quarters, the fund files the lists with the Securities and Exchange Commission on Form N-Q. Shareholders can look up the fund’s Forms N-Q on the SEC’s website at sec.gov. Forms N-Q may also be reviewed and copied at the SEC’s Public Reference Room (see the back cover of this report for further information).
| | | |
| | | | Market |
| | | | Value• |
| | | Shares | ($000) |
| Common Stocks (99.2%)1 | | |
| Consumer Discretionary (18.0%) | |
| | Dollar General Corp. | 1,430 | 125 |
| | Estee Lauder Cos. Inc. | | |
| | Class A | 813 | 122 |
| | TJX Cos. Inc. | 1,325 | 120 |
| * | Bright Horizons Family | | |
| | Solutions Inc. | 1,170 | 118 |
| | Callaway Golf Co. | 5,970 | 113 |
| * | Etsy Inc. | 3,021 | 98 |
| | Scholastic Corp. | 2,085 | 94 |
| * | Madison Square Garden Co. | | |
| | Class A | 341 | 89 |
| | Hasbro Inc. | 994 | 86 |
| | McDonald’s Corp. | 441 | 71 |
| | John Wiley & Sons Inc. | | |
| | Class A | 1,002 | 68 |
| | Tapestry Inc. | 1,411 | 62 |
| * | Booking Holdings Inc. | 27 | 57 |
| | PriceSmart Inc. | 635 | 54 |
| | Columbia Sportswear Co. | 592 | 52 |
| * | XO Group Inc. | 1,577 | 51 |
| * | Lululemon Athletica Inc. | 468 | 49 |
| | Service Corp. International | 1,282 | 47 |
| | Cable One Inc. | 72 | 47 |
| * | Michael Kors Holdings Ltd. | 708 | 41 |
| * | Qurate Retail Group Inc. QVC | | |
| | Group Class A | 1,746 | 36 |
| * | Red Robin Gourmet Burgers | | |
| | Inc. | 685 | 34 |
| | VF Corp. | 260 | 21 |
| | New Media Investment | | |
| | Group Inc. | 1,241 | 21 |
| | Walt Disney Co. | 205 | 20 |
| | Johnson Outdoors Inc. | | |
| | Class A | 242 | 18 |
| | New York Times Co. Class A | 676 | 15 |
| | World Wrestling | | |
| | Entertainment Inc. Class A | 229 | 13 |
| | | |
| | Churchill Downs Inc. | 44 | 13 |
| * | Monarch Casino & Resort Inc. | 257 | 11 |
| * | Instructure Inc. | 228 | 10 |
| | Omnicom Group Inc. | 127 | 9 |
| | Acushnet Holdings Corp. | 253 | 6 |
| * | Amazon.com Inc. | 3 | 5 |
| * | Deckers Outdoor Corp. | 41 | 5 |
| | Nutrisystem Inc. | 89 | 3 |
| | | | 1,804 |
| Consumer Staples (8.4%) | | |
| | Vector Group Ltd. | 7,737 | 150 |
| | Constellation Brands Inc. | | |
| | Class A | 521 | 116 |
| | Procter & Gamble Co. | 1,370 | 100 |
| | Colgate-Palmolive Co. | 1,570 | 99 |
| | Altria Group Inc. | 1,710 | 95 |
| * | USANA Health Sciences Inc. | 608 | 71 |
| | Universal Corp. | 1,042 | 69 |
| | Philip Morris International Inc. | 703 | 56 |
| | Turning Point Brands Inc. | 1,698 | 46 |
| | Church & Dwight Co. Inc. | 612 | 29 |
| | Coca-Cola Co. | 184 | 8 |
| | | | 839 |
| Energy (6.8%) | | |
| | Phillips 66 | 1,288 | 150 |
| | Chevron Corp. | 965 | 120 |
| | Exxon Mobil Corp. | 1,445 | 117 |
| | Occidental Petroleum Corp. | 1,233 | 104 |
| * | Renewable Energy Group Inc. | 5,114 | 91 |
| | Evolution Petroleum Corp. | 5,310 | 51 |
| | Cabot Oil & Gas Corp. | 1,046 | 24 |
| * | Par Pacific Holdings Inc. | 1,175 | 21 |
| | | | 678 |
| Financial Services (21.8%) | | |
| | Progressive Corp. | 2,097 | 130 |
| | White Mountains Insurance | | |
| | Group Ltd. | 136 | 123 |
| | Starwood Property Trust Inc. | 5,544 | 120 |
29
U.S. Minimum Volatility ETF
| | | |
| | | | Market |
| | | | Value• |
| | | Shares | ($000) |
| * | Equity Commonwealth | 3,833 | 119 |
| | AG Mortgage Investment | | |
| | Trust Inc. | 6,197 | 117 |
| | Apollo Commercial Real | | |
| | Estate Finance Inc. | 6,186 | 115 |
| | AGNC Investment Corp. | 5,893 | 111 |
| | Easterly Government | | |
| | Properties Inc. | 5,356 | 108 |
| | Aon plc | 683 | 96 |
| | RBB Bancorp | 3,093 | 94 |
| | Kearny Financial Corp. | 6,314 | 91 |
| | Oritani Financial Corp. | 5,193 | 83 |
| | Marsh & McLennan Cos. Inc. | 1,005 | 81 |
| | Fidelity National Information | | |
| | Services Inc. | 784 | 80 |
| | Ladder Capital Corp. Class A | 4,609 | 72 |
| | Highwoods Properties Inc. | 1,480 | 71 |
| | Brown & Brown Inc. | 2,534 | 70 |
| | MFA Financial Inc. | 8,715 | 68 |
| | Annaly Capital Management | | |
| | Inc. | 6,042 | 63 |
| | Aflac Inc. | 1,212 | 55 |
| | Granite Point Mortgage | | |
| | Trust Inc. | 2,866 | 52 |
| | PennyMac Mortgage | | |
| | Investment Trust | 2,694 | 50 |
| * | St. Joe Co. | 2,417 | 43 |
| | Two Harbors Investment | | |
| | Corp. | 2,453 | 38 |
| | Washington REIT | 963 | 28 |
| | Orchid Island Capital Inc. | 2,826 | 21 |
| | Southern National Bancorp | | |
| | of Virginia Inc. | 1,141 | 20 |
| | Duke Realty Corp. | 693 | 19 |
| | TPG RE Finance Trust Inc. | 888 | 18 |
| * | Forestar Group Inc. | 613 | 14 |
| | CBTX Inc. | 259 | 8 |
| | Equity LifeStyle Properties Inc. | 75 | 7 |
| | FirstCash Inc. | 50 | 5 |
| | | | 2,190 |
| Health Care (10.7%) | | |
| | Zoetis Inc. | 1,404 | 118 |
| * | Laboratory Corp. of America | | |
| | Holdings | 629 | 114 |
| | Cigna Corp. | 660 | 112 |
| | Quest Diagnostics Inc. | 963 | 103 |
| | Johnson & Johnson | 845 | 101 |
| | US Physical Therapy Inc. | 956 | 89 |
| * | Providence Service Corp. | 1,132 | 81 |
| * | Geron Corp. | 19,149 | 78 |
| * | Triple-S Management Corp. | | |
| | Class B | 2,059 | 75 |
| | STERIS plc | 703 | 73 |
| * | Myriad Genetics Inc. | 1,047 | 38 |
| | | |
| | Eli Lilly & Co. | 249 | 21 |
| | Bio-Techne Corp. | 120 | 18 |
| * | Ligand Pharmaceuticals Inc. | 61 | 12 |
| | Pfizer Inc. | 304 | 11 |
| | Merck & Co. Inc. | 149 | 9 |
| * | Eagle Pharmaceuticals Inc. | 122 | 8 |
| | Chemed Corp. | 23 | 7 |
| * | LHC Group Inc. | 58 | 4 |
| | | | 1,072 |
| Materials & Processing (2.2%) | | |
| | Ecolab Inc. | 852 | 122 |
| | International Flavors & | | |
| | Fragrances Inc. | 364 | 44 |
| | Royal Gold Inc. | 416 | 37 |
| | Newmont Mining Corp. | 444 | 17 |
| | | | 220 |
| Producer Durables (7.8%) | | |
| | Genpact Ltd. | 4,147 | 124 |
| | Raytheon Co. | 535 | 112 |
| | AMETEK Inc. | 1,514 | 111 |
| * | ExlService Holdings Inc. | 1,907 | 108 |
| | Ship Finance International | | |
| | Ltd. | 6,351 | 90 |
| * | Conduent Inc. | 3,754 | 72 |
| | L3 Technologies Inc. | 341 | 68 |
| * | CoStar Group Inc. | 116 | 44 |
| | Northrop Grumman Corp. | 119 | 39 |
| | Accenture plc Class A | 69 | 11 |
| * | Eagle Bulk Shipping Inc. | 898 | 5 |
| * | Daseke Inc. | 282 | 3 |
| | | | 787 |
| Technology (16.2%) | | |
| | Motorola Solutions Inc. | 1,105 | 119 |
| | CA Inc. | 3,274 | 117 |
| | Amdocs Ltd. | 1,681 | 113 |
| | Harris Corp. | 716 | 108 |
| * | VeriSign Inc. | 793 | 103 |
| * | NetScout Systems Inc. | 3,273 | 88 |
| | Cognizant Technology | | |
| | Solutions Corp. Class A | 1,013 | 76 |
| * | Palo Alto Networks Inc. | 359 | 75 |
| * | CommScope Holding Co. | | |
| | Inc. | 2,287 | 67 |
| * | Viavi Solutions Inc. | 6,809 | 65 |
| * | TechTarget Inc. | 2,305 | 62 |
| * | Alarm.com Holdings Inc. | 1,282 | 57 |
| | ADTRAN Inc. | 4,046 | 56 |
| * | ChannelAdvisor Corp. | 3,424 | 51 |
| * | Bottomline Technologies de | | |
| | Inc. | 1,045 | 50 |
| * | Sigma Designs Inc. | 8,007 | 50 |
| * | Synopsys Inc. | 549 | 48 |
| | Cisco Systems Inc. | 1,091 | 47 |
| * | F5 Networks Inc. | 226 | 39 |
30
U.S. Minimum Volatility ETF
| | | |
| | | | Market |
| | | | Value• |
| | | Shares | ($000) |
| * | Blucora Inc. | 911 | 35 |
| * | Q2 Holdings Inc. | 579 | 33 |
| * | SPS Commerce Inc. | 424 | 32 |
| * | Model N Inc. | 1,611 | 29 |
| * | Arista Networks Inc. | 81 | 20 |
| | InterDigital Inc. | 235 | 19 |
| * | Tucows Inc. Class A | 257 | 16 |
| * | Tableau Software Inc. Class A | 153 | 15 |
| * | Hortonworks Inc. | 722 | 13 |
| | Plantronics Inc. | 115 | 8 |
| * | Workiva Inc. | 229 | 6 |
| * | EchoStar Corp. Class A | 96 | 4 |
| | | | 1,621 |
| Utilities (7.3%) | | |
| | CMS Energy Corp. | 2,559 | 118 |
| | Xcel Energy Inc. | 2,526 | 115 |
| | American Electric Power | | |
| | Co. Inc. | 1,692 | 115 |
| | Duke Energy Corp. | 1,439 | 111 |
| | Southern Co. | 2,310 | 104 |
| | NextEra Energy Inc. | 350 | 58 |
| | ALLETE Inc. | 653 | 50 |
| | Consolidated Edison Inc. | 386 | 30 |
| | Public Service Enterprise | | |
| | Group Inc. | 527 | 28 |
| | Hawaiian Electric Industries | | |
| | Inc. | 126 | 5 |
| | | | 734 |
| Total Common Stocks | | |
| (Cost $9,495) | | 9,945 |
| Temporary Cash Investment (0.7%)1 | |
| Money Market Fund (0.7%) | | |
| 2 | Vanguard Market Liquidity Fund, | |
| | 1.961% (Cost $71) | 710 | 71 |
| Total Investments (99.9%) | | |
| (Cost $9,566) | | 10,016 |
| |
| Amount |
| | ($000) |
| Other Assets and Liabilities (0.1%) | |
| Other Assets | |
| Investment in Vanguard | 1 |
| Receivables for Accrued Income | 12 |
| Other Assets 3 | 4 |
| Total Other Assets | 17 |
| Liabilities | |
| Payables to Vanguard | (1) |
| Variation Margin Payable—Futures Contracts | (1) |
| Other Liabilities | (1) |
| Total Liabilities | (3) |
| Net Assets (100%) | |
| Applicable to 125,000 outstanding | |
| $.001 par value shares of beneficial | |
| interest (unlimited authorization) | 10,030 |
| Net Asset Value Per Share | $80.24 |
| |
| At May 31, 2018, net assets consisted of: | |
| | Amount |
| | ($000) |
| Paid-in Capital | 9,505 |
| Undistributed Net Investment Income | 59 |
| Accumulated Net Realized Gains | 11 |
| Unrealized Appreciation (Depreciation) | |
| Investment Securities | 450 |
| Futures Contracts | 5 |
| Net Assets | 10,030 |
• See Note A in Notes to Financial Statements.
* Non-income-producing security.
1 The fund invests a portion of its cash reserves in equity
markets through the use of index futures contracts. After
giving effect to futures investments, the fund’s effective
common stock and temporary cash investment positions
represent 100.0% and -0.1%, respectively, of net assets.
2 Affiliated money market fund available only to Vanguard funds
and certain trusts and accounts managed by Vanguard. Rate
shown is the 7-day yield.
3 Cash of $4,000 has been segregated as initial margin for open
futures contracts.
REIT—Real Estate Investment Trust.
31
U.S. Minimum Volatility ETF
| | | | |
| Derivative Financial Instruments Outstanding as of Period End | | |
| Futures Contracts | | | | |
| | | | ($000) |
| | | | | Value and |
| | | Number of | | Unrealized |
| | | Long (Short) | Notional | Appreciation |
| | Expiration | Contracts | Amount | (Depreciation) |
| Long Futures Contracts | | | | |
| E-mini Russell 2000 Index | June 2018 | 1 | 82 | 5 |
Unrealized appreciation (depreciation) on open futures contracts is required to be treated as realized
gain (loss) for tax purposes.
See accompanying Notes, which are an integral part of the Financial Statements.
32
U.S. Minimum Volatility ETF
Statement of Operations
| |
| | February13,20181 to |
| | May 31, 2018 |
| | ($000) |
| Investment Income | |
| Income | |
| Dividends | 62 |
| Interest 2 | — |
| Total Income | 62 |
| Expenses | |
| The Vanguard Group—Note B | |
| Management and Administrative | 2 |
| Marketing and Distribution | — |
| Custodian Fees | — |
| Shareholders’ Reports | 1 |
| Total Expenses | 3 |
| Net Investment Income | 59 |
| Realized Net Gain (Loss) | |
| Investment Securities Sold 2 | 11 |
| Futures Contracts | — |
| Realized Net Gain (Loss) | 11 |
| Change in Unrealized Appreciation (Depreciation) | |
| Investment Securities 2 | 450 |
| Futures Contracts | 5 |
| Change in Unrealized Appreciation (Depreciation) | 455 |
| Net Increase (Decrease) in Net Assets Resulting from Operations | 525 |
1 Inception.
2 Interest income, realized net gain (loss), and change in unrealized appreciation (depreciation) from an affiliated company of the fund
were each less than $1,000. Purchases and sales are for temporary cash investment purposes.
See accompanying Notes, which are an integral part of the Financial Statements.
33
U.S. Minimum Volatility ETF
Statement of Changes in Net Assets
| |
| | February13,20181 to |
| | May 31, 2018 |
| | ($000) |
| Increase (Decrease) in Net Assets | |
| Operations | |
| Net Investment Income | 59 |
| Realized Net Gain (Loss) | 11 |
| Change in Unrealized Appreciation (Depreciation) | 455 |
| Net Increase (Decrease) in Net Assets Resulting from Operations | 525 |
| Distributions | |
| Net Investment Income | — |
| Realized Capital Gain | — |
| Total Distributions | — |
| Capital Share Transactions | |
| Issued | 9,505 |
| Issued in Lieu of Cash Distributions | — |
| Redeemed | — |
| Net Increase (Decrease) from Capital Share Transactions | 9,505 |
| Total Increase (Decrease) | 10,030 |
| Net Assets | |
| Beginning of Period | — |
| End of Period2 | 10,030 |
| 1 Inception. |
| 2 Net Assets – End of Period includes undistributed (overdistributed) net investment income of $59,000. |
See accompanying Notes, which are an integral part of the Financial Statements.
34
U.S. Minimum Volatility ETF
Financial Highlights
| |
| | February 13, 20181 to |
| For a Share Outstanding Throughout the Period | May 31, 2018 |
| Net Asset Value, Beginning of Period | $75.00 |
| Investment Operations | |
| Net Investment Income2 | .589 |
| Net Realized and Unrealized Gain (Loss) on Investments | 4.651 |
| Total from Investment Operations | 5.240 |
| Distributions | |
| Dividends from Net Investment Income | — |
| Distributions from Realized Capital Gains | — |
| Total Distributions | — |
| Net Asset Value, End of Period | $80.24 |
| |
| Total Return | 6.99% |
| |
| Ratios/Supplemental Data | |
| Net Assets, End of Period (Millions) | $10 |
| Ratio of Total Expenses to Average Net Assets | 0.13%3 |
| Ratio of Net Investment Income to Average Net Assets | 2.57%3 |
| Portfolio Turnover Rate | 2% 3 |
| 1 Inception. |
| 2 Calculated based on average shares outstanding. |
| 3 Annualized. |
See accompanying Notes, which are an integral part of the Financial Statements.
35
U.S. Minimum Volatility ETF
Notes to Financial Statements
Vanguard U.S. Minimum Volatility ETF is registered under the Investment Company Act of 1940 as an open-end investment company, or mutual fund. ETF Shares are listed for trading on Cboe BZX Exchange; they can be purchased and sold through a broker.
A. The following significant accounting policies conform to generally accepted accounting principles for U.S. investment companies. The fund consistently follows such policies in preparing its financial statements.
1. Security Valuation: Securities are valued as of the close of trading on the New York Stock Exchange (generally 4 p.m., Eastern time) on the valuation date. Equity securities are valued at the latest quoted sales prices or official closing prices taken from the primary market in which each security trades; such securities not traded on the valuation date are valued at the mean of the latest quoted bid and asked prices. Securities for which market quotations are not readily available, or whose values have been materially affected by events occurring before the fund’s pricing time but after the close of the securities’ primary markets, are valued by methods deemed by the board of trustees to represent fair value. Investments in Vanguard Market Liquidity Fund are valued at that fund’s net asset value.
2. Futures Contracts: The fund uses index futures contracts to a limited extent, with the objective of maintaining full exposure to the stock market while maintaining liquidity. The fund may purchase or sell futures contracts to achieve a desired level of investment, whether to accommodate portfolio turnover or cash flows from capital share transactions. The primary risks associated with the use of futures contracts are imperfect correlation between changes in market values of stocks held by the fund and the prices of futures contracts, and the possibility of an illiquid market. Counterparty risk involving futures is mitigated because a regulated clearinghouse is the counterparty instead of the clearing broker. To further mitigate counterparty risk, the fund trades futures contracts on an exchange, monitors the financial strength of its clearing brokers and clearinghouse, and has entered into clearing agreements with its clearing brokers. The clearinghouse imposes initial margin requirements to secure the fund’s performance and requires daily settlement of variation margin representing changes in the market value of each contract.
Futures contracts are valued at their quoted daily settlement prices. The notional amounts of the contracts are not recorded in the Statement of Net Assets. Fluctuations in the value of the contracts are recorded in the Statement of Net Assets as an asset (liability) and in the Statement of Operations as unrealized appreciation (depreciation) until the contracts are closed, when they are recorded as realized futures gains (losses).
During the period ended May 31, 2018, the fund’s average investments in long and short futures contracts represented less than 1% and 0% of net assets, respectively, based on the average of the notional amounts at each quarter-end during the period.
3. Federal Income Taxes: The fund intends to qualify as a regulated investment company and distribute all of its taxable income. Management has analyzed the fund’s tax positions taken for the period ended May 31, 2018, and has concluded that no provision for federal income tax is required in the fund’s financial statements.
4. Distributions: Distributions to shareholders are recorded on the ex-dividend date.
36
|
| U.S. Minimum Volatility ETF |
5. Other: Dividend income is recorded on the ex-dividend date. Interest income includes income distributions received from Vanguard Market Liquidity Fund and is accrued daily. Security transactions are accounted for on the date securities are bought or sold. Costs used to determine realized gains (losses) on the sale of investment securities are those of the specific securities sold.
B. In accordance with the terms of a Funds’ Service Agreement (the “FSA”) between Vanguard and the fund, Vanguard furnishes to the fund investment advisory, corporate management, administrative, marketing, and distribution services at Vanguard’s cost of operations (as defined by the FSA). These costs of operations are allocated to the fund based on methods and guidelines approved by the board of trustees, and generally settled twice a month.
Upon the request of Vanguard, the fund may invest up to 0.40% of its net assets as capital in Vanguard. At May 31, 2018, the fund had contributed to Vanguard capital in the amount of $1,000, representing 0.01% of the fund’s net assets and 0.00% of Vanguard’s capitalization. The fund’s trustees and officers are also directors and employees, respectively, of Vanguard.
C. Various inputs may be used to determine the value of the fund’s investments. These inputs are summarized in three broad levels for financial statement purposes. The inputs or methodologies used to value securities are not necessarily an indication of the risk associated with investing in those securities.
Level 1—Quoted prices in active markets for identical securities.
Level 2—Other significant observable inputs (including quoted prices for similar securities, interest rates, prepayment speeds, credit risk, etc.).
Level 3—Significant unobservable inputs (including the fund’s own assumptions used to determine
the fair value of investments). Any investments valued with significant unobservable inputs are
noted on the Statement of Net Assets.
At May 31, 2018, 100% of the market value of the fund’s investments was determined based on Level 1 inputs.
D. Distributions are determined on a tax basis and may differ from net investment income and realized capital gains for financial reporting purposes. Differences may be permanent or temporary. Permanent differences are reclassified among capital accounts in the financial statements to reflect their tax character. Temporary differences arise when certain items of income, expense, gain, or loss are recognized in different periods for financial statement and tax purposes. These differences will reverse at some time in the future. Differences in classification may also result from the treatment of short-term gains as ordinary income for tax purposes. The fund’s tax-basis capital gains and losses are determined only at the end of each fiscal year.
At May 31, 2018, the cost of investment securities for tax purposes was $9,566,000. Net unrealized appreciation of investment securities for tax purposes was $450,000, consisting of unrealized gains of $641,000 on securities that had risen in value since their purchase and $191,000 in unrealized losses on securities that had fallen in value since their purchase.
E. During the period ended May 31, 2018, the fund purchased $9,534,000 of investment securities and sold $50,000 of investment securities, other than temporary cash investments.
37
U.S. Minimum Volatility ETF
F. Capital shares issued and redeemed were:
| |
| | February 13, 20181 to |
| | May 31, 2018 |
| | Shares |
| | (000) |
| Issued | 125 |
| Issued in Lieu of Cash Distributions | — |
| Redeemed | — |
| Net Increase (Decrease) in Shares Outstanding | 125 |
| 1 Inception. |
G. Management has determined that no events or transactions occurred subsequent to May 31, 2018, that would require recognition or disclosure in these financial statements.
38
U.S. Momentum Factor ETF
Fund Profile
As of May 31, 2018
| | |
| Portfolio Characteristics | | |
| | | Russell |
| | | 3000 |
| | Fund | Index |
| Number of Stocks | 727 | 2,941 |
| Median Market Cap | $11.3B | $66.7B |
| Price/Earnings Ratio | 24.5x | 20.8x |
| Price/Book Ratio | 4.4x | 3.0x |
| Return on Equity | 12.8% | 15.0% |
| Earnings Growth | | |
| Rate | 10.5% | 7.9% |
| Dividend Yield | 0.8% | 1.8% |
| Foreign Holdings | 0.0% | 0.0% |
| Turnover Rate | | |
| (Annualized) | 48% | — |
| Ticker Symbol | VFMO | — |
| Expense Ratio1 | 0.13% | — |
| 30-Day SEC Yield | 0.76% | — |
| Short-Term Reserves | 0.5% | — |
| | |
| Sector Diversification (% of equity exposure) |
| | | Russell |
| | | 3000 |
| | Fund | Index |
| Consumer Discretionary | 18.0% | 14.3% |
| Consumer Staples | 1.8 | 5.3 |
| Energy | 4.0 | 6.0 |
| Financial Services | 18.2 | 21.1 |
| Health Care | 17.2 | 13.2 |
| Materials & Processing | 4.1 | 3.8 |
| Other | 0.3 | 0.0 |
| Producer Durables | 12.8 | 10.8 |
| Technology | 22.4 | 21.0 |
| Utilities | 1.2 | 4.5 |
Sector categories are based on the Russell Global Sectors (“RGS”),
except for the “Other” category (if applicable), which includes
securities that have not been provided a RGS classification as of
the effective reporting period.
| | |
| Ten Largest Holdings (% of total net assets) |
| Micron Technology Inc. | Semiconductors & | |
| | Components | 1.2% |
| Netflix Inc. | Specialty Retail | 1.1 |
| NVIDIA Corp. | Semiconductors & | |
| | Components | 1.1 |
| Adobe Systems Inc. | Computer Services | |
| | Software & Systems | 1.1 |
| Intel Corp. | Semiconductors & | |
| | Components | 1.0 |
| Estee Lauder Cos. Inc. | Cosmetics | 1.0 |
| Marathon Petroleum | Oil: Refining & | |
| Corp. | Marketing | 1.0 |
| Mastercard Inc. | Financial Data & | |
| | Systems | 1.0 |
| Progressive Corp. | Insurance: | |
| | Property-Casualty | 1.0 |
| Intuit Inc. | Computer Services | |
| | Software & Systems | 1.0 |
| Top Ten | | 10.5% |
| The holdings listed exclude any temporary cash investments andequity index products. |
1 The expense ratio shown is from the prospectus dated February 13, 2018, and represents estimated costs for the current fiscal year. For
the period from inception through May 31, 2018, the annualized expense ratio was 0.13%.
39
U.S. Momentum Factor ETF
Performance Summary
All of the returns in this report represent past performance, which is not a guarantee of future results that may be achieved by the fund. (Current performance may be lower or higher than the performance data cited. For performance data current to the most recent month-end, visit our website at vanguard.com/performance.) Note, too, that both investment returns and principal value can fluctuate widely, so an investor’s shares, when sold, could be worth more or less than their original cost. The returns shown do not reflect taxes that a shareholder would pay on fund distributions or on the sale of fund shares.
Fiscal-Period Total Returns (%): February 13, 2018, Through May 31, 2018

Total Returns: Period Ended March 31, 2018
This table presents returns through the latest calendar quarter—rather than through the end of the fiscal period.
Securities and Exchange Commission rules require that we provide this information.
| | |
| | Inception | Since |
| | Date | Inception |
| ETF Shares | 2/13/2018 | |
| Market Price | | 2.01% |
| Net Asset Value | | 1.93 |
See Financial Highlights for dividend and capital gains information.
40
U.S. Momentum Factor ETF
Financial Statements (unaudited)
Statement of Net Assets
As of May 31, 2018
The fund reports a complete list of its holdings in regulatory filings four times in each fiscal year, at the quarter-ends. For the second and fourth fiscal quarters, the lists appear in the fund’s semiannual and annual reports to shareholders. For the first and third fiscal quarters, the fund files the lists with the Securities and Exchange Commission on Form N-Q. Shareholders can look up the fund’s Forms N-Q on the SEC’s website at sec.gov. Forms N-Q may also be reviewed and copied at the SEC’s Public Reference Room (see the back cover of this report for further information).
| | | |
| | | | Market |
| | | | Value• |
| | | Shares | ($000) |
| Common Stocks (99.4%) | | |
| Consumer Discretionary (17.9%) | |
| * | Netflix Inc. | 380 | 134 |
| | Estee Lauder Cos. Inc. | | |
| | Class A | 789 | 118 |
| * | Amazon.com Inc. | 47 | 77 |
| | Marriott International Inc. | | |
| | Class A | 525 | 71 |
| | VF Corp. | 875 | 71 |
| * | 2U Inc. | 594 | 56 |
| | Las Vegas Sands Corp. | 641 | 52 |
| | New York Times Co. | | |
| | Class A | 2,048 | 47 |
| * | Carvana Co. Class A | 1,557 | 45 |
| * | American Public Education | | |
| | Inc. | 1,005 | 43 |
| | Tapestry Inc. | 885 | 39 |
| | Target Corp. | 429 | 31 |
| * | Scientific Games Corp. | 459 | 27 |
| | Buckle Inc. | 1,050 | 27 |
| * | eBay Inc. | 642 | 24 |
| | Home Depot Inc. | 127 | 24 |
| | Ralph Lauren Corp. Class A | 162 | 22 |
| | Churchill Downs Inc. | 69 | 21 |
| | Wynn Resorts Ltd. | 104 | 20 |
| | Boyd Gaming Corp. | 524 | 20 |
| * | Crocs Inc. | 1,072 | 19 |
| | PVH Corp. | 118 | 19 |
| * | Michael Kors Holdings Ltd. | 313 | 18 |
| * | NVR Inc. | 6 | 18 |
| * | Boot Barn Holdings Inc. | 756 | 18 |
| | Kohl’s Corp. | 267 | 18 |
| * | Wayfair Inc. | 192 | 18 |
| * | Etsy Inc. | 534 | 17 |
| * | Penn National Gaming Inc. | 501 | 17 |
| | World Wrestling | | |
| | Entertainment Inc. Class A | 292 | 17 |
| | Best Buy Co. Inc. | 241 | 16 |
| * | Cimpress NV | 117 | 16 |
| | | |
| * | RH | 160 | 16 |
| | Hilton Worldwide Holdings | | |
| | Inc. | 191 | 15 |
| * | Weight Watchers | | |
| | International Inc. | 202 | 15 |
| * | QuinStreet Inc. | 1,105 | 15 |
| * | Chegg Inc. | 537 | 15 |
| * | At Home Group Inc. | 426 | 15 |
| * | Ollie’s Bargain Outlet Holdings | | |
| | Inc. | 206 | 15 |
| * | LGI Homes Inc. | 239 | 15 |
| | Abercrombie & Fitch Co. | 606 | 14 |
| * | Grand Canyon Education Inc. | 124 | 14 |
| | Wingstop Inc. | 272 | 14 |
| * | SiteOne Landscape Supply Inc. | 181 | 14 |
| * | Lululemon Athletica Inc. | 130 | 14 |
| * | Burlington Stores Inc. | 93 | 14 |
| | Walmart Inc. | 164 | 14 |
| | DR Horton Inc. | 318 | 13 |
| | Marriott Vacations Worldwide | | |
| | Corp. | 109 | 13 |
| | Yum! Brands Inc. | 161 | 13 |
| * | Hilton Grand Vacations Inc. | 329 | 13 |
| | Guess? Inc. | 663 | 13 |
| * | Eldorado Resorts Inc. | 286 | 13 |
| * | Skechers U.S.A. Inc. Class A | 442 | 13 |
| | Dollar General Corp. | 146 | 13 |
| | Polaris Industries Inc. | 113 | 13 |
| * | ServiceMaster Global Holdings | | |
| | Inc. | 221 | 13 |
| * | Dollar Tree Inc. | 152 | 13 |
| * | Live Nation Entertainment Inc. | 293 | 12 |
| | Texas Roadhouse Inc. Class A | 201 | 12 |
| | Hyatt Hotels Corp. Class A | 150 | 12 |
| * | Urban Outfitters Inc. | 295 | 12 |
| * | Instructure Inc. | 274 | 12 |
| | Tiffany & Co. | 89 | 12 |
| | Carter’s Inc. | 105 | 11 |
| * | MCBC Holdings Inc. | 380 | 11 |
41
U.S. Momentum Factor ETF
| | | |
| | | | Market |
| | | | Value• |
| | Shares | ($000) |
| | Choice Hotels International Inc. | 139 | 11 |
| * | Monarch Casino & Resort Inc. | 246 | 11 |
| * | Shutterfly Inc. | 115 | 11 |
| * | Bright Horizons Family | | |
| | Solutions Inc. | 105 | 11 |
| | Wyndham Worldwide Corp. | 96 | 10 |
| * | Stamps.com Inc. | 41 | 10 |
| * | Conn’s Inc. | 443 | 10 |
| | Aptiv plc | 104 | 10 |
| * | Planet Fitness Inc. Class A | 253 | 10 |
| * | Floor & Decor Holdings Inc. | | |
| | Class A | 208 | 10 |
| * | Care.com Inc. | 470 | 10 |
| | News Corp. Class A | 630 | 9 |
| * | Overstock.com Inc. | 280 | 9 |
| * | Malibu Boats Inc. Class A | 215 | 9 |
| | Columbia Sportswear Co. | 105 | 9 |
| | Gap Inc. | 326 | 9 |
| | Johnson Outdoors Inc. Class A | 120 | 9 |
| | Yum China Holdings Inc. | 231 | 9 |
| * | Five Below Inc. | 126 | 9 |
| * | G-III Apparel Group Ltd. | 211 | 9 |
| | Tailored Brands Inc. | 265 | 9 |
| * | Stoneridge Inc. | 275 | 9 |
| * | Career Education Corp. | 561 | 9 |
| * | ZAGG Inc. | 559 | 8 |
| | PulteGroup Inc. | 278 | 8 |
| | Lear Corp. | 42 | 8 |
| * | Deckers Outdoor Corp. | 71 | 8 |
| * | TRI Pointe Group Inc. | 465 | 8 |
| | Movado Group Inc. | 162 | 8 |
| * | America’s Car-Mart Inc. | 127 | 8 |
| | Red Rock Resorts Inc. Class A | 230 | 8 |
| | Toll Brothers Inc. | 199 | 8 |
| | KB Home | 297 | 8 |
| * | LKQ Corp. | 240 | 8 |
| * | Regis Corp. | 429 | 7 |
| | International Game | | |
| | Technology plc | 295 | 7 |
| | Ross Stores Inc. | 92 | 7 |
| | Royal Caribbean Cruises Ltd. | 69 | 7 |
| | Garmin Ltd. | 120 | 7 |
| * | Lands’ End Inc. | 363 | 7 |
| * | Cavco Industries Inc. | 34 | 7 |
| | Oxford Industries Inc. | 81 | 7 |
| | Citi Trends Inc. | 219 | 7 |
| | Steven Madden Ltd. | 123 | 6 |
| | Inter Parfums Inc. | 119 | 6 |
| | Gannett Co. Inc. | 598 | 6 |
| | BorgWarner Inc. | 128 | 6 |
| * | M/I Homes Inc. | 219 | 6 |
| | Service Corp. International | 164 | 6 |
| | Callaway Golf Co. | 315 | 6 |
| * | Qurate Retail Group Inc. QVC | | |
| | Group Class A | 293 | 6 |
| | | |
| | Wolverine World Wide Inc. | 177 | 6 |
| | Ruth’s Hospitality Group Inc. | 222 | 6 |
| * | Adtalem Global Education Inc. | 120 | 6 |
| | American Eagle Outfitters Inc. | 249 | 6 |
| * | Madison Square Garden Co. | | |
| | Class A | 21 | 6 |
| | Acushnet Holdings Corp. | 225 | 5 |
| | Dine Brands Global Inc. | 83 | 5 |
| | Dana Inc. | 235 | 5 |
| | Bloomin’ Brands Inc. | 238 | 5 |
| * | Golden Entertainment Inc. | 165 | 5 |
| | John Wiley & Sons Inc. | | |
| | Class A | 73 | 5 |
| * | Drive Shack Inc. | 745 | 5 |
| * | Taylor Morrison Home Corp. | | |
| | Class A | 208 | 4 |
| | International Speedway Corp. | | |
| | Class A | 106 | 4 |
| * | Fox Factory Holding Corp. | 110 | 4 |
| * | Meritor Inc. | 200 | 4 |
| | Dillard’s Inc. Class A | 50 | 4 |
| | New Media Investment Group | | |
| | Inc. | 222 | 4 |
| * | Meritage Homes Corp. | 80 | 4 |
| | Children’s Place Inc. | 27 | 3 |
| | Lennar Corp. Class A | 62 | 3 |
| * | American Woodmark Corp. | 30 | 3 |
| * | Avis Budget Group Inc. | 78 | 3 |
| * | Zumiez Inc. | 105 | 3 |
| * | Eros International plc | 173 | 2 |
| | Domino’s Pizza Inc. | 9 | 2 |
| * | Vera Bradley Inc. | 168 | 2 |
| * | Century Communities Inc. | 64 | 2 |
| * | Sleep Number Corp. | 66 | 2 |
| * | William Lyon Homes Class A | 73 | 2 |
| | | | 2,177 |
| Consumer Staples (1.8%) | | |
| | Constellation Brands Inc. | | |
| | Class A | 163 | 36 |
| * | Monster Beverage Corp. | 522 | 27 |
| | Medifast Inc. | 129 | 19 |
| * | Herbalife Nutrition Ltd. | 298 | 15 |
| | Lamb Weston Holdings Inc. | 237 | 15 |
| | Brown-Forman Corp. Class B | 256 | 14 |
| * | USANA Health Sciences Inc. | 93 | 11 |
| | MGP Ingredients Inc. | 122 | 11 |
| | Nu Skin Enterprises Inc. | | |
| | Class A | 113 | 9 |
| | Tyson Foods Inc. Class A | 135 | 9 |
| | PetMed Express Inc. | 238 | 9 |
| * | Freshpet Inc. | 340 | 8 |
| * | Boston Beer Co. Inc. Class A | 30 | 8 |
| * | Chefs’ Warehouse Inc. | 275 | 8 |
| | Calavo Growers Inc. | 83 | 7 |
42
U.S. Momentum Factor ETF
| | | |
| | | | Market |
| | | | Value• |
| | Shares | ($000) |
| * | Performance Food Group Co. | 201 | 7 |
| * | Sprouts Farmers Market Inc. | 269 | 6 |
| | WD-40 Co. | 18 | 2 |
| | | | 221 |
| Energy (4.0%) | | |
| | Marathon Petroleum Corp. | 1,491 | 118 |
| | Valero Energy Corp. | 638 | 77 |
| | ConocoPhillips | 912 | 61 |
| | HollyFrontier Corp. | 422 | 32 |
| * | First Solar Inc. | 306 | 21 |
| | Peabody Energy Corp. | 397 | 17 |
| * | W&T Offshore Inc. | 2,419 | 17 |
| * | Denbury Resources Inc. | 3,058 | 13 |
| * | WildHorse Resource | | |
| | Development Corp. | 476 | 13 |
| * | California Resources Corp. | 337 | 12 |
| | Delek US Holdings Inc. | 216 | 12 |
| * | Continental Resources Inc. | 164 | 11 |
| | PBF Energy Inc. Class A | 232 | 11 |
| * | Mammoth Energy Services | | |
| | Inc. | 262 | 10 |
| * | Sunrun Inc. | 810 | 10 |
| | CVR Energy Inc. | 255 | 10 |
| | Warrior Met Coal Inc. | 350 | 9 |
| * | Talos Energy Inc. | 212 | 7 |
| | Arch Coal Inc. Class A | 81 | 7 |
| * | HighPoint Resources Corp. | 839 | 6 |
| * | Ring Energy Inc. | 369 | 5 |
| | Diamondback Energy Inc. | 27 | 3 |
| * | Apergy Corp. | 45 | 2 |
| | | | 484 |
| Financial Services (18.1%) | | |
| | Mastercard Inc. Class A | 619 | 118 |
| | Progressive Corp. | 1,881 | 117 |
| | S&P Global Inc. | 568 | 112 |
| | CME Group Inc. | 688 | 112 |
| | TD Ameritrade Holding Corp. | 1,891 | 112 |
| | Moody’s Corp. | 598 | 102 |
| * | PayPal Holdings Inc. | 963 | 79 |
| * | LendingTree Inc. | 205 | 53 |
| | Broadridge Financial Solutions | | |
| | Inc. | 449 | 52 |
| | Visa Inc. Class A | 393 | 51 |
| | BlackRock Inc. | 92 | 49 |
| | Hanover Insurance Group Inc. | 404 | 49 |
| | JPMorgan Chase & Co. | 437 | 47 |
| | PNC Financial Services Group | | |
| | Inc. | 323 | 46 |
| * | FleetCor Technologies Inc. | 225 | 45 |
| | FirstCash Inc. | 471 | 43 |
| | Crown Castle International | | |
| | Corp. | 335 | 35 |
| | Bank of America Corp. | 1,181 | 34 |
| * | Square Inc. | 477 | 28 |
| | | |
| | Charles Schwab Corp. | 421 | 23 |
| | TransUnion | 322 | 22 |
| * | SVB Financial Group | 70 | 22 |
| | Comerica Inc. | 225 | 21 |
| * | Credit Acceptance Corp. | 57 | 20 |
| | Zions Bancorporation | 338 | 19 |
| | Interactive Brokers Group Inc. | 247 | 18 |
| * | Bancorp Inc. | 1,575 | 18 |
| * | Zillow Group Inc. | 277 | 16 |
| | T. Rowe Price Group Inc. | 133 | 16 |
| | Regions Financial Corp. | 866 | 16 |
| | Hamilton Lane Inc. Class A | 337 | 16 |
| * | SBA Communications Corp. | | |
| | Class A | 99 | 16 |
| | Umpqua Holdings Corp. | 652 | 15 |
| | LPL Financial Holdings Inc. | 211 | 14 |
| | TCF Financial Corp. | 551 | 14 |
| * | Western Alliance Bancorp | 233 | 14 |
| * | E*TRADE Financial Corp. | 220 | 14 |
| | MSCI Inc. Class A | 85 | 14 |
| * | Trupanion Inc. | 428 | 14 |
| * | Triumph Bancorp Inc. | 324 | 13 |
| | Total System Services Inc. | 156 | 13 |
| | First American Financial Corp. | 249 | 13 |
| | Virtu Financial Inc. Class A | 417 | 13 |
| * | WEX Inc. | 73 | 13 |
| * | Enova International Inc. | 380 | 13 |
| | FNF Group | 345 | 13 |
| | Rayonier Inc. | 328 | 13 |
| * | NMI Holdings Inc. Class A | 763 | 13 |
| | Cboe Global Markets Inc. | 130 | 13 |
| | SEI Investments Co. | 191 | 12 |
| * | World Acceptance Corp. | 110 | 12 |
| * | Green Dot Corp. Class A | 160 | 11 |
| | Opus Bank | 371 | 11 |
| | Kemper Corp. | 141 | 11 |
| | Bank of NT Butterfield & Son | | |
| | Ltd. | 228 | 11 |
| | Synovus Financial Corp. | 200 | 11 |
| | Primerica Inc. | 109 | 11 |
| | Jones Lang LaSalle Inc. | 65 | 11 |
| | Morningstar Inc. | 88 | 11 |
| * | Health Insurance Innovations | | |
| | Inc. Class A | 316 | 10 |
| | Carolina Financial Corp. | 225 | 10 |
| | Ameriprise Financial Inc. | 71 | 10 |
| * | CBRE Group Inc. Class A | 205 | 9 |
| | Jack Henry & Associates Inc. | 75 | 9 |
| * | Forestar Group Inc. | 395 | 9 |
| | Global Payments Inc. | 80 | 9 |
| | Fifth Third Bancorp | 282 | 9 |
| * | EZCORP Inc. Class A | 694 | 9 |
| | Lazard Ltd. Class A | 165 | 8 |
| | Eaton Vance Corp. | 156 | 8 |
| | Ally Financial Inc. | 322 | 8 |
43
U.S. Momentum Factor ETF
| | | |
| | | | Market |
| | | | Value• |
| | Shares | ($000) |
| | Voya Financial Inc. | 157 | 8 |
| | Houlihan Lokey Inc. Class A | 164 | 8 |
| | BGC Partners Inc. Class A | 692 | 8 |
| * | BofI Holding Inc. | 188 | 8 |
| | HFF Inc. Class A | 229 | 8 |
| | ConnectOne Bancorp Inc. | 277 | 7 |
| * | CorePoint Lodging Inc. | 257 | 7 |
| * | Worldpay Inc. Class A | 90 | 7 |
| | Kinsale Capital Group Inc. | 134 | 7 |
| | Moelis & Co. Class A | 115 | 7 |
| | Brown & Brown Inc. | 244 | 7 |
| | FB Financial Corp. | 161 | 7 |
| | PJT Partners Inc. | 118 | 7 |
| | Heritage Financial Corp. | 196 | 6 |
| * | Flagstar Bancorp Inc. | 176 | 6 |
| | Artisan Partners Asset | | |
| | Management Inc. Class A | 179 | 6 |
| | Cohen & Steers Inc. | 145 | 6 |
| | Meta Financial Group Inc. | 48 | 5 |
| | Federal Agricultural Mortgage | | |
| | Corp. | 58 | 5 |
| * | Marcus & Millichap Inc. | 144 | 5 |
| * | MGIC Investment Corp. | 500 | 5 |
| | Pebblebrook Hotel Trust | 127 | 5 |
| | Evercore Inc. Class A | 49 | 5 |
| | Heritage Insurance Holdings | | |
| | Inc. | 302 | 5 |
| * | Fair Isaac Corp. | 27 | 5 |
| | First Citizens BancShares Inc. | | |
| | Class A | 11 | 5 |
| | Independent Bank Group Inc. | 63 | 5 |
| | Selective Insurance Group Inc. | 83 | 5 |
| * | eHealth Inc. | 214 | 5 |
| * | PennyMac Financial Services | | |
| | Inc. Class A | 225 | 5 |
| * | Ocwen Financial Corp. | 991 | 4 |
| | Piper Jaffray Cos. | 57 | 4 |
| | Universal Insurance Holdings | | |
| | Inc. | 119 | 4 |
| | Green Bancorp Inc. | 181 | 4 |
| | Federated Investors Inc. | | |
| | Class B | 166 | 4 |
| | WisdomTree Investments Inc. | 357 | 4 |
| * | Altisource Portfolio Solutions | | |
| | SA | 132 | 4 |
| * | Essent Group Ltd. | 109 | 4 |
| | East West Bancorp Inc. | 50 | 3 |
| | M&T Bank Corp. | 20 | 3 |
| | United Insurance Holdings | | |
| | Corp. | 99 | 2 |
| | Ryman Hospitality Properties | | |
| | Inc. | 24 | 2 |
| | SunTrust Banks Inc. | 29 | 2 |
| | | | 2,205 |
| | | |
| Health Care (17.1%) | | |
| | Zoetis Inc. | 1,344 | 112 |
| * | Intuitive Surgical Inc. | 175 | 80 |
| * | Illumina Inc. | 253 | 69 |
| | AbbVie Inc. | 668 | 66 |
| | Anthem Inc. | 287 | 64 |
| | UnitedHealth Group Inc. | 258 | 62 |
| * | Vertex Pharmaceuticals Inc. | 334 | 51 |
| | Abbott Laboratories | 826 | 51 |
| * | G1 Therapeutics Inc. | 1,062 | 46 |
| * | ABIOMED Inc. | 79 | 30 |
| * | Madrigal Pharmaceuticals Inc. | 112 | 30 |
| * | Align Technology Inc. | 82 | 27 |
| * | AxoGen Inc. | 533 | 26 |
| * | Tabula Rasa HealthCare Inc. | 427 | 23 |
| * | Neurocrine Biosciences Inc. | 238 | 23 |
| * | ICU Medical Inc. | 78 | 23 |
| * | Insulet Corp. | 241 | 23 |
| | Chemed Corp. | 66 | 22 |
| * | Molina Healthcare Inc. | 242 | 21 |
| * | Nektar Therapeutics Class A | 253 | 20 |
| * | Loxo Oncology Inc. | 113 | 20 |
| * | Quidel Corp. | 316 | 20 |
| * | Centene Corp. | 166 | 19 |
| * | Sage Therapeutics Inc. | 126 | 19 |
| * | Novocure Ltd. | 595 | 19 |
| * | LivaNova plc | 198 | 19 |
| | Baxter International Inc. | 262 | 19 |
| * | Enanta Pharmaceuticals Inc. | 180 | 18 |
| * | Abeona Therapeutics Inc. | 1,002 | 18 |
| * | Bluebird Bio Inc. | 98 | 18 |
| * | Exact Sciences Corp. | 287 | 17 |
| * | Immunomedics Inc. | 774 | 17 |
| * | PRA Health Sciences Inc. | 195 | 17 |
| * | Alnylam Pharmaceuticals Inc. | 165 | 16 |
| | Arena Pharmaceuticals Inc. | 350 | 16 |
| * | WellCare Health Plans Inc. | 72 | 16 |
| * | Atara Biotherapeutics Inc. | 314 | 16 |
| * | Sarepta Therapeutics Inc. | 163 | 15 |
| * | Intersect ENT Inc. | 355 | 15 |
| * | Stemline Therapeutics Inc. | 766 | 15 |
| * | Varian Medical Systems Inc. | 123 | 15 |
| | PerkinElmer Inc. | 191 | 14 |
| * | Foundation Medicine Inc. | 142 | 14 |
| * | ImmunoGen Inc. | 1,221 | 14 |
| | ResMed Inc. | 134 | 14 |
| * | Spectrum Pharmaceuticals | | |
| | Inc. | 685 | 13 |
| | Cantel Medical Corp. | 120 | 13 |
| * | Audentes Therapeutics Inc. | 345 | 13 |
| * | FibroGen Inc. | 241 | 13 |
| * | Cutera Inc. | 309 | 13 |
| * | Adamas Pharmaceuticals Inc. | 446 | 13 |
| * | Aimmune Therapeutics Inc. | 382 | 13 |
44
U.S. Momentum Factor ETF
| | | |
| | | | Market |
| | | | Value• |
| | Shares | ($000) |
| * | Array BioPharma Inc. | 762 | 12 |
| * | Zogenix Inc. | 290 | 12 |
| * | Agios Pharmaceuticals Inc. | 130 | 12 |
| | HCA Healthcare Inc. | 116 | 12 |
| * | WaVe Life Sciences Ltd. | 256 | 12 |
| * | PTC Therapeutics Inc. | 349 | 12 |
| | Teleflex Inc. | 44 | 12 |
| * | Voyager Therapeutics Inc. | 591 | 12 |
| * | Tenet Healthcare Corp. | 323 | 11 |
| * | Novavax Inc. | 7,003 | 11 |
| * | Collegium Pharmaceutical Inc. | 504 | 11 |
| * | Iovance Biotherapeutics Inc. | 772 | 11 |
| * | Geron Corp. | 2,755 | 11 |
| * | Inogen Inc. | 60 | 11 |
| * | Haemonetics Corp. | 121 | 11 |
| * | Orthofix International NV | 200 | 11 |
| * | Penumbra Inc. | 67 | 11 |
| * | Catalent Inc. | 268 | 11 |
| * | REGENXBIO Inc. | 194 | 11 |
| * | Globus Medical Inc. | 187 | 10 |
| * | Catalyst Pharmaceuticals | | |
| | Inc. | 2,697 | 10 |
| * | iRhythm Technologies Inc. | 136 | 10 |
| * | RadNet Inc. | 813 | 10 |
| * | Intra-Cellular Therapies Inc. | 442 | 10 |
| * | Medpace Holdings Inc. | 240 | 10 |
| * | Blueprint Medicines Corp. | 118 | 10 |
| * | Kura Oncology Inc. | 594 | 10 |
| * | Amicus Therapeutics Inc. | 581 | 10 |
| * | Triple-S Management Corp. | | |
| | Class B | 266 | 10 |
| * | Sangamo Therapeutics Inc. | 589 | 10 |
| * | Global Blood Therapeutics | | |
| | Inc. | 200 | 10 |
| * | Editas Medicine Inc. | 251 | 10 |
| * | AnaptysBio Inc. | 123 | 10 |
| * | Magellan Health Inc. | 104 | 10 |
| * | Concert Pharmaceuticals Inc. | 464 | 9 |
| * | Veeva Systems Inc. Class A | 122 | 9 |
| * | Fate Therapeutics Inc. | 861 | 9 |
| * | MyoKardia Inc. | 198 | 9 |
| | Encompass Health Corp. | 145 | 9 |
| * | Karyopharm Therapeutics Inc. | 498 | 9 |
| | Agilent Technologies Inc. | 149 | 9 |
| * | Heron Therapeutics Inc. | 282 | 9 |
| * | Dynavax Technologies Corp. | 580 | 9 |
| * | Cerus Corp. | 1,370 | 9 |
| * | IQVIA Holdings Inc. | 91 | 9 |
| | Bruker Corp. | 295 | 9 |
| * | Assembly Biosciences Inc. | 211 | 9 |
| | Bio-Techne Corp. | 58 | 9 |
| * | Pieris Pharmaceuticals Inc. | 1,538 | 9 |
| * | CytomX Therapeutics Inc. | 334 | 9 |
| * | Intellia Therapeutics Inc. | 305 | 8 |
| | | |
| * | Emergent BioSolutions Inc. | 160 | 8 |
| * | Tactile Systems Technology | | |
| | Inc. | 164 | 8 |
| | STERIS plc | 77 | 8 |
| * | Halozyme Therapeutics Inc. | 433 | 8 |
| * | Providence Service Corp. | 109 | 8 |
| * | Merit Medical Systems Inc. | 149 | 8 |
| * | Ligand Pharmaceuticals Inc. | 39 | 7 |
| * | TG Therapeutics Inc. | 559 | 7 |
| | Hill-Rom Holdings Inc. | 81 | 7 |
| * | Supernus Pharmaceuticals Inc. | 132 | 7 |
| * | Myriad Genetics Inc. | 191 | 7 |
| * | Syndax Pharmaceuticals Inc. | 767 | 7 |
| * | Acceleron Pharma Inc. | 188 | 7 |
| * | Teladoc Inc. | 128 | 7 |
| * | BioScrip Inc. | 2,365 | 6 |
| * | Revance Therapeutics Inc. | 224 | 6 |
| * | Rigel Pharmaceuticals Inc. | 1,871 | 6 |
| | CONMED Corp. | 87 | 6 |
| | LeMaitre Vascular Inc. | 173 | 6 |
| * | AMN Healthcare Services Inc. | 102 | 6 |
| | Invacare Corp. | 340 | 6 |
| * | Agenus Inc. | 1,517 | 5 |
| * | Esperion Therapeutics Inc. | 129 | 5 |
| | Phibro Animal Health Corp. | | |
| | Class A | 103 | 5 |
| * | Innoviva Inc. | 310 | 5 |
| * | HealthEquity Inc. | 61 | 5 |
| * | MacroGenics Inc. | 176 | 4 |
| * | Amneal Pharmaceuticals Inc. | 193 | 4 |
| * | Neos Therapeutics Inc. | 432 | 3 |
| * | Varex Imaging Corp. | 59 | 2 |
| * | Insmed Inc. | 76 | 2 |
| * | OraSure Technologies Inc. | 119 | 2 |
| | | | 2,087 |
| Materials & Processing (4.0%) | | |
| | Southern Copper Corp. | 2,133 | 104 |
| * | USG Corp. | 1,144 | 47 |
| | Sherwin-Williams Co. | 72 | 27 |
| | Westlake Chemical Corp. | 137 | 16 |
| | LyondellBasell Industries NV | | |
| | Class A | 131 | 15 |
| * | Trex Co. Inc. | 119 | 14 |
| | Boise Cascade Co. | 293 | 14 |
| * | Verso Corp. | 607 | 12 |
| | United States Steel Corp. | 313 | 12 |
| | Owens Corning | 168 | 11 |
| | Packaging Corp. of America | 84 | 10 |
| | Steel Dynamics Inc. | 196 | 10 |
| * | PGT Innovations Inc. | 448 | 9 |
| | CF Industries Holdings Inc. | 222 | 9 |
| | Materion Corp. | 167 | 9 |
| * | Kraton Corp. | 187 | 9 |
| | Hexcel Corp. | 116 | 8 |
45
U.S. Momentum Factor ETF
| | | |
| | | | Market |
| | | | Value• |
| | Shares | ($000) |
| | KMG Chemicals Inc. | 120 | 8 |
| | Freeport-McMoRan Inc. | 474 | 8 |
| * | Builders FirstSource Inc. | 407 | 8 |
| | PolyOne Corp. | 186 | 8 |
| | Lennox International Inc. | 38 | 8 |
| | Schnitzer Steel Industries Inc. | 244 | 8 |
| * | Ferro Corp. | 366 | 8 |
| | Cabot Microelectronics Corp. | 65 | 7 |
| * | Armstrong World Industries | | |
| | Inc. | 120 | 7 |
| | Masco Corp. | 193 | 7 |
| | Simpson Manufacturing Co. | | |
| | Inc. | 106 | 7 |
| | Domtar Corp. | 136 | 7 |
| | Graphic Packaging Holding Co. | 438 | 6 |
| | Rayonier Advanced Materials | | |
| | Inc. | 350 | 6 |
| * | Ingevity Corp. | 81 | 6 |
| | Interface Inc. Class A | 265 | 6 |
| * | Intrepid Potash Inc. | 1,333 | 6 |
| * | Summit Materials Inc. | | |
| | Class A | 207 | 6 |
| * | Alcoa Corp. | 114 | 6 |
| | Kaiser Aluminum Corp. | 46 | 5 |
| * | RBC Bearings Inc. | 38 | 5 |
| | Commercial Metals Co. | 155 | 4 |
| | Gold Resource Corp. | 549 | 3 |
| | Huntsman Corp. | 107 | 3 |
| * | Allegheny Technologies Inc. | 116 | 3 |
| | Chemours Co. | 62 | 3 |
| | | | 495 |
| Other (0.3%) | | |
| | TE Connectivity Ltd. | 193 | 18 |
| * | Yandex NV Class A | 346 | 12 |
| | MercadoLibre Inc. | 32 | 9 |
| | | | 39 |
| Producer Durables (12.7%) | | |
| | Northrop Grumman Corp. | 333 | 109 |
| | Raytheon Co. | 492 | 103 |
| | Boeing Co. | 245 | 86 |
| | Caterpillar Inc. | 469 | 71 |
| | Old Dominion Freight Line Inc. | 358 | 56 |
| | Deere & Co. | 366 | 55 |
| | WW Grainger Inc. | 172 | 53 |
| * | Keysight Technologies Inc. | 900 | 53 |
| * | ASGN Inc. | 610 | 47 |
| | Barrett Business Services Inc. | 462 | 40 |
| | Accenture plc Class A | 189 | 29 |
| | FedEx Corp. | 110 | 27 |
| | Lockheed Martin Corp. | 83 | 26 |
| | Union Pacific Corp. | 180 | 26 |
| | Spirit AeroSystems Holdings | | |
| | Inc. Class A | 216 | 18 |
| * | CoStar Group Inc. | 46 | 18 |
| | | |
| * | Teledyne Technologies Inc. | 86 | 17 |
| * | XPO Logistics Inc. | 161 | 17 |
| * | Copart Inc. | 300 | 16 |
| | IDEX Corp. | 113 | 16 |
| * | Proto Labs Inc. | 123 | 15 |
| | Systemax Inc. | 443 | 15 |
| * | Axon Enterprise Inc. | 229 | 15 |
| | Cintas Corp. | 77 | 14 |
| | FLIR Systems Inc. | 258 | 14 |
| | Graco Inc. | 306 | 14 |
| | Spartan Motors Inc. | 896 | 14 |
| | Insperity Inc. | 139 | 13 |
| * | Casella Waste Systems Inc. | | |
| | Class A | 536 | 13 |
| | BWX Technologies Inc. | 188 | 13 |
| * | Waters Corp. | 64 | 12 |
| | Kadant Inc. | 124 | 12 |
| | Curtiss-Wright Corp. | 94 | 12 |
| | Avery Dennison Corp. | 113 | 12 |
| | Xylem Inc. | 168 | 12 |
| | Knight-Swift Transportation | | |
| | Holdings Inc. | 280 | 11 |
| | ITT Inc. | 216 | 11 |
| * | TriNet Group Inc. | 196 | 10 |
| | AMETEK Inc. | 139 | 10 |
| * | TopBuild Corp. | 119 | 10 |
| | Genpact Ltd. | 319 | 10 |
| * | Modine Manufacturing Co. | 531 | 10 |
| | Rollins Inc. | 188 | 9 |
| * | Aerojet Rocketdyne Holdings | | |
| | Inc. | 321 | 9 |
| | Sun Hydraulics Corp. | 186 | 9 |
| | CH Robinson Worldwide Inc. | 103 | 9 |
| | Stanley Black & Decker Inc. | 64 | 9 |
| | HEICO Corp. | 97 | 9 |
| | Alamo Group Inc. | 93 | 9 |
| | Crane Co. | 101 | 8 |
| * | NV5 Global Inc. | 131 | 8 |
| * | Aerovironment Inc. | 142 | 8 |
| | Trinity Industries Inc. | 237 | 8 |
| | Columbus McKinnon Corp. | 195 | 8 |
| | Korn/Ferry International | 147 | 8 |
| | McGrath RentCorp | 122 | 8 |
| | Landstar System Inc. | 69 | 8 |
| * | Echo Global Logistics Inc. | 279 | 8 |
| | Huntington Ingalls Industries | | |
| | Inc. | 35 | 8 |
| | Exponent Inc. | 77 | 8 |
| * | Saia Inc. | 91 | 7 |
| * | Covenant Transportation Group | | |
| | Inc. Class A | 247 | 7 |
| | John Bean Technologies Corp. | 83 | 7 |
| * | Chart Industries Inc. | 113 | 7 |
| * | Energous Corp. | 390 | 7 |
46
U.S. Momentum Factor ETF
| | | |
| | | | Market |
| | | | Value• |
| | Shares | ($000) |
| | Heidrick & Struggles | | |
| | International Inc. | 190 | 7 |
| | Roper Technologies Inc. | 26 | 7 |
| | Dover Corp. | 91 | 7 |
| * | United Rentals Inc. | 44 | 7 |
| | ArcBest Corp. | 146 | 7 |
| | Marten Transport Ltd. | 301 | 7 |
| * | Titan Machinery Inc. | 379 | 7 |
| | ICF International Inc. | 96 | 7 |
| * | Zebra Technologies Corp. | 44 | 7 |
| | Air Lease Corp. Class A | 152 | 7 |
| | National Instruments Corp. | 161 | 7 |
| | Copa Holdings SA Class A | 60 | 7 |
| | H&E Equipment Services Inc. | 191 | 7 |
| | L3 Technologies Inc. | 33 | 7 |
| * | Astronics Corp. | 185 | 6 |
| | Werner Enterprises Inc. | 157 | 6 |
| * | Paylocity Holding Corp. | 99 | 6 |
| | Mobile Mini Inc. | 129 | 6 |
| | UniFirst Corp. | 32 | 6 |
| | SkyWest Inc. | 99 | 6 |
| * | Control4 Corp. | 227 | 6 |
| * | FARO Technologies Inc. | 101 | 5 |
| | Douglas Dynamics Inc. | 117 | 5 |
| * | Generac Holdings Inc. | 107 | 5 |
| * | Dycom Industries Inc. | 55 | 5 |
| | GasLog Ltd. | 282 | 5 |
| * | Kratos Defense & Security | | |
| | Solutions Inc. | 429 | 5 |
| * | SPX FLOW Inc. | 110 | 5 |
| | Kelly Services Inc. Class A | 212 | 5 |
| * | ExlService Holdings Inc. | 76 | 4 |
| | EnPro Industries Inc. | 56 | 4 |
| | Albany International Corp. | 67 | 4 |
| | Badger Meter Inc. | 93 | 4 |
| * | Darling Ingredients Inc. | 187 | 4 |
| * | Vectrus Inc. | 85 | 3 |
| | Hyster-Yale Materials Handling | |
| | Inc. | 36 | 2 |
| * | Textainer Group Holdings Ltd. | 140 | 2 |
| | TransDigm Group Inc. | 7 | 2 |
| | Cubic Corp. | 31 | 2 |
| | Bristow Group Inc. | 146 | 2 |
| | | | 1,554 |
| Technology (22.3%) | | |
| * | Micron Technology Inc. | 2,535 | 146 |
| | NVIDIA Corp. | 526 | 133 |
| * | Adobe Systems Inc. | 517 | 129 |
| | Intel Corp. | 2,151 | 119 |
| | Intuit Inc. | 574 | 116 |
| * | salesforce.com Inc. | 827 | 107 |
| | Cisco Systems Inc. | 2,206 | 94 |
| | Lam Research Corp. | 360 | 71 |
| | Texas Instruments Inc. | 574 | 64 |
| | | |
| | Microsoft Corp. | 581 | 57 |
| | Applied Materials Inc. | 1,105 | 56 |
| * | HubSpot Inc. | 454 | 55 |
| * | PTC Inc. | 577 | 50 |
| | Activision Blizzard Inc. | 699 | 50 |
| * | SMART Global Holdings Inc. | 1,073 | 48 |
| | Seagate Technology plc | 831 | 47 |
| | Harris Corp. | 278 | 42 |
| | HP Inc. | 1,268 | 28 |
| | Hewlett Packard Enterprise | | |
| | Co. | 1,630 | 25 |
| * | GrubHub Inc. | 222 | 24 |
| * | Atlassian Corp. plc Class A | 372 | 24 |
| | Cognizant Technology | | |
| | Solutions Corp. Class A | 302 | 23 |
| * | ServiceNow Inc. | 128 | 23 |
| * | New Relic Inc. | 212 | 22 |
| * | USA Technologies Inc. | 1,587 | 21 |
| * | Zendesk Inc. | 378 | 21 |
| * | Twitter Inc. | 604 | 21 |
| * | IAC/InterActiveCorp | 131 | 20 |
| * | RealPage Inc. | 340 | 20 |
| * | IPG Photonics Corp. | 82 | 20 |
| * | Take-Two Interactive Software | | |
| | Inc. | 176 | 20 |
| * | Varonis Systems Inc. | 242 | 19 |
| * | Arista Networks Inc. | 73 | 18 |
| * | Everbridge Inc. | 384 | 18 |
| * | Palo Alto Networks Inc. | 84 | 17 |
| * | Lumentum Holdings Inc. | 291 | 17 |
| * | Bottomline Technologies de | | |
| | Inc. | 351 | 17 |
| * | Red Hat Inc. | 101 | 16 |
| * | ON Semiconductor Corp. | 648 | 16 |
| * | Paycom Software Inc. | 153 | 16 |
| | NetApp Inc. | 233 | 16 |
| * | Tableau Software Inc. Class A | 159 | 16 |
| * | Electro Scientific Industries | | |
| | Inc. | 800 | 16 |
| * | VMware Inc. Class A | 113 | 16 |
| | SS&C Technologies Holdings | | |
| | Inc. | 305 | 15 |
| * | GoDaddy Inc. Class A | 215 | 15 |
| * | EPAM Systems Inc. | 124 | 15 |
| * | Fortinet Inc. | 249 | 15 |
| * | Ubiquiti Networks Inc. | 184 | 15 |
| * | Apptio Inc. Class A | 458 | 15 |
| * | Glu Mobile Inc. | 2,567 | 14 |
| * | Splunk Inc. | 126 | 14 |
| * | Workiva Inc. | 536 | 14 |
| * | Rapid7 Inc. | 438 | 14 |
| * | Model N Inc. | 776 | 14 |
| * | ANSYS Inc. | 83 | 13 |
| | Entegris Inc. | 382 | 13 |
47
U.S. Momentum Factor ETF
| | | | |
| | | | | Market |
| | | | | Value• |
| | | Shares | ($000) |
| * | Nutanix Inc. | | 247 | 13 |
| | Comtech Telecommunications | | |
| | Corp. | | 409 | 13 |
| | MKS Instruments Inc. | | 113 | 13 |
| | Teradyne Inc. | | 330 | 12 |
| | Marvell Technology Group Ltd. | 571 | 12 |
| * | RingCentral Inc. Class A | | 159 | 12 |
| | Cognex Corp. | | 262 | 12 |
| * | Aspen Technology Inc. | | 128 | 12 |
| * | LivePerson Inc. | | 613 | 12 |
| * | Okta Inc. | | 211 | 12 |
| * | Proofpoint Inc. | | 100 | 12 |
| * | VeriSign Inc. | | 89 | 12 |
| | DXC Technology Co. | | 124 | 11 |
| * | Novanta Inc. | | 172 | 11 |
| * | Hortonworks Inc. | | 626 | 11 |
| * | Alteryx Inc. Class A | | 326 | 11 |
| | Monolithic Power Systems Inc. | 84 | 11 |
| * | Qualys Inc. | | 143 | 11 |
| * | Yelp Inc. Class A | | 255 | 11 |
| * | Appfolio Inc. | | 184 | 11 |
| * | Synopsys Inc. | | 123 | 11 |
| * | Immersion Corp. | | 706 | 11 |
| * | Five9 Inc. | | 305 | 11 |
| * | PROS Holdings Inc. | | 298 | 11 |
| * | Upland Software Inc. | | 291 | 10 |
| * | Blucora Inc. | | 272 | 10 |
| * | Limelight Networks Inc. | 2,087 | 10 |
| * | Workday Inc. Class A | | 78 | 10 |
| | Amphenol Corp. Class A | | 116 | 10 |
| * | Match Group Inc. | | 245 | 10 |
| * | GTT Communications Inc. | 213 | 10 |
| | Progress Software Corp. | | 262 | 10 |
| * | Silicon Laboratories Inc. | | 93 | 10 |
| * | Teradata Corp. | | 243 | 10 |
| * | Cree Inc. | | 204 | 9 |
| * | Virtusa Corp. | | 194 | 9 |
| | Motorola Solutions Inc. | | 87 | 9 |
| | Leidos Holdings Inc. | | 150 | 9 |
| * | Coupa Software Inc. | | 166 | 9 |
| * | Guidewire Software Inc. | | 93 | 9 |
| * | Tyler Technologies Inc. | | 35 | 8 |
| * | Carbonite Inc. | | 208 | 8 |
| | Blackbaud Inc. | | 82 | 8 |
| * | Pure Storage Inc. Class A | 370 | 8 |
| * | Envestnet Inc. | | 148 | 8 |
| | Dolby Laboratories Inc. Class A | 121 | 8 |
| * | MINDBODY Inc. Class A | | 185 | 7 |
| | Xilinx Inc. | | 104 | 7 |
| | | |
| | KLA-Tencor Corp. | 62 | 7 |
| * | Zynga Inc. Class A | 1,538 | 7 |
| * | Syntel Inc. | 214 | 7 |
| | Ebix Inc. | 90 | 7 |
| | ManTech International Corp. | | |
| | Class A | 124 | 7 |
| * | Ultimate Software Group Inc. | 25 | 7 |
| * | NETGEAR Inc. | 107 | 6 |
| * | CalAmp Corp. | 264 | 6 |
| * | Blackline Inc. | 133 | 6 |
| | Maxim Integrated Products Inc. | 94 | 5 |
| * | Mercury Systems Inc. | 140 | 5 |
| * | Cloudera Inc. | 310 | 5 |
| * | MobileIron Inc. | 1,110 | 5 |
| * | Axcelis Technologies Inc. | 208 | 4 |
| | Monotype Imaging Holdings | | |
| | Inc. | 198 | 4 |
| * | Rogers Corp. | 37 | 4 |
| * | Q2 Holdings Inc. | 71 | 4 |
| * | Autodesk Inc. | 31 | 4 |
| * | KEMET Corp. | 193 | 4 |
| * | Perficient Inc. | 146 | 4 |
| | Cohu Inc. | 147 | 3 |
| * | Twilio Inc. Class A | 61 | 3 |
| * | Akamai Technologies Inc. | 27 | 2 |
| * | FireEye Inc. | 111 | 2 |
| | | | 2,713 |
| Utilities (1.2%) | | |
| | NextEra Energy Inc. | 264 | 44 |
| | NRG Energy Inc. | 712 | 24 |
| * | Intelsat SA | 1,024 | 18 |
| * | Vonage Holdings Corp. | 1,224 | 14 |
| * | Vistra Energy Corp. | 443 | 11 |
| * | Boingo Wireless Inc. | 378 | 8 |
| | Avangrid Inc. | 149 | 8 |
| * | Iridium Communications Inc. | 366 | 6 |
| | American States Water Co. | 92 | 5 |
| * | 8x8 Inc. | 273 | 5 |
| | | | 143 |
| Total Common Stocks | | |
| (Cost $11,226) | | 12,118 |
| Temporary Cash Investment (0.5%) | |
| Money Market Fund (0.5%) | | |
| 1 | Vanguard Market Liquidity Fund, | |
| | 1.961% (Cost $57) | 574 | 57 |
| Total Investments (99.9%) | | |
| (Cost $11,283) | | 12,175 |
48
U.S. Momentum Factor ETF
| |
| | Amount |
| | ($000) |
| Other Assets and Liabilities (0.1%) | |
| Other Assets | |
| Investment in Vanguard | 1 |
| Receivables for Accrued Income | 9 |
| Other Assets | 5 |
| Total Other Assets | 15 |
| Liabilities | |
| Payables to Vanguard | (1) |
| Total Liabilities | (1) |
| Net Assets (100%) | |
| Applicable to 150,000 outstanding | |
| $.001 par value shares of beneficial | |
| interest (unlimited authorization) | 12,189 |
| Net Asset Value Per Share | $81.26 |
| |
| At May 31, 2018, net assets consisted of: | |
| | Amount |
| | ($000) |
| Paid-in Capital | 11,327 |
| Undistributed Net Investment Income | 33 |
| Accumulated Net Realized Losses | (63) |
| Unrealized Appreciation (Depreciation) | 892 |
| Net Assets | 12,189 |
• See Note A in Notes to Financial Statements.
* Non-income-producing security.
1 Affiliated money market fund available only to Vanguard funds
and certain trusts and accounts managed by Vanguard. Rate
shown is the 7-day yield.
See accompanying Notes, which are an integral part of the Financial Statements.
49
U.S. Momentum Factor ETF
Statement of Operations
| |
| | February13,20181 to |
| | May 31, 2018 |
| | ($000) |
| Investment Income | |
| Income | |
| Dividends | 37 |
| Interest 2 | — |
| Total Income | 37 |
| Expenses | |
| The Vanguard Group—Note B | |
| Management and Administrative | — |
| Marketing and Distribution | — |
| Custodian Fees | 2 |
| Shareholders’ Reports | 2 |
| Total Expenses | 4 |
| Net Investment Income | 33 |
| Realized Net Gain (Loss) | |
| Investment Securities Sold 2 | (69) |
| Futures Contracts | 6 |
| Realized Net Gain (Loss) | (63) |
| Change in Unrealized Appreciation (Depreciation) of Investment Securities2 | 892 |
| Net Increase (Decrease) in Net Assets Resulting from Operations | 862 |
1 Inception.
2 Interest income, realized net gain (loss), and change in unrealized appreciation (depreciation) from an affiliated company of the fund
were each less than $1,000. Purchases and sales are for temporary cash investment purposes.
See accompanying Notes, which are an integral part of the Financial Statements.
50
U.S. Momentum Factor ETF
Statement of Changes in Net Assets
| |
| | February13,20181 to |
| | May 31, 2018 |
| | ($000) |
| Increase (Decrease) in Net Assets | |
| Operations | |
| Net Investment Income | 33 |
| Realized Net Gain (Loss) | (63) |
| Change in Unrealized Appreciation (Depreciation) | 892 |
| Net Increase (Decrease) in Net Assets Resulting from Operations | 862 |
| Distributions | |
| Net Investment Income | — |
| Realized Capital Gain | — |
| Total Distributions | — |
| Capital Share Transactions | |
| Issued | 11,327 |
| Issued in Lieu of Cash Distributions | — |
| Redeemed | — |
| Net Increase (Decrease) from Capital Share Transactions | 11,327 |
| Total Increase (Decrease) | 12,189 |
| Net Assets | |
| Beginning of Period | — |
| End of Period2 | 12,189 |
| 1 Inception. |
| 2 Net Assets—End of Period includes undistributed (overdistributed) net investment income of $33,000. |
See accompanying Notes, which are an integral part of the Financial Statements.
51
U.S. Momentum Factor ETF
Financial Highlights
| |
| | February 13, 20181 to |
| For a Share Outstanding Throughout the Period | May 31, 2018 |
| Net Asset Value, Beginning of Period | $75.00 |
| Investment Operations | |
| Net Investment Income2 | .256 |
| Net Realized and Unrealized Gain (Loss) on Investments | 6.004 |
| Total from Investment Operations | 6.260 |
| Distributions | |
| Dividends from Net Investment Income | — |
| Distributions from Realized Capital Gains | — |
| Total Distributions | — |
| Net Asset Value, End of Period | $81.26 |
| |
| Total Return | 8.35% |
| |
| Ratios/Supplemental Data | |
| Net Assets, End of Period (Millions) | $12 |
| Ratio of Total Expenses to Average Net Assets | 0.13%3 |
| Ratio of Net Investment Income to Average Net Assets | 1.11%3 |
| Portfolio Turnover Rate | 48%3 |
| 1 Inception. |
| 2 Calculated based on average shares outstanding. |
| 3 Annualized. |
See accompanying Notes, which are an integral part of the Financial Statements.
52
U.S. Momentum Factor ETF
Notes to Financial Statements
Vanguard U.S. Momentum Factor ETF is registered under the Investment Company Act of 1940 as an open-end investment company, or mutual fund. ETF Shares are listed for trading on Cboe BZX Exchange; they can be purchased and sold through a broker.
A. The following significant accounting policies conform to generally accepted accounting principles for U.S. investment companies. The fund consistently follows such policies in preparing its financial statements.
1. Security Valuation: Securities are valued as of the close of trading on the New York Stock Exchange (generally 4 p.m., Eastern time) on the valuation date. Equity securities are valued at the latest quoted sales prices or official closing prices taken from the primary market in which each security trades; such securities not traded on the valuation date are valued at the mean of the latest quoted bid and asked prices. Securities for which market quotations are not readily available, or whose values have been materially affected by events occurring before the fund’s pricing time but after the close of the securities’ primary markets, are valued by methods deemed by the board of trustees to represent fair value. Investments in Vanguard Market Liquidity Fund are valued at that fund’s net asset value.
2. Futures Contracts: The fund uses index futures contracts to a limited extent, with the objective of maintaining full exposure to the stock market while maintaining liquidity. The fund may purchase or sell futures contracts to achieve a desired level of investment, whether to accommodate portfolio turnover or cash flows from capital share transactions. The primary risks associated with the use of futures contracts are imperfect correlation between changes in market values of stocks held by the fund and the prices of futures contracts, and the possibility of an illiquid market. Counterparty risk involving futures is mitigated because a regulated clearinghouse is the counterparty instead of the clearing broker. To further mitigate counterparty risk, the fund trades futures contracts on an exchange, monitors the financial strength of its clearing brokers and clearinghouse, and has entered into clearing agreements with its clearing brokers. The clearinghouse imposes initial margin requirements to secure the fund’s performance and requires daily settlement of variation margin representing changes in the market value of each contract.
Futures contracts are valued at their quoted daily settlement prices. The notional amounts of the contracts are not recorded in the Statement of Net Assets. Fluctuations in the value of the contracts are recorded in the Statement of Net Assets as an asset (liability) and in the Statement of Operations as unrealized appreciation (depreciation) until the contracts are closed, when they are recorded as realized futures gains (losses).
During the period ended May 31, 2018, the fund’s average investments in long and short futures contracts represented less than 1% and 0% of net assets, respectively, based on the average of the notional amounts at each quarter-end during the period. The fund had no open futures contracts at May 31, 2018.
3. Federal Income Taxes: The fund intends to qualify as a regulated investment company and distribute all of its taxable income. Management has analyzed the fund’s tax positions taken for the period ended May 31, 2018, and has concluded that no provision for federal income tax is required in the fund’s financial statements.
4. Distributions: Distributions to shareholders are recorded on the ex-dividend date.
53
U.S. Momentum Factor ETF
5. Other: Dividend income is recorded on the ex-dividend date. Interest income includes income distributions received from Vanguard Market Liquidity Fund and is accrued daily. Security transactions are accounted for on the date securities are bought or sold. Costs used to determine realized gains (losses) on the sale of investment securities are those of the specific securities sold.
B. In accordance with the terms of a Funds’ Service Agreement (the “FSA”) between Vanguard and the fund, Vanguard furnishes to the fund investment advisory, corporate management, administrative, marketing, and distribution services at Vanguard’s cost of operations (as defined by the FSA). These costs of operations are allocated to the fund based on methods and guidelines approved by the board of trustees, and generally settled twice a month.
Upon the request of Vanguard, the fund may invest up to 0.40% of its net assets as capital in Vanguard. At May 31, 2018, the fund had contributed to Vanguard capital in the amount of $1,000, representing 0.01% of the fund’s net assets and 0.00% of Vanguard’s capitalization. The fund’s trustees and officers are also directors and employees, respectively, of Vanguard.
C. Various inputs may be used to determine the value of the fund’s investments. These inputs are summarized in three broad levels for financial statement purposes. The inputs or methodologies used to value securities are not necessarily an indication of the risk associated with investing in those securities.
Level 1—Quoted prices in active markets for identical securities.
Level 2—Other significant observable inputs (including quoted prices for similar securities, interest rates, prepayment speeds, credit risk, etc.).
Level 3—Significant unobservable inputs (including the fund’s own assumptions used to determine
the fair value of investments). Any investments valued with significant unobservable inputs are
noted on the Statement of Net Assets.
At May 31, 2018, 100% of the market value of the fund’s investments was determined based on Level 1 inputs.
D. Distributions are determined on a tax basis and may differ from net investment income and realized capital gains for financial reporting purposes. Differences may be permanent or temporary. Permanent differences are reclassified among capital accounts in the financial statements to reflect their tax character. Temporary differences arise when certain items of income, expense, gain, or loss are recognized in different periods for financial statement and tax purposes. These differences will reverse at some time in the future. Differences in classification may also result from the treatment of short-term gains as ordinary income for tax purposes. The fund’s tax-basis capital gains and losses are determined only at the end of each fiscal year.
At May 31, 2018, the cost of investment securities for tax purposes was $11,283,000. Net unrealized appreciation of investment securities for tax purposes was $892,000, consisting of unrealized gains of $1,152,000 on securities that had risen in value since their purchase and $260,000 in unrealized losses on securities that had fallen in value since their purchase.
E. During the period ended May 31, 2018, the fund purchased $13,136,000 of investment securities and sold $1,841,000 of investment securities, other than temporary cash investments.
54
U.S. Momentum Factor ETF
F. Capital shares issued and redeemed were:
| |
| | February 13, 20181 to |
| | May 31, 2018 |
| | Shares |
| | (000) |
| Issued | 150 |
| Issued in Lieu of Cash Distributions | — |
| Redeemed | — |
| Net Increase (Decrease) in Shares Outstanding | 150 |
| 1 Inception. |
G. Management has determined that no events or transactions occurred subsequent to May 31, 2018, that would require recognition or disclosure in these financial statements.
55
U.S. Multifactor ETF
Fund Profile
As of May 31, 2018
| | |
| Portfolio Characteristics | | |
| | | Russell |
| | | 3000 |
| | Fund | Index |
| Number of Stocks | 611 | 2,941 |
| Median Market Cap | $10.7B | $66.7B |
| Price/Earnings Ratio | 17.1x | 20.8x |
| Price/Book Ratio | 2.2x | 3.0x |
| Return on Equity | 11.6% | 15.0% |
| Earnings Growth | | |
| Rate | 8.3% | 7.9% |
| Dividend Yield | 1.6% | 1.8% |
| Foreign Holdings | 0.0% | 0.0% |
| Turnover Rate | | |
| (Annualized) | 58% | — |
| Ticker Symbol | VFMF | — |
| Expense Ratio1 | 0.18% | — |
| 30-Day SEC Yield | 1.30% | — |
| Short-Term Reserves | -0.2% | — |
| | |
| Sector Diversification (% of equity exposure) |
| | | Russell |
| | | 3000 |
| | Fund | Index |
| Consumer Discretionary | 19.2% | 14.3% |
| Consumer Staples | 2.7 | 5.3 |
| Energy | 10.0 | 6.0 |
| Financial Services | 30.9 | 21.1 |
| Health Care | 7.9 | 13.2 |
| Materials & Processing | 4.3 | 3.8 |
| Other | 0.5 | 0.0 |
| Producer Durables | 11.6 | 10.8 |
| Technology | 10.2 | 21.0 |
| Utilities | 2.7 | 4.5 |
Sector categories are based on the Russell Global Sectors (“RGS”),
except for the “Other” category (if applicable), which includes
securities that have not been provided a RGS classification as of
the effective reporting period.
| | |
| Ten Largest Holdings (% of total net assets) |
| SunTrust Banks Inc. | Banks: Diversified | 1.3% |
| Valero Energy Corp. | Oil: Refining & | |
| | Marketing | 1.2 |
| Chevron Corp. | Oil: Integrated | 1.2 |
| JPMorgan Chase & Co. | Diversified Financial | |
| | Services | 1.2 |
| Walmart Inc. | Diversified Retail | 1.1 |
| PNC Financial Services | | |
| Group Inc. | Banks: Diversified | 1.1 |
| Humana Inc. | Health Care | |
| | Management | |
| | Services | 1.1 |
| Occidental Petroleum | | |
| Corp. | Oil: Crude Producers | 1.1 |
| ConocoPhillips | Oil: Integrated | 1.1 |
| Phillips 66 | Oil: Refining & | |
| | Marketing | 1.0 |
| Top Ten | | 11.4% |
| The holdings listed exclude any temporary cash investments and equity index products. |
1 The expense ratio shown is from the prospectus dated February 13, 2018, and represents estimated costs for the current fiscal year. For
the period from inception through May 31, 2018, the annualized expense ratio was 0.18%.
56
U.S. Multifactor ETF
Performance Summary
All of the returns in this report represent past performance, which is not a guarantee of future results that may be achieved by the fund. (Current performance may be lower or higher than the performance data cited. For performance data current to the most recent month-end, visit our website at vanguard.com/performance.) Note, too, that both investment returns and principal value can fluctuate widely, so an investor’s shares, when sold, could be worth more or less than their original cost. The returns shown do not reflect taxes that a shareholder would pay on fund distributions or on the sale of fund shares.
Fiscal-Period Total Returns (%): February 13, 2018, Through May 31, 2018

Total Returns: Period Ended March 31, 2018
This table presents returns through the latest calendar quarter—rather than through the end of the fiscal period.
Securities and Exchange Commission rules require that we provide this information.
| | |
| | Inception | Since |
| | Date | Inception |
| ETF Shares | 2/13/2018 | |
| Market Price | | 1.99% |
| Net Asset Value | | 1.88 |
See Financial Highlights for dividend and capital gains information.
57
Financial Statements (unaudited)
Statement of Net Assets
As of May 31, 2018
The fund reports a complete list of its holdings in regulatory filings four times in each fiscal year, at the quarter-ends. For the second and fourth fiscal quarters, the lists appear in the fund’s semiannual and annual reports to shareholders. For the first and third fiscal quarters, the fund files the lists with the Securities and Exchange Commission on Form N-Q. Shareholders can look up the fund’s Forms N-Q on the SEC’s website at sec.gov. Forms N-Q may also be reviewed and copied at the SEC’s Public Reference Room (see the back cover of this report for further information).
| | | |
| | | | Market |
| | | | Value• |
| | | Shares | ($000) |
| Common Stocks (99.7%)1 | | |
| Consumer Discretionary (19.2%) | |
| | Walmart Inc. | 5,804 | 479 |
| | Ross Stores Inc. | 5,328 | 420 |
| | Las Vegas Sands Corp. | 5,046 | 407 |
| | Estee Lauder Cos. Inc. | | |
| | Class A | 1,902 | 284 |
| | Walt Disney Co. | 2,407 | 239 |
| | NIKE Inc. Class B | 2,737 | 197 |
| | Nordstrom Inc. | 3,462 | 170 |
| | Costco Wholesale Corp. | 818 | 162 |
| | Gap Inc. | 5,554 | 155 |
| | Tractor Supply Co. | 1,925 | 143 |
| | Carnival Corp. | 1,909 | 119 |
| | Williams-Sonoma Inc. | 1,972 | 109 |
| | Tailored Brands Inc. | 3,043 | 100 |
| | Gentex Corp. | 4,073 | 98 |
| | Kohl’s Corp. | 1,425 | 95 |
| | Tiffany & Co. | 683 | 89 |
| | Ralph Lauren Corp. Class A | 630 | 85 |
| | Movado Group Inc. | 1,707 | 84 |
| | Citi Trends Inc. | 2,772 | 83 |
| | PVH Corp. | 515 | 82 |
| * | Burlington Stores Inc. | 533 | 78 |
| * | AutoNation Inc. | 1,689 | 77 |
| * | ZAGG Inc. | 4,975 | 76 |
| * | Monarch Casino & Resort | | |
| | Inc. | 1,692 | 75 |
| | Haverty Furniture Cos. Inc. | 3,745 | 75 |
| * | Etsy Inc. | 2,259 | 73 |
| * | MCBC Holdings Inc. | 2,466 | 73 |
| * | Cavco Industries Inc. | 343 | 71 |
| * | Grand Canyon Education Inc. | 638 | 71 |
| | Gannett Co. Inc. | 6,683 | 71 |
| * | Career Education Corp. | 4,576 | 70 |
| | Wolverine World Wide Inc. | 2,086 | 70 |
| * | NVR Inc. | 23 | 69 |
| | Oxford Industries Inc. | 831 | 69 |
| | Hyatt Hotels Corp. Class A | 839 | 69 |
| | | |
| | American Eagle Outfitters | | |
| | Inc. | 3,066 | 68 |
| | Caleres Inc. | 1,845 | 65 |
| * | Vera Bradley Inc. | 5,546 | 65 |
| | Viad Corp. | 1,218 | 64 |
| | Dollar General Corp. | 734 | 64 |
| | Ruth’s Hospitality Group Inc. | 2,416 | 64 |
| | Columbia Sportswear Co. | 732 | 64 |
| | Buckle Inc. | 2,514 | 64 |
| | National Presto Industries | | |
| | Inc. | 561 | 63 |
| * | Urban Outfitters Inc. | 1,523 | 63 |
| * | Deckers Outdoor Corp. | 555 | 63 |
| * | Lululemon Athletica Inc. | 595 | 63 |
| | John Wiley & Sons Inc. | | |
| | Class A | 912 | 62 |
| * | Helen of Troy Ltd. | 685 | 62 |
| * | Adtalem Global Education | | |
| | Inc. | 1,279 | 61 |
| * | Zumiez Inc. | 2,472 | 60 |
| | Texas Roadhouse Inc. | | |
| | Class A | 941 | 58 |
| | Aaron’s Inc. | 1,455 | 58 |
| | Darden Restaurants Inc. | 654 | 57 |
| | Lithia Motors Inc. Class A | 580 | 57 |
| | Tenneco Inc. | 1,276 | 56 |
| | Lear Corp. | 279 | 55 |
| * | Sally Beauty Holdings Inc. | 3,648 | 55 |
| * | Five Below Inc. | 772 | 55 |
| | Yum! Brands Inc. | 663 | 54 |
| * | Madison Square Garden Co. | | |
| | Class A | 204 | 53 |
| | Cracker Barrel Old Country | | |
| | Store Inc. | 331 | 52 |
| | La-Z-Boy Inc. | 1,659 | 52 |
| | Yum China Holdings Inc. | 1,303 | 51 |
| | Thor Industries Inc. | 538 | 50 |
| | Chico’s FAS Inc. | 5,629 | 48 |
| | DSW Inc. Class A | 1,978 | 47 |
58
U.S. Multifactor ETF
| | | |
| | | | Market |
| | | | Value• |
| | Shares | ($000) |
| | Standard Motor Products Inc. | 1,017 | 46 |
| | BorgWarner Inc. | 853 | 42 |
| * | MSG Networks Inc. | 2,103 | 41 |
| | Garmin Ltd. | 649 | 39 |
| * | Asbury Automotive Group Inc. | 544 | 38 |
| * | AutoZone Inc. | 58 | 38 |
| | H&R Block Inc. | 1,359 | 37 |
| | Royal Caribbean Cruises Ltd. | 344 | 36 |
| | Sonic Automotive Inc. | | |
| | Class A | 1,645 | 35 |
| | Children’s Place Inc. | 270 | 35 |
| * | Crocs Inc. | 1,864 | 33 |
| | Strayer Education Inc. | 286 | 31 |
| * | Regis Corp. | 1,759 | 30 |
| * | Shutterfly Inc. | 323 | 30 |
| | Travelport Worldwide Ltd. | 1,727 | 30 |
| | Johnson Outdoors Inc. | | |
| | Class A | 399 | 30 |
| | Wynn Resorts Ltd. | 151 | 30 |
| | Steven Madden Ltd. | 551 | 29 |
| | BJ’s Restaurants Inc. | 513 | 29 |
| | Whirlpool Corp. | 197 | 29 |
| | Dick’s Sporting Goods Inc. | 766 | 28 |
| * | Cooper-Standard Holdings Inc. | 225 | 28 |
| | Tower International Inc. | 901 | 27 |
| | International Speedway Corp. | | |
| | Class A | 629 | 26 |
| | Winnebago Industries Inc. | 721 | 26 |
| | Ethan Allen Interiors Inc. | 1,102 | 26 |
| * | Genesco Inc. | 586 | 26 |
| | New York Times Co. Class A | 1,124 | 26 |
| * | Sleep Number Corp. | 890 | 25 |
| | Bloomin’ Brands Inc. | 1,087 | 23 |
| * | Red Robin Gourmet Burgers | | |
| | Inc. | 448 | 23 |
| | Cato Corp. Class A | 981 | 22 |
| | Best Buy Co. Inc. | 298 | 20 |
| | Extended Stay America Inc. | 917 | 19 |
| * | G-III Apparel Group Ltd. | 458 | 19 |
| * | TRI Pointe Group Inc. | 1,060 | 18 |
| * | Shutterstock Inc. | 384 | 18 |
| * | Francesca’s Holdings Corp. | 3,048 | 18 |
| * | K12 Inc. | 1,114 | 18 |
| * | Denny’s Corp. | 1,177 | 18 |
| * | Party City Holdco Inc. | 1,215 | 18 |
| | Cheesecake Factory Inc. | 341 | 18 |
| | Marcus Corp. | 558 | 18 |
| | Wingstop Inc. | 345 | 17 |
| | Brinker International Inc. | 397 | 17 |
| * | Planet Fitness Inc. Class A | 437 | 17 |
| | Toll Brothers Inc. | 403 | 16 |
| | PulteGroup Inc. | 526 | 16 |
| | Carter’s Inc. | 117 | 13 |
| * | Drive Shack Inc. | 1,901 | 12 |
| | | |
| * | Qurate Retail Group Inc. | | |
| | QVC Group Class A | 607 | 12 |
| | News Corp. Class A | 764 | 12 |
| | New Media Investment Group | | |
| | Inc. | 615 | 10 |
| | DR Horton Inc. | 237 | 10 |
| * | Care.com Inc. | 431 | 9 |
| | World Wrestling | | |
| | Entertainment Inc. Class A | 151 | 9 |
| | Expedia Group Inc. | 72 | 9 |
| | Dana Inc. | 373 | 8 |
| * | Motorcar Parts of America Inc. | 375 | 8 |
| | KB Home | 298 | 8 |
| | Graham Holdings Co. Class B | 12 | 7 |
| | Inter Parfums Inc. | 128 | 7 |
| * | Ollie’s Bargain Outlet Holdings | |
| | Inc. | 96 | 7 |
| | Hooker Furniture Corp. | 173 | 6 |
| | Sinclair Broadcast Group Inc. | | |
| | Class A | 232 | 6 |
| * | Potbelly Corp. | 359 | 5 |
| | | | 7,997 |
| Consumer Staples (2.7%) | | |
| | Nu Skin Enterprises Inc. | | |
| | Class A | 1,350 | 111 |
| | Brown-Forman Corp. | | |
| | Class B | 1,584 | 90 |
| * | US Foods Holding Corp. | 2,386 | 85 |
| * | Boston Beer Co. Inc. Class A | 306 | 78 |
| * | United Natural Foods Inc. | 1,448 | 66 |
| | JM Smucker Co. | 546 | 59 |
| | Ingredion Inc. | 525 | 58 |
| | Lamb Weston Holdings Inc. | 916 | 58 |
| | J&J Snack Foods Corp. | 385 | 55 |
| | Flowers Foods Inc. | 2,630 | 53 |
| * | Cal-Maine Foods Inc. | 1,103 | 53 |
| | Hormel Foods Corp. | 1,355 | 49 |
| | Sanderson Farms Inc. | 495 | 48 |
| | Walgreens Boots Alliance Inc. | 515 | 32 |
| * | USANA Health Sciences Inc. | 264 | 31 |
| * | Performance Food Group Co. | 846 | 30 |
| | Weis Markets Inc. | 535 | 29 |
| | Calavo Growers Inc. | 280 | 25 |
| * | Sprouts Farmers Market Inc. | 1,084 | 24 |
| | Medifast Inc. | 138 | 20 |
| | John B Sanfilippo & Son Inc. | 268 | 18 |
| | PetMed Express Inc. | 500 | 18 |
| | Tyson Foods Inc. Class A | 152 | 10 |
| | Casey’s General Stores Inc. | 82 | 8 |
| | | | 1,108 |
| Energy (10.0%) | | |
| | Valero Energy Corp. | 4,283 | 519 |
| | Chevron Corp. | 4,055 | 504 |
| | Occidental Petroleum Corp. | 5,358 | 451 |
59
U.S. Multifactor ETF
| | | |
| | | | Market |
| | | | Value• |
| | | Shares | ($000) |
| | ConocoPhillips | 6,581 | 444 |
| | Phillips 66 | 3,687 | 430 |
| | Marathon Petroleum Corp. | 4,761 | 376 |
| | Murphy Oil Corp. | 6,043 | 186 |
| | HollyFrontier Corp. | 1,968 | 152 |
| | Peabody Energy Corp. | 3,302 | 143 |
| * | Continental Resources Inc. | 1,609 | 108 |
| * | ProPetro Holding Corp. | 6,410 | 104 |
| | PBF Energy Inc. Class A | 1,689 | 80 |
| * | Matrix Service Co. | 3,413 | 66 |
| | Marathon Oil Corp. | 2,904 | 62 |
| * | Energen Corp. | 863 | 59 |
| | Arch Coal Inc. Class A | 692 | 57 |
| | Warrior Met Coal Inc. | 2,052 | 56 |
| | Exxon Mobil Corp. | 683 | 55 |
| | Helmerich & Payne Inc. | 677 | 45 |
| * | Ring Energy Inc. | 2,872 | 40 |
| * | Solaris Oilfield Infrastructure | | |
| | Inc. Class A | 2,461 | 38 |
| * | WildHorse Resource | | |
| | Development Corp. | 1,280 | 34 |
| | Delek US Holdings Inc. | 558 | 31 |
| * | Abraxas Petroleum Corp. | 7,957 | 21 |
| * | W&T Offshore Inc. | 2,748 | 19 |
| * | SRC Energy Inc. | 1,408 | 18 |
| * | TPI Composites Inc. | 675 | 18 |
| * | WPX Energy Inc. | 948 | 17 |
| * | Talos Energy Inc. | 370 | 12 |
| * | REX American Resources | | |
| | Corp. | 95 | 7 |
| | | | 4,152 |
| Financial Services (30.8%) | | |
| | SunTrust Banks Inc. | 7,765 | 524 |
| | JPMorgan Chase & Co. | 4,708 | 504 |
| | PNC Financial Services | | |
| | Group Inc. | 3,320 | 476 |
| | Allstate Corp. | 4,070 | 380 |
| | Bank of America Corp. | 12,995 | 377 |
| | Bank of New York Mellon | | |
| | Corp. | 5,450 | 298 |
| | Aflac Inc. | 6,495 | 293 |
| | Progressive Corp. | 4,308 | 267 |
| | Travelers Cos. Inc. | 1,835 | 236 |
| | BlackRock Inc. | 407 | 217 |
| | BB&T Corp. | 4,118 | 216 |
| | Morgan Stanley | 4,094 | 205 |
| | Capital One Financial Corp. | 2,142 | 201 |
| | Discover Financial Services | 2,620 | 194 |
| | Prosperity Bancshares Inc. | 2,433 | 176 |
| | Dun & Bradstreet Corp. | 1,368 | 168 |
| | People’s United Financial Inc. | 8,814 | 162 |
| | International Bancshares | | |
| | Corp. | 3,730 | 161 |
| | Visa Inc. Class A | 1,163 | 152 |
| | | |
| | Northwest Bancshares Inc. | 8,216 | 142 |
| | US Bancorp | 2,674 | 134 |
| | Commerce Bancshares Inc. | 2,057 | 133 |
| | Primerica Inc. | 1,332 | 131 |
| | Horace Mann Educators | | |
| | Corp. | 2,674 | 118 |
| | Mastercard Inc. Class A | 621 | 118 |
| | Goldman Sachs Group Inc. | 517 | 117 |
| | Synovus Financial Corp. | 2,157 | 117 |
| | Evercore Inc. Class A | 1,102 | 115 |
| | Zions Bancorporation | 2,048 | 112 |
| | Ally Financial Inc. | 4,049 | 104 |
| | Walker & Dunlop Inc. | 1,833 | 103 |
| | Lincoln National Corp. | 1,543 | 102 |
| | Brown & Brown Inc. | 3,639 | 101 |
| | BOK Financial Corp. | 928 | 94 |
| | Fifth Third Bancorp | 3,041 | 93 |
| | KeyCorp | 4,774 | 93 |
| | Selective Insurance Group | | |
| | Inc. | 1,517 | 86 |
| | SEI Investments Co. | 1,348 | 86 |
| | M&T Bank Corp. | 497 | 86 |
| | Enterprise Financial Services | | |
| | Corp. | 1,538 | 84 |
| | Voya Financial Inc. | 1,592 | 83 |
| | T. Rowe Price Group Inc. | 674 | 82 |
| | Opus Bank | 2,674 | 79 |
| | MetLife Inc. | 1,714 | 79 |
| | Raymond James Financial | | |
| | Inc. | 773 | 75 |
| | 1st Source Corp. | 1,378 | 73 |
| | CoBiz Financial Inc. | 3,262 | 73 |
| | CME Group Inc. | 444 | 72 |
| | NBT Bancorp Inc. | 1,884 | 72 |
| | Broadridge Financial | | |
| | Solutions Inc. | 615 | 71 |
| | Hanmi Financial Corp. | 2,354 | 70 |
| | Torchmark Corp. | 827 | 70 |
| | ServisFirst Bancshares Inc. | 1,666 | 70 |
| | S&T Bancorp Inc. | 1,549 | 70 |
| | American Equity Investment | | |
| | Life Holding Co. | 1,961 | 69 |
| | Legg Mason Inc. | 1,859 | 69 |
| * | Customers Bancorp Inc. | 2,278 | 69 |
| | CNA Financial Corp. | 1,468 | 69 |
| | Ameriprise Financial Inc. | 496 | 69 |
| | Northern Trust Corp. | 662 | 68 |
| | FirstCash Inc. | 744 | 68 |
| | Jack Henry & Associates Inc. | 539 | 67 |
| | Lakeland Bancorp Inc. | 3,352 | 67 |
| | Central Pacific Financial | | |
| | Corp. | 2,256 | 66 |
| | Houlihan Lokey Inc. Class A | 1,351 | 66 |
| | TriCo Bancshares | 1,697 | 66 |
| | Bank of Hawaii Corp. | 760 | 65 |
60
U.S. Multifactor ETF
| | | |
| | | | Market |
| | | | Value• |
| | Shares | ($000) |
| | Independent Bank Corp. | 822 | 64 |
| | Regions Financial Corp. | 3,509 | 64 |
| | Kinsale Capital Group Inc. | 1,193 | 63 |
| * | TriState Capital Holdings Inc. | 2,457 | 63 |
| | National Western Life Group | | |
| | Inc. Class A | 201 | 63 |
| | Citizens Financial Group Inc. | 1,513 | 62 |
| | United Financial Bancorp Inc. | 3,547 | 62 |
| | Trustmark Corp. | 1,920 | 62 |
| | Invesco Ltd. | 2,255 | 62 |
| | Heritage Financial Corp. | 1,898 | 61 |
| | Capitol Federal Financial Inc. | 4,602 | 60 |
| | Fulton Financial Corp. | 3,353 | 59 |
| | Hope Bancorp Inc. | 3,233 | 58 |
| * | PennyMac Financial Services | | |
| | Inc. Class A | 2,872 | 58 |
| | East West Bancorp Inc. | 828 | 58 |
| | Unum Group | 1,482 | 58 |
| | Preferred Bank | 883 | 56 |
| | Cathay General Bancorp | 1,325 | 56 |
| | WesBanco Inc. | 1,186 | 55 |
| | First Bancorp | 1,280 | 53 |
| | Huntington Bancshares Inc. | 3,537 | 53 |
| * | HomeStreet Inc. | 1,937 | 52 |
| | First American Financial Corp. | 974 | 51 |
| | Bank of NT Butterfield & Son | | |
| | Ltd. | 1,053 | 50 |
| | TrustCo Bank Corp. | 5,706 | 50 |
| | Wintrust Financial Corp. | 535 | 49 |
| | Chemical Financial Corp. | 864 | 48 |
| | City Holding Co. | 649 | 48 |
| | BankUnited Inc. | 1,143 | 48 |
| | Umpqua Holdings Corp. | 2,018 | 48 |
| | FNB Corp. | 3,553 | 47 |
| | Federated Investors Inc. | | |
| | Class B | 1,935 | 47 |
| | Comerica Inc. | 490 | 46 |
| | Cullen/Frost Bankers Inc. | 388 | 44 |
| * | Third Point Reinsurance Ltd. | 3,314 | 44 |
| * | Eagle Bancorp Inc. | 726 | 44 |
| | LPL Financial Holdings Inc. | 639 | 44 |
| | Citigroup Inc. | 654 | 44 |
| | American National Insurance | | |
| | Co. | 366 | 44 |
| | National General Holdings | | |
| | Corp. | 1,561 | 43 |
| | UMB Financial Corp. | 526 | 41 |
| | Oritani Financial Corp. | 2,524 | 40 |
| * | E*TRADE Financial Corp. | 613 | 39 |
| | CorEnergy Infrastructure | | |
| | Trust Inc. | 1,064 | 39 |
| * | Western Alliance Bancorp | 638 | 38 |
| | State Street Corp. | 396 | 38 |
| | TD Ameritrade Holding Corp. | 630 | 37 |
| | | |
| | Cadence BanCorp Class A | 1,272 | 37 |
| | ConnectOne Bancorp Inc. | 1,381 | 36 |
| | Hanover Insurance Group Inc. | 295 | 36 |
| | CIT Group Inc. | 699 | 35 |
| | Reinsurance Group of | | |
| | America Inc. Class A | 231 | 35 |
| | FNF Group | 914 | 34 |
| | Morningstar Inc. | 264 | 32 |
| | First Citizens BancShares Inc. | | |
| | Class A | 71 | 31 |
| | Nelnet Inc. Class A | 494 | 30 |
| * | Essent Group Ltd. | 882 | 30 |
| * | BofI Holding Inc. | 685 | 28 |
| | Loews Corp. | 577 | 28 |
| | Old Republic International | | |
| | Corp. | 1,307 | 27 |
| * | Forestar Group Inc. | 1,146 | 27 |
| | American Financial Group Inc. | 237 | 26 |
| | Washington Federal Inc. | 802 | 26 |
| | Affiliated Managers Group Inc. | 163 | 26 |
| | Great Western Bancorp Inc. | 594 | 26 |
| | Banco Latinoamericano de | | |
| | Comercio Exterior SA | 964 | 26 |
| * | Encore Capital Group Inc. | 648 | 26 |
| | Park National Corp. | 218 | 25 |
| | Meridian Bancorp Inc. | 1,250 | 24 |
| | PJT Partners Inc. | 440 | 24 |
| | Heartland Financial USA Inc. | 439 | 24 |
| | Lakeland Financial Corp. | 486 | 24 |
| | BancFirst Corp. | 367 | 22 |
| | Chesapeake Lodging Trust | 598 | 19 |
| | Federal Agricultural Mortgage | | |
| | Corp. | 195 | 18 |
| | Synchrony Financial | 511 | 18 |
| | United Insurance Holdings | | |
| | Corp. | 849 | 18 |
| * | First BanCorp | 2,253 | 17 |
| | LegacyTexas Financial Group | | |
| | Inc. | 413 | 17 |
| * | Bancorp Inc. | 1,518 | 17 |
| | Peapack Gladstone Financial | | |
| | Corp. | 472 | 16 |
| | CNO Financial Group Inc. | 792 | 16 |
| | Total System Services Inc. | 182 | 16 |
| | Principal Financial Group Inc. | 244 | 14 |
| | Assurant Inc. | 139 | 13 |
| | TCF Financial Corp. | 492 | 13 |
| | Kemper Corp. | 152 | 12 |
| | Lazard Ltd. Class A | 213 | 11 |
| | BancorpSouth Bank | 279 | 9 |
| | Jones Lang LaSalle Inc. | 55 | 9 |
| | Waddell & Reed Financial Inc. | | |
| | Class A | 464 | 9 |
61
U.S. Multifactor ETF
| | | | |
| | | | | Market |
| | | | | Value• |
| | | Shares | ($000) |
| | Provident Financial Services | | |
| | Inc. | | 312 | 9 |
| | Hartford Financial Services | | |
| | Group Inc. | | 160 | 8 |
| | Green Bancorp Inc. | | 366 | 8 |
| | Dime Community Bancshares | | |
| | Inc. | | 377 | 8 |
| | | | | 12,846 |
| Health Care (7.8%) | | | |
| | Humana Inc. | | 1,597 | 465 |
| | UnitedHealth Group Inc. | 1,394 | 337 |
| | HCA Healthcare Inc. | | 2,096 | 216 |
| | Cigna Corp. | | 1,088 | 184 |
| * | Biogen Inc. | | 527 | 155 |
| * | Premier Inc. Class A | | 4,013 | 131 |
| | ResMed Inc. | | 1,253 | 129 |
| | Danaher Corp. | | 1,263 | 125 |
| * | Haemonetics Corp. | | 1,057 | 95 |
| | Anthem Inc. | | 392 | 87 |
| * | Centene Corp. | | 735 | 86 |
| | Chemed Corp. | | 244 | 79 |
| | Universal Health Services Inc. | | |
| | Class B | | 659 | 76 |
| * | Triple-S Management Corp. | | |
| | Class B | | 1,968 | 72 |
| * | Globus Medical Inc. | | 1,274 | 71 |
| * | Medpace Holdings Inc. | | 1,664 | 70 |
| * | WellCare Health Plans Inc. | 316 | 70 |
| * | AngioDynamics Inc. | | 3,222 | 68 |
| * | Amneal Pharmaceuticals Inc. | 3,153 | 62 |
| | National HealthCare Corp. | 889 | 59 |
| * | PDL BioPharma Inc. | 20,947 | 56 |
| * | Magellan Health Inc. | | 607 | 55 |
| * | MEDNAX Inc. | | 1,207 | 55 |
| * | Veeva Systems Inc. Class A | 659 | 51 |
| | Cantel Medical Corp. | | 465 | 51 |
| * | Innoviva Inc. | | 2,733 | 40 |
| | CONMED Corp. | | 558 | 38 |
| * | Intuitive Surgical Inc. | | 78 | 36 |
| * | Align Technology Inc. | | 108 | 36 |
| * | AMN Healthcare Services Inc. | 455 | 26 |
| * | Select Medical Holdings | | |
| | Corp. | | 1,357 | 25 |
| * | ICU Medical Inc. | | 65 | 19 |
| * | HealthEquity Inc. | | 247 | 18 |
| * | Sangamo Therapeutics Inc. | 1,110 | 18 |
| * | Orthofix International NV | 332 | 18 |
| | LeMaitre Vascular Inc. | | 519 | 18 |
| | STERIS plc | | 123 | 13 |
| * | Inogen Inc. | | 61 | 11 |
| * | Laboratory Corp. of America | | |
| | Holdings | | 53 | 10 |
| * | Providence Service Corp. | 125 | 9 |
| * | Varian Medical Systems Inc. | 68 | 8 |
| | | |
| | Luminex Corp. | 272 | 8 |
| | Patterson Cos. Inc. | 231 | 5 |
| | | | 3,261 |
| Materials & Processing (4.4%) | | |
| | LyondellBasell Industries | | |
| | NV Class A | 2,988 | 335 |
| | Owens Corning | 2,274 | 144 |
| | Domtar Corp. | 2,434 | 117 |
| | Eastman Chemical Co. | 835 | 87 |
| | Reliance Steel & Aluminum | | |
| | Co. | 795 | 74 |
| | Westlake Chemical Corp. | 606 | 70 |
| | Materion Corp. | 1,244 | 68 |
| | Louisiana-Pacific Corp. | 2,130 | 62 |
| | WestRock Co. | 1,000 | 59 |
| | Interface Inc. Class A | 2,502 | 57 |
| | Stepan Co. | 757 | 55 |
| | Commercial Metals Co. | 2,296 | 54 |
| | Universal Forest Products | | |
| | Inc. | 1,291 | 47 |
| * | Kraton Corp. | 964 | 47 |
| | Boise Cascade Co. | 961 | 46 |
| | Steel Dynamics Inc. | 765 | 38 |
| | Newmont Mining Corp. | 786 | 31 |
| | Royal Gold Inc. | 330 | 30 |
| * | Continental Building Products | | |
| | Inc. | 963 | 29 |
| | Greif Inc. Class A | 478 | 28 |
| | PolyOne Corp. | 661 | 28 |
| | Cabot Microelectronics Corp. | 242 | 27 |
| | Rayonier Advanced Materials | | |
| | Inc. | 1,489 | 27 |
| | Carpenter Technology Corp. | 440 | 26 |
| | Comfort Systems USA Inc. | 560 | 26 |
| * | BMC Stock Holdings Inc. | 1,241 | 25 |
| | Schnitzer Steel Industries Inc. | 781 | 24 |
| * | GMS Inc. | 788 | 24 |
| * | NCI Building Systems Inc. | 963 | 18 |
| | PH Glatfelter Co. | 1,036 | 18 |
| | Watsco Inc. | 98 | 18 |
| * | Armstrong Flooring Inc. | 1,350 | 18 |
| | Packaging Corp. of America | 127 | 15 |
| * | AdvanSix Inc. | 301 | 11 |
| | Huntsman Corp. | 330 | 11 |
| | Simpson Manufacturing Co. | | |
| | Inc. | 145 | 9 |
| | Albemarle Corp. | 83 | 8 |
| | | | 1,811 |
| Other (0.5%) | | |
| | Autoliv Inc. | 714 | 106 |
| | TE Connectivity Ltd. | 636 | 59 |
| | Janus Henderson Group plc | 1,182 | 36 |
| | | | 201 |
62
U.S. Multifactor ETF
| | | |
| | | | Market |
| | | | Value• |
| | Shares | ($000) |
| Producer Durables (11.5%) | | |
| | Raytheon Co. | 1,389 | 291 |
| | Johnson Controls | | |
| | International plc | 6,007 | 202 |
| | Huntington Ingalls Industries | | |
| | Inc. | 680 | 150 |
| | Accenture plc Class A | 845 | 132 |
| | Kansas City Southern | 1,168 | 125 |
| | McGrath RentCorp | 1,822 | 119 |
| * | Teledyne Technologies Inc. | 586 | 118 |
| | Landstar System Inc. | 817 | 93 |
| | IDEX Corp. | 657 | 91 |
| | Hyster-Yale Materials | | |
| | Handling Inc. | 1,245 | 83 |
| | Spirit AeroSystems Holdings | | |
| | Inc. Class A | 965 | 82 |
| | Boeing Co. | 222 | 78 |
| | Cummins Inc. | 546 | 78 |
| | Barrett Business Services Inc. | 862 | 74 |
| | JB Hunt Transport Services | | |
| | Inc. | 549 | 70 |
| | Robert Half International Inc. | 1,094 | 70 |
| | Trinity Industries Inc. | 1,960 | 68 |
| | Knight-Swift Transportation | | |
| | Holdings Inc. | 1,604 | 65 |
| * | Sykes Enterprises Inc. | 2,285 | 64 |
| * | ASGN Inc. | 833 | 64 |
| | Hillenbrand Inc. | 1,356 | 63 |
| | Stanley Black & Decker Inc. | 454 | 63 |
| * | Generac Holdings Inc. | 1,260 | 63 |
| | CH Robinson Worldwide Inc. | 719 | 63 |
| | Primoris Services Corp. | 2,394 | 62 |
| | Convergys Corp. | 2,636 | 62 |
| | MAXIMUS Inc. | 1,008 | 61 |
| | Xylem Inc. | 862 | 61 |
| | Deluxe Corp. | 912 | 61 |
| | EMCOR Group Inc. | 789 | 60 |
| | AMETEK Inc. | 817 | 60 |
| * | Modine Manufacturing Co. | 3,308 | 60 |
| | FedEx Corp. | 237 | 59 |
| | Marten Transport Ltd. | 2,551 | 58 |
| * | WESCO International Inc. | 970 | 58 |
| | Ryder System Inc. | 838 | 56 |
| | Herman Miller Inc. | 1,693 | 55 |
| | ManpowerGroup Inc. | 603 | 54 |
| * | CBIZ Inc. | 2,526 | 52 |
| | Ship Finance International | | |
| | Ltd. | 3,636 | 52 |
| | Alamo Group Inc. | 519 | 48 |
| | Old Dominion Freight Line | | |
| | Inc. | 303 | 47 |
| * | Zebra Technologies Corp. | 301 | 46 |
| | Kelly Services Inc. Class A | 2,007 | 45 |
| | Schneider National Inc. | | |
| | Class B | 1,522 | 45 |
| | | |
| | Curtiss-Wright Corp. | 341 | 43 |
| | Watts Water Technologies | | |
| | Inc. Class A | 516 | 40 |
| * | CoStar Group Inc. | 101 | 38 |
| | National Instruments Corp. | 868 | 36 |
| * | JetBlue Airways Corp. | 1,902 | 36 |
| | Textron Inc. | 518 | 34 |
| | Copa Holdings SA Class A | 309 | 34 |
| | ICF International Inc. | 458 | 32 |
| | Matson Inc. | 926 | 32 |
| | Dover Corp. | 405 | 31 |
| | Korn/Ferry International | 571 | 31 |
| | Insperity Inc. | 339 | 31 |
| * | TriNet Group Inc. | 574 | 31 |
| * | SEACOR Holdings Inc. | 588 | 31 |
| | AGCO Corp. | 482 | 31 |
| | Werner Enterprises Inc. | 765 | 30 |
| * | FTI Consulting Inc. | 483 | 30 |
| | UniFirst Corp. | 168 | 30 |
| * | Saia Inc. | 361 | 30 |
| | Genpact Ltd. | 956 | 29 |
| * | Copart Inc. | 509 | 28 |
| | Rollins Inc. | 554 | 28 |
| * | Darling Ingredients Inc. | 1,467 | 28 |
| | Steelcase Inc. Class A | 1,900 | 27 |
| | SkyWest Inc. | 478 | 27 |
| * | SP Plus Corp. | 739 | 27 |
| * | Proto Labs Inc. | 217 | 26 |
| * | Sensata Technologies | | |
| | Holding plc | 511 | 26 |
| * | Casella Waste Systems Inc. | | |
| | Class A | 1,077 | 25 |
| * | FARO Technologies Inc. | 465 | 25 |
| | Encore Wire Corp. | 502 | 24 |
| * | TrueBlue Inc. | 933 | 24 |
| | Costamare Inc. | 3,265 | 24 |
| * | Dycom Industries Inc. | 246 | 23 |
| | Systemax Inc. | 565 | 19 |
| | Kforce Inc. | 550 | 18 |
| | Kaman Corp. | 249 | 18 |
| * | Atlas Air Worldwide | | |
| | Holdings Inc. | 258 | 18 |
| | Teekay Corp. | 2,203 | 18 |
| * | SPX FLOW Inc. | 402 | 17 |
| * | Herc Holdings Inc. | 304 | 17 |
| | FLIR Systems Inc. | 237 | 13 |
| * | Covenant Transportation | | |
| | Group Inc. Class A | 416 | 12 |
| | Allison Transmission Holdings | | |
| | Inc. | 300 | 12 |
| | Air Lease Corp. Class A | 277 | 12 |
| | Heidrick & Struggles | | |
| | International Inc. | 286 | 11 |
| | Pentair plc | 246 | 11 |
| | Graco Inc. | 207 | 9 |
63
U.S. Multifactor ETF
| | | |
| | | | Market |
| | | | Value• |
| | | Shares | ($000) |
| | Forward Air Corp. | 130 | 8 |
| * | ExlService Holdings Inc. | 136 | 8 |
| | AAR Corp. | 170 | 8 |
| | Knoll Inc. | 376 | 8 |
| | HEICO Corp. | 82 | 7 |
| | Briggs & Stratton Corp. | 397 | 7 |
| * | nVent Electric plc | 246 | 7 |
| | | | 4,811 |
| Technology (10.1%) | | |
| | HP Inc. | 17,247 | 380 |
| | Cognizant Technology | | |
| | Solutions Corp. Class A | 2,845 | 214 |
| * | salesforce.com Inc. | 1,621 | 210 |
| * | Adobe Systems Inc. | 787 | 196 |
| | Texas Instruments Inc. | 1,562 | 175 |
| | Apple Inc. | 858 | 160 |
| | Intuit Inc. | 673 | 136 |
| * | CACI International Inc. | | |
| | Class A | 617 | 103 |
| * | ON Semiconductor Corp. | 3,743 | 94 |
| * | Fortinet Inc. | 1,475 | 90 |
| * | Diodes Inc. | 2,535 | 87 |
| * | New Relic Inc. | 840 | 85 |
| | Maxim Integrated Products | | |
| | Inc. | 1,362 | 80 |
| * | Dell Technologies Inc. | | |
| | Class V | 983 | 79 |
| * | Qualys Inc. | 1,013 | 78 |
| * | Perficient Inc. | 2,755 | 72 |
| * | RingCentral Inc. Class A | 942 | 71 |
| * | Red Hat Inc. | 438 | 71 |
| * | ANSYS Inc. | 425 | 69 |
| | Jabil Inc. | 2,445 | 69 |
| | Comtech | | |
| | Telecommunications Corp. | 2,207 | 69 |
| * | Pure Storage Inc. Class A | 3,176 | 68 |
| | Cypress Semiconductor | | |
| | Corp. | 4,131 | 68 |
| * | Workiva Inc. | 2,535 | 66 |
| | Teradyne Inc. | 1,661 | 63 |
| | DXC Technology Co. | 661 | 61 |
| | Hewlett Packard Enterprise | | |
| | Co. | 3,908 | 60 |
| | Harris Corp. | 393 | 59 |
| * | Syntel Inc. | 1,860 | 59 |
| * | Akamai Technologies Inc. | 754 | 57 |
| * | VMware Inc. Class A | 402 | 55 |
| * | EchoStar Corp. Class A | 1,130 | 53 |
| * | CalAmp Corp. | 2,473 | 52 |
| * | F5 Networks Inc. | 288 | 50 |
| * | PTC Inc. | 567 | 49 |
| | Dolby Laboratories Inc. | | |
| | Class A | 748 | 47 |
| | | |
| | LogMeIn Inc. | 408 | 44 |
| | Monotype Imaging Holdings | | |
| | Inc. | 1,993 | 43 |
| * | Presidio Inc. | 3,038 | 41 |
| * | Qorvo Inc. | 465 | 37 |
| | Entegris Inc. | 945 | 33 |
| | Amdocs Ltd. | 482 | 33 |
| | Motorola Solutions Inc. | 298 | 32 |
| * | ePlus Inc. | 333 | 30 |
| | CA Inc. | 833 | 30 |
| | ManTech International Corp. | | |
| | Class A | 547 | 30 |
| * | IPG Photonics Corp. | 121 | 29 |
| * | LivePerson Inc. | 1,487 | 29 |
| * | TTM Technologies Inc. | 1,595 | 29 |
| | Cohu Inc. | 1,189 | 29 |
| * | Virtusa Corp. | 552 | 27 |
| | SS&C Technologies Holdings | | |
| | Inc. | 521 | 27 |
| * | Varonis Systems Inc. | 338 | 26 |
| | Progress Software Corp. | 656 | 25 |
| * | Rudolph Technologies Inc. | 722 | 24 |
| | Skyworks Solutions Inc. | 243 | 24 |
| * | NetScout Systems Inc. | 860 | 23 |
| | Blackbaud Inc. | 236 | 23 |
| * | Amkor Technology Inc. | 2,421 | 22 |
| * | NETGEAR Inc. | 299 | 18 |
| * | Synopsys Inc. | 153 | 13 |
| | Vishay Intertechnology Inc. | 579 | 12 |
| * | Appfolio Inc. | 200 | 12 |
| * | VeriSign Inc. | 89 | 12 |
| * | Yelp Inc. Class A | 194 | 8 |
| | | | 4,220 |
| Utilities (2.7%) | | |
| | AT&T Inc. | 11,907 | 385 |
| | Exelon Corp. | 4,900 | 203 |
| | ALLETE Inc. | 1,535 | 118 |
| | Hawaiian Electric Industries | | |
| | Inc. | 2,705 | 93 |
| | Avangrid Inc. | 1,342 | 71 |
| | Ameren Corp. | 1,122 | 66 |
| | Telephone & Data Systems | | |
| | Inc. | 2,169 | 56 |
| * | Vonage Holdings Corp. | 2,303 | 26 |
| * | Boingo Wireless Inc. | 1,202 | 26 |
| | American States Water Co. | 423 | 24 |
| * | United States Cellular Corp. | 644 | 23 |
| | ATN International Inc. | 341 | 18 |
| | Portland General Electric Co. | 197 | 8 |
| | Consolidated Edison Inc. | 103 | 8 |
| | | | 1,125 |
| Total Common Stocks | | |
| (Cost $40,788) | | 41,532 |
64
U.S. Multifactor ETF
| | |
| | | Market |
| | | Value• |
| | Shares | ($000) |
| Temporary Cash Investment (0.1%)1 | |
| Money Market Fund (0.1%) | | |
| 2 Vanguard Market Liquidity Fund, | |
| 1.961% (Cost $48) | 485 | 48 |
| Total Investments (99.8%) | | |
| (Cost $40,836) | | 41,580 |
| |
| | Amount |
| | | ($000) |
| Other Assets and Liabilities (0.2%) | |
| Other Assets | | |
| Investment in Vanguard | | 2 |
| Receivables for Investment Securities Sold | 46 |
| Receivables for Accrued Income | 49 |
| Other Assets 3 | | 9 |
| Total Other Assets | | 106 |
| Liabilities | | |
| Payables to Vanguard | | (3) |
| Variation Margin Payable—Futures Contracts | (1) |
| Total Liabilities | | (4) |
| Net Assets (100%) | | |
| Applicable to 525,000 outstanding | |
| $.001 par value shares of beneficial | |
| interest (unlimited authorization) | 41,682 |
| Net Asset Value Per Share | | $79.39 |
| |
| At May 31, 2018, net assets consisted of: | |
| | Amount |
| | ($000) |
| Paid-in Capital | 40,844 |
| Undistributed Net Investment Income | 102 |
| Accumulated Net Realized Losses | (8) |
| Unrealized Appreciation (Depreciation) | |
| Investment Securities | 744 |
| Futures Contracts | — |
| Net Assets | 41,682 |
• See Note A in Notes to Financial Statements.
* Non-income-producing security.
1 The fund invests a portion of its cash reserves in equity
markets through the use of index futures contracts. After
giving effect to futures investments, the fund’s effective
common stock and temporary cash investment positions
represent 100.0% and (0.2%), respectively, of net assets.
2 Affiliated money market fund available only to Vanguard funds
and certain trusts and accounts managed by Vanguard. Rate
shown is the 7-day yield.
3 Cash of $9,000 has been segregated as initial margin for open
futures contracts.
| | | | |
| Derivative Financial Instruments Outstanding as of Period End | | |
| |
| Futures Contracts | | | | |
| | | | ($000) |
| | | | | Value and |
| | | Number of | | Unrealized |
| | | Long (Short) | Notional | Appreciation |
| | Expiration | Contracts | Amount | (Depreciation) |
| Long Futures Contracts | | | | |
| E-mini S&P 500 Index | June 2018 | 1 | 135 | — |
Unrealized appreciation (depreciation) on open futures contracts is required to be treated as realized gain (loss) for tax purposes.
See accompanying Notes, which are an integral part of the Financial Statements.
65
U.S. Multifactor ETF
Statement of Operations
| |
| | February13,20181 to |
| | May 31, 2018 |
| | ($000) |
| Investment Income | |
| Income | |
| Dividends 2 | 111 |
| Interest 3 | 1 |
| Total Income | 112 |
| Expenses | |
| The Vanguard Group—Note B | |
| Investment Advisory Services | — |
| Management and Administrative | 6 |
| Marketing and Distribution | — |
| Custodian Fees | 1 |
| Shareholders’ Reports | 3 |
| Total Expenses | 10 |
| Net Investment Income | 102 |
| Realized Net Gain (Loss) | |
| Investment Securities Sold 3 | (2) |
| Futures Contracts | (6) |
| Realized Net Gain (Loss) | (8) |
| Change in Unrealized Appreciation (Depreciation) | |
| Investment Securities 3 | 744 |
| Futures Contracts | — |
| Change in Unrealized Appreciation (Depreciation) | 744 |
| Net Increase (Decrease) in Net Assets Resulting from Operations | 838 |
1 Inception.
2 Dividends are net of foreign withholding taxes of less than $1,000.
3 Interest income, realized net gain (loss), and change in unrealized appreciation (depreciation) from an affiliated company of the fund
were each less than $1,000. Purchases and sales are for temporary cash investment purposes.
See accompanying Notes, which are an integral part of the Financial Statements.
66
U.S. Multifactor ETF
Statement of Changes in Net Assets
| |
| | February 13, 20181 to |
| | May 31, 2018 |
| | ($000) |
| Increase (Decrease) in Net Assets | |
| Operations | |
| Net Investment Income | 102 |
| Realized Net Gain (Loss) | (8) |
| Change in Unrealized Appreciation (Depreciation) | 744 |
| Net Increase (Decrease) in Net Assets Resulting from Operations | 838 |
| Distributions | |
| Net Investment Income | — |
| Realized Capital Gain | — |
| Total Distributions | — |
| Capital Share Transactions | |
| Issued | 40,844 |
| Issued in Lieu of Cash Distributions | — |
| Redeemed | — |
| Net Increase (Decrease) from Capital Share Transactions | 40,844 |
| Total Increase (Decrease) | 41,682 |
| Net Assets | |
| Beginning of Period | — |
| End of Period2 | 41,682 |
| 1 Inception. |
| 2 Net Assets—End of Period includes undistributed (overdistributed) net investment income of $102,000. |
See accompanying Notes, which are an integral part of the Financial Statements.
67
U.S. Multifactor ETF
Financial Highlights
| |
| | February 13, 20181 to |
| For a Share Outstanding Throughout the Period | May 31, 2018 |
| Net Asset Value, Beginning of Period | $75.00 |
| Investment Operations | |
| Net Investment Income2 | .400 |
| Net Realized and Unrealized Gain (Loss) on Investments | 3.990 |
| Total from Investment Operations | 4.390 |
| Distributions | |
| Dividends from Net Investment Income | — |
| Distributions from Realized Capital Gains | — |
| Total Distributions | — |
| Net Asset Value, End of Period | $79.39 |
| |
| Total Return | 5.85% |
| |
| Ratios/Supplemental Data | |
| Net Assets, End of Period (Millions) | $42 |
| Ratio of Total Expenses to Average Net Assets | 0.18%3 |
| Ratio of Net Investment Income to Average Net Assets | 1.59%3 |
| Portfolio Turnover Rate | 58%3 |
| 1 Inception. |
| 2 Calculated based on average shares outstanding. |
| 3 Annualized. |
See accompanying Notes, which are an integral part of the Financial Statements.
68
U.S. Multifactor ETF
Notes to Financial Statements
Vanguard U.S. Multifactor ETF is registered under the Investment Company Act of 1940 as an open-end investment company, or mutual fund. ETF Shares are listed for trading on Cboe BZX Exchange; they can be purchased and sold through a broker.
A. The following significant accounting policies conform to generally accepted accounting principles for U.S. investment companies. The fund consistently follows such policies in preparing its financial statements.
1. Security Valuation: Securities are valued as of the close of trading on the New York Stock Exchange (generally 4 p.m., Eastern time) on the valuation date. Equity securities are valued at the latest quoted sales prices or official closing prices taken from the primary market in which each security trades; such securities not traded on the valuation date are valued at the mean of the latest quoted bid and asked prices. Securities for which market quotations are not readily available, or whose values have been materially affected by events occurring before the fund’s pricing time but after the close of the securities’ primary markets, are valued by methods deemed by the board of trustees to represent fair value. Investments in Vanguard Market Liquidity Fund are valued at that fund’s net asset value.
2. Futures Contracts: The fund uses index futures contracts to a limited extent, with the objectives of maintaining full exposure to the stock market, maintaining liquidity, and minimizing transaction costs. The fund may purchase futures contracts to immediately invest incoming cash in the market, or sell futures in response to cash outflows, thereby simulating a fully invested position in the underlying index while maintaining a cash balance for liquidity. The primary risks associated with the use of futures contracts are imperfect correlation between changes in market values of stocks held by the fund and the prices of futures contracts, and the possibility of an illiquid market. Counter-party risk involving futures is mitigated because a regulated clearinghouse is the counterparty instead of the clearing broker. To further mitigate counterparty risk, the fund trades futures contracts on an exchange, monitors the financial strength of its clearing brokers and clearinghouse, and has entered into clearing agreements with its clearing brokers. The clearinghouse imposes initial margin requirements to secure the fund’s performance and requires daily settlement of variation margin representing changes in the market value of each contract.
Futures contracts are valued at their quoted daily settlement prices. The notional amounts of the contracts are not recorded in the Statement of Net Assets. Fluctuations in the value of the contracts are recorded in the Statement of Net Assets as an asset (liability) and in the Statement of Operations as unrealized appreciation (depreciation) until the contracts are closed, when they are recorded as realized futures gains (losses).
During the period ended May 31, 2018, the fund’s average investments in long and short futures contracts represented less than 1% and 0% of net assets, respectively, based on the average of the notional amounts at each quarter-end during the period.
3. Federal Income Taxes: The fund intends to qualify as a regulated investment company and distribute all of its taxable income. Management has analyzed the fund’s tax positions taken for the period ended May 31, 2018, and has concluded that no provision for federal income tax is required in the fund’s financial statements.
4. Distributions: Distributions to shareholders are recorded on the ex-dividend date.
69
U.S. Multifactor ETF
5. Other: Dividend income is recorded on the ex-dividend date. Interest income includes income distributions received from Vanguard Market Liquidity Fund and is accrued daily. Security transactions are accounted for on the date securities are bought or sold. Costs used to determine realized gains (losses) on the sale of investment securities are those of the specific securities sold.
B. In accordance with the terms of a Funds’ Service Agreement (the “FSA”) between Vanguard and the fund, Vanguard furnishes to the fund investment advisory, corporate management, administrative, marketing, and distribution services at Vanguard’s cost of operations (as defined by the FSA). These costs of operations are allocated to the fund based on methods and guidelines approved by the board of trustees, and generally settled twice a month.
Upon the request of Vanguard, the fund may invest up to 0.40% of its net assets as capital in Vanguard. At May 31, 2018, the fund had contributed to Vanguard capital in the amount of $2,000, representing 0.00% of the fund’s net assets and 0.00% of Vanguard’s capitalization. The fund’s trustees and officers are also directors and employees, respectively, of Vanguard.
C. Various inputs may be used to determine the value of the fund’s investments. These inputs are summarized in three broad levels for financial statement purposes. The inputs or methodologies used to value securities are not necessarily an indication of the risk associated with investing in those securities.
Level 1—Quoted prices in active markets for identical securities.
Level 2—Other significant observable inputs (including quoted prices for similar securities, interest
rates, prepayment speeds, credit risk, etc.).
Level 3—Significant unobservable inputs (including the fund’s own assumptions used to determine
the fair value of investments). Any investments valued with significant unobservable inputs are
noted on the Statement of Net Assets.
At May 31, 2018, 100% of the market value of the fund’s investments was determined based on Level 1 inputs.
D. Distributions are determined on a tax basis and may differ from net investment income and realized capital gains for financial reporting purposes. Differences may be permanent or temporary. Permanent differences are reclassified among capital accounts in the financial statements to reflect their tax character. Temporary differences arise when certain items of income, expense, gain, or loss are recognized in different periods for financial statement and tax purposes. These differences will reverse at some time in the future. Differences in classification may also result from the treatment of short-term gains as ordinary income for tax purposes. The fund’s tax-basis capital gains and losses are determined only at the end of each fiscal year.
At May 31, 2018, the cost of investment securities for tax purposes was $40,836,000. Net unrealized appreciation of investment securities for tax purposes was $744,000, consisting of unrealized gains of $1,597,000 on securities that had risen in value since their purchase and $853,000 in unrealized losses on securities that had fallen in value since their purchase.
E. During the period ended May 31, 2018, the fund purchased $45,911,000 of investment securities and sold $5,121,000 of investment securities, other than temporary cash investments.
70
U.S. Multifactor ETF
F. Capital shares issued and redeemed were:
| |
| | February 13, 20181 to |
| | May 31, 2018 |
| | Shares |
| | (000) |
| Issued | 525 |
| Issued in Lieu of Cash Distributions | — |
| Redeemed | — |
| Net Increase (Decrease) in Shares Outstanding | 525 |
| 1 Inception. |
G. Management has determined that no events or transactions occurred subsequent to May 31, 2018, that would require recognition or disclosure in these financial statements.
71
U.S. Quality Factor ETF
Fund Profile
As of May 31, 2018
| | |
| Portfolio Characteristics | | |
| | | Russell |
| | | 3000 |
| | Fund | Index |
| Number of Stocks | 664 | 2,941 |
| Median Market Cap | $10.1B | $66.7B |
| Price/Earnings Ratio | 22.4x | 20.8x |
| Price/Book Ratio | 3.1x | 3.0x |
| Return on Equity | 13.6% | 15.0% |
| Earnings Growth | | |
| Rate | 8.9% | 7.9% |
| Dividend Yield | 1.3% | 1.8% |
| Foreign Holdings | 0.2% | 0.0% |
| Turnover Rate | | |
| (Annualized) | 35% | — |
| Ticker Symbol | VFQY | — |
| Expense Ratio1 | 0.13% | — |
| 30-Day SEC Yield | 1.18% | — |
| Short-Term Reserves | 0.4% | — |
| | |
| Sector Diversification (% of equity exposure) |
| | | Russell |
| | | 3000 |
| | Fund | Index |
| Consumer Discretionary | 24.3% | 14.3% |
| Consumer Staples | 5.4 | 5.3 |
| Energy | 2.1 | 6.0 |
| Financial Services | 19.1 | 21.1 |
| Health Care | 10.1 | 13.2 |
| Materials & Processing | 3.9 | 3.8 |
| Producer Durables | 12.0 | 10.8 |
| Technology | 22.3 | 21.0 |
| Utilities | 0.8 | 4.5 |
Sector categories are based on the Russell Global Sectors (“RGS”),
except for the “Other” category (if applicable), which includes
securities that have not been provided a RGS classification as of
the effective reporting period.
| | |
| Ten Largest Holdings (% of total net assets) |
| Ross Stores Inc. | Specialty Retail | 1.1% |
| TJX Cos. Inc. | Specialty Retail | 1.0 |
| Adobe Systems Inc. | Computer Services | |
| | Software & Systems | 0.9 |
| Walmart Inc. | Diversified Retail | 0.9 |
| US Bancorp | Banks: Diversified | 0.9 |
| Illumina Inc. | Medical Equipment | 0.8 |
| Intuit Inc. | Computer Services | |
| | Software & Systems | 0.8 |
| Costco Wholesale Corp. | Diversified Retail | 0.8 |
| Humana Inc. | Health Care | |
| | Management | |
| | Services | 0.8 |
| Applied Materials Inc. | Production | |
| | Technology | |
| | Equipment | 0.8 |
| Top Ten | | 8.8% |
| The holdings listed exclude any temporary cash investments and equity index products. |
1 The expense ratio shown is from the prospectus dated February 13, 2018, and represents estimated costs for the current fiscal year. For
the period from inception through May 31, 2018, the annualized expense ratio was 0.13%.
72
U.S. Quality Factor ETF
Performance Summary
All of the returns in this report represent past performance, which is not a guarantee of future results that may be achieved by the fund. (Current performance may be lower or higher than the performance data cited. For performance data current to the most recent month-end, visit our website at vanguard.com/performance.) Note, too, that both investment returns and principal value can fluctuate widely, so an investor’s shares, when sold, could be worth more or less than their original cost. The returns shown do not reflect taxes that a shareholder would pay on fund distributions or on the sale of fund shares.
Fiscal-Period Total Returns (%): February 13, 2018, Through May 31, 2018
Total Returns: Period Ended March 31, 2018
This table presents returns through the latest calendar quarter—rather than through the end of the fiscal period.
Securities and Exchange Commission rules require that we provide this information.
| | |
| | Inception | Since |
| | Date | Inception |
| ETF Shares | 2/13/2018 | |
| Market Price | | 1.95% |
| Net Asset Value | | 1.88 |
See Financial Highlights for dividend and capital gains information.
73
U.S. Quality Factor ETF
Financial Statements (unaudited)
Statement of Net Assets
As of May 31, 2018
The fund reports a complete list of its holdings in regulatory filings four times in each fiscal year, at the quarter-ends. For the second and fourth fiscal quarters, the lists appear in the fund’s semiannual and annual reports to shareholders. For the first and third fiscal quarters, the fund files the lists with the Securities and Exchange Commission on Form N-Q. Shareholders can look up the fund’s Forms N-Q on the SEC’s website at sec.gov. Forms N-Q may also be reviewed and copied at the SEC’s Public Reference Room (see the back cover of this report for further information).
| | | |
| | | | Market |
| | | | Value• |
| | Shares | ($000) |
| Common Stocks (99.5%) | | |
| Consumer Discretionary (24.2%) | |
| | Ross Stores Inc. | 1,072 | 85 |
| | TJX Cos. Inc. | 863 | 78 |
| | Walmart Inc. | 880 | 73 |
| | Costco Wholesale Corp. | 336 | 67 |
| | NIKE Inc. Class B | 889 | 64 |
| | Target Corp. | 795 | 58 |
| | Las Vegas Sands Corp. | 697 | 56 |
| | Estee Lauder Cos. Inc. | | |
| | Class A | 341 | 51 |
| * | Amazon.com Inc. | 21 | 34 |
| | Walt Disney Co. | 334 | 33 |
| | Haverty Furniture Cos. Inc. | 1,455 | 29 |
| | Guess? Inc. | 1,406 | 28 |
| * | Chipotle Mexican Grill Inc. | | |
| | Class A | 52 | 22 |
| | Marriott International Inc. | | |
| | Class A | 140 | 19 |
| * | Lululemon Athletica Inc. | 176 | 18 |
| * | Grand Canyon Education Inc. | 155 | 17 |
| | Macy’s Inc. | 490 | 17 |
| | Foot Locker Inc. | 303 | 16 |
| | Ralph Lauren Corp. Class A | 121 | 16 |
| | Tiffany & Co. | 124 | 16 |
| | Cato Corp. Class A | 706 | 16 |
| * | Burlington Stores Inc. | 109 | 16 |
| * | TripAdvisor Inc. | 305 | 16 |
| | Texas Roadhouse Inc. Class A | 243 | 15 |
| | Gentex Corp. | 620 | 15 |
| | Tractor Supply Co. | 199 | 15 |
| | Williams-Sonoma Inc. | 257 | 14 |
| | Columbia Sportswear Co. | 162 | 14 |
| | Kohl’s Corp. | 209 | 14 |
| * | Etsy Inc. | 415 | 13 |
| | Yum China Holdings Inc. | 335 | 13 |
| | Cracker Barrel Old Country | | |
| | Store Inc. | 83 | 13 |
| * | Fossil Group Inc. | 592 | 13 |
| | | |
| | Nordstrom Inc. | 264 | 13 |
| | Best Buy Co. Inc. | 186 | 13 |
| * | Ulta Beauty Inc. | 50 | 12 |
| | Gap Inc. | 433 | 12 |
| | Signet Jewelers Ltd. | 278 | 12 |
| * | J. Jill Inc. | 1,522 | 12 |
| | Polaris Industries Inc. | 106 | 12 |
| | Shoe Carnival Inc. | 366 | 12 |
| | Expedia Group Inc. | 97 | 12 |
| | Citi Trends Inc. | 371 | 11 |
| | Dollar General Corp. | 127 | 11 |
| | Genuine Parts Co. | 119 | 11 |
| | Bed Bath & Beyond Inc. | 593 | 11 |
| | American Eagle Outfitters Inc. | 478 | 11 |
| | DSW Inc. Class A | 444 | 11 |
| * | Crocs Inc. | 594 | 11 |
| * | Urban Outfitters Inc. | 253 | 10 |
| | BJ’s Restaurants Inc. | 187 | 10 |
| | Dillard’s Inc. Class A | 128 | 10 |
| * | Zumiez Inc. | 418 | 10 |
| | Darden Restaurants Inc. | 115 | 10 |
| | Buckle Inc. | 398 | 10 |
| | HealthStream Inc. | 360 | 10 |
| | Ruth’s Hospitality Group Inc. | 368 | 10 |
| * | Vera Bradley Inc. | 838 | 10 |
| * | Quotient Technology Inc. | 722 | 10 |
| | Wynn Resorts Ltd. | 49 | 10 |
| | Johnson Outdoors Inc. Class A | 126 | 10 |
| * | Potbelly Corp. | 710 | 9 |
| * | Hibbett Sports Inc. | 355 | 9 |
| * | Instructure Inc. | 214 | 9 |
| * | Genesco Inc. | 210 | 9 |
| * | MCBC Holdings Inc. | 311 | 9 |
| | H&R Block Inc. | 334 | 9 |
| | National Presto Industries Inc. | 81 | 9 |
| | Movado Group Inc. | 186 | 9 |
| | La-Z-Boy Inc. | 292 | 9 |
| * | Francesca’s Holdings Corp. | 1,540 | 9 |
| | Abercrombie & Fitch Co. | 381 | 9 |
74
U.S. Quality Factor ETF
| | | | |
| | | | | Market |
| | | | | Value• |
| | | Shares | ($000) |
| | John Wiley & Sons Inc. | | | |
| | Class A | | 134 | 9 |
| | Oxford Industries Inc. | | 110 | 9 |
| * | Deckers Outdoor Corp. | | 80 | 9 |
| * | NVR Inc. | | 3 | 9 |
| | Advance Auto Parts Inc. | | 69 | 9 |
| | Cheesecake Factory Inc. | | 171 | 9 |
| * | Chuy’s Holdings Inc. | | 299 | 9 |
| | Steven Madden Ltd. | | 166 | 9 |
| | World Wrestling Entertainment | | |
| | Inc. Class A | | 148 | 9 |
| | Dick’s Sporting Goods Inc. | 234 | 9 |
| * | Shutterstock Inc. | | 178 | 8 |
| | Strayer Education Inc. | | 76 | 8 |
| * | American Public Education Inc. | 191 | 8 |
| | Ethan Allen Interiors Inc. | | 345 | 8 |
| * | Michael Kors Holdings Ltd. | 140 | 8 |
| * | Shutterfly Inc. | | 84 | 8 |
| * | Care.com Inc. | | 379 | 8 |
| | Inter Parfums Inc. | | 146 | 8 |
| * | Nautilus Inc. | | 518 | 8 |
| | Aaron’s Inc. | | 194 | 8 |
| | Thor Industries Inc. | | 83 | 8 |
| * | ZAGG Inc. | | 503 | 8 |
| | Chico’s FAS Inc. | | 902 | 8 |
| * | Dorman Products Inc. | | 118 | 8 |
| | Children’s Place Inc. | | 59 | 8 |
| * | Wayfair Inc. | | 82 | 8 |
| * | RH | | 77 | 8 |
| | Travelport Worldwide Ltd. | 429 | 8 |
| * | Ollie’s Bargain Outlet Holdings | | |
| | Inc. | | 106 | 7 |
| * | Cavco Industries Inc. | | 36 | 7 |
| | Tile Shop Holdings Inc. | | 1,015 | 7 |
| | Carter’s Inc. | | 66 | 7 |
| | Nutrisystem Inc. | | 192 | 7 |
| | Standard Motor Products Inc. | 158 | 7 |
| * | Liberty Expedia Holdings Inc. | | |
| | Class A | | 164 | 7 |
| * | Sears Holdings Corp. | 2,506 | 7 |
| * | Fitbit Inc. Class A | | 1,291 | 7 |
| * | Live Nation Entertainment Inc. | 162 | 7 |
| | Wolverine World Wide Inc. | 205 | 7 |
| * | Sleep Number Corp. | | 244 | 7 |
| * | K12 Inc. | | 419 | 7 |
| | Big 5 Sporting Goods Corp. | 809 | 7 |
| * | Helen of Troy Ltd. | | 73 | 7 |
| * | Regis Corp. | | 378 | 7 |
| | Gannett Co. Inc. | | 614 | 6 |
| | Fortune Brands Home & | | | |
| | Security Inc. | | 113 | 6 |
| | Winnebago Industries Inc. | 175 | 6 |
| | New Media Investment | | | |
| | Group Inc. | | 379 | 6 |
| * | Express Inc. | | 735 | 6 |
| | | |
| * | Fiesta Restaurant Group Inc. | 251 | 6 |
| | PriceSmart Inc. | 73 | 6 |
| | Garmin Ltd. | 101 | 6 |
| * | Stamps.com Inc. | 24 | 6 |
| * | El Pollo Loco Holdings Inc. | 566 | 6 |
| | News Corp. Class A | 397 | 6 |
| | Pier 1 Imports Inc. | 2,462 | 6 |
| * | Asbury Automotive Group Inc. | 84 | 6 |
| * | Dave & Buster’s | | |
| | Entertainment Inc. | 139 | 6 |
| | Monro Inc. | 102 | 6 |
| | Tailored Brands Inc. | 172 | 6 |
| * | Red Robin Gourmet Burgers | | |
| | Inc. | 112 | 6 |
| * | Five Below Inc. | 79 | 6 |
| * | Lumber Liquidators Holdings | | |
| | Inc. | 263 | 6 |
| | Bloomin’ Brands Inc. | 253 | 5 |
| * | Bridgepoint Education Inc. | | |
| | Class A | 768 | 5 |
| | Cable One Inc. | 8 | 5 |
| * | America’s Car-Mart Inc. | 81 | 5 |
| | Caleres Inc. | 138 | 5 |
| * | Boot Barn Holdings Inc. | 199 | 5 |
| | New York Times Co. Class A | 202 | 5 |
| | Hasbro Inc. | 52 | 4 |
| * | Del Frisco’s Restaurant Group | | |
| | Inc. | 331 | 4 |
| * | Adtalem Global Education Inc. | 90 | 4 |
| * | Motorcar Parts of America Inc. | 194 | 4 |
| * | Habit Restaurants Inc. Class A | 468 | 4 |
| | Big Lots Inc. | 97 | 4 |
| * | Revlon Inc. Class A | 229 | 4 |
| | Hyatt Hotels Corp. Class A | 48 | 4 |
| * | IMAX Corp. | 182 | 4 |
| * | FTD Cos. Inc. | 627 | 4 |
| | Rent-A-Center Inc. | 371 | 3 |
| | International Speedway Corp. | | |
| | Class A | 84 | 3 |
| * | Hovnanian Enterprises Inc. | | |
| | Class A | 1,939 | 3 |
| * | Sally Beauty Holdings Inc. | 222 | 3 |
| | GameStop Corp. Class A | 226 | 3 |
| | Tenneco Inc. | 66 | 3 |
| | Fred’s Inc. Class A | 1,770 | 2 |
| | | | 1,945 |
| Consumer Staples (5.3%) | | |
| | Procter & Gamble Co. | 703 | 52 |
| | Walgreens Boots Alliance Inc. | 787 | 49 |
| * | Monster Beverage Corp. | 907 | 46 |
| | Sysco Corp. | 526 | 34 |
| | Medifast Inc. | 130 | 19 |
| | General Mills Inc. | 427 | 18 |
| | Nu Skin Enterprises Inc. | | |
| | Class A | 179 | 15 |
75
U.S. Quality Factor ETF
| | | |
| | | | Market |
| | | | Value• |
| | Shares | ($000) |
| | Lancaster Colony Corp. | 114 | 14 |
| * | USANA Health Sciences Inc. | 111 | 13 |
| | Flowers Foods Inc. | 620 | 13 |
| * | Boston Beer Co. Inc. Class A | 48 | 12 |
| | Hormel Foods Corp. | 338 | 12 |
| | Weis Markets Inc. | 208 | 11 |
| | National Beverage Corp. | 107 | 10 |
| | Kroger Co. | 406 | 10 |
| * | Freshpet Inc. | 393 | 9 |
| * | Performance Food Group Co. | 230 | 8 |
| * | United Natural Foods Inc. | 176 | 8 |
| | J&J Snack Foods Corp. | 54 | 8 |
| | PetMed Express Inc. | 204 | 7 |
| | Calavo Growers Inc. | 83 | 7 |
| | Casey’s General Stores Inc. | 73 | 7 |
| | Ingredion Inc. | 63 | 7 |
| | Sanderson Farms Inc. | 65 | 6 |
| * | Cal-Maine Foods Inc. | 131 | 6 |
| * | Sprouts Farmers Market Inc. | 285 | 6 |
| | John B Sanfilippo & Son Inc. | 81 | 6 |
| | Ingles Markets Inc. Class A | 189 | 6 |
| | Tootsie Roll Industries Inc. | 166 | 5 |
| | JM Smucker Co. | 43 | 5 |
| | | | 429 |
| Energy (2.1%) | | |
| | Chevron Corp. | 370 | 46 |
| | Exxon Mobil Corp. | 513 | 42 |
| | Valero Energy Corp. | 204 | 25 |
| | Marathon Oil Corp. | 404 | 9 |
| * | Matrix Service Co. | 377 | 7 |
| | RPC Inc. | 407 | 7 |
| | Arch Coal Inc. Class A | 77 | 6 |
| * | REX American Resources Corp. | 81 | 6 |
| * | TPI Composites Inc. | 221 | 6 |
| * | Dril-Quip Inc. | 94 | 5 |
| * | Exterran Corp. | 159 | 4 |
| * | Flotek Industries Inc. | 1,042 | 3 |
| | | | 166 |
| Financial Services (19.0%) | | |
| | US Bancorp | 1,405 | 70 |
| | SunTrust Banks Inc. | 752 | 51 |
| | State Street Corp. | 470 | 45 |
| | Visa Inc. Class A | 344 | 45 |
| | BB&T Corp. | 789 | 41 |
| | Mastercard Inc. Class A | 212 | 40 |
| | Wells Fargo & Co. | 714 | 39 |
| | PNC Financial Services | | |
| | Group Inc. | 261 | 37 |
| | Synchrony Financial | 1,054 | 36 |
| | JPMorgan Chase & Co. | 319 | 34 |
| | Commerce Bancshares Inc. | 497 | 32 |
| | Bank of New York Mellon | | |
| | Corp. | 556 | 30 |
| | Allstate Corp. | 304 | 28 |
| | | |
| | Bank of Hawaii Corp. | 330 | 28 |
| | Charles Schwab Corp. | 499 | 28 |
| | Aflac Inc. | 345 | 16 |
| | Jack Henry & Associates Inc. | 113 | 14 |
| | T. Rowe Price Group Inc. | 110 | 13 |
| | Cullen/Frost Bankers Inc. | 114 | 13 |
| | Northern Trust Corp. | 123 | 13 |
| | Discover Financial Services | 165 | 12 |
| | Webster Financial Corp. | 188 | 12 |
| | Synovus Financial Corp. | 222 | 12 |
| * | Credit Acceptance Corp. | 34 | 12 |
| | MarketAxess Holdings Inc. | 56 | 12 |
| | Regions Financial Corp. | 647 | 12 |
| | Broadridge Financial Solutions | | |
| | Inc. | 100 | 12 |
| | SEI Investments Co. | 177 | 11 |
| | Huntington Bancshares Inc. | 749 | 11 |
| | Brown & Brown Inc. | 396 | 11 |
| | M&T Bank Corp. | 62 | 11 |
| | East West Bancorp Inc. | 153 | 11 |
| | Comerica Inc. | 112 | 11 |
| | Equifax Inc. | 92 | 10 |
| | BOK Financial Corp. | 102 | 10 |
| * | Western Alliance Bancorp | 167 | 10 |
| | KeyCorp | 512 | 10 |
| | Lincoln National Corp. | 150 | 10 |
| | Fifth Third Bancorp | 324 | 10 |
| | TFS Financial Corp. | 617 | 10 |
| | Total System Services Inc. | 115 | 10 |
| | Ameriprise Financial Inc. | 70 | 10 |
| * | Zillow Group Inc. | 166 | 10 |
| | Morningstar Inc. | 80 | 10 |
| | Zions Bancorporation | 175 | 10 |
| | Citizens Financial Group Inc. | 234 | 10 |
| | Invesco Ltd. | 348 | 9 |
| * | BofI Holding Inc. | 228 | 9 |
| | Erie Indemnity Co. Class A | 82 | 9 |
| | First Citizens BancShares Inc. | | |
| | Class A | 21 | 9 |
| | Primerica Inc. | 91 | 9 |
| | Ally Financial Inc. | 347 | 9 |
| | First Financial Bankshares Inc. | 169 | 9 |
| | Extra Space Storage Inc. | 92 | 9 |
| | Park National Corp. | 77 | 9 |
| | Umpqua Holdings Corp. | 373 | 9 |
| | Prosperity Bancshares Inc. | 121 | 9 |
| * | Texas Capital Bancshares Inc. | 90 | 9 |
| | WR Berkley Corp. | 108 | 8 |
| | First Financial Bancorp | 262 | 8 |
| | Alexander’s Inc. | 21 | 8 |
| | TCF Financial Corp. | 309 | 8 |
| | 1st Source Corp. | 151 | 8 |
| | BancorpSouth Bank | 236 | 8 |
| | Lakeland Financial Corp. | 161 | 8 |
| | Preferred Bank | 123 | 8 |
76
U.S. Quality Factor ETF
| | | |
| | | | Market |
| | | | Value• |
| | Shares | ($000) |
| | BancFirst Corp. | 129 | 8 |
| | LTC Properties Inc. | 187 | 8 |
| | Kinsale Capital Group Inc. | 143 | 8 |
| | Assurant Inc. | 81 | 8 |
| | S&T Bancorp Inc. | 165 | 7 |
| | ServisFirst Bancshares Inc. | 176 | 7 |
| | International Bancshares Corp. | 170 | 7 |
| | Lakeland Bancorp Inc. | 362 | 7 |
| * | SVB Financial Group | 23 | 7 |
| * | Signature Bank | 56 | 7 |
| | Washington Federal Inc. | 219 | 7 |
| | UMB Financial Corp. | 92 | 7 |
| | Cincinnati Financial Corp. | 101 | 7 |
| | MSCI Inc. Class A | 43 | 7 |
| | AMERISAFE Inc. | 117 | 7 |
| * | E*TRADE Financial Corp. | 110 | 7 |
| | TrustCo Bank Corp. NY | 800 | 7 |
| | Torchmark Corp. | 82 | 7 |
| | Hospitality Properties Trust | 240 | 7 |
| | FactSet Research Systems Inc. | 34 | 7 |
| | Nelnet Inc. Class A | 111 | 7 |
| | Great Western Bancorp Inc. | 155 | 7 |
| | Raymond James Financial Inc. | 69 | 7 |
| | TD Ameritrade Holding Corp. | 112 | 7 |
| * | Fair Isaac Corp. | 36 | 7 |
| | Legg Mason Inc. | 176 | 7 |
| | Federal Realty Investment | | |
| | Trust | 54 | 6 |
| * | Eagle Bancorp Inc. | 105 | 6 |
| | First Republic Bank | 61 | 6 |
| | Universal Insurance Holdings | | |
| | Inc. | 170 | 6 |
| | Urstadt Biddle Properties Inc. | | |
| | Class A | 277 | 6 |
| | Capitol Federal Financial Inc. | 451 | 6 |
| | Senior Housing Properties | | |
| | Trust | 335 | 6 |
| | Unum Group | 150 | 6 |
| | Independent Bank Corp. | 74 | 6 |
| | Assured Guaranty Ltd. | 163 | 6 |
| * | TriState Capital Holdings Inc. | 222 | 6 |
| | Provident Financial Services | | |
| | Inc. | 204 | 6 |
| | SL Green Realty Corp. | 58 | 6 |
| | National Western Life Group | | |
| | Inc. Class A | 18 | 6 |
| | Hanmi Financial Corp. | 183 | 5 |
| | Investors Bancorp Inc. | 408 | 5 |
| | Trustmark Corp. | 169 | 5 |
| | Fulton Financial Corp. | 310 | 5 |
| | Columbia Property Trust Inc. | 244 | 5 |
| | FirstCash Inc. | 59 | 5 |
| | WesBanco Inc. | 113 | 5 |
| | Hope Bancorp Inc. | 289 | 5 |
| | | |
| | RLI Corp. | 79 | 5 |
| | Bank of the Ozarks | 109 | 5 |
| | NBT Bancorp Inc. | 136 | 5 |
| | WSFS Financial Corp. | 98 | 5 |
| | Glacier Bancorp Inc. | 130 | 5 |
| | CorEnergy Infrastructure | | |
| | Trust Inc. | 138 | 5 |
| | Beneficial Bancorp Inc. | 292 | 5 |
| | CVB Financial Corp. | 205 | 5 |
| | Evercore Inc. Class A | 45 | 5 |
| | Bank of NT Butterfield & Son | | |
| | Ltd. | 98 | 5 |
| | Cathay General Bancorp | 110 | 5 |
| | Tompkins Financial Corp. | 55 | 5 |
| | Xenia Hotels & Resorts Inc. | 183 | 5 |
| | Hersha Hospitality Trust | | |
| | Class A | 208 | 4 |
| | Selective Insurance Group Inc. | 76 | 4 |
| | LegacyTexas Financial Group | | |
| | Inc. | 100 | 4 |
| | Federated Investors Inc. | | |
| | Class B | 172 | 4 |
| | RE/MAX Holdings Inc. Class A | 80 | 4 |
| | Pebblebrook Hotel Trust | 101 | 4 |
| | TriCo Bancshares | 105 | 4 |
| | City Holding Co. | 55 | 4 |
| | Waddell & Reed Financial Inc. | | |
| | Class A | 201 | 4 |
| | Cohen & Steers Inc. | 99 | 4 |
| | Banco Latinoamericano de | | |
| | Comercio Exterior SA | 133 | 4 |
| | Meridian Bancorp Inc. | 181 | 3 |
| * | HomeStreet Inc. | 129 | 3 |
| | | | 1,530 |
| Health Care (10.1%) | | |
| * | Illumina Inc. | 249 | 68 |
| | Humana Inc. | 224 | 65 |
| * | Biogen Inc. | 208 | 61 |
| | UnitedHealth Group Inc. | 227 | 55 |
| * | Vertex Pharmaceuticals Inc. | 278 | 43 |
| | Cigna Corp. | 139 | 24 |
| * | Intuitive Surgical Inc. | 44 | 20 |
| | Medtronic plc | 227 | 20 |
| * | Veeva Systems Inc. Class A | 251 | 19 |
| | Chemed Corp. | 55 | 18 |
| * | athenahealth Inc. | 107 | 16 |
| * | Boston Scientific Corp. | 499 | 15 |
| * | WellCare Health Plans Inc. | 67 | 15 |
| * | Align Technology Inc. | 44 | 15 |
| * | Inogen Inc. | 71 | 13 |
| | West Pharmaceutical Services | | |
| | Inc. | 125 | 12 |
| * | HealthEquity Inc. | 155 | 11 |
| * | Varian Medical Systems Inc. | 97 | 11 |
77
U.S. Quality Factor ETF
| | | |
| | | | Market |
| | | | Value• |
| | Shares | ($000) |
| | Luminex Corp. | 386 | 11 |
| * | Globus Medical Inc. | 190 | 11 |
| * | Centene Corp. | 90 | 11 |
| | Cantel Medical Corp. | 93 | 10 |
| * | Haemonetics Corp. | 106 | 10 |
| * | Cerner Corp. | 159 | 9 |
| * | Quality Systems Inc. | 537 | 9 |
| | Atrion Corp. | 16 | 9 |
| * | Myriad Genetics Inc. | 249 | 9 |
| | Meridian Bioscience Inc. | 577 | 9 |
| * | K2M Group Holdings Inc. | 357 | 8 |
| * | Genomic Health Inc. | 210 | 8 |
| * | Triple-S Management Corp. | | |
| | Class B | 226 | 8 |
| * | Neogen Corp. | 106 | 8 |
| * | Glaukos Corp. | 211 | 8 |
| * | AngioDynamics Inc. | 374 | 8 |
| | Patterson Cos. Inc. | 368 | 8 |
| * | Henry Schein Inc. | 109 | 8 |
| | CONMED Corp. | 104 | 7 |
| | Agilent Technologies Inc. | 115 | 7 |
| * | Cambrex Corp. | 157 | 7 |
| * | Medpace Holdings Inc. | 158 | 7 |
| * | Momenta Pharmaceuticals Inc. | 282 | 7 |
| * | AMN Healthcare Services Inc. | 113 | 6 |
| | LeMaitre Vascular Inc. | 184 | 6 |
| * | Providence Service Corp. | 86 | 6 |
| * | LHC Group Inc. | 79 | 6 |
| | STERIS plc | 58 | 6 |
| * | Foundation Medicine Inc. | 60 | 6 |
| * | Exelixis Inc. | 276 | 6 |
| * | AtriCure Inc. | 239 | 6 |
| * | Alkermes plc | 120 | 6 |
| * | Amphastar Pharmaceuticals | | |
| | Inc. | 328 | 5 |
| * | Orthofix International NV | 93 | 5 |
| * | Vanda Pharmaceuticals Inc. | 288 | 5 |
| * | Anika Therapeutics Inc. | 124 | 5 |
| * | Amedisys Inc. | 66 | 5 |
| | US Physical Therapy Inc. | 52 | 5 |
| * | Retrophin Inc. | 172 | 5 |
| * | MiMedx Group Inc. | 508 | 4 |
| * | Sangamo Therapeutics Inc. | 252 | 4 |
| * | Cutera Inc. | 97 | 4 |
| * | MyoKardia Inc. | 83 | 4 |
| * | Insys Therapeutics Inc. | 600 | 4 |
| * | Pulse Biosciences Inc. | 201 | 3 |
| * | Calithera Biosciences Inc. | 578 | 3 |
| | | | 813 |
| Materials & Processing (3.9%) | | |
| | Fastenal Co. | 614 | 33 |
| | PPG Industries Inc. | 217 | 22 |
| | Ecolab Inc. | 141 | 20 |
| | Louisiana-Pacific Corp. | 487 | 14 |
| | | |
| | Watsco Inc. | 66 | 12 |
| | Acuity Brands Inc. | 92 | 11 |
| | Chase Corp. | 83 | 10 |
| | Royal Gold Inc. | 109 | 10 |
| | Gold Resource Corp. | 1,557 | 10 |
| | Materion Corp. | 171 | 9 |
| | AptarGroup Inc. | 100 | 9 |
| | Cabot Microelectronics Corp. | 79 | 9 |
| | Reliance Steel & Aluminum Co. | 93 | 9 |
| | Balchem Corp. | 85 | 8 |
| * | Continental Building Products | | |
| | Inc. | 264 | 8 |
| | Quaker Chemical Corp. | 50 | 8 |
| | Stepan Co. | 104 | 8 |
| | Simpson Manufacturing Co. | | |
| | Inc. | 119 | 8 |
| | Comfort Systems USA Inc. | 154 | 7 |
| | Westlake Chemical Corp. | 62 | 7 |
| | AAON Inc. | 230 | 7 |
| | Interface Inc. Class A | 284 | 6 |
| * | RBC Bearings Inc. | 51 | 6 |
| | Greif Inc. Class A | 109 | 6 |
| * | GCP Applied Technologies Inc. | 197 | 6 |
| | Caesarstone Ltd. | 391 | 6 |
| | Packaging Corp. of America | 52 | 6 |
| | Tahoe Resources Inc. | 1,142 | 6 |
| | Newmont Mining Corp. | 145 | 6 |
| * | Armstrong Flooring Inc. | 416 | 5 |
| * | Verso Corp. | 242 | 5 |
| | Boise Cascade Co. | 96 | 5 |
| | Insteel Industries Inc. | 139 | 4 |
| | Neenah Inc. | 44 | 4 |
| | | | 310 |
| Producer Durables (11.9%) | | |
| | Accenture plc Class A | 318 | 50 |
| | Raytheon Co. | 215 | 45 |
| | Delta Air Lines Inc. | 710 | 38 |
| | Johnson Controls | | |
| | International plc | 975 | 33 |
| | Systemax Inc. | 924 | 31 |
| | Terex Corp. | 718 | 28 |
| | Cummins Inc. | 157 | 22 |
| | General Dynamics Corp. | 99 | 20 |
| | Boeing Co. | 50 | 18 |
| | Robert Half International Inc. | 266 | 17 |
| | Old Dominion Freight Line Inc. | 98 | 15 |
| * | HD Supply Holdings Inc. | 358 | 15 |
| | Rollins Inc. | 291 | 14 |
| | WW Grainger Inc. | 46 | 14 |
| | MAXIMUS Inc. | 221 | 13 |
| | Landstar System Inc. | 118 | 13 |
| | EMCOR Group Inc. | 172 | 13 |
| | IDEX Corp. | 94 | 13 |
| | Paychex Inc. | 188 | 12 |
78
U.S. Quality Factor ETF
| | | |
| | | | Market |
| | | | Value• |
| | Shares | ($000) |
| * | CoStar Group Inc. | 32 | 12 |
| | National Instruments Corp. | 284 | 12 |
| | Insperity Inc. | 120 | 11 |
| | Expeditors International of | | |
| | Washington Inc. | 147 | 11 |
| | Toro Co. | 186 | 11 |
| * | TriNet Group Inc. | 200 | 11 |
| | Deluxe Corp. | 155 | 10 |
| | MSC Industrial Direct Co. Inc. | | |
| | Class A | 109 | 10 |
| | Textron Inc. | 150 | 10 |
| | ICF International Inc. | 135 | 10 |
| | McGrath RentCorp | 143 | 9 |
| | JB Hunt Transport Services | | |
| | Inc. | 72 | 9 |
| * | JetBlue Airways Corp. | 476 | 9 |
| | Xylem Inc. | 127 | 9 |
| | Convergys Corp. | 376 | 9 |
| | UniFirst Corp. | 50 | 9 |
| * | Trimble Inc. | 266 | 9 |
| | Hillenbrand Inc. | 185 | 9 |
| | Dover Corp. | 106 | 8 |
| | Alaska Air Group Inc. | 132 | 8 |
| * | Copart Inc. | 143 | 8 |
| | AO Smith Corp. | 124 | 8 |
| | Graco Inc. | 172 | 8 |
| | Pentair plc | 177 | 8 |
| * | FARO Technologies Inc. | 142 | 8 |
| | Primoris Services Corp. | 292 | 8 |
| | Werner Enterprises Inc. | 192 | 8 |
| | Barrett Business Services Inc. | 87 | 7 |
| * | Harsco Corp. | 303 | 7 |
| | Marten Transport Ltd. | 321 | 7 |
| * | ASGN Inc. | 95 | 7 |
| * | ExlService Holdings Inc. | 128 | 7 |
| | Forward Air Corp. | 122 | 7 |
| * | Proto Labs Inc. | 60 | 7 |
| * | Sykes Enterprises Inc. | 257 | 7 |
| | Exponent Inc. | 72 | 7 |
| | Badger Meter Inc. | 161 | 7 |
| | Huntington Ingalls Industries | | |
| | Inc. | 31 | 7 |
| | Heidrick & Struggles | | |
| | International Inc. | 179 | 7 |
| * | Control4 Corp. | 266 | 7 |
| * | Casella Waste Systems Inc. | | |
| | Class A | 277 | 7 |
| | Essendant Inc. | 449 | 6 |
| | Allison Transmission Holdings | | |
| | Inc. | 152 | 6 |
| | Snap-on Inc. | 42 | 6 |
| * | Echo Global Logistics Inc. | 223 | 6 |
| * | Middleby Corp. | 62 | 6 |
| * | Covenant Transportation | | |
| | Group Inc. Class A | 205 | 6 |
| | | |
| | H&E Equipment Services Inc. | 176 | 6 |
| | Astec Industries Inc. | 103 | 6 |
| | Stanley Black & Decker Inc. | 43 | 6 |
| | FLIR Systems Inc. | 111 | 6 |
| | Brady Corp. Class A | 152 | 6 |
| | Herman Miller Inc. | 178 | 6 |
| * | SP Plus Corp. | 160 | 6 |
| | ManpowerGroup Inc. | 63 | 6 |
| | Steelcase Inc. Class A | 393 | 6 |
| | Kaman Corp. | 79 | 6 |
| | Heartland Express Inc. | 289 | 5 |
| * | Saia Inc. | 65 | 5 |
| | Korn/Ferry International | 97 | 5 |
| * | Dycom Industries Inc. | 55 | 5 |
| | Knoll Inc. | 253 | 5 |
| * | Advanced Energy Industries | | |
| | Inc. | 77 | 5 |
| | Raven Industries Inc. | 130 | 5 |
| | Ryder System Inc. | 69 | 5 |
| * | Team Inc. | 213 | 5 |
| | Encore Wire Corp. | 93 | 4 |
| | Hyster-Yale Materials Handling | |
| | Inc. | 61 | 4 |
| * | TrueBlue Inc. | 149 | 4 |
| | Argan Inc. | 94 | 4 |
| | Briggs & Stratton Corp. | 196 | 4 |
| | HNI Corp. | 97 | 4 |
| | Granite Construction Inc. | 63 | 4 |
| * | Titan Machinery Inc. | 194 | 4 |
| | Sun Hydraulics Corp. | 69 | 3 |
| | Alamo Group Inc. | 37 | 3 |
| * | WageWorks Inc. | 65 | 3 |
| | Kelly Services Inc. Class A | 134 | 3 |
| | | | 959 |
| Technology (22.2%) | | |
| * | Adobe Systems Inc. | 297 | 74 |
| | Intuit Inc. | 339 | 68 |
| | Applied Materials Inc. | 1,272 | 65 |
| * | salesforce.com Inc. | 493 | 64 |
| | Texas Instruments Inc. | 561 | 63 |
| | Intel Corp. | 1,083 | 60 |
| * | Alphabet Inc. Class A | 52 | 57 |
| | HP Inc. | 2,582 | 57 |
| * | Facebook Inc. Class A | 292 | 56 |
| | Activision Blizzard Inc. | 719 | 51 |
| | NVIDIA Corp. | 195 | 49 |
| | Cognizant Technology | | |
| | Solutions Corp. Class A | 582 | 44 |
| * | Electronic Arts Inc. | 280 | 37 |
| | Apple Inc. | 186 | 35 |
| | Lam Research Corp. | 169 | 33 |
| * | Ubiquiti Networks Inc. | 397 | 33 |
| | Pegasystems Inc. | 295 | 18 |
| * | Red Hat Inc. | 110 | 18 |
79
U.S. Quality Factor ETF
| | | |
| | | | Market |
| | | | Value• |
| | Shares | ($000) |
| * | F5 Networks Inc. | 101 | 17 |
| * | Fortinet Inc. | 283 | 17 |
| * | VMware Inc. Class A | 119 | 16 |
| * | Silicon Laboratories Inc. | 139 | 15 |
| * | Manhattan Associates Inc. | 336 | 15 |
| * | ANSYS Inc. | 88 | 14 |
| | Blackbaud Inc. | 145 | 14 |
| * | Tyler Technologies Inc. | 61 | 14 |
| * | LivePerson Inc. | 722 | 14 |
| * | Splunk Inc. | 122 | 14 |
| * | Akamai Technologies Inc. | 175 | 13 |
| * | New Relic Inc. | 127 | 13 |
| * | Appfolio Inc. | 216 | 13 |
| | Amdocs Ltd. | 186 | 13 |
| * | EPAM Systems Inc. | 99 | 12 |
| | Skyworks Solutions Inc. | 122 | 12 |
| * | Synopsys Inc. | 136 | 12 |
| * | Glu Mobile Inc. | 2,085 | 12 |
| * | Nutanix Inc. | 212 | 11 |
| * | Arista Networks Inc. | 45 | 11 |
| | MKS Instruments Inc. | 99 | 11 |
| * | Atlassian Corp. plc Class A | 174 | 11 |
| * | PTC Inc. | 127 | 11 |
| * | SPS Commerce Inc. | 147 | 11 |
| * | Zendesk Inc. | 195 | 11 |
| * | Workday Inc. Class A | 83 | 11 |
| | NetApp Inc. | 159 | 11 |
| * | RingCentral Inc. Class A | 143 | 11 |
| * | Ellie Mae Inc. | 101 | 11 |
| | Harris Corp. | 71 | 11 |
| | Xilinx Inc. | 156 | 11 |
| * | Cadence Design Systems Inc. | 249 | 11 |
| | Entegris Inc. | 300 | 11 |
| * | Coherent Inc. | 62 | 10 |
| * | ePlus Inc. | 113 | 10 |
| * | Qualys Inc. | 133 | 10 |
| * | VASCO Data Security | | |
| | International Inc. | 469 | 10 |
| * | Q2 Holdings Inc. | 177 | 10 |
| | Maxim Integrated Products | | |
| | Inc. | 169 | 10 |
| | Jabil Inc. | 350 | 10 |
| * | Rudolph Technologies Inc. | 293 | 10 |
| * | Workiva Inc. | 371 | 10 |
| | NIC Inc. | 627 | 10 |
| * | Palo Alto Networks Inc. | 46 | 10 |
| * | Cree Inc. | 204 | 9 |
| * | IPG Photonics Corp. | 39 | 9 |
| * | Everbridge Inc. | 203 | 9 |
| * | Yelp Inc. Class A | 217 | 9 |
| * | Rapid7 Inc. | 291 | 9 |
| * | Ultimate Software Group Inc. | 35 | 9 |
| | Teradyne Inc. | 239 | 9 |
| * | Qorvo Inc. | 111 | 9 |
| | | |
| * | GrubHub Inc. | 81 | 9 |
| * | Varonis Systems Inc. | 111 | 9 |
| * | Pure Storage Inc. Class A | 401 | 9 |
| * | Blackline Inc. | 201 | 8 |
| * | Twitter Inc. | 238 | 8 |
| * | Hortonworks Inc. | 463 | 8 |
| | Dolby Laboratories Inc. | | |
| | Class A | 127 | 8 |
| * | VeriSign Inc. | 61 | 8 |
| | Monolithic Power Systems | | |
| | Inc. | 59 | 8 |
| * | Diodes Inc. | 222 | 8 |
| * | Teradata Corp. | 188 | 7 |
| * | Perficient Inc. | 286 | 7 |
| * | Coupa Software Inc. | 137 | 7 |
| * | Harmonic Inc. | 1,844 | 7 |
| * | Virtusa Corp. | 145 | 7 |
| * | Amkor Technology Inc. | 763 | 7 |
| * | Acxiom Corp. | 236 | 7 |
| | Comtech Telecommunications | | |
| | Corp. | 220 | 7 |
| * | TrueCar Inc. | 696 | 7 |
| * | Imperva Inc. | 139 | 7 |
| * | Groupon Inc. Class A | 1,364 | 7 |
| * | TTM Technologies Inc. | 360 | 6 |
| | Juniper Networks Inc. | 238 | 6 |
| * | NetScout Systems Inc. | 230 | 6 |
| * | Cirrus Logic Inc. | 165 | 6 |
| * | Mitek Systems Inc. | 697 | 6 |
| * | CACI International Inc. Class A | 36 | 6 |
| * | MINDBODY Inc. Class A | 151 | 6 |
| * | CommVault Systems Inc. | 86 | 6 |
| * | Photronics Inc. | 671 | 6 |
| * | MicroStrategy Inc. Class A | 45 | 6 |
| | Power Integrations Inc. | 77 | 6 |
| * | A10 Networks Inc. | 843 | 5 |
| | Progress Software Corp. | 141 | 5 |
| * | Synchronoss Technologies Inc. | 920 | 5 |
| | Monotype Imaging Holdings | | |
| | Inc. | 239 | 5 |
| * | Infinera Corp. | 586 | 5 |
| * | Box Inc. | 197 | 5 |
| * | HubSpot Inc. | 41 | 5 |
| * | FormFactor Inc. | 339 | 5 |
| * | Limelight Networks Inc. | 932 | 5 |
| | Vishay Intertechnology Inc. | 207 | 4 |
| * | Tucows Inc. Class A | 69 | 4 |
| * | Ambarella Inc. | 88 | 4 |
| * | CEVA Inc. | 124 | 4 |
| * | Vocera Communications Inc. | 142 | 4 |
| * | NETGEAR Inc. | 63 | 4 |
| * | CalAmp Corp. | 178 | 4 |
| | Benchmark Electronics Inc. | 136 | 4 |
| | | | 1,782 |
80
U.S. Quality Factor ETF
| | | |
| | | | Market |
| | | | Value• |
| | Shares | ($000) |
| Utilities (0.8%) | | |
| | MDU Resources Group Inc. | 360 | 10 |
| | j2 Global Inc. | 110 | 9 |
| | Hawaiian Electric Industries | | |
| | Inc. | 248 | 9 |
| * | Vonage Holdings Corp. | 680 | 8 |
| * | Boingo Wireless Inc. | 294 | 6 |
| * | 8x8 Inc. | 338 | 6 |
| * | United States Cellular Corp. | 155 | 6 |
| | Telephone & Data Systems | | |
| | Inc. | 211 | 5 |
| | American States Water Co. | 91 | 5 |
| | | | 64 |
| Total Common Stocks | | |
| (Cost $7,506) | | 7,998 |
| Temporary Cash Investment (0.4%) | |
| Money Market Fund (0.4%) | | |
| 1 | Vanguard Market Liquidity Fund, | | |
| | 1.961% (Cost $31) | 312 | 31 |
| Total Investments (99.9%) | | |
| (Cost $7,537) | | 8,029 |
| |
| | | | Amount |
| | | | ($000) |
| Other Assets and Liabilities (0.1%) | |
| Other Assets | | |
| Investment in Vanguard | | 1 |
| Receivables for Accrued Income | | 9 |
| Total Other Assets | | 10 |
| Liabilities | | |
| Payables to Vanguard | | (1) |
| Total Liabilities | | (1) |
| Net Assets (100%) | | |
| Applicable to 100,000 outstanding | |
| $.001 par value shares of beneficial | |
| interest (unlimited authorization) | | 8,038 |
| Net Asset Value Per Share | | $80.38 |
| |
| At May 31, 2018, net assets consisted of: | |
| | Amount |
| | ($000) |
| Paid-in Capital | 7,500 |
| Undistributed Net Investment Income | 32 |
| Accumulated Net Realized Gains | 14 |
| Unrealized Appreciation (Depreciation) | 492 |
| Net Assets | 8,038 |
• See Note A in Notes to Financial Statements.
* Non-income-producing security.
1 Affiliated money market fund available only to Vanguard funds
and certain trusts and accounts managed by Vanguard. Rate
shown is the 7-day yield.
See accompanying Notes, which are an integral part of the Financial Statements.
81
U.S. Quality Factor ETF
Statement of Operations
| |
| | February13,20181 to |
| | May 31, 2018 |
| | ($000) |
| Investment Income | |
| Income | |
| Dividends | 34 |
| Interest 2 | 1 |
| Total Income | 35 |
| Expenses | |
| The Vanguard Group—Note B | |
| Management and Administrative | — |
| Marketing and Distribution | — |
| Custodian Fees | 2 |
| Shareholders’ Reports | 1 |
| Total Expenses | 3 |
| Net Investment Income | 32 |
| Realized Net Gain (Loss) on Investment Securities Sold2 | 14 |
| Change in Unrealized Appreciation (Depreciation) of Investment Securities2 | 492 |
| Net Increase (Decrease) in Net Assets Resulting from Operations | 538 |
1 Inception.
2 Interest income, realized net gain (loss), and change in unrealized appreciation (depreciation) from an affiliated company of the fund
were each less than $1,000. Purchases and sales are for temporary cash investment purposes.
See accompanying Notes, which are an integral part of the Financial Statements.
82
U.S. Quality Factor ETF
Statement of Changes in Net Assets
| |
| | February13,20181 to |
| | May 31, 2018 |
| | ($000) |
| Increase (Decrease) in Net Assets | |
| Operations | |
| Net Investment Income | 32 |
| Realized Net Gain (Loss) | 14 |
| Change in Unrealized Appreciation (Depreciation) | 492 |
| Net Increase (Decrease) in Net Assets Resulting from Operations | 538 |
| Distributions | |
| Net Investment Income | — |
| Realized Capital Gain | — |
| Total Distributions | — |
| Capital Share Transactions | |
| Issued | 7,500 |
| Issued in Lieu of Cash Distributions | — |
| Redeemed | — |
| Net Increase (Decrease) from Capital Share Transactions | 7,500 |
| Total Increase (Decrease) | 8,038 |
| Net Assets | |
| Beginning of Period | — |
| End of Period2 | 8,038 |
| 1 Inception. |
| 2 Net Assets—End of Period includes undistributed (overdistributed) net investment income of $32,000. |
See accompanying Notes, which are an integral part of the Financial Statements.
83
U.S. Quality Factor ETF
Financial Highlights
| |
| | February 13, 20181 to |
| For a Share Outstanding Throughout the Period | May 31, 2018 |
| Net Asset Value, Beginning of Period | $75.00 |
| Investment Operations | |
| Net Investment Income2 | .317 |
| Net Realized and Unrealized Gain (Loss) on Investments | 5.063 |
| Total from Investment Operations | 5.380 |
| Distributions | |
| Dividends from Net Investment Income | — |
| Distributions from Realized Capital Gains | — |
| Total Distributions | — |
| Net Asset Value, End of Period | $80.38 |
| |
| Total Return | 7.17% |
| |
| Ratios/Supplemental Data | |
| Net Assets, End of Period (Millions) | $8 |
| Ratio of Total Expenses to Average Net Assets | 0.13%3 |
| Ratio of Net Investment Income to Average Net Assets | 1.36%3 |
| Portfolio Turnover Rate | 35%3 |
| 1 Inception. |
| 2 Calculated based on average shares outstanding. |
| 3 Annualized. |
See accompanying Notes, which are an integral part of the Financial Statements.
84
U.S. Quality Factor ETF
Notes to Financial Statements
Vanguard U.S. Quality Factor ETF is registered under the Investment Company Act of 1940 as an open-end investment company, or mutual fund. ETF Shares are listed for trading on Cboe BZX Exchange; they can be purchased and sold through a broker.
A. The following significant accounting policies conform to generally accepted accounting principles for U.S. investment companies. The fund consistently follows such policies in preparing its financial statements.
1. Security Valuation: Securities are valued as of the close of trading on the New York Stock Exchange (generally 4 p.m., Eastern time) on the valuation date. Equity securities are valued at the latest quoted sales prices or official closing prices taken from the primary market in which each security trades; such securities not traded on the valuation date are valued at the mean of the latest quoted bid and asked prices. Securities for which market quotations are not readily available, or whose values have been materially affected by events occurring before the fund’s pricing time but after the close of the securities’ primary markets, are valued by methods deemed by the board of trustees to represent fair value. Investments in Vanguard Market Liquidity Fund are valued at that fund’s net asset value.
2. Federal Income Taxes: The fund intends to qualify as a regulated investment company and distribute all of its taxable income. Management has analyzed the fund’s tax positions taken for the period ended May 31, 2018, and has concluded that no provision for federal income tax is required in the fund’s financial statements.
3. Distributions: Distributions to shareholders are recorded on the ex-dividend date.
4. Other: Dividend income is recorded on the ex-dividend date. Interest income includes income distributions received from Vanguard Market Liquidity Fund and is accrued daily. Security transactions are accounted for on the date securities are bought or sold. Costs used to determine realized gains (losses) on the sale of investment securities are those of the specific securities sold.
B. In accordance with the terms of a Funds’ Service Agreement (the “FSA”) between Vanguard and the fund, Vanguard furnishes to the fund investment advisory, corporate management, administrative, marketing, and distribution services at Vanguard’s cost of operations (as defined by the FSA). These costs of operations are allocated to the fund based on methods and guidelines approved by the board of trustees, and generally settled twice a month.
Upon the request of Vanguard, the fund may invest up to 0.40% of its net assets as capital in Vanguard. At May 31, 2018, the fund had contributed to Vanguard capital in the amount of $1,000, representing 0.01% of the fund’s net assets and 0.00% of Vanguard’s capitalization. The fund’s trustees and officers are also directors and employees, respectively, of Vanguard.
C. Various inputs may be used to determine the value of the fund’s investments. These inputs are summarized in three broad levels for financial statement purposes. The inputs or methodologies used to value securities are not necessarily an indication of the risk associated with investing in those securities.
Level 1—Quoted prices in active markets for identical securities.
Level 2—Other significant observable inputs (including quoted prices for similar securities, interest rates, prepayment speeds, credit risk, etc.).
Level 3—Significant unobservable inputs (including the fund’s own assumptions used to determine
the fair value of investments). Any investments valued with significant unobservable inputs are
noted on the Statement of Net Assets.
85
U.S. Quality Factor ETF
At May 31, 2018, 100% of the market value of the fund’s investments was determined based on Level 1 inputs.
D. Distributions are determined on a tax basis and may differ from net investment income and realized capital gains for financial reporting purposes. Differences may be permanent or temporary. Permanent differences are reclassified among capital accounts in the financial statements to reflect their tax character. Temporary differences arise when certain items of income, expense, gain, or loss are recognized in different periods for financial statement and tax purposes. These differences will reverse at some time in the future. Differences in classification may also result from the treatment of short-term gains as ordinary income for tax purposes. The fund’s tax-basis capital gains and losses are determined only at the end of each fiscal year.
At May 31, 2018, the cost of investment securities for tax purposes was $7,537,000. Net unrealized appreciation of investment securities for tax purposes was $492,000, consisting of unrealized gains of $711,000 on securities that had risen in value since their purchase and $219,000 in unrealized losses on securities that had fallen in value since their purchase.
E. During the period ended May 31, 2018, the fund purchased $8,575,000 of investment securities and sold $1,084,000 of investment securities, other than temporary cash investments.
F. Capital shares issued and redeemed were:
| |
| | February 13, 20181 to |
| | May 31, 2018 |
| | Shares |
| | (000) |
| Issued | 100 |
| Issued in Lieu of Cash Distributions | — |
| Redeemed | — |
| Net Increase (Decrease) in Shares Outstanding | 100 |
| 1 Inception. |
G. Management has determined that no events or transactions occurred subsequent to May 31, 2018, that would require recognition or disclosure in these financial statements.
86
U.S. Value Factor ETF
Fund Profile
As of May 31, 2018
| | |
| Portfolio Characteristics | | |
| | | Russell |
| | | 3000 |
| | Fund | Index |
| Number of Stocks | 773 | 2,941 |
| Median Market Cap | $5.7B | $66.7B |
| Price/Earnings Ratio | 11.4x | 20.8x |
| Price/Book Ratio | 1.4x | 3.0x |
| Return on Equity | 9.7% | 15.0% |
| Earnings Growth | | |
| Rate | 9.4% | 7.9% |
| Dividend Yield | 1.9% | 1.8% |
| Foreign Holdings | 0.6% | 0.0% |
| Turnover Rate | | |
| (Annualized) | 19% | — |
| Ticker Symbol | VFVA | — |
| Expense Ratio1 | 0.13% | — |
| 30-Day SEC Yield | 1.79% | — |
| Short-Term Reserves | 0.1% | — |
| | |
| Sector Diversification (% of equity exposure) |
| | | Russell |
| | | 3000 |
| | Fund | Index |
| Consumer Discretionary | 18.9% | 14.3% |
| Consumer Staples | 4.8 | 5.3 |
| Energy | 7.0 | 6.0 |
| Financial Services | 26.3 | 21.1 |
| Health Care | 6.2 | 13.2 |
| Materials & Processing | 8.0 | 3.8 |
| Other | 0.5 | 0.0 |
| Producer Durables | 12.3 | 10.8 |
| Technology | 8.0 | 21.0 |
| Utilities | 8.0 | 4.5 |
Sector categories are based on the Russell Global Sectors (“RGS”),
except for the “Other” category (if applicable), which includes
securities that have not been provided a RGS classification as of
the effective reporting period.
| | |
| Ten Largest Holdings (% of total net assets) |
| General Motors Co. | Automobiles | 0.8% |
| Micron Technology Inc. | Semiconductors & | |
| | Components | 0.7 |
| Ford Motor Co. | Automobiles | 0.7 |
| PG&E Corp. | Utilities: Electrical | 0.7 |
| Duke Energy Corp. | Utilities: Electrical | 0.7 |
| Johnson Controls | Scientific | |
| International plc | Instruments: Control | |
| | & Filter | 0.7 |
| Exelon Corp. | Utilities: Electrical | 0.7 |
| AT&T Inc. | Utilities: | |
| | Telecommunications | 0.7 |
| Delta Air Lines Inc. | Air Transport | 0.7 |
| Wells Fargo & Co. | Banks: Diversified | 0.7 |
| Top Ten | | 7.1% |
| The holdings listed exclude any temporary cash investments and equity index products. |
1 The expense ratio shown is from the prospectus dated February 13, 2018, and represents estimated costs for the current fiscal year. For
the period from inception through May 31, 2018, the annualized expense ratio was 0.13%.
87
U.S. Value Factor ETF
Performance Summary
All of the returns in this report represent past performance, which is not a guarantee of future results that may be achieved by the fund. (Current performance may be lower or higher than the performance data cited. For performance data current to the most recent month-end, visit our website at vanguard.com/performance.) Note, too, that both investment returns and principal value can fluctuate widely, so an investor’s shares, when sold, could be worth more or less than their original cost. The returns shown do not reflect taxes that a shareholder would pay on fund distributions or on the sale of fund shares.
Fiscal-Period Total Returns (%): February 13, 2018, Through May 31, 2018

Total Returns: Period Ended March 31, 2018
This table presents returns through the latest calendar quarter—rather than through the end of the fiscal period.
Securities and Exchange Commission rules require that we provide this information.
| | |
| | Inception | Since |
| | Date | Inception |
| ETF Shares | 2/13/2018 | |
| Market Price | | 1.25% |
| Net Asset Value | | 1.20 |
See Financial Highlights for dividend and capital gains information.
88
U.S. Value Factor ETF
Financial Statements (unaudited)
Statement of Net Assets
As of May 31, 2018
The fund reports a complete list of its holdings in regulatory filings four times in each fiscal year, at the quarter-ends. For the second and fourth fiscal quarters, the lists appear in the fund’s semiannual and annual reports to shareholders. For the first and third fiscal quarters, the fund files the lists with the Securities and Exchange Commission on Form N-Q. Shareholders can look up the fund’s Forms N-Q on the SEC’s website at sec.gov. Forms N-Q may also be reviewed and copied at the SEC’s Public Reference Room (see the back cover of this report for further information).
| | | |
| | | | Market |
| | | | Value• |
| | | Shares | ($000) |
| Common Stocks (99.3%)1 | | |
| Consumer Discretionary (18.8%) | |
| | General Motors Co. | 4,330 | 185 |
| | Ford Motor Co. | 14,450 | 167 |
| | Carnival Corp. | 2,190 | 136 |
| | Comcast Corp. Class A | 4,188 | 131 |
| | Target Corp. | 1,276 | 93 |
| | L Brands Inc. | 2,499 | 85 |
| | Foot Locker Inc. | 1,538 | 83 |
| | H&R Block Inc. | 2,890 | 79 |
| | Haverty Furniture Cos. Inc. | 3,926 | 79 |
| * | Motorcar Parts of America | | |
| | Inc. | 3,457 | 74 |
| * | El Pollo Loco Holdings Inc. | 6,993 | 74 |
| * | Del Taco Restaurants Inc. | 6,023 | 72 |
| * | American Axle & | | |
| | Manufacturing Holdings Inc. | 4,583 | 72 |
| * | Liberty Broadband Corp. | 937 | 65 |
| * | WideOpenWest Inc. | 7,261 | 64 |
| | Standard Motor Products Inc. | 1,399 | 63 |
| | Gap Inc. | 2,151 | 60 |
| | Penske Automotive Group | | |
| | Inc. | 1,215 | 58 |
| * | Discovery Communications | | |
| | Inc. Class A | 2,728 | 58 |
| * | ZAGG Inc. | 3,749 | 57 |
| | Viacom Inc. Class B | 2,072 | 56 |
| * | AutoNation Inc. | 1,203 | 55 |
| * | Michaels Cos. Inc. | 2,984 | 55 |
| | Goodyear Tire & Rubber Co. | 2,207 | 54 |
| | Thor Industries Inc. | 578 | 54 |
| | Signet Jewelers Ltd. | 1,237 | 53 |
| | Bed Bath & Beyond Inc. | 2,921 | 53 |
| * | William Lyon Homes Class A | 2,214 | 53 |
| | Whirlpool Corp. | 358 | 52 |
| * | DISH Network Corp. Class A | 1,654 | 49 |
| * | MSG Networks Inc. | 2,500 | 48 |
| | Adient plc | 906 | 48 |
| | | |
| * | Qurate Retail Group Inc. | | |
| | QVC Group Class A | 2,372 | 48 |
| | Lithia Motors Inc. Class A | 487 | 48 |
| | Cooper Tire & Rubber Co. | 1,846 | 47 |
| | International Speedway Corp. | | |
| | Class A | 1,137 | 47 |
| | Tower International Inc. | 1,555 | 46 |
| | Macy’s Inc. | 1,242 | 43 |
| | Toll Brothers Inc. | 994 | 39 |
| | Kohl’s Corp. | 585 | 39 |
| * | AutoZone Inc. | 60 | 39 |
| | PulteGroup Inc. | 1,212 | 37 |
| | National Presto Industries Inc. | 319 | 36 |
| * | Norwegian Cruise Line | | |
| | Holdings Ltd. | 680 | 36 |
| * | J. Jill Inc. | 4,444 | 35 |
| | National CineMedia Inc. | 4,660 | 35 |
| | Royal Caribbean Cruises Ltd. | 303 | 32 |
| * | K12 Inc. | 1,950 | 31 |
| | Dana Inc. | 1,407 | 31 |
| | Tenneco Inc. | 695 | 31 |
| | Lear Corp. | 152 | 30 |
| * | Laureate Education Inc. | | |
| | Class A | 1,799 | 29 |
| * | Helen of Troy Ltd. | 320 | 29 |
| | Dick’s Sporting Goods Inc. | 784 | 29 |
| | Dillard’s Inc. Class A | 348 | 28 |
| | Shoe Carnival Inc. | 871 | 28 |
| * | Sally Beauty Holdings Inc. | 1,723 | 26 |
| | Office Depot Inc. | 10,903 | 26 |
| | Sonic Automotive Inc. | | |
| | Class A | 1,201 | 26 |
| * | Party City Holdco Inc. | 1,733 | 25 |
| | Newell Brands Inc. | 1,066 | 25 |
| | Travelport Worldwide Ltd. | 1,425 | 25 |
| | AMERCO | 77 | 25 |
| | Walmart Inc. | 301 | 25 |
| * | TRI Pointe Group Inc. | 1,426 | 25 |
| | KB Home | 930 | 24 |
| | Aaron’s Inc. | 613 | 24 |
89
U.S. Value Factor ETF
| | | |
| | | | Market |
| | | | Value• |
| | | Shares | ($000) |
| | Brinker International Inc. | 551 | 24 |
| * | Gray Television Inc. | 2,176 | 24 |
| | Graham Holdings Co. Class B | 41 | 24 |
| * | Taylor Morrison Home Corp. | | |
| | Class A | 1,103 | 24 |
| * | Francesca’s Holdings Corp. | 3,980 | 24 |
| | Group 1 Automotive Inc. | 333 | 23 |
| | GameStop Corp. Class A | 1,740 | 23 |
| * | MDC Partners Inc. Class A | 5,382 | 22 |
| * | Horizon Global Corp. | 3,303 | 22 |
| | Sinclair Broadcast Group Inc. | | |
| | Class A | 793 | 22 |
| | Gannett Co. Inc. | 2,043 | 22 |
| | Walt Disney Co. | 216 | 21 |
| * | Hibbett Sports Inc. | 782 | 21 |
| | Marcus Corp. | 652 | 21 |
| | Matthews International Corp. | |
| | Class A | 371 | 20 |
| | Entravision Communications | | |
| | Corp. Class A | 4,979 | 20 |
| * | Express Inc. | 2,320 | 20 |
| * | JC Penney Co. Inc. | 8,156 | 20 |
| | Sonic Corp. | 799 | 19 |
| | Ethan Allen Interiors Inc. | 808 | 19 |
| | Big Lots Inc. | 460 | 19 |
| | AMC Entertainment Holdings | | |
| | Inc. Class A | 1,257 | 19 |
| | Lions Gate Entertainment | | |
| | Corp. Class A | 802 | 19 |
| * | Cooper-Standard Holdings | | |
| | Inc. | 142 | 18 |
| | Chico’s FAS Inc. | 1,988 | 17 |
| | Cato Corp. Class A | 679 | 15 |
| | Ralph Lauren Corp. Class A | 88 | 12 |
| | Big 5 Sporting Goods Corp. | 1,414 | 12 |
| | TEGNA Inc. | 1,007 | 10 |
| * | Liberty Media Corp-Liberty | | |
| | SiriusXM C | 223 | 10 |
| | Movado Group Inc. | 200 | 10 |
| | DSW Inc. Class A | 369 | 9 |
| * | Sportsman’s Warehouse | | |
| | Holdings Inc. | 1,597 | 8 |
| * | RH | 84 | 8 |
| * | Genesco Inc. | 186 | 8 |
| * | Zumiez Inc. | 326 | 8 |
| | BorgWarner Inc. | 162 | 8 |
| | Williams-Sonoma Inc. | 142 | 8 |
| | Citi Trends Inc. | 261 | 8 |
| * | Eastman Kodak Co. | 1,525 | 8 |
| * | Nautilus Inc. | 512 | 8 |
| | Harley-Davidson Inc. | 177 | 7 |
| | Tailored Brands Inc. | 221 | 7 |
| | Gentex Corp. | 298 | 7 |
| | Pier 1 Imports Inc. | 2,982 | 7 |
| | MDC Holdings Inc. | 220 | 7 |
| | | |
| | Caleres Inc. | 192 | 7 |
| | Buckle Inc. | 263 | 7 |
| | Rent-A-Center Inc. | 673 | 6 |
| * | Liberty Expedia Holdings Inc. | | |
| | Class A | 142 | 6 |
| * | Asbury Automotive Group Inc. | 85 | 6 |
| | Extended Stay America Inc. | 269 | 6 |
| | American Eagle Outfitters Inc. | 237 | 5 |
| * | Bridgepoint Education Inc. | | |
| | Class A | 741 | 5 |
| | Meredith Corp. | 100 | 5 |
| * | Vera Bradley Inc. | 430 | 5 |
| | EW Scripps Co. Class A | 379 | 5 |
| | Cinemark Holdings Inc. | 140 | 5 |
| | Abercrombie & Fitch Co. | 190 | 5 |
| | Carriage Services Inc. Class A | 179 | 4 |
| * | Regis Corp. | 260 | 4 |
| | Hyatt Hotels Corp. Class A | 55 | 4 |
| | La-Z-Boy Inc. | 139 | 4 |
| * | Gentherm Inc. | 120 | 4 |
| * | Conn’s Inc. | 181 | 4 |
| | New Media Investment Group | | |
| | Inc. | 247 | 4 |
| * | AMC Networks Inc. Class A | 72 | 4 |
| * | Red Robin Gourmet Burgers | | |
| | Inc. | 80 | 4 |
| * | Habit Restaurants Inc. Class A | 427 | 4 |
| * | Meritage Homes Corp. | 82 | 4 |
| | Hooker Furniture Corp. | 98 | 4 |
| | Nexstar Media Group Inc. | | |
| | Class A | 55 | 4 |
| * | Beazer Homes USA Inc. | 240 | 4 |
| * | Murphy USA Inc. | 52 | 3 |
| * | M/I Homes Inc. | 117 | 3 |
| * | Stoneridge Inc. | 102 | 3 |
| | Nielsen Holdings plc | 100 | 3 |
| | Winnebago Industries Inc. | 83 | 3 |
| * | Meritor Inc. | 139 | 3 |
| | Barnes & Noble Inc. | 484 | 3 |
| * | Iconix Brand Group Inc. | 3,837 | 2 |
| * | Avis Budget Group Inc. | 59 | 2 |
| * | Hertz Global Holdings Inc. | 111 | 2 |
| | | | 4,402 |
| Consumer Staples (4.7%) | | |
| | Kraft Heinz Co. | 2,539 | 146 |
| | CVS Health Corp. | 2,210 | 140 |
| | Walgreens Boots Alliance | | |
| | Inc. | 1,937 | 121 |
| | Kroger Co. | 3,131 | 76 |
| | Tootsie Roll Industries Inc. | 2,241 | 65 |
| | Ingles Markets Inc. Class A | 1,996 | 57 |
| | Tyson Foods Inc. Class A | 793 | 54 |
| | JM Smucker Co. | 487 | 52 |
| | Molson Coors Brewing Co. | | |
| | Class B | 717 | 44 |
90
U.S. Value Factor ETF
| | | |
| | | | Market |
| | | | Value• |
| | | Shares | ($000) |
| | Coca-Cola European | | |
| | Partners plc | 1,001 | 38 |
| * | Post Holdings Inc. | 472 | 36 |
| * | Pilgrim’s Pride Corp. | 1,563 | 31 |
| | Bunge Ltd. | 437 | 30 |
| | Andersons Inc. | 863 | 28 |
| | Weis Markets Inc. | 462 | 25 |
| * | Hostess Brands Inc. Class A | 1,682 | 23 |
| | Dean Foods Co. | 2,310 | 22 |
| * | United Natural Foods Inc. | 458 | 21 |
| | Sanderson Farms Inc. | 206 | 20 |
| | Fresh Del Monte Produce Inc. | 425 | 19 |
| | Mondelez International Inc. | | |
| | Class A | 316 | 13 |
| | Archer-Daniels-Midland Co. | 264 | 12 |
| | SUPERVALU Inc. | 583 | 11 |
| | SpartanNash Co. | 296 | 7 |
| * | US Foods Holding Corp. | 175 | 6 |
| | Universal Corp. | 73 | 5 |
| * | Smart & Final Stores Inc. | 821 | 4 |
| | | | 1,106 |
| Energy (6.9%) | | |
| | Kinder Morgan Inc. | 7,790 | 130 |
| | Marathon Petroleum Corp. | 1,556 | 123 |
| * | Par Pacific Holdings Inc. | 3,762 | 67 |
| | Peabody Energy Corp. | 1,511 | 65 |
| | Phillips 66 | 556 | 65 |
| | Valero Energy Corp. | 498 | 60 |
| | Warrior Met Coal Inc. | 1,991 | 54 |
| * | Chesapeake Energy Corp. | 11,891 | 53 |
| | Range Resources Corp. | 2,642 | 42 |
| * | Antero Resources Corp. | 2,160 | 41 |
| * | Smart Sand Inc. | 6,375 | 39 |
| | Exxon Mobil Corp. | 463 | 38 |
| | Chevron Corp. | 289 | 36 |
| * | Ultra Petroleum Corp. | 18,986 | 34 |
| * | Sunrun Inc. | 2,639 | 32 |
| * | Newfield Exploration Co. | 1,062 | 31 |
| | CNX Resources Corp. | 1,839 | 30 |
| * | Energen Corp. | 438 | 30 |
| | Murphy Oil Corp. | 951 | 29 |
| * | Sanchez Energy Corp. | 7,095 | 28 |
| * | Bonanza Creek Energy Inc. | 738 | 27 |
| * | Gulfport Energy Corp. | 2,412 | 27 |
| * | Resolute Energy Corp. | 746 | 27 |
| * | Southwestern Energy Co. | 5,606 | 26 |
| * | W&T Offshore Inc. | 3,810 | 26 |
| | PBF Energy Inc. Class A | 543 | 26 |
| * | Halcon Resources Corp. | 5,105 | 25 |
| * | Denbury Resources Inc. | 5,728 | 24 |
| | Arch Coal Inc. Class A | 277 | 23 |
| * | SRC Energy Inc. | 1,677 | 22 |
| | HollyFrontier Corp. | 269 | 21 |
| * | Unit Corp. | 943 | 21 |
| | | |
| * | REX American Resources | | |
| | Corp. | 262 | 20 |
| * | Laredo Petroleum Inc. | 2,108 | 20 |
| * | Callon Petroleum Co. | 1,616 | 19 |
| * | SandRidge Energy Inc. | 1,301 | 19 |
| | SM Energy Co. | 717 | 19 |
| * | C&J Energy Services Inc. | 645 | 17 |
| * | Parsley Energy Inc. Class A | 475 | 14 |
| * | WildHorse Resource | | |
| | Development Corp. | 463 | 12 |
| * | Penn Virginia Corp. | 178 | 12 |
| * | PDC Energy Inc. | 194 | 12 |
| | Delek US Holdings Inc. | 189 | 11 |
| * | Oasis Petroleum Inc. | 781 | 10 |
| * | Carrizo Oil & Gas Inc. | 371 | 9 |
| * | Renewable Energy Group Inc. | 493 | 9 |
| * | QEP Resources Inc. | 665 | 8 |
| * | EP Energy Corp. Class A | 2,573 | 7 |
| * | Matrix Service Co. | 363 | 7 |
| | Archrock Inc. | 563 | 6 |
| * | Abraxas Petroleum Corp. | 2,264 | 6 |
| * | Talos Energy Inc. | 181 | 6 |
| * | Rowan Cos. plc Class A | 351 | 5 |
| | Apache Corp. | 135 | 5 |
| * | Noble Corp. plc | 955 | 5 |
| * | Helix Energy Solutions Group | | |
| | Inc. | 696 | 5 |
| | World Fuel Services Corp. | 237 | 5 |
| * | Cloud Peak Energy Inc. | 1,305 | 5 |
| * | Extraction Oil & Gas Inc. | 221 | 4 |
| * | Exterran Corp. | 136 | 4 |
| | Diamondback Energy Inc. | 30 | 4 |
| | McDermott International Inc. | 164 | 4 |
| * | Flotek Industries Inc. | 1,092 | 3 |
| * | Diamond Offshore Drilling Inc. | 161 | 3 |
| | Cimarex Energy Co. | 22 | 2 |
| * | Pacific Ethanol Inc. | 434 | 1 |
| | | | 1,620 |
| Financial Services (26.1%) | | |
| | Wells Fargo & Co. | 2,917 | 157 |
| | Citigroup Inc. | 2,321 | 155 |
| | Morgan Stanley | 3,084 | 155 |
| | Bank of America Corp. | 5,139 | 149 |
| | Capital One Financial Corp. | 1,493 | 140 |
| | Prudential Financial Inc. | 1,422 | 138 |
| | Allstate Corp. | 1,459 | 136 |
| | MetLife Inc. | 2,948 | 136 |
| | American International | | |
| | Group Inc. | 2,563 | 135 |
| | Travelers Cos. Inc. | 1,044 | 134 |
| | Chubb Ltd. | 1,004 | 131 |
| | Goldman Sachs Group Inc. | 544 | 123 |
| | Aflac Inc. | 2,301 | 104 |
| | Santander Consumer USA | | |
| | Holdings Inc. | 4,454 | 80 |
91
U.S. Value Factor ETF
| | | |
| | | | Market |
| | | | Value• |
| | Shares | ($000) |
| | Lincoln National Corp. | 1,171 | 78 |
| | Pinnacle Financial Partners | | |
| | Inc. | 1,151 | 77 |
| | Assured Guaranty Ltd. | 2,161 | 77 |
| | Franklin Resources Inc. | 2,220 | 74 |
| | CNA Financial Corp. | 1,566 | 74 |
| | Regions Financial Corp. | 4,019 | 73 |
| | Sterling Bancorp | 2,810 | 69 |
| | Legg Mason Inc. | 1,834 | 68 |
| | Radian Group Inc. | 3,893 | 62 |
| | Ally Financial Inc. | 2,406 | 62 |
| | Oritani Financial Corp. | 3,822 | 61 |
| | Navient Corp. | 4,188 | 58 |
| * | MGIC Investment Corp. | 5,544 | 58 |
| | JPMorgan Chase & Co. | 535 | 57 |
| | SunTrust Banks Inc. | 823 | 56 |
| | Bank of New York Mellon | | |
| | Corp. | 1,010 | 55 |
| | BankUnited Inc. | 1,311 | 55 |
| | ConnectOne Bancorp Inc. | 2,023 | 53 |
| | BB&T Corp. | 1,009 | 53 |
| | CNO Financial Group Inc. | 2,582 | 52 |
| | United Bankshares Inc. | 1,406 | 51 |
| * | iStar Inc. | 4,592 | 50 |
| | CIT Group Inc. | 962 | 48 |
| * | Athene Holding Ltd. Class A | 1,065 | 48 |
| | Jernigan Capital Inc. | 2,374 | 47 |
| | First American Financial Corp. | 900 | 47 |
| | Realogy Holdings Corp. | 1,958 | 47 |
| | Cathay General Bancorp | 1,099 | 46 |
| * | MoneyGram International | | |
| | Inc. | 6,724 | 45 |
| | Unum Group | 1,140 | 44 |
| | FNB Corp. | 3,328 | 44 |
| | IBERIABANK Corp. | 514 | 41 |
| | First Hawaiian Inc. | 1,266 | 37 |
| | Synchrony Financial | 1,067 | 37 |
| | Citizens Financial Group Inc. | 904 | 37 |
| * | Customers Bancorp Inc. | 1,214 | 37 |
| | Everest Re Group Ltd. | 161 | 36 |
| | PacWest Bancorp | 677 | 36 |
| | Hancock Whitney Corp. | 709 | 36 |
| | Popular Inc. | 783 | 35 |
| | KeyCorp | 1,817 | 35 |
| | Hilltop Holdings Inc. | 1,489 | 35 |
| | Voya Financial Inc. | 667 | 35 |
| | Assurant Inc. | 369 | 34 |
| | Invesco Ltd. | 1,258 | 34 |
| | Bank of the Ozarks | 719 | 34 |
| | Reinsurance Group of | | |
| | America Inc. Class A | 228 | 34 |
| | Old Republic International | | |
| | Corp. | 1,619 | 34 |
| | | |
| | Hartford Financial Services | | |
| | Group Inc. | 644 | 34 |
| * | HomeStreet Inc. | 1,253 | 34 |
| * | HRG Group Inc. | 2,644 | 34 |
| | First Horizon National Corp. | 1,807 | 33 |
| | New York Community | | |
| | Bancorp Inc. | 2,878 | 33 |
| * | Essent Group Ltd. | 967 | 33 |
| | Axis Capital Holdings Ltd. | 583 | 33 |
| | Valley National Bancorp | 2,588 | 33 |
| | Banco Latinoamericano de | | |
| | Comercio Exterior SA | 1,230 | 33 |
| | Fifth Third Bancorp | 1,071 | 33 |
| | Principal Financial Group Inc. | 583 | 33 |
| * | Arch Capital Group Ltd. | 411 | 32 |
| | American National Insurance | | |
| | Co. | 270 | 32 |
| * | PennyMac Financial Services | | |
| | Inc. Class A | 1,592 | 32 |
| | RenaissanceRe Holdings Ltd. | 256 | 31 |
| | Simmons First National Corp. | | |
| | Class A | 947 | 30 |
| | Stifel Financial Corp. | 510 | 30 |
| | Medical Properties Trust Inc. | 2,192 | 30 |
| | Loews Corp. | 587 | 29 |
| | Peapack Gladstone Financial | | |
| | Corp. | 810 | 28 |
| | Maiden Holdings Ltd. | 3,166 | 28 |
| | American Equity Investment | | |
| | Life Holding Co. | 775 | 27 |
| | Midland States Bancorp Inc. | 846 | 27 |
| | PNC Financial Services Group | | |
| | Inc. | 167 | 24 |
| * | Ambac Financial Group Inc. | 1,290 | 24 |
| | Arlington Asset Investment | | |
| | Corp. Class A | 2,052 | 23 |
| | State Street Corp. | 242 | 23 |
| * | Third Point Reinsurance Ltd. | 1,693 | 23 |
| * | Cowen Inc. Class A | 1,494 | 22 |
| | Nelnet Inc. Class A | 355 | 22 |
| | US Bancorp | 431 | 22 |
| | Heritage Insurance Holdings | | |
| | Inc. | 1,271 | 21 |
| | Aspen Insurance Holdings | | |
| | Ltd. | 492 | 21 |
| | GAIN Capital Holdings Inc. | 2,582 | 21 |
| | OFG Bancorp | 1,486 | 21 |
| | National Western Life Group | | |
| | Inc. Class A | 65 | 20 |
| * | First BanCorp | 2,551 | 20 |
| | Global Net Lease Inc. | 968 | 19 |
| | Sabra Health Care REIT Inc. | 919 | 19 |
| | Dime Community | | |
| | Bancshares Inc. | 904 | 18 |
92
U.S. Value Factor ETF
| | | | |
| | | | | Market |
| | | | | Value• |
| | | Shares | ($000) |
| * | EZCORP Inc. Class A | 1,459 | 18 |
| | First Interstate BancSystem | | |
| | Inc. Class A | | 407 | 18 |
| | United Financial Bancorp Inc. | 1,011 | 18 |
| | Hope Bancorp Inc. | | 966 | 17 |
| * | Flagstar Bancorp Inc. | | 498 | 17 |
| | Berkshire Hills Bancorp Inc. | 430 | 17 |
| | Old National Bancorp | | 934 | 17 |
| | Columbia Property Trust Inc. | 705 | 16 |
| | Washington Federal Inc. | | 471 | 15 |
| * | First Data Corp. Class A | | 665 | 13 |
| | Associated Banc-Corp | | 399 | 11 |
| * | Enstar Group Ltd. | | 51 | 10 |
| | Hanover Insurance Group Inc. | 85 | 10 |
| | Omega Healthcare Investors | | |
| | Inc. | | 311 | 10 |
| | National General Holdings | | |
| | Corp. | | 343 | 9 |
| | Discover Financial Services | 127 | 9 |
| | Zions Bancorporation | | 163 | 9 |
| | Umpqua Holdings Corp. | | 378 | 9 |
| | Chemical Financial Corp. | | 156 | 9 |
| * | Jefferies Financial Group Inc. | 400 | 9 |
| * | SLM Corp. | | 764 | 9 |
| | People’s United Financial Inc. | 466 | 9 |
| | Huntington Bancshares Inc. | 547 | 8 |
| | First Citizens BancShares Inc. | | |
| | Class A | | 18 | 8 |
| | Federal Agricultural Mortgage | | |
| | Corp. | | 80 | 7 |
| | American Financial Group Inc. | 68 | 7 |
| | Torchmark Corp. | | 88 | 7 |
| | Wintrust Financial Corp. | | 81 | 7 |
| | Prosperity Bancshares Inc. | 101 | 7 |
| | HCI Group Inc. | | 174 | 7 |
| | BOK Financial Corp. | | 71 | 7 |
| | CoreCivic Inc. | | 331 | 7 |
| | FNF Group | | 190 | 7 |
| | Raymond James Financial Inc. | 70 | 7 |
| | NorthStar Realty Europe Corp. | 466 | 7 |
| * | Franklin Financial Network Inc. | 177 | 6 |
| | Synovus Financial Corp. | | 117 | 6 |
| | Alleghany Corp. | | 11 | 6 |
| | Argo Group International | | | |
| | Holdings Ltd. | | 102 | 6 |
| | TCF Financial Corp. | | 233 | 6 |
| | Park Hotels & Resorts Inc. | 188 | 6 |
| | Investors Bancorp Inc. | | 445 | 6 |
| | Affiliated Managers Group Inc. | 37 | 6 |
| | Home BancShares Inc. | | 253 | 6 |
| | Comerica Inc. | | 61 | 6 |
| | EPR Properties | | 93 | 6 |
| * | Signature Bank | | 44 | 6 |
| | Apple Hospitality REIT Inc. | 292 | 6 |
| | | |
| * | Encore Capital Group Inc. | 139 | 5 |
| | Opus Bank | 180 | 5 |
| | Great Western Bancorp Inc. | 121 | 5 |
| | Virtus Investment Partners Inc. | 42 | 5 |
| | Walker & Dunlop Inc. | 92 | 5 |
| | M&T Bank Corp. | 30 | 5 |
| | Kemper Corp. | 64 | 5 |
| | United Insurance Holdings | | |
| | Corp. | 238 | 5 |
| | Provident Financial Services | | |
| | Inc. | 175 | 5 |
| | UMB Financial Corp. | 63 | 5 |
| | United Fire Group Inc. | 90 | 5 |
| | First Midwest Bancorp Inc. | 183 | 5 |
| | Waddell & Reed Financial Inc. | | |
| | Class A | 242 | 5 |
| | Willis Towers Watson plc | 31 | 5 |
| | WesBanco Inc. | 100 | 5 |
| * | Seacoast Banking Corp. of | | |
| | Florida | 149 | 5 |
| | S&T Bancorp Inc. | 102 | 5 |
| * | Braemar Hotels & Resorts Inc. | 415 | 5 |
| | Piper Jaffray Cos. | 61 | 5 |
| | InfraREIT Inc. | 213 | 5 |
| | Universal Insurance Holdings | | |
| | Inc. | 126 | 4 |
| | Navigators Group Inc. | 76 | 4 |
| | Horace Mann Educators Corp. | 100 | 4 |
| | Renasant Corp. | 92 | 4 |
| | First Bancorp | 105 | 4 |
| * | World Acceptance Corp. | 40 | 4 |
| | Safety Insurance Group Inc. | 50 | 4 |
| | Enterprise Financial Services | | |
| | Corp. | 78 | 4 |
| | Boston Private Financial | | |
| | Holdings Inc. | 247 | 4 |
| | OceanFirst Financial Corp. | 142 | 4 |
| | Banner Corp. | 69 | 4 |
| | First Commonwealth Financial | | |
| | Corp. | 263 | 4 |
| | Sandy Spring Bancorp Inc. | 99 | 4 |
| | Brookline Bancorp Inc. | 226 | 4 |
| * | TriState Capital Holdings Inc. | 160 | 4 |
| * | Veritex Holdings Inc. | 133 | 4 |
| * | On Deck Capital Inc. | 614 | 4 |
| | Univest Corp. of Pennsylvania | 140 | 4 |
| | Independent Bank Group Inc. | 54 | 4 |
| | International Bancshares Corp. | 94 | 4 |
| | Green Bancorp Inc. | 180 | 4 |
| | WSFS Financial Corp. | 77 | 4 |
| | Ameriprise Financial Inc. | 29 | 4 |
| | Mercury General Corp. | 85 | 4 |
| | First Merchants Corp. | 88 | 4 |
| | Towne Bank | 126 | 4 |
93
U.S. Value Factor ETF
| | | |
| | | | Market |
| | | | Value• |
| | Shares | ($000) |
| | First Busey Corp. | 124 | 4 |
| | Fulton Financial Corp. | 228 | 4 |
| * | Bancorp Inc. | 351 | 4 |
| | Seritage Growth Properties | | |
| | Class A | 95 | 4 |
| | 1st Source Corp. | 74 | 4 |
| | United Community Banks Inc. | 121 | 4 |
| | Bryn Mawr Bank Corp. | 83 | 4 |
| | Heartland Financial USA Inc. | 71 | 4 |
| | NBT Bancorp Inc. | 102 | 4 |
| | BancorpSouth Bank | 116 | 4 |
| * | Pacific Premier Bancorp Inc. | 94 | 4 |
| | Select Income REIT | 179 | 4 |
| | TriCo Bancshares | 99 | 4 |
| | South State Corp. | 43 | 4 |
| | Trustmark Corp. | 118 | 4 |
| | Northwest Bancshares Inc. | 220 | 4 |
| | Capitol Federal Financial Inc. | 286 | 4 |
| | Central Pacific Financial Corp. | 127 | 4 |
| | Lakeland Bancorp Inc. | 186 | 4 |
| | TrustCo Bank Corp. NY | 427 | 4 |
| | CorEnergy Infrastructure Trust | | |
| | Inc. | 102 | 4 |
| | Dun & Bradstreet Corp. | 30 | 4 |
| | Southside Bancshares Inc. | 107 | 4 |
| | James River Group Holdings | | |
| | Ltd. | 96 | 4 |
| | LegacyTexas Financial Group | | |
| | Inc. | 86 | 4 |
| | Hanmi Financial Corp. | 120 | 4 |
| | Employers Holdings Inc. | 90 | 4 |
| | Houlihan Lokey Inc. Class A | 48 | 2 |
| * | NMI Holdings Inc. Class A | 133 | 2 |
| | | | 6,120 |
| Health Care (6.2%) | | |
| | McKesson Corp. | 1,078 | 153 |
| | HCA Healthcare Inc. | 1,459 | 150 |
| * | Acadia Healthcare Co. Inc. | 2,348 | 94 |
| * | Mylan NV | 2,133 | 82 |
| * | United Therapeutics Corp. | 693 | 74 |
| | Patterson Cos. Inc. | 3,312 | 69 |
| * | Triple-S Management Corp. | | |
| | Class B | 1,632 | 60 |
| * | Envision Healthcare Corp. | 1,391 | 60 |
| | Cigna Corp. | 336 | 57 |
| * | MEDNAX Inc. | 1,205 | 55 |
| | Universal Health Services | | |
| | Inc. Class B | 432 | 50 |
| | National HealthCare Corp. | 684 | 45 |
| | Cardinal Health Inc. | 741 | 39 |
| * | Amneal Pharmaceuticals Inc. | 1,504 | 30 |
| * | Magellan Health Inc. | 318 | 29 |
| * | Lannett Co. Inc. | 1,740 | 29 |
| * | Mallinckrodt plc | 1,600 | 27 |
| | | | |
| * | PDL BioPharma Inc. | | 9,577 | 25 |
| | Owens & Minor Inc. | | 1,553 | 25 |
| | Perrigo Co. plc | | 341 | 25 |
| * | LifePoint Health Inc. | | 462 | 24 |
| * | Innoviva Inc. | | 1,620 | 24 |
| * | Premier Inc. Class A | | 730 | 24 |
| | Anthem Inc. | | 107 | 24 |
| | Gilead Sciences Inc. | | 342 | 23 |
| * | Prestige Brands Holdings Inc. | | 682 | 23 |
| | Medtronic plc | | 260 | 22 |
| | Allergan plc | | 127 | 19 |
| | Humana Inc. | | 61 | 18 |
| * | Depomed Inc. | | 2,846 | 18 |
| * | Laboratory Corp. of America | | | |
| | Holdings | | 46 | 8 |
| * | Centene Corp. | | 68 | 8 |
| * | Endo International plc | | 1,223 | 8 |
| * | Hologic Inc. | | 178 | 7 |
| * | AngioDynamics Inc. | | 272 | 6 |
| | Quest Diagnostics Inc. | | 51 | 5 |
| | Zimmer Biomet Holdings Inc. | | 39 | 4 |
| * | Select Medical Holdings Corp. | 102 | 2 |
| * | Integer Holdings Corp. | | 27 | 2 |
| | | | | 1,447 |
| Materials & Processing (8.0%) | | |
| | LyondellBasell Industries | | |
| | NV Class A | | 1,329 | 149 |
| | United States Steel Corp. | 2,606 | 96 |
| | WestRock Co. | | 1,397 | 82 |
| | Louisiana-Pacific Corp. | | 2,689 | 78 |
| * | Alcoa Corp. | | 1,597 | 77 |
| | Schnitzer Steel Industries | | |
| | Inc. | | 2,394 | 75 |
| | Commercial Metals Co. | | 3,090 | 73 |
| * | Owens-Illinois Inc. | | 3,903 | 73 |
| * | Summit Materials Inc. | | | |
| | Class A | | 2,402 | 68 |
| | Olin Corp. | | 1,930 | 62 |
| | PH Glatfelter Co. | | 3,253 | 57 |
| | Mosaic Co. | | 2,055 | 57 |
| | Quanex Building Products | | |
| | Corp. | | 3,328 | 56 |
| | Freeport-McMoRan Inc. | 3,243 | 55 |
| | Owens Corning | | 846 | 54 |
| | Aceto Corp. | 18,269 | 48 |
| * | Clearwater Paper Corp. | | 1,950 | 47 |
| | Acuity Brands Inc. | | 386 | 46 |
| * | Unifi Inc. | | 1,348 | 43 |
| * | Armstrong Flooring Inc. | | 3,240 | 42 |
| * | BMC Stock Holdings Inc. | 1,723 | 35 |
| * | Foundation Building | | | |
| | Materials Inc. | | 2,142 | 33 |
| | Westlake Chemical Corp. | 276 | 32 |
| * | Kraton Corp. | | 658 | 32 |
94
U.S. Value Factor ETF
| | | |
| | | | Market |
| | | | Value• |
| | | Shares | ($000) |
| | Reliance Steel & Aluminum | | |
| | Co. | 324 | 30 |
| * | Verso Corp. | 1,284 | 26 |
| * | Cleveland-Cliffs Inc. | 2,966 | 25 |
| | Tahoe Resources Inc. | 4,772 | 25 |
| * | Beacon Roofing Supply Inc. | 573 | 24 |
| | Rayonier Advanced Materials | | |
| | Inc. | 1,235 | 22 |
| | Greif Inc. Class A | 370 | 22 |
| * | Ryerson Holding Corp. | 1,740 | 22 |
| | Belden Inc. | 351 | 19 |
| | US Silica Holdings Inc. | 627 | 19 |
| | Apogee Enterprises Inc. | 441 | 19 |
| | Stepan Co. | 252 | 18 |
| | Eastman Chemical Co. | 95 | 10 |
| | Steel Dynamics Inc. | 178 | 9 |
| | International Paper Co. | 148 | 8 |
| * | AK Steel Holding Corp. | 1,751 | 8 |
| * | Platform Specialty Products | | |
| | Corp. | 585 | 7 |
| | Newmont Mining Corp. | 166 | 6 |
| | Carpenter Technology Corp. | 106 | 6 |
| | Domtar Corp. | 131 | 6 |
| | Sonoco Products Co. | 118 | 6 |
| | Ball Corp. | 160 | 6 |
| | Caesarstone Ltd. | 363 | 6 |
| | Tronox Ltd. Class A | 297 | 5 |
| | Minerals Technologies Inc. | 73 | 5 |
| | Innophos Holdings Inc. | 104 | 5 |
| | NN Inc. | 226 | 5 |
| | Kronos Worldwide Inc. | 169 | 4 |
| | Worthington Industries Inc. | 86 | 4 |
| | Schweitzer-Mauduit | | |
| | International Inc. | 91 | 4 |
| * | Veritiv Corp. | 119 | 4 |
| | Olympic Steel Inc. | 168 | 4 |
| | Kaiser Aluminum Corp. | 35 | 4 |
| * | AdvanSix Inc. | 105 | 4 |
| | Nucor Corp. | 47 | 3 |
| | Hecla Mining Co. | 433 | 2 |
| | | | 1,872 |
| Other (0.5%) | | |
| * | AerCap Holdings NV | 847 | 47 |
| * | Flex Ltd. | 2,600 | 36 |
| | Janus Henderson Group plc | 875 | 27 |
| | | | 110 |
| Producer Durables (12.2%) | | |
| | Johnson Controls | | |
| | International plc | 4,812 | 161 |
| | Delta Air Lines Inc. | 2,923 | 158 |
| | Eaton Corp. plc | 2,022 | 155 |
| | Southwest Airlines Co. | 2,804 | 143 |
| | General Electric Co. | 9,060 | 128 |
| | Air Lease Corp. Class A | 1,982 | 88 |
| | | |
| * | United Rentals Inc. | 513 | 82 |
| * | Engility Holdings Inc. | 2,443 | 77 |
| * | Darling Ingredients Inc. | 3,605 | 68 |
| | ACCO Brands Corp. | 4,848 | 63 |
| | Ryder System Inc. | 825 | 55 |
| * | JetBlue Airways Corp. | 2,892 | 55 |
| * | United Continental Holdings | | |
| | Inc. | 784 | 55 |
| | Copa Holdings SA Class A | 473 | 52 |
| | Terex Corp. | 1,301 | 51 |
| | Alaska Air Group Inc. | 811 | 49 |
| | Briggs & Stratton Corp. | 2,578 | 48 |
| * | TrueBlue Inc. | 1,759 | 45 |
| * | Tutor Perini Corp. | 2,229 | 44 |
| * | AECOM | 1,268 | 42 |
| | Macquarie Infrastructure | | |
| | Corp. | 1,050 | 41 |
| * | Stericycle Inc. | 633 | 40 |
| | Xerox Corp. | 1,466 | 40 |
| | Herman Miller Inc. | 1,192 | 39 |
| | Trinity Industries Inc. | 1,117 | 39 |
| | Kelly Services Inc. Class A | 1,584 | 36 |
| | American Airlines Group Inc. | 801 | 35 |
| | KBR Inc. | 1,835 | 34 |
| | Union Pacific Corp. | 230 | 33 |
| | AGCO Corp. | 513 | 33 |
| * | Modine Manufacturing Co. | 1,709 | 31 |
| | Schneider National Inc. | | |
| | Class B | 999 | 29 |
| | Hyster-Yale Materials | | |
| | Handling Inc. | 438 | 29 |
| * | Milacron Holdings Corp. | 1,478 | 29 |
| | Arconic Inc. | 1,586 | 28 |
| * | YRC Worldwide Inc. | 2,409 | 26 |
| | Quad/Graphics Inc. | 1,292 | 26 |
| | Triton International Ltd. | 732 | 25 |
| * | Textainer Group Holdings | | |
| | Ltd. | 1,500 | 25 |
| | Costamare Inc. | 3,474 | 25 |
| * | Atlas Air Worldwide | | |
| | Holdings Inc. | 364 | 25 |
| * | Spirit Airlines Inc. | 663 | 24 |
| | Aircastle Ltd. | 1,090 | 23 |
| | Greenbrier Cos. Inc. | 467 | 23 |
| | American Railcar Industries | | |
| | Inc. | 563 | 23 |
| | Hawaiian Holdings Inc. | 616 | 23 |
| | SkyWest Inc. | 391 | 22 |
| | ArcBest Corp. | 468 | 22 |
| | Steelcase Inc. Class A | 1,530 | 22 |
| * | Sykes Enterprises Inc. | 768 | 22 |
| * | WESCO International Inc. | 360 | 21 |
| * | CAI International Inc. | 889 | 21 |
| | GATX Corp. | 295 | 21 |
95
U.S. Value Factor ETF
| | | |
| | | | Market |
| | | | Value• |
| | Shares | ($000) |
| | Norfolk Southern Corp. | 139 | 21 |
| * | Vectrus Inc. | 655 | 21 |
| * | Atkore International Group Inc. | 945 | 20 |
| | Convergys Corp. | 857 | 20 |
| * | Covenant Transportation | | |
| | Group Inc. Class A | 658 | 20 |
| | FedEx Corp. | 78 | 19 |
| | Ship Finance International | | |
| | Ltd. | 1,361 | 19 |
| | Teekay Corp. | 2,096 | 17 |
| * | Genesee & Wyoming Inc. | | |
| | Class A | 163 | 13 |
| | Cummins Inc. | 87 | 12 |
| * | Quanta Services Inc. | 246 | 9 |
| | Regal Beloit Corp. | 107 | 9 |
| | LSC Communications Inc. | 601 | 8 |
| | Deluxe Corp. | 114 | 8 |
| | RR Donnelley & Sons Co. | 1,179 | 7 |
| | PACCAR Inc. | 109 | 7 |
| * | HD Supply Holdings Inc. | 158 | 6 |
| * | Navigant Consulting Inc. | 248 | 6 |
| | Matson Inc. | 164 | 6 |
| | ICF International Inc. | 79 | 6 |
| | AAR Corp. | 116 | 5 |
| | Argan Inc. | 133 | 5 |
| * | CBIZ Inc. | 229 | 5 |
| | Wabash National Corp. | 216 | 4 |
| | MTS Systems Corp. | 78 | 4 |
| | Knoll Inc. | 200 | 4 |
| | Primoris Services Corp. | 151 | 4 |
| * | Esterline Technologies Corp. | 53 | 4 |
| | GasLog Ltd. | 213 | 4 |
| * | SPX FLOW Inc. | 81 | 4 |
| * | Lydall Inc. | 83 | 3 |
| | Pentair plc | 77 | 3 |
| * | Rush Enterprises Inc. Class A | 77 | 3 |
| | Triumph Group Inc. | 148 | 3 |
| | Kansas City Southern | 25 | 3 |
| | Pitney Bowes Inc. | 300 | 3 |
| * | nVent Electric plc | 77 | 2 |
| | Werner Enterprises Inc. | 45 | 2 |
| | | | 2,873 |
| Technology (7.9%) | | |
| * | Micron Technology Inc. | 2,908 | 167 |
| | HP Inc. | 6,935 | 153 |
| | Hewlett Packard Enterprise | | |
| | Co. | 8,981 | 137 |
| | Jabil Inc. | 3,141 | 89 |
| * | CommScope Holding Co. | | |
| | Inc. | 2,481 | 73 |
| * | TTM Technologies Inc. | 4,011 | 72 |
| | SYNNEX Corp. | 636 | 68 |
| * | Anixter International Inc. | 1,101 | 67 |
| | | |
| * | Inovalon Holdings Inc. | | |
| | Class A | 5,927 | 62 |
| * | Dell Technologies Inc. | | |
| | Class V | 748 | 60 |
| * | Cirrus Logic Inc. | 1,520 | 57 |
| * | ARRIS International plc | 2,063 | 52 |
| * | Broadcom Inc. | 204 | 51 |
| * | NCR Corp. | 1,414 | 43 |
| | Juniper Networks Inc. | 1,579 | 42 |
| * | Qorvo Inc. | 492 | 39 |
| * | CACI International Inc. | | |
| | Class A | 213 | 36 |
| | Corning Inc. | 1,293 | 35 |
| | Western Digital Corp. | 388 | 32 |
| * | Applied Optoelectronics Inc. | 630 | 29 |
| | DXC Technology Co. | 312 | 29 |
| * | Unisys Corp. | 2,213 | 27 |
| * | Loral Space & | | |
| | Communications Inc. | 686 | 26 |
| * | Amkor Technology Inc. | 2,797 | 25 |
| * | Synchronoss Technologies | | |
| | Inc. | 4,224 | 24 |
| | Intel Corp. | 412 | 23 |
| * | Presidio Inc. | 1,696 | 23 |
| * | Photronics Inc. | 2,576 | 22 |
| * | Web.com Group Inc. | 1,014 | 20 |
| * | NetScout Systems Inc. | 727 | 20 |
| * | EchoStar Corp. Class A | 411 | 19 |
| * | KEMET Corp. | 933 | 19 |
| | Vishay Intertechnology Inc. | 872 | 18 |
| | TiVo Corp. | 1,272 | 18 |
| | Xperi Corp. | 920 | 18 |
| * | Electro Scientific Industries | | |
| | Inc. | 918 | 18 |
| | Avnet Inc. | 353 | 13 |
| * | VMware Inc. Class A | 93 | 13 |
| * | Meet Group Inc. | 3,194 | 12 |
| * | FormFactor Inc. | 776 | 11 |
| * | Arrow Electronics Inc. | 96 | 7 |
| * | Fabrinet | 197 | 7 |
| | International Business | | |
| | Machines Corp. | 47 | 7 |
| | CA Inc. | 184 | 7 |
| * | Diodes Inc. | 186 | 6 |
| * | ON Semiconductor Corp. | 248 | 6 |
| * | Finisar Corp. | 350 | 6 |
| * | Ultra Clean Holdings Inc. | 277 | 5 |
| | ManTech International Corp. | | |
| | Class A | 90 | 5 |
| * | Sanmina Corp. | 166 | 5 |
| * | Tech Data Corp. | 54 | 5 |
| * | Super Micro Computer Inc. | 194 | 5 |
| * | ScanSource Inc. | 114 | 4 |
| * | Knowles Corp. | 273 | 4 |
96
U.S. Value Factor ETF
| | | |
| | | | Market |
| | | | Value• |
| | | Shares | ($000) |
| | Benchmark Electronics Inc. | 125 | 3 |
| | Symantec Corp. | 82 | 2 |
| | Comtech Telecommunications | |
| | Corp. | 52 | 2 |
| | Lam Research Corp. | 8 | 2 |
| | Diebold Nixdorf Inc. | 97 | 1 |
| | | | 1,851 |
| Utilities (8.0%) | | |
| | PG&E Corp. | 3,811 | 165 |
| | Duke Energy Corp. | 2,096 | 162 |
| | Exelon Corp. | 3,858 | 160 |
| | AT&T Inc. | 4,940 | 160 |
| * | T-Mobile US Inc. | 2,189 | 122 |
| | Dominion Energy Inc. | 1,629 | 105 |
| | PPL Corp. | 2,416 | 66 |
| | Black Hills Corp. | 1,101 | 64 |
| | Verizon Communications Inc. | 1,156 | 55 |
| | Entergy Corp. | 679 | 55 |
| | NRG Yield Inc. | 3,107 | 54 |
| | Edison International | 818 | 51 |
| | American Electric Power Co. | | |
| | Inc. | 607 | 41 |
| | AES Corp. | 3,194 | 41 |
| | Consolidated Edison Inc. | 507 | 39 |
| | Portland General Electric Co. | 845 | 36 |
| * | Vistra Energy Corp. | 1,429 | 35 |
| | CenturyLink Inc. | 1,893 | 34 |
| | Hawaiian Electric Industries | | |
| | Inc. | 996 | 34 |
| | Pinnacle West Capital Corp. | 424 | 34 |
| | OGE Energy Corp. | 942 | 33 |
| | Eversource Energy | 541 | 31 |
| | Southern Co. | 544 | 24 |
| | NorthWestern Corp. | 379 | 21 |
| | NextEra Energy Inc. | 116 | 19 |
| | Sempra Energy | 171 | 18 |
| | Telephone & Data Systems | | |
| | Inc. | 712 | 18 |
| | Avangrid Inc. | 228 | 12 |
| | Spire Inc. | 154 | 11 |
| | NiSource Inc. | 430 | 11 |
| | UGI Corp. | 197 | 10 |
| | Atmos Energy Corp. | 104 | 9 |
| | Ameren Corp. | 156 | 9 |
| | DTE Energy Co. | 87 | 9 |
| | South Jersey Industries Inc. | 263 | 9 |
| | Southwest Gas Holdings Inc. | 113 | 9 |
| | Public Service Enterprise | | |
| | Group Inc. | 154 | 8 |
| | | |
| | | | Market |
| | | | Value• |
| | | Shares | ($000) |
| * | Iridium Communications Inc. | 533 | 8 |
| | Westar Energy Inc. Class A | 138 | 8 |
| | Xcel Energy Inc. | 170 | 8 |
| | Alliant Energy Corp. | 180 | 7 |
| | ONE Gas Inc. | 95 | 7 |
| | ALLETE Inc. | 90 | 7 |
| | WEC Energy Group Inc. | 105 | 7 |
| | CenterPoint Energy Inc. | 246 | 6 |
| | PNM Resources Inc. | 157 | 6 |
| | IDACORP Inc. | 66 | 6 |
| | CMS Energy Corp. | 125 | 6 |
| * | United States Cellular Corp. | 159 | 6 |
| | El Paso Electric Co. | 72 | 4 |
| | Unitil Corp. | 84 | 4 |
| | ATN International Inc. | 42 | 2 |
| * | Cincinnati Bell Inc. | 134 | 2 |
| | | | 1,868 |
| Total Common Stocks | | |
| (Cost $22,931) | | 23,269 |
| Temporary Cash Investment (0.5%)1 | |
| Money Market Fund (0.5%) | | |
| 2 | Vanguard Market Liquidity Fund, | |
| | 1.961% (Cost $111) | 1,112 | 111 |
| Total Investments (99.8%) | | |
| (Cost $23,042) | | 23,380 |
| |
| | Amount |
| | ($000) |
| Other Assets and Liabilities (0.2%) | |
| Other Assets | |
| Investment in Vanguard | 1 |
| Receivables for Investment Securities Sold | 1 |
| Receivables for Accrued Income | 42 |
| Other Assets 3 | 6 |
| Total Other Assets | 50 |
| Liabilities | |
| Payables to Vanguard | (2) |
| Variation Margin Payable— | |
| Futures Contracts Liabilities | (1) |
| Total Liabilities | (3) |
| Net Assets (100%) | |
| Applicable to 300,000 outstanding | |
| $.001 par value shares of beneficial | |
| interest (unlimited authorization) | 23,427 |
| Net Asset Value Per Share | $78.09 |
97
U.S. Value Factor ETF
| |
| At May 31, 2018, net assets consisted of: | |
| | Amount |
| | ($000) |
| Paid-in Capital | 22,929 |
| Undistributed Net Investment Income | 82 |
| Accumulated Net Realized Gains | 74 |
| Unrealized Appreciation (Depreciation) | |
| Investment Securities | 338 |
| Futures Contracts | 4 |
| Net Assets | 23,427 |
• See Note A in Notes to Financial Statements.
* Non-income-producing security.
1 The fund invests a portion of its cash reserves in equity
markets through the use of index futures contracts. After
giving effect to futures investments, the fund’s effective
common stock and temporary cash investment positions
represent 99.7% and 0.1%, respectively, of net assets.
2 Affiliated money market fund available only to Vanguard funds
and certain trusts and accounts managed by Vanguard. Rate
shown is the 7-day yield.
3 Cash of $6,000 has been segregated as initial margin for open
futures contracts.
REIT—Real Estate Investment Trust.
| | | | |
| Derivative Financial Instruments Outstanding as of Period End | | |
| |
| Futures Contracts | | | | |
| | | | ($000) |
| | | | | Value and |
| | | Number of | | Unrealized |
| | | Long (Short) | Notional | Appreciation |
| | Expiration | Contracts | Amount | (Depreciation) |
| Long Futures Contracts | | | | |
| E-mini Russell 2000 Index | June 2018 | 1 | 82 | 4 |
Unrealized appreciation (depreciation) on open futures contracts is required to be treated as realized gain (loss) for tax purposes.
See accompanying Notes, which are an integral part of the Financial Statements.
98
U.S. Value Factor ETF
Statement of Operations
| |
| | February13,20181 to |
| | May 31, 2018 |
| | ($000) |
| Investment Income | |
| Income | |
| Dividends | 86 |
| Interest 2 | — |
| Total Income | 86 |
| Expenses | |
| The Vanguard Group—Note B | |
| Management and Administrative | — |
| Marketing and Distribution | — |
| Custodian Fees | 2 |
| Shareholders’ Reports | 2 |
| Total Expenses | 4 |
| Net Investment Income | 82 |
| Realized Net Gain (Loss) on Investment Securities Sold2 | 74 |
| Change in Unrealized Appreciation (Depreciation) of Investment Securities | |
| Investment Securities 2 | 338 |
| Futures Contracts | 4 |
| Change in Unrealized Appreciation (Depreciation) | 342 |
| Net Increase (Decrease) in Net Assets Resulting from Operations | 498 |
1 Inception.
2 Interest income, realized net gain (loss), and change in unrealized appreciation (depreciation) from an affiliated company of the fund
were each less than $1,000. Purchases and sales are for temporary cash investment purposes.
See accompanying Notes, which are an integral part of the Financial Statements.
99
U.S. Value Factor ETF
Statement of Changes in Net Assets
| |
| | February13,20181 to |
| | May 31, 2018 |
| | ($000) |
| Increase (Decrease) in Net Assets | |
| Operations | |
| Net Investment Income | 82 |
| Realized Net Gain (Loss) | 74 |
| Change in Unrealized Appreciation (Depreciation) | 342 |
| Net Increase (Decrease) in Net Assets Resulting from Operations | 498 |
| Distributions | |
| Net Investment Income | — |
| Realized Capital Gain | — |
| Total Distributions | — |
| Capital Share Transactions | |
| Issued | 22,929 |
| Issued in Lieu of Cash Distributions | — |
| Redeemed | — |
| Net Increase (Decrease) from Capital Share Transactions | 22,929 |
| Total Increase (Decrease) | 23,427 |
| Net Assets | |
| Beginning of Period | — |
| End of Period2 | 23,427 |
| 1 Inception. |
| 2 Net Assets—End of Period includes undistributed (overdistributed) net investment income of $82,000. |
See accompanying Notes, which are an integral part of the Financial Statements.
100
U.S. Value Factor ETF
Financial Highlights
| |
| | February 13, 20181 to |
| For a Share Outstanding Throughout the Period | May 31, 2018 |
| Net Asset Value, Beginning of Period | $75.00 |
| Investment Operations | |
| Net Investment Income2 | .554 |
| Net Realized and Unrealized Gain (Loss) on Investments | 2.536 |
| Total from Investment Operations | 3.090 |
| Distributions | |
| Dividends from Net Investment Income | — |
| Distributions from Realized Capital Gains | — |
| Total Distributions | — |
| Net Asset Value, End of Period | $78.09 |
| |
| Total Return | 4.12% |
| |
| Ratios/Supplemental Data | |
| Net Assets, End of Period (Millions) | $23 |
| Ratio of Total Expenses to Average Net Assets | 0.13%3 |
| Ratio of Net Investment Income to Average Net Assets | 2.40%3 |
| Portfolio Turnover Rate | 19%3 |
| 1 Inception. |
| 2 Calculated based on average shares outstanding. |
| 3 Annualized. |
See accompanying Notes, which are an integral part of the Financial Statements.
101
U.S. Value Factor ETF
Notes to Financial Statements
Vanguard U.S. Value Factor ETF is registered under the Investment Company Act of 1940 as an open-end investment company, or mutual fund. ETF Shares are listed for trading on Cboe BZX Exchange; they can be purchased and sold through a broker.
A. The following significant accounting policies conform to generally accepted accounting principles for U.S. investment companies. The fund consistently follows such policies in preparing its financial statements.
1. Security Valuation: Securities are valued as of the close of trading on the New York Stock Exchange (generally 4 p.m., Eastern time) on the valuation date. Equity securities are valued at the latest quoted sales prices or official closing prices taken from the primary market in which each security trades; such securities not traded on the valuation date are valued at the mean of the latest quoted bid and asked prices. Securities for which market quotations are not readily available, or whose values have been materially affected by events occurring before the fund’s pricing time but after the close of the securities’ primary markets, are valued by methods deemed by the board of trustees to represent fair value. Investments in Vanguard Market Liquidity Fund are valued at that fund’s net asset value.
2. Futures Contracts: The fund uses index futures contracts to a limited extent, with the objective of maintaining full exposure to the stock market while maintaining liquidity. The fund may purchase or sell futures contracts to achieve a desired level of investment, whether to accommodate portfolio turnover or cash flows from capital share transactions. The primary risks associated with the use of futures contracts are imperfect correlation between changes in market values of stocks held by the fund and the prices of futures contracts, and the possibility of an illiquid market. Counterparty risk involving futures is mitigated because a regulated clearinghouse is the counterparty instead of the clearing broker. To further mitigate counterparty risk, the fund trades futures contracts on an exchange, monitors the financial strength of its clearing brokers and clearinghouse, and has entered into clearing agreements with its clearing brokers. The clearinghouse imposes initial margin requirements to secure the fund’s performance and requires daily settlement of variation margin representing changes in the market value of each contract.
Futures contracts are valued at their quoted daily settlement prices. The notional amounts of the contracts are not recorded in the Statement of Net Assets. Fluctuations in the value of the contracts are recorded in the Statement of Net Assets as an asset (liability) and in the Statement of Operations as unrealized appreciation (depreciation) until the contracts are closed, when they are recorded as realized futures gains (losses).
During the period ended May 31, 2018, the fund’s average investments in long and short futures contracts represented less than 1% and 0% of net assets, respectively, based on the average of the notional amounts at each quarter-end during the period.
3. Federal Income Taxes: The fund intends to qualify as a regulated investment company and distribute all of its taxable income. Management has analyzed the fund’s tax positions taken for the period ended May 31, 2018, and has concluded that no provision for federal income tax is required in the fund’s financial statements.
4. Distributions: Distributions to shareholders are recorded on the ex-dividend date.
102
U.S. Value Factor ETF
5. Other: Dividend income is recorded on the ex-dividend date. Interest income includes income distributions received from Vanguard Market Liquidity Fund and is accrued daily. Security transactions are accounted for on the date securities are bought or sold. Costs used to determine realized gains (losses) on the sale of investment securities are those of the specific securities sold.
B. In accordance with the terms of a Funds’ Service Agreement (the “FSA”) between Vanguard and the fund, Vanguard furnishes to the fund investment advisory, corporate management, administrative, marketing, and distribution services at Vanguard’s cost of operations (as defined by the FSA). These costs of operations are allocated to the fund based on methods and guidelines approved by the board of trustees, and generally settled twice a month.
Upon the request of Vanguard, the fund may invest up to 0.40% of its net assets as capital in Vanguard. At May 31, 2018, the fund had contributed to Vanguard capital in the amount of $1,000, representing 0.00% of the fund’s net assets and 0.00% of Vanguard’s capitalization. The fund’s trustees and officers are also directors and employees, respectively, of Vanguard.
C. Various inputs may be used to determine the value of the fund’s investments. These inputs are summarized in three broad levels for financial statement purposes. The inputs or methodologies used to value securities are not necessarily an indication of the risk associated with investing in those securities.
Level 1—Quoted prices in active markets for identical securities.
Level 2—Other significant observable inputs (including quoted prices for similar securities, interest rates, prepayment speeds, credit risk, etc.).
Level 3—Significant unobservable inputs (including the fund’s own assumptions used to determine
the fair value of investments). Any investments valued with significant unobservable inputs are
noted on the Statement of Net Assets.
At May 31, 2018, 100% of the market value of the fund’s investments was determined based on Level 1 inputs.
D. Distributions are determined on a tax basis and may differ from net investment income and realized capital gains for financial reporting purposes. Differences may be permanent or temporary. Permanent differences are reclassified among capital accounts in the financial statements to reflect their tax character. Temporary differences arise when certain items of income, expense, gain, or loss are recognized in different periods for financial statement and tax purposes. These differences will reverse at some time in the future. Differences in classification may also result from the treatment of short-term gains as ordinary income for tax purposes. The fund’s tax-basis capital gains and losses are determined only at the end of each fiscal year.
At May 31, 2018, the cost of investment securities for tax purposes was $23,042,000. Net unrealized appreciation of investment securities for tax purposes was $338,000, consisting of unrealized gains of $960,000 on securities that had risen in value since their purchase and $622,000 in unrealized losses on securities that had fallen in value since their purchase.
E. During the period ended May 31, 2018, the fund purchased $23,733,000 of investment securities and sold $875,000 of investment securities, other than temporary cash investments.
103
U.S. Value Factor ETF
F. Capital shares issued and redeemed were:
| |
| | February 13, 20181 to |
| | May 31, 2018 |
| | Shares |
| | (000) |
| Issued | 300 |
| Issued in Lieu of Cash Distributions | — |
| Redeemed | — |
| Net Increase (Decrease) in Shares Outstanding | 300 |
| 1 Inception. |
At May 31, 2018, one shareholder was the record or beneficial owner of 33% of the fund’s net assets. If the shareholder were to redeem its investment in the fund, the redemption might result in an increase in the fund’s expense ratio.
G. Management has determined that no events or transactions occurred subsequent to May 31, 2018, that would require recognition or disclosure in these financial statements.
104
About Your Fund’s Expenses
As a shareholder of the fund, you incur ongoing costs, which include costs for portfolio management, administrative services, and shareholder reports (like this one), among others. Operating expenses, which are deducted from a fund’s gross income, directly reduce the investment return of the fund.
A fund’s expenses are expressed as a percentage of its average net assets. This figure is known as the expense ratio. The following examples are intended to help you understand the ongoing costs (in dollars) of investing in your fund and to compare these costs with those of other mutual funds. The examples are based on an investment of $1,000 made at the beginning of the period shown and held for the entire period.
The accompanying table illustrates your fund’s costs in two ways:
• Based on actual fund return. This section helps you to estimate the actual expenses that you paid over the period. The ”Ending Account Value“ shown is derived from the fund‘s actual return, and the third column shows the dollar amount that would have been paid by an investor who started with $1,000 in the fund. You may use the information here, together with the amount you invested, to estimate the expenses that you paid over the period.
To do so, simply divide your account value by $1,000 (for example, an $8,600 account value divided by $1,000 = 8.6), then multiply the result by the number given for your fund under the heading ”Expenses Paid During Period.“
• Based on hypothetical 5% yearly return. This section is intended to help you compare your fund‘s costs with those of other mutual funds. It assumes that the fund had a yearly return of 5% before expenses, but that the expense ratio is unchanged. In this case—because the return used is not the fund’s actual return—the results do not apply to your investment. The example is useful in making comparisons because the Securities and Exchange Commission requires all mutual funds to calculate expenses based on a 5% return. You can assess your fund’s costs by comparing this hypothetical example with the hypothetical examples that appear in shareholder reports of other funds.
Note that the expenses shown in the table are meant to highlight and help you compare ongoing costs only and do not reflect transaction costs incurred by the fund for buying and selling securities. Further, the expenses do not include any purchase, redemption, or account service fees described in the fund prospectus. If such fees were applied to your account, your costs would be higher. Your fund does not carry a “sales load.”
The calculations assume no shares were bought or sold during the period. Your actual costs may have been higher or lower, depending on the amount of your investment and the timing of any purchases or redemptions.
You can find more information about the fund’s expenses, including annual expense ratios, in the Financial Statements section of this report. For additional information on operating expenses and other shareholder costs, please refer to your fund’s current prospectus.
105
| | | |
| Period Ended May 31, 2018 | | | |
| | Beginning | Ending | Expenses |
| | Account Value | Account Value | Paid During |
| | 2/13/2018 | 5/31/2018 | Period |
| Based on Actual Fund Return | | | |
| U.S. Liquidity Factor ETF | | | |
| ETF Shares | $1,000.00 | $1,071.87 | $0.40 |
| U.S. Minimum Volatility ETF | | | |
| ETF Shares | $1,000.00 | $1,069.87 | $0.40 |
| U.S. Momentum Factor ETF | | | |
| ETF Shares | $1,000.00 | $1,083.47 | $0.40 |
| U.S. Multifactor ETF | | | |
| ETF Shares | $1,000.00 | $1,058.53 | $0.55 |
| U.S. Quality Factor ETF | | | |
| ETF Shares | $1,000.00 | $1,071.73 | $0.40 |
| U.S. Value Factor ETF | | | |
| ETF Shares | $1,000.00 | $1,041.20 | $0.39 |
| Based on Hypothetical 5% Yearly Return | | | |
| U.S. Liquidity Factor ETF | | | |
| ETF Shares | $1,000.00 | $1,014.41 | $0.39 |
| U.S. Minimum Volatility ETF | | | |
| ETF Shares | $1,000.00 | $1,014.41 | $0.39 |
| U.S. Momentum Factor ETF | | | |
| ETF Shares | $1,000.00 | $1,014.41 | $0.39 |
| U.S. Multifactor ETF | | | |
| ETF Shares | $1,000.00 | $1,014.26 | $0.54 |
| U.S. Quality Factor ETF | | | |
| ETF Shares | $1,000.00 | $1,014.41 | $0.39 |
| U.S. Value Factor ETF | | | |
| ETF Shares | $1,000.00 | $1,014.41 | $0.39 |
The calculations are based on expenses incurred in the period from the funds’ February 13, 2018, inception through May 31, 2018. The
funds’ annualized expense ratios for that period are 0.13% for the U.S. Liquidity Factor ETF, 0.13% for the U.S. Minimum Volatility ETF,
0.13% for the U.S. Momentum Factor ETF, 0.18% for the U.S. Multifactor ETF, 0.13% for the U.S. Quality Factor ETF, and 0.13% for the
U.S. Value Factor ETF. The dollar amounts shown as “Expenses Paid” are equal to the annualized expense ratio multiplied by the average
account value over the period from inception through May 31, 2018, multiplied by the number of days in that period, then divided by the
number of days in the most recent 12-month period (108/365).
106
Trustees Approve Advisory Arrangements
Effective February 2018, the board of trustees of Vanguard Wellington Fund approved the launch of Vanguard U.S. Liquidity Factor ETF, Vanguard U.S. Minimum Volatility ETF, Vanguard U.S. Momentum Factor ETF, Vanguard U.S. Multifactor ETF, Vanguard U.S. Quality Factor ETF, and Vanguard U.S. Value Factor ETF, which utilize an internalized management structure whereby The Vanguard Group, Inc. (Vanguard), through its Quantitative Equity Group, provides investment advisory services to the funds. The board determined that the investment advisory arrangements with Vanguard were in the best interests of the funds and their prospective shareholders.
The board based its decision upon an evaluation of the advisor’s investment staff, portfolio management process, and performance. This evaluation included information provided to the board by Vanguard’s Portfolio Review Department, which is responsible for fund and advisor oversight and product management. The trustees considered the factors discussed below, among others. However, no single factor determined whether the board approved the arrangement. Rather, it was the totality of the circumstances that drove the board’s decision.
Nature, extent, and quality of services
The board considered the quality of the investment management services to be provided to the funds and took into account the organizational depth and stability of the advisor. The board noted that Vanguard has been managing investments for more than four decades. The Quantitative Equity Group adheres to a sound, disciplined investment management process; the team has considerable experience, stability, and depth.
The board concluded that Vanguard’s experience, stability, depth, and performance, among other factors, warranted approval of the advisory arrangements.
Investment performance
The board determined that the Quantitative Equity Group, in its management of other Vanguard funds, has a track record of consistent performance and disciplined investment processes. Information about each fund’s performance since inception can be found in the Performance Summary sections of this report.
Cost
The board concluded that each fund’s expense ratio will be well below the average expense ratio charged by funds in its peer group. Information about the funds’ expenses appears in the About Your Fund’s Expenses section of this report as well as in the Financial Statements sections.
The board does not conduct a profitability analysis of Vanguard because of Vanguard’s unique “at-cost” structure. Unlike most other mutual fund management companies, Vanguard is owned by the funds it oversees and produces “profits” only in the form of reduced expenses for fund shareholders.
The benefit of economies of scale
The board concluded that Vanguard’s at-cost arrangement with the funds ensures that the funds will realize economies of scale as they grow, with the cost to shareholders declining as fund assets increase.
The board will consider whether to renew the advisory arrangements after a one-year period.
107
Glossary
30-Day SEC Yield. A fund’s 30-day SEC yield is derived using a formula specified by the U.S. Securities and Exchange Commission. Under the formula, data related to the fund’s security holdings in the previous 30 days are used to calculate the fund’s hypothetical net income for that period, which is then annualized and divided by the fund’s estimated average net assets over the calculation period. For the purposes of this calculation, a security’s income is based on its current market yield to maturity (for bonds), its actual income (for asset-backed securities), or its projected dividend yield (for stocks). Because the SEC yield represents hypothetical annualized income, it will differ—at times significantly—from the fund’s actual experience. As a result, the fund’s income distributions may be higher or lower than implied by the SEC yield.
Beta. A measure of the magnitude of a fund’s past share-price fluctuations in relation to the ups and downs of a given market index. The index is assigned a beta of 1.00. Compared with a given index, a fund with a beta of 1.20 typically would have seen its share price rise or fall by 12% when the index rose or fell by 10%. For this report, beta is based on returns over the past 36 months for both the fund and the index. Note that a fund’s beta should be reviewed in conjunction with its R-squared (see definition). The lower the R-squared, the less correlation there is between the fund and the index, and the less reliable beta is as an indicator of volatility.
Dividend Yield. Dividend income earned by stocks, expressed as a percentage of the aggregate market value (or of net asset value, for a fund). The yield is determined by dividing the amount of the annual dividends by the aggregate value (or net asset value) at the end of the period. For a fund, the dividend yield is based solely on stock holdings and does not include any income produced by other investments.
Earnings Growth Rate. The average annual rate of growth in earnings over the past five years for the stocks now in a fund.
Equity Exposure. A measure that reflects a fund’s investments in stocks and stock futures. Any holdings in short-term reserves are excluded.
Expense Ratio. A fund’s total annual operating expenses expressed as a percentage of the fund’s average net assets. The expense ratio includes management and administrative expenses, but does not include the transaction costs of buying and selling portfolio securities.
Foreign Holdings. The percentage of a fund represented by securities or depositary receipts of companies based outside the United States.
Inception Date. The date on which the assets of a fund (or one of its share classes) are first invested in accordance with the fund’s investment objective. For funds with a subscription period, the inception date is the day after that period ends. Investment performance is measured from the inception date.
Median Market Cap. An indicator of the size of companies in which a fund invests; the midpoint of market capitalization (market price x shares outstanding) of a fund’s stocks, weighted by the proportion of the fund’s assets invested in each stock. Stocks representing half of the fund’s assets have market capitalizations above the median, and the rest are below it.
Price/Book Ratio. The share price of a stock divided by its net worth, or book value, per share.
For a fund, the weighted average price/book ratio of the stocks it holds.
108
Price/Earnings Ratio. The ratio of a stock’s current price to its per-share earnings over the past year. For a fund, the weighted average P/E of the stocks it holds. P/E is an indicator of market expectations about corporate prospects; the higher the P/E, the greater the expectations for a company’s future growth.
R-Squared. A measure of how much of a fund’s past returns can be explained by the returns from the market in general, as measured by a given index. If a fund’s total returns were precisely synchronized with an index’s returns, its R-squared would be 1.00. If the fund’s returns bore no relationship to the index’s returns, its R-squared would be 0. For this report, R-squared is based on returns over the past 36 months for both the fund and the index.
Return on Equity. The annual average rate of return generated by a company during the past five years for each dollar of shareholder’s equity (net income divided by shareholder’s equity). For a fund, the weighted average return on equity for the companies whose stocks it holds.
Short-Term Reserves. The percentage of a fund invested in highly liquid, short-term securities that can be readily converted to cash.
Turnover Rate. An indication of the fund’s trading activity. Funds with high turnover rates incur higher transaction costs and may be more likely to distribute capital gains (which may be taxable to investors). The turnover rate excludes in-kind transactions, which have minimal impact on costs.
109
This page intentionally left blank.
The People Who Govern Your Fund
The trustees of your mutual fund are there to see that the fund is operated and managed in your best interests since, as a shareholder, you are a part owner of the fund. Your fund’s trustees also serve on the board of directors of The Vanguard Group, Inc., which is owned by the Vanguard funds and provides services to them on an at-cost basis.
A majority of Vanguard’s board members are independent, meaning that they have no affiliation with Vanguard or the funds they oversee, apart from the sizable personal investments they have made as private individuals. The independent board members have distinguished backgrounds in business, academia, and public service. Each of the trustees and executive officers oversees 208 Vanguard funds.
Information for each trustee and executive officer of the fund appears below. The mailing address of the trustees and officers is P.O. Box 876, Valley Forge, PA 19482. More information about the trustees is in the Statement of Additional Information, which can be obtained, without charge, by contacting Vanguard at 800-662-7447, or online at vanguard.com.
Interested Trustees1
F. William McNabb III
Born in 1957. Trustee since July 2009. Principal occupation(s) during the past five years and other experience: chairman of the board (January 2010–present) of Vanguard and of each of the investment companies served by Vanguard, trustee (2009–present) of each of the investment companies served by Vanguard, and director (2008–present) of Vanguard. Chief executive officer and president (2008–2017) of Vanguard and each of the investment companies served by Vanguard, managing director (1995–2008) of Vanguard, and director (1997–2018) of Vanguard Marketing Corporation. Director (2018–present) of UnitedHealth Group.
Mortimer J. Buckley
Born in 1969. Trustee since January 2018. Principal occupation(s) during the past five years and other experience: chief executive officer (January 2018–present) of Vanguard; chief executive officer, president, and trustee (January 2018–present) of each of the investment companies served by Vanguard; president and director (2017–present) of Vanguard; and president (February 2018–present) of Vanguard Marketing Corporation. Chief investment officer (2013–2017), managing director (2002–2017), head of the Retail Investor Group (2006–2012), and chief information officer (2001–2006) of Vanguard. Chairman of the board (2011–2017) of the Children’s Hospital of Philadelphia.
Independent Trustees
Emerson U. Fullwood
Born in 1948. Trustee since January 2008. Principal occupation(s) during the past five years and other experience: executive chief staff and marketing officer for North America and corporate vice president (retired 2008) of Xerox Corporation (document management products and services). Former president of the Worldwide Channels Group, Latin America, and Worldwide Customer Service and executive chief staff officer of Developing Markets of Xerox. Executive in residence and 2009–2010 Distinguished Minett Professor at the Rochester Institute of Technology. Lead director of SPX FLOW, Inc. (multi-industry manufacturing). Director of the University of Rochester Medical Center, the Monroe Community College Foundation, the United Way of Rochester, North Carolina A&T University, and Roberts Wesleyan College. Trustee of the University of Rochester.
Amy Gutmann
Born in 1949. Trustee since June 2006. Principal occupation(s) during the past five years and other experience: president (2004–present) of the University of Pennsylvania. Christopher H. Browne Distinguished Professor of Political Science, School of Arts and Sciences, and professor of communication, Annenberg School for Communication, with secondary faculty appointments in the Department of Philosophy, School of Arts and Sciences, and at the Graduate School of Education, University of Pennsylvania. Trustee of the National Constitution Center.
1 Mr. McNabb and Mr. Buckley are considered “interested persons,” as defined in the Investment Company Act of 1940, because they are officers of the Vanguard funds.
JoAnn Heffernan Heisen
Born in 1950. Trustee since July 1998. Principal occupation(s) during the past five years and other experience: corporate vice president of Johnson & Johnson (pharmaceuticals/medical devices/consumer products) and member of its executive committee (1997–2008). Chief global diversity officer (retired 2008), vice president and chief information officer (1997–2006), controller (1995–1997), treasurer (1991–1995), and assistant treasurer (1989–1991) of Johnson & Johnson. Director of Skytop Lodge Corporation (hotels) and the Robert Wood Johnson Foundation. Member of the advisory board of the Institute for Women’s Leadership at Rutgers University.
F. Joseph Loughrey
Born in 1949. Trustee since October 2009. Principal occupation(s) during the past five years and other experience: president and chief operating officer (retired 2009) and vice chairman of the board (2008–2009) of Cummins Inc. (industrial machinery). Chairman of the board of Hillenbrand, Inc. (specialized consumer services), Oxfam America, and the Lumina Foundation for Education. Director of the V Foundation for Cancer Research. Member of the advisory council for the College of Arts and Letters and chair of the advisory board to the Kellogg Institute for International Studies, both at the University of Notre Dame.
Mark Loughridge
Born in 1953. Trustee since March 2012. Principal occupation(s) during the past five years and other experience: senior vice president and chief financial officer (retired 2013) of IBM (information technology services). Fiduciary member of IBM’s Retirement Plan Committee (2004–2013), senior vice president and general manager (2002–2004) of IBM Global Financing, vice president and controller (1998–2002) of IBM, and a variety of other prior management roles at IBM. Member of the Council on Chicago Booth.
Scott C. Malpass
Born in 1962. Trustee since March 2012. Principal occupation(s) during the past five years and other experience: chief investment officer (1989–present) and vice president (1996–present) of the University of Notre Dame. Assistant professor of finance at the Mendoza College of Business, University of Notre Dame, and member of the Notre Dame 403(b) Investment Committee. Chairman of the board of TIFF Advisory Services, Inc. Member of the board of Catholic Investment Services, Inc. (investment advisors), the board of advisors for Spruceview Capital Partners, and the board of superintendence of the Institute for the Works of Religion.
Deanna Mulligan
Born in 1963. Trustee since January 2018. Principal occupation(s) during the past five years and other experience: president (2010–present) and chief executive officer (2011–present) of The Guardian Life Insurance Company of America. Chief operating officer (2010–2011) and executive vice president (2008–2010) of Individual Life and Disability of The Guardian Life Insurance Company of America. Member of the board of The Guardian Life Insurance Company of America, the American Council of Life Insurers, the Partnership for New York City (business leadership), and the Committee Encouraging Corporate Philanthropy. Trustee of the Economic Club of New York and the Bruce Museum (arts and science). Member of the Advisory Council for the Stanford Graduate School of Business.
André F. Perold
Born in 1952. Trustee since December 2004. Principal occupation(s) during the past five years and other experience: George Gund Professor of Finance and Banking, Emeritus at the Harvard Business School (retired 2011). Chief investment officer and co-managing partner of HighVista Strategies LLC (private investment firm). Overseer of the Museum of Fine Arts Boston.
Sarah Bloom Raskin
Born in 1961. Trustee since January 2018. Principal occupation(s) during the past five years and other experience: deputy secretary (2014–2017) of the United States Department of the Treasury. Governor (2010–2014) of the Federal Reserve Board. Commissioner (2007–2010) of financial regulation for the State of Maryland. Member of the board of directors (2012–2014) of Neighborhood Reinvestment Corporation. Director of i(x) Investments, LLC.
Peter F. Volanakis
Born in 1955. Trustee since July 2009. Principal occupation(s) during the past five years and other experience: president and chief operating officer (retired 2010) of Corning Incorporated (communications equipment) and director of Corning Incorporated (2000–2010) and Dow Corning (2001–2010). Director (2012) of SPX Corporation (multi-industry manufacturing). Overseer of the Amos Tuck School of Business Administration, Dartmouth College (2001–2013). Chairman of the board of trustees of Colby-Sawyer College. Member of the Board of Hypertherm Inc. (industrial cutting systems, software, and consumables).
Executive Officers
Glenn Booraem
Born in 1967. Principal occupation(s) during the past five years and other experience: principal of Vanguard. Investment stewardship officer (2017–present), treasurer (2015–2017), controller (2010–2015), and assistant controller (2001–2010) of each of the investment companies served by Vanguard.
Christine M. Buchanan
Born in 1970. Principal occupation(s) during the past five years and other experience: principal of Vanguard and global head of Fund Administration at Vanguard. Treasurer (2017–present) of each of the investment companies served by Vanguard. Partner (2005–2017) at KPMG LLP (audit, tax, and advisory services).
Brian Dvorak
Born in 1973. Principal occupation(s) during the past five years and other experience: principal of Vanguard. Chief compliance officer (2017–present) of Vanguard and each of the investment companies served by Vanguard. Assistant vice president (2017–present) of Vanguard Marketing Corporation. Vice president and director of Enterprise Risk Management (2011–2013) at Oppenheimer Funds, Inc.
Thomas J. Higgins
Born in 1957. Principal occupation(s) during the past five years and other experience: principal of Vanguard. Chief financial officer (2008–present) and treasurer (1998–2008) of each of the investment companies served by Vanguard.
Peter Mahoney
Born in 1974. Principal occupation(s) during the past five years and other experience: principal of Vanguard. Controller (2015–present) of each of the investment companies served by Vanguard. Head of International Fund Services (2008–2014) at Vanguard.
Anne E. Robinson
Born in 1970. Principal occupation(s) during the past five years and other experience: general counsel (2016–present) of Vanguard. Secretary (2016–present) of Vanguard and of each of the investment companies served by Vanguard. Managing director (2016–present) of Vanguard. Director and senior vice president (2016–2018) of Vanguard Marketing Corporation. Managing director and general counsel of Global Cards and Consumer Services (2014–2016) at Citigroup. Counsel (2003–2014) at American Express.
Michael Rollings
Born in 1963. Principal occupation(s) during the past five years and other experience: finance director (2017–present) and treasurer (2017) of each of the investment companies served by Vanguard. Managing director (2016–present) of Vanguard. Chief financial officer (2016–present) of Vanguard. Director (2016–present) of Vanguard Marketing Corporation. Executive vice president and chief financial officer (2006–2016) of MassMutual Financial Group.
| |
| Vanguard Senior Management Team |
| |
| Mortimer J. Buckley | James M. Norris |
| Gregory Davis | Thomas M. Rampulla |
| John James | Karin A. Risi |
| Martha G. King | Anne E. Robinson |
| John T. Marcante | Michael Rollings |
| Chris D. McIsaac | |
| |
| |
| Chairman Emeritus and Senior Advisor |
| |
| John J. Brennan | |
| Chairman, 1996–2009 | |
| Chief Executive Officer and President, 1996–2008 |
| |
| |
| Founder | |
| |
| John C. Bogle | |
| Chairman and Chief Executive Officer, 1974–1996 |
|  |
| | P.O. Box 2600 |
| | Valley Forge, PA 19482-2600 |
| |
| |
| |
| Connect with Vanguard® > vanguard.com |
| |
| |
| |
| Fund Information > 800-662-7447 | Source for Bloomberg Barclays indexes: Bloomberg |
| Direct Investor Account Services > 800-662-2739 | Index Services Limited. Copyright 2018, Bloomberg. All |
| | rights reserved. |
| Institutional Investor Services > 800-523-1036 | |
| Text Telephone for People | |
| Who Are Deaf or Hard of Hearing > 800-749-7273 | |
| |
| This material may be used in conjunction | |
| with the offering of shares of any Vanguard | |
| fund only if preceded or accompanied by | |
| the fund’s current prospectus. | |
| |
| All comparative mutual fund data are from Lipper, a | |
| Thomson Reuters Company, or Morningstar, Inc., unless | |
| otherwise noted. | |
| |
| You can obtain a free copy of Vanguard’s proxy voting | |
| guidelines by visiting vanguard.com/proxyreporting or by | |
| calling Vanguard at 800-662-2739. The guidelines are | |
| also available from the SEC’s website, sec.gov. In | |
| addition, you may obtain a free report on how your fund | |
| voted the proxies for securities it owned during the 12 | |
| months ended June 30. To get the report, visit either | |
| vanguard.com/proxyreporting or sec.gov. | |
| |
| You can review and copy information about your fund at | |
| the SEC’s Public Reference Room in Washington, D.C. To | |
| find out more about this public service, call the SEC at | |
| 202-551-8090. Information about your fund is also | |
| available on the SEC’s website, and you can receive | |
| copies of this information, for a fee, by sending a | |
| request in either of two ways: via email addressed to | |
| publicinfo@sec.gov or via regular mail addressed to the | |
| Public Reference Section, Securities and Exchange | |
| Commission, Washington, DC 20549-1520. | |
| | © 2018 The Vanguard Group, Inc. |
| | All rights reserved. |
| | Vanguard Marketing Corporation, Distributor. |
| |
| | Q44192 072018 |

Semiannual Report | May 31, 2018
Vanguard U.S. Multifactor Fund
Vanguard’s Principles for Investing Success
We want to give you the best chance of investment success. These principles, grounded in Vanguard’s research and experience, can put you on the right path.
Goals. Create clear, appropriate investment goals.
Balance. Develop a suitable asset allocation using broadly diversified funds.
Cost. Minimize cost.
Discipline. Maintain perspective and long-term discipline.
A single theme unites these principles: Focus on the things you can control.
We believe there is no wiser course for any investor.
| |
| Contents | |
| Your Fund’s Performance at a Glance. | 1 |
| CEO’s Perspective. | 2 |
| Advisor’s Report. | 4 |
| Fund Profile. | 6 |
| Performance Summary. | 7 |
| Financial Statements. | 8 |
| About Your Fund’s Expenses. | 22 |
| Trustees Approve Advisory Arrangement. | 24 |
| Glossary. | 25 |
Please note: The opinions expressed in this report are just that—informed opinions. They should not be considered promises
or advice. Also, please keep in mind that the information and opinions cover the period through the date on the front of this
report. Of course, the risks of investing in your fund are spelled out in the prospectus.
See the Glossary for definitions of investment terms used in this report.
About the cover: Nautical images have been part of Vanguard’s rich heritage since its start in 1975. For an
incoming ship, a lighthouse offers a beacon and safe path to shore. You can similarly depend on Vanguard to put
you first––and light the way––as you strive to meet your financial goals. Our client focus and low costs,
stemming from our unique ownership structure, assure that your interests are paramount.
Your Fund’s Performance at a Glance
• From its February 15, 2018, inception through May 31, 2018, Vanguard U.S.
Multifactor Fund returned 3.28% for Admiral Shares. The fund outperformed its benchmark, the Russell 3000 Index.
• The fund seeks to provide long-term capital appreciation by investing in stocks that have relatively strong recent performance, strong fundamentals, and low prices relative to broad U.S. equity market fundamentals as determined by the advisor.
• In terms of relative sector performance, the advisor’s selections in and underweighting of health care and consumer staples contributed the most to returns, while utilities detracted.
| |
| Total Returns: Period Ended May 31, 2018 | |
| | Since Inception |
| Vanguard U.S. Multifactor Fund (Inception: 2/15/2018) | 3.28% |
| Russell 3000 Index | 0.43 |
| Multi-Cap Core Funds Average | -0.47 |
| Multi-Cap Core Funds Average: Derived from data provided by Lipper, a Thomson Reuters Company, and captures information from |
| February 28, 2018, through May 31, 2018. |
| Admiral Shares carry lower expenses and are available to investors who meet certain account-balance requirements. |
| | |
| Expense Ratios | | |
| Your Fund Compared With Its Peer Group | | |
| | | Peer Group |
| | Fund | Average |
| U.S. Multifactor Fund | 0.18% | 1.11% |
The fund expense ratio shown is from the prospectus dated February 13, 2018, and represents estimated costs for the current fiscal year.
For the period from the fund’s February 15, 2018, inception through May 31, 2018, the fund’s annualized expense ratio was 0.18%. The
peer-group expense ratio is derived from data provided by Lipper, a Thomson Reuters Company, and captures information through
year-end 2017.
Peer group: Multi-Cap Core Funds.
1
CEO’s Perspective

Tim Buckley
President and Chief Executive Officer
Dear Shareholder,
I feel extremely fortunate to have the chance to lead a company filled with people who come to work every day passionate about Vanguard’s core purpose: to take a stand for all investors, to treat them fairly, and to give them the best chance for investment success.
When I joined Vanguard in 1991, I found a mission-driven team focused on improving lives—helping people retire more comfortably, put their children through college, and achieve financial security. I also found a company with purpose in an industry ripe for improvement.
It was clear, even early in my career, that the cards were stacked against most investors. Hidden fees, performance-chasing, and poor advice were relentlessly eroding investors’ dreams.
We knew Vanguard could be different and, as a result, could make a real difference. We have lowered the costs of investing for our shareholders significantly. And we’re proud of the performance of our funds.
Vanguard is built for Vanguard investors—we focus solely on you, our fund shareholders. Everything we do is designed to give our clients the best chance for investment success. In my role as CEO, I’ll keep this priority
2
front and center. We’re proud of what we’ve achieved, but we’re even more excited about what’s to come.
Steady, time-tested guidance
Our guidance for investors, as always, is to stay the course, tune out the hyperbolic headlines, and focus on your goals and what you can control, such as costs and how much you save. This time-tested advice has served our clients well over the decades.
Regardless of how the markets perform in the short term, I’m incredibly optimistic about the future for our investors. We have a dedicated team serving you, and we will never stop striving to make Vanguard the best place for you to invest through our high-quality funds and services,
advice and guidance to help you meet your financial goals, and an experience that makes you feel good about entrusting us with your hard-earned savings.
Thank you for your continued loyalty.
Sincerely,

Mortimer J. Buckley
President and Chief Executive Officer
June 12, 2018
| | | |
| Market Barometer | | | |
| | | | Total Returns |
| | | Periods Ended May 31, 2018 |
| | Six | One | Five Years |
| | Months | Year | (Annualized) |
| Stocks | | | |
| Russell 1000 Index (Large-caps) | 3.33% | 14.60% | 12.91% |
| Russell 2000 Index (Small-caps) | 6.47 | 20.76 | 12.18 |
| Russell 3000 Index (Broad U.S. market) | 3.57 | 15.06 | 12.85 |
| FTSE All-World ex US Index (International) | 0.36 | 9.62 | 5.84 |
| |
| Bonds | | | |
| Bloomberg Barclays U.S. Aggregate Bond Index | | | |
| (Broad taxable market) | -1.04% | -0.37% | 1.98% |
| Bloomberg Barclays Municipal Bond Index | | | |
| (Broad tax-exempt market) | 0.71 | 1.11 | 2.92 |
| Citigroup Three-Month U.S. Treasury Bill Index | 0.73 | 1.24 | 0.35 |
| |
| CPI | | | |
| Consumer Price Index | 1.99% | 2.80% | 1.55% |
3
Advisor’s Report
Vanguard U.S. Multifactor Fund Admiral Shares returned 3.28% from the fund’s February 15, 2018, inception through May 31, 2018. The fund outperformed the 0.43% return of its benchmark, the Russell 3000 Index.
The fund seeks to create a portfolio with broad equity exposure and the potential for long-term capital appreciation by investing in stocks with relatively strong recent performance, strong fundamentals, and low prices relative to fundamentals. To promote diversification and to mitigate exposure to less liquid and more volatile stocks, a rules-based screen is applied to the universe of all U.S. large-, mid-, and small-capitalization stocks. We then evaluate the remaining securities based on exposure to momentum, quality, and value factors.
The investment environment
The broad U.S. equity market advanced for the period, with small-cap stocks outperforming large-caps and growth stocks outperforming value stocks. Volatility returned after an unusually long period of calm as markets reacted to recently enacted U.S. tax cuts, trade-war jitters, and perceived inflation risks.
The Federal Reserve, under new Chair Jerome Powell, raised the federal funds target rate in March by a quarter percentage point and began signaling that it could speed up its timetable for subsequent increases. (In June, after the close of the period covered in this report, the Fed raised the rate another quarter point, to 1.75%–2%, and signaled that it could raise the rate twice more in 2018 and at least three times in 2019.)
U.S. gross domestic product grew at an annual rate of 2.2% in the first quarter of 2018, a decrease from the previous quarter’s 2.9%. Nonresidential fixed investment, personal consumption, exports, and private inventory investment boosted growth, as did government spending at the federal, state, and local levels. Imports, however, slowed.
Small-cap companies tended to be better-positioned to benefit from the recent U.S. tax-law changes than large-caps, which can spread their tax liabilities globally. Small-caps are also likely to have less international exposure and thus be less affected by trade friction.
The outperformance of growth stocks was most pronounced within large-caps, with big technology companies showing the strongest overall momentum. Across the market cap spectrum, the energy and tech sectors performed best. Health care did well within small-caps.
Financial services disappointed, despite expectations for rising interest rates. Market commentators have attributed this to slow loan growth.
4
The fund’s successes and shortfalls
Exposure to small-cap stocks drove the U.S. Multifactor Fund’s advance. Quality and momentum factors provided the biggest contributions, with value factors helping to a lesser extent. Among sectors, health care and consumer staples added the most.
We expect our approach to portfolio construction to produce long-term capital appreciation that reflects the momentum, quality, and value factors emphasized by the fund. Not all periods will produce such favorable results across each factor.
However, we believe that focusing on the risk-adjusted returns of the portfolio relative to its targeted factors and the benchmark will serve investors well over time.
We thank you for your investment and look forward to serving you in the period ahead.
Antonio Picca, Portfolio Manager
Liqian Ren, Portfolio Manager
Quantitative Equity Group
June 20, 2018
5
U.S. Multifactor Fund
Fund Profile
As of May 31, 2018
| | |
| Portfolio Characteristics | | |
| | | Russell |
| | | 3000 |
| | Fund | Index |
| Number of Stocks | 577 | 2,941 |
| Median Market Cap | $10.7B | $66.7B |
| Price/Earnings Ratio | 17.3x | 20.8x |
| Price/Book Ratio | 2.3x | 2.1x |
| Return on Equity | 11.6% | 15.0% |
| Earnings Growth | | |
| Rate | 8.5% | 7.9% |
| Dividend Yield | 1.5% | 1.8% |
| Foreign Holdings | 0.0% | 0.0% |
| Turnover Rate | | |
| (Annualized) | 55% | — |
| Ticker Symbol | VFMFX | — |
| Expense Ratio1 | 0.18% | — |
| 30-Day SEC Yield | 1.37% | — |
| Short-Term Reserves | 1.0% | — |
| | |
| Ten Largest Holdings (% of total net assets) |
| Humana Inc. | Health Care | |
| | Management | |
| | Services | 1.2% |
| SunTrust Banks Inc. | Banks: Diversified | 1.1 |
| ConocoPhillips | Oil: Integrated | 1.1 |
| HP Inc. | Computer | |
| | Technology | 1.1 |
| Bank of New York | Diversified Financial | |
| Mellon Corp. | Services | 1.1 |
| Valero Energy Corp. | Oil: Refining & | |
| | Marketing | 1.1 |
| JPMorgan Chase & Co. | Diversified Financial | |
| | Services | 1.0 |
| Ross Stores Inc. | Specialty Retail | 1.0 |
| BlackRock Inc. | Asset Management | |
| | & Custodian | 0.9 |
| UnitedHealth Group Inc. | Health Care | |
| | Management | |
| | Services | 0.9 |
| Top Ten | | 10.5% |
| The holdings listed exclude any temporary cash investments and |
| equity index products. | | |
| | |
| Sector Diversification (% of equity exposure) |
| | | Russell |
| | | 3000 |
| | Fund | Index |
| Consumer Discretionary | 20.1% | 14.3% |
| Consumer Staples | 2.6 | 5.3 |
| Energy | 8.6 | 6.0 |
| Financial Services | 31.4 | 21.1 |
| Health Care | 8.3 | 13.2 |
| Materials & Processing | 3.7 | 3.8 |
| Other | 0.5 | 0.0 |
| Producer Durables | 11.5 | 10.8 |
| Technology | 11.0 | 21.0 |
| Utilities | 2.3 | 4.5 |
| Sector categories are based on the Russell Global Sectors (“RGS”), |
| except for the “Other” category (if applicable), which includes |
| securities that have not been provided a RGS classification as of |
| the effective reporting period. |
1 The expense ratio shown is from the prospectus dated February 13, 2018, and represents estimated costs for the current fiscal year. For
the period from the fund’s February 15, 2018, inception through May 31, 2018, the annualized expense ratio was 0.18%.
6
U.S. Multifactor Fund
Performance Summary
All of the returns in this report represent past performance, which is not a guarantee of future results that may be achieved by the fund. (Current performance may be lower or higher than the performance data cited. For performance data current to the most recent month-end, visit our website at vanguard.com/performance.) Note, too, that both investment returns and principal value can fluctuate widely, so an investor’s shares, when sold, could be worth more or less than their original cost. The returns shown do not reflect taxes that a shareholder would pay on fund distributions or on the sale of fund shares.
Fiscal-Period Total Returns (%): February 15, 2018, Through May 31, 2018
Total Return: Period Ended March 31, 2018
This table presents returns through the latest calendar quarter—rather than through the end of the fiscal period.
Securities and Exchange Commission rules require that we provide this information.
| | |
| | Inception | Since |
| | Date | Inception |
| Admiral Shares | 2/15/2018 | -0.56% |
See Financial Highlights for dividend and capital gains information.
7
U.S. Multifactor Fund
Financial Statements (unaudited)
Statement of Net Assets
As of May 31, 2018
The fund reports a complete list of its holdings in regulatory filings four times in each fiscal year, at the quarter-ends. For the second and fourth fiscal quarters, the lists appear in the fund’s semiannual and annual reports to shareholders. For the first and third fiscal quarters, the fund files the lists with the Securities and Exchange Commission on Form N-Q. Shareholders can look up the fund’s Forms N-Q on the SEC’s website at sec.gov. Forms N-Q may also be reviewed and copied at the SEC’s Public Reference Room (see the back cover of this report for further information).
| | | |
| | | | Market |
| | | | Value• |
| | | Shares | ($000) |
| Common Stocks (100.0%)1 | | |
| Consumer Discretionary (20.1%) | |
| | Ross Stores Inc. | 4,211 | 332 |
| | Walmart Inc. | 3,169 | 262 |
| | Las Vegas Sands Corp. | 3,058 | 246 |
| | Estee Lauder Cos. Inc. | | |
| | Class A | 1,577 | 236 |
| | Walt Disney Co. | 2,224 | 221 |
| | Carnival Corp. | 2,649 | 165 |
| | Kohl’s Corp. | 2,058 | 137 |
| | Gap Inc. | 4,720 | 132 |
| | PVH Corp. | 811 | 130 |
| * | Vera Bradley Inc. | 11,038 | 129 |
| | Dollar General Corp. | 1,469 | 128 |
| | Tower International Inc. | 4,292 | 126 |
| | Oxford Industries Inc. | 1,512 | 125 |
| | Tailored Brands Inc. | 3,796 | 125 |
| | Brinker International Inc. | 2,845 | 124 |
| | NIKE Inc. Class B | 1,636 | 117 |
| * | Cooper-Standard Holdings | | |
| | Inc. | 931 | 116 |
| * | Lululemon Athletica Inc. | 1,042 | 109 |
| | La-Z-Boy Inc. | 3,296 | 103 |
| | Lithia Motors Inc. Class A | 1,034 | 101 |
| * | Deckers Outdoor Corp. | 891 | 101 |
| * | Regis Corp. | 5,708 | 99 |
| | Lear Corp. | 453 | 90 |
| | Chico’s FAS Inc. | 10,228 | 87 |
| | DR Horton Inc. | 2,045 | 86 |
| | Marcus Corp. | 2,712 | 86 |
| | Ralph Lauren Corp. | | |
| | Class A | 617 | 83 |
| | Costco Wholesale Corp. | 401 | 79 |
| | Viad Corp. | 1,463 | 77 |
| * | Helen of Troy Ltd. | 821 | 74 |
| * | Sally Beauty Holdings Inc. | 4,616 | 70 |
| * | Madison Square Garden | | |
| | Co. Class A | 261 | 68 |
| | | |
| | International Speedway | | |
| | Corp. Class A | 1,633 | 68 |
| | Citi Trends Inc. | 2,240 | 67 |
| | Johnson Outdoors Inc. | | |
| | Class A | 784 | 59 |
| | Nordstrom Inc. | 1,159 | 57 |
| | Tractor Supply Co. | 723 | 54 |
| * | Zumiez Inc. | 2,186 | 53 |
| * | Shutterfly Inc. | 548 | 52 |
| | Cracker Barrel Old Country | | |
| | Store Inc. | 313 | 49 |
| | Standard Motor Products | | |
| | Inc. | 1,037 | 47 |
| | Caleres Inc. | 1,317 | 47 |
| * | Party City Holdco Inc. | 3,165 | 47 |
| | Yum! Brands Inc. | 567 | 46 |
| | Texas Roadhouse Inc. | | |
| | Class A | 741 | 46 |
| * | Adtalem Global Education Inc. | 940 | 45 |
| | Marriott International Inc. | | |
| | Class A | 331 | 45 |
| | H&R Block Inc. | 1,622 | 45 |
| | Ruth’s Hospitality Group Inc. | 1,665 | 44 |
| | News Corp. Class A | 2,917 | 44 |
| | Wynn Resorts Ltd. | 223 | 44 |
| | Williams-Sonoma Inc. | 708 | 39 |
| | American Eagle Outfitters | | |
| | Inc. | 1,678 | 37 |
| | New Media Investment | | |
| | Group Inc. | 2,212 | 37 |
| | DSW Inc. Class A | 1,545 | 37 |
| * | Urban Outfitters Inc. | 854 | 35 |
| | Best Buy Co. Inc. | 511 | 35 |
| * | AutoNation Inc. | 720 | 33 |
| | Toll Brothers Inc. | 822 | 32 |
| | Gannett Co. Inc. | 3,010 | 32 |
| | John Wiley & Sons Inc. | | |
| | Class A | 466 | 32 |
| | Dick’s Sporting Goods Inc. | 855 | 31 |
8
U.S. Multifactor Fund
| | | |
| | | | Market |
| | | | Value• |
| | Shares | ($000) |
| | Buckle Inc. | 1,234 | 31 |
| | Gentex Corp. | 1,277 | 31 |
| | Aaron’s Inc. | 736 | 29 |
| | Travelport Worldwide Ltd. | 1,613 | 28 |
| * | AutoZone Inc. | 43 | 28 |
| | Thor Industries Inc. | 296 | 27 |
| * | Red Robin Gourmet Burgers | | |
| | Inc. | 528 | 27 |
| | Yum China Holdings Inc. | 674 | 26 |
| | Children’s Place Inc. | 205 | 26 |
| * | Perry Ellis International Inc. | 933 | 26 |
| | National Presto Industries Inc. | 221 | 25 |
| | Royal Caribbean Cruises Ltd. | 233 | 24 |
| | Hyatt Hotels Corp. Class A | 292 | 24 |
| * | ZAGG Inc. | 1,512 | 23 |
| * | Grand Canyon Education Inc. | 197 | 22 |
| * | Burlington Stores Inc. | 146 | 21 |
| * | Qurate Retail Group Inc. | | |
| | QVC Group Class A | 1,039 | 21 |
| | Tiffany & Co. | 156 | 20 |
| | Winnebago Industries Inc. | 486 | 18 |
| | Movado Group Inc. | 357 | 18 |
| | Haverty Furniture Cos. Inc. | 805 | 16 |
| | Columbia Sportswear Co. | 183 | 16 |
| * | Shutterstock Inc. | 328 | 16 |
| * | NVR Inc. | 5 | 15 |
| | Cato Corp. Class A | 653 | 15 |
| | PulteGroup Inc. | 477 | 14 |
| | Darden Restaurants Inc. | 163 | 14 |
| * | Crocs Inc. | 784 | 14 |
| * | America’s Car-Mart Inc. | 220 | 14 |
| * | Monarch Casino & Resort | | |
| | Inc. | 295 | 13 |
| | Carter’s Inc. | 120 | 13 |
| | BorgWarner Inc. | 264 | 13 |
| * | MSG Networks Inc. | 663 | 13 |
| | Entravision Communications | | |
| | Corp. Class A | 3,133 | 13 |
| * | Etsy Inc. | 385 | 12 |
| | Garmin Ltd. | 192 | 12 |
| * | Liberty Expedia Holdings | | |
| | Inc. Class A | 255 | 11 |
| * | Asbury Automotive Group Inc. | 159 | 11 |
| | Steven Madden Ltd. | 208 | 11 |
| | Wolverine World Wide Inc. | 327 | 11 |
| | Rent-A-Center Inc. | 1,063 | 10 |
| | BJ’s Restaurants Inc. | 180 | 10 |
| | Ethan Allen Interiors Inc. | 410 | 10 |
| * | Care.com Inc. | 435 | 9 |
| * | Genesco Inc. | 193 | 8 |
| | Graham Holdings Co. Class B | 14 | 8 |
| | Hooker Furniture Corp. | 216 | 8 |
| * | Sleep Number Corp. | 287 | 8 |
| | Inter Parfums Inc. | 150 | 8 |
| | KB Home | 298 | 8 |
| | | |
| * | Ollie’s Bargain Outlet | | |
| | Holdings Inc. | 111 | 8 |
| * | Cavco Industries Inc. | 37 | 8 |
| * | MCBC Holdings Inc. | 256 | 8 |
| | Sonic Automotive Inc. | | |
| | Class A | 349 | 7 |
| * | Career Education Corp. | 474 | 7 |
| | Sinclair Broadcast Group Inc. | | |
| | Class A | 257 | 7 |
| * | Motorcar Parts of America | | |
| | Inc. | 328 | 7 |
| | Big Lots Inc. | 166 | 7 |
| * | El Pollo Loco Holdings Inc. | 622 | 7 |
| * | Stoneridge Inc. | 208 | 7 |
| * | Five Below Inc. | 89 | 6 |
| | Bloomin’ Brands Inc. | 296 | 6 |
| * | Murphy USA Inc. | 93 | 6 |
| | Monro Inc. | 106 | 6 |
| * | Potbelly Corp. | 390 | 5 |
| | New York Times Co. | | |
| | Class A | 190 | 4 |
| | Tenneco Inc. | 95 | 4 |
| | | | 6,462 |
| Consumer Staples (2.6%) | | |
| | Nu Skin Enterprises Inc. | | |
| | Class A | 1,482 | 121 |
| | Sanderson Farms Inc. | 872 | 85 |
| | Lamb Weston Holdings Inc. | 1,232 | 79 |
| | JM Smucker Co. | 604 | 65 |
| | Brown-Forman Corp. | | |
| | Class B | 1,056 | 60 |
| | Flowers Foods Inc. | 2,760 | 56 |
| | Medifast Inc. | 324 | 47 |
| * | US Foods Holding Corp. | 1,197 | 43 |
| | Ingredion Inc. | 343 | 38 |
| * | Cal-Maine Foods Inc. | 724 | 35 |
| | Walgreens Boots Alliance | | |
| | Inc. | 525 | 33 |
| * | Boston Beer Co. Inc. | | |
| | Class A | 126 | 32 |
| | Calavo Growers Inc. | 363 | 32 |
| * | United Natural Foods Inc. | 696 | 32 |
| * | USANA Health Sciences Inc. | 122 | 14 |
| * | Performance Food Group Co. | 355 | 13 |
| | Weis Markets Inc. | 214 | 12 |
| | Tyson Foods Inc. Class A | 153 | 10 |
| | Casey’s General Stores Inc. | 86 | 8 |
| * | Sprouts Farmers Market Inc. | 308 | 7 |
| | J&J Snack Foods Corp. | 45 | 6 |
| | | | 828 |
| Energy (8.6%) | | |
| | ConocoPhillips | 5,390 | 363 |
| | Valero Energy Corp. | 2,829 | 343 |
| | Phillips 66 | 2,401 | 280 |
| | Chevron Corp. | 2,037 | 253 |
9
U.S. Multifactor Fund
| | | |
| | | | Market |
| | | | Value• |
| | | Shares | ($000) |
| | Marathon Petroleum Corp. | 2,836 | 224 |
| | Occidental Petroleum Corp. | 2,487 | 209 |
| | Murphy Oil Corp. | 4,927 | 152 |
| * | Energen Corp. | 1,760 | 119 |
| | Helmerich & Payne Inc. | 1,774 | 118 |
| * | Solaris Oilfield Infrastructure | | |
| | Inc. Class A | 6,477 | 100 |
| * | ProPetro Holding Corp. | 5,981 | 97 |
| | Arch Coal Inc. Class A | 1,049 | 86 |
| * | Matrix Service Co. | 3,875 | 75 |
| | Warrior Met Coal Inc. | 2,499 | 68 |
| | HollyFrontier Corp. | 746 | 58 |
| | Marathon Oil Corp. | 2,466 | 53 |
| * | WildHorse Resource | | |
| | Development Corp. | 1,798 | 48 |
| | Peabody Energy Corp. | 1,042 | 45 |
| | Exxon Mobil Corp. | 440 | 36 |
| * | W&T Offshore Inc. | 2,669 | 18 |
| | Delek US Holdings Inc. | 193 | 11 |
| | PBF Energy Inc. Class A | 213 | 10 |
| * | REX American Resources | | |
| | Corp. | 102 | 8 |
| * | Abraxas Petroleum Corp. | 2,602 | 7 |
| | | | 2,781 |
| Financial Services (31.4%) | | |
| | SunTrust Banks Inc. | 5,476 | 370 |
| | Bank of New York Mellon | | |
| | Corp. | 6,308 | 345 |
| | JPMorgan Chase & Co. | 3,160 | 338 |
| | BlackRock Inc. | 552 | 295 |
| | BB&T Corp. | 5,016 | 263 |
| | Allstate Corp. | 2,604 | 243 |
| | Visa Inc. Class A | 1,850 | 242 |
| | Travelers Cos. Inc. | 1,789 | 230 |
| | Progressive Corp. | 3,701 | 230 |
| | American Express Co. | 2,106 | 207 |
| | PNC Financial Services | | |
| | Group Inc. | 1,380 | 198 |
| | Aflac Inc. | 4,194 | 189 |
| | Morgan Stanley | 3,765 | 189 |
| | Bank of America Corp. | 5,359 | 156 |
| | Mastercard Inc. Class A | 797 | 152 |
| | Prosperity Bancshares Inc. | 1,908 | 138 |
| | CME Group Inc. | 787 | 128 |
| | Goldman Sachs Group Inc. | 544 | 123 |
| | Walker & Dunlop Inc. | 2,182 | 122 |
| | Synovus Financial Corp. | 2,011 | 109 |
| | Zions Bancorporation | 1,947 | 107 |
| | Hanover Insurance Group | | |
| | Inc. | 879 | 107 |
| | First Interstate BancSystem | | |
| | Inc. Class A | 2,439 | 106 |
| | Synchrony Financial | 3,064 | 106 |
| | CIT Group Inc. | 2,030 | 101 |
| | East West Bancorp Inc. | 1,408 | 98 |
| | | |
| | US Bancorp | 1,885 | 94 |
| | Primerica Inc. | 958 | 94 |
| | CVB Financial Corp. | 3,977 | 92 |
| | LegacyTexas Financial | | |
| | Group Inc. | 2,184 | 92 |
| | NBT Bancorp Inc. | 2,400 | 91 |
| | Hanmi Financial Corp. | 3,040 | 91 |
| | People’s United Financial | | |
| | Inc. | 4,805 | 88 |
| | Northwest Bancshares Inc. | 5,120 | 88 |
| | CoBiz Financial Inc. | 3,953 | 88 |
| * | Third Point Reinsurance Ltd. | 6,587 | 88 |
| | M&T Bank Corp. | 510 | 88 |
| | CorEnergy Infrastructure | | |
| | Trust Inc. | 2,385 | 86 |
| | Independent Bank Group | | |
| | Inc. | 1,146 | 86 |
| | Central Pacific Financial | | |
| | Corp. | 2,890 | 85 |
| | American National | | |
| | Insurance Co. | 713 | 85 |
| * | HomeStreet Inc. | 3,152 | 84 |
| | BOK Financial Corp. | 830 | 84 |
| | Great Western Bancorp Inc. | 1,910 | 83 |
| | Fidelity Southern Corp. | 3,383 | 83 |
| | Brown & Brown Inc. | 2,964 | 82 |
| | International Bancshares | | |
| | Corp. | 1,814 | 78 |
| | Discover Financial Services | 1,055 | 78 |
| | State Street Corp. | 795 | 76 |
| | S&P Global Inc. | 384 | 76 |
| | BancorpSouth Bank | 2,252 | 75 |
| | Cadence BanCorp Class A | 2,571 | 75 |
| | MetLife Inc. | 1,631 | 75 |
| * | BofI Holding Inc. | 1,762 | 73 |
| | TD Ameritrade Holding | | |
| | Corp. | 1,210 | 72 |
| | Opus Bank | 2,387 | 71 |
| | Stifel Financial Corp. | 1,198 | 70 |
| | Cullen/Frost Bankers Inc. | 577 | 66 |
| | Trustmark Corp. | 2,035 | 65 |
| | SEI Investments Co. | 1,021 | 65 |
| | Umpqua Holdings Corp. | 2,696 | 63 |
| | FirstCash Inc. | 658 | 60 |
| | Commerce Bancshares Inc. | 915 | 59 |
| * | TriState Capital Holdings Inc. | 2,213 | 57 |
| | National General Holdings | | |
| | Corp. | 2,057 | 56 |
| | S&T Bancorp Inc. | 1,210 | 55 |
| | City Holding Co. | 714 | 53 |
| | WesBanco Inc. | 1,138 | 53 |
| | Broadridge Financial | | |
| | Solutions Inc. | 456 | 53 |
| * | Eagle Bancorp Inc. | 829 | 50 |
| | Ally Financial Inc. | 1,907 | 49 |
10
U.S. Multifactor Fund
| | | |
| | | | Market |
| | | | Value• |
| | Shares | ($000) |
| | Northern Trust Corp. | 449 | 46 |
| | KeyCorp | 2,292 | 45 |
| | Federal Agricultural | | |
| | Mortgage Corp. | 461 | 43 |
| | Voya Financial Inc. | 828 | 43 |
| | Enterprise Financial Services | | |
| | Corp. | 775 | 42 |
| | T. Rowe Price Group Inc. | 348 | 42 |
| | BancFirst Corp. | 696 | 42 |
| | WR Berkley Corp. | 529 | 40 |
| | Invesco Ltd. | 1,476 | 40 |
| | Torchmark Corp. | 472 | 40 |
| | Washington Federal Inc. | 1,157 | 38 |
| * | Encore Capital Group Inc. | 934 | 37 |
| | BankUnited Inc. | 865 | 37 |
| | TCF Financial Corp. | 1,382 | 36 |
| | Comerica Inc. | 385 | 36 |
| | Regions Financial Corp. | 1,977 | 36 |
| | Reinsurance Group of | | |
| | America Inc. Class A | 241 | 36 |
| | FNF Group | 960 | 36 |
| | Principal Financial Group Inc. | 628 | 35 |
| | Fifth Third Bancorp | 1,132 | 35 |
| | First American Financial Corp. | 651 | 34 |
| * | Essent Group Ltd. | 988 | 34 |
| | Citizens Financial Group Inc. | 825 | 34 |
| | Ameriprise Financial Inc. | 241 | 33 |
| | CNA Financial Corp. | 699 | 33 |
| | Lincoln National Corp. | 490 | 33 |
| | Affiliated Managers Group | | |
| | Inc. | 199 | 32 |
| * | Western Alliance Bancorp | 474 | 29 |
| | First Citizens BancShares | | |
| | Inc. Class A | 64 | 28 |
| | LPL Financial Holdings Inc. | 401 | 28 |
| | Huntington Bancshares Inc. | 1,838 | 27 |
| * | Signature Bank | 210 | 27 |
| | UMB Financial Corp. | 339 | 26 |
| | Wintrust Financial Corp. | 279 | 26 |
| * | Forestar Group Inc. | 1,059 | 25 |
| | Selective Insurance Group | | |
| | Inc. | 418 | 24 |
| * | E*TRADE Financial Corp. | 344 | 22 |
| | Bank of NT Butterfield & | | |
| | Son Ltd. | 430 | 21 |
| | Banco Latinoamericano de | | |
| | Comercio Exterior SA | 752 | 20 |
| | Chemical Financial Corp. | 342 | 19 |
| | TriCo Bancshares | 472 | 18 |
| | ConnectOne Bancorp Inc. | 692 | 18 |
| | Peapack Gladstone | | |
| | Financial Corp. | 522 | 18 |
| | Bank of Hawaii Corp. | 207 | 18 |
| | Cathay General Bancorp | 410 | 17 |
| | Preferred Bank | 270 | 17 |
| | | |
| | Legg Mason Inc. | 456 | 17 |
| | Total System Services Inc. | 188 | 16 |
| | Raymond James Financial | | |
| | Inc. | 157 | 15 |
| | Loews Corp. | 292 | 14 |
| | Fulton Financial Corp. | 810 | 14 |
| | Unum Group | 353 | 14 |
| | CNO Financial Group Inc. | 667 | 13 |
| | Nelnet Inc. Class A | 210 | 13 |
| | Morningstar Inc. | 103 | 12 |
| | Assurant Inc. | 126 | 12 |
| | Jack Henry & Associates Inc. | 91 | 11 |
| | FNB Corp. | 831 | 11 |
| | Lazard Ltd. Class A | 205 | 11 |
| | National Western Life Group | | |
| | Inc. Class A | 32 | 10 |
| | Waddell & Reed Financial | | |
| | Inc. Class A | 501 | 10 |
| | Provident Financial Services | | |
| | Inc. | 346 | 10 |
| | TrustCo Bank Corp. NY | 1,111 | 10 |
| | 1st Source Corp. | 181 | 10 |
| * | CBRE Group Inc. Class A | 208 | 10 |
| | Green Bancorp Inc. | 405 | 9 |
| | Lakeland Bancorp Inc. | 428 | 9 |
| | Kinsale Capital Group Inc. | 156 | 8 |
| * | PennyMac Financial Services | | |
| | Inc. Class A | 403 | 8 |
| | First Bancorp | 194 | 8 |
| | Park National Corp. | 70 | 8 |
| | First Financial Bancorp | 255 | 8 |
| | Houlihan Lokey Inc. Class A | 164 | 8 |
| | American Financial Group Inc. | 72 | 8 |
| | Hartford Financial Services | | |
| | Group Inc. | 150 | 8 |
| | Dime Community Bancshares | | |
| | Inc. | 380 | 8 |
| | Lakeland Financial Corp. | 154 | 8 |
| | Heartland Financial USA Inc. | 133 | 7 |
| | Meridian Bancorp Inc. | 372 | 7 |
| | Horace Mann Educators Corp. | 156 | 7 |
| | Independent Bank Corp. | 85 | 7 |
| | Safety Insurance Group Inc. | 77 | 7 |
| | Capitol Federal Financial Inc. | 492 | 6 |
| | Federated Investors Inc. | | |
| | Class B | 262 | 6 |
| | WSFS Financial Corp. | 121 | 6 |
| | Hope Bancorp Inc. | 344 | 6 |
| | American Equity Investment | | |
| | Life Holding Co. | 173 | 6 |
| | | | 10,109 |
| Health Care (8.3%) | | |
| | Humana Inc. | 1,276 | 371 |
| | UnitedHealth Group Inc. | 1,163 | 281 |
| | HCA Healthcare Inc. | 2,415 | 249 |
11
U.S. Multifactor Fund
| | | |
| | | | Market |
| | | | Value• |
| | | Shares | ($000) |
| | Cigna Corp. | 1,406 | 238 |
| * | Amneal Pharmaceuticals Inc. | 7,603 | 150 |
| * | Biogen Inc. | 459 | 135 |
| * | Medpace Holdings Inc. | 2,697 | 114 |
| * | ICU Medical Inc. | 360 | 105 |
| * | Magellan Health Inc. | 1,141 | 104 |
| | Danaher Corp. | 1,008 | 100 |
| | Universal Health Services | | |
| | Inc. Class B | 843 | 97 |
| | Anthem Inc. | 307 | 68 |
| * | HealthEquity Inc. | 826 | 61 |
| * | athenahealth Inc. | 392 | 59 |
| * | Intuitive Surgical Inc. | 118 | 54 |
| * | Veeva Systems Inc. Class A | 634 | 49 |
| * | Centene Corp. | 405 | 47 |
| * | Triple-S Management Corp. | | |
| | Class B | 1,249 | 46 |
| * | WellCare Health Plans Inc. | 199 | 44 |
| | Cantel Medical Corp. | 401 | 44 |
| | CONMED Corp. | 615 | 42 |
| * | Innoviva Inc. | 2,535 | 38 |
| * | AngioDynamics Inc. | 1,235 | 26 |
| * | Globus Medical Inc. | 466 | 26 |
| | Chemed Corp. | 52 | 17 |
| * | Align Technology Inc. | 46 | 15 |
| | STERIS plc | 131 | 14 |
| * | Haemonetics Corp. | 124 | 11 |
| * | Inogen Inc. | 60 | 11 |
| * | Providence Service Corp. | 133 | 10 |
| * | Laboratory Corp. of America | | |
| | Holdings | 51 | 9 |
| * | AMN Healthcare Services | | |
| | Inc. | 144 | 8 |
| * | PDL BioPharma Inc. | 3,033 | 8 |
| | Luminex Corp. | 277 | 8 |
| * | Select Medical Holdings | | |
| | Corp. | 398 | 7 |
| | Patterson Cos. Inc. | 315 | 7 |
| | | | 2,673 |
| Materials & Processing (3.7%) | | |
| | LyondellBasell Industries NV | | |
| | Class A | 1,394 | 156 |
| | Universal Forest Products | | |
| | Inc. | 2,992 | 110 |
| * | NCI Building Systems Inc. | 4,751 | 91 |
| * | Unifi Inc. | 2,825 | 89 |
| * | Foundation Building | | |
| | Materials Inc. | 5,603 | 86 |
| | WestRock Co. | 1,130 | 67 |
| * | Kraton Corp. | 1,213 | 59 |
| | Commercial Metals Co. | 2,082 | 49 |
| | Boise Cascade Co. | 954 | 45 |
| | Westlake Chemical Corp. | 353 | 41 |
| | Louisiana-Pacific Corp. | 1,377 | 40 |
| | Steel Dynamics Inc. | 809 | 40 |
| | | |
| | Rayonier Advanced | | |
| | Materials Inc. | 1,664 | 30 |
| | Owens Corning | 439 | 28 |
| | Gold Resource Corp. | 4,038 | 25 |
| | Materion Corp. | 461 | 25 |
| | Simpson Manufacturing | | |
| | Co. Inc. | 374 | 24 |
| | Packaging Corp. of America | 134 | 16 |
| | Reliance Steel & Aluminum | | |
| | Co. | 168 | 16 |
| | Newmont Mining Corp. | 345 | 13 |
| | Domtar Corp. | 241 | 12 |
| * | AdvanSix Inc. | 298 | 11 |
| | Greif Inc. Class A | 183 | 11 |
| * | Continental Building | | |
| | Products Inc. | 351 | 11 |
| | PolyOne Corp. | 246 | 10 |
| | Cabot Microelectronics Corp. | 84 | 10 |
| | Huntsman Corp. | 295 | 9 |
| | Watsco Inc. | 50 | 9 |
| | Interface Inc. Class A | 403 | 9 |
| | Comfort Systems USA Inc. | 191 | 9 |
| * | BMC Stock Holdings Inc. | 409 | 8 |
| | Carpenter Technology Corp. | 115 | 7 |
| | Chase Corp. | 57 | 7 |
| | Stepan Co. | 88 | 6 |
| * | RBC Bearings Inc. | 49 | 6 |
| * | GMS Inc. | 204 | 6 |
| | Schnitzer Steel Industries | | |
| | Inc. | 193 | 6 |
| | | | 1,197 |
| Other (0.5%) | | |
| | Autoliv Inc. | 548 | 81 |
| | TE Connectivity Ltd. | 748 | 70 |
| | | | 151 |
| Producer Durables (11.5%) | | |
| | Raytheon Co. | 1,167 | 245 |
| | Johnson Controls | | |
| | International plc | 3,552 | 119 |
| | Deluxe Corp. | 1,723 | 115 |
| | Systemax Inc. | 3,349 | 111 |
| | Accenture plc Class A | 695 | 108 |
| | Kaman Corp. | 1,454 | 103 |
| | ICF International Inc. | 1,411 | 100 |
| | Schneider National Inc. | | |
| | Class B | 3,374 | 99 |
| * | Modine Manufacturing Co. | 5,199 | 94 |
| | Korn/Ferry International | 1,599 | 87 |
| | Boeing Co. | 240 | 85 |
| | Primoris Services Corp. | 3,232 | 84 |
| | Huntington Ingalls | | |
| | Industries Inc. | 380 | 84 |
| * | Teledyne Technologies Inc. | 396 | 80 |
| * | TrueBlue Inc. | 3,087 | 80 |
| | Marten Transport Ltd. | 3,353 | 76 |
12
U.S. Multifactor Fund
| | | |
| | | | Market |
| | | | Value• |
| | | Shares | ($000) |
| | Cummins Inc. | 532 | 76 |
| * | JetBlue Airways Corp. | 3,981 | 75 |
| * | TriNet Group Inc. | 1,344 | 72 |
| | Curtiss-Wright Corp. | 553 | 70 |
| | IDEX Corp. | 495 | 69 |
| * | Zebra Technologies Corp. | 443 | 68 |
| | Stanley Black & Decker Inc. | 451 | 63 |
| | National Instruments Corp. | 1,467 | 61 |
| | Hyster-Yale Materials | | |
| | Handling Inc. | 911 | 61 |
| | FedEx Corp. | 243 | 61 |
| | Spirit AeroSystems Holdings | | |
| | Inc. Class A | 702 | 59 |
| | Knight-Swift Transportation | | |
| | Holdings Inc. | 1,439 | 59 |
| | ACCO Brands Corp. | 4,016 | 52 |
| | Pentair plc | 1,171 | 51 |
| | McGrath RentCorp | 776 | 51 |
| | Xylem Inc. | 699 | 49 |
| | EMCOR Group Inc. | 630 | 48 |
| | Copa Holdings SA Class A | 431 | 48 |
| | Landstar System Inc. | 417 | 47 |
| | JB Hunt Transport Services | | |
| | Inc. | 344 | 44 |
| | Convergys Corp. | 1,818 | 43 |
| | Steelcase Inc. Class A | 2,895 | 42 |
| * | Covenant Transportation | | |
| | Group Inc. Class A | 1,169 | 35 |
| * | nVent Electric plc | 1,171 | 32 |
| | Barrett Business Services | | |
| | Inc. | 364 | 31 |
| | Old Dominion Freight Line | | |
| | Inc. | 200 | 31 |
| | Werner Enterprises Inc. | 789 | 31 |
| | Matson Inc. | 855 | 29 |
| | ManpowerGroup Inc. | 296 | 27 |
| | Kelly Services Inc. Class A | 1,085 | 24 |
| | Herman Miller Inc. | 702 | 23 |
| * | Saia Inc. | 278 | 23 |
| | Forward Air Corp. | 371 | 22 |
| | SkyWest Inc. | 386 | 22 |
| * | Sykes Enterprises Inc. | 753 | 21 |
| * | Casella Waste Systems | | |
| | Inc. Class A | 855 | 20 |
| | Robert Half International Inc. | 266 | 17 |
| | Textron Inc. | 247 | 16 |
| | Ryder System Inc. | 215 | 14 |
| | Dover Corp. | 170 | 13 |
| * | CBIZ Inc. | 633 | 13 |
| | MAXIMUS Inc. | 211 | 13 |
| | Air Lease Corp. Class A | 286 | 13 |
| | Insperity Inc. | 137 | 13 |
| | Allison Transmission | | |
| | Holdings Inc. | 301 | 12 |
| | UniFirst Corp. | 70 | 12 |
| | | |
| * | FTI Consulting Inc. | 190 | 12 |
| | FLIR Systems Inc. | 204 | 11 |
| | Trinity Industries Inc. | 315 | 11 |
| | Heidrick & Struggles | | |
| | International Inc. | 277 | 10 |
| | Hillenbrand Inc. | 223 | 10 |
| * | Darling Ingredients Inc. | 532 | 10 |
| * | CoStar Group Inc. | 26 | 10 |
| * | Copart Inc. | 172 | 9 |
| | Kansas City Southern | 87 | 9 |
| | Graco Inc. | 196 | 9 |
| | Rollins Inc. | 178 | 9 |
| * | SP Plus Corp. | 246 | 9 |
| * | ASGN Inc. | 107 | 8 |
| * | Proto Labs Inc. | 68 | 8 |
| * | Dycom Industries Inc. | 87 | 8 |
| | Knoll Inc. | 399 | 8 |
| | Republic Services Inc. | | |
| | Class A | 119 | 8 |
| | Granite Construction Inc. | 141 | 8 |
| * | ExlService Holdings Inc. | 139 | 8 |
| | Briggs & Stratton Corp. | 424 | 8 |
| | AMETEK Inc. | 104 | 8 |
| | AAR Corp. | 169 | 8 |
| | Snap-on Inc. | 48 | 7 |
| | HEICO Corp. | 76 | 7 |
| | Encore Wire Corp. | 143 | 7 |
| * | FARO Technologies Inc. | 127 | 7 |
| | Quad/Graphics Inc. | 339 | 7 |
| | Watts Water Technologies | | |
| | Inc. Class A | 86 | 7 |
| * | TopBuild Corp. | 77 | 6 |
| * | Generac Holdings Inc. | 125 | 6 |
| | Ship Finance International | | |
| | Ltd. | 409 | 6 |
| * | WESCO International Inc. | 74 | 4 |
| | | | 3,709 |
| Technology (11.0%) | | |
| | HP Inc. | 16,029 | 353 |
| | Cognizant Technology | | |
| | Solutions Corp. Class A | 3,421 | 258 |
| | Texas Instruments Inc. | 2,234 | 250 |
| * | Adobe Systems Inc. | 983 | 245 |
| | Apple Inc. | 811 | 152 |
| * | salesforce.com Inc. | 1,161 | 150 |
| | Intuit Inc. | 700 | 141 |
| * | CACI International Inc. | | |
| | Class A | 738 | 123 |
| | Jabil Inc. | 4,110 | 116 |
| | Entegris Inc. | 3,244 | 114 |
| * | Diodes Inc. | 2,787 | 95 |
| * | Akamai Technologies Inc. | 1,245 | 94 |
| | Intel Corp. | 1,563 | 86 |
| | Comtech | | |
| | Telecommunications Corp. | 2,341 | 73 |
13
U.S. Multifactor Fund
| | | |
| | | | Market |
| | | | Value• |
| | | Shares | ($000) |
| * | Fortinet Inc. | 1,112 | 68 |
| * | NETGEAR Inc. | 1,120 | 68 |
| * | VMware Inc. Class A | 461 | 63 |
| * | ANSYS Inc. | 387 | 63 |
| | Maxim Integrated Products | | |
| | Inc. | 1,010 | 59 |
| | CA Inc. | 1,457 | 52 |
| | Activision Blizzard Inc. | 705 | 50 |
| | Teradyne Inc. | 1,309 | 50 |
| * | Dell Technologies Inc. | | |
| | Class V | 606 | 49 |
| | Hewlett Packard Enterprise | | |
| | Co. | 3,206 | 49 |
| * | Perficient Inc. | 1,830 | 48 |
| | Harris Corp. | 313 | 47 |
| | Amdocs Ltd. | 635 | 43 |
| | Cohu Inc. | 1,497 | 36 |
| * | Qorvo Inc. | 442 | 35 |
| * | Virtusa Corp. | 712 | 35 |
| | ManTech International Corp. | | |
| | Class A | 613 | 33 |
| * | Syntel Inc. | 931 | 29 |
| * | New Relic Inc. | 252 | 26 |
| * | F5 Networks Inc. | 146 | 25 |
| * | Zendesk Inc. | 450 | 25 |
| | Motorola Solutions Inc. | 230 | 25 |
| * | TTM Technologies Inc. | 1,270 | 23 |
| * | ON Semiconductor Corp. | 865 | 22 |
| | Blackbaud Inc. | 219 | 21 |
| | Progress Software Corp. | 447 | 17 |
| * | Red Hat Inc. | 97 | 16 |
| * | Synopsys Inc. | 159 | 14 |
| | Vishay Intertechnology Inc. | 629 | 13 |
| * | EPAM Systems Inc. | 108 | 13 |
| | DXC Technology Co. | 143 | 13 |
| * | ePlus Inc. | 142 | 13 |
| * | Appfolio Inc. | 208 | 12 |
| * | IPG Photonics Corp. | 46 | 11 |
| * | VeriSign Inc. | 83 | 11 |
| * | LivePerson Inc. | 542 | 11 |
| | Skyworks Solutions Inc. | 103 | 10 |
| * | RingCentral Inc. Class A | 130 | 10 |
| | | |
| | Monotype Imaging | | |
| | Holdings Inc. | 453 | 10 |
| | Dolby Laboratories Inc. | | |
| | Class A | 154 | 10 |
| * | Qualys Inc. | 118 | 9 |
| | Cypress Semiconductor | | |
| | Corp. | 548 | 9 |
| * | Yelp Inc. Class A | 207 | 9 |
| * | Amkor Technology Inc. | 974 | 9 |
| * | Workday Inc. Class A | 59 | 8 |
| * | Limelight Networks Inc. | 1,481 | 7 |
| * | EchoStar Corp. Class A | 152 | 7 |
| * | Rudolph Technologies Inc. | 205 | 7 |
| * | Inovalon Holdings Inc. | | |
| | Class A | 614 | 6 |
| * | CalAmp Corp. | 291 | 6 |
| * | Workiva Inc. | 213 | 6 |
| | | | 3,561 |
| Utilities (2.3%) | | |
| | Exelon Corp. | 6,681 | 276 |
| | Hawaiian Electric Industries | | |
| | Inc. | 2,835 | 97 |
| | ALLETE Inc. | 923 | 71 |
| * | United States Cellular Corp. | 1,934 | 69 |
| | Ameren Corp. | 1,129 | 67 |
| | Avangrid Inc. | 1,096 | 58 |
| | AT&T Inc. | 1,753 | 57 |
| * | Vonage Holdings Corp. | 1,890 | 22 |
| | Portland General Electric Co. | 219 | 9 |
| * | Boingo Wireless Inc. | 360 | 8 |
| | Telephone & Data Systems | | |
| | Inc. | 272 | 7 |
| | | | 741 |
| Total Common Stocks (Cost $31,502) | 32,212 |
| Temporary Cash Investment (1.2%)1 | |
| Money Market Fund (1.2%) | | |
| 2 | Vanguard Market Liquidity | | |
| | Fund, 1.961% | | |
| | (Cost $406) | 4,061 | 406 |
| Total Investments (101.2%) | | |
| (Cost $31,908) | | 32,618 |
14
U.S. Multifactor Fund
| |
| Amount |
| | ($000) |
| Other Assets and Liabilities (-1.2%) | |
| Other Assets | |
| Investment in Vanguard | 1 |
| Receivables for Accrued Income | 50 |
| Receivables for Capital Shares Issued | 119 |
| Other Assets | 14 |
| Total Other Assets | 184 |
| Liabilities | |
| Payables for Investment Securities Purchased (456) |
| Payables for Capital Shares Redeemed | (124) |
| Payables to Vanguard | (3) |
| Variation Margin Payable—Futures Contracts | — |
| Total Liabilities | (583) |
| Net Assets (100%) | |
| Applicable to 1,247,924 outstanding $.001 | |
| par value shares of beneficial interest | |
| (unlimited authorization) | 32,219 |
| Net Asset Value Per Share | $25.82 |
| |
| At May 31, 2018, net assets consisted of: | |
| | Amount |
| | ($000) |
| Paid-in Capital | 31,410 |
| Undistributed Net Investment Income | 121 |
| Accumulated Net Realized Losses | (22) |
| Unrealized Appreciation (Depreciation) | |
| Investment Securities | 710 |
| Futures Contracts | — |
| Net Assets | 32,219 |
• See Note A in Notes to Financial Statements.
* Non-income-producing security.
1 The fund invests a portion of its cash reserves in equity
markets through the use of index futures contracts. After
giving effect to futures investments, the fund’s effective
common stock and temporary cash investment positions
represent 100.2% and 1.0%, respectively, of net assets.
2 Affiliated money market fund available only to Vanguard funds
and certain trusts and accounts managed by Vanguard. Rate
shown is the 7-day yield.
| | | | |
| Derivative Financial Instruments Outstanding as of Period End | | |
| |
| Futures Contracts | | | | |
| | | | | ($000) |
| | | | | Value and |
| | | Number of | | Unrealized |
| | | Long (Short) | Notional | Appreciation |
| | Expiration | Contracts | Amount | (Depreciation) |
| Long Futures Contracts | | | | |
| E-mini Russell 2000 Index | June 2018 | 1 | 82 | — |
Unrealized appreciation (depreciation) on open futures contracts is required to be treated as realized
gain (loss) for tax purposes.
See accompanying Notes, which are an integral part of the Financial Statements.
15
U.S. Multifactor Fund
Statement of Operations
| |
| | February15,20181 to |
| | May 31, 2018 |
| | ($000) |
| Investment Income | |
| Income | |
| Dividends | 127 |
| Interest 2 | 5 |
| Total Income | 132 |
| Expenses | |
| The Vanguard Group—Note B | |
| Management and Administrative | 7 |
| Marketing and Distribution | — |
| Custodian Fees | 2 |
| Shareholders’ Reports | 2 |
| Total Expenses | 11 |
| Net Investment Income | 121 |
| Realized Net Gain (Loss) | |
| Investment Securities Sold 2 | (15) |
| Futures Contracts | (7) |
| Realized Net Gain (Loss) | (22) |
| Change in Unrealized Appreciation (Depreciation) | |
| Investment Securities 2 | 710 |
| Futures Contracts | — |
| Change in Unrealized Appreciation (Depreciation) | 710 |
| Net Increase (Decrease) in Net Assets Resulting from Operations | 809 |
1 Inception.
2 Interest income, realized net gain (loss), and change in unrealized appreciation (depreciation) from an affiliated company of the
fund were $5,000, $1,000, and less than $1,000, respectively. Purchases and sales are for temporary cash investment purposes.
See accompanying Notes, which are an integral part of the Financial Statements.
16
U.S. Multifactor Fund
Statement of Changes in Net Assets
| |
| | February15,20181 to |
| | May 31, 2018 |
| | ($000) |
| Increase (Decrease) in Net Assets | |
| Operations | |
| Net Investment Income | 121 |
| Realized Net Gain (Loss) | (22) |
| Change in Unrealized Appreciation (Depreciation) | 710 |
| Net Increase (Decrease) in Net Assets Resulting from Operations | 809 |
| Distributions | |
| Net Investment Income | — |
| Realized Capital Gain | — |
| Total Distributions | — |
| Capital Share Transactions | |
| Issued | 34,486 |
| Issued in Lieu of Cash Distributions | — |
| Redeemed | (3,076) |
| Net Increase (Decrease) from Capital Share Transactions | 31,410 |
| Total Increase (Decrease) | 32,219 |
| Net Assets | |
| Beginning of Period | — |
| End of Period2 | 32,219 |
| 1 Inception. |
| 2 Net Assets—End of Period includes undistributed (overdistributed) net investment income of $121,000. |
See accompanying Notes, which are an integral part of the Financial Statements.
17
U.S. Multifactor Fund
Financial Highlights
| |
| | February 15, 20181 to |
| For a Share Outstanding Throughout the Period | May 31, 2018 |
| Net Asset Value, Beginning of Period | $25.00 |
| Investment Operations | |
| Net Investment Income2 | .148 |
| Net Realized and Unrealized Gain (Loss) on Investments | .672 |
| Total from Investment Operations | . 820 |
| Distributions | |
| Dividends from Net Investment Income | — |
| Distributions from Realized Capital Gains | — |
| Total Distributions | — |
| Net Asset Value, End of Period | $25.82 |
| |
| Total Return3 | 3.28% |
| |
| Ratios/Supplemental Data | |
| Net Assets, End of Period (Millions) | $32 |
| Ratio of Total Expenses to Average Net Assets | 0.18%4 |
| Ratio of Net Investment Income to Average Net Assets | 1.80%4 |
| Portfolio Turnover Rate | 55%4 |
1 Inception.
2 Calculated based on average shares outstanding.
3 Total returns do not include account service fees that may have applied in the periods shown. Fund prospectuses provide information
about any applicable account service fees.
4 Annualized.
See accompanying Notes, which are an integral part of the Financial Statements.
18
U.S. Multifactor Fund
Notes to Financial Statements
Vanguard U.S. Multifactor Fund is registered under the Investment Company Act of 1940 as an open-end investment company, or mutual fund.
A. The following significant accounting policies conform to generally accepted accounting principles for U.S. investment companies. The fund consistently follows such policies in preparing its financial statements.
1. Security Valuation: Securities are valued as of the close of trading on the New York Stock Exchange (generally 4 p.m., Eastern time) on the valuation date. Equity securities are valued at the latest quoted sales prices or official closing prices taken from the primary market in which each security trades; such securities not traded on the valuation date are valued at the mean of the latest quoted bid and asked prices. Securities for which market quotations are not readily available, or whose values have been materially affected by events occurring before the fund’s pricing time but after the close of the securities’ primary markets, are valued by methods deemed by the board of trustees to represent fair value. Investments in Vanguard Market Liquidity Fund are valued at that fund’s net asset value.
2. Futures Contracts: The fund uses index futures contracts to a limited extent, with the objective of maintaining full exposure to the stock market while maintaining liquidity. The fund may purchase or sell futures contracts to achieve a desired level of investment, whether to accommodate portfolio turnover or cash flows from capital share transactions. The primary risks associated with the use of futures contracts are imperfect correlation between changes in market values of stocks held by the fund and the prices of futures contracts, and the possibility of an illiquid market. Counterparty risk involving futures is mitigated because a regulated clearinghouse is the counterparty instead of the clearing broker. To further mitigate counterparty risk, the fund trades futures contracts on an exchange, monitors the financial strength of its clearing brokers and clearinghouse, and has entered into clearing agreements with its clearing brokers. The clearinghouse imposes initial margin requirements to secure the fund’s performance and requires daily settlement of variation margin representing changes in the market value of each contract.
Futures contracts are valued at their quoted daily settlement prices. The notional amounts of the contracts are not recorded in the Statement of Net Assets. Fluctuations in the value of the contracts are recorded in the Statement of Net Assets as an asset (liability) and in the Statement of Operations as unrealized appreciation (depreciation) until the contracts are closed, when they are recorded as realized futures gains (losses).
During the period ended May 31, 2018, the fund’s average investments in long and short futures contracts represented 1% and 0% of net assets, respectively, based on the average of the notional amounts at each quarter-end during the period.
3. Federal Income Taxes: The fund intends to qualify as a regulated investment company and distribute all of its taxable income. Management has analyzed the fund’s tax positions taken for the period ended May 31, 2018, and has concluded that no provision for federal income tax is required in the fund’s financial statements.
4. Distributions: Distributions to shareholders are recorded on the ex-dividend date.
5. Credit Facility: The fund and certain other funds managed by The Vanguard Group (“Vanguard”) participate in a $3.1 billion committed credit facility provided by a syndicate of lenders pursuant to a credit agreement that may be renewed annually; each fund is individually liable for its borrowings, if any, under the credit facility. Borrowings may be utilized for temporary and emergency purposes,
19
U.S. Multifactor Fund
and are subject to the fund’s regulatory and contractual borrowing restrictions. The participating funds are charged administrative fees and an annual commitment fee of 0.10% of the undrawn amount of the facility; these fees are allocated to the funds based on a method approved by the fund’s board of trustees and included in Management and Administrative expenses on the fund’s Statement of Operations. Any borrowings under this facility bear interest at a rate based upon the higher of the one-month London Interbank Offered Rate, federal funds effective rate, or overnight bank funding rate plus an agreed-upon spread.
The fund had no borrowings outstanding at May 31, 2018, or at any time during the period then ended.
6. Other: Dividend income is recorded on the ex-dividend date. Interest income includes income distributions received from Vanguard Market Liquidity Fund and is accrued daily. Security transactions are accounted for on the date securities are bought or sold. Costs used to determine realized gains (losses) on the sale of investment securities are those of the specific securities sold.
B. In accordance with the terms of a Funds’ Service Agreement (the “FSA”) between Vanguard and the fund, Vanguard furnishes to the fund investment advisory, corporate management, administrative, marketing, and distribution services at Vanguard’s cost of operations (as defined by the FSA). These costs of operations are allocated to the fund based on methods and guidelines approved by the board of trustees, and generally settled twice a month.
Upon the request of Vanguard, the fund may invest up to 0.40% of its net assets as capital in Vanguard. At May 31, 2018, the fund had contributed to Vanguard capital in the amount of $1,000, representing 0.00% of the fund’s net assets and 0.00% of Vanguard’s capitalization. The fund’s trustees and officers are also directors and employees, respectively, of Vanguard.
C. Various inputs may be used to determine the value of the fund’s investments. These inputs are summarized in three broad levels for financial statement purposes. The inputs or methodologies used to value securities are not necessarily an indication of the risk associated with investing in those securities.
Level 1—Quoted prices in active markets for identical securities.
Level 2—Other significant observable inputs (including quoted prices for similar securities, interest rates, prepayment speeds, credit risk, etc.).
Level 3—Significant unobservable inputs (including the fund’s own assumptions used to determine the fair value of investments). Any investments valued with significant unobservable inputs are
noted on the Statement of Net Assets.
At May 31, 2018, 100% of the market value of the fund’s investments was determined based on Level 1 inputs.
D. Distributions are determined on a tax basis and may differ from net investment income and realized capital gains for financial reporting purposes. Differences may be permanent or temporary. Permanent differences are reclassified among capital accounts in the financial statements to reflect their tax character. Temporary differences arise when certain items of income, expense, gain, or loss are recognized in different periods for financial statement and tax purposes. These differences will reverse at some time in the future. Differences in classification may also result from the treatment of short-term gains as ordinary income for tax purposes. The fund’s tax-basis capital gains and losses are determined only at the end of each fiscal year.
20
U.S. Multifactor Fund
At May 31, 2018, the cost of investment securities for tax purposes was $31,908,000. Net unrealized appreciation of investment securities for tax purposes was $710,000, consisting of unrealized gains of $1,584,000 on securities that had risen in value since their purchase and $874,000 in unrealized losses on securities that had fallen in value since their purchase.
E. During the period ended May 31, 2018, the fund purchased $36,293,000 of investment securities and sold $4,775,000 of investment securities, other than temporary cash investments.
F. Capital shares issued and redeemed were:
| |
| | February 15, 20181 to |
| | May 31, 2018 |
| | Shares |
| | (000) |
| Issued | 1,370 |
| Issued in Lieu of Cash Distributions | — |
| Redeemed | (122) |
| Net Increase (Decrease) in Shares Outstanding | 1,248 |
| 1 Inception. |
G. Management has determined that no events or transactions occurred subsequent to May 31, 2018, that would require recognition or disclosure in these financial statements.
21
About Your Fund’s Expenses
As a shareholder of the fund, you incur ongoing costs, which include costs for portfolio management, administrative services, and shareholder reports (like this one), among others. Operating expenses, which are deducted from a fund’s gross income, directly reduce the investment return of the fund.
A fund’s expenses are expressed as a percentage of its average net assets. This figure is known as the expense ratio. The following examples are intended to help you understand the ongoing costs (in dollars) of investing in your fund and to compare these costs with those of other mutual funds. The examples are based on an investment of $1,000 made at the beginning of the period shown and held for the entire period.
The accompanying table illustrates your fund’s costs in two ways:
• Based on actual fund return. This section helps you to estimate the actual expenses that you paid over the period. The ”Ending Account Value“ shown is derived from the fund‘s actual return, and the third column shows the dollar amount that would have been paid by an investor who started with $1,000 in the fund. You may use the information here, together with the amount you invested, to estimate the expenses that you paid over the period.
To do so, simply divide your account value by $1,000 (for example, an $8,600 account value divided by $1,000 = 8.6), then multiply the result by the number given for your fund under the heading ”Expenses Paid During Period.“
• Based on hypothetical 5% yearly return. This section is intended to help you compare your fund‘s costs with those of other mutual funds. It assumes that the fund had a yearly return of 5% before expenses, but that the expense ratio is unchanged. In this case—because the return used is not the fund’s actual return—the results do not apply to your investment. The example is useful in making comparisons because the Securities and Exchange Commission requires all mutual funds to calculate expenses based on a 5% return. You can assess your fund’s costs by comparing this hypothetical example with the hypothetical examples that appear in shareholder reports of other funds.
Note that the expenses shown in the table are meant to highlight and help you compare ongoing costs only and do not reflect transaction costs incurred by the fund for buying and selling securities. Further, the expenses do not include any purchase, redemption, or account service fees described in the fund prospectus. If such fees were applied to your account, your costs would be higher. Your fund does not carry a “sales load.”
The calculations assume no shares were bought or sold during the period. Your actual costs may have been higher or lower, depending on the amount of your investment and the timing of any purchases or redemptions.
You can find more information about the fund’s expenses, including annual expense ratios, in the Financial Statements section of this report. For additional information on operating expenses and other shareholder costs, please refer to your fund’s current prospectus.
22
| | | |
| Period Ended May 31, 2018 | | | |
| | Beginning | Ending | Expenses |
| | Account Value | Account Value | Paid During |
| U.S. Multifactor Fund | 2/15/2018 | 5/31/2018 | Period |
| Based on Actual Fund Return | $1,000.00 | $1,032.80 | $0.53 |
| Based on Hypothetical 5% Yearly Return | 1,000.00 | 1,014.00 | 0.53 |
The calculations are based on expenses incurred in the period from the fund’s February 15, 2018, inception through May 31,
2018. The fund’s annualized expense ratio for the period is 0.18%. The dollar amounts shown as ”Expenses Paid” are equal to
the annualized expense ratio multiplied by the average account value over the period from inception through May 31, 2018,
multiplied by the number of days in that period, then divided by the number of days in the most recent 12-month period
(106/365).
23
Trustees Approve Advisory Arrangement
Effective February 2018, the board of trustees of Vanguard Wellington Fund approved the launch of Vanguard U.S. Multifactor Fund, which utilizes an internalized management structure whereby The Vanguard Group, Inc. (Vanguard), through its Quantitative Equity Group, provides investment advisory services to the fund. The board determined that the investment advisory arrangement with Vanguard was in the best interests of the fund and its prospective shareholders.
The board based its decision upon an evaluation of the advisor’s investment staff, portfolio management process, and performance. This evaluation included information provided to the board by Vanguard’s Portfolio Review Department, which is responsible for fund and advisor oversight and product management. The trustees considered the factors discussed below, among others. However, no single factor determined whether the board approved the arrangement. Rather, it was the totality of the circumstances that drove the board’s decision.
Nature, extent, and quality of services
The board considered the quality of the investment management services to be provided to the fund and took into account the organizational depth and stability of the advisor. The board noted that Vanguard has been managing investments for more than four decades. The Quantitative Equity Group adheres to a sound, disciplined investment management process; the team has considerable experience, stability, and depth.
The board concluded that Vanguard’s experience, stability, depth, and performance, among other factors, warranted approval of the advisory arrangement.
Investment performance
The board determined that the Quantitative Equity Group, in its management of other Vanguard funds, has a track record of consistent performance and disciplined investment processes. Information about the fund’s performance since inception can be found in the Performance Summary section of this report.
Cost
The board concluded that the fund’s expense ratio will be well below the average expense ratio charged by funds in its peer group. Information about the fund’s expenses appears in the About Your Fund’s Expenses section of this report as well as in the Financial Statements section.
The board does not conduct a profitability analysis of Vanguard because of Vanguard’s unique “at-cost” structure. Unlike most other mutual fund management companies, Vanguard is owned by the funds it oversees and produces “profits” only in the form of reduced expenses for fund shareholders.
The benefit of economies of scale
The board concluded that Vanguard’s at-cost arrangement with the fund ensures that the fund will realize economies of scale as it grows, with the cost to shareholders declining as fund assets increase.
The board will consider whether to renew the advisory arrangement after a one-year period.
24
Glossary
30-Day SEC Yield. A fund’s 30-day SEC yield is derived using a formula specified by the U.S. Securities and Exchange Commission. Under the formula, data related to the fund’s security holdings in the previous 30 days are used to calculate the fund’s hypothetical net income for that period, which is then annualized and divided by the fund’s estimated average net assets over the calculation period. For the purposes of this calculation, a security’s income is based on its current market yield to maturity (for bonds), its actual income (for asset-backed securities), or its projected dividend yield (for stocks). Because the SEC yield represents hypothetical annualized income, it will differ—at times significantly—from the fund’s actual experience. As a result, the fund’s income distributions may be higher or lower than implied by the SEC yield.
Beta. A measure of the magnitude of a fund’s past share-price fluctuations in relation to the ups and downs of a given market index. The index is assigned a beta of 1.00. Compared with a given index, a fund with a beta of 1.20 typically would have seen its share price rise or fall by 12% when the index rose or fell by 10%. For this report, beta is based on returns over the past 36 months for both the fund and the index. Note that a fund’s beta should be reviewed in conjunction with its R-squared (see definition). The lower the R-squared, the less correlation there is between the fund and the index, and the less reliable beta is as an indicator of volatility.
Dividend Yield. Dividend income earned by stocks, expressed as a percentage of the aggregate market value (or of net asset value, for a fund). The yield is determined by dividing the amount of the annual dividends by the aggregate value (or net asset value) at the end of the period. For a fund, the dividend yield is based solely on stock holdings and does not include any income produced by other investments.
Earnings Growth Rate. The average annual rate of growth in earnings over the past five years for the stocks now in a fund.
Equity Exposure. A measure that reflects a fund’s investments in stocks and stock futures. Any holdings in short-term reserves are excluded.
Expense Ratio. A fund’s total annual operating expenses expressed as a percentage of the fund’s average net assets. The expense ratio includes management and administrative expenses, but does not include the transaction costs of buying and selling portfolio securities.
Foreign Holdings. The percentage of a fund represented by securities or depositary receipts of companies based outside the United States.
Inception Date. The date on which the assets of a fund (or one of its share classes) are first invested in accordance with the fund’s investment objective. For funds with a subscription period, the inception date is the day after that period ends. Investment performance is measured from the inception date.
Median Market Cap. An indicator of the size of companies in which a fund invests; the midpoint of market capitalization (market price x shares outstanding) of a fund’s stocks, weighted by the proportion of the fund’s assets invested in each stock. Stocks representing half of the fund’s assets have market capitalizations above the median, and the rest are below it.
Price/Book Ratio. The share price of a stock divided by its net worth, or book value, per share.
For a fund, the weighted average price/book ratio of the stocks it holds.
25
Price/Earnings Ratio. The ratio of a stock’s current price to its per-share earnings over the past year. For a fund, the weighted average P/E of the stocks it holds. P/E is an indicator of market expectations about corporate prospects; the higher the P/E, the greater the expectations for a company’s future growth.
R-Squared. A measure of how much of a fund’s past returns can be explained by the returns from the market in general, as measured by a given index. If a fund’s total returns were precisely synchronized with an index’s returns, its R-squared would be 1.00. If the fund’s returns bore no relationship to the index’s returns, its R-squared would be 0. For this report, R-squared is based on returns over the past 36 months for both the fund and the index.
Return on Equity. The annual average rate of return generated by a company during the past five years for each dollar of shareholder’s equity (net income divided by shareholder’s equity). For a fund, the weighted average return on equity for the companies whose stocks it holds.
Short-Term Reserves. The percentage of a fund invested in highly liquid, short-term securities that can be readily converted to cash.
Turnover Rate. An indication of the fund’s trading activity. Funds with high turnover rates incur higher transaction costs and may be more likely to distribute capital gains (which may be taxable to investors). The turnover rate excludes in-kind transactions, which have minimal impact on costs.
26
The People Who Govern Your Fund
The trustees of your mutual fund are there to see that the fund is operated and managed in your best interests since, as a shareholder, you are a part owner of the fund. Your fund’s trustees also serve on the board of directors of The Vanguard Group, Inc., which is owned by the Vanguard funds and provides services to them on an at-cost basis.
A majority of Vanguard’s board members are independent, meaning that they have no affiliation with Vanguard or the funds they oversee, apart from the sizable personal investments they have made as private individuals. The independent board members have distinguished backgrounds in business, academia, and public service. Each of the trustees and executive officers oversees 208 Vanguard funds.
Information for each trustee and executive officer of the fund appears below. The mailing address of the trustees and officers is P.O. Box 876, Valley Forge, PA 19482. More information about the trustees is in the Statement of Additional Information, which can be obtained, without charge, by contacting Vanguard at 800-662-7447, or online at vanguard.com.
Interested Trustees1
F. William McNabb III
Born in 1957. Trustee since July 2009. Principal occupation(s) during the past five years and other experience: chairman of the board (January 2010–present) of Vanguard and of each of the investment companies served by Vanguard, trustee (2009–present) of each of the investment companies served by Vanguard, and director (2008–present) of Vanguard. Chief executive officer and president (2008–2017) of Vanguard and each of the investment companies served by Vanguard, managing director (1995–2008) of Vanguard, and director (1997–2018) of Vanguard Marketing Corporation. Director (2018–present) of UnitedHealth Group.
Mortimer J. Buckley
Born in 1969. Trustee since January 2018. Principal occupation(s) during the past five years and other experience: chief executive officer (January 2018–present) of Vanguard; chief executive officer, president, and trustee (January 2018–present) of each of the investment companies served by Vanguard; president and director (2017–present) of Vanguard; and president (February 2018–present) of Vanguard Marketing Corporation. Chief investment officer (2013–2017), managing director (2002–2017), head of the Retail Investor Group (2006–2012), and chief information officer (2001–2006) of Vanguard. Chairman of the board (2011–2017) of the Children’s Hospital of Philadelphia.
Independent Trustees
Emerson U. Fullwood
Born in 1948. Trustee since January 2008. Principal occupation(s) during the past five years and other experience: executive chief staff and marketing officer for North America and corporate vice president (retired 2008) of Xerox Corporation (document management products and services). Former president of the Worldwide Channels Group, Latin America, and Worldwide Customer Service and executive chief staff officer of Developing Markets of Xerox. Executive in residence and 2009–2010 Distinguished Minett Professor at the Rochester Institute of Technology. Lead director of SPX FLOW, Inc. (multi-industry manufacturing). Director of the University of Rochester Medical Center, the Monroe Community College Foundation, the United Way of Rochester, North Carolina A&T University, and Roberts Wesleyan College. Trustee of the University of Rochester.
Amy Gutmann
Born in 1949. Trustee since June 2006. Principal occupation(s) during the past five years and other experience: president (2004–present) of the University of Pennsylvania. Christopher H. Browne Distinguished Professor of Political Science, School of Arts and Sciences, and professor of communication, Annenberg School for Communication, with secondary faculty appointments in the Department of Philosophy, School of Arts and Sciences, and at the Graduate School of Education, University of Pennsylvania. Trustee of the National Constitution Center.
1 Mr. McNabb and Mr. Buckley are considered “interested persons,” as defined in the Investment Company Act of 1940, because they are officers of the Vanguard funds.
JoAnn Heffernan Heisen
Born in 1950. Trustee since July 1998. Principal occupation(s) during the past five years and other experience: corporate vice president of Johnson & Johnson (pharmaceuticals/medical devices/consumer products) and member of its executive committee (1997–2008). Chief global diversity officer (retired 2008), vice president and chief information officer (1997–2006), controller (1995–1997), treasurer (1991–1995), and assistant treasurer (1989–1991) of Johnson & Johnson. Director of Skytop Lodge Corporation (hotels) and the Robert Wood Johnson Foundation. Member of the advisory board of the Institute for Women’s Leadership at Rutgers University.
F. Joseph Loughrey
Born in 1949. Trustee since October 2009. Principal occupation(s) during the past five years and other experience: president and chief operating officer (retired 2009) and vice chairman of the board (2008–2009) of Cummins Inc. (industrial machinery). Chairman of the board of Hillenbrand, Inc. (specialized consumer services), Oxfam America, and the Lumina Foundation for Education. Director of the V Foundation for Cancer Research. Member of the advisory council for the College of Arts and Letters and chair of the advisory board to the Kellogg Institute for International Studies, both at the University of Notre Dame.
Mark Loughridge
Born in 1953. Trustee since March 2012. Principal occupation(s) during the past five years and other experience: senior vice president and chief financial officer (retired 2013) of IBM (information technology services). Fiduciary member of IBM’s Retirement Plan Committee (2004–2013), senior vice president and general manager (2002–2004) of IBM Global Financing, vice president and controller (1998–2002) of IBM, and a variety of other prior management roles at IBM. Member of the Council on Chicago Booth.
Scott C. Malpass
Born in 1962. Trustee since March 2012. Principal occupation(s) during the past five years and other experience: chief investment officer (1989–present) and vice president (1996–present) of the University of Notre Dame. Assistant professor of finance at the Mendoza College of Business, University of Notre Dame, and member of the Notre Dame 403(b) Investment Committee. Chairman of the board of TIFF Advisory Services, Inc. Member of the board of Catholic Investment Services, Inc. (investment advisors), the board of advisors for Spruceview Capital Partners, and the board of superintendence of the Institute for the Works of Religion.
Deanna Mulligan
Born in 1963. Trustee since January 2018. Principal occupation(s) during the past five years and other experience: president (2010–present) and chief executive officer (2011–present) of The Guardian Life Insurance Company of America. Chief operating officer (2010–2011) and executive vice president (2008–2010) of Individual Life and Disability of The Guardian Life Insurance Company of America. Member of the board of The Guardian Life Insurance Company of America, the American Council of Life Insurers, the Partnership for New York City (business leadership), and the Committee Encouraging Corporate Philanthropy. Trustee of the Economic Club of New York and the Bruce Museum (arts and science). Member of the Advisory Council for the Stanford Graduate School of Business.
André F. Perold
Born in 1952. Trustee since December 2004. Principal occupation(s) during the past five years and other experience: George Gund Professor of Finance and Banking, Emeritus at the Harvard Business School (retired 2011). Chief investment officer and co-managing partner of HighVista Strategies LLC (private investment firm). Overseer of the Museum of Fine Arts Boston.
Sarah Bloom Raskin
Born in 1961. Trustee since January 2018. Principal occupation(s) during the past five years and other experience: deputy secretary (2014–2017) of the United States Department of the Treasury. Governor (2010–2014) of the Federal Reserve Board. Commissioner (2007–2010) of financial regulation for the State of Maryland. Member of the board of directors (2012–2014) of Neighborhood Reinvestment Corporation. Director of i(x) Investments, LLC.
Peter F. Volanakis
Born in 1955. Trustee since July 2009. Principal occupation(s) during the past five years and other experience: president and chief operating officer (retired 2010) of Corning Incorporated (communications equipment) and director of Corning Incorporated (2000–2010) and Dow Corning (2001–2010). Director (2012) of SPX Corporation (multi-industry manufacturing). Overseer of the Amos Tuck School of Business Administration, Dartmouth College (2001–2013). Chairman of the board of trustees of Colby-Sawyer College. Member of the Board of Hypertherm Inc. (industrial cutting systems, software, and consumables).
Executive Officers
Glenn Booraem
Born in 1967. Principal occupation(s) during the past five years and other experience: principal of Vanguard. Investment stewardship officer (2017–present), treasurer (2015–2017), controller (2010–2015), and assistant controller (2001–2010) of each of the investment companies served by Vanguard.
Christine M. Buchanan
Born in 1970. Principal occupation(s) during the past five years and other experience: principal of Vanguard and global head of Fund Administration at Vanguard. Treasurer (2017–present) of each of the investment companies served by Vanguard. Partner (2005–2017) at KPMG LLP (audit, tax, and advisory services).
Brian Dvorak
Born in 1973. Principal occupation(s) during the past five years and other experience: principal of Vanguard. Chief compliance officer (2017–present) of Vanguard and each of the investment companies served by Vanguard. Assistant vice president (2017–present) of Vanguard Marketing Corporation. Vice president and director of Enterprise Risk Management (2011–2013) at Oppenheimer Funds, Inc.
Thomas J. Higgins
Born in 1957. Principal occupation(s) during the past five years and other experience: principal of Vanguard. Chief financial officer (2008–present) and treasurer (1998–2008) of each of the investment companies served by Vanguard.
Peter Mahoney
Born in 1974. Principal occupation(s) during the past five years and other experience: principal of Vanguard. Controller (2015–present) of each of the investment companies served by Vanguard. Head of International Fund Services (2008–2014) at Vanguard.
Anne E. Robinson
Born in 1970. Principal occupation(s) during the past five years and other experience: general counsel (2016–present) of Vanguard. Secretary (2016–present) of Vanguard and of each of the investment companies served by Vanguard. Managing director (2016–present) of Vanguard. Director and senior vice president (2016–2018) of Vanguard Marketing Corporation. Managing director and general counsel of Global Cards and Consumer Services (2014–2016) at Citigroup. Counsel (2003–2014) at American Express.
Michael Rollings
Born in 1963. Principal occupation(s) during the past five years and other experience: finance director (2017–present) and treasurer (2017) of each of the investment companies served by Vanguard. Managing director (2016–present) of Vanguard. Chief financial officer (2016–present) of Vanguard. Director (2016–present) of Vanguard Marketing Corporation. Executive vice president and chief financial officer (2006–2016) of MassMutual Financial Group.
| |
| Vanguard Senior Management Team |
| |
| Mortimer J. Buckley | James M. Norris |
| Gregory Davis | Thomas M. Rampulla |
| John James | Karin A. Risi |
| Martha G. King | Anne E. Robinson |
| John T. Marcante | Michael Rollings |
| Chris D. McIsaac | |
| |
| |
| Chairman Emeritus and Senior Advisor |
| |
| John J. Brennan | |
| Chairman, 1996–2009 | |
| Chief Executive Officer and President, 1996–2008 |
| |
| |
| Founder | |
| |
| John C. Bogle | |
| Chairman and Chief Executive Officer, 1974–1996 |
|  |
| | P.O. Box 2600 |
| | Valley Forge, PA 19482-2600 |
| |
| |
| |
| Connect with Vanguard® > vanguard.com |
| |
| |
| |
| Fund Information > 800-662-7447 | Source for Bloomberg Barclays indexes: Bloomberg |
| Direct Investor Account Services > 800-662-2739 | Index Services Limited. Copyright 2018, Bloomberg. All |
| | rights reserved. |
| Institutional Investor Services > 800-523-1036 | |
| Text Telephone for People | |
| Who Are Deaf or Hard of Hearing > 800-749-7273 | |
| |
| This material may be used in conjunction | |
| with the offering of shares of any Vanguard | |
| fund only if preceded or accompanied by | |
| the fund’s current prospectus. | |
| |
| All comparative mutual fund data are from Lipper, a | |
| Thomson Reuters Company, or Morningstar, Inc., unless | |
| otherwise noted. | |
| |
| You can obtain a free copy of Vanguard’s proxy voting | |
| guidelines by visiting vanguard.com/proxyreporting or by | |
| calling Vanguard at 800-662-2739. The guidelines are | |
| also available from the SEC’s website, sec.gov. In | |
| addition, you may obtain a free report on how your fund | |
| voted the proxies for securities it owned during the 12 | |
| months ended June 30. To get the report, visit either | |
| vanguard.com/proxyreporting or sec.gov. | |
| |
| You can review and copy information about your fund at | |
| the SEC’s Public Reference Room in Washington, D.C. To | |
| find out more about this public service, call the SEC at | |
| 202-551-8090. Information about your fund is also | |
| available on the SEC’s website, and you can receive | |
| copies of this information, for a fee, by sending a | |
| request in either of two ways: via email addressed to | |
| publicinfo@sec.gov or via regular mail addressed to the | |
| Public Reference Section, Securities and Exchange | |
| Commission, Washington, DC 20549-1520. | |
| | © 2018 The Vanguard Group, Inc. |
| | All rights reserved. |
| | Vanguard Marketing Corporation, Distributor. |
| |
| | Q5162 072018 |
Item 2: Code of Ethics.
Not Applicable.
Item 3: Audit Committee Financial Expert.
Not Applicable.
Item 4: Principal Accountant Fees and Services.
(a) Audit Fees.
Not Applicable.
Item 5: Audit Committee of Listed Registrants.
Not Applicable.
Item 6: Investments.
| | | |
| Vanguard® Wellington Fund | | |
| Schedule of Investments | | |
| May 31, 2018 | | |
| |
| | | | Market |
| | | | Value |
| | | Shares | ($000) |
| |
| Common Stocks (65.2%) | | |
| Consumer Discretionary (4.1%) | | |
| | Comcast Corp. Class A | 43,726,638 | 1,363,396 |
| | TJX Cos. Inc. | 6,147,706 | 555,261 |
| | Lowe's Cos. Inc. | 5,544,119 | 526,747 |
| | Hilton Worldwide Holdings Inc. | 6,087,704 | 491,338 |
| | CBS Corp. Class B | 9,402,896 | 473,624 |
| | Home Depot Inc. | 1,858,712 | 346,743 |
| | Ford Motor Co. | 28,215,290 | 325,887 |
| | Volkswagen AG Preference Shares | 1,028,618 | 193,195 |
| | | | 4,276,191 |
| Consumer Staples (3.8%) | | |
| | PepsiCo Inc. | 8,367,417 | 838,834 |
| | Unilever NV | 13,628,051 | 760,025 |
| | Diageo plc | 15,078,735 | 554,047 |
| | Sysco Corp. | 8,378,434 | 544,850 |
| | Philip Morris International Inc. | 6,188,031 | 492,196 |
| | Costco Wholesale Corp. | 2,382,895 | 472,385 |
| | Walmart Inc. | 3,862,983 | 318,851 |
| | | | 3,981,188 |
| Energy (6.1%) | | |
| | Chevron Corp. | 14,882,886 | 1,849,943 |
| | TOTAL SA | 18,407,775 | 1,119,087 |
| | ConocoPhillips | 13,132,802 | 885,020 |
| | Suncor Energy Inc. | 19,600,424 | 780,631 |
| | BP plc | 73,432,456 | 561,632 |
| | Halliburton Co. | 11,159,145 | 555,056 |
| | Hess Corp. | 6,534,230 | 394,798 |
| | Canadian Natural Resources Ltd. | 3,919,199 | 135,447 |
| | | | 6,281,614 |
| Financials (15.1%) | | |
| | JPMorgan Chase & Co. | 21,337,032 | 2,283,276 |
| | Bank of America Corp. | 75,654,951 | 2,197,020 |
| | Chubb Ltd. | 10,329,478 | 1,349,960 |
| | Prudential Financial Inc. | 13,231,263 | 1,281,316 |
| | PNC Financial Services Group Inc. | 8,525,423 | 1,222,631 |
| | Northern Trust Corp. | 7,535,860 | 772,576 |
| | Intercontinental Exchange Inc. | 10,107,857 | 716,546 |
| | American International Group Inc. | 12,927,605 | 682,448 |
| | BlackRock Inc. | 1,245,095 | 665,167 |
| | Citigroup Inc. | 9,605,252 | 640,574 |
| | Mitsubishi UFJ Financial Group Inc. | 94,103,100 | 567,274 |
| | MetLife Inc. | 11,582,038 | 532,658 |
| | Bank of Nova Scotia | 8,702,316 | 525,011 |
| | Marsh & McLennan Cos. Inc. | 5,924,066 | 476,117 |
| | Hartford Financial Services Group Inc. | 6,783,981 | 355,006 |
| ^ | BNP Paribas SA | 5,505,600 | 342,097 |
| | Tokio Marine Holdings Inc. | 6,776,940 | 325,049 |
| | UBS Group AG | 16,991,568 | 258,612 |
| | ING Groep NV | 16,807,410 | 244,797 |
| | Zurich Insurance Group AG | 604,365 | 179,111 |
| * | Brighthouse Financial Inc. | 881,703 | 41,537 |
| | | | 15,658,783 |
| Health Care (9.2%) | | |
| | Bristol-Myers Squibb Co. | 24,029,236 | 1,264,418 |
| | AstraZeneca plc ADR | 34,070,454 | 1,261,629 |
| | Medtronic plc | 11,797,542 | 1,018,364 |
| | Pfizer Inc. | 25,881,943 | 929,938 |
| | Merck & Co. Inc. | 15,460,795 | 920,381 |
| | UnitedHealth Group Inc. | 3,800,444 | 917,845 |
| | CVS Health Corp. | 10,493,933 | 665,210 |
| | Eli Lilly & Co. | 7,668,951 | 652,168 |
| | Novartis AG | 8,424,043 | 626,267 |
| |
| |
| |
| |
| 1 |
| | | |
| Vanguard® Wellington Fund | | |
| Schedule of Investments | | |
| May 31, 2018 | | |
| |
| | | | Market |
| | | | Value |
| | | Shares | ($000) |
| | Abbott Laboratories | 8,586,547 | 528,330 |
| | Cardinal Health Inc. | 7,519,457 | 391,689 |
| | HCA Healthcare Inc. | 1,526,399 | 157,433 |
| | Koninklijke Philips NV | 3,195,482 | 131,596 |
| * | Regeneron Pharmaceuticals Inc. | 343,995 | 103,309 |
| | | | 9,568,577 |
| Industrials (7.0%) | | |
| | United Parcel Service Inc. Class B | 9,517,164 | 1,105,133 |
| | Union Pacific Corp. | 4,814,825 | 687,364 |
| | Schneider Electric SE | 7,191,204 | 621,647 |
| | Caterpillar Inc. | 3,990,176 | 606,148 |
| | BAE Systems plc | 61,014,001 | 517,944 |
| | Lockheed Martin Corp. | 1,481,530 | 466,000 |
| | Canadian Pacific Railway Ltd. | 2,192,821 | 422,754 |
| | United Technologies Corp. | 3,265,701 | 407,625 |
| | Johnson Controls International plc | 12,139,497 | 407,402 |
| | Honeywell International Inc. | 2,667,730 | 394,584 |
| | Eaton Corp. plc | 4,472,554 | 342,508 |
| | Assa Abloy AB Class B | 13,974,950 | 300,439 |
| | ABB Ltd. ADR | 11,473,207 | 260,901 |
| | Canadian National Railway Co. | 3,034,234 | 253,298 |
| | Safran SA | 1,801,811 | 214,914 |
| | Vinci SA | 1,343,807 | 132,168 |
| | Canadian National Railway Co. | 618,300 | 51,620 |
| | | | 7,192,449 |
| Information Technology (11.3%) | | |
| | Microsoft Corp. | 27,863,831 | 2,754,061 |
| * | Alphabet Inc. Class A | 1,691,379 | 1,860,517 |
| | Intel Corp. | 32,811,103 | 1,811,173 |
| | Cisco Systems Inc. | 21,652,645 | 924,785 |
| | Apple Inc. | 4,862,457 | 908,647 |
| | Texas Instruments Inc. | 5,164,261 | 577,932 |
| | HP Inc. | 26,164,428 | 576,402 |
| * | eBay Inc. | 15,224,646 | 574,274 |
| | Accenture plc Class A | 3,390,654 | 528,061 |
| | QUALCOMM Inc. | 8,223,097 | 477,926 |
| | International Business Machines Corp. | 3,137,939 | 443,422 |
| | Samsung Electronics Co. Ltd. GDR | 190,936 | 225,912 |
| | | | 11,663,112 |
| Materials (2.2%) | | |
| | BHP Billiton plc | 28,585,282 | 657,263 |
| | International Paper Co. | 11,362,866 | 607,913 |
| | Linde AG- Tender Line | 2,181,835 | 498,585 |
| | LyondellBasell Industries NV Class A | 2,183,890 | 244,858 |
| | Praxair Inc. | 1,394,617 | 217,923 |
| | Linde AG | 251,900 | 52,110 |
| | | | 2,278,652 |
| Real Estate (1.3%) | | |
| | American Tower Corp. | 5,324,704 | 736,779 |
| | Simon Property Group Inc. | 3,881,024 | 621,818 |
| | | | 1,358,597 |
| Telecommunication Services (2.3%) | | |
| | Verizon Communications Inc. | 42,550,768 | 2,028,395 |
| | AT&T Inc. | 9,246,100 | 298,834 |
| | | | 2,327,229 |
| Utilities (2.8%) | | |
| | NextEra Energy Inc. | 7,037,666 | 1,166,915 |
| | Dominion Energy Inc. | 12,426,114 | 797,632 |
| | Exelon Corp. | 15,800,310 | 653,975 |
| | Iberdrola SA | 37,476,310 | 266,135 |
| |
| | | | 2,884,657 |
| |
| Total Common Stocks (Cost $44,871,487) | | 67,471,049 |
| |
| |
| |
| |
| 2 |
| | | | | |
| Vanguard® Wellington Fund | | | | |
| Schedule of Investments | | | | |
| May 31, 2018 | | | | |
| |
| | | | | Face | Market |
| | | | Maturity | Amount | Value |
| | | Coupon | Date | ($000) | ($000) |
| |
| U.S. Government and Agency Obligations (6.3%) | | | | |
| U.S. Government Securities (5.6%) | | | | |
| | United States Treasury Note/Bond | 1.750% | 9/30/19 | 537,170 | 532,975 |
| | United States Treasury Note/Bond | 1.375% | 2/15/20 | 231,935 | 227,948 |
| 1 | United States Treasury Note/Bond | 1.375% | 2/29/20 | 62,000 | 60,905 |
| | United States Treasury Note/Bond | 2.250% | 2/29/20 | 1,496,000 | 1,492,021 |
| | United States Treasury Note/Bond | 2.250% | 3/31/20 | 210,000 | 209,376 |
| | United States Treasury Note/Bond | 1.625% | 6/30/20 | 67,210 | 66,107 |
| | United States Treasury Note/Bond | 1.250% | 3/31/21 | 52,000 | 50,172 |
| | United States Treasury Note/Bond | 2.125% | 12/31/22 | 136,500 | 133,280 |
| | United States Treasury Note/Bond | 2.500% | 3/31/23 | 337,000 | 334,210 |
| | United States Treasury Note/Bond | 2.000% | 2/15/25 | 364,360 | 346,710 |
| | United States Treasury Note/Bond | 2.000% | 8/15/25 | 121,680 | 115,292 |
| | United States Treasury Note/Bond | 2.250% | 11/15/25 | 6,805 | 6,545 |
| | United States Treasury Note/Bond | 1.625% | 5/15/26 | 110,190 | 100,686 |
| | United States Treasury Note/Bond | 2.000% | 11/15/26 | 43,000 | 40,252 |
| | United States Treasury Note/Bond | 2.375% | 5/15/27 | 28,000 | 26,937 |
| | United States Treasury Note/Bond | 2.250% | 11/15/27 | 515,340 | 489,171 |
| | United States Treasury Note/Bond | 2.750% | 2/15/28 | 273,700 | 271,133 |
| | United States Treasury Note/Bond | 2.875% | 5/15/43 | 275,732 | 269,313 |
| | United States Treasury Note/Bond | 3.375% | 5/15/44 | 149,670 | 159,422 |
| | United States Treasury Note/Bond | 2.500% | 2/15/46 | 50,745 | 45,829 |
| | United States Treasury Note/Bond | 2.250% | 8/15/46 | 117,264 | 100,224 |
| | United States Treasury Note/Bond | 2.875% | 11/15/46 | 60,140 | 58,486 |
| | United States Treasury Note/Bond | 3.000% | 2/15/47 | 217,005 | 216,328 |
| | United States Treasury Note/Bond | 2.750% | 8/15/47 | 216,575 | 205,272 |
| | United States Treasury Note/Bond | 2.750% | 11/15/47 | 48,061 | 45,538 |
| | United States Treasury Note/Bond | 3.125% | 5/15/48 | 300 | 306 |
| | United States Treasury Strip Principal | 0.000% | 5/15/47 | 127,000 | 52,953 |
| | United States Treasury Strip Principal | 0.000% | 8/15/47 | 247,840 | 102,524 |
| | | | | | 5,759,915 |
| Conventional Mortgage-Backed Securities (0.6%) | | | | |
| 2,3 | Fannie Mae Pool | 2.500% | 9/1/27–12/1/28 | 5,419 | 5,290 |
| 2,3,4 | Fannie Mae Pool | 3.500% | 6/1/48–7/1/48 | 672,000 | 670,058 |
| 2,3 | Fannie Mae Pool | 4.500% | 10/1/33–3/1/41 | | — |
| 2,3 | Freddie Mac Gold Pool | 3.000% | 5/1/22–9/1/22 | 19 | 19 |
| 2 | Ginnie Mae I Pool | 7.000% | 11/15/31–11/15/33 | 2,305 | 2,677 |
| | | | | | 678,044 |
| Nonconventional Mortgage-Backed Securities (0.1%) | | | | |
| 2,3 | Fannie Mae REMICS | 3.500% | 4/25/31 | 9,730 | 9,828 |
| 2,3 | Fannie Mae REMICS | 4.000% | 9/25/29–5/25/31 | 18,581 | 19,071 |
| 2,3 | Freddie Mac REMICS | 3.500% | 3/15/31 | 5,760 | 5,828 |
| 2,3 | Freddie Mac REMICS | 4.000% | 12/15/30–4/15/31 | 106,515 | 110,245 |
| |
| | | | | | 144,972 |
| |
| Total U.S. Government and Agency Obligations (Cost $6,614,088) | | | | 6,582,931 |
| |
| Asset-Backed/Commercial Mortgage-Backed Securities (1.8%) | | | |
| 2 | Ally Auto Receivables Trust 2018-1 | 1.750% | 2/15/19 | 19,494 | 19,489 |
| 2,5 | American Express Credit Account Master Trust | 2.950% | 3/15/23 | 50,000 | 49,847 |
| 5 | American Tower Trust I | 3.070% | 3/15/23 | 43,000 | 42,411 |
| 2 | Americredit Automobile Receivables Trust 2018-1 | 2.450% | 5/20/19 | 53,288 | 53,293 |
| 2,5,6 | Apidos CLO XVII | 3.663% | 4/17/26 | 50,310 | 50,344 |
| 2,5,6 | Ares XXIX CLO Ltd. | 3.543% | 4/17/26 | 49,210 | 49,236 |
| 2,5,6 | Atlas Senior Loan Fund X Ltd. | 3.438% | 1/15/31 | 7,940 | 7,941 |
| 2,5,6 | Avery Point IV CLO Ltd. | 3.460% | 4/25/26 | 46,220 | 46,239 |
| 2,5,6 | Babson CLO Ltd. 2014-I | 3.509% | 7/20/25 | 5,660 | 5,662 |
| 5 | Bank of Montreal | 2.500% | 1/11/22 | 60,000 | 58,686 |
| 2,5,6 | BlueMountain CLO 2014-1 Ltd. | 3.619% | 4/30/26 | 26,794 | 26,811 |
| 2 | BMW Vehicle Owner Trust | 1.650% | 1/25/19 | 7,546 | 7,542 |
| 2,5 | Canadian Pacer Auto Receivables Trust 2018-1 | 2.300% | 4/19/19 | 27,907 | 27,911 |
| 2,5 | Capital Auto Receivables Asset Trust 2018-1 | 2.100% | 3/20/19 | 18,239 | 18,240 |
| 2,5,7 | CARDS II Trust | 2.289% | 4/18/22 | 17,780 | 17,795 |
| |
| |
| |
| |
| 3 |
| | | | | |
| Vanguard® Wellington Fund | | | | |
| Schedule of Investments | | | | |
| May 31, 2018 | | | | |
| |
| | | | | Face | Market |
| | | | Maturity | Amount | Value |
| | | Coupon | Date | ($000) | ($000) |
| 2,5,7 | CARDS II Trust 2016-1A | 2.619% | 7/15/21 | 13,117 | 13,126 |
| 2 | CarMax Auto Owner Trust | 1.700% | 2/15/19 | 17,350 | 17,339 |
| 2 | CarMax Auto Owner Trust | 2.300% | 5/15/19 | 18,276 | 18,279 |
| 2,5,6 | Cent CLO 20 Ltd. | 3.460% | 1/25/26 | 38,425 | 38,441 |
| 2,5,6 | Cent CLO 21 Ltd. | 3.576% | 7/27/26 | 24,170 | 24,168 |
| 2,5,6 | Cent CLO 22 Ltd. | 3.773% | 11/7/26 | 36,895 | 36,944 |
| 2,5 | Chesapeake Funding II LLC 2018-1 | 3.040% | 4/15/30 | 44,985 | 44,971 |
| 2,5 | Chesapeake Funding II LLC 2018-2A | 1.990% | 5/15/29 | 8,845 | 8,747 |
| 2 | CNH Equipment Trust 2018-A | 2.450% | 6/14/19 | 41,842 | 41,851 |
| 2 | COMM 2012-CCRE2 Mortgage Trust | 3.147% | 8/15/45 | 18,085 | 18,022 |
| 2,5 | Daimler Trucks Retail Trust 2018-1 | 2.200% | 4/15/19 | 20,163 | 20,165 |
| 5 | DNB Boligkreditt AS | 2.500% | 3/28/22 | 47,550 | 46,463 |
| 2,5 | Enterprise Fleet Financing LLC | 2.150% | 3/20/19 | 22,341 | 22,341 |
| 2,5 | Enterprise Fleet Financing LLC Series 2017-1 | 2.130% | 7/20/22 | 6,072 | 6,033 |
| 2,5 | Enterprise Fleet Financing LLC Series 2018-1 | 2.870% | 10/20/23 | 30,025 | 29,975 |
| 2,5 | First Investors Auto Owner Trust | 2.000% | 3/15/22 | 7,549 | 7,502 |
| 2 | Ford Credit Auto Lease Trust 2018-A | 2.300% | 5/15/19 | 23,696 | 23,700 |
| 2 | Ford Credit Auto Owner Trust | 2.356% | 5/15/19 | 24,228 | 24,231 |
| 2,5 | GM Financial Consumer Automobile 2017-1 | 1.510% | 3/16/20 | 10,618 | 10,589 |
| 2 | GM Financial Consumer Automobile Receivables Trust | 2.300% | 4/16/19 | 9,475 | 9,475 |
| 2 | Honda Auto Receivables 2018-1 Owner Trust | 1.900% | 3/15/19 | 18,841 | 18,841 |
| 2,5 | Hyundai Auto Lease Securitization Trust 2018-A | 1.950% | 3/15/19 | 7,052 | 7,052 |
| 2,5 | Hyundai Auto Lease Securitization Trust 2018-A | 2.550% | 8/17/20 | 20,825 | 20,789 |
| 2 | John Deere Owner Trust 2018 | 1.950% | 3/15/19 | 22,270 | 22,250 |
| 2,8 | LB-UBS Commercial Mortgage Trust 2008-C1 | 6.319% | 4/15/41 | 45 | 45 |
| 2,5,6 | Limerock CLO II Ltd. | 3.655% | 4/18/26 | 46,065 | 46,095 |
| 2,5,6 | Madison Park Funding XII Ltd. | 3.619% | 7/20/26 | 37,385 | 37,390 |
| 2,5,6 | Madison Park Funding XIII Ltd. | 3.305% | 4/19/30 | 33,570 | 33,546 |
| 2,5,7 | Master Credit Card Trust II Series 2018-1A | 2.443% | 7/22/24 | 36,370 | 36,479 |
| 2,5,7 | Mercedes-Benz Master Owner Trust 2016-B | 2.619% | 5/17/21 | 13,265 | 13,327 |
| 2,5 | MMAF Equipment Finance LLC 2013-AA | 2.570% | 6/9/33 | 8,570 | 8,546 |
| 2,5 | MMAF Equipment Finance LLC 2017-A | 1.730% | 5/18/20 | 5,562 | 5,545 |
| 2,5 | MMAF Equipment Finance LLC 2018-A | 2.400% | 6/10/19 | 33,108 | 33,108 |
| 2 | Nissan Auto Receivables 2018-A Owner Trust | 1.900% | 3/15/19 | 6,254 | 6,255 |
| 2,5 | OneMain Direct Auto Receivables Trust 2017-2 | 2.310% | 12/14/21 | 27,390 | 27,217 |
| 2,5 | OneMain Financial Issuance Trust 2016-2 | 4.100% | 3/20/28 | 6,323 | 6,365 |
| 2,5 | OneMain Financial Issuance Trust 2017-1 | 2.370% | 9/14/32 | 23,742 | 23,377 |
| 2 | Santander Drive Auto Receivables Trust 2014-2 | 2.330% | 11/15/19 | 576 | 576 |
| 2 | Santander Drive Auto Receivables Trust 2016-3 | 1.890% | 6/15/21 | 11,264 | 11,208 |
| 2 | Santander Drive Auto Receivables Trust 2018-1 | 1.830% | 2/15/19 | 10,560 | 10,559 |
| 2 | Santander Drive Auto Receivables Trust 2018-2 | 2.350% | 4/15/19 | 26,399 | 26,399 |
| 2,5 | Santander Retail Auto Lease Trust 2018-A | 2.200% | 3/20/19 | 8,426 | 8,426 |
| 5 | SBA Tower Trust | 2.898% | 10/8/19 | 46,310 | 46,062 |
| 5 | SBA Tower Trust | 3.168% | 4/11/22 | 48,960 | 48,573 |
| 5 | SBA Tower Trust | 3.448% | 3/15/23 | 23,770 | 23,717 |
| 2,5 | Securitized Term Auto Receivables Trust 2018-1 | 2.400% | 4/25/19 | 27,930 | 27,924 |
| 2,5,6 | Seneca Park CLO Ltd. 2014-1 | 3.473% | 7/17/26 | 27,340 | 27,351 |
| 2,5,8 | SFAVE Commercial Mortgage Securities Trust 2015- | | | | |
| | 5AVE | 4.144% | 1/5/43 | 27,300 | 26,749 |
| 2,5,6 | Shackleton 2014-VI CLO | 3.513% | 7/17/26 | 26,700 | 26,712 |
| 2,5 | Sofi Consumer Loan Program 2018-2 Trust | 2.930% | 4/26/27 | 26,202 | 26,204 |
| 2,5 | Springleaf Funding Trust | 3.160% | 11/15/24 | 38,148 | 38,134 |
| 2,5 | Springleaf Funding Trust 2015-B | 3.480% | 5/15/28 | 23,420 | 23,468 |
| 2,5,6 | Symphony CLO XIV Ltd. | 3.628% | 7/14/26 | 46,405 | 46,431 |
| 2,5,6 | Thacher Park CLO Ltd. | 3.519% | 10/20/26 | 19,915 | 19,923 |
| 5 | Toronto-Dominion Bank | 2.500% | 1/18/22 | 76,400 | 74,718 |
| 2 | Utility Debt Securitization Authority Series 2013T | 3.435% | 12/15/25 | 8,625 | 8,697 |
| 2,5 | Vantage Data Centers Issuer, LLC 2018-1A | 4.072% | 2/16/43 | 17,701 | 17,683 |
| 2,5,6 | Voya CLO 2014-1 Ltd. | 3.345% | 4/18/31 | 20,685 | 20,669 |
| 2,5 | Westlake Automobile Receivables Trust 2018-1 | 1.750% | 2/15/19 | 4,481 | 4,480 |
| 2,5 | Westlake Automobile Receivables Trust 2018-2 | 2.500% | 5/15/19 | 29,302 | 29,303 |
| |
| Total Asset-Backed/Commercial Mortgage-Backed Securities (Cost $1,890,784) | | | 1,884,003 |
| |
| |
| |
| |
| 4 |
| | | | | |
| Vanguard® Wellington Fund | | | | |
| Schedule of Investments | | | | |
| May 31, 2018 | | | | |
| |
| | | | | Face | Market |
| | | | Maturity | Amount | Value |
| | | Coupon | Date | ($000) | ($000) |
| |
| Corporate Bonds (20.4%) | | | | |
| Finance (8.2%) | | | | |
| | Banking (6.7%) | | | | |
| 5 | ABN AMRO Bank NV | 2.450% | 6/4/20 | 19,999 | 19,712 |
| | American Express Credit Corp. | 2.125% | 7/27/18 | 49,605 | 49,587 |
| | American Express Credit Corp. | 2.250% | 8/15/19 | 30,200 | 30,017 |
| | American Express Credit Corp. | 2.700% | 3/3/22 | 54,990 | 53,874 |
| | Banco Santander SA | 3.125% | 2/23/23 | 30,600 | 29,166 |
| | Banco Santander SA | 3.848% | 4/12/23 | 23,800 | 23,394 |
| | Bank of America Corp. | 3.300% | 1/11/23 | 7,905 | 7,835 |
| 2 | Bank of America Corp. | 2.816% | 7/21/23 | 60,525 | 58,699 |
| | Bank of America Corp. | 3.004% | 12/20/23 | 49,160 | 47,726 |
| | Bank of America Corp. | 4.125% | 1/22/24 | 16,100 | 16,446 |
| | Bank of America Corp. | 4.000% | 1/22/25 | 32,900 | 32,515 |
| | Bank of America Corp. | 3.500% | 4/19/26 | 10,000 | 9,689 |
| 2 | Bank of America Corp. | 3.593% | 7/21/28 | 37,950 | 36,347 |
| | Bank of America Corp. | 3.419% | 12/20/28 | 8,681 | 8,183 |
| | Bank of America Corp. | 5.875% | 2/7/42 | 9,965 | 11,904 |
| | Bank of America Corp. | 5.000% | 1/21/44 | 39,433 | 42,370 |
| | Bank of Montreal | 3.100% | 4/13/21 | 46,200 | 46,189 |
| | Bank of New York Mellon Corp. | 2.150% | 2/24/20 | 61,325 | 60,643 |
| | Bank of New York Mellon Corp. | 2.200% | 8/16/23 | 16,670 | 15,717 |
| | Bank of New York Mellon Corp. | 3.000% | 2/24/25 | 27,990 | 26,779 |
| | Bank of Nova Scotia | 2.050% | 10/30/18 | 64,150 | 64,030 |
| | Bank of Nova Scotia | 2.800% | 7/21/21 | 25,650 | 25,416 |
| | Barclays Bank plc | 5.140% | 10/14/20 | 11,905 | 12,281 |
| | Barclays plc | 3.684% | 1/10/23 | 29,605 | 29,020 |
| 6 | Barclays plc | 3.710% | 5/16/24 | 36,385 | 36,306 |
| | BB&T Corp. | 5.250% | 11/1/19 | 8,000 | 8,246 |
| | BB&T Corp. | 3.200% | 9/3/21 | 25,900 | 25,869 |
| | BB&T Corp. | 2.750% | 4/1/22 | 61,300 | 60,083 |
| | BB&T Corp. | 3.700% | 6/5/25 | 49,000 | 48,901 |
| | BNP Paribas SA | 2.400% | 12/12/18 | 53,700 | 53,663 |
| 5 | BNP Paribas SA | 2.950% | 5/23/22 | 22,800 | 22,133 |
| | BNP Paribas SA | 3.250% | 3/3/23 | 12,270 | 12,126 |
| 5 | BNP Paribas SA | 3.800% | 1/10/24 | 44,775 | 43,999 |
| 5 | BNP Paribas SA | 3.375% | 1/9/25 | 60,670 | 57,513 |
| 5 | BNP Paribas SA | 3.500% | 11/16/27 | 82,000 | 76,324 |
| | BPCE SA | 2.500% | 12/10/18 | 18,325 | 18,323 |
| | BPCE SA | 2.500% | 7/15/19 | 53,100 | 52,852 |
| 5 | BPCE SA | 3.000% | 5/22/22 | 9,490 | 9,237 |
| 5 | BPCE SA | 5.700% | 10/22/23 | 6,225 | 6,578 |
| | BPCE SA | 4.000% | 4/15/24 | 30,615 | 30,742 |
| 5 | BPCE SA | 5.150% | 7/21/24 | 43,790 | 44,851 |
| 5 | BPCE SA | 3.500% | 10/23/27 | 64,230 | 59,154 |
| | Branch Banking & Trust Co. | 2.625% | 1/15/22 | 45,425 | 44,339 |
| 6 | Canadian Imperial Bank of Commerce | 2.865% | 6/16/22 | 57,780 | 58,131 |
| | Capital One Bank USA NA | 2.150% | 11/21/18 | 45,055 | 44,983 |
| | Capital One Financial Corp. | 2.500% | 5/12/20 | 21,500 | 21,202 |
| | Capital One Financial Corp. | 4.750% | 7/15/21 | 18,835 | 19,553 |
| | Capital One Financial Corp. | 3.750% | 4/24/24 | 55,460 | 54,809 |
| | Capital One Financial Corp. | 3.200% | 2/5/25 | 33,400 | 31,486 |
| | Capital One Financial Corp. | 4.200% | 10/29/25 | 11,740 | 11,513 |
| | Citibank NA | 3.050% | 5/1/20 | 67,400 | 67,418 |
| | Citigroup Inc. | 2.500% | 9/26/18 | 18,000 | 18,000 |
| | Citigroup Inc. | 2.550% | 4/8/19 | 55,000 | 54,947 |
| | Citigroup Inc. | 2.500% | 7/29/19 | 37,530 | 37,434 |
| | Citigroup Inc. | 2.400% | 2/18/20 | 65,200 | 64,483 |
| | Citigroup Inc. | 4.500% | 1/14/22 | 33,920 | 35,167 |
| | Citigroup Inc. | 4.125% | 7/25/28 | 14,550 | 14,048 |
| 2 | Citigroup Inc. | 3.520% | 10/27/28 | 72,550 | 67,986 |
| | Citigroup Inc. | 6.625% | 6/15/32 | 45,000 | 53,451 |
| 2 | Citigroup Inc. | 3.878% | 1/24/39 | 37,030 | 33,925 |
| |
| |
| |
| |
| 5 |
| | | | | |
| Vanguard® Wellington Fund | | | | |
| Schedule of Investments | | | | |
| May 31, 2018 | | | | |
| |
| | | | | Face | Market |
| | | | Maturity | Amount | Value |
| | | Coupon | Date | ($000) | ($000) |
| | Citigroup Inc. | 8.125% | 7/15/39 | 4,638 | 6,649 |
| | Citigroup Inc. | 4.750% | 5/18/46 | 15,055 | 14,631 |
| | Commonwealth Bank of Australia | 2.300% | 3/12/20 | 20,290 | 20,068 |
| | Compass Bank | 2.750% | 9/29/19 | 15,105 | 15,015 |
| | Cooperatieve Rabobank UA | 2.250% | 1/14/19 | 55,610 | 55,507 |
| 5 | Credit Agricole SA | 2.500% | 4/15/19 | 57,830 | 57,698 |
| 5,6 | Credit Agricole SA | 3.379% | 4/24/23 | 16,500 | 16,441 |
| 5 | Credit Agricole SA | 3.750% | 4/24/23 | 31,675 | 31,174 |
| 5 | Credit Agricole SA | 3.250% | 10/4/24 | 24,375 | 23,008 |
| | Credit Suisse AG | 2.300% | 5/28/19 | 109,260 | 108,739 |
| | Credit Suisse AG | 3.000% | 10/29/21 | 18,325 | 18,151 |
| | Credit Suisse AG | 3.625% | 9/9/24 | 4,885 | 4,843 |
| 5 | Credit Suisse Group AG | 3.574% | 1/9/23 | 20,675 | 20,351 |
| 2,5 | Credit Suisse Group AG | 3.869% | 1/12/29 | 10,980 | 10,303 |
| | Credit Suisse Group Funding Guernsey Ltd. | 3.800% | 9/15/22 | 55,260 | 55,454 |
| | Credit Suisse Group Funding Guernsey Ltd. | 3.750% | 3/26/25 | 67,850 | 65,302 |
| | Deutsche Bank AG | 2.500% | 2/13/19 | 15,225 | 15,153 |
| | Deutsche Bank AG | 2.700% | 7/13/20 | 24,500 | 23,887 |
| | Deutsche Bank AG | 3.150% | 1/22/21 | 51,485 | 50,504 |
| | Deutsche Bank AG | 4.250% | 10/14/21 | 45,220 | 44,817 |
| | Fifth Third Bank | 2.875% | 10/1/21 | 10,345 | 10,221 |
| | Goldman Sachs Group Inc. | 5.375% | 3/15/20 | 30,790 | 31,995 |
| | Goldman Sachs Group Inc. | 2.600% | 4/23/20 | 25,750 | 25,510 |
| | Goldman Sachs Group Inc. | 6.000% | 6/15/20 | 11,090 | 11,710 |
| | Goldman Sachs Group Inc. | 5.250% | 7/27/21 | 56,720 | 59,829 |
| | Goldman Sachs Group Inc. | 5.750% | 1/24/22 | 40,725 | 43,773 |
| | Goldman Sachs Group Inc. | 3.000% | 4/26/22 | 30,275 | 29,716 |
| 2 | Goldman Sachs Group Inc. | 2.876% | 10/31/22 | 64,880 | 63,291 |
| | Goldman Sachs Group Inc. | 3.625% | 1/22/23 | 35,320 | 35,254 |
| | Goldman Sachs Group Inc. | 3.500% | 1/23/25 | 17,545 | 16,918 |
| 2 | Goldman Sachs Group Inc. | 3.272% | 9/29/25 | 46,260 | 44,050 |
| | Goldman Sachs Group Inc. | 3.850% | 1/26/27 | 17,980 | 17,374 |
| 2 | Goldman Sachs Group Inc. | 3.691% | 6/5/28 | 15,055 | 14,276 |
| 2 | Goldman Sachs Group Inc. | 3.814% | 4/23/29 | 45,870 | 43,713 |
| 2 | Goldman Sachs Group Inc. | 4.223% | 5/1/29 | 67,740 | 66,712 |
| | Goldman Sachs Group Inc. | 6.750% | 10/1/37 | 43,995 | 52,745 |
| | Goldman Sachs Group Inc. | 6.250% | 2/1/41 | 35,320 | 42,034 |
| | Goldman Sachs Group Inc. | 4.800% | 7/8/44 | 30,675 | 31,006 |
| | Goldman Sachs Group Inc. | 4.750% | 10/21/45 | 12,715 | 12,794 |
| 5 | HSBC Bank plc | 4.125% | 8/12/20 | 15,000 | 15,326 |
| 5 | HSBC Bank plc | 4.750% | 1/19/21 | 62,040 | 64,350 |
| | HSBC Holdings plc | 3.400% | 3/8/21 | 33,270 | 33,306 |
| | HSBC Holdings plc | 4.000% | 3/30/22 | 72,455 | 73,609 |
| | HSBC Holdings plc | 3.600% | 5/25/23 | 60,200 | 59,876 |
| 6 | HSBC Holdings plc | 3.326% | 5/18/24 | 26,340 | 26,239 |
| | HSBC Holdings plc | 3.900% | 5/25/26 | 12,085 | 11,823 |
| 2 | HSBC Holdings plc | 4.041% | 3/13/28 | 21,805 | 21,329 |
| | HSBC Holdings plc | 6.500% | 5/2/36 | 25,000 | 29,671 |
| | HSBC Holdings plc | 6.100% | 1/14/42 | 40,665 | 50,009 |
| | HSBC Holdings plc | 5.250% | 3/14/44 | 13,210 | 13,649 |
| | HSBC USA Inc. | 2.625% | 9/24/18 | 20,000 | 20,011 |
| | HSBC USA Inc. | 2.350% | 3/5/20 | 105,645 | 104,364 |
| | HSBC USA Inc. | 3.500% | 6/23/24 | 28,025 | 27,532 |
| | Huntington National Bank | 2.200% | 4/1/19 | 22,280 | 22,215 |
| | Huntington National Bank | 2.400% | 4/1/20 | 44,990 | 44,501 |
| | ING Groep NV | 3.150% | 3/29/22 | 12,955 | 12,730 |
| | ING Groep NV | 3.950% | 3/29/27 | 32,965 | 32,306 |
| | JPMorgan Chase & Co. | 6.300% | 4/23/19 | 10,340 | 10,666 |
| | JPMorgan Chase & Co. | 4.950% | 3/25/20 | 55,000 | 56,945 |
| | JPMorgan Chase & Co. | 4.350% | 8/15/21 | 41,386 | 42,709 |
| | JPMorgan Chase & Co. | 4.500% | 1/24/22 | 44,780 | 46,500 |
| | JPMorgan Chase & Co. | 3.250% | 9/23/22 | 18,645 | 18,483 |
| | JPMorgan Chase & Co. | 3.375% | 5/1/23 | 27,610 | 27,103 |
| | JPMorgan Chase & Co. | 3.875% | 2/1/24 | 39,000 | 39,487 |
| |
| |
| |
| |
| 6 |
| | | | | |
| Vanguard® Wellington Fund | | | | |
| Schedule of Investments | | | | |
| May 31, 2018 | | | | |
| |
| | | | | Face | Market |
| | | | Maturity | Amount | Value |
| | | Coupon | Date | ($000) | ($000) |
| | JPMorgan Chase & Co. | 3.900% | 7/15/25 | 13,870 | 13,833 |
| | JPMorgan Chase & Co. | 4.125% | 12/15/26 | 29,835 | 29,669 |
| | JPMorgan Chase & Co. | 4.250% | 10/1/27 | 13,420 | 13,365 |
| | JPMorgan Chase & Co. | 5.600% | 7/15/41 | 96,000 | 110,518 |
| | JPMorgan Chase & Co. | 5.400% | 1/6/42 | 18,035 | 20,388 |
| | JPMorgan Chase & Co. | 5.625% | 8/16/43 | 16,100 | 18,012 |
| | JPMorgan Chase & Co. | 4.950% | 6/1/45 | 15,000 | 15,392 |
| 2 | JPMorgan Chase & Co. | 3.964% | 11/15/48 | 159,600 | 147,017 |
| 5 | Macquarie Bank Ltd. | 2.400% | 1/21/20 | 12,610 | 12,449 |
| 2,5 | Macquarie Group Ltd. | 4.150% | 3/27/24 | 49,500 | 49,314 |
| | Manufacturers & Traders Trust Co. | 2.100% | 2/6/20 | 17,870 | 17,614 |
| | Manufacturers & Traders Trust Co. | 2.900% | 2/6/25 | 24,685 | 23,748 |
| | Morgan Stanley | 2.500% | 1/24/19 | 100,000 | 99,888 |
| | Morgan Stanley | 5.625% | 9/23/19 | 24,355 | 25,201 |
| | Morgan Stanley | 5.750% | 1/25/21 | 79,825 | 84,819 |
| | Morgan Stanley | 2.500% | 4/21/21 | 21,815 | 21,334 |
| | Morgan Stanley | 2.625% | 11/17/21 | 30,000 | 29,241 |
| | Morgan Stanley | 2.750% | 5/19/22 | 63,420 | 61,703 |
| | Morgan Stanley | 3.875% | 4/29/24 | 97,010 | 97,909 |
| | Morgan Stanley | 3.700% | 10/23/24 | 29,050 | 28,856 |
| | Morgan Stanley | 4.000% | 7/23/25 | 29,455 | 29,557 |
| | Morgan Stanley | 3.125% | 7/27/26 | 11,435 | 10,682 |
| | Morgan Stanley | 6.250% | 8/9/26 | 20,000 | 22,778 |
| | Morgan Stanley | 3.625% | 1/20/27 | 64,000 | 61,748 |
| 2 | Morgan Stanley | 3.772% | 1/24/29 | 56,905 | 54,712 |
| | Morgan Stanley | 4.300% | 1/27/45 | 18,360 | 17,636 |
| | National City Corp. | 6.875% | 5/15/19 | 13,950 | 14,475 |
| 5 | NBK SPC Ltd. | 2.750% | 5/30/22 | 56,530 | 53,769 |
| | Northern Trust Corp. | 3.450% | 11/4/20 | 9,000 | 9,103 |
| | PNC Bank NA | 3.300% | 10/30/24 | 18,195 | 17,921 |
| | PNC Bank NA | 4.200% | 11/1/25 | 16,650 | 17,026 |
| | PNC Bank NA | 3.100% | 10/25/27 | 41,975 | 39,693 |
| | PNC Bank NA | 3.250% | 1/22/28 | 60,465 | 57,786 |
| | PNC Financial Services Group Inc. | 3.900% | 4/29/24 | 41,565 | 41,612 |
| | Royal Bank of Canada | 2.750% | 2/1/22 | 43,960 | 43,178 |
| | Santander Holdings USA Inc. | 2.700% | 5/24/19 | 16,310 | 16,228 |
| | Santander Holdings USA Inc. | 2.650% | 4/17/20 | 23,185 | 23,052 |
| | Santander Holdings USA Inc. | 3.700% | 3/28/22 | 33,065 | 32,670 |
| | Santander Holdings USA Inc. | 3.400% | 1/18/23 | 20,375 | 19,746 |
| 5 | Skandinaviska Enskilda Banken AB | 2.450% | 5/27/20 | 61,300 | 60,474 |
| 5 | Societe Generale SA | 3.250% | 1/12/22 | 54,445 | 53,462 |
| 2 | State Street Corp. | 2.653% | 5/15/23 | 30,770 | 29,929 |
| | SunTrust Bank | 3.300% | 5/15/26 | 12,895 | 12,232 |
| | Synchrony Bank | 3.650% | 5/24/21 | 46,195 | 46,275 |
| | Synchrony Financial | 2.600% | 1/15/19 | 20,920 | 20,886 |
| | Synchrony Financial | 3.000% | 8/15/19 | 10,990 | 10,983 |
| | Synchrony Financial | 2.700% | 2/3/20 | 15,605 | 15,499 |
| | Toronto-Dominion Bank | 2.500% | 12/14/20 | 49,340 | 48,652 |
| 5 | UBS AG | 2.200% | 6/8/20 | 53,390 | 52,422 |
| 5 | UBS Group Funding Jersey Ltd. | 2.950% | 9/24/20 | 44,570 | 44,267 |
| 5 | UBS Group Funding Jersey Ltd. | 3.000% | 4/15/21 | 5,130 | 5,058 |
| | US Bancorp | 2.625% | 1/24/22 | 46,910 | 46,060 |
| | US Bancorp | 3.700% | 1/30/24 | 52,500 | 53,307 |
| | Wells Fargo & Co. | 2.150% | 1/15/19 | 91,150 | 90,898 |
| | Wells Fargo & Co. | 2.150% | 1/30/20 | 46,155 | 45,522 |
| | Wells Fargo & Co. | 3.000% | 1/22/21 | 26,735 | 26,636 |
| | Wells Fargo & Co. | 3.500% | 3/8/22 | 64,245 | 64,179 |
| | Wells Fargo & Co. | 3.069% | 1/24/23 | 12,990 | 12,636 |
| | Wells Fargo & Co. | 3.450% | 2/13/23 | 48,895 | 47,941 |
| | Wells Fargo & Co. | 4.480% | 1/16/24 | 46,156 | 47,240 |
| | Wells Fargo & Co. | 3.550% | 9/29/25 | 32,170 | 31,172 |
| | Wells Fargo & Co. | 3.000% | 4/22/26 | 39,405 | 36,754 |
| | Wells Fargo & Co. | 5.606% | 1/15/44 | 68,281 | 74,775 |
| | Wells Fargo & Co. | 4.650% | 11/4/44 | 10,315 | 9,910 |
| |
| |
| |
| |
| 7 |
| | | | | |
| Vanguard® Wellington Fund | | | | |
| Schedule of Investments | | | | |
| May 31, 2018 | | | | |
| |
| | | | | Face | Market |
| | | | Maturity | Amount | Value |
| | | Coupon | Date | ($000) | ($000) |
| | Wells Fargo & Co. | 4.900% | 11/17/45 | 19,160 | 19,227 |
| | Wells Fargo & Co. | 4.400% | 6/14/46 | 38,300 | 35,637 |
| | Wells Fargo & Co. | 4.750% | 12/7/46 | 23,150 | 22,771 |
| | Westpac Banking Corp. | 2.300% | 5/26/20 | 22,554 | 22,284 |
| | Brokerage (0.0%) | | | | |
| | Ameriprise Financial Inc. | 5.300% | 3/15/20 | 11,590 | 11,996 |
| | Charles Schwab Corp. | 3.200% | 3/2/27 | 19,665 | 18,991 |
| | Finance Companies (0.2%) | | | | |
| | GE Capital International Funding Co. Unlimited Co. | 4.418% | 11/15/35 | 168,370 | 161,009 |
| |
| | Insurance (1.2%) | | | | |
| | ACE Capital Trust II | 9.700% | 4/1/30 | 20,000 | 28,600 |
| | Aetna Inc. | 2.800% | 6/15/23 | 25,660 | 24,529 |
| | Anthem Inc. | 2.300% | 7/15/18 | 15,110 | 15,118 |
| | Anthem Inc. | 3.700% | 8/15/21 | 10,000 | 10,087 |
| | Anthem Inc. | 3.125% | 5/15/22 | 53,740 | 53,003 |
| | Anthem Inc. | 3.300% | 1/15/23 | 42,468 | 41,771 |
| | Anthem Inc. | 4.101% | 3/1/28 | 40,910 | 40,302 |
| | Anthem Inc. | 4.650% | 8/15/44 | 13,445 | 13,109 |
| | Anthem Inc. | 4.375% | 12/1/47 | 9,745 | 9,112 |
| | Chubb Corp. | 6.000% | 5/11/37 | 50,000 | 61,820 |
| | Chubb INA Holdings Inc. | 2.300% | 11/3/20 | 6,330 | 6,226 |
| | Chubb INA Holdings Inc. | 3.350% | 5/15/24 | 22,345 | 22,080 |
| | Chubb INA Holdings Inc. | 4.350% | 11/3/45 | 29,835 | 30,696 |
| | Cigna Corp. | 3.250% | 4/15/25 | 31,655 | 29,925 |
| | CNA Financial Corp. | 3.950% | 5/15/24 | 5,410 | 5,405 |
| 5 | Farmers Exchange Capital | 7.050% | 7/15/28 | 25,000 | 29,835 |
| 5 | Five Corners Funding Trust | 4.419% | 11/15/23 | 5,935 | 6,120 |
| 5 | Jackson National Life Global Funding | 3.250% | 1/30/24 | 24,070 | 23,582 |
| 5 | Jackson National Life Insurance Co. | 8.150% | 3/15/27 | 18,890 | 23,636 |
| 5 | Liberty Mutual Group Inc. | 4.250% | 6/15/23 | 14,330 | 14,557 |
| 5 | Liberty Mutual Insurance Co. | 7.875% | 10/15/26 | 31,210 | 38,820 |
| 5 | MassMutual Global Funding II | 2.100% | 8/2/18 | 46,890 | 46,899 |
| 5 | MassMutual Global Funding II | 2.350% | 4/9/19 | 28,000 | 27,928 |
| | MetLife Inc. | 3.600% | 4/10/24 | 35,035 | 34,973 |
| | MetLife Inc. | 4.125% | 8/13/42 | 5,565 | 5,314 |
| | MetLife Inc. | 4.875% | 11/13/43 | 20,820 | 22,290 |
| 5 | Metropolitan Life Global Funding I | 1.875% | 6/22/18 | 12,690 | 12,687 |
| 5 | Metropolitan Life Global Funding I | 2.650% | 4/8/22 | 13,770 | 13,439 |
| 5 | Metropolitan Life Global Funding I | 3.450% | 12/18/26 | 23,660 | 23,022 |
| 5 | Metropolitan Life Global Funding I | 3.000% | 9/19/27 | 21,455 | 20,004 |
| 5 | New York Life Global Funding | 2.900% | 1/17/24 | 29,050 | 28,198 |
| 5 | New York Life Insurance Co. | 5.875% | 5/15/33 | 55,395 | 66,714 |
| 5 | Northwestern Mutual Life Insurance Co. | 3.850% | 9/30/47 | 24,134 | 22,264 |
| | Prudential Financial Inc. | 2.300% | 8/15/18 | 24,545 | 24,530 |
| | Prudential Financial Inc. | 4.500% | 11/15/20 | 24,365 | 25,246 |
| 5 | Teachers Insurance & Annuity Assn. of America | 4.900% | 9/15/44 | 24,830 | 26,790 |
| 5 | Teachers Insurance & Annuity Assn. of America | 4.270% | 5/15/47 | 42,390 | 41,287 |
| | Torchmark Corp. | 7.875% | 5/15/23 | 45,000 | 52,362 |
| | UnitedHealth Group Inc. | 3.875% | 10/15/20 | 27,960 | 28,517 |
| | UnitedHealth Group Inc. | 2.875% | 3/15/22 | 4,696 | 4,642 |
| | UnitedHealth Group Inc. | 2.875% | 3/15/23 | 16,000 | 15,674 |
| | UnitedHealth Group Inc. | 3.100% | 3/15/26 | 15,350 | 14,698 |
| | UnitedHealth Group Inc. | 4.625% | 7/15/35 | 23,710 | 25,198 |
| | UnitedHealth Group Inc. | 4.250% | 3/15/43 | 67,400 | 67,596 |
| | UnitedHealth Group Inc. | 4.750% | 7/15/45 | 30,995 | 33,368 |
| | UnitedHealth Group Inc. | 4.200% | 1/15/47 | 8,620 | 8,591 |
| | Other Finance (0.0%) | | | | |
| 5 | LeasePlan Corp. NV | 2.875% | 1/22/19 | 24,670 | 24,632 |
| |
| | Real Estate Investment Trusts (0.1%) | | | | |
| | AvalonBay Communities Inc. | 3.625% | 10/1/20 | 20,780 | 20,935 |
| |
| |
| |
| |
| 8 |
| | | | | |
| Vanguard® Wellington Fund | | | | |
| Schedule of Investments | | | | |
| May 31, 2018 | | | | |
| |
| | | | | Face | Market |
| | | | Maturity | Amount | Value |
| | | Coupon | Date | ($000) | ($000) |
| | Boston Properties LP | 3.125% | 9/1/23 | 13,275 | 12,927 |
| | Boston Properties LP | 3.800% | 2/1/24 | 1,750 | 1,747 |
| | Realty Income Corp. | 4.650% | 8/1/23 | 25,010 | 25,973 |
| | Simon Property Group LP | 3.750% | 2/1/24 | 3,265 | 3,273 |
| | Simon Property Group LP | 3.375% | 10/1/24 | 10,055 | 9,839 |
| 5 | WEA Finance LLC / Westfield UK & Europe Finance plc | 2.700% | 9/17/19 | 22,360 | 22,226 |
| | | | | | 8,497,511 |
| Industrial (10.0%) | | | | |
| | Basic Industry (0.0%) | | | | |
| | International Paper Co. | 4.350% | 8/15/48 | 27,425 | 24,905 |
| 2 | Rohm and Haas Holdings Ltd. | 9.800% | 4/15/20 | 1,500 | 1,593 |
| | Capital Goods (0.7%) | | | | |
| 5 | BAE Systems Holdings Inc. | 2.850% | 12/15/20 | 6,060 | 5,973 |
| 5 | BAE Systems Holdings Inc. | 3.850% | 12/15/25 | 11,010 | 10,925 |
| | Boeing Co. | 8.625% | 11/15/31 | 9,460 | 13,810 |
| | Boeing Co. | 5.875% | 2/15/40 | 4,825 | 6,104 |
| | Caterpillar Financial Services Corp. | 2.625% | 3/1/23 | 53,000 | 51,418 |
| | Caterpillar Inc. | 3.900% | 5/27/21 | 46,914 | 48,248 |
| | Caterpillar Inc. | 2.600% | 6/26/22 | 11,345 | 11,062 |
| | Caterpillar Inc. | 3.400% | 5/15/24 | 14,200 | 14,215 |
| | Deere & Co. | 7.125% | 3/3/31 | 17,500 | 22,789 |
| | General Dynamics Corp. | 2.875% | 5/11/20 | 54,380 | 54,346 |
| | General Dynamics Corp. | 3.875% | 7/15/21 | 14,925 | 15,226 |
| | General Electric Co. | 2.700% | 10/9/22 | 9,965 | 9,662 |
| | General Electric Co. | 3.100% | 1/9/23 | 8,635 | 8,493 |
| | Honeywell International Inc. | 4.250% | 3/1/21 | 40,681 | 42,161 |
| | Illinois Tool Works Inc. | 3.500% | 3/1/24 | 52,955 | 53,560 |
| | John Deere Capital Corp. | 2.250% | 4/17/19 | 28,125 | 28,063 |
| | John Deere Capital Corp. | 1.700% | 1/15/20 | 21,935 | 21,524 |
| | John Deere Capital Corp. | 3.450% | 3/13/25 | 43,145 | 43,096 |
| | Lockheed Martin Corp. | 2.900% | 3/1/25 | 10,450 | 9,965 |
| | Lockheed Martin Corp. | 4.500% | 5/15/36 | 8,015 | 8,388 |
| | Lockheed Martin Corp. | 4.700% | 5/15/46 | 14,370 | 15,274 |
| | Lockheed Martin Corp. | 4.090% | 9/15/52 | 5,500 | 5,227 |
| | Parker-Hannifin Corp. | 4.450% | 11/21/44 | 17,735 | 18,613 |
| 5 | Siemens Financieringsmaatschappij NV | 2.900% | 5/27/22 | 39,625 | 39,024 |
| 5 | Siemens Financieringsmaatschappij NV | 3.125% | 3/16/24 | 61,400 | 60,619 |
| 5 | Siemens Financieringsmaatschappij NV | 4.400% | 5/27/45 | 34,365 | 36,280 |
| | United Technologies Corp. | 3.100% | 6/1/22 | 7,010 | 6,922 |
| | United Technologies Corp. | 6.050% | 6/1/36 | 20,325 | 23,631 |
| | United Technologies Corp. | 6.125% | 7/15/38 | 37,300 | 44,217 |
| | Communication (1.4%) | | | | |
| | 21st Century Fox America Inc. | 3.000% | 9/15/22 | 11,891 | 11,647 |
| | America Movil SAB de CV | 3.125% | 7/16/22 | 84,600 | 83,266 |
| | America Movil SAB de CV | 6.125% | 3/30/40 | 7,380 | 8,728 |
| | American Tower Corp. | 3.450% | 9/15/21 | 30,665 | 30,657 |
| | American Tower Corp. | 5.000% | 2/15/24 | 7,655 | 8,006 |
| | American Tower Corp. | 4.400% | 2/15/26 | 7,315 | 7,291 |
| | AT&T Inc. | 5.200% | 3/15/20 | 10,120 | 10,500 |
| | AT&T Inc. | 2.450% | 6/30/20 | 12,000 | 11,850 |
| | AT&T Inc. | 4.600% | 2/15/21 | 5,000 | 5,156 |
| | AT&T Inc. | 4.450% | 5/15/21 | 10,000 | 10,298 |
| | AT&T Inc. | 4.500% | 3/9/48 | 24,959 | 22,071 |
| | CBS Corp. | 4.300% | 2/15/21 | 27,830 | 28,349 |
| | Comcast Corp. | 3.000% | 2/1/24 | 25,345 | 24,421 |
| | Comcast Corp. | 3.600% | 3/1/24 | 50,730 | 50,227 |
| | Comcast Corp. | 3.375% | 2/15/25 | 2,540 | 2,462 |
| | Comcast Corp. | 2.350% | 1/15/27 | 19,620 | 17,145 |
| | Comcast Corp. | 4.250% | 1/15/33 | 42,890 | 41,915 |
| | Comcast Corp. | 4.200% | 8/15/34 | 26,890 | 25,883 |
| | Comcast Corp. | 5.650% | 6/15/35 | 4,725 | 5,290 |
| | Comcast Corp. | 4.400% | 8/15/35 | 32,325 | 31,500 |
| | Comcast Corp. | 6.500% | 11/15/35 | 4,720 | 5,701 |
| |
| |
| |
| |
| 9 |
| | | | | |
| Vanguard® Wellington Fund | | | | |
| Schedule of Investments | | | | |
| May 31, 2018 | | | | |
| |
| | | | | Face | Market |
| | | | Maturity | Amount | Value |
| | | Coupon | Date | ($000) | ($000) |
| | Comcast Corp. | 6.400% | 5/15/38 | 968 | 1,181 |
| | Comcast Corp. | 4.650% | 7/15/42 | 47,970 | 46,837 |
| | Comcast Corp. | 4.500% | 1/15/43 | 22,000 | 20,935 |
| | Comcast Corp. | 4.750% | 3/1/44 | 34,643 | 34,193 |
| | Comcast Corp. | 4.600% | 8/15/45 | 43,296 | 41,615 |
| | Comcast Corp. | 3.969% | 11/1/47 | 8,452 | 7,462 |
| | Comcast Corp. | 4.000% | 3/1/48 | 12,180 | 10,788 |
| | Comcast Corp. | 3.999% | 11/1/49 | 23,162 | 20,343 |
| | Comcast Corp. | 4.049% | 11/1/52 | 2,670 | 2,335 |
| 5 | Cox Communications Inc. | 4.800% | 2/1/35 | 30,000 | 28,420 |
| 5 | Cox Communications Inc. | 6.450% | 12/1/36 | 5,850 | 6,631 |
| 5 | Cox Communications Inc. | 4.600% | 8/15/47 | 4,435 | 4,152 |
| | Crown Castle International Corp. | 3.650% | 9/1/27 | 10,215 | 9,599 |
| | Crown Castle International Corp. | 3.800% | 2/15/28 | 8,435 | 8,004 |
| | Discovery Communications LLC | 5.625% | 8/15/19 | 6,511 | 6,714 |
| 5 | GTP Acquisition Partners I LLC | 2.350% | 6/15/20 | 22,530 | 22,145 |
| 5 | NBCUniversal Enterprise Inc. | 1.974% | 4/15/19 | 100,115 | 99,406 |
| | NBCUniversal Media LLC | 4.375% | 4/1/21 | 23,900 | 24,640 |
| | NBCUniversal Media LLC | 2.875% | 1/15/23 | 9,760 | 9,494 |
| | NBCUniversal Media LLC | 4.450% | 1/15/43 | 10,370 | 9,909 |
| | Orange SA | 4.125% | 9/14/21 | 60,990 | 62,750 |
| | Orange SA | 9.000% | 3/1/31 | 20,280 | 28,801 |
| 5 | SK Telecom Co. Ltd. | 3.750% | 4/16/23 | 11,995 | 11,918 |
| 5 | Sky plc | 2.625% | 9/16/19 | 38,021 | 37,783 |
| 5 | Sky plc | 3.750% | 9/16/24 | 45,046 | 45,187 |
| 2,5 | Sprint Spectrum Co LLC / Sprint Spectrum Co II LLC / | | | | |
| | Sprint Spectrum Co III LLC | 4.738% | 3/20/25 | 46,090 | 45,804 |
| | Time Warner Cable LLC | 8.750% | 2/14/19 | 1,120 | 1,163 |
| | Time Warner Cable LLC | 8.250% | 4/1/19 | 14,433 | 15,063 |
| | Time Warner Entertainment Co. LP | 8.375% | 3/15/23 | 3,925 | 4,611 |
| | Time Warner Inc. | 4.875% | 3/15/20 | 14,000 | 14,457 |
| | Time Warner Inc. | 4.750% | 3/29/21 | 8,000 | 8,307 |
| | Time Warner Inc. | 3.600% | 7/15/25 | 22,350 | 21,514 |
| | Verizon Communications Inc. | 3.500% | 11/1/21 | 5,495 | 5,531 |
| | Verizon Communications Inc. | 4.812% | 3/15/39 | 85,963 | 83,770 |
| | Verizon Communications Inc. | 4.750% | 11/1/41 | 11,880 | 11,456 |
| | Verizon Communications Inc. | 4.862% | 8/21/46 | 36,117 | 34,834 |
| | Verizon Communications Inc. | 5.012% | 4/15/49 | 21,754 | 21,323 |
| | Vodafone Group plc | 3.750% | 1/16/24 | 43,335 | 43,095 |
| | Vodafone Group plc | 5.000% | 5/30/38 | 1,895 | 1,890 |
| | Vodafone Group plc | 5.250% | 5/30/48 | 28,420 | 28,763 |
| | Walt Disney Co. | 4.125% | 6/1/44 | 23,115 | 22,848 |
| | Consumer Cyclical (1.1%) | | | | |
| | Alibaba Group Holding Ltd. | 2.500% | 11/28/19 | 12,965 | 12,836 |
| | Alibaba Group Holding Ltd. | 3.125% | 11/28/21 | 2,515 | 2,496 |
| | Alibaba Group Holding Ltd. | 3.600% | 11/28/24 | 39,860 | 39,361 |
| | Alibaba Group Holding Ltd. | 3.400% | 12/6/27 | 59,970 | 56,633 |
| | Amazon.com Inc. | 2.500% | 11/29/22 | 34,760 | 33,936 |
| 5 | Amazon.com Inc. | 2.800% | 8/22/24 | 26,480 | 25,625 |
| | Amazon.com Inc. | 4.800% | 12/5/34 | 37,370 | 41,530 |
| | Amazon.com Inc. | 4.950% | 12/5/44 | 22,605 | 25,573 |
| 5 | Amazon.com Inc. | 4.250% | 8/22/57 | 51,360 | 51,159 |
| | American Honda Finance Corp. | 2.125% | 10/10/18 | 45,655 | 45,606 |
| | AutoZone Inc. | 3.700% | 4/15/22 | 46,136 | 46,466 |
| | AutoZone Inc. | 3.125% | 7/15/23 | 33,000 | 32,198 |
| 5 | BMW US Capital LLC | 2.000% | 4/11/21 | 21,300 | 20,628 |
| 5 | BMW US Capital LLC | 2.800% | 4/11/26 | 5,805 | 5,413 |
| 5 | Daimler Finance North America LLC | 2.375% | 8/1/18 | 35,000 | 34,990 |
| 5 | Daimler Finance North America LLC | 2.250% | 7/31/19 | 73,100 | 72,577 |
| 5 | Daimler Finance North America LLC | 2.200% | 5/5/20 | 16,565 | 16,288 |
| 5 | Daimler Finance North America LLC | 2.450% | 5/18/20 | 8,340 | 8,243 |
| 5 | Daimler Finance North America LLC | 2.300% | 2/12/21 | 34,470 | 33,635 |
| 5 | Daimler Finance North America LLC | 3.875% | 9/15/21 | 3,961 | 4,025 |
| |
| |
| |
| |
| 10 |
| | | | | |
| Vanguard® Wellington Fund | | | | |
| Schedule of Investments | | | | |
| May 31, 2018 | | | | |
| |
| | | | | Face | Market |
| | | | Maturity | Amount | Value |
| | | Coupon | Date | ($000) | ($000) |
| 5 | Daimler Finance North America LLC | 3.250% | 8/1/24 | 5,870 | 5,745 |
| | Ford Motor Credit Co. LLC | 2.375% | 3/12/19 | 45,000 | 44,859 |
| | Ford Motor Credit Co. LLC | 3.157% | 8/4/20 | 26,655 | 26,551 |
| | General Motors Financial Co. Inc. | 3.550% | 4/9/21 | 16,395 | 16,400 |
| | General Motors Financial Co. Inc. | 3.950% | 4/13/24 | 57,810 | 57,069 |
| | Home Depot Inc. | 2.250% | 9/10/18 | 39,555 | 39,543 |
| | Home Depot Inc. | 2.700% | 4/1/23 | 31,170 | 30,629 |
| | Home Depot Inc. | 4.400% | 3/15/45 | 28,655 | 30,004 |
| 5 | Hyundai Capital America | 2.550% | 4/3/20 | 28,910 | 28,449 |
| | Lowe's Cos. Inc. | 3.100% | 5/3/27 | 68,700 | 65,477 |
| | Lowe's Cos. Inc. | 6.500% | 3/15/29 | 13,301 | 16,198 |
| | McDonald's Corp. | 2.625% | 1/15/22 | 7,805 | 7,687 |
| | McDonald's Corp. | 3.250% | 6/10/24 | 5,460 | 5,404 |
| | McDonald's Corp. | 4.875% | 12/9/45 | 9,940 | 10,557 |
| 5 | Nissan Motor Acceptance Corp. | 2.650% | 9/26/18 | 24,990 | 25,015 |
| 5 | Volkswagen Group of America Finance LLC | 2.450% | 11/20/19 | 16,935 | 16,797 |
| | Walmart Inc. | 2.550% | 4/11/23 | 38,325 | 37,382 |
| | Walmart Inc. | 3.625% | 12/15/47 | 14,215 | 13,484 |
| | Consumer Noncyclical (3.4%) | | | | |
| | Allergan Funding SCS | 3.000% | 3/12/20 | 42,408 | 42,188 |
| | Allergan Funding SCS | 3.450% | 3/15/22 | 18,695 | 18,395 |
| | Allergan Funding SCS | 3.800% | 3/15/25 | 35,925 | 34,894 |
| | Allergan Funding SCS | 4.550% | 3/15/35 | 10,240 | 9,787 |
| | Allergan Funding SCS | 4.850% | 6/15/44 | 18,000 | 17,291 |
| | Allergan Funding SCS | 4.750% | 3/15/45 | 20,800 | 19,776 |
| | Altria Group Inc. | 4.750% | 5/5/21 | 23,376 | 24,433 |
| | Altria Group Inc. | 2.850% | 8/9/22 | 18,810 | 18,410 |
| | Altria Group Inc. | 4.500% | 5/2/43 | 10,705 | 10,376 |
| | AmerisourceBergen Corp. | 3.500% | 11/15/21 | 12,320 | 12,369 |
| | Amgen Inc. | 3.875% | 11/15/21 | 13,315 | 13,581 |
| | Amgen Inc. | 5.150% | 11/15/41 | 36,380 | 39,034 |
| | Amgen Inc. | 4.663% | 6/15/51 | 9,600 | 9,572 |
| | Anheuser-Busch Cos. LLC | 6.500% | 1/1/28 | 19,550 | 22,807 |
| | Anheuser-Busch InBev Finance Inc. | 3.300% | 2/1/23 | 75,400 | 75,013 |
| | Anheuser-Busch InBev Finance Inc. | 3.650% | 2/1/26 | 68,045 | 66,779 |
| | Anheuser-Busch InBev Finance Inc. | 4.700% | 2/1/36 | 133,300 | 136,675 |
| | Anheuser-Busch InBev Finance Inc. | 4.900% | 2/1/46 | 99,460 | 103,138 |
| | Anheuser-Busch InBev Worldwide Inc. | 3.750% | 1/15/22 | 2,390 | 2,432 |
| | Anheuser-Busch InBev Worldwide Inc. | 2.500% | 7/15/22 | 117,831 | 113,968 |
| | Anheuser-Busch InBev Worldwide Inc. | 4.375% | 4/15/38 | 22,845 | 22,559 |
| | Anheuser-Busch InBev Worldwide Inc. | 4.950% | 1/15/42 | 4,100 | 4,311 |
| | Anheuser-Busch InBev Worldwide Inc. | 3.750% | 7/15/42 | 19,610 | 17,405 |
| | Anheuser-Busch InBev Worldwide Inc. | 4.600% | 4/15/48 | 14,225 | 14,177 |
| 2 | Ascension Health | 4.847% | 11/15/53 | 44,750 | 49,309 |
| | AstraZeneca plc | 1.950% | 9/18/19 | 12,065 | 11,924 |
| | AstraZeneca plc | 2.375% | 11/16/20 | 44,480 | 43,748 |
| | AstraZeneca plc | 6.450% | 9/15/37 | 23,385 | 29,612 |
| 5 | BAT Capital Corp. | 3.557% | 8/15/27 | 63,450 | 59,602 |
| 5 | BAT International Finance plc | 2.750% | 6/15/20 | 21,250 | 20,994 |
| 5 | BAT International Finance plc | 3.250% | 6/7/22 | 58,280 | 57,440 |
| 5 | BAT International Finance plc | 3.500% | 6/15/22 | 8,980 | 8,930 |
| 5 | Bayer US Finance LLC | 2.375% | 10/8/19 | 7,510 | 7,442 |
| 5 | Bayer US Finance LLC | 3.000% | 10/8/21 | 46,850 | 46,206 |
| | Biogen Inc. | 2.900% | 9/15/20 | 21,115 | 21,009 |
| | Cardinal Health Inc. | 2.400% | 11/15/19 | 27,350 | 27,093 |
| | Cardinal Health Inc. | 3.200% | 3/15/23 | 13,035 | 12,690 |
| | Cardinal Health Inc. | 3.079% | 6/15/24 | 12,670 | 12,005 |
| | Cardinal Health Inc. | 3.500% | 11/15/24 | 24,705 | 23,832 |
| | Cardinal Health Inc. | 4.500% | 11/15/44 | 28,805 | 26,623 |
| 5 | Cargill Inc. | 4.307% | 5/14/21 | 60,532 | 62,542 |
| 5 | Cargill Inc. | 6.875% | 5/1/28 | 19,355 | 23,633 |
| 5 | Cargill Inc. | 4.760% | 11/23/45 | 28,190 | 30,409 |
| | Catholic Health Initiatives Colorado GO | 2.600% | 8/1/18 | 9,745 | 9,749 |
| |
| |
| |
| |
| 11 |
| | | | | |
| Vanguard® Wellington Fund | | | | |
| Schedule of Investments | | | | |
| May 31, 2018 | | | | |
| |
| | | | | Face | Market |
| | | | Maturity | Amount | Value |
| | | Coupon | Date | ($000) | ($000) |
| | Catholic Health Initiatives Colorado GO | 2.950% | 11/1/22 | 18,735 | 18,198 |
| | Catholic Health Initiatives Colorado GO | 4.200% | 8/1/23 | 9,885 | 10,045 |
| 2 | Catholic Health Initiatives Colorado GO | 4.350% | 11/1/42 | 22,115 | 20,664 |
| | Celgene Corp. | 2.250% | 5/15/19 | 6,565 | 6,530 |
| | Celgene Corp. | 3.250% | 8/15/22 | 16,250 | 15,962 |
| | Celgene Corp. | 3.550% | 8/15/22 | 18,400 | 18,307 |
| | Coca-Cola Co. | 3.500% | 9/15/20 | 9,900 | 9,952 |
| | Coca-Cola Co. | 3.300% | 9/1/21 | 10,075 | 10,209 |
| | Coca-Cola Co. | 4.500% | 9/1/21 | 8,430 | 8,681 |
| | Coca-Cola Femsa SAB de CV | 2.375% | 11/26/18 | 13,596 | 13,577 |
| | Coca-Cola Femsa SAB de CV | 3.875% | 11/26/23 | 34,200 | 34,327 |
| | Colgate-Palmolive Co. | 7.600% | 5/19/25 | 13,920 | 17,464 |
| | Constellation Brands Inc. | 2.700% | 5/9/22 | 2,385 | 2,320 |
| | CVS Health Corp. | 2.750% | 12/1/22 | 40,255 | 38,719 |
| | CVS Health Corp. | 4.875% | 7/20/35 | 6,900 | 6,977 |
| | CVS Health Corp. | 5.125% | 7/20/45 | 51,200 | 52,621 |
| | CVS Health Corp. | 5.050% | 3/25/48 | 22,120 | 22,568 |
| | Diageo Capital plc | 2.625% | 4/29/23 | 48,310 | 46,845 |
| | Diageo Investment Corp. | 2.875% | 5/11/22 | 26,991 | 26,640 |
| | Dignity Health California GO | 2.637% | 11/1/19 | 5,595 | 5,558 |
| | Dignity Health California GO | 3.812% | 11/1/24 | 20,780 | 20,573 |
| | Eli Lilly & Co. | 3.700% | 3/1/45 | 24,450 | 23,444 |
| 5 | EMD Finance LLC | 2.950% | 3/19/22 | 23,660 | 23,267 |
| 5 | Forest Laboratories Inc. | 4.875% | 2/15/21 | 4,184 | 4,310 |
| | Gilead Sciences Inc. | 2.550% | 9/1/20 | 26,330 | 26,098 |
| | Gilead Sciences Inc. | 3.700% | 4/1/24 | 26,895 | 27,049 |
| | Gilead Sciences Inc. | 3.500% | 2/1/25 | 22,335 | 22,082 |
| | Gilead Sciences Inc. | 4.500% | 2/1/45 | 32,375 | 32,422 |
| | Gilead Sciences Inc. | 4.750% | 3/1/46 | 7,340 | 7,593 |
| | GlaxoSmithKline Capital Inc. | 2.800% | 3/18/23 | 31,740 | 31,015 |
| | GlaxoSmithKline Capital Inc. | 5.375% | 4/15/34 | 45,000 | 51,243 |
| | GlaxoSmithKline Capital plc | 2.850% | 5/8/22 | 28,930 | 28,517 |
| 5 | Imperial Tobacco Finance plc | 3.750% | 7/21/22 | 34,745 | 34,508 |
| 5 | Japan Tobacco Inc. | 2.100% | 7/23/18 | 22,200 | 22,190 |
| | Kaiser Foundation Hospitals | 3.500% | 4/1/22 | 20,786 | 20,904 |
| | Kaiser Foundation Hospitals | 3.150% | 5/1/27 | 17,935 | 17,175 |
| | Kaiser Foundation Hospitals | 4.875% | 4/1/42 | 14,250 | 15,802 |
| | Kraft Heinz Foods Co. | 3.000% | 6/1/26 | 19,550 | 17,805 |
| | Kraft Heinz Foods Co. | 5.000% | 7/15/35 | 8,940 | 8,898 |
| | Kraft Heinz Foods Co. | 4.375% | 6/1/46 | 61,615 | 54,574 |
| | Kroger Co. | 4.450% | 2/1/47 | 6,450 | 5,891 |
| | McKesson Corp. | 2.700% | 12/15/22 | 7,710 | 7,391 |
| | McKesson Corp. | 2.850% | 3/15/23 | 7,620 | 7,326 |
| | Medtronic Inc. | 2.500% | 3/15/20 | 34,350 | 34,161 |
| | Medtronic Inc. | 3.150% | 3/15/22 | 72,005 | 71,928 |
| | Medtronic Inc. | 3.625% | 3/15/24 | 10,350 | 10,390 |
| | Medtronic Inc. | 3.500% | 3/15/25 | 76,150 | 75,906 |
| | Medtronic Inc. | 4.375% | 3/15/35 | 9,889 | 10,338 |
| | Memorial Sloan-Kettering Cancer Center New York GO | 4.125% | 7/1/52 | 12,320 | 12,218 |
| | Memorial Sloan-Kettering Cancer Center New York GO | 4.200% | 7/1/55 | 15,150 | 15,656 |
| | Merck & Co. Inc. | 2.350% | 2/10/22 | 30,760 | 30,025 |
| | Merck & Co. Inc. | 2.800% | 5/18/23 | 54,775 | 53,804 |
| | Merck & Co. Inc. | 2.750% | 2/10/25 | 47,090 | 45,264 |
| | Merck & Co. Inc. | 4.150% | 5/18/43 | 22,090 | 22,608 |
| | Molson Coors Brewing Co. | 3.500% | 5/1/22 | 16,525 | 16,483 |
| | Molson Coors Brewing Co. | 5.000% | 5/1/42 | 6,465 | 6,473 |
| | Mylan NV | 3.950% | 6/15/26 | 32,620 | 31,076 |
| | New York & Presbyterian Hospital | 4.024% | 8/1/45 | 28,410 | 27,964 |
| | Novartis Capital Corp. | 3.400% | 5/6/24 | 16,695 | 16,701 |
| | Novartis Capital Corp. | 4.400% | 5/6/44 | 25,896 | 27,950 |
| | Orlando Health Obligated Group | 4.089% | 10/1/48 | 3,045 | 2,997 |
| | Partners Healthcare System Massachusetts GO | 3.443% | 7/1/21 | 1,950 | 1,966 |
| | PepsiCo Inc. | 2.750% | 3/1/23 | 29,800 | 29,240 |
| | PepsiCo Inc. | 4.000% | 3/5/42 | 51,391 | 50,996 |
| |
| |
| |
| |
| 12 |
| | | | | |
| Vanguard® Wellington Fund | | | | |
| Schedule of Investments | | | | |
| May 31, 2018 | | | | |
| |
| | | | | Face | Market |
| | | | Maturity | Amount | Value |
| | | Coupon | Date | ($000) | ($000) |
| | Pfizer Inc. | 3.000% | 6/15/23 | 47,025 | 46,700 |
| | Philip Morris International Inc. | 4.500% | 3/26/20 | 8,250 | 8,475 |
| | Philip Morris International Inc. | 4.125% | 5/17/21 | 43,025 | 44,141 |
| | Philip Morris International Inc. | 2.500% | 8/22/22 | 21,645 | 20,877 |
| | Philip Morris International Inc. | 2.625% | 3/6/23 | 46,850 | 45,128 |
| | Philip Morris International Inc. | 3.375% | 8/11/25 | 14,440 | 14,063 |
| | Philip Morris International Inc. | 4.875% | 11/15/43 | 6,185 | 6,440 |
| 2 | Procter & Gamble - Esop | 9.360% | 1/1/21 | 19,917 | 21,535 |
| 2 | Providence St. Joseph Health Obligated Group | 3.930% | 10/1/48 | 11,805 | 11,423 |
| 5 | Roche Holdings Inc. | 2.875% | 9/29/21 | 33,000 | 32,842 |
| | Sanofi | 4.000% | 3/29/21 | 44,090 | 45,420 |
| 5 | Sigma Alimentos SA de CV | 4.125% | 5/2/26 | 17,400 | 16,126 |
| | SSM Health Care Corp. | 3.823% | 6/1/27 | 34,910 | 34,738 |
| | Stanford Health Care | 3.795% | 11/15/48 | 12,975 | 12,398 |
| | Teva Pharmaceutical Finance Netherlands III BV | 2.800% | 7/21/23 | 37,215 | 31,814 |
| | The Kroger Co. | 3.850% | 8/1/23 | 10,770 | 10,855 |
| | The Kroger Co. | 4.000% | 2/1/24 | 22,290 | 22,413 |
| | The Pepsi Bottling Group Inc. | 7.000% | 3/1/29 | 10,000 | 12,838 |
| | Unilever Capital Corp. | 4.250% | 2/10/21 | 95,235 | 98,208 |
| | Wyeth LLC | 5.950% | 4/1/37 | 25,000 | 31,136 |
| | Zeneca Wilmington Inc. | 7.000% | 11/15/23 | 29,000 | 33,994 |
| | Energy (1.3%) | | | | |
| 5 | BG Energy Capital plc | 4.000% | 10/15/21 | 5,000 | 5,104 |
| | BP Capital Markets plc | 4.750% | 3/10/19 | 27,215 | 27,650 |
| | BP Capital Markets plc | 2.315% | 2/13/20 | 5,855 | 5,804 |
| | BP Capital Markets plc | 4.500% | 10/1/20 | 16,000 | 16,561 |
| | BP Capital Markets plc | 3.062% | 3/17/22 | 43,130 | 42,965 |
| | BP Capital Markets plc | 3.245% | 5/6/22 | 35,000 | 34,994 |
| | BP Capital Markets plc | 2.500% | 11/6/22 | 22,000 | 21,281 |
| | BP Capital Markets plc | 3.994% | 9/26/23 | 16,185 | 16,638 |
| | BP Capital Markets plc | 3.814% | 2/10/24 | 38,938 | 39,495 |
| | BP Capital Markets plc | 3.506% | 3/17/25 | 50,285 | 50,051 |
| | Chevron Corp. | 3.191% | 6/24/23 | 49,470 | 49,107 |
| | ConocoPhillips Co. | 3.350% | 11/15/24 | 8,470 | 8,439 |
| | ConocoPhillips Co. | 3.350% | 5/15/25 | 9,440 | 9,300 |
| | ConocoPhillips Co. | 4.950% | 3/15/26 | 4,385 | 4,721 |
| | ConocoPhillips Co. | 4.300% | 11/15/44 | 51,780 | 53,051 |
| | Devon Energy Corp. | 3.250% | 5/15/22 | 18,600 | 18,362 |
| | Dominion Energy Gas Holdings LLC | 3.550% | 11/1/23 | 21,445 | 21,351 |
| | Dominion Energy Gas Holdings LLC | 4.800% | 11/1/43 | 4,185 | 4,374 |
| | Dominion Energy Gas Holdings LLC | 4.600% | 12/15/44 | 7,008 | 7,040 |
| | Enterprise Products Operating LLC | 4.250% | 2/15/48 | 36,320 | 34,224 |
| | EOG Resources Inc. | 5.625% | 6/1/19 | 23,100 | 23,702 |
| | Exxon Mobil Corp. | 2.222% | 3/1/21 | 14,165 | 13,950 |
| | Exxon Mobil Corp. | 2.726% | 3/1/23 | 11,910 | 11,666 |
| | Exxon Mobil Corp. | 3.043% | 3/1/26 | 8,115 | 7,860 |
| | Exxon Mobil Corp. | 4.114% | 3/1/46 | 12,060 | 12,310 |
| | Halliburton Co. | 3.500% | 8/1/23 | 78,795 | 78,647 |
| | Noble Energy Inc. | 4.150% | 12/15/21 | 15,961 | 16,276 |
| | Occidental Petroleum Corp. | 4.100% | 2/1/21 | 39,240 | 40,276 |
| | Occidental Petroleum Corp. | 2.700% | 2/15/23 | 10,750 | 10,462 |
| | Occidental Petroleum Corp. | 3.400% | 4/15/26 | 28,910 | 28,239 |
| | Plains All American Pipeline LP / PAA Finance Corp. | 3.850% | 10/15/23 | 36,775 | 36,023 |
| 5 | Schlumberger Holdings Corp. | 3.000% | 12/21/20 | 30,755 | 30,641 |
| 5 | Schlumberger Investment SA | 2.400% | 8/1/22 | 23,925 | 23,045 |
| | Schlumberger Investment SA | 3.650% | 12/1/23 | 44,520 | 45,045 |
| | Shell International Finance BV | 4.375% | 3/25/20 | 28,875 | 29,667 |
| | Shell International Finance BV | 3.250% | 5/11/25 | 11,051 | 10,840 |
| | Shell International Finance BV | 4.125% | 5/11/35 | 43,465 | 44,084 |
| | Shell International Finance BV | 5.500% | 3/25/40 | 12,990 | 15,286 |
| | Shell International Finance BV | 4.375% | 5/11/45 | 96,700 | 99,915 |
| | Suncor Energy Inc. | 5.950% | 12/1/34 | 20,700 | 24,682 |
| | Sunoco Logistics Partners Operations LP | 4.400% | 4/1/21 | 30,900 | 31,469 |
| |
| |
| |
| |
| 13 |
| | | | | |
| Vanguard® Wellington Fund | | | | |
| Schedule of Investments | | | | |
| May 31, 2018 | | | | |
| |
| | | | | Face | Market |
| | | | Maturity | Amount | Value |
| | | Coupon | Date | ($000) | ($000) |
| | Total Capital International SA | 2.700% | 1/25/23 | 36,510 | 35,507 |
| | Total Capital International SA | 3.750% | 4/10/24 | 41,500 | 42,124 |
| | Total Capital SA | 2.125% | 8/10/18 | 42,000 | 41,983 |
| | TransCanada PipeLines Ltd. | 3.800% | 10/1/20 | 47,125 | 47,829 |
| | TransCanada PipeLines Ltd. | 4.875% | 1/15/26 | 47,256 | 49,682 |
| | Other Industrial (0.0%) | | | | |
| 2 | Johns Hopkins University Maryland GO | 4.083% | 7/1/53 | 26,970 | 26,933 |
| | Technology (1.6%) | | | | |
| | Apple Inc. | 2.850% | 5/6/21 | 44,000 | 44,064 |
| | Apple Inc. | 3.000% | 2/9/24 | 22,535 | 22,141 |
| | Apple Inc. | 3.450% | 5/6/24 | 39,950 | 40,185 |
| | Apple Inc. | 2.850% | 5/11/24 | 44,990 | 43,789 |
| | Apple Inc. | 2.750% | 1/13/25 | 21,495 | 20,620 |
| | Apple Inc. | 3.250% | 2/23/26 | 37,631 | 36,965 |
| | Apple Inc. | 2.450% | 8/4/26 | 43,466 | 40,092 |
| | Apple Inc. | 3.350% | 2/9/27 | 55,925 | 55,040 |
| | Apple Inc. | 3.200% | 5/11/27 | 39,185 | 38,045 |
| | Apple Inc. | 2.900% | 9/12/27 | 55,355 | 52,308 |
| | Apple Inc. | 3.850% | 5/4/43 | 17,000 | 16,339 |
| | Apple Inc. | 4.450% | 5/6/44 | 5,075 | 5,365 |
| | Apple Inc. | 3.850% | 8/4/46 | 36,890 | 35,593 |
| | Applied Materials Inc. | 3.300% | 4/1/27 | 31,840 | 30,950 |
| | Broadcom Corp. / Broadcom Cayman Finance Ltd. | 3.625% | 1/15/24 | 35,975 | 35,020 |
| | Cisco Systems Inc. | 4.450% | 1/15/20 | 24,095 | 24,788 |
| | Cisco Systems Inc. | 2.900% | 3/4/21 | 13,350 | 13,350 |
| | Cisco Systems Inc. | 2.500% | 9/20/26 | 15,676 | 14,520 |
| | Intel Corp. | 2.875% | 5/11/24 | 29,395 | 28,528 |
| | Intel Corp. | 4.100% | 5/19/46 | 51,605 | 52,302 |
| | International Business Machines Corp. | 8.375% | 11/1/19 | 25,000 | 26,937 |
| | International Business Machines Corp. | 3.375% | 8/1/23 | 70,925 | 71,108 |
| | International Business Machines Corp. | 3.625% | 2/12/24 | 35,000 | 35,296 |
| | International Business Machines Corp. | 5.875% | 11/29/32 | 20,240 | 24,700 |
| | Microsoft Corp. | 2.375% | 2/12/22 | 24,670 | 24,203 |
| | Microsoft Corp. | 3.625% | 12/15/23 | 16,000 | 16,400 |
| | Microsoft Corp. | 2.875% | 2/6/24 | 70,885 | 69,627 |
| | Microsoft Corp. | 3.125% | 11/3/25 | 31,615 | 31,063 |
| | Microsoft Corp. | 2.400% | 8/8/26 | 53,545 | 49,592 |
| | Microsoft Corp. | 3.500% | 2/12/35 | 23,520 | 22,851 |
| | Microsoft Corp. | 3.450% | 8/8/36 | 65,320 | 62,749 |
| | Microsoft Corp. | 4.100% | 2/6/37 | 45,385 | 47,500 |
| | Microsoft Corp. | 4.450% | 11/3/45 | 14,250 | 15,485 |
| | Microsoft Corp. | 3.700% | 8/8/46 | 61,115 | 59,234 |
| | Microsoft Corp. | 4.250% | 2/6/47 | 91,700 | 97,364 |
| | Oracle Corp. | 2.500% | 5/15/22 | 46,930 | 45,875 |
| | Oracle Corp. | 2.950% | 11/15/24 | 79,830 | 77,452 |
| | Oracle Corp. | 2.950% | 5/15/25 | 13,635 | 13,140 |
| | Oracle Corp. | 3.250% | 11/15/27 | 111,485 | 108,094 |
| | Oracle Corp. | 4.000% | 11/15/47 | 32,175 | 31,463 |
| | QUALCOMM Inc. | 2.600% | 1/30/23 | 26,010 | 24,872 |
| | QUALCOMM Inc. | 2.900% | 5/20/24 | 37,735 | 35,804 |
| 5 | Tencent Holdings Ltd. | 3.595% | 1/19/28 | 57,300 | 54,752 |
| | Transportation (0.4%) | | | | |
| | Burlington Northern Santa Fe LLC | 3.050% | 3/15/22 | 7,595 | 7,592 |
| | Burlington Northern Santa Fe LLC | 3.000% | 3/15/23 | 21,397 | 21,059 |
| | Burlington Northern Santa Fe LLC | 3.850% | 9/1/23 | 20,891 | 21,369 |
| | Burlington Northern Santa Fe LLC | 3.250% | 6/15/27 | 12,315 | 12,001 |
| 2 | Continental Airlines 2007-1 Class A Pass Through Trust | 5.983% | 10/19/23 | 22,068 | 23,337 |
| | CSX Corp. | 4.300% | 3/1/48 | 16,150 | 15,554 |
| 5 | ERAC USA Finance LLC | 2.350% | 10/15/19 | 27,135 | 26,887 |
| 5 | ERAC USA Finance LLC | 4.500% | 8/16/21 | 9,295 | 9,609 |
| |
| |
| |
| |
| 14 |
| | | | | |
| Vanguard® Wellington Fund | | | | |
| Schedule of Investments | | | | |
| May 31, 2018 | | | | |
| |
| | | | | Face | Market |
| | | | Maturity | Amount | Value |
| | | Coupon | Date | ($000) | ($000) |
| 5 | ERAC USA Finance LLC | 7.000% | 10/15/37 | 32,995 | 41,699 |
| 5 | ERAC USA Finance LLC | 5.625% | 3/15/42 | 10,000 | 11,085 |
| 2 | Federal Express Corp. 1998 Pass Through Trust | 6.720% | 1/15/22 | 15,916 | 16,787 |
| | FedEx Corp. | 2.700% | 4/15/23 | 23,430 | 22,568 |
| | FedEx Corp. | 3.875% | 8/1/42 | 5,095 | 4,567 |
| | FedEx Corp. | 4.100% | 4/15/43 | 20,500 | 19,053 |
| | FedEx Corp. | 5.100% | 1/15/44 | 18,015 | 19,086 |
| | Kansas City Southern | 4.950% | 8/15/45 | 16,985 | 17,190 |
| 5 | Penske Truck Leasing Co. LP / PTL Finance Corp. | 3.950% | 3/10/25 | 52,010 | 51,480 |
| 2 | Southwest Airlines Co. 2007-1 Pass Through Trust | 6.150% | 2/1/24 | 13,466 | 14,237 |
| 2 | United Airlines 2018-1 Class B Pass Through Trust | 4.600% | 3/1/26 | 7,780 | 7,873 |
| | United Parcel Service Inc. | 2.450% | 10/1/22 | 17,950 | 17,446 |
| | United Parcel Service Inc. | 4.875% | 11/15/40 | 4,925 | 5,400 |
| | | | | | 10,206,045 |
| Utilities (2.3%) | | | | |
| | Electric (2.1%) | | | | |
| | Alabama Power Co. | 5.700% | 2/15/33 | 15,000 | 17,532 |
| | Alabama Power Co. | 3.750% | 3/1/45 | 24,430 | 23,353 |
| | Ameren Illinois Co. | 3.800% | 5/15/28 | 22,215 | 22,485 |
| | Ameren Illinois Co. | 6.125% | 12/15/28 | 54,000 | 60,845 |
| | Ameren Illinois Co. | 3.700% | 12/1/47 | 5,045 | 4,728 |
| | Berkshire Hathaway Energy Co. | 6.125% | 4/1/36 | 41,995 | 52,683 |
| | Berkshire Hathaway Energy Co. | 5.150% | 11/15/43 | 10,715 | 12,174 |
| | Commonwealth Edison Co. | 4.350% | 11/15/45 | 8,130 | 8,449 |
| | Commonwealth Edison Co. | 3.650% | 6/15/46 | 6,365 | 5,930 |
| | Commonwealth Edison Co. | 4.000% | 3/1/48 | 17,455 | 17,339 |
| | Consolidated Edison Co. of New York Inc. | 7.125% | 12/1/18 | 11,278 | 11,512 |
| | Consolidated Edison Co. of New York Inc. | 4.500% | 12/1/45 | 36,735 | 38,656 |
| | Consolidated Edison Co. of New York Inc. | 3.850% | 6/15/46 | 2,729 | 2,594 |
| | Consolidated Edison Co. of New York Inc. | 4.625% | 12/1/54 | 66,625 | 69,207 |
| | Consolidated Edison Co. of New York Inc. | 4.500% | 5/15/58 | 24,220 | 24,727 |
| | Delmarva Power & Light Co. | 3.500% | 11/15/23 | 11,816 | 11,816 |
| 8 | Dominion Energy Inc. | 2.962% | 7/1/19 | 18,210 | 18,220 |
| | Dominion Energy Inc. | 5.200% | 8/15/19 | 19,250 | 19,740 |
| | Dominion Energy Inc. | 2.579% | 7/1/20 | 23,655 | 23,326 |
| | Dominion Energy Inc. | 3.625% | 12/1/24 | 29,400 | 28,727 |
| | DTE Energy Co. | 3.800% | 3/15/27 | 9,550 | 9,352 |
| | Duke Energy Carolinas LLC | 3.900% | 6/15/21 | 50,025 | 51,149 |
| | Duke Energy Carolinas LLC | 6.050% | 4/15/38 | 4,000 | 5,040 |
| | Duke Energy Carolinas LLC | 3.700% | 12/1/47 | 17,085 | 16,066 |
| | Duke Energy Corp. | 2.650% | 9/1/26 | 11,775 | 10,665 |
| | Duke Energy Corp. | 4.800% | 12/15/45 | 44,700 | 47,239 |
| | Duke Energy Corp. | 3.750% | 9/1/46 | 9,940 | 8,841 |
| | Duke Energy Florida LLC | 6.350% | 9/15/37 | 8,000 | 10,486 |
| | Duke Energy Florida LLC | 6.400% | 6/15/38 | 27,055 | 35,410 |
| | Duke Energy Progress LLC | 6.300% | 4/1/38 | 14,705 | 19,212 |
| | Duke Energy Progress LLC | 4.200% | 8/15/45 | 38,025 | 38,641 |
| | Entergy Louisiana LLC | 3.120% | 9/1/27 | 14,935 | 14,202 |
| | Eversource Energy | 4.500% | 11/15/19 | 3,535 | 3,609 |
| | Eversource Energy | 2.900% | 10/1/24 | 17,450 | 16,594 |
| | Eversource Energy | 3.150% | 1/15/25 | 5,025 | 4,849 |
| | Eversource Energy | 3.300% | 1/15/28 | 14,410 | 13,630 |
| | Florida Power & Light Co. | 5.650% | 2/1/35 | 50,000 | 60,848 |
| | Florida Power & Light Co. | 4.950% | 6/1/35 | 10,000 | 11,126 |
| | Florida Power & Light Co. | 5.650% | 2/1/37 | 5,000 | 6,019 |
| | Florida Power & Light Co. | 5.950% | 2/1/38 | 39,215 | 48,937 |
| | Florida Power & Light Co. | 5.690% | 3/1/40 | 4,000 | 4,902 |
| | Florida Power & Light Co. | 3.700% | 12/1/47 | 17,370 | 16,477 |
| | Fortis Inc. | 3.055% | 10/4/26 | 28,565 | 26,297 |
| | Georgia Power Co. | 4.750% | 9/1/40 | 9,893 | 10,511 |
| | Georgia Power Co. | 4.300% | 3/15/42 | 16,055 | 16,245 |
| 5 | Massachusetts Electric Co. | 5.900% | 11/15/39 | 21,565 | 26,365 |
| | MidAmerican Energy Co. | 4.250% | 5/1/46 | 5,485 | 5,676 |
| |
| |
| |
| |
| 15 |
| | | | | |
| Vanguard® Wellington Fund | | | | |
| Schedule of Investments | | | | |
| May 31, 2018 | | | | |
| |
| | | | | Face | Market |
| | | | Maturity | Amount | Value |
| | | Coupon | Date | ($000) | ($000) |
| | National Rural Utilities Cooperative Finance Corp. | 2.950% | 2/7/24 | 15,255 | 14,774 |
| | National Rural Utilities Cooperative Finance Corp. | 2.850% | 1/27/25 | 40,345 | 38,539 |
| | NextEra Energy Capital Holdings Inc. | 3.550% | 5/1/27 | 32,275 | 30,930 |
| | Northern States Power Co. | 6.250% | 6/1/36 | 50,000 | 64,556 |
| | Oglethorpe Power Corp. | 5.950% | 11/1/39 | 6,075 | 7,345 |
| | Oglethorpe Power Corp. | 4.550% | 6/1/44 | 1,825 | 1,822 |
| | Oglethorpe Power Corp. | 4.250% | 4/1/46 | 19,060 | 18,306 |
| | Oglethorpe Power Corp. | 5.250% | 9/1/50 | 12,370 | 13,514 |
| | Oncor Electric Delivery Co. LLC | 4.550% | 12/1/41 | 2,675 | 2,855 |
| | Pacific Gas & Electric Co. | 4.250% | 5/15/21 | 11,365 | 11,564 |
| | Pacific Gas & Electric Co. | 3.850% | 11/15/23 | 17,950 | 17,880 |
| | Pacific Gas & Electric Co. | 3.750% | 2/15/24 | 12,250 | 12,138 |
| | Pacific Gas & Electric Co. | 2.950% | 3/1/26 | 4,860 | 4,470 |
| | Pacific Gas & Electric Co. | 6.050% | 3/1/34 | 13,840 | 16,035 |
| | Pacific Gas & Electric Co. | 5.800% | 3/1/37 | 50,567 | 56,645 |
| | Pacific Gas & Electric Co. | 6.350% | 2/15/38 | 2,830 | 3,348 |
| | Pacific Gas & Electric Co. | 6.250% | 3/1/39 | 14,255 | 16,845 |
| | Pacific Gas & Electric Co. | 5.400% | 1/15/40 | 73,220 | 79,288 |
| | Pacific Gas & Electric Co. | 5.125% | 11/15/43 | 22,455 | 23,508 |
| | Pacific Gas & Electric Co. | 4.750% | 2/15/44 | 5,445 | 5,460 |
| | Pacific Gas & Electric Co. | 4.300% | 3/15/45 | 2,878 | 2,697 |
| | Pacific Gas & Electric Co. | 4.000% | 12/1/46 | 9,755 | 8,838 |
| | Pacific Gas & Electric Co. | 3.950% | 12/1/47 | 14,336 | 12,801 |
| | PacifiCorp | 2.950% | 6/1/23 | 29,675 | 29,188 |
| | PacifiCorp | 5.900% | 8/15/34 | 12,500 | 14,786 |
| | PacifiCorp | 6.250% | 10/15/37 | 36,635 | 47,144 |
| | Potomac Electric Power Co. | 6.500% | 11/15/37 | 25,000 | 32,675 |
| | San Diego Gas & Electric Co. | 6.000% | 6/1/26 | 3,600 | 4,103 |
| | Sierra Pacific Power Co. | 3.375% | 8/15/23 | 34,040 | 34,177 |
| | Sierra Pacific Power Co. | 2.600% | 5/1/26 | 7,857 | 7,272 |
| | South Carolina Electric & Gas Co. | 5.800% | 1/15/33 | 9,000 | 10,085 |
| | South Carolina Electric & Gas Co. | 5.300% | 5/15/33 | 1,438 | 1,525 |
| | South Carolina Electric & Gas Co. | 6.050% | 1/15/38 | 44,155 | 50,503 |
| | South Carolina Electric & Gas Co. | 5.450% | 2/1/41 | 2,945 | 3,186 |
| | South Carolina Electric & Gas Co. | 4.350% | 2/1/42 | 3,305 | 3,154 |
| | South Carolina Electric & Gas Co. | 4.600% | 6/15/43 | 7,251 | 7,134 |
| | South Carolina Electric & Gas Co. | 4.100% | 6/15/46 | 10,400 | 9,493 |
| | South Carolina Electric & Gas Co. | 4.500% | 6/1/64 | 3,490 | 3,160 |
| | South Carolina Electric & Gas Co. | 5.100% | 6/1/65 | 29,850 | 29,901 |
| | Southern California Edison Co. | 2.400% | 2/1/22 | 4,295 | 4,164 |
| | Southern California Edison Co. | 6.000% | 1/15/34 | 7,695 | 9,200 |
| | Southern California Edison Co. | 5.550% | 1/15/37 | 50,475 | 58,709 |
| | Southern California Edison Co. | 5.950% | 2/1/38 | 40,000 | 49,361 |
| | Southern California Edison Co. | 6.050% | 3/15/39 | 1,980 | 2,453 |
| | Southern California Edison Co. | 4.050% | 3/15/42 | 15,662 | 15,217 |
| | Southern California Edison Co. | 3.900% | 3/15/43 | 8,020 | 7,615 |
| | Southern California Edison Co. | 4.650% | 10/1/43 | 16,640 | 17,531 |
| | Southern California Edison Co. | 3.600% | 2/1/45 | 3,560 | 3,214 |
| | Southern California Edison Co. | 4.125% | 3/1/48 | 4,125 | 4,026 |
| | Southern Co. | 2.450% | 9/1/18 | 9,395 | 9,393 |
| | Southern Co. | 2.950% | 7/1/23 | 48,400 | 46,997 |
| | Southern Co. | 3.250% | 7/1/26 | 30,885 | 29,089 |
| | Southern Co. | 4.400% | 7/1/46 | 15,635 | 15,589 |
| | Southwestern Electric Power Co. | 6.200% | 3/15/40 | 9,800 | 12,112 |
| | Southwestern Public Service Co. | 3.700% | 8/15/47 | 3,756 | 3,532 |
| | Virginia Electric & Power Co. | 2.750% | 3/15/23 | 34,540 | 33,512 |
| | Virginia Electric & Power Co. | 3.500% | 3/15/27 | 16,025 | 15,665 |
| | Virginia Electric & Power Co. | 6.000% | 5/15/37 | 1,740 | 2,126 |
| | Wisconsin Electric Power Co. | 5.700% | 12/1/36 | 17,280 | 20,669 |
| | Wisconsin Public Service Corp. | 6.080% | 12/1/28 | 45,000 | 51,509 |
| | Natural Gas (0.2%) | | | | |
| 5 | Boston Gas Co. | 3.150% | 8/1/27 | 5,385 | 5,087 |
| 5 | Brooklyn Union Gas Co. | 4.273% | 3/15/48 | 61,265 | 61,932 |
| |
| |
| |
| |
| 16 |
| | | | | |
| Vanguard® Wellington Fund | | | | |
| Schedule of Investments | | | | |
| May 31, 2018 | | | | |
| |
| | | | | Face | Market |
| | | | Maturity | Amount | Value |
| | | Coupon | Date | ($000) | ($000) |
| | CenterPoint Energy Resources Corp. | 4.500% | 1/15/21 | 3,820 | 3,916 |
| 5 | KeySpan Gas East Corp. | 2.742% | 8/15/26 | 25,345 | 23,364 |
| | Nisource Finance Corp. | 5.250% | 2/15/43 | 14,588 | 15,977 |
| | NiSource Finance Corp. | 4.800% | 2/15/44 | 10,370 | 10,791 |
| | Sempra Energy | 2.875% | 10/1/22 | 27,530 | 26,834 |
| | Sempra Energy | 3.250% | 6/15/27 | 80,765 | 75,608 |
| | Other Utility (0.0%) | | | | |
| | American Water Capital Corp. | 2.950% | 9/1/27 | 9,975 | 9,368 |
| 5 | Infraestructura Energetica Nova SAB de CV | 4.875% | 1/14/48 | 16,565 | 14,538 |
| |
| | | | | | 2,423,173 |
| |
| Total Corporate Bonds (Cost $21,005,031) | | | | 21,126,729 |
| |
| Sovereign Bonds (1.9%) | | | | |
| 5 | CDP Financial Inc. | 4.400% | 11/25/19 | 40,000 | 40,990 |
| 5 | Electricite de France SA | 4.600% | 1/27/20 | 50,000 | 51,244 |
| 5 | Electricite de France SA | 4.875% | 1/22/44 | 1,775 | 1,827 |
| 5 | Electricite de France SA | 4.950% | 10/13/45 | 15,100 | 15,652 |
| | Export-Import Bank of Korea | 1.750% | 5/26/19 | 75,100 | 74,253 |
| | International Bank for Reconstruction & Development | 4.750% | 2/15/35 | 40,000 | 48,736 |
| | Japan Bank for International Cooperation | 2.250% | 2/24/20 | 52,670 | 52,205 |
| | Japan Bank for International Cooperation | 2.125% | 6/1/20 | 32,682 | 32,228 |
| | Japan Bank for International Cooperation | 2.125% | 7/21/20 | 40,250 | 39,644 |
| 9 | Japan Treasury Discount Bill | 0.000% | 7/17/18 | 9,000,000 | 82,741 |
| 9 | Japan Treasury Discount Bill | 0.000% | 7/23/18 | 9,000,000 | 82,749 |
| 9 | Japan Treasury Discount Bill | 0.000% | 7/30/18 | 9,104,000 | 83,705 |
| 5 | Kingdom of Saudi Arabia | 2.375% | 10/26/21 | 31,330 | 30,106 |
| 5 | Kingdom of Saudi Arabia | 2.875% | 3/4/23 | 48,885 | 46,956 |
| 5 | Kingdom of Saudi Arabia | 4.000% | 4/17/25 | 44,185 | 43,730 |
| | Korea Development Bank | 2.875% | 8/22/18 | 18,855 | 18,886 |
| | Korea Development Bank | 2.500% | 3/11/20 | 78,800 | 77,847 |
| 5 | Kuwait | 2.750% | 3/20/22 | 4,255 | 4,145 |
| 5 | Mexico City Airport Trust | 5.500% | 7/31/47 | 29,685 | 25,894 |
| 5 | Petroleos Mexicanos | 6.350% | 2/12/48 | 33,975 | 30,841 |
| | Province of Ontario | 4.000% | 10/7/19 | 56,415 | 57,383 |
| | Province of Ontario | 4.400% | 4/14/20 | 50,000 | 51,497 |
| | Province of Ontario | 2.500% | 4/27/26 | 40,160 | 38,068 |
| | Province of Quebec | 2.500% | 4/20/26 | 145,430 | 138,358 |
| 5 | Sinopec Group Overseas Development 2015 Ltd. | 2.500% | 4/28/20 | 62,500 | 61,566 |
| 5 | Sinopec Group Overseas Development 2015 Ltd. | 3.250% | 4/28/25 | 62,500 | 59,286 |
| 5 | Sinopec Group Overseas Development 2017 Ltd. | 3.000% | 4/12/22 | 31,000 | 30,303 |
| 5 | State Grid Overseas Investment 2014 Ltd. | 2.750% | 5/7/19 | 51,455 | 51,321 |
| 5 | State Grid Overseas Investment 2016 Ltd. | 2.750% | 5/4/22 | 62,480 | 60,645 |
| 5 | State Grid Overseas Investment 2016 Ltd. | 3.500% | 5/4/27 | 28,630 | 27,433 |
| 5 | State of Qatar | 5.250% | 1/20/20 | 53,430 | 55,025 |
| 5 | State of Qatar | 2.375% | 6/2/21 | 55,190 | 53,109 |
| 5 | State of Qatar | 3.875% | 4/23/23 | 71,330 | 71,188 |
| 5 | State of Qatar | 5.103% | 4/23/48 | 29,730 | 29,479 |
| | Statoil ASA | 2.250% | 11/8/19 | 22,515 | 22,343 |
| | Statoil ASA | 2.900% | 11/8/20 | 57,210 | 57,199 |
| | Statoil ASA | 2.750% | 11/10/21 | 32,860 | 32,522 |
| | Statoil ASA | 2.450% | 1/17/23 | 15,017 | 14,481 |
| | Statoil ASA | 2.650% | 1/15/24 | 14,000 | 13,481 |
| | Statoil ASA | 3.700% | 3/1/24 | 25,320 | 25,779 |
| | Statoil ASA | 3.250% | 11/10/24 | 29,975 | 29,769 |
| 5 | Temasek Financial I Ltd. | 2.375% | 1/23/23 | 45,150 | 43,352 |
| | United Mexican States | 4.000% | 10/2/23 | 13,956 | 13,976 |
| | United Mexican States | 4.750% | 3/8/44 | 9,750 | 8,980 |
| |
| Total Sovereign Bonds (Cost $1,949,501) | | | | 1,930,922 |
| |
| Taxable Municipal Bonds (1.8%) | | | | |
| | Atlanta GA Downtown Development Authority | | | | |
| | Revenue | 6.875% | 2/1/21 | 4,265 | 4,545 |
| |
| |
| |
| |
| 17 |
| | | | | |
| Vanguard® Wellington Fund | | | | |
| Schedule of Investments | | | | |
| May 31, 2018 | | | | |
| |
| | | | | Face | Market |
| | | | Maturity | Amount | Value |
| | | Coupon | Date | ($000) | ($000) |
| | Bay Area Toll Authority California Toll Bridge Revenue | | | | |
| | (San Francisco Bay Area) | 6.263% | 4/1/49 | 33,765 | 47,064 |
| | Bay Area Toll Authority California Toll Bridge Revenue | | | | |
| | (San Francisco Bay Area) | 7.043% | 4/1/50 | 33,915 | 50,370 |
| | California GO | 5.700% | 11/1/21 | 16,840 | 18,367 |
| | California GO | 7.550% | 4/1/39 | 30,325 | 45,163 |
| | California GO | 7.300% | 10/1/39 | 11,800 | 16,796 |
| | California GO | 7.350% | 11/1/39 | 66,875 | 96,084 |
| | California GO | 7.625% | 3/1/40 | 1,275 | 1,889 |
| | California GO | 7.600% | 11/1/40 | 29,920 | 45,447 |
| | Chicago IL Metropolitan Water Reclamation District GO | 5.720% | 12/1/38 | 8,545 | 10,563 |
| | Chicago IL O'Hare International Airport Revenue | 6.845% | 1/1/38 | 25,680 | 27,237 |
| | Chicago IL O'Hare International Airport Revenue | 6.395% | 1/1/40 | 8,970 | 11,855 |
| | Chicago IL Transit Authority Sales Tax Receipts | | | | |
| | Revenue | 6.200% | 12/1/40 | 1,790 | 2,232 |
| | Chicago IL Transit Authority Transfer Tax Receipts | | | | |
| | Revenue | 6.899% | 12/1/40 | 29,855 | 39,127 |
| | Chicago IL Transit Authority | 6.899% | 12/1/40 | 54,480 | 71,399 |
| | Dallas TX Area Rapid Transit Revenue | 5.999% | 12/1/44 | 29,925 | 39,016 |
| | Georgia Municipal Electric Power Authority Revenue | 6.637% | 4/1/57 | 52,111 | 65,275 |
| | Grand Parkway Transportation Corp. Texas System Toll | | | | |
| | Revenue | 5.184% | 10/1/42 | 40,435 | 48,178 |
| | Houston TX GO | 6.290% | 3/1/32 | 22,740 | 26,601 |
| | Illinois Finance Authority | 4.545% | 10/1/18 | 29,580 | 29,713 |
| | Illinois GO | 5.100% | 6/1/33 | 44,360 | 42,697 |
| | Illinois Toll Highway Authority Revenue | 6.184% | 1/1/34 | 29,200 | 36,687 |
| | Kansas Development Finance Authority Revenue | 4.927% | 4/15/45 | 10,350 | 11,301 |
| 10 | Kansas Development Finance Authority Revenue | | | | |
| | (Public Employees Retirement System) | 5.501% | 5/1/34 | 50,000 | 57,259 |
| | Los Angeles CA Community College District GO | 6.750% | 8/1/49 | 13,625 | 20,150 |
| | Los Angeles CA Unified School District GO | 5.750% | 7/1/34 | 55,325 | 67,145 |
| | Louisville & Jefferson County KY Metropolitan Sewer | | | | |
| | District Sewer & Drainage System Revenue | 6.250% | 5/15/43 | 19,000 | 25,262 |
| | Maryland Transportation Authority Facilities Projects | | | | |
| | Revenue | 5.888% | 7/1/43 | 21,685 | 27,791 |
| | Massachusetts School Building Authority Dedicated | | | | |
| | Sales Tax Revenue | 5.715% | 8/15/39 | 22,105 | 27,013 |
| | New Jersey Turnpike Authority Revenue | 7.414% | 1/1/40 | 35,285 | 51,747 |
| | New Jersey Turnpike Authority Revenue | 7.102% | 1/1/41 | 4,000 | 5,648 |
| | New York City NY Municipal Water Finance Authority | | | | |
| | Water & Sewer System Revenue | 5.790% | 6/15/41 | 2,030 | 2,139 |
| | New York City NY Municipal Water Finance Authority | | | | |
| | Water & Sewer System Revenue | 5.882% | 6/15/44 | 16,995 | 22,374 |
| | New York Metropolitan Transportation Authority | | | | |
| | Revenue | 6.814% | 11/15/40 | 4,000 | 5,411 |
| | New York Metropolitan Transportation Authority | | | | |
| | Revenue (Dedicated Tax Fund) | 7.336% | 11/15/39 | 10,860 | 16,055 |
| | New York Metropolitan Transportation Authority | | | | |
| | Revenue (Dedicated Tax Fund) | 6.089% | 11/15/40 | 16,085 | 20,502 |
| | New York State Urban Development Corp. Revenue | 2.100% | 3/15/22 | 111,295 | 109,429 |
| | North Texas Tollway Authority System Revenue | 6.718% | 1/1/49 | 61,100 | 87,798 |
| | Oregon Department of Transportation Highway User | | | | |
| | Tax Revenue | 5.834% | 11/15/34 | 25,930 | 31,948 |
| | Oregon GO | 5.902% | 8/1/38 | 19,510 | 23,673 |
| 10 | Oregon School Boards Association GO | 5.528% | 6/30/28 | 50,000 | 56,304 |
| | Port Authority of New York & New Jersey Revenue | 5.859% | 12/1/24 | 12,735 | 14,712 |
| | Port Authority of New York & New Jersey Revenue | 6.040% | 12/1/29 | 10,455 | 12,869 |
| | Port Authority of New York & New Jersey Revenue | 4.458% | 10/1/62 | 48,460 | 52,364 |
| | Port Authority of New York & New Jersey Revenue | 4.810% | 10/15/65 | 21,985 | 25,290 |
| | Regents of the University of California Revenue | 3.063% | 7/1/25 | 49,360 | 48,415 |
| | San Antonio TX Electric & Gas Systems Revenue | 5.985% | 2/1/39 | 11,890 | 15,555 |
| | Stanford University | 6.875% | 2/1/24 | 34,745 | 40,853 |
| | Stanford University | 7.650% | 6/15/26 | 29,000 | 37,097 |
| |
| |
| |
| |
| 18 |
| | | | |
| Vanguard® Wellington Fund | | | | |
| Schedule of Investments | | | | |
| May 31, 2018 | | | | |
| |
| | | | Face | Market |
| | | Maturity | Amount | Value |
| | Coupon | Date | ($000) | ($000) |
| University of California Regents Medical Center | | | | |
| Revenue | 6.548% | 5/15/48 | 18,650 | 25,259 |
| University of California Regents Medical Center | | | | |
| Revenue | 6.583% | 5/15/49 | 21,260 | 28,551 |
| University of California Revenue | 4.601% | 5/15/31 | 21,975 | 23,619 |
| University of California Revenue | 5.770% | 5/15/43 | 24,325 | 30,239 |
| University of California Revenue | 4.765% | 5/15/44 | 5,980 | 6,361 |
| University of California Revenue | 3.931% | 5/15/45 | 22,370 | 22,308 |
| |
| Total Taxable Municipal Bonds (Cost $1,601,109) | | | | 1,828,746 |
| |
| |
| | | | Shares | |
| |
| Temporary Cash Investments (3.3%) | | | | |
| Money Market Fund (0.3%) | | | | |
| 11,12 Vanguard Market Liquidity Fund | 1.961% | | 3,685 | 368,537 |
| |
| |
| | | | Face | |
| | | | Amount | |
| | | | ($000) | |
| Repurchase Agreements (1.4%) | | | | |
| Bank of America Securities, LLC(Dated 5/31/18, | | | | |
| Repurchase Value $18,301,000, collateralized by | | | | |
| Federal Home Loan Mortgage Corp. 2.349%-6.000%, | | | | |
| 11/1/22-12/1/47, Federal Farm Credit Bank 3.140%, | | | | |
| 4/18/36 with a value of $18,667,000) | 1.790% | 6/1/18 | 18,300 | 18,300 |
| Citigroup Global Markets Inc.(Dated 5/31/18, | | | | |
| Repurchase Value $292,214,000, collateralized by | | | | |
| U.S. Treasury Note/Bond 2.000%-3.750%, 5/31/24- | | | | |
| 8/15/41, with a value of $298,044,000) | 1.770% | 6/1/18 | 292,200 | 292,200 |
| Deutsche Bank Securities, Inc.(Dated 5/31/18, | | | | |
| Repurchase Value $18,101,000, collateralized by U.S. | | | | |
| Treasury Note/Bond 2.000%-3.750%, 11/15/26- | | | | |
| 11/15/43, with a value of $18,462,000) | 1.790% | 6/1/18 | 18,100 | 18,100 |
| HSBC Bank USA(Dated 5/31/18, Repurchase Value | | | | |
| $112,106,000, collateralized by U.S Treasury | | | | |
| Note/Bond 1.250%, 3/31/19-3/31/21, with a value of | | | | |
| $114,344,000) | 1.780% | 6/1/18 | 112,100 | 112,100 |
| HSBC Bank USA(Dated 5/31/18, Repurchase Value | | | | |
| $59,903,000, collateralized by Federal National | | | | |
| Mortgage Assn. 3.500%, 1/1/47, with a value of | | | | |
| $61,103,000) | 1.790% | 6/1/18 | 59,900 | 59,900 |
| RBC Capital Markets LLC(Dated 5/31/18, Repurchase | | | | |
| Value $223,111,000, collateralized by Federal | | | | |
| National Mortgage Assn. 2.183%-6.000%, 4/1/19- | | | | |
| 5/1/48, Federal Home Loan Mortgage Corp. 3.000%- | | | | |
| 4.000%, 4/1/38-5/1/48, with a value of $227,562,000) | 1.780% | 6/1/18 | 223,100 | 223,100 |
| TD Securities (USA) LLC(Dated 5/31/18, Repurchase | | | | |
| Value $243,912,000, collateralized by Federal | | | | |
| National Mortgage Assn. 3.500%-4.000%, 5/1/47- | | | | |
| 9/1/47, Federal Home Loan Mortgage Corp. 4.000%, | | | | |
| 11/1/47, with a value of $248,778,000) | 1.780% | 6/1/18 | 243,900 | 243,900 |
| Wells Fargo & Co.(Dated 5/31/18, Repurchase Value | | | | |
| $475,024,000, collateralized by Federal National | | | | |
| Mortgage Assn. 2.000%-6.500%, 11/1/19-6/1/48, | | | | |
| Federal Home Loan Mortgage Corp. 3.000%-5.000%, | | | | |
| 7/1/23-5/1/48, with a value of $484,500,000) | 1.790% | 6/1/18 | 475,000 | 475,000 |
| | | | | 1,442,600 |
| |
| |
| |
| |
| 19 |
| | | | |
| Vanguard® Wellington Fund | | | |
| Schedule of Investments | | | |
| May 31, 2018 | | | |
| |
| | | | Face | Market |
| | | | Amount | Value |
| | | Coupon | ($000) | ($000) |
| Commercial Paper (1.6%) | | | |
| 13 | Bank Nederlandse Gemeenten NV | 1.923% | 250,000 | 249,715 |
| 13 | Chevron Corp. | 1.793% | 100,000 | 99,881 |
| 13 | DNB Bank ASA | 1.783% | 150,000 | 149,873 |
| | Exxon Mobil Corp. | 1.822% | 175,000 | 174,811 |
| 13 | KFW | 1.823% | 200,000 | 199,816 |
| 13 | MetLife Short Term Funding LLC | 1.924% | 100,000 | 99,978 |
| 13 | MetLife Short Term Funding LLC | 1.923% | 148,887 | 148,729 |
| 13 | PepsiCo Inc. | 1.793% | 44,440 | 44,404 |
| 13 | Procter & Gamble Co. | 1.783% | 159,000 | 158,860 |
| 13 | Societe Generale SA | 1.793% | 125,000 | 124,855 |
| 13 | Walmart Inc. | 1.832% | 150,000 | 149,883 |
| 13 | Walmart Inc. | 1.812% | 50,000 | 49,959 |
| |
| | | | | 1,650,764 |
| |
| Total Temporary Cash Investments (Cost $3,461,664) | | | 3,461,901 |
| |
| Total Investments (100.7%) (Cost $81,393,664) | | | 104,286,281 |
| Other Assets and Liabilities—Net (-0.7%)14 | | | (733,723) |
| |
| Net Assets (100%) | | | 103,552,558 |
^ Includes partial security positions on loan to broker-dealers. The total value of securities on loan is $341,135,000.
* Non-income-producing security.
1 Securities with a value of $443,000 have been segregated as collateral for open forward currency contracts.
2 The average or expected maturity is shorter than the final maturity shown because of the possibility of interim principal payments and
prepayments or the possibility of the issue being called.
3 The issuer was placed under federal conservatorship in September 2008; since that time, its daily operations have been managed by the Federal
Housing Finance Agency and it receives capital from the U.S. Treasury, as needed to maintain a positive net worth, in exchange for senior
preferred stock.
4 Includes securities purchased on a when-issued or delayed-delivery basis for which the fund has not taken delivery as of May 31, 2018.
5 Security exempt from registration under Rule 144A of the Securities Act of 1933. Such securities may be sold in transactions exempt from
registration, normally to qualified institutional buyers. At May 31, 2018, the aggregate value of these securities was $5,440,935,000,
representing 5.3% of net assets.
6 Adjustable-rate security based upon 3-month USD LIBOR plus spread.
7 Adjustable-rate security based upon 1-month USD LIBOR plus spread.
8 Adjustable-rate security.
9 Face amount denominated in Japanese yen.
10 Scheduled principal and interest payments are guaranteed by AGM (Assured Guaranty Municipal Corporation).
11 Includes $368,467,000 of collateral received for securities on loan.
12 Affiliated money market fund available only to Vanguard funds and certain trusts and accounts managed by Vanguard. Rate shown is the 7-day
yield.
13 Security exempt from registration under Section 4(2) of the Securities Act of 1933. Such securities may be sold in transactions exempt from
registration only to dealers in that program or other "accredited investors." At May 31, 2018, the aggregate value of these securities was
$1,475,953,000, representing 1.4% of net assets.
14 Cash of $6,821,000 has been segregated as initial margin for open futures contracts.
ADR—American Depositary Receipt.
GDR—Global Depositary Receipt.
GO—General Obligation Bond.
20
This page intentionally left blank.
© 2018 The Vanguard Group, Inc.
All rights reserved.
Vanguard Marketing Corporation, Distributor.
SNA212 072018
Item 7: Disclosure of Proxy Voting Policies and Procedures for Closed-End Management Investment
Companies.
Not Applicable.
Item 8: Portfolio Managers of Closed-End Management Investment Companies.
Not Applicable.
Item 9: Purchase of Equity Securities by Closed-End Management Investment Company and
Affiliated Purchasers.
Not Applicable.
Item 10: Submission of Matters to a Vote of Security Holders.
Not Applicable.
Item 11: Controls and Procedures.
(a) Disclosure Controls and Procedures. The Principal Executive and Financial Officers concluded that the Registrant’s Disclosure Controls and Procedures are effective based on their evaluation of the Disclosure Controls and Procedures as of a date within 90 days of the filing date of this report.
(b) Internal Control Over Financial Reporting. There were no significant changes in Registrant’s Internal Control Over Financial Reporting or in other factors that could significantly affect this control subsequent to the date of the evaluation, including any corrective actions with regard to significant deficiencies and material weaknesses.
Item 12: Disclosure of Securities Lending Activities for Closed-End Management Investment Companies.
Not Applicable.
Item 13: Exhibits.
(a) Certifications.
Pursuant to the requirements of the Securities Exchange Act of 1934 and the Investment Company Act of 1940, the registrant has duly caused this report to be signed on its behalf by the undersigned, thereunto duly authorized.
| |
| | VANGUARD WELLINGTON FUND |
| |
| |
| BY: | /s/ MORTIMER J. BUCKLEY* |
| | MORTIMER J. BUCKLEY |
| | CHIEF EXECUTIVE OFFICER |
| |
| Date: July 20, 2018 |
Pursuant to the requirements of the Securities Exchange Act of 1934 and the Investment Company Act of 1940, this report has been signed below by the following persons on behalf of the registrant and in the capacities and on the dates indicated.
| |
| | VANGUARD WELLINGTON FUND |
| |
| BY: | /s/ MORTIMER J. BUCKLEY* |
| | MORTIMER J. BUCKLEY |
| | CHIEF EXECUTIVE OFFICER |
| Date: July 20, 2018 |
| VANGUARD WELLINGTON FUND |
| |
| BY: | /s/ THOMAS J. HIGGINS* |
| THOMAS J. HIGGINS |
| | CHIEF FINANCIAL OFFICER |
| Date: July 20, 2018 |
* By: /s/ Anne E. Robinson
Anne E. Robinson, pursuant to a Power of Attorney filed on January 18, 2018; see file Number
33-32216, Incorporated by Reference.