UNITED STATES
SECURITIES AND EXCHANGE COMMISSION
Washington, D.C. 20549
FORM N-CSR
CERTIFIED SHAREHOLDER REPORT
OF
REGISTERED MANAGEMENT INVESTMENT COMPANIES
Investment Company Act file number: 811-00121
| Name of Registrant: | Vanguard Wellington Fund |
| Address of Registrant: | P.O. Box 2600 |
| | Valley Forge, PA 19482 |
| Name and address of agent for service: | John E. Schadl, Esquire |
| | P.O. Box 876 |
| | Valley Forge, PA 19482 |
Registrant’s telephone number, including area code: (610) 669-1000
Date of fiscal year end: November 30
Date of reporting period: December 1, 2023—November 30, 2024
Item 1: Reports to Shareholders.
TABLE OF CONTENTS
Vanguard U.S. Minimum Volatility ETF
ETF Shares (VFMV) CBOE BZX Exchange, Inc.
Annual Shareholder Report | November 30, 2024
This annual shareholder report contains important information about Vanguard U.S. Minimum Volatility ETF (the "Fund") for the period of December 1, 2023, to November 30, 2024. You can find additional information about the Fund at https://personal1.vanguard.com/ngf-next-gen-form-webapp/fund-literature. You can also request this information by contacting us at 800-662-7447.
What were the Fund costs for the last year?
(based on a hypothetical $10,000 investment)
| Share Class Name | Costs of a $10,000 investment | Costs paid as a percentage of a $10,000 investment |
|---|
| ETF Shares | $15 | 0.13% |
|---|
How did the Fund perform during the reporting period?
For the 12 months ended November 30, 2024, the Fund underperformed its expense-free benchmark, the Russell 3000 Index.
U.S. economic growth hovered around 3% on a year-over-year basis for the period, quelling recession fears. Consumer price inflation trended lower, falling below 3% in July, and the Federal Reserve began to ease monetary policy with cuts to short-term interest rates in September and November. Against this positive macroeconomic backdrop, U.S. stocks posted very strong gains.
The Fund lagged its benchmark in seven of 11 industry sectors. Subpar stock selection in information technology, financials, and industrials hurt most. Strong selection in energy and health care, as well as an underweight to materials, which lagged the overall market, helped performance.
The Fund seeks to build a portfolio of stocks with lower volatility than the broad U.S. equity market. The Fund’s average volatility for the 12 months was nearly 20% less than that of its benchmark.
The absolute returns of the Fund and the market during the fiscal year were remarkable. The Fund’s benchmark returned far less during the past decade, which was a good one for stocks. As such, long-term shareholders should expect periods of lower performance.
How did the Fund perform since inception?
Keep in mind that the Fund's past performance does not indicate how the Fund will perform in the future. Updated performance information is available on our website at vanguard.com/performance or by calling Vanguard toll-free at 800-662-7447. The graph and returns shown do not reflect taxes that a shareholder would pay on fund distributions or on the sale of fund shares.
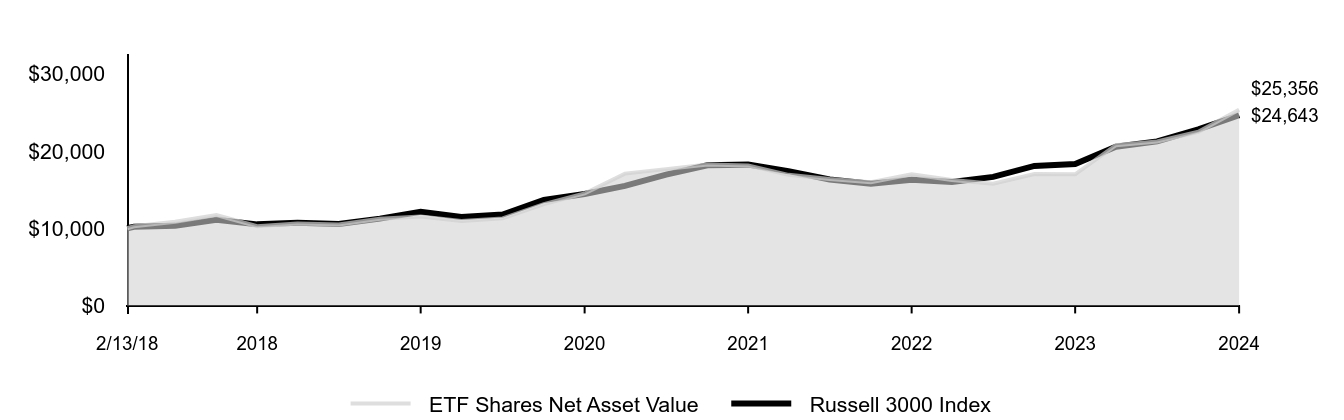
Cumulative Performance: February 13, 2018, Through November 30, 2024
Initial Investment of $10,000
| ETF Shares Net Asset Value | Russell 3000 Index |
|---|
| 2/13/18 | $10,000 | $10,000 |
|---|
| 2/28/18 | $10,111 | $10,194 |
|---|
| 5/31/18 | $10,699 | $10,310 |
|---|
| 8/31/18 | $11,464 | $11,098 |
|---|
| 11/30/18 | $11,007 | $10,504 |
|---|
| 2/28/19 | $11,238 | $10,708 |
|---|
| 5/31/19 | $11,354 | $10,567 |
|---|
| 8/31/19 | $12,212 | $11,244 |
|---|
| 11/30/19 | $12,613 | $12,132 |
|---|
| 2/29/20 | $11,817 | $11,447 |
|---|
| 5/31/20 | $11,282 | $11,779 |
|---|
| 8/31/20 | $12,027 | $13,655 |
|---|
| 11/30/20 | $12,362 | $14,440 |
|---|
| 2/28/21 | $12,865 | $15,492 |
|---|
| 5/31/21 | $13,871 | $16,951 |
|---|
| 8/31/21 | $14,785 | $18,166 |
|---|
| 11/30/21 | $14,491 | $18,243 |
|---|
| 2/28/22 | $14,458 | $17,396 |
|---|
| 5/31/22 | $14,670 | $16,327 |
|---|
| 8/31/22 | $14,223 | $15,754 |
|---|
| 11/30/22 | $15,138 | $16,272 |
|---|
| 2/28/23 | $14,582 | $15,992 |
|---|
| 5/31/23 | $14,419 | $16,659 |
|---|
| 8/31/23 | $14,986 | $18,078 |
|---|
| 11/30/23 | $15,308 | $18,324 |
|---|
| 2/29/24 | $16,537 | $20,566 |
|---|
| 5/31/24 | $17,117 | $21,254 |
|---|
| 8/31/24 | $18,594 | $22,805 |
|---|
| 11/30/24 | $19,570 | $24,643 |
|---|
Average Annual Total Returns
| | 1 Year | 5 Years | Since Inception 2/13/18 |
|---|
| ETF Shares Net Asset Value | 27.84% | 9.18% | 10.39% |
|---|
| ETF Shares Market Price | 27.84% | 9.18% | 10.39% |
|---|
| Russell 3000 Index | 34.49% | 15.23% | 14.19% |
|---|
This table reflects the Fund's investments, including short-term investments, derivatives and other assets and liabilities.
Portfolio Composition % of Net Assets
(as of November 30, 2024)
| Basic Materials | 1.5% | |
| Consumer Discretionary | 11.8% | |
| Consumer Staples | 11.4% | |
| Energy | 4.6% | |
| Financials | 10.6% | |
| Health Care | 11.8% | |
| Industrials | 6.9% | |
| Real Estate | 1.4% | |
| Technology | 22.6% | |
| Telecommunications | 8.1% | |
| Utilities | 8.8% | |
| Other Assets and Liabilities—Net | 0.5% | |
Fund Statistics
(as of November 30, 2024)
| Fund Net Assets (in millions) | $153 |
|---|
| Number of Portfolio Holdings | 165 |
|---|
| Portfolio Turnover Rate | 39% |
|---|
| Total Investment Advisory Fees (in thousands) | $25 |
|---|
Where can I find additional information about the Fund?
Additional information about the Fund, including its prospectus, financial information, holdings, and proxy voting information is available at https://personal1.vanguard.com/ngf-next-gen-form-webapp/fund-literature.
Connect with Vanguard® • vanguard.com
Fund Information • 800-662-7447
Direct Investor Account Services • 800-662-2739
Text Telephone for People Who Are Deaf or Hard of Hearing •
800-749-7273
© 2024 The Vanguard Group, Inc.
All rights reserved.
Vanguard Marketing Corporation, Distributor.
AR4419
Vanguard U.S. Momentum Factor ETF
ETF Shares (VFMO) CBOE BZX Exchange, Inc.
Annual Shareholder Report | November 30, 2024
This annual shareholder report contains important information about Vanguard U.S. Momentum Factor ETF (the "Fund") for the period of December 1, 2023, to November 30, 2024. You can find additional information about the Fund at https://personal1.vanguard.com/ngf-next-gen-form-webapp/fund-literature. You can also request this information by contacting us at 800-662-7447.
What were the Fund costs for the last year?
(based on a hypothetical $10,000 investment)
| Share Class Name | Costs of a $10,000 investment | Costs paid as a percentage of a $10,000 investment |
|---|
| ETF Shares | $16 | 0.13% |
|---|
How did the Fund perform during the reporting period?
For the 12 months ended November 30, 2024, the Fund outperformed its expense-free benchmark, the Russell 3000 Index.
U.S. economic growth hovered around 3% on a year-over-year basis for the period, quelling recession fears. Consumer price inflation trended lower, falling below 3% in July, and the Federal Reserve began to ease monetary policy with cuts to short-term interest rates in September and November. Against this positive macroeconomic backdrop, U.S. stocks posted very strong gains.
The Fund outpaced its benchmark in eight of 11 industry sectors. Stock selection in industrials, information technology, and health care contributed most. An overweight to energy, which lagged the overall market, detracted most.
The Fund seeks long-term capital appreciation by investing in stocks with relatively strong recent performance.
The returns of the Fund and the market during the fiscal year were remarkable. The Fund’s benchmark returned far less during the past decade, which was a good one for stocks. As such, long-term shareholders should expect periods of lower performance.
How did the Fund perform since inception?
Keep in mind that the Fund's past performance does not indicate how the Fund will perform in the future. Updated performance information is available on our website at vanguard.com/performance or by calling Vanguard toll-free at 800-662-7447. The graph and returns shown do not reflect taxes that a shareholder would pay on fund distributions or on the sale of fund shares.
Cumulative Performance: February 13, 2018, Through November 30, 2024
Initial Investment of $10,000
| ETF Shares Net Asset Value | Russell 3000 Index |
|---|
| 2/13/18 | $10,000 | $10,000 |
|---|
| 2/28/18 | $10,252 | $10,194 |
|---|
| 5/31/18 | $10,835 | $10,310 |
|---|
| 8/31/18 | $11,720 | $11,098 |
|---|
| 11/30/18 | $10,267 | $10,504 |
|---|
| 2/28/19 | $10,616 | $10,708 |
|---|
| 5/31/19 | $10,490 | $10,567 |
|---|
| 8/31/19 | $11,222 | $11,244 |
|---|
| 11/30/19 | $11,525 | $12,132 |
|---|
| 2/29/20 | $10,936 | $11,447 |
|---|
| 5/31/20 | $11,277 | $11,779 |
|---|
| 8/31/20 | $13,121 | $13,655 |
|---|
| 11/30/20 | $14,511 | $14,440 |
|---|
| 2/28/21 | $17,083 | $15,492 |
|---|
| 5/31/21 | $17,661 | $16,951 |
|---|
| 8/31/21 | $18,259 | $18,166 |
|---|
| 11/30/21 | $18,140 | $18,243 |
|---|
| 2/28/22 | $16,918 | $17,396 |
|---|
| 5/31/22 | $16,377 | $16,327 |
|---|
| 8/31/22 | $15,959 | $15,754 |
|---|
| 11/30/22 | $17,002 | $16,272 |
|---|
| 2/28/23 | $16,245 | $15,992 |
|---|
| 5/31/23 | $15,761 | $16,659 |
|---|
| 8/31/23 | $17,032 | $18,078 |
|---|
| 11/30/23 | $16,991 | $18,324 |
|---|
| 2/29/24 | $20,758 | $20,566 |
|---|
| 5/31/24 | $21,238 | $21,254 |
|---|
| 8/31/24 | $22,496 | $22,805 |
|---|
| 11/30/24 | $25,356 | $24,643 |
|---|
Average Annual Total Returns
| | 1 Year | 5 Years | Since Inception 2/13/18 |
|---|
| ETF Shares Net Asset Value | 49.23% | 17.08% | 14.68% |
|---|
| ETF Shares Market Price | 49.14% | 17.08% | 14.67% |
|---|
| Russell 3000 Index | 34.49% | 15.23% | 14.19% |
|---|
This table reflects the Fund's investments, including short-term investments, derivatives and other assets and liabilities.
Portfolio Composition % of Net Assets
(as of November 30, 2024)
| Basic Materials | 3.0% | |
| Consumer Discretionary | 12.5% | |
| Consumer Staples | 4.0% | |
| Energy | 3.5% | |
| Financials | 21.2% | |
| Health Care | 17.4% | |
| Industrials | 21.0% | |
| Real Estate | 1.0% | |
| Technology | 11.9% | |
| Telecommunications | 3.7% | |
| Utilities | 0.5% | |
| Other Assets and Liabilities—Net | 0.3% | |
Fund Statistics
(as of November 30, 2024)
| Fund Net Assets (in millions) | $919 |
|---|
| Number of Portfolio Holdings | 707 |
|---|
| Portfolio Turnover Rate | 77% |
|---|
| Total Investment Advisory Fees (in thousands) | $151 |
|---|
Where can I find additional information about the Fund?
Additional information about the Fund, including its prospectus, financial information, holdings, and proxy voting information is available at https://personal1.vanguard.com/ngf-next-gen-form-webapp/fund-literature.
Connect with Vanguard® • vanguard.com
Fund Information • 800-662-7447
Direct Investor Account Services • 800-662-2739
Text Telephone for People Who Are Deaf or Hard of Hearing •
800-749-7273
© 2024 The Vanguard Group, Inc.
All rights reserved.
Vanguard Marketing Corporation, Distributor.
AR4418
Vanguard U.S. Multifactor Fund
Annual Shareholder Report | November 30, 2024
This annual shareholder report contains important information about Vanguard U.S. Multifactor Fund (the "Fund") for the period of December 1, 2023, to November 30, 2024. You can find additional information about the Fund at https://personal1.vanguard.com/ngf-next-gen-form-webapp/fund-literature. You can also request this information by contacting us at 800-662-7447. The report describes changes to the Fund that occurred during the reporting period.
What were the Fund costs for the last year?
(based on a hypothetical $10,000 investment)
| Share Class Name | Costs of a $10,000 investment | Costs paid as a percentage of a $10,000 investment |
|---|
| Admiral Shares | $21 | 0.18% |
|---|
How did the Fund perform during the reporting period?
For the 12 months ended November 30, 2024, the Fund outperformed its benchmark, the Russell 3000 Index.
U.S. economic growth hovered around 3% on a year-over-year-basis for the period, quelling recession fears. Consumer price inflation trended lower, falling below 3% in July, and the Federal Reserve began to ease monetary policy with cuts to short-term interest rates in September and November. Against this positive macroeconomic backdrop, U.S. stocks posted very strong gains.
Six of the Fund’s 11 industry sectors positively impacted relative performance. Financials contributed the most, owing to both strong selection and an overweight allocation. Selection in industrials, consumer discretionary, and consumer staples also boosted results.
Energy detracted most from relative performance, due to both selection and an overweight allocation. Information technology also lagged, owing to both selection and an underweight allocation.
How did the Fund perform since inception?
Keep in mind that the Fund's past performance does not indicate how the Fund will perform in the future. Updated performance information is available on our website at vanguard.com/performance or by calling Vanguard toll-free at 800-662-7447. The graph and returns shown do not reflect taxes that a shareholder would pay on fund distributions or on the sale of fund shares.
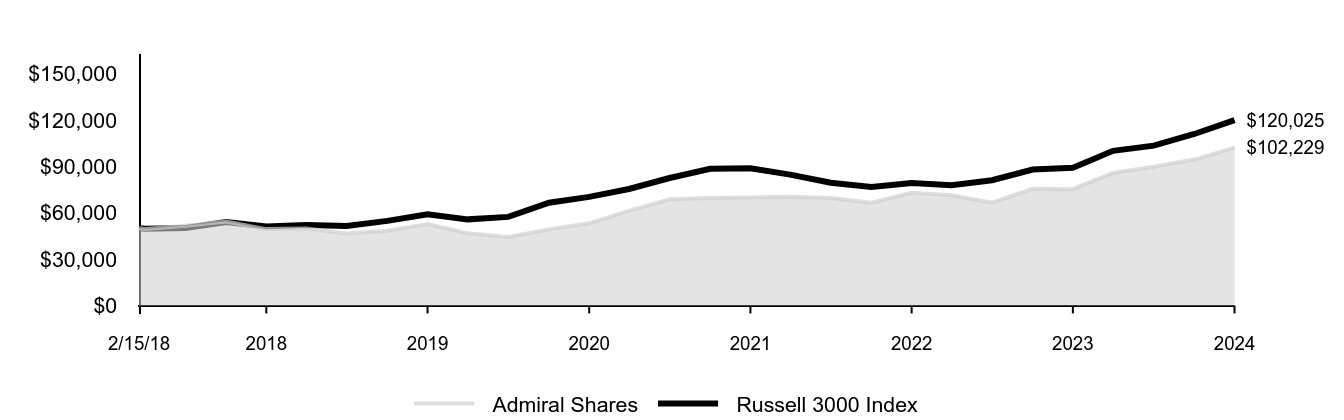
Cumulative Performance: February 15, 2018, Through November 30, 2024
Initial Investment of $50,000
| Admiral Shares | Russell 3000 Index |
|---|
| 2/15/18 | $50,000 | $50,000 |
|---|
| 2/28/18 | $49,460 | $49,649 |
|---|
| 5/31/18 | $51,640 | $50,216 |
|---|
| 8/31/18 | $54,358 | $54,056 |
|---|
| 11/30/18 | $49,446 | $51,163 |
|---|
| 2/28/19 | $49,899 | $52,156 |
|---|
| 5/31/19 | $46,619 | $51,469 |
|---|
| 8/31/19 | $48,352 | $54,764 |
|---|
| 11/30/19 | $52,681 | $59,088 |
|---|
| 2/29/20 | $46,697 | $55,756 |
|---|
| 5/31/20 | $44,362 | $57,370 |
|---|
| 8/31/20 | $49,278 | $66,506 |
|---|
| 11/30/20 | $53,192 | $70,329 |
|---|
| 2/28/21 | $61,252 | $75,453 |
|---|
| 5/31/21 | $68,804 | $82,562 |
|---|
| 8/31/21 | $69,526 | $88,481 |
|---|
| 11/30/21 | $69,892 | $88,853 |
|---|
| 2/28/22 | $70,336 | $84,729 |
|---|
| 5/31/22 | $69,582 | $79,520 |
|---|
| 8/31/22 | $66,529 | $76,729 |
|---|
| 11/30/22 | $72,989 | $79,255 |
|---|
| 2/28/23 | $71,358 | $77,889 |
|---|
| 5/31/23 | $66,606 | $81,138 |
|---|
| 8/31/23 | $75,556 | $88,052 |
|---|
| 11/30/23 | $75,315 | $89,248 |
|---|
| 2/29/24 | $85,873 | $100,167 |
|---|
| 5/31/24 | $89,851 | $103,518 |
|---|
| 8/31/24 | $94,482 | $111,073 |
|---|
| 11/30/24 | $102,229 | $120,025 |
|---|
Average Annual Total Returns
| | 1 Year | 5 Years | Since Inception 2/15/18 |
|---|
| Admiral Shares | 35.74% | 14.18% | 11.11% |
|---|
| Russell 3000 Index | 34.49% | 15.23% | 13.77% |
|---|
This table reflects the Fund's investments, including short-term investments, derivatives and other assets and liabilities.
Portfolio Composition % of Net Assets
(as of November 30, 2024)
| Basic Materials | 2.6% | |
| Consumer Discretionary | 17.1% | |
| Consumer Staples | 8.0% | |
| Energy | 5.9% | |
| Financials | 26.6% | |
| Health Care | 10.0% | |
| Industrials | 17.1% | |
| Real Estate | 0.4% | |
| Technology | 8.5% | |
| Telecommunications | 3.0% | |
| Utilities | 0.0% | |
| Other Assets and Liabilities—Net | 0.8% | |
Fund Statistics
(as of November 30, 2024)
| Fund Net Assets (in millions) | $169 |
|---|
| Number of Portfolio Holdings | 572 |
|---|
| Portfolio Turnover Rate | 56% |
|---|
| Total Investment Advisory Fees (in thousands) | $25 |
|---|
How has the Fund changed?
The Fund added as a principal risk "management of certain similar funds."
This is a summary of certain changes to the Fund since November 30, 2023. For more complete information, you may review the Fund’s next prospectus, which we expect to be available by March 31, 2025 at https://personal1.vanguard.com/ngf-next-gen-form-webapp/fund-literature or upon request at 800-662-7447.
Where can I find additional information about the Fund?
Additional information about the Fund, including its prospectus, financial information, holdings, and proxy voting information is available at https://personal1.vanguard.com/ngf-next-gen-form-webapp/fund-literature.
Connect with Vanguard® • vanguard.com
Fund Information • 800-662-7447
Direct Investor Account Services • 800-662-2739
Text Telephone for People Who Are Deaf or Hard of Hearing •
800-749-7273
© 2024 The Vanguard Group, Inc.
All rights reserved.
Vanguard Marketing Corporation, Distributor.
AR516
Vanguard U.S. Quality Factor ETF
ETF Shares (VFQY) CBOE BZX Exchange, Inc.
Annual Shareholder Report | November 30, 2024
This annual shareholder report contains important information about Vanguard U.S. Quality Factor ETF (the "Fund") for the period of December 1, 2023, to November 30, 2024. You can find additional information about the Fund at https://personal1.vanguard.com/ngf-next-gen-form-webapp/fund-literature. You can also request this information by contacting us at 800-662-7447.
What were the Fund costs for the last year?
(based on a hypothetical $10,000 investment)
| Share Class Name | Costs of a $10,000 investment | Costs paid as a percentage of a $10,000 investment |
|---|
| ETF Shares | $15 | 0.13% |
|---|
How did the Fund perform during the reporting period?
For the 12 months ended November 30, 2024, the Fund underperformed its benchmark, the Russell 3000 Index.
U.S. economic growth hovered around 3% on a year-over-year basis for the period, quelling recession fears. Consumer price inflation trended lower, falling below 3% in July, and the Federal Reserve began to ease monetary policy with cuts to short-term interest rates in September and November. Against this positive macroeconomic backdrop, U.S. stocks posted very strong gains.
The Fund seeks to provide long-term capital appreciation by investing in stocks with strong operation, earning, and balance sheet quality, as determined by the advisor.
Only five of the 11 industry sectors contributed to relative performance. The greatest detractors included stock selection in the information technology, consumer discretionary, and consumer staples sectors. An overweight allocation to consumer staples and an underweight to communication services also detracted. The greatest contributor was selection among financial stocks.
How did the Fund perform since inception?
Keep in mind that the Fund's past performance does not indicate how the Fund will perform in the future. Updated performance information is available on our website at vanguard.com/performance or by calling Vanguard toll-free at 800-662-7447. The graph and returns shown do not reflect taxes that a shareholder would pay on fund distributions or on the sale of fund shares.
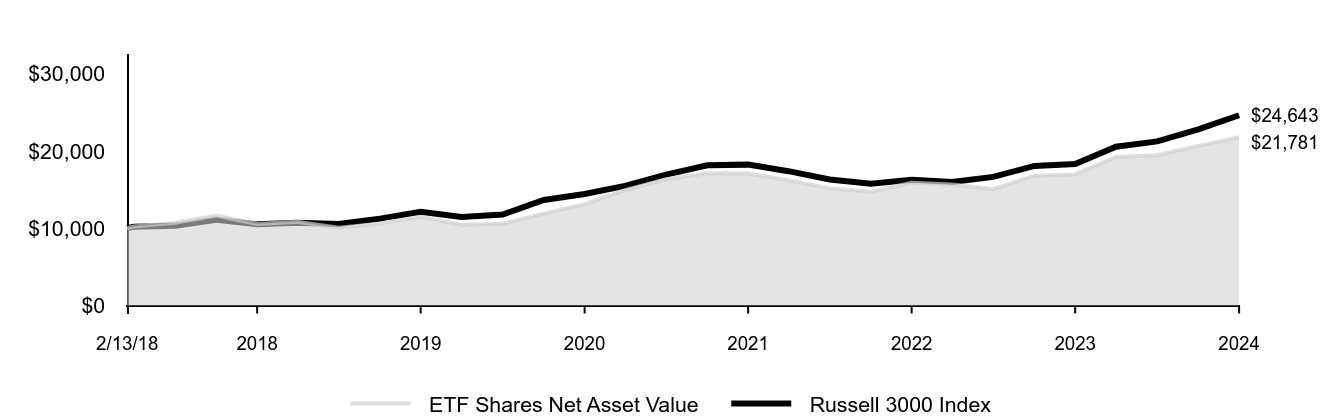
Cumulative Performance: February 13, 2018, Through November 30, 2024
Initial Investment of $10,000
| ETF Shares Net Asset Value | Russell 3000 Index |
|---|
| 2/13/18 | $10,000 | $10,000 |
|---|
| 2/28/18 | $10,227 | $10,194 |
|---|
| 5/31/18 | $10,717 | $10,310 |
|---|
| 8/31/18 | $11,647 | $11,098 |
|---|
| 11/30/18 | $10,552 | $10,504 |
|---|
| 2/28/19 | $10,850 | $10,708 |
|---|
| 5/31/19 | $10,080 | $10,567 |
|---|
| 8/31/19 | $10,598 | $11,244 |
|---|
| 11/30/19 | $11,475 | $12,132 |
|---|
| 2/29/20 | $10,445 | $11,447 |
|---|
| 5/31/20 | $10,574 | $11,779 |
|---|
| 8/31/20 | $11,899 | $13,655 |
|---|
| 11/30/20 | $13,115 | $14,440 |
|---|
| 2/28/21 | $14,921 | $15,492 |
|---|
| 5/31/21 | $16,358 | $16,951 |
|---|
| 8/31/21 | $17,134 | $18,166 |
|---|
| 11/30/21 | $17,105 | $18,243 |
|---|
| 2/28/22 | $16,209 | $17,396 |
|---|
| 5/31/22 | $15,166 | $16,327 |
|---|
| 8/31/22 | $14,731 | $15,754 |
|---|
| 11/30/22 | $15,883 | $16,272 |
|---|
| 2/28/23 | $15,675 | $15,992 |
|---|
| 5/31/23 | $15,064 | $16,659 |
|---|
| 8/31/23 | $16,807 | $18,078 |
|---|
| 11/30/23 | $16,970 | $18,324 |
|---|
| 2/29/24 | $19,226 | $20,566 |
|---|
| 5/31/24 | $19,453 | $21,254 |
|---|
| 8/31/24 | $20,671 | $22,805 |
|---|
| 11/30/24 | $21,781 | $24,643 |
|---|
Average Annual Total Returns
| | 1 Year | 5 Years | Since Inception 2/13/18 |
|---|
| ETF Shares Net Asset Value | 28.35% | 13.67% | 12.14% |
|---|
| ETF Shares Market Price | 28.35% | 13.68% | 12.15% |
|---|
| Russell 3000 Index | 34.49% | 15.23% | 14.19% |
|---|
This table reflects the Fund's investments, including short-term investments, derivatives and other assets and liabilities.
Portfolio Composition % of Net Assets
(as of November 30, 2024)
| Basic Materials | 3.2% | |
| Consumer Discretionary | 22.2% | |
| Consumer Staples | 8.2% | |
| Energy | 3.3% | |
| Financials | 13.1% | |
| Health Care | 9.9% | |
| Industrials | 22.1% | |
| Technology | 17.1% | |
| Telecommunications | 0.6% | |
| Other Assets and Liabilities—Net | 0.3% | |
Fund Statistics
(as of November 30, 2024)
| Fund Net Assets (in millions) | $438 |
|---|
| Number of Portfolio Holdings | 385 |
|---|
| Portfolio Turnover Rate | 44% |
|---|
| Total Investment Advisory Fees (in thousands) | $94 |
|---|
Where can I find additional information about the Fund?
Additional information about the Fund, including its prospectus, financial information, holdings, and proxy voting information is available at https://personal1.vanguard.com/ngf-next-gen-form-webapp/fund-literature.
Connect with Vanguard® • vanguard.com
Fund Information • 800-662-7447
Direct Investor Account Services • 800-662-2739
Text Telephone for People Who Are Deaf or Hard of Hearing •
800-749-7273
© 2024 The Vanguard Group, Inc.
All rights reserved.
Vanguard Marketing Corporation, Distributor.
AR4417
Vanguard U.S. Value Factor ETF
ETF Shares (VFVA) CBOE BZX Exchange, Inc.
Annual Shareholder Report | November 30, 2024
This annual shareholder report contains important information about Vanguard U.S. Value Factor ETF (the "Fund") for the period of December 1, 2023, to November 30, 2024. You can find additional information about the Fund at https://personal1.vanguard.com/ngf-next-gen-form-webapp/fund-literature. You can also request this information by contacting us at 800-662-7447.
What were the Fund costs for the last year?
(based on a hypothetical $10,000 investment)
| Share Class Name | Costs of a $10,000 investment | Costs paid as a percentage of a $10,000 investment |
|---|
| ETF Shares | $15 | 0.13% |
|---|
How did the Fund perform during the reporting period?
For the 12 months ended November 30, 2024, the Fund underperformed its benchmark, the Russell 3000 Index.
U.S. economic growth hovered around 3% on a year-over-year basis for the period, quelling recession fears. Consumer price inflation trended lower, falling below 3% in July, and the Federal Reserve began to ease monetary policy with cuts to short-term interest rates in September and November. Against this positive macroeconomic backdrop, U.S. stocks posted very strong gains.
In recent years, value stocks have underperformed their growth counterparts. This period was no exception. Seven of 11 industry sectors detracted from relative results.
Energy—particularly stock selection and, to a lesser extent, an overweight position in the sector—was the portfolio’s greatest detractor. A combination of stock selection and an underweight position in information technology was another large detractor. Materials and communication services also lagged. By far, the greatest overall contributor was financials, due to a combination of stock selection and allocation decisions.
How did the Fund perform since inception?
Keep in mind that the Fund's past performance does not indicate how the Fund will perform in the future. Updated performance information is available on our website at vanguard.com/performance or by calling Vanguard toll-free at 800-662-7447. The graph and returns shown do not reflect taxes that a shareholder would pay on fund distributions or on the sale of fund shares.
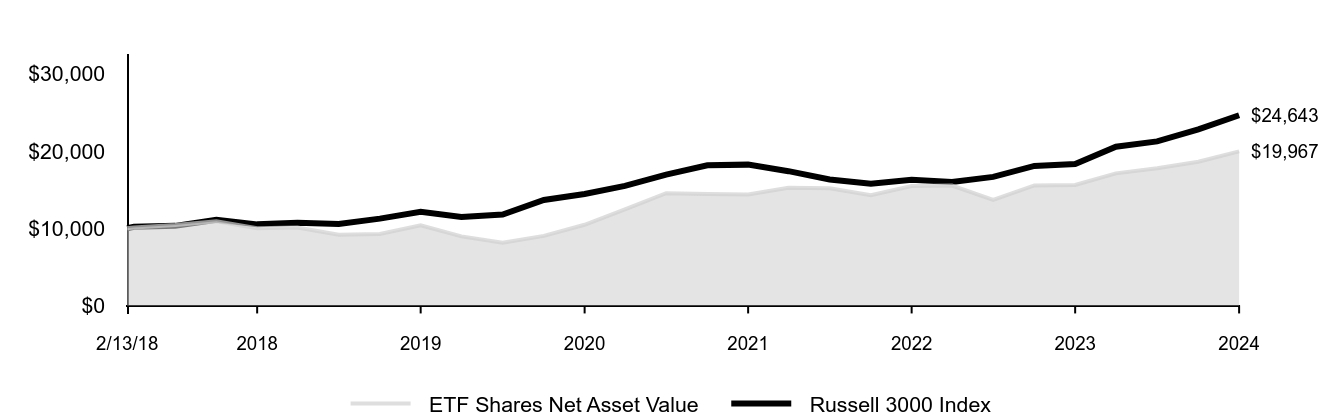
Cumulative Performance: February 13, 2018, Through November 30, 2024
Initial Investment of $10,000
| ETF Shares Net Asset Value | Russell 3000 Index |
|---|
| 2/13/18 | $10,000 | $10,000 |
|---|
| 2/28/18 | $10,109 | $10,194 |
|---|
| 5/31/18 | $10,412 | $10,310 |
|---|
| 8/31/18 | $10,897 | $11,098 |
|---|
| 11/30/18 | $9,992 | $10,504 |
|---|
| 2/28/19 | $10,097 | $10,708 |
|---|
| 5/31/19 | $9,165 | $10,567 |
|---|
| 8/31/19 | $9,268 | $11,244 |
|---|
| 11/30/19 | $10,375 | $12,132 |
|---|
| 2/29/20 | $8,948 | $11,447 |
|---|
| 5/31/20 | $8,109 | $11,779 |
|---|
| 8/31/20 | $9,009 | $13,655 |
|---|
| 11/30/20 | $10,448 | $14,440 |
|---|
| 2/28/21 | $12,445 | $15,492 |
|---|
| 5/31/21 | $14,545 | $16,951 |
|---|
| 8/31/21 | $14,432 | $18,166 |
|---|
| 11/30/21 | $14,367 | $18,243 |
|---|
| 2/28/22 | $15,235 | $17,396 |
|---|
| 5/31/22 | $15,191 | $16,327 |
|---|
| 8/31/22 | $14,266 | $15,754 |
|---|
| 11/30/22 | $15,464 | $16,272 |
|---|
| 2/28/23 | $15,534 | $15,992 |
|---|
| 5/31/23 | $13,679 | $16,659 |
|---|
| 8/31/23 | $15,554 | $18,078 |
|---|
| 11/30/23 | $15,614 | $18,324 |
|---|
| 2/29/24 | $17,110 | $20,566 |
|---|
| 5/31/24 | $17,781 | $21,254 |
|---|
| 8/31/24 | $18,619 | $22,805 |
|---|
| 11/30/24 | $19,967 | $24,643 |
|---|
Average Annual Total Returns
| | 1 Year | 5 Years | Since Inception 2/13/18 |
|---|
| ETF Shares Net Asset Value | 27.88% | 13.99% | 10.71% |
|---|
| ETF Shares Market Price | 27.93% | 13.98% | 10.72% |
|---|
| Russell 3000 Index | 34.49% | 15.23% | 14.19% |
|---|
This table reflects the Fund's investments, including short-term investments, derivatives and other assets and liabilities.
Portfolio Composition % of Net Assets
(as of November 30, 2024)
| Basic Materials | 5.3% | |
| Consumer Discretionary | 15.0% | |
| Consumer Staples | 6.4% | |
| Energy | 13.6% | |
| Financials | 26.3% | |
| Health Care | 8.1% | |
| Industrials | 15.1% | |
| Real Estate | 0.6% | |
| Technology | 5.8% | |
| Telecommunications | 3.4% | |
| Utilities | 0.1% | |
| Other Assets and Liabilities—Net | 0.3% | |
Fund Statistics
(as of November 30, 2024)
| Fund Net Assets (in millions) | $841 |
|---|
| Number of Portfolio Holdings | 644 |
|---|
| Portfolio Turnover Rate | 39% |
|---|
| Total Investment Advisory Fees (in thousands) | $198 |
|---|
Where can I find additional information about the Fund?
Additional information about the Fund, including its prospectus, financial information, holdings, and proxy voting information is available at https://personal1.vanguard.com/ngf-next-gen-form-webapp/fund-literature.
Connect with Vanguard® • vanguard.com
Fund Information • 800-662-7447
Direct Investor Account Services • 800-662-2739
Text Telephone for People Who Are Deaf or Hard of Hearing •
800-749-7273
© 2024 The Vanguard Group, Inc.
All rights reserved.
Vanguard Marketing Corporation, Distributor.
AR4416
Vanguard U.S. Multifactor ETF
ETF Shares (VFMF) CBOE BZX Exchange, Inc.
Annual Shareholder Report | November 30, 2024
This annual shareholder report contains important information about Vanguard U.S. Multifactor ETF (the "Fund") for the period of December 1, 2023, to November 30, 2024. You can find additional information about the Fund at https://personal1.vanguard.com/ngf-next-gen-form-webapp/fund-literature. You can also request this information by contacting us at 800-662-7447. The report describes changes to the Fund that occurred during the reporting period.
What were the Fund costs for the last year?
(based on a hypothetical $10,000 investment)
| Share Class Name | Costs of a $10,000 investment | Costs paid as a percentage of a $10,000 investment |
|---|
| ETF Shares | $21 | 0.18% |
|---|
How did the Fund perform during the reporting period?
For the 12 months ended November 30, 2024, the Fund performed in line with its benchmark, the Russell 3000 Index.
U.S. economic growth hovered around 3% on a year-over-year-basis for the period, quelling recession fears. Consumer price inflation trended lower, falling below 3% in July, and the Federal Reserve began to ease monetary policy with cuts to short-term interest rates in September and November. Against this positive macroeconomic backdrop, U.S. stocks posted very strong gains.
Six of the Fund’s 11 industry sectors positively impacted relative performance. Selection in industrials, financials, and consumer discretionary especially contributed, as did an overweight allocation to financials.
Information technology detracted the most from relative performance, due to both selection and an underweight allocation. Energy lagged as well, owing to both selection and an overweight allocation.
How did the Fund perform since inception?
Keep in mind that the Fund's past performance does not indicate how the Fund will perform in the future. Updated performance information is available on our website at vanguard.com/performance or by calling Vanguard toll-free at 800-662-7447. The graph and returns shown do not reflect taxes that a shareholder would pay on fund distributions or on the sale of fund shares.
Cumulative Performance: February 13, 2018, Through November 30, 2024
Initial Investment of $10,000
| ETF Shares Net Asset Value | Russell 3000 Index |
|---|
| 2/13/18 | $10,000 | $10,000 |
|---|
| 2/28/18 | $10,183 | $10,194 |
|---|
| 5/31/18 | $10,585 | $10,310 |
|---|
| 8/31/18 | $11,223 | $11,098 |
|---|
| 11/30/18 | $10,203 | $10,504 |
|---|
| 2/28/19 | $10,306 | $10,708 |
|---|
| 5/31/19 | $9,635 | $10,567 |
|---|
| 8/31/19 | $10,029 | $11,244 |
|---|
| 11/30/19 | $10,862 | $12,132 |
|---|
| 2/29/20 | $9,652 | $11,447 |
|---|
| 5/31/20 | $9,217 | $11,779 |
|---|
| 8/31/20 | $10,242 | $13,655 |
|---|
| 11/30/20 | $11,117 | $14,440 |
|---|
| 2/28/21 | $12,773 | $15,492 |
|---|
| 5/31/21 | $14,338 | $16,951 |
|---|
| 8/31/21 | $14,486 | $18,166 |
|---|
| 11/30/21 | $14,612 | $18,243 |
|---|
| 2/28/22 | $14,596 | $17,396 |
|---|
| 5/31/22 | $14,350 | $16,327 |
|---|
| 8/31/22 | $13,739 | $15,754 |
|---|
| 11/30/22 | $15,158 | $16,272 |
|---|
| 2/28/23 | $14,937 | $15,992 |
|---|
| 5/31/23 | $13,905 | $16,659 |
|---|
| 8/31/23 | $15,706 | $18,078 |
|---|
| 11/30/23 | $15,676 | $18,324 |
|---|
| 2/29/24 | $17,898 | $20,566 |
|---|
| 5/31/24 | $18,565 | $21,254 |
|---|
| 8/31/24 | $19,477 | $22,805 |
|---|
| 11/30/24 | $21,094 | $24,643 |
|---|
Average Annual Total Returns
| | 1 Year | 5 Years | Since Inception 2/13/18 |
|---|
| ETF Shares Net Asset Value | 34.57% | 14.20% | 11.61% |
|---|
| ETF Shares Market Price | 34.57% | 14.20% | 11.62% |
|---|
| Russell 3000 Index | 34.49% | 15.23% | 14.19% |
|---|
This table reflects the Fund's investments, including short-term investments, derivatives and other assets and liabilities.
Portfolio Composition % of Net Assets
(as of November 30, 2024)
| Basic Materials | 2.9% | |
| Consumer Discretionary | 17.1% | |
| Consumer Staples | 7.0% | |
| Energy | 5.1% | |
| Financials | 26.9% | |
| Health Care | 10.8% | |
| Industrials | 17.6% | |
| Real Estate | 0.4% | |
| Technology | 8.6% | |
| Telecommunications | 3.3% | |
| Other Assets and Liabilities—Net | 0.3% | |
Fund Statistics
(as of November 30, 2024)
| Fund Net Assets (in millions) | $333 |
|---|
| Number of Portfolio Holdings | 512 |
|---|
| Portfolio Turnover Rate | 50% |
|---|
| Total Investment Advisory Fees (in thousands) | $74 |
|---|
How has the Fund changed?
The Fund added as a principal risk "management of certain similar funds."
This is a summary of certain changes to the Fund since November 30, 2023. For more complete information, you may review the Fund’s next prospectus, which we expect to be available by March 31, 2025 at https://personal1.vanguard.com/ngf-next-gen-form-webapp/fund-literature or upon request at 800-662-7447.
Where can I find additional information about the Fund?
Additional information about the Fund, including its prospectus, financial information, holdings, and proxy voting information is available at https://personal1.vanguard.com/ngf-next-gen-form-webapp/fund-literature.
Connect with Vanguard® • vanguard.com
Fund Information • 800-662-7447
Direct Investor Account Services • 800-662-2739
Text Telephone for People Who Are Deaf or Hard of Hearing •
800-749-7273
© 2024 The Vanguard Group, Inc.
All rights reserved.
Vanguard Marketing Corporation, Distributor.
AR4421
Vanguard Short-Term Tax-Exempt Bond ETF
ETF Shares (VTES) NYSE Arca
Annual Shareholder Report | November 30, 2024
This annual shareholder report contains important information about Vanguard Short-Term Tax-Exempt Bond ETF (the "Fund") for the period of December 1, 2023, to November 30, 2024. You can find additional information about the Fund at https://personal1.vanguard.com/ngf-next-gen-form-webapp/fund-literature. You can also request this information by contacting us at 800-662-7447. The report describes changes to the Fund that occurred during the reporting period.
What were the Fund costs for the last year?
(based on a hypothetical $10,000 investment)
| Share Class Name | Costs of a $10,000 investment | Costs paid as a percentage of a $10,000 investment |
|---|
| ETF Shares | $7 | 0.07% |
|---|
How did the Fund perform during the reporting period?
For the 12 months ended November 30, 2024, the Fund performed in line with its benchmark, the S&P 0–7 Year National AMT-Free Municipal Bond Index.
U.S. economic growth hovered around 3% on a year-over-year basis for the period, quelling recession fears. Consumer price inflation trended lower, falling below 3% in July, and the Federal Reserve began to cut short-term interest rates in September. The pivot in monetary policy contributed to strong gains for U.S. investment-grade bonds.
The muni bond market performed well for the period, but it lagged the taxable U.S. bond market.
Revenue bonds in the broad muni market returned more than their general obligation counterparts. By credit quality, munis on the bottom rung of the investment-grade credit ladder outperformed their higher-rated counterparts. By maturity, longer-dated muni bonds posted the strongest gains.
How did the Fund perform since inception?
Keep in mind that the Fund's past performance does not indicate how the Fund will perform in the future. Updated performance information is available on our website at vanguard.com/performance or by calling Vanguard toll-free at 800-662-7447. The graph and returns shown do not reflect taxes that a shareholder would pay on fund distributions or on the sale of fund shares.
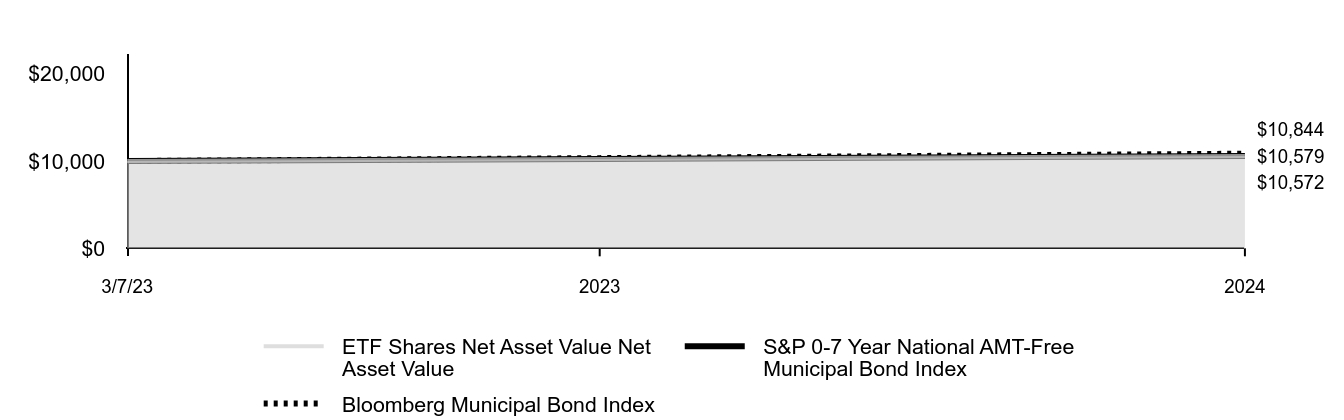
Cumulative Performance: March 7, 2023, Through November 30, 2024
Initial Investment of $10,000
| ETF Shares Net Asset Value Net Asset Value | S&P 0-7 Year National AMT-Free Municipal Bond Index | Bloomberg Municipal Bond Index |
|---|
| 3/7/23 | $10,000 | $10,000 | $10,000 |
|---|
| 2023 | $10,238 | $10,240 | $10,335 |
|---|
| 2024 | $10,572 | $10,579 | $10,844 |
|---|
Average Annual Total Returns
| | 1 Year | Since Inception 3/7/23 |
|---|
| ETF Shares Net Asset Value | 3.26% | 3.26% |
|---|
| ETF Shares Market Price | 3.50% | 3.32% |
|---|
| S&P 0-7 Year National AMT-Free Municipal Bond Index | 3.30% | 3.30% |
|---|
Bloomberg Municipal Bond IndexFootnote Reference* | 4.93% | 4.78% |
|---|
| Footnote | Description |
Footnote* | The Fund added a broad-based benchmark to reflect new regulatory requirements. The Bloomberg Municipal Bond Index is considered broadly representative of the overall securities market applicable to the Fund. |
This table reflects the Fund's investments, including short-term investments and other assets and liabilities.
Distribution by Stated Maturity % of Net Assets
(as of November 30, 2024)
| Less than 1 Year | 16.8% |
| 1 to 3 Years | 29.1% |
| 3 to 5 Years | 25.7% |
| 5 to 10 Years | 25.5% |
| 10 to 20 Years | 0.4% |
| 20 to 30 Years | 1.6% |
| Greater than 30 Years | 0.2% |
| Other Assets and Liabilities—Net | 0.7% |
Fund Statistics
(as of November 30, 2024)
| Fund Net Assets (in millions) | $561 |
|---|
| Number of Portfolio Holdings | 2,338 |
|---|
| Portfolio Turnover Rate | 21% |
|---|
| Total Investment Advisory Fees (in thousands) | $8 |
|---|
How has the Fund changed?
The Fund's principal investment strategy was modified to add that the Fund may become nondiversified under the Investment Company Act of 1940 solely as a result of an index rebalance or market movement. The Fund added nondiversification risk as a principal risk.
This is a summary of certain changes to the Fund since November 30, 2023. For more complete information, you may review the Fund’s next prospectus, which we expect to be available by March 31, 2025 at https://personal1.vanguard.com/ngf-next-gen-form-webapp/fund-literature or upon request at 800-662-7447.
Where can I find additional information about the Fund?
Additional information about the Fund, including its prospectus, financial information, holdings, and proxy voting information is available at https://personal1.vanguard.com/ngf-next-gen-form-webapp/fund-literature.
Connect with Vanguard® • vanguard.com
Fund Information • 800-662-7447
Direct Investor Account Services • 800-662-2739
Text Telephone for People Who Are Deaf or Hard of Hearing •
800-749-7273
© 2024 The Vanguard Group, Inc.
All rights reserved.
Vanguard Marketing Corporation, Distributor.
ARV014
Item 2: Code of Ethics.
The Registrant has adopted a code of ethics that applies to the Registrant’s principal executive officer, principal financial officer, principal accounting officer or controller or persons performing similar functions. The Code of Ethics was amended during the reporting period covered by this report to make certain technical, non-material changes.
Item 3: Audit Committee Financial Expert.
All members of the Audit Committee have been determined by the Registrant’s Board of Trustees to be Audit Committee Financial Experts and to be independent: F. Joseph Loughrey, Mark Loughridge, Sarah Bloom Raskin, and Peter F. Volanakis.
Item 4: Principal Accountant Fees and Services.
Includes fees billed in connection with services to the Registrant only.
| | | Fiscal Year Ended
November 30,
2024 | | | Fiscal Year Ended
November 30,
2023 | |
| (a) Audit Fees. | | $ | 253,000 | | | $ | 230,000 | |
| (b) Audit-Related Fees. | | | 0 | | | | 0 | |
| (c) Tax Fees. | | | 0 | | | | 0 | |
| (d) All Other Fees. | | | 0 | | | | 0 | |
| Total. | | $ | 253,000 | | | $ | 230,000 | |
| (e) | (1) Pre-Approval Policies. The audit committee is responsible for pre-approving all audit and non-audit services provided by PwC to: (i) the Vanguard funds; and (ii) Vanguard, or any entity controlled by Vanguard that provides ongoing services to the Vanguard funds. All services provided to Vanguard entities by the independent auditor, whether or not they are subject to preapproval, must be disclosed to the audit committee. The audit committee chair may preapprove any permissible audit and non-audit services as long as any preapproval is brought to the attention of the full audit committee at the next scheduled meeting. |
| | |
| | (2) No percentage of the principal accountant’s fees or services were approved pursuant to the waiver provision of paragraph (c)(7)(i)(C) of Rule 2-01 of Regulation S-X. |
(f) For the most recent fiscal year, over 50% of the hours worked under the principal accountant’s engagement were not performed by persons other than full-time, permanent employees of the principal accountant.
(g) Aggregate Non-Audit Fees.
Includes fees billed for non-audit services provided to the Registrant, other registered investment companies in the Vanguard complex, The Vanguard Group, Inc., and Vanguard Marketing Corporation.
| | | Fiscal Year Ended
November 30,
2024 | | | Fiscal Year Ended
November 30,
2023 | |
| Non-audit fees to the Registrant only, listed as (b) through (d) above. | | $ | 0 | | | $ | 0 | |
| | | | | | | | | |
| Non-audit Fees to other registered investment companies in the Vanguard complex, The Vanguard Group, Inc., and Vanguard Marketing Corporation. | | | | | | | | |
| Audit-Related Fees. | | $ | 3,802,420 | | | $ | 3,295,934 | |
| Tax Fees. | | $ | 1,960,472 | | | $ | 1,678,928 | |
| All Other Fees. | | $ | 293,000 | | | $ | 25,000 | |
| Total. | | $ | 6,055,892 | | | $ | 4,999,862 | |
(h) For the most recent fiscal year, the Audit Committee has determined that the provision of all non-audit services was consistent with maintaining the principal accountant’s independence.
Item 5: Audit Committee of Listed Registrants.
The Registrant is a listed issuer as defined in rule 10A-3 under the Securities Exchange Act of 1934 (“Exchange Act”). The Registrant has a separately-designated standing audit committee established in accordance with Section 3(a)(58)(A) of the Exchange Act. The Registrant’s audit committee members are: F. Joseph Loughrey, Mark Loughridge, Sarah Bloom Raskin, and Peter F. Volanakis.
Item 6: Investments.
Not applicable. The complete schedule of investments is included in the financial statements filed under Item 7 of this Form.
Item 7: Financial Statements and Financial Highlights for Open-End Management Investment Companies.
Financial Statements
For the year ended November 30, 2024
Vanguard U.S. Factor ETFs
| Vanguard U.S. Minimum Volatility ETF |
| Vanguard U.S. Momentum Factor ETF |
| Vanguard U.S. Multifactor ETF |
| Vanguard U.S. Quality Factor ETF |
| Vanguard U.S. Value Factor ETF |
Contents
U.S. Minimum Volatility ETF
| 1 |
U.S. Momentum Factor ETF
| 12 |
U.S. Multifactor ETF
| 31 |
U.S. Quality Factor ETF
| 47 |
U.S. Value Factor ETF
| 61 |
Report of Independent Registered Public Accounting Firm
| 79 |
Tax information
| 80 |
| | |
U.S. Minimum Volatility ETF
Schedule of Investments
As of November 30, 2024
The fund files its complete schedule of portfolio holdings with the Securities and Exchange Commission (SEC) for the first and third quarters of each fiscal year as an exhibit to its reports on Form N-PORT. The fund’s Form N-PORT reports are available on the SEC’s website at www.sec.gov.
| | | Shares | Market
Value•
($000) |
| Common Stocks (99.5%) |
| Basic Materials (1.5%) |
| | Linde plc | 4,865 | 2,243 |
| Consumer Discretionary (11.8%) |
| | TJX Cos. Inc. | 16,680 | 2,097 |
| | Murphy USA Inc. | 3,180 | 1,742 |
| * | O'Reilly Automotive Inc. | 1,354 | 1,683 |
| | Walmart Inc. | 17,607 | 1,629 |
| * | Stride Inc. | 14,823 | 1,584 |
| * | Spotify Technology SA | 3,309 | 1,578 |
| | Electronic Arts Inc. | 9,516 | 1,557 |
| * | TKO Group Holdings Inc. | 10,408 | 1,436 |
| | McDonald's Corp. | 3,594 | 1,064 |
| | eBay Inc. | 10,489 | 664 |
| * | QuinStreet Inc. | 23,390 | 533 |
| * | AutoZone Inc. | 150 | 475 |
| | Fox Corp. Class B | 10,567 | 473 |
| | Marcus Corp. | 15,310 | 347 |
| * | Grand Canyon Education Inc. | 1,631 | 268 |
| * | Ollie's Bargain Outlet Holdings Inc. | 1,825 | 181 |
| * | Laureate Education Inc. | 8,847 | 168 |
| | Rollins Inc. | 3,002 | 151 |
| * | Liberty Media Corp.-Liberty Formula One Class A | 1,424 | 115 |
| * | Atlanta Braves Holdings Inc. Class C | 2,752 | 111 |
| * | Atlanta Braves Holdings Inc. Class A | 2,421 | 102 |
| | New York Times Co. Class A | 1,823 | 99 |
| | | | 18,057 |
| Consumer Staples (11.4%) |
| | Procter & Gamble Co. | 12,866 | 2,306 |
| | Cencora Inc. | 9,084 | 2,285 |
| | McKesson Corp. | 3,596 | 2,260 |
| | General Mills Inc. | 33,989 | 2,252 |
| | Church & Dwight Co. Inc. | 20,415 | 2,248 |
| | Coca-Cola Co. | 34,370 | 2,203 |
| | Colgate-Palmolive Co. | 13,982 | 1,351 |
| | Flowers Foods Inc. | 22,518 | 509 |
| | Hershey Co. | 2,612 | 460 |
| | Mondelez International Inc. Class A | 5,258 | 342 |
| * | Pilgrim's Pride Corp. | 6,526 | 337 |
| | Ingredion Inc. | 2,278 | 336 |
| | Fresh Del Monte Produce Inc. | 7,150 | 241 |
| | J & J Snack Foods Corp. | 1,071 | 186 |
| | John B Sanfilippo & Son Inc. | 1,396 | 121 |
| | PepsiCo Inc. | 363 | 59 |
| | Altria Group Inc. | 565 | 33 |
| | | | 17,529 |
| Energy (4.6%) |
| | Kinder Morgan Inc. | 82,011 | 2,318 |
| | Exxon Mobil Corp. | 17,930 | 2,115 |
| | DTE Midstream LLC | 7,127 | 756 |
| | Williams Cos. Inc. | 11,088 | 649 |
| | Chevron Corp. | 3,478 | 563 |
| * | First Solar Inc. | 1,660 | 331 |
| | ONEOK Inc. | 2,514 | 286 |
| | | | 7,018 |
| Financials (10.6%) |
| | CME Group Inc. | 9,501 | 2,261 |
| | Progressive Corp. | 8,047 | 2,164 |
| | Cboe Global Markets Inc. | 8,911 | 1,923 |
U.S. Minimum Volatility ETF
| | | Shares | Market
Value•
($000) |
| | Willis Towers Watson plc | 5,045 | 1,625 |
| * | Clearwater Analytics Holdings Inc. Class A | 42,573 | 1,321 |
| * | Berkshire Hathaway Inc. Class B | 1,991 | 962 |
| | Commerce Bancshares Inc. | 12,927 | 953 |
| | White Mountains Insurance Group Ltd. | 438 | 880 |
| | Marsh & McLennan Cos. Inc. | 3,410 | 795 |
| | Travelers Cos. Inc. | 2,225 | 592 |
| | Safety Insurance Group Inc. | 6,560 | 563 |
| | Arthur J Gallagher & Co. | 1,738 | 543 |
| | RLI Corp. | 2,688 | 473 |
| | First Financial Corp. | 5,065 | 247 |
| | Tradeweb Markets Inc. Class A | 1,402 | 190 |
| | Intercontinental Exchange Inc. | 813 | 131 |
| | Chubb Ltd. | 347 | 100 |
| | Unum Group | 1,291 | 99 |
| | JPMorgan Chase & Co. | 311 | 78 |
| | Donegal Group Inc. Class A | 4,595 | 76 |
| | Peoples Bancorp of North Carolina Inc. | 2,148 | 69 |
| | CNA Financial Corp. | 1,023 | 52 |
| * | California BanCorp | 2,857 | 51 |
| | Employers Holdings Inc. | 921 | 49 |
| * | Columbia Financial Inc. | 1,735 | 32 |
| | First Financial Northwest Inc. | 1,402 | 32 |
| | | | 16,261 |
| Health Care (11.8%) |
| | Abbott Laboratories | 19,259 | 2,287 |
| | Johnson & Johnson | 14,527 | 2,252 |
| | Merck & Co. Inc. | 17,038 | 1,732 |
| * | Boston Scientific Corp. | 15,969 | 1,448 |
| | HealthStream Inc. | 40,365 | 1,336 |
| | Gilead Sciences Inc. | 13,676 | 1,266 |
| | Cardinal Health Inc. | 9,572 | 1,170 |
| | Chemed Corp. | 1,880 | 1,076 |
| | UnitedHealth Group Inc. | 1,751 | 1,069 |
| | AbbVie Inc. | 5,192 | 950 |
| | Pfizer Inc. | 35,487 | 930 |
| * | Prestige Consumer Healthcare Inc. | 7,938 | 673 |
| * | Hologic Inc. | 6,065 | 482 |
| | Eli Lilly & Co. | 506 | 402 |
| * | Exelixis Inc. | 10,973 | 400 |
| * | Regeneron Pharmaceuticals Inc. | 413 | 310 |
| | Bristol-Myers Squibb Co. | 2,918 | 173 |
| * | Vertex Pharmaceuticals Inc. | 77 | 36 |
| | Cigna Group | 91 | 31 |
| | | | 18,023 |
| Industrials (6.9%) |
| | Lockheed Martin Corp. | 3,746 | 1,983 |
| | RTX Corp. | 13,869 | 1,690 |
| | Northrop Grumman Corp. | 3,078 | 1,507 |
| | General Dynamics Corp. | 5,203 | 1,478 |
| * | Kirby Corp. | 9,792 | 1,239 |
| | Matson Inc. | 4,363 | 668 |
| * | FTI Consulting Inc. | 2,927 | 593 |
| | Visa Inc. Class A | 1,755 | 553 |
| | AptarGroup Inc. | 2,179 | 377 |
| | Accenture plc Class A | 789 | 286 |
| | Mastercard Inc. Class A | 265 | 141 |
| | Cass Information Systems Inc. | 2,305 | 103 |
| | | | 10,618 |
| Real Estate (1.4%) |
| | Agree Realty Corp. | 11,475 | 881 |
| | CareTrust REIT Inc. | 29,199 | 870 |
| | Realty Income Corp. | 7,926 | 459 |
| | | | 2,210 |
| Technology (22.6%) |
| * | MACOM Technology Solutions Holdings Inc. | 17,970 | 2,387 |
| | Analog Devices Inc. | 10,395 | 2,267 |
| * | Tyler Technologies Inc. | 3,532 | 2,222 |
U.S. Minimum Volatility ETF
| | | Shares | Market
Value•
($000) |
| | International Business Machines Corp. | 9,483 | 2,156 |
| * | CommVault Systems Inc. | 12,452 | 2,137 |
| | Texas Instruments Inc. | 10,626 | 2,136 |
| | Amdocs Ltd. | 23,722 | 2,057 |
| | NetApp Inc. | 15,343 | 1,882 |
| | Roper Technologies Inc. | 3,303 | 1,871 |
| | Apple Inc. | 5,974 | 1,418 |
| | Microsoft Corp. | 3,181 | 1,347 |
| | HP Inc. | 36,973 | 1,310 |
| | Dolby Laboratories Inc. Class A | 14,107 | 1,105 |
| | Alphabet Inc. Class C | 5,585 | 952 |
| * | Blackbaud Inc. | 10,779 | 905 |
| | Alphabet Inc. Class A | 5,339 | 902 |
| * | GoDaddy Inc. Class A | 4,045 | 799 |
| | Broadcom Inc. | 4,650 | 754 |
| * | Cirrus Logic Inc. | 7,083 | 740 |
| * | Yelp Inc. | 17,941 | 686 |
| | Skyworks Solutions Inc. | 7,548 | 661 |
| | Meta Platforms Inc. Class A | 1,136 | 652 |
| * | CCC Intelligent Solutions Holdings Inc. | 45,918 | 579 |
| | NVE Corp. | 7,243 | 560 |
| * | Vertex Inc. Class A | 8,809 | 478 |
| | Microchip Technology Inc. | 6,865 | 468 |
| * | N-able Inc. | 24,087 | 251 |
| | Hackett Group Inc. | 7,531 | 236 |
| | Sapiens International Corp. NV | 5,350 | 146 |
| * | Grindr Inc. | 7,149 | 108 |
| * | Veeco Instruments Inc. | 3,774 | 105 |
| * | Impinj Inc. | 543 | 104 |
| | Cognizant Technology Solutions Corp. Class A | 1,143 | 92 |
| | KLA Corp. | 121 | 78 |
| | PC Connection Inc. | 917 | 67 |
| | Applied Materials Inc. | 316 | 55 |
| | | | 34,673 |
| Telecommunications (8.1%) |
| | T-Mobile US Inc. | 9,280 | 2,291 |
| | AT&T Inc. | 98,101 | 2,272 |
| | InterDigital Inc. | 10,342 | 2,027 |
| | Cisco Systems Inc. | 31,852 | 1,886 |
| | IDT Corp. Class B | 35,221 | 1,819 |
| | Verizon Communications Inc. | 28,311 | 1,255 |
| | Motorola Solutions Inc. | 1,129 | 564 |
| | Spok Holdings Inc. | 13,524 | 222 |
| | | | 12,336 |
| Utilities (8.8%) |
| | Consolidated Edison Inc. | 22,457 | 2,259 |
| | Duke Energy Corp. | 18,419 | 2,156 |
| | Southern Co. | 23,529 | 2,097 |
| | Republic Services Inc. | 8,255 | 1,802 |
| | Waste Management Inc. | 7,079 | 1,615 |
| | MGE Energy Inc. | 13,519 | 1,410 |
| | FirstEnergy Corp. | 26,407 | 1,124 |
| | WEC Energy Group Inc. | 7,593 | 767 |
| | Ameren Corp. | 3,065 | 289 |
| | CMS Energy Corp. | 527 | 37 |
| | | | 13,556 |
| Total Common Stocks (Cost $125,093) | 152,524 |
U.S. Minimum Volatility ETF
| | | Shares | Market
Value•
($000) |
| Temporary Cash Investments (0.3%) |
| Money Market Fund (0.3%) |
| 1 | Vanguard Market Liquidity Fund, 4.651% (Cost $423) | 4,229 | 423 |
| Total Investments (99.8%) (Cost $125,516) | 152,947 |
| Other Assets and Liabilities—Net (0.2%) | 267 |
| Net Assets (100%) | 153,214 |
| Cost is in $000. |
| • | See Note A in Notes to Financial Statements. |
| * | Non-income-producing security. |
| 1 | Affiliated money market fund available only to Vanguard funds and certain trusts and accounts managed by Vanguard. Rate shown is the 7-day yield. |
| | REIT—Real Estate Investment Trust. |
Derivative Financial Instruments Outstanding as of Period End
| Futures Contracts |
| | | | ($000) |
| | Expiration | Number of
Long (Short)
Contracts | Notional
Amount | Value and
Unrealized
Appreciation
(Depreciation) |
| Long Futures Contracts | | | | |
| E-mini S&P 500 Index | December 2024 | 1 | 302 | 4 |
| Micro E-mini S&P 500 Index | December 2024 | 6 | 182 | 2 |
| | | | | 6 |
See accompanying Notes, which are an integral part of the Financial Statements.
U.S. Minimum Volatility ETF
Statement of Assets and Liabilities
|
| ($000s, except shares, footnotes, and per-share amounts) | Amount |
| Assets | |
| Investments in Securities, at Value | |
| Unaffiliated Issuers (Cost $125,093) | 152,524 |
| Affiliated Issuers (Cost $423) | 423 |
| Total Investments in Securities | 152,947 |
| Investment in Vanguard | 4 |
| Cash Collateral Pledged—Futures Contracts | 24 |
| Receivables for Accrued Income | 246 |
| Variation Margin Receivable—Futures Contracts | 3 |
| Total Assets | 153,224 |
| Liabilities | |
| Payables for Investment Securities Purchased | 2 |
| Payables to Vanguard | 8 |
| Total Liabilities | 10 |
| Net Assets | 153,214 |
| At November 30, 2024, net assets consisted of: | |
| | |
| Paid-in Capital | 136,500 |
| Total Distributable Earnings (Loss) | 16,714 |
| Net Assets | 153,214 |
| |
| Net Assets | |
Applicable to 1,200,000 outstanding $.001 par value shares of
beneficial interest (unlimited authorization) | 153,214 |
| Net Asset Value Per Share | $127.68 |
See accompanying Notes, which are an integral part of the Financial Statements.
U.S. Minimum Volatility ETF
|
| | Year Ended
November 30, 2024 |
| | ($000) |
| Investment Income | |
| Income | |
| Dividends1 | 1,952 |
| Interest2 | 26 |
| Securities Lending—Net | — |
| Total Income | 1,978 |
| Expenses | |
| The Vanguard Group—Note B | |
| Investment Advisory Services | 25 |
| Management and Administrative | 41 |
| Marketing and Distribution | 5 |
| Auditing Fees | 31 |
| Shareholders’ Reports and Proxy Fees | 30 |
| Trustees’ Fees and Expenses | — |
| Professional Services | 15 |
| Total Expenses | 147 |
| Net Investment Income | 1,831 |
| Realized Net Gain (Loss) | |
| Investment Securities Sold2,3 | 4,339 |
| Futures Contracts | 82 |
| Realized Net Gain (Loss) | 4,421 |
| Change in Unrealized Appreciation (Depreciation) | |
| Investment Securities2 | 22,028 |
| Futures Contracts | 1 |
| Change in Unrealized Appreciation (Depreciation) | 22,029 |
| Net Increase (Decrease) in Net Assets Resulting from Operations | 28,281 |
| 1 | Dividends are net of foreign withholding taxes of $1,000. |
| 2 | Interest income, realized net gain (loss), capital gain distributions received, and change in unrealized appreciation (depreciation) from an affiliated company of the fund were $21,000, less than $1,000, less than $1,000, and ($1,000), respectively. Purchases and sales are for temporary cash investment purposes. |
| 3 | Includes $4,969,000 of net gain (loss) resulting from in-kind redemptions. |
See accompanying Notes, which are an integral part of the Financial Statements.
U.S. Minimum Volatility ETF
Statement of Changes in Net Assets
|
| | Year Ended November 30, |
| | 2024
($000) | 2023
($000) |
| Increase (Decrease) in Net Assets | | |
| Operations | | |
| Net Investment Income | 1,831 | 2,090 |
| Realized Net Gain (Loss) | 4,421 | 639 |
| Change in Unrealized Appreciation (Depreciation) | 22,029 | (1,777) |
| Net Increase (Decrease) in Net Assets Resulting from Operations | 28,281 | 952 |
| Distributions | | |
| Total Distributions | (1,762) | (2,061) |
| Capital Share Transactions | | |
| Issued | 51,009 | 31,343 |
| Issued in Lieu of Cash Distributions | — | — |
| Redeemed | (17,707) | (17,629) |
| Net Increase (Decrease) from Capital Share Transactions | 33,302 | 13,714 |
| Total Increase (Decrease) | 59,821 | 12,605 |
| Net Assets | | |
| Beginning of Period | 93,393 | 80,788 |
| End of Period | 153,214 | 93,393 |
See accompanying Notes, which are an integral part of the Financial Statements.
U.S. Minimum Volatility ETF
For a Share Outstanding
Throughout Each Period | Year Ended November 30, |
| 2024 | 2023 | 2022 | 2021 | 2020 |
| Net Asset Value, Beginning of Period | $101.51 | $102.91 | $100.28 | $87.08 | $91.10 |
| Investment Operations | | | | | |
| Net Investment Income1 | 1.838 | 2.373 | 2.160 | 1.374 | 1.779 |
| Net Realized and Unrealized Gain (Loss) on Investments | 26.142 | (1.354) | 2.231 | 13.497 | (3.776) |
| Total from Investment Operations | 27.980 | 1.019 | 4.391 | 14.871 | (1.997) |
| Distributions | | | | | |
| Dividends from Net Investment Income | (1.810) | (2.419) | (1.761) | (1.671) | (2.023) |
| Distributions from Realized Capital Gains | — | — | — | — | — |
| Total Distributions | (1.810) | (2.419) | (1.761) | (1.671) | (2.023) |
| Net Asset Value, End of Period | $127.68 | $101.51 | $102.91 | $100.28 | $87.08 |
| Total Return | 27.84% | 1.13% | 4.46% | 17.22% | -1.99% |
| Ratios/Supplemental Data | | | | | |
| Net Assets, End of Period (Millions) | $153 | $93 | $81 | $47 | $57 |
| Ratio of Total Expenses to Average Net Assets | 0.13% | 0.13%2 | 0.13% | 0.13% | 0.13% |
| Ratio of Net Investment Income to Average Net Assets | 1.61% | 2.40% | 2.18% | 1.43% | 2.14% |
| Portfolio Turnover Rate3 | 39% | 26% | 32% | 46% | 83% |
| 1 | Calculated based on average shares outstanding. |
| 2 | The ratio of expenses to average net assets for the period net of reduction from custody fee offset arrangements was 0.13%. |
| 3 | Excludes the value of portfolio securities received or delivered as a result of in-kind purchases or redemptions of the fund’s capital shares, including ETF Creation Units. |
See accompanying Notes, which are an integral part of the Financial Statements.
U.S. Minimum Volatility ETF
Notes to Financial Statements
Vanguard U.S. Minimum Volatility ETF is registered under the Investment Company Act of 1940 as an open-end investment company, or mutual fund. ETF Shares are listed for trading on Cboe BZX Exchange, Inc.; they can be purchased and sold through a broker.
| A. | The following significant accounting policies conform to generally accepted accounting principles for U.S. investment companies. The fund consistently follows such policies in preparing its financial statements. |
1. Security Valuation: Securities are valued as of the close of trading on the New York Stock Exchange (generally 4 p.m., Eastern time) on the valuation date. Equity securities are valued at the latest quoted sales prices or official closing prices taken from the primary market in which each security trades; such securities not traded on the valuation date are valued at the mean of the latest quoted bid and asked prices. Securities for which market quotations are not readily available, or whose values have been affected by events occurring before the fund’s pricing time but after the close of the securities’ primary markets, are valued by methods deemed by the valuation designee to represent fair value and subject to oversight by the board of trustees. Investments in Vanguard Market Liquidity Fund are valued at that fund's net asset value.
2. Futures Contracts: The fund uses index futures contracts to a limited extent, with the objective of maintaining full exposure to the stock market while maintaining liquidity. The fund may purchase or sell futures contracts to achieve a desired level of investment, whether to accommodate portfolio turnover or cash flows from capital share transactions. The primary risks associated with the use of futures contracts are imperfect correlation between changes in market values of stocks held by the fund and the prices of futures contracts, and the possibility of an illiquid market. Counterparty risk involving futures is mitigated because a regulated clearinghouse is the counterparty instead of the clearing broker. To further mitigate counterparty risk, the fund trades futures contracts on an exchange, monitors the financial strength of its clearing brokers and clearinghouse, and has entered into clearing agreements with its clearing brokers. The clearinghouse imposes initial margin requirements to secure the fund’s performance and requires daily settlement of variation margin representing changes in the market value of each contract. Any securities pledged as initial margin for open contracts are noted in the Schedule of Investments.
Futures contracts are valued at their quoted daily settlement prices. The notional amounts of the contracts are not recorded in the Statement of Assets and Liabilities. Fluctuations in the value of the contracts are recorded in the Statement of Assets and Liabilities as an asset (liability) and in the Statement of Operations as unrealized appreciation (depreciation) until the contracts are closed, when they are recorded as realized gains (losses) on futures contracts.
During the year ended November 30, 2024, the fund’s average investments in long and short futures contracts represented less than 1% and 0% of net assets, respectively, based on the average of the notional amounts at each quarter-end during the period.
3. Federal Income Taxes: The fund intends to continue to qualify as a regulated investment company and distribute virtually all of its taxable income. The fund’s tax returns are open to examination by the relevant tax authorities until expiration of the applicable statute of limitations, which is generally three years after the filing of the tax return. Management has analyzed the fund’s tax positions taken for all open federal and state income tax years, and has concluded that no provision for income tax is required in the fund’s financial statements.
4. Distributions: Distributions to shareholders are recorded on the ex-dividend date. Distributions are determined on a tax basis at the fiscal year-end and may differ from net investment income and realized capital gains for financial reporting purposes.
5. Securities Lending: To earn additional income, the fund lends its securities to qualified institutional borrowers. Security loans are subject to termination by the fund at any time, and are required to be secured at all times by collateral in an amount at least equal to the market value of securities loaned. Daily market fluctuations could cause the value of loaned securities to be more or less than the value of the collateral received. When this occurs, the collateral is adjusted and settled before the opening of the market on the next business day. The fund further mitigates its counterparty risk by entering into securities lending transactions only with a diverse group of prequalified counterparties, monitoring their financial strength, and entering into master securities lending agreements with its counterparties. The master securities lending agreements provide that, in the event of a counterparty’s default (including bankruptcy), the fund may terminate any loans with that borrower, determine the net amount owed, and sell or retain the collateral up to the net amount owed to the fund; however, such actions may be subject to legal proceedings. While collateral mitigates counterparty risk, in the event of a default, the fund may experience delays and costs in recovering the securities loaned. The fund invests cash collateral received in Vanguard Market Liquidity Fund, and records a liability in the Statement of Assets and Liabilities for the return of the collateral, during the period the securities are on loan. Collateral investments in Vanguard Market Liquidity Fund are subject to market appreciation or depreciation. Securities lending income represents fees charged to borrowers plus income earned on invested cash collateral, less expenses associated with the loan. During the term of the loan, the fund is entitled to all distributions made on or in respect of the loaned securities.
6. Credit Facilities and Interfund Lending Program: The fund and certain other funds managed by The Vanguard Group ("Vanguard") participate in a $4.3 billion committed credit facility provided by a syndicate of lenders pursuant to a credit agreement and an uncommitted credit facility provided by Vanguard. Both facilities may be renewed annually. Each fund is individually liable for its borrowings, if any, under the credit facilities. Borrowings may be utilized for temporary or emergency purposes and are subject to the fund’s regulatory and contractual borrowing restrictions. With respect to the committed credit facility, the participating funds are charged administrative fees and an annual commitment fee of 0.10% of the undrawn committed amount of the facility, which are allocated to the funds based on a method approved by the fund’s board of trustees and included in Management and Administrative expenses on the fund’s Statement of Operations. Any borrowings under either facility bear interest at an agreed-upon spread plus the higher of the federal funds effective rate, the overnight bank funding rate, or the Daily Simple Secured Overnight Financing Rate inclusive of an additional agreed-upon spread. However, borrowings under the uncommitted credit facility may bear interest based upon an alternate rate agreed to by the fund and Vanguard.
In accordance with an exemptive order (the “Order”) from the SEC, the fund may participate in a joint lending and borrowing program that allows registered open-end Vanguard funds to borrow money from and lend money to each other for temporary or emergency purposes (the “Interfund Lending Program”), subject to compliance with the terms and conditions of the Order, and to the extent permitted by the fund’s investment objective and investment policies. Interfund loans and borrowings normally extend overnight but can have a maximum duration of seven days. Loans may be
U.S. Minimum Volatility ETF
called on one business day’s notice. The interest rate to be charged is governed by the conditions of the Order and internal procedures adopted by the board of trustees. The board of trustees is responsible for overseeing the Interfund Lending Program.
For the year ended November 30, 2024, the fund did not utilize the credit facilities or the Interfund Lending Program.
7. Other: Dividend income is recorded on the ex-dividend date. Non-cash dividends included in income, if any, are recorded at the fair value of the securities received. Interest income includes income distributions received from Vanguard Market Liquidity Fund and is accrued daily. Security transactions are accounted for on the date securities are bought or sold. Costs used to determine realized gains (losses) on the sale of investment securities are those of the specific securities sold.
| B. | In accordance with the terms of a Funds' Service Agreement (the “FSA”) between Vanguard and the fund, Vanguard furnishes to the fund investment advisory, corporate management, administrative, marketing, and distribution services at Vanguard’s cost of operations (as defined by the FSA). These costs of operations are allocated to the fund based on methods and guidelines approved by the board of trustees and are generally settled twice a month. |
Upon the request of Vanguard, the fund may invest up to 0.40% of its net assets as capital in Vanguard. At November 30, 2024, the fund had contributed to Vanguard capital in the amount of $4,000, representing less than 0.01% of the fund’s net assets and less than 0.01% of Vanguard’s capital received pursuant to the FSA. The fund’s trustees and officers are also directors and employees, respectively, of Vanguard.
| C. | Various inputs may be used to determine the value of the fund’s investments and derivatives. These inputs are summarized in three broad levels for financial statement purposes. The inputs or methodologies used to value securities are not necessarily an indication of the risk associated with investing in those securities. |
Level 1—Quoted prices in active markets for identical securities.
Level 2—Other significant observable inputs (including quoted prices for similar securities, interest rates, prepayment speeds, credit risk, etc.).
Level 3—Significant unobservable inputs (including the fund’s own assumptions used to determine the fair value of investments). Any investments and derivatives valued with significant unobservable inputs are noted on the Schedule of Investments.
At November 30, 2024, 100% of the market value of the fund’s investments and derivatives was determined based on Level 1 inputs.
| D. | Permanent differences between book-basis and tax-basis components of net assets are reclassified among capital accounts in the financial statements to reflect their tax character. These reclassifications have no effect on net assets or net asset value per share. As of period end, permanent differences primarily attributable to the accounting for in-kind redemptions were reclassified between the following accounts: |
| | Amount
($000) |
| Paid-in Capital | 4,969 |
| Total Distributable Earnings (Loss) | (4,969) |
Temporary differences between book-basis and tax-basis components of total distributable earnings (loss) arise when certain items of income, gain, or loss are recognized in different periods for financial statement and tax purposes; these differences will reverse at some time in the future. The differences are primarily related to capital loss carryforwards; the deferral of losses from wash sales; and the recognition of unrealized gains or losses from certain derivative contracts. As of period end, the tax-basis components of total distributable earnings (loss) are detailed in the table as follows:
| | Amount
($000) |
| Undistributed Ordinary Income | 477 |
| Undistributed Long-Term Gains | — |
| Net Unrealized Gains (Losses) | 27,431 |
| Capital Loss Carryforwards | (11,194) |
| Qualified Late-Year Losses | — |
| Other Temporary Differences | — |
| Total | 16,714 |
The tax character of distributions paid was as follows:
| | Year Ended November 30, |
| | 2024
Amount
($000) | 2023
Amount
($000) |
| Ordinary Income* | 1,762 | 2,061 |
| Long-Term Capital Gains | — | — |
| Total | 1,762 | 2,061 |
| * | Includes short-term capital gains, if any. |
U.S. Minimum Volatility ETF
As of November 30, 2024, gross unrealized appreciation and depreciation for investments and derivatives based on cost for U.S. federal income tax purposes were as follows:
| | Amount
($000) |
| Tax Cost | 125,516 |
| Gross Unrealized Appreciation | 28,397 |
| Gross Unrealized Depreciation | (966) |
| Net Unrealized Appreciation (Depreciation) | 27,431 |
| E. | During the year ended November 30, 2024, the fund purchased $93,536,000 of investment securities and sold $44,750,000 of investment securities, other than temporary cash investments. In addition, the fund purchased and sold investment securities of $0 and $15,409,000, respectively, in connection with in-kind purchases and redemptions of the fund's capital shares. |
The fund purchased securities from and sold securities to other Vanguard funds or accounts managed by Vanguard or its affiliates, in accordance with procedures adopted by the board of trustees in compliance with Rule 17a-7 of the Investment Company Act of 1940. For the year ended November 30, 2024, such purchases were $1,741,000 and sales were $600,000, resulting in net realized loss of $177,000; these amounts, other than temporary cash investments, are included in the purchases and sales of investment securities noted above.
| F. | Capital shares issued and redeemed were: |
| | Year Ended November 30, |
| | 2024
Shares
(000) | 2023
Shares
(000) |
| Issued | 440 | 315 |
| Issued in Lieu of Cash Distributions | — | — |
| Redeemed | (160) | (180) |
| Net Increase (Decrease) in Shares Outstanding | 280 | 135 |
| G. | Significant market disruptions, such as those caused by pandemics, natural or environmental disasters, war, acts of terrorism, or other events, can adversely affect local and global markets and normal market operations. Any such disruptions could have an adverse impact on the value of the fund’s investments and fund performance. |
To the extent the fund’s investment portfolio reflects concentration in a particular market, industry, sector, country or asset class, the fund may be adversely affected by the performance of these concentrations and may be subject to increased price volatility and other risks.
The use of derivatives may expose the fund to various risks. Derivatives can be highly volatile, and any initial investment is generally small relative to the notional amount so that transactions may be leveraged in terms of market exposure. A relatively small market movement may have a potentially larger impact on derivatives than on standard securities. Leveraged derivatives positions can, therefore, increase volatility. Additional information regarding the fund’s use of derivative(s) and the specific risks associated is described under significant accounting policies.
At November 30, 2024, one shareholder was a record or beneficial owner of 39% of the fund’s net assets. If this shareholder were to redeem its investment in the fund, the redemption might result in an increase in the fund’s expense ratio, cause the fund to incur higher transaction costs, or lead to the realization of taxable capital gains.
| H. | Management has determined that no events or transactions occurred subsequent to November 30, 2024, that would require recognition or disclosure in these financial statements. |
Schedule of Investments
As of November 30, 2024
The fund files its complete schedule of portfolio holdings with the Securities and Exchange Commission (SEC) for the first and third quarters of each fiscal year as an exhibit to its reports on Form N-PORT. The fund’s Form N-PORT reports are available on the SEC’s website at www.sec.gov.
| | | Shares | Market
Value•
($000) |
| Common Stocks (99.7%) |
| Basic Materials (3.0%) |
| | Newmont Corp. (XNYS) | 137,170 | 5,753 |
| | Air Products & Chemicals Inc. | 10,678 | 3,570 |
| | Ecolab Inc. | 12,001 | 2,985 |
| | Carpenter Technology Corp. | 12,228 | 2,373 |
| | Mueller Industries Inc. | 16,378 | 1,323 |
| * | Coeur Mining Inc. | 198,323 | 1,281 |
| | Hawkins Inc. | 8,579 | 1,154 |
| *,1 | ASP Isotopes Inc. | 202,061 | 1,121 |
| | Southern Copper Corp. | 10,584 | 1,062 |
| | International Flavors & Fragrances Inc. | 11,365 | 1,038 |
| | Hecla Mining Co. | 143,818 | 794 |
| * | Century Aluminum Co. | 32,266 | 737 |
| | Sylvamo Corp. | 7,775 | 718 |
| * | Perimeter Solutions Inc. | 53,091 | 680 |
| | International Paper Co. | 9,403 | 553 |
| | Avient Corp. | 9,604 | 492 |
| | Alcoa Corp. | 10,161 | 472 |
| * | Rayonier Advanced Materials Inc. | 49,155 | 433 |
| | Scotts Miracle-Gro Co. | 5,587 | 431 |
| | Minerals Technologies Inc. | 2,863 | 233 |
| | | | 27,203 |
| Consumer Discretionary (12.5%) |
| * | Netflix Inc. | 7,626 | 6,763 |
| | Costco Wholesale Corp. | 6,684 | 6,496 |
| | Walmart Inc. | 62,806 | 5,810 |
| | General Motors Co. | 83,018 | 4,615 |
| | DR Horton Inc. | 27,141 | 4,581 |
| * | Spotify Technology SA | 9,299 | 4,435 |
| * | Carvana Co. | 12,807 | 3,335 |
| * | SkyWest Inc. | 26,589 | 3,051 |
| | Garmin Ltd. | 12,118 | 2,576 |
| | Royal Caribbean Cruises Ltd. | 10,339 | 2,523 |
| * | Deckers Outdoor Corp. | 12,542 | 2,458 |
| | Fox Corp. Class A | 48,158 | 2,269 |
| | Hilton Worldwide Holdings Inc. | 8,708 | 2,207 |
| * | SharkNinja Inc. | 20,643 | 2,076 |
| | TJX Cos. Inc. | 15,431 | 1,940 |
| | KB Home | 23,341 | 1,931 |
| * | United Airlines Holdings Inc. | 19,495 | 1,888 |
| * | Stride Inc. | 17,189 | 1,837 |
| * | Cava Group Inc. | 12,262 | 1,728 |
| | Hasbro Inc. | 25,540 | 1,664 |
| * | TKO Group Holdings Inc. | 11,882 | 1,639 |
| | PulteGroup Inc. | 11,600 | 1,569 |
| * | Rush Street Interactive Inc. | 103,756 | 1,496 |
| | Murphy USA Inc. | 2,615 | 1,433 |
| | Ralph Lauren Corp. | 6,155 | 1,424 |
| | Toll Brothers Inc. | 8,393 | 1,386 |
| * | Coupang Inc. | 54,029 | 1,370 |
| * | Trade Desk Inc. Class A | 10,483 | 1,348 |
| * | Brinker International Inc. | 9,696 | 1,283 |
| * | Universal Technical Institute Inc. | 49,534 | 1,281 |
| * | Skechers USA Inc. Class A | 18,762 | 1,197 |
| * | Sweetgreen Inc. Class A | 29,165 | 1,195 |
| * | Adtalem Global Education Inc. | 12,681 | 1,159 |
| * | NVR Inc. | 125 | 1,154 |
| * | Burlington Stores Inc. | 4,079 | 1,150 |
| * | GameStop Corp. Class A | 38,900 | 1,130 |
| | Dick's Sporting Goods Inc. | 5,395 | 1,118 |
| | | Shares | Market
Value•
($000) |
| * | Cinemark Holdings Inc. | 32,274 | 1,114 |
| | Wingstop Inc. | 3,261 | 1,072 |
| | Williams-Sonoma Inc. | 6,185 | 1,064 |
| * | Revolve Group Inc. | 27,866 | 1,005 |
| | Interface Inc. | 36,753 | 976 |
| * | Bright Horizons Family Solutions Inc. | 8,266 | 956 |
| | Lennar Corp. Class A | 5,251 | 916 |
| * | Life Time Group Holdings Inc. | 36,165 | 878 |
| * | Abercrombie & Fitch Co. Class A | 5,860 | 877 |
| | Perdoceo Education Corp. | 29,543 | 811 |
| | Phinia Inc. | 14,270 | 800 |
| * | Liberty Media Corp.-Liberty Live Class C | 10,909 | 797 |
| * | Shake Shack Inc. Class A | 5,953 | 796 |
| | eBay Inc. | 12,495 | 791 |
| | HNI Corp. | 13,800 | 782 |
| * | Chipotle Mexican Grill Inc. | 12,611 | 776 |
| | PROG Holdings Inc. | 15,472 | 753 |
| | H&R Block Inc. | 12,540 | 743 |
| | Wolverine World Wide Inc. | 31,511 | 731 |
| * | Green Brick Partners Inc. | 9,410 | 672 |
| | New York Times Co. Class A | 12,140 | 659 |
| * | QuinStreet Inc. | 28,853 | 657 |
| * | Boot Barn Holdings Inc. | 4,486 | 615 |
| * | Dorman Products Inc. | 4,298 | 602 |
| | Fox Corp. Class B | 13,198 | 590 |
| | Kontoor Brands Inc. | 6,376 | 585 |
| * | Gannett Co. Inc. | 112,003 | 581 |
| | Meritage Homes Corp. | 3,000 | 573 |
| * | Hovnanian Enterprises Inc. Class A | 2,763 | 543 |
| * | Despegar.com Corp. | 28,897 | 517 |
| * | Laureate Education Inc. | 27,158 | 516 |
| * | Norwegian Cruise Line Holdings Ltd. | 18,128 | 487 |
| | OneSpaWorld Holdings Ltd. | 25,223 | 479 |
| * | Hanesbrands Inc. | 51,519 | 448 |
| | Lennar Corp. Class B | 1,915 | 316 |
| * | Petco Health & Wellness Co. Inc. | 72,619 | 310 |
| * | Ollie's Bargain Outlet Holdings Inc. | 2,776 | 275 |
| | Steven Madden Ltd. | 5,926 | 270 |
| * | National CineMedia Inc. | 32,957 | 229 |
| *,1 | GigaCloud Technology Inc. Class A | 8,644 | 214 |
| * | U-Haul Holding Co. (XNYS) | 2,840 | 201 |
| | Group 1 Automotive Inc. | 473 | 201 |
| * | Daily Journal Corp. | 350 | 198 |
| * | Uber Technologies Inc. | 2,451 | 176 |
| | A-Mark Precious Metals Inc. | 5,628 | 171 |
| * | Funko Inc. Class A | 14,065 | 165 |
| | Shoe Carnival Inc. | 4,477 | 151 |
| | Sinclair Inc. | 8,176 | 150 |
| | VF Corp. | 6,375 | 129 |
| | | | 114,833 |
| Consumer Staples (4.0%) |
| | Philip Morris International Inc. | 41,455 | 5,516 |
| * | Sprouts Farmers Market Inc. | 31,189 | 4,818 |
| | Colgate-Palmolive Co. | 46,492 | 4,493 |
| | Coca-Cola Consolidated Inc. | 1,561 | 2,036 |
| * | Freshpet Inc. | 12,841 | 1,965 |
| * | BellRing Brands Inc. | 22,537 | 1,768 |
| | Altria Group Inc. | 29,276 | 1,690 |
| * | Pilgrim's Pride Corp. | 31,960 | 1,649 |
| | Turning Point Brands Inc. | 23,627 | 1,463 |
| | Ingredion Inc. | 9,845 | 1,451 |
| | Tyson Foods Inc. Class A | 22,000 | 1,419 |
| | Primo Brands Corp. Class A | 43,451 | 1,239 |
| * | Honest Co. Inc. | 127,197 | 1,055 |
| | Dole plc | 59,218 | 892 |
| | Casey's General Stores Inc. | 2,086 | 878 |
| | Cal-Maine Foods Inc. | 8,394 | 819 |
| | Coca-Cola Co. | 11,560 | 741 |
| * | Vital Farms Inc. | 17,850 | 593 |
| | | Shares | Market
Value•
($000) |
| | WK Kellogg Co. | 22,276 | 463 |
| * | US Foods Holding Corp. | 6,048 | 422 |
| | Spectrum Brands Holdings Inc. | 3,842 | 353 |
| | WD-40 Co. | 1,249 | 346 |
| | Campbell Soup Co. | 7,400 | 342 |
| * | Lifeway Foods Inc. | 11,446 | 280 |
| * | United Natural Foods Inc. | 11,114 | 276 |
| | | | 36,967 |
| Energy (3.5%) |
| | Williams Cos. Inc. | 90,441 | 5,292 |
| | ONEOK Inc. | 38,039 | 4,321 |
| | Targa Resources Corp. | 16,035 | 3,276 |
| | Archrock Inc. | 93,860 | 2,405 |
| | Texas Pacific Land Corp. | 1,376 | 2,202 |
| | DTE Midstream LLC | 20,709 | 2,198 |
| * | CNX Resources Corp. | 39,621 | 1,605 |
| | TechnipFMC plc | 49,307 | 1,547 |
| | Kinder Morgan Inc. | 52,220 | 1,476 |
| * | First Solar Inc. | 5,996 | 1,195 |
| * | EVgo Inc. | 174,556 | 1,136 |
| * | Sable Offshore Corp. | 48,334 | 1,135 |
| * | Centrus Energy Corp. Class A | 9,164 | 834 |
| | Golar LNG Ltd. | 19,607 | 772 |
| | Kodiak Gas Services Inc. | 16,890 | 683 |
| | Viper Energy Inc. | 11,850 | 641 |
| | Antero Midstream Corp. | 36,389 | 581 |
| * | American Superconductor Corp. | 10,655 | 363 |
| | VAALCO Energy Inc. | 70,891 | 363 |
| * | REX American Resources Corp. | 6,897 | 299 |
| | | | 32,324 |
| Financials (21.2%) |
| | KKR & Co. Inc. | 55,156 | 8,983 |
| | Bank of New York Mellon Corp. | 87,673 | 7,178 |
| | Progressive Corp. | 25,461 | 6,846 |
| | Apollo Global Management Inc. | 29,549 | 5,172 |
| | Truist Financial Corp. | 104,561 | 4,985 |
| | Aflac Inc. | 38,233 | 4,359 |
| | Allstate Corp. | 18,033 | 3,740 |
| | Blackstone Inc. | 18,077 | 3,454 |
| | Intercontinental Exchange Inc. | 20,541 | 3,306 |
| | M&T Bank Corp. | 13,873 | 3,052 |
| | PNC Financial Services Group Inc. | 13,323 | 2,861 |
| | Huntington Bancshares Inc. | 157,108 | 2,830 |
| | Fifth Third Bancorp | 52,476 | 2,522 |
| * | Dave Inc. | 24,889 | 2,456 |
| | Citigroup Inc. | 32,962 | 2,336 |
| | Willis Towers Watson plc | 6,807 | 2,192 |
| | Axis Capital Holdings Ltd. | 23,472 | 2,184 |
| * | Robinhood Markets Inc. Class A | 57,541 | 2,160 |
| | Wells Fargo & Co. | 27,115 | 2,065 |
| | Stewart Information Services Corp. | 27,458 | 2,062 |
| | JPMorgan Chase & Co. | 8,085 | 2,019 |
| | Citizens Financial Group Inc. | 39,981 | 1,925 |
| | Glacier Bancorp Inc. | 32,913 | 1,905 |
| | Piper Sandler Cos. | 5,532 | 1,897 |
| | TPG Inc. | 26,938 | 1,885 |
| | Ryan Specialty Holdings Inc. | 24,947 | 1,881 |
| | Moody's Corp. | 3,760 | 1,880 |
| | Jefferies Financial Group Inc. | 22,601 | 1,789 |
| | Morgan Stanley | 13,571 | 1,786 |
| | Interactive Brokers Group Inc. Class A | 9,194 | 1,757 |
| * | NU Holdings Ltd. Class A | 135,160 | 1,694 |
| | Old Republic International Corp. | 43,406 | 1,692 |
| | Stifel Financial Corp. | 14,432 | 1,671 |
| | Evercore Inc. Class A | 5,355 | 1,649 |
| | Victory Capital Holdings Inc. Class A | 23,247 | 1,615 |
| * | Root Inc. Class A | 16,142 | 1,611 |
| | Jackson Financial Inc. Class A | 15,860 | 1,589 |
| | Western Alliance Bancorp | 16,718 | 1,565 |
| | | Shares | Market
Value•
($000) |
| | Corebridge Financial Inc. | 46,994 | 1,521 |
| | Goldman Sachs Group Inc. | 2,484 | 1,512 |
| | First BanCorp (XNYS) | 71,902 | 1,487 |
| | Lazard Inc. | 24,851 | 1,443 |
| * | Skyward Specialty Insurance Group Inc. | 26,224 | 1,419 |
| | Mercury General Corp. | 17,787 | 1,404 |
| | Synovus Financial Corp. | 23,760 | 1,356 |
| | Virtu Financial Inc. Class A | 36,183 | 1,350 |
| | Houlihan Lokey Inc. | 7,077 | 1,338 |
| | Hartford Financial Services Group Inc. | 10,794 | 1,331 |
| | Travelers Cos. Inc. | 4,886 | 1,300 |
| | Wintrust Financial Corp. | 9,370 | 1,293 |
| | Hamilton Lane Inc. Class A | 6,677 | 1,285 |
| | Ares Management Corp. Class A | 7,242 | 1,280 |
| | Pathward Financial Inc. | 15,227 | 1,277 |
| | SLM Corp. | 46,199 | 1,265 |
| | Ameriprise Financial Inc. | 2,168 | 1,244 |
| | BankUnited Inc. | 29,566 | 1,244 |
| | Central Pacific Financial Corp. | 38,888 | 1,241 |
| | Tradeweb Markets Inc. Class A | 9,104 | 1,234 |
| * | Mr. Cooper Group Inc. | 12,483 | 1,232 |
| | Blue Owl Capital Inc. | 51,799 | 1,229 |
| | Park National Corp. | 6,452 | 1,228 |
| | UMB Financial Corp. | 9,562 | 1,200 |
| * | Oscar Health Inc. Class A | 67,401 | 1,168 |
| | NBT Bancorp Inc. | 22,403 | 1,123 |
| * | Coinbase Global Inc. Class A | 3,742 | 1,108 |
| | Perella Weinberg Partners | 42,532 | 1,092 |
| | Popular Inc. | 10,820 | 1,075 |
| | Independent Bank Corp. | 28,020 | 1,054 |
| | Pinnacle Financial Partners Inc. | 8,254 | 1,049 |
| | Amalgamated Financial Corp. | 28,940 | 1,031 |
| | East West Bancorp Inc. | 9,236 | 1,013 |
| | S&T Bancorp Inc. | 22,760 | 974 |
| | StepStone Group Inc. Class A | 14,734 | 971 |
| | Arch Capital Group Ltd. | 9,525 | 959 |
| | Prosperity Bancshares Inc. | 11,400 | 955 |
| * | Upstart Holdings Inc. | 12,102 | 954 |
| | Commerce Bancshares Inc. | 12,820 | 945 |
| | Bank of America Corp. | 19,494 | 926 |
| * | Enova International Inc. | 8,767 | 925 |
| | Bread Financial Holdings Inc. | 15,572 | 916 |
| * | Rocket Cos. Inc. Class A | 62,373 | 906 |
| | BGC Group Inc. Class A | 90,651 | 883 |
| | First Citizens BancShares Inc. Class A | 379 | 870 |
| | Primerica Inc. | 2,823 | 855 |
| * | Baldwin Insurance Group Inc. | 17,255 | 845 |
| * | American Coastal Insurance Corp. Class C | 61,317 | 842 |
| | UWM Holdings Corp. | 124,489 | 810 |
| | FB Financial Corp. | 13,929 | 786 |
| * | LendingTree Inc. | 17,596 | 778 |
| | MGIC Investment Corp. | 29,552 | 776 |
| | W R Berkley Corp. | 11,503 | 743 |
| | HCI Group Inc. | 6,028 | 735 |
| | Cohen & Steers Inc. | 6,932 | 726 |
| | CNO Financial Group Inc. | 17,641 | 704 |
| * | LendingClub Corp. | 42,106 | 701 |
| | International Bancshares Corp. | 9,446 | 691 |
| | First Financial Bankshares Inc. | 16,278 | 678 |
| * | Goosehead Insurance Inc. Class A | 5,348 | 674 |
| | Towne Bank | 18,231 | 668 |
| * | SiriusPoint Ltd. | 41,777 | 644 |
| | Ameris Bancorp | 9,142 | 643 |
| * | NMI Holdings Inc. | 16,005 | 640 |
| * | Palomar Holdings Inc. | 5,666 | 614 |
| | Preferred Bank | 6,448 | 608 |
| | S&P Global Inc. | 1,160 | 606 |
| | BOK Financial Corp. | 5,088 | 605 |
| * | SoFi Technologies Inc. | 34,886 | 572 |
| * | Trupanion Inc. | 10,444 | 557 |
| | | Shares | Market
Value•
($000) |
| | Banner Corp. | 7,460 | 556 |
| | Universal Insurance Holdings Inc. | 24,359 | 551 |
| | Assurant Inc. | 2,413 | 548 |
| | Moelis & Co. Class A | 6,971 | 537 |
| | Banco Latinoamericano de Comercio Exterior SA Class E | 15,680 | 534 |
| | Zions Bancorp NA | 8,724 | 528 |
| | OFG Bancorp | 11,523 | 523 |
| | Brown & Brown Inc. | 4,599 | 520 |
| | City Holding Co. | 3,844 | 505 |
| | German American Bancorp Inc. | 11,115 | 500 |
| | ServisFirst Bancshares Inc. | 5,131 | 491 |
| | Blackrock Inc. | 477 | 488 |
| | Univest Financial Corp. | 15,120 | 480 |
| | WisdomTree Inc. | 39,377 | 471 |
| | CNA Financial Corp. | 9,284 | 468 |
| | Radian Group Inc. | 12,921 | 462 |
| | Reinsurance Group of America Inc. | 2,013 | 460 |
| | Raymond James Financial Inc. | 2,713 | 459 |
| | Cboe Global Markets Inc. | 2,076 | 448 |
| | Nasdaq Inc. | 5,196 | 431 |
| | PJT Partners Inc. Class A | 2,576 | 431 |
| * | Clearwater Analytics Holdings Inc. Class A | 13,666 | 424 |
| * | Bancorp Inc. | 7,162 | 418 |
| | Janus Henderson Group plc | 9,226 | 418 |
| | Stock Yards Bancorp Inc. | 5,447 | 415 |
| | Veritex Holdings Inc. | 13,550 | 412 |
| | Community Financial System Inc. | 5,903 | 409 |
| | Simmons First National Corp. Class A | 16,458 | 403 |
| | National Bank Holdings Corp. Class A | 8,099 | 387 |
| | Fidelity National Financial Inc. | 5,466 | 346 |
| | Fulton Financial Corp. | 15,992 | 345 |
| | Trustmark Corp. | 8,545 | 334 |
| | Hingham Institution for Savings | 1,160 | 329 |
| * | Axos Financial Inc. | 3,952 | 327 |
| | Enact Holdings Inc. | 8,843 | 311 |
| | First Commonwealth Financial Corp. | 13,530 | 255 |
| | 1st Source Corp. | 3,763 | 244 |
| * | Hippo Holdings Inc. | 7,012 | 232 |
| | First Horizon Corp. | 9,884 | 209 |
| | Enterprise Financial Services Corp. | 3,257 | 197 |
| | Northeast Bank | 1,974 | 194 |
| | QCR Holdings Inc. | 2,069 | 191 |
| | PennyMac Financial Services Inc. | 1,735 | 186 |
| | Fidelis Insurance Holdings Ltd. | 8,710 | 179 |
| | Kemper Corp. | 2,495 | 178 |
| * | Heritage Insurance Holdings Inc. | 13,185 | 164 |
| | Chubb Ltd. | 560 | 162 |
| | Mercantile Bank Corp. | 3,225 | 161 |
| | | | 194,885 |
| Health Care (17.4%) |
| * | Boston Scientific Corp. | 88,939 | 8,063 |
| * | Intuitive Surgical Inc. | 11,640 | 6,309 |
| | Eli Lilly & Co. | 6,712 | 5,338 |
| | HCA Healthcare Inc. | 15,310 | 5,010 |
| * | Natera Inc. | 21,306 | 3,575 |
| | AbbVie Inc. | 16,487 | 3,016 |
| * | Praxis Precision Medicines Inc. | 36,740 | 2,945 |
| * | Vaxcyte Inc. | 27,646 | 2,608 |
| * | DaVita Inc. | 15,689 | 2,607 |
| * | Insmed Inc. | 34,631 | 2,603 |
| * | REVOLUTION Medicines Inc. | 43,112 | 2,494 |
| * | Alnylam Pharmaceuticals Inc. | 8,777 | 2,221 |
| * | Glaukos Corp. | 14,024 | 2,015 |
| * | United Therapeutics Corp. | 5,416 | 2,007 |
| * | GeneDx Holdings Corp. | 24,981 | 1,958 |
| * | Vertex Pharmaceuticals Inc. | 3,960 | 1,854 |
| * | Edgewise Therapeutics Inc. | 54,231 | 1,790 |
| * | ADMA Biologics Inc. | 86,290 | 1,735 |
| | Universal Health Services Inc. Class B | 7,892 | 1,618 |
| | | Shares | Market
Value•
($000) |
| * | Lantheus Holdings Inc. | 18,116 | 1,617 |
| | Encompass Health Corp. | 15,467 | 1,592 |
| | Gilead Sciences Inc. | 15,656 | 1,449 |
| | ResMed Inc. | 5,657 | 1,409 |
| * | WaVe Life Sciences Ltd. | 91,548 | 1,382 |
| * | Globus Medical Inc. Class A | 15,988 | 1,369 |
| * | Travere Therapeutics Inc. | 71,548 | 1,346 |
| * | Innoviva Inc. | 69,670 | 1,323 |
| * | Summit Therapeutics Inc. (XNMS) | 70,750 | 1,306 |
| * | Novavax Inc. | 149,468 | 1,303 |
| * | TG Therapeutics Inc. | 37,312 | 1,298 |
| * | Protagonist Therapeutics Inc. | 29,431 | 1,289 |
| * | Exelixis Inc. | 34,863 | 1,271 |
| * | Tenet Healthcare Corp. | 8,909 | 1,271 |
| * | Dyne Therapeutics Inc. | 41,478 | 1,270 |
| *,1 | Capricor Therapeutics Inc. | 66,348 | 1,261 |
| * | ARS Pharmaceuticals Inc. | 82,844 | 1,202 |
| * | Harrow Inc. | 28,555 | 1,197 |
| * | Nurix Therapeutics Inc. | 53,324 | 1,179 |
| * | Crinetics Pharmaceuticals Inc. | 19,409 | 1,110 |
| * | Halozyme Therapeutics Inc. | 22,718 | 1,095 |
| * | Scholar Rock Holding Corp. | 27,418 | 1,094 |
| * | Merit Medical Systems Inc. | 10,269 | 1,067 |
| | Phibro Animal Health Corp. Class A | 45,507 | 1,064 |
| * | Neurogene Inc. | 41,624 | 1,059 |
| * | Ocular Therapeutix Inc. | 104,405 | 1,033 |
| * | Viking Therapeutics Inc. | 19,395 | 1,027 |
| * | Janux Therapeutics Inc. | 22,693 | 1,026 |
| * | Amneal Pharmaceuticals Inc. | 123,517 | 1,022 |
| * | Insulet Corp. | 3,815 | 1,018 |
| * | Avidity Biosciences Inc. | 23,149 | 996 |
| | Ensign Group Inc. | 6,787 | 992 |
| * | Vera Therapeutics Inc. | 19,875 | 989 |
| *,1 | Pulse Biosciences Inc. | 45,955 | 983 |
| * | Rhythm Pharmaceuticals Inc. | 15,819 | 981 |
| * | CorMedix Inc. | 97,899 | 965 |
| * | TransMedics Group Inc. | 11,078 | 961 |
| * | Phathom Pharmaceuticals Inc. | 106,912 | 948 |
| * | Doximity Inc. Class A | 17,368 | 921 |
| * | CareDx Inc. | 37,101 | 911 |
| * | Aquestive Therapeutics Inc. | 178,967 | 911 |
| * | Catalyst Pharmaceuticals Inc. | 40,607 | 896 |
| * | AnaptysBio Inc. | 35,713 | 891 |
| * | Brookdale Senior Living Inc. | 156,829 | 891 |
| | National HealthCare Corp. | 7,047 | 882 |
| * | Annexon Inc. | 163,165 | 880 |
| * | Cogent Biosciences Inc. | 92,276 | 878 |
| * | Masimo Corp. | 5,004 | 863 |
| * | Alignment Healthcare Inc. | 67,432 | 850 |
| * | Ultragenyx Pharmaceutical Inc. | 17,565 | 837 |
| * | Geron Corp. (XNGS) | 200,588 | 826 |
| * | PROCEPT BioRobotics Corp. | 8,581 | 820 |
| * | Agios Pharmaceuticals Inc. | 13,272 | 788 |
| * | Soleno Therapeutics Inc. | 14,529 | 766 |
| * | Akero Therapeutics Inc. | 23,844 | 765 |
| * | Pennant Group Inc. | 24,364 | 760 |
| * | Tandem Diabetes Care Inc. | 24,577 | 753 |
| *,1 | Humacyte Inc. | 165,885 | 750 |
| * | Y-mAbs Therapeutics Inc. | 62,867 | 749 |
| * | Nuvation Bio Inc. | 253,387 | 735 |
| * | Veracyte Inc. | 16,987 | 730 |
| * | PTC Therapeutics Inc. | 16,502 | 724 |
| * | Castle Biosciences Inc. | 23,908 | 724 |
| * | Nuvalent Inc. Class A | 7,472 | 722 |
| * | Arbutus Biopharma Corp. | 208,247 | 721 |
| * | Kymera Therapeutics Inc. | 15,362 | 720 |
| * | Tarsus Pharmaceuticals Inc. | 13,615 | 714 |
| * | ICU Medical Inc. | 4,343 | 712 |
| * | Sarepta Therapeutics Inc. | 5,335 | 711 |
| * | Krystal Biotech Inc. | 3,562 | 703 |
| | | Shares | Market
Value•
($000) |
| * | MannKind Corp. | 102,924 | 698 |
| * | Integer Holdings Corp. | 4,964 | 697 |
| * | Arcellx Inc. | 7,794 | 686 |
| * | Biohaven Ltd. | 14,851 | 683 |
| * | RxSight Inc. | 14,484 | 679 |
| * | Corcept Therapeutics Inc. | 11,625 | 671 |
| * | Liquidia Corp. | 57,593 | 665 |
| * | Evolus Inc. | 48,348 | 662 |
| * | Dianthus Therapeutics Inc. | 27,455 | 659 |
| * | Spyre Therapeutics Inc. | 23,140 | 658 |
| * | RadNet Inc. | 8,040 | 657 |
| * | Corbus Pharmaceuticals Holdings Inc. | 36,021 | 642 |
| * | Inspire Medical Systems Inc. | 3,303 | 637 |
| * | Twist Bioscience Corp. | 12,803 | 630 |
| * | Collegium Pharmaceutical Inc. | 20,606 | 629 |
| * | Arcutis Biotherapeutics Inc. | 47,791 | 623 |
| * | Artivion Inc. | 21,066 | 622 |
| * | Omnicell Inc. | 13,217 | 616 |
| * | UFP Technologies Inc. | 1,908 | 616 |
| | LeMaitre Vascular Inc. | 5,743 | 614 |
| * | Mind Medicine MindMed Inc. | 75,138 | 614 |
| * | Stoke Therapeutics Inc. | 49,991 | 605 |
| * | Hims & Hers Health Inc. | 18,492 | 596 |
| * | Terns Pharmaceuticals Inc. | 90,340 | 564 |
| * | Community Health Systems Inc. | 163,356 | 562 |
| * | Immunome Inc. | 40,976 | 555 |
| * | Zimvie Inc. | 37,298 | 551 |
| * | Mirum Pharmaceuticals Inc. | 11,714 | 541 |
| * | Warby Parker Inc. Class A | 23,433 | 528 |
| * | BioCryst Pharmaceuticals Inc. | 68,024 | 510 |
| *,1 | Candel Therapeutics Inc. | 108,049 | 508 |
| * | Intra-Cellular Therapies Inc. | 5,620 | 481 |
| * | Kiniksa Pharmaceuticals International plc | 21,622 | 477 |
| * | Apogee Therapeutics Inc. | 10,504 | 474 |
| * | Viridian Therapeutics Inc. | 21,925 | 473 |
| *,1 | Ocugen Inc. | 479,782 | 471 |
| * | Cullinan Therapeutics Inc. | 31,300 | 421 |
| * | Ligand Pharmaceuticals Inc. | 3,424 | 416 |
| | Select Medical Holdings Corp. | 19,139 | 404 |
| * | Addus HomeCare Corp. | 3,248 | 399 |
| * | KalVista Pharmaceuticals Inc. | 36,543 | 368 |
| * | CorVel Corp. | 978 | 357 |
| * | Zevra Therapeutics Inc. | 37,724 | 352 |
| * | Keros Therapeutics Inc. | 5,951 | 344 |
| * | Avadel Pharmaceuticals plc | 30,657 | 339 |
| | Concentra Group Holdings Parent Inc. | 15,445 | 337 |
| | SIGA Technologies Inc. | 46,027 | 335 |
| * | Axogen Inc. | 23,410 | 325 |
| * | Enliven Therapeutics Inc. | 12,971 | 316 |
| * | Perspective Therapeutics Inc. | 69,212 | 301 |
| * | Jasper Therapeutics Inc. | 12,560 | 287 |
| * | Nkarta Inc. | 97,716 | 280 |
| * | Vanda Pharmaceuticals Inc. | 53,078 | 273 |
| * | Applied Therapeutics Inc. | 128,390 | 261 |
| * | Larimar Therapeutics Inc. | 41,065 | 260 |
| * | Inogen Inc. | 25,474 | 247 |
| * | Tyra Biosciences Inc. | 14,663 | 230 |
| * | Astrana Health Inc. | 5,199 | 225 |
| * | Zymeworks Inc. | 15,674 | 221 |
| * | BioLife Solutions Inc. | 7,813 | 215 |
| | Organon & Co. | 11,960 | 190 |
| * | Black Diamond Therapeutics Inc. | 71,018 | 188 |
| *,1 | Heron Therapeutics Inc. | 154,404 | 184 |
| | LENZ Therapeutics Inc. | 5,130 | 183 |
| * | Bioventus Inc. Class A | 10,449 | 128 |
| * | Kura Oncology Inc. | 8,353 | 92 |
| *,1 | Cassava Sciences Inc. | 23,993 | 92 |
| * | Lexicon Pharmaceuticals Inc. | 85,730 | 69 |
| | | | 160,227 |
| | | Shares | Market
Value•
($000) |
| Industrials (21.0%) |
| | General Electric Co. | 40,590 | 7,394 |
| | 3M Co. | 52,244 | 6,976 |
| | Trane Technologies plc | 16,145 | 6,720 |
| * | Fiserv Inc. | 26,612 | 5,880 |
| | RTX Corp. | 48,052 | 5,854 |
| | American Express Co. | 18,319 | 5,581 |
| | Cintas Corp. | 23,820 | 5,378 |
| | Carrier Global Corp. | 65,009 | 5,030 |
| | TransDigm Group Inc. | 3,565 | 4,467 |
| | Lockheed Martin Corp. | 8,186 | 4,334 |
| | EMCOR Group Inc. | 7,497 | 3,824 |
| | FTAI Aviation Ltd. | 19,483 | 3,289 |
| | Automatic Data Processing Inc. | 10,684 | 3,279 |
| | Allison Transmission Holdings Inc. | 26,491 | 3,139 |
| | Armstrong World Industries Inc. | 19,293 | 3,084 |
| | Comfort Systems USA Inc. | 6,020 | 2,970 |
| * | IES Holdings Inc. | 8,674 | 2,688 |
| * | Fair Isaac Corp. | 994 | 2,361 |
| | Louisiana-Pacific Corp. | 18,785 | 2,220 |
| | HEICO Corp. | 8,013 | 2,191 |
| * | ACI Worldwide Inc. | 38,361 | 2,180 |
| | Powell Industries Inc. | 7,824 | 2,092 |
| * | Axon Enterprise Inc. | 3,178 | 2,056 |
| | United Rentals Inc. | 2,155 | 1,866 |
| * | SPX Technologies Inc. | 10,488 | 1,851 |
| * | Mohawk Industries Inc. | 12,961 | 1,799 |
| * | Limbach Holdings Inc. | 17,796 | 1,771 |
| | Westinghouse Air Brake Technologies Corp. | 8,512 | 1,708 |
| * | Modine Manufacturing Co. | 12,526 | 1,701 |
| | Crane Co. | 9,255 | 1,685 |
| | AAON Inc. | 11,914 | 1,624 |
| * | Sezzle Inc. | 3,807 | 1,614 |
| * | AeroVironment Inc. | 8,179 | 1,591 |
| | CSW Industrials Inc. | 3,747 | 1,583 |
| *,1 | Intuitive Machines Inc. | 96,071 | 1,571 |
| | AZZ Inc. | 16,281 | 1,516 |
| * | ExlService Holdings Inc. | 32,209 | 1,493 |
| | Parker-Hannifin Corp. | 2,086 | 1,466 |
| | REV Group Inc. | 46,647 | 1,447 |
| | Griffon Corp. | 16,978 | 1,431 |
| * | Rocket Lab USA Inc. | 52,069 | 1,420 |
| *,1 | PureCycle Technologies Inc. | 106,744 | 1,419 |
| * | Construction Partners Inc. Class A | 13,874 | 1,410 |
| | Howmet Aerospace Inc. | 11,847 | 1,402 |
| | TransUnion | 13,742 | 1,395 |
| | WW Grainger Inc. | 1,106 | 1,333 |
| * | Sterling Infrastructure Inc. | 6,850 | 1,332 |
| | Carlisle Cos. Inc. | 2,852 | 1,303 |
| * | ATI Inc. | 21,530 | 1,295 |
| | Esab Corp. | 9,930 | 1,282 |
| | Tetra Tech Inc. | 30,192 | 1,253 |
| | Moog Inc. Class A | 5,601 | 1,239 |
| | Matson Inc. | 7,947 | 1,217 |
| | BWX Technologies Inc. | 9,100 | 1,191 |
| * | Kirby Corp. | 9,350 | 1,183 |
| * | MasTec Inc. | 8,083 | 1,164 |
| * | PayPal Holdings Inc. | 13,350 | 1,158 |
| | Primoris Services Corp. | 13,575 | 1,136 |
| | Synchrony Financial | 16,767 | 1,132 |
| * | Dycom Industries Inc. | 6,183 | 1,120 |
| | Argan Inc. | 7,126 | 1,111 |
| | CRH plc | 10,646 | 1,089 |
| * | Tutor Perini Corp. | 39,761 | 1,081 |
| | Johnson Controls International plc | 12,815 | 1,075 |
| * | Zebra Technologies Corp. Class A | 2,638 | 1,074 |
| | Applied Industrial Technologies Inc. | 3,803 | 1,045 |
| * | Blue Bird Corp. | 25,448 | 1,035 |
| | Veralto Corp. | 9,564 | 1,035 |
| | Curtiss-Wright Corp. | 2,766 | 1,034 |
| | | Shares | Market
Value•
($000) |
| | Acuity Brands Inc. | 3,215 | 1,031 |
| * | Payoneer Global Inc. | 88,512 | 966 |
| | Granite Construction Inc. | 9,678 | 962 |
| * | Leonardo DRS Inc. | 27,224 | 947 |
| | Badger Meter Inc. | 4,341 | 941 |
| * | Aurora Innovation Inc. | 144,546 | 935 |
| | Lennox International Inc. | 1,399 | 933 |
| | Atmus Filtration Technologies Inc. | 21,423 | 927 |
| | Eagle Materials Inc. | 2,960 | 914 |
| | Caterpillar Inc. | 2,243 | 911 |
| * | BrightView Holdings Inc. | 52,412 | 896 |
| | Exponent Inc. | 8,974 | 886 |
| | CH Robinson Worldwide Inc. | 8,108 | 856 |
| | Eaton Corp. plc | 2,185 | 820 |
| | DHT Holdings Inc. | 85,611 | 806 |
| * | Affirm Holdings Inc. | 11,519 | 806 |
| | FTAI Infrastructure Inc. | 91,918 | 795 |
| * | Aspen Aerogels Inc. | 52,561 | 778 |
| | United States Lime & Minerals Inc. | 4,983 | 762 |
| | Sherwin-Williams Co. | 1,840 | 731 |
| | Quanta Services Inc. | 1,985 | 684 |
| | CRA International Inc. | 3,445 | 672 |
| | Pentair plc | 6,142 | 669 |
| | Cadre Holdings Inc. | 19,266 | 643 |
| | Bel Fuse Inc. Class B | 7,831 | 628 |
| | Watsco Inc. | 1,135 | 626 |
| 1 | CompoSecure Inc. Class A | 38,847 | 620 |
| | Woodward Inc. | 3,430 | 619 |
| * | CECO Environmental Corp. | 19,052 | 611 |
| | VSE Corp. | 4,972 | 583 |
| | Booz Allen Hamilton Holding Corp. | 3,922 | 581 |
| * | Itron Inc. | 4,717 | 559 |
| * | Byrna Technologies Inc. | 27,951 | 540 |
| | Hyster-Yale Inc. | 9,555 | 537 |
| | Patrick Industries Inc. | 3,973 | 534 |
| * | Masterbrand Inc. | 29,670 | 513 |
| | Teekay Tankers Ltd. Class A | 12,186 | 491 |
| | Herc Holdings Inc. | 1,984 | 460 |
| | Tecnoglass Inc. | 5,640 | 457 |
| * | Teekay Corp. Ltd. | 60,774 | 449 |
| * | RXO Inc. | 14,789 | 446 |
| * | GMS Inc. | 4,022 | 404 |
| | Fidelity National Information Services Inc. | 4,692 | 400 |
| | ICF International Inc. | 2,789 | 387 |
| | Pitney Bowes Inc. | 45,475 | 367 |
| | International Seaways Inc. | 9,242 | 360 |
| * | Triumph Group Inc. | 17,576 | 338 |
| | Federal Signal Corp. | 3,456 | 337 |
| * | Kratos Defense & Security Solutions Inc. | 12,383 | 335 |
| * | DXP Enterprises Inc. | 4,408 | 323 |
| * | OSI Systems Inc. | 1,767 | 314 |
| | Genco Shipping & Trading Ltd. | 19,228 | 305 |
| * | Mirion Technologies Inc. | 17,569 | 296 |
| | Willis Lease Finance Corp. | 1,280 | 279 |
| * | Ranpak Holdings Corp. | 35,396 | 276 |
| | Costamare Inc. | 20,137 | 266 |
| | Ball Corp. | 3,883 | 241 |
| *,1 | Spire Global Inc. | 14,719 | 241 |
| | Owens Corning | 1,126 | 232 |
| | Installed Building Products Inc. | 989 | 226 |
| | Enerpac Tool Group Corp. | 4,510 | 218 |
| * | Donnelley Financial Solutions Inc. | 3,505 | 211 |
| * | Willdan Group Inc. | 4,699 | 205 |
| | Trinity Industries Inc. | 5,132 | 194 |
| | Golden Ocean Group Ltd. | 18,884 | 189 |
| | Ardagh Metal Packaging SA | 49,928 | 184 |
| | Hubbell Inc. | 357 | 164 |
| | Mesa Laboratories Inc. | 1,236 | 145 |
| | Scorpio Tankers Inc. | 2,618 | 133 |
| | | Shares | Market
Value•
($000) |
| | Safe Bulkers Inc. | 33,668 | 130 |
| | | | 192,892 |
| Real Estate (1.0%) |
| * | Jones Lang LaSalle Inc. | 7,210 | 2,023 |
| * | Compass Inc. Class A | 240,290 | 1,704 |
| * | CBRE Group Inc. Class A | 10,091 | 1,413 |
| * | GEO Group Inc. | 43,099 | 1,229 |
| * | Redfin Corp. | 99,399 | 943 |
| | Newmark Group Inc. Class A | 56,849 | 880 |
| | HA Sustainable Infrastructure Capital Inc. | 21,876 | 686 |
| * | Real Brokerage Inc. | 78,205 | 411 |
| | | | 9,289 |
| Technology (11.9%) |
| * | Palantir Technologies Inc. Class A | 134,830 | 9,044 |
| | NVIDIA Corp. | 55,882 | 7,726 |
| * | AppLovin Corp. Class A | 21,634 | 7,285 |
| | Meta Platforms Inc. Class A | 10,225 | 5,872 |
| | Oracle Corp. | 27,870 | 5,151 |
| | Broadcom Inc. | 26,238 | 4,253 |
| | Vertiv Holdings Co. Class A | 31,952 | 4,077 |
| | International Business Machines Corp. | 15,323 | 3,485 |
| * | MicroStrategy Inc. Class A | 8,877 | 3,440 |
| * | GoDaddy Inc. Class A | 16,008 | 3,163 |
| * | CommVault Systems Inc. | 17,447 | 2,994 |
| * | ServiceNow Inc. | 2,523 | 2,648 |
| | NetApp Inc. | 21,175 | 2,597 |
| | Amphenol Corp. Class A | 31,101 | 2,259 |
| * | CACI International Inc. Class A | 4,102 | 1,886 |
| * | Guidewire Software Inc. | 9,251 | 1,877 |
| | Leidos Holdings Inc. | 11,260 | 1,862 |
| * | Terawulf Inc. | 230,379 | 1,818 |
| * | Coherent Corp. | 18,011 | 1,804 |
| * | NextNav Inc. | 101,951 | 1,773 |
| * | Tyler Technologies Inc. | 2,691 | 1,693 |
| * | Credo Technology Group Holding Ltd. | 34,377 | 1,683 |
| | Corning Inc. | 33,859 | 1,648 |
| * | Toast Inc. Class A | 36,333 | 1,582 |
| * | Fortinet Inc. | 12,675 | 1,205 |
| * | AvePoint Inc. | 66,342 | 1,171 |
| * | Zeta Global Holdings Corp. Class A | 54,909 | 1,170 |
| * | Innodata Inc. | 26,089 | 1,072 |
| | Monolithic Power Systems Inc. | 1,860 | 1,056 |
| * | Impinj Inc. | 5,224 | 1,004 |
| * | Parsons Corp. | 10,206 | 979 |
| * | Cipher Mining Inc. | 144,221 | 966 |
| * | Vertex Inc. Class A | 17,592 | 954 |
| * | Applied Digital Corp. | 94,266 | 952 |
| * | Semtech Corp. | 14,756 | 945 |
| * | Hut 8 Corp. | 30,705 | 860 |
| | Clear Secure Inc. Class A | 31,941 | 827 |
| * | Grindr Inc. | 52,514 | 792 |
| * | Nutanix Inc. Class A | 11,644 | 760 |
| * | EverQuote Inc. Class A | 37,636 | 722 |
| * | Blend Labs Inc. Class A | 139,518 | 713 |
| * | Alkami Technology Inc. | 17,912 | 707 |
| * | Q2 Holdings Inc. | 6,229 | 652 |
| *,1 | Trump Media & Technology Group Corp. | 20,532 | 649 |
| * | IonQ Inc. | 14,955 | 546 |
| * | Magnite Inc. | 31,926 | 536 |
| * | Alpha & Omega Semiconductor Ltd. | 12,093 | 502 |
| | Pegasystems Inc. | 4,940 | 469 |
| * | Sitime Corp. | 2,185 | 464 |
| * | Intapp Inc. | 7,392 | 462 |
| * | Mediaalpha Inc. Class A | 36,298 | 458 |
| * | Cleanspark Inc. | 31,791 | 456 |
| * | DoorDash Inc. Class A | 2,513 | 454 |
| * | Bit Digital Inc. | 90,826 | 419 |
| * | Agilysys Inc. | 3,021 | 406 |
| * | DocuSign Inc. | 5,001 | 399 |
| | | Shares | Market
Value•
($000) |
| * | Daktronics Inc. | 25,188 | 388 |
| * | Maplebear Inc. | 8,505 | 371 |
| * | Gartner Inc. | 652 | 338 |
| * | Varonis Systems Inc. | 6,561 | 328 |
| * | Bandwidth Inc. Class A | 14,965 | 315 |
| * | Cirrus Logic Inc. | 2,911 | 304 |
| *,1 | SoundHound AI Inc. Class A | 32,528 | 303 |
| * | AudioEye Inc. | 10,391 | 280 |
| * | PAR Technology Corp. | 3,181 | 258 |
| | Dell Technologies Inc. Class C | 1,771 | 226 |
| * | Ouster Inc. | 20,336 | 201 |
| * | Diebold Nixdorf Inc. | 3,925 | 181 |
| * | ScanSource Inc. | 3,274 | 165 |
| | Immersion Corp. | 16,349 | 146 |
| | Sapiens International Corp. NV | 3,816 | 104 |
| | | | 109,255 |
| Telecommunications (3.7%) |
| | AT&T Inc. | 310,254 | 7,185 |
| * | Arista Networks Inc. | 15,480 | 6,282 |
| | T-Mobile US Inc. | 23,146 | 5,716 |
| | Motorola Solutions Inc. | 11,414 | 5,704 |
| * | Lumen Technologies Inc. | 178,757 | 1,312 |
| * | AST SpaceMobile Inc. | 49,752 | 1,185 |
| | Telephone & Data Systems Inc. | 31,746 | 1,085 |
| * | EchoStar Corp. Class A | 38,270 | 968 |
| * | CommScope Holding Co. Inc. | 191,025 | 911 |
| | Ubiquiti Inc. | 2,538 | 879 |
| | InterDigital Inc. | 3,354 | 657 |
| * | Powerfleet Inc. NJ | 80,928 | 570 |
| | Cogent Communications Holdings Inc. | 6,921 | 569 |
| * | Ciena Corp. | 6,990 | 487 |
| | IDT Corp. Class B | 6,457 | 333 |
| * | NETGEAR Inc. | 7,260 | 179 |
| | Verizon Communications Inc. | 3,434 | 152 |
| | | | 34,174 |
| Utilities (0.5%) |
| *,1 | NuScale Power Corp. | 72,323 | 2,144 |
| * | Clean Harbors Inc. | 4,453 | 1,158 |
| * | Sunrun Inc. | 53,899 | 622 |
| | Aris Water Solutions Inc. Class A | 22,813 | 614 |
| * | Enviri Corp. | 39,086 | 289 |
| | | | 4,827 |
| Total Common Stocks (Cost $716,748) | 916,876 |
| Temporary Cash Investments (0.8%) |
| Money Market Fund (0.8%) |
| 2,3 | Vanguard Market Liquidity Fund, 4.651% (Cost $7,084) | 70,846 | 7,084 |
| Total Investments (100.5%) (Cost $723,832) | 923,960 |
| Other Assets and Liabilities—Net (-0.5%) | (4,712) |
| Net Assets (100%) | 919,248 |
| Cost is in $000. |
| • | See Note A in Notes to Financial Statements. |
| * | Non-income-producing security. |
| 1 | Includes partial security positions on loan to broker-dealers. The total value of securities on loan is $6,507,000. |
| 2 | Affiliated money market fund available only to Vanguard funds and certain trusts and accounts managed by Vanguard. Rate shown is the 7-day yield. |
| 3 | Collateral of $6,807,000 was received for securities on loan. |
Derivative Financial Instruments Outstanding as of Period End
| Futures Contracts |
| | | | ($000) |
| | Expiration | Number of
Long (Short)
Contracts | Notional
Amount | Value and
Unrealized
Appreciation
(Depreciation) |
| Long Futures Contracts | | | | |
| E-mini S&P 500 Index | December 2024 | 5 | 1,513 | 73 |
See accompanying Notes, which are an integral part of the Financial Statements.
Statement of Assets and Liabilities
|
| ($000s, except shares, footnotes, and per-share amounts) | Amount |
| Assets | |
| Investments in Securities, at Value1 | |
| Unaffiliated Issuers (Cost $716,748) | 916,876 |
| Affiliated Issuers (Cost $7,084) | 7,084 |
| Total Investments in Securities | 923,960 |
| Investment in Vanguard | 19 |
| Cash | 1,747 |
| Cash Collateral Pledged—Futures Contracts | 76 |
| Receivables for Accrued Income | 574 |
| Variation Margin Receivable—Futures Contracts | 9 |
| Total Assets | 926,385 |
| Liabilities | |
| Payables for Investment Securities Purchased | 284 |
| Collateral for Securities on Loan | 6,807 |
| Payables to Vanguard | 46 |
| Total Liabilities | 7,137 |
| Net Assets | 919,248 |
| 1 Includes $6,507,000 of securities on loan. | |
| At November 30, 2024, net assets consisted of: | |
| | |
| Paid-in Capital | 763,922 |
| Total Distributable Earnings (Loss) | 155,326 |
| Net Assets | 919,248 |
| |
| Net Assets | |
Applicable to 5,160,000 outstanding $.001 par value shares of
beneficial interest (unlimited authorization) | 919,248 |
| Net Asset Value Per Share | $178.15 |
See accompanying Notes, which are an integral part of the Financial Statements.
|
| | Year Ended
November 30, 2024 |
| | ($000) |
| Investment Income | |
| Income | |
| Dividends1 | 5,004 |
| Interest2 | 97 |
| Securities Lending—Net | 385 |
| Total Income | 5,486 |
| Expenses | |
| The Vanguard Group—Note B | |
| Investment Advisory Services | 151 |
| Management and Administrative | 443 |
| Marketing and Distribution | 27 |
| Custodian Fees | 1 |
| Auditing Fees | 31 |
| Shareholders’ Reports and Proxy Fees | 51 |
| Trustees’ Fees and Expenses | — |
| Other Expenses | 16 |
| Total Expenses | 720 |
| Net Investment Income | 4,766 |
| Realized Net Gain (Loss) | |
| Investment Securities Sold2,3 | 43,401 |
| Futures Contracts | 188 |
| Realized Net Gain (Loss) | 43,589 |
| Change in Unrealized Appreciation (Depreciation) | |
| Investment Securities2 | 159,652 |
| Futures Contracts | 57 |
| Change in Unrealized Appreciation (Depreciation) | 159,709 |
| Net Increase (Decrease) in Net Assets Resulting from Operations | 208,064 |
| 1 | Dividends are net of foreign withholding taxes of $19,000. |
| 2 | Interest income, realized net gain (loss), capital gain distributions received, and change in unrealized appreciation (depreciation) from an affiliated company of the fund were $79,000, $2,000, less than $1,000, and less than $1,000, respectively. Purchases and sales are for temporary cash investment purposes. |
| 3 | Includes $34,098,000 of net gain (loss) resulting from in-kind redemptions. |
See accompanying Notes, which are an integral part of the Financial Statements.
Statement of Changes in Net Assets
|
| | Year Ended November 30, |
| | 2024
($000) | 2023
($000) |
| Increase (Decrease) in Net Assets | | |
| Operations | | |
| Net Investment Income | 4,766 | 3,270 |
| Realized Net Gain (Loss) | 43,589 | (5,064) |
| Change in Unrealized Appreciation (Depreciation) | 159,709 | 3,311 |
| Net Increase (Decrease) in Net Assets Resulting from Operations | 208,064 | 1,517 |
| Distributions | | |
| Total Distributions | (3,896) | (3,438) |
| Capital Share Transactions | | |
| Issued | 527,176 | 189,620 |
| Issued in Lieu of Cash Distributions | — | — |
| Redeemed | (145,933) | (137,717) |
| Net Increase (Decrease) from Capital Share Transactions | 381,243 | 51,903 |
| Total Increase (Decrease) | 585,411 | 49,982 |
| Net Assets | | |
| Beginning of Period | 333,837 | 283,855 |
| End of Period | 919,248 | 333,837 |
See accompanying Notes, which are an integral part of the Financial Statements.
For a Share Outstanding
Throughout Each Period | Year Ended November 30, |
| 2024 | 2023 | 2022 | 2021 | 2020 |
| Net Asset Value, Beginning of Period | $120.30 | $121.83 | $132.12 | $106.33 | $85.18 |
| Investment Operations | | | | | |
| Net Investment Income1 | 1.301 | 1.232 | 2.072 | 1.227 | .552 |
| Net Realized and Unrealized Gain (Loss) on Investments | 57.668 | (1.405) | (10.460) | 25.325 | 21.279 |
| Total from Investment Operations | 58.969 | (.173) | (8.388) | 26.552 | 21.831 |
| Distributions | | | | | |
| Dividends from Net Investment Income | (1.119) | (1.357) | (1.902) | (.762) | (.681) |
| Distributions from Realized Capital Gains | — | — | — | — | — |
| Total Distributions | (1.119) | (1.357) | (1.902) | (.762) | (.681) |
| Net Asset Value, End of Period | $178.15 | $120.30 | $121.83 | $132.12 | $106.33 |
| Total Return | 49.23% | -0.06% | -6.27% | 25.01% | 25.91% |
| Ratios/Supplemental Data | | | | | |
| Net Assets, End of Period (Millions) | $919 | $334 | $284 | $191 | $58 |
| Ratio of Total Expenses to Average Net Assets | 0.13% | 0.13%2 | 0.13% | 0.13% | 0.13% |
| Ratio of Net Investment Income to Average Net Assets | 0.86% | 1.07% | 1.76% | 0.95% | 0.62% |
| Portfolio Turnover Rate3 | 77% | 73% | 88% | 103% | 115% |
| 1 | Calculated based on average shares outstanding. |
| 2 | The ratio of expenses to average net assets for the period net of reduction from custody fee offset arrangements was 0.13%. |
| 3 | Excludes the value of portfolio securities received or delivered as a result of in-kind purchases or redemptions of the fund’s capital shares, including ETF Creation Units. |
See accompanying Notes, which are an integral part of the Financial Statements.
Notes to Financial Statements
Vanguard U.S. Momentum Factor ETF is registered under the Investment Company Act of 1940 as an open-end investment company, or mutual fund. ETF Shares are listed for trading on Cboe BZX Exchange, Inc.; they can be purchased and sold through a broker.
| A. | The following significant accounting policies conform to generally accepted accounting principles for U.S. investment companies. The fund consistently follows such policies in preparing its financial statements. |
1. Security Valuation: Securities are valued as of the close of trading on the New York Stock Exchange (generally 4 p.m., Eastern time) on the valuation date. Equity securities are valued at the latest quoted sales prices or official closing prices taken from the primary market in which each security trades; such securities not traded on the valuation date are valued at the mean of the latest quoted bid and asked prices. Securities for which market quotations are not readily available, or whose values have been affected by events occurring before the fund’s pricing time but after the close of the securities’ primary markets, are valued by methods deemed by the valuation designee to represent fair value and subject to oversight by the board of trustees. Investments in Vanguard Market Liquidity Fund are valued at that fund's net asset value.
2. Futures Contracts: The fund uses index futures contracts to a limited extent, with the objective of maintaining full exposure to the stock market while maintaining liquidity. The fund may purchase or sell futures contracts to achieve a desired level of investment, whether to accommodate portfolio turnover or cash flows from capital share transactions. The primary risks associated with the use of futures contracts are imperfect correlation between changes in market values of stocks held by the fund and the prices of futures contracts, and the possibility of an illiquid market. Counterparty risk involving futures is mitigated because a regulated clearinghouse is the counterparty instead of the clearing broker. To further mitigate counterparty risk, the fund trades futures contracts on an exchange, monitors the financial strength of its clearing brokers and clearinghouse, and has entered into clearing agreements with its clearing brokers. The clearinghouse imposes initial margin requirements to secure the fund’s performance and requires daily settlement of variation margin representing changes in the market value of each contract. Any securities pledged as initial margin for open contracts are noted in the Schedule of Investments.
Futures contracts are valued at their quoted daily settlement prices. The notional amounts of the contracts are not recorded in the Statement of Assets and Liabilities. Fluctuations in the value of the contracts are recorded in the Statement of Assets and Liabilities as an asset (liability) and in the Statement of Operations as unrealized appreciation (depreciation) until the contracts are closed, when they are recorded as realized gains (losses) on futures contracts.
During the year ended November 30, 2024, the fund’s average investments in long and short futures contracts represented less than 1% and 0% of net assets, respectively, based on the average of the notional amounts at each quarter-end during the period.
3. Federal Income Taxes: The fund intends to continue to qualify as a regulated investment company and distribute virtually all of its taxable income. The fund’s tax returns are open to examination by the relevant tax authorities until expiration of the applicable statute of limitations, which is generally three years after the filing of the tax return. Management has analyzed the fund’s tax positions taken for all open federal and state income tax years, and has concluded that no provision for income tax is required in the fund’s financial statements.
4. Distributions: Distributions to shareholders are recorded on the ex-dividend date. Distributions are determined on a tax basis at the fiscal year-end and may differ from net investment income and realized capital gains for financial reporting purposes.
5. Securities Lending: To earn additional income, the fund lends its securities to qualified institutional borrowers. Security loans are subject to termination by the fund at any time, and are required to be secured at all times by collateral in an amount at least equal to the market value of securities loaned. Daily market fluctuations could cause the value of loaned securities to be more or less than the value of the collateral received. When this occurs, the collateral is adjusted and settled before the opening of the market on the next business day. The fund further mitigates its counterparty risk by entering into securities lending transactions only with a diverse group of prequalified counterparties, monitoring their financial strength, and entering into master securities lending agreements with its counterparties. The master securities lending agreements provide that, in the event of a counterparty’s default (including bankruptcy), the fund may terminate any loans with that borrower, determine the net amount owed, and sell or retain the collateral up to the net amount owed to the fund; however, such actions may be subject to legal proceedings. While collateral mitigates counterparty risk, in the event of a default, the fund may experience delays and costs in recovering the securities loaned. The fund invests cash collateral received in Vanguard Market Liquidity Fund, and records a liability in the Statement of Assets and Liabilities for the return of the collateral, during the period the securities are on loan. Collateral investments in Vanguard Market Liquidity Fund are subject to market appreciation or depreciation. Securities lending income represents fees charged to borrowers plus income earned on invested cash collateral, less expenses associated with the loan. During the term of the loan, the fund is entitled to all distributions made on or in respect of the loaned securities.
6. Credit Facilities and Interfund Lending Program: The fund and certain other funds managed by The Vanguard Group ("Vanguard") participate in a $4.3 billion committed credit facility provided by a syndicate of lenders pursuant to a credit agreement and an uncommitted credit facility provided by Vanguard. Both facilities may be renewed annually. Each fund is individually liable for its borrowings, if any, under the credit facilities. Borrowings may be utilized for temporary or emergency purposes and are subject to the fund’s regulatory and contractual borrowing restrictions. With respect to the committed credit facility, the participating funds are charged administrative fees and an annual commitment fee of 0.10% of the undrawn committed amount of the facility, which are allocated to the funds based on a method approved by the fund’s board of trustees and included in Management and Administrative expenses on the fund’s Statement of Operations. Any borrowings under either facility bear interest at an agreed-upon spread plus the higher of the federal funds effective rate, the overnight bank funding rate, or the Daily Simple Secured Overnight Financing Rate inclusive of an additional agreed-upon spread. However, borrowings under the uncommitted credit facility may bear interest based upon an alternate rate agreed to by the fund and Vanguard.
In accordance with an exemptive order (the “Order”) from the SEC, the fund may participate in a joint lending and borrowing program that allows registered open-end Vanguard funds to borrow money from and lend money to each other for temporary or emergency purposes (the “Interfund Lending Program”), subject to compliance with the terms and conditions of the Order, and to the extent permitted by the fund’s investment objective and investment policies. Interfund loans and borrowings normally extend overnight but can have a maximum duration of seven days. Loans may be
called on one business day’s notice. The interest rate to be charged is governed by the conditions of the Order and internal procedures adopted by the board of trustees. The board of trustees is responsible for overseeing the Interfund Lending Program.
For the year ended November 30, 2024, the fund did not utilize the credit facilities or the Interfund Lending Program.
7. Other: Dividend income is recorded on the ex-dividend date. Non-cash dividends included in income, if any, are recorded at the fair value of the securities received. Interest income includes income distributions received from Vanguard Market Liquidity Fund and is accrued daily. Security transactions are accounted for on the date securities are bought or sold. Costs used to determine realized gains (losses) on the sale of investment securities are those of the specific securities sold.
| B. | In accordance with the terms of a Funds' Service Agreement (the “FSA”) between Vanguard and the fund, Vanguard furnishes to the fund investment advisory, corporate management, administrative, marketing, and distribution services at Vanguard’s cost of operations (as defined by the FSA). These costs of operations are allocated to the fund based on methods and guidelines approved by the board of trustees and are generally settled twice a month. |
Upon the request of Vanguard, the fund may invest up to 0.40% of its net assets as capital in Vanguard. At November 30, 2024, the fund had contributed to Vanguard capital in the amount of $19,000, representing less than 0.01% of the fund’s net assets and 0.01% of Vanguard’s capital received pursuant to the FSA. The fund’s trustees and officers are also directors and employees, respectively, of Vanguard.
| C. | Various inputs may be used to determine the value of the fund’s investments and derivatives. These inputs are summarized in three broad levels for financial statement purposes. The inputs or methodologies used to value securities are not necessarily an indication of the risk associated with investing in those securities. |
Level 1—Quoted prices in active markets for identical securities.
Level 2—Other significant observable inputs (including quoted prices for similar securities, interest rates, prepayment speeds, credit risk, etc.).
Level 3—Significant unobservable inputs (including the fund’s own assumptions used to determine the fair value of investments). Any investments and derivatives valued with significant unobservable inputs are noted on the Schedule of Investments.
At November 30, 2024, 100% of the market value of the fund’s investments and derivatives was determined based on Level 1 inputs.
| D. | Permanent differences between book-basis and tax-basis components of net assets are reclassified among capital accounts in the financial statements to reflect their tax character. These reclassifications have no effect on net assets or net asset value per share. As of period end, permanent differences primarily attributable to the accounting for in-kind redemptions, passive foreign investment companies, and distributions in connection with fund share redemptions were reclassified between the following accounts: |
| | Amount
($000) |
| Paid-in Capital | 37,287 |
| Total Distributable Earnings (Loss) | (37,287) |
Temporary differences between book-basis and tax-basis components of total distributable earnings (loss) arise when certain items of income, gain, or loss are recognized in different periods for financial statement and tax purposes; these differences will reverse at some time in the future. The differences are primarily related to capital loss carryforwards; the deferral of losses from wash sales; the recognition of unrealized gains or losses from certain derivative contracts; and the recognition of unrealized gains from passive foreign investment companies. As of period end, the tax-basis components of total distributable earnings (loss) are detailed in the table as follows:
| | Amount
($000) |
| Undistributed Ordinary Income | 1,667 |
| Undistributed Long-Term Gains | — |
| Net Unrealized Gains (Losses) | 197,608 |
| Capital Loss Carryforwards | (43,949) |
| Qualified Late-Year Losses | — |
| Other Temporary Differences | — |
| Total | 155,326 |
The tax character of distributions paid was as follows:
| | Year Ended November 30, |
| | 2024
Amount
($000) | 2023
Amount
($000) |
| Ordinary Income* | 3,896 | 3,438 |
| Long-Term Capital Gains | — | — |
| Total | 3,896 | 3,438 |
| * | Includes short-term capital gains, if any. |
As of November 30, 2024, gross unrealized appreciation and depreciation for investments and derivatives based on cost for U.S. federal income tax purposes were as follows:
| | Amount
($000) |
| Tax Cost | 726,352 |
| Gross Unrealized Appreciation | 215,810 |
| Gross Unrealized Depreciation | (18,202) |
| Net Unrealized Appreciation (Depreciation) | 197,608 |
| E. | During the year ended November 30, 2024, the fund purchased $830,939,000 of investment securities and sold $428,817,000 of investment securities, other than temporary cash investments. In addition, the fund purchased and sold investment securities of $126,190,000 and $146,798,000, respectively, in connection with in-kind purchases and redemptions of the fund's capital shares. |
The fund purchased securities from and sold securities to other Vanguard funds or accounts managed by Vanguard or its affiliates, in accordance with procedures adopted by the board of trustees in compliance with Rule 17a-7 of the Investment Company Act of 1940. For the year ended November 30, 2024, such purchases were $11,114,000 and sales were $16,949,000, resulting in net realized loss of $1,176,000; these amounts, other than temporary cash investments, are included in the purchases and sales of investment securities noted above.
| F. | Capital shares issued and redeemed were: |
| | Year Ended November 30, |
| | 2024
Shares
(000) | 2023
Shares
(000) |
| Issued | 3,345 | 1,615 |
| Issued in Lieu of Cash Distributions | — | — |
| Redeemed | (960) | (1,170) |
| Net Increase (Decrease) in Shares Outstanding | 2,385 | 445 |
| G. | Significant market disruptions, such as those caused by pandemics, natural or environmental disasters, war, acts of terrorism, or other events, can adversely affect local and global markets and normal market operations. Any such disruptions could have an adverse impact on the value of the fund’s investments and fund performance. |
To the extent the fund’s investment portfolio reflects concentration in a particular market, industry, sector, country or asset class, the fund may be adversely affected by the performance of these concentrations and may be subject to increased price volatility and other risks.
The use of derivatives may expose the fund to various risks. Derivatives can be highly volatile, and any initial investment is generally small relative to the notional amount so that transactions may be leveraged in terms of market exposure. A relatively small market movement may have a potentially larger impact on derivatives than on standard securities. Leveraged derivatives positions can, therefore, increase volatility. Additional information regarding the fund’s use of derivative(s) and the specific risks associated is described under significant accounting policies.
At November 30, 2024, one shareholder was a record or beneficial owner of 45% of the fund’s net assets. If this shareholder were to redeem its investment in the fund, the redemption might result in an increase in the fund’s expense ratio, cause the fund to incur higher transaction costs, or lead to the realization of taxable capital gains.
| H. | Management has determined that no events or transactions occurred subsequent to November 30, 2024, that would require recognition or disclosure in these financial statements. |
Schedule of Investments
As of November 30, 2024
The fund files its complete schedule of portfolio holdings with the Securities and Exchange Commission (SEC) for the first and third quarters of each fiscal year as an exhibit to its reports on Form N-PORT. The fund’s Form N-PORT reports are available on the SEC’s website at www.sec.gov.
| | | Shares | Market
Value•
($000) |
| Common Stocks (99.7%) |
| Basic Materials (2.9%) |
| | Mueller Industries Inc. | 28,143 | 2,273 |
| | Newmont Corp. (XNYS) | 35,668 | 1,496 |
| | Freeport-McMoRan Inc. | 33,130 | 1,464 |
| | UFP Industries Inc. | 8,300 | 1,128 |
| | Steel Dynamics Inc. | 4,164 | 605 |
| | Hawkins Inc. | 4,458 | 600 |
| | Sylvamo Corp. | 5,330 | 492 |
| | Commercial Metals Co. | 7,748 | 478 |
| | Carpenter Technology Corp. | 2,341 | 454 |
| | Reliance Inc. | 1,175 | 378 |
| | Cabot Corp. | 1,405 | 154 |
| * | Magnera Corp. | 1,231 | 25 |
| | | | 9,547 |
| Consumer Discretionary (17.1%) |
| | Walmart Inc. | 28,807 | 2,665 |
| | PulteGroup Inc. | 14,736 | 1,993 |
| | Booking Holdings Inc. | 363 | 1,888 |
| | DR Horton Inc. | 9,970 | 1,683 |
| | Costco Wholesale Corp. | 1,724 | 1,676 |
| | Target Corp. | 12,398 | 1,640 |
| | General Motors Co. | 28,691 | 1,595 |
| * | Brinker International Inc. | 9,958 | 1,317 |
| | TJX Cos. Inc. | 10,443 | 1,313 |
| | H&R Block Inc. | 21,043 | 1,247 |
| | Perdoceo Education Corp. | 45,308 | 1,244 |
| | PVH Corp. | 11,380 | 1,233 |
| | News Corp. Class B | 37,822 | 1,214 |
| | Steelcase Inc. Class A | 69,601 | 938 |
| | Williams-Sonoma Inc. | 5,318 | 915 |
| * | G-III Apparel Group Ltd. | 29,290 | 868 |
| | Signet Jewelers Ltd. | 8,623 | 864 |
| | Phinia Inc. | 15,317 | 859 |
| | Toll Brothers Inc. | 4,821 | 796 |
| * | Spotify Technology SA | 1,607 | 766 |
| * | Skechers USA Inc. Class A | 11,528 | 736 |
| | Interface Inc. | 27,616 | 733 |
| * | M/I Homes Inc. | 4,249 | 701 |
| * | Cavco Industries Inc. | 1,355 | 697 |
| | MillerKnoll Inc. | 27,634 | 695 |
| * | Adtalem Global Education Inc. | 7,392 | 676 |
| * | SkyWest Inc. | 5,773 | 662 |
| | Macy's Inc. | 40,685 | 661 |
| | Ralph Lauren Corp. | 2,856 | 661 |
| | Academy Sports & Outdoors Inc. | 12,403 | 611 |
| * | Despegar.com Corp. | 33,765 | 604 |
| | Fox Corp. Class A | 12,556 | 592 |
| * | Deckers Outdoor Corp. | 2,934 | 575 |
| * | Taylor Morrison Home Corp. | 7,654 | 565 |
| | Tapestry Inc. | 8,948 | 557 |
| | Caleres Inc. | 17,736 | 551 |
| | Lennar Corp. Class B | 3,324 | 548 |
| | Travel & Leisure Co. | 9,816 | 548 |
| * | United Airlines Holdings Inc. | 5,536 | 536 |
| * | Dorman Products Inc. | 3,800 | 532 |
| | Kontoor Brands Inc. | 5,384 | 494 |
| | Hasbro Inc. | 7,529 | 491 |
| * | NVR Inc. | 53 | 490 |
| * | Expedia Group Inc. | 2,625 | 485 |
| | Murphy USA Inc. | 863 | 473 |
| | | Shares | Market
Value•
($000) |
| | Royal Caribbean Cruises Ltd. | 1,930 | 471 |
| | Build-A-Bear Workshop Inc. | 12,324 | 468 |
| | KB Home | 5,602 | 464 |
| * | Urban Outfitters Inc. | 9,518 | 464 |
| * | Hanesbrands Inc. | 52,746 | 459 |
| | Dick's Sporting Goods Inc. | 2,172 | 450 |
| * | Crocs Inc. | 4,179 | 441 |
| * | Alaska Air Group Inc. | 8,184 | 431 |
| | American Eagle Outfitters Inc. | 22,324 | 430 |
| | VF Corp. | 21,075 | 426 |
| | John Wiley & Sons Inc. Class A | 8,033 | 419 |
| * | AutoNation Inc. | 2,308 | 413 |
| * | Abercrombie & Fitch Co. Class A | 2,654 | 397 |
| | Ethan Allen Interiors Inc. | 12,906 | 397 |
| * | Tri Pointe Homes Inc. | 8,713 | 379 |
| * | Under Armour Inc. Class C | 42,998 | 377 |
| * | Stride Inc. | 3,494 | 373 |
| * | frontdoor Inc. | 6,347 | 372 |
| | Shoe Carnival Inc. | 10,776 | 364 |
| | Best Buy Co. Inc. | 3,815 | 343 |
| * | Sally Beauty Holdings Inc. | 23,933 | 333 |
| * | Zumiez Inc. | 14,261 | 315 |
| | Upbound Group Inc. | 7,748 | 266 |
| * | Universal Technical Institute Inc. | 10,135 | 262 |
| | Gap Inc. | 10,332 | 251 |
| | Oxford Industries Inc. | 3,000 | 250 |
| * | Green Brick Partners Inc. | 3,432 | 245 |
| | La-Z-Boy Inc. | 5,153 | 233 |
| | PriceSmart Inc. | 2,451 | 220 |
| | Nordstrom Inc. | 9,602 | 218 |
| | Fox Corp. Class B | 4,645 | 208 |
| * | Amazon.com Inc. | 998 | 207 |
| | Meritage Homes Corp. | 1,079 | 206 |
| * | Burlington Stores Inc. | 718 | 202 |
| | Lennar Corp. Class A | 1,146 | 200 |
| | eBay Inc. | 3,059 | 194 |
| | HNI Corp. | 3,430 | 194 |
| | J Jill Inc. | 6,998 | 193 |
| * | Grand Canyon Education Inc. | 1,165 | 192 |
| | Garmin Ltd. | 889 | 189 |
| | Newell Brands Inc. | 19,614 | 188 |
| * | Liquidity Services Inc. | 7,007 | 179 |
| | TEGNA Inc. | 9,471 | 178 |
| * | BJ's Wholesale Club Holdings Inc. | 1,825 | 176 |
| | BorgWarner Inc. (XNYS) | 4,975 | 171 |
| | Buckle Inc. | 3,267 | 170 |
| | Playtika Holding Corp. | 19,987 | 168 |
| * | SharkNinja Inc. | 1,373 | 138 |
| | Nexstar Media Group Inc. | 752 | 128 |
| | Acushnet Holdings Corp. | 1,715 | 125 |
| | Monarch Casino & Resort Inc. | 1,484 | 125 |
| * | Stagwell Inc. | 15,913 | 125 |
| | Dillard's Inc. Class A | 265 | 117 |
| | Steven Madden Ltd. | 2,551 | 116 |
| | Winnebago Industries Inc. | 1,858 | 109 |
| | Boyd Gaming Corp. | 1,228 | 91 |
| | Strategic Education Inc. | 870 | 86 |
| | Group 1 Automotive Inc. | 198 | 84 |
| * | United Parks & Resorts Inc. | 1,296 | 76 |
| | | | 57,054 |
| Consumer Staples (7.0%) |
| | Philip Morris International Inc. | 23,717 | 3,156 |
| | Altria Group Inc. | 50,172 | 2,897 |
| | Kroger Co. | 37,565 | 2,294 |
| | McKesson Corp. | 3,331 | 2,094 |
| | Kimberly-Clark Corp. | 13,296 | 1,853 |
| | Ingredion Inc. | 7,634 | 1,125 |
| | Cal-Maine Foods Inc. | 11,132 | 1,087 |
| | Procter & Gamble Co. | 4,746 | 851 |
| | | Shares | Market
Value•
($000) |
| | Coca-Cola Consolidated Inc. | 527 | 687 |
| * | Sprouts Farmers Market Inc. | 4,360 | 673 |
| * | Pilgrim's Pride Corp. | 12,967 | 669 |
| | Cencora Inc. | 2,280 | 574 |
| | Flowers Foods Inc. | 23,088 | 522 |
| | Ingles Markets Inc. Class A | 7,063 | 522 |
| | Kenvue Inc. | 21,263 | 512 |
| | Weis Markets Inc. | 6,716 | 489 |
| * | Performance Food Group Co. | 5,517 | 487 |
| | Fresh Del Monte Produce Inc. | 13,962 | 471 |
| | Primo Brands Corp. Class A | 16,481 | 470 |
| | Dole plc | 29,278 | 441 |
| | Tyson Foods Inc. Class A | 6,356 | 410 |
| | SpartanNash Co. | 13,948 | 265 |
| | ACCO Brands Corp. | 43,656 | 254 |
| | Turning Point Brands Inc. | 3,562 | 220 |
| | Casey's General Stores Inc. | 414 | 174 |
| | | | 23,197 |
| Energy (5.1%) |
| | EOG Resources Inc. | 19,357 | 2,580 |
| | Valero Energy Corp. | 11,178 | 1,555 |
| | Select Water Solutions Inc. | 62,244 | 919 |
| | SunCoke Energy Inc. | 55,921 | 697 |
| | Texas Pacific Land Corp. | 387 | 619 |
| | Magnolia Oil & Gas Corp. Class A | 20,204 | 560 |
| * | MRC Global Inc. | 39,739 | 555 |
| | Diamondback Energy Inc. | 3,113 | 553 |
| * | Newpark Resources Inc. | 59,419 | 497 |
| | Kinetik Holdings Inc. | 7,626 | 450 |
| | Warrior Met Coal Inc. | 6,087 | 428 |
| | Vitesse Energy Inc. | 14,769 | 415 |
| | CONSOL Energy Inc. | 3,121 | 408 |
| | RPC Inc. | 63,246 | 407 |
| * | DNOW Inc. | 26,467 | 398 |
| | World Kinect Corp. | 13,068 | 378 |
| | Coterra Energy Inc. | 13,319 | 356 |
| | Alpha Metallurgical Resources Inc. | 1,404 | 345 |
| | Liberty Energy Inc. | 18,487 | 340 |
| | Cactus Inc. Class A | 4,921 | 338 |
| | TechnipFMC plc | 10,235 | 321 |
| * | ProPetro Holding Corp. | 37,555 | 315 |
| | ConocoPhillips | 2,875 | 312 |
| * | REX American Resources Corp. | 7,143 | 309 |
| | SM Energy Co. | 6,538 | 295 |
| | Devon Energy Corp. | 7,473 | 284 |
| | Chevron Corp. | 1,615 | 262 |
| | California Resources Corp. | 4,185 | 248 |
| * | CNX Resources Corp. | 5,912 | 240 |
| | Murphy Oil Corp. | 7,062 | 229 |
| | Permian resources Corp. | 14,635 | 229 |
| | Chord Energy Corp. | 1,555 | 198 |
| | Northern Oil & Gas Inc. | 4,055 | 176 |
| | Granite Ridge Resources Inc. | 23,599 | 152 |
| * | Gulfport Energy Corp. | 799 | 141 |
| | Peabody Energy Corp. | 5,819 | 139 |
| | Matador Resources Co. | 1,189 | 71 |
| | Berry Corp. | 17,245 | 70 |
| | Marathon Petroleum Corp. | 358 | 56 |
| | Weatherford International plc | 629 | 52 |
| | | | 16,897 |
| Financials (26.9%) |
| | Wells Fargo & Co. | 65,654 | 5,001 |
| | Bank of New York Mellon Corp. | 40,248 | 3,295 |
| | Aflac Inc. | 28,652 | 3,266 |
| | JPMorgan Chase & Co. | 10,070 | 2,515 |
| | East West Bancorp Inc. | 20,973 | 2,300 |
| | Hartford Financial Services Group Inc. | 17,715 | 2,184 |
| | MGIC Investment Corp. | 81,920 | 2,151 |
| | Citizens Financial Group Inc. | 41,116 | 1,979 |
| | | Shares | Market
Value•
($000) |
| | Popular Inc. | 19,674 | 1,955 |
| | Progressive Corp. | 7,176 | 1,929 |
| | OFG Bancorp | 41,829 | 1,900 |
| | American International Group Inc. | 23,728 | 1,824 |
| | Moody's Corp. | 3,605 | 1,802 |
| | OneMain Holdings Inc. | 28,795 | 1,651 |
| | Old Republic International Corp. | 37,592 | 1,465 |
| | SLM Corp. | 53,324 | 1,460 |
| | First BanCorp (XNYS) | 70,336 | 1,455 |
| | Apollo Global Management Inc. | 8,178 | 1,431 |
| | CNO Financial Group Inc. | 33,832 | 1,350 |
| | Amalgamated Financial Corp. | 37,162 | 1,324 |
| | Morgan Stanley | 9,868 | 1,299 |
| | Fifth Third Bancorp | 26,841 | 1,290 |
| | Commerce Bancshares Inc. | 16,864 | 1,244 |
| | International Bancshares Corp. | 16,982 | 1,242 |
| | Pathward Financial Inc. | 13,387 | 1,123 |
| | Employers Holdings Inc. | 21,016 | 1,121 |
| | W R Berkley Corp. | 17,001 | 1,097 |
| | Unum Group | 14,072 | 1,082 |
| | Cboe Global Markets Inc. | 4,931 | 1,064 |
| | Affiliated Managers Group Inc. | 5,394 | 1,012 |
| | Central Pacific Financial Corp. | 30,651 | 978 |
| | Primerica Inc. | 3,078 | 932 |
| | Bank of NT Butterfield & Son Ltd. | 24,094 | 914 |
| | 1st Source Corp. | 13,809 | 896 |
| * | NMI Holdings Inc. | 22,358 | 894 |
| | Preferred Bank | 9,224 | 870 |
| | Virtu Financial Inc. Class A | 22,404 | 836 |
| | Lazard Inc. | 14,263 | 828 |
| | Enact Holdings Inc. | 23,434 | 825 |
| | WSFS Financial Corp. | 13,674 | 821 |
| | First Commonwealth Financial Corp. | 42,676 | 804 |
| * | Axos Financial Inc. | 9,297 | 770 |
| | State Street Corp. | 7,593 | 748 |
| * | Genworth Financial Inc. | 90,653 | 707 |
| | Jefferies Financial Group Inc. | 8,921 | 706 |
| | Fidelity National Financial Inc. | 11,119 | 705 |
| | Jackson Financial Inc. Class A | 6,867 | 688 |
| | Equitable Holdings Inc. | 13,791 | 665 |
| | BOK Financial Corp. | 5,475 | 651 |
| | Victory Capital Holdings Inc. Class A | 9,376 | 651 |
| | Radian Group Inc. | 17,776 | 636 |
| | Ameriprise Financial Inc. | 1,083 | 622 |
| | Assured Guaranty Ltd. | 6,500 | 606 |
| | Associated Banc-Corp. | 22,553 | 602 |
| 1 | Fidelis Insurance Holdings Ltd. | 29,093 | 597 |
| | ConnectOne Bancorp Inc. | 21,474 | 591 |
| | Bank of America Corp. | 12,009 | 571 |
| | Banco Latinoamericano de Comercio Exterior SA Class E | 16,738 | 570 |
| | Mercury General Corp. | 6,982 | 551 |
| | Hanmi Financial Corp. | 19,897 | 526 |
| | MetLife Inc. | 5,926 | 523 |
| * | Mr. Cooper Group Inc. | 5,296 | 523 |
| | City Holding Co. | 3,902 | 512 |
| * | Bancorp Inc. | 8,689 | 508 |
| | Synovus Financial Corp. | 8,803 | 502 |
| | BGC Group Inc. Class A | 50,871 | 496 |
| | Brightsphere Investment Group Inc. | 15,747 | 491 |
| | Corebridge Financial Inc. | 14,827 | 480 |
| | S&T Bancorp Inc. | 11,050 | 473 |
| | Westamerica BanCorp | 8,246 | 472 |
| | Ameris Bancorp | 6,642 | 467 |
| | Northern Trust Corp. | 3,817 | 424 |
| | Community Financial System Inc. | 6,111 | 423 |
| | Hancock Whitney Corp. | 6,974 | 414 |
| | First Interstate BancSystem Inc. Class A | 11,551 | 404 |
| | Berkshire Hills Bancorp Inc. | 12,998 | 396 |
| | Globe Life Inc. | 3,547 | 395 |
| | Enterprise Financial Services Corp. | 6,066 | 368 |
| | | Shares | Market
Value•
($000) |
| | QCR Holdings Inc. | 3,872 | 357 |
| | Independent Bank Corp. (XNGS) | 4,698 | 340 |
| | Southside Bancshares Inc. | 9,657 | 339 |
| | RenaissanceRe Holdings Ltd. | 1,018 | 291 |
| | Navient Corp. | 17,279 | 269 |
| | Carlyle Group Inc. | 4,938 | 263 |
| | Simmons First National Corp. Class A | 10,447 | 256 |
| | Veritex Holdings Inc. | 8,126 | 247 |
| * | SiriusPoint Ltd. | 15,102 | 233 |
| | Federal Agricultural Mortgage Corp. Class C | 1,013 | 216 |
| | Cathay General Bancorp | 4,116 | 214 |
| | FB Financial Corp. | 3,793 | 214 |
| | First Merchants Corp. | 4,726 | 207 |
| | CNA Financial Corp. | 4,009 | 202 |
| | Old Second Bancorp Inc. | 10,355 | 193 |
| | Principal Financial Group Inc. | 2,192 | 191 |
| | Citigroup Inc. | 2,675 | 190 |
| | Park National Corp. | 939 | 179 |
| * | Texas Capital Bancshares Inc. | 1,951 | 173 |
| | Northeast Bank | 1,575 | 155 |
| | Cincinnati Financial Corp. | 908 | 145 |
| | BankUnited Inc. | 3,112 | 131 |
| | Raymond James Financial Inc. | 768 | 130 |
| | Travelers Cos. Inc. | 444 | 118 |
| | Axis Capital Holdings Ltd. | 1,148 | 107 |
| | Heritage Financial Corp. | 4,024 | 106 |
| | TriCo Bancshares | 2,167 | 105 |
| | Univest Financial Corp. | 2,788 | 89 |
| | Mercantile Bank Corp. | 1,672 | 84 |
| | Peoples Bancorp Inc. | 2,131 | 75 |
| | First Busey Corp. | 2,411 | 64 |
| | | | 89,726 |
| Health Care (10.8%) |
| | Gilead Sciences Inc. | 29,413 | 2,723 |
| | HCA Healthcare Inc. | 8,229 | 2,693 |
| | AbbVie Inc. | 13,854 | 2,534 |
| | Bristol-Myers Squibb Co. | 36,838 | 2,181 |
| | Johnson & Johnson | 11,610 | 1,800 |
| | Cigna Group | 4,225 | 1,427 |
| | Cardinal Health Inc. | 10,583 | 1,294 |
| | Merck & Co. Inc. | 12,338 | 1,254 |
| * | United Therapeutics Corp. | 3,030 | 1,122 |
| * | Lantheus Holdings Inc. | 7,707 | 688 |
| | SIGA Technologies Inc. | 92,940 | 677 |
| * | Globus Medical Inc. Class A | 7,430 | 636 |
| | ResMed Inc. | 2,546 | 634 |
| | Premier Inc. Class A | 26,885 | 616 |
| * | Tenet Healthcare Corp. | 4,262 | 608 |
| * | Alkermes plc | 20,913 | 607 |
| * | Amneal Pharmaceuticals Inc. | 66,155 | 547 |
| * | Catalyst Pharmaceuticals Inc. | 24,357 | 537 |
| * | Pediatrix Medical Group Inc. | 34,022 | 509 |
| * | Innoviva Inc. | 26,311 | 500 |
| | Organon & Co. | 31,236 | 496 |
| * | AdaptHealth Corp. | 49,028 | 492 |
| * | Community Health Systems Inc. | 140,597 | 484 |
| * | DaVita Inc. | 2,905 | 483 |
| * | Supernus Pharmaceuticals Inc. | 13,007 | 476 |
| * | Incyte Corp. | 6,325 | 472 |
| * | Medpace Holdings Inc. | 1,345 | 458 |
| * | Exelixis Inc. | 12,529 | 457 |
| | Medtronic plc | 5,184 | 449 |
| * | Omnicell Inc. | 9,043 | 421 |
| * | Owens & Minor Inc. | 30,541 | 411 |
| * | Halozyme Therapeutics Inc. | 8,456 | 407 |
| | Phibro Animal Health Corp. Class A | 16,218 | 379 |
| | Viatris Inc. | 28,340 | 371 |
| * | Hims & Hers Health Inc. | 11,339 | 365 |
| * | Harmony Biosciences Holdings Inc. | 10,384 | 360 |
| | | Shares | Market
Value•
($000) |
| * | CareDx Inc. | 14,514 | 356 |
| * | Corcept Therapeutics Inc. | 6,073 | 350 |
| | LeMaitre Vascular Inc. | 3,243 | 347 |
| * | Protagonist Therapeutics Inc. | 7,665 | 336 |
| * | ADMA Biologics Inc. | 16,579 | 333 |
| | Dentsply Sirona Inc. | 16,674 | 328 |
| * | CorVel Corp. | 771 | 282 |
| * | Doximity Inc. Class A | 5,127 | 272 |
| * | Castle Biosciences Inc. | 8,954 | 271 |
| * | Inmode Ltd. | 13,856 | 271 |
| | HealthStream Inc. | 8,129 | 269 |
| | Universal Health Services Inc. Class B | 1,274 | 261 |
| | Embecta Corp. | 11,813 | 246 |
| * | Tactile Systems Technology Inc. | 11,463 | 224 |
| * | Zimvie Inc. | 14,521 | 214 |
| * | Pacira BioSciences Inc. | 12,151 | 205 |
| * | Orthofix Medical Inc. | 9,820 | 192 |
| * | AngioDynamics Inc. | 23,991 | 166 |
| | National HealthCare Corp. | 1,304 | 163 |
| * | Avanos Medical Inc. | 6,641 | 127 |
| * | Inogen Inc. | 11,184 | 109 |
| * | MannKind Corp. | 5,319 | 36 |
| | | | 35,926 |
| Industrials (17.6%) |
| | American Express Co. | 8,955 | 2,728 |
| | 3M Co. | 19,527 | 2,607 |
| * | PayPal Holdings Inc. | 29,516 | 2,561 |
| * | Fiserv Inc. | 11,249 | 2,486 |
| | Lockheed Martin Corp. | 3,622 | 1,917 |
| | Synchrony Financial | 27,123 | 1,831 |
| | FedEx Corp. | 5,782 | 1,750 |
| | Boise Cascade Co. | 11,006 | 1,624 |
| | Owens Corning | 7,454 | 1,533 |
| * | Masterbrand Inc. | 85,743 | 1,483 |
| | Caterpillar Inc. | 3,630 | 1,474 |
| | Trane Technologies plc | 3,318 | 1,381 |
| | CRH plc | 12,867 | 1,316 |
| | Allison Transmission Holdings Inc. | 9,175 | 1,087 |
| | Cintas Corp. | 4,721 | 1,066 |
| | RTX Corp. | 8,664 | 1,056 |
| | Griffon Corp. | 12,254 | 1,033 |
| | Acuity Brands Inc. | 2,749 | 882 |
| * | IES Holdings Inc. | 2,691 | 834 |
| * | Corpay Inc. | 2,145 | 818 |
| | EMCOR Group Inc. | 1,482 | 756 |
| | Matson Inc. | 4,802 | 736 |
| | Louisiana-Pacific Corp. | 5,884 | 695 |
| * | GMS Inc. | 6,629 | 665 |
| | Packaging Corp. of America | 2,644 | 658 |
| | Applied Industrial Technologies Inc. | 2,290 | 629 |
| | Comfort Systems USA Inc. | 1,214 | 599 |
| | REV Group Inc. | 18,953 | 588 |
| | Fidelity National Information Services Inc. | 6,868 | 586 |
| | Deluxe Corp. | 25,216 | 584 |
| * | American Woodmark Corp. | 6,353 | 577 |
| | Snap-on Inc. | 1,533 | 567 |
| | Argan Inc. | 3,602 | 562 |
| * | Mohawk Industries Inc. | 4,007 | 556 |
| | Terex Corp. | 10,147 | 556 |
| 1 | CompoSecure Inc. Class A | 34,401 | 549 |
| * | TopBuild Corp. | 1,397 | 546 |
| | Crane Co. | 2,977 | 542 |
| | United Rentals Inc. | 625 | 541 |
| * | ACI Worldwide Inc. | 9,503 | 540 |
| | Bel Fuse Inc. Class B | 6,729 | 540 |
| | Ryder System Inc. | 3,200 | 540 |
| | Esab Corp. | 4,044 | 522 |
| * | NCR Atleos Corp. | 15,788 | 518 |
| * | Teekay Corp. Ltd. | 69,224 | 511 |
| | | Shares | Market
Value•
($000) |
| | Patrick Industries Inc. | 3,750 | 504 |
| * | Kirby Corp. | 3,970 | 502 |
| * | BrightView Holdings Inc. | 29,230 | 500 |
| * | Tutor Perini Corp. | 18,291 | 497 |
| | WESCO International Inc. | 2,092 | 443 |
| | Genco Shipping & Trading Ltd. | 24,460 | 388 |
| * | DXP Enterprises Inc. | 5,134 | 376 |
| | Ardmore Shipping Corp. | 32,943 | 368 |
| * | Gibraltar Industries Inc. | 4,951 | 359 |
| * | Builders FirstSource Inc. | 1,900 | 354 |
| | Parker-Hannifin Corp. | 499 | 351 |
| | AZZ Inc. | 3,750 | 349 |
| | Brink's Co. | 3,570 | 345 |
| | Eagle Materials Inc. | 1,112 | 343 |
| | Silgan Holdings Inc. | 5,542 | 319 |
| * | Itron Inc. | 2,638 | 313 |
| | Apogee Enterprises Inc. | 3,687 | 310 |
| | Moog Inc. Class A | 1,348 | 298 |
| | Crown Holdings Inc. | 3,167 | 292 |
| * | Sterling Infrastructure Inc. | 1,491 | 290 |
| | Heidrick & Struggles International Inc. | 6,067 | 280 |
| | Valmont Industries Inc. | 789 | 274 |
| | Scorpio Tankers Inc. | 5,190 | 263 |
| | DHT Holdings Inc. | 27,573 | 260 |
| | International Seaways Inc. | 6,611 | 258 |
| | Graphic Packaging Holding Co. | 8,394 | 253 |
| | Barrett Business Services Inc. | 5,560 | 239 |
| | Carlisle Cos. Inc. | 493 | 225 |
| | Preformed Line Products Co. | 1,622 | 221 |
| | LSI Industries Inc. | 10,048 | 205 |
| * | Payoneer Global Inc. | 18,506 | 202 |
| | Teekay Tankers Ltd. Class A | 4,632 | 186 |
| | ICF International Inc. | 1,337 | 185 |
| | Western Union Co. | 14,613 | 161 |
| | Covenant Logistics Group Inc. | 2,731 | 159 |
| | Quanex Building Products Corp. | 5,320 | 158 |
| | CRA International Inc. | 730 | 142 |
| | Veralto Corp. | 1,317 | 142 |
| * | Proto Labs Inc. | 2,794 | 115 |
| * | WEX Inc. | 602 | 114 |
| | Kforce Inc. | 1,868 | 112 |
| | Mesa Laboratories Inc. | 902 | 106 |
| | Enerpac Tool Group Corp. | 2,122 | 102 |
| | Wabash National Corp. | 5,025 | 100 |
| | Ardagh Metal Packaging SA | 27,227 | 100 |
| | Kennametal Inc. | 3,281 | 94 |
| | Booz Allen Hamilton Holding Corp. | 619 | 92 |
| | ADT Inc. | 9,890 | 75 |
| * | Cross Country Healthcare Inc. | 6,466 | 70 |
| | Ennis Inc. | 3,225 | 69 |
| | Safe Bulkers Inc. | 13,659 | 53 |
| | | | 58,646 |
| Real Estate (0.4%) |
| | Newmark Group Inc. Class A | 42,522 | 658 |
| * | CBRE Group Inc. Class A | 2,322 | 325 |
| * | GEO Group Inc. | 9,838 | 281 |
| | | | 1,264 |
| Technology (8.6%) |
| | Meta Platforms Inc. Class A | 4,257 | 2,445 |
| | QUALCOMM Inc. | 14,212 | 2,253 |
| | Alphabet Inc. Class C | 11,286 | 1,924 |
| | International Business Machines Corp. | 8,161 | 1,856 |
| | NVIDIA Corp. | 11,276 | 1,559 |
| | Alphabet Inc. Class A | 8,858 | 1,497 |
| | KLA Corp. | 1,421 | 919 |
| | Jabil Inc. | 6,016 | 817 |
| | Dell Technologies Inc. Class C | 5,820 | 743 |
| * | Kyndryl Holdings Inc. | 20,702 | 719 |
| | Leidos Holdings Inc. | 3,595 | 595 |
| | | Shares | Market
Value•
($000) |
| | HP Inc. | 15,755 | 558 |
| | Gen Digital Inc. (XNGS) | 17,240 | 532 |
| * | Insight Enterprises Inc. | 3,361 | 526 |
| * | Cirrus Logic Inc. | 5,022 | 524 |
| | NetApp Inc. | 4,143 | 508 |
| | Amkor Technology Inc. | 19,090 | 505 |
| * | Photronics Inc. | 20,206 | 503 |
| * | Daktronics Inc. | 31,638 | 487 |
| * | ScanSource Inc. | 9,494 | 479 |
| * | DXC Technology Co. | 20,689 | 465 |
| * | CommVault Systems Inc. | 2,668 | 458 |
| * | Diebold Nixdorf Inc. | 9,753 | 451 |
| * | ePlus Inc. | 5,307 | 429 |
| * | Vertex Inc. Class A | 7,782 | 422 |
| | PC Connection Inc. | 5,484 | 398 |
| * | AvePoint Inc. | 22,393 | 395 |
| * | Pure Storage Inc. Class A | 7,055 | 374 |
| | Cognizant Technology Solutions Corp. Class A | 4,625 | 372 |
| * | OneSpan Inc. | 19,871 | 360 |
| | Clear Secure Inc. Class A | 13,907 | 360 |
| * | Sanmina Corp. | 4,391 | 349 |
| | Adeia Inc. | 27,647 | 335 |
| | Hewlett Packard Enterprise Co. | 15,604 | 331 |
| * | Grindr Inc. | 21,263 | 321 |
| | Benchmark Electronics Inc. | 6,139 | 298 |
| | Amdocs Ltd. | 3,265 | 283 |
| * | NetScout Systems Inc. | 12,077 | 264 |
| * | RingCentral Inc. Class A | 6,799 | 256 |
| * | Arrow Electronics Inc. | 1,939 | 233 |
| | Skyworks Solutions Inc. | 2,647 | 232 |
| * | Match Group Inc. | 6,719 | 220 |
| * | DoorDash Inc. Class A | 1,074 | 194 |
| * | CACI International Inc. Class A | 381 | 175 |
| | Monolithic Power Systems Inc. | 309 | 175 |
| * | Vimeo Inc. | 20,555 | 134 |
| | CTS Corp. | 2,178 | 120 |
| | A10 Networks Inc. | 5,179 | 88 |
| * | F5 Inc. | 308 | 77 |
| * | Maplebear Inc. | 1,485 | 65 |
| * | Fortinet Inc. | 421 | 40 |
| | Hackett Group Inc. | 609 | 19 |
| | | | 28,642 |
| Telecommunications (3.3%) |
| | AT&T Inc. | 117,561 | 2,723 |
| | T-Mobile US Inc. | 10,693 | 2,641 |
| | Verizon Communications Inc. | 52,054 | 2,308 |
| | Motorola Solutions Inc. | 1,932 | 966 |
| | IDT Corp. Class B | 12,285 | 634 |
| * | NETGEAR Inc. | 18,225 | 448 |
| | Spok Holdings Inc. | 24,783 | 407 |
| * | Liberty Latin America Ltd. Class C | 54,310 | 375 |
| | InterDigital Inc. | 1,533 | 300 |
| * | Liberty Latin America Ltd. Class A | 31,027 | 216 |
| | | | 11,018 |
| Total Common Stocks (Cost $259,361) | 331,917 |
| | | Shares | Market
Value•
($000) |
| Temporary Cash Investments (0.3%) |
| Money Market Fund (0.3%) |
| 2,3 | Vanguard Market Liquidity Fund, 4.651% (Cost $883) | 8,826 | 883 |
| Total Investments (100.0%) (Cost $260,244) | 332,800 |
| Other Assets and Liabilities—Net (0.0%) | 56 |
| Net Assets (100%) | 332,856 |
| Cost is in $000. |
| • | See Note A in Notes to Financial Statements. |
| * | Non-income-producing security. |
| 1 | Includes partial security positions on loan to broker-dealers. The total value of securities on loan is $893,000. |
| 2 | Affiliated money market fund available only to Vanguard funds and certain trusts and accounts managed by Vanguard. Rate shown is the 7-day yield. |
| 3 | Collateral of $955,000 was received for securities on loan, of which $321,000 is held in Vanguard Market Liquidity Fund and $634,000 is held in cash. |
Derivative Financial Instruments Outstanding as of Period End
| Futures Contracts |
| | | | ($000) |
| | Expiration | Number of
Long (Short)
Contracts | Notional
Amount | Value and
Unrealized
Appreciation
(Depreciation) |
| Long Futures Contracts | | | | |
| Micro E-mini S&P 500 Index | December 2024 | 18 | 545 | 32 |
See accompanying Notes, which are an integral part of the Financial Statements.
Statement of Assets and Liabilities
|
| ($000s, except shares, footnotes, and per-share amounts) | Amount |
| Assets | |
| Investments in Securities, at Value1 | |
| Unaffiliated Issuers (Cost $259,361) | 331,917 |
| Affiliated Issuers (Cost $883) | 883 |
| Total Investments in Securities | 332,800 |
| Investment in Vanguard | 8 |
| Cash | 634 |
| Cash Collateral Pledged—Futures Contracts | 28 |
| Receivables for Accrued Income | 364 |
| Variation Margin Receivable—Futures Contracts | 3 |
| Total Assets | 333,837 |
| Liabilities | |
| Due to Custodian | 1 |
| Payables for Investment Securities Purchased | 2 |
| Collateral for Securities on Loan | 955 |
| Payables to Vanguard | 23 |
| Total Liabilities | 981 |
| Net Assets | 332,856 |
| 1 Includes $893,000 of securities on loan. | |
| At November 30, 2024, net assets consisted of: | |
| | |
| Paid-in Capital | 280,752 |
| Total Distributable Earnings (Loss) | 52,104 |
| Net Assets | 332,856 |
| |
| Net Assets | |
Applicable to 2,365,000 outstanding $.001 par value shares of
beneficial interest (unlimited authorization) | 332,856 |
| Net Asset Value Per Share | $140.74 |
See accompanying Notes, which are an integral part of the Financial Statements.
|
| | Year Ended
November 30, 2024 |
| | ($000) |
| Investment Income | |
| Income | |
| Dividends1 | 4,895 |
| Interest2 | 45 |
| Securities Lending—Net | — |
| Total Income | 4,940 |
| Expenses | |
| The Vanguard Group—Note B | |
| Investment Advisory Services | 74 |
| Management and Administrative | 307 |
| Marketing and Distribution | 13 |
| Custodian Fees | 2 |
| Auditing Fees | 31 |
| Shareholders’ Reports and Proxy Fees | 36 |
| Trustees’ Fees and Expenses | — |
| Other Expenses | 15 |
| Total Expenses | 478 |
| Expenses Paid Indirectly | (2) |
| Net Expenses | 476 |
| Net Investment Income | 4,464 |
| Realized Net Gain (Loss) | |
| Investment Securities Sold2,3 | 22,708 |
| Futures Contracts | 178 |
| Realized Net Gain (Loss) | 22,886 |
| Change in Unrealized Appreciation (Depreciation) | |
| Investment Securities2 | 49,452 |
| Futures Contracts | 17 |
| Change in Unrealized Appreciation (Depreciation) | 49,469 |
| Net Increase (Decrease) in Net Assets Resulting from Operations | 76,819 |
| 1 | Dividends are net of foreign withholding taxes of $20,000. |
| 2 | Interest income, realized net gain (loss), capital gain distributions received, and change in unrealized appreciation (depreciation) from an affiliated company of the fund were $41,000, less than $1,000, less than $1,000, and less than $1,000, respectively. Purchases and sales are for temporary cash investment purposes. |
| 3 | Includes $18,903,000 of net gain (loss) resulting from in-kind redemptions. |
See accompanying Notes, which are an integral part of the Financial Statements.
Statement of Changes in Net Assets
|
| | Year Ended November 30, |
| | 2024
($000) | 2023
($000) |
| Increase (Decrease) in Net Assets | | |
| Operations | | |
| Net Investment Income | 4,464 | 3,571 |
| Realized Net Gain (Loss) | 22,886 | 5,465 |
| Change in Unrealized Appreciation (Depreciation) | 49,469 | (2,529) |
| Net Increase (Decrease) in Net Assets Resulting from Operations | 76,819 | 6,507 |
| Distributions | | |
| Total Distributions | (4,261) | (3,596) |
| Capital Share Transactions | | |
| Issued | 113,427 | 52,488 |
| Issued in Lieu of Cash Distributions | — | — |
| Redeemed | (47,225) | (31,560) |
| Net Increase (Decrease) from Capital Share Transactions | 66,202 | 20,928 |
| Total Increase (Decrease) | 138,760 | 23,839 |
| Net Assets | | |
| Beginning of Period | 194,096 | 170,257 |
| End of Period | 332,856 | 194,096 |
See accompanying Notes, which are an integral part of the Financial Statements.
For a Share Outstanding
Throughout Each Period | Year Ended November 30, |
| 2024 | 2023 | 2022 | 2021 | 2020 |
| Net Asset Value, Beginning of Period | $106.35 | $105.10 | $103.55 | $79.93 | $79.60 |
| Investment Operations | | | | | |
| Net Investment Income1 | 2.094 | 2.111 | 2.188 | 1.534 | 1.191 |
| Net Realized and Unrealized Gain (Loss) on Investments | 34.345 | 1.295 | 1.467 | 23.442 | .372 |
| Total from Investment Operations | 36.439 | 3.406 | 3.655 | 24.976 | 1.563 |
| Distributions | | | | | |
| Dividends from Net Investment Income | (2.049) | (2.156) | (2.105) | (1.356) | (1.233) |
| Distributions from Realized Capital Gains | — | — | — | — | — |
| Total Distributions | (2.049) | (2.156) | (2.105) | (1.356) | (1.233) |
| Net Asset Value, End of Period | $140.74 | $106.35 | $105.10 | $103.55 | $79.93 |
| Total Return | 34.57% | 3.42% | 3.73% | 31.43% | 2.35% |
| Ratios/Supplemental Data | | | | | |
| Net Assets, End of Period (Millions) | $333 | $194 | $170 | $110 | $62 |
| Ratio of Total Expenses to Average Net Assets | 0.18%2 | 0.18% | 0.18%2 | 0.18% | 0.19%2 |
| Ratio of Net Investment Income to Average Net Assets | 1.69% | 2.07% | 2.21% | 1.56% | 1.66% |
| Portfolio Turnover Rate3 | 50% | 37% | 33% | 75% | 95% |
| 1 | Calculated based on average shares outstanding. |
| 2 | The ratio of expenses to average net assets for the period net of reduction from custody fee offset arrangements was 0.18%. |
| 3 | Excludes the value of portfolio securities received or delivered as a result of in-kind purchases or redemptions of the fund’s capital shares, including ETF Creation Units. |
See accompanying Notes, which are an integral part of the Financial Statements.
Notes to Financial Statements
Vanguard U.S. Multifactor ETF is registered under the Investment Company Act of 1940 as an open-end investment company, or mutual fund. ETF Shares are listed for trading on Cboe BZX Exchange, Inc.; they can be purchased and sold through a broker.
| A. | The following significant accounting policies conform to generally accepted accounting principles for U.S. investment companies. The fund consistently follows such policies in preparing its financial statements. |
1. Security Valuation: Securities are valued as of the close of trading on the New York Stock Exchange (generally 4 p.m., Eastern time) on the valuation date. Equity securities are valued at the latest quoted sales prices or official closing prices taken from the primary market in which each security trades; such securities not traded on the valuation date are valued at the mean of the latest quoted bid and asked prices. Securities for which market quotations are not readily available, or whose values have been affected by events occurring before the fund’s pricing time but after the close of the securities’ primary markets, are valued by methods deemed by the valuation designee to represent fair value and subject to oversight by the board of trustees. Investments in Vanguard Market Liquidity Fund are valued at that fund's net asset value.
2. Futures Contracts: The fund uses index futures contracts to a limited extent, with the objective of maintaining full exposure to the stock market while maintaining liquidity. The fund may purchase or sell futures contracts to achieve a desired level of investment, whether to accommodate portfolio turnover or cash flows from capital share transactions. The primary risks associated with the use of futures contracts are imperfect correlation between changes in market values of stocks held by the fund and the prices of futures contracts, and the possibility of an illiquid market. Counterparty risk involving futures is mitigated because a regulated clearinghouse is the counterparty instead of the clearing broker. To further mitigate counterparty risk, the fund trades futures contracts on an exchange, monitors the financial strength of its clearing brokers and clearinghouse, and has entered into clearing agreements with its clearing brokers. The clearinghouse imposes initial margin requirements to secure the fund’s performance and requires daily settlement of variation margin representing changes in the market value of each contract. Any securities pledged as initial margin for open contracts are noted in the Schedule of Investments.
Futures contracts are valued at their quoted daily settlement prices. The notional amounts of the contracts are not recorded in the Statement of Assets and Liabilities. Fluctuations in the value of the contracts are recorded in the Statement of Assets and Liabilities as an asset (liability) and in the Statement of Operations as unrealized appreciation (depreciation) until the contracts are closed, when they are recorded as realized gains (losses) on futures contracts.
During the year ended November 30, 2024, the fund’s average investments in long and short futures contracts represented less than 1% and 0% of net assets, respectively, based on the average of the notional amounts at each quarter-end during the period.
3. Federal Income Taxes: The fund intends to continue to qualify as a regulated investment company and distribute virtually all of its taxable income. The fund’s tax returns are open to examination by the relevant tax authorities until expiration of the applicable statute of limitations, which is generally three years after the filing of the tax return. Management has analyzed the fund’s tax positions taken for all open federal and state income tax years, and has concluded that no provision for income tax is required in the fund’s financial statements.
4. Distributions: Distributions to shareholders are recorded on the ex-dividend date. Distributions are determined on a tax basis at the fiscal year-end and may differ from net investment income and realized capital gains for financial reporting purposes.
5. Securities Lending: To earn additional income, the fund lends its securities to qualified institutional borrowers. Security loans are subject to termination by the fund at any time, and are required to be secured at all times by collateral in an amount at least equal to the market value of securities loaned. Daily market fluctuations could cause the value of loaned securities to be more or less than the value of the collateral received. When this occurs, the collateral is adjusted and settled before the opening of the market on the next business day. The fund further mitigates its counterparty risk by entering into securities lending transactions only with a diverse group of prequalified counterparties, monitoring their financial strength, and entering into master securities lending agreements with its counterparties. The master securities lending agreements provide that, in the event of a counterparty’s default (including bankruptcy), the fund may terminate any loans with that borrower, determine the net amount owed, and sell or retain the collateral up to the net amount owed to the fund; however, such actions may be subject to legal proceedings. While collateral mitigates counterparty risk, in the event of a default, the fund may experience delays and costs in recovering the securities loaned. The fund invests cash collateral received in Vanguard Market Liquidity Fund, and records a liability in the Statement of Assets and Liabilities for the return of the collateral, during the period the securities are on loan. Collateral investments in Vanguard Market Liquidity Fund are subject to market appreciation or depreciation. Securities lending income represents fees charged to borrowers plus income earned on invested cash collateral, less expenses associated with the loan. During the term of the loan, the fund is entitled to all distributions made on or in respect of the loaned securities.
6. Credit Facilities and Interfund Lending Program: The fund and certain other funds managed by The Vanguard Group ("Vanguard") participate in a $4.3 billion committed credit facility provided by a syndicate of lenders pursuant to a credit agreement and an uncommitted credit facility provided by Vanguard. Both facilities may be renewed annually. Each fund is individually liable for its borrowings, if any, under the credit facilities. Borrowings may be utilized for temporary or emergency purposes and are subject to the fund’s regulatory and contractual borrowing restrictions. With respect to the committed credit facility, the participating funds are charged administrative fees and an annual commitment fee of 0.10% of the undrawn committed amount of the facility, which are allocated to the funds based on a method approved by the fund’s board of trustees and included in Management and Administrative expenses on the fund’s Statement of Operations. Any borrowings under either facility bear interest at an agreed-upon spread plus the higher of the federal funds effective rate, the overnight bank funding rate, or the Daily Simple Secured Overnight Financing Rate inclusive of an additional agreed-upon spread. However, borrowings under the uncommitted credit facility may bear interest based upon an alternate rate agreed to by the fund and Vanguard.
In accordance with an exemptive order (the “Order”) from the SEC, the fund may participate in a joint lending and borrowing program that allows registered open-end Vanguard funds to borrow money from and lend money to each other for temporary or emergency purposes (the “Interfund Lending Program”), subject to compliance with the terms and conditions of the Order, and to the extent permitted by the fund’s investment objective and investment policies. Interfund loans and borrowings normally extend overnight but can have a maximum duration of seven days. Loans may be
called on one business day’s notice. The interest rate to be charged is governed by the conditions of the Order and internal procedures adopted by the board of trustees. The board of trustees is responsible for overseeing the Interfund Lending Program.
For the year ended November 30, 2024, the fund did not utilize the credit facilities or the Interfund Lending Program.
7. Other: Dividend income is recorded on the ex-dividend date. Non-cash dividends included in income, if any, are recorded at the fair value of the securities received. Interest income includes income distributions received from Vanguard Market Liquidity Fund and is accrued daily. Security transactions are accounted for on the date securities are bought or sold. Costs used to determine realized gains (losses) on the sale of investment securities are those of the specific securities sold.
| B. | In accordance with the terms of a Funds' Service Agreement (the “FSA”) between Vanguard and the fund, Vanguard furnishes to the fund investment advisory, corporate management, administrative, marketing, and distribution services at Vanguard’s cost of operations (as defined by the FSA). These costs of operations are allocated to the fund based on methods and guidelines approved by the board of trustees and are generally settled twice a month. |
Upon the request of Vanguard, the fund may invest up to 0.40% of its net assets as capital in Vanguard. At November 30, 2024, the fund had contributed to Vanguard capital in the amount of $8,000, representing less than 0.01% of the fund’s net assets and less than 0.01% of Vanguard’s capital received pursuant to the FSA. The fund’s trustees and officers are also directors and employees, respectively, of Vanguard.
| C. | The fund’s custodian bank has agreed to reduce its fees when the fund maintains cash on deposit in the non-interest-bearing custody account. For the year ended November 30, 2024, custodian fee offset arrangements reduced the fund’s expenses by $2,000 (an annual rate of less than 0.01% of average net assets). |
| D. | Various inputs may be used to determine the value of the fund’s investments and derivatives. These inputs are summarized in three broad levels for financial statement purposes. The inputs or methodologies used to value securities are not necessarily an indication of the risk associated with investing in those securities. |
Level 1—Quoted prices in active markets for identical securities.
Level 2—Other significant observable inputs (including quoted prices for similar securities, interest rates, prepayment speeds, credit risk, etc.).
Level 3—Significant unobservable inputs (including the fund’s own assumptions used to determine the fair value of investments). Any investments and derivatives valued with significant unobservable inputs are noted on the Schedule of Investments.
At November 30, 2024, 100% of the market value of the fund’s investments and derivatives was determined based on Level 1 inputs.
| E. | Permanent differences between book-basis and tax-basis components of net assets are reclassified among capital accounts in the financial statements to reflect their tax character. These reclassifications have no effect on net assets or net asset value per share. As of period end, permanent differences primarily attributable to the accounting for in-kind redemptions were reclassified between the following accounts: |
| | Amount
($000) |
| Paid-in Capital | 18,903 |
| Total Distributable Earnings (Loss) | (18,903) |
Temporary differences between book-basis and tax-basis components of total distributable earnings (loss) arise when certain items of income, gain, or loss are recognized in different periods for financial statement and tax purposes; these differences will reverse at some time in the future. The differences are primarily related to capital loss carryforwards; the deferral of losses from wash sales; and the recognition of unrealized gains or losses from certain derivative contracts. As of period end, the tax-basis components of total distributable earnings (loss) are detailed in the table as follows:
| | Amount
($000) |
| Undistributed Ordinary Income | 875 |
| Undistributed Long-Term Gains | — |
| Net Unrealized Gains (Losses) | 72,556 |
| Capital Loss Carryforwards | (21,327) |
| Qualified Late-Year Losses | — |
| Other Temporary Differences | — |
| Total | 52,104 |
The tax character of distributions paid was as follows:
| | Year Ended November 30, |
| | 2024
Amount
($000) | 2023
Amount
($000) |
| Ordinary Income* | 4,261 | 3,596 |
| Long-Term Capital Gains | — | — |
| Total | 4,261 | 3,596 |
| * | Includes short-term capital gains, if any. |
As of November 30, 2024, gross unrealized appreciation and depreciation for investments and derivatives based on cost for U.S. federal income tax purposes were as follows:
| | Amount
($000) |
| Tax Cost | 260,244 |
| Gross Unrealized Appreciation | 77,365 |
| Gross Unrealized Depreciation | (4,809) |
| Net Unrealized Appreciation (Depreciation) | 72,556 |
| F. | During the year ended November 30, 2024, the fund purchased $223,884,000 of investment securities and sold $131,550,000 of investment securities, other than temporary cash investments. In addition, the fund purchased and sold investment securities of $21,471,000 and $47,223,000, respectively, in connection with in-kind purchases and redemptions of the fund's capital shares. |
The fund purchased securities from and sold securities to other Vanguard funds or accounts managed by Vanguard or its affiliates, in accordance with procedures adopted by the board of trustees in compliance with Rule 17a-7 of the Investment Company Act of 1940. For the year ended November 30, 2024, such purchases were $5,820,000 and sales were $2,761,000, resulting in net realized loss of $97,000; these amounts, other than temporary cash investments, are included in the purchases and sales of investment securities noted above.
| G. | Capital shares issued and redeemed were: |
| | Year Ended November 30, |
| | 2024
Shares
(000) | 2023
Shares
(000) |
| Issued | 925 | 515 |
| Issued in Lieu of Cash Distributions | — | — |
| Redeemed | (385) | (310) |
| Net Increase (Decrease) in Shares Outstanding | 540 | 205 |
| H. | Significant market disruptions, such as those caused by pandemics, natural or environmental disasters, war, acts of terrorism, or other events, can adversely affect local and global markets and normal market operations. Any such disruptions could have an adverse impact on the value of the fund’s investments and fund performance. |
To the extent the fund’s investment portfolio reflects concentration in a particular market, industry, sector, country or asset class, the fund may be adversely affected by the performance of these concentrations and may be subject to increased price volatility and other risks.
The use of derivatives may expose the fund to various risks. Derivatives can be highly volatile, and any initial investment is generally small relative to the notional amount so that transactions may be leveraged in terms of market exposure. A relatively small market movement may have a potentially larger impact on derivatives than on standard securities. Leveraged derivatives positions can, therefore, increase volatility. Additional information regarding the fund’s use of derivative(s) and the specific risks associated is described under significant accounting policies.
At November 30, 2024, one shareholder was a record or beneficial owner of 32% of the fund’s net assets. If this shareholder were to redeem its investment in the fund, the redemption might result in an increase in the fund’s expense ratio, cause the fund to incur higher transaction costs, or lead to the realization of taxable capital gains.
| I. | Management has determined that no events or transactions occurred subsequent to November 30, 2024, that would require recognition or disclosure in these financial statements. |
Schedule of Investments
As of November 30, 2024
The fund files its complete schedule of portfolio holdings with the Securities and Exchange Commission (SEC) for the first and third quarters of each fiscal year as an exhibit to its reports on Form N-PORT. The fund’s Form N-PORT reports are available on the SEC’s website at www.sec.gov.
| | | Shares | Market
Value•
($000) |
| Common Stocks (99.7%) |
| Basic Materials (3.2%) |
| | Ecolab Inc. | 24,858 | 6,184 |
| | Fastenal Co. | 30,732 | 2,568 |
| | UFP Industries Inc. | 9,956 | 1,353 |
| | Avery Dennison Corp. | 6,559 | 1,351 |
| | Mueller Industries Inc. | 8,474 | 684 |
| | Hawkins Inc. | 3,922 | 528 |
| | Sylvamo Corp. | 5,475 | 505 |
| | Innospec Inc. | 2,484 | 295 |
| | Steel Dynamics Inc. | 1,882 | 273 |
| | Olin Corp. | 5,947 | 253 |
| | | | 13,994 |
| Consumer Discretionary (22.2%) |
| | NIKE Inc. Class B | 106,064 | 8,355 |
| | Target Corp. | 61,142 | 8,090 |
| | Walmart Inc. | 85,426 | 7,902 |
| | TJX Cos. Inc. | 59,068 | 7,424 |
| * | Amazon.com Inc. | 26,494 | 5,508 |
| | Costco Wholesale Corp. | 5,067 | 4,924 |
| * | Netflix Inc. | 3,865 | 3,427 |
| * | Expedia Group Inc. | 10,156 | 1,875 |
| | Ralph Lauren Corp. | 8,103 | 1,875 |
| | Best Buy Co. Inc. | 19,480 | 1,753 |
| | Pool Corp. | 4,482 | 1,690 |
| * | Deckers Outdoor Corp. | 8,250 | 1,617 |
| * | Mattel Inc. | 83,533 | 1,589 |
| * | Abercrombie & Fitch Co. Class A | 10,106 | 1,513 |
| * | Lululemon Athletica Inc. | 4,534 | 1,454 |
| | Macy's Inc. | 86,120 | 1,399 |
| | Dick's Sporting Goods Inc. | 6,631 | 1,374 |
| | John Wiley & Sons Inc. Class A | 26,249 | 1,370 |
| * | Grand Canyon Education Inc. | 8,009 | 1,318 |
| | Electronic Arts Inc. | 7,931 | 1,298 |
| * | BJ's Wholesale Club Holdings Inc. | 12,905 | 1,243 |
| | Estee Lauder Cos. Inc. Class A | 16,015 | 1,155 |
| | BorgWarner Inc. (XNYS) | 33,282 | 1,142 |
| | eBay Inc. | 17,931 | 1,135 |
| | Build-A-Bear Workshop Inc. | 27,882 | 1,059 |
| * | Skechers USA Inc. Class A | 15,888 | 1,014 |
| | American Eagle Outfitters Inc. | 51,386 | 989 |
| * | Ulta Beauty Inc. | 2,423 | 937 |
| | Rollins Inc. | 18,594 | 936 |
| | Hasbro Inc. | 13,965 | 910 |
| * | Coupang Inc. | 34,886 | 885 |
| * | Crocs Inc. | 8,260 | 872 |
| * | YETI Holdings Inc. | 21,388 | 863 |
| * | NVR Inc. | 88 | 813 |
| | Steven Madden Ltd. | 16,970 | 773 |
| | Genuine Parts Co. | 6,067 | 769 |
| | PVH Corp. | 6,873 | 745 |
| | Interface Inc. | 25,793 | 685 |
| | Newell Brands Inc. | 67,700 | 649 |
| | Polaris Inc. | 9,359 | 646 |
| * | Chegg Inc. | 301,020 | 635 |
| | Perdoceo Education Corp. | 22,416 | 615 |
| | Steelcase Inc. Class A | 43,559 | 587 |
| | HNI Corp. | 9,598 | 544 |
| * | G-III Apparel Group Ltd. | 17,406 | 516 |
| | Buckle Inc. | 9,824 | 512 |
| * | SharkNinja Inc. | 5,091 | 512 |
| | | Shares | Market
Value•
($000) |
| * | Stitch Fix Inc. Class A | 106,889 | 509 |
| * | Rush Street Interactive Inc. | 31,938 | 460 |
| * | Spotify Technology SA | 961 | 458 |
| * | Sonos Inc. | 31,456 | 428 |
| | LCI Industries | 3,399 | 411 |
| | Caleres Inc. | 13,075 | 406 |
| | Monarch Casino & Resort Inc. | 4,814 | 404 |
| | La-Z-Boy Inc. | 8,751 | 396 |
| * | ODP Corp. | 14,772 | 379 |
| * | Under Armour Inc. Class A | 37,948 | 368 |
| | New York Times Co. Class A | 6,758 | 367 |
| * | Genesco Inc. | 10,783 | 362 |
| * | Thryv Holdings Inc. | 22,738 | 360 |
| | PriceSmart Inc. | 3,780 | 339 |
| | Ross Stores Inc. | 2,172 | 336 |
| | MillerKnoll Inc. | 13,080 | 329 |
| * | National Vision Holdings Inc. | 25,194 | 305 |
| | Ethan Allen Interiors Inc. | 9,850 | 303 |
| * | Arlo Technologies Inc. | 26,385 | 296 |
| | Monro Inc. | 9,950 | 280 |
| * | Foot Locker Inc. | 10,438 | 262 |
| | Murphy USA Inc. | 466 | 255 |
| * | Universal Technical Institute Inc. | 9,286 | 240 |
| | Cricut Inc. Class A | 44,057 | 229 |
| * | TripAdvisor Inc. | 14,477 | 207 |
| | Haverty Furniture Cos. Inc. | 7,547 | 178 |
| * | Liquidity Services Inc. | 6,764 | 173 |
| * | Udemy Inc. | 16,403 | 131 |
| | Booking Holdings Inc. | 24 | 125 |
| * | GoPro Inc. Class A | 92,397 | 114 |
| * | Duolingo Inc. | 322 | 112 |
| | | | 97,418 |
| Consumer Staples (8.2%) |
| | Kimberly-Clark Corp. | 61,508 | 8,571 |
| | PepsiCo Inc. | 44,231 | 7,230 |
| | Flowers Foods Inc. | 120,946 | 2,736 |
| | Kroger Co. | 32,054 | 1,958 |
| | Kenvue Inc. | 64,537 | 1,554 |
| | Coca-Cola Consolidated Inc. | 945 | 1,233 |
| | Hershey Co. | 6,623 | 1,167 |
| | Ingredion Inc. | 7,153 | 1,054 |
| * | Monster Beverage Corp. | 18,565 | 1,023 |
| | Church & Dwight Co. Inc. | 8,745 | 963 |
| | Nu Skin Enterprises Inc. Class A | 122,258 | 892 |
| * | Boston Beer Co. Inc. Class A | 2,792 | 883 |
| | WD-40 Co. | 3,099 | 859 |
| | Casey's General Stores Inc. | 1,957 | 824 |
| | General Mills Inc. | 10,420 | 690 |
| | National Beverage Corp. | 13,136 | 649 |
| | Cencora Inc. | 2,438 | 613 |
| | Primo Brands Corp. Class A | 17,899 | 510 |
| * | Vita Coco Co. Inc. | 12,795 | 455 |
| * | Performance Food Group Co. | 4,920 | 434 |
| | Lancaster Colony Corp. | 2,219 | 412 |
| * | Honest Co. Inc. | 49,057 | 407 |
| | SpartanNash Co. | 17,517 | 332 |
| | Procter & Gamble Co. | 1,474 | 264 |
| | Ingles Markets Inc. Class A | 2,822 | 209 |
| | ACCO Brands Corp. | 33,824 | 197 |
| | | | 36,119 |
| Energy (3.3%) |
| | EOG Resources Inc. | 36,764 | 4,899 |
| | Texas Pacific Land Corp. | 910 | 1,456 |
| | Weatherford International plc | 15,105 | 1,243 |
| | Patterson-UTI Energy Inc. | 127,396 | 1,070 |
| * | Tidewater Inc. | 20,321 | 1,051 |
| | TechnipFMC plc | 27,376 | 859 |
| | Murphy Oil Corp. | 22,609 | 734 |
| | Marathon Petroleum Corp. | 3,550 | 554 |
| | | Shares | Market
Value•
($000) |
| | CONSOL Energy Inc. | 4,077 | 533 |
| * | MRC Global Inc. | 32,367 | 452 |
| | Solaris Energy Infrastructure Inc. | 13,390 | 330 |
| * | ProPetro Holding Corp. | 37,589 | 316 |
| | Select Water Solutions Inc. | 18,686 | 276 |
| * | TETRA Technologies Inc. | 68,484 | 264 |
| | SM Energy Co. | 3,667 | 166 |
| | Alpha Metallurgical Resources Inc. | 647 | 159 |
| | SunCoke Energy Inc. | 12,059 | 150 |
| * | Oceaneering International Inc. | 4,661 | 140 |
| | | | 14,652 |
| Financials (13.1%) |
| | Equitable Holdings Inc. | 57,584 | 2,777 |
| | Ameriprise Financial Inc. | 4,734 | 2,717 |
| | State Street Corp. | 24,098 | 2,374 |
| | SLM Corp. | 82,620 | 2,262 |
| | Primerica Inc. | 7,270 | 2,201 |
| * | Axos Financial Inc. | 23,422 | 1,941 |
| | Pathward Financial Inc. | 21,888 | 1,836 |
| | CNO Financial Group Inc. | 44,545 | 1,777 |
| | First BanCorp (XNYS) | 80,968 | 1,674 |
| | Northern Trust Corp. | 14,540 | 1,616 |
| | Bread Financial Holdings Inc. | 27,222 | 1,601 |
| * | Bancorp Inc. | 27,109 | 1,584 |
| | Broadridge Financial Solutions Inc. | 6,514 | 1,537 |
| | WSFS Financial Corp. | 24,484 | 1,470 |
| | Globe Life Inc. | 12,442 | 1,384 |
| | OFG Bancorp | 30,006 | 1,363 |
| | Zions Bancorp NA | 21,630 | 1,309 |
| | Aflac Inc. | 10,611 | 1,210 |
| | Jackson Financial Inc. Class A | 12,071 | 1,209 |
| | Popular Inc. | 12,157 | 1,208 |
| | American International Group Inc. | 15,475 | 1,190 |
| | Hartford Financial Services Group Inc. | 8,821 | 1,088 |
| | Bank of NT Butterfield & Son Ltd. | 27,974 | 1,061 |
| | Citizens Financial Group Inc. | 21,348 | 1,028 |
| | Voya Financial Inc. | 10,839 | 900 |
| | PJT Partners Inc. Class A | 5,372 | 899 |
| | Commerce Bancshares Inc. | 11,947 | 881 |
| | City Holding Co. | 5,781 | 759 |
| * | Palomar Holdings Inc. | 6,571 | 712 |
| * | NMI Holdings Inc. | 16,581 | 663 |
| | BOK Financial Corp. | 5,496 | 653 |
| | Radian Group Inc. | 17,692 | 633 |
| | Aon plc Class A (XNYS) | 1,542 | 604 |
| | Independent Bank Corp. (XNGS) | 8,243 | 597 |
| | Westamerica BanCorp | 9,956 | 570 |
| * | Customers Bancorp Inc. | 9,692 | 547 |
| | Central Pacific Financial Corp. | 16,488 | 526 |
| | Cathay General Bancorp | 9,950 | 518 |
| | Universal Insurance Holdings Inc. | 19,192 | 434 |
| | Community Financial System Inc. | 6,229 | 431 |
| * | Texas Capital Bancshares Inc. | 4,858 | 430 |
| | First Horizon Corp. | 20,064 | 424 |
| | AMERISAFE Inc. | 6,974 | 412 |
| * | Markel Group Inc. | 229 | 408 |
| | Unum Group | 5,192 | 399 |
| | MGIC Investment Corp. | 15,046 | 395 |
| | Berkshire Hills Bancorp Inc. | 12,840 | 391 |
| | Regions Financial Corp. | 13,793 | 376 |
| | SEI Investments Co. | 4,387 | 362 |
| | Willis Towers Watson plc | 1,047 | 337 |
| | Old Republic International Corp. | 8,541 | 333 |
| | Virtus Investment Partners Inc. | 1,334 | 329 |
| | Amalgamated Financial Corp. | 8,550 | 305 |
| | Diamond Hill Investment Group Inc. | 1,840 | 304 |
| * | Genworth Financial Inc. | 36,368 | 284 |
| | Moody's Corp. | 558 | 279 |
| | Cboe Global Markets Inc. | 1,289 | 278 |
| | | Shares | Market
Value•
($000) |
| | Southside Bancshares Inc. | 7,794 | 274 |
| | Enact Holdings Inc. | 7,463 | 263 |
| | Artisan Partners Asset Management Inc. Class A | 5,158 | 252 |
| 1 | Fidelis Insurance Holdings Ltd. | 12,078 | 248 |
| | MarketAxess Holdings Inc. | 950 | 246 |
| | Hanmi Financial Corp. | 5,890 | 156 |
| | Lakeland Financial Corp. | 1,494 | 110 |
| * | Brighthouse Financial Inc. | 1,746 | 91 |
| | | | 57,430 |
| Health Care (9.9%) |
| | Gilead Sciences Inc. | 99,740 | 9,234 |
| | Merck & Co. Inc. | 70,701 | 7,186 |
| | Johnson & Johnson | 15,063 | 2,335 |
| * | IDEXX Laboratories Inc. | 5,088 | 2,146 |
| * | Alkermes plc | 73,127 | 2,122 |
| * | Medpace Holdings Inc. | 3,858 | 1,314 |
| * | United Therapeutics Corp. | 3,519 | 1,304 |
| * | Lantheus Holdings Inc. | 13,412 | 1,197 |
| | Agilent Technologies Inc. | 8,659 | 1,195 |
| | Chemed Corp. | 1,977 | 1,132 |
| * | Penumbra Inc. | 4,635 | 1,131 |
| * | Illumina Inc. | 7,753 | 1,118 |
| | ResMed Inc. | 4,298 | 1,070 |
| * | DexCom Inc. | 13,482 | 1,051 |
| * | Incyte Corp. | 12,650 | 944 |
| | Dentsply Sirona Inc. | 42,539 | 836 |
| * | Teladoc Health Inc. | 68,560 | 821 |
| | Eli Lilly & Co. | 1,024 | 814 |
| * | Masimo Corp. | 4,395 | 758 |
| * | CorVel Corp. | 1,935 | 707 |
| * | Option Care Health Inc. | 28,720 | 684 |
| * | Pacira BioSciences Inc. | 28,560 | 483 |
| | Patterson Cos. Inc. | 21,594 | 464 |
| * | ACADIA Pharmaceuticals Inc. | 26,501 | 432 |
| * | Supernus Pharmaceuticals Inc. | 10,897 | 399 |
| * | Owens & Minor Inc. | 27,220 | 367 |
| * | 10X Genomics Inc. Class A | 20,433 | 325 |
| * | MiMedx Group Inc. | 34,216 | 316 |
| * | Harmony Biosciences Holdings Inc. | 7,646 | 265 |
| * | ANI Pharmaceuticals Inc. | 4,404 | 252 |
| * | CareDx Inc. | 8,742 | 215 |
| * | Organogenesis Holdings Inc. | 50,197 | 194 |
| * | Catalyst Pharmaceuticals Inc. | 7,553 | 167 |
| * | Tactile Systems Technology Inc. | 6,485 | 127 |
| * | AngioDynamics Inc. | 15,430 | 107 |
| * | Molina Healthcare Inc. | 243 | 72 |
| | | | 43,284 |
| Industrials (22.1%) |
| | 3M Co. | 61,324 | 8,189 |
| | Cintas Corp. | 30,508 | 6,888 |
| | American Express Co. | 20,167 | 6,145 |
| * | PayPal Holdings Inc. | 65,838 | 5,713 |
| | Trane Technologies plc | 11,093 | 4,617 |
| | Acuity Brands Inc. | 7,676 | 2,462 |
| | CH Robinson Worldwide Inc. | 21,888 | 2,311 |
| | Paychex Inc. | 15,021 | 2,197 |
| | RPM International Inc. | 15,516 | 2,153 |
| | Robert Half Inc. | 26,250 | 1,959 |
| | Landstar System Inc. | 10,512 | 1,954 |
| | MSC Industrial Direct Co. Inc. Class A | 22,588 | 1,940 |
| | Donaldson Co. Inc. | 24,023 | 1,875 |
| * | Builders FirstSource Inc. | 9,051 | 1,688 |
| | WW Grainger Inc. | 1,322 | 1,593 |
| | Louisiana-Pacific Corp. | 12,285 | 1,452 |
| | Synchrony Financial | 21,476 | 1,450 |
| | Valmont Industries Inc. | 3,913 | 1,361 |
| | Rockwell Automation Inc. | 4,482 | 1,323 |
| | Apogee Enterprises Inc. | 15,545 | 1,309 |
| | Simpson Manufacturing Co. Inc. | 6,896 | 1,299 |
| | | Shares | Market
Value•
($000) |
| | Toro Co. | 14,357 | 1,250 |
| | Caterpillar Inc. | 2,986 | 1,213 |
| | Applied Industrial Technologies Inc. | 4,227 | 1,161 |
| | PPG Industries Inc. | 9,067 | 1,128 |
| | MSA Safety Inc. | 6,454 | 1,122 |
| | Lincoln Electric Holdings Inc. | 4,636 | 1,013 |
| * | IES Holdings Inc. | 2,977 | 922 |
| | A O Smith Corp. | 12,369 | 921 |
| | CSW Industrials Inc. | 1,882 | 795 |
| | Barrett Business Services Inc. | 18,428 | 791 |
| | Kforce Inc. | 12,764 | 766 |
| * | Blue Bird Corp. | 18,523 | 753 |
| | Enerpac Tool Group Corp. | 15,529 | 749 |
| * | Legalzoom.com Inc. | 94,480 | 749 |
| | Automatic Data Processing Inc. | 2,366 | 726 |
| * | FTI Consulting Inc. | 3,583 | 726 |
| | Maximus Inc. | 9,563 | 712 |
| | Advanced Drainage Systems Inc. | 5,154 | 697 |
| | Mastercard Inc. Class A | 1,279 | 682 |
| | Jack Henry & Associates Inc. | 3,719 | 655 |
| * | Masterbrand Inc. | 37,601 | 651 |
| * | AZEK Co. Inc. | 12,010 | 638 |
| * | ExlService Holdings Inc. | 13,385 | 621 |
| * | GMS Inc. | 6,138 | 616 |
| * | TopBuild Corp. | 1,538 | 601 |
| | Cummins Inc. | 1,536 | 576 |
| | Atkore Inc. | 5,927 | 559 |
| | Franklin Electric Co. Inc. | 5,069 | 549 |
| | Ferguson Enterprises Inc. | 2,507 | 541 |
| * | Teekay Corp. Ltd. | 72,366 | 534 |
| | Bel Fuse Inc. Class B | 6,370 | 511 |
| | Kadant Inc. | 1,236 | 510 |
| | Fortune Brands Innovations Inc. | 6,152 | 482 |
| | WESCO International Inc. | 2,241 | 474 |
| | Comfort Systems USA Inc. | 931 | 459 |
| * | Franklin Covey Co. | 12,506 | 455 |
| * | Sterling Infrastructure Inc. | 2,341 | 455 |
| | Old Dominion Freight Line Inc. | 1,968 | 443 |
| * | Proto Labs Inc. | 9,564 | 394 |
| | BWX Technologies Inc. | 3,003 | 393 |
| * | Cross Country Healthcare Inc. | 34,900 | 376 |
| | Carlisle Cos. Inc. | 811 | 370 |
| | Expeditors International of Washington Inc. | 2,986 | 363 |
| | ManpowerGroup Inc. | 5,576 | 359 |
| * | Donnelley Financial Solutions Inc. | 5,769 | 348 |
| | AptarGroup Inc. | 1,943 | 336 |
| | Graco Inc. | 3,655 | 333 |
| | EMCOR Group Inc. | 644 | 329 |
| | Veralto Corp. | 2,935 | 318 |
| | Cadre Holdings Inc. | 8,825 | 295 |
| | Badger Meter Inc. | 1,330 | 288 |
| * | Upwork Inc. | 16,149 | 274 |
| | Powell Industries Inc. | 1,017 | 272 |
| * | WNS Holdings Ltd. | 5,003 | 271 |
| * | ASGN Inc. | 2,950 | 270 |
| | Scorpio Tankers Inc. | 5,255 | 266 |
| * | JELD-WEN Holding Inc. | 24,233 | 264 |
| | Wabash National Corp. | 13,154 | 261 |
| * | Trex Co. Inc. | 3,457 | 259 |
| * | AeroVironment Inc. | 1,271 | 247 |
| | CRA International Inc. | 1,266 | 247 |
| | Dorian LPG Ltd. | 9,743 | 238 |
| | Napco Security Technologies Inc. | 5,622 | 221 |
| | Snap-on Inc. | 546 | 202 |
| | Standex International Corp. | 887 | 184 |
| | REV Group Inc. | 5,662 | 176 |
| | ICF International Inc. | 1,172 | 162 |
| * | Target Hospitality Corp. | 18,683 | 155 |
| | Boise Cascade Co. | 959 | 142 |
| * | Generac Holdings Inc. | 740 | 139 |
| | | Shares | Market
Value•
($000) |
| | LSI Industries Inc. | 6,770 | 138 |
| | Hyster-Yale Inc. | 2,371 | 133 |
| | Teekay Tankers Ltd. Class A | 3,080 | 124 |
| * | TrueBlue Inc. | 16,189 | 122 |
| | Crane NXT Co. | 1,742 | 109 |
| | Mesa Laboratories Inc. | 913 | 107 |
| | TriNet Group Inc. | 817 | 76 |
| | | | 96,645 |
| Technology (17.1%) |
| | Apple Inc. | 34,733 | 8,243 |
| | Lam Research Corp. | 96,337 | 7,117 |
| | QUALCOMM Inc. | 44,180 | 7,004 |
| | KLA Corp. | 10,264 | 6,641 |
| * | Adobe Inc. | 12,310 | 6,351 |
| * | Autodesk Inc. | 15,773 | 4,604 |
| | Meta Platforms Inc. Class A | 7,850 | 4,508 |
| | NetApp Inc. | 15,948 | 1,956 |
| | Vertiv Holdings Co. Class A | 15,100 | 1,927 |
| * | CommVault Systems Inc. | 11,223 | 1,926 |
| * | Kyndryl Holdings Inc. | 47,413 | 1,646 |
| * | Teradata Corp. | 49,329 | 1,524 |
| * | Gartner Inc. | 2,693 | 1,395 |
| * | Manhattan Associates Inc. | 4,593 | 1,311 |
| * | Cadence Design Systems Inc. | 4,048 | 1,242 |
| * | Qualys Inc. | 7,769 | 1,193 |
| * | Appfolio Inc. Class A | 4,001 | 1,015 |
| | Applied Materials Inc. | 5,807 | 1,015 |
| | NVIDIA Corp. | 6,562 | 907 |
| | Monolithic Power Systems Inc. | 1,389 | 788 |
| | Pegasystems Inc. | 7,959 | 756 |
| * | DXC Technology Co. | 31,635 | 712 |
| * | Cirrus Logic Inc. | 6,684 | 698 |
| | Hackett Group Inc. | 21,087 | 661 |
| * | Pure Storage Inc. Class A | 12,447 | 660 |
| * | F5 Inc. | 2,617 | 655 |
| | Clear Secure Inc. Class A | 25,311 | 655 |
| | Alphabet Inc. Class A | 3,811 | 644 |
| * | Gitlab Inc. Class A | 9,881 | 630 |
| * | Photronics Inc. | 24,750 | 617 |
| | A10 Networks Inc. | 34,044 | 580 |
| * | Yelp Inc. | 14,597 | 558 |
| | Jabil Inc. | 3,976 | 540 |
| | CSG Systems International Inc. | 9,735 | 534 |
| * | Cargurus Inc. | 13,264 | 502 |
| * | Pinterest Inc. Class A | 12,693 | 385 |
| * | Yext Inc. | 40,015 | 331 |
| | Teradyne Inc. | 2,938 | 323 |
| * | Daktronics Inc. | 19,366 | 298 |
| | PC Connection Inc. | 3,853 | 280 |
| * | Fortinet Inc. | 2,808 | 267 |
| | CDW Corp. | 1,491 | 262 |
| | Paycom Software Inc. | 1,114 | 258 |
| * | NerdWallet Inc. Class A | 16,571 | 232 |
| * | EverQuote Inc. Class A | 11,892 | 228 |
| | CTS Corp. | 3,682 | 202 |
| | | | 74,781 |
| Telecommunications (0.6%) |
| | IDT Corp. Class B | 16,292 | 841 |
| * | Extreme Networks Inc. | 44,495 | 739 |
| * | Roku Inc. | 10,200 | 704 |
| * | Xperi Inc. | 29,585 | 280 |
| | | | 2,564 |
| Total Common Stocks (Cost $357,069) | 436,887 |
| | | Shares | Market
Value•
($000) |
| Temporary Cash Investments (0.2%) |
| Money Market Fund (0.2%) |
| 2,3 | Vanguard Market Liquidity Fund, 4.651% (Cost $867) | 8,672 | 867 |
| Total Investments (99.9%) (Cost $357,936) | 437,754 |
| Other Assets and Liabilities—Net (0.1%) | 456 |
| Net Assets (100%) | 438,210 |
| Cost is in $000. |
| • | See Note A in Notes to Financial Statements. |
| * | Non-income-producing security. |
| 1 | Includes partial security positions on loan to broker-dealers. The total value of securities on loan is $72,000. |
| 2 | Affiliated money market fund available only to Vanguard funds and certain trusts and accounts managed by Vanguard. Rate shown is the 7-day yield. |
| 3 | Collateral of $77,000 was received for securities on loan, of which less than $1,000 is held in Vanguard Market Liquidity Fund and $77,000 is held in cash. |
Derivative Financial Instruments Outstanding as of Period End
| Futures Contracts |
| | | | ($000) |
| | Expiration | Number of
Long (Short)
Contracts | Notional
Amount | Value and
Unrealized
Appreciation
(Depreciation) |
| Long Futures Contracts | | | | |
| E-mini S&P 500 Index | December 2024 | 1 | 303 | 17 |
| Micro E-mini S&P 500 Index | December 2024 | 13 | 393 | 23 |
| | | | | 40 |
See accompanying Notes, which are an integral part of the Financial Statements.
Statement of Assets and Liabilities
|
| ($000s, except shares, footnotes, and per-share amounts) | Amount |
| Assets | |
| Investments in Securities, at Value1 | |
| Unaffiliated Issuers (Cost $357,069) | 436,887 |
| Affiliated Issuers (Cost $867) | 867 |
| Total Investments in Securities | 437,754 |
| Investment in Vanguard | 11 |
| Cash | 78 |
| Cash Collateral Pledged—Futures Contracts | 35 |
| Receivables for Accrued Income | 430 |
| Variation Margin Receivable—Futures Contracts | 4 |
| Total Assets | 438,312 |
| Liabilities | |
| Payables for Investment Securities Purchased | 2 |
| Collateral for Securities on Loan | 77 |
| Payables to Vanguard | 23 |
| Total Liabilities | 102 |
| Net Assets | 438,210 |
| 1 Includes $72,000 of securities on loan. | |
| At November 30, 2024, net assets consisted of: | |
| | |
| Paid-in Capital | 378,955 |
| Total Distributable Earnings (Loss) | 59,255 |
| Net Assets | 438,210 |
| |
| Net Assets | |
Applicable to 2,940,000 outstanding $.001 par value shares of
beneficial interest (unlimited authorization) | 438,210 |
| Net Asset Value Per Share | $149.05 |
See accompanying Notes, which are an integral part of the Financial Statements.
|
| | Year Ended
November 30, 2024 |
| | ($000) |
| Investment Income | |
| Income | |
| Dividends1 | 4,937 |
| Interest2 | 54 |
| Securities Lending—Net | — |
| Total Income | 4,991 |
| Expenses | |
| The Vanguard Group—Note B | |
| Investment Advisory Services | 94 |
| Management and Administrative | 245 |
| Marketing and Distribution | 16 |
| Custodian Fees | 2 |
| Auditing Fees | 31 |
| Shareholders’ Reports and Proxy Fees | 40 |
| Trustees’ Fees and Expenses | — |
| Other Expenses | 15 |
| Total Expenses | 443 |
| Expenses Paid Indirectly | (2) |
| Net Expenses | 441 |
| Net Investment Income | 4,550 |
| Realized Net Gain (Loss) | |
| Investment Securities Sold2,3 | 14,434 |
| Futures Contracts | 212 |
| Realized Net Gain (Loss) | 14,646 |
| Change in Unrealized Appreciation (Depreciation) | |
| Investment Securities2 | 61,456 |
| Futures Contracts | 25 |
| Change in Unrealized Appreciation (Depreciation) | 61,481 |
| Net Increase (Decrease) in Net Assets Resulting from Operations | 80,677 |
| 1 | Dividends are net of foreign withholding taxes of $19,000. |
| 2 | Interest income, realized net gain (loss), capital gain distributions received, and change in unrealized appreciation (depreciation) from an affiliated company of the fund were $47,000, less than $1,000, less than $1,000, and less than $1,000, respectively. Purchases and sales are for temporary cash investment purposes. |
| 3 | Includes $13,672,000 of net gain (loss) resulting from in-kind redemptions. |
See accompanying Notes, which are an integral part of the Financial Statements.
Statement of Changes in Net Assets
|
| | Year Ended November 30, |
| | 2024
($000) | 2023
($000) |
| Increase (Decrease) in Net Assets | | |
| Operations | | |
| Net Investment Income | 4,550 | 3,648 |
| Realized Net Gain (Loss) | 14,646 | 10,852 |
| Change in Unrealized Appreciation (Depreciation) | 61,481 | 496 |
| Net Increase (Decrease) in Net Assets Resulting from Operations | 80,677 | 14,996 |
| Distributions | | |
| Total Distributions | (4,552) | (3,512) |
| Capital Share Transactions | | |
| Issued | 144,810 | 74,318 |
| Issued in Lieu of Cash Distributions | — | — |
| Redeemed | (26,451) | (48,124) |
| Net Increase (Decrease) from Capital Share Transactions | 118,359 | 26,194 |
| Total Increase (Decrease) | 194,484 | 37,678 |
| Net Assets | | |
| Beginning of Period | 243,726 | 206,048 |
| End of Period | 438,210 | 243,726 |
See accompanying Notes, which are an integral part of the Financial Statements.
For a Share Outstanding
Throughout Each Period | Year Ended November 30, |
| 2024 | 2023 | 2022 | 2021 | 2020 |
| Net Asset Value, Beginning of Period | $117.74 | $111.98 | $122.20 | $94.79 | $84.21 |
| Investment Operations | | | | | |
| Net Investment Income1 | 1.809 | 1.818 | 1.562 | 1.403 | 1.291 |
| Net Realized and Unrealized Gain (Loss) on Investments | 31.358 | 5.667 | (10.356) | 27.292 | 10.428 |
| Total from Investment Operations | 33.167 | 7.485 | (8.794) | 28.695 | 11.719 |
| Distributions | | | | | |
| Dividends from Net Investment Income | (1.857) | (1.725) | (1.426) | (1.285) | (1.139) |
| Distributions from Realized Capital Gains | — | — | — | — | — |
| Total Distributions | (1.857) | (1.725) | (1.426) | (1.285) | (1.139) |
| Net Asset Value, End of Period | $149.05 | $117.74 | $111.98 | $122.20 | $94.79 |
| Total Return | 28.35% | 6.84% | -7.15% | 30.42% | 14.29% |
| Ratios/Supplemental Data | | | | | |
| Net Assets, End of Period (Millions) | $438 | $244 | $206 | $144 | $55 |
| Ratio of Total Expenses to Average Net Assets | 0.13%2 | 0.13%2 | 0.13% | 0.13% | 0.13% |
| Ratio of Net Investment Income to Average Net Assets | 1.34% | 1.64% | 1.43% | 1.21% | 1.59% |
| Portfolio Turnover Rate | 44%3 | 55%3 | 49%3 | 56%3 | 58% |
| 1 | Calculated based on average shares outstanding. |
| 2 | The ratio of expenses to average net assets for the period net of reduction from custody fee offset arrangements was 0.13%. |
| 3 | Excludes the value of portfolio securities received or delivered as a result of in-kind purchases or redemptions of the fund’s capital shares, including ETF Creation Units. |
See accompanying Notes, which are an integral part of the Financial Statements.
Notes to Financial Statements
Vanguard U.S. Quality Factor ETF is registered under the Investment Company Act of 1940 as an open-end investment company, or mutual fund. ETF Shares are listed for trading on Cboe BZX Exchange, Inc.; they can be purchased and sold through a broker.
| A. | The following significant accounting policies conform to generally accepted accounting principles for U.S. investment companies. The fund consistently follows such policies in preparing its financial statements. |
1. Security Valuation: Securities are valued as of the close of trading on the New York Stock Exchange (generally 4 p.m., Eastern time) on the valuation date. Equity securities are valued at the latest quoted sales prices or official closing prices taken from the primary market in which each security trades; such securities not traded on the valuation date are valued at the mean of the latest quoted bid and asked prices. Securities for which market quotations are not readily available, or whose values have been affected by events occurring before the fund’s pricing time but after the close of the securities’ primary markets, are valued by methods deemed by the valuation designee to represent fair value and subject to oversight by the board of trustees. Investments in Vanguard Market Liquidity Fund are valued at that fund's net asset value.
2. Futures Contracts: The fund uses index futures contracts to a limited extent, with the objective of maintaining full exposure to the stock market while maintaining liquidity. The fund may purchase or sell futures contracts to achieve a desired level of investment, whether to accommodate portfolio turnover or cash flows from capital share transactions. The primary risks associated with the use of futures contracts are imperfect correlation between changes in market values of stocks held by the fund and the prices of futures contracts, and the possibility of an illiquid market. Counterparty risk involving futures is mitigated because a regulated clearinghouse is the counterparty instead of the clearing broker. To further mitigate counterparty risk, the fund trades futures contracts on an exchange, monitors the financial strength of its clearing brokers and clearinghouse, and has entered into clearing agreements with its clearing brokers. The clearinghouse imposes initial margin requirements to secure the fund’s performance and requires daily settlement of variation margin representing changes in the market value of each contract. Any securities pledged as initial margin for open contracts are noted in the Schedule of Investments.
Futures contracts are valued at their quoted daily settlement prices. The notional amounts of the contracts are not recorded in the Statement of Assets and Liabilities. Fluctuations in the value of the contracts are recorded in the Statement of Assets and Liabilities as an asset (liability) and in the Statement of Operations as unrealized appreciation (depreciation) until the contracts are closed, when they are recorded as realized gains (losses) on futures contracts.
During the year ended November 30, 2024, the fund’s average investments in long and short futures contracts represented less than 1% and 0% of net assets, respectively, based on the average of the notional amounts at each quarter-end during the period.
3. Federal Income Taxes: The fund intends to continue to qualify as a regulated investment company and distribute virtually all of its taxable income. The fund’s tax returns are open to examination by the relevant tax authorities until expiration of the applicable statute of limitations, which is generally three years after the filing of the tax return. Management has analyzed the fund’s tax positions taken for all open federal and state income tax years, and has concluded that no provision for income tax is required in the fund’s financial statements.
4. Distributions: Distributions to shareholders are recorded on the ex-dividend date. Distributions are determined on a tax basis at the fiscal year-end and may differ from net investment income and realized capital gains for financial reporting purposes.
5. Securities Lending: To earn additional income, the fund lends its securities to qualified institutional borrowers. Security loans are subject to termination by the fund at any time, and are required to be secured at all times by collateral in an amount at least equal to the market value of securities loaned. Daily market fluctuations could cause the value of loaned securities to be more or less than the value of the collateral received. When this occurs, the collateral is adjusted and settled before the opening of the market on the next business day. The fund further mitigates its counterparty risk by entering into securities lending transactions only with a diverse group of prequalified counterparties, monitoring their financial strength, and entering into master securities lending agreements with its counterparties. The master securities lending agreements provide that, in the event of a counterparty’s default (including bankruptcy), the fund may terminate any loans with that borrower, determine the net amount owed, and sell or retain the collateral up to the net amount owed to the fund; however, such actions may be subject to legal proceedings. While collateral mitigates counterparty risk, in the event of a default, the fund may experience delays and costs in recovering the securities loaned. The fund invests cash collateral received in Vanguard Market Liquidity Fund, and records a liability in the Statement of Assets and Liabilities for the return of the collateral, during the period the securities are on loan. Collateral investments in Vanguard Market Liquidity Fund are subject to market appreciation or depreciation. Securities lending income represents fees charged to borrowers plus income earned on invested cash collateral, less expenses associated with the loan. During the term of the loan, the fund is entitled to all distributions made on or in respect of the loaned securities.
6. Credit Facilities and Interfund Lending Program: The fund and certain other funds managed by The Vanguard Group ("Vanguard") participate in a $4.3 billion committed credit facility provided by a syndicate of lenders pursuant to a credit agreement and an uncommitted credit facility provided by Vanguard. Both facilities may be renewed annually. Each fund is individually liable for its borrowings, if any, under the credit facilities. Borrowings may be utilized for temporary or emergency purposes and are subject to the fund’s regulatory and contractual borrowing restrictions. With respect to the committed credit facility, the participating funds are charged administrative fees and an annual commitment fee of 0.10% of the undrawn committed amount of the facility, which are allocated to the funds based on a method approved by the fund’s board of trustees and included in Management and Administrative expenses on the fund’s Statement of Operations. Any borrowings under either facility bear interest at an agreed-upon spread plus the higher of the federal funds effective rate, the overnight bank funding rate, or the Daily Simple Secured Overnight Financing Rate inclusive of an additional agreed-upon spread. However, borrowings under the uncommitted credit facility may bear interest based upon an alternate rate agreed to by the fund and Vanguard.
In accordance with an exemptive order (the “Order”) from the SEC, the fund may participate in a joint lending and borrowing program that allows registered open-end Vanguard funds to borrow money from and lend money to each other for temporary or emergency purposes (the “Interfund Lending Program”), subject to compliance with the terms and conditions of the Order, and to the extent permitted by the fund’s investment objective and investment policies. Interfund loans and borrowings normally extend overnight but can have a maximum duration of seven days. Loans may be
called on one business day’s notice. The interest rate to be charged is governed by the conditions of the Order and internal procedures adopted by the board of trustees. The board of trustees is responsible for overseeing the Interfund Lending Program.
For the year ended November 30, 2024, the fund did not utilize the credit facilities or the Interfund Lending Program.
7. Other: Dividend income is recorded on the ex-dividend date. Non-cash dividends included in income, if any, are recorded at the fair value of the securities received. Interest income includes income distributions received from Vanguard Market Liquidity Fund and is accrued daily. Security transactions are accounted for on the date securities are bought or sold. Costs used to determine realized gains (losses) on the sale of investment securities are those of the specific securities sold.
| B. | In accordance with the terms of a Funds' Service Agreement (the “FSA”) between Vanguard and the fund, Vanguard furnishes to the fund investment advisory, corporate management, administrative, marketing, and distribution services at Vanguard’s cost of operations (as defined by the FSA). These costs of operations are allocated to the fund based on methods and guidelines approved by the board of trustees and are generally settled twice a month. |
Upon the request of Vanguard, the fund may invest up to 0.40% of its net assets as capital in Vanguard. At November 30, 2024, the fund had contributed to Vanguard capital in the amount of $11,000, representing less than 0.01% of the fund’s net assets and less than 0.01% of Vanguard’s capital received pursuant to the FSA. The fund’s trustees and officers are also directors and employees, respectively, of Vanguard.
| C. | The fund’s custodian bank has agreed to reduce its fees when the fund maintains cash on deposit in the non-interest-bearing custody account. For the year ended November 30, 2024, custodian fee offset arrangements reduced the fund’s expenses by $2,000 (an annual rate of less than 0.01% of average net assets). |
| D. | Various inputs may be used to determine the value of the fund’s investments and derivatives. These inputs are summarized in three broad levels for financial statement purposes. The inputs or methodologies used to value securities are not necessarily an indication of the risk associated with investing in those securities. |
Level 1—Quoted prices in active markets for identical securities.
Level 2—Other significant observable inputs (including quoted prices for similar securities, interest rates, prepayment speeds, credit risk, etc.).
Level 3—Significant unobservable inputs (including the fund’s own assumptions used to determine the fair value of investments). Any investments and derivatives valued with significant unobservable inputs are noted on the Schedule of Investments.
At November 30, 2024, 100% of the market value of the fund’s investments and derivatives was determined based on Level 1 inputs.
| E. | Permanent differences between book-basis and tax-basis components of net assets are reclassified among capital accounts in the financial statements to reflect their tax character. These reclassifications have no effect on net assets or net asset value per share. As of period end, permanent differences primarily attributable to the accounting for in-kind redemptions and passive foreign investment companies were reclassified between the following accounts: |
| | Amount
($000) |
| Paid-in Capital | 13,672 |
| Total Distributable Earnings (Loss) | (13,672) |
Temporary differences between book-basis and tax-basis components of total distributable earnings (loss) arise when certain items of income, gain, or loss are recognized in different periods for financial statement and tax purposes; these differences will reverse at some time in the future. The differences are primarily related to capital loss carryforwards; the deferral of losses from wash sales; and the recognition of unrealized gains or losses from certain derivative contracts. As of period end, the tax-basis components of total distributable earnings (loss) are detailed in the table as follows:
| | Amount
($000) |
| Undistributed Ordinary Income | 755 |
| Undistributed Long-Term Gains | — |
| Net Unrealized Gains (Losses) | 79,818 |
| Capital Loss Carryforwards | (21,318) |
| Qualified Late-Year Losses | — |
| Other Temporary Differences | — |
| Total | 59,255 |
The tax character of distributions paid was as follows:
| | Year Ended November 30, |
| | 2024
Amount
($000) | 2023
Amount
($000) |
| Ordinary Income* | 4,552 | 3,512 |
| Long-Term Capital Gains | — | — |
| Total | 4,552 | 3,512 |
| * | Includes short-term capital gains, if any. |
As of November 30, 2024, gross unrealized appreciation and depreciation for investments and derivatives based on cost for U.S. federal income tax purposes were as follows:
| | Amount
($000) |
| Tax Cost | 357,936 |
| Gross Unrealized Appreciation | 90,926 |
| Gross Unrealized Depreciation | (11,108) |
| Net Unrealized Appreciation (Depreciation) | 79,818 |
| F. | During the year ended November 30, 2024, the fund purchased $294,773,000 of investment securities and sold $149,791,000 of investment securities, other than temporary cash investments. In addition, the fund purchased and sold investment securities of $0 and $26,375,000, respectively, in connection with in-kind purchases and redemptions of the fund's capital shares. |
The fund purchased securities from and sold securities to other Vanguard funds or accounts managed by Vanguard or its affiliates, in accordance with procedures adopted by the board of trustees in compliance with Rule 17a-7 of the Investment Company Act of 1940. For the year ended November 30, 2024, such purchases were $2,532,000 and sales were $1,783,000, resulting in net realized gain of $392,000; these amounts, other than temporary cash investments, are included in the purchases and sales of investment securities noted above.
| G. | Capital shares issued and redeemed were: |
| | Year Ended November 30, |
| | 2024
Shares
(000) | 2023
Shares
(000) |
| Issued | 1,070 | 665 |
| Issued in Lieu of Cash Distributions | — | — |
| Redeemed | (200) | (435) |
| Net Increase (Decrease) in Shares Outstanding | 870 | 230 |
| H. | Significant market disruptions, such as those caused by pandemics, natural or environmental disasters, war, acts of terrorism, or other events, can adversely affect local and global markets and normal market operations. Any such disruptions could have an adverse impact on the value of the fund’s investments and fund performance. |
To the extent the fund’s investment portfolio reflects concentration in a particular market, industry, sector, country or asset class, the fund may be adversely affected by the performance of these concentrations and may be subject to increased price volatility and other risks.
The use of derivatives may expose the fund to various risks. Derivatives can be highly volatile, and any initial investment is generally small relative to the notional amount so that transactions may be leveraged in terms of market exposure. A relatively small market movement may have a potentially larger impact on derivatives than on standard securities. Leveraged derivatives positions can, therefore, increase volatility. Additional information regarding the fund’s use of derivative(s) and the specific risks associated is described under significant accounting policies.
At November 30, 2024, one shareholder was a record or beneficial owner of 46% of the fund’s net assets. If this shareholder were to redeem its investment in the fund, the redemption might result in an increase in the fund’s expense ratio, cause the fund to incur higher transaction costs, or lead to the realization of taxable capital gains.
| I. | Management has determined that no events or transactions occurred subsequent to November 30, 2024, that would require recognition or disclosure in these financial statements. |
Schedule of Investments
As of November 30, 2024
The fund files its complete schedule of portfolio holdings with the Securities and Exchange Commission (SEC) for the first and third quarters of each fiscal year as an exhibit to its reports on Form N-PORT. The fund’s Form N-PORT reports are available on the SEC’s website at www.sec.gov.
| | | Shares | Market
Value•
($000) |
| Common Stocks (99.7%) |
| Basic Materials (5.3%) |
| | Newmont Corp. (XNYS) | 84,842 | 3,558 |
| | Freeport-McMoRan Inc. | 66,540 | 2,941 |
| | Nucor Corp. | 17,466 | 2,702 |
| | LyondellBasell Industries NV Class A | 23,928 | 1,994 |
| | Mueller Industries Inc. | 22,870 | 1,847 |
| | Mosaic Co. | 67,427 | 1,784 |
| * | SSR Mining Inc. (XTSE) | 290,777 | 1,689 |
| | Commercial Metals Co. | 26,828 | 1,655 |
| | AdvanSix Inc. | 45,723 | 1,485 |
| | CF Industries Holdings Inc. | 16,415 | 1,472 |
| | Koppers Holdings Inc. | 37,641 | 1,448 |
| | Sylvamo Corp. | 14,055 | 1,297 |
| | Tronox Holdings plc | 105,597 | 1,278 |
| * | Ecovyst Inc. | 158,499 | 1,260 |
| | Celanese Corp. | 16,859 | 1,234 |
| | Ryerson Holding Corp. | 47,054 | 1,209 |
| | Steel Dynamics Inc. | 8,301 | 1,206 |
| * | Metallus Inc. | 67,121 | 1,119 |
| * | Cleveland-Cliffs Inc. | 78,817 | 981 |
| | Olin Corp. | 22,535 | 960 |
| | Orion SA | 49,577 | 913 |
| | UFP Industries Inc. | 6,600 | 897 |
| | Ashland Inc. | 10,842 | 846 |
| * | Constellium SE | 68,753 | 843 |
| | Olympic Steel Inc. | 19,317 | 817 |
| * | Clearwater Paper Corp. | 29,053 | 788 |
| | Mativ Holdings Inc. | 50,790 | 668 |
| | Timken Co. | 8,578 | 664 |
| | Eastman Chemical Co. | 6,192 | 648 |
| * | LSB Industries Inc. | 72,953 | 644 |
| | Minerals Technologies Inc. | 7,527 | 614 |
| * | Rayonier Advanced Materials Inc. | 69,296 | 610 |
| | FutureFuel Corp. | 81,212 | 423 |
| | Kaiser Aluminum Corp. | 4,744 | 386 |
| | FMC Corp. | 6,028 | 356 |
| | Stepan Co. | 3,739 | 287 |
| * | Magnera Corp. | 12,088 | 248 |
| * | Intrepid Potash Inc. | 8,506 | 231 |
| | Element Solutions Inc. | 7,626 | 219 |
| | International Paper Co. | 3,512 | 207 |
| | Reliance Inc. | 562 | 181 |
| | | | 44,609 |
| Consumer Discretionary (15.0%) |
| | General Motors Co. | 135,998 | 7,560 |
| | Ford Motor Co. | 499,363 | 5,558 |
| | Walt Disney Co. | 32,373 | 3,803 |
| | Fox Corp. Class B | 65,670 | 2,937 |
| | Perdoceo Education Corp. | 98,945 | 2,716 |
| * | United Airlines Holdings Inc. | 24,747 | 2,396 |
| | Target Corp. | 17,273 | 2,285 |
| | DR Horton Inc. | 12,574 | 2,122 |
| * | Alaska Air Group Inc. | 39,984 | 2,103 |
| * | AutoZone Inc. | 651 | 2,063 |
| | Travel & Leisure Co. | 35,649 | 1,992 |
| | Delta Air Lines Inc. | 30,874 | 1,970 |
| | BorgWarner Inc. (XNYS) | 54,459 | 1,869 |
| | TEGNA Inc. | 96,844 | 1,818 |
| | Macy's Inc. | 110,348 | 1,792 |
| | PVH Corp. | 16,305 | 1,767 |
| | | Shares | Market
Value•
($000) |
| * | Carnival Corp. | 67,811 | 1,724 |
| | Whirlpool Corp. | 14,980 | 1,669 |
| * | Helen of Troy Ltd. | 22,696 | 1,664 |
| | Boyd Gaming Corp. | 22,031 | 1,627 |
| | Bath & Body Works Inc. | 43,892 | 1,591 |
| * | Tri Pointe Homes Inc. | 36,197 | 1,576 |
| | KB Home | 18,998 | 1,572 |
| | Leggett & Platt Inc. | 124,183 | 1,563 |
| | U-Haul Holding Co. | 23,684 | 1,479 |
| | Lennar Corp. Class B | 8,639 | 1,424 |
| * | M/I Homes Inc. | 8,549 | 1,411 |
| * | Chegg Inc. | 658,158 | 1,389 |
| * | Sally Beauty Holdings Inc. | 93,686 | 1,305 |
| | Dine Brands Global Inc. | 36,253 | 1,302 |
| * | American Axle & Manufacturing Holdings Inc. | 196,887 | 1,301 |
| | Newell Brands Inc. | 135,569 | 1,300 |
| | Playtika Holding Corp. | 154,245 | 1,299 |
| | Toll Brothers Inc. | 7,827 | 1,293 |
| * | G-III Apparel Group Ltd. | 43,423 | 1,287 |
| * | Asbury Automotive Group Inc. | 4,948 | 1,286 |
| * | Sun Country Airlines Holdings Inc. | 88,089 | 1,268 |
| * | Capri Holdings Ltd. | 53,209 | 1,246 |
| * | Adient plc | 64,346 | 1,237 |
| | Century Communities Inc. | 13,424 | 1,213 |
| * | ODP Corp. | 46,962 | 1,206 |
| | American Eagle Outfitters Inc. | 61,868 | 1,190 |
| | LKQ Corp. | 30,166 | 1,185 |
| | Lear Corp. | 11,983 | 1,172 |
| * | Malibu Boats Inc. Class A | 26,939 | 1,168 |
| | La-Z-Boy Inc. | 25,667 | 1,162 |
| * | SkyWest Inc. | 9,738 | 1,117 |
| * | Adtalem Global Education Inc. | 11,650 | 1,065 |
| * | Genesco Inc. | 31,436 | 1,056 |
| * | Goodyear Tire & Rubber Co. | 97,610 | 1,048 |
| * | Dollar Tree Inc. | 14,310 | 1,020 |
| | Dana Inc. | 99,942 | 999 |
| | Phinia Inc. | 17,385 | 975 |
| * | Coty Inc. Class A | 130,826 | 967 |
| | Marriott Vacations Worldwide Corp. | 9,560 | 949 |
| * | National Vision Holdings Inc. | 76,282 | 923 |
| | Standard Motor Products Inc. | 27,495 | 904 |
| | Gray Television Inc. | 210,776 | 900 |
| | MillerKnoll Inc. | 35,587 | 895 |
| | Academy Sports & Outdoors Inc. | 17,875 | 880 |
| * | Aptiv plc | 15,571 | 865 |
| | Haverty Furniture Cos. Inc. | 36,400 | 859 |
| * | Hanesbrands Inc. | 96,761 | 842 |
| | Gap Inc. | 34,275 | 831 |
| | Scholastic Corp. | 31,145 | 822 |
| | PulteGroup Inc. | 5,931 | 802 |
| | Caleres Inc. | 25,192 | 783 |
| * | Leslie's Inc. | 334,849 | 770 |
| * | Foot Locker Inc. | 29,195 | 734 |
| * | Beazer Homes USA Inc. | 20,687 | 723 |
| * | Urban Outfitters Inc. | 14,113 | 688 |
| * | Mattel Inc. | 34,972 | 665 |
| | Build-A-Bear Workshop Inc. | 16,763 | 637 |
| * | Denny's Corp. | 96,962 | 636 |
| | Lennar Corp. Class A | 3,375 | 589 |
| * | Topgolf Callaway Brands Corp. | 66,878 | 563 |
| * | Five Below Inc. | 6,057 | 562 |
| * | Crocs Inc. | 5,251 | 555 |
| | Upbound Group Inc. | 16,116 | 554 |
| * | Fox Factory Holding Corp. | 16,645 | 541 |
| | Movado Group Inc. | 26,484 | 539 |
| | Matthews International Corp. Class A | 17,288 | 521 |
| * | Dave & Buster's Entertainment Inc. | 13,176 | 518 |
| * | Central Garden & Pet Co. Class A | 14,900 | 504 |
| * | Taylor Morrison Home Corp. | 6,775 | 501 |
| | Wynn Resorts Ltd. | 5,294 | 500 |
| | | Shares | Market
Value•
($000) |
| * | Warner Bros Discovery Inc. | 46,979 | 492 |
| | Polaris Inc. | 7,087 | 489 |
| | Group 1 Automotive Inc. | 1,142 | 486 |
| | Dollar General Corp. | 6,117 | 473 |
| | Graham Holdings Co. Class B | 488 | 454 |
| | Nexstar Media Group Inc. | 2,539 | 433 |
| * | EW Scripps Co. Class A | 213,271 | 427 |
| | J Jill Inc. | 14,606 | 403 |
| * | Norwegian Cruise Line Holdings Ltd. | 14,959 | 402 |
| * | Eastman Kodak Co. | 51,816 | 376 |
| | Tapestry Inc. | 5,883 | 366 |
| | eBay Inc. | 5,573 | 353 |
| * | Under Armour Inc. Class C | 39,673 | 348 |
| | Meritage Homes Corp. | 1,781 | 340 |
| * | Driven Brands Holdings Inc. | 18,880 | 318 |
| * | United Parks & Resorts Inc. | 5,327 | 312 |
| | Steelcase Inc. Class A | 22,982 | 310 |
| | Bloomin' Brands Inc. | 19,756 | 275 |
| * | Xponential Fitness Inc. Class A | 17,800 | 271 |
| * | MarineMax Inc. | 7,713 | 265 |
| * | Despegar.com Corp. | 13,920 | 249 |
| | Harley-Davidson Inc. | 6,049 | 203 |
| * | Visteon Corp. | 2,149 | 201 |
| | International Game Technology plc | 9,436 | 181 |
| * | Hilton Grand Vacations Inc. | 4,168 | 177 |
| * | Penn Entertainment Inc. | 8,154 | 176 |
| | Six Flags Entertainment Corp. | 3,609 | 167 |
| | Sirius XM Holdings Inc. | 6,057 | 163 |
| | Shoe Carnival Inc. | 4,735 | 160 |
| | | | 125,932 |
| Consumer Staples (6.4%) |
| | Altria Group Inc. | 152,717 | 8,818 |
| | CVS Health Corp. | 100,207 | 5,997 |
| | McKesson Corp. | 5,483 | 3,446 |
| | Ingles Markets Inc. Class A | 26,201 | 1,936 |
| | Ingredion Inc. | 13,062 | 1,925 |
| | Bunge Global SA | 21,366 | 1,917 |
| | Kroger Co. | 30,330 | 1,853 |
| | Kraft Heinz Co. | 54,072 | 1,729 |
| | Molson Coors Beverage Co. Class B | 27,739 | 1,721 |
| | Archer-Daniels-Midland Co. | 29,800 | 1,627 |
| | Seaboard Corp. | 582 | 1,521 |
| * | Darling Ingredients Inc. | 35,285 | 1,430 |
| | Nu Skin Enterprises Inc. Class A | 194,280 | 1,418 |
| * | United Natural Foods Inc. | 53,250 | 1,322 |
| * | Hain Celestial Group Inc. | 158,983 | 1,315 |
| | Fresh Del Monte Produce Inc. | 36,575 | 1,234 |
| | B&G Foods Inc. | 183,057 | 1,223 |
| | Tyson Foods Inc. Class A | 18,619 | 1,201 |
| | SpartanNash Co. | 61,073 | 1,159 |
| | Philip Morris International Inc. | 8,525 | 1,134 |
| | Andersons Inc. | 23,685 | 1,131 |
| | J M Smucker Co. | 9,605 | 1,131 |
| | Conagra Brands Inc. | 39,294 | 1,083 |
| | Weis Markets Inc. | 14,168 | 1,032 |
| * | Grocery Outlet Holding Corp. | 47,139 | 990 |
| | Dole plc | 57,236 | 863 |
| | Edgewell Personal Care Co. | 23,153 | 847 |
| | ACCO Brands Corp. | 144,340 | 840 |
| | Mondelez International Inc. Class A | 7,276 | 473 |
| * | Pilgrim's Pride Corp. | 6,811 | 352 |
| * | Post Holdings Inc. | 2,689 | 324 |
| * | Herbalife Ltd. | 35,365 | 275 |
| * | Olaplex Holdings Inc. | 107,277 | 207 |
| | | | 53,474 |
| Energy (13.6%) |
| | Exxon Mobil Corp. | 57,287 | 6,758 |
| | EOG Resources Inc. | 47,346 | 6,309 |
| | Chevron Corp. | 36,983 | 5,989 |
| | | Shares | Market
Value•
($000) |
| | Phillips 66 | 42,076 | 5,637 |
| | Schlumberger NV | 127,285 | 5,593 |
| | Valero Energy Corp. | 37,902 | 5,271 |
| | ConocoPhillips | 47,782 | 5,177 |
| | Marathon Petroleum Corp. | 26,925 | 4,204 |
| | Williams Cos. Inc. | 58,955 | 3,450 |
| | Occidental Petroleum Corp. | 57,440 | 2,905 |
| | Ovintiv Inc. (XNYS) | 53,431 | 2,427 |
| | Diamondback Energy Inc. | 13,485 | 2,395 |
| | Murphy Oil Corp. | 65,641 | 2,131 |
| | Noble Corp. plc | 57,608 | 1,928 |
| | SM Energy Co. | 42,300 | 1,912 |
| * | Gulfport Energy Corp. | 10,256 | 1,803 |
| | DTE Midstream LLC | 16,868 | 1,790 |
| | Crescent Energy Co. Class A | 116,220 | 1,728 |
| | Civitas Resources Inc. | 32,928 | 1,708 |
| | NOV Inc. | 105,616 | 1,692 |
| | Coterra Energy Inc. | 62,882 | 1,680 |
| | EQT Corp. | 36,962 | 1,680 |
| | Matador Resources Co. | 27,720 | 1,663 |
| * | ProPetro Holding Corp. | 190,430 | 1,600 |
| | APA Corp. | 68,655 | 1,555 |
| | Permian resources Corp. | 94,413 | 1,479 |
| | Warrior Met Coal Inc. | 20,874 | 1,468 |
| * | Seadrill Ltd. | 34,948 | 1,420 |
| | Alpha Metallurgical Resources Inc. | 5,702 | 1,400 |
| | SunCoke Energy Inc. | 111,006 | 1,383 |
| | Chord Energy Corp. | 10,524 | 1,342 |
| | CONSOL Energy Inc. | 10,103 | 1,320 |
| * | Par Pacific Holdings Inc. | 69,117 | 1,205 |
| * | Kosmos Energy Ltd. | 300,825 | 1,185 |
| * | Antero Resources Corp. | 36,081 | 1,179 |
| | World Kinect Corp. | 39,378 | 1,140 |
| | HF Sinclair Corp. | 27,220 | 1,114 |
| | Patterson-UTI Energy Inc. | 130,789 | 1,099 |
| | Kinder Morgan Inc. | 38,204 | 1,080 |
| | California Resources Corp. | 17,555 | 1,039 |
| | SandRidge Energy Inc. | 78,919 | 926 |
| | Range Resources Corp. | 25,762 | 921 |
| | Berry Corp. | 216,647 | 884 |
| * | Helix Energy Solutions Group Inc. | 81,928 | 876 |
| * | DNOW Inc. | 54,979 | 827 |
| | Select Water Solutions Inc. | 54,054 | 798 |
| | Riley Exploration Permian Inc. | 22,222 | 780 |
| * | Bristow Group Inc. | 20,314 | 776 |
| | Northern Oil & Gas Inc. | 15,633 | 680 |
| | Devon Energy Corp. | 16,712 | 634 |
| * | MRC Global Inc. | 42,559 | 595 |
| | PBF Energy Inc. Class A | 18,852 | 594 |
| * | Oil States International Inc. | 103,463 | 569 |
| | Halliburton Co. | 17,823 | 568 |
| | VAALCO Energy Inc. | 108,115 | 554 |
| * | Green Plains Inc. | 49,970 | 540 |
| * | Expro Group Holdings NV | 37,444 | 520 |
| * | TETRA Technologies Inc. | 128,460 | 495 |
| | Peabody Energy Corp. | 19,367 | 462 |
| * | DMC Global Inc. | 57,087 | 460 |
| | Liberty Energy Inc. | 21,008 | 387 |
| * | Talos Energy Inc. | 32,199 | 362 |
| * | REX American Resources Corp. | 8,133 | 352 |
| | Weatherford International plc | 4,170 | 343 |
| * | Newpark Resources Inc. | 40,340 | 337 |
| * | Amplify Energy Corp. | 43,587 | 292 |
| * | Tidewater Inc. | 5,314 | 275 |
| | ONEOK Inc. | 2,031 | 231 |
| * | Shoals Technologies Group Inc. Class A | 44,257 | 231 |
| * | Hallador Energy Co. | 17,712 | 216 |
| | | | 114,323 |
| | | Shares | Market
Value•
($000) |
| Financials (26.3%) |
| | Bank of America Corp. | 148,780 | 7,069 |
| | US Bancorp | 120,733 | 6,434 |
| | Citigroup Inc. | 89,117 | 6,316 |
| | Truist Financial Corp. | 132,245 | 6,305 |
| | Wells Fargo & Co. | 81,513 | 6,209 |
| | Unum Group | 68,995 | 5,306 |
| | JPMorgan Chase & Co. | 19,975 | 4,988 |
| | Bank of New York Mellon Corp. | 54,178 | 4,436 |
| | MetLife Inc. | 48,696 | 4,296 |
| | Travelers Cos. Inc. | 15,901 | 4,230 |
| | Goldman Sachs Group Inc. | 6,908 | 4,204 |
| | American International Group Inc. | 53,692 | 4,128 |
| | Chubb Ltd. | 12,874 | 3,717 |
| | Morgan Stanley | 24,123 | 3,175 |
| | Essent Group Ltd. | 54,577 | 3,153 |
| | Columbia Banking System Inc. | 100,947 | 3,130 |
| | PNC Financial Services Group Inc. | 13,939 | 2,993 |
| | Lincoln National Corp. | 78,183 | 2,779 |
| | Everest Group Ltd. | 6,391 | 2,477 |
| | Axis Capital Holdings Ltd. | 25,525 | 2,375 |
| | Prudential Financial Inc. | 18,147 | 2,348 |
| | Allstate Corp. | 11,192 | 2,321 |
| | Webster Financial Corp. | 36,402 | 2,249 |
| | MGIC Investment Corp. | 84,673 | 2,224 |
| | Radian Group Inc. | 61,665 | 2,207 |
| | Ally Financial Inc. | 54,047 | 2,161 |
| | Old National Bancorp | 89,169 | 2,065 |
| | S&T Bancorp Inc. | 47,242 | 2,022 |
| * | Brighthouse Financial Inc. | 38,238 | 1,999 |
| | Synovus Financial Corp. | 34,175 | 1,950 |
| | First Financial Bancorp | 62,534 | 1,847 |
| | FNB Corp. | 107,001 | 1,835 |
| | Associated Banc-Corp. | 68,245 | 1,821 |
| | M&T Bank Corp. | 7,979 | 1,755 |
| | Hancock Whitney Corp. | 29,523 | 1,753 |
| | KeyCorp | 89,414 | 1,742 |
| | WaFd Inc. | 46,181 | 1,689 |
| | Affiliated Managers Group Inc. | 8,999 | 1,688 |
| | Jefferies Financial Group Inc. | 21,306 | 1,686 |
| | RenaissanceRe Holdings Ltd. | 5,735 | 1,641 |
| | Bread Financial Holdings Inc. | 27,557 | 1,621 |
| * | Genworth Financial Inc. | 203,441 | 1,587 |
| | Zions Bancorp NA | 26,077 | 1,578 |
| | Franklin Resources Inc. | 69,281 | 1,577 |
| | Enterprise Financial Services Corp. | 25,739 | 1,560 |
| | Western Alliance Bancorp | 16,328 | 1,528 |
| | Invesco Ltd. | 83,591 | 1,512 |
| | Cadence Bank | 39,483 | 1,508 |
| * | Metropolitan Bank Holding Corp. | 22,741 | 1,477 |
| | Comerica Inc. | 19,538 | 1,412 |
| | Aflac Inc. | 12,334 | 1,406 |
| | Ameris Bancorp | 19,996 | 1,405 |
| | Arch Capital Group Ltd. | 13,801 | 1,390 |
| | OceanFirst Financial Corp. | 66,316 | 1,371 |
| | BankUnited Inc. | 32,008 | 1,347 |
| | Stifel Financial Corp. | 11,285 | 1,307 |
| | Jackson Financial Inc. Class A | 12,662 | 1,269 |
| | Peoples Bancorp Inc. | 34,012 | 1,193 |
| | Veritex Holdings Inc. | 38,920 | 1,184 |
| | Citizens Financial Group Inc. | 24,460 | 1,178 |
| | First Citizens BancShares Inc. Class A | 513 | 1,177 |
| | CNA Financial Corp. | 22,874 | 1,154 |
| | Dime Community Bancshares Inc. | 31,739 | 1,139 |
| | Pinnacle Financial Partners Inc. | 8,911 | 1,133 |
| | Old Republic International Corp. | 29,049 | 1,132 |
| | Fidelity National Financial Inc. | 17,659 | 1,119 |
| | Banc of California Inc. | 64,192 | 1,106 |
| | First Horizon Corp. | 51,383 | 1,086 |
| | Bank OZK | 21,320 | 1,065 |
| | | Shares | Market
Value•
($000) |
| * | Mr. Cooper Group Inc. | 10,746 | 1,060 |
| | Eagle Bancorp Inc. | 35,751 | 1,050 |
| | Navient Corp. | 64,670 | 1,008 |
| | First Commonwealth Financial Corp. | 53,462 | 1,007 |
| | WesBanco Inc. | 28,083 | 992 |
| * | Customers Bancorp Inc. | 17,271 | 975 |
| | Charles Schwab Corp. | 11,712 | 969 |
| | Pacific Premier Bancorp Inc. | 33,935 | 964 |
| | Globe Life Inc. | 8,615 | 958 |
| | Hanmi Financial Corp. | 35,219 | 932 |
| | Renasant Corp. | 24,612 | 926 |
| | Fulton Financial Corp. | 42,753 | 923 |
| | Universal Insurance Holdings Inc. | 40,132 | 908 |
| | Regions Financial Corp. | 32,987 | 899 |
| | East West Bancorp Inc. | 7,974 | 875 |
| | Banner Corp. | 11,566 | 863 |
| | Cathay General Bancorp | 16,436 | 855 |
| | First Busey Corp. | 31,660 | 845 |
| | Raymond James Financial Inc. | 4,921 | 833 |
| | Hope Bancorp Inc. | 59,108 | 805 |
| | Valley National Bancorp | 74,293 | 790 |
| | Stewart Information Services Corp. | 10,458 | 785 |
| | Atlantic Union Bankshares Corp. | 18,386 | 780 |
| | Bank of NT Butterfield & Son Ltd. | 19,965 | 757 |
| | NBT Bancorp Inc. | 14,613 | 732 |
| | BOK Financial Corp. | 6,089 | 724 |
| | Assured Guaranty Ltd. | 7,754 | 723 |
| * | Axos Financial Inc. | 8,599 | 712 |
| | 1st Source Corp. | 10,777 | 699 |
| | Janus Henderson Group plc | 15,233 | 690 |
| | SouthState Corp. | 6,052 | 670 |
| | First American Financial Corp. | 9,541 | 669 |
| | Berkshire Hills Bancorp Inc. | 21,895 | 667 |
| | James River Group Holdings Ltd. | 141,725 | 665 |
| | Trustmark Corp. | 16,902 | 661 |
| * | StoneX Group Inc. | 6,306 | 654 |
| | OneMain Holdings Inc. | 11,314 | 649 |
| | Independent Bank Corp. (XNGS) | 8,809 | 638 |
| | Nicolet Bankshares Inc. | 5,720 | 637 |
| | Eastern Bankshares Inc. | 34,117 | 636 |
| | Equitable Holdings Inc. | 13,108 | 632 |
| | First Interstate BancSystem Inc. Class A | 17,814 | 623 |
| | TrustCo Bank Corp. NY | 16,153 | 602 |
| | Byline Bancorp Inc. | 18,909 | 594 |
| | Merchants Bancorp | 14,210 | 587 |
| | Apollo Global Management Inc. | 3,356 | 587 |
| | ConnectOne Bancorp Inc. | 21,210 | 583 |
| 1 | Fidelis Insurance Holdings Ltd. | 27,113 | 557 |
| | White Mountains Insurance Group Ltd. | 276 | 555 |
| * | NMI Holdings Inc. | 13,847 | 554 |
| | Heritage Financial Corp. | 20,581 | 544 |
| | TriCo Bancshares | 11,160 | 539 |
| | Hartford Financial Services Group Inc. | 4,308 | 531 |
| | Brookline Bancorp Inc. | 42,122 | 530 |
| | Provident Financial Services Inc. | 23,619 | 499 |
| | Popular Inc. | 4,990 | 496 |
| | Burford Capital Ltd. | 35,920 | 490 |
| | Principal Financial Group Inc. | 5,379 | 468 |
| | First Merchants Corp. | 10,525 | 460 |
| | Employers Holdings Inc. | 8,519 | 455 |
| | Towne Bank | 12,369 | 453 |
| * | Enova International Inc. | 4,225 | 446 |
| | Enact Holdings Inc. | 12,591 | 443 |
| | Nelnet Inc. Class A | 4,045 | 441 |
| | Northwest Bancshares Inc. | 29,797 | 437 |
| * | Heritage Insurance Holdings Inc. | 34,308 | 426 |
| | First Foundation Inc. | 50,093 | 398 |
| | Preferred Bank | 4,151 | 392 |
| | Capitol Federal Financial Inc. | 58,265 | 389 |
| | Horace Mann Educators Corp. | 9,149 | 383 |
| | | Shares | Market
Value•
($000) |
| | OFG Bancorp | 8,440 | 383 |
| | PennyMac Financial Services Inc. | 3,512 | 376 |
| * | ProAssurance Corp. | 22,440 | 375 |
| | CNO Financial Group Inc. | 9,049 | 361 |
| | Hanover Insurance Group Inc. | 2,168 | 358 |
| * | SiriusPoint Ltd. | 22,792 | 351 |
| | Reinsurance Group of America Inc. | 1,527 | 349 |
| | Selective Insurance Group Inc. | 3,298 | 337 |
| | Origin Bancorp Inc. | 9,742 | 335 |
| * | LendingClub Corp. | 19,463 | 324 |
| * | Markel Group Inc. | 181 | 323 |
| | SLM Corp. | 11,792 | 323 |
| | QCR Holdings Inc. | 3,118 | 287 |
| * | PRA Group Inc. | 13,491 | 286 |
| * | Hamilton Insurance Group Ltd. Class B | 14,588 | 278 |
| | Carlyle Group Inc. | 5,131 | 273 |
| | Amalgamated Financial Corp. | 7,672 | 273 |
| * | Ambac Financial Group Inc. | 21,085 | 271 |
| | Old Second Bancorp Inc. | 14,544 | 271 |
| | Amerant Bancorp Inc. | 10,369 | 258 |
| | Westamerica BanCorp | 4,467 | 256 |
| | National Bank Holdings Corp. Class A | 4,918 | 235 |
| | Kemper Corp. | 3,102 | 222 |
| | State Street Corp. | 2,122 | 209 |
| | Home BancShares Inc. | 6,563 | 208 |
| * | World Acceptance Corp. | 1,580 | 191 |
| | United Community Banks Inc. | 5,480 | 185 |
| | Corebridge Financial Inc. | 5,615 | 182 |
| | Northfield Bancorp Inc. | 12,796 | 171 |
| | | | 221,174 |
| Health Care (8.1%) |
| | Pfizer Inc. | 218,078 | 5,716 |
| | Cigna Group | 14,864 | 5,021 |
| | HCA Healthcare Inc. | 14,595 | 4,776 |
| | Bristol-Myers Squibb Co. | 80,630 | 4,775 |
| | Gilead Sciences Inc. | 40,453 | 3,745 |
| | Medtronic plc | 35,809 | 3,099 |
| | Royalty Pharma plc Class A | 113,433 | 3,024 |
| | Viatris Inc. | 197,807 | 2,589 |
| | Becton Dickinson & Co. | 10,776 | 2,391 |
| | Cardinal Health Inc. | 18,362 | 2,245 |
| | Perrigo Co. plc | 71,263 | 2,034 |
| | Merck & Co. Inc. | 16,654 | 1,693 |
| * | Jazz Pharmaceuticals plc | 13,492 | 1,641 |
| | Dentsply Sirona Inc. | 81,279 | 1,597 |
| * | Pediatrix Medical Group Inc. | 95,075 | 1,422 |
| * | Pacira BioSciences Inc. | 83,626 | 1,414 |
| * | Owens & Minor Inc. | 103,960 | 1,400 |
| | Johnson & Johnson | 8,852 | 1,372 |
| * | Centene Corp. | 22,649 | 1,359 |
| * | AdaptHealth Corp. | 123,703 | 1,241 |
| * | United Therapeutics Corp. | 3,277 | 1,214 |
| * | Integra LifeSciences Holdings Corp. | 48,100 | 1,182 |
| | Universal Health Services Inc. Class B | 5,515 | 1,131 |
| * | Ironwood Pharmaceuticals Inc. | 286,770 | 1,009 |
| | Organon & Co. | 61,780 | 980 |
| * | Elanco Animal Health Inc. (XNYS) | 72,070 | 952 |
| * | Biogen Inc. | 5,672 | 911 |
| * | Teladoc Health Inc. | 72,765 | 872 |
| | Embecta Corp. | 40,400 | 842 |
| * | Envista Holdings Corp. | 35,833 | 799 |
| * | Varex Imaging Corp. | 46,127 | 769 |
| * | Alkermes plc | 22,489 | 653 |
| * | QuidelOrtho Corp. | 13,770 | 565 |
| * | Community Health Systems Inc. | 155,484 | 535 |
| | Humana Inc. | 1,593 | 472 |
| | Elevance Health Inc. | 1,031 | 420 |
| * | Zimvie Inc. | 23,988 | 354 |
| | Zimmer Biomet Holdings Inc. | 3,040 | 341 |
| | | Shares | Market
Value•
($000) |
| * | Enhabit Inc. | 37,704 | 291 |
| * | Inmode Ltd. | 14,239 | 278 |
| | Quest Diagnostics Inc. | 1,600 | 260 |
| | Thermo Fisher Scientific Inc. | 486 | 257 |
| * | Regeneron Pharmaceuticals Inc. | 335 | 251 |
| * | Acadia Healthcare Co. Inc. | 4,927 | 200 |
| | Premier Inc. Class A | 8,152 | 187 |
| * | Amneal Pharmaceuticals Inc. | 21,213 | 175 |
| | | | 68,454 |
| Industrials (15.1%) |
| | FedEx Corp. | 25,174 | 7,619 |
| | Capital One Financial Corp. | 34,371 | 6,600 |
| * | Fiserv Inc. | 18,998 | 4,198 |
| | PACCAR Inc. | 33,279 | 3,894 |
| | Ryder System Inc. | 21,678 | 3,660 |
| | Air Lease Corp. | 69,870 | 3,556 |
| | Synchrony Financial | 51,328 | 3,466 |
| | CRH plc | 27,811 | 2,844 |
| * | Gates Industrial Corp. plc | 115,824 | 2,567 |
| | Herc Holdings Inc. | 10,514 | 2,439 |
| | Atkore Inc. | 23,715 | 2,237 |
| * | PayPal Holdings Inc. | 23,976 | 2,080 |
| * | O-I Glass Inc. | 158,483 | 1,997 |
| | WESCO International Inc. | 9,289 | 1,965 |
| | General Dynamics Corp. | 6,745 | 1,916 |
| * | Mohawk Industries Inc. | 13,654 | 1,896 |
| | Matson Inc. | 11,479 | 1,758 |
| | Sonoco Products Co. | 33,653 | 1,746 |
| | Terex Corp. | 31,395 | 1,720 |
| | Fidelity National Information Services Inc. | 20,041 | 1,709 |
| | Greenbrier Cos. Inc. | 24,737 | 1,682 |
| | Knight-Swift Transportation Holdings Inc. | 27,445 | 1,629 |
| | Allison Transmission Holdings Inc. | 13,022 | 1,543 |
| * | BlueLinx Holdings Inc. | 11,915 | 1,498 |
| * | Resideo Technologies Inc. | 54,976 | 1,494 |
| | International Seaways Inc. | 36,645 | 1,429 |
| | CNH Industrial NV | 113,565 | 1,426 |
| | AGCO Corp. | 13,967 | 1,414 |
| | Schneider National Inc. Class B | 40,092 | 1,347 |
| | Emerson Electric Co. | 10,121 | 1,342 |
| | Brunswick Corp. | 16,602 | 1,337 |
| | Deluxe Corp. | 57,491 | 1,332 |
| * | Titan International Inc. | 174,084 | 1,274 |
| | Deere & Co. | 2,713 | 1,264 |
| * | Alight Inc. Class A | 151,243 | 1,210 |
| | Dow Inc. | 26,270 | 1,161 |
| | RTX Corp. | 8,862 | 1,080 |
| * | Tutor Perini Corp. | 39,518 | 1,074 |
| | Scorpio Tankers Inc. | 21,205 | 1,074 |
| | Sensata Technologies Holding plc | 33,084 | 1,063 |
| | Bel Fuse Inc. Class B | 12,855 | 1,031 |
| | Genco Shipping & Trading Ltd. | 62,969 | 999 |
| | Teekay Tankers Ltd. Class A | 23,538 | 947 |
| | Pitney Bowes Inc. | 117,310 | 946 |
| | Regal Rexnord Corp. | 5,453 | 942 |
| * | CoreCivic Inc. | 41,869 | 935 |
| | Silgan Holdings Inc. | 15,892 | 914 |
| * | Repay Holdings Corp. | 112,872 | 912 |
| | Global Payments Inc. | 7,530 | 896 |
| * | Teekay Corp. Ltd. | 120,510 | 889 |
| | EnerSys | 8,835 | 854 |
| | Dorian LPG Ltd. | 34,561 | 846 |
| * | BrightView Holdings Inc. | 47,663 | 815 |
| | Pactiv Evergreen Inc. | 59,990 | 814 |
| | DHT Holdings Inc. | 85,053 | 801 |
| | ManpowerGroup Inc. | 12,424 | 800 |
| * | Green Dot Corp. Class A | 76,587 | 787 |
| | Golden Ocean Group Ltd. | 77,606 | 776 |
| | Costamare Inc. | 58,610 | 774 |
| | | Shares | Market
Value•
($000) |
| | Greif Inc. Class A | 10,552 | 750 |
| * | DXP Enterprises Inc. | 10,085 | 739 |
| | H&E Equipment Services Inc. | 12,045 | 720 |
| | Quanex Building Products Corp. | 24,006 | 714 |
| * | JELD-WEN Holding Inc. | 64,090 | 698 |
| | Ardmore Shipping Corp. | 61,302 | 684 |
| | ArcBest Corp. | 5,897 | 680 |
| | Hillenbrand Inc. | 19,995 | 680 |
| | Textron Inc. | 7,766 | 665 |
| | Patrick Industries Inc. | 4,851 | 652 |
| | Columbus McKinnon Corp. | 16,330 | 642 |
| * | Cross Country Healthcare Inc. | 59,315 | 638 |
| | Huntington Ingalls Industries Inc. | 3,089 | 611 |
| | Owens Corning | 2,963 | 609 |
| | TTEC Holdings Inc. | 116,236 | 602 |
| * | Cimpress plc | 7,290 | 585 |
| * | Builders FirstSource Inc. | 3,124 | 583 |
| | Safe Bulkers Inc. | 147,721 | 572 |
| | ADT Inc. | 73,211 | 558 |
| | Boise Cascade Co. | 3,768 | 556 |
| | Korn Ferry | 6,854 | 537 |
| | SFL Corp. Ltd. | 51,087 | 537 |
| * | Proto Labs Inc. | 12,285 | 506 |
| | Norfolk Southern Corp. | 1,759 | 485 |
| | Graphic Packaging Holding Co. | 15,956 | 480 |
| | GATX Corp. | 2,809 | 461 |
| | Resources Connection Inc. | 53,937 | 455 |
| * | PagSeguro Digital Ltd. Class A | 60,465 | 444 |
| | Kelly Services Inc. Class A | 30,082 | 441 |
| * | American Woodmark Corp. | 4,815 | 437 |
| * | Manitowoc Co. Inc. | 40,760 | 433 |
| * | ASGN Inc. | 4,559 | 417 |
| | Nordic American Tankers Ltd. | 150,989 | 405 |
| * | Masterbrand Inc. | 22,962 | 397 |
| * | Hillman Solutions Corp. | 31,837 | 363 |
| | Covenant Logistics Group Inc. | 6,172 | 358 |
| | Hub Group Inc. Class A | 6,659 | 344 |
| * | Great Lakes Dredge & Dock Corp. | 26,178 | 331 |
| | Ardagh Metal Packaging SA | 84,472 | 311 |
| * | StoneCo. Ltd. Class A | 32,437 | 307 |
| | Wabash National Corp. | 14,615 | 290 |
| | CSX Corp. | 7,161 | 262 |
| | Insteel Industries Inc. | 8,680 | 256 |
| | Werner Enterprises Inc. | 6,259 | 256 |
| | Heidrick & Struggles International Inc. | 5,127 | 237 |
| | Vestis Corp. | 14,661 | 236 |
| * | Forward Air Corp. | 6,285 | 231 |
| * | Hudson Technologies Inc. | 37,845 | 225 |
| | Hyster-Yale Inc. | 3,264 | 184 |
| * | Titan Machinery Inc. | 11,259 | 174 |
| | | | 126,956 |
| Real Estate (0.6%) |
| | Newmark Group Inc. Class A | 82,444 | 1,276 |
| * | RE/MAX Holdings Inc. Class A | 87,578 | 1,152 |
| * | Jones Lang LaSalle Inc. | 3,467 | 973 |
| * | GEO Group Inc. | 26,798 | 764 |
| * | Cushman & Wakefield plc | 44,985 | 688 |
| * | Forestar Group Inc. | 8,093 | 242 |
| | | | 5,095 |
| Technology (5.8%) |
| | Micron Technology Inc. | 44,539 | 4,363 |
| | Intel Corp. | 137,131 | 3,298 |
| | HP Inc. | 90,321 | 3,200 |
| * | Arrow Electronics Inc. | 25,164 | 3,024 |
| | Hewlett Packard Enterprise Co. | 116,372 | 2,469 |
| * | TTM Technologies Inc. | 95,938 | 2,339 |
| * | DXC Technology Co. | 87,211 | 1,962 |
| | Avnet Inc. | 35,502 | 1,942 |
| | TD SYNNEX Corp. | 15,690 | 1,867 |
| | | Shares | Market
Value•
($000) |
| * | Dropbox Inc. Class A | 60,593 | 1,676 |
| * | Ziff Davis Inc. | 27,751 | 1,633 |
| * | RingCentral Inc. Class A | 42,588 | 1,603 |
| * | Consensus Cloud Solutions Inc. | 60,702 | 1,515 |
| * | ZoomInfo Technologies Inc. | 136,143 | 1,489 |
| | International Business Machines Corp. | 6,260 | 1,424 |
| * | Photronics Inc. | 41,647 | 1,037 |
| * | Bumble Inc. Class A | 116,391 | 1,011 |
| * | Unisys Corp. | 119,285 | 952 |
| | Adeia Inc. | 76,195 | 924 |
| * | ScanSource Inc. | 18,270 | 921 |
| * | NetScout Systems Inc. | 36,780 | 805 |
| | Dun & Bradstreet Holdings Inc. | 60,834 | 773 |
| * | Match Group Inc. | 22,495 | 737 |
| * | Verint Systems Inc. | 26,789 | 675 |
| * | Sanmina Corp. | 8,404 | 667 |
| * | Twilio Inc. Class A | 6,314 | 660 |
| | SS&C Technologies Holdings Inc. | 8,006 | 619 |
| * | Qorvo Inc. | 8,748 | 604 |
| | QUALCOMM Inc. | 3,300 | 523 |
| * | Penguin Solutions Inc. | 28,801 | 522 |
| | Vishay Intertechnology Inc. | 26,841 | 513 |
| | Amkor Technology Inc. | 17,400 | 460 |
| * | E2open Parent Holdings Inc. | 136,234 | 414 |
| | Methode Electronics Inc. | 36,343 | 397 |
| * | Digital Turbine Inc. | 275,228 | 396 |
| * | Bandwidth Inc. Class A | 17,882 | 376 |
| | Jabil Inc. | 1,941 | 264 |
| | SolarWinds Corp. | 17,241 | 230 |
| | Skyworks Solutions Inc. | 2,354 | 206 |
| | Benchmark Electronics Inc. | 3,786 | 184 |
| | | | 48,674 |
| Telecommunications (3.4%) |
| | AT&T Inc. | 356,202 | 8,250 |
| | Verizon Communications Inc. | 143,394 | 6,358 |
| | Comcast Corp. Class A | 125,594 | 5,424 |
| | T-Mobile US Inc. | 11,378 | 2,810 |
| | Telephone & Data Systems Inc. | 39,065 | 1,335 |
| | Cisco Systems Inc. | 19,870 | 1,177 |
| * | Liberty Latin America Ltd. Class C | 157,915 | 1,091 |
| * | CommScope Holding Co. Inc. | 201,606 | 962 |
| * | EchoStar Corp. Class A | 27,922 | 706 |
| * | Liberty Latin America Ltd. Class A | 39,712 | 276 |
| | | | 28,389 |
| Utilities (0.1%) |
| | MDU Resources Group Inc. | 50,368 | 1,009 |
| | Aris Water Solutions Inc. Class A | 11,514 | 310 |
| | | | 1,319 |
| Total Common Stocks (Cost $680,103) | 838,399 |
| Temporary Cash Investments (0.0%) |
| Money Market Fund (0.0%) |
| 2,3 | Vanguard Market Liquidity Fund, 4.651% (Cost $46) | 461 | 46 |
| Total Investments (99.7%) (Cost $680,149) | 838,445 |
| Other Assets and Liabilities—Net (0.3%) | 2,557 |
| Net Assets (100%) | 841,002 |
| Cost is in $000. |
| • | See Note A in Notes to Financial Statements. |
| * | Non-income-producing security. |
| 1 | Includes partial security positions on loan to broker-dealers. The total value of securities on loan is $550,000. |
| 2 | Affiliated money market fund available only to Vanguard funds and certain trusts and accounts managed by Vanguard. Rate shown is the 7-day yield. |
| 3 | Collateral of $590,000 was received for securities on loan, of which $41,000 is held in Vanguard Market Liquidity Fund and $549,000 is held in cash. |
Derivative Financial Instruments Outstanding as of Period End
| Futures Contracts |
| | | | ($000) |
| | Expiration | Number of
Long (Short)
Contracts | Notional
Amount | Value and
Unrealized
Appreciation
(Depreciation) |
| Long Futures Contracts | | | | |
| E-mini S&P 500 Index | December 2024 | 5 | 1,513 | 74 |
| Micro E-mini S&P 500 Index | December 2024 | 15 | 454 | 19 |
| | | | | 93 |
See accompanying Notes, which are an integral part of the Financial Statements.
Statement of Assets and Liabilities
|
| ($000s, except shares, footnotes, and per-share amounts) | Amount |
| Assets | |
| Investments in Securities, at Value1 | |
| Unaffiliated Issuers (Cost $680,103) | 838,399 |
| Affiliated Issuers (Cost $46) | 46 |
| Total Investments in Securities | 838,445 |
| Investment in Vanguard | 21 |
| Cash | 1,597 |
| Cash Collateral Pledged—Futures Contracts | 98 |
| Receivables for Accrued Income | 1,468 |
| Variation Margin Receivable—Futures Contracts | 12 |
| Total Assets | 841,641 |
| Liabilities | |
| Payables for Investment Securities Purchased | 5 |
| Collateral for Securities on Loan | 590 |
| Payables to Vanguard | 44 |
| Total Liabilities | 639 |
| Net Assets | 841,002 |
| 1 Includes $550,000 of securities on loan. | |
| At November 30, 2024, net assets consisted of: | |
| | |
| Paid-in Capital | 787,767 |
| Total Distributable Earnings (Loss) | 53,235 |
| Net Assets | 841,002 |
| |
| Net Assets | |
Applicable to 6,525,000 outstanding $.001 par value shares of
beneficial interest (unlimited authorization) | 841,002 |
| Net Asset Value Per Share | $128.89 |
See accompanying Notes, which are an integral part of the Financial Statements.
|
| | Year Ended
November 30, 2024 |
| | ($000) |
| Investment Income | |
| Income | |
| Dividends1 | 17,751 |
| Interest2 | 107 |
| Securities Lending—Net | 3 |
| Total Income | 17,861 |
| Expenses | |
| The Vanguard Group—Note B | |
| Investment Advisory Services | 198 |
| Management and Administrative | 604 |
| Marketing and Distribution | 34 |
| Custodian Fees | — |
| Auditing Fees | 31 |
| Shareholders’ Reports and Proxy Fees | 42 |
| Trustees’ Fees and Expenses | — |
| Other Expenses | 16 |
| Total Expenses | 925 |
| Net Investment Income | 16,936 |
| Realized Net Gain (Loss) | |
| Investment Securities Sold2,3 | (5,224) |
| Futures Contracts | 633 |
| Realized Net Gain (Loss) | (4,591) |
| Change in Unrealized Appreciation (Depreciation) | |
| Investment Securities2 | 160,840 |
| Futures Contracts | (53) |
| Change in Unrealized Appreciation (Depreciation) | 160,787 |
| Net Increase (Decrease) in Net Assets Resulting from Operations | 173,132 |
| 1 | Dividends are net of foreign withholding taxes of $5,000. |
| 2 | Interest income, realized net gain (loss), capital gain distributions received, and change in unrealized appreciation (depreciation) from an affiliated company of the fund were $95,000, less than $1,000, less than $1,000, and less than $1,000, respectively. Purchases and sales are for temporary cash investment purposes. |
| 3 | Includes $11,051,000 of net gain (loss) resulting from in-kind redemptions. |
See accompanying Notes, which are an integral part of the Financial Statements.
Statement of Changes in Net Assets
|
| | Year Ended November 30, |
| | 2024
($000) | 2023
($000) |
| Increase (Decrease) in Net Assets | | |
| Operations | | |
| Net Investment Income | 16,936 | 15,916 |
| Realized Net Gain (Loss) | (4,591) | 37,070 |
| Change in Unrealized Appreciation (Depreciation) | 160,787 | (61,842) |
| Net Increase (Decrease) in Net Assets Resulting from Operations | 173,132 | (8,856) |
| Distributions | | |
| Total Distributions | (17,118) | (15,929) |
| Capital Share Transactions | | |
| Issued | 117,299 | 221,012 |
| Issued in Lieu of Cash Distributions | — | — |
| Redeemed | (23,694) | (275,525) |
| Net Increase (Decrease) from Capital Share Transactions | 93,605 | (54,513) |
| Total Increase (Decrease) | 249,619 | (79,298) |
| Net Assets | | |
| Beginning of Period | 591,383 | 670,681 |
| End of Period | 841,002 | 591,383 |
See accompanying Notes, which are an integral part of the Financial Statements.
For a Share Outstanding
Throughout Each Period | Year Ended November 30, |
| 2024 | 2023 | 2022 | 2021 | 2020 |
| Net Asset Value, Beginning of Period | $103.30 | $105.20 | $99.84 | $73.96 | $75.51 |
| Investment Operations | | | | | |
| Net Investment Income1 | 2.756 | 2.689 | 2.220 | 1.923 | 1.689 |
| Net Realized and Unrealized Gain (Loss) on Investments | 25.667 | (1.898) | 5.212 | 25.644 | (1.634) |
| Total from Investment Operations | 28.423 | .791 | 7.432 | 27.567 | .055 |
| Distributions | | | | | |
| Dividends from Net Investment Income | (2.833) | (2.691) | (2.072) | (1.687) | (1.605) |
| Distributions from Realized Capital Gains | — | — | — | — | — |
| Total Distributions | (2.833) | (2.691) | (2.072) | (1.687) | (1.605) |
| Net Asset Value, End of Period | $128.89 | $103.30 | $105.20 | $99.84 | $73.96 |
| Total Return | 27.88% | 0.97% | 7.63% | 37.51% | 0.70% |
| Ratios/Supplemental Data | | | | | |
| Net Assets, End of Period (Millions) | $841 | $591 | $671 | $448 | $133 |
| Ratio of Total Expenses to Average Net Assets | 0.13%2 | 0.13%2 | 0.13%2 | 0.13% | 0.14%2 |
| Ratio of Net Investment Income to Average Net Assets | 2.38% | 2.68% | 2.22% | 1.98% | 2.68% |
| Portfolio Turnover Rate3 | 39% | 24% | 64% | 43% | 52% |
| 1 | Calculated based on average shares outstanding. |
| 2 | The ratio of expenses to average net assets for the period net of reduction from custody fee offset arrangements was 0.13%. |
| 3 | Excludes the value of portfolio securities received or delivered as a result of in-kind purchases or redemptions of the fund’s capital shares, including ETF Creation Units. |
See accompanying Notes, which are an integral part of the Financial Statements.
Notes to Financial Statements
Vanguard U.S. Value Factor ETF is registered under the Investment Company Act of 1940 as an open-end investment company, or mutual fund. ETF Shares are listed for trading on Cboe BZX Exchange, Inc.; they can be purchased and sold through a broker.
| A. | The following significant accounting policies conform to generally accepted accounting principles for U.S. investment companies. The fund consistently follows such policies in preparing its financial statements. |
1. Security Valuation: Securities are valued as of the close of trading on the New York Stock Exchange (generally 4 p.m., Eastern time) on the valuation date. Equity securities are valued at the latest quoted sales prices or official closing prices taken from the primary market in which each security trades; such securities not traded on the valuation date are valued at the mean of the latest quoted bid and asked prices. Securities for which market quotations are not readily available, or whose values have been affected by events occurring before the fund’s pricing time but after the close of the securities’ primary markets, are valued by methods deemed by the valuation designee to represent fair value and subject to oversight by the board of trustees. Investments in Vanguard Market Liquidity Fund are valued at that fund's net asset value.
2. Futures Contracts: The fund uses index futures contracts to a limited extent, with the objective of maintaining full exposure to the stock market while maintaining liquidity. The fund may purchase or sell futures contracts to achieve a desired level of investment, whether to accommodate portfolio turnover or cash flows from capital share transactions. The primary risks associated with the use of futures contracts are imperfect correlation between changes in market values of stocks held by the fund and the prices of futures contracts, and the possibility of an illiquid market. Counterparty risk involving futures is mitigated because a regulated clearinghouse is the counterparty instead of the clearing broker. To further mitigate counterparty risk, the fund trades futures contracts on an exchange, monitors the financial strength of its clearing brokers and clearinghouse, and has entered into clearing agreements with its clearing brokers. The clearinghouse imposes initial margin requirements to secure the fund’s performance and requires daily settlement of variation margin representing changes in the market value of each contract. Any securities pledged as initial margin for open contracts are noted in the Schedule of Investments.
Futures contracts are valued at their quoted daily settlement prices. The notional amounts of the contracts are not recorded in the Statement of Assets and Liabilities. Fluctuations in the value of the contracts are recorded in the Statement of Assets and Liabilities as an asset (liability) and in the Statement of Operations as unrealized appreciation (depreciation) until the contracts are closed, when they are recorded as realized gains (losses) on futures contracts.
During the year ended November 30, 2024, the fund’s average investments in long and short futures contracts represented less than 1% and 0% of net assets, respectively, based on the average of the notional amounts at each quarter-end during the period.
3. Federal Income Taxes: The fund intends to continue to qualify as a regulated investment company and distribute virtually all of its taxable income. The fund’s tax returns are open to examination by the relevant tax authorities until expiration of the applicable statute of limitations, which is generally three years after the filing of the tax return. Management has analyzed the fund’s tax positions taken for all open federal and state income tax years, and has concluded that no provision for income tax is required in the fund’s financial statements.
4. Distributions: Distributions to shareholders are recorded on the ex-dividend date. Distributions are determined on a tax basis at the fiscal year-end and may differ from net investment income and realized capital gains for financial reporting purposes.
5. Securities Lending: To earn additional income, the fund lends its securities to qualified institutional borrowers. Security loans are subject to termination by the fund at any time, and are required to be secured at all times by collateral in an amount at least equal to the market value of securities loaned. Daily market fluctuations could cause the value of loaned securities to be more or less than the value of the collateral received. When this occurs, the collateral is adjusted and settled before the opening of the market on the next business day. The fund further mitigates its counterparty risk by entering into securities lending transactions only with a diverse group of prequalified counterparties, monitoring their financial strength, and entering into master securities lending agreements with its counterparties. The master securities lending agreements provide that, in the event of a counterparty’s default (including bankruptcy), the fund may terminate any loans with that borrower, determine the net amount owed, and sell or retain the collateral up to the net amount owed to the fund; however, such actions may be subject to legal proceedings. While collateral mitigates counterparty risk, in the event of a default, the fund may experience delays and costs in recovering the securities loaned. The fund invests cash collateral received in Vanguard Market Liquidity Fund, and records a liability in the Statement of Assets and Liabilities for the return of the collateral, during the period the securities are on loan. Collateral investments in Vanguard Market Liquidity Fund are subject to market appreciation or depreciation. Securities lending income represents fees charged to borrowers plus income earned on invested cash collateral, less expenses associated with the loan. During the term of the loan, the fund is entitled to all distributions made on or in respect of the loaned securities.
6. Credit Facilities and Interfund Lending Program: The fund and certain other funds managed by The Vanguard Group ("Vanguard") participate in a $4.3 billion committed credit facility provided by a syndicate of lenders pursuant to a credit agreement and an uncommitted credit facility provided by Vanguard. Both facilities may be renewed annually. Each fund is individually liable for its borrowings, if any, under the credit facilities. Borrowings may be utilized for temporary or emergency purposes and are subject to the fund’s regulatory and contractual borrowing restrictions. With respect to the committed credit facility, the participating funds are charged administrative fees and an annual commitment fee of 0.10% of the undrawn committed amount of the facility, which are allocated to the funds based on a method approved by the fund’s board of trustees and included in Management and Administrative expenses on the fund’s Statement of Operations. Any borrowings under either facility bear interest at an agreed-upon spread plus the higher of the federal funds effective rate, the overnight bank funding rate, or the Daily Simple Secured Overnight Financing Rate inclusive of an additional agreed-upon spread. However, borrowings under the uncommitted credit facility may bear interest based upon an alternate rate agreed to by the fund and Vanguard.
In accordance with an exemptive order (the “Order”) from the SEC, the fund may participate in a joint lending and borrowing program that allows registered open-end Vanguard funds to borrow money from and lend money to each other for temporary or emergency purposes (the “Interfund Lending Program”), subject to compliance with the terms and conditions of the Order, and to the extent permitted by the fund’s investment objective and investment policies. Interfund loans and borrowings normally extend overnight but can have a maximum duration of seven days. Loans may be
called on one business day’s notice. The interest rate to be charged is governed by the conditions of the Order and internal procedures adopted by the board of trustees. The board of trustees is responsible for overseeing the Interfund Lending Program.
For the year ended November 30, 2024, the fund did not utilize the credit facilities or the Interfund Lending Program.
7. Other: Dividend income is recorded on the ex-dividend date. Non-cash dividends included in income, if any, are recorded at the fair value of the securities received. Interest income includes income distributions received from Vanguard Market Liquidity Fund and is accrued daily. Security transactions are accounted for on the date securities are bought or sold. Costs used to determine realized gains (losses) on the sale of investment securities are those of the specific securities sold.
| B. | In accordance with the terms of a Funds' Service Agreement (the “FSA”) between Vanguard and the fund, Vanguard furnishes to the fund investment advisory, corporate management, administrative, marketing, and distribution services at Vanguard’s cost of operations (as defined by the FSA). These costs of operations are allocated to the fund based on methods and guidelines approved by the board of trustees and are generally settled twice a month. |
Upon the request of Vanguard, the fund may invest up to 0.40% of its net assets as capital in Vanguard. At November 30, 2024, the fund had contributed to Vanguard capital in the amount of $21,000, representing less than 0.01% of the fund’s net assets and 0.01% of Vanguard’s capital received pursuant to the FSA. The fund’s trustees and officers are also directors and employees, respectively, of Vanguard.
| C. | Various inputs may be used to determine the value of the fund’s investments and derivatives. These inputs are summarized in three broad levels for financial statement purposes. The inputs or methodologies used to value securities are not necessarily an indication of the risk associated with investing in those securities. |
Level 1—Quoted prices in active markets for identical securities.
Level 2—Other significant observable inputs (including quoted prices for similar securities, interest rates, prepayment speeds, credit risk, etc.).
Level 3—Significant unobservable inputs (including the fund’s own assumptions used to determine the fair value of investments). Any investments and derivatives valued with significant unobservable inputs are noted on the Schedule of Investments.
At November 30, 2024, 100% of the market value of the fund’s investments and derivatives was determined based on Level 1 inputs.
| D. | Permanent differences between book-basis and tax-basis components of net assets are reclassified among capital accounts in the financial statements to reflect their tax character. These reclassifications have no effect on net assets or net asset value per share. As of period end, permanent differences primarily attributable to the accounting for in-kind redemptions were reclassified between the following accounts were reclassified between the following accounts: |
| | Amount
($000) |
| Paid-in Capital | 11,051 |
| Total Distributable Earnings (Loss) | (11,051) |
Temporary differences between book-basis and tax-basis components of total distributable earnings (loss) arise when certain items of income, gain, or loss are recognized in different periods for financial statement and tax purposes; these differences will reverse at some time in the future. The differences are primarily related to capital loss carryforwards; the deferral of losses from wash sales; the recognition of unrealized gains or losses from certain derivative contracts; and the recognition of unrealized gains from passive foreign investment companies. As of period end, the tax-basis components of total distributable earnings (loss) are detailed in the table as follows:
| | Amount
($000) |
| Undistributed Ordinary Income | 2,895 |
| Undistributed Long-Term Gains | — |
| Net Unrealized Gains (Losses) | 158,273 |
| Capital Loss Carryforwards | (107,933) |
| Qualified Late-Year Losses | — |
| Other Temporary Differences | — |
| Total | 53,235 |
The tax character of distributions paid was as follows:
| | Year Ended November 30, |
| | 2024
Amount
($000) | 2023
Amount
($000) |
| Ordinary Income* | 17,118 | 15,929 |
| Long-Term Capital Gains | — | — |
| Total | 17,118 | 15,929 |
| * | Includes short-term capital gains, if any. |
As of November 30, 2024, gross unrealized appreciation and depreciation for investments and derivatives based on cost for U.S. federal income tax purposes were as follows:
| | Amount
($000) |
| Tax Cost | 680,171 |
| Gross Unrealized Appreciation | 184,820 |
| Gross Unrealized Depreciation | (26,547) |
| Net Unrealized Appreciation (Depreciation) | 158,273 |
| E. | During the year ended November 30, 2024, the fund purchased $397,697,000 of investment securities and sold $279,430,000 of investment securities, other than temporary cash investments. In addition, the fund purchased and sold investment securities of $0 and $23,724,000, respectively, in connection with in-kind purchases and redemptions of the fund's capital shares. |
The fund purchased securities from and sold securities to other Vanguard funds or accounts managed by Vanguard or its affiliates, in accordance with procedures adopted by the board of trustees in compliance with Rule 17a-7 of the Investment Company Act of 1940. For the year ended November 30, 2024, such purchases were $4,776,000 and sales were $4,412,000, resulting in net realized loss of $1,756,000; these amounts, other than temporary cash investments, are included in the purchases and sales of investment securities noted above.
| F. | Capital shares issued and redeemed were: |
| | Year Ended November 30, |
| | 2024
Shares
(000) | 2023
Shares
(000) |
| Issued | 1,005 | 2,120 |
| Issued in Lieu of Cash Distributions | — | — |
| Redeemed | (205) | (2,770) |
| Net Increase (Decrease) in Shares Outstanding | 800 | (650) |
| G. | Significant market disruptions, such as those caused by pandemics, natural or environmental disasters, war, acts of terrorism, or other events, can adversely affect local and global markets and normal market operations. Any such disruptions could have an adverse impact on the value of the fund’s investments and fund performance. |
To the extent the fund’s investment portfolio reflects concentration in a particular market, industry, sector, country or asset class, the fund may be adversely affected by the performance of these concentrations and may be subject to increased price volatility and other risks.
The use of derivatives may expose the fund to various risks. Derivatives can be highly volatile, and any initial investment is generally small relative to the notional amount so that transactions may be leveraged in terms of market exposure. A relatively small market movement may have a potentially larger impact on derivatives than on standard securities. Leveraged derivatives positions can, therefore, increase volatility. Additional information regarding the fund’s use of derivative(s) and the specific risks associated is described under significant accounting policies.
At November 30, 2024, one shareholder was the record or beneficial owner of 26% of the fund’s net assets. If this shareholder were to redeem its investment in the fund, the redemption might result in an increase in the fund’s expense ratio, cause the fund to incur higher transaction costs, or lead to the realization of taxable capital gains.
| H. | Management has determined that no events or transactions occurred subsequent to November 30, 2024, that would require recognition or disclosure in these financial statements. |
Report of Independent Registered Public Accounting Firm
To the Board of Trustees of Vanguard Wellington Fund and Shareholders of Vanguard U.S. Minimum Volatility ETF, Vanguard U.S. Momentum Factor ETF, Vanguard U.S. Multifactor ETF, Vanguard U.S. Quality Factor ETF and Vanguard U.S. Value Factor ETF
Opinions on the Financial Statements
We have audited the accompanying statements of assets and liabilities, including the schedules of investments, of Vanguard U.S. Minimum Volatility ETF, Vanguard U.S. Momentum Factor ETF, Vanguard U.S. Multifactor ETF, Vanguard U.S. Quality Factor ETF and Vanguard U.S. Value Factor ETF (five of the funds constituting Vanguard Wellington Fund, hereafter collectively referred to as the "Funds") as of November 30, 2024, the related statements of operations for the year ended November 30, 2024, the statements of changes in net assets for each of the two years in the period ended November 30, 2024, including the related notes, and the financial highlights for each of the five years in the period ended November 30, 2024 (collectively referred to as the "financial statements"). In our opinion, the financial statements present fairly, in all material respects, the financial position of each of the Funds as of November 30, 2024, the results of each of their operations for the year then ended, the changes in each of their net assets for each of the two years in the period ended November 30, 2024 and each of the financial highlights for each of the five years in the period ended November 30, 2024 in conformity with accounting principles generally accepted in the United States of America.
Basis for Opinions
These financial statements are the responsibility of the Funds’ management. Our responsibility is to express an opinion on the Funds’ financial statements based on our audits. We are a public accounting firm registered with the Public Company Accounting Oversight Board (United States) (PCAOB) and are required to be independent with respect to the Funds in accordance with the U.S. federal securities laws and the applicable rules and regulations of the Securities and Exchange Commission and the PCAOB.
We conducted our audits of these financial statements in accordance with the standards of the PCAOB. Those standards require that we plan and perform the audit to obtain reasonable assurance about whether the financial statements are free of material misstatement, whether due to error or fraud.
Our audits included performing procedures to assess the risks of material misstatement of the financial statements, whether due to error or fraud, and performing procedures that respond to those risks. Such procedures included examining, on a test basis, evidence regarding the amounts and disclosures in the financial statements. Our audits also included evaluating the accounting principles used and significant estimates made by management, as well as evaluating the overall presentation of the financial statements. Our procedures included confirmation of securities owned as of November 30, 2024 by correspondence with the custodian, transfer agent and brokers; when replies were not received from brokers, we performed other auditing procedures. We believe that our audits provide a reasonable basis for our opinions.
/s/PricewaterhouseCoopers LLP
Philadelphia, Pennsylvania
January 17, 2025
We have served as the auditor of one or more investment companies in The Vanguard Group of Funds since 1975.
Tax information (unaudited)
The following percentages, or if subsequently determined to be different, the maximum percentages allowable by law, of ordinary income (dividend income plus short-term gains, if any) for the fiscal year qualified for the dividends-received deduction for corporate shareholders.
| Fund | Percentage |
| U.S. Minimum Volatility ETF | 100.0% |
| U.S. Momentum Factor ETF | 83.9 |
| U.S. Multifactor ETF | 97.6 |
| U.S. Quality Factor ETF | 100.0 |
| U.S. Value Factor ETF | 93.7 |
The following amounts, or if subsequently determined to be different, the maximum amounts allowable by law, are hereby designated as qualified dividend income for purposes of the maximum rate under section 1(h)(11)for calendar year 2023. Shareholders will be notified in January 2025 via IRS Form 1099 of the amounts for use in preparing their 2024 income tax return.
| Fund | ($000) |
| U.S. Minimum Volatility ETF | 1,879 |
| U.S. Momentum Factor ETF | 3,092 |
| U.S. Multifactor ETF | 3,776 |
| U.S. Quality Factor ETF | 3,935 |
| U.S. Value Factor ETF | 16,224 |
The following amounts for the fiscal year, or if subsequently determined to be different, the maximum amounts allowable by law, are hereby designated as interest earned from obligations of the U.S. government which is generally exempt from state income tax.
| Fund | ($000) |
| U.S. Minimum Volatility ETF | 8 |
| U.S. Momentum Factor ETF | 30 |
| U.S. Multifactor ETF | 15 |
| U.S. Quality Factor ETF | 17 |
| U.S. Value Factor ETF | 37 |
The following amounts, or if subsequently determined to be different, the maximum amounts allowable by law, are hereby designated as qualified business income under section 199A for calendar year 2023. Shareholders will be notified in January 2025 via IRS Form 1099 of the amounts for use in preparing their 2024 income tax return.
| Fund | ($000) |
| U.S. Minimum Volatility ETF | 38 |
| U.S. Momentum Factor ETF | — |
| U.S. Multifactor ETF | — |
| U.S. Quality Factor ETF | — |
| U.S. Value Factor ETF | — |
Q44190 012025
Financial Statements
For the year ended November 30, 2024
Vanguard U.S. Multifactor Fund
Contents
Financial Statements
| 1 |
Report of Independent Registered Public Accounting Firm
| 18 |
Tax information
| 19 |
| | |
Schedule of Investments
As of November 30, 2024
The fund files its complete schedule of portfolio holdings with the Securities and Exchange Commission (SEC) for the first and third quarters of each fiscal year as an exhibit to its reports on Form N-PORT. The fund’s Form N-PORT reports are available on the SEC’s website at www.sec.gov.
| | | Shares | Market
Value•
($000) |
| Common Stocks (99.2%) |
| Basic Materials (2.6%) |
| | Mueller Industries Inc. | 9,574 | 773 |
| | Newmont Corp. (XNYS) | 8,793 | 369 |
| | Hawkins Inc. | 2,572 | 346 |
| | UFP Industries Inc. | 2,477 | 337 |
| | Cabot Corp. | 2,958 | 324 |
| | Reliance Inc. | 945 | 303 |
| | Steel Dynamics Inc. | 2,032 | 295 |
| | Sylvamo Corp. | 2,771 | 256 |
| | Freeport-McMoRan Inc. | 5,264 | 233 |
| | Olympic Steel Inc. | 4,370 | 185 |
| | Commercial Metals Co. | 2,803 | 173 |
| | FutureFuel Corp. | 27,342 | 142 |
| * | Metallus Inc. | 7,445 | 124 |
| | LyondellBasell Industries NV Class A | 1,426 | 119 |
| | Carpenter Technology Corp. | 539 | 105 |
| | International Paper Co. | 1,478 | 87 |
| | Minerals Technologies Inc. | 991 | 81 |
| | Eastman Chemical Co. | 726 | 76 |
| | Southern Copper Corp. | 650 | 65 |
| | | | 4,393 |
| Consumer Discretionary (17.1%) |
| | Walmart Inc. | 16,913 | 1,564 |
| | DR Horton Inc. | 5,957 | 1,005 |
| | Target Corp. | 7,502 | 993 |
| | Costco Wholesale Corp. | 975 | 948 |
| | General Motors Co. | 14,292 | 794 |
| | PulteGroup Inc. | 4,923 | 666 |
| * | Brinker International Inc. | 4,862 | 643 |
| | H&R Block Inc. | 9,508 | 564 |
| | Ralph Lauren Corp. | 2,348 | 543 |
| | PVH Corp. | 4,530 | 491 |
| * | Deckers Outdoor Corp. | 2,472 | 484 |
| | News Corp. Class B | 13,215 | 424 |
| * | Adtalem Global Education Inc. | 4,468 | 408 |
| | Tapestry Inc. | 6,542 | 407 |
| | Booking Holdings Inc. | 77 | 401 |
| * | M/I Homes Inc. | 2,381 | 393 |
| | Perdoceo Education Corp. | 14,193 | 390 |
| * | Abercrombie & Fitch Co. Class A | 2,582 | 387 |
| | Travel & Leisure Co. | 6,919 | 387 |
| * | Despegar.com Corp. | 20,962 | 375 |
| | TJX Cos. Inc. | 2,940 | 370 |
| | Signet Jewelers Ltd. | 3,677 | 368 |
| | Williams-Sonoma Inc. | 1,950 | 335 |
| | KB Home | 3,877 | 321 |
| | Kontoor Brands Inc. | 3,499 | 321 |
| * | SkyWest Inc. | 2,757 | 316 |
| * | Grand Canyon Education Inc. | 1,909 | 314 |
| | Delta Air Lines Inc. | 4,878 | 311 |
| | Lennar Corp. Class A | 1,782 | 311 |
| * | Skechers USA Inc. Class A | 4,878 | 311 |
| | Macy's Inc. | 18,915 | 307 |
| | Build-A-Bear Workshop Inc. | 7,888 | 300 |
| * | United Airlines Holdings Inc. | 3,084 | 299 |
| | eBay Inc. | 4,703 | 298 |
| * | NVR Inc. | 32 | 296 |
| | Best Buy Co. Inc. | 3,226 | 290 |
| * | G-III Apparel Group Ltd. | 9,620 | 285 |
| | Toll Brothers Inc. | 1,718 | 284 |
| | | Shares | Market
Value•
($000) |
| | Fox Corp. Class B | 6,324 | 283 |
| | Lennar Corp. Class B | 1,703 | 281 |
| | Dick's Sporting Goods Inc. | 1,339 | 278 |
| | American Eagle Outfitters Inc. | 14,194 | 273 |
| | Meritage Homes Corp. | 1,426 | 272 |
| | Murphy USA Inc. | 495 | 271 |
| | Interface Inc. | 10,080 | 268 |
| | Hasbro Inc. | 4,105 | 267 |
| | Steelcase Inc. Class A | 19,785 | 267 |
| | BorgWarner Inc. (XNYS) | 7,650 | 263 |
| | Phinia Inc. | 4,544 | 255 |
| * | Stride Inc. | 2,346 | 251 |
| * | Sally Beauty Holdings Inc. | 17,892 | 249 |
| * | Hanesbrands Inc. | 28,370 | 247 |
| | Royal Caribbean Cruises Ltd. | 1,002 | 245 |
| * | Crocs Inc. | 2,252 | 238 |
| | Dillard's Inc. Class A | 533 | 236 |
| * | Stagwell Inc. | 28,957 | 228 |
| | Ethan Allen Interiors Inc. | 6,692 | 206 |
| * | Tri Pointe Homes Inc. | 4,696 | 204 |
| | HNI Corp. | 3,585 | 203 |
| | Six Flags Entertainment Corp. | 4,379 | 202 |
| * | Alaska Air Group Inc. | 3,784 | 199 |
| | La-Z-Boy Inc. | 4,351 | 197 |
| | MillerKnoll Inc. | 7,710 | 194 |
| | John Wiley & Sons Inc. Class A | 3,693 | 193 |
| * | Cavco Industries Inc. | 353 | 182 |
| | Shoe Carnival Inc. | 5,295 | 179 |
| * | Green Brick Partners Inc. | 2,403 | 172 |
| | Caleres Inc. | 5,506 | 171 |
| | J Jill Inc. | 6,141 | 169 |
| | Upbound Group Inc. | 4,886 | 168 |
| * | Urban Outfitters Inc. | 3,288 | 160 |
| | Acushnet Holdings Corp. | 2,169 | 159 |
| | Nordstrom Inc. | 6,926 | 157 |
| | VF Corp. | 7,784 | 157 |
| * | Coupang Inc. | 5,571 | 141 |
| | Standard Motor Products Inc. | 4,100 | 135 |
| * | 1-800-Flowers.com Inc. Class A | 15,589 | 127 |
| * | Expedia Group Inc. | 681 | 126 |
| | Group 1 Automotive Inc. | 297 | 126 |
| | Columbia Sportswear Co. | 1,382 | 121 |
| | Kohl's Corp. | 7,737 | 116 |
| * | Under Armour Inc. Class A | 11,360 | 110 |
| * | Taylor Morrison Home Corp. | 1,476 | 109 |
| * | ODP Corp. | 3,793 | 97 |
| | TEGNA Inc. | 5,118 | 96 |
| | Texas Roadhouse Inc. | 458 | 94 |
| * | Universal Technical Institute Inc. | 3,604 | 93 |
| * | BJ's Wholesale Club Holdings Inc. | 929 | 89 |
| | Rush Enterprises Inc. Class A | 1,431 | 89 |
| | Buckle Inc. | 1,659 | 86 |
| * | Zumiez Inc. | 3,885 | 86 |
| | Playtika Holding Corp. | 10,215 | 86 |
| * | Liquidity Services Inc. | 3,302 | 84 |
| * | Mattel Inc. | 4,266 | 81 |
| | Oxford Industries Inc. | 966 | 80 |
| * | SharkNinja Inc. | 798 | 80 |
| | Academy Sports & Outdoors Inc. | 1,612 | 79 |
| | Nexstar Media Group Inc. | 438 | 75 |
| * | Vera Bradley Inc. | 12,396 | 73 |
| | PriceSmart Inc. | 774 | 69 |
| * | frontdoor Inc. | 1,156 | 68 |
| | Gap Inc. | 2,819 | 68 |
| * | Central Garden & Pet Co. Class A | 1,992 | 67 |
| | Winnebago Industries Inc. | 1,116 | 65 |
| * | Central Garden & Pet Co. | 1,572 | 62 |
| | Movado Group Inc. | 2,619 | 53 |
| | Garmin Ltd. | 205 | 44 |
| | | Shares | Market
Value•
($000) |
| | Strategic Education Inc. | 289 | 29 |
| | | | 28,852 |
| Consumer Staples (8.0%) |
| | Philip Morris International Inc. | 13,607 | 1,811 |
| | Altria Group Inc. | 25,399 | 1,467 |
| | Procter & Gamble Co. | 6,699 | 1,201 |
| | Kimberly-Clark Corp. | 7,540 | 1,051 |
| | Kroger Co. | 12,543 | 766 |
| | Coca-Cola Co. | 9,098 | 583 |
| | Primo Brands Corp. Class A | 18,277 | 521 |
| | McKesson Corp. | 745 | 468 |
| | Coca-Cola Consolidated Inc. | 342 | 446 |
| | Ingredion Inc. | 2,834 | 418 |
| | Cal-Maine Foods Inc. | 4,166 | 407 |
| | Kenvue Inc. | 16,625 | 400 |
| * | Sprouts Farmers Market Inc. | 2,539 | 392 |
| | Ingles Markets Inc. Class A | 3,353 | 248 |
| * | Pilgrim's Pride Corp. | 4,756 | 245 |
| | Flowers Foods Inc. | 10,473 | 237 |
| | General Mills Inc. | 3,390 | 225 |
| | Andersons Inc. | 4,572 | 218 |
| | Casey's General Stores Inc. | 508 | 214 |
| | Weis Markets Inc. | 2,873 | 209 |
| | Fresh Del Monte Produce Inc. | 6,172 | 208 |
| | ACCO Brands Corp. | 35,602 | 207 |
| * | Performance Food Group Co. | 2,207 | 195 |
| | Dole plc | 12,078 | 182 |
| | Turning Point Brands Inc. | 2,834 | 175 |
| | Bunge Global SA | 1,880 | 169 |
| | Tyson Foods Inc. Class A | 2,310 | 149 |
| | Colgate-Palmolive Co. | 1,397 | 135 |
| | Cencora Inc. | 534 | 134 |
| * | US Foods Holding Corp. | 1,261 | 88 |
| | Edgewell Personal Care Co. | 2,215 | 81 |
| | SpartanNash Co. | 4,059 | 77 |
| * | USANA Health Sciences Inc. | 1,699 | 65 |
| * | Post Holdings Inc. | 483 | 58 |
| | | | 13,450 |
| Energy (5.9%) |
| | EOG Resources Inc. | 7,998 | 1,066 |
| | Valero Energy Corp. | 6,702 | 932 |
| | Select Water Solutions Inc. | 36,261 | 536 |
| | Diamondback Energy Inc. | 2,982 | 530 |
| | ConocoPhillips | 3,408 | 369 |
| | Marathon Petroleum Corp. | 2,292 | 358 |
| | SunCoke Energy Inc. | 28,290 | 353 |
| | Northern Oil & Gas Inc. | 7,679 | 334 |
| * | MRC Global Inc. | 22,696 | 317 |
| | California Resources Corp. | 5,118 | 303 |
| | TechnipFMC plc | 9,571 | 300 |
| | Magnolia Oil & Gas Corp. Class A | 10,781 | 299 |
| | Chord Energy Corp. | 2,262 | 289 |
| | SM Energy Co. | 6,336 | 286 |
| | Permian resources Corp. | 18,030 | 282 |
| | CONSOL Energy Inc. | 2,055 | 269 |
| * | Gulfport Energy Corp. | 1,379 | 242 |
| | Murphy Oil Corp. | 6,786 | 220 |
| | Coterra Energy Inc. | 8,156 | 218 |
| | Warrior Met Coal Inc. | 3,063 | 215 |
| * | DNOW Inc. | 13,601 | 205 |
| | Devon Energy Corp. | 4,819 | 183 |
| | Vitesse Energy Inc. | 6,135 | 172 |
| * | Newpark Resources Inc. | 20,212 | 169 |
| | Solaris Energy Infrastructure Inc. | 6,662 | 164 |
| | Liberty Energy Inc. | 8,601 | 158 |
| | SandRidge Energy Inc. | 12,156 | 143 |
| | Texas Pacific Land Corp. | 89 | 142 |
| | Granite Ridge Resources Inc. | 20,825 | 134 |
| * | ProPetro Holding Corp. | 14,969 | 126 |
| | | Shares | Market
Value•
($000) |
| * | REX American Resources Corp. | 2,788 | 121 |
| | Ovintiv Inc. (XNYS) | 2,350 | 107 |
| | Peabody Energy Corp. | 4,157 | 99 |
| | Alpha Metallurgical Resources Inc. | 351 | 86 |
| | Cactus Inc. Class A | 1,210 | 83 |
| | RPC Inc. | 12,190 | 79 |
| | World Kinect Corp. | 2,654 | 77 |
| | VAALCO Energy Inc. | 7,845 | 40 |
| | Berry Corp. | 6,718 | 27 |
| | | | 10,033 |
| Financials (26.6%) |
| | Wells Fargo & Co. | 24,202 | 1,843 |
| | Bank of New York Mellon Corp. | 19,298 | 1,580 |
| | Aflac Inc. | 13,329 | 1,520 |
| | JPMorgan Chase & Co. | 5,557 | 1,388 |
| | MetLife Inc. | 10,505 | 927 |
| | Progressive Corp. | 3,327 | 895 |
| | SLM Corp. | 29,961 | 820 |
| | OneMain Holdings Inc. | 14,286 | 819 |
| | East West Bancorp Inc. | 6,883 | 755 |
| | Hartford Financial Services Group Inc. | 6,070 | 749 |
| | MGIC Investment Corp. | 27,812 | 730 |
| | Bank of NT Butterfield & Son Ltd. | 17,054 | 647 |
| | OFG Bancorp | 13,749 | 625 |
| | Enact Holdings Inc. | 16,863 | 594 |
| | Old Republic International Corp. | 15,158 | 591 |
| | Popular Inc. | 5,940 | 590 |
| | Moody's Corp. | 1,177 | 588 |
| | Bank of America Corp. | 11,407 | 542 |
| | Amalgamated Financial Corp. | 15,223 | 542 |
| | Ameriprise Financial Inc. | 910 | 522 |
| | CNO Financial Group Inc. | 12,763 | 509 |
| | Preferred Bank | 5,355 | 505 |
| | First BanCorp (XNYS) | 23,928 | 495 |
| | Jefferies Financial Group Inc. | 6,188 | 490 |
| | Apollo Global Management Inc. | 2,711 | 475 |
| | Primerica Inc. | 1,561 | 473 |
| | International Bancshares Corp. | 6,453 | 472 |
| | Unum Group | 5,929 | 456 |
| | Banco Latinoamericano de Comercio Exterior SA Class E | 12,255 | 418 |
| | Pathward Financial Inc. | 4,920 | 413 |
| * | NMI Holdings Inc. | 10,287 | 411 |
| | State Street Corp. | 4,125 | 406 |
| | QCR Holdings Inc. | 4,384 | 404 |
| | American International Group Inc. | 4,876 | 375 |
| | Citizens Financial Group Inc. | 7,706 | 371 |
| | Regions Financial Corp. | 13,330 | 363 |
| | Jackson Financial Inc. Class A | 3,627 | 363 |
| * | Mr. Cooper Group Inc. | 3,640 | 359 |
| | Lazard Inc. | 6,185 | 359 |
| | W R Berkley Corp. | 5,314 | 343 |
| | Employers Holdings Inc. | 6,323 | 337 |
| | Central Pacific Financial Corp. | 10,536 | 336 |
| | Fifth Third Bancorp | 6,996 | 336 |
| | Raymond James Financial Inc. | 1,971 | 334 |
| | RenaissanceRe Holdings Ltd. | 1,167 | 334 |
| | Carlyle Group Inc. | 6,283 | 334 |
| | Equitable Holdings Inc. | 6,910 | 333 |
| | Axis Capital Holdings Ltd. | 3,559 | 331 |
| | Globe Life Inc. | 2,937 | 327 |
| * | Axos Financial Inc. | 3,928 | 325 |
| | Radian Group Inc. | 9,027 | 323 |
| | Stifel Financial Corp. | 2,787 | 323 |
| | Cincinnati Financial Corp. | 2,007 | 321 |
| | Northern Trust Corp. | 2,868 | 319 |
| | PNC Financial Services Group Inc. | 1,476 | 317 |
| | Morgan Stanley | 2,386 | 314 |
| | Virtu Financial Inc. Class A | 8,179 | 305 |
| | Corebridge Financial Inc. | 9,389 | 304 |
| | | Shares | Market
Value•
($000) |
| * | Genworth Financial Inc. | 38,111 | 297 |
| | 1st Source Corp. | 4,508 | 293 |
| | Brightsphere Investment Group Inc. | 9,160 | 286 |
| | Assurant Inc. | 1,243 | 282 |
| | Commerce Bancshares Inc. | 3,818 | 282 |
| | Victory Capital Holdings Inc. Class A | 4,015 | 279 |
| | Willis Towers Watson plc | 863 | 278 |
| | Univest Financial Corp. | 8,719 | 277 |
| | Affiliated Managers Group Inc. | 1,468 | 275 |
| | Northeast Bank | 2,774 | 273 |
| | Independent Bank Corp. (XNGS) | 3,733 | 270 |
| | Independent Bank Corp. | 7,172 | 270 |
| | S&T Bancorp Inc. | 6,290 | 269 |
| * | Hamilton Insurance Group Ltd. Class B | 14,002 | 267 |
| * | Bancorp Inc. | 4,531 | 265 |
| | Fidelis Insurance Holdings Ltd. | 12,836 | 264 |
| | First Commonwealth Financial Corp. | 13,972 | 263 |
| | Community Financial System Inc. | 3,741 | 259 |
| | Heritage Financial Corp. | 9,705 | 257 |
| | ConnectOne Bancorp Inc. | 8,977 | 247 |
| | Mercury General Corp. | 3,036 | 240 |
| | Enterprise Financial Services Corp. | 3,949 | 239 |
| | BOK Financial Corp. | 1,999 | 238 |
| | Cathay General Bancorp | 4,570 | 238 |
| | Assured Guaranty Ltd. | 2,540 | 237 |
| | Berkshire Hills Bancorp Inc. | 7,616 | 232 |
| | Park National Corp. | 1,197 | 228 |
| | BGC Group Inc. Class A | 23,451 | 228 |
| | Hanmi Financial Corp. | 8,573 | 227 |
| | WSFS Financial Corp. | 3,544 | 213 |
| | First Merchants Corp. | 4,820 | 211 |
| | TriCo Bancshares | 4,369 | 211 |
| | First Citizens BancShares Inc. Class A | 90 | 207 |
| | Ameris Bancorp | 2,843 | 200 |
| | Southside Bancshares Inc. | 5,517 | 194 |
| | CNA Financial Corp. | 3,816 | 192 |
| | Allstate Corp. | 864 | 179 |
| | Prudential Financial Inc. | 1,336 | 173 |
| | Towne Bank | 4,727 | 173 |
| | Westamerica BanCorp | 3,030 | 173 |
| | Merchants Bancorp | 3,845 | 159 |
| | Associated Banc-Corp. | 5,895 | 157 |
| | Capitol Federal Financial Inc. | 23,072 | 154 |
| | Federal Agricultural Mortgage Corp. Class C | 650 | 139 |
| | Arch Capital Group Ltd. | 1,334 | 134 |
| | Piper Sandler Cos. | 381 | 131 |
| | BancFirst Corp. | 937 | 118 |
| | Citigroup Inc. | 1,642 | 116 |
| | Old Second Bancorp Inc. | 5,723 | 106 |
| | Synovus Financial Corp. | 1,738 | 99 |
| | Voya Financial Inc. | 1,191 | 99 |
| | Janus Henderson Group plc | 2,182 | 99 |
| | UMB Financial Corp. | 773 | 97 |
| | PJT Partners Inc. Class A | 576 | 96 |
| | FB Financial Corp. | 1,684 | 95 |
| | Truist Financial Corp. | 2,002 | 95 |
| | Fidelity National Financial Inc. | 1,472 | 93 |
| | Veritex Holdings Inc. | 3,015 | 92 |
| | German American Bancorp Inc. | 2,024 | 91 |
| | OceanFirst Financial Corp. | 4,308 | 89 |
| | First Interstate BancSystem Inc. Class A | 2,529 | 88 |
| | Hingham Institution for Savings | 304 | 86 |
| | Mercantile Bank Corp. | 1,725 | 86 |
| | Peoples Bancorp Inc. | 2,446 | 86 |
| | Northfield Bancorp Inc. | 6,319 | 85 |
| | First Hawaiian Inc. | 3,039 | 84 |
| | American Financial Group Inc. | 564 | 83 |
| | First Financial Bancorp | 2,710 | 80 |
| | NBT Bancorp Inc. | 1,570 | 79 |
| | Reinsurance Group of America Inc. | 346 | 79 |
| | | Shares | Market
Value•
($000) |
| | City Holding Co. | 597 | 78 |
| | Diamond Hill Investment Group Inc. | 439 | 73 |
| | Cboe Global Markets Inc. | 309 | 67 |
| | Stock Yards Bancorp Inc. | 855 | 65 |
| * | Coastal Financial Corp. | 797 | 61 |
| | Navient Corp. | 3,869 | 60 |
| | Community Trust Bancorp Inc. | 960 | 57 |
| * | Texas Capital Bancshares Inc. | 596 | 53 |
| | Northwest Bancshares Inc. | 3,405 | 50 |
| | Nelnet Inc. Class A | 371 | 40 |
| | | | 44,965 |
| Health Care (10.0%) |
| | HCA Healthcare Inc. | 4,321 | 1,414 |
| | Gilead Sciences Inc. | 14,834 | 1,373 |
| | Merck & Co. Inc. | 10,839 | 1,102 |
| | Johnson & Johnson | 6,944 | 1,076 |
| | Bristol-Myers Squibb Co. | 15,453 | 915 |
| | AbbVie Inc. | 4,552 | 833 |
| * | Collegium Pharmaceutical Inc. | 12,651 | 386 |
| * | United Therapeutics Corp. | 1,020 | 378 |
| * | Lantheus Holdings Inc. | 4,219 | 377 |
| | Cardinal Health Inc. | 2,816 | 344 |
| * | Globus Medical Inc. Class A | 3,716 | 318 |
| * | Tenet Healthcare Corp. | 2,006 | 286 |
| | Cigna Group | 845 | 285 |
| | ResMed Inc. | 1,115 | 278 |
| * | Community Health Systems Inc. | 80,630 | 277 |
| * | DaVita Inc. | 1,618 | 269 |
| * | Medpace Holdings Inc. | 741 | 252 |
| * | Alkermes plc | 8,645 | 251 |
| * | AdaptHealth Corp. | 24,931 | 250 |
| | Universal Health Services Inc. Class B | 1,195 | 245 |
| * | Amneal Pharmaceuticals Inc. | 29,534 | 244 |
| | Embecta Corp. | 11,371 | 237 |
| * | Supernus Pharmaceuticals Inc. | 6,456 | 236 |
| * | Catalyst Pharmaceuticals Inc. | 10,602 | 234 |
| | Phibro Animal Health Corp. Class A | 9,977 | 233 |
| * | Exelixis Inc. | 6,340 | 231 |
| * | Innoviva Inc. | 11,692 | 222 |
| * | Pediatrix Medical Group Inc. | 14,703 | 220 |
| | Organon & Co. | 13,120 | 208 |
| | SIGA Technologies Inc. | 27,818 | 203 |
| | HealthStream Inc. | 5,810 | 192 |
| * | Omnicell Inc. | 4,130 | 192 |
| * | Owens & Minor Inc. | 13,992 | 189 |
| | LeMaitre Vascular Inc. | 1,727 | 185 |
| * | Protagonist Therapeutics Inc. | 3,953 | 173 |
| * | Halozyme Therapeutics Inc. | 3,343 | 161 |
| | Eli Lilly & Co. | 195 | 155 |
| | Baxter International Inc. | 4,468 | 151 |
| * | Zimvie Inc. | 9,818 | 145 |
| * | Hims & Hers Health Inc. | 4,193 | 135 |
| * | AngioDynamics Inc. | 18,545 | 129 |
| * | CareDx Inc. | 5,080 | 125 |
| * | Orthofix Medical Inc. | 6,393 | 125 |
| * | Harmony Biosciences Holdings Inc. | 3,459 | 120 |
| | Dentsply Sirona Inc. | 5,869 | 115 |
| | National HealthCare Corp. | 911 | 114 |
| * | Inogen Inc. | 11,585 | 113 |
| * | Doximity Inc. Class A | 2,111 | 112 |
| * | ADMA Biologics Inc. | 5,060 | 102 |
| * | Avanos Medical Inc. | 5,209 | 100 |
| * | Corcept Therapeutics Inc. | 1,733 | 100 |
| * | Castle Biosciences Inc. | 3,294 | 100 |
| | Viatris Inc. | 6,591 | 86 |
| * | Incyte Corp. | 1,142 | 85 |
| | Premier Inc. Class A | 3,702 | 85 |
| * | Kiniksa Pharmaceuticals International plc | 3,681 | 81 |
| * | CorVel Corp. | 220 | 80 |
| | | Shares | Market
Value•
($000) |
| * | Tactile Systems Technology Inc. | 4,113 | 80 |
| * | UFP Technologies Inc. | 220 | 71 |
| * | Inmode Ltd. | 2,739 | 54 |
| | | | 16,832 |
| Industrials (17.1%) |
| | American Express Co. | 4,246 | 1,294 |
| * | Fiserv Inc. | 5,673 | 1,254 |
| * | PayPal Holdings Inc. | 14,452 | 1,254 |
| | 3M Co. | 8,987 | 1,200 |
| | CRH plc | 10,299 | 1,053 |
| | Synchrony Financial | 13,489 | 911 |
| | Lockheed Martin Corp. | 1,647 | 872 |
| | EMCOR Group Inc. | 1,098 | 560 |
| | Trane Technologies plc | 1,307 | 544 |
| | Cintas Corp. | 2,302 | 520 |
| * | Builders FirstSource Inc. | 2,576 | 480 |
| | Argan Inc. | 2,967 | 463 |
| | RTX Corp. | 3,743 | 456 |
| * | IES Holdings Inc. | 1,405 | 435 |
| | Boise Cascade Co. | 2,810 | 415 |
| | Matson Inc. | 2,707 | 415 |
| | Louisiana-Pacific Corp. | 3,249 | 384 |
| | Acuity Brands Inc. | 1,184 | 380 |
| * | Masterbrand Inc. | 20,593 | 356 |
| | Kelly Services Inc. Class A | 24,140 | 354 |
| | Allison Transmission Holdings Inc. | 2,925 | 347 |
| | United Rentals Inc. | 398 | 345 |
| * | BrightView Holdings Inc. | 19,793 | 338 |
| | FedEx Corp. | 1,105 | 334 |
| | Owens Corning | 1,581 | 325 |
| * | Teekay Corp. Ltd. | 43,967 | 324 |
| | Cummins Inc. | 853 | 320 |
| | Genco Shipping & Trading Ltd. | 20,072 | 319 |
| 1 | CompoSecure Inc. Class A | 19,470 | 311 |
| * | American Woodmark Corp. | 3,326 | 302 |
| | Caterpillar Inc. | 738 | 300 |
| | Comfort Systems USA Inc. | 595 | 294 |
| | Fidelity National Information Services Inc. | 3,375 | 288 |
| * | GMS Inc. | 2,820 | 283 |
| | Apogee Enterprises Inc. | 3,216 | 271 |
| | Ryder System Inc. | 1,583 | 267 |
| * | Corpay Inc. | 698 | 266 |
| | Parker-Hannifin Corp. | 377 | 265 |
| | Heidrick & Struggles International Inc. | 5,704 | 263 |
| | Bel Fuse Inc. Class B | 3,247 | 260 |
| | Patrick Industries Inc. | 1,929 | 259 |
| * | Mohawk Industries Inc. | 1,850 | 257 |
| | Griffon Corp. | 3,026 | 255 |
| | Carlisle Cos. Inc. | 543 | 248 |
| | Applied Industrial Technologies Inc. | 898 | 247 |
| | Brink's Co. | 2,468 | 239 |
| | Ennis Inc. | 11,086 | 236 |
| | Teekay Tankers Ltd. Class A | 5,692 | 229 |
| * | Payoneer Global Inc. | 20,807 | 227 |
| | Moog Inc. Class A | 1,011 | 224 |
| | Ardmore Shipping Corp. | 19,720 | 220 |
| | REV Group Inc. | 7,018 | 218 |
| | Barrett Business Services Inc. | 4,960 | 213 |
| | Deluxe Corp. | 9,211 | 213 |
| | General Electric Co. | 1,144 | 208 |
| * | TopBuild Corp. | 511 | 200 |
| | ADT Inc. | 25,144 | 192 |
| * | Sterling Infrastructure Inc. | 873 | 170 |
| | Esab Corp. | 1,296 | 167 |
| | Safe Bulkers Inc. | 42,347 | 164 |
| | International Seaways Inc. | 3,829 | 149 |
| | Scorpio Tankers Inc. | 2,906 | 147 |
| | Western Union Co. | 13,137 | 145 |
| | DHT Holdings Inc. | 15,385 | 145 |
| | | Shares | Market
Value•
($000) |
| * | Euronet Worldwide Inc. | 1,365 | 144 |
| | United States Lime & Minerals Inc. | 919 | 141 |
| | Valmont Industries Inc. | 397 | 138 |
| * | Tutor Perini Corp. | 5,033 | 137 |
| | Terex Corp. | 2,466 | 135 |
| | Graphic Packaging Holding Co. | 4,162 | 125 |
| * | WEX Inc. | 665 | 125 |
| | Snap-on Inc. | 334 | 123 |
| | Dorian LPG Ltd. | 4,983 | 122 |
| | Covenant Logistics Group Inc. | 2,088 | 121 |
| * | ACI Worldwide Inc. | 2,085 | 118 |
| * | Knife River Corp. | 1,120 | 116 |
| | WW Grainger Inc. | 94 | 113 |
| * | DXP Enterprises Inc. | 1,482 | 109 |
| | CRA International Inc. | 545 | 106 |
| * | Gibraltar Industries Inc. | 1,447 | 105 |
| | AAON Inc. | 760 | 104 |
| | Crown Holdings Inc. | 1,123 | 103 |
| | LSI Industries Inc. | 4,783 | 98 |
| | Quanex Building Products Corp. | 3,255 | 97 |
| | Flowserve Corp. | 1,543 | 94 |
| | Miller Industries Inc. | 1,231 | 91 |
| * | Gates Industrial Corp. plc | 4,059 | 90 |
| | Westinghouse Air Brake Technologies Corp. | 443 | 89 |
| | RPM International Inc. | 637 | 88 |
| | Curtiss-Wright Corp. | 227 | 85 |
| * | Itron Inc. | 721 | 85 |
| | Mueller Water Products Inc. Class A | 3,364 | 84 |
| | Preformed Line Products Co. | 600 | 82 |
| | Federal Signal Corp. | 820 | 80 |
| * | ASGN Inc. | 879 | 80 |
| | Installed Building Products Inc. | 347 | 79 |
| | Wabash National Corp. | 3,997 | 79 |
| | ICF International Inc. | 550 | 76 |
| | Costamare Inc. | 5,712 | 75 |
| | Watsco Inc. | 132 | 73 |
| * | NCR Atleos Corp. | 2,057 | 67 |
| | Packaging Corp. of America | 264 | 66 |
| * | Donnelley Financial Solutions Inc. | 1,083 | 65 |
| | Maximus Inc. | 853 | 64 |
| * | Target Hospitality Corp. | 7,664 | 63 |
| | Kforce Inc. | 1,003 | 60 |
| | Franklin Electric Co. Inc. | 516 | 56 |
| * | Hudson Technologies Inc. | 8,628 | 51 |
| | Napco Security Technologies Inc. | 1,292 | 51 |
| * | Conduent Inc. | 11,157 | 42 |
| | Nordic American Tankers Ltd. | 14,322 | 38 |
| * | Cross Country Healthcare Inc. | 2,792 | 30 |
| | | | 28,957 |
| Real Estate (0.4%) |
| | Newmark Group Inc. Class A | 34,497 | 534 |
| * | GEO Group Inc. | 4,482 | 128 |
| | | | 662 |
| Technology (8.5%) |
| | Meta Platforms Inc. Class A | 2,282 | 1,311 |
| | International Business Machines Corp. | 5,219 | 1,187 |
| | QUALCOMM Inc. | 7,056 | 1,119 |
| | NVIDIA Corp. | 7,052 | 975 |
| | Alphabet Inc. Class C | 5,280 | 900 |
| | Alphabet Inc. Class A | 4,025 | 680 |
| | NetApp Inc. | 3,694 | 453 |
| | Jabil Inc. | 3,160 | 429 |
| * | Kyndryl Holdings Inc. | 11,766 | 408 |
| * | F5 Inc. | 1,564 | 392 |
| | Dell Technologies Inc. Class C | 2,687 | 343 |
| * | Daktronics Inc. | 21,643 | 333 |
| | HP Inc. | 9,386 | 333 |
| | Gen Digital Inc. (XNGS) | 10,422 | 322 |
| | Hewlett Packard Enterprise Co. | 14,868 | 315 |
| | | Shares | Market
Value•
($000) |
| * | Photronics Inc. | 12,458 | 310 |
| | KLA Corp. | 469 | 303 |
| * | Insight Enterprises Inc. | 1,915 | 300 |
| | Leidos Holdings Inc. | 1,764 | 292 |
| * | CommVault Systems Inc. | 1,574 | 270 |
| * | OneSpan Inc. | 14,309 | 259 |
| * | ScanSource Inc. | 4,810 | 242 |
| | PC Connection Inc. | 3,104 | 225 |
| | Benchmark Electronics Inc. | 4,625 | 224 |
| | TD SYNNEX Corp. | 1,859 | 221 |
| * | Cirrus Logic Inc. | 1,992 | 208 |
| | Monolithic Power Systems Inc. | 316 | 179 |
| | Amkor Technology Inc. | 6,665 | 176 |
| * | Diebold Nixdorf Inc. | 3,609 | 167 |
| * | Pure Storage Inc. Class A | 2,852 | 151 |
| * | E2open Parent Holdings Inc. | 49,654 | 151 |
| * | ePlus Inc. | 1,742 | 141 |
| | Pegasystems Inc. | 1,027 | 98 |
| | Cognizant Technology Solutions Corp. Class A | 1,110 | 89 |
| | Clear Secure Inc. Class A | 3,406 | 88 |
| * | Arrow Electronics Inc. | 724 | 87 |
| * | DXC Technology Co. | 3,826 | 86 |
| * | NetScout Systems Inc. | 3,773 | 83 |
| * | CACI International Inc. Class A | 163 | 75 |
| * | PubMatic Inc. Class A | 4,731 | 75 |
| | Hackett Group Inc. | 2,074 | 65 |
| | Skyworks Solutions Inc. | 738 | 65 |
| * | Sanmina Corp. | 735 | 58 |
| * | GoDaddy Inc. Class A | 277 | 55 |
| * | Manhattan Associates Inc. | 192 | 55 |
| * | Grindr Inc. | 3,569 | 54 |
| * | Qorvo Inc. | 676 | 47 |
| | | | 14,399 |
| Telecommunications (3.0%) |
| | AT&T Inc. | 55,926 | 1,295 |
| | T-Mobile US Inc. | 4,984 | 1,231 |
| | Verizon Communications Inc. | 25,593 | 1,135 |
| | IDT Corp. Class B | 8,382 | 433 |
| | Motorola Solutions Inc. | 747 | 373 |
| * | Liberty Latin America Ltd. Class C | 32,687 | 226 |
| * | NETGEAR Inc. | 8,198 | 202 |
| | Spok Holdings Inc. | 11,356 | 186 |
| * | Liberty Latin America Ltd. Class A | 7,807 | 54 |
| | | | 5,135 |
| Utilities (0.0%) |
| * | Enviri Corp. | 5,765 | 43 |
| Total Common Stocks (Cost $127,688) | 167,721 |
| Temporary Cash Investments (0.7%) |
| Money Market Fund (0.7%) |
| 2,3 | Vanguard Market Liquidity Fund, 4.651% (Cost $1,299) | 12,992 | 1,299 |
| Total Investments (99.9%) (Cost $128,987) | 169,020 |
| Other Assets and Liabilities—Net (0.1%) | 94 |
| Net Assets (100%) | 169,114 |
| Cost is in $000. |
| • | See Note A in Notes to Financial Statements. |
| * | Non-income-producing security. |
| 1 | Includes partial security positions on loan to broker-dealers. The total value of securities on loan is $234,000. |
| 2 | Affiliated money market fund available only to Vanguard funds and certain trusts and accounts managed by Vanguard. Rate shown is the 7-day yield. |
| 3 | Collateral of $250,000 was received for securities on loan. |
Derivative Financial Instruments Outstanding as of Period End
| Futures Contracts |
| | | | ($000) |
| | Expiration | Number of
Long (Short)
Contracts | Notional
Amount | Value and
Unrealized
Appreciation
(Depreciation) |
| Long Futures Contracts | | | | |
| Micro E-mini S&P 500 Index | December 2024 | 45 | 1,362 | 23 |
See accompanying Notes, which are an integral part of the Financial Statements.
Statement of Assets and Liabilities
|
| ($000s, except shares, footnotes, and per-share amounts) | Amount |
| Assets | |
| Investments in Securities, at Value1 | |
| Unaffiliated Issuers (Cost $127,688) | 167,721 |
| Affiliated Issuers (Cost $1,299) | 1,299 |
| Total Investments in Securities | 169,020 |
| Investment in Vanguard | 4 |
| Cash Collateral Pledged—Futures Contracts | 58 |
| Receivables for Accrued Income | 202 |
| Receivables for Capital Shares Issued | 182 |
| Variation Margin Receivable—Futures Contracts | 7 |
| Total Assets | 169,473 |
| Liabilities | |
| Payables for Investment Securities Purchased | 3 |
| Collateral for Securities on Loan | 250 |
| Payables for Capital Shares Redeemed | 94 |
| Payables to Vanguard | 12 |
| Total Liabilities | 359 |
| Net Assets | 169,114 |
| 1 Includes $234,000 of securities on loan. | |
| At November 30, 2024, net assets consisted of: | |
| | |
| Paid-in Capital | 125,978 |
| Total Distributable Earnings (Loss) | 43,136 |
| Net Assets | 169,114 |
| |
| Net Assets | |
Applicable to 3,708,824 outstanding $.001 par value shares of
beneficial interest (unlimited authorization) | 169,114 |
| Net Asset Value Per Share | $45.60 |
See accompanying Notes, which are an integral part of the Financial Statements.
|
| | Year Ended
November 30, 2024 |
| | ($000) |
| Investment Income | |
| Income | |
| Dividends1 | 2,205 |
| Interest2 | 72 |
| Securities Lending—Net | 1 |
| Total Income | 2,278 |
| Expenses | |
| The Vanguard Group—Note B | |
| Investment Advisory Services | 25 |
| Management and Administrative | 108 |
| Marketing and Distribution | 5 |
| Custodian Fees | 6 |
| Auditing Fees | 31 |
| Shareholders’ Reports and Proxy Fees | 25 |
| Trustees’ Fees and Expenses | — |
| Professional Services | 15 |
| Total Expenses | 215 |
| Expenses Paid Indirectly | (1) |
| Net Expenses | 214 |
| Net Investment Income | 2,064 |
| Realized Net Gain (Loss) | |
| Investment Securities Sold2 | 9,367 |
| Futures Contracts | 317 |
| Realized Net Gain (Loss) | 9,684 |
| Change in Unrealized Appreciation (Depreciation) | |
| Investment Securities2 | 23,832 |
| Futures Contracts | (22) |
| Change in Unrealized Appreciation (Depreciation) | 23,810 |
| Net Increase (Decrease) in Net Assets Resulting from Operations | 35,558 |
| 1 | Dividends are net of foreign withholding taxes of $9,000. |
| 2 | Interest income, realized net gain (loss), capital gain distributions received, and change in unrealized appreciation (depreciation) from an affiliated company of the fund were $69,000, less than $1,000, less than $1,000, and less than $1,000, respectively. Purchases and sales are for temporary cash investment purposes. |
See accompanying Notes, which are an integral part of the Financial Statements.
Statement of Changes in Net Assets
|
| | Year Ended November 30, |
| | 2024
($000) | 2023
($000) |
| Increase (Decrease) in Net Assets | | |
| Operations | | |
| Net Investment Income | 2,064 | 1,326 |
| Realized Net Gain (Loss) | 9,684 | (1,381) |
| Change in Unrealized Appreciation (Depreciation) | 23,810 | 2,215 |
| Net Increase (Decrease) in Net Assets Resulting from Operations | 35,558 | 2,160 |
| Distributions | | |
| Total Distributions | (1,851) | (1,309) |
| Capital Share Transactions | | |
| Issued | 96,657 | 28,467 |
| Issued in Lieu of Cash Distributions | 1,569 | 1,097 |
| Redeemed | (39,580) | (20,463) |
| Net Increase (Decrease) from Capital Share Transactions | 58,646 | 9,101 |
| Total Increase (Decrease) | 92,353 | 9,952 |
| Net Assets | | |
| Beginning of Period | 76,761 | 66,809 |
| End of Period | 169,114 | 76,761 |
See accompanying Notes, which are an integral part of the Financial Statements.
For a Share Outstanding
Throughout Each Period | Year Ended November 30, |
| 2024 | 2023 | 2022 | 2021 | 2020 |
| Net Asset Value, Beginning of Period | $34.15 | $33.75 | $32.99 | $25.47 | $25.70 |
| Investment Operations | | | | | |
| Net Investment Income1 | .699 | .625 | .680 | .466 | .382 |
| Net Realized and Unrealized Gain (Loss) on Investments | 11.397 | .401 | .725 | 7.485 | (.214) |
| Total from Investment Operations | 12.096 | 1.026 | 1.405 | 7.951 | .168 |
| Distributions | | | | | |
| Dividends from Net Investment Income | (.646) | (.626) | (.645) | (.431) | (.398) |
| Distributions from Realized Capital Gains | — | — | — | — | — |
| Total Distributions | (.646) | (.626) | (.645) | (.431) | (.398) |
| Net Asset Value, End of Period | $45.60 | $34.15 | $33.75 | $32.99 | $25.47 |
| Total Return2 | 35.74% | 3.19% | 4.43% | 31.39% | 0.97% |
| Ratios/Supplemental Data | | | | | |
| Net Assets, End of Period (Millions) | $169 | $77 | $67 | $48 | $26 |
| Ratio of Total Expenses to Average Net Assets | 0.18%3 | 0.18% | 0.18% | 0.18% | 0.18% |
| Ratio of Net Investment Income to Average Net Assets | 1.74% | 1.91% | 2.13% | 1.48% | 1.66% |
| Portfolio Turnover Rate | 56% | 50% | 55% | 62% | 74% |
| 1 | Calculated based on average shares outstanding. |
| 2 | Total returns do not include transaction or account service fees that may have applied in the periods shown. Fund prospectuses provide information about any applicable transaction and account service fees. |
| 3 | The ratio of expenses to average net assets for the period net of reduction from custody fee offset arrangements was 0.18%. |
See accompanying Notes, which are an integral part of the Financial Statements.
Notes to Financial Statements
Vanguard U.S. Multifactor Fund is registered under the Investment Company Act of 1940 as an open-end investment company, or mutual fund.
| A. | The following significant accounting policies conform to generally accepted accounting principles for U.S. investment companies. The fund consistently follows such policies in preparing its financial statements. |
1. Security Valuation: Securities are valued as of the close of trading on the New York Stock Exchange (generally 4 p.m., Eastern time) on the valuation date. Equity securities are valued at the latest quoted sales prices or official closing prices taken from the primary market in which each security trades; such securities not traded on the valuation date are valued at the mean of the latest quoted bid and asked prices. Securities for which market quotations are not readily available, or whose values have been affected by events occurring before the fund’s pricing time but after the close of the securities’ primary markets, are valued by methods deemed by the valuation designee to represent fair value and subject to oversight by the board of trustees. Investments in Vanguard Market Liquidity Fund are valued at that fund's net asset value.
2. Futures Contracts: The fund uses index futures contracts to a limited extent, with the objective of maintaining full exposure to the stock market while maintaining liquidity. The fund may purchase or sell futures contracts to achieve a desired level of investment, whether to accommodate portfolio turnover or cash flows from capital share transactions. The primary risks associated with the use of futures contracts are imperfect correlation between changes in market values of stocks held by the fund and the prices of futures contracts, and the possibility of an illiquid market. Counterparty risk involving futures is mitigated because a regulated clearinghouse is the counterparty instead of the clearing broker. To further mitigate counterparty risk, the fund trades futures contracts on an exchange, monitors the financial strength of its clearing brokers and clearinghouse, and has entered into clearing agreements with its clearing brokers. The clearinghouse imposes initial margin requirements to secure the fund’s performance and requires daily settlement of variation margin representing changes in the market value of each contract. Any securities pledged as initial margin for open contracts are noted in the Schedule of Investments.
Futures contracts are valued at their quoted daily settlement prices. The notional amounts of the contracts are not recorded in the Statement of Assets and Liabilities. Fluctuations in the value of the contracts are recorded in the Statement of Assets and Liabilities as an asset (liability) and in the Statement of Operations as unrealized appreciation (depreciation) until the contracts are closed, when they are recorded as realized gains (losses) on futures contracts.
During the year ended November 30, 2024, the fund’s average investments in long and short futures contracts represented 1% and 0% of net assets, respectively, based on the average of the notional amounts at each quarter-end during the period.
3. Federal Income Taxes: The fund intends to continue to qualify as a regulated investment company and distribute virtually all of its taxable income. The fund’s tax returns are open to examination by the relevant tax authorities until expiration of the applicable statute of limitations, which is generally three years after the filing of the tax return. Management has analyzed the fund’s tax positions taken for all open federal and state income tax years, and has concluded that no provision for income tax is required in the fund’s financial statements.
4. Distributions: Distributions to shareholders are recorded on the ex-dividend date. Distributions are determined on a tax basis at the fiscal year-end and may differ from net investment income and realized capital gains for financial reporting purposes.
5. Securities Lending: To earn additional income, the fund lends its securities to qualified institutional borrowers. Security loans are subject to termination by the fund at any time, and are required to be secured at all times by collateral in an amount at least equal to the market value of securities loaned. Daily market fluctuations could cause the value of loaned securities to be more or less than the value of the collateral received. When this occurs, the collateral is adjusted and settled before the opening of the market on the next business day. The fund further mitigates its counterparty risk by entering into securities lending transactions only with a diverse group of prequalified counterparties, monitoring their financial strength, and entering into master securities lending agreements with its counterparties. The master securities lending agreements provide that, in the event of a counterparty’s default (including bankruptcy), the fund may terminate any loans with that borrower, determine the net amount owed, and sell or retain the collateral up to the net amount owed to the fund; however, such actions may be subject to legal proceedings. While collateral mitigates counterparty risk, in the event of a default, the fund may experience delays and costs in recovering the securities loaned. The fund invests cash collateral received in Vanguard Market Liquidity Fund, and records a liability in the Statement of Assets and Liabilities for the return of the collateral, during the period the securities are on loan. Collateral investments in Vanguard Market Liquidity Fund are subject to market appreciation or depreciation. Securities lending income represents fees charged to borrowers plus income earned on invested cash collateral, less expenses associated with the loan. During the term of the loan, the fund is entitled to all distributions made on or in respect of the loaned securities.
6. Credit Facilities and Interfund Lending Program: The fund and certain other funds managed by The Vanguard Group ("Vanguard") participate in a $4.3 billion committed credit facility provided by a syndicate of lenders pursuant to a credit agreement and an uncommitted credit facility provided by Vanguard. Both facilities may be renewed annually. Each fund is individually liable for its borrowings, if any, under the credit facilities. Borrowings may be utilized for temporary or emergency purposes and are subject to the fund’s regulatory and contractual borrowing restrictions. With respect to the committed credit facility, the participating funds are charged administrative fees and an annual commitment fee of 0.10% of the undrawn committed amount of the facility, which are allocated to the funds based on a method approved by the fund’s board of trustees and included in Management and Administrative expenses on the fund’s Statement of Operations. Any borrowings under either facility bear interest at an agreed-upon spread plus the higher of the federal funds effective rate, the overnight bank funding rate, or the Daily Simple Secured Overnight Financing Rate inclusive of an additional agreed-upon spread. However, borrowings under the uncommitted credit facility may bear interest based upon an alternate rate agreed to by the fund and Vanguard.
In accordance with an exemptive order (the “Order”) from the SEC, the fund may participate in a joint lending and borrowing program that allows registered open-end Vanguard funds to borrow money from and lend money to each other for temporary or emergency purposes (the “Interfund Lending Program”), subject to compliance with the terms and conditions of the Order, and to the extent permitted by the fund’s investment objective and investment policies. Interfund loans and borrowings normally extend overnight but can have a maximum duration of seven days. Loans may be
called on one business day’s notice. The interest rate to be charged is governed by the conditions of the Order and internal procedures adopted by the board of trustees. The board of trustees is responsible for overseeing the Interfund Lending Program.
For the year ended November 30, 2024, the fund did not utilize the credit facilities or the Interfund Lending Program.
7. Other: Dividend income is recorded on the ex-dividend date. Non-cash dividends included in income, if any, are recorded at the fair value of the securities received. Interest income includes income distributions received from Vanguard Market Liquidity Fund and is accrued daily. Security transactions are accounted for on the date securities are bought or sold. Costs used to determine realized gains (losses) on the sale of investment securities are those of the specific securities sold.
| B. | In accordance with the terms of a Funds' Service Agreement (the “FSA”) between Vanguard and the fund, Vanguard furnishes to the fund investment advisory, corporate management, administrative, marketing, and distribution services at Vanguard’s cost of operations (as defined by the FSA). These costs of operations are allocated to the fund based on methods and guidelines approved by the board of trustees and are generally settled twice a month. |
Upon the request of Vanguard, the fund may invest up to 0.40% of its net assets as capital in Vanguard. At November 30, 2024, the fund had contributed to Vanguard capital in the amount of $4,000, representing less than 0.01% of the fund’s net assets and less than 0.01% of Vanguard’s capital received pursuant to the FSA. The fund’s trustees and officers are also directors and employees, respectively, of Vanguard.
| C. | The fund’s custodian bank has agreed to reduce its fees when the fund maintains cash on deposit in the non-interest-bearing custody account. For the year ended November 30, 2024, custodian fee offset arrangements reduced the fund’s expenses by $1,000 (an annual rate of less than 0.01% of average net assets). |
| D. | Various inputs may be used to determine the value of the fund’s investments and derivatives. These inputs are summarized in three broad levels for financial statement purposes. The inputs or methodologies used to value securities are not necessarily an indication of the risk associated with investing in those securities. |
Level 1—Quoted prices in active markets for identical securities.
Level 2—Other significant observable inputs (including quoted prices for similar securities, interest rates, prepayment speeds, credit risk, etc.).
Level 3—Significant unobservable inputs (including the fund’s own assumptions used to determine the fair value of investments). Any investments and derivatives valued with significant unobservable inputs are noted on the Schedule of Investments.
At November 30, 2024, 100% of the market value of the fund’s investments and derivatives was determined based on Level 1 inputs.
| E. | Permanent differences between book-basis and tax-basis components of net assets are reclassified among capital accounts in the financial statements to reflect their tax character. These reclassifications have no effect on net assets or net asset value per share. As of period end, permanent differences primarily attributable to the accounting for distributions in connection with fund share redemptions were reclassified between the following accounts: |
| | Amount
($000) |
| Paid-in Capital | 78 |
| Total Distributable Earnings (Loss) | (78) |
Temporary differences between book-basis and tax-basis components of total distributable earnings (loss) arise when certain items of income, gain, or loss are recognized in different periods for financial statement and tax purposes; these differences will reverse at some time in the future. The differences are primarily related to the deferral of losses from wash sales; and the recognition of unrealized gains or losses from certain derivative contracts. As of period end, the tax-basis components of total distributable earnings (loss) are detailed in the table as follows:
| | Amount
($000) |
| Undistributed Ordinary Income | 480 |
| Undistributed Long-Term Gains | 2,624 |
| Net Unrealized Gains (Losses) | 40,032 |
| Capital Loss Carryforwards | — |
| Qualified Late-Year Losses | — |
| Other Temporary Differences | — |
| Total | 43,136 |
The tax character of distributions paid was as follows:
| | Year Ended November 30, |
| | 2024
Amount
($000) | 2023
Amount
($000) |
| Ordinary Income* | 1,851 | 1,309 |
| Long-Term Capital Gains | — | — |
| Total | 1,851 | 1,309 |
| * | Includes short-term capital gains, if any. |
As of November 30, 2024, gross unrealized appreciation and depreciation for investments and derivatives based on cost for U.S. federal income tax purposes were as follows:
| | Amount
($000) |
| Tax Cost | 128,988 |
| Gross Unrealized Appreciation | 43,324 |
| Gross Unrealized Depreciation | (3,292) |
| Net Unrealized Appreciation (Depreciation) | 40,032 |
| F. | During the year ended November 30, 2024, the fund purchased $124,873,000 of investment securities and sold $66,062,000 of investment securities, other than temporary cash investments. |
The fund purchased securities from and sold securities to other Vanguard funds or accounts managed by Vanguard or its affiliates, in accordance with procedures adopted by the board of trustees in compliance with Rule 17a-7 of the Investment Company Act of 1940. For the year ended November 30, 2024, such purchases were $1,883,000 and sales were $1,530,000, resulting in net realized gain of $36,000; these amounts, other than temporary cash investments, are included in the purchases and sales of investment securities noted above.
| G. | Capital shares issued and redeemed were: |
| | Year Ended November 30, |
| | 2024
Shares
(000) | 2023
Shares
(000) |
| Issued | 2,405 | 866 |
| Issued in Lieu of Cash Distributions | 40 | 34 |
| Redeemed | (984) | (631) |
| Net Increase (Decrease) in Shares Outstanding | 1,461 | 269 |
| H. | Significant market disruptions, such as those caused by pandemics, natural or environmental disasters, war, acts of terrorism, or other events, can adversely affect local and global markets and normal market operations. Any such disruptions could have an adverse impact on the value of the fund’s investments and fund performance. |
To the extent the fund’s investment portfolio reflects concentration in a particular market, industry, sector, country or asset class, the fund may be adversely affected by the performance of these concentrations and may be subject to increased price volatility and other risks.
The use of derivatives may expose the fund to various risks. Derivatives can be highly volatile, and any initial investment is generally small relative to the notional amount so that transactions may be leveraged in terms of market exposure. A relatively small market movement may have a potentially larger impact on derivatives than on standard securities. Leveraged derivatives positions can, therefore, increase volatility. Additional information regarding the fund’s use of derivative(s) and the specific risks associated is described under significant accounting policies.
| I. | Management has determined that no events or transactions occurred subsequent to November 30, 2024, that would require recognition or disclosure in these financial statements. |
Report of Independent Registered Public Accounting Firm
To the Board of Trustees of Vanguard Wellington Fund and Shareholders of Vanguard U.S. Multifactor Fund
Opinion on the Financial Statements
We have audited the accompanying statement of assets and liabilities, including the schedule of investments, of Vanguard U.S. Multifactor Fund (one of the funds constituting Vanguard Wellington Fund, referred to hereafter as the "Fund") as of November 30, 2024, the related statement of operations for the year ended November 30, 2024, the statement of changes in net assets for each of the two years in the period ended November 30, 2024, including the related notes, and the financial highlights for each of the five years in the period ended November 30, 2024 (collectively referred to as the "financial statements"). In our opinion, the financial statements present fairly, in all material respects, the financial position of the Fund as of November 30, 2024, the results of its operations for the year then ended, the changes in its net assets for each of the two years in the period ended November 30, 2024 and the financial highlights for each of the five years in the period ended November 30, 2024 in conformity with accounting principles generally accepted in the United States of America.
Basis for Opinion
These financial statements are the responsibility of the Fund’s management. Our responsibility is to express an opinion on the Fund’s financial statements based on our audits. We are a public accounting firm registered with the Public Company Accounting Oversight Board (United States) (PCAOB) and are required to be independent with respect to the Fund in accordance with the U.S. federal securities laws and the applicable rules and regulations of the Securities and Exchange Commission and the PCAOB.
We conducted our audits of these financial statements in accordance with the standards of the PCAOB. Those standards require that we plan and perform the audit to obtain reasonable assurance about whether the financial statements are free of material misstatement, whether due to error or fraud.
Our audits included performing procedures to assess the risks of material misstatement of the financial statements, whether due to error or fraud, and performing procedures that respond to those risks. Such procedures included examining, on a test basis, evidence regarding the amounts and disclosures in the financial statements. Our audits also included evaluating the accounting principles used and significant estimates made by management, as well as evaluating the overall presentation of the financial statements. Our procedures included confirmation of securities owned as of November 30, 2024 by correspondence with the custodian, transfer agent and brokers; when replies were not received from brokers, we performed other auditing procedures. We believe that our audits provide a reasonable basis for our opinion.
/s/PricewaterhouseCoopers LLP
Philadelphia, Pennsylvania
January 17, 2025
We have served as the auditor of one or more investment companies in The Vanguard Group of Funds since 1975.
Tax information (unaudited)
For corporate shareholders, 93.4%, or if subsequently determined to be different, the maximum percentage allowable by law, of ordinary income (dividend income plus short-term gains, if any) for the fiscal year qualified for the dividends-received deduction.
The fund hereby designates $1,396,000, or if subsequently determined to be different, the maximum amount allowable by law, as qualified dividend income for purposes of the maximum rate under section 1(h)(11) for calendar year 2023. Shareholders will be notified in January 2025 via IRS Form 1099 of the amounts for use in preparing their 2024 income tax return.
The fund hereby designates for the fiscal year $25,000, or if subsequently determined to be different, the maximum amount allowable by law, of interest earned from obligations of the U.S. government which is generally exempt from state income tax.
The fund distributed $78,000 as capital gain dividends (20% rate gain distributions) to shareholders during the fiscal year.
Q5160 012025
Financial Statements
For the year ended November 30, 2024
Vanguard Short-Term Tax-Exempt Bond ETF
Contents
Financial Statements
| 1 |
Report of Independent Registered Public Accounting Firm
| 45 |
Tax information
| 46 |
| | |
Short-Term Tax-Exempt Bond ETF
Schedule of Investments
As of November 30, 2024
The fund files its complete schedule of portfolio holdings with the Securities and Exchange Commission (SEC) for the first and third quarters of each fiscal year as an exhibit to its reports on Form N-PORT. The fund’s Form N-PORT reports are available on the SEC’s website at www.sec.gov.
| | | Coupon | Maturity
Date | Face
Amount
($000) | Market
Value•
($000) |
| Tax-Exempt Municipal Bonds (99.3%) |
| Alabama (0.9%) |
| | Alabama Federal Aid Highway Finance Authority Fuel Sales Tax Revenue, Prere. | 5.000% | 9/1/26 | 60 | 62 |
| | Alabama Federal Aid Highway Finance Authority Fuel Sales Tax Revenue, Prere. | 5.000% | 9/1/26 | 525 | 544 |
| | Alabama Federal Aid Highway Finance Authority Government Fund/Grant Revenue, ETM | 5.000% | 9/1/25 | 370 | 375 |
| | Alabama Federal Aid Highway Finance Authority Government Fund/Grant Revenue, ETM | 5.000% | 9/1/26 | 105 | 109 |
| | Alabama Federal Aid Highway Finance Authority Government Fund/Grant Revenue, Prere. | 4.000% | 9/1/27 | 195 | 201 |
| | Alabama Federal Aid Highway Finance Authority Government Fund/Grant Revenue, Prere. | 5.000% | 9/1/27 | 445 | 470 |
| | Alabama GO | 5.000% | 8/1/27 | 95 | 98 |
| | Alabama Public School & College Authority Miscellaneous Taxes Revenue | 5.000% | 11/1/26 | 220 | 230 |
| | Alabama Public School & College Authority Miscellaneous Taxes Revenue | 5.000% | 11/1/27 | 1,025 | 1,092 |
| | Alabama Public School & College Authority Miscellaneous Taxes Revenue | 5.000% | 11/1/29 | 275 | 305 |
| | Alabama Public School & College Authority Miscellaneous Taxes Revenue | 5.000% | 11/1/30 | 130 | 146 |
| | Alabama Public School & College Authority Sales Tax Revenue | 5.000% | 1/1/25 | 405 | 406 |
| | Alabama Public School & College Authority Sales Tax Revenue | 5.000% | 1/1/27 | 160 | 160 |
| | Birmingham Water Works Board Water Revenue, Prere. | 5.000% | 1/1/27 | 245 | 257 |
| | Jefferson County AL Sewer Revenue | 5.000% | 10/1/27 | 100 | 106 |
| | Jefferson County AL Sewer Revenue | 5.000% | 10/1/28 | 100 | 107 |
| | Jefferson County AL Sewer Revenue | 5.000% | 10/1/29 | 100 | 109 |
| | Jefferson County AL Sewer Revenue | 5.000% | 10/1/30 | 240 | 265 |
| | | | | | 5,042 |
| Arizona (1.3%) |
| | Arizona COP, ETM | 5.000% | 10/1/25 | 350 | 356 |
| | Arizona COP, ETM | 5.000% | 10/1/26 | 80 | 83 |
| | Arizona COP, ETM | 5.000% | 10/1/27 | 250 | 267 |
| | Arizona COP, ETM | 5.000% | 10/1/28 | 625 | 681 |
| | Arizona COP, ETM | 5.000% | 10/1/29 | 25 | 28 |
| | Arizona Department of Transportation State Highway Fund Fuel Sales Tax Revenue | 5.000% | 7/1/26 | 45 | 47 |
| | Arizona Department of Transportation State Highway Fund Fuel Sales Tax Revenue | 5.000% | 7/1/27 | 35 | 37 |
| | Arizona Department of Transportation State Highway Fund Fuel Sales Tax Revenue | 5.000% | 7/1/28 | 105 | 113 |
| | Arizona Department of Transportation State Highway Fund Fuel Sales Tax Revenue | 5.000% | 7/1/30 | 130 | 146 |
| | Arizona Department of Transportation State Highway Fund Fuel Sales Tax Revenue | 5.000% | 7/1/31 | 60 | 68 |
| | Arizona IDA Charter School Aid Revenue | 5.000% | 11/1/28 | 605 | 643 |
| | Arizona IDA Charter School Aid Revenue | 5.000% | 11/1/29 | 170 | 184 |
| | Arizona Lottery Revenue, ETM | 5.000% | 7/1/28 | 15 | 16 |
| | Arizona Transportation Board Sales Tax Revenue | 5.000% | 7/1/25 | 665 | 668 |
| | Arizona Transportation Board Sales Tax Revenue | 5.000% | 7/1/25 | 70 | 71 |
| | Arizona Water Infrastructure Finance Authority Water Revenue | 5.000% | 10/1/26 | 1,000 | 1,001 |
| | Mesa AZ Utility System Multiple Utility Revenue | 3.250% | 7/1/29 | 130 | 130 |
| | Phoenix Civic Improvement Corp. Intergovernmental Agreement Revenue | 5.000% | 7/1/25 | 115 | 115 |
| | Phoenix Civic Improvement Corp. Intergovernmental Agreement Revenue | 5.000% | 7/1/27 | 110 | 110 |
| | Phoenix Civic Improvement Corp. Intergovernmental Agreement Revenue | 4.000% | 7/1/28 | 200 | 200 |
| | Phoenix Civic Improvement Corp. Intergovernmental Agreement Revenue | 5.000% | 7/1/31 | 40 | 42 |
| | Salt River Project Agricultural Improvement & Power District Electric Power & Light Revenue | 5.000% | 1/1/25 | 170 | 170 |
| | Salt River Project Agricultural Improvement & Power District Electric Power & Light Revenue | 5.000% | 1/1/26 | 65 | 67 |
| | Salt River Project Agricultural Improvement & Power District Electric Power & Light Revenue | 5.000% | 1/1/27 | 150 | 157 |
| | Salt River Project Agricultural Improvement & Power District Electric Power & Light Revenue | 5.000% | 1/1/28 | 195 | 204 |
| | Salt River Project Agricultural Improvement & Power District Electric Power & Light Revenue | 5.000% | 1/1/29 | 100 | 104 |
| | Salt River Project Agricultural Improvement & Power District Electric Power & Light Revenue | 5.000% | 1/1/31 | 150 | 169 |
| | Salt River Project Agricultural Improvement & Power District Electric Power & Light Revenue (Salt River Project) | 5.000% | 1/1/25 | 225 | 225 |
| | Salt River Project Agricultural Improvement & Power District Electric Power & Light Revenue (Salt River Project) | 5.000% | 1/1/26 | 200 | 205 |
| | Salt River Project Agricultural Improvement & Power District Electric Power & Light Revenue (Salt River Project) | 5.000% | 1/1/27 | 35 | 37 |
| | Salt River Project Agricultural Improvement & Power District Electric Power & Light Revenue (Salt River Project) | 5.000% | 1/1/27 | 195 | 205 |
| | Salt River Project Agricultural Improvement & Power District Electric Power & Light Revenue (Salt River Project) | 5.000% | 1/1/28 | 105 | 112 |
| | Salt River Project Agricultural Improvement & Power District Electric Power & Light Revenue (Salt River Project) | 5.000% | 1/1/29 | 115 | 123 |
Short-Term Tax-Exempt Bond ETF
| | | Coupon | Maturity
Date | Face
Amount
($000) | Market
Value•
($000) |
| | Salt River Project Agricultural Improvement & Power District Electric Power & Light Revenue (Salt River Project) | 5.000% | 1/1/31 | 505 | 539 |
| | Scottsdale Municipal Property Corp. Sales Tax Revenue | 5.000% | 7/1/30 | 100 | 108 |
| | | | | | 7,431 |
| Arkansas (0.1%) |
| | Little Rock AR Water Reclamation System Sewer Revenue, Prere. | 3.500% | 4/1/25 | 160 | 160 |
| | Pulaski County Public Facilities Board Health, Hospital, Nursing Home Revenue, Prere. | 5.000% | 12/1/24 | 500 | 500 |
| | | | | | 660 |
| California (15.8%) |
| 1 | Anaheim Public Financing Authority Lease (Abatement) Revenue (Anaheim Public Improvements Project) | 0.000% | 9/1/25 | 50 | 49 |
| 1 | Anaheim Public Financing Authority Lease (Abatement) Revenue (Anaheim Public Improvements Project) | 0.000% | 9/1/30 | 120 | 100 |
| | Bay Area Toll Authority Highway Revenue | 5.000% | 4/1/27 | 100 | 106 |
| | Bay Area Toll Authority Highway Revenue | 5.000% | 4/1/28 | 260 | 282 |
| | Bay Area Toll Authority Highway Revenue | 4.000% | 4/1/29 | 310 | 317 |
| | Bay Area Toll Authority Highway Revenue | 5.000% | 4/1/29 | 135 | 150 |
| | Bay Area Toll Authority Highway Revenue | 4.000% | 4/1/30 | 275 | 281 |
| | Bay Area Toll Authority Highway Revenue | 5.000% | 4/1/30 | 25 | 28 |
| | Bay Area Toll Authority Highway Revenue PUT | 2.125% | 4/1/25 | 400 | 398 |
| | Bay Area Toll Authority Highway Revenue PUT | 2.000% | 4/1/28 | 300 | 286 |
| | Bay Area Toll Authority Highway Revenue, Prere. | 5.000% | 4/1/27 | 110 | 117 |
| | Bay Area Toll Authority Highway Revenue, Prere. | 5.000% | 10/1/29 | 205 | 229 |
| | California Department of Water Resources Water Revenue | 5.000% | 12/1/24 | 255 | 255 |
| | California Department of Water Resources Water Revenue | 5.000% | 12/1/25 | 140 | 140 |
| | California Department of Water Resources Water Revenue | 5.000% | 12/1/27 | 170 | 183 |
| | California Department of Water Resources Water Revenue | 5.000% | 12/1/28 | 155 | 162 |
| | California Department of Water Resources Water Revenue | 5.000% | 12/1/29 | 200 | 209 |
| | California Department of Water Resources Water Revenue, Prere. | 5.000% | 12/1/24 | 365 | 365 |
| | California Department of Water Resources Water Revenue, Prere. | 5.000% | 12/1/24 | 370 | 370 |
| | California Department of Water Resources Water Revenue, Prere. | 5.000% | 12/1/24 | 340 | 340 |
| | California Department of Water Resources Water Revenue, Prere. | 5.000% | 12/1/24 | 210 | 210 |
| | California Department of Water Resources Water Revenue, Prere. | 5.000% | 6/1/29 | 50 | 56 |
| | California Educational Facilities Authority College & University Revenue, Prere. | 5.000% | 4/1/26 | 75 | 77 |
| | California GO | 4.000% | 12/1/24 | 270 | 270 |
| | California GO | 5.000% | 12/1/24 | 100 | 100 |
| | California GO | 5.000% | 3/1/25 | 105 | 106 |
| | California GO | 5.000% | 4/1/25 | 85 | 86 |
| | California GO | 5.000% | 8/1/25 | 180 | 183 |
| | California GO | 5.000% | 8/1/25 | 205 | 208 |
| | California GO | 5.000% | 8/1/25 | 275 | 279 |
| | California GO | 5.000% | 9/1/25 | 100 | 102 |
| | California GO | 5.000% | 9/1/25 | 100 | 102 |
| | California GO | 5.000% | 9/1/25 | 25 | 25 |
| | California GO | 5.000% | 9/1/25 | 55 | 56 |
| | California GO | 5.000% | 9/1/25 | 30 | 31 |
| | California GO | 5.000% | 9/1/25 | 525 | 534 |
| | California GO | 4.000% | 10/1/25 | 1,000 | 1,011 |
| | California GO | 5.000% | 10/1/25 | 280 | 285 |
| | California GO | 5.000% | 10/1/25 | 25 | 25 |
| | California GO | 5.000% | 10/1/25 | 250 | 255 |
| | California GO | 5.000% | 10/1/25 | 310 | 316 |
| | California GO | 4.000% | 11/1/25 | 15 | 15 |
| | California GO | 5.000% | 11/1/25 | 115 | 117 |
| | California GO | 5.000% | 11/1/25 | 235 | 240 |
| | California GO | 5.000% | 11/1/25 | 120 | 122 |
| | California GO | 5.000% | 11/1/25 | 300 | 306 |
| | California GO | 3.250% | 2/1/26 | 100 | 100 |
| | California GO | 5.000% | 3/1/26 | 150 | 151 |
| | California GO | 5.000% | 4/1/26 | 290 | 299 |
| | California GO | 5.000% | 4/1/26 | 50 | 51 |
| | California GO | 3.875% | 8/1/26 | 500 | 508 |
| | California GO | 5.000% | 8/1/26 | 165 | 171 |
| | California GO | 5.000% | 8/1/26 | 325 | 329 |
| | California GO | 5.000% | 8/1/26 | 205 | 213 |
| | California GO | 5.000% | 8/1/26 | 100 | 104 |
| | California GO | 5.000% | 8/1/26 | 500 | 519 |
| | California GO | 5.000% | 9/1/26 | 150 | 156 |
| | California GO | 5.000% | 9/1/26 | 200 | 208 |
| | California GO | 5.000% | 9/1/26 | 100 | 104 |
| | California GO | 5.000% | 9/1/26 | 200 | 208 |
Short-Term Tax-Exempt Bond ETF
| | | Coupon | Maturity
Date | Face
Amount
($000) | Market
Value•
($000) |
| | California GO | 5.000% | 9/1/26 | 1,000 | 1,040 |
| | California GO | 4.000% | 10/1/26 | 75 | 77 |
| | California GO | 5.000% | 10/1/26 | 35 | 36 |
| | California GO | 5.000% | 10/1/26 | 415 | 432 |
| | California GO | 5.000% | 10/1/26 | 260 | 268 |
| | California GO | 5.000% | 10/1/26 | 100 | 104 |
| | California GO | 4.000% | 11/1/26 | 245 | 251 |
| | California GO | 5.000% | 11/1/26 | 200 | 209 |
| | California GO | 5.000% | 11/1/26 | 225 | 235 |
| | California GO | 5.000% | 12/1/26 | 1,060 | 1,109 |
| 2 | California GO | 5.000% | 2/1/27 | 180 | 189 |
| | California GO | 5.000% | 3/1/27 | 250 | 251 |
| | California GO | 5.000% | 3/1/27 | 350 | 352 |
| | California GO | 5.000% | 4/1/27 | 10 | 11 |
| | California GO | 5.000% | 4/1/27 | 370 | 390 |
| | California GO | 3.500% | 8/1/27 | 105 | 107 |
| | California GO | 5.000% | 8/1/27 | 515 | 534 |
| | California GO | 5.000% | 8/1/27 | 250 | 259 |
| | California GO | 5.000% | 8/1/27 | 35 | 37 |
| | California GO | 5.000% | 8/1/27 | 500 | 531 |
| | California GO | 4.000% | 9/1/27 | 1,085 | 1,124 |
| | California GO | 5.000% | 9/1/27 | 1,005 | 1,044 |
| | California GO | 5.000% | 9/1/27 | 250 | 266 |
| | California GO | 5.000% | 10/1/27 | 145 | 155 |
| | California GO | 5.000% | 10/1/27 | 250 | 267 |
| | California GO | 5.000% | 10/1/27 | 160 | 171 |
| | California GO | 4.000% | 11/1/27 | 220 | 220 |
| | California GO | 5.000% | 11/1/27 | 335 | 358 |
| | California GO | 5.000% | 11/1/27 | 205 | 219 |
| | California GO | 5.000% | 11/1/27 | 10 | 11 |
| | California GO | 5.000% | 12/1/27 | 385 | 412 |
| | California GO | 5.000% | 4/1/28 | 670 | 722 |
| | California GO | 5.000% | 8/1/28 | 750 | 777 |
| | California GO | 5.000% | 8/1/28 | 135 | 140 |
| | California GO | 5.000% | 8/1/28 | 270 | 286 |
| | California GO | 5.000% | 8/1/28 | 40 | 40 |
| | California GO | 5.000% | 8/1/28 | 225 | 239 |
| | California GO | 5.000% | 8/1/28 | 190 | 206 |
| | California GO | 5.000% | 8/1/28 | 670 | 727 |
| | California GO | 4.000% | 9/1/28 | 115 | 117 |
| | California GO | 5.000% | 9/1/28 | 505 | 524 |
| | California GO | 5.000% | 9/1/28 | 155 | 161 |
| | California GO | 5.000% | 9/1/28 | 95 | 103 |
| | California GO | 5.000% | 9/1/28 | 1,200 | 1,304 |
| | California GO | 5.000% | 10/1/28 | 245 | 266 |
| | California GO | 5.000% | 10/1/28 | 235 | 256 |
| | California GO | 5.000% | 10/1/28 | 570 | 620 |
| | California GO | 4.000% | 11/1/28 | 100 | 100 |
| | California GO | 5.000% | 11/1/28 | 115 | 123 |
| | California GO | 5.000% | 11/1/28 | 115 | 125 |
| | California GO | 5.000% | 11/1/28 | 450 | 490 |
| | California GO | 3.000% | 3/1/29 | 90 | 90 |
| | California GO | 3.000% | 3/1/29 | 215 | 215 |
| | California GO | 5.000% | 4/1/29 | 530 | 582 |
| | California GO | 5.000% | 4/1/29 | 250 | 274 |
| | California GO | 3.000% | 8/1/29 | 5 | 5 |
| | California GO | 5.000% | 8/1/29 | 295 | 305 |
| | California GO | 5.000% | 8/1/29 | 165 | 175 |
| | California GO | 5.000% | 8/1/29 | 250 | 253 |
| | California GO | 5.000% | 8/1/29 | 180 | 186 |
| | California GO | 5.000% | 8/1/29 | 70 | 76 |
| | California GO | 5.000% | 8/1/29 | 315 | 333 |
| | California GO | 5.000% | 8/1/29 | 105 | 111 |
| | California GO | 5.000% | 8/1/29 | 740 | 817 |
| | California GO | 5.000% | 8/1/29 | 5 | 5 |
| | California GO | 5.000% | 9/1/29 | 155 | 161 |
| | California GO | 5.000% | 9/1/29 | 105 | 109 |
| | California GO | 5.000% | 9/1/29 | 135 | 149 |
| | California GO | 5.000% | 10/1/29 | 165 | 183 |
| | California GO | 5.000% | 10/1/29 | 310 | 319 |
Short-Term Tax-Exempt Bond ETF
| | | Coupon | Maturity
Date | Face
Amount
($000) | Market
Value•
($000) |
| | California GO | 5.000% | 10/1/29 | 210 | 228 |
| | California GO | 5.000% | 10/1/29 | 5 | 6 |
| | California GO | 5.000% | 10/1/29 | 200 | 222 |
| | California GO | 5.000% | 10/1/29 | 50 | 50 |
| | California GO | 5.000% | 11/1/29 | 220 | 234 |
| | California GO | 5.000% | 11/1/29 | 525 | 582 |
| | California GO | 5.000% | 12/1/29 | 355 | 394 |
| | California GO | 5.000% | 3/1/30 | 350 | 351 |
| | California GO | 5.000% | 3/1/30 | 310 | 346 |
| | California GO | 5.000% | 4/1/30 | 10 | 11 |
| | California GO | 5.000% | 4/1/30 | 320 | 358 |
| | California GO | 5.000% | 4/1/30 | 125 | 140 |
| | California GO | 5.000% | 8/1/30 | 405 | 419 |
| | California GO | 5.000% | 8/1/30 | 440 | 465 |
| | California GO | 5.000% | 8/1/30 | 395 | 417 |
| | California GO | 5.000% | 8/1/30 | 435 | 469 |
| | California GO | 5.000% | 8/1/30 | 225 | 253 |
| | California GO | 5.000% | 9/1/30 | 125 | 129 |
| | California GO | 5.000% | 9/1/30 | 60 | 68 |
| | California GO | 5.000% | 9/1/30 | 300 | 338 |
| | California GO | 5.000% | 9/1/30 | 200 | 225 |
| | California GO | 5.000% | 10/1/30 | 100 | 110 |
| | California GO | 5.000% | 10/1/30 | 375 | 423 |
| | California GO | 5.000% | 10/1/30 | 260 | 293 |
| | California GO | 5.000% | 11/1/30 | 120 | 135 |
| | California GO | 5.000% | 3/1/31 | 110 | 122 |
| | California GO | 5.000% | 4/1/31 | 125 | 142 |
| | California GO | 5.000% | 4/1/31 | 290 | 329 |
| | California GO | 5.000% | 4/1/31 | 235 | 257 |
| | California GO | 5.000% | 4/1/31 | 120 | 131 |
| | California GO | 4.000% | 8/1/31 | 235 | 239 |
| | California GO | 5.000% | 8/1/31 | 200 | 228 |
| | California GO | 5.000% | 8/1/31 | 635 | 724 |
| | California GO | 5.000% | 9/1/31 | 275 | 314 |
| | California GO | 5.000% | 9/1/31 | 1,000 | 1,142 |
| | California GO | 5.000% | 9/1/31 | 400 | 457 |
| | California GO | 5.000% | 10/1/31 | 260 | 286 |
| | California GO | 5.000% | 11/1/31 | 235 | 254 |
| | California GO | 5.000% | 11/1/31 | 180 | 203 |
| 3 | California Infrastructure & Economic Development Bank Highway Revenue, Prere. | 5.000% | 1/1/28 | 705 | 754 |
| 2 | California Infrastructure & Economic Development Bank Highway Revenue, Prere. | 5.000% | 1/1/28 | 685 | 739 |
| 2 | California Infrastructure & Economic Development Bank Highway Revenue, Prere. | 5.000% | 1/1/28 | 115 | 124 |
| | California Infrastructure & Economic Development Bank Miscellaneous Revenue | 5.000% | 4/1/28 | 100 | 108 |
| | California Infrastructure & Economic Development Bank Recreational Revenue | 3.250% | 8/1/29 | 170 | 171 |
| | California Infrastructure & Economic Development Bank Water Revenue | 5.000% | 10/1/25 | 35 | 36 |
| | California Infrastructure & Economic Development Bank Water Revenue | 5.000% | 10/1/25 | 60 | 61 |
| | California Infrastructure & Economic Development Bank Water Revenue | 5.000% | 10/1/27 | 150 | 159 |
| | California Municipal Finance Authority College & University Revenue, Prere. | 5.000% | 1/1/28 | 30 | 32 |
| | California State Public Works Board Lease (Abatement) Revenue | 5.000% | 10/1/25 | 45 | 46 |
| | California State Public Works Board Lease (Abatement) Revenue | 5.000% | 2/1/26 | 10 | 10 |
| | California State Public Works Board Lease (Abatement) Revenue | 5.000% | 5/1/26 | 145 | 146 |
| | California State Public Works Board Lease (Abatement) Revenue | 5.000% | 8/1/26 | 300 | 312 |
| | California State Public Works Board Lease (Abatement) Revenue | 5.000% | 10/1/26 | 95 | 99 |
| | California State Public Works Board Lease (Abatement) Revenue | 5.000% | 5/1/27 | 460 | 464 |
| | California State Public Works Board Lease (Abatement) Revenue | 5.000% | 10/1/27 | 335 | 357 |
| | California State Public Works Board Lease (Abatement) Revenue | 5.000% | 8/1/28 | 145 | 157 |
| | California State Public Works Board Lease (Abatement) Revenue | 5.000% | 10/1/29 | 195 | 207 |
| | California State Public Works Board Lease (Abatement) Revenue | 5.000% | 2/1/30 | 250 | 278 |
| | California State Public Works Board Lease (Abatement) Revenue | 5.000% | 8/1/30 | 115 | 129 |
| | California State Public Works Board Lease (Abatement) Revenue | 5.000% | 2/1/31 | 610 | 691 |
| | California State Public Works Board Lease (Abatement) Revenue (Various Capital Projects) | 5.000% | 12/1/24 | 100 | 100 |
| | California State Public Works Board Lease (Abatement) Revenue (Various Capital Projects) | 5.000% | 9/1/25 | 100 | 102 |
| | California State Public Works Board Lease (Abatement) Revenue (Various Capital Projects) | 5.000% | 12/1/25 | 120 | 123 |
| | California State Public Works Board Lease (Abatement) Revenue (Various Capital Projects) | 5.000% | 9/1/26 | 100 | 104 |
| | California State Public Works Board Lease (Abatement) Revenue (Various Capital Projects) | 5.000% | 9/1/26 | 500 | 521 |
| | California State Public Works Board Lease (Abatement) Revenue (Various Capital Projects) | 5.000% | 9/1/27 | 110 | 117 |
| | California State Public Works Board Lease (Abatement) Revenue (Various Capital Projects) | 5.000% | 12/1/27 | 100 | 107 |
| | California State Public Works Board Lease (Abatement) Revenue (Various Capital Projects) | 5.000% | 9/1/28 | 155 | 168 |
| | California State Public Works Board Lease (Abatement) Revenue (Various Capital Projects) | 5.000% | 9/1/28 | 500 | 543 |
| | California State Public Works Board Lease (Abatement) Revenue (Various Capital Projects) | 5.000% | 12/1/28 | 120 | 131 |
Short-Term Tax-Exempt Bond ETF
| | | Coupon | Maturity
Date | Face
Amount
($000) | Market
Value•
($000) |
| | California State Public Works Board Lease (Abatement) Revenue (Various Capital Projects) | 5.000% | 9/1/29 | 130 | 144 |
| | California State Public Works Board Lease (Abatement) Revenue (Various Capital Projects) | 5.000% | 9/1/30 | 110 | 124 |
| | California State Public Works Board Lease (Abatement) Revenue (Various Capital Projects) | 5.000% | 9/1/31 | 680 | 777 |
| | California State Public Works Board Lease (Abatement) Revenue, ETM | 5.000% | 10/1/26 | 10 | 10 |
| | California State Public Works Board Lease (Abatement) Revenue, Prere. | 5.000% | 10/1/27 | 15 | 16 |
| | California State University College & University Revenue | 5.000% | 11/1/25 | 300 | 307 |
| | California State University College & University Revenue | 5.000% | 11/1/25 | 50 | 51 |
| | California State University College & University Revenue | 5.000% | 11/1/26 | 180 | 184 |
| | California State University College & University Revenue | 5.000% | 11/1/28 | 115 | 122 |
| | California State University College & University Revenue | 5.000% | 11/1/29 | 45 | 48 |
| | California State University College & University Revenue | 5.000% | 11/1/30 | 320 | 330 |
| | California State University College & University Revenue | 5.000% | 11/1/31 | 95 | 100 |
| | California State University College & University Revenue | 5.000% | 11/1/31 | 395 | 407 |
| | California State University College & University Revenue PUT | 0.550% | 11/1/26 | 75 | 71 |
| | California State University College & University Revenue PUT | 3.125% | 11/1/26 | 250 | 250 |
| | Chino Basin Regional Financing Authority Lease Revenue | 4.000% | 11/1/25 | 1,150 | 1,159 |
| 1 | Coast Community College District GO | 0.000% | 8/1/28 | 245 | 221 |
| | Coast Community College District GO, Prere. | 5.000% | 8/15/25 | 385 | 391 |
| | Coast Community College District GO, Prere. | 4.500% | 8/1/27 | 110 | 116 |
| | East Bay Municipal Utility District Water System Water Revenue | 5.000% | 6/1/25 | 100 | 101 |
| | East Bay Municipal Utility District Water System Water Revenue | 5.000% | 6/1/26 | 90 | 91 |
| | East Bay Municipal Utility District Water System Water Revenue | 5.000% | 6/1/27 | 40 | 40 |
| | East Bay Municipal Utility District Water System Water Revenue | 5.000% | 6/1/28 | 120 | 121 |
| | East Bay Municipal Utility District Water System Water Revenue | 5.000% | 6/1/29 | 65 | 66 |
| | Foothill-Eastern Transportation Corridor Agency Highway Revenue, ETM | 0.000% | 1/1/25 | 35 | 35 |
| | Foothill-Eastern Transportation Corridor Agency Highway Revenue, ETM | 0.000% | 1/1/26 | 200 | 194 |
| | Foothill-Eastern Transportation Corridor Agency Highway Revenue, ETM | 0.000% | 1/1/28 | 100 | 92 |
| | Foothill-Eastern Transportation Corridor Agency Highway Revenue, ETM | 0.000% | 1/1/29 | 130 | 116 |
| | Glendale Unified School District GO, Prere. | 4.000% | 9/1/25 | 45 | 45 |
| | Los Angeles CA Community College District GO | 5.000% | 8/1/25 | 95 | 96 |
| | Los Angeles CA Community College District GO | 5.000% | 8/1/25 | 105 | 107 |
| | Los Angeles CA Community College District GO | 5.000% | 8/1/25 | 200 | 203 |
| | Los Angeles CA Community College District GO | 5.000% | 6/1/26 | 115 | 119 |
| | Los Angeles CA Community College District GO | 5.000% | 8/1/26 | 130 | 135 |
| | Los Angeles CA Community College District GO | 5.000% | 8/1/26 | 100 | 104 |
| | Los Angeles CA Community College District GO | 5.000% | 8/1/27 | 330 | 353 |
| | Los Angeles CA Community College District GO | 5.000% | 8/1/28 | 115 | 126 |
| | Los Angeles CA Community College District GO | 5.000% | 8/1/29 | 100 | 111 |
| | Los Angeles CA Community College District GO | 5.000% | 8/1/29 | 500 | 557 |
| | Los Angeles CA Community College District GO | 5.000% | 8/1/30 | 275 | 313 |
| | Los Angeles CA Unified School District GO | 5.000% | 7/1/25 | 100 | 101 |
| | Los Angeles CA Unified School District GO | 5.000% | 7/1/25 | 465 | 471 |
| | Los Angeles CA Unified School District GO | 5.000% | 7/1/25 | 10 | 10 |
| | Los Angeles CA Unified School District GO | 5.000% | 7/1/25 | 215 | 218 |
| | Los Angeles CA Unified School District GO | 5.000% | 7/1/25 | 260 | 264 |
| | Los Angeles CA Unified School District GO | 5.000% | 7/1/26 | 85 | 86 |
| | Los Angeles CA Unified School District GO | 5.000% | 7/1/26 | 680 | 707 |
| | Los Angeles CA Unified School District GO | 5.000% | 7/1/26 | 160 | 166 |
| | Los Angeles CA Unified School District GO | 5.000% | 7/1/27 | 160 | 171 |
| | Los Angeles CA Unified School District GO | 5.000% | 7/1/27 | 435 | 464 |
| | Los Angeles CA Unified School District GO | 5.000% | 7/1/27 | 180 | 192 |
| | Los Angeles CA Unified School District GO | 5.000% | 7/1/28 | 125 | 135 |
| | Los Angeles CA Unified School District GO | 5.000% | 7/1/28 | 215 | 235 |
| | Los Angeles CA Unified School District GO | 5.000% | 7/1/28 | 40 | 44 |
| | Los Angeles CA Unified School District GO | 5.000% | 7/1/28 | 200 | 207 |
| | Los Angeles CA Unified School District GO | 5.000% | 7/1/28 | 500 | 546 |
| | Los Angeles CA Unified School District GO | 5.000% | 7/1/29 | 200 | 215 |
| | Los Angeles CA Unified School District GO | 5.000% | 7/1/29 | 185 | 206 |
| | Los Angeles CA Unified School District GO | 5.000% | 7/1/29 | 300 | 334 |
| | Los Angeles CA Unified School District GO | 5.000% | 7/1/30 | 350 | 376 |
| | Los Angeles CA Unified School District GO | 5.000% | 7/1/30 | 165 | 188 |
| | Los Angeles CA Unified School District GO | 5.000% | 7/1/30 | 300 | 341 |
| | Los Angeles CA Unified School District GO | 3.000% | 7/1/31 | 50 | 50 |
| | Los Angeles CA Unified School District GO | 5.000% | 7/1/31 | 715 | 827 |
| | Los Angeles CA Unified School District GO | 5.000% | 7/1/31 | 200 | 231 |
| | Los Angeles CA Wastewater System Sewer Revenue | 5.000% | 6/1/25 | 300 | 303 |
| | Los Angeles CA Wastewater System Sewer Revenue | 5.000% | 6/1/26 | 235 | 244 |
| | Los Angeles CA Wastewater System Sewer Revenue | 5.000% | 6/1/28 | 60 | 65 |
| | Los Angeles County Facilities Inc. Lease (Abatement) Revenue, Prere. | 5.000% | 12/1/28 | 85 | 93 |
| | Los Angeles County Metropolitan Transportation Authority Sales Tax Revenue | 5.000% | 6/1/25 | 15 | 15 |
Short-Term Tax-Exempt Bond ETF
| | | Coupon | Maturity
Date | Face
Amount
($000) | Market
Value•
($000) |
| | Los Angeles County Metropolitan Transportation Authority Sales Tax Revenue | 5.000% | 6/1/26 | 70 | 73 |
| | Los Angeles County Metropolitan Transportation Authority Sales Tax Revenue | 5.000% | 6/1/27 | 145 | 155 |
| | Los Angeles County Metropolitan Transportation Authority Sales Tax Revenue | 5.000% | 6/1/29 | 45 | 50 |
| | Los Angeles County Metropolitan Transportation Authority Sales Tax Revenue | 5.000% | 6/1/30 | 230 | 260 |
| | Los Angeles Department of Airports Port, Airport & Marina Revenue | 5.000% | 5/15/28 | 150 | 163 |
| | Los Angeles Department of Airports Port, Airport & Marina Revenue | 5.000% | 5/15/31 | 80 | 90 |
| | Los Angeles Department of Airports Port, Airport & Marina Revenue, Prere. | 5.000% | 5/15/29 | 35 | 39 |
| | Los Angeles Department of Water & Power Electric Power & Light Revenue | 5.000% | 7/1/25 | 75 | 76 |
| | Los Angeles Department of Water & Power Electric Power & Light Revenue | 5.000% | 7/1/25 | 10 | 10 |
| | Los Angeles Department of Water & Power Electric Power & Light Revenue | 4.000% | 7/1/26 | 195 | 199 |
| | Los Angeles Department of Water & Power Electric Power & Light Revenue | 5.000% | 7/1/26 | 145 | 150 |
| | Los Angeles Department of Water & Power Electric Power & Light Revenue | 5.000% | 7/1/26 | 205 | 213 |
| | Los Angeles Department of Water & Power Electric Power & Light Revenue | 5.000% | 7/1/26 | 10 | 10 |
| | Los Angeles Department of Water & Power Electric Power & Light Revenue | 5.000% | 7/1/26 | 75 | 78 |
| | Los Angeles Department of Water & Power Electric Power & Light Revenue | 5.000% | 7/1/26 | 50 | 52 |
| | Los Angeles Department of Water & Power Electric Power & Light Revenue | 5.000% | 7/1/28 | 60 | 60 |
| | Los Angeles Department of Water & Power Electric Power & Light Revenue | 5.000% | 7/1/28 | 225 | 245 |
| | Los Angeles Department of Water & Power Electric Power & Light Revenue | 5.000% | 7/1/28 | 25 | 27 |
| | Los Angeles Department of Water & Power Electric Power & Light Revenue | 5.000% | 7/1/29 | 120 | 134 |
| | Los Angeles Department of Water & Power Electric Power & Light Revenue | 5.000% | 7/1/29 | 100 | 111 |
| | Los Angeles Department of Water & Power Electric Power & Light Revenue | 5.000% | 7/1/29 | 50 | 56 |
| | Los Angeles Department of Water & Power Electric Power & Light Revenue | 5.000% | 7/1/30 | 300 | 300 |
| | Los Angeles Department of Water & Power Water System Water Revenue | 4.000% | 7/1/29 | 260 | 278 |
| | Los Angeles Department of Water & Power Water System Water Revenue | 4.000% | 7/1/30 | 245 | 265 |
| | Los Angeles Department of Water & Power Water System Water Revenue | 5.000% | 7/1/31 | 105 | 122 |
| | Los Angeles Municipal Improvement Corp. Lease (Abatement) Revenue | 5.000% | 11/1/29 | 275 | 287 |
| | Los Angeles Unified School District GO | 2.000% | 7/1/29 | 65 | 61 |
| | Los Rios Community College District GO | 3.000% | 8/1/25 | 160 | 160 |
| | Metropolitan Water District of Southern California Water Revenue | 5.000% | 7/1/25 | 260 | 264 |
| | Metropolitan Water District of Southern California Water Revenue | 2.500% | 7/1/26 | 465 | 461 |
| | Metropolitan Water District of Southern California Water Revenue | 5.000% | 7/1/27 | 190 | 203 |
| | Metropolitan Water District of Southern California Water Revenue | 3.000% | 7/1/28 | 200 | 203 |
| | Metropolitan Water District of Southern California Water Revenue | 5.000% | 7/1/30 | 135 | 149 |
| | Metropolitan Water District of Southern California Water Revenue PUT | 5.000% | 7/1/29 | 295 | 318 |
| | Metropolitan Water District of Southern California Water Revenue PUT | 5.000% | 7/1/31 | 340 | 378 |
| | Metropolitan Water District of Southern California Water Revenue, Prere. | 5.000% | 7/1/25 | 715 | 725 |
| | Mountain View-Whisman School District GO, Prere. | 4.000% | 9/1/26 | 300 | 308 |
| | Oxnard Union High School District GO, Prere. | 5.000% | 8/1/26 | 10 | 10 |
| | Port of Los Angeles Port, Airport & Marina Revenue, Prere. | 4.000% | 8/1/26 | 570 | 583 |
| | Riverside County Public Financing Authority Lease (Abatement) Revenue (Capital Facilities Project), Prere. | 4.125% | 11/1/25 | 125 | 127 |
| | Riverside County Public Financing Authority Lease (Abatement) Revenue (Capital Facilities Project), Prere. | 5.250% | 11/1/25 | 100 | 102 |
| 2 | Sacramento City Financing Authority Lease (Abatement) Revenue (Master Lease Program) | 5.250% | 12/1/30 | 210 | 235 |
| | San Bernardino Community College District GO, Prere. | 4.000% | 8/16/27 | 195 | 203 |
| | San Bernardino County CA (Arrowhead Project) COP | 5.000% | 10/1/25 | 200 | 204 |
| | San Bernardino County CA (Arrowhead Project) COP | 5.000% | 10/1/26 | 5 | 5 |
| | San Diego Association of Governments Appropriations Revenue, Prere. | 5.000% | 11/15/25 | 600 | 613 |
| | San Diego CA Unified School District GO | 5.000% | 7/1/25 | 200 | 203 |
| | San Diego CA Unified School District GO | 5.000% | 7/1/26 | 215 | 218 |
| 1 | San Diego CA Unified School District GO | 5.500% | 7/1/26 | 5 | 5 |
| 1 | San Diego CA Unified School District GO | 5.500% | 7/1/27 | 50 | 54 |
| | San Diego CA Unified School District GO | 5.000% | 7/1/28 | 200 | 219 |
| 1 | San Diego CA Unified School District GO | 5.250% | 7/1/28 | 175 | 193 |
| | San Diego CA Unified School District GO | 4.000% | 7/1/29 | 145 | 148 |
| | San Diego CA Unified School District GO | 5.000% | 7/1/29 | 105 | 117 |
| | San Diego CA Unified School District GO | 0.000% | 7/1/30 | 60 | 51 |
| | San Diego CA Unified School District GO | 0.000% | 7/1/31 | 10 | 8 |
| | San Diego CA Unified School District GO | 4.000% | 7/1/31 | 170 | 173 |
| | San Diego Community College District GO, Prere. | 4.000% | 8/1/26 | 340 | 348 |
| | San Diego Community College District GO, Prere. | 5.000% | 8/1/26 | 70 | 73 |
| | San Diego Community College District GO, Prere. | 5.000% | 8/1/26 | 230 | 239 |
| | San Diego Public Facilities Financing Authority Sewer Revenue | 5.000% | 5/15/25 | 320 | 323 |
| | San Diego Public Facilities Financing Authority Sewer Revenue | 4.000% | 5/15/26 | 130 | 131 |
| | San Diego Public Facilities Financing Authority Sewer Revenue | 5.000% | 5/15/29 | 160 | 166 |
| | San Diego Public Facilities Financing Authority Water Revenue | 5.000% | 8/1/26 | 215 | 224 |
| | San Diego Public Facilities Financing Authority Water Revenue | 5.000% | 8/1/27 | 155 | 161 |
| | San Francisco CA City & County GO | 5.000% | 6/15/25 | 105 | 106 |
| | San Francisco CA City & County GO | 5.000% | 6/15/27 | 240 | 256 |
| | San Francisco CA City & County GO | 5.000% | 6/15/29 | 35 | 39 |
| | San Francisco CA Public Utilities Commission Water Revenue | 5.000% | 11/1/25 | 45 | 45 |
| | San Francisco CA Public Utilities Commission Water Revenue | 5.000% | 11/1/25 | 25 | 26 |
Short-Term Tax-Exempt Bond ETF
| | | Coupon | Maturity
Date | Face
Amount
($000) | Market
Value•
($000) |
| | San Francisco CA Public Utilities Commission Water Revenue | 5.000% | 11/1/26 | 120 | 126 |
| | San Francisco City & County Public Utilities Commission Wastewater Sewer Revenue | 5.000% | 10/1/27 | 100 | 107 |
| | San Francisco City & County Public Utilities Commission Wastewater Sewer Revenue | 5.000% | 10/1/28 | 140 | 154 |
| | San Francisco City & County Public Utilities Commission Wastewater Sewer Revenue | 5.000% | 10/1/29 | 105 | 118 |
| | San Francisco City & County Public Utilities Commission Wastewater Sewer Revenue | 5.000% | 10/1/30 | 10 | 11 |
| | San Francisco City & County Public Utilities Commission Wastewater Sewer Revenue PUT | 4.000% | 10/1/29 | 100 | 105 |
| 4 | San Joaquin Hills Transportation Corridor Agency Highway Revenue | 0.000% | 1/15/25 | 240 | 239 |
| | San Joaquin Hills Transportation Corridor Agency Highway Revenue, ETM | 0.000% | 1/1/25 | 50 | 50 |
| | San Jose Redevelopment Agency Successor Agency Tax Increment/Allocation Revenue | 5.000% | 8/1/25 | 95 | 96 |
| | San Mateo Foster City Public Financing Authority Lease (Non-Terminable) Revenue, ETM | 5.000% | 8/1/25 | 200 | 203 |
| | San Mateo Foster City Public Financing Authority Lease (Non-Terminable) Revenue, ETM | 5.000% | 8/1/25 | 1,135 | 1,152 |
| | Santa Clara Valley Transportation Authority Sales Tax Revenue | 5.000% | 4/1/25 | 55 | 55 |
| | Santa Clara Valley Transportation Authority Sales Tax Revenue | 5.000% | 4/1/26 | 5 | 5 |
| | Santa Clara Valley Transportation Authority Sales Tax Revenue | 5.000% | 4/1/27 | 10 | 11 |
| | Santa Clara Valley Water District (Water Utility System Important Project) COP | 4.000% | 6/1/26 | 55 | 56 |
| | Southern California Public Power Authority Electric Power & Light Revenue | 5.000% | 7/1/25 | 30 | 30 |
| | Southern California Public Power Authority Electric Power & Light Revenue | 5.000% | 7/1/26 | 180 | 180 |
| | Southern California Public Power Authority Electric Power & Light Revenue (Canyon Power Project) PUT | 0.650% | 7/1/25 | 50 | 49 |
| | Southern California Public Power Authority Electric Power & Light Revenue (Windy Point/Windy Flats Project) | 5.000% | 7/1/30 | 50 | 57 |
| | University of California College & University Revenue | 5.000% | 5/15/25 | 150 | 152 |
| | University of California College & University Revenue | 5.000% | 5/15/26 | 155 | 157 |
| | University of California College & University Revenue | 5.000% | 5/15/26 | 75 | 78 |
| | University of California College & University Revenue | 5.000% | 5/15/26 | 200 | 207 |
| | University of California College & University Revenue | 5.000% | 5/15/26 | 250 | 259 |
| | University of California College & University Revenue | 5.000% | 5/15/27 | 70 | 71 |
| | University of California College & University Revenue | 5.000% | 5/15/27 | 85 | 90 |
| | University of California College & University Revenue | 5.000% | 5/15/28 | 170 | 185 |
| | University of California College & University Revenue | 3.250% | 5/15/29 | 75 | 75 |
| | University of California College & University Revenue | 5.000% | 5/15/29 | 145 | 161 |
| | University of California College & University Revenue | 5.000% | 5/15/29 | 190 | 201 |
| | University of California College & University Revenue | 5.000% | 5/15/29 | 205 | 228 |
| | University of California College & University Revenue | 5.000% | 5/15/30 | 115 | 122 |
| | University of California College & University Revenue | 5.000% | 5/15/31 | 500 | 575 |
| | University of California College & University Revenue (Limited Project) | 5.000% | 5/15/25 | 50 | 51 |
| | University of California College & University Revenue (Limited Project) | 5.000% | 5/15/26 | 215 | 217 |
| | University of California College & University Revenue (Limited Project) | 5.000% | 5/15/27 | 230 | 232 |
| | University of California College & University Revenue (Limited Project) | 5.000% | 5/15/28 | 75 | 76 |
| | University of California College & University Revenue (Limited Project) | 5.000% | 5/15/29 | 130 | 131 |
| | University of California College & University Revenue (Limited Project) | 5.000% | 5/15/30 | 100 | 101 |
| | University of Cincinnati College & University Revenue | 5.000% | 5/15/29 | 310 | 345 |
| | Vernon CA Electric System Electric Power & Light Revenue | 5.000% | 10/1/27 | 100 | 105 |
| | Vernon CA Electric System Electric Power & Light Revenue | 5.000% | 4/1/28 | 400 | 424 |
| | | | | | 88,384 |
| Colorado (0.9%) |
| | Adams & Arapahoe Joint School District 28J Aurora GO | 5.000% | 12/1/24 | 80 | 80 |
| | Adams & Arapahoe Joint School District 28J Aurora GO | 5.000% | 12/1/29 | 320 | 355 |
| | Adams 12 Five Star Schools GO, Prere. | 5.000% | 12/15/26 | 25 | 26 |
| | Aurora CO Water Revenue, Prere. | 5.000% | 8/1/26 | 240 | 249 |
| | Board of Governors of Colorado State University System College & University Revenue, Prere. | 5.000% | 3/1/25 | 460 | 462 |
| | Colorado COP | 5.000% | 12/15/30 | 100 | 112 |
| | Colorado COP | 5.000% | 12/15/31 | 320 | 344 |
| | Colorado Springs CO Utilities System Multiple Utility Revenue | 5.000% | 11/15/30 | 30 | 34 |
| | Colorado Springs CO Utilities System Water Revenue | 5.000% | 11/15/25 | 115 | 117 |
| | Denver City & County School District No. 1 GO | 5.000% | 12/1/24 | 25 | 25 |
| | Denver City & County School District No. 1 GO | 5.000% | 12/1/25 | 185 | 189 |
| | Denver City & County School District No. 1 GO | 4.000% | 12/1/26 | 275 | 278 |
| | Denver CO City & County Airport System Port, Airport & Marina Revenue | 5.000% | 11/15/25 | 380 | 387 |
| | Denver CO City & County GO | 5.000% | 8/1/28 | 100 | 108 |
| | Denver CO City & County GO | 5.000% | 8/1/29 | 145 | 160 |
| | Denver CO City & County GO | 5.000% | 8/1/30 | 60 | 67 |
| 4 | E-470 Public Highway Authority Highway Revenue | 0.000% | 9/1/29 | 110 | 94 |
| 4 | E-470 Public Highway Authority Highway Revenue | 0.000% | 9/1/30 | 130 | 108 |
| 4 | E-470 Public Highway Authority Miscellaneous Revenue | 0.000% | 9/1/27 | 100 | 92 |
| | Larimer County School District No. R-1 Poudre GO | 5.000% | 12/15/31 | 420 | 455 |
| | Regional Transportation District Sales Tax Revenue (Fastracks Project) | 5.000% | 11/1/27 | 250 | 267 |
| | Regional Transportation District Sales Tax Revenue (Fastracks Project) | 5.000% | 11/1/27 | 170 | 181 |
| | Regional Transportation District Sales Tax Revenue (Fastracks Project) | 5.000% | 11/1/28 | 100 | 109 |
| | Regional Transportation District Sales Tax Revenue (Fastracks Project) | 5.000% | 11/1/29 | 175 | 194 |
| | University of Colorado College & University Revenue, Prere. | 4.000% | 6/1/28 | 100 | 104 |
Short-Term Tax-Exempt Bond ETF
| | | Coupon | Maturity
Date | Face
Amount
($000) | Market
Value•
($000) |
| | University of Colorado College & University Revenue, Prere. | 4.000% | 6/1/28 | 115 | 120 |
| | University of Colorado College & University Revenue, Prere. | 4.000% | 6/1/28 | 25 | 26 |
| | | | | | 4,743 |
| Connecticut (3.4%) |
| | Connecticut Clean Water Fund - State Revolving Fund Lease Revenue | 5.000% | 3/1/29 | 35 | 35 |
| | Connecticut GO | 5.000% | 4/15/25 | 35 | 35 |
| | Connecticut GO | 5.000% | 5/15/25 | 50 | 50 |
| | Connecticut GO | 5.000% | 8/1/25 | 100 | 101 |
| | Connecticut GO | 5.000% | 9/15/25 | 300 | 305 |
| | Connecticut GO | 5.000% | 1/15/26 | 150 | 154 |
| | Connecticut GO | 5.000% | 4/15/26 | 100 | 103 |
| | Connecticut GO | 5.000% | 4/15/26 | 100 | 103 |
| | Connecticut GO | 5.000% | 5/15/26 | 185 | 191 |
| | Connecticut GO | 5.000% | 8/1/26 | 100 | 104 |
| | Connecticut GO | 5.000% | 10/15/26 | 45 | 47 |
| | Connecticut GO | 5.000% | 11/15/26 | 125 | 127 |
| | Connecticut GO | 5.000% | 11/15/26 | 500 | 520 |
| | Connecticut GO | 4.000% | 1/15/27 | 80 | 82 |
| | Connecticut GO | 4.000% | 1/15/27 | 100 | 103 |
| | Connecticut GO | 5.000% | 4/15/27 | 145 | 153 |
| | Connecticut GO | 5.000% | 4/15/27 | 60 | 63 |
| | Connecticut GO | 5.000% | 5/15/27 | 45 | 46 |
| | Connecticut GO | 5.000% | 6/15/27 | 25 | 25 |
| | Connecticut GO | 5.000% | 9/15/27 | 80 | 85 |
| | Connecticut GO | 4.000% | 1/15/28 | 110 | 114 |
| | Connecticut GO | 4.000% | 1/15/28 | 125 | 130 |
| | Connecticut GO | 5.000% | 1/15/28 | 60 | 64 |
| | Connecticut GO | 5.000% | 4/15/28 | 270 | 290 |
| | Connecticut GO | 5.000% | 4/15/28 | 250 | 269 |
| | Connecticut GO | 5.000% | 11/15/28 | 80 | 87 |
| | Connecticut GO | 5.000% | 11/15/28 | 265 | 288 |
| | Connecticut GO | 4.000% | 1/15/29 | 325 | 341 |
| | Connecticut GO | 5.000% | 1/15/29 | 120 | 131 |
| | Connecticut GO | 5.000% | 4/15/29 | 350 | 383 |
| | Connecticut GO | 3.250% | 11/15/29 | 65 | 65 |
| | Connecticut GO | 5.000% | 11/15/29 | 260 | 287 |
| | Connecticut GO | 4.000% | 1/15/30 | 220 | 233 |
| | Connecticut GO | 5.000% | 4/15/30 | 150 | 164 |
| | Connecticut GO | 5.000% | 9/15/30 | 40 | 45 |
| | Connecticut GO | 5.000% | 11/15/30 | 145 | 163 |
| | Connecticut GO | 4.000% | 1/15/31 | 65 | 69 |
| | Connecticut GO | 5.000% | 1/15/31 | 160 | 177 |
| | Connecticut GO | 5.000% | 1/15/31 | 460 | 518 |
| | Connecticut GO | 5.000% | 4/15/31 | 300 | 327 |
| | Connecticut GO | 5.000% | 9/15/31 | 85 | 97 |
| | Connecticut GO | 5.000% | 11/15/31 | 110 | 125 |
| | Connecticut GO | 5.000% | 11/15/31 | 435 | 495 |
| | Connecticut Special Obligation Revenue Fuel Sales Tax Revenue | 5.000% | 1/1/25 | 60 | 60 |
| | Connecticut Special Obligation Revenue Fuel Sales Tax Revenue | 5.000% | 5/1/25 | 150 | 151 |
| | Connecticut Special Obligation Revenue Fuel Sales Tax Revenue | 5.000% | 7/1/25 | 390 | 394 |
| | Connecticut Special Obligation Revenue Fuel Sales Tax Revenue | 5.000% | 9/1/25 | 245 | 249 |
| | Connecticut Special Obligation Revenue Fuel Sales Tax Revenue | 5.000% | 5/1/26 | 75 | 77 |
| | Connecticut Special Obligation Revenue Fuel Sales Tax Revenue | 5.000% | 7/1/26 | 100 | 103 |
| | Connecticut Special Obligation Revenue Fuel Sales Tax Revenue | 5.000% | 7/1/26 | 100 | 103 |
| | Connecticut Special Obligation Revenue Fuel Sales Tax Revenue | 5.000% | 8/1/26 | 85 | 86 |
| | Connecticut Special Obligation Revenue Fuel Sales Tax Revenue | 5.000% | 9/1/26 | 175 | 175 |
| | Connecticut Special Obligation Revenue Fuel Sales Tax Revenue | 5.000% | 10/1/26 | 485 | 503 |
| | Connecticut Special Obligation Revenue Fuel Sales Tax Revenue | 5.000% | 5/1/27 | 140 | 148 |
| | Connecticut Special Obligation Revenue Fuel Sales Tax Revenue | 5.000% | 7/1/27 | 125 | 132 |
| | Connecticut Special Obligation Revenue Fuel Sales Tax Revenue | 5.000% | 7/1/27 | 100 | 106 |
| | Connecticut Special Obligation Revenue Fuel Sales Tax Revenue | 5.000% | 8/1/27 | 145 | 147 |
| | Connecticut Special Obligation Revenue Fuel Sales Tax Revenue | 5.000% | 9/1/27 | 135 | 140 |
| | Connecticut Special Obligation Revenue Fuel Sales Tax Revenue | 5.000% | 10/1/27 | 100 | 106 |
| | Connecticut Special Obligation Revenue Fuel Sales Tax Revenue | 5.000% | 1/1/28 | 160 | 171 |
| | Connecticut Special Obligation Revenue Fuel Sales Tax Revenue | 5.000% | 5/1/28 | 125 | 134 |
| | Connecticut Special Obligation Revenue Fuel Sales Tax Revenue | 5.000% | 8/1/28 | 170 | 172 |
| | Connecticut Special Obligation Revenue Fuel Sales Tax Revenue | 5.000% | 9/1/28 | 390 | 403 |
| | Connecticut Special Obligation Revenue Fuel Sales Tax Revenue | 5.000% | 7/1/29 | 155 | 170 |
| | Connecticut Special Obligation Revenue Fuel Sales Tax Revenue | 5.000% | 8/1/29 | 20 | 20 |
Short-Term Tax-Exempt Bond ETF
| | | Coupon | Maturity
Date | Face
Amount
($000) | Market
Value•
($000) |
| | Connecticut Special Obligation Revenue Fuel Sales Tax Revenue | 5.000% | 9/1/29 | 210 | 210 |
| | Connecticut Special Obligation Revenue Fuel Sales Tax Revenue | 5.000% | 7/1/30 | 150 | 167 |
| | Connecticut Special Obligation Revenue Fuel Sales Tax Revenue | 5.000% | 9/1/30 | 120 | 124 |
| | Connecticut Special Obligation Revenue Fuel Sales Tax Revenue | 5.000% | 9/1/30 | 1,000 | 1,000 |
| | Connecticut Special Tax Fuel Sales Tax Revenue | 5.000% | 1/1/25 | 1,000 | 1,001 |
| 5 | Connecticut Special Tax Fuel Sales Tax Revenue | 5.000% | 7/1/26 | 500 | 516 |
| 5 | Connecticut Special Tax Fuel Sales Tax Revenue | 5.000% | 7/1/27 | 500 | 529 |
| 5 | Connecticut Special Tax Fuel Sales Tax Revenue | 5.000% | 7/1/28 | 500 | 539 |
| | Connecticut Special Tax Fuel Sales Tax Revenue | 5.000% | 1/1/29 | 105 | 112 |
| 5 | Connecticut Special Tax Fuel Sales Tax Revenue | 5.000% | 7/1/29 | 500 | 549 |
| | Connecticut Special Tax Fuel Sales Tax Revenue | 5.000% | 7/1/30 | 25 | 28 |
| 5 | Connecticut Special Tax Fuel Sales Tax Revenue | 5.000% | 7/1/30 | 500 | 558 |
| | Connecticut Special Tax Fuel Sales Tax Revenue | 5.000% | 1/1/31 | 75 | 80 |
| | Connecticut Special Tax Fuel Sales Tax Revenue | 5.000% | 5/1/31 | 320 | 355 |
| 5 | Connecticut Special Tax Fuel Sales Tax Revenue | 5.000% | 7/1/31 | 100 | 113 |
| | Connecticut State Health & Educational Facilities Authority College & University Revenue PUT | 2.800% | 2/3/26 | 400 | 398 |
| | Connecticut State Health & Educational Facilities Authority College & University Revenue PUT | 2.800% | 2/10/26 | 1,150 | 1,145 |
| | Connecticut State Health & Educational Facilities Authority College & University Revenue PUT | 2.000% | 7/1/26 | 315 | 310 |
| | Connecticut State Health & Educational Facilities Authority College & University Revenue PUT | 3.200% | 7/1/26 | 10 | 10 |
| | Connecticut State Health & Educational Facilities Authority College & University Revenue PUT | 2.950% | 7/1/27 | 400 | 399 |
| | Connecticut State Health & Educational Facilities Authority College & University Revenue PUT | 5.000% | 2/1/28 | 40 | 43 |
| | | | | | 19,230 |
| Delaware (0.2%) |
| | Delaware GO | 5.000% | 1/1/27 | 85 | 89 |
| | Delaware GO | 5.000% | 1/1/28 | 167 | 179 |
| | Delaware GO | 5.000% | 3/1/29 | 555 | 609 |
| | Delaware GO | 5.000% | 3/1/31 | 170 | 193 |
| | Delaware Transportation Authority Fuel Sales Tax Revenue | 5.000% | 7/1/30 | 105 | 118 |
| | | | | | 1,188 |
| District of Columbia (1.5%) |
| | District of Columbia College & University Revenue | 5.000% | 4/1/30 | 30 | 31 |
| | District of Columbia GO | 5.000% | 10/15/26 | 100 | 104 |
| | District of Columbia GO | 5.000% | 10/15/27 | 50 | 53 |
| | District of Columbia GO | 5.000% | 12/1/28 | 100 | 109 |
| | District of Columbia GO | 5.000% | 6/1/29 | 370 | 407 |
| | District of Columbia GO | 5.000% | 10/15/30 | 410 | 449 |
| | District of Columbia GO | 5.000% | 6/1/31 | 385 | 404 |
| | District of Columbia GO | 5.000% | 8/1/31 | 325 | 370 |
| | District of Columbia GO | 5.000% | 10/15/31 | 250 | 273 |
| | District of Columbia Income Tax Revenue | 5.000% | 10/1/25 | 180 | 183 |
| | District of Columbia Income Tax Revenue | 5.000% | 12/1/25 | 90 | 92 |
| | District of Columbia Income Tax Revenue | 5.000% | 10/1/26 | 285 | 297 |
| | District of Columbia Income Tax Revenue | 5.000% | 12/1/26 | 95 | 99 |
| | District of Columbia Income Tax Revenue | 5.000% | 10/1/27 | 320 | 341 |
| | District of Columbia Income Tax Revenue | 5.000% | 12/1/27 | 90 | 96 |
| | District of Columbia Income Tax Revenue | 5.000% | 10/1/28 | 65 | 71 |
| | District of Columbia Income Tax Revenue | 5.000% | 3/1/29 | 235 | 258 |
| | District of Columbia Income Tax Revenue | 5.000% | 10/1/29 | 85 | 94 |
| | District of Columbia Income Tax Revenue | 5.000% | 10/1/29 | 5 | 6 |
| | District of Columbia Income Tax Revenue | 5.000% | 12/1/29 | 210 | 233 |
| | District of Columbia Income Tax Revenue | 5.000% | 3/1/30 | 255 | 281 |
| | District of Columbia Income Tax Revenue | 5.000% | 10/1/30 | 130 | 146 |
| | District of Columbia Income Tax Revenue | 5.000% | 10/1/30 | 100 | 113 |
| | District of Columbia Income Tax Revenue | 5.000% | 3/1/31 | 325 | 357 |
| | District of Columbia Income Tax Revenue | 5.000% | 10/1/31 | 100 | 114 |
| | District of Columbia Income Tax Revenue | 5.000% | 10/1/31 | 395 | 451 |
| | District of Columbia Income Tax Revenue | 5.000% | 10/1/31 | 320 | 365 |
| | District of Columbia Income Tax Revenue | 5.000% | 12/1/31 | 120 | 137 |
| 6 | Metropolitan Washington Airports Authority Dulles Toll Road Highway Revenue | 0.000% | 10/1/30 | 65 | 54 |
| 6 | Metropolitan Washington Airports Authority Dulles Toll Road Highway Revenue, Prere. | 6.500% | 10/1/26 | 500 | 532 |
| | Washington Convention & Sports Authority Miscellaneous Taxes Revenue | 5.000% | 10/1/26 | 10 | 11 |
| | Washington Convention & Sports Authority Miscellaneous Taxes Revenue | 5.000% | 10/1/27 | 50 | 53 |
| | Washington Convention & Sports Authority Miscellaneous Taxes Revenue | 5.000% | 10/1/28 | 260 | 276 |
| | Washington Convention & Sports Authority Miscellaneous Taxes Revenue | 5.000% | 10/1/30 | 1,000 | 1,056 |
| | Washington Metropolitan Area Transit Authority Dedicated Appropriations Revenue | 5.000% | 7/15/30 | 130 | 145 |
| | Washington Metropolitan Area Transit Authority Dedicated Appropriations Revenue | 5.000% | 7/15/31 | 155 | 175 |
| | | | | | 8,236 |
Short-Term Tax-Exempt Bond ETF
| | | Coupon | Maturity
Date | Face
Amount
($000) | Market
Value•
($000) |
| Florida (2.9%) |
| | Broward County FL School District COP | 5.000% | 7/1/26 | 90 | 91 |
| | Broward County FL School District COP | 5.000% | 7/1/27 | 475 | 502 |
| | Broward County FL School District COP | 5.000% | 7/1/28 | 1,090 | 1,172 |
| | Broward County FL School District COP | 5.000% | 7/1/30 | 100 | 111 |
| | Broward County FL School District COP | 5.000% | 7/1/31 | 115 | 127 |
| 1 | Central Florida Expressway Authority Highway Revenue | 5.000% | 7/1/27 | 115 | 121 |
| | Central Florida Expressway Authority Highway Revenue | 5.000% | 7/1/28 | 425 | 439 |
| | Central Florida Expressway Authority Highway Revenue | 4.000% | 7/1/30 | 625 | 633 |
| 1 | Central Florida Expressway Authority Highway Revenue | 5.000% | 7/1/31 | 360 | 407 |
| 1 | Duval County Public Schools COP | 5.000% | 7/1/25 | 100 | 101 |
| 1 | Duval County Public Schools COP | 5.000% | 7/1/26 | 105 | 109 |
| 1 | Duval County Public Schools COP | 5.000% | 7/1/27 | 170 | 179 |
| 1 | Duval County Public Schools COP | 5.000% | 7/1/28 | 390 | 418 |
| 1 | Duval County Public Schools COP | 5.000% | 7/1/29 | 265 | 289 |
| 1 | Duval County Public Schools COP | 5.000% | 7/1/30 | 1,000 | 1,105 |
| 1 | Duval County Public Schools COP | 5.000% | 7/1/31 | 145 | 160 |
| | Florida Department of Management Services COP | 5.000% | 11/1/26 | 270 | 281 |
| | Florida Department of Management Services COP | 5.000% | 11/1/27 | 75 | 80 |
| | Florida Department of Transportation Turnpike System Highway Revenue | 5.000% | 7/1/25 | 50 | 51 |
| | Florida Department of Transportation Turnpike System Highway Revenue | 5.000% | 7/1/27 | 305 | 323 |
| | Florida GO | 5.000% | 6/1/26 | 75 | 78 |
| | Florida GO | 5.000% | 6/1/27 | 270 | 285 |
| | Florida GO | 5.000% | 6/1/29 | 290 | 319 |
| | Florida Insurance Assistance Interlocal Agency Inc. Miscellaneous Revenue | 5.000% | 9/1/25 | 360 | 361 |
| | Florida Insurance Assistance Interlocal Agency Inc. Miscellaneous Revenue | 5.000% | 9/1/26 | 270 | 276 |
| | Florida Insurance Assistance Interlocal Agency Inc. Miscellaneous Revenue | 5.000% | 9/1/27 | 150 | 155 |
| | Florida Insurance Assistance Interlocal Agency Inc. Miscellaneous Revenue | 5.000% | 9/1/28 | 100 | 103 |
| | Florida Lottery Revenue | 5.000% | 7/1/25 | 50 | 51 |
| | Florida Lottery Revenue | 5.000% | 7/1/25 | 150 | 152 |
| | Florida Lottery Revenue | 5.000% | 7/1/27 | 520 | 550 |
| | Florida Lottery Revenue | 5.000% | 7/1/28 | 265 | 287 |
| | Florida Municipal Power Agency Electric Power & Light Revenue | 5.000% | 10/1/27 | 170 | 176 |
| | Florida Municipal Power Agency Electric Power & Light Revenue | 5.000% | 10/1/28 | 75 | 77 |
| | Florida Municipal Power Agency Electric Power & Light Revenue | 5.000% | 10/1/29 | 305 | 315 |
| | Florida Municipal Power Agency Electric Power & Light Revenue | 5.000% | 10/1/30 | 35 | 36 |
| | JEA Electric System Electric Power & Light Revenue | 5.000% | 10/1/27 | 125 | 132 |
| | JEA Electric System Electric Power & Light Revenue | 5.000% | 10/1/28 | 30 | 32 |
| 6 | JEA Electric System Electric Power & Light Revenue | 5.000% | 10/1/28 | 250 | 271 |
| | JEA Electric System Electric Power & Light Revenue | 5.000% | 10/1/30 | 30 | 32 |
| 6 | JEA Electric System Electric Power & Light Revenue | 5.000% | 10/1/30 | 100 | 112 |
| 6 | JEA Electric System Electric Power & Light Revenue | 5.000% | 10/1/31 | 145 | 165 |
| | JEA Water & Sewer System Water Revenue | 5.000% | 10/1/29 | 175 | 185 |
| | Miami-Dade County Expressway Authority Highway Revenue | 5.000% | 7/1/25 | 125 | 126 |
| | Miami-Dade County FL Water & Sewer System Water Revenue | 5.000% | 10/1/25 | 110 | 112 |
| | Miami-Dade County FL Water & Sewer System Water Revenue | 5.000% | 10/1/26 | 1,035 | 1,051 |
| | Miami-Dade County FL Water & Sewer System Water Revenue | 5.000% | 10/1/27 | 105 | 111 |
| | Miami-Dade County FL Water & Sewer System Water Revenue | 5.000% | 10/1/28 | 180 | 190 |
| | Miami-Dade County FL Water & Sewer System Water Revenue | 5.000% | 10/1/29 | 20 | 21 |
| | Miami-Dade County FL Water & Sewer System Water Revenue | 5.000% | 10/1/30 | 500 | 559 |
| | Miami-Dade County School Board COP | 5.000% | 2/1/26 | 65 | 67 |
| | Miami-Dade County School Board COP | 5.000% | 5/1/26 | 70 | 71 |
| | Miami-Dade County School Board COP | 5.000% | 2/1/27 | 195 | 199 |
| | Miami-Dade County School Board COP | 5.000% | 5/1/28 | 435 | 438 |
| | Miami-Dade County School Board COP | 4.000% | 8/1/28 | 145 | 145 |
| | Miami-Dade County School Board COP | 5.000% | 2/1/29 | 225 | 230 |
| | Miami-Dade County School Board COP | 4.000% | 8/1/29 | 155 | 155 |
| | Miami-Dade County School Board COP | 5.000% | 5/1/30 | 145 | 146 |
| | Miami-Dade County School Board COP | 5.000% | 2/1/31 | 300 | 306 |
| | Orange County School Board COP, Prere. | 5.000% | 8/1/25 | 215 | 218 |
| | Orange County School Board COP, Prere. | 5.000% | 8/1/25 | 100 | 101 |
| | Orlando Utilities Commission Electric Power & Light Revenue PUT | 1.250% | 10/1/28 | 180 | 163 |
| | Palm Beach County School District COP | 5.000% | 8/1/27 | 180 | 191 |
| | Palm Beach County School District COP | 5.000% | 8/1/27 | 10 | 10 |
| | Palm Beach County School District COP | 5.000% | 8/1/28 | 235 | 254 |
| | Palm Beach County School District COP | 5.000% | 8/1/31 | 40 | 40 |
| | Tampa Bay Water Revenue | 4.000% | 10/1/31 | 200 | 201 |
| 4 | Tampa Bay Water Revenue, ETM | 6.000% | 10/1/29 | 215 | 242 |
| | | | | | 16,196 |
Short-Term Tax-Exempt Bond ETF
| | | Coupon | Maturity
Date | Face
Amount
($000) | Market
Value•
($000) |
| Georgia (2.0%) |
| | Atlanta GA Department of Aviation Port, Airport & Marina Revenue | 5.000% | 7/1/25 | 150 | 152 |
| | Atlanta GA Department of Aviation Port, Airport & Marina Revenue | 5.000% | 7/1/29 | 240 | 263 |
| | Atlanta GA Department of Aviation Port, Airport & Marina Revenue | 5.000% | 7/1/30 | 315 | 351 |
| | Atlanta GA Water & Wastewater Water Revenue | 5.000% | 11/1/25 | 125 | 126 |
| | Atlanta GA Water & Wastewater Water Revenue | 5.000% | 11/1/26 | 45 | 45 |
| 1 | Atlanta GA Water & Wastewater Water Revenue | 5.250% | 11/1/27 | 35 | 37 |
| | Atlanta GA Water & Wastewater Water Revenue | 5.000% | 11/1/28 | 245 | 247 |
| 7 | Atlanta GA Water & Wastewater Water Revenue | 5.000% | 11/1/30 | 500 | 561 |
| 7 | Atlanta GA Water & Wastewater Water Revenue | 5.000% | 11/1/31 | 500 | 568 |
| | Atlanta GA Water & Wastewater Water Revenue, Prere. | 5.000% | 5/1/25 | 75 | 76 |
| | Atlanta GA Water & Wastewater Water Revenue, Prere. | 5.000% | 5/1/25 | 95 | 96 |
| | Gainesville & Hall County Hospital Authority Health, Hospital, Nursing Home Revenue (Northeast Georgia Health System Inc. Project), Prere. | 4.000% | 2/15/25 | 55 | 55 |
| | Georgia GO | 5.000% | 7/1/25 | 100 | 101 |
| | Georgia GO | 5.000% | 7/1/25 | 50 | 51 |
| | Georgia GO | 5.000% | 7/1/25 | 100 | 101 |
| | Georgia GO | 5.000% | 8/1/25 | 165 | 167 |
| | Georgia GO | 4.000% | 1/1/26 | 100 | 101 |
| | Georgia GO | 5.000% | 1/1/26 | 85 | 87 |
| | Georgia GO | 4.000% | 2/1/26 | 165 | 165 |
| | Georgia GO | 5.000% | 2/1/26 | 105 | 108 |
| | Georgia GO | 5.000% | 2/1/26 | 60 | 62 |
| | Georgia GO | 5.000% | 7/1/26 | 130 | 135 |
| | Georgia GO | 4.000% | 1/1/27 | 100 | 103 |
| | Georgia GO | 5.000% | 2/1/27 | 290 | 305 |
| | Georgia GO | 5.000% | 7/1/27 | 75 | 79 |
| | Georgia GO | 5.000% | 7/1/27 | 15 | 16 |
| | Georgia GO | 5.000% | 7/1/27 | 55 | 58 |
| | Georgia GO | 5.000% | 7/1/27 | 100 | 106 |
| | Georgia GO | 5.000% | 8/1/27 | 220 | 234 |
| | Georgia GO | 4.000% | 1/1/28 | 100 | 104 |
| | Georgia GO | 5.000% | 2/1/28 | 285 | 300 |
| | Georgia GO | 4.000% | 7/1/28 | 70 | 73 |
| | Georgia GO | 5.000% | 7/1/28 | 430 | 466 |
| | Georgia GO | 5.000% | 7/1/28 | 110 | 117 |
| | Georgia GO | 5.000% | 8/1/28 | 230 | 249 |
| | Georgia GO | 3.000% | 2/1/29 | 140 | 140 |
| | Georgia GO | 5.000% | 2/1/29 | 250 | 262 |
| | Georgia GO | 4.000% | 7/1/29 | 50 | 53 |
| | Georgia GO | 5.000% | 7/1/29 | 10 | 11 |
| | Georgia GO | 5.000% | 7/1/29 | 10 | 11 |
| | Georgia GO | 5.000% | 8/1/29 | 50 | 55 |
| | Georgia GO | 5.000% | 2/1/30 | 100 | 105 |
| | Georgia GO | 5.000% | 7/1/30 | 420 | 462 |
| | Georgia GO | 5.000% | 7/1/30 | 235 | 264 |
| | Georgia GO | 5.000% | 7/1/31 | 75 | 82 |
| | Georgia GO | 5.000% | 7/1/31 | 195 | 223 |
| 2 | Georgia Municipal Electric Authority Electric Power & Light Revenue | 7.000% | 1/1/25 | 15 | 15 |
| | Georgia State Road & Tollway Authority Government Fund/Grant Revenue | 5.000% | 6/1/25 | 75 | 76 |
| | Georgia State Road & Tollway Authority Government Fund/Grant Revenue | 5.000% | 6/1/26 | 250 | 258 |
| | Georgia State Road & Tollway Authority Government Fund/Grant Revenue | 5.000% | 6/1/27 | 270 | 285 |
| | Georgia State Road & Tollway Authority Government Fund/Grant Revenue | 5.000% | 6/1/28 | 105 | 113 |
| | Georgia State Road & Tollway Authority Government Fund/Grant Revenue | 5.000% | 6/1/29 | 135 | 148 |
| | Georgia State Road & Tollway Authority Government Fund/Grant Revenue | 5.000% | 6/1/30 | 215 | 240 |
| | Gwinnett County School District GO | 5.000% | 8/1/27 | 285 | 303 |
| | Metropolitan Atlanta Rapid Transit Authority Sales Tax Revenue | 4.000% | 7/1/25 | 75 | 75 |
| | Private Colleges & Universities Authority College & University Revenue | 5.000% | 9/1/29 | 640 | 705 |
| | Private Colleges & Universities Authority College & University Revenue | 5.000% | 9/1/29 | 300 | 331 |
| | Private Colleges & Universities Authority College & University Revenue | 5.000% | 9/1/30 | 440 | 493 |
| | Sandy Springs Public Facilities Authority Lease (Non-Terminable) Revenue (Sandy Springs City Center Project), Prere. | 4.000% | 5/1/26 | 410 | 417 |
| | | | | | 10,992 |
| Hawaii (1.0%) |
| | Hawaii GO | 5.000% | 10/1/25 | 135 | 137 |
| | Hawaii GO | 5.000% | 1/1/26 | 75 | 77 |
| | Hawaii GO | 4.000% | 4/1/26 | 65 | 66 |
| | Hawaii GO | 5.000% | 5/1/26 | 140 | 144 |
| | Hawaii GO | 5.000% | 10/1/26 | 445 | 453 |
| | Hawaii GO | 5.000% | 10/1/26 | 315 | 328 |
Short-Term Tax-Exempt Bond ETF
| | | Coupon | Maturity
Date | Face
Amount
($000) | Market
Value•
($000) |
| | Hawaii GO | 5.000% | 5/1/27 | 200 | 211 |
| | Hawaii GO | 5.000% | 8/1/27 | 350 | 350 |
| | Hawaii GO | 5.000% | 10/1/27 | 120 | 125 |
| | Hawaii GO | 5.000% | 10/1/27 | 50 | 52 |
| | Hawaii GO | 5.000% | 5/1/28 | 50 | 53 |
| | Hawaii GO | 5.000% | 1/1/29 | 210 | 224 |
| | Hawaii GO | 5.000% | 10/1/29 | 95 | 99 |
| | Hawaii GO | 5.000% | 1/1/30 | 235 | 251 |
| | Hawaii GO | 5.000% | 10/1/30 | 20 | 21 |
| | Hawaii GO | 5.000% | 1/1/31 | 145 | 154 |
| | Hawaii GO | 4.000% | 5/1/31 | 135 | 138 |
| | Hawaii GO | 4.000% | 10/1/31 | 125 | 127 |
| | Hawaii GO | 5.000% | 10/1/31 | 105 | 111 |
| | Hawaii GO, Prere. | 5.000% | 10/1/25 | 30 | 31 |
| | Hawaii GO, Prere. | 5.000% | 10/1/25 | 175 | 178 |
| | Honolulu HI City & County (Honolulu Rail Transit Project) GO | 5.000% | 3/1/26 | 115 | 118 |
| | Honolulu HI City & County (Honolulu Rail Transit Project) GO | 5.000% | 9/1/26 | 225 | 234 |
| | Honolulu HI City & County (Honolulu Rail Transit Project) GO | 5.000% | 3/1/27 | 150 | 158 |
| | Honolulu HI City & County (Honolulu Rail Transit Project) GO | 5.000% | 3/1/27 | 540 | 568 |
| | Honolulu HI City & County (Honolulu Rail Transit Project) GO | 5.000% | 3/1/28 | 120 | 129 |
| | Honolulu HI City & County (Honolulu Rail Transit Project) GO | 5.000% | 3/1/29 | 150 | 164 |
| | Honolulu HI City & County (Honolulu Rail Transit Project) GO | 5.000% | 9/1/29 | 265 | 286 |
| | Honolulu HI City & County (Honolulu Rail Transit Project) GO | 5.000% | 3/1/30 | 100 | 111 |
| | Honolulu HI City & County (Honolulu Rail Transit Project) GO | 5.000% | 3/1/30 | 335 | 372 |
| | Honolulu HI City & County (Honolulu Rail Transit Project) GO | 5.000% | 9/1/30 | 100 | 108 |
| | Honolulu HI City & County (Honolulu Rail Transit Project) GO | 5.000% | 3/1/31 | 110 | 122 |
| | Honolulu HI City & County (Honolulu Rail Transit Project) GO | 5.000% | 3/1/31 | 40 | 45 |
| | | | | | 5,745 |
| Idaho (0.1%) |
| | Idaho Housing & Finance Association Appropriations Revenue | 5.000% | 7/15/29 | 230 | 252 |
| | Idaho Housing & Finance Association Appropriations Revenue RAN | 5.000% | 7/15/26 | 60 | 62 |
| | Idaho State Building Authority Intergovernmental Agreement Revenue | 5.000% | 6/1/28 | 285 | 307 |
| | Idaho State Building Authority Lease (Appropriation) Revenue (St. Office Campus Project), Prere. | 4.000% | 9/1/27 | 15 | 16 |
| | | | | | 637 |
| Illinois (8.4%) |
| | Chicago IL GO | 5.000% | 1/1/25 | 130 | 130 |
| | Chicago IL GO | 5.000% | 1/1/25 | 500 | 501 |
| | Chicago IL GO | 5.000% | 1/1/26 | 150 | 152 |
| | Chicago IL GO | 5.000% | 1/1/27 | 250 | 258 |
| | Chicago IL GO | 5.000% | 1/1/28 | 155 | 162 |
| | Chicago IL GO | 0.000% | 1/1/29 | 100 | 86 |
| | Chicago IL GO | 5.000% | 1/1/29 | 150 | 158 |
| | Chicago IL GO | 5.000% | 1/1/30 | 50 | 53 |
| 4 | Chicago IL GO, ETM | 0.000% | 1/1/28 | 135 | 123 |
| | Chicago IL GO, Prere. | 5.250% | 1/1/25 | 210 | 210 |
| 1 | Chicago IL Waterworks Water Revenue | 5.000% | 11/1/31 | 530 | 597 |
| 7 | Chicago Midway International Airport Port, Airport & Marina Revenue | 5.000% | 1/1/26 | 100 | 102 |
| | Chicago O'Hare International Airport Port, Airport & Marina Revenue | 5.000% | 1/1/25 | 195 | 195 |
| | Chicago O'Hare International Airport Port, Airport & Marina Revenue | 5.000% | 1/1/25 | 95 | 95 |
| | Chicago O'Hare International Airport Port, Airport & Marina Revenue | 5.000% | 1/1/26 | 100 | 100 |
| | Chicago O'Hare International Airport Port, Airport & Marina Revenue | 5.000% | 1/1/26 | 210 | 215 |
| | Chicago O'Hare International Airport Port, Airport & Marina Revenue | 5.000% | 1/1/27 | 210 | 210 |
| | Chicago O'Hare International Airport Port, Airport & Marina Revenue | 5.000% | 1/1/27 | 160 | 167 |
| | Chicago O'Hare International Airport Port, Airport & Marina Revenue | 5.000% | 1/1/28 | 240 | 240 |
| | Chicago O'Hare International Airport Port, Airport & Marina Revenue | 5.000% | 1/1/28 | 205 | 218 |
| | Chicago O'Hare International Airport Port, Airport & Marina Revenue | 5.250% | 1/1/28 | 75 | 79 |
| | Chicago O'Hare International Airport Port, Airport & Marina Revenue | 5.000% | 1/1/29 | 375 | 376 |
| | Chicago O'Hare International Airport Port, Airport & Marina Revenue | 5.000% | 1/1/29 | 105 | 107 |
| | Chicago O'Hare International Airport Port, Airport & Marina Revenue | 5.000% | 1/1/29 | 65 | 70 |
| | Chicago O'Hare International Airport Port, Airport & Marina Revenue | 5.000% | 1/1/29 | 155 | 168 |
| | Chicago O'Hare International Airport Port, Airport & Marina Revenue | 5.000% | 1/1/30 | 1,010 | 1,011 |
| | Chicago O'Hare International Airport Port, Airport & Marina Revenue | 5.000% | 1/1/30 | 200 | 220 |
| | Chicago O'Hare International Airport Port, Airport & Marina Revenue | 5.000% | 1/1/31 | 1,300 | 1,302 |
| | Chicago O'Hare International Airport Port, Airport & Marina Revenue | 5.000% | 1/1/31 | 250 | 279 |
| | Chicago O'Hare International Airport Port, Airport & Marina Revenue | 5.000% | 1/1/32 | 250 | 282 |
| | Chicago O'Hare International Airport Port, Airport & Marina Revenue | 5.000% | 1/1/46 | 1,930 | 1,933 |
| | Chicago Transit Authority Capital Grant Receipts Government Fund/Grant Revenue | 5.000% | 6/1/28 | 300 | 317 |
| | Cook County IL GO | 4.000% | 11/15/25 | 60 | 61 |
| | Cook County IL GO | 5.000% | 11/15/25 | 265 | 270 |
Short-Term Tax-Exempt Bond ETF
| | | Coupon | Maturity
Date | Face
Amount
($000) | Market
Value•
($000) |
| | Cook County IL GO | 4.000% | 11/15/26 | 85 | 87 |
| 1 | Cook County IL GO | 5.000% | 11/15/26 | 1,045 | 1,087 |
| | Cook County IL GO | 4.000% | 11/15/27 | 615 | 633 |
| | Cook County IL GO | 5.000% | 11/15/28 | 65 | 70 |
| | Cook County IL GO | 5.000% | 11/15/29 | 860 | 942 |
| | Illinois (Rebuild Illinois Program) GO | 5.000% | 11/1/30 | 325 | 351 |
| | Illinois Finance Authority College & University Revenue | 5.000% | 4/1/31 | 585 | 657 |
| | Illinois Finance Authority Water Revenue | 5.000% | 7/1/31 | 340 | 353 |
| | Illinois GO | 5.000% | 12/1/24 | 250 | 250 |
| | Illinois GO | 5.000% | 2/1/25 | 500 | 501 |
| | Illinois GO | 5.000% | 2/1/25 | 500 | 501 |
| | Illinois GO | 5.000% | 3/1/25 | 90 | 90 |
| | Illinois GO | 5.000% | 3/1/25 | 740 | 743 |
| | Illinois GO | 5.000% | 3/1/25 | 600 | 602 |
| | Illinois GO | 5.000% | 7/1/25 | 220 | 222 |
| | Illinois GO | 5.000% | 11/1/25 | 220 | 224 |
| | Illinois GO | 5.000% | 12/1/25 | 135 | 138 |
| | Illinois GO | 5.000% | 2/1/26 | 150 | 150 |
| | Illinois GO | 5.000% | 2/1/26 | 190 | 194 |
| | Illinois GO | 5.000% | 2/1/26 | 1,125 | 1,149 |
| | Illinois GO | 5.000% | 3/1/26 | 150 | 153 |
| | Illinois GO | 5.000% | 3/1/26 | 150 | 153 |
| | Illinois GO | 5.000% | 5/1/26 | 500 | 513 |
| | Illinois GO | 5.000% | 7/1/26 | 265 | 273 |
| | Illinois GO | 5.000% | 11/1/26 | 1,000 | 1,036 |
| | Illinois GO | 5.000% | 2/1/27 | 265 | 276 |
| | Illinois GO | 5.000% | 2/1/27 | 380 | 395 |
| | Illinois GO | 5.000% | 3/1/27 | 245 | 255 |
| | Illinois GO | 5.000% | 3/1/27 | 200 | 208 |
| | Illinois GO | 5.000% | 5/1/27 | 300 | 301 |
| | Illinois GO | 5.000% | 6/1/27 | 155 | 159 |
| | Illinois GO | 5.000% | 7/1/27 | 125 | 131 |
| | Illinois GO | 5.000% | 10/1/27 | 65 | 68 |
| | Illinois GO | 5.000% | 10/1/27 | 50 | 53 |
| | Illinois GO | 5.000% | 11/1/27 | 1,140 | 1,200 |
| | Illinois GO | 5.000% | 2/1/28 | 1,050 | 1,089 |
| | Illinois GO | 5.000% | 3/1/28 | 350 | 370 |
| | Illinois GO | 5.000% | 3/1/28 | 235 | 249 |
| | Illinois GO | 5.000% | 3/1/28 | 150 | 159 |
| | Illinois GO | 5.000% | 5/1/28 | 100 | 106 |
| | Illinois GO | 5.000% | 7/1/28 | 430 | 457 |
| | Illinois GO | 5.000% | 10/1/28 | 190 | 203 |
| | Illinois GO | 5.000% | 11/1/28 | 395 | 413 |
| | Illinois GO | 5.000% | 12/1/28 | 25 | 26 |
| | Illinois GO | 5.000% | 2/1/29 | 90 | 93 |
| | Illinois GO | 5.000% | 2/1/29 | 115 | 123 |
| | Illinois GO | 5.000% | 3/1/29 | 250 | 269 |
| | Illinois GO | 5.000% | 5/1/29 | 100 | 108 |
| | Illinois GO | 5.000% | 7/1/29 | 595 | 642 |
| | Illinois GO | 5.000% | 10/1/29 | 100 | 106 |
| | Illinois GO | 5.000% | 11/1/29 | 695 | 727 |
| 1 | Illinois GO | 4.000% | 2/1/30 | 425 | 431 |
| | Illinois GO | 5.250% | 2/1/30 | 100 | 100 |
| | Illinois GO | 5.000% | 3/1/30 | 355 | 386 |
| | Illinois GO | 5.000% | 5/1/30 | 100 | 109 |
| | Illinois GO | 5.500% | 5/1/30 | 900 | 969 |
| | Illinois GO | 5.000% | 7/1/30 | 380 | 415 |
| 1 | Illinois GO | 4.000% | 2/1/31 | 145 | 147 |
| | Illinois GO | 5.000% | 3/1/31 | 25 | 28 |
| | Illinois GO | 5.000% | 5/1/31 | 520 | 573 |
| | Illinois GO | 5.000% | 5/1/32 | 500 | 501 |
| | Illinois Municipal Electric Agency Electric Power & Light Revenue | 5.000% | 2/1/25 | 240 | 241 |
| | Illinois Municipal Electric Agency Electric Power & Light Revenue | 5.000% | 2/1/27 | 115 | 116 |
| | Illinois Municipal Electric Agency Electric Power & Light Revenue | 5.000% | 2/1/29 | 235 | 237 |
| | Illinois Municipal Electric Agency Electric Power & Light Revenue | 5.000% | 2/1/30 | 40 | 40 |
| | Illinois Sales Tax Revenue | 5.000% | 6/15/30 | 140 | 154 |
| | Illinois State Toll Highway Authority Highway Revenue | 5.000% | 1/1/25 | 1,225 | 1,227 |
| | Illinois State Toll Highway Authority Highway Revenue | 5.000% | 1/1/25 | 200 | 200 |
| | Illinois State Toll Highway Authority Highway Revenue | 5.000% | 1/1/25 | 180 | 180 |
| | Illinois State Toll Highway Authority Highway Revenue | 5.000% | 1/1/26 | 160 | 164 |
Short-Term Tax-Exempt Bond ETF
| | | Coupon | Maturity
Date | Face
Amount
($000) | Market
Value•
($000) |
| | Illinois State Toll Highway Authority Highway Revenue | 5.000% | 1/1/26 | 130 | 133 |
| | Illinois State Toll Highway Authority Highway Revenue | 5.000% | 1/1/26 | 135 | 138 |
| | Illinois State Toll Highway Authority Highway Revenue | 5.000% | 1/1/27 | 150 | 157 |
| | Illinois State Toll Highway Authority Highway Revenue | 5.000% | 1/1/27 | 345 | 361 |
| | Illinois State Toll Highway Authority Highway Revenue | 5.000% | 1/1/27 | 105 | 110 |
| | Illinois State Toll Highway Authority Highway Revenue | 5.000% | 1/1/28 | 5 | 5 |
| | Illinois State Toll Highway Authority Highway Revenue | 5.000% | 1/1/28 | 655 | 699 |
| | Illinois State Toll Highway Authority Highway Revenue | 5.000% | 1/1/29 | 140 | 152 |
| | Illinois State Toll Highway Authority Highway Revenue | 5.000% | 1/1/29 | 390 | 424 |
| | Illinois State Toll Highway Authority Highway Revenue | 5.000% | 1/1/30 | 15 | 16 |
| | Illinois State Toll Highway Authority Highway Revenue | 5.000% | 1/1/30 | 230 | 254 |
| | Illinois State Toll Highway Authority Highway Revenue | 5.000% | 1/1/30 | 125 | 138 |
| | Illinois State Toll Highway Authority Highway Revenue | 5.000% | 1/1/31 | 110 | 119 |
| | Illinois State Toll Highway Authority Highway Revenue | 5.000% | 1/1/31 | 185 | 204 |
| | Illinois State Toll Highway Authority Highway Revenue | 5.000% | 1/1/31 | 225 | 248 |
| | Illinois State Toll Highway Authority Highway Revenue | 4.000% | 12/1/31 | 320 | 323 |
| | Illinois State Toll Highway Authority Highway Revenue | 5.000% | 12/1/31 | 160 | 163 |
| 1 | Metropolitan Pier & Exposition Authority Appropriations Revenue | 0.000% | 6/15/27 | 345 | 318 |
| 4 | Metropolitan Pier & Exposition Authority Appropriations Revenue | 0.000% | 6/15/30 | 500 | 414 |
| | Metropolitan Pier & Exposition Authority Appropriations Revenue (MCCormick Place Expansion Project) | 4.000% | 12/15/26 | 435 | 441 |
| 4 | Metropolitan Pier & Exposition Authority Appropriations Revenue (MCCormick Place Expansion Project) | 0.000% | 6/15/28 | 460 | 409 |
| | Metropolitan Pier & Exposition Authority Appropriations Revenue (MCCormick Place Expansion Project) | 5.000% | 6/15/29 | 230 | 241 |
| | Metropolitan Water Reclamation District of Greater Chicago GO | 5.000% | 12/1/24 | 60 | 60 |
| | Metropolitan Water Reclamation District of Greater Chicago GO | 5.000% | 12/1/25 | 135 | 138 |
| | Metropolitan Water Reclamation District of Greater Chicago GO | 5.000% | 12/1/26 | 245 | 255 |
| | Metropolitan Water Reclamation District of Greater Chicago GO | 5.000% | 12/1/27 | 20 | 21 |
| | Metropolitan Water Reclamation District of Greater Chicago GO | 5.000% | 12/1/28 | 270 | 281 |
| | Metropolitan Water Reclamation District of Greater Chicago GO | 5.000% | 12/1/29 | 40 | 42 |
| | Metropolitan Water Reclamation District of Greater Chicago GO | 5.000% | 12/1/31 | 100 | 104 |
| | Metropolitan Water Reclamation District of Greater Chicago GO, Prere. | 5.000% | 12/1/24 | 1,070 | 1,070 |
| 1 | Regional Transportation Authority Sales Tax Revenue | 5.750% | 6/1/29 | 215 | 236 |
| | Sales Tax Securitization Corp. Intergovernmental Agreement Revenue | 5.000% | 1/1/27 | 10 | 10 |
| | Sales Tax Securitization Corp. Intergovernmental Agreement Revenue | 5.000% | 1/1/30 | 1,255 | 1,371 |
| | Sales Tax Securitization Corp. Intergovernmental Agreement Revenue | 5.000% | 1/1/31 | 310 | 344 |
| | Sales Tax Securitization Corp. Sales Tax Revenue | 5.000% | 1/1/25 | 160 | 160 |
| | Sales Tax Securitization Corp. Sales Tax Revenue | 5.000% | 1/1/27 | 240 | 250 |
| | Sales Tax Securitization Corp. Sales Tax Revenue | 5.000% | 1/1/28 | 355 | 377 |
| | Sales Tax Securitization Corp. Sales Tax Revenue | 5.000% | 1/1/29 | 335 | 362 |
| | Sales Tax Securitization Corp. Sales Tax Revenue | 5.000% | 1/1/30 | 415 | 453 |
| 1 | St Clair County Community Unit School District No. 187 Cahokia GO, ETM | 4.000% | 1/1/28 | 25 | 26 |
| | Will County IL GO, Prere. | 5.000% | 11/15/25 | 75 | 76 |
| | | | | | 47,026 |
| Indiana (0.3%) |
| | Indiana Finance Authority Lease Revenue | 5.000% | 12/1/25 | 285 | 291 |
| | Indiana Finance Authority Lease Revenue | 5.000% | 2/1/26 | 25 | 26 |
| | Indiana Finance Authority Lease Revenue | 5.000% | 6/1/27 | 105 | 109 |
| | Indiana Finance Authority Lease Revenue | 5.000% | 6/1/28 | 135 | 141 |
| | Indiana Finance Authority Lease Revenue | 5.000% | 6/1/28 | 305 | 329 |
| | Indiana Finance Authority Lease Revenue | 5.000% | 6/1/29 | 305 | 336 |
| | Indiana Finance Authority Water Revenue | 5.000% | 2/1/25 | 100 | 100 |
| | Indiana Finance Authority Water Revenue | 5.000% | 2/1/27 | 315 | 326 |
| 2 | Indianapolis Local Public Improvement Bond Bank Miscellaneous Revenue | 0.000% | 2/1/27 | 235 | 219 |
| | | | | | 1,877 |
| Iowa (0.1%) |
| | Iowa Finance Authority Water Revenue | 5.000% | 8/1/27 | 60 | 64 |
| | Iowa Finance Authority Water Revenue | 5.000% | 8/1/28 | 165 | 174 |
| | Iowa Finance Authority Water Revenue | 5.000% | 8/1/30 | 150 | 158 |
| | | | | | 396 |
| Kansas (0.4%) |
| | Kansas Department of Transportation Fuel Sales Tax Revenue | 5.000% | 9/1/25 | 200 | 203 |
| | Kansas Department of Transportation Fuel Sales Tax Revenue | 5.000% | 9/1/26 | 355 | 360 |
| | Kansas Department of Transportation Fuel Sales Tax Revenue | 5.000% | 9/1/27 | 105 | 107 |
| | Kansas Department of Transportation Fuel Sales Tax Revenue | 5.000% | 9/1/28 | 300 | 304 |
| | Kansas Department of Transportation Fuel Sales Tax Revenue | 5.000% | 9/1/29 | 290 | 294 |
| | Kansas Department of Transportation Fuel Sales Tax Revenue | 5.000% | 9/1/30 | 25 | 26 |
| | Kansas Department of Transportation Fuel Sales Tax Revenue | 5.000% | 9/1/31 | 250 | 284 |
| | Wyandotte County Unified School District No. 500 Kansas City GO, Prere. | 4.125% | 9/1/26 | 260 | 266 |
Short-Term Tax-Exempt Bond ETF
| | | Coupon | Maturity
Date | Face
Amount
($000) | Market
Value•
($000) |
| | Wyandotte County Unified School District No. 500 Kansas City GO, Prere. | 5.500% | 9/1/26 | 270 | 283 |
| | | | | | 2,127 |
| Kentucky (0.4%) |
| | Kentucky State Property & Building Commission Lease (Appropriation) Revenue (Project No. 112) | 5.000% | 11/1/25 | 260 | 265 |
| | Kentucky State Property & Building Commission Lease (Appropriation) Revenue (Project No. 112) | 5.000% | 11/1/26 | 325 | 338 |
| | Kentucky State Property & Building Commission Lease (Appropriation) Revenue (Project No. 112) | 5.000% | 11/1/27 | 260 | 270 |
| | Kentucky State Property & Building Commission Lease (Appropriation) Revenue (Project No. 112) | 5.000% | 11/1/28 | 205 | 213 |
| | Kentucky State Property & Building Commission Lease (Appropriation) Revenue (Project No. 130) | 5.000% | 11/1/27 | 595 | 632 |
| | Kentucky State Property & Building Commission Lease (Appropriation) Revenue (Project No. 130) | 5.000% | 11/1/28 | 70 | 76 |
| | Kentucky State Property & Building Commission Lease (Appropriation) Revenue (Project No. 130) | 5.000% | 11/1/29 | 60 | 66 |
| | Kentucky Turnpike Authority Lease (Appropriation) Revenue (Revitalization Projects) | 5.000% | 7/1/25 | 465 | 470 |
| | | | | | 2,330 |
| Louisiana (0.4%) |
| | East Baton Rouge Sewerage Commission Sewer Revenue, Prere. | 5.000% | 2/1/25 | 435 | 436 |
| | Louisiana Gasoline & Fuels Tax Fuel Sales Tax Revenue, Prere. | 4.500% | 5/1/25 | 105 | 106 |
| | Louisiana GO | 5.000% | 8/1/26 | 25 | 26 |
| | Louisiana GO | 5.000% | 8/1/27 | 90 | 93 |
| | Louisiana GO | 5.000% | 8/1/28 | 215 | 222 |
| | Louisiana Local Government Environmental Facilities & Community Development Authority Intergovernmental Agreement Revenue | 5.000% | 8/15/28 | 100 | 105 |
| | Louisiana Local Government Environmental Facilities & Community Development Authority Intergovernmental Agreement Revenue | 5.000% | 8/15/30 | 160 | 167 |
| | Louisiana Public Facilities Authority Health, Hospital, Nursing Home Revenue, Prere. | 5.500% | 5/15/26 | 110 | 113 |
| | New Orleans LA Water System Water Revenue, Prere. | 5.000% | 12/1/24 | 720 | 720 |
| | | | | | 1,988 |
| Maryland (2.5%) |
| | Maryland Department of Transportation Fuel Sales Tax Revenue | 5.000% | 9/1/25 | 45 | 46 |
| | Maryland Department of Transportation Fuel Sales Tax Revenue | 5.000% | 10/1/25 | 80 | 81 |
| | Maryland Department of Transportation Fuel Sales Tax Revenue | 4.000% | 11/1/25 | 520 | 520 |
| | Maryland Department of Transportation Fuel Sales Tax Revenue | 5.000% | 10/1/26 | 125 | 130 |
| | Maryland Department of Transportation Fuel Sales Tax Revenue | 5.000% | 10/1/26 | 140 | 146 |
| | Maryland Department of Transportation Fuel Sales Tax Revenue | 5.000% | 9/1/27 | 160 | 170 |
| | Maryland Department of Transportation Fuel Sales Tax Revenue | 5.000% | 10/1/27 | 80 | 83 |
| | Maryland Department of Transportation Fuel Sales Tax Revenue | 5.000% | 10/1/27 | 210 | 224 |
| | Maryland Department of Transportation Fuel Sales Tax Revenue | 3.000% | 11/1/28 | 255 | 254 |
| | Maryland Department of Transportation Fuel Sales Tax Revenue | 5.000% | 9/1/29 | 75 | 79 |
| | Maryland Department of Transportation Fuel Sales Tax Revenue | 5.000% | 10/1/29 | 175 | 182 |
| | Maryland Department of Transportation Fuel Sales Tax Revenue | 4.000% | 12/15/29 | 115 | 115 |
| | Maryland Department of Transportation Fuel Sales Tax Revenue | 2.125% | 10/1/31 | 150 | 136 |
| | Maryland GO | 5.000% | 8/1/25 | 445 | 451 |
| | Maryland GO | 5.000% | 8/1/25 | 300 | 304 |
| | Maryland GO | 5.000% | 8/1/25 | 295 | 299 |
| | Maryland GO | 5.000% | 3/15/26 | 110 | 113 |
| | Maryland GO | 5.000% | 3/15/26 | 245 | 252 |
| | Maryland GO | 5.000% | 3/15/26 | 125 | 129 |
| | Maryland GO | 5.000% | 6/1/26 | 85 | 85 |
| | Maryland GO | 3.000% | 8/1/26 | 120 | 120 |
| | Maryland GO | 5.000% | 8/1/26 | 190 | 197 |
| | Maryland GO | 5.000% | 8/1/26 | 55 | 57 |
| | Maryland GO | 5.000% | 8/1/26 | 100 | 104 |
| | Maryland GO | 5.000% | 3/1/27 | 80 | 84 |
| | Maryland GO | 5.000% | 3/15/27 | 280 | 295 |
| | Maryland GO | 5.000% | 3/15/27 | 160 | 168 |
| | Maryland GO | 5.000% | 3/15/27 | 80 | 84 |
| | Maryland GO | 4.000% | 6/1/27 | 50 | 50 |
| | Maryland GO | 3.000% | 8/1/27 | 125 | 125 |
| | Maryland GO | 5.000% | 8/1/27 | 155 | 165 |
| | Maryland GO | 5.000% | 8/1/27 | 75 | 80 |
| | Maryland GO | 5.000% | 8/1/27 | 30 | 32 |
| | Maryland GO | 5.000% | 8/1/27 | 100 | 106 |
| | Maryland GO | 5.000% | 3/15/28 | 125 | 134 |
| | Maryland GO | 4.000% | 6/1/28 | 80 | 80 |
| | Maryland GO | 5.000% | 6/1/28 | 150 | 162 |
| | Maryland GO | 4.000% | 8/1/28 | 25 | 26 |
| | Maryland GO | 5.000% | 8/1/28 | 210 | 228 |
| | Maryland GO | 5.000% | 8/1/28 | 605 | 656 |
| | Maryland GO | 5.000% | 8/1/28 | 680 | 737 |
| | Maryland GO | 5.000% | 3/15/29 | 285 | 313 |
| | Maryland GO | 4.000% | 6/1/29 | 200 | 200 |
Short-Term Tax-Exempt Bond ETF
| | | Coupon | Maturity
Date | Face
Amount
($000) | Market
Value•
($000) |
| | Maryland GO | 4.000% | 8/1/29 | 120 | 127 |
| | Maryland GO | 5.000% | 8/1/29 | 200 | 221 |
| | Maryland GO | 5.000% | 8/1/29 | 270 | 292 |
| | Maryland GO | 5.000% | 8/1/29 | 500 | 530 |
| | Maryland GO | 5.000% | 8/1/29 | 90 | 99 |
| | Maryland GO | 5.000% | 3/15/30 | 160 | 171 |
| | Maryland GO | 5.000% | 3/15/30 | 145 | 159 |
| | Maryland GO | 5.000% | 8/1/30 | 155 | 171 |
| | Maryland GO | 5.000% | 8/1/30 | 505 | 568 |
| | Maryland GO | 5.000% | 8/1/30 | 260 | 292 |
| | Maryland GO | 5.000% | 8/1/30 | 315 | 340 |
| | Maryland GO | 5.000% | 3/1/31 | 295 | 335 |
| | Maryland GO | 5.000% | 3/15/31 | 600 | 655 |
| | Maryland GO | 5.000% | 3/15/31 | 245 | 278 |
| | Maryland GO | 5.000% | 8/1/31 | 180 | 198 |
| | Maryland GO | 5.000% | 8/1/31 | 265 | 303 |
| | Maryland Stadium Authority Lottery Revenue (Baltimore City Public Schools Construction and Revitalization Program) , Prere. | 5.000% | 5/1/26 | 135 | 139 |
| | Maryland Stadium Authority Lottery Revenue, Prere. | 5.000% | 5/1/28 | 135 | 145 |
| | Maryland State Transportation Authority Highway Revenue (Transportation Facilities Project) | 5.000% | 7/1/31 | 50 | 57 |
| | Montgomery County MD GO | 5.000% | 10/1/25 | 135 | 138 |
| | Montgomery County MD GO | 5.000% | 10/1/26 | 360 | 375 |
| | Prince George's County MD GO | 5.000% | 7/15/26 | 80 | 83 |
| | Prince George's County MD GO | 5.000% | 9/15/26 | 45 | 47 |
| | Prince George's County MD GO | 5.000% | 7/15/27 | 160 | 170 |
| | Prince George's County MD GO | 5.000% | 7/15/28 | 160 | 173 |
| | | | | | 14,068 |
| Massachusetts (2.4%) |
| | Commonwealth of Massachusetts Federal Highway Grant Anticipation Note Government Fund/Grant Revenue GAN | 5.000% | 6/15/26 | 95 | 96 |
| | Commonwealth of Massachusetts Federal Highway Grant Anticipation Note Government Fund/Grant Revenue GAN | 5.000% | 6/15/26 | 305 | 305 |
| 2 | Commonwealth of Massachusetts GO | 5.500% | 12/1/24 | 50 | 50 |
| | Commonwealth of Massachusetts GO | 5.000% | 1/1/25 | 125 | 125 |
| | Commonwealth of Massachusetts GO | 5.000% | 3/1/25 | 250 | 251 |
| | Commonwealth of Massachusetts GO | 5.000% | 5/1/25 | 100 | 101 |
| | Commonwealth of Massachusetts GO | 5.000% | 7/1/25 | 405 | 410 |
| 1 | Commonwealth of Massachusetts GO | 5.250% | 9/1/25 | 305 | 311 |
| | Commonwealth of Massachusetts GO | 3.000% | 12/1/25 | 150 | 150 |
| | Commonwealth of Massachusetts GO | 5.000% | 1/1/26 | 200 | 205 |
| | Commonwealth of Massachusetts GO | 5.000% | 3/1/26 | 50 | 51 |
| | Commonwealth of Massachusetts GO | 5.000% | 4/1/26 | 5 | 5 |
| | Commonwealth of Massachusetts GO | 5.000% | 5/1/26 | 100 | 103 |
| | Commonwealth of Massachusetts GO | 5.000% | 7/1/26 | 130 | 135 |
| | Commonwealth of Massachusetts GO | 5.000% | 7/1/26 | 255 | 264 |
| | Commonwealth of Massachusetts GO | 5.000% | 11/1/26 | 110 | 115 |
| | Commonwealth of Massachusetts GO | 5.000% | 12/1/26 | 220 | 230 |
| | Commonwealth of Massachusetts GO | 5.000% | 1/1/27 | 70 | 73 |
| | Commonwealth of Massachusetts GO | 5.000% | 5/1/27 | 100 | 106 |
| | Commonwealth of Massachusetts GO | 5.000% | 7/1/27 | 210 | 223 |
| | Commonwealth of Massachusetts GO | 5.000% | 7/1/27 | 145 | 154 |
| | Commonwealth of Massachusetts GO | 5.000% | 9/1/27 | 65 | 69 |
| | Commonwealth of Massachusetts GO | 5.000% | 10/1/27 | 70 | 75 |
| | Commonwealth of Massachusetts GO | 5.000% | 11/1/27 | 150 | 160 |
| | Commonwealth of Massachusetts GO | 5.000% | 1/1/28 | 600 | 644 |
| | Commonwealth of Massachusetts GO | 5.000% | 5/1/28 | 100 | 108 |
| | Commonwealth of Massachusetts GO | 3.000% | 7/1/28 | 50 | 50 |
| | Commonwealth of Massachusetts GO | 3.250% | 7/1/28 | 100 | 100 |
| | Commonwealth of Massachusetts GO | 5.000% | 7/1/28 | 275 | 298 |
| | Commonwealth of Massachusetts GO | 5.000% | 7/1/28 | 300 | 325 |
| | Commonwealth of Massachusetts GO | 5.250% | 8/1/28 | 215 | 235 |
| | Commonwealth of Massachusetts GO | 5.000% | 11/1/28 | 125 | 136 |
| | Commonwealth of Massachusetts GO | 5.000% | 11/1/28 | 20 | 22 |
| | Commonwealth of Massachusetts GO | 5.000% | 1/1/29 | 55 | 59 |
| | Commonwealth of Massachusetts GO | 5.000% | 5/1/29 | 100 | 110 |
| | Commonwealth of Massachusetts GO | 5.000% | 7/1/29 | 10 | 10 |
| | Commonwealth of Massachusetts GO | 5.000% | 7/1/29 | 390 | 431 |
| | Commonwealth of Massachusetts GO | 5.000% | 7/1/29 | 160 | 177 |
| | Commonwealth of Massachusetts GO | 5.000% | 9/1/29 | 5 | 6 |
| | Commonwealth of Massachusetts GO | 5.000% | 11/1/29 | 10 | 11 |
Short-Term Tax-Exempt Bond ETF
| | | Coupon | Maturity
Date | Face
Amount
($000) | Market
Value•
($000) |
| | Commonwealth of Massachusetts GO | 5.000% | 1/1/30 | 115 | 123 |
| | Commonwealth of Massachusetts GO | 5.000% | 1/1/30 | 25 | 27 |
| | Commonwealth of Massachusetts GO | 5.000% | 7/1/30 | 30 | 30 |
| | Commonwealth of Massachusetts GO | 5.000% | 7/1/30 | 100 | 113 |
| 2 | Commonwealth of Massachusetts GO | 5.500% | 8/1/30 | 695 | 789 |
| | Commonwealth of Massachusetts GO | 5.000% | 9/1/30 | 130 | 147 |
| | Commonwealth of Massachusetts GO | 5.000% | 9/1/30 | 75 | 83 |
| | Commonwealth of Massachusetts GO | 5.000% | 11/1/30 | 220 | 249 |
| | Commonwealth of Massachusetts GO | 5.000% | 11/1/30 | 200 | 226 |
| | Commonwealth of Massachusetts GO | 5.000% | 1/1/31 | 30 | 33 |
| | Commonwealth of Massachusetts GO | 5.000% | 3/1/31 | 165 | 188 |
| | Commonwealth of Massachusetts GO | 5.000% | 9/1/31 | 255 | 292 |
| | Commonwealth of Massachusetts GO | 5.000% | 10/1/31 | 50 | 57 |
| | Commonwealth of Massachusetts GO | 5.000% | 11/1/31 | 55 | 58 |
| 4 | Commonwealth of Massachusetts Special Obligation | 5.500% | 1/1/25 | 100 | 100 |
| 4 | Commonwealth of Massachusetts Special Obligation | 5.500% | 1/1/27 | 285 | 301 |
| 4 | Commonwealth of Massachusetts Special Obligation | 5.500% | 1/1/30 | 65 | 73 |
| | Massachusetts Bay Transportation Authority Assessment Indirect Ad Valorem Property Revenue | 4.000% | 7/1/26 | 215 | 219 |
| | Massachusetts Bay Transportation Authority Sales Tax Revenue | 5.000% | 7/1/25 | 250 | 253 |
| | Massachusetts Bay Transportation Authority Sales Tax Revenue | 5.000% | 7/1/26 | 135 | 140 |
| | Massachusetts Bay Transportation Authority Sales Tax Revenue | 5.000% | 7/1/27 | 95 | 101 |
| | Massachusetts Bay Transportation Authority Sales Tax Revenue | 5.000% | 7/1/28 | 15 | 16 |
| | Massachusetts Bay Transportation Authority Sales Tax Revenue | 0.000% | 7/1/29 | 55 | 48 |
| | Massachusetts Bay Transportation Authority Sales Tax Revenue | 5.000% | 7/1/29 | 80 | 89 |
| | Massachusetts Bay Transportation Authority Sales Tax Revenue | 5.250% | 7/1/29 | 20 | 22 |
| | Massachusetts Bay Transportation Authority Sales Tax Revenue | 5.250% | 7/1/30 | 105 | 120 |
| | Massachusetts Bay Transportation Authority Sales Tax Revenue | 5.000% | 7/1/31 | 250 | 287 |
| | Massachusetts Bay Transportation Authority Sales Tax Revenue, Prere. | 5.000% | 7/1/25 | 275 | 278 |
| | Massachusetts Development Finance Agency College & University Revenue | 5.000% | 7/15/27 | 55 | 57 |
| | Massachusetts Development Finance Agency College & University Revenue | 5.000% | 10/15/27 | 150 | 161 |
| | Massachusetts Development Finance Agency College & University Revenue | 4.000% | 7/15/29 | 110 | 112 |
| | Massachusetts Development Finance Agency College & University Revenue | 5.000% | 7/15/31 | 35 | 36 |
| | Massachusetts School Building Authority Sales Tax Revenue | 5.000% | 8/15/26 | 115 | 117 |
| | Massachusetts School Building Authority Sales Tax Revenue, Prere. | 5.000% | 11/15/25 | 25 | 25 |
| | Massachusetts Transportation Trust Fund Metropolitan Highway System Highway Revenue | 5.000% | 1/1/26 | 230 | 235 |
| | Massachusetts Transportation Trust Fund Metropolitan Highway System Highway Revenue | 5.000% | 1/1/27 | 55 | 57 |
| | Massachusetts Transportation Trust Fund Metropolitan Highway System Highway Revenue | 5.000% | 1/1/27 | 95 | 100 |
| | Massachusetts Transportation Trust Fund Metropolitan Highway System Highway Revenue | 5.000% | 1/1/30 | 50 | 55 |
| 1 | Massachusetts Water Resources Authority Water Revenue | 5.250% | 8/1/25 | 110 | 112 |
| | Massachusetts Water Resources Authority Water Revenue | 5.000% | 8/1/26 | 250 | 260 |
| 1 | Massachusetts Water Resources Authority Water Revenue | 5.250% | 8/1/26 | 275 | 287 |
| 1 | Massachusetts Water Resources Authority Water Revenue | 5.250% | 8/1/27 | 40 | 43 |
| 1 | Massachusetts Water Resources Authority Water Revenue | 5.250% | 8/1/28 | 25 | 27 |
| | Massachusetts Water Resources Authority Water Revenue | 5.000% | 8/1/29 | 165 | 171 |
| | Massachusetts Water Resources Authority Water Revenue, Prere. | 5.000% | 8/1/26 | 5 | 5 |
| | Massachusetts Water Resources Authority Water Revenue, Prere. | 5.000% | 8/1/26 | 400 | 414 |
| | Massachusetts Water Resources Authority Water Revenue, Prere. | 5.000% | 8/1/26 | 75 | 78 |
| | | | | | 13,303 |
| Michigan (1.1%) |
| 1,8 | Detroit City School District GO | 6.000% | 5/1/29 | 280 | 299 |
| 1,8 | Detroit City School District GO | 5.250% | 5/1/30 | 200 | 224 |
| | Great Lakes Water Authority Sewage Disposal System Sewer Revenue | 5.000% | 7/1/25 | 235 | 238 |
| | Great Lakes Water Authority Sewage Disposal System Water Revenue | 5.000% | 7/1/30 | 115 | 118 |
| | Great Lakes Water Authority Sewage Disposal System Water Revenue | 5.000% | 7/1/30 | 40 | 41 |
| | Great Lakes Water Authority Water Supply System Water Revenue | 5.000% | 7/1/27 | 460 | 486 |
| | Great Lakes Water Authority Water Supply System Water Revenue | 5.000% | 7/1/31 | 35 | 36 |
| | Michigan Appropriations Revenue GAN | 5.000% | 3/15/25 | 295 | 297 |
| | Michigan Appropriations Revenue GAN | 5.000% | 3/15/26 | 600 | 616 |
| | Michigan Appropriations Revenue GAN | 5.000% | 3/15/27 | 570 | 599 |
| | Michigan Finance Authority Water Revenue | 5.000% | 10/1/27 | 70 | 73 |
| | Michigan Finance Authority Water Revenue | 5.000% | 10/1/28 | 195 | 203 |
| | Michigan Finance Authority Water Revenue | 5.000% | 10/1/29 | 150 | 156 |
| | Michigan State Building Authority Lease (Appropriation) Revenue | 5.000% | 10/15/30 | 135 | 140 |
| | Michigan State Building Authority Lease (Appropriation) Revenue | 5.000% | 10/15/31 | 350 | 363 |
| | Michigan State Building Authority Lease (Appropriation) Revenue (Facilities Program) | 5.000% | 4/15/27 | 110 | 112 |
| | Michigan State Building Authority Lease (Appropriation) Revenue (Facilities Program) | 5.000% | 4/15/28 | 85 | 86 |
| | Michigan State Building Authority Lease (Appropriation) Revenue (Facilities Program) | 5.000% | 10/15/28 | 100 | 108 |
| | Michigan State Building Authority Lease (Appropriation) Revenue (Facilities Program) | 5.000% | 4/15/29 | 100 | 102 |
| | Michigan State Building Authority Lease (Appropriation) Revenue (Facilities Program) | 5.000% | 4/15/30 | 140 | 142 |
Short-Term Tax-Exempt Bond ETF
| | | Coupon | Maturity
Date | Face
Amount
($000) | Market
Value•
($000) |
| | Michigan State Building Authority Lease (Appropriation) Revenue (Facilities Program) | 5.000% | 4/15/31 | 30 | 30 |
| | Michigan Trunk Line Fuel Sales Tax Revenue | 5.000% | 11/15/27 | 95 | 102 |
| | Michigan Trunk Line Fuel Sales Tax Revenue | 5.000% | 11/15/28 | 50 | 54 |
| | Michigan Trunk Line Fuel Sales Tax Revenue | 5.000% | 11/15/29 | 350 | 388 |
| | Michigan Trunk Line Fuel Sales Tax Revenue (Rebuilding Michigan Program) | 5.000% | 11/15/29 | 205 | 227 |
| | Michigan Trunk Line Fuel Sales Tax Revenue (Rebuilding Michigan Program) | 5.000% | 11/15/30 | 320 | 360 |
| | University of Michigan College & University Revenue | 5.000% | 4/1/26 | 70 | 72 |
| | University of Michigan College & University Revenue, Prere. | 5.000% | 4/1/26 | 385 | 396 |
| | University of Michigan College & University Revenue, Prere. | 5.000% | 4/1/26 | 175 | 180 |
| | University of Michigan College & University Revenue, Prere. | 5.000% | 4/1/27 | 25 | 26 |
| | | | | | 6,274 |
| Minnesota (1.1%) |
| | Metropolitan Council GAN GO | 5.000% | 12/1/25 | 820 | 838 |
| | Metropolitan Council GAN GO | 5.000% | 12/1/26 | 440 | 460 |
| | Metropolitan Council GAN GO | 5.000% | 12/1/27 | 100 | 107 |
| | Metropolitan Council GAN GO | 5.000% | 12/1/28 | 260 | 282 |
| | Metropolitan Council GAN GO | 5.000% | 12/1/29 | 180 | 199 |
| | Minneapolis-St. Paul Metropolitan Airports Commission Port, Airport & Marina Revenue | 5.000% | 1/1/25 | 100 | 100 |
| | Minneapolis-St. Paul Metropolitan Airports Commission Port, Airport & Marina Revenue | 5.000% | 1/1/27 | 100 | 105 |
| | Minneapolis-St. Paul Metropolitan Airports Commission Port, Airport & Marina Revenue | 5.000% | 1/1/29 | 40 | 42 |
| | Minneapolis-St. Paul Metropolitan Airports Commission Port, Airport & Marina Revenue | 5.000% | 1/1/30 | 590 | 615 |
| | Minneapolis-St. Paul Metropolitan Airports Commission Port, Airport & Marina Revenue | 5.000% | 1/1/31 | 180 | 187 |
| | Minnesota Appropriations Revenue | 5.000% | 3/1/27 | 190 | 200 |
| | Minnesota Appropriations Revenue | 5.000% | 3/1/28 | 260 | 279 |
| | Minnesota Appropriations Revenue | 5.000% | 3/1/29 | 130 | 142 |
| | Minnesota GO | 5.000% | 8/1/25 | 440 | 446 |
| | Minnesota GO | 5.000% | 8/1/25 | 75 | 76 |
| | Minnesota GO | 5.000% | 8/1/26 | 275 | 285 |
| | Minnesota GO | 5.000% | 9/1/26 | 635 | 660 |
| | Minnesota GO | 5.000% | 10/1/26 | 55 | 57 |
| | Minnesota GO | 5.000% | 8/1/27 | 120 | 122 |
| | Minnesota GO | 5.000% | 9/1/27 | 145 | 154 |
| | Minnesota GO | 5.000% | 10/1/27 | 190 | 203 |
| | Minnesota GO | 5.000% | 8/1/28 | 25 | 27 |
| | Minnesota GO | 5.000% | 9/1/28 | 100 | 109 |
| | Minnesota GO | 5.000% | 8/1/30 | 170 | 191 |
| | Minnesota GO | 5.000% | 9/1/31 | 305 | 349 |
| | Minnesota Public Facilities Authority State Revolving Fund Water Revenue | 5.000% | 3/1/26 | 10 | 10 |
| | Minnesota Public Facilities Authority State Revolving Fund Water Revenue | 5.000% | 3/1/31 | 135 | 153 |
| | | | | | 6,398 |
| Mississippi (0.3%) |
| | Mississippi Development Bank Special Obligation Revenue (Desoto County, Mississippi Highway Refunding Project) | 5.000% | 1/1/31 | 300 | 335 |
| | Mississippi GO | 5.000% | 10/1/26 | 305 | 310 |
| | Mississippi GO | 5.000% | 10/1/27 | 485 | 516 |
| | Mississippi GO | 5.000% | 10/1/29 | 55 | 58 |
| | Mississippi GO, Prere. | 5.000% | 10/1/27 | 345 | 367 |
| | Mississippi GO, Prere. | 5.000% | 10/1/27 | 20 | 21 |
| | Mississippi GO, Prere. | 5.000% | 10/1/27 | 25 | 27 |
| | | | | | 1,634 |
| Missouri (0.3%) |
| | Metropolitan St. Louis Sewer District Sewer Revenue | 5.000% | 5/1/29 | 120 | 126 |
| | Missouri Highway & Transportation Commission Appropriations Revenue (State Appropriations Mega Project) | 5.000% | 5/1/26 | 200 | 206 |
| | Missouri Highway & Transportation Commission Sales Tax Revenue | 5.000% | 5/1/25 | 40 | 40 |
| | Missouri Highway & Transportation Commission Sales Tax Revenue | 5.000% | 5/1/26 | 250 | 251 |
| | Missouri Highway & Transportation Commission Sales Tax Revenue | 5.000% | 5/1/26 | 270 | 279 |
| | Missouri State Board of Public Buildings Appropriations Revenue | 4.000% | 10/1/28 | 270 | 282 |
| | Springfield MO Public Utility Multiple Utility Revenue | 3.375% | 8/1/30 | 110 | 110 |
| 4 | St. Louis MO Airport Port, Airport & Marina Revenue | 5.500% | 7/1/28 | 100 | 109 |
| | University of Missouri of Curators College & University Revenue | 5.000% | 11/1/30 | 335 | 377 |
| | | | | | 1,780 |
| Nebraska (0.3%) |
| | Nebraska Public Power District Electric Power & Light Revenue | 5.000% | 7/1/28 | 465 | 497 |
| | Omaha Public Power District Electric Power & Light Revenue | 5.000% | 2/1/30 | 335 | 366 |
| | Omaha Public Power District Electric Power & Light Revenue | 5.000% | 2/1/31 | 570 | 620 |
| | | | | | 1,483 |
Short-Term Tax-Exempt Bond ETF
| | | Coupon | Maturity
Date | Face
Amount
($000) | Market
Value•
($000) |
| Nevada (1.0%) |
| | Clark County Department of Aviation Port, Airport & Marina Revenue | 5.000% | 7/1/25 | 45 | 45 |
| | Clark County Department of Aviation Port, Airport & Marina Revenue | 5.000% | 7/1/26 | 115 | 119 |
| | Clark County Department of Aviation Port, Airport & Marina Revenue | 5.000% | 7/1/28 | 285 | 307 |
| | Clark County Department of Aviation Port, Airport & Marina Revenue | 5.000% | 7/1/29 | 1,270 | 1,390 |
| | Clark County Department of Aviation Port, Airport & Marina Revenue | 5.000% | 7/1/30 | 85 | 93 |
| | Clark County NV GO | 5.000% | 11/1/26 | 405 | 422 |
| | Clark County NV GO | 5.000% | 11/1/27 | 20 | 21 |
| | Clark County NV GO | 5.000% | 11/1/28 | 100 | 104 |
| | Clark County NV GO | 4.000% | 11/1/31 | 145 | 147 |
| | Clark County NV Passenger Facility Charge Port, Airport & Marina Revenue | 5.000% | 7/1/26 | 140 | 145 |
| | Clark County School District GO | 5.000% | 6/15/25 | 95 | 96 |
| | Clark County School District GO | 5.000% | 6/15/25 | 355 | 358 |
| | Clark County School District GO | 5.000% | 6/15/26 | 350 | 357 |
| | Clark County School District GO | 5.000% | 6/15/26 | 230 | 237 |
| | Clark County School District GO | 5.000% | 6/15/27 | 290 | 295 |
| | Las Vegas Valley Water District GO | 5.000% | 12/1/25 | 95 | 96 |
| | Nevada GO | 5.000% | 5/1/25 | 215 | 217 |
| | Nevada GO | 5.000% | 4/1/26 | 40 | 40 |
| | Nevada GO | 5.000% | 4/1/27 | 15 | 15 |
| | Nevada Highway Improvement Fuel Sales Tax Revenue | 5.000% | 12/1/24 | 200 | 200 |
| | Nevada Highway Improvement Fuel Sales Tax Revenue | 5.000% | 12/1/25 | 155 | 158 |
| | Nevada Highway Improvement Fuel Sales Tax Revenue | 5.000% | 12/1/26 | 380 | 393 |
| | Nevada Highway Improvement Fuel Sales Tax Revenue | 5.000% | 12/1/27 | 240 | 248 |
| | Nevada Highway Improvement Fuel Sales Tax Revenue | 5.000% | 12/1/28 | 235 | 243 |
| | | | | | 5,746 |
| New Jersey (6.0%) |
| 1 | Garden State Preservation Trust Appropriations Revenue | 5.750% | 11/1/28 | 290 | 310 |
| 1 | Garden State Preservation Trust Recreational Revenue | 0.000% | 11/1/27 | 150 | 136 |
| 1 | New Jersey Economic Development Authority Appropriations Revenue | 5.000% | 6/15/25 | 500 | 501 |
| | New Jersey Economic Development Authority Appropriations Revenue | 5.000% | 6/15/25 | 175 | 177 |
| | New Jersey Economic Development Authority Appropriations Revenue | 4.250% | 6/15/26 | 240 | 241 |
| | New Jersey Economic Development Authority Appropriations Revenue | 5.250% | 6/15/27 | 750 | 757 |
| 7 | New Jersey Economic Development Authority Appropriations Revenue | 5.000% | 7/1/27 | 75 | 78 |
| 4 | New Jersey Economic Development Authority Appropriations Revenue | 5.500% | 9/1/27 | 345 | 369 |
| | New Jersey Economic Development Authority Appropriations Revenue | 5.250% | 6/15/28 | 145 | 146 |
| 7 | New Jersey Economic Development Authority Appropriations Revenue | 5.000% | 7/1/28 | 500 | 522 |
| | New Jersey Economic Development Authority Appropriations Revenue, Prere. | 5.000% | 6/15/25 | 10 | 10 |
| | New Jersey Economic Development Authority Appropriations Revenue, Prere. | 5.000% | 6/15/25 | 100 | 101 |
| | New Jersey Economic Development Authority Appropriations Revenue, Prere. | 5.000% | 6/15/25 | 20 | 20 |
| | New Jersey Economic Development Authority Appropriations Revenue, Prere. | 5.250% | 6/15/25 | 1,175 | 1,189 |
| | New Jersey Economic Development Authority Appropriations Revenue, Prere. | 5.250% | 6/15/25 | 140 | 142 |
| | New Jersey Economic Development Authority Appropriations Revenue, Prere. | 5.250% | 6/15/25 | 1,040 | 1,052 |
| | New Jersey Economic Development Authority Appropriations Revenue, Prere. | 4.750% | 12/15/26 | 140 | 146 |
| | New Jersey Economic Development Authority Appropriations Revenue, Prere. | 5.000% | 12/15/26 | 50 | 52 |
| | New Jersey Economic Development Authority Appropriations Revenue, Prere. | 5.000% | 12/15/26 | 70 | 73 |
| | New Jersey Economic Development Authority Intergovernmental Agreement Revenue | 5.000% | 3/1/25 | 325 | 326 |
| | New Jersey Economic Development Authority Intergovernmental Agreement Revenue | 5.000% | 3/1/26 | 150 | 154 |
| | New Jersey Economic Development Authority Intergovernmental Agreement Revenue | 5.000% | 6/15/26 | 1,100 | 1,133 |
| | New Jersey Economic Development Authority Intergovernmental Agreement Revenue | 5.000% | 3/1/28 | 1,110 | 1,184 |
| | New Jersey Economic Development Authority Lease (Appropriation) Revenue | 5.000% | 11/1/26 | 255 | 264 |
| | New Jersey Economic Development Authority Lease (Appropriation) Revenue | 4.000% | 11/1/27 | 185 | 191 |
| | New Jersey Economic Development Authority Lease (Appropriation) Revenue, Prere. | 4.000% | 6/15/27 | 630 | 651 |
| | New Jersey Economic Development Authority Lease (Appropriation) Revenue, Prere. | 5.000% | 6/15/27 | 25 | 26 |
| | New Jersey Educational Facilities Authority College & University Revenue | 5.000% | 3/1/27 | 275 | 290 |
| | New Jersey Educational Facilities Authority College & University Revenue | 5.000% | 7/1/28 | 15 | 16 |
| | New Jersey Educational Facilities Authority College & University Revenue | 5.000% | 7/1/29 | 80 | 85 |
| | New Jersey GO | 5.000% | 6/1/25 | 1,310 | 1,323 |
| | New Jersey GO | 5.000% | 6/1/26 | 545 | 562 |
| | New Jersey GO | 5.000% | 6/1/27 | 145 | 153 |
| | New Jersey GO | 5.000% | 6/1/28 | 640 | 689 |
| | New Jersey GO | 5.000% | 6/1/29 | 240 | 263 |
| | New Jersey GO | 4.000% | 6/1/30 | 1,015 | 1,079 |
| | New Jersey GO | 4.000% | 6/1/31 | 500 | 535 |
| | New Jersey GO, Prere. | 5.000% | 6/1/25 | 100 | 101 |
| | New Jersey GO, Prere. | 5.000% | 6/1/25 | 150 | 151 |
| | New Jersey Transportation Trust Fund Authority Appropriations Revenue | 5.000% | 6/15/25 | 250 | 252 |
| | New Jersey Transportation Trust Fund Authority Appropriations Revenue | 5.000% | 12/15/25 | 200 | 204 |
| | New Jersey Transportation Trust Fund Authority Appropriations Revenue | 5.000% | 12/15/25 | 230 | 234 |
Short-Term Tax-Exempt Bond ETF
| | | Coupon | Maturity
Date | Face
Amount
($000) | Market
Value•
($000) |
| 2 | New Jersey Transportation Trust Fund Authority Appropriations Revenue | 0.000% | 12/15/26 | 320 | 300 |
| | New Jersey Transportation Trust Fund Authority Appropriations Revenue | 0.000% | 12/15/26 | 305 | 286 |
| | New Jersey Transportation Trust Fund Authority Appropriations Revenue | 5.000% | 12/15/26 | 150 | 156 |
| | New Jersey Transportation Trust Fund Authority Appropriations Revenue | 5.000% | 12/15/26 | 150 | 156 |
| | New Jersey Transportation Trust Fund Authority Appropriations Revenue | 5.000% | 6/15/27 | 1,230 | 1,265 |
| | New Jersey Transportation Trust Fund Authority Appropriations Revenue | 5.000% | 6/15/27 | 200 | 210 |
| 4 | New Jersey Transportation Trust Fund Authority Appropriations Revenue | 0.000% | 12/15/27 | 305 | 276 |
| | New Jersey Transportation Trust Fund Authority Appropriations Revenue | 0.000% | 12/15/27 | 100 | 91 |
| | New Jersey Transportation Trust Fund Authority Appropriations Revenue | 5.000% | 12/15/27 | 130 | 138 |
| | New Jersey Transportation Trust Fund Authority Appropriations Revenue | 5.000% | 12/15/27 | 205 | 218 |
| | New Jersey Transportation Trust Fund Authority Appropriations Revenue | 5.000% | 6/15/28 | 530 | 545 |
| | New Jersey Transportation Trust Fund Authority Appropriations Revenue | 5.000% | 6/15/28 | 530 | 568 |
| | New Jersey Transportation Trust Fund Authority Appropriations Revenue | 5.000% | 6/15/28 | 100 | 107 |
| 2 | New Jersey Transportation Trust Fund Authority Appropriations Revenue | 0.000% | 12/15/28 | 195 | 171 |
| | New Jersey Transportation Trust Fund Authority Appropriations Revenue | 0.000% | 12/15/28 | 285 | 249 |
| | New Jersey Transportation Trust Fund Authority Appropriations Revenue | 0.000% | 12/15/28 | 445 | 389 |
| | New Jersey Transportation Trust Fund Authority Appropriations Revenue | 5.000% | 6/15/29 | 25 | 26 |
| | New Jersey Transportation Trust Fund Authority Appropriations Revenue | 5.000% | 6/15/29 | 110 | 120 |
| | New Jersey Transportation Trust Fund Authority Appropriations Revenue | 5.000% | 6/15/29 | 205 | 223 |
| 1 | New Jersey Transportation Trust Fund Authority Appropriations Revenue | 0.000% | 12/15/29 | 285 | 242 |
| | New Jersey Transportation Trust Fund Authority Appropriations Revenue | 0.000% | 12/15/29 | 900 | 761 |
| | New Jersey Transportation Trust Fund Authority Appropriations Revenue | 5.000% | 6/15/30 | 1,250 | 1,284 |
| | New Jersey Transportation Trust Fund Authority Appropriations Revenue | 5.000% | 6/15/30 | 100 | 103 |
| | New Jersey Transportation Trust Fund Authority Appropriations Revenue | 5.000% | 6/15/30 | 2,110 | 2,336 |
| | New Jersey Transportation Trust Fund Authority Appropriations Revenue | 5.000% | 6/15/30 | 145 | 161 |
| | New Jersey Transportation Trust Fund Authority Appropriations Revenue | 5.000% | 6/15/30 | 525 | 581 |
| 4 | New Jersey Transportation Trust Fund Authority Appropriations Revenue | 0.000% | 12/15/30 | 120 | 98 |
| | New Jersey Transportation Trust Fund Authority Appropriations Revenue | 4.100% | 6/15/31 | 155 | 157 |
| | New Jersey Transportation Trust Fund Authority Appropriations Revenue | 5.000% | 6/15/31 | 250 | 280 |
| | New Jersey Transportation Trust Fund Authority Appropriations Revenue | 0.000% | 12/15/31 | 170 | 134 |
| | New Jersey Transportation Trust Fund Authority Appropriations Revenue | 5.000% | 6/15/32 | 750 | 751 |
| 2 | New Jersey Transportation Trust Fund Authority Appropriations Revenue, ETM | 0.000% | 12/15/24 | 190 | 190 |
| 4 | New Jersey Transportation Trust Fund Authority Miscellaneous Revenue | 5.750% | 6/15/25 | 160 | 162 |
| | New Jersey Turnpike Authority Highway Revenue | 5.000% | 1/1/25 | 115 | 115 |
| 2 | New Jersey Turnpike Authority Highway Revenue | 5.500% | 1/1/25 | 310 | 311 |
| 1 | New Jersey Turnpike Authority Highway Revenue | 5.250% | 1/1/26 | 10 | 10 |
| | New Jersey Turnpike Authority Highway Revenue | 5.000% | 1/1/27 | 105 | 105 |
| | New Jersey Turnpike Authority Highway Revenue | 5.000% | 1/1/27 | 300 | 314 |
| | New Jersey Turnpike Authority Highway Revenue | 5.000% | 1/1/27 | 600 | 628 |
| 1 | New Jersey Turnpike Authority Highway Revenue | 5.250% | 1/1/27 | 175 | 184 |
| | New Jersey Turnpike Authority Highway Revenue | 5.000% | 1/1/28 | 1,090 | 1,118 |
| | New Jersey Turnpike Authority Highway Revenue | 5.000% | 1/1/28 | 110 | 118 |
| | New Jersey Turnpike Authority Highway Revenue | 5.000% | 1/1/29 | 85 | 89 |
| | New Jersey Turnpike Authority Highway Revenue | 5.000% | 1/1/29 | 215 | 230 |
| | New Jersey Turnpike Authority Highway Revenue | 5.000% | 1/1/29 | 60 | 64 |
| | New Jersey Turnpike Authority Highway Revenue | 5.000% | 1/1/29 | 335 | 365 |
| | New Jersey Turnpike Authority Highway Revenue | 5.000% | 1/1/29 | 200 | 218 |
| | New Jersey Turnpike Authority Highway Revenue | 5.000% | 1/1/30 | 200 | 222 |
| | New Jersey Turnpike Authority Highway Revenue | 3.375% | 1/1/31 | 135 | 135 |
| | New Jersey Turnpike Authority Highway Revenue | 5.000% | 1/1/31 | 300 | 319 |
| | New Jersey Turnpike Authority Highway Revenue | 5.000% | 1/1/31 | 520 | 553 |
| | New Jersey Turnpike Authority Highway Revenue | 5.000% | 1/1/31 | 25 | 26 |
| | New Jersey Turnpike Authority Highway Revenue | 5.000% | 1/1/31 | 100 | 112 |
| | | | | | 33,858 |
| New Mexico (0.7%) |
| | New Mexico Finance Authority Fuel Sales Tax Revenue | 5.000% | 6/15/26 | 160 | 165 |
| | New Mexico Finance Authority Fuel Sales Tax Revenue | 5.000% | 6/15/26 | 55 | 57 |
| | New Mexico Finance Authority Fuel Sales Tax Revenue | 5.000% | 6/15/27 | 250 | 264 |
| | New Mexico Finance Authority Fuel Sales Tax Revenue | 5.000% | 6/15/29 | 315 | 339 |
| | New Mexico Finance Authority Fuel Sales Tax Revenue | 5.000% | 6/15/29 | 150 | 165 |
| | New Mexico Finance Authority Fuel Sales Tax Revenue | 5.000% | 6/15/30 | 200 | 223 |
| | New Mexico Severance Tax Permanent Fund Severance Tax Revenue | 5.000% | 7/1/26 | 1,110 | 1,148 |
| | New Mexico Severance Tax Permanent Fund Severance Tax Revenue | 5.000% | 7/1/27 | 335 | 354 |
| | New Mexico Severance Tax Permanent Fund Severance Tax Revenue | 5.000% | 7/1/29 | 40 | 44 |
| | New Mexico Severance Tax Permanent Fund Severance Tax Revenue | 5.000% | 7/1/29 | 205 | 225 |
| | New Mexico Severance Tax Permanent Fund Severance Tax Revenue | 5.000% | 7/1/30 | 280 | 311 |
| | New Mexico Severance Tax Permanent Fund Severance Tax Revenue | 5.000% | 7/1/30 | 220 | 245 |
| | New Mexico Severance Tax Permanent Fund Severance Tax Revenue | 5.000% | 7/1/31 | 125 | 141 |
Short-Term Tax-Exempt Bond ETF
| | | Coupon | Maturity
Date | Face
Amount
($000) | Market
Value•
($000) |
| | New Mexico Severance Tax Permanent Fund Severance Tax Revenue | 5.000% | 7/1/31 | 145 | 163 |
| | | | | | 3,844 |
| New York (16.1%) |
| | Battery Park City Authority Miscellaneous Revenue | 5.000% | 11/1/25 | 100 | 102 |
| | Battery Park City Authority Miscellaneous Revenue | 5.000% | 11/1/26 | 100 | 105 |
| | Battery Park City Authority Miscellaneous Revenue | 5.000% | 11/1/28 | 100 | 109 |
| | Battery Park City Authority Miscellaneous Revenue | 5.000% | 11/1/30 | 200 | 227 |
| | Empire State Development Corp. Income Tax Revenue | 5.000% | 3/15/26 | 235 | 242 |
| | Empire State Development Corp. Income Tax Revenue | 5.000% | 3/15/26 | 225 | 232 |
| | Empire State Development Corp. Income Tax Revenue | 5.000% | 3/15/29 | 375 | 411 |
| | Empire State Development Corp. Income Tax Revenue | 5.000% | 9/15/29 | 50 | 55 |
| | Empire State Development Corp. Income Tax Revenue | 5.000% | 3/15/30 | 270 | 301 |
| | Empire State Development Corp. Income Tax Revenue | 5.000% | 3/15/30 | 205 | 214 |
| | Empire State Development Corp. Income Tax Revenue | 5.000% | 3/15/30 | 180 | 201 |
| | Empire State Development Corp. Income Tax Revenue | 5.000% | 3/15/30 | 60 | 67 |
| | Empire State Development Corp. Income Tax Revenue | 5.000% | 9/15/30 | 185 | 208 |
| | Empire State Development Corp. Income Tax Revenue | 5.000% | 3/15/31 | 240 | 246 |
| | Empire State Development Corp. Income Tax Revenue | 5.000% | 3/15/31 | 120 | 134 |
| | Empire State Development Corp. Income Tax Revenue | 5.000% | 9/15/31 | 445 | 508 |
| | Empire State Development Corp. Income Tax Revenue, ETM | 5.000% | 3/15/25 | 225 | 226 |
| | Empire State Development Corp. Income Tax Revenue, ETM | 5.000% | 3/15/25 | 630 | 634 |
| | Empire State Development Corp. Income Tax Revenue, ETM | 5.000% | 3/15/26 | 105 | 108 |
| | Empire State Development Corp. Income Tax Revenue, ETM | 5.000% | 3/15/26 | 35 | 36 |
| | Empire State Development Corp. Income Tax Revenue, ETM | 5.000% | 3/15/26 | 500 | 515 |
| | Empire State Development Corp. Income Tax Revenue, ETM | 5.000% | 3/15/27 | 110 | 116 |
| | Empire State Development Corp. Income Tax Revenue, ETM | 5.000% | 9/15/27 | 210 | 224 |
| | Empire State Development Corp. Income Tax Revenue, ETM | 5.000% | 9/15/27 | 205 | 218 |
| | Empire State Development Corp. Income Tax Revenue, Prere. | 5.000% | 9/15/25 | 150 | 153 |
| | Empire State Development Corp. Income Tax Revenue, Prere. | 5.000% | 9/15/25 | 70 | 71 |
| | Empire State Development Corp. Income Tax Revenue, Prere. | 5.000% | 9/15/25 | 35 | 36 |
| | Empire State Development Corp. Income Tax Revenue, Prere. | 5.000% | 3/15/26 | 540 | 556 |
| | Empire State Development Corp. Income Tax Revenue, Prere. | 5.000% | 3/15/27 | 25 | 26 |
| | Empire State Development Corp. Income Tax Revenue, Prere. | 5.000% | 3/15/27 | 5 | 5 |
| | Empire State Development Corp. Lease (Appropriation) Revenue | 5.000% | 3/15/30 | 275 | 307 |
| | Hudson Yards Infrastructure Corp. Miscellaneous Revenue | 5.000% | 2/15/25 | 160 | 161 |
| | Hudson Yards Infrastructure Corp. Miscellaneous Revenue | 5.000% | 2/15/30 | 15 | 16 |
| | Hudson Yards Infrastructure Corp. Miscellaneous Revenue | 5.000% | 2/15/31 | 235 | 245 |
| 1 | Long Island Power Authority Electric Power & Light Revenue | 0.000% | 6/1/25 | 60 | 59 |
| | Long Island Power Authority Electric Power & Light Revenue | 5.000% | 9/1/27 | 20 | 21 |
| | Long Island Power Authority Electric Power & Light Revenue | 5.000% | 9/1/28 | 20 | 22 |
| 1 | Long Island Power Authority Electric Power & Light Revenue | 0.000% | 6/1/29 | 175 | 150 |
| | Long Island Power Authority Electric Power & Light Revenue | 5.000% | 9/1/30 | 85 | 87 |
| | Long Island Power Authority Electric Power & Light Revenue PUT | 1.500% | 9/1/26 | 340 | 326 |
| | Long Island Power Authority Electric Power & Light Revenue PUT | 3.000% | 9/1/29 | 425 | 420 |
| | Long Island Power Authority Electric Power & Light Revenue PUT | 3.000% | 9/1/31 | 420 | 413 |
| | Metropolitan Transportation Authority Dedicated Tax Fund Fuel Sales Tax Revenue | 5.250% | 11/15/28 | 295 | 309 |
| | Metropolitan Transportation Authority Dedicated Tax Fund Fuel Sales Tax Revenue | 5.250% | 11/15/29 | 565 | 591 |
| | Metropolitan Transportation Authority Miscellaneous Taxes Revenue | 3.000% | 11/15/28 | 110 | 109 |
| | Metropolitan Transportation Authority Miscellaneous Taxes Revenue | 0.000% | 11/15/30 | 520 | 426 |
| | Metropolitan Transportation Authority Transit Revenue | 5.000% | 11/15/25 | 455 | 463 |
| | Metropolitan Transportation Authority Transit Revenue | 5.000% | 11/15/25 | 390 | 397 |
| | Metropolitan Transportation Authority Transit Revenue | 4.000% | 11/15/26 | 350 | 356 |
| | Metropolitan Transportation Authority Transit Revenue | 5.000% | 11/15/26 | 85 | 88 |
| | Metropolitan Transportation Authority Transit Revenue | 5.000% | 11/15/26 | 620 | 645 |
| | Metropolitan Transportation Authority Transit Revenue | 5.000% | 11/15/26 | 405 | 421 |
| | Metropolitan Transportation Authority Transit Revenue | 0.000% | 11/15/27 | 270 | 245 |
| | Metropolitan Transportation Authority Transit Revenue | 5.000% | 11/15/27 | 100 | 106 |
| | Metropolitan Transportation Authority Transit Revenue | 5.000% | 11/15/27 | 75 | 79 |
| | Metropolitan Transportation Authority Transit Revenue | 5.000% | 11/15/27 | 70 | 72 |
| | Metropolitan Transportation Authority Transit Revenue | 5.000% | 11/15/27 | 150 | 155 |
| | Metropolitan Transportation Authority Transit Revenue | 5.000% | 11/15/27 | 220 | 233 |
| | Metropolitan Transportation Authority Transit Revenue | 5.000% | 11/15/28 | 920 | 978 |
| | Metropolitan Transportation Authority Transit Revenue | 0.000% | 11/15/29 | 415 | 350 |
| | Metropolitan Transportation Authority Transit Revenue | 5.000% | 11/15/29 | 670 | 711 |
| | Metropolitan Transportation Authority Transit Revenue | 5.000% | 11/15/30 | 270 | 286 |
| | Metropolitan Transportation Authority Transit Revenue | 5.000% | 11/15/30 | 1,160 | 1,295 |
| | Metropolitan Transportation Authority Transit Revenue | 5.000% | 11/15/30 | 100 | 112 |
| | Metropolitan Transportation Authority Transit Revenue | 5.000% | 11/15/30 | 300 | 335 |
| | Metropolitan Transportation Authority Transit Revenue | 5.000% | 11/15/31 | 100 | 102 |
Short-Term Tax-Exempt Bond ETF
| | | Coupon | Maturity
Date | Face
Amount
($000) | Market
Value•
($000) |
| | Metropolitan Transportation Authority Transit Revenue | 5.000% | 11/15/31 | 500 | 565 |
| | Nassau County Interim Finance Authority Sales Tax Revenue | 5.000% | 11/15/31 | 120 | 138 |
| | Nassau County NY GO | 5.000% | 10/1/27 | 5 | 5 |
| | New York City Health and Hospitals Corp. Health, Hospital, Nursing Home Revenue | 5.000% | 2/15/27 | 40 | 42 |
| 1 | New York City Industrial Development Agency Miscellaneous Revenue (Yankee Stadium Project) PILOT | 5.000% | 3/1/29 | 55 | 60 |
| | New York City Municipal Water Finance Authority Water Revenue | 5.000% | 6/15/25 | 375 | 379 |
| | New York City Municipal Water Finance Authority Water Revenue | 5.000% | 6/15/26 | 55 | 55 |
| | New York City Municipal Water Finance Authority Water Revenue | 5.000% | 6/15/26 | 410 | 410 |
| | New York City Municipal Water Finance Authority Water Revenue | 5.000% | 6/15/27 | 180 | 184 |
| | New York City Municipal Water Finance Authority Water Revenue | 5.000% | 6/15/27 | 375 | 383 |
| | New York City Municipal Water Finance Authority Water Revenue | 5.000% | 6/15/27 | 115 | 116 |
| | New York City Municipal Water Finance Authority Water Revenue | 5.000% | 6/15/27 | 300 | 306 |
| | New York City Municipal Water Finance Authority Water Revenue | 5.000% | 6/15/27 | 60 | 64 |
| | New York City Municipal Water Finance Authority Water Revenue | 5.000% | 6/15/27 | 120 | 123 |
| | New York City Municipal Water Finance Authority Water Revenue | 5.000% | 6/15/28 | 275 | 287 |
| | New York City Municipal Water Finance Authority Water Revenue | 5.000% | 6/15/28 | 120 | 130 |
| | New York City Municipal Water Finance Authority Water Revenue | 5.000% | 6/15/28 | 565 | 590 |
| | New York City Municipal Water Finance Authority Water Revenue | 5.000% | 6/15/28 | 90 | 91 |
| | New York City Municipal Water Finance Authority Water Revenue | 5.000% | 6/15/29 | 315 | 348 |
| | New York City Municipal Water Finance Authority Water Revenue | 5.000% | 6/15/29 | 210 | 224 |
| | New York City Municipal Water Finance Authority Water Revenue | 5.000% | 6/15/29 | 220 | 222 |
| | New York City Municipal Water Finance Authority Water Revenue | 5.000% | 6/15/30 | 225 | 253 |
| | New York City Municipal Water Finance Authority Water Revenue | 5.000% | 6/15/30 | 105 | 118 |
| | New York City Municipal Water Finance Authority Water Revenue | 5.000% | 6/15/30 | 100 | 108 |
| | New York City Municipal Water Finance Authority Water Revenue | 5.000% | 6/15/30 | 35 | 39 |
| | New York City Municipal Water Finance Authority Water Revenue | 5.000% | 6/15/31 | 265 | 303 |
| | New York City Municipal Water Finance Authority Water Revenue | 5.000% | 6/15/31 | 80 | 81 |
| | New York City Municipal Water Finance Authority Water Revenue | 5.000% | 6/15/31 | 125 | 132 |
| | New York City Municipal Water Finance Authority Water Revenue, Prere. | 5.000% | 6/15/25 | 165 | 167 |
| | New York City Municipal Water Finance Authority Water Revenue, Prere. | 5.000% | 6/15/25 | 20 | 20 |
| | New York City Transitional Finance Authority Building Aid Appropriations Revenue | 5.000% | 7/15/25 | 55 | 56 |
| | New York City Transitional Finance Authority Building Aid Appropriations Revenue | 5.000% | 7/15/26 | 70 | 73 |
| | New York City Transitional Finance Authority Building Aid Appropriations Revenue | 5.000% | 7/15/27 | 140 | 148 |
| | New York City Transitional Finance Authority Building Aid Appropriations Revenue | 5.000% | 7/15/27 | 150 | 159 |
| | New York City Transitional Finance Authority Building Aid Appropriations Revenue | 5.000% | 7/15/28 | 175 | 185 |
| | New York City Transitional Finance Authority Building Aid Appropriations Revenue | 5.000% | 7/15/28 | 300 | 324 |
| | New York City Transitional Finance Authority Building Aid Appropriations Revenue | 5.000% | 7/15/29 | 120 | 127 |
| | New York City Transitional Finance Authority Building Aid Appropriations Revenue | 5.000% | 7/15/30 | 300 | 304 |
| | New York City Transitional Finance Authority Building Aid Appropriations Revenue | 5.000% | 7/15/30 | 100 | 112 |
| | New York City Transitional Finance Authority Building Aid Appropriations Revenue | 5.000% | 7/15/30 | 155 | 174 |
| | New York City Transitional Finance Authority Building Aid Income Tax Revenue | 5.000% | 7/15/29 | 200 | 216 |
| | New York City Transitional Finance Authority Building Aid Income Tax Revenue | 5.000% | 7/15/30 | 135 | 138 |
| | New York City Transitional Finance Authority Building Aid Income Tax Revenue | 5.000% | 7/15/30 | 180 | 194 |
| | New York City Transitional Finance Authority Future Tax Secured Income Tax Revenue | 5.000% | 11/1/25 | 60 | 60 |
| | New York City Transitional Finance Authority Future Tax Secured Income Tax Revenue | 5.000% | 11/1/25 | 160 | 163 |
| | New York City Transitional Finance Authority Future Tax Secured Income Tax Revenue | 5.000% | 11/1/25 | 285 | 291 |
| | New York City Transitional Finance Authority Future Tax Secured Income Tax Revenue | 5.000% | 11/1/25 | 100 | 102 |
| | New York City Transitional Finance Authority Future Tax Secured Income Tax Revenue | 5.000% | 11/1/26 | 60 | 61 |
| | New York City Transitional Finance Authority Future Tax Secured Income Tax Revenue | 5.000% | 11/1/26 | 110 | 115 |
| | New York City Transitional Finance Authority Future Tax Secured Income Tax Revenue | 5.000% | 11/1/26 | 370 | 386 |
| | New York City Transitional Finance Authority Future Tax Secured Income Tax Revenue | 5.000% | 11/1/26 | 90 | 94 |
| | New York City Transitional Finance Authority Future Tax Secured Income Tax Revenue | 5.000% | 11/1/26 | 80 | 82 |
| | New York City Transitional Finance Authority Future Tax Secured Income Tax Revenue | 5.000% | 11/1/26 | 105 | 110 |
| | New York City Transitional Finance Authority Future Tax Secured Income Tax Revenue | 5.000% | 11/1/26 | 185 | 193 |
| | New York City Transitional Finance Authority Future Tax Secured Income Tax Revenue | 5.000% | 11/1/27 | 30 | 32 |
| | New York City Transitional Finance Authority Future Tax Secured Income Tax Revenue | 5.000% | 11/1/27 | 235 | 251 |
| | New York City Transitional Finance Authority Future Tax Secured Income Tax Revenue | 5.000% | 11/1/27 | 55 | 59 |
| | New York City Transitional Finance Authority Future Tax Secured Income Tax Revenue | 5.000% | 11/1/27 | 230 | 246 |
| | New York City Transitional Finance Authority Future Tax Secured Income Tax Revenue | 5.000% | 8/1/28 | 120 | 130 |
| | New York City Transitional Finance Authority Future Tax Secured Income Tax Revenue | 5.000% | 8/1/28 | 50 | 51 |
| | New York City Transitional Finance Authority Future Tax Secured Income Tax Revenue | 5.000% | 11/1/28 | 270 | 294 |
| | New York City Transitional Finance Authority Future Tax Secured Income Tax Revenue | 5.000% | 11/1/28 | 255 | 278 |
| | New York City Transitional Finance Authority Future Tax Secured Income Tax Revenue | 5.000% | 11/1/28 | 420 | 458 |
| | New York City Transitional Finance Authority Future Tax Secured Income Tax Revenue | 5.000% | 2/1/29 | 195 | 199 |
| | New York City Transitional Finance Authority Future Tax Secured Income Tax Revenue | 5.000% | 2/1/29 | 140 | 143 |
| | New York City Transitional Finance Authority Future Tax Secured Income Tax Revenue | 5.000% | 5/1/29 | 145 | 149 |
| | New York City Transitional Finance Authority Future Tax Secured Income Tax Revenue | 5.000% | 8/1/29 | 75 | 77 |
| | New York City Transitional Finance Authority Future Tax Secured Income Tax Revenue | 5.000% | 11/1/29 | 115 | 127 |
| | New York City Transitional Finance Authority Future Tax Secured Income Tax Revenue | 5.000% | 11/1/29 | 45 | 50 |
| | New York City Transitional Finance Authority Future Tax Secured Income Tax Revenue | 5.000% | 11/1/29 | 350 | 388 |
Short-Term Tax-Exempt Bond ETF
| | | Coupon | Maturity
Date | Face
Amount
($000) | Market
Value•
($000) |
| | New York City Transitional Finance Authority Future Tax Secured Income Tax Revenue | 5.000% | 11/1/29 | 335 | 371 |
| | New York City Transitional Finance Authority Future Tax Secured Income Tax Revenue | 5.000% | 2/1/30 | 255 | 265 |
| | New York City Transitional Finance Authority Future Tax Secured Income Tax Revenue | 4.000% | 5/1/30 | 230 | 232 |
| | New York City Transitional Finance Authority Future Tax Secured Income Tax Revenue | 5.000% | 5/1/30 | 380 | 398 |
| | New York City Transitional Finance Authority Future Tax Secured Income Tax Revenue | 5.000% | 8/1/30 | 110 | 113 |
| | New York City Transitional Finance Authority Future Tax Secured Income Tax Revenue | 3.000% | 11/1/30 | 85 | 85 |
| | New York City Transitional Finance Authority Future Tax Secured Income Tax Revenue | 5.000% | 11/1/30 | 5 | 5 |
| | New York City Transitional Finance Authority Future Tax Secured Income Tax Revenue | 5.000% | 11/1/30 | 250 | 262 |
| | New York City Transitional Finance Authority Future Tax Secured Income Tax Revenue | 5.000% | 11/1/30 | 360 | 405 |
| | New York City Transitional Finance Authority Future Tax Secured Income Tax Revenue | 5.000% | 11/1/30 | 125 | 141 |
| | New York City Transitional Finance Authority Future Tax Secured Income Tax Revenue | 5.000% | 2/1/31 | 420 | 428 |
| | New York City Transitional Finance Authority Future Tax Secured Income Tax Revenue | 4.000% | 5/1/31 | 80 | 81 |
| | New York City Transitional Finance Authority Future Tax Secured Income Tax Revenue | 5.000% | 5/1/31 | 100 | 112 |
| | New York City Transitional Finance Authority Future Tax Secured Income Tax Revenue | 5.000% | 8/1/31 | 80 | 82 |
| | New York City Transitional Finance Authority Future Tax Secured Income Tax Revenue | 5.000% | 8/1/31 | 105 | 110 |
| | New York City Transitional Finance Authority Future Tax Secured Income Tax Revenue | 5.000% | 11/1/31 | 50 | 57 |
| | New York City Transitional Finance Authority Future Tax Secured Income Tax Revenue | 5.000% | 11/1/31 | 205 | 234 |
| | New York City Transitional Finance Authority Future Tax Secured Income Tax Revenue | 5.000% | 11/1/31 | 70 | 80 |
| | New York City Transitional Finance Authority Future Tax Secured Income Tax Revenue, ETM | 5.000% | 8/1/25 | 135 | 137 |
| | New York City Transitional Finance Authority Income Tax Revenue | 5.000% | 8/1/25 | 875 | 887 |
| | New York City Transitional Finance Authority Income Tax Revenue | 5.000% | 11/1/25 | 95 | 97 |
| | New York City Transitional Finance Authority Income Tax Revenue | 5.000% | 11/1/27 | 100 | 107 |
| | New York City Transitional Finance Authority Income Tax Revenue | 5.000% | 11/1/27 | 750 | 801 |
| | New York City Transitional Finance Authority Income Tax Revenue | 5.000% | 11/1/28 | 200 | 218 |
| | New York City Transitional Finance Authority Income Tax Revenue | 5.000% | 5/1/29 | 500 | 549 |
| | New York City Transitional Finance Authority Income Tax Revenue | 5.000% | 5/1/29 | 250 | 275 |
| | New York City Transitional Finance Authority Income Tax Revenue | 5.000% | 11/1/29 | 170 | 188 |
| | New York City Transitional Finance Authority Income Tax Revenue | 5.000% | 5/1/30 | 90 | 100 |
| | New York City Transitional Finance Authority Income Tax Revenue | 5.000% | 11/1/30 | 100 | 112 |
| | New York City Transitional Finance Authority Income Tax Revenue | 5.000% | 11/1/31 | 780 | 889 |
| | New York City Transitional Finance Authority Income Tax Revenue, ETM | 5.000% | 8/1/25 | 235 | 238 |
| | New York City Transitional Finance Authority Income Tax Revenue, ETM | 5.000% | 11/1/25 | 10 | 10 |
| | New York City Transitional Finance Authority Income Tax Revenue, ETM | 5.000% | 8/1/27 | 5 | 5 |
| | New York GO | 5.000% | 3/15/30 | 30 | 34 |
| | New York NY GO | 5.000% | 8/1/25 | 165 | 167 |
| | New York NY GO | 5.000% | 8/1/25 | 200 | 201 |
| | New York NY GO | 5.000% | 8/1/25 | 370 | 375 |
| | New York NY GO | 5.000% | 8/1/25 | 40 | 41 |
| | New York NY GO | 5.000% | 8/1/25 | 560 | 568 |
| | New York NY GO | 5.000% | 8/1/25 | 315 | 319 |
| | New York NY GO | 5.000% | 8/1/25 | 60 | 61 |
| | New York NY GO | 5.000% | 8/1/25 | 190 | 193 |
| | New York NY GO | 5.000% | 8/1/25 | 625 | 634 |
| | New York NY GO | 5.000% | 8/1/25 | 100 | 101 |
| | New York NY GO | 5.000% | 8/1/25 | 300 | 304 |
| | New York NY GO | 5.000% | 8/1/25 | 200 | 203 |
| | New York NY GO | 5.000% | 8/1/25 | 250 | 254 |
| | New York NY GO | 5.000% | 8/1/26 | 15 | 15 |
| | New York NY GO | 5.000% | 8/1/26 | 10 | 10 |
| | New York NY GO | 5.000% | 8/1/26 | 110 | 114 |
| | New York NY GO | 5.000% | 8/1/26 | 175 | 182 |
| | New York NY GO | 5.000% | 8/1/26 | 255 | 265 |
| | New York NY GO | 5.000% | 8/1/26 | 40 | 42 |
| | New York NY GO | 5.000% | 8/1/26 | 200 | 207 |
| | New York NY GO | 5.000% | 8/1/26 | 85 | 88 |
| | New York NY GO | 5.000% | 8/1/26 | 230 | 239 |
| | New York NY GO | 5.000% | 8/1/26 | 100 | 104 |
| | New York NY GO | 5.000% | 8/1/26 | 100 | 104 |
| | New York NY GO | 5.000% | 8/1/26 | 45 | 47 |
| | New York NY GO | 5.000% | 8/1/26 | 300 | 311 |
| | New York NY GO | 5.000% | 9/1/26 | 500 | 520 |
| | New York NY GO | 5.000% | 3/1/27 | 45 | 47 |
| | New York NY GO | 5.000% | 8/1/27 | 20 | 20 |
| | New York NY GO | 5.000% | 8/1/27 | 155 | 160 |
| | New York NY GO | 5.000% | 8/1/27 | 300 | 318 |
| | New York NY GO | 5.000% | 8/1/27 | 100 | 106 |
| | New York NY GO | 5.000% | 8/1/27 | 190 | 199 |
| | New York NY GO | 5.000% | 8/1/27 | 160 | 170 |
| | New York NY GO | 5.000% | 8/1/27 | 295 | 313 |
| | New York NY GO | 5.000% | 8/1/27 | 195 | 207 |
Short-Term Tax-Exempt Bond ETF
| | | Coupon | Maturity
Date | Face
Amount
($000) | Market
Value•
($000) |
| | New York NY GO | 5.000% | 8/1/28 | 150 | 152 |
| | New York NY GO | 5.000% | 8/1/28 | 425 | 445 |
| | New York NY GO | 5.000% | 8/1/28 | 285 | 301 |
| | New York NY GO | 5.000% | 8/1/28 | 215 | 230 |
| | New York NY GO | 5.000% | 8/1/28 | 180 | 195 |
| | New York NY GO | 5.000% | 8/1/28 | 120 | 130 |
| | New York NY GO | 5.000% | 8/1/28 | 315 | 341 |
| | New York NY GO | 5.000% | 8/1/28 | 1,000 | 1,082 |
| | New York NY GO | 5.000% | 9/1/28 | 500 | 542 |
| | New York NY GO | 5.000% | 8/1/29 | 135 | 143 |
| | New York NY GO | 5.000% | 8/1/29 | 200 | 220 |
| | New York NY GO | 5.000% | 8/1/29 | 135 | 149 |
| | New York NY GO | 5.000% | 8/1/29 | 160 | 176 |
| | New York NY GO | 5.000% | 8/1/29 | 570 | 628 |
| | New York NY GO | 5.000% | 8/1/29 | 145 | 160 |
| | New York NY GO | 5.000% | 8/1/29 | 330 | 364 |
| | New York NY GO | 5.000% | 10/1/29 | 60 | 66 |
| | New York NY GO | 5.000% | 4/1/30 | 205 | 228 |
| | New York NY GO | 5.000% | 8/1/30 | 5 | 5 |
| | New York NY GO | 5.000% | 8/1/30 | 115 | 119 |
| | New York NY GO | 5.000% | 8/1/30 | 165 | 185 |
| | New York NY GO | 5.000% | 8/1/30 | 285 | 319 |
| | New York NY GO | 5.000% | 8/1/30 | 540 | 604 |
| | New York NY GO | 5.000% | 8/1/30 | 100 | 112 |
| | New York NY GO | 5.000% | 8/1/30 | 10 | 11 |
| | New York NY GO | 5.000% | 8/1/30 | 190 | 213 |
| | New York NY GO | 5.000% | 8/1/30 | 160 | 179 |
| | New York NY GO | 5.000% | 10/1/30 | 20 | 22 |
| | New York NY GO | 5.000% | 10/1/30 | 180 | 202 |
| | New York NY GO | 5.250% | 10/1/30 | 35 | 37 |
| | New York NY GO | 5.000% | 3/1/31 | 800 | 902 |
| | New York NY GO | 5.000% | 8/1/31 | 95 | 101 |
| | New York NY GO | 5.000% | 8/1/31 | 490 | 556 |
| | New York NY GO | 5.000% | 8/1/31 | 675 | 751 |
| | New York NY GO | 5.000% | 8/1/31 | 330 | 374 |
| | New York NY GO | 5.000% | 8/1/31 | 35 | 40 |
| | New York NY GO | 5.000% | 8/1/31 | 140 | 140 |
| | New York NY GO | 5.000% | 8/1/31 | 235 | 267 |
| | New York NY GO | 5.250% | 10/1/31 | 115 | 122 |
| 1 | New York Power Authority Electric Power & Light Revenue (Green Transmission Project) | 5.000% | 11/15/27 | 100 | 107 |
| 1 | New York Power Authority Electric Power & Light Revenue (Green Transmission Project) | 5.000% | 11/15/28 | 100 | 109 |
| | New York State Dormitory Authority College & University Revenue | 5.000% | 7/1/26 | 100 | 103 |
| | New York State Dormitory Authority College & University Revenue | 5.000% | 7/1/31 | 120 | 124 |
| | New York State Dormitory Authority College & University Revenue | 5.000% | 7/1/31 | 90 | 104 |
| | New York State Dormitory Authority College & University Revenue | 5.000% | 10/1/31 | 250 | 289 |
| | New York State Dormitory Authority Income Tax Revenue | 5.000% | 3/15/26 | 35 | 36 |
| | New York State Dormitory Authority Income Tax Revenue | 5.000% | 3/15/28 | 100 | 108 |
| | New York State Dormitory Authority Income Tax Revenue | 5.000% | 3/15/28 | 305 | 329 |
| | New York State Dormitory Authority Income Tax Revenue | 5.000% | 3/15/29 | 100 | 110 |
| | New York State Dormitory Authority Income Tax Revenue | 5.000% | 3/15/29 | 350 | 385 |
| | New York State Dormitory Authority Income Tax Revenue | 5.000% | 2/15/30 | 460 | 482 |
| | New York State Dormitory Authority Income Tax Revenue | 5.000% | 3/15/30 | 85 | 86 |
| | New York State Dormitory Authority Income Tax Revenue | 5.000% | 3/15/30 | 5 | 6 |
| | New York State Dormitory Authority Income Tax Revenue | 5.000% | 3/15/30 | 100 | 112 |
| | New York State Dormitory Authority Income Tax Revenue | 5.000% | 3/15/30 | 305 | 332 |
| | New York State Dormitory Authority Income Tax Revenue | 5.000% | 3/15/30 | 120 | 134 |
| | New York State Dormitory Authority Income Tax Revenue | 5.000% | 3/15/30 | 255 | 285 |
| | New York State Dormitory Authority Income Tax Revenue | 5.000% | 9/15/30 | 215 | 232 |
| | New York State Dormitory Authority Income Tax Revenue | 5.000% | 2/15/31 | 110 | 115 |
| | New York State Dormitory Authority Income Tax Revenue | 5.000% | 2/15/31 | 130 | 135 |
| | New York State Dormitory Authority Income Tax Revenue | 5.000% | 2/15/31 | 475 | 525 |
| | New York State Dormitory Authority Income Tax Revenue | 5.000% | 3/15/31 | 195 | 196 |
| | New York State Dormitory Authority Income Tax Revenue | 5.000% | 3/15/31 | 180 | 204 |
| | New York State Dormitory Authority Income Tax Revenue | 5.000% | 3/15/31 | 265 | 286 |
| | New York State Dormitory Authority Income Tax Revenue | 5.000% | 3/15/31 | 95 | 103 |
| | New York State Dormitory Authority Income Tax Revenue | 5.000% | 3/15/31 | 365 | 408 |
| | New York State Dormitory Authority Income Tax Revenue | 5.000% | 3/15/31 | 545 | 618 |
| | New York State Dormitory Authority Income Tax Revenue | 5.000% | 3/15/31 | 150 | 170 |
| | New York State Dormitory Authority Income Tax Revenue, ETM | 5.000% | 2/15/25 | 285 | 286 |
| | New York State Dormitory Authority Income Tax Revenue, ETM | 5.000% | 2/15/25 | 330 | 331 |
Short-Term Tax-Exempt Bond ETF
| | | Coupon | Maturity
Date | Face
Amount
($000) | Market
Value•
($000) |
| | New York State Dormitory Authority Income Tax Revenue, ETM | 5.000% | 2/15/25 | 160 | 161 |
| | New York State Dormitory Authority Income Tax Revenue, ETM | 5.000% | 3/15/25 | 250 | 251 |
| | New York State Dormitory Authority Income Tax Revenue, ETM | 5.000% | 3/15/25 | 300 | 302 |
| | New York State Dormitory Authority Income Tax Revenue, ETM | 5.000% | 2/15/26 | 120 | 123 |
| | New York State Dormitory Authority Income Tax Revenue, ETM | 5.000% | 2/15/26 | 80 | 82 |
| | New York State Dormitory Authority Income Tax Revenue, ETM | 5.000% | 3/15/26 | 100 | 103 |
| | New York State Dormitory Authority Income Tax Revenue, ETM | 5.000% | 3/15/26 | 25 | 26 |
| | New York State Dormitory Authority Income Tax Revenue, ETM | 5.000% | 2/15/27 | 165 | 173 |
| | New York State Dormitory Authority Income Tax Revenue, ETM | 5.000% | 2/15/27 | 285 | 300 |
| | New York State Dormitory Authority Income Tax Revenue, ETM | 5.000% | 3/15/27 | 5 | 5 |
| | New York State Dormitory Authority Income Tax Revenue, ETM | 5.000% | 3/15/28 | 15 | 16 |
| | New York State Dormitory Authority Income Tax Revenue, ETM | 5.000% | 3/15/28 | 185 | 199 |
| | New York State Dormitory Authority Income Tax Revenue, ETM | 5.000% | 3/15/28 | 310 | 334 |
| | New York State Dormitory Authority Income Tax Revenue, ETM | 5.000% | 3/15/29 | 500 | 549 |
| | New York State Dormitory Authority Income Tax Revenue, Prere. | 5.000% | 2/15/25 | 100 | 100 |
| | New York State Dormitory Authority Income Tax Revenue, Prere. | 5.000% | 2/15/25 | 100 | 100 |
| | New York State Dormitory Authority Income Tax Revenue, Prere. | 5.000% | 3/15/25 | 15 | 15 |
| | New York State Dormitory Authority Income Tax Revenue, Prere. | 5.000% | 3/15/25 | 500 | 503 |
| | New York State Dormitory Authority Income Tax Revenue, Prere. | 5.000% | 3/15/25 | 170 | 171 |
| | New York State Dormitory Authority Income Tax Revenue, Prere. | 5.000% | 3/15/25 | 250 | 251 |
| | New York State Dormitory Authority Income Tax Revenue, Prere. | 4.000% | 9/15/25 | 500 | 505 |
| | New York State Dormitory Authority Income Tax Revenue, Prere. | 5.000% | 9/15/25 | 30 | 31 |
| | New York State Dormitory Authority Income Tax Revenue, Prere. | 5.000% | 8/15/26 | 300 | 312 |
| | New York State Dormitory Authority Income Tax Revenue, Prere. | 5.000% | 8/15/26 | 130 | 135 |
| | New York State Dormitory Authority Income Tax Revenue, Prere. | 5.000% | 8/15/27 | 175 | 186 |
| | New York State Dormitory Authority Income Tax Revenue, Prere. | 5.000% | 8/15/27 | 140 | 149 |
| | New York State Dormitory Authority Intergovernmental Agreement Revenue | 5.000% | 10/1/25 | 170 | 173 |
| 1 | New York State Dormitory Authority Intergovernmental Agreement Revenue | 5.000% | 10/1/25 | 265 | 270 |
| | New York State Dormitory Authority Intergovernmental Agreement Revenue | 5.000% | 10/1/27 | 95 | 101 |
| 1 | New York State Dormitory Authority Intergovernmental Agreement Revenue | 5.000% | 10/1/28 | 200 | 218 |
| | New York State Dormitory Authority Intergovernmental Agreement Revenue | 5.000% | 10/1/29 | 200 | 211 |
| | New York State Dormitory Authority Intergovernmental Agreement Revenue | 5.000% | 10/1/30 | 200 | 210 |
| 1 | New York State Dormitory Authority Intergovernmental Agreement Revenue | 5.000% | 10/1/30 | 200 | 225 |
| | New York State Dormitory Authority Intergovernmental Agreement Revenue (School Districts Revenue Bond Financing Program) | 5.000% | 10/1/28 | 160 | 166 |
| 1 | New York State Dormitory Authority Intergovernmental Agreement Revenue (School Districts Revenue Bond Financing Program) | 5.000% | 10/1/28 | 100 | 109 |
| | New York State Dormitory Authority Intergovernmental Agreement Revenue (School Districts Revenue Bond Financing Program) | 5.000% | 10/1/29 | 195 | 202 |
| 1 | New York State Dormitory Authority Intergovernmental Agreement Revenue (School Districts Revenue Bond Financing Program) | 5.000% | 10/1/29 | 200 | 222 |
| | New York State Dormitory Authority Intergovernmental Agreement Revenue (School Districts Revenue Bond Financing Program) | 5.000% | 10/1/30 | 180 | 186 |
| 1 | New York State Dormitory Authority Intergovernmental Agreement Revenue (School Districts Revenue Bond Financing Program) | 5.000% | 10/1/30 | 100 | 113 |
| | New York State Dormitory Authority Intergovernmental Agreement Revenue (School Districts Revenue Bond Financing Program) | 5.000% | 10/1/31 | 100 | 103 |
| 1 | New York State Dormitory Authority Intergovernmental Agreement Revenue (School Districts Revenue Bond Financing Program) | 5.000% | 10/1/31 | 165 | 188 |
| 1 | New York State Dormitory Authority Intergovernmental Agreement Revenue (Unrefunded School Districts Finance Program) | 5.000% | 10/1/30 | 45 | 48 |
| | New York State Dormitory Authority Lease (Appropriation) Revenue | 5.000% | 1/15/26 | 100 | 102 |
| | New York State Dormitory Authority Lease (Appropriation) Revenue | 5.000% | 3/15/26 | 400 | 412 |
| | New York State Dormitory Authority Lease (Appropriation) Revenue | 5.000% | 1/15/27 | 55 | 58 |
| | New York State Dormitory Authority Lease (Appropriation) Revenue | 5.000% | 3/15/28 | 250 | 269 |
| | New York State Dormitory Authority Lease (Appropriation) Revenue | 5.000% | 3/15/29 | 185 | 203 |
| | New York State Dormitory Authority Lease (Appropriation) Revenue | 5.000% | 3/15/30 | 190 | 212 |
| | New York State Dormitory Authority Lease (Appropriation) Revenue, ETM | 5.000% | 3/15/29 | 60 | 66 |
| | New York State Dormitory Authority Sales Tax Revenue | 5.000% | 3/15/30 | 375 | 380 |
| | New York State Dormitory Authority Sales Tax Revenue | 5.000% | 3/15/30 | 150 | 155 |
| | New York State Dormitory Authority Sales Tax Revenue | 5.000% | 3/15/30 | 375 | 390 |
| | New York State Dormitory Authority Sales Tax Revenue | 5.000% | 3/15/31 | 335 | 346 |
| | New York State Dormitory Authority Sales Tax Revenue | 5.000% | 3/15/31 | 145 | 154 |
| | New York State Dormitory Authority Sales Tax Revenue | 5.000% | 3/15/31 | 185 | 197 |
| | New York State Dormitory Authority Sales Tax Revenue | 5.000% | 3/15/31 | 560 | 602 |
| | New York State Dormitory Authority Sales Tax Revenue, ETM | 5.000% | 3/15/25 | 50 | 50 |
| | New York State Dormitory Authority Sales Tax Revenue, ETM | 5.000% | 3/15/25 | 155 | 156 |
| | New York State Dormitory Authority Sales Tax Revenue, ETM | 5.000% | 3/15/26 | 50 | 52 |
| | New York State Dormitory Authority Sales Tax Revenue, ETM | 5.000% | 3/15/26 | 185 | 191 |
| | New York State Dormitory Authority Sales Tax Revenue, ETM | 5.000% | 3/15/26 | 220 | 227 |
| | New York State Dormitory Authority Sales Tax Revenue, ETM | 5.000% | 3/15/27 | 105 | 111 |
Short-Term Tax-Exempt Bond ETF
| | | Coupon | Maturity
Date | Face
Amount
($000) | Market
Value•
($000) |
| | New York State Dormitory Authority Sales Tax Revenue, ETM | 5.000% | 3/15/27 | 75 | 79 |
| | New York State Dormitory Authority Sales Tax Revenue, Prere. | 5.000% | 3/15/25 | 10 | 10 |
| | New York State Dormitory Authority Sales Tax Revenue, Prere. | 5.000% | 3/15/25 | 435 | 437 |
| | New York State Dormitory Authority Sales Tax Revenue, Prere. | 5.000% | 9/15/25 | 45 | 46 |
| | New York State Dormitory Authority Sales Tax Revenue, Prere. | 5.000% | 9/15/25 | 95 | 97 |
| | New York State Dormitory Authority Sales Tax Revenue, Prere. | 5.000% | 9/15/26 | 200 | 209 |
| | New York State Dormitory Authority Sales Tax Revenue, Prere. | 5.000% | 9/15/26 | 170 | 177 |
| | New York State Thruway Authority Highway Revenue | 5.000% | 1/1/25 | 100 | 100 |
| | New York State Thruway Authority Highway Revenue | 5.000% | 1/1/26 | 100 | 102 |
| | New York State Thruway Authority Highway Revenue | 5.000% | 1/1/27 | 210 | 220 |
| | New York State Thruway Authority Highway Revenue | 5.000% | 1/1/28 | 50 | 50 |
| | New York State Thruway Authority Highway Revenue | 5.000% | 1/1/29 | 115 | 115 |
| | New York State Thruway Authority Highway Revenue | 5.000% | 1/1/29 | 100 | 109 |
| | New York State Thruway Authority Highway Revenue | 5.000% | 1/1/30 | 130 | 130 |
| | New York State Thruway Authority Highway Revenue | 5.000% | 1/1/30 | 5 | 6 |
| | New York State Thruway Authority Highway Revenue | 5.000% | 1/1/31 | 200 | 226 |
| | New York State Thruway Authority Income Tax Revenue | 5.000% | 3/15/30 | 165 | 184 |
| | New York State Thruway Authority Income Tax Revenue | 5.000% | 3/15/31 | 230 | 260 |
| | New York State Thruway Authority Lease (Appropriation) Revenue | 5.000% | 3/15/26 | 105 | 108 |
| | New York State Thruway Authority Lease (Appropriation) Revenue, ETM | 5.000% | 3/15/25 | 110 | 111 |
| | Port Authority of New York & New Jersey Port, Airport & Marina Revenue | 5.000% | 12/1/25 | 100 | 102 |
| | Port Authority of New York & New Jersey Port, Airport & Marina Revenue | 5.000% | 5/1/26 | 75 | 76 |
| | Port Authority of New York & New Jersey Port, Airport & Marina Revenue | 5.000% | 10/15/26 | 75 | 76 |
| | Port Authority of New York & New Jersey Port, Airport & Marina Revenue | 5.000% | 5/1/27 | 30 | 30 |
| | Port Authority of New York & New Jersey Port, Airport & Marina Revenue | 5.000% | 10/15/27 | 150 | 152 |
| | Port Authority of New York & New Jersey Port, Airport & Marina Revenue | 5.375% | 3/1/28 | 70 | 74 |
| | Port Authority of New York & New Jersey Port, Airport & Marina Revenue | 5.000% | 10/15/28 | 200 | 203 |
| | Port Authority of New York & New Jersey Port, Airport & Marina Revenue | 5.000% | 12/1/28 | 100 | 109 |
| | Port Authority of New York & New Jersey Port, Airport & Marina Revenue | 5.000% | 10/15/29 | 75 | 76 |
| | Port Authority of New York & New Jersey Port, Airport & Marina Revenue | 5.000% | 5/1/30 | 30 | 30 |
| | Port Authority of New York & New Jersey Port, Airport & Marina Revenue | 5.000% | 7/15/30 | 150 | 160 |
| | Port Authority of New York & New Jersey Port, Airport & Marina Revenue | 5.000% | 12/1/30 | 100 | 113 |
| | Port Authority of New York & New Jersey Port, Airport & Marina Revenue | 5.000% | 10/15/31 | 160 | 162 |
| | Triborough Bridge & Tunnel Authority Fuel Sales Tax Revenue | 5.000% | 11/15/28 | 35 | 38 |
| | Triborough Bridge & Tunnel Authority Highway Revenue | 5.000% | 11/15/25 | 285 | 291 |
| | Triborough Bridge & Tunnel Authority Highway Revenue | 5.000% | 11/15/26 | 100 | 104 |
| | Triborough Bridge & Tunnel Authority Highway Revenue | 5.000% | 11/15/26 | 250 | 261 |
| | Triborough Bridge & Tunnel Authority Highway Revenue | 5.000% | 11/15/27 | 315 | 337 |
| | Triborough Bridge & Tunnel Authority Highway Revenue | 5.000% | 11/15/28 | 75 | 82 |
| | Triborough Bridge & Tunnel Authority Highway Revenue | 5.000% | 11/15/28 | 205 | 224 |
| | Triborough Bridge & Tunnel Authority Highway Revenue | 5.000% | 11/15/28 | 200 | 218 |
| | Triborough Bridge & Tunnel Authority Highway Revenue | 0.000% | 11/15/29 | 300 | 254 |
| | Triborough Bridge & Tunnel Authority Highway Revenue | 5.000% | 11/15/29 | 225 | 236 |
| | Triborough Bridge & Tunnel Authority Highway Revenue | 5.000% | 11/15/29 | 145 | 161 |
| | Triborough Bridge & Tunnel Authority Highway Revenue | 0.000% | 11/15/30 | 50 | 41 |
| | Triborough Bridge & Tunnel Authority Highway Revenue | 5.000% | 11/15/30 | 500 | 525 |
| | Triborough Bridge & Tunnel Authority Highway Revenue | 5.000% | 11/15/30 | 5 | 6 |
| | Triborough Bridge & Tunnel Authority Highway Revenue | 5.000% | 11/15/31 | 245 | 257 |
| | Triborough Bridge & Tunnel Authority Miscellaneous Taxes Revenue | 4.000% | 5/15/26 | 170 | 173 |
| | Triborough Bridge & Tunnel Authority Miscellaneous Taxes Revenue | 5.000% | 5/15/26 | 755 | 779 |
| | Triborough Bridge & Tunnel Authority Miscellaneous Taxes Revenue | 5.000% | 11/15/27 | 555 | 591 |
| | Triborough Bridge & Tunnel Authority Miscellaneous Taxes Revenue | 5.000% | 11/15/27 | 200 | 213 |
| | Triborough Bridge & Tunnel Authority Miscellaneous Taxes Revenue | 5.000% | 5/15/28 | 80 | 87 |
| | Triborough Bridge & Tunnel Authority Miscellaneous Taxes Revenue | 5.000% | 11/15/28 | 440 | 478 |
| | Triborough Bridge & Tunnel Authority Miscellaneous Taxes Revenue | 5.000% | 5/15/29 | 175 | 193 |
| | Triborough Bridge & Tunnel Authority Miscellaneous Taxes Revenue | 5.000% | 11/15/29 | 215 | 239 |
| | Triborough Bridge & Tunnel Authority Miscellaneous Taxes Revenue | 5.000% | 5/15/30 | 375 | 421 |
| | Triborough Bridge & Tunnel Authority Miscellaneous Taxes Revenue | 5.000% | 11/15/30 | 520 | 586 |
| | Triborough Bridge & Tunnel Authority Miscellaneous Taxes Revenue | 5.000% | 5/15/31 | 100 | 114 |
| | Triborough Bridge & Tunnel Authority Miscellaneous Taxes Revenue | 5.000% | 5/15/31 | 300 | 340 |
| | Triborough Bridge & Tunnel Authority Miscellaneous Taxes Revenue PUT | 5.000% | 5/15/26 | 50 | 51 |
| | Utility Debt Securitization Authority Electric Power & Light Revenue | 5.000% | 12/15/26 | 375 | 375 |
| | Utility Debt Securitization Authority Electric Power & Light Revenue | 5.000% | 6/15/27 | 435 | 440 |
| | Utility Debt Securitization Authority Electric Power & Light Revenue | 5.000% | 6/15/27 | 280 | 283 |
| | Utility Debt Securitization Authority Electric Power & Light Revenue | 5.000% | 12/15/27 | 85 | 87 |
| | Utility Debt Securitization Authority Electric Power & Light Revenue | 5.000% | 6/15/28 | 190 | 197 |
| | Utility Debt Securitization Authority Electric Power & Light Revenue | 5.000% | 12/15/28 | 50 | 52 |
| | Utility Debt Securitization Authority Electric Power & Light Revenue | 5.000% | 6/15/29 | 100 | 105 |
| | Utility Debt Securitization Authority Electric Power & Light Revenue | 5.000% | 6/15/29 | 580 | 610 |
| | Utility Debt Securitization Authority Electric Power & Light Revenue | 5.000% | 12/15/29 | 650 | 689 |
Short-Term Tax-Exempt Bond ETF
| | | Coupon | Maturity
Date | Face
Amount
($000) | Market
Value•
($000) |
| | Utility Debt Securitization Authority Electric Power & Light Revenue | 5.000% | 12/15/29 | 100 | 106 |
| | Utility Debt Securitization Authority Electric Power & Light Revenue | 5.000% | 6/15/30 | 150 | 162 |
| | Utility Debt Securitization Authority Electric Power & Light Revenue | 5.000% | 6/15/30 | 100 | 108 |
| | Utility Debt Securitization Authority Electric Power & Light Revenue | 5.000% | 12/15/30 | 110 | 120 |
| | | | | | 90,032 |
| North Carolina (1.5%) |
| | North Carolina Appropriations Revenue | 5.000% | 5/1/25 | 280 | 282 |
| | North Carolina Appropriations Revenue | 5.000% | 6/1/25 | 95 | 96 |
| | North Carolina Appropriations Revenue | 5.000% | 5/1/26 | 235 | 242 |
| | North Carolina Appropriations Revenue | 5.000% | 5/1/27 | 545 | 576 |
| | North Carolina Appropriations Revenue | 5.000% | 5/1/28 | 195 | 205 |
| | North Carolina Appropriations Revenue | 5.000% | 5/1/29 | 350 | 367 |
| | North Carolina Appropriations Revenue | 5.000% | 5/1/30 | 195 | 204 |
| | North Carolina Appropriations Revenue (Build NC Programs) | 5.000% | 5/1/25 | 245 | 247 |
| | North Carolina Appropriations Revenue (Build NC Programs) | 5.000% | 5/1/26 | 30 | 31 |
| | North Carolina Appropriations Revenue (Build NC Programs) | 5.000% | 5/1/27 | 40 | 42 |
| | North Carolina Appropriations Revenue (Build NC Programs) | 5.000% | 5/1/28 | 245 | 264 |
| | North Carolina Appropriations Revenue (Build NC Programs) | 5.000% | 5/1/29 | 115 | 126 |
| | North Carolina Appropriations Revenue (Build NC Programs) | 5.000% | 5/1/30 | 50 | 56 |
| | North Carolina Appropriations Revenue (Build NC Programs) | 5.000% | 5/1/31 | 265 | 295 |
| | North Carolina Capital Facilities Finance Agency College & University Revenue, Prere. | 5.000% | 10/1/25 | 430 | 437 |
| | North Carolina Capital Facilities Finance Agency College & University Revenue, Prere. | 5.000% | 10/1/25 | 1,145 | 1,164 |
| | North Carolina GO | 5.000% | 6/1/25 | 10 | 10 |
| | North Carolina GO | 5.000% | 6/1/26 | 225 | 233 |
| | North Carolina GO | 5.000% | 6/1/27 | 45 | 47 |
| | North Carolina GO | 5.000% | 6/1/28 | 180 | 186 |
| | North Carolina GO | 5.000% | 6/1/30 | 130 | 143 |
| | North Carolina Government Fund/Grant Revenue | 5.000% | 3/1/25 | 130 | 131 |
| | North Carolina Government Fund/Grant Revenue | 5.000% | 3/1/25 | 375 | 377 |
| | North Carolina Government Fund/Grant Revenue | 5.000% | 3/1/26 | 10 | 10 |
| | North Carolina Government Fund/Grant Revenue | 5.000% | 3/1/26 | 330 | 339 |
| | North Carolina Government Fund/Grant Revenue | 5.000% | 3/1/27 | 555 | 583 |
| | North Carolina Government Fund/Grant Revenue | 5.000% | 3/1/28 | 175 | 176 |
| | North Carolina Government Fund/Grant Revenue | 5.000% | 3/1/29 | 115 | 125 |
| | North Carolina Government Fund/Grant Revenue | 5.000% | 3/1/30 | 315 | 342 |
| | North Carolina Government Fund/Grant Revenue | 5.000% | 3/1/31 | 130 | 141 |
| | North Carolina Municipal Power Agency No. 1 Electric Power & Light Revenue | 5.000% | 1/1/25 | 140 | 140 |
| | North Carolina Municipal Power Agency No. 1 Electric Power & Light Revenue | 5.000% | 1/1/27 | 310 | 316 |
| | North Carolina Municipal Power Agency No. 1 Electric Power & Light Revenue | 5.000% | 1/1/28 | 85 | 87 |
| | North Carolina Municipal Power Agency No. 1 Electric Power & Light Revenue | 5.000% | 1/1/31 | 40 | 41 |
| | Wake County NC GO | 5.000% | 3/1/25 | 85 | 85 |
| | | | | | 8,146 |
| North Dakota (0.0%) |
| | Cass County Joint Water Resource District Intergovernmental Agreement Revenue | 3.450% | 4/1/27 | 110 | 110 |
| Ohio (2.1%) |
| | American Municipal Power Inc. Electric Power & Light Revenue (Prairie State Energy Campus Project) | 5.000% | 2/15/26 | 100 | 102 |
| | American Municipal Power Inc. Electric Power & Light Revenue (Prairie State Energy Campus Project) | 5.000% | 2/15/27 | 100 | 105 |
| | American Municipal Power Inc. Electric Power & Light Revenue (Prairie State Energy Campus Project) | 5.000% | 2/15/28 | 115 | 123 |
| | American Municipal Power Inc. Electric Power & Light Revenue (Prairie State Energy Campus Project) | 5.000% | 2/15/29 | 100 | 108 |
| 4 | Cincinnati City School District GO | 5.250% | 12/1/29 | 220 | 245 |
| | Columbus OH GO | 5.000% | 7/1/25 | 200 | 202 |
| | Columbus OH Sewerage Sewer Revenue | 5.000% | 6/1/25 | 50 | 50 |
| | Columbus OH Sewerage Sewer Revenue | 5.000% | 6/1/29 | 390 | 402 |
| | Columbus OH Sewerage Sewer Revenue | 5.000% | 6/1/30 | 15 | 15 |
| | Columbus OH Sewerage Sewer Revenue, Prere. | 5.000% | 12/1/24 | 295 | 295 |
| | Franklin County Convention Facilities Authority Lease (Appropriation) Revenue, Prere. | 5.000% | 12/1/24 | 265 | 265 |
| | Greater Cleveland Regional Transit Authority Sales Tax Revenue, Prere. | 5.000% | 6/1/29 | 45 | 49 |
| | Greater Cleveland Regional Transit Authority Sales Tax Revenue, Prere. | 5.000% | 6/1/29 | 20 | 22 |
| | Hamilton County OH Sales Tax Revenue | 4.000% | 12/1/31 | 75 | 76 |
| | Ohio GO | 5.000% | 12/15/24 | 80 | 80 |
| | Ohio GO | 5.000% | 5/1/25 | 55 | 55 |
| | Ohio GO | 5.000% | 8/1/25 | 470 | 477 |
| | Ohio GO | 5.000% | 8/1/25 | 125 | 127 |
| | Ohio GO | 5.000% | 9/15/25 | 295 | 300 |
| | Ohio GO | 5.000% | 8/1/26 | 50 | 52 |
| | Ohio GO | 5.000% | 9/15/26 | 150 | 156 |
| | Ohio GO | 5.000% | 8/1/27 | 225 | 239 |
| | Ohio GO | 5.000% | 5/1/28 | 125 | 135 |
Short-Term Tax-Exempt Bond ETF
| | | Coupon | Maturity
Date | Face
Amount
($000) | Market
Value•
($000) |
| | Ohio GO | 5.000% | 8/1/28 | 415 | 450 |
| | Ohio GO | 5.000% | 9/15/29 | 260 | 287 |
| | Ohio Government Fund/Grant Revenue | 5.000% | 12/15/24 | 75 | 75 |
| | Ohio Government Fund/Grant Revenue | 5.000% | 12/15/26 | 65 | 68 |
| | Ohio Government Fund/Grant Revenue | 5.000% | 12/15/27 | 125 | 134 |
| | Ohio Government Fund/Grant Revenue | 5.000% | 12/15/28 | 75 | 77 |
| | Ohio Government Fund/Grant Revenue | 5.000% | 12/15/29 | 180 | 186 |
| | Ohio State University College & University Revenue | 5.000% | 12/1/29 | 325 | 361 |
| | Ohio State University College & University Revenue | 5.000% | 12/1/39 | 1,000 | 1,000 |
| | Ohio Turnpike & Infrastructure Commission Highway Revenue | 5.000% | 2/15/29 | 150 | 163 |
| | Ohio Turnpike & Infrastructure Commission Highway Revenue | 5.000% | 2/15/29 | 60 | 64 |
| | Ohio Turnpike & Infrastructure Commission Highway Revenue | 5.000% | 2/15/30 | 100 | 107 |
| | Ohio Turnpike & Infrastructure Commission Highway Revenue | 5.000% | 2/15/31 | 50 | 56 |
| | Ohio Turnpike & Infrastructure Commission Highway Revenue | 5.000% | 2/15/31 | 40 | 43 |
| | Ohio Water Development Authority Water Pollution Control Loan Fund Water Revenue | 5.000% | 12/1/24 | 50 | 50 |
| | Ohio Water Development Authority Water Pollution Control Loan Fund Water Revenue | 5.000% | 12/1/25 | 105 | 107 |
| | Ohio Water Development Authority Water Pollution Control Loan Fund Water Revenue | 5.000% | 6/1/26 | 215 | 222 |
| | Ohio Water Development Authority Water Pollution Control Loan Fund Water Revenue | 5.000% | 6/1/26 | 810 | 837 |
| | Ohio Water Development Authority Water Pollution Control Loan Fund Water Revenue | 5.000% | 6/1/27 | 175 | 185 |
| | Ohio Water Development Authority Water Pollution Control Loan Fund Water Revenue | 5.000% | 12/1/30 | 200 | 225 |
| | Ohio Water Development Authority Water Pollution Control Loan Fund Water Revenue | 5.000% | 12/1/31 | 700 | 799 |
| | Ohio Water Development Authority Water Pollution Control Loan Fund Water Revenue, Prere. | 5.000% | 12/1/25 | 1,000 | 1,020 |
| | Ohio Water Development Authority Water Revenue | 5.000% | 6/1/28 | 250 | 270 |
| | Ohio Water Development Authority Water Revenue | 5.000% | 6/1/29 | 670 | 732 |
| | Ohio Water Development Authority Water Revenue | 5.000% | 12/1/29 | 505 | 556 |
| | Upper Arlington City School District GO, Prere. | 5.000% | 12/1/27 | 100 | 107 |
| | Willoughby-Eastlake City School District GO, Prere. | 5.000% | 12/1/25 | 50 | 51 |
| | | | | | 11,912 |
| Oklahoma (0.7%) |
| | Canadian County Educational Facilities Authority Lease (Appropriation) Revenue (Mustang Public School Project) | 3.000% | 9/1/29 | 170 | 167 |
| | Cleveland County Educational Facilities Authority Lease (Appropriation) Revenue (Moore Public Schools Project) | 4.000% | 6/1/27 | 565 | 579 |
| | Grand River Dam Authority Electric Power & Light Revenue | 5.000% | 6/1/25 | 210 | 212 |
| | Grand River Dam Authority Electric Power & Light Revenue | 5.000% | 6/1/26 | 60 | 62 |
| | Grand River Dam Authority Electric Power & Light Revenue | 5.000% | 6/1/27 | 45 | 47 |
| | Grand River Dam Authority Electric Power & Light Revenue | 5.000% | 6/1/28 | 220 | 229 |
| | Grand River Dam Authority Electric Power & Light Revenue | 5.000% | 6/1/30 | 100 | 104 |
| | Grand River Dam Authority Electric Power & Light Revenue | 5.000% | 6/1/31 | 25 | 26 |
| | Oklahoma City & County Independent School District No. 89 GO | 3.000% | 7/1/27 | 50 | 50 |
| | Oklahoma County Independent School District No. 89 Oklahoma City GO | 3.000% | 7/1/25 | 640 | 640 |
| | Oklahoma County Independent School District No. 89 Oklahoma City GO | 4.000% | 7/1/27 | 125 | 129 |
| | Oklahoma Industries Authority Lease (Appropriation) Revenue (Oklahoma City Public School Project) | 5.000% | 4/1/28 | 150 | 160 |
| | Oklahoma Industries Authority Lease (Appropriation) Revenue (Oklahoma City Public School Project) | 5.000% | 4/1/31 | 200 | 223 |
| | Oklahoma Turnpike Authority Highway Revenue | 5.000% | 1/1/25 | 270 | 270 |
| | Oklahoma Turnpike Authority Highway Revenue | 5.000% | 1/1/26 | 320 | 328 |
| | Oklahoma Turnpike Authority Highway Revenue | 5.000% | 1/1/27 | 165 | 172 |
| | Oklahoma Turnpike Authority Highway Revenue | 5.000% | 1/1/30 | 220 | 243 |
| | Tulsa Public Facilities Authority Intergovernmental Agreement Revenue | 5.000% | 6/1/25 | 285 | 288 |
| | | | | | 3,929 |
| Oregon (0.5%) |
| | Multnomah County OR GO | 5.000% | 6/15/27 | 185 | 196 |
| | Multnomah County OR School District No. 1 Portland GO | 5.000% | 6/15/25 | 180 | 182 |
| | Multnomah County OR School District No. 1 Portland GO | 5.000% | 6/15/25 | 230 | 232 |
| | Multnomah County School District No. 1 Portland GO | 5.000% | 6/15/26 | 105 | 109 |
| | Oregon (Article XI-Q State Projects) GO | 5.000% | 5/1/25 | 120 | 121 |
| | Oregon Department of Transportation Fuel Sales Tax Revenue | 5.000% | 11/15/25 | 70 | 71 |
| | Oregon Department of Transportation Fuel Sales Tax Revenue | 5.000% | 11/15/26 | 10 | 11 |
| | Oregon Department of Transportation Miscellaneous Revenue | 5.000% | 11/15/29 | 500 | 554 |
| | Oregon Department of Transportation Miscellaneous Revenue | 5.000% | 11/15/31 | 165 | 188 |
| | Oregon Health & Science University Health, Hospital, Nursing Home Revenue PUT | 5.000% | 2/1/30 | 100 | 108 |
| | Oregon State Lottery Revenue | 5.000% | 4/1/27 | 10 | 10 |
| | Oregon State Lottery Revenue | 5.000% | 4/1/28 | 95 | 96 |
| | Oregon Tri-County Metropolitan Transportation District Miscellaneous Taxes Revenue, Prere. | 5.000% | 9/1/27 | 305 | 324 |
| | Oregon Tri-County Metropolitan Transportation Miscellaneous Taxes Revenue, Prere. | 5.000% | 9/1/27 | 360 | 382 |
| | Washington County OR GO, Prere. | 3.000% | 7/1/29 | 20 | 20 |
| | | | | | 2,604 |
Short-Term Tax-Exempt Bond ETF
| | | Coupon | Maturity
Date | Face
Amount
($000) | Market
Value•
($000) |
| Pennsylvania (3.8%) |
| | Allegheny County PA GO | 5.000% | 11/1/28 | 45 | 47 |
| | Commonwealth of Pennsylvania GO | 5.000% | 1/1/25 | 205 | 205 |
| | Commonwealth of Pennsylvania GO | 5.000% | 1/15/25 | 140 | 140 |
| | Commonwealth of Pennsylvania GO | 5.000% | 3/1/25 | 125 | 126 |
| | Commonwealth of Pennsylvania GO | 5.000% | 3/15/25 | 175 | 176 |
| | Commonwealth of Pennsylvania GO | 5.000% | 6/15/25 | 370 | 371 |
| | Commonwealth of Pennsylvania GO | 5.000% | 7/15/25 | 300 | 304 |
| | Commonwealth of Pennsylvania GO | 5.000% | 8/15/25 | 220 | 223 |
| | Commonwealth of Pennsylvania GO | 5.000% | 9/1/25 | 165 | 168 |
| | Commonwealth of Pennsylvania GO | 5.000% | 9/15/25 | 375 | 381 |
| | Commonwealth of Pennsylvania GO | 5.000% | 9/15/25 | 205 | 208 |
| | Commonwealth of Pennsylvania GO | 5.000% | 10/1/25 | 315 | 321 |
| | Commonwealth of Pennsylvania GO | 5.000% | 1/1/26 | 330 | 338 |
| | Commonwealth of Pennsylvania GO | 5.000% | 3/1/26 | 20 | 21 |
| | Commonwealth of Pennsylvania GO | 5.000% | 3/15/26 | 235 | 236 |
| | Commonwealth of Pennsylvania GO | 5.000% | 7/15/26 | 120 | 124 |
| | Commonwealth of Pennsylvania GO | 5.000% | 9/1/26 | 200 | 207 |
| | Commonwealth of Pennsylvania GO | 5.000% | 9/15/26 | 530 | 550 |
| | Commonwealth of Pennsylvania GO | 5.000% | 9/15/26 | 165 | 171 |
| | Commonwealth of Pennsylvania GO | 5.000% | 10/1/26 | 125 | 130 |
| | Commonwealth of Pennsylvania GO | 5.000% | 1/1/27 | 165 | 173 |
| | Commonwealth of Pennsylvania GO | 5.000% | 1/15/27 | 140 | 147 |
| | Commonwealth of Pennsylvania GO | 5.000% | 3/1/27 | 60 | 63 |
| | Commonwealth of Pennsylvania GO | 5.000% | 3/15/27 | 30 | 30 |
| | Commonwealth of Pennsylvania GO | 5.000% | 7/15/27 | 510 | 540 |
| | Commonwealth of Pennsylvania GO | 5.000% | 9/1/27 | 250 | 265 |
| | Commonwealth of Pennsylvania GO | 5.000% | 9/15/27 | 160 | 166 |
| | Commonwealth of Pennsylvania GO | 5.000% | 1/1/28 | 230 | 240 |
| | Commonwealth of Pennsylvania GO | 5.000% | 1/15/28 | 575 | 599 |
| | Commonwealth of Pennsylvania GO | 5.000% | 3/1/28 | 125 | 134 |
| | Commonwealth of Pennsylvania GO | 5.000% | 3/15/28 | 170 | 171 |
| | Commonwealth of Pennsylvania GO | 3.000% | 6/15/28 | 80 | 80 |
| | Commonwealth of Pennsylvania GO | 5.000% | 7/15/28 | 285 | 308 |
| | Commonwealth of Pennsylvania GO | 5.000% | 9/1/28 | 400 | 433 |
| | Commonwealth of Pennsylvania GO | 5.000% | 10/1/28 | 250 | 271 |
| | Commonwealth of Pennsylvania GO | 4.000% | 1/1/29 | 100 | 102 |
| | Commonwealth of Pennsylvania GO | 5.000% | 3/15/29 | 1,025 | 1,030 |
| | Commonwealth of Pennsylvania GO | 5.000% | 7/15/29 | 500 | 550 |
| 1 | Commonwealth of Pennsylvania GO | 4.000% | 8/15/29 | 205 | 206 |
| | Commonwealth of Pennsylvania GO | 5.000% | 9/1/29 | 625 | 689 |
| | Commonwealth of Pennsylvania GO | 3.000% | 3/15/30 | 525 | 525 |
| 1 | Commonwealth of Pennsylvania GO | 4.000% | 8/15/30 | 250 | 251 |
| | Commonwealth of Pennsylvania GO | 5.000% | 9/1/30 | 200 | 224 |
| | Commonwealth of Pennsylvania GO | 4.000% | 9/15/30 | 45 | 46 |
| | Commonwealth of Pennsylvania GO | 5.000% | 10/1/30 | 285 | 320 |
| | Commonwealth of Pennsylvania GO | 3.000% | 1/1/31 | 165 | 165 |
| | Commonwealth of Pennsylvania GO | 4.000% | 2/15/31 | 250 | 266 |
| | Commonwealth of Pennsylvania GO | 5.000% | 3/15/31 | 110 | 111 |
| | Commonwealth of Pennsylvania GO | 5.000% | 5/15/31 | 85 | 96 |
| | Delaware River Port Authority Highway Revenue | 5.000% | 1/1/25 | 160 | 160 |
| | Delaware River Port Authority Highway Revenue | 5.000% | 1/1/26 | 200 | 205 |
| 2 | Delaware Valley Regional Finance Authority Lease Revenue | 5.500% | 8/1/28 | 1,475 | 1,599 |
| | Pennsylvania Turnpike Commission Highway Revenue | 5.000% | 12/1/24 | 220 | 220 |
| | Pennsylvania Turnpike Commission Highway Revenue | 5.000% | 6/1/25 | 30 | 30 |
| | Pennsylvania Turnpike Commission Highway Revenue | 5.000% | 12/1/25 | 100 | 101 |
| | Pennsylvania Turnpike Commission Highway Revenue | 5.000% | 12/1/25 | 65 | 66 |
| | Pennsylvania Turnpike Commission Highway Revenue | 5.000% | 6/1/26 | 210 | 214 |
| | Pennsylvania Turnpike Commission Highway Revenue | 5.000% | 6/1/26 | 80 | 82 |
| | Pennsylvania Turnpike Commission Highway Revenue | 5.000% | 12/1/26 | 110 | 115 |
| | Pennsylvania Turnpike Commission Highway Revenue | 5.000% | 12/1/26 | 520 | 525 |
| | Pennsylvania Turnpike Commission Highway Revenue | 5.000% | 6/1/28 | 690 | 711 |
| | Pennsylvania Turnpike Commission Highway Revenue | 5.000% | 12/1/30 | 675 | 696 |
| | Pennsylvania Turnpike Commission Highway Revenue | 5.000% | 12/1/31 | 100 | 114 |
| | Philadelphia PA GO | 5.000% | 8/1/25 | 145 | 147 |
| | Philadelphia PA GO | 5.000% | 8/1/26 | 120 | 124 |
| 1 | Philadelphia PA GO | 5.000% | 8/1/30 | 100 | 105 |
| 6 | Philadelphia PA Water & Wastewater Water Revenue | 5.000% | 9/1/31 | 250 | 282 |
| 1 | Pittsburgh Water & Sewer Authority Water Revenue | 5.000% | 9/1/26 | 295 | 306 |
| | School District of Philadelphia GO | 5.000% | 9/1/26 | 715 | 738 |
Short-Term Tax-Exempt Bond ETF
| | | Coupon | Maturity
Date | Face
Amount
($000) | Market
Value•
($000) |
| 7 | School District of Philadelphia GO | 5.000% | 9/1/27 | 175 | 181 |
| | School District of Philadelphia GO | 5.000% | 9/1/29 | 25 | 26 |
| 1 | State Public School Building Authority Lease (Appropriation) Revenue (Philadelphia School District Project) | 5.500% | 6/1/28 | 205 | 222 |
| 1 | State Public School Building Authority Lease (Non-Terminable) Revenue | 5.000% | 6/1/29 | 310 | 336 |
| | University of Pittsburgh-of the Commonwealth System of Higher Education College & University Revenue | 4.000% | 4/15/26 | 790 | 801 |
| | University of Pittsburgh-of the Commonwealth System of Higher Education College & University Revenue | 5.000% | 2/15/29 | 300 | 327 |
| | | | | | 21,081 |
| Rhode Island (0.3%) |
| | Rhode Island Commerce Corp. Government Fund/Grant Revenue | 5.000% | 6/15/25 | 455 | 459 |
| | Rhode Island Commerce Corp. Government Fund/Grant Revenue | 5.000% | 6/15/26 | 605 | 623 |
| | Rhode Island Commerce Corp. Government Fund/Grant Revenue | 5.000% | 6/15/29 | 50 | 52 |
| | Rhode Island Commerce Corp. Government Fund/Grant Revenue | 5.000% | 6/15/30 | 285 | 293 |
| | Rhode Island Commerce Corp. Government Fund/Grant Revenue | 5.000% | 6/15/31 | 45 | 46 |
| | Rhode Island Health and Educational Building Corp. College & University Revenue | 5.000% | 9/1/29 | 200 | 212 |
| | | | | | 1,685 |
| South Carolina (0.4%) |
| | Charleston Educational Excellence Finance Corp. Intergovernmental Agreement Revenue (Charleston County School District, South Carolina Project) | 5.000% | 12/1/24 | 100 | 100 |
| | Charleston Educational Excellence Finance Corp. Intergovernmental Agreement Revenue (Charleston County School District, South Carolina Project) | 5.000% | 12/1/26 | 120 | 125 |
| | Columbia SC Waterworks & Sewer System Water Revenue, Prere. | 5.000% | 2/1/29 | 5 | 6 |
| | Greenville County School District Lease (Appropriation) Revenue (SC Project) | 5.000% | 12/1/24 | 60 | 60 |
| | Greenville County School District Lease (Appropriation) Revenue (SC Project) | 5.000% | 12/1/25 | 235 | 240 |
| | Greenville County School District Lease (Appropriation) Revenue (SC Project) | 5.000% | 12/1/26 | 50 | 52 |
| | Greenville County School District Lease (Appropriation) Revenue (SC Project) | 5.000% | 12/1/27 | 135 | 144 |
| | Horry County SC School District GO | 5.000% | 3/1/29 | 100 | 109 |
| | South Carolina Public Service Authority Miscellaneous Revenue | 5.000% | 12/1/25 | 240 | 240 |
| | South Carolina Public Service Authority Miscellaneous Revenue | 5.000% | 12/1/26 | 100 | 100 |
| | South Carolina Transportation Infrastructure Bank Miscellaneous Revenue | 5.000% | 10/1/26 | 645 | 672 |
| | South Carolina Transportation Infrastructure Bank Miscellaneous Revenue | 5.000% | 10/1/28 | 250 | 271 |
| | South Carolina Transportation Infrastructure Bank Miscellaneous Revenue | 5.000% | 10/1/30 | 60 | 67 |
| | | | | | 2,186 |
| Tennessee (0.4%) |
| | Memphis TN GO | 5.000% | 4/1/26 | 30 | 30 |
| | Metropolitan Government of Nashville & Davidson County TN GO | 5.000% | 1/1/25 | 90 | 90 |
| | Metropolitan Government of Nashville & Davidson County TN GO | 5.000% | 1/1/26 | 85 | 87 |
| | Metropolitan Government of Nashville & Davidson County TN GO | 5.000% | 7/1/26 | 115 | 119 |
| | Metropolitan Government of Nashville & Davidson County TN GO | 5.000% | 1/1/27 | 310 | 321 |
| | Metropolitan Government of Nashville & Davidson County TN GO | 4.000% | 7/1/28 | 25 | 26 |
| | Metropolitan Government of Nashville & Davidson County TN GO | 4.000% | 7/1/28 | 225 | 232 |
| | Metropolitan Government of Nashville & Davidson County TN GO | 2.500% | 1/1/29 | 150 | 144 |
| | Metropolitan Government of Nashville & Davidson County TN GO | 5.000% | 1/1/29 | 30 | 33 |
| | Metropolitan Government of Nashville & Davidson County TN GO | 4.000% | 7/1/29 | 165 | 169 |
| | Metropolitan Government of Nashville & Davidson County TN GO | 5.000% | 7/1/29 | 65 | 70 |
| | Metropolitan Government of Nashville & Davidson County TN GO | 5.000% | 1/1/30 | 10 | 11 |
| | Metropolitan Government of Nashville & Davidson County TN GO | 4.000% | 7/1/30 | 105 | 107 |
| | Metropolitan Government of Nashville & Davidson County TN GO | 5.000% | 7/1/30 | 15 | 16 |
| | Tennessee State School Bond Authority College & University Revenue (Higher Educational Facilities 2nd Program), Prere. | 5.000% | 11/1/25 | 230 | 234 |
| | Tennessee State School Bond Authority College & University Revenue (Higher Educational Facilities 2nd Program), Prere. | 5.000% | 11/1/25 | 600 | 611 |
| | | | | | 2,300 |
| Texas (9.1%) |
| | Alamo Community College District GO | 5.000% | 2/15/25 | 170 | 171 |
| | Alamo Community College District GO | 5.000% | 2/15/26 | 100 | 103 |
| | Alamo Community College District GO | 5.000% | 2/15/27 | 440 | 461 |
| | Alamo Community College District GO | 5.000% | 2/15/29 | 385 | 419 |
| | Austin Independent School District GO | 5.000% | 8/1/25 | 260 | 263 |
| | Austin TX GO | 2.950% | 9/1/27 | 220 | 219 |
| 4 | Austin TX Multiple Utility Revenue | 5.250% | 5/15/25 | 70 | 71 |
| | Austin TX Water & Wastewater System Water Revenue | 5.000% | 11/15/28 | 165 | 179 |
| | Bexar County TX GO, Prere. | 5.000% | 6/15/26 | 1,060 | 1,092 |
| | Board of Regents of the University of Texas System College & University Revenue | 5.000% | 8/15/25 | 575 | 583 |
| | Board of Regents of the University of Texas System College & University Revenue | 5.000% | 8/15/25 | 195 | 198 |
| | Board of Regents of the University of Texas System College & University Revenue | 5.000% | 8/15/26 | 115 | 119 |
| | Board of Regents of the University of Texas System College & University Revenue | 5.000% | 8/15/26 | 165 | 171 |
| | Board of Regents of the University of Texas System College & University Revenue | 5.000% | 8/15/26 | 135 | 140 |
| | Board of Regents of the University of Texas System College & University Revenue | 5.000% | 8/15/26 | 95 | 99 |
| | Board of Regents of the University of Texas System College & University Revenue | 5.000% | 8/15/27 | 100 | 106 |
Short-Term Tax-Exempt Bond ETF
| | | Coupon | Maturity
Date | Face
Amount
($000) | Market
Value•
($000) |
| | Board of Regents of the University of Texas System College & University Revenue | 5.000% | 8/15/29 | 100 | 110 |
| | Board of Regents of the University of Texas System College & University Revenue | 5.000% | 8/15/30 | 1,120 | 1,254 |
| | Board of Regents of the University of Texas System College & University Revenue | 5.000% | 8/15/31 | 435 | 494 |
| | Board of Regents of the University of Texas System College & University Revenue | 5.000% | 8/15/31 | 475 | 539 |
| | Central Texas Regional Mobility Authority Highway Revenue, Prere. | 5.000% | 7/1/25 | 50 | 51 |
| | Central Texas Turnpike System Highway Revenue | 5.000% | 8/15/31 | 495 | 553 |
| | Central Texas Turnpike System Highway Revenue PUT | 5.000% | 8/15/30 | 135 | 146 |
| 9 | Clear Creek Independent School District GO | 5.000% | 2/15/30 | 250 | 251 |
| 9 | Conroe Independent School District GO | 5.000% | 2/15/29 | 180 | 197 |
| 9 | Cypress-Fairbanks Independent School District GO | 5.000% | 2/15/25 | 20 | 20 |
| 9 | Cypress-Fairbanks Independent School District GO | 5.000% | 2/15/26 | 300 | 308 |
| 9 | Cypress-Fairbanks Independent School District GO | 5.000% | 2/15/27 | 275 | 282 |
| 9 | Cypress-Fairbanks Independent School District GO | 5.000% | 2/15/27 | 100 | 105 |
| 9 | Cypress-Fairbanks Independent School District GO | 5.000% | 2/15/29 | 150 | 151 |
| 9 | Cypress-Fairbanks Independent School District GO | 4.000% | 2/15/31 | 1,000 | 1,001 |
| 2 | Dallas Area Rapid Transit Sales Tax Revenue | 5.250% | 12/1/28 | 140 | 152 |
| | Dallas Area Rapid Transit Sales Tax Revenue | 5.000% | 12/1/29 | 355 | 388 |
| | Dallas Area Rapid Transit Sales Tax Revenue | 5.000% | 12/1/30 | 245 | 268 |
| 2 | Dallas Area Rapid Transit Sales Tax Revenue | 5.250% | 12/1/31 | 80 | 91 |
| | Dallas Area Rapid Transit Sales Tax Revenue, Prere. | 5.000% | 12/1/24 | 570 | 570 |
| | Dallas Area Rapid Transit Sales Tax Revenue, Prere. | 5.000% | 12/1/25 | 100 | 102 |
| | Dallas Area Rapid Transit Sales Tax Revenue, Prere. | 5.000% | 12/1/25 | 50 | 51 |
| | Dallas Area Rapid Transit Sales Tax Revenue, Prere. | 5.000% | 12/1/25 | 660 | 674 |
| | Dallas College GO | 5.000% | 2/15/25 | 155 | 156 |
| | Dallas County Utility & Reclamation District GO | 5.000% | 2/15/28 | 100 | 106 |
| | Dallas Fort Worth International Airport Port, Airport & Marina Revenue | 5.000% | 11/1/25 | 365 | 372 |
| | Dallas Fort Worth International Airport Port, Airport & Marina Revenue | 5.000% | 11/1/25 | 100 | 102 |
| | Dallas Fort Worth International Airport Port, Airport & Marina Revenue | 5.000% | 11/1/26 | 190 | 198 |
| | Dallas Fort Worth International Airport Port, Airport & Marina Revenue | 5.000% | 11/1/27 | 70 | 74 |
| | Dallas Fort Worth International Airport Port, Airport & Marina Revenue | 5.000% | 11/1/28 | 100 | 108 |
| | Dallas Fort Worth International Airport Port, Airport & Marina Revenue | 5.000% | 11/1/29 | 100 | 110 |
| | Dallas Fort Worth International Airport Port, Airport & Marina Revenue | 5.000% | 11/1/30 | 50 | 56 |
| | Dallas Fort Worth International Airport Port, Airport & Marina Revenue | 5.000% | 11/1/30 | 110 | 123 |
| | Dallas Fort Worth International Airport Port, Airport & Marina Revenue | 5.000% | 11/1/31 | 50 | 56 |
| | Dallas TX GO | 5.000% | 2/15/25 | 1,000 | 1,004 |
| | Dallas TX GO | 5.000% | 2/15/25 | 120 | 120 |
| | Dallas TX GO | 5.000% | 2/15/26 | 515 | 528 |
| | Dallas TX GO | 5.000% | 2/15/27 | 150 | 157 |
| | Dallas TX GO | 5.000% | 2/15/27 | 145 | 152 |
| | Dallas TX GO | 5.000% | 2/15/28 | 100 | 107 |
| | Dallas TX GO | 5.000% | 2/15/29 | 710 | 773 |
| | Dallas TX GO | 5.000% | 2/15/30 | 100 | 111 |
| | Dallas TX Waterworks & Sewer System Water Revenue | 5.000% | 10/1/25 | 70 | 71 |
| | Dallas TX Waterworks & Sewer System Water Revenue | 5.000% | 10/1/30 | 5 | 5 |
| 9 | Denton Independent School District GO, Prere. | 5.000% | 8/15/25 | 100 | 101 |
| 9 | Denton Independent School District GO, Prere. | 5.000% | 8/15/25 | 175 | 177 |
| 9 | Fort Bend Independent School District GO | 5.000% | 8/15/25 | 500 | 507 |
| 9 | Fort Bend Independent School District GO PUT | 0.720% | 8/1/26 | 370 | 350 |
| 9 | Fort Bend Independent School District GO PUT | 4.000% | 8/1/27 | 770 | 787 |
| 9 | Fort Worth Independent School District GO | 5.000% | 2/15/28 | 105 | 105 |
| 9 | Fort Worth Independent School District GO, Prere. | 5.000% | 2/15/25 | 10 | 10 |
| | Grand Parkway Transportation Corp. Highway Revenue PUT | 5.000% | 4/1/28 | 250 | 266 |
| | Harris County Cultural Education Facilities Finance Corp. Health, Hospital, Nursing Home Revenue | 5.000% | 5/15/29 | 150 | 163 |
| | Harris County TX GO | 5.000% | 10/1/25 | 205 | 209 |
| | Harris County TX GO | 5.000% | 10/1/26 | 130 | 132 |
| | Harris County TX GO | 5.000% | 10/1/26 | 330 | 344 |
| | Harris County TX GO | 5.000% | 10/1/27 | 155 | 157 |
| | Harris County TX Highway Revenue | 5.000% | 8/15/25 | 230 | 233 |
| | Harris County TX Highway Revenue | 5.000% | 8/15/30 | 25 | 26 |
| | Harris County TX Highway Revenue | 5.000% | 8/15/31 | 265 | 273 |
| | Harris County TX Toll Road Highway Revenue | 5.000% | 8/15/30 | 45 | 50 |
| | Harris County TX Toll Road Highway Revenue | 5.000% | 8/15/31 | 680 | 723 |
| 6 | Harris County-Houston Sports Authority Hotel Occupancy Tax Revenue | 5.000% | 11/15/27 | 520 | 551 |
| 6 | Harris County-Houston Sports Authority Hotel Occupancy Tax Revenue | 5.000% | 11/15/29 | 660 | 722 |
| 6 | Harris County-Houston Sports Authority Hotel Occupancy Tax Revenue | 5.000% | 11/15/30 | 955 | 1,059 |
| 9 | Houston Independent School District GO | 5.000% | 2/15/25 | 225 | 226 |
| 9 | Houston Independent School District GO | 5.000% | 2/15/25 | 1,135 | 1,139 |
| 9 | Houston Independent School District GO | 5.000% | 2/15/26 | 420 | 431 |
| 9 | Houston Independent School District GO | 5.000% | 2/15/26 | 140 | 144 |
| 9 | Houston Independent School District GO | 5.000% | 2/15/27 | 140 | 143 |
Short-Term Tax-Exempt Bond ETF
| | | Coupon | Maturity
Date | Face
Amount
($000) | Market
Value•
($000) |
| 9 | Houston Independent School District GO | 5.000% | 2/15/28 | 135 | 142 |
| 9 | Houston Independent School District GO | 5.000% | 2/15/28 | 50 | 51 |
| 9 | Houston Independent School District GO | 5.000% | 2/15/30 | 75 | 77 |
| 9 | Houston Independent School District GO | 5.000% | 2/15/31 | 60 | 61 |
| | Houston TX Airport System Port, Airport & Marina Revenue | 5.000% | 7/1/29 | 85 | 91 |
| | Houston TX Airport System Port, Airport & Marina Revenue | 5.000% | 7/1/30 | 200 | 214 |
| | Houston TX Combined Utility System Sewer Revenue | 5.000% | 5/15/25 | 445 | 446 |
| | Houston TX GO | 5.000% | 3/1/25 | 135 | 136 |
| | Houston TX GO | 5.000% | 3/1/25 | 150 | 151 |
| | Houston TX GO | 5.000% | 3/1/26 | 310 | 318 |
| | Houston TX GO | 5.000% | 3/1/26 | 100 | 103 |
| | Houston TX GO | 5.000% | 3/1/27 | 275 | 282 |
| | Houston TX GO | 5.000% | 3/1/27 | 85 | 89 |
| | Houston TX GO | 5.000% | 3/1/28 | 100 | 104 |
| | Houston TX GO | 5.000% | 3/1/28 | 90 | 96 |
| | Houston TX GO | 5.000% | 3/1/29 | 105 | 110 |
| | Houston TX GO | 5.000% | 3/1/29 | 35 | 38 |
| | Houston TX GO | 5.000% | 3/1/30 | 30 | 33 |
| 9 | Hutto Independent School District GO PUT | 2.000% | 8/1/25 | 250 | 248 |
| | Lewisville Independent School District GO | 5.000% | 8/15/25 | 180 | 182 |
| | Lewisville Independent School District GO | 5.000% | 8/15/28 | 175 | 177 |
| 9 | Lewisville Independent School District GO | 5.000% | 8/15/29 | 105 | 116 |
| 9 | Little Elm Independent School District GO PUT | 3.700% | 8/15/28 | 260 | 261 |
| | Lower Colorado River Authority Intergovernmental Agreement Revenue | 5.000% | 5/15/25 | 105 | 106 |
| 1 | Lower Colorado River Authority Intergovernmental Agreement Revenue | 5.000% | 5/15/27 | 270 | 285 |
| 1 | Lower Colorado River Authority Intergovernmental Agreement Revenue | 5.000% | 5/15/30 | 205 | 227 |
| 9 | North East TX Independent School District GO | 5.250% | 2/1/27 | 155 | 163 |
| | North Texas Tollway Authority Highway Revenue | 5.000% | 1/1/25 | 130 | 130 |
| | North Texas Tollway Authority Highway Revenue | 5.000% | 1/1/25 | 165 | 165 |
| | North Texas Tollway Authority Highway Revenue | 5.000% | 1/1/25 | 135 | 135 |
| | North Texas Tollway Authority Highway Revenue | 5.000% | 1/1/26 | 100 | 102 |
| | North Texas Tollway Authority Highway Revenue | 5.000% | 1/1/27 | 310 | 324 |
| | North Texas Tollway Authority Highway Revenue | 5.000% | 1/1/27 | 165 | 173 |
| | North Texas Tollway Authority Highway Revenue | 5.000% | 1/1/28 | 460 | 469 |
| | North Texas Tollway Authority Highway Revenue | 5.000% | 1/1/28 | 135 | 138 |
| | North Texas Tollway Authority Highway Revenue | 5.000% | 1/1/29 | 530 | 531 |
| | North Texas Tollway Authority Highway Revenue | 5.000% | 1/1/29 | 310 | 315 |
| | North Texas Tollway Authority Highway Revenue | 5.000% | 1/1/29 | 235 | 255 |
| | North Texas Tollway Authority Highway Revenue | 5.000% | 1/1/30 | 200 | 204 |
| | North Texas Tollway Authority Highway Revenue | 5.000% | 1/1/30 | 120 | 132 |
| | North Texas Tollway Authority Highway Revenue | 5.000% | 1/1/31 | 75 | 76 |
| | North Texas Tollway Authority Highway Revenue | 5.000% | 1/1/31 | 75 | 76 |
| | North Texas Tollway Authority Highway Revenue | 5.000% | 1/1/31 | 265 | 296 |
| | North Texas Tollway Authority Highway Revenue | 5.000% | 1/1/31 | 75 | 76 |
| | North Texas Tollway Authority Highway Revenue | 5.000% | 1/1/31 | 200 | 223 |
| | North Texas Tollway Authority Highway Revenue, Prere. | 6.500% | 1/1/25 | 500 | 501 |
| 6 | North Texas Tollway Authority Miscellaneous Revenue | 0.000% | 1/1/28 | 320 | 290 |
| 6 | North Texas Tollway Authority Miscellaneous Revenue | 0.000% | 1/1/29 | 150 | 131 |
| 6 | North Texas Tollway Authority Miscellaneous Revenue | 0.000% | 1/1/30 | 690 | 583 |
| 6 | North Texas Tollway Authority Miscellaneous Revenue | 0.000% | 1/1/31 | 510 | 415 |
| 9 | Northside Independent School District GO PUT | 0.700% | 6/1/25 | 20 | 20 |
| 9 | Northside Independent School District GO PUT | 3.000% | 8/1/26 | 150 | 149 |
| 9 | Northside Independent School District GO PUT | 2.000% | 6/1/27 | 250 | 241 |
| | Permanent University Fund - University of Texas System College & University Revenue | 5.000% | 7/1/27 | 260 | 275 |
| | Permanent University Fund - University of Texas System College & University Revenue | 5.000% | 7/1/31 | 610 | 692 |
| | Plano Independent School District GO | 5.000% | 2/15/25 | 440 | 442 |
| 9 | Rockwall Independent School District GO, Prere. | 5.000% | 2/15/25 | 100 | 100 |
| 9 | Round Rock Independent School District GO | 5.000% | 8/1/30 | 115 | 127 |
| 9 | Round Rock Independent School District GO | 5.000% | 8/1/31 | 200 | 220 |
| | San Antonio TX Electric & Gas Systems Electric Power & Light Revenue | 5.000% | 2/1/25 | 150 | 150 |
| | San Antonio TX Electric & Gas Systems Electric Power & Light Revenue | 5.250% | 2/1/25 | 415 | 416 |
| | San Antonio TX Electric & Gas Systems Electric Power & Light Revenue | 5.000% | 2/1/26 | 315 | 323 |
| | San Antonio TX Electric & Gas Systems Electric Power & Light Revenue | 5.000% | 2/1/26 | 50 | 51 |
| | San Antonio TX Electric & Gas Systems Electric Power & Light Revenue | 5.000% | 2/1/27 | 80 | 83 |
| | San Antonio TX Electric & Gas Systems Electric Power & Light Revenue | 5.000% | 2/1/28 | 645 | 689 |
| | San Antonio TX Electric & Gas Systems Electric Power & Light Revenue | 5.000% | 2/1/29 | 215 | 222 |
| | San Antonio TX Electric & Gas Systems Electric Power & Light Revenue | 5.000% | 2/1/30 | 255 | 263 |
| | San Antonio TX Electric & Gas Systems Electric Power & Light Revenue PUT | 3.650% | 12/1/26 | 150 | 151 |
| | San Antonio TX GO | 5.000% | 2/1/25 | 250 | 251 |
| 9 | Spring Branch Independent School District GO | 5.000% | 2/1/26 | 100 | 102 |
Short-Term Tax-Exempt Bond ETF
| | | Coupon | Maturity
Date | Face
Amount
($000) | Market
Value•
($000) |
| | Texas A&M University College & University Revenue | 5.000% | 5/15/25 | 85 | 86 |
| | Texas A&M University College & University Revenue | 5.000% | 5/15/26 | 175 | 181 |
| | Texas A&M University College & University Revenue | 5.000% | 5/15/26 | 500 | 516 |
| | Texas A&M University College & University Revenue | 5.000% | 5/15/27 | 150 | 158 |
| | Texas A&M University College & University Revenue | 5.000% | 5/15/28 | 85 | 89 |
| | Texas Department of Transportation State Highway Fund Fuel Sales Tax Revenue | 5.000% | 10/1/25 | 790 | 803 |
| | Texas Department of Transportation State Highway Fund Fuel Sales Tax Revenue | 5.000% | 10/1/26 | 50 | 52 |
| | Texas GO | 5.000% | 10/1/25 | 90 | 90 |
| | Texas GO | 5.000% | 10/1/26 | 185 | 185 |
| | Texas GO | 5.000% | 10/1/26 | 180 | 183 |
| | Texas GO | 5.000% | 10/1/27 | 90 | 90 |
| | Texas GO | 5.000% | 10/1/27 | 240 | 244 |
| | Texas GO | 3.200% | 10/1/28 | 200 | 200 |
| | Texas GO | 5.000% | 10/1/28 | 75 | 76 |
| | Texas GO | 5.000% | 10/1/28 | 125 | 136 |
| | Texas GO | 5.000% | 10/1/29 | 150 | 158 |
| | Texas GO | 5.000% | 10/1/29 | 175 | 178 |
| | Texas GO | 5.000% | 10/1/31 | 110 | 112 |
| | Texas GO | 5.000% | 10/1/31 | 75 | 79 |
| | Texas State University System College & University Revenue | 5.000% | 3/15/27 | 1,080 | 1,134 |
| | Texas State University System College & University Revenue | 5.000% | 3/15/28 | 85 | 89 |
| | Texas State University System College & University Revenue | 5.000% | 3/15/28 | 500 | 535 |
| | Texas State University System College & University Revenue | 5.000% | 3/15/31 | 100 | 104 |
| | Texas State University System College & University Revenue | 5.000% | 3/15/31 | 115 | 129 |
| | Texas Transportation Commission GO | 5.000% | 4/1/26 | 230 | 236 |
| | Texas Transportation Commission GO | 5.000% | 4/1/29 | 1,000 | 1,093 |
| | Texas Transportation Commission GO | 5.000% | 4/1/30 | 195 | 217 |
| | Texas Transportation Commission GO | 5.000% | 4/1/31 | 550 | 621 |
| | Texas Water Development Board Water Revenue | 5.000% | 4/15/25 | 175 | 176 |
| | Texas Water Development Board Water Revenue | 5.000% | 4/15/29 | 300 | 317 |
| | Texas Water Development Board Water Revenue | 5.000% | 10/15/29 | 70 | 71 |
| | Texas Water Development Board Water Revenue | 5.000% | 4/15/30 | 50 | 54 |
| | Texas Water Development Board Water Revenue | 5.000% | 4/15/31 | 75 | 81 |
| | Trinity River Authority Central Regional Wastewater System Sewer Revenue | 3.000% | 8/1/31 | 695 | 689 |
| | Trinity River Authority Central Regional Wastewater System Water Revenue | 5.000% | 8/1/28 | 295 | 312 |
| | Williamson County TX GO | 4.000% | 2/15/26 | 160 | 162 |
| | Williamson County TX GO | 5.000% | 2/15/30 | 245 | 271 |
| | Williamson County TX GO | 5.000% | 2/15/31 | 180 | 202 |
| 9 | Ysleta Independent School District GO, Prere. | 5.000% | 8/15/25 | 435 | 441 |
| | | | | | 51,233 |
| Utah (0.9%) |
| | Intermountain Power Agency Electric Power & Light Revenue | 5.000% | 7/1/28 | 130 | 140 |
| | Intermountain Power Agency Electric Power & Light Revenue | 5.000% | 7/1/29 | 225 | 247 |
| | Intermountain Power Agency Electric Power & Light Revenue | 5.000% | 7/1/30 | 240 | 268 |
| | Intermountain Power Agency Electric Power & Light Revenue | 5.000% | 7/1/30 | 100 | 112 |
| | Intermountain Power Agency Electric Power & Light Revenue | 5.000% | 7/1/31 | 150 | 170 |
| | Intermountain Power Agency Electric Power & Light Revenue | 5.000% | 7/1/31 | 155 | 175 |
| | Utah GO | 5.000% | 7/1/25 | 150 | 152 |
| | Utah GO | 5.000% | 7/1/27 | 200 | 212 |
| | Utah GO | 5.000% | 7/1/29 | 100 | 109 |
| | Utah GO | 5.000% | 7/1/30 | 550 | 599 |
| | Utah GO | 5.000% | 7/1/31 | 510 | 555 |
| | Utah Transit Authority Government Securities & Interest Revenue, Prere. | 5.000% | 6/15/25 | 340 | 344 |
| | Utah Transit Authority Sales Tax Revenue, Prere. | 4.000% | 6/15/25 | 100 | 101 |
| | Utah Transit Authority Sales Tax Revenue, Prere. | 4.000% | 6/15/25 | 1,055 | 1,061 |
| | Utah Transit Authority Sales Tax Revenue, Prere. | 5.000% | 6/15/25 | 110 | 111 |
| | Utah Transit Authority Sales Tax Revenue, Prere. | 5.000% | 6/15/25 | 210 | 212 |
| | Utah Transit Authority Sales Tax Revenue, Prere. | 5.000% | 6/15/25 | 70 | 71 |
| | Utah Transit Authority Sales Tax Revenue, Prere. | 5.000% | 6/15/25 | 100 | 101 |
| | Utah Transit Authority Sales Tax Revenue, Prere. | 5.000% | 6/15/25 | 20 | 20 |
| | Utah Transit Authority Sales Tax Revenue, Prere. | 5.000% | 6/15/25 | 315 | 318 |
| | Utah Transit Authority Sales Tax Revenue, Prere. | 5.000% | 6/15/25 | 55 | 56 |
| | | | | | 5,134 |
| Virginia (2.0%) |
| | Fairfax VA County GO | 4.000% | 10/1/26 | 490 | 498 |
| | Fairfax VA County GO | 4.000% | 10/1/27 | 160 | 163 |
| | Hampton Roads Transportation Accountability Commission Appropriations Revenue BAN, ETM | 5.000% | 7/1/26 | 315 | 325 |
| | Hampton Roads Transportation Accountability Commission Sales Tax Revenue, Prere. | 5.000% | 1/1/28 | 65 | 70 |
| | Richmond VA Public Utility Water Revenue, Prere. | 5.000% | 1/15/26 | 100 | 102 |
Short-Term Tax-Exempt Bond ETF
| | | Coupon | Maturity
Date | Face
Amount
($000) | Market
Value•
($000) |
| | Richmond VA Public Utility Water Revenue, Prere. | 5.000% | 1/15/26 | 50 | 51 |
| | Richmond VA Public Utility Water Revenue, Prere. | 5.000% | 1/15/26 | 155 | 159 |
| | Virginia College Building Authority Appropriations Revenue | 5.000% | 2/1/25 | 105 | 105 |
| | Virginia College Building Authority Appropriations Revenue | 5.000% | 2/1/26 | 65 | 67 |
| | Virginia College Building Authority Appropriations Revenue | 3.000% | 2/1/27 | 155 | 154 |
| | Virginia College Building Authority Appropriations Revenue (21st Century College & Equipment Programs) | 5.000% | 2/1/25 | 320 | 321 |
| | Virginia College Building Authority Appropriations Revenue (21st Century College & Equipment Programs) | 5.000% | 2/1/25 | 240 | 241 |
| | Virginia College Building Authority Appropriations Revenue (21st Century College & Equipment Programs) | 5.000% | 2/1/26 | 275 | 282 |
| | Virginia College Building Authority Appropriations Revenue (21st Century College & Equipment Programs) | 5.000% | 2/1/26 | 80 | 82 |
| | Virginia College Building Authority Appropriations Revenue (21st Century College & Equipment Programs) | 5.000% | 2/1/26 | 100 | 103 |
| | Virginia College Building Authority Appropriations Revenue (21st Century College & Equipment Programs) | 5.000% | 2/1/27 | 55 | 58 |
| | Virginia College Building Authority Appropriations Revenue (21st Century College & Equipment Programs) | 5.000% | 2/1/27 | 100 | 105 |
| | Virginia College Building Authority Appropriations Revenue (21st Century College & Equipment Programs) | 5.000% | 2/1/27 | 525 | 551 |
| | Virginia College Building Authority Appropriations Revenue (21st Century College & Equipment Programs) | 5.000% | 2/1/28 | 125 | 134 |
| | Virginia College Building Authority Appropriations Revenue (21st Century College & Equipment Programs) | 5.000% | 2/1/28 | 285 | 305 |
| | Virginia College Building Authority Appropriations Revenue (21st Century College & Equipment Programs) | 5.000% | 2/1/28 | 125 | 134 |
| | Virginia College Building Authority Appropriations Revenue (21st Century College & Equipment Programs) | 5.000% | 2/1/29 | 220 | 235 |
| | Virginia College Building Authority Appropriations Revenue (21st Century College & Equipment Programs) | 5.000% | 2/1/29 | 260 | 284 |
| | Virginia College Building Authority Appropriations Revenue (21st Century College & Equipment Programs) | 5.000% | 2/1/29 | 200 | 218 |
| | Virginia College Building Authority Appropriations Revenue (21st Century College & Equipment Programs) | 5.000% | 2/1/30 | 285 | 298 |
| | Virginia College Building Authority Appropriations Revenue (21st Century College & Equipment Programs) | 5.000% | 2/1/31 | 245 | 256 |
| | Virginia College Building Authority Appropriations Revenue (21st Century College & Equipment Programs) | 5.000% | 2/1/31 | 50 | 53 |
| | Virginia College Building Authority Appropriations Revenue (21st Century College & Equipment Programs) | 5.000% | 2/1/31 | 425 | 480 |
| | Virginia College Building Authority Appropriations Revenue, Prere. | 5.000% | 2/1/25 | 825 | 828 |
| | Virginia College Building Authority College & University Revenue | 5.000% | 9/1/27 | 190 | 197 |
| | Virginia College Building Authority Intergovernmental Agreement Revenue | 5.000% | 2/1/29 | 150 | 164 |
| | Virginia College Building Authority Lease (Appropriation) Revenue (21st Century College & Equipment Program) | 5.000% | 2/1/25 | 425 | 426 |
| | Virginia College Building Authority Lease (Appropriation) Revenue (21st Century College & Equipment Program) | 5.000% | 2/1/26 | 70 | 72 |
| | Virginia Commonwealth Transportation Board Appropriations Revenue | 5.000% | 5/15/25 | 190 | 192 |
| | Virginia Commonwealth Transportation Board Appropriations Revenue | 5.000% | 5/15/26 | 200 | 207 |
| | Virginia Commonwealth Transportation Board Appropriations Revenue | 5.000% | 5/15/27 | 465 | 491 |
| | Virginia Commonwealth Transportation Board Appropriations Revenue | 5.000% | 5/15/28 | 210 | 224 |
| | Virginia Commonwealth Transportation Board Appropriations Revenue | 5.000% | 5/15/30 | 100 | 106 |
| | Virginia Commonwealth Transportation Board Appropriations Revenue (Transportation Capital Project) | 5.000% | 5/15/31 | 245 | 278 |
| | Virginia Commonwealth Transportation Board Appropriations Revenue (Virginia Transportation Capital Projects) | 5.000% | 5/15/30 | 50 | 56 |
| | Virginia Commonwealth Transportation Board Government Fund/Grant Revenue GAN | 5.000% | 3/15/25 | 25 | 25 |
| | Virginia Commonwealth Transportation Board Government Fund/Grant Revenue GAN | 5.000% | 9/15/25 | 235 | 239 |
| | Virginia Commonwealth Transportation Board Government Fund/Grant Revenue GAN | 5.000% | 3/15/26 | 40 | 41 |
| | Virginia Commonwealth Transportation Board Government Fund/Grant Revenue GAN | 5.000% | 9/15/26 | 250 | 260 |
| | Virginia Commonwealth Transportation Board Government Fund/Grant Revenue GAN | 5.000% | 3/15/27 | 100 | 105 |
| | Virginia Commonwealth Transportation Board Government Fund/Grant Revenue GAN | 5.000% | 9/15/27 | 60 | 64 |
| | Virginia Public Building Authority Appropriations Revenue | 5.000% | 8/1/25 | 100 | 101 |
| | Virginia Public Building Authority Appropriations Revenue | 5.000% | 8/1/26 | 380 | 394 |
| | Virginia Public Building Authority Appropriations Revenue | 5.000% | 8/1/28 | 100 | 106 |
| | Virginia Public Building Authority Appropriations Revenue | 5.000% | 8/1/31 | 180 | 205 |
| | Virginia Public School Authority Intergovernmental Agreement Revenue | 5.000% | 8/1/25 | 15 | 15 |
| | Virginia Public School Authority Intergovernmental Agreement Revenue | 5.000% | 8/1/26 | 400 | 406 |
| | Virginia Public School Authority Intergovernmental Agreement Revenue | 5.000% | 8/1/27 | 125 | 127 |
| | Virginia Public School Authority Intergovernmental Agreement Revenue | 5.000% | 8/1/28 | 20 | 20 |
| | | | | | 11,183 |
| Washington (4.3%) |
| | Central Puget Sound Regional Transit Authority Sales Tax Revenue | 5.000% | 11/1/26 | 205 | 214 |
| | Central Puget Sound Regional Transit Authority Sales Tax Revenue | 5.000% | 11/1/27 | 550 | 587 |
| | Central Puget Sound Regional Transit Authority Sales Tax Revenue | 5.000% | 11/1/28 | 45 | 49 |
| | Central Puget Sound Regional Transit Authority Sales Tax Revenue | 5.000% | 11/1/29 | 120 | 133 |
| | Central Puget Sound Regional Transit Authority Sales Tax Revenue | 5.000% | 11/1/30 | 45 | 51 |
| | Central Puget Sound Regional Transit Authority Sales Tax Revenue | 5.000% | 11/1/31 | 120 | 137 |
| | Central Puget Sound Regional Transit Authority Sales Tax Revenue, Prere. | 4.000% | 11/1/25 | 440 | 445 |
| | Central Puget Sound Regional Transit Authority Sales Tax Revenue, Prere. | 4.000% | 11/1/25 | 620 | 627 |
| | Central Puget Sound Regional Transit Authority Sales Tax Revenue, Prere. | 5.000% | 11/1/25 | 105 | 107 |
| | Central Puget Sound Regional Transit Authority Sales Tax Revenue, Prere. | 5.000% | 11/1/25 | 515 | 525 |
| | Central Puget Sound Regional Transit Authority Sales Tax Revenue, Prere. | 5.000% | 11/1/25 | 25 | 25 |
| | Central Puget Sound Regional Transit Authority Sales Tax Revenue, Prere. | 5.000% | 11/1/25 | 280 | 286 |
| | Central Puget Sound Regional Transit Authority Sales Tax Revenue, Prere. | 5.000% | 11/1/25 | 660 | 673 |
| | Central Puget Sound Regional Transit Authority Sales Tax Revenue, Prere. | 5.000% | 11/1/25 | 130 | 133 |
| | Energy Northwest Nuclear Revenue | 5.000% | 7/1/25 | 80 | 81 |
| | Energy Northwest Nuclear Revenue | 5.000% | 7/1/26 | 45 | 47 |
Short-Term Tax-Exempt Bond ETF
| | | Coupon | Maturity
Date | Face
Amount
($000) | Market
Value•
($000) |
| | Energy Northwest Nuclear Revenue | 5.000% | 7/1/26 | 245 | 248 |
| | Energy Northwest Nuclear Revenue | 5.000% | 7/1/28 | 130 | 134 |
| | Energy Northwest Nuclear Revenue | 5.000% | 7/1/29 | 150 | 158 |
| | Energy Northwest Nuclear Revenue | 4.000% | 7/1/30 | 390 | 414 |
| | Energy Northwest Nuclear Revenue | 5.000% | 7/1/30 | 25 | 28 |
| | Energy Northwest Nuclear Revenue | 5.000% | 7/1/31 | 390 | 442 |
| | Energy Northwest Nuclear Revenue (Project No. 1 Electric Revenue) | 5.000% | 7/1/25 | 150 | 152 |
| | Energy Northwest Nuclear Revenue (Project No. 1 Electric Revenue) | 5.000% | 7/1/26 | 100 | 103 |
| | Energy Northwest Nuclear Revenue (Project No. 1 Electric Revenue) | 5.000% | 7/1/27 | 175 | 185 |
| | Energy Northwest Nuclear Revenue (Project No. 1) | 5.000% | 7/1/25 | 160 | 162 |
| | Energy Northwest Nuclear Revenue (Project No. 1) | 5.000% | 7/1/26 | 210 | 217 |
| | Energy Northwest Nuclear Revenue (Project No. 1) | 5.000% | 7/1/26 | 130 | 135 |
| | Energy Northwest Nuclear Revenue (Project No. 1) | 5.000% | 7/1/27 | 210 | 222 |
| | Energy Northwest Nuclear Revenue (Project No. 1) | 5.000% | 7/1/28 | 230 | 248 |
| | Energy Northwest Nuclear Revenue (Project No. 3 Electric Revenue) | 5.000% | 7/1/25 | 95 | 96 |
| | Energy Northwest Nuclear Revenue (Project No. 3 Electric Revenue) | 5.000% | 7/1/26 | 405 | 419 |
| | Energy Northwest Nuclear Revenue (Project No. 3 Electric Revenue) | 5.000% | 7/1/26 | 165 | 167 |
| | Energy Northwest Nuclear Revenue (Project No. 3 Electric Revenue) | 5.000% | 7/1/28 | 710 | 767 |
| | Energy Northwest Nuclear Revenue (Project No. 3) | 5.000% | 7/1/25 | 145 | 147 |
| | Energy Northwest Nuclear Revenue (Project No. 3) | 5.000% | 7/1/28 | 305 | 323 |
| | Energy Northwest Nuclear Revenue (Project No. 3) | 5.000% | 7/1/28 | 220 | 238 |
| | Franklin County School District No. 1 Pasco GO | 4.000% | 12/1/28 | 140 | 147 |
| | King County School District No. 414 Lake Washington GO | 4.000% | 12/1/27 | 55 | 57 |
| | King County School District No. 414 Lake Washington GO | 4.000% | 12/1/28 | 115 | 121 |
| | King County WA GO | 4.000% | 1/1/26 | 215 | 218 |
| | King County WA GO | 4.000% | 1/1/27 | 175 | 180 |
| | King County WA GO | 5.000% | 1/1/30 | 265 | 294 |
| | King County WA GO | 5.000% | 1/1/31 | 70 | 79 |
| | King County WA Sewer Revenue | 4.000% | 7/1/30 | 300 | 304 |
| | King County WA Sewer Revenue | 4.000% | 7/1/31 | 30 | 30 |
| | King County WA Sewer Revenue, Prere. | 5.000% | 1/1/25 | 140 | 140 |
| | King County WA Sewer Revenue, Prere. | 5.000% | 1/1/25 | 100 | 100 |
| | King County WA Sewer Revenue, Prere. | 5.000% | 1/1/25 | 15 | 15 |
| | Pierce County School District No. 10 Tacoma GO, Prere. | 5.250% | 12/1/24 | 25 | 25 |
| | Pierce County School District No. 10 Tacoma GO, Prere. | 5.000% | 12/1/25 | 100 | 102 |
| | Port of Seattle WA Port, Airport & Marina Revenue | 5.000% | 8/1/30 | 5 | 6 |
| | Seattle WA Municipal Light & Power Electric Power & Light Revenue | 5.000% | 2/1/25 | 215 | 216 |
| | University of Washington College & University Revenue PUT | 4.000% | 8/1/27 | 100 | 102 |
| | Washington GO | 5.000% | 7/1/25 | 320 | 324 |
| | Washington GO | 5.000% | 7/1/25 | 510 | 516 |
| | Washington GO | 5.000% | 7/1/25 | 330 | 330 |
| | Washington GO | 5.000% | 7/1/25 | 200 | 202 |
| | Washington GO | 5.000% | 8/1/25 | 75 | 76 |
| | Washington GO | 4.000% | 7/1/26 | 535 | 546 |
| | Washington GO | 4.000% | 7/1/26 | 65 | 66 |
| | Washington GO | 5.000% | 7/1/26 | 50 | 51 |
| | Washington GO | 5.000% | 7/1/26 | 150 | 150 |
| | Washington GO | 5.000% | 7/1/26 | 175 | 175 |
| | Washington GO | 5.000% | 8/1/26 | 185 | 192 |
| | Washington GO | 5.000% | 8/1/26 | 110 | 114 |
| | Washington GO | 5.000% | 8/1/26 | 575 | 597 |
| | Washington GO | 4.000% | 7/1/27 | 625 | 645 |
| | Washington GO | 5.000% | 7/1/27 | 305 | 305 |
| | Washington GO | 5.000% | 8/1/27 | 350 | 371 |
| | Washington GO | 4.000% | 7/1/28 | 115 | 120 |
| | Washington GO | 5.000% | 7/1/28 | 160 | 164 |
| | Washington GO | 5.000% | 7/1/28 | 325 | 325 |
| | Washington GO | 5.000% | 8/1/28 | 60 | 64 |
| | Washington GO | 5.000% | 7/1/29 | 255 | 255 |
| | Washington GO | 5.000% | 7/1/29 | 95 | 97 |
| | Washington GO | 5.000% | 7/1/29 | 250 | 250 |
| | Washington GO | 5.000% | 7/1/29 | 500 | 550 |
| | Washington GO | 5.000% | 8/1/29 | 225 | 232 |
| | Washington GO | 5.000% | 8/1/29 | 145 | 153 |
| | Washington GO | 5.000% | 8/1/29 | 800 | 881 |
| | Washington GO | 5.000% | 7/1/30 | 235 | 240 |
| | Washington GO | 5.000% | 7/1/30 | 305 | 305 |
| | Washington GO | 5.000% | 7/1/30 | 250 | 280 |
| | Washington GO | 5.000% | 7/1/30 | 200 | 200 |
| | Washington GO | 5.000% | 7/1/30 | 500 | 560 |
Short-Term Tax-Exempt Bond ETF
| | | Coupon | Maturity
Date | Face
Amount
($000) | Market
Value•
($000) |
| | Washington GO | 5.000% | 8/1/30 | 15 | 15 |
| | Washington GO | 5.000% | 8/1/30 | 395 | 417 |
| | Washington GO | 5.000% | 7/1/31 | 155 | 155 |
| | Washington GO | 5.000% | 7/1/31 | 460 | 469 |
| | Washington GO | 5.000% | 7/1/31 | 315 | 358 |
| | Washington GO | 5.000% | 7/1/31 | 1,000 | 1,136 |
| | Washington GO | 5.000% | 8/1/31 | 675 | 710 |
| | Washington GO | 5.000% | 8/1/31 | 280 | 288 |
| | | | | | 24,145 |
| Wisconsin (1.4%) |
| | Dane County WI GO | 2.500% | 6/1/27 | 100 | 97 |
| | Wisconsin Appropriations Revenue, ETM | 5.000% | 5/1/26 | 1,375 | 1,416 |
| | Wisconsin Appropriations Revenue, ETM | 5.000% | 5/1/27 | 25 | 26 |
| | Wisconsin Appropriations Revenue, Prere. | 5.000% | 5/1/27 | 350 | 369 |
| | Wisconsin Appropriations Revenue, Prere. | 5.000% | 5/1/27 | 310 | 327 |
| | Wisconsin Department of Transportation Miscellaneous Revenue | 5.000% | 7/1/28 | 100 | 106 |
| | Wisconsin Department of Transportation Miscellaneous Revenue | 5.000% | 7/1/28 | 100 | 106 |
| | Wisconsin Department of Transportation Miscellaneous Revenue | 5.000% | 7/1/30 | 260 | 291 |
| | Wisconsin Department of Transportation Miscellaneous Revenue | 5.000% | 7/1/30 | 105 | 111 |
| | Wisconsin Department of Transportation Miscellaneous Revenue | 5.000% | 7/1/31 | 515 | 584 |
| | Wisconsin GO | 5.000% | 5/1/25 | 260 | 262 |
| | Wisconsin GO | 5.000% | 11/1/25 | 35 | 35 |
| | Wisconsin GO | 5.000% | 11/1/25 | 150 | 153 |
| | Wisconsin GO | 5.000% | 5/1/26 | 90 | 93 |
| 5 | Wisconsin GO | 5.000% | 5/1/26 | 205 | 210 |
| | Wisconsin GO | 5.000% | 11/1/26 | 455 | 475 |
| | Wisconsin GO | 5.000% | 5/1/27 | 85 | 90 |
| 5 | Wisconsin GO | 5.000% | 5/1/27 | 170 | 179 |
| | Wisconsin GO | 5.000% | 11/1/27 | 175 | 184 |
| | Wisconsin GO | 5.000% | 11/1/27 | 665 | 700 |
| | Wisconsin GO | 5.000% | 11/1/27 | 130 | 137 |
| | Wisconsin GO | 5.000% | 5/1/28 | 100 | 108 |
| 5 | Wisconsin GO | 5.000% | 5/1/28 | 280 | 300 |
| | Wisconsin GO | 5.000% | 11/1/28 | 115 | 121 |
| | Wisconsin GO | 5.000% | 11/1/28 | 225 | 237 |
| | Wisconsin GO | 5.000% | 11/1/29 | 105 | 110 |
| | Wisconsin GO | 5.000% | 11/1/29 | 275 | 289 |
| | Wisconsin GO | 5.000% | 5/1/30 | 180 | 201 |
| | Wisconsin GO | 5.000% | 5/1/30 | 260 | 290 |
| | Wisconsin GO | 5.000% | 5/1/31 | 150 | 170 |
| | Wisconsin GO | 5.000% | 11/1/31 | 280 | 294 |
| | | | | | 8,071 |
| Total Tax-Exempt Municipal Bonds (Cost $553,035) | 556,367 |
Short-Term Tax-Exempt Bond ETF
| | | Coupon | | Shares | Market
Value•
($000) |
| Temporary Cash Investments (0.2%) |
| Investment Company (0.2%) |
| 10 | Vanguard Municipal Low Duration Fund (Cost $1,377) | 2.890% | | 137,750 | 1,378 |
| Total Investments (99.5%) (Cost $554,412) | 557,745 |
| Other Assets and Liabilities—Net (0.5%) | 2,838 |
| Net Assets (100%) | 560,583 |
| Cost is in $000. |
| • | See Note A in Notes to Financial Statements. |
| 1 | Scheduled principal and interest payments are guaranteed by Assured Guaranty Municipal Corp. |
| 2 | Scheduled principal and interest payments are guaranteed by Ambac Assurance Corp. |
| 3 | Scheduled principal and interest payments are guaranteed by Financial Guaranty Insurance Co. |
| 4 | Scheduled principal and interest payments are guaranteed by National Public Finance Guarantee Corp. |
| 5 | Includes securities purchased on a when-issued or delayed-delivery basis for which the fund has not taken delivery as of November 30, 2024. |
| 6 | Scheduled principal and interest payments are guaranteed by Assured Guaranty Corp. |
| 7 | Scheduled principal and interest payments are guaranteed by Build America Mutual Assurance Co. |
| 8 | Scheduled principal and interest payments are guaranteed by Michigan School Board Loan Fund. |
| 9 | Scheduled principal and interest payments are guaranteed by Texas Permanent School Fund. |
| 10 | Affiliated short-term municipal bond fund available only to Vanguard funds and certain trusts and accounts managed by Vanguard. Rate shown is the 7-day yield. |
| | BAN—Bond Anticipation Note. |
| | COP—Certificate of Participation. |
| | ETM—Escrowed to Maturity. |
| | GAN—Grant Anticipation Note. |
| | GO—General Obligation Bond. |
| | IDA—Industrial Development Authority Bond. |
| | PILOT—Payments in Lieu of Taxes. |
| | Prere.—Prerefunded. |
| | PUT—Put Option Obligation. |
| | RAN—Revenue Anticipation Note. |
See accompanying Notes, which are an integral part of the Financial Statements.
Short-Term Tax-Exempt Bond ETF
Statement of Assets and Liabilities
|
| ($000s, except shares, footnotes, and per-share amounts) | Amount |
| Assets | |
| Investments in Securities, at Value | |
| Unaffiliated Issuers (Cost $553,035) | 556,367 |
| Affiliated Issuers (Cost $1,377) | 1,378 |
| Total Investments in Securities | 557,745 |
| Investment in Vanguard | 14 |
| Cash | 1 |
| Receivables for Accrued Income | 7,319 |
| Total Assets | 565,079 |
| Liabilities | |
| Payables for Investment Securities Purchased | 4,480 |
| Payables to Vanguard | 16 |
| Total Liabilities | 4,496 |
| Net Assets | 560,583 |
| At November 30, 2024, net assets consisted of: | |
| | |
| Paid-in Capital | 555,922 |
| Total Distributable Earnings (Loss) | 4,661 |
| Net Assets | 560,583 |
| |
| Net Assets | |
Applicable to 5,550,000 outstanding $.001 par value shares of
beneficial interest (unlimited authorization) | 560,583 |
| Net Asset Value Per Share | $101.01 |
See accompanying Notes, which are an integral part of the Financial Statements.
Short-Term Tax-Exempt Bond ETF
|
| | Year Ended
November 30, 2024 |
| | ($000) |
| Investment Income | |
| Income | |
| Interest1 | 14,040 |
| Total Income | 14,040 |
| Expenses | |
| The Vanguard Group—Note B | |
| Investment Advisory Services | 8 |
| Management and Administrative | 230 |
| Marketing and Distribution | 18 |
| Custodian Fees | 9 |
| Auditing Fees | 32 |
| Shareholders’ Reports and Proxy Fees | 8 |
| Trustees’ Fees and Expenses | — |
| Other Expenses | 12 |
| Total Expenses | 317 |
| Expenses Paid Indirectly | (2) |
| Net Expenses | 315 |
| Net Investment Income | 13,725 |
| Realized Net Gain (Loss) on Investment Securities Sold1,2 | 1,078 |
| Change in Unrealized Appreciation (Depreciation) of Investment Securities1 | 455 |
| Net Increase (Decrease) in Net Assets Resulting from Operations | 15,258 |
| 1 | Interest income, realized net gain (loss), capital gain distributions received, and change in unrealized appreciation (depreciation) from an affiliated company of the fund were $162,000, less than $1,000, less than $1,000, and $1,000, respectively. Purchases and sales are for temporary cash investment purposes. |
| 2 | Includes $1,010,000 of net gain (loss) resulting from in-kind redemptions. |
See accompanying Notes, which are an integral part of the Financial Statements.
Short-Term Tax-Exempt Bond ETF
Statement of Changes in Net Assets
|
| | Year Ended November 30, 2024 | | March 7, 20231 to
November 30, 2023 |
| | ($000) | | ($000) |
| Increase (Decrease) in Net Assets | | | |
| Operations | | | |
| Net Investment Income | 13,725 | | 3,847 |
| Realized Net Gain (Loss) | 1,078 | | (377) |
| Change in Unrealized Appreciation (Depreciation) | 455 | | 2,878 |
| Net Increase (Decrease) in Net Assets Resulting from Operations | 15,258 | | 6,348 |
| Distributions | | | |
| Total Distributions | (13,276) | | (2,931) |
| Capital Share Transactions | | | |
| Issued | 228,896 | | 417,141 |
| Issued in Lieu of Cash Distributions | — | | — |
| Redeemed | (60,834) | | (30,019) |
| Net Increase (Decrease) from Capital Share Transactions | 168,062 | | 387,122 |
| Total Increase (Decrease) | 170,044 | | 390,539 |
| Net Assets | | | |
| Beginning of Period | 390,539 | | — |
| End of Period | 560,583 | | 390,539 |
See accompanying Notes, which are an integral part of the Financial Statements.
Short-Term Tax-Exempt Bond ETF
For a Share Outstanding
Throughout Each Period | Year
Ended
November 30, 2024 | March 7,
20231to
November 30, 2023 |
| Net Asset Value, Beginning of Period | $100.78 | $100.00 |
| Investment Operations | | |
| Net Investment Income2 | 3.068 | 2.098 |
| Net Realized and Unrealized Gain (Loss) on Investments | .163 | .252 |
| Total from Investment Operations | 3.231 | 2.350 |
| Distributions | | |
| Dividends from Net Investment Income | (3.001) | (1.570) |
| Distributions from Realized Capital Gains | — | — |
| Total Distributions | (3.001) | (1.570) |
| Net Asset Value, End of Period | $101.01 | $100.78 |
| Total Return | 3.26% | 2.38% |
| Ratios/Supplemental Data | | |
| Net Assets, End of Period (Millions) | $561 | $391 |
| Ratio of Total Expenses to Average Net Assets | 0.07%3 | 0.07%4 |
| Ratio of Net Investment Income to Average Net Assets | 3.05% | 2.85%4 |
| Portfolio Turnover Rate | 21%5 | 9%5 |
| 1 | Inception. |
| 2 | Calculated based on average shares outstanding. |
| 3 | The ratio of expenses to average net assets for the period net of reduction from custody fee offset arrangements was 0.07%. |
| 4 | Annualized. |
| 5 | Excludes the value of portfolio securities received or delivered as a result of in-kind purchases or redemptions of the fund’s capital shares, including ETF Creation Units. |
See accompanying Notes, which are an integral part of the Financial Statements.
Short-Term Tax-Exempt Bond ETF
Notes to Financial Statements
Vanguard Short-Term Tax-Exempt Bond ETF is registered under the Investment Company Act of 1940 as an open-end investment company, or mutual fund. ETF Shares are listed for trading on NYSE Arca; they can be purchased and sold through a broker.
| A. | The following significant accounting policies conform to generally accepted accounting principles for U.S. investment companies. The fund consistently follows such policies in preparing its financial statements. |
1. Security Valuation: Securities are valued as of the close of trading on the New York Stock Exchange (generally 4 p.m., Eastern time) on the valuation date. Bonds and other temporary cash investments are valued using the latest bid prices or using valuations based on a matrix system (which considers such factors as security prices, yields, maturities, and ratings), both as furnished by independent pricing services. Investments in Vanguard Municipal Low Duration Fund are valued at that fund's net asset value. Securities for which market quotations are not readily available, or whose values have been affected by events occurring before the fund’s pricing time but after the close of the securities’ primary markets, are valued by methods deemed by the valuation designee to represent fair value and subject to oversight by the board of trustees.
2. Federal Income Taxes: The fund intends to continue to qualify as a regulated investment company and distribute virtually all of its income. The fund’s tax returns are open to examination by the relevant tax authorities until expiration of the applicable statute of limitations, which is generally three years after the filing of the tax return. Management has analyzed the fund’s tax positions taken for all open federal and state income tax years, and has concluded that no provision for income tax is required in the fund’s financial statements.
3. Distributions: Distributions to shareholders are recorded on the ex-dividend date. Distributions are determined on a tax basis at the fiscal year-end and may differ from net investment income and realized capital gains for financial reporting purposes.
4. Credit Facilities and Interfund Lending Program: The fund and certain other funds managed by The Vanguard Group ("Vanguard") participate in a $4.3 billion committed credit facility provided by a syndicate of lenders pursuant to a credit agreement and an uncommitted credit facility provided by Vanguard. Both facilities may be renewed annually. Each fund is individually liable for its borrowings, if any, under the credit facilities. Borrowings may be utilized for temporary or emergency purposes and are subject to the fund’s regulatory and contractual borrowing restrictions. With respect to the committed credit facility, the participating funds are charged administrative fees and an annual commitment fee of 0.10% of the undrawn committed amount of the facility, which are allocated to the funds based on a method approved by the fund’s board of trustees and included in Management and Administrative expenses on the fund’s Statement of Operations. Any borrowings under either facility bear interest at an agreed-upon spread plus the higher of the federal funds effective rate, the overnight bank funding rate, or the Daily Simple Secured Overnight Financing Rate inclusive of an additional agreed-upon spread. However, borrowings under the uncommitted credit facility may bear interest based upon an alternate rate agreed to by the fund and Vanguard.
In accordance with an exemptive order (the “Order”) from the SEC, the fund may participate in a joint lending and borrowing program that allows registered open-end Vanguard funds to borrow money from and lend money to each other for temporary or emergency purposes (the “Interfund Lending Program”), subject to compliance with the terms and conditions of the Order, and to the extent permitted by the fund’s investment objective and investment policies. Interfund loans and borrowings normally extend overnight but can have a maximum duration of seven days. Loans may be called on one business day’s notice. The interest rate to be charged is governed by the conditions of the Order and internal procedures adopted by the board of trustees. The board of trustees is responsible for overseeing the Interfund Lending Program.
For the year ended November 30, 2024, the fund did not utilize the credit facilities or the Interfund Lending Program.
5. Other: Interest income includes income distributions received from Vanguard Municipal Low Duration Fund and is accrued daily. Premiums and discounts on debt securities are amortized and accreted, respectively, to interest income over the lives of the respective securities, except for premiums on certain callable debt securities that are amortized to the earliest call date. Security transactions are accounted for on the date securities are bought or sold. Costs used to determine realized gains (losses) on the sale of investment securities are those of the specific securities sold.
| B. | In accordance with the terms of a Funds' Service Agreement (the “FSA”) between Vanguard and the fund, Vanguard furnishes to the fund investment advisory, corporate management, administrative, marketing, and distribution services at Vanguard’s cost of operations (as defined by the FSA). These costs of operations are allocated to the fund based on methods and guidelines approved by the board of trustees and are generally settled twice a month. |
Upon the request of Vanguard, the fund may invest up to 0.40% of its net assets as capital in Vanguard. At November 30, 2024, the fund had contributed to Vanguard capital in the amount of $14,000, representing less than 0.01% of the fund’s net assets and 0.01% of Vanguard’s capital received pursuant to the FSA. The fund’s trustees and officers are also directors and employees, respectively, of Vanguard.
| C. | The fund’s custodian bank has agreed to reduce its fees when the fund maintains cash on deposit in the non-interest-bearing custody account. For the year ended November 30, 2024, custodian fee offset arrangements reduced the fund’s expenses by $2,000 (an annual rate of less than 0.01% of average net assets). |
| D. | Various inputs may be used to determine the value of the fund’s investments. These inputs are summarized in three broad levels for financial statement purposes. The inputs or methodologies used to value securities are not necessarily an indication of the risk associated with investing in those securities. |
Level 1—Quoted prices in active markets for identical securities.
Level 2—Other significant observable inputs (including quoted prices for similar securities, interest rates, prepayment speeds, credit risk, etc.).
Level 3—Significant unobservable inputs (including the fund’s own assumptions used to determine the fair value of investments). Any investments valued with significant unobservable inputs are noted on the Schedule of Investments.
Short-Term Tax-Exempt Bond ETF
The following table summarizes the market value of the fund’s investments as of November 30, 2024, based on the inputs used to value them:
| | Level 1
($000) | Level 2
($000) | Level 3
($000) | Total
($000) |
| Investments | | | | |
| Assets | | | | |
| Tax-Exempt Municipal Bonds | — | 556,367 | — | 556,367 |
| Temporary Cash Investments | 1,378 | — | — | 1,378 |
| Total | 1,378 | 556,367 | — | 557,745 |
| E. | Permanent differences between book-basis and tax-basis components of net assets are reclassified among capital accounts in the financial statements to reflect their tax character. These reclassifications have no effect on net assets or net asset value per share. As of period end, permanent differences primarily attributable to the accounting for in-kind redemptions were reclassified between the following accounts: |
| | Amount
($000) |
| Paid-in Capital | 1,000 |
| Total Distributable Earnings (Loss) | (1,000) |
Temporary differences between book-basis and tax-basis components of total distributable earnings (loss) arise when certain items of income, gain, or loss are recognized in different periods for financial statement and tax purposes; these differences will reverse at some time in the future. The differences are primarily related to capital loss carryforwards; the deferral of losses from wash sales; and the treatment of amortization adjustments from certain fixed income securities. As of period end, the tax-basis components of total distributable earnings (loss) are detailed in the table as follows:
| | Amount
($000) |
| Undistributed Tax-Exempt Income | 1,366 |
| Undistributed Ordinary Income | — |
| Undistributed Long-Term Gains | — |
| Net Unrealized Gains (Losses) | 3,319 |
| Capital Loss Carryforwards | (24) |
| Qualified Late-Year Losses | — |
| Other Temporary Differences | — |
| Total | 4,661 |
The tax character of distributions paid was as follows:
| | Year Ended November 30, |
| | 2024
Amount
($000) | 2023
Amount
($000) |
| Tax-Exempt Income | 13,273 | 2,931 |
| Ordinary Income* | 3 | — |
| Long-Term Capital Gains | — | — |
| Total | 13,276 | 2,931 |
| * | Includes short-term capital gains, if any. |
As of November 30, 2024, gross unrealized appreciation and depreciation for investments based on cost for U.S. federal income tax purposes were as follows:
| | Amount
($000) |
| Tax Cost | 554,426 |
| Gross Unrealized Appreciation | 3,919 |
| Gross Unrealized Depreciation | (600) |
| Net Unrealized Appreciation (Depreciation) | 3,319 |
| F. | During the year ended November 30, 2024, the fund purchased $281,418,000 of investment securities and sold $92,770,000 of investment securities, other than temporary cash investments. In addition, the fund purchased and sold investment securities of $53,577,000 and $53,514,000, respectively, in connection with in-kind purchases and redemptions of the fund's capital shares. |
Short-Term Tax-Exempt Bond ETF
| G. | Capital shares issued and redeemed were: |
| | Year Ended November 30,
2024 | | March 7, 20231 to
November 30,
2023 |
| | Shares
(000) | | Shares
(000) |
| Issued | 2,275 | | 4,175 |
| Issued in Lieu of Cash Distributions | — | | — |
| Redeemed | (600) | | (300) |
| Net Increase (Decrease) in Shares Outstanding | 1,675 | | 3,875 |
| H. | Significant market disruptions, such as those caused by pandemics, natural or environmental disasters, war, acts of terrorism, or other events, can adversely affect local and global markets and normal market operations. Any such disruptions could have an adverse impact on the value of the fund’s investments and fund performance. |
To the extent the fund’s investment portfolio reflects concentration in a particular market, industry, sector, country or asset class, the fund may be adversely affected by the performance of these concentrations and may be subject to increased price volatility and other risks.
Credit risk is the risk that a counterparty to a transaction or an issuer of a financial instrument will fail to pay interest and principal when due, or that perceptions of the issuer’s ability to make such payments will cause the price of an investment to decline. Investment in debt securities will generally increase credit risk.
At November 30, 2024, one shareholder was the record or beneficial owner of 43% of the fund’s net assets. If this shareholder were to redeem its investment in the fund, the redemption might result in an increase in the fund’s expense ratio, cause the fund to incur higher transaction costs, or lead to the realization of taxable capital gains.
| I. | Management has determined that no other events or transactions occurred subsequent to November 30, 2024, that would require recognition or disclosure in these financial statements. |
Report of Independent Registered Public Accounting Firm
To the Board of Trustees of Vanguard Wellington Fund and Shareholders of Vanguard Short-Term Tax-Exempt Bond ETF
Opinion on the Financial Statements
We have audited the accompanying statement of assets and liabilities, including the schedule of investments, of Vanguard Short-Term Tax-Exempt Bond ETF (one of the funds constituting Vanguard Wellington Fund, referred to hereafter as the "Fund") as of November 30, 2024, the related statements of operations for the year ended November 30, 2024 and the statement of changes in net assets and the financial highlights for the year ended November 30, 2024 and for the period March 7, 2023 (inception) through November 30, 2023, including the related notes (collectively referred to as the "financial statements"). In our opinion, the financial statements present fairly, in all material respects, the financial position of the Fund as of November 30, 2024, the results of its operations for the year ended November 30, 2024, and the changes in its net assets and the financial highlights for the year ended November 30, 2024 and for the period March 7, 2023 (inception) through November 30, 2023 in conformity with accounting principles generally accepted in the United States of America.
Basis for Opinion
These financial statements are the responsibility of the Fund’s management. Our responsibility is to express an opinion on the Fund’s financial statements based on our audits. We are a public accounting firm registered with the Public Company Accounting Oversight Board (United States) (PCAOB) and are required to be independent with respect to the Fund in accordance with the U.S. federal securities laws and the applicable rules and regulations of the Securities and Exchange Commission and the PCAOB.
We conducted our audits of these financial statements in accordance with the standards of the PCAOB. Those standards require that we plan and perform the audit to obtain reasonable assurance about whether the financial statements are free of material misstatement, whether due to error or fraud.
Our audits included performing procedures to assess the risks of material misstatement of the financial statements, whether due to error or fraud, and performing procedures that respond to those risks. Such procedures included examining, on a test basis, evidence regarding the amounts and disclosures in the financial statements. Our audits also included evaluating the accounting principles used and significant estimates made by management, as well as evaluating the overall presentation of the financial statements. Our procedures included confirmation of securities owned as of November 30, 2024 by correspondence with the custodian, transfer agent and brokers; when replies were not received from brokers, we performed other auditing procedures. We believe that our audits provide a reasonable basis for our opinion.
/s/PricewaterhouseCoopers LLP
Philadelphia, Pennsylvania
January 17, 2025
We have served as the auditor of one or more investment companies in The Vanguard Group of Funds since 1975.
Tax information (unaudited)
The fund designates 100% of its income dividends as exempt-interest dividends.
QV0140 012025
Item 8: Changes in and Disagreements with Accountants for Open-End Management Investment Companies.
Not applicable.
Item 9: Proxy Disclosures for Open-End Management Investment Companies.
Not applicable.
Item 10: Remuneration Paid to Directors, Officers, and Others of Open-End Management Investment Companies.
Not applicable. The Trustees’ Fees and Expenses are included in the financial statements filed under Item 7 of this Form.
Item 11: Statement Regarding Basis for Approval of Investment Advisory Contracts.
Not applicable.
Item 12: Disclosure of Proxy Voting Policies and Procedures for Closed-End Management Investment Companies.
Not applicable.
Item 13: Portfolio Managers of Closed-End Management Investment Companies.
Not applicable.
Item 14: Purchase of Equity Securities by Closed-End Management Investment Company and Affiliated Purchasers.
Not applicable.
Item 15: Submission of Matters to a Vote of Security Holders.
Not applicable.
Item 16: Controls and Procedures.
(a) Disclosure Controls and Procedures. The Principal Executive and Financial Officers concluded that the Registrant’s disclosure controls and procedures are effective based on their evaluation of the disclosure controls and procedures as of a date within 90 days of the filing date of this report.
(b) Internal Control Over Financial Reporting. In February 2024, a third-party service provider began performing security pricing services for the Registrant. There were no other changes in the Registrant’s internal control over financial reporting or in other factors that could significantly affect this control during the period covered by this report, including any corrective actions with regard to significant deficiencies and material weaknesses.
Item 17: Disclosure of Securities Lending Activities for Closed-End Management Investment Companies.
Not applicable.
Item 18: Recovery of Erroneously Awarded Compensation.
Not applicable.
Item 19: Exhibits.
Pursuant to the requirements of the Securities Exchange Act of 1934 and the Investment Company Act of 1940, the registrant has duly caused this report to be signed on its behalf by the undersigned, thereunto duly authorized.
| | VANGUARD WELLINGTON FUND | |
| | |
| BY: | /s/ SALIM RAMJI* | |
| | | |
| | SALIM RAMJI | |
| | CHIEF EXECUTIVE OFFICER | |
Date: January 21, 2025
Pursuant to the requirements of the Securities Exchange Act of 1934 and the Investment Company Act of 1940, this report has been signed below by the following persons on behalf of the registrant and in the capacities and on the dates indicated.
| | VANGUARD WELLINGTON FUND | |
| | |
| BY: | /s/ SALIM RAMJI* | |
| | | |
| | SALIM RAMJI | |
| | CHIEF EXECUTIVE OFFICER | |
Date: January 21, 2025
| | VANGUARD WELLINGTON FUND | |
| | |
| BY: | /s/ CHRISTINE BUCHANAN* | |
| | | |
| | CHRISTINE BUCHANAN | |
| | CHIEF FINANCIAL OFFICER | |
Date: January 21, 2025
John E. Schadl, pursuant to a Power of Attorney filed on December 20, 2024 (see File Number 33-49023) and a Power of Attorney filed on July 25, 2024 (see File Number 33-48863), each Incorporated by Reference.