UNITED STATES
SECURITIES AND EXCHANGE COMMISSION
Washington, D.C. 20549
FORM N-CSR
CERTIFIED SHAREHOLDER REPORT
OF
REGISTERED MANAGEMENT INVESTMENT COMPANIES
Investment Company Act file number: 811-00121
| Name of Registrant: | Vanguard Wellington Fund |
| Address of Registrant: | P.O. Box 2600 |
| | Valley Forge, PA 19482 |
| Name and address of agent for service: | John E. Schadl, Esquire |
| | P.O. Box 876 |
| | Valley Forge, PA 19482 |
Registrant’s telephone number, including area code: (610) 669-1000
Date of fiscal year end: November 30
Date of reporting period: December 1, 2023—November 30, 2024
Item 1: Reports to Shareholders.
TABLE OF CONTENTS
Vanguard Wellington™ Fund
Investor Shares (VWELX)
Annual Shareholder Report | November 30, 2024
This annual shareholder report contains important information about Vanguard Wellington™ Fund (the "Fund") for the period of December 1, 2023, to November 30, 2024. You can find additional information about the Fund at https://personal1.vanguard.com/ngf-next-gen-form-webapp/fund-literature. You can also request this information by contacting us at 800-662-7447.
What were the Fund costs for the last year?
(based on a hypothetical $10,000 investment)
| Share Class Name | Costs of a $10,000 investment | Costs paid as a percentage of a $10,000 investment |
| Investor Shares | $28 | 0.25% |
How did the Fund perform during the reporting period?
For the 12 months ended November 30, 2024, the Fund underperformed its composite benchmark, a mix of 65% U.S. stocks and 35% U.S. bonds that reflects the Fund’s target asset allocation.
U.S. economic growth hovered around 3% on a year-over-year basis for the period, quelling recession fears. Consumer price inflation trended lower, falling below 3% in July, and the Federal Reserve began to ease monetary policy with cuts to short-term interest rates in September and November. Against this positive macroeconomic backdrop, U.S. stocks posted very strong gains.
The stock portion of the Fund’s portfolio underperformed the Standard & Poor’s 500 Index by more than 4 percentage points. Stock selection in the information technology, consumer staples, health care, and industrial sectors accounted for most of this underperformance. Selection in the financial and communication services sectors helped results.
The bond portion outperformed the Bloomberg U.S. Credit A or Better Bond Index. Security selection within the Fund, particularly among investment-grade issues, helped bolster relative returns.
How did the Fund perform over the past 10 years?
Keep in mind that the Fund's past performance does not indicate how the Fund will perform in the future. Updated performance information is available on our website at vanguard.com/performance or by calling Vanguard toll-free at 800-662-7447. The graph and returns shown do not reflect taxes that a shareholder would pay on fund distributions or on the sale of fund shares.
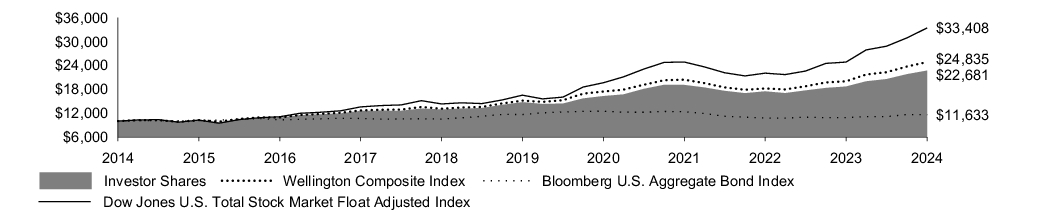
Cumulative Performance: November 30, 2014, Through November 30, 2024
Initial Investment of $10,000
| Average Annual Total Returns | | | |
| 1 Year | 5 Years | 10 Years |
| Investor Shares | 21.47% | 9.00% | 8.53% |
| Wellington Composite Index | 24.15% | 10.40% | 9.52% |
| Bloomberg U.S. Aggregate Bond Index | 6.88% | -0.01% | 1.52% |
| Dow Jones U.S. Total Stock Market Float Adjusted Index | 34.56% | 15.13% | 12.82% |
This table reflects the Fund’s investments, including short-term investments, derivatives and other assets and liabilities.
Fund Statistics
(as of November 30, 2024) | |
Fund Net Assets
(in millions) | $115,968% |
| Number of Portfolio Holdings | $1,526% |
| Portfolio Turnover Rate | $61% |
Total Investment Advisory Fees
(in thousands) | $75,292% |
Portfolio Composition % of Net Assets
(as of November 30, 2024) | |
| Asset-Backed/Commercial Mortgage-Backed Securities | 1.3% |
| Common Stocks | 65.9% |
| Corporate Bonds | 21.2% |
| Sovereign Bonds | 0.5% |
| Taxable Municipal Bonds | 1.4% |
| U.S. Government and Agency Obligations | 8.1% |
| Other Assets and Liabilities—Net | 1.6% |
Where can I find additional information about the Fund?
Additional information about the Fund, including its prospectus, financial information, holdings, and proxy voting information is available at https://personal1.vanguard.com/ngf-next-gen-form-webapp/fund-literature.
Connect with Vanguard ® • vanguard.com
Fund Information • 800-662-7447
Direct Investor Account Services • 800-662-2739
Text Telephone for People Who Are Deaf or Hard of Hearing • 800-749-7273
© 2025 The Vanguard Group, Inc.
All rights reserved.
Vanguard Marketing Corporation, Distributor.
AR21
Vanguard Wellington™ Fund
Admiral™ Shares (VWENX)
Annual Shareholder Report | November 30, 2024
This annual shareholder report contains important information about Vanguard Wellington™ Fund (the "Fund") for the period of December 1, 2023, to November 30, 2024. You can find additional information about the Fund at https://personal1.vanguard.com/ngf-next-gen-form-webapp/fund-literature. You can also request this information by contacting us at 800-662-7447.
What were the Fund costs for the last year?
(based on a hypothetical $10,000 investment)
| Share Class Name | Costs of a $10,000 investment | Costs paid as a percentage of a $10,000 investment |
| Admiral Shares | $19 | 0.17% |
How did the Fund perform during the reporting period?
For the 12 months ended November 30, 2024, the Fund underperformed its composite benchmark, a mix of 65% U.S. stocks and 35% U.S. bonds that reflects the Fund’s target asset allocation.
U.S. economic growth hovered around 3% on a year-over-year basis for the period, quelling recession fears. Consumer price inflation trended lower, falling below 3% in July, and the Federal Reserve began to ease monetary policy with cuts to short-term interest rates in September and November. Against this positive macroeconomic backdrop, U.S. stocks posted very strong gains.
The stock portion of the Fund’s portfolio underperformed the Standard & Poor’s 500 Index by more than 4 percentage points. Stock selection in the information technology, consumer staples, health care, and industrial sectors accounted for most of this underperformance. Selection in the financial and communication services sectors helped results.
The bond portion outperformed the Bloomberg U.S. Credit A or Better Bond Index. Security selection within the Fund, particularly among investment-grade issues, helped bolster relative returns.
How did the Fund perform over the past 10 years?
Keep in mind that the Fund's past performance does not indicate how the Fund will perform in the future. Updated performance information is available on our website at vanguard.com/performance or by calling Vanguard toll-free at 800-662-7447. The graph and returns shown do not reflect taxes that a shareholder would pay on fund distributions or on the sale of fund shares.
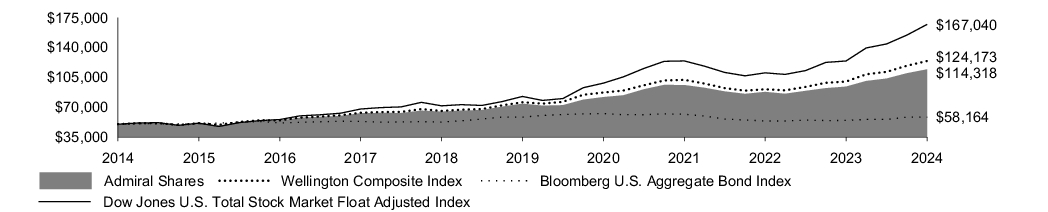
Cumulative Performance: November 30, 2014, Through November 30, 2024
Initial Investment of $50,000
| Average Annual Total Returns | | | |
| 1 Year | 5 Years | 10 Years |
| Admiral Shares | 21.55% | 9.08% | 8.62% |
| Wellington Composite Index | 24.15% | 10.40% | 9.52% |
| Bloomberg U.S. Aggregate Bond Index | 6.88% | -0.01% | 1.52% |
| Dow Jones U.S. Total Stock Market Float Adjusted Index | 34.56% | 15.13% | 12.82% |
This table reflects the Fund’s investments, including short-term investments, derivatives and other assets and liabilities.
Fund Statistics
(as of November 30, 2024) | |
Fund Net Assets
(in millions) | $115,968% |
| Number of Portfolio Holdings | $1,526% |
| Portfolio Turnover Rate | $61% |
Total Investment Advisory Fees
(in thousands) | $75,292% |
Portfolio Composition % of Net Assets
(as of November 30, 2024) | |
| Asset-Backed/Commercial Mortgage-Backed Securities | 1.3% |
| Common Stocks | 65.9% |
| Corporate Bonds | 21.2% |
| Sovereign Bonds | 0.5% |
| Taxable Municipal Bonds | 1.4% |
| U.S. Government and Agency Obligations | 8.1% |
| Other Assets and Liabilities—Net | 1.6% |
Where can I find additional information about the Fund?
Additional information about the Fund, including its prospectus, financial information, holdings, and proxy voting information is available at https://personal1.vanguard.com/ngf-next-gen-form-webapp/fund-literature.
Connect with Vanguard ® • vanguard.com
Fund Information • 800-662-7447
Direct Investor Account Services • 800-662-2739
Text Telephone for People Who Are Deaf or Hard of Hearing • 800-749-7273
© 2025 The Vanguard Group, Inc.
All rights reserved.
Vanguard Marketing Corporation, Distributor.
AR521
Item 2: Code of Ethics.
The Registrant has adopted a code of ethics that applies to the Registrant’s principal executive officer, principal financial officer, principal accounting officer or controller or persons performing similar functions. The Code of Ethics was amended during the reporting period covered by this report to make certain technical, non-material changes.
Item 3: Audit Committee Financial Expert.
All members of the Audit Committee have been determined by the Registrant’s Board of Trustees to be Audit Committee Financial Experts and to be independent: F. Joseph Loughrey, Mark Loughridge, Sarah Bloom Raskin, and Peter F. Volanakis.
Item 4: Principal Accountant Fees and Services.
Includes fees billed in connection with services to the Registrant only.
| | | Fiscal Year Ended
November 30,
2024 | | | Fiscal Year Ended
November 30,
2023 | |
| (a) Audit Fees. | | $ | 253,000 | | | $ | 230,000 | |
| (b) Audit-Related Fees. | | | 0 | | | | 0 | |
| (c) Tax Fees. | | | 0 | | | | 0 | |
| (d) All Other Fees. | | | 0 | | | | 0 | |
| Total. | | $ | 253,000 | | | $ | 230,000 | |
| (e) | (1) Pre-Approval Policies. The audit committee is responsible for pre-approving all audit and non-audit services provided by PwC to: (i) the Vanguard funds; and (ii) Vanguard, or any entity controlled by Vanguard that provides ongoing services to the Vanguard funds. All services provided to Vanguard entities by the independent auditor, whether or not they are subject to preapproval, must be disclosed to the audit committee. The audit committee chair may preapprove any permissible audit and non-audit services as long as any preapproval is brought to the attention of the full audit committee at the next scheduled meeting. (2) No percentage of the principal accountant’s fees or services were approved pursuant to the waiver provision of paragraph (c)(7)(i)(C) of Rule 2-01 of Regulation S-X. |
| | |
| (f) | For the most recent fiscal year, over 50% of the hours worked under the principal accountant’s engagement were not performed by persons other than full-time, permanent employees of the principal accountant. |
| | |
| (g) | Aggregate Non-Audit Fees. |
Includes fees billed for non-audit services provided to the Registrant, other registered investment companies in the Vanguard complex, The Vanguard Group, Inc., and Vanguard Marketing Corporation.
| | | Fiscal Year Ended
November 30,
2024 | | | Fiscal Year Ended November 30,
2023 | |
| Non-audit fees to the Registrant only, listed as (b) through (d) above. | | $ | 0 | | | $ | 0 | |
| | | | | | | | | |
| Non-audit Fees to other registered investment companies in the Vanguard complex, The Vanguard Group, Inc., and Vanguard Marketing Corporation. | | | | | | | | |
| Audit-Related Fees. | | $ | 3,802,420 | | | $ | 3,295,934 | |
| Tax Fees. | | $ | 1,960,472 | | | $ | 1,678,928 | |
| All Other Fees. | | $ | 293,000 | | | $ | 25,000 | |
| Total. | | $ | 6,055,892 | | | $ | 4,999,862 | |
| (h) | For the most recent fiscal year, the Audit Committee has determined that the provision of all non-audit services was consistent with maintaining the principal accountant’s independence. |
Item 5: Audit Committee of Listed Registrants.
The Registrant is a listed issuer as defined in rule 10A-3 under the Securities Exchange Act of 1934 (“Exchange Act”). The Registrant has a separately-designated standing audit committee established in accordance with Section 3(a)(58)(A) of the Exchange Act. The Registrant’s audit committee members are: F. Joseph Loughrey, Mark Loughridge, Sarah Bloom Raskin, and Peter F. Volanakis.
Item 6: Investments.
Not applicable. The complete schedule of investments is included in the financial statements filed under Item 7 of this Form.
Item 7: Financial Statements and Financial Highlights for Open-End Management Investment Companies.
Financial Statements
For the year ended November 30, 2024
Vanguard Wellington™ Fund
Contents
Financial Statements
| 1 |
Report of Independent Registered
Public Accounting Firm
| 36 |
Tax information
| 37 |
| | |
Schedule of Investments
As of November 30, 2024
The fund files its complete schedule of portfolio holdings with the Securities and Exchange Commission (SEC) for the first and third quarters of each fiscal year as an exhibit to its reports on Form N-PORT. The fund’s Form N-PORT reports are available on the SEC’s website at www.sec.gov.
| | | | | | Shares | Market
Value•
($000) |
| Common Stocks (65.9%) |
| Communication Services (6.2%) |
| | Alphabet Inc. Class A | 21,779,307 | 3,679,614 |
| | Meta Platforms Inc. Class A | 2,756,317 | 1,583,008 |
| | T-Mobile US Inc. | 3,854,584 | 951,851 |
| * | Netflix Inc. | 1,066,468 | 945,754 |
| | | | | | | 7,160,227 |
| Consumer Discretionary (8.5%) |
| * | Amazon.com Inc. | 18,659,505 | 3,879,124 |
| | McDonald's Corp. | 3,489,215 | 1,032,843 |
| | Home Depot Inc. | 2,242,010 | 962,114 |
| | TJX Cos. Inc. | 7,074,534 | 889,198 |
| * | O'Reilly Automotive Inc. | 629,049 | 782,046 |
| * | Tesla Inc. | 1,775,374 | 612,788 |
| | Starbucks Corp. | 5,129,000 | 525,517 |
| | Marriott International Inc. Class A | 1,603,288 | 463,495 |
| | Tractor Supply Co. | 1,566,239 | 444,295 |
| * | MercadoLibre Inc. | 104,028 | 206,513 |
| | | | | | | 9,797,933 |
| Consumer Staples (2.1%) |
| | Unilever plc | 16,423,093 | 983,446 |
| | Pernod Ricard SA | 4,969,751 | 556,786 |
| | Procter & Gamble Co. | 2,839,236 | 508,962 |
| | Haleon plc | 71,398,005 | 340,577 |
| | | | | | | 2,389,771 |
| Energy (3.6%) |
| | Exxon Mobil Corp. | 12,189,806 | 1,437,909 |
| | Williams Cos. Inc. | 11,199,711 | 655,407 |
| | Targa Resources Corp. | 2,898,107 | 592,083 |
| | EQT Corp. | 12,537,294 | 569,695 |
| | Cheniere Energy Inc. | 2,110,000 | 472,661 |
| | Marathon Petroleum Corp. | 2,636,207 | 411,644 |
| | | | | | | 4,139,399 |
| Financials (9.8%) |
| | Wells Fargo & Co. | 33,116,726 | 2,522,501 |
| | JPMorgan Chase & Co. | 7,857,482 | 1,962,170 |
| | Progressive Corp. | 5,569,971 | 1,497,654 |
| | S&P Global Inc. | 2,450,123 | 1,280,214 |
| | KKR & Co. Inc. | 7,490,264 | 1,219,939 |
| | American Express Co. | 3,677,222 | 1,120,376 |
| | Nasdaq Inc. | 12,895,999 | 1,070,239 |
| | Morgan Stanley | 5,350,685 | 704,204 |
| | | | | | | 11,377,297 |
| Health Care (6.8%) |
| | UnitedHealth Group Inc. | 3,400,819 | 2,075,180 |
| | Merck & Co. Inc. | 10,457,144 | 1,062,864 |
| | AstraZeneca plc ADR | 12,656,012 | 855,800 |
| | Gilead Sciences Inc. | 8,023,353 | 742,802 |
| | Eli Lilly & Co. | 903,677 | 718,739 |
| | HCA Healthcare Inc. | 2,166,327 | 708,866 |
| | Novartis AG (Registered) | 6,640,570 | 704,029 |
| | Danaher Corp. | 2,407,523 | 577,059 |
| | Daiichi Sankyo Co. Ltd. | 12,279,317 | 389,939 |
| | Astellas Pharma Inc. | 9,938,132 | 103,484 |
| | | | | | | 7,938,762 |
| Industrials (4.4%) |
| | Republic Services Inc. Class A | 4,662,668 | 1,017,861 |
| | Parker-Hannifin Corp. | 1,435,240 | 1,008,830 |
| * | Uber Technologies Inc. | 12,368,680 | 890,050 |
| | | | | | Shares | Market
Value•
($000) |
| | Deere & Co. | 1,526,660 | 711,271 |
| * | Boeing Co. | 3,930,192 | 610,909 |
| | Johnson Controls International plc | 6,185,195 | 518,691 |
| | PACCAR Inc. | 3,431,712 | 401,510 |
| | | | | | | 5,159,122 |
| Information Technology (20.3%) |
| | NVIDIA Corp. | 39,970,057 | 5,525,860 |
| | Microsoft Corp. | 12,840,983 | 5,437,643 |
| | Apple Inc. | 19,780,736 | 4,694,562 |
| | Broadcom Inc. | 10,694,496 | 1,733,364 |
| * | ServiceNow Inc. | 1,159,077 | 1,216,382 |
| | Salesforce Inc. | 3,630,155 | 1,197,915 |
| | Intuit Inc. | 1,546,990 | 992,750 |
| | Texas Instruments Inc. | 4,553,570 | 915,404 |
| | Corning Inc. | 13,273,179 | 646,005 |
| | KLA Corp. | 651,075 | 421,265 |
| | NXP Semiconductors NV | 1,728,080 | 396,370 |
| | Jabil Inc. | 2,690,275 | 365,420 |
| | | | | | | 23,542,940 |
| Materials (0.9%) |
| | Glencore plc | 135,003,687 | 653,716 |
| | Anglo American plc | 12,689,749 | 407,496 |
| | | | | | | 1,061,212 |
| Real Estate (1.3%) |
| | Welltower Inc. | 5,606,023 | 774,640 |
| | Crown Castle Inc. | 7,151,308 | 759,827 |
| | | | | | | 1,534,467 |
| Utilities (2.0%) |
| | Duke Energy Corp. | 9,298,452 | 1,088,384 |
| | Exelon Corp. | 15,268,511 | 604,022 |
| | Sempra | 6,326,225 | 592,578 |
| | | | | | | 2,284,984 |
| Total Common Stocks (Cost $43,670,266) | 76,386,114 |
| | | | Coupon | Maturity
Date | Face
Amount
($000) | |
| U.S. Government and Agency Obligations (8.1%) |
| U.S. Government Securities (7.3%) |
| | United States Treasury Note/Bond | 4.250% | 12/31/25 | 10,000 | 9,988 |
| | United States Treasury Note/Bond | 0.375% | 1/31/26 | 216,635 | 206,920 |
| | United States Treasury Note/Bond | 4.625% | 2/28/26 | 65,000 | 65,234 |
| | United States Treasury Note/Bond | 4.500% | 3/31/26 | 121,750 | 122,054 |
| | United States Treasury Note/Bond | 4.875% | 4/30/26 | 60,000 | 60,488 |
| | United States Treasury Note/Bond | 1.625% | 5/15/26 | 31,710 | 30,536 |
| | United States Treasury Note/Bond | 4.875% | 5/31/26 | 220,000 | 221,891 |
| | United States Treasury Note/Bond | 4.500% | 7/15/26 | 2,120 | 2,128 |
| | United States Treasury Note/Bond | 4.375% | 7/31/26 | 56,800 | 56,924 |
| | United States Treasury Note/Bond | 4.375% | 8/15/26 | 85,690 | 85,891 |
| | United States Treasury Note/Bond | 0.750% | 8/31/26 | 120,380 | 113,383 |
| 1 | United States Treasury Note/Bond | 3.750% | 8/31/26 | 195,563 | 193,974 |
| | United States Treasury Note/Bond | 3.500% | 9/30/26 | 165,000 | 162,963 |
| | United States Treasury Note/Bond | 4.625% | 10/15/26 | 105,000 | 105,771 |
| | United States Treasury Note/Bond | 4.125% | 10/31/26 | 275,000 | 274,613 |
| | United States Treasury Note/Bond | 2.000% | 11/15/26 | 17,430 | 16,719 |
| | United States Treasury Note/Bond | 4.625% | 11/15/26 | 168,160 | 169,474 |
| | United States Treasury Note/Bond | 4.000% | 1/15/27 | 48,611 | 48,429 |
| | United States Treasury Note/Bond | 4.125% | 2/15/27 | 268,187 | 267,852 |
| | United States Treasury Note/Bond | 4.250% | 3/15/27 | 85,000 | 85,146 |
| 1 | United States Treasury Note/Bond | 2.500% | 3/31/27 | 172,366 | 166,118 |
| | United States Treasury Note/Bond | 2.750% | 4/30/27 | 175,241 | 169,655 |
| 1 | United States Treasury Note/Bond | 4.500% | 5/15/27 | 150,680 | 151,880 |
| | United States Treasury Note/Bond | 4.375% | 7/15/27 | 121,767 | 122,471 |
| | United States Treasury Note/Bond | 2.750% | 7/31/27 | 114,106 | 110,130 |
| | United States Treasury Note/Bond | 3.750% | 8/15/27 | 128,580 | 127,334 |
| | United States Treasury Note/Bond | 3.125% | 8/31/27 | 50,631 | 49,310 |
| | | | Coupon | Maturity
Date | Face
Amount
($000) | Market
Value•
($000) |
| | United States Treasury Note/Bond | 4.125% | 9/30/27 | 35,000 | 35,000 |
| | United States Treasury Note/Bond | 4.125% | 10/31/27 | 69,470 | 69,491 |
| | United States Treasury Note/Bond | 2.250% | 11/15/27 | 24,532 | 23,259 |
| | United States Treasury Note/Bond | 3.875% | 11/30/27 | 67,100 | 66,639 |
| | United States Treasury Note/Bond | 3.875% | 12/31/27 | 40,552 | 40,267 |
| | United States Treasury Note/Bond | 4.000% | 2/29/28 | 55,525 | 55,308 |
| | United States Treasury Note/Bond | 3.625% | 3/31/28 | 19,195 | 18,901 |
| | United States Treasury Note/Bond | 3.625% | 5/31/28 | 12,367 | 12,168 |
| | United States Treasury Note/Bond | 4.125% | 7/31/28 | 162,089 | 162,089 |
| 1 | United States Treasury Note/Bond | 4.375% | 8/31/28 | 147,499 | 148,744 |
| | United States Treasury Note/Bond | 4.625% | 9/30/28 | 159,623 | 162,441 |
| | United States Treasury Note/Bond | 4.375% | 11/30/28 | 101,214 | 102,163 |
| | United States Treasury Note/Bond | 3.750% | 12/31/28 | 113,213 | 111,657 |
| 2 | United States Treasury Note/Bond | 4.000% | 1/31/29 | 301,007 | 299,691 |
| | United States Treasury Note/Bond | 4.250% | 2/28/29 | 330,395 | 332,150 |
| | United States Treasury Note/Bond | 4.125% | 3/31/29 | 166,346 | 166,398 |
| | United States Treasury Note/Bond | 4.625% | 4/30/29 | 257,545 | 262,897 |
| | United States Treasury Note/Bond | 4.500% | 5/31/29 | 117,992 | 119,928 |
| | United States Treasury Note/Bond | 4.250% | 6/30/29 | 267,546 | 269,135 |
| | United States Treasury Note/Bond | 4.000% | 7/31/29 | 323,862 | 322,547 |
| | United States Treasury Note/Bond | 3.625% | 8/31/29 | 25,059 | 24,562 |
| | United States Treasury Note/Bond | 3.500% | 9/30/29 | 314,558 | 306,498 |
| | United States Treasury Note/Bond | 3.875% | 9/30/29 | 4,297 | 4,254 |
| | United States Treasury Note/Bond | 4.000% | 10/31/29 | 15,799 | 15,730 |
| | United States Treasury Note/Bond | 4.125% | 10/31/29 | 280,118 | 280,556 |
| | United States Treasury Note/Bond | 3.500% | 4/30/30 | 8,526 | 8,276 |
| | United States Treasury Note/Bond | 3.750% | 5/31/30 | 11,316 | 11,114 |
| | United States Treasury Note/Bond | 4.000% | 7/31/30 | 20,804 | 20,684 |
| | United States Treasury Note/Bond | 4.875% | 10/31/30 | 4,088 | 4,248 |
| | United States Treasury Note/Bond | 3.750% | 12/31/30 | 19,022 | 18,645 |
| | United States Treasury Note/Bond | 4.125% | 7/31/31 | 28,458 | 28,440 |
| | United States Treasury Note/Bond | 3.625% | 9/30/31 | 23,067 | 22,375 |
| | United States Treasury Note/Bond | 4.125% | 10/31/31 | 14,405 | 14,401 |
| | United States Treasury Note/Bond | 4.375% | 5/15/34 | 85,844 | 87,024 |
| | United States Treasury Note/Bond | 3.875% | 8/15/34 | 218,078 | 212,489 |
| | United States Treasury Note/Bond | 4.250% | 11/15/34 | 43,647 | 43,844 |
| | United States Treasury Note/Bond | 1.750% | 8/15/41 | 12,610 | 8,602 |
| | United States Treasury Note/Bond | 2.000% | 11/15/41 | 213,276 | 150,826 |
| | United States Treasury Note/Bond | 2.375% | 2/15/42 | 8,898 | 6,664 |
| | United States Treasury Note/Bond | 3.250% | 5/15/42 | 20,950 | 17,909 |
| | United States Treasury Note/Bond | 3.375% | 8/15/42 | 120,104 | 104,228 |
| | United States Treasury Note/Bond | 4.000% | 11/15/42 | 110,357 | 104,322 |
| | United States Treasury Note/Bond | 3.875% | 2/15/43 | 92,413 | 85,655 |
| | United States Treasury Note/Bond | 3.875% | 5/15/43 | 93,222 | 86,259 |
| | United States Treasury Note/Bond | 4.375% | 8/15/43 | 98,006 | 96,934 |
| | United States Treasury Note/Bond | 4.750% | 11/15/43 | 43,742 | 45,369 |
| | United States Treasury Note/Bond | 4.500% | 2/15/44 | 60,646 | 60,797 |
| | United States Treasury Note/Bond | 4.625% | 5/15/44 | 63,124 | 64,288 |
| | United States Treasury Note/Bond | 4.125% | 8/15/44 | 118,440 | 112,740 |
| | United States Treasury Note/Bond | 2.375% | 5/15/51 | 16,737 | 11,297 |
| | United States Treasury Note/Bond | 3.000% | 8/15/52 | 109 | 84 |
| | United States Treasury Note/Bond | 4.000% | 11/15/52 | 437 | 407 |
| | United States Treasury Note/Bond | 3.625% | 2/15/53 | 32,421 | 28,252 |
| | United States Treasury Note/Bond | 3.625% | 5/15/53 | 22,045 | 19,221 |
| | United States Treasury Note/Bond | 4.125% | 8/15/53 | 13,415 | 12,792 |
| | United States Treasury Note/Bond | 4.250% | 2/15/54 | 14,692 | 14,348 |
| | United States Treasury Note/Bond | 4.625% | 5/15/54 | 56,707 | 58,931 |
| | United States Treasury Note/Bond | 4.250% | 8/15/54 | 193,347 | 189,117 |
| | United States Treasury Note/Bond | 4.500% | 11/15/54 | 64,413 | 65,751 |
| | | | | | | 8,426,082 |
| Conventional Mortgage-Backed Securities (0.7%) | |
| 3,4 | Fannie Mae Pool | 1.770% | 1/1/36 | 19,229 | 15,027 |
| 3,4 | Fannie Mae Pool | 3.000% | 6/1/43 | 5,505 | 4,950 |
| 3 | Ginnie Mae I Pool | 7.000% | 11/15/31–11/15/33 | 546 | 558 |
| 3,5 | Ginnie Mae II Pool | 5.000% | 12/15/54 | 88,929 | 87,678 |
| 3,4 | UMBS Pool | 2.500% | 9/1/27–4/1/38 | 20,590 | 18,892 |
| 3,4 | UMBS Pool | 3.000% | 3/1/33 | 19,780 | 19,063 |
| 3,4 | UMBS Pool | 3.500% | 11/1/45–6/1/46 | 47 | 44 |
| 3,4 | UMBS Pool | 5.000% | 11/1/43–7/1/53 | 181,073 | 179,329 |
| | | | Coupon | Maturity
Date | Face
Amount
($000) | Market
Value•
($000) |
| 3,4,5 | UMBS Pool | 5.500% | 3/1/53–12/25/54 | 207,621 | 207,868 |
| 3,4,5 | UMBS Pool | 6.000% | 8/1/53–12/25/54 | 237,166 | 240,590 |
| | | | | | | 773,999 |
| Nonconventional Mortgage-Backed Securities (0.1%) | |
| 3,4 | Fannie Mae REMICS | 1.500% | 8/25/41 | 1,624 | 1,546 |
| 3,4 | Fannie Mae REMICS | 1.700% | 6/25/43 | 362 | 357 |
| 3,4 | Fannie Mae REMICS | 2.000% | 6/25/44 | 31 | 31 |
| 3,4 | Fannie Mae REMICS | 2.500% | 8/25/46 | 11,338 | 9,321 |
| 3,4 | Fannie Mae REMICS | 3.000% | 12/25/39–9/25/57 | 25,442 | 23,096 |
| 3,4 | Fannie Mae REMICS | 3.500% | 4/25/31–11/25/57 | 48,926 | 46,747 |
| 3,4 | Fannie Mae REMICS | 4.000% | 7/25/53 | 1,487 | 1,472 |
| 3,4 | Freddie Mac REMICS | 3.000% | 6/15/44–7/15/45 | 9,032 | 8,044 |
| 3,4 | Freddie Mac REMICS | 3.500% | 3/15/31–12/15/46 | 12,046 | 11,129 |
| 3,4 | Freddie Mac REMICS | 4.000% | 12/15/30–2/15/31 | 3,004 | 2,976 |
| 3 | Ginnie Mae REMICS | 2.500% | 10/20/49 | 64,413 | 56,628 |
| | | | | | | 161,347 |
| Total U.S. Government and Agency Obligations (Cost $9,447,455) | 9,361,428 |
| Asset-Backed/Commercial Mortgage-Backed Securities (1.3%) |
| 3,6 | Aaset Trust Series 2019-1 | 3.844% | 5/15/39 | 753 | 731 |
| 3,6 | Affirm Asset Securitization Trust Series 2021-Z2 | 1.170% | 11/16/26 | 493 | 488 |
| 3,6 | Aligned Data Centers Issuer LLC Series 2021-1A | 1.937% | 8/15/46 | 60,180 | 57,016 |
| 3 | American Express Credit Account Master Trust Series 2023-4 | 5.150% | 9/15/30 | 43,970 | 45,120 |
| 3,6 | American Tower Trust #1 | 5.490% | 3/15/28 | 66,310 | 67,185 |
| 3,6 | Angel Oak Mortgage Trust Series 2019-5 | 2.593% | 10/25/49 | 813 | 795 |
| 3,6 | Angel Oak Mortgage Trust Series 2019-6 | 2.620% | 11/25/59 | 2,240 | 2,191 |
| 3,6 | Angel Oak Mortgage Trust Series 2021-6 | 1.458% | 9/25/66 | 19,843 | 16,545 |
| 3,6,7 | BX Trust Series 2021-ARIA, TSFR1M + 1.014% | 5.623% | 10/15/36 | 14,785 | 14,711 |
| 3,6 | Castlelake Aircraft Structured Trust Series 2019-1A | 3.967% | 4/15/39 | 16,061 | 14,776 |
| 3,6 | CF Hippolyta Issuer LLC Series 2020-1 | 1.690% | 7/15/60 | 5,132 | 4,992 |
| 3,6 | CF Hippolyta Issuer LLC Series 2021-1A | 1.530% | 3/15/61 | 36,873 | 34,744 |
| 3,6 | CF Hippolyta Issuer LLC Series 2022-1A | 5.970% | 8/15/62 | 3,603 | 3,598 |
| 3,6 | Chesapeake Funding II LLC Series 2024-1A | 5.520% | 5/15/36 | 19,858 | 20,052 |
| 3,6 | DB Master Finance LLC Series 2019-1A | 4.021% | 5/20/49 | 13,497 | 13,278 |
| 3,6 | Domino's Pizza Master Issuer LLC Series 2021-1A | 2.662% | 4/25/51 | 13,377 | 12,201 |
| 3,6 | Domino's Pizza Master Issuer LLC Series 2021-1A | 3.151% | 4/25/51 | 23,496 | 20,713 |
| 3,6 | Enterprise Fleet Financing LLC Series 2023-3 | 6.400% | 3/20/30 | 40,217 | 40,927 |
| 3,6 | Enterprise Fleet Financing LLC Series 2024-1 | 5.230% | 3/20/30 | 20,574 | 20,703 |
| 3,4,7 | Fannie Mae Connecticut Avenue Securities Series 2016-C03, SOFR30A + 6.014% | 10.749% | 10/25/28 | 1,244 | 1,295 |
| 3,6 | FirstKey Homes Trust Series 2021-SFR1 | 1.538% | 8/17/38 | 61,441 | 58,401 |
| 3,6 | Ford Credit Floorplan Master Owner Trust A Series 2024-1 | 5.290% | 4/15/29 | 47,750 | 48,566 |
| 3,4 | Freddie Mac Multifamily Structured Pass-Through Certificates Series K156 | 4.430% | 2/25/33 | 28,605 | 28,327 |
| 3,4 | Freddie Mac Multifamily Structured Pass-Through Certificates Series K511 | 4.860% | 10/25/28 | 40,745 | 41,191 |
| 3,4 | Freddie Mac Multifamily Structured Pass-Through Certificates Series K516 | 5.477% | 1/25/29 | 47,852 | 49,371 |
| 3,4 | Freddie Mac Multifamily Structured Pass-Through Certificates Series K-1512 | 3.059% | 4/25/34 | 6,000 | 5,278 |
| 3,4 | Freddie Mac Multifamily Structured Pass-Through Certificates Series K-1513 | 2.797% | 8/25/34 | 7,500 | 6,431 |
| 3,4 | Freddie Mac Multifamily Structured Pass-Through Certificates Series K-1521 | 2.184% | 8/25/36 | 17,705 | 13,685 |
| 3,4 | Freddie Mac Seasoned Credit Risk Transfer Trust Series 2019-3 | 3.500% | 10/25/58 | 19,030 | 18,130 |
| 3 | GM Financial Automobile Leasing Trust Series 2024-2 | 5.390% | 7/20/27 | 26,005 | 26,288 |
| 3 | GM Financial Consumer Automobile Receivables Trust Series 2023-2 | 4.470% | 2/16/28 | 9,420 | 9,414 |
| 3 | GM Financial Consumer Automobile Receivables Trust Series 2024-2 | 5.100% | 3/16/29 | 27,035 | 27,321 |
| 3,6 | GM Financial Revolving Receivables Trust Series 2023-2 | 5.770% | 8/11/36 | 53,067 | 55,359 |
| 3,6 | GM Financial Revolving Receivables Trust Series 2024-1 | 4.980% | 12/11/36 | 58,230 | 59,100 |
| 3,6 | GMF Floorplan Owner Revolving Trust Series 2024-2A | 5.060% | 3/15/31 | 26,405 | 26,902 |
| 3,6 | Home Partners of America Trust Series 2021-2 | 1.901% | 12/17/26 | 31,896 | 30,070 |
| 3 | Honda Auto Receivables Owner Trust Series 2024-2 | 5.270% | 11/20/28 | 34,745 | 35,209 |
| 3,6 | Horizon Aircraft Finance II Ltd. Series 2019-1 | 3.721% | 7/15/39 | 6,526 | 6,200 |
| 3,6 | Horizon Aircraft Finance III Ltd. Series 2019-2 | 3.425% | 11/15/39 | 7,422 | 6,898 |
| 3,6 | MACH 1 Cayman Ltd. Series 2019-1 | 3.474% | 10/15/39 | 6,237 | 5,931 |
| 3,6 | MAPS Ltd. Series 2019-1A | 4.458% | 3/15/44 | 1,713 | 1,619 |
| 3,6 | New Economy Assets Phase 1 Sponsor LLC Series 2021-1 | 1.910% | 10/20/61 | 85,715 | 79,022 |
| 3,6 | OneMain Direct Auto Receivables Trust Series 2021-1A | 0.870% | 7/14/28 | 9,970 | 9,802 |
| 3,6 | Retained Vantage Data Centers Issuer LLC Series 2023-1A | 5.000% | 9/15/48 | 44,711 | 44,311 |
| 3,6 | SoFi Professional Loan Program Trust Series 2021-B | 1.140% | 2/15/47 | 11,434 | 9,857 |
| 3,6 | Start II Ltd. Series 2019-1 | 4.089% | 3/15/44 | 8,097 | 7,945 |
| 3,6 | Taco Bell Funding LLC Series 2021-1A | 1.946% | 8/25/51 | 19,129 | 17,834 |
| 3,6 | Taco Bell Funding LLC Series 2021-1A | 2.294% | 8/25/51 | 35,385 | 31,571 |
| 3,6 | Toyota Auto Loan Extended Note Trust Series 2021-1A | 1.070% | 2/27/34 | 51,826 | 49,603 |
| 3 | Toyota Auto Receivables Owner Trust Series 2024-D | 4.400% | 6/15/29 | 29,410 | 29,397 |
| | | | Coupon | Maturity
Date | Face
Amount
($000) | Market
Value•
($000) |
| 3,6 | Vantage Data Centers Issuer LLC Series 2020-1A | 1.645% | 9/15/45 | 24,304 | 23,631 |
| 3,6 | Vantage Data Centers Issuer LLC Series 2021-1A | 2.165% | 10/15/46 | 38,038 | 35,905 |
| 3 | Volkswagen Auto Lease Trust Series 2024-A | 5.210% | 6/21/27 | 25,860 | 26,138 |
| 3,6 | Wheels Fleet Lease Funding LLC Series 2023-1A | 5.800% | 4/18/38 | 26,423 | 26,587 |
| 3,6 | Wheels Fleet Lease Funding LLC Series 2023-2A | 6.460% | 8/18/38 | 80,936 | 82,421 |
| 3,6 | Wheels Fleet Lease Funding LLC Series 2024-2A | 4.870% | 6/21/39 | 22,890 | 22,945 |
| Total Asset-Backed/Commercial Mortgage-Backed Securities (Cost $1,473,758) | 1,448,721 |
| Corporate Bonds (21.2%) |
| Communications (1.2%) |
| | America Movil SAB de CV | 3.625% | 4/22/29 | 26,990 | 25,688 |
| | America Movil SAB de CV | 6.125% | 3/30/40 | 7,380 | 7,881 |
| | AT&T Inc. | 5.400% | 2/15/34 | 9,900 | 10,186 |
| | AT&T Inc. | 4.500% | 5/15/35 | 48,688 | 46,343 |
| | AT&T Inc. | 3.500% | 6/1/41 | 69,950 | 56,018 |
| | AT&T Inc. | 4.300% | 12/15/42 | 41,340 | 36,095 |
| | AT&T Inc. | 3.650% | 6/1/51 | 2,941 | 2,187 |
| | AT&T Inc. | 3.550% | 9/15/55 | 9,500 | 6,755 |
| | AT&T Inc. | 3.650% | 9/15/59 | 31,881 | 22,507 |
| | Charter Communications Operating LLC | 3.500% | 3/1/42 | 38,550 | 27,389 |
| | Charter Communications Operating LLC | 6.484% | 10/23/45 | 33,777 | 33,273 |
| | Charter Communications Operating LLC | 5.375% | 5/1/47 | 8,253 | 7,060 |
| | Charter Communications Operating LLC | 6.834% | 10/23/55 | 3,182 | 3,235 |
| | Comcast Corp. | 3.400% | 4/1/30 | 4,940 | 4,645 |
| | Comcast Corp. | 4.250% | 1/15/33 | 42,890 | 41,038 |
| | Comcast Corp. | 4.200% | 8/15/34 | 30,890 | 29,099 |
| | Comcast Corp. | 5.650% | 6/15/35 | 4,725 | 4,958 |
| | Comcast Corp. | 4.400% | 8/15/35 | 32,325 | 30,699 |
| | Comcast Corp. | 6.500% | 11/15/35 | 945 | 1,059 |
| | Comcast Corp. | 3.250% | 11/1/39 | 24,000 | 18,979 |
| | Comcast Corp. | 3.750% | 4/1/40 | 2,700 | 2,268 |
| | Comcast Corp. | 3.969% | 11/1/47 | 15,577 | 12,540 |
| | Comcast Corp. | 4.000% | 3/1/48 | 12,180 | 9,876 |
| | Comcast Corp. | 3.999% | 11/1/49 | 23,162 | 18,654 |
| | Comcast Corp. | 2.887% | 11/1/51 | 56,240 | 36,414 |
| | Comcast Corp. | 2.450% | 8/15/52 | 13,355 | 7,813 |
| | Comcast Corp. | 4.049% | 11/1/52 | 10,339 | 8,303 |
| | Comcast Corp. | 5.350% | 5/15/53 | 42,600 | 42,000 |
| | Comcast Corp. | 2.937% | 11/1/56 | 203,578 | 128,025 |
| | Comcast Corp. | 2.987% | 11/1/63 | 84,251 | 51,250 |
| 6 | Cox Communications Inc. | 4.800% | 2/1/35 | 30,000 | 28,046 |
| | Meta Platforms Inc. | 4.950% | 5/15/33 | 49,450 | 50,645 |
| | Meta Platforms Inc. | 5.600% | 5/15/53 | 39,775 | 42,011 |
| | Meta Platforms Inc. | 5.400% | 8/15/54 | 32,705 | 33,433 |
| | Meta Platforms Inc. | 5.750% | 5/15/63 | 15,440 | 16,447 |
| | NBCUniversal Media LLC | 4.450% | 1/15/43 | 11,031 | 9,904 |
| 6 | NTT Finance Corp. | 1.162% | 4/3/26 | 44,235 | 42,283 |
| 6 | NTT Finance Corp. | 2.065% | 4/3/31 | 10,370 | 8,844 |
| | Omnicom Group Inc. | 5.300% | 11/1/34 | 15,971 | 16,182 |
| 6 | Ooredoo International Finance Ltd. | 2.625% | 4/8/31 | 23,430 | 20,627 |
| | Orange SA | 9.000% | 3/1/31 | 20,280 | 24,610 |
| 6 | Sprint Spectrum Co. LLC | 4.738% | 3/20/25 | 5,408 | 5,401 |
| | Telefonica Emisiones SA | 5.213% | 3/8/47 | 12,100 | 11,223 |
| | Telefonica Emisiones SA | 5.520% | 3/1/49 | 13,822 | 13,414 |
| | T-Mobile USA Inc. | 2.050% | 2/15/28 | 37,110 | 34,279 |
| | T-Mobile USA Inc. | 4.200% | 10/1/29 | 50,702 | 49,664 |
| | T-Mobile USA Inc. | 3.875% | 4/15/30 | 29,560 | 28,251 |
| | T-Mobile USA Inc. | 4.375% | 4/15/40 | 15,735 | 14,198 |
| | T-Mobile USA Inc. | 3.000% | 2/15/41 | 14,785 | 11,064 |
| | T-Mobile USA Inc. | 5.250% | 6/15/55 | 23,961 | 23,094 |
| | T-Mobile USA Inc. | 3.600% | 11/15/60 | 4,250 | 2,986 |
| | TWDC Enterprises 18 Corp. | 4.375% | 8/16/41 | 26,724 | 24,144 |
| | Uber Technologies Inc. | 4.800% | 9/15/34 | 29,435 | 28,881 |
| | Uber Technologies Inc. | 5.350% | 9/15/54 | 21,195 | 20,728 |
| | Verizon Communications Inc. | 2.355% | 3/15/32 | 64,265 | 54,280 |
| | Verizon Communications Inc. | 4.812% | 3/15/39 | 24,854 | 23,777 |
| | Verizon Communications Inc. | 3.400% | 3/22/41 | 3,000 | 2,370 |
| | Verizon Communications Inc. | 3.850% | 11/1/42 | 3,000 | 2,469 |
| | Verizon Communications Inc. | 2.875% | 11/20/50 | 4,445 | 2,894 |
| | | | Coupon | Maturity
Date | Face
Amount
($000) | Market
Value•
($000) |
| | Verizon Communications Inc. | 3.000% | 11/20/60 | 4,599 | 2,855 |
| | Walt Disney Co. | 3.500% | 5/13/40 | 46,973 | 39,116 |
| | Walt Disney Co. | 4.750% | 9/15/44 | 2,358 | 2,231 |
| | | | | | | 1,422,588 |
| Consumer Discretionary (0.6%) |
| | Amazon.com Inc. | 3.600% | 4/13/32 | 84,875 | 79,867 |
| | Amazon.com Inc. | 2.875% | 5/12/41 | 2,600 | 1,993 |
| | Amazon.com Inc. | 4.950% | 12/5/44 | 24,105 | 24,203 |
| | Amazon.com Inc. | 4.050% | 8/22/47 | 2,100 | 1,816 |
| | Amazon.com Inc. | 3.950% | 4/13/52 | 11,995 | 10,009 |
| | Amazon.com Inc. | 4.250% | 8/22/57 | 41,967 | 36,434 |
| | Amazon.com Inc. | 4.100% | 4/13/62 | 8,245 | 6,855 |
| 6 | BMW US Capital LLC | 1.250% | 8/12/26 | 28,900 | 27,336 |
| 3 | Brown University | 2.924% | 9/1/50 | 5,205 | 3,708 |
| 3 | Duke University | 2.832% | 10/1/55 | 25,700 | 17,334 |
| 3 | Georgetown University | 4.315% | 4/1/49 | 5,405 | 4,783 |
| 3 | Georgetown University | 2.943% | 4/1/50 | 7,495 | 5,193 |
| | Georgetown University | 5.115% | 4/1/53 | 7,326 | 7,408 |
| | Home Depot Inc. | 3.900% | 12/6/28 | 10,250 | 10,077 |
| | Home Depot Inc. | 4.850% | 6/25/31 | 21,510 | 21,796 |
| | Home Depot Inc. | 3.250% | 4/15/32 | 57,046 | 51,984 |
| | Home Depot Inc. | 3.300% | 4/15/40 | 18,410 | 14,921 |
| | Home Depot Inc. | 4.200% | 4/1/43 | 8,075 | 7,120 |
| | Home Depot Inc. | 4.875% | 2/15/44 | 6,800 | 6,510 |
| | Home Depot Inc. | 4.400% | 3/15/45 | 28,655 | 25,733 |
| | Home Depot Inc. | 4.250% | 4/1/46 | 25,000 | 21,861 |
| | Home Depot Inc. | 4.500% | 12/6/48 | 12,215 | 11,026 |
| | Home Depot Inc. | 3.125% | 12/15/49 | 2,490 | 1,767 |
| | Home Depot Inc. | 2.375% | 3/15/51 | 2,495 | 1,501 |
| | Home Depot Inc. | 2.750% | 9/15/51 | 19,955 | 12,945 |
| | Home Depot Inc. | 3.625% | 4/15/52 | 25,570 | 19,706 |
| | Home Depot Inc. | 4.950% | 9/15/52 | 7,565 | 7,271 |
| | Home Depot Inc. | 5.300% | 6/25/54 | 35,670 | 36,107 |
| | Home Depot Inc. | 5.400% | 6/25/64 | 3,665 | 3,736 |
| 6 | Hyundai Capital America | 1.650% | 9/17/26 | 36,480 | 34,476 |
| 3 | Johns Hopkins University | 4.083% | 7/1/53 | 7,805 | 6,755 |
| 3 | Johns Hopkins University | 2.813% | 1/1/60 | 6,420 | 4,072 |
| 3 | Leland Stanford Junior University | 7.650% | 6/15/26 | 29,000 | 30,401 |
| | Leland Stanford Junior University | 2.413% | 6/1/50 | 2,441 | 1,567 |
| | Lowe's Cos. Inc. | 3.100% | 5/3/27 | 8,700 | 8,414 |
| | Lowe's Cos. Inc. | 6.500% | 3/15/29 | 13,301 | 14,308 |
| | Lowe's Cos. Inc. | 3.650% | 4/5/29 | 8,415 | 8,090 |
| | Lowe's Cos. Inc. | 2.800% | 9/15/41 | 4,250 | 3,042 |
| | Lowe's Cos. Inc. | 5.800% | 9/15/62 | 16,328 | 16,733 |
| 3 | Massachusetts Institute of Technology | 2.989% | 7/1/50 | 852 | 616 |
| 3 | Massachusetts Institute of Technology | 2.294% | 7/1/51 | 2,100 | 1,302 |
| 3 | McDonald's Corp. | 4.875% | 7/15/40 | 10,000 | 9,712 |
| 3 | Northeastern University | 2.894% | 10/1/50 | 6,995 | 4,867 |
| 3 | Northwestern University | 2.640% | 12/1/50 | 805 | 522 |
| | President & Fellows of Harvard College | 3.745% | 11/15/52 | 450 | 372 |
| | Thomas Jefferson University | 3.847% | 11/1/57 | 7,065 | 5,315 |
| 3 | Trustees of Princeton University | 2.516% | 7/1/50 | 1,997 | 1,309 |
| | Trustees of Princeton University | 4.201% | 3/1/52 | 2,157 | 1,952 |
| 3 | Trustees of the University of Pennsylvania | 2.396% | 10/1/50 | 6,430 | 4,076 |
| 3 | University of Chicago | 2.761% | 4/1/45 | 5,825 | 4,524 |
| 3 | University of Southern California | 2.945% | 10/1/51 | 1,855 | 1,311 |
| | University of Southern California | 4.976% | 10/1/53 | 20,970 | 21,158 |
| 3 | Yale University | 2.402% | 4/15/50 | 1,366 | 878 |
| | | | | | | 666,772 |
| Consumer Staples (1.0%) |
| | Anheuser-Busch Cos. LLC | 6.500% | 1/1/28 | 19,550 | 20,645 |
| 3 | Anheuser-Busch Cos. LLC | 4.700% | 2/1/36 | 60,450 | 59,272 |
| 3 | Anheuser-Busch Cos. LLC | 4.900% | 2/1/46 | 48,146 | 46,047 |
| | Anheuser-Busch InBev Worldwide Inc. | 4.375% | 4/15/38 | 17,598 | 16,549 |
| | Anheuser-Busch InBev Worldwide Inc. | 5.450% | 1/23/39 | 6,675 | 6,933 |
| | Anheuser-Busch InBev Worldwide Inc. | 4.950% | 1/15/42 | 51,856 | 50,469 |
| | Anheuser-Busch InBev Worldwide Inc. | 5.550% | 1/23/49 | 25,167 | 26,235 |
| | Anheuser-Busch InBev Worldwide Inc. | 4.750% | 4/15/58 | 30,829 | 28,791 |
| | Anheuser-Busch InBev Worldwide Inc. | 5.800% | 1/23/59 | 10,479 | 11,337 |
| | | | Coupon | Maturity
Date | Face
Amount
($000) | Market
Value•
($000) |
| | Anheuser-Busch InBev Worldwide Inc. | 4.600% | 6/1/60 | 12,237 | 11,330 |
| | Archer-Daniels-Midland Co. | 4.500% | 3/15/49 | 35,045 | 31,288 |
| | BAT Capital Corp. | 6.343% | 8/2/30 | 10,115 | 10,775 |
| | BAT Capital Corp. | 6.000% | 2/20/34 | 9,900 | 10,416 |
| | BAT Capital Corp. | 4.390% | 8/15/37 | 24,400 | 21,764 |
| | BAT Capital Corp. | 7.079% | 8/2/43 | 11,335 | 12,758 |
| 6 | Cargill Inc. | 6.875% | 5/1/28 | 19,355 | 20,526 |
| 6 | CK Hutchison International 20 Ltd. | 3.375% | 5/8/50 | 22,015 | 16,521 |
| | Coca-Cola Consolidated Inc. | 5.250% | 6/1/29 | 30,002 | 30,739 |
| | Coca-Cola Consolidated Inc. | 5.450% | 6/1/34 | 15,575 | 16,033 |
| 3 | Colgate-Palmolive Co. | 7.600% | 5/19/25 | 13,920 | 14,101 |
| 6 | Danone SA | 2.947% | 11/2/26 | 30,550 | 29,610 |
| | Diageo Capital plc | 2.375% | 10/24/29 | 20,000 | 18,147 |
| | Diageo Capital plc | 2.000% | 4/29/30 | 5,830 | 5,109 |
| | Diageo Capital plc | 2.125% | 4/29/32 | 1,845 | 1,541 |
| | Kenvue Inc. | 5.000% | 3/22/30 | 33,325 | 34,100 |
| | Kenvue Inc. | 5.100% | 3/22/43 | 15,025 | 14,985 |
| | Kenvue Inc. | 5.050% | 3/22/53 | 16,335 | 15,994 |
| | Keurig Dr Pepper Inc. | 5.050% | 3/15/29 | 14,825 | 15,044 |
| | Molson Coors Beverage Co. | 3.000% | 7/15/26 | 54,900 | 53,482 |
| | Philip Morris International Inc. | 5.125% | 11/17/27 | 39,385 | 40,033 |
| | Philip Morris International Inc. | 5.625% | 11/17/29 | 39,305 | 40,938 |
| | Philip Morris International Inc. | 5.125% | 2/15/30 | 107,792 | 109,861 |
| | Philip Morris International Inc. | 5.125% | 2/13/31 | 28,130 | 28,635 |
| | Philip Morris International Inc. | 4.750% | 11/1/31 | 21,770 | 21,679 |
| | Philip Morris International Inc. | 5.750% | 11/17/32 | 50,815 | 53,436 |
| | Philip Morris International Inc. | 5.375% | 2/15/33 | 83,714 | 85,752 |
| | Philip Morris International Inc. | 5.250% | 2/13/34 | 72,635 | 73,821 |
| | Philip Morris International Inc. | 4.375% | 11/15/41 | 3,744 | 3,330 |
| | Philip Morris International Inc. | 4.500% | 3/20/42 | 3,294 | 2,973 |
| | Philip Morris International Inc. | 4.125% | 3/4/43 | 3,565 | 3,040 |
| | Philip Morris International Inc. | 4.875% | 11/15/43 | 11,614 | 10,936 |
| | Philip Morris International Inc. | 4.250% | 11/10/44 | 2,590 | 2,227 |
| | | | | | | 1,127,202 |
| Energy (1.2%) |
| | BP Capital Markets America Inc. | 1.749% | 8/10/30 | 12,780 | 10,953 |
| | BP Capital Markets America Inc. | 2.721% | 1/12/32 | 42,755 | 37,385 |
| | BP Capital Markets America Inc. | 4.812% | 2/13/33 | 38,275 | 37,944 |
| | BP Capital Markets America Inc. | 4.893% | 9/11/33 | 39,975 | 39,693 |
| | BP Capital Markets America Inc. | 5.227% | 11/17/34 | 48,820 | 49,581 |
| | BP Capital Markets America Inc. | 3.060% | 6/17/41 | 20,000 | 15,064 |
| | BP Capital Markets America Inc. | 2.772% | 11/10/50 | 11,870 | 7,594 |
| | BP Capital Markets America Inc. | 2.939% | 6/4/51 | 30,385 | 20,033 |
| | BP Capital Markets America Inc. | 3.001% | 3/17/52 | 54,366 | 36,181 |
| | BP Capital Markets America Inc. | 3.379% | 2/8/61 | 12,750 | 8,650 |
| | Cheniere Energy Partners LP | 5.950% | 6/30/33 | 16,500 | 17,236 |
| 6 | Columbia Pipelines Holding Co. LLC | 5.097% | 10/1/31 | 8,490 | 8,392 |
| 6 | Columbia Pipelines Holding Co. LLC | 5.681% | 1/15/34 | 4,550 | 4,609 |
| 6 | Columbia Pipelines Operating Co. LLC | 5.927% | 8/15/30 | 11,830 | 12,332 |
| 6 | Columbia Pipelines Operating Co. LLC | 6.036% | 11/15/33 | 12,665 | 13,329 |
| 6 | Columbia Pipelines Operating Co. LLC | 6.497% | 8/15/43 | 39,861 | 43,078 |
| 6 | Columbia Pipelines Operating Co. LLC | 6.544% | 11/15/53 | 14,928 | 16,524 |
| 6 | Columbia Pipelines Operating Co. LLC | 6.714% | 8/15/63 | 8,253 | 9,265 |
| | Eastern Gas Transmission & Storage Inc. | 3.000% | 11/15/29 | 19,580 | 18,154 |
| 3 | Eastern Gas Transmission & Storage Inc. | 4.800% | 11/1/43 | 4,185 | 3,819 |
| 3 | Eastern Gas Transmission & Storage Inc. | 4.600% | 12/15/44 | 24,863 | 22,002 |
| 6 | EIG Pearl Holdings Sarl | 3.545% | 8/31/36 | 21,220 | 18,370 |
| 6 | EIG Pearl Holdings Sarl | 4.387% | 11/30/46 | 16,115 | 12,797 |
| | Enbridge Inc. | 6.700% | 11/15/53 | 12,000 | 13,767 |
| | Enbridge Inc. | 5.950% | 4/5/54 | 9,700 | 10,180 |
| | Energy Transfer LP | 5.250% | 4/15/29 | 40,000 | 40,634 |
| | Energy Transfer LP | 6.550% | 12/1/33 | 15,150 | 16,511 |
| | Energy Transfer LP | 5.550% | 5/15/34 | 8,900 | 9,070 |
| | Energy Transfer LP | 5.350% | 5/15/45 | 4,800 | 4,538 |
| | Energy Transfer LP | 6.125% | 12/15/45 | 5,000 | 5,169 |
| | Energy Transfer LP | 5.300% | 4/15/47 | 5,745 | 5,332 |
| | Energy Transfer LP | 5.400% | 10/1/47 | 8,253 | 7,779 |
| | Energy Transfer LP | 5.000% | 5/15/50 | 5,110 | 4,570 |
| | Energy Transfer LP | 5.950% | 5/15/54 | 22,860 | 23,266 |
| | | | Coupon | Maturity
Date | Face
Amount
($000) | Market
Value•
($000) |
| 6 | Eni SpA | 5.950% | 5/15/54 | 22,380 | 22,782 |
| | Enterprise Products Operating LLC | 5.950% | 2/1/41 | 3,000 | 3,207 |
| | Enterprise Products Operating LLC | 5.100% | 2/15/45 | 15,220 | 14,811 |
| | Enterprise Products Operating LLC | 3.300% | 2/15/53 | 9,600 | 6,762 |
| | Exxon Mobil Corp. | 2.610% | 10/15/30 | 29,975 | 27,072 |
| | Exxon Mobil Corp. | 4.114% | 3/1/46 | 5,060 | 4,324 |
| 6 | Galaxy Pipeline Assets Bidco Ltd. | 2.160% | 3/31/34 | 39,833 | 34,575 |
| 6 | Galaxy Pipeline Assets Bidco Ltd. | 2.940% | 9/30/40 | 40,019 | 32,434 |
| 6 | Greensaif Pipelines Bidco Sarl | 5.853% | 2/23/36 | 15,660 | 15,717 |
| 6 | Greensaif Pipelines Bidco Sarl | 6.129% | 2/23/38 | 8,839 | 9,038 |
| 3 | Greensaif Pipelines Bidco Sarl | 6.129% | 2/23/38 | 8,075 | 8,258 |
| 6 | Greensaif Pipelines Bidco Sarl | 6.510% | 2/23/42 | 26,755 | 27,846 |
| 6 | Greensaif Pipelines Bidco Sarl | 6.103% | 8/23/42 | 26,490 | 26,580 |
| | MPLX LP | 2.650% | 8/15/30 | 6,929 | 6,152 |
| | MPLX LP | 4.950% | 9/1/32 | 7,275 | 7,189 |
| | MPLX LP | 5.500% | 6/1/34 | 25,810 | 26,146 |
| | ONEOK Inc. | 5.650% | 11/1/28 | 10,995 | 11,348 |
| | ONEOK Inc. | 4.750% | 10/15/31 | 22,625 | 22,346 |
| | ONEOK Inc. | 6.050% | 9/1/33 | 5,000 | 5,278 |
| 6 | Schlumberger Holdings Corp. | 3.900% | 5/17/28 | 31,025 | 30,396 |
| 6 | Schlumberger Holdings Corp. | 5.000% | 11/15/29 | 14,400 | 14,589 |
| 3 | Shell Finance US Inc. | 4.125% | 5/11/35 | 43,465 | 41,094 |
| 3 | Shell Finance US Inc. | 4.550% | 8/12/43 | 2,650 | 2,431 |
| 3 | Shell Finance US Inc. | 4.375% | 5/11/45 | 107,950 | 94,901 |
| 3 | Shell Finance US Inc. | 4.000% | 5/10/46 | 10,000 | 8,287 |
| | Shell International Finance BV | 5.500% | 3/25/40 | 12,990 | 13,506 |
| | Shell International Finance BV | 2.875% | 11/26/41 | 15,000 | 11,119 |
| | Shell International Finance BV | 3.000% | 11/26/51 | 47,845 | 32,304 |
| | Suncor Energy Inc. | 5.950% | 12/1/34 | 20,700 | 21,954 |
| | Targa Resources Corp. | 6.150% | 3/1/29 | 29,070 | 30,577 |
| | TotalEnergies Capital SA | 5.150% | 4/5/34 | 29,905 | 30,426 |
| | TotalEnergies Capital SA | 5.488% | 4/5/54 | 14,760 | 14,915 |
| | TotalEnergies Capital SA | 5.275% | 9/10/54 | 14,655 | 14,370 |
| | TotalEnergies Capital SA | 5.638% | 4/5/64 | 22,020 | 22,324 |
| | TotalEnergies Capital SA | 5.425% | 9/10/64 | 29,105 | 28,583 |
| | TransCanada PipeLines Ltd. | 4.875% | 1/15/26 | 36,221 | 36,240 |
| | TransCanada PipeLines Ltd. | 4.100% | 4/15/30 | 3,885 | 3,741 |
| 6 | Whistler Pipeline LLC | 5.400% | 9/30/29 | 7,725 | 7,797 |
| 6 | Whistler Pipeline LLC | 5.700% | 9/30/31 | 5,790 | 5,896 |
| | | | | | | 1,381,116 |
| Financials (9.2%) |
| 6 | Abu Dhabi Developmental Holding Co. PJSC | 5.375% | 5/8/29 | 37,660 | 38,461 |
| 6 | Abu Dhabi Developmental Holding Co. PJSC | 4.375% | 10/2/31 | 38,985 | 37,884 |
| 6 | Abu Dhabi Developmental Holding Co. PJSC | 5.500% | 5/8/34 | 59,425 | 61,403 |
| | ACE Capital Trust II | 9.700% | 4/1/30 | 20,000 | 24,234 |
| | AerCap Ireland Capital DAC | 3.000% | 10/29/28 | 15,230 | 14,211 |
| | AerCap Ireland Capital DAC | 3.300% | 1/30/32 | 3,550 | 3,154 |
| 6 | AIB Group plc | 5.871% | 3/28/35 | 16,510 | 16,943 |
| | Allstate Corp. | 5.250% | 3/30/33 | 10,000 | 10,183 |
| | Allstate Corp. | 5.550% | 5/9/35 | 6,611 | 6,915 |
| | Allstate Corp. | 3.850% | 8/10/49 | 4,741 | 3,764 |
| | American Express Co. | 5.532% | 4/25/30 | 9,500 | 9,769 |
| | American Express Co. | 6.489% | 10/30/31 | 10,570 | 11,473 |
| | American Express Co. | 5.043% | 5/1/34 | 66,555 | 67,059 |
| | American Express Co. | 5.625% | 7/28/34 | 6,675 | 6,876 |
| | American Express Co. | 5.915% | 4/25/35 | 8,900 | 9,315 |
| | American Express Co. | 5.284% | 7/26/35 | 14,900 | 15,121 |
| | American International Group Inc. | 6.250% | 5/1/36 | 7,775 | 8,432 |
| | American International Group Inc. | 4.800% | 7/10/45 | 10,680 | 9,911 |
| | American International Group Inc. | 4.750% | 4/1/48 | 17,120 | 15,806 |
| | American International Group Inc. | 4.375% | 6/30/50 | 12,500 | 10,865 |
| | Ameriprise Financial Inc. | 5.700% | 12/15/28 | 16,748 | 17,474 |
| | Ameriprise Financial Inc. | 4.500% | 5/13/32 | 11,845 | 11,654 |
| | Ameriprise Financial Inc. | 5.150% | 5/15/33 | 16,715 | 17,061 |
| | Aon Corp. | 2.850% | 5/28/27 | 18,870 | 18,094 |
| 6 | Athene Global Funding | 5.349% | 7/9/27 | 35,830 | 36,170 |
| 6 | Athene Global Funding | 1.985% | 8/19/28 | 290 | 261 |
| 6 | Athene Global Funding | 2.717% | 1/7/29 | 33,350 | 30,519 |
| 6 | Athene Global Funding | 5.583% | 1/9/29 | 28,585 | 29,207 |
| | | | Coupon | Maturity
Date | Face
Amount
($000) | Market
Value•
($000) |
| 6 | Athene Global Funding | 4.721% | 10/8/29 | 39,962 | 39,495 |
| | Athene Holding Ltd. | 4.125% | 1/12/28 | 6,663 | 6,537 |
| | Athene Holding Ltd. | 6.250% | 4/1/54 | 18,400 | 19,404 |
| 6 | Australia & New Zealand Banking Group Ltd. | 2.570% | 11/25/35 | 22,135 | 19,010 |
| 6 | Aviation Capital Group LLC | 1.950% | 9/20/26 | 14,298 | 13,538 |
| | Banco Santander SA | 1.849% | 3/25/26 | 14,000 | 13,463 |
| 3 | Banco Santander SA | 5.365% | 7/15/28 | 30,400 | 30,708 |
| | Banco Santander SA | 2.749% | 12/3/30 | 8,400 | 7,246 |
| 3 | Bank of America Corp. | 3.500% | 4/19/26 | 10,000 | 9,857 |
| 3 | Bank of America Corp. | 3.559% | 4/23/27 | 86,705 | 85,248 |
| 3 | Bank of America Corp. | 3.593% | 7/21/28 | 47,950 | 46,566 |
| 3 | Bank of America Corp. | 4.948% | 7/22/28 | 8,415 | 8,457 |
| | Bank of America Corp. | 6.204% | 11/10/28 | 9,700 | 10,097 |
| 3 | Bank of America Corp. | 3.419% | 12/20/28 | 8,681 | 8,347 |
| | Bank of America Corp. | 5.202% | 4/25/29 | 5,000 | 5,063 |
| 3 | Bank of America Corp. | 4.271% | 7/23/29 | 74,365 | 73,149 |
| | Bank of America Corp. | 5.819% | 9/15/29 | 9,500 | 9,846 |
| 3 | Bank of America Corp. | 3.974% | 2/7/30 | 80,000 | 77,373 |
| 3 | Bank of America Corp. | 3.194% | 7/23/30 | 35,285 | 32,901 |
| 3 | Bank of America Corp. | 2.496% | 2/13/31 | 50,870 | 45,394 |
| | Bank of America Corp. | 2.572% | 10/20/32 | 17,275 | 14,878 |
| 3 | Bank of America Corp. | 5.015% | 7/22/33 | 10,085 | 10,126 |
| | Bank of America Corp. | 5.872% | 9/15/34 | 65,405 | 69,044 |
| | Bank of America Corp. | 5.468% | 1/23/35 | 25,228 | 25,945 |
| | Bank of America Corp. | 3.846% | 3/8/37 | 40,872 | 36,938 |
| 3 | Bank of America Corp. | 5.875% | 2/7/42 | 9,965 | 10,820 |
| | Bank of America Corp. | 3.311% | 4/22/42 | 55,635 | 43,707 |
| 3 | Bank of America Corp. | 5.000% | 1/21/44 | 39,433 | 38,661 |
| 3 | Bank of America Corp. | 3.946% | 1/23/49 | 5,380 | 4,405 |
| 3 | Bank of America Corp. | 4.330% | 3/15/50 | 66,970 | 58,077 |
| | Bank of America Corp. | 2.972% | 7/21/52 | 65,950 | 44,867 |
| 3 | Bank of New York Mellon Corp. | 5.148% | 5/22/26 | 17,665 | 17,693 |
| 3 | Bank of New York Mellon Corp. | 5.834% | 10/25/33 | 18,540 | 19,655 |
| | Bank of New York Mellon Corp. | 4.706% | 2/1/34 | 14,535 | 14,324 |
| 3 | Bank of New York Mellon Corp. | 4.967% | 4/26/34 | 39,750 | 39,822 |
| 3 | Bank of New York Mellon Corp. | 5.188% | 3/14/35 | 1,615 | 1,645 |
| | Bank of Nova Scotia | 5.350% | 12/7/26 | 58,000 | 58,877 |
| | Bank of Nova Scotia | 1.950% | 2/2/27 | 12,470 | 11,814 |
| 6 | Banque Federative du Credit Mutuel SA | 1.604% | 10/4/26 | 34,305 | 32,456 |
| 3 | Barclays plc | 2.852% | 5/7/26 | 9,975 | 9,879 |
| | Barclays plc | 2.279% | 11/24/27 | 14,930 | 14,180 |
| | Barclays plc | 2.667% | 3/10/32 | 40,502 | 35,063 |
| | Barclays plc | 5.335% | 9/10/35 | 9,500 | 9,391 |
| | Barclays plc | 3.330% | 11/24/42 | 27,170 | 20,581 |
| 6 | Beacon Funding Trust | 6.266% | 8/15/54 | 43,160 | 44,407 |
| | BlackRock Funding Inc. | 5.250% | 3/14/54 | 30,180 | 30,252 |
| | BlackRock Funding Inc. | 5.350% | 1/8/55 | 12,055 | 12,280 |
| | Blackrock Inc. | 2.100% | 2/25/32 | 24,849 | 20,972 |
| | Blackrock Inc. | 4.750% | 5/25/33 | 68,215 | 68,387 |
| 6 | Blackstone Holdings Finance Co. LLC | 2.550% | 3/30/32 | 22,680 | 19,439 |
| 6 | BNP Paribas SA | 1.323% | 1/13/27 | 18,995 | 18,230 |
| 6 | BNP Paribas SA | 3.500% | 11/16/27 | 69,325 | 66,710 |
| 6 | BNP Paribas SA | 2.591% | 1/20/28 | 25,560 | 24,355 |
| 6 | BNP Paribas SA | 5.335% | 6/12/29 | 36,955 | 37,459 |
| 6 | BNP Paribas SA | 5.497% | 5/20/30 | 8,245 | 8,379 |
| 6 | BNP Paribas SA | 5.738% | 2/20/35 | 9,500 | 9,722 |
| 6 | BPCE SA | 2.045% | 10/19/27 | 25,245 | 23,854 |
| 6 | BPCE SA | 3.500% | 10/23/27 | 64,230 | 61,663 |
| 6 | BPCE SA | 5.281% | 5/30/29 | 19,230 | 19,521 |
| 6 | BPCE SA | 2.700% | 10/1/29 | 50,000 | 45,283 |
| 6 | BPCE SA | 7.003% | 10/19/34 | 6,675 | 7,290 |
| 6 | BPCE SA | 5.936% | 5/30/35 | 10,150 | 10,361 |
| 6 | Brighthouse Financial Global Funding | 1.750% | 1/13/25 | 16,910 | 16,847 |
| 6 | Brighthouse Financial Global Funding | 1.550% | 5/24/26 | 20,210 | 19,238 |
| 6 | Brighthouse Financial Global Funding | 2.000% | 6/28/28 | 16,275 | 14,577 |
| 6 | Brighthouse Financial Global Funding | 5.650% | 6/10/29 | 39,595 | 40,361 |
| | Canadian Imperial Bank of Commerce | 5.237% | 6/28/27 | 35,885 | 36,430 |
| | Canadian Imperial Bank of Commerce | 4.508% | 9/11/27 | 30,005 | 29,902 |
| | Canadian Imperial Bank of Commerce | 4.631% | 9/11/30 | 35,495 | 35,154 |
| | Capital One Financial Corp. | 7.149% | 10/29/27 | 15,235 | 15,850 |
| | | | Coupon | Maturity
Date | Face
Amount
($000) | Market
Value•
($000) |
| | Capital One Financial Corp. | 6.312% | 6/8/29 | 11,785 | 12,252 |
| | Capital One Financial Corp. | 5.700% | 2/1/30 | 16,562 | 16,967 |
| 3 | Capital One Financial Corp. | 7.624% | 10/30/31 | 31,761 | 35,551 |
| | Capital One Financial Corp. | 5.817% | 2/1/34 | 8,000 | 8,229 |
| | Capital One Financial Corp. | 6.377% | 6/8/34 | 71,120 | 75,603 |
| | Capital One Financial Corp. | 6.051% | 2/1/35 | 50,194 | 52,384 |
| | Capital One Financial Corp. | 5.884% | 7/26/35 | 23,453 | 24,230 |
| | Charles Schwab Corp. | 3.200% | 3/2/27 | 14,750 | 14,320 |
| | Charles Schwab Corp. | 2.000% | 3/20/28 | 20,309 | 18,745 |
| | Chubb Corp. | 6.000% | 5/11/37 | 50,000 | 54,481 |
| | Chubb INA Holdings LLC | 4.350% | 11/3/45 | 23,885 | 21,313 |
| 3 | Citibank NA | 5.570% | 4/30/34 | 26,335 | 27,423 |
| | Citigroup Inc. | 1.462% | 6/9/27 | 62,962 | 59,864 |
| 3 | Citigroup Inc. | 3.070% | 2/24/28 | 65,000 | 62,662 |
| | Citigroup Inc. | 4.125% | 7/25/28 | 9,025 | 8,828 |
| 3 | Citigroup Inc. | 3.520% | 10/27/28 | 33,088 | 31,970 |
| | Citigroup Inc. | 5.174% | 2/13/30 | 5,000 | 5,059 |
| 3 | Citigroup Inc. | 3.878% | 1/24/39 | 37,030 | 32,201 |
| | Citigroup Inc. | 2.904% | 11/3/42 | 19,370 | 14,212 |
| | Citizens Financial Group Inc. | 5.841% | 1/23/30 | 5,795 | 5,959 |
| 6 | CNO Global Funding | 1.650% | 1/6/25 | 8,725 | 8,693 |
| 6 | CNO Global Funding | 5.875% | 6/4/27 | 34,533 | 35,285 |
| 6 | CNO Global Funding | 2.650% | 1/6/29 | 12,585 | 11,471 |
| 6 | Commonwealth Bank of Australia | 5.071% | 9/14/28 | 36,585 | 37,370 |
| 6 | Commonwealth Bank of Australia | 2.688% | 3/11/31 | 74,015 | 64,280 |
| 6 | Commonwealth Bank of Australia | 3.784% | 3/14/32 | 9,885 | 9,045 |
| 6 | Cooperatieve Rabobank UA | 1.106% | 2/24/27 | 46,710 | 44,570 |
| 6 | Cooperatieve Rabobank UA | 4.655% | 8/22/28 | 26,667 | 26,522 |
| | Corebridge Financial Inc. | 3.900% | 4/5/32 | 30,000 | 27,872 |
| | Corebridge Financial Inc. | 6.050% | 9/15/33 | 5,070 | 5,369 |
| | Corebridge Financial Inc. | 5.750% | 1/15/34 | 38,315 | 39,807 |
| | Corebridge Financial Inc. | 4.350% | 4/5/42 | 2,760 | 2,389 |
| | Corebridge Financial Inc. | 4.400% | 4/5/52 | 34,623 | 29,157 |
| 6 | Corebridge Global Funding | 5.750% | 7/2/26 | 17,660 | 17,945 |
| 6 | Corebridge Global Funding | 5.900% | 9/19/28 | 8,525 | 8,852 |
| 6 | Corebridge Global Funding | 5.200% | 1/12/29 | 21,335 | 21,634 |
| 6 | Corebridge Global Funding | 5.200% | 6/24/29 | 14,205 | 14,402 |
| 6 | Credit Agricole SA | 5.589% | 7/5/26 | 40,520 | 41,094 |
| 6 | Credit Agricole SA | 4.631% | 9/11/28 | 32,140 | 31,902 |
| 6 | Credit Agricole SA | 6.316% | 10/3/29 | 16,442 | 17,215 |
| 6 | Danske Bank A/S | 1.621% | 9/11/26 | 28,990 | 28,242 |
| 6 | Danske Bank A/S | 6.259% | 9/22/26 | 35,035 | 35,372 |
| 6 | Danske Bank A/S | 1.549% | 9/10/27 | 55,460 | 52,397 |
| 6 | Danske Bank A/S | 5.705% | 3/1/30 | 6,505 | 6,666 |
| | Deutsche Bank AG | 6.720% | 1/18/29 | 5,860 | 6,127 |
| | Deutsche Bank AG | 6.819% | 11/20/29 | 26,925 | 28,460 |
| 6 | DNB Bank ASA | 1.535% | 5/25/27 | 44,030 | 41,920 |
| 6 | DNB Bank ASA | 1.605% | 3/30/28 | 45,870 | 42,559 |
| 6 | Equitable Financial Life Global Funding | 1.400% | 7/7/25 | 10,395 | 10,187 |
| 6 | Equitable Financial Life Global Funding | 1.300% | 7/12/26 | 26,755 | 25,358 |
| 6 | Equitable Financial Life Global Funding | 1.700% | 11/12/26 | 12,440 | 11,749 |
| 6 | Equitable Financial Life Global Funding | 1.400% | 8/27/27 | 18,220 | 16,716 |
| 6 | Equitable Financial Life Global Funding | 1.800% | 3/8/28 | 28,220 | 25,686 |
| 6 | Farmers Exchange Capital | 7.050% | 7/15/28 | 25,000 | 26,049 |
| 6 | Federation des Caisses Desjardins du Quebec | 5.147% | 11/27/28 | 35,825 | 36,608 |
| 6 | Federation des Caisses Desjardins du Quebec | 5.250% | 4/26/29 | 62,400 | 63,434 |
| | Fifth Third Bancorp | 4.055% | 4/25/28 | 15,040 | 14,756 |
| | Fifth Third Bancorp | 4.337% | 4/25/33 | 32,330 | 30,757 |
| 6 | Five Corners Funding Trust II | 2.850% | 5/15/30 | 34,750 | 31,458 |
| 6 | Five Corners Funding Trust III | 5.791% | 2/15/33 | 26,260 | 27,577 |
| 6 | Five Corners Funding Trust IV | 5.997% | 2/15/53 | 47,972 | 50,873 |
| 6 | GA Global Funding Trust | 4.400% | 9/23/27 | 49,745 | 49,206 |
| 6 | GA Global Funding Trust | 5.500% | 1/8/29 | 16,439 | 16,791 |
| | Goldman Sachs Group Inc. | 3.850% | 1/26/27 | 17,980 | 17,687 |
| | Goldman Sachs Group Inc. | 1.431% | 3/9/27 | 30,000 | 28,752 |
| | Goldman Sachs Group Inc. | 1.542% | 9/10/27 | 97,685 | 92,226 |
| 3 | Goldman Sachs Group Inc. | 3.691% | 6/5/28 | 20,055 | 19,523 |
| 3 | Goldman Sachs Group Inc. | 3.814% | 4/23/29 | 23,795 | 23,060 |
| 3 | Goldman Sachs Group Inc. | 4.223% | 5/1/29 | 67,740 | 66,546 |
| | Goldman Sachs Group Inc. | 3.800% | 3/15/30 | 23,040 | 21,946 |
| | | | Coupon | Maturity
Date | Face
Amount
($000) | Market
Value•
($000) |
| | Goldman Sachs Group Inc. | 4.692% | 10/23/30 | 9,500 | 9,437 |
| | Goldman Sachs Group Inc. | 1.992% | 1/27/32 | 30,600 | 25,731 |
| | Goldman Sachs Group Inc. | 2.615% | 4/22/32 | 88,125 | 76,692 |
| | Goldman Sachs Group Inc. | 2.383% | 7/21/32 | 94,160 | 80,346 |
| | Goldman Sachs Group Inc. | 2.650% | 10/21/32 | 14,050 | 12,115 |
| | Goldman Sachs Group Inc. | 3.102% | 2/24/33 | 26,995 | 23,845 |
| | Goldman Sachs Group Inc. | 6.750% | 10/1/37 | 43,995 | 48,793 |
| | Goldman Sachs Group Inc. | 6.250% | 2/1/41 | 20,135 | 22,161 |
| 3 | Goldman Sachs Group Inc. | 4.800% | 7/8/44 | 25,675 | 24,093 |
| 6 | Guardian Life Global Funding | 1.250% | 5/13/26 | 6,735 | 6,425 |
| | HSBC Holdings plc | 5.887% | 8/14/27 | 45,153 | 45,858 |
| 3 | HSBC Holdings plc | 4.041% | 3/13/28 | 21,805 | 21,392 |
| | HSBC Holdings plc | 5.597% | 5/17/28 | 69,410 | 70,430 |
| | HSBC Holdings plc | 7.390% | 11/3/28 | 36,196 | 38,581 |
| 3 | HSBC Holdings plc | 4.583% | 6/19/29 | 40,480 | 39,963 |
| | HSBC Holdings plc | 2.206% | 8/17/29 | 53,960 | 48,854 |
| 3 | HSBC Holdings plc | 2.357% | 8/18/31 | 54,320 | 46,881 |
| | HSBC Holdings plc | 2.804% | 5/24/32 | 36,410 | 31,534 |
| | HSBC Holdings plc | 6.547% | 6/20/34 | 9,900 | 10,468 |
| | HSBC Holdings plc | 6.500% | 5/2/36 | 22,500 | 24,368 |
| | HSBC Holdings plc | 6.100% | 1/14/42 | 38,220 | 42,345 |
| | Huntington National Bank | 4.552% | 5/17/28 | 11,240 | 11,159 |
| | ING Groep NV | 3.950% | 3/29/27 | 41,940 | 41,229 |
| | ING Groep NV | 1.726% | 4/1/27 | 16,075 | 15,410 |
| | ING Groep NV | 5.335% | 3/19/30 | 12,040 | 12,220 |
| | Intercontinental Exchange Inc. | 4.350% | 6/15/29 | 8,575 | 8,500 |
| | Intercontinental Exchange Inc. | 1.850% | 9/15/32 | 26,030 | 21,099 |
| | Intercontinental Exchange Inc. | 4.600% | 3/15/33 | 38,595 | 37,968 |
| | Intercontinental Exchange Inc. | 2.650% | 9/15/40 | 14,275 | 10,443 |
| | Intercontinental Exchange Inc. | 3.000% | 6/15/50 | 55,205 | 37,674 |
| | Intercontinental Exchange Inc. | 4.950% | 6/15/52 | 90,350 | 85,992 |
| 6 | Jackson National Life Global Funding | 1.750% | 1/12/25 | 18,915 | 18,847 |
| 6 | Jackson National Life Global Funding | 5.550% | 7/2/27 | 19,860 | 20,150 |
| 6 | Jackson National Life Insurance Co. | 8.150% | 3/15/27 | 18,890 | 19,646 |
| | JPMorgan Chase & Co. | 4.851% | 7/25/28 | 5,000 | 5,010 |
| | JPMorgan Chase & Co. | 2.069% | 6/1/29 | 42,085 | 38,508 |
| 3 | JPMorgan Chase & Co. | 4.452% | 12/5/29 | 64,735 | 63,967 |
| | JPMorgan Chase & Co. | 5.012% | 1/23/30 | 24,600 | 24,801 |
| 3 | JPMorgan Chase & Co. | 3.702% | 5/6/30 | 16,000 | 15,318 |
| | JPMorgan Chase & Co. | 4.603% | 10/22/30 | 77,025 | 76,480 |
| | JPMorgan Chase & Co. | 2.580% | 4/22/32 | 58,675 | 51,169 |
| | JPMorgan Chase & Co. | 4.586% | 4/26/33 | 30,000 | 29,313 |
| | JPMorgan Chase & Co. | 5.350% | 6/1/34 | 104,600 | 107,115 |
| | JPMorgan Chase & Co. | 4.946% | 10/22/35 | 26,640 | 26,469 |
| 3 | JPMorgan Chase & Co. | 3.109% | 4/22/41 | 19,440 | 15,135 |
| | JPMorgan Chase & Co. | 5.600% | 7/15/41 | 96,000 | 100,638 |
| | JPMorgan Chase & Co. | 5.400% | 1/6/42 | 18,035 | 18,552 |
| | JPMorgan Chase & Co. | 3.157% | 4/22/42 | 50,000 | 38,658 |
| | JPMorgan Chase & Co. | 5.625% | 8/16/43 | 16,100 | 16,856 |
| | JPMorgan Chase & Co. | 4.950% | 6/1/45 | 15,000 | 14,347 |
| 3 | JPMorgan Chase & Co. | 3.964% | 11/15/48 | 170,535 | 141,029 |
| 3 | JPMorgan Chase & Co. | 3.109% | 4/22/51 | 19,885 | 14,009 |
| 6 | KBC Group NV | 5.796% | 1/19/29 | 3,602 | 3,688 |
| 6 | KBC Group NV | 6.324% | 9/21/34 | 28,255 | 29,990 |
| 6 | Liberty Mutual Group Inc. | 4.569% | 2/1/29 | 14,170 | 14,012 |
| 6 | Liberty Mutual Group Inc. | 5.500% | 6/15/52 | 26,870 | 25,856 |
| 6 | Liberty Mutual Insurance Co. | 7.875% | 10/15/26 | 31,210 | 32,537 |
| | Lloyds Banking Group plc | 5.087% | 11/26/28 | 23,710 | 23,832 |
| | Lloyds Banking Group plc | 5.679% | 1/5/35 | 9,500 | 9,706 |
| 6 | Lseg US Fin Corp. | 5.297% | 3/28/34 | 8,475 | 8,659 |
| 6 | LSEGA Financing plc | 1.375% | 4/6/26 | 56,790 | 54,399 |
| 6 | LSEGA Financing plc | 2.000% | 4/6/28 | 24,615 | 22,584 |
| 6 | LSEGA Financing plc | 2.500% | 4/6/31 | 50,408 | 43,836 |
| | M&T Bank Corp. | 7.413% | 10/30/29 | 29,435 | 31,782 |
| 6 | Macquarie Group Ltd. | 1.935% | 4/14/28 | 42,835 | 39,941 |
| 6 | Macquarie Group Ltd. | 2.871% | 1/14/33 | 50,277 | 43,437 |
| 3 | Manufacturers & Traders Trust Co. | 2.900% | 2/6/25 | 24,685 | 24,578 |
| | Manufacturers & Traders Trust Co. | 4.700% | 1/27/28 | 78,846 | 78,508 |
| | Marsh & McLennan Cos. Inc. | 4.375% | 3/15/29 | 23,405 | 23,259 |
| | Marsh & McLennan Cos. Inc. | 4.900% | 3/15/49 | 4,965 | 4,680 |
| | | | Coupon | Maturity
Date | Face
Amount
($000) | Market
Value•
($000) |
| | Marsh & McLennan Cos. Inc. | 2.900% | 12/15/51 | 20,255 | 13,363 |
| | Marsh & McLennan Cos. Inc. | 5.450% | 3/15/53 | 7,835 | 7,976 |
| 6 | Massachusetts Mutual Life Insurance Co. | 3.200% | 12/1/61 | 30,000 | 19,046 |
| 6 | Met Tower Global Funding | 5.250% | 4/12/29 | 11,205 | 11,472 |
| | MetLife Inc. | 4.125% | 8/13/42 | 15,565 | 13,539 |
| | MetLife Inc. | 4.875% | 11/13/43 | 17,000 | 16,180 |
| | MetLife Inc. | 5.000% | 7/15/52 | 15,634 | 14,966 |
| 6 | Metropolitan Life Global Funding I | 3.450% | 12/18/26 | 23,660 | 23,163 |
| 6 | Metropolitan Life Global Funding I | 3.000% | 9/19/27 | 21,455 | 20,599 |
| 6 | Metropolitan Life Global Funding I | 4.300% | 8/25/29 | 15,345 | 15,105 |
| 6 | Metropolitan Life Global Funding I | 2.400% | 1/11/32 | 53,825 | 46,059 |
| 6 | Metropolitan Life Global Funding I | 5.150% | 3/28/33 | 16,475 | 16,735 |
| | Mitsubishi UFJ Financial Group Inc. | 5.017% | 7/20/28 | 31,915 | 32,145 |
| 3 | Morgan Stanley | 3.125% | 7/27/26 | 11,435 | 11,169 |
| 3 | Morgan Stanley | 6.250% | 8/9/26 | 20,000 | 20,521 |
| | Morgan Stanley | 3.625% | 1/20/27 | 60,000 | 58,998 |
| 3 | Morgan Stanley | 3.772% | 1/24/29 | 64,293 | 62,474 |
| 3 | Morgan Stanley | 2.699% | 1/22/31 | 74,290 | 67,012 |
| 3 | Morgan Stanley | 1.928% | 4/28/32 | 50,000 | 41,675 |
| 3 | Morgan Stanley | 2.239% | 7/21/32 | 81,175 | 68,646 |
| 3 | Morgan Stanley | 2.511% | 10/20/32 | 36,580 | 31,309 |
| | Morgan Stanley | 2.943% | 1/21/33 | 31,555 | 27,635 |
| | Morgan Stanley | 6.627% | 11/1/34 | 21,815 | 24,119 |
| | Morgan Stanley | 5.466% | 1/18/35 | 19,775 | 20,252 |
| | Morgan Stanley | 2.484% | 9/16/36 | 37,680 | 31,173 |
| | Morgan Stanley | 5.948% | 1/19/38 | 25,160 | 25,788 |
| | Morgan Stanley | 4.300% | 1/27/45 | 18,360 | 16,198 |
| | Nasdaq Inc. | 5.550% | 2/15/34 | 34,945 | 36,044 |
| | Nasdaq Inc. | 3.950% | 3/7/52 | 18,120 | 14,169 |
| | Nasdaq Inc. | 5.950% | 8/15/53 | 31,115 | 32,915 |
| | Nasdaq Inc. | 6.100% | 6/28/63 | 4,555 | 4,852 |
| | National Australia Bank Ltd. | 3.905% | 6/9/27 | 33,500 | 33,093 |
| 6 | National Australia Bank Ltd. | 5.134% | 11/28/28 | 51,330 | 52,587 |
| 6 | National Australia Bank Ltd. | 2.332% | 8/21/30 | 75,550 | 65,061 |
| 6 | National Securities Clearing Corp. | 5.100% | 11/21/27 | 52,090 | 52,876 |
| 6 | Nationwide Financial Services Inc. | 3.900% | 11/30/49 | 48,905 | 37,753 |
| 6 | Nationwide Mutual Insurance Co. | 4.350% | 4/30/50 | 41,675 | 32,874 |
| | NatWest Group plc | 1.642% | 6/14/27 | 29,040 | 27,638 |
| 6 | NBK SPC Ltd. | 1.625% | 9/15/27 | 67,900 | 63,817 |
| 6 | New York Life Global Funding | 5.000% | 1/9/34 | 39,770 | 40,301 |
| 6 | New York Life Insurance Co. | 5.875% | 5/15/33 | 55,395 | 58,711 |
| 6 | New York Life Insurance Co. | 3.750% | 5/15/50 | 9,245 | 7,146 |
| 6 | New York Life Insurance Co. | 4.450% | 5/15/69 | 15,270 | 12,694 |
| 6 | Nordea Bank Abp | 1.500% | 9/30/26 | 65,800 | 62,172 |
| 6 | Northwestern Mutual Global Funding | 5.160% | 5/28/31 | 27,865 | 28,552 |
| 6 | Northwestern Mutual Life Insurance Co. | 3.850% | 9/30/47 | 30,684 | 24,158 |
| 6 | Northwestern Mutual Life Insurance Co. | 3.625% | 9/30/59 | 9,324 | 6,695 |
| 6 | Nuveen LLC | 5.550% | 1/15/30 | 4,255 | 4,392 |
| 6 | Nuveen LLC | 5.850% | 4/15/34 | 9,655 | 10,013 |
| 6 | Pacific Life Global Funding II | 1.375% | 4/14/26 | 27,085 | 25,960 |
| 6 | Pacific LifeCorp | 5.400% | 9/15/52 | 18,030 | 17,917 |
| 6 | Penske Truck Leasing Co. LP | 3.950% | 3/10/25 | 52,010 | 51,841 |
| 6 | Penske Truck Leasing Co. LP | 4.450% | 1/29/26 | 16,450 | 16,341 |
| 6 | Penske Truck Leasing Co. LP | 5.875% | 11/15/27 | 42,565 | 43,843 |
| 6 | Penske Truck Leasing Co. LP | 5.700% | 2/1/28 | 37,855 | 38,848 |
| 6 | Penske Truck Leasing Co. LP | 6.050% | 8/1/28 | 37,310 | 38,820 |
| 6 | Penske Truck Leasing Co. LP | 5.350% | 3/30/29 | 13,045 | 13,273 |
| 6 | Penske Truck Leasing Co. LP | 6.200% | 6/15/30 | 7,282 | 7,761 |
| 3 | PNC Bank NA | 3.100% | 10/25/27 | 41,975 | 40,368 |
| 3 | PNC Bank NA | 3.250% | 1/22/28 | 60,465 | 58,220 |
| 6 | Pricoa Global Funding I | 5.100% | 5/30/28 | 33,975 | 34,569 |
| 6 | Pricoa Global Funding I | 4.650% | 8/27/31 | 17,999 | 17,803 |
| 6 | Principal Life Global Funding II | 2.500% | 9/16/29 | 25,000 | 22,599 |
| | Progressive Corp. | 4.950% | 6/15/33 | 54,414 | 55,177 |
| | Progressive Corp. | 4.125% | 4/15/47 | 9,955 | 8,468 |
| 6 | Prologis Targeted US Logistics Fund LP | 5.250% | 1/15/35 | 18,116 | 18,190 |
| 6 | Protective Life Global Funding | 4.714% | 7/6/27 | 18,335 | 18,385 |
| | Prudential Financial Inc. | 3.905% | 12/7/47 | 7,767 | 6,241 |
| 6 | RGA Global Funding | 2.700% | 1/18/29 | 14,330 | 13,215 |
| 6 | RGA Global Funding | 5.448% | 5/24/29 | 19,510 | 20,023 |
| | | | Coupon | Maturity
Date | Face
Amount
($000) | Market
Value•
($000) |
| 6 | RGA Global Funding | 5.500% | 1/11/31 | 16,515 | 17,020 |
| 3 | Royal Bank of Canada | 5.000% | 2/1/33 | 44,538 | 44,836 |
| 6 | Standard Chartered plc | 6.301% | 1/9/29 | 32,130 | 33,309 |
| 6 | Standard Chartered plc | 5.005% | 10/15/30 | 24,960 | 24,797 |
| | State Street Corp. | 4.821% | 1/26/34 | 14,655 | 14,568 |
| 6 | Svenska Handelsbanken AB | 1.418% | 6/11/27 | 62,395 | 59,247 |
| 6 | Swedbank AB | 6.136% | 9/12/26 | 33,865 | 34,653 |
| 6 | Swedbank AB | 4.998% | 11/20/29 | 43,980 | 44,376 |
| 6 | Teachers Insurance & Annuity Association of America | 4.900% | 9/15/44 | 32,380 | 30,303 |
| 6 | Teachers Insurance & Annuity Association of America | 4.270% | 5/15/47 | 42,390 | 35,663 |
| | Toronto-Dominion Bank | 4.456% | 6/8/32 | 13,271 | 12,889 |
| 3 | Truist Financial Corp. | 3.700% | 6/5/25 | 49,000 | 48,710 |
| 3 | Truist Financial Corp. | 4.873% | 1/26/29 | 34,945 | 34,959 |
| | UBS AG | 1.250% | 6/1/26 | 36,125 | 34,393 |
| | UBS AG | 7.500% | 2/15/28 | 38,712 | 41,759 |
| | UBS AG | 5.650% | 9/11/28 | 52,280 | 54,125 |
| 6 | UBS Group AG | 1.305% | 2/2/27 | 14,940 | 14,314 |
| 6 | UBS Group AG | 1.494% | 8/10/27 | 40,005 | 37,765 |
| 6 | UBS Group AG | 3.869% | 1/12/29 | 15,905 | 15,430 |
| 6 | UBS Group AG | 5.428% | 2/8/30 | 7,425 | 7,547 |
| 6 | UBS Group AG | 5.617% | 9/13/30 | 20,930 | 21,450 |
| 6 | UBS Group AG | 2.095% | 2/11/32 | 23,650 | 19,898 |
| 6 | UBS Group AG | 3.091% | 5/14/32 | 68,085 | 60,486 |
| 6 | UBS Group AG | 2.746% | 2/11/33 | 16,800 | 14,346 |
| 6 | UBS Group AG | 6.537% | 8/12/33 | 25,565 | 27,677 |
| 6 | UBS Group AG | 9.016% | 11/15/33 | 9,250 | 11,434 |
| 6 | UBS Group AG | 6.301% | 9/22/34 | 56,285 | 60,365 |
| 6 | UBS Group AG | 3.179% | 2/11/43 | 36,770 | 27,742 |
| 6 | UniCredit SpA | 1.982% | 6/3/27 | 35,165 | 33,566 |
| 6 | UniCredit SpA | 3.127% | 6/3/32 | 35,545 | 31,307 |
| | Wells Fargo & Co. | 3.000% | 4/22/26 | 26,660 | 26,055 |
| 3 | Wells Fargo & Co. | 3.196% | 6/17/27 | 60,555 | 59,100 |
| 3 | Wells Fargo & Co. | 3.526% | 3/24/28 | 19,500 | 18,963 |
| 3 | Wells Fargo & Co. | 5.574% | 7/25/29 | 9,900 | 10,154 |
| | Wells Fargo & Co. | 6.303% | 10/23/29 | 43,660 | 45,967 |
| | Wells Fargo & Co. | 5.198% | 1/23/30 | 9,900 | 10,048 |
| 3 | Wells Fargo & Co. | 2.879% | 10/30/30 | 15,000 | 13,731 |
| 3 | Wells Fargo & Co. | 2.572% | 2/11/31 | 83,408 | 74,545 |
| 3 | Wells Fargo & Co. | 3.350% | 3/2/33 | 7,970 | 7,146 |
| 3 | Wells Fargo & Co. | 4.897% | 7/25/33 | 117,741 | 116,561 |
| | Wells Fargo & Co. | 5.389% | 4/24/34 | 20,025 | 20,329 |
| 5 | Wells Fargo & Co. | 5.211% | 12/3/35 | 51,795 | 52,141 |
| | Wells Fargo & Co. | 5.606% | 1/15/44 | 71,831 | 71,716 |
| 3 | Wells Fargo & Co. | 4.650% | 11/4/44 | 10,315 | 9,137 |
| 3 | Wells Fargo & Co. | 4.900% | 11/17/45 | 19,160 | 17,399 |
| 3 | Wells Fargo & Co. | 4.400% | 6/14/46 | 73,300 | 62,064 |
| 3 | Wells Fargo & Co. | 4.750% | 12/7/46 | 23,150 | 20,578 |
| 3 | Wells Fargo & Co. | 4.611% | 4/25/53 | 84,025 | 75,337 |
| | Wells Fargo Bank NA | 5.254% | 12/11/26 | 97,083 | 98,386 |
| | | | | | | 10,704,794 |
| Health Care (2.0%) |
| | AbbVie Inc. | 4.950% | 3/15/31 | 33,475 | 33,906 |
| | AbbVie Inc. | 5.350% | 3/15/44 | 18,173 | 18,453 |
| | AbbVie Inc. | 4.850% | 6/15/44 | 5,100 | 4,839 |
| | AbbVie Inc. | 4.700% | 5/14/45 | 21,111 | 19,577 |
| | AbbVie Inc. | 5.400% | 3/15/54 | 37,491 | 38,103 |
| 3 | AdventHealth Obligated Group | 2.795% | 11/15/51 | 30,030 | 19,979 |
| 3 | Advocate Health & Hospitals Corp. | 2.211% | 6/15/30 | 7,210 | 6,366 |
| 3 | Advocate Health & Hospitals Corp. | 3.008% | 6/15/50 | 8,980 | 6,307 |
| 6 | Alcon Finance Corp. | 2.750% | 9/23/26 | 5,830 | 5,636 |
| 6 | Alcon Finance Corp. | 2.600% | 5/27/30 | 5,665 | 5,069 |
| 6 | Alcon Finance Corp. | 5.375% | 12/6/32 | 8,550 | 8,762 |
| 6 | Alcon Finance Corp. | 3.800% | 9/23/49 | 6,025 | 4,694 |
| 6 | Alcon Finance Corp. | 5.750% | 12/6/52 | 9,480 | 9,901 |
| 3 | Ascension Health | 2.532% | 11/15/29 | 22,515 | 20,596 |
| 3 | Ascension Health | 4.847% | 11/15/53 | 23,970 | 22,845 |
| | AstraZeneca plc | 4.000% | 1/17/29 | 44,555 | 43,819 |
| | AstraZeneca plc | 6.450% | 9/15/37 | 23,385 | 26,426 |
| | Banner Health | 2.907% | 1/1/42 | 29,965 | 22,340 |
| | | | Coupon | Maturity
Date | Face
Amount
($000) | Market
Value•
($000) |
| 6 | Bayer US Finance II LLC | 4.250% | 12/15/25 | 46,665 | 46,253 |
| 3 | Beth Israel Lahey Health Inc. | 3.080% | 7/1/51 | 8,555 | 5,636 |
| 3 | Bon Secours Mercy Health Inc. | 4.302% | 7/1/28 | 20,339 | 20,105 |
| 3 | Bon Secours Mercy Health Inc. | 3.464% | 6/1/30 | 17,085 | 16,191 |
| 3 | Bon Secours Mercy Health Inc. | 2.095% | 6/1/31 | 11,305 | 9,613 |
| | Bristol-Myers Squibb Co. | 3.550% | 3/15/42 | 63,155 | 51,247 |
| | Bristol-Myers Squibb Co. | 5.500% | 2/22/44 | 11,320 | 11,676 |
| | Bristol-Myers Squibb Co. | 4.550% | 2/20/48 | 5,703 | 5,129 |
| | Bristol-Myers Squibb Co. | 4.250% | 10/26/49 | 4,235 | 3,620 |
| | Bristol-Myers Squibb Co. | 5.550% | 2/22/54 | 8,900 | 9,164 |
| | Bristol-Myers Squibb Co. | 5.650% | 2/22/64 | 60,351 | 61,747 |
| 3 | Cedars-Sinai Health System | 2.288% | 8/15/31 | 43,795 | 37,782 |
| 3 | Children's Hospital Corp. | 2.585% | 2/1/50 | 5,460 | 3,540 |
| | Cigna Group | 4.375% | 10/15/28 | 18,600 | 18,439 |
| | CommonSpirit Health | 3.347% | 10/1/29 | 36,655 | 34,551 |
| | CommonSpirit Health | 2.782% | 10/1/30 | 21,827 | 19,632 |
| | CommonSpirit Health | 5.205% | 12/1/31 | 40,770 | 41,569 |
| 3 | CommonSpirit Health | 4.350% | 11/1/42 | 28,315 | 23,976 |
| | CommonSpirit Health | 3.910% | 10/1/50 | 4,370 | 3,432 |
| 3 | Cottage Health Obligated Group | 3.304% | 11/1/49 | 9,875 | 7,332 |
| 6 | CSL Finance plc | 4.250% | 4/27/32 | 31,340 | 30,185 |
| 6 | CSL Finance plc | 4.750% | 4/27/52 | 1,160 | 1,058 |
| | CVS Health Corp. | 1.750% | 8/21/30 | 4,940 | 4,119 |
| | CVS Health Corp. | 4.875% | 7/20/35 | 1,375 | 1,309 |
| | Elevance Health Inc. | 3.650% | 12/1/27 | 20,000 | 19,496 |
| | Elevance Health Inc. | 4.101% | 3/1/28 | 8,486 | 8,350 |
| | Elevance Health Inc. | 2.550% | 3/15/31 | 31,515 | 27,584 |
| | Elevance Health Inc. | 5.500% | 10/15/32 | 17,525 | 18,123 |
| | Elevance Health Inc. | 6.100% | 10/15/52 | 4,640 | 4,968 |
| | Eli Lilly & Co. | 4.875% | 2/27/53 | 8,710 | 8,361 |
| | Eli Lilly & Co. | 5.050% | 8/14/54 | 13,505 | 13,277 |
| | Eli Lilly & Co. | 4.950% | 2/27/63 | 7,570 | 7,231 |
| | Eli Lilly & Co. | 5.200% | 8/14/64 | 4,570 | 4,517 |
| | Gilead Sciences Inc. | 2.600% | 10/1/40 | 45,247 | 32,774 |
| | Gilead Sciences Inc. | 4.800% | 4/1/44 | 8,075 | 7,548 |
| | Gilead Sciences Inc. | 4.500% | 2/1/45 | 13,465 | 12,085 |
| | Gilead Sciences Inc. | 4.150% | 3/1/47 | 14,930 | 12,654 |
| | GlaxoSmithKline Capital Inc. | 5.375% | 4/15/34 | 19,870 | 20,773 |
| | HCA Inc. | 5.450% | 4/1/31 | 10,175 | 10,326 |
| | HCA Inc. | 6.000% | 4/1/54 | 34,245 | 34,767 |
| 3 | Indiana University Health Inc. Obligated Group | 2.852% | 11/1/51 | 12,370 | 8,341 |
| | Inova Health System Foundation | 4.068% | 5/15/52 | 20,740 | 17,630 |
| | Kaiser Foundation Hospitals | 3.150% | 5/1/27 | 10,731 | 10,436 |
| 3 | Kaiser Foundation Hospitals | 2.810% | 6/1/41 | 37,455 | 27,830 |
| | Kaiser Foundation Hospitals | 4.150% | 5/1/47 | 14,000 | 12,115 |
| 3 | Kaiser Foundation Hospitals | 3.002% | 6/1/51 | 36,720 | 25,628 |
| 3 | Mass General Brigham Inc. | 3.192% | 7/1/49 | 12,361 | 8,983 |
| 3 | Mass General Brigham Inc. | 3.342% | 7/1/60 | 32,045 | 22,541 |
| 3 | Memorial Sloan-Kettering Cancer Center | 2.955% | 1/1/50 | 18,985 | 13,278 |
| | Memorial Sloan-Kettering Cancer Center | 4.125% | 7/1/52 | 12,320 | 10,612 |
| 3 | Memorial Sloan-Kettering Cancer Center | 4.200% | 7/1/55 | 5,910 | 5,068 |
| | Merck & Co. Inc. | 4.150% | 5/18/43 | 22,090 | 19,462 |
| | Merck & Co. Inc. | 4.000% | 3/7/49 | 52,385 | 43,527 |
| | Novartis Capital Corp. | 4.400% | 5/6/44 | 25,896 | 23,832 |
| | OhioHealth Corp. | 2.297% | 11/15/31 | 26,665 | 22,907 |
| | OhioHealth Corp. | 2.834% | 11/15/41 | 16,515 | 12,190 |
| | Pfizer Inc. | 3.450% | 3/15/29 | 70,335 | 67,673 |
| | Pfizer Inc. | 1.700% | 5/28/30 | 6,065 | 5,233 |
| | Pfizer Inc. | 4.100% | 9/15/38 | 53,995 | 49,031 |
| | Pfizer Investment Enterprises Pte. Ltd. | 4.750% | 5/19/33 | 28,395 | 28,115 |
| | Pfizer Investment Enterprises Pte. Ltd. | 5.110% | 5/19/43 | 19,907 | 19,533 |
| | Pfizer Investment Enterprises Pte. Ltd. | 5.300% | 5/19/53 | 21,620 | 21,367 |
| 3 | Piedmont Healthcare Inc. | 2.044% | 1/1/32 | 8,825 | 7,369 |
| 3 | Piedmont Healthcare Inc. | 2.719% | 1/1/42 | 8,830 | 6,366 |
| | Piedmont Healthcare Inc. | 2.864% | 1/1/52 | 11,725 | 7,795 |
| 3 | Providence St. Joseph Health Obligated Group | 2.532% | 10/1/29 | 17,470 | 15,805 |
| | Providence St. Joseph Health Obligated Group | 5.403% | 10/1/33 | 14,986 | 15,291 |
| 3 | Providence St. Joseph Health Obligated Group | 3.930% | 10/1/48 | 11,805 | 9,417 |
| 3 | Providence St. Joseph Health Obligated Group | 2.700% | 10/1/51 | 39,905 | 24,658 |
| 6 | Roche Holdings Inc. | 2.607% | 12/13/51 | 8,330 | 5,289 |
| | | | Coupon | Maturity
Date | Face
Amount
($000) | Market
Value•
($000) |
| | Royalty Pharma plc | 5.400% | 9/2/34 | 14,095 | 14,053 |
| | Royalty Pharma plc | 3.300% | 9/2/40 | 5,158 | 3,875 |
| | Royalty Pharma plc | 3.550% | 9/2/50 | 9,555 | 6,737 |
| | Royalty Pharma plc | 5.900% | 9/2/54 | 17,095 | 17,229 |
| 3 | SSM Health Care Corp. | 3.823% | 6/1/27 | 34,910 | 34,314 |
| 3 | Sutter Health | 2.294% | 8/15/30 | 9,670 | 8,522 |
| | Takeda Pharmaceutical Co. Ltd. | 2.050% | 3/31/30 | 26,687 | 23,315 |
| | Takeda Pharmaceutical Co. Ltd. | 5.300% | 7/5/34 | 53,619 | 54,478 |
| | Takeda Pharmaceutical Co. Ltd. | 3.025% | 7/9/40 | 13,665 | 10,337 |
| | Toledo Hospital | 5.750% | 11/15/38 | 18,440 | 18,560 |
| | UnitedHealth Group Inc. | 3.850% | 6/15/28 | 34,565 | 33,950 |
| | UnitedHealth Group Inc. | 2.000% | 5/15/30 | 7,515 | 6,576 |
| | UnitedHealth Group Inc. | 2.300% | 5/15/31 | 14,960 | 12,990 |
| | UnitedHealth Group Inc. | 4.950% | 1/15/32 | 37,860 | 38,229 |
| | UnitedHealth Group Inc. | 4.200% | 5/15/32 | 23,545 | 22,788 |
| | UnitedHealth Group Inc. | 5.150% | 7/15/34 | 7,275 | 7,409 |
| | UnitedHealth Group Inc. | 3.500% | 8/15/39 | 7,480 | 6,226 |
| | UnitedHealth Group Inc. | 2.750% | 5/15/40 | 8,505 | 6,297 |
| | UnitedHealth Group Inc. | 5.950% | 2/15/41 | 10,250 | 10,964 |
| | UnitedHealth Group Inc. | 3.050% | 5/15/41 | 34,267 | 26,097 |
| | UnitedHealth Group Inc. | 4.250% | 3/15/43 | 67,400 | 60,039 |
| | UnitedHealth Group Inc. | 5.500% | 7/15/44 | 29,135 | 29,881 |
| | UnitedHealth Group Inc. | 4.750% | 7/15/45 | 24,520 | 22,934 |
| | UnitedHealth Group Inc. | 4.200% | 1/15/47 | 8,620 | 7,346 |
| | UnitedHealth Group Inc. | 3.750% | 10/15/47 | 4,985 | 3,947 |
| | UnitedHealth Group Inc. | 4.250% | 6/15/48 | 22,215 | 18,952 |
| | UnitedHealth Group Inc. | 4.450% | 12/15/48 | 4,970 | 4,372 |
| | UnitedHealth Group Inc. | 3.700% | 8/15/49 | 23,160 | 17,997 |
| | UnitedHealth Group Inc. | 2.900% | 5/15/50 | 31,449 | 20,951 |
| | UnitedHealth Group Inc. | 3.250% | 5/15/51 | 40,050 | 28,379 |
| | UnitedHealth Group Inc. | 4.750% | 5/15/52 | 7,175 | 6,577 |
| | UnitedHealth Group Inc. | 5.875% | 2/15/53 | 62,616 | 66,957 |
| | UnitedHealth Group Inc. | 5.625% | 7/15/54 | 47,843 | 49,695 |
| | UnitedHealth Group Inc. | 3.875% | 8/15/59 | 19,125 | 14,611 |
| | UnitedHealth Group Inc. | 5.750% | 7/15/64 | 40,450 | 42,324 |
| | Wyeth LLC | 5.950% | 4/1/37 | 25,000 | 26,911 |
| | | | | | | 2,379,898 |
| Industrials (0.8%) |
| 6 | Ashtead Capital Inc. | 2.450% | 8/12/31 | 17,915 | 15,156 |
| 6 | Ashtead Capital Inc. | 5.500% | 8/11/32 | 10,173 | 10,231 |
| 6 | Ashtead Capital Inc. | 5.550% | 5/30/33 | 4,400 | 4,432 |
| 6 | Ashtead Capital Inc. | 5.950% | 10/15/33 | 8,445 | 8,744 |
| 6 | Ashtead Capital Inc. | 5.800% | 4/15/34 | 32,455 | 33,262 |
| 6 | BAE Systems Holdings Inc. | 3.850% | 12/15/25 | 11,010 | 10,898 |
| 6 | BAE Systems plc | 3.400% | 4/15/30 | 7,335 | 6,863 |
| 6 | BAE Systems plc | 5.250% | 3/26/31 | 6,175 | 6,296 |
| | Boeing Co. | 8.625% | 11/15/31 | 8,715 | 10,141 |
| | Burlington Northern Santa Fe LLC | 4.550% | 9/1/44 | 6,000 | 5,469 |
| | Burlington Northern Santa Fe LLC | 4.150% | 4/1/45 | 13,365 | 11,538 |
| | Burlington Northern Santa Fe LLC | 4.050% | 6/15/48 | 2,715 | 2,283 |
| | Burlington Northern Santa Fe LLC | 3.050% | 2/15/51 | 9,950 | 6,891 |
| | Burlington Northern Santa Fe LLC | 3.300% | 9/15/51 | 20,000 | 14,535 |
| | Burlington Northern Santa Fe LLC | 2.875% | 6/15/52 | 17,935 | 11,870 |
| | Burlington Northern Santa Fe LLC | 4.450% | 1/15/53 | 2,609 | 2,316 |
| | Canadian National Railway Co. | 2.450% | 5/1/50 | 6,870 | 4,270 |
| | Canadian Pacific Railway Co. | 4.950% | 8/15/45 | 16,985 | 16,217 |
| | CSX Corp. | 3.350% | 9/15/49 | 5,535 | 4,086 |
| | CSX Corp. | 4.900% | 3/15/55 | 8,635 | 8,148 |
| 6 | Daimler Truck Finance North America LLC | 5.150% | 1/16/26 | 14,600 | 14,654 |
| 6 | Daimler Truck Finance North America LLC | 5.000% | 1/15/27 | 6,890 | 6,926 |
| 6 | Daimler Truck Finance North America LLC | 3.650% | 4/7/27 | 17,489 | 17,069 |
| 6 | Daimler Truck Finance North America LLC | 5.125% | 1/19/28 | 4,630 | 4,684 |
| 6 | Daimler Truck Finance North America LLC | 5.375% | 1/18/34 | 11,760 | 11,993 |
| | Deere & Co. | 7.125% | 3/3/31 | 17,500 | 20,093 |
| | Eaton Corp. | 4.700% | 8/23/52 | 5,205 | 4,859 |
| 6 | Element Fleet Management Corp. | 5.643% | 3/13/27 | 14,900 | 15,164 |
| 6 | ERAC USA Finance LLC | 5.000% | 2/15/29 | 8,975 | 9,111 |
| 6 | ERAC USA Finance LLC | 4.900% | 5/1/33 | 45,854 | 45,718 |
| 6 | ERAC USA Finance LLC | 5.200% | 10/30/34 | 22,750 | 23,076 |
| | | | Coupon | Maturity
Date | Face
Amount
($000) | Market
Value•
($000) |
| 6 | ERAC USA Finance LLC | 5.625% | 3/15/42 | 21,787 | 22,632 |
| 6 | ERAC USA Finance LLC | 5.400% | 5/1/53 | 27,091 | 27,334 |
| | Honeywell International Inc. | 4.250% | 1/15/29 | 26,905 | 26,847 |
| | Honeywell International Inc. | 4.875% | 9/1/29 | 5,325 | 5,423 |
| | Honeywell International Inc. | 5.000% | 2/15/33 | 50,000 | 50,910 |
| | Honeywell International Inc. | 5.375% | 3/1/41 | 4,260 | 4,417 |
| | John Deere Capital Corp. | 4.500% | 1/16/29 | 22,410 | 22,477 |
| 3 | John Deere Capital Corp. | 5.150% | 9/8/33 | 32,170 | 33,155 |
| | Lockheed Martin Corp. | 1.850% | 6/15/30 | 1,700 | 1,477 |
| | Lockheed Martin Corp. | 4.500% | 5/15/36 | 8,015 | 7,744 |
| | Lockheed Martin Corp. | 4.700% | 5/15/46 | 8,420 | 7,862 |
| | Lockheed Martin Corp. | 5.700% | 11/15/54 | 19,676 | 21,074 |
| | Regal Rexnord Corp. | 6.050% | 2/15/26 | 7,196 | 7,270 |
| | Republic Services Inc. | 4.875% | 4/1/29 | 3,595 | 3,631 |
| | Republic Services Inc. | 5.000% | 12/15/33 | 8,415 | 8,474 |
| | Republic Services Inc. | 5.200% | 11/15/34 | 19,090 | 19,536 |
| | RTX Corp. | 4.125% | 11/16/28 | 12,085 | 11,880 |
| | RTX Corp. | 4.450% | 11/16/38 | 1,210 | 1,118 |
| 6 | Siemens Financieringsmaatschappij NV | 1.700% | 3/11/28 | 20,360 | 18,720 |
| 6 | Siemens Financieringsmaatschappij NV | 2.150% | 3/11/31 | 33,030 | 28,726 |
| 6 | Siemens Financieringsmaatschappij NV | 4.400% | 5/27/45 | 31,740 | 28,810 |
| | Teledyne Technologies Inc. | 2.250% | 4/1/28 | 30,011 | 27,765 |
| | Teledyne Technologies Inc. | 2.750% | 4/1/31 | 30,128 | 26,676 |
| | Trane Technologies Financing Ltd. | 5.250% | 3/3/33 | 16,705 | 17,147 |
| | Trane Technologies Financing Ltd. | 5.100% | 6/13/34 | 985 | 999 |
| | Union Pacific Corp. | 2.800% | 2/14/32 | 357 | 318 |
| | Union Pacific Corp. | 3.375% | 2/14/42 | 17,635 | 14,058 |
| | Union Pacific Corp. | 3.250% | 2/5/50 | 1,409 | 1,021 |
| | Union Pacific Corp. | 3.799% | 10/1/51 | 24,211 | 19,198 |
| | Union Pacific Corp. | 3.500% | 2/14/53 | 61,297 | 45,877 |
| | Union Pacific Corp. | 3.750% | 2/5/70 | 13,510 | 9,775 |
| 3 | United Airlines Pass-Through Trust Class B Series 2018-1 | 4.600% | 3/1/26 | 3,439 | 3,384 |
| | | | | | | 892,728 |
| Materials (0.2%) |
| 6 | Glencore Finance Canada Ltd. | 6.000% | 11/15/41 | 2,711 | 2,798 |
| 6 | Glencore Funding LLC | 4.875% | 3/12/29 | 6,929 | 6,952 |
| 6 | Glencore Funding LLC | 5.371% | 4/4/29 | 37,393 | 38,087 |
| 6 | Glencore Funding LLC | 6.375% | 10/6/30 | 36,446 | 38,912 |
| 6 | Glencore Funding LLC | 2.625% | 9/23/31 | 8,527 | 7,346 |
| 6 | Glencore Funding LLC | 5.700% | 5/8/33 | 1,565 | 1,620 |
| 6 | Glencore Funding LLC | 6.500% | 10/6/33 | 15,265 | 16,629 |
| 6 | Glencore Funding LLC | 5.634% | 4/4/34 | 45,917 | 47,050 |
| 6 | Glencore Funding LLC | 3.875% | 4/27/51 | 2,360 | 1,799 |
| 6 | Glencore Funding LLC | 3.375% | 9/23/51 | 8,466 | 5,906 |
| 6 | Glencore Funding LLC | 5.893% | 4/4/54 | 24,895 | 25,545 |
| | | | | | | 192,644 |
| Real Estate (0.6%) |
| | American Tower Corp. | 4.400% | 2/15/26 | 7,315 | 7,283 |
| | American Tower Corp. | 3.800% | 8/15/29 | 51,562 | 49,467 |
| | American Tower Corp. | 5.000% | 1/31/30 | 7,335 | 7,389 |
| | American Tower Corp. | 5.900% | 11/15/33 | 4,053 | 4,272 |
| | American Tower Corp. | 5.450% | 2/15/34 | 1,615 | 1,653 |
| | Crown Castle Inc. | 2.250% | 1/15/31 | 2,775 | 2,366 |
| | Crown Castle Inc. | 5.200% | 9/1/34 | 9,700 | 9,641 |
| | Crown Castle Inc. | 4.000% | 11/15/49 | 7,282 | 5,734 |
| | CubeSmart LP | 2.250% | 12/15/28 | 12,135 | 11,025 |
| | CubeSmart LP | 2.500% | 2/15/32 | 7,767 | 6,627 |
| | Extra Space Storage LP | 5.500% | 7/1/30 | 12,185 | 12,542 |
| | Extra Space Storage LP | 5.900% | 1/15/31 | 25,059 | 26,239 |
| | Extra Space Storage LP | 5.350% | 1/15/35 | 18,115 | 18,241 |
| | Healthpeak OP LLC | 2.125% | 12/1/28 | 30,395 | 27,595 |
| | Healthpeak OP LLC | 3.000% | 1/15/30 | 31,475 | 28,926 |
| | NNN REIT Inc. | 5.500% | 6/15/34 | 26,511 | 27,116 |
| | Prologis LP | 5.250% | 6/15/53 | 9,062 | 8,968 |
| | Public Storage Operating Co. | 5.350% | 8/1/53 | 10,525 | 10,569 |
| | Realty Income Corp. | 2.200% | 6/15/28 | 24,400 | 22,465 |
| | Realty Income Corp. | 4.700% | 12/15/28 | 27,200 | 27,301 |
| | Realty Income Corp. | 3.250% | 1/15/31 | 12,940 | 11,878 |
| | Realty Income Corp. | 2.850% | 12/15/32 | 25,860 | 22,314 |
| | | | Coupon | Maturity
Date | Face
Amount
($000) | Market
Value•
($000) |
| | Realty Income Corp. | 4.900% | 7/15/33 | 26,434 | 26,170 |
| | Realty Income Corp. | 5.125% | 2/15/34 | 30,285 | 30,458 |
| 6 | SBA Tower Trust | 2.836% | 1/15/25 | 25,075 | 25,002 |
| 6 | SBA Tower Trust | 1.884% | 1/15/26 | 8,960 | 8,648 |
| 6 | SBA Tower Trust | 1.631% | 11/15/26 | 34,975 | 32,682 |
| 6 | SBA Tower Trust | 1.840% | 4/15/27 | 54,190 | 50,112 |
| 6 | SBA Tower Trust | 2.593% | 10/15/31 | 51,750 | 43,379 |
| 6 | Scentre Group Trust 1 | 4.375% | 5/28/30 | 19,110 | 18,622 |
| | Simon Property Group LP | 2.450% | 9/13/29 | 19,865 | 18,031 |
| 6 | VICI Properties LP | 3.750% | 2/15/27 | 8,075 | 7,830 |
| | VICI Properties LP | 5.750% | 4/1/34 | 8,415 | 8,648 |
| | VICI Properties LP | 6.125% | 4/1/54 | 39,522 | 40,984 |
| | | | | | | 660,177 |
| Technology (1.4%) |
| | Apple Inc. | 3.850% | 5/4/43 | 48,000 | 41,653 |
| | Apple Inc. | 3.450% | 2/9/45 | 5,075 | 4,088 |
| | Apple Inc. | 4.650% | 2/23/46 | 5,600 | 5,351 |
| | Apple Inc. | 3.850% | 8/4/46 | 36,890 | 31,193 |
| | Apple Inc. | 2.650% | 5/11/50 | 24,045 | 15,869 |
| | Apple Inc. | 2.650% | 2/8/51 | 27,145 | 17,766 |
| | Apple Inc. | 3.950% | 8/8/52 | 12,831 | 10,796 |
| | Broadcom Corp. | 3.875% | 1/15/27 | 11,385 | 11,219 |
| | Broadcom Inc. | 4.110% | 9/15/28 | 37,859 | 37,223 |
| | Broadcom Inc. | 5.050% | 7/12/29 | 26,120 | 26,433 |
| | Broadcom Inc. | 4.350% | 2/15/30 | 23,355 | 22,940 |
| | Broadcom Inc. | 4.150% | 11/15/30 | 24,480 | 23,699 |
| 6 | Broadcom Inc. | 2.600% | 2/15/33 | 31,355 | 26,300 |
| | Broadcom Inc. | 4.800% | 10/15/34 | 9,500 | 9,304 |
| 6 | Broadcom Inc. | 3.187% | 11/15/36 | 17,097 | 14,068 |
| 6 | Broadcom Inc. | 3.500% | 2/15/41 | 4,250 | 3,404 |
| | Cisco Systems Inc. | 4.950% | 2/26/31 | 55,815 | 56,904 |
| | Cisco Systems Inc. | 5.050% | 2/26/34 | 49,855 | 50,880 |
| | Cisco Systems Inc. | 5.300% | 2/26/54 | 23,240 | 23,890 |
| 6 | Constellation Software Inc. | 5.158% | 2/16/29 | 19,494 | 19,841 |
| 6 | Constellation Software Inc. | 5.461% | 2/16/34 | 12,465 | 12,778 |
| 6 | Foundry JV Holdco LLC | 5.900% | 1/25/30 | 18,710 | 19,104 |
| 6 | Foundry JV Holdco LLC | 6.150% | 1/25/32 | 21,265 | 21,832 |
| 6 | Foundry JV Holdco LLC | 5.875% | 1/25/34 | 16,067 | 16,204 |
| 6 | Foundry JV Holdco LLC | 6.250% | 1/25/35 | 60,292 | 62,437 |
| 6 | Foundry JV Holdco LLC | 6.400% | 1/25/38 | 47,413 | 49,585 |
| | Intel Corp. | 2.000% | 8/12/31 | 3,635 | 3,011 |
| | Intel Corp. | 4.000% | 12/15/32 | 4,750 | 4,414 |
| | Intel Corp. | 5.625% | 2/10/43 | 38,241 | 37,217 |
| | Intel Corp. | 4.100% | 5/19/46 | 45,545 | 35,078 |
| | Intel Corp. | 4.100% | 5/11/47 | 21,904 | 16,836 |
| | Intel Corp. | 4.900% | 8/5/52 | 16,659 | 14,192 |
| | Intel Corp. | 5.600% | 2/21/54 | 15,549 | 14,737 |
| | International Business Machines Corp. | 3.300% | 5/15/26 | 155,985 | 153,261 |
| | International Business Machines Corp. | 3.500% | 5/15/29 | 99,238 | 95,126 |
| | International Business Machines Corp. | 5.875% | 11/29/32 | 20,240 | 21,693 |
| | International Business Machines Corp. | 4.250% | 5/15/49 | 9,500 | 8,059 |
| | Intuit Inc. | 5.200% | 9/15/33 | 48,900 | 50,198 |
| | Intuit Inc. | 5.500% | 9/15/53 | 39,159 | 40,241 |
| | KLA Corp. | 4.950% | 7/15/52 | 25,110 | 23,980 |
| | Micron Technology Inc. | 4.663% | 2/15/30 | 9,861 | 9,757 |
| | Microsoft Corp. | 3.450% | 8/8/36 | 31,097 | 27,852 |
| | Microsoft Corp. | 2.525% | 6/1/50 | 122,844 | 79,871 |
| | Microsoft Corp. | 2.500% | 9/15/50 | 16,363 | 10,511 |
| | Microsoft Corp. | 2.921% | 3/17/52 | 119,367 | 83,546 |
| | Oracle Corp. | 1.650% | 3/25/26 | 17,300 | 16,642 |
| | Oracle Corp. | 3.250% | 11/15/27 | 48,711 | 47,063 |
| | Oracle Corp. | 3.800% | 11/15/37 | 9,500 | 8,189 |
| | Oracle Corp. | 3.600% | 4/1/40 | 8,400 | 6,831 |
| | Oracle Corp. | 4.500% | 7/8/44 | 33,877 | 29,935 |
| | Oracle Corp. | 4.125% | 5/15/45 | 25,243 | 20,914 |
| | Oracle Corp. | 4.000% | 7/15/46 | 3,800 | 3,062 |
| | Oracle Corp. | 5.550% | 2/6/53 | 16,112 | 16,139 |
| | Oracle Corp. | 5.375% | 9/27/54 | 9,900 | 9,632 |
| | QUALCOMM Inc. | 2.150% | 5/20/30 | 29,475 | 26,047 |
| | | | Coupon | Maturity
Date | Face
Amount
($000) | Market
Value•
($000) |
| | QUALCOMM Inc. | 4.300% | 5/20/47 | 9,500 | 8,229 |
| | QUALCOMM Inc. | 4.500% | 5/20/52 | 16,672 | 14,700 |
| | S&P Global Inc. | 2.700% | 3/1/29 | 3,693 | 3,437 |
| | S&P Global Inc. | 3.700% | 3/1/52 | 41,670 | 32,852 |
| 6 | UL Solutions Inc. | 6.500% | 10/20/28 | 12,800 | 13,464 |
| | | | | | | 1,621,477 |
| Utilities (3.0%) |
| 3 | AEP Texas Inc. | 4.150% | 5/1/49 | 5,065 | 4,010 |
| 3 | AEP Texas Inc. | 3.450% | 1/15/50 | 16,810 | 11,991 |
| 3 | AEP Transmission Co. LLC | 4.500% | 6/15/52 | 9,195 | 8,095 |
| | Alabama Power Co. | 5.700% | 2/15/33 | 15,000 | 15,722 |
| | Alabama Power Co. | 6.000% | 3/1/39 | 21,773 | 23,642 |
| | Alabama Power Co. | 3.750% | 3/1/45 | 24,430 | 19,757 |
| 3 | Alabama Power Co. | 4.300% | 7/15/48 | 28,015 | 24,404 |
| | Ameren Illinois Co. | 3.800% | 5/15/28 | 22,215 | 21,730 |
| | Ameren Illinois Co. | 6.125% | 12/15/28 | 54,000 | 55,707 |
| | Ameren Illinois Co. | 3.700% | 12/1/47 | 5,045 | 3,991 |
| | American Water Capital Corp. | 2.950% | 9/1/27 | 9,975 | 9,560 |
| | American Water Capital Corp. | 4.450% | 6/1/32 | 22,115 | 21,666 |
| | American Water Capital Corp. | 3.750% | 9/1/47 | 1,435 | 1,125 |
| | American Water Capital Corp. | 4.200% | 9/1/48 | 30,403 | 25,571 |
| | American Water Capital Corp. | 4.150% | 6/1/49 | 850 | 709 |
| | American Water Capital Corp. | 3.450% | 5/1/50 | 2,280 | 1,687 |
| | Arizona Public Service Co. | 6.350% | 12/15/32 | 6,080 | 6,578 |
| | Arizona Public Service Co. | 5.550% | 8/1/33 | 8,253 | 8,459 |
| | Arizona Public Service Co. | 3.350% | 5/15/50 | 5,270 | 3,760 |
| | Atmos Energy Corp. | 5.000% | 12/15/54 | 20,700 | 19,747 |
| | Baltimore Gas & Electric Co. | 4.250% | 9/15/48 | 5,000 | 4,232 |
| | Baltimore Gas & Electric Co. | 2.900% | 6/15/50 | 6,549 | 4,366 |
| | Berkshire Hathaway Energy Co. | 6.125% | 4/1/36 | 41,185 | 44,466 |
| | Berkshire Hathaway Energy Co. | 5.950% | 5/15/37 | 830 | 891 |
| | Berkshire Hathaway Energy Co. | 5.150% | 11/15/43 | 10,715 | 10,622 |
| | Berkshire Hathaway Energy Co. | 4.250% | 10/15/50 | 15,865 | 13,268 |
| | Berkshire Hathaway Energy Co. | 4.600% | 5/1/53 | 53,132 | 46,824 |
| 6 | Boston Gas Co. | 3.150% | 8/1/27 | 5,385 | 5,147 |
| 6 | Boston Gas Co. | 3.001% | 8/1/29 | 5,970 | 5,478 |
| 6 | Boston Gas Co. | 3.757% | 3/16/32 | 4,225 | 3,831 |
| 6 | Brooklyn Union Gas Co. | 3.407% | 3/10/26 | 2,685 | 2,632 |
| 6 | Brooklyn Union Gas Co. | 4.273% | 3/15/48 | 27,737 | 22,365 |
| | CenterPoint Energy Houston Electric LLC | 5.150% | 3/1/34 | 15,365 | 15,653 |
| | CenterPoint Energy Resources Corp. | 5.250% | 3/1/28 | 35,850 | 36,568 |
| | CenterPoint Energy Resources Corp. | 4.000% | 4/1/28 | 8,068 | 7,906 |
| | CenterPoint Energy Resources Corp. | 5.400% | 3/1/33 | 28,139 | 28,971 |
| | CenterPoint Energy Resources Corp. | 5.400% | 7/1/34 | 6,560 | 6,737 |
| | Cleco Corporate Holdings LLC | 3.375% | 9/15/29 | 9,180 | 8,389 |
| 3 | Cleco Securitization I LLC | 4.646% | 9/1/42 | 27,070 | 26,146 |
| | Commonwealth Edison Co. | 4.350% | 11/15/45 | 13,610 | 12,030 |
| | Commonwealth Edison Co. | 3.650% | 6/15/46 | 2,165 | 1,713 |
| 3 | Commonwealth Edison Co. | 3.750% | 8/15/47 | 10,000 | 7,911 |
| | Commonwealth Edison Co. | 4.000% | 3/1/48 | 13,787 | 11,342 |
| 3 | Commonwealth Edison Co. | 3.850% | 3/15/52 | 3,755 | 2,967 |
| | Consolidated Edison Co. of New York Inc. | 4.450% | 3/15/44 | 4,900 | 4,386 |
| | Consolidated Edison Co. of New York Inc. | 4.500% | 12/1/45 | 36,735 | 32,743 |
| | Consolidated Edison Co. of New York Inc. | 3.850% | 6/15/46 | 2,729 | 2,198 |
| 3 | Consolidated Edison Co. of New York Inc. | 4.125% | 5/15/49 | 4,105 | 3,406 |
| 3 | Consolidated Edison Co. of New York Inc. | 3.950% | 4/1/50 | 1,690 | 1,407 |
| | Consolidated Edison Co. of New York Inc. | 3.200% | 12/1/51 | 27,865 | 19,408 |
| | Consolidated Edison Co. of New York Inc. | 6.150% | 11/15/52 | 12,957 | 14,384 |
| | Consolidated Edison Co. of New York Inc. | 4.625% | 12/1/54 | 68,575 | 61,533 |
| 3 | Consolidated Edison Co. of New York Inc. | 4.000% | 11/15/57 | 9,500 | 7,479 |
| | Consolidated Edison Co. of New York Inc. | 4.500% | 5/15/58 | 32,349 | 27,659 |
| | Consumers Energy Co. | 4.200% | 9/1/52 | 13,360 | 11,431 |
| 3 | Dominion Energy Inc. | 3.375% | 4/1/30 | 3,083 | 2,875 |
| | Dominion Energy Inc. | 5.375% | 11/15/32 | 15,787 | 16,205 |
| 3 | Dominion Energy Inc. | 5.250% | 8/1/33 | 5,706 | 5,774 |
| 3 | Dominion Energy Inc. | 4.900% | 8/1/41 | 5,800 | 5,417 |
| 3 | Dominion Energy Inc. | 4.600% | 3/15/49 | 27,385 | 23,724 |
| 3 | Dominion Energy Inc. | 4.850% | 8/15/52 | 30,363 | 27,610 |
| | Dominion Energy South Carolina Inc. | 6.625% | 2/1/32 | 4,886 | 5,416 |
| | | | Coupon | Maturity
Date | Face
Amount
($000) | Market
Value•
($000) |
| | Dominion Energy South Carolina Inc. | 5.800% | 1/15/33 | 9,000 | 9,431 |
| | Dominion Energy South Carolina Inc. | 5.300% | 5/15/33 | 1,438 | 1,474 |
| | Dominion Energy South Carolina Inc. | 6.050% | 1/15/38 | 44,155 | 47,720 |
| | Dominion Energy South Carolina Inc. | 5.450% | 2/1/41 | 2,945 | 2,990 |
| | Dominion Energy South Carolina Inc. | 4.600% | 6/15/43 | 7,251 | 6,580 |
| | Dominion Energy South Carolina Inc. | 5.100% | 6/1/65 | 29,850 | 28,284 |
| | DTE Energy Co. | 4.950% | 7/1/27 | 20,780 | 20,933 |
| | Duke Energy Carolinas LLC | 4.950% | 1/15/33 | 4,810 | 4,846 |
| | Duke Energy Carolinas LLC | 6.100% | 6/1/37 | 3,404 | 3,658 |
| | Duke Energy Carolinas LLC | 6.050% | 4/15/38 | 4,000 | 4,353 |
| | Duke Energy Carolinas LLC | 3.700% | 12/1/47 | 17,085 | 13,292 |
| | Duke Energy Carolinas LLC | 5.350% | 1/15/53 | 52,380 | 52,710 |
| | Duke Energy Corp. | 2.650% | 9/1/26 | 11,775 | 11,389 |
| | Duke Energy Corp. | 3.400% | 6/15/29 | 12,030 | 11,399 |
| | Duke Energy Corp. | 4.500% | 8/15/32 | 4,250 | 4,132 |
| | Duke Energy Corp. | 3.300% | 6/15/41 | 39,505 | 30,209 |
| | Duke Energy Corp. | 4.800% | 12/15/45 | 44,700 | 40,449 |
| | Duke Energy Corp. | 3.750% | 9/1/46 | 13,840 | 10,716 |
| | Duke Energy Corp. | 4.200% | 6/15/49 | 25,820 | 21,019 |
| | Duke Energy Corp. | 3.500% | 6/15/51 | 34,035 | 24,392 |
| | Duke Energy Corp. | 5.000% | 8/15/52 | 19,060 | 17,530 |
| | Duke Energy Florida LLC | 6.350% | 9/15/37 | 8,000 | 8,826 |
| | Duke Energy Florida LLC | 6.400% | 6/15/38 | 27,055 | 30,144 |
| | Duke Energy Florida LLC | 5.950% | 11/15/52 | 11,250 | 12,160 |
| | Duke Energy Progress LLC | 3.400% | 4/1/32 | 15,845 | 14,538 |
| | Duke Energy Progress LLC | 6.300% | 4/1/38 | 14,705 | 16,175 |
| | Duke Energy Progress LLC | 4.100% | 3/15/43 | 615 | 523 |
| | Duke Energy Progress LLC | 4.200% | 8/15/45 | 40,400 | 34,453 |
| | Duke Energy Progress LLC | 2.500% | 8/15/50 | 2,475 | 1,532 |
| | Duke Energy Progress LLC | 2.900% | 8/15/51 | 2,450 | 1,615 |
| | Duke Energy Progress LLC | 4.000% | 4/1/52 | 4,185 | 3,393 |
| 3 | Duke Energy Progress NC Storm Funding LLC | 2.387% | 7/1/37 | 34,870 | 28,892 |
| 6 | East Ohio Gas Co. | 2.000% | 6/15/30 | 8,960 | 7,740 |
| 6 | East Ohio Gas Co. | 3.000% | 6/15/50 | 13,050 | 8,476 |
| | Edison International | 5.250% | 11/15/28 | 22,192 | 22,460 |
| | Emera US Finance LP | 3.550% | 6/15/26 | 25,624 | 25,111 |
| | Entergy Louisiana LLC | 3.120% | 9/1/27 | 14,935 | 14,408 |
| | Evergy Kansas Central Inc. | 3.250% | 9/1/49 | 5,062 | 3,573 |
| 3 | Evergy Metro Inc. | 2.250% | 6/1/30 | 5,680 | 4,992 |
| | Evergy Metro Inc. | 4.200% | 3/15/48 | 3,419 | 2,863 |
| 3 | Eversource Energy | 3.300% | 1/15/28 | 14,410 | 13,815 |
| | Eversource Energy | 5.450% | 3/1/28 | 24,675 | 25,249 |
| | Eversource Energy | 3.375% | 3/1/32 | 5,495 | 4,932 |
| | Eversource Energy | 5.125% | 5/15/33 | 6,780 | 6,764 |
| | Exelon Corp. | 3.350% | 3/15/32 | 18,315 | 16,582 |
| 6 | FirstEnergy Pennsylvania Electric Co. | 5.150% | 3/30/26 | 910 | 912 |
| 6 | FirstEnergy Pennsylvania Electric Co. | 5.200% | 4/1/28 | 1,910 | 1,942 |
| 6 | FirstEnergy Pennsylvania Electric Co. | 4.300% | 1/15/29 | 6,572 | 6,458 |
| | Florida Power & Light Co. | 5.650% | 2/1/35 | 50,000 | 52,930 |
| | Florida Power & Light Co. | 4.950% | 6/1/35 | 10,000 | 10,041 |
| | Florida Power & Light Co. | 5.650% | 2/1/37 | 5,000 | 5,289 |
| | Florida Power & Light Co. | 5.950% | 2/1/38 | 21,188 | 23,061 |
| | Florida Power & Light Co. | 3.700% | 12/1/47 | 13,702 | 10,899 |
| | Florida Power & Light Co. | 5.300% | 4/1/53 | 17,250 | 17,534 |
| | Fortis Inc. | 3.055% | 10/4/26 | 28,565 | 27,696 |
| | Georgia Power Co. | 4.700% | 5/15/32 | 21,575 | 21,476 |
| | Georgia Power Co. | 4.950% | 5/17/33 | 20,085 | 20,251 |
| | Georgia Power Co. | 5.250% | 3/15/34 | 15,025 | 15,417 |
| | Georgia Power Co. | 5.400% | 6/1/40 | 6,665 | 6,656 |
| 3 | Georgia Power Co. | 4.750% | 9/1/40 | 34,703 | 33,043 |
| | Georgia Power Co. | 4.300% | 3/15/42 | 14,834 | 13,156 |
| | Georgia Power Co. | 5.125% | 5/15/52 | 19,840 | 19,397 |
| | Indiana Michigan Power Co. | 4.250% | 8/15/48 | 14,980 | 12,483 |
| 6 | ITC Holdings Corp. | 4.950% | 9/22/27 | 2,425 | 2,442 |
| | Johnsonville Aeroderivative Combustion Turbine Generation LLC | 5.078% | 10/1/54 | 20,995 | 20,902 |
| 6 | KeySpan Gas East Corp. | 2.742% | 8/15/26 | 25,345 | 24,426 |
| 6 | Massachusetts Electric Co. | 5.900% | 11/15/39 | 21,565 | 22,073 |
| | MidAmerican Energy Co. | 4.400% | 10/15/44 | 1,050 | 941 |
| | MidAmerican Energy Co. | 4.250% | 5/1/46 | 5,485 | 4,764 |
| | MidAmerican Energy Co. | 4.250% | 7/15/49 | 6,595 | 5,691 |
| | | | Coupon | Maturity
Date | Face
Amount
($000) | Market
Value•
($000) |
| | MidAmerican Energy Co. | 3.150% | 4/15/50 | 38,026 | 27,242 |
| 6 | Mid-Atlantic Interstate Transmission LLC | 4.100% | 5/15/28 | 3,170 | 3,106 |
| 3 | Mississippi Power Co. | 4.250% | 3/15/42 | 7,024 | 6,095 |
| 6 | Monongahela Power Co. | 5.400% | 12/15/43 | 4,570 | 4,497 |
| 3 | Nevada Power Co. | 3.125% | 8/1/50 | 15,345 | 10,420 |
| | NextEra Energy Capital Holdings Inc. | 6.051% | 3/1/25 | 12,700 | 12,731 |
| | NextEra Energy Capital Holdings Inc. | 5.749% | 9/1/25 | 13,955 | 14,049 |
| | NextEra Energy Capital Holdings Inc. | 1.900% | 6/15/28 | 27,465 | 25,040 |
| | NextEra Energy Capital Holdings Inc. | 3.500% | 4/1/29 | 14,165 | 13,516 |
| 6 | Niagara Mohawk Power Corp. | 4.278% | 12/15/28 | 35,970 | 35,160 |
| 6 | Niagara Mohawk Power Corp. | 3.025% | 6/27/50 | 14,840 | 9,767 |
| | NiSource Inc. | 5.250% | 3/30/28 | 19,368 | 19,718 |
| | NiSource Inc. | 5.250% | 2/15/43 | 14,588 | 14,320 |
| | NiSource Inc. | 4.800% | 2/15/44 | 12,750 | 11,812 |
| | NiSource Inc. | 5.000% | 6/15/52 | 19,985 | 18,656 |
| | Northern States Power Co. | 2.250% | 4/1/31 | 4,940 | 4,281 |
| | Northern States Power Co. | 6.250% | 6/1/36 | 50,000 | 55,776 |
| 6 | Oglethorpe Power Corp. | 6.191% | 1/1/31 | 31,994 | 33,014 |
| | Oglethorpe Power Corp. | 5.950% | 11/1/39 | 6,075 | 6,354 |
| | Oglethorpe Power Corp. | 4.550% | 6/1/44 | 1,825 | 1,552 |
| | Oglethorpe Power Corp. | 4.250% | 4/1/46 | 19,060 | 15,394 |
| | Oglethorpe Power Corp. | 4.500% | 4/1/47 | 4,095 | 3,531 |
| | Oglethorpe Power Corp. | 5.050% | 10/1/48 | 4,690 | 4,358 |
| 6 | Oglethorpe Power Corp. | 5.800% | 6/1/54 | 5,525 | 5,719 |
| | Oncor Electric Delivery Co. LLC | 4.150% | 6/1/32 | 4,425 | 4,242 |
| | Oncor Electric Delivery Co. LLC | 4.550% | 9/15/32 | 19,394 | 19,106 |
| | Oncor Electric Delivery Co. LLC | 5.650% | 11/15/33 | 37,160 | 39,282 |
| | Oncor Electric Delivery Co. LLC | 4.550% | 12/1/41 | 10,735 | 9,839 |
| | Oncor Electric Delivery Co. LLC | 2.700% | 11/15/51 | 23,120 | 14,594 |
| | Oncor Electric Delivery Co. LLC | 4.600% | 6/1/52 | 26,115 | 23,121 |
| | Oncor Electric Delivery Co. LLC | 4.950% | 9/15/52 | 3,788 | 3,600 |
| | Pacific Gas & Electric Co. | 6.150% | 1/15/33 | 19,542 | 20,651 |
| | Pacific Gas & Electric Co. | 6.400% | 6/15/33 | 18,130 | 19,497 |
| | Pacific Gas & Electric Co. | 6.950% | 3/15/34 | 30,080 | 33,680 |
| | Pacific Gas & Electric Co. | 5.800% | 5/15/34 | 17,265 | 17,980 |
| | Pacific Gas & Electric Co. | 4.500% | 7/1/40 | 68,831 | 61,039 |
| | Pacific Gas & Electric Co. | 3.950% | 12/1/47 | 14,559 | 11,271 |
| | Pacific Gas & Electric Co. | 6.750% | 1/15/53 | 13,479 | 15,158 |
| | Pacific Gas & Electric Co. | 6.700% | 4/1/53 | 22,964 | 25,881 |
| | PECO Energy Co. | 2.850% | 9/15/51 | 8,000 | 5,267 |
| | PECO Energy Co. | 4.600% | 5/15/52 | 12,845 | 11,716 |
| 3 | PG&E Energy Recovery Funding LLC | 2.280% | 1/15/36 | 3,775 | 3,058 |
| 3 | PG&E Energy Recovery Funding LLC | 2.822% | 7/15/46 | 16,989 | 12,514 |
| 3 | PG&E Wildfire Recovery Funding LLC | 4.451% | 12/1/47 | 12,150 | 11,080 |
| 3 | PG&E Wildfire Recovery Funding LLC | 5.212% | 12/1/47 | 25,815 | 25,834 |
| 3 | PG&E Wildfire Recovery Funding LLC | 5.099% | 6/1/52 | 23,500 | 23,688 |
| | Piedmont Natural Gas Co. Inc. | 5.050% | 5/15/52 | 9,130 | 8,482 |
| | Potomac Electric Power Co. | 6.500% | 11/15/37 | 25,000 | 28,369 |
| | PPL Electric Utilities Corp. | 5.250% | 5/15/53 | 5,710 | 5,773 |
| | Public Service Enterprise Group Inc. | 5.200% | 4/1/29 | 17,595 | 17,994 |
| | Public Service Enterprise Group Inc. | 5.450% | 4/1/34 | 11,295 | 11,550 |
| | San Diego Gas & Electric Co. | 6.000% | 6/1/26 | 3,600 | 3,676 |
| 3 | San Diego Gas & Electric Co. | 1.700% | 10/1/30 | 4,940 | 4,204 |
| 3 | San Diego Gas & Electric Co. | 3.750% | 6/1/47 | 5,390 | 4,255 |
| | San Diego Gas & Electric Co. | 4.150% | 5/15/48 | 5,940 | 4,945 |
| 3 | San Diego Gas & Electric Co. | 2.950% | 8/15/51 | 714 | 490 |
| | San Diego Gas & Electric Co. | 3.700% | 3/15/52 | 29,320 | 22,439 |
| | San Diego Gas & Electric Co. | 5.350% | 4/1/53 | 39,740 | 39,833 |
| 3 | SCE Recovery Funding LLC | 0.861% | 11/15/31 | 6,893 | 6,027 |
| 3 | SCE Recovery Funding LLC | 1.942% | 5/15/38 | 3,655 | 2,790 |
| 3 | SCE Recovery Funding LLC | 2.510% | 11/15/43 | 3,310 | 2,316 |
| | Sempra | 3.250% | 6/15/27 | 80,765 | 78,073 |
| | Sempra | 3.700% | 4/1/29 | 2,295 | 2,200 |
| | Sempra | 6.000% | 10/15/39 | 14,800 | 15,639 |
| | Sierra Pacific Power Co. | 2.600% | 5/1/26 | 7,857 | 7,649 |
| 3 | Southern California Edison Co. | 3.700% | 8/1/25 | 3,315 | 3,290 |
| | Southern California Edison Co. | 5.150% | 6/1/29 | 32,950 | 33,545 |
| | Southern California Edison Co. | 5.450% | 6/1/31 | 11,460 | 11,850 |
| | Southern California Edison Co. | 5.950% | 11/1/32 | 30,370 | 32,409 |
| | Southern California Edison Co. | 6.000% | 1/15/34 | 7,695 | 8,281 |
| | | | Coupon | Maturity
Date | Face
Amount
($000) | Market
Value•
($000) |
| 3 | Southern California Edison Co. | 5.550% | 1/15/37 | 50,475 | 52,092 |
| 3 | Southern California Edison Co. | 5.950% | 2/1/38 | 40,000 | 42,483 |
| | Southern California Edison Co. | 6.050% | 3/15/39 | 1,980 | 2,123 |
| | Southern California Edison Co. | 4.650% | 10/1/43 | 3,255 | 2,979 |
| | Southern California Edison Co. | 4.000% | 4/1/47 | 6,530 | 5,323 |
| 3 | Southern California Edison Co. | 4.125% | 3/1/48 | 11,495 | 9,518 |
| 3 | Southern California Edison Co. | 4.875% | 3/1/49 | 2,985 | 2,748 |
| | Southern California Edison Co. | 3.650% | 2/1/50 | 5,405 | 4,116 |
| | Southern California Edison Co. | 5.700% | 3/1/53 | 6,815 | 7,043 |
| | Southern California Edison Co. | 5.875% | 12/1/53 | 7,292 | 7,718 |
| | Southern California Edison Co. | 5.750% | 4/15/54 | 8,485 | 8,838 |
| | Southern California Gas Co. | 6.350% | 11/15/52 | 17,580 | 19,996 |
| | Southern Co. | 3.250% | 7/1/26 | 30,885 | 30,261 |
| | Southern Co. | 4.400% | 7/1/46 | 50,637 | 44,011 |
| | Southern Co. Gas Capital Corp. | 5.750% | 9/15/33 | 6,670 | 6,988 |
| | Southwest Gas Corp. | 2.200% | 6/15/30 | 6,310 | 5,530 |
| | Southwestern Electric Power Co. | 6.200% | 3/15/40 | 9,800 | 10,508 |
| | Southwestern Public Service Co. | 3.700% | 8/15/47 | 3,756 | 2,864 |
| | Tampa Electric Co. | 4.900% | 3/1/29 | 8,065 | 8,117 |
| 6 | Texas Electric Market Stabilization Funding N LLC | 4.966% | 2/1/42 | 39,235 | 39,113 |
| 6 | Texas Electric Market Stabilization Funding N LLC | 5.057% | 8/1/46 | 18,860 | 18,468 |
| 6 | Texas Electric Market Stabilization Funding N LLC | 5.167% | 2/1/50 | 17,640 | 17,479 |
| | Tucson Electric Power Co. | 5.500% | 4/15/53 | 6,825 | 6,885 |
| | Union Electric Co. | 4.000% | 4/1/48 | 14,316 | 11,760 |
| | Union Electric Co. | 3.900% | 4/1/52 | 8,575 | 6,910 |
| | Union Electric Co. | 5.450% | 3/15/53 | 8,045 | 8,128 |
| 3 | Virginia Electric & Power Co. | 3.500% | 3/15/27 | 16,025 | 15,656 |
| 3 | Virginia Electric & Power Co. | 6.000% | 5/15/37 | 1,740 | 1,859 |
| | Wisconsin Electric Power Co. | 5.700% | 12/1/36 | 17,280 | 18,554 |
| | Wisconsin Public Service Corp. | 6.080% | 12/1/28 | 45,000 | 46,381 |
| | | | | | | 3,536,757 |
| Total Corporate Bonds (Cost $26,021,783) | 24,586,153 |
| Sovereign Bonds (0.5%) |
| 3,6 | Bermuda | 2.375% | 8/20/30 | 18,130 | 15,427 |
| 3,6 | Bermuda | 3.375% | 8/20/50 | 6,835 | 4,584 |
| 3,6 | Corp. Nacional del Cobre de Chile | 3.700% | 1/30/50 | 20,705 | 14,482 |
| | Equinor ASA | 2.875% | 4/6/25 | 4,775 | 4,742 |
| | Equinor ASA | 3.125% | 4/6/30 | 53,605 | 50,094 |
| 3,6 | Kingdom of Saudi Arabia | 5.000% | 1/16/34 | 34,704 | 34,685 |
| 3,6 | Kingdom of Saudi Arabia | 5.000% | 1/18/53 | 39,870 | 35,675 |
| 3,6 | Kingdom of Saudi Arabia | 5.750% | 1/16/54 | 23,848 | 23,549 |
| 3,6 | NBN Co. Ltd. | 1.625% | 1/8/27 | 26,265 | 24,681 |
| 3,6 | NBN Co. Ltd. | 2.625% | 5/5/31 | 37,954 | 33,426 |
| 3,6 | NBN Co. Ltd. | 2.500% | 1/8/32 | 77,087 | 66,136 |
| 6 | OMERS Finance Trust | 4.000% | 4/20/28 | 18,090 | 17,863 |
| 3,6 | Qatar Energy | 2.250% | 7/12/31 | 31,765 | 27,213 |
| 3,6 | Qatar Energy | 3.125% | 7/12/41 | 23,200 | 17,653 |
| 3 | Republic of Chile | 2.550% | 7/27/33 | 36,780 | 30,586 |
| 3 | Republic of Chile | 3.500% | 1/31/34 | 20,300 | 18,077 |
| | Republic of Chile | 3.500% | 4/15/53 | 20,175 | 14,730 |
| | State of Israel | 5.375% | 3/12/29 | 36,740 | 37,170 |
| | State of Israel | 5.500% | 3/12/34 | 17,400 | 17,410 |
| | State of Israel | 5.750% | 3/12/54 | 58,355 | 55,966 |
| 3,6 | State of Qatar | 4.400% | 4/16/50 | 14,035 | 12,450 |
| 3,6 | UAE International Government Bond | 4.951% | 7/7/52 | 13,725 | 12,937 |
| 3 | United Mexican States | 6.338% | 5/4/53 | 27,000 | 25,261 |
| 3 | United Mexican States | 6.400% | 5/7/54 | 35,375 | 33,377 |
| Total Sovereign Bonds (Cost $688,107) | 628,174 |
| Taxable Municipal Bonds (1.4%) |
| | Alabama Federal Aid Highway Finance Authority SO Revenue | 2.650% | 9/1/37 | 4,935 | 3,970 |
| | Bay Area Toll Authority California Toll Bridge Revenue (San Francisco Bay Area) | 6.918% | 4/1/40 | 9,605 | 11,125 |
| | Bay Area Toll Authority California Toll Bridge Revenue (San Francisco Bay Area) | 6.263% | 4/1/49 | 1,965 | 2,183 |
| | Bay Area Toll Authority California Toll Bridge Revenue (San Francisco Bay Area) | 7.043% | 4/1/50 | 26,165 | 31,646 |
| | Broward County FL Airport System Revenue | 3.477% | 10/1/43 | 10,370 | 8,747 |
| | California GO | 7.550% | 4/1/39 | 12,375 | 15,159 |
| | California GO | 7.300% | 10/1/39 | 48,825 | 57,360 |
| | California GO | 5.875% | 10/1/41 | 29,515 | 31,219 |
| | | | Coupon | Maturity
Date | Face
Amount
($000) | Market
Value•
($000) |
| | California Health Facilities Financing Authority Revenue | 4.190% | 6/1/37 | 4,380 | 4,102 |
| | California State University Systemwide Revenue | 2.719% | 11/1/52 | 12,090 | 8,509 |
| | California State University Systemwide Revenue | 2.939% | 11/1/52 | 15,225 | 10,972 |
| | Chicago IL Transit Authority Sales & Transfer Tax Receipts Revenue | 6.899% | 12/1/40 | 31,976 | 36,274 |
| | Chicago IL Transit Authority Sales & Transfer Tax Receipts Revenue | 6.899% | 12/1/40 | 54,604 | 61,943 |
| | Chicago IL Transit Authority Sales Tax Receipts Revenue | 6.200% | 12/1/40 | 2,260 | 2,402 |
| | Dallas-Fort Worth TX International Airport Revenue | 3.089% | 11/1/40 | 7,405 | 5,982 |
| | Dallas-Fort Worth TX International Airport Revenue | 2.843% | 11/1/46 | 18,860 | 14,003 |
| | Dallas-Fort Worth TX International Airport Revenue | 4.087% | 11/1/51 | 2,695 | 2,349 |
| | Dallas-Fort Worth TX International Airport Revenue | 4.507% | 11/1/51 | 7,635 | 7,034 |
| | Florida State Board of Administration Finance Corp. Revenue | 1.705% | 7/1/27 | 29,555 | 27,493 |
| 8 | Foothill-Eastern Transportation Corridor Agency CA Toll Road Revenue | 3.924% | 1/15/53 | 11,545 | 9,545 |
| | Georgia Municipal Electric Power Authority Revenue | 6.637% | 4/1/57 | 68,128 | 76,444 |
| | Golden State Tobacco Securitization Corp. California Revenue | 2.746% | 6/1/34 | 2,430 | 2,093 |
| | Golden State Tobacco Securitization Corp. California Revenue | 3.293% | 6/1/42 | 4,645 | 3,693 |
| | Golden State Tobacco Securitization Corp. California Revenue | 3.000% | 6/1/46 | 8,070 | 7,521 |
| | Grand Parkway Transportation Corp. Texas System Toll Revenue | 5.184% | 10/1/42 | 5,645 | 5,746 |
| | Grand Parkway Transportation Corp. Texas System Toll Revenue | 3.236% | 10/1/52 | 28,900 | 21,493 |
| | Houston TX GO | 6.290% | 3/1/32 | 12,560 | 13,345 |
| | Illinois GO | 5.100% | 6/1/33 | 193,186 | 194,174 |
| | Illinois Toll Highway Authority Revenue | 6.184% | 1/1/34 | 29,200 | 31,202 |
| | JobsOhio Beverage System OH Statewide Liquor Profits Revenue | 4.433% | 1/1/33 | 11,150 | 11,102 |
| | JobsOhio Beverage System OH Statewide Liquor Profits Revenue | 2.833% | 1/1/38 | 5,480 | 4,501 |
| | Kansas Development Finance Authority Revenue | 4.927% | 4/15/45 | 7,745 | 7,703 |
| 9 | Kansas Development Finance Authority Revenue | 2.774% | 5/1/51 | 15,140 | 10,905 |
| 8 | Kansas Development Finance Authority Revenue (Employees Retirement System) | 5.501% | 5/1/34 | 50,000 | 52,141 |
| | Louisiana Local Government Environmental Facilities & Community Development Authority System Restoration Taxable Bonds Revenue | 5.198% | 12/1/39 | 21,505 | 21,884 |
| | Louisville & Jefferson County KY Metropolitan Sewer District Sewer & Drainage System Revenue | 6.250% | 5/15/43 | 19,000 | 20,773 |
| | Maryland Economic Development Corp. Revenue (Prince George's County Public Schools) | 5.433% | 5/31/56 | 12,445 | 12,671 |
| | Massachusetts School Building Authority Dedicated Sales Tax Revenue | 1.753% | 8/15/30 | 27,675 | 24,522 |
| | Massachusetts School Building Authority Dedicated Sales Tax Revenue | 5.715% | 8/15/39 | 22,105 | 23,233 |
| | Massachusetts School Building Authority Dedicated Sales Tax Revenue | 3.395% | 10/15/40 | 16,520 | 14,196 |
| | Massachusetts School Building Authority Dedicated Sales Tax Revenue | 2.950% | 5/15/43 | 21,350 | 16,646 |
| | Massachusetts SO Revenue | 4.110% | 7/15/31 | 7,817 | 7,691 |
| | Michigan Finance Authority Revenue (Trinity Health Credit Group) | 3.084% | 12/1/34 | 11,320 | 10,036 |
| | New Jersey Turnpike Authority Revenue | 7.414% | 1/1/40 | 30,285 | 36,328 |
| | New York City NY GO | 4.610% | 9/1/37 | 29,690 | 29,144 |
| | New York City NY GO | 5.094% | 10/1/49 | 19,215 | 19,301 |
| | New York City NY GO | 5.114% | 10/1/54 | 9,070 | 9,196 |
| | New York Metropolitan Transportation Authority Revenue (Build America Bonds) | 6.200% | 11/15/26 | 960 | 974 |
| | New York Metropolitan Transportation Authority Revenue (Build America Bonds) | 6.814% | 11/15/40 | 27,295 | 30,317 |
| | New York Metropolitan Transportation Authority Revenue (Dedicated Tax Fund) | 7.336% | 11/15/39 | 9,530 | 11,528 |
| | New York Metropolitan Transportation Authority Revenue (Green Bond) | 5.175% | 11/15/49 | 2,425 | 2,198 |
| | North Texas Tollway Authority System Revenue | 6.718% | 1/1/49 | 11,035 | 12,870 |
| 8 | Oregon School Boards Association GO | 5.528% | 6/30/28 | 34,965 | 35,595 |
| 9 | Oregon State University General Revenue | 3.424% | 3/1/60 | 28,000 | 20,891 |
| 10 | Philadelphia PA Authority for Industrial Development Revenue | 6.550% | 10/15/28 | 66,810 | 71,086 |
| | Port Authority of New York & New Jersey Revenue | 5.859% | 12/1/24 | 2,600 | 2,600 |
| | Port Authority of New York & New Jersey Revenue | 5.647% | 11/1/40 | 40 | 43 |
| | Port Authority of New York & New Jersey Revenue | 5.072% | 7/15/53 | 34,900 | 34,872 |
| | Port Authority of New York & New Jersey Revenue | 4.458% | 10/1/62 | 44,055 | 39,739 |
| | Port Authority of New York & New Jersey Revenue | 4.810% | 10/15/65 | 21,985 | 21,111 |
| | Riverside CA Pension Obligation Bonds Revenue | 3.857% | 6/1/45 | 8,775 | 7,743 |
| | Riverside County CA Pension Obligation Bonds Revenue | 3.818% | 2/15/38 | 9,585 | 8,871 |
| | Rutgers State University New Jersey Revenue | 3.270% | 5/1/43 | 11,960 | 9,913 |
| | Sales Tax Securitization Corp. Illinois Revenue | 3.238% | 1/1/42 | 34,905 | 28,959 |
| | Texas Natural Gas Securitization Finance Corp. Revenue (Winter Storm Uri) | 5.102% | 4/1/35 | 12,634 | 12,872 |
| | Texas Natural Gas Securitization Finance Corp. Revenue (Winter Storm Uri) | 5.169% | 4/1/41 | 30,674 | 31,426 |
| | University of California Regents Medical Center Pooled Revenue | 4.132% | 5/15/32 | 17,265 | 16,801 |
| | University of California Regents Medical Center Pooled Revenue | 6.548% | 5/15/48 | 9,465 | 10,598 |
| | University of California Regents Medical Center Pooled Revenue | 6.583% | 5/15/49 | 15,150 | 16,968 |
| | University of California Regents Medical Center Pooled Revenue | 3.006% | 5/15/50 | 15,445 | 10,797 |
| | University of California Regents Medical Center Pooled Revenue | 4.563% | 5/15/53 | 46,830 | 42,994 |
| | University of California Regents Medical Center Pooled Revenue | 3.256% | 5/15/60 | 26,520 | 18,474 |
| | University of California Revenue | 1.316% | 5/15/27 | 7,470 | 6,945 |
| | University of California Revenue | 1.614% | 5/15/30 | 16,140 | 13,976 |
| | University of California Revenue | 3.931% | 5/15/45 | 22,370 | 20,757 |
| | | | Coupon | Maturity
Date | Face
Amount
($000) | Market
Value•
($000) |
| | University of Michigan Revenue | 2.562% | 4/1/50 | 32,056 | 21,357 |
| | University of Michigan Revenue | 3.504% | 4/1/52 | 7,445 | 5,924 |
| | University of Minnesota Revenue | 4.048% | 4/1/52 | 25,160 | 21,942 |
| Total Taxable Municipal Bonds (Cost $1,733,795) | 1,630,842 |
| | | | | | Shares | |
| Temporary Cash Investments (1.3%) |
| Money Market Fund (0.0%) |
| 11 | Vanguard Market Liquidity Fund | 4.651% | | 791 | 79 |
| | | | | Maturity
Date | Face
Amount
($000) | |
| Repurchase Agreements (1.2%) |
| | Bank of America Securities, LLC
(Dated 11/29/24, Repurchase Value $17,407,000, collateralized by Freddie Mac 3.000%–6.000%, 5/1/47–11/1/53, with a value of $17,748,000) | 4.580% | 12/2/24 | 17,400 | 17,400 |
| | Citigroup Global Markets Inc.
(Dated 11/29/24, Repurchase Value $272,104,000, collateralized by U.S. Treasury Note/Bond 4.125%–4.375%, 8/31/28–3/31/29, with a value of $277,440,000) | 4.570% | 12/2/24 | 272,000 | 272,000 |
| | Credit Agricole Securities (USA) Inc.
(Dated 11/29/24, Repurchase Value $40,215,000, collateralized by U.S. Treasury Note/Bond 2.250%, 2/15/27, with a value of $41,004,000) | 4.570% | 12/2/24 | 40,200 | 40,200 |
| | Deutsche Bank Securities, Inc.
(Dated 11/29/24, Repurchase Value $37,314,000, collateralized by U.S. Treasury Note/Bond 3.875%, 8/15/40, with a value of $38,046,000) | 4.580% | 12/2/24 | 37,300 | 37,300 |
| | HSBC Bank USA
(Dated 11/29/24, Repurchase Value $162,162,000, collateralized by U.S. Treasury Note/Bond 0.500%–4.625%, 6/30/25–8/15/53, with a value of $165,342,000) | 4.580% | 12/2/24 | 162,100 | 162,100 |
| | HSBC Bank USA
(Dated 11/29/24, Repurchase Value $118,945,000, collateralized by Fannie Mae 2.500%–7.000%, 1/1/37–8/1/54, and Freddie Mac 2.000%–6.500%, 8/1/38–11/1/54, with a value of $121,278,000) | 4.590% | 12/2/24 | 118,900 | 118,900 |
| | JP Morgan Securities LLC
(Dated 11/29/24, Repurchase Value $25,010,000, collateralized by U.S. Treasury Note/Bond 1.625%, 11/30/26, with a value of $25,500,000) | 4.580% | 12/2/24 | 25,000 | 25,000 |
| | Nomura International plc
(Dated 11/29/24, Repurchase Value $144,255,000, collateralized by U.S. Treasury Note/Bond 0.375%–4.375%, 12/31/25–8/15/43, with a value of $147,121,000) | 4.570% | 12/2/24 | 144,200 | 144,200 |
| | RBC Capital Markets LLC
(Dated 11/29/24, Repurchase Value $118,945,000, collateralized by Fannie Mae 5.000%–6.000%, 11/1/52–6/1/54, U.S. Treasury Bill 0.000%, 1/23/25–10/30/25, and U.S. Treasury Note/Bond 2.250%–4.250%, 5/15/39–8/15/46, with a value of $121,278,000) | 4.570% | 12/2/24 | 118,900 | 118,900 |
| | Societe Generale
(Dated 11/29/24, Repurchase Value $74,228,000, collateralized by U.S. Treasury Note/Bond 4.250%, 11/15/40, with a value of $75,684,000) | 4.570% | 12/2/24 | 74,200 | 74,200 |
| | TD Securities (USA) LLC
(Dated 11/29/24, Repurchase Value $52,820,000, collateralized by Fannie Mae 5.500%, 11/1/54, with a value of $53,856,000) | 4.580% | 12/2/24 | 52,800 | 52,800 |
| | Wells Fargo & Co.
(Dated 11/29/24, Repurchase Value $323,824,000, collateralized by Freddie Mac 5.500%, 11/1/54, with a value of $330,174,000) | 4.590% | 12/2/24 | 323,700 | 323,700 |
| | | | | | | 1,386,700 |
| Treasury Bills (0.1%) |
| 12 | Canadian Treasury Bill | 3.560% | 1/3/25 | 96,970 | 69,037 |
| | | | Coupon | Maturity
Date | Face
Amount
($000) | Market
Value•
($000) |
| 12 | Canadian Treasury Bill | 3.503% | 1/15/25 | 96,970 | 68,961 |
| | | | | | | 137,998 |
| Total Temporary Cash Investments (Cost $1,524,960) | 1,524,777 |
| Total Investments (99.7%) (Cost $84,560,124) | | 115,566,209 |
| Other Assets and Liabilities—Net (0.3%) | | 401,620 |
| Net Assets (100%) | | 115,967,829 |
| • | See Note A in Notes to Financial Statements. |
| * | Non-income-producing security. |
| 1 | Securities with a value of $1,328,000 have been segregated as collateral for certain open To Be Announced (TBA) transactions. |
| 2 | Securities with a value of $12,499,000 have been segregated as initial margin for open futures contracts. |
| 3 | The average or expected maturity is shorter than the final maturity shown because of the possibility of interim principal payments and prepayments or the possibility of the issue being called. |
| 4 | The issuer was placed under federal conservatorship in September 2008; since that time, its daily operations have been managed by the Federal Housing Finance Agency and it receives capital from the U.S. Treasury, as needed to maintain a positive net worth, in exchange for senior preferred stock. |
| 5 | Includes securities purchased on a when-issued or delayed-delivery basis for which the fund has not taken delivery as of November 30, 2024. |
| 6 | Security exempt from registration under Rule 144A of the Securities Act of 1933. Such securities may be sold in transactions exempt from registration, normally to qualified institutional buyers. At November 30, 2024, the aggregate value was $7,422,672,000, representing 6.4% of net assets. |
| 7 | Variable-rate security; rate shown is effective rate at period end. Certain variable-rate securities are not based on a published reference rate and spread but are determined by the issuer or agent based on current market conditions. |
| 8 | Scheduled principal and interest payments are guaranteed by Assured Guaranty Municipal Corp. |
| 9 | Scheduled principal and interest payments are guaranteed by Build America Mutual Assurance Co. |
| 10 | Scheduled principal and interest payments are guaranteed by National Public Finance Guarantee Corp. |
| 11 | Affiliated money market fund available only to Vanguard funds and certain trusts and accounts managed by Vanguard. Rate shown is the 7-day yield. |
| 12 | Face amount denominated in Canadian dollars. |
| | ADR—American Depositary Receipt. |
| | DAC—Designated Activity Company. |
| | GO—General Obligation Bond. |
| | REIT—Real Estate Investment Trust. |
| | REMICS—Real Estate Mortgage Investment Conduits. |
| | SO—Special Obligation. |
| | SOFR30A—30 Day Average Secured Overnight Financing Rate. |
| | TSFR1M—CME Term Secured Overnight Financing Rate 1-Month. |
| | UMBS—Uniform Mortgage-Backed Securities. |
Derivative Financial Instruments Outstanding as of Period End
| Futures Contracts |
| | | | ($000) |
| | Expiration | Number of
Long (Short)
Contracts | Notional
Amount | Value and
Unrealized
Appreciation
(Depreciation) |
| Long Futures Contracts |
| 5-Year U.S. Treasury Note | March 2025 | 913 | 98,240 | 817 |
| |
| Short Futures Contracts |
| 10-Year U.S. Treasury Note | March 2025 | (6,306) | (701,148) | (8,744) |
| | | | | (7,927) |
| Forward Currency Contracts |
| | Contract
Settlement
Date | Contract Amount (000) | Unrealized
Appreciation
($000) | Unrealized
(Depreciation)
($000) |
| Counterparty | | Receive | | Deliver |
| BNP Paribas | 1/15/25 | USD | 69,471 | CAD | 96,970 | 91 | — |
| BNP Paribas | 1/3/25 | USD | 69,447 | CAD | 96,970 | 98 | — |
| | | | | | | 189 | — |
| CAD—Canadian dollar. |
| USD—U.S. dollar. |
See accompanying Notes, which are an integral part of the Financial Statements.
Statement of Assets and Liabilities
|
| ($000s, except shares, footnotes, and per-share amounts) | Amount |
| Assets | |
| Investments in Securities, at Value | |
| Unaffiliated Issuers (Cost $84,560,048) | 115,566,130 |
| Affiliated Issuers (Cost $76) | 79 |
| Total Investments in Securities | 115,566,209 |
| Investment in Vanguard | 3,083 |
| Cash | 15,058 |
| Foreign Currency, at Value (Cost $13,463) | 13,132 |
| Receivables for Investment Securities Sold | 735,772 |
| Receivables for Accrued Income | 518,487 |
| Receivables for Capital Shares Issued | 15,340 |
| Unrealized Appreciation—Forward Currency Contracts | 189 |
| Total Assets | 116,867,270 |
| Liabilities | |
| Payables for Investment Securities Purchased | 843,007 |
| Payables for Capital Shares Redeemed | 30,475 |
| Payables to Investment Advisor | 19,169 |
| Payables to Vanguard | 5,145 |
| Variation Margin Payable—Futures Contracts | 1,645 |
| Total Liabilities | 899,441 |
| Net Assets | 115,967,829 |
At November 30, 2024, net assets consisted of: |
|
| | |
| Paid-in Capital | 75,886,731 |
| Total Distributable Earnings (Loss) | 40,081,098 |
| Net Assets | 115,967,829 |
| |
| Investor Shares—Net Assets | |
Applicable to 292,740,221 outstanding $.001 par value shares of
beneficial interest (unlimited authorization) | 13,936,408 |
| Net Asset Value Per Share—Investor Shares | $47.61 |
| |
| Admiral™ Shares—Net Assets | |
Applicable to 1,241,108,855 outstanding $.001 par value shares of
beneficial interest (unlimited authorization) | 102,031,421 |
| Net Asset Value Per Share—Admiral Shares | $82.21 |
See accompanying Notes, which are an integral part of the Financial Statements.
|
| | Year Ended
November 30, 2024 |
| | ($000) |
| Investment Income | |
| Income | |
| Dividends1 | 1,000,116 |
| Interest2 | 1,668,923 |
| Securities Lending—Net | 103 |
| Total Income | 2,669,142 |
| Expenses | |
| Investment Advisory Fees—Note B | |
| Basic Fee | 85,108 |
| Performance Adjustment | (9,816) |
| The Vanguard Group—Note C | |
| Management and Administrative—Investor Shares | 22,961 |
| Management and Administrative—Admiral Shares | 93,431 |
| Marketing and Distribution—Investor Shares | 576 |
| Marketing and Distribution—Admiral Shares | 3,125 |
| Custodian Fees | 232 |
| Auditing Fees | 35 |
| Shareholders’ Reports and Proxy Fees—Investor Shares | 459 |
| Shareholders’ Reports and Proxy Fees—Admiral Shares | 519 |
| Trustees’ Fees and Expenses | 74 |
| Other Expenses | 135 |
| Total Expenses | 196,839 |
| Expenses Paid Indirectly | (199) |
| Net Expenses | 196,640 |
| Net Investment Income | 2,472,502 |
| Realized Net Gain (Loss) | |
| Investment Securities Sold2 | 9,287,058 |
| Futures Contracts | (4,900) |
| Foreign Currencies | 1,571 |
| Realized Net Gain (Loss) | 9,283,729 |
| Change in Unrealized Appreciation (Depreciation) | |
| Investment Securities2 | 9,794,213 |
| Futures Contracts | (9,742) |
| Forward Currency Contracts | 189 |
| Foreign Currencies | (1,777) |
| Change in Unrealized Appreciation (Depreciation) | 9,782,883 |
| Net Increase (Decrease) in Net Assets Resulting from Operations | 21,539,114 |
| 1 | Dividends are net of foreign withholding taxes of $8,261,000. |
| 2 | Interest income, realized net gain (loss), and change in unrealized appreciation (depreciation) from an affiliated company of the fund were $0, $12,000, and less than $1,000, respectively. Purchases and sales are for temporary cash investment purposes. |
See accompanying Notes, which are an integral part of the Financial Statements.
Statement of Changes in Net Assets
|
| | Year Ended November 30, |
| | 2024
($000) | 2023
($000) |
| Increase (Decrease) in Net Assets | | |
| Operations | | |
| Net Investment Income | 2,472,502 | 2,439,201 |
| Realized Net Gain (Loss) | 9,283,729 | 4,185,463 |
| Change in Unrealized Appreciation (Depreciation) | 9,782,883 | 346,591 |
| Net Increase (Decrease) in Net Assets Resulting from Operations | 21,539,114 | 6,971,255 |
| Distributions | | |
| Investor Shares | (775,238) | (992,127) |
| Admiral Shares | (5,673,701) | (7,162,238) |
| Total Distributions | (6,448,939) | (8,154,365) |
| Capital Share Transactions | | |
| Investor Shares | (711,002) | (110,436) |
| Admiral Shares | (3,154,837) | (552,828) |
| Net Increase (Decrease) from Capital Share Transactions | (3,865,839) | (663,264) |
| Total Increase (Decrease) | 11,224,336 | (1,846,374) |
| Net Assets | | |
| Beginning of Period | 104,743,493 | 106,589,867 |
| End of Period | 115,967,829 | 104,743,493 |
See accompanying Notes, which are an integral part of the Financial Statements.
| Investor Shares | | | | | |
For a Share Outstanding
Throughout Each Period | Year Ended November 30, |
| 2024 | 2023 | 2022 | 2021 | 2020 |
| Net Asset Value, Beginning of Period | $41.61 | $42.19 | $50.15 | $46.10 | $43.72 |
| Investment Operations | | | | | |
| Net Investment Income1 | .949 | .917 | .857 | .811 | .966 |
| Net Realized and Unrealized Gain (Loss) on Investments | 7.588 | 1.704 | (4.681) | 6.638 | 3.345 |
| Total from Investment Operations | 8.537 | 2.621 | (3.824) | 7.449 | 4.311 |
| Distributions | | | | | |
| Dividends from Net Investment Income | (.986) | (.921) | (.828) | (.818) | (1.004) |
| Distributions from Realized Capital Gains | (1.551) | (2.280) | (3.308) | (2.581) | (.927) |
| Total Distributions | (2.537) | (3.201) | (4.136) | (3.399) | (1.931) |
| Net Asset Value, End of Period | $47.61 | $41.61 | $42.19 | $50.15 | $46.10 |
| Total Return2 | 21.47% | 6.94% | -8.43% | 17.16% | 10.41% |
| Ratios/Supplemental Data | | | | | |
| Net Assets, End of Period (Millions) | $13,936 | $12,831 | $13,097 | $15,469 | $15,635 |
| Ratio of Total Expenses to Average Net Assets3 | 0.25%4 | 0.26%4 | 0.25%4 | 0.24% | 0.24% |
| Ratio of Net Investment Income to Average Net Assets | 2.16% | 2.29% | 1.98% | 1.70% | 2.28% |
| Portfolio Turnover Rate5 | 61% | 39% | 41% | 35% | 51% |
| 1 | Calculated based on average shares outstanding. |
| 2 | Total returns do not include account service fees that may have applied in the periods shown. Fund prospectuses provide information about any applicable account service fees. |
| 3 | Includes performance-based investment advisory fee increases (decreases) of (0.01%), (0.00%), (0.01%), (0.02%), and (0.02%). |
| 4 | The ratio of expenses to average net assets for the period net of reduction from custody fee offset and broker commission abatement arrangements was 0.25%, 0.26% and 0.25%, respectively. |
| 5 | Includes 1%, 1%, 8%, 2%, and 3%, respectively, attributable to mortgage-dollar-roll activity. |
See accompanying Notes, which are an integral part of the Financial Statements.
| Admiral Shares | | | | | |
For a Share Outstanding
Throughout Each Period | Year Ended November 30, |
| 2024 | 2023 | 2022 | 2021 | 2020 |
| Net Asset Value, Beginning of Period | $71.86 | $72.86 | $86.61 | $79.62 | $75.51 |
| Investment Operations | | | | | |
| Net Investment Income1 | 1.700 | 1.638 | 1.540 | 1.464 | 1.720 |
| Net Realized and Unrealized Gain (Loss) on Investments | 13.091 | 2.945 | (8.083) | 11.461 | 5.784 |
| Total from Investment Operations | 14.791 | 4.583 | (6.543) | 12.925 | 7.504 |
| Distributions | | | | | |
| Dividends from Net Investment Income | (1.763) | (1.646) | (1.493) | (1.477) | (1.794) |
| Distributions from Realized Capital Gains | (2.678) | (3.937) | (5.714) | (4.458) | (1.600) |
| Total Distributions | (4.441) | (5.583) | (7.207) | (5.935) | (3.394) |
| Net Asset Value, End of Period | $82.21 | $71.86 | $72.86 | $86.61 | $79.62 |
| Total Return2 | 21.55% | 7.03% | -8.36% | 17.25% | 10.50% |
| Ratios/Supplemental Data | | | | | |
| Net Assets, End of Period (Millions) | $102,031 | $91,912 | $93,492 | $108,386 | $96,009 |
| Ratio of Total Expenses to Average Net Assets3 | 0.17%4 | 0.18%4 | 0.17%4 | 0.16% | 0.16% |
| Ratio of Net Investment Income to Average Net Assets | 2.24% | 2.37% | 2.06% | 1.77% | 2.35% |
| Portfolio Turnover Rate5 | 61% | 39% | 41% | 35% | 51% |
| 1 | Calculated based on average shares outstanding. |
| 2 | Total returns do not include account service fees that may have applied in the periods shown. Fund prospectuses provide information about any applicable account service fees. |
| 3 | Includes performance-based investment advisory fee increases (decreases) of (0.01%), (0.00%), (0.01%), (0.02%), and (0.02%). |
| 4 | The ratio of expenses to average net assets for the period net of reduction from custody fee offset and broker commission abatement arrangements was 0.17%, 0.18% and 0.17%, respectively. |
| 5 | Includes 1%, 1%, 8%, 2%, and 3%, respectively, attributable to mortgage-dollar-roll activity. |
See accompanying Notes, which are an integral part of the Financial Statements.
Notes to Financial Statements
Vanguard Wellington Fund is registered under the Investment Company Act of 1940 as an open-end investment company, or mutual fund. The fund offers two classes of shares: Investor Shares and Admiral Shares. Each of the share classes has different eligibility and minimum purchase requirements, and is designed for different types of investors.
A. The following significant accounting policies conform to generally accepted accounting principles for U.S. investment companies. The fund consistently follows such policies in preparing its financial statements.
1. Security Valuation: Securities are valued as of the close of trading on the New York Stock Exchange (generally 4 p.m., Eastern time) on the valuation date. Equity securities are valued at the latest quoted sales prices or official closing prices taken from the primary market in which each security trades; such securities not traded on the valuation date are valued at the mean of the latest quoted bid and asked prices. Bonds and other temporary cash investments are valued using the latest bid prices or using valuations based on a matrix system (which considers such factors as security prices, yields, maturities, and ratings), both as furnished by independent pricing services. Structured debt securities, including mortgages and asset-backed securities, are valued using the latest bid prices or using valuations based on a matrix system that considers such factors as issuer, tranche, nominal or option-adjusted spreads, weighted average coupon, weighted average maturity, credit enhancements, and collateral, as furnished by independent pricing services. Investments in Vanguard Market Liquidity Fund are valued at that fund's net asset value. Securities for which market quotations are not readily available, or whose values have been affected by events occurring before the fund’s pricing time but after the close of the securities’ primary markets, are valued by methods deemed by the valuation designee to represent fair value and subject to oversight by the board of trustees. These procedures include obtaining quotations from an independent pricing service, monitoring news to identify significant market- or security-specific events, and evaluating changes in the values of foreign market proxies (for example, ADRs, futures contracts, or exchange-traded funds), between the time the foreign markets close and the fund’s pricing time. When fair-value pricing is employed, the prices of securities used by a fund to calculate its net asset value may differ from quoted or published prices for the same securities.
2. Foreign Currency: Securities and other assets and liabilities denominated in foreign currencies are translated into U.S. dollars using exchange rates obtained from an independent third party as of the fund’s pricing time on the valuation date. Realized gains (losses) and unrealized appreciation (depreciation) on investment securities include the effects of changes in exchange rates since the securities were purchased, combined with the effects of changes in security prices. Fluctuations in the value of other assets and liabilities resulting from changes in exchange rates are recorded as unrealized foreign currency gains (losses) until the assets or liabilities are settled in cash, at which time they are recorded as realized foreign currency gains (losses).
3. To Be Announced (TBA) Transactions: A TBA transaction is an agreement to buy or sell mortgage-backed securities with agreed-upon characteristics (face amount, coupon, maturity) for settlement at a future date. The fund may be a seller of TBA transactions to reduce its exposure to the mortgage-backed securities market or in order to sell mortgage-backed securities it owns under delayed-delivery arrangements. When the fund is a buyer of TBA transactions, it maintains cash, short-term investments, or Treasuries in an amount sufficient to meet the purchase price at the settlement date of the TBA transaction. The primary risk associated with TBA transactions is that a counterparty may default on its obligations. The fund mitigates its counterparty risk by, among other things, performing a credit analysis of counterparties, allocating transactions among numerous counterparties, and monitoring its exposure to each counterparty. The fund may also enter into a Master Securities Forward Transaction Agreement (MSFTA) with certain counterparties and require them to transfer collateral as security for their performance. In the absence of a default, the collateral pledged or received by the fund cannot be repledged, resold, or rehypothecated. Under an MSFTA, upon a counterparty default (including bankruptcy), the fund may terminate any TBA transactions with that counterparty, determine the net amount owed by either party in accordance with its MSFTA, and sell or retain any collateral held up to the net amount owed to the fund under the MSFTA.
At November 30, 2024, counterparties had deposited in segregated accounts securities with a value of $1,156,000 and cash of $365,000 in connection with TBA transactions.
4. Mortgage Dollar Rolls: The fund enters into mortgage-dollar-roll transactions, in which the fund sells mortgage-backed securities to a dealer and simultaneously agrees to purchase substantially similar securities in the future at a predetermined price on a predetermined date. The fund forgoes principal and interest paid on the securities sold. In exchange for the forgone principal and interest paid, the fund is compensated by investing the proceeds of the sale, typically in high-quality short-term fixed income securities, and earning interest on such investments. Further the fund receives a lower price on the securities to be repurchased. The fund also enters into mortgage-dollar-roll transactions in which the fund buys mortgage-backed securities from a dealer pursuant to a TBA transaction and simultaneously agrees to sell substantially similar securities in the future at a predetermined price. The securities bought in mortgage-dollar-roll transactions are used to cover an open TBA sell position. The fund continues to earn interest on mortgage-backed security pools already held and receives a lower price on the securities to be sold in the future. The fund accounts for mortgage-dollar-roll transactions as purchases and sales; as such, these transactions may increase the fund’s portfolio turnover rate. Amounts to be received or paid in connection with open mortgage dollar rolls are included in Receivables for Investment Securities Sold or Payables for Investment Securities Purchased in the Statement of Assets and Liabilities.
5. Repurchase Agreements: The fund enters into repurchase agreements with institutional counterparties. Securities pledged as collateral to the fund under repurchase agreements are held by a custodian bank until the agreements mature, and in the absence of a default, such collateral cannot be repledged, resold, or rehypothecated. Each agreement requires that the market value of the collateral be sufficient to cover payments of interest and principal. The fund further mitigates its counterparty risk by entering into repurchase agreements only with a diverse group of prequalified counterparties, monitoring their financial strength, and entering into master repurchase agreements with its counterparties. The master repurchase agreements provide that, in the event of a counterparty's default (including bankruptcy), the fund may terminate any repurchase agreements with that counterparty, determine the net amount owed, and sell or retain the collateral up to the net amount owed to the fund. Such action may be subject to legal proceedings, which may delay or limit the disposition of collateral.
6. Futures Contracts: The fund uses futures contracts to invest in fixed income asset classes with greater efficiency and lower cost than is possible through direct investment, to add value when these instruments are attractively priced, or to adjust sensitivity to changes in interest rates. The primary risks associated with the use of futures contracts are imperfect correlation between changes in market values of bonds held by the fund and the prices of futures contracts, and the possibility of an illiquid market. Counterparty risk involving futures is mitigated because a regulated clearinghouse is the counterparty instead of the clearing broker. To further mitigate counterparty risk, the fund trades futures contracts on an exchange, monitors the financial strength of its clearing brokers and clearinghouse, and has entered into clearing agreements with its clearing brokers. The clearinghouse imposes initial margin requirements to secure the fund’s performance and requires daily settlement of variation margin representing changes in the market value of each contract. Any securities pledged as initial margin for open contracts are noted in the Schedule of Investments.
Futures contracts are valued at their quoted daily settlement prices. The notional amounts of the contracts are not recorded in the Statement of Assets and Liabilities. Fluctuations in the value of the contracts are recorded in the Statement of Assets and Liabilities as an asset (liability) and in the Statement of Operations as unrealized appreciation (depreciation) until the contracts are closed, when they are recorded as realized gains (losses) on futures contracts.
During the year ended November 30, 2024, the fund’s average investments in long and short futures contracts represented less than 1% of net assets, based on the average of the notional amounts at each quarter-end during the period.
7. Forward Currency Contracts: The fund enters into forward currency contracts to protect the value of securities and related receivables and payables against changes in future foreign exchange rates. Risks associated with these types of forward currency contracts include movement in the values of the foreign currencies relative to the U.S. dollar and the ability of the counterparties to fulfill their obligations under the contracts. The fund mitigates its counterparty risk by entering into forward currency contracts only with a diverse group of prequalified counterparties, monitoring their financial strength, entering into master netting arrangements with its counterparties, and requiring its counterparties to transfer collateral as security for their performance. In the absence of a default, the collateral pledged or received by the fund cannot be repledged, resold, or rehypothecated. The master netting arrangements provide that, in the event of a counterparty’s default (including bankruptcy), the fund may terminate the forward currency contracts, determine the net amount owed by either party in accordance with its master netting arrangements, and sell or retain any collateral held up to the net amount owed to the fund under the master netting arrangements. The forward currency contracts contain provisions whereby a counterparty may terminate open contracts if the fund’s net assets decline below a certain level, triggering a payment by the fund if the fund is in a net liability position at the time of the termination. The payment amount would be reduced by any collateral the fund has pledged. Any securities pledged as collateral for open contracts are noted in the Schedule of Investments. The value of collateral received or pledged is compared daily to the value of the forward currency contracts exposure with each counterparty, and any difference, if in excess of a specified minimum transfer amount, is adjusted and settled within two business days.
Forward currency contracts are valued at their quoted daily prices obtained from an independent third party, adjusted for currency risk based on the expiration date of each contract. The notional amounts of the contracts are not recorded in the Statement of Assets and Liabilities. Fluctuations in the value of the contracts are recorded in the Statement of Assets and Liabilities as an asset (liability) and in the Statement of Operations as unrealized appreciation (depreciation) until the contracts are closed, when they are recorded as realized gains (losses) on forward currency contracts.
During the year ended November 30, 2024, the fund’s average investment in forward currency contracts represented less than 1% of net assets, based on the average of the notional amounts at each quarter-end during the period.
8. Federal Income Taxes: The fund intends to continue to qualify as a regulated investment company and distribute virtually all of its taxable income. The fund’s tax returns are open to examination by the relevant tax authorities until expiration of the applicable statute of limitations, which is generally three years after the filing of the tax return. Management has analyzed the fund’s tax positions taken for all open federal and state income tax years, and has concluded that no provision for income tax is required in the fund’s financial statements.
9. Distributions: Distributions to shareholders are recorded on the ex-dividend date. Distributions are determined on a tax basis at the fiscal year-end and may differ from net investment income and realized capital gains for financial reporting purposes.
10. Securities Lending: To earn additional income, the fund lends its securities to qualified institutional borrowers. Security loans are subject to termination by the fund at any time, and are required to be secured at all times by collateral in an amount at least equal to the market value of securities loaned. Daily market fluctuations could cause the value of loaned securities to be more or less than the value of the collateral received. When this occurs, the collateral is adjusted and settled before the opening of the market on the next business day. The fund further mitigates its counterparty risk by entering into securities lending transactions only with a diverse group of prequalified counterparties, monitoring their financial strength, and entering into master securities lending agreements with its counterparties. The master securities lending agreements provide that, in the event of a counterparty’s default (including bankruptcy), the fund may terminate any loans with that borrower, determine the net amount owed, and sell or retain the collateral up to the net amount owed to the fund; however, such actions may be subject to legal proceedings. While collateral mitigates counterparty risk, in the event of a default, the fund may experience delays and costs in recovering the securities loaned. The fund invests cash collateral received in Vanguard Market Liquidity Fund, and records a liability in the Statement of Assets and Liabilities for the return of the collateral, during the period the securities are on loan. Collateral investments in Vanguard Market Liquidity Fund are subject to market appreciation or depreciation. Securities lending income represents fees charged to borrowers plus income earned on invested cash collateral, less expenses associated with the loan. During the term of the loan, the fund is entitled to all distributions made on or in respect of the loaned securities.
11. Credit Facilities and Interfund Lending Program: The fund and certain other funds managed by The Vanguard Group ("Vanguard") participate in a $4.3 billion committed credit facility provided by a syndicate of lenders pursuant to a credit agreement and an uncommitted credit facility provided by Vanguard. Both facilities may be renewed annually. Each fund is individually liable for its borrowings, if any, under the credit facilities. Borrowings may be utilized for temporary or emergency purposes and are subject to the fund’s regulatory and contractual borrowing restrictions. With respect to the committed credit facility, the participating funds are charged administrative fees and an annual commitment fee of 0.10% of the undrawn committed amount of the facility, which are allocated to the funds based on a method approved by the fund’s board of trustees and included in Management and
Administrative expenses on the fund’s Statement of Operations. Any borrowings under either facility bear interest at an agreed-upon spread plus the higher of the federal funds effective rate, the overnight bank funding rate, or the Daily Simple Secured Overnight Financing Rate inclusive of an additional agreed-upon spread. However, borrowings under the uncommitted credit facility may bear interest based upon an alternate rate agreed to by the fund and Vanguard.
In accordance with an exemptive order (the “Order”) from the SEC, the fund may participate in a joint lending and borrowing program that allows registered open-end Vanguard funds to borrow money from and lend money to each other for temporary or emergency purposes (the “Interfund Lending Program”), subject to compliance with the terms and conditions of the Order, and to the extent permitted by the fund’s investment objective and investment policies. Interfund loans and borrowings normally extend overnight but can have a maximum duration of seven days. Loans may be called on one business day’s notice. The interest rate to be charged is governed by the conditions of the Order and internal procedures adopted by the board of trustees. The board of trustees is responsible for overseeing the Interfund Lending Program.
For the year ended November 30, 2024, the fund did not utilize the credit facilities or the Interfund Lending Program.
12. Other: Dividend income is recorded on the ex-dividend date. Non-cash dividends included in income, if any, are recorded at the fair value of the securities received. Interest income includes income distributions received from Vanguard Market Liquidity Fund and is accrued daily. Premiums and discounts on debt securities are amortized and accreted, respectively, to interest income over the lives of the respective securities, except for premiums on certain callable debt securities that are amortized to the earliest call date. Security transactions are accounted for on the date securities are bought or sold. Costs used to determine realized gains (losses) on the sale of investment securities are those of the specific securities sold.
Taxes on foreign dividends and capital gains have been provided for in accordance with the applicable countries’ tax rules and rates. Deferred foreign capital gains tax, if any, is accrued daily based upon net unrealized gains. The fund has filed tax reclaims for previously withheld taxes on dividends earned in certain European Union countries. These filings are subject to various administrative and judicial proceedings within these countries. Amounts related to these reclaims are recorded when there are no significant uncertainties as to the ultimate resolution of proceedings, the likelihood of receipt of these reclaims, and the potential timing of payment. Such tax reclaims and related professional fees, if any, are included in dividend income and other expenses, respectively.
Each class of shares has equal rights as to assets and earnings, except that each class separately bears certain class-specific expenses related to maintenance of shareholder accounts (included in Management and Administrative expenses), shareholder reporting, and proxy fees. Marketing and distribution expenses are allocated to each class of shares based on a method approved by the board of trustees. Income, other non-class-specific expenses, and gains and losses on investments are allocated to each class of shares based on its relative net assets.
B. Wellington Management Company llp provides investment advisory services to the fund for a fee calculated at an annual percentage rate of average net assets. The basic fee is subject to quarterly adjustments based on the fund's performance relative to the combined index comprising the S&P 500 Index and the Bloomberg Capital U.S. Credit A or Better Bond Index for the preceding three years. For the year ended November 30, 2024, the investment advisory fee represented an effective annual basic rate of 0.08% of the fund’s average net assets before a net decrease of $9,816,000 (0.01%) based on performance.
C. In accordance with the terms of a Funds’ Service Agreement (the “FSA”) between Vanguard and the fund, Vanguard furnishes to the fund corporate management, administrative, marketing, and distribution services at Vanguard’s cost of operations (as defined by the FSA). These costs of operations are allocated to the fund based on methods and guidelines approved by the board of trustees and are generally settled twice a month.
Upon the request of Vanguard, the fund may invest up to 0.40% of its net assets as capital in Vanguard. At November 30, 2024, the fund had contributed to Vanguard capital in the amount of $3,083,000, representing less than 0.01% of the fund’s net assets and 1.23% of Vanguard’s capital received pursuant to the FSA. The fund’s trustees and officers are also directors and employees, respectively, of Vanguard.
D. The fund has asked its investment advisor to direct certain security trades, subject to obtaining the best price and execution, to brokers who have agreed to rebate to the fund part of the commissions generated. Such rebates are used solely to reduce the fund’s management and administrative expenses. For the year ended November 30, 2024, these arrangements reduced the fund’s expenses by $199,000 (an annual rate of less than 0.01% of average net assets).
E. Various inputs may be used to determine the value of the fund’s investments and derivatives. These inputs are summarized in three broad levels for financial statement purposes. The inputs or methodologies used to value securities are not necessarily an indication of the risk associated with investing in those securities.
Level 1—Quoted prices in active markets for identical securities.
Level 2—Other significant observable inputs (including quoted prices for similar securities, interest rates, prepayment speeds, credit risk, etc.).
Level 3—Significant unobservable inputs (including the fund’s own assumptions used to determine the fair value of investments). Any investments and derivatives valued with significant unobservable inputs are noted on the Schedule of Investments.
The following table summarizes the market value of the fund's investments and derivatives as of November 30, 2024, based on the inputs used to value them:
| | Level 1
($000) | Level 2
($000) | Level 3
($000) | Total
($000) |
| Investments | | | | |
| Assets | | | | |
| Common Stocks | 72,246,641 | 4,139,473 | — | 76,386,114 |
| U.S. Government and Agency Obligations | — | 9,361,428 | — | 9,361,428 |
| Asset-Backed/Commercial Mortgage-Backed Securities | — | 1,448,721 | — | 1,448,721 |
| Corporate Bonds | — | 24,586,153 | — | 24,586,153 |
| Sovereign Bonds | — | 628,174 | — | 628,174 |
| Taxable Municipal Bonds | — | 1,630,842 | — | 1,630,842 |
| Temporary Cash Investments | 79 | 1,524,698 | — | 1,524,777 |
| Total | 72,246,720 | 43,319,489 | — | 115,566,209 |
| | | | |
| Derivative Financial Instruments | | | | |
| Assets | | | | |
| Futures Contracts1 | 817 | — | — | 817 |
| Forward Currency Contracts | — | 189 | — | 189 |
| Total | 817 | 189 | — | 1,006 |
| Liabilities | | | | |
| Futures Contracts1 | (8,744) | — | — | (8,744) |
| 1 | Includes cumulative appreciation (depreciation) on futures contracts and centrally cleared swaps, if any, as reported in the Schedule of Investments. Only current day’s variation margin is reported within the Statement of Assets and Liabilities. |
F. At November 30, 2024, the fair values of derivatives were reflected in the Statement of Assets and Liabilities as follows:
| Statement of Assets and Liabilities | Interest
Rate
Contracts
($000) | Foreign
Exchange
Contracts
($000) | Total
($000) |
| Unrealized Appreciation—Futures Contracts1 | 817 | — | 817 |
| Unrealized Appreciation—Forward Currency Contracts | — | 189 | 189 |
| Total Assets | 817 | 189 | 1,006 |
| | | | |
| Unrealized Depreciation—Futures Contracts1 | (8,744) | — | (8,744) |
| Total Liabilities | (8,744) | — | (8,744) |
| 1 | Includes cumulative appreciation (depreciation) on futures contracts and centrally cleared swaps, if any, as reported in the Schedule of Investments. Only current day’s variation margin is reported within the Statement of Assets and Liabilities. |
Realized net gain (loss) and the change in unrealized appreciation (depreciation) on derivatives for the year ended November 30, 2024, were:
| Realized Net Gain (Loss) on Derivatives | Interest
Rate
Contracts
($000) | Foreign
Exchange
Contracts
($000) | Total
($000) |
| Futures Contracts | (4,900) | — | (4,900) |
| Realized Net Gain (Loss) on Derivatives | (4,900) | — | (4,900) |
| |
| Change in Unrealized Appreciation (Depreciation) on Derivatives | | | |
| Futures Contracts | (9,742) | — | (9,742) |
| Forward Currency Contracts | — | 189 | 189 |
| Change in Unrealized Appreciation (Depreciation) on Derivatives | (9,742) | 189 | (9,553) |
G. Permanent differences between book-basis and tax-basis components of net assets are reclassified among capital accounts in the financial statements to reflect their tax character. These reclassifications have no effect on net assets or net asset value per share. As of period end, permanent differences primarily attributable to the accounting for foreign currency transactions and distributions in connection with fund share redemptions were reclassified between the following accounts:
| | Amount
($000) |
| Paid-in Capital | 580,623 |
| Total Distributable Earnings (Loss) | (580,623) |
Temporary differences between book-basis and tax-basis components of total distributable earnings (loss) arise when certain items of income, gain, or loss are recognized in different periods for financial statement and tax purposes; these differences will reverse at some time in the future. The differences are primarily related to the deferral of losses from wash sales; the deferral of losses from straddles; the recognition of unrealized gains or losses from certain derivative contracts; and the treatment of amortization adjustments from certain fixed income securities. As of period end, the tax-basis components of total distributable earnings (loss) are detailed in the table as follows:
| | Amount
($000) |
| Undistributed Ordinary Income | 940,150 |
| Undistributed Long-Term Gains | 8,314,621 |
| Net Unrealized Gains (Losses) | 30,826,327 |
| Capital Loss Carryforwards | — |
| Qualified Late-Year Losses | — |
| Other Temporary Differences | — |
| Total | 40,081,098 |
The tax character of distributions paid was as follows:
| | Year Ended November 30, |
| | 2024
Amount
($000) | 2023
Amount
($000) |
| Ordinary Income* | 2,568,166 | 2,430,007 |
| Long-Term Capital Gains | 3,880,773 | 5,724,358 |
| Total | 6,448,939 | 8,154,365 |
| * | Includes short-term capital gains, if any. |
As of November 30, 2024, gross unrealized appreciation and depreciation for investments and derivatives based on cost for U.S. federal income tax purposes were as follows:
| | Amount
($000) |
| Tax Cost | 84,740,971 |
| Gross Unrealized Appreciation | 34,092,187 |
| Gross Unrealized Depreciation | (3,266,949) |
| Net Unrealized Appreciation (Depreciation) | 30,825,238 |
H. During the year ended November 30, 2024, the fund purchased $24,253,216,000 of investment securities and sold $23,914,713,000 of investment securities, other than U.S. government securities and temporary cash investments. Purchases and sales of U.S. government securities were $42,599,746,000 and $51,250,410,000, respectively.
The fund purchased securities from and sold securities to other funds or accounts managed by its investment advisor or their affiliates, in accordance with procedures adopted by the board of trustees in compliance with Rule 17a-7 of the Investment Company Act of 1940. For the year ended November 30, 2024, such purchases were $0 and sales were $158,785,000, resulting in net realized gain of $108,986,000; these amounts, other than temporary cash investments, are included in the purchases and sales of investment securities noted above.
I. Capital share transactions for each class of shares were:
| | Year Ended November 30, |
| | 2024 | | 2023 |
| | Amount
($000) | Shares
(000) | | Amount
($000) | Shares
(000) |
| Investor Shares | | | | | |
| Issued | 1,098,669 | 25,005 | | 1,206,571 | 29,910 |
| Issued in Lieu of Cash Distributions | 737,786 | 17,686 | | 948,779 | 24,646 |
| Redeemed | (2,547,457) | (58,291) | | (2,265,786) | (56,621) |
| Net Increase (Decrease)—Investor Shares | (711,002) | (15,600) | | (110,436) | (2,065) |
| Admiral Shares | | | | | |
| Issued | 4,538,711 | 60,184 | | 4,339,920 | 62,780 |
| Issued in Lieu of Cash Distributions | 5,235,097 | 72,622 | | 6,614,009 | 99,497 |
| Redeemed | (12,928,645) | (170,731) | | (11,506,757) | (166,348) |
| Net Increase (Decrease)—Admiral Shares | (3,154,837) | (37,925) | | (552,828) | (4,071) |
J. Significant market disruptions, such as those caused by pandemics, natural or environmental disasters, war, acts of terrorism, or other events, can adversely affect local and global markets and normal market operations. Any such disruptions could have an adverse impact on the value of the fund’s investments and fund performance.
To the extent the fund’s investment portfolio reflects concentration in a particular market, industry, sector, country or asset class, the fund may be adversely affected by the performance of these concentrations and may be subject to increased price volatility and other risks.
Credit risk is the risk that a counterparty to a transaction or an issuer of a financial instrument will fail to pay interest and principal when due, or that perceptions of the issuer’s ability to make such payments will cause the price of an investment to decline. Investment in debt securities will generally increase credit risk.
The use of derivatives may expose the fund to various risks. Derivatives can be highly volatile, and any initial investment is generally small relative to the notional amount so that transactions may be leveraged in terms of market exposure. A relatively small market movement may have a potentially larger impact on derivatives than on standard securities. Leveraged derivatives positions can, therefore, increase volatility. Additional information regarding the fund’s use of derivative(s) and the specific risks associated is described under significant accounting policies.
K. Management has determined that no events or transactions occurred subsequent to November 30, 2024, that would require recognition or disclosure in these financial statements.
Report of Independent Registered
Public Accounting Firm
To the Board of Trustees of Vanguard Wellington Fund and Shareholders of Vanguard Wellington™ Fund
Opinion on the Financial Statements
We have audited the accompanying statement of assets and liabilities, including the schedule of investments, of Vanguard Wellington™ Fund (one of the funds constituting Vanguard Wellington Fund, referred to hereafter as the "Fund") as of November 30, 2024, the related statement of operations for the year ended November 30, 2024, the statement of changes in net assets for each of the two years in the period ended November 30, 2024, including the related notes, and the financial highlights for each of the five years in the period ended November 30, 2024 (collectively referred to as the "financial statements"). In our opinion, the financial statements present fairly, in all material respects, the financial position of the Fund as of November 30, 2024, the results of its operations for the year then ended, the changes in its net assets for each of the two years in the period ended November 30, 2024 and the financial highlights for each of the five years in the period ended November 30, 2024 in conformity with accounting principles generally accepted in the United States of America.
Basis for Opinion
These financial statements are the responsibility of the Fund’s management. Our responsibility is to express an opinion on the Fund’s financial statements based on our audits. We are a public accounting firm registered with the Public Company Accounting Oversight Board (United States) (PCAOB) and are required to be independent with respect to the Fund in accordance with the U.S. federal securities laws and the applicable rules and regulations of the Securities and Exchange Commission and the PCAOB.
We conducted our audits of these financial statements in accordance with the standards of the PCAOB. Those standards require that we plan and perform the audit to obtain reasonable assurance about whether the financial statements are free of material misstatement, whether due to error or fraud.
Our audits included performing procedures to assess the risks of material misstatement of the financial statements, whether due to error or fraud, and performing procedures that respond to those risks. Such procedures included examining, on a test basis, evidence regarding the amounts and disclosures in the financial statements. Our audits also included evaluating the accounting principles used and significant estimates made by management, as well as evaluating the overall presentation of the financial statements. Our procedures included confirmation of securities owned as of November 30, 2024 by correspondence with the custodian, transfer agent and brokers; when replies were not received from brokers, we performed other auditing procedures. We believe that our audits provide a reasonable basis for our opinion.
/s/PricewaterhouseCoopers LLP
Philadelphia, Pennsylvania
January 17, 2025
We have served as the auditor of one or more investment companies in The Vanguard Group of Funds since 1975.
Tax information (unaudited)
For corporate shareholders, 26.2%, or if subsequently determined to be different, the maximum percentage allowable by law, of ordinary income (dividend income plus short-term gains, if any) for the fiscal year qualified for the dividends-received deduction.
The fund hereby designates $1,117,515,000, or if subsequently determined to be different, the maximum amount allowable by law, as qualified dividend income for purposes of the maximum rate under section 1(h)(11) for calendar year 2023. Shareholders will be notified in January 2025 via IRS Form 1099 of the amounts for use in preparing their 2024 income tax return.
The fund hereby designates for the fiscal year $273,669,000, or if subsequently determined to be different, the maximum amount allowable by law, of interest earned from obligations of the U.S. government which is generally exempt from state income tax.
For nonresident alien shareholders, 100% of short-term capital gain dividends distributed by the fund for the fiscal year are qualified short-term capital gains.
The fund distributed $4,427,581,000 as capital gain dividends (20% rate gain distributions) to shareholders during the fiscal year.
The fund hereby designates 76.8%, or if subsequently determined to be different, the maximum percentage allowable by law, of ordinary income dividends eligible to be treated as interest income for purposes of section 163(j) and the regulations thereunder for the fiscal year.
The fund hereby designates $45,941,000, or if subsequently determined to be different, the maximum amount allowable by law, of qualified business income under section 199A for calendar year 2023. Shareholders will be notified in January 2025 via IRS Form 1099 of the amounts for use in preparing their 2024 income tax return.
Q210 012025
Item 8: Changes in and Disagreements with Accountants for Open-End Management Investment Companies.
Not applicable.
Item 9: Proxy Disclosures for Open-End Management Investment Companies.
Not applicable.
Item 10: Remuneration Paid to Directors, Officers, and Others of Open-End Management Investment Companies.
Not applicable. The Trustees’ Fees and Expenses are included in the financial statements filed under Item 7 of this Form.
Item 11: Statement Regarding Basis for Approval of Investment Advisory Contracts.
Trustees Approve Advisory Arrangement – Vanguard Wellington Fund
The board of trustees of Vanguard Wellington Fund has renewed the fund’s investment advisory arrangement with Wellington Management Company llp (Wellington Management). The board determined that renewing the fund’s advisory arrangement was in the best interests of the fund and its shareholders.
The board based its decision upon an evaluation of the advisor’s investment staff, portfolio management process, and performance. This evaluation included information provided to the board by Vanguard’s Oversight & Manager Search Team, which is responsible for fund and advisor oversight and product management. The Oversight & Manager Search Team met regularly with the advisor and made presentations to the board during the fiscal year that directed the board’s focus to relevant information and topics.
The board, or an investment committee made up of board members, also received information throughout the year during advisor presentations conducted by the Oversight & Manager Search Team. For each advisor presentation, the board was provided with letters and reports that included information about, among other things, the advisory firm and the advisor’s assessment of the investment environment, portfolio performance, and portfolio characteristics.
In addition, the board received periodic reports throughout the year, which included information about the fund’s performance relative to its peers and benchmark, as applicable, and updates, as needed, on the Oversight & Manager Search Team’s ongoing assessment of the advisor.
Prior to their meeting, the trustees were provided with a memo and materials that summarized the information they received over the course of the year. They also considered the factors discussed below, among others. However, no single factor determined whether the board approved the arrangement. Rather, it was the totality of the circumstances that drove the board’s decision.
Nature, extent, and quality of services
The board reviewed the quality of the fund’s investment management services over both the short and long term, and took into account the organizational depth and stability of the advisor. The board considered that Wellington Management, founded in 1928, is among the nation’s oldest and most respected institutional managers. The portfolio managers leverage tenured teams of equity and fixed income research analysts who conduct detailed fundamental analysis of their respective industries and companies. In managing the equity portion of the fund, the portfolio manager employs bottom-up, fundamental research focusing on high-quality companies with above-average yields, strong balance sheets, sustainable competitive advantages, and attractive valuations. In managing the fixed income portion of the fund, the portfolio manager focuses on investment-grade corporate bonds. The firm has advised the fund since its inception in 1929.
The board concluded that the advisor’s experience, stability, depth, and performance, among other factors, warranted continuation of the advisory arrangement.
Investment performance
The board considered the short- and long-term performance of the fund, including any periods of outperformance or underperformance compared with a relevant benchmark index and peer group. The board concluded that the performance was such that the advisory arrangement should continue.
Cost
The board concluded that the fund’s expense ratio was below the average expense ratio charged by funds in its peer group and that the fund’s advisory fee rate was also below the peer-group average.
The board did not consider the profitability of Wellington Management in determining whether to approve the advisory fee because Wellington Management is independent of Vanguard and the advisory fee is the result of arm’s-length negotiations.
The benefit of economies of scale
The board concluded that the fund’s shareholders benefit from economies of scale because of the breakpoints in the fund’s advisory fee schedule. The breakpoints reduce the effective rate of the fee as the fund’s assets increase.
The board will consider whether to renew the advisory arrangement again after a one-year period.
Item 12: Disclosure of Proxy Voting Policies and Procedures for Closed-End Management Investment Companies.
Not applicable.
Item 13: Portfolio Managers of Closed-End Management Investment Companies.
Not applicable.
Item 14: Purchase of Equity Securities by Closed-End Management Investment Company and Affiliated Purchasers.
Not applicable.
Item 15: Submission of Matters to a Vote of Security Holders.
Not applicable.
Item 16: Controls and Procedures.
(a) Disclosure Controls and Procedures. The Principal Executive and Financial Officers concluded that the Registrant’s disclosure controls and procedures are effective based on their evaluation of the disclosure controls and procedures as of a date within 90 days of the filing date of this report.
(b) Internal Control Over Financial Reporting. In February 2024, a third-party service provider began performing security pricing services for the Registrant. There were no other changes in the Registrant’s internal control over financial reporting or in other factors that could significantly affect this control during the period covered by this report, including any corrective actions with regard to significant deficiencies and material weaknesses.
Item 17: Disclosure of Securities Lending Activities for Closed-End Management Investment Companies.
Not applicable.
Item 18: Recovery of Erroneously Awarded Compensation.
Not applicable.
Item 19: Exhibits.
Pursuant to the requirements of the Securities Exchange Act of 1934 and the Investment Company Act of 1940, the registrant has duly caused this report to be signed on its behalf by the undersigned, thereunto duly authorized.
| | VANGUARD WELLINGTON FUND | | |
| | | | |
| BY: | /s/ SALIM RAMJI* | | |
| | | | |
| | SALIM RAMJI | | |
| | CHIEF EXECUTIVE OFFICER | | |
Date: January 21, 2025
Pursuant to the requirements of the Securities Exchange Act of 1934 and the Investment Company Act of 1940, this report has been signed below by the following persons on behalf of the registrant and in the capacities and on the dates indicated.
| | VANGUARD WELLINGTON FUND | | |
| | | | |
| BY: | /s/ SALIM RAMJI* | | |
| | | | |
| | SALIM RAMJI | | |
| | CHIEF EXECUTIVE OFFICER | | |
Date: January 21, 2025
| | VANGUARD WELLINGTON FUND | | |
| | | | |
| BY: | /s/ CHRISTINE BUCHANAN* | | |
| | | | |
| | CHRISTINE BUCHANAN | | |
| | CHIEF FINANCIAL OFFICER | | |
Date: January 21, 2025
John E. Schadl, pursuant to a Power of Attorney filed on December 20, 2024 (see File Number 33-49023) and a Power of Attorney filed on July 25, 2024 (see File Number 33-48863), each Incorporated by Reference.