UNITED STATES
SECURITIES AND EXCHANGE COMMISSION
Washington, D.C. 20549
FORM N-CSR
CERTIFIED SHAREHOLDER REPORT OF REGISTERED MANAGEMENT
INVESTMENT COMPANIES
Investment Company Act file number | 811-08673 |
| |
| Dreyfus Investment Portfolios | |
| (Exact name of Registrant as specified in charter) | |
| | |
| c/o The Dreyfus Corporation 200 Park Avenue New York, New York 10166 | |
| (Address of principal executive offices) (Zip code) | |
| | |
| Bennett A. MacDougall, Esq. 200 Park Avenue New York, New York 10166 | |
| (Name and address of agent for service) | |
|
Registrant's telephone number, including area code: | (212) 922-6400 |
| |
Date of fiscal year end: | 12/31 | |
Date of reporting period: | 12/31/16 | |
| | | | | | | |
FORM N-CSR
Item 1. Reports to Stockholders.
Dreyfus Investment Portfolios, Core Value Portfolio
| | | |

| | ANNUAL REPORT
December 31, 2016 |
| |
The views expressed in this report reflect those of the portfolio manager(s) only through the end of the period covered and do not necessarily represent the views of Dreyfus or any other person in the Dreyfus organization. Any such views are subject to change at any time based upon market or other conditions and Dreyfus disclaims any responsibility to update such views. These views may not be relied on as investment advice and, because investment decisions for a Dreyfus fund are based on numerous factors, may not be relied on as an indication of trading intent on behalf of any Dreyfus fund. |
| |
Not FDIC-Insured • Not Bank-Guaranteed • May Lose Value |
Contents
THE FUND
FOR MORE INFORMATION
Back Cover
| | | | |
| |
Dreyfus Investment Portfolios, Core Value Portfolio
| | The Fund |
A LETTER FROM THE CHIEF EXECUTIVE OFFICER
Dear Shareholder:
We are pleased to present this annual report for Dreyfus Investment Portfolios, Core Value Portfolio, covering the 12-month period from January 1, 2016 through December 31, 2016. For information about how the fund performed during the reporting period, as well as general market perspectives, we provide a Discussion of Fund Performance on the pages that follow.
Stocks and bonds advanced over 2016 despite bouts of market volatility stemming from various economic and political developments. In January, stocks declined sharply and long-term interest rates fell in response to sluggish global economic growth, falling commodity prices, and worries following the first increase in short-term U.S. interest rates in nearly a decade. However, equities began a sustained rebound in February when U.S. monetary policymakers refrained from additional rate hikes, other central banks eased their monetary policies, and commodity prices recovered. After a bout of volatility in June stemming from the United Kingdom’s referendum to leave the European Union, stocks generally continued to climb over the summer. Stock prices moderated in advance of U.S. elections, but markets subsequently rallied to new highs in anticipation of changes in U.S. fiscal and tax policies. In the bond market, yields of high-quality government bonds moved lower over much of the reporting period amid robust investor demand for current income, but yields surged higher after the election due to expectations of rising interest rates. Corporate-backed bonds fared especially well in this environment.
The transition to a new U.S. president and ongoing global economic headwinds suggest that volatility may persist in the financial markets. Some asset classes and industry groups seem likely to benefit from a changing economic and geopolitical landscape, while others probably will face challenges. Consequently, selectivity seems likely to be an important determinant of investment success in 2017. As always, we encourage you to discuss the implications of our observations with your financial advisor.
Thank you for your continued confidence and support.
Sincerely,

Mark D. Santero
Chief Executive Officer
The Dreyfus Corporation
January 17, 2017
2
DISCUSSION OF FUND PERFORMANCE
For the period of January 1, 2016 through December 31, 2016, as provided by Brian Ferguson, Portfolio Manager
Fund and Market Performance Overview
For the 12-month period ended December 31, 2016, Dreyfus Investment Portfolios, Core Value Portfolio’s Initial shares produced a total return of 18.32%, and its Service shares returned 18.00%.1 In comparison, the fund’s benchmark, the Russell 1000 Value Index, produced a total return of 17.34% for the same period.2
U.S. equities gained ground during 2016 despite heightened global and domestic economic concerns, with traditionally defensive, high yielding stocks outperforming early in the year and their more growth-oriented counterparts leading the market in the second half. The fund produced higher returns than its benchmark, largely due to strong stock selections in the financials, information technology and telecommunications services sectors, as well as underweighted exposure to the real estate and health care sectors.
The Fund’s Investment Approach
The fund seeks long-term growth of capital, with current income as a secondary objective. To pursue its goals, the fund normally invests at least 80% of its net assets, plus any borrowings for investment purposes, in stocks, focusing on stocks of large-cap value companies. The fund typically invests in the stocks of U.S. issuers, and will limit holdings of foreign stocks to 20%.
When choosing stocks, the fund uses a “bottom-up” stock-selection approach, focusing on individual companies, rather than a “top-down” approach that forecasts market trends. A three-step value screening process is used to select stocks based on value, sound business fundamentals, and positive business momentum.
Stocks Advanced Despite Global Uncertainties
The year 2016 began on a negative note with stocks coming under pressure from deteriorating commodity prices, disappointing global economic growth, and concerns surrounding a recent increase in short-term U.S. interest rates. However, equities rebounded strongly during the spring, bolstered by rebounding commodity prices, better economic data, and more accommodative monetary policies from major central banks.
In June, the United Kingdom’s referendum to leave the European Union prompted another brief-but-sharp decline in equity prices, but stocks again recovered quickly. Stocks continued to advance during the closing months of the reporting period, driven by robust consumer spending, broad-based wage growth, and expectations of more business-friendly policies under a new presidential administration. Financial sector stocks performed particularly well in the weeks after the election, bolstered by expectations of a more favorable regulatory environment.
Allocations and Stock Selections Bolstered Fund Performance
The decision to allocate a relatively large percentage of the fund’s assets to the financials sector contributed to the fund’s positive relative performance. Top performers included banking institutions, such as Bank of America, JPMorgan Chase, and Comerica, as well as capital markets companies, such as The Goldman Sachs Group and Morgan Stanley. Avoiding Wells Fargo, which was impacted by a sales practices scandal, also helped relative performance. Stock selection in the information technology sector produced positive returns. The fund emphasized semiconductor manufacturers and equipment makers, such as Microchip Technology, Texas
3
DISCUSSION OF FUND PERFORMANCE (continued)
Instruments, and Applied Materials, which benefited from the increasing use of semiconductors in new industrial and consumer applications.
Underweighted exposure to the comparatively weak real estate sector also helped relative performance. In the telecommunications sector, infrastructure developer Communications Sales & Leasing was a strong performer, and the fund benefited from good timing as industry giant AT&T rallied over the first half of 2016 and declined after the position was eliminated. Underweighted exposure to the lagging health care sector further bolstered relative performance, as did favorable individual stock selections including managed care provider UnitedHealth Group. Notable strong performers in other sectors included independent oil and gas companies EOG Resources and Pioneer Natural Resources, and construction materials producer Vulcan Materials.
Although relatively few holdings detracted from the fund’s performance in 2016, Delta Air Lines struggled with industrywide capacity issues and the fund had no exposure to some of the industrial sector’s better performing stocks in the machinery and road-and-rail freight industries. In the energy sector, underweighted exposure to large integrated oil companies dampened returns compared to the benchmark. Our preference for the exploration and production company Occidental Petroleum lagged market averages. Other weak holdings included agricultural chemical maker CF Industries Holdings and pharmacy benefit management company Express Scripts Holding.
Positioned for Additional Growth
While we can’t predict the timing or magnitude of the new presidential administration’s impact on the economy, we believe the announced emphasis on pro-growth, pro-business fiscal, tax, and regulatory policies are likely to boost corporate earnings and revenue growth, particularly for companies exposed to more economically sensitive business trends. Therefore, we have positioned the fund to participate in the market segments most exposed to these trends, including the financials, materials, consumer discretionary, consumer staples, energy, and technology sectors. In contrast, as of the end of the reporting period, the fund held relatively little exposure to the utilities, real estate, telecommunications services, and health care sectors, where growth prospects do not appear to be as bright.
January 17, 2017
Please note, the position in any security highlighted with italicized typeface was sold during the reporting period.
Equities are subject generally to market, market sector, market liquidity, issuer, and investment style risks, among other factors, to varying degrees, all of which are more fully described in the fund’s prospectus.
The fund is only available as a funding vehicle under variable life insurance policies or variable annuity contracts issued by insurance companies. Individuals may not purchase shares of the fund directly. A variable annuity is an insurance contract issued by an insurance company that enables investors to accumulate assets on a tax-deferred basis for retirement or other long-term goals. The investment objective and policies of Dreyfus Investment Portfolios, Core Value Portfolio made available through insurance products may be similar to other funds managed or advised by Dreyfus. However, the investment results of the fund may be higher or lower than, and may not be comparable to, those of any other Dreyfus fund.
1 Total return includes reinvestment of dividends and any capital gains paid. Past performance is no guarantee of future results. Share price and investment return fluctuate such that upon redemption, fund shares may be worth more or less than their original cost.
2 Source: Lipper Inc.—The Russell 1000 Value Index is an unmanaged index, which measures the performance of those Russell 1000 companies with lower price-to-book ratios and lower forecasted growth values. Investors cannot invest directly in any index.
4
FUND PERFORMANCE
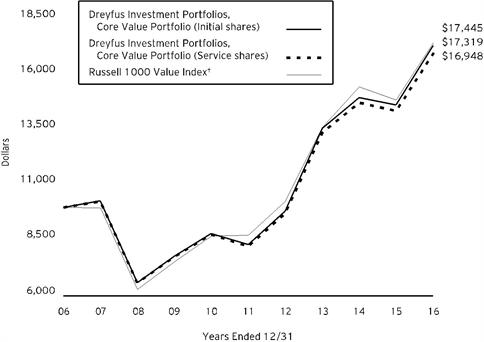
Comparison of change in value of $10,000 investment in Dreyfus Investment Portfolios, Core Value Portfolio Initial shares and Service shares and the Russell 1000 Value Index (the “Index”)
| | | | |
Average Annual Total Returns as of 12/31/16 |
| 1 Year | 5 Years | 10 Years |
Initial shares | 18.32% | 15.80% | 5.65% |
Service shares | 18.00% | 15.50% | 5.42% |
Russell 1000 Value Index | 17.34% | 14.80% | 5.72% |
† Source: Lipper Inc.
Past performance is not predictive of future performance. The fund’s performance shown in the graph and table does not reflect the deduction of taxes that a shareholder would pay on fund distributions or the redemption of fund shares.
The fund’s performance does not reflect the deduction of additional charges and expenses imposed in connection with investing in variable insurance contracts which will reduce returns.
The above graph compares a $10,000 investment made in Initial and Service shares of Dreyfus Investment Portfolios, Core Value Portfolio on 12/31/06 to a $10,000 investment made in the Index on that date.
The fund’s Initial shares are not subject to a Rule 12b-1 fee. The fund’s Service shares are subject to a 0.25% annual Rule 12b-1 fee. All dividends and capital gain distributions are reinvested.
The fund’s performance shown in the line graph above takes into account all applicable fund fees and expenses for Initial and Service shares (after any expense reimbursements). The Index is an unmanaged index, which measures the performance of those Russell 1000 companies with lower price-to-book ratios and lower forecasted growth values. Unlike a mutual fund, the Index is not subject to charges, fees and other expenses. Investors cannot invest directly in any index. Further information relating to fund performance, including expense reimbursements, if applicable, is contained in the Financial Highlights section of the prospectus and elsewhere in this report.
5
UNDERSTANDING YOUR FUND’S EXPENSES (Unaudited)
As a mutual fund investor, you pay ongoing expenses, such as management fees and other expenses. Using the information below, you can estimate how these expenses affect your investment and compare them with the expenses of other funds. You also may pay one-time transaction expenses, including sales charges (loads), redemption fees and expenses associated with variable annuity or insurance contracts, which are not shown in this section and would have resulted in higher total expenses. For more information, see your fund’s prospectus or talk to your financial adviser.
Review your fund’s expenses
The table below shows the expenses you would have paid on a $1,000 investment in Dreyfus Investment Portfolios, Core Value Portfolio from July 1, 2016 to December 31, 2016. It also shows how much a $1,000 investment would be worth at the close of the period, assuming actual returns and expenses.
| | | | | | | | |
Expenses and Value of a $1,000 Investment | | |
assuming actual returns for the six months ended December 31, 2016 | |
| | | | Initial Shares | Service Shares |
Expenses paid per $1,000† | | | $5.82 | | $7.17 |
Ending value (after expenses) | | | $1,163.50 | | $1,162.10 |
COMPARING YOUR FUND’S EXPENSES
WITH THOSE OF OTHER FUNDS (Unaudited)
Using the SEC’s method to compare expenses
The Securities and Exchange Commission (SEC) has established guidelines to help investors assess fund expenses. Per these guidelines, the table below shows your fund’s expenses based on a $1,000 investment, assuming a hypothetical 5% annualized return. You can use this information to compare the ongoing expenses (but not transaction expenses or total cost) of investing in the fund with those of other funds. All mutual fund shareholder reports will provide this information to help you make this comparison. Please note that you cannot use this information to estimate your actual ending account balance and expenses paid during the period.
| | | | | | | | |
Expenses and Value of a $1,000 Investment | | |
assuming a hypothetical 5% annualized return for the six months ended December 31, 2016 |
| | | | Initial Shares | Service Shares |
Expenses paid per $1,000† | | | $5.43 | | $6.70 |
Ending value (after expenses) | | | $1,019.76 | | $1,018.50 |
† Expenses are equal to the fund’s annualized expense ratio of 1.07% for Initial shares and 1.32% for Service shares, multiplied by the average account value over the period, multiplied by 184/366 (to reflect the one-half year period).
6
STATEMENT OF INVESTMENTS
December 31, 2016
| | | | | | |
| |
Common Stocks - 97.9% | | Shares | | Value ($) | |
Automobiles & Components - .6% | | | | | |
Goodyear Tire & Rubber | | 5,989 | | 184,880 | |
Banks - 11.0% | | | | | |
Bank of America | | 45,832 | | 1,012,887 | |
BB&T | | 4,597 | | 216,151 | |
JPMorgan Chase & Co. | | 16,211 | | 1,398,847 | |
PNC Financial Services Group | | 3,708 | | 433,688 | |
SunTrust Banks | | 4,002 | | 219,510 | |
| | | | | 3,281,083 | |
Capital Goods - 7.4% | | | | | |
General Dynamics | | 1,705 | | 294,385 | |
Honeywell International | | 3,721 | | 431,078 | |
Quanta Services | | 4,690 | a | 163,447 | |
Raytheon | | 6,246 | | 886,932 | |
United Technologies | | 3,933 | | 431,135 | |
| | | | | 2,206,977 | |
Diversified Financials - 15.5% | | | | | |
Berkshire Hathaway, Cl. B | | 8,146 | a | 1,327,635 | |
Charles Schwab | | 7,458 | | 294,367 | |
E*TRADE Financial | | 11,153 | a | 386,451 | |
Goldman Sachs Group | | 3,345 | | 800,960 | |
Morgan Stanley | | 5,016 | | 211,926 | |
Raymond James Financial | | 4,817 | | 333,674 | |
Synchrony Financial | | 18,077 | | 655,653 | |
Voya Financial | | 15,337 | | 601,517 | |
| | | | | 4,612,183 | |
Energy - 14.1% | | | | | |
Anadarko Petroleum | | 7,888 | | 550,030 | |
EOG Resources | | 6,851 | | 692,636 | |
Halliburton | | 12,573 | | 680,074 | |
Kinder Morgan | | 11,864 | | 245,703 | |
Marathon Petroleum | | 5,977 | | 300,942 | |
Occidental Petroleum | | 9,157 | | 652,253 | |
Phillips 66 | | 6,093 | | 526,496 | |
Pioneer Natural Resources | | 1,179 | | 212,303 | |
Valero Energy | | 4,839 | | 330,600 | |
| | | | | 4,191,037 | |
7
STATEMENT OF INVESTMENTS (continued)
| | | | | | |
| |
Common Stocks - 97.9% (continued) | | Shares | | Value ($) | |
Exchange-Traded Funds - .2% | | | | | |
iShares Russell 1000 Value ETF | | 576 | | 64,529 | |
Food & Staples Retailing - 1.1% | | | | | |
Walgreens Boots Alliance | | 3,822 | | 316,309 | |
Food, Beverage & Tobacco - 8.1% | | | | | |
Archer-Daniels-Midland | | 6,076 | | 277,369 | |
Coca-Cola | | 6,091 | | 252,533 | |
Coca-Cola European Partners | | 6,139 | | 192,765 | |
ConAgra Foods | | 7,330 | | 289,902 | |
Kellogg | | 6,981 | | 514,570 | |
Lamb Weston Holdings | | 4,037 | | 152,800 | |
Molson Coors Brewing, Cl. B | | 5,303 | | 516,035 | |
Mondelez International, Cl. A | | 4,407 | | 195,362 | |
| | | | | 2,391,336 | |
Health Care Equipment & Services - 5.9% | | | | | |
Abbott Laboratories | | 8,066 | | 309,815 | |
AmerisourceBergen | | 1,920 | | 150,125 | |
Boston Scientific | | 14,762 | a | 319,302 | |
Humana | | 1,043 | | 212,803 | |
Laboratory Corporation of America Holdings | | 1,406 | a | 180,502 | |
UnitedHealth Group | | 2,643 | | 422,986 | |
Zimmer Biomet Holdings | | 1,371 | | 141,487 | |
| | | | | 1,737,020 | |
Insurance - 4.2% | | | | | |
Athene Holding, Cl. A | | 4,937 | | 236,927 | |
Chubb | | 2,184 | | 288,550 | |
Hartford Financial Services Group | | 3,028 | | 144,284 | |
Prudential Financial | | 5,678 | | 590,853 | |
| | | | | 1,260,614 | |
Materials - 5.7% | | | | | |
CF Industries Holdings | | 10,340 | | 325,503 | |
Dow Chemical | | 2,409 | | 137,843 | |
Martin Marietta Materials | | 1,882 | | 416,919 | |
Packaging Corporation of America | | 4,676 | | 396,618 | |
Vulcan Materials | | 3,252 | | 406,988 | |
| | | | | 1,683,871 | |
Media - 4.6% | | | | | |
Comcast, Cl. A | | 4,140 | | 285,867 | |
Omnicom Group | | 5,741 | | 488,617 | |
8
| | | | | | |
| |
Common Stocks - 97.9% (continued) | | Shares | | Value ($) | |
Media - 4.6% (continued) | | | | | |
Time Warner | | 6,007 | | 579,856 | |
| | | | | 1,354,340 | |
Pharmaceuticals, Biotechnology & Life Sciences - 3.4% | | | | | |
Bristol-Myers Squibb | | 3,485 | | 203,663 | |
Eli Lilly & Co. | | 3,371 | | 247,937 | |
Merck & Co. | | 9,694 | | 570,686 | |
| | | | | 1,022,286 | |
Real Estate - 1.0% | | | | | |
Communications Sales & Leasing | | 11,712 | b | 297,602 | |
Retailing - .9% | | | | | |
Staples | | 28,277 | | 255,907 | |
Semiconductors & Semiconductor Equipment - 2.7% | | | | | |
Applied Materials | | 5,312 | | 171,418 | |
Microchip Technology | | 2,287 | c | 146,711 | |
Texas Instruments | | 6,593 | | 481,091 | |
| | | | | 799,220 | |
Software & Services - 3.3% | | | | | |
Alphabet, Cl. A | | 315 | a | 249,622 | |
eBay | | 7,692 | a | 228,375 | |
Oracle | | 7,378 | | 283,684 | |
Teradata | | 7,581 | a | 205,976 | |
| | | | | 967,657 | |
Technology Hardware & Equipment - 3.7% | | | | | |
Apple | | 2,638 | | 305,533 | |
Cisco Systems | | 12,829 | | 387,692 | |
Corning | | 8,869 | | 215,251 | |
Harris | | 1,995 | | 204,428 | |
| | | | | 1,112,904 | |
Telecommunication Services - 2.3% | | | | | |
AT&T | | 16,301 | | 693,282 | |
Transportation - 2.2% | | | | | |
Delta Air Lines | | 9,687 | | 476,504 | |
9
STATEMENT OF INVESTMENTS (continued)
| | | | | | |
| |
Common Stocks - 97.9% (continued) | | Shares | | Value ($) | |
Transportation - 2.2% (continued) | | | | | |
United Continental Holdings | | 2,319 | a | 169,009 | |
| | | | | 645,513 | |
Total Investments (cost $23,346,510) | | 97.9% | | 29,078,550 | |
Cash and Receivables (Net) | | 2.1% | | 624,981 | |
Net Assets | | 100.0% | | 29,703,531 | |
ETF—Exchange-Traded Fund
aNon-income producing security.
bInvestment in real estate investment trust.
cSecurity, or portion thereof, on loan. At December 31, 2016, the value of the fund’s securities on loan was $146,711 and the value of the collateral held by the fund was $151,183, consisting of U.S. Government & Agency securities.
| | |
Portfolio Summary (Unaudited) † | Value (%) |
Diversified Financials | 15.5 |
Energy | 14.1 |
Banks | 11.0 |
Food, Beverage & Tobacco | 8.1 |
Capital Goods | 7.4 |
Health Care Equipment & Services | 5.9 |
Materials | 5.7 |
Media | 4.6 |
Insurance | 4.2 |
Technology Hardware & Equipment | 3.7 |
Pharmaceuticals, Biotechnology & Life Sciences | 3.4 |
Software & Services | 3.3 |
Semiconductors & Semiconductor Equipment | 2.7 |
Telecommunication Services | 2.3 |
Transportation | 2.2 |
Food & Staples Retailing | 1.1 |
Real Estate | 1.0 |
Retailing | .9 |
Automobiles & Components | .6 |
Exchange-Traded Funds | .2 |
| | 97.9 |
† Based on net assets.
See notes to financial statements.
10
STATEMENT OF ASSETS AND LIABILITIES
December 31, 2016
| | | | | | | |
| | | | | | |
| | | Cost | | Value | |
Assets ($): | | | | |
Investments in securities—See Statement of Investments
(including securities on loan, valued at $146,711)—Note 1(b): | | 23,346,510 | | 29,078,550 | |
Receivable for investment securities sold | | | | | 1,030,775 | |
Dividends and securities lending income receivable | | | | | 45,919 | |
Prepaid expenses | | | | | 219 | |
| | | | | 30,155,463 | |
Liabilities ($): | | | | |
Due to The Dreyfus Corporation and affiliates—Note 3(b) | | | | | 35,901 | |
Cash overdraft due to Custodian | | | | | 115,133 | |
Payable for investment securities purchased | | | | | 249,657 | |
Payable for shares of Beneficial Interest redeemed | | | | | 4,705 | |
Accrued expenses | | | | | 46,536 | |
| | | | | 451,932 | |
Net Assets ($) | | | 29,703,531 | |
Composition of Net Assets ($): | | | | |
Paid-in capital | | | | | 22,016,283 | |
Accumulated undistributed investment income—net | | | | | 321,975 | |
Accumulated net realized gain (loss) on investments | | | | | 1,633,233 | |
Accumulated net unrealized appreciation (depreciation)
on investments | | | | 5,732,040 | |
Net Assets ($) | | | 29,703,531 | |
| | | | |
Net Asset Value Per Share | Initial Shares | Service Shares | |
Net Assets ($) | 17,958,317 | 11,745,214 | |
Shares Outstanding | 1,021,755 | 663,200 | |
Net Asset Value Per Share ($) | 17.58 | 17.71 | |
| | | | |
See notes to financial statements. | | | |
11
STATEMENT OF OPERATIONS
Year Ended December 31, 2016
| | | | | | | |
| | | | | | |
| | | | | | |
Investment Income ($): | | | | |
Income: | | | | |
Cash dividends: | | | | |
Unaffiliated issuers | | | 663,289 | |
Affiliated issuers | | | 271 | |
Income from securities lending—Note 1(b) | | | 1,924 | |
Total Income | | | 665,484 | |
Expenses: | | | | |
Management fee—Note 3(a) | | | 219,699 | |
Professional fees | | | 49,281 | |
Distribution fees—Note 3(b) | | | 27,114 | |
Custodian fees—Note 3(b) | | | 13,218 | |
Prospectus and shareholders’ reports | | | 7,281 | |
Trustees’ fees and expenses—Note 3(c) | | | 6,490 | |
Loan commitment fees—Note 2 | | | 512 | |
Shareholder servicing costs—Note 3(b) | | | 168 | |
Interest expense—Note 2 | | | 118 | |
Registration fees | | | 53 | |
Miscellaneous | | | 17,694 | |
Total Expenses | | | 341,628 | |
Less—reduction in fees due to earnings credits—Note 3(b) | | | (6) | |
Net Expenses | | | 341,622 | |
Investment Income—Net | | | 323,862 | |
Realized and Unrealized Gain (Loss) on Investments—Note 4 ($): | | |
Net realized gain (loss) on investments | 1,863,490 | |
Net unrealized appreciation (depreciation) on investments | | | 2,792,011 | |
Net Realized and Unrealized Gain (Loss) on Investments | | | 4,655,501 | |
Net Increase in Net Assets Resulting from Operations | | 4,979,363 | |
| | | | | | | |
See notes to financial statements. | | | | | |
12
STATEMENT OF CHANGES IN NET ASSETS
| | | | | | | | | | |
| | | | Year Ended December 31, |
| | | | 2016 | | | | 2015 | |
Operations ($): | | | | | | | | |
Investment income—net | | | 323,862 | | | | 268,663 | |
Net realized gain (loss) on investments | | 1,863,490 | | | | 4,043,371 | |
Net unrealized appreciation (depreciation)
on investments | | 2,792,011 | | | | (4,940,829) | |
Net Increase (Decrease) in Net Assets
Resulting from Operations | 4,979,363 | | | | (628,795) | |
Distributions to Shareholders from ($): | | | | | | | | |
Investment income—net: | | | | | | | | |
Initial Shares | | | (191,807) | | | | (171,896) | |
Service Shares | | | (77,183) | | | | (67,061) | |
Net realized gain on investments: | | | | | | | | |
Initial Shares | | | (2,717,752) | | | | (2,336,587) | |
Service Shares | | | (1,526,399) | | | | (1,374,475) | |
Total Distributions | | | (4,513,141) | | | | (3,950,019) | |
Beneficial Interest Transactions ($): | | | | | | | | |
Net proceeds from shares sold: | | | | | | | | |
Initial Shares | | | 1,790,283 | | | | 2,070,552 | |
Service Shares | | | 341,208 | | | | 405,935 | |
Distributions reinvested: | | | | | | | | |
Initial Shares | | | 2,909,559 | | | | 2,508,483 | |
Service Shares | | | 1,603,582 | | | | 1,441,536 | |
Cost of shares redeemed: | | | | | | | | |
Initial Shares | | | (6,180,059) | | | | (4,124,702) | |
Service Shares | | | (1,370,060) | | | | (2,381,881) | |
Increase (Decrease) in Net Assets
from Beneficial Interest Transactions | (905,487) | | | | (80,077) | |
Total Increase (Decrease) in Net Assets | (439,265) | | | | (4,658,891) | |
Net Assets ($): | | | | | | | | |
Beginning of Period | | | 30,142,796 | | | | 34,801,687 | |
End of Period | | | 29,703,531 | | | | 30,142,796 | |
Undistributed investment income—net | 321,975 | | | | 267,766 | |
Capital Share Transactions (Shares): | | | | | | | | |
Initial Shares | | | | | | | | |
Shares sold | | | 108,329 | | | | 113,108 | |
Shares issued for distributions reinvested | | | 201,075 | | | | 137,980 | |
Shares redeemed | | | (378,750) | | | | (221,497) | |
Net Increase (Decrease) in Shares Outstanding | (69,346) | | | | 29,591 | |
Service Shares | | | | | | | | |
Shares sold | | | 21,023 | | | | 21,583 | |
Shares issued for distributions reinvested | | | 109,759 | | | | 78,686 | |
Shares redeemed | | | (84,512) | | | | (126,233) | |
Net Increase (Decrease) in Shares Outstanding | 46,270 | | | | (25,964) | |
| | | | | | | | | | |
See notes to financial statements. | | | | | | | | |
13
FINANCIAL HIGHLIGHTS
The following tables describe the performance for each share class for the fiscal periods indicated. All information (except portfolio turnover rate) reflects financial results for a single fund share. Total return shows how much your investment in the fund would have increased (or decreased) during each period, assuming you had reinvested all dividends and distributions. The fund’s total returns do not reflect expenses associated with variable annuity or insurance contracts. These figures have been derived from the fund’s financial statements.
| | | | | | | |
| | | |
| | | |
| | Year Ended December 31, |
Initial Shares | 2016 | 2015 | 2014 | 2013 | 2012 |
Per Share Data ($): | | | | | | |
Net asset value,
beginning of period | | 17.61 | 20.38 | 19.43 | 14.28 | 12.17 |
Investment Operations: | | | | | | |
Investment income—neta | | .19 | .17 | .15 | .16 | .19 |
Net realized and unrealized gain
(loss) on investments | | 2.46 | (.55) | 1.78 | 5.20 | 2.04 |
Total from Investment Operations | | 2.65 | (.38) | 1.93 | 5.36 | 2.23 |
Distributions: | | | | | | |
Dividends from
investment income—net | | (.18) | (.16) | (.18) | (.21) | (.12) |
Dividends from net realized
gain on investments | | (2.50) | (2.23) | (.80) | — | — |
Total Distributions | | (2.68) | (2.39) | (.98) | (.21) | (.12) |
Net asset value, end of period | | 17.58 | 17.61 | 20.38 | 19.43 | 14.28 |
Total Return (%) | | 18.32 | (2.22) | 10.31 | 37.87 | 18.34 |
Ratios/Supplemental Data (%): | | | | | | |
Ratio of total expenses
to average net assets | | 1.07 | 1.07 | 1.03 | 1.02 | 1.05 |
Ratio of net expenses
to average net assets | | 1.07 | 1.07 | 1.03 | .99 | .80 |
Ratio of net investment income
to average net assets | | 1.20 | .92 | .79 | .95 | 1.43 |
Portfolio Turnover Rate | | 87.64 | 105.48 | 66.78 | 65.33 | 67.59 |
Net Assets,
end of period ($ x 1,000) | | 17,958 | 19,216 | 21,637 | 20,605 | 16,630 |
a Based on average shares outstanding.
See notes to financial statements.
14
| | | | | | | |
| | | |
| | | |
| | Year Ended December 31, |
Service Shares | 2016 | 2015 | 2014 | 2013 | 2012 |
Per Share Data ($): | | | | | | |
Net asset value,
beginning of period | | 17.71 | 20.48 | 19.51 | 14.34 | 12.23 |
Investment Operations: | | | | | | |
Investment income—neta | | .15 | .12 | .11 | .12 | .16 |
Net realized and unrealized gain
(loss) on investments | | 2.48 | (.55) | 1.79 | 5.22 | 2.04 |
Total from Investment Operations | | 2.63 | (.43) | 1.90 | 5.34 | 2.20 |
Distributions: | | | | | | |
Dividends from
investment income—net | | (.13) | (.11) | (.13) | (.17) | (.09) |
Dividends from net realized
gain on investments | | (2.50) | (2.23) | (.80) | — | — |
Total Distributions | | (2.63) | (2.34) | (.93) | (.17) | (.09) |
Net asset value, end of period | | 17.71 | 17.71 | 20.48 | 19.51 | 14.34 |
Total Return (%) | | 18.00 | (2.50) | 10.09 | 37.52 | 18.02 |
Ratios/Supplemental Data (%): | | | | | | |
Ratio of total expenses
to average net assets | | 1.32 | 1.32 | 1.28 | 1.27 | 1.30 |
Ratio of net expenses
to average net assets | | 1.32 | 1.32 | 1.28 | 1.24 | 1.05 |
Ratio of net investment income
to average net assets | | .94 | .67 | .54 | .70 | 1.17 |
Portfolio Turnover Rate | | 87.64 | 105.48 | 66.78 | 65.33 | 67.59 |
Net Assets,
end of period ($ x 1,000) | | 11,745 | 10,927 | 13,165 | 15,451 | 12,560 |
a Based on average shares outstanding.
See notes to financial statements.
15
NOTES TO FINANCIAL STATEMENTS
NOTE 1—Significant Accounting Policies:
Core Value Portfolio (the “fund”) is a separate diversified series of Dreyfus Investment Portfolios (the “Company”), which is registered under the Investment Company Act of 1940, as amended (the “Act”), as an open-end management investment company and operates as a series company currently offering four series, including the fund. The fund is only offered to separate accounts established by insurance companies to fund variable annuity contracts and variable life insurance policies.The fund’s investment objective is to seek long-term capital growth. The Dreyfus Corporation (the “Manager” or “Dreyfus”), a wholly-owned subsidiary of The Bank of New York Mellon Corporation (“BNY Mellon”), serves as the fund’s investment adviser.
MBSC Securities Corporation (the “Distributor”), a wholly-owned subsidiary of Dreyfus, is the distributor of the fund’s shares, which are sold without a sales charge. The fund is authorized to issue an unlimited number of $.001 par value shares of Beneficial Interest in each of the following classes of shares: Initial and Service. Each class of shares has identical rights and privileges, except with respect to the Distribution Plan, and the expenses borne by each class, the allocation of certain transfer agency costs, and certain voting rights. Income, expenses (other than expenses attributable to a specific class), and realized and unrealized gains or losses on investments are allocated to each class of shares based on its relative net assets.
The Company accounts separately for the assets, liabilities and operations of each series. Expenses directly attributable to each series are charged to that series’ operations; expenses which are applicable to all series are allocated among them on a pro rata basis.
The Financial Accounting Standards Board (“FASB”) Accounting Standards Codification is the exclusive reference of authoritative U.S. generally accepted accounting principles (“GAAP”) recognized by the FASB to be applied by nongovernmental entities. Rules and interpretive releases of the Securities and Exchange Commission (“SEC”) under authority of federal laws are also sources of authoritative GAAP for SEC registrants. The fund’s financial statements are prepared in accordance with GAAP, which may require the use of management estimates and assumptions. Actual results could differ from those estimates.
The Company enters into contracts that contain a variety of indemnifications. The fund’s maximum exposure under these arrangements is unknown. The fund does not anticipate recognizing any loss related to these arrangements.
16
(a) Portfolio valuation: The fair value of a financial instrument is the amount that would be received to sell an asset or paid to transfer a liability in an orderly transaction between market participants at the measurement date (i.e., the exit price). GAAP establishes a fair value hierarchy that prioritizes the inputs of valuation techniques used to measure fair value. This hierarchy gives the highest priority to unadjusted quoted prices in active markets for identical assets or liabilities (Level 1 measurements) and the lowest priority to unobservable inputs (Level 3 measurements).
Additionally, GAAP provides guidance on determining whether the volume and activity in a market has decreased significantly and whether such a decrease in activity results in transactions that are not orderly. GAAP requires enhanced disclosures around valuation inputs and techniques used during annual and interim periods.
Various inputs are used in determining the value of the fund’s investments relating to fair value measurements. These inputs are summarized in the three broad levels listed below:
Level 1—unadjusted quoted prices in active markets for identical investments.
Level 2—other significant observable inputs (including quoted prices for similar investments, interest rates, prepayment speeds, credit risk, etc.).
Level 3—significant unobservable inputs (including the fund’s own assumptions in determining the fair value of investments).
The inputs or methodology used for valuing securities are not necessarily an indication of the risk associated with investing in those securities.
Changes in valuation techniques may result in transfers in or out of an assigned level within the disclosure hierarchy. Valuation techniques used to value the fund’s investments are as follows:
Investments in securities are valued at the last sales price on the securities exchange or national securities market on which such securities are primarily traded. Securities listed on the National Market System for which market quotations are available are valued at the official closing price or, if there is no official closing price that day, at the last sales price. For open short positions, asked prices are used for valuation purposes. Bid price is used when no asked price is available. Registered investment companies that are not traded on an exchange are valued at their net asset value. All of the preceding securities are generally categorized within Level 1 of the fair value hierarchy.
17
NOTES TO FINANCIAL STATEMENTS (continued)
Securities not listed on an exchange or the national securities market, or securities for which there were no transactions, are valued at the average of the most recent bid and asked prices. These securities are generally categorized within Level 2 of the fair value hierarchy.
Fair valuing of securities may be determined with the assistance of a pricing service using calculations based on indices of domestic securities and other appropriate indicators, such as prices of relevant American Depository Receipts and futures. Utilizing these techniques may result in transfers between Level 1 and Level 2 of the fair value hierarchy.
When market quotations or official closing prices are not readily available, or are determined not to reflect accurately fair value, such as when the value of a security has been significantly affected by events after the close of the exchange or market on which the security is principally traded (for example, a foreign exchange or market), but before the fund calculates its net asset value, the fund may value these investments at fair value as determined in accordance with the procedures approved by the Company’s Board of Trustees (the “Board”). Certain factors may be considered when fair valuing investments such as: fundamental analytical data, the nature and duration of restrictions on disposition, an evaluation of the forces that influence the market in which the securities are purchased and sold, and public trading in similar securities of the issuer or comparable issuers. These securities are either categorized within Level 2 or 3 of the fair value hierarchy depending on the relevant inputs used.
For restricted securities where observable inputs are limited, assumptions about market activity and risk are used and are generally categorized within Level 3 of the fair value hierarchy.
The following is a summary of the inputs used as of December 31, 2016 in valuing the fund’s investments:
| | | | | |
| | Level 1 - Unadjusted Quoted Prices | Level 2 - Other Significant Observable Inputs | Level 3 -Significant Unobservable Inputs | Total |
Assets ($) | | | | |
Investments in Securities: | | | |
Equity Securities - Domestic Common Stocks† | 29,014,021 | - | - | 29,014,021 |
Exchange-Traded Funds | 64,529 | - | - | 64,529 |
† See Statement of Investments for additional detailed categorizations.
18
At December 31, 2016, there were no transfers between levels of the fair value hierarchy.
(b) Securities transactions and investment income: Securities transactions are recorded on a trade date basis. Realized gains and losses from securities transactions are recorded on the identified cost basis. Dividend income is recognized on the ex-dividend date and interest income, including, where applicable, accretion of discount and amortization of premium on investments, is recognized on the accrual basis.
Pursuant to a securities lending agreement with The Bank of New York Mellon, a subsidiary of BNY Mellon and an affiliate of Dreyfus, the fund may lend securities to qualified institutions. It is the fund’s policy that, at origination, all loans are secured by collateral of at least 102% of the value of U.S. securities loaned and 105% of the value of foreign securities loaned. Collateral equivalent to at least 100% of the market value of securities on loan is maintained at all times. Collateral is either in the form of cash, which can be invested in certain money market mutual funds managed by Dreyfus, or U.S. Government and Agency securities. The fund is entitled to receive all dividends, interest and distributions on securities loaned, in addition to income earned as a result of the lending transaction. Should a borrower fail to return the securities in a timely manner, The Bank of New York Mellon is required to replace the securities for the benefit of the fund or credit the fund with the market value of the unreturned securities and is subrogated to the fund’s rights against the borrower and the collateral. Additionally, the contractual maturity of security lending transactions are on an overnight and continuous basis. During the period ended December 31, 2016, The Bank of New York Mellon earned $452 from lending portfolio securities, pursuant to the securities lending agreement.
(c) Affiliated issuers: Investments in other investment companies advised by Dreyfus are defined as “affiliated” under the Act. Investments in affiliated investment companies during the period ended December 31, 2016 were as follows:
19
NOTES TO FINANCIAL STATEMENTS (continued)
| | | | | | |
Affiliated Investment Company | Value 12/31/2015 ($) | Purchases ($) | Sales ($) | Value 12/31/2016 ($) | Net
Assets (%) |
Dreyfus Institutional Cash Advantage Fund, Institutional Shares† | 319,117 | 5,745,475 | 6,064,592 | - | - |
Dreyfus Institutional Preferred Government Plus Money Market Fund†† | 32,833 | 6,623,407 | 6,656,240 | - | - |
Dreyfus Institutional Preferred Money Market Fund, Hamilton Shares† | - | 851,589 | 851,589 | - | - |
Total | 351,950 | 13,220,471 | 13,572,421 | - | - |
† During the period ended December 31, 2016, Dreyfus Institutional Cash Advantage Fund was acquired by Dreyfus Institutional Preferred Money Market Fund.
†† Formerly Dreyfus Institutional Preferred Plus Money Market Fund.
(d) Dividends and distributions to shareholders: Dividends and distributions are recorded on the ex-dividend date. Dividends from investment income-net and dividends from net realized capital gains, if any, are normally declared and paid annually, but the fund may make distributions on a more frequent basis to comply with the distribution requirements of the Internal Revenue Code of 1986, as amended (the “Code”). To the extent that net realized capital gains can be offset by capital loss carryovers, it is the policy of the fund not to distribute such gains. Income and capital gain distributions are determined in accordance with income tax regulations, which may differ from GAAP.
(e) Federal income taxes: It is the policy of the fund to continue to qualify as a regulated investment company, if such qualification is in the best interests of its shareholders, by complying with the applicable provisions of the Code, and to make distributions of taxable income sufficient to relieve it from substantially all federal income and excise taxes.
As of and during the period ended December 31, 2016, the fund did not have any liabilities for any uncertain tax positions. The fund recognizes interest and penalties, if any, related to uncertain tax positions as income
20
tax expense in the Statement of Operations. During the period ended December 31, 2016, the fund did not incur any interest or penalties.
Each tax year in the four-year period ended December 31, 2016 remains subject to examination by the Internal Revenue Service and state taxing authorities.
At December 31, 2016, the components of accumulated earnings on a tax basis were as follows: undistributed ordinary income $314,770, undistributed capital gains $1,908,333 and unrealized appreciation $5,456,942.
The tax character of distributions paid to shareholders during the fiscal periods ended December 31, 2016 and December 31, 2015 were as follows: ordinary income $528,010 and $952,052, and long-term capital gains $3,985,131 and $2,997,967, respectively.
During the period ended December 31, 2016, as a result of permanent book to tax differences, primarily due to the tax treatment for dividend reclassification, the fund decreased accumulated undistributed investment income-net by $663 and increased accumulated net realized gain (loss) on investments by the same amount. Net assets and net asset value per share were not affected by this reclassification.
NOTE 2—Bank Lines of Credit:
The fund participates with other Dreyfus-managed funds in an $810 million unsecured credit facility led by Citibank, N.A. and a $300 million unsecured credit facility provided by The Bank of New York Mellon (each, a “Facility”), each to be utilized primarily for temporary or emergency purposes, including the financing of redemptions. Prior to October 5, 2016, the unsecured credit facility with Citibank, N.A. was $555 million and prior to January 11, 2016, the unsecured credit facility with Citibank, N.A. was $480 million. In connection therewith, the fund has agreed to pay its pro rata portion of commitment fees for each Facility. Interest is charged to the fund based on rates determined pursuant to the terms of the respective Facility at the time of borrowing.
The average amount of borrowings outstanding under the Facilities during the period ended December 31, 2016 was approximately $8,200 with a related weighted average annualized interest rate of 1.44%.
21
NOTES TO FINANCIAL STATEMENTS (continued)
NOTE 3—Management Fee and Other Transactions with Affiliates:
(a) Pursuant to a management agreement with Dreyfus, the management fee is computed at the annual rate of .75% of the value of the fund’s average daily net assets and is payable monthly.
(b) Under the Distribution Plan adopted pursuant to Rule 12b-1 under the Act, Service shares pay the Distributor for distributing its shares, for servicing and/or maintaining Service shares’ shareholder accounts and for advertising and marketing for Service shares. The Distribution Plan provides for payments to be made at an annual rate of .25% of the value of the Service shares’ average daily net assets. The Distributor may make payments to Participating Insurance Companies and to brokers and dealers acting as principal underwriter for their variable insurance products. The fees payable under the Distribution Plan are payable without regard to actual expenses incurred. During the period ended December 31, 2016, Service shares were charged $27,114 pursuant to the Distribution Plan.
The fund has arrangements with the transfer agent and the custodian whereby the fund may receive earnings credits when positive cash balances are maintained, which are used to offset transfer agency and custody fees. For financial reporting purposes, the fund includes net earnings credits as an expense offset in the Statement of Operations.
The fund compensates Dreyfus Transfer, Inc., a wholly-owned subsidiary of Dreyfus, under a transfer agency agreement for providing transfer agency and cash management services for the fund. The majority of transfer agency fees are comprised of amounts paid on a per account basis, while cash management fees are related to fund subscriptions and redemptions. During the period ended December 31, 2016, the fund was charged $109 for transfer agency services and $13 for cash management services. These fees are included in Shareholder servicing costs in the Statement of Operations. Cash management fees were partially offset by earnings credits of $6.
The fund compensates The Bank of New York Mellon under a custody agreement for providing custodial services for the fund. These fees are determined based on net assets, geographic region and transaction activity. During the period ended December 31, 2016, the fund was charged $13,218 pursuant to the custody agreement.
During the period ended December 31, 2016, the fund was charged $9,640 for services performed by the Chief Compliance Officer and his staff.
22
The components of “Due to The Dreyfus Corporation and affiliates” in the Statement of Assets and Liabilities consist of: management fees $19,065, Distribution Plan fees $2,498, custodian fees $7,000, Chief Compliance Officer fees $7,314 and transfer agency fees $24.
(c) Each Board member also serves as a Board member of other funds within the Dreyfus complex. Annual retainer fees and attendance fees are allocated to each fund based on net assets.
NOTE 4—Securities Transactions:
The aggregate amount of purchases and sales of investment securities, excluding short-term securities, during the period ended December 31, 2016, amounted to $25,793,549 and $31,529,639, respectively.
At December 31, 2016, the cost of investments for federal income tax purposes was $23,621,608; accordingly, accumulated net unrealized appreciation on investments was $5,456,942, consisting of $5,957,834 gross unrealized appreciation and $500,892 gross unrealized depreciation.
23
REPORT OF INDEPENDENT REGISTERED
PUBLIC ACCOUNTING FIRM
Shareholders and Board of Trustees
Dreyfus Investment Portfolios, Core Value Portfolio
We have audited the accompanying statement of assets and liabilities, including the statement of investments, of Dreyfus Investment Portfolios, Core Value Portfolio (one of the series comprising Dreyfus Investment Portfolios) as of December 31, 2016, and the related statement of operations for the year then ended, the statement of changes in net assets for each of the two years in the period then ended, and the financial highlights for each of the five years in the period then ended. These financial statements and financial highlights are the responsibility of the Fund’s management. Our responsibility is to express an opinion on these financial statements and financial highlights based on our audits.
We conducted our audits in accordance with the standards of the Public Company Accounting Oversight Board (United States). Those standards require that we plan and perform the audit to obtain reasonable assurance about whether the financial statements and financial highlights are free of material misstatement. We were not engaged to perform an audit of the Fund’s internal control over financial reporting. Our audits included consideration of internal control over financial reporting as a basis for designing audit procedures that are appropriate in the circumstances, but not for the purpose of expressing an opinion on the effectiveness of the Fund’s internal control over financial reporting. Accordingly, we express no such opinion. An audit also includes examining, on a test basis, evidence supporting the amounts and disclosures in the financial statements and financial highlights, assessing the accounting principles used and significant estimates made by management, and evaluating the overall financial statement presentation. Our procedures included confirmation of securities owned as of December 31, 2016 by correspondence with the custodian and others. We believe that our audits provide a reasonable basis for our opinion.
In our opinion, the financial statements and financial highlights referred to above present fairly, in all material respects, the financial position of Dreyfus Investment Portfolios, Core Value Portfolio at December 31, 2016, the results of its operations for the year then ended, the changes in its net assets for each of the two years in the period then ended, and the financial highlights for each of the five years in the period then ended, in conformity with U.S. generally accepted accounting principles.

New York, New York
February 10, 2017
24
IMPORTANT TAX INFORMATION (Unaudited)
For federal tax purposes, the portfolio hereby reports 100% of the ordinary dividends paid during the fiscal year ended December 31, 2016 as qualifying for the corporate dividends received deduction. Shareholders will receive notification in early 2017 of the percentage applicable to the preparation of their 2016 income tax returns. Also, the fund hereby reports $.1528 per share as a short-term capital gain distribution and $2.3509 per share as a long-term capital gain distribution paid on March 24, 2016.
25
INFORMATION ABOUT THE RENEWAL OF THE FUND’S MANAGEMENT AGREEMENT (Unaudited)
At a meeting of the fund’s Board of Trustees held on July 20-21, 2016, the Board considered the renewal of the fund’s Management Agreement pursuant to which Dreyfus provides the fund with investment advisory and administrative services (the “Agreement”). The Board members, a majority of whom are not “interested persons” (as defined in the Investment Company Act of 1940, as amended) of the fund, were assisted in their review by independent legal counsel and met with counsel in executive session separate from Dreyfus representatives. In considering the renewal of the Agreement, the Board considered all factors that it believed to be relevant, including those discussed below. The Board did not identify any one factor as dispositive, and each Board member may have attributed different weights to the factors considered.
Analysis of Nature, Extent, and Quality of Services Provided to the Fund. The Board considered information provided to them at the meeting and in previous presentations from Dreyfus representatives regarding the nature, extent, and quality of the services provided to funds in the Dreyfus fund complex. Dreyfus provided the number of open accounts in the fund, the fund’s asset size and the allocation of fund assets among distribution channels. Dreyfus also had previously provided information regarding the diverse intermediary relationships and distribution channels of funds in the Dreyfus fund complex (such as retail direct or intermediary, in which intermediaries typically are paid by the fund and/or Dreyfus) and Dreyfus’ corresponding need for broad, deep, and diverse resources to be able to provide ongoing shareholder services to each intermediary or distribution channel, as applicable to the fund.
The Board also considered research support available to, and portfolio management capabilities of, the fund’s portfolio management personnel and that Dreyfus also provides oversight of day-to-day fund operations, including fund accounting and administration and assistance in meeting legal and regulatory requirements. The Board also considered Dreyfus’ extensive administrative, accounting and compliance infrastructures. The Board also considered portfolio management’s brokerage policies and practices (including policies and practices regarding soft dollars) and the standards applied in seeking best execution.
Comparative Analysis of the Fund’s Performance and Management Fee and Expense Ratio. The Board reviewed reports prepared by Broadridge Financial Solutions, Inc. (“Broadridge”), an independent provider of investment company data, which included information comparing (1) the fund’s performance with the performance of a group of comparable funds (the “Performance Group”) and with a broader group of funds (the “Performance Universe”), all for various periods ended May 31, 2016, and (2) the fund’s actual and contractual management fees and total expenses with those of a group of comparable funds (the “Expense Group”) and with a broader group of funds (the “Expense Universe”), the information for which was derived in part from fund financial statements available to Broadridge as of the date of its analysis. Dreyfus previously had furnished the Board with a description of the methodology Broadridge used to select the Performance Group and Performance Universe and the Expense Group and Expense Universe.
Dreyfus representatives stated that the usefulness of performance comparisons may be affected by a number of factors, including different investment limitations that may be applicable to the fund and comparison funds. The Board discussed the results of the comparisons and noted that the fund’s total return performance was above the Performance
26
Group median for all periods, except for the one- and ten-year periods when the fund’s performance was slightly below the median, and above the Performance Universe median for all periods. Dreyfus also provided a comparison of the fund’s calendar year total returns to the returns of the fund’s benchmark index.
The Board also reviewed the range of actual and contractual management fees and total expenses of the Expense Group and Expense Universe funds and discussed the results of the comparisons. The Board noted that the fund’s contractual management fee was at the Expense Group median and the fund’s actual management fee and total expenses were above the Expense Group and Expense Universe medians.
Dreyfus representatives reviewed with the Board the management or investment advisory fees (1) paid by funds advised or administered by Dreyfus that are in the same Broadridge category as the fund and (2) paid to Dreyfus or the Dreyfus-affiliated primary employer of the fund’s primary portfolio manager(s) for advising any separate accounts and/or other types of client portfolios that are considered to have similar investment strategies and policies as the fund (the “Similar Clients”), and explained the nature of the Similar Clients. They discussed differences in fees paid and the relationship of the fees paid in light of any differences in the services provided and other relevant factors. The Board considered the relevance of the fee information provided for the Similar Clients to evaluate the appropriateness of the fund’s management fee.
Analysis of Profitability and Economies of Scale. Dreyfus representatives reviewed the expenses allocated and profit received by Dreyfus and its affiliates and the resulting profitability percentage for managing the fund and the aggregate profitability percentage to Dreyfus and its affiliates for managing the funds in the Dreyfus fund complex, and the method used to determine the expenses and profit. The Board concluded that the profitability results were not unreasonable, given the services rendered and service levels provided by Dreyfus. The Board also had been provided with information prepared by an independent consulting firm regarding Dreyfus’ approach to allocating costs to, and determining the profitability of, individual funds and the entire Dreyfus fund complex. The consulting firm also had analyzed where any economies of scale might emerge in connection with the management of a fund.
The Board considered, on the advice of its counsel, the profitability analysis (1) as part of its evaluation of whether the fees under the Agreement, considered in relation to the mix of services provided by Dreyfus, including the nature, extent and quality of such services, supported the renewal of the Agreement and (2) in light of the relevant circumstances for the fund and the extent to which economies of scale would be realized if the fund grows and whether fee levels reflect these economies of scale for the benefit of fund shareholders. Dreyfus representatives noted that a discussion of economies of scale is predicated on a fund having achieved a substantial size with increasing assets and that, if a fund’s assets had been stable or decreasing, the possibility that Dreyfus may have realized any economies of scale would be less. Dreyfus representatives also noted that, as a result of shared and allocated costs among funds in the Dreyfus fund complex, the extent of economies of scale could depend substantially on the level of assets in the complex as a whole, so that increases and decreases in complex-wide assets can affect potential economies of scale in a manner that is disproportionate to, or even in the opposite direction from, changes in the fund’s asset level. The Board also considered potential benefits to Dreyfus from acting as
27
INFORMATION ABOUT THE RENEWAL OF THE FUND’S MANAGEMENT AGREEMENT (Unaudited) (continued)
investment adviser and noted the soft dollar arrangements in effect for trading the fund’s investments.
At the conclusion of these discussions, the Board agreed that it had been furnished with sufficient information to make an informed business decision with respect to the renewal of the Agreement. Based on the discussions and considerations as described above, the Board concluded and determined as follows.
· The Board concluded that the nature, extent and quality of the services provided by Dreyfus are adequate and appropriate.
· The Board was satisfied with the fund’s performance.
· The Board concluded that the fee paid to Dreyfus supported the renewal of the Agreement in light of the considerations described above.
· The Board determined that the economies of scale which may accrue to Dreyfus and its affiliates in connection with the management of the fund had been adequately considered by Dreyfus in connection with the fee rate charged to the fund pursuant to the Agreement and that, to the extent in the future it were determined that material economies of scale had not been shared with the fund, the Board would seek to have those economies of scale shared with the fund.
In evaluating the Agreement, the Board considered these conclusions and determinations and also relied on its previous knowledge, gained through meetings and other interactions with Dreyfus and its affiliates, of the fund and the services provided to the fund by Dreyfus. The Board also relied on information received on a routine and regular basis throughout the year relating to the operations of the fund and the investment management and other services provided under the Agreement, including information on the investment performance of the fund in comparison to similar mutual funds and benchmark performance indices; general market outlook as applicable to the fund; and compliance reports. In addition, the Board’s consideration of the contractual fee arrangements for this fund had the benefit of a number of years of reviews of prior or similar agreements during which lengthy discussions took place between the Board and Dreyfus representatives. Certain aspects of the arrangements may receive greater scrutiny in some years than in others, and the Board’s conclusions may be based, in part, on their consideration of the same or similar arrangements in prior years. The Board determined to renew the Agreement.
28
BOARD MEMBERS INFORMATION (Unaudited)
INDEPENDENT BOARD MEMBERS
Joseph S. DiMartino (73)
Chairman of the Board (1995)
Principal Occupation During Past 5 Years:
· Corporate Director and Trustee (1995-present)
Other Public Company Board Memberships During Past 5 Years:
· CBIZ (formerly, Century Business Services, Inc.), a provider of outsourcing functions for small and medium size companies, Director (1997-present)
No. of Portfolios for which Board Member Serves: 135
———————
Francine J. Bovich (65)
Board Member (2015)
Principal Occupation During Past 5 Years:
· Trustee, The Bradley Trusts, private trust funds (2011-present)
Other Public Company Board Memberships During Past 5 Years:
· Annaly Capital Management, Inc., Board Member (May 2014-present)
No. of Portfolios for which Board Member Serves: 76
———————
Gordon J. Davis (75)
Board Member (2012)
Principal Occupation During Past 5 Years:
· Partner in the law firm of Venable LLP (2012-present)
· Partner in the law firm of Dewey & LeBoeuf LLP (1994-2012)
Other Public Company Board Memberships During Past 5 Years:
· Consolidated Edison, Inc., a utility company, Director (1997-2014)
· The Phoenix Companies, Inc., a life insurance company, Director (2000-2014)
No. of Portfolios for which Board Member Serves: 58
———————
29
BOARD MEMBERS INFORMATION (Unaudited) (continued)
INDEPENDENT BOARD MEMBERS (continued)
Nathan Leventhal (73)
Board Member (2009)
Principal Occupation During Past 5 Years:
· President Emeritus of Lincoln Center for the Performing Arts (2001-present)
· Chairman of the Avery Fisher Artist Program (1997-2014)
· Commissioner, NYC Planning Commission (2007-2011)
Other Public Company Board Memberships During Past 5 Years:
· Movado Group, Inc., Director (2003-present)
No. of Portfolios for which Board Member Serves: 48
———————
Robin A. Melvin (53)
Board Member (2014)
Principal Occupation During Past 5 Years:
· Co-chairman, Illinois Mentoring Partnership, non-profit organization dedicated to increasing the quantity and quality of mentoring services in Illinois; (2014-present; board member since 2013)
· Director, Boisi Family Foundation, a private family foundation that supports youth-serving organizations that promote the self sufficiency of youth from disadvantaged circumstances (1995-2012)
No. of Portfolios for which Board Member Serves: 107
———————
Roslyn M. Watson (67)
Board Member (2014)
Principal Occupation During Past 5 Years:
· Principal, Watson Ventures, Inc., a real estate investment company (1993-present)
No. of Portfolios for which Board Member Serves: 62
———————
Benaree Pratt Wiley (70)
Board Member (2009)
Principal Occupation During Past 5 Years:
· Principal, The Wiley Group, a firm specializing in strategy and business development (2005-present)
Other Public Company Board Memberships During Past 5 Years:
· CBIZ (formerly, Century Business Services, Inc.), a provider of outsourcing functions for small and medium size companies, Director (2008-present)
No. of Portfolios for which Board Member Serves: 86
———————
30
INTERESTED BOARD MEMBERS
J. Charles Cardona (61)
Board Member (2014)
Principal Occupation During Past 5 Years:
· Retired President and a Director of the Manager (2008-2016), Chairman of the Distributor (2013-2016, Executive Vice President, 1997-2013),
No. of Portfolios for which Board Member Serves: 34
J. Charles Cardona is deemed to be an “interested person” (as defined under the Act) of the Company as a result of his affiliation with The Dreyfus Corporation.
———————
Isabel P. Dunst (69)
Board Member (2014)
Principal Occupation During Past 5 Years:
· Of Counsel to the law firm of Hogan Lovells LLP (2015-present; previously, Partner, 1990-2014)
No. of Portfolios for which Board Member Serves: 34
Isabel P. Dunst is deemed to be an “interested person” (as defined under the Act) of the Company as a result of her affiliation with Hogan Lovells LLP, which provides legal services to BNY Mellon and certain of its affiliates.
———————
Once elected all Board Members serve for an indefinite term, but achieve Emeritus status upon reaching age 80. The address of the Board Members and Officers is c/o The Dreyfus Corporation, 200 Park Avenue, New York, New York 10166. Additional information about the Board Members is available in the fund’s Statement of Additional Information which can be obtained from Dreyfus free of charge by calling this toll free number: 1-800-DREYFUS.
Clifford L. Alexander, Jr., Emeritus Board Member
Whitney I. Gerard, Emeritus Board Member
George L. Perry, Emeritus Board Member
31
OFFICERS OF THE FUND (Unaudited)
BRADLEY J. SKAPYAK, President since January 2010.
Chief Operating Officer and a director of the Manager since June 2009, Chairman of Dreyfus Transfer, Inc., an affiliate of the Manager and the transfer agent of the funds, since May 2011 and Executive Vice President of MBSC Securities Corporation since June 2007. He is an officer of 64 investment companies (comprised of 135 portfolios) managed by the Manager. He is 58 years old and has been an employee of the Manager since February 1988.
BENNETT A. MACDOUGALL, Chief Legal Officer since October 2015.
Chief Legal Officer of the Manager and Associate General Counsel and Managing Director of BNY Mellon since June 2015; from June 2005 to June 2015, he served in various capacities with Deutsche Bank – Asset & Wealth Management Division, including as Director and Associate General Counsel, and Chief Legal Officer of Deutsche Investment Management Americas Inc. from June 2012 to May 2015. He is an officer of 65 investment companies (comprised of 160 portfolios) managed by the Manager. He is 45 years old and has been an employee of the Manager since June 2015.
JANETTE E. FARRAGHER, Vice President and Secretary since December 2011.
Associate General Counsel of BNY Mellon, and an officer of 65 investment companies (comprised of 160 portfolios) managed by the Manager. She is 54 years old and has been an employee of the Manager since February 1984.
JAMES BITETTO, Vice President and Assistant Secretary since August 2005.
Managing Counsel of BNY Mellon and Secretary of the Manager, and an officer of 65 investment companies (comprised of 160 portfolios) managed by the Manager. He is 50 years old and has been an employee of the Manager since December 1996.
JONI LACKS CHARATAN, Vice President and Assistant Secretary since August 2005.
Managing Counsel of BNY Mellon, and an officer of 65 investment companies (comprised of 160 portfolios) managed by the Manager. She is 61 years old and has been an employee of the Manager since October 1988.
JOSEPH M. CHIOFFI, Vice President and Assistant Secretary since August 2005.
Managing Counsel of BNY Mellon, and an officer of 65 investment companies (comprised of 160 portfolios) managed by the Manager. He is 55 years old and has been an employee of the Manager since June 2000.
MAUREEN E. KANE, Vice President and Assistant Secretary since April 2015.
Managing Counsel of BNY Mellon since July 2014; from October 2004 until July 2014, General Counsel, and from May 2009 until July 2014, Chief Compliance Officer of Century Capital Management. She is an officer of 65 investment companies (comprised of 160 portfolios) managed by the Manager. She is 54 years old and has been an employee of the Manager since July 2014.
SARAH S. KELLEHER, Vice President and Assistant Secretary since April 2014.
Senior Counsel of BNY Mellon since March 2013, from August 2005 to March 2013, Associate General Counsel of Third Avenue Management. She is an officer of 65 investment companies (comprised of 160 portfolios) managed by the Manager. She is 41 years old and has been an employee of the Manager since March 2013.
JEFF PRUSNOFSKY, Vice President and Assistant Secretary since August 2005.
Senior Managing Counsel of BNY Mellon, and an officer of 65 investment companies (comprised of 160 portfolios) managed by the Manager. He is 51 years old and has been an employee of the Manager since October 1990.
JAMES WINDELS, Treasurer since November 2001.
Director – Mutual Fund Accounting of the Manager, and an officer of 65 investment companies (comprised of 160 portfolios) managed by the Manager. He is 58 years old and has been an employee of the Manager since April 1985.
RICHARD CASSARO, Assistant Treasurer since January 2008.
Senior Accounting Manager – Money Market, Municipal Bond and Equity Funds of the Manager, and an officer of 65 investment companies (comprised of 160 portfolios) managed by the Manager. He is 57 years old and has been an employee of the Manager since September 1982.
32
GAVIN C. REILLY, Assistant Treasurer since December 2005.
Tax Manager of the Investment Accounting and Support Department of the Manager, and an officer of 65 investment companies (comprised of 160 portfolios) managed by the Manager. He is 48 years old and has been an employee of the Manager since April 1991.
ROBERT S. ROBOL, Assistant Treasurer since August 2005.
Senior Accounting Manager of the Manager, and an officer of 65 investment companies (comprised of 160 portfolios) managed by the Manager. He is 52 years old and has been an employee of the Manager since October 1988.
ROBERT SALVIOLO, Assistant Treasurer since July 2007.
Senior Accounting Manager – Equity Funds of the Manager, and an officer of 65 investment companies (comprised of 160 portfolios) managed by the Manager. He is 49 years old and has been an employee of the Manager since June 1989.
ROBERT SVAGNA, Assistant Treasurer since December 2002.
Senior Accounting Manager – Fixed Income and Equity Funds of the Manager, and an officer of 65 investment companies (comprised of 160 portfolios) managed by the Manager. He is 49 years old and has been an employee of the Manager since November 1990.
JOSEPH W. CONNOLLY, Chief Compliance Officer since October 2004.
Chief Compliance Officer of the Manager and The Dreyfus Family of Funds (65 investment companies, comprised of 160 portfolios). He is 59 years old and has served in various capacities with the Manager since 1980, including manager of the firm’s Fund Accounting Department from 1997 through October 2001.
CARIDAD M. CAROSELLA, Anti-Money Laundering Compliance Officer since January 2016.
Anti-Money Laundering Compliance Officer of the Dreyfus Family of Funds and BNY Mellon Funds Trust since January 2016; from May 2015 to December 2015, Interim Anti-Money Laundering Compliance Officer of the Dreyfus Family of Funds and BNY Mellon Funds Trust and the Distributor; from January 2012 to May 2015, AML Surveillance Officer of the Distributor and from 2007 to December 2011, Financial Processing Manager of the Distributor. She is an officer of 60 investment companies (comprised of 155 portfolios) managed by the Manager. She is 48 years old and has been an employee of the Distributor since 1997.
33
Dreyfus Investment Portfolios, Core Value Portfolio
200 Park Avenue
New York, NY 10166
Manager
The Dreyfus Corporation
200 Park Avenue
New York, NY 10166
Custodian
The Bank of New York Mellon
225 Liberty Street
New York, NY 10286
Transfer Agent &
Dividend Disbursing Agent
Dreyfus Transfer, Inc.
200 Park Avenue
New York, NY 10166
Distributor
MBSC Securities Corporation
200 Park Avenue
New York, NY 10166
Telephone 1-800-258-4260 or 1-800-258-4261
Mail The Dreyfus Family of Funds, 144 Glenn Curtiss Boulevard, Uniondale, NY 11556-0144 Attn: Institutional Services Department
E-mail Send your request to info@dreyfus.com
Internet Information can be viewed online or downloaded at www.dreyfus.com
The fund files its complete schedule of portfolio holdings with the Securities and Exchange Commission (“SEC”) for the first and third quarters of each fiscal year on Form N-Q. The fund’s Forms N-Q are available on the SEC’s website at http://www.sec.gov and may be reviewed and copied at the SEC’s Public Reference Room in Washington, DC. Information on the operation of the Public Reference Room may be obtained by calling 1-800-SEC-0330.
A description of the policies and procedures that the fund uses to determine how to vote proxies relating to portfolio securities, and information regarding how the fund voted these proxies for the most recent 12-month period ended June 30 is available at http://www.dreyfus.com and on the SEC’s website at http://www.sec.gov. The description of the policies and procedures is also available without charge, upon request, by calling 1-800-DREYFUS.
| | |
© 2017 MBSC Securities Corporation
0172AR1216 | 
|
Dreyfus Investment Portfolios, MidCap Stock Portfolio
| | | |

| | ANNUAL REPORT
December 31, 2016 |
| |
The views expressed in this report reflect those of the portfolio manager(s) only through the end of the period covered and do not necessarily represent the views of Dreyfus or any other person in the Dreyfus organization. Any such views are subject to change at any time based upon market or other conditions and Dreyfus disclaims any responsibility to update such views. These views may not be relied on as investment advice and, because investment decisions for a Dreyfus fund are based on numerous factors, may not be relied on as an indication of trading intent on behalf of any Dreyfus fund. |
| |
Not FDIC-Insured • Not Bank-Guaranteed • May Lose Value |
Contents
THE FUND
FOR MORE INFORMATION
Back Cover
| | | | |
| |
Dreyfus Investment Portfolios, MidCap Stock Portfolio
| | The Fund |
A LETTER FROM THE CHIEF EXECUTIVE OFFICER
Dear Shareholder:
We are pleased to present this annual report for Dreyfus Investment Portfolios, MidCap Stock Portfolio, covering the 12-month period from January 1, 2016 through December 31, 2016. For information about how the fund performed during the reporting period, as well as general market perspectives, we provide a Discussion of Fund Performance on the pages that follow.
Stocks and bonds advanced over 2016 despite bouts of market volatility stemming from various economic and political developments. In January, stocks declined sharply and long-term interest rates fell in response to sluggish global economic growth, falling commodity prices, and worries following the first increase in short-term U.S. interest rates in nearly a decade. However, equities began a sustained rebound in February when U.S. monetary policymakers refrained from additional rate hikes, other central banks eased their monetary policies, and commodity prices recovered. After a bout of volatility in June stemming from the United Kingdom’s referendum to leave the European Union, stocks generally continued to climb over the summer. Stock prices moderated in advance of U.S. elections, but markets subsequently rallied to new highs in anticipation of changes in U.S. fiscal and tax policies. In the bond market, yields of high-quality government bonds moved lower over much of the reporting period amid robust investor demand for current income, but yields surged higher after the election due to expectations of rising interest rates. Corporate-backed bonds fared especially well in this environment.
The transition to a new U.S. president and ongoing global economic headwinds suggest that volatility may persist in the financial markets. Some asset classes and industry groups seem likely to benefit from a changing economic and geopolitical landscape, while others probably will face challenges. Consequently, selectivity seems likely to be an important determinant of investment success in 2017. As always, we encourage you to discuss the implications of our observations with your financial advisor.
Thank you for your continued confidence and support.
Sincerely,

Mark D. Santero
Chief Executive Officer
The Dreyfus Corporation
January 17, 2017
2
DISCUSSION OF FUND PERFORMANCE
For the period of January 1, 2016 through December 31, 2016, as provided by C. Wesley Boggs, William S. Cazalet, CAIA, and Ronald P. Gala, CFA, Portfolio Managers
Market and Fund Performance Overview
For the 12-month period ended December 31, 2016, Dreyfus Investment Portfolios, MidCap Stock Portfolio’s Initial shares produced a total return of 15.47%, and its Service shares produced a total return of 15.20%.1 In comparison, the fund’s benchmark, the S&P MidCap 400 Index (the “Index”), produced a total return of 20.74% for the same period.2
Midcap stocks achieved solid returns in 2016 on the strength of positive economic growth and expectations of changing U.S. fiscal, tax, and regulatory policies under a new presidential administration. The fund lagged its Index, mainly due to security selection shortfalls in the energy and financials sectors.
The Fund’s Investment Approach
The fund seeks investment results that are greater than the total return performance of publicly traded common stocks of medium-sized domestic companies in the aggregate, as represented by the Index. To pursue this goal, the fund normally invests at least 80% of its net assets, plus any borrowings for investment purposes, in stocks of midcap companies.
The fund invests in growth and value stocks, which are chosen through a disciplined investment process that combines computer modeling techniques, fundamental analysis, and risk management. Consistency of returns compared to the Index is a primary goal of the investment process.
Economic and Political Developments Drove Equity Markets
U.S. stocks across all capitalization ranges moved sharply lower over the opening weeks of 2016 due to weakening commodity prices, disappointing global economic data, and higher short-term U.S. interest rates. However, equities began a dramatic recovery in February and rallied through the spring in response to rebounding commodity prices, global monetary easing, and indications that additional U.S. rate increases would be delayed.
The market’s advance faltered in June over concerns regarding the United Kingdom’s referendum to leave the European Union, but the decline proved short lived. By early July, the market had regained most of its lost ground, and encouraging U.S. economic data helped the Index advance further over the summer. Midcap stocks gave back some of their previous gains in October when investors became more cautious ahead of the presidential election. After the election, midcap stocks again rallied strongly, and the Index achieved record highs as investors anticipated higher government spending, lower corporate taxes, and a less stringent regulatory environment.
For the reporting period overall, midcap stocks generally produced higher returns than large-cap stocks, but midcap stocks underperformed their small-cap counterparts on average.
Security Selections Produced Mixed Results
Although the fund participated significantly in its benchmark’s gains, relative performance was dampened by some disappointing security selections. In the energy sector, oil refiners such as Western Refining lost value in a challenging environment for profit margins, and offshore drilling services provider Oceaneering International declined when its earnings were reduced during the reporting period. The fund’s investments among financial institutions also generally lagged sector
3
DISCUSSION OF FUND PERFORMANCE (continued)
averages. Within the financials sector, the fund generally struggled with security selection shortfalls among capital markets companies and an underweighted exposure to banks.
In other areas, voice-recognition technologies provider Nuance Communications lost value when its management revised downward the company’s future earnings expectations. Likewise, natural food retailer Sprouts Farmers Market struggled in the wake of two guidance reductions during the year.
The fund achieved better relative results from our stock selection in the real estate sector. Among materials producers, overweighted exposure to metals-and-mining companies helped the fund participate more fully in the industry group’s rebound from previous weakness. In addition, steel producer and a metal recycler Steel Dynamics benefited over the final weeks of the year from expectations of higher infrastructure spending by the U.S. government. In the information technology sector, electronic design automation tools supplier Mentor Graphics gained considerable value late in the reporting period after an acquisition offer from a large German technology company, and self-service equipment maker NCR Corp. exhibited strong earnings momentum and consistently surpassed analysts’ estimates. Among individual stocks, regional financial services provider Synovus Financial reported better-than-expected quarterly earnings and benefited from post-election expectations of a friendlier regulatory environment.
Maintaining a Disciplined Investment Process
As of the reporting period’s end, our quantitative models have continued to identify what we believe are attractive investment opportunities across a broad spectrum of midcap companies and industry groups. Indeed, recent bouts of volatility have provided opportunities to purchase the stocks of companies ranked highly by our process. When the fund’s holdings reach what we perceive to be fuller valuations, we expect to replace them with high-quality companies that display then-currently attractive valuations in our model. In addition, we continue to maintain a broadly diversified portfolio.
January 17, 2017
Equities are subject generally to market, market sector, market liquidity, issuer, and investment style risks, among other factors, to varying degrees, all of which are more fully described in the fund’s prospectus.
Stocks of midcap companies often experience sharper price fluctuations than stocks of large-cap companies.
The fund is only available as a funding vehicle under variable life insurance policies or variable annuity contracts issued by insurance companies. Individuals may not purchase shares of the fund directly. A variable annuity is an insurance contract issued by an insurance company that enables investors to accumulate assets on a tax-deferred basis for retirement or other long-term goals. The investment objective and policies of Dreyfus Investment Portfolios, MidCap Stock Portfolio made available through insurance products may be similar to other funds managed by Dreyfus. However, the investment results of the fund may be higher or lower than, and may not be comparable to, those of any other Dreyfus fund.
1 Total return includes reinvestment of dividends and any capital gains paid. Past performance is no guarantee of future results. Share price and investment return fluctuate such that upon redemption, fund shares may be worth more or less than their original cost. The fund’s performance does not reflect the deduction of additional charges and expenses imposed in connection with investing in variable insurance contracts, which will reduce returns.
2 Source: Lipper Inc. —The S&P MidCap 400 Index is a widely accepted, unmanaged total return index measuring the performance of the midsize company segment of the U.S. market. Investors cannot invest directly in any index.
4
FUND PERFORMANCE

Comparison of change in value of $10,000 investment in Dreyfus Investment Portfolios, MidCap Stock Portfolio Initial shares and Service shares and the S&P MidCap 400 Index (the “Index”)
| | | | |
Average Annual Total Returns as of 12/31/16 |
| 1 Year | 5 Years | 10 Years |
Initial shares | 15.47% | 15.36% | 7.89% |
Service shares | 15.20% | 15.07% | 7.69% |
S&P MidCap 400 Index | 20.74% | 15.33% | 9.16% |
† Source: Lipper Inc.
Past performance is not predictive of future performance. The fund’s performance shown in the graph and table does not reflect the deduction of taxes that a shareholder would pay on fund distributions or the redemption of fund shares.
The fund’s performance does not reflect the deduction of additional charges and expenses imposed in connection with investing in variable insurance contracts which will reduce returns.
The above graph compares a $10,000 investment made in Initial and Service shares of Dreyfus Investment Portfolios, MidCap Stock Portfolio on 12/31/06 to a $10,000 investment made in the Index on that date.
The fund’s Initial shares are not subject to a Rule 12b-1 fee. The fund’s Service shares are subject to a 0.25% annual Rule 12b-1 fee. All dividends and capital gain distributions are reinvested.
The fund’s performance shown in the line graph above takes into account all applicable fund fees and expenses for Initial and Service shares (after any expense reimbursements). The Index is a widely accepted, unmanaged total return index measuring the performance of the midsize company segment of the U.S. stock market. Unlike a mutual fund, the Index is not subject to charges, fees and other expenses. Investors cannot invest directly in any index. Further information relating to fund performance, including expense reimbursements, if applicable, is contained in the Financial Highlights section of the prospectus and elsewhere in this report.
5
UNDERSTANDING YOUR FUND’S EXPENSES (Unaudited)
As a mutual fund investor, you pay ongoing expenses, such as management fees and other expenses. Using the information below, you can estimate how these expenses affect your investment and compare them with the expenses of other funds. You also may pay one-time transaction expenses, including sales charges (loads), redemption fees and expenses associated with variable annuity or insurance contracts, which are not shown in this section and would have resulted in higher total expenses. For more information, see your fund’s prospectus or talk to your financial adviser.
Review your fund’s expenses
The table below shows the expenses you would have paid on a $1,000 investment in Dreyfus Investment Portfolios, MidCap Stock Portfolio from July 1, 2016 to December 31, 2016. It also shows how much a $1,000 investment would be worth at the close of the period, assuming actual returns and expenses.
| | | | | | | | | |
Expenses and Value of a $1,000 Investment |
assuming actual returns for the six months ended December 31, 2016 |
| | | | | | Initial Shares | Service Shares |
Expenses paid per $1,000† | | | | | | $4.51 | | $5.84 |
Ending value (after expenses) | | | | | | $1,111.20 | | $1,110.40 |
COMPARING YOUR FUND’S EXPENSES
WITH THOSE OF OTHER FUNDS (Unaudited)
Using the SEC’s method to compare expenses
The Securities and Exchange Commission (SEC) has established guidelines to help investors assess fund expenses. Per these guidelines, the table below shows your fund’s expenses based on a $1,000 investment, assuming a hypothetical 5% annualized return. You can use this information to compare the ongoing expenses (but not transaction expenses or total cost) of investing in the fund with those of other funds. All mutual fund shareholder reports will provide this information to help you make this comparison. Please note that you cannot use this information to estimate your actual ending account balance and expenses paid during the period.
| | | | | | | | | |
Expenses and Value of a $1,000 Investment |
assuming a hypothetical 5% annualized return for the six months ended December 31, 2016 |
| | | | | | Initial Shares | Service Shares |
Expenses paid per $1,000† | | | | | | $4.32 | | $5.58 |
Ending value (after expenses) | | | | | | $1,020.86 | | $1,019.61 |
† Expenses are equal to the fund’s annualized expense ratio of .85% for Initial shares and 1.10% for Service shares, multiplied by the average account value over the period, multiplied by 184/366 (to reflect the one-half year period).
6
STATEMENT OF INVESTMENTS
December 31, 2016
| | | | | | |
| |
Common Stocks - 99.5% | | Shares | | Value ($) | |
Banks - 4.7% | | | | | |
Cathay General Bancorp | | 69,395 | | 2,639,092 | |
Commerce Bancshares | | 5,187 | | 299,861 | |
East West Bancorp | | 15,465 | | 786,086 | |
First Horizon National | | 81,360 | | 1,628,014 | |
Synovus Financial | | 84,090 | | 3,454,417 | |
| | | | | 8,807,470 | |
Capital Goods - 14.3% | | | | | |
BWX Technologies | | 55,610 | | 2,207,717 | |
CLARCOR | | 21,600 | | 1,781,352 | |
Curtiss-Wright | | 29,600 | | 2,911,456 | |
GATX | | 36,585 | a | 2,252,904 | |
HD Supply Holdings | | 60,615 | b | 2,576,744 | |
Huntington Ingalls Industries | | 5,585 | | 1,028,701 | |
Lennox International | | 19,915 | a | 3,050,381 | |
Oshkosh | | 29,200 | | 1,886,612 | |
Owens Corning | | 33,990 | | 1,752,524 | |
Spirit AeroSystems Holdings, Cl. A | | 39,955 | | 2,331,374 | |
Toro | | 51,500 | | 2,881,425 | |
Woodward | | 31,170 | | 2,152,289 | |
| | | | | 26,813,479 | |
Consumer Durables & Apparel - 5.5% | | | | | |
Brunswick | | 55,420 | | 3,022,607 | |
Kate Spade & Co | | 13,700 | b | 255,779 | |
KB Home | | 78,680 | a | 1,243,931 | |
NVR | | 1,470 | b | 2,453,430 | |
Tempur Sealy International | | 37,700 | a,b | 2,574,156 | |
TRI Pointe Group | | 58,805 | b | 675,081 | |
| | | | | 10,224,984 | |
Consumer Services - 2.5% | | | | | |
Brinker International | | 39,870 | a | 1,974,761 | |
Darden Restaurants | | 34,865 | | 2,535,383 | |
Wyndham Worldwide | | 2,270 | | 173,360 | |
| | | | | 4,683,504 | |
Diversified Financials - 2.9% | | | | | |
Affiliated Managers Group | | 13,850 | b | 2,012,405 | |
CBOE Holdings | | 8,615 | | 636,562 | |
7
STATEMENT OF INVESTMENTS (continued)
| | | | | | |
| |
Common Stocks - 99.5% (continued) | | Shares | | Value ($) | |
Diversified Financials - 2.9% (continued) | | | | | |
SEI Investments | | 57,100 | | 2,818,456 | |
| | | | | 5,467,423 | |
Energy - 3.0% | | | | | |
CONSOL Energy | | 48,400 | | 882,332 | |
Dril-Quip | | 36,210 | b | 2,174,410 | |
World Fuel Services | | 55,950 | | 2,568,664 | |
| | | | | 5,625,406 | |
Food & Staples Retailing - 1.2% | | | | | |
Casey's General Stores | | 1,800 | | 213,984 | |
Sprouts Farmers Markets | | 110,980 | a,b | 2,099,742 | |
| | | | | 2,313,726 | |
Food, Beverage & Tobacco - 4.0% | | | | | |
Blue Buffalo Pet Products | | 47,900 | b | 1,151,516 | |
Dean Foods | | 135,960 | | 2,961,209 | |
Ingredion | | 26,450 | | 3,305,192 | |
| | | | | 7,417,917 | |
Health Care Equipment & Services - 5.0% | | | | | |
Allscripts Healthcare Solutions | | 17,520 | b | 178,879 | |
Halyard Health | | 41,200 | b | 1,523,576 | |
Hologic | | 34,925 | b | 1,401,191 | |
Teleflex | | 18,875 | | 3,041,706 | |
WellCare Health Plans | | 24,000 | b | 3,289,920 | |
| | | | | 9,435,272 | |
Household & Personal Products - 1.3% | | | | | |
Church & Dwight | | 52,800 | | 2,333,232 | |
Insurance - 6.9% | | | | | |
Aspen Insurance Holdings | | 20,630 | | 1,134,650 | |
CNO Financial Group | | 136,360 | | 2,611,294 | |
Hanover Insurance Group | | 26,295 | | 2,393,108 | |
Old Republic International | | 124,260 | | 2,360,940 | |
Primerica | | 41,145 | a | 2,845,177 | |
Reinsurance Group of America | | 12,945 | | 1,628,869 | |
| | | | | 12,974,038 | |
Materials - 8.8% | | | | | |
Bemis | | 18,820 | | 899,972 | |
Cabot | | 54,295 | | 2,744,069 | |
Celanese, Ser. A | | 12,900 | | 1,015,746 | |
Commercial Metals | | 82,750 | | 1,802,295 | |
Owens-Illinois | | 145,000 | b | 2,524,450 | |
8
| | | | | | |
| |
Common Stocks - 99.5% (continued) | | Shares | | Value ($) | |
Materials - 8.8% (continued) | | | | | |
PolyOne | | 34,605 | | 1,108,744 | |
Reliance Steel & Aluminum | | 32,420 | | 2,578,687 | |
Steel Dynamics | | 54,745 | | 1,947,827 | |
Worthington Industries | | 39,745 | | 1,885,503 | |
| | | | | 16,507,293 | |
Media - .9% | | | | | |
New York Times, Cl. A | | 122,725 | | 1,632,243 | |
Pharmaceuticals, Biotechnology & Life Sciences - 5.0% | | | | | |
Agilent Technologies | | 19,150 | | 872,474 | |
Charles River Laboratories International | | 30,820 | b | 2,348,176 | |
Mettler-Toledo International | | 6,300 | b | 2,636,928 | |
United Therapeutics | | 23,775 | a,b | 3,410,048 | |
| | | | | 9,267,626 | |
Real Estate - 8.6% | | | | | |
First Industrial Realty Trust | | 100,400 | c | 2,816,220 | |
General Growth Properties | | 71,665 | c | 1,790,192 | |
Hospitality Properties Trust | | 67,535 | c | 2,143,561 | |
Kilroy Realty | | 20,355 | c | 1,490,393 | |
Lamar Advertising, Cl. A | | 45,095 | c | 3,032,188 | |
Tanger Factory Outlet Centers | | 65,700 | c | 2,350,746 | |
Weingarten Realty Investors | | 71,570 | c | 2,561,490 | |
| | | | | 16,184,790 | |
Retailing - 2.9% | | | | | |
American Eagle Outfitters | | 152,680 | a | 2,316,155 | |
Big Lots | | 52,040 | a | 2,612,928 | |
Foot Locker | | 6,180 | a | 438,100 | |
| | | | | 5,367,183 | |
Semiconductors & Semiconductor Equipment - .2% | | | | | |
Integrated Device Technology | | 12,445 | b | 293,204 | |
Software & Services - 11.0% | | | | | |
Acxiom | | 31,250 | b | 837,500 | |
ANSYS | | 6,415 | b | 593,323 | |
CDK Global | | 3,200 | | 191,008 | |
Citrix Systems | | 28,525 | b | 2,547,568 | |
Convergys | | 70,565 | a | 1,733,076 | |
CoreLogic | | 48,530 | b | 1,787,360 | |
DST Systems | | 25,900 | | 2,775,185 | |
Fair Isaac | | 10,900 | | 1,299,498 | |
Manhattan Associates | | 32,550 | b | 1,726,127 | |
9
STATEMENT OF INVESTMENTS (continued)
| | | | | | |
| |
Common Stocks - 99.5% (continued) | | Shares | | Value ($) | |
Software & Services - 11.0% (continued) | | | | | |
Mentor Graphics | | 85,250 | | 3,144,872 | |
NeuStar, Cl. A | | 50,360 | a,b | 1,682,024 | |
Nuance Communications | | 128,805 | b | 1,919,195 | |
VeriSign | | 3,380 | a,b | 257,117 | |
| | | | | 20,493,853 | |
Technology Hardware & Equipment - 4.2% | | | | | |
Arrow Electronics | | 17,265 | b | 1,230,995 | |
Belden | | 24,080 | | 1,800,462 | |
InterDigital | | 16,720 | | 1,527,372 | |
NCR | | 83,335 | b | 3,380,068 | |
| | | | | 7,938,897 | |
Telecommunication Services - .4% | | | | | |
CenturyLink | | 34,505 | a | 820,529 | |
Utilities - 6.2% | | | | | |
FirstEnergy | | 58,775 | | 1,820,262 | |
Great Plains Energy | | 86,330 | | 2,361,125 | |
MDU Resources Group | | 105,900 | | 3,046,743 | |
NiSource | | 62,680 | | 1,387,735 | |
Westar Energy | | 52,390 | | 2,952,176 | |
| | | | | 11,568,041 | |
Total Common Stocks (cost $158,459,512) | | | | 186,170,110 | |
Other Investment - .6% | | | | | |
Registered Investment Company; | | | | | |
Dreyfus Institutional Preferred Government Plus Money Market Fund
(cost $1,199,499) | | 1,199,499 | d | 1,199,499 | |
Investment of Cash Collateral for Securities Loaned - 6.7% | | | | | |
Registered Investment Company; | | | | | |
Dreyfus Institutional Preferred Money Market Fund, Hamilton Shares
(cost $12,494,102) | | 12,494,102 | d | 12,494,102 | |
Total Investments (cost $172,153,113) | | 106.8% | | 199,863,711 | |
Liabilities, Less Cash and Receivables | | (6.8%) | | (12,665,216) | |
Net Assets | | 100.0% | | 187,198,495 | |
aSecurity, or portion thereof, on loan. At December 31, 2016, the value of the fund’s securities on loan was $16,486,373 and the value of the collateral held by the fund was $17,006,370, consisting of cash collateral of $12,494,102 and U.S. Government & Agency securities valued at $4,512,268.
bNon-income producing security.
cInvestment in real estate investment trust.
dInvestment in affiliated money market mutual fund.
10
| | |
Portfolio Summary (Unaudited) † | Value (%) |
Capital Goods | 14.3 |
Software & Services | 11.0 |
Materials | 8.8 |
Real Estate | 8.6 |
Money Market Investments | 7.3 |
Insurance | 6.9 |
Utilities | 6.2 |
Consumer Durables & Apparel | 5.5 |
Health Care Equipment & Services | 5.0 |
Pharmaceuticals, Biotechnology & Life Sciences | 5.0 |
Banks | 4.7 |
Technology Hardware & Equipment | 4.2 |
Food, Beverage & Tobacco | 4.0 |
Energy | 3.0 |
Diversified Financials | 2.9 |
Retailing | 2.9 |
Consumer Services | 2.5 |
Household & Personal Products | 1.3 |
Food & Staples Retailing | 1.2 |
Media | .9 |
Telecommunication Services | .4 |
Semiconductors & Semiconductor Equipment | .2 |
| | 106.8 |
† Based on net assets.
See notes to financial statements.
11
STATEMENT OF ASSETS AND LIABILITIES
December 31, 2016
| | | | | | | |
| | | | | | |
| | | Cost | | Value | |
Assets ($): | | | | |
Investments in securities—See Statement of Investments
(including securities on loan, valued at $16,486,373)—Note 1(b): | | | | |
Unaffiliated issuers | | 158,459,512 | | 186,170,110 | |
Affiliated issuers | | 13,693,601 | | 13,693,601 | |
Cash | | | | | 11,547 | |
Dividends and securities lending income receivable | | | | | 263,582 | |
Prepaid expenses | | | | | 2,110 | |
| | | | | 200,140,950 | |
Liabilities ($): | | | | |
Due to The Dreyfus Corporation and affiliates—Note 3(b) | | | | | 152,578 | |
Liability for securities on loan—Note 1(b) | | | | | 12,494,102 | |
Payable for shares of Beneficial Interest redeemed | | | | | 237,286 | |
Accrued expenses | | | | | 58,489 | |
| | | | | 12,942,455 | |
Net Assets ($) | | | 187,198,495 | |
Composition of Net Assets ($): | | | | |
Paid-in capital | | | | | 154,669,459 | |
Accumulated undistributed investment income—net | | | | | 1,911,067 | |
Accumulated net realized gain (loss) on investments | | | | | 2,907,371 | |
Accumulated net unrealized appreciation (depreciation)
on investments | | | | 27,710,598 | |
Net Assets ($) | | | 187,198,495 | |
| | | | |
Net Asset Value Per Share | Initial Shares | Service Shares | |
Net Assets ($) | 123,226,202 | 63,972,293 | |
Shares Outstanding | 6,133,274 | 3,197,823 | |
Net Asset Value Per Share ($) | 20.09 | 20.00 | |
| | | | |
See notes to financial statements. | | | |
12
STATEMENT OF OPERATIONS
Year Ended December 31, 2016
| | | | | | | |
| | | | | | |
| | | | | | |
Investment Income ($): | | | | |
Income: | | | | |
Cash dividends: | | | | |
Unaffiliated issuers | | | 3,374,246 | |
Affiliated issuers | | | 3,260 | |
Income from securities lending—Note 1(b) | | | 84,609 | |
Total Income | | | 3,462,115 | |
Expenses: | | | | |
Management fee—Note 3(a) | | | 1,286,415 | |
Distribution fees—Note 3(b) | | | 137,939 | |
Professional fees | | | 62,574 | |
Trustees’ fees and expenses—Note 3(c) | | | 46,846 | |
Custodian fees—Note 3(b) | | | 24,256 | |
Prospectus and shareholders’ reports | | | 17,643 | |
Loan commitment fees—Note 2 | | | 1,859 | |
Shareholder servicing costs—Note 3(b) | | | 1,464 | |
Miscellaneous | | | 14,807 | |
Total Expenses | | | 1,593,803 | |
Less—reduction in fees due to earnings credits—Note 3(b) | | | (50) | |
Net Expenses | | | 1,593,753 | |
Investment Income—Net | | | 1,868,362 | |
Realized and Unrealized Gain (Loss) on Investments—Note 4 ($): | | |
Net realized gain (loss) on investments | 3,001,502 | |
Net unrealized appreciation (depreciation) on investments | | | 19,665,475 | |
Net Realized and Unrealized Gain (Loss) on Investments | | | 22,666,977 | |
Net Increase in Net Assets Resulting from Operations | | 24,535,339 | |
| | | | | | | |
See notes to financial statements. | | | | | |
13
STATEMENT OF CHANGES IN NET ASSETS
| | | | | | | | | | |
| | | | Year Ended December 31, |
| | | | 2016 | | | | 2015 | |
Operations ($): | | | | | | | | |
Investment income—net | | | 1,868,362 | | | | 1,682,208 | |
Net realized gain (loss) on investments | | 3,001,502 | | | | 11,812,133 | |
Net unrealized appreciation (depreciation)
on investments | | 19,665,475 | | | | (17,983,109) | |
Net Increase (Decrease) in Net Assets
Resulting from Operations | 24,535,339 | | | | (4,488,768) | |
Distributions to Shareholders from ($): | | | | | | | | |
Investment income—net: | | | | | | | | |
Initial Shares | | | (1,238,123) | | | | (944,587) | |
Service Shares | | | (437,208) | | | | (179,129) | |
Net realized gain on investments: | | | | | | | | |
Initial Shares | | | (8,219,760) | | | | (24,657,461) | |
Service Shares | | | (3,656,285) | | | | (6,393,134) | |
Total Distributions | | | (13,551,376) | | | | (32,174,311) | |
Beneficial Interest Transactions ($): | | | | | | | | |
Net proceeds from shares sold: | | | | | | | | |
Initial Shares | | | 9,957,409 | | | | 9,905,018 | |
Service Shares | | | 15,951,441 | | | | 28,104,037 | |
Distributions reinvested: | | | | | | | | |
Initial Shares | | | 9,457,883 | | | | 25,602,048 | |
Service Shares | | | 4,093,493 | | | | 6,572,263 | |
Cost of shares redeemed: | | | | | | | | |
Initial Shares | | | (26,474,897) | | | | (44,189,452) | |
Service Shares | | | (9,488,390) | | | | (12,307,883) | |
Increase (Decrease) in Net Assets
from Beneficial Interest Transactions | 3,496,939 | | | | 13,686,031 | |
Total Increase (Decrease) in Net Assets | 14,480,902 | | | | (22,977,048) | |
Net Assets ($): | | | | | | | | |
Beginning of Period | | | 172,717,593 | | | | 195,694,641 | |
End of Period | | | 187,198,495 | | | | 172,717,593 | |
Undistributed investment income—net | 1,911,067 | | | | 1,718,036 | |
Capital Share Transactions (Shares): | | | | | | | | |
Initial Shares | | | | | | | | |
Shares sold | | | 530,948 | | | | 482,702 | |
Shares issued for distributions reinvested | | | 537,991 | | | | 1,278,824 | |
Shares redeemed | | | (1,445,546) | | | | (2,221,204) | |
Net Increase (Decrease) in Shares Outstanding | (376,607) | | | | (459,678) | |
Service Shares | | | | | | | | |
Shares sold | | | 863,832 | | | | 1,364,856 | |
Shares issued for distributions reinvested | | | 233,381 | | | | 328,942 | |
Shares redeemed | | | (514,524) | | | | (611,910) | |
Net Increase (Decrease) in Shares Outstanding | 582,689 | | | | 1,081,888 | |
| | | | | | | | | | |
See notes to financial statements. | | | | | | | | |
14
FINANCIAL HIGHLIGHTS
The following tables describe the performance for each share class for the fiscal periods indicated. All information (except portfolio turnover rate) reflects financial results for a single fund share. Total return shows how much your investment in the fund would have increased (or decreased) during each period, assuming you had reinvested all dividends and distributions. The fund’s total returns do not reflect expenses associated with variable annuity or insurance contracts. These figures have been derived from the fund’s financial statements.
| | | | | | | |
| | | |
| | |
| | Year Ended December 31, |
Initial Shares | 2016 | 2015 | 2014 | 2013 | 2012 |
Per Share Data ($): | | | | | | |
Net asset value, beginning of period | | 18.95 | 23.03 | 20.87 | 15.68 | 13.16 |
Investment Operations: | | | | | | |
Investment income—neta | | .21 | .18 | .14 | .20 | .23 |
Net realized and unrealized
gain (loss) on investments | | 2.50 | (.50) | 2.35 | 5.24 | 2.36 |
Total from Investment Operations | | 2.71 | (.32) | 2.49 | 5.44 | 2.59 |
Distributions: | | | | | | |
Dividends from investment income—net | | (.21) | (.14) | (.21) | (.25) | (.07) |
Dividends from net realized gain on investments | | (1.36) | (3.62) | (.12) | - | - |
Total Distributions | | (1.57) | (3.76) | (.33) | (.25) | (.07) |
Net asset value, end of period | | 20.09 | 18.95 | 23.03 | 20.87 | 15.68 |
Total Return (%) | | 15.47 | (2.29) | 12.09 | 34.99 | 19.67 |
Ratios/Supplemental Data (%): | | | | | | |
Ratio of total expenses to average net assets | | .85 | .85 | .85 | .86 | .85 |
Ratio of net expenses to average net assets | | .85 | .85 | .85 | .86 | .85 |
Ratio of net investment income
to average net assets | | 1.16 | .89 | .64 | 1.11 | 1.58 |
Portfolio Turnover Rate | | 65.52 | 80.27 | 83.06 | 68.72 | 73.96 |
Net Assets, end of period ($ x 1,000) | | 123,226 | 123,354 | 160,482 | 158,682 | 128,410 |
a Based on average shares outstanding.
See notes to financial statements.
15
FINANCIAL HIGHLIGHTS (continued)
| | | | | | | |
| | | |
| | |
| | Year Ended December 31, |
Service Shares | 2016 | 2015 | 2014 | 2013 | 2012 |
Per Share Data ($): | | | | | | |
Net asset value, beginning of period | | 18.88 | 22.97 | 20.83 | 15.65 | 13.14 |
Investment Operations: | | | | | | |
Investment income—neta | | .17 | .15 | .09 | .16 | .19 |
Net realized and unrealized
gain (loss) on investments | | 2.47 | (.52) | 2.34 | 5.23 | 2.35 |
Total from Investment Operations | | 2.64 | (.37) | 2.43 | 5.39 | 2.54 |
Distributions: | | | | | | |
Dividends from investment income—net | | (.16) | (.10) | (.17) | (.21) | (.03) |
Dividends from net realized gain on investments | | (1.36) | (3.62) | (.12) | - | - |
Total Distributions | | (1.52) | (3.72) | (.29) | (.21) | (.03) |
Net asset value, end of period | | 20.00 | 18.88 | 22.97 | 20.83 | 15.65 |
Total Return (%) | | 15.20 | (2.52) | 11.76 | 34.70 | 19.34 |
Ratios/Supplemental Data (%): | | | | | | |
Ratio of total expenses to average net assets | | 1.10 | 1.10 | 1.10 | 1.11 | 1.10 |
Ratio of net expenses to average net assets | | 1.10 | 1.10 | 1.10 | 1.11 | 1.10 |
Ratio of net investment income
to average net assets | | .94 | .72 | .40 | .86 | 1.32 |
Portfolio Turnover Rate | | 65.52 | 80.27 | 83.06 | 68.72 | 73.96 |
Net Assets, end of period ($ x 1,000) | | 63,972 | 49,363 | 35,213 | 23,838 | 17,836 |
a Based on average shares outstanding.
See notes to financial statements.
16
NOTES TO FINANCIAL STATEMENTS
NOTE 1—Significant Accounting Policies:
MidCap Stock Portfolio (the “fund”) is a separate diversified series of Dreyfus Investment Portfolios (the “Company”), which is registered under the Investment Company Act of 1940, as amended (the “Act”), as an open-end management investment company and operates as a series company currently offering four series, including the fund. The fund is only offered to separate accounts established by insurance companies to fund variable annuity contracts and variable life insurance policies. The fund’s investment objective is to seek investment results that are greater than the total return performance of publicly traded common stocks of medium-size domestic companies in the aggregate, as represented by the Standard & Poor’s MidCap 400® Index. The Dreyfus Corporation (the “Manager” or “Dreyfus”), a wholly-owned subsidiary of The Bank of New York Mellon Corporation (“BNY Mellon”), serves as the fund’s investment adviser.
MBSC Securities Corporation (the “Distributor”), a wholly-owned subsidiary of Dreyfus, is the distributor of the fund’s shares, which are sold without a sales charge. The fund is authorized to issue an unlimited number of $.001 par value shares of Beneficial Interest in each of the following classes of shares: Initial and Service. Each class of shares has identical rights and privileges, except with respect to the Distribution Plan, and the expenses borne by each class, the allocation of certain transfer agency costs, and certain voting rights. Income, expenses (other than expenses attributable to a specific class), and realized and unrealized gains or losses on investments are allocated to each class of shares based on its relative net assets.
The Company accounts separately for the assets, liabilities and operations of each series. Expenses directly attributable to each series are charged to that series’ operations; expenses which are applicable to all series are allocated among them on a pro rata basis.
The Financial Accounting Standards Board (“FASB”) Accounting Standards Codification is the exclusive reference of authoritative U.S. generally accepted accounting principles (“GAAP”) recognized by the FASB to be applied by nongovernmental entities. Rules and interpretive releases of the Securities and Exchange Commission (“SEC”) under authority of federal laws are also sources of authoritative GAAP for SEC registrants. The fund’s financial statements are prepared in accordance with GAAP, which may require the use of management estimates and assumptions. Actual results could differ from those estimates.
17
NOTES TO FINANCIAL STATEMENTS (continued)
The Company enters into contracts that contain a variety of indemnifications. The fund’s maximum exposure under these arrangements is unknown. The fund does not anticipate recognizing any loss related to these arrangements.
(a) Portfolio valuation: The fair value of a financial instrument is the amount that would be received to sell an asset or paid to transfer a liability in an orderly transaction between market participants at the measurement date (i.e., the exit price). GAAP establishes a fair value hierarchy that prioritizes the inputs of valuation techniques used to measure fair value. This hierarchy gives the highest priority to unadjusted quoted prices in active markets for identical assets or liabilities (Level 1 measurements) and the lowest priority to unobservable inputs (Level 3 measurements).
Additionally, GAAP provides guidance on determining whether the volume and activity in a market has decreased significantly and whether such a decrease in activity results in transactions that are not orderly. GAAP requires enhanced disclosures around valuation inputs and techniques used during annual and interim periods.
Various inputs are used in determining the value of the fund’s investments relating to fair value measurements. These inputs are summarized in the three broad levels listed below:
Level 1—unadjusted quoted prices in active markets for identical investments.
Level 2—other significant observable inputs (including quoted prices for similar investments, interest rates, prepayment speeds, credit risk, etc.).
Level 3—significant unobservable inputs (including the fund’s own assumptions in determining the fair value of investments).
The inputs or methodology used for valuing securities are not necessarily an indication of the risk associated with investing in those securities.
Changes in valuation techniques may result in transfers in or out of an assigned level within the disclosure hierarchy. Valuation techniques used to value the fund’s investments are as follows:
Investments in securities are valued at the last sales price on the securities exchange or national securities market on which such securities are primarily traded. Securities listed on the National Market System for which market quotations are available are valued at the official closing price or, if there is no official closing price that day, at the last sales price. For open short positions, asked prices are used for valuation purposes. Bid price is
18
used when no asked price is available. Registered investment companies that are not traded on an exchange are valued at their net asset value. All of the preceding securities are generally categorized within Level 1 of the fair value hierarchy.
Securities not listed on an exchange or the national securities market, or securities for which there were no transactions, are valued at the average of the most recent bid and asked prices. These securities are generally categorized within Level 2 of the fair value hierarchy.
Fair valuing of securities may be determined with the assistance of a pricing service using calculations based on indices of domestic securities and other appropriate indicators, such as prices of relevant American Depository Receipts and futures. Utilizing these techniques may result in transfers between Level 1 and Level 2 of the fair value hierarchy.
When market quotations or official closing prices are not readily available, or are determined not to reflect accurately fair value, such as when the value of a security has been significantly affected by events after the close of the exchange or market on which the security is principally traded (for example, a foreign exchange or market), but before the fund calculates its net asset value, the fund may value these investments at fair value as determined in accordance with the procedures approved by the Company’s Board of Trustees (the “Board”). Certain factors may be considered when fair valuing investments such as: fundamental analytical data, the nature and duration of restrictions on disposition, an evaluation of the forces that influence the market in which the securities are purchased and sold, and public trading in similar securities of the issuer or comparable issuers. These securities are either categorized within Level 2 or 3 of the fair value hierarchy depending on the relevant inputs used.
For restricted securities where observable inputs are limited, assumptions about market activity and risk are used and are generally categorized within Level 3 of the fair value hierarchy.
The following is a summary of the inputs used as of December 31, 2016 in valuing the fund’s investments:
19
NOTES TO FINANCIAL STATEMENTS (continued)
| | | | | |
| | Level 1 -
Unadjusted
Quoted Prices | Level 2 – Other
Significant
Observable
Inputs | Level 3 -
Significant
Unobservable
Inputs | Total |
Assets ($) | | | | |
Investments in Securities: | | | | |
Equity Securities-
Domestic Common Stocks† | 186,170,110 | - | - | 186,170,110 |
Registered Investment Companies | 13,693,601 | - | - | 13,693,601 |
† See Statement of Investments for additional detailed categorizations.
At December 31, 2016, there were no transfers between levels of the fair value hierarchy.
(b) Securities transactions and investment income: Securities transactions are recorded on a trade date basis. Realized gains and losses from securities transactions are recorded on the identified cost basis. Dividend income is recognized on the ex-dividend date and interest income, including, where applicable, accretion of discount and amortization of premium on investments, is recognized on the accrual basis.
Pursuant to a securities lending agreement with The Bank of New York Mellon, a subsidiary of BNY Mellon and an affiliate of Dreyfus, the fund may lend securities to qualified institutions. It is the fund’s policy that, at origination, all loans are secured by collateral of at least 102% of the value of U.S. securities loaned and 105% of the value of foreign securities loaned. Collateral equivalent to at least 100% of the market value of securities on loan is maintained at all times. Collateral is either in the form of cash, which can be invested in certain money market mutual funds managed by Dreyfus, or U.S. Government and Agency securities. The fund is entitled to receive all dividends, interest and distributions on securities loaned, in addition to income earned as a result of the lending transaction. Should a borrower fail to return the securities in a timely manner, The Bank of New York Mellon is required to replace the securities for the benefit of the fund or credit the fund with the market value of the unreturned securities and is subrogated to the fund’s rights against the borrower and the collateral. Additionally, the contractual maturity of security lending transactions are on an overnight and continuous basis. During the period ended December 31, 2016, The Bank of New York Mellon earned $17,892 from lending portfolio securities, pursuant to the securities lending agreement.
(c) Affiliated issuers: Investments in other investment companies advised by Dreyfus are defined as “affiliated” under the Act. Investments in
20
affiliated investment companies during the period ended December 31, 2016 were as follows:
| | | | | | |
Affiliated Investment Company | Value 12/31/2015 ($) | Purchases ($) | Sales ($) | Value
12/31/2016 ($) | Net
Assets (%) |
Dreyfus Institutional Cash Advantage Fund, Institutional Shares† | 2,401,926 | 120,703,813 | 123,105,739 | - | - |
Dreyfus Institutional Preferred Government Plus Money Market Fund†† | 458,721 | 25,660,748 | 24,919,970 | 1,199,499 | .6 |
Dreyfus Institutional Preferred Money Market Fund, Hamilton Shares† | - | 47,453,503 | 34,959,401 | 12,494,102 | 6.7 |
Total | 2,860,647 | 193,818,064 | 182,985,110 | 13,693,601 | 7.3 |
† During the period ended December 31, 2016, Dreyfus Institutional Cash Advantage Fund was acquired by Dreyfus Institutional Preferred Money Market Fund.
†† Formerly Dreyfus Institutional Preferred Plus Money Market Fund.
(d) Dividends and distributions to shareholders: Dividends and distributions are recorded on the ex-dividend date. Dividends from investment income-net and dividends from net realized capital gains, if any, are normally declared and paid annually, but the fund may make distributions on a more frequent basis to comply with the distribution requirements of the Internal Revenue Code of 1986, as amended (the “Code”). To the extent that net realized capital gains can be offset by capital loss carryovers, it is the policy of the fund not to distribute such gains. Income and capital gain distributions are determined in accordance with income tax regulations, which may differ from GAAP.
(e) Federal income taxes: It is the policy of the fund to continue to qualify as a regulated investment company, if such qualification is in the best interests of its shareholders, by complying with the applicable provisions of the Code, and to make distributions of taxable income sufficient to relieve it from substantially all federal income and excise taxes.
As of and during the period ended December 31, 2016, the fund did not have any liabilities for any uncertain tax positions. The fund recognizes interest and penalties, if any, related to uncertain tax positions as income
21
NOTES TO FINANCIAL STATEMENTS (continued)
tax expense in the Statement of Operations. During the period ended December 31, 2016, the fund did not incur any interest or penalties.
Each tax year in the four-year period ended December 31, 2016 remains subject to examination by the Internal Revenue Service and state taxing authorities.
At December 31, 2016, the components of accumulated earnings on a tax basis were as follows: undistributed ordinary income $1,887,753, undistributed capital gains $2,994,498 and unrealized appreciation $27,623,471.
The tax character of distributions paid to shareholders during the fiscal periods ended December 31, 2016 and December 31, 2015 were as follows: ordinary income $1,675,331 and $8,873,053, and long-term capital gains $11,876,045 and $23,301,258, respectively.
NOTE 2—Bank Lines of Credit:
The fund participates with other Dreyfus-managed funds in an $810 million unsecured credit facility led by Citibank, N.A. and a $300 million unsecured credit facility provided by The Bank of New York Mellon (each, a “Facility”), each to be utilized primarily for temporary or emergency purposes, including the financing of redemptions. Prior to October 5, 2016, the unsecured credit facility with Citibank, N.A. was $555 million and prior to January 11, 2016, the unsecured credit facility with Citibank, N.A. was $480 million. In connection therewith, the fund has agreed to pay its pro rata portion of commitment fees for each Facility. Interest is charged to the fund based on rates determined pursuant to the terms of the respective Facility at the time of borrowing. During the period ended December 31, 2016, the fund did not borrow under the Facilities.
NOTE 3—Management Fee and Other Transactions with Affiliates:
(a) Pursuant to a management agreement with Dreyfus, the management fee is computed at the annual rate of .75% of the value of the fund's average daily net assets and is payable monthly.
(b) Under the Distribution Plan adopted pursuant to Rule 12b-1 under the Act, Service shares pay the Distributor for distributing its shares, for servicing and/or maintaining Service shares’ shareholder accounts and for advertising and marketing for Service shares. The Distribution Plan provides for payments to be made at an annual rate of .25% of the value of the Service shares’ average daily net assets. The Distributor may make payments to Participating Insurance Companies and to brokers and dealers
22
acting as principal underwriter for their variable insurance products. The fees payable under the Distribution Plan are payable without regard to actual expenses incurred. During the period ended December 31, 2016, Service shares were charged $137,939 pursuant to the Distribution Plan.
The fund has arrangements with the transfer agent and the custodian whereby the fund may receive earnings credits when positive cash balances are maintained, which are used to offset transfer agency and custody fees. For financial reporting purposes, the fund includes net earnings credits as an expense offset in the Statement of Operations.
The fund compensates Dreyfus Transfer, Inc., a wholly-owned subsidiary of Dreyfus, under a transfer agency agreement for providing transfer agency and cash management services for the fund. The majority of transfer agency fees are comprised of amounts paid on a per account basis, while cash management fees are related to fund subscriptions and redemptions. During the period ended December 31, 2016, the fund was charged $1,191 for transfer agency services and $107 for cash management services. These fees are included in Shareholder servicing costs in the Statement of Operations. Cash management fees were partially offset by earnings credits of $50.
The fund compensates The Bank of New York Mellon under a custody agreement for providing custodial services for the fund. These fees are determined based on net assets, geographic region and transaction activity. During the period ended December 31, 2016, the fund was charged $24,256 pursuant to the custody agreement.
During the period ended December 31, 2016, the fund was charged $9,640 for services performed by the Chief Compliance Officer and his staff.
The components of “Due to The Dreyfus Corporation and affiliates” in the Statement of Assets and Liabilities consist of: management fees $119,947, Distribution Plan fees $13,568, custodian fees $11,453, Chief Compliance Officer fees $7,314 and transfer agency fees $296.
(c) Each Board member also serves as a Board member of other funds within the Dreyfus complex. Annual retainer fees and attendance fees are allocated to each fund based on net assets.
NOTE 4—Securities Transactions:
The aggregate amount of purchases and sales of investment securities, excluding short-term securities, during the period ended December 31, 2016, amounted to $112,351,705 and $120,608,635, respectively.
23
NOTES TO FINANCIAL STATEMENTS (continued)
At December 31, 2016, the cost of investments for federal income tax purposes was $172,240,240; accordingly, accumulated net unrealized appreciation on investments was $27,623,471, consisting of $31,633,002 gross unrealized appreciation and $4,009,531 gross unrealized depreciation.
24
REPORT OF INDEPENDENT REGISTERED
PUBLIC ACCOUNTING FIRM
Shareholders and Board of Trustees
Dreyfus Investment Portfolios, MidCap Stock Portfolio
We have audited the accompanying statement of assets and liabilities, including the statement of investments, of Dreyfus Investment Portfolios, MidCap Stock Portfolio (one of the series comprising Dreyfus Investment Portfolios) as of December 31, 2016, and the related statement of operations for the year then ended, the statement of changes in net assets for each of the two years in the period then ended, and the financial highlights for each of the five years in the period then ended. These financial statements and financial highlights are the responsibility of the Fund’s management. Our responsibility is to express an opinion on these financial statements and financial highlights based on our audits.
We conducted our audits in accordance with the standards of the Public Company Accounting Oversight Board (United States). Those standards require that we plan and perform the audit to obtain reasonable assurance about whether the financial statements and financial highlights are free of material misstatement. We were not engaged to perform an audit of the Fund’s internal control over financial reporting. Our audits included consideration of internal control over financial reporting as a basis for designing audit procedures that are appropriate in the circumstances, but not for the purpose of expressing an opinion on the effectiveness of the Fund’s internal control over financial reporting. Accordingly, we express no such opinion. An audit also includes examining, on a test basis, evidence supporting the amounts and disclosures in the financial statements and financial highlights, assessing the accounting principles used and significant estimates made by management, and evaluating the overall financial statement presentation. Our procedures included confirmation of securities owned as of December 31, 2016 by correspondence with the custodian and others. We believe that our audits provide a reasonable basis for our opinion.
In our opinion, the financial statements and financial highlights referred to above present fairly, in all material respects, the financial position of Dreyfus Investment Portfolios, MidCap Stock Portfolio at December 31, 2016, the results of its operations for the year then ended, the changes in its net assets for each of the two years in the period then ended, and the financial highlights for each of the five years in the period then ended, in conformity with U.S. generally accepted accounting principles.

New York, New York
February 10, 2017
25
IMPORTANT TAX INFORMATION (Unaudited)
For federal tax purposes, the fund hereby reports 100% of the ordinary dividends paid during the fiscal year ended December 31, 2016 as qualifying for the corporate dividends received deduction. Shareholders will receive notification in early 2017 of the percentage applicable to the preparation of their 2016 income tax returns. Also, the fund hereby reports $1.3623 per share as a long-term capital gain distribution paid on March 23, 2016.
26
INFORMATION ABOUT THE RENEWAL OF THE FUND’S INVESTMENT ADVISORY AGREEMENT (Unaudited)
At a meeting of the fund’s Board of Trustees held on July 20-21, 2016, the Board considered the renewal of the fund’s Management Agreement pursuant to which Dreyfus provides the fund with investment advisory and administrative services (the “Agreement”). The Board members, a majority of whom are not “interested persons” (as defined in the Investment Company Act of 1940, as amended) of the fund, were assisted in their review by independent legal counsel and met with counsel in executive session separate from Dreyfus representatives. In considering the renewal of the Agreement, the Board considered all factors that it believed to be relevant, including those discussed below. The Board did not identify any one factor as dispositive, and each Board member may have attributed different weights to the factors considered.
Analysis of Nature, Extent, and Quality of Services Provided to the Fund. The Board considered information provided to them at the meeting and in previous presentations from Dreyfus representatives regarding the nature, extent, and quality of the services provided to funds in the Dreyfus fund complex. Dreyfus provided the number of open accounts in the fund, the fund’s asset size and the allocation of fund assets among distribution channels. Dreyfus also had previously provided information regarding the diverse intermediary relationships and distribution channels of funds in the Dreyfus fund complex (such as retail direct or intermediary, in which intermediaries typically are paid by the fund and/or Dreyfus) and Dreyfus’ corresponding need for broad, deep, and diverse resources to be able to provide ongoing shareholder services to each intermediary or distribution channel, as applicable to the fund.
The Board also considered research support available to, and portfolio management capabilities of, the fund’s portfolio management personnel and that Dreyfus also provides oversight of day-to-day fund operations, including fund accounting and administration and assistance in meeting legal and regulatory requirements. The Board also considered Dreyfus’ extensive administrative, accounting and compliance infrastructures. The Board also considered portfolio management’s brokerage policies and practices (including policies and practices regarding soft dollars) and the standards applied in seeking best execution.
Comparative Analysis of the Fund’s Performance and Management Fee and Expense Ratio. The Board reviewed reports prepared by Broadridge Financial Solutions, Inc. (“Broadridge”), an independent provider of investment company data, which included information comparing (1) the fund’s performance with the performance of a group of comparable funds (the “Performance Group”) and with a broader group of funds (the “Performance Universe”), all for various periods ended May 31, 2016, and (2) the fund’s actual and contractual management fees and total expenses with those of a group of comparable funds (the “Expense Group”) and with a broader group of funds (the “Expense Universe”), the information for which was derived in part from fund financial statements available to Broadridge as of the date of its analysis. Dreyfus previously had furnished the Board with a description of the methodology Broadridge used to select the Performance Group and Performance Universe and the Expense Group and Expense Universe.
Dreyfus representatives stated that the usefulness of performance comparisons may be affected by a number of factors, including different investment limitations that may be applicable to the fund and comparison funds. The Board discussed the results of the
27
INFORMATION ABOUT THE RENEWAL OF THE FUND’S INVESTMENT ADVISORY AGREEMENT (Unaudited) (continued)
comparisons and noted that the fund’s total return performance was above the Performance Group and Performance Universe medians for all periods (ranking first in the Performance Group for all periods, except for the ten-year period), except for the ten-year period when the fund’s performance was slightly below the Performance Universe median. Dreyfus also provided a comparison of the fund’s calendar year total returns to the returns of the fund’s benchmark index.
The Board also reviewed the range of actual and contractual management fees and total expenses of the Expense Group and Expense Universe funds and discussed the results of the comparisons. The Board noted that the fund’s contractual management fee was below the Expense Group median and the fund’s actual management fee and total expenses were at the Expense Group and Expense Universe medians.
Dreyfus representatives reviewed with the Board the management or investment advisory fees (1) paid by funds advised or administered by Dreyfus that are in the same Broadridge category as the fund and (2) paid to Dreyfus or the Dreyfus-affiliated primary employer of the fund’s primary portfolio manager(s) for advising any separate accounts and/or other types of client portfolios that are considered to have similar investment strategies and policies as the fund (the “Similar Clients”), and explained the nature of the Similar Clients. They discussed differences in fees paid and the relationship of the fees paid in light of any differences in the services provided and other relevant factors. The Board considered the relevance of the fee information provided for the Similar Clients to evaluate the appropriateness of the fund’s management fee.
Analysis of Profitability and Economies of Scale. Dreyfus representatives reviewed the expenses allocated and profit received by Dreyfus and its affiliates and the resulting profitability percentage for managing the fund and the aggregate profitability percentage to Dreyfus and its affiliates for managing the funds in the Dreyfus fund complex, and the method used to determine the expenses and profit. The Board concluded that the profitability results were not unreasonable, given the services rendered and service levels provided by Dreyfus. The Board also had been provided with information prepared by an independent consulting firm regarding Dreyfus’ approach to allocating costs to, and determining the profitability of, individual funds and the entire Dreyfus fund complex. The consulting firm also had analyzed where any economies of scale might emerge in connection with the management of a fund.
The Board considered, on the advice of its counsel, the profitability analysis (1) as part of its evaluation of whether the fees under the Agreement, considered in relation to the mix of services provided by Dreyfus, including the nature, extent and quality of such services, supported the renewal of the Agreement and (2) in light of the relevant circumstances for the fund and the extent to which economies of scale would be realized if the fund grows and whether fee levels reflect these economies of scale for the benefit of fund shareholders. Dreyfus representatives noted that a discussion of economies of scale is predicated on a fund having achieved a substantial size with increasing assets and that, if a fund’s assets had been stable or decreasing, the possibility that Dreyfus may have realized any economies of scale would be less. Dreyfus representatives also noted that, as a result of shared and allocated costs among funds in the Dreyfus fund complex, the extent of economies of scale could depend substantially on the level of assets in the complex as a whole, so that increases and decreases in complex-wide assets can affect potential economies of scale in a manner
28
that is disproportionate to, or even in the opposite direction from, changes in the fund’s asset level. The Board also considered potential benefits to Dreyfus from acting as investment adviser and noted the soft dollar arrangements in effect for trading the fund’s investments.
At the conclusion of these discussions, the Board agreed that it had been furnished with sufficient information to make an informed business decision with respect to the renewal of the Agreement. Based on the discussions and considerations as described above, the Board concluded and determined as follows.
· The Board concluded that the nature, extent and quality of the services provided by Dreyfus are adequate and appropriate.
· The Board was satisfied with the fund’s performance.
· The Board concluded that the fee paid to Dreyfus supported the renewal of the Agreement in light of the considerations described above.
· The Board determined that the economies of scale which may accrue to Dreyfus and its affiliates in connection with the management of the fund had been adequately considered by Dreyfus in connection with the fee rate charged to the fund pursuant to the Agreement and that, to the extent in the future it were determined that material economies of scale had not been shared with the fund, the Board would seek to have those economies of scale shared with the fund.
In evaluating the Agreement, the Board considered these conclusions and determinations and also relied on its previous knowledge, gained through meetings and other interactions with Dreyfus and its affiliates, of the fund and the services provided to the fund by Dreyfus. The Board also relied on information received on a routine and regular basis throughout the year relating to the operations of the fund and the investment management and other services provided under the Agreement, including information on the investment performance of the fund in comparison to similar mutual funds and benchmark performance indices; general market outlook as applicable to the fund; and compliance reports. In addition, the Board’s consideration of the contractual fee arrangements for this fund had the benefit of a number of years of reviews of prior or similar agreements during which lengthy discussions took place between the Board and Dreyfus representatives. Certain aspects of the arrangements may receive greater scrutiny in some years than in others, and the Board’s conclusions may be based, in part, on their consideration of the same or similar arrangements in prior years. The Board determined to renew the Agreement.
29
BOARD MEMBERS INFORMATION (Unaudited)
INDEPENDENT BOARD MEMBERS
Joseph S. DiMartino (73)
Chairman of the Board (1995)
Principal Occupation During Past 5 Years:
· Corporate Director and Trustee (1995-present)
Other Public Company Board Memberships During Past 5 Years:
· CBIZ (formerly, Century Business Services, Inc.), a provider of outsourcing functions for small and medium size companies, Director (1997-present)
No. of Portfolios for which Board Member Serves: 135
———————
Francine J. Bovich (65)
Board Member (2014)
Principal Occupation During Past 5 Years:
· Trustee, The Bradley Trusts, private trust funds (2011-present)
Other Public Company Board Memberships During Past 5 Years:
· Annaly Capital Management, Inc., Board Member (May 2014-present)
No. of Portfolios for which Board Member Serves: 76
———————
Gordon J. Davis (75)
Board Member (2012)
Principal Occupation During Past 5 Years:
· Partner in the law firm of Venable LLP (2012-present)
· Partner in the law firm of Dewey & LeBoeuf LLP (1994-2012)
Other Public Company Board Memberships During Past 5 Years:
· Consolidated Edison, Inc., a utility company, Director (1997-2014)
· The Phoenix Companies, Inc., a life insurance company, Director (2000-2014)
No. of Portfolios for which Board Member Serves: 58
———————
30
Nathan Leventhal (73)
Board Member (2009)
Principal Occupation During Past 5 Years:
· President Emeritus of Lincoln Center for the Performing Arts (2001-present)
· Chairman of the Avery Fisher Artist Program (1997-2014)
· Commissioner, NYC Planning Commission (2007-2011)
Other Public Company Board Memberships During Past 5 Years:
· Movado Group, Inc., Director (2003-present)
No. of Portfolios for which Board Member Serves: 48
———————
Robin A. Melvin (53)
Board Member (2014)
Principal Occupation During Past 5 Years:
· Co-chairman, Illinois Mentoring Partnership, non-profit organization dedicated to increasing the quantity and quality of mentoring services in Illinois; (2014-present; board member since 2013)
· Director, Boisi Family Foundation, a private family foundation that supports youth-serving organizations that promote the self sufficiency of youth from disadvantaged circumstances (1995-2012)
No. of Portfolios for which Board Member Serves: 107
———————
Roslyn M. Watson (67)
Board Member (2014)
Principal Occupation During Past 5 Years:
· Principal, Watson Ventures, Inc., a real estate investment company (1993-present)
No. of Portfolios for which Board Member Serves: 62
———————
Benaree Pratt Wiley (70)
Board Member (2009)
Principal Occupation During Past 5 Years:
· Principal, The Wiley Group, a firm specializing in strategy and business development (2005-present)
Other Public Company Board Memberships During Past 5 Years:
· CBIZ (formerly, Century Business Services, Inc.), a provider of outsourcing functions for small and medium size companies, Director (2008-present)
No. of Portfolios for which Board Member Serves: 86
———————
31
BOARD MEMBERS INFORMATION (Unaudited) (continued)
INTERESTED BOARD MEMBERS
J. Charles Cardona (61)
Board Member (2014)
Principal Occupation During Past 5 Years:
· Retired President and a Director of the Manager (2008-2016), Chairman of the Distributor (2013-2016, Executive Vice President, 1997-2013),
No. of Portfolios for which Board Member Serves: 34
J. Charles Cardona is deemed to be an “interested person” (as defined under the Act) of the Company as a result of his affiliation with The Dreyfus Corporation.
———————
Isabel P. Dunst (69)
Board Member (2014)
Principal Occupation During Past 5 Years:
· Of Counsel to the law firm of Hogan Lovells LLP (2015-present; previously, Partner, 1990-2014)
No. of Portfolios for which Board Member Serves: 34
Isabel P. Dunst is deemed to be an “interested person” (as defined under the Act) of the Company as a result of her affiliation with Hogan Lovells LLP, which provides legal services to BNY Mellon and certain of its affiliates.
———————
Once elected all Board Members serve for an indefinite term, but achieve Emeritus status upon reaching age 80. The address of the Board Members and Officers is c/o The Dreyfus Corporation, 200 Park Avenue, New York, New York 10166. Additional information about the Board Members is available in the fund’s Statement of Additional Information which can be obtained from Dreyfus free of charge by calling this toll free number: 1-800-DREYFUS.
Clifford L. Alexander, Jr., Emeritus Board Member
Whitney I. Gerard, Emeritus Board Member
George L. Perry, Emeritus Board Member
32
OFFICERS OF THE FUND (Unaudited)
BRADLEY J. SKAPYAK, President since January 2010.
Chief Operating Officer and a director of the Manager since June 2009, Chairman of Dreyfus Transfer, Inc., an affiliate of the Manager and the transfer agent of the funds, since May 2011 and Executive Vice President of MBSC Securities Corporation since June 2007. He is an officer of 64 investment companies (comprised of 135 portfolios) managed by the Manager. He is 58 years old and has been an employee of the Manager since February 1988.
BENNETT A. MACDOUGALL, Chief Legal Officer since October 2015.
Chief Legal Officer of the Manager and Associate General Counsel and Managing Director of BNY Mellon since June 2015; from June 2005 to June 2015, he served in various capacities with Deutsche Bank – Asset & Wealth Management Division, including as Director and Associate General Counsel, and Chief Legal Officer of Deutsche Investment Management Americas Inc. from June 2012 to May 2015. He is an officer of 65 investment companies (comprised of 160 portfolios) managed by the Manager. He is 45 years old and has been an employee of the Manager since June 2015.
JANETTE E. FARRAGHER, Vice President and Secretary since December 2011.
Associate General Counsel of BNY Mellon, and an officer of 65 investment companies (comprised of 160 portfolios) managed by the Manager. She is 54 years old and has been an employee of the Manager since February 1984.
JAMES BITETTO, Vice President and Assistant Secretary since August 2005.
Managing Counsel of BNY Mellon and Secretary of the Manager, and an officer of 65 investment companies (comprised of 160 portfolios) managed by the Manager. He is 50 years old and has been an employee of the Manager since December 1996.
JONI LACKS CHARATAN, Vice President and Assistant Secretary since August 2005.
Managing Counsel of BNY Mellon, and an officer of 65 investment companies (comprised of 160 portfolios) managed by the Manager. She is 61 years old and has been an employee of the Manager since October 1988.
JOSEPH M. CHIOFFI, Vice President and Assistant Secretary since August 2005.
Managing Counsel of BNY Mellon, and an officer of 65 investment companies (comprised of 160 portfolios) managed by the Manager. He is 55 years old and has been an employee of the Manager since June 2000.
MAUREEN E. KANE, Vice President and Assistant Secretary since April 2015.
Managing Counsel of BNY Mellon since July 2014; from October 2004 until July 2014, General Counsel, and from May 2009 until July 2014, Chief Compliance Officer of Century Capital Management. She is an officer of 65 investment companies (comprised of 160 portfolios) managed by the Manager. She is 54 years old and has been an employee of the Manager since July 2014.
SARAH S. KELLEHER, Vice President and Assistant Secretary since April 2014.
Senior Counsel of BNY Mellon since March 2013, from August 2005 to March 2013, Associate General Counsel of Third Avenue Management. She is an officer of 65 investment companies (comprised of 160 portfolios) managed by the Manager. She is 41 years old and has been an employee of the Manager since March 2013.
JEFF PRUSNOFSKY, Vice President and Assistant Secretary since August 2005.
Senior Managing Counsel of BNY Mellon, and an officer of 65 investment companies (comprised of 160 portfolios) managed by the Manager. He is 51 years old and has been an employee of the Manager since October 1990.
JAMES WINDELS, Treasurer since November 2001.
Director – Mutual Fund Accounting of the Manager, and an officer of 65 investment companies (comprised of 160 portfolios) managed by the Manager. He is 58 years old and has been an employee of the Manager since April 1985.
RICHARD CASSARO, Assistant Treasurer since January 2008.
Senior Accounting Manager – Money Market, Municipal Bond and Equity Funds of the Manager, and an officer of 65 investment companies (comprised of 160 portfolios) managed by the Manager. He is 57 years old and has been an employee of the Manager since September 1982.
33
OFFICERS OF THE FUND (Unaudited) (continued)
GAVIN C. REILLY, Assistant Treasurer since December 2005.
Tax Manager of the Investment Accounting and Support Department of the Manager, and an officer of 65 investment companies (comprised of 160 portfolios) managed by the Manager. He is 48 years old and has been an employee of the Manager since April 1991.
ROBERT S. ROBOL, Assistant Treasurer since August 2005.
Senior Accounting Manager of the Manager, and an officer of 65 investment companies (comprised of 160 portfolios) managed by the Manager. He is 52 years old and has been an employee of the Manager since October 1988.
ROBERT SALVIOLO, Assistant Treasurer since July 2007.
Senior Accounting Manager – Equity Funds of the Manager, and an officer of 65 investment companies (comprised of 160 portfolios) managed by the Manager. He is 49 years old and has been an employee of the Manager since June 1989.
ROBERT SVAGNA, Assistant Treasurer since December 2002.
Senior Accounting Manager – Fixed Income and Equity Funds of the Manager, and an officer of 65 investment companies (comprised of 160 portfolios) managed by the Manager. He is 49 years old and has been an employee of the Manager since November 1990.
JOSEPH W. CONNOLLY, Chief Compliance Officer since October 2004.
Chief Compliance Officer of the Manager and The Dreyfus Family of Funds (65 investment companies, comprised of 160 portfolios). He is 59 years old and has served in various capacities with the Manager since 1980, including manager of the firm’s Fund Accounting Department from 1997 through October 2001.
CARIDAD M. CAROSELLA, Anti-Money Laundering Compliance Officer since January 2016.
Anti-Money Laundering Compliance Officer of the Dreyfus Family of Funds and BNY Mellon Funds Trust since January 2016; from May 2015 to December 2015, Interim Anti-Money Laundering Compliance Officer of the Dreyfus Family of Funds and BNY Mellon Funds Trust and the Distributor; from January 2012 to May 2015, AML Surveillance Officer of the Distributor and from 2007 to December 2011, Financial Processing Manager of the Distributor. She is an officer of 60 investment companies (comprised of 155 portfolios) managed by the Manager. She is 48 years old and has been an employee of the Distributor since 1997.
34
NOTES
35
NOTES
36
NOTES
37
Dreyfus Investment Portfolios, MidCap Stock Portfolio
200 Park Avenue
New York, NY 10166
Manager
The Dreyfus Corporation
200 Park Avenue
New York, NY 10166
Custodian
The Bank of New York Mellon
225 Liberty Street
New York, NY 10286
Transfer Agent &
Dividend Disbursing Agent
Dreyfus Transfer, Inc.
200 Park Avenue
New York, NY 10166
Distributor
MBSC Securities Corporation
200 Park Avenue
New York, NY 10166
Telephone 1-800-258-4260 or 1-800-258-4261
Mail The Dreyfus Family of Funds, 144 Glenn Curtiss Boulevard, Uniondale, NY 11556-0144 Attn: Institutional Services Department
E-mail Send your request to info@dreyfus.com
Internet Information can be viewed online or downloaded at www.dreyfus.com
The fund files its complete schedule of portfolio holdings with the Securities and Exchange Commission (“SEC”) for the first and third quarters of each fiscal year on Form N-Q. The fund’s Forms N-Q are available on the SEC’s website at http://www.sec.gov and may be reviewed and copied at the SEC’s Public Reference Room in Washington, DC. Information on the operation of the Public Reference Room may be obtained by calling 1-800-SEC-0330.
A description of the policies and procedures that the fund uses to determine how to vote proxies relating to portfolio securities, and information regarding how the fund voted these proxies for the most recent 12-month period ended June 30 is available at http://www.dreyfus.com and on the SEC’s website at http://www.sec.gov. The description of the policies and procedures is also available without charge, upon request, by calling 1-800-DREYFUS.
| | |
© 2017 MBSC Securities Corporation
0174AR1216 | 
|
Dreyfus Investment Portfolios, Small Cap Stock Index Portfolio
| | | |

| | ANNUAL REPORT
December 31, 2016 |
| |
The views expressed in this report reflect those of the portfolio manager(s) only through the end of the period covered and do not necessarily represent the views of Dreyfus or any other person in the Dreyfus organization. Any such views are subject to change at any time based upon market or other conditions and Dreyfus disclaims any responsibility to update such views. These views may not be relied on as investment advice and, because investment decisions for a Dreyfus fund are based on numerous factors, may not be relied on as an indication of trading intent on behalf of any Dreyfus fund. |
| |
Not FDIC-Insured • Not Bank-Guaranteed • May Lose Value |
Contents
THE FUND
FOR MORE INFORMATION
Back Cover
| | | | |
| |
Dreyfus Investment Portfolios, Small Cap Stock Index Portfolio
| | The Fund |
A LETTER FROM THE CHIEF EXECUTIVE OFFICER
Dear Shareholder:
We are pleased to present this annual report for Dreyfus Investment Portfolios, Small Cap Stock Index Portfolio, covering the 12-month period from January 1, 2016 through December 31, 2016. For information about how the fund performed during the reporting period, as well as general market perspectives, we provide a Discussion of Fund Performance on the pages that follow.
Stocks and bonds advanced over 2016 despite bouts of market volatility stemming from various economic and political developments. In January, stocks declined sharply and long-term interest rates fell in response to sluggish global economic growth, falling commodity prices, and worries following the first increase in short-term U.S. interest rates in nearly a decade. However, equities began a sustained rebound in February when U.S. monetary policymakers refrained from additional rate hikes, other central banks eased their monetary policies, and commodity prices recovered. After a bout of volatility in June stemming from the United Kingdom’s referendum to leave the European Union, stocks generally continued to climb over the summer. Stock prices moderated in advance of U.S. elections, but markets subsequently rallied to new highs in anticipation of changes in U.S. fiscal and tax policies. In the bond market, yields of high-quality government bonds moved lower over much of the reporting period amid robust investor demand for current income, but yields surged higher after the election due to expectations of rising interest rates. Corporate-backed bonds fared especially well in this environment.
The transition to a new U.S. president and ongoing global economic headwinds suggest that volatility may persist in the financial markets. Some asset classes and industry groups seem likely to benefit from a changing economic and geopolitical landscape, while others probably will face challenges. Consequently, selectivity seems likely to be an important determinant of investment success in 2017. As always, we encourage you to discuss the implications of our observations with your financial advisor.
Thank you for your continued confidence and support.
Sincerely,

Mark D. Santero
Chief Executive Officer
The Dreyfus Corporation
January 17, 2017
2
DISCUSSION OF FUND PERFORMANCE
For the period of January 1, 2016 through December 31, 2016, as provided by Thomas J. Durante, CFA, Karen Q. Wong, CFA, and Richard A. Brown, CFA, Portfolio Managers
Market and Fund Performance Overview
For the 12-month period ended December 31, 2016, Dreyfus Investment Portfolios, Small Cap Stock Index Portfolio produced a total return of 25.73%.1 In comparison, the fund’s benchmark, the S&P SmallCap 600 Index (the “Index”), produced a 26.56% total return for the same period.2,3
Small-cap stocks achieved robust returns in 2016 on the strength of positive U.S. economic growth and expectations of changing fiscal, tax, and regulatory policies under a new presidential administration. The difference in returns between the fund and the Index was primarily the result of transaction costs and operating expenses that are not reflected in the Index’s results.
The Fund’s Investment Approach
The fund seeks to match the performance of the Index. To pursue its goal, the fund invests in a representative sample of stocks included in the Index, and in futures whose performance is tied to the Index.
The fund attempts to have a correlation between its performance and that of the index of at least .95, before fees and expenses. A correlation of 1.00 would mean that the fund and the index were perfectly correlated. The fund’s portfolio managers select investments for the fund by using a “sampling” process based on market capitalization, industry representation and other fundamental benchmark characteristics.
Economic and Political Developments Drove Equity Markets
U.S. stocks across all capitalization ranges moved sharply lower over the opening weeks of 2016 in the midst of weakening commodity prices, disappointing global economic data, and higher short-term U.S. interest rates. However, equities began a dramatic recovery in February and rallied through the spring in response to rebounding commodity prices, more accommodative global monetary policies from major central banks, and indications that additional U.S. rate increases would be delayed.
The market’s advance faltered in June over concerns regarding the United Kingdom’s referendum to leave the European Union, but the decline proved short lived. By early July, the market had regained most of its lost ground, and encouraging U.S. economic data helped the Index advance further over the summer. Stocks gave back some of their previous gains in October when investors became more cautious ahead of the presidential election. After the election, stocks again rallied strongly, and the Index rose to record highs as investors anticipated higher government spending, lower corporate taxes, and a less stringent regulatory environment under a new presidential administration.
For the reporting period overall, small-cap stocks produced higher returns than their large-cap and midcap counterparts, in part because the domestic focus of small-cap companies helped to shelter them from international economic and trade policy concerns.
Industrial and Technology Stocks Led the 2016 Market
The Index’s strong advance during 2016 was led by the industrials sector, which fared especially well after the presidential election amid expectations of rising government spending on
3
DISCUSSION OF FUND PERFORMANCE (continued)
infrastructure construction and repair. This development especially benefited large equipment producers and makers of building products. Meanwhile, airlines gained value when reduced industry capacity led to higher ticket prices. Gains in the information technology sector were driven by growing smartphone sales and rising mergers-and-acquisitions activity. For example, smaller electronic equipment producers benefited from robust demand for the lasers, advanced fuses, and semiconductors used in the manufacture of flat screens for smartphones, televisions, and automobiles.
The financials sector languished for much of 2016, in part due to the dampening effect of low interest rates and high regulatory costs on profit margins. However, banks and other financial institutions gained considerable ground in the weeks after the presidential election as investors looked forward to higher interest rates stemming from new pro-growth fiscal policies, an easing of costly banking regulations, lower corporate tax rates, and higher trading volumes.
In contrast, the health care sector produced only a modestly positive total return in 2016. Pharmaceutical developers contended throughout the year with industrywide pricing pressures, and service providers struggled late in the year with uncertainty surrounding the future of the Affordable Care Act. Biotechnology firms also were hurt by delays in regulatory approvals for new medicines. Although the consumer discretionary sector produced double-digit returns for the year overall, it lagged market averages as a result of weakness in the retailing and media industry groups. Sluggish spending trends, reduced store traffic volumes, and competition from online commerce hindered financial results for many small retailers, and poor advertising revenues and online competition hurt earnings for newspaper publishers.
Replicating the Performance of the Index
Although we do not actively manage the fund’s investments in response to macroeconomic trends, we have been encouraged by the stock market’s resilience in the face of political change and persistent global economic headwinds. As always, we have continued to monitor the factors considered by the fund’s investment model in light of current market conditions.
January 17, 2017
Equities are subject generally to market, market sector, market liquidity, issuer, and investment style risks, among other factors, to varying degrees, all of which are more fully described in the fund’s prospectus. Stocks of small- and/or midcap companies often experience sharper price fluctuations than stocks of large-cap companies.
The fund is only available as a funding vehicle under variable life insurance policies or variable annuity contracts issued by insurance companies. Individuals may not purchase shares of the fund directly. A variable annuity is an insurance contract issued by an insurance company that enables investors to accumulate assets on a tax-deferred basis for retirement or other long-term goals. The investment objective and policies of Dreyfus Investment Portfolios, Small Cap Stock Index Portfolio made available through insurance products may be similar to other funds managed by Dreyfus. However, the investment results of the fund may be higher or lower than, and may not be comparable to, those of any other Dreyfus fund.
1 Total return includes reinvestment of dividends and any capital gains paid. Past performance is no guarantee of future results. Share price and investment return fluctuate such that upon redemption fund shares may be worth more or less than their original cost. The fund’s performance does not reflect the deduction of additional charges and expenses imposed in connection with investing in variable insurance contracts, which will reduce returns. The Dreyfus Corporation has agreed to pay all of the fund’s expenses except management fees, Rule 12b-1 fees, and certain other expenses, including fees and expenses of the non-interested board members and their counsel.
2 Source: Lipper Inc. — The S&P SmallCap 600 Index is a broad-based index and a widely accepted, unmanaged index of overall small-cap stock market performance. Investors cannot invest directly in any index.
3 “Standard & Poor’s®,” “S&P®,” and “Standard & Poor’s® SmallCap 600 Index” are trademarks of Standard & Poor’s Financial Services LLC (“Standard & Poor’s”), and have been licensed for use by the fund. The fund is not sponsored, endorsed, sold, or promoted by Standard & Poor’s, and Standard & Poor’s makes no representation regarding the advisability of investing in the fund.
4
FUND PERFORMANCE

Comparison of change in value of $10,000 investment in Dreyfus Investment Portfolio and the S&P SmallCap 600 Index (the “Index”)
† Source: Lipper Inc.
Past performance is not predictive of future performance. The fund’s performance shown in the graph and table does not reflect the deduction of taxes that a shareholder would pay on fund distributions or the redemption of fund shares.
The fund’s performance does not reflect the deduction of additional charges and expenses imposed in connection with investing in variable insurance contracts which will reduce returns.
The above graph compares a $10,000 investment made in Dreyfus Investment Portfolios, Small Cap Stock Index Portfolio on 12/31/06 to a $10,000 investment made in the Index on that date.
The fund is subject to a 0.25% annual Rule 12b-1 fee. All dividends and capital gain distributions are reinvested.
The fund’s performance shown in the line graph above takes into account all applicable fund fees and expenses. The Index is a broad-based index and a widely accepted, unmanaged index of overall small-cap stock market performance. Unlike a mutual fund, the Index is not subject to charges, fees and other expenses. Investors cannot invest directly in any index. Further information relating to fund performance, including expense reimbursements, if applicable, is contained in the Financial Highlights section of the prospectus and elsewhere in this report.
| | | | |
Average Annual Total Returns as of 12/31/16 | |
| 1 Year | 5 Years | 10 Years |
Portfolio | 25.73% | 16.02% | 8.60% |
S&P SmallCap 600 Index | 26.56% | 16.62% | 9.03% |
Past performance is not predictive of future performance. The fund’s performance shown in the graph and table does not reflect the deduction of taxes that a shareholder would pay on fund distributions or the redemption of fund shares.
5
UNDERSTANDING YOUR FUND’S EXPENSES (Unaudited)
As a mutual fund investor, you pay ongoing expenses, such as management fees and other expenses. Using the information below, you can estimate how these expenses affect your investment and compare them with the expenses of other funds. You also may pay one-time transaction expenses, including sales charges (loads), redemption fees and expenses associated with variable annuity or insurance contracts, which are not shown in this section and would have resulted in higher total expenses. For more information, see your fund’s prospectus or talk to your financial adviser.
Review your fund’s expenses
The table below shows the expenses you would have paid on a $1,000 investment in Dreyfus Investment Portfolios, Small Cap Stock Index Portfolio from July 1, 2016 to December 31, 2016. It also shows how much a $1,000 investment would be worth at the close of the period, assuming actual returns and expenses.
| | | | | | | | | | |
Expenses and Value of a $1,000 Investment |
assuming actual returns for the six months ended December 31, 2016 | | |
| | | | | | | | | |
Expenses paid per $1,000† | | | | $3.30 | | | |
Ending value (after expenses) | | | | $1,186.70 | | | |
COMPARING YOUR FUND’S EXPENSES
WITH THOSE OF OTHER FUNDS (Unaudited)
Using the SEC’s method to compare expenses
The Securities and Exchange Commission (SEC) has established guidelines to help investors assess fund expenses. Per these guidelines, the table below shows your fund’s expenses based on a $1,000 investment, assuming a hypothetical 5% annualized return. You can use this information to compare the ongoing expenses (but not transaction expenses or total cost) of investing in the fund with those of other funds. All mutual fund shareholder reports will provide this information to help you make this comparison. Please note that you cannot use this information to estimate your actual ending account balance and expenses paid during the period.
| | | | | | | | | | |
Expenses and Value of a $1,000 Investment |
assuming a hypothetical 5% annualized return for the six months ended December 31, 2016 |
| | | | | | | | | |
Expenses paid per $1,000† | | | | $3.05 | | | |
Ending value (after expenses) | | | | $1,022.12 | | | |
† Expenses are equal to the fund’s annualized expense ratio of .60%, multiplied by the average account value over the period, multiplied by 184/366 (to reflect the one-half year period).
6
STATEMENT OF INVESTMENTS
December 31, 2016
| | | | | | |
| |
Common Stocks - 99.2% | | Shares | | Value ($) | |
Automobiles & Components - 1.8% | | | | | |
American Axle & Manufacturing Holdings | | 59,995 | a | 1,157,903 | |
Cooper-Standard Holding | | 13,998 | a | 1,447,113 | |
Dorman Products | | 20,333 | a | 1,485,529 | |
Drew Industries | | 19,140 | | 2,062,335 | |
Fox Factory Holding | | 16,159 | a | 448,412 | |
Gentherm | | 26,291 | a | 889,950 | |
Motorcar Parts of America | | 9,250 | a | 249,010 | |
Standard Motor Products | | 12,206 | | 649,603 | |
Superior Industries International | | 15,892 | | 418,754 | |
Winnebago Industries | | 18,060 | b | 571,599 | |
| | | | | 9,380,208 | |
Banks - 12.5% | | | | | |
Ameris Bancorp | | 28,445 | | 1,240,202 | |
Astoria Financial | | 61,746 | | 1,151,563 | |
Banc of California | | 43,341 | b | 751,966 | |
Bank Mutual | | 48,677 | | 459,998 | |
Banner | | 16,819 | | 938,668 | |
BofI Holding | | 37,777 | a,b | 1,078,533 | |
Boston Private Financial Holdings | | 71,015 | | 1,175,298 | |
Brookline Bancorp | | 59,282 | | 972,225 | |
Cardinal Financial | | 20,581 | | 674,851 | |
Central Pacific Financial | | 27,298 | | 857,703 | |
City Holding | | 11,305 | | 764,218 | |
Columbia Banking System | | 44,913 | | 2,006,713 | |
Community Bank System | | 30,517 | b | 1,885,645 | |
Customers Bancorp | | 24,608 | a | 881,459 | |
CVB Financial | | 78,237 | | 1,793,974 | |
Dime Community Bancshares | | 29,602 | | 595,000 | |
Fidelity Southern | | 12,829 | | 303,662 | |
First BanCorp | | 97,237 | a | 642,737 | |
First Commonwealth Financial | | 75,862 | | 1,075,723 | |
First Financial Bancorp | | 49,734 | | 1,414,932 | |
First Financial Bankshares | | 50,056 | b | 2,262,531 | |
First Midwest Bancorp | | 55,406 | | 1,397,893 | |
First NBC Bank Holding | | 10,807 | a,b | 78,891 | |
Glacier Bancorp | | 57,914 | | 2,098,224 | |
Great Western Bancorp | | 39,754 | | 1,732,877 | |
7
STATEMENT OF INVESTMENTS (continued)
| | | | | | |
| |
Common Stocks - 99.2% (continued) | | Shares | | Value ($) | |
Banks - 12.5% (continued) | | | | | |
Hanmi Financial | | 28,113 | | 981,144 | |
Home BancShares | | 93,116 | | 2,585,831 | |
HomeStreet | | 16,866 | a | 532,966 | |
Hope Bancorp | | 87,332 | | 1,911,697 | |
Independent Bank | | 22,085 | | 1,555,888 | |
LegacyTexas Financial Group | | 29,177 | | 1,256,362 | |
LendingTree | | 4,224 | a,b | 428,102 | |
National Bank Holdings, Cl. A | | 23,999 | | 765,328 | |
NBT Bancorp | | 32,730 | b | 1,370,732 | |
Northfield Bancorp | | 40,619 | | 811,161 | |
Northwest Bancshares | | 66,620 | | 1,201,159 | |
OFG Bancorp | | 40,775 | | 534,153 | |
Old National Bancorp | | 92,485 | | 1,678,603 | |
Opus Bank | | 10,237 | | 307,622 | |
Oritani Financial | | 32,881 | | 616,519 | |
Pinnacle Financial Partners | | 29,872 | | 2,070,130 | |
Provident Financial Services | | 40,346 | | 1,141,792 | |
S&T Bancorp | | 21,689 | | 846,739 | |
ServisFirst Bancshares | | 30,202 | b | 1,130,763 | |
Simmons First National, Cl. A | | 19,452 | | 1,208,942 | |
Southside Bancshares | | 22,775 | | 857,934 | |
Sterling Bancorp | | 93,131 | | 2,179,265 | |
Texas Capital Bancshares | | 34,095 | a | 2,673,048 | |
Tompkins Financial | | 10,433 | | 986,336 | |
TrustCo Bank | | 58,886 | | 515,253 | |
United Bankshares | | 57,511 | b | 2,659,884 | |
United Community Banks | | 48,164 | | 1,426,618 | |
Walker & Dunlop | | 21,476 | a | 670,051 | |
Westamerica Bancorporation | | 18,802 | b | 1,183,210 | |
Wintrust Financial | | 36,268 | | 2,631,969 | |
| | | | | 66,954,687 | |
Capital Goods - 10.0% | | | | | |
AAON | | 32,826 | | 1,084,899 | |
AAR | | 22,521 | | 744,319 | |
Actuant, Cl. A | | 40,824 | b | 1,059,383 | |
Aegion | | 22,030 | a | 522,111 | |
Aerojet Rocketdyne Holdings | | 50,905 | a | 913,745 | |
Aerovironment | | 9,699 | a,b | 260,224 | |
Alamo Group | | 8,690 | | 661,309 | |
8
| | | | | | |
| |
Common Stocks - 99.2% (continued) | | Shares | | Value ($) | |
Capital Goods - 10.0% (continued) | | | | | |
Albany International, Cl. A | | 18,642 | | 863,125 | |
American Woodmark | | 11,857 | a | 892,239 | |
Apogee Enterprises | | 20,336 | | 1,089,196 | |
Applied Industrial Technologies | | 27,414 | | 1,628,392 | |
Astec Industries | | 16,555 | | 1,116,800 | |
AZZ | | 18,933 | | 1,209,819 | |
Barnes Group | | 37,011 | | 1,755,062 | |
Briggs & Stratton | | 26,629 | | 592,762 | |
Chart Industries | | 25,628 | a | 923,121 | |
CIRCOR International | | 11,283 | | 732,041 | |
Comfort Systems USA | | 29,354 | | 977,488 | |
Cubic | | 15,512 | | 743,800 | |
DXP Enterprises | | 9,578 | a | 332,740 | |
Encore Wire | | 13,980 | | 606,033 | |
Engility Holdings | | 12,341 | a | 415,892 | |
EnPro Industries | | 14,063 | b | 947,284 | |
ESCO Technologies | | 17,189 | | 973,757 | |
Federal Signal | | 49,967 | | 779,985 | |
Franklin Electric | | 24,858 | | 966,976 | |
General Cable | | 37,624 | | 716,737 | |
Gibraltar Industries | | 26,669 | a | 1,110,764 | |
Greenbrier Companies | | 22,099 | b | 918,213 | |
Griffon | | 22,456 | b | 588,347 | |
Harsco | | 55,515 | | 755,004 | |
Hillenbrand | | 49,799 | | 1,909,792 | |
Insteel Industries | | 12,523 | | 446,320 | |
John Bean Technologies | | 20,127 | | 1,729,916 | |
Kaman | | 17,441 | | 853,388 | |
Lindsay | | 5,993 | b | 447,138 | |
Lydall | | 14,798 | a | 915,256 | |
Mercury Systems | | 26,275 | a | 794,030 | |
Moog, Cl. A | | 25,098 | a | 1,648,437 | |
Mueller Industries | | 42,585 | | 1,701,697 | |
MYR Group | | 15,977 | a | 602,013 | |
National Presto Industries | | 2,856 | b | 303,878 | |
Orion Group Holdings | | 13,205 | a | 131,390 | |
Patrick Industries | | 10,766 | a | 821,446 | |
PGT | | 29,745 | a | 340,580 | |
Powell Industries | | 6,957 | | 271,323 | |
9
STATEMENT OF INVESTMENTS (continued)
| | | | | | |
| |
Common Stocks - 99.2% (continued) | | Shares | | Value ($) | |
Capital Goods - 10.0% (continued) | | | | | |
Proto Labs | | 16,969 | a,b | 871,358 | |
Quanex Building Products | | 31,665 | | 642,800 | |
Raven Industries | | 22,464 | | 566,093 | |
Simpson Manufacturing | | 29,671 | | 1,298,106 | |
SPX | | 35,216 | a | 835,324 | |
SPX FLOW | | 28,667 | | 919,064 | |
Standex International | | 10,258 | | 901,165 | |
TASER International | | 41,447 | a,b | 1,004,675 | |
Tennant | | 12,130 | | 863,656 | |
Titan International | | 26,746 | b | 299,823 | |
Trex | | 23,993 | a | 1,545,149 | |
Universal Forest Products | | 16,130 | | 1,648,163 | |
Veritiv | | 4,819 | a | 259,021 | |
Vicor | | 6,324 | a | 95,492 | |
Wabash National | | 57,437 | b | 908,653 | |
Watts Water Technologies, Cl. A | | 18,308 | | 1,193,682 | |
| | | | | 53,650,395 | |
Commercial & Professional Services - 5.5% | | | | | |
ABM Industries | | 37,460 | | 1,529,866 | |
Brady, Cl. A | | 38,018 | | 1,427,576 | |
Brink's | | 35,077 | | 1,446,926 | |
Essendant | | 23,202 | | 484,922 | |
Exponent | | 17,517 | | 1,056,275 | |
G&K Services, Cl. A | | 15,684 | | 1,512,722 | |
Healthcare Services Group | | 50,214 | b | 1,966,882 | |
Heidrick & Struggles International | | 18,289 | | 441,679 | |
Insperity | | 15,404 | | 1,092,914 | |
Interface | | 54,050 | | 1,002,627 | |
Kelly Services, Cl. A | | 26,769 | | 613,545 | |
Korn/Ferry International | | 37,618 | | 1,107,098 | |
LSC Communications | | 18,582 | | 551,514 | |
Matthews International, Cl. A | | 22,042 | | 1,693,928 | |
Mobile Mini | | 28,897 | | 874,134 | |
Multi-Color | | 9,241 | | 717,102 | |
Navigant Consulting | | 32,752 | a | 857,447 | |
On Assignment | | 37,761 | a | 1,667,526 | |
R.R. Donnelley & Sons Co. | | 50,747 | b | 828,191 | |
Resources Connection | | 19,230 | | 370,178 | |
Team | | 19,980 | a,b | 784,215 | |
10
| | | | | | |
| |
Common Stocks - 99.2% (continued) | | Shares | | Value ($) | |
Commercial & Professional Services - 5.5% (continued) | | | | | |
Tetra Tech | | 39,212 | | 1,691,998 | |
TrueBlue | | 35,789 | a | 882,199 | |
UniFirst | | 11,086 | | 1,592,504 | |
US Ecology | | 12,841 | | 631,135 | |
Viad | | 13,869 | | 611,623 | |
WageWorks | | 26,299 | a | 1,906,677 | |
| | | | | 29,343,403 | |
Consumer Durables & Apparel - 3.3% | | | | | |
Arctic Cat | | 2,882 | a,b | 43,288 | |
Callaway Golf | | 77,614 | | 850,649 | |
Cavco Industries | | 6,235 | a | 622,565 | |
Crocs | | 56,695 | a | 388,928 | |
Ethan Allen Interiors | | 22,249 | b | 819,876 | |
G-III Apparel Group | | 31,265 | a | 924,193 | |
Iconix Brand Group | | 41,516 | a | 387,759 | |
Installed Building Products | | 12,771 | a | 527,442 | |
iRobot | | 21,823 | a,b | 1,275,554 | |
La-Z-Boy | | 39,585 | | 1,229,114 | |
LGI Homes | | 8,782 | a,b | 252,307 | |
M.D.C. Holdings | | 29,247 | | 750,478 | |
M/I Homes | | 19,688 | a | 495,744 | |
Meritage Homes | | 30,469 | a | 1,060,321 | |
Movado Group | | 12,012 | | 345,345 | |
Nautilus | | 18,185 | a,b | 336,423 | |
Oxford Industries | | 9,997 | b | 601,120 | |
Perry Ellis International | | 14,574 | a | 363,038 | |
Steven Madden | | 43,552 | a | 1,556,984 | |
Sturm Ruger & Co. | | 15,992 | b | 842,778 | |
TopBuild | | 31,484 | a | 1,120,830 | |
Unifi | | 6,466 | a | 210,986 | |
Universal Electronics | | 8,629 | a | 557,002 | |
Vera Bradley | | 27,356 | a | 320,612 | |
WCI Communities | | 11,161 | a | 261,725 | |
Wolverine World Wide | | 76,814 | | 1,686,067 | |
| | | | | 17,831,128 | |
Consumer Services - 3.2% | | | | | |
American Public Education | | 10,067 | a | 247,145 | |
Belmond, Cl. A | | 51,185 | a | 683,320 | |
Biglari Holdings | | 752 | a | 355,846 | |
11
STATEMENT OF INVESTMENTS (continued)
| | | | | | |
| |
Common Stocks - 99.2% (continued) | | Shares | | Value ($) | |
Consumer Services - 3.2% (continued) | | | | | |
BJ's Restaurants | | 17,256 | a | 678,161 | |
Bob Evans Farms | | 13,732 | | 730,680 | |
Boyd Gaming | | 67,197 | a | 1,355,363 | |
Capella Education | | 7,505 | | 658,939 | |
Career Education | | 51,594 | a | 520,583 | |
Chuy's Holdings | | 11,510 | a | 373,500 | |
Dave & Buster's Entertainment | | 29,464 | a | 1,658,823 | |
DineEquity | | 12,356 | | 951,412 | |
El Pollo Loco Holdings | | 15,034 | a,b | 184,918 | |
Fiesta Restaurant Group | | 18,536 | a | 553,300 | |
ILG | | 69,866 | | 1,269,465 | |
Marcus | | 10,120 | | 318,780 | |
Marriott Vacations Worldwide | | 16,843 | b | 1,429,129 | |
Monarch Casino & Resort | | 6,498 | a | 167,518 | |
Popeyes Louisiana Kitchen | | 17,254 | a | 1,043,522 | |
Red Robin Gourmet Burgers | | 7,342 | a | 414,089 | |
Regis | | 16,914 | a | 245,591 | |
Ruby Tuesday | | 27,633 | a | 89,255 | |
Ruth's Hospitality Group | | 28,065 | | 513,590 | |
Scientific Games, Cl. A | | 41,872 | a,b | 586,208 | |
Sonic | | 34,830 | | 923,343 | |
Strayer Education | | 7,765 | a | 626,092 | |
Wingstop | | 20,762 | | 614,348 | |
| | | | | 17,192,920 | |
Diversified Financials - 2.6% | | | | | |
Calamos Asset Management, Cl. A | | 1,107 | | 9,465 | |
Capstead Mortgage | | 72,934 | c | 743,197 | |
Donnelley Financial Solutions | | 18,582 | | 427,014 | |
Encore Capital Group | | 15,456 | a,b | 442,814 | |
Enova International | | 15,929 | a | 199,909 | |
Evercore Partners, Cl. A | | 30,653 | | 2,105,861 | |
EZCORP, Cl. A | | 23,359 | a | 248,773 | |
Financial Engines | | 37,553 | b | 1,380,073 | |
FirstCash | | 34,057 | | 1,600,679 | |
Green Dot, Cl. A | | 32,919 | a | 775,242 | |
Greenhill & Co. | | 25,698 | | 711,835 | |
Interactive Brokers Group, Cl. A | | 46,446 | b | 1,695,743 | |
INTL. FCStone | | 9,952 | a | 394,099 | |
Investment Technology Group | | 17,301 | | 341,522 | |
12
| | | | | | |
| |
Common Stocks - 99.2% (continued) | | Shares | | Value ($) | |
Diversified Financials - 2.6% (continued) | | | | | |
Piper Jaffray | | 12,333 | a | 894,142 | |
PRA Group | | 32,909 | a,b | 1,286,742 | |
Virtus Investment Partners | | 3,086 | b | 364,302 | |
World Acceptance | | 6,316 | a,b | 405,992 | |
| | | | | 14,027,404 | |
Energy - 3.6% | | | | | |
Archrock | | 53,614 | | 707,705 | |
Atwood Oceanics | | 51,825 | b | 680,462 | |
Bill Barrett | | 74,590 | a | 521,384 | |
Bristow Group | | 24,254 | b | 496,722 | |
CARBO Ceramics | | 14,459 | a,b | 151,241 | |
Carrizo Oil & Gas | | 48,743 | a | 1,820,551 | |
Cloud Peak Energy | | 43,634 | a,b | 244,787 | |
Contango Oil & Gas | | 25,529 | a | 238,441 | |
Era Group | | 10,874 | a | 184,532 | |
Exterran | | 18,210 | | 435,219 | |
Geospace Technologies | | 11,124 | a,b | 226,485 | |
Green Plains | | 29,023 | | 808,291 | |
Gulf Island Fabrication | | 9,026 | | 107,409 | |
Helix Energy Solutions Group | | 79,933 | a | 705,009 | |
Hornbeck Offshore Services | | 34,165 | a,b | 246,671 | |
Matrix Service | | 24,747 | a | 561,757 | |
Newpark Resources | | 53,270 | a | 399,525 | |
Northern Oil and Gas | | 65,150 | a,b | 179,163 | |
PDC Energy | | 39,189 | a | 2,844,338 | |
Pioneer Energy Services | | 56,043 | a | 383,895 | |
REX American Resources | | 4,497 | a | 444,079 | |
SEACOR Holdings | | 9,941 | a | 708,594 | |
Synergy Resources | | 132,270 | a,b | 1,178,526 | |
Tesco | | 34,444 | a | 284,163 | |
TETRA Technologies | | 81,691 | a | 410,089 | |
Tidewater | | 50,566 | a,b | 172,430 | |
Unit | | 41,429 | a | 1,113,197 | |
US Silica Holdings | | 50,181 | | 2,844,259 | |
| | | | | 19,098,924 | |
Food & Staples Retailing - .5% | | | | | |
Andersons | | 16,584 | | 741,305 | |
SpartanNash | | 27,857 | | 1,101,466 | |
13
STATEMENT OF INVESTMENTS (continued)
| | | | | | |
| |
Common Stocks - 99.2% (continued) | | Shares | | Value ($) | |
Food & Staples Retailing - .5% (continued) | | | | | |
SUPERVALU | | 186,354 | a | 870,273 | |
| | | | | 2,713,044 | |
Food, Beverage & Tobacco - 1.7% | | | | | |
B&G Foods | | 47,376 | b | 2,075,069 | |
Calavo Growers | | 13,430 | | 824,602 | |
Cal-Maine Foods | | 18,883 | b | 834,157 | |
Darling Ingredients | | 121,795 | a | 1,572,373 | |
J&J Snack Foods | | 9,755 | | 1,301,610 | |
Sanderson Farms | | 14,528 | b | 1,369,119 | |
Seneca Foods, Cl. A | | 3,166 | a | 126,798 | |
Universal | | 19,183 | b | 1,222,916 | |
| | | | | 9,326,644 | |
Health Care Equipment & Services - 8.0% | | | | | |
Abaxis | | 16,834 | | 888,330 | |
Aceto | | 21,592 | | 474,376 | |
Adeptus Health, Cl. A | | 9,536 | a,b | 72,855 | |
Air Methods | | 24,465 | a,b | 779,210 | |
Almost Family | | 4,966 | a | 219,001 | |
Amedisys | | 19,779 | a | 843,179 | |
AMN Healthcare Services | | 34,385 | a | 1,322,103 | |
Analogic | | 9,725 | b | 806,689 | |
AngioDynamics | | 31,070 | a | 524,151 | |
Anika Therapeutics | | 9,616 | a | 470,799 | |
BioTelemetry | | 25,985 | a | 580,765 | |
Cantel Medical | | 26,738 | | 2,105,617 | |
Chemed | | 12,695 | | 2,036,405 | |
Community Health Systems | | 80,903 | a | 452,248 | |
Computer Programs & Systems | | 3,372 | b | 79,579 | |
CONMED | | 15,335 | | 677,347 | |
CorVel | | 7,586 | a | 277,648 | |
Cross Country Healthcare | | 22,752 | a | 355,159 | |
CryoLife | | 15,470 | a | 296,251 | |
Cynosure, Cl. A | | 19,073 | a | 869,729 | |
Diplomat Pharmacy | | 28,298 | a,b | 356,555 | |
Ensign Group | | 29,538 | | 656,039 | |
Haemonetics | | 41,887 | a | 1,683,857 | |
HealthEquity | | 30,149 | a,b | 1,221,637 | |
HealthStream | | 14,103 | a | 353,280 | |
Healthways | | 26,280 | a | 597,870 | |
14
| | | | | | |
| |
Common Stocks - 99.2% (continued) | | Shares | | Value ($) | |
Health Care Equipment & Services - 8.0% (continued) | | | | | |
HMS Holdings | | 70,861 | a | 1,286,836 | |
ICU Medical | | 10,037 | a | 1,478,952 | |
Inogen | | 13,430 | a,b | 902,093 | |
Integer Holdings | | 15,658 | a | 461,128 | |
Integra LifeSciences Holdings | | 23,847 | a | 2,045,834 | |
Invacare | | 16,612 | | 216,787 | |
Kindred Healthcare | | 49,016 | | 384,776 | |
Landauer | | 7,625 | | 366,763 | |
LHC Group | | 11,843 | a | 541,225 | |
Magellan Health | | 16,707 | a | 1,257,202 | |
Masimo | | 34,074 | a | 2,296,588 | |
Medidata Solutions | | 39,667 | a | 1,970,260 | |
Meridian Bioscience | | 28,214 | | 499,388 | |
Merit Medical Systems | | 28,182 | a | 746,823 | |
Natus Medical | | 28,758 | a | 1,000,778 | |
Neogen | | 26,250 | a | 1,732,500 | |
Omnicell | | 23,279 | a | 789,158 | |
PharMerica | | 19,622 | a | 493,493 | |
Providence Service | | 7,760 | a | 295,268 | |
Quality Systems | | 35,397 | a | 465,471 | |
Quorum Health | | 26,493 | a | 192,604 | |
Select Medical Holdings | | 76,217 | a | 1,009,875 | |
Surgical Care Affiliates | | 19,656 | a | 909,483 | |
SurModics | | 11,952 | a | 303,581 | |
U.S. Physical Therapy | | 8,450 | | 593,190 | |
Vascular Solutions | | 10,116 | a | 567,508 | |
Zeltiq Aesthetics | | 25,840 | a,b | 1,124,557 | |
| | | | | 42,932,800 | |
Household & Personal Products - .6% | | | | | |
Central Garden & Pet | | 12,204 | a,b | 403,830 | |
Central Garden & Pet, Cl. A | | 20,417 | a | 630,885 | |
Inter Parfums | | 12,560 | | 411,340 | |
Medifast | | 10,428 | | 434,118 | |
WD-40 | | 11,548 | b | 1,349,961 | |
| | | | | 3,230,134 | |
Insurance - 3.0% | | | | | |
American Equity Investment Life Holding | | 58,763 | | 1,324,518 | |
AMERISAFE | | 15,524 | | 967,921 | |
eHealth | | 6,541 | a | 69,662 | |
15
STATEMENT OF INVESTMENTS (continued)
| | | | | | |
| |
Common Stocks - 99.2% (continued) | | Shares | | Value ($) | |
Insurance - 3.0% (continued) | | | | | |
Employers Holdings | | 24,714 | | 978,674 | |
HCI Group | | 7,204 | | 284,414 | |
Horace Mann Educators | | 25,847 | | 1,106,252 | |
Infinity Property & Casualty | | 6,338 | | 557,110 | |
Maiden Holdings | | 61,849 | b | 1,079,265 | |
Navigators Group | | 6,823 | | 803,408 | |
ProAssurance | | 37,484 | | 2,106,601 | |
RLI | | 26,018 | | 1,642,516 | |
Safety Insurance Group | | 11,955 | | 881,083 | |
Selective Insurance Group | | 42,073 | | 1,811,243 | |
Stewart Information Services | | 13,860 | | 638,669 | |
United Fire Group | | 13,444 | | 661,041 | |
United Insurance Holdings | | 20,554 | b | 311,188 | |
Universal Insurance Holdings | | 29,481 | | 837,260 | |
| | | | | 16,060,825 | |
Materials - 6.3% | | | | | |
A. Schulman | | 18,969 | | 634,513 | |
AdvanSix | | 21,500 | | 476,010 | |
AK Steel Holding | | 224,350 | a | 2,290,613 | |
American Vanguard | | 24,989 | | 478,539 | |
Balchem | | 21,806 | | 1,829,960 | |
Boise Cascade | | 24,106 | a | 542,385 | |
Calgon Carbon | | 37,249 | | 633,233 | |
Century Aluminum | | 25,331 | a | 216,833 | |
Chemours | | 136,357 | | 3,012,126 | |
Clearwater Paper | | 13,534 | a | 887,154 | |
Deltic Timber | | 5,845 | | 450,474 | |
Flotek Industries | | 27,908 | a,b | 262,056 | |
FutureFuel | | 24,713 | | 343,511 | |
Glatfelter | | 29,608 | | 707,335 | |
H.B. Fuller | | 39,405 | | 1,903,656 | |
Hawkins | | 4,260 | | 229,827 | |
Haynes International | | 5,991 | | 257,553 | |
Headwaters | | 54,296 | a | 1,277,042 | |
Ingevity | | 28,893 | | 1,585,070 | |
Innophos Holdings | | 14,352 | | 750,036 | |
Innospec | | 17,320 | | 1,186,420 | |
Kaiser Aluminum | | 14,238 | | 1,106,150 | |
KapStone Paper and Packaging | | 61,835 | | 1,363,462 | |
16
| | | | | | |
| |
Common Stocks - 99.2% (continued) | | Shares | | Value ($) | |
Materials - 6.3% (continued) | | | | | |
Koppers Holdings | | 15,946 | a | 642,624 | |
Kraton | | 20,804 | a,b | 592,498 | |
LSB Industries | | 9,842 | a,b | 82,870 | |
Materion | | 15,893 | | 629,363 | |
Myers Industries | | 16,620 | | 237,666 | |
Neenah Paper | | 12,279 | | 1,046,171 | |
Olympic Steel | | 9,943 | | 240,919 | |
Quaker Chemical | | 9,347 | | 1,195,855 | |
Rayonier Advanced Materials | | 37,686 | b | 582,626 | |
Schweitzer-Mauduit International | | 25,424 | | 1,157,555 | |
Stepan | | 14,241 | | 1,160,357 | |
Stillwater Mining | | 86,088 | a,b | 1,386,878 | |
SunCoke Energy | | 46,193 | a | 523,829 | |
TimkenSteel | | 31,589 | a | 488,998 | |
Tredegar | | 24,178 | | 580,272 | |
US Concrete | | 8,007 | a,b | 524,459 | |
| | | | | 33,496,898 | |
Media - .7% | | | | | |
E.W. Scripps, Cl. A | | 45,059 | a,b | 870,990 | |
Gannett Company | | 93,013 | | 903,156 | |
New Media Investment Group | | 37,809 | | 604,566 | |
Scholastic | | 18,707 | | 888,395 | |
World Wrestling Entertainment, Cl. A | | 20,474 | | 376,722 | |
| | | | | 3,643,829 | |
Pharmaceuticals, Biotechnology & Life Sciences - 3.3% | | | | | |
Acorda Therapeutics | | 32,543 | a | 611,808 | |
Albany Molecular Research | | 16,669 | a,b | 312,710 | |
AMAG Pharmaceuticals | | 26,776 | a,b | 931,805 | |
Amphastar Pharmaceuticals | | 29,551 | a,b | 544,329 | |
ANI Pharmaceuticals | | 5,170 | a,b | 313,405 | |
Cambrex | | 25,103 | a | 1,354,307 | |
DepoMed | | 46,456 | a,b | 837,137 | |
Eagle Pharmaceuticals | | 5,366 | a | 425,738 | |
Emergent BioSolutions | | 28,881 | a | 948,452 | |
Enanta Pharmaceuticals | | 10,507 | a | 351,985 | |
Impax Laboratories | | 57,723 | a | 764,830 | |
Innoviva | | 71,524 | a,b | 765,307 | |
Lannett | | 22,289 | a,b | 491,472 | |
Ligand Pharmaceuticals | | 14,000 | a,b | 1,422,540 | |
17
STATEMENT OF INVESTMENTS (continued)
| | | | | | |
| |
Common Stocks - 99.2% (continued) | | Shares | | Value ($) | |
Pharmaceuticals, Biotechnology & Life Sciences - 3.3% (continued) | | | | | |
Luminex | | 32,306 | a | 653,550 | |
Medicines | | 47,196 | a,b | 1,601,832 | |
MiMedx Group | | 67,874 | a,b | 601,364 | |
Momenta Pharmaceuticals | | 42,898 | a | 645,615 | |
Nektar Therapeutics | | 101,818 | a | 1,249,307 | |
Phibro Animal Health, Cl. A | | 13,015 | | 381,340 | |
Repligen | | 22,310 | a | 687,594 | |
SciClone Pharmaceuticals | | 47,312 | a | 510,970 | |
Spectrum Pharmaceuticals | | 50,435 | a,b | 223,427 | |
Supernus Pharmaceuticals | | 35,893 | a | 906,298 | |
| | | | | 17,537,122 | |
Real Estate - 6.1% | | | | | |
Acadia Realty Trust | | 56,576 | c | 1,848,904 | |
Agree Realty | | 16,650 | c | 766,733 | |
American Assets Trust | | 29,405 | c | 1,266,767 | |
CareTrust | | 51,324 | c | 786,284 | |
Cedar Realty Trust | | 39,978 | c | 261,056 | |
Chesapeake Lodging Trust | | 47,132 | c | 1,218,834 | |
CoreSite Realty | | 25,724 | c | 2,041,714 | |
DiamondRock Hospitality | | 149,386 | c | 1,722,421 | |
EastGroup Properties | | 26,004 | c | 1,920,135 | |
Forestar Group | | 28,023 | a,c | 372,706 | |
Four Corners Property Trust | | 47,105 | c | 966,595 | |
Franklin Street Properties | | 69,483 | b,c | 900,500 | |
GEO Group | | 53,571 | c | 1,924,806 | |
Getty Realty | | 22,433 | c | 571,817 | |
Government Properties Income Trust | | 44,896 | b,c | 855,942 | |
HFF, Cl. A | | 29,521 | | 893,010 | |
Kite Realty Group Trust | | 56,056 | c | 1,316,195 | |
Lexington Realty Trust | | 165,239 | c | 1,784,581 | |
LTC Properties | | 31,639 | b,c | 1,486,400 | |
Parkway | | 30,552 | a,c | 679,782 | |
Pennsylvania Real Estate Investment Trust | | 55,342 | b,c | 1,049,284 | |
PS Business Parks | | 15,459 | c | 1,801,283 | |
RE/MAX Holdings, Cl. A | | 12,851 | | 719,656 | |
Retail Opportunity Investments | | 73,061 | c | 1,543,779 | |
Sabra Health Care | | 50,818 | c | 1,240,976 | |
Saul Centers | | 6,721 | c | 447,686 | |
Summit Hotel Properties | | 70,947 | c | 1,137,280 | |
18
| | | | | | |
| |
Common Stocks - 99.2% (continued) | | Shares | | Value ($) | |
Real Estate - 6.1% (continued) | | | | | |
Universal Health Realty Income Trust | | 10,840 | c | 710,996 | |
Urstadt Biddle Properties, Cl. A | | 24,912 | c | 600,628 | |
| | | | | 32,836,750 | |
Retailing - 5.0% | | | | | |
Abercrombie & Fitch, Cl. A | | 47,721 | b | 572,652 | |
Asbury Automotive Group | | 16,449 | a | 1,014,903 | |
Ascena Retail Group | | 126,393 | a | 782,373 | |
Barnes & Noble | | 46,519 | | 518,687 | |
Barnes and Noble Education | | 33,819 | a | 387,904 | |
Big 5 Sporting Goods | | 20,316 | | 352,483 | |
Blue Nile | | 5,303 | | 215,461 | |
Buckle | | 23,265 | b | 530,442 | |
Caleres | | 31,890 | | 1,046,630 | |
Cato, Cl. A | | 19,471 | | 585,688 | |
Core-Mark Holding | | 30,272 | | 1,303,815 | |
Express | | 59,864 | a | 644,137 | |
Finish Line, Cl. A | | 36,834 | | 692,848 | |
Five Below | | 42,999 | a | 1,718,240 | |
Francesca's Holdings | | 34,335 | a | 619,060 | |
Fred's, Cl. A | | 12,833 | b | 238,180 | |
FTD Companies | | 17,661 | a | 421,038 | |
Genesco | | 16,988 | a | 1,054,955 | |
Group 1 Automotive | | 16,151 | b | 1,258,809 | |
Guess? | | 40,827 | b | 494,007 | |
Haverty Furnitures | | 12,207 | | 289,306 | |
Hibbett Sports | | 13,391 | a,b | 499,484 | |
Kirkland's | | 7,728 | a | 119,861 | |
Lithia Motors, Cl. A | | 17,129 | | 1,658,601 | |
Lumber Liquidators Holdings | | 13,722 | a,b | 215,984 | |
MarineMax | | 24,178 | a | 467,844 | |
Monro Muffler Brake | | 22,741 | b | 1,300,785 | |
NutriSystem | | 19,433 | | 673,353 | |
Ollie's Bargain Outlet Holdings | | 33,814 | a | 962,008 | |
PetMed Express | | 8,780 | b | 202,555 | |
Rent-A-Center | | 48,434 | b | 544,883 | |
Select Comfort | | 36,718 | a | 830,561 | |
Shoe Carnival | | 13,858 | | 373,889 | |
Sonic Automotive, Cl. A | | 18,949 | | 433,932 | |
Stein Mart | | 8,459 | | 46,355 | |
19
STATEMENT OF INVESTMENTS (continued)
| | | | | | |
| |
Common Stocks - 99.2% (continued) | | Shares | | Value ($) | |
Retailing - 5.0% (continued) | | | | | |
Tailored Brands | | 34,814 | | 889,498 | |
The Children's Place | | 14,315 | b | 1,445,099 | |
Tile Shop Holdings | | 29,255 | a | 571,935 | |
Tuesday Morning | | 11,062 | a | 59,735 | |
Vitamin Shoppe | | 17,196 | a | 408,405 | |
Zumiez | | 8,636 | a,b | 188,697 | |
| | | | | 26,635,082 | |
Semiconductors & Semiconductor Equipment - 3.2% | | | | | |
Advanced Energy Industries | | 32,061 | a | 1,755,340 | |
Brooks Automation | | 47,120 | | 804,338 | |
Cabot Microelectronics | | 15,350 | | 969,659 | |
CEVA | | 15,441 | a | 518,046 | |
Cohu | | 23,974 | | 333,239 | |
Diodes | | 23,678 | a | 607,814 | |
DSP Group | | 26,285 | a | 343,019 | |
Exar | | 38,449 | a | 414,480 | |
Kopin | | 30,842 | a | 87,591 | |
Kulicke & Soffa Industries | | 59,968 | a | 956,490 | |
MKS Instruments | | 37,392 | | 2,221,085 | |
Nanometrics | | 24,279 | a | 608,432 | |
Power Integrations | | 21,516 | | 1,459,861 | |
Rambus | | 78,208 | a | 1,076,924 | |
Rudolph Technologies | | 29,354 | a | 685,416 | |
Semtech | | 49,473 | a | 1,560,873 | |
Tessera Holding | | 37,282 | | 1,647,864 | |
Ultratech | | 23,704 | a | 568,422 | |
Veeco Instruments | | 24,238 | a | 706,538 | |
| | | | | 17,325,431 | |
Software & Services - 6.0% | | | | | |
8x8 | | 59,155 | a | 845,916 | |
Blackbaud | | 33,399 | | 2,137,536 | |
Blucora | | 26,720 | a | 394,120 | |
Bottomline Technologies (de) | | 28,203 | a | 705,639 | |
CACI International, Cl. A | | 16,993 | a | 2,112,230 | |
Cardtronics, Cl. A | | 35,687 | a | 1,947,440 | |
CSG Systems International | | 25,970 | | 1,256,948 | |
DHI Group | | 39,509 | a | 246,931 | |
Ebix | | 15,754 | b | 898,766 | |
ExlService Holdings | | 26,351 | a | 1,329,144 | |
20
| | | | | | |
| |
Common Stocks - 99.2% (continued) | | Shares | | Value ($) | |
Software & Services - 6.0% (continued) | | | | | |
Forrester Research | | 6,829 | | 293,306 | |
Liquidity Services | | 6,943 | a | 67,694 | |
LivePerson | | 38,041 | a | 287,210 | |
LogMeIn | | 17,701 | a | 1,709,032 | |
ManTech International, Cl. A | | 19,696 | | 832,156 | |
MicroStrategy, Cl. A | | 7,375 | a | 1,455,825 | |
Monotype Imaging Holdings | | 30,207 | | 599,609 | |
NIC | | 48,935 | | 1,169,546 | |
Perficient | | 31,543 | a | 551,687 | |
Progress Software | | 40,691 | | 1,299,264 | |
Qualys | | 24,401 | a | 772,292 | |
QuinStreet | | 18,606 | a | 69,959 | |
Shutterstock | | 15,974 | a,b | 759,084 | |
SPS Commerce | | 11,997 | a | 838,470 | |
Stamps.com | | 11,602 | a,b | 1,330,169 | |
Sykes Enterprises | | 31,449 | a | 907,618 | |
Synchronoss Technologies | | 31,342 | a | 1,200,399 | |
Take-Two Interactive Software | | 60,374 | a | 2,975,834 | |
Tangoe | | 23,458 | a | 184,849 | |
TeleTech Holdings | | 7,348 | | 224,114 | |
TiVo | | 82,653 | a | 1,727,448 | |
VASCO Data Security International | | 29,657 | a,b | 404,818 | |
Virtusa | | 16,037 | a | 402,849 | |
XO Group | | 20,522 | a | 399,153 | |
| | | | | 32,337,055 | |
Technology Hardware & Equipment - 6.0% | | | | | |
ADTRAN | | 33,603 | | 751,027 | |
Agilysys | | 7,915 | a | 81,999 | |
Anixter International | | 19,042 | a | 1,543,354 | |
Badger Meter | | 19,558 | | 722,668 | |
Bel Fuse, Cl. B | | 7,659 | | 236,663 | |
Benchmark Electronics | | 34,162 | a | 1,041,941 | |
Black Box | | 14,232 | | 217,038 | |
CalAmp | | 28,714 | a | 416,353 | |
Coherent | | 17,661 | a | 2,426,356 | |
Comtech Telecommunications | | 9,173 | | 108,700 | |
Cray | | 26,008 | a | 538,366 | |
CTS | | 20,943 | | 469,123 | |
Daktronics | | 32,023 | | 342,646 | |
21
STATEMENT OF INVESTMENTS (continued)
| | | | | | |
| |
Common Stocks - 99.2% (continued) | | Shares | | Value ($) | |
Technology Hardware & Equipment - 6.0% (continued) | | | | | |
Digi International | | 31,079 | a | 427,336 | |
Electro Scientific Industries | | 43,172 | a,b | 255,578 | |
Electronics For Imaging | | 34,534 | a | 1,514,661 | |
ePlus | | 3,684 | a | 424,397 | |
Fabrinet | | 23,354 | a | 941,166 | |
FARO Technologies | | 14,552 | a | 523,872 | |
Harmonic | | 35,310 | a,b | 176,550 | |
II-VI | | 37,257 | a | 1,104,670 | |
Insight Enterprises | | 22,517 | a | 910,587 | |
Itron | | 26,915 | a | 1,691,608 | |
Ixia | | 49,348 | a | 794,503 | |
Lumentum Holdings | | 36,205 | a | 1,399,323 | |
Methode Electronics | | 30,336 | | 1,254,394 | |
MTS Systems | | 10,694 | | 606,350 | |
NETGEAR | | 26,349 | a | 1,432,068 | |
OSI Systems | | 11,661 | a | 887,635 | |
Park Electrochemical | | 21,056 | | 392,694 | |
Plexus | | 23,741 | a | 1,282,964 | |
Rogers | | 15,097 | a | 1,159,601 | |
Sanmina | | 55,870 | a | 2,047,635 | |
ScanSource | | 20,975 | a | 846,341 | |
Super Micro Computer | | 26,478 | a | 742,708 | |
TTM Technologies | | 72,213 | a | 984,263 | |
Viavi Solutions | | 177,528 | a | 1,452,179 | |
| | | | | 32,149,317 | |
Telecommunication Services - 1.1% | | | | | |
ATN International | | 6,498 | | 520,685 | |
Cincinnati Bell | | 29,510 | a | 659,549 | |
Cogent Communications Holdings | | 32,675 | | 1,351,111 | |
Consolidated Communications Holdings | | 41,718 | b | 1,120,128 | |
General Communication, Cl. A | | 18,218 | a | 354,340 | |
Inteliquent | | 27,915 | | 639,812 | |
Iridium Communications | | 54,425 | a,b | 522,480 | |
Lumos Networks | | 8,602 | a | 134,363 | |
Spok Holdings | | 14,757 | | 306,208 | |
| | | | | 5,608,676 | |
Transportation - 2.7% | | | | | |
Allegiant Travel | | 9,475 | | 1,576,640 | |
ArcBest | | 14,574 | | 402,971 | |
22
| | | | | | |
| |
Common Stocks - 99.2% (continued) | | Shares | | Value ($) | |
Transportation - 2.7% (continued) | | | | | |
Atlas Air Worldwide Holdings | | 19,905 | a | 1,038,046 | |
Celadon Group | | 10,925 | b | 78,114 | |
Echo Global Logistics | | 20,682 | a | 518,084 | |
Forward Air | | 25,465 | | 1,206,532 | |
Hawaiian Holdings | | 41,966 | a | 2,392,062 | |
Heartland Express | | 35,109 | b | 714,819 | |
Hub Group, Cl. A | | 27,502 | a | 1,203,212 | |
Knight Transportation | | 45,255 | | 1,495,678 | |
Marten Transport | | 17,814 | | 415,066 | |
Matson | | 27,533 | | 974,393 | |
Roadrunner Transportation Systems | | 37,615 | a | 390,820 | |
Saia | | 15,367 | a | 678,453 | |
SkyWest | | 42,185 | | 1,537,643 | |
| | | | | 14,622,533 | |
Utilities - 2.5% | | | | | |
ALLETE | | 36,959 | | 2,372,398 | |
American States Water | | 23,751 | | 1,082,096 | |
Avista | | 49,639 | | 1,985,064 | |
California Water Service Group | | 31,494 | | 1,067,647 | |
El Paso Electric | | 32,567 | | 1,514,365 | |
Northwest Natural Gas | | 19,092 | | 1,141,702 | |
South Jersey Industries | | 59,017 | | 1,988,283 | |
Spire | | 35,033 | | 2,261,380 | |
| | | | | 13,412,935 | |
Total Common Stocks (cost $389,488,532) | | | | 531,348,144 | |
Short-Term Investments - .1% | | Principal Amount ($) | | Value ($) | |
U.S. Treasury Bills | | | | | |
0.52%, 3/16/17
(cost $499,466) | | 500,000 | d | 499,505 | |
Other Investment - .9% | | Shares | | Value ($) | |
Registered Investment Company; | | | | | |
Dreyfus Institutional Preferred Government Plus Money Market Fund
(cost $4,920,308) | | 4,920,308 | e | 4,920,308 | |
23
STATEMENT OF INVESTMENTS (continued)
| | | | | | |
| |
Investment of Cash Collateral for Securities Loaned - 6.5% | | Shares | | Value ($) | |
Registered Investment Company; | | | | | |
Dreyfus Institutional Preferred Money Market Fund, Hamilton Shares
(cost $34,545,409) | | 34,545,409 | e | 34,545,409 | |
Total Investments (cost $429,453,715) | | 106.7% | | 571,313,366 | |
Liabilities, Less Cash and Receivables | | (6.7%) | | (35,710,010) | |
Net Assets | | 100.0% | | 535,603,356 | |
aNon-income producing security.
bSecurity, or portion thereof, on loan. At December 31, 2016, the value of the fund’s securities on loan was $57,340,384 and the value of the collateral held by the fund was $58,458,648, consisting of cash collateral of $34,545,409 and U.S. Government & Agency securities valued at $23,913,239.
cInvestment in real estate investment trust.
dHeld by or on behalf of a counterparty for open futures contracts.
eInvestment in affiliated money market mutual fund.
24
| | |
Portfolio Summary (Unaudited) † | Value (%) |
Banks | 12.5 |
Capital Goods | 10.0 |
Health Care Equipment & Services | 8.0 |
Short-Term/Money Market Investments | 7.5 |
Materials | 6.3 |
Real Estate | 6.1 |
Software & Services | 6.0 |
Technology Hardware & Equipment | 6.0 |
Commercial & Professional Services | 5.5 |
Retailing | 5.0 |
Energy | 3.6 |
Consumer Durables & Apparel | 3.3 |
Pharmaceuticals, Biotechnology & Life Sciences | 3.3 |
Consumer Services | 3.2 |
Semiconductors & Semiconductor Equipment | 3.2 |
Insurance | 3.0 |
Transportation | 2.7 |
Diversified Financials | 2.6 |
Utilities | 2.5 |
Automobiles & Components | 1.8 |
Food, Beverage & Tobacco | 1.7 |
Telecommunication Services | 1.1 |
Media | .7 |
Household & Personal Products | .6 |
Food & Staples Retailing | .5 |
| | 106.7 |
† Based on net assets.
See notes to financial statements.
25
STATEMENT OF FUTURES
December 31, 2016
| | | | | | | | |
| | Contracts | Market Value Covered by Contracts ($) | Expiration | Unrealized (Depreciation) ($) | |
| | | | | | |
Futures Long | | |
Russell 2000 Mini | 86 | | 5,834,670 | March 2017 | (63,104) | |
Gross Unrealized Depreciation | | (63,104) | |
See notes to financial statements.
26
STATEMENT OF ASSETS AND LIABILITIES
December 31, 2016
| | | | | | | | | | |
| | | | | | |
| | | Cost | | Value | |
Assets ($): | | | | |
Investments in securities—See Statement of Investments
(including securities on loan, valued at $57,340,384)—Note 1(b): | | | | |
Unaffiliated issuers | | 389,987,998 | | 531,847,649 | |
Affiliated issuers | | 39,465,717 | | 39,465,717 | |
Cash | | | | | 449,793 | |
Dividends and securities lending income receivable | | | | | 705,400 | |
Other assets | | | | | 12,306 | |
| | | | | 572,480,865 | |
Liabilities ($): | | | | |
Due to The Dreyfus Corporation and affiliates—Note 3(b) | | | | | 261,093 | |
Liability for securities on loan—Note 1(b) | | | | | 34,545,409 | |
Payable for shares of Beneficial Interest redeemed | | | | | 2,048,049 | |
Payable for futures variation margin—Note 4 | | | | | 21,758 | |
Accrued expenses | | | | | 1,200 | |
| | | | | 36,877,509 | |
Net Assets ($) | | | 535,603,356 | |
Composition of Net Assets ($): | | | | |
Paid-in capital | | | | | 372,843,775 | |
Accumulated undistributed investment income—net | | | | | 3,647,393 | |
Accumulated net realized gain (loss) on investments | | | | | 17,315,641 | |
Accumulated net unrealized appreciation (depreciation)
on investments [including ($63,104) net unrealized
(depreciation) on futures] | | | | 141,796,547 | |
Net Assets ($) | | | 535,603,356 | |
Shares Outstanding | | |
(unlimited number of $.001 par value shares of Beneficial Interest authorized) | | 28,363,356 | |
Net Asset Value Per Share ($) | | 18.88 | |
| | | | | |
See notes to financial statements. | | | | |
27
STATEMENT OF OPERATIONS
Year Ended December 31, 2016
| | | | | | | |
| | | | | | |
| | | | | | |
Investment Income ($): | | | | |
Income: | | | | |
Cash dividends (net of $577 foreign taxes withheld at source): | | | | |
Unaffiliated issuers | | | 5,414,630 | |
Affiliated issuers | | | 13,081 | |
Income from securities lending—Note 1(b) | | | 366,503 | |
Interest | | | 778 | |
Total Income | | | 5,794,992 | |
Expenses: | | | | |
Management fee—Note 3(a) | | | 1,303,057 | |
Distribution fees—Note 3(b) | | | 930,755 | |
Trustees’ fees—Note 3(a,c) | | | 102,777 | |
Loan commitment fees—Note 2 | | | 8,797 | |
Interest expense—Note 2 | | | 207 | |
Total Expenses | | | 2,345,593 | |
Less—Trustees’ fees reimbursed by Dreyfus—Note 3(a) | | | (102,777) | |
Net Expenses | | | 2,242,816 | |
Investment Income—Net | | | 3,552,176 | |
Realized and Unrealized Gain (Loss) on Investments—Note 4 ($): | | |
Net realized gain (loss) on investments | 22,121,680 | |
Net realized gain (loss) on futures | 822,342 | |
Net Realized Gain (Loss) | | | 22,944,022 | |
Net unrealized appreciation (depreciation) on investments | | | 66,750,259 | |
Net unrealized appreciation (depreciation) on futures | | | (57,351) | |
Net Unrealized Appreciation (Depreciation) | | | 66,692,908 | |
Net Realized and Unrealized Gain (Loss) on Investments | | | 89,636,930 | |
Net Increase in Net Assets Resulting from Operations | | 93,189,106 | |
| | | | | | | |
See notes to financial statements. | | | | | |
28
STATEMENT OF CHANGES IN NET ASSETS
| | | | | | | | | | |
| | | | Year Ended December 31, |
| | | | 2016 | | | | 2015 | |
Operations ($): | | | | | | | | |
Investment income—net | | | 3,552,176 | | | | 2,921,962 | |
Net realized gain (loss) on investments | | 22,944,022 | | | | 28,314,429 | |
Net unrealized appreciation (depreciation)
on investments | | 66,692,908 | | | | (38,358,951) | |
Net Increase (Decrease) in Net Assets
Resulting from Operations | 93,189,106 | | | | (7,122,560) | |
Distributions to Shareholders from ($): | | | | | | | | |
Investment income—net | | | (2,881,636) | | | | (2,379,002) | |
Net realized gain on investments | | | (27,317,040) | | | | (21,208,628) | |
Total Distributions | | | (30,198,676) | | | | (23,587,630) | |
Beneficial Interest Transactions ($): | | | | | | | | |
Net proceeds from shares sold | | | 197,804,376 | | | | 47,225,229 | |
Distributions reinvested | | | 30,198,676 | | | | 23,587,630 | |
Cost of shares redeemed | | | (63,090,822) | | | | (70,053,589) | |
Increase (Decrease) in Net Assets
from Beneficial Interest Transactions | 164,912,230 | | | | 759,270 | |
Total Increase (Decrease) in Net Assets | 227,902,660 | | | | (29,950,920) | |
Net Assets ($): | | | | | | | | |
Beginning of Period | | | 307,700,696 | | | | 337,651,616 | |
End of Period | | | 535,603,356 | | | | 307,700,696 | |
Undistributed investment income—net | 3,647,393 | | | | 2,976,853 | |
Capital Share Transactions (Shares): | | | | | | | | |
Shares sold | | | 11,747,279 | | | | 2,682,982 | |
Shares issued for distributions reinvested | | | 2,029,481 | | | | 1,340,206 | |
Shares redeemed | | | (3,823,393) | | | | (3,960,019) | |
Net Increase (Decrease) in Shares Outstanding | 9,953,367 | | | | 63,169 | |
| | | | | | | | | | |
See notes to financial statements. | | | | | | | | |
29
FINANCIAL HIGHLIGHTS
The following table describes the performance for the fiscal periods indicated. Total return shows how much your investment in the fund would have increased (or decreased) during each period, assuming you had reinvested all dividends and distributions. The fund’s total returns do not reflect expenses associated with variable annuity or insurance contracts. These figures have been derived from the fund’s financial statements.
| | | | | | | | | | | |
| | | | | |
| | |
| | Year Ended December 31, |
| | | 2016 | 2015 | 2014 | 2013 | 2012 |
Per Share Data ($): | | | | | | |
Net asset value, beginning of period | | 16.71 | 18.40 | 18.60 | 13.56 | 12.17 |
Investment Operations: | | | | | | |
Investment income—neta | | .16 | .16 | .13 | .11 | .17 |
Net realized and unrealized
gain (loss) on investments | | 3.69 | (.53) | .79 | 5.31 | 1.73 |
Total from Investment Operations | | 3.85 | (.37) | .92 | 5.42 | 1.90 |
Distributions: | | | | | | |
Dividends from investment income—net | | (.16) | (.13) | (.11) | (.17) | (.06) |
Dividends from net realized
gain on investments | | (1.52) | (1.19) | (1.01) | (.21) | (.45) |
Total Distributions | | (1.68) | (1.32) | (1.12) | (.38) | (.51) |
Net asset value, end of period | | 18.88 | 16.71 | 18.40 | 18.60 | 13.56 |
Total Return (%) | | 25.73 | (2.33) | 5.12 | 40.72 | 15.74 |
Ratios/Supplemental Data (%): | | | | | | |
Ratio of total expenses to average net assets | | .63 | .63 | .63 | .60 | .60 |
Ratio of net expenses to average net assets | | .60 | .60 | .60 | .60 | .60 |
Ratio of net investment income
to average net assets | | .95 | .90 | .73 | .70 | 1.32 |
Portfolio Turnover Rate | | 24.24 | 19.72 | 14.30 | 16.76 | 13.66 |
Net Assets, end of period ($ x 1,000) | | 535,603 | 307,701 | 337,652 | 331,995 | 219,570 |
a Based on average shares outstanding.
See notes to financial statements.
30
NOTES TO FINANCIAL STATEMENTS
NOTE 1—Significant Accounting Policies:
Small Cap Stock Index Portfolio (the “fund”) is a separate diversified series of Dreyfus Investment Portfolios (the “Company”), which is registered under the Investment Company Act of 1940, as amended (the “Act”), as an open-end management investment company and operates as a series company currently offering four series, including the fund. The fund is only offered to separate accounts established by insurance companies to fund variable annuity contracts and variable life insurance policies. The fund’s investment objective is to seek to match the performance of the S&P SmallCap 600® Index. The Dreyfus Corporation (the “Manager” or “Dreyfus”), a wholly-owned subsidiary of The Bank of New York Mellon Corporation (“BNY Mellon”), serves as the fund’s investment adviser. MBSC Securities Corporation (the “Distributor”), a wholly-owned subsidiary of Dreyfus, is the distributor of the fund’s shares, which are sold without a sales charge.
The Company accounts separately for the assets, liabilities and operations of each series. Expenses directly attributable to each series are charged to that series’ operations; expenses which are applicable to all series are allocated among them on a pro rata basis.
The Financial Accounting Standards Board (“FASB”) Accounting Standards Codification is the exclusive reference of authoritative U.S. generally accepted accounting principles (“GAAP”) recognized by the FASB to be applied by nongovernmental entities. Rules and interpretive releases of the Securities and Exchange Commission (“SEC”) under authority of federal laws are also sources of authoritative GAAP for SEC registrants. The fund’s financial statements are prepared in accordance with GAAP, which may require the use of management estimates and assumptions. Actual results could differ from those estimates.
The Company enters into contracts that contain a variety of indemnifications. The fund’s maximum exposure under these arrangements is unknown. The fund does not anticipate recognizing any loss related to these arrangements.
(a) Portfolio valuation: The fair value of a financial instrument is the amount that would be received to sell an asset or paid to transfer a liability in an orderly transaction between market participants at the measurement date (i.e., the exit price). GAAP establishes a fair value hierarchy that prioritizes the inputs of valuation techniques used to measure fair value. This hierarchy gives the highest priority to unadjusted quoted prices in active markets for identical assets or liabilities (Level 1 measurements) and the lowest priority to unobservable inputs (Level 3 measurements).
31
NOTES TO FINANCIAL STATEMENTS (continued)
Additionally, GAAP provides guidance on determining whether the volume and activity in a market has decreased significantly and whether such a decrease in activity results in transactions that are not orderly. GAAP requires enhanced disclosures around valuation inputs and techniques used during annual and interim periods.
Various inputs are used in determining the value of the fund’s investments relating to fair value measurements. These inputs are summarized in the three broad levels listed below:
Level 1—unadjusted quoted prices in active markets for identical investments.
Level 2—other significant observable inputs (including quoted prices for similar investments, interest rates, prepayment speeds, credit risk, etc.).
Level 3—significant unobservable inputs (including the fund’s own assumptions in determining the fair value of investments).
The inputs or methodology used for valuing securities are not necessarily an indication of the risk associated with investing in those securities.
Changes in valuation techniques may result in transfers in or out of an assigned level within the disclosure hierarchy. Valuation techniques used to value the fund’s investments are as follows:
Investments in securities are valued at the last sales price on the securities exchange or national securities market on which such securities are primarily traded. Securities listed on the National Market System for which market quotations are available are valued at the official closing price or, if there is no official closing price that day, at the last sales price. For open short positions, asked prices are used for valuation purposes. Bid price is used when no asked price is available. Registered investment companies that are not traded on an exchange are valued at their net asset value. All of the preceding securities are generally categorized within Level 1 of the fair value hierarchy.
Securities not listed on an exchange or the national securities market, or securities for which there were no transactions, are valued at the average of the most recent bid and asked prices. U.S. Treasury Bills are valued at the mean price between quoted bid prices and asked prices by an independent pricing service (the “Service”) approved by the Company’s Board of Trustees (the “Board”). These securities are generally categorized within Level 2 of the fair value hierarchy.
The Service is engaged under the general supervision of the Board.
32
Fair valuing of securities may be determined with the assistance of a pricing service using calculations based on indices of domestic securities and other appropriate indicators, such as prices of relevant American Depository Receipts and futures. Utilizing these techniques may result in transfers between Level 1 and Level 2 of the fair value hierarchy.
When market quotations or official closing prices are not readily available, or are determined not to reflect accurately fair value, such as when the value of a security has been significantly affected by events after the close of the exchange or market on which the security is principally traded (for example, a foreign exchange or market), but before the fund calculates its net asset value, the fund may value these investments at fair value as determined in accordance with the procedures approved by the Board. Certain factors may be considered when fair valuing investments such as: fundamental analytical data, the nature and duration of restrictions on disposition, an evaluation of the forces that influence the market in which the securities are purchased and sold, and public trading in similar securities of the issuer or comparable issuers. These securities are either categorized within Level 2 or 3 of the fair value hierarchy depending on the relevant inputs used.
For restricted securities where observable inputs are limited, assumptions about market activity and risk are used and are generally categorized within Level 3 of the fair value hierarchy.
Futures, which are traded on an exchange, are valued at the last sales price on the securities exchange on which such securities are primarily traded or at the last sales price on the national securities market on each business day and are generally categorized within Level 1 of the fair value hierarchy.
The following is a summary of the inputs used as of December 31, 2016 in valuing the fund’s investments:
33
NOTES TO FINANCIAL STATEMENTS (continued)
| | | | | | |
| | Level 1 - Unadjusted Quoted Prices | Level 2 - Other Significant Observable Inputs | Level 3 -Significant Unobservable Inputs | Total |
Assets ($) | | | | |
Investments in Securities: | | |
Equity Securities—
Domestic
Common Stocks† | 528,767,168 | – | – | 528,767,168 |
Equity Securities—
Foreign Common
Stocks† | 2,580,976 | – | – | 2,580,976 |
Registered
Investment
Companies | 39,465,717 | – | – | 39,465,717 |
U.S. Treasury | – | 499,505 | – | 499,505 |
Liabilities ($) | | | | |
Other Financial Instruments: | | |
Futures†† | (63,104) | – | – | (63,104) |
† See Statement of Investments for additional detailed categorizations.
†† Amount shown represents unrealized (depreciation) at period end.
At December 31, 2016, there were no transfers between levels of the fair value hierarchy.
(b) Securities transactions and investment income: Securities transactions are recorded on a trade date basis. Realized gains and losses from securities transactions are recorded on the identified cost basis. Dividend income is recognized on the ex-dividend date and interest income, including, where applicable, accretion of discount and amortization of premium on investments, is recognized on the accrual basis.
Pursuant to a securities lending agreement with The Bank of New York Mellon, a subsidiary of BNY Mellon and an affiliate of Dreyfus, the fund may lend securities to qualified institutions. It is the fund’s policy that, at origination, all loans are secured by collateral of at least 102% of the value of U.S. securities loaned and 105% of the value of foreign securities loaned. Collateral equivalent to at least 100% of the market value of securities on loan is maintained at all times. Collateral is either in the form of cash, which can be invested in certain money market mutual funds managed by Dreyfus, or U.S. Government and Agency securities. The fund is entitled to receive all dividends, interest and distributions on securities loaned, in addition to income earned as a result of the lending transaction. Should a borrower fail to return the securities in a timely manner, The Bank of New York Mellon is required to replace the securities for the benefit of the fund or credit the fund with the market value of the unreturned securities and is subrogated to the fund’s rights against the
34
borrower and the collateral. Additionally, the contractual maturity of security lending transactions are on an overnight and continuous basis. During the period ended December 31, 2016, The Bank of New York Mellon earned $87,534 from lending portfolio securities, pursuant to the securities lending agreement.
(c) Affiliated issuers: Investments in other investment companies advised by Dreyfus are defined as “affiliated” under the Act. Investments in affiliated investment companies during the period ended December 31, 2016 were as follows:
| | | | | | |
Affiliated Investment Company | Value 12/31/2015 ($) | Purchases ($) | Sales ($) | Value 12/31/2016 ($) | Net Assets (%) |
Dreyfus Institutional Cash Advantage Fund, Institutional Shares† | 20,190,534 | 127,036,797 | 147,227,331 | – | – |
Dreyfus Institutional Preferred Government Plus Money Market Fund†† | 4,242,412 | 185,649,308 | 184,971,412 | 4,920,308 | .9 |
Dreyfus Institutional Preferred Money Market Fund, Hamilton Shares† | – | 76,197,978 | 41,652,569 | 34,545,409 | 6.5 |
Total | 24,432,946 | 388,884,083 | 373,851,312 | 39,465,717 | 7.4 |
† During the period ended December 31, 2016, Dreyfus Institutional Cash Advantage Fund was acquired by Dreyfus Institutional Preferred Money Market Fund.
†† Formerly Dreyfus Institutional Preferred Plus Money Market Fund.
(d) Dividends and distributions to shareholders: Dividends and distributions are recorded on the ex-dividend date. Dividends from investment income-net and dividends from net realized capital gains, if any, are normally declared and paid annually, but the fund may make distributions on a more frequent basis to comply with the distribution requirements of the Internal Revenue Code of 1986, as amended (the “Code”). To the extent that net realized capital gains can be offset by capital loss carryovers, it is the policy of the fund not to distribute such gains. Income and capital gain distributions are determined in accordance with income tax regulations, which may differ from GAAP.
35
NOTES TO FINANCIAL STATEMENTS (continued)
(e) Federal income taxes: It is the policy of the fund to continue to qualify as a regulated investment company, if such qualification is in the best interests of its shareholders, by complying with the applicable provisions of the Code, and to make distributions of taxable income sufficient to relieve it from substantially all federal income and excise taxes.
As of and during the period ended December 31, 2016, the fund did not have any liabilities for any uncertain tax positions. The fund recognizes interest and penalties, if any, related to uncertain tax positions as income tax expense in the Statement of Operations. During the period ended December 31, 2016, the fund did not incur any interest or penalties.
Each tax year in the four-year period ended December 31, 2016 remains subject to examination by the Internal Revenue Service and state taxing authorities.
At December 31, 2016, the components of accumulated earnings on a tax basis were as follows: undistributed ordinary income $4,238,624, undistributed capital gains $22,560,594 and unrealized appreciation $135,863,141.
The tax character of distributions paid to shareholders during the fiscal periods ended December 31, 2016 and December 31, 2015 were as follows: ordinary income $2,881,636 and $3,115,782, and long-term capital gains $27,317,040 and $20,471,848, respectively.
NOTE 2—Bank Lines of Credit:
The fund participates with other Dreyfus-managed funds in an $810 million unsecured credit facility led by Citibank, N.A. and a $300 million unsecured credit facility provided by The Bank of New York Mellon (each, a “Facility”), each to be utilized primarily for temporary or emergency purposes, including the financing of redemptions. Prior to October 5, 2016, the unsecured credit facility with Citibank, N.A. was $555 million and prior to January 11, 2016, the unsecured credit facility with Citibank, N.A. was $480 million. In connection therewith, the fund has agreed to pay its pro rata portion of commitment fees for each Facility. Interest is charged to the fund based on rates determined pursuant to the terms of the respective Facility at the time of borrowing.
The average amount of borrowings outstanding under the Facilities during the period ended December 31, 2016 was approximately $15,300 with a related weighted average annualized interest rate of 1.35%.
36
NOTE 3—Management Fee and Other Transactions with Affiliates:
(a) Pursuant to a management agreement (the “Agreement”) with Dreyfus, the management fee is computed at the annual rate of .35% of the value of the fund’s average daily net assets and is payable monthly. Under the terms of the Agreement, Dreyfus has agreed to pay all of the expenses of the fund (excluding management fees, Rule 12b-1 Distribution Plan fees, taxes, interest expense, brokerage commissions, commitment fees on borrowings, fees and expenses of non-interested Trustees (including counsel fees), and extraordinary expenses). In addition, Dreyfus has also agreed to reduce its management fee in an amount equal to the fund’s allocable portion of the accrued fees and expenses of the non-interested Trustees (including counsel fees). During the period ended December 31, 2016, fees reimbursed by Dreyfus amounted to $102,777.
(b) Under the Distribution Plan adopted pursuant to Rule 12b-1 under the Act, the fund pays the Distributor for distributing its shares, for servicing and/or maintaining shareholder accounts and for advertising and marketing. The Distribution Plan provides for payments to be made at an annual rate of .25% of the value of the fund’s average daily net assets. The Distributor may make payments to Participating Insurance Companies and to brokers and dealers acting as principal underwriter for their variable insurance products. The fees payable under the Distribution Plan are payable without regard to actual expenses incurred. During the period ended December 31, 2016, the fund was charged $930,755 pursuant to the Distribution Plan.
The components of “Due to The Dreyfus Corporation and affiliates” in the Statement of Assets and Liabilities consist of: management fees $158,841 and Distribution Plan fees $113,458, which are offset against an expense reimbursement currently in effect in the amount of $11,206.
(c) Each Board member also serves as a Board member of other funds within the Dreyfus complex. Annual retainer fees and attendance fees are allocated to each fund based on net assets.
NOTE 4—Securities Transactions:
The aggregate amount of purchases and sales of investment securities, excluding short-term securities and futures, during the period ended December 31, 2016, amounted to $230,414,821 and $90,726,057, respectively.
Derivatives: A derivative is a financial instrument whose performance is derived from the performance of another asset. Each type of derivative
37
NOTES TO FINANCIAL STATEMENTS (continued)
instrument that was held by the fund during the period ended December 31, 2016 is discussed below.
Futures: In the normal course of pursuing its investment objective, the fund is exposed to market risk, including equity price risk, as a result of changes in value of underlying financial instruments. The fund invests in futures in order to manage its exposure to or protect against changes in the market. A futures contract represents a commitment for the future purchase or a sale of an asset at a specified date. Upon entering into such contracts, these investments require initial margin deposits with a counterparty, which consist of cash or cash equivalents. The amount of these deposits is determined by the exchange or Board of Trade on which the contract is traded and is subject to change. Accordingly, variation margin payments are received or made to reflect daily unrealized gains or losses which are recorded in the Statement of Operations. When the contracts are closed, the fund recognizes a realized gain or loss which is reflected in the Statement of Operations. There is minimal counterparty credit risk to the fund with futures since they are exchange traded, and the exchange guarantees the futures against default. Futures open at December 31, 2016 are set forth in the Statement of Futures.
The following summarizes the average market value of derivatives outstanding during the period ended December 31, 2016:
| | | |
| | Average Market Value ($) |
Equity futures | | 3,572,147 |
| | | |
At December 31, 2016, the cost of investments for federal income tax purposes was $435,450,225; accordingly, accumulated net unrealized appreciation on investments was $135,863,141, consisting of $156,380,577 gross unrealized appreciation and $20,517,436 gross unrealized depreciation.
38
REPORT OF INDEPENDENT REGISTERED
PUBLIC ACCOUNTING FIRM
Shareholders and Board of Trustees
Dreyfus Investment Portfolios, Small Cap Stock Index Portfolio
We have audited the accompanying statement of assets and liabilities, including the statements of investments and futures, of Dreyfus Investment Portfolios, Small Cap Stock Index Portfolio (one of the series comprising Dreyfus Investment Portfolios) as of December 31, 2016, and the related statement of operations for the year then ended, the statement of changes in net assets for each of the two years in the period then ended, and the financial highlights for each of the five years in the period then ended. These financial statements and financial highlights are the responsibility of the Fund’s management. Our responsibility is to express an opinion on these financial statements and financial highlights based on our audits.
We conducted our audits in accordance with the standards of the Public Company Accounting Oversight Board (United States). Those standards require that we plan and perform the audit to obtain reasonable assurance about whether the financial statements and financial highlights are free of material misstatement. We were not engaged to perform an audit of the Fund’s internal control over financial reporting. Our audits included consideration of internal control over financial reporting as a basis for designing audit procedures that are appropriate in the circumstances, but not for the purpose of expressing an opinion on the effectiveness of the Fund’s internal control over financial reporting. Accordingly, we express no such opinion. An audit also includes examining, on a test basis, evidence supporting the amounts and disclosures in the financial statements and financial highlights, assessing the accounting principles used and significant estimates made by management, and evaluating the overall financial statement presentation. Our procedures included confirmation of securities owned as of December 31, 2016 by correspondence with the custodian and others. We believe that our audits provide a reasonable basis for our opinion.
In our opinion, the financial statements and financial highlights referred to above present fairly, in all material respects, the financial position of Dreyfus Investment Portfolios, Small Cap Stock Index Portfolio at December 31, 2016, the results of its operations for the year then ended, the changes in its net assets for each of the two years in the period then ended, and the financial highlights for each of the five years in the period then ended, in conformity with U.S. generally accepted accounting principles.

New York, New York
February 10, 2017
39
IMPORTANT TAX INFORMATION (Unaudited)
For federal tax purposes, the fund hereby reports 100% of the ordinary dividends paid during the fiscal year ended December 31, 2016 as qualifying for the corporate dividends received deduction. Shareholders will receive notification in early 2017 of the percentage applicable to the preparation of their 2016 income tax returns. Also, the fund hereby reports $1.5177 per share as a long-term capital gain distribution paid on March 23, 2016.
40
INFORMATION ABOUT THE RENEWAL OF THE FUND’S MANAGEMENT AGREEMENT (Unaudited)
At a meeting of the fund’s Board of Trustees held on July 20-21, 2016, the Board considered the renewal of the fund’s Management Agreement pursuant to which Dreyfus provides the fund with investment advisory and administrative services (the “Agreement”). The Board members, a majority of whom are not “interested persons” (as defined in the Investment Company Act of 1940, as amended) of the fund, were assisted in their review by independent legal counsel and met with counsel in executive session separate from Dreyfus representatives. In considering the renewal of the Agreement, the Board considered all factors that it believed to be relevant, including those discussed below. The Board did not identify any one factor as dispositive, and each Board member may have attributed different weights to the factors considered.
Analysis of Nature, Extent, and Quality of Services Provided to the Fund. The Board considered information provided to them at the meeting and in previous presentations from Dreyfus representatives regarding the nature, extent, and quality of the services provided to funds in the Dreyfus fund complex. Dreyfus provided the number of open accounts in the fund, the fund’s asset size and the allocation of fund assets among distribution channels. Dreyfus also had previously provided information regarding the diverse intermediary relationships and distribution channels of funds in the Dreyfus fund complex (such as retail direct or intermediary, in which intermediaries typically are paid by the fund and/or Dreyfus) and Dreyfus’ corresponding need for broad, deep, and diverse resources to be able to provide ongoing shareholder services to each intermediary or distribution channel, as applicable to the fund.
The Board also considered research support available to, and portfolio management capabilities of, the fund’s portfolio management personnel and that Dreyfus also provides oversight of day-to-day fund operations, including fund accounting and administration and assistance in meeting legal and regulatory requirements. The Board also considered Dreyfus’ extensive administrative, accounting and compliance infrastructures. The Board also considered portfolio management’s brokerage policies and practices (including policies and practices regarding soft dollars) and the standards applied in seeking best execution.
Comparative Analysis of the Fund’s Performance and Management Fee and Expense Ratio. The Board reviewed reports prepared by Broadridge Financial Solutions, Inc. (“Broadridge”), an independent provider of investment company data, which included information comparing (1) the fund’s performance with the performance of a group of comparable funds (the “Performance Group”) and with a broader group of funds (the “Performance Universe”), all for various periods ended May 31, 2016, and (2) the fund’s actual and contractual management fees and total expenses with those of a group of comparable funds (the “Expense Group”) and with a broader group of funds (the “Expense Universe”), the information for which was derived in part from fund financial statements available to Broadridge as of the date of its analysis. Dreyfus previously had furnished the Board with a description of the methodology Broadridge used to select the Performance Group and Performance Universe and the Expense Group and Expense Universe.
41
INFORMATION ABOUT THE RENEWAL OF THE FUND’S MANAGEMENT AGREEMENT (Unaudited) (continued)
Dreyfus representatives stated that the usefulness of performance comparisons may be affected by a number of factors, including different investment limitations that may be applicable to the fund and comparison funds. The Board discussed the results of the comparisons and noted that the fund’s total return performance was below the Performance Group median for all periods and above the Performance Universe median for all periods. The Board noted the proximity of the fund’s performance to the Performance Group medians in all periods and also noted that there were only three or four funds, including the fund, in the Performance Group. Dreyfus also provided a comparison of the fund’s calendar year total returns to the returns of the fund’s benchmark index.
The Board also reviewed the range of actual and contractual management fees and total expenses of the Expense Group and Expense Universe funds and discussed the results of the comparisons. Taking into account the fund’s “unitary” fee structure, the Board noted that the fund’s contractual management fee was slightly below the Expense Group median, the fund’s actual management fee was slightly above the Expense Group median and slightly below the Expense Universe median and the fund’s total expenses were above the Expense Group and Expense Universe medians.
Dreyfus representatives reviewed with the Board the management or investment advisory fees (1) paid by funds advised or administered by Dreyfus that are in the same Broadridge category as the fund and (2) paid to Dreyfus or the Dreyfus-affiliated primary employer of the fund’s primary portfolio manager(s) for advising any separate accounts and/or other types of client portfolios that are considered to have similar investment strategies and policies as the fund (the “Similar Clients”), and explained the nature of the Similar Clients. They discussed differences in fees paid and the relationship of the fees paid in light of any differences in the services provided and other relevant factors, noting the fund’s “unitary” fee structure. The Board considered the relevance of the fee information provided for the Similar Clients to evaluate the appropriateness of the fund’s management fee.
Analysis of Profitability and Economies of Scale. Dreyfus representatives reviewed the expenses allocated and profit received by Dreyfus and its affiliates and the resulting profitability percentage for managing the fund and the aggregate profitability percentage to Dreyfus and its affiliates for managing the funds in the Dreyfus fund complex, and the method used to determine the expenses and profit. The Board concluded that the profitability results were not unreasonable, given the services rendered and service levels provided by Dreyfus. The Board also had been provided with information prepared by an independent consulting firm regarding Dreyfus’ approach to allocating costs to, and determining the profitability of, individual funds and the entire Dreyfus fund complex. The consulting firm also had analyzed where any economies of scale might emerge in connection with the management of a fund.
The Board considered, on the advice of its counsel, the profitability analysis (1) as part of its evaluation of whether the fees under the Agreement, considered in relation to the mix of services provided by Dreyfus, including the nature, extent and quality of such services, supported the renewal of the Agreement and (2) in light of the relevant
42
circumstances for the fund and the extent to which economies of scale would be realized if the fund grows and whether fee levels reflect these economies of scale for the benefit of fund shareholders. Dreyfus representatives noted that a discussion of economies of scale is predicated on a fund having achieved a substantial size with increasing assets and that, if a fund’s assets had been stable or decreasing, the possibility that Dreyfus may have realized any economies of scale would be less. Dreyfus representatives also noted that, as a result of shared and allocated costs among funds in the Dreyfus fund complex, the extent of economies of scale could depend substantially on the level of assets in the complex as a whole, so that increases and decreases in complex-wide assets can affect potential economies of scale in a manner that is disproportionate to, or even in the opposite direction from, changes in the fund’s asset level. The Board also considered potential benefits to Dreyfus from acting as investment adviser and noted that there were no soft dollar arrangements in effect for trading the fund’s investments.
At the conclusion of these discussions, the Board agreed that it had been furnished with sufficient information to make an informed business decision with respect to the renewal of the Agreement. Based on the discussions and considerations as described above, the Board concluded and determined as follows.
· The Board concluded that the nature, extent and quality of the services provided by Dreyfus are adequate and appropriate.
· The Board generally was satisfied with the fund’s performance.
· The Board concluded that the fee paid to Dreyfus supported the renewal of the Agreement in light of the considerations described above.
· The Board determined that the economies of scale which may accrue to Dreyfus and its affiliates in connection with the management of the fund had been adequately considered by Dreyfus in connection with the fee rate charged to the fund pursuant to the Agreement and that, to the extent in the future it were determined that material economies of scale had not been shared with the fund, the Board would seek to have those economies of scale shared with the fund.
In evaluating the Agreement, the Board considered these conclusions and determinations and also relied on its previous knowledge, gained through meetings and other interactions with Dreyfus and its affiliates, of the fund and the services provided to the fund by Dreyfus. The Board also relied on information received on a routine and regular basis throughout the year relating to the operations of the fund and the investment management and other services provided under the Agreement, including information on the investment performance of the fund in comparison to similar mutual funds and benchmark performance indices; general market outlook as applicable to the fund; and compliance reports. In addition, the Board’s consideration of the contractual fee arrangements for this fund had the benefit of a number of years of reviews of prior or similar agreements during which lengthy discussions took place between the Board and Dreyfus representatives. Certain aspects of the arrangements
43
INFORMATION ABOUT THE RENEWAL OF THE FUND’S MANAGEMENT AGREEMENT (Unaudited) (continued)
may receive greater scrutiny in some years than in others, and the Board’s conclusions may be based, in part, on their consideration of the same or similar arrangements in prior years. The Board determined to renew the Agreement.
44
BOARD MEMBERS INFORMATION (Unaudited)
INDEPENDENT BOARD MEMBERS
Joseph S. DiMartino (73)
Chairman of the Board (1995)
Principal Occupation During Past 5 Years:
· Corporate Director and Trustee (1995-present)
Other Public Company Board Memberships During Past 5 Years:
· CBIZ (formerly, Century Business Services, Inc.), a provider of outsourcing functions for small and medium size companies, Director (1997-present)
No. of Portfolios for which Board Member Serves: 135
———————
Francine J. Bovich (65)
Board Member (2014)
Principal Occupation During Past 5 Years:
· Trustee, The Bradley Trusts, private trust funds (2011-present)
Other Public Company Board Memberships During Past 5 Years:
· Annaly Capital Management, Inc., Board Member (May 2014-present)
No. of Portfolios for which Board Member Serves: 76
———————
Gordon J. Davis (75)
Board Member (2012)
Principal Occupation During Past 5 Years:
· Partner in the law firm of Venable LLP (2012-present)
· Partner in the law firm of Dewey & LeBoeuf LLP (1994-2012)
Other Public Company Board Memberships During Past 5 Years:
· Consolidated Edison, Inc., a utility company, Director (1997-2014)
· The Phoenix Companies, Inc., a life insurance company, Director (2000-2014)
No. of Portfolios for which Board Member Serves: 58
———————
45
BOARD MEMBERS INFORMATION (Unaudited) (continued)
INDEPENDENT BOARD MEMBERS (continued)
Nathan Leventhal (73)
Board Member (2009)
Principal Occupation During Past 5 Years:
· President Emeritus of Lincoln Center for the Performing Arts (2001-present)
· Chairman of the Avery Fisher Artist Program (1997-2014)
· Commissioner, NYC Planning Commission (2007-2011)
Other Public Company Board Memberships During Past 5 Years:
· Movado Group, Inc., Director (2003-present)
No. of Portfolios for which Board Member Serves: 48
———————
Robin A. Melvin (53)
Board Member (2014)
Principal Occupation During Past 5 Years:
· Co-chairman, Illinois Mentoring Partnership, non-profit organization dedicated to increasing the quantity and quality of mentoring services in Illinois; (2014-present; board member since 2013)
· Director, Boisi Family Foundation, a private family foundation that supports youth-serving organizations that promote the self sufficiency of youth from disadvantaged circumstances (1995-2012)
No. of Portfolios for which Board Member Serves: 107
———————
Roslyn M. Watson (67)
Board Member (2014)
Principal Occupation During Past 5 Years:
· Principal, Watson Ventures, Inc., a real estate investment company (1993-present)
No. of Portfolios for which Board Member Serves: 62
———————
Benaree Pratt Wiley (70)
Board Member (2009)
Principal Occupation During Past 5 Years:
· Principal, The Wiley Group, a firm specializing in strategy and business development (2005-present)
Other Public Company Board Memberships During Past 5 Years:
· CBIZ (formerly, Century Business Services, Inc.), a provider of outsourcing functions for small and medium size companies, Director (2008-present)
No. of Portfolios for which Board Member Serves: 86
———————
46
INTERESTED BOARD MEMBERS
J. Charles Cardona (61)
Board Member (2014)
Principal Occupation During Past 5 Years:
· Retired President and a Director of the Manager (2008-2016), Chairman of the Distributor (2013-2016, Executive Vice President, 1997-2013),
No. of Portfolios for which Board Member Serves: 34
J. Charles Cardona is deemed to be an “interested person” (as defined under the Act) of the Company as a result of his affiliation with The Dreyfus Corporation.
———————
Isabel P. Dunst (69)
Board Member (2014)
Principal Occupation During Past 5 Years:
· Of Counsel to the law firm of Hogan Lovells LLP (2015-present; previously, Partner, 1990-2014)
No. of Portfolios for which Board Member Serves: 34
Isabel P. Dunst is deemed to be an “interested person” (as defined under the Act) of the Company as a result of her affiliation with Hogan Lovells LLP, which provides legal services to BNY Mellon and certain of its affiliates.
———————
Once elected all Board Members serve for an indefinite term, but achieve Emeritus status upon reaching age 80. The address of the Board Members and Officers is c/o The Dreyfus Corporation, 200 Park Avenue, New York, New York 10166. Additional information about the Board Members is available in the fund’s Statement of Additional Information which can be obtained from Dreyfus free of charge by calling this toll free number: 1-800-DREYFUS.
Clifford L. Alexander, Jr., Emeritus Board Member
Whitney I. Gerard, Emeritus Board Member
George L. Perry, Emeritus Board Member
47
OFFICERS OF THE FUND (Unaudited)
BRADLEY J. SKAPYAK, President since January 2010.
Chief Operating Officer and a director of the Manager since June 2009, Chairman of Dreyfus Transfer, Inc., an affiliate of the Manager and the transfer agent of the funds, since May 2011 and Executive Vice President of MBSC Securities Corporation since June 2007. He is an officer of 64 investment companies (comprised of 135 portfolios) managed by the Manager. He is 58 years old and has been an employee of the Manager since February 1988.
BENNETT A. MACDOUGALL, Chief Legal Officer since October 2015.
Chief Legal Officer of the Manager and Associate General Counsel and Managing Director of BNY Mellon since June 2015; from June 2005 to June 2015, he served in various capacities with Deutsche Bank – Asset & Wealth Management Division, including as Director and Associate General Counsel, and Chief Legal Officer of Deutsche Investment Management Americas Inc. from June 2012 to May 2015. He is an officer of 65 investment companies (comprised of 160 portfolios) managed by the Manager. He is 45 years old and has been an employee of the Manager since June 2015.
JANETTE E. FARRAGHER, Vice President and Secretary since December 2011.
Associate General Counsel of BNY Mellon, and an officer of 65 investment companies (comprised of 160 portfolios) managed by the Manager. She is 54 years old and has been an employee of the Manager since February 1984.
JAMES BITETTO, Vice President and Assistant Secretary since August 2005.
Managing Counsel of BNY Mellon and Secretary of the Manager, and an officer of 65 investment companies (comprised of 160 portfolios) managed by the Manager. He is 50 years old and has been an employee of the Manager since December 1996.
JONI LACKS CHARATAN, Vice President and Assistant Secretary since August 2005.
Managing Counsel of BNY Mellon, and an officer of 65 investment companies (comprised of 160 portfolios) managed by the Manager. She is 61 years old and has been an employee of the Manager since October 1988.
JOSEPH M. CHIOFFI, Vice President and Assistant Secretary since August 2005.
Managing Counsel of BNY Mellon, and an officer of 65 investment companies (comprised of 160 portfolios) managed by the Manager. He is 55 years old and has been an employee of the Manager since June 2000.
MAUREEN E. KANE, Vice President and Assistant Secretary since April 2015.
Managing Counsel of BNY Mellon since July 2014; from October 2004 until July 2014, General Counsel, and from May 2009 until July 2014, Chief Compliance Officer of Century Capital Management. She is an officer of 65 investment companies (comprised of 160 portfolios) managed by the Manager. She is 54 years old and has been an employee of the Manager since July 2014.
SARAH S. KELLEHER, Vice President and Assistant Secretary since April 2014.
Senior Counsel of BNY Mellon since March 2013, from August 2005 to March 2013, Associate General Counsel of Third Avenue Management. She is an officer of 65 investment companies (comprised of 160 portfolios) managed by the Manager. She is 41 years old and has been an employee of the Manager since March 2013.
JEFF PRUSNOFSKY, Vice President and Assistant Secretary since August 2005.
Senior Managing Counsel of BNY Mellon, and an officer of 65 investment companies (comprised of 160 portfolios) managed by the Manager. He is 51 years old and has been an employee of the Manager since October 1990.
JAMES WINDELS, Treasurer since November 2001.
Director – Mutual Fund Accounting of the Manager, and an officer of 65 investment companies (comprised of 160 portfolios) managed by the Manager. He is 58 years old and has been an employee of the Manager since April 1985.
RICHARD CASSARO, Assistant Treasurer since January 2008.
Senior Accounting Manager – Money Market, Municipal Bond and Equity Funds of the Manager, and an officer of 65 investment companies (comprised of 160 portfolios) managed by the Manager. He is 57 years old and has been an employee of the Manager since September 1982.
48
GAVIN C. REILLY, Assistant Treasurer since December 2005.
Tax Manager of the Investment Accounting and Support Department of the Manager, and an officer of 65 investment companies (comprised of 160 portfolios) managed by the Manager. He is 48 years old and has been an employee of the Manager since April 1991.
ROBERT S. ROBOL, Assistant Treasurer since August 2005.
Senior Accounting Manager of the Manager, and an officer of 65 investment companies (comprised of 160 portfolios) managed by the Manager. He is 52 years old and has been an employee of the Manager since October 1988.
ROBERT SALVIOLO, Assistant Treasurer since July 2007.
Senior Accounting Manager – Equity Funds of the Manager, and an officer of 65 investment companies (comprised of 160 portfolios) managed by the Manager. He is 49 years old and has been an employee of the Manager since June 1989.
ROBERT SVAGNA, Assistant Treasurer since December 2002.
Senior Accounting Manager – Fixed Income and Equity Funds of the Manager, and an officer of 65 investment companies (comprised of 160 portfolios) managed by the Manager. He is 49 years old and has been an employee of the Manager since November 1990.
JOSEPH W. CONNOLLY, Chief Compliance Officer since October 2004.
Chief Compliance Officer of the Manager and The Dreyfus Family of Funds (65 investment companies, comprised of 160 portfolios). He is 59 years old and has served in various capacities with the Manager since 1980, including manager of the firm’s Fund Accounting Department from 1997 through October 2001.
CARIDAD M. CAROSELLA, Anti-Money Laundering Compliance Officer since January 2016.
Anti-Money Laundering Compliance Officer of the Dreyfus Family of Funds and BNY Mellon Funds Trust since January 2016; from May 2015 to December 2015, Interim Anti-Money Laundering Compliance Officer of the Dreyfus Family of Funds and BNY Mellon Funds Trust and the Distributor; from January 2012 to May 2015, AML Surveillance Officer of the Distributor and from 2007 to December 2011, Financial Processing Manager of the Distributor. She is an officer of 60 investment companies (comprised of 155 portfolios) managed by the Manager. She is 48 years old and has been an employee of the Distributor since 1997.
49
Dreyfus Investment Portfolios, Small Cap Stock Index Portfolio
200 Park Avenue
New York, NY 10166
Manager
The Dreyfus Corporation
200 Park Avenue
New York, NY 10166
Custodian
The Bank of New York Mellon
225 Liberty Street
New York, NY 10286
Transfer Agent &
Dividend Disbursing Agent
Dreyfus Transfer, Inc.
200 Park Avenue
New York, NY 10166
Distributor
MBSC Securities Corporation
200 Park Avenue
New York, NY 10166
Telephone 1-800-258-4260 or 1-800-258-4261
Mail The Dreyfus Family of Funds, 144 Glenn Curtiss Boulevard, Uniondale, NY 11556-0144 Attn: Institutional Services Department
E-mail Send your request to info@dreyfus.com
Internet Information can be viewed online or downloaded at www.dreyfus.com
The fund files its complete schedule of portfolio holdings with the Securities and Exchange Commission (“SEC”) for the first and third quarters of each fiscal year on Form N-Q. The fund’s Forms N-Q are available on the SEC’s website at http://www.sec.gov and may be reviewed and copied at the SEC’s Public Reference Room in Washington, DC. Information on the operation of the Public Reference Room may be obtained by calling 1-800-SEC-0330.
A description of the policies and procedures that the fund uses to determine how to vote proxies relating to portfolio securities, and information regarding how the fund voted these proxies for the most recent 12-month period ended June 30 is available at http://www.dreyfus.com and on the SEC’s website at http://www.sec.gov. The description of the policies and procedures is also available without charge, upon request, by calling 1-800-DREYFUS.
| | |
© 2017 MBSC Securities Corporation
0410AR1216 | 
|
Dreyfus Investment Portfolios, Technology Growth Portfolio
| | | |

| | ANNUAL REPORT
December 31, 2016 |
| |
The views expressed in this report reflect those of the portfolio manager(s) only through the end of the period covered and do not necessarily represent the views of Dreyfus or any other person in the Dreyfus organization. Any such views are subject to change at any time based upon market or other conditions and Dreyfus disclaims any responsibility to update such views. These views may not be relied on as investment advice and, because investment decisions for a Dreyfus fund are based on numerous factors, may not be relied on as an indication of trading intent on behalf of any Dreyfus fund. |
| |
Not FDIC-Insured • Not Bank-Guaranteed • May Lose Value |
Contents
THE FUND
FOR MORE INFORMATION
Back Cover
| | | | |
| |
Dreyfus Investment Portfolios, Technology Growth Portfolio
| | The Fund |
A LETTER FROM THE CHIEF EXECUTIVE OFFICER
Dear Shareholder:
We are pleased to present this annual report for Dreyfus Investment Portfolios, Technology Growth Portfolio, covering the 12-month period from January 1, 2016 through December 31, 2016. For information about how the fund performed during the reporting period, as well as general market perspectives, we provide a Discussion of Fund Performance on the pages that follow.
Stocks and bonds advanced over 2016 despite bouts of market volatility stemming from various economic and political developments. In January, stocks declined sharply and long-term interest rates fell in response to sluggish global economic growth, falling commodity prices, and worries following the first increase in short-term U.S. interest rates in nearly a decade. However, equities began a sustained rebound in February when U.S. monetary policymakers refrained from additional rate hikes, other central banks eased their monetary policies, and commodity prices recovered. After a bout of volatility in June stemming from the United Kingdom’s referendum to leave the European Union, stocks generally continued to climb over the summer. Stock prices moderated in advance of U.S. elections, but markets subsequently rallied to new highs in anticipation of changes in U.S. fiscal and tax policies. In the bond market, yields of high-quality government bonds moved lower over much of the reporting period amid robust investor demand for current income, but yields surged higher after the election due to expectations of rising interest rates. Corporate-backed bonds fared especially well in this environment.
The transition to a new U.S. president and ongoing global economic headwinds suggest that volatility may persist in the financial markets. Some asset classes and industry groups seem likely to benefit from a changing economic and geopolitical landscape, while others probably will face challenges. Consequently, selectivity seems likely to be an important determinant of investment success in 2017. As always, we encourage you to discuss the implications of our observations with your financial advisor.
Thank you for your continued confidence and support.
Sincerely,

Mark D. Santero
Chief Executive Officer
The Dreyfus Corporation
January 17, 2017
2
DISCUSSION OF FUND PERFORMANCE
For the period of January 1, 2016 through December 31, 2016, as provided by Barry K. Mills, CFA, Portfolio Manager
Fund and Market Performance Overview
For the 12-month period ended December 31, 2016, Dreyfus Investment Portfolios, Technology Growth Portfolio’s Initial shares produced a total return of 4.72%, and its Service shares produced a total return of 4.38%.1 The fund’s benchmarks, the Morgan Stanley High-Technology 35 Index and the S&P 500 Index, produced total returns of 13.62% and 11.94%, respectively, over the same period.2,3
Broad market averages achieved double digit gains despite various global and domestic economic headwinds over the reporting period. Technology stocks outperformed broader market averages due to the market’s shift in favor of growth-oriented, economically sensitive stocks. The fund lagged its indices, primarily due to underweighted exposure to semiconductor and hardware companies, overweighted exposure to software developers, and a few disappointing stock selections.
The Fund’s Investment Approach
The fund seeks capital appreciation. To pursue its goal, the fund normally invests at least 80% of its net assets in the stocks of growth companies of any size that Dreyfus believes to be leading producers or beneficiaries of technological innovation. Up to 25% of the fund’s assets may be invested in foreign securities.
In choosing stocks, the fund looks for technology companies with the potential for strong earnings or revenue growth rates, although some of the fund’s investments may currently be experiencing losses. The fund’s investment process centers on a multi-dimensional approach that looks for opportunities across emerging growth, cyclical, or stable growth companies. The fund’s investment approach seeks companies that appear to have strong earnings momentum, positive earnings revisions, favorable growth, product, or market cycles, and/or favorable valuations.
Sentiment Shifted in Favor of Growth Stocks
Stocks lost ground at the start of 2016 under pressure from deteriorating oil prices, disappointing U.S. GDP growth, and an economic slowdown in China. However, equities rebounded strongly during the spring, bolstered by rebounding commodity prices and accommodative monetary policies from central banks in the United States, Europe, and Asia. In June, the United Kingdom’s unexpected vote to leave the European Union in a so-called “Brexit” prompted another brief-but-sharp decline in equity prices, but stocks again recovered quickly. Equities continued to rise during the closing months of the reporting period, with investor sentiment shifting in favor of growth-oriented cyclical stocks on the strength of robust consumer spending, broad-based wage growth, and expectations of more business-friendly policies under a new presidential administration.
As is typically the case, technology stocks proved more volatile than the broader market, suffering more during market declines and rising faster when markets gained ground. The semiconductor industry led the sector’s gains as many companies benefited from industry consolidation and growing demand for flash memory and the industrial semiconductors used in a new generation of interconnected devices. Other significant areas of growth included the rapid adoption of cloud computing services, the monetization of social media and internet search services through the
3
DISCUSSION OF FUND PERFORMANCE (continued)
expansion of digital advertising, the proliferation of electronic content, and increasing commercial applications of artificial intelligence in consumer and industrial products.
Allocations and Stock Selections Dampened Gains
While the fund participated to a degree in the technology sector’s advance, a combination of industry allocations and individual stock selections caused returns to lag the benchmarks. Underweighted exposure to fast-growing semiconductor equipment makers and hardware manufacturers particularly undermined relative performance, as did the fund’s overweighted exposure to software companies, such as salesforce.com and Oracle, which reported modestly lower growth rates. A few company-specific disappointments further detracted from returns: most notably, consulting firm Cognizant Technology Solutions faced slowing growth and corporate governance issues, and semiconductor designer Cavium announced an earnings shortfall while investors reacted skeptically to the company’s acquisition of a slower growing competitor.
On a more positive note, several holdings enhanced the fund’s relative results. Cloud-based software-as-a-service provider LogMeIn gained ground after announcing a sizeable acquisition that was well received by the market. Semiconductor makers Texas Instruments and Microchip Technology benefited from growing demand from car makers and other industries for interconnected capabilities. This trend toward the Internet of Things (IoT) also bolstered earnings and revenues for Amphenol, a manufacturer of power and data connectivity components for a wide array of industries.
Secular Growth Trends Remain in Place
The potential impact of the recent presidential election on U.S. trade, tax, and regulatory policies could pose new challenges over the years ahead for U.S. technology companies doing business in international markets. Nonetheless, the potential for future growth in areas such as cloud computing, digital advertising, artificial intelligence, and interconnected devices remains compelling. Therefore, the fund has continued to emphasize investments in these and other areas where we see opportunities to capitalize on rapidly emerging trends in technology.
January 17, 2017
The technology sector has been among the most volatile sectors of the stock market. Technology companies involve greater risk because their revenue and/or earnings tend to be less predictable, and some companies may be experiencing significant losses.
Equities are subject generally to market, market sector, market liquidity, issuer, and investment style risks, among other factors, to varying degrees, all of which are more fully described in the fund’s prospectus.
The fund is only available as a funding vehicle under variable life insurance policies or variable annuity contracts issued by insurance companies. Individuals may not purchase shares of the fund directly. A variable annuity is an insurance contract issued by an insurance company that enables investors to accumulate assets on a tax-deferred basis for retirement or other long-term goals. The investment objective and policies of Dreyfus Investment Portfolios, Technology Growth Portfolio made available through insurance products may be similar to other funds managed or advised by Dreyfus. However, the investment results of the fund may be higher or lower than, and may not be comparable to, those of any other Dreyfus fund.
1 Total return includes reinvestment of dividends and any capital gains paid. Past performance is no guarantee of future results. Share price and investment return fluctuate such that upon redemption, fund shares may be worth more or less than their original cost. The fund’s performance does not reflect the deduction of additional charges and expenses imposed in connection with investing in variable insurance contracts, which will reduce returns.
2 Source: Bloomberg L.P. — The Morgan Stanley High-Technology 35 Index is an unmanaged, equal dollar-weighted index of 35 stocks from the electronics-based subsectors. Investors cannot invest directly in any index.
3 Source: Lipper Inc. — The S&P 500 Index is an unmanaged index of 500 common stocks chosen to reflect the industries of the U.S. economy and is often considered a proxy for the stock market in general. Investors cannot invest directly in any index
4
FUND PERFORMANCE
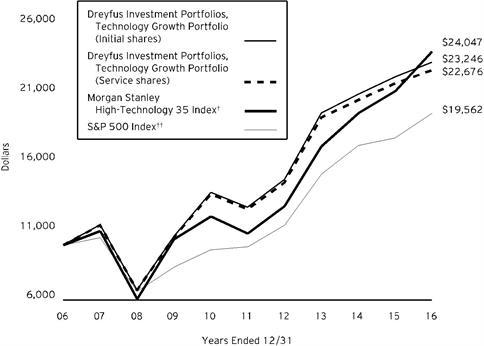
Comparison of change in value of $10,000 investment in Dreyfus Investment Portfolios, Technology Growth Portfolio Initial shares and Service shares, the Morgan Stanley High-Technology 35 Index, and the S&P 500 Index
| | | | |
Average Annual Total Returns as of 12/31/16 |
| 1 Year | 5 Years | 10 Years |
Initial shares | 4.72% | 12.77% | 8.80% |
Service shares | 4.38% | 12.48% | 8.53% |
Morgan Stanley High-
Technology 35 Index | 13.62% | 17.23% | 9.16% |
S&P 500 Index | 11.94% | 14.65% | 6.94% |
† Source: Bloomberg L.P.
†† Source: Lipper Inc.
Past performance is not predictive of future performance. The fund’s performance shown in the graph and table does not reflect the deduction of taxes that a shareholder would pay on fund distributions or the redemption of fund shares.
The fund’s performance does not reflect the deduction of additional charges and expenses imposed in connection with investing in variable insurance contracts which will reduce returns.
The above graph compares a $10,000 investment made in Initial and Service shares of Dreyfus Investment Portfolios, Technology Growth Portfolio on 12/31/06 to a $10,000 investment made in the Morgan Stanley High-Technology 35 Index and the S&P 500 Index on that date.
The fund’s Initial shares are not subject to a Rule 12b-1 fee. The fund’s Service shares are subject to a 0.25% annual Rule 12b-1 fee. All dividends and capital gain distributions are reinvested.
The fund’s performance shown in the line graph above takes into account all applicable fund fees and expenses for Initial and Service shares. The Morgan Stanley High-Technology 35 Index is an unmanaged, equal dollar-weighted index of 35 stocks from the electronics-based subsectors. The S&P 500 Index is an unmanaged index of 500 common stocks chosen to reflect the industries of the U.S. economy and is often considered a proxy for the stock market in general. Unlike a mutual fund, the indices are not subject to charges, fees and other expenses. Investors cannot invest directly in any index. Further information relating to fund performance, including expense reimbursements, if applicable, is contained in the Financial Highlights section of the prospectus and elsewhere in this report.
5
UNDERSTANDING YOUR FUND’S EXPENSES (Unaudited)
As a mutual fund investor, you pay ongoing expenses, such as management fees and other expenses. Using the information below, you can estimate how these expenses affect your investment and compare them with the expenses of other funds. You also may pay one-time transaction expenses, including sales charges (loads), redemption fees and expenses associated with variable annuity or insurance contracts, which are not shown in this section and would have resulted in higher total expenses. For more information, see your fund’s prospectus or talk to your financial adviser.
Review your fund’s expenses
The table below shows the expenses you would have paid on a $1,000 investment in Dreyfus Investment Portfolios, Technology Growth Portfolio from July 1, 2016 to December 31, 2016. It also shows how much a $1,000 investment would be worth at the close of the period, assuming actual returns and expenses.
| | | | | | | | |
Expenses and Value of a $1,000 Investment | | |
assuming actual returns for the six months ended December 31, 2016 | |
| | | | Initial Shares | Service Shares |
Expenses paid per $1,000† | | | $4.25 | | $5.54 |
Ending value (after expenses) | | | $1,062.50 | | $1,060.30 |
COMPARING YOUR FUND’S EXPENSES
WITH THOSE OF OTHER FUNDS (Unaudited)
Using the SEC’s method to compare expenses
The Securities and Exchange Commission (SEC) has established guidelines to help investors assess fund expenses. Per these guidelines, the table below shows your fund’s expenses based on a $1,000 investment, assuming a hypothetical 5% annualized return. You can use this information to compare the ongoing expenses (but not transaction expenses or total cost) of investing in the fund with those of other funds. All mutual fund shareholder reports will provide this information to help you make this comparison. Please note that you cannot use this information to estimate your actual ending account balance and expenses paid during the period.
| | | | | | | | |
Expenses and Value of a $1,000 Investment | | |
assuming a hypothetical 5% annualized return for the six months ended December 31, 2016 |
| | | | Initial Shares | Service Shares |
Expenses paid per $1,000† | | | $4.17 | | $5.43 |
Ending value (after expenses) | | | $1,021.01 | | $1,019.76 |
† Expenses are equal to the fund’s annualized expense ratio of .82% for Initial shares and 1.07% for Service shares, multiplied by the average account value over the period, multiplied by 184/366 (to reflect the one-half year period).
6
STATEMENT OF INVESTMENTS
December 31, 2016
| | | | | | |
| |
Common Stocks - 98.1% | | Shares | | Value ($) | |
Application Software - 12.2% | | | | | |
Citrix Systems | | 130,482 | a | 11,653,347 | |
HubSpot | | 69,455 | a | 3,264,385 | |
salesforce.com | | 187,518 | a | 12,837,482 | |
Splunk | | 200,958 | a | 10,279,002 | |
| | | | | 38,034,216 | |
Automobile Manufacturers - 2.7% | | | | | |
Tesla Motors | | 38,810 | a,b | 8,293,309 | |
Communications Equipment - 4.1% | | | | | |
Cisco Systems | | 428,844 | | 12,959,666 | |
Computer Storage & Peripherals - 7.6% | | | | | |
Apple | | 96,310 | | 11,154,624 | |
Western Digital | | 183,992 | | 12,502,256 | |
| | | | | 23,656,880 | |
Data Processing & Outsourced Services - 5.1% | | | | | |
Paychex | | 155,797 | | 9,484,921 | |
Visa, Cl. A | | 83,453 | b | 6,511,003 | |
| | | | | 15,995,924 | |
Electronic Components - 6.5% | | | | | |
Amphenol, Cl. A | | 163,185 | | 10,966,032 | |
Corning | | 388,088 | | 9,418,896 | |
| | | | | 20,384,928 | |
Exchange-Traded Funds - 1.0% | | | | | |
Technology Select Sector SPDR Fund | | 65,475 | | 3,166,371 | |
Health Care Equipment - 1.7% | | | | | |
ABIOMED | | 48,329 | a | 5,445,712 | |
Internet Retail - 10.4% | | | | | |
Amazon.com | | 14,956 | a | 11,215,056 | |
Netflix | | 77,761 | a | 9,626,812 | |
Priceline Group | | 8,054 | a | 11,807,647 | |
| | | | | 32,649,515 | |
Internet Software & Services - 15.8% | | | | | |
Alphabet, Cl. A | | 9,041 | a | 7,164,540 | |
Alphabet, Cl. C | | 18,618 | a | 14,369,745 | |
eBay | | 321,512 | a | 9,545,691 | |
Facebook, Cl. A | | 104,366 | a | 12,007,308 | |
Tencent Holdings | | 266,400 | | 6,517,000 | |
| | | | | 49,604,284 | |
7
STATEMENT OF INVESTMENTS (continued)
| | | | | | |
| |
Common Stocks - 98.1% (continued) | | Shares | | Value ($) | |
IT Consulting & Other Services - 2.4% | | | | | |
Teradata | | 270,492 | a,b | 7,349,268 | |
Semiconductor Equipment - 20.8% | | | | | |
Applied Materials | | 223,739 | | 7,220,058 | |
Broadcom | | 79,454 | | 14,045,084 | |
Lam Research | | 117,830 | | 12,458,166 | |
Microchip Technology | | 196,303 | b | 12,592,838 | |
Micron Technology | | 237,937 | a | 5,215,579 | |
Texas Instruments | | 184,331 | | 13,450,633 | |
| | | | | 64,982,358 | |
Systems Software - 7.8% | | | | | |
Microsoft | | 214,059 | | 13,301,626 | |
Oracle | | 290,535 | | 11,171,071 | |
| | | | | 24,472,697 | |
Total Common Stocks (cost $247,291,356) | | | | 306,995,128 | |
Other Investment - 2.0% | | | | | |
Registered Investment Company; | | | | | |
Dreyfus Institutional Preferred Government Plus Money Market Fund
(cost $6,282,306) | | 6,282,306 | c | 6,282,306 | |
Investment of Cash Collateral for Securities Loaned - 6.3% | | | | | |
Registered Investment Company; | | | | | |
Dreyfus Institutional Preferred Money Market Fund, Hamilton Shares
(cost $19,931,017) | | 19,931,017 | c | 19,931,017 | |
Total Investments (cost $273,504,679) | | 106.4% | | 333,208,451 | |
Liabilities, Less Cash and Receivables | | (6.4%) | | (20,164,772) | |
Net Assets | | 100.0% | | 313,043,679 | |
SPDR—Standard & Poor's Depository Receipt
aNon-income producing security.
bSecurity, or portion thereof, on loan. At December 31, 2016, the value of the fund’s securities on loan was $26,134,044 and the value of the collateral held by the fund was $26,864,937, consisting of cash collateral of $19,931,017 and U.S. Government & Agency securities valued at $6,933,920.
cInvestment in affiliated money market mutual fund.
8
| | |
Portfolio Summary (Unaudited) † | Value (%) |
Semiconductor Equipment | 20.8 |
Internet Software & Services | 15.8 |
Application Software | 12.2 |
Internet Retail | 10.4 |
Money Market Investments | 8.3 |
Systems Software | 7.8 |
Computer Storage & Peripherals | 7.6 |
Electronic Components | 6.5 |
Data Processing & Outsourced Services | 5.1 |
Communications Equipment | 4.1 |
Automobile Manufacturers | 2.7 |
IT Consulting & Other Services | 2.4 |
Health Care Equipment | 1.7 |
Exchange-Traded Funds | 1.0 |
| | 106.4 |
† Based on net assets.
See notes to financial statements.
9
STATEMENT OF ASSETS AND LIABILITIES
December 31, 2016
| | | | | | | |
| | | | | | |
| | | Cost | | Value | |
Assets ($): | | | | |
Investments in securities—See Statement of Investments
(including securities on loan, valued at $26,134,044)—Note 1(b): | | | | |
Unaffiliated issuers | | 247,291,356 | | 306,995,128 | |
Affiliated issuers | | 26,213,323 | | 26,213,323 | |
Cash | | | | | 57,880 | |
Dividends and securities lending income receivable | | | | | 198,828 | |
Prepaid expenses | | | | | 4,714 | |
| | | | | 333,469,873 | |
Liabilities ($): | | | | |
Due to The Dreyfus Corporation and affiliates—Note 3(b) | | | | | 268,519 | |
Liability for securities on loan—Note 1(b) | | | | | 19,931,017 | |
Payable for shares of Beneficial Interest redeemed | | | | | 160,761 | |
Accrued expenses | | | | | 65,897 | |
| | | | | 20,426,194 | |
Net Assets ($) | | | 313,043,679 | |
Composition of Net Assets ($): | | | | |
Paid-in capital | | | | | 234,993,637 | |
Accumulated net realized gain (loss) on investments | | | | | 18,346,270 | |
Accumulated net unrealized appreciation (depreciation)
on investments | | | | 59,703,772 | |
Net Assets ($) | | | 313,043,679 | |
| | | | |
Net Asset Value Per Share | Initial Shares | Service Shares | |
Net Assets ($) | 87,242,774 | 225,800,905 | |
Shares Outstanding | 4,933,002 | 13,373,692 | |
Net Asset Value Per Share ($) | 17.69 | 16.88 | |
| | | | |
See notes to financial statements. | | | |
10
STATEMENT OF OPERATIONS
Year Ended December 31, 2016
| | | | | | | |
| | | | | | |
| | | | | | |
Investment Income ($): | | | | |
Income: | | | | |
Cash dividends: | | | | |
Unaffiliated issuers | | | 2,341,561 | |
Affiliated issuers | | | 39,083 | |
Income from securities lending—Note 1(b) | | | 398,042 | |
Total Income | | | 2,778,686 | |
Expenses: | | | | |
Management fee—Note 3(a) | | | 2,324,004 | |
Distribution fees—Note 3(b) | | | 549,788 | |
Professional fees | | | 87,132 | |
Trustees’ fees and expenses—Note 3(c) | | | 72,261 | |
Prospectus and shareholders’ reports | | | 30,259 | |
Custodian fees—Note 3(b) | | | 22,023 | |
Loan commitment fees—Note 2 | | | 6,726 | |
Shareholder servicing costs—Note 3(b) | | | 978 | |
Registration fees | | | 737 | |
Miscellaneous | | | 20,725 | |
Total Expenses | | | 3,114,633 | |
Less—reduction in fees due to earnings credits—Note 3(b) | | | (33) | |
Net Expenses | | | 3,114,600 | |
Investment (Loss)—Net | | | (335,914) | |
Realized and Unrealized Gain (Loss) on Investments—Note 4 ($): | | |
Net realized gain (loss) on investments | 19,002,594 | |
Net unrealized appreciation (depreciation) on investments | | | (4,407,627) | |
Net Realized and Unrealized Gain (Loss) on Investments | | | 14,594,967 | |
Net Increase in Net Assets Resulting from Operations | | 14,259,053 | |
| | | | | | | |
See notes to financial statements. | | | | | |
11
STATEMENT OF CHANGES IN NET ASSETS
| | | | | | | | | | |
| | | | Year Ended December 31, |
| | | | 2016 | | | | 2015 | |
Operations ($): | | | | | | | | |
Investment (loss)—net | | | (335,914) | | | | (1,133,908) | |
Net realized gain (loss) on investments | | 19,002,594 | | | | 15,805,224 | |
Net unrealized appreciation (depreciation)
on investments | | (4,407,627) | | | | 974,346 | |
Net Increase (Decrease) in Net Assets
Resulting from Operations | 14,259,053 | | | | 15,645,662 | |
Distributions to Shareholders from ($): | | | | | | | | |
Net realized gain on investments: | | | | | | | | |
Initial Shares | | | (4,600,212) | | | | (9,027,789) | |
Service Shares | | | (11,204,730) | | | | (20,490,561) | |
Total Distributions | | | (15,804,942) | | | | (29,518,350) | |
Beneficial Interest Transactions ($): | | | | | | | | |
Net proceeds from shares sold: | | | | | | | | |
Initial Shares | | | 4,075,216 | | | | 13,941,725 | |
Service Shares | | | 33,004,959 | | | | 39,688,601 | |
Distributions reinvested: | | | | | | | | |
Initial Shares | | | 4,600,212 | | | | 9,027,789 | |
Service Shares | | | 11,204,730 | | | | 20,490,561 | |
Cost of shares redeemed: | | | | | | | | |
Initial Shares | | | (17,367,887) | | | | (18,993,051) | |
Service Shares | | | (34,355,018) | | | | (21,132,366) | |
Increase (Decrease) in Net Assets
from Beneficial Interest Transactions | 1,162,212 | | | | 43,023,259 | |
Total Increase (Decrease) in Net Assets | (383,677) | | | | 29,150,571 | |
Net Assets ($): | | | | | | | | |
Beginning of Period | | | 313,427,356 | | | | 284,276,785 | |
End of Period | | | 313,043,679 | | | | 313,427,356 | |
Capital Share Transactions (Shares): | | | | | | | | |
Initial Shares | | | | | | | | |
Shares sold | | | 238,348 | | | | 786,590 | |
Shares issued for distributions reinvested | | | 279,309 | | | | 524,566 | |
Shares redeemed | | | (1,006,713) | | | | (1,052,737) | |
Net Increase (Decrease) in Shares Outstanding | (489,056) | | | | 258,419 | |
Service Shares | | | | | | | | |
Shares sold | | | 2,020,775 | | | | 2,301,337 | |
Shares issued for distributions reinvested | | | 711,412 | | | | 1,238,849 | |
Shares redeemed | | | (2,080,062) | | | | (1,253,793) | |
Net Increase (Decrease) in Shares Outstanding | 652,125 | | | | 2,286,393 | |
| | | | | | | | | | |
See notes to financial statements. | | | | | | | | |
12
FINANCIAL HIGHLIGHTS
The following tables describe the performance for each share class for the fiscal periods indicated. All information (except portfolio turnover rate) reflects financial results for a single fund share. Total return shows how much your investment in the fund would have increased (or decreased) during each period, assuming you had reinvested all dividends and distributions. The fund’s total returns do not reflect expenses associated with variable annuity or insurance contracts. These figures have been derived from the fund’s financial statements.
| | | | | | | |
| | | |
| | | |
| | Year Ended December 31, |
Initial Shares | 2016 | 2015 | 2014 | 2013 | 2012 |
Per Share Data ($): | | | | | | |
Net asset value,
beginning of period | | 17.78 | 18.65 | 18.38 | 13.84 | 11.97 |
Investment Operations: | | | | | | |
Investment income (loss)—neta | | .01 | (.04) | (.01) | (.01) | .00a |
Net realized and unrealized gain
(loss) on investments | | .77 | 1.12 | 1.26 | 4.55 | 1.87 |
Total from Investment Operations | | .78 | 1.08 | 1.25 | 4.54 | 1.87 |
Distributions: | | | | | | |
Dividends from net realized
gain on investments | | (.87) | (1.95) | (.98) | — | — |
Net asset value, end of period | | 17.69 | 17.78 | 18.65 | 18.38 | 13.84 |
Total Return (%) | | 4.72 | 6.16 | 6.82 | 32.80 | 15.62 |
Ratios/Supplemental Data (%): | | | | | | |
Ratio of total expenses
to average net assets | | .83 | .83 | .83 | .85 | .83 |
Ratio of net expenses
to average net assets | | .83 | .83 | .83 | .85 | .83 |
Ratio of net investment income
(loss) to average net assets | | .07 | (.22) | (.05) | (.05) | .03 |
Portfolio Turnover Rate | | 64.26 | 70.33 | 72.20 | 68.73 | 52.00 |
Net Assets,
end of period ($ x 1,000) | | 87,243 | 96,422 | 96,320 | 96,786 | 79,353 |
a a Based on average shares outstanding.
b Amount represents less than $.01 per share.
See notes to financial statements.
13
FINANCIAL HIGHLIGHTS (continued)
| | | | | | | |
| | | |
| | | |
| | Year Ended December 31, |
Service Shares | 2016 | 2015 | 2014 | 2013 | 2012 |
Per Share Data ($): | | | | | | |
Net asset value, beginning of period | | 17.06 | 18.01 | 17.82 | 13.45 | 11.66 |
Investment Operations: | | | | | | |
Investment (loss)—neta | | (.03) | (.08) | (.05) | (.04) | (.03) |
Net realized and unrealized gain
(loss) on investments | | .72 | 1.08 | 1.22 | 4.41 | 1.82 |
Total from Investment Operations | | .69 | 1.00 | 1.17 | 4.37 | 1.79 |
Distributions: | | | | | | |
Dividends from net realized
gain on investments | | (.87) | (1.95) | (.98) | — | — |
Net asset value, end of period | | 16.88 | 17.06 | 18.01 | 17.82 | 13.45 |
Total Return (%) | | 4.38 | 5.92 | 6.58 | 32.49 | 15.35 |
Ratios/Supplemental Data (%): | | | | | | |
Ratio of total expenses
to average net assets | | 1.08 | 1.08 | 1.08 | 1.10 | 1.08 |
Ratio of net expenses
to average net assets | | 1.08 | 1.08 | 1.08 | 1.10 | 1.08 |
Ratio of net investment (loss)
to average net assets | | (.18) | (.47) | (.30) | (.30) | (.22) |
Portfolio Turnover Rate | | 64.26 | 70.33 | 72.20 | 68.73 | 52.00 |
Net Assets,
end of period ($ x 1,000) | | 225,801 | 217,006 | 187,957 | 184,493 | 160,409 |
a Based on average shares outstanding.
See notes to financial statements.
14
NOTES TO FINANCIAL STATEMENTS
NOTE 1—Significant Accounting Policies:
Technology Growth Portfolio (the “fund”) is a separate diversified series of Dreyfus Investment Portfolios (the “Company”), which is registered under the Investment Company Act of 1940, as amended (the “Act”), as an open-end management investment company and operates as a series company currently offering four series, including the fund. The fund is only offered to separate accounts established by insurance companies to fund variable annuity contracts and variable life insurance policies. The fund’s investment objective is to seek capital appreciation. The Dreyfus Corporation (the “Manager” or “Dreyfus”), a wholly-owned subsidiary of The Bank of New York Mellon Corporation (“BNY Mellon”), serves as the fund’s investment adviser.
MBSC Securities Corporation (the “Distributor”), a wholly-owned subsidiary of Dreyfus, is the distributor of the fund’s shares, which are sold without a sales charge. The fund is authorized to issue an unlimited number of $.001 par value shares of Beneficial Interest in each of the following classes of shares: Initial and Service. Each class of shares has identical rights and privileges, except with respect to the Distribution Plan, and the expenses borne by each class, the allocation of certain transfer agency costs, and certain voting rights. Income, expenses (other than expenses attributable to a specific class), and realized and unrealized gains or losses on investments are allocated to each class of shares based on its relative net assets.
The Company accounts separately for the assets, liabilities and operations of each series. Expenses directly attributable to each series are charged to that series’ operations; expenses which are applicable to all series are allocated among them on a pro rata basis.
The Financial Accounting Standards Board (“FASB”) Accounting Standards Codification is the exclusive reference of authoritative U.S. generally accepted accounting principles (“GAAP”) recognized by the FASB to be applied by nongovernmental entities. Rules and interpretive releases of the Securities and Exchange Commission (“SEC”) under authority of federal laws are also sources of authoritative GAAP for SEC registrants. The fund’s financial statements are prepared in accordance with GAAP, which may require the use of management estimates and assumptions. Actual results could differ from those estimates.
The Company enters into contracts that contain a variety of indemnifications. The fund’s maximum exposure under these arrangements is unknown. The fund does not anticipate recognizing any loss related to these arrangements.
15
NOTES TO FINANCIAL STATEMENTS (continued)
(a) Portfolio valuation: The fair value of a financial instrument is the amount that would be received to sell an asset or paid to transfer a liability in an orderly transaction between market participants at the measurement date (i.e., the exit price). GAAP establishes a fair value hierarchy that prioritizes the inputs of valuation techniques used to measure fair value. This hierarchy gives the highest priority to unadjusted quoted prices in active markets for identical assets or liabilities (Level 1 measurements) and the lowest priority to unobservable inputs (Level 3 measurements).
Additionally, GAAP provides guidance on determining whether the volume and activity in a market has decreased significantly and whether such a decrease in activity results in transactions that are not orderly. GAAP requires enhanced disclosures around valuation inputs and techniques used during annual and interim periods.
Various inputs are used in determining the value of the fund’s investments relating to fair value measurements. These inputs are summarized in the three broad levels listed below:
Level 1—unadjusted quoted prices in active markets for identical investments.
Level 2—other significant observable inputs (including quoted prices for similar investments, interest rates, prepayment speeds, credit risk, etc.).
Level 3—significant unobservable inputs (including the fund’s own assumptions in determining the fair value of investments).
The inputs or methodology used for valuing securities are not necessarily an indication of the risk associated with investing in those securities.
Changes in valuation techniques may result in transfers in or out of an assigned level within the disclosure hierarchy. Valuation techniques used to value the fund’s investments are as follows:
Investments in securities are valued at the last sales price on the securities exchange or national securities market on which such securities are primarily traded. Securities listed on the National Market System for which market quotations are available are valued at the official closing price or, if there is no official closing price that day, at the last sales price. For open short positions, asked prices are used for valuation purposes. Bid price is used when no asked price is available. Registered investment companies that are not traded on an exchange are valued at their net asset value. All of the preceding securities are generally categorized within Level 1 of the fair value hierarchy.
16
Securities not listed on an exchange or the national securities market, or securities for which there were no transactions, are valued at the average of the most recent bid and asked prices. These securities are generally categorized within Level 2 of the fair value hierarchy.
Fair valuing of securities may be determined with the assistance of a pricing service using calculations based on indices of domestic securities and other appropriate indicators, such as prices of relevant American Depository Receipts and futures. Utilizing these techniques may result in transfers between Level 1 and Level 2 of the fair value hierarchy.
When market quotations or official closing prices are not readily available, or are determined not to reflect accurately fair value, such as when the value of a security has been significantly affected by events after the close of the exchange or market on which the security is principally traded (for example, a foreign exchange or market), but before the fund calculates its net asset value, the fund may value these investments at fair value as determined in accordance with the procedures approved by the Company’s Board of Trustees (the “Board”). Certain factors may be considered when fair valuing investments such as: fundamental analytical data, the nature and duration of restrictions on disposition, an evaluation of the forces that influence the market in which the securities are purchased and sold, and public trading in similar securities of the issuer or comparable issuers. These securities are either categorized within Level 2 or 3 of the fair value hierarchy depending on the relevant inputs used.
For restricted securities where observable inputs are limited, assumptions about market activity and risk are used and are generally categorized within Level 3 of the fair value hierarchy.
The following is a summary of the inputs used as of December 31, 2016 in valuing the fund’s investments:
17
NOTES TO FINANCIAL STATEMENTS (continued)
| | | | | |
| | Level 1 - Unadjusted Quoted Prices | Level 2 - Other Significant Observable Inputs | Level 3 -Significant Unobservable Inputs | Total |
Assets ($) | | | | |
Investments in Securities: | | | |
Equity Securities - Domestic Common Stocks† | 283,266,673 | - | - | 283,266,673 |
Equity Securities - Foreign Common Stocks† | 20,562,084 | - | - | 20,562,084 |
Exchange-Traded Funds | 3,166,371 | - | - | 3,166,371 |
Registered Investment Companies | 26,213,323 | - | - | 26,213,323 |
† See Statement of Investments for additional detailed categorizations.
At December 31, 2015, $6,435,705 of exchange traded foreign equity securities were classified within Level 2 of the fair value hierarchy pursuant to the fund’s fair valuation procedures.
(b) Securities transactions and investment income: Securities transactions are recorded on a trade date basis. Realized gains and losses from securities transactions are recorded on the identified cost basis. Dividend income is recognized on the ex-dividend date and interest income, including, where applicable, accretion of discount and amortization of premium on investments, is recognized on the accrual basis.
Pursuant to a securities lending agreement with The Bank of New York Mellon, a subsidiary of BNY Mellon and an affiliate of Dreyfus, the fund may lend securities to qualified institutions. It is the fund’s policy that, at origination, all loans are secured by collateral of at least 102% of the value of U.S. securities loaned and 105% of the value of foreign securities loaned. Collateral equivalent to at least 100% of the market value of securities on loan is maintained at all times. Collateral is either in the form of cash, which can be invested in certain money market mutual funds managed by Dreyfus, or U.S. Government and Agency securities. The fund is entitled to receive all dividends, interest and distributions on securities loaned, in addition to income earned as a result of the lending transaction. Should a borrower fail to return the securities in a timely manner, The Bank of New York Mellon is required to replace the securities for the benefit of the fund or credit the fund with the market value of the unreturned securities and is subrogated to the fund’s rights against the borrower and the collateral. Additionally, the contractual maturity of
18
security lending transactions are on an overnight and continuous basis. During the period ended December 31, 2016, The Bank of New York Mellon earned $82,199 from lending portfolio securities, pursuant to the securities lending agreement.
(c) Affiliated issuers: Investments in other investment companies advised by Dreyfus are defined as “affiliated” under the Act. Investments in affiliated investment companies during the period ended December 31, 2016 were as follows:
| | | | | | |
Affiliated Investment Company | Value 12/31/2015 ($) | Purchases ($) | Sales ($) | Value 12/31/2016 ($) | Net
Assets (%) |
Dreyfus Institutional Cash Advantage Fund, Institutional Shares† | 23,436,129 | 130,666,598 | 154,102,727 | - | - |
Dreyfus Institutional Preferred Government Plus Money Market Fund†† | 12,475,861 | 101,649,803 | 107,843,358 | 6,282,306 | 2.0 |
Dreyfus Institutional Preferred Money Market Fund, Hamilton Shares† | - | 57,091,647 | 37,160,630 | 19,931,017 | 6.3 |
Total | 35,911,990 | 289,408,048 | 299,106,715 | 26,213,323 | 8.3 |
† During the period ended December 31, 2016, Dreyfus Institutional Cash Advantage Fund was acquired by Dreyfus Institutional Preferred Money Market Fund.
†† Formerly Dreyfus Institutional Preferred Plus Money Market Fund.
(d) Dividends and distributions to shareholders: Dividends and distributions are recorded on the ex-dividend date. Dividends from investment income-net and dividends from net realized capital gains, if any, are normally declared and paid annually, but the fund may make distributions on a more frequent basis to comply with the distribution requirements of the Internal Revenue Code of 1986, as amended (the “Code”). To the extent that net realized capital gains can be offset by capital loss carryovers, it is the policy of the fund not to distribute such gains. Income and capital gain distributions are determined in accordance with income tax regulations, which may differ from GAAP.
19
NOTES TO FINANCIAL STATEMENTS (continued)
(e) Federal income taxes: It is the policy of the fund to continue to qualify as a regulated investment company, if such qualification is in the best interests of its shareholders, by complying with the applicable provisions of the Code, and to make distributions of taxable income sufficient to relieve it from substantially all federal income and excise taxes.
As of and during the period ended December 31, 2016, the fund did not have any liabilities for any uncertain tax positions. The fund recognizes interest and penalties, if any, related to uncertain tax positions as income tax expense in the Statement of Operations. During the period ended December 31, 2016, the fund did not incur any interest or penalties.
Each tax year in the four-year period ended December 31, 2016 remains subject to examination by the Internal Revenue Service and state taxing authorities.
At December 31, 2016, the components of accumulated earnings on a tax basis were as follows: undistributed capital gains $18,969,995 and unrealized appreciation $59,080,047.
The tax character of distributions paid to shareholders during the fiscal periods ended December 31, 2016 and December 31, 2015 were as follows: ordinary income $0 and $4,362,415, and long-term capital gains $15,804,942 and $25,155,935, respectively.
During the period ended December 31, 2016, as a result of permanent book to tax differences, primarily due to the tax treatment for net operating losses, the fund increased accumulated undistributed investment income-net by $335,914 and decreased paid-in capital by the same amount. Net assets and net asset value per share were not affected by this reclassification.
NOTE 2—Bank Lines of Credit:
The fund participates with other Dreyfus-managed funds in an $810 million unsecured credit facility led by Citibank, N.A. and a $300 million unsecured credit facility provided by The Bank of New York Mellon (each, a “Facility”), each to be utilized primarily for temporary or emergency purposes, including the financing of redemptions. Prior to October 5, 2016, the unsecured credit facility with Citibank, N.A. was $555 million and prior to January 11, 2016, the unsecured credit facility with Citibank, N.A. was $480 million. In connection therewith, the fund has agreed to pay its pro rata portion of commitment fees for each Facility. Interest is charged to the fund based on rates determined pursuant to the terms of the respective Facility at the time of borrowing. During the period ended December 31, 2016, the fund did not borrow under the Facilities.
20
NOTE 3—Management Fee and Other Transactions with Affiliates:
(a) Pursuant to a management agreement with Dreyfus, the management fee is computed at the annual rate of .75% of the value of the fund’s average daily net assets and is payable monthly.
(b) Under the Distribution Plan adopted pursuant to Rule 12b-1 under the Act, Service shares pay the Distributor for distributing its shares, for servicing and/or maintaining Service shares’ shareholder accounts and for advertising and marketing for Service shares. The Distribution Plan provides for payments to be made at an annual rate of .25% of the value of the Service shares’ average daily net assets. The Distributor may make payments to Participating Insurance Companies and to brokers and dealers acting as principal underwriter for their variable insurance products. The fees payable under the Distribution Plan are payable without regard to actual expenses incurred. During the period ended December 31, 2016, Service shares were charged $549,788 pursuant to the Distribution Plan.
The fund has arrangements with the transfer agent and the custodian whereby the fund may receive earnings credits when positive cash balances are maintained, which are used to offset transfer agency and custody fees. For financial reporting purposes, the fund includes net earnings credits as an expense offset in the Statement of Operations.
The fund compensates Dreyfus Transfer, Inc., a wholly-owned subsidiary of Dreyfus, under a transfer agency agreement for providing transfer agency and cash management services for the fund. The majority of transfer agency fees are comprised of amounts paid on a per account basis, while cash management fees are related to fund subscriptions and redemptions. During the period ended December 31, 2016, the fund was charged $783 for transfer agency services and $71 for cash management services. These fees are included in Shareholder servicing costs in the Statement of Operations. Cash management fees were partially offset by earnings credits of $33.
The fund compensates The Bank of New York Mellon under a custody agreement for providing custodial services for the fund. These fees are determined based on net assets, geographic region and transaction activity. During the period ended December 31, 2016, the fund was charged $22,023 pursuant to the custody agreement.
During the period ended December 31, 2016, the fund was charged $9,640 for services performed by the Chief Compliance Officer and his staff.
21
NOTES TO FINANCIAL STATEMENTS (continued)
The components of “Due to The Dreyfus Corporation and affiliates” in the Statement of Assets and Liabilities consist of: management fees $200,282, Distribution Plan fees $48,114, custodian fees $12,177, Chief Compliance Officer fees $7,314 and transfer agency fees $632.
(c) Each Board member also serves as a Board member of other funds within the Dreyfus complex. Annual retainer fees and attendance fees are allocated to each fund based on net assets.
NOTE 4—Securities Transactions:
The aggregate amount of purchases and sales of investment securities, excluding short-term securities, during the period ended December 31, 2016, amounted to $192,718,790 and $200,561,982, respectively.
At December 31, 2016, the cost of investments for federal income tax purposes was $274,128,404; accordingly, accumulated net unrealized appreciation on investments was $59,080,047, consisting of $65,357,045 gross unrealized appreciation and $6,276,998 gross unrealized depreciation.
22
REPORT OF INDEPENDENT REGISTERED
PUBLIC ACCOUNTING FIRM
Shareholders and Board of Trustees
Dreyfus Investment Portfolios, Technology Growth Portfolio
We have audited the accompanying statement of assets and liabilities, including the statement of investments, of Dreyfus Investment Portfolios, Technology Growth Portfolio (one of the series comprising Dreyfus Investment Portfolios) as of December 31, 2016, and the related statement of operations for the year then ended, the statement of changes in net assets for each of the two years in the period then ended, and the financial highlights for each of the five years in the period then ended. These financial statements and financial highlights are the responsibility of the Fund’s management. Our responsibility is to express an opinion on these financial statements and financial highlights based on our audits.
We conducted our audits in accordance with the standards of the Public Company Accounting Oversight Board (United States). Those standards require that we plan and perform the audit to obtain reasonable assurance about whether the financial statements and financial highlights are free of material misstatement. We were not engaged to perform an audit of the Fund’s internal control over financial reporting. Our audits included consideration of internal control over financial reporting as a basis for designing audit procedures that are appropriate in the circumstances, but not for the purpose of expressing an opinion on the effectiveness of the Fund’s internal control over financial reporting. Accordingly, we express no such opinion. An audit also includes examining, on a test basis, evidence supporting the amounts and disclosures in the financial statements and financial highlights, assessing the accounting principles used and significant estimates made by management, and evaluating the overall financial statement presentation. Our procedures included confirmation of securities owned as of December 31, 2016 by correspondence with the custodian and others. We believe that our audits provide a reasonable basis for our opinion.
In our opinion, the financial statements and financial highlights referred to above present fairly, in all material respects, the financial position of Dreyfus Investment Portfolios, Technology Growth Portfolio at December 31, 2016, the results of its operations for the year then ended, the changes in its net assets for each of the two years in the period then ended, and the financial highlights for each of the five years in the period then ended, in conformity with U.S. generally accepted accounting principles.

New York, New York
February 10, 2017
23
IMPORTANT TAX INFORMATION (Unaudited)
For federal tax purposes, fund hereby reports $.8655 per share as a long-term capital gain distribution paid on March 24, 2016.
24
INFORMATION ABOUT THE RENEWAL OF THE FUND’S MANAGEMENT AGREEMENT (Unaudited)
At a meeting of the fund’s Board of Trustees held on July 20-21, 2016, the Board considered the renewal of the fund’s Management Agreement pursuant to which Dreyfus provides the fund with investment advisory and administrative services (the “Agreement”). The Board members, a majority of whom are not “interested persons” (as defined in the Investment Company Act of 1940, as amended) of the fund, were assisted in their review by independent legal counsel and met with counsel in executive session separate from Dreyfus representatives. In considering the renewal of the Agreement, the Board considered all factors that it believed to be relevant, including those discussed below. The Board did not identify any one factor as dispositive, and each Board member may have attributed different weights to the factors considered.
Analysis of Nature, Extent, and Quality of Services Provided to the Fund. The Board considered information provided to them at the meeting and in previous presentations from Dreyfus representatives regarding the nature, extent, and quality of the services provided to funds in the Dreyfus fund complex. Dreyfus provided the number of open accounts in the fund, the fund’s asset size and the allocation of fund assets among distribution channels. Dreyfus also had previously provided information regarding the diverse intermediary relationships and distribution channels of funds in the Dreyfus fund complex (such as retail direct or intermediary, in which intermediaries typically are paid by the fund and/or Dreyfus) and Dreyfus’ corresponding need for broad, deep, and diverse resources to be able to provide ongoing shareholder services to each intermediary or distribution channel, as applicable to the fund.
The Board also considered research support available to, and portfolio management capabilities of, the fund’s portfolio management personnel and that Dreyfus also provides oversight of day-to-day fund operations, including fund accounting and administration and assistance in meeting legal and regulatory requirements. The Board also considered Dreyfus’ extensive administrative, accounting and compliance infrastructures. The Board also considered portfolio management’s brokerage policies and practices (including policies and practices regarding soft dollars) and the standards applied in seeking best execution.
Comparative Analysis of the Fund’s Performance and Management Fee and Expense Ratio. The Board reviewed reports prepared by Broadridge Financial Solutions, Inc. (“Broadridge”), an independent provider of investment company data, which included information comparing (1) the fund’s performance with the performance of a group of comparable funds (the “Performance Group”) and with a broader group of funds (the “Performance Universe”), all for various periods ended May 31, 2016, and (2) the fund’s actual and contractual management fees and total expenses with those of a group of comparable funds (the “Expense Group”) and with a broader group of funds (the “Expense Universe”), the information for which was derived in part from fund financial statements available to Broadridge as of the date of its analysis. Dreyfus previously had furnished the Board with a description of the methodology Broadridge used to select the Performance Group and Performance Universe and the Expense Group and Expense Universe.
Dreyfus representatives stated that the usefulness of performance comparisons may be affected by a number of factors, including different investment limitations that may be applicable to the fund and comparison funds. The Board discussed the results of the comparisons and noted that the fund’s total return performance was below the Performance
25
INFORMATION ABOUT THE RENEWAL OF THE FUND’S MANAGEMENT AGREEMENT (Unaudited) (continued)
Group median for all periods, except for the one-year period when it was above the Performance Group median, and variously above, below and at the Performance Universe median. They noted the relative proximity to the median of the Performance Group and/or Performance Universe of the fund’s performance in certain periods. Dreyfus also provided a comparison of the fund’s calendar year total returns to the returns of the fund’s benchmark indices and noted that the fund’s performance was above one or both of the indices in seven of the ten calendar years shown.
The Board also reviewed the range of actual and contractual management fees and total expenses of the Expense Group and Expense Universe funds and discussed the results of the comparisons. The Board noted that the fund’s contractual management fee was below the Expense Group median and the fund’s actual management fee and total expenses were below the Expense Group and Expense Universe medians.
Dreyfus representatives reviewed with the Board the management or investment advisory fees (1) paid by funds advised or administered by Dreyfus that are in the same Broadridge category as the fund and (2) paid to Dreyfus or the Dreyfus-affiliated primary employer of the fund’s primary portfolio manager(s) for advising any separate accounts and/or other types of client portfolios that are considered to have similar investment strategies and policies as the fund (the “Similar Clients”), and explained the nature of the Similar Clients. They discussed differences in fees paid and the relationship of the fees paid in light of any differences in the services provided and other relevant factors. The Board considered the relevance of the fee information provided for the Similar Clients to evaluate the appropriateness of the fund’s management fee.
Analysis of Profitability and Economies of Scale. Dreyfus representatives reviewed the expenses allocated and profit received by Dreyfus and its affiliates and the resulting profitability percentage for managing the fund and the aggregate profitability percentage to Dreyfus and its affiliates for managing the funds in the Dreyfus fund complex, and the method used to determine the expenses and profit. The Board concluded that the profitability results were not unreasonable, given the services rendered and service levels provided by Dreyfus. The Board also had been provided with information prepared by an independent consulting firm regarding Dreyfus’ approach to allocating costs to, and determining the profitability of, individual funds and the entire Dreyfus fund complex. The consulting firm also had analyzed where any economies of scale might emerge in connection with the management of a fund.
The Board considered, on the advice of its counsel, the profitability analysis (1) as part of its evaluation of whether the fees under the Agreement, considered in relation to the mix of services provided by Dreyfus, including the nature, extent and quality of such services, supported the renewal of the Agreement and (2) in light of the relevant circumstances for the fund and the extent to which economies of scale would be realized if the fund grows and whether fee levels reflect these economies of scale for the benefit of fund shareholders. Dreyfus representatives also noted that, as a result of shared and allocated costs among funds in the Dreyfus fund complex, the extent of economies of scale could depend substantially on the level of assets in the complex as a whole, so that increases and decreases in complex-wide assets can affect potential economies of scale in a manner that is disproportionate to, or even in the opposite direction from, changes in the fund’s asset level.
26
The Board also considered potential benefits to Dreyfus from acting as investment adviser and noted the soft dollar arrangements in effect for trading the fund’s investments.
At the conclusion of these discussions, the Board agreed that it had been furnished with sufficient information to make an informed business decision with respect to the renewal of the Agreement. Based on the discussions and considerations as described above, the Board concluded and determined as follows.
· The Board concluded that the nature, extent and quality of the services provided by Dreyfus are adequate and appropriate.
· The Board generally was satisfied with the fund’s improved performance.
· The Board concluded that the fee paid to Dreyfus supported the renewal of the Agreement in light of the considerations described above.
· The Board determined that the economies of scale which may accrue to Dreyfus and its affiliates in connection with the management of the fund had been adequately considered by Dreyfus in connection with the fee rate charged to the fund pursuant to the Agreement and that, to the extent in the future it were determined that material economies of scale had not been shared with the fund, the Board would seek to have those economies of scale shared with the fund.
In evaluating the Agreement, the Board considered these conclusions and determinations and also relied on its previous knowledge, gained through meetings and other interactions with Dreyfus and its affiliates, of the fund and the services provided to the fund by Dreyfus. The Board also relied on information received on a routine and regular basis throughout the year relating to the operations of the fund and the investment management and other services provided under the Agreement, including information on the investment performance of the fund in comparison to similar mutual funds and benchmark performance indices; general market outlook as applicable to the fund; and compliance reports. In addition, the Board’s consideration of the contractual fee arrangements for this fund had the benefit of a number of years of reviews of prior or similar agreements during which lengthy discussions took place between the Board and Dreyfus representatives. Certain aspects of the arrangements may receive greater scrutiny in some years than in others, and the Board’s conclusions may be based, in part, on their consideration of the same or similar arrangements in prior years. The Board determined to renew the Agreement.
27
BOARD MEMBERS INFORMATION (Unaudited)
INDEPENDENT BOARD MEMBERS
Joseph S. DiMartino (73)
Chairman of the Board (1995)
Principal Occupation During Past 5 Years:
· Corporate Director and Trustee (1995-present)
Other Public Company Board Memberships During Past 5 Years:
· CBIZ (formerly, Century Business Services, Inc.), a provider of outsourcing functions for small and medium size companies, Director (1997-present)
No. of Portfolios for which Board Member Serves: 135
———————
Francine J. Bovich (65)
Board Member (2015)
Principal Occupation During Past 5 Years:
· Trustee, The Bradley Trusts, private trust funds (2011-present)
Other Public Company Board Memberships During Past 5 Years:
· Annaly Capital Management, Inc., Board Member (May 2014-present)
No. of Portfolios for which Board Member Serves: 76
———————
Gordon J. Davis (75)
Board Member (2012)
Principal Occupation During Past 5 Years:
· Partner in the law firm of Venable LLP (2012-present)
· Partner in the law firm of Dewey & LeBoeuf LLP (1994-2012)
Other Public Company Board Memberships During Past 5 Years:
· Consolidated Edison, Inc., a utility company, Director (1997-2014)
· The Phoenix Companies, Inc., a life insurance company, Director (2000-2014)
No. of Portfolios for which Board Member Serves: 58
———————
28
Nathan Leventhal (73)
Board Member (2009)
Principal Occupation During Past 5 Years:
· President Emeritus of Lincoln Center for the Performing Arts (2001-present)
· Chairman of the Avery Fisher Artist Program (1997-2014)
· Commissioner, NYC Planning Commission (2007-2011)
Other Public Company Board Memberships During Past 5 Years:
· Movado Group, Inc., Director (2003-present)
No. of Portfolios for which Board Member Serves: 48
———————
Robin A. Melvin (53)
Board Member (2014)
Principal Occupation During Past 5 Years:
· Co-chairman, Illinois Mentoring Partnership, non-profit organization dedicated to increasing the quantity and quality of mentoring services in Illinois; (2014-present; board member since 2013)
· Director, Boisi Family Foundation, a private family foundation that supports youth-serving organizations that promote the self sufficiency of youth from disadvantaged circumstances (1995-2012)
No. of Portfolios for which Board Member Serves: 107
———————
Roslyn M. Watson (67)
Board Member (2014)
Principal Occupation During Past 5 Years:
· Principal, Watson Ventures, Inc., a real estate investment company (1993-present)
No. of Portfolios for which Board Member Serves: 62
———————
Benaree Pratt Wiley (70)
Board Member (2009)
Principal Occupation During Past 5 Years:
· Principal, The Wiley Group, a firm specializing in strategy and business development (2005-present)
Other Public Company Board Memberships During Past 5 Years:
· CBIZ (formerly, Century Business Services, Inc.), a provider of outsourcing functions for small and medium size companies, Director (2008-present)
No. of Portfolios for which Board Member Serves: 86
———————
29
BOARD MEMBERS INFORMATION (Unaudited) (continued)
INTERESTED BOARD MEMBERS
J. Charles Cardona (61)
Board Member (2014)
Principal Occupation During Past 5 Years:
· Retired President and a Director of the Manager (2008-2016), Chairman of the Distributor (2013-2016, Executive Vice President, 1997-2013),
No. of Portfolios for which Board Member Serves: 34
J. Charles Cardona is deemed to be an “interested person” (as defined under the Act) of the Company as a result of his affiliation with The Dreyfus Corporation.
———————
Isabel P. Dunst (69)
Board Member (2014)
Principal Occupation During Past 5 Years:
· Of Counsel to the law firm of Hogan Lovells LLP (2015-present; previously, Partner, 1990-2014)
No. of Portfolios for which Board Member Serves: 34
Isabel P. Dunst is deemed to be an “interested person” (as defined under the Act) of the Company as a result of her affiliation with Hogan Lovells LLP, which provides legal services to BNY Mellon and certain of its affiliates.
———————
Once elected all Board Members serve for an indefinite term, but achieve Emeritus status upon reaching age 80. The address of the Board Members and Officers is c/o The Dreyfus Corporation, 200 Park Avenue, New York, New York 10166. Additional information about the Board Members is available in the fund’s Statement of Additional Information which can be obtained from Dreyfus free of charge by calling this toll free number: 1-800-DREYFUS.
Clifford L. Alexander, Jr., Emeritus Board Member
Whitney I. Gerard, Emeritus Board Member
George L. Perry, Emeritus Board Member
30
OFFICERS OF THE FUND (Unaudited)
BRADLEY J. SKAPYAK, President since January 2010.
Chief Operating Officer and a director of the Manager since June 2009, Chairman of Dreyfus Transfer, Inc., an affiliate of the Manager and the transfer agent of the funds, since May 2011 and Executive Vice President of MBSC Securities Corporation since June 2007. He is an officer of 64 investment companies (comprised of 135 portfolios) managed by the Manager. He is 58 years old and has been an employee of the Manager since February 1988.
BENNETT A. MACDOUGALL, Chief Legal Officer since October 2015.
Chief Legal Officer of the Manager and Associate General Counsel and Managing Director of BNY Mellon since June 2015; from June 2005 to June 2015, he served in various capacities with Deutsche Bank – Asset & Wealth Management Division, including as Director and Associate General Counsel, and Chief Legal Officer of Deutsche Investment Management Americas Inc. from June 2012 to May 2015. He is an officer of 65 investment companies (comprised of 160 portfolios) managed by the Manager. He is 45 years old and has been an employee of the Manager since June 2015.
JANETTE E. FARRAGHER, Vice President and Secretary since December 2011.
Associate General Counsel of BNY Mellon, and an officer of 65 investment companies (comprised of 160 portfolios) managed by the Manager. She is 54 years old and has been an employee of the Manager since February 1984.
JAMES BITETTO, Vice President and Assistant Secretary since August 2005.
Managing Counsel of BNY Mellon and Secretary of the Manager, and an officer of 65 investment companies (comprised of 160 portfolios) managed by the Manager. He is 50 years old and has been an employee of the Manager since December 1996.
JONI LACKS CHARATAN, Vice President and Assistant Secretary since August 2005.
Managing Counsel of BNY Mellon, and an officer of 65 investment companies (comprised of 160 portfolios) managed by the Manager. She is 61 years old and has been an employee of the Manager since October 1988.
JOSEPH M. CHIOFFI, Vice President and Assistant Secretary since August 2005.
Managing Counsel of BNY Mellon, and an officer of 65 investment companies (comprised of 160 portfolios) managed by the Manager. He is 55 years old and has been an employee of the Manager since June 2000.
MAUREEN E. KANE, Vice President and Assistant Secretary since April 2015.
Managing Counsel of BNY Mellon since July 2014; from October 2004 until July 2014, General Counsel, and from May 2009 until July 2014, Chief Compliance Officer of Century Capital Management. She is an officer of 65 investment companies (comprised of 160 portfolios) managed by the Manager. She is 54 years old and has been an employee of the Manager since July 2014.
SARAH S. KELLEHER, Vice President and Assistant Secretary since April 2014.
Senior Counsel of BNY Mellon since March 2013, from August 2005 to March 2013, Associate General Counsel of Third Avenue Management. She is an officer of 65 investment companies (comprised of 160 portfolios) managed by the Manager. She is 41 years old and has been an employee of the Manager since March 2013.
JEFF PRUSNOFSKY, Vice President and Assistant Secretary since August 2005.
Senior Managing Counsel of BNY Mellon, and an officer of 65 investment companies (comprised of 160 portfolios) managed by the Manager. He is 51 years old and has been an employee of the Manager since October 1990.
JAMES WINDELS, Treasurer since November 2001.
Director – Mutual Fund Accounting of the Manager, and an officer of 65 investment companies (comprised of 160 portfolios) managed by the Manager. He is 58 years old and has been an employee of the Manager since April 1985.
RICHARD CASSARO, Assistant Treasurer since January 2008.
Senior Accounting Manager – Money Market, Municipal Bond and Equity Funds of the Manager, and an officer of 65 investment companies (comprised of 160 portfolios) managed by the Manager. He is 57 years old and has been an employee of the Manager since September 1982.
31
OFFICERS OF THE FUND (Unaudited) (continued)
GAVIN C. REILLY, Assistant Treasurer since December 2005.
Tax Manager of the Investment Accounting and Support Department of the Manager, and an officer of 65 investment companies (comprised of 160 portfolios) managed by the Manager. He is 48 years old and has been an employee of the Manager since April 1991.
ROBERT S. ROBOL, Assistant Treasurer since August 2005.
Senior Accounting Manager of the Manager, and an officer of 65 investment companies (comprised of 160 portfolios) managed by the Manager. He is 52 years old and has been an employee of the Manager since October 1988.
ROBERT SALVIOLO, Assistant Treasurer since July 2007.
Senior Accounting Manager – Equity Funds of the Manager, and an officer of 65 investment companies (comprised of 160 portfolios) managed by the Manager. He is 49 years old and has been an employee of the Manager since June 1989.
ROBERT SVAGNA, Assistant Treasurer since December 2002.
Senior Accounting Manager – Fixed Income and Equity Funds of the Manager, and an officer of 65 investment companies (comprised of 160 portfolios) managed by the Manager. He is 49 years old and has been an employee of the Manager since November 1990.
JOSEPH W. CONNOLLY, Chief Compliance Officer since October 2004.
Chief Compliance Officer of the Manager and The Dreyfus Family of Funds (65 investment companies, comprised of 160 portfolios). He is 59 years old and has served in various capacities with the Manager since 1980, including manager of the firm’s Fund Accounting Department from 1997 through October 2001.
CARIDAD M. CAROSELLA, Anti-Money Laundering Compliance Officer since January 2016.
Anti-Money Laundering Compliance Officer of the Dreyfus Family of Funds and BNY Mellon Funds Trust since January 2016; from May 2015 to December 2015, Interim Anti-Money Laundering Compliance Officer of the Dreyfus Family of Funds and BNY Mellon Funds Trust and the Distributor; from January 2012 to May 2015, AML Surveillance Officer of the Distributor and from 2007 to December 2011, Financial Processing Manager of the Distributor. She is an officer of 60 investment companies (comprised of 155 portfolios) managed by the Manager. She is 48 years old and has been an employee of the Distributor since 1997.
32
NOTES
33
Dreyfus Investment Portfolios, Technology Growth Portfolio
200 Park Avenue
New York, NY 10166
Manager
The Dreyfus Corporation
200 Park Avenue
New York, NY 10166
Custodian
The Bank of New York Mellon
225 Liberty Street
New York, NY 10286
Transfer Agent &
Dividend Disbursing Agent
Dreyfus Transfer, Inc.
200 Park Avenue
New York, NY 10166
Distributor
MBSC Securities Corporation
200 Park Avenue
New York, NY 10166
Telephone 1-800-258-4260 or 1-800-258-4261
Mail The Dreyfus Family of Funds, 144 Glenn Curtiss Boulevard, Uniondale, NY 11556-0144 Attn: Institutional Services Department
E-mail Send your request to info@dreyfus.com
Internet Information can be viewed online or downloaded at www.dreyfus.com
The fund files its complete schedule of portfolio holdings with the Securities and Exchange Commission (“SEC”) for the first and third quarters of each fiscal year on Form N-Q. The fund’s Forms N-Q are available on the SEC’s website at http://www.sec.gov and may be reviewed and copied at the SEC’s Public Reference Room in Washington, DC. Information on the operation of the Public Reference Room may be obtained by calling 1-800-SEC-0330.
A description of the policies and procedures that the fund uses to determine how to vote proxies relating to portfolio securities, and information regarding how the fund voted these proxies for the most recent 12-month period ended June 30 is available at http://www.dreyfus.com and on the SEC’s website at http://www.sec.gov. The description of the policies and procedures is also available without charge, upon request, by calling 1-800-DREYFUS.
| | |
© 2017 MBSC Securities Corporation
0175AR1216 | 
|
Item 2. Code of Ethics.
The Registrant has adopted a code of ethics that applies to the Registrant's principal executive officer, principal financial officer, principal accounting officer or controller, or persons performing similar functions. There have been no amendments to, or waivers in connection with, the Code of Ethics during the period covered by this Report.
Item 3. Audit Committee Financial Expert.
The Registrant's Board has determined that Joseph S. DiMartino, a member of the Audit Committee of the Board, is an audit committee financial expert as defined by the Securities and Exchange Commission (the "SEC"). Joseph S. DiMartino is "independent" as defined by the SEC for purposes of audit committee financial expert determinations.
Item 4. Principal Accountant Fees and Services.
(a) Audit Fees. The aggregate fees billed for each of the last two fiscal years (the "Reporting Periods") for professional services rendered by the Registrant's principal accountant (the "Auditor") for the audit of the Registrant's annual financial statements or services that are normally provided by the Auditor in connection with the statutory and regulatory filings or engagements for the Reporting Periods, were $132,124 in 2015 and $135,424 in 2016.
(b) Audit-Related Fees. The aggregate fees billed in the Reporting Periods for assurance and related services by the Auditor that are reasonably related to the performance of the audit of the Registrant's financial statements and are not reported under paragraph (a) of this Item 4 were $37,400 in 2015 and $38,028 in 2016. These services consisted of one or more of the following: (i) agreed upon procedures related to compliance with Internal Revenue Code section 817(h), (ii) security counts required by Rule 17f-2 under the Investment Company Act of 1940, as amended, (iii) advisory services as to the accounting or disclosure treatment of Registrant transactions or events and (iv) advisory services to the accounting or disclosure treatment of the actual or potential impact to the Registrant of final or proposed rules, standards or interpretations by the Securities and Exchange Commission, the Financial Accounting Standards Boards or other regulatory or standard-setting bodies.
The aggregate fees billed in the Reporting Periods for non-audit assurance and related services by the Auditor to the Registrant's investment adviser (not including any sub-investment adviser whose role is primarily portfolio management and is subcontracted with or overseen by another investment adviser), and any entity controlling, controlled by or under common control with the investment adviser that provides ongoing services to the Registrant ("Service Affiliates"), that were reasonably related to the performance of the annual audit of the Service Affiliate, which required pre-approval by the Audit Committee were $0 in 2015 and $0 in 2016.
(c) Tax Fees. The aggregate fees billed in the Reporting Periods for professional services rendered by the Auditor for tax compliance, tax advice, and tax planning ("Tax Services") were $13,955 in 2015 and $15,063 in 2016. These services consisted of: (i) review or preparation of U.S. federal, state, local and excise tax returns; (ii) U.S. federal, state and local tax planning, advice and assistance regarding statutory, regulatory or administrative developments; (iii) tax advice regarding tax qualification matters and/or treatment of various financial instruments held or proposed to be acquired or held, and (iv) determination of Passive Foreign Investment Companies. The aggregate fees billed in the Reporting Periods for Tax Services by the Auditor to Service Affiliates, which required pre-approval by the Audit Committee were $0 in 2015 and $0 in 2016.
(d) All Other Fees. The aggregate fees billed in the Reporting Periods for products and services provided by the Auditor, other than the services reported in paragraphs (a) through (c) of this Item, were $29 in 2015 and $40 in 2016. These services consisted of a review of the Registrant's anti-money laundering program.
The aggregate fees billed in the Reporting Periods for Non-Audit Services by the Auditor to Service Affiliates, other than the services reported in paragraphs (b) through (c) of this Item, which required pre-approval by the Audit Committee, were $0 in 2015 and $0 in 2016.
(e)(1) Audit Committee Pre-Approval Policies and Procedures. The Registrant's Audit Committee has established policies and procedures (the "Policy") for pre-approval (within specified fee limits) of the Auditor's engagements for non-audit services to the Registrant and Service Affiliates without specific case-by-case consideration. The pre-approved services in the Policy can include pre-approved audit services, pre-approved audit-related services, pre-approved tax services and pre-approved all other services. Pre-approval considerations include whether the proposed services are compatible with maintaining the Auditor's independence. Pre-approvals pursuant to the Policy are considered annually.
(e)(2) Note. None of the services described in paragraphs (b) through (d) of this Item 4 were approved by the Audit Committee pursuant to paragraph (c)(7)(i)(C) of Rule 2-01 of Regulation S-X.
(f) None of the hours expended on the principal accountant's engagement to audit the registrant's financial statements for the most recent fiscal year were attributed to work performed by persons other than the principal account's full-time, permanent employees.
Non-Audit Fees. The aggregate non-audit fees billed by the Auditor for services rendered to the Registrant, and rendered to Service Affiliates, for the Reporting Periods were $20,055,582 in 2015and $19,533,050 in 2016.
Auditor Independence. The Registrant's Audit Committee has considered whether the provision of non-audit services that were rendered to Service Affiliates, which were not pre-approved (not requiring pre-approval), is compatible with maintaining the Auditor's independence.
Item 5. Audit Committee of Listed Registrants.
Not applicable.
Item 6. Investments.
(a) Not applicable.
Item 7. Disclosure of Proxy Voting Policies and Procedures for Closed-End Management Investment Companies.
Not applicable.
Item 8. Portfolio Managers of Closed-End Management Investment Companies.
Not applicable.
Item 9. Purchases of Equity Securities by Closed-End Management Investment Companies and Affiliated Purchasers.
Not applicable.
Item 10. Submission of Matters to a Vote of Security Holders.
There have been no material changes to the procedures applicable to Item 10.
Item 11. Controls and Procedures.
(a) The Registrant's principal executive and principal financial officers have concluded, based on their evaluation of the Registrant's disclosure controls and procedures as of a date within 90 days of the filing date of this report, that the Registrant's disclosure controls and procedures are reasonably designed to ensure that information required to be disclosed by the Registrant on Form N-CSR is recorded, processed, summarized and reported within the required time periods and that information required to be disclosed by the Registrant in the reports that it files or submits on Form N-CSR is accumulated and communicated to the Registrant's management, including its principal executive and principal financial officers, as appropriate to allow timely decisions regarding required disclosure.
(b) There were no changes to the Registrant's internal control over financial reporting that occurred during the second fiscal quarter of the period covered by this report that have materially affected, or are reasonably likely to materially affect, the Registrant's internal control over financial reporting.
Item 12. Exhibits.
(a)(1) Code of ethics referred to in Item 2.
(a)(2) Certifications of principal executive and principal financial officers as required by Rule 30a-2(a) under the Investment Company Act of 1940.
(a)(3) Not applicable.
(b) Certification of principal executive and principal financial officers as required by Rule 30a-2(b) under the Investment Company Act of 1940.
SIGNATURES
Pursuant to the requirements of the Securities Exchange Act of 1934 and the Investment Company Act of 1940, the Registrant has duly caused this Report to be signed on its behalf by the undersigned, thereunto duly authorized.
Dreyfus Investment Portfolios
By: /s/ Bradley J. Skapyak
Bradley J. Skapyak
President
Date: February 14, 2017
Pursuant to the requirements of the Securities Exchange Act of 1934 and the Investment Company Act of 1940, this Report has been signed below by the following persons on behalf of the Registrant and in the capacities and on the dates indicated.
By: /s/ Bradley J. Skapyak
Bradley J. Skapyak
President
Date: February 14, 2017
By: /s/ James Windels
James Windels
Treasurer
Date: February 14, 2017
EXHIBIT INDEX
(a)(1) Code of ethics referred to in Item 2.
(a)(2) Certifications of principal executive and principal financial officers as required by Rule 30a-2(a) under the Investment Company Act of 1940. (EX-99.CERT)
(b) Certification of principal executive and principal financial officers as required by Rule 30a-2(b) under the Investment Company Act of 1940. (EX-99.906CERT)


