UNITED STATES
SECURITIES AND EXCHANGE COMMISSION
Washington, D.C. 20549
FORM N-CSR
CERTIFIED SHAREHOLDER REPORT OF REGISTERED MANAGEMENT
INVESTMENT COMPANIES
Investment Company Act file number: | 811-08673 |
| |
| Dreyfus Investment Portfolios | |
| (Exact name of Registrant as specified in charter) | |
| | |
| c/o The Dreyfus Corporation 200 Park Avenue New York, New York 10166 | |
| (Address of principal executive offices) (Zip code) | |
| | |
| Bennett A. MacDougall, Esq. 200 Park Avenue New York, New York 10166 | |
| (Name and address of agent for service) | |
|
Registrant's telephone number, including area code: | (212) 922-6400 |
| |
Date of fiscal year end: | 12/31 | |
Date of reporting period: | 12/31/18 | |
| | | | | | | |
FORM N-CSR
Item 1. Reports to Stockholders.
Dreyfus Investment Portfolios, Core Value Portfolio
| | | |

| | ANNUAL REPORT
December 31, 2018 |
| |
The views expressed in this report reflect those of the portfolio manager(s) only through the end of the period covered and do not necessarily represent the views of Dreyfus or any other person in the Dreyfus organization. Any such views are subject to change at any time based upon market or other conditions and Dreyfus disclaims any responsibility to update such views. These views may not be relied on as investment advice and, because investment decisions for a Dreyfus fund are based on numerous factors, may not be relied on as an indication of trading intent on behalf of any Dreyfus fund. |
| |
Not FDIC-Insured • Not Bank-Guaranteed • May Lose Value |
Contents
THE FUND
FOR MORE INFORMATION
Back Cover
| | | | |
| |
Dreyfus Investment Portfolios, Core Value Portfolio
| | The Fund |
A LETTER FROM THE PRESIDENT OF DREYFUS
Dear Shareholder:
We are pleased to present this annual report for Dreyfus Investment Portfolios, Core Value Portfolio, covering the 12-month period from January 1, 2018 through December 31, 2018. For information about how the fund performed during the reporting period, as well as general market perspectives, we provide a Discussion of Fund Performance on the pages that follow.
The reporting period began with major global economies achieving above-trend growth. In the United States, a robust economy and strong labor market encouraged the Federal Reserve to continue moving away from its accommodative monetary policy while other major central banks began to consider monetary tightening. Both U.S. and non-U.S. equity markets remained on an uptrend. Interest rates rose across the yield curve, putting pressure on bond prices.
A few months into the reporting period, global growth trends began to diverge and market volatility returned. While the U.S. economy continued to grow at a healthy rate, other developed markets began to weaken. However, robust growth and strong corporate earnings continued to support U.S. stock returns while other developed markets declined throughout the summer. In the fall, a broad sell-off occurred, partially offsetting earlier U.S. gains. Emerging markets remained under pressure as weakness in their currencies relative to the U.S. dollar added to investors’ uneasiness. Global equities continued their general decline through the end of the period.
Fixed income markets struggled during the first half of the period as interest rates rose and favorable U.S. equity markets fed investor risk appetites. However, in autumn volatility crept in, the yield curve began a flattening trend that continued through the end of December. As long-term debt yields fell, prices rose for many bonds, leading to moderately positive returns for several fixed income market sectors.
Despite continuing political variables, U.S. inflationary pressures and flagging growth rates, we are optimistic that the U.S. economy will remain strong in the near term. However, we remain attentive to signs that point to potential changes on the horizon. As always, we encourage you to discuss the risks and opportunities in today’s investment environment with your financial advisor.
Thank you for your continued confidence and support.
Sincerely,

Renee Laroche-Morris
President
The Dreyfus Corporation
January 15, 2019
2
DISCUSSION OF FUND PERFORMANCE(Unaudited)
For the period from January 1, 2018 through December 31, 2018, as provided by Brian Ferguson, Portfolio Manager
Market and Fund Performance Overview
For the 12-month period ended December 31, 2018, Dreyfus Investment Portfolios, Core Value Portfolio’s Initial shares produced a total return of -11.24%, and its Service shares returned -11.51%.1 In comparison, the fund’s benchmark, the Russell 1000® Value Index (the “Index”), produced a total return of -8.27% for the same period.2
Value-oriented stocks posted losses, on average, during the reporting period amid intensifying inflationary pressures, rising interest rates and international trade tensions. The fund underperformed the Index largely due to sector allocation decisions.
The Fund’s Investment Approach
The fund seeks long-term growth of capital, with current income as a secondary objective. To pursue its goals, the fund normally invests at least 80% of its net assets, plus any borrowings for investment purposes, in stocks. The fund focuses on stocks of large-cap value companies. The fund typically invests mainly in the stocks of U.S. issuers, and will limit its holdings of foreign stocks to 20% of the value of its total assets.
When choosing stocks, the fund uses a “bottom-up” stock-selection approach, focusing on individual companies, rather than a “top-down” approach that forecasts market trends. A three-step value-screening process is used to select stocks based on value, sound business fundamentals and positive business momentum.
Stocks Sold Off Late in the Year
A growing U.S. economy and passage of business-friendly tax reforms drove U.S. stocks sharply higher early in the reporting period. But volatility soared in response to rising wage pressures, which, along with other indicators, signaled a possible acceleration of inflation, and stocks lost ground. Although the market recovered as these concerns eased, March saw another decline sparked by escalating geopolitical tensions stemming from more protectionist U.S. trade policies.
Positive U.S. economic data continued to accrue as the reporting period progressed, and stocks gradually recouped earlier losses. But the market’s advance was constrained by concerns related to tariffs imposed by the United States on steel and aluminum imports, which were followed by retaliation from overseas trading partners. The industrials and materials sectors were hit particularly hard by escalating trade tensions while interest rate-sensitive industry groups also lagged market averages.
Late in the reporting period, growing concerns about rising interest rates, geopolitical turmoil and ongoing trade tensions with China weighed on returns. In addition, falling oil prices suggested that global economic growth could be weakening. These factors, combined with high market valuations and disappointing earnings reports, particularly among technology companies, resulted in a sharp sell-off at year-end. In this challenging environment, value-oriented stocks generally underperformed their more growth-oriented counterparts.
Sector Allocation Drove Fund Performance
The fund’s underperformance was due primarily to its underweighting of defensive and “bond proxy” sectors, including health care, utilities and real estate, which benefited from the sell-off
3
DISCUSSION OF FUND PERFORMANCE(Unaudited) (continued)
that occurred late in the year. The fund’s overweighting of cyclical sectors, including the financials, energy and materials sectors, also hindered performance. Gains from stock selection were modestly negative. In the financials sector, a position in Ameriprise Financial, a wealth management firm, was hampered by weakness in the asset management industry. The fund’s position in Goldman Sachs Group suffered as the bank faced concerns about slowing GDP growth restraining earnings. The fund’s holding of American International Group, an insurance company, also dragged on performance. In the energy sector, our holding of refiner Marathon Petroleum, and our focus on companies that benefit from rising oil prices, including Anadarko Petroleum and Hess Corporation, harmed returns as oil prices declined late in the reporting period. In the health care sector, Quest Diagnostics underperformed as it faced slower growth for its services. In the consumer staples sector, holdings of food product companies ConAgra Brands and Kraft Heinz lagged in part due to a consumer trend away from packaged foods.
On a more positive note, holdings in the communication services sector, including Verizon Communications and AT&T, added to the fund’s performance. In the information technology sector, positions in Cisco Systems,Fortinet and Qualcomm also proved beneficial as did an underweight to the consumer discretionary sector and underweight exposure to General Electric.
Portfolio Positioned for Gains
Despite rising interest rates and ongoing trade tensions, we believe the economy remains strong. Consumer spending remains supportive and wage gains have been strong while a decline in energy prices should provide additional support to U.S. consumers. These factors, combined with strong earnings, should support continued stock market advances. The sell-off late in the reporting period has resulted in lower valuations, and value stocks now appear especially attractive versus the broader market.
We are emphasizing cyclical sectors, including financials, materials, communications services, information technology and energy. We have underweighted exposure to the utilities, real estate, consumer discretionary and consumer staples sectors, and we are neutral on the health care sector.
January 15, 2019
1 Total return includes reinvestment of dividends and any capital gains paid. Past performance is no guarantee of future results. Share price and investment return fluctuate such that upon redemption, fund shares may be worth more or less than their original cost.
2 Source: Lipper Inc. — The Russell 1000® Value Index measures the performance of the large-cap value segment of the U.S. equity universe. It includes those Russell 1000 companies that are considered more value-oriented relative to the overall market as defined by Russell’s leading style methodology. The Russell 1000® Value Index is constructed to provide a comprehensive and unbiased barometer for the large-cap value segment. The index is completely reconstituted annually to ensure new and growing equities are included and that the represented companies continue to reflect value characteristics. Investors cannot invest directly in any index.
Please note: the position in any security highlighted with italicized typeface was sold during the reporting period.
Equities are subject generally to market, market sector, market liquidity, issuer, and investment style risks, among other factors, to varying degrees, all of which are more fully described in the fund’s prospectus.
The fund is only available as a funding vehicle under variable life insurance policies or variable annuity contracts issued by insurance companies. Individuals may not purchase shares of the fund directly. A variable annuity is an insurance contract issued by an insurance company that enables investors to accumulate assets on a tax-deferred basis for retirement or other long-term goals. The investment objective and policies of Dreyfus Investment Portfolios, Core Value Portfolio made available through insurance products may be similar to those of other funds managed or advised by Dreyfus. However, the investment results of the fund may be higher or lower than, and may not be comparable to, those of any other Dreyfus fund.
4
FUND PERFORMANCE(Unaudited)
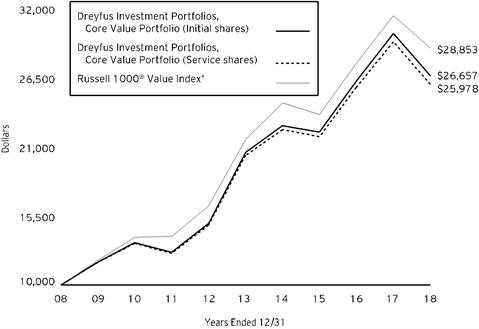
Comparison of change in value of $10,000 investment in Dreyfus Investment Portfolios, Core Value Portfolio Initial shares and Service shares and the Russell 1000® Value Index (the “Index”)
† Source: Lipper Inc.
Past performance is not predictive of future performance. The fund’s performance does not reflect the deduction of additional charges and expenses imposed in connection with investing in variable insurance contracts which will reduce returns.
The above graph compares a $10,000 investment made in Initial and Service shares of Dreyfus Investment Portfolios, Core Value Portfolio on 12/31/08 to a $10,000 investment made in the Index on that date.
The fund’s performance shown in the line graph above takes into account all applicable fees and expenses. The Index measures the performance of the large-cap value segment of the U.S. equity universe. It includes those Russell 1000 companies that are considered more value-oriented relative to the overall market as defined by Russell’s leading style methodology. The Index is constructed to provide a comprehensive and unbiased barometer for the large-cap value segment. The Index is completely reconstituted annually to ensure new and growing equities are included and that the represented companies continue to reflect value characteristics. Unlike a mutual fund, the Index is not subject to charges, fees and other expenses. Investors cannot invest directly in any index. Further information relating to fund performance, including expense reimbursements, if applicable, is contained in the Financial Highlights section of the prospectus and elsewhere in this report.
5
FUND PERFORMANCE(Unaudited) (continued)
| | | | |
Average Annual Total Returns as of 12/31/18 |
| 1 Year | 5 Years | 10 Years |
Initial shares | -11.24% | 5.33% | 10.30% |
Service shares | -11.51% | 5.04% | 10.02% |
Russell 1000® Value Index | -8.27% | 5.95% | 11.18% |
The performance data quoted represents past performance, which is no guarantee of future results. Share price and investment return fluctuate and an investor’s shares may be worth more or less than original cost upon redemption. Current performance may be lower or higher than the performance quoted. Go to Dreyfus.com for the fund’s most recent month-end returns.
The fund’s Initial shares are not subject to a Rule 12b-1 fee. The fund’s Service shares are subject to a 0.25% annual Rule 12b-1 fee. All dividends and capital gain distributions are reinvested.
The fund’s performance shown in the graph and table does not reflect the deduction of taxes that a shareholder would pay on fund distributions or the redemption of fund shares.
6
UNDERSTANDING YOUR FUND’S EXPENSES(Unaudited)
As a mutual fund investor, you pay ongoing expenses, such as management fees and other expenses. Using the information below, you can estimate how these expenses affect your investment and compare them with the expenses of other funds. You also may pay one-time transaction expenses, including sales charges (loads), redemption fees and expenses associated with variable annuity or insurance contracts, which are not shown in this section and would have resulted in higher total expenses. For more information, see your fund’s prospectus or talk to your financial adviser.
Review your fund’s expenses
The table below shows the expenses you would have paid on a $1,000 investment in Dreyfus Investment Portfolios, Core Value Portfolio from July 1, 2018 to December 31, 2018. It also shows how much a $1,000 investment would be worth at the close of the period, assuming actual returns and expenses.
| | | | | | | | |
Expenses and Value of a $1,000 Investment | | |
assuming actual returns for the six months ended December 31, 2018 | |
| | | | Initial Shares | Service Shares |
Expenses paid per $1,000† | | | $6.83 | | $8.02 |
Ending value (after expenses) | | | $895.70 | | $894.40 |
COMPARING YOUR FUND’S EXPENSES
WITH THOSE OF OTHER FUNDS(Unaudited)
Using the SEC’s method to compare expenses
The Securities and Exchange Commission (“SEC”) has established guidelines to help investors assess fund expenses. Per these guidelines, the table below shows your fund’s expenses based on a $1,000 investment, assuming a hypothetical 5% annualized return. You can use this information to compare the ongoing expenses (but not transaction expenses or total cost) of investing in the fund with those of other funds. All mutual fund shareholder reports will provide this information to help you make this comparison. Please note that you cannot use this information to estimate your actual ending account balance and expenses paid during the period.
| | | | | | | | |
Expenses and Value of a $1,000 Investment | | |
assuming a hypothetical 5% annualized return for the six months ended December 31, 2018 |
| | | | Initial Shares | Service Shares |
Expenses paid per $1,000† | | | $7.27 | | $8.54 |
Ending value (after expenses) | | | $1,018.00 | | $1,016.74 |
† Expenses are equal to the fund’s annualized expense ratio of 1.43% for Initial shares and 1.68% for Service shares, multiplied by the average account value over the period, multiplied by 184/365 (to reflect the one-half year period).
7
STATEMENT OF INVESTMENTS
December 31, 2018
| | | | | | | | |
| |
Description | | | | Shares | | Value ($) | |
Common Stocks - 98.3% | | | | | |
Automobiles & Components - .8% | | | | | |
General Motors | | | | 4,246 | | 142,029 | |
Banks - 14.1% | | | | | |
Bank of America | | | | 20,836 | | 513,399 | |
Citigroup | | | | 7,005 | | 364,680 | |
JPMorgan Chase & Co. | | | | 7,849 | | 766,219 | |
U.S. Bancorp | | | | 7,308 | | 333,976 | |
Wells Fargo & Co. | | | | 8,961 | | 412,923 | |
| | | | | 2,391,197 | |
Capital Goods - 5.9% | | | | | |
General Electric | | | | 11,992 | | 90,779 | |
Harris | | | | 1,192 | | 160,503 | |
Honeywell International | | | | 1,932 | | 255,256 | |
Quanta Services | | | | 2,595 | | 78,110 | |
Raytheon | | | | 795 | | 121,913 | |
United Technologies | | | | 2,811 | | 299,315 | |
| | | | | 1,005,876 | |
Consumer Services - .8% | | | | | |
Las Vegas Sands | | | | 2,469 | | 128,511 | |
Diversified Financials - 11.9% | | | | | |
American Express | | | | 1,286 | | 122,582 | |
Ameriprise Financial | | | | 1,544 | | 161,147 | |
Berkshire Hathaway | | | | 4,085 | a | 834,075 | |
Capital One Financial | | | | 1,438 | | 108,698 | |
Goldman Sachs | | | | 1,225 | | 204,636 | |
LPL Financial Holdings | | | | 2,131 | | 130,161 | |
Morgan Stanley | | | | 4,279 | | 169,662 | |
Raymond James Financial | | | | 1,388 | | 103,281 | |
Voya Financial | | | | 4,966 | b | 199,335 | |
| | | | | 2,033,577 | |
Energy - 10.3% | | | | | |
Anadarko Petroleum | | | | 5,400 | | 236,736 | |
Apergy | | | | 3,677 | | 99,573 | |
Hess | | | | 4,955 | | 200,678 | |
Marathon Petroleum | | | | 6,983 | | 412,067 | |
Occidental Petroleum | | | | 4,722 | | 289,836 | |
Phillips 66 | | | | 3,761 | | 324,010 | |
Schlumberger | | | | 2,002 | | 72,232 | |
Valero Energy | | | | 1,661 | | 124,525 | |
| | | | | 1,759,657 | |
Food, Beverage & Tobacco - 3.7% | | | | | |
Coca-Cola European Partners | | | | 1,799 | | 82,484 | |
8
| | | | | | | | |
| |
Description | | | | Shares | | Value ($) | |
Common Stocks - 98.3% (continued) | | | | | |
Food, Beverage & Tobacco - 3.7% (continued) | | | | | |
Conagra Brands | | | | 8,855 | | 189,143 | |
Kraft Heinz | | | | 1,715 | | 73,814 | |
Mondelez International, Cl. A | | | | 2,054 | | 82,222 | |
PepsiCo | | | | 1,804 | | 199,306 | |
| | | | | 626,969 | |
Health Care Equipment & Services - 9.4% | | | | | |
Abbott Laboratories | | | | 3,629 | | 262,486 | |
Boston Scientific | | | | 2,367 | a | 83,650 | |
Centene | | | | 653 | a | 75,291 | |
Cigna | | | | 694 | | 131,805 | |
CVS Health | | | | 3,470 | | 227,354 | |
DaVita | | | | 1,529 | a | 78,682 | |
HCA Healthcare | | | | 711 | | 88,484 | |
Humana | | | | 276 | | 79,068 | |
McKesson | | | | 691 | | 76,335 | |
Medtronic | | | | 3,741 | | 340,281 | |
Quest Diagnostics | | | | 1,014 | | 84,436 | |
UnitedHealth Group | | | | 322 | | 80,217 | |
| | | | | 1,608,089 | |
Household & Personal Products - .8% | | | | | |
Colgate-Palmolive | | | | 2,203 | | 131,123 | |
Insurance - 2.9% | | | | | |
American International Group | | | | 5,523 | | 217,661 | |
Assurant | | | | 1,304 | | 116,630 | |
Hartford Financial Services | | | | 3,530 | | 156,909 | |
| | | | | 491,200 | |
Materials - 9.3% | | | | | |
CF Industries Holdings | | | | 8,521 | | 370,749 | |
DowDuPont | | | | 4,688 | | 250,714 | |
Freeport-McMoRan | | | | 9,856 | | 101,615 | |
Martin Marietta Materials | | | | 1,421 | b | 244,227 | |
Mosaic | | | | 7,529 | | 219,922 | |
Newmont Mining | | | | 3,954 | | 137,006 | |
Vulcan Materials | | | | 2,580 | | 254,904 | |
| | | | | 1,579,137 | |
Media & Entertainment - 3.4% | | | | | |
Alphabet, Cl. A | | | | 122 | a | 127,485 | |
Comcast, Cl. A | | | | 8,199 | | 279,176 | |
Omnicom Group | | | | 2,321 | b | 169,990 | |
| | | | | 576,651 | |
Pharmaceuticals Biotechnology & Life Sciences - 6.1% | | | | | |
Biogen | | | | 276 | a | 83,054 | |
Bristol-Myers Squibb | | | | 1,671 | | 86,859 | |
9
STATEMENT OF INVESTMENTS (continued)
| | | | | | | | |
| |
Description | | | | Shares | | Value ($) | |
Common Stocks - 98.3% (continued) | | | | | |
Pharmaceuticals Biotechnology & Life Sciences - 6.1% (continued) | | | | | |
Merck & Co. | | | | 6,820 | | 521,116 | |
Pfizer | | | | 7,945 | | 346,799 | |
| | | | | 1,037,828 | |
Semiconductors & Semiconductor Equipment - 2.6% | | | | | |
Broadcom | | | | 506 | | 128,666 | |
Qualcomm | | | | 3,995 | | 227,355 | |
Texas Instruments | | | | 899 | | 84,956 | |
| | | | | 440,977 | |
Software & Services - 3.3% | | | | | |
International Business Machines | | | | 1,927 | | 219,042 | |
Oracle | | | | 5,486 | | 247,693 | |
Teradata | | | | 2,367 | a,b | 90,798 | |
| | | | | 557,533 | |
Technology Hardware & Equipment - 5.0% | | | | | |
Cisco Systems | | | | 13,246 | �� | 573,949 | |
Corning | | | | 6,027 | | 182,076 | |
Palo Alto Networks | | | | 479 | a | 90,220 | |
| | | | | 846,245 | |
Telecommunication Services - 6.5% | | | | | |
AT&T | | | | 16,366 | | 467,086 | |
Verizon Communications | | | | 11,403 | | 641,077 | |
| | | | | 1,108,163 | |
Transportation - 1.5% | | | | | |
Delta Air Lines | | | | 5,047 | | 251,845 | |
Total Common Stocks(cost $16,051,128) | | | | 16,716,607 | |
| | | | | | | | |
Exchange-Traded Funds - 1.9% | | | | | |
Registered Investment Companies - 1.9% | | | | | |
iShares Russell 1000 Value ETF
(cost $329,437) | | | | 2,909 | | 323,044 | |
10
| | | | | | | | |
| |
Description | | 1-Day
Yield (%) | | Shares | | Value ($) | |
Investment Companies - 1.3% | | | | | |
Registered Investment Companies - 1.3% | | | | | |
Dreyfus Institutional Preferred Government Plus Money Market Fund
(cost $232,993) | | 2.32 | | 232,993 | c | 232,993 | |
Total Investments(cost $16,613,558) | | 101.5% | | 17,272,644 | |
Liabilities, Less Cash and Receivables | | (1.5%) | | (262,691) | |
Net Assets | | 100.0% | | 17,009,953 | |
ETF—Exchange-Traded Fund
a Non-income producing security.
b Security, or portion thereof, on loan. At December 31, 2018, the value of the fund’s securities on loan was $457,157 and the value of the collateral held by the fund was $459,249, consisting of U.S. Government & Agency securities.
c Investment in affiliated issuer. The investment objective of this investment company is publicly available and can be found within the investment company’s prospectus.
| | |
Portfolio Summary (Unaudited)† | Value (%) |
Financials | 28.9 |
Health Care | 15.5 |
Information Technology | 10.8 |
Energy | 10.3 |
Communication Services | 9.9 |
Materials | 9.3 |
Industrials | 7.4 |
Consumer Staples | 4.5 |
Investment Companies | 3.3 |
Consumer Discretionary | 1.6 |
| | 101.5 |
† Based on net assets.
See notes to financial statements.
11
STATEMENT OF INVESTMENTS IN AFFILIATED ISSUERS
| | | | | | | |
Registered Investment Companies | Value
12/31/17($) | Purchases($) | Sales($) | Value
12/31/18($) | Net
Assets(%) | Dividends/
Distributions($) |
Dreyfus Institutional Preferred Government Plus Money Market Fund | 46,300 | 5,594,419 | 5,407,726 | 232,993 | 1.3 | 1,040 |
Dreyfus Institutional Preferred Government Money Market Fund, Institutional Shares | 201,569 | 888,469 | 1,090,038 | - | - | - |
Total | 247,869 | 6,482,888 | 6,497,764 | 232,993 | 1.3 | 1,040 |
See notes to financial statements.
12
STATEMENT OF ASSETS AND LIABILITIES
December 31, 2018
| | | | | | | |
| | | | | | |
| | | Cost | | Value | |
Assets ($): | | | | |
Investments in securities—See Statement of Investments
(including securities on loan, valued at $457,157)—Note 1(c): | | | |
Unaffiliated issuers | 16,380,565 | | 17,039,651 | |
Affiliated issuers | | 232,993 | | 232,993 | |
Dividends and securities lending income receivable | | 22,450 | |
Receivable for shares of Beneficial Interest subscribed | | 3,698 | |
Prepaid expenses | | | | | 51 | |
| | | | | 17,298,843 | |
Liabilities ($): | | | | |
Due to The Dreyfus Corporation and affiliates—Note 3(b) | | | | 22,493 | |
Payable for investment securities purchased | | 201,707 | |
Payable for shares of Beneficial Interest redeemed | | 2,319 | |
Trustees fees and expenses payable | | 2,202 | |
Accrued expenses | | | | | 60,169 | |
| | | | | 288,890 | |
Net Assets ($) | | | 17,009,953 | |
Composition of Net Assets ($): | | | | |
Paid-in capital | | | | | 14,640,634 | |
Total distributable earnings (loss) | | | | | 2,369,319 | |
Net Assets ($) | | | 17,009,953 | |
| | | | |
Net Asset Value Per Share | Initial Shares | Service Shares | |
Net Assets ($) | 16,417,917 | 592,036 | |
Shares Outstanding | 1,257,244 | 44,499 | |
Net Asset Value Per Share ($) | 13.06 | 13.30 | |
| | | | |
See notes to financial statements. | | | |
13
STATEMENT OF OPERATIONS
Year Ended December 31, 2018
| | | | | | | |
| | | | | | |
| | | | | | |
Investment Income ($): | | | | |
Income: | | | | |
Cash dividends: | |
Unaffiliated issuers | | | 447,440 | |
Affiliated issuers | | | 1,040 | |
Income from securities lending—Note 1(c) | | | 1,031 | |
Total Income | | | 449,511 | |
Expenses: | | | | |
Management fee—Note 3(a) | | | 145,864 | |
Professional fees | | | 89,346 | |
Custodian fees—Note 3(b) | | | 11,313 | |
Prospectus and shareholders’ reports | | | 9,745 | |
Trustees’ fees and expenses—Note 3(c) | | | 2,935 | |
Distribution fees—Note 3(b) | | | 1,829 | |
Loan commitment fees—Note 2 | | | 307 | |
Shareholder servicing costs—Note 3(b) | | | 148 | |
Miscellaneous | | | 34,507 | |
Total Expenses | | | 295,994 | |
Investment Income—Net | | | 153,517 | |
Realized and Unrealized Gain (Loss) on Investments—Note 4 ($): | | |
Net realized gain (loss) on investments and foreign currency transactions | 1,729,935 | |
Net unrealized appreciation (depreciation) on investments | | | (4,004,534) | |
Net Realized and Unrealized Gain (Loss) on Investments | | | (2,274,599) | |
Net (Decrease) in Net Assets Resulting from Operations | | (2,121,082) | |
| | | | | | | |
See notes to financial statements. | | | | | |
14
STATEMENT OF CHANGES IN NET ASSETS
| | | | | | | | | | |
| | | | Year Ended December 31, |
| | | | 2018 | | 2017a | |
Operations ($): | | | | | | | | |
Investment income—net | | | 153,517 | | | | 178,128 | |
Net realized gain (loss) on investments | | 1,729,935 | | | | 3,914,287 | |
Net unrealized appreciation (depreciation)
on investments | | (4,004,534) | | | | (1,068,420) | |
Net Increase (Decrease) in Net Assets
Resulting from Operations | (2,121,082) | | | | 3,023,995 | |
Distributions ($): | |
Distributions to shareholders: | | | | | | | | |
Initial Shares | | | (3,841,035) | | | | (1,345,002) | |
Service Shares | | | (155,263) | | | | (879,542) | |
Total Distributions | | | (3,996,298) | | | | (2,224,544) | |
Beneficial Interest Transactions ($): | |
Net proceeds from shares sold: | | | | | | | | |
Initial Shares | | | 2,430,661 | | | | 1,071,739 | |
Service Shares | | | 285,250 | | | | 509,986 | |
Distributions reinvested: | | | | | | | | |
Initial Shares | | | 3,841,035 | | | | 1,345,002 | |
Service Shares | | | 155,263 | | | | 879,542 | |
Cost of shares redeemed: | | | | | | | | |
Initial Shares | | | (2,922,797) | | | | (2,559,148) | |
Service Shares | | | (374,047) | | | | (12,038,135) | |
Increase (Decrease) in Net Assets
from Beneficial Interest Transactions | 3,415,365 | | | | (10,791,014) | |
Total Increase (Decrease) in Net Assets | (2,702,015) | | | | (9,991,563) | |
Net Assets ($): | |
Beginning of Period | | | 19,711,968 | | | | 29,703,531 | |
End of Period | | | 17,009,953 | | | | 19,711,968 | |
Capital Share Transactions (Shares): | |
Initial Shares | | | | | | | | |
Shares sold | | | 153,714 | | | | 63,098 | |
Shares issued for distributions reinvested | | | 268,041 | | | | 81,073 | |
Shares redeemed | | | (184,242) | | | | (146,195) | |
Net Increase (Decrease) in Shares Outstanding | 237,513 | | | | (2,024) | |
Service Shares | | | | | | | | |
Shares sold | | | 17,693 | | | | 28,910 | |
Shares issued for distributions reinvested | | | 10,613 | | | | 52,479 | |
Shares redeemed | | | (24,574) | | | | (703,822) | |
Net Increase (Decrease) in Shares Outstanding | 3,732 | | | | (622,433) | |
| | | | | | | | | | |
aDistributions to shareholders include $204,693 Initial shares and $110,815 Service shares distributions from net investment income and $1,140,309 Initial shares and $768,727 Service shares distributions from net realized gains. Undistributed investment income—net was $184,595 in 2017 and is no longer presented as a result of the adoption of SEC’s Disclosure Update and Simplification Rule.
| |
See notes to financial statements. | | | | | | | | |
15
FINANCIAL HIGHLIGHTS
The following tables describe the performance for each share class for the fiscal periods indicated. All information (except portfolio turnover rate) reflects financial results for a single fund share. Total return shows how much your investment in the fund would have increased (or decreased) during each period, assuming you had reinvested all dividends and distributions. The fund’s total returns do not reflect expenses associated with variable annuity or insurance contracts. These figures have been derived from the fund’s financial statements.
| | | | | | | | |
| | | |
| | | |
| | Year Ended December 31, |
Initial Shares | | 2018 | 2017 | 2016 | 2015 | 2014 |
Per Share Data ($): | | | | | | |
Net asset value, beginning of period | | 18.58 | 17.58 | 17.61 | 20.38 | 19.43 |
Investment Operations: | | | | | | |
Investment income—neta | | .12 | .13 | .19 | .17 | .15 |
Net realized and unrealized gain
(loss) on investments | | (1.88) | 2.25 | 2.46 | (.55) | 1.78 |
Total from Investment Operations | | (1.76) | 2.38 | 2.65 | (.38) | 1.93 |
Distributions: | | | | | | |
Dividends from
investment income—net | | (.18) | (.21) | (.18) | (.16) | (.18) |
Dividends from net realized
gain on investments | | (3.58) | (1.17) | (2.50) | (2.23) | (.80) |
Total Distributions | | (3.76) | (1.38) | (2.68) | (2.39) | (.98) |
Net asset value, end of period | | 13.06 | 18.58 | 17.58 | 17.61 | 20.38 |
Total Return (%) | | (11.24) | 14.47 | 18.32 | (2.22) | 10.31 |
Ratios/Supplemental Data (%): | | | | | | |
Ratio of total expenses
to average net assets | | 1.51 | 1.17 | 1.07 | 1.07 | 1.03 |
Ratio of net expenses
to average net assets | | 1.51 | 1.17 | 1.07 | 1.07 | 1.03 |
Ratio of net investment income
to average net assets | | .80 | .75 | 1.20 | .92 | .79 |
Portfolio Turnover Rate | | 118.35 | 91.07 | 87.64 | 105.48 | 66.78 |
Net Assets, end of period ($ x 1,000) | | 16,418 | 18,949 | 17,958 | 19,216 | 21,637 |
a Based on average shares outstanding.
See notes to financial statements.
16
| | | | | | | | |
| | | |
| | | |
| | Year Ended December 31, |
Service Shares | | 2018 | 2017 | 2016 | 2015 | 2014 |
Per Share Data ($): | | | | | | |
Net asset value, beginning of period | | 18.71 | 17.71 | 17.71 | 20.48 | 19.51 |
Investment Operations: | | | | | | |
Investment income—neta | | .09 | .09 | .15 | .12 | .11 |
Net realized and unrealized gain
(loss) on investments | | (1.92) | 2.25 | 2.48 | (.55) | 1.79 |
Total from Investment Operations | | (1.83) | 2.34 | 2.63 | (.43) | 1.90 |
Distributions: | | | | | | |
Dividends from
investment income—net | | - | (.17) | (.13) | (.11) | (.13) |
Dividends from net realized
gain on investments | | (3.58) | (1.17) | (2.50) | (2.23) | (.80) |
Total Distributions | | (3.58) | (1.34) | (2.63) | (2.34) | (.93) |
Net asset value, end of period | | 13.30 | 18.71 | 17.71 | 17.71 | 20.48 |
Total Return (%) | | (11.51) | 14.07 | 18.00 | (2.50) | 10.09 |
Ratios/Supplemental Data (%): | | | | | | |
Ratio of total expenses
to average net assets | | 1.76 | 1.42 | 1.32 | 1.32 | 1.28 |
Ratio of net expenses
to average net assets | | 1.76 | 1.42 | 1.32 | 1.32 | 1.28 |
Ratio of net investment income
to average net assets | | .54 | .50 | .94 | .67 | .54 |
Portfolio Turnover Rate | | 118.35 | 91.07 | 87.64 | 105.48 | 66.78 |
Net Assets, end of period ($ x 1,000) | | 592 | 763 | 11,745 | 10,927 | 13,165 |
a Based on average shares outstanding.
See notes to financial statements.
17
NOTES TO FINANCIAL STATEMENTS
NOTE 1—Significant Accounting Policies:
Core Value Portfolio (the “fund”) is a separate diversified series of Dreyfus Investment Portfolios (the “Company”), which is registered under the Investment Company Act of 1940, as amended (the “Act”), as an open-end management investment company and operates as a series company currently offering four series, including the fund. The fund is only offered to separate accounts established by insurance companies to fund variable annuity contracts and variable life insurance policies. The fund’s investment objective is to seek long-term growth of capital, with current income as a secondary objective. The Dreyfus Corporation (the “Manager” or “Dreyfus”), a wholly-owned subsidiary of The Bank of New York Mellon Corporation (“BNY Mellon”), serves as the fund’s investment adviser.
MBSC Securities Corporation (the “Distributor”), a wholly-owned subsidiary of Dreyfus, is the distributor of the fund’s shares, which are sold without a sales charge. The fund is authorized to issue an unlimited number of $.001 par value shares of Beneficial Interest in each of the following classes of shares: Initial and Service. Each class of shares has identical rights and privileges, except with respect to the Distribution Plan, and the expenses borne by each class, the allocation of certain transfer agency costs, and certain voting rights. Income, expenses (other than expenses attributable to a specific class), and realized and unrealized gains or losses on investments are allocated to each class of shares based on its relative net assets.
The Company accounts separately for the assets, liabilities and operations of each series. Expenses directly attributable to each series are charged to that series’ operations; expenses which are applicable to all series are allocated among them on a pro rata basis.
The Financial Accounting Standards Board (“FASB”) Accounting Standards Codification is the exclusive reference of authoritative U.S. generally accepted accounting principles (“GAAP”) recognized by the FASB to be applied by nongovernmental entities. Rules and interpretive releases of the Securities and Exchange Commission (“SEC”) under authority of federal laws are also sources of authoritative GAAP for SEC registrants. The fund’s financial statements are prepared in accordance with GAAP, which may require the use of management estimates and assumptions. Actual results could differ from those estimates.
The Companyenters into contracts that contain a variety of indemnifications. The fund’s maximum exposure under these
18
arrangements is unknown. The fund does not anticipate recognizing any loss related to these arrangements.
(a) Portfolio valuation: The fair value of a financial instrument is the amount that would be received to sell an asset or paid to transfer a liability in an orderly transaction between market participants at the measurement date (i.e., the exit price). GAAP establishes a fair value hierarchy that prioritizes the inputs of valuation techniques used to measure fair value. This hierarchy gives the highest priority to unadjusted quoted prices in active markets for identical assets or liabilities (Level 1 measurements) and the lowest priority to unobservable inputs (Level 3 measurements).
Additionally, GAAP provides guidance on determining whether the volume and activity in a market has decreased significantly and whether such a decrease in activity results in transactions that are not orderly. GAAP requires enhanced disclosures around valuation inputs and techniques used during annual and interim periods.
Various inputs are used in determining the value of the fund’s investments relating to fair value measurements. These inputs are summarized in the three broad levels listed below:
Level 1—unadjusted quoted prices in active markets for identical investments.
Level 2—other significant observable inputs (including quoted prices for similar investments, interest rates, prepayment speeds, credit risk, etc.).
Level 3—significant unobservable inputs (including the fund’s own assumptions in determining the fair value of investments).
The inputs or methodology used for valuing securities are not necessarily an indication of the risk associated with investing in those securities.
Changes in valuation techniques may result in transfers in or out of an assigned level within the disclosure hierarchy. Valuation techniques used to value the fund’s investments are as follows:
Investments in securities are valued at the last sales price on the securities exchange or national securities market on which such securities are primarily traded. Securities listed on the National Market System for which market quotations are available are valued at the official closing price or, if there is no official closing price that day, at the last sales price. For open short positions, asked prices are used for valuation purposes. Bid price is used when no asked price is available. Registered investment companies that are not traded on an exchange are valued at their net asset value. All of
19
NOTES TO FINANCIAL STATEMENTS(continued)
the preceding securities are generally categorized within Level 1 of the fair value hierarchy.
Securities not listed on an exchange or the national securities market, or securities for which there were no transactions, are valued at the average of the most recent bid and asked prices. These securities are generally categorized within Level 2 of the fair value hierarchy.
Fair valuing of securities may be determined with the assistance of a pricing service using calculations based on indices of domestic securities and other appropriate indicators, such as prices of relevant American Depository Receipts and futures. Utilizing these techniques may result in transfers between Level 1 and Level 2 of the fair value hierarchy.
When market quotations or official closing prices are not readily available, or are determined not to accurately reflect fair value, such as when the value of a security has been significantly affected by events after the close of the exchange or market on which the security is principally traded (for example, a foreign exchange or market), but before the fund calculates its net asset value, the fund may value these investments at fair value as determined in accordance with the procedures approved by the Company’s Board of Trustees (the “Board”). Certain factors may be considered when fair valuing investments such as: fundamental analytical data, the nature and duration of restrictions on disposition, an evaluation of the forces that influence the market in which the securities are purchased and sold, and public trading in similar securities of the issuer or comparable issuers. These securities are either categorized within Level 2 or 3 of the fair value hierarchy depending on the relevant inputs used.
For restricted securities where observable inputs are limited, assumptions about market activity and risk are used and such securities are generally categorized within Level 3 of the fair value hierarchy.
The following is a summary of the inputs used as of December 31, 2018in valuing the fund’s investments:
| | | | | |
| | Level 1 - Unadjusted Quoted Prices | Level 2 - Other Significant Observable Inputs | Level 3 -Significant Unobservable Inputs | Total |
Assets ($) | | | | |
Investments in Securities: | | | |
Equity Securities - Common Stocks† | 16,716,607 | - | - | 16,716,607 |
Exchange-Traded Funds | 323,044 | - | - | 323,044 |
20
| | | | | |
| | Level 1 - Unadjusted Quoted Prices | Level 2 - Other Significant Observable Inputs | Level 3 -Significant Unobservable Inputs | Total |
Assets ($) | | | | |
Investment Companies | 232,993 | - | - | 232,993 |
† See Statement of Investments for additional detailed categorizations.
At December 31, 2018, there were no transfers between levels of the fair value hierarchy. It is the fund’s policy to recognize transfers between levels at the end of the reporting period.
(b) Foreign currency transactions: The fund does not isolate that portion of the results of operations resulting from changes in foreign exchange rates on investments from the fluctuations arising from changes in the market prices of securities held. Such fluctuations are included with the net realized and unrealized gain or loss on investments.
Net realized foreign exchange gains or losses arise from sales of foreign currencies, currency gains or losses realized on securities transactions between trade and settlement date, and the difference between the amounts of dividends, interest and foreign withholding taxes recorded on the fund’s books and the U.S. dollar equivalent of the amounts actually received or paid. Net unrealized foreign exchange gains and losses arise from changes in the value of assets and liabilities other than investments resulting from changes in exchange rates. Foreign currency gains and losses on foreign currency transactions are also included with net realized and unrealized gain or loss on investments.
(c)Securities transactions and investment income: Securities transactions are recorded on a trade date basis. Realized gains and losses from securities transactions are recorded on the identified cost basis. Dividend income is recognized on the ex-dividend date and interest income, including, where applicable, accretion of discount and amortization of premium on investments, is recognized on the accrual basis.
Pursuant to a securities lending agreement with The Bank of New York Mellon, a subsidiary of BNY Mellon and an affiliate of Dreyfus, the fund may lend securities to qualified institutions. It is the fund’s policy that, at origination, all loans are secured by collateral of at least 102% of the value of U.S. securities loaned and 105% of the value of foreign securities loaned. Collateral equivalent to at least 100% of the market value of securities on loan is maintained at all times. Collateral is either in the form
21
NOTES TO FINANCIAL STATEMENTS(continued)
of cash, which can be invested in certain money market mutual funds managed by Dreyfus, or U.S. Government and Agency securities. The fund is entitled to receive all dividends, interest and distributions on securities loaned, in addition to income earned as a result of the lending transaction. Should a borrower fail to return the securities in a timely manner, The Bank of New York Mellon is required to replace the securities for the benefit of the fund or credit the fund with the market value of the unreturned securities and is subrogated to the fund’s rights against the borrower and the collateral. Additionally, the contractual maturity of security lending transactions are on an overnight and continuous basis. During the period ended December 31, 2018, The Bank of New York Mellon earned $191 from lending portfolio securities, pursuant to the securities lending agreement.
(d) Affiliated issuers: Investments in other investment companies advised by Dreyfus are considered “affiliated” under the Act.
(e) Dividends and distributions to shareholders: Dividends and distributions are recorded on the ex-dividend date. Dividends from investment income-net and dividends from net realized capital gains, if any, are normally declared and paid annually, but the fund may make distributions on a more frequent basis to comply with the distribution requirements of the Internal Revenue Code of 1986, as amended (the “Code”). To the extent that net realized capital gains can be offset by capital loss carryovers, it is the policy of the fund not to distribute such gains. Income and capital gain distributions are determined in accordance with income tax regulations, which may differ from GAAP.
(f) Federal income taxes: It is the policy of the fund to continue to qualify as a regulated investment company, if such qualification is in the best interests of its shareholders, by complying with the applicable provisions of the Code, and to make distributions of taxable income and net realized capital gain sufficient to relieve it from substantially all federal income and excise taxes.
As of and during the period ended December 31, 2018, the fund did not have any liabilities for any uncertain tax positions. The fund recognizes interest and penalties, if any, related to uncertain tax positions as income tax expense in the Statement of Operations. During the period ended December 31, 2018, the fund did not incur any interest or penalties.
Each tax year in the four-year period ended December 31, 2018 remains subject to examination by the Internal Revenue Service and state taxing authorities.
22
At December 31, 2018, the components of accumulated earnings on a tax basis were as follows: undistributed ordinary income $179,816, undistributed capital gains $1,806,596 and unrealized appreciation $382,907.
The tax character of distributions paid to shareholders during the fiscal periods ended December 31, 2018 and December 31, 2017 were as follows: ordinary income $1,071,941 and $315,508, and long-term capital gains $2,924,357 and $1,909,036, respectively.
(g) New Accounting Pronouncements: In August 2018, the FASB issued Accounting Standards Update 2018-13, Fair Value Measurement (Topic 820): Disclosure Framework—Changes to the Disclosure Requirements for Fair Value Measurement (“ASU 2018-13”). The update provides guidance that eliminates, adds and modifies certain disclosure requirements for fair value measurements. ASU 2018-13 will be effective for annual periods beginning after December 15, 2019. Management is currently assessing the potential impact of these changes to future financial statements.
NOTE 2—Bank Lines of Credit:
The fund participates with other Dreyfus-managed long-term open-end funds in a $1.030 billion unsecured credit facility led by Citibank, N.A. (the “Citibank Credit Facility”) and a $300 million unsecured credit facility provided by The Bank of New York Mellon (the “BNYM Credit Facility”), each to be utilized primarily for temporary or emergency purposes, including the financing of redemptions (each, a “Facility”). The Citibank Credit Facility is available in two tranches: (i) Tranche A is in an amount equal to $830 million and is available to all long-term open-ended funds, including the fund, and (ii) Tranche B is in amount equal to $200 million and is available only to the Dreyfus Floating Rate Income Fund, a series of The Dreyfus/Laurel Funds, Inc. Prior to October 3, 2018, the unsecured credit facility with Citibank, N.A. was $830 million. In connection therewith, the fund has agreed to pay its pro rata portion of commitment fees for Tranche A of the Citibank Credit Facility and the BNYM Credit Facility. Interest is charged to the fund based on rates determined pursuant to the terms of the respective Facility at the time of borrowing. During the period ended December 31, 2018, the fund did not borrow under the Facilities.
23
NOTES TO FINANCIAL STATEMENTS(continued)
NOTE 3—Management Fee and Other Transactions with Affiliates:
(a)Pursuant to a management agreement with Dreyfus, the management fee is computed at the annual rate of .75% of the value of the fund’s average daily net assets and is payable monthly.
(b)Under the Distribution Plan adopted pursuant to Rule 12b-1 under the Act, Service shares pay the Distributor for distributing its shares, for servicing and/or maintaining Service shares’ shareholder accounts and for advertising and marketing for Service shares. The Distribution Plan provides for payments to be made at an annual rate of .25% of the value of the Service shares’ average daily net assets. The Distributor may make payments to Participating Insurance Companies and to brokers and dealers acting as principal underwriter for their variable insurance products. The fees payable under the Distribution Plan are payable without regard to actual expenses incurred. During the period ended December 31, 2018,Service shares were charged $1,829 pursuant to the Distribution Plan.
The fund has arrangements with the transfer agent and the custodian whereby the fund may receive earnings credits when positive cash balances are maintained, which are used to offset transfer agency and custody fees. For financial reporting purposes, the fund includes net earnings credits, if any, as an expense offset in the Statement of Operations.
The fund compensates Dreyfus Transfer, Inc., a wholly-owned subsidiary of Dreyfus, under a transfer agency agreement for providing transfer agency and cash management services for the fund. The majority of transfer agency fees are comprised of amounts paid on a per account basis, while cash management fees are related to fund subscriptions and redemptions. During the period ended December 31, 2018, the fund was charged $136 for transfer agency services. These fees are included in Shareholder servicing costs in the Statement of Operations.
The fund compensates The Bank of New York Mellon under a custody agreement for providing custodial services for the fund. These fees are determined based on net assets, geographic region and transaction activity. During the period ended December 31, 2018, the fund was charged $11,313 pursuant to the custody agreement.
During the period ended December 31, 2018, the fund was charged $12,774 for services performed by the Chief Compliance Officer and his staff. These fees are included in Miscellaneous in the Statement of Operations.
24
The components of “Due to The Dreyfus Corporation and affiliates” in the Statement of Assets and Liabilities consist of: management fees $10,982, Distribution Plan fees $131, custodian fees $4,878, Chief Compliance Officer fees $6,289 and transfer agency fees $213.
(c) Each Board member also serves as a Board member of other funds within the Dreyfus complex. Annual retainer fees and attendance fees are allocated to each fund based on net assets.
NOTE 4—Securities Transactions:
The aggregate amount of purchases and sales of investment securities, excluding short-term securities, during the period ended December 31, 2018, amounted to $22,927,331 and $23,243,644, respectively.
At December 31, 2018, the cost of investments for federal income tax purposes was $16,889,737; accordingly, accumulated net unrealized appreciation on investments was $382,907, consisting of $2,201,565 gross unrealized appreciation and $1,818,658 gross unrealized depreciation.
25
REPORT OF INDEPENDENT REGISTERED PUBLIC ACCOUNTING FIRM
To the Shareholders and the Board of Trustees of Core Value Portfolio
Opinion on the Financial Statements
We have audited the accompanying statement of assets and liabilities of Core Value Portfolio (the “Fund”) (one of the funds constituting Dreyfus Investment Portfolios), including the statements of investments and investments in affiliated issuers, as of December 31, 2018, and the related statement of operations for the year then ended, the statements of changes in net assets for each of the two years in the period then ended, the financial highlights for each of the five years in the period then ended and the related notes (collectively referred to as the “financial statements”). In our opinion, the financial statements present fairly, in all material respects, the financial position of the Fund (one of the funds constituting Dreyfus Investment Portfolios) at December 31, 2018, the results of its operations for the year then ended, the changes in its net assets for each of the two years in the period then ended and its financial highlights for each of the five years in the period then ended, in conformity with U.S. generally accepted accounting principles.
Basis for Opinion
These financial statements are the responsibility of the Fund’s management. Our responsibility is to express an opinion on the Fund’s financial statements based on our audits. We are a public accounting firm registered with the Public Company Accounting Oversight Board (United States) (“PCAOB”) and are required to be independent with respect to the Fund in accordance with the U.S. federal securities laws and the applicable rules and regulations of the Securities and Exchange Commission and the PCAOB.
We conducted our audits in accordance with the standards of the PCAOB. Those standards require that we plan and perform the audit to obtain reasonable assurance about whether the financial statements are free of material misstatement, whether due to error or fraud. The Fund is not required to have, nor were we engaged to perform, an audit of the Fund’s internal control over financial reporting. As part of our audits, we are required to obtain an understanding of internal control over financial reporting, but not for the purpose of expressing an opinion on the effectiveness of the Fund’s internal control over financial reporting. Accordingly, we express no such opinion.
Our audits included performing procedures to assess the risks of material misstatement of the financial statements, whether due to error or fraud, and performing procedures that respond to those risks. Such procedures included examining, on a test basis, evidence regarding the amounts and disclosures in the financial statements. Our procedures included confirmation of securities owned as of December 31, 2018, by correspondence with the custodian and others or by other appropriate auditing procedures where replies from others were not received. Our audits also included evaluating the accounting principles used and significant estimates made by management, as well as evaluating the overall presentation of the financial statements. We believe that our audits provide a reasonable basis for our opinion.

We have served as the auditor of one or more Dreyfus investment companies since at least 1957, but we are unable to determine the specific year.
New York, New York
February 11, 2019
26
IMPORTANT TAX INFORMATION(Unaudited)
For federal tax purposes, the portfolio hereby reports 47.71% of the ordinary dividends paid during the fiscal year ended December 31, 2018 as qualifying for the corporate dividends received deduction. Shareholders will receive notification in early 2019 of the percentage applicable to the preparation of their 2018 income tax returns. Also, the portfolio hereby reports $.8322 per share as a short-term capital gain distribution and $2.7500 per share as a long-term capital gain distribution paid on March 22, 2018.
27
INFORMATION ABOUT THE RENEWAL OF THE FUND’S MANAGEMENT AGREEMENT (Unaudited)
At a meeting of the fund’s Board of Trustees held on July 18-19, 2018, the Board considered the renewal of the fund’s Management Agreement pursuant to which Dreyfus provides the fund with investment advisory and administrative services (the “Agreement”). The Board members, a majority of whom are not “interested persons” (as defined in the Investment Company Act of 1940, as amended) of the fund, were assisted in their review by independent legal counsel and met with counsel in executive session separate from Dreyfus representatives. In considering the renewal of the Agreement, the Board considered all factors that it believed to be relevant, including those discussed below. The Board did not identify any one factor as dispositive, and each Board member may have attributed different weights to the factors considered.
Analysis of Nature, Extent, and Quality of Services Provided to the Fund. The Board considered information provided to them at the meeting and in previous presentations from Dreyfus representatives regarding the nature, extent, and quality of the services provided to funds in the Dreyfus fund complex. Dreyfus provided the number of open accounts in the fund, the fund’s asset size and the allocation of fund assets among distribution channels. Dreyfus also had previously provided information regarding the diverse intermediary relationships and distribution channels of funds in the Dreyfus fund complex (such as retail direct or intermediary, in which intermediaries typically are paid by the fund and/or Dreyfus) and Dreyfus’ corresponding need for broad, deep, and diverse resources to be able to provide ongoing shareholder services to each intermediary or distribution channel, as applicable to the fund.
The Board also considered research support available to, and portfolio management capabilities of, the fund’s portfolio management personnel and that Dreyfus also provides oversight of day-to-day fund operations, including fund accounting and administration and assistance in meeting legal and regulatory requirements. The Board also considered Dreyfus’ extensive administrative, accounting and compliance infrastructures. The Board also considered portfolio management’s brokerage policies and practices (including policies and practices regarding soft dollars) and the standards applied in seeking best execution.
Comparative Analysis of the Fund’s Performance and Management Fee and Expense Ratio. The Board reviewed reports prepared by Broadridge Financial Solutions, Inc. (“Broadridge”), an independent provider of investment company data, which included information comparing (1) the fund’s performance with the performance of a group of comparable funds (the “Performance Group”) and with a broader group of funds (the “Performance Universe”), all for various periods ended May 31, 2018, and (2) the fund’s actual and contractual management fees and total expenses with those of a group of comparable funds (the “Expense Group”) and with a broader group of funds (the “Expense Universe”), the information for which was derived in part from fund financial statements available to Broadridge as of the date of its analysis. Dreyfus previously had furnished the Board with a description of the methodology Broadridge used to select the Performance Group and Performance Universe and the Expense Group and Expense Universe.
28
Dreyfus representatives stated that the usefulness of performance comparisons may be affected by a number of factors, including different investment limitations that may be applicable to the fund and comparison funds. The Board discussed with representatives of Dreyfus and/or its affiliates the results of the comparisons and considered that the fund’s total return performance was above the Performance Group and Performance Universe medians for all periods except the ten-year period when it was slightly below the Performance Universe median. Dreyfus also provided a comparison of the fund’s calendar year total returns to the returns of the fund’s benchmark index.
The Board also reviewed the range of actual and contractual management fees and total expenses of the Expense Group and Expense Universe funds and discussed the results of the comparisons. The Board considered that the fund’s contractual management fee was at the Expense Group median and the fund’s actual management fee and total expenses were above the Expense Group and Expense Universe medians.
Dreyfus representatives reviewed with the Board the management or investment advisory fees (1) paid by funds advised or administered by Dreyfus that are in the same Lipper category as the fund and (2) paid to Dreyfus or the Dreyfus-affiliated primary employer of the fund’s primary portfolio manager(s) for advising any separate accounts and/or other types of client portfolios that are considered to have similar investment strategies and policies as the fund (the “Similar Clients”), and explained the nature of the Similar Clients. They discussed differences in fees paid and the relationship of the fees paid in light of any differences in the services provided and other relevant factors. The Board considered the relevance of the fee information provided for the Similar Clients to evaluate the appropriateness of the fund’s management fee.
Analysis of Profitability and Economies of Scale. Dreyfus representatives reviewed the expenses allocated and profit received by Dreyfus and its affiliates and the resulting profitability percentage for managing the fund and the aggregate profitability percentage to Dreyfus and its affiliates for managing the funds in the Dreyfus fund complex, and the method used to determine the expenses and profit. The Board concluded that the profitability results were not unreasonable, given the services rendered and service levels provided by Dreyfus. The Board also had been provided with information prepared by an independent consulting firm regarding Dreyfus’ approach to allocating costs to, and determining the profitability of, individual funds and the entire Dreyfus fund complex. The consulting firm also had analyzed where any economies of scale might emerge in connection with the management of a fund.
The Board considered, on the advice of its counsel, the profitability analysis (1) as part of its evaluation of whether the fees under the Agreement, considered in relation to the mix of services provided by Dreyfus, including the nature, extent and quality of such services, supported the renewal of the Agreement and (2) in light of the relevant circumstances for the fund and the extent to which economies of scale would be realized if the fund grows and whether fee levels reflect these economies of scale for the benefit of fund shareholders. Dreyfus representatives stated that a discussion of economies of scale is predicated on a fund having achieved a substantial size with increasing assets and that, if a fund’s assets had been stable or decreasing, the possibility
29
INFORMATION ABOUT THE RENEWAL OF THE FUND’S MANAGEMENT AGREEMENT (Unaudited) (continued)
that Dreyfus may have realized any economies of scale would be less. Dreyfus representatives also stated that, as a result of shared and allocated costs among funds in the Dreyfus fund complex, the extent of economies of scale could depend substantially on the level of assets in the complex as a whole, so that increases and decreases in complex-wide assets can affect potential economies of scale in a manner that is disproportionate to, or even in the opposite direction from, changes in the fund’s asset level. The Board also considered potential benefits to Dreyfus from acting as investment adviser and took into consideration the soft dollar arrangements in effect for trading the fund’s investments.
At the conclusion of these discussions, the Board agreed that it had been furnished with sufficient information to make an informed business decision with respect to the renewal of the Agreement. Based on the discussions and considerations as described above, the Board concluded and determined as follows.
· The Board concluded that the nature, extent and quality of the services provided by Dreyfus are adequate and appropriate.
· The Board was satisfied with the fund’s performance.
· The Board concluded that the fee paid to Dreyfus continued to be appropriate under the circumstances and in light of the factors and the totality of the services provided as discussed above.
· The Board determined that the economies of scale which may accrue to Dreyfus and its affiliates in connection with the management of the fund had been adequately considered by Dreyfus in connection with the fee rate charged to the fund pursuant to the Agreement and that, to the extent in the future it were determined that material economies of scale had not been shared with the fund, the Board would seek to have those economies of scale shared with the fund.
In evaluating the Agreement, the Board considered these conclusions and determinations and also relied on its previous knowledge, gained through meetings and other interactions with Dreyfus and its affiliates, of Dreyfus and the services provided to the fund by Dreyfus. The Board also relied on information received on a routine and regular basis throughout the year relating to the operations of the fund and the investment management and other services provided under the Agreement, including information on the investment performance of the fund in comparison to similar mutual funds and benchmark performance indices; general market outlook as applicable to the fund; and compliance reports. In addition, the Board’s consideration of the contractual fee arrangements for this fund had the benefit of a number of years of reviews of the Agreement for the fund, or substantially similar agreements for other Dreyfus funds that the Board oversees, during which lengthy discussions took place between the Board and Dreyfus representatives. Certain aspects of the arrangements may receive greater scrutiny in some years than in others, and the Board’s conclusions may be based, in part, on their consideration of the fund’s arrangements, or substantially
30
similar arrangements for other Dreyfus funds that the Board oversees, in prior years. The Board determined to renew the Agreement.
31
BOARD MEMBERS INFORMATION(Unaudited)
INDEPENDENT BOARD MEMBERS
Joseph S. DiMartino (75)
Chairman of the Board (1995)
Principal Occupation During Past 5 Years:
· Corporate Director and Trustee (1995-present)
Other Public Company Board Memberships During Past 5 Years:
· CBIZ (formerly, Century Business Services, Inc.), a provider of outsourcing functions for small and medium size companies, Director (1997-present)
No. of Portfolios for which Board Member Serves:122
———————
Francine J. Bovich (67)
Board Member (2015)
Principal Occupation During Past 5 Years:
· Trustee, The Bradley Trusts, private trust funds (2011-present)
Other Public Company Board Memberships During Past 5 Years:
· Annaly Capital Management, Inc., a real estate investment trust, Director (2014-present)
No. of Portfolios for which Board Member Serves:70
———————
Gordon J. Davis (77)
Board Member (2012)
Principal Occupation During Past 5 Years:
· Partner in the law firm of Venable LLP (2012-present)
Other Public Company Board Memberships During Past 5 Years:
· Consolidated Edison, Inc., a utility company, Director (1997-2014)
· The Phoenix Companies, Inc., a life insurance company, Director (2000-2014)
No. of Portfolios for which Board Member Serves:54
———————
Isabel P. Dunst (71)
Board Member (2014)
Principal Occupation During Past 5 Years:
· Senior Counsel, Hogan Lovells LLP (2018-present; previously, Of Counsel, 2015-2018, Partner, 1990-2014)
No. of Portfolios for which Board Member Serves:33
———————
32
Nathan Leventhal (75)
Board Member (2009)
Principal Occupation During Past 5 Years:
· President Emeritus of Lincoln Center for the Performing Arts (2001-present)
· Chairman of the Avery Fisher Artist Program (1997-2014)
Other Public Company Board Memberships During Past 5 Years:
· Movado Group, Inc., Director (2003-present)
No. of Portfolios for which Board Member Serves:47
———————
Robin A. Melvin (55)
Board Member (2014)
Principal Occupation During Past 5 Years:
· Co-chairman, Illinois Mentoring Partnership, non-profit organization dedicated to increasing the quantity and quality of mentoring services in Illinois (2014-present; board member since 2013)
No. of Portfolios for which Board Member Serves:99
———————
Roslyn M. Watson (69)
Board Member (2014)
Principal Occupation During Past 5 Years:
· Principal, Watson Ventures, Inc., a real estate investment company (1993-present)
No. of Portfolios for which Board Member Serves:56
———————
Benaree Pratt Wiley (72)
Board Member (2009)
Principal Occupation During Past 5 Years:
· Principal, The Wiley Group, a firm specializing in strategy and business development (2005-present)
Other Public Company Board Memberships During Past 5 Years:
· CBIZ (formerly, Century Business Services, Inc.), a provider of outsourcing functions for small and medium size companies, Director (2008-present)
No. of Portfolios for which Board Member Serves:77
———————
33
BOARD MEMBERS INFORMATION (Unaudited) (continued)
INTERESTED BOARD MEMBER
J. Charles Cardona (62)
Board Member (2014)
Principal Occupation During Past 5 Years:
· Retired. President and a Director of the Manager (2008-2016), Chairman of the Distributor (2013-2016, Executive Vice President, 1997-2013)
No. of Portfolios for which Board Member Serves:33
J. Charles Cardona is deemed to be an “interested person” (as defined under the Act) of the Company as a result of his previous affiliation with The Dreyfus Corporation.
———————
Once elected all Board Members serve for an indefinite term, but achieve Emeritus status upon reaching age 80. The address of the Board Members and Officers is c/o The Dreyfus Corporation, 200 Park Avenue, New York, New York 10166. Additional information about the Board Members is available in the fund’s Statement of Additional Information which can be obtained from Dreyfus free of charge by calling this toll free number: 1-800-DREYFUS.
Clifford L. Alexander, Jr., Emeritus Board Member
Whitney I. Gerard, Emeritus Board Member
George L. Perry, Emeritus Board Member
34
OFFICERS OF THE FUND(Unaudited)
BRADLEY J. SKAPYAK, President since January 2010.
Chief Operating Officer and a director of the Manager since June 2009, Chairman of Dreyfus Transfer, Inc., an affiliate of the Manager and the transfer agent of the funds, since May 2011 and Chief Executive Officer of MBSC Securities Corporation since August 2016. He is an officer of 62 investment companies (comprised of 122 portfolios) managed by the Manager. He is 60 years old and has been an employee of the Manager since February 1988.
BENNETT A. MACDOUGALL, Chief Legal Officer since October 2015.
Chief Legal Officer of the Manager and Associate General Counsel and Managing Director of BNY Mellon since June 2015; from June 2005 to June 2015, he served in various capacities with Deutsche Bank – Asset & Wealth Management Division, including as Director and Associate General Counsel, and Chief Legal Officer of Deutsche Investment Management Americas Inc. from June 2012 to May 2015. He is an officer of 63 investment companies (comprised of 147 portfolios) managed by the Manager. He is 47 years old and has been an employee of the Manager since June 2015.
JAMES BITETTO, Vice President since August 2005 and Secretary since February 2018.
Managing Counsel of BNY Mellon and Secretary of the Manager, and an officer of 63 investment companies (comprised of 147 portfolios) managed by the Manager. He is 52 years old and has been an employee of the Manager since December 1996.
SONALEE CROSS, Vice President and Assistant Secretary since March 2018.
Counsel of BNY Mellon since October 2016; Associate at Proskauer Rose LLP from April 2016 to September 2016; Attorney at EnTrust Capital from August 2015 to February 2016; Associate at Sidley Austin LLP from September 2013 until August 2015. She is an officer of 63 investment companies (comprised of 147 portfolios) managed by Dreyfus. She is 31 years old and has been an employee of the Manager since October 2016.
SARAH S. KELLEHER, Vice President and Assistant Secretary since April 2014.
Managing Counsel of BNY Mellon since December 2017, from March 2013 to December 2017, Senior Counsel of BNY Mellon. She is an officer of 63 investment companies (comprised of 147 portfolios) managed by the Manager. She is 43 years old and has been an employee of the Manager since March 2013.
JEFF PRUSNOFSKY, Vice President and Assistant Secretary since August 2005.
Senior Managing Counsel of BNY Mellon, and an officer of 63 investment companies (comprised of 147 portfolios) managed by the Manager. He is 53 years old and has been an employee of the Manager since October 1990.
NATALYA ZELENSKY, Vice President and Assistant Secretary since March 2017.
Counsel of BNY Mellon since May 2016; Attorney at Wildermuth Endowment Strategy Fund/Wildermuth Advisory, LLC from November 2015 until May 2016; Assistant General Counsel at RCS Advisory Services from July 2014 until November 2015; Associate at Sutherland, Asbill & Brennan from January 2013 until January 2014. She is an officer of 63 investment companies (comprised of 147 portfolios) managed by Dreyfus. She is 33 years old and has been an employee of the Manager since May 2016.
JAMES WINDELS, Treasurer since November 2001.
Director – Mutual Fund Accounting of the Manager, and an officer of 63 investment companies (comprised of 147 portfolios) managed by the Manager. He is 60 years old and has been an employee of the Manager since April 1985.
GAVIN C. REILLY, Assistant Treasurer since December 2005.
Tax Manager of the Investment Accounting and Support Department of the Manager, and an officer of 63 investment companies (comprised of 147 portfolios) managed by the Manager. He is 50 years old and has been an employee of the Manager since April 1991.
ROBERT S. ROBOL, Assistant Treasurer since August 2002.
Senior Accounting Manager – Dreyfus Financial Reporting of the Manager, and an officer of 63 investment companies (comprised of 147 portfolios) managed by the Manager. He is 54 years old and has been an employee of the Manager since October 1988.
35
OFFICERS OF THE FUND (Unaudited)(continued)
ROBERT SALVIOLO, Assistant Treasurer since July 2007.
Senior Accounting Manager – Equity Funds of the Manager, and an officer of 63 investment companies (comprised of 147 portfolios) managed by the Manager. He is 51 years old and has been an employee of the Manager since June 1989.
ROBERT SVAGNA, Assistant Treasurer since December 2002.
Senior Accounting Manager – Fixed Income and Equity Funds of the Manager, and an officer of 63 investment companies (comprised of 147 portfolios) managed by the Manager. He is 51 years old and has been an employee of the Manager since November 1990.
JOSEPH W. CONNOLLY, Chief Compliance Officer since October 2004.
Chief Compliance Officer of the Manager, the Dreyfus Family of Funds and BNY Mellon Funds Trust (63 investment companies, comprised of 147 portfolios). He is 61 years old and has served in various capacities with the Manager since 1980, including manager of the firm’s Fund Accounting Department from 1997 through October 2001.
CARIDAD M. CAROSELLA, Anti-Money Laundering Compliance Officer since January 2016.
Anti-Money Laundering Compliance Officer of the Dreyfus Family of Funds and BNY Mellon Funds Trust since January 2016; from May 2015 to December 2015, Interim Anti-Money Laundering Compliance Officer of the Dreyfus Family of Funds and BNY Mellon Funds Trust and the Distributor; from January 2012 to May 2015, AML Surveillance Officer of the Distributor and from 2007 to December 2011, Financial Processing Manager of the Distributor. She is an officer of 57 investment companies (comprised of 141 portfolios) managed by the Manager. She is 50 years old and has been an employee of the Distributor since 1997.
36
NOTES
37
Dreyfus Investment Portfolios, Core Value Portfolio
200 Park Avenue
New York, NY 10166
Manager
The Dreyfus Corporation
200 Park Avenue
New York, NY 10166
Custodian
The Bank of New York Mellon
240 Greenwich Street
New York, NY 10286
Transfer Agent &
Dividend Disbursing Agent
Dreyfus Transfer, Inc.
200 Park Avenue
New York, NY 10166
Distributor
MBSC Securities Corporation
200 Park Avenue
New York, NY 10166
Telephone 1-800-258-4260 or 1-800-258-4261
Mail The Dreyfus Family of Funds, 144 Glenn Curtiss Boulevard, Uniondale, NY 11556-0144 Attn: Institutional Services Department
E-mailSend your request toinfo@dreyfus.com
InternetInformation can be viewed online or downloaded atwww.dreyfus.com
The fund files its complete schedule of portfolio holdings with the Securities and Exchange Commission (“SEC”) for the first and third quarters of each fiscal year on Form N-Q. The fund’s Forms N-Q are available on the SEC’s website at http://www.sec.gov and may be reviewed and copied at the SEC’s Public Reference Room in Washington, D.C. Information on the operation of the Public Reference Room may be obtained by calling 1-800-SEC-0330.
A description of the policies and procedures that the fund uses to determine how to vote proxies relating to portfolio securities, and information regarding how the fund voted these proxies for the most recent 12-month period ended June 30 is available at http://www.dreyfus.com and on the SEC’s website at http://www.sec.gov. The description of the policies and procedures is also available without charge, upon request, by calling 1-800-DREYFUS.
| | |
© 2019 MBSC Securities Corporation
0172AR1218 | 
|
Dreyfus Investment Portfolios, MidCap Stock Portfolio
| | | |

| | ANNUAL REPORT
December 31, 2018 |
| |
The views expressed in this report reflect those of the portfolio manager(s) only through the end of the period covered and do not necessarily represent the views of Dreyfus or any other person in the Dreyfus organization. Any such views are subject to change at any time based upon market or other conditions and Dreyfus disclaims any responsibility to update such views. These views may not be relied on as investment advice and, because investment decisions for a Dreyfus fund are based on numerous factors, may not be relied on as an indication of trading intent on behalf of any Dreyfus fund. |
| |
Not FDIC-Insured • Not Bank-Guaranteed • May Lose Value |
Contents
THE FUND
FOR MORE INFORMATION
Back Cover
| | | | |
| |
Dreyfus Investment Portfolios, MidCap Stock Portfolio
| | The Fund |
A LETTER FROM THE PRESIDENT OF DREYFUS
Dear Shareholder:
We are pleased to present this annual report for Dreyfus Investment Portfolios, MidCap Stock Portfolio, covering the 12-month period from January 1, 2018 through December 31, 2018. For information about how the fund performed during the reporting period, as well as general market perspectives, we provide a Discussion of Fund Performance on the pages that follow.
The reporting period began with major global economies achieving above-trend growth. In the United States, a robust economy and strong labor market encouraged the Federal Reserve to continue moving away from its accommodative monetary policy while other major central banks began to consider monetary tightening. Both U.S. and non-U.S. equity markets remained on an uptrend. Interest rates rose across the yield curve, putting pressure on bond prices.
A few months into the reporting period, global growth trends began to diverge and market volatility returned. While the U.S. economy continued to grow at a healthy rate, other developed markets began to weaken. However, robust growth and strong corporate earnings continued to support U.S. stock returns while other developed markets declined throughout the summer. In the fall, a broad sell-off occurred, partially offsetting earlier U.S. gains. Emerging markets remained under pressure as weakness in their currencies relative to the U.S. dollar added to investors’ uneasiness. Global equities continued their general decline through the end of the period.
Fixed income markets struggled during the first half of the period as interest rates rose and favorable U.S. equity markets fed investor risk appetites. However, in autumn volatility crept in, the yield curve began a flattening trend that continued through the end of December. As long-term debt yields fell, prices rose for many bonds, leading to moderately positive returns for several fixed income market sectors.
Despite continuing political variables, U.S. inflationary pressures and flagging growth rates, we are optimistic that the U.S. economy will remain strong in the near term. However, we remain attentive to signs that point to potential changes on the horizon. As always, we encourage you to discuss the risks and opportunities in today’s investment environment with your financial advisor.
Thank you for your continued confidence and support.
Sincerely,

Renee Laroche-Morris
President
The Dreyfus Corporation
January 15, 2019
2
DISCUSSION OF FUND PERFORMANCE(Unaudited)
For the period from January 1, 2018 through December 31, 2018, as provided by C. Wesley Boggs, William S. Cazalet, CAIA, Peter D. Goslin, CFA, and Syed A. Zamil, CFA, Portfolio Managers
Market and Fund Performance Overview
For the 12-month period ended December 31, 2018, Dreyfus Investment Portfolios, MidCap Stock Portfolio’s Initial shares produced a total return of -15.49%, and its Service shares produced a total return of -15.69%.1 In comparison, the fund’s benchmark, the S&P MidCap 400® Index (the “Index”), produced a total return of -11.08% for the same period.2
Mid-cap stocks lost value in a volatile market over the reporting period amid escalating trade tensions and slowing global economic growth rates. The fund lagged the Index, primarily due to security selection shortfalls in the materials, consumer discretionary, information technology and consumer staples sectors.
The Fund’s Investment Approach
The fund seeks investment results that are greater than the total return performance of publicly traded common stocks of medium-sized domestic companies in the aggregate, as represented by the Index. To pursue this goal, the fund normally invests at least 80% of its net assets, plus any borrowings for investment purposes, in stocks of mid-cap companies.
The fund invests in growth and value stocks, which are chosen through a disciplined investment process that combines computer-modeling techniques, fundamental analysis and risk management. Consistency of returns compared to the Index is a primary goal of the investment process.
The portfolio managers select stocks through a “bottom-up” structured approach that seeks to identify undervalued securities using a quantitative ranking process. The process is driven by a proprietary quantitative model that measures a diverse set of corporate characteristics to identify and rank stocks based on valuation, momentum, sentiment and earnings quality measures.
Next, the fund’s portfolio managers construct the portfolio through a risk-controlled process, focusing on stock selection as opposed to making proactive decisions as to industry and sector exposure. The portfolio managers seek to maintain a portfolio that has exposure to industries and market capitalizations that are generally similar to the fund’s benchmark. Finally, within each sector and style subset, the fund will seek to overweight the most attractive stocks and underweight or not hold the stocks that have been ranked least attractive.
Positive U.S. Economic Indicators Amid Volatility
A positive economic backdrop supported U.S. equity markets at the start of 2018, including sustained GDP growth, a robust labor market, and higher growth forecasts from the Federal Reserve Board (the “Fed”). Enactment of corporate tax cuts as part of major tax reform legislation in late December 2017 sparked additional market gains, driving the Index to new all-time highs in January.
In the first few months of 2018, volatility entered the picture, as concerns over inflation and the potential for trade disputes roiled markets. However, U.S. markets were able to stabilize,
3
DISCUSSION OF FUND PERFORMANCE(Unaudited) (continued)
and the upward trend continued on the back of continued positive economic data, corporate balance sheet strength and robust consumer spending. However, non-U.S. markets retreated as the rate of economic improvement in areas such as the Eurozone stalled. In late summer, continued political rhetoric in the U.S. regarding trade and midterm elections, and concerns over issues abroad in areas such as Italy, Turkey, Argentina and the United Kingdom, weighed on sentiment. Despite strong underlying fundamentals, volatility crept back into the picture in U.S. markets. Firm labor markets, tightening monetary policy and the possibility of slowing growth provoked a defensive sentiment among investors. In October, markets reversed and started to move lower. Continued worries over rising rates, trade disputes and falling commodity prices pressured equity markets throughout the rest of the period.
In this environment, large-cap stocks generally outperformed their mid- and small-cap counterparts.
Security Selections Constrained Fund Performance
The fund’s performance compared to the Index was mainly the result of stock selection shortfalls across several market sectors. In the materials sector, chemicals company Westlake Chemical hurt relative results when the stock fell after the company reported earnings in August that were below consensus expectations. While the company reported earnings that exceeded analyst estimates in November, concerns about the macroeconomic environment continued to weigh on the stock. Westlake was one of the largest detractors from overall performance during the period. Within the consumer discretionary sector, the selection effect was also negative, particularly among the home builders within the household durables industry. Stock selection in the semiconductor and semiconductor equipment industry within the information technology sector also detracted. The industry proved challenging and ended as one of the worst detractors from performance for the year. Selection in the food products industry within the consumer staples sector also weighed on results. Elsewhere in the portfolio, results in the health care sector were constrained by lack of exposure to medical devices maker ABIOMED, which more than doubled in value, “graduating” out of the benchmark during the period. ABIOMED was one of the largest detractors from relative results during the year. A position in insurance company CNO Financial Group underperformed the broader market due to weak growth and its exposure to the long-term care insurance market.
The fund achieved better results in several other areas. Our stock selection in energy benefited from an overweight to refining companies and largely avoided reserve and equipment companies, which lost significant value. Stock selection and allocation within the utilities sector also helped relative results. Independent power and renewable energy company NRG Energy was a top contributor to overall performance during the period. Within health care, a relative overweight was additive. Successful stock selection also benefited returns, particularly within the pharmaceutical industry. In addition, a position in biotechnology company Exelixis, which was added to the fund during the fourth quarter, was a top contributor as the stock rose through the end of the year on the back of a strong third-quarter earnings report. Outdoor apparel and shoe manufacturer Deckers Outdoor was also among the top overall contributors. This consumer discretionary sector company beat earnings and raised guidance each quarter of the reporting period.
4
A Disciplined Approach to Stock Picking
As of the reporting period’s end, our quantitative models have continued to identify what we believe are attractive investment opportunities across a broad spectrum of mid-cap companies and industry groups. Stock market volatility experienced this year may have provided opportunities to purchase the stocks of companies ranked highly by our process. When the fund’s holdings reach what we perceive to be fuller valuations, we expect to replace them with high-quality companies that display then-currently attractive valuations in our model. In addition, we continue to maintain a broadly diversified portfolio.
January 15, 2019
1 Total return includes reinvestment of dividends and any capital gains paid. Past performance is no guarantee of future results. Share price and investment return fluctuate such that upon redemption, fund shares may be worth more or less than their original cost. The fund’s performance does not reflect the deduction of additional charges and expenses imposed in connection with investing in variable insurance contracts, which will reduce returns.
2 Source: Lipper Inc. — The S&P MidCap 400® Index provides investors with a benchmark for mid-sized companies. The index measures the performance of mid-sized companies, reflecting the distinctive risk and return characteristics of this market segment. Investors cannot invest directly in any index.
Equities are subject generally to market, market sector, market liquidity, issuer, and investment style risks, among other factors, to varying degrees, all of which are more fully described in the fund’s prospectus.
Stocks of mid-cap companies often experience sharper price fluctuations than stocks of large-cap companies.
The fund is only available as a funding vehicle under variable life insurance policies or variable annuity contracts issued by insurance companies. Individuals may not purchase shares of the fund directly. A variable annuity is an insurance contract issued by an insurance company that enables investors to accumulate assets on a tax-deferred basis for retirement or other long-term goals. The investment objective and policies of Dreyfus Investment Portfolios, MidCap Stock Portfolio made available through insurance products may be similar to those of other funds managed by Dreyfus. However, the investment results of the fund may be higher or lower than, and may not be comparable to, those of any other Dreyfus fund.
5
FUND PERFORMANCE(Unaudited)

Comparison of change in value of $10,000 investment in Dreyfus Investment Portfolios, MidCap Stock PortfolioInitial shares and Service shares and the S&P MidCap 400® Index (the “Index”)
† Source: Lipper Inc.
Past performance is not predictive of future performance. The fund’s performance does not reflect the deduction of additional charges and expenses imposed in connection with investing in variable insurance contracts which will reduce returns.
The above graph compares a $10,000 investment made in Initial and Service shares of Dreyfus Investment Portfolios, MidCap Stock Portfolio on 12/31/08 to a $10,000 investment made in the Index on that date.
The fund’s performance shown in the line graph above takes into account all applicable fees and expenses. The Index provides investors with a benchmark for midsized companies. The Index measures the performance of midsized companies, reflecting the distinctive risk and return characteristics of this market segment. Unlike a mutual fund, the Index is not subject to charges, fees and other expenses. Investors cannot invest directly in any index. Further information relating to fund performance, including expense reimbursements, if applicable, is contained in the Financial Highlights section of the prospectus and elsewhere in this report.
| | | | |
Average Annual Total Returns as of 12/31/18 |
| 1 Year | 5 Years | 10 Years |
Initial shares | -15.49% | 4.28% | 13.17% |
Service shares | -15.69% | 4.01% | 12.91% |
S&P MidCap 400® Index | -11.08% | 6.03% | 13.68% |
The performance data quoted represents past performance, which is no guarantee of future results. Share price and investment return fluctuate and an investor’s shares may be worth more or less than original cost upon redemption. Current performance may be lower or higher than the performance quoted. Go to Dreyfus.com for the fund’s most recent month-end returns.
The fund’s Initial shares are not subject to a Rule 12b-1 fee. The fund’s Service shares are subject to a 0.25% annual Rule 12b-1 fee. All dividends and capital gain distributions are reinvested.
The fund’s performance shown in the graph and table does not reflect the deduction of taxes that a shareholder would pay on fund distributions or the redemption of fund shares.
6
UNDERSTANDING YOUR FUND’S EXPENSES(Unaudited)
As a mutual fund investor, you pay ongoing expenses, such as management fees and other expenses. Using the information below, you can estimate how these expenses affect your investment and compare them with the expenses of other funds. You also may pay one-time transaction expenses, including sales charges (loads), redemption fees and expenses associated with variable annuity or insurance contracts, which are not shown in this section and would have resulted in higher total expenses. For more information, see your fund’s prospectus or talk to your financial adviser.
Review your fund’s expenses
The table below shows the expenses you would have paid on a $1,000 investment in Dreyfus Investment Portfolios, MidCap Stock Portfolio from July 1, 2018 to December 31, 2018. It also shows how much a $1,000 investment would be worth at the close of the period, assuming actual returns and expenses.
| | | | | | | | | |
Expenses and Value of a $1,000 Investment |
assuming actual returns for the six months ended December 31, 2018 |
| | | | | | Initial Shares | Service Shares |
Expenses paid per $1,000† | | | | | | $4.07 | | $5.24 |
Ending value (after expenses) | | | | | | $858.00 | | $856.90 |
COMPARING YOUR FUND’S EXPENSES
WITH THOSE OF OTHER FUNDS(Unaudited)
Using the SEC’s method to compare expenses
The Securities and Exchange Commission (“SEC”) has established guidelines to help investors assess fund expenses. Per these guidelines, the table below shows your fund’s expenses based on a $1,000 investment, assuming a hypothetical 5% annualized return. You can use this information to compare the ongoing expenses (but not transaction expenses or total cost) of investing in the fund with those of other funds. All mutual fund shareholder reports will provide this information to help you make this comparison. Please note that you cannot use this information to estimate your actual ending account balance and expenses paid during the period.
| | | | | | | | | |
Expenses and Value of a $1,000 Investment |
assuming a hypothetical 5% annualized return for the six months ended December 31, 2018 |
| | | | | | Initial Shares | Service Shares |
Expenses paid per $1,000† | | | | | | $4.43 | | $5.70 |
Ending value (after expenses) | | | | | | $1,020.82 | | $1,019.56 |
† Expenses are equal to the fund’s annualized expense ratio of .87% for Initial shares and 1.12% for Service shares, multiplied by the average account value over the period, multiplied by 184/365 (to reflect the one-half year period).
7
STATEMENT OF INVESTMENTS
December 31, 2018
| | | | | | | | |
| |
Description | | | | Shares | | Value ($) | |
Common Stocks - 99.3% | | | | | |
Automobiles & Components - 1.4% | | | | | |
Gentex | | | | 91,930 | | 1,857,905 | |
Banks - 8.2% | | | | | |
BancorpSouth Bank | | | | 26,300 | a | 687,482 | |
Cathay General Bancorp | | | | 63,255 | | 2,120,940 | |
Comerica | | | | 24,300 | | 1,669,167 | |
Commerce Bancshares | | | | 5,199 | a | 293,068 | |
East West Bancorp | | | | 17,095 | | 744,145 | |
Popular | | | | 35,340 | | 1,668,755 | |
Synovus Financial | | | | 54,850 | a | 1,754,651 | |
TCF Financial | | | | 93,540 | | 1,823,095 | |
Washington Federal | | | | 12,120 | a | 323,725 | |
| | | | | 11,085,028 | |
Capital Goods - 8.2% | | | | | |
Allison Transmission Holdings | | | | 25,740 | | 1,130,243 | |
Curtiss-Wright | | | | 16,680 | | 1,703,362 | |
EMCOR Group | | | | 32,000 | | 1,910,080 | |
Kennametal | | | | 55,180 | | 1,836,390 | |
MSC Industrial Direct, Cl. A | | | | 1,960 | | 150,763 | |
Oshkosh | | | | 2,300 | | 141,013 | |
Pentair | | | | 3,700 | | 139,786 | |
Spirit AeroSystems Holdings, Cl. A | | | | 8,615 | | 621,055 | |
Teledyne Technologies | | | | 9,040 | b | 1,871,913 | |
Terex | | | | 57,600 | a | 1,588,032 | |
| | | | | 11,092,637 | |
Commercial & Professional Services - 1.4% | | | | | |
Copart | | | | 29,660 | b | 1,417,155 | |
HNI | | | | 12,060 | | 427,286 | |
| | | | | 1,844,441 | |
Consumer Durables & Apparel - 5.1% | | | | | |
Brunswick | | | | 28,980 | | 1,346,121 | |
Deckers Outdoor | | | | 19,550 | b | 2,501,422 | |
KB Home | | | | 73,050 | | 1,395,255 | |
NVR | | | | 560 | b | 1,364,714 | |
TRI Pointe | | | | 25,360 | a,b | 277,185 | |
| | | | | 6,884,697 | |
Consumer Services - 2.1% | | | | | |
Hyatt Hotels, Cl. A | | | | 5,800 | | 392,080 | |
International Speedway, Cl. A | | | | 7,240 | | 317,546 | |
Weight Watchers International | | | | 23,020 | a,b | 887,421 | |
Wendy's | | | | 82,540 | a | 1,288,449 | |
| | | | | 2,885,496 | |
8
| | | | | | | | |
| |
Description | | | | Shares | | Value ($) | |
Common Stocks - 99.3% (continued) | | | | | |
Diversified Financials - 3.0% | | | | | |
Evercore, Cl. A | | | | 4,280 | | 306,277 | |
Federated Investors, Cl. B | | | | 75,800 | a | 2,012,490 | |
SEI Investments | | | | 38,440 | | 1,775,928 | |
| | | | | 4,094,695 | |
Energy - 3.3% | | | | | |
HollyFrontier | | | | 32,520 | | 1,662,422 | |
Marathon Petroleum | | | | 2,500 | | 147,525 | |
Murphy Oil | | | | 38,460 | | 899,579 | |
PBF Energy, Cl. A | | | | 54,700 | | 1,787,049 | |
| | | | | 4,496,575 | |
Food, Beverage & Tobacco - 1.5% | | | | | |
Ingredion | | | | 22,740 | | 2,078,436 | |
Health Care Equipment & Services - 4.9% | | | | | |
Cantel Medical | | | | 17,230 | | 1,282,773 | |
Haemonetics | | | | 24,300 | b | 2,431,215 | |
ICU Medical | | | | 5,820 | b | 1,336,447 | |
Masimo | | | | 6,860 | b | 736,558 | |
Varian Medical Systems | | | | 6,160 | b | 697,990 | |
West Pharmaceutical Services | | | | 1,900 | | 186,257 | |
| | | | | 6,671,240 | |
Household & Personal Products - .6% | | | | | |
Edgewell Personal Care | | | | 18,050 | a,b | 674,168 | |
Energizer Holdings | | | | 2,700 | a | 121,905 | |
| | | | | 796,073 | |
Insurance - 7.4% | | | | | |
Brown & Brown | | | | 15,540 | | 428,282 | |
CNO Financial Group | | | | 101,390 | | 1,508,683 | |
Kemper | | | | 11,920 | | 791,250 | |
Old Republic International | | | | 97,380 | | 2,003,107 | |
Primerica | | | | 22,375 | | 2,186,261 | |
Reinsurance Group of America | | | | 11,805 | | 1,655,415 | |
Torchmark | | | | 20,500 | | 1,527,865 | |
| | | | | 10,100,863 | |
Materials - 4.9% | | | | | |
CF Industries Holdings | | | | 11,780 | | 512,548 | |
Chemours | | | | 52,210 | | 1,473,366 | |
Greif, Cl. A | | | | 17,960 | | 666,496 | |
Huntsman | | | | 68,690 | | 1,325,030 | |
Louisiana-Pacific | | | | 90,690 | | 2,015,132 | |
United States Steel | | | | 4,700 | | 85,728 | |
Westlake Chemical | | | | 7,640 | a | 505,539 | |
| | | | | 6,583,839 | |
9
STATEMENT OF INVESTMENTS (continued)
| | | | | | | | |
| |
Description | | | | Shares | | Value ($) | |
Common Stocks - 99.3% (continued) | | | | | |
Media & Entertainment - .7% | | | | | |
John Wiley & Sons, Cl. A | | | | 20,700 | | 972,279 | |
Pharmaceuticals Biotechnology & Life Sciences - 7.7% | | | | | |
Agilent Technologies | | | | 11,080 | | 747,457 | |
Bio-Rad Laboratories | | | | 4,560 | b | 1,058,923 | |
Charles River Laboratories International | | | | 20,550 | b | 2,325,849 | |
Exelixis | | | | 124,530 | b | 2,449,505 | |
Mettler-Toledo International | | | | 1,080 | b | 610,826 | |
United Therapeutics | | | | 5,665 | b | 616,919 | |
Waters | | | | 3,660 | b | 690,459 | |
Zoetis | | | | 22,670 | | 1,939,192 | |
| | | | | 10,439,130 | |
Real Estate - 7.2% | | | | | |
CubeSmart | | | | 6,100 | c | 175,009 | |
First Industrial Realty Trust | | | | 80,020 | c | 2,309,377 | |
Highwoods Properties | | | | 24,600 | c | 951,774 | |
Hospitality Properties Trust | | | | 16,075 | c | 383,871 | |
Kilroy Realty | | | | 15,055 | a,c | 946,658 | |
Lamar Advertising, Cl. A | | | | 34,605 | c | 2,393,974 | |
Piedmont Office Realty Trust, Cl. A | | | | 17,880 | a,c | 304,675 | |
Tanger Factory Outlet Centers | | | | 7,680 | a,c | 155,290 | |
Weingarten Realty Investors | | | | 85,650 | c | 2,124,976 | |
| | | | | 9,745,604 | |
Retailing - 4.2% | | | | | |
American Eagle Outfitters | | | | 100,260 | a | 1,938,026 | |
Best Buy | | | | 10,810 | | 572,498 | |
Dick's Sporting Goods | | | | 63,300 | a | 1,974,960 | |
Foot Locker | | | | 5,960 | | 317,072 | |
Signet Jewelers | | | | 27,710 | a | 880,347 | |
| | | | | 5,682,903 | |
Semiconductors & Semiconductor Equipment - .5% | | | | | |
ON Semiconductor | | | | 31,830 | b | 525,513 | |
Silicon Laboratories | | | | 2,450 | b | 193,085 | |
| | | | | 718,598 | |
Software & Services - 11.1% | | | | | |
Aspen Technology | | | | 9,960 | b | 818,513 | |
Broadridge Financial Solutions | | | | 11,870 | | 1,142,488 | |
CDK Global | | | | 43,630 | | 2,089,004 | |
CoreLogic | | | | 44,200 | b | 1,477,164 | |
Fair Isaac | | | | 6,470 | b | 1,209,890 | |
j2 Global | | | | 29,800 | a | 2,067,524 | |
Manhattan Associates | | | | 47,470 | a,b | 2,011,304 | |
MAXIMUS | | | | 34,500 | | 2,245,605 | |
Science Applications International | | | | 21,460 | | 1,367,002 | |
10
| | | | | | | | |
| |
Description | | | | Shares | | Value ($) | |
Common Stocks - 99.3% (continued) | | | | | |
Software & Services - 11.1% (continued) | | | | | |
WEX | | | | 4,610 | b | 645,677 | |
| | | | | 15,074,171 | |
Technology Hardware & Equipment - 5.7% | | | | | |
F5 Networks | | | | 6,750 | b | 1,093,703 | |
Lumentum Holdings | | | | 46,660 | b | 1,960,187 | |
Vishay Intertechnology | | | | 105,770 | a | 1,904,918 | |
Zebra Technologies, Cl. A | | | | 17,140 | b | 2,729,202 | |
| | | | | 7,688,010 | |
Transportation - 3.3% | | | | | |
Old Dominion Freight Line | | | | 18,100 | | 2,235,169 | |
United Continental Holdings | | | | 12,600 | b | 1,054,998 | |
Werner Enterprises | | | | 40,800 | a | 1,205,232 | |
| | | | | 4,495,399 | |
Utilities - 6.9% | | | | | |
IDACORP | | | | 10,000 | | 930,600 | |
MDU Resources Group | | | | 97,680 | | 2,328,691 | |
New Jersey Resources | | | | 19,870 | | 907,463 | |
NorthWestern | | | | 8,730 | a | 518,911 | |
NRG Energy | | | | 48,750 | | 1,930,500 | |
OGE Energy | | | | 68,710 | a | 2,692,745 | |
| | | | | 9,308,910 | |
Total Common Stocks(cost $137,815,932) | | | | 134,596,929 | |
| | | 1-Day
Yield (%) | | | | | |
Investment Companies - .8% | | | | | |
Registered Investment Companies - .8% | | | | | |
Dreyfus Institutional Preferred Government Plus Money Market Fund
(cost $1,087,825) | | 2.32 | | 1,087,825 | d | 1,087,825 | |
11
STATEMENT OF INVESTMENTS (continued)
| | | | | | | | |
| |
Description | | 1-Day
Yield (%) | | Shares | | Value ($) | |
Investment of Cash Collateral for Securities Loaned - 1.5% | | | | | |
Registered Investment Companies - 1.5% | | | | | |
Dreyfus Institutional Preferred Government Money Market Fund, Institutional Shares
(cost $2,039,430) | | 2.69 | | 2,039,430 | d | 2,039,430 | |
Total Investments(cost $140,943,187) | | 101.6% | | 137,724,184 | |
Liabilities, Less Cash and Receivables | | (1.6%) | | (2,148,828) | |
Net Assets | | 100.0% | | 135,575,356 | |
a Security, or portion thereof, on loan. At December 31, 2018, the value of the fund’s securities on loan was $20,173,671 and the value of the collateral held by the fund was $20,564,327, consisting of cash collateral of $2,039,430 and U.S. Government & Agency securities valued at $18,524,897.
b Non-income producing security.
c Investment in real estate investment trust.
d Investment in affiliated issuer. The investment objective of this investment company is publicly available and can be found within the investment company’s prospectus.
| | |
Portfolio Summary (Unaudited)† | Value (%) |
Financials | 18.6 |
Information Technology | 17.3 |
Industrials | 12.9 |
Consumer Discretionary | 12.8 |
Health Care | 12.6 |
Real Estate | 7.2 |
Utilities | 6.9 |
Materials | 4.9 |
Energy | 3.3 |
Investment Companies | 2.3 |
Consumer Staples | 2.1 |
Communication Services | .7 |
| | 101.6 |
† Based on net assets.
See notes to financial statements.
12
STATEMENT OF INVESTMENTS IN AFFILIATED ISSUERS
| | | | | | | |
Registered Investment Companies | Value
12/31/17($) | Purchases($) | Sales($) | Value
12/31/18($) | Net
Assets(%) | Dividends/
Distributions($) |
Dreyfus Institutional Preferred Government Plus Money Market Fund | 1,813,429 | 14,623,301 | 15,348,905 | 1,087,825 | .8 | 12,762 |
Dreyfus Institutional Preferred Government Money Market Fund, Institutional Shares | 5,638,451 | 29,098,345 | 32,697,366 | 2,039,430 | 1.5 | - |
Total | 7,451,880 | 43,721,646 | 48,046,271 | 3,127,255 | 2.3 | 12,762 |
See notes to financial statements.
13
STATEMENT OF ASSETS AND LIABILITIES
December 31, 2018
| | | | | | | |
| | | | | | |
| | | Cost | | Value | |
Assets ($): | | | | |
Investments in securities—See Statement of Investments
(including securities on loan, valued at $20,173,671)—Note 1(b): | | | |
Unaffiliated issuers | 137,815,932 | | 134,596,929 | |
Affiliated issuers | | 3,127,255 | | 3,127,255 | |
Dividends and securities lending income receivable | | 147,635 | |
Receivable for shares of Beneficial Interest subscribed | | 28,058 | |
Prepaid expenses | | | | | 2,810 | |
| | | | | 137,902,687 | |
Liabilities ($): | | | | |
Due to The Dreyfus Corporation and affiliates—Note 3(b) | | | | 111,219 | |
Liability for securities on loan—Note 1(b) | | 2,039,430 | |
Payable for shares of Beneficial Interest redeemed | | 99,944 | |
Trustees fees and expenses payable | | 3,090 | |
Accrued expenses | | | | | 73,648 | |
| | | | | 2,327,331 | |
Net Assets ($) | | | 135,575,356 | |
Composition of Net Assets ($): | | | | |
Paid-in capital | | | | | 127,170,641 | |
Total distributable earnings (loss) | | | | | 8,404,715 | |
Net Assets ($) | | | 135,575,356 | |
| | | | |
Net Asset Value Per Share | Initial Shares | Service Shares | |
Net Assets ($) | 72,373,840 | 63,201,516 | |
Shares Outstanding | 4,307,092 | 3,781,643 | |
Net Asset Value Per Share ($) | 16.80 | 16.71 | |
| | | | |
See notes to financial statements. | | | |
14
STATEMENT OF OPERATIONS
Year Ended December 31, 2018
| | | | | | | |
| | | | | | |
| | | | | | |
Investment Income ($): | | | | |
Income: | | | | |
Cash dividends (net of $883 foreign taxes withheld at source): | |
Unaffiliated issuers | | | 2,322,008 | |
Affiliated issuers | | | 12,762 | |
Income from securities lending—Note 1(b) | | | 22,103 | |
Total Income | | | 2,356,873 | |
Expenses: | | | | |
Management fee—Note 3(a) | | | 1,215,760 | |
Distribution fees—Note 3(b) | | | 185,722 | |
Professional fees | | | 88,726 | |
Prospectus and shareholders’ reports | | | 37,564 | |
Trustees’ fees and expenses—Note 3(c) | | | 7,848 | |
Custodian fees—Note 3(b) | | | 3,871 | |
Loan commitment fees—Note 2 | | | 2,881 | |
Shareholder servicing costs—Note 3(b) | | | 1,253 | |
Miscellaneous | | | 39,237 | |
Total Expenses | | | 1,582,862 | |
Investment Income—Net | | | 774,011 | |
Realized and Unrealized Gain (Loss) on Investments—Note 4 ($): | | |
Net realized gain (loss) on investments | 10,954,767 | |
Net unrealized appreciation (depreciation) on investments | | | (36,858,835) | |
Net Realized and Unrealized Gain (Loss) on Investments | | | (25,904,068) | |
Net (Decrease) in Net Assets Resulting from Operations | | (25,130,057) | |
| | | | | | | |
See notes to financial statements. | | | | | |
15
STATEMENT OF CHANGES IN NET ASSETS
| | | | | | | | | | |
| | | | Year Ended December 31, |
| | | | 2018 | | 2017a | |
Operations ($): | | | | | | | | |
Investment income—net | | | 774,011 | | | | 776,876 | |
Net realized gain (loss) on investments | | 10,954,767 | | | | 19,205,766 | |
Net unrealized appreciation (depreciation)
on investments | | (36,858,835) | | | | 5,929,234 | |
Net Increase (Decrease) in Net Assets
Resulting from Operations | (25,130,057) | | | | 25,911,876 | |
Distributions ($): | |
Distributions to shareholders: | | | | | | | | |
Initial Shares | | | (10,986,089) | | | | (3,265,870) | |
Service Shares | | | (9,034,600) | | | | (1,619,581) | |
Total Distributions | | | (20,020,689) | | | | (4,885,451) | |
Beneficial Interest Transactions ($): | |
Net proceeds from shares sold: | | | | | | | | |
Initial Shares | | | 6,689,007 | | | | 7,641,567 | |
Service Shares | | | 11,050,270 | | | | 16,117,819 | |
Distributions reinvested: | | | | | | | | |
Initial Shares | | | 10,986,089 | | | | 3,265,870 | |
Service Shares | | | 9,034,600 | | | | 1,619,581 | |
Cost of shares redeemed: | | | | | | | | |
Initial Shares | | | (13,668,427) | | | | (54,096,819) | |
Service Shares | | | (13,088,711) | | | | (13,049,664) | |
Increase (Decrease) in Net Assets
from Beneficial Interest Transactions | 11,002,828 | | | | (38,501,646) | |
Total Increase (Decrease) in Net Assets | (34,147,918) | | | | (17,475,221) | |
Net Assets ($): | |
Beginning of Period | | | 169,723,274 | | | | 187,198,495 | |
End of Period | | | 135,575,356 | | | | 169,723,274 | |
Capital Share Transactions (Shares): | |
Initial Shares | | | | | | | | |
Shares sold | | | 327,514 | | | | 360,786 | |
Shares issued for distributions reinvested | | | 551,234 | | | | 163,702 | |
Shares redeemed | | | (684,648) | | | | (2,544,770) | |
Net Increase (Decrease) in Shares Outstanding | 194,100 | | | | (2,020,282) | |
Service Shares | | | | | | | | |
Shares sold | | | 553,063 | | | | 781,309 | |
Shares issued for distributions reinvested | | | 454,915 | | | | 81,427 | |
Shares redeemed | | | (653,885) | | | | (633,009) | |
Net Increase (Decrease) in Shares Outstanding | 354,093 | | | | 229,727 | |
| | | | | | | | | | |
aDistributions to shareholders include $1,318,278 Initial shares and $571,428 Service shares of distributions from net investment income and $1,947,592 Initial shares and $1,048,153 Service shares of distributions from net realized gains. Undistributed investment income—net was $798,237 in 2017 and is no longer presented as a result of the adoption of SEC’s Disclosure Update and Simplification Rule.
| |
See notes to financial statements. | | | | | | | | |
16
FINANCIAL HIGHLIGHTS
The following tables describe the performance for each share class for the fiscal periods indicated. All information (except portfolio turnover rate) reflects financial results for a single fund share. Total return shows how much your investment in the fund would have increased (or decreased) during each period, assuming you had reinvested all dividends and distributions. The fund’s total returns do not reflect expenses associated with variable annuity or insurance contracts. These figures have been derived from the fund’s financial statements.
| | | | | | | |
| | | |
| | | |
| | | Year Ended December 31, |
Initial Shares | | 2018 | 2017 | 2016 | 2015 | 2014 |
Per Share Data ($): | | | | | | |
Net asset value, beginning of period | | 22.56 | 20.09 | 18.95 | 23.03 | 20.87 |
Investment Operations: | | | | | | |
Investment income—neta | | .12 | .10 | .21 | .18 | .14 |
Net realized and unrealized
gain (loss) on investments | | (3.19) | 2.92 | 2.50 | (.50) | 2.35 |
Total from Investment Operations | | (3.07) | 3.02 | 2.71 | (.32) | 2.49 |
Distributions: | | | | | | |
Dividends from
investment income—net | | (.13) | (.22) | (.21) | (.14) | (.21) |
Dividends from
net realized gain on investments | | (2.56) | (.33) | (1.36) | (3.62) | (.12) |
Total Distributions | | (2.69) | (.55) | (1.57) | (3.76) | (.33) |
Net asset value, end of period | | 16.80 | 22.56 | 20.09 | 18.95 | 23.03 |
Total Return (%) | | (15.49) | 15.38 | 15.47 | (2.29) | 12.09 |
Ratios/Supplemental Data (%): | | | | | | |
Ratio of total expenses
to average net assets | | .86 | .87 | .85 | .85 | .85 |
Ratio of net expenses
to average net assets | | .86 | .87 | .85 | .85 | .85 |
Ratio of net investment income
to average net assets | | .59 | .50 | 1.16 | .89 | .64 |
Portfolio Turnover Rate | | 68.02 | 64.86 | 65.52 | 80.27 | 83.06 |
Net Assets, end of period ($ x 1,000) | | 72,374 | 92,776 | 123,226 | 123,354 | 160,482 |
a Based on average shares outstanding.
See notes to financial statements.
17
FINANCIAL HIGHLIGHTS (continued)
| | | | | | | |
| | | |
| | | |
| | | Year Ended December 31, |
Service Shares | | 2018 | 2017 | 2016 | 2015 | 2014 |
Per Share Data ($): | | | | | | |
Net asset value, beginning of period | | 22.45 | 20.00 | 18.88 | 22.97 | 20.83 |
Investment Operations: | | | | | | |
Investment income—neta | | .07 | .06 | .17 | .15 | .09 |
Net realized and unrealized
gain (loss) on investments | | (3.18) | 2.90 | 2.47 | (.52) | 2.34 |
Total from Investment Operations | | (3.11) | 2.96 | 2.64 | (.37) | 2.43 |
Distributions: | | | | | | |
Dividends from
investment income—net | | (.07) | (.18) | (.16) | (.10) | (.17) |
Dividends from
net realized gain on investments | | (2.56) | (.33) | (1.36) | (3.62) | (.12) |
Total Distributions | | (2.63) | (.51) | (1.52) | (3.72) | (.29) |
Net asset value, end of period | | 16.71 | 22.45 | 20.00 | 18.88 | 22.97 |
Total Return (%) | | (15.69) | 15.04 | 15.20 | (2.52) | 11.76 |
Ratios/Supplemental Data (%): | | | | | | |
Ratio of total expenses
to average net assets | | 1.11 | 1.12 | 1.10 | 1.10 | 1.10 |
Ratio of net expenses
to average net assets | | 1.11 | 1.12 | 1.10 | 1.10 | 1.10 |
Ratio of net investment income
to average net assets | | .34 | .28 | .94 | .72 | .40 |
Portfolio Turnover Rate | | 68.02 | 64.86 | 65.52 | 80.27 | 83.06 |
Net Assets, end of period ($ x 1,000) | | 63,202 | 76,948 | 63,972 | 49,363 | 35,213 |
a Based on average shares outstanding.
See notes to financial statements.
18
NOTES TO FINANCIAL STATEMENTS
NOTE 1—Significant Accounting Policies:
MidCap Stock Portfolio (the “fund”) is a separate diversified series of Dreyfus Investment Portfolios (the “Company”), which is registered under the Investment Company Act of 1940, as amended (the “Act”), as an open-end management investment company and operates as a series company currently offering four series, including the fund. The fund is only offered to separate accounts established by insurance companies to fund variable annuity contracts and variable life insurance policies. The fund’s investment objective is to seek investment results that are greater than the total return performance of publicly traded common stocks of medium-size domestic companies in the aggregate, as represented by the Standard & Poor’s MidCap 400® Index. The Dreyfus Corporation (the “Manager” or “Dreyfus”), a wholly-owned subsidiary of The Bank of New York Mellon Corporation (“BNY Mellon”), serves as the fund’s investment adviser.
MBSC Securities Corporation (the “Distributor”), a wholly-owned subsidiary of Dreyfus, is the distributor of the fund’s shares, which are sold without a sales charge. The fund is authorized to issue an unlimited number of $.001 par value shares of Beneficial Interest in each of the following classes of shares: Initial and Service. Each class of shares has identical rights and privileges, except with respect to the Distribution Plan, and the expenses borne by each class, the allocation of certain transfer agency costs, and certain voting rights. Income, expenses (other than expenses attributable to a specific class), and realized and unrealized gains or losses on investments are allocated to each class of shares based on its relative net assets.
The Company accounts separately for the assets, liabilities and operations of each series. Expenses directly attributable to each series are charged to that series’ operations; expenses which are applicable to all series are allocated among them on a pro rata basis.
The Financial Accounting Standards Board (“FASB”) Accounting Standards Codification is the exclusive reference of authoritative U.S. generally accepted accounting principles (“GAAP”) recognized by the FASB to be applied by nongovernmental entities. Rules and interpretive releases of the Securities and Exchange Commission (“SEC”) under authority of federal laws are also sources of authoritative GAAP for SEC registrants. The fund’s financial statements are prepared in accordance with GAAP, which may require the use of management estimates and assumptions. Actual results could differ from those estimates.
19
NOTES TO FINANCIAL STATEMENTS(continued)
The Companyenters into contracts that contain a variety of indemnifications. The fund’s maximum exposure under these arrangements is unknown. The fund does not anticipate recognizing any loss related to these arrangements.
(a) Portfolio valuation: The fair value of a financial instrument is the amount that would be received to sell an asset or paid to transfer a liability in an orderly transaction between market participants at the measurement date (i.e., the exit price). GAAP establishes a fair value hierarchy that prioritizes the inputs of valuation techniques used to measure fair value. This hierarchy gives the highest priority to unadjusted quoted prices in active markets for identical assets or liabilities (Level 1 measurements) and the lowest priority to unobservable inputs (Level 3 measurements).
Additionally, GAAP provides guidance on determining whether the volume and activity in a market has decreased significantly and whether such a decrease in activity results in transactions that are not orderly. GAAP requires enhanced disclosures around valuation inputs and techniques used during annual and interim periods.
Various inputs are used in determining the value of the fund’s investments relating to fair value measurements. These inputs are summarized in the three broad levels listed below:
Level 1—unadjusted quoted prices in active markets for identical investments.
Level 2—other significant observable inputs (including quoted prices for similar investments, interest rates, prepayment speeds, credit risk, etc.).
Level 3—significant unobservable inputs (including the fund’s own assumptions in determining the fair value of investments).
The inputs or methodology used for valuing securities are not necessarily an indication of the risk associated with investing in those securities.
Changes in valuation techniques may result in transfers in or out of an assigned level within the disclosure hierarchy. Valuation techniques used to value the fund’s investments are as follows:
Investments in securities are valued at the last sales price on the securities exchange or national securities market on which such securities are primarily traded. Securities listed on the National Market System for which market quotations are available are valued at the official closing price or, if there is no official closing price that day, at the last sales price. For open short positions, asked prices are used for valuation purposes. Bid price is
20
used when no asked price is available. Registered investment companies that are not traded on an exchange are valued at their net asset value. All of the preceding securities are generally categorized within Level 1 of the fair value hierarchy.
Securities not listed on an exchange or the national securities market, or securities for which there were no transactions, are valued at the average of the most recent bid and asked prices. These securities are generally categorized within Level 2 of the fair value hierarchy.
Fair valuing of securities may be determined with the assistance of a pricing service using calculations based on indices of domestic securities and other appropriate indicators, such as prices of relevant American Depository Receipts and futures. Utilizing these techniques may result in transfers between Level 1 and Level 2 of the fair value hierarchy.
When market quotations or official closing prices are not readily available, or are determined not to accurately reflect fair value, such as when the value of a security has been significantly affected by events after the close of the exchange or market on which the security is principally traded (for example, a foreign exchange or market), but before the fund calculates its net asset value, the fund may value these investments at fair value as determined in accordance with the procedures approved by the Company’s Board of Trustees (the “Board”). Certain factors may be considered when fair valuing investments such as: fundamental analytical data, the nature and duration of restrictions on disposition, an evaluation of the forces that influence the market in which the securities are purchased and sold, and public trading in similar securities of the issuer or comparable issuers. These securities are either categorized within Level 2 or 3 of the fair value hierarchy depending on the relevant inputs used.
For restricted securities where observable inputs are limited, assumptions about market activity and risk are used and such securities are generally categorized within Level 3 of the fair value hierarchy.
The following is a summary of the inputs used as of December 31, 2018in valuing the fund’s investments:
21
NOTES TO FINANCIAL STATEMENTS(continued)
| | | | | |
| | Level 1 -
Unadjusted
Quoted Prices | Level 2 – Other
Significant
Observable
Inputs | Level 3 -
Significant
Unobservable
Inputs | Total |
Assets ($) | | | | |
Investments in Securities: | | | | |
Equity Securities-
Common Stocks† | 134,596,929 | - | - | 134,596,929 |
Registered Investment Companies | 3,127,255 | - | - | 3,127,255 |
† See Statement of Investments for additional detailed categorizations.
At December 31, 2018, there were no transfers between levels of the fair value hierarchy. It is the fund’s policy to recognize transfers between levels at the end of the reporting period.
(b)Securities transactions and investment income: Securities transactions are recorded on a trade date basis. Realized gains and losses from securities transactions are recorded on the identified cost basis. Dividend income is recognized on the ex-dividend date and interest income, including, where applicable, accretion of discount and amortization of premium on investments, is recognized on the accrual basis.
Pursuant to a securities lending agreement with The Bank of New York Mellon, a subsidiary of BNY Mellon and an affiliate of Dreyfus, the fund may lend securities to qualified institutions. It is the fund’s policy that, at origination, all loans are secured by collateral of at least 102% of the value of U.S. securities loaned and 105% of the value of foreign securities loaned. Collateral equivalent to at least 100% of the market value of securities on loan is maintained at all times. Collateral is either in the form of cash, which can be invested in certain money market mutual funds managed by Dreyfus, or U.S. Government and Agency securities. The fund is entitled to receive all dividends, interest and distributions on securities loaned, in addition to income earned as a result of the lending transaction. Should a borrower fail to return the securities in a timely manner, The Bank of New York Mellon is required to replace the securities for the benefit of the fund or credit the fund with the market value of the unreturned securities and is subrogated to the fund’s rights against the borrower and the collateral. Additionally, the contractual maturity of security lending transactions are on an overnight and continuous basis. During the period ended December 31, 2018, The Bank of New York Mellon earned $4,132 from lending portfolio securities, pursuant to the securities lending agreement.
22
(c) Affiliated issuers: Investments in other investment companies advised by Dreyfus are considered “affiliated” under the Act.
(d) Dividends and distributions to shareholders: Dividends and distributions are recorded on the ex-dividend date. Dividends from investment income-net and dividends from net realized capital gains, if any, are normally declared and paid annually, but the fund may make distributions on a more frequent basis to comply with the distribution requirements of the Internal Revenue Code of 1986, as amended (the “Code”). To the extent that net realized capital gains can be offset by capital loss carryovers, it is the policy of the fund not to distribute such gains. Income and capital gain distributions are determined in accordance with income tax regulations, which may differ from GAAP.
(e) Federal income taxes: It is the policy of the fund to continue to qualify as a regulated investment company, if such qualification is in the best interests of its shareholders, by complying with the applicable provisions of the Code, and to make distributions of taxable income and net realized capital gain sufficient to relieve it from substantially all federal income and excise taxes.
As of and during the period ended December 31, 2018, the fund did not have any liabilities for any uncertain tax positions. The fund recognizes interest and penalties, if any, related to uncertain tax positions as income tax expense in the Statement of Operations. During the period ended December 31, 2018, the fund did not incur any interest or penalties.
Each tax year in the four-year period ended December 31, 2018 remains subject to examination by the Internal Revenue Service and state taxing authorities.
At December 31, 2018, the components of accumulated earnings on a tax basis were as follows: undistributed ordinary income $792,943, undistributed capital gains $10,846,386 and unrealized depreciation $3,243,416.
The tax character of distributions paid to shareholders during the fiscal periods ended December 31, 2018 and December 31, 2017 were as follows: ordinary income $4,070,215 and $1,889,706, and long-term capital gains $15,950,474 and $2,995,745, respectively.
(f) New Accounting Pronouncements: In August 2018, the FASB issued Accounting Standards Update 2018-13, Fair Value Measurement (Topic 820): Disclosure Framework—Changes to the Disclosure Requirements for Fair Value Measurement (“ASU 2018-13”). The update provides guidance that eliminates, adds and modifies certain disclosure
23
NOTES TO FINANCIAL STATEMENTS(continued)
requirements for fair value measurements. ASU 2018-13 will be effective for annual periods beginning after December 15, 2019. Management is currently assessing the potential impact of these changes to future financial statements.
NOTE 2—Bank Lines of Credit:
The fund participates with other Dreyfus-managed long-term open-end funds in a $1.030 billion unsecured credit facility led by Citibank, N.A. (the “Citibank Credit Facility”) and a $300 million unsecured credit facility provided by The Bank of New York Mellon (the “BNYM Credit Facility”), each to be utilized primarily for temporary or emergency purposes, including the financing of redemptions (each, a “Facility”). The Citibank Credit Facility is available in two tranches: (i) Tranche A is in an amount equal to $830 million and is available to all long-term open-ended funds, including the fund, and (ii) Tranche B is in amount equal to $200 million and is available only to the Dreyfus Floating Rate Income Fund, a series of The Dreyfus/Laurel Funds, Inc. Prior to October 3, 2018, the unsecured credit facility with Citibank, N.A. was $830 million. In connection therewith, the fund has agreed to pay its pro rata portion of commitment fees for Tranche A of the Citibank Credit Facility and the BNYM Credit Facility. Interest is charged to the fund based on rates determined pursuant to the terms of the respective Facility at the time of borrowing. During the period ended December 31, 2018, the fund did not borrow under the Facilities.
NOTE 3—Management Fee and Other Transactions with Affiliates:
(a)Pursuant to a management agreement with Dreyfus, the management fee is computed at the annual rate of .75% of the value of the fund's average daily net assets and is payable monthly.
(b)Under the Distribution Plan adopted pursuant to Rule 12b-1 under the Act, Service shares pay the Distributor for distributing its shares, for servicing and/or maintaining Service shares’ shareholder accounts and for advertising and marketing for Service shares. The Distribution Plan provides for payments to be made at an annual rate of .25% of the value of the Service shares’ average daily net assets. The Distributor may make payments to Participating Insurance Companies and to brokers and dealers acting as principal underwriter for their variable insurance products. The fees payable under the Distribution Plan are payable without regard to actual expenses incurred. During the period ended December 31, 2018,Service shares were charged $185,722 pursuant to the Distribution Plan.
24
The fund has arrangements with the transfer agent and the custodian whereby the fund may receive earnings credits when positive cash balances are maintained, which are used to offset transfer agency and custody fees. For financial reporting purposes, the fund includes net earnings credits, if any, as an expense offset in the Statement of Operations.
The fund compensates Dreyfus Transfer, Inc., a wholly-owned subsidiary of Dreyfus, under a transfer agency agreement for providing transfer agency and cash management services for the fund. The majority of transfer agency fees are comprised of amounts paid on a per account basis, while cash management fees are related to fund subscriptions and redemptions. During the period ended December 31, 2018, the fund was charged $1,178 for transfer agency services. These fees are included in Shareholder servicing costs in the Statement of Operations.
The fund compensates The Bank of New York Mellon under a custody agreement for providing custodial services for the fund. These fees are determined based on net assets, geographic region and transaction activity. During the period ended December 31, 2018, the fund was charged $3,871 pursuant to the custody agreement.
During the period ended December 31, 2018, the fund was charged $12,774 for services performed by the Chief Compliance Officer and his staff. These fees are included in Miscellaneous in the Statement of Operations.
The components of “Due to The Dreyfus Corporation and affiliates” in the Statement of Assets and Liabilities consist of: management fees $88,653, Distribution Plan fees $13,734, custodian fees $2,400, Chief Compliance Officer fees $6,289 and transfer agency fees $143.
(c) Each Board member also serves as a Board member of other funds within the Dreyfus complex. Annual retainer fees and attendance fees are allocated to each fund based on net assets.
NOTE 4—Securities Transactions:
The aggregate amount of purchases and sales of investment securities, excluding short-term securities, during the period ended December 31, 2018, amounted to $109,253,021 and $116,542,591, respectively.
At December 31, 2018, the cost of investments for federal income tax purposes was $140,967,600; accordingly, accumulated net unrealized depreciation on investments was $3,243,416, consisting of $13,211,579 gross unrealized appreciation and $16,454,995 gross unrealized depreciation.
25
REPORT OF INDEPENDENT REGISTERED PUBLIC ACCOUNTING FIRM
To the Shareholders and the Board of Trustees of MidCap Stock Portfolio
Opinion on the Financial Statements
We have audited the accompanying statement of assets and liabilities of MidCap Stock Portfolio (the “Fund”) (one of the funds constituting Dreyfus Investment Portfolios), including the statements of investments and investments in affiliated issuers, as of December 31, 2018, and the related statement of operations for the year then ended, the statements of changes in net assets for each of the two years in the period then ended, the financial highlights for each of the five years in the period then ended and the related notes (collectively referred to as the “financial statements”). In our opinion, the financial statements present fairly, in all material respects, the financial position of the Fund (one of the funds constituting Dreyfus Investment Portfolios) at December 31, 2018, the results of its operations for the year then ended, the changes in its net assets for each of the two years in the period then ended and its financial highlights for each of the five years in the period then ended, in conformity with U.S. generally accepted accounting principles.
Basis for Opinion
These financial statements are the responsibility of the Fund’s management. Our responsibility is to express an opinion on the Fund’s financial statements based on our audits. We are a public accounting firm registered with the Public Company Accounting Oversight Board (United States) (“PCAOB”) and are required to be independent with respect to the Fund in accordance with the U.S. federal securities laws and the applicable rules and regulations of the Securities and Exchange Commission and the PCAOB.
We conducted our audits in accordance with the standards of the PCAOB. Those standards require that we plan and perform the audit to obtain reasonable assurance about whether the financial statements are free of material misstatement, whether due to error or fraud. The Fund is not required to have, nor were we engaged to perform, an audit of the Fund’s internal control over financial reporting. As part of our audits, we are required to obtain an understanding of internal control over financial reporting, but not for the purpose of expressing an opinion on the effectiveness of the Fund’s internal control over financial reporting. Accordingly, we express no such opinion.
Our audits included performing procedures to assess the risks of material misstatement of the financial statements, whether due to error or fraud, and performing procedures that respond to those risks. Such procedures included examining, on a test basis, evidence regarding the amounts and disclosures in the financial statements. Our procedures included confirmation of securities owned as of December 31, 2018, by correspondence with the custodian and others or by other appropriate auditing procedures where replies from others were not received. Our audits also included evaluating the accounting principles used and significant estimates made by management, as well as evaluating the overall presentation of the financial statements. We believe that our audits provide a reasonable basis for our opinion.

We have served as the auditor of one or more Dreyfus investment companies since at least 1957, but we are unable to determine the specific year.
New York, New York
February 11, 2019
26
IMPORTANT TAX INFORMATION(Unaudited)
For federal tax purposes, the portfolio hereby reports 65.57% of the ordinary dividends paid during the fiscal year ended December 31, 2018 as qualifying for the corporate dividends received deduction. Shareholders will receive notification in early 2019 of the percentage applicable to the preparation of their 2018 income tax returns. Also, the fund hereby reports $0.44 per share as a short-term capital gain distribution and $2.123 per share as a long-term capital gain distribution paid on March 21, 2018.
27
INFORMATION ABOUT THE RENEWAL OF THE FUND’S INVESTMENT ADVISORY AGREEMENT (Unaudited)
At a meeting of the fund’s Board of Trustees held on July 18-19, 2018, the Board considered the renewalof the fund’s Management Agreement pursuant to which Dreyfus provides the fund with investment advisory and administrative services (the “Agreement”). The Board members, a majority of whom are not “interested persons” (as defined in the Investment Company Act of 1940, as amended) of the fund, were assisted in their review by independent legal counsel and met with counsel in executive session separate from Dreyfus representatives. In considering the renewal of the Agreement, the Board considered all factors that it believed to be relevant, including those discussed below. The Board did not identify any one factor as dispositive, and each Board member may have attributed different weights to the factors considered.
Analysis of Nature, Extent, and Quality of Services Provided to the Fund. The Board considered information provided to them at the meeting and in previous presentations from Dreyfus representatives regarding the nature, extent, and quality of the services provided to funds in the Dreyfus fund complex. Dreyfus provided the number of open accounts in the fund, the fund’s asset size and the allocation of fund assets among distribution channels. Dreyfus also had previously provided information regarding the diverse intermediary relationships and distribution channels of funds in the Dreyfus fund complex (such as retail direct or intermediary, in which intermediaries typically are paid by the fund and/or Dreyfus) and Dreyfus’ corresponding need for broad, deep, and diverse resources to be able to provide ongoing shareholder services to each intermediary or distribution channel, as applicable to the fund.
The Board also considered research support available to, and portfolio management capabilities of, the fund’s portfolio management personnel and that Dreyfus also provides oversight of day-to-day fund operations, including fund accounting and administration and assistance in meeting legal and regulatory requirements. The Board also considered Dreyfus’ extensive administrative, accounting and compliance infrastructures. The Board also considered portfolio management’s brokerage policies and practices (including policies and practices regarding soft dollars) and the standards applied in seeking best execution.
Comparative Analysis of the Fund’s Performance and Management Fee and Expense Ratio. The Board reviewed reports prepared by Broadridge Financial Solutions, Inc. (“Broadridge”), an independent provider of investment company data, which included information comparing (1) the fund’s performance with the performance of a group of comparable funds (the “Performance Group”) and with a broader group of funds (the “Performance Universe”), all for various periods ended May 31, 2018, and (2) the fund’s actual and contractual management fees and total expenses with those of a group of comparable funds (the “Expense Group”) and with a broader group of funds (the “Expense Universe”), the information for which was derived in part from fund financial statements available to Broadridge as of the date of its analysis. Dreyfus previously had furnished the Board with a description of the methodology Broadridge used to select
28
the Performance Group and Performance Universe and the Expense Group and Expense Universe.
Dreyfus representatives stated that the usefulness of performance comparisons may be affected by a number of factors, including different investment limitations that may be applicable to the fund and comparison funds. The Board discussed with representatives of Dreyfus and/or its affiliates the results of the comparisons and considered that the fund’s total return performance was above the Performance Group and Performance Universe medians for all periods except thetwo-year period when it was slightly below the Performance Universe median. Dreyfus also provided a comparison of the fund’s calendar year total returns to the returns of the fund’s benchmark index.
The Board also reviewed the range of actual and contractual management fees and total expenses of the Expense Group and Expense Universe funds and discussed the results of the comparisons. The Board considered that the fund’s contractual management fee was at the Expense Group median and the fund’s actual management fee and total expenses were above the Expense Group and Expense Universe medians.
Dreyfus representatives reviewed with the Board the management or investment advisory fees (1) paid by funds advised or administered by Dreyfus that are in the same Lipper category as the fund and (2) paid to Dreyfus or the Dreyfus-affiliated primary employer of the fund’s primary portfolio manager(s) for advising any separate accounts and/or other types of client portfolios that are considered to have similar investment strategies and policies as the fund (the “Similar Clients”), and explained the nature of the Similar Clients. They discussed differences in fees paid and the relationship of the fees paid in light of any differences in the services provided and other relevant factors. The Board considered the relevance of the fee information provided for the Similar Clients to evaluate the appropriateness of the fund’s management fee.
Analysis of Profitability and Economies of Scale. Dreyfus representatives reviewed the expenses allocated and profit received by Dreyfus and its affiliates and the resulting profitability percentage for managing the fund and the aggregate profitability percentage to Dreyfus and its affiliates for managing the funds in the Dreyfus fund complex, and the method used to determine the expenses and profit. The Board concluded that the profitability results were not unreasonable, given the services rendered and service levels provided by Dreyfus. The Board also had been provided with information prepared by an independent consulting firm regarding Dreyfus’ approach to allocating costs to, and determining the profitability of, individual funds and the entire Dreyfus fund complex. The consulting firm also had analyzed where any economies of scale might emerge in connection with the management of a fund.
The Board considered, on the advice of its counsel, the profitability analysis (1) as part of its evaluation of whether the fees under the Agreement, considered in relation to the mix of services provided by Dreyfus, including the nature, extent and quality of such services, supported the renewal of the Agreement and (2) in light of the relevant circumstances for the fund and the extent to which economies of scale would be realized if the fund grows and whether fee levels reflect these economies of scale for the
29
INFORMATION ABOUT THE RENEWAL OF THE FUND’S INVESTMENT ADVISORY AGREEMENT (Unaudited) (continued)
benefit of fund shareholders. Dreyfus representatives stated that a discussion of economies of scale is predicated on a fund having achieved a substantial size with increasing assets and that, if a fund’s assets had been stable or decreasing, the possibility that Dreyfus may have realized any economies of scale would be less. Dreyfus representatives also stated that, as a result of shared and allocated costs among funds in the Dreyfus fund complex, the extent of economies of scale could depend substantially on the level of assets in the complex as a whole, so that increases and decreases in complex-wide assets can affect potential economies of scale in a manner that is disproportionate to, or even in the opposite direction from, changes in the fund’s asset level. The Board also considered potential benefits to Dreyfus from acting as investment adviser and took into consideration the soft dollar arrangements in effect for trading the fund’s investments.
At the conclusion of these discussions, the Board agreed that it had been furnished with sufficient information to make an informed business decision with respect to the renewal of the Agreement. Based on the discussions and considerations as described above, the Board concluded and determined as follows.
· The Board concluded that the nature, extent and quality of the services provided by Dreyfus are adequate and appropriate.
· The Board was satisfied with the fund’s performance.
· The Board concluded that the fee paid to Dreyfus continued to be appropriate under the circumstances and in light of the factors and the totality of the services provided as discussed above.
· The Board determined that the economies of scale which may accrue to Dreyfus and its affiliates in connection with the management of the fund had been adequately considered by Dreyfus in connection with the fee rate charged to the fund pursuant to the Agreement and that, to the extent in the future it were determined that material economies of scale had not been shared with the fund, the Board would seek to have those economies of scale shared with the fund.
In evaluating the Agreement, the Board considered these conclusions and determinations and also relied on its previous knowledge, gained through meetings and other interactions with Dreyfus and its affiliates, of Dreyfus and the services provided to the fund by Dreyfus. The Board also relied on information received on a routine and regular basis throughout the year relating to the operations of the fund and the investment management and other services provided under the Agreement, including information on the investment performance of the fund in comparison to similar mutual funds and benchmark performance indices; general market outlook as applicable to the fund; and compliance reports. In addition, the Board’s consideration of the contractual fee arrangements for this fund had the benefit of a number of years of reviews of the Agreement for the fund, or substantially similar agreements for other Dreyfus funds that the Board oversees, during which lengthy discussions took place
30
between the Board and Dreyfus representatives. Certain aspects of the arrangements may receive greater scrutiny in some years than in others, and the Board’s conclusions may be based, in part, on their consideration of the fund’s arrangements, or substantially similar arrangements for other Dreyfus funds that the Board oversees, in prior years. The Board determined to renew the Agreement.
31
BOARD MEMBERS INFORMATION(Unaudited)
INDEPENDENT BOARD MEMBERS
Joseph S. DiMartino (75)
Chairman of the Board (1995)
Principal Occupation During Past 5 Years:
· Corporate Director and Trustee (1995-present)
Other Public Company Board Memberships During Past 5 Years:
· CBIZ (formerly, Century Business Services, Inc.), a provider of outsourcing functions for small and medium size companies, Director (1997-present)
No. of Portfolios for which Board Member Serves:122
———————
Francine J. Bovich (67)
Board Member (2015)
Principal Occupation During Past 5 Years:
· Trustee, The Bradley Trusts, private trust funds (2011-present)
Other Public Company Board Memberships During Past 5 Years:
· Annaly Capital Management, Inc., a real estate investment trust, Director (2014-present)
No. of Portfolios for which Board Member Serves:70
———————
Gordon J. Davis (77)
Board Member (2012)
Principal Occupation During Past 5 Years:
· Partner in the law firm of Venable LLP (2012-present)
Other Public Company Board Memberships During Past 5 Years:
· Consolidated Edison, Inc., a utility company, Director (1997-2014)
· The Phoenix Companies, Inc., a life insurance company, Director (2000-2014)
No. of Portfolios for which Board Member Serves:54
———————
Isabel P. Dunst (71)
Board Member (2014)
Principal Occupation During Past 5 Years:
· Senior Counsel, Hogan Lovells LLP (2018-present; previously, Of Counsel, 2015-2018, Partner, 1990-2014)
No. of Portfolios for which Board Member Serves:33
———————
32
Nathan Leventhal (75)
Board Member (2009)
Principal Occupation During Past 5 Years:
· President Emeritus of Lincoln Center for the Performing Arts (2001-present)
· Chairman of the Avery Fisher Artist Program (1997-2014)
Other Public Company Board Memberships During Past 5 Years:
· Movado Group, Inc., Director (2003-present)
No. of Portfolios for which Board Member Serves:47
———————
Robin A. Melvin (55)
Board Member (2014)
Principal Occupation During Past 5 Years:
· Co-chairman, Illinois Mentoring Partnership, non-profit organization dedicated to increasing the quantity and quality of mentoring services in Illinois (2014-present; board member since 2013)
No. of Portfolios for which Board Member Serves:99
———————
Roslyn M. Watson (69)
Board Member (2014)
Principal Occupation During Past 5 Years:
· Principal, Watson Ventures, Inc., a real estate investment company (1993-present)
No. of Portfolios for which Board Member Serves:56
———————
Benaree Pratt Wiley (72)
Board Member (2009)
Principal Occupation During Past 5 Years:
· Principal, The Wiley Group, a firm specializing in strategy and business development (2005-present)
Other Public Company Board Memberships During Past 5 Years:
· CBIZ (formerly, Century Business Services, Inc.), a provider of outsourcing functions for small and medium size companies, Director (2008-present)
No. of Portfolios for which Board Member Serves:77
———————
33
BOARD MEMBERS INFORMATION (Unaudited) (continued)
INTERESTED BOARD MEMBER
J. Charles Cardona (63)
Board Member (2014)
Principal Occupation During Past 5 Years:
· Retired. President and a Director of the Manager (2008-2016), Chairman of the Distributor (2013-2016, Executive Vice President, 1997-2013)
No. of Portfolios for which Board Member Serves:33
J. Charles Cardona is deemed to be an “interested person” (as defined under the Act) of the Company as a result of his previous affiliation with The Dreyfus Corporation.
———————
Once elected all Board Members serve for an indefinite term, but achieve Emeritus status upon reaching age 80. The address of the Board Members and Officers is c/o The Dreyfus Corporation, 200 Park Avenue, New York, New York 10166. Additional information about the Board Members is available in the fund’s Statement of Additional Information which can be obtained from Dreyfus free of charge by calling this toll free number: 1-800-DREYFUS.
Clifford L. Alexander, Jr., Emeritus Board Member
Whitney I. Gerard, Emeritus Board Member
George L. Perry, Emeritus Board Member
34
OFFICERS OF THE FUND(Unaudited)
BRADLEY J. SKAPYAK, President since January 2010.
Chief Operating Officer and a director of the Manager since June 2009, Chairman of Dreyfus Transfer, Inc., an affiliate of the Manager and the transfer agent of the funds, since May 2011 and Chief Executive Officer of MBSC Securities Corporation since August 2016. He is an officer of 62 investment companies (comprised of 122 portfolios) managed by the Manager. He is 60 years old and has been an employee of the Manager since February 1988.
BENNETT A. MACDOUGALL, Chief Legal Officer since October 2015.
Chief Legal Officer of the Manager and Associate General Counsel and Managing Director of BNY Mellon since June 2015; from June 2005 to June 2015, he served in various capacities with Deutsche Bank – Asset & Wealth Management Division, including as Director and Associate General Counsel, and Chief Legal Officer of Deutsche Investment Management Americas Inc. from June 2012 to May 2015. He is an officer of 63 investment companies (comprised of 147 portfolios) managed by the Manager. He is 47 years old and has been an employee of the Manager since June 2015.
JAMES BITETTO, Vice President since August 2005 and Secretary since February 2018.
Managing Counsel of BNY Mellon and Secretary of the Manager, and an officer of 63 investment companies (comprised of 147 portfolios) managed by the Manager. He is 52 years old and has been an employee of the Manager since December 1996.
SONALEE CROSS, Vice President and Assistant Secretary since March 2018.
Counsel of BNY Mellon since October 2016; Associate at Proskauer Rose LLP from April 2016 to September 2016; Attorney at EnTrust Capital from August 2015 to February 2016; Associate at Sidley Austin LLP from September 2013 until August 2015. She is an officer of 63 investment companies (comprised of 147 portfolios) managed by Dreyfus. She is 31 years old and has been an employee of the Manager since October 2016.
SARAH S. KELLEHER, Vice President and Assistant Secretary since April 2014.
Managing Counsel of BNY Mellon since December 2017, from March 2013 to December 2017, Senior Counsel of BNY Mellon. She is an officer of 63 investment companies (comprised of 147 portfolios) managed by the Manager. She is 43 years old and has been an employee of the Manager since March 2013.
JEFF PRUSNOFSKY, Vice President and Assistant Secretary since August 2005.
Senior Managing Counsel of BNY Mellon, and an officer of 63 investment companies (comprised of 147 portfolios) managed by the Manager. He is 53 years old and has been an employee of the Manager since October 1990.
NATALYA ZELENSKY, Vice President and Assistant Secretary since March 2017.
Counsel of BNY Mellon since May 2016; Attorney at Wildermuth Endowment Strategy Fund/Wildermuth Advisory, LLC from November 2015 until May 2016; Assistant General Counsel at RCS Advisory Services from July 2014 until November 2015; Associate at Sutherland, Asbill & Brennan from January 2013 until January 2014. She is an officer of 63 investment companies (comprised of 147 portfolios) managed by Dreyfus. She is 33 years old and has been an employee of the Manager since May 2016.
JAMES WINDELS, Treasurer since November 2001.
Director – Mutual Fund Accounting of the Manager, and an officer of 63 investment companies (comprised of 147 portfolios) managed by the Manager. He is 60 years old and has been an employee of the Manager since April 1985.
GAVIN C. REILLY, Assistant Treasurer since December 2005.
Tax Manager of the Investment Accounting and Support Department of the Manager, and an officer of 63 investment companies (comprised of 147 portfolios) managed by the Manager. He is 50 years old and has been an employee of the Manager since April 1991.
ROBERT S. ROBOL, Assistant Treasurer since August 2002.
Senior Accounting Manager – Dreyfus Financial Reporting of the Manager, and an officer of 63 investment companies (comprised of 147 portfolios) managed by the Manager. He is 54 years old and has been an employee of the Manager since October 1988.
35
OFFICERS OF THE FUND (Unaudited)(continued)
ROBERT SALVIOLO, Assistant Treasurer since July 2007.
Senior Accounting Manager – Equity Funds of the Manager, and an officer of 63 investment companies (comprised of 147 portfolios) managed by the Manager. He is 51 years old and has been an employee of the Manager since June 1989.
ROBERT SVAGNA, Assistant Treasurer since December 2002.
Senior Accounting Manager – Fixed Income and Equity Funds of the Manager, and an officer of 63 investment companies (comprised of 147 portfolios) managed by the Manager. He is 51 years old and has been an employee of the Manager since November 1990.
JOSEPH W. CONNOLLY, Chief Compliance Officer since October 2004.
Chief Compliance Officer of the Manager, the Dreyfus Family of Funds and BNY Mellon Funds Trust (63 investment companies, comprised of 147 portfolios). He is 61 years old and has served in various capacities with the Manager since 1980, including manager of the firm’s Fund Accounting Department from 1997 through October 2001.
CARIDAD M. CAROSELLA, Anti-Money Laundering Compliance Officer since January 2016.
Anti-Money Laundering Compliance Officer of the Dreyfus Family of Funds and BNY Mellon Funds Trust since January 2016; from May 2015 to December 2015, Interim Anti-Money Laundering Compliance Officer of the Dreyfus Family of Funds and BNY Mellon Funds Trust and the Distributor; from January 2012 to May 2015, AML Surveillance Officer of the Distributor and from 2007 to December 2011, Financial Processing Manager of the Distributor. She is an officer of 57 investment companies (comprised of 141 portfolios) managed by the Manager. She is 50 years old and has been an employee of the Distributor since 1997.
36
NOTES
37
Dreyfus Investment Portfolios, MidCap Stock Portfolio
200 Park Avenue
New York, NY 10166
Manager
The Dreyfus Corporation
200 Park Avenue
New York, NY 10166
Custodian
The Bank of New York Mellon
240 Greenwich Street
New York, NY 10286
Transfer Agent &
Dividend Disbursing Agent
Dreyfus Transfer, Inc.
200 Park Avenue
New York, NY 10166
Distributor
MBSC Securities Corporation
200 Park Avenue
New York, NY 10166
Telephone 1-800-258-4260 or 1-800-258-4261
Mail The Dreyfus Family of Funds, 144 Glenn Curtiss Boulevard, Uniondale, NY 11556-0144 Attn: Institutional Services Department
E-mailSend your request toinfo@dreyfus.com
InternetInformation can be viewed online or downloaded atwww.dreyfus.com
The fund files its complete schedule of portfolio holdings with the Securities and Exchange Commission (“SEC”) for the first and third quarters of each fiscal year on Form N-Q. The fund’s Forms N-Q are available on the SEC’s website at http://www.sec.gov and may be reviewed and copied at the SEC’s Public Reference Room in Washington, D.C. Information on the operation of the Public Reference Room may be obtained by calling 1-800-SEC-0330.
A description of the policies and procedures that the fund uses to determine how to vote proxies relating to portfolio securities, and information regarding how the fund voted these proxies for the most recent 12-month period ended June 30 is available at http://www.dreyfus.com and on the SEC’s website at http://www.sec.gov. The description of the policies and procedures is also available without charge, upon request, by calling 1-800-DREYFUS.
| | |
© 2019 MBSC Securities Corporation
0174AR1218 | 
|
Dreyfus Investment Portfolios, Small Cap Stock Index Portfolio
| | | |

| | ANNUAL REPORT
December 31, 2018 |
| |
The views expressed in this report reflect those of the portfolio manager(s) only through the end of the period covered and do not necessarily represent the views of Dreyfus or any other person in the Dreyfus organization. Any such views are subject to change at any time based upon market or other conditions and Dreyfus disclaims any responsibility to update such views. These views may not be relied on as investment advice and, because investment decisions for a Dreyfus fund are based on numerous factors, may not be relied on as an indication of trading intent on behalf of any Dreyfus fund. |
| |
Not FDIC-Insured • Not Bank-Guaranteed • May Lose Value |
Contents
THE FUND
FOR MORE INFORMATION
Back Cover
| | | | |
| |
Dreyfus Investment Portfolios, Small Cap Stock Index Portfolio
| | The Fund |
A LETTER FROM THE PRESIDENT OF DREYFUS
Dear Shareholder:
We are pleased to present this annual report for Dreyfus Investment Portfolios, Small Cap Stock Index Portfolio, covering the 12-month period from January 1, 2018 through December 31, 2018. For information about how the fund performed during the reporting period, as well as general market perspectives, we provide a Discussion of Fund Performance on the pages that follow.
The reporting period began with major global economies achieving above-trend growth. In the United States, a robust economy and strong labor market encouraged the Federal Reserve to continue moving away from its accommodative monetary policy while other major central banks began to consider monetary tightening. Both U.S. and non-U.S. equity markets remained on an uptrend. Interest rates rose across the yield curve, putting pressure on bond prices.
A few months into the reporting period, global growth trends began to diverge and market volatility returned. While the U.S. economy continued to grow at a healthy rate, other developed markets began to weaken. However, robust growth and strong corporate earnings continued to support U.S. stock returns while other developed markets declined throughout the summer. In the fall, a broad sell-off occurred, partially offsetting earlier U.S. gains. Emerging markets remained under pressure as weakness in their currencies relative to the U.S. dollar added to investors’ uneasiness. Global equities continued their general decline through the end of the period.
Fixed income markets struggled during the first half of the period as interest rates rose and favorable U.S. equity markets fed investor risk appetites. However, in autumn volatility crept in, the yield curve began a flattening trend that continued through the end of December. As long-term debt yields fell, prices rose for many bonds, leading to moderately positive returns for several fixed income market sectors.
Despite continuing political variables, U.S. inflationary pressures and flagging growth rates, we are optimistic that the U.S. economy will remain strong in the near term. However, we remain attentive to signs that point to potential changes on the horizon. As always, we encourage you to discuss the risks and opportunities in today’s investment environment with your financial advisor.
Thank you for your continued confidence and support.
Sincerely,

Renee Laroche-Morris
President
The Dreyfus Corporation
January 15, 2019
2
DISCUSSION OF FUND PERFORMANCE(Unaudited)
For the period from January 1, 2018 through December 31, 2018, as provided by portfolio managers Thomas J. Durante, CFA, Karen Q. Wong, CFA, and Richard A. Brown, CFA, of Mellon Investments Corporation, Sub-Investment Adviser
Market and Fund Performance Overview
For the 12-month period ended December 31, 2018, Dreyfus Investment Portfolios, Small Cap Stock Index Portfolio produced a total return of -8.98%.1 In comparison, the fund’s benchmark, the S&P SmallCap 600® Index (the “Index”), produced a -8.48% total return for the same period.2,3
Small-cap stocks lost value over the reporting period amid escalating trade tensions and slowing global economic growth rates. The difference in returns between the fund and the Index was primarily the result of transaction costs and operating expenses that are not reflected in the Index’s results.
The Fund’s Investment Approach
The fund seeks to match the performance of the Index. To pursue its goal, the fund generally invests in all of the stocks that comprise the Index. The fund generally invests in all 600 stocks in the Index in proportion to their weighting in the Index; however, at times, the fund may invest in a representative sample of stocks included in the Index. Under these circumstances, the fund expects to invest in approximately 500 or more of the stocks in the Index.
Positive U.S. Economic Indicators Amid Volatility
A positive economic backdrop supported U.S. equity markets at the start of 2018, including sustained GDP growth, a robust labor market and higher growth forecasts from the Federal Reserve Board (the “Fed”). Enactment of corporate tax cuts as part of major tax reform legislation in late December 2017 sparked additional market gains, driving the Index to new all-time highs in January.
In the first few months of 2018, volatility entered the picture, as concerns over inflation and the potential for trade disputes roiled markets. However, U.S. markets were able to stabilize, and the upward trend continued on the back of continued positive economic data, corporate balance sheet strength and robust consumer spending. However, non-U.S. markets retreated as the rate of economic improvement in areas such as the Eurozone stalled. In late summer, continued political rhetoric in the U.S. regarding trade and midterm elections and concerns over issues abroad in areas such as Italy, Turkey, Argentina and the United Kingdom
3
DISCUSSION OF FUND PERFORMANCE(Unaudited) (continued)
weighed on investor sentiment. Despite strong underlying fundamentals, volatility crept back into the picture in U.S. markets. Firm labor markets, tightening monetary policy and the possibility of slowing growth provoked a defensive posture among investors. In October, markets reversed and started to move lower. Continued worries over rising rates, trade disputes and falling commodity prices pressured equity markets throughout the rest of the period.
In this environment, large-cap stocks generally outperformed their mid- and small-cap counterparts.
Market Sectors Disrupted by Trade Disputes
During 2018, industrials, energy and technology companies underperformed the broader market. Industrials were hurt by tariffs, hiring difficulties and rising labor costs. Building products stocks also experienced headwinds due to slowing home starts and home improvement activity. Low demand from the housing market also hurt cabinet makers, concrete and rock providers. Steel and aluminum tariffs also depressed RV sales and the revenue of component makers. In energy, fracking companies generally fell due to depressed oil prices. This particularly affected drillers, equipment makers and pipe makers. Semiconductors and semiconductor equipment were the hardest hit industries in the information technology sector. Electronic equipment and chip prices were also depressed. Trade concerns slowed production and purchases of autos and industrials, which use many such parts in their manufacturing process. Smartphone and PC sales also slowed, decreasing the demand for these components.
Conversely, the health care and communication services sectors produced positive results during the year. Health care stocks posted the highest returns in the Index’s various market segments. Small pharmaceutical and medical equipment companies led the advance. Prices were buoyed by speedy FDA approvals and mergers and acquisitions activity. Several product breakthroughs during the period also helped returns. The communication services sector was another top contributor, driven by one stock in particular.World Wrestling Entertainment was up significantly for the period, with most of the increase coming after the company announced its contract for performances in Saudi Arabia. Elsewhere in the sector, theatre company Marcus was another top contributor as was Iridium Communications.
Replicating the Performance of the Index
Although we do not actively manage the fund’s investments in response to macroeconomic trends, it is worth noting that the U.S. economic recovery remains intact, supported by a strong labor market and sound corporate balance sheets. However, the small-cap stock market’s currently constructive conditions could be undermined by unexpected political and
4
economic developments. As always, we have continued to monitor the factors considered by the fund’s investments.
January 15, 2019
1 Total return includes reinvestment of dividends and any capital gains paid. Past performance is no guarantee of future results. Share price and investment return fluctuate such that upon redemption, fund shares may be worth more or less than their original cost. The fund’s performance does not reflect the deduction of additional charges and expenses imposed in connection with investing in variable insurance contracts, which will reduce returns. The Dreyfus Corporation has agreed to pay all of the fund’s expenses except management fees, Rule 12b-1 fees, and certain other expenses, including fees and expenses of the non-interested board members and their counsel.
2 Source: Lipper Inc. — The S&P SmallCap 600® Index measures the small-cap segment of the U.S. equity market. The index is designed to track companies that meet specific inclusion criteria to ensure that they are liquid and financially viable. Investors cannot invest directly in any index.
3 “Standard & Poor’s®,” “S&P®,” and “Standard & Poor’s® SmallCap 600 Index” are trademarks of Standard & Poor’s Financial Services LLC (“Standard & Poor’s”), and have been licensed for use by the fund. The fund is not sponsored, endorsed, sold, or promoted by Standard & Poor’s, and Standard & Poor’s makes no representation regarding the advisability of investing in the fund.
Please note: the position in any security highlighted with italicized typeface was sold during the reporting period.
Equities are subject generally to market, market sector, market liquidity, issuer, and investment style risks, among other factors, to varying degrees, all of which are more fully described in the fund’s prospectus. Stocks of small- and/or mid-cap companies often experience sharper price fluctuations than stocks of large-cap companies.
The fund is only available as a funding vehicle under variable life insurance policies or variable annuity contracts issued by insurance companies. Individuals may not purchase shares of the fund directly. A variable annuity is an insurance contract issued by an insurance company that enables investors to accumulate assets on a tax-deferred basis for retirement or other long-term goals. The investment objective and policies of Dreyfus Investment Portfolios, Small Cap Stock Index Portfolio made available through insurance products may be similar to those of other funds managed by Dreyfus. However, the investment results of the fund may be higher or lower than, and may not be comparable to, those of any other Dreyfus fund.
5
FUND PERFORMANCE(Unaudited)

Comparison of change in value of $10,000 investment in Dreyfus Investment Portfolios, Small Cap Stock Index Portfolio shares and the S&P SmallCap 600® Index (the “Index”)
† Source: Lipper Inc.
Past performance is not predictive of future performance. The fund’s performance does not reflect the deduction of additional charges and expenses imposed in connection with investing in variable insurance contracts which will reduce returns.
The above graph compares a $10,000 investment made in Dreyfus Investment Portfolios, Small Cap Stock Index Portfolio on 12/31/08 to a $10,000 investment made in the Index on that date.
The fund’s performance shown in the line graph above takes into account all applicable fees and expenses. The Index measures the small-cap segment of the U.S. equity market. The Index is designed to track companies that meet specific inclusion criteria to ensure that they are liquid and financially viable. Unlike a mutual fund, the Index is not subject to charges, fees and other expenses. Investors cannot invest directly in any index. Further information relating to fund performance, including expense reimbursements, if applicable, is contained in the Financial Highlights section of the prospectus and elsewhere in this report.
| | | | |
Average Annual Total Returns as of 12/31/18 | |
| 1 Year | 5 Years | 10 Years |
Portfolio | -8.98% | 5.72% | 13.03% |
S&P SmallCap 600® Index | -8.48% | 6.34% | 13.61% |
The performance data quoted represents past performance, which is no guarantee of future results. Share price and investment return fluctuate and an investor’s shares may be worth more or less than original cost upon redemption. Current performance may be lower or higher than the performance quoted. Go to Dreyfus.com for the fund’s most recent month-end returns.
The fund is subject to a 0.25% annual Rule 12b-1 fee. All dividends and capital gain distributions are reinvested.
The fund’s performance shown in the graph and table does not reflect the deduction of taxes that a shareholder would pay on fund distributions or the redemption of fund shares.
6
UNDERSTANDING YOUR FUND’S EXPENSES(Unaudited)
As a mutual fund investor, you pay ongoing expenses, such as management fees and other expenses. Using the information below, you can estimate how these expenses affect your investment and compare them with the expenses of other funds. You also may pay one-time transaction expenses, including sales charges (loads), redemption fees and expenses associated with variable annuity or insurance contracts, which are not shown in this section and would have resulted in higher total expenses. For more information, see your fund’s prospectus or talk to your financial adviser.
Review your fund’s expenses
The table below shows the expenses you would have paid on a $1,000 investment in Dreyfus Investment Portfolios, Small Cap Stock Index Portfolio from July 1, 2018 to December 31, 2018. It also shows how much a $1,000 investment would be worth at the close of the period, assuming actual returns and expenses.
| | | | | | | | | | |
Expenses and Value of a $1,000 Investment |
assuming actual returns for the six months ended December 31, 2018 | | |
| | | | | | | | | |
Expenses paid per $1,000† | | | | $2.77 | | | |
Ending value (after expenses) | | | | $834.30 | | | |
COMPARING YOUR FUND’S EXPENSES
WITH THOSE OF OTHER FUNDS(Unaudited)
Using the SEC’s method to compare expenses
The Securities and Exchange Commission (“SEC”) has established guidelines to help investors assess fund expenses. Per these guidelines, the table below shows your fund’s expenses based on a $1,000 investment, assuming a hypothetical 5% annualized return. You can use this information to compare the ongoing expenses (but not transaction expenses or total cost) of investing in the fund with those of other funds. All mutual fund shareholder reports will provide this information to help you make this comparison. Please note that you cannot use this information to estimate your actual ending account balance and expenses paid during the period.
| | | | | | | | | | |
Expenses and Value of a $1,000 Investment |
assuming a hypothetical 5% annualized return for the six months ended December 31, 2018 |
| | | | | | | | | |
Expenses paid per $1,000† | | | | $3.06 | | | |
Ending value (after expenses) | | | | $1,022.18 | | | |
† Expenses are equal to the fund’s annualized expense ratio of .60%, multiplied by the average account value over the period, multiplied by 184/365 (to reflect the one-half year period).
7
STATEMENT OF INVESTMENTS
December 31, 2018
| | | | | | | | |
| |
Description | | | | Shares | | Value ($) | |
Common Stocks - 99.4% | | | | | |
Automobiles & Components - 2.2% | | | | | |
American Axle & Manufacturing Holdings | | | | 86,227 | a,b | 957,120 | |
Cooper Tire & Rubber Co. | | | | 38,588 | a | 1,247,550 | |
Cooper-Standard Holding | | | | 12,813 | b | 795,944 | |
Dorman Products | | | | 22,027 | b | 1,982,871 | |
Fox Factory Holding | | | | 28,785 | b | 1,694,573 | |
Garrett Motion | | | | 57,586 | | 710,611 | |
Gentherm | | | | 26,831 | b | 1,072,703 | |
LCI Industries | | | | 19,170 | | 1,280,556 | |
Motorcar Parts of America | | | | 14,976 | a,b | 249,201 | |
Standard Motor Products | | | | 15,283 | | 740,156 | |
Superior Industries International | | | | 18,292 | | 87,985 | |
Winnebago Industries | | | | 21,726 | a | 525,986 | |
| | | | | 11,345,256 | |
Banks - 11.1% | | | | | |
Ameris Bancorp | | | | 30,322 | | 960,298 | |
Axos Financial | | | | 41,927 | b | 1,055,722 | |
Banc of California | | | | 32,333 | a | 430,352 | |
Banner | | | | 23,651 | | 1,264,855 | |
Berkshire Hills Bancorp | | | | 31,213 | a | 841,815 | |
Boston Private Financial Holdings | | | | 65,119 | | 688,308 | |
Brookline Bancorp | | | | 61,481 | | 849,667 | |
Central Pacific Financial | | | �� | 22,544 | | 548,946 | |
City Holding | | | | 12,567 | | 849,404 | |
Columbia Banking System | | | | 56,283 | | 2,042,510 | |
Community Bank System | | | | 39,239 | a | 2,287,634 | |
Customers Bancorp | | | | 22,082 | b | 401,892 | |
CVB Financial | | | | 78,761 | a | 1,593,335 | |
Dime Community Bancshares | | | | 24,279 | a | 412,257 | |
Eagle Bancorp | | | | 23,980 | a,b | 1,168,066 | |
Fidelity Southern | | | | 16,935 | | 440,649 | |
First BanCorp | | | | 163,121 | | 1,402,841 | |
First Commonwealth Financial | | | | 76,085 | | 919,107 | |
First Financial Bancorp | | | | 75,237 | | 1,784,622 | |
First Financial Bankshares | | | | 51,908 | a | 2,994,573 | |
First Midwest Bancorp | | | | 81,204 | | 1,608,651 | |
Flagstar Bancorp | | | | 22,784 | b | 601,498 | |
Franklin Financial Network | | | | 9,492 | a,b | 250,304 | |
Glacier Bancorp | | | | 64,118 | a | 2,540,355 | |
Great Western Bancorp | | | | 43,559 | | 1,361,219 | |
Green Bancorp | | | | 20,661 | | 354,130 | |
8
| | | | | | | | |
| |
Description | | | | Shares | | Value ($) | |
Common Stocks - 99.4% (continued) | | | | | |
Banks - 11.1% (continued) | | | | | |
Hanmi Financial | | | | 23,582 | | 464,565 | |
Heritage Financial | | | | 25,667 | a | 762,823 | |
HomeStreet | | | | 20,654 | b | 438,484 | |
Hope Bancorp | | | | 93,828 | | 1,112,800 | |
Independent Bank | | | | 20,947 | | 1,472,784 | |
LegacyTexas Financial Group | | | | 33,699 | | 1,081,401 | |
Meta Financial Group | | | | 21,321 | | 413,414 | |
National Bank Holdings, Cl. A | | | | 19,577 | | 604,342 | |
NBT Bancorp | | | | 33,144 | a | 1,146,451 | |
NMI Holdings, Cl. A | | | | 50,797 | b | 906,726 | |
Northfield Bancorp | | | | 35,931 | | 486,865 | |
Northwest Bancshares | | | | 78,351 | a | 1,327,266 | |
OFG Bancorp | | | | 33,551 | | 552,249 | |
Old National Bancorp | | | | 113,554 | a | 1,748,732 | |
Opus Bank | | | | 16,874 | | 330,562 | |
Oritani Financial | | | | 29,703 | a | 438,119 | |
Pacific Premier Bancorp | | | | 34,687 | b | 885,212 | |
Preferred Bank | | | | 10,867 | | 471,084 | |
Provident Financial Services | | | | 47,405 | | 1,143,883 | |
S&T Bancorp | | | | 26,549 | a | 1,004,614 | |
Seacoast Bankingoration of Florida | | | | 39,143 | a,b | 1,018,501 | |
ServisFirst Bancshares | | | | 34,724 | a | 1,106,654 | |
Simmons First National, Cl. A | | | | 70,934 | | 1,711,637 | |
Southside Bancshares | | | | 25,514 | a | 810,070 | |
Tompkins Financial | | | | 9,510 | a | 713,345 | |
Triumph Bancorp | | | | 18,745 | b | 556,727 | |
TrustCo Bank | | | | 74,850 | | 513,471 | |
United Community Banks | | | | 60,171 | | 1,291,270 | |
Veritex Holdings | | | | 18,352 | a,b | 392,366 | |
Walker & Dunlop | | | | 21,806 | | 943,109 | |
Westamerica Bancorporation | | | | 20,247 | a | 1,127,353 | |
| | | | | 56,629,889 | |
Capital Goods - 11.9% | | | | | |
AAON | | | | 30,946 | a | 1,084,967 | |
AAR | | | | 24,934 | | 931,036 | |
Actuant, Cl. A | | | | 46,209 | a | 969,927 | |
Aegion | | | | 24,737 | b | 403,708 | |
Aerojet Rocketdyne Holdings | | | | 55,014 | a,b | 1,938,143 | |
AeroVironment | | | | 16,194 | a,b | 1,100,382 | |
Alamo Group | | | | 7,414 | | 573,250 | |
Albany International | | | | 22,052 | | 1,376,706 | |
American Woodmark | | | | 11,493 | a,b | 639,930 | |
Apogee Enterprises | | | | 21,895 | | 653,566 | |
9
STATEMENT OF INVESTMENTS (continued)
| | | | | | | | |
| |
Description | | | | Shares | | Value ($) | |
Common Stocks - 99.4% (continued) | | | | | |
Capital Goods - 11.9% (continued) | | | | | |
Applied Industrial Technologies | | | | 29,166 | | 1,573,214 | |
Arcosa | | | | 36,720 | | 1,016,777 | |
Astec Industries | | | | 17,812 | | 537,744 | |
Axon Enterprise | | | | 44,245 | b | 1,935,719 | |
AZZ | | | | 19,898 | | 803,083 | |
Barnes Group | | | | 36,188 | | 1,940,401 | |
Briggs & Stratton | | | | 33,092 | | 432,843 | |
Chart Industries | | | | 23,577 | b | 1,533,212 | |
CIRCOR International | | | | 15,313 | a,b | 326,167 | |
Comfort Systems USA | | | | 28,318 | | 1,236,930 | |
Cubic | | | | 21,663 | | 1,164,170 | |
DXP Enterprises | | | | 12,055 | b | 335,611 | |
Encore Wire | | | | 16,139 | | 809,855 | |
Engility Holdings | | | | 13,568 | b | 386,145 | |
EnPro Industries | | | | 15,902 | a | 955,710 | |
ESCO Technologies | | | | 19,675 | | 1,297,566 | |
Federal Signal | | | | 45,913 | | 913,669 | |
Franklin Electric | | | | 29,449 | | 1,262,773 | |
Gibraltar Industries | | | | 24,398 | b | 868,325 | |
Griffon | | | | 25,820 | | 269,819 | |
Harsco | | | | 61,492 | b | 1,221,231 | |
Hillenbrand | | | | 47,880 | | 1,816,088 | |
Insteel Industries | | | | 13,825 | | 335,671 | |
John Bean Technologies | | | | 24,297 | a | 1,744,768 | |
Kaman | | | | 21,275 | | 1,193,315 | |
Lindsay | | | | 8,165 | a | 785,881 | |
Lydall | | | | 13,750 | b | 279,263 | |
Mercury Systems | | | | 36,836 | b | 1,741,974 | |
Moog, Cl. A | | | | 24,710 | | 1,914,531 | |
Mueller Industries | | | | 43,696 | | 1,020,739 | |
MYR Group | | | | 12,665 | b | 356,773 | |
National Presto Industries | | | | 3,831 | a | 447,921 | |
Orion Marine Group | | | | 20,611 | b | 88,421 | |
Patrick Industries | | | | 16,966 | a,b | 502,363 | |
PGT | | | | 43,912 | b | 696,005 | |
Powell Industries | | | | 6,923 | | 173,144 | |
Proto Labs | | | | 20,750 | b | 2,340,392 | |
Quanex Building Products | | | | 26,761 | | 363,682 | |
Raven Industries | | | | 27,256 | | 986,395 | |
Simpson Manufacturing | | | | 31,734 | a | 1,717,761 | |
SPX | | | | 32,632 | b | 914,022 | |
SPX FLOW | | | | 32,291 | b | 982,292 | |
Standex International | | | | 9,860 | | 662,395 | |
10
| | | | | | | | |
| |
Description | | | | Shares | | Value ($) | |
Common Stocks - 99.4% (continued) | | | | | |
Capital Goods - 11.9% (continued) | | | | | |
Tennant | | | | 13,818 | | 720,056 | |
The Greenbrier Companies | | | | 24,098 | a | 952,835 | |
Titan International | | | | 37,963 | | 176,908 | |
Trex | | | | 45,069 | b | 2,675,296 | |
Triumph Group | | | | 38,523 | a | 443,015 | |
Universal Forest Products | | | | 46,827 | | 1,215,629 | |
Veritiv | | | | 10,035 | b | 250,574 | |
Vicor | | | | 12,341 | a,b | 466,366 | |
Wabash National | | | | 41,746 | | 546,038 | |
Watts Water Technologies, Cl. A | | | | 21,140 | | 1,364,164 | |
| | | | | 60,367,256 | |
Commercial & Professional Services - 4.4% | | | | | |
ABM Industries | | | | 50,082 | a | 1,608,133 | |
Brady, Cl. A | | | | 36,646 | | 1,592,635 | |
Essendant | | | | 25,009 | | 314,613 | |
Exponent | | | | 39,402 | | 1,998,075 | |
Forrester Research | | | | 7,770 | | 347,319 | |
FTI Consulting | | | | 29,368 | b | 1,957,084 | |
Heidrick & Struggles International | | | | 14,504 | | 452,380 | |
Interface | | | | 46,116 | | 657,153 | |
Kelly Services, Cl. A | | | | 23,031 | | 471,675 | |
Korn/Ferry International | | | | 42,925 | | 1,697,254 | |
LSC Communications | | | | 25,508 | | 178,556 | |
Matthews International, Cl. A | | | | 24,595 | a | 999,049 | |
Mobile Mini | | | | 33,938 | | 1,077,531 | |
Multi-Color | | | | 10,808 | | 379,253 | |
Navigant Consulting | | | | 32,963 | | 792,760 | |
R.R. Donnelley & Sons Co. | | | | 52,492 | | 207,868 | |
Resources Connection | | | | 22,668 | | 321,886 | |
Team | | | | 22,869 | a,b | 335,031 | |
Tetra Tech | | | | 42,492 | | 2,199,811 | |
TrueBlue | | | | 31,226 | b | 694,779 | |
UniFirst | | | | 11,739 | | 1,679,499 | |
US Ecology | | | | 16,685 | | 1,050,821 | |
Viad | | | | 15,735 | | 788,166 | |
WageWorks | | | | 30,098 | b | 817,462 | |
| | | | | 22,618,793 | |
Consumer Durables & Apparel - 4.0% | | | | | |
Callaway Golf | | | | 67,488 | | 1,032,566 | |
Cavco Industries | | | | 6,476 | b | 844,341 | |
Crocs | | | | 50,456 | b | 1,310,847 | |
Ethan Allen Interiors | | | | 18,853 | | 331,624 | |
Fossil Group | | | | 35,300 | b | 555,269 | |
11
STATEMENT OF INVESTMENTS (continued)
| | | | | | | | |
| |
Description | | | | Shares | | Value ($) | |
Common Stocks - 99.4% (continued) | | | | | |
Consumer Durables & Apparel - 4.0% (continued) | | | | | |
G-III Apparel Group | | | | 31,754 | b | 885,619 | |
Installed Building Products | | | | 16,289 | a,b | 548,776 | |
iRobot | | | | 21,140 | a,b | 1,770,264 | |
La-Z-Boy | | | | 35,397 | | 980,851 | |
LGI Homes | | | | 14,409 | a,b | 651,575 | |
M.D.C. Holdings | | | | 34,861 | | 979,943 | |
M/I Homes | | | | 21,858 | b | 459,455 | |
Meritage Homes | | | | 28,988 | b | 1,064,439 | |
Movado Group | | | | 12,639 | a | 399,645 | |
Nautilus | | | | 23,987 | a,b | 261,458 | |
Oxford Industries | | | | 12,856 | a | 913,290 | |
Steven Madden | | | | 60,255 | | 1,823,316 | |
Sturm Ruger & Co. | | | | 13,431 | | 714,798 | |
TopBuild | | | | 27,077 | b | 1,218,465 | |
Unifi | | | | 11,057 | b | 252,542 | |
Universal Electronics | | | | 10,467 | b | 264,606 | |
Vera Bradley | | | | 17,535 | b | 150,275 | |
Vista Outdoor | | | | 43,637 | b | 495,280 | |
William Lyon Homes, Cl. A | | | | 26,147 | b | 279,511 | |
Wolverine World Wide | | | | 71,917 | | 2,293,433 | |
| | | | | 20,482,188 | |
Consumer Services - 2.4% | | | | | |
American Public Education | | | | 12,496 | b | 355,636 | |
Belmond | | | | 67,804 | b | 1,697,134 | |
BJ's Restaurants | | | | 16,059 | | 812,104 | |
Career Education | | | | 54,033 | b | 617,057 | |
Chuy's Holdings | | | | 12,942 | b | 229,591 | |
Dave & Buster's Entertainment | | | | 29,323 | | 1,306,633 | |
DineEquity | | | | 13,431 | a | 904,444 | |
El Pollo Loco Holdings | | | | 17,445 | b | 264,641 | |
Fiesta Restaurant Group | | | | 17,851 | a,b | 276,869 | |
Monarch Casino & Resort | | | | 8,930 | b | 340,590 | |
Red Robin Gourmet Burgers | | | | 9,902 | b | 264,581 | |
Regis | | | | 25,145 | b | 426,208 | |
Ruth's Hospitality Group | | | | 21,861 | | 496,901 | |
Shake Shack, Cl. A | | | | 19,855 | b | 901,814 | |
Strategic Education | | | | 16,532 | | 1,875,059 | |
Wingstop | | | | 22,249 | | 1,428,163 | |
| | | | | 12,197,425 | |
Diversified Financials - 4.1% | | | | | |
Apollo Commercial Real Estate Finance | | | | 84,064 | a,c | 1,400,506 | |
ARMOUR Residential REIT | | | | 32,486 | a,c | 665,963 | |
Blucora | | | | 36,748 | b | 978,967 | |
12
| | | | | | | | |
| |
Description | | | | Shares | | Value ($) | |
Common Stocks - 99.4% (continued) | | | | | |
Diversified Financials - 4.1% (continued) | | | | | |
Capstead Mortgage | | | | 70,180 | a,c | 468,101 | |
Donnelley Financial Solutions | | | | 25,893 | b | 363,279 | |
Encore Capital Group | | | | 19,724 | a,b | 463,514 | |
Enova International | | | | 26,583 | b | 517,305 | |
EZCORP, Cl. A | | | | 39,850 | a,b | 308,041 | |
FirstCash | | | | 33,241 | | 2,404,986 | |
Granite Point Mortgage Trust | | | | 33,731 | a,c | 608,170 | |
Green Dot, Cl. A | | | | 36,300 | b | 2,886,576 | |
Greenhill & Co. | | | | 13,691 | | 334,060 | |
INTL. FCStone | | | | 11,921 | b | 436,070 | |
Invesco Mortgage Capital | | | | 85,978 | c | 1,244,961 | |
Investment Technology Group | | | | 25,162 | | 760,899 | |
New York Mortgage Trust | | | | 117,395 | c | 691,457 | |
PennyMac Mortgage Investment Trust | | | | 47,059 | c | 876,239 | |
Piper Jaffray | | | | 11,308 | | 744,519 | |
PRA Group | | | | 34,368 | a,b | 837,548 | |
Redwood Trust | | | | 62,884 | c | 947,662 | |
Virtus Investment Partners | | | | 5,426 | a | 430,987 | |
Waddell & Reed Financial, Cl. A | | | | 60,535 | a | 1,094,473 | |
WisdomTree Investments | | | | 88,240 | a | 586,796 | |
World Acceptance | | | | 5,223 | a,b | 534,104 | |
| | | | | 20,585,183 | |
Energy - 3.4% | | | | | |
Archrock | | | | 98,134 | | 735,024 | |
Bonanza Creek Energy | | | | 14,200 | b | 293,514 | |
Bristow Group | | | | 29,096 | a,b | 70,703 | |
C&J Energy Services | | | | 48,628 | b | 656,478 | |
CARBO Ceramics | | | | 15,708 | a,b | 54,664 | |
Carrizo Oil & Gas | | | | 64,682 | a,b | 730,260 | |
Cloud Peak Energy | | | | 53,988 | b | 19,776 | |
CONSOL Energy | | | | 20,780 | b | 658,934 | |
Denbury Resources | | | | 349,650 | a,b | 597,902 | |
Era Group | | | | 14,812 | a,b | 129,457 | |
Exterran | | | | 24,185 | b | 428,075 | |
Geospace Technologies | | | | 11,046 | b | 113,884 | |
Green Plains | | | | 29,781 | | 390,429 | |
Gulf Island Fabrication | | | | 9,549 | b | 68,944 | |
Gulfport Energy | | | | 119,067 | a,b | 779,889 | |
Helix Energy Solutions Group | | | | 106,824 | b | 577,918 | |
HighPoint Resources | | | | 83,872 | b | 208,841 | |
KLX Energy Services Holdings | | | | 15,517 | | 363,874 | |
Laredo Petroleum | | | | 118,040 | a,b | 427,305 | |
Matrix Service | | | | 20,997 | b | 376,686 | |
13
STATEMENT OF INVESTMENTS (continued)
| | | | | | | | |
| |
Description | | | | Shares | | Value ($) | |
Common Stocks - 99.4% (continued) | | | | | |
Energy - 3.4% (continued) | | | | | |
Nabors Industries | | | | 245,902 | a | 491,804 | |
Newpark Resources | | | | 69,316 | a,b | 476,201 | |
Noble | | | | 188,799 | a,b | 494,653 | |
Oil States International | | | | 46,367 | a,b | 662,121 | |
Par Pacific Holdings | | | | 21,977 | b | 311,634 | |
PDC Energy | | | | 50,810 | b | 1,512,106 | |
Penn Virginia | | | | 10,148 | b | 548,601 | |
Pioneer Energy Services | | | | 58,462 | b | 71,908 | |
ProPetro Holding | | | | 56,852 | b | 700,417 | |
Renewable Energy Group | | | | 28,852 | b | 741,496 | |
REX American Resources | | | | 4,341 | b | 295,666 | |
Ring Energy | | | | 44,566 | a,b | 226,395 | |
SEACOR Holdings | | | | 13,337 | b | 493,469 | |
SRC Energy | | | | 184,268 | b | 866,060 | |
Superior Energy Services | | | | 117,607 | b | 393,983 | |
TETRA Technologies | | | | 96,062 | b | 161,384 | |
Unit | | | | 41,881 | a,b | 598,061 | |
US Silica Holdings | | | | 59,444 | a | 605,140 | |
| | | | | 17,333,656 | |
Food & Staples Retailing - .4% | | | | | |
Chefs' Warehouse | | | | 17,482 | b | 559,074 | |
SpartanNash | | | | 27,486 | | 472,209 | |
The Andersons | | | | 20,122 | | 601,447 | |
United Natural Foods | | | | 38,562 | a,b | 408,372 | |
| | | | | 2,041,102 | |
Food, Beverage & Tobacco - 2.0% | | | | | |
B&G Foods | | | | 50,733 | a | 1,466,691 | |
Calavo Growers | | | | 11,867 | a | 865,816 | |
Cal-Maine Foods | | | | 23,341 | a | 987,324 | |
Coca-Cola Consolidated | | | | 3,592 | a | 637,149 | |
Darling Ingredients | | | | 124,884 | b | 2,402,768 | |
Dean Foods | | | | 69,955 | a | 266,529 | |
J&J Snack Foods | | | | 11,512 | a | 1,664,520 | |
John B. Sanfilippo & Son | | | | 6,671 | a | 371,308 | |
MGP Ingredients | | | | 9,580 | a | 546,539 | |
Seneca Foods, Cl. A | | | | 4,933 | b | 139,209 | |
Universal | | | | 18,954 | | 1,026,359 | |
| | | | | 10,374,212 | |
Health Care Equipment & Services - 7.4% | | | | | |
Addus HomeCare | | | | 7,483 | b | 507,946 | |
Amedisys | | | | 21,914 | b | 2,566,349 | |
AMN Healthcare Services | | | | 35,509 | a,b | 2,011,940 | |
AngioDynamics | | | | 28,392 | b | 571,531 | |
14
| | | | | | | | |
| |
Description | | | | Shares | | Value ($) | |
Common Stocks - 99.4% (continued) | | | | | |
Health Care Equipment & Services - 7.4% (continued) | | | | | |
Anika Therapeutics | | | | 10,440 | b | 350,888 | |
BioTelemetry | | | | 25,414 | a,b | 1,517,724 | |
Community Health Systems | | | | 88,237 | a,b | 248,828 | |
Computer Programs & Systems | | | | 9,505 | | 238,576 | |
CONMED | | | | 19,919 | | 1,278,800 | |
CorVel | | | | 7,023 | b | 433,460 | |
Cross Country Healthcare | | | | 27,943 | b | 204,822 | |
CryoLife | | | | 25,866 | b | 734,077 | |
Cutera | | | | 10,140 | b | 172,583 | |
Diplomat Pharmacy | | | | 43,862 | a,b | 590,383 | |
Ensign Group | | | | 37,649 | | 1,460,405 | |
HealthStream | | | | 19,467 | | 470,128 | |
Heska | | | | 5,162 | a,b | 444,448 | |
HMS Holdings | | | | 64,105 | b | 1,803,274 | |
Integer Holdings | | | | 22,744 | b | 1,734,457 | |
Invacare | | | | 25,069 | | 107,797 | |
Lantheus Holdings | | | | 29,838 | b | 466,965 | |
LeMaitre Vascular | | | | 12,409 | a | 293,349 | |
LHC Group | | | | 21,923 | b | 2,058,131 | |
Magellan Health | | | | 18,268 | b | 1,039,267 | |
Meridian Bioscience | | | | 32,265 | | 560,120 | |
Merit Medical Systems | | | | 42,020 | a,b | 2,345,136 | |
Natus Medical | | | | 25,376 | a,b | 863,545 | |
Neogen | | | | 39,793 | b | 2,268,201 | |
NextGen Healthcare | | | | 35,894 | b | 543,794 | |
Omnicell | | | | 30,262 | a,b | 1,853,245 | |
OraSure Technologies | | | | 47,346 | b | 553,001 | |
Orthofix Medical | | | | 14,185 | b | 744,571 | |
Owens & Minor | | | | 47,605 | a | 301,340 | |
Providence Service | | | | 8,560 | b | 513,771 | |
Quorum Health | | | | 20,727 | b | 59,901 | |
Select Medical Holdings | | | | 83,336 | b | 1,279,208 | |
SurModics | | | | 10,371 | b | 490,133 | |
Tabula Rasa HealthCare | | | | 12,978 | a,b | 827,477 | |
Tactile Systems Technology | | | | 12,930 | a,b | 588,962 | |
Tivity Health | | | | 30,930 | b | 767,373 | |
U.S. Physical Therapy | | | | 9,625 | | 985,119 | |
Varex Imaging | | | | 28,751 | b | 680,824 | |
| | | | | 37,531,849 | |
Household & Personal Products - 1.1% | | | | | |
Avon Products | | | | 341,100 | b | 518,472 | |
Central Garden & Pet | | | | 8,142 | b | 280,492 | |
Central Garden & Pet, Cl. A | | | | 31,538 | b | 985,562 | |
15
STATEMENT OF INVESTMENTS (continued)
| | | | | | | | |
| |
Description | | | | Shares | | Value ($) | |
Common Stocks - 99.4% (continued) | | | | | |
Household & Personal Products - 1.1% (continued) | | | | | |
Inter Parfums | | | | 13,330 | | 874,048 | |
Medifast | | | | 8,967 | | 1,121,054 | |
WD-40 | | | | 10,483 | a | 1,921,115 | |
| | | | | 5,700,743 | |
Insurance - 3.8% | | | | | |
Ambac Financial Group | | | | 34,453 | a,b | 593,970 | |
American Equity Investment Life Holding | | | | 69,360 | | 1,937,919 | |
AMERISAFE | | | | 14,599 | | 827,617 | |
eHealth | | | | 12,567 | b | 482,824 | |
Employers Holdings | | | | 24,858 | | 1,043,290 | |
HCI Group | | | | 5,796 | a | 294,495 | |
Horace Mann Educators | | | | 31,143 | | 1,166,305 | |
James River Group Holdings | | | | 23,132 | | 845,243 | |
Maiden Holdings | | | | 50,606 | | 83,500 | |
Navigators Group | | | | 17,890 | | 1,243,176 | |
ProAssurance | | | | 41,234 | | 1,672,451 | |
RLI | | | | 29,913 | | 2,063,698 | |
Safety Insurance Group | | | | 11,001 | | 899,992 | |
Selective Insurance Group | | | | 45,144 | | 2,751,075 | |
Stewart Information Services | | | | 18,381 | | 760,973 | |
Third Point Reinsurance | | | | 57,836 | b | 557,539 | |
United Fire Group | | | | 16,288 | | 903,170 | |
United Insurance Holdings | | | | 16,850 | a | 280,047 | |
Universal Insurance Holdings | | | | 24,323 | | 922,328 | |
| | | | | 19,329,612 | |
Materials - 4.1% | | | | | |
AdvanSix | | | | 22,208 | b | 540,543 | |
AK Steel Holding | | | | 241,218 | a,b | 542,741 | |
American Vanguard | | | | 21,076 | | 320,144 | |
Balchem | | | | 24,753 | | 1,939,398 | |
Boise Cascade | | | | 29,735 | | 709,180 | |
Century Aluminum | | | | 37,238 | b | 272,210 | |
Clearwater Paper | | | | 12,930 | b | 315,104 | |
FutureFuel | | | | 20,329 | | 322,418 | |
Glatfelter | | | | 33,229 | | 324,315 | |
H.B. Fuller | | | | 38,515 | a | 1,643,435 | |
Hawkins | | | | 7,520 | | 307,944 | |
Haynes International | | | | 9,361 | | 247,130 | |
Ingevity | | | | 32,006 | b | 2,678,582 | |
Innophos Holdings | | | | 15,175 | | 372,243 | |
Innospec | | | | 18,542 | | 1,145,154 | |
Kaiser Aluminum | | | | 12,629 | | 1,127,643 | |
16
| | | | | | | | |
| |
Description | | | | Shares | | Value ($) | |
Common Stocks - 99.4% (continued) | | | | | |
Materials - 4.1% (continued) | | | | | |
Koppers Holdings | | | | 16,064 | b | 273,731 | |
Kraton | | | | 24,766 | b | 540,889 | |
LSB Industries | | | | 14,961 | a,b | 82,585 | |
Materion | | | | 15,471 | | 696,040 | |
Myers Industries | | | | 27,479 | | 415,208 | |
Neeah Paper | | | | 12,883 | | 759,066 | |
Olympic Steel | | | | 7,105 | | 101,388 | |
Quaker Chemical | | | | 10,244 | a | 1,820,461 | |
Rayonier Advanced Materials | | | | 39,133 | a | 416,766 | |
Schweitzer-Mauduit International | | | | 23,545 | | 589,802 | |
Stepan | | | | 15,396 | | 1,139,304 | |
SunCoke Energy | | | | 50,351 | b | 430,501 | |
TimkenSteel | | | | 29,890 | a,b | 261,239 | |
Tredegar | | | | 19,469 | | 308,778 | |
US Concrete | | | | 12,456 | b | 439,448 | |
| | | | | 21,083,390 | |
Media & Entertainment - .8% | | | | | |
E.W. Scripps, Cl. A | | | | 42,166 | | 663,271 | |
Gannet | | | | 86,388 | a | 736,890 | |
Marcus | | | | 15,274 | | 603,323 | |
New Media Investment Group | | | | 41,239 | | 477,135 | |
QuinStreet | | | | 27,896 | b | 452,752 | |
Scholastic | | | | 21,239 | | 855,082 | |
TechTarget | | | | 16,890 | b | 206,227 | |
| | | | | 3,994,680 | |
Pharmaceuticals Biotechnology & Life Sciences - 4.2% | | | | | |
Acorda Therapeutics | | | | 29,983 | a,b | 467,135 | |
Akorn | | | | 72,917 | b | 247,189 | |
AMAG Pharmaceuticals | | | | 26,880 | b | 408,307 | |
Amphastar Pharmaceuticals | | | | 26,951 | b | 536,325 | |
ANI Pharmaceuticals | | | | 6,286 | a,b | 282,996 | |
Assertio Therapeutics | | | | 46,156 | a,b | 166,623 | |
Cambrex | | | | 25,269 | a,b | 954,157 | |
Corcept Therapeutics | | | | 79,041 | a,b | 1,055,988 | |
Cytokinetics | | | | 42,963 | a,b | 271,526 | |
Eagle Pharmaceuticals | | | | 8,681 | b | 349,757 | |
Emergent BioSolutions | | | | 33,804 | b | 2,003,901 | |
Enanta Pharmaceuticals | | | | 12,127 | a,b | 858,955 | |
Endo International | | | | 153,239 | a,b | 1,118,645 | |
Innoviva | | | | 51,528 | b | 899,164 | |
Lannett | | | | 25,876 | a,b | 128,345 | |
Luminex | | | | 31,717 | | 732,980 | |
Medicines | | | | 49,873 | b | 954,569 | |
17
STATEMENT OF INVESTMENTS (continued)
| | | | | | | | |
| |
Description | | | | Shares | | Value ($) | |
Common Stocks - 99.4% (continued) | | | | | |
Pharmaceuticals Biotechnology & Life Sciences - 4.2% (continued) | | | | | |
Medpace Holdings | | | | 19,811 | b | 1,048,596 | |
Momenta Pharmaceuticals | | | | 73,004 | b | 805,964 | |
Myriad Genetics | | | | 56,914 | a,b | 1,654,490 | |
Phibro Animal Health, Cl. A | | | | 14,894 | | 478,991 | |
Progenics Pharmaceuticals | | | | 62,818 | b | 263,836 | |
REGENXBIO | | | | 22,341 | b | 937,205 | |
Repligen | | | | 29,376 | a,b | 1,549,290 | |
Spectrum Pharmaceuticals | | | | 76,326 | a,b | 667,853 | |
Supernus Pharmaceuticals | | | | 40,177 | a,b | 1,334,680 | |
Vanda Pharmaceuticals | | | | 40,045 | b | 1,046,376 | |
| | | | | 21,223,843 | |
Real Estate - 6.4% | | | | | |
Acadia Realty Trust | | | | 62,664 | a,c | 1,488,897 | |
Agree Realty | | | | 26,522 | c | 1,567,981 | |
American Assets Trust | | | | 29,114 | c | 1,169,509 | |
Armada Hoffler Properties | | | | 37,872 | c | 532,480 | |
CareTrust REIT | | | | 62,390 | c | 1,151,719 | |
CBL & Associates Properties | | | | 134,331 | a,c | 257,916 | |
Cedar Realty Trust | | | | 69,805 | c | 219,188 | |
Chatham Lodging Trust | | | | 35,562 | c | 628,736 | |
Chesapeake Lodging Trust | | | | 45,879 | c | 1,117,154 | |
Community Healthcare Trust | | | | 13,533 | a,c | 390,156 | |
DiamondRock Hospitality | | | | 159,893 | c | 1,451,828 | |
Easterly Government Properties | | | | 46,166 | a,c | 723,883 | |
EastGroup Properties | | | | 27,425 | c | 2,515,695 | |
Four Corners Property Trust | | | | 51,453 | c | 1,348,069 | |
Franklin Street Properties | | | | 79,684 | c | 496,431 | |
Getty Realty | | | | 25,607 | c | 753,102 | |
Global Net Lease | | | | 57,240 | a,c | 1,008,569 | |
Hersha Hospitality Trust | | | | 27,945 | c | 490,155 | |
HFF, Cl. A | | | | 30,168 | | 1,000,371 | |
Independence Realty Trust | | | | 67,934 | a,c | 623,634 | |
iStar | | | | 52,014 | a,c | 476,968 | |
Kite Realty Group Trust | | | | 63,437 | c | 893,827 | |
Lexington Realty Trust | | | | 162,146 | c | 1,331,219 | |
LTC Properties | | | | 30,107 | c | 1,254,860 | |
Marcus & Millichap | | | | 16,292 | b | 559,304 | |
National Storage Affiliates Trust | | | | 42,897 | c | 1,135,055 | |
Pennsylvania Real Estate Investment Trust | | | | 48,730 | a,c | 289,456 | |
PS Business Parks | | | | 15,327 | c | 2,007,837 | |
RE/MAX Holdings, Cl. A | | | | 13,780 | | 423,735 | |
18
| | | | | | | | |
| |
Description | | | | Shares | | Value ($) | |
Common Stocks - 99.4% (continued) | | | | | |
Real Estate - 6.4% (continued) | | | | | |
Retail Opportunity Investments | | | | 85,744 | c | 1,361,615 | |
RPT Realty | | | | 61,954 | a,c | 740,350 | |
Saul Centers | | | | 8,707 | c | 411,145 | |
Summit Hotel Properties | | | | 80,080 | a,c | 779,178 | |
Universal Health Realtyome Trust | | | | 9,611 | c | 589,827 | |
Urstadt Biddle Properties, Cl. A | | | | 22,724 | c | 436,755 | |
Washington Prime Group | | | | 141,089 | a,c | 685,693 | |
Whitestone REIT | | | | 30,225 | c | 370,559 | |
| | | | | 32,682,856 | |
Retailing - 5.4% | | | | | |
Abercrombie & Fitch, Cl. A | | | | 49,549 | a | 993,457 | |
Asbury Automotive Group | | | | 14,752 | a,b | 983,368 | |
Ascena Retail Group | | | | 132,753 | b | 333,210 | |
Barnes & Noble | | | | 44,865 | a | 318,093 | |
Barnes and Noble Education | | | | 27,435 | b | 110,014 | |
Buckle | | | | 21,415 | a | 414,166 | |
Caleres | | | | 32,777 | a | 912,184 | |
Cato, Cl. A | | | | 18,159 | | 259,129 | |
Chico's FAS | | | | 95,194 | a | 534,990 | |
Core-Mark Holding | | | | 34,897 | | 811,355 | |
DSW, Cl. A | | | | 51,841 | a | 1,280,473 | |
Express | | | | 49,800 | a,b | 254,478 | |
Francesca's Holdings | | | | 26,996 | a,b | 26,208 | |
GameStop, Cl. A | | | | 77,331 | a | 975,917 | |
Genesco | | | | 15,444 | a,b | 684,169 | |
Group 1 Automotive | | | | 13,695 | a | 722,000 | |
Guess? | | | | 42,970 | | 892,487 | |
Haverty Furniture | | | | 14,574 | | 273,700 | |
Hibbett Sports | | | | 13,370 | b | 191,191 | |
J.C. Penney | | | | 247,509 | a,b | 257,409 | |
Kirkland's | | | | 11,419 | b | 108,823 | |
Liquidity Services | | | | 18,877 | b | 116,471 | |
Lithia Motors, Cl. A | | | | 17,009 | | 1,298,297 | |
Lumber Liquidators Holdings | | | | 21,741 | a,b | 206,974 | |
MarineMax | | | | 17,434 | b | 319,217 | |
Monro Muffler Brake | | | | 25,269 | | 1,737,244 | |
NutriSystem | | | | 22,471 | | 986,027 | |
Office Depot | | | | 412,183 | | 1,063,432 | |
Office Properties Income Trust | | | | 145,860 | b | 1,002,058 | |
PetMed Express | | | | 15,796 | a | 367,415 | |
Rent-A-Center | | | | 33,806 | b | 547,319 | |
RH | | | | 14,128 | a,b | 1,692,817 | |
Shoe Carnival | | | | 7,930 | a | 265,734 | |
19
STATEMENT OF INVESTMENTS (continued)
| | | | | | | | |
| |
Description | | | | Shares | | Value ($) | |
Common Stocks - 99.4% (continued) | | | | | |
Retailing - 5.4% (continued) | | | | | |
Shutterfly | | | | 25,408 | a,b | 1,022,926 | |
Shutterstock | | | | 14,412 | | 518,976 | |
Sleep Number | | | | 24,932 | b | 791,092 | |
Sonic Automotive, Cl. A | | | | 18,500 | a | 254,560 | |
Stamps.com | | | | 12,892 | a,b | 2,006,511 | |
Tailored Brands | | | | 38,073 | | 519,316 | |
The Children's Place | | | | 12,209 | | 1,099,909 | |
Tile Shop Holdings | | | | 31,472 | a | 172,467 | |
Vitamin Shoppe | | | | 12,093 | b | 57,321 | |
Zumiez | | | | 14,369 | a,b | 275,454 | |
| | | | | 27,658,358 | |
Semiconductors & Semiconductor Equipment - 3.7% | | | | | |
Advanced Energy Industries | | | | 29,049 | b | 1,247,074 | |
Axcelis Technologies | | | | 24,523 | b | 436,509 | |
Brooks Automation | | | | 53,749 | a | 1,407,149 | |
Cabot Microelectronics | | | | 21,572 | | 2,056,890 | |
CEVA | | | | 16,936 | b | 374,116 | |
Cohu | | | | 31,480 | | 505,884 | |
Diodes | | | | 30,555 | b | 985,704 | |
DSP Group | | | | 15,749 | b | 176,389 | |
FormFactor | | | | 55,935 | b | 788,124 | |
Ichor Holdings | | | | 18,037 | a,b | 294,003 | |
Kopin | | | | 44,532 | b | 44,487 | |
Kulicke & Soffa Industries | | | | 51,272 | | 1,039,283 | |
MaxLinear, Cl. A | | | | 48,240 | a,b | 849,024 | |
Nanometrics | | | | 18,397 | b | 502,790 | |
PDF Solutions | | | | 20,701 | a,b | 174,509 | |
Photronics | | | | 51,847 | b | 501,879 | |
Power Integrations | | | | 22,337 | | 1,362,110 | |
Rambus | | | | 81,874 | b | 627,974 | |
Rudolph Technologies | | | | 24,156 | b | 494,473 | |
Semtech | | | | 50,032 | b | 2,294,968 | |
SMART Global Holdings | | | | 9,355 | b | 277,844 | |
SolarEdge Technologies | | | | 32,948 | a,b | 1,156,475 | |
Tessera Holding | | | | 37,525 | | 690,085 | |
Ultra Clean Holdings | | | | 29,203 | a,b | 247,349 | |
Veeco Instruments | | | | 38,554 | a,b | 285,685 | |
| | | | | 18,820,777 | |
Software & Services - 4.5% | | | | | |
8x8 | | | | 70,875 | b | 1,278,585 | |
Agilysys | | | | 12,957 | b | 185,803 | |
Alarm.com Holdings | | | | 26,813 | a,b | 1,390,790 | |
Bottomline Technologies | | | | 28,178 | b | 1,352,544 | |
20
| | | | | | | | |
| |
Description | | | | Shares | | Value ($) | |
Common Stocks - 99.4% (continued) | | | | | |
Software & Services - 4.5% (continued) | | | | | |
Cardtronics | | | | 28,857 | b | 750,282 | |
CSG Systems International | | | | 25,487 | | 809,722 | |
Ebix | | | | 16,878 | a | 718,328 | |
EVERTEC | | | | 45,826 | | 1,315,206 | |
ExlService Holdings | | | | 26,409 | b | 1,389,642 | |
LivePerson | | | | 43,525 | b | 820,882 | |
ManTech International, Cl. A | | | | 20,029 | | 1,047,417 | |
MicroStrategy, Cl. A | | | | 7,211 | b | 921,205 | |
Monotype Imaging Holdings | | | | 32,058 | | 497,540 | |
NIC | | | | 50,472 | | 629,891 | |
OneSpan | | | | 23,940 | b | 310,023 | |
Perficient | | | | 24,725 | b | 550,379 | |
Progress Software | | | | 34,150 | | 1,211,983 | |
Qualys | | | | 25,769 | b | 1,925,975 | |
SPS Commerce | | | | 13,269 | b | 1,093,100 | |
SYKES Enterprises | | | | 30,817 | b | 762,104 | |
TiVo | | | | 94,793 | | 892,002 | |
Travelport Worldwide | | | | 100,142 | | 1,564,218 | |
TTEC Holdings | | | | 10,792 | | 308,327 | |
Unisys | | | | 39,721 | b | 461,955 | |
Virtusa | | | | 20,916 | b | 890,812 | |
| | | | | 23,078,715 | |
Technology Hardware & Equipment - 6.1% | | | | | |
3D Systems | | | | 88,012 | a,b | 895,082 | |
ADTRAN | | | | 36,155 | | 388,305 | |
Anixter International | | | | 21,876 | b | 1,188,086 | |
Applied Optoelectronics | | | | 14,624 | a,b | 225,648 | |
Badger Meter | | | | 22,089 | a | 1,087,000 | |
Bel Fuse | | | | 7,659 | | 141,079 | |
Benchmark Electronics | | | | 33,843 | | 716,795 | |
CalAmp | | | | 26,724 | b | 347,679 | |
Comtech Telecommunications | | | | 17,983 | | 437,706 | |
Control4 | | | | 20,272 | b | 356,787 | |
Cray | | | | 30,859 | a,b | 666,246 | |
CTS | | | | 25,035 | | 648,156 | |
Daktronics | | | | 31,114 | | 230,244 | |
Diebold | | | | 57,698 | a | 143,668 | |
Digi International | | | | 21,669 | b | 218,640 | |
Electro Scientific Industries | | | | 25,978 | b | 778,301 | |
Electronics For Imaging | | | | 34,042 | b | 844,242 | |
ePlus | | | | 10,615 | b | 755,470 | |
Extreme Networks | | | | 90,279 | b | 550,702 | |
Fabrinet | | | | 27,685 | b | 1,420,517 | |
21
STATEMENT OF INVESTMENTS (continued)
| | | | | | | | |
| |
Description | | | | Shares | | Value ($) | |
Common Stocks - 99.4% (continued) | | | | | |
Technology Hardware & Equipment - 6.1% (continued) | | | | | |
FARO Technologies | | | | 12,887 | b | 523,728 | |
Finisar | | | | 89,108 | b | 1,924,733 | |
Harmonic | | | | 65,068 | b | 307,121 | |
II-VI | | | | 44,763 | a,b | 1,453,007 | |
Insight Enterprises | | | | 26,953 | b | 1,098,335 | |
Itron | | | | 25,382 | b | 1,200,315 | |
KEMET | | | | 44,358 | | 778,039 | |
Knowles | | | | 69,574 | a,b | 926,030 | |
Methode Electronics | | | | 28,274 | | 658,501 | |
MTS Systems | | | | 13,858 | a | 556,122 | |
NETGEAR | | | | 24,167 | a,b | 1,257,409 | |
OSI Systems | | | | 12,864 | a,b | 942,931 | |
Park Electrochemical | | | | 15,222 | | 275,062 | |
Plexus | | | | 23,738 | b | 1,212,537 | |
Rogers | | | | 13,993 | a,b | 1,386,147 | |
Sanmina | | | | 51,630 | b | 1,242,218 | |
ScanSource | | | | 19,824 | b | 681,549 | |
TTM Technologies | | | | 71,458 | a,b | 695,286 | |
Viavi Solutions | | | | 174,287 | b | 1,751,584 | |
| | | | | 30,911,007 | |
Telecommunication Services - 1.2% | | | | | |
ATN International | | | | 8,304 | | 593,985 | |
Cincinnati Bell | | | | 38,380 | b | 298,596 | |
Cogent Communications Holdings | | | | 32,170 | a | 1,454,406 | |
Consolidated Communications Holdings | | | | 55,288 | a | 546,245 | |
Frontier Communications | | | | 82,382 | a | 196,069 | |
Iridium Communications | | | | 72,506 | b | 1,337,736 | |
Spok Holdings | | | | 14,757 | | 195,678 | |
Vonage Holdings | | | | 169,123 | b | 1,476,444 | |
| | | | | 6,099,159 | |
Transportation - 2.2% | | | | | |
Allegiant Travel | | | | 9,693 | | 971,432 | |
ArcBest | | | | 19,636 | a | 672,729 | |
Atlas Air Worldwide Holdings | | | | 19,394 | b | 818,233 | |
Echo Global Logistics | | | | 22,156 | b | 450,431 | |
Forward Air | | | | 22,033 | | 1,208,510 | |
Hawaiian Holdings | | | | 37,182 | a | 981,977 | |
Heartland Express | | | | 35,998 | | 658,763 | |
Hub Group, Cl. A | | | | 25,597 | b | 948,881 | |
Marten Transport | | | | 29,456 | | 476,893 | |
Matson | | | | 32,405 | | 1,037,608 | |
Saia | | | | 19,511 | b | 1,089,104 | |
22
| | | | | | | | |
| |
Description | | | | Shares | | Value ($) | |
Common Stocks - 99.4% (continued) | | | | | |
Transportation - 2.2% (continued) | | | | | |
SkyWest | | | | 39,283 | | 1,746,915 | |
| | | | | 11,061,476 | |
Utilities - 2.6% | | | | | |
American States Water | | | | 28,234 | a | 1,892,807 | |
Avista | | | | 50,452 | | 2,143,201 | |
California Water Service Group | | | | 36,962 | a | 1,761,609 | |
El Paso Electric | | | | 31,291 | | 1,568,618 | |
Northwest Natural Holding | | | | 22,009 | | 1,330,664 | |
South Jersey Industries | | | | 65,698 | a | 1,826,404 | |
Spire | | | | 38,464 | | 2,849,413 | |
| | | | | 13,372,716 | |
Total Common Stocks(cost $439,099,304) | | | | 506,524,141 | |
| | | | | Number of Rights | | | |
Rights - .0% | | | | | |
Materials - .0% | | | | | |
Schulman A CVR
(cost $0) | | | | 22,372 | | 0 | |
| | | | | Principal Amount ($) | | | |
Short-Term Investments - .1% | | | | | |
U.S. Treasury Bills - .1% | | | | | |
2.40%, 3/7/19
(cost $358,471) | | | | 360,000 | d,e | 358,451 | |
| | | 1-Day
Yield (%) | | Shares | | | |
Investment Companies - .5% | | | | | |
Registered Investment Companies - .5% | | | | | |
Dreyfus Institutional Preferred Government Plus Money Market Fund
(cost $2,787,245) | | 2.32 | | 2,787,245 | f | 2,787,245 | |
23
STATEMENT OF INVESTMENTS (continued)
| | | | | | | | |
| |
Description | | 1-Day
Yield (%) | | Shares | | Value ($) | |
Investment of Cash Collateral for Securities Loaned - 2.2% | | | | | |
Registered Investment Companies - 2.2% | | | | | |
Dreyfus Institutional Preferred Government Money Market Fund, Institutional Shares
(cost $11,321,620) | | 2.69 | | 11,321,620 | f | 11,321,620 | |
Total Investments(cost $453,566,640) | | 102.2% | | 520,991,457 | |
Liabilities, Less Cash and Receivables | | (2.2%) | | (11,296,349) | |
Net Assets | | 100.0% | | 509,695,108 | |
a Security, or portion thereof, on loan. At December 31, 2018, the value of the fund’s securities on loan was $100,135,323 and the value of the collateral held by the fund was $102,149,272, consisting of cash collateral of $11,321,620 and U.S. Government & Agency securities valued at $90,827,652.
b Non-income producing security.
c Investment in real estate investment trust.
d Held by a counterparty for open exchange traded derivative contracts.
e Security is a discount security. Income is recognized through the accretion of discount.
f Investment in affiliated issuer. The investment objective of this investment company is publicly available and can be found within the investment company’s prospectus.
| | |
Portfolio Summary (Unaudited)† | Value (%) |
Financials | 18.9 |
Industrials | 18.5 |
Information Technology | 14.3 |
Consumer Discretionary | 13.9 |
Health Care | 11.5 |
Real Estate | 6.6 |
Materials | 4.1 |
Consumer Staples | 3.6 |
Energy | 3.4 |
Investment Companies | 2.7 |
Utilities | 2.6 |
Communication Services | 2.0 |
Government | .1 |
| | 102.2 |
† Based on net assets.
See notes to financial statements.
24
STATEMENT OF INVESTMENTS IN AFFILIATED ISSUERS
| | | | | | | |
Registered Investment Companies | Value
12/31/17 ($) | Purchases ($) | Sales ($) | Value
12/31/18 ($) | Net
Assets (%) | Dividends/
Distributions ($) |
Dreyfus Institutional Preferred Government Money Market Fund, Institutional Shares | 37,211,810 | 130,058,545 | 155,948,735 | 11,321,620 | 2.2 | — |
Dreyfus Institutional Preferred Government Plus Money Market Fund | 4,448,090 | 103,253,939 | 104,914,784 | 2,787,245 | .5 | 99,277 |
Total | 41,659,900 | 233,312,484 | 260,863,519 | 14,108,865 | 2.7 | 99,277 |
See notes to financial statements.
25
STATEMENT OF FUTURES
December 31, 2018
| | | | | | | |
Description | Number of
Contracts | Expiration | Notional
Value ($) | Value ($) | Unrealized (Depreciation) ($) | |
Futures Long | | |
E-mini Russell 2000 | 53 | 3/19 | 3,680,608 | 3,574,850 | (105,758) | |
Gross Unrealized Depreciation | | (105,758) | |
See notes to financial statements.
26
STATEMENT OF ASSETS AND LIABILITIES
December 31, 2018
| | | | | | | | | |
| | | | | | |
| | | Cost | | Value | |
Assets ($): | | | | |
Investments in securities—See Statement of Investments
(including securities on loan, valued at $100,135,323)—Note 1(b): | | | |
Unaffiliated issuers | 439,457,775 | | 506,882,592 | |
Affiliated issuers | | 14,108,865 | | 14,108,865 | |
Cash | | | | | 27,298 | |
Receivable for investment securities sold | | 1,454,310 | |
Dividends and securities lending income receivable | | 691,231 | |
Receivable for shares of Beneficial Interest subscribed | | 366,766 | |
Receivable for futures variation margin—Note 4 | | 21,090 | |
| | | | | 523,552,152 | |
Liabilities ($): | | | | |
Due to The Dreyfus Corporation and affiliates—Note 3(b) | | | | 264,401 | |
Liability for securities on loan—Note 1(b) | | 11,321,620 | |
Payable for investment securities purchased | | 1,534,801 | |
Payable for shares of Beneficial Interest redeemed | | 733,682 | |
Trustees fees and expenses payable | | 2,378 | |
Interest payable—Note 2 | | 162 | |
| | | | | 13,857,044 | |
Net Assets ($) | | | 509,695,108 | |
Composition of Net Assets ($): | | | | |
Paid-in capital | | | | | 397,562,302 | |
Total distributable earnings (loss) | | | | | 112,132,806 | |
Net Assets ($) | | | 509,695,108 | |
Shares Outstanding | | |
(unlimited number of $.001 par value shares of Beneficial Interest authorized) | 29,689,674 | |
Net Asset Value Per Share ($) | | 17.17 | |
| | | | | |
See notes to financial statements. | | | | |
27
STATEMENT OF OPERATIONS
Year Ended December 31, 2018
| | | | | | | |
| | | | | | |
| | | | | | |
Investment Income ($): | | | | |
Income: | | | | |
Cash dividends (net of $1,320 foreign taxes withheld at source): | |
Unaffiliated issuers | | | 7,808,292 | |
Affiliated issuers | | | 99,277 | |
Income from securities lending—Note 1(b) | | | 518,737 | |
Interest | | | 25,930 | |
Total Income | | | 8,452,236 | |
Expenses: | | | | |
Management fee—Note 3(a) | | | 2,080,394 | |
Distribution fees—Note 3(b) | | | 1,485,996 | |
Trustees’ fees—Note 3(a,c) | | | 50,408 | |
Loan commitment fees—Note 2 | | | 11,588 | |
Interest expense—Note 2 | | | 531 | |
Total Expenses | | | 3,628,917 | |
Less—Trustees’ fees reimbursed by Dreyfus—Note 3(a) | | | (50,408) | |
Net Expenses | | | 3,578,509 | |
Investment Income—Net | | | 4,873,727 | |
Realized and Unrealized Gain (Loss) on Investments—Note 4 ($): | | |
Net realized gain (loss) on investments | 46,310,667 | |
Net realized gain (loss) on futures | (997,745) | |
Net Realized Gain (Loss) | | | 45,312,922 | |
Net unrealized appreciation (depreciation) on investments | | | (101,716,633) | |
Net unrealized appreciation (depreciation) on futures | | | (135,102) | |
Net Unrealized Appreciation (Depreciation) | | | (101,851,735) | |
Net Realized and Unrealized Gain (Loss) on Investments | | | (56,538,813) | |
Net (Decrease) in Net Assets Resulting from Operations | | (51,665,086) | |
| | | | | | | |
See notes to financial statements. | | | | | |
28
STATEMENT OF CHANGES IN NET ASSETS
| | | | | | | | | | |
| | | | Year Ended December 31, |
| | | | 2018 | | 2017a | |
Operations ($): | | | | | | | | |
Investment income—net | | | 4,873,727 | | | | 4,719,653 | |
Net realized gain (loss) on investments | | 45,312,922 | | | | 31,498,969 | |
Net unrealized appreciation (depreciation)
on investments | | (101,851,735) | | | | 27,374,247 | |
Net Increase (Decrease) in Net Assets
Resulting from Operations | (51,665,086) | | | | 63,592,869 | |
Distributions ($): | |
Distributions to shareholders | | | (35,748,989) | | | | (26,805,569) | |
Beneficial Interest Transactions ($): | |
Net proceeds from shares sold | | | 100,526,735 | | | | 68,204,179 | |
Distributions reinvested | | | 35,748,989 | | | | 26,805,569 | |
Cost of shares redeemed | | | (101,180,124) | | | | (105,386,821) | |
Increase (Decrease) in Net Assets
from Beneficial Interest Transactions | 35,095,600 | | | | (10,377,073) | |
Total Increase (Decrease) in Net Assets | (52,318,475) | | | | 26,410,227 | |
Net Assets ($): | |
Beginning of Period | | | 562,013,583 | | | | 535,603,356 | |
End of Period | | | 509,695,108 | | | | 562,013,583 | |
Capital Share Transactions (Shares): | |
Shares sold | | | 5,002,002 | | | | 3,640,107 | |
Shares issued for distributions reinvested | | | 1,837,050 | | | | 1,528,253 | |
Shares redeemed | | | (5,081,360) | | | | (5,599,734) | |
Net Increase (Decrease) in Shares Outstanding | 1,757,692 | | | | (431,374) | |
| | | | | | | | | | |
aDistributions to shareholders include $3,553,050 of distributions from net investment income and $23,252,519 distributions from net realized gains. Undistributed investment income—net was $4,813,996 in 2017 and is no longer presented as a result of the adoption of SEC’s Disclosure Update and Simplification Rule.
| |
See notes to financial statements. | | | | | | | | |
29
FINANCIAL HIGHLIGHTS
The following table describes the performance for the fiscal periods indicated. Total return shows how much your investment in the fund would have increased (or decreased) during each period, assuming you had reinvested all dividends and distributions. The fund’s total returns do not reflect expenses associated with variable annuity or insurance contracts. These figures have been derived from the fund’s financial statements.
| | | | | | | | | | | |
| | | | | |
| | |
| | Year Ended December 31, |
| | | 2018 | 2017 | 2016 | 2015 | 2014 |
Per Share Data ($): | | | | | | |
Net asset value, beginning of period | | 20.12 | 18.88 | 16.71 | 18.40 | 18.60 |
Investment Operations: | | | | | | |
Investment income—neta | | .17 | .16 | .16 | .16 | .13 |
Net realized and unrealized
gain (loss) on investments | | (1.82) | 2.04 | 3.69 | (.53) | .79 |
Total from Investment Operations | | (1.65) | 2.20 | 3.85 | (.37) | .92 |
Distributions: | | | | | | |
Dividends from
investment income—net | | (.17) | (.13) | (.16) | (.13) | (.11) |
Dividends from net realized
gain on investments | | (1.13) | (.83) | (1.52) | (1.19) | (1.01) |
Total Distributions | | (1.30) | (.96) | (1.68) | (1.32) | (1.12) |
Net asset value, end of period | | 17.17 | 20.12 | 18.88 | 16.71 | 18.40 |
Total Return (%) | | (8.98) | 12.40 | 25.73 | (2.33) | 5.12 |
Ratios/Supplemental Data (%): | | | | | | |
Ratio of total expenses
to average net assets | | .61 | .63 | .63 | .63 | .63 |
Ratio of net expenses
to average net assets | | .60 | .60 | .60 | .60 | .60 |
Ratio of net investment income
to average net assets | | .82 | .88 | .95 | .90 | .73 |
Portfolio Turnover Rate | | 23.26 | 16.90 | 24.24 | 19.72 | 14.30 |
Net Assets, end of period ($ x 1,000) | | 509,695 | 562,014 | 535,603 | 307,701 | 337,652 |
a Based on average shares outstanding.
See notes to financial statements.
30
NOTES TO FINANCIAL STATEMENTS
NOTE 1—Significant Accounting Policies:
Small Cap Stock Index Portfolio (the “fund”) is a separate diversified series of Dreyfus Investment Portfolios (the “Company”), which is registered under the Investment Company Act of 1940, as amended (the “Act”), as an open-end management investment company and operates as a series company currently offering four series, including the fund. The fund is only offered to separate accounts established by insurance companies to fund variable annuity contracts and variable life insurance policies. The fund’s investment objective is to seek to match the performance of the S&P SmallCap 600®Index. The Dreyfus Corporation (the “Manager” or “Dreyfus”), a wholly-owned subsidiary of The Bank of New York Mellon Corporation (“BNY Mellon”), serves as the fund’s investment adviser. MBSC Securities Corporation (the “Distributor”), a wholly-owned subsidiary of Dreyfus, is the distributor of the fund’s shares, which are sold without a sales charge.
The Company accounts separately for the assets, liabilities and operations of each series. Expenses directly attributable to each series are charged to that series’ operations; expenses which are applicable to all series are allocated among them on a pro rata basis.
The Financial Accounting Standards Board (“FASB”) Accounting Standards Codification is the exclusive reference of authoritative U.S. generally accepted accounting principles (“GAAP”) recognized by the FASB to be applied by nongovernmental entities. Rules and interpretive releases of the Securities and Exchange Commission (“SEC”) under authority of federal laws are also sources of authoritative GAAP for SEC registrants. The fund’s financial statements are prepared in accordance with GAAP, which may require the use of management estimates and assumptions. Actual results could differ from those estimates.
The Companyenters into contracts that contain a variety of indemnifications. The fund’s maximum exposure under these arrangements is unknown. The fund does not anticipate recognizing any loss related to these arrangements.
(a) Portfolio valuation: The fair value of a financial instrument is the amount that would be received to sell an asset or paid to transfer a liability in an orderly transaction between market participants at the measurement date (i.e., the exit price). GAAP establishes a fair value hierarchy that prioritizes the inputs of valuation techniques used to measure fair value. This hierarchy gives the highest priority to unadjusted quoted prices in active markets for identical assets or liabilities (Level 1 measurements) and the lowest priority to unobservable inputs (Level 3 measurements).
31
NOTES TO FINANCIAL STATEMENTS(continued)
Additionally, GAAP provides guidance on determining whether the volume and activity in a market has decreased significantly and whether such a decrease in activity results in transactions that are not orderly. GAAP requires enhanced disclosures around valuation inputs and techniques used during annual and interim periods.
Various inputs are used in determining the value of the fund’s investments relating to fair value measurements. These inputs are summarized in the three broad levels listed below:
Level 1—unadjusted quoted prices in active markets for identical investments.
Level 2—other significant observable inputs (including quoted prices for similar investments, interest rates, prepayment speeds, credit risk, etc.).
Level 3—significant unobservable inputs (including the fund’s own assumptions in determining the fair value of investments).
The inputs or methodology used for valuing securities are not necessarily an indication of the risk associated with investing in those securities.
Changes in valuation techniques may result in transfers in or out of an assigned level within the disclosure hierarchy. Valuation techniques used to value the fund’s investments are as follows:
Investments in securities are valued at the last sales price on the securities exchange or national securities market on which such securities are primarily traded. Securities listed on the National Market System for which market quotations are available are valued at the official closing price or, if there is no official closing price that day, at the last sales price. For open short positions, asked prices are used for valuation purposes. Bid price is used when no asked price is available. Registered investment companies that are not traded on an exchange are valued at their net asset value. All of the preceding securities are generally categorized within Level 1 of the fair value hierarchy.
Securities not listed on an exchange or the national securities market, or securities for which there were no transactions, are valued at the average of the most recent bid and asked prices. U.S. Treasury Bills are valued at the mean price between quoted bid prices and asked prices by an independent pricing service (the “Service”) approved by the Company’s Board of Trustees (the “Board”). These securities are generally categorized within Level 2 of the fair value hierarchy.
The Service is engaged under the general supervision of the Board.
32
Fair valuing of securities may be determined with the assistance of a pricing service using calculations based on indices of domestic securities and other appropriate indicators, such as prices of relevant American Depository Receipts and futures. Utilizing these techniques may result in transfers between Level 1 and Level 2 of the fair value hierarchy.
When market quotations or official closing prices are not readily available, or are determined not to accurately reflect fair value, such as when the value of a security has been significantly affected by events after the close of the exchange or market on which the security is principally traded (for example, a foreign exchange or market), but before the fund calculates its net asset value, the fund may value these investments at fair value as determined in accordance with the procedures approved by the Board. Certain factors may be considered when fair valuing investments such as: fundamental analytical data, the nature and duration of restrictions on disposition, an evaluation of the forces that influence the market in which the securities are purchased and sold, and public trading in similar securities of the issuer or comparable issuers. These securities are either categorized within Level 2 or 3 of the fair value hierarchy depending on the relevant inputs used.
For restricted securities where observable inputs are limited, assumptions about market activity and risk are used and such securities are generally categorized within Level 3 of the fair value hierarchy.
Futures, which are traded on an exchange, are valued at the last sales price on the securities exchange on which such securities are primarily traded or at the last sales price on the national securities market on each business day and are generally categorized within Level 1 of the fair value hierarchy.
The following is a summary of the inputs used as of December 31, 2018in valuing the fund’s investments:
| | | | | | |
| | Level 1 - Unadjusted Quoted Prices | Level 2 - Other Significant Observable Inputs | Level 3 -Significant Unobservable Inputs | Total |
Assets ($) | | | | |
Investments in Securities: | | |
Equity Securities—
Common Stocks† | 506,524,141 | – | – | 506,524,141 |
Rights | - | 0 | - | 0 |
33
NOTES TO FINANCIAL STATEMENTS(continued)
| | | | | | |
| | Level 1 - Unadjusted Quoted Prices | Level 2 - Other Significant Observable Inputs | Level 3 -Significant Unobservable Inputs | Total |
Assets ($) | | | | |
Investment
Companies | 14,108,865 | – | – | 14,108,865 |
U.S. Treasury | – | 358,451 | – | 358,451 |
Liabilities ($) | | | | |
Other Financial Instruments: | | |
Futures†† | (105,758) | – | – | (105,758) |
† See Statement of Investments for additional detailed categorizations.
†† Amount shown represents unrealized depreciation at period end.
At December 31, 2018, there were no transfers between levels of the fair value hierarchy. It is the fund’s policy to recognize transfers between levels at the end of the reporting period.
(b)Securities transactions and investment income: Securities transactions are recorded on a trade date basis. Realized gains and losses from securities transactions are recorded on the identified cost basis. Dividend income is recognized on the ex-dividend date and interest income, including, where applicable, accretion of discount and amortization of premium on investments, is recognized on the accrual basis.
Pursuant to a securities lending agreement with The Bank of New York Mellon, a subsidiary of BNY Mellon and an affiliate of Dreyfus, the fund may lend securities to qualified institutions. It is the fund’s policy that, at origination, all loans are secured by collateral of at least 102% of the value of U.S. securities loaned and 105% of the value of foreign securities loaned. Collateral equivalent to at least 100% of the market value of securities on loan is maintained at all times. Collateral is either in the form of cash, which can be invested in certain money market mutual funds managed by Dreyfus, or U.S. Government and Agency securities. The fund is entitled to receive all dividends, interest and distributions on securities loaned, in addition to income earned as a result of the lending transaction. Should a borrower fail to return the securities in a timely manner, The Bank of New York Mellon is required to replace the securities for the benefit of the fund or credit the fund with the market value of the unreturned securities and is subrogated to the fund’s rights against the borrower and the collateral. Additionally, the contractual maturity of security lending transactions are on an overnight and continuous basis. During the period ended December 31, 2018, The Bank of New York
34
Mellon earned $99,391 from lending portfolio securities, pursuant to the securities lending agreement.
(c) Affiliated issuers: Investments in other investment companies advised by Dreyfus are considered “affiliated” under the Act.
(d) Dividends and distributions to shareholders: Dividends and distributions are recorded on the ex-dividend date. Dividends from investment income-net and dividends from net realized capital gains, if any, are normally declared and paid annually, but the fund may make distributions on a more frequent basis to comply with the distribution requirements of the Internal Revenue Code of 1986, as amended (the “Code”). To the extent that net realized capital gains can be offset by capital loss carryovers, it is the policy of the fund not to distribute such gains. Income and capital gain distributions are determined in accordance with income tax regulations, which may differ from GAAP.
(e) Federal income taxes: It is the policy of the fund to continue to qualify as a regulated investment company, if such qualification is in the best interests of its shareholders, by complying with the applicable provisions of the Code, and to make distributions of taxable income and net realized capital gain sufficient to relieve it from substantially all federal income and excise taxes.
As of and during the period ended December 31, 2018, the fund did not have any liabilities for any uncertain tax positions. The fund recognizes interest and penalties, if any, related to uncertain tax positions as income tax expense in the Statement of Operations. During the period ended December 31, 2018, the fund did not incur any interest or penalties.
Each tax year in the four-year period ended December 31, 2018 remains subject to examination by the Internal Revenue Service and state taxing authorities.
At December 31, 2018, the components of accumulated earnings on a tax basis were as follows: undistributed ordinary income $6,696,799, undistributed capital gains $44,740,437 and unrealized appreciation $60,536,829.
The tax character of distributions paid to shareholders during the fiscal periods ended December 31, 2018 and December 31, 2017 were as follows: ordinary income $10,686,933 and $4,242,448, and long-term capital gains $25,062,056 and $22,563,121, respectively.
(f) New Accounting Pronouncements: In August 2018, the FASB issued Accounting Standards Update 2018-13, Fair Value Measurement (Topic 820): Disclosure Framework—Changes to the Disclosure
35
NOTES TO FINANCIAL STATEMENTS(continued)
Requirements for Fair Value Measurement (“ASU 2018-13”). The update provides guidance that eliminates, adds and modifies certain disclosure requirements for fair value measurements. ASU 2018-13 will be effective for annual periods beginning after December 15, 2019. Management is currently assessing the potential impact of these changes to future financial statements.
NOTE 2—Bank Lines of Credit:
The fund participates with other Dreyfus-managed long-term open-end funds in a $1.030 billion unsecured credit facility led by Citibank, N.A. (the “Citibank Credit Facility”) and a $300 million unsecured credit facility provided by The Bank of New York Mellon (the “BNYM Credit Facility”), each to be utilized primarily for temporary or emergency purposes, including the financing of redemptions (each, a “Facility”). The Citibank Credit Facility is available in two tranches: (i) Tranche A is in an amount equal to $830 million and is available to all long-term open-ended funds, including the fund, and (ii) Tranche B is in amount equal to $200 million and is available only to the Dreyfus Floating Rate Income Fund, a series of The Dreyfus/Laurel Funds, Inc. Prior to October 3, 2018, the unsecured credit facility with Citibank, N.A. was $830 million. In connection therewith, the fund has agreed to pay its pro rata portion of commitment fees for Tranche A of the Citibank Credit Facility and the BNYM Credit Facility. Interest is charged to the fund based on rates determined pursuant to the terms of the respective Facility at the time of borrowing.
The average amount of borrowings outstanding under the Facilities during the period ended December 31, 2018 was approximately $16,440 with a related weighted average annualized interest rate of 3.23%.
NOTE 3—Management Fee and Other Transactions with Affiliates:
(a)Pursuant to a management agreement (the “Agreement”) with Dreyfus, the management fee is computed at the annual rate of .35% of the value of the fund’s average daily net assets and is payable monthly. Under the terms of the Agreement, Dreyfus has agreed to pay all of the fund’s direct expenses, except management fees, Rule 12b-1 Distribution Plan fees, taxes, interest expense, brokerage commissions, commitment fees on borrowings, fees and expenses of non-interested Trustees (including counsel fees), and extraordinary expenses. Dreyfus has also agreed to reduce its management fee in an amount equal to the fund’s allocable portion of the accrued fees and expenses of the non-interested Trustees (including counsel fees). During the period ended December 31, 2018, fees reimbursed by Dreyfus amounted to $50,408.
36
(b)Under the Distribution Plan adopted pursuant to Rule 12b-1 under the Act, the fund pays the Distributor for distributing its shares, for servicing and/or maintaining shareholder accounts and for advertising and marketing. The Distribution Plan provides for payments to be made at an annual rate of .25% of the value of the fund’s average daily net assets. The Distributor may make payments to Participating Insurance Companies and to brokers and dealers acting as principal underwriter for their variable insurance products. The fees payable under the Distribution Plan are payable without regard to actual expenses incurred. During the period ended December 31, 2018,the fund was charged $1,485,996 pursuant to the Distribution Plan.
The components of “Due to The Dreyfus Corporation and affiliates” in the Statement of Assets and Liabilities consist of: management fees $157,156 and Distribution Plan fees $112,255, which are offset against an expense reimbursement currently in effect in the amount of $5,010.
(c) Each Board member also serves as a Board member of other funds within the Dreyfus complex. Annual retainer fees and attendance fees are allocated to each fund based on net assets.
NOTE 4—Securities Transactions:
The aggregate amount of purchases and sales of investment securities, excluding short-term securities and futures, during the period ended December 31, 2018, amounted to $143,482,587 and $135,654,091, respectively.
Derivatives:A derivative is a financial instrument whose performance is derived from the performance of another asset. Each type of derivative instrument that was held by the fund during the period ended December 31, 2018 is discussed below.
Futures:In the normal course of pursuing its investment objective, the fund is exposed to market risk, including equity price risk,as a result of changes in value of underlying financial instruments. The fund invests in futures in order to manage its exposure to or protect against changes in the market. A futures contract represents a commitment for the future purchase or a sale of an asset at a specified date. Upon entering into such contracts, these investments require initial margin deposits with a counterparty, which consist of cash or cash equivalents. The amount of these deposits is determined by the exchange or Board of Trade on which the contract is traded and is subject to change. Accordingly, variation margin payments are received or made to reflect daily unrealized gains or losses which are recorded in the Statement of Operations. When the contracts are closed, the fund recognizes a realized gain or loss which is
37
NOTES TO FINANCIAL STATEMENTS(continued)
reflected in the Statement of Operations. There is minimal counterparty credit risk to the fund with futures since they are exchange traded, and the exchange guarantees the futures against default. Futures open at December 31, 2018 are set forth in the Statement of Futures.
The following summarizes the average market value of derivatives outstanding duringthe period ended December 31, 2018:
| | | |
| | Average Market Value ($) |
Equity futures | | 5,712,206 |
At December 31, 2018, the cost of investments for federal income tax purposes was $460,454,628; accordingly, accumulated net unrealized appreciation on investments was $60,536,829, consisting of $129,798,302 gross unrealized appreciation and $69,261,473 gross unrealized depreciation.
38
REPORT OF INDEPENDENT REGISTERED PUBLIC ACCOUNTING FIRM
To the Shareholders and the Board of Trustees of Small Cap Stock Index Portfolio
Opinion on the Financial Statements
We have audited the accompanying statement of assets and liabilities of Small Cap Stock Index Portfolio (the “Fund”) (one of the funds constituting Dreyfus Investment Portfolios), including the statements of investments, investments in affiliated issuers and futures, as of December 31, 2018, and the related statement of operations for the year then ended, the statements of changes in net assets for each of the two years in the period then ended, the financial highlights for each of the five years in the period then ended and the related notes (collectively referred to as the “financial statements”). In our opinion, the financial statements present fairly, in all material respects, the financial position of the Fund (one of the funds constituting Dreyfus Investment Portfolios) at December 31, 2018, the results of its operations for the year then ended, the changes in its net assets for each of the two years in the period then ended and its financial highlights for each of the five years in the period then ended, in conformity with U.S. generally accepted accounting principles.
Basis for Opinion
These financial statements are the responsibility of the Fund’s management. Our responsibility is to express an opinion on the Fund’s financial statements based on our audits. We are a public accounting firm registered with the Public Company Accounting Oversight Board (United States) (“PCAOB”) and are required to be independent with respect to the Fund in accordance with the U.S. federal securities laws and the applicable rules and regulations of the Securities and Exchange Commission and the PCAOB.
We conducted our audits in accordance with the standards of the PCAOB. Those standards require that we plan and perform the audit to obtain reasonable assurance about whether the financial statements are free of material misstatement, whether due to error or fraud. The Fund is not required to have, nor were we engaged to perform, an audit of the Fund’s internal control over financial reporting. As part of our audits, we are required to obtain an understanding of internal control over financial reporting, but not for the purpose of expressing an opinion on the effectiveness of the Fund’s internal control over financial reporting. Accordingly, we express no such opinion.
Our audits included performing procedures to assess the risks of material misstatement of the financial statements, whether due to error or fraud, and performing procedures that respond to those risks. Such procedures included examining, on a test basis, evidence regarding the amounts and disclosures in the financial statements. Our procedures included confirmation of securities owned as of December 31, 2018, by correspondence with the custodian and others or by other appropriate auditing procedures where replies from others were not received. Our audits also included evaluating the accounting principles used and significant estimates made by management, as well as evaluating the overall presentation of the financial statements. We believe that our audits provide a reasonable basis for our opinion.

We have served as the auditor of one or more Dreyfus investment companies since at least 1957, but we are unable to determine the specific year.
New York, New York
February 11, 2019
39
IMPORTANT TAX INFORMATION(Unaudited)
For federal tax purposes, the portfolio hereby reports 71.48% of the ordinary dividends paid during the fiscal year ended December 31, 2018 as qualifying for the corporate dividends received deduction. Shareholders will receive notification in early 2019 of the percentage applicable to the preparation of their 2018 income tax returns. Also, the fund hereby reports $.2190 per share as a short-term capital gain distribution and $.9092 per share as a long-term capital gain distribution paid on March 21, 2018.
40
INFORMATION ABOUT THE RENEWAL OF THE FUND’S MANAGEMENT AGREEMENT (Unaudited)
At a meeting of the fund’s Board of Trustees held on July 18-19, 2018, the Board considered the renewal of the fund’s Management Agreement pursuant to which Dreyfus provides the fund with investment advisory and administrative services (the “Agreement”). The Board members, a majority of whom are not “interested persons” (as defined in the Investment Company Act of 1940, as amended) of the fund, were assisted in their review by independent legal counsel and met with counsel in executive session separate from Dreyfus representatives. In considering the renewal of the Agreement, the Board considered all factors that it believed to be relevant, including those discussed below. The Board did not identify any one factor as dispositive, and each Board member may have attributed different weights to the factors considered.
Analysis of Nature, Extent, and Quality of Services Provided to the Fund. The Board considered information provided to them at the meeting and in previous presentations from Dreyfus representatives regarding the nature, extent, and quality of the services provided to funds in the Dreyfus fund complex. Dreyfus provided the number of open accounts in the fund, the fund’s asset size and the allocation of fund assets among distribution channels. Dreyfus also had previously provided information regarding the diverse intermediary relationships and distribution channels of funds in the Dreyfus fund complex (such as retail direct or intermediary, in which intermediaries typically are paid by the fund and/or Dreyfus) and Dreyfus’ corresponding need for broad, deep, and diverse resources to be able to provide ongoing shareholder services to each intermediary or distribution channel, as applicable to the fund.
The Board also considered research support available to, and portfolio management capabilities of, the fund’s portfolio management personnel and that Dreyfus also provides oversight of day-to-day fund operations, including fund accounting and administration and assistance in meeting legal and regulatory requirements. The Board also considered Dreyfus’ extensive administrative, accounting and compliance infrastructures. The Board also considered portfolio management’s brokerage policies and practices (including policies and practices regarding soft dollars) and the standards applied in seeking best execution.
Comparative Analysis of the Fund’s Performance and Management Fee and Expense Ratio. The Board reviewed reports prepared by Broadridge Financial Solutions, Inc. (“Broadridge”), an independent provider of investment company data, which included information comparing (1) the fund’s performance with the performance of a group of comparable funds (the “Performance Group”) and with a broader group of funds (the “Performance Universe”), all for various periods ended May 31, 2018, and (2) the fund’s actual and contractual management fees and total expenses with those of a group of comparable funds (the “Expense Group”) and with a broader group of funds (the “Expense Universe”), the information for which was derived in part from fund financial statements available to Broadridge as of the date of its analysis. Dreyfus previously had furnished the Board with a description of the methodology Broadridge used to select the Performance Group and Performance Universe and the Expense Group and Expense Universe.
41
INFORMATION ABOUT THE RENEWAL OF THE FUND’S MANAGEMENT AGREEMENT (Unaudited) (continued)
Dreyfus representatives stated that the usefulness of performance comparisons may be affected by a number of factors, including different investment limitations that may be applicable to the fund and comparison funds. The Board discussed with representatives of Dreyfus and/or its affiliates the results of the comparisons and considered that the fund’s total return performance was below the Performance Group median for all periods and above the Performance Universe median for all periods. The Board considered the relative proximity of the fund’s performance to the Performance Group median in all periods and that there were only four funds, including the fund, in the Performance Group. Dreyfus also provided a comparison of the fund’s calendar year total returns to the returns of the fund’s benchmark index.
The Board also reviewed the range of actual and contractual management fees and total expenses of the Expense Group and Expense Universe funds and discussed the results of the comparisons. Taking into account the fund’s “unitary” fee structure, the Board considered that the fund’s contractual management fee was above the Expense Group median and the fund’s actual management fee and total expenses were above the Expense Group medians and below the Expense Universe medians.
Dreyfus representatives reviewed with the Board the management or investment advisory fees (1) paid by funds advised or administered by Dreyfus that are in the same Lipper category as the fund and (2) paid to Dreyfus or the Dreyfus-affiliated primary employer of the fund’s primary portfolio manager(s) for advising any separate accounts and/or other types of client portfolios that are considered to have similar investment strategies and policies as the fund (the “Similar Clients”), and explained the nature of the Similar Clients. They discussed differences in fees paid and the relationship of the fees paid in light of any differences in the services provided and other relevant factors, noting the fund’s “unitary” fee structure. The Board considered the relevance of the fee information provided for the Similar Clients to evaluate the appropriateness of the fund’s management fee.
Analysis of Profitability and Economies of Scale. Dreyfus representatives reviewed the expenses allocated and profit received by Dreyfus and its affiliates and the resulting profitability percentage for managing the fund and the aggregate profitability percentage to Dreyfus and its affiliates for managing the funds in the Dreyfus fund complex, and the method used to determine the expenses and profit. The Board concluded that the profitability results were not unreasonable, given the services rendered and service levels provided by Dreyfus. The Board also had been provided with information prepared by an independent consulting firm regarding Dreyfus’ approach to allocating costs to, and determining the profitability of, individual funds and the entire Dreyfus fund complex. The consulting firm also had analyzed where any economies of scale might emerge in connection with the management of a fund.
The Board considered, on the advice of its counsel, the profitability analysis (1) as part of its evaluation of whether the fees under the Agreement, considered in relation to the mix of services provided by Dreyfus, including the nature, extent and quality of such services, supported the renewal of the Agreement and (2) in light of the relevant circumstances for the fund and the extent to which economies of scale would be
42
realized if the fund grows and whether fee levels reflect these economies of scale for the benefit of fund shareholders. Dreyfus representatives also stated that, as a result of shared and allocated costs among funds in the Dreyfus fund complex, the extent of economies of scale could depend substantially on the level of assets in the complex as a whole, so that increases and decreases in complex-wide assets can affect potential economies of scale in a manner that is disproportionate to, or even in the opposite direction from, changes in the fund’s asset level. The Board also considered potential benefits to Dreyfus from acting as investment adviser and took into consideration that there were no soft dollar arrangements in effect for trading the fund’s investments.
At the conclusion of these discussions, the Board agreed that it had been furnished with sufficient information to make an informed business decision with respect to the renewal of the Agreement. Based on the discussions and considerations as described above, the Board concluded and determined as follows.
· The Board concluded that the nature, extent and quality of the services provided by Dreyfus are adequate and appropriate.
· The Board generally was satisfied with the fund’s performance.
· The Board concluded that the fee paid to Dreyfus continued to be appropriate under the circumstances and in light of the factors and the totality of the services provided as discussed above.
· The Board determined that the economies of scale which may accrue to Dreyfus and its affiliates in connection with the management of the fund had been adequately considered by Dreyfus in connection with the fee rate charged to the fund pursuant to the Agreement and that, to the extent in the future it were determined that material economies of scale had not been shared with the fund, the Board would seek to have those economies of scale shared with the fund.
In evaluating the Agreement, the Board considered these conclusions and determinations and also relied on its previous knowledge, gained through meetings and other interactions with Dreyfus and its affiliates, of Dreyfus and the services provided to the fund by Dreyfus. The Board also relied on information received on a routine and regular basis throughout the year relating to the operations of the fund and the investment management and other services provided under the Agreement, including information on the investment performance of the fund in comparison to similar mutual funds and benchmark performance indices; general market outlook as applicable to the fund; and compliance reports. In addition, the Board’s consideration of the contractual fee arrangements for this fund had the benefit of a number of years of reviews of the Agreement for the fund, or substantially similar agreements for other Dreyfus funds that the Board oversees, during which lengthy discussions took place between the Board and Dreyfus representatives. Certain aspects of the arrangements may receive greater scrutiny in some years than in others, and the Board’s conclusions may be based, in part, on their consideration of the fund’s arrangements, or substantially
43
INFORMATION ABOUT THE RENEWAL OF THE FUND’S MANAGEMENT AGREEMENT (Unaudited) (continued)
similar arrangements for other Dreyfus funds that the Board oversees, in prior years. The Board determined to renew the Agreement.
44
BOARD MEMBERS INFORMATION(Unaudited)
INDEPENDENT BOARD MEMBERS
Joseph S. DiMartino (75)
Chairman of the Board (1995)
Principal Occupation During Past 5 Years:
· Corporate Director and Trustee (1995-present)
Other Public Company Board Memberships During Past 5 Years:
· CBIZ (formerly, Century Business Services, Inc.), a provider of outsourcing functions for small and medium size companies, Director (1997-present)
No. of Portfolios for which Board Member Serves:122
———————
Francine J. Bovich (67)
Board Member (2015)
Principal Occupation During Past 5 Years:
· Trustee, The Bradley Trusts, private trust funds (2011-present)
Other Public Company Board Memberships During Past 5 Years:
· Annaly Capital Management, Inc., a real estate investment trust, Director (2014-present)
No. of Portfolios for which Board Member Serves:70
———————
Gordon J. Davis (77)
Board Member (2012)
Principal Occupation During Past 5 Years:
· Partner in the law firm of Venable LLP (2012-present)
Other Public Company Board Memberships During Past 5 Years:
· Consolidated Edison, Inc., a utility company, Director (1997-2014)
· The Phoenix Companies, Inc., a life insurance company, Director (2000-2014)
No. of Portfolios for which Board Member Serves:54
———————
Isabel P. Dunst (71)
Board Member (2014)
Principal Occupation During Past 5 Years:
· Senior Counsel, Hogan Lovells LLP (2018-present; previously, Of Counsel, 2015-2018, Partner, 1990-2014)
No. of Portfolios for which Board Member Serves:33
———————
45
BOARD MEMBERS INFORMATION (Unaudited) (continued)
INDEPENDENT BOARD MEMBERS (continued)
Nathan Leventhal (75)
Board Member (2009)
Principal Occupation During Past 5 Years:
· President Emeritus of Lincoln Center for the Performing Arts (2001-present)
· Chairman of the Avery Fisher Artist Program (1997-2014)
Other Public Company Board Memberships During Past 5 Years:
· Movado Group, Inc., Director (2003-present)
No. of Portfolios for which Board Member Serves:47
———————
Robin A. Melvin (55)
Board Member (2014)
Principal Occupation During Past 5 Years:
· Co-chairman, Illinois Mentoring Partnership, non-profit organization dedicated to increasing the quantity and quality of mentoring services in Illinois (2014-present; board member since 2013)
No. of Portfolios for which Board Member Serves:99
———————
Roslyn M. Watson (69)
Board Member (2014)
Principal Occupation During Past 5 Years:
· Principal, Watson Ventures, Inc., a real estate investment company (1993-present)
No. of Portfolios for which Board Member Serves:56
———————
Benaree Pratt Wiley (72)
Board Member (2009)
Principal Occupation During Past 5 Years:
· Principal, The Wiley Group, a firm specializing in strategy and business development (2005-present)
Other Public Company Board Memberships During Past 5 Years:
· CBIZ (formerly, Century Business Services, Inc.), a provider of outsourcing functions for small and medium size companies, Director (2008-present)
No. of Portfolios for which Board Member Serves:77
———————
46
INTERESTED BOARD MEMBER
J. Charles Cardona (63)
Board Member (2014)
Principal Occupation During Past 5 Years:
· Retired. President and a Director of the Manager (2008-2016), Chairman of the Distributor (2013-2016, Executive Vice President, 1997-2013)
No. of Portfolios for which Board Member Serves:33
J. Charles Cardona is deemed to be an “interested person” (as defined under the Act) of the Company as a result of his previous affiliation with The Dreyfus Corporation.
———————
Once elected all Board Members serve for an indefinite term, but achieve Emeritus status upon reaching age 80. The address of the Board Members and Officers is c/o The Dreyfus Corporation, 200 Park Avenue, New York, New York 10166. Additional information about the Board Members is available in the fund’s Statement of Additional Information which can be obtained from Dreyfus free of charge by calling this toll free number: 1-800-DREYFUS.
Clifford L. Alexander, Jr., Emeritus Board Member
Whitney I. Gerard, Emeritus Board Member
George L. Perry, Emeritus Board Member
47
OFFICERS OF THE FUND(Unaudited)
BRADLEY J. SKAPYAK, President since January 2010.
Chief Operating Officer and a director of the Manager since June 2009, Chairman of Dreyfus Transfer, Inc., an affiliate of the Manager and the transfer agent of the funds, since May 2011 and Chief Executive Officer of MBSC Securities Corporation since August 2016. He is an officer of 62 investment companies (comprised of 122 portfolios) managed by the Manager. He is 60 years old and has been an employee of the Manager since February 1988.
BENNETT A. MACDOUGALL, Chief Legal Officer since October 2015.
Chief Legal Officer of the Manager and Associate General Counsel and Managing Director of BNY Mellon since June 2015; from June 2005 to June 2015, he served in various capacities with Deutsche Bank – Asset & Wealth Management Division, including as Director and Associate General Counsel, and Chief Legal Officer of Deutsche Investment Management Americas Inc. from June 2012 to May 2015. He is an officer of 63 investment companies (comprised of 147 portfolios) managed by the Manager. He is 47 years old and has been an employee of the Manager since June 2015.
JAMES BITETTO, Vice President since August 2005 and Secretary since February 2018.
Managing Counsel of BNY Mellon and Secretary of the Manager, and an officer of 63 investment companies (comprised of 147 portfolios) managed by the Manager. He is 52 years old and has been an employee of the Manager since December 1996.
SONALEE CROSS, Vice President and Assistant Secretary since March 2018.
Counsel of BNY Mellon since October 2016; Associate at Proskauer Rose LLP from April 2016 to September 2016; Attorney at EnTrust Capital from August 2015 to February 2016; Associate at Sidley Austin LLP from September 2013 until August 2015. She is an officer of 63 investment companies (comprised of 147 portfolios) managed by Dreyfus. She is 31 years old and has been an employee of the Manager since October 2016.
SARAH S. KELLEHER, Vice President and Assistant Secretary since April 2014.
Managing Counsel of BNY Mellon since December 2017, from March 2013 to December 2017, Senior Counsel of BNY Mellon. She is an officer of 63 investment companies (comprised of 147 portfolios) managed by the Manager. She is 43 years old and has been an employee of the Manager since March 2013.
JEFF PRUSNOFSKY, Vice President and Assistant Secretary since August 2005.
Senior Managing Counsel of BNY Mellon, and an officer of 63 investment companies (comprised of 147 portfolios) managed by the Manager. He is 53 years old and has been an employee of the Manager since October 1990.
NATALYA ZELENSKY, Vice President and Assistant Secretary since March 2017.
Counsel of BNY Mellon since May 2016; Attorney at Wildermuth Endowment Strategy Fund/Wildermuth Advisory, LLC from November 2015 until May 2016; Assistant General Counsel at RCS Advisory Services from July 2014 until November 2015; Associate at Sutherland, Asbill & Brennan from January 2013 until January 2014. She is an officer of 63 investment companies (comprised of 147 portfolios) managed by Dreyfus. She is 33 years old and has been an employee of the Manager since May 2016.
JAMES WINDELS, Treasurer since November 2001.
Director – Mutual Fund Accounting of the Manager, and an officer of 63 investment companies (comprised of 147 portfolios) managed by the Manager. He is 60 years old and has been an employee of the Manager since April 1985.
GAVIN C. REILLY, Assistant Treasurer since December 2005.
Tax Manager of the Investment Accounting and Support Department of the Manager, and an officer of 63 investment companies (comprised of 147 portfolios) managed by the Manager. He is 50 years old and has been an employee of the Manager since April 1991.
ROBERT S. ROBOL, Assistant Treasurer since August 2002.
Senior Accounting Manager – Dreyfus Financial Reporting of the Manager, and an officer of 63 investment companies (comprised of 147 portfolios) managed by the Manager. He is 54 years old and has been an employee of the Manager since October 1988.
48
ROBERT SALVIOLO, Assistant Treasurer since July 2007.
Senior Accounting Manager – Equity Funds of the Manager, and an officer of 63 investment companies (comprised of 147 portfolios) managed by the Manager. He is 51 years old and has been an employee of the Manager since June 1989.
ROBERT SVAGNA, Assistant Treasurer since December 2002.
Senior Accounting Manager – Fixed Income and Equity Funds of the Manager, and an officer of 63 investment companies (comprised of 147 portfolios) managed by the Manager. He is 51 years old and has been an employee of the Manager since November 1990.
JOSEPH W. CONNOLLY, Chief Compliance Officer since October 2004.
Chief Compliance Officer of the Manager, the Dreyfus Family of Funds and BNY Mellon Funds Trust (63 investment companies, comprised of 147 portfolios). He is 61 years old and has served in various capacities with the Manager since 1980, including manager of the firm’s Fund Accounting Department from 1997 through October 2001.
CARIDAD M. CAROSELLA, Anti-Money Laundering Compliance Officer since January 2016.
Anti-Money Laundering Compliance Officer of the Dreyfus Family of Funds and BNY Mellon Funds Trust since January 2016; from May 2015 to December 2015, Interim Anti-Money Laundering Compliance Officer of the Dreyfus Family of Funds and BNY Mellon Funds Trust and the Distributor; from January 2012 to May 2015, AML Surveillance Officer of the Distributor and from 2007 to December 2011, Financial Processing Manager of the Distributor. She is an officer of 57 investment companies (comprised of 141 portfolios) managed by the Manager. She is 50 years old and has been an employee of the Distributor since 1997.
49
Dreyfus Investment Portfolios, Small Cap Stock Index Portfolio
200 Park Avenue
New York, NY 10166
Manager
The Dreyfus Corporation
200 Park Avenue
New York, NY 10166
Custodian
The Bank of New York Mellon
240 Greenwich Street
New York, NY 10286
Transfer Agent &
Dividend Disbursing Agent
Dreyfus Transfer, Inc.
200 Park Avenue
New York, NY 10166
Distributor
MBSC Securities Corporation
200 Park Avenue
New York, NY 10166
Telephone 1-800-258-4260 or 1-800-258-4261
Mail The Dreyfus Family of Funds, 144 Glenn Curtiss Boulevard, Uniondale, NY 11556-0144 Attn: Institutional Services Department
E-mailSend your request toinfo@dreyfus.com
InternetInformation can be viewed online or downloaded atwww.dreyfus.com
The fund files its complete schedule of portfolio holdings with the Securities and Exchange Commission (“SEC”) for the first and third quarters of each fiscal year on Form N-Q. The fund’s Forms N-Q are available on the SEC’s website at http://www.sec.gov and may be reviewed and copied at the SEC’s Public Reference Room in Washington, D.C. Information on the operation of the Public Reference Room may be obtained by calling 1-800-SEC-0330.
A description of the policies and procedures that the fund uses to determine how to vote proxies relating to portfolio securities, and information regarding how the fund voted these proxies for the most recent 12-month period ended June 30 is available at http://www.dreyfus.com and on the SEC’s website at http://www.sec.gov. The description of the policies and procedures is also available without charge, upon request, by calling 1-800-DREYFUS.
| | |
© 2019 MBSC Securities Corporation
0410AR1218 | 
|
Dreyfus Investment Portfolios, Technology Growth Portfolio
| | | |

| | ANNUAL REPORT
December 31, 2018 |
| |
The views expressed in this report reflect those of the portfolio manager(s) only through the end of the period covered and do not necessarily represent the views of Dreyfus or any other person in the Dreyfus organization. Any such views are subject to change at any time based upon market or other conditions and Dreyfus disclaims any responsibility to update such views. These views may not be relied on as investment advice and, because investment decisions for a Dreyfus fund are based on numerous factors, may not be relied on as an indication of trading intent on behalf of any Dreyfus fund. |
| |
Not FDIC-Insured • Not Bank-Guaranteed • May Lose Value |
Contents
THE FUND
FOR MORE INFORMATION
Back Cover
| | | | |
| |
Dreyfus Investment Portfolios, Technology Growth Portfolio
| | The Fund |
A LETTER FROM THE PRESIDENT OF DREYFUS
Dear Shareholder:
We are pleased to present this annual report for Dreyfus Investment Portfolios, Technology Growth Portfolio, covering the 12-month period from January 1, 2018 through December 31, 2018. For information about how the fund performed during the reporting period, as well as general market perspectives, we provide a Discussion of Fund Performance on the pages that follow.
The reporting period began with major global economies achieving above-trend growth. In the United States, a robust economy and strong labor market encouraged the Federal Reserve to continue moving away from its accommodative monetary policy while other major central banks began to consider monetary tightening. Both U.S. and non-U.S. equity markets remained on an uptrend. Interest rates rose across the yield curve, putting pressure on bond prices.
A few months into the reporting period, global growth trends began to diverge and market volatility returned. While the U.S. economy continued to grow at a healthy rate, other developed markets began to weaken. However, robust growth and strong corporate earnings continued to support U.S. stock returns while other developed markets declined throughout the summer. In the fall, a broad sell-off occurred, partially offsetting earlier U.S. gains. Emerging markets remained under pressure as weakness in their currencies relative to the U.S. dollar added to investors’ uneasiness. Global equities continued their general decline through the end of the period.
Fixed income markets struggled during the first half of the period as interest rates rose and favorable U.S. equity markets fed investor risk appetites. However, in autumn volatility crept in, the yield curve began a flattening trend that continued through the end of December. As long-term debt yields fell, prices rose for many bonds, leading to moderately positive returns for several fixed income market sectors.
Despite continuing political variables, U.S. inflationary pressures and flagging growth rates, we are optimistic that the U.S. economy will remain strong in the near term. However, we remain attentive to signs that point to potential changes on the horizon. As always, we encourage you to discuss the risks and opportunities in today’s investment environment with your financial advisor.
Thank you for your continued confidence and support.
Sincerely,

Renee Laroche-Morris
President
The Dreyfus Corporation
January 15, 2019
2
DISCUSSION OF FUND PERFORMANCE(Unaudited)
For the period from January 1, 2018 through December 31, 2018, as provided by Barry K. Mills, CFA, Portfolio Manager
Market and Fund Performance Overview
For the 12-month period ended December 31, 2018, Dreyfus Investment Portfolios, Technology Growth Portfolio’s Initial shares produced a total return of -0.98%, and its Service shares produced a total return of -1.27%.1 The fund’s benchmarks, the NYSE® Technology Index and the S&P 500® Index, produced total returns of -6.68% and -4.38%, respectively, over the same period.2,3
Technology stocks lost ground amid rising interest rates, expectations of slower economic and earnings growth, international trade tensions, and indications that business spending on technology had peaked. The fund outperformed its benchmarks on the strength of favorable stock selection.
The Fund’s Investment Approach
The fund seeks capital appreciation. To pursue its goal, the fund normally invests at least 80% of its net assets in the stocks of growth companies of any size that Dreyfus believes to be leading producers or beneficiaries of technological innovation. Up to 25% of the fund’s assets may be invested in foreign securities.
In choosing stocks, the fund looks for technology companies with the potential for strong earnings or revenue growth rates, although some of the fund’s investments may currently be experiencing losses. The fund’s investment process centers on a multi-dimensional approach that looks for opportunities across emerging growth, cyclical, or stable growth companies. The fund’s investment approach seeks companies that appear to have strong earnings momentum, positive earnings revisions, favorable growth, product, or market cycles and/or favorable valuations.
Information Technology Slumped in Late in 2018
Stocks encountered heightened levels of volatility during the reporting period in response to rapidly shifting investor sentiment. The period started on a strong note, with U.S. equities rising broadly in response to domestic economic expansion and passage of major business-friendly tax reforms. In February, stocks plunged and volatility soared in response to rising wage pressures, which, along with other indicators, signaled a possible uptick in inflation. Markets recovered ground as these concerns eased, with information technology stocks far outpacing other market sectors. But March saw another broad-based market decline amid escalating trade tensions stemming from higher U.S. tariffs.
Stocks advanced midway through the reporting period when positive U.S. economic data continued to accrue and information technology stocks once more led the way. However, the market’s advance was limited by concerns related to tariffs imposed by the U.S. government on Chinese imports, followed by Chinese retaliation and the threat of additional tariffs. The industrials and materials sectors were hit particularly hard by escalating trade tensions while interest rate-sensitive sectors lagged as well. In contrast, information technology continued to outperform.
In the second half of the reporting period, the market suffered as earnings reports were mixed and the Federal Reserve sent mixed messages about its intent to raise interest rates. Stocks were also hindered by ongoing trade tensions with China and by an anticipated slowdown in the Chinese economy. Technology stocks were also hurt by surveys indicating that business spending on technology had peaked.
Stock Selection Enhanced Returns
The fund outperformed its benchmarks in part by allocating relatively few assets to lagging semiconductor companies. Instead, we emphasized holdings in the more robust Internet and software industries where strong individual stock selections further enhanced returns. Top performers included
3
DISCUSSION OF FUND PERFORMANCE(Unaudited) (continued)
payment processorSquare, which further expanded a global platform for small businesses to manage inventories and borrow capital; Visa, which benefited from higher-fee transactions in Europe and the ongoing trend away from cash; and Microsoft, which continues to take advantage of the growth in cloud computing. Another leading holding, Internet retailer Amazon.com, continued its ongoing pattern of gaining market share in its established markets while making progress toward establishing footholds in new ones, such as grocery and pharmaceutical sales.
The fund also benefited from avoiding or underweighting certain stocks. For example, JD.com, China’s version of Amazon.com, was hurt by the weakening Chinese economy and a decline in demand for appliances. NXP Semiconductor was hindered when its acquisition by Qualcomm was not approved by Chinese officials. Baidu, a Chinese search engine company, also lagged as it faced competition from online rival Alibaba Group Holding.
Of course, a few holdings fared less well over the reporting period.Broadcom, a semiconductor company, acquired software maker Computer Associates, a move that perplexed the market. Social media companyWeibo, based in China, was hurt by the broader decline in Chinese stocks prompted by fears of a trade war. Our positions inTesla, a maker of electric cars, andRoku, a manufacturer of digital media players, also hurt the fund’s performance. Lack of exposure to semiconductor company Intel hindered the fund’s performance as the company benefited from a shift to defensive stocks late in the reporting period.
Positioning the Fund for Slower Growth
We remain wary of escalating trade tensions between the United States and its trading partners, particularly China, and watchful of U.S. inflation trends. These concerns have prompted us to increase the fund’s exposure to more defensive technology stocks while continuing to position the fund to benefit from long-term technological trends.
January 15, 2019
1 Total return includes reinvestment of dividends and any capital gains paid. Past performance is no guarantee of future results. Share price and investment return fluctuate such that upon redemption, fund shares may be worth more or less than their original cost. The fund’s performance does not reflect the deduction of additional charges and expenses imposed in connection with investing in variable insurance contracts, which will reduce returns.
2 Source: Bloomberg L.P. — The NYSE®Technology Index is an equal-dollar weighted index designed to objectively represent the technology sector by holding 35 of the leading U.S. technology-related companies. Investors cannot invest directly in any index.
3 Source: Lipper Inc. — The S&P 500® Index is widely regarded as the best single gauge of large-cap U.S. equities. The index includes 500 leading companies and captures approximately 80% coverage of available market capitalization. Investors cannot invest directly in any index.
Please note: the position in any security highlighted with italicized typeface was sold during the reporting period.
The technology sector has been among the most volatile sectors of the stock market. Technology companies involve greater risk because their revenue and/or earnings tend to be less predictable, and some companies may be experiencing significant losses.
Equities are subject generally to market, market sector, market liquidity, issuer, and investment style risks, among other factors, to varying degrees, all of which are more fully described in the fund’s prospectus.
The fund is only available as a funding vehicle under variable life insurance policies or variable annuity contracts issued by insurance companies. Individuals may not purchase shares of the fund directly. A variable annuity is an insurance contract issued by an insurance company that enables investors to accumulate assets on a tax-deferred basis for retirement or other long-term goals. The investment objective and policies of Dreyfus Investment Portfolios, Technology Growth Portfolio made available through insurance products may be similar to those of other funds managed or advised by Dreyfus. However, the investment results of the fund may be higher or lower than, and may not be comparable to, those of any other Dreyfus fund.
4
FUND PERFORMANCE(Unaudited)
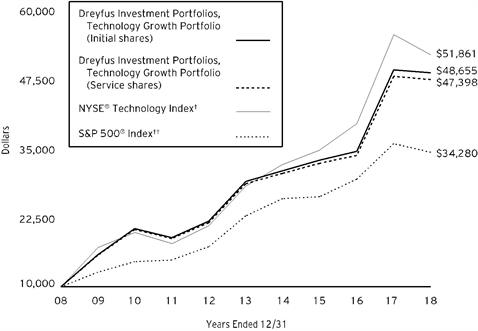
Comparison of change in value of $10,000 investment in Dreyfus Investment Portfolios, Technology Growth Portfolio Initial shares and Service shares and the NYSE® Technology Index and S&P 500® Index
† Source: Bloomberg L.P.
†† Source: Lipper Inc.
Past performance is not predictive of future performance. The fund’s performance does not reflect the deduction of additional charges and expenses imposed in connection with investing in variable insurance contracts which will reduce returns.
The above graph compares a $10,000 investment made in Initial and Service shares of Dreyfus Investment Portfolios, Technology Growth Portfolio on 12/31/08 to a $10,000 investment made in the NYSE® Technology Index and S&P 500® Index on that date.
The fund’s performance shown in the line graph above takes into account all applicable fees and expenses. The NYSE® Technology Index is an equal-dollar weighted index designed to objectively represent the technology sector by holding 35 of the leading U.S. technology-related companies. The S&P 500® Index is widely regarded as the best single gauge of large-cap U.S. equities. The Index includes 500 leading companies and captures approximately 80% coverage of available market capitalization. Unlike a mutual fund, the indices are not subject to charges, fees and other expenses. Investors cannot invest directly in any index. Further information relating to fund performance, including expense reimbursements, if applicable, is contained in the Financial Highlights section of the prospectus and elsewhere in this report.
5
FUND PERFORMANCE(Unaudited) (continued)
| | | | |
Average Annual Total Returns as of 12/31/18 |
| 1 Year | 5 Years | 10 Years |
Initial shares | -0.98% | 10.90% | 17.14% |
Service shares | -1.27% | 10.62% | 16.84% |
NYSE® Technology Index | -6.68% | 12.93% | 17.84% |
S&P 500® Index | -4.38% | 8.49% | 13.11% |
The performance data quoted represents past performance, which is no guarantee of future results. Share price and investment return fluctuate and an investor’s shares may be worth more or less than original cost upon redemption. Current performance may be lower or higher than the performance quoted. Go to Dreyfus.com for the fund’s most recent month-end returns.
The fund’s Initial shares are not subject to a Rule 12b-1 fee. The fund’s Service shares are subject to a 0.25% annual Rule 12b-1 fee. All dividends and capital gain distributions are reinvested.
The fund’s performance shown in the graph and table does not reflect the deduction of taxes that a shareholder would pay on fund distributions or the redemption of fund shares.
6
UNDERSTANDING YOUR FUND’S EXPENSES(Unaudited)
As a mutual fund investor, you pay ongoing expenses, such as management fees and other expenses. Using the information below, you can estimate how these expenses affect your investment and compare them with the expenses of other funds. You also may pay one-time transaction expenses, including sales charges (loads), redemption fees and expenses associated with variable annuity or insurance contracts, which are not shown in this section and would have resulted in higher total expenses. For more information, see your fund’s prospectus or talk to your financial adviser.
Review your fund’s expenses
The table below shows the expenses you would have paid on a $1,000 investment in Dreyfus Investment Portfolios, Technology Growth Portfolio from July 1, 2018 to December 31, 2018. It also shows how much a $1,000 investment would be worth at the close of the period, assuming actual returns and expenses.
| | | | | | | | |
Expenses and Value of a $1,000 Investment | | |
assuming actual returns for the six months ended December 31, 2018 | |
| | | | Initial Shares | Service Shares |
Expenses paid per $1,000† | | | $3.72 | | $4.90 |
Ending value (after expenses) | | | $870.70 | | $869.10 |
COMPARING YOUR FUND’S EXPENSES
WITH THOSE OF OTHER FUNDS(Unaudited)
Using the SEC’s method to compare expenses
The Securities and Exchange Commission (“SEC”) has established guidelines to help investors assess fund expenses. Per these guidelines, the table below shows your fund’s expenses based on a $1,000 investment, assuming a hypothetical 5% annualized return. You can use this information to compare the ongoing expenses (but not transaction expenses or total cost) of investing in the fund with those of other funds. All mutual fund shareholder reports will provide this information to help you make this comparison. Please note that you cannot use this information to estimate your actual ending account balance and expenses paid during the period.
| | | | | | | | |
Expenses and Value of a $1,000 Investment | | |
assuming a hypothetical 5% annualized return for the six months ended December 31, 2018 |
| | | | Initial Shares | Service Shares |
Expenses paid per $1,000† | | | $4.02 | | $5.30 |
Ending value (after expenses) | | | $1,021.22 | | $1,019.96 |
† Expenses are equal to the fund’s annualized expense ratio of .79% for Initial shares and 1.04% for Service shares, multiplied by the average account value over the period, multiplied by 184/365(to reflect the one-half year period).
7
STATEMENT OF INVESTMENTS
December 31, 2018
| | | | | | | | |
| |
Description | | | | Shares | | Value ($) | |
Common Stocks - 95.3% | | | | | |
Application Software - 12.2% | | | | | |
Adobe | | | | 104,538 | a | 23,650,677 | |
salesforce.com | | | | 185,839 | a | 25,454,368 | |
Splunk | | | | 71,485 | a,b | 7,495,202 | |
SS&C Technologies Holdings | | | | 114,439 | | 5,162,343 | |
| | | | | 61,762,590 | |
Communications Equipment - 6.3% | | | | | |
Cisco Systems | | | | 485,173 | | 21,022,546 | |
Palo Alto Networks | | | | 58,038 | a | 10,931,457 | |
| | | | | 31,954,003 | |
Data Processing & Outsourced S - 10.6% | | | | | |
Automatic Data Processing | | | | 120,381 | | 15,784,357 | |
PayPal Holdings | | | | 235,639 | a | 19,814,884 | |
Visa, Cl. A | | | | 139,025 | | 18,342,958 | |
| | | | | 53,942,199 | |
Electronic Components - 1.4% | | | | | |
Amphenol | | | | 88,465 | | 7,167,434 | |
Health Care Equipment - 2.1% | | | | | |
Intuitive Surgical | | | | 21,753 | a | 10,417,947 | |
Integrated Telecommunication S - 3.3% | | | | | |
Verizon Communications | | | | 298,864 | | 16,802,134 | |
Interactive Home Entertainment - 3.1% | | | | | |
Activision Blizzard | | | | 235,762 | | 10,979,436 | |
Take-Two Interactive Software | | | | 48,351 | a | 4,977,252 | |
| | | | | 15,956,688 | |
Interactive Media & Services - 9.3% | | | | | |
Alphabet, Cl. C | | | | 29,956 | a | 31,022,733 | |
Tencent Holdings | | | | 409,100 | | 16,216,326 | |
| | | | | 47,239,059 | |
Internet & Direct Marketing Re - 9.7% | | | | | |
Alibaba Group Holding, ADR | | | | 135,015 | a,b | 18,506,506 | |
Amazon.com | | | | 16,975 | a | 25,495,941 | |
GrubHub | | | | 69,299 | a,b | 5,322,856 | |
| | | | | 49,325,303 | |
IT Consulting & Other Services - 2.7% | | | | | |
International Business Machines | | | | 119,932 | | 13,632,670 | |
Life Sciences Tools & Services - 2.0% | | | | | |
Illumina | | | | 34,411 | a | 10,320,891 | |
Movies & Entertainment - 4.7% | | | | | |
Netflix | | | | 70,672 | a | 18,916,068 | |
Spotify Technology | | | | 41,394 | a | 4,698,219 | |
| | | | | 23,614,287 | |
8
| | | | | | | | |
| |
Description | | | | Shares | | Value ($) | |
Common Stocks - 95.3% (continued) | | | | | |
Research & Consulting Services - 2.0% | | | | | |
CoStar Group | | | | 30,741 | a | 10,370,169 | |
Semiconductors - 12.8% | | | | | |
Qualcomm | | | | 304,293 | b | 17,317,315 | |
Taiwan Semiconductor Manufacturing, ADR | | | | 560,611 | | 20,692,152 | |
Texas Instruments | | | | 137,535 | | 12,997,057 | |
Xilinx | | | | 161,934 | | 13,791,919 | |
| | | | | 64,798,443 | |
Systems Software - 11.2% | | | | | |
Microsoft | | | | 304,801 | | 30,958,638 | |
Oracle | | | | 346,851 | | 15,660,323 | |
ServiceNow | | | | 56,610 | a | 10,079,411 | |
| | | | | 56,698,372 | |
Technology Hardware, Storage & - 1.9% | | | | | |
Apple | | | | 60,754 | | 9,583,336 | |
Total Common Stocks(cost $394,534,780) | | | | 483,585,525 | |
| | | 1-Day
Yield (%) | | | | | |
Investment Companies - 5.5% | | | | | |
Registered Investment Companies - 5.5% | | | | | |
Dreyfus Institutional Preferred Government Plus Money Market Fund
(cost $28,028,206) | | 2.32 | | 28,028,206 | c | 28,028,206 | |
Total Investments(cost $422,562,986) | | 100.8% | | 511,613,731 | |
Liabilities, Less Cash and Receivables | | (.8%) | | (3,992,916) | |
Net Assets | | 100.0% | | 507,620,815 | |
ADR—American Depository Receipt
a Non-income producing security.
b Security, or portion thereof, on loan. At December 31, 2018, the value of the fund’s securities on loan was $26,098,540 and the value of the collateral held by the fund was $26,573,685, consisting of U.S. Government & Agency securities.
c Investment in affiliated issuer. The investment objective of this investment company is publicly available and can be found within the investment company’s prospectus.
| | |
Portfolio Summary (Unaudited)† | Value (%) |
Information Technology | 59.0 |
Communication Services | 20.4 |
Consumer Discretionary | 9.7 |
Investment Companies | 5.5 |
Health Care | 4.1 |
Industrials | 2.1 |
| | 100.8 |
† Based on net assets.
See notes to financial statements.
9
STATEMENT OF INVESTMENTS IN AFFILIATED ISSUERS
| | | | | | | |
Registered Investment Companies | Value
12/31/17($) | Purchases($) | Sales($) | Value
12/31/18($) | Net
Assets(%) | Dividends/
Distributions($) |
Dreyfus Institutional Preferred Government Plus Money Market Fund | 9,767,983 | 159,501,363 | 141,241,140 | 28,028,206 | 5.5 | 327,506 |
Dreyfus Institutional Preferred Government Money Market Fund, Institutional Shares | 17,229,167 | 148,263,218 | 165,492,385 | - | - | - |
Total | 26,997,150 | 307,764,581 | 306,733,525 | 28,028,206 | 5.5 | 327,506 |
See notes to financial statements.
10
STATEMENT OF ASSETS AND LIABILITIES
December 31, 2018
| | | | | | | |
| | | | | | |
| | | Cost | | Value | |
Assets ($): | | | | |
Investments in securities—See Statement of Investments
(including securities on loan, valued at $26,098,540)—Note 1(c): | | | |
Unaffiliated issuers | 394,534,780 | | 483,585,525 | |
Affiliated issuers | | 28,028,206 | | 28,028,206 | |
Receivable for shares of Beneficial Interest subscribed | | 522,751 | |
Dividends and securities lending income receivable | | 173,254 | |
Prepaid expenses | | | | | 3,417 | |
| | | | | 512,313,153 | |
Liabilities ($): | | | | |
Due to The Dreyfus Corporation and affiliates—Note 3(b) | | | | 425,680 | |
Payable for investment securities purchased | | 3,999,030 | |
Payable for shares of Beneficial Interest redeemed | | 203,311 | |
Trustees fees and expenses payable | | 4,631 | |
Accrued expenses | | | | | 59,686 | |
| | | | | 4,692,338 | |
Net Assets ($) | | | 507,620,815 | |
Composition of Net Assets ($): | | | | |
Paid-in capital | | | | | 350,297,828 | |
Total distributable earnings (loss) | | | | | 157,322,987 | |
Net Assets ($) | | | 507,620,815 | |
| | | | |
Net Asset Value Per Share | Initial Shares | Service Shares | |
Net Assets ($) | 119,469,986 | 388,150,829 | |
Shares Outstanding | 5,296,633 | 18,211,827 | |
Net Asset Value Per Share ($) | 22.56 | 21.31 | |
| | | | |
See notes to financial statements. | | | |
11
STATEMENT OF OPERATIONS
Year Ended December 31, 2018
| | | | | | | |
| | | | | | |
| | | | | | |
Investment Income ($): | | | | |
Income: | | | | |
Cash dividends: | |
Unaffiliated issuers | | | 4,787,782 | |
Affiliated issuers | | | 327,506 | |
Income from securities lending—Note 1(c) | | | 145,229 | |
Total Income | | | 5,260,517 | |
Expenses: | | | | |
Management fee—Note 3(a) | | | 4,247,442 | |
Distribution fees—Note 3(b) | | | 1,074,399 | |
Professional fees | | | 93,354 | |
Trustees’ fees and expenses—Note 3(c) | | | 35,764 | |
Prospectus and shareholders’ reports | | | 22,809 | |
Loan commitment fees—Note 2 | | | 13,246 | |
Custodian fees—Note 3(b) | | | 9,211 | |
Shareholder servicing costs—Note 3(b) | | | 770 | |
Miscellaneous | | | 33,755 | |
Total Expenses | | | 5,530,750 | |
Less—reduction in fees due to earnings credits—Note 3(b) | | | (18) | |
Net Expenses | | | 5,530,732 | |
Investment (Loss)—Net | | | (270,215) | |
Realized and Unrealized Gain (Loss) on Investments—Note 4 ($): | | |
Net realized gain (loss) on investments and foreign currency transactions | 68,298,336 | |
Net unrealized appreciation (depreciation) on investments
and foreign currency transactions | | | (78,510,083) | |
Net Realized and Unrealized Gain (Loss) on Investments | | | (10,211,747) | |
Net (Decrease) in Net Assets Resulting from Operations | | (10,481,962) | |
| | | | | | | |
See notes to financial statements. | | | | | |
12
STATEMENT OF CHANGES IN NET ASSETS
| | | | | | | | | | |
| | | | Year Ended December 31, |
| | | | 2018 | | 2017a | |
Operations ($): | | | | | | | | |
Investment (loss)—net | | | (270,215) | | | | (951,137) | |
Net realized gain (loss) on investments | | 68,298,336 | | | | 30,839,567 | |
Net unrealized appreciation (depreciation)
on investments | | (78,510,083) | | | | 107,857,056 | |
Net Increase (Decrease) in Net Assets
Resulting from Operations | (10,481,962) | | | | 137,745,486 | |
Distributions ($): | |
Distributions to shareholders: | | | | | | | | |
Initial Shares | | | (6,797,939) | | | | (4,962,679) | |
Service Shares | | | (22,491,966) | | | | (14,008,431) | |
Total Distributions | | | (29,289,905) | | | | (18,971,110) | |
Beneficial Interest Transactions ($): | |
Net proceeds from shares sold: | | | | | | | | |
Initial Shares | | | 10,375,145 | | | | 8,829,083 | |
Service Shares | | | 109,254,245 | | | | 71,523,776 | |
Distributions reinvested: | | | | | | | | |
Initial Shares | | | 6,797,939 | | | | 4,962,679 | |
Service Shares | | | 22,491,966 | | | | 14,008,431 | |
Cost of shares redeemed: | | | | | | | | |
Initial Shares | | | (12,323,077) | | | | (10,261,805) | |
Service Shares | | | (77,103,922) | | | | (32,979,833) | |
Increase (Decrease) in Net Assets
from Beneficial Interest Transactions | 59,492,296 | | | | 56,082,331 | |
Total Increase (Decrease) in Net Assets | 19,720,429 | | | | 174,856,707 | |
Net Assets ($): | |
Beginning of Period | | | 487,900,386 | | | | 313,043,679 | |
End of Period | | | 507,620,815 | | | | 487,900,386 | |
Capital Share Transactions (Shares): | |
Initial Shares | | | | | | | | |
Shares sold | | | 399,715 | | | | 414,443 | |
Shares issued for distributions reinvested | | | 263,180 | | | | 261,607 | |
Shares redeemed | | | (487,590) | | | | (487,724) | |
Net Increase (Decrease) in Shares Outstanding | 175,305 | | | | 188,326 | |
Service Shares | | | | | | | | |
Shares sold | | | 4,452,721 | | | | 3,549,112 | |
Shares issued for distributions reinvested | | | 919,541 | | | | 775,661 | |
Shares redeemed | | | (3,213,266) | | | | (1,645,634) | |
Net Increase (Decrease) in Shares Outstanding | 2,158,996 | | | | 2,679,139 | |
| | | | | | | | | | |
aDistributions to shareholders include only distributions from net realized gains on investment.
| |
See notes to financial statements. | | | | | | | | |
13
FINANCIAL HIGHLIGHTS
The following tables describe the performance for each share class for the fiscal periods indicated. All information (except portfolio turnover rate) reflects financial results for a single fund share. Total return shows how much your investment in the fund would have increased (or decreased) during each period, assuming you had reinvested all dividends and distributions. The fund’s total returns do not reflect expenses associated with variable annuity or insurance contracts. These figures have been derived from the fund’s financial statements.
| | | | | | | | |
| | | |
| | | |
| | Year Ended December 31, |
Initial Shares | | 2018 | 2017 | 2016 | 2015 | 2014 |
Per Share Data ($): | | | | | | |
Net asset value,
beginning of period | | 23.95 | 17.69 | 17.78 | 18.65 | 18.38 |
Investment Operations: | | | | | | |
Investment income (loss)—neta | | .04 | (.01) | .01 | (.04) | (.01) |
Net realized and unrealized gain
(loss) on investments | | (.11) | 7.29 | .77 | 1.12 | 1.26 |
Total from Investment Operations | | (.07) | 7.28 | .78 | 1.08 | 1.25 |
Distributions: | | | | | | |
Dividends from net realized
gain on investments | | (1.32) | (1.02) | (.87) | (1.95) | (.98) |
Net asset value, end of period | | 22.56 | 23.95 | 17.69 | 17.78 | 18.65 |
Total Return (%) | | (.98) | 42.64 | 4.72 | 6.16 | 6.82 |
Ratios/Supplemental Data (%): | | | | | | |
Ratio of total expenses
to average net assets | | .79 | .82 | .83 | .83 | .83 |
Ratio of net expenses
to average net assets | | .79 | .82 | .83 | .83 | .83 |
Ratio of net investment income
(loss) to average net assets | | .14 | (.05) | .07 | (.22) | (.05) |
Portfolio Turnover Rate | | 55.34 | 42.07 | 64.26 | 70.33 | 72.20 |
Net Assets, end of period ($ x 1,000) | | 119,470 | 122,670 | 87,243 | 96,422 | 96,320 |
a Based on average shares outstanding.
See notes to financial statements.
14
| | | | | | | | |
| | | |
| | | |
| | Year Ended December 31, |
Service Shares | | 2018 | 2017 | 2016 | 2015 | 2014 |
Per Share Data ($): | | | | | | |
Net asset value, beginning of period | | 22.75 | 16.88 | 17.06 | 18.01 | 17.82 |
Investment Operations: | | | | | | |
Investment (loss)—neta | | (.03) | (.06) | (.03) | (.08) | (.05) |
Net realized and unrealized gain
(loss) on investments | | (.09) | 6.95 | .72 | 1.08 | 1.22 |
Total from Investment Operations | | (.12) | 6.89 | .69 | 1.00 | 1.17 |
Distributions: | | | | | | |
Dividends from net realized
gain on investments | | (1.32) | (1.02) | (.87) | (1.95) | (.98) |
Net asset value, end of period | | 21.31 | 22.75 | 16.88 | 17.06 | 18.01 |
Total Return (%) | | (1.27) | 42.36 | 4.38 | 5.92 | 6.58 |
Ratios/Supplemental Data (%): | | | | | | |
Ratio of total expenses
to average net assets | | 1.04 | 1.07 | 1.08 | 1.08 | 1.08 |
Ratio of net expenses
to average net assets | | 1.04 | 1.07 | 1.08 | 1.08 | 1.08 |
Ratio of net investment (loss)
to average net assets | | (.11) | (.30) | (.18) | (.47) | (.30) |
Portfolio Turnover Rate | | 55.34 | 42.07 | 64.26 | 70.33 | 72.20 |
Net Assets, end of period ($ x 1,000) | | 388,151 | 365,231 | 225,801 | 217,006 | 187,957 |
a Based on average shares outstanding.
See notes to financial statements.
15
NOTES TO FINANCIAL STATEMENTS
NOTE 1—Significant Accounting Policies:
Technology Growth Portfolio (the “fund”) is a separate diversified series of Dreyfus Investment Portfolios (the “Company”), which is registered under the Investment Company Act of 1940, as amended (the “Act”), as an open-end management investment company and operates as a series company currently offering four series, including the fund. The fund is only offered to separate accounts established by insurance companies to fund variable annuity contracts and variable life insurance policies. The fund’s investment objective is to seek capital appreciation. The Dreyfus Corporation (the “Manager” or “Dreyfus”), a wholly-owned subsidiary of The Bank of New York Mellon Corporation (“BNY Mellon”), serves as the fund’s investment adviser.
MBSC Securities Corporation (the “Distributor”), a wholly-owned subsidiary of Dreyfus, is the distributor of the fund’s shares, which are sold without a sales charge. The fund is authorized to issue an unlimited number of $.001 par value shares of Beneficial Interest in each of the following classes of shares: Initial and Service. Each class of shares has identical rights and privileges, except with respect to the Distribution Plan, and the expenses borne by each class, the allocation of certain transfer agency costs, and certain voting rights. Income, expenses (other than expenses attributable to a specific class), and realized and unrealized gains or losses on investments are allocated to each class of shares based on its relative net assets.
The Company accounts separately for the assets, liabilities and operations of each series. Expenses directly attributable to each series are charged to that series’ operations; expenses which are applicable to all series are allocated among them on a pro rata basis.
The Financial Accounting Standards Board (“FASB”) Accounting Standards Codification is the exclusive reference of authoritative U.S. generally accepted accounting principles (“GAAP”) recognized by the FASB to be applied by nongovernmental entities. Rules and interpretive releases of the Securities and Exchange Commission (“SEC”) under authority of federal laws are also sources of authoritative GAAP for SEC registrants. The fund’s financial statements are prepared in accordance with GAAP, which may require the use of management estimates and assumptions. Actual results could differ from those estimates.
The Companyenters into contracts that contain a variety of indemnifications. The fund’s maximum exposure under these arrangements is unknown. The fund does not anticipate recognizing any loss related to these arrangements.
16
(a) Portfolio valuation: The fair value of a financial instrument is the amount that would be received to sell an asset or paid to transfer a liability in an orderly transaction between market participants at the measurement date (i.e., the exit price). GAAP establishes a fair value hierarchy that prioritizes the inputs of valuation techniques used to measure fair value. This hierarchy gives the highest priority to unadjusted quoted prices in active markets for identical assets or liabilities (Level 1 measurements) and the lowest priority to unobservable inputs (Level 3 measurements).
Additionally, GAAP provides guidance on determining whether the volume and activity in a market has decreased significantly and whether such a decrease in activity results in transactions that are not orderly. GAAP requires enhanced disclosures around valuation inputs and techniques used during annual and interim periods.
Various inputs are used in determining the value of the fund’s investments relating to fair value measurements. These inputs are summarized in the three broad levels listed below:
Level 1—unadjusted quoted prices in active markets for identical investments.
Level 2—other significant observable inputs (including quoted prices for similar investments, interest rates, prepayment speeds, credit risk, etc.).
Level 3—significant unobservable inputs (including the fund’s own assumptions in determining the fair value of investments).
The inputs or methodology used for valuing securities are not necessarily an indication of the risk associated with investing in those securities.
Changes in valuation techniques may result in transfers in or out of an assigned level within the disclosure hierarchy. Valuation techniques used to value the fund’s investments are as follows:
Investments in securities are valued at the last sales price on the securities exchange or national securities market on which such securities are primarily traded. Securities listed on the National Market System for which market quotations are available are valued at the official closing price or, if there is no official closing price that day, at the last sales price. For open short positions, asked prices are used for valuation purposes. Bid price is used when no asked price is available. Registered investment companies that are not traded on an exchange are valued at their net asset value. All of the preceding securities are generally categorized within Level 1 of the fair value hierarchy.
17
NOTES TO FINANCIAL STATEMENTS(continued)
Securities not listed on an exchange or the national securities market, or securities for which there were no transactions, are valued at the average of the most recent bid and asked prices. These securities are generally categorized within Level 2 of the fair value hierarchy.
Fair valuing of securities may be determined with the assistance of a pricing service using calculations based on indices of domestic securities and other appropriate indicators, such as prices of relevant ADRs and futures. Utilizing these techniques may result in transfers between Level 1 and Level 2 of the fair value hierarchy.
When market quotations or official closing prices are not readily available, or are determined not to accurately reflect fair value, such as when the value of a security has been significantly affected by events after the close of the exchange or market on which the security is principally traded (for example, a foreign exchange or market), but before the fund calculates its net asset value, the fund may value these investments at fair value as determined in accordance with the procedures approved by the Company’s Board of Trustees (the “Board”). Certain factors may be considered when fair valuing investments such as: fundamental analytical data, the nature and duration of restrictions on disposition, an evaluation of the forces that influence the market in which the securities are purchased and sold, and public trading in similar securities of the issuer or comparable issuers. These securities are either categorized within Level 2 or 3 of the fair value hierarchy depending on the relevant inputs used.
For restricted securities where observable inputs are limited, assumptions about market activity and risk are used and such securities are generally categorized within Level 3 of the fair value hierarchy.
Investments denominated in foreign currencies are translated to U.S. dollars at the prevailing rates of exchange.
The following is a summary of the inputs used as of December 31, 2018in valuing the fund’s investments:
| | | | | |
| | Level 1 - Unadjusted Quoted Prices | Level 2 - Other Significant Observable Inputs | Level 3 -Significant Unobservable Inputs | Total |
Assets ($) | | | | |
Investments in Securities: | | | |
Equity Securities - Common Stocks† | 467,369,199 | 16,216,326†† | - | 483,585,525 |
18
| | | | | |
| | Level 1 - Unadjusted Quoted Prices | Level 2 - Other Significant Observable Inputs | Level 3 -Significant Unobservable Inputs | Total |
Assets ($) | | | | |
Investment Companies | 28,028,206 | - | - | 28,028,206 |
† See Statement of Investments for additional detailed categorizations.
†† Securities classified within Level 2 at period end as the values were determined pursuant to the fund’s fair valuation procedures.
At December 31, 2018, there were no transfers between levels of the fair value hierarchy. It is the fund’s policy to recognize transfers between levels at the end of the reporting period.
(b) Foreign currency transactions: The fund does not isolate that portion of the results of operations resulting from changes in foreign exchange rates on investments from the fluctuations arising from changes in the market prices of securities held. Such fluctuations are included with the net realized and unrealized gain or loss on investments.
Net realized foreign exchange gains or losses arise from sales of foreign currencies, currency gains or losses realized on securities transactions between trade and settlement date, and the difference between the amounts of dividends, interest and foreign withholding taxes recorded on the fund’s books and the U.S. dollar equivalent of the amounts actually received or paid. Net unrealized foreign exchange gains and losses arise from changes in the value of assets and liabilities other than investments resulting from changes in exchange rates. Foreign currency gains and losses on foreign currency transactions are also included with net realized and unrealized gain or loss on investments.
(c)Securities transactions and investment income: Securities transactions are recorded on a trade date basis. Realized gains and losses from securities transactions are recorded on the identified cost basis. Dividend income is recognized on the ex-dividend date and interest income, including, where applicable, accretion of discount and amortization of premium on investments, is recognized on the accrual basis.
Pursuant to a securities lending agreement with The Bank of New York Mellon, a subsidiary of BNY Mellon and an affiliate of Dreyfus, the fund may lend securities to qualified institutions. It is the fund’s policy that, at origination, all loans are secured by collateral of at least 102% of the value of U.S. securities loaned and 105% of the value of foreign securities
19
NOTES TO FINANCIAL STATEMENTS(continued)
loaned. Collateral equivalent to at least 100% of the market value of securities on loan is maintained at all times. Collateral is either in the form of cash, which can be invested in certain money market mutual funds managed by Dreyfus, or U.S. Government and Agency securities. The fund is entitled to receive all dividends, interest and distributions on securities loaned, in addition to income earned as a result of the lending transaction. Should a borrower fail to return the securities in a timely manner, The Bank of New York Mellon is required to replace the securities for the benefit of the fund or credit the fund with the market value of the unreturned securities and is subrogated to the fund’s rights against the borrower and the collateral. Additionally, the contractual maturity of security lending transactions are on an overnight and continuous basis. During the period ended December 31, 2018, The Bank of New York Mellon earned $27,765 from lending portfolio securities, pursuant to the securities lending agreement.
(d) Affiliated issuers: Investments in other investment companies advised by Dreyfus are considered “affiliated” under the Act.
(e) Dividends and distributions to shareholders: Dividends and distributions are recorded on the ex-dividend date. Dividends from investment income-net and dividends from net realized capital gains, if any, are normally declared and paid annually, but the fund may make distributions on a more frequent basis to comply with the distribution requirements of the Internal Revenue Code of 1986, as amended (the “Code”). To the extent that net realized capital gains can be offset by capital loss carryovers, it is the policy of the fund not to distribute such gains. Income and capital gain distributions are determined in accordance with income tax regulations, which may differ from GAAP.
(f) Federal income taxes: It is the policy of the fund to continue to qualify as a regulated investment company, if such qualification is in the best interests of its shareholders, by complying with the applicable provisions of the Code, and to make distributions of taxable income and net realized capital gain sufficient to relieve it from substantially all federal income and excise taxes.
As of and during the period ended December 31, 2018, the fund did not have any liabilities for any uncertain tax positions. The fund recognizes interest and penalties, if any, related to uncertain tax positions as income tax expense in the Statement of Operations. During the period ended December 31, 2018, the fund did not incur any interest or penalties.
20
Each tax year in the four-year period ended December 31, 2018 remains subject to examination by the Internal Revenue Service and state taxing authorities.
At December 31, 2018, the components of accumulated earnings on a tax basis were as follows: undistributed capital gains $68,545,097 and unrealized appreciation $88,777,890.
The tax character of distributions paid to shareholders during the fiscal periods ended December 31, 2018 and December 31, 2017 were as follows: ordinary income $10,979,108 and $0, and long-term capital gains $18,310,797 and $18,971,110, respectively.
During the period ended December 31, 2018, as a result of permanent book to tax differences, primarily due to the tax treatment for net operating losses, the fund increased total distributable earnings (loss) by $270,436 and decreased paid-in capital by the same amount. Net assets and net asset value per share were not affected by this reclassification.
(g) New Accounting Pronouncements: In August 2018, the FASB issued Accounting Standards Update 2018-13, Fair Value Measurement (Topic 820): Disclosure Framework—Changes to the Disclosure Requirements for Fair Value Measurement (“ASU 2018-13”). The update provides guidance that eliminates, adds and modifies certain disclosure requirements for fair value measurements. ASU 2018-13 will be effective for annual periods beginning after December 15, 2019. Management is currently assessing the potential impact of these changes to future financial statements.
NOTE 2—Bank Lines of Credit:
The fund participates with other Dreyfus-managed long-term open-end funds in a $1.030 billion unsecured credit facility led by Citibank, N.A. (the “Citibank Credit Facility”) and a $300 million unsecured credit facility provided by The Bank of New York Mellon (the “BNYM Credit Facility”), each to be utilized primarily for temporary or emergency purposes, including the financing of redemptions (each, a “Facility”). The Citibank Credit Facility is available in two tranches: (i) Tranche A is in an amount equal to $830 million and is available to all long-term open-ended funds, including the fund, and (ii) Tranche B is in amount equal to $200 million and is available only to the Dreyfus Floating Rate Income Fund, a series of The Dreyfus/Laurel Funds, Inc. Prior to October 3, 2018, the unsecured credit facility with Citibank, N.A. was $830 million. In connection therewith, the fund has agreed to pay its pro rata portion of commitment fees for Tranche A of the Citibank Credit Facility and the BNYM Credit Facility. Interest is charged to the fund based on rates determined pursuant
21
NOTES TO FINANCIAL STATEMENTS(continued)
to the terms of the respective Facility at the time of borrowing. During the period ended December 31, 2018, the fund did not borrow under the Facilities.
NOTE 3—Management Fee and Other Transactions with Affiliates:
(a)Pursuant to a management agreement with Dreyfus, the management fee is computed at the annual rate of .75% of the value of the fund’s average daily net assets and is payable monthly.
(b)Under the Distribution Plan adopted pursuant to Rule 12b-1 under the Act, Service shares pay the Distributor for distributing its shares, for servicing and/or maintaining Service shares’ shareholder accounts and for advertising and marketing for Service shares. The Distribution Plan provides for payments to be made at an annual rate of .25% of the value of the Service shares’ average daily net assets. The Distributor may make payments to Participating Insurance Companies and to brokers and dealers acting as principal underwriter for their variable insurance products. The fees payable under the Distribution Plan are payable without regard to actual expenses incurred. During the period ended December 31, 2018,Service shares were charged $1,074,399 pursuant to the Distribution Plan.
The fund has arrangements with the transfer agent and the custodian whereby the fund may receive earnings credits when positive cash balances are maintained, which are used to offset transfer agency and custody fees. For financial reporting purposes, the fund includes net earnings credits, if any, as an expense offset in the Statement of Operations.
The fund compensates Dreyfus Transfer, Inc., a wholly-owned subsidiary of Dreyfus, under a transfer agency agreement for providing transfer agency and cash management services for the fund. The majority of transfer agency fees are comprised of amounts paid on a per account basis, while cash management fees are related to fund subscriptions and redemptions. During the period ended December 31, 2018, the fund was charged $731 for transfer agency services. These fees are included in Shareholder servicing costs in the Statement of Operations.
The fund compensates The Bank of New York Mellon under a custody agreement for providing custodial services for the fund. These fees are determined based on net assets, geographic region and transaction activity. During the period ended December 31, 2018, the fund was charged $9,211 pursuant to the custody agreement. These fees were partially offset by earnings credits of $18.
22
During the period ended December 31, 2018, the fund was charged $12,774 for services performed by the Chief Compliance Officer and his staff. These fees are included in Miscellaneous in the Statement of Operations.
The components of “Due to The Dreyfus Corporation and affiliates” in the Statement of Assets and Liabilities consist of: management fees $328,498, Distribution Plan fees $83,659, custodian fees $7,123, Chief Compliance Officer fees $6,289 and transfer agency fees $111.
(c) Each Board member also serves as a Board member of other funds within the Dreyfus complex. Annual retainer fees and attendance fees are allocated to each fund based on net assets.
NOTE 4—Securities Transactions:
The aggregate amount of purchases and sales of investment securities, excluding short-term securities, during the period ended December 31, 2018, amounted to $316,421,486 and $300,602,326, respectively.
At December 31, 2018, the cost of investments for federal income tax purposes was $422,835,841; accordingly, accumulated net unrealized appreciation on investments was $88,777,890, consisting of $121,425,770 gross unrealized appreciation and $32,647,880 gross unrealized depreciation.
23
REPORT OF INDEPENDENT REGISTERED PUBLIC ACCOUNTING FIRM
To the Shareholders and the Board of Trustees of Technology Growth Portfolio
Opinion on the Financial Statements
We have audited the accompanying statement of assets and liabilities of Technology Growth Portfolio (the “Fund”) (one of the funds constituting Dreyfus Investment Portfolios), including the statements of investments and investments in affiliated issuers, as of December 31, 2018, and the related statement of operations for the year then ended, the statement of changes in net assets for each of the two years in the period then ended, the financial highlights for each of the five years in the period then ended and the related notes (collectively referred to as the “financial statements”). In our opinion, the financial statements present fairly, in all material respects, the financial position of the Fund (one of the funds constituting Dreyfus Investment Portfolios) at December 31, 2018, the results of its operations for the year then ended, the changes in its net assets for each of the two years in the period then ended and its financial highlights for each of the five years in the period then ended, in conformity with U.S. generally accepted accounting principles.
Basis for Opinion
These financial statements are the responsibility of the Fund’s management. Our responsibility is to express an opinion on the Fund’s financial statements based on our audits. We are a public accounting firm registered with the Public Company Accounting Oversight Board (United States) (“PCAOB”) and are required to be independent with respect to the Fund in accordance with the U.S. federal securities laws and the applicable rules and regulations of the Securities and Exchange Commission and the PCAOB.
We conducted our audits in accordance with the standards of the PCAOB. Those standards require that we plan and perform the audit to obtain reasonable assurance about whether the financial statements are free of material misstatement, whether due to error or fraud. The Fund is not required to have, nor were we engaged to perform, an audit of the Fund’s internal control over financial reporting. As part of our audits, we are required to obtain an understanding of internal control over financial reporting, but not for the purpose of expressing an opinion on the effectiveness of the Fund’s internal control over financial reporting. Accordingly, we express no such opinion.
Our audits included performing procedures to assess the risks of material misstatement of the financial statements, whether due to error or fraud, and performing procedures that respond to those risks. Such procedures included examining, on a test basis, evidence regarding the amounts and disclosures in the financial statements. Our procedures included confirmation of securities owned as of December 31, 2018, by correspondence with the custodian and others or by other appropriate auditing procedures where replies from others were not received. Our audits also included evaluating the accounting principles used and significant estimates made by management, as well as evaluating the overall presentation of the financial statements. We believe that our audits provide a reasonable basis for our opinion.

We have served as the auditor of one or more Dreyfus investment companies since at least 1957, but we are unable to determine the specific year.
New York, New York
February 11, 2019
24
IMPORTANT TAX INFORMATION(Unaudited)
For federal tax purposes, the fund hereby reports 23.50% of the ordinary dividends paid during the fiscal year ended December 31, 2018 as qualifying for the corporate dividends received deduction. Shareholders will receive notification in early 2019 of the percentage applicable to the presentation of their 2018 income tax returns. Also, the fund hereby reports $.4958 per share as a short-term capital gain distribution and $.8260 per share as a long-term capital gain distribution paid on March 21, 2018.
25
INFORMATION ABOUT THE RENEWAL OF THE FUND’S MANAGEMENT AGREEMENT (Unaudited)
At a meeting of the fund’s Board of Trustees held on July 18-19, 2018, the Board considered the renewal of the fund’s Management Agreement pursuant to which Dreyfus provides the fund with investment advisory and administrative services (the “Agreement”). The Board members, a majority of whom are not “interested persons” (as defined in the Investment Company Act of 1940, as amended) of the fund, were assisted in their review by independent legal counsel and met with counsel in executive session separate from Dreyfus representatives. In considering the renewal of the Agreement, the Board considered all factors that it believed to be relevant, including those discussed below. The Board did not identify any one factor as dispositive, and each Board member may have attributed different weights to the factors considered.
Analysis of Nature, Extent, and Quality of Services Provided to the Fund. The Board considered information provided to them at the meeting and in previous presentations from Dreyfus representatives regarding the nature, extent, and quality of the services provided to funds in the Dreyfus fund complex. Dreyfus provided the number of open accounts in the fund, the fund’s asset size and the allocation of fund assets among distribution channels. Dreyfus also had previously provided information regarding the diverse intermediary relationships and distribution channels of funds in the Dreyfus fund complex (such as retail direct or intermediary, in which intermediaries typically are paid by the fund and/or Dreyfus) and Dreyfus’ corresponding need for broad, deep, and diverse resources to be able to provide ongoing shareholder services to each intermediary or distribution channel, as applicable to the fund.
The Board also considered research support available to, and portfolio management capabilities of, the fund’s portfolio management personnel and that Dreyfus also provides oversight of day-to-day fund operations, including fund accounting and administration and assistance in meeting legal and regulatory requirements. The Board also considered Dreyfus’ extensive administrative, accounting and compliance infrastructures. The Board also considered portfolio management’s brokerage policies and practices (including policies and practices regarding soft dollars) and the standards applied in seeking best execution.
Comparative Analysis of the Fund’s Performance and Management Fee and Expense Ratio. The Board reviewed reports prepared by Broadridge Financial Solutions, Inc. (“Broadridge”), an independent provider of investment company data, which included information comparing (1) the fund’s performance with the performance of a group of comparable funds (the “Performance Group”) and with a broader group of funds (the “Performance Universe”), all for various periods ended May 31, 2018, and (2) the fund’s actual and contractual management fees and total expenses with those of a group of comparable funds (the “Expense Group”) and with a broader group of funds (the “Expense Universe”), the information for which was derived in part from fund financial statements available to Broadridge as of the date of its analysis. Dreyfus previously had furnished the Board with a description of the methodology Broadridge used to select the Performance Group and Performance Universe and the Expense Group and Expense Universe.
26
Dreyfus representatives stated that the usefulness of performance comparisons may be affected by a number of factors, including different investment limitations that may be applicable to the fund and comparison funds. The Board discussed with representatives of Dreyfus and/or its affiliates the results of the comparisons and considered that the fund’s total return performance was below the Performance Group median for all periods except the one-year period when it was above the median and above the Performance Universe median for the one-, three- and ten-year periods and below the median for the two-, four- and five-year periods. The Board considered the relative proximity of the fund’s performance to the Performance Group and/or Performance Universe median(s) during certain periods when performance was below median. Dreyfus also provided a comparison of the fund’s calendar year total returns to the returns of the fund’s benchmark indices, and it was considered that the fund’s returns were above the returns of one of the indices in four of the ten calendar years shown and above the other index in five of the ten calendar years shown.
The Board also reviewed the range of actual and contractual management fees and total expenses of the Expense Group and Expense Universe funds and discussed the results of the comparisons. The Board considered that the fund’s contractual management fee was below the Expense Group median and the fund’s actual management fee and total expenses were below the Expense Group and Expense Universe medians.
Dreyfus representatives reviewed with the Board the management or investment advisory fees (1) paid by funds advised or administered by Dreyfus that are in the same Lipper category as the fund and (2) paid to Dreyfus or the Dreyfus-affiliated primary employer of the fund’s primary portfolio manager(s) for advising any separate accounts and/or other types of client portfolios that are considered to have similar investment strategies and policies as the fund (the “Similar Clients”), and explained the nature of the Similar Clients. They discussed differences in fees paid and the relationship of the fees paid in light of any differences in the services provided and other relevant factors. The Board considered the relevance of the fee information provided for the Similar Clients to evaluate the appropriateness of the fund’s management fee.
Analysis of Profitability and Economies of Scale. Dreyfus representatives reviewed the expenses allocated and profit received by Dreyfus and its affiliates and the resulting profitability percentage for managing the fund and the aggregate profitability percentage to Dreyfus and its affiliates for managing the funds in the Dreyfus fund complex, and the method used to determine the expenses and profit. The Board concluded that the profitability results were not unreasonable, given the services rendered and service levels provided by Dreyfus. The Board also had been provided with information prepared by an independent consulting firm regarding Dreyfus’ approach to allocating costs to, and determining the profitability of, individual funds and the entire Dreyfus fund complex. The consulting firm also had analyzed where any economies of scale might emerge in connection with the management of a fund.
The Board considered, on the advice of its counsel, the profitability analysis (1) as part of its evaluation of whether the fees under the Agreement, considered in relation to the mix of services provided by Dreyfus, including the nature, extent and quality of such
27
INFORMATION ABOUT THE RENEWAL OF THE FUND’S MANAGEMENT AGREEMENT (Unaudited) (continued)
services, supported the renewal of the Agreement and (2) in light of the relevant circumstances for the fund and the extent to which economies of scale would be realized if the fund grows and whether fee levels reflect these economies of scale for the benefit of fund shareholders. Dreyfus representatives also stated that, as a result of shared and allocated costs among funds in the Dreyfus fund complex, the extent of economies of scale could depend substantially on the level of assets in the complex as a whole, so that increases and decreases in complex-wide assets can affect potential economies of scale in a manner that is disproportionate to, or even in the opposite direction from, changes in the fund’s asset level. The Board also considered potential benefits to Dreyfus from acting as investment adviser and took into consideration the soft dollar arrangements in effect for trading the fund’s investments.
At the conclusion of these discussions, the Board agreed that it had been furnished with sufficient information to make an informed business decision with respect to the renewal of the Agreement. Based on the discussions and considerations as described above, the Board concluded and determined as follows.
· The Board concluded that the nature, extent and quality of the services provided by Dreyfus are adequate and appropriate.
· The Board noted the improved relative performance in the most recent measurement period, but determined to closely monitor performance.
· The Board concluded that the fee paid to Dreyfus continued to be appropriate under the circumstances and in light of the factors and the totality of the services provided as discussed above.
· The Board determined that the economies of scale which may accrue to Dreyfus and its affiliates in connection with the management of the fund had been adequately considered by Dreyfus in connection with the fee rate charged to the fund pursuant to the Agreement and that, to the extent in the future it were determined that material economies of scale had not been shared with the fund, the Board would seek to have those economies of scale shared with the fund.
In evaluating the Agreement, the Board considered these conclusions and determinations and also relied on its previous knowledge, gained through meetings and other interactions with Dreyfus and its affiliates, of Dreyfus and the services provided to the fund by Dreyfus. The Board also relied on information received on a routine and regular basis throughout the year relating to the operations of the fund and the investment management and other services provided under the Agreement, including information on the investment performance of the fund in comparison to similar mutual funds and benchmark performance indices; general market outlook as applicable to the fund; and compliance reports. In addition, the Board’s consideration of the contractual fee arrangements for this fund had the benefit of a number of years of reviews of the Agreement for the fund, or substantially similar agreements for other Dreyfus funds that the Board oversees, during which lengthy discussions took place between the Board and Dreyfus representatives. Certain aspects of the arrangements
28
may receive greater scrutiny in some years than in others, and the Board’s conclusions may be based, in part, on their consideration of the fund’s arrangements, or similar arrangements for other Dreyfus funds that the Board oversees, in prior years. The Board determined to renew the Agreement.
29
BOARD MEMBERS INFORMATION(Unaudited)
INDEPENDENT BOARD MEMBERS
Joseph S. DiMartino (75)
Chairman of the Board (1995)
Principal Occupation During Past 5 Years:
· Corporate Director and Trustee (1995-present)
Other Public Company Board Memberships During Past 5 Years:
· CBIZ (formerly, Century Business Services, Inc.), a provider of outsourcing functions for small and medium size companies, Director (1997-present)
No. of Portfolios for which Board Member Serves:122
———————
Francine J. Bovich (67)
Board Member (2015)
Principal Occupation During Past 5 Years:
· Trustee, The Bradley Trusts, private trust funds (2011-present)
Other Public Company Board Memberships During Past 5 Years:
· Annaly Capital Management, Inc., a real estate investment trust, Director (2014-present)
No. of Portfolios for which Board Member Serves:70
———————
Gordon J. Davis (77)
Board Member (2012)
Principal Occupation During Past 5 Years:
· Partner in the law firm of Venable LLP (2012-present)
Other Public Company Board Memberships During Past 5 Years:
· Consolidated Edison, Inc., a utility company, Director (1997-2014)
· The Phoenix Companies, Inc., a life insurance company, Director (2000-2014)
No. of Portfolios for which Board Member Serves:54
———————
Isabel P. Dunst (71)
Board Member (2014)
Principal Occupation During Past 5 Years:
· Senior Counsel, Hogan Lovells LLP (2018-present; previously, Of Counsel, 2015-2018, Partner, 1990-2014)
No. of Portfolios for which Board Member Serves:33
———————
30
Nathan Leventhal (75)
Board Member (2009)
Principal Occupation During Past 5 Years:
· President Emeritus of Lincoln Center for the Performing Arts (2001-present)
· Chairman of the Avery Fisher Artist Program (1997-2014)
Other Public Company Board Memberships During Past 5 Years:
· Movado Group, Inc., Director (2003-present)
No. of Portfolios for which Board Member Serves:47
———————
Robin A. Melvin (55)
Board Member (2014)
Principal Occupation During Past 5 Years:
· Co-chairman, Illinois Mentoring Partnership, non-profit organization dedicated to increasing the quantity and quality of mentoring services in Illinois (2014-present; board member since 2013)
No. of Portfolios for which Board Member Serves:99
———————
Roslyn M. Watson (69)
Board Member (2014)
Principal Occupation During Past 5 Years:
· Principal, Watson Ventures, Inc., a real estate investment company (1993-present)
No. of Portfolios for which Board Member Serves:56
———————
Benaree Pratt Wiley (72)
Board Member (2009)
Principal Occupation During Past 5 Years:
· Principal, The Wiley Group, a firm specializing in strategy and business development (2005-present)
Other Public Company Board Memberships During Past 5 Years:
· CBIZ (formerly, Century Business Services, Inc.), a provider of outsourcing functions for small and medium size companies, Director (2008-present)
No. of Portfolios for which Board Member Serves:77
———————
31
BOARD MEMBERS INFORMATION (Unaudited) (continued)
INTERESTED BOARD MEMBER
J. Charles Cardona (63)
Board Member (2014)
Principal Occupation During Past 5 Years:
· Retired. President and a Director of the Manager (2008-2016), Chairman of the Distributor (2013-2016, Executive Vice President, 1997-2013)
No. of Portfolios for which Board Member Serves:33
J. Charles Cardona is deemed to be an “interested person” (as defined under the Act) of the Company as a result of his previous affiliation with The Dreyfus Corporation.
———————
Once elected all Board Members serve for an indefinite term, but achieve Emeritus status upon reaching age 80. The address of the Board Members and Officers is c/o The Dreyfus Corporation, 200 Park Avenue, New York, New York 10166. Additional information about the Board Members is available in the fund’s Statement of Additional Information which can be obtained from Dreyfus free of charge by calling this toll free number: 1-800-DREYFUS.
Clifford L. Alexander, Jr., Emeritus Board Member
Whitney I. Gerard, Emeritus Board Member
George L. Perry, Emeritus Board Member
32
OFFICERS OF THE FUND(Unaudited)
BRADLEY J. SKAPYAK, President since January 2010.
Chief Operating Officer and a director of the Manager since June 2009, Chairman of Dreyfus Transfer, Inc., an affiliate of the Manager and the transfer agent of the funds, since May 2011 and Chief Executive Officer of MBSC Securities Corporation since August 2016. He is an officer of 62 investment companies (comprised of 122 portfolios) managed by the Manager. He is 60 years old and has been an employee of the Manager since February 1988.
BENNETT A. MACDOUGALL, Chief Legal Officer since October 2015.
Chief Legal Officer of the Manager and Associate General Counsel and Managing Director of BNY Mellon since June 2015; from June 2005 to June 2015, he served in various capacities with Deutsche Bank – Asset & Wealth Management Division, including as Director and Associate General Counsel, and Chief Legal Officer of Deutsche Investment Management Americas Inc. from June 2012 to May 2015. He is an officer of 63 investment companies (comprised of 147 portfolios) managed by the Manager. He is 47 years old and has been an employee of the Manager since June 2015.
JAMES BITETTO, Vice President since August 2005 and Secretary since February 2018.
Managing Counsel of BNY Mellon and Secretary of the Manager, and an officer of 63 investment companies (comprised of 147 portfolios) managed by the Manager. He is 52 years old and has been an employee of the Manager since December 1996.
SONALEE CROSS, Vice President and Assistant Secretary since March 2018.
Counsel of BNY Mellon since October 2016; Associate at Proskauer Rose LLP from April 2016 to September 2016; Attorney at EnTrust Capital from August 2015 to February 2016; Associate at Sidley Austin LLP from September 2013 until August 2015. She is an officer of 63 investment companies (comprised of 147 portfolios) managed by Dreyfus. She is 31 years old and has been an employee of the Manager since October 2016.
SARAH S. KELLEHER, Vice President and Assistant Secretary since April 2014.
Managing Counsel of BNY Mellon since December 2017, from March 2013 to December 2017, Senior Counsel of BNY Mellon. She is an officer of 63 investment companies (comprised of 147 portfolios) managed by the Manager. She is 43 years old and has been an employee of the Manager since March 2013.
JEFF PRUSNOFSKY, Vice President and Assistant Secretary since August 2005.
Senior Managing Counsel of BNY Mellon, and an officer of 63 investment companies (comprised of 147 portfolios) managed by the Manager. He is 53 years old and has been an employee of the Manager since October 1990.
NATALYA ZELENSKY, Vice President and Assistant Secretary since March 2017.
Counsel of BNY Mellon since May 2016; Attorney at Wildermuth Endowment Strategy Fund/Wildermuth Advisory, LLC from November 2015 until May 2016; Assistant General Counsel at RCS Advisory Services from July 2014 until November 2015; Associate at Sutherland, Asbill & Brennan from January 2013 until January 2014. She is an officer of 63 investment companies (comprised of 147 portfolios) managed by Dreyfus. She is 33 years old and has been an employee of the Manager since May 2016.
JAMES WINDELS, Treasurer since November 2001.
Director – Mutual Fund Accounting of the Manager, and an officer of 63 investment companies (comprised of 147 portfolios) managed by the Manager. He is 60 years old and has been an employee of the Manager since April 1985.
GAVIN C. REILLY, Assistant Treasurer since December 2005.
Tax Manager of the Investment Accounting and Support Department of the Manager, and an officer of 63 investment companies (comprised of 147 portfolios) managed by the Manager. He is 50 years old and has been an employee of the Manager since April 1991.
ROBERT S. ROBOL, Assistant Treasurer since August 2002.
Senior Accounting Manager – Dreyfus Financial Reporting of the Manager, and an officer of 63 investment companies (comprised of 147 portfolios) managed by the Manager. He is 54 years old and has been an employee of the Manager since October 1988.
33
OFFICERS OF THE FUND (Unaudited)(continued)
ROBERT SALVIOLO, Assistant Treasurer since July 2007.
Senior Accounting Manager – Equity Funds of the Manager, and an officer of 63 investment companies (comprised of 147 portfolios) managed by the Manager. He is 51 years old and has been an employee of the Manager since June 1989.
ROBERT SVAGNA, Assistant Treasurer since December 2002.
Senior Accounting Manager – Fixed Income and Equity Funds of the Manager, and an officer of 63 investment companies (comprised of 147 portfolios) managed by the Manager. He is 51 years old and has been an employee of the Manager since November 1990.
JOSEPH W. CONNOLLY, Chief Compliance Officer since October 2004.
Chief Compliance Officer of the Manager, the Dreyfus Family of Funds and BNY Mellon Funds Trust (63 investment companies, comprised of 147 portfolios). He is 61 years old and has served in various capacities with the Manager since 1980, including manager of the firm’s Fund Accounting Department from 1997 through October 2001.
CARIDAD M. CAROSELLA, Anti-Money Laundering Compliance Officer since January 2016.
Anti-Money Laundering Compliance Officer of the Dreyfus Family of Funds and BNY Mellon Funds Trust since January 2016; from May 2015 to December 2015, Interim Anti-Money Laundering Compliance Officer of the Dreyfus Family of Funds and BNY Mellon Funds Trust and the Distributor; from January 2012 to May 2015, AML Surveillance Officer of the Distributor and from 2007 to December 2011, Financial Processing Manager of the Distributor. She is an officer of 57 investment companies (comprised of 141 portfolios) managed by the Manager. She is 50 years old and has been an employee of the Distributor since 1997.
34
NOTES
35
NOTES
36
NOTES
37
Dreyfus Investment Portfolios, Technology Growth Portfolio
200 Park Avenue
New York, NY 10166
Manager
The Dreyfus Corporation
200 Park Avenue
New York, NY 10166
Custodian
The Bank of New York Mellon
240 Greenwich Street
New York, NY 10286
Transfer Agent &
Dividend Disbursing Agent
Dreyfus Transfer, Inc.
200 Park Avenue
New York, NY 10166
Distributor
MBSC Securities Corporation
200 Park Avenue
New York, NY 10166
Telephone 1-800-258-4260 or 1-800-258-4261
Mail The Dreyfus Family of Funds, 144 Glenn Curtiss Boulevard, Uniondale, NY 11556-0144 Attn: Institutional Services Department
E-mailSend your request toinfo@dreyfus.com
InternetInformation can be viewed online or downloaded atwww.dreyfus.com
The fund files its complete schedule of portfolio holdings with the Securities and Exchange Commission (“SEC”) for the first and third quarters of each fiscal year on Form N-Q. The fund’s Forms N-Q are available on the SEC’s website at http://www.sec.gov and may be reviewed and copied at the SEC’s Public Reference Room in Washington, D.C. Information on the operation of the Public Reference Room may be obtained by calling 1-800-SEC-0330.
A description of the policies and procedures that the fund uses to determine how to vote proxies relating to portfolio securities, and information regarding how the fund voted these proxies for the most recent 12-month period ended June 30 is available at http://www.dreyfus.com and on the SEC’s website at http://www.sec.gov. The description of the policies and procedures is also available without charge, upon request, by calling 1-800-DREYFUS.
| | |
© 2019 MBSC Securities Corporation
0175AR1218 | 
|
Item 2. Code of Ethics.
The Registrant has adopted a code of ethics that applies to the Registrant's principal executive officer, principal financial officer, principal accounting officer or controller, or persons performing similar functions. There have been no amendments to, or waivers in connection with, the Code of Ethics during the period covered by this Report.
Item 3. Audit Committee Financial Expert.
The Registrant's Board has determined that Joseph S. DiMartino, a member of the Audit Committee of the Board, is an audit committee financial expert as defined by the Securities and Exchange Commission (the "SEC"). Mr. DiMartino is "independent" as defined by the SEC for purposes of audit committee financial expert determinations.
Item 4. Principal Accountant Fees and Services.
(a) Audit Fees. The aggregate fees billed for each of the last two fiscal years (the "Reporting Periods") for professional services rendered by the Registrant's principal accountant (the "Auditor") for the audit of the Registrant's annual financial statements or services that are normally provided by the Auditor in connection with the statutory and regulatory filings or engagements for the Reporting Periods, were $138,808 in 2017 and $140,888 in 2018.
(b) Audit-Related Fees. The aggregate fees billed in the Reporting Periods for assurance and related services by the Auditor that are reasonably related to the performance of the audit of the Registrant's financial statements and are not reported under paragraph (a) of this Item 4 were $39,391 in 2017 and $40,064 in 2018. These services consisted of one or more of the following: (i) agreed upon procedures related to compliance with Internal Revenue Code section 817(h), (ii) security counts required by Rule 17f-2 under the Investment Company Act of 1940, as amended, (iii) advisory services as to the accounting or disclosure treatment of Registrant transactions or events and (iv) advisory services to the accounting or disclosure treatment of the actual or potential impact to the Registrant of final or proposed rules, standards or interpretations by the Securities and Exchange Commission, the Financial Accounting Standards Boards or other regulatory or standard-setting bodies.
The aggregate fees billed in the Reporting Periods for non-audit assurance and related services by the Auditor to the Registrant's investment adviser (not including any sub-investment adviser whose role is primarily portfolio management and is subcontracted with or overseen by another investment adviser), and any entity controlling, controlled by or under common control with the investment adviser that provides ongoing services to the Registrant ("Service Affiliates"), that were reasonably related to the performance of the annual audit of the Service Affiliate, which required pre-approval by the Audit Committee were $0 in 2017 and $0 in 2018.
(c) Tax Fees. The aggregate fees billed in the Reporting Periods for professional services rendered by the Auditor for tax compliance, tax advice, and tax planning ("Tax Services") were $14,036 in 2017 and $17,972 in 2018. These services consisted of: (i) review or preparation of U.S. federal, state, local and excise tax returns; (ii) U.S. federal, state and local tax planning, advice and assistance regarding statutory, regulatory or administrative developments; (iii) tax advice regarding tax qualification matters and/or treatment of various financial instruments held or proposed to be acquired or held, and (iv) determination of Passive Foreign Investment Companies. The aggregate fees billed in the Reporting Periods for Tax Services by the Auditor to Service Affiliates, which required pre-approval by the Audit Committee were $0 in 2017 and $0 in 2018.
(d) All Other Fees. The aggregate fees billed in the Reporting Periods for products and services provided by the Auditor, other than the services reported in paragraphs (a) through (c) of this Item, were $46 in 2017 and $50 in 2018. These services consisted of a review of the Registrant's anti-money laundering program.
The aggregate fees billed in the Reporting Periods for Non-Audit Services by the Auditor to Service Affiliates, other than the services reported in paragraphs (b) through (c) of this Item, which required pre-approval by the Audit Committee, were $0 in 2017 and $0 in 2018.
(e)(1) Audit Committee Pre-Approval Policies and Procedures. The Registrant's Audit Committee has established policies and procedures (the "Policy") for pre-approval (within specified fee limits) of the Auditor's engagements for non-audit services to the Registrant and Service Affiliates without specific case-by-case consideration. The pre-approved services in the Policy can include pre-approved audit services, pre-approved audit-related services, pre-approved tax services and pre-approved all other services. Pre-approval considerations include whether the proposed services are compatible with maintaining the Auditor's independence. Pre-approvals pursuant to the Policy are considered annually.
(e)(2) Note. None of the services described in paragraphs (b) through (d) of this Item 4 were approved by the Audit Committee pursuant to paragraph (c)(7)(i)(C) of Rule 2-01 of Regulation S-X.
(f) None of the hours expended on the principal accountant's engagement to audit the registrant's financial statements for the most recent fiscal year were attributed to work performed by persons other than the principal account's full-time, permanent employees.
Non-Audit Fees. The aggregate non-audit fees billed by the Auditor for services rendered to the Registrant, and rendered to Service Affiliates, for the Reporting Periods were $31,379,272 in 2017 and $53,294,289 in 2018.
Auditor Independence. The Registrant's Audit Committee has considered whether the provision of non-audit services that were rendered to Service Affiliates, which were not pre-approved (not requiring pre-approval), is compatible with maintaining the Auditor's independence.
Item 5. Audit Committee of Listed Registrants.
Not applicable.
Item 6. Investments.
(a) Not applicable.
Item 7. Disclosure of Proxy Voting Policies and Procedures for Closed-End Management Investment Companies.
Not applicable.
Item 8. Portfolio Managers of Closed-End Management Investment Companies.
Not applicable.
Item 9. Purchases of Equity Securities by Closed-End Management Investment Companies and Affiliated Purchasers.
Not applicable.
Item 10. Submission of Matters to a Vote of Security Holders.
There have been no material changes to the procedures applicable to Item 10.
Item 11. Controls and Procedures.
(a) The Registrant's principal executive and principal financial officers have concluded, based on their evaluation of the Registrant's disclosure controls and procedures as of a date within 90 days of the filing date of this report, that the Registrant's disclosure controls and procedures are reasonably designed to ensure that information required to be disclosed by the Registrant on Form N-CSR is recorded, processed, summarized and reported within the required time periods and that information required to be disclosed by the Registrant in the reports that it files or submits on Form N-CSR is accumulated and communicated to the Registrant's management, including its principal executive and principal financial officers, as appropriate to allow timely decisions regarding required disclosure.
(b) There were no changes to the Registrant's internal control over financial reporting that occurred during the second fiscal quarter of the period covered by this report that have materially affected, or are reasonably likely to materially affect, the Registrant's internal control over financial reporting.
Item 12. Disclosure of Securities Lending Activities for Closed-End Management Investment Companies.
Not applicable.
Item 13. Exhibits.
(a)(1) Code of ethics referred to in Item 2.
(a)(2) Certifications of principal executive and principal financial officers as required by Rule 30a-2(a) under the Investment Company Act of 1940.
(a)(3) Not applicable.
(b) Certification of principal executive and principal financial officers as required by Rule 30a-2(b) under the Investment Company Act of 1940.
SIGNATURES
Pursuant to the requirements of the Securities Exchange Act of 1934 and the Investment Company Act of 1940, the Registrant has duly caused this Report to be signed on its behalf by the undersigned, thereunto duly authorized.
Dreyfus Investment Portfolios
By: /s/ Bradley J. Skapyak
Bradley J. Skapyak
President
Date: February 8, 2019
Pursuant to the requirements of the Securities Exchange Act of 1934 and the Investment Company Act of 1940, this Report has been signed below by the following persons on behalf of the Registrant and in the capacities and on the dates indicated.
By: /s/ Bradley J. Skapyak
Bradley J. Skapyak
President
Date: February 8, 2019
By: /s/ James Windels
James Windels
Treasurer
Date: February 8, 2019
EXHIBIT INDEX
(a)(1) Code of ethics referred to in Item 2.
(a)(2) Certifications of principal executive and principal financial officers as required by Rule 30a-2(a) under the Investment Company Act of 1940. (EX-99.CERT)
(b) Certification of principal executive and principal financial officers as required by Rule 30a-2(b) under the Investment Company Act of 1940. (EX-99.906CERT)