UNITED STATES
SECURITIES AND EXCHANGE COMMISSION
Washington, D.C. 20549
FORM N-CSR
CERTIFIED SHAREHOLDER REPORT OF REGISTERED MANAGEMENT
INVESTMENT COMPANIES
| Investment Company Act file number | 811-08673 |
| | |
| | BNY Mellon Investment Portfolios | |
| | (Exact name of Registrant as specified in charter) | |
| | | |
| | c/o BNY Mellon Investment Adviser, Inc. 240 Greenwich Street New York, New York 10286 | |
| | (Address of principal executive offices) (Zip code) | |
| | | |
| | Deirdre Cunnane, Esq. 240 Greenwich Street New York, New York 10286 | |
| | (Name and address of agent for service) | |
| |
| Registrant's telephone number, including area code: | (212) 922-6400 |
| | |
Date of fiscal year end: | 12/31 | |
| Date of reporting period: | 12/31/2021 | |
| | | | | | | |
FORM N-CSR
Item 1. Reports to Stockholders.
BNY Mellon Investment Portfolios, MidCap Stock Portfolio
| |
ANNUAL REPORT December 31, 2021 |

| |
Save time. Save paper. View your next shareholder report online as soon as it’s available. Log into www.im.bnymellon.com and sign up for eCommunications. It’s simple and only takes a few minutes. |
| |
The views expressed in this report reflect those of the portfolio manager(s) only through the end of the period covered and do not necessarily represent the views of BNY Mellon Investment Adviser, Inc. or any other person in the BNY Mellon Investment Adviser, Inc. organization. Any such views are subject to change at any time based upon market or other conditions and BNY Mellon Investment Adviser, Inc. disclaims any responsibility to update such views. These views may not be relied on as investment advice and, because investment decisions for a fund in the BNY Mellon Family of Funds are based on numerous factors, may not be relied on as an indication of trading intent on behalf of any fund in the BNY Mellon Family of Funds. |
| |
Not FDIC-Insured • Not Bank-Guaranteed • May Lose Value |
Contents
THE FUND
FOR MORE INFORMATION
Back Cover
DISCUSSION OF FUND PERFORMANCE (Unaudited)
For the period from January 1, 2021 through December 31, 2021, as provided by portfolio managers Peter D. Goslin, CFA and Adam T. Logan, CFA of Newton Investment Management North America, LLC, sub-investment adviser
Market and Fund Performance Overview
For the 12-month period ended December 31, 2021, BNY Mellon Investment Portfolios, MidCap Stock Portfolio’s (the “fund”) Initial shares produced a total return of 25.89%, and its Service shares produced a total return of 25.56.1 In comparison, the fund’s benchmark, the S&P MidCap 400® Index (the “Index”), produced a total return of 24.76% for the same period.2
Mid-cap stocks produced strongly positive returns bolstered by accommodative monetary and fiscal stimulus and strong economic growth as the economy began to rebound from pandemic-related restrictions. The fund outperformed the Index, largely due to the effectiveness of the fund’s value and quality factors in identifying stocks favored by the market.
The Fund’s Investment Approach
The fund seeks investment results that are greater than the total return performance of publicly traded, common stocks of medium-sized, domestic companies in the aggregate, as represented by the Index. To pursue this goal, the fund normally invests at least 80% of its net assets, plus any borrowings for investment purposes, in stocks of mid-cap companies.
The fund invests in growth and value stocks, which are chosen through a disciplined investment process that combines quantitative-modeling techniques, fundamental analysis and risk management. Consistency of returns compared to the Index is a primary goal of the investment process.
The portfolio managers select stocks through a “bottom-up” structured approach that seeks to identify undervalued securities using a quantitative ranking process. The process is driven by a proprietary stock selection model that measures a diverse set of corporate characteristics to identify and rank stocks based on valuation, momentum, sentiment and earnings-quality measures.
Next, the fund’s portfolio managers construct the portfolio through a risk-controlled process, focusing on stock selection, as opposed to making proactive decisions as to industry and sector exposure. The portfolio managers seek to maintain a portfolio that has exposure to industries and market capitalizations that are generally similar to the fund’s benchmark. Finally, within each sector and style subset, the fund will seek to overweight the most attractive stocks and underweight or not hold the stocks that have been ranked least attractive.
Equities Advance Despite Pandemic-Related Challenges
After a sharp recovery from COVID-19-related losses in 2020, U.S. equities made further headway in 2021. Although fresh lockdowns were enforced in some locations, the accelerating rollout of COVID-19 vaccination programs bolstered investors’ risk appetite. By contrast, the impact of monetary accommodation, which provided critical support for
2
financial asset prices, proved more complex. With reflation underway and an elevated pace of growth expected in the second half of the year, investors began to anticipate a dialing back of the exceptional levels of monetary stimulus provided earlier in the pandemic. This contributed to a sharp rise in government bond yields early in 2021, with the long end of the U.S. Treasury market experiencing its worst quarter since 1980. The nature of fiscal stimulus also continued to evolve as President Biden formally announced his long-awaited $2 trillion infrastructure program.
U.S. equities continued to advance during the second half of the period, albeit at a slower pace, drawing strength from an impressive slate of U.S. economic data, robust corporate earnings and further evidence that vaccination programs could be paving the way for a full reopening of economies. However, headwinds emerged as the widening scope of regulatory intervention within China unnerved investors, as did debt-related problems in the Chinese real estate industry that threatened a broader crisis in the property and financial sectors. Globally, higher energy prices, goods shortages and wage-inflation numbers led to the suggestion that monetary stimulus could be ‘tapered’ and interest rates moved higher. Nevertheless, U.S. equities continued on an upward trajectory, taking the prospect of monetary policy tightening and the lack of legislative progress for President Biden’s ‘Build Back Better’ bill in their stride. Markets dipped in early December, when the new, highly transmissible COVID-19 Omicron variant was detected in the United States. Risk assets also reacted negatively to incrementally more hawkish rhetoric regarding the tapering of the U.S. Federal Reserve’s (the “Fed”) asset-purchase program that emerged from the Fed’s December meeting. While large-cap stocks recovered into the end of the year, mid-cap stocks continue to trade off their previous highs.
Value and Quality Factors Outperform
The fund’s performance compared to the Index benefited from the effectiveness of valuation and earnings-quality factors in identifying strong-performing stocks. While the fund’s systematic stock selection approach is based on rankings of valuation, momentum, sentiment and earnings-quality measures rather than focusing on industry or sector exposure, some industries and sectors contributed more to outperformance than others. During the review period, the energy and health care sectors proved most accretive to the fund’s relative performance. As the fund invests in a large number of stocks, the performance of any individual holdings had minimal impact on overall fund performance. Nevertheless, top-performing holdings included health care and information technology- solutions provider Cerner, which was acquired during the period at a premium to its pre-acquisition stock price, and independent oil and gas exploration and production companies Marathon Oil and Murphy Oil, which benefited from rising commodity prices and strong demand.
Conversely, investors failed to reward the growth, momentum and dividend-yield factors employed by the fund. Underperforming sectors included financials and utilities. Notably weak individual contributors to relative performance included Texas-based insurance company Globe Life, which suffered from the impact of the COVID-19 pandemic, and natural gas utility ONE Gas.
Maintaining a Diversified Portfolio and Consistent Investment Approach
With the economy continuing to recover from the effects of COVID-19, despite the pandemic’s lingering impact, we expect to see further economic growth ahead, albeit at a
3
DISCUSSION OF FUND PERFORMANCE (Unaudited) (continued)
somewhat slower pace than in 2021. At the same time, equity markets are likely to face headwinds in the coming months, making the exceptionally strong returns of the current reporting period less likely to be repeated in the near future. Increasing inflationary pressures, driven by strong demand and supply-chain disruptions, have increased the possibility that the Fed may soon taper its asset-buying program and eventually begin to raise interest rates, removing some support for equity markets and signaling a phase of slower economic growth. While inflationary pressures may moderate somewhat as the supply chain untangles, tight labor market conditions currently show no signs of easing. On the other hand, rising interest rates are likely to continue to constrain fixed-income markets, leaving investors with few options as attractive as equities.
The fund’s investment strategy maintains an unwavering focus on our systematic approach to evaluating securities and building portfolios. This approach has allowed us to create an investment process that participates in rising equity markets and helps protect capital during times of stress in the marketplace. As of the end of the review period, the fund holds over 294 individual securities characterized by attractive valuations and improving fundamentals. Sector weightings remain close to those of the Index, with slightly overweight exposure to information technology, health care and communication services, and slightly underweight exposure to industrials, materials and consumer discretionary. As always, overweights and underweights are determined by our bottom-up, factor-driven stock selection process rather than top-down macroeconomic opinions. We continue to control risks relative to the Index from a sector and market capitalization standpoint, and believe the fund is well positioned to benefit from the prevailing market environment.
January 18, 2022
1 Total return includes reinvestment of dividends and any capital gains paid. Past performance is no guarantee of future results. Share price and investment return fluctuate such that upon redemption, fund shares may be worth more or less than their original cost. The fund’s performance does not reflect the deduction of additional charges and expenses imposed in connection with investing in variable insurance contracts, which will reduce returns. The fund’s return reflects the absorption of certain fund expenses by BNY Mellon Investment Adviser, Inc. pursuant to an agreement in effect through April 30, 2022, at which time it may be extended, modified or terminated. Had these expenses not been absorbed, returns would have been lower.
2 Source: Lipper Inc. — The S&P MidCap 400® Index provides investors with a benchmark for mid-sized companies. The Index measures the performance of mid-sized companies, reflecting the distinctive risk and return characteristics of this market segment. Investors cannot invest directly in any index.
Please note: the position in any security highlighted with italicized typeface was sold during the reporting period.
Equities are subject generally to market, market sector, market liquidity, issuer and investment style risks, among other factors, to varying degrees, all of which are more fully described in the fund’s prospectus.
Recent market risks include pandemic risks related to COVID-19. The effects of COVID-19 have contributed to increased volatility in global markets and will likely affect certain countries, companies, industries and market sectors more dramatically than others. To the extent the fund may overweight its investments in certain countries, companies, industries or market sectors, such positions will increase the fund’s exposure to risk of loss from adverse developments affecting those countries, companies, industries or sectors.
Stocks of mid-cap companies often experience sharper price fluctuations than stocks of large-cap companies.
The fund is only available as a funding vehicle under variable life insurance policies or variable annuity contracts issued by insurance companies. Individuals may not purchase shares of the fund directly. A variable annuity is an insurance contract issued by an insurance company that enables investors to accumulate assets on a tax-deferred basis for retirement or other long-term goals. The investment objective and policies of BNY Mellon Investment Portfolios, MidCap Stock Portfolio made available through insurance products may be similar to those of other funds managed by BNY Mellon Investment Adviser, Inc. However, the investment results of the fund may be higher or lower than, and may not be comparable to, those of any other BNY Mellon Investment Adviser, Inc. fund.
4
FUND PERFORMANCE (Unaudited)
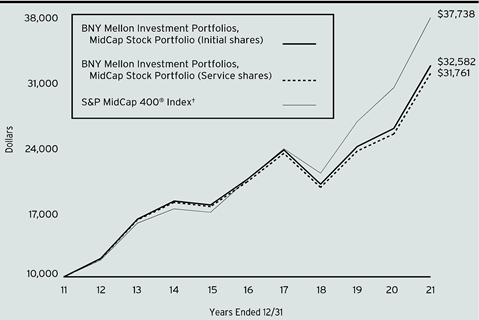
Comparison of change in value of a $10,000 investment in Initial shares and Service shares of BNY Mellon Investment Portfolios, MidCap Stock Portfolio with a hypothetical investment of $10,000 in the S&P MidCap 400® Index (the “Index”).
† Source: Lipper Inc.
Past performance is not predictive of future performance. The fund’s performance does not reflect the deduction of additional charges and expenses imposed in connection with investing in variable insurance contracts which will reduce returns.
The above graph compares a hypothetical investment of $10,000 investment made in each of the Initial shares and Service shares of BNY Mellon Investment Portfolios, MidCap Stock Portfolio on 12/31/11 to a hypothetical investment of $10,000 made in the Index on that date.
The fund’s performance shown in the line graph above takes into account all applicable fees and expenses. The Index provides investors with a benchmark for midsized companies. The Index measures the performance of midsized companies, reflecting the distinctive risk and return characteristics of this market segment. Unlike a mutual fund, the Index is not subject to charges, fees and other expenses. Investors cannot invest directly in any index. Further information relating to fund performance, including expense reimbursements, if applicable, is contained in the Financial Highlights section of the prospectus and elsewhere in this report.
| | | | |
Average Annual Total Returns as of 12/31/2021 |
| 1 Year | 5 Years | 10 Years |
Initial shares | 25.89% | 9.78% | 12.54% |
Service shares | 25.56% | 9.50% | 12.25% |
S&P MidCap 400® Index | 24.76% | 13.09% | 14.20% |
The performance data quoted represents past performance, which is no guarantee of future results. Share price and investment return fluctuate and an investor’s shares may be worth more or less than original cost upon redemption. Current performance may be lower or higher than the performance quoted. Go to www.im.bnymellon.com for the fund’s most recent month-end returns.
The fund’s Initial shares are not subject to a Rule 12b-1 fee. The fund’s Service shares are subject to a 0.25% annual Rule 12b-1 fee. All dividends and capital gain distributions are reinvested.
The fund’s performance shown in the graph and table does not reflect the deduction of taxes that a shareholder would pay on fund distributions or the redemption of fund shares.
5
UNDERSTANDING YOUR FUND’S EXPENSES (Unaudited)
As a mutual fund investor, you pay ongoing expenses, such as management fees and other expenses. Using the information below, you can estimate how these expenses affect your investment and compare them with the expenses of other funds. You also may pay one-time transaction expenses, including sales charges (loads), redemption fees and expenses associated with variable annuity or insurance contracts, which are not shown in this section and would have resulted in higher total expenses. For more information, see your fund’s prospectus or talk to your financial adviser.
Review your fund’s expenses
The table below shows the expenses you would have paid on a $1,000 investment in BNY Mellon Investment Portfolios, MidCap Stock Portfolio from July 1, 2021 to December 31, 2021. It also shows how much a $1,000 investment would be worth at the close of the period, assuming actual returns and expenses.
| | | | | |
Expenses and Value of a $1,000 Investment | |
Assume actual returns for the six months ended December 31, 2021 | |
| | | | |
| | Initial Shares | Service Shares | |
Expenses paid per $1,000† | $4.32 | $5.62 | |
Ending value (after expenses) | $1,065.80 | $1,063.90 | |
COMPARING YOUR FUND’S EXPENSES
WITH THOSE OF OTHER FUNDS (Unaudited)
Using the SEC’s method to compare expenses
The Securities and Exchange Commission (“SEC”) has established guidelines to help investors assess fund expenses. Per these guidelines, the table below shows your fund’s expenses based on a $1,000 investment, assuming a hypothetical 5% annualized return. You can use this information to compare the ongoing expenses (but not transaction expenses or total cost) of investing in the fund with those of other funds. All mutual fund shareholder reports will provide this information to help you make this comparison. Please note that you cannot use this information to estimate your actual ending account balance and expenses paid during the period.
| | | | | |
Expenses and Value of a $1,000 Investment | |
Assuming a hypothetical 5% annualized return for the six months ended December 31, 2021 | |
| | | | |
| | Initial Shares | Service Shares | |
Expenses paid per $1,000† | $4.23 | $5.50 | |
Ending value (after expenses) | $1,021.02 | $1,019.76 | |
† | Expenses are equal to the fund’s annualized expense ratio of .83% for Initial Shares and 1.08% for Service Shares, multiplied by the average account value over the period, multiplied by 184/365 (to reflect the one-half year period). |
6
STATEMENT OF INVESTMENTS
December 31, 2021
| | | | | | | | |
| |
Description | | | | Shares | | Value ($) | |
Common Stocks - 99.8% | | | | | |
Automobiles & Components - 1.7% | | | | | |
Adient | | | | 8,590 | a | 411,289 | |
Dana | | | | 5,965 | | 136,121 | |
Fox Factory Holding | | | | 2,670 | a | 454,167 | |
Harley-Davidson | | | | 11,745 | | 442,669 | |
The Goodyear Tire & Rubber Company | | | | 43,940 | a | 936,801 | |
Thor Industries | | | | 7,010 | | 727,428 | |
| | | | | 3,108,475 | |
Banks - 6.6% | | | | | |
Cathay General Bancorp | | | | 42,280 | | 1,817,617 | |
Essent Group | | | | 8,390 | | 381,997 | |
Fulton Financial | | | | 98,205 | | 1,669,485 | |
Hancock Whitney | | | | 23,625 | | 1,181,722 | |
International Bancshares | | | | 6,850 | | 290,372 | |
MGIC Investment | | | | 45,035 | | 649,405 | |
New York Community Bancorp | | | | 58,025 | | 708,485 | |
PacWest Bancorp | | | | 15,120 | | 682,970 | |
Sterling Bancorp | | | | 36,320 | | 936,693 | |
UMB Financial | | | | 15,990 | | 1,696,699 | |
United Bankshares | | | | 26,170 | | 949,448 | |
Washington Federal | | | | 25,850 | | 862,873 | |
Webster Financial | | | | 4,285 | | 239,274 | |
| | | | | 12,067,040 | |
Capital Goods - 12.7% | | | | | |
A.O. Smith | | | | 6,335 | | 543,860 | |
Acuity Brands | | | | 4,365 | | 924,158 | |
AECOM | | | | 11,100 | | 858,585 | |
AGCO | | | | 8,005 | | 928,740 | |
Allegion | | | | 2,460 | | 325,802 | |
Allison Transmission Holdings | | | | 10,245 | | 372,406 | |
Armstrong World Industries | | | | 5,365 | | 622,984 | |
Axon Enterprise | | | | 1,655 | a | 259,835 | |
Builders FirstSource | | | | 12,515 | a | 1,072,661 | |
Carlisle | | | | 1,645 | | 408,157 | |
Crane | | | | 8,595 | | 874,369 | |
Curtiss-Wright | | | | 5,020 | | 696,123 | |
Donaldson | | | | 22,400 | | 1,327,424 | |
EMCOR Group | | | | 12,745 | | 1,623,586 | |
Flowserve | | | | 23,090 | | 706,554 | |
Huntington Ingalls Industries | | | | 1,470 | | 274,508 | |
Kennametal | | | | 15,030 | | 539,727 | |
Lennox International | | | | 4,695 | | 1,522,870 | |
7
STATEMENT OF INVESTMENTS (continued)
| | | | | | | | |
| |
Description | | | | Shares | | Value ($) | |
Common Stocks - 99.8% (continued) | | | | | |
Capital Goods - 12.7% (continued) | | | | | |
Lincoln Electric Holdings | | | | 4,380 | | 610,879 | |
MasTec | | | | 8,235 | a | 759,926 | |
nVent Electric | | | | 39,475 | | 1,500,050 | |
Oshkosh | | | | 1,430 | | 161,175 | |
Owens Corning | | | | 8,395 | | 759,747 | |
Pentair | | | | 5,940 | b | 433,798 | |
Quanta Services | | | | 2,870 | | 329,074 | |
Sunrun | | | | 5,590 | a,b | 191,737 | |
Terex | | | | 16,640 | | 731,328 | |
Textron | | | | 6,955 | | 536,926 | |
The Middleby | | | | 4,510 | a | 887,388 | |
The Toro Company | | | | 10,060 | | 1,005,094 | |
Trex | | | | 2,490 | a | 336,225 | |
Valmont Industries | | | | 1,000 | | 250,500 | |
Watsco | | | | 765 | | 239,353 | |
Woodward | | | | 3,505 | | 383,657 | |
| | | | | 22,999,206 | |
Commercial & Professional Services - 2.1% | | | | | |
ASGN | | | | 6,630 | a | 818,142 | |
Clean Harbors | | | | 8,005 | a | 798,659 | |
FTI Consulting | | | | 2,815 | a | 431,877 | |
Insperity | | | | 2,090 | | 246,850 | |
Jacobs Engineering Group | | | | 1,220 | | 169,861 | |
ManpowerGroup | | | | 8,615 | | 838,498 | |
Science Applications International | | | | 1,610 | | 134,580 | |
The Brink's Company | | | | 4,680 | | 306,868 | |
| | | | | 3,745,335 | |
Consumer Durables & Apparel - 5.1% | | | | | |
Brunswick | | | | 7,695 | | 775,117 | |
Capri Holdings | | | | 13,455 | a | 873,364 | |
Columbia Sportswear | | | | 3,170 | | 308,885 | |
Crocs | | | | 5,735 | a | 735,342 | |
Deckers Outdoor | | | | 1,360 | a | 498,182 | |
Mattel | | | | 36,290 | a | 782,412 | |
Peloton Interactive, Cl. A | | | | 4,070 | a,b | 145,543 | |
Polaris | | | | 3,850 | | 423,153 | |
PulteGroup | | | | 4,310 | | 246,360 | |
PVH | | | | 3,995 | | 426,067 | |
Tapestry | | | | 10,895 | | 442,337 | |
Tempur Sealy International | | | | 23,370 | | 1,099,091 | |
Toll Brothers | | | | 6,690 | | 484,289 | |
TopBuild | | | | 2,175 | a | 600,104 | |
Tri Pointe Homes | | | | 25,270 | a | 704,780 | |
8
| | | | | | | | |
| |
Description | | | | Shares | | Value ($) | |
Common Stocks - 99.8% (continued) | | | | | |
Consumer Durables & Apparel - 5.1% (continued) | | | | | |
Under Armour, Cl. A | | | | 8,360 | a | 177,148 | |
YETI Holdings | | | | 6,600 | a | 546,678 | |
| | | | | 9,268,852 | |
Consumer Services - 3.9% | | | | | |
Boyd Gaming | | | | 8,710 | a | 571,115 | |
Chipotle Mexican Grill | | | | 380 | a | 664,335 | |
Frontdoor | | | | 6,940 | a | 254,351 | |
Graham Holdings, Cl. B | | | | 655 | | 412,539 | |
Grand Canyon Education | | | | 7,480 | a | 641,111 | |
H&R Block | | | | 9,600 | | 226,176 | |
Jack in the Box | | | | 6,255 | | 547,187 | |
Marriott Vacations Worldwide | | | | 5,635 | | 952,202 | |
Planet Fitness, Cl. A | | | | 6,155 | a | 557,520 | |
Scientific Games | | | | 5,730 | a | 382,936 | |
Service Corp. International | | | | 11,030 | | 783,020 | |
The Wendy's Company | | | | 17,635 | | 420,595 | |
Wyndham Hotels & Resorts | | | | 8,170 | | 732,440 | |
| | | | | 7,145,527 | |
Diversified Financials - 3.0% | | | | | |
Affiliated Managers Group | | | | 5,175 | | 851,339 | |
Evercore, Cl. A | | | | 4,475 | | 607,929 | |
FactSet Research Systems | | | | 2,205 | | 1,071,652 | |
Federated Hermes | | | | 5,155 | | 193,725 | |
Janus Henderson Group | | | | 13,740 | | 576,256 | |
Jefferies Financial Group | | | | 20,930 | | 812,084 | |
OneMain Holdings | | | | 2,735 | | 136,859 | |
Stifel Financial | | | | 17,220 | | 1,212,632 | |
| | | | | 5,462,476 | |
Energy - 2.5% | | | | | |
Antero Midstream | | | | 23,400 | | 226,512 | |
ChampionX | | | | 13,520 | a | 273,239 | |
Continental Resources | | | | 2,970 | b | 132,937 | |
Equitrans Midstream | | | | 33,180 | | 343,081 | |
Hess | | | | 5,745 | | 425,302 | |
Marathon Oil | | | | 80,505 | | 1,321,892 | |
Murphy Oil | | | | 23,860 | | 622,985 | |
Occidental Petroleum | | | | 6,335 | | 183,652 | |
Targa Resources | | | | 18,825 | | 983,418 | |
| | | | | 4,513,018 | |
Food & Staples Retailing - 1.3% | | | | | |
BJ's Wholesale Club Holdings | | | | 12,835 | a | 859,560 | |
Casey's General Stores | | | | 1,695 | | 334,508 | |
Sprouts Farmers Market | | | | 23,995 | a | 712,172 | |
9
STATEMENT OF INVESTMENTS (continued)
| | | | | | | | |
| |
Description | | | | Shares | | Value ($) | |
Common Stocks - 99.8% (continued) | | | | | |
Food & Staples Retailing - 1.3% (continued) | | | | | |
The Kroger Company | | | | 9,835 | | 445,132 | |
| | | | | 2,351,372 | |
Food, Beverage & Tobacco - 1.6% | | | | | |
Darling Ingredients | | | | 13,505 | a | 935,761 | |
Flowers Foods | | | | 37,855 | | 1,039,877 | |
Sanderson Farms | | | | 2,525 | | 482,477 | |
The Hain Celestial Group | | | | 12,335 | a | 525,594 | |
| | | | | 2,983,709 | |
Health Care Equipment & Services - 7.4% | | | | | |
Acadia Healthcare | | | | 12,040 | a | 730,828 | |
Amedisys | | | | 4,030 | a | 652,376 | |
Cerner | | | | 12,925 | | 1,200,345 | |
Chemed | | | | 2,985 | | 1,579,184 | |
Dentsply Sirona | | | | 7,915 | | 441,578 | |
Encompass Health | | | | 3,995 | | 260,714 | |
Envista Holdings | | | | 14,345 | a | 646,386 | |
Globus Medical, Cl. A | | | | 4,660 | a | 336,452 | |
HealthEquity | | | | 4,680 | a | 207,043 | |
Henry Schein | | | | 1,265 | a | 98,075 | |
ICU Medical | | | | 2,545 | a | 604,030 | |
Integra LifeSciences Holdings | | | | 16,510 | a | 1,106,005 | |
LivaNova | | | | 8,850 | a | 773,755 | |
Molina Healthcare | | | | 4,685 | a | 1,490,205 | |
NuVasive | | | | 4,765 | a | 250,067 | |
Option Care Health | | | | 17,385 | a | 494,429 | |
Patterson Companies | | | | 6,380 | | 187,253 | |
Progyny | | | | 3,145 | a | 158,351 | |
Quidel | | | | 3,535 | a | 477,190 | |
STAAR Surgical | | | | 6,250 | a | 570,625 | |
Teladoc Health | | | | 2,320 | a | 213,022 | |
Teleflex | | | | 530 | | 174,094 | |
Tenet Healthcare | | | | 9,795 | a | 800,153 | |
| | | | | 13,452,160 | |
Household & Personal Products - .4% | | | | | |
Coty, Cl. A | | | | 37,405 | a | 392,753 | |
Nu Skin Enterprises, Cl. A | | | | 5,205 | | 264,154 | |
| | | | | 656,907 | |
Insurance - 4.7% | | | | | |
Alleghany | | | | 1,395 | a | 931,288 | |
American Financial Group | | | | 6,560 | | 900,819 | |
Cincinnati Financial | | | | 2,475 | | 281,977 | |
CNA Financial | | | | 6,080 | | 268,006 | |
First American Financial | | | | 11,660 | | 912,162 | |
10
| | | | | | | | |
| |
Description | | | | Shares | | Value ($) | |
Common Stocks - 99.8% (continued) | | | | | |
Insurance - 4.7% (continued) | | | | | |
Globe Life | | | | 7,605 | | 712,741 | |
Kinsale Capital Group | | | | 3,105 | | 738,648 | |
Mercury General | | | | 3,980 | | 211,179 | |
Primerica | | | | 8,090 | | 1,239,954 | |
RLI | | | | 5,010 | | 561,621 | |
Selective Insurance Group | | | | 10,910 | | 893,965 | |
The Hanover Insurance Group | | | | 6,475 | | 848,613 | |
| | | | | 8,500,973 | |
Materials - 5.4% | | | | | |
Alcoa | | | | 3,415 | | 203,466 | |
CF Industries Holdings | | | | 8,170 | | 578,273 | |
Cleveland-Cliffs | | | | 48,025 | a,b | 1,045,504 | |
Commercial Metals | | | | 18,895 | | 685,700 | |
Eagle Materials | | | | 7,210 | | 1,200,177 | |
Element Solutions | | | | 7,995 | | 194,119 | |
Greif, Cl. A | | | | 5,035 | | 303,963 | |
Ingevity | | | | 11,650 | a | 835,305 | |
Louisiana-Pacific | | | | 7,975 | | 624,841 | |
Minerals Technologies | | | | 12,140 | | 888,041 | |
Olin | | | | 11,330 | | 651,702 | |
Reliance Steel & Aluminum | | | | 6,165 | | 1,000,086 | |
The Chemours Company | | | | 17,810 | | 597,704 | |
The Mosaic Company | | | | 7,890 | | 309,998 | |
U.S. Steel | | | | 18,320 | | 436,199 | |
Westlake Chemical | | | | 3,260 | | 316,644 | |
| | | | | 9,871,722 | |
Media & Entertainment - 2.2% | | | | | |
Altice USA, Cl. A | | | | 7,405 | a | 119,813 | |
Cable One | | | | 130 | | 229,249 | |
Fox, Cl. A | | | | 3,410 | | 125,829 | |
John Wiley & Sons, Cl. A | | | | 10,755 | | 615,939 | |
News Corporation, Cl. A | | | | 11,355 | | 253,330 | |
The Interpublic Group of Companies | | | | 17,725 | | 663,801 | |
The New York Times Company, Cl. A | | | | 20,580 | | 994,014 | |
World Wrestling Entertainment, Cl. A | | | | 7,170 | b | 353,768 | |
Yelp | | | | 14,215 | a | 515,152 | |
Ziff Davis | | | | 1,415 | a | 156,867 | |
| | | | | 4,027,762 | |
Pharmaceuticals Biotechnology & Life Sciences - 3.4% | | | | | |
Bio-Techne | | | | 1,165 | | 602,701 | |
Bruker | | | | 7,895 | | 662,469 | |
Exelixis | | | | 8,835 | a | 161,504 | |
Halozyme Therapeutics | | | | 9,450 | a | 379,985 | |
11
STATEMENT OF INVESTMENTS (continued)
| | | | | | | | |
| |
Description | | | | Shares | | Value ($) | |
Common Stocks - 99.8% (continued) | | | | | |
Pharmaceuticals Biotechnology & Life Sciences - 3.4% (continued) | | | | | |
Jazz Pharmaceuticals | | | | 1,095 | a | 139,503 | |
Medpace Holdings | | | | 2,380 | a | 517,983 | |
Repligen | | | | 6,265 | a | 1,659,223 | |
Royalty Pharma, CI. A | | | | 9,510 | | 378,974 | |
Seagen | | | | 2,630 | a | 406,598 | |
Syneos Health | | | | 7,665 | a | 787,042 | |
United Therapeutics | | | | 2,575 | a | 556,406 | |
| | | | | 6,252,388 | |
Real Estate - 9.7% | | | | | |
AvalonBay Communities | | | | 1,160 | c | 293,004 | |
Brixmor Property Group | | | | 24,630 | c | 625,848 | |
Camden Property Trust | | | | 3,345 | c | 597,685 | |
Corporate Office Properties Trust | | | | 30,905 | c | 864,413 | |
Federal Realty Investment Trust | | | | 4,955 | c | 675,466 | |
First Industrial Realty Trust | | | | 9,170 | c | 607,054 | |
Highwoods Properties | | | | 16,695 | c | 744,430 | |
Jones Lang LaSalle | | | | 3,015 | a | 812,060 | |
Kilroy Realty | | | | 19,715 | c | 1,310,259 | |
Kite Realty Group Trust | | | | 45,690 | c | 995,128 | |
Lamar Advertising, Cl. A | | | | 9,350 | c | 1,134,155 | |
Mid-America Apartment Communities | | | | 2,365 | c | 542,626 | |
National Retail Properties | | | | 39,090 | c | 1,879,056 | |
National Storage Affiliates Trust | | | | 15,945 | c | 1,103,394 | |
Potlatchdeltic | | | | 2,640 | c | 158,981 | |
PS Business Parks | | | | 9,550 | c | 1,758,823 | |
Rayonier | | | | 13,825 | c | 557,977 | |
Regency Centers | | | | 11,800 | c | 889,130 | |
SL Green Realty | | | | 10,040 | b,c | 719,868 | |
Spirit Realty Capital | | | | 13,150 | c | 633,698 | |
Urban Edge Properties | | | | 36,560 | c | 694,640 | |
| | | | | 17,597,695 | |
Retailing - 4.0% | | | | | |
American Eagle Outfitters | | | | 23,185 | b | 587,044 | |
AutoNation | | | | 3,890 | a | 454,546 | |
Dick's Sporting Goods | | | | 4,820 | b | 554,252 | |
Five Below | | | | 5,230 | a | 1,082,035 | |
Foot Locker | | | | 8,060 | | 351,658 | |
GameStop, Cl. A | | | | 4,170 | a,b | 618,786 | |
Kohl's | | | | 16,585 | | 819,133 | |
Lithia Motors | | | | 1,940 | | 576,083 | |
Murphy USA | | | | 2,065 | | 411,431 | |
RH | | | | 730 | a | 391,236 | |
12
| | | | | | | | |
| |
Description | | | | Shares | | Value ($) | |
Common Stocks - 99.8% (continued) | | | | | |
Retailing - 4.0% (continued) | | | | | |
Wayfair, Cl. A | | | | 1,950 | a,b | 370,442 | |
Williams-Sonoma | | | | 6,710 | | 1,134,862 | |
| | | | | 7,351,508 | |
Semiconductors & Semiconductor Equipment - 4.5% | | | | | |
Allegro MicroSystems | | | | 10,885 | a | 393,819 | |
Azenta | | | | 1,320 | | 136,105 | |
Cirrus Logic | | | | 4,110 | a | 378,202 | |
CMC Materials | | | | 1,100 | | 210,859 | |
Entegris | | | | 2,205 | | 305,569 | |
First Solar | | | | 1,745 | a | 152,094 | |
Lattice Semiconductor | | | | 13,635 | a | 1,050,713 | |
MKS Instruments | | | | 7,480 | | 1,302,792 | |
ON Semiconductor | | | | 6,880 | a | 467,290 | |
Qorvo | | | | 1,310 | a | 204,871 | |
Semtech | | | | 10,200 | a | 907,086 | |
Silicon Laboratories | | | | 1,085 | a | 223,966 | |
SiTime | | | | 510 | a | 149,195 | |
SunPower | | | | 10,370 | a,b | 216,422 | |
Synaptics | | | | 3,345 | a | 968,411 | |
Teradyne | | | | 3,885 | | 635,314 | |
Universal Display | | | | 2,480 | | 409,274 | |
| | | | | 8,111,982 | |
Software & Services - 6.2% | | | | | |
ACI Worldwide | | | | 29,570 | a | 1,026,079 | |
Alliance Data Systems | | | | 6,770 | | 450,679 | |
Aspen Technology | | | | 1,675 | a | 254,935 | |
Blackbaud | | | | 1,795 | a | 141,769 | |
Concentrix | | | | 3,585 | | 640,353 | |
DocuSign | | | | 1,920 | a | 292,435 | |
Dolby Laboratories, Cl. A | | | | 4,435 | | 422,301 | |
Euronet Worldwide | | | | 2,270 | a | 270,516 | |
Fair Isaac | | | | 2,200 | a | 954,074 | |
Genpact | | | | 11,485 | | 609,624 | |
HubSpot | | | | 1,165 | a | 767,910 | |
Jack Henry & Associates | | | | 2,650 | | 442,523 | |
Manhattan Associates | | | | 3,785 | a | 588,530 | |
Mimecast | | | | 5,325 | a | 423,710 | |
NCR | | | | 18,610 | a | 748,122 | |
Nuance Communications | | | | 10,930 | a | 604,648 | |
Palo Alto Networks | | | | 1,525 | a | 849,059 | |
PTC | | | | 1,790 | a | 216,859 | |
Qualys | | | | 3,760 | a | 515,947 | |
Splunk | | | | 2,920 | a | 337,902 | |
13
STATEMENT OF INVESTMENTS (continued)
| | | | | | | | |
| |
Description | | | | Shares | | Value ($) | |
Common Stocks - 99.8% (continued) | | | | | |
Software & Services - 6.2% (continued) | | | | | |
Teradata | | | | 12,675 | a | 538,307 | |
The Western Union Company | | | | 11,405 | | 203,465 | |
| | | | | 11,299,747 | |
Technology Hardware & Equipment - 4.9% | | | | | |
Arrow Electronics | | | | 5,295 | a | 710,960 | |
Avnet | | | | 18,600 | | 766,878 | |
Belden | | | | 7,240 | | 475,885 | |
CDW | | | | 2,430 | | 497,615 | |
Ciena | | | | 10,770 | a | 828,967 | |
Cognex | | | | 13,695 | | 1,064,923 | |
Corning | | | | 11,800 | | 439,314 | |
II-VI | | | | 13,330 | a,b | 910,839 | |
Jabil | | | | 4,300 | | 302,505 | |
Littelfuse | | | | 1,375 | | 432,685 | |
Lumentum Holdings | | | | 6,055 | a,b | 640,437 | |
TD SYNNEX | | | | 2,280 | | 260,741 | |
Trimble | | | | 5,835 | a | 508,754 | |
Ubiquiti | | | | 535 | b | 164,085 | |
Vontier | | | | 14,945 | | 459,260 | |
Xerox Holdings | | | | 22,135 | | 501,136 | |
| | | | | 8,964,984 | |
Telecommunication Services - .3% | | | | | |
Iridium Communications | | | | 12,180 | a | 502,912 | |
Transportation - 2.3% | | | | | |
Avis Budget Group | | | | 3,270 | a | 678,100 | |
Kirby | | | | 18,235 | a | 1,083,524 | |
Knight-Swift Transportation Holdings | | | | 9,030 | | 550,288 | |
Old Dominion Freight Line | | | | 1,705 | | 611,038 | |
Ryder System | | | | 3,050 | | 251,412 | |
Saia | | | | 2,820 | a | 950,425 | |
| | | | | 4,124,787 | |
Utilities - 3.9% | | | | | |
ALLETE | | | | 21,760 | | 1,443,776 | |
Black Hills | | | | 17,105 | | 1,207,100 | |
DTE Energy | | | | 2,180 | | 260,597 | |
Hawaiian Electric Industries | | | | 26,730 | | 1,109,295 | |
IDACORP | | | | 10,930 | | 1,238,478 | |
MDU Resources Group | | | | 21,880 | | 674,779 | |
New Jersey Resources | | | | 7,845 | | 322,116 | |
NorthWestern | | | | 9,245 | | 528,444 | |
UGI | | | | 7,160 | | 328,716 | |
| | | | | 7,113,301 | |
Total Common Stocks (cost $149,231,315) | | | | 181,473,838 | |
14
| | | | | | | | |
| |
Description | | 1-Day
Yield (%) | | Shares | | Value ($) | |
Investment Companies - .2% | | | | | |
Registered Investment Companies - .2% | | | | | |
Dreyfus Institutional Preferred Government Plus Money Market Fund, Institutional Shares
(cost $426,188) | | 0.07 | | 426,188 | d | 426,188 | |
| | | | | | | | |
Investment of Cash Collateral for Securities Loaned - .5% | | | | | |
Registered Investment Companies - .5% | | | | | |
Dreyfus Institutional Preferred Government Plus Money Market Fund, SL Shares
(cost $914,695) | | 0.07 | | 914,695 | d | 914,695 | |
Total Investments (cost $150,572,198) | | 100.5% | | 182,814,721 | |
Liabilities, Less Cash and Receivables | | (.5%) | | (989,303) | |
Net Assets | | 100.0% | | 181,825,418 | |
a Non-income producing security.
b Security, or portion thereof, on loan. At December 31, 2021, the value of the fund’s securities on loan was $6,474,717 and the value of the collateral was $6,629,910, consisting of cash collateral of $914,695 and U.S. Government & Agency securities valued at $5,715,215. In addition, the value of collateral may include pending sales that are also on loan.
c Investment in real estate investment trust within the United States.
d Investment in affiliated issuer. The investment objective of this investment company is publicly available and can be found within the investment company’s prospectus.
| | |
Portfolio Summary (Unaudited) † | Value (%) |
Industrials | 17.0 |
Information Technology | 15.6 |
Consumer Discretionary | 14.8 |
Financials | 14.3 |
Health Care | 10.8 |
Real Estate | 9.7 |
Materials | 5.4 |
Utilities | 3.9 |
Consumer Staples | 3.3 |
Communication Services | 2.5 |
Energy | 2.5 |
Investment Companies | .7 |
| | 100.5 |
† Based on net assets.
See notes to financial statements.
15
STATEMENT OF INVESTMENTS IN AFFILIATED ISSUERS
| | | | | | | |
Description | Value ($) 12/31/2020 | Purchases ($)† | Sales ($) | Value ($) 12/31/2021 | Dividends/
Distributions ($) | |
Registered Investment Companies - .2% | | |
Dreyfus Institutional Preferred Government Plus Money Market Fund, Institutional Shares - .2% | 1,225,389 | 22,965,807 | (23,765,008) | 426,188 | 690 | |
Investment of Cash Collateral for Securities Loaned - .5% | | |
Dreyfus Institutional Preferred Government Plus Money Market Fund, SL Shares - .5% | 827,423 | 15,550,828 | (15,463,556) | 914,695 | 16,578 | †† |
Total - .7% | 2,052,812 | 38,516,635 | (39,228,564) | 1,340,883 | 17,268 | |
† Includes reinvested dividends/distributions.
†† Represents securities lending income earned from the reinvestment of cash collateral from loaned securities, net of fees and collateral investment expenses, and other payments to and from borrowers of securities.
See notes to financial statements.
16
STATEMENT OF ASSETS AND LIABILITIES
December 31, 2021
| | | | | | | |
| | | | | | |
| | | Cost | | Value | |
Assets ($): | | | | |
Investments in securities—See Statement of Investments
(including securities on loan, valued at $6,474,717)—Note 1(b): | | | |
Unaffiliated issuers | 149,231,315 | | 181,473,838 | |
Affiliated issuers | | 1,340,883 | | 1,340,883 | |
Dividends and securities lending income receivable | | 158,601 | |
Receivable for shares of Beneficial Interest subscribed | | 89,700 | |
Prepaid expenses | | | | | 3,519 | |
| | | | | 183,066,541 | |
Liabilities ($): | | | | |
Due to BNY Mellon Investment Adviser, Inc. and affiliates—Note 3(b) | | 137,414 | |
Liability for securities on loan—Note 1(b) | | 914,695 | |
Payable for shares of Beneficial Interest redeemed | | 119,051 | |
Trustees’ fees and expenses payable | | 1,650 | |
Other accrued expenses | | | | | 68,313 | |
| | | | | 1,241,123 | |
Net Assets ($) | | | 181,825,418 | |
Composition of Net Assets ($): | | | | |
Paid-in capital | | | | | 111,442,077 | |
Total distributable earnings (loss) | | | | | 70,383,341 | |
Net Assets ($) | | | 181,825,418 | |
| | | | |
Net Asset Value Per Share | Initial Shares | Service Shares | |
Net Assets ($) | 86,836,664 | 94,988,754 | |
Shares Outstanding | 3,505,979 | 3,854,387 | |
Net Asset Value Per Share ($) | 24.77 | 24.64 | |
| | | |
See notes to financial statements. | | | |
17
STATEMENT OF OPERATIONS
Year Ended December 31, 2021
| | | | | | | |
| | | | | | |
| | | | | | |
Investment Income ($): | | | | |
Income: | | | | |
Cash dividends: | |
Unaffiliated issuers | | | 2,596,714 | |
Affiliated issuers | | | 690 | |
Income from securities lending—Note 1(b) | | | 16,578 | |
Total Income | | | 2,613,982 | |
Expenses: | | | | |
Management fee—Note 3(a) | | | 1,323,384 | |
Distribution fees—Note 3(b) | | | 226,866 | |
Professional fees | | | 100,362 | |
Prospectus and shareholders’ reports | | | 27,472 | |
Custodian fees—Note 3(b) | | | 21,022 | |
Chief Compliance Officer fees—Note 3(b) | | | 14,276 | |
Trustees’ fees and expenses—Note 3(c) | | | 13,751 | |
Loan commitment fees—Note 2 | | | 2,475 | |
Shareholder servicing costs—Note 3(b) | | | 1,565 | |
Interest expense—Note 2 | | | 101 | |
Miscellaneous | | | 19,042 | |
Total Expenses | | | 1,750,316 | |
Less—reduction in expenses due to undertaking—Note 3(a) | | | (21,189) | |
Net Expenses | | | 1,729,127 | |
Investment Income—Net | | | 884,855 | |
Realized and Unrealized Gain (Loss) on Investments—Note 4 ($): | | |
Net realized gain (loss) on investments | 37,494,447 | |
Net change in unrealized appreciation (depreciation) on investments | 574,376 | |
Net Realized and Unrealized Gain (Loss) on Investments | | | 38,068,823 | |
Net Increase in Net Assets Resulting from Operations | | 38,953,678 | |
| | | | | | |
See notes to financial statements. | | | | | |
18
STATEMENT OF CHANGES IN NET ASSETS
| | | | | | | | | | |
| | | | Year Ended December 31, |
| | | | 2021 | | 2020 | |
Operations ($): | | | | | | | | |
Investment income—net | | | 884,855 | | | | 894,861 | |
Net realized gain (loss) on investments | | 37,494,447 | | | | 3,459,022 | |
Net change in unrealized appreciation
(depreciation) on investments | | 574,376 | | | | 6,471,918 | |
Net Increase (Decrease) in Net Assets
Resulting from Operations | 38,953,678 | | | | 10,825,801 | |
Distributions ($): | |
Distributions to shareholders: | | | | | | | | |
Initial Shares | | | (1,082,003) | | | | (552,702) | |
Service Shares | | | (940,992) | | | | (343,563) | |
Total Distributions | | | (2,022,995) | | | | (896,265) | |
Beneficial Interest Transactions ($): | |
Net proceeds from shares sold: | | | | | | | | |
Initial Shares | | | 8,847,860 | | | | 7,458,751 | |
Service Shares | | | 13,852,574 | | | | 14,678,777 | |
Distributions reinvested: | | | | | | | | |
Initial Shares | | | 1,082,003 | | | | 552,702 | |
Service Shares | | | 940,992 | | | | 343,563 | |
Cost of shares redeemed: | | | | | | | | |
Initial Shares | | | (16,848,704) | | | | (13,780,638) | |
Service Shares | | | (16,490,420) | | | | (16,960,443) | |
Increase (Decrease) in Net Assets
from Beneficial Interest Transactions | (8,615,695) | | | | (7,707,288) | |
Total Increase (Decrease) in Net Assets | 28,314,988 | | | | 2,222,248 | |
Net Assets ($): | |
Beginning of Period | | | 153,510,430 | | | | 151,288,182 | |
End of Period | | | 181,825,418 | | | | 153,510,430 | |
Capital Share Transactions (Shares): | |
Initial Shares | | | | | | | | |
Shares sold | | | 390,569 | | | | 456,232 | |
Shares issued for distributions reinvested | | | 48,783 | | | | 45,155 | |
Shares redeemed | | | (729,080) | | | | (828,281) | |
Net Increase (Decrease) in Shares Outstanding | (289,728) | | | | (326,894) | |
Service Shares | | | | | | | | |
Shares sold | | | 620,993 | | | | 938,110 | |
Shares issued for distributions reinvested | | | 42,560 | | | | 28,138 | |
Shares redeemed | | | (732,921) | | | | (1,060,385) | |
Net Increase (Decrease) in Shares Outstanding | (69,368) | | | | (94,137) | |
| | | | | | | | | |
See notes to financial statements. | | | | | | | | |
19
FINANCIAL HIGHLIGHTS
The following tables describe the performance for each share class for the fiscal periods indicated. All information (except portfolio turnover rate) reflects financial results for a single fund share. Net asset value total return is calculated assuming an initial investment made at the net asset value at the beginning of the period, reinvestment of all dividends and distributions at net asset value during the period, and redemption at net asset value on the last day of the period. Net asset value total return includes adjustments in accordance with accounting principles generally accepted in the United States of America and as such, the net asset value for financial reporting purposes and the returns based upon those net asset values may differ from the net asset value and returns for shareholder transactions. The fund’s total returns do not reflect expenses associated with variable annuity or insurance contracts. These figures have been derived from the fund’s financial statements.
| | | | | | | |
| | | |
| | | |
| | | Year Ended December 31, |
Initial Shares | | 2021 | 2020 | 2019 | 2018 | 2017 |
Per Share Data ($): | | | | | | |
Net asset value, beginning of period | | 19.93 | 18.64 | 16.80 | 22.56 | 20.09 |
Investment Operations: | | | | | | |
Investment income—neta | | .15 | .13 | .13 | .12 | .10 |
Net realized and unrealized
gain (loss) on investments | | 4.97 | 1.30 | 3.15 | (3.19) | 2.92 |
Total from Investment Operations | | 5.12 | 1.43 | 3.28 | (3.07) | 3.02 |
Distributions: | | | | | | |
Dividends from
investment income—net | | (.14) | (.14) | (.12) | (.13) | (.22) |
Dividends from
net realized gain on investments | | (.14) | - | (1.32) | (2.56) | (.33) |
Total Distributions | | (.28) | (.14) | (1.44) | (2.69) | (.55) |
Net asset value, end of period | | 24.77 | 19.93 | 18.64 | 16.80 | 22.56 |
Total Return (%) | | 25.89 | 8.11 | 20.18 | (15.49) | 15.38 |
Ratios/Supplemental Data (%): | | | | | | |
Ratio of total expenses
to average net assets | | .86 | .87 | .86 | .86 | .87 |
Ratio of net expenses
to average net assets | | .85 | .87 | .86 | .86 | .87 |
Ratio of net investment income
to average net assets | | .63 | .81 | .73 | .59 | .50 |
Portfolio Turnover Rate | | 90.95 | 92.40 | 82.88 | 68.02 | 64.86 |
Net Assets, end of period ($ x 1,000) | | 86,837 | 75,649 | 76,835 | 72,374 | 92,776 |
a Based on average shares outstanding.
See notes to financial statements.
20
| | | | | | | |
| | | |
| | | |
| | | Year Ended December 31, |
Service Shares | | 2021 | 2020 | 2019 | 2018 | 2017 |
Per Share Data ($): | | | | | | |
Net asset value, beginning of period | | 19.84 | 18.53 | 16.71 | 22.45 | 20.00 |
Investment Operations: | | | | | | |
Investment income—neta | | .09 | .09 | .09 | .07 | .06 |
Net realized and unrealized
gain (loss) on investments | | 4.95 | 1.31 | 3.12 | (3.18) | 2.90 |
Total from Investment Operations | | 5.04 | 1.40 | 3.21 | (3.11) | 2.96 |
Distributions: | | | | | | |
Dividends from
investment income—net | | (.10) | (.09) | (.07) | (.07) | (.18) |
Dividends from
net realized gain on investments | | (.14) | - | (1.32) | (2.56) | (.33) |
Total Distributions | | (.24) | (.09) | (1.39) | (2.63) | (.51) |
Net asset value, end of period | | 24.64 | 19.84 | 18.53 | 16.71 | 22.45 |
Total Return (%) | | 25.56 | 7.85 | 19.85 | (15.69) | 15.04 |
Ratios/Supplemental Data (%): | | | | | | |
Ratio of total expenses
to average net assets | | 1.11 | 1.12 | 1.11 | 1.11 | 1.12 |
Ratio of net expenses
to average net assets | | 1.10 | 1.12 | 1.11 | 1.11 | 1.12 |
Ratio of net investment income
to average net assets | | .38 | .56 | .48 | .34 | .28 |
Portfolio Turnover Rate | | 90.95 | 92.40 | 82.88 | 68.02 | 64.86 |
Net Assets, end of period ($ x 1,000) | | 94,989 | 77,862 | 74,454 | 63,202 | 76,948 |
a Based on average shares outstanding.
See notes to financial statements.
21
NOTES TO FINANCIAL STATEMENTS
NOTE 1—Significant Accounting Policies:
MidCap Stock Portfolio (the “fund”) is a separate diversified series of BNY Mellon Investment Portfolios (the “Trust”), which is registered under the Investment Company Act of 1940, as amended (the “Act”), as an open-end management investment company and operates as a series company currently offering three series, including the fund. The fund is only offered to separate accounts established by insurance companies to fund variable annuity contracts and variable life insurance policies. The fund’s investment objective is to seek investment results that are greater than the total return performance of publicly traded common stocks of medium-size domestic companies in the aggregate, as represented by the Standard & Poor’s MidCap 400® Index. BNY Mellon Investment Adviser, Inc. (the “Adviser”), a wholly-owned subsidiary of The Bank of New York Mellon Corporation (“BNY Mellon”), serves as the fund’s investment adviser. Effective September 1, 2021 (the “Effective Date”), the Adviser has engaged its affiliate, Newton Investment Management North America, LLC (the “Sub-Adviser”) as the fund’s sub-investment adviser pursuant to a sub-investment advisory agreement between the Adviser and the Sub-Adviser. As the fund’s sub-investment adviser, the Sub-Adviser provides the day-to-day management of the fund’s investments, subject to the Adviser’s supervision and approval. The Adviser (and not the fund) pays the Sub-Adviser for its sub-advisory services. As of the Effective Date, portfolio managers responsible for managing the fund’s investments who were employees of Mellon Investments Corporation (“Mellon”) in a dual employment arrangement with the Adviser, have become employees of the Sub-Adviser, and are no longer employees of Mellon.
BNY Mellon Securities Corporation (the “Distributor”), a wholly-owned subsidiary of the Adviser, is the distributor of the fund’s shares, which are sold without a sales charge. The fund is authorized to issue an unlimited number of $.001 par value shares of Beneficial Interest in each of the following classes of shares: Initial and Service. Each class of shares has identical rights and privileges, except with respect to the Distribution Plan, and the expenses borne by each class, the allocation of certain transfer agency costs, and certain voting rights. Income, expenses (other than expenses attributable to a specific class), and realized and unrealized gains or losses on investments are allocated to each class of shares based on its relative net assets.
The Trust accounts separately for the assets, liabilities and operations of each series. Expenses directly attributable to each series are charged to that series’ operations; expenses which are applicable to all series are allocated among them on a pro rata basis.
22
The Financial Accounting Standards Board (“FASB”) Accounting Standards Codification (“ASC”) is the exclusive reference of authoritative U.S. generally accepted accounting principles (“GAAP”) recognized by the FASB to be applied by nongovernmental entities. Rules and interpretive releases of the SEC under authority of federal laws are also sources of authoritative GAAP for SEC registrants. The fund is an investment company and applies the accounting and reporting guidance of the FASB ASC Topic 946 Financial Services-Investment Companies. The fund’s financial statements are prepared in accordance with GAAP, which may require the use of management estimates and assumptions. Actual results could differ from those estimates.
The Trust enters into contracts that contain a variety of indemnifications. The fund’s maximum exposure under these arrangements is unknown. The fund does not anticipate recognizing any loss related to these arrangements.
(a) Portfolio valuation: The fair value of a financial instrument is the amount that would be received to sell an asset or paid to transfer a liability in an orderly transaction between market participants at the measurement date (i.e., the exit price). GAAP establishes a fair value hierarchy that prioritizes the inputs of valuation techniques used to measure fair value. This hierarchy gives the highest priority to unadjusted quoted prices in active markets for identical assets or liabilities (Level 1 measurements) and the lowest priority to unobservable inputs (Level 3 measurements).
Additionally, GAAP provides guidance on determining whether the volume and activity in a market has decreased significantly and whether such a decrease in activity results in transactions that are not orderly. GAAP requires enhanced disclosures around valuation inputs and techniques used during annual and interim periods.
Various inputs are used in determining the value of the fund’s investments relating to fair value measurements. These inputs are summarized in the three broad levels listed below:
Level 1—unadjusted quoted prices in active markets for identical investments.
Level 2—other significant observable inputs (including quoted prices for similar investments, interest rates, prepayment speeds, credit risk, etc.).
Level 3—significant unobservable inputs (including the fund’s own assumptions in determining the fair value of investments).
23
NOTES TO FINANCIAL STATEMENTS (continued)
The inputs or methodology used for valuing securities are not necessarily an indication of the risk associated with investing in those securities.
Changes in valuation techniques may result in transfers in or out of an assigned level within the disclosure hierarchy. Valuation techniques used to value the fund’s investments are as follows:
Investments in equity securities are valued at the last sales price on the securities exchange or national securities market on which such securities are primarily traded. Securities listed on the National Market System for which market quotations are available are valued at the official closing price or, if there is no official closing price that day, at the last sales price. For open short positions, asked prices are used for valuation purposes. Bid price is used when no asked price is available. Registered investment companies that are not traded on an exchange are valued at their net asset value. All of the preceding securities are generally categorized within Level 1 of the fair value hierarchy.
Securities not listed on an exchange or the national securities market, or securities for which there were no transactions, are valued at the average of the most recent bid and asked prices. These securities are generally categorized within Level 2 of the fair value hierarchy.
Fair valuing of securities may be determined with the assistance of a pricing service using calculations based on indices of domestic securities and other appropriate indicators, such as prices of relevant American Depository Receipts and futures. Utilizing these techniques may result in transfers between Level 1 and Level 2 of the fair value hierarchy.
When market quotations or official closing prices are not readily available, or are determined not to accurately reflect fair value, such as when the value of a security has been significantly affected by events after the close of the exchange or market on which the security is principally traded (for example, a foreign exchange or market), but before the fund calculates its net asset value, the fund may value these investments at fair value as determined in accordance with the procedures approved by the Trust’s Board of Trustees (the “Board”). Certain factors may be considered when fair valuing investments such as: fundamental analytical data, the nature and duration of restrictions on disposition, an evaluation of the forces that influence the market in which the securities are purchased and sold, and public trading in similar securities of the issuer or comparable issuers. These securities are either categorized within Level 2 or 3 of the fair value hierarchy depending on the relevant inputs used.
24
For securities where observable inputs are limited, assumptions about market activity and risk are used and such securities are generally categorized within Level 3 of the fair value hierarchy.
The following is a summary of the inputs used as of December 31, 2021 in valuing the fund’s investments:
| | | | | | | |
| | Level 1-Unadjusted Quoted Prices | Level 2- Other Significant Observable Inputs | | Level 3-Significant Unobservable Inputs | Total | |
Assets ($) | | |
Investments in Securities:† | | |
Equity Securities - Common Stocks | 181,473,838 | - | | - | 181,473,838 | |
Investment Companies | 1,340,883 | - | | - | 1,340,883 | |
† See Statement of Investments for additional detailed categorizations, if any.
(b) Securities transactions and investment income: Securities transactions are recorded on a trade date basis. Realized gains and losses from securities transactions are recorded on the identified cost basis. Dividend income is recognized on the ex-dividend date and interest income, including, where applicable, accretion of discount and amortization of premium on investments, is recognized on the accrual basis.
Pursuant to a securities lending agreement with The Bank of New York Mellon, a subsidiary of BNY Mellon and an affiliate of the Adviser, the fund may lend securities to qualified institutions. It is the fund’s policy that, at origination, all loans are secured by collateral of at least 102% of the value of U.S. securities loaned and 105% of the value of foreign securities loaned. Collateral equivalent to at least 100% of the market value of securities on loan is maintained at all times. Collateral is either in the form of cash, which can be invested in certain money market mutual funds managed by the Adviser, or U.S. Government and Agency securities. The fund is entitled to receive all dividends, interest and distributions on securities loaned, in addition to income earned as a result of the lending transaction. Should a borrower fail to return the securities in a timely manner, The Bank of New York Mellon is required to replace the securities for the benefit of the fund or credit the fund with the market value of the unreturned securities and is subrogated to the fund’s rights against the borrower and the collateral. Additionally, the contractual maturity of security lending transactions are on an overnight and continuous basis. During the period ended December 31, 2021, The Bank
25
NOTES TO FINANCIAL STATEMENTS (continued)
of New York Mellon earned $2,256 from the lending of the fund’s portfolio securities, pursuant to the securities lending agreement.
(c) Affiliated issuers: Investments in other investment companies advised by the Adviser are considered “affiliated” under the Act.
(d) Risk: Certain events particular to the industries in which the fund’s investments conduct their operations, as well as general economic, political and public health conditions, may have a significant negative impact on the investee’s operations and profitability. In addition, turbulence in financial markets and reduced liquidity in equity, credit and/or fixed income markets may negatively affect many issuers, which could adversely affect the fund. Global economies and financial markets are becoming increasingly interconnected, and conditions and events in one country, region or financial market may adversely impact issuers in a different country, region or financial market. These risks may be magnified if certain events or developments adversely interrupt the global supply chain; in these and other circumstances, such risks might affect companies world-wide. Recent examples include pandemic risks related to COVID-19 and aggressive measures taken world-wide in response by governments, including closing borders, restricting international and domestic travel, and the imposition of prolonged quarantines of large populations, and by businesses, including changes to operations and reducing staff. The effects of COVID-19 have contributed to increased volatility in global markets and will likely affect certain countries, companies, industries and market sectors more dramatically than others. The COVID-19 pandemic has had, and any other outbreak of an infectious disease or other serious public health concern could have, a significant negative impact on economic and market conditions and could trigger a prolonged period of global economic slowdown. To the extent the fund may overweight its investments in certain countries, companies, industries or market sectors, such positions will increase the fund’s exposure to risk of loss from adverse developments affecting those countries, companies, industries or sectors.
(e) Dividends and distributions to shareholders: Dividends and distributions are recorded on the ex-dividend date. Dividends from investment income-net and dividends from net realized capital gains, if any, are normally declared and paid annually, but the fund may make distributions on a more frequent basis to comply with the distribution requirements of the Internal Revenue Code of 1986, as amended (the “Code”). To the extent that net realized capital gains can be offset by capital loss carryovers, it is the policy of the fund not to distribute such gains. Income and capital gain distributions are determined in accordance with income tax regulations, which may differ from GAAP.
26
(f) Federal income taxes: It is the policy of the fund to continue to qualify as a regulated investment company, if such qualification is in the best interests of its shareholders, by complying with the applicable provisions of the Code, and to make distributions of taxable income and net realized capital gain sufficient to relieve it from substantially all federal income and excise taxes.
As of and during the period ended December 31, 2021, the fund did not have any liabilities for any uncertain tax positions. The fund recognizes interest and penalties, if any, related to uncertain tax positions as income tax expense in the Statement of Operations. During the period ended December 31, 2021, the fund did not incur any interest or penalties.
Each tax year in the four-year period ended December 31, 2021 remains subject to examination by the Internal Revenue Service and state taxing authorities.
At December 31, 2021, the components of accumulated earnings on a tax basis were as follows: undistributed ordinary income $14,072,379, undistributed capital gains $24,318,354 and unrealized appreciation $31,992,608.
The tax character of distributions paid to shareholders during the fiscal periods ended December 31, 2021 and December 31, 2020 were as follows: ordinary income $924,151 and $896,265, and long-term capital gains $1,098,844 and $0, respectively.
NOTE 2—Bank Lines of Credit:
The fund participates with other long-term open-end funds managed by the Adviser in a $823.5 million unsecured credit facility led by Citibank, N.A. (the “Citibank Credit Facility”) and a $300 million unsecured credit facility provided by The Bank of New York Mellon (the “BNYM Credit Facility”), each to be utilized primarily for temporary or emergency purposes, including the financing of redemptions (each, a “Facility”). The Citibank Credit Facility is available in two tranches: (i) Tranche A is in an amount equal to $688.5 million and is available to all long-term open-ended funds, including the fund, and (ii) Tranche B is an amount equal to $135 million and is available only to BNY Mellon Floating Rate Income Fund, a series of BNY Mellon Investment Funds IV, Inc. In connection therewith, the fund has agreed to pay its pro rata portion of commitment fees for Tranche A of the Citibank Credit Facility and the BNYM Credit Facility. Interest is charged to the fund based on rates determined pursuant to the terms of the respective Facility at the time of borrowing.
27
NOTES TO FINANCIAL STATEMENTS (continued)
The average amount of borrowings outstanding under the Facilities during the period ended December 31, 2021 was approximately $8,219 with a related weighted average annualized rate of 1.23%.
NOTE 3—Management Fee, Sub-Investment Advisory Fee and Other Transactions with Affiliates:
(a) Pursuant to a management agreement with the Adviser, the management fee is computed at the annual rate of .75% of the value of the fund's average daily net assets and is payable monthly. The Adviser had contractually agreed, from January 1, 2021 through September 27, 2021, to waive receipt of its fees and/or assume the expenses of the fund, so that the direct expenses of the fund (excluding Rule 12b-1 Distribution Plan fees, taxes, interest expense, brokerage commissions, commitment fees on borrowings and extraordinary expenses) do not exceed 1.00%. The Adviser has contractually agreed, from September 27, 2021 through April 30, 2022, to waive receipt of its fees and/or assume the expenses of the fund, so that the direct expenses of the fund (excluding expenses as described above) do not exceed .80%. On or after April 30, 2022, the Adviser may terminate this expense limitation at any time. The reduction in expense pursuant to undertaking amount to $21,189 for the period ended December 31, 2021.
As of the Effective Date, pursuant to a sub-investment advisory agreement between the Adviser and the Sub-Adviser, the Adviser pays the Sub-Adviser a monthly fee at an annual rate of .36% of the value of the fund’s average daily net assets.
(b) Under the Distribution Plan adopted pursuant to Rule 12b-1 under the Act, Service shares pay the Distributor for distributing its shares, for servicing and/or maintaining Service shares’ shareholder accounts and for advertising and marketing for Service shares. The Distribution Plan provides for payments to be made at an annual rate of .25% of the value of the Service shares’ average daily net assets. The Distributor may make payments to Participating Insurance Companies and to brokers and dealers acting as principal underwriter for their variable insurance products. The fees payable under the Distribution Plan are payable without regard to actual expenses incurred. During the period ended December 31, 2021, Service shares were charged $226,866 pursuant to the Distribution Plan.
The fund has an arrangement with the transfer agent whereby the fund may receive earnings credits when positive cash balances are maintained, which are used to offset transfer agency fees. For financial reporting purposes, the fund includes net earnings credits, if any, as shareholder servicing costs in the Statement of Operations.
28
The fund has an arrangement with the custodian whereby the fund will receive interest income or be charged overdraft fees when cash balances are maintained. For financial reporting purposes, the fund includes this interest income and overdraft fees, if any, as interest income in the Statement of Operations.
The fund compensates BNY Mellon Transfer, Inc., a wholly-owned subsidiary of the Adviser, under a transfer agency agreement for providing transfer agency and cash management services inclusive of earnings credits, if any, for the fund. The majority of transfer agency fees are comprised of amounts paid on a per account basis, while cash management fees are related to fund subscriptions and redemptions. During the period ended December 31, 2021, the fund was charged $1,368 for transfer agency services, inclusive of earnings credit, if any. These fees are included in Shareholder servicing costs in the Statement of Operations.
The fund compensates The Bank of New York Mellon under a custody agreement for providing custodial services for the fund. These fees are determined based on net assets, geographic region and transaction activity. During the period ended December 31, 2021, the fund was charged $21,022 pursuant to the custody agreement.
During the period ended December 31, 2021, the fund was charged $14,276 for services performed by the Chief Compliance Officer and his staff. These fees are included in Chief Compliance Officer fees in the Statement of Operations.
The components of “Due to BNY Mellon Investment Adviser, Inc. and affiliates” in the Statement of Assets and Liabilities consist of: management fees of $113,368, Distribution Plan fees of $19,649, custodian fees of $4,400, Chief Compliance Officer fees of $3,627 and transfer agency fees of $262, which are offset against an expense reimbursement currently in effect in the amount of $3,892.
(c) Each Board member also serves as a Board member of other funds in the BNY Mellon Family of Funds complex. Annual retainer fees and attendance fees are allocated to each fund based on net assets.
NOTE 4—Securities Transactions:
The aggregate amount of purchases and sales of investment securities, excluding short-term securities, during the period ended December 31, 2021, amounted to $157,387,822 and $166,053,511, respectively.
At December 31, 2021, the cost of investments for federal income tax purposes was $150,822,113; accordingly, accumulated net unrealized
29
NOTES TO FINANCIAL STATEMENTS (continued)
appreciation on investments was $31,992,608, consisting of $35,340,079 gross unrealized appreciation and $3,347,471 gross unrealized depreciation.
30
REPORT OF INDEPENDENT REGISTERED PUBLIC ACCOUNTING FIRM
To the Shareholders and the Board of Trustees of MidCap Stock Portfolio
Opinion on the Financial Statements
We have audited the accompanying statement of assets and liabilities of MidCap Stock Portfolio (the “Fund”) (one of the funds constituting BNY Mellon Investment Portfolios), including the statements of investments and investments in affiliated issuers, as of December 31, 2021, and the related statement of operations for the year then ended, the statements of changes in net assets for each of the two years in the period then ended, the financial highlights for each of the five years in the period then ended and the related notes (collectively referred to as the “financial statements”). In our opinion, the financial statements present fairly, in all material respects, the financial position of the Fund (one of the funds constituting BNY Mellon Investment Portfolios) at December 31, 2021, the results of its operations for the year then ended, the changes in its net assets for each of the two years in the period then ended and its financial highlights for each of the five years in the period then ended, in conformity with U.S. generally accepted accounting principles.
Basis for Opinion
These financial statements are the responsibility of the Fund’s management. Our responsibility is to express an opinion on the Fund’s financial statements based on our audits. We are a public accounting firm registered with the Public Company Accounting Oversight Board (United States) (“PCAOB”) and are required to be independent with respect to the Fund in accordance with the U.S. federal securities laws and the applicable rules and regulations of the Securities and Exchange Commission and the PCAOB.
We conducted our audits in accordance with the standards of the PCAOB. Those standards require that we plan and perform the audit to obtain reasonable assurance about whether the financial statements are free of material misstatement, whether due to error or fraud. The Fund is not required to have, nor were we engaged to perform, an audit of the Fund’s internal control over financial reporting. As part of our audits, we are required to obtain an understanding of internal control over financial reporting, but not for the purpose of expressing an opinion on the effectiveness of the Fund’s internal control over financial reporting. Accordingly, we express no such opinion.
Our audits included performing procedures to assess the risks of material misstatement of the financial statements, whether due to error or fraud, and performing procedures that respond to those risks. Such procedures included examining, on a test basis, evidence regarding the amounts and disclosures in the financial statements. Our procedures included confirmation of securities owned as of December 31, 2021, by correspondence with the custodian and others or by other appropriate auditing procedures where replies from others were not received. Our audits also included evaluating the accounting principles used and significant estimates made by management, as well as evaluating the overall presentation of the financial statements. We believe that our audits provide a reasonable basis for our opinion.

We have served as the auditor of one or more investment companies in the BNY Mellon Family of Funds since at least 1957, but we are unable to determine the specific year.
New York, New York
February 8, 2022
31
IMPORTANT TAX INFORMATION (Unaudited)
For federal tax purposes, the portfolio hereby reports 99.84% of the ordinary dividends paid during the fiscal year ended December 31, 2021 as qualifying for the corporate dividends received deduction. Shareholders will receive notification in early 2022 of the percentage applicable to the preparation of their 2021 income tax returns. Also, the fund hereby reports $.1434 per share as a long-term capital gain distribution paid on March 30, 2021.
32
INFORMATION ABOUT THE RENEWAL OF THE FUND’S MANAGEMENT AGREEMENT (Unaudited)
At a meeting of the fund’s Board of Trustees held on August 3-4, 2021, the Board considered the renewal of the fund’s Management Agreement pursuant to which the Adviser provides the fund with investment advisory and administrative services (the “Agreement”). The Board members, none of whom are “interested persons” (as defined in the Investment Company Act of 1940, as amended) of the fund, were assisted in their review by independent legal counsel and met with counsel in executive session separate from representatives of the Adviser. In considering the renewal of the Agreement, the Board considered several factors that it believed to be relevant, including those discussed below. The Board did not identify any one factor as dispositive, and each Board member may have attributed different weights to the factors considered.
Analysis of Nature, Extent, and Quality of Services Provided to the Fund. The Board considered information provided to it at the meeting and in previous presentations from representatives of the Adviser regarding the nature, extent, and quality of the services provided to funds in the BNY Mellon fund complex, including the fund. The Adviser provided the number of open accounts in the fund, the fund’s asset size and the allocation of fund assets among distribution channels. The Adviser also had previously provided information regarding the diverse intermediary relationships and distribution channels of funds in the BNY Mellon fund complex (such as retail direct or intermediary, in which intermediaries typically are paid by the fund and/or the Adviser) and the Adviser’s corresponding need for broad, deep, and diverse resources to be able to provide ongoing shareholder services to each intermediary or distribution channel, as applicable to the fund.
The Board also considered research support available to, and portfolio management capabilities of, the fund’s portfolio management personnel and that the Adviser also provides oversight of day-to-day fund operations, including fund accounting and administration and assistance in meeting legal and regulatory requirements. The Board also considered the Adviser’s extensive administrative, accounting and compliance infrastructures.
Comparative Analysis of the Fund’s Performance and Management Fee and Expense Ratio. The Board reviewed reports prepared by Broadridge Financial Solutions, Inc. (“Broadridge”), an independent provider of investment company data based on classifications provided by Thomson Reuters Lipper, which included information comparing (1) the performance of the fund’s Initial shares with the performance of a group of small-cap core funds underlying variable insurance products (“VIPs”) selected by Broadridge as comparable to the fund (the “Performance Group”) and with a broader group of funds consisting of all small-cap core funds underlying VIPs (the “Performance Universe”), all for various periods ended June 30, 2021, and (2) the fund’s actual and contractual management fees and total expenses of the fund’s Initial shares with those of the same group of funds in the Performance Group (the “Expense Group”) and the fund’s Initial shares and Service shares with a broader group of small-cap core funds underlying VIPs with similar 12b-1/non-12b-1 structures, excluding
33
INFORMATION ABOUT THE RENEWAL OF THE FUND’S MANAGEMENT AGREEMENT (Unaudited) (continued)
outliers (the “Expense Universe”), the information for which was derived in part from fund financial statements available to Broadridge as of the date of its analysis. The Adviser previously had furnished the Board with a description of the methodology Broadridge used to select the Performance Group and Performance Universe and the Expense Group and Expense Universe.
Performance Comparisons. Representatives of the Adviser stated that the usefulness of performance comparisons may be affected by a number of factors, including different investment limitations and policies that may be applicable to the fund and comparison funds and the end date selected. They also considered that performance generally should be considered over longer periods of time, although it is possible that long-term performance can be adversely affected by even one period of significant underperformance so that a single investment decision or theme has the ability to affect disproportionately long-term performance. The Board discussed with representatives of the Adviser the results of the comparisons and considered that the fund’s total return performance was below the Performance Group and Performance Universe medians for all periods. The Board considered the relative proximity of the fund’s performance to the Performance Group and/or Performance Universe median in certain periods, particularly the ten-year period when performance was only slightly below the Performance Group and Performance Universe medians. The Adviser also provided a comparison of the fund’s calendar year total returns to the returns of the fund’s benchmark index, and it was noted that the fund’s returns were above the returns of the index in four of the ten calendar years shown. Representatives of the Adviser noted that the fund had a three star Morningstar rating for its ten-year risk-adjusted return.
Management Fee and Expense Ratio Comparisons. The Board reviewed and considered the contractual management fee rate payable by the fund to the Adviser in light of the nature, extent and quality of the management services provided by the Adviser. In addition, the Board reviewed and considered the actual management fee rate paid by the fund over the fund’s last fiscal year. The Board also reviewed the range of actual and contractual management fees and total expenses as a percentage of average net assets of the Expense Group and Expense Universe funds and discussed the results of the comparisons.
The Board considered that the fund’s contractual management fee was lower than the Expense Group median contractual management fee, the fund’s actual management fee was lower than the Expense Group median and Expense Universe median actual management fee and the total expenses of the fund’s Initial shares were lower than the Expense Group median and slightly higher than the Expense Universe median total expenses and the total expenses of the fund’s Service shares were higher than the Expense Universe median total expenses.
Representatives of the Adviser stated that the Adviser has contractually agreed, until April 30, 2022, to waive receipt of its fee and/or assume the direct expenses of the fund so that the direct expenses of none of its classes (excluding Rule 12b-1 fees, taxes, interest, brokerage commissions, commitment fees on borrowings and extraordinary expenses) exceed 0.80% of the fund’s average daily net assets.
34
Representatives of the Adviser reviewed with the Board the management or investment advisory fees paid by funds advised or administered by the Adviser that are in the same Lipper category as the fund (the “Similar Funds”), and explained the nature of the Similar Funds. They discussed differences in fees paid and the relationship of the fees paid in light of any differences in the services provided and other relevant factors. The Board considered the relevance of the fee information provided for the Similar Funds to evaluate the appropriateness of the fund’s management fee. Representatives of the Adviser noted that there were no separate accounts and/or other types of client portfolios advised by the Adviser that are considered to have similar investment strategies and policies as the fund.
Analysis of Profitability and Economies of Scale. Representatives of the Adviser reviewed the expenses allocated and profit received by the Adviser and its affiliates and the resulting profitability percentage for managing the fund and the aggregate profitability percentage to the Adviser and its affiliates for managing the funds in the BNY Mellon fund complex, and the method used to determine the expenses and profit. The Board concluded that the profitability results were not excessive, given the services rendered and service levels provided by the Adviser and its affiliates. The Board also had been provided with information prepared by an independent consulting firm regarding the Adviser’s approach to allocating costs to, and determining the profitability of, individual funds and the entire BNY Mellon fund complex. The consulting firm also had analyzed where any economies of scale might emerge in connection with the management of a fund.
The Board considered, on the advice of its counsel, the profitability analysis (1) as part of its evaluation of whether the fee under the Agreement, considered in relation to the mix of services provided by the Adviser, including the nature, extent and quality of such services, supported the renewal of the Agreement and (2) in light of the relevant circumstances for the fund and the extent to which economies of scale would be realized if the fund grows and whether fee levels reflect these economies of scale for the benefit of fund shareholders. Representatives of the Adviser stated that, as a result of shared and allocated costs among funds in the BNY Mellon fund complex, the extent of economies of scale could depend substantially on the level of assets in the complex as a whole, so that increases and decreases in complex-wide assets can affect potential economies of scale in a manner that is disproportionate to, or even in the opposite direction from, changes in the fund’s asset level. The Board also considered potential benefits to the Adviser from acting as investment adviser and took into consideration that there were no soft dollar arrangements in effect for trading the fund’s investments.
At the conclusion of these discussions, the Board agreed that it had been furnished with sufficient information to make an informed business decision with respect to the renewal of the Agreement. Based on the discussions and considerations as described above, the Board concluded and determined as follows.
· The Board concluded that the nature, extent and quality of the services provided by the Adviser are adequate and appropriate.
35
INFORMATION ABOUT THE RENEWAL OF THE FUND’S MANAGEMENT AGREEMENT (Unaudited) (continued)
· The Board agreed to closely monitor performance and determined to approve renewal of the Agreement only through the first quarter 2022 regular Board meeting.
· The Board concluded that the fee paid to the Adviser continued to be appropriate under the circumstances and in light of the factors and the totality of the services provided as discussed above, subject to review no later than the next renewal consideration.
· The Board determined that the economies of scale which may accrue to the Adviser and its affiliates in connection with the management of the fund had been adequately considered by the Adviser in connection with the fee rate charged to the fund pursuant to the Agreement and that, to the extent in the future it were determined that material economies of scale had not been shared with the fund, the Board would seek to have those economies of scale shared with the fund.
In evaluating the Agreement, the Board considered these conclusions and determinations and also relied on its previous knowledge, gained through meetings and other interactions with the Adviser and its affiliates, of the Adviser and the services provided to the fund by the Adviser. The Board also relied on information received on a routine and regular basis throughout the year relating to the operations of the fund and the investment management and other services provided under the Agreement, including information on the investment performance of the fund in comparison to similar mutual funds and benchmark performance indices; general market outlook as applicable to the fund; and compliance reports. In addition, the Board’s consideration of the contractual fee arrangements for the fund had the benefit of a number of years of reviews of the Agreement for the fund, or substantially similar agreements for other BNY Mellon funds that the Board oversees, during which lengthy discussions took place between the Board and representatives of the Adviser. Certain aspects of the arrangements may receive greater scrutiny in some years than in others, and the Board’s conclusions may be based, in part, on their consideration of the fund’s arrangements, or substantially similar arrangements for other BNY Mellon funds that the Board oversees, in prior years. The Board determined to renew the Agreement through the first quarter 2022 regular Board meeting.
36
BOARD MEMBERS INFORMATION (Unaudited)
Independent Board Members
Joseph S. DiMartino (78)
Chairman of the Board (1995)
Principal Occupation During Past 5 Years:
· Director or Trustee of funds in the BNY Mellon Family of Funds and certain other entities (as described in the fund’s Statement of Additional Information) (1995-Present)
Other Public Company Board Memberships During Past 5 Years:
· CBIZ, Inc., a public company providing professional business services, products and solutions, Director (1997-Present)
No. of Portfolios for which Board Member Serves: 96
———————
Francine J. Bovich (70)
Board Member (2015)
Principal Occupation During Past 5 Years:
· The Bradley Trusts, private trust funds, Trustee (2011-Present)
Other Public Company Board Memberships During Past 5 Years:
· Annaly Capital Management, Inc., a real estate investment trust, Director (2014-Present)
No. of Portfolios for which Board Member Serves: 54
———————
J. Charles Cardona (66)
Board Member (2014)
Principal Occupation During Past 5 Years:
· President and Director of the Adviser (2008-2016)
· Chief Executive Officer of Dreyfus Cash Investment Strategies, a division of the Adviser (2009-2016)
· Chairman of the Distributor (2013–2016)
Other Public Company Board Memberships During Past 5 Years:
· BNY Mellon ETF Trust, Chairman and Trustee (2020-Present)
· BNY Mellon Liquidity Funds, Director (2004-Present) and Chairman (2019-2021)
No. of Portfolios for which Board Member Serves: 35
———————
37
BOARD MEMBERS INFORMATION (Unaudited) (continued)
Andrew J. Donohue (71)
Board Member (2019)
Principal Occupation During Past 5 Years:
· Attorney, Solo Law Practice (2019-Present)
· Shearman & Sterling LLP, a law firm, Of Counsel (2017-2019)
· Chief of Staff to the Chair of the SEC (2015-2017)
Other Public Company Board Memberships During Past 5 Years:
· Oppenheimer Funds (58 funds), Director (2017-2019)
No. of Portfolios for which Board Member Serves: 44
———————
Isabel P. Dunst (74)
Board Member (2014)
Principal Occupation During Past 5 Years:
· Hogan Lovells LLP, a law firm, Retired (2019-Present); Senior Counsel (2018-2019); Of Counsel (2015-2018); Partner (1990-2014)
· Hebrew Union College Jewish Institute of Religion, Member of the Board of Governors (2015-Present)
· Bend the ARC, a civil rights organization, Board Member (2016-Present)
No. of Portfolios for which Board Member Serves: 22
———————
Nathan Leventhal (78)
Board Member (2009)
Principal Occupation During Past 5 Years:
· Lincoln Center for the Performing Arts, President Emeritus (2001-Present)
· Palm Beach Opera, President (2016-Present)
Other Public Company Board Memberships During Past 5 Years:
· Movado Group, Inc., a public company that designs, sources, markets and distributes watches Director (2003-2020)
No. of Portfolios for which Board Member Serves: 32
———————
38
Robin A. Melvin (58)
Board Member (2014)
Principal Occupation During Past 5 Years:
· Westover School, a private girls' boarding school in Middlebury, Connecticut, Trustee (2019-Present)
· Mentor Illinois, a non-profit organization dedicated to increasing the quality of mentoring services in Illinois, Co-Chair (2014-2020); Board Member, Mentor Illinois (2013-2020)
· JDRF, a non-profit juvenile diabetes research foundation, Board Member (June 2021-Present)
Other Public Company Board Memberships During Past 5 Years:
· HPS Corporate Lending Fund, a closed-end management investment company regulated as a business development company, Trustee (August 2021-Present)
No. of Portfolios for which Board Member Serves: 74
———————
Roslyn M. Watson (72)
Board Member (2014)
Principal Occupation During Past 5 Years:
· Watson Ventures, Inc., a real estate investment company. Principal (1993-Present)
Other Public Company Board Memberships During Past 5 Years:
· American Express Bank, FSB, Director (1993-2018)
No. of Portfolios for which Board Member Serves: 44
———————
Benaree Pratt Wiley (75)
Board Member (2009)
Principal Occupation During Past 5 Years:
· The Wiley Group, a firm specializing in strategy and business development, Principal (2005-Present)
Other Public Company Board Memberships During Past 5 Years:
· CBIZ, Inc., a public company providing professional business services, products and solutions, Director (2008-Present)
· Blue Cross Blue Shield of Massachusetts, Director (2004-2020)
No. of Portfolios for which Board Member Serves: 62
———————
39
BOARD MEMBERS INFORMATION (Unaudited) (continued)
Tamara Belinfanti (46)
Advisory Board Member (2021)
Principal Occupation During Past 5 Years:
· New York Law School, Lester Martin Professor of Law (2009-Present)
No. of Portfolios for which Advisory Board Member Serves: 22
———————
Gordon J. Davis (80)
Advisory Board Member (2021)
Principal Occupation During Past 5 Years:
· Venable LLP, a law firm Partner (2012-Present)
No. of Portfolios for which Advisory Board Member Serves: 40
———————
Once elected all Board Members serve for an indefinite term, but achieve Emeritus status upon reaching age 80. The address of the Board Members and Officers is c/o BNY Mellon Investment Adviser, Inc. 240 Greenwich Street, New York, New York 10286. Additional information about the Board Members is available in the fund’s Statement of Additional Information which can be obtained from the Adviser free of charge by calling this toll free number: 1-800-373-9387.
Clifford L. Alexander, Jr., Emeritus Board Member
Whitney I. Gerard, Emeritus Board Member
George L. Perry, Emeritus Board Member
40
OFFICERS OF THE FUND (Unaudited)
DAVID DIPETRILLO, President since January 2021.
Vice President and Director of the Adviser since February 2021; Head of North America Product, BNY Mellon Investment Management since January 2018; Director of Product Strategy, BNY Mellon Investment Management from January 2016 to December 2017. He is an officer of 56 investment companies (comprised of 109 portfolios) managed by the Adviser or an affiliate of the Adviser. He is 43 years old and has been an employee of BNY Mellon since 2005.
JAMES WINDELS, Treasurer since November 2001.
Vice President of the Adviser since September 2020; Director–BNY Mellon Fund Administration, and an officer of 57 investment companies (comprised of 130 portfolios) managed by the Adviser or an affiliate of the Adviser. He is 63 years old and has been an employee of the Adviser since April 1985.
PETER M. SULLIVAN, Chief Legal Officer since July 2021 and Vice President and Assistant Secretary since March 2019.
Chief Legal Officer of the Adviser and Associate General Counsel of BNY Mellon since July 2021; Senior Managing Counsel of BNY Mellon from December 2020 to July 2021; Managing Counsel of BNY Mellon from March 2009 to December 2020, and an officer of 57 investment companies (comprised of 130 portfolios) managed by the Adviser or an affiliate of the Adviser. He is 53 years old and has been an employee of BNY Mellon since April 2004.
JAMES BITETTO, Vice President since August 2005 and Secretary since February 2018.
Senior Managing Counsel of BNY Mellon since December 2019; Managing Counsel of BNY Mellon from April 2014 to December 2019; Secretary of the Adviser, and an officer of 57 investment companies (comprised of 130 portfolios) managed by the Adviser or an affiliate of the Adviser. He is 55 years old and has been an employee of the Adviser since December 1996.
DEIRDRE CUNNANE, Vice President and Assistant Secretary since March 2019.
Managing Counsel of BNY Mellon since December 2021, Counsel of BNY Mellon from August 2018 to December 2021; and Senior Regulatory Specialist at BNY Mellon Investment Management Services from February 2016 to August 2018. She is an officer of 57 investment companies (comprised of 130 portfolios) managed by the Adviser or an affiliate of the Adviser. She is 31 years old and has been an employee of the Adviser since August 2018.
SARAH S. KELLEHER, Vice President and Assistant Secretary since April 2014.
Vice President of BNY Mellon ETF Investment Adviser; LLC since February 2020; Senior Managing Counsel of BNY Mellon since September 2021; Managing Counsel of BNY Mellon from December 2017 to September 2021; and Senior Counsel of BNY Mellon from March 2013 to December 2017. She is an officer of 57 investment companies (comprised of 130 portfolios) managed by the Adviser or an affiliate of the Adviser. She is 46 years old and has been an employee of the Adviser since March 2013.
JEFF PRUSNOFSKY, Vice President and Assistant Secretary since August 2005.
Senior Managing Counsel of BNY Mellon, and an officer of 57 investment companies (comprised of 130 portfolios) managed by the Adviser or an affiliate of the Adviser. He is 56 years old and has been an employee of the Adviser since October 1990.
AMANDA QUINN, Vice President and Assistant Secretary since March 2020.
Counsel of BNY Mellon since June 2019; Regulatory Administration Manager at BNY Mellon Investment Management Services from September 2018 to May 2019; and Senior Regulatory Specialist at BNY Mellon Investment Management Services from April 2015 to August 2018. She is an officer of 57 investment companies (comprised of 130 portfolios) managed by the Adviser or an affiliate of the Adviser. She is 36 years old and has been an employee of the Adviser since June 2019.
41
OFFICERS OF THE FUND (Unaudited) (continued)
NATALYA ZELENSKY, Vice President and Assistant Secretary since March 2017.
Chief Compliance Officer since August 2021 and Vice President since February 2020 of BNY Mellon ETF Investment Adviser, LLC; Chief Compliance Officer since August 2021 and Vice President and Assistant Secretary since February 2020 of BNY Mellon ETF Trust; Managing Counsel of BNY Mellon from December 2019 to August 2021; Counsel of BNY Mellon from May 2016 to December 2019; Assistant Secretary of the Adviser from April 2018 to August 2021. She is an officer of 56 investment companies (comprised of 129 portfolios) managed by the Adviser or an affiliate of the Adviser. She is 36 years old and has been an employee of BNY Mellon since May 2016.
GAVIN C. REILLY, Assistant Treasurer since December 2005.
Tax Manager–BNY Mellon Fund Administration, and an officer of 57 investment companies (comprised of 130 portfolios) managed by the Adviser or an affiliate of the Adviser. He is 53 years old and has been an employee of the Adviser since April 1991.
ROBERT SALVIOLO, Assistant Treasurer since July 2007.
Senior Accounting Manager–BNY Mellon Fund Administration, and an officer of 57 investment companies (comprised of 130 portfolios) managed by the Adviser or an affiliate of the Adviser. He is 54 years old and has been an employee of the Adviser since June 1989.
ROBERT SVAGNA, Assistant Treasurer since December 2002.
Senior Accounting Manager–BNY Mellon Fund Administration, and an officer of 57 investment companies (comprised of 130 portfolios) managed by the Adviser or an affiliate of the Adviser. He is 54 years old and has been an employee of the Adviser since November 1990.
JOSEPH W. CONNOLLY, Chief Compliance Officer since October 2004.
Chief Compliance Officer of the BNY Mellon Family of Funds and BNY Mellon Funds Trust since 2004; Chief Compliance Officer of the Adviser from 2004 until June 2021. He is an officer of 56 investment companies (comprised of 117 portfolios) managed by the Adviser. He is 64 years old.
CARIDAD M. CAROSELLA, Anti-Money Laundering Compliance Officer since January 2016.
Anti-Money Laundering Compliance Officer of the BNY Mellon Family of Funds and BNY Mellon Funds Trust. She is an officer of 49 investment companies (comprised of 122 portfolios) managed by the Adviser or an affiliate of the Adviser. She is 53 years old and has been an employee of the Distributor since 1997.
42
This page intentionally left blank.
43
This page intentionally left blank.
44
This page intentionally left blank.
45
BNY Mellon Investment Portfolios, MidCap Stock Portfolio
240 Greenwich Street
New York, NY 10286
Adviser
BNY Mellon Investment Adviser, Inc.
240 Greenwich Street
New York, NY 10286
Sub-Adviser
Newton Investment Management
North America, LLC
BNY Mellon Center
201 Washington Place
Boston, MA 02108
Custodian
The Bank of New York Mellon
240 Greenwich Street
New York, NY 10286
Transfer Agent &
Dividend Disbursing Agent
BNY Mellon Transfer, Inc.
240 Greenwich Street
New York, NY 10286
Distributor
BNY Mellon Securities Corporation
240 Greenwich Street
New York, NY 10286
Telephone 1-800-258-4260 or 1-800-258-4261
Mail The BNY Mellon Family of Funds, 144 Glenn Curtiss Boulevard, Uniondale, NY 11556-0144 Attn: Institutional Services Department
E-mail Send your request to info@bnymellon.com
Internet Information can be viewed online or downloaded at www.im.bnymellon.com
The fund files its complete schedule of portfolio holdings with the Securities and Exchange Commission (“SEC”) for the first and third quarters of each fiscal year on Form N-PORT. The fund’s Forms N-PORT are available on the SEC’s website at www.sec.gov.
A description of the policies and procedures that the fund uses to determine how to vote proxies relating to portfolio securities and information regarding how the fund voted these proxies for the most recent 12-month period ended June 30 is available at www.im.bnymellon.com and on the SEC’s website at www.sec.gov and without charge, upon request, by calling 1-800-373-9387.
| | |
© 2022 BNY Mellon Securities Corporation
0174AR1221 | 
|
BNY Mellon Investment Portfolios, Small Cap Stock Index Portfolio
| |
ANNUAL REPORT December 31, 2021 |

| |
Save time. Save paper. View your next shareholder report online as soon as it’s available. Log into www.im.bnymellon.com and sign up for eCommunications. It’s simple and only takes a few minutes. |
| |
The views expressed in this report reflect those of the portfolio manager(s) only through the end of the period covered and do not necessarily represent the views of BNY Mellon Investment Adviser, Inc. or any other person in the BNY Mellon Investment Adviser, Inc. organization. Any such views are subject to change at any time based upon market or other conditions and BNY Mellon Investment Adviser, Inc. disclaims any responsibility to update such views. These views may not be relied on as investment advice and, because investment decisions for a fund in the BNY Mellon Family of Funds are based on numerous factors, may not be relied on as an indication of trading intent on behalf of any fund in the BNY Mellon Family of Funds. |
| |
Not FDIC-Insured • Not Bank-Guaranteed • May Lose Value |
Contents
THE FUND
FOR MORE INFORMATION
Back Cover
DISCUSSION OF FUND PERFORMANCE (Unaudited)
For the period from January 1, 2021 through December 31, 2021, as provided by portfolio managers David France, Todd Frysinger, Vlasta Sheremeta, Michael Stoll and Marlene Walker Smith.
Market and Fund Performance Overview
For the 12-month period ended December 31, 2021, BNY Mellon Investment Portfolios, Small Cap Stock Index Portfolio (the “fund”) produced a total return of 26.14%.1 In comparison, the fund’s benchmark, the S&P SmallCap 600® Index (the “Index”), produced a 26.82% total return for the same period.2,3
U.S. equities rose during the reporting period, supported by government stimulus programs, accommodative central bank policies, strong corporate earnings and improving investor sentiment as vaccines for the COVID-19 pandemic rolled out. Small-cap stocks generally underperformed their mid- and large-cap counterparts. The difference in returns between the fund and the Index was primarily the result of transaction costs and operating expenses that are not reflected in the Index’s results.
The Fund’s Investment Approach
The fund seeks to match the performance of the Index. To pursue its goal, the fund generally invests in all of the stocks that comprise the Index. The fund generally invests in all 600 stocks in the Index in proportion to their weighting in the Index; however, at times, the fund may invest in a representative sample of stocks included in the Index. Under these circumstances, the fund expects to invest in approximately 500 or more of the stocks in the Index.
Equities Advance Despite Pandemic-Related Challenges
In the wake of a sharp recovery from COVID-19-related losses in 2020, U.S. equities made further headway in 2021. Although fresh lockdowns were enforced in some locations, the accelerating rollout of COVID-19 vaccination programs bolstered investors’ risk appetite. By contrast, the impact of monetary accommodation, which provided critical support for financial asset prices, proved more complex. With reflation underway and an elevated pace of growth expected in the second half of the year, investors began to anticipate a dialing back of the exceptional levels of monetary stimulus provided earlier in the pandemic. This contributed to a sharp rise in government bond yields early in 2021, with the long end of the U.S. Treasury market experiencing its worst quarter since 1980. The nature of fiscal stimulus also continued to evolve as President Biden formally announced his long-awaited $2 trillion infrastructure program.
U.S. equities continued to advance during the second half of the period, albeit at a slower pace, drawing strength from an impressive slate of U.S. economic data, robust corporate earnings and further evidence that vaccination programs could be paving the way for a full reopening of economies. However, headwinds emerged as the widening scope of regulatory
2
intervention within China unnerved investors, as did debt-related problems in the Chinese real estate industry that threatened a broader crisis in the property and financial sectors. Globally, higher energy prices, goods shortages and wage-inflation numbers led to the suggestion that monetary stimulus could be ‘tapered’ and interest rates moved higher. Small-cap U.S. equities retreated from early June through mid-September, before continuing on an upward trajectory, taking the prospect of monetary policy tightening and the lack of legislative progress for President Biden’s ‘Build Back Better’ bill in their stride. Small-cap shares declined again in mid-November as sharply rising inflationary pressures caused investors to take a more cautious view of risk. Markets moved more broadly lower in early December, when the new, highly transmissible COVID-19 Omicron variant was detected in the United States. Risk assets also reacted negatively to incrementally more hawkish rhetoric regarding the tapering of the Fed’s asset-purchase program that emerged from the Fed’s December meeting. While large-cap stocks recovered into the end of the year, small-cap stocks continue to trade off their previous highs.
Market Continues to Advance Broadly
While most sectors in the Index generated robust returns, some contributed more strongly than others to the Index’s gains. Consumer discretionary stocks benefited from high levels of consumer spending fueled by government stimulus checks and rising wages. Financials also outperformed the broader market as rising interest rates and a steeper yield curve improved balance sheets and enhanced revenues for diversified, regional and investment banks. Small-cap industrials rode the reopening wave higher, with cyclicals generally outperforming as the economy continued to grow. Information technology stocks, which had led the market’s rise in 2020, slowed their advance but continued to contribute positively to market strength. While energy produced the strongest absolute returns for the period, the small size of the sector in the Index kept it from making a significant contribution to overall performance.
On the negative side, while utilities generated positive returns, the sector lagged the broader market, due to high valuations, rising interest rates and the impact of high commodity prices on costs. Communication services trailed the Index in the face of competitive pressures as investors sought greater growth opportunities in other sectors. Health care suffered due to disappointing returns from biotechnology and digital health services.
Expecting Moderate, Continued Growth
With the economy continuing to recover from the effects of COVID-19 despite the pandemic’s lingering impact, we expect to see further economic growth ahead, albeit at a somewhat slower pace than in 2021. At the same time, equity markets are likely to face headwinds in the coming months, making the exceptionally strong returns of the current reporting period less likely to be repeated in the near future. Increasing inflationary pressures, driven by strong demand and supply-chain disruptions, have increased the possibility that the Fed may soon taper its asset-buying program and eventually begin to raise interest rates, removing some support for equity markets and signaling a phase of slower economic growth. While inflationary pressures may moderate somewhat as the supply chain
3
DISCUSSION OF FUND PERFORMANCE (Unaudited) (continued)
untangles, tight labor market conditions currently show no signs of easing. On the other hand, rising interest rates are likely to continue to constrain fixed-income markets, leaving investors with few options as attractive as equities.
January 18, 2022
1 Total return includes reinvestment of dividends and any capital gains paid. Past performance is no guarantee of future results. Share price and investment return fluctuate such that upon redemption, fund shares may be worth more or less than their original cost. The fund’s performance does not reflect the deduction of additional charges and expenses imposed in connection with investing in variable insurance contracts, which will reduce returns. The fund’s returns reflect the absorption of certain fund expenses by BNY Mellon Investment Adviser, Inc. pursuant to an agreement in effect that may be extended, terminated or modified at any time. Had these expenses not been absorbed, returns would have been lower.
2 Source: Lipper Inc. — The S&P SmallCap 600® Index measures the small-cap segment of the U.S. equity market. The index is designed to track companies that meet specific inclusion criteria to ensure that they are liquid and financially viable. Investors cannot invest directly in any index.
3 “Standard & Poor’s®,” “S&P®,” and “Standard & Poor’s® SmallCap 600 Index” are trademarks of Standard & Poor’s Financial Services LLC (“Standard & Poor’s”) and have been licensed for use by the fund. The fund is not sponsored, endorsed, sold or promoted by Standard & Poor’s, and Standard & Poor’s makes no representation regarding the advisability of investing in the fund.
Equities are subject generally to market, market sector, market liquidity, issuer and investment style risks, among other factors, to varying degrees, all of which are more fully described in the fund’s prospectus. Stocks of small- and/or mid-cap companies often experience sharper price fluctuations than stocks of large-cap companies.
Recent market risks include pandemic risks related to COVID-19. The effects of COVID-19 have contributed to increased volatility in global markets and will likely affect certain countries, companies, industries and market sectors more dramatically than others. To the extent the fund may overweight its investments in certain countries, companies, industries or market sectors, such positions will increase the fund’s exposure to risk of loss from adverse developments affecting those countries, companies, industries or sectors.
The fund may, but is not required to, use derivative instruments. A small investment in derivatives could have a potentially large impact on the fund’s performance. The use of derivatives involves risks different from, or possibly greater than, the risks associated with investing directly in the underlying assets.
The fund is only available as a funding vehicle under variable life insurance policies or variable annuity contracts issued by insurance companies. Individuals may not purchase shares of the fund directly. A variable annuity is an insurance contract issued by an insurance company that enables investors to accumulate assets on a tax-deferred basis for retirement or other long-term goals. The investment objective and policies of BNY Mellon Investment Portfolios, Small Cap Stock Index Portfolio made available through insurance products may be similar to those of other funds managed by BNY Mellon Investment Adviser, Inc. However, the investment results of the fund may be higher or lower than, and may not be comparable to, those of any other BNY Mellon Investment Adviser, Inc. fund.
4
FUND PERFORMANCE (Unaudited)
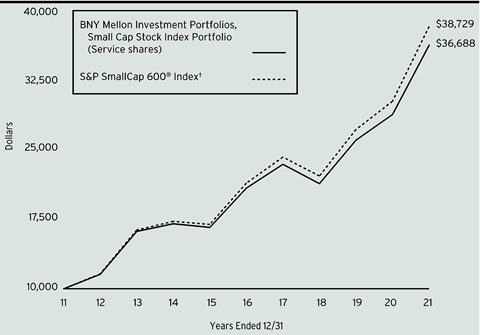
Comparison of change in value of a $10,000 investment in BNY Mellon Investment Portfolios, Small Cap Stock Index Portfolio’s Service shares with a hypothetical investment of $10,000 in the S&P SmallCap 600® Index (the “Index”).
† Source: Lipper Inc.
Past performance is not predictive of future performance. The fund’s performance does not reflect the deduction of additional charges and expenses imposed in connection with investing in variable insurance contracts which will reduce returns.
The above graph compares a hypothetical $10,000 investment made in Service shares of BNY Mellon Investment Portfolios, Small Cap Stock Index Portfolio on 12/31/11 to a hypothetical investment of $10,000 made in the Index on that date.
The fund’s performance shown in the line graph above takes into account all applicable fees and expenses. The Index measures the small-cap segment of the U.S. equity market. The Index is designed to track companies that meet specific inclusion criteria to ensure that they are liquid and financially viable. Unlike a mutual fund, the Index is not subject to charges, fees and other expenses. Investors cannot invest directly in any index. Further information relating to fund performance, including expense reimbursements, if applicable, is contained in the Financial Highlights section of the prospectus and elsewhere in this report.
5
FUND PERFORMANCE (Unaudited) (continued)
| | | | |
Average Annual Total Returns as of 12/31/2021 | |
| 1 Year | 5 Years | 10 Years |
Portfolio | 26.14% | 11.78% | 13.88% |
S&P SmallCap 600® Index | 26.82% | 12.42% | 14.50% |
The performance data quoted represents past performance, which is no guarantee of future results. Share price and investment return fluctuate and an investor’s shares may be worth more or less than original cost upon redemption. Current performance may be lower or higher than the performance quoted. Go to www.im.bnymellon.com for the fund’s most recent month-end returns.
The fund is subject to a 0.25% annual Rule 12b-1 fee. All dividends and capital gain distributions are reinvested.
The fund’s performance shown in the graph and table does not reflect the deduction of taxes that a shareholder would pay on fund distributions or the redemption of fund shares.
6
UNDERSTANDING YOUR FUND’S EXPENSES (Unaudited)
As a mutual fund investor, you pay ongoing expenses, such as management fees and other expenses. Using the information below, you can estimate how these expenses affect your investment and compare them with the expenses of other funds. You also may pay one-time transaction expenses, including sales charges (loads), redemption fees and expenses associated with variable annuity or insurance contracts, which are not shown in this section and would have resulted in higher total expenses. For more information, see your fund’s prospectus or talk to your financial adviser.
Review your fund’s expenses
The table below shows the expenses you would have paid on a $1,000 investment in BNY Mellon Investment Portfolios, Small Cap Stock Index Portfolio from July 1, 2021 to December 31, 2021. It also shows how much a $1,000 investment would be worth at the close of the period, assuming actual returns and expenses.
| | | | |
Expenses and Value of a $1,000 Investment | |
Assume actual returns for the six months ended December 31, 2021 | |
| | | |
| | | |
Expenses paid per $1,000† | $3.06 | |
Ending value (after expenses) | $1,023.50 | |
COMPARING YOUR FUND’S EXPENSES
WITH THOSE OF OTHER FUNDS (Unaudited)
Using the SEC’s method to compare expenses
The Securities and Exchange Commission (“SEC”) has established guidelines to help investors assess fund expenses. Per these guidelines, the table below shows your fund’s expenses based on a $1,000 investment, assuming a hypothetical 5% annualized return. You can use this information to compare the ongoing expenses (but not transaction expenses or total cost) of investing in the fund with those of other funds. All mutual fund shareholder reports will provide this information to help you make this comparison. Please note that you cannot use this information to estimate your actual ending account balance and expenses paid during the period.
| | | | |
Expenses and Value of a $1,000 Investment | |
Assuming a hypothetical 5% annualized return for the six months ended December 31, 2021 | |
| | | |
| | | |
Expenses paid per $1,000† | $3.06 | |
Ending value (after expenses) | $1,022.18 | |
† | Expenses are equal to the fund’s annualized expense ratio of .60%, multiplied by the average account value over the period, multiplied by 184/365 (to reflect the one-half year period). |
7
STATEMENT OF INVESTMENTS
December 31, 2021
| | | | | | | | |
| |
Description | | | | Shares | | Value ($) | |
Common Stocks - 100.1% | | | | | |
Automobiles & Components - 1.6% | | | | | |
American Axle & Manufacturing Holdings | | | | 76,736 | a | 715,947 | |
Cooper-Standard Holdings | | | | 11,760 | a | 263,542 | |
Dorman Products | | | | 19,130 | a | 2,161,881 | |
Gentherm | | | | 22,530 | a | 1,957,857 | |
LCI Industries | | | | 16,986 | | 2,647,608 | |
Motorcar Parts of America | | | | 12,963 | a | 221,278 | |
Patrick Industries | | | | 15,105 | | 1,218,822 | |
Standard Motor Products | | | | 12,592 | | 659,695 | |
Winnebago Industries | | | | 22,369 | | 1,675,885 | |
| | | | | 11,522,515 | |
Banks - 12.7% | | | | | |
Allegiance Bancshares | | | | 12,724 | | 537,080 | |
Ameris Bancorp | | | | 44,686 | | 2,220,000 | |
Axos Financial | | | | 35,989 | a | 2,012,145 | |
Banc of California | | | | 35,766 | | 701,729 | |
BancFirst | | | | 12,724 | | 897,805 | |
BankUnited | | | | 59,880 | | 2,533,523 | |
Banner | | | | 23,201 | | 1,407,605 | |
Berkshire Hills Bancorp | | | | 32,247 | | 916,782 | |
Brookline Bancorp | | | | 52,097 | | 843,450 | |
Capitol Federal Financial | | | | 86,379 | | 978,674 | |
Central Pacific Financial | | | | 19,237 | | 541,906 | |
City Holding | | | | 10,266 | | 839,656 | |
Columbia Banking System | | | | 51,998 | | 1,701,375 | |
Community Bank System | | | | 36,248 | | 2,699,751 | |
Customers Bancorp | | | | 19,808 | a | 1,294,849 | |
CVB Financial | | | | 85,621 | | 1,833,146 | |
Dime Community Bancshares | | | | 22,083 | | 776,438 | |
Eagle Bancorp | | | | 21,472 | | 1,252,676 | |
FB Financial | | | | 24,431 | | 1,070,566 | |
First Bancorp | | | | 138,217 | | 1,904,630 | |
First Bancorp | | | | 23,278 | | 1,064,270 | |
First Commonwealth Financial | | | | 63,870 | | 1,027,668 | |
First Financial Bancorp | | | | 62,769 | | 1,530,308 | |
First Hawaiian | | | | 86,581 | | 2,366,259 | |
First Midwest Bancorp | | | | 76,019 | | 1,556,869 | |
Flagstar Bancorp | | | | 35,531 | | 1,703,356 | |
Great Western Bancorp | | | | 36,962 | | 1,255,230 | |
Hanmi Financial | | | | 19,842 | | 469,859 | |
Heritage Financial | | | | 23,301 | | 569,476 | |
8
| | | | | | | | |
| |
Description | | | | Shares | | Value ($) | |
Common Stocks - 100.1% (continued) | | | | | |
Banks - 12.7% (continued) | | | | | |
Hilltop Holdings | | | | 40,982 | | 1,440,107 | |
HomeStreet | | | | 13,744 | | 714,688 | |
Hope Bancorp | | | | 80,928 | | 1,190,451 | |
Independent Bank | | | | 32,092 | | 2,616,461 | |
Independent Bank Group | | | | 24,818 | | 1,790,619 | |
Investors Bancorp | | | | 150,378 | | 2,278,227 | |
Lakeland Financial | | | | 16,839 | | 1,349,477 | |
Meta Financial Group | | | | 21,171 | | 1,263,062 | |
Mr. Cooper Group | | | | 50,491 | a | 2,100,930 | |
National Bank Holdings, Cl. A | | | | 20,363 | | 894,750 | |
NBT Bancorp | | | | 29,002 | | 1,117,157 | |
NMI Holdings, Cl. A | | | | 58,654 | a | 1,281,590 | |
Northfield Bancorp | | | | 29,504 | | 476,785 | |
Northwest Bancshares | | | | 85,094 | | 1,204,931 | |
OFG Bancorp | | | | 33,861 | | 899,348 | |
Old National Bancorp | | | | 112,412 | | 2,036,905 | |
Pacific Premier Bancorp | | | | 63,418 | | 2,538,623 | |
Park National | | | | 9,843 | | 1,351,542 | |
Preferred Bank | | | | 9,016 | | 647,259 | |
Provident Financial Services | | | | 52,525 | | 1,272,155 | |
Renasant | | | | 37,839 | | 1,435,990 | |
S&T Bancorp | | | | 27,021 | | 851,702 | |
Seacoast Banking Corp. of Florida | | | | 39,322 | | 1,391,606 | |
ServisFirst Bancshares | | | | 32,792 | | 2,785,352 | |
Simmons First National, Cl. A | | | | 77,179 | | 2,282,955 | |
Southside Bancshares | | | | 21,616 | | 903,981 | |
The Bancorp | | | | 38,184 | a | 966,437 | |
Tompkins Financial | | | | 8,112 | | 678,001 | |
Triumph Bancorp | | | | 15,873 | a | 1,890,157 | |
TrustCo Bank | | | | 13,028 | | 433,963 | |
Trustmark | | | | 41,597 | | 1,350,239 | |
United Community Bank | | | | 70,199 | | 2,522,952 | |
Veritex Holdings | | | | 33,222 | | 1,321,571 | |
Walker & Dunlop | | | | 19,811 | | 2,989,084 | |
Westamerica Bancorporation | | | | 17,798 | | 1,027,479 | |
WSFS Financial | | | | 44,416 | | 2,226,130 | |
| | | | | 92,029,747 | |
Capital Goods - 11.4% | | | | | |
AAON | | | | 28,006 | | 2,224,517 | |
AAR | | | | 22,621 | a | 882,898 | |
Aerojet Rocketdyne Holdings | | | | 50,319 | | 2,352,916 | |
AeroVironment | | | | 15,373 | a | 953,587 | |
Alamo Group | | | | 6,554 | | 964,618 | |
9
STATEMENT OF INVESTMENTS (continued)
| | | | | | | | |
| |
Description | | | | Shares | | Value ($) | |
Common Stocks - 100.1% (continued) | | | | | |
Capital Goods - 11.4% (continued) | | | | | |
Albany International, Cl. A | | | | 21,580 | | 1,908,751 | |
American Woodmark | | | | 11,194 | a | 729,849 | |
Apogee Enterprises | | | | 16,718 | | 804,972 | |
Applied Industrial Technologies | | | | 25,848 | | 2,654,590 | |
Arcosa | | | | 32,245 | | 1,699,311 | |
Astec Industries | | | | 15,185 | | 1,051,865 | |
AZZ | | | | 16,524 | | 913,612 | |
Barnes Group | | | | 31,713 | | 1,477,509 | |
Boise Cascade | | | | 26,435 | | 1,882,172 | |
Chart Industries | | | | 23,942 | a | 3,818,510 | |
CIRCOR International | | | | 13,172 | a | 358,015 | |
Comfort Systems USA | | | | 24,224 | | 2,396,723 | |
DXP Enterprises | | | | 11,731 | a | 301,135 | |
Encore Wire | | | | 13,670 | | 1,956,177 | |
Enerpac Tool Group | | | | 40,070 | | 812,620 | |
EnPro Industries | | | | 14,004 | | 1,541,420 | |
ESCO Technologies | | | | 17,736 | | 1,596,063 | |
Federal Signal | | | | 41,119 | | 1,782,097 | |
Franklin Electric | | | | 26,214 | | 2,478,796 | |
Gibraltar Industries | | | | 21,722 | a | 1,448,423 | |
GMS | | | | 29,000 | a | 1,743,190 | |
Granite Construction | | | | 30,746 | | 1,189,870 | |
Griffon | | | | 32,058 | | 913,012 | |
Hillenbrand | | | | 49,090 | | 2,552,189 | |
Insteel Industries | | | | 13,137 | | 522,984 | |
John Bean Technologies | | | | 21,352 | | 3,278,813 | |
Kaman | | | | 18,791 | | 810,832 | |
Lindsay | | | | 7,237 | | 1,100,024 | |
Meritor | | | | 46,686 | a | 1,156,879 | |
Moog, Cl. A | | | | 19,710 | | 1,595,919 | |
Mueller Industries | | | | 38,557 | | 2,288,744 | |
MYR Group | | | | 11,339 | a | 1,253,526 | |
National Presto Industries | | | | 3,452 | | 283,168 | |
NOW | | | | 72,638 | a | 620,329 | |
NV5 Global | | | | 7,940 | a | 1,096,673 | |
Park Aerospace | | | | 13,575 | | 179,190 | |
PGT Innovations | | | | 40,553 | a | 912,037 | |
Powell Industries | | | | 6,157 | | 181,570 | |
Proto Labs | | | | 18,463 | a | 948,075 | |
Quanex Building Products | | | | 22,300 | | 552,594 | |
Resideo Technologies | | | | 97,044 | a | 2,526,055 | |
SPX | | | | 30,802 | a | 1,838,263 | |
SPX FLOW | | | | 28,209 | | 2,439,514 | |
10
| | | | | | | | |
| |
Description | | | | Shares | | Value ($) | |
Common Stocks - 100.1% (continued) | | | | | |
Capital Goods - 11.4% (continued) | | | | | |
Standex International | | | | 8,382 | | 927,552 | |
Tennant | | | | 12,365 | | 1,002,060 | |
The Greenbrier Companies | | | | 21,912 | | 1,005,542 | |
Titan International | | | | 34,881 | a | 382,296 | |
Triumph Group | | | | 43,423 | a | 804,628 | |
UFP Industries | | | | 41,596 | | 3,827,248 | |
Veritiv | | | | 9,285 | a | 1,138,062 | |
Wabash National | | | | 33,241 | | 648,864 | |
Watts Water Technologies, Cl. A | | | | 18,522 | | 3,596,417 | |
| | | | | 82,307,265 | |
Commercial & Professional Services - 3.6% | | | | | |
ABM Industries | | | | 45,646 | | 1,864,639 | |
Brady, Cl. A | | | | 32,961 | | 1,776,598 | |
CoreCivic | | | | 82,559 | a | 823,113 | |
Deluxe | | | | 28,477 | | 914,396 | |
Exponent | | | | 35,025 | | 4,088,468 | |
Forrester Research | | | | 7,255 | a | 426,086 | |
Harsco | | | | 53,284 | a | 890,376 | |
Healthcare Services Group | | | | 51,130 | | 909,603 | |
Heidrick & Struggles International | | | | 13,155 | | 575,268 | |
HNI | | | | 29,202 | | 1,227,944 | |
Interface | | | | 39,689 | | 633,040 | |
KAR Auction Services | | | | 81,430 | a | 1,271,937 | |
Kelly Services, Cl. A | | | | 24,191 | | 405,683 | |
Korn Ferry | | | | 36,634 | | 2,774,293 | |
ManTech International, Cl. A | | | | 18,302 | | 1,334,765 | |
Matthews International, Cl. A | | | | 20,798 | | 762,663 | |
Pitney Bowes | | | | 114,140 | | 756,748 | |
Resources Connection | | | | 20,354 | | 363,115 | |
TrueBlue | | | | 23,580 | a | 652,459 | |
U.S. Ecology | | | | 21,455 | a | 685,273 | |
UniFirst | | | | 10,234 | | 2,153,234 | |
Viad | | | | 13,906 | a | 595,038 | |
| | | | | 25,884,739 | |
Consumer Durables & Apparel - 4.0% | | | | | |
Cavco Industries | | | | 5,736 | a | 1,822,040 | |
Century Communities | | | | 20,231 | | 1,654,693 | |
Ethan Allen Interiors | | | | 14,596 | | 383,729 | |
Fossil Group | | | | 32,209 | a | 331,431 | |
G-III Apparel Group | | | | 30,020 | a | 829,753 | |
Installed Building Products | | | | 15,774 | | 2,203,943 | |
iRobot | | | | 18,119 | a,b | 1,193,680 | |
Kontoor Brands | | | | 31,762 | | 1,627,802 | |
11
STATEMENT OF INVESTMENTS (continued)
| | | | | | | | |
| |
Description | | | | Shares | | Value ($) | |
Common Stocks - 100.1% (continued) | | | | | |
Consumer Durables & Apparel - 4.0% (continued) | | | | | |
La-Z-Boy | | | | 29,535 | | 1,072,416 | |
LGI Homes | | | | 14,357 | a,b | 2,217,869 | |
M.D.C. Holdings | | | | 37,689 | | 2,104,177 | |
M/I Homes | | | | 19,669 | a | 1,223,018 | |
Meritage Homes | | | | 25,077 | a | 3,060,899 | |
Movado Group | | | | 11,079 | | 463,435 | |
Oxford Industries | | | | 10,569 | | 1,072,965 | |
Steven Madden | | | | 51,426 | | 2,389,766 | |
Sturm Ruger & Co. | | | | 11,805 | | 802,976 | |
Tupperware Brands | | | | 32,897 | a | 502,995 | |
Unifi | | | | 8,751 | a | 202,586 | |
Universal Electronics | | | | 8,482 | a | 345,641 | |
Vera Bradley | | | | 18,624 | a | 158,490 | |
Vista Outdoor | | | | 38,213 | a | 1,760,473 | |
Wolverine World Wide | | | | 54,848 | | 1,580,171 | |
| | | | | 29,004,948 | |
Consumer Services - 1.8% | | | | | |
Adtalem Global Education | | | | 33,446 | a | 988,664 | |
American Public Education | | | | 12,988 | a | 288,983 | |
BJ's Restaurants | | | | 15,486 | a | 535,041 | |
Bloomin‘ Brands | | | | 54,002 | a | 1,132,962 | |
Brinker International | | | | 30,784 | a | 1,126,387 | |
Chuy's Holdings | | | | 13,702 | a | 412,704 | |
Dave & Buster's Entertainment | | | | 25,771 | a | 989,606 | |
Dine Brands Global | | | | 11,765 | | 891,905 | |
El Pollo Loco Holdings | | | | 12,830 | a | 182,058 | |
Fiesta Restaurant Group | | | | 11,926 | a | 131,305 | |
Monarch Casino & Resort | | | | 8,839 | a | 653,644 | |
Perdoceo Education | | | | 47,873 | a | 562,986 | |
Red Robin Gourmet Burgers | | | | 10,801 | a | 178,541 | |
Ruth's Hospitality Group | | | | 21,782 | a | 433,462 | |
Shake Shack, Cl. A | | | | 26,109 | a | 1,884,025 | |
Strategic Education | | | | 15,021 | | 868,815 | |
The Cheesecake Factory | | | | 32,381 | a | 1,267,716 | |
WW International | | | | 35,967 | a | 580,148 | |
| | | | | 13,108,952 | |
Diversified Financials - 3.3% | | | | | |
Apollo Commercial Real Estate Finance | | | | 87,660 | c | 1,153,606 | |
ARMOUR Residential REIT | | | | 60,656 | b,c | 595,035 | |
B. Riley Financial | | | | 10,647 | | 946,092 | |
Blucora | | | | 31,978 | a | 553,859 | |
Brightsphere Investment Group | | | | 24,169 | | 618,726 | |
Donnelley Financial Solutions | | | | 19,560 | a | 922,058 | |
12
| | | | | | | | |
| |
Description | | | | Shares | | Value ($) | |
Common Stocks - 100.1% (continued) | | | | | |
Diversified Financials - 3.3% (continued) | | | | | |
Ellington Financial | | | | 36,589 | c | 625,306 | |
Encore Capital Group | | | | 16,538 | a,b | 1,027,175 | |
Enova International | | | | 24,302 | a | 995,410 | |
EZCORP, Cl. A | | | | 33,800 | a | 249,106 | |
Franklin BSP Realty Trust | | | | 28,829 | c | 430,705 | |
Granite Point Mortgage Trust | | | | 35,915 | c | 420,565 | |
Green Dot, Cl. A | | | | 36,507 | a | 1,323,014 | |
Greenhill & Co. | | | | 9,863 | | 176,844 | |
Invesco Mortgage Capital | | | | 208,905 | c | 580,756 | |
KKR Real Estate Finance Trust | | | | 30,012 | c | 625,150 | |
LendingTree | | | | 7,695 | a | 943,407 | |
New York Mortgage Trust | | | | 255,304 | c | 949,731 | |
PennyMac Mortgage Investment Trust | | | | 66,113 | b,c | 1,145,738 | |
Piper Sandler | | | | 9,499 | | 1,695,666 | |
PRA Group | | | | 29,313 | a | 1,471,806 | |
Ready Capital | | | | 39,590 | c | 618,792 | |
Redwood Trust | | | | 76,871 | c | 1,013,928 | |
StoneX Group | | | | 11,346 | a | 694,942 | |
Two Harbors Investment | | | | 228,783 | b,c | 1,320,078 | |
Virtus Investment Partners | | | | 4,765 | | 1,415,681 | |
WisdomTree Investments | | | | 70,783 | | 433,192 | |
World Acceptance | | | | 2,835 | a | 695,794 | |
| | | | | 23,642,162 | |
Energy - 4.8% | | | | | |
Archrock | | | | 90,667 | | 678,189 | |
Bristow Group | | | | 15,891 | a | 503,268 | |
Callon Petroleum | | | | 31,779 | a,b | 1,501,558 | |
Civitas Resources | | | | 48,227 | | 2,361,676 | |
CONSOL Energy | | | | 21,764 | a | 494,260 | |
Core Laboratories | | | | 31,245 | | 697,076 | �� |
DMC Global | | | | 12,447 | a | 493,026 | |
Dorian LPG | | | | 19,228 | | 244,003 | |
Dril-Quip | | | | 23,930 | a | 470,942 | |
Green Plains | | | | 35,864 | a,b | 1,246,633 | |
Helix Energy Solutions Group | | | | 95,691 | a | 298,556 | |
Helmerich & Payne | | | | 72,521 | | 1,718,748 | |
Laredo Petroleum | | | | 9,610 | a,b | 577,849 | |
Matador Resources | | | | 74,132 | | 2,736,953 | |
Nabors Industries | | | | 5,104 | a | 413,883 | |
Oceaneering International | | | | 66,476 | a | 751,844 | |
Oil States International | | | | 41,479 | a | 206,151 | |
Par Pacific Holdings | | | | 29,867 | a | 492,507 | |
Patterson-UTI Energy | | | | 144,077 | | 1,217,451 | |
13
STATEMENT OF INVESTMENTS (continued)
| | | | | | | | |
| |
Description | | | | Shares | | Value ($) | |
Common Stocks - 100.1% (continued) | | | | | |
Energy - 4.8% (continued) | | | | | |
PBF Energy, Cl. A | | | | 65,175 | a | 845,320 | |
PDC Energy | | | | 65,451 | | 3,192,700 | |
ProPetro Holding | | | | 55,154 | a | 446,747 | |
Range Resources | | | | 167,889 | a | 2,993,461 | |
Ranger Oil, Cl. A | | | | 14,125 | a | 380,245 | |
Renewable Energy Group | | | | 33,788 | a | 1,433,963 | |
REX American Resources | | | | 3,510 | a | 336,960 | |
RPC | | | | 46,567 | a | 211,414 | |
SM Energy | | | | 81,645 | | 2,406,895 | |
Southwestern Energy | | | | 682,183 | a | 3,178,973 | |
Talos Energy | | | | 26,764 | a | 262,287 | |
U.S. Silica Holdings | | | | 50,473 | a | 474,446 | |
World Fuel Services | | | | 43,162 | | 1,142,498 | |
| | | | | 34,410,482 | |
Food & Staples Retailing - .7% | | | | | |
PriceSmart | | | | 16,217 | | 1,186,598 | |
SpartanNash | | | | 24,460 | | 630,090 | |
The Andersons | | | | 20,767 | | 803,891 | |
The Chefs' Warehouse | | | | 21,719 | a | 723,243 | |
United Natural Foods | | | | 38,210 | a | 1,875,347 | |
| | | | | 5,219,169 | |
Food, Beverage & Tobacco - 2.4% | | | | | |
B&G Foods | | | | 44,238 | b | 1,359,434 | |
Calavo Growers | | | | 11,966 | | 507,358 | |
Cal-Maine Foods | | | | 24,776 | | 916,464 | |
Celsius Holdings | | | | 25,645 | a | 1,912,348 | |
Coca-Cola Consolidated | | | | 3,089 | | 1,912,678 | |
Fresh Del Monte Produce | | | | 22,276 | | 614,818 | |
J&J Snack Foods | | | | 9,901 | | 1,563,962 | |
John B. Sanfilippo & Son | | | | 5,975 | | 538,706 | |
MGP Ingredients | | | | 8,557 | | 727,259 | |
National Beverage | | | | 15,534 | b | 704,156 | |
Seneca Foods, Cl. A | | | | 4,328 | a | 207,528 | |
The Simply Good Foods Company | | | | 57,119 | a | 2,374,437 | |
Tootsie Roll Industries | | | | 11,612 | | 420,703 | |
TreeHouse Foods | | | | 37,968 | a | 1,538,843 | |
Universal | | | | 16,681 | | 916,121 | |
Vector Group | | | | 87,101 | | 999,919 | |
| | | | | 17,214,734 | |
Health Care Equipment & Services - 8.1% | | | | | |
Addus HomeCare | | | | 10,820 | a | 1,011,778 | |
Allscripts Healthcare Solutions | | | | 82,383 | a | 1,519,966 | |
AMN Healthcare Services | | | | 31,774 | a | 3,886,913 | |
14
| | | | | | | | |
| |
Description | | | | Shares | | Value ($) | |
Common Stocks - 100.1% (continued) | | | | | |
Health Care Equipment & Services - 8.1% (continued) | | | | | |
AngioDynamics | | | | 25,484 | a | 702,849 | |
Apollo Medical Holdings | | | | 25,388 | a,b | 1,865,510 | |
Avanos Medical | | | | 32,813 | a | 1,137,627 | |
BioLife Solutions | | | | 20,170 | a | 751,736 | |
Cardiovascular Systems | | | | 26,596 | a | 499,473 | |
Community Health Systems | | | | 83,157 | a | 1,106,820 | |
Computer Programs & Systems | | | | 9,732 | a | 285,148 | |
CONMED | | | | 19,657 | | 2,786,576 | |
CorVel | | | | 6,312 | a | 1,312,896 | |
Covetrus | | | | 69,503 | a | 1,387,975 | |
Cross Country Healthcare | | | | 23,296 | a | 646,697 | |
CryoLife | | | | 26,078 | a | 530,687 | |
Cutera | | | | 11,015 | a,b | 455,140 | |
Fulgent Genetics | | | | 12,920 | a,b | 1,299,623 | |
Glaukos | | | | 31,903 | a | 1,417,769 | |
Hanger | | | | 24,855 | a | 450,621 | |
HealthStream | | | | 17,189 | a | 453,102 | |
Heska | | | | 7,183 | a,b | 1,310,826 | |
Inogen | | | | 13,725 | a | 466,650 | |
Integer Holdings | | | | 22,193 | a | 1,899,499 | |
Lantheus Holdings | | | | 45,043 | a | 1,301,292 | |
LeMaitre Vascular | | | | 12,873 | b | 646,611 | |
Magellan Health | | | | 15,867 | a | 1,507,206 | |
MEDNAX | | | | 58,106 | a | 1,581,064 | |
Meridian Bioscience | | | | 28,726 | a | 586,010 | |
Merit Medical Systems | | | | 34,343 | a | 2,139,569 | |
Mesa Laboratories | | | | 3,509 | b | 1,151,268 | |
ModivCare | | | | 8,213 | a | 1,217,906 | |
Natus Medical | | | | 23,061 | a | 547,238 | |
NextGen Healthcare | | | | 38,726 | a | 688,936 | |
Omnicell | | | | 29,535 | a | 5,329,295 | |
OptimizeRx | | | | 11,759 | a | 730,351 | |
OraSure Technologies | | | | 49,618 | a | 431,180 | |
Orthofix Medical | | | | 13,610 | a | 423,135 | |
Owens & Minor | | | | 50,291 | | 2,187,658 | |
RadNet | | | | 29,509 | a | 888,516 | |
Select Medical Holdings | | | | 71,227 | | 2,094,074 | |
Simulations Plus | | | | 10,838 | b | 512,637 | |
SurModics | | | | 9,365 | a | 450,925 | |
Tabula Rasa HealthCare | | | | 15,383 | a,b | 230,745 | |
Tactile Systems Technology | | | | 13,408 | a | 255,154 | |
The Ensign Group | | | | 35,281 | | 2,962,193 | |
The Joint | | | | 9,684 | a | 636,142 | |
15
STATEMENT OF INVESTMENTS (continued)
| | | | | | | | |
| |
Description | | | | Shares | | Value ($) | |
Common Stocks - 100.1% (continued) | | | | | |
Health Care Equipment & Services - 8.1% (continued) | | | | | |
The Pennant Group | | | | 17,943 | a | 414,124 | |
Tivity Health | | | | 29,348 | a | 775,961 | |
U.S. Physical Therapy | | | | 8,705 | | 831,763 | |
Varex Imaging | | | | 26,699 | a | 842,353 | |
Zynex | | | | 12,659 | a,b | 126,210 | |
| | | | | 58,675,397 | |
Household & Personal Products - 1.4% | | | | | |
Central Garden & Pet | | | | 6,818 | a | 358,831 | |
Central Garden & Pet, Cl. A | | | | 26,781 | a | 1,281,471 | |
e.l.f. Beauty | | | | 32,369 | a | 1,074,974 | |
Edgewell Personal Care | | | | 36,930 | | 1,688,070 | |
Inter Parfums | | | | 11,952 | | 1,277,669 | |
Medifast | | | | 7,729 | | 1,618,684 | |
USANA Health Sciences | | | | 7,759 | a | 785,211 | |
WD-40 | | | | 9,138 | | 2,235,520 | |
| | | | | 10,320,430 | |
Insurance - 2.7% | | | | | |
Ambac Financial Group | | | | 31,169 | a | 500,262 | |
American Equity Investment Life Holding | | | | 55,740 | | 2,169,401 | |
AMERISAFE | | | | 13,172 | | 709,049 | |
Assured Guaranty | | | | 46,918 | | 2,355,284 | |
eHealth | | | | 16,355 | a | 417,052 | |
Employers Holdings | | | | 18,603 | | 769,792 | |
Genworth Financial, Cl. A | | | | 345,631 | a | 1,399,806 | |
HCI Group | | | | 5,368 | | 448,443 | |
Horace Mann Educators | | | | 27,802 | | 1,075,937 | |
James River Group Holdings | | | | 24,886 | | 716,966 | |
Palomar Holdings | | | | 16,184 | a | 1,048,238 | |
ProAssurance | | | | 36,192 | | 915,658 | |
Safety Insurance Group | | | | 9,624 | | 818,329 | |
Selectquote | | | | 83,608 | a | 757,488 | |
SiriusPoint | | | | 58,355 | a | 474,426 | |
Stewart Information Services | | | | 18,290 | | 1,458,262 | |
Trupanion | | | | 23,062 | a | 3,044,876 | |
United Fire Group | | | | 14,462 | | 335,374 | |
Universal Insurance Holdings | | | | 18,885 | | 321,045 | |
| | | | | 19,735,688 | |
Materials - 5.1% | | | | | |
AdvanSix | | | | 18,532 | | 875,637 | |
Allegheny Technologies | | | | 84,669 | a | 1,348,777 | |
American Vanguard | | | | 18,341 | | 300,609 | |
Arconic | | | | 71,572 | a | 2,362,592 | |
16
| | | | | | | | |
| |
Description | | | | Shares | | Value ($) | |
Common Stocks - 100.1% (continued) | | | | | |
Materials - 5.1% (continued) | | | | | |
Balchem | | | | 21,764 | | 3,669,410 | |
Carpenter Technology | | | | 32,357 | | 944,501 | |
Century Aluminum | | | | 33,851 | a | 560,573 | |
Clearwater Paper | | | | 11,191 | a | 410,374 | |
Ferro | | | | 55,721 | a | 1,216,389 | |
FutureFuel | | | | 17,234 | | 131,668 | |
GCP Applied Technologies | | | | 35,842 | a | 1,134,758 | |
Glatfelter | | | | 30,552 | | 525,494 | |
H.B. Fuller | | | | 35,320 | | 2,860,920 | |
Hawkins | | | | 12,925 | | 509,891 | |
Haynes International | | | | 8,408 | | 339,095 | |
Innospec | | | | 16,391 | | 1,480,763 | |
Kaiser Aluminum | | | | 10,830 | | 1,017,370 | |
Koppers Holdings | | | | 14,346 | a | 449,030 | |
Kraton | | | | 21,675 | a | 1,003,986 | |
Livent | | | | 108,597 | a | 2,647,595 | |
Materion | | | | 13,737 | | 1,262,980 | |
Mercer International | | | | 26,998 | | 323,706 | |
Myers Industries | | | | 24,578 | | 491,806 | |
Neenah | | | | 11,254 | | 520,835 | |
O-I Glass | | | | 104,717 | a | 1,259,745 | |
Olympic Steel | | | | 6,766 | | 159,001 | |
Quaker Chemical | | | | 9,020 | b | 2,081,636 | |
Rayonier Advanced Materials | | | | 43,765 | a | 249,898 | |
Schweitzer-Mauduit International | | | | 21,509 | | 643,119 | |
Stepan | | | | 14,216 | | 1,766,907 | |
SunCoke Energy | | | | 55,670 | | 366,865 | |
Sylvamo | | | | 23,743 | a | 662,192 | |
TimkenSteel | | | | 27,607 | a | 455,515 | |
Tredegar | | | | 18,507 | | 218,753 | |
Trinseo | | | | 26,043 | | 1,366,216 | |
Warrior Met Coal | | | | 34,471 | | 886,249 | |
| | | | | 36,504,855 | |
Media & Entertainment - 1.1% | | | | | |
AMC Networks, Cl. A | | | | 20,191 | a | 695,378 | |
Cars.com | | | | 45,192 | a | 727,139 | |
Cinemark Holdings | | | | 70,752 | a,b | 1,140,522 | |
Gannett | | | | 95,667 | a | 509,905 | |
Loyalty Ventures | | | | 13,334 | a | 400,953 | |
QuinStreet | | | | 33,528 | a | 609,874 | |
Scholastic | | | | 20,055 | | 801,398 | |
TechTarget | | | | 17,433 | a | 1,667,641 | |
The E.W. Scripps Company, Cl. A | | | | 38,535 | a | 745,652 | |
17
STATEMENT OF INVESTMENTS (continued)
| | | | | | | | |
| |
Description | | | | Shares | | Value ($) | |
Common Stocks - 100.1% (continued) | | | | | |
Media & Entertainment - 1.1% (continued) | | | | | |
The Marcus | | | | 13,983 | a,b | 249,736 | |
Thryv Holdings | | | | 11,154 | a | 458,764 | |
| | | | | 8,006,962 | |
Pharmaceuticals Biotechnology & Life Sciences - 4.2% | | | | | |
Amphastar Pharmaceuticals | | | | 24,101 | a | 561,312 | |
ANI Pharmaceuticals | | | | 7,277 | a | 335,324 | |
Anika Therapeutics | | | | 9,472 | a | 339,382 | |
Avid Bioservices | | | | 41,166 | a | 1,201,224 | |
Cara Therapeutics | | | | 28,745 | a | 350,114 | |
Coherus Biosciences | | | | 42,930 | a | 685,163 | |
Collegium Pharmaceutical | | | | 23,017 | a | 429,958 | |
Corcept Therapeutics | | | | 63,783 | a,b | 1,262,903 | |
Cytokinetics | | | | 56,379 | a,b | 2,569,755 | |
Eagle Pharmaceuticals | | | | 7,926 | a | 403,592 | |
Emergent BioSolutions | | | | 32,182 | a | 1,398,952 | |
Enanta Pharmaceuticals | | | | 11,975 | a | 895,490 | |
Endo International | | | | 153,713 | a | 577,961 | |
Harmony Biosciences Holdings | | | | 15,744 | a | 671,324 | |
Innoviva | | | | 42,849 | a | 739,145 | |
Ligand Pharmaceuticals | | | | 11,339 | a,b | 1,751,422 | |
Myriad Genetics | | | | 53,672 | a | 1,481,347 | |
Nektar Therapeutics | | | | 124,044 | a | 1,675,834 | |
NeoGenomics | | | | 82,956 | a | 2,830,459 | |
Organogenesis Holdings | | | | 41,189 | a | 380,586 | |
Pacira Biosciences | | | | 29,667 | a | 1,785,063 | |
Phibro Animal Health, Cl. A | | | | 13,766 | | 281,102 | |
Prestige Consumer Healthcare | | | | 33,372 | a | 2,024,012 | |
REGENXBIO | | | | 25,301 | a | 827,343 | |
Spectrum Pharmaceuticals | | | | 107,102 | a | 136,020 | |
Supernus Pharmaceuticals | | | | 35,689 | a | 1,040,691 | |
uniQure | | | | 24,061 | a | 499,025 | |
Vanda Pharmaceuticals | | | | 37,615 | a | 590,179 | |
Vericel | | | | 31,929 | a | 1,254,810 | |
Xencor | | | | 39,680 | a | 1,591,962 | |
| | | | | 30,571,454 | |
Real Estate - 8.1% | | | | | |
Acadia Realty Trust | | | | 58,860 | c | 1,284,914 | |
Agree Realty | | | | 46,900 | c | 3,346,784 | |
Alexander & Baldwin | | | | 48,369 | c | 1,213,578 | |
American Assets Trust | | | | 35,066 | c | 1,316,027 | |
Armada Hoffler Properties | | | | 41,164 | c | 626,516 | |
Brandywine Realty Trust | | | | 116,407 | c | 1,562,182 | |
CareTrust REIT | | | | 64,558 | c | 1,473,859 | |
18
| | | | | | | | |
| |
Description | | | | Shares | | Value ($) | |
Common Stocks - 100.1% (continued) | | | | | |
Real Estate - 8.1% (continued) | | | | | |
Centerspace | | | | 9,779 | c | 1,084,491 | |
Chatham Lodging Trust | | | | 31,770 | a,c | 435,884 | |
Community Healthcare Trust | | | | 15,579 | c | 736,419 | |
DiamondRock Hospitality | | | | 141,894 | a,c | 1,363,601 | |
Diversified Healthcare Trust | | | | 161,528 | c | 499,122 | |
Douglas Elliman | | | | 43,550 | a | 500,825 | |
Easterly Government Properties | | | | 57,895 | c | 1,326,953 | |
Essential Properties Realty Trust | | | | 81,712 | c | 2,355,757 | |
Four Corners Property Trust | | | | 52,236 | c | 1,536,261 | |
Franklin Street Properties | | | | 65,881 | c | 391,992 | |
Getty Realty | | | | 26,322 | c | 844,673 | |
Global Net Lease | | | | 70,510 | c | 1,077,393 | |
Hersha Hospitality Trust | | | | 22,801 | a,c | 209,085 | |
Independence Realty Trust | | | | 70,926 | c | 1,832,019 | |
Industrial Logistics Properties Trust | | | | 43,353 | c | 1,085,993 | |
Innovative Industrial Properties | | | | 16,082 | c | 4,228,119 | |
iStar | | | | 46,709 | b,c | 1,206,493 | |
Lexington Realty Trust | | | | 190,086 | c | 2,969,143 | |
LTC Properties | | | | 26,949 | b,c | 920,039 | |
Mack-Cali Realty | | | | 54,817 | c | 1,007,536 | |
Marcus & Millichap | | | | 16,843 | a | 866,741 | |
NexPoint Residential Trust | | | | 15,141 | c | 1,269,270 | |
Office Properties Income Trust | | | | 32,675 | c | 811,647 | |
Orion Office REIT | | | | 36,723 | a,c | 685,618 | |
RE/MAX Holdings, Cl. A | | | | 12,748 | | 388,687 | |
Realogy Holdings | | | | 77,513 | a | 1,302,994 | |
Retail Opportunity Investments | | | | 81,611 | c | 1,599,576 | |
RPT Realty | | | | 56,777 | c | 759,676 | |
Safehold | | | | 9,491 | c | 757,856 | |
Saul Centers | | | | 9,087 | c | 481,793 | |
Service Properties Trust | | | | 111,637 | c | 981,289 | |
SITE Centers | | | | 119,549 | c | 1,892,461 | |
Summit Hotel Properties | | | | 70,756 | a,c | 690,579 | |
Tanger Factory Outlet Centers | | | | 69,890 | b,c | 1,347,479 | |
The GEO Group | | | | 80,393 | c | 623,046 | |
The St. Joe Company | | | | 22,119 | | 1,151,294 | |
Uniti Group | | | | 158,667 | b,c | 2,222,925 | |
Universal Health Realty Income Trust | | | | 8,845 | c | 526,012 | |
Urstadt Biddle Properties, Cl. A | | | | 20,790 | c | 442,827 | |
Washington Real Estate Investment Trust | | | | 56,301 | c | 1,455,381 | |
Whitestone REIT | | | | 31,132 | b,c | 315,367 | |
19
STATEMENT OF INVESTMENTS (continued)
| | | | | | | | |
| |
Description | | | | Shares | | Value ($) | |
Common Stocks - 100.1% (continued) | | | | | |
Real Estate - 8.1% (continued) | | | | | |
Xenia Hotels & Resorts | | | | 75,952 | a,c | 1,375,491 | |
| | | | | 58,383,667 | |
Retailing - 4.7% | | | | | |
Abercrombie & Fitch, Cl. A | | | | 39,710 | a | 1,383,099 | |
America's Car-Mart | | | | 4,027 | a | 412,365 | |
Asbury Automotive Group | | | | 15,550 | a | 2,685,951 | |
Barnes & Noble Education | | | | 23,812 | a | 162,160 | |
Bed Bath & Beyond | | | | 67,761 | a,b | 987,955 | |
Big Lots | | | | 21,898 | | 986,505 | |
Boot Barn Holdings | | | | 19,901 | a | 2,448,818 | |
Caleres | | | | 25,843 | | 586,119 | |
Chico's FAS | | | | 81,601 | a | 439,013 | |
Conn's | | | | 12,547 | a | 295,105 | |
Designer Brands, Cl. A | | | | 41,452 | a | 589,033 | |
Genesco | | | | 9,503 | a | 609,807 | |
Group 1 Automotive | | | | 12,166 | b | 2,375,047 | |
Guess? | | | | 27,030 | | 640,070 | |
Haverty Furniture | | | | 9,898 | | 302,582 | |
Hibbett | | | | 10,018 | | 720,595 | |
Liquidity Services | | | | 18,043 | a | 398,389 | |
Ll Flooring Holdings | | | | 19,904 | a | 339,761 | |
MarineMax | | | | 14,952 | a | 882,766 | |
Monro | | | | 22,874 | | 1,332,868 | |
PetMed Express | | | | 13,737 | b | 346,997 | |
Rent-A-Center | | | | 40,969 | | 1,968,151 | |
Sally Beauty Holdings | | | | 75,122 | a | 1,386,752 | |
Shoe Carnival | | | | 11,838 | | 462,629 | |
Shutterstock | | | | 15,620 | | 1,731,946 | |
Signet Jewelers | | | | 35,660 | | 3,103,490 | |
Sleep Number | | | | 15,181 | a | 1,162,865 | |
Sonic Automotive, Cl. A | | | | 13,953 | | 689,976 | |
The Aaron's Company | | | | 21,137 | | 521,027 | |
The Buckle | | | | 19,493 | b | 824,749 | |
The Cato, Cl. A | | | | 13,779 | | 236,448 | |
The Children's Place | | | | 9,381 | a | 743,819 | |
The ODP | | | | 30,850 | a | 1,211,788 | |
Zumiez | | | | 14,403 | a | 691,200 | |
| | | | | 33,659,845 | |
Semiconductors & Semiconductor Equipment - 3.7% | | | | | |
Axcelis Technologies | | | | 22,390 | a | 1,669,398 | |
CEVA | | | | 15,834 | a | 684,662 | |
Cohu | | | | 33,178 | a | 1,263,750 | |
Diodes | | | | 30,257 | a | 3,322,521 | |
20
| | | | | | | | |
| |
Description | | | | Shares | | Value ($) | |
Common Stocks - 100.1% (continued) | | | | | |
Semiconductors & Semiconductor Equipment - 3.7% (continued) | | | | | |
FormFactor | | | | 52,564 | a | 2,403,226 | |
Ichor Holdings | | | | 18,823 | a | 866,423 | |
Kulicke & Soffa Industries | | | | 41,650 | b | 2,521,491 | |
MaxLinear | | | | 47,449 | a | 3,577,180 | |
Onto Innovation | | | | 33,121 | a | 3,352,839 | |
PDF Solutions | | | | 19,629 | a | 624,006 | |
Photronics | | | | 40,971 | a | 772,303 | |
Rambus | | | | 73,506 | a | 2,160,341 | |
SMART Global Holdings | | | | 15,553 | a | 1,104,107 | |
Ultra Clean Holdings | | | | 30,178 | a | 1,731,010 | |
Veeco Instruments | | | | 34,242 | a,b | 974,870 | |
| | | | | 27,028,127 | |
Software & Services - 4.4% | | | | | |
8x8 | | | | 76,588 | a | 1,283,615 | |
Agilysys | | | | 13,082 | a | 581,626 | |
Alarm.com Holdings | | | | 30,954 | a | 2,625,209 | |
Bottomline Technologies | | | | 26,202 | a | 1,479,627 | |
Consensus Cloud Solutions | | | | 10,740 | a | 621,524 | |
CSG Systems International | | | | 21,948 | | 1,264,644 | |
Ebix | | | | 15,944 | b | 484,698 | |
EVERTEC | | | | 39,816 | | 1,990,004 | |
ExlService Holdings | | | | 22,383 | a | 3,240,387 | |
InterDigital | | | | 20,428 | | 1,463,258 | |
LivePerson | | | | 44,232 | a,b | 1,579,967 | |
OneSpan | | | | 23,466 | a | 397,279 | |
Perficient | | | | 22,138 | a | 2,862,222 | |
Progress Software | | | | 29,829 | | 1,439,846 | |
SPS Commerce | | | | 24,172 | a | 3,440,884 | |
TTEC Holdings | | | | 12,162 | | 1,101,269 | |
Unisys | | | | 45,108 | a | 927,872 | |
Vonage Holdings | | | | 169,692 | a | 3,527,897 | |
Xperi Holding | | | | 69,672 | | 1,317,498 | |
| | | | | 31,629,326 | |
Technology Hardware & Equipment - 5.6% | | | | | |
3D Systems | | | | 85,849 | a | 1,849,187 | |
ADTRAN | | | | 32,606 | | 744,395 | |
Advanced Energy Industries | | | | 25,319 | | 2,305,548 | |
Arlo Technologies | | | | 58,483 | a | 613,487 | |
Badger Meter | | | | 19,802 | | 2,110,101 | |
Benchmark Electronics | | | | 24,351 | | 659,912 | |
CalAmp | | | | 24,381 | a | 172,130 | |
Comtech Telecommunications | | | | 17,773 | | 421,042 | |
21
STATEMENT OF INVESTMENTS (continued)
| | | | | | | | |
| |
Description | | | | Shares | | Value ($) | |
Common Stocks - 100.1% (continued) | | | | | |
Technology Hardware & Equipment - 5.6% (continued) | | | | | |
CTS | | | | 21,578 | | 792,344 | |
Diebold Nixdorf | | | | 49,117 | a | 444,509 | |
Digi International | | | | 22,474 | a | 552,186 | |
ePlus | | | | 18,151 | a | 977,976 | |
Extreme Networks | | | | 87,118 | a | 1,367,753 | |
Fabrinet | | | | 24,880 | a | 2,947,534 | |
FARO Technologies | | | | 12,001 | a | 840,310 | |
Harmonic | | | | 69,230 | a | 814,145 | |
Insight Enterprises | | | | 23,609 | a | 2,516,719 | |
Itron | | | | 30,428 | a | 2,084,927 | |
Knowles | | | | 61,688 | a | 1,440,415 | |
Methode Electronics | | | | 25,421 | | 1,249,951 | |
NETGEAR | | | | 19,706 | a | 575,612 | |
NETSCOUT Systems | | | | 49,653 | a | 1,642,521 | |
OSI Systems | | | | 11,279 | a | 1,051,203 | |
PC Connection | | | | 7,439 | | 320,844 | |
Plantronics | | | | 28,313 | a | 830,703 | |
Plexus | | | | 18,823 | a | 1,804,937 | |
Rogers | | | | 12,589 | a | 3,436,797 | |
Sanmina | | | | 43,377 | a | 1,798,410 | |
ScanSource | | | | 17,188 | a | 602,955 | |
TTM Technologies | | | | 71,094 | a | 1,059,301 | |
Viavi Solutions | | | | 159,753 | a | 2,814,848 | |
| | | | | 40,842,702 | |
Telecommunication Services - .7% | | | | | |
ATN International | | | | 7,474 | | 298,586 | |
Cogent Communications Holdings | | | | 28,312 | | 2,071,872 | |
Consolidated Communications Holdings | | | | 49,797 | a | 372,482 | |
Shenandoah Telecommunication | | | | 33,884 | | 864,042 | |
Telephone & Data Systems | | | | 66,129 | | 1,332,499 | |
| | | | | 4,939,481 | |
Transportation - 2.1% | | | | | |
Allegiant Travel | | | | 10,272 | a | 1,921,275 | |
ArcBest | | | | 17,185 | | 2,059,622 | |
Atlas Air Worldwide Holdings | | | | 17,951 | a | 1,689,548 | |
Forward Air | | | | 18,119 | | 2,194,030 | |
Hawaiian Holdings | | | | 34,259 | a | 629,338 | |
Heartland Express | | | | 30,673 | | 515,920 | |
Hub Group, Cl. A | | | | 22,846 | a | 1,924,547 | |
Marten Transport | | | | 39,251 | | 673,547 | |
Matson | | | | 28,250 | | 2,543,347 | |
SkyWest | | | | 33,861 | a | 1,330,737 | |
| | | | | 15,481,911 | |
22
| | | | | | | | |
| |
Description | | | | Shares | | Value ($) | |
Common Stocks - 100.1% (continued) | | | | | |
Utilities - 1.9% | | | | | |
American States Water | | | | 24,641 | | 2,548,865 | |
Avista | | | | 47,625 | | 2,023,586 | |
California Water Service Group | | | | 35,359 | | 2,540,898 | |
Chesapeake Utilities | | | | 11,832 | | 1,725,224 | |
Middlesex Water | | | | 11,942 | b | 1,436,623 | |
Northwest Natural Holding | | | | 20,798 | | 1,014,526 | |
South Jersey Industries | | | | 74,946 | b | 1,957,590 | |
Unitil | | | | 10,383 | | 477,514 | |
| | | | | 13,724,826 | |
Total Common Stocks (cost $446,446,706) | | | | 723,849,384 | |
| | | | | | | | |
Exchange-Traded Funds - .4% | | | | | |
Registered Investment Companies - .4% | | | | | |
iShares Core S&P Small-Cap ETF
(cost $2,869,075) | | | | 26,731 | b | 3,060,967 | |
| | | 1-Day
Yield (%) | | | | | |
Investment Companies - .4% | | | | | |
Registered Investment Companies - .4% | | | | | |
Dreyfus Institutional Preferred Government Plus Money Market Fund, Institutional Shares
(cost $2,920,647) | | 0.07 | | 2,920,647 | d | 2,920,647 | |
| | | | | | | | |
Investment of Cash Collateral for Securities Loaned - .8% | | | | | |
Registered Investment Companies - .8% | | | | | |
Dreyfus Institutional Preferred Government Plus Money Market Fund, SL Shares
(cost $5,553,518) | | 0.07 | | 5,553,518 | d | 5,553,518 | |
Total Investments (cost $457,789,946) | | 101.7% | | 735,384,516 | |
Liabilities, Less Cash and Receivables | | (1.7%) | | (12,361,354) | |
Net Assets | | 100.0% | | 723,023,162 | |
ETF—Exchange-Traded Fund
REIT—Real Estate Investment Trust
a Non-income producing security.
b Security, or portion thereof, on loan. At December 31, 2021, the value of the fund’s securities on loan was $35,767,257 and the value of the collateral was $36,936,597, consisting of cash collateral of $5,553,518 and U.S. Government & Agency securities valued at $31,383,079. In addition, the value of collateral may include pending sales that are also on loan.
c Investment in real estate investment trust within the United States.
d Investment in affiliated issuer. The investment objective of this investment company is publicly available and can be found within the investment company’s prospectus.
23
STATEMENT OF INVESTMENTS (continued)
| | |
Portfolio Summary (Unaudited) † | Value (%) |
Financials | 18.7 |
Industrials | 17.1 |
Information Technology | 13.8 |
Health Care | 12.3 |
Consumer Discretionary | 12.1 |
Real Estate | 8.0 |
Materials | 5.0 |
Energy | 4.8 |
Consumer Staples | 4.5 |
Utilities | 1.9 |
Communication Services | 1.8 |
Investment Companies | 1.6 |
Financial | .1 |
| | 101.7 |
† Based on net assets.
See notes to financial statements.
24
STATEMENT OF INVESTMENTS IN AFFILIATED ISSUERS
| | | | | | | |
Description | Value ($) 12/31/2020 | Purchases ($)† | Sales ($) | Value ($) 12/31/2021 | Dividends/
Distributions ($) | |
Registered Investment Companies - .4% | | |
Dreyfus Institutional Preferred Government Plus Money Market Fund, Institutional Shares - .4% | 661,144 | 191,298,841 | (189,039,338) | 2,920,647 | 1,909 | |
Investment of Cash Collateral for Securities Loaned - .8% | | |
Dreyfus Institutional Preferred Government Plus Money Market Fund, SL Shares - .8% | 10,413,704 | 139,328,063 | (144,188,249) | 5,553,518 | 201,106 | †† |
Total - 1.2% | 11,074,848 | 330,626,904 | (333,227,587) | 8,474,165 | 203,015 | |
† Includes reinvested dividends/distributions.
†† Represents securities lending income earned from the reinvestment of cash collateral from loaned securities, net of fees and collateral investment expenses, and other payments to and from borrowers of securities.
See notes to financial statements.
25
STATEMENT OF FUTURES
December 31, 2021
| | | | | | | |
Description | Number of
Contracts | Expiration | Notional
Value ($) | Market
Value ($) | Unrealized Appreciation ($) | |
Futures Long | | |
E-mini Russell 2000 | 34 | 3/18/2022 | 3,755,874 | 3,812,760 | 56,886 | |
Gross Unrealized Appreciation | | 56,886 | |
See notes to financial statements.
26
STATEMENT OF ASSETS AND LIABILITIES
December 31, 2021
| | | | | | | |
| | | | | | |
| | | Cost | | Value | |
Assets ($): | | | | |
Investments in securities—See Statement of Investments
(including securities on loan, valued at $35,767,257)—Note 1(c): | | | |
Unaffiliated issuers | 449,315,781 | | 726,910,351 | |
Affiliated issuers | | 8,474,165 | | 8,474,165 | |
Receivable for investment securities sold | | 1,524,156 | |
Dividends and securities lending income receivable | | 759,723 | |
Cash collateral held by broker—Note 4 | | 242,000 | |
Receivable for shares of Beneficial Interest subscribed | | 113,077 | |
| | | | | 738,023,472 | |
Liabilities ($): | | | | |
Due to BNY Mellon Investment Adviser, Inc. and affiliates—Note 3(b) | | 360,390 | |
Cash overdraft due to Custodian | | | | | 1,530 | |
Payable for shares of Beneficial Interest redeemed | | 7,824,701 | |
Liability for securities on loan—Note 1(c) | | 5,553,518 | |
Payable for investment securities purchased | | 1,237,594 | |
Trustees’ fees and expenses payable | | 15,440 | |
Payable for futures variation margin—Note 4 | | 6,970 | |
Interest payable—Note 2 | | 167 | |
| | | | | 15,000,310 | |
Net Assets ($) | | | 723,023,162 | |
Composition of Net Assets ($): | | | | |
Paid-in capital | | | | | 386,766,510 | |
Total distributable earnings (loss) | | | | | 336,256,652 | |
Net Assets ($) | | | 723,023,162 | |
| | | | | |
Shares Outstanding | | |
(unlimited number of $.001 par value shares of Beneficial Interest authorized) | 30,701,808 | |
Net Asset Value Per Share ($) | | 23.55 | |
| | | | |
See notes to financial statements. | | | | |
27
STATEMENT OF OPERATIONS
Year Ended December 31, 2021
| | | | | | | |
| | | | | | |
| | | | | | |
Investment Income ($): | | | | |
Income: | | | | |
Cash dividends (net of $7,977 foreign taxes withheld at source): | |
Unaffiliated issuers | | | 9,300,413 | |
Affiliated issuers | | | 1,909 | |
Income from securities lending—Note 1(c) | | | 201,106 | |
Total Income | | | 9,503,428 | |
Expenses: | | | | |
Management fee—Note 3(a) | | | 2,500,349 | |
Distribution fees—Note 3(b) | | | 1,785,963 | |
Trustees’ fees—Note 3(a,c) | | | 45,240 | |
Loan commitment fees—Note 2 | | | 14,340 | |
Interest expense—Note 2 | | | 3,260 | |
Professional fees | | | 227 | |
Total Expenses | | | 4,349,379 | |
Less—Trustees’ fees reimbursed by
BNY Mellon Investment Adviser, Inc.—Note 3(a) | | | (45,240) | |
Net Expenses | | | 4,304,139 | |
Investment Income—Net | | | 5,199,289 | |
Realized and Unrealized Gain (Loss) on Investments—Note 4 ($): | | |
Net realized gain (loss) on investments | 68,503,786 | |
Net realized gain (loss) on futures | 472,726 | |
Net Realized Gain (Loss) | | | 68,976,512 | |
Net change in unrealized appreciation (depreciation) on investments | 83,864,451 | |
Net change in unrealized appreciation (depreciation) on futures | 16,975 | |
Net Change in Unrealized Appreciation (Depreciation) | | | 83,881,426 | |
Net Realized and Unrealized Gain (Loss) on Investments | | | 152,857,938 | |
Net Increase in Net Assets Resulting from Operations | | 158,057,227 | |
| | | | | | |
See notes to financial statements. | | | | | |
28
STATEMENT OF CHANGES IN NET ASSETS
| | | | | | | | | | |
| | | | Year Ended December 31, |
| | | | 2021 | | 2020 | |
Operations ($): | | | | | | | | |
Investment income—net | | | 5,199,289 | | | | 4,580,651 | |
Net realized gain (loss) on investments | | 68,976,512 | | | | 2,212,092 | |
Net change in unrealized appreciation
(depreciation) on investments | | 83,881,426 | | | | 49,630,698 | |
Net Increase (Decrease) in Net Assets
Resulting from Operations | 158,057,227 | | | | 56,423,441 | |
Distributions ($): | |
Distributions to shareholders | | | (14,696,730) | | | | (34,316,237) | |
Beneficial Interest Transactions ($): | |
Net proceeds from shares sold | | | 133,850,453 | | | | 151,009,753 | |
Distributions reinvested | | | 14,696,730 | | | | 34,316,237 | |
Cost of shares redeemed | | | (186,869,361) | | | | (165,956,575) | |
Increase (Decrease) in Net Assets
from Beneficial Interest Transactions | (38,322,178) | | | | 19,369,415 | |
Total Increase (Decrease) in Net Assets | 105,038,319 | | | | 41,476,619 | |
Net Assets ($): | |
Beginning of Period | | | 617,984,843 | | | | 576,508,224 | |
End of Period | | | 723,023,162 | | | | 617,984,843 | |
Capital Share Transactions (Shares): | |
Shares sold | | | 5,937,501 | | | | 9,954,046 | |
Shares issued for distributions reinvested | | | 668,337 | | | | 3,099,931 | |
Shares redeemed | | | (8,328,118) | | | | (10,884,588) | |
Net Increase (Decrease) in Shares Outstanding | (1,722,280) | | | | 2,169,389 | |
| | | | | | | | | |
See notes to financial statements. | | | | | | | | |
29
FINANCIAL HIGHLIGHTS
The following table describes the performance for the fiscal periods indicated. Net asset value total return is calculated assuming an initial investment made at the net asset value at the beginning of the period, reinvestment of all dividends and distributions at net asset value during the period, and redemption at net asset value on the last day of the period. Net asset value total return includes adjustments in accordance with accounting principles generally accepted in the United States of America and as such, the net asset value for financial reporting purposes and the returns based upon those net asset values may differ from the net asset value and returns for shareholder transactions. The fund’s total returns do not reflect expenses associated with variable annuity or insurance contracts. These figures have been derived from the fund’s financial statements.
| | | | | | | | | | | |
| | | | | |
| | |
| | Year Ended December 31, |
| | | 2021 | 2020 | 2019 | 2018 | 2017 |
Per Share Data ($): | | | | | | |
Net asset value, beginning of period | | 19.06 | 19.06 | 17.17 | 20.12 | 18.88 |
Investment Operations: | | | | | | |
Investment income—neta | | .16 | .14 | .17 | .17 | .16 |
Net realized and unrealized
gain (loss) on investments | | 4.79 | 1.04 | 3.48 | (1.82) | 2.04 |
Total from Investment Operations | | 4.95 | 1.18 | 3.65 | (1.65) | 2.20 |
Distributions: | | | | | | |
Dividends from
investment income—net | | (.15) | (.18) | (.17) | (.17) | (.13) |
Dividends from net realized
gain on investments | | (.31) | (1.00) | (1.59) | (1.13) | (.83) |
Total Distributions | | (.46) | (1.18) | (1.76) | (1.30) | (.96) |
Net asset value, end of period | | 23.55 | 19.06 | 19.06 | 17.17 | 20.12 |
Total Return (%) | | 26.14 | 10.64 | 22.21 | (8.98) | 12.40 |
Ratios/Supplemental Data (%): | | | | | | |
Ratio of total expenses
to average net assets | | .61 | .61 | .61 | .61 | .63 |
Ratio of net expenses
to average net assets | | .60 | .60 | .60 | .60 | .60 |
Ratio of net investment income
to average net assets | | .73 | .95 | .94 | .82 | .88 |
Portfolio Turnover Rate | | 46.01 | 47.77 | 28.13 | 23.26 | 16.90 |
Net Assets, end of period ($ x 1,000) | | 723,023 | 617,985 | 576,508 | 509,695 | 562,014 |
a Based on average shares outstanding.
See notes to financial statements.
30
NOTES TO FINANCIAL STATEMENTS
NOTE 1—Significant Accounting Policies:
Small Cap Stock Index Portfolio (the “fund”) is a separate diversified series of BNY Mellon Investment Portfolios (the “Trust”), which is registered under the Investment Company Act of 1940, as amended (the “Act”), as an open-end management investment company and operates as a series company currently offering three series, including the fund. The fund is only offered to separate accounts established by insurance companies to fund variable annuity contracts and variable life insurance policies. The fund’s investment objective is to seek to match the performance of the Standard & Poor’s® SmallCap 600 Index. BNY Mellon Investment Adviser, Inc. (the “Adviser”), a wholly-owned subsidiary of The Bank of New York Mellon Corporation (“BNY Mellon”), serves as the fund’s investment adviser. BNY Mellon Securities Corporation (the “Distributor”), a wholly-owned subsidiary of the Adviser, is the distributor of the fund’s shares, which are sold to the public without a sales charge.
The Trust accounts separately for the assets, liabilities and operations of each series. Expenses directly attributable to each series are charged to that series’ operations; expenses which are applicable to all series are allocated among them on a pro rata basis.
The Financial Accounting Standards Board (“FASB”) Accounting Standards Codification (“ASC”) is the exclusive reference of authoritative U.S. generally accepted accounting principles (“GAAP”) recognized by the FASB to be applied by nongovernmental entities. Rules and interpretive releases of the SEC under authority of federal laws are also sources of authoritative GAAP for SEC registrants. The fund is an investment company and applies the accounting and reporting guidance of the FASB ASC Topic 946 Financial Services-Investment Companies. The fund’s financial statements are prepared in accordance with GAAP, which may require the use of management estimates and assumptions. Actual results could differ from those estimates.
The Trust enters into contracts that contain a variety of indemnifications. The fund’s maximum exposure under these arrangements is unknown. The fund does not anticipate recognizing any loss related to these arrangements.
(a) Portfolio valuation: The fair value of a financial instrument is the amount that would be received to sell an asset or paid to transfer a liability in an orderly transaction between market participants at the measurement date (i.e., the exit price). GAAP establishes a fair value hierarchy that prioritizes the inputs of valuation techniques used to measure fair value. This hierarchy gives the highest priority to unadjusted quoted prices in
31
NOTES TO FINANCIAL STATEMENTS (continued)
active markets for identical assets or liabilities (Level 1 measurements) and the lowest priority to unobservable inputs (Level 3 measurements).
Additionally, GAAP provides guidance on determining whether the volume and activity in a market has decreased significantly and whether such a decrease in activity results in transactions that are not orderly. GAAP requires enhanced disclosures around valuation inputs and techniques used during annual and interim periods.
Various inputs are used in determining the value of the fund’s investments relating to fair value measurements. These inputs are summarized in the three broad levels listed below:
Level 1—unadjusted quoted prices in active markets for identical investments.
Level 2—other significant observable inputs (including quoted prices for similar investments, interest rates, prepayment speeds, credit risk, etc.).
Level 3—significant unobservable inputs (including the fund’s own assumptions in determining the fair value of investments).
The inputs or methodology used for valuing securities are not necessarily an indication of the risk associated with investing in those securities.
Changes in valuation techniques may result in transfers in or out of an assigned level within the disclosure hierarchy. Valuation techniques used to value the fund’s investments are as follows:
Investments in equity securities are valued at the last sales price on the securities exchange or national securities market on which such securities are primarily traded. Securities listed on the National Market System for which market quotations are available are valued at the official closing price or, if there is no official closing price that day, at the last sales price. For open short positions, asked prices are used for valuation purposes. Bid price is used when no asked price is available. Registered investment companies that are not traded on an exchange are valued at their net asset value. All of the preceding securities are generally categorized within Level 1 of the fair value hierarchy.
Securities not listed on an exchange or the national securities market, or securities for which there were no transactions, are valued at the average of the most recent bid and asked prices. These securities are generally categorized within Level 2 of the fair value hierarchy.
Fair valuing of securities may be determined with the assistance of a pricing service using calculations based on indices of domestic securities
32
and other appropriate indicators, such as prices of relevant American Depository Receipts and futures. Utilizing these techniques may result in transfers between Level 1 and Level 2 of the fair value hierarchy.
When market quotations or official closing prices are not readily available, or are determined not to accurately reflect fair value, such as when the value of a security has been significantly affected by events after the close of the exchange or market on which the security is principally traded (for example, a foreign exchange or market), but before the fund calculates its net asset value, the fund may value these investments at fair value as determined in accordance with the procedures approved by the Trust's Board of Trustees (the “Board”). Certain factors may be considered when fair valuing investments such as: fundamental analytical data, the nature and duration of restrictions on disposition, an evaluation of the forces that influence the market in which the securities are purchased and sold, and public trading in similar securities of the issuer or comparable issuers. These securities are either categorized within Level 2 or 3 of the fair value hierarchy depending on the relevant inputs used.
For securities where observable inputs are limited, assumptions about market activity and risk are used and such securities are generally categorized within Level 3 of the fair value hierarchy.
Futures, which are traded on an exchange, are valued at the last sales price on the securities exchange on which such securities are primarily traded or at the last sales price on the national securities market on each business day and are generally categorized within Level 1 of the fair value hierarchy.
The following is a summary of the inputs used as of December 31, 2021 in valuing the fund’s investments:
| | | | | | | |
| | Level 1-Unadjusted Quoted Prices | Level 2- Other Significant Observable Inputs | | Level 3-Significant Unobservable Inputs | Total | |
Assets ($) | | |
Investments in Securities:† | | |
Equity Securities - Common Stocks | 723,849,384 | - | | - | 723,849,384 | |
Exchange-Traded Funds | 3,060,967 | - | | - | 3,060,967 | |
Investment Companies | 8,474,165 | - | | - | 8,474,165 | |
33
NOTES TO FINANCIAL STATEMENTS (continued)
| | | | | | | | |
| | Level 1-Unadjusted Quoted Prices | Level 2- Other Significant Observable Inputs | | Level 3-Significant Unobservable Inputs | Total | |
Assets ($)(continued) | | |
Other Financial Instruments: | | |
Futures†† | 56,886 | - | | - | 56,886 | |
† See Statement of Investments for additional detailed categorizations, if any.
†† Amount shown represents unrealized appreciation (depreciation) at period end, but only variation margin on exchange-traded and centrally cleared derivatives, if any, are reported in the Statement of Assets and Liabilities.
(b) Foreign taxes: The fund may be subject to foreign taxes (a portion of which may be reclaimable) on income, stock dividends, realized and unrealized capital gains on investments or certain foreign currency transactions. Foreign taxes are recorded in accordance with the applicable foreign tax regulations and rates that exist in the foreign jurisdictions in which the fund invests. These foreign taxes, if any, are paid by the fund and are reflected in the Statement of Operations, if applicable. Foreign taxes payable or deferred or those subject to reclaims as of December 31, 2021, if any, are disclosed in the fund’s Statement of Assets and Liabilities.
(c) Securities transactions and investment income: Securities transactions are recorded on a trade date basis. Realized gains and losses from securities transactions are recorded on the identified cost basis. Dividend income is recognized on the ex-dividend date and interest income, including, where applicable, accretion of discount and amortization of premium on investments, is recognized on the accrual basis.
Pursuant to a securities lending agreement with The Bank of New York Mellon, a subsidiary of BNY Mellon and an affiliate of the Adviser, the fund may lend securities to qualified institutions. It is the fund’s policy that, at origination, all loans are secured by collateral of at least 102% of the value of U.S. securities loaned and 105% of the value of foreign securities loaned. Collateral equivalent to at least 100% of the market value of securities on loan is maintained at all times. Collateral is either in the form of cash, which can be invested in certain money market mutual funds managed by the Adviser, or U.S. Government and Agency securities. The fund is entitled to receive all dividends, interest and distributions on securities loaned, in addition to income earned as a result of the lending transaction. Should a borrower fail to return the securities in a timely manner, The Bank of New York Mellon is required to replace the securities for the benefit of the fund or credit the fund with the market value of the unreturned securities and is subrogated to the fund’s rights against the borrower and the collateral. Additionally, the contractual maturity of security lending transactions are on an overnight and
34
continuous basis. During the period ended December 31, 2021, The Bank of New York Mellon earned $27,405 from the lending of the fund’s portfolio securities, pursuant to the securities lending agreement.
(d) Affiliated issuers: Investments in other investment companies advised by the Adviser are considered “affiliated” under the Act.
(e) Risk: Certain events particular to the industries in which the fund’s investments conduct their operations, as well as general economic, political and public health conditions, may have a significant negative impact on the investee’s operations and profitability. In addition, turbulence in financial markets and reduced liquidity in equity, credit and/or fixed income markets may negatively affect many issuers, which could adversely affect the fund. Global economies and financial markets are becoming increasingly interconnected, and conditions and events in one country, region or financial market may adversely impact issuers in a different country, region or financial market. These risks may be magnified if certain events or developments adversely interrupt the global supply chain; in these and other circumstances, such risks might affect companies world-wide. Recent examples include pandemic risks related to COVID-19 and aggressive measures taken world-wide in response by governments, including closing borders, restricting international and domestic travel, and the imposition of prolonged quarantines of large populations, and by businesses, including changes to operations and reducing staff. The effects of COVID-19 have contributed to increased volatility in global markets and will likely affect certain countries, companies, industries and market sectors more dramatically than others. The COVID-19 pandemic has had, and any other outbreak of an infectious disease or other serious public health concern could have, a significant negative impact on economic and market conditions and could trigger a prolonged period of global economic slowdown. To the extent the fund may overweight its investments in certain countries, companies, industries or market sectors, such positions will increase the fund’s exposure to risk of loss from adverse developments affecting those countries, companies, industries or sectors.
(f) Dividends and distributions to shareholders: Dividends and distributions are recorded on the ex-dividend date. Dividends from investment income-net and dividends from net realized capital gains, if any, are normally declared and paid annually, but the fund may make distributions on a more frequent basis to comply with the distribution requirements of the Internal Revenue Code of 1986, as amended (the “Code”). To the extent that net realized capital gains can be offset by capital loss carryovers, it is the policy of the fund not to distribute such
35
NOTES TO FINANCIAL STATEMENTS (continued)
gains. Income and capital gain distributions are determined in accordance with income tax regulations, which may differ from GAAP.
(g) Federal income taxes: It is the policy of the fund to continue to qualify as a regulated investment company, if such qualification is in the best interests of its shareholders, by complying with the applicable provisions of the Code, and to make distributions of taxable income and net realized capital gain sufficient to relieve it from substantially all federal income and excise taxes.
As of and during the period ended December 31, 2021, the fund did not have any liabilities for any uncertain tax positions. The fund recognizes interest and penalties, if any, related to uncertain tax positions as income tax expense in the Statement of Operations. During the period ended December 31, 2021, the fund did not incur any interest or penalties.
Each tax year in the four-year period ended December 31, 2021 remains subject to examination by the Internal Revenue Service and state taxing authorities.
At December 31, 2021, the components of accumulated earnings on a tax basis were as follows: undistributed ordinary income $13,582,198, undistributed capital gains $62,606,989 and unrealized appreciation $260,067,465.
The tax character of distributions paid to shareholders during the fiscal periods ended December 31, 2021 and December 31, 2020 were as follows: ordinary income $6,792,687 and $6,973,992, and long-term capital gains $7,904,043 and $27,342,245, respectively.
NOTE 2—Bank Lines of Credit:
The fund participates with other long-term open-end funds managed by the Adviser in a $823.5 million unsecured credit facility led by Citibank, N.A. (the “Citibank Credit Facility”) and a $300 million unsecured credit facility provided by The Bank of New York Mellon (the “BNYM Credit Facility”), each to be utilized primarily for temporary or emergency purposes, including the financing of redemptions (each, a “Facility”). The Citibank Credit Facility is available in two tranches: (i) Tranche A is in an amount equal to $688.5 million and is available to all long-term open-ended funds, including the fund, and (ii) Tranche B is an amount equal to $135 million and is available only to BNY Mellon Floating Rate Income Fund, a series of BNY Mellon Investment Funds IV, Inc. In connection therewith, the fund has agreed to pay its pro rata portion of commitment fees for Tranche A of the Citibank Credit Facility and the BNYM Credit
36
Facility. Interest is charged to the fund based on rates determined pursuant to the terms of the respective Facility at the time of borrowing.
The average amount of borrowings outstanding under the Facilities during the period ended December 31, 2021 was approximately $286,027 with a related weighted average annualized rate of 1.14%.
NOTE 3—Management Fee and Other Transactions with Affiliates:
(a) Pursuant to a management agreement (the “Agreement”) with the Adviser, the management fee is computed at the annual rate of .35% of the value of the fund’s average daily net assets and is payable monthly. Under the terms of the Agreement, the Adviser has agreed to pay all of the fund’s direct expenses, except management fees, Rule 12b-1 Distribution Plan fees, taxes, interest expense, brokerage commissions, commitment fees on borrowings, fees and expenses of non-interested Trustees (including counsel fees), and extraordinary expenses. The Adviser has also agreed to reduce its management fee in an amount equal to the fund’s allocable portion of the accrued fees and expenses of the non-interested Trustees (including counsel fees). During the period ended December 31, 2021, fees reimbursed by the Adviser amounted to $45,240.
(b) Under the Distribution Plan adopted pursuant to Rule 12b-1 under the Act, the fund pays the Distributor for distributing its shares, for servicing and/or maintaining shareholder accounts and for advertising and marketing. The Distribution Plan provides for payments to be made at an annual rate of .25% of the value of the fund’s average daily net assets. The Distributor may make payments to Participating Insurance Companies and to brokers and dealers acting as principal underwriter for their variable insurance products. The fees payable under the Distribution Plan are payable without regard to actual expenses incurred. During the period ended December 31, 2021, the fund was charged $1,785,963 pursuant to the Distribution Plan.
The components of “Due to BNY Mellon Investment Adviser, Inc. and affiliates” in the Statement of Assets and Liabilities consist of: management fees of $211,855 and Distribution Plan fees of $151,325, which are offset against an expense reimbursement currently in effect in the amount of $2,790.
(c) Each Board member also serves as a Board member of other funds in the BNY Mellon Family of Funds complex. Annual retainer fees and attendance fees are allocated to each fund based on net assets.
37
NOTES TO FINANCIAL STATEMENTS (continued)
NOTE 4—Securities Transactions:
The aggregate amount of purchases and sales of investment securities, excluding short-term securities and futures, during the period ended December 31, 2021, amounted to $321,820,960 and $326,017,148, respectively.
Derivatives: A derivative is a financial instrument whose performance is derived from the performance of another asset. Each type of derivative instrument that was held by the fund during the period ended December 31, 2021 is discussed below.
Futures: In the normal course of pursuing its investment objective, the fund is exposed to market risk, including equity price risk, as a result of changes in value of underlying financial instruments. The fund invests in futures in order to manage its exposure to or protect against changes in the market. A futures contract represents a commitment for the future purchase or a sale of an asset at a specified date. Upon entering into such contracts, these investments require initial margin deposits with a counterparty, which consist of cash or cash equivalents. The amount of these deposits is determined by the exchange or Board of Trade on which the contract is traded and is subject to change. Accordingly, variation margin payments are received or made to reflect daily unrealized gains or losses which are recorded in the Statement of Operations. When the contracts are closed, the fund recognizes a realized gain or loss which is reflected in the Statement of Operations. There is minimal counterparty credit risk to the fund with futures since they are exchange traded, and the exchange guarantees the futures against default. Futures open at December 31, 2021 are set forth in the Statement of Futures.
The following summarizes the average market value of derivatives outstanding during the period ended December 31, 2021:
| | | |
| | Average Market Value ($) |
Equity futures | | 3,470,999 |
At December 31, 2021, the cost of investments for federal income tax purposes was $475,317,051; accordingly, accumulated net unrealized appreciation on investments was $260,067,465, consisting of $304,197,766 gross unrealized appreciation and $44,130,301 gross unrealized depreciation.
38
REPORT OF INDEPENDENT REGISTERED PUBLIC ACCOUNTING FIRM
To the Shareholders and the Board of Trustees of Small Cap Stock Index Portfolio
Opinion on the Financial Statements
We have audited the accompanying statement of assets and liabilities of Small Cap Stock Index Portfolio (the “Fund”) (one of the funds constituting BNY Mellon Investment Portfolios), including the statements of investments, investments in affiliated issuers and futures, as of December 31, 2021, and the related statement of operations for the year then ended, the statements of changes in net assets for each of the two years in the period then ended, the financial highlights for each of the five years in the period then ended and the related notes (collectively referred to as the “financial statements”). In our opinion, the financial statements present fairly, in all material respects, the financial position of the Fund (one of the funds constituting BNY Mellon Investment Portfolios) at December 31, 2021, the results of its operations for the year then ended, the changes in its net assets for each of the two years in the period then ended and its financial highlights for each of the five years in the period then ended, in conformity with U.S. generally accepted accounting principles.
Basis for Opinion
These financial statements are the responsibility of the Fund’s management. Our responsibility is to express an opinion on the Fund’s financial statements based on our audits. We are a public accounting firm registered with the Public Company Accounting Oversight Board (United States) (“PCAOB”) and are required to be independent with respect to the Fund in accordance with the U.S. federal securities laws and the applicable rules and regulations of the Securities and Exchange Commission and the PCAOB.
We conducted our audits in accordance with the standards of the PCAOB. Those standards require that we plan and perform the audit to obtain reasonable assurance about whether the financial statements are free of material misstatement, whether due to error or fraud. The Fund is not required to have, nor were we engaged to perform, an audit of the Fund’s internal control over financial reporting. As part of our audits, we are required to obtain an understanding of internal control over financial reporting, but not for the purpose of expressing an opinion on the effectiveness of the Fund’s internal control over financial reporting. Accordingly, we express no such opinion.
Our audits included performing procedures to assess the risks of material misstatement of the financial statements, whether due to error or fraud, and performing procedures that respond to those risks. Such procedures included examining, on a test basis, evidence regarding the amounts and disclosures in the financial statements. Our procedures included confirmation of securities owned as of December 31, 2021, by correspondence with the custodian and others or by other appropriate auditing procedures where replies from others were not received. Our audits also included evaluating the accounting principles used and significant estimates made by management, as well as evaluating the overall presentation of the financial statements. We believe that our audits provide a reasonable basis for our opinion.

We have served as the auditor of one or more investment companies in the BNY Mellon Family of Funds since at least 1957, but we are unable to determine the specific year.
New York, New York
February 8, 2022
39
IMPORTANT TAX INFORMATION (Unaudited)
For federal tax purposes, the portfolio hereby reports 65.46% of the ordinary dividends paid during the fiscal year ended December 31, 2021 as qualifying for the corporate dividends received deduction. Shareholders will receive notification in early 2022 of the percentage applicable to the preparation of their 2021 income tax returns. Also, the fund hereby reports $.0617 per share as a short-term capital gain distribution and $.2475 per share as a long-term capital gain distribution paid on March 30, 2021.
40
INFORMATION ABOUT THE RENEWAL OF THE FUND’S MANAGEMENT AGREEMENT (Unaudited)
At a meeting of the fund’s Board of Trustees held on August 3-4, 2021, the Board considered the renewal of the fund’s Management Agreement pursuant to which the Adviser provides the fund with investment advisory and administrative services (the “Agreement”). The Board members, none of whom are “interested persons” (as defined in the Investment Company Act of 1940, as amended) of the fund, were assisted in their review by independent legal counsel and met with counsel in executive session separate from representatives of the Adviser. In considering the renewal of the Agreement, the Board considered several factors that it believed to be relevant, including those discussed below. The Board did not identify any one factor as dispositive, and each Board member may have attributed different weights to the factors considered.
Analysis of Nature, Extent, and Quality of Services Provided to the Fund. The Board considered information provided to it at the meeting and in previous presentations from representatives of the Adviser regarding the nature, extent, and quality of the services provided to funds in the BNY Mellon fund complex, including the fund. The Adviser provided the number of open accounts in the fund, the fund’s asset size and the allocation of fund assets among distribution channels. The Adviser also had previously provided information regarding the diverse intermediary relationships and distribution channels of funds in the BNY Mellon fund complex (such as retail direct or intermediary, in which intermediaries typically are paid by the fund and/or the Adviser) and the Adviser’s corresponding need for broad, deep, and diverse resources to be able to provide ongoing shareholder services to each intermediary or distribution channel, as applicable to the fund.
The Board also considered research support available to, and portfolio management capabilities of, the fund’s portfolio management personnel and that the Adviser also provides oversight of day-to-day fund operations, including fund accounting and administration and assistance in meeting legal and regulatory requirements. The Board also considered the Adviser’s extensive administrative, accounting and compliance infrastructures.
Comparative Analysis of the Fund’s Performance and Management Fee and Expense Ratio. The Board reviewed reports prepared by Broadridge Financial Solutions, Inc. (“Broadridge”), an independent provider of investment company data based on classifications provided by Thomson Reuters Lipper, which included information comparing (1) the performance of the fund’s Service shares with the performance of a group of small-cap core pure index funds underlying variable insurance products (“VIPs”) benchmarked against the S&P Small Cap Index selected by Broadridge as comparable to the fund (the “Performance Group”) and with a broader group of funds consisting of all small-cap core funds underlying VIPs (the “Performance Universe”), all for various periods ended June 30, 2021, and (2) the fund’s actual and contractual management fees and total expenses with those of the same group of funds in the Performance Group (the “Expense Group”) and with a broader group of all other small-cap core funds underlying VIPs with similar 12b-1/non-12b-1 structures, excluding outliers (the “Expense Universe”), the information for which was derived in
41
INFORMATION ABOUT THE RENEWAL OF THE FUND’S MANAGEMENT AGREEMENT (Unaudited) (continued)
part from fund financial statements available to Broadridge as of the date of its analysis. The Adviser previously had furnished the Board with a description of the methodology Broadridge used to select the Performance Group and Performance Universe and the Expense Group and Expense Universe.
Performance Comparisons. Representatives of the Adviser stated that the usefulness of performance comparisons may be affected by a number of factors, including different investment limitations and policies that may be applicable to the fund and comparison funds and the end date selected. The Board discussed with representatives of the Adviser the results of the comparisons and considered that the fund’s total return performance was below the Performance Group median for all periods and above the Performance Universe median for all periods, ranking in the first quartile for the ten-year period. It was noted that there were only three other funds in the Performance Group and that the fund ranked third out of the four funds in the one- and two-year periods. The Adviser also provided a comparison of the fund’s calendar year total returns to the returns of the fund’s benchmark index.
Management Fee and Expense Ratio Comparisons. The Board reviewed and considered the contractual management fee rate payable by the fund to the Adviser in light of the nature, extent and quality of the management services provided by the Adviser. In addition, the Board reviewed and considered the actual management fee rate paid by the fund over the fund’s last fiscal year. The Board also reviewed the range of actual and contractual management fees and total expenses as a percentage of average net assets of the Expense Group and Expense Universe funds and discussed the results of the comparisons. Taking into account the fund’s “unitary” fee structure, the Board considered that the fund’s contractual management fee was higher than the Expense Group median contractual management fee, the fund’s actual management fee was higher than the Expense Group median and slightly higher than the Expense Universe median actual management fee and the total expenses were higher than the Expense Group median and lower than the Expense Universe median total expenses.
Representatives of the Adviser reviewed with the Board the management or investment advisory fees paid by funds advised or administered by the Adviser that are in the same Lipper category as the fund (the “Similar Funds”), and explained the nature of the Similar Funds. They discussed differences in fees paid and the relationship of the fees paid in light of any differences in the services provided and other relevant factors, noting the fund’s “unitary” fee structure. The Board considered the relevance of the fee information provided for the Similar Funds to evaluate the appropriateness of the fund’s management fee. Representatives of the Adviser noted that there were no separate accounts and/or other types of client portfolios advised by the Adviser that are considered to have similar investment strategies and policies as the fund.
Analysis of Profitability and Economies of Scale. Representatives of the Adviser reviewed the expenses allocated and profit received by the Adviser and its affiliates and the resulting profitability percentage for managing the fund and the aggregate profitability percentage to the Adviser and its affiliates for managing the funds in the BNY Mellon fund complex, and the method used to determine the expenses and profit.
42
The Board concluded that the profitability results were not excessive, given the services rendered and service levels provided by the Adviser and its affiliates. The Board also had been provided with information prepared by an independent consulting firm regarding the Adviser’s approach to allocating costs to, and determining the profitability of, individual funds and the entire BNY Mellon fund complex. The consulting firm also had analyzed where any economies of scale might emerge in connection with the management of a fund.
The Board considered, on the advice of its counsel, the profitability analysis (1) as part of its evaluation of whether the fees under the Agreement, considered in relation to the mix of services provided by the Adviser, including the nature, extent and quality of such services, supported the renewal of the Agreement and (2) in light of the relevant circumstances for the fund and the extent to which economies of scale would be realized if the fund grows and whether fee levels reflect these economies of scale for the benefit of fund shareholders. Representatives of the Adviser also stated that, as a result of shared and allocated costs among funds in the BNY Mellon fund complex, the extent of economies of scale could depend substantially on the level of assets in the complex as a whole, so that increases and decreases in complex-wide assets can affect potential economies of scale in a manner that is disproportionate to, or even in the opposite direction from, changes in the fund’s asset level. The Board also considered potential benefits to the Adviser from acting as investment adviser and took into consideration that there were no soft dollar arrangements in effect for trading the fund’s investments.
At the conclusion of these discussions, the Board agreed that it had been furnished with sufficient information to make an informed business decision with respect to the renewal of the Agreement. Based on the discussions and considerations as described above, the Board concluded and determined as follows.
· The Board concluded that the nature, extent and quality of the services provided by the Adviser are adequate and appropriate.
· The Board generally was satisfied with the fund’s overall performance.
· The Board concluded that the fee paid to the Adviser continued to be appropriate under the circumstances and in light of the factors and the totality of the services provided as discussed above.
· The Board determined that the economies of scale which may accrue to the Adviser and its affiliates in connection with the management of the fund had been adequately considered by the Adviser in connection with the fee rate charged to the fund pursuant to the Agreement and that, to the extent in the future it were determined that material economies of scale had not been shared with the fund, the Board would seek to have those economies of scale shared with the fund.
In evaluating the Agreement, the Board considered these conclusions and determinations and also relied on its previous knowledge, gained through meetings and other interactions with the Adviser and its affiliates, of the Adviser and the services provided to the fund by the Adviser. The Board also relied on information received on a
43
INFORMATION ABOUT THE RENEWAL OF THE FUND’S MANAGEMENT AGREEMENT (Unaudited) (continued)
routine and regular basis throughout the year relating to the operations of the fund and the investment management and other services provided under the Agreement, including information on the investment performance of the fund in comparison to similar mutual funds and benchmark performance indices; general market outlook as applicable to the fund; and compliance reports. In addition, the Board’s consideration of the contractual fee arrangements for the fund had the benefit of a number of years of reviews of the Agreement for the fund, or substantially similar agreements for other BNY Mellon funds that the Board oversees, during which lengthy discussions took place between the Board and representatives of the Adviser. Certain aspects of the arrangements may receive greater scrutiny in some years than in others, and the Board’s conclusions may be based, in part, on their consideration of the fund’s arrangements, or substantially similar arrangements for other BNY Mellon funds that the Board oversees, in prior years. The Board determined to renew the Agreement.
44
BOARD MEMBERS INFORMATION (Unaudited)
Independent Board Members
Joseph S. DiMartino (78)
Chairman of the Board (1995)
Principal Occupation During Past 5 Years:
· Director or Trustee of funds in the BNY Mellon Family of Funds and certain other entities (as described in the fund’s Statement of Additional Information) (1995-Present)
Other Public Company Board Memberships During Past 5 Years:
· CBIZ, Inc., a public company providing professional business services, products and solutions, Director (1997-Present)
No. of Portfolios for which Board Member Serves: 96
———————
Francine J. Bovich (70)
Board Member (2015)
Principal Occupation During Past 5 Years:
· The Bradley Trusts, private trust funds, Trustee (2011-Present)
Other Public Company Board Memberships During Past 5 Years:
· Annaly Capital Management, Inc., a real estate investment trust, Director (2014-Present)
No. of Portfolios for which Board Member Serves: 54
———————
J. Charles Cardona (66)
Board Member (2014)
Principal Occupation During Past 5 Years:
· President and Director of the Adviser (2008-2016)
· Chief Executive Officer of Dreyfus Cash Investment Strategies, a division of the Adviser (2009-2016)
· Chairman of the Distributor (2013–2016)
Other Public Company Board Memberships During Past 5 Years:
· BNY Mellon ETF Trust, Chairman and Trustee (2020-Present)
· BNY Mellon Liquidity Funds, Director (2004-Present) and Chairman (2019-2021)
No. of Portfolios for which Board Member Serves: 35
———————
45
BOARD MEMBERS INFORMATION (Unaudited) (continued)
Andrew J. Donohue (71)
Board Member (2019)
Principal Occupation During Past 5 Years:
· Attorney, Solo Law Practice (2019-Present)
· Shearman & Sterling LLP, a law firm, Of Counsel (2017-2019)
· Chief of Staff to the Chair of the SEC (2015-2017)
Other Public Company Board Memberships During Past 5 Years:
· Oppenheimer Funds (58 funds), Director (2017-2019)
No. of Portfolios for which Board Member Serves: 44
———————
Isabel P. Dunst (74)
Board Member (2014)
Principal Occupation During Past 5 Years:
· Hogan Lovells LLP, a law firm, Retired (2019-Present); Senior Counsel (2018-2019); Of Counsel (2015-2018); Partner (1990-2014)
· Hebrew Union College Jewish Institute of Religion, Member of the Board of Governors (2015-Present)
· Bend the ARC, a civil rights organization, Board Member (2016-Present)
No. of Portfolios for which Board Member Serves: 22
———————
Nathan Leventhal (78)
Board Member (2009)
Principal Occupation During Past 5 Years:
· Lincoln Center for the Performing Arts, President Emeritus (2001-Present)
· Palm Beach Opera, President (2016-Present)
Other Public Company Board Memberships During Past 5 Years:
· Movado Group, Inc., a public company that designs, sources, markets and distributes watches Director (2003-2020)
No. of Portfolios for which Board Member Serves: 32
———————
46
Robin A. Melvin (58)
Board Member (2014)
Principal Occupation During Past 5 Years:
· Westover School, a private girls' boarding school in Middlebury, Connecticut, Trustee (2019-Present)
· Mentor Illinois, a non-profit organization dedicated to increasing the quality of mentoring services in Illinois, Co-Chair (2014-2020); Board Member, Mentor Illinois (2013-2020)
· JDRF, a non-profit juvenile diabetes research foundation, Board Member (June 2021-Present)
Other Public Company Board Memberships During Past 5 Years:
· HPS Corporate Lending Fund, a closed-end management investment company regulated as a business development company, Trustee (August 2021-Present)
No. of Portfolios for which Board Member Serves: 74
———————
Roslyn M. Watson (72)
Board Member (2014)
Principal Occupation During Past 5 Years:
· Watson Ventures, Inc., a real estate investment company. Principal (1993-Present)
Other Public Company Board Memberships During Past 5 Years:
· American Express Bank, FSB, Director (1993-2018)
No. of Portfolios for which Board Member Serves: 44
———————
Benaree Pratt Wiley (75)
Board Member (2009)
Principal Occupation During Past 5 Years:
· The Wiley Group, a firm specializing in strategy and business development, Principal (2005-Present)
Other Public Company Board Memberships During Past 5 Years:
· CBIZ, Inc., a public company providing professional business services, products and solutions, Director (2008-Present)
· Blue Cross Blue Shield of Massachusetts, Director (2004-2020)
No. of Portfolios for which Board Member Serves: 62
———————
47
BOARD MEMBERS INFORMATION (Unaudited) (continued)
Tamara Belinfanti (46)
Advisory Board Member (2021)
Principal Occupation During Past 5 Years:
· New York Law School, Lester Martin Professor of Law (2009-Present)
No. of Portfolios for which Advisory Board Member Serves: 22
———————
Gordon J. Davis (80)
Advisory Board Member (2021)
Principal Occupation During Past 5 Years:
· Venable LLP, a law firm Partner (2012-Present)
No. of Portfolios for which Advisory Board Member Serves: 40
———————
The address of the Board Members and Officers is c/o BNY Mellon Investment Adviser, Inc. 240 Greenwich Street, New York, New York 10286. Additional information about the Board Members is available in the fund’s Statement of Additional Information which can be obtained from the Adviser free of charge by calling this toll free number: 1-800-373-9387.
Clifford L. Alexander, Jr., Emeritus Board Member
Whitney I. Gerard, Emeritus Board Member
George L. Perry, Emeritus Board Member
48
OFFICERS OF THE FUND (Unaudited)
DAVID DIPETRILLO, President since January 2021.
Vice President and Director of the Adviser since February 2021; Head of North America Product, BNY Mellon Investment Management since January 2018; Director of Product Strategy, BNY Mellon Investment Management from January 2016 to December 2017. He is an officer of 56 investment companies (comprised of 109 portfolios) managed by the Adviser or an affiliate of the Adviser. He is 43 years old and has been an employee of BNY Mellon since 2005.
JAMES WINDELS, Treasurer since November 2001.
Vice President of the Adviser since September 2020; Director–BNY Mellon Fund Administration, and an officer of 57 investment companies (comprised of 130 portfolios) managed by the Adviser or an affiliate of the Adviser. He is 63 years old and has been an employee of the Adviser since April 1985.
PETER M. SULLIVAN, Chief Legal Officer since July 2021 and Vice President and Assistant Secretary since March 2019.
Chief Legal Officer of the Adviser and Associate General Counsel of BNY Mellon since July 2021; Senior Managing Counsel of BNY Mellon from December 2020 to July 2021; Managing Counsel of BNY Mellon from March 2009 to December 2020, and an officer of 57 investment companies (comprised of 130 portfolios) managed by the Adviser or an affiliate of the Adviser. He is 53 years old and has been an employee of BNY Mellon since April 2004.
JAMES BITETTO, Vice President since August 2005 and Secretary since February 2018.
Senior Managing Counsel of BNY Mellon since December 2019; Managing Counsel of BNY Mellon from April 2014 to December 2019; Secretary of the Adviser, and an officer of 57 investment companies (comprised of 130 portfolios) managed by the Adviser or an affiliate of the Adviser. He is 55 years old and has been an employee of the Adviser since December 1996.
DEIRDRE CUNNANE, Vice President and Assistant Secretary since March 2019.
Managing Counsel of BNY Mellon since December 2021, Counsel of BNY Mellon from August 2018 to December 2021; and Senior Regulatory Specialist at BNY Mellon Investment Management Services from February 2016 to August 2018. She is an officer of 57 investment companies (comprised of 130 portfolios) managed by the Adviser or an affiliate of the Adviser. She is 31 years old and has been an employee of the Adviser since August 2018.
SARAH S. KELLEHER, Vice President and Assistant Secretary since April 2014.
Vice President of BNY Mellon ETF Investment Adviser; LLC since February 2020; Senior Managing Counsel of BNY Mellon since September 2021; Managing Counsel of BNY Mellon from December 2017 to September 2021; and Senior Counsel of BNY Mellon from March 2013 to December 2017. She is an officer of 57 investment companies (comprised of 130 portfolios) managed by the Adviser or an affiliate of the Adviser. She is 46 years old and has been an employee of the Adviser since March 2013.
JEFF PRUSNOFSKY, Vice President and Assistant Secretary since August 2005.
Senior Managing Counsel of BNY Mellon, and an officer of 57 investment companies (comprised of 130 portfolios) managed by the Adviser or an affiliate of the Adviser. He is 56 years old and has been an employee of the Adviser since October 1990.
AMANDA QUINN, Vice President and Assistant Secretary since March 2020.
Counsel of BNY Mellon since June 2019; Regulatory Administration Manager at BNY Mellon Investment Management Services from September 2018 to May 2019; and Senior Regulatory Specialist at BNY Mellon Investment Management Services from April 2015 to August 2018. She is an officer of 57 investment companies (comprised of 130 portfolios) managed by the Adviser or an affiliate of the Adviser. She is 36 years old and has been an employee of the Adviser since June 2019.
49
OFFICERS OF THE FUND (Unaudited) (continued)
NATALYA ZELENSKY, Vice President and Assistant Secretary since March 2017.
Chief Compliance Officer since August 2021 and Vice President since February 2020 of BNY Mellon ETF Investment Adviser, LLC; Chief Compliance Officer since August 2021 and Vice President and Assistant Secretary since February 2020 of BNY Mellon ETF Trust; Managing Counsel of BNY Mellon from December 2019 to August 2021; Counsel of BNY Mellon from May 2016 to December 2019; Assistant Secretary of the Adviser from April 2018 to August 2021. She is an officer of 56 investment companies (comprised of 129 portfolios) managed by the Adviser or an affiliate of the Adviser. She is 36 years old and has been an employee of BNY Mellon since May 2016.
GAVIN C. REILLY, Assistant Treasurer since December 2005.
Tax Manager–BNY Mellon Fund Administration, and an officer of 57 investment companies (comprised of 130 portfolios) managed by the Adviser or an affiliate of the Adviser. He is 53 years old and has been an employee of the Adviser since April 1991.
ROBERT SALVIOLO, Assistant Treasurer since July 2007.
Senior Accounting Manager–BNY Mellon Fund Administration, and an officer of 57 investment companies (comprised of 130 portfolios) managed by the Adviser or an affiliate of the Adviser. He is 54 years old and has been an employee of the Adviser since June 1989.
ROBERT SVAGNA, Assistant Treasurer since December 2002.
Senior Accounting Manager–BNY Mellon Fund Administration, and an officer of 57 investment companies (comprised of 130 portfolios) managed by the Adviser or an affiliate of the Adviser. He is 54 years old and has been an employee of the Adviser since November 1990.
JOSEPH W. CONNOLLY, Chief Compliance Officer since October 2004.
Chief Compliance Officer of the BNY Mellon Family of Funds and BNY Mellon Funds Trust since 2004; Chief Compliance Officer of the Adviser from 2004 until June 2021. He is an officer of 56 investment companies (comprised of 117 portfolios) managed by the Adviser. He is 64 years old.
CARIDAD M. CAROSELLA, Anti-Money Laundering Compliance Officer since January 2016.
Anti-Money Laundering Compliance Officer of the BNY Mellon Family of Funds and BNY Mellon Funds Trust. She is an officer of 49 investment companies (comprised of 122 portfolios) managed by the Adviser or an affiliate of the Adviser. She is 53 years old and has been an employee of the Distributor since 1997.
50
This page intentionally left blank.
51
This page intentionally left blank.
52
This page intentionally left blank.
53
BNY Mellon Investment Portfolios, Small Cap Stock Index Portfolio
240 Greenwich Street
New York, NY 10286
Adviser
BNY Mellon Investment Adviser, Inc.
240 Greenwich Street
New York, NY 10286
Custodian
The Bank of New York Mellon
240 Greenwich Street
New York, NY 10286
Transfer Agent &
Dividend Disbursing Agent
BNY Mellon Transfer, Inc.
240 Greenwich Street
New York, NY 10286
Distributor
BNY Mellon Securities Corporation
240 Greenwich Street
New York, NY 10286
Telephone 1-800-258-4260 or 1-800-258-4261
Mail The BNY Mellon Family of Funds, 144 Glenn Curtiss Boulevard, Uniondale, NY 11556-0144 Attn: Institutional Services Department
E-mail Send your request to info@bnymellon.com
Internet Information can be viewed online or downloaded at www.im.bnymellon.com
The fund files its complete schedule of portfolio holdings with the Securities and Exchange Commission (“SEC”) for the first and third quarters of each fiscal year on Form N-PORT. The fund’s Forms N-PORT are available on the SEC’s website at www.sec.gov.
A description of the policies and procedures that the fund uses to determine how to vote proxies relating to portfolio securities and information regarding how the fund voted these proxies for the most recent 12-month period ended June 30 is available at www.im.bnymellon.com and on the SEC’s website at www.sec.gov and without charge, upon request, by calling 1-800-373-9387.
| | |
© 2022 BNY Mellon Securities Corporation
0410AR1221 | 
|
BNY Mellon Investment Portfolios, Technology Growth Portfolio
| |
ANNUAL REPORT December 31, 2021 |

| |
Save time. Save paper. View your next shareholder report online as soon as it’s available. Log into www.im.bnymellon.com and sign up for eCommunications. It’s simple and only takes a few minutes. |
| |
The views expressed in this report reflect those of the portfolio manager(s) only through the end of the period covered and do not necessarily represent the views of BNY Mellon Investment Adviser, Inc. or any other person in the BNY Mellon Investment Adviser, Inc. organization. Any such views are subject to change at any time based upon market or other conditions and BNY Mellon Investment Adviser, Inc. disclaims any responsibility to update such views. These views may not be relied on as investment advice and, because investment decisions for a fund in the BNY Mellon Family of Funds are based on numerous factors, may not be relied on as an indication of trading intent on behalf of any fund in the BNY Mellon Family of Funds. |
| |
Not FDIC-Insured • Not Bank-Guaranteed • May Lose Value |
Contents
THE FUND
FOR MORE INFORMATION
Back Cover
DISCUSSION OF FUND PERFORMANCE (Unaudited)
For the period from January 1, 2021 through December 31, 2021, as provided by portfolio managers Erik A. Swords and Justin Sumner, CFA of Newton Investment Management North America, LLC, sub-investment adviser
Market and Fund Performance Overview
For the 12-month period ended December 31, 2021, BNY Mellon Investment Portfolios, Technology Growth Portfolio’s (the “fund”) Initial shares produced a total return of 12.93%, and its Service shares produced a total return of 12.64%.1 The fund’s benchmarks, the NYSE® Technology Index (the “Index”) and the S&P 500® Index, produced total returns of 18.03% and 28.70%, respectively, over the same period.2,3
Technology stocks gained ground during the reporting period. The fund performed well but slightly lagged the Index, due largely to certain sector allocation decisions, a lack of exposure to cyclical technology companies and a few unfavorable stock selections.
The Fund’s Investment Approach
The fund seeks capital appreciation. To pursue its goal, the fund normally invests at least 80% of its net assets in the stocks of growth companies of any size that BNY Mellon Investment Adviser, Inc. believes to be leading producers or beneficiaries of technological innovation. Up to 25% of the fund’s assets may be invested in foreign securities.
In choosing stocks, the fund looks for technology companies with the potential for strong earnings or revenue growth rates, although some of the fund’s investments may currently be experiencing losses. The fund’s investment process centers on a multi-dimensional approach that looks for opportunities across emerging-growth, cyclical or stable-growth companies. The fund’s investment approach seeks companies that appear to have strong earnings momentum, positive earnings revisions, favorable growth, product, or market cycles and/or favorable valuations.
Stocks Weather COVID-19 Variants, Supply Bottlenecks, Inflation and Monetary Policy
Markets performed well during the reporting period, supported generally by strong corporate earnings. Early in the period, stocks benefited from the approval of multiple COVID-19 vaccines in November 2020, which brightened the global economic outlook and improved investor sentiment. Investors also factored the likelihood of additional stimulus and infrastructure spending into their calculations. Returns were also boosted by interest rates, which remained low.
With the end of the pandemic apparently in view early in 2021, government lockdowns were eased, and businesses that had been hard hit by the pandemic began to show signs of recovery. Businesses also became more confident and increased their capital spending. With continued economic rebound likely, investors began to shift away from growth-oriented stocks and into value-oriented stocks.
But with the emergence of the Delta variant of COVID-19 midway through 2021, questions about whether the economic recovery would stall weighed on the market. In addition, supply-chain bottlenecks hindered sales in some industries and created winners and losers. Supply-chain bottlenecks, combined with loose monetary policy and massive federal spending, caused inflation to rise during the reporting period. While the Federal Reserve (the “Fed”) initially called it “transitory,” it acknowledged late in the period that pricing pressures were more permanent. In response, the Fed announced that in addition to tapering its bond purchases late in 2021, it was likely to hike interest rate in 2022.
Growth stocks came into, and fell out of, favor at times. When concerns about the economy rose, the market favored growth stocks, but when positive news on the pandemic emerged, value and cyclical stocks came into favor. When expectations that the Fed would begin to tighten monetary policy rose, the performance of growth stocks lagged, and when the Omicron variant of the COVID-19 posed a threat to the economic recovery, growth stocks benefited, while cyclical stocks lagged.
While markets wavered at times as investors digested pandemic news, rising inflation and Fed policy, markets were supported by strong corporate earnings worldwide, especially in the U.S.
2
Sector Allocation and Stock Selection Drove Returns
The fund produced a positive return but lagged the Index. Certain allocation decisions detracted from performance, including an underweight in the communication services sector, an underweight position in the semiconductor industry and an overweight in the software industry. Another detractor was lack of exposure to more cyclical stocks in the Index, including Oracle, Cisco and IBM, which tend to fall short of our minimum requirements for growth. However, these companies benefited from a surge in enterprise spending. The fund’s positions in Roku, a maker of streaming technology, and Sea, a Singaporean consumer internet company, also detracted, as did holdings of PayPal Holdings and Block (formerly Square). A position in Uber Technologies also hindered relative performance. Certain selections in the software industry detracted as well, including Twilio, CrowdStrike Holdings and Zoom Video Communications.
On a more positive note, an underweight position in the consumer discretionary sector was advantageous because the sector includes many Chinese e-commerce companies, which have struggled lately. Also, our position in Tesla, which performed well, contributed positively. In addition, stock selections in the communication services sector were beneficial, including Alphabet (parent of Google), Meta Platforms (formerly Facebook), and Roblox, a gaming company. In the software industry, a position in Datadog, an artificial intelligence and data analysis company, was beneficial.
Valuations Have Improved
The secular growth themes remain intact, and we remain optimistic about the prospects for technology and growth-oriented companies. We are also anticipating that the pandemic will continue to wane and that the enterprise spending cycle will benefit the high-growth names that sold off over the past year. Although interest rates are likely to keep rising, we believe the market will digest this factor and that investors will soon return to a focus on fundamentals, which should benefit technology stocks. While valuations among growth and technology stocks have recently pulled back, we believe this has created attractive opportunities. The fund continues to position itself to capitalize on a secular shift that is producing digitization across all sectors of the economy.
January 18, 2022
1 Total return includes reinvestment of dividends and any capital gains paid. Past performance is no guarantee of future results. Share price and investment return fluctuate such that upon redemption, fund shares may be worth more or less than their original cost. The fund’s performance does not reflect the deduction of additional charges and expenses imposed in connection with investing in variable insurance contracts, which will reduce returns.
2 Source: Bloomberg L.P. — The NYSE® Technology Index is an equal-dollar-weighted index designed to objectively represent the technology sector by holding 35 of the leading U.S., technology-related companies. Investors cannot invest directly in any index.
3 Source: Lipper Inc. — The S&P 500® Index is widely regarded as the best single gauge of large-cap U.S. equities. The index includes 500 leading companies and captures approximately 80% coverage of available market capitalization. Investors cannot invest directly in any index.
Please note: the position in any security highlighted with italicized typeface was sold during the reporting period.
The technology sector has been among the most volatile sectors of the stock market. Technology companies involve greater risk because their revenue and/or earnings tend to be less predictable, and some companies may be experiencing significant losses.
Equities are subject generally to market, market sector, market liquidity, issuer and investment style risks, among other factors, to varying degrees, all of which are more fully described in the fund’s prospectus.
The fund is only available as a funding vehicle under variable life insurance policies or variable annuity contracts issued by insurance companies. Individuals may not purchase shares of the fund directly. A variable annuity is an insurance contract issued by an insurance company that enables investors to accumulate assets on a tax-deferred basis for retirement or other long-term goals. The investment objective and policies of BNY Mellon Investment Portfolios, Technology Growth Portfolio made available through insurance products may be similar to those of other funds managed or advised by BNY Mellon Investment Adviser, Inc. However, the investment results of the fund may be higher or lower than, and may not be comparable to, those of any other BNY Mellon fund.
Recent market risks include pandemic risks related to COVID-19. The effects of COVID-19 have contributed to increased volatility in global markets and will likely affect certain countries, companies, industries and market sectors more dramatically than others. To the extent the fund may overweight its investments in certain countries, companies, industries or market sectors, such positions will increase the fund’s exposure to risk of loss from adverse developments affecting those countries, companies, industries or sectors.
3
FUND PERFORMANCE (Unaudited)
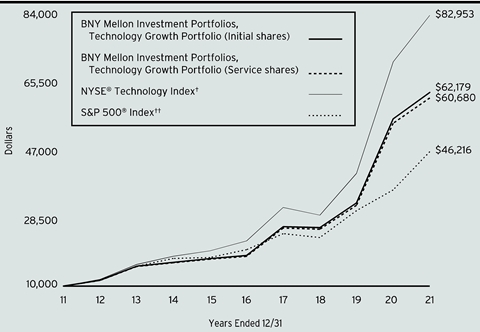
Comparison of change in value of a $10,000 investment in Initial shares and Service shares of BNY Mellon Investment Portfolios, Technology Growth Portfolio with a hypothetical investment of $10,000 in the NYSE® Technology Index and S&P 500® Index.
† Source: Bloomberg L.P.
†† Source: Lipper Inc.
Past performance is not predictive of future performance. The fund’s performance does not reflect the deduction of additional charges and expenses imposed in connection with investing in variable insurance contracts which will reduce returns.
The above graph compares a hypothetical investment of $10,000 made in each of the Initial shares and Service shares of BNY Mellon Investment Portfolios, Technology Growth Portfolio on 12/31/11 to a hypothetical investment of $10,000 made in the NYSE® Technology Index and S&P 500® Index on that date.
The fund’s performance shown in the line graph above takes into account all applicable fees and expenses. The NYSE® Technology Index is an equal-dollar weighted index designed to objectively represent the technology sector by holding 35 of the leading U.S. technology-related companies. The S&P 500® Index is widely regarded as the best single gauge of large-cap U.S. equities. The index includes 500 leading companies and captures approximately 80% coverage of available market capitalization. Unlike a mutual fund, the indices are not subject to charges, fees and other expenses. Investors cannot invest directly in any index. Further information relating to fund performance, including expense reimbursements, if applicable, is contained in the Financial Highlights section of the prospectus and elsewhere in this report.
4
| | | | |
Average Annual Total Returns as of 12/31/2021 |
| 1 Year | 5 Years | 10 Years |
Initial shares | 12.93% | 27.80% | 20.05% |
Service shares | 12.64% | 27.50% | 19.76% |
NYSE® Technology Index | 18.03% | 30.22% | 23.53% |
S&P 500® Index | 28.70% | 18.47% | 16.54% |
The performance data quoted represents past performance, which is no guarantee of future results. Share price and investment return fluctuate and an investor’s shares may be worth more or less than original cost upon redemption. Current performance may be lower or higher than the performance quoted. Go to www.im.bnymellon.com for the fund’s most recent month-end returns.
The fund’s Initial shares are not subject to a Rule 12b-1 fee. The fund’s Service shares are subject to a 0.25% annual Rule 12b-1 fee. All dividends and capital gain distributions are reinvested.
The fund’s performance shown in the graph and table does not reflect the deduction of taxes that a shareholder would pay on fund distributions or the redemption of fund shares.
5
UNDERSTANDING YOUR FUND’S EXPENSES (Unaudited)
As a mutual fund investor, you pay ongoing expenses, such as management fees and other expenses. Using the information below, you can estimate how these expenses affect your investment and compare them with the expenses of other funds. You also may pay one-time transaction expenses, including sales charges (loads), redemption fees and expenses associated with variable annuity or insurance contracts, which are not shown in this section and would have resulted in higher total expenses. For more information, see your fund’s prospectus or talk to your financial adviser.
Review your fund’s expenses
The table below shows the expenses you would have paid on a $1,000 investment in BNY Mellon Investment Portfolios, Technology Growth Portfolio from July 1, 2021 to December 31, 2021. It also shows how much a $1,000 investment would be worth at the close of the period, assuming actual returns and expenses.
| | | | | |
Expenses and Value of a $1,000 Investment | |
Assume actual returns for the six months ended December 31, 2021 | |
| | | | |
| | Initial Shares | Service Shares | |
Expenses paid per $1,000† | $3.95 | $5.22 | |
Ending value (after expenses) | $1,010.20 | $1,009.00 | |
COMPARING YOUR FUND’S EXPENSES
WITH THOSE OF OTHER FUNDS (Unaudited)
Using the SEC’s method to compare expenses
The Securities and Exchange Commission (“SEC”) has established guidelines to help investors assess fund expenses. Per these guidelines, the table below shows your fund’s expenses based on a $1,000 investment, assuming a hypothetical 5% annualized return. You can use this information to compare the ongoing expenses (but not transaction expenses or total cost) of investing in the fund with those of other funds. All mutual fund shareholder reports will provide this information to help you make this comparison. Please note that you cannot use this information to estimate your actual ending account balance and expenses paid during the period.
| | | | | |
Expenses and Value of a $1,000 Investment | |
Assuming a hypothetical 5% annualized return for the six months ended December 31, 2021 | |
| | | | |
| | Initial Shares | Service Shares | |
Expenses paid per $1,000† | $3.97 | $5.24 | |
Ending value (after expenses) | $1,021.27 | $1,020.01 | |
† | Expenses are equal to the fund’s annualized expense ratio of .78% for Initial Shares and 1.03% for Service Shares, multiplied by the average account value over the period, multiplied by 184/365 (to reflect the one-half year period). |
6
STATEMENT OF INVESTMENTS
December 31, 2021
| | | | | | | | |
| |
Description | | | | Shares | | Value ($) | |
Common Stocks - 96.4% | | | | | |
Application Software - 12.4% | | | | | |
Adobe | | | | 56,120 | a | 31,823,407 | |
Bill.com Holdings | | | | 55,760 | a | 13,892,604 | |
Datadog, Cl. A | | | | 118,530 | a | 21,111,378 | |
HubSpot | | | | 32,289 | a | 21,283,294 | |
salesforce.com | | | | 162,211 | a | 41,222,682 | |
Unity Software | | | | 69,719 | a | 9,969,120 | |
| | | | | 139,302,485 | |
Automobile Manufacturers - 4.3% | | | | | |
Tesla | | | | 45,254 | a | 47,823,522 | |
Communications Equipment - 1.8% | | | | | |
Nokia, ADR | | | | 3,223,930 | a | 20,052,845 | |
Data Processing & Outsourced Services - 2.6% | | | | | |
Block | | | | 122,503 | a | 19,785,460 | |
Visa, Cl. A | | | | 44,841 | b | 9,717,493 | |
| | | | | 29,502,953 | |
Holding Companies-Divers - 1.3% | | | | | |
Figure Acquisition | | | | 1,164,783 | a | 11,719,930 | |
Ribbit LEAP | | | | 311,027 | a | 3,091,608 | |
| | | | | 14,811,538 | |
Interactive Home Entertainment - 7.4% | | | | | |
Roblox, CI. A | | | | 468,983 | a | 48,380,286 | |
Sea, ADR | | | | 151,948 | a | 33,992,287 | |
| | | | | 82,372,573 | |
Interactive Media & Services - 9.8% | | | | | |
Alphabet, Cl. C | | | | 17,036 | a | 49,295,199 | |
Meta Platforms, Cl. A | | | | 100,211 | a | 33,705,970 | |
Snap, Cl. A | | | | 565,347 | a | 26,588,269 | |
| | | | | 109,589,438 | |
Internet & Direct Marketing Research - 8.6% | | | | | |
Amazon.com | | | | 10,693 | a | 35,654,098 | |
Coupang | | | | 194,685 | a,b | 5,719,845 | |
JD.com, ADR | | | | 451,490 | a | 31,635,904 | |
MercadoLibre | | | | 17,523 | a | 23,628,013 | |
| | | | | 96,637,860 | |
Internet Services & Infrastructure - 5.5% | | | | | |
Shopify, Cl. A | | | | 16,241 | a | 22,370,191 | |
Snowflake, Cl. A | | | | 69,556 | a | 23,562,095 | |
Twilio, Cl. A | | | | 60,202 | a | 15,853,595 | |
| | | | | 61,785,881 | |
Movies & Entertainment - .5% | | | | | |
Roku | | | | 22,753 | a | 5,192,235 | |
7
STATEMENT OF INVESTMENTS (continued)
| | | | | | | | |
| |
Description | | | | Shares | | Value ($) | |
Common Stocks - 96.4% (continued) | | | | | |
Semiconductor Equipment - 8.0% | | | | | |
Applied Materials | | | | 254,716 | | 40,082,110 | |
Lam Research | | | | 69,404 | | 49,911,887 | |
| | | | | 89,993,997 | |
Semiconductors - 21.5% | | | | | |
Diodes | | | | 63,977 | a | 7,025,314 | |
Marvell Technology | | | | 600,528 | | 52,540,195 | |
NVIDIA | | | | 281,409 | | 82,765,201 | |
Qualcomm | | | | 288,398 | | 52,739,342 | |
Taiwan Semiconductor Manufacturing, ADR | | | | 377,952 | | 45,471,405 | |
| | | | | 240,541,457 | |
Systems Software - 9.7% | | | | | |
CrowdStrike Holdings, CI. A | | | | 91,147 | a | 18,662,348 | |
Microsoft | | | | 129,939 | | 43,701,085 | |
ServiceNow | | | | 70,248 | a | 45,598,679 | |
| | | | | 107,962,112 | |
Technology Hardware, Storage & Equipment - 1.9% | | | | | |
Apple | | | | 116,622 | | 20,708,569 | |
Trucking - 1.1% | | | | | |
Uber Technologies | | | | 299,127 | a | 12,542,395 | |
Total Common Stocks (cost $622,689,235) | | | | 1,078,819,860 | |
| | | | | | | | |
Private Equity - .5% | | | | | |
Software - .5% | | | | | |
Databricks
(cost $5,258,231) | | | | 23,852 | c | 5,556,562 | |
| | | 1-Day
Yield (%) | | | | | |
Investment Companies - 3.2% | | | | | |
Registered Investment Companies - 3.2% | | | | | |
Dreyfus Institutional Preferred Government Plus Money Market Fund, Institutional Shares
(cost $35,847,292) | | 0.07 | | 35,847,292 | d | 35,847,292 | |
8
| | | | | | | | |
| |
Description | | 1-Day
Yield (%) | | Shares | | Value ($) | |
Investment of Cash Collateral for Securities Loaned - .0% | | | | | |
Registered Investment Companies - .0% | | | | | |
Dreyfus Institutional Preferred Government Plus Money Market Fund, SL Shares
(cost $362,002) | | 0.07 | | 362,002 | d | 362,002 | |
Total Investments (cost $664,156,760) | | 100.1% | | 1,120,585,716 | |
Liabilities, Less Cash and Receivables | | (.1%) | | (1,047,268) | |
Net Assets | | 100.0% | | 1,119,538,448 | |
ADR—American Depository Receipt
a Non-income producing security.
b Security, or portion thereof, on loan. At December 31, 2021, the value of the fund’s securities on loan was $9,971,781 and the value of the collateral was $10,227,383, consisting of cash collateral of $362,002 and U.S. Government & Agency securities valued at $9,865,381. In addition, the value of collateral may include pending sales that are also on loan.
c The fund held Level 3 securities at December 31, 2021. These securities were valued at $5,556,562 or ..5% of net assets.
d Investment in affiliated issuer. The investment objective of this investment company is publicly available and can be found within the investment company’s prospectus.
| | |
Portfolio Summary (Unaudited) † | Value (%) |
Information Technology | 63.5 |
Communication Services | 17.6 |
Consumer Discretionary | 12.9 |
Investment Companies | 3.2 |
Diversified | 1.3 |
Industrials | 1.1 |
Technology | .5 |
| | 100.1 |
† Based on net assets.
See notes to financial statements.
9
STATEMENT OF INVESTMENTS IN AFFILIATED ISSUERS
| | | | | | | |
Description | Value ($) 12/31/2020 | Purchases ($)† | Sales ($) | Value ($) 12/31/2021 | Dividends/
Distributions ($) | |
Registered Investment Companies - 3.2% | | |
Dreyfus Institutional Preferred Government Plus Money Market Fund, Institutional Shares - 3.2% | 12,877,205 | 184,906,161 | (161,936,074) | 35,847,292 | 13,063 | |
Investment of Cash Collateral for Securities Loaned - .0% | | |
Dreyfus Institutional Preferred Government Plus Money Market Fund, SL Shares - .0% | 14,820,447 | 58,163,815 | (72,622,260) | 362,002 | 61,580 | †† |
Total - 3.2% | 27,697,652 | 243,069,976 | (234,558,334) | 36,209,294 | 74,643 | |
† Includes reinvested dividends/distributions.
†† Represents securities lending income earned from the reinvestment of cash collateral from loaned securities, net of fees and collateral investment expenses, and other payments to and from borrowers of securities.
See notes to financial statements.
10
STATEMENT OF ASSETS AND LIABILITIES
December 31, 2021
| | | | | | | |
| | | | | | |
| | | Cost | | Value | |
Assets ($): | | | | |
Investments in securities—See Statement of Investments
(including securities on loan, valued at $9,971,781)—Note 1(c): | | | |
Unaffiliated issuers | 627,947,466 | | 1,084,376,422 | |
Affiliated issuers | | 36,209,294 | | 36,209,294 | |
Cash denominated in foreign currency | | | 53,100 | | 53,299 | |
Dividends and securities lending income receivable | | 255,338 | |
Receivable for shares of Beneficial Interest subscribed | | 132,851 | |
Prepaid expenses | | | | | 2,580 | |
| | | | | 1,121,029,784 | |
Liabilities ($): | | | | |
Due to BNY Mellon Investment Adviser, Inc. and affiliates—Note 3(b) | | 901,135 | |
Liability for securities on loan—Note 1(c) | | 362,002 | |
Payable for shares of Beneficial Interest redeemed | | 149,275 | |
Trustees’ fees and expenses payable | | 2,693 | |
Other accrued expenses | | | | | 76,231 | |
| | | | | 1,491,336 | |
Net Assets ($) | | | 1,119,538,448 | |
Composition of Net Assets ($): | | | | |
Paid-in capital | | | | | 581,367,175 | |
Total distributable earnings (loss) | | | | | 538,171,273 | |
Net Assets ($) | | | 1,119,538,448 | |
| | | | |
Net Asset Value Per Share | Initial Shares | Service Shares | |
Net Assets ($) | 266,078,128 | 853,460,320 | |
Shares Outstanding | 7,475,862 | 26,328,234 | |
Net Asset Value Per Share ($) | 35.59 | 32.42 | |
| | | |
See notes to financial statements. | | | |
11
STATEMENT OF OPERATIONS
Year Ended December 31, 2021
| | | | | | | |
| | | | | | |
| | | | | | |
Investment Income ($): | | | | |
Income: | | | | |
Cash dividends (net of $190,729 foreign taxes withheld at source): | |
Unaffiliated issuers | | | 3,058,648 | |
Affiliated issuers | | | 13,063 | |
Income from securities lending—Note 1(c) | | | 61,580 | |
Total Income | | | 3,133,291 | |
Expenses: | | | | |
Management fee—Note 3(a) | | | 8,049,678 | |
Distribution fees—Note 3(b) | | | 2,048,884 | |
Professional fees | | | 105,722 | |
Trustees’ fees and expenses—Note 3(c) | | | 84,610 | |
Custodian fees—Note 3(b) | | | 33,923 | |
Loan commitment fees—Note 2 | | | 24,721 | |
Prospectus and shareholders’ reports | | | 19,159 | |
Chief Compliance Officer fees—Note 3(b) | | | 14,276 | |
Shareholder servicing costs—Note 3(b) | | | 1,551 | |
Registration fees | | | 55 | |
Miscellaneous | | | 31,238 | |
Total Expenses | | | 10,413,817 | |
Investment (Loss)—Net | | | (7,280,526) | |
Realized and Unrealized Gain (Loss) on Investments—Note 4 ($): | | |
Net realized gain (loss) on investments and foreign currency transactions | 82,695,383 | |
Net change in unrealized appreciation (depreciation) on investments
and foreign currency transactions | 50,070,915 | |
Net Realized and Unrealized Gain (Loss) on Investments | | | 132,766,298 | |
Net Increase in Net Assets Resulting from Operations | | 125,485,772 | |
| | | | | | |
See notes to financial statements. | | | | | |
12
STATEMENT OF CHANGES IN NET ASSETS
| | | | | | | | | | |
| | | | Year Ended December 31, |
| | | | 2021 | | 2020 | |
Operations ($): | | | | | | | | |
Investment (loss)—net | | | (7,280,526) | | | | (2,153,677) | |
Net realized gain (loss) on investments | | 82,695,383 | | | | 144,422,804 | |
Net change in unrealized appreciation
(depreciation) on investments | | 50,070,915 | | | | 266,454,921 | |
Net Increase (Decrease) in Net Assets
Resulting from Operations | 125,485,772 | | | | 408,724,048 | |
Distributions ($): | |
Distributions to shareholders: | | | | | | | | |
Initial Shares | | | (32,359,709) | | | | (17,108,961) | |
Service Shares | | | (111,542,791) | | | | (60,123,345) | |
Total Distributions | | | (143,902,500) | | | | (77,232,306) | |
Beneficial Interest Transactions ($): | |
Net proceeds from shares sold: | | | | | | | | |
Initial Shares | | | 38,635,032 | | | | 25,487,190 | |
Service Shares | | | 69,994,785 | | | | 50,456,990 | |
Distributions reinvested: | | | | | | | | |
Initial Shares | | | 32,359,709 | | | | 17,108,961 | |
Service Shares | | | 111,542,791 | | | | 60,123,345 | |
Cost of shares redeemed: | | | | | | | | |
Initial Shares | | | (29,954,495) | | | | (34,411,906) | |
Service Shares | | | (48,205,685) | | | | (102,412,089) | |
Increase (Decrease) in Net Assets
from Beneficial Interest Transactions | 174,372,137 | | | | 16,352,491 | |
Total Increase (Decrease) in Net Assets | 155,955,409 | | | | 347,844,233 | |
Net Assets ($): | |
Beginning of Period | | | 963,583,039 | | | | 615,738,806 | |
End of Period | | | 1,119,538,448 | | | | 963,583,039 | |
Capital Share Transactions (Shares): | |
Initial Shares | | | | | | | | |
Shares sold | | | 1,082,297 | | | | 869,993 | |
Shares issued for distributions reinvested | | | 1,048,937 | | | | 900,946 | |
Shares redeemed | | | (852,079) | | | | (1,140,904) | |
Net Increase (Decrease) in Shares Outstanding | 1,279,155 | | | | 630,035 | |
Service Shares | | | | | | | | |
Shares sold | | | 2,177,251 | | | | 2,098,579 | |
Shares issued for distributions reinvested | | | 3,962,443 | | | | 3,416,099 | |
Shares redeemed | | | (1,499,462) | | | | (3,933,228) | |
Net Increase (Decrease) in Shares Outstanding | 4,640,232 | | | | 1,581,450 | |
| | | | | | | | | |
See notes to financial statements. | | | | | | | | |
13
FINANCIAL HIGHLIGHTS
The following tables describe the performance for each share class for the fiscal periods indicated. All information (except portfolio turnover rate) reflects financial results for a single fund share. Net asset value total return is calculated assuming an initial investment made at the net asset value at the beginning of the period, reinvestment of all dividends and distributions at net asset value during the period, and redemption at net asset value on the last day of the period. Net asset value total return includes adjustments in accordance with accounting principles generally accepted in the United States of America and as such, the net asset value for financial reporting purposes and the returns based upon those net asset values may differ from the net asset value and returns for shareholder transactions. The fund’s total returns do not reflect expenses associated with variable annuity or insurance contracts. These figures have been derived from the fund’s financial statements.
| | | | | | | | |
| | | |
| | Year Ended December 31, |
Initial Shares | | 2021 | 2020 | 2019 | 2018 | 2017 |
Per Share Data ($): | | | | | | |
Net asset value,
beginning of period | | 36.68 | 25.26 | 22.56 | 23.95 | 17.69 |
Investment Operations: | | | | | | |
Investment income (loss)—neta | | (.17) | (.03) | .08 | .04 | (.01) |
Net realized and unrealized gain
(loss) on investments | | 4.14 | 14.68 | 5.55 | (.11) | 7.29 |
Total from Investment Operations | | 3.97 | 14.65 | 5.63 | (.07) | 7.28 |
Distributions: | | | | | | |
Dividends from investment
income—net | | - | (.08) | - | - | - |
Dividends from net realized
gain on investments | | (5.06) | (3.15) | (2.93) | (1.32) | (1.02) |
Total Distributions | | (5.06) | (3.23) | (2.93) | (1.32) | (1.02) |
Net asset value, end of period | | 35.59 | 36.68 | 25.26 | 22.56 | 23.95 |
Total Return (%) | | 12.93 | 69.92 | 25.82 | (.98) | 42.64 |
Ratios/Supplemental Data (%): | | | | | | |
Ratio of total expenses
to average net assets | | .78 | .78 | .79 | .79 | .82 |
Ratio of net investment income
(loss) to average net assets | | (.49) | (.10) | .33 | .14 | (.05) |
Portfolio Turnover Rate | | 38.70 | 80.81 | 77.56 | 55.34 | 42.07 |
Net Assets, end of period ($ x 1,000) | | 266,078 | 227,325 | 140,591 | 119,470 | 122,670 |
a Based on average shares outstanding.
See notes to financial statements.
14
| | | | | | | | |
| | | |
| | Year Ended December 31, |
Service Shares | | 2021 | 2020 | 2019 | 2018 | 2017 |
Per Share Data ($): | | | | | | |
Net asset value, beginning of period | | 33.95 | 23.63 | 21.31 | 22.75 | 16.88 |
Investment Operations: | | | | | | |
Investment income (loss)—neta | | (.24) | (.09) | .02 | (.03) | (.06) |
Net realized and unrealized gain
(loss) on investments | | 3.77 | 13.58 | 5.23 | (.09) | 6.95 |
Total from Investment Operations | | 3.53 | 13.49 | 5.25 | (.12) | 6.89 |
Distributions: | | | | | | |
Dividends from investment
income—net | | - | (.02) | - | - | - |
Dividends from net realized
gain on investments | | (5.06) | (3.15) | (2.93) | (1.32) | (1.02) |
Total Distributions | | (5.06) | (3.17) | (2.93) | (1.32) | (1.02) |
Net asset value, end of period | | 32.42 | 33.95 | 23.63 | 21.31 | 22.75 |
Total Return (%) | | 12.64 | 69.57 | 25.51 | (1.27) | 42.36 |
Ratios/Supplemental Data (%): | | | | | | |
Ratio of total expenses
to average net assets | | 1.03 | 1.03 | 1.04 | 1.04 | 1.07 |
Ratio of net investment income (loss)
to average net assets | | (.74) | (.34) | .08 | (.11) | (.30) |
Portfolio Turnover Rate | | 38.70 | 80.81 | 77.56 | 55.34 | 42.07 |
Net Assets, end of period ($ x 1,000) | | 853,460 | 736,258 | 475,148 | 388,151 | 365,231 |
a Based on average shares outstanding.
See notes to financial statements.
15
NOTES TO FINANCIAL STATEMENTS
NOTE 1—Significant Accounting Policies:
Technology Growth Portfolio (the “fund”) is a separate diversified series of BNY Mellon Investment Portfolios (the “Trust”), which is registered under the Investment Company Act of 1940, as amended (the “Act”), as an open-end management investment company and operates as a series company currently offering three series, including the fund. The fund is only offered to separate accounts established by insurance companies to fund variable annuity contracts and variable life insurance policies. The fund’s investment objective is to seek capital appreciation. BNY Mellon Investment Adviser, Inc. (the “Adviser”), a wholly-owned subsidiary of The Bank of New York Mellon Corporation (“BNY Mellon”), serves as the fund’s investment adviser. Effective September 1, 2021 (the “Effective Date”), the Adviser has engaged its affiliate, Newton Investment Management North America, LLC (the “Sub-Adviser”) as the fund’s sub-investment adviser pursuant to a sub-investment advisory agreement between the Adviser and the Sub-Adviser. As the fund’s sub-investment adviser, the Sub-Adviser provides the day-to-day management of the fund’s investments, subject to the Adviser’s supervision and approval. The Adviser (and not the fund) pays the Sub-Adviser for its sub-advisory services. As of the Effective Date, portfolio managers responsible for managing the fund’s investments who were employees of Mellon Investments Corporation (“Mellon”) in a dual employment arrangement with the Adviser, have become employees of the Sub-Adviser, and are no longer employees of Mellon.
BNY Mellon Securities Corporation (the “Distributor”), a wholly-owned subsidiary of the Adviser, is the distributor of the fund’s shares, which are sold without a sales charge. The fund is authorized to issue an unlimited number of $.001 par value shares of Beneficial Interest in each of the following classes of shares: Initial and Service. Each class of shares has identical rights and privileges, except with respect to the Distribution Plan, and the expenses borne by each class, the allocation of certain transfer agency costs, and certain voting rights. Income, expenses (other than expenses attributable to a specific class), and realized and unrealized gains or losses on investments are allocated to each class of shares based on its relative net assets.
The Trust accounts separately for the assets, liabilities and operations of each series. Expenses directly attributable to each series are charged to that series’ operations; expenses which are applicable to all series are allocated among them on a pro rata basis.
16
The Financial Accounting Standards Board (“FASB”) Accounting Standards Codification (“ASC”) is the exclusive reference of authoritative U.S. generally accepted accounting principles (“GAAP”) recognized by the FASB to be applied by nongovernmental entities. Rules and interpretive releases of the SEC under authority of federal laws are also sources of authoritative GAAP for SEC registrants. The fund is an investment company and applies the accounting and reporting guidance of the FASB ASC Topic 946 Financial Services-Investment Companies. The fund’s financial statements are prepared in accordance with GAAP, which may require the use of management estimates and assumptions. Actual results could differ from those estimates.
The Trust enters into contracts that contain a variety of indemnifications. The fund’s maximum exposure under these arrangements is unknown. The fund does not anticipate recognizing any loss related to these arrangements.
(a) Portfolio valuation: The fair value of a financial instrument is the amount that would be received to sell an asset or paid to transfer a liability in an orderly transaction between market participants at the measurement date (i.e., the exit price). GAAP establishes a fair value hierarchy that prioritizes the inputs of valuation techniques used to measure fair value. This hierarchy gives the highest priority to unadjusted quoted prices in active markets for identical assets or liabilities (Level 1 measurements) and the lowest priority to unobservable inputs (Level 3 measurements).
Additionally, GAAP provides guidance on determining whether the volume and activity in a market has decreased significantly and whether such a decrease in activity results in transactions that are not orderly. GAAP requires enhanced disclosures around valuation inputs and techniques used during annual and interim periods.
Various inputs are used in determining the value of the fund’s investments relating to fair value measurements. These inputs are summarized in the three broad levels listed below:
Level 1—unadjusted quoted prices in active markets for identical investments.
Level 2—other significant observable inputs (including quoted prices for similar investments, interest rates, prepayment speeds, credit risk, etc.).
Level 3—significant unobservable inputs (including the fund’s own assumptions in determining the fair value of investments).
17
NOTES TO FINANCIAL STATEMENTS (continued)
The inputs or methodology used for valuing securities are not necessarily an indication of the risk associated with investing in those securities.
Changes in valuation techniques may result in transfers in or out of an assigned level within the disclosure hierarchy. Valuation techniques used to value the fund’s investments are as follows:
Investments in equity securities are valued at the last sales price on the securities exchange or national securities market on which such securities are primarily traded. Securities listed on the National Market System for which market quotations are available are valued at the official closing price or, if there is no official closing price that day, at the last sales price. For open short positions, asked prices are used for valuation purposes. Bid price is used when no asked price is available. Registered investment companies that are not traded on an exchange are valued at their net asset value. All of the preceding securities are generally categorized within Level 1 of the fair value hierarchy.
Securities not listed on an exchange or the national securities market, or securities for which there were no transactions, are valued at the average of the most recent bid and asked prices. These securities are generally categorized within Level 2 of the fair value hierarchy.
Fair valuing of securities may be determined with the assistance of a pricing service using calculations based on indices of domestic securities and other appropriate indicators, such as prices of relevant ADRs and futures. Utilizing these techniques may result in transfers between Level 1 and Level 2 of the fair value hierarchy.
When market quotations or official closing prices are not readily available, or are determined not to accurately reflect fair value, such as when the value of a security has been significantly affected by events after the close of the exchange or market on which the security is principally traded (for example, a foreign exchange or market), but before the fund calculates its net asset value, the fund may value these investments at fair value as determined in accordance with the procedures approved by the Trust’s Board of Trustees (the “Board”). Certain factors may be considered when fair valuing investments such as: fundamental analytical data, the nature and duration of restrictions on disposition, an evaluation of the forces that influence the market in which the securities are purchased and sold, and public trading in similar securities of the issuer or comparable issuers. These securities are either categorized within Level 2 or 3 of the fair value hierarchy depending on the relevant inputs used.
18
For securities where observable inputs are limited, assumptions about market activity and risk are used and such securities are generally categorized within Level 3 of the fair value hierarchy.
Investment in private equity securities will be fair valued by the Board in accordance with valuation procedures approved by the Board. Those portfolio valuations will be based on unobservable inputs and certain assumptions about how market participants would price the instrument. The fund expects that inputs into the determination of fair value of those investments will require significant management judgment or estimation. Because valuations may fluctuate over short periods of time and may be based on estimates, fair value determinations may differ materially from the value received in an actual transaction. Additionally, valuations of private companies are inherently uncertain. The fund’s net asset value could be adversely affected if the fund���s determinations regarding the fair value of those investments were materially higher or lower than the values that it ultimately realized upon the disposal of such investments. These securities are categorized within level 3 of the fair value hierarchy.
Investments denominated in foreign currencies are translated to U.S. dollars at the prevailing rates of exchange.
The following is a summary of the inputs used as of December 31, 2021 in valuing the fund’s investments:
| | | | | | | |
| | Level 1-Unadjusted Quoted Prices | Level 2- Other Significant Observable Inputs | | Level 3-Significant Unobservable Inputs | Total | |
Assets ($) | | |
Investments In Securities:† | | |
Equity Securities - Common Stocks | 1,078,819,860 | - | | - | 1,078,819,860 | |
Equity Securities - Private Equity | - | - | | 5,556,562 | 5,556,562 | |
Investment Companies | 36,209,294 | - | | - | 36,209,294 | |
† See Statement of Investments for additional detailed categorizations, if any.
19
NOTES TO FINANCIAL STATEMENTS (continued)
The following is a reconciliation of Level 3 assets for which significant unobservable inputs were used to determine fair value:
| | |
| | Equity Securities-Private Equity ($) |
Balance as of 12/31/2020 | - |
Realized gain (loss) | - |
Change in unrealized appreciation (depreciation) | 298,331 |
Purchases/Issuances | 5,258,231 |
Sales/Dispositions | - |
Transfers into Level 3 | - |
Transfers out of Level 3 | - |
Balances as of 12/31/2021† | 5,556,562 |
The amount of total realized gains (losses) for the period included in earnings attributable to the change in unrealized appreciation (depreciation) relating to investments still held at 12/31/2021 | 298,331 |
† Securities deemed as Level 3 due to the lack of observable inputs by management assessment.
The following table summarizes the significant unobservable inputs the fund used to value its investment categorized within Level 3 as of December 31, 2021. In addition to the techniques and inputs noted in the table below, according to the fund’s valuation policy, other valuation techniques and methodologies when determining the fund’s fair value measurements may be used. The below table is not intended to be all-inclusive, but rather provide information on the significant unobservable inputs as they are to the fund’s determination of fair values.
| | | | | | |
Asset Category | Value ($) | Valuation
Technologies/
Methodologies | Unobservable
Inputs | Range | Weighted
Average |
Private Equity | 5,556,562 | Enterprise Value | Enterprise
Value Price | 207.89-236.77 | 232.96 |
(b) Foreign currency transactions: The fund does not isolate that portion of the results of operations resulting from changes in foreign exchange rates on investments from the fluctuations arising from changes in the market prices of securities held. Such fluctuations are included with the net realized and unrealized gain or loss on investments.
Net realized foreign exchange gains or losses arise from sales of foreign currencies, currency gains or losses realized on securities transactions between trade and settlement date, and the difference between the amounts of dividends, interest and foreign withholding taxes recorded on
20
the fund’s books and the U.S. dollar equivalent of the amounts actually received or paid. Net unrealized foreign exchange gains and losses arise from changes in the value of assets and liabilities other than investments resulting from changes in exchange rates. Foreign currency gains and losses on foreign currency transactions are also included with net realized and unrealized gain or loss on investments.
Foreign taxes: The fund may be subject to foreign taxes (a portion of which may be reclaimable) on income, stock dividends, realized and unrealized capital gains on investments or certain foreign currency transactions. Foreign taxes are recorded in accordance with the applicable foreign tax regulations and rates that exist in the foreign jurisdictions in which the fund invests. These foreign taxes, if any, are paid by the fund and are reflected in the Statement of Operations, if applicable. Foreign taxes payable or deferred or those subject to reclaims as of December 31, 2021, if any, are disclosed in the fund’s Statement of Assets and Liabilities.
(c) Securities transactions and investment income: Securities transactions are recorded on a trade date basis. Realized gains and losses from securities transactions are recorded on the identified cost basis. Dividend income is recognized on the ex-dividend date and interest income, including, where applicable, accretion of discount and amortization of premium on investments, is recognized on the accrual basis.
Pursuant to a securities lending agreement with The Bank of New York Mellon, a subsidiary of BNY Mellon and an affiliate of the Adviser, the fund may lend securities to qualified institutions. It is the fund’s policy that, at origination, all loans are secured by collateral of at least 102% of the value of U.S. securities loaned and 105% of the value of foreign securities loaned. Collateral equivalent to at least 100% of the market value of securities on loan is maintained at all times. Collateral is either in the form of cash, which can be invested in certain money market mutual funds managed by the Adviser, or U.S. Government and Agency securities. The fund is entitled to receive all dividends, interest and distributions on securities loaned, in addition to income earned as a result of the lending transaction. Should a borrower fail to return the securities in a timely manner, The Bank of New York Mellon is required to replace the securities for the benefit of the fund or credit the fund with the market value of the unreturned securities and is subrogated to the fund’s rights against the borrower and the collateral. Additionally, the contractual maturity of security lending transactions are on an overnight and continuous basis. During the period ended December 31, 2021, The Bank
21
NOTES TO FINANCIAL STATEMENTS (continued)
of New York Mellon earned $8,396 from the lending of the fund’s portfolio securities, pursuant to the securities lending agreement.
(d) Affiliated issuers: Investments in other investment companies advised by the Adviser are considered “affiliated” under the Act.
(e) Risk: Certain events particular to the industries in which the fund’s investments conduct their operations, as well as general economic, political and public health conditions, may have a significant negative impact on the investee’s operations and profitability. In addition, turbulence in financial markets and reduced liquidity in equity, credit and/or fixed income markets may negatively affect many issuers, which could adversely affect the fund. Global economies and financial markets are becoming increasingly interconnected, and conditions and events in one country, region or financial market may adversely impact issuers in a different country, region or financial market. These risks may be magnified if certain events or developments adversely interrupt the global supply chain; in these and other circumstances, such risks might affect companies world-wide. Recent examples include pandemic risks related to COVID-19 and aggressive measures taken world-wide in response by governments, including closing borders, restricting international and domestic travel, and the imposition of prolonged quarantines of large populations, and by businesses, including changes to operations and reducing staff. The effects of COVID-19 have contributed to increased volatility in global markets and will likely affect certain countries, companies, industries and market sectors more dramatically than others. The COVID-19 pandemic has had, and any other outbreak of an infectious disease or other serious public health concern could have, a significant negative impact on economic and market conditions and could trigger a prolonged period of global economic slowdown. To the extent the fund may overweight its investments in certain countries, companies, industries or market sectors, such positions will increase the fund’s exposure to risk of loss from adverse developments affecting those countries, companies, industries or sectors.
(f) Dividends and distributions to shareholders: Dividends and distributions are recorded on the ex-dividend date. Dividends from investment income-net and dividends from net realized capital gains, if any, are normally declared and paid annually, but the fund may make distributions on a more frequent basis to comply with the distribution requirements of the Internal Revenue Code of 1986, as amended (the “Code”). To the extent that net realized capital gains can be offset by capital loss carryovers, it is the policy of the fund not to distribute such gains. Income and capital gain distributions are determined in accordance with income tax regulations, which may differ from GAAP.
22
(g) Federal income taxes: It is the policy of the fund to continue to qualify as a regulated investment company, if such qualification is in the best interests of its shareholders, by complying with the applicable provisions of the Code, and to make distributions of taxable income and net realized capital gain sufficient to relieve it from substantially all federal income and excise taxes.
As of and during the period ended December 31, 2021, the fund did not have any liabilities for any uncertain tax positions. The fund recognizes interest and penalties, if any, related to uncertain tax positions as income tax expense in the Statement of Operations. During the period ended December 31, 2021, the fund did not incur any interest or penalties.
Each tax year in the four-year period ended December 31, 2021 remains subject to examination by the Internal Revenue Service and state taxing authorities.
At December 31, 2021, the components of accumulated earnings on a tax basis were as follows: undistributed capital gains $82,467,011 and unrealized appreciation $455,704,262.
The tax character of distributions paid to shareholders during the fiscal periods ended December 31, 2021 and December 31, 2020 were as follows: ordinary income $65,968,826 and $791,589, and long-term capital gains $77,933,674 and $76,440,717, respectively.
During the period ended December 31, 2021, as a result of permanent book to tax differences, primarily due to the tax treatment for net operating losses, the fund increased total distributable earnings (loss) by $8,103,831 and decreased paid-in capital by the same amount. Net assets and net asset value per share were not affected by this reclassification.
NOTE 2—Bank Lines of Credit:
The fund participates with other long-term open-end funds managed by the Adviser in a $823.5 million unsecured credit facility led by Citibank, N.A. (the “Citibank Credit Facility”) and a $300 million unsecured credit facility provided by The Bank of New York Mellon (the “BNYM Credit Facility”), each to be utilized primarily for temporary or emergency purposes, including the financing of redemptions (each, a “Facility”). The Citibank Credit Facility is available in two tranches: (i) Tranche A is in an amount equal to $688.5 million and is available to all long-term open-ended funds, including the fund, and (ii) Tranche B is an amount equal to $135 million and is available only to BNY Mellon Floating Rate Income Fund, a series of BNY Mellon Investment Funds IV, Inc. In connection therewith, the fund has agreed to pay its pro rata portion of commitment
23
NOTES TO FINANCIAL STATEMENTS (continued)
fees for Tranche A of the Citibank Credit Facility and the BNYM Credit Facility. Interest is charged to the fund based on rates determined pursuant to the terms of the respective Facility at the time of borrowing. During the period ended December 31, 2021, the fund did not borrow under the Facilities.
NOTE 3—Management Fee, Sub-Investment Advisory Fee and Other Transactions with Affiliates:
(a) Pursuant to a management agreement with the Adviser, the management fee is computed at the annual rate of .75% of the value of the fund’s average daily net assets and is payable monthly.
As of the Effective Date, pursuant to a sub-investment advisory agreement between the Adviser and the Sub-Adviser, the Adviser pays the Sub-Adviser a monthly fee at an annual rate of .36% of the value of the fund’s average daily net assets.
(b) Under the Distribution Plan adopted pursuant to Rule 12b-1 under the Act, Service shares pay the Distributor for distributing its shares, for servicing and/or maintaining Service shares’ shareholder accounts and for advertising and marketing for Service shares. The Distribution Plan provides for payments to be made at an annual rate of .25% of the value of the Service shares’ average daily net assets. The Distributor may make payments to Participating Insurance Companies and to brokers and dealers acting as principal underwriter for their variable insurance products. The fees payable under the Distribution Plan are payable without regard to actual expenses incurred. During the period ended December 31, 2021, Service shares were charged $2,048,884 pursuant to the Distribution Plan.
The fund has an arrangement with the transfer agent whereby the fund may receive earnings credits when positive cash balances are maintained, which are used to offset transfer agency fees. For financial reporting purposes, the fund includes net earnings credits, if any, as shareholder servicing costs in the Statement of Operations.
The fund has an arrangement with the custodian whereby the fund will receive interest income or be charged overdraft fees when cash balances are maintained. For financial reporting purposes, the fund includes this interest income and overdraft fees, if any, as interest income in the Statement of Operations.
The fund compensates BNY Mellon Transfer, Inc., a wholly-owned subsidiary of the Adviser, under a transfer agency agreement for providing transfer agency and cash management services inclusive of earnings credits, if any, for the fund. The majority of transfer agency fees are comprised of
24
amounts paid on a per account basis, while cash management fees are related to fund subscriptions and redemptions. During the period ended December 31, 2021, the fund was charged $916 for transfer agency services, inclusive of earnings credit, if any. These fees are included in Shareholder servicing costs in the Statement of Operations.
The fund compensates The Bank of New York Mellon under a custody agreement for providing custodial services for the fund. These fees are determined based on net assets, geographic region and transaction activity. During the period ended December 31, 2021, the fund was charged $33,923 pursuant to the custody agreement.
During the period ended December 31, 2021, the fund was charged $14,276 for services performed by the Chief Compliance Officer and his staff. These fees are included in Chief Compliance Officer fees in the Statement of Operations.
The components of “Due to BNY Mellon Investment Adviser, Inc. and affiliates” in the Statement of Assets and Liabilities consist of: management fees of $710,560, Distribution Plan fees of $180,773, custodian fees of $6,000, Chief Compliance Officer fees of $3,627 and transfer agency fees of $175.
(c) Each Board member also serves as a Board member of other funds in the BNY Mellon Family of Funds complex. Annual retainer fees and attendance fees are allocated to each fund based on net assets.
NOTE 4—Securities Transactions:
The aggregate amount of purchases and sales of investment securities, excluding short-term securities during the period ended December 31, 2021, amounted to $404,889,148 and $405,108,635, respectively.
At December 31, 2021, the cost of investments for federal income tax purposes was $664,881,653; accordingly, accumulated net unrealized appreciation on investments was $455,704,063, consisting of $493,432,252 gross unrealized appreciation and $37,728,189 gross unrealized depreciation.
25
REPORT OF INDEPENDENT REGISTERED PUBLIC ACCOUNTING FIRM
To the Shareholders and the Board of Trustees of Technology Growth Portfolio
Opinion on the Financial Statements
We have audited the accompanying statement of assets and liabilities of Technology Growth Portfolio (the “Fund”) (one of the funds constituting BNY Mellon Investment Portfolios), including the statements of investments and investments in affiliated issuers, as of December 31, 2021, and the related statement of operations for the year then ended, the statements of changes in net assets for each of the two years in the period then ended, the financial highlights for each of the five years in the period then ended and the related notes (collectively referred to as the “financial statements”). In our opinion, the financial statements present fairly, in all material respects, the financial position of the Fund (one of the funds constituting BNY Mellon Investment Portfolios) at December 31, 2021, the results of its operations for the year then ended, the changes in its net assets for each of the two years in the period then ended and its financial highlights for each of the five years in the period then ended, in conformity with U.S. generally accepted accounting principles.
Basis for Opinion
These financial statements are the responsibility of the Fund’s management. Our responsibility is to express an opinion on the Fund’s financial statements based on our audits. We are a public accounting firm registered with the Public Company Accounting Oversight Board (United States) (“PCAOB”) and are required to be independent with respect to the Fund in accordance with the U.S. federal securities laws and the applicable rules and regulations of the Securities and Exchange Commission and the PCAOB.
We conducted our audits in accordance with the standards of the PCAOB. Those standards require that we plan and perform the audit to obtain reasonable assurance about whether the financial statements are free of material misstatement, whether due to error or fraud. The Fund is not required to have, nor were we engaged to perform, an audit of the Fund’s internal control over financial reporting. As part of our audits, we are required to obtain an understanding of internal control over financial reporting, but not for the purpose of expressing an opinion on the effectiveness of the Fund’s internal control over financial reporting. Accordingly, we express no such opinion.
Our audits included performing procedures to assess the risks of material misstatement of the financial statements, whether due to error or fraud, and performing procedures that respond to those risks. Such procedures included examining, on a test basis, evidence regarding the amounts and disclosures in the financial statements. Our procedures included confirmation of securities owned as of December 31, 2021, by correspondence with the custodian and others or by other appropriate auditing procedures where replies from others were not received. Our audits also included evaluating the accounting principles used and significant estimates made by management, as well as evaluating the overall presentation of the financial statements. We believe that our audits provide a reasonable basis for our opinion.

We have served as the auditor of one or more investment companies in the BNY Mellon Family of Funds since at least 1957, but we are unable to determine the specific year.
New York, New York
February 8, 2022
26
IMPORTANT TAX INFORMATION (Unaudited)
For federal tax purposes, the portfolio hereby reports 99.51% of the ordinary dividends paid during the fiscal year ended December 31, 2021 as qualifying for the corporate dividends received deduction. Shareholders will receive notification in early 2022 of the percentage applicable to the preparation of their 2021 income tax returns. Also, the portfolio hereby reports $2.7378 per share as a long-term capital gain distribution and $2.3177 per share as a short-term capital gain distribution paid on March 30, 2021.
27
INFORMATION ABOUT THE RENEWAL OF THE FUND’S MANAGEMENT ADVISORY AGREEMENT (Unaudited)
At a meeting of the fund’s Board of Trustees held on August 3-4, 2021, the Board considered the renewal of the fund’s Management Agreement pursuant to which the Adviser provides the fund with investment advisory and administrative services (the “Agreement”). The Board members, none of whom are “interested persons” (as defined in the Investment Company Act of 1940, as amended) of the fund, were assisted in their review by independent legal counsel and met with counsel in executive session separate from representatives of the Adviser. In considering the renewal of the Agreement, the Board considered several factors that it believed to be relevant, including those discussed below. The Board did not identify any one factor as dispositive, and each Board member may have attributed different weights to the factors considered.
Analysis of Nature, Extent, and Quality of Services Provided to the Fund. The Board considered information provided to it at the meeting and in previous presentations from representatives of the Adviser regarding the nature, extent, and quality of the services provided to funds in the BNY Mellon fund complex, including the fund. The Adviser provided the number of open accounts in the fund, the fund’s asset size and the allocation of fund assets among distribution channels. The Adviser also had previously provided information regarding the diverse intermediary relationships and distribution channels of funds in the BNY Mellon fund complex (such as retail direct or intermediary, in which intermediaries typically are paid by the fund and/or the Adviser) and the Adviser’s corresponding need for broad, deep, and diverse resources to be able to provide ongoing shareholder services to each intermediary or distribution channel, as applicable to the fund.
The Board also considered research support available to, and portfolio management capabilities of, the fund’s portfolio management personnel and that the Adviser also provides oversight of day-to-day fund operations, including fund accounting and administration and assistance in meeting legal and regulatory requirements. The Board also considered the Adviser’s extensive administrative, accounting and compliance infrastructures. The Board also considered portfolio management’s brokerage policies and practices (including policies and practices regarding soft dollars) and the standards applied in seeking best execution.
Comparative Analysis of the Fund’s Performance and Management Fee and Expense Ratio. The Board reviewed reports prepared by Broadridge Financial Solutions, Inc. (“Broadridge”), an independent provider of investment company data based on classifications provided by Thomson Reuters Lipper, which included information comparing (1) the performance of the fund’s Initial shares with the performance of a group of science and technology funds underlying variable insurance products (“VIPs”) selected by Broadridge as comparable to the fund (the “Performance Group”) and with a broader group of funds consisting of all science and technology funds underlying VIPs (the “Performance Universe”), all for various periods ended June 30, 2021, and (2) the fund’s actual and contractual management fees and total expenses of the fund’s Initial shares with those of the same group of funds in the Performance Group (the “Expense Group”) and the fund’s Initial shares and Service shares with a broader group of all
28
science and technology funds underlying VIPs with similar 12b-1/non-12b-1 structures, excluding outliers (the “Expense Universe”), the information for which was derived in part from fund financial statements available to Broadridge as of the date of its analysis. The Adviser previously had furnished the Board with a description of the methodology Broadridge used to select the Performance Group and Performance Universe and the Expense Group and Expense Universe.
Performance Comparisons. Representatives of the Adviser stated that the usefulness of performance comparisons may be affected by a number of factors, including different investment limitations and policies that may be applicable to the fund and comparison funds and the end date selected. The Board discussed with representatives of the Adviser the results of the comparisons and considered that the fund’s total return performance was at or above the Performance Group median for the one-, two- and three-year periods and above the Performance Universe median for the one-, two- and four-year periods and below the medians for all other periods. The Board considered the relative proximity of the fund’s performance to the Performance Group and/or Performance Universe medians in most of the periods when performance was below median, ranking in the third quartile of the Performance Group and/or Performance Universe in all periods performance was below median except one. The Adviser also provided a comparison of the fund’s calendar year total returns to the returns of the fund’s benchmark indices, and it was noted that the fund’s returns were above the returns of the S&P 500 Index in five of the ten calendar years shown.
Management Fee and Expense Ratio Comparisons. The Board reviewed and considered the contractual management fee rate payable by the fund to the Adviser in light of the nature, extent and quality of the management services provided by the Adviser. In addition, the Board reviewed and considered the actual management fee rate paid by the fund over the fund’s last fiscal year. The Board also reviewed the range of actual and contractual management fees and total expenses as a percentage of average net assets of the Expense Group and Expense Universe funds and discussed the results of the comparisons.
The Board considered that the fund’s contractual management fee was lower than the Expense Group median contractual management fee, the fund’s actual management fee was lower than the Expense Group median and Expense Universe median actual management fee and the total expenses of the fund’s Initial shares were lower than the Expense Group median and Expense Universe median total expenses and the total expenses of the fund’s Service shares were higher than the Expense Universe median total expenses.
Representatives of the Adviser noted that there were no other funds advised or administered by the Adviser that are in the same Lipper category as the fund or separate accounts and/or other types of client portfolios advised by the Adviser that are considered to have similar investment strategies and policies as the fund.
Analysis of Profitability and Economies of Scale. Representatives of the Adviser reviewed the expenses allocated and profit received by the Adviser and its affiliates and
29
INFORMATION ABOUT THE RENEWAL OF THE FUND’S MANAGEMENT ADVISORY AGREEMENT (Unaudited) (continued)
the resulting profitability percentage for managing the fund and the aggregate profitability percentage to the Adviser and its affiliates for managing the funds in the BNY Mellon fund complex, and the method used to determine the expenses and profit. The Board concluded that the profitability results were not excessive, given the services rendered and service levels provided by the Adviser and its affiliates. The Board also had been provided with information prepared by an independent consulting firm regarding the Adviser’s approach to allocating costs to, and determining the profitability of, individual funds and the entire BNY Mellon fund complex. The consulting firm also had analyzed where any economies of scale might emerge in connection with the management of a fund.
The Board considered, on the advice of its counsel, the profitability analysis (1) as part of its evaluation of whether the fee under the Agreement, considered in relation to the mix of services provided by the Adviser, including the nature, extent and quality of such services, supported the renewal of the Agreement and (2) in light of the relevant circumstances for the fund and the extent to which economies of scale would be realized if the fund grows and whether fee levels reflect these economies of scale for the benefit of fund shareholders. Representatives of the Adviser stated that, as a result of shared and allocated costs among funds in the BNY Mellon fund complex, the extent of economies of scale could depend substantially on the level of assets in the complex as a whole, so that increases and decreases in complex-wide assets can affect potential economies of scale in a manner that is disproportionate to, or even in the opposite direction from, changes in the fund’s asset level. The Board also considered potential benefits to the Adviser from acting as investment adviser and took into consideration the soft dollar arrangements in effect for trading the fund’s investments.
At the conclusion of these discussions, the Board agreed that it had been furnished with sufficient information to make an informed business decision with respect to the renewal of the Agreement. Based on the discussions and considerations as described above, the Board concluded and determined as follows.
· The Board concluded that the nature, extent and quality of the services provided by the Adviser are adequate and appropriate.
· The Board was generally satisfied with the fund’s overall performance.
· The Board concluded that the fee paid to the Adviser continued to be appropriate under the circumstances and in light of the factors and the totality of the services provided as discussed above.
· The Board determined that the economies of scale which may accrue to the Adviser and its affiliates in connection with the management of the fund had been adequately considered by the Adviser in connection with the fee rate charged to the fund pursuant to the Agreement and that, to the extent in the future it were determined that material economies of scale had not been shared with the fund, the Board would seek to have those economies of scale shared with the fund.
30
In evaluating the Agreement, the Board considered these conclusions and determinations and also relied on its previous knowledge, gained through meetings and other interactions with the Adviser and its affiliates, of the Adviser and the services provided to the fund by the Adviser. The Board also relied on information received on a routine and regular basis throughout the year relating to the operations of the fund and the investment management and other services provided under the Agreement, including information on the investment performance of the fund in comparison to similar mutual funds and benchmark performance indices; general market outlook as applicable to the fund; and compliance reports. In addition, the Board’s consideration of the contractual fee arrangements for the fund had the benefit of a number of years of reviews of the Agreement for the fund, or substantially similar agreements for other BNY Mellon funds that the Board oversees, during which lengthy discussions took place between the Board and representatives of the Adviser. Certain aspects of the arrangements may receive greater scrutiny in some years than in others, and the Board’s conclusions may be based, in part, on their consideration of the fund’s arrangements, or substantially similar arrangements for other BNY Mellon funds that the Board oversees, in prior years. The Board determined to renew the Agreement.
31
BOARD MEMBERS INFORMATION (Unaudited)
Independent Board Members
Joseph S. DiMartino (78)
Chairman of the Board (1995)
Principal Occupation During Past 5 Years:
· Director or Trustee of funds in the BNY Mellon Family of Funds and certain other entities (as described in the fund’s Statement of Additional Information) (1995-Present)
Other Public Company Board Memberships During Past 5 Years:
· CBIZ, Inc., a public company providing professional business services, products and solutions, Director (1997-Present)
No. of Portfolios for which Board Member Serves: 96
———————
Francine J. Bovich (70)
Board Member (2015)
Principal Occupation During Past 5 Years:
· The Bradley Trusts, private trust funds, Trustee (2011-Present)
Other Public Company Board Memberships During Past 5 Years:
· Annaly Capital Management, Inc., a real estate investment trust, Director (2014-Present)
No. of Portfolios for which Board Member Serves: 54
———————
J. Charles Cardona (66)
Board Member (2014)
Principal Occupation During Past 5 Years:
· President and Director of the Adviser (2008-2016)
· Chief Executive Officer of Dreyfus Cash Investment Strategies, a division of the Adviser (2009-2016)
· Chairman of the Distributor (2013–2016)
Other Public Company Board Memberships During Past 5 Years:
· BNY Mellon ETF Trust, Chairman and Trustee (2020-Present)
· BNY Mellon Liquidity Funds, Director (2004-Present) and Chairman (2019-2021)
No. of Portfolios for which Board Member Serves: 35
———————
32
Andrew J. Donohue (71)
Board Member (2019)
Principal Occupation During Past 5 Years:
· Attorney, Solo Law Practice (2019-Present)
· Shearman & Sterling LLP, a law firm, Of Counsel (2017-2019)
· Chief of Staff to the Chair of the SEC (2015-2017)
Other Public Company Board Memberships During Past 5 Years:
· Oppenheimer Funds (58 funds), Director (2017-2019)
No. of Portfolios for which Board Member Serves: 44
———————
Isabel P. Dunst (74)
Board Member (2014)
Principal Occupation During Past 5 Years:
· Hogan Lovells LLP, a law firm, Retired (2019-Present); Senior Counsel (2018-2019); Of Counsel (2015-2018); Partner (1990-2014)
· Hebrew Union College Jewish Institute of Religion, Member of the Board of Governors (2015-Present)
· Bend the ARC, a civil rights organization, Board Member (2016-Present)
No. of Portfolios for which Board Member Serves: 22
———————
Nathan Leventhal (78)
Board Member (2009)
Principal Occupation During Past 5 Years:
· Lincoln Center for the Performing Arts, President Emeritus (2001-Present)
· Palm Beach Opera, President (2016-Present)
Other Public Company Board Memberships During Past 5 Years:
· Movado Group, Inc., a public company that designs, sources, markets and distributes watches Director (2003-2020)
No. of Portfolios for which Board Member Serves: 32
———————
33
BOARD MEMBERS INFORMATION (Unaudited) (continued)
Robin A. Melvin (58)
Board Member (2014)
Principal Occupation During Past 5 Years:
· Westover School, a private girls' boarding school in Middlebury, Connecticut, Trustee (2019-Present)
· Mentor Illinois, a non-profit organization dedicated to increasing the quality of mentoring services in Illinois, Co-Chair (2014-2020); Board Member, Mentor Illinois (2013-2020)
· JDRF, a non-profit juvenile diabetes research foundation, Board Member (June 2021-Present)
Other Public Company Board Memberships During Past 5 Years:
· HPS Corporate Lending Fund, a closed-end management investment company regulated as a business development company, Trustee (August 2021-Present)
No. of Portfolios for which Board Member Serves: 74
———————
Roslyn M. Watson (72)
Board Member (2014)
Principal Occupation During Past 5 Years:
· Watson Ventures, Inc., a real estate investment company. Principal (1993-Present)
Other Public Company Board Memberships During Past 5 Years:
· American Express Bank, FSB, Director (1993-2018)
No. of Portfolios for which Board Member Serves: 44
———————
Benaree Pratt Wiley (75)
Board Member (2009)
Principal Occupation During Past 5 Years:
· The Wiley Group, a firm specializing in strategy and business development, Principal (2005-Present)
Other Public Company Board Memberships During Past 5 Years:
· CBIZ, Inc., a public company providing professional business services, products and solutions, Director (2008-Present)
· Blue Cross Blue Shield of Massachusetts, Director (2004-2020)
No. of Portfolios for which Board Member Serves: 62
———————
34
Tamara Belinfanti (46)
Advisory Board Member (2021)
Principal Occupation During Past 5 Years:
· New York Law School, Lester Martin Professor of Law (2009-Present)
No. of Portfolios for which Advisory Board Member Serves: 22
———————
Gordon J. Davis (80)
Advisory Board Member (2021)
Principal Occupation During Past 5 Years:
· Venable LLP, a law firm Partner (2012-Present)
No. of Portfolios for which Advisory Board Member Serves: 40
———————
Once elected all Board Members serve for an indefinite term, but achieve Emeritus status upon reaching age 80. The address of the Board Members and Officers is c/o BNY Mellon Investment Adviser, Inc. 240 Greenwich Street, New York, New York 10286. Additional information about the Board Members is available in the fund’s Statement of Additional Information which can be obtained from the Adviser free of charge by calling this toll free number: 1-800-373-9387.
Clifford L. Alexander, Jr., Emeritus Board Member
Whitney I. Gerard, Emeritus Board Member
George L. Perry, Emeritus Board Member
35
OFFICERS OF THE FUND (Unaudited)
DAVID DIPETRILLO, President since January 2021.
Vice President and Director of the Adviser since February 2021; Head of North America Product, BNY Mellon Investment Management since January 2018; Director of Product Strategy, BNY Mellon Investment Management from January 2016 to December 2017. He is an officer of 56 investment companies (comprised of 109 portfolios) managed by the Adviser or an affiliate of the Adviser. He is 43 years old and has been an employee of BNY Mellon since 2005.
JAMES WINDELS, Treasurer since November 2001.
Vice President of the Adviser since September 2020; Director–BNY Mellon Fund Administration, and an officer of 57 investment companies (comprised of 130 portfolios) managed by the Adviser or an affiliate of the Adviser. He is 63 years old and has been an employee of the Adviser since April 1985.
PETER M. SULLIVAN, Chief Legal Officer since July 2021 and Vice President and Assistant Secretary since March 2019.
Chief Legal Officer of the Adviser and Associate General Counsel of BNY Mellon since July 2021; Senior Managing Counsel of BNY Mellon from December 2020 to July 2021; Managing Counsel of BNY Mellon from March 2009 to December 2020, and an officer of 57 investment companies (comprised of 130 portfolios) managed by the Adviser or an affiliate of the Adviser. He is 53 years old and has been an employee of BNY Mellon since April 2004.
JAMES BITETTO, Vice President since August 2005 and Secretary since February 2018.
Senior Managing Counsel of BNY Mellon since December 2019; Managing Counsel of BNY Mellon from April 2014 to December 2019; Secretary of the Adviser, and an officer of 57 investment companies (comprised of 130 portfolios) managed by the Adviser or an affiliate of the Adviser. He is 55 years old and has been an employee of the Adviser since December 1996.
DEIRDRE CUNNANE, Vice President and Assistant Secretary since March 2019.
Managing Counsel of BNY Mellon since December 2021, Counsel of BNY Mellon from August 2018 to December 2021; and Senior Regulatory Specialist at BNY Mellon Investment Management Services from February 2016 to August 2018. She is an officer of 57 investment companies (comprised of 130 portfolios) managed by the Adviser or an affiliate of the Adviser. She is 31 years old and has been an employee of the Adviser since August 2018.
SARAH S. KELLEHER, Vice President and Assistant Secretary since April 2014.
Vice President of BNY Mellon ETF Investment Adviser; LLC since February 2020; Senior Managing Counsel of BNY Mellon since September 2021; Managing Counsel of BNY Mellon from December 2017 to September 2021; and Senior Counsel of BNY Mellon from March 2013 to December 2017. She is an officer of 57 investment companies (comprised of 130 portfolios) managed by the Adviser or an affiliate of the Adviser. She is 46 years old and has been an employee of the Adviser since March 2013.
JEFF PRUSNOFSKY, Vice President and Assistant Secretary since August 2005.
Senior Managing Counsel of BNY Mellon, and an officer of 57 investment companies (comprised of 130 portfolios) managed by the Adviser or an affiliate of the Adviser. He is 56 years old and has been an employee of the Adviser since October 1990.
AMANDA QUINN, Vice President and Assistant Secretary since March 2020.
Counsel of BNY Mellon since June 2019; Regulatory Administration Manager at BNY Mellon Investment Management Services from September 2018 to May 2019; and Senior Regulatory Specialist at BNY Mellon Investment Management Services from April 2015 to August 2018. She is an officer of 57 investment companies (comprised of 130 portfolios) managed by the Adviser or an affiliate of the Adviser. She is 36 years old and has been an employee of the Adviser since June 2019.
36
NATALYA ZELENSKY, Vice President and Assistant Secretary since March 2017.
Chief Compliance Officer since August 2021 and Vice President since February 2020 of BNY Mellon ETF Investment Adviser, LLC; Chief Compliance Officer since August 2021 and Vice President and Assistant Secretary since February 2020 of BNY Mellon ETF Trust; Managing Counsel of BNY Mellon from December 2019 to August 2021; Counsel of BNY Mellon from May 2016 to December 2019; Assistant Secretary of the Adviser from April 2018 to August 2021. She is an officer of 56 investment companies (comprised of 129 portfolios) managed by the Adviser or an affiliate of the Adviser. She is 36 years old and has been an employee of BNY Mellon since May 2016.
GAVIN C. REILLY, Assistant Treasurer since December 2005.
Tax Manager–BNY Mellon Fund Administration, and an officer of 57 investment companies (comprised of 130 portfolios) managed by the Adviser or an affiliate of the Adviser. He is 53 years old and has been an employee of the Adviser since April 1991.
ROBERT SALVIOLO, Assistant Treasurer since July 2007.
Senior Accounting Manager–BNY Mellon Fund Administration, and an officer of 57 investment companies (comprised of 130 portfolios) managed by the Adviser or an affiliate of the Adviser. He is 54 years old and has been an employee of the Adviser since June 1989.
ROBERT SVAGNA, Assistant Treasurer since December 2002.
Senior Accounting Manager–BNY Mellon Fund Administration, and an officer of 57 investment companies (comprised of 130 portfolios) managed by the Adviser or an affiliate of the Adviser. He is 54 years old and has been an employee of the Adviser since November 1990.
JOSEPH W. CONNOLLY, Chief Compliance Officer since October 2004.
Chief Compliance Officer of the BNY Mellon Family of Funds and BNY Mellon Funds Trust since 2004; Chief Compliance Officer of the Adviser from 2004 until June 2021. He is an officer of 56 investment companies (comprised of 117 portfolios) managed by the Adviser. He is 64 years old.
CARIDAD M. CAROSELLA, Anti-Money Laundering Compliance Officer since January 2016.
Anti-Money Laundering Compliance Officer of the BNY Mellon Family of Funds and BNY Mellon Funds Trust. She is an officer of 49 investment companies (comprised of 122 portfolios) managed by the Adviser or an affiliate of the Adviser. She is 53 years old and has been an employee of the Distributor since 1997.
37
BNY Mellon Investment Portfolios, Technology Growth Portfolio
240 Greenwich Street
New York, NY 10286
Adviser
BNY Mellon Investment Adviser, Inc.
240 Greenwich Street
New York, NY 10286
Sub-Adviser
Newton Investment Management
North America, LLC
BNY Mellon Center
201 Washington Place
Boston, MA 02108
Custodian
The Bank of New York Mellon
240 Greenwich Street
New York, NY 10286
Transfer Agent &
Dividend Disbursing Agent
BNY Mellon Transfer, Inc.
240 Greenwich Street
New York, NY 10286
Distributor
BNY Mellon Securities Corporation
240 Greenwich Street
New York, NY 10286
Telephone 1-800-258-4260 or 1-800-258-4261
Mail The BNY Mellon Family of Funds, 144 Glenn Curtiss Boulevard, Uniondale, NY 11556-0144 Attn: Institutional Services Department
E-mail Send your request to info@bnymellon.com
Internet Information can be viewed online or downloaded at www.im.bnymellon.com
The fund files its complete schedule of portfolio holdings with the Securities and Exchange Commission (“SEC”) for the first and third quarters of each fiscal year on Form N-PORT. The fund’s Forms N-PORT are available on the SEC’s website at www.sec.gov.
A description of the policies and procedures that the fund uses to determine how to vote proxies relating to portfolio securities and information regarding how the fund voted these proxies for the most recent 12-month period ended June 30 is available at www.im.bnymellon.com and on the SEC’s website at www.sec.gov and without charge, upon request, by calling 1-800-373-9387.
| | |
© 2022 BNY Mellon Securities Corporation
0175AR1221 | 
|
Item 2. Code of Ethics.
The Registrant has adopted a code of ethics that applies to the Registrant's principal executive officer, principal financial officer, principal accounting officer or controller, or persons performing similar functions. There have been no amendments to, or waivers in connection with, the Code of Ethics during the period covered by this Report.
Item 3. Audit Committee Financial Expert.
The Registrant's Board has determined that J. Charles Cardona, a member of the Audit Committee of the Board, is an audit committee financial expert as defined by the Securities and Exchange Commission (the "SEC"). J. Charles Cardona is "independent" as defined by the SEC for purposes of audit committee financial expert determinations.
Item 4. Principal Accountant Fees and Services.
(a) Audit Fees. The aggregate fees billed for each of the last two fiscal years (the "Reporting Periods") for professional services rendered by the Registrant's principal accountant (the "Auditor") for the audit of the Registrant's annual financial statements or services that are normally provided by the Auditor in connection with the statutory and regulatory filings or engagements for the Reporting Periods, were $104,559 in 2020 and $104,559 in 2021.
(b) Audit-Related Fees. The aggregate fees billed in the Reporting Periods for assurance and related services by the Auditor that are reasonably related to the performance of the audit of the Registrant's financial statements and are not reported under paragraph (a) of this Item 4 were $31,456 in 2020 and $21,239 in 2021. These services consisted of one or more of the following: (i) agreed upon procedures related to compliance with Internal Revenue Code section 817(h), (ii) security counts required by Rule 17f-2 under the Investment Company Act of 1940, as amended, (iii) advisory services as to the accounting or disclosure treatment of Registrant transactions or events and (iv) advisory services to the accounting or disclosure treatment of the actual or potential impact to the Registrant of final or proposed rules, standards or interpretations by the Securities and Exchange Commission, the Financial Accounting Standards Boards or other regulatory or standard-setting bodies.
The aggregate fees billed in the Reporting Periods for non-audit assurance and related services by the Auditor to the Registrant's investment adviser (not including any sub-investment adviser whose role is primarily portfolio management and is subcontracted with or overseen by another investment adviser), and any entity controlling, controlled by or under common control with the investment adviser that provides ongoing services to the Registrant ("Service Affiliates"), that were reasonably related to the performance of the annual audit of the Service Affiliate, which required pre-approval by the Audit Committee were $0 in 2020 and $0 in 2021.
(c) Tax Fees. The aggregate fees billed in the Reporting Periods for professional services rendered by the Auditor for tax compliance, tax advice, and tax planning ("Tax Services") were $9,441 in 2020 and $15,207 in 2021. These services consisted of: (i) review or preparation of U.S. federal, state, local and excise tax returns; (ii) U.S. federal, state and local tax planning, advice and assistance regarding statutory, regulatory or administrative developments; (iii) tax advice regarding tax qualification matters and/or treatment of various financial instruments held or proposed to be acquired or held, and (iv) determination of Passive Foreign Investment Companies. The aggregate fees billed in the Reporting Periods for Tax Services by the Auditor to Service Affiliates, which required pre-approval by the Audit Committee were $0 in 2020 and $8,211 in 2021.
(d) All Other Fees. The aggregate fees billed in the Reporting Periods for products and services provided by the Auditor, other than the services reported in paragraphs (a) through (c) of this Item, were $0 in 2020 and $142 in 2021. These services consisted of a review of the Registrant's anti-money laundering program.
The aggregate fees billed in the Reporting Periods for Non-Audit Services by the Auditor to Service Affiliates, other than the services reported in paragraphs (b) through (c) of this Item, which required pre-approval by the Audit Committee, were $0 in 2020 and $0 in 2021.
(e)(1) Audit Committee Pre-Approval Policies and Procedures. The Registrant's Audit Committee has established policies and procedures (the "Policy") for pre-approval (within specified fee limits) of the Auditor's engagements for non-audit services to the Registrant and Service Affiliates without specific case-by-case consideration. The pre-approved services in the Policy can include pre-approved audit services, pre-approved audit-related services, pre-approved tax services and pre-approved all other services. Pre-approval considerations include whether the proposed services are compatible with maintaining the Auditor's independence. Pre-approvals pursuant to the Policy are considered annually.
(e)(2) Note. None of the services described in paragraphs (b) through (d) of this Item 4 were approved by the Audit Committee pursuant to paragraph (c)(7)(i)(C) of Rule 2-01 of Regulation S-X.
(f) None of the hours expended on the principal accountant's engagement to audit the registrant's financial statements for the most recent fiscal year were attributed to work performed by persons other than the principal accountant's full-time, permanent employees.
Non-Audit Fees. The aggregate non-audit fees billed by the Auditor for services rendered to the Registrant, and rendered to Service Affiliates, for the Reporting Periods were $1,264,899 in 2020 and $3,095,435 in 2021.
Auditor Independence. The Registrant's Audit Committee has considered whether the provision of non-audit services that were rendered to Service Affiliates, which were not pre-approved (not requiring pre-approval), is compatible with maintaining the Auditor's independence.
Item 5. Audit Committee of Listed Registrants.
Not applicable.
Item 6. Investments.
(a) Not applicable.
| Item 7. | Disclosure of Proxy Voting Policies and Procedures for Closed-End Management Investment Companies. |
Not applicable.
Item 8. Portfolio Managers of Closed-End Management Investment Companies.
Not applicable.
| Item 9. | Purchases of Equity Securities by Closed-End Management Investment Companies and Affiliated Purchasers. |
Not applicable.
| Item 10. | Submission of Matters to a Vote of Security Holders. |
There have been no material changes to the procedures applicable to Item 10.
| Item 11. | Controls and Procedures. |
(a) The Registrant's principal executive and principal financial officers have concluded, based on their evaluation of the Registrant's disclosure controls and procedures as of a date within 90 days of the filing date of this report, that the Registrant's disclosure controls and procedures are reasonably designed to ensure that information required to be disclosed by the Registrant on Form N-CSR is recorded, processed, summarized and reported within the required time periods and that information required to be disclosed by the Registrant in the reports that it files or submits on Form N-CSR is accumulated and communicated to the Registrant's management, including its principal executive and principal financial officers, as appropriate to allow timely decisions regarding required disclosure.
(b) There were no changes to the Registrant's internal control over financial reporting that occurred during the period covered by this report that have materially affected, or are reasonably likely to materially affect, the Registrant's internal control over financial reporting.
| Item 12. | Disclosure of Securities Lending Activities for Closed-End Management Investment Companies. |
Not applicable.
(a)(1) Code of ethics referred to in Item 2.
(a)(2) Certifications of principal executive and principal financial officers as required by Rule 30a-2(a) under the Investment Company Act of 1940.
(a)(3) Not applicable.
(b) Certification of principal executive and principal financial officers as required by Rule 30a-2(b) under the Investment Company Act of 1940.
SIGNATURES
Pursuant to the requirements of the Securities Exchange Act of 1934 and the Investment Company Act of 1940, the Registrant has duly caused this Report to be signed on its behalf by the undersigned, thereunto duly authorized.
BNY Mellon Investment Portfolios
By: /s/ David DiPetrillo
David DiPetrillo
President (Principal Executive Officer)
Date: February 7, 2022
Pursuant to the requirements of the Securities Exchange Act of 1934 and the Investment Company Act of 1940, this Report has been signed below by the following persons on behalf of the Registrant and in the capacities and on the dates indicated.
By: /s/ David DiPetrillo
David DiPetrillo
President (Principal Executive Officer)
Date: February 7, 2022
By: /s/ James Windels
James Windels
Treasurer (Principal Financial Officer)
Date: February 7, 2022
EXHIBIT INDEX
(a)(1) Code of ethics referred to in Item 2.
(a)(2) Certifications of principal executive and principal financial officers as required by Rule 30a-2(a) under the Investment Company Act of 1940. (EX-99.CERT)
(b) Certification of principal executive and principal financial officers as required by Rule 30a-2(b) under the Investment Company Act of 1940. (EX-99.906CERT)