UNITED STATES
SECURITIES AND EXCHANGE COMMISSION
Washington, D.C. 20549
FORM N-CSR
CERTIFIED SHAREHOLDER REPORT OF REGISTERED MANAGEMENT
INVESTMENT COMPANIES
Investment Company Act file number | 811-08673 |
| |
| BNY Mellon Investment Portfolios | |
| (Exact name of Registrant as specified in charter) | |
| | |
| c/o BNY Mellon Investment Adviser, Inc. 240 Greenwich Street New York, New York 10286 | |
| (Address of principal executive offices) (Zip code) | |
| | |
| Bennett A. MacDougall, Esq. 240 Greenwich Street New York, New York 10286 | |
| (Name and address of agent for service) | |
|
Registrant's telephone number, including area code: | (212) 922-6400 |
| |
Date of fiscal year end: | 12/31 | |
Date of reporting period: | 12/31/2020 | |
| | | | | | | |
FORM N-CSR
Item 1. Reports to Stockholders.
BNY Mellon Investment Portfolios, MidCap Stock Portfolio
| |
ANNUAL REPORT December 31, 2020 |

| |
The views expressed in this report reflect those of the portfolio manager(s) only through the end of the period covered and do not necessarily represent the views of BNY Mellon Investment Adviser, Inc. or any other person in the BNY Mellon Investment Adviser, Inc. organization. Any such views are subject to change at any time based upon market or other conditions and BNY Mellon Investment Adviser, Inc. disclaims any responsibility to update such views. These views may not be relied on as investment advice and, because investment decisions for a fund in the BNY Mellon Family of Funds are based on numerous factors, may not be relied on as an indication of trading intent on behalf of any fund in the BNY Mellon Family of Funds. |
| |
Not FDIC-Insured • Not Bank-Guaranteed • May Lose Value |
Contents
THE FUND
FOR MORE INFORMATION
Back Cover
DISCUSSION OF FUND PERFORMANCE (Unaudited)
For the period from January 1, 2020 through December 31, 2020, as provided by Peter D. Goslin, CFA, Adam Logan, CFA, Chris Yao, CFA and Syed A. Zamil, CFA, Portfolio Managers
Market and Fund Performance Overview
For the 12-month period ended December 31, 2020, BNY Mellon Investment Portfolios, MidCap Stock Portfolio’s Initial shares produced a total return of 8.11%, and its Service shares produced a total return of 7.85%.1 In comparison, the fund’s benchmark, the S&P MidCap 400® Index (the “Index”), produced a total return of 13.66% for the same period.2
Mid-cap stocks posted gains over the reporting period, bolstered by supportive central bank policies during the COVID-19 pandemic. The fund lagged the Index, primarily due to security selection shortfalls in the industrials, information technology and consumer discretionary sectors.
The Fund’s Investment Approach
The fund seeks investment results that are greater than the total return performance of publicly traded, common stocks of medium-sized, domestic companies in the aggregate, as represented by the Index. To pursue this goal, the fund normally invests at least 80% of its net assets, plus any borrowings for investment purposes, in stocks of mid-cap companies.
The fund invests in growth and value stocks, which are chosen through a disciplined investment process that combines quantitative-modeling techniques, fundamental analysis and risk management. Consistency of returns compared to the Index is a primary goal of the investment process.
The portfolio managers select stocks through a “bottom-up” structured approach that seeks to identify undervalued securities using a quantitative ranking process. The process is driven by a proprietary stock selection model that measures a diverse set of corporate characteristics to identify and rank stocks based on valuation, momentum, sentiment and earnings quality measures.
Next, the fund’s portfolio managers construct the portfolio through a risk-controlled process, focusing on stock selection, as opposed to making proactive decisions as to industry and sector exposure. The portfolio managers seek to maintain a portfolio that has exposure to industries and market capitalizations that are generally similar to the fund’s benchmark. Finally, within each sector and style subset, the fund will seek to overweight the most attractive stocks and underweight or not hold the stocks that have been ranked least attractive.
Central Bank Policy and COVID-19 Influence Markets
After an optimistic end to 2019, markets gave way to extreme risk aversion in early 2020, as the global scope of the COVID-19 pandemic became apparent. Equity valuations in the U.S. remained robust throughout January and February 2020, while markets in areas that experienced the virus earlier, such as China, began to experience volatility closer to the start of the calendar year. Financial markets also had to contend with a second major shock in the form of an oil-price war between Saudi Arabia and Russia, which caused oil prices to fall precipitously in March 2020. Worldwide, governments and central banks launched an
2
unprecedented array of fiscal initiatives that sought to offset the economic impact of widespread lockdown measures and bolster asset prices. The intervention provided comfort to investors, and indices began to rally towards the end of March 2020. Supported by the intervention, equities generally went on to stage a recovery that lasted through August 2020. However, the recovery was company and sector specific, as several industries that remained affected by COVID-19 prevention procedures did not fully participate.
In September 2020, volatility crept back into equity markets, as increasing COVID-19 infection rates began to concern investors. By October, several countries had begun to reinstitute some degree of behavioral restriction among residents in order to stem the spread of the virus. In addition, mounting political rhetoric in the U.S. due to the election, renewed trade difficulties between the U.S. and China, and other geopolitical events stoked investor anxiety. However, resolution in the U.S. presidential election and promising progress towards a COVID-19 vaccine during the month of November 2020 helped stocks resurrect their upward momentum. December 2020 brought vaccine approvals and passage of another U.S. fiscal stimulus package, both of which helped to support the rally which lasted through the end of the year.
According to the S&P family of indices, large-cap stocks generally outperformed their mid- and small-cap counterparts during the period.
Security Selections Drove Fund Performance
The fund’s performance compared to the Index was constrained by stock selection shortfalls across the industrials, information technology and consumer discretionary sectors. The industrials sector, particularly within the aerospace and defense and construction and engineering industries, was the primary driver of underperformance. The spread of COVID-19 drastically reduced demand for products and services from these market segments, negatively affecting stock prices. Negative security selection within the semiconductor and semiconductor equipment industry in the information technology sector also weighed on relative results. Within the consumer discretionary sector, the hotels, restaurants and leisure industry was the hardest hit. Valuations in this market segment were also harmed by the pandemic, as a widespread lockdown canceled the majority of consumer demand for these businesses’ products. From an individual issuer perspective, food company Domino’s Pizza was among one of the top detractors for the period. A lack of exposure during the early part of the year to the well-performing pizza delivery company caused underperformance. The position was purchased later in the period, although sold prior to the end of the year after it graduated from the index. A position in office equipment company Xerox Holdings was among the leading detractors. Due to office closures and the trend toward working from home, investors became concerned that corporate clients would use Xerox Holdings’ products less. We have exited the position. Elsewhere in the markets, a position in real estate company Weingarten Realty Investors also provided a headwind. The stock came under pressure, as concerns mounted over tenants’ ability to pay rent amid widespread lockdowns and growing unemployment. A position in Brandywine Realty Trust also weighed on results.
The fund achieved better results in several other areas. Positioning within the financials and health care sectors was positive for results. An underweight to the underperforming financials sector benefited returns. An underweight exposure to bank stocks, which were hit particularly hard, due in part to the low rate environment during the year, was particularly
3
DISCUSSION OF FUND PERFORMANCE (Unaudited) (continued)
additive. Within health care, security selections within the health care technology industry provided a tailwind. From an individual issuer perspective, life science research company Bio-Rad Laboratories beat earnings expectations several times throughout the year, leading to substantial earnings momentum and gains during the period. Veeva Systems, which provides computing solutions for life sciences companies, was a top contributor to positive results as well. The company beat earnings expectations and raised guidance repeatedly during the 12 months. We have closed the position. Elsewhere in the markets, outdoor shoe and apparel company Deckers Outdoor was also among the leading performers. The company beat earnings several times throughout the year. The stock moved higher on positive financial results.
A Disciplined Approach to Stock Picking
As of the reporting period’s end, our quantitative models have continued to identify what we believe are attractive investment opportunities across a broad spectrum of mid-cap companies and industry groups. Investor preference for top line growth is a theme we observed in 2020. We had exposure to this theme and found the opportunity during the fourth quarter to add to this exposure. Stock market volatility experienced during the period may have provided opportunities to purchase the stocks of companies ranked highly by our process. When the fund’s holdings reach what we perceive to be fuller valuations, we expect to replace them with high-quality companies that display then-currently-attractive valuations in our model. In addition, we continue to maintain a broadly diversified portfolio.
January 15, 2021
1 Total return includes reinvestment of dividends and any capital gains paid. Past performance is no guarantee of future results. Share price and investment return fluctuate such that upon redemption, fund shares may be worth more or less than their original cost. The fund’s performance does not reflect the deduction of additional charges and expenses imposed in connection with investing in variable insurance contracts, which will reduce returns. The fund’s return reflects the absorption of certain fund expenses by BNY Mellon Investment Adviser, Inc. pursuant to an agreement in effect through May 1, 2021, at which time it may be extended, modified or terminated. Had these expenses not been absorbed, returns would have been lower.
2 Source: Lipper Inc. — The S&P MidCap 400® Index provides investors with a benchmark for mid-sized companies. The index measures the performance of mid-sized companies, reflecting the distinctive risk and return characteristics of this market segment. Investors cannot invest directly in any index.
Please note: the position in any security highlighted with italicized typeface was sold during the reporting period.
Equities are subject generally to market, market sector, market liquidity, issuer and investment style risks, among other factors, to varying degrees, all of which are more fully described in the fund’s prospectus.
Recent market risks include pandemic risks related to COVID-19. The effects of COVID-19 have contributed to increased volatility in global markets and will likely affect certain countries, companies, industries and market sectors more dramatically than others. To the extent the fund may overweight its investments in certain countries, companies, industries or market sectors, such positions will increase the fund's exposure to risk of loss from adverse developments affecting those countries, companies, industries or sectors.
Stocks of mid-cap companies often experience sharper price fluctuations than stocks of large-cap companies.
The fund is only available as a funding vehicle under variable life insurance policies or variable annuity contracts issued by insurance companies. Individuals may not purchase shares of the fund directly. A variable annuity is an insurance contract issued by an insurance company that enables investors to accumulate assets on a tax-deferred basis for retirement or other long-term goals. The investment objective and policies of BNY Mellon Investment Portfolios, MidCap Stock Portfolio made available through insurance products may be similar to those of other funds managed by BNY Mellon Investment Adviser, Inc. However, the investment results of the fund may be higher or lower than, and may not be comparable to, those of any other BNY Mellon Investment Adviser, Inc. fund.
The fund uses an indexing strategy. It does not attempt to manage market volatility, use defensive strategies or reduce the effects of any long-term periods of poor stock performance.
4
FUND PERFORMANCE (Unaudited)
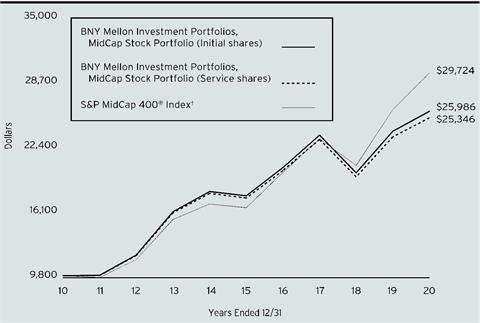
Comparison of change in value of a $10,000 investment in Initial shares and Service shares of BNY Mellon Investment Portfolios, MidCap Stock Portfolio with a hypothetical investment of $10,000 in the S&P MidCap 400® Index (the “Index”)
† Source: Lipper Inc.
Past performance is not predictive of future performance. The fund’s performance does not reflect the deduction of additional charges and expenses imposed in connection with investing in variable insurance contracts which will reduce returns.
The above graph compares a hypothetical investment of $10,000 investment made in each of the Initial shares and Service shares of BNY Mellon Investment Portfolios, MidCap Stock Portfolio on 12/31/10 to a hypothetical investment of $10,000 made in the Index on that date.
The fund’s performance shown in the line graph above takes into account all applicable fees and expenses. The Index provides investors with a benchmark for midsized companies. The Index measures the performance of midsized companies, reflecting the distinctive risk and return characteristics of this market segment. Unlike a mutual fund, the Index is not subject to charges, fees and other expenses. Investors cannot invest directly in any index. Further information relating to fund performance, including expense reimbursements, if applicable, is contained in the Financial Highlights section of the prospectus and elsewhere in this report.
| | | | |
Average Annual Total Returns as of 12/31/2020 |
| 1 Year | 5 Years | 10 Years |
Initial shares | 8.11% | 7.90% | 10.02% |
Service shares | 7.85% | 7.63% | 9.75% |
S&P MidCap 400® Index | 13.66% | 12.35% | 11.51% |
The performance data quoted represents past performance, which is no guarantee of future results. Share price and investment return fluctuate and an investor’s shares may be worth more or less than original cost upon redemption. Current performance may be lower or higher than the performance quoted. Go to www.im.bnymellon.com for the fund’s most recent month-end returns.
The fund’s Initial shares are not subject to a Rule 12b-1 fee. The fund’s Service shares are subject to a 0.25% annual Rule 12b-1 fee. All dividends and capital gain distributions are reinvested.
The fund’s performance shown in the graph and table does not reflect the deduction of taxes that a shareholder would pay on fund distributions or the redemption of fund shares.
5
UNDERSTANDING YOUR FUND’S EXPENSES (Unaudited)
As a mutual fund investor, you pay ongoing expenses, such as management fees and other expenses. Using the information below, you can estimate how these expenses affect your investment and compare them with the expenses of other funds. You also may pay one-time transaction expenses, including sales charges (loads), redemption fees and expenses associated with variable annuity or insurance contracts, which are not shown in this section and would have resulted in higher total expenses. For more information, see your fund’s prospectus or talk to your financial adviser.
Review your fund’s expenses
The table below shows the expenses you would have paid on a $1,000 investment in BNY Mellon Investment Portfolios, MidCap Stock Portfolio from July 1, 2020 to December 31, 2020. It also shows how much a $1,000 investment would be worth at the close of the period, assuming actual returns and expenses.
| | | | | |
Expenses and Value of a $1,000 Investment | |
Assume actual returns for the six months ended December 31, 2020 | |
| | | | |
| | Initial Shares | Service Shares | |
Expense paid per $1,000† | $5.01 | $6.45 | |
Ending value (after expenses) | $1,292.50 | $1,290.80 | |
COMPARING YOUR FUND’S EXPENSES
WITH THOSE OF OTHER FUNDS (Unaudited)
Using the SEC’s method to compare expenses
The Securities and Exchange Commission (“SEC”) has established guidelines to help investors assess fund expenses. Per these guidelines, the table below shows your fund’s expenses based on a $1,000 investment, assuming a hypothetical 5% annualized return. You can use this information to compare the ongoing expenses (but not transaction expenses or total cost) of investing in the fund with those of other funds. All mutual fund shareholder reports will provide this information to help you make this comparison. Please note that you cannot use this information to estimate your actual ending account balance and expenses paid during the period.
| | | | | |
Expenses and Value of a $1,000 Investment | |
Assuming a hypothetical 5% annualized return for the six months ended December 31, 2020 | |
| | | | |
| | Initial Shares | Service Shares | |
Expense paid per $1,000† | $4.42 | $5.69 | |
Ending value (after expenses) | $1,020.76 | $1,019.51 | |
† Expenses are equal to the fund’s annualized expense ratio of .87% for Initial Shares and 1.12% for Service Shares, multiplied by the average account value over the period, multiplied by 184/366 (to reflect the one-half year period). |
6
STATEMENT OF INVESTMENTS
December 31, 2020
| | | | | | | | |
| |
Description | | | | Shares | | Value ($) | |
Common Stocks - 99.2% | | | | | |
Automobiles & Components - 2.1% | | | | | |
Adient | | | | 12,190 | a | 423,846 | |
Dana | | | | 28,750 | | 561,200 | |
Gentex | | | | 35,640 | | 1,209,265 | |
Harley-Davidson | | | | 9,360 | | 343,512 | |
Thor Industries | | | | 4,880 | | 453,791 | |
Visteon | | | | 1,580 | a | 198,322 | |
| | | | | 3,189,936 | |
Banks - 6.7% | | | | | |
Associated Banc-Corp | | | | 46,810 | | 798,110 | |
Bank OZK | | | | 6,450 | | 201,692 | |
BOK Financial | | | | 5,150 | | 352,672 | |
Cathay General Bancorp | | | | 49,625 | | 1,597,429 | |
CIT Group | | | | 13,170 | | 472,803 | |
Comerica | | | | 8,510 | | 475,369 | |
East West Bancorp | | | | 9,960 | | 505,072 | |
Essent Group | | | | 15,470 | | 668,304 | |
First Citizens Bancshares, Cl. A | | | | 780 | | 447,931 | |
First Financial Bankshares | | | | 8,260 | | 298,806 | |
Glacier Bancorp | | | | 11,200 | | 515,312 | |
International Bancshares | | | | 17,530 | | 656,323 | |
KeyCorp | | | | 34,460 | | 565,489 | |
MGIC Investment | | | | 28,120 | | 352,906 | |
New York Community Bancorp | | | | 59,790 | | 630,784 | |
Prosperity Bancshares | | | | 5,080 | | 352,349 | |
Regions Financial | | | | 38,600 | | 622,232 | |
Western Alliance Bancorp | | | | 11,920 | | 714,604 | |
| | | | | 10,228,187 | |
Capital Goods - 11.3% | | | | | |
Acuity Brands | | | | 9,240 | | 1,118,872 | |
AGCO | | | | 5,340 | | 550,501 | |
Axon Enterprise | | | | 2,370 | a | 290,396 | |
Carlisle | | | | 2,780 | | 434,180 | |
Colfax | | | | 8,720 | a,b | 333,453 | |
Crane | | | | 8,860 | | 688,068 | |
Curtiss-Wright | | | | 8,980 | | 1,044,823 | |
Donaldson | | | | 16,980 | | 948,842 | |
Dycom Industries | | | | 3,850 | a | 290,752 | |
EMCOR Group | | | | 13,130 | | 1,200,870 | |
EnerSys | | | | 3,330 | | 276,590 | |
Fortune Brands Home & Security | | | | 4,100 | | 351,452 | |
GATX | | | | 1,630 | | 135,583 | |
7
STATEMENT OF INVESTMENTS (continued)
| | | | | | | | |
| |
Description | | | | Shares | | Value ($) | |
Common Stocks - 99.2% (continued) | | | | | |
Capital Goods - 11.3% (continued) | | | | | |
Generac Holdings | | | | 4,950 | a | 1,125,679 | |
Hubbell | | | | 2,740 | | 429,605 | |
ITT | | | | 12,680 | | 976,614 | |
Lennox International | | | | 690 | | 189,039 | |
Lincoln Electric Holdings | | | | 3,400 | | 395,250 | |
MasTec | | | | 9,630 | a,b | 656,573 | |
Nordson | | | | 3,110 | | 624,954 | |
Owens Corning | | | | 5,360 | | 406,074 | |
Regal Beloit | | | | 6,580 | | 808,090 | |
Simpson Manufacturing | | | | 5,730 | | 535,468 | |
Sunrun | | | | 5,740 | a | 398,241 | |
Teledyne Technologies | | | | 890 | a | 348,862 | |
The Middleby | | | | 2,800 | a | 360,976 | |
The Timken Company | | | | 15,950 | | 1,233,892 | |
Trex | | | | 5,240 | a,b | 438,693 | |
Trinity Industries | | | | 7,420 | b | 195,814 | |
Univar Solutions | | | | 13,430 | a | 255,304 | |
Watsco | | | | 1,300 | | 294,515 | |
| | | | | 17,338,025 | |
Commercial & Professional Services - 2.5% | | | | | |
Clean Harbors | | | | 7,330 | a | 557,813 | |
CoreLogic | | | | 5,120 | | 395,878 | |
FTI Consulting | | | | 3,020 | a | 337,394 | |
Healthcare Services Group | | | | 7,940 | | 223,114 | |
Herman Miller | | | | 6,000 | | 202,800 | |
HNI | | | | 16,600 | | 572,036 | |
IAA | | | | 6,070 | a | 394,429 | |
Insperity | | | | 4,230 | | 344,407 | |
ManpowerGroup | | | | 4,610 | | 415,730 | |
Tetra Tech | | | | 3,110 | | 360,076 | |
| | | | | 3,803,677 | |
Consumer Durables & Apparel - 4.5% | | | | | |
Brunswick | | | | 7,940 | | 605,346 | |
Carter's | | | | 4,860 | | 457,180 | |
Deckers Outdoor | | | | 4,630 | a | 1,327,791 | |
Helen of Troy | | | | 1,720 | a,b | 382,167 | |
Peloton Interactive, Cl. A | | | | 3,910 | a | 593,225 | |
Polaris | | | | 7,960 | | 758,429 | |
PulteGroup | | | | 4,420 | | 190,590 | |
PVH | | | | 2,990 | | 280,731 | |
Tempur Sealy International | | | | 29,310 | a | 791,370 | |
Toll Brothers | | | | 4,410 | | 191,703 | |
TopBuild | | | | 3,510 | a | 646,121 | |
8
| | | | | | | | |
| |
Description | | | | Shares | | Value ($) | |
Common Stocks - 99.2% (continued) | | | | | |
Consumer Durables & Apparel - 4.5% (continued) | | | | | |
TRI Pointe Group | | | | 33,840 | a,b | 583,740 | |
Whirlpool | | | | 690 | | 124,538 | |
| | | | | 6,932,931 | |
Consumer Services - 4.9% | | | | | |
Adtalem Global Education | | | | 6,620 | a | 224,749 | |
Boyd Gaming | | | | 17,960 | | 770,843 | |
Caesars Entertainment | | | | 13,320 | a | 989,276 | |
Chipotle Mexican Grill | | | | 340 | a | 471,481 | |
Churchill Downs | | | | 930 | b | 181,155 | |
Graham Holdings, Cl. B | | | | 960 | | 512,045 | |
Grand Canyon Education | | | | 4,070 | a | 378,958 | |
Jack in the Box | | | | 6,470 | | 600,416 | |
Marriott Vacations Worldwide | | | | 1,680 | | 230,530 | |
Papa John's International | | | | 4,270 | | 362,309 | |
Penn National Gaming | | | | 10,190 | a,b | 880,110 | |
Planet Fitness, Cl. A | | | | 5,960 | a | 462,675 | |
Scientific Games | | | | 4,490 | a | 186,290 | |
Service Corp. International | | | | 15,770 | | 774,307 | |
Strategic Education | | | | 1,180 | | 112,489 | |
WW International | | | | 4,020 | a | 98,088 | |
Wyndham Destinations | | | | 7,930 | | 355,740 | |
| | | | | 7,591,461 | |
Diversified Financials - 3.5% | | | | | |
Eaton Vance | | | | 8,110 | | 550,912 | |
Evercore, Cl. A | | | | 1,740 | | 190,774 | |
FactSet Research Systems | | | | 1,110 | | 369,075 | |
Federated Hermes | | | | 16,330 | | 471,774 | |
Interactive Brokers Group, Cl. A | | | | 4,770 | | 290,588 | |
Janus Henderson Group | | | | 10,300 | | 334,853 | |
Jefferies Financial Group | | | | 21,560 | | 530,376 | |
OneMain Holdings | | | | 8,520 | | 410,323 | |
PROG Holdings | | | | 4,950 | | 266,657 | |
SEI Investments | | | | 24,380 | | 1,401,119 | |
Stifel Financial | | | | 10,845 | | 547,239 | |
| | | | | 5,363,690 | |
Energy - 2.1% | | | | | |
Antero Midstream | | | | 40,710 | | 313,874 | |
ChampionX | | | | 15,940 | a | 243,882 | |
CNX Resources | | | | 15,010 | a | 162,108 | |
EQT | | | | 12,340 | | 156,841 | |
Equitrans Midstream | | | | 34,090 | | 274,084 | |
Halliburton | | | | 14,770 | | 279,153 | |
Marathon Oil | | | | 47,470 | | 316,625 | |
9
STATEMENT OF INVESTMENTS (continued)
| | | | | | | | |
| |
Description | | | | Shares | | Value ($) | |
Common Stocks - 99.2% (continued) | | | | | |
Energy - 2.1% (continued) | | | | | |
Murphy Oil | | | | 43,670 | | 528,407 | |
NOV | | | | 21,360 | a | 293,273 | |
World Fuel Services | | | | 10,600 | | 330,296 | |
WPX Energy | | | | 44,690 | a | 364,223 | |
| | | | | 3,262,766 | |
Food & Staples Retailing - .9% | | | | | |
BJ's Wholesale Club Holdings | | | | 11,020 | a | 410,826 | |
Casey's General Stores | | | | 3,510 | | 626,956 | |
Sprouts Farmers Market | | | | 16,880 | a | 339,288 | |
| | | | | 1,377,070 | |
Food, Beverage & Tobacco - 1.5% | | | | | |
Campbell Soup | | | | 4,340 | | 209,839 | |
Conagra Brands | | | | 3,750 | | 135,975 | |
Darling Ingredients | | | | 8,540 | a | 492,587 | |
Flowers Foods | | | | 30,740 | | 695,646 | |
The Boston Beer Company, Cl. A | | | | 380 | a | 377,830 | |
The Hain Celestial Group | | | | 5,810 | a | 233,272 | |
TreeHouse Foods | | | | 4,520 | a | 192,055 | |
| | | | | 2,337,204 | |
Health Care Equipment & Services - 6.2% | | | | | |
Acadia Healthcare | | | | 5,340 | a | 268,389 | |
Align Technology | | | | 970 | a | 518,349 | |
Amedisys | | | | 2,730 | a | 800,791 | |
AmerisourceBergen | | | | 2,180 | | 213,117 | |
Cantel Medical | | | | 3,430 | | 270,490 | |
Chemed | | | | 2,070 | | 1,102,503 | |
DaVita | | | | 1,500 | a | 176,100 | |
Globus Medical, Cl. A | | | | 5,060 | a | 330,013 | |
Haemonetics | | | | 1,280 | a | 152,000 | |
HealthEquity | | | | 2,760 | a | 192,400 | |
Hill-Rom Holdings | | | | 8,220 | | 805,313 | |
ICU Medical | | | | 830 | a | 178,027 | |
LHC Group | | | | 2,010 | a | 428,773 | |
McKesson | | | | 860 | | 149,571 | |
Molina Healthcare | | | | 3,310 | a | 703,971 | |
Neogen | | | | 4,250 | a | 337,025 | |
NuVasive | | | | 4,660 | a | 262,498 | |
Patterson Companies | | | | 6,580 | | 194,965 | |
Quidel | | | | 1,140 | a | 204,801 | |
Steris | | | | 7,170 | | 1,359,002 | |
Teladoc Health | | | | 2,220 | a,b | 443,911 | |
Tenet Healthcare | | | | 10,100 | a | 403,293 | |
| | | | | 9,495,302 | |
10
| | | | | | | | |
| |
Description | | | | Shares | | Value ($) | |
Common Stocks - 99.2% (continued) | | | | | |
Household & Personal Products - .6% | | | | | |
Nu Skin Enterprises, Cl. A | | | | 12,770 | | 697,625 | |
The Clorox Company | | | | 840 | | 169,613 | |
| | | | | 867,238 | |
Insurance - 4.2% | | | | | |
First American Financial | | | | 12,020 | | 620,593 | |
Globe Life | | | | 7,850 | | 745,436 | |
Kemper | | | | 9,700 | | 745,251 | |
Mercury General | | | | 4,080 | | 213,017 | |
Primerica | | | | 15,195 | | 2,035,066 | |
Reinsurance Group of America | | | | 4,070 | | 471,713 | |
RenaissanceRe Holdings | | | | 1,680 | | 278,578 | |
Selective Insurance Group | | | | 6,030 | | 403,889 | |
The Hanover Insurance Group | | | | 5,770 | | 674,628 | |
White Mountains Insurance Group | | | | 210 | | 210,139 | |
| | | | | 6,398,310 | |
Materials - 5.1% | | | | | |
Avient | | | | 10,320 | | 415,690 | |
Compass Minerals International | | | | 2,750 | | 169,730 | |
Eagle Materials | | | | 7,430 | | 753,030 | |
Element Solutions | | | | 10,410 | | 184,569 | |
FMC | | | | 980 | | 112,631 | |
Graphic Packaging Holding | | | | 26,360 | | 446,538 | |
Ingevity | | | | 1,720 | a | 130,256 | |
Louisiana-Pacific | | | | 11,470 | | 426,340 | |
Minerals Technologies | | | | 8,250 | | 512,490 | |
NewMarket | | | | 840 | | 334,564 | |
Reliance Steel & Aluminum | | | | 10,600 | | 1,269,350 | |
RPM International | | | | 10,020 | | 909,616 | |
Silgan Holdings | | | | 11,280 | | 418,262 | |
The Chemours Company | | | | 14,670 | | 363,669 | |
The Scotts Miracle-Gro Company | | | | 3,180 | | 633,265 | |
Valvoline | | | | 17,750 | | 410,735 | |
Worthington Industries | | | | 6,000 | | 308,040 | |
| | | | | 7,798,775 | |
Media & Entertainment - 2.2% | | | | | |
Cable One | | | | 300 | | 668,316 | |
Cinemark Holdings | | | | 13,690 | b | 238,343 | |
DISH Network, Cl. A | | | | 6,220 | a | 201,155 | |
Lions Gate Entertainment, Cl. A | | | | 18,050 | a,b | 205,229 | |
Take-Two Interactive Software | | | | 770 | a | 159,998 | |
The Interpublic Group of Companies | | | | 6,390 | | 150,293 | |
The New York Times Company, Cl. A | | | | 16,440 | | 851,099 | |
World Wrestling Entertainment, Cl. A | | | | 2,980 | | 143,189 | |
11
STATEMENT OF INVESTMENTS (continued)
| | | | | | | | |
| |
Description | | | | Shares | | Value ($) | |
Common Stocks - 99.2% (continued) | | | | | |
Media & Entertainment - 2.2% (continued) | | | | | |
Yelp | | | | 17,560 | a | 573,685 | |
Zillow Group, Cl. C | | | | 1,200 | a | 155,760 | |
| | | | | 3,347,067 | |
Pharmaceuticals Biotechnology & Life Sciences - 5.4% | | | | | |
Bio-Rad Laboratories, Cl. A | | | | 1,440 | a | 839,434 | |
Bio-Techne | | | | 870 | | 276,269 | |
Catalent | | | | 7,000 | a | 728,490 | |
Charles River Laboratories International | | | | 6,780 | a | 1,694,051 | |
Emergent BioSolutions | | | | 3,650 | a | 327,040 | |
Exelixis | | | | 23,510 | a | 471,846 | |
Halozyme Therapeutics | | | | 5,090 | a,b | 217,394 | |
Jazz Pharmaceuticals | | | | 3,450 | a | 569,422 | |
Medpace Holdings | | | | 1,680 | a | 233,856 | |
PRA Health Sciences | | | | 5,220 | a | 654,797 | |
Prestige Consumer Healthcare | | | | 6,300 | a | 219,681 | |
Repligen | | | | 6,060 | a | 1,161,278 | |
Seagen | | | | 2,510 | a | 439,601 | |
Syneos Health | | | | 5,500 | a | 374,715 | |
United Therapeutics | | | | 1,110 | a | 168,487 | |
| | | | | 8,376,361 | |
Real Estate - 8.8% | | | | | |
Brandywine Realty Trust | | | | 91,300 | c | 1,087,383 | |
Camden Property Trust | | | | 4,920 | c | 491,606 | |
CoreSite Realty | | | | 1,250 | c | 156,600 | |
Corporate Office Properties Trust | | | | 46,760 | c | 1,219,501 | |
Cousins Properties | | | | 18,540 | c | 621,090 | |
CyrusOne | | | | 1,960 | c | 143,374 | |
EastGroup Properties | | | | 4,940 | c | 682,016 | |
First Industrial Realty Trust | | | | 46,870 | c | 1,974,633 | |
Gaming & Leisure Properties | | | | 26 | c | 1,102 | |
Healthcare Realty Trust | | | | 20,130 | c | 595,848 | |
Highwoods Properties | | | | 17,200 | c | 681,636 | |
Lamar Advertising, Cl. A | | | | 16,875 | c | 1,404,337 | |
Life Storage | | | | 5,050 | c | 602,919 | |
Omega Healthcare Investors | | | | 17,800 | c | 646,496 | |
Physicians Realty Trust | | | | 20,030 | c | 356,534 | |
PS Business Parks | | | | 9,850 | c | 1,308,769 | |
Sabra Health Care REIT | | | | 22,550 | c | 391,693 | |
Service Properties Trust | | | | 27,895 | c | 320,514 | |
Weingarten Realty Investors | | | | 37,580 | c | 814,359 | |
| | | | | 13,500,410 | |
Retailing - 3.6% | | | | | |
AutoNation | | | | 5,750 | a | 401,292 | |
12
| | | | | | | | |
| |
Description | | | | Shares | | Value ($) | |
Common Stocks - 99.2% (continued) | | | | | |
Retailing - 3.6% (continued) | | | | | |
Dick's Sporting Goods | | | | 7,420 | | 417,078 | |
Foot Locker | | | | 8,290 | | 335,248 | |
Kohl's | | | | 14,380 | | 585,122 | |
Lithia Motors, Cl. A | | | | 1,990 | | 582,413 | |
Murphy USA | | | | 2,320 | | 303,618 | |
Nordstrom | | | | 9,410 | b | 293,686 | |
Ollie's Bargain Outlet Holdings | | | | 5,010 | a,b | 409,668 | |
Pool | | | | 900 | | 335,250 | |
RH | | | | 1,690 | a | 756,309 | |
Wayfair, Cl. A | | | | 1,880 | a,b | 424,523 | |
Williams-Sonoma | | | | 6,870 | | 699,641 | |
| | | | | 5,543,848 | |
Semiconductors & Semiconductor Equipment - 5.6% | | | | | |
Cirrus Logic | | | | 9,890 | a | 812,958 | |
Enphase Energy | | | | 8,380 | a | 1,470,439 | |
First Solar | | | | 6,080 | a | 601,434 | |
MKS Instruments | | | | 2,180 | | 327,981 | |
Monolithic Power Systems | | | | 3,420 | | 1,252,507 | |
Qorvo | | | | 1,370 | a | 227,790 | |
Semtech | | | | 8,660 | a | 624,299 | |
Silicon Laboratories | | | | 4,240 | a | 539,922 | |
SolarEdge Technologies | | | | 1,200 | a | 382,944 | |
Synaptics | | | | 3,570 | a,b | 344,148 | |
Teradyne | | | | 15,800 | | 1,894,262 | |
Universal Display | | | | 870 | | 199,926 | |
| | | | | 8,678,610 | |
Software & Services - 8.0% | | | | | |
Alliance Data Systems | | | | 6,950 | | 514,995 | |
CACI International, Cl. A | | | | 3,330 | a | 830,269 | |
CDK Global | | | | 4,340 | | 224,942 | |
Ceridian HCM Holding | | | | 4,570 | a | 486,979 | |
Concentrix | | | | 3,260 | a | 321,762 | |
DocuSign | | | | 1,860 | a | 413,478 | |
Fair Isaac | | | | 2,250 | a | 1,149,840 | |
Fortinet | | | | 1,360 | a | 202,001 | |
HubSpot | | | | 1,160 | a | 459,870 | |
J2 Global | | | | 10,640 | a,b | 1,039,422 | |
KBR | | | | 19,230 | | 594,784 | |
Leidos Holdings | | | | 3,590 | | 377,381 | |
Manhattan Associates | | | | 4,740 | a | 498,553 | |
Medallia | | | | 14,690 | a,b | 488,002 | |
Nuance Communications | | | | 10,650 | a,b | 469,558 | |
Palo Alto Networks | | | | 1,470 | a | 522,423 | |
13
STATEMENT OF INVESTMENTS (continued)
| | | | | | | | |
| |
Description | | | | Shares | | Value ($) | |
Common Stocks - 99.2% (continued) | | | | | |
Software & Services - 8.0% (continued) | | | | | |
Paylocity Holding | | | | 1,620 | a | 333,574 | |
PTC | | | | 4,350 | a | 520,303 | |
Qualys | | | | 3,760 | a | 458,231 | |
Splunk | | | | 2,780 | a | 472,294 | |
Teradata | | | | 7,580 | a | 170,323 | |
Twilio, Cl. A | | | | 1,410 | a | 477,285 | |
WEX | | | | 5,920 | a | 1,204,898 | |
| | | | | 12,231,167 | |
Technology Hardware & Equipment - 4.6% | | | | | |
Arrow Electronics | | | | 5,470 | a | 532,231 | |
Avnet | | | | 19,150 | | 672,356 | |
Ciena | | | | 18,200 | a | 961,870 | |
Cognex | | | | 9,870 | | 792,413 | |
II-VI | | | | 7,350 | a,b | 558,306 | |
InterDigital | | | | 5,780 | | 350,730 | |
Jabil | | | | 4,410 | | 187,557 | |
Lumentum Holdings | | | | 6,240 | a | 591,552 | |
NCR | | | | 19,180 | a | 720,593 | |
NETSCOUT Systems | | | | 8,270 | a | 226,763 | |
SYNNEX | | | | 3,260 | | 265,494 | |
Trimble | | | | 14,360 | a | 958,817 | |
Zebra Technologies, Cl. A | | | | 570 | a | 219,068 | |
| | | | | 7,037,750 | |
Telecommunication Services - .1% | | | | | |
Telephone & Data Systems | | | | 8,490 | | 157,659 | |
Transportation - 1.4% | | | | | |
Avis Budget Group | | | | 10,340 | a | 385,682 | |
Kansas City Southern | | | | 660 | | 134,726 | |
Old Dominion Freight Line | | | | 1,775 | | 346,445 | |
Werner Enterprises | | | | 6,750 | | 264,735 | |
XPO Logistics | | | | 8,250 | a | 983,400 | |
| | | | | 2,114,988 | |
Utilities - 3.4% | | | | | |
Black Hills | | | | 4,760 | | 292,502 | |
Hawaiian Electric Industries | | | | 15,240 | | 539,344 | |
IDACORP | | | | 11,750 | | 1,128,352 | |
MDU Resources Group | | | | 26,510 | | 698,273 | |
NorthWestern | | | | 4,050 | | 236,156 | |
OGE Energy | | | | 36,770 | | 1,171,492 | |
ONE Gas | | | | 9,010 | | 691,698 | |
Spire | | | | 8,270 | | 529,611 | |
| | | | | 5,287,428 | |
Total Common Stocks (cost $120,591,713) | | | | 152,259,860 | |
14
| | | | | | | | |
| |
Description | | 1-Day
Yield (%) | | Shares | | Value ($) | |
Investment Companies - .8% | | | | | |
Registered Investment Companies - .8% | | | | | |
Dreyfus Institutional Preferred Government Plus Money Market Fund, Institutional Shares
(cost $1,225,389) | | 0.09 | | 1,225,389 | d | 1,225,389 | |
| | | | | | | | |
Investment of Cash Collateral for Securities Loaned - .5% | | | | | |
Registered Investment Companies - .5% | | | | | |
Dreyfus Institutional Preferred Government Plus Money Market Fund, SL Shares
(cost $827,423) | | 0.05 | | 827,423 | d | 827,423 | |
Total Investments (cost $122,644,525) | | 100.5% | | 154,312,672 | |
Liabilities, Less Cash and Receivables | | (.5%) | | (802,242) | |
Net Assets | | 100.0% | | 153,510,430 | |
REIT—Real Estate Investment Trust
aNon-income producing security.
bSecurity, or portion thereof, on loan. At December 31, 2020, the value of the fund’s securities on loan was $7,655,641 and the value of the collateral was $7,864,881, consisting of cash collateral of $827,423 and U.S. Government & Agency securities valued at $7,037,458.
cInvestment in real estate investment trust within the United States.
dInvestment in affiliated issuer. The investment objective of this investment company is publicly available and can be found within the investment company’s prospectus.
| | |
Portfolio Summary (Unaudited) † | Value (%) |
Information Technology | 18.2 |
Consumer Discretionary | 15.2 |
Industrials | 15.2 |
Financials | 14.3 |
Health Care | 11.6 |
Real Estate | 8.8 |
Materials | 5.1 |
Utilities | 3.4 |
Consumer Staples | 3.0 |
Communication Services | 2.3 |
Energy | 2.1 |
Investment Companies | 1.3 |
| | 100.5 |
† Based on net assets.
See notes to financial statements.
15
STATEMENT OF INVESTMENTS IN AFFILIATED ISSUERS
| | | | | | | | | | |
Investment Companies | Value
12/31/19 ($) | Purchases ($)† | Sales ($) | Value
12/31/20 ($) | Net
Assets(%) | Dividends/
Distributions ($) |
Registered Investment Companies; |
Dreyfus Institutional Preferred Government Plus Money Market Fund, Institutional Shares | 1,003,692 | 23,740,514 | (23,518,817) | 1,225,389 | .8 | 4,986 |
Investment of Cash Collateral for Securities Loaned:†† |
Dreyfus Institutional Preferred Government Plus Money Market Fund, Institutional Shares | 386,235 | 9,797,325 | (10,183,560) | - | - | 21,650††† |
Dreyfus Institutional Preferred Government Plus Money Market Fund, SL Shares | - | 2,516,219 | (1,688,796) | 827,423 | .5 | 3,139††† |
Total | 1,389,927 | 36,054,058 | (35,391,173) | 2,052,812 | 1.3 | 29,775 |
† Included reinvested dividends/distributions.
†† Effective November 9, 2020, cash collateral for securities lending was transferred from Dreyfus Institutional Preferred Government Plus Money Market Fund, Institutional Shares to Dreyfus Institutional Preferred Government Plus Money Market Fund, SL Shares.
††† Represents securities lending income earned from the reinvestment of cash collateral from loaned securities, net of fees and collateral investment expenses, and other payments to and from borrowers of securities.
See notes to financial statements.
16
STATEMENT OF ASSETS AND LIABILITIES
December 31, 2020
| | | | | | | |
| | | | | | |
| | | Cost | | Value | |
Assets ($): | | | | |
Investments in securities—See Statement of Investments
(including securities on loan, valued at $7,655,641)—Note 1(c): | | | |
Unaffiliated issuers | 120,591,713 | | 152,259,860 | |
Affiliated issuers | | 2,052,812 | | 2,052,812 | |
Receivable for shares of Beneficial Interest subscribed | | 123,317 | |
Dividends and securities lending income receivable | | 99,945 | |
Prepaid expenses | | | | | 2,831 | |
| | | | | 154,538,765 | |
Liabilities ($): | | | | |
Due to BNY Mellon Investment Adviser, Inc. and affiliates—Note 3(b) | | 119,224 | |
Liability for securities on loan—Note 1(c) | | 827,423 | |
Payable for shares of Beneficial Interest redeemed | | 13,052 | |
Trustees’ fees and expenses payable | | 1,464 | |
Other accrued expenses | | | | | 67,172 | |
| | | | | 1,028,335 | |
Net Assets ($) | | | 153,510,430 | |
Composition of Net Assets ($): | | | | |
Paid-in capital | | | | | 120,057,772 | |
Total distributable earnings (loss) | | | | | 33,452,658 | |
Net Assets ($) | | | 153,510,430 | |
| | | | |
Net Asset Value Per Share | Initial Shares | Service Shares | |
Net Assets ($) | 75,648,823 | 77,861,607 | |
Shares Outstanding | 3,795,707 | 3,923,755 | |
Net Asset Value Per Share ($) | 19.93 | 19.84 | |
| | | |
See notes to financial statements. | | | |
17
STATEMENT OF OPERATIONS
Year Ended December 31, 2020
| | | | | | | |
| | | | | | |
| | | | | | |
Investment Income ($): | | | | |
Income: | | | | |
Cash dividends (net of $1,491 foreign taxes withheld at source): | |
Unaffiliated issuers | | | 2,166,876 | |
Affiliated issuers | | | 4,863 | |
Income from securities lending—Note 1(c) | | | 24,789 | |
Interest | | | 180 | |
Total Income | | | 2,196,708 | |
Expenses: | | | | |
Management fee—Note 3(a) | | | 979,797 | |
Distribution fees—Note 3(b) | | | 161,947 | |
Professional fees | | | 84,325 | |
Prospectus and shareholders’ reports | | | 18,533 | |
Chief Compliance Officer fees—Note 3(b) | | | 13,982 | |
Custodian fees—Note 3(b) | | | 10,326 | |
Trustees’ fees and expenses—Note 3(c) | | | 8,708 | |
Loan commitment fees—Note 2 | | | 4,944 | |
Shareholder servicing costs—Note 3(b) | | | 1,413 | |
Miscellaneous | | | 17,872 | |
Total Expenses | | | 1,301,847 | |
Investment Income—Net | | | 894,861 | |
Realized and Unrealized Gain (Loss) on Investments—Note 4 ($): | | |
Net realized gain (loss) on investments | 3,458,899 | |
Capital gain distributions from affiliated issuers | 123 | |
Net Realized Gain (Loss) | | | 3,459,022 | |
Net change in unrealized appreciation (depreciation) on investments | 6,471,918 | |
Net Realized and Unrealized Gain (Loss) on Investments | | | 9,930,940 | |
Net Increase in Net Assets Resulting from Operations | | 10,825,801 | |
| | | | | | |
See notes to financial statements. | | | | | |
18
STATEMENT OF CHANGES IN NET ASSETS
| | | | | | | | | | |
| | | | Year Ended December 31, |
| | | | 2020 | | 2019 | |
Operations ($): | | | | | | | | |
Investment income—net | | | 894,861 | | | | 921,708 | |
Net realized gain (loss) on investments | | 3,459,022 | | | | (2,572,437) | |
Net change in unrealized appreciation
(depreciation) on investments | | 6,471,918 | | | | 28,415,232 | |
Net Increase (Decrease) in Net Assets
Resulting from Operations | 10,825,801 | | | | 26,764,503 | |
Distributions ($): | |
Distributions to shareholders: | | | | | | | | |
Initial Shares | | | (552,702) | | | | (6,099,962) | |
Service Shares | | | (343,563) | | | | (5,546,134) | |
Total Distributions | | | (896,265) | | | | (11,646,096) | |
Beneficial Interest Transactions ($): | |
Net proceeds from shares sold: | | | | | | | | |
Initial Shares | | | 7,458,751 | | | | 3,870,606 | |
Service Shares | | | 14,678,777 | | | | 10,588,703 | |
Distributions reinvested: | | | | | | | | |
Initial Shares | | | 552,702 | | | | 6,099,962 | |
Service Shares | | | 343,563 | | | | 5,546,134 | |
Cost of shares redeemed: | | | | | | | | |
Initial Shares | | | (13,780,638) | | | | (13,408,861) | |
Service Shares | | | (16,960,443) | | | | (12,102,125) | |
Increase (Decrease) in Net Assets
from Beneficial Interest Transactions | (7,707,288) | | | | 594,419 | |
Total Increase (Decrease) in Net Assets | 2,222,248 | | | | 15,712,826 | |
Net Assets ($): | |
Beginning of Period | | | 151,288,182 | | | | 135,575,356 | |
End of Period | | | 153,510,430 | | | | 151,288,182 | |
Capital Share Transactions (Shares): | |
Initial Shares | | | | | | | | |
Shares sold | | | 456,232 | | | | 216,730 | |
Shares issued for distributions reinvested | | | 45,155 | | | | 351,583 | |
Shares redeemed | | | (828,281) | | | | (752,804) | |
Net Increase (Decrease) in Shares Outstanding | (326,894) | | | | (184,491) | |
Service Shares | | | | | | | | |
Shares sold | | | 938,110 | | | | 600,304 | |
Shares issued for distributions reinvested | | | 28,138 | | | | 320,957 | |
Shares redeemed | | | (1,060,385) | | | | (685,012) | |
Net Increase (Decrease) in Shares Outstanding | (94,137) | | | | 236,249 | |
| | | | | | | | | |
See notes to financial statements. | | | | | | | | |
19
FINANCIAL HIGHLIGHTS
The following tables describe the performance for each share class for the fiscal periods indicated. All information (except portfolio turnover rate) reflects financial results for a single fund share. Net asset value total return is calculated assuming an initial investment made at the net asset value at the beginning of the period, reinvestment of all dividends and distributions at net asset value during the period, and redemption at net asset value on the last day of the period. Net asset value total return includes adjustments in accordance with accounting principles generally accepted in the United States of America and as such, the net asset value for financial reporting purposes and the returns based upon those net asset values may differ from the net asset value and returns for shareholder transactions. The fund’s total returns do not reflect expenses associated with variable annuity or insurance contracts. These figures have been derived from the fund’s financial statements.
| | | | | | | |
| | | |
| | | |
| | | Year Ended December 31, |
Initial Shares | | 2020 | 2019 | 2018 | 2017 | 2016 |
Per Share Data ($): | | | | | | |
Net asset value, beginning of period | | 18.64 | 16.80 | 22.56 | 20.09 | 18.95 |
Investment Operations: | | | | | | |
Investment income—neta | | .13 | .13 | .12 | .10 | .21 |
Net realized and unrealized
gain (loss) on investments | | 1.30 | 3.15 | (3.19) | 2.92 | 2.50 |
Total from Investment Operations | | 1.43 | 3.28 | (3.07) | 3.02 | 2.71 |
Distributions: | | | | | | |
Dividends from
investment income—net | | (.14) | (.12) | (.13) | (.22) | (.21) |
Dividends from
net realized gain on investments | | - | (1.32) | (2.56) | (.33) | (1.36) |
Total Distributions | | (.14) | (1.44) | (2.69) | (.55) | (1.57) |
Net asset value, end of period | | 19.93 | 18.64 | 16.80 | 22.56 | 20.09 |
Total Return (%) | | 8.11 | 20.18 | (15.49) | 15.38 | 15.47 |
Ratios/Supplemental Data (%): | | | | | | |
Ratio of total expenses
to average net assets | | .87 | .86 | .86 | .87 | .85 |
Ratio of net investment income
to average net assets | | .81 | .73 | .59 | .50 | 1.16 |
Portfolio Turnover Rate | | 92.40 | 82.88 | 68.02 | 64.86 | 65.52 |
Net Assets, end of period ($ x 1,000) | | 75,649 | 76,835 | 72,374 | 92,776 | 123,226 |
a Based on average shares outstanding.
See notes to financial statements.
20
| | | | | | | |
| | | |
| | | |
| | | Year Ended December 31, |
Service Shares | | 2020 | 2019 | 2018 | 2017 | 2016 |
Per Share Data ($): | | | | | | |
Net asset value, beginning of period | | 18.53 | 16.71 | 22.45 | 20.00 | 18.88 |
Investment Operations: | | | | | | |
Investment income—neta | | .09 | .09 | .07 | .06 | .17 |
Net realized and unrealized
gain (loss) on investments | | 1.31 | 3.12 | (3.18) | 2.90 | 2.47 |
Total from Investment Operations | | 1.40 | 3.21 | (3.11) | 2.96 | 2.64 |
Distributions: | | | | | | |
Dividends from
investment income—net | | (.09) | (.07) | (.07) | (.18) | (.16) |
Dividends from
net realized gain on investments | | - | (1.32) | (2.56) | (.33) | (1.36) |
Total Distributions | | (.09) | (1.39) | (2.63) | (.51) | (1.52) |
Net asset value, end of period | | 19.84 | 18.53 | 16.71 | 22.45 | 20.00 |
Total Return (%) | | 7.85 | 19.85 | (15.69) | 15.04 | 15.20 |
Ratios/Supplemental Data (%): | | | | | | |
Ratio of total expenses
to average net assets | | 1.12 | 1.11 | 1.11 | 1.12 | 1.10 |
Ratio of net investment income
to average net assets | | .56 | .48 | .34 | .28 | .94 |
Portfolio Turnover Rate | | 92.40 | 82.88 | 68.02 | 64.86 | 65.52 |
Net Assets, end of period ($ x 1,000) | | 77,862 | 74,454 | 63,202 | 76,948 | 63,972 |
a Based on average shares outstanding.
See notes to financial statements.
21
NOTES TO FINANCIAL STATEMENTS
NOTE 1—Significant Accounting Policies:
MidCap Stock Portfolio (the “fund”) is a separate diversified series of BNY Mellon Investment Portfolios (the “Company”), which is registered under the Investment Company Act of 1940, as amended (the “Act”), as an open-end management investment company and operates as a series company currently offering three series, including the fund. The fund is only offered to separate accounts established by insurance companies to fund variable annuity contracts and variable life insurance policies. The fund’s investment objective is to seek investment results that are greater than the total return performance of publicly traded common stocks of medium-size domestic companies in the aggregate, as represented by the Standard & Poor’s MidCap 400® Index. BNY Mellon Investment Adviser, Inc. (the “Adviser”), a wholly-owned subsidiary of The Bank of New York Mellon Corporation (“BNY Mellon”), serves as the fund’s investment adviser.
BNY Mellon Securities Corporation (the “Distributor”), a wholly-owned subsidiary of the Adviser, is the distributor of the fund’s shares, which are sold without a sales charge. The fund is authorized to issue an unlimited number of $.001 par value shares of Beneficial Interest in each of the following classes of shares: Initial and Service. Each class of shares has identical rights and privileges, except with respect to the Distribution Plan, and the expenses borne by each class, the allocation of certain transfer agency costs, and certain voting rights. Income, expenses (other than expenses attributable to a specific class), and realized and unrealized gains or losses on investments are allocated to each class of shares based on its relative net assets.
The Company accounts separately for the assets, liabilities and operations of each series. Expenses directly attributable to each series are charged to that series’ operations; expenses which are applicable to all series are allocated among them on a pro rata basis.
The Financial Accounting Standards Board (“FASB”) Accounting Standards Codification (“ASC”) is the exclusive reference of authoritative U.S. generally accepted accounting principles (“GAAP”) recognized by the FASB to be applied by nongovernmental entities. Rules and interpretive releases of the Securities and Exchange Commission (“SEC”) under authority of federal laws are also sources of authoritative GAAP for SEC registrants. The fund is an investment company and applies the accounting and reporting guidance of the FASB ASC Topic 946 Financial Services-Investment Companies. The fund’s financial statements are prepared in accordance with GAAP, which may require the use of management
22
estimates and assumptions. Actual results could differ from those estimates.
The Company enters into contracts that contain a variety of indemnifications. The fund’s maximum exposure under these arrangements is unknown. The fund does not anticipate recognizing any loss related to these arrangements.
(a) Portfolio valuation: The fair value of a financial instrument is the amount that would be received to sell an asset or paid to transfer a liability in an orderly transaction between market participants at the measurement date (i.e., the exit price). GAAP establishes a fair value hierarchy that prioritizes the inputs of valuation techniques used to measure fair value. This hierarchy gives the highest priority to unadjusted quoted prices in active markets for identical assets or liabilities (Level 1 measurements) and the lowest priority to unobservable inputs (Level 3 measurements).
Additionally, GAAP provides guidance on determining whether the volume and activity in a market has decreased significantly and whether such a decrease in activity results in transactions that are not orderly. GAAP requires enhanced disclosures around valuation inputs and techniques used during annual and interim periods.
Various inputs are used in determining the value of the fund’s investments relating to fair value measurements. These inputs are summarized in the three broad levels listed below:
Level 1—unadjusted quoted prices in active markets for identical investments.
Level 2—other significant observable inputs (including quoted prices for similar investments, interest rates, prepayment speeds, credit risk, etc.).
Level 3—significant unobservable inputs (including the fund’s own assumptions in determining the fair value of investments).
The inputs or methodology used for valuing securities are not necessarily an indication of the risk associated with investing in those securities.
Changes in valuation techniques may result in transfers in or out of an assigned level within the disclosure hierarchy. Valuation techniques used to value the fund’s investments are as follows:
Investments in equity securities are valued at the last sales price on the securities exchange or national securities market on which such securities are primarily traded. Securities listed on the National Market System for which market quotations are available are valued at the official closing
23
NOTES TO FINANCIAL STATEMENTS (continued)
price or, if there is no official closing price that day, at the last sales price. For open short positions, asked prices are used for valuation purposes. Bid price is used when no asked price is available. Registered investment companies that are not traded on an exchange are valued at their net asset value. All of the preceding securities are generally categorized within Level 1 of the fair value hierarchy.
Securities not listed on an exchange or the national securities market, or securities for which there were no transactions, are valued at the average of the most recent bid and asked prices. These securities are generally categorized within Level 2 of the fair value hierarchy.
Fair valuing of securities may be determined with the assistance of a pricing service using calculations based on indices of domestic securities and other appropriate indicators, such as prices of relevant American Depository Receipts and futures. Utilizing these techniques may result in transfers between Level 1 and Level 2 of the fair value hierarchy.
When market quotations or official closing prices are not readily available, or are determined not to accurately reflect fair value, such as when the value of a security has been significantly affected by events after the close of the exchange or market on which the security is principally traded (for example, a foreign exchange or market), but before the fund calculates its net asset value, the fund may value these investments at fair value as determined in accordance with the procedures approved by the Company’s Board of Trustees (the “Board”). Certain factors may be considered when fair valuing investments such as: fundamental analytical data, the nature and duration of restrictions on disposition, an evaluation of the forces that influence the market in which the securities are purchased and sold, and public trading in similar securities of the issuer or comparable issuers. These securities are either categorized within Level 2 or 3 of the fair value hierarchy depending on the relevant inputs used.
For securities where observable inputs are limited, assumptions about market activity and risk are used and such securities are generally categorized within Level 3 of the fair value hierarchy.
The following is a summary of the inputs used as of December 31, 2020 in valuing the fund’s investments:
24
| | | | | |
| | Level 1 -
Unadjusted
Quoted Prices | Level 2 – Other
Significant
Observable
Inputs | Level 3 -
Significant
Unobservable
Inputs | Total |
Assets ($) | | | | |
Investments in Securities:† | | | | |
Equity Securities-
Common Stocks | 152,259,860 | - | - | 152,259,860 |
Investment Companies | 2,052,812 | - | - | 2,052,812 |
† See Statement of Investments for additional detailed categorizations, if any.
(b) Foreign Taxes: The fund may be subject to foreign taxes (a portion of which may be reclaimable) on income, stock dividends, realized and unrealized capital gains on investments or certain foreign currency transactions. Foreign taxes are recorded in accordance with the applicable foreign tax regulations and rates that exist in the foreign jurisdictions in which the fund invests. These foreign taxes, if any, are paid by the fund and are reflected in the Statement of Operations, if applicable. Foreign taxes payable or deferred or those subject to reclaims as of December 31, 2020, if any, are disclosed in the fund’s Statement of Assets and Liabilities.
(c) Securities transactions and investment income: Securities transactions are recorded on a trade date basis. Realized gains and losses from securities transactions are recorded on the identified cost basis. Dividend income is recognized on the ex-dividend date and interest income, including, where applicable, accretion of discount and amortization of premium on investments, is recognized on the accrual basis.
Pursuant to a securities lending agreement with The Bank of New York Mellon, a subsidiary of BNY Mellon and an affiliate of the Adviser, the fund may lend securities to qualified institutions. It is the fund’s policy that, at origination, all loans are secured by collateral of at least 102% of the value of U.S. securities loaned and 105% of the value of foreign securities loaned. Collateral equivalent to at least 100% of the market value of securities on loan is maintained at all times. Collateral is either in the form of cash, which can be invested in certain money market mutual funds managed by the Adviser, or U.S. Government and Agency securities. The fund is entitled to receive all dividends, interest and distributions on securities loaned, in addition to income earned as a result of the lending transaction. Should a borrower fail to return the securities in a timely manner, The Bank of New York Mellon is required to replace the securities for the benefit of the fund or credit the fund with the market value of the unreturned securities and is subrogated to the fund’s rights against the borrower and the collateral. Additionally, the contractual
25
NOTES TO FINANCIAL STATEMENTS (continued)
maturity of security lending transactions are on an overnight and continuous basis. During the period ended December 31, 2020, The Bank of New York Mellon earned $4,961 from the lending of the fund’s portfolio securities, pursuant to the securities lending agreement.
(d) Affiliated issuers: Investments in other investment companies advised by the Adviser are considered “affiliated” under the Act.
(e) Risk: Certain events particular to the industries in which the fund’s investments conduct their operations, as well as general economic, political and public health conditions, may have a significant negative impact on the investee’s operations and profitability. In addition, turbulence in financial markets and reduced liquidity in equity, credit and/or fixed income markets may negatively affect many issuers, which could adversely affect the fund. Global economies and financial markets are becoming increasingly interconnected, and conditions and events in one country, region or financial market may adversely impact issuers in a different country, region or financial market. These risks may be magnified if certain events or developments adversely interrupt the global supply chain; in these and other circumstances, such risks might affect companies world-wide. Recent examples include pandemic risks related to COVID-19 and aggressive measures taken world-wide in response by governments, including closing borders, restricting international and domestic travel, and the imposition of prolonged quarantines of large populations, and by businesses, including changes to operations and reducing staff. To the extent the fund may overweight its investments in certain countries, companies, industries or market sectors, such positions will increase the fund’s exposure to risk of loss from adverse developments affecting those countries, companies, industries or sectors.
(f) Dividends and distributions to shareholders: Dividends and distributions are recorded on the ex-dividend date. Dividends from investment income-net and dividends from net realized capital gains, if any, are normally declared and paid annually, but the fund may make distributions on a more frequent basis to comply with the distribution requirements of the Internal Revenue Code of 1986, as amended (the “Code”). To the extent that net realized capital gains can be offset by capital loss carryovers, it is the policy of the fund not to distribute such gains. Income and capital gain distributions are determined in accordance with income tax regulations, which may differ from GAAP.
(g) Federal income taxes: It is the policy of the fund to continue to qualify as a regulated investment company, if such qualification is in the best interests of its shareholders, by complying with the applicable provisions of the Code, and to make distributions of taxable income and
26
net realized capital gain sufficient to relieve it from substantially all federal income and excise taxes.
As of and during the period ended December 31, 2020, the fund did not have any liabilities for any uncertain tax positions. The fund recognizes interest and penalties, if any, related to uncertain tax positions as income tax expense in the Statement of Operations. During the period ended December 31, 2020, the fund did not incur any interest or penalties.
Each tax year in the four-year period ended December 31, 2020 remains subject to examination by the Internal Revenue Service and state taxing authorities.
At December 31, 2020, the components of accumulated earnings on a tax basis were as follows: undistributed ordinary income $922,462, undistributed capital gains $1,096,701 and unrealized appreciation $31,433,495.
The tax character of distributions paid to shareholders during the fiscal periods ended December 31, 2020 and December 31, 2019 were as follows: ordinary income $896,265 and $799,710, and long-term capital gains $0 and $10,846,386, respectively.
NOTE 2—Bank Lines of Credit:
The fund participates with other long-term open-end funds managed by the Adviser in a $823.5 million unsecured credit facility led by Citibank, N.A. (the “Citibank Credit Facility”) and a $300 million unsecured credit facility provided by The Bank of New York Mellon (the “BNYM Credit Facility”), each to be utilized primarily for temporary or emergency purposes, including the financing of redemptions (each, a “Facility”). The Citibank Credit Facility is available in two tranches: (i) Tranche A is in an amount equal to $688.5 million and is available to all long-term open-ended funds, including the fund, and (ii) Tranche B is an amount equal to $135 million and is available only to BNY Mellon Floating Rate Income Fund, a series of BNY Mellon Investment Funds IV, Inc. Prior to September 30, 2020, the Citibank Credit Facility was $927 million with Tranche A available in an amount equal to $747 million and Tranche B available in an amount equal to $180 million. Prior to March 11, 2020, the Citibank Credit Facility was $1.030 billion with Tranche A available in an amount equal to $830 million and Tranche B available in an amount equal to $200 million. In connection therewith, the fund has agreed to pay its pro rata portion of commitment fees for Tranche A of the Citibank Credit Facility and the BNYM Credit Facility. Interest is charged to the fund based on rates determined pursuant to the terms of the respective Facility
27
NOTES TO FINANCIAL STATEMENTS (continued)
at the time of borrowing. During the period ended December 31, 2020, the fund did not borrow under the Facilities.
NOTE 3—Management Fee and Other Transactions with Affiliates:
(a) Pursuant to a management agreement with the Adviser, the management fee is computed at the annual rate of .75% of the value of the fund's average daily net assets and is payable monthly. The Adviser has contractually agreed, from May 1, 2020 through May 1, 2021, to waive receipt of its fees and/or assume the expenses of the fund, so that the direct expenses of the fund (excluding Rule 12b-1 Distribution Plan fees, taxes, interest expense, brokerage commissions, commitment fees on borrowings and extraordinary expenses) do not exceed 1.00%. On or after May 1, 2021, the Adviser may terminate this expense limitation at any time. During the period ended December 31, 2020, there were no reduction in expense pursuant to undertaking.
(b) Under the Distribution Plan adopted pursuant to Rule 12b-1 under the Act, Service shares pay the Distributor for distributing its shares, for servicing and/or maintaining Service shares’ shareholder accounts and for advertising and marketing for Service shares. The Distribution Plan provides for payments to be made at an annual rate of .25% of the value of the Service shares’ average daily net assets. The Distributor may make payments to Participating Insurance Companies and to brokers and dealers acting as principal underwriter for their variable insurance products. The fees payable under the Distribution Plan are payable without regard to actual expenses incurred. During the period ended December 31, 2020, Service shares were charged $161,947 pursuant to the Distribution Plan.
The fund has an arrangement with the transfer agent whereby the fund may receive earnings credits when positive cash balances are maintained, which are used to offset transfer agency fees. For financial reporting purposes, the fund includes net earnings credits, if any, as shareholder servicing costs in the Statement of Operations.
The fund has an arrangement with the custodian whereby the fund will receive interest income or be charged an overdraft fees when cash balances are maintained. For financial reporting purposes, the fund includes this interest income and overdraft fees, if any, as interest income in the Statement of Operations.
The fund compensates BNY Mellon Transfer, Inc., a wholly-owned subsidiary of the Adviser, under a transfer agency agreement for providing transfer agency and cash management services inclusive of earnings credits, if any, for the fund. The majority of transfer agency fees are comprised of
28
amounts paid on a per account basis, while cash management fees are related to fund subscriptions and redemptions. During the period ended December 31, 2020, the fund was charged $1,237 for transfer agency services, inclusive of earnings credit, if any. These fees are included in Shareholder servicing costs in the Statement of Operations.
The fund compensates The Bank of New York Mellon under a custody agreement for providing custodial services for the fund. These fees are determined based on net assets, geographic region and transaction activity. During the period ended December 31, 2020, the fund was charged $10,326 pursuant to the custody agreement.
During the period ended December 31, 2020, the fund was charged $13,982 for services performed by the Chief Compliance Officer and his staff. These fees are included in Chief Compliance Officer fees in the Statement of Operations.
The components of “Due to BNY Mellon Investment Adviser, Inc. and affiliates” in the Statement of Assets and Liabilities consist of: management fees of $95,942, Distribution Plan fees of $16,089, custodian fees of $4,056, Chief Compliance Officer fees of $2,903 and transfer agency fees of $234.
(c) Each Board member also serves as a Board member of other funds in the BNY Mellon Family of Funds complex. Annual retainer fees and attendance fees are allocated to each fund based on net assets.
NOTE 4—Securities Transactions:
The aggregate amount of purchases and sales of investment securities, excluding short-term securities, during the period ended December 31, 2020, amounted to $120,427,615 and $128,364,915, respectively.
At December 31, 2020, the cost of investments for federal income tax purposes was $122,879,177; accordingly, accumulated net unrealized appreciation on investments was $31,433,495, consisting of $34,746,746 gross unrealized appreciation and $3,313,251 gross unrealized depreciation.
29
REPORT OF INDEPENDENT REGISTERED PUBLIC ACCOUNTING FIRM
To the Shareholders and the Board of Trustees of MidCap Stock Portfolio
Opinion on the Financial Statements
We have audited the accompanying statement of assets and liabilities of MidCap Stock Portfolio (the “Fund”) (one of the funds constituting BNY Mellon Investment Portfolios), including the statements of investments and investments in affiliated issuers, as of December 31, 2020, and the related statement of operations for the year then ended, the statements of changes in net assets for each of the two years in the period then ended, the financial highlights for each of the five years in the period then ended and the related notes (collectively referred to as the “financial statements”). In our opinion, the financial statements present fairly, in all material respects, the financial position of the Fund (one of the funds constituting BNY Mellon Investment Portfolios) at December 31, 2020, the results of its operations for the year then ended, the changes in its net assets for each of the two years in the period then ended and its financial highlights for each of the five years in the period then ended, in conformity with U.S. generally accepted accounting principles.
Basis for Opinion
These financial statements are the responsibility of the Fund’s management. Our responsibility is to express an opinion on the Fund’s financial statements based on our audits. We are a public accounting firm registered with the Public Company Accounting Oversight Board (United States) (“PCAOB”) and are required to be independent with respect to the Fund in accordance with the U.S. federal securities laws and the applicable rules and regulations of the Securities and Exchange Commission and the PCAOB.
We conducted our audits in accordance with the standards of the PCAOB. Those standards require that we plan and perform the audit to obtain reasonable assurance about whether the financial statements are free of material misstatement, whether due to error or fraud. The Fund is not required to have, nor were we engaged to perform, an audit of the Fund’s internal control over financial reporting. As part of our audits, we are required to obtain an understanding of internal control over financial reporting, but not for the purpose of expressing an opinion on the effectiveness of the Fund’s internal control over financial reporting. Accordingly, we express no such opinion.
Our audits included performing procedures to assess the risks of material misstatement of the financial statements, whether due to error or fraud, and performing procedures that respond to those risks. Such procedures included examining, on a test basis, evidence regarding the amounts and disclosures in the financial statements. Our procedures included confirmation of securities owned as of December 31, 2020, by correspondence with the custodian and others or by other appropriate auditing procedures where replies from others were not received. Our audits also included evaluating the accounting principles used and significant estimates made by management, as well as evaluating the overall presentation of the financial statements. We believe that our audits provide a reasonable basis for our opinion.

We have served as the auditor of one or more investment companies in the BNY Mellon Family of Funds since at least 1957, but we are unable to determine the specific year.
New York, New York
February 9, 2021
30
IMPORTANT TAX INFORMATION (Unaudited)
For federal tax purposes, the portfolio hereby reports 100% of the ordinary dividends paid during the fiscal year ended December 31, 2020 as qualifying for the corporate dividends received deduction. Shareholders will receive notification in early 2021 of the percentage applicable to the preparation of their 2020 income tax returns.
31
INFORMATION ABOUT THE RENEWAL OF THE FUND’S INVESTMENT ADVISORY AGREEMENT (Unaudited)
At a meeting of the fund’s Board of Trustees held on July 20-21, 2020, the Board considered the renewal of the fund’s Management Agreement pursuant to which the Adviser provides the fund with investment advisory and administrative services (the “Agreement”). The Board members, none of whom are “interested persons” (as defined in the Investment Company Act of 1940, as amended) of the fund, were assisted in their review by independent legal counsel and met with counsel in executive session separate from representatives of the Adviser. In considering the renewal of the Agreement, the Board considered several factors that it believed to be relevant, including those discussed below. The Board did not identify any one factor as dispositive, and each Board member may have attributed different weights to the factors considered.
Analysis of Nature, Extent, and Quality of Services Provided to the Fund. The Board considered information provided to it at the meeting and in previous presentations from representatives of the Adviser regarding the nature, extent, and quality of the services provided to funds in the BNY Mellon fund complex, including the fund. The Adviser provided the number of open accounts in the fund, the fund’s asset size and the allocation of fund assets among distribution channels. The Adviser also had previously provided information regarding the diverse intermediary relationships and distribution channels of funds in the BNY Mellon fund complex (such as retail direct or intermediary, in which intermediaries typically are paid by the fund and/or the Adviser) and the Adviser’s corresponding need for broad, deep, and diverse resources to be able to provide ongoing shareholder services to each intermediary or distribution channel, as applicable to the fund.
The Board also considered research support available to, and portfolio management capabilities of, the fund’s portfolio management personnel and that the Adviser also provides oversight of day-to-day fund operations, including fund accounting and administration and assistance in meeting legal and regulatory requirements. The Board also considered the Adviser’s extensive administrative, accounting and compliance infrastructures. The Board also considered portfolio management’s brokerage policies and practices (including policies and practices regarding soft dollars) and the standards applied in seeking best execution.
Comparative Analysis of the Fund’s Performance and Management Fee and Expense Ratio. The Board reviewed reports prepared by Broadridge Financial Solutions, Inc. (“Broadridge”), an independent provider of investment company data based on classifications provided by Thomson Reuters Lipper, which included information comparing (1) the performance of the fund’s Initial shares with the performance of a group of small-cap core funds underlying variable insurance products (“VIPs”) selected by Broadridge as comparable to the fund (the “Performance Group”) and with a broader group of funds consisting of all small-cap core funds underlying VIPs (the “Performance Universe”), all for various periods ended May 31, 2020, and (2) the fund’s actual and contractual management fees and total expenses with those of the same
32
group of funds in the Performance Group (the “Expense Group”) and with a broader group of small-cap core funds underlying VIPs with similar 12b-1/non12b-1 structures, excluding outliers (the “Expense Universe”), the information for which was derived in part from fund financial statements available to Broadridge as of the date of its analysis. The Adviser previously had furnished the Board with a description of the methodology Broadridge used to select the Performance Group and Performance Universe and the Expense Group and Expense Universe.
Performance Comparisons. Representatives of the Adviser stated that the usefulness of performance comparisons may be affected by a number of factors, including different investment limitations and policies that may be applicable to the fund and comparison funds and the end date selected. The Board discussed with representatives of the Adviser the results of the comparisons and considered that the fund’s total return performance was at or above the Performance Group and Performance Universe medians for all periods, except the three- and four-year periods when performance was below the medians and the five-year period when it was below the Performance Universe median. The Adviser also provided a comparison of the fund’s calendar year total returns to the returns of the fund’s benchmark index, and it was noted that the fund’s returns were above the returns of the index in five of the ten calendar years shown.
Management Fee and Expense Ratio Comparisons. The Board reviewed and considered the contractual management fee rate payable by the fund to the Adviser in light of the nature, extent and quality of the management services provided by the Adviser. In addition, the Board reviewed and considered the actual management fee rate paid by the fund over the fund’s last fiscal year. The Board also reviewed the range of actual and contractual management fees and total expenses as a percentage of average net assets of the Expense Group and Expense Universe funds and discussed the results of the comparisons. The Board considered that the fund’s contractual management fee was lower than the Expense Group median contractual management fee, the fund’s actual management fee was lower than the Expense Group and Expense Universe actual management fee medians and the fund’s total expenses were slightly higher than the Expense Group and Expense Universe total expenses medians.
Representatives of the Adviser stated that the Adviser has contractually agreed, until May 1, 2021, to waive receipt of its fees and/or assume the direct expenses of the fund so that the direct expenses of none of its classes (excluding Rule 12b-1 fees, shareholder services fees, taxes, interest, brokerage commissions, commitment fees on borrowings and extraordinary expenses) exceed 1.00% of the fund’s average daily net assets.
Representatives of the Adviser reviewed with the Board the management or investment advisory fees paid by funds advised or administered by the Adviser that are in the same Lipper category as the fund (the “Similar Funds”), and explained the nature of the Similar Funds. They discussed differences in fees paid and the relationship of the fees paid in light of any differences in the services provided and other relevant factors. The Board considered the relevance of the fee information provided for the Similar Funds to evaluate the appropriateness of the fund’s management fee. Representatives of the
33
INFORMATION ABOUT THE RENEWAL OF THE FUND’S INVESTMENT ADVISORY AGREEMENT (Unaudited) (continued)
Adviser noted that there were no separate accounts and/or other types of client portfolios advised by the Adviser that are considered to have similar investment strategies and policies as the fund.
Analysis of Profitability and Economies of Scale. Representatives of the Adviser reviewed the expenses allocated and profit received by the Adviser and its affiliates and the resulting profitability percentage for managing the fund and the aggregate profitability percentage to the Adviser and its affiliates for managing the funds in the BNY Mellon fund complex, and the method used to determine the expenses and profit. The Board concluded that the profitability results were not excessive, given the services rendered and service levels provided by the Adviser and its affiliates. The Board also had been provided with information prepared by an independent consulting firm regarding the Adviser’s approach to allocating costs to, and determining the profitability of, individual funds and the entire BNY Mellon fund complex. The consulting firm also had analyzed where any economies of scale might emerge in connection with the management of a fund.
The Board considered, on the advice of its counsel, the profitability analysis (1) as part of its evaluation of whether the fees under the Agreement, considered in relation to the mix of services provided by the Adviser, including the nature, extent and quality of such services, supported the renewal of the Agreement and (2) in light of the relevant circumstances for the fund and the extent to which economies of scale would be realized if the fund grows and whether fee levels reflect these economies of scale for the benefit of fund shareholders. Representatives of the Adviser stated that a discussion of economies of scale is predicated on a fund having achieved a substantial size with increasing assets and that, if a fund’s assets had been stable or decreasing, the possibility that the Adviser may have realized any economies of scale would be less. Representatives of the Adviser also stated that, as a result of shared and allocated costs among funds in the BNY Mellon fund complex, the extent of economies of scale could depend substantially on the level of assets in the complex as a whole, so that increases and decreases in complex-wide assets can affect potential economies of scale in a manner that is disproportionate to, or even in the opposite direction from, changes in the fund’s asset level. The Board also considered potential benefits to the Adviser from acting as investment adviser and took into consideration the soft dollar arrangements in effect for trading the fund’s investments.
At the conclusion of these discussions, the Board agreed that it had been furnished with sufficient information to make an informed business decision with respect to the renewal of the Agreement. Based on the discussions and considerations as described above, the Board concluded and determined as follows.
· The Board concluded that the nature, extent and quality of the services provided by the Adviser are adequate and appropriate.
· The Board was satisfied with the fund’s improved performance.
34
· The Board concluded that the fee paid to the Adviser continued to be appropriate under the circumstances and in light of the factors and the totality of the services provided as discussed above.
· The Board determined that the economies of scale which may accrue to the Adviser and its affiliates in connection with the management of the fund had been adequately considered by the Adviser in connection with the fee rate charged to the fund pursuant to the Agreement and that, to the extent in the future it were determined that material economies of scale had not been shared with the fund, the Board would seek to have those economies of scale shared with the fund.
In evaluating the Agreement, the Board considered these conclusions and determinations and also relied on its previous knowledge, gained through meetings and other interactions with the Adviser and its affiliates, of the Adviser and the services provided to the fund by the Adviser. The Board also relied on information received on a routine and regular basis throughout the year relating to the operations of the fund and the investment management and other services provided under the Agreement, including information on the investment performance of the fund in comparison to similar mutual funds and benchmark performance indices; general market outlook as applicable to the fund; and compliance reports. In addition, the Board’s consideration of the contractual fee arrangements for the fund had the benefit of a number of years of reviews of the Agreement for the fund, or substantially similar agreements for other BNY Mellon funds that the Board oversees, during which lengthy discussions took place between the Board and representatives of the Adviser. Certain aspects of the arrangements may receive greater scrutiny in some years than in others, and the Board’s conclusions may be based, in part, on their consideration of the fund’s arrangements, or substantially similar arrangements for other BNY Mellon funds that the Board oversees, in prior years. The Board determined to renew the Agreement.
35
BOARD MEMBERS INFORMATION (Unaudited)
INDEPENDENT BOARD MEMBERS
Joseph S. DiMartino (77)
Chairman of the Board (1995)
Principal Occupation During Past 5 Years:
· Director or Trustee of funds in the BNY Mellon Family of Funds and certain other entities (as described in the fund’s Statement of Additional Information) (1995-Present)
Other Public Company Board Memberships During Past 5 Years:
· CBIZ, Inc., a public company providing professional business services, products and solutions, Director (1997-Present)
No. of Portfolios for which Board Member Serves: 109
———————
Francine J. Bovich (69)
Board Member (2015)
Principal Occupation During Past 5 Years:
· Trustee, The Bradley Trusts, private trust funds (2011-Present)
Other Public Company Board Memberships During Past 5 Years:
· Annaly Capital Management, Inc., a real estate investment trust, Director (2014-Present)
No. of Portfolios for which Board Member Serves: 66
———————
J. Charles Cardona (65)
Board Member (2014)
Principal Occupation During Past 5 Years:
· BNY Mellon Liquidity Funds, Director (2004-Present) and Chairman (since 2019)
· President and Director of the Adviser (2008-2016)
· Chief Executive Officer of Dreyfus Cash Investment Strategies, a division of the Adviser (2009-2016)
· Chairman (2013 – 2016) Director (2005-2016) and Executive Vice President (2006-2015) of the Distributor
Other Public Company Board Memberships During Past 5 Years:
· BNY Mellon ETF Trust, Chairman and Trustee (2020-Present)
No. of Portfolios for which Board Member Serves: 38
———————
Gordon J. Davis (79)
Board Member (2012)
Principal Occupation During Past 5 Years:
· Partner in the law firm of Venable LLP (2012-Present)
No. of Portfolios for which Board Member Serves: 48
———————
36
Andrew J. Donohue (70)
Board Member (2019)
Principal Occupation During Past 5 Years:
· Of Counsel, Shearman & Sterling LLP (2017-2019)
· Chief of Staff to the Chair of the SEC (2015-2017)
· Managing Director and Investment Company General Counsel of Goldman Sachs (2012-2015)
· Attorney, Solo Law Practice (2019-Present)
Other Public Company Board Memberships During Past 5 Years:
· Oppenheimer Funds (58 funds), Director (2017-2019)
No. of Portfolios for which Board Member Serves: 52
———————
Isabel P. Dunst (73)
Board Member (2014)
Principal Occupation During Past 5 Years:
· Hogan Lovells LLP, a law firm, Senior Counsel (2018-2019); Of Counsel (2015-2018); Partner (1990-2014)
· Member of the Board of Governors, Hebrew Union College Jewish Institute of Religion (2015-Present)
· Board Member, Bend the ARC, a civil rights organization, (2016- Present)
No. of Portfolios for which Board Member Serves: 30
———————
Nathan Leventhal (77)
Board Member (2009)
Principal Occupation During Past 5 Years:
· President Emeritus of Lincoln Center for the Performing Arts (2001-Present)
· President of the Palm Beach Opera (2016-Present)
Other Public Company Board Memberships During Past 5 Years:
· Movado Group, Inc., a public company that designs, sources, markets and distributes watches Director (2003-Present)
No. of Portfolios for which Board Member Serves: 44
———————
37
BOARD MEMBERS INFORMATION (Unaudited) (continued)
INDEPENDENT BOARD MEMBERS (continued)
Robin A. Melvin (57)
Board Member (2014)
Principal Occupation During Past 5 Years:
· Co-Chair, Mentor Illinois, a non-profit organization dedicated to increasing the quality of mentoring services in Illinois (2014 - 2020); Board member, Mentor Illinois (2013-2020)
· Trustee, Westover School, a private girls' boarding school in Middlebury, Connecticut (2019-Present)
No. of Portfolios for which Board Member Serves: 87
———————
Roslyn M. Watson (71)
Board Member (2014)
Principal Occupation During Past 5 Years:
· Principal, Watson Ventures, Inc., a real estate investment company (1993-Present)
Other Public Company Board Memberships During Past 5 Years:
· American Express Bank, FSB, Director (1993-2018)
No. of Portfolios for which Board Member Serves: 52
———————
Benaree Pratt Wiley (74)
Board Member (2009)
Principal Occupation During Past 5 Years:
· Principal, The Wiley Group, a firm specializing in strategy and business development (2005-Present)
Other Public Company Board Memberships During Past 5 Years:
· CBIZ, Inc., a public company providing professional business services, products and solutions, Director (2008-Present)
· Blue Cross Blue Shield of Massachusetts, Director (2004-Present)
No. of Portfolios for which Board Member Serves: 70
———————
Once elected all Board Members serve for an indefinite term, but achieve Emeritus status upon reaching age 80. The address of the Board Members and Officers is c/o BNY Mellon Investment Adviser, Inc. 240 Greenwich Street, New York, New York 10286. Additional information about the Board Members is available in the fund’s Statement of Additional Information which can be obtained from the Adviser free of charge by calling this toll free number: 1-800-373-9387.
Clifford L. Alexander, Jr., Emeritus Board Member
Whitney I. Gerard, Emeritus Board Member
George L. Perry, Emeritus Board Member
38
OFFICERS OF THE FUND (Unaudited)
DAVID DIPETRILLO, President since January 2021.
Head of North America Product, BNY Mellon Investment Management since January 2018, Director of Product Strategy, BNY Mellon Investment Management from January 2016 to December 2017; Head of US Retail Product and Channel Marketing, BNY Mellon Investment Management from January 2014 to December 2015. He is an officer of 62 investment companies (comprised of 117 portfolios) managed by the Adviser or an affiliate of the Adviser. He is 42 years old and has been an employee of BNY Mellon since 2005.
JAMES WINDELS, Treasurer since November 2001.
Director-BNY Mellon Fund Administration, and an officer of 63 investment companies (comprised of 140 portfolios) managed by the Adviser or an affiliate of the Adviser. He is 62 years old and has been an employee of the Adviser since April 1985.
BENNETT A. MACDOUGALL, Chief Legal Officer since October 2015.
Chief Legal Officer of the Adviser and Associate General Counsel and Managing Director of BNY Mellon since June 2015; Director and Associate General Counsel of Deutsche Bank–Asset & Wealth Management Division from June 2005 to June 2015, and as Chief Legal Officer of Deutsche Investment Management Americas Inc. from June 2012 to May 2015. He is an officer of 63 investment companies (comprised of 140 portfolios) managed by the Adviser or an affiliate of the Adviser. He is 49 years old and has been an employee of the Adviser since June 2015.
JAMES BITETTO, Vice President since August 2005 and Secretary since February 2018.
Senior Managing Counsel of BNY Mellon since December 2019; Managing Counsel of BNY Mellon from April 2014 to December 2019; Secretary of the Adviser, and an officer of 63 investment companies (comprised of 140 portfolios) managed by the Adviser or an affiliate of the Adviser. He is 54 years old and has been an employee of the Adviser since December 1996.
DEIRDRE CUNNANE, Vice President and Assistant Secretary since March 2019.
Counsel of BNY Mellon since August 2018; Senior Regulatory Specialist at BNY Mellon Investment Management Services from February 2016 to August 2018; Trustee Associate at BNY Mellon Trust Company (Ireland) Limited from August 2013 to February 2016. She is an officer of 63 investment companies (comprised of 140 portfolios) managed by the Adviser or an affiliate of the Adviser. She is 30 years old and has been an employee of the Adviser since August 2018.
SARAH S. KELLEHER, Vice President and Assistant Secretary since April 2014.
Managing Counsel of BNY Mellon since December 2017, Senior Counsel of BNY Mellon from March 2013 to December 2017. She is an officer of 63 investment companies (comprised of 140 portfolios) managed by the Adviser or an affiliate of the Adviser. She is 45 years old and has been an employee of the Adviser since March 2013.
JEFF PRUSNOFSKY, Vice President and Assistant Secretary since August 2005.
Senior Managing Counsel of BNY Mellon, and an officer of 63 investment companies (comprised of 140 portfolios) managed by the Adviser or an affiliate of the Adviser. He is 55 years old and has been an employee of the Adviser since October 1990.
AMANDA QUINN, Vice President and Assistant Secretary since March 2020.
Counsel of BNY Mellon since June 2019; Regulatory Administration Manager at BNY Mellon Investment Management Services from September 2018 to May 2019; Senior Regulatory Specialist at BNY Mellon Investment Management Services from April 2015 to August 2018. She is an officer of 63 investment companies (comprised of 140 portfolios) managed by the Adviser or an affiliate of the Adviser. She is 35 years old and has been an employee of the Adviser since June 2019.
PETER M. SULLIVAN, Vice President and Assistant Secretary since March 2019.
Senior Managing Counsel of BNY Mellon since December 2020; Managing Counsel of BNY Mellon from March 2009 to December 2020, and an officer of 63 investment companies (comprised of 140 portfolios) managed by the the Adviser or an affiliate of the the Adviser. He is 52 years old and has been an employee of the BNY Mellon since April 2004.
39
OFFICERS OF THE FUND (Unaudited) (continued)
NATALYA ZELENSKY, Vice President and Assistant Secretary since March 2017.
Managing Counsel of BNY Mellon since December 2019; Counsel of BNY Mellon from May 2016 to December 2019; Assistant Secretary of the Adviser since 2018; Attorney at Wildermuth Endowment Strategy Fund/Wildermuth Advisory, LLC from November 2015 to May 2016 and Assistant General Counsel at RCS Advisory Services from July 2014 to November 2015. She is an officer of 63 investment companies (comprised of 140 portfolios) managed by the Adviser or an affiliate of the Adviser. She is 35 years old and has been an employee of the Adviser since May 2016.
GAVIN C. REILLY, Assistant Treasurer since December 2005.
Tax Manager-BNY Mellon Fund Administration, and an officer of 63 investment companies (comprised of 140 portfolios) managed by the Adviser or an affiliate of the Adviser. He is 52 years old and has been an employee of the Adviser since April 1991.
ROBERT S. ROBOL, Assistant Treasurer since August 2002.
Senior Accounting Manager-BNY Mellon Fund Administration, and an officer of 63 investment companies (comprised of 141 portfolios) managed by the Adviser or an affiliate of the Adviser. He is 56 years old and has been an employee of the Adviser since October 1988.
ROBERT SALVIOLO, Assistant Treasurer since July 2007.
Senior Accounting Manager–BNY Mellon Fund Administration, and an officer of 63 investment companies (comprised of 140 portfolios) managed by the Adviser or an affiliate of the Adviser. He is 53 years old and has been an employee of the Adviser since June 1989.
ROBERT SVAGNA, Assistant Treasurer since December 2002.
Senior Accounting Manager–BNY Mellon Fund Administration, and an officer of 63 investment companies (comprised of 140 portfolios) managed by the Adviser or an affiliate of the Adviser. He is 53 years old and has been an employee of the Adviser since November 1990.
JOSEPH W. CONNOLLY, Chief Compliance Officer since October 2004.
Chief Compliance Officer of the Adviser, the BNY Mellon Family of Funds and BNY Mellon Funds Trust (62 investment companies, comprised of 132 portfolios). He is 63 years old and has served in various capacities with the Adviser since 1980, including manager of the firm’s Fund Accounting Department from 1997 through October 2001.
CARIDAD M. CAROSELLA, Anti-Money Laundering Compliance Officer since January 2016.
Anti-Money Laundering Compliance Officer of the BNY Mellon Family of Funds and BNY Mellon Funds Trust since January 2016; from May 2015 to December 2015, Interim Anti-Money Laundering Compliance Officer of the BNY Mellon Family of Funds and BNY Mellon Funds Trust and the Distributor; from January 2012 to May 2015, AML Surveillance Officer of the Distributor. She is an officer of 56 investment companies (comprised of 133 portfolios) managed by the Adviser or an affiliate of the Adviser. She is 52 years old and has been an employee of the Distributor since 1997.
40
This page intentionally left blank.
41
BNY Mellon Investment Portfolios, MidCap Stock Portfolio
240 Greenwich Street
New York, NY 10286
Adviser
BNY Mellon Investment Adviser, Inc.
240 Greenwich Street
New York, NY 10286
Custodian
The Bank of New York Mellon
240 Greenwich Street
New York, NY 10286
Transfer Agent &
Dividend Disbursing Agent
BNY Mellon Transfer, Inc.
240 Greenwich Street
New York, NY 10286
Distributor
BNY Mellon Securities Corporation
240 Greenwich Street
New York, NY 10286
Telephone 1-800-258-4260 or 1-800-258-4261
Mail The BNY Mellon Family of Funds, 144 Glenn Curtiss Boulevard, Uniondale, NY 11556-0144 Attn: Institutional Services Department
E-mail Send your request to info@bnymellon.com
Internet Information can be viewed online or downloaded at www.im.bnymellon.com
The fund files its complete schedule of portfolio holdings with the Securities and Exchange Commission (“SEC”) for the first and third quarters of each fiscal year on Form N-PORT. The fund’s Forms N-PORT are available on the SEC’s website at www.sec.gov.
A description of the policies and procedures that the fund uses to determine how to vote proxies relating to portfolio securities and information regarding how the fund voted these proxies for the most recent 12-month period ended June 30 is available at www.im.bnymellon.com and on the SEC’s website at www.sec.gov and without charge, upon request, by calling 1-800-373-9387.
| | |
© 2021 BNY Mellon Securities Corporation
0174AR1220 | 
|
BNY Mellon Investment Portfolios, Small Cap Stock Index Portfolio
| |
ANNUAL REPORT December 31, 2020 |

| |
The views expressed in this report reflect those of the portfolio manager(s) only through the end of the period covered and do not necessarily represent the views of BNY Mellon Investment Adviser, Inc. or any other person in the BNY Mellon Investment Adviser, Inc. organization. Any such views are subject to change at any time based upon market or other conditions and BNY Mellon Investment Adviser, Inc. disclaims any responsibility to update such views. These views may not be relied on as investment advice and, because investment decisions for a fund in the BNY Mellon Family of Funds are based on numerous factors, may not be relied on as an indication of trading intent on behalf of any fund in the BNY Mellon Family of Funds. |
| |
Not FDIC-Insured • Not Bank-Guaranteed • May Lose Value |
Contents
THE FUND
FOR MORE INFORMATION
Back Cover
DISCUSSION OF FUND PERFORMANCE (Unaudited)
For the period from January 1, 2020 through December 31, 2020, as provided by Thomas J. Durante, CFA, David France, CFA, Todd Frysinger, CFA, Vlasta Sheremeta, CFA, Michael Stoll, and Marlene Walker Smith, of Mellon Investments Corporation, Sub-Investment Adviser
Market and Fund Performance Overview
For the 12-month period ended December 31, 2020, BNY Mellon Investment Portfolios, Small Cap Stock Index Portfolio produced a total return of 10.64%.1 In comparison, the fund’s benchmark, the S&P SmallCap 600® Index (the “Index”), produced a 11.29% total return for the same period.2,3
Small-cap stocks posted gains over the reporting period, bolstered by supportive central bank policies during the COVID-19 pandemic. The difference in returns between the fund and the Index was primarily the result of transaction costs and operating expenses that are not reflected in the Index’s results.
The Fund’s Investment Approach
The fund seeks to match the performance of the Index. To pursue its goal, the fund generally invests in all of the stocks that comprise the Index. The fund generally invests in all 600 stocks in the Index in proportion to their weighting in the Index; however, at times, the fund may invest in a representative sample of stocks included in the Index. Under these circumstances, the fund expects to invest in approximately 500 or more of the stocks in the Index.
Central Bank Policy and COVID-19 Influence Markets
After an optimistic end to 2019, markets gave way to extreme risk aversion in early 2020, as the global scope of the COVID-19 pandemic became apparent. Equity valuations in the U.S. remained robust throughout January and February 2020, while markets in areas that experienced the virus earlier, such as China, began to experience volatility closer to the start of the calendar year. Financial markets also had to contend with a second major shock in the form of an oil-price war between Saudi Arabia and Russia, which caused oil prices to fall precipitously in March 2020. Worldwide, governments and central banks launched an unprecedented array of fiscal initiatives that sought to offset the economic impact of widespread lockdown measures and bolster asset prices. The intervention provided comfort to investors, and indices began to rally towards the end of March 2020. Supported by the intervention, equities generally went on to stage a recovery that lasted through August 2020. However, the recovery was company and sector specific, as several industries that remained affected by COVID-19 prevention procedures did not fully participate.
In September, volatility crept back into equity markets, as increasing COVID-19 infection rates began to concern investors. By October, several countries had begun to reinstitute some degree of behavioral restriction among residents in order to stem the spread of the virus. In addition, mounting political rhetoric in the U.S. due to the election, renewed trade difficulties between the U.S. and China, and other geopolitical events stoked investor anxiety. However, resolution in the U.S. presidential election and promising progress towards a COVID-19 vaccine during the month of November 2020 helped stocks resurrect their upward momentum. December 2020 brought vaccine approvals and passage of another
2
U.S. fiscal stimulus package, both of which helped to support the rally which lasted through the end of the year.
According to the S&P family of indices, large-cap stocks generally outperformed their mid- and small-cap counterparts during the period.
Consumer Discretionary Names Support the U.S. Small-Cap Market
During the 12-month period, the S&P 600 Index posted positive returns. The consumer discretionary sector performed well, particularly within the household durables industry. Demand for items such as cleaning products and food storage containers was very strong during the lockdown, boosting stock prices for companies such as Tupperware Brands. Many internet and direct marketing retail companies also posted positive results. People opted to purchase things online as opposed to visiting stores where they could be exposed to the virus. Companies such as Bed Bath & Beyond and Stamps.com helped drive performance within the sector. Information technology companies also provided a tailwind to returns. Chip makers dominated the space, as demand for their products soared during the year. Due to the boost in e-commerce, payment providers also benefited from increased demand for their services, boosting stock prices. Networking equipment was also in high demand, as was 5G infrastructure equipment. Health care companies also performed well during the year. Health care providers were the best performing companies within the sector. Biotechnology also posted strong results. Smaller biotech companies are nimbler than their larger counterparts and can often pivot their research and development efforts quickly. Many companies partnered with larger drug makers to develop and distribute COVID-19 therapies and treatments, bolstering stock prices.
Conversely, a few sectors weighed on results for the year. Within the financials sector, small banks were particularly hard hit, as a large portion of their revenues depends on mortgage products. Lower rates generally reduce the profitability of lending money. In addition, high rates of unemployment during the period have investors concerned about a possible uptick in mortgage defaults. Banks have set aside large sums of money as reserves in case of loan defaults, which could imperil balance sheet health for these institutions. Insurance company stocks also came under pressure, as investors speculated over the possible extent of costs associated with COVID-19 claims. As people sheltered in place during the period, real estate securities were also hit. Commercial and retail REITs were negatively affected, as people worked from home and did not visit stores in person. Hotel REITs also suffered, as business and personal travel ground to a halt. The energy sector also performed poorly. Reduced demand for gasoline from commuters and business travelers has helped to depress oil prices. Lower oil prices have financially strained some energy companies, resulting in reduced dividends and investor speculation about corporate viability.
3
DISCUSSION OF FUND PERFORMANCE (Unaudited) (continued)
Replicating the Performance of the Index
Although we do not actively manage the fund’s investments in response to macroeconomic trends, it is worth noting that while the spread of COVID-19 and resulting economic implications continue to impact markets and the economy, the U.S. government and Federal Reserve remain dedicated to supporting capital markets and the economy with various fiscal and monetary techniques. As always, we will continue to monitor the factors affecting the fund’s investments.
January 15, 2021
1 Total return includes reinvestment of dividends and any capital gains paid. Past performance is no guarantee of future results. Share price and investment return fluctuate such that upon redemption, fund shares may be worth more or less than their original cost. The fund’s performance does not reflect the deduction of additional charges and expenses imposed in connection with investing in variable insurance contracts, which will reduce returns. The fund’s returns reflect the absorption of certain fund expenses by BNY Mellon Investment Adviser, Inc. pursuant to an agreement in effect that may be extended, terminated or modified at any time. Had these expenses not been absorbed, returns would have been lower.
2 Source: Lipper Inc. — The S&P SmallCap 600® Index measures the small-cap segment of the U.S. equity market. The index is designed to track companies that meet specific inclusion criteria to ensure that they are liquid and financially viable. Investors cannot invest directly in any index.
3 “Standard & Poor’s®,” “S&P®,” and “Standard & Poor’s® SmallCap 600 Index” are trademarks of Standard & Poor’s Financial Services LLC (“Standard & Poor’s”) and have been licensed for use by the fund. The fund is not sponsored, endorsed, sold or promoted by Standard & Poor’s, and Standard & Poor’s makes no representation regarding the advisability of investing in the fund.
Equities are subject generally to market, market sector, market liquidity, issuer and investment style risks, among other factors, to varying degrees, all of which are more fully described in the fund’s prospectus. Stocks of small- and/or mid-cap companies often experience sharper price fluctuations than stocks of large-cap companies.
Recent market risks include pandemic risks related to COVID-19. The effects of COVID-19 have contributed to increased volatility in global markets and will likely affect certain countries, companies, industries and market sectors more dramatically than others. To the extent the fund may overweight its investments in certain countries, companies, industries or market sectors, such positions will increase the fund’s exposure to risk of loss from adverse developments affecting those countries, companies, industries or sectors.
The fund may, but is not required to, use derivative instruments. A small investment in derivatives could have a potentially large impact on the fund’s performance. The use of derivatives involves risks different from, or possibly greater than, the risks associated with investing directly in the underlying assets.
The fund is only available as a funding vehicle under variable life insurance policies or variable annuity contracts issued by insurance companies. Individuals may not purchase shares of the fund directly. A variable annuity is an insurance contract issued by an insurance company that enables investors to accumulate assets on a tax-deferred basis for retirement or other long-term goals. The investment objective and policies of BNY Mellon Investment Portfolios, Small Cap Stock Index Portfolio made available through insurance products may be similar to those of other funds managed by BNY Mellon Investment Adviser, Inc. However, the investment results of the fund may be higher or lower than, and may not be comparable to, those of any other BNY Mellon Investment Adviser, Inc. fund.
4
FUND PERFORMANCE (Unaudited)
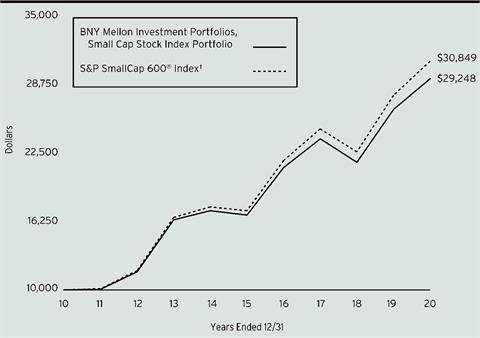
Comparison of change in value of a $10,000 investment in BNY Mellon Investment Portfolios, Small Cap Stock Index Portfolio shares with a hypothetical investment of $10,000 in the S&P SmallCap 600® Index (the “Index”)
† Source: Lipper Inc.
Past performance is not predictive of future performance. The fund’s performance does not reflect the deduction of additional charges and expenses imposed in connection with investing in variable insurance contracts which will reduce returns.
The above graph compares a hypothetical $10,000 investment made in BNY Mellon Investment Portfolios, Small Cap Stock Index Portfolio on 12/31/10 to a hypothetical investment of $10,000 made in the Index on that date.
The fund’s performance shown in the line graph above takes into account all applicable fees and expenses. The Index measures the small-cap segment of the U.S. equity market. The Index is designed to track companies that meet specific inclusion criteria to ensure that they are liquid and financially viable. Unlike a mutual fund, the Index is not subject to charges, fees and other expenses. Investors cannot invest directly in any index. Further information relating to fund performance, including expense reimbursements, if applicable, is contained in the Financial Highlights section of the prospectus and elsewhere in this report.
| | | | |
Average Annual Total Returns as of 12/31/2020 | |
| 1 Year | 5 Years | 10 Years |
Portfolio | 10.64% | 11.71% | 11.33% |
S&P SmallCap 600® Index | 11.29% | 12.37% | 11.92% |
The performance data quoted represents past performance, which is no guarantee of future results. Share price and investment return fluctuate and an investor’s shares may be worth more or less than original cost upon redemption. Current performance may be lower or higher than the performance quoted. Go to www.im.bnymellon.com for the fund’s most recent month-end returns.
The fund is subject to a 0.25% annual Rule 12b-1 fee. All dividends and capital gain distributions are reinvested.
The fund’s performance shown in the graph and table does not reflect the deduction of taxes that a shareholder would pay on fund distributions or the redemption of fund shares.
5
UNDERSTANDING YOUR FUND’S EXPENSES (Unaudited)
As a mutual fund investor, you pay ongoing expenses, such as management fees and other expenses. Using the information below, you can estimate how these expenses affect your investment and compare them with the expenses of other funds. You also may pay one-time transaction expenses, including sales charges (loads), redemption fees and expenses associated with variable annuity or insurance contracts, which are not shown in this section and would have resulted in higher total expenses. For more information, see your fund’s prospectus or talk to your financial adviser.
Review your fund’s expenses
The table below shows the expenses you would have paid on a $1,000 investment in BNY Mellon Investment Portfolios, Small Cap Stock Index Portfolio from July 1, 2020 to December 31, 2020. It also shows how much a $1,000 investment would be worth at the close of the period, assuming actual returns and expenses.
| | | | |
Expenses and Value of a $1,000 Investment | |
Assume actual returns for the six months ended December 31, 2020 | |
| | | |
| | | |
Expense paid per $1,000† | $3.55 | |
Ending value (after expenses) | $1,350.80 | |
COMPARING YOUR FUND’S EXPENSES
WITH THOSE OF OTHER FUNDS (Unaudited)
Using the SEC’s method to compare expenses
The Securities and Exchange Commission (“SEC”) has established guidelines to help investors assess fund expenses. Per these guidelines, the table below shows your fund’s expenses based on a $1,000 investment, assuming a hypothetical 5% annualized return. You can use this information to compare the ongoing expenses (but not transaction expenses or total cost) of investing in the fund with those of other funds. All mutual fund shareholder reports will provide this information to help you make this comparison. Please note that you cannot use this information to estimate your actual ending account balance and expenses paid during the period.
| | | | |
Expenses and Value of a $1,000 Investment | |
Assuming a hypothetical 5% annualized return for the six months ended December 31, 2020 | |
| | | |
| | | |
Expense paid per $1,000† | $3.05 | |
Ending value (after expenses) | $1,022.12 | |
† Expenses are equal to the fund’s annualized expense ratio of .60%, multiplied by the average account value over the period, multiplied by 184/366 (to reflect the one-half year period). |
6
STATEMENT OF INVESTMENTS
December 31, 2020
| | | | | | | | |
| |
Description | | | | Shares | | Value ($) | |
Common Stocks - 93.6% | | | | | |
Automobiles & Components - 1.7% | | | | | |
American Axle & Manufacturing Holdings | | | | 73,368 | a | 611,889 | |
Cooper Tire & Rubber | | | | 33,143 | | 1,342,292 | |
Cooper-Standard Holdings | | | | 10,931 | a | 378,978 | |
Dorman Products | | | | 19,243 | a | 1,670,677 | |
Gentherm | | | | 21,446 | a | 1,398,708 | |
LCI Industries | | | | 16,587 | | 2,151,002 | |
Motorcar Parts of America | | | | 12,423 | a,b | 243,739 | |
Patrick Industries | | | | 14,464 | | 988,614 | |
Standard Motor Products | | | | 13,354 | | 540,303 | |
Winnebago Industries | | | | 22,634 | | 1,356,682 | |
| | | | | 10,682,884 | |
Banks - 10.0% | | | | | |
Allegiance Bancshares | | | | 12,724 | | 434,270 | |
Ameris Bancorp | | | | 45,684 | | 1,739,190 | |
Axos Financial | | | | 34,057 | a | 1,278,159 | |
Banc of California | | | | 30,018 | | 441,565 | |
BancFirst | | | | 12,337 | b | 724,182 | |
BankUnited | | | | 61,256 | | 2,130,484 | |
Banner | | | | 23,101 | | 1,076,276 | |
Berkshire Hills Bancorp | | | | 33,328 | | 570,575 | |
Boston Private Financial Holdings | | | | 55,542 | | 469,330 | |
Brookline Bancorp | | | | 52,286 | | 629,523 | |
Cadence Bancorp | | | | 82,907 | | 1,361,333 | |
Capitol Federal Financial | | | | 85,530 | | 1,069,125 | |
Central Pacific Financial | | | | 19,206 | | 365,106 | |
City Holding | | | | 10,355 | | 720,190 | |
Columbia Banking System | | | | 47,056 | | 1,689,310 | |
Community Bank System | | | | 35,391 | | 2,205,213 | |
Customers Bancorp | | | | 18,933 | a | 344,202 | |
CVB Financial | | | | 84,503 | | 1,647,809 | |
Dime Community Bancshares | | | | 19,304 | | 304,424 | |
Eagle Bancorp | | | | 21,033 | | 868,663 | |
FB Financial | | | | 21,035 | b | 730,546 | |
First Bancorp/NC | | | | 19,455 | | 658,163 | |
First Bancorp/Puerto Rico | | | | 143,542 | | 1,323,457 | |
First Commonwealth Financial | | | | 64,084 | | 701,079 | |
First Financial Bancorp | | | | 64,444 | | 1,129,703 | |
First Hawaiian | | | | 87,515 | | 2,063,604 | |
First Midwest Bancorp | | | | 75,164 | | 1,196,611 | |
Flagstar Bancorp | | | | 31,311 | | 1,276,236 | |
7
STATEMENT OF INVESTMENTS (continued)
| | | | | | | | |
| |
Description | | | | Shares | | Value ($) | |
Common Stocks - 93.6% (continued) | | | | | |
Banks - 10.0% (continued) | | | | | |
Great Western Bancorp | | | | 35,760 | | 747,384 | |
Hanmi Financial | | | | 18,826 | | 213,487 | |
Heritage Financial | | | | 23,247 | | 543,747 | |
HomeStreet | | | | 14,636 | | 493,965 | |
Hope Bancorp | | | | 83,045 | | 906,021 | |
Independent Bank | | | | 21,654 | | 1,581,608 | |
Independent Bank Group | | | | 24,637 | | 1,540,305 | |
Meta Financial Group | | | | 22,084 | | 807,391 | |
Mr. Cooper Group | | | | 47,243 | a | 1,465,950 | |
National Bank Holdings, Cl. A | | | | 20,309 | | 665,323 | |
NBT Bancorp | | | | 28,610 | | 918,381 | |
NMI Holdings, Cl. A | | | | 55,853 | a | 1,265,070 | |
Northfield Bancorp | | | | 31,708 | | 390,960 | |
Northwest Bancshares | | | | 85,404 | | 1,088,047 | |
OFG Bancorp | | | | 34,768 | | 644,599 | |
Old National Bancorp | | | | 110,692 | | 1,833,060 | |
Pacific Premier Bancorp | | | | 62,499 | | 1,958,094 | |
Park National | | | | 9,452 | b | 992,555 | |
Preferred Bank | | | | 9,148 | | 461,700 | |
Provident Financial Services | | | | 48,463 | | 870,396 | |
Renasant | | | | 37,721 | | 1,270,443 | |
S&T Bancorp | | | | 25,925 | | 643,977 | |
Seacoast Banking Corp. of Florida | | | | 37,085 | a | 1,092,153 | |
ServisFirst Bancshares | | | | 30,925 | | 1,245,968 | |
Simmons First National, Cl. A | | | | 71,476 | | 1,543,167 | |
Southside Bancshares | | | | 20,487 | | 635,712 | |
Tompkins Financial | | | | 8,028 | | 566,777 | |
Triumph Bancorp | | | | 15,235 | a | 739,659 | |
TrustCo Bank | | | | 64,453 | | 429,902 | |
United Community Bank | | | | 57,493 | | 1,635,101 | |
Veritex Holdings | | | | 33,109 | | 849,577 | |
Walker & Dunlop | | | | 19,446 | | 1,789,421 | |
Westamerica Bancorporation | | | | 18,079 | | 999,588 | |
| | | | | 61,977,816 | |
Capital Goods - 11.0% | | | | | |
AAON | | | | 27,285 | b | 1,818,000 | |
AAR | | | | 22,106 | | 800,679 | |
Aegion | | | | 21,027 | a | 399,303 | |
Aerojet Rocketdyne Holdings | | | | 47,422 | | 2,506,253 | |
AeroVironment | | | | 14,721 | a | 1,279,255 | |
Alamo Group | | | | 6,469 | | 892,399 | |
Albany International, Cl. A | | | | 20,246 | | 1,486,461 | |
American Woodmark | | | | 11,323 | a | 1,062,664 | |
8
| | | | | | | | |
| |
Description | | | | Shares | | Value ($) | |
Common Stocks - 93.6% (continued) | | | | | |
Capital Goods - 11.0% (continued) | | | | | |
Apogee Enterprises | | | | 17,882 | | 566,502 | |
Applied Industrial Technologies | | | | 25,695 | | 2,003,953 | |
Arcosa | | | | 31,731 | | 1,742,984 | |
Astec Industries | | | | 15,225 | | 881,223 | |
AZZ | | | | 17,389 | | 824,934 | |
Barnes Group | | | | 30,582 | | 1,550,202 | |
Chart Industries | | | | 23,304 | a | 2,744,978 | |
CIRCOR International | | | | 12,802 | a | 492,109 | |
Comfort Systems USA | | | | 24,137 | | 1,271,054 | |
Cubic | | | | 21,157 | | 1,312,580 | |
DXP Enterprises | | | | 10,927 | a | 242,907 | |
Encore Wire | | | | 13,710 | | 830,415 | |
Enerpac Tool Group | | | | 38,996 | | 881,700 | |
EnPro Industries | | | | 13,467 | | 1,017,028 | |
ESCO Technologies | | | | 17,272 | | 1,782,816 | |
Federal Signal | | | | 40,598 | | 1,346,636 | |
Foundation Building Materials | | | | 14,663 | a | 281,676 | |
Franklin Electric | | | | 25,306 | | 1,751,428 | |
Gibraltar Industries | | | | 21,357 | a | 1,536,423 | |
GMS | | | | 27,937 | a | 851,520 | |
Granite Construction | | | | 31,037 | b | 828,998 | |
Griffon | | | | 29,270 | | 596,523 | |
Hillenbrand | | | | 49,343 | | 1,963,851 | |
Insteel Industries | | | | 12,804 | | 285,145 | |
John Bean Technologies | | | | 20,935 | b | 2,383,868 | |
Kaman | | | | 18,168 | | 1,037,938 | |
Lindsay | | | | 7,315 | | 939,685 | |
Lydall | | | | 11,544 | a | 346,666 | |
Meritor | | | | 47,598 | a | 1,328,460 | |
Moog, Cl. A | | | | 19,347 | | 1,534,217 | |
Mueller Industries | | | | 38,287 | | 1,344,257 | |
MYR Group | | | | 11,174 | a | 671,557 | |
National Presto Industries | | | | 3,452 | | 305,260 | |
NOW | | | | 74,349 | a | 533,826 | |
Park Aerospace | | | | 11,817 | | 158,466 | |
PGT Innovations | | | | 39,752 | a | 808,556 | |
Powell Industries | | | | 5,267 | | 155,324 | |
Proto Labs | | | | 17,662 | a | 2,709,351 | |
Quanex Building Products | | | | 22,256 | | 493,416 | |
Raven Industries | | | | 24,174 | | 799,918 | |
Resideo Technologies | | | | 92,600 | a | 1,968,676 | |
SPX | | | | 29,420 | a | 1,604,567 | |
SPX FLOW | | | | 28,053 | a | 1,625,952 | |
9
STATEMENT OF INVESTMENTS (continued)
| | | | | | | | |
| |
Description | | | | Shares | | Value ($) | |
Common Stocks - 93.6% (continued) | | | | | |
Capital Goods - 11.0% (continued) | | | | | |
Standex International | | | | 8,343 | | 646,749 | |
Tennant | | | | 12,441 | | 872,985 | |
The Greenbrier Companies | | | | 22,137 | | 805,344 | |
Titan International | | | | 29,431 | | 143,035 | |
Triumph Group | | | | 34,975 | | 439,286 | |
UFP Industries | | | | 40,356 | | 2,241,776 | |
Veritiv | | | | 7,362 | a | 153,056 | |
Vicor | | | | 14,170 | a | 1,306,757 | |
Wabash National | | | | 35,844 | | 617,592 | |
Watts Water Technologies, Cl. A | | | | 18,090 | | 2,201,553 | |
| | | | | 68,010,692 | |
Commercial & Professional Services - 2.8% | | | | | |
ABM Industries | | | | 44,229 | | 1,673,625 | |
Brady, Cl. A | | | | 31,930 | | 1,686,543 | |
Deluxe | | | | 27,836 | | 812,811 | |
Exponent | | | | 34,096 | | 3,069,663 | |
Forrester Research | | | | 7,045 | a | 295,186 | |
Harsco | | | | 52,754 | a | 948,517 | |
Heidrick & Struggles International | | | | 13,155 | | 386,494 | |
Interface | | | | 39,689 | | 416,735 | |
Kelly Services, Cl. A | | | | 22,633 | | 465,561 | |
Korn Ferry | | | | 35,706 | | 1,553,211 | |
Matthews International, Cl. A | | | | 21,531 | | 633,011 | |
Pitney Bowes | | | | 116,914 | | 720,190 | |
Resources Connection | | | | 20,354 | | 255,850 | |
Team | | | | 20,197 | a | 220,147 | |
TrueBlue | | | | 23,820 | a | 445,196 | |
U.S. Ecology | | | | 20,507 | | 745,019 | |
UniFirst | | | | 10,188 | | 2,156,698 | |
Viad | | | | 13,912 | | 503,197 | |
| | | | | 16,987,654 | |
Consumer Durables & Apparel - 5.6% | | | | | |
Callaway Golf | | | | 61,832 | b | 1,484,586 | |
Capri Holdings | | | | 99,625 | a | 4,184,250 | |
Cavco Industries | | | | 5,629 | a | 987,608 | |
Century Communities | | | | 18,966 | a | 830,332 | |
Crocs | | | | 44,557 | a | 2,791,942 | |
Ethan Allen Interiors | | | | 14,596 | | 294,985 | |
Fossil Group | | | | 29,466 | a | 255,470 | |
G-III Apparel Group | | | | 28,214 | a | 669,800 | |
Installed Building Products | | | | 15,051 | a | 1,534,148 | |
iRobot | | | | 18,472 | a,b | 1,483,117 | |
Kontoor Brands | | | | 30,848 | b | 1,251,195 | |
10
| | | | | | | | |
| |
Description | | | | Shares | | Value ($) | |
Common Stocks - 93.6% (continued) | | | | | |
Consumer Durables & Apparel - 5.6% (continued) | | | | | |
La-Z-Boy | | | | 30,230 | | 1,204,363 | |
LGI Homes | | | | 14,567 | a,b | 1,541,917 | |
M.D.C. Holdings | | | | 34,315 | | 1,667,709 | |
M/I Homes | | | | 19,348 | a | 856,923 | |
Meritage Homes | | | | 25,154 | a | 2,083,254 | |
Movado Group | | | | 10,849 | | 180,310 | |
Oxford Industries | | | | 11,140 | | 729,781 | |
Steven Madden | | | | 51,805 | | 1,829,753 | |
Sturm Ruger & Co. | | | | 11,750 | | 764,573 | |
Tupperware Brands | | | | 32,221 | a | 1,043,638 | |
Unifi | | | | 8,826 | a | 156,573 | |
Universal Electronics | | | | 9,079 | a | 476,284 | |
Vera Bradley | | | | 15,071 | a,b | 119,965 | |
Vista Outdoor | | | | 39,280 | a | 933,293 | |
Wolverine World Wide | | | | 54,260 | | 1,695,625 | |
YETI Holdings | | | | 49,475 | a | 3,387,553 | |
| | | | | 34,438,947 | |
Consumer Services - 1.7% | | | | | |
American Public Education | | | | 10,120 | a | 308,458 | |
BJ's Restaurants | | | | 14,848 | | 571,500 | |
Bloomin‘ Brands | | | | 52,117 | | 1,012,112 | |
Brinker International | | | | 29,759 | | 1,683,467 | |
Chuy's Holdings | | | | 12,839 | a | 340,105 | |
Dave & Buster's Entertainment | | | | 31,960 | b | 959,439 | |
Dine Brands Global | | | | 10,903 | | 632,374 | |
El Pollo Loco Holdings | | | | 12,830 | a | 232,223 | |
Fiesta Restaurant Group | | | | 11,926 | a | 135,956 | |
Monarch Casino & Resort | | | | 8,509 | a | 520,921 | |
Perdoceo Education | | | | 45,825 | a | 578,770 | |
Red Robin Gourmet Burgers | | | | 10,114 | a | 194,492 | |
Regis | | | | 16,708 | a,b | 153,547 | |
Ruth's Hospitality Group | | | | 21,831 | | 387,064 | |
Shake Shack, Cl. A | | | | 23,843 | a,b | 2,021,410 | |
The Cheesecake Factory | | | | 27,468 | b | 1,017,964 | |
| | | | | 10,749,802 | |
Diversified Financials - 2.7% | | | | | |
Apollo Commercial Real Estate Finance | | | | 85,229 | c | 952,008 | |
ARMOUR Residential REIT | | | | 43,978 | b,c | 474,523 | |
Blucora | | | | 30,766 | a | 489,487 | |
Brightsphere Investment Group | | | | 38,913 | | 750,243 | |
Capstead Mortgage | | | | 66,208 | c | 384,668 | |
Donnelley Financial Solutions | | | | 18,681 | a | 317,017 | |
Encore Capital Group | �� | | | 20,501 | a | 798,514 | |
11
STATEMENT OF INVESTMENTS (continued)
| | | | | | | | |
| |
Description | | | | Shares | | Value ($) | |
Common Stocks - 93.6% (continued) | | | | | |
Diversified Financials - 2.7% (continued) | | | | | |
Enova International | | | | 23,948 | a | 593,192 | |
EZCORP, Cl. A | | | | 33,800 | a,b | 161,902 | |
Granite Point Mortgage Trust | | | | 37,828 | b,c | 377,902 | |
Green Dot, Cl. A | | | | 35,783 | a | 1,996,691 | |
Greenhill & Co. | | | | 9,863 | | 119,737 | |
Invesco Mortgage Capital | | | | 115,403 | b,c | 390,062 | |
KKR Real Estate Finance Trust | | | | 17,779 | b,c | 318,600 | |
New York Mortgage Trust | | | | 254,322 | c | 938,448 | |
PennyMac Mortgage Investment Trust | | | | 65,300 | c | 1,148,627 | |
Piper Sandler | | | | 9,007 | | 908,806 | |
PRA Group | | | | 30,602 | a | 1,213,675 | |
Ready Capital | | | | 26,855 | c | 334,345 | |
Redwood Trust | | | | 73,824 | c | 648,175 | |
StoneX Group | | | | 10,498 | a | 607,834 | |
Virtus Investment Partners | | | | 4,687 | | 1,017,079 | |
Waddell & Reed Financial, Cl. A | | | | 41,211 | | 1,049,644 | |
WisdomTree Investments | | | | 76,280 | | 408,098 | |
World Acceptance | | | | 2,667 | a,b | 272,621 | |
| | | | | 16,671,898 | |
Energy - 2.9% | | | | | |
Archrock | | | | 83,505 | | 723,153 | |
Bonanza Creek Energy | | | | 11,854 | a | 229,138 | |
Bristow Group | | | | 14,882 | a | 391,694 | |
Callon Petroleum | | | | 27,206 | a,b | 358,031 | |
CONSOL Energy | | | | 17,793 | a | 128,288 | |
Core Laboratories | | | | 29,659 | b | 786,260 | |
DMC Global | | | | 9,720 | | 420,390 | |
Dorian LPG | | | | 21,674 | a | 264,206 | |
Dril-Quip | | | | 23,693 | a | 701,787 | |
Exterran | | | | 18,093 | a | 79,971 | |
Green Plains | | | | 22,593 | a,b | 297,550 | |
Helix Energy Solutions Group | | | | 95,691 | a | 401,902 | |
Helmerich & Payne | | | | 70,714 | | 1,637,736 | |
Laredo Petroleum | | | | 6,319 | a | 124,484 | |
Matador Resources | | | | 72,966 | a,b | 879,970 | |
Matrix Service | | | | 17,424 | a | 192,012 | |
Nabors Industries | | | | 4,381 | b | 255,106 | |
Oceaneering International | | | | 64,851 | a | 515,565 | |
Oil States International | | | | 37,304 | a | 187,266 | |
Par Pacific Holdings | | | | 26,352 | a | 368,401 | |
Patterson-UTI Energy | | | | 126,714 | | 666,516 | |
PBF Energy, Cl. A | | | | 65,492 | b | 464,993 | |
PDC Energy | | | | 66,281 | a | 1,360,749 | |
12
| | | | | | | | |
| |
Description | | | | Shares | | Value ($) | |
Common Stocks - 93.6% (continued) | | | | | |
Energy - 2.9% (continued) | | | | | |
Penn Virginia | | | | 10,148 | a | 103,002 | |
ProPetro Holding | | | | 51,188 | a | 378,279 | |
QEP Resources | | | | 165,722 | | 396,076 | |
Range Resources | | | | 168,923 | b | 1,131,784 | |
Renewable Energy Group | | | | 26,061 | a | 1,845,640 | |
REX American Resources | | | | 3,264 | a | 239,806 | |
RPC | | | | 38,561 | a | 121,467 | |
SM Energy | | | | 72,721 | b | 445,053 | |
Southwestern Energy | | | | 433,148 | a | 1,290,781 | |
Talos Energy | | | | 15,100 | a,b | 124,424 | |
U.S. Silica Holdings | | | | 47,946 | b | 336,581 | |
| | | | | 17,848,061 | |
Food & Staples Retailing - .6% | | | | | |
PriceSmart | | | | 15,628 | | 1,423,555 | |
SpartanNash | | | | 24,384 | | 424,525 | |
The Andersons | | | | 19,622 | | 480,935 | |
The Chefs' Warehouse | | | | 21,528 | a | 553,054 | |
United Natural Foods | | | | 36,515 | a | 583,145 | |
| | | | | 3,465,214 | |
Food, Beverage & Tobacco - 1.8% | | | | | |
B&G Foods | | | | 43,117 | b | 1,195,634 | |
Calavo Growers | | | | 10,838 | | 752,482 | |
Cal-Maine Foods | | | | 24,395 | a | 915,788 | |
Coca-Cola Consolidated | | | | 3,112 | | 828,632 | |
Fresh Del Monte Produce | | | | 20,591 | | 495,625 | |
J&J Snack Foods | | | | 9,882 | | 1,535,366 | |
John B. Sanfilippo & Son | | | | 5,975 | | 471,189 | |
MGP Ingredients | | | | 8,951 | | 421,234 | |
National Beverage | | | | 7,748 | b | 657,805 | |
Seneca Foods, Cl. A | | | | 4,328 | a | 172,687 | |
The Simply Good Foods Company | | | | 55,922 | a | 1,753,714 | |
Universal | | | | 16,524 | | 803,232 | |
Vector Group | | | | 85,511 | | 996,203 | |
| | | | | 10,999,591 | |
Health Care Equipment & Services - 8.2% | | | | | |
Addus HomeCare | | | | 9,902 | a | 1,159,425 | |
Allscripts Healthcare Solutions | | | | 104,162 | a,b | 1,504,099 | |
AMN Healthcare Services | | | | 31,458 | a | 2,147,009 | |
AngioDynamics | | | | 23,993 | a | 367,813 | |
BioTelemetry | | | | 22,510 | a | 1,622,521 | |
Cardiovascular Systems | | | | 26,955 | a | 1,179,551 | |
Community Health Systems | | | | 72,508 | a | 538,734 | |
Computer Programs & Systems | | | | 8,688 | | 233,186 | |
13
STATEMENT OF INVESTMENTS (continued)
| | | | | | | | |
| |
Description | | | | Shares | | Value ($) | |
Common Stocks - 93.6% (continued) | | | | | |
Health Care Equipment & Services - 8.2% (continued) | | | | | |
CONMED | | | | 18,962 | | 2,123,744 | |
CorVel | | | | 6,097 | a | 646,282 | |
Covetrus | | | | 65,310 | a | 1,877,009 | |
Cross Country Healthcare | | | | 21,522 | a | 190,900 | |
CryoLife | | | | 26,338 | a | 621,840 | |
Cutera | | | | 11,471 | a | 276,566 | |
Fulgent Genetics | | | | 8,482 | a,b | 441,912 | |
Glaukos | | | | 29,650 | a,b | 2,231,459 | |
Hanger | | | | 25,810 | a | 567,562 | |
HealthStream | | | | 17,189 | a | 375,408 | |
Heska | | | | 5,832 | a | 849,431 | |
HMS Holdings | | | | 58,731 | a | 2,158,364 | |
Inogen | | | | 12,450 | a | 556,266 | |
Integer Holdings | | | | 21,613 | a | 1,754,759 | |
Invacare | | | | 20,765 | b | 185,847 | |
Lantheus Holdings | | | | 45,211 | a | 609,896 | |
LeMaitre Vascular | | | | 11,234 | | 454,977 | |
Magellan Health | | | | 15,300 | a | 1,267,452 | |
MEDNAX | | | | 57,408 | a,b | 1,408,792 | |
Meridian Bioscience | | | | 29,175 | a | 545,281 | |
Merit Medical Systems | | | | 32,350 | a | 1,795,749 | |
Mesa Laboratories | | | | 3,174 | | 909,795 | |
Natus Medical | | | | 23,061 | a | 462,142 | |
NextGen Healthcare | | | | 36,532 | a | 666,344 | |
Omnicell | | | | 27,946 | a | 3,354,079 | |
OraSure Technologies | | | | 47,583 | a | 503,666 | |
Orthofix Medical | | | | 12,980 | a | 557,880 | |
Owens & Minor | | | | 49,295 | | 1,333,430 | |
R1 RCM | | | | 78,111 | a | 1,876,226 | |
RadNet | | | | 28,799 | a | 563,596 | |
Select Medical Holdings | | | | 71,044 | a | 1,965,077 | |
Simulations Plus | | | | 9,840 | b | 707,693 | |
SurModics | | | | 9,365 | a | 407,565 | |
Tabula Rasa HealthCare | | | | 14,187 | a,b | 607,771 | |
Tactile Systems Technology | | | | 12,545 | a | 563,772 | |
The Ensign Group | | | | 33,640 | | 2,453,029 | |
The Pennant Group | | | | 17,053 | a | 990,097 | |
The Providence Service | | | | 8,288 | a | 1,148,965 | |
Tivity Health | | | | 25,455 | a | 498,663 | |
U.S. Physical Therapy | | | | 8,428 | | 1,013,467 | |
Varex Imaging | | | | 26,702 | a | 445,389 | |
Zynex | | | | 12,659 | a,b | 170,390 | |
| | | | | 50,890,870 | |
14
| | | | | | | | |
| |
Description | | | | Shares | | Value ($) | |
Common Stocks - 93.6% (continued) | | | | | |
Household & Personal Products - 1.0% | | | | | |
Central Garden & Pet | | | | 6,791 | a | 262,201 | |
Central Garden & Pet, Cl. A | | | | 25,497 | a | 926,306 | |
Inter Parfums | | | | 11,525 | | 697,147 | |
Medifast | | | | 7,754 | | 1,522,420 | |
USANA Health Sciences | | | | 8,114 | a | 625,589 | |
WD-40 | | | | 9,015 | | 2,395,105 | |
| | | | | 6,428,768 | |
Insurance - 2.6% | | | | | |
Ambac Financial Group | | | | 31,169 | a | 479,379 | |
American Equity Investment Life Holding | | | | 60,470 | | 1,672,600 | |
AMERISAFE | | | | 13,041 | | 748,945 | |
Assured Guaranty | | | | 53,257 | | 1,677,063 | |
eHealth | | | | 17,000 | a,b | 1,200,370 | |
Employers Holdings | | | | 18,847 | | 606,685 | |
HCI Group | | | | 4,176 | | 218,405 | |
Horace Mann Educators | | | | 27,810 | | 1,169,132 | |
James River Group Holdings | | | | 20,580 | | 1,011,507 | |
Palomar Holdings | | | | 14,370 | a | 1,276,631 | |
ProAssurance | | | | 36,424 | | 647,983 | |
Safety Insurance Group | | | | 9,326 | | 726,495 | |
Stewart Information Services | | | | 17,489 | | 845,768 | |
Third Point Reinsurance | | | | 54,947 | a | 523,095 | |
Trupanion | | | | 21,603 | a | 2,586,095 | |
United Fire Group | | | | 14,462 | | 362,996 | |
United Insurance Holdings | | | | 12,884 | | 73,696 | |
Universal Insurance Holdings | | | | 18,885 | | 285,352 | |
| | | | | 16,112,197 | |
Materials - 5.5% | | | | | |
AdvanSix | | | | 17,978 | a | 359,380 | |
Allegheny Technologies | | | | 83,206 | a | 1,395,365 | |
American Vanguard | | | | 17,468 | | 271,103 | |
Arconic | | | | 64,095 | a | 1,910,031 | |
Balchem | | | | 21,344 | | 2,459,256 | |
Boise Cascade | | | | 26,151 | | 1,250,018 | |
Carpenter Technology | | | | 32,336 | | 941,624 | |
Century Aluminum | | | | 33,851 | a | 373,377 | |
Clearwater Paper | | | | 11,191 | a | 422,460 | |
Cleveland-Cliffs | | | | 263,855 | b | 3,841,729 | |
Ferro | | | | 55,217 | a | 807,825 | |
FutureFuel | | | | 17,234 | | 218,872 | |
GCP Applied Technologies | | | | 31,556 | a | 746,299 | |
Glatfelter | | | | 29,323 | | 480,311 | |
15
STATEMENT OF INVESTMENTS (continued)
| | | | | | | | |
| |
Description | | | | Shares | | Value ($) | |
Common Stocks - 93.6% (continued) | | | | | |
Materials - 5.5% (continued) | | | | | |
H.B. Fuller | | | | 34,252 | | 1,776,994 | |
Hawkins | | | | 6,446 | | 337,190 | |
Haynes International | | | | 8,408 | | 200,447 | |
Innospec | | | | 16,134 | | 1,463,838 | |
Kaiser Aluminum | | | | 10,508 | | 1,039,241 | |
Koppers Holdings | | | | 14,346 | a | 447,021 | |
Kraton | | | | 20,618 | a | 572,974 | |
Livent | | | | 98,001 | a,b | 1,846,339 | |
Materion | | | | 13,697 | | 872,773 | |
Mercer International | | | | 26,998 | | 276,730 | |
Myers Industries | | | | 24,307 | | 505,099 | |
Neenah | | | | 11,367 | | 628,822 | |
Olympic Steel | | | | 5,143 | | 68,556 | |
Quaker Chemical | | | | 8,701 | b | 2,204,746 | |
Rayonier Advanced Materials | | | | 43,765 | a | 285,348 | |
Schweitzer-Mauduit International | | | | 20,844 | | 838,137 | |
Stepan | | | | 14,136 | | 1,686,708 | |
SunCoke Energy | | | | 53,727 | | 233,712 | |
TimkenSteel | | | | 25,881 | a | 120,864 | |
Tredegar | | | | 16,905 | | 282,314 | |
Trinseo | | | | 25,115 | | 1,286,139 | |
U.S. Concrete | | | | 10,799 | a | 431,636 | |
Warrior Met Coal | | | | 34,616 | | 738,013 | |
| | | | | 33,621,291 | |
Media & Entertainment - .9% | | | | | |
AMC Networks, Cl. A | | | | 19,673 | a,b | 703,703 | |
Gannett | | | | 88,830 | | 298,469 | |
Glu Mobile | | | | 97,437 | a | 877,907 | |
Meredith | | | | 27,496 | b | 527,923 | |
QuinStreet | | | | 32,863 | a | 704,583 | |
Scholastic | | | | 19,183 | | 479,575 | |
TechTarget | | | | 15,397 | a | 910,117 | |
The E.W. Scripps Company, Cl. A | | | | 38,141 | | 583,176 | |
The Marcus | | | | 14,120 | | 190,338 | |
| | | | | 5,275,791 | |
Pharmaceuticals Biotechnology & Life Sciences - 3.1% | | | | | |
Amphastar Pharmaceuticals | | | | 24,140 | a | 485,455 | |
ANI Pharmaceuticals | | | | 6,746 | a | 195,904 | |
Anika Therapeutics | | | | 9,439 | a | 427,209 | |
Coherus Biosciences | | | | 42,207 | a,b | 733,558 | |
Corcept Therapeutics | | | | 69,992 | a,b | 1,830,991 | |
Cytokinetics | | | | 47,023 | a | 977,138 | |
Eagle Pharmaceuticals | | | | 7,886 | a | 367,251 | |
16
| | | | | | | | |
| |
Description | | | | Shares | | Value ($) | |
Common Stocks - 93.6% (continued) | | | | | |
Pharmaceuticals Biotechnology & Life Sciences - 3.1% (continued) | | | | | |
Enanta Pharmaceuticals | | | | 11,868 | a | 499,643 | |
Endo International | | | | 151,998 | a | 1,091,346 | |
Innoviva | | | | 42,749 | a | 529,660 | |
Lannett | | | | 21,872 | a | 142,605 | |
Luminex | | | | 29,227 | | 675,728 | |
Myriad Genetics | | | | 49,675 | a,b | 982,323 | |
NeoGenomics | | | | 73,387 | a | 3,951,156 | |
Pacira Biosciences | | | | 28,552 | a | 1,708,552 | |
Phibro Animal Health, Cl. A | | | | 13,766 | | 267,336 | |
REGENXBIO | | | | 19,528 | a | 885,790 | |
Spectrum Pharmaceuticals | | | | 99,505 | a | 339,312 | |
Supernus Pharmaceuticals | | | | 35,543 | a | 894,262 | |
Vanda Pharmaceuticals | | | | 35,851 | a | 471,082 | |
Xencor | | | | 37,939 | a,b | 1,655,279 | |
| | | | | 19,111,580 | |
Real Estate - 7.4% | | | | | |
Acadia Realty Trust | | | | 58,130 | c | 824,865 | |
Agree Realty | | | | 36,528 | b,c | 2,432,034 | |
Alexander & Baldwin | | | | 48,330 | c | 830,309 | |
American Assets Trust | | | | 33,292 | c | 961,473 | |
Armada Hoffler Properties | | | | 38,647 | c | 433,619 | |
Brandywine Realty Trust | | | | 114,421 | c | 1,362,754 | |
CareTrust REIT | | | | 64,175 | c | 1,423,402 | |
Centerspace | | | | 8,606 | c | 607,928 | |
Chatham Lodging Trust | | | | 31,877 | c | 344,272 | |
Community Healthcare Trust | | | | 14,880 | c | 700,997 | |
CoreCivic | | | | 77,718 | c | 509,053 | |
DiamondRock Hospitality | | | | 131,008 | c | 1,080,816 | |
Diversified Healthcare Trust | | | | 157,630 | c | 649,436 | |
Easterly Government Properties | | | | 53,259 | c | 1,206,316 | |
Essential Properties Realty Trust | | | | 68,696 | c | 1,456,355 | |
Four Corners Property Trust | | | | 48,204 | c | 1,435,033 | |
Franklin Street Properties | | | | 65,837 | c | 287,708 | |
Getty Realty | | | | 23,763 | c | 654,433 | |
Global Net Lease | | | | 60,169 | c | 1,031,297 | |
Hersha Hospitality Trust | | | | 25,084 | c | 197,913 | |
Independence Realty Trust | | | | 63,910 | c | 858,311 | |
Industrial Logistics Properties Trust | | | | 42,812 | c | 997,092 | |
Innovative Industrial Properties | | | | 14,636 | c | 2,680,291 | |
iStar | | | | 49,683 | b,c | 737,793 | |
Kite Realty Group Trust | | | | 55,954 | c | 837,072 | |
Lexington Realty Trust | | | | 183,755 | c | 1,951,478 | |
17
STATEMENT OF INVESTMENTS (continued)
| | | | | | | | |
| |
Description | | | | Shares | | Value ($) | |
Common Stocks - 93.6% (continued) | | | | | |
Real Estate - 7.4% (continued) | | | | | |
LTC Properties | | | | 25,773 | c | 1,002,827 | |
Mack-Cali Realty | | | | 56,229 | a,c | 700,613 | |
Marcus & Millichap | | | | 16,059 | a | 597,877 | |
National Storage Affiliates Trust | | | | 40,875 | b,c | 1,472,726 | |
NexPoint Residential Trust | | | | 14,526 | c | 614,595 | |
Office Properties Income Trust | | | | 32,610 | b,c | 740,899 | |
RE/MAX Holdings, Cl. A | | | | 12,146 | | 441,264 | |
Realogy Holdings | | | | 77,550 | a | 1,017,456 | |
Retail Opportunity Investments | | | | 77,377 | c | 1,036,078 | |
Retail Properties of America, Cl. A | | | | 140,966 | c | 1,206,669 | |
RPT Realty | | | | 54,744 | c | 473,536 | |
Safehold | | | | 9,343 | b,c | 677,274 | |
Saul Centers | | | | 8,309 | c | 263,229 | |
SITE Centers | | | | 98,978 | c | 1,001,657 | |
Summit Hotel Properties | | | | 71,383 | c | 643,161 | |
Tanger Factory Outlet Centers | | | | 63,085 | b,c | 628,327 | |
The GEO Group | | | | 81,351 | b,c | 720,770 | |
The St. Joe Company | | | | 20,357 | b | 864,155 | |
Uniti Group | | | | 155,850 | c | 1,828,121 | |
Universal Health Realty Income Trust | | | | 8,484 | c | 545,267 | |
Urstadt Biddle Properties, Cl. A | | | | 20,699 | c | 292,477 | |
Washington Real Estate Investment Trust | | | | 54,953 | c | 1,188,633 | |
Whitestone REIT | | | | 24,172 | c | 192,651 | |
Xenia Hotels & Resorts | | | | 74,718 | c | 1,135,714 | |
| | | | | 45,778,026 | |
Retailing - 4.9% | | | | | |
Abercrombie & Fitch, Cl. A | | | | 42,048 | | 856,097 | |
America's Car-Mart | | | | 4,054 | a | 445,291 | |
Asbury Automotive Group | | | | 12,773 | a | 1,861,537 | |
Barnes & Noble Education | | | | 20,898 | a | 97,176 | |
Bed Bath & Beyond | | | | 82,754 | b | 1,469,711 | |
Big Lots | | | | 23,842 | b | 1,023,537 | |
Boot Barn Holdings | | | | 18,897 | a,b | 819,374 | |
Caleres | | | | 25,843 | | 404,443 | |
Chico's FAS | | | | 86,457 | | 137,467 | |
Conn's | | | | 12,547 | a | 146,674 | |
Core-Mark Holding | | | | 29,614 | | 869,763 | |
Designer Brands, Cl. A | | | | 38,533 | b | 294,777 | |
GameStop, Cl. A | | | | 37,098 | a,b | 698,926 | |
Genesco | | | | 9,503 | a | 285,945 | |
Group 1 Automotive | | | | 11,300 | b | 1,481,882 | |
Guess? | | | | 24,233 | | 548,150 | |
18
| | | | | | | | |
| |
Description | | | | Shares | | Value ($) | |
Common Stocks - 93.6% (continued) | | | | | |
Retailing - 4.9% (continued) | | | | | |
Haverty Furniture | | | | 11,243 | | 311,094 | |
Hibbett Sports | | | | 11,082 | a | 511,767 | |
Liquidity Services | | | | 18,043 | a | 287,064 | |
Lumber Liquidators Holdings | | | | 18,782 | a | 577,359 | |
Macy's | | | | 204,732 | b | 2,303,235 | |
MarineMax | | | | 14,764 | a | 517,183 | |
Monro | | | | 22,205 | | 1,183,527 | |
PetMed Express | | | | 13,737 | b | 440,408 | |
Rent-A-Center | | | | 31,941 | | 1,223,021 | |
Sally Beauty Holdings | | | | 75,945 | a | 990,323 | |
Shoe Carnival | | | | 5,919 | | 231,906 | |
Shutterstock | | | | 14,855 | | 1,065,104 | |
Signet Jewelers | | | | 34,894 | b | 951,559 | |
Sleep Number | | | | 18,226 | a | 1,491,980 | |
Sonic Automotive, Cl. A | | | | 15,723 | | 606,436 | |
Stamps.com | | | | 12,033 | a | 2,360,754 | |
The Aaron's Company | | | | 22,257 | a | 421,993 | |
The Buckle | | | | 18,952 | | 553,398 | |
The Cato, Cl. A | | | | 11,185 | | 107,264 | |
The Children's Place | | | | 9,589 | b | 480,409 | |
The Michaels Companies | | | | 49,915 | a,b | 649,394 | |
The ODP | | | | 34,602 | | 1,013,839 | |
Zumiez | | | | 13,555 | a | 498,553 | |
| | | | | 30,218,320 | |
Semiconductors & Semiconductor Equipment - 4.0% | | | | | |
Advanced Energy Industries | | | | 25,251 | a | 2,448,589 | |
Axcelis Technologies | | | | 22,646 | a | 659,452 | |
Brooks Automation | | | | 48,785 | | 3,310,062 | |
CEVA | | | | 14,370 | a | 653,835 | |
Cohu | | | | 28,206 | | 1,076,905 | |
Diodes | | | | 28,212 | a | 1,988,946 | |
DSP Group | | | | 13,458 | a | 223,268 | |
FormFactor | | | | 51,030 | a | 2,195,311 | |
Ichor Holdings | | | | 15,751 | a | 474,814 | |
Kulicke & Soffa Industries | | | | 40,791 | | 1,297,562 | |
MaxLinear | | | | 45,232 | a | 1,727,410 | |
Onto Innovation | | | | 32,069 | a | 1,524,881 | |
PDF Solutions | | | | 19,362 | a | 418,219 | |
Photronics | | | | 42,152 | a | 470,416 | |
Power Integrations | | | | 39,538 | | 3,236,581 | |
Rambus | | | | 76,416 | a | 1,334,223 | |
SMART Global Holdings | | | | 9,234 | a,b | 347,475 | |
Ultra Clean Holdings | | | | 27,274 | a | 849,585 | |
19
STATEMENT OF INVESTMENTS (continued)
| | | | | | | | |
| |
Description | | | | Shares | | Value ($) | |
Common Stocks - 93.6% (continued) | | | | | |
Semiconductors & Semiconductor Equipment - 4.0% (continued) | | | | | |
Veeco Instruments | | | | 33,164 | a,b | 575,727 | |
| | | | | 24,813,261 | |
Software & Services - 5.0% | | | | | |
8x8 | | | | 70,141 | a | 2,417,760 | |
Agilysys | | | | 13,697 | a | 525,691 | |
Alarm.com Holdings | | | | 29,514 | a | 3,053,223 | |
Bottomline Technologies | | | | 25,720 | a | 1,356,473 | |
Cardtronics, Cl. A | | | | 23,978 | a | 846,423 | |
CSG Systems International | | | | 21,720 | | 978,920 | |
Ebix | | | | 15,680 | b | 595,370 | |
EVERTEC | | | | 39,534 | | 1,554,477 | |
ExlService Holdings | | | | 22,625 | a | 1,926,066 | |
LivePerson | | | | 41,046 | a,b | 2,554,293 | |
ManTech International, Cl. A | | | | 17,852 | | 1,587,757 | |
MicroStrategy, Cl. A | | | | 4,778 | a | 1,856,492 | |
NIC | | | | 44,060 | | 1,138,070 | |
OneSpan | | | | 22,567 | a | 466,686 | |
Perficient | | | | 21,851 | a | 1,041,200 | |
Progress Software | | | | 30,258 | | 1,367,359 | |
SPS Commerce | | | | 23,300 | a | 2,530,147 | |
Sykes Enterprises | | | | 26,022 | a | 980,249 | |
TTEC Holdings | | | | 12,223 | | 891,423 | |
Unisys | | | | 41,078 | a | 808,415 | |
Virtusa | | | | 18,645 | a | 953,319 | |
Xperi Holding | | | | 69,670 | | 1,456,103 | |
| | | | | 30,885,916 | |
Technology Hardware & Equipment - 4.8% | | | | | |
3D Systems | | | | 80,940 | a,b | 848,251 | |
ADTRAN | | | | 32,606 | | 481,591 | |
Applied Optoelectronics | | | | 12,920 | a,b | 109,949 | |
Arlo Technologies | | | | 51,668 | a | 402,494 | |
Badger Meter | | | | 19,271 | | 1,812,630 | |
Bel Fuse, Cl. B | | | | 5,674 | | 85,280 | |
Benchmark Electronics | | | | 23,604 | | 637,544 | |
CalAmp | | | | 24,381 | a | 241,860 | |
Comtech Telecommunications | | | | 17,149 | | 354,813 | |
CTS | | | | 21,077 | | 723,573 | |
Daktronics | | | | 26,639 | | 124,671 | |
Diebold Nixdorf | | | | 52,631 | a | 561,046 | |
Digi International | | | | 19,990 | a | 377,811 | |
ePlus | | | | 9,006 | a | 792,078 | |
Extreme Networks | | | | 83,337 | a | 574,192 | |
20
| | | | | | | | |
| |
Description | | | | Shares | | Value ($) | |
Common Stocks - 93.6% (continued) | | | | | |
Technology Hardware & Equipment - 4.8% (continued) | | | | | |
Fabrinet | | | | 24,723 | a | 1,918,258 | |
FARO Technologies | | | | 12,015 | a | 848,619 | |
Harmonic | | | | 65,696 | a,b | 485,493 | |
Insight Enterprises | | | | 23,141 | a | 1,760,799 | |
Itron | | | | 26,657 | a | 2,556,406 | |
Knowles | | | | 61,600 | a | 1,135,288 | |
Methode Electronics | | | | 24,586 | | 941,152 | |
MTS Systems | | | | 12,793 | | 744,041 | |
NETGEAR | | | | 20,421 | a | 829,705 | |
OSI Systems | | | | 11,041 | a | 1,029,242 | |
PC Connection | | | | 7,439 | a | 351,790 | |
Plantronics | | | | 24,535 | b | 663,181 | |
Plexus | | | | 19,075 | a | 1,491,856 | |
Rogers | | | | 12,499 | a | 1,940,970 | |
Sanmina | | | | 42,942 | a | 1,369,420 | |
ScanSource | | | | 16,188 | a | 427,039 | |
TTM Technologies | | | | 66,847 | a | 922,154 | |
Viavi Solutions | | | | 151,014 | a | 2,261,435 | |
| | | | | 29,804,631 | |
Telecommunication Services - 1.5% | | | | | |
ATN International | | | | 7,474 | | 312,114 | |
Cincinnati Bell | | | | 32,458 | a | 495,958 | |
Cogent Communications Holdings | | | | 27,769 | | 1,662,530 | |
Consolidated Communications Holdings | | | | 49,484 | a | 241,977 | |
Iridium Communications | | | | 77,464 | a | 3,046,272 | |
Shenandoah Telecommunication | | | | 33,073 | | 1,430,407 | |
Spok Holdings | | | | 10,080 | | 112,190 | |
Vonage Holdings | | | | 156,154 | a | 2,010,483 | |
| | | | | 9,311,931 | |
Transportation - 2.4% | | | | | |
Allegiant Travel | | | | 8,786 | | 1,662,663 | |
ArcBest | | | | 16,503 | | 704,183 | |
Atlas Air Worldwide Holdings | | | | 17,156 | a | 935,688 | |
Echo Global Logistics | | | | 17,161 | a | 460,258 | |
Forward Air | | | | 18,111 | | 1,391,649 | |
Hawaiian Holdings | | | | 29,598 | | 523,885 | |
Heartland Express | | | | 33,126 | | 599,581 | |
Hub Group, Cl. A | | | | 22,477 | a | 1,281,189 | |
Marten Transport | | | | 38,977 | | 671,574 | |
Matson | | | | 28,428 | | 1,619,543 | |
Saia | | | | 17,275 | a | 3,123,320 | |
SEACOR Holdings | | | | 12,669 | a | 525,130 | |
21
STATEMENT OF INVESTMENTS (continued)
| | | | | | | | |
| |
Description | | | | Shares | | Value ($) | |
Common Stocks - 93.6% (continued) | | | | | |
Transportation - 2.4% (continued) | | | | | |
SkyWest | | | | 33,628 | | 1,355,545 | |
| | | | | 14,854,208 | |
Utilities - 1.5% | | | | | |
American States Water | | | | 24,490 | | 1,947,200 | |
Avista | | | | 46,020 | | 1,847,243 | |
California Water Service Group | | | | 33,370 | | 1,802,981 | |
Chesapeake Utilities | | | | 11,720 | | 1,268,221 | |
Northwest Natural Holding | | | | 20,559 | | 945,508 | |
South Jersey Industries | | | | 66,598 | | 1,435,187 | |
| | | | | 9,246,340 | |
Total Common Stocks (cost $384,455,551) | | | | 578,185,689 | |
| | | | | | | | |
Exchange-Traded Funds - .2% | | | | | |
Registered Investment Companies - .2% | | | | | |
iShares Core S&P Small-Cap ETF
(cost $1,488,269) | | | | 16,194 | | 1,488,229 | |
| | | | | Principal Amount ($) | | | |
Short-Term Investments - .0% | | | | | |
U.S. Treasury Bills - .0% | | | | | |
0.18%, 2/25/21
(cost $112,970) | | | | 113,000 | d | 112,991 | |
| | | 1-Day
Yield (%) | | Shares | | | |
Investment Companies - .1% | | | | | |
Registered Investment Companies - .1% | | | | | |
Dreyfus Institutional Preferred Government Plus Money Market Fund, Institutional Shares
(cost $661,144) | | 0.09 | | 661,144 | e | 661,144 | |
22
| | | | | | | | |
| |
Description | | 1-Day
Yield (%) | | Shares | | Value ($) | |
Investment of Cash Collateral for Securities Loaned - 1.7% | | | | | |
Registered Investment Companies - 1.7% | | | | | |
Dreyfus Institutional Preferred Government Plus Money Market Fund, SL Shares
(cost $10,413,704) | | 0.05 | | 10,413,704 | e | 10,413,704 | |
Total Investments (cost $397,131,638) | | 95.6% | | 590,861,757 | |
Cash and Receivables (Net) | | 4.4% | | 27,123,086 | |
Net Assets | | 100.0% | | 617,984,843 | |
ETF—Exchange-Traded Fund
REIT—Real Estate Investment Trust
aNon-income producing security.
bSecurity, or portion thereof, on loan. At December 31, 2020, the value of the fund’s securities on loan was $54,217,465 and the value of the collateral was $55,674,521, consisting of cash collateral of $10,413,704 and U.S. Government & Agency securities valued at $45,260,817.
cInvestment in real estate investment trust within the United States.
dSecurity is a discount security. Income is recognized through the accretion of discount.
eInvestment in affiliated issuer. The investment objective of this investment company is publicly available and can be found within the investment company’s prospectus.
| | |
Portfolio Summary (Unaudited) † | Value (%) |
Industrials | 16.2 |
Financials | 15.3 |
Consumer Discretionary | 13.9 |
Information Technology | 13.8 |
Health Care | 11.3 |
Real Estate | 7.4 |
Materials | 5.5 |
Consumer Staples | 3.4 |
Energy | 2.9 |
Communication Services | 2.4 |
Investment Companies | 2.0 |
Utilities | 1.5 |
Government | .0 |
| | 95.6 |
† Based on net assets.
See notes to financial statements.
23
STATEMENT OF INVESTMENTS IN AFFILIATED ISSUERS
| | | | | | | | |
Investment Companies | Value
12/31/19 ($) | Purchases ($)† | Sales ($) | Value
12/31/20 ($) | Net
Assets (%) | Dividends/
Distributions ($) |
Registered Investment Companies; | | | | |
Dreyfus Institutional Preferred Government Plus Money Market Fund, Institutional Shares | 195,402 | 126,112,787 | (125,647,045) | 661,144 | .1 | 9,037 |
Investment of Cash Collateral for Securities Loaned:†† | | | | |
Dreyfus Institutional Preferred Government Plus Money Market Fund, Institutional Shares | 13,048,576 | 73,421,354 | (86,469,930) | - | - | 277,952††† |
Dreyfus Institutional Preferred Government Plus Money Market Fund, SL Shares | - | 27,938,658 | (17,524,954) | 10,413,704 | 1.7 | 34,514††† |
Total | 13,243,978 | 227,472,799 | (229,641,929) | 11,074,848 | 1.8 | 321,503 |
† Includes reinvested dividends/distributions.
†† Effective November 9, 2020, cash collateral for securities lending was transferred from Dreyfus Institutional Preferred Government Plus Money Market Fund, Institutional Shares to Dreyfus Institutional Preferred Government Plus Money Market Fund, SL Shares.
††† Represents securities lending income earned from reinvestment of cash collateral from loaned securities, net of fees and collateral investment expenses, and other payments to and from borrowers of securities.
See notes to financial statements.
24
STATEMENT OF FUTURES
December 31, 2020
| | | | | | | |
Description | Number of
Contracts | Expiration | Notional
Value ($) | Market
Value ($) | Unrealized Appreciation ($) | |
Futures Long | | |
E-mini Russell 2000 | 29 | 3/19/2021 | 2,823,549 | 2,863,460 | 39,911 | |
Gross Unrealized Appreciation | | 39,911 | |
See notes to financial statements.
25
STATEMENT OF ASSETS AND LIABILITIES
December 31, 2020
| | | | | | | |
| | | | | | |
| | | Cost | | Value | |
Assets ($): | | | | |
Investments in securities—See Statement of Investments
(including securities on loan, valued at $54,217,465)—Note 1(c): | | | |
Unaffiliated issuers | 386,056,790 | | 579,786,909 | |
Affiliated issuers | | 11,074,848 | | 11,074,848 | |
Receivable for shares of Beneficial Interest subscribed | | 36,294,316 | |
Receivable for investment securities sold | | 3,309,388 | |
Dividends and securities lending income receivable | | 631,300 | |
| | | | | 631,096,761 | |
Liabilities ($): | | | | |
Due to BNY Mellon Investment Adviser, Inc. and affiliates—Note 3(b) | | 285,461 | |
Liability for securities on loan—Note 1(c) | | 10,413,704 | |
Payable for investment securities purchased | | 1,488,269 | |
Payable for shares of Beneficial Interest redeemed | | 894,154 | |
Trustees’ fees and expenses payable | | 25,138 | |
Payable for futures variation margin—Note 4 | | 5,116 | |
Interest payable—Note 2 | | 76 | |
| | | | | 13,111,918 | |
Net Assets ($) | | | 617,984,843 | |
Composition of Net Assets ($): | | | | |
Paid-in capital | | | | | 425,088,688 | |
Total distributable earnings (loss) | | | | | 192,896,155 | |
Net Assets ($) | | | 617,984,843 | |
| | | | | |
Shares Outstanding | | |
(unlimited number of $.001 par value shares of Beneficial Interest authorized) | 32,424,088 | |
Net Asset Value Per Share ($) | | 19.06 | |
| | | | |
See notes to financial statements. | | | | |
26
STATEMENT OF OPERATIONS
Year Ended December 31, 2020
| | | | | | | |
| | | | | | |
| | | | | | |
Investment Income ($): | | | | |
Income: | | | | |
Cash dividends (net of $9,092 foreign taxes withheld at source): | |
Unaffiliated issuers | | | 7,179,778 | |
Affiliated issuers | | | 8,838 | |
Income from securities lending—Note 1(c) | | | 312,466 | |
Total Income | | | 7,501,082 | |
Expenses: | | | | |
Management fee—Note 3(a) | | | 1,694,012 | |
Distribution fees—Note 3(b) | | | 1,210,009 | |
Trustees’ fees—Note 3(a,c) | | | 54,920 | |
Loan commitment fees—Note 2 | | | 13,945 | |
Interest expense—Note 2 | | | 2,465 | |
Total Expenses | | | 2,975,351 | |
Less—Trustees’ fees reimbursed by
BNY Mellon Investment Adviser, Inc.—Note 3(a) | | | (54,920) | |
Net Expenses | | | 2,920,431 | |
Investment Income—Net | | | 4,580,651 | |
Realized and Unrealized Gain (Loss) on Investments—Note 4 ($): | | |
Net realized gain (loss) on investments | 1,764,506 | |
Net realized gain (loss) on futures | 447,387 | |
Capital gain distributions from affiliated issuers | 199 | |
Net Realized Gain (Loss) | | | 2,212,092 | |
Net change in unrealized appreciation (depreciation) on investments | 49,590,498 | |
Net change in unrealized appreciation (depreciation) on futures | 40,200 | |
Net Change in Unrealized Appreciation (Depreciation) | | | 49,630,698 | |
Net Realized and Unrealized Gain (Loss) on Investments | | | 51,842,790 | |
Net Increase in Net Assets Resulting from Operations | | 56,423,441 | |
| | | | | | |
See notes to financial statements. | | | | | |
27
STATEMENT OF CHANGES IN NET ASSETS
| | | | | | | | | | |
| | | | Year Ended December 31, |
| | | | 2020 | | 2019 | |
Operations ($): | | | | | | | | |
Investment income—net | | | 4,580,651 | | | | 5,266,626 | |
Net realized gain (loss) on investments | | 2,212,092 | | | | 28,016,828 | |
Net change in unrealized appreciation
(depreciation) on investments | | 49,630,698 | | | | 76,820,273 | |
Net Increase (Decrease) in Net Assets
Resulting from Operations | 56,423,441 | | | | 110,103,727 | |
Distributions ($): | |
Distributions to shareholders | | | (34,316,237) | | | | (51,447,582) | |
Beneficial Interest Transactions ($): | |
Net proceeds from shares sold | | | 151,009,753 | | | | 53,986,435 | |
Distributions reinvested | | | 34,316,237 | | | | 51,447,582 | |
Cost of shares redeemed | | | (165,956,575) | | | | (97,277,046) | |
Increase (Decrease) in Net Assets
from Beneficial Interest Transactions | 19,369,415 | | | | 8,156,971 | |
Total Increase (Decrease) in Net Assets | 41,476,619 | | | | 66,813,116 | |
Net Assets ($): | |
Beginning of Period | | | 576,508,224 | | | | 509,695,108 | |
End of Period | | | 617,984,843 | | | | 576,508,224 | |
Capital Share Transactions (Shares): | |
Shares sold | | | 9,954,046 | | | | 3,009,705 | |
Shares issued for distributions reinvested | | | 3,099,931 | | | | 2,958,457 | |
Shares redeemed | | | (10,884,588) | | | | (5,403,137) | |
Net Increase (Decrease) in Shares Outstanding | 2,169,389 | | | | 565,025 | |
| | | | | | | | | |
See notes to financial statements. | | | | | | | | |
28
FINANCIAL HIGHLIGHTS
The following table describes the performance for the fiscal periods indicated. Net asset value total return is calculated assuming an initial investment made at the net asset value at the beginning of the period, reinvestment of all dividends and distributions at net asset value during the period, and redemption at net asset value on the last day of the period. Net asset value total return includes adjustments in accordance with accounting principles generally accepted in the United States of America and as such, the net asset value for financial reporting purposes and the returns based upon those net asset values may differ from the net asset value and returns for shareholder transactions. The fund’s total returns do not reflect expenses associated with variable annuity or insurance contracts. These figures have been derived from the fund’s financial statements.
| | | | | | | | | | | |
| | | | | |
| | |
| | Year Ended December 31, |
| | | 2020 | 2019 | 2018 | 2017 | 2016 |
Per Share Data ($): | | | | | | |
Net asset value, beginning of period | | 19.06 | 17.17 | 20.12 | 18.88 | 16.71 |
Investment Operations: | | | | | | |
Investment income—neta | | .14 | .17 | .17 | .16 | .16 |
Net realized and unrealized
gain (loss) on investments | | 1.04 | 3.48 | (1.82) | 2.04 | 3.69 |
Total from Investment Operations | | 1.18 | 3.65 | (1.65) | 2.20 | 3.85 |
Distributions: | | | | | | |
Dividends from
investment income—net | | (.18) | (.17) | (.17) | (.13) | (.16) |
Dividends from net realized
gain on investments | | (1.00) | (1.59) | (1.13) | (.83) | (1.52) |
Total Distributions | | (1.18) | (1.76) | (1.30) | (.96) | (1.68) |
Net asset value, end of period | | 19.06 | 19.06 | 17.17 | 20.12 | 18.88 |
Total Return (%) | | 10.64 | 22.21 | (8.98) | 12.40 | 25.73 |
Ratios/Supplemental Data (%): | | | | | | |
Ratio of total expenses
to average net assets | | .61 | .61 | .61 | .63 | .63 |
Ratio of net expenses
to average net assets | | .60 | .60 | .60 | .60 | .60 |
Ratio of net investment income
to average net assets | | .95 | .94 | .82 | .88 | .95 |
Portfolio Turnover Rate | | 47.77 | 28.13 | 23.26 | 16.90 | 24.24 |
Net Assets, end of period ($ x 1,000) | | 617,985 | 576,508 | 509,695 | 562,014 | 535,603 |
a Based on average shares outstanding.
See notes to financial statements.
29
NOTES TO FINANCIAL STATEMENTS
NOTE 1—Significant Accounting Policies:
Small Cap Stock Index Portfolio (the “fund”) is a separate diversified series of BNY Mellon Investment Portfolios (the “Company”), which is registered under the Investment Company Act of 1940, as amended (the “Act”), as an open-end management investment company and operates as a series company currently offering three series, including the fund. The fund is only offered to separate accounts established by insurance companies to fund variable annuity contracts and variable life insurance policies. The fund’s investment objective is to seek to match the performance of the S&P SmallCap 600® Index. BNY Mellon Investment Adviser, Inc. (the “Adviser”), a wholly-owned subsidiary of The Bank of New York Mellon Corporation (“BNY Mellon”), serves as the fund’s investment adviser. BNY Mellon Securities Corporation (the “Distributor”), a wholly-owned subsidiary of the Adviser, is the distributor of the fund’s shares, which are sold to the public without a sales charge.
The Company accounts separately for the assets, liabilities and operations of each series. Expenses directly attributable to each series are charged to that series’ operations; expenses which are applicable to all series are allocated among them on a pro rata basis.
The Financial Accounting Standards Board (“FASB”) Accounting Standards Codification (“ASC”) is the exclusive reference of authoritative U.S. generally accepted accounting principles (“GAAP”) recognized by the FASB to be applied by nongovernmental entities. Rules and interpretive releases of the Securities and Exchange Commission (“SEC”) under authority of federal laws are also sources of authoritative GAAP for SEC registrants. The fund is an investment company and applies the accounting and reporting guidance of the FASB ASC Topic 946 Financial Services-Investment Companies. The fund’s financial statements are prepared in accordance with GAAP, which may require the use of management estimates and assumptions. Actual results could differ from those estimates.
The Company enters into contracts that contain a variety of indemnifications. The fund’s maximum exposure under these arrangements is unknown. The fund does not anticipate recognizing any loss related to these arrangements.
(a) Portfolio valuation: The fair value of a financial instrument is the amount that would be received to sell an asset or paid to transfer a liability in an orderly transaction between market participants at the measurement date (i.e., the exit price). GAAP establishes a fair value hierarchy that prioritizes the inputs of valuation techniques used to measure fair value.
30
This hierarchy gives the highest priority to unadjusted quoted prices in active markets for identical assets or liabilities (Level 1 measurements) and the lowest priority to unobservable inputs (Level 3 measurements).
Additionally, GAAP provides guidance on determining whether the volume and activity in a market has decreased significantly and whether such a decrease in activity results in transactions that are not orderly. GAAP requires enhanced disclosures around valuation inputs and techniques used during annual and interim periods.
Various inputs are used in determining the value of the fund’s investments relating to fair value measurements. These inputs are summarized in the three broad levels listed below:
Level 1—unadjusted quoted prices in active markets for identical investments.
Level 2—other significant observable inputs (including quoted prices for similar investments, interest rates, prepayment speeds, credit risk, etc.).
Level 3—significant unobservable inputs (including the fund’s own assumptions in determining the fair value of investments).
The inputs or methodology used for valuing securities are not necessarily an indication of the risk associated with investing in those securities.
Changes in valuation techniques may result in transfers in or out of an assigned level within the disclosure hierarchy. Valuation techniques used to value the fund’s investments are as follows:
Investments in equity securities are valued at the last sales price on the securities exchange or national securities market on which such securities are primarily traded. Securities listed on the National Market System for which market quotations are available are valued at the official closing price or, if there is no official closing price that day, at the last sales price. For open short positions, asked prices are used for valuation purposes. Bid price is used when no asked price is available. Registered investment companies that are not traded on an exchange are valued at their net asset value. All of the preceding securities are generally categorized within Level 1 of the fair value hierarchy.
Securities not listed on an exchange or the national securities market, or securities for which there were no transactions, are valued at the average of the most recent bid and asked prices. U.S. Treasury Bills are valued at the mean price between quoted bid prices and asked prices by an independent pricing service (the “Service”) approved by the Company’s Board of
31
NOTES TO FINANCIAL STATEMENTS (continued)
Trustees (the “Board”). These securities are generally categorized within Level 2 of the fair value hierarchy.
The Service is engaged under the general oversight of the Board.
Fair valuing of securities may be determined with the assistance of a pricing service using calculations based on indices of domestic securities and other appropriate indicators, such as prices of relevant American Depository Receipts and futures. Utilizing these techniques may result in transfers between Level 1 and Level 2 of the fair value hierarchy.
When market quotations or official closing prices are not readily available, or are determined not to accurately reflect fair value, such as when the value of a security has been significantly affected by events after the close of the exchange or market on which the security is principally traded (for example, a foreign exchange or market), but before the fund calculates its net asset value, the fund may value these investments at fair value as determined in accordance with the procedures approved by the Board. Certain factors may be considered when fair valuing investments such as: fundamental analytical data, the nature and duration of restrictions on disposition, an evaluation of the forces that influence the market in which the securities are purchased and sold, and public trading in similar securities of the issuer or comparable issuers. These securities are either categorized within Level 2 or 3 of the fair value hierarchy depending on the relevant inputs used.
For securities where observable inputs are limited, assumptions about market activity and risk are used and such securities are generally categorized within Level 3 of the fair value hierarchy.
Futures, which are traded on an exchange, are valued at the last sales price on the securities exchange on which such securities are primarily traded or at the last sales price on the national securities market on each business day and are generally categorized within Level 1 of the fair value hierarchy.
The following is a summary of the inputs used as of December 31, 2020 in valuing the fund’s investments:
32
| | | | | | |
| | Level 1 – Unadjusted
Quoted Prices | Level 2 - Other Significant Observable
Inputs | Level 3 -Significant Unobservable
Inputs | Total |
Assets ($) | | | | |
Investments in Securities: † | | |
Equity Securities—
Common Stocks | 578,185,689 | - | - | 578,185,689 |
Exchange-Traded Funds | 1,488,229 | - | - | 1,488,229 |
Investment Companies | 11,074,848 | - | - | 11,074,848 |
U.S. Treasury Securities | - | 112,991 | - | 112,991 |
Other Financial Instruments: | | |
Futures†† | 39,911 | - | - | 39,911 |
† See Statement of Investments for additional detailed categorizations, if any.
†† Amount shown represents unrealized appreciation (depreciation) at period end, but only variation margin on exchanged traded and centrally cleared derivatives, if any, are reported in the Statement of Assets and Liabilities.
(b) Foreign Taxes: The fund may be subject to foreign taxes (a portion of which may be reclaimable) on income, stock dividends, realized and unrealized capital gains on investments or certain foreign currency transactions. Foreign taxes are recorded in accordance with the applicable foreign tax regulations and rates that exist in the foreign jurisdictions in which the fund invests. These foreign taxes, if any, are paid by the fund and are reflected in the Statement of Operations, if applicable. Foreign taxes payable or deferred or those subject to reclaims as of December 31, 2020, if any, are disclosed in the fund’s Statement of Assets and Liabilities.
(c) Securities transactions and investment income: Securities transactions are recorded on a trade date basis. Realized gains and losses from securities transactions are recorded on the identified cost basis. Dividend income is recognized on the ex-dividend date and interest income, including, where applicable, accretion of discount and amortization of premium on investments, is recognized on the accrual basis.
Pursuant to a securities lending agreement with The Bank of New York Mellon, a subsidiary of BNY Mellon and an affiliate of the Adviser, the fund may lend securities to qualified institutions. It is the fund’s policy that, at origination, all loans are secured by collateral of at least 102% of the value of U.S. securities loaned and 105% of the value of foreign securities loaned. Collateral equivalent to at least 100% of the market value of securities on loan is maintained at all times. Collateral is either in the form of cash, which can be invested in certain money market mutual funds
33
NOTES TO FINANCIAL STATEMENTS (continued)
managed by the Adviser, or U.S. Government and Agency securities. The fund is entitled to receive all dividends, interest and distributions on securities loaned, in addition to income earned as a result of the lending transaction. Should a borrower fail to return the securities in a timely manner, The Bank of New York Mellon is required to replace the securities for the benefit of the fund or credit the fund with the market value of the unreturned securities and is subrogated to the fund’s rights against the borrower and the collateral. Additionally, the contractual maturity of security lending transactions are on an overnight and continuous basis. During the period ended December 31, 2020, The Bank of New York Mellon earned $59,466 from the lending of the fund’s portfolio securities, pursuant to the securities lending agreement.
(d) Affiliated issuers: Investments in other investment companies advised by the Adviser are considered “affiliated” under the Act.
(e) Risk: Certain events particular to the industries in which the fund’s investments conduct their operations, as well as general economic, political and public health conditions, may have a significant negative impact on the investee’s operations and profitability. In addition, turbulence in financial markets and reduced liquidity in equity, credit and/or fixed income markets may negatively affect many issuers, which could adversely affect the fund. Global economies and financial markets are becoming increasingly interconnected, and conditions and events in one country, region or financial market may adversely impact issuers in a different country, region or financial market. These risks may be magnified if certain events or developments adversely interrupt the global supply chain; in these and other circumstances, such risks might affect companies worldwide. Recent examples include pandemic risks related to COVID-19 and aggressive measures taken world-wide in response by governments, including closing borders, restricting international and domestic travel, and the imposition of prolonged quarantines of large populations, and by businesses, including changes to operations and reducing staff. To the extent the fund may overweight its investments in certain countries, companies, industries or market sectors, such positions will increase the fund’s exposure to risk of loss from adverse developments affecting those countries, companies, industries or sectors.
(f) Dividends and distributions to shareholders: Dividends and distributions are recorded on the ex-dividend date. Dividends from investment income-net and dividends from net realized capital gains, if any, are normally declared and paid annually, but the fund may make distributions on a more frequent basis to comply with the distribution requirements of the Internal Revenue Code of 1986, as amended (the
34
“Code”). To the extent that net realized capital gains can be offset by capital loss carryovers, it is the policy of the fund not to distribute such gains. Income and capital gain distributions are determined in accordance with income tax regulations, which may differ from GAAP.
(g) Federal income taxes: It is the policy of the fund to continue to qualify as a regulated investment company, if such qualification is in the best interests of its shareholders, by complying with the applicable provisions of the Code, and to make distributions of taxable income and net realized capital gain sufficient to relieve it from substantially all federal income and excise taxes.
As of and during the period ended December 31, 2020, the fund did not have any liabilities for any uncertain tax positions. The fund recognizes interest and penalties, if any, related to uncertain tax positions as income tax expense in the Statement of Operations. During the period ended December 31, 2020, the fund did not incur any interest or penalties.
Each tax year in the four-year period ended December 31, 2020 remains subject to examination by the Internal Revenue Service and state taxing authorities.
At December 31, 2020, the components of accumulated earnings on a tax basis were as follows: undistributed ordinary income $6,786,260, undistributed capital gains $7,901,280 and unrealized appreciation $178,149,955.
The tax character of distributions paid to shareholders during the fiscal periods ended December 31, 2020 and December 31, 2019 were as follows: ordinary income $6,973,992 and $6,700,232, and long-term capital gains $27,342,245 and $44,747,350, respectively.
NOTE 2—Bank Lines of Credit:
The fund participates with other long-term open-end funds managed by the Adviser in a $823.5 million unsecured credit facility led by Citibank, N.A. (the “Citibank Credit Facility”) and a $300 million unsecured credit facility provided by The Bank of New York Mellon (the “BNYM Credit Facility”), each to be utilized primarily for temporary or emergency purposes, including the financing of redemptions (each, a “Facility”). The Citibank Credit Facility is available in two tranches: (i) Tranche A is in an amount equal to $688.5 million and is available to all long-term open-ended funds, including the fund, and (ii) Tranche B is an amount equal to $135 million and is available only to BNY Mellon Floating Rate Income Fund, a series of BNY Mellon Investment Funds IV, Inc. Prior to September 30, 2020, the Citibank Credit Facility was $927 million with
35
NOTES TO FINANCIAL STATEMENTS (continued)
Tranche A available in an amount equal to $747 million and Tranche B available in an amount equal to $180 million. Prior to March 11, 2020, the Citibank Credit Facility was $1.030 billion with Tranche A available in an amount equal to $830 million and Tranche B available in an amount equal to $200 million. In connection therewith, the fund has agreed to pay its pro rata portion of commitment fees for Tranche A of the Citibank Credit Facility and the BNYM Credit Facility. Interest is charged to the fund based on rates determined pursuant to the terms of the respective Facility at the time of borrowing.
The average amount of borrowings outstanding under the Facilities during the period ended December 31, 2020 was approximately $373,770 with a related weighted average annualized rate of .66%.
NOTE 3—Management Fee and Other Transactions with Affiliates:
(a) Pursuant to a management agreement (the “Agreement”) with the Adviser, the management fee is computed at the annual rate of .35% of the value of the fund’s average daily net assets and is payable monthly. Under the terms of the Agreement, the Adviser has agreed to pay all of the fund’s direct expenses, except management fees, Rule 12b-1 Distribution Plan fees, taxes, interest expense, brokerage commissions, commitment fees on borrowings, fees and expenses of non-interested Trustees (including counsel fees), and extraordinary expenses. The Adviser has also agreed to reduce its management fee in an amount equal to the fund’s allocable portion of the accrued fees and expenses of the non-interested Trustees (including counsel fees). During the period ended December 31, 2020, fees reimbursed by the Adviser amounted to $54,920.
(b) Under the Distribution Plan adopted pursuant to Rule 12b-1 under the Act, the fund pays the Distributor for distributing its shares, for servicing and/or maintaining shareholder accounts and for advertising and marketing. The Distribution Plan provides for payments to be made at an annual rate of .25% of the value of the fund’s average daily net assets. The Distributor may make payments to Participating Insurance Companies and to brokers and dealers acting as principal underwriter for their variable insurance products. The fees payable under the Distribution Plan are payable without regard to actual expenses incurred. During the period ended December 31, 2020, the fund was charged $1,210,009 pursuant to the Distribution Plan.
The components of “Due to BNY Mellon Investment Adviser, Inc. and affiliates” in the Statement of Assets and Liabilities consist of: management fees of $170,515 and Distribution Plan fees of $121,796, which are offset
36
against an expense reimbursement currently in effect in the amount of $6,850.
(c) Each Board member also serves as a Board member of other funds in the BNY Mellon Family of Funds complex. Annual retainer fees and attendance fees are allocated to each fund based on net assets.
NOTE 4—Securities Transactions:
The aggregate amount of purchases and sales of investment securities, excluding short-term securities and futures, during the period ended December 31, 2020, amounted to $231,324,680 and $277,892,871, respectively.
Derivatives: A derivative is a financial instrument whose performance is derived from the performance of another asset. Each type of derivative instrument that was held by the fund during the period ended December 31, 2020 is discussed below.
Futures: In the normal course of pursuing its investment objective, the fund is exposed to market risk, including equity price risk, as a result of changes in value of underlying financial instruments. The fund invests in futures in order to manage its exposure to or protect against changes in the market. A futures contract represents a commitment for the future purchase or a sale of an asset at a specified date. Upon entering into such contracts, these investments require initial margin deposits with a counterparty, which consist of cash or cash equivalents. The amount of these deposits is determined by the exchange or Board of Trade on which the contract is traded and is subject to change. Accordingly, variation margin payments are received or made to reflect daily unrealized gains or losses which are recorded in the Statement of Operations. When the contracts are closed, the fund recognizes a realized gain or loss which is reflected in the Statement of Operations. There is minimal counterparty credit risk to the fund with futures since they are exchange traded, and the exchange guarantees the futures against default. Futures open at December 31, 2020 are set forth in the Statement of Futures.
The following summarizes the average market value of derivatives outstanding during the period ended December 31, 2020:
| | | |
| | Average Market Value ($) |
Equity futures | | 2,240,539 |
| | |
At December 31, 2020, the cost of investments for federal income tax purposes was $412,711,802; accordingly, accumulated net unrealized appreciation on investments was $178,149,955, consisting of $228,927,250
37
NOTES TO FINANCIAL STATEMENTS (continued)
gross unrealized appreciation and $50,777,295 gross unrealized depreciation.
38
REPORT OF INDEPENDENT REGISTERED PUBLIC ACCOUNTING FIRM
To the Shareholders and the Board of Trustees of Small Cap Stock Index Portfolio
Opinion on the Financial Statements
We have audited the accompanying statement of assets and liabilities of Small Cap Stock Index Portfolio (the “Fund”) (one of the funds constituting BNY Mellon Investment Portfolios), including the statements of investments, investments in affiliated issuers and futures, as of December 31, 2020, and the related statement of operations for the year then ended, the statements of changes in net assets for each of the two years in the period then ended, the financial highlights for each of the five years in the period then ended and the related notes (collectively referred to as the “financial statements”). In our opinion, the financial statements present fairly, in all material respects, the financial position of the Fund (one of the funds constituting BNY Mellon Investment Portfolios) at December 31, 2020, the results of its operations for the year then ended, the changes in its net assets for each of the two years in the period then ended and its financial highlights for each of the five years in the period then ended, in conformity with U.S. generally accepted accounting principles.
Basis for Opinion
These financial statements are the responsibility of the Fund’s management. Our responsibility is to express an opinion on the Fund’s financial statements based on our audits. We are a public accounting firm registered with the Public Company Accounting Oversight Board (United States) (“PCAOB”) and are required to be independent with respect to the Fund in accordance with the U.S. federal securities laws and the applicable rules and regulations of the Securities and Exchange Commission and the PCAOB.
We conducted our audits in accordance with the standards of the PCAOB. Those standards require that we plan and perform the audit to obtain reasonable assurance about whether the financial statements are free of material misstatement, whether due to error or fraud. The Fund is not required to have, nor were we engaged to perform, an audit of the Fund’s internal control over financial reporting. As part of our audits, we are required to obtain an understanding of internal control over financial reporting, but not for the purpose of expressing an opinion on the effectiveness of the Fund’s internal control over financial reporting. Accordingly, we express no such opinion.
Our audits included performing procedures to assess the risks of material misstatement of the financial statements, whether due to error or fraud, and performing procedures that respond to those risks. Such procedures included examining, on a test basis, evidence regarding the amounts and disclosures in the financial statements. Our procedures included confirmation of securities owned as of December 31, 2020, by correspondence with the custodian and others or by other appropriate auditing procedures where replies from others were not received. Our audits also included evaluating the accounting principles used and significant estimates made by management, as well as evaluating the overall presentation of the financial statements. We believe that our audits provide a reasonable basis for our opinion.

We have served as the auditor of one or more investment companies in the BNY Mellon Family of Funds since at least 1957, but we are unable to determine the specific year.
New York, New York
February 9, 2021
39
IMPORTANT TAX INFORMATION (Unaudited)
For federal tax purposes, the portfolio hereby reports 86.83% of the ordinary dividends paid during the fiscal year ended December 31, 2020 as qualifying for the corporate dividends received deduction. Shareholders will receive notification in early 2021 of the percentage applicable to the preparation of their 2018 income tax returns. Also, the fund hereby reports $0.0634 per share as a short-term capital gain distribution and $.9382 per share as a long-term capital gain distribution paid on March 25, 2020.
40
INFORMATION ABOUT THE RENEWAL OF THE FUND’S MANAGEMENT AGREEMENT (Unaudited)
At a meeting of the fund’s Board of Trustees held on July 20-21, 2020, the Board considered the renewal of the fund’s Management Agreement pursuant to which the Adviser provides the fund with investment advisory and administrative services (the “Agreement”). The Board members, none of whom are “interested persons” (as defined in the Investment Company Act of 1940, as amended) of the fund, were assisted in their review by independent legal counsel and met with counsel in executive session separate from representatives of the Adviser. In considering the renewal of the Agreement, the Board considered several factors that it believed to be relevant, including those discussed below. The Board did not identify any one factor as dispositive, and each Board member may have attributed different weights to the factors considered.
Analysis of Nature, Extent, and Quality of Services Provided to the Fund. The Board considered information provided to it at the meeting and in previous presentations from representatives of the Adviser regarding the nature, extent, and quality of the services provided to funds in the BNY Mellon fund complex, including the fund. The Adviser provided the number of open accounts in the fund, the fund’s asset size and the allocation of fund assets among distribution channels. The Adviser also had previously provided information regarding the diverse intermediary relationships and distribution channels of funds in the BNY Mellon fund complex (such as retail direct or intermediary, in which intermediaries typically are paid by the fund and/or the Adviser) and the Adviser’s corresponding need for broad, deep, and diverse resources to be able to provide ongoing shareholder services to each intermediary or distribution channel, as applicable to the fund.
The Board also considered research support available to, and portfolio management capabilities of, the fund’s portfolio management personnel and that the Adviser also provides oversight of day-to-day fund operations, including fund accounting and administration and assistance in meeting legal and regulatory requirements. The Board also considered the Adviser’s extensive administrative, accounting and compliance infrastructures. The Board also considered portfolio management’s brokerage policies and practices (including policies and practices regarding soft dollars) and the standards applied in seeking best execution.
Comparative Analysis of the Fund’s Performance and Management Fee and Expense Ratio. The Board reviewed reports prepared by Broadridge Financial Solutions, Inc. (“Broadridge”), an independent provider of investment company data based on classifications provided by Thomson Reuters Lipper, which included information comparing (1) the performance of the fund’s Service shares with the performance of a group of small-cap core pure index funds benchmarked against the S&P Small Cap Index underlying variable insurance products (“VIPs”) selected by Broadridge as comparable to the fund (the “Performance Group”) and with a broader group of funds consisting of all small-cap core funds underlying VIPs (the “Performance Universe”), all for various periods ended May 31, 2020, and (2) the fund’s actual and contractual management fees and total expenses with those of the same group of funds in the Performance Group (the “Expense Group”) and with a broader group of all other
41
INFORMATION ABOUT THE RENEWAL OF THE FUND’S MANAGEMENT AGREEMENT (Unaudited) (continued)
small-cap core funds underlying VIPs with similar 12b-1/non-12b-1 structures, excluding outliers (the “Expense Universe”), the information for which was derived in part from fund financial statements available to Broadridge as of the date of its analysis. The Adviser previously had furnished the Board with a description of the methodology Broadridge used to select the Performance Group and Performance Universe and the Expense Group and Expense Universe.
Performance Comparisons. Representatives of the Adviser stated that the usefulness of performance comparisons may be affected by a number of factors, including different investment limitations and policies that may be applicable to the fund and comparison funds and the end date selected. The Board discussed with representatives of the Adviser the results of the comparisons and considered that the fund’s total return performance was below the Performance Group median for all periods and above the Performance Universe median for all periods, except the one- and two-year periods. The Board considered the relative proximity of the fund’s performance to the Performance Group median in certain periods. It was noted that there were only three other funds in the Performance Group. The Adviser also provided a comparison of the fund’s calendar year total returns to the returns of the fund’s benchmark index.
Management Fee and Expense Ratio Comparisons. The Board reviewed and considered the contractual management fee rate payable by the fund to the Adviser in light of the nature, extent and quality of the management services provided by the Adviser. In addition, the Board reviewed and considered the actual management fee rate paid by the fund over the fund’s last fiscal year. The Board also reviewed the range of actual and contractual management fees and total expenses as a percentage of average net assets of the Expense Group and Expense Universe funds and discussed the results of the comparisons. Taking into account the fund’s “unitary” fee structure, the Board considered that the fund’s contractual management fee was equal to the Expense Group median contractual management fee, the fund’s actual management fee was slightly above the Expense Group and Expense Universe actual management fee medians and the fund’s total expenses were above the Expense Group and Expense Universe total expenses medians.
Representatives of the Adviser reviewed with the Board the management or investment advisory fees paid by funds advised or administered by the Adviser that are in the same Lipper category as the fund (the “Similar Funds”), and explained the nature of the Similar Funds. They discussed differences in fees paid and the relationship of the fees paid in light of any differences in the services provided and other relevant factors, noting the fund’s “unitary” fee structure. The Board considered the relevance of the fee information provided for the Similar Funds to evaluate the appropriateness of the fund’s management fee. Representatives of the Adviser noted that there were no separate accounts and/or other types of client portfolios advised by the Adviser that are considered to have similar investment strategies and policies as the fund.
Analysis of Profitability and Economies of Scale. Representatives of the Adviser reviewed the expenses allocated and profit received by the Adviser and its affiliates and the resulting profitability percentage for managing the fund and the aggregate
42
profitability percentage to the Adviser and its affiliates for managing the funds in the BNY Mellon fund complex, and the method used to determine the expenses and profit. The Board concluded that the profitability results were not excessive, given the services rendered and service levels provided by the Adviser and its affiliates. The Board also had been provided with information prepared by an independent consulting firm regarding the Adviser’s approach to allocating costs to, and determining the profitability of, individual funds and the entire BNY Mellon fund complex. The consulting firm also had analyzed where any economies of scale might emerge in connection with the management of a fund.
The Board considered, on the advice of its counsel, the profitability analysis (1) as part of its evaluation of whether the fees under the Agreement, considered in relation to the mix of services provided by the Adviser, including the nature, extent and quality of such services, supported the renewal of the Agreement and (2) in light of the relevant circumstances for the fund and the extent to which economies of scale would be realized if the fund grows and whether fee levels reflect these economies of scale for the benefit of fund shareholders. Representatives of the Adviser stated that a discussion of economies of scale is predicated on a fund having achieved a substantial size with increasing assets and that, if a fund’s assets had been stable or decreasing, the possibility that the Adviser may have realized any economies of scale would be less. Representatives of the Adviser also stated that, as a result of shared and allocated costs among funds in the BNY Mellon fund complex, the extent of economies of scale could depend substantially on the level of assets in the complex as a whole, so that increases and decreases in complex-wide assets can affect potential economies of scale in a manner that is disproportionate to, or even in the opposite direction from, changes in the fund’s asset level. The Board also considered potential benefits to the Adviser from acting as investment adviser and took into consideration [the/that there were no] soft dollar arrangements in effect for trading the fund’s investments.
At the conclusion of these discussions, the Board agreed that it had been furnished with sufficient information to make an informed business decision with respect to the renewal of the Agreement. Based on the discussions and considerations as described above, the Board concluded and determined as follows.
· The Board concluded that the nature, extent and quality of the services provided by the Adviser are adequate and appropriate.
· The Board generally was satisfied with the fund’s overall relative performance.
· The Board concluded that the fee paid to the Adviser continued to be appropriate under the circumstances and in light of the factors and the totality of the services provided as discussed above.
· The Board determined that the economies of scale which may accrue to the Adviser and its affiliates in connection with the management of the fund had been adequately considered by the Adviser in connection with the fee rate charged to the fund pursuant to the Agreement and that, to the extent in the future it were
43
INFORMATION ABOUT THE RENEWAL OF THE FUND’S MANAGEMENT AGREEMENT (Unaudited) (continued)
determined that material economies of scale had not been shared with the fund, the Board would seek to have those economies of scale shared with the fund.
In evaluating the Agreement, the Board considered these conclusions and determinations and also relied on its previous knowledge, gained through meetings and other interactions with the Adviser and its affiliates, of the Adviser and the services provided to the fund by the Adviser. The Board also relied on information received on a routine and regular basis throughout the year relating to the operations of the fund and the investment management and other services provided under the Agreement, including information on the investment performance of the fund in comparison to similar mutual funds and benchmark performance indices; general market outlook as applicable to the fund; and compliance reports. In addition, the Board’s consideration of the contractual fee arrangements for the fund had the benefit of a number of years of reviews of the Agreement for the fund, or substantially similar agreements for other BNY Mellon funds that the Board oversees, during which lengthy discussions took place between the Board and representatives of the Adviser. Certain aspects of the arrangements may receive greater scrutiny in some years than in others, and the Board’s conclusions may be based, in part, on their consideration of the fund’s arrangements, or substantially similar arrangements for other BNY Mellon funds that the Board oversees, in prior years. The Board determined to renew the Agreement.
44
BOARD MEMBERS INFORMATION (Unaudited)
INDEPENDENT BOARD MEMBERS
Joseph S. DiMartino (77)
Chairman of the Board (1995)
Principal Occupation During Past 5 Years:
· Director or Trustee of funds in the BNY Mellon Family of Funds and certain other entities (as described in the fund’s Statement of Additional Information) (1995-Present)
Other Public Company Board Memberships During Past 5 Years:
· CBIZ, Inc., a public company providing professional business services, products and solutions, Director (1997-Present)
No. of Portfolios for which Board Member Serves: 109
———————
Francine J. Bovich (69)
Board Member (2015)
Principal Occupation During Past 5 Years:
· Trustee, The Bradley Trusts, private trust funds (2011-Present)
Other Public Company Board Memberships During Past 5 Years:
· Annaly Capital Management, Inc., a real estate investment trust, Director (2014-Present)
No. of Portfolios for which Board Member Serves: 66
———————
J. Charles Cardona (65)
Board Member (2014)
Principal Occupation During Past 5 Years:
· BNY Mellon Liquidity Funds, Director (2004-Present) and Chairman (since 2019)
· President and Director of the Adviser (2008-2016)
· Chief Executive Officer of Dreyfus Cash Investment Strategies, a division of the Adviser (2009-2016)
· Chairman (2013 – 2016) Director (2005-2016) and Executive Vice President (2006-2015) of the Distributor
Other Public Company Board Memberships During Past 5 Years:
· BNY Mellon ETF Trust, Chairman and Trustee (2020-Present)
No. of Portfolios for which Board Member Serves: 38
———————
Gordon J. Davis (79)
Board Member (2012)
Principal Occupation During Past 5 Years:
· Partner in the law firm of Venable LLP (2012-Present)
No. of Portfolios for which Board Member Serves: 48
———————
45
BOARD MEMBERS INFORMATION (Unaudited) (continued)
INDEPENDENT BOARD MEMBERS (continued)
Andrew J. Donohue (70)
Board Member (2019)
Principal Occupation During Past 5 Years:
· Of Counsel, Shearman & Sterling LLP (2017-2019)
· Chief of Staff to the Chair of the SEC (2015-2017)
· Managing Director and Investment Company General Counsel of Goldman Sachs (2012-2015)
· Attorney, Solo Law Practice (2019-Present)
Other Public Company Board Memberships During Past 5 Years:
· Oppenheimer Funds (58 funds), Director (2017-2019)
No. of Portfolios for which Board Member Serves: 52
———————
Isabel P. Dunst (73)
Board Member (2014)
Principal Occupation During Past 5 Years:
· Hogan Lovells LLP, a law firm, Senior Counsel (2018-2019); Of Counsel (2015-2018); Partner (1990-2014)
· Member of the Board of Governors, Hebrew Union College Jewish Institute of Religion (2015-Present)
· Board Member, Bend the ARC, a civil rights organization, (2016- Present)
No. of Portfolios for which Board Member Serves: 30
———————
Nathan Leventhal (77)
Board Member (2009)
Principal Occupation During Past 5 Years:
· President Emeritus of Lincoln Center for the Performing Arts (2001-Present)
· President of the Palm Beach Opera (2016-Present)
Other Public Company Board Memberships During Past 5 Years:
· Movado Group, Inc., a public company that designs, sources, markets and distributes watches Director (2003-Present)
No. of Portfolios for which Board Member Serves: 44
———————
46
Robin A. Melvin (57)
Board Member (2014)
Principal Occupation During Past 5 Years:
· Co-Chair, Mentor Illinois, a non-profit organization dedicated to increasing the quality of mentoring services in Illinois (2014 - 2020); Board member, Mentor Illinois (2013-2020)
· Trustee, Westover School, a private girls' boarding school in Middlebury, Connecticut (2019-Present)
No. of Portfolios for which Board Member Serves: 87
———————
Roslyn M. Watson (71)
Board Member (2014)
Principal Occupation During Past 5 Years:
· Principal, Watson Ventures, Inc., a real estate investment company (1993-Present)
Other Public Company Board Memberships During Past 5 Years:
· American Express Bank, FSB, Director (1993-2018)
No. of Portfolios for which Board Member Serves: 52
———————
Benaree Pratt Wiley (74)
Board Member (2009)
Principal Occupation During Past 5 Years:
· Principal, The Wiley Group, a firm specializing in strategy and business development (2005-Present)
Other Public Company Board Memberships During Past 5 Years:
· CBIZ, Inc., a public company providing professional business services, products and solutions, Director (2008-Present)
· Blue Cross Blue Shield of Massachusetts, Director (2004-Present)
No. of Portfolios for which Board Member Serves: 70
———————
The address of the Board Members and Officers is c/o BNY Mellon Investment Adviser, Inc. 240 Greenwich Street, New York, New York 10286. Additional information about the Board Members is available in the fund’s Statement of Additional Information which can be obtained from the Adviser free of charge by calling this toll free number: 1-800-373-9387.
Clifford L. Alexander, Jr., Emeritus Board Member
Whitney I. Gerard, Emeritus Board Member
George L. Perry, Emeritus Board Member
47
OFFICERS OF THE FUND (Unaudited)
DAVID DIPETRILLO, President since January 2021.
Head of North America Product, BNY Mellon Investment Management since January 2018, Director of Product Strategy, BNY Mellon Investment Management from January 2016 to December 2017; Head of US Retail Product and Channel Marketing, BNY Mellon Investment Management from January 2014 to December 2015. He is an officer of 62 investment companies (comprised of 117 portfolios) managed by the Adviser or an affiliate of the Adviser. He is 42 years old and has been an employee of BNY Mellon since 2005.
JAMES WINDELS, Treasurer since November 2001.
Director-BNY Mellon Fund Administration, and an officer of 63 investment companies (comprised of 140 portfolios) managed by the Adviser or an affiliate of the Adviser. He is 62 years old and has been an employee of the Adviser since April 1985.
BENNETT A. MACDOUGALL, Chief Legal Officer since October 2015.
Chief Legal Officer of the Adviser and Associate General Counsel and Managing Director of BNY Mellon since June 2015; Director and Associate General Counsel of Deutsche Bank–Asset & Wealth Management Division from June 2005 to June 2015, and as Chief Legal Officer of Deutsche Investment Management Americas Inc. from June 2012 to May 2015. He is an officer of 63 investment companies (comprised of 140 portfolios) managed by the Adviser or an affiliate of the Adviser. He is 49 years old and has been an employee of the Adviser since June 2015.
JAMES BITETTO, Vice President since August 2005 and Secretary since February 2018.
Senior Managing Counsel of BNY Mellon since December 2019; Managing Counsel of BNY Mellon from April 2014 to December 2019; Secretary of the Adviser, and an officer of 63 investment companies (comprised of 140 portfolios) managed by the Adviser or an affiliate of the Adviser. He is 54 years old and has been an employee of the Adviser since December 1996.
DEIRDRE CUNNANE, Vice President and Assistant Secretary since March 2019.
Counsel of BNY Mellon since August 2018; Senior Regulatory Specialist at BNY Mellon Investment Management Services from February 2016 to August 2018; Trustee Associate at BNY Mellon Trust Company (Ireland) Limited from August 2013 to February 2016. She is an officer of 63 investment companies (comprised of 140 portfolios) managed by the Adviser or an affiliate of the Adviser. She is 30 years old and has been an employee of the Adviser since August 2018.
SARAH S. KELLEHER, Vice President and Assistant Secretary since April 2014.
Managing Counsel of BNY Mellon since December 2017, Senior Counsel of BNY Mellon from March 2013 to December 2017. She is an officer of 63 investment companies (comprised of 140 portfolios) managed by the Adviser or an affiliate of the Adviser. She is 45 years old and has been an employee of the Adviser since March 2013.
JEFF PRUSNOFSKY, Vice President and Assistant Secretary since August 2005.
Senior Managing Counsel of BNY Mellon, and an officer of 63 investment companies (comprised of 140 portfolios) managed by the Adviser or an affiliate of the Adviser. He is 55 years old and has been an employee of the Adviser since October 1990.
AMANDA QUINN, Vice President and Assistant Secretary since March 2020.
Counsel of BNY Mellon since June 2019; Regulatory Administration Manager at BNY Mellon Investment Management Services from September 2018 to May 2019; Senior Regulatory Specialist at BNY Mellon Investment Management Services from April 2015 to August 2018. She is an officer of 63 investment companies (comprised of 140 portfolios) managed by the Adviser or an affiliate of the Adviser. She is 35 years old and has been an employee of the Adviser since June 2019.
PETER M. SULLIVAN, Vice President and Assistant Secretary since March 2019.
Senior Managing Counsel of BNY Mellon since December 2020; Managing Counsel of BNY Mellon from March 2009 to December 2020, and an officer of 63 investment companies (comprised of 140 portfolios) managed by the the Adviser or an affiliate of the the Adviser. He is 52 years old and has been an employee of the BNY Mellon since April 2004.
48
NATALYA ZELENSKY, Vice President and Assistant Secretary since March 2017.
Managing Counsel of BNY Mellon since December 2019; Counsel of BNY Mellon from May 2016 to December 2019; Assistant Secretary of the Adviser since 2018; Attorney at Wildermuth Endowment Strategy Fund/Wildermuth Advisory, LLC from November 2015 to May 2016 and Assistant General Counsel at RCS Advisory Services from July 2014 to November 2015. She is an officer of 63 investment companies (comprised of 140 portfolios) managed by the Adviser or an affiliate of the Adviser. She is 35 years old and has been an employee of the Adviser since May 2016.
GAVIN C. REILLY, Assistant Treasurer since December 2005.
Tax Manager-BNY Mellon Fund Administration, and an officer of 63 investment companies (comprised of 140 portfolios) managed by the Adviser or an affiliate of the Adviser. He is 52 years old and has been an employee of the Adviser since April 1991.
ROBERT S. ROBOL, Assistant Treasurer since August 2002.
Senior Accounting Manager-BNY Mellon Fund Administration, and an officer of 63 investment companies (comprised of 141 portfolios) managed by the Adviser or an affiliate of the Adviser. He is 56 years old and has been an employee of the Adviser since October 1988.
ROBERT SALVIOLO, Assistant Treasurer since July 2007.
Senior Accounting Manager–BNY Mellon Fund Administration, and an officer of 63 investment companies (comprised of 140 portfolios) managed by the Adviser or an affiliate of the Adviser. He is 53 years old and has been an employee of the Adviser since June 1989.
ROBERT SVAGNA, Assistant Treasurer since December 2002.
Senior Accounting Manager–BNY Mellon Fund Administration, and an officer of 63 investment companies (comprised of 140 portfolios) managed by the Adviser or an affiliate of the Adviser. He is 53 years old and has been an employee of the Adviser since November 1990.
JOSEPH W. CONNOLLY, Chief Compliance Officer since October 2004.
Chief Compliance Officer of the Adviser, the BNY Mellon Family of Funds and BNY Mellon Funds Trust (62 investment companies, comprised of 132 portfolios). He is 63 years old and has served in various capacities with the Adviser since 1980, including manager of the firm’s Fund Accounting Department from 1997 through October 2001.
CARIDAD M. CAROSELLA, Anti-Money Laundering Compliance Officer since January 2016.
Anti-Money Laundering Compliance Officer of the BNY Mellon Family of Funds and BNY Mellon Funds Trust since January 2016; from May 2015 to December 2015, Interim Anti-Money Laundering Compliance Officer of the BNY Mellon Family of Funds and BNY Mellon Funds Trust and the Distributor; from January 2012 to May 2015, AML Surveillance Officer of the Distributor. She is an officer of 56 investment companies (comprised of 133 portfolios) managed by the Adviser or an affiliate of the Adviser. She is 52 years old and has been an employee of the Distributor since 1997.
49
BNY Mellon Investment Portfolios, Small Cap Stock Index Portfolio
240 Greenwich Street
New York, NY 10286
Adviser
BNY Mellon Investment Adviser, Inc.
240 Greenwich Street
New York, NY 10286
Custodian
The Bank of New York Mellon
240 Greenwich Street
New York, NY 10286
Transfer Agent &
Dividend Disbursing Agent
BNY Mellon Transfer, Inc.
240 Greenwich Street
New York, NY 10286
Distributor
BNY Mellon Securities Corporation
240 Greenwich Street
New York, NY 10286
Telephone 1-800-258-4260 or 1-800-258-4261
Mail The BNY Mellon Family of Funds, 144 Glenn Curtiss Boulevard, Uniondale, NY 11556-0144 Attn: Institutional Services Department
E-mail Send your request to info@bnymellon.com
Internet Information can be viewed online or downloaded at www.im.bnymellon.com
The fund files its complete schedule of portfolio holdings with the Securities and Exchange Commission (“SEC”) for the first and third quarters of each fiscal year on Form N-PORT. The fund’s Forms N-PORT are available on the SEC’s website at www.sec.gov.
A description of the policies and procedures that the fund uses to determine how to vote proxies relating to portfolio securities and information regarding how the fund voted these proxies for the most recent 12-month period ended June 30 is available at www.im.bnymellon.com and on the SEC’s website at www.sec.gov and without charge, upon request, by calling 1-800-373-9387.
| | |
© 2021 BNY Mellon Securities Corporation
0410AR1220 | 
|
BNY Mellon Investment Portfolios, Technology Growth Portfolio
| |
ANNUAL REPORT December 31, 2020 |

| |
The views expressed in this report reflect those of the portfolio manager(s) only through the end of the period covered and do not necessarily represent the views of BNY Mellon Investment Adviser, Inc. or any other person in the BNY Mellon Investment Adviser, Inc. organization. Any such views are subject to change at any time based upon market or other conditions and BNY Mellon Investment Adviser, Inc. disclaims any responsibility to update such views. These views may not be relied on as investment advice and, because investment decisions for a fund in the BNY Mellon Family of Funds are based on numerous factors, may not be relied on as an indication of trading intent on behalf of any fund in the BNY Mellon Family of Funds. |
| |
Not FDIC-Insured • Not Bank-Guaranteed • May Lose Value |
Contents
THE FUND
FOR MORE INFORMATION
Back Cover
DISCUSSION OF FUND PERFORMANCE (Unaudited)
For the period from January 1, 2020 through December 31, 2020, as provided by Erik A. Swords, Matthew Griffin and Justin Sumner, Portfolio Managers
Market and Fund Performance Overview
For the 12-month period ended December 31, 2020, BNY Mellon Investment Portfolios, Technology Growth Portfolio’s Initial shares produced a total return of 69.92%, and its Service shares produced a total return of 69.57%.1 The fund’s benchmarks, the NYSE® Technology Index and the S&P 500® Index, produced total returns of 74.41% and 18.40%, respectively, over the same period.2,3
Technology stocks gained ground during the reporting period, outpacing the broader market. The fund performed well but lagged the NYSE Technology Index, due largely to the need to manage risk presented by the extraordinary performance of one stock, Tesla, the auto, battery and solar power company.
The Fund’s Investment Approach
The fund seeks capital appreciation. To pursue its goal, the fund normally invests at least 80% of its net assets in the stocks of growth companies of any size that BNY Mellon Investment Adviser, Inc. believes to be leading producers or beneficiaries of technological innovation. Up to 25% of the fund’s assets may be invested in foreign securities. The fund also may invest in U.S. dollar-denominated American Depository Receipts (ADRs).
In choosing stocks, the fund looks for technology companies with the potential for strong earnings or revenue growth rates, although some of the fund’s investments may currently be experiencing losses. The fund’s investment process centers on a multi-dimensional approach that looks for opportunities across emerging-growth, cyclical or stable-growth companies. The fund’s investment approach seeks companies that appear to have strong earnings momentum, positive earnings revisions, favorable growth, product, or market cycles and/or favorable valuations.
Stocks Recover as the Economy Rebounds
Prior to the reporting period, stocks were supported by three rate cuts by the Federal Reserve (the “Fed”) late in 2019, by steady economic data and an announcement of a “Phase One” U.S.-China trade agreement. Stocks also benefited from the approval of a new U.S.-Mexico-Canada Trade Agreement, potentially reducing trade uncertainty with America’s neighbors.
However, early in 2020, markets experienced a sharp correction, amid growing concerns about COVID-19 in China, erasing gains that occurred late in 2019 and early in 2020. In response, the Fed reduced the federal funds rate by 50 basis points early in March 2020, bringing the target rate down to 1.00–1.25%. The Fed made another cut in mid-March 2020, bringing the federal funds rate target to 0.00-0.25%.
In addition, the Fed and other central banks initiated various programs to ease liquidity concerns in certain markets, and government authorities introduced programs to keep small businesses afloat. Steps were also taken to provide relief to employees who had lost their jobs as a result of government-mandated business shutdowns.
2
In the second quarter of 2020, the economy began to show signs of recovery. Retail sales rebounded, and the outlook for manufacturing also improved. Job creation surged, beating economists’ expectations, and markets began to rebound as relief programs took effect, government shutdowns began to ease and hope for a COVID-19 vaccine or effective therapy took hold. Markets also began to rebound as relief programs took effect, as government shutdowns began to ease, and as economic data improved.
Late in the reporting period, markets benefited from the announcement that COVID-19 vaccines would be available within a few months. Uncertainty surrounding the November 2020 election also eased, and investors began to factor the likelihood of additional stimulus and infrastructure spending into their calculations. With the end of the pandemic in view and continued economic rebound likely, investors began to shift away from growth-oriented stocks and into value-oriented stocks.
While many sectors of the economy have suffered from the economic downturn resulting from COVID-19 and efforts to contain the virus, many technology companies have been beneficiaries. Social distancing and the adoption of work-from-home policies, in particular, have accelerated the adoption of certain online video and collaborative work technologies. In addition, technology stocks continue to benefit from an ongoing uptrend in outsourcing. This spending encompasses a number of themes across a wide range of industries, including artificial intelligence, blockchain technology, 5G, mobility, e-commerce, cybersecurity, social media and voice interfacing.
Stock Selection and Risk Management Drove Returns
The fund lagged the NYSE Technology Index, primarily due to the need to manage risk related to the performance of Tesla, the auto, battery and solar energy company. Tesla rose 743% during the reporting period, growing to approximately 15% of the NYSE Technology Index. The fund owned Tesla throughout the reporting period, maintaining an average allocation of 4%, but this required trimming the holding in order to reduce the risk that arises when one position becomes too large. Other detractors included positions in the semiconductor industry, including Micron Technology and Microchip Technology, which were hindered by the delay in the recovery of the computer chip market. In addition, Applied Materials lagged due to government regulations that hampered sales to China. In the software industry, Splunk’s performance detracted from returns, as some major deals were delayed, hurting revenues late in the year.
On a more positive note, many stocks benefited from the acceleration of the digital transformation of the economy that has occurred during the pandemic. Square, a financial technology company, gained nearly 250%, Twilio, a cloud communications company, rose 244%, and Snap, a social media company, increased 186%. In addition, the fund’s positions in Shopify, which supports e-commerce, and HubSpot, a marketing software firm, contributed positively to performance, rising 184% and 150%, respectively. The fund also benefited from avoiding legacy technology companies, including Cisco, IBM, Oracle and Intel, which lagged the index.
3
DISCUSSION OF FUND PERFORMANCE (Unaudited) (continued)
Positioning for Economic Recovery and Continued Digital Transformation of the Economy
Given supportive policies from the Fed and the rollout of COVID-19 vaccines, we remain optimistic about economic recovery in 2021. We are tilting the fund away from companies that benefited from the pandemic and toward those that will benefit most from economic recovery. In addition, the fund continues to position itself to capitalize on a secular shift that is producing digitization across all sectors of the economy.
January 15, 2021
1 Total return includes reinvestment of dividends and any capital gains paid. Past performance is no guarantee of future results. Share price and investment return fluctuate such that upon redemption, fund shares may be worth more or less than their original cost. The fund’s performance does not reflect the deduction of additional charges and expenses imposed in connection with investing in variable insurance contracts, which will reduce returns.
2 Source: Bloomberg L.P. — The NYSE® Technology Index is an equal-dollar-weighted index designed to objectively represent the technology sector by holding 35 of the leading U.S., technology-related companies. Investors cannot invest directly in any index.
3 Source: Lipper Inc. — The S&P 500® Index is widely regarded as the best single gauge of large-cap U.S. equities. The index includes 500 leading companies and captures approximately 80% coverage of available market capitalization. Investors cannot invest directly in any index.
Please note: the position in any security highlighted with italicized typeface was sold during the reporting period.
The technology sector has been among the most volatile sectors of the stock market. Technology companies involve greater risk because their revenue and/or earnings tend to be less predictable, and some companies may be experiencing significant losses.
Equities are subject generally to market, market sector, market liquidity, issuer and investment style risks, among other factors, to varying degrees, all of which are more fully described in the fund’s prospectus.
The fund is only available as a funding vehicle under variable life insurance policies or variable annuity contracts issued by insurance companies. Individuals may not purchase shares of the fund directly. A variable annuity is an insurance contract issued by an insurance company that enables investors to accumulate assets on a tax-deferred basis for retirement or other long-term goals. The investment objective and policies of BNY Mellon Investment Portfolios, Technology Growth Portfolio made available through insurance products may be similar to those of other funds managed or advised by BNY Mellon Investment Adviser, Inc. However, the investment results of the fund may be higher or lower than, and may not be comparable to, those of any other BNY Mellon fund.
Recent market risks include pandemic risks related to COVID-19. The effects of COVID-19 have contributed to increased volatility in global markets and will likely affect certain countries, companies, industries and market sectors more dramatically than others. To the extent the fund may overweight its investments in certain countries, companies, industries or market sectors, such positions will increase the fund’s exposure to risk of loss from adverse developments affecting those countries, companies, industries or sectors.
4
FUND PERFORMANCE (Unaudited)

Comparison of change in value of a $10,000 investment in Initial shares and Service shares of BNY Mellon Investment Portfolios, Technology Growth Portfolio with a hypothetical investment of $10,000 in the NYSE® Technology Index and S&P 500® Index
† Source: Bloomberg L.P.
†† Source: Lipper Inc.
Past performance is not predictive of future performance. The fund’s performance does not reflect the deduction of additional charges and expenses imposed in connection with investing in variable insurance contracts which will reduce returns.
The above graph compares a hypothetical investment of $10,000 made in each of the Initial shares and Service shares of BNY Mellon Investment Portfolios, Technology Growth Portfolio on 12/31/10 to a hypothetical investment of $10,000 made in the NYSE® Technology Index and S&P 500® Index on that date.
The fund’s performance shown in the line graph above takes into account all applicable fees and expenses. The NYSE® Technology Index is an equal-dollar weighted index designed to objectively represent the technology sector by holding 35 of the leading U.S. technology-related companies. The S&P 500® Index is widely regarded as the best single gauge of large-cap U.S. equities. The index includes 500 leading companies and captures approximately 80% coverage of available market capitalization. Unlike a mutual fund, the indices are not subject to charges, fees and other expenses. Investors cannot invest directly in any index. Further information relating to fund performance, including expense reimbursements, if applicable, is contained in the Financial Highlights section of the prospectus and elsewhere in this report.
5
FUND PERFORMANCE (Unaudited) (continued)
| | | | |
Average Annual Total Returns as of 12/31/2020 |
| 1 Year | 5 Years | 10 Years |
Initial shares | 69.92% | 25.89% | 17.64% |
Service shares | 69.57% | 25.58% | 17.35% |
NYSE® Technology Index | 74.41% | 29.23% | 20.20% |
S&P 500® Index | 18.40% | 15.21% | 13.87% |
The performance data quoted represents past performance, which is no guarantee of future results. Share price and investment return fluctuate and an investor’s shares may be worth more or less than original cost upon redemption. Current performance may be lower or higher than the performance quoted. Go to www.im.bnymellon.com for the fund’s most recent month-end returns.
The fund’s Initial shares are not subject to a Rule 12b-1 fee. The fund’s Service shares are subject to a 0.25% annual Rule 12b-1 fee. All dividends and capital gain distributions are reinvested.
The fund’s performance shown in the graph and table does not reflect the deduction of taxes that a shareholder would pay on fund distributions or the redemption of fund shares.
6
UNDERSTANDING YOUR FUND’S EXPENSES (Unaudited)
As a mutual fund investor, you pay ongoing expenses, such as management fees and other expenses. Using the information below, you can estimate how these expenses affect your investment and compare them with the expenses of other funds. You also may pay one-time transaction expenses, including sales charges (loads), redemption fees and expenses associated with variable annuity or insurance contracts, which are not shown in this section and would have resulted in higher total expenses. For more information, see your fund’s prospectus or talk to your financial adviser.
Review your fund’s expenses
The table below shows the expenses you would have paid on a $1,000 investment in BNY Mellon Investment Portfolios, Technology Growth Portfolio from July 1, 2020 to December 31, 2020. It also shows how much a $1,000 investment would be worth at the close of the period, assuming actual returns and expenses.
| | | | | |
Expenses and Value of a $1,000 Investment | |
Assume actual returns for the six months ended December 31, 2020 | |
| | | | |
| | Initial Shares | Service Shares | |
Expense paid per $1,000† | $4.64 | $6.12 | |
Ending value (after expenses) | $1,365.10 | $1,363.50 | |
COMPARING YOUR FUND’S EXPENSES
WITH THOSE OF OTHER FUNDS (Unaudited)
Using the SEC’s method to compare expenses
The Securities and Exchange Commission (“SEC”) has established guidelines to help investors assess fund expenses. Per these guidelines, the table below shows your fund’s expenses based on a $1,000 investment, assuming a hypothetical 5% annualized return. You can use this information to compare the ongoing expenses (but not transaction expenses or total cost) of investing in the fund with those of other funds. All mutual fund shareholder reports will provide this information to help you make this comparison. Please note that you cannot use this information to estimate your actual ending account balance and expenses paid during the period.
| | | | | |
Expenses and Value of a $1,000 Investment | |
Assuming a hypothetical 5% annualized return for the six months ended December 31, 2020 | |
| | | | |
| | Initial Shares | Service Shares | |
Expense paid per $1,000† | $3.96 | $5.23 | |
Ending value (after expenses) | $1,021.22 | $1,019.96 | |
† Expenses are equal to the fund’s annualized expense ratio of .78% for Initial Shares and 1.03% for Service Shares, multiplied by the average account value over the period, multiplied by 184/366 (to reflect the one-half year period). |
7
STATEMENT OF INVESTMENTS
December 31, 2020
| | | | | | | | |
| |
Description | | | | Shares | | Value ($) | |
Common Stocks - 98.8% | | | | | |
Alternative Carriers - .4% | | | | | |
Bandwidth, Cl. A | | | | 27,328 | a,b | 4,199,494 | |
Application Software - 15.2% | | | | | |
Adobe | | | | 57,384 | b | 28,698,886 | |
Datadog, Cl. A | | | | 121,259 | a,b | 11,936,736 | |
Everbridge | | | | 41,006 | a,b | 6,112,764 | |
HubSpot | | | | 28,862 | b | 11,442,051 | |
Medallia | | | | 263,617 | a,b | 8,757,357 | |
OneConnect Financial Technology, ADR | | | | 214,299 | a,b | 4,223,833 | |
salesforce.com | | | | 149,234 | b | 33,209,042 | |
Splunk | | | | 115,949 | b | 19,698,576 | |
Zoom Video Communications, CI. A | | | | 66,502 | b | 22,432,455 | |
| | | | | 146,511,700 | |
Automobile Manufacturers - 4.1% | | | | | |
NIO, ADR | | | | 213,052 | b | 10,384,154 | |
Tesla | | | | 41,074 | a,b | 28,984,690 | |
| | | | | 39,368,844 | |
Data Processing & Outsourced Services - 4.4% | | | | | |
PayPal Holdings | | | | 77,769 | b | 18,213,500 | |
Square, Cl. A | | | | 109,430 | b | 23,816,345 | |
| | | | | 42,029,845 | |
Electronic Component-Semiconductors - 17.3% | | | | | |
Advanced Micro Devices | | | | 405,690 | b | 37,205,830 | |
Diodes | | | | 178,618 | b | 12,592,569 | |
Marvell Technology Group | | | | 619,977 | | 29,473,707 | |
Microchip Technology | | | | 155,877 | | 21,528,172 | |
Micron Technology | | | | 377,841 | b | 28,406,086 | |
NVIDIA | | | | 72,541 | | 37,880,910 | |
| | | | | 167,087,274 | |
Holding Companies-Divers - .5% | | | | | |
Ribbit LEAP | | | | 311,027 | a,b | 4,656,074 | |
Interactive Media & Services - 10.9% | | | | | |
Alphabet, Cl. C | | | | 17,583 | b | 30,803,306 | |
Facebook, Cl. A | | | | 139,381 | b | 38,073,314 | |
Pinterest, Cl. A | | | | 103,525 | b | 6,822,298 | |
Snap, Cl. A | | | | 583,655 | b | 29,223,606 | |
| | | | | 104,922,524 | |
Internet & Direct Marketing Research - 11.5% | | | | | |
Alibaba Group Holding, ADR | | | | 111,634 | b | 25,980,581 | |
Amazon.com | | | | 10,936 | b | 35,617,786 | |
JD.com, ADR | | | | 556,442 | b | 48,911,252 | |
| | | | | 110,509,619 | |
8
| | | | | | | | |
| |
Description | | | | Shares | | Value ($) | |
Common Stocks - 98.8% (continued) | | | | | |
Internet Services & Infrastructure - 4.6% | | | | | |
BASE | | | | 66,000 | b | 6,186,768 | |
Shopify, Cl. A | | | | 16,770 | b | 18,982,801 | |
Snowflake, Cl. A | | | | 18,775 | a,b | 5,283,285 | |
Twilio, Cl. A | | | | 42,365 | b | 14,340,552 | |
| | | | | 44,793,406 | |
Semiconductor Equipment - 13.6% | | | | | |
Lam Research | | | | 40,511 | | 19,132,130 | |
NXP Semiconductors | | | | 94,705 | | 15,059,042 | |
Qualcomm | | | | 253,046 | | 38,549,028 | |
Taiwan Semiconductor Manufacturing, ADR | | | | 451,495 | | 49,231,015 | |
United Microelectronics, ADR | | | | 1,048,599 | a | 8,839,690 | |
| | | | | 130,810,905 | |
Systems Software - 9.2% | | | | | |
Crowdstrike Holdings, CI. A | | | | 75,567 | b | 16,006,602 | |
Microsoft | | | | 132,868 | | 29,552,501 | |
Proofpoint | | | | 52,749 | b | 7,195,491 | |
ServiceNow | | | | 65,148 | b | 35,859,414 | |
| | | | | 88,614,008 | |
Technology Hardware, Storage & Equipment - 4.1% | | | | | |
Apple | | | | 295,166 | | 39,165,577 | |
Trucking - 3.0% | | | | | |
Uber Technologies | | | | 572,008 | b | 29,172,408 | |
Total Common Stocks (cost $545,483,947) | | | | 951,841,678 | |
| | | 1-Day
Yield (%) | | | | | |
Investment Companies - 1.3% | | | | | |
Registered Investment Companies - 1.3% | | | | | |
Dreyfus Institutional Preferred Government Plus Money Market Fund, Institutional Shares
(cost $12,877,205) | | 0.09 | | 12,877,205 | c | 12,877,205 | |
9
STATEMENT OF INVESTMENTS (continued)
| | | | | | | | |
| |
Description | | 1-Day
Yield (%) | | Shares | | Value ($) | |
Investment of Cash Collateral for Securities Loaned - 1.6% | | | | | |
Registered Investment Companies - 1.6% | | | | | |
Dreyfus Institutional Preferred Government Plus Money Market Fund, SL Shares
(cost $14,820,447) | | 0.05 | | 14,820,447 | c | 14,820,447 | |
Total Investments (cost $573,181,599) | | 101.7% | | 979,539,330 | |
Liabilities, Less Cash and Receivables | | (1.7%) | | (15,956,291) | |
Net Assets | | 100.0% | | 963,583,039 | |
ADR—American Depository Receipt
aSecurity, or portion thereof, on loan. At December 31, 2020, the value of the fund’s securities on loan was $27,777,958 and the value of the collateral was $29,052,483, consisting of cash collateral of $14,820,447 and U.S. Government & Agency securities valued at $14,232,036.
bNon-income producing security.
cInvestment in affiliated issuer. The investment objective of this investment company is publicly available and can be found within the investment company’s prospectus.
| | |
Portfolio Summary (Unaudited) † | Value (%) |
Information Technology | 68.4 |
Consumer Discretionary | 15.6 |
Communication Services | 11.3 |
Industrials | 3.0 |
Investment Companies | 2.9 |
Diversified | .5 |
| | 101.7 |
† Based on net assets.
See notes to financial statements.
10
STATEMENT OF INVESTMENTS IN AFFILIATED ISSUERS
| | | | | | | |
Investment Companies | Value
12/31/19($) | Purchases($)† | Sales($) | Value
12/31/20($) | Net
Assets(%) | Dividends/
Distributions($) |
Registered Investment Companies; |
Dreyfus Institutional Preferred Government Plus Money Market Fund, Institutional Shares | 4,705,932 | 214,396,185 | (206,224,912) | 12,877,205 | 1.3 | 35,747 |
Investment of Cash Collateral for Securities Loaned;†† |
Dreyfus Institutional Preferred Government Plus Money Market Fund, Institutional Shares | 8,597,487 | 132,283,508 | (140,880,995) | - | - | 1,992,023††† |
Dreyfus Institutional Preferred Government Plus Money Market Fund, SL Shares | - | 41,201,424 | (26,380,977) | 14,820,447 | 1.6 | 17,069††† |
Total | 13,303,419 | 387,881,117 | (373,486,884) | 27,697,652 | 2.9 | 2,044,839 |
† Includes reinvested dividends/distributions.
†† Effective November 9, 2020, cash collateral for securities lending was transferred from Dreyfus Institutional Preferred Government Plus Money Market Fund, Institutional Shares to Dreyfus Institutional Preferred Government Plus Money Market Fund, SL Shares.
††† Represents securities lending income earned from the reinvestment of cash collateral from loaned securities, net of fees and collateral investment expenses, and other payments to and from borrowers of securities.
See notes to financial statements.
11
STATEMENT OF ASSETS AND LIABILITIES
December 31, 2020
| | | | | | | |
| | | | | | |
| | | Cost | | Value | |
Assets ($): | | | | |
Investments in securities—See Statement of Investments
(including securities on loan, valued at $27,777,958)—Note 1(c): | | | |
Unaffiliated issuers | 545,483,947 | | 951,841,678 | |
Affiliated issuers | | 27,697,652 | | 27,697,652 | |
Cash denominated in foreign currency | | | 53,100 | | 53,609 | |
Receivable for investment securities sold | | 4,791,252 | |
Dividends and securities lending income receivable | | 287,513 | |
Receivable for shares of Beneficial Interest subscribed | | 228,564 | |
Prepaid expenses | | | | | 6,041 | |
| | | | | 984,906,309 | |
Liabilities ($): | | | | |
Due to BNY Mellon Investment Adviser, Inc. and affiliates—Note 3(b) | | 774,522 | |
Liability for securities on loan—Note 1(c) | | 14,820,447 | |
Payable for investment securities purchased | | 5,554,450 | |
Payable for shares of Beneficial Interest redeemed | | 102,051 | |
Trustees’ fees and expenses payable | | 1,533 | |
Other accrued expenses | | | | | 70,267 | |
| | | | | 21,323,270 | |
Net Assets ($) | | | 963,583,039 | |
Composition of Net Assets ($): | | | | |
Paid-in capital | | | | | 415,098,869 | |
Total distributable earnings (loss) | | | | | 548,484,170 | |
Net Assets ($) | | | 963,583,039 | |
| | | | |
Net Asset Value Per Share | Initial Shares | Service Shares | |
Net Assets ($) | 227,324,835 | 736,258,204 | |
Shares Outstanding | 6,196,707 | 21,688,002 | |
Net Asset Value Per Share ($) | 36.68 | 33.95 | |
| | | |
See notes to financial statements. | | | |
12
STATEMENT OF OPERATIONS
Year Ended December 31, 2020
| | | | | | | |
| | | | | | |
| | | | | | |
Investment Income ($): | | | | |
Income: | | | | |
Cash dividends (net of $195,758 foreign taxes withheld at source): | |
Unaffiliated issuers | | | 3,126,431 | |
Affiliated issuers | | | 33,553 | |
Income from securities lending—Note 1(c) | | | 2,009,092 | |
Total Income | | | 5,169,076 | |
Expenses: | | | | |
Management fee—Note 3(a) | | | 5,629,338 | |
Distribution fees—Note 3(b) | | | 1,440,311 | |
Professional fees | | | 93,404 | |
Trustees’ fees and expenses—Note 3(c) | | | 51,434 | |
Loan commitment fees—Note 2 | | | 30,584 | |
Prospectus and shareholders’ reports | | | 24,070 | |
Custodian fees—Note 3(b) | | | 19,848 | |
Chief Compliance Officer fees—Note 3(b) | | | 13,982 | |
Shareholder servicing costs—Note 3(b) | | | 1,060 | |
Interest expense—Note 2 | | | 342 | |
Miscellaneous | | | 18,380 | |
Total Expenses | | | 7,322,753 | |
Investment (Loss)—Net | | | (2,153,677) | |
Realized and Unrealized Gain (Loss) on Investments—Note 4 ($): | | |
Net realized gain (loss) on investments and foreign currency transactions | 144,433,172 | |
Net realized gain (loss) on forward foreign currency exchange contracts | (12,562) | |
Capital gain distributions from affiliated issuers | 2,194 | |
Net Realized Gain (Loss) | | | 144,422,804 | |
Net change in unrealized appreciation (depreciation) on investments
and foreign currency transactions | 266,454,921 | |
Net Realized and Unrealized Gain (Loss) on Investments | | | 410,877,725 | |
Net Increase in Net Assets Resulting from Operations | | 408,724,048 | |
| | | | | | |
See notes to financial statements. | | | | | |
13
STATEMENT OF CHANGES IN NET ASSETS
| | | | | | | | | | |
| | | | Year Ended December 31, |
| | | | 2020 | | 2019 | |
Operations ($): | | | | | | | | |
Investment income (loss)—net | | | (2,153,677) | | | | 786,901 | |
Net realized gain (loss) on investments | | 144,422,804 | | | | 76,581,455 | |
Net change in unrealized appreciation
(depreciation) on investments | | 266,454,921 | | | | 50,852,574 | |
Net Increase (Decrease) in Net Assets
Resulting from Operations | 408,724,048 | | | | 128,220,930 | |
Distributions ($): | |
Distributions to shareholders: | | | | | | | | |
Initial Shares | | | (17,108,961) | | | | (15,372,855) | |
Service Shares | | | (60,123,345) | | | | (53,178,634) | |
Total Distributions | | | (77,232,306) | | | | (68,551,489) | |
Beneficial Interest Transactions ($): | |
Net proceeds from shares sold: | | | | | | | | |
Initial Shares | | | 25,487,190 | | | | 5,520,702 | |
Service Shares | | | 50,456,990 | | | | 34,966,237 | |
Distributions reinvested: | | | | | | | | |
Initial Shares | | | 17,108,961 | | | | 15,372,855 | |
Service Shares | | | 60,123,345 | | | | 53,178,634 | |
Cost of shares redeemed: | | | | | | | | |
Initial Shares | | | (34,411,906) | | | | (14,531,490) | |
Service Shares | | | (102,412,089) | | | | (46,058,388) | |
Increase (Decrease) in Net Assets
from Beneficial Interest Transactions | 16,352,491 | | | | 48,448,550 | |
Total Increase (Decrease) in Net Assets | 347,844,233 | | | | 108,117,991 | |
Net Assets ($): | |
Beginning of Period | | | 615,738,806 | | | | 507,620,815 | |
End of Period | | | 963,583,039 | | | | 615,738,806 | |
Capital Share Transactions (Shares): | |
Initial Shares | | | | | | | | |
Shares sold | | | 869,993 | | | | 226,629 | |
Shares issued for distributions reinvested | | | 900,946 | | | | 647,824 | |
Shares redeemed | | | (1,140,904) | | | | (604,414) | |
Net Increase (Decrease) in Shares Outstanding | 630,035 | | | | 270,039 | |
Service Shares | | | | | | | | |
Shares sold | | | 2,098,579 | | | | 1,548,688 | |
Shares issued for distributions reinvested | | | 3,416,099 | | | | 2,390,051 | |
Shares redeemed | | | (3,933,228) | | | | (2,044,014) | |
Net Increase (Decrease) in Shares Outstanding | 1,581,450 | | | | 1,894,725 | |
| | | | | | | | | |
See notes to financial statements. | | | | | | | | |
14
FINANCIAL HIGHLIGHTS
The following tables describe the performance for each share class for the fiscal periods indicated. All information (except portfolio turnover rate) reflects financial results for a single fund share. Net asset value total return is calculated assuming an initial investment made at the net asset value at the beginning of the period, reinvestment of all dividends and distributions at net asset value during the period, and redemption at net asset value on the last day of the period. Net asset value total return includes adjustments in accordance with accounting principles generally accepted in the United States of America and as such, the net asset value for financial reporting purposes and the returns based upon those net asset values may differ from the net asset value and returns for shareholder transactions. The fund’s total returns do not reflect expenses associated with variable annuity or insurance contracts. These figures have been derived from the fund’s financial statements.
| | | | | | | | |
| | | |
| | Year Ended December 31, |
Initial Shares | | 2020 | 2019 | 2018 | 2017 | 2016 |
Per Share Data ($): | | | | | | |
Net asset value,
beginning of period | | 25.26 | 22.56 | 23.95 | 17.69 | 17.78 |
Investment Operations: | | | | | | |
Investment income (loss)—neta | | (.03) | .08 | .04 | (.01) | .01 |
Net realized and unrealized gain
(loss) on investments | | 14.68 | 5.55 | (.11) | 7.29 | .77 |
Total from Investment Operations | | 14.65 | 5.63 | (.07) | 7.28 | .78 |
Distributions: | | | | | | |
Dividends from investment
income—net | | (.08) | - | - | - | - |
Dividends from net realized
gain on investments | | (3.15) | (2.93) | (1.32) | (1.02) | (.87) |
Total Distributions | | (3.23) | (2.93) | (1.32) | (1.02) | (.87) |
Net asset value, end of period | | 36.68 | 25.26 | 22.56 | 23.95 | 17.69 |
Total Return (%) | | 69.92 | 25.82 | (.98) | 42.64 | 4.72 |
Ratios/Supplemental Data (%): | | | | | | |
Ratio of total expenses
to average net assets | | .78 | .79 | .79 | .82 | .83 |
Ratio of net investment income
(loss) to average net assets | | (.10) | .33 | .14 | (.05) | .07 |
Portfolio Turnover Rate | | 80.81 | 77.56 | 55.34 | 42.07 | 64.26 |
Net Assets, end of period ($ x 1,000) | | 227,325 | 140,591 | 119,470 | 122,670 | 87,243 |
a Based on average shares outstanding.
See notes to financial statements.
15
FINANCIAL HIGHLIGHTS (continued)
| | | | | | | | |
| | | |
| | Year Ended December 31, |
Service Shares | | 2020 | 2019 | 2018 | 2017 | 2016 |
Per Share Data ($): | | | | | | |
Net asset value, beginning of period | | 23.63 | 21.31 | 22.75 | 16.88 | 17.06 |
Investment Operations: | | | | | | |
Investment income (loss)—neta | | (.09) | .02 | (.03) | (.06) | (.03) |
Net realized and unrealized gain
(loss) on investments | | 13.58 | 5.23 | (.09) | 6.95 | .72 |
Total from Investment Operations | | 13.49 | 5.25 | (.12) | 6.89 | .69 |
Distributions: | | | | | | |
Dividends from investment
income—net | | (.02) | - | - | - | - |
Dividends from net realized
gain on investments | | (3.15) | (2.93) | (1.32) | (1.02) | (.87) |
Total Distributions | | (3.17) | (2.93) | (1.32) | (1.02) | (.87) |
Net asset value, end of period | | 33.95 | 23.63 | 21.31 | 22.75 | 16.88 |
Total Return (%) | | 69.57 | 25.51 | (1.27) | 42.36 | 4.38 |
Ratios/Supplemental Data (%): | | | | | | |
Ratio of total expenses
to average net assets | | 1.03 | 1.04 | 1.04 | 1.07 | 1.08 |
Ratio of net investment income (loss)
to average net assets | | (.34) | .08 | (.11) | (.30) | (.18) |
Portfolio Turnover Rate | | 80.81 | 77.56 | 55.34 | 42.07 | 64.26 |
Net Assets, end of period ($ x 1,000) | | 736,258 | 475,148 | 388,151 | 365,231 | 225,801 |
a Based on average shares outstanding.
See notes to financial statements.
16
NOTES TO FINANCIAL STATEMENTS
NOTE 1—Significant Accounting Policies:
Technology Growth Portfolio (the “fund”) is a separate diversified series of BNY Mellon Investment Portfolios (the “Company”), which is registered under the Investment Company Act of 1940, as amended (the “Act”), as an open-end management investment company and operates as a series company currently offering three series, including the fund. The fund is only offered to separate accounts established by insurance companies to fund variable annuity contracts and variable life insurance policies. The fund’s investment objective is to seek capital appreciation. BNY Mellon Investment Adviser, Inc. (the “Adviser”), a wholly-owned subsidiary of The Bank of New York Mellon Corporation (“BNY Mellon”), serves as the fund’s investment adviser.
BNY Mellon Securities Corporation (the “Distributor”), a wholly-owned subsidiary of the Adviser, is the distributor of the fund’s shares, which are sold without a sales charge. The fund is authorized to issue an unlimited number of $.001 par value shares of Beneficial Interest in each of the following classes of shares: Initial and Service. Each class of shares has identical rights and privileges, except with respect to the Distribution Plan, and the expenses borne by each class, the allocation of certain transfer agency costs, and certain voting rights. Income, expenses (other than expenses attributable to a specific class), and realized and unrealized gains or losses on investments are allocated to each class of shares based on its relative net assets.
The Company accounts separately for the assets, liabilities and operations of each series. Expenses directly attributable to each series are charged to that series’ operations; expenses which are applicable to all series are allocated among them on a pro rata basis.
The Financial Accounting Standards Board (“FASB”) Accounting Standards Codification (“ASC”) is the exclusive reference of authoritative U.S. generally accepted accounting principles (“GAAP”) recognized by the FASB to be applied by nongovernmental entities. Rules and interpretive releases of the Securities and Exchange Commission (“SEC”) under authority of federal laws are also sources of authoritative GAAP for SEC registrants. The fund is an investment company and applies the accounting and reporting guidance of the FASB ASC Topic 946 Financial Services-Investment Companies. The fund’s financial statements are prepared in accordance with GAAP, which may require the use of management estimates and assumptions. Actual results could differ from those estimates.
17
NOTES TO FINANCIAL STATEMENTS (continued)
The Company enters into contracts that contain a variety of indemnifications. The fund’s maximum exposure under these arrangements is unknown. The fund does not anticipate recognizing any loss related to these arrangements.
(a) Portfolio valuation: The fair value of a financial instrument is the amount that would be received to sell an asset or paid to transfer a liability in an orderly transaction between market participants at the measurement date (i.e., the exit price). GAAP establishes a fair value hierarchy that prioritizes the inputs of valuation techniques used to measure fair value. This hierarchy gives the highest priority to unadjusted quoted prices in active markets for identical assets or liabilities (Level 1 measurements) and the lowest priority to unobservable inputs (Level 3 measurements).
Additionally, GAAP provides guidance on determining whether the volume and activity in a market has decreased significantly and whether such a decrease in activity results in transactions that are not orderly. GAAP requires enhanced disclosures around valuation inputs and techniques used during annual and interim periods.
Various inputs are used in determining the value of the fund’s investments relating to fair value measurements. These inputs are summarized in the three broad levels listed below:
Level 1—unadjusted quoted prices in active markets for identical investments.
Level 2—other significant observable inputs (including quoted prices for similar investments, interest rates, prepayment speeds, credit risk, etc.).
Level 3—significant unobservable inputs (including the fund’s own assumptions in determining the fair value of investments).
The inputs or methodology used for valuing securities are not necessarily an indication of the risk associated with investing in those securities.
Changes in valuation techniques may result in transfers in or out of an assigned level within the disclosure hierarchy. Valuation techniques used to value the fund’s investments are as follows:
Investments in equity securities are valued at the last sales price on the securities exchange or national securities market on which such securities are primarily traded. Securities listed on the National Market System for which market quotations are available are valued at the official closing price or, if there is no official closing price that day, at the last sales price. For open short positions, asked prices are used for valuation purposes. Bid
18
price is used when no asked price is available. Registered investment companies that are not traded on an exchange are valued at their net asset value. All of the preceding securities are generally categorized within Level 1 of the fair value hierarchy.
Securities not listed on an exchange or the national securities market, or securities for which there were no transactions, are valued at the average of the most recent bid and asked prices. These securities are generally categorized within Level 2 of the fair value hierarchy.
Fair valuing of securities may be determined with the assistance of a pricing service using calculations based on indices of domestic securities and other appropriate indicators, such as prices of relevant ADRs and futures. Utilizing these techniques may result in transfers between Level 1 and Level 2 of the fair value hierarchy.
When market quotations or official closing prices are not readily available, or are determined not to accurately reflect fair value, such as when the value of a security has been significantly affected by events after the close of the exchange or market on which the security is principally traded (for example, a foreign exchange or market), but before the fund calculates its net asset value, the fund may value these investments at fair value as determined in accordance with the procedures approved by the Company’s Board of Trustees (the “Board”). Certain factors may be considered when fair valuing investments such as: fundamental analytical data, the nature and duration of restrictions on disposition, an evaluation of the forces that influence the market in which the securities are purchased and sold, and public trading in similar securities of the issuer or comparable issuers. These securities are either categorized within Level 2 or 3 of the fair value hierarchy depending on the relevant inputs used.
For securities where observable inputs are limited, assumptions about market activity and risk are used and such securities are generally categorized within Level 3 of the fair value hierarchy.
Investments denominated in foreign currencies are translated to U.S. dollars at the prevailing rates of exchange.
The following is a summary of the inputs used as of December 31, 2020 in valuing the fund’s investments:
19
NOTES TO FINANCIAL STATEMENTS (continued)
| | | | | | |
Assets ($) | Level 1 - Unadjusted Quoted Prices | Level 2 - Other Significant Observable Inputs | | Level 3 -Significant Unobservable Inputs | Total |
Investments in Securities:† | | | | |
Equity Securities - Common Stocks | 945,654,910 | 6,186,768 | †† | - | 951,841,678 |
Investment Companies | 27,697,652 | - | | - | 27,697,652 |
† See Statement of Investments for additional detailed categorizations, if any.
†† Securities classified within Level 2 at period end as the values were determined pursuant to the fund’s fair valuation procedures.
(b) Foreign currency transactions: The fund does not isolate that portion of the results of operations resulting from changes in foreign exchange rates on investments from the fluctuations arising from changes in the market prices of securities held. Such fluctuations are included with the net realized and unrealized gain or loss on investments.
Net realized foreign exchange gains or losses arise from sales of foreign currencies, currency gains or losses realized on securities transactions between trade and settlement date, and the difference between the amounts of dividends, interest and foreign withholding taxes recorded on the fund’s books and the U.S. dollar equivalent of the amounts actually received or paid. Net unrealized foreign exchange gains and losses arise from changes in the value of assets and liabilities other than investments resulting from changes in exchange rates. Foreign currency gains and losses on foreign currency transactions are also included with net realized and unrealized gain or loss on investments.
Foreign Taxes: The fund may be subject to foreign taxes (a portion of which may be reclaimable) on income, stock dividends, realized and unrealized capital gains on investments or certain foreign currency transactions. Foreign taxes are recorded in accordance with the applicable foreign tax regulations and rates that exist in the foreign jurisdictions in which the fund invests. These foreign taxes, if any, are paid by the fund and are reflected in the Statement of Operations, if applicable. Foreign taxes payable or deferred or those subject to reclaims as of December 31, 2020, if any, are disclosed in the fund’s Statement of Assets and Liabilities.
(c) Securities transactions and investment income: Securities transactions are recorded on a trade date basis. Realized gains and losses from securities transactions are recorded on the identified cost basis. Dividend income is recognized on the ex-dividend date and interest income, including, where applicable, accretion of discount and amortization of premium on investments, is recognized on the accrual basis.
20
Pursuant to a securities lending agreement with The Bank of New York Mellon, a subsidiary of BNY Mellon and an affiliate of the Adviser, the fund may lend securities to qualified institutions. It is the fund’s policy that, at origination, all loans are secured by collateral of at least 102% of the value of U.S. securities loaned and 105% of the value of foreign securities loaned. Collateral equivalent to at least 100% of the market value of securities on loan is maintained at all times. Collateral is either in the form of cash, which can be invested in certain money market mutual funds managed by the Adviser, or U.S. Government and Agency securities. The fund is entitled to receive all dividends, interest and distributions on securities loaned, in addition to income earned as a result of the lending transaction. Should a borrower fail to return the securities in a timely manner, The Bank of New York Mellon is required to replace the securities for the benefit of the fund or credit the fund with the market value of the unreturned securities and is subrogated to the fund’s rights against the borrower and the collateral. Additionally, the contractual maturity of security lending transactions are on an overnight and continuous basis. During the period ended December 31, 2020, The Bank of New York Mellon earned $345,596 from the lending of the fund’s portfolio securities, pursuant to the securities lending agreement.
(d) Affiliated issuers: Investments in other investment companies advised by the Adviser are considered “affiliated” under the Act.
(e) Risk: Certain events particular to the industries in which the fund’s investments conduct their operations, as well as general economic, political and public health conditions, may have a significant negative impact on the investee’s operations and profitability. In addition, turbulence in financial markets and reduced liquidity in equity, credit and/or fixed income markets may negatively affect many issuers, which could adversely affect the fund. Global economies and financial markets are becoming increasingly interconnected, and conditions and events in one country, region or financial market may adversely impact issuers in a different country, region or financial market. These risks may be magnified if certain events or developments adversely interrupt the global supply chain; in these and other circumstances, such risks might affect companies worldwide. Recent examples include pandemic risks related to COVID-19 and aggressive measures taken world-wide in response by governments, including closing borders, restricting international and domestic travel, and the imposition of prolonged quarantines of large populations, and by businesses, including changes to operations and reducing staff. To the extent the fund may overweight its investments in certain countries, companies, industries or market sectors, such positions will increase the
21
NOTES TO FINANCIAL STATEMENTS (continued)
fund’s exposure to risk of loss from adverse developments affecting those countries, companies, industries or sectors.
(f) Dividends and distributions to shareholders: Dividends and distributions are recorded on the ex-dividend date. Dividends from investment income-net and dividends from net realized capital gains, if any, are normally declared and paid annually, but the fund may make distributions on a more frequent basis to comply with the distribution requirements of the Internal Revenue Code of 1986, as amended (the “Code”). To the extent that net realized capital gains can be offset by capital loss carryovers, it is the policy of the fund not to distribute such gains. Income and capital gain distributions are determined in accordance with income tax regulations, which may differ from GAAP.
(g) Federal income taxes: It is the policy of the fund to continue to qualify as a regulated investment company, if such qualification is in the best interests of its shareholders, by complying with the applicable provisions of the Code, and to make distributions of taxable income and net realized capital gain sufficient to relieve it from substantially all federal income and excise taxes.
As of and during the period ended December 31, 2020, the fund did not have any liabilities for any uncertain tax positions. The fund recognizes interest and penalties, if any, related to uncertain tax positions as income tax expense in the Statement of Operations. During the period ended December 31, 2020, the fund did not incur any interest or penalties.
Each tax year in the four-year period ended December 31, 2020 remains subject to examination by the Internal Revenue Service and state taxing authorities.
At December 31, 2020, the components of accumulated earnings on a tax basis were as follows: undistributed ordinary income $65,968,826, undistributed capital gains $77,926,275 and unrealized appreciation $404,589,069.
The tax character of distributions paid to shareholders during the fiscal periods ended December 31, 2020 and December 31, 2019 were as follows: ordinary income $791,589 and $0, and long-term capital gains $76,440,717 and $68,551,489, respectively.
NOTE 2—Bank Lines of Credit:
The fund participates with other long-term open-end funds managed by the Adviser in a $823.5 million unsecured credit facility led by Citibank, N.A. (the “Citibank Credit Facility”) and a $300 million unsecured credit facility provided by The Bank of New York Mellon (the “BNYM Credit
22
Facility”), each to be utilized primarily for temporary or emergency purposes, including the financing of redemptions (each, a “Facility”). The Citibank Credit Facility is available in two tranches: (i) Tranche A is in an amount equal to $688.5 million and is available to all long-term open-ended funds, including the fund, and (ii) Tranche B is an amount equal to $135 million and is available only to BNY Mellon Floating Rate Income Fund, a series of BNY Mellon Investment Funds IV, Inc. Prior to September 30, 2020, the Citibank Credit Facility was $927 million with Tranche A available in an amount equal to $747 million and Tranche B available in an amount equal to $180 million. Prior to March 11, 2020, the Citibank Credit Facility was $1.030 billion with Tranche A available in an amount equal to $830 million and Tranche B available in an amount equal to $200 million. In connection therewith, the fund has agreed to pay its pro rata portion of commitment fees for Tranche A of the Citibank Credit Facility and the BNYM Credit Facility. Interest is charged to the fund based on rates determined pursuant to the terms of the respective Facility at the time of borrowing.
The average amount of borrowings outstanding under the Facilities during the period ended December 31, 2020 was approximately $14,481 with a related weighted average annualized interest rate of 2.36%.
NOTE 3—Management Fee and Other Transactions with Affiliates:
(a) Pursuant to a management agreement with the Adviser, the management fee is computed at the annual rate of .75% of the value of the fund’s average daily net assets and is payable monthly.
(b) Under the Distribution Plan adopted pursuant to Rule 12b-1 under the Act, Service shares pay the Distributor for distributing its shares, for servicing and/or maintaining Service shares’ shareholder accounts and for advertising and marketing for Service shares. The Distribution Plan provides for payments to be made at an annual rate of .25% of the value of the Service shares’ average daily net assets. The Distributor may make payments to Participating Insurance Companies and to brokers and dealers acting as principal underwriter for their variable insurance products. The fees payable under the Distribution Plan are payable without regard to actual expenses incurred. During the period ended December 31, 2020, Service shares were charged $1,440,311 pursuant to the Distribution Plan.
The fund has an arrangement with the transfer agent whereby the fund may receive earnings credits when positive cash balances are maintained, which are used to offset transfer agency fees. For financial reporting
23
NOTES TO FINANCIAL STATEMENTS (continued)
purposes, the fund includes net earnings credits, if any, as shareholder servicing costs in the Statement of Operations.
The fund has an arrangement with the custodian whereby the fund will receive interest income or be charged an overdraft fees when cash balances are maintained. For financial reporting purposes, the fund includes this interest income and overdraft fees, if any, as interest income in the Statement of Operations.
The fund compensates BNY Mellon Transfer, Inc., a wholly-owned subsidiary of the Adviser, under a transfer agency agreement for providing transfer agency and cash management services inclusive of earnings credits, if any, for the fund. The majority of transfer agency fees are comprised of amounts paid on a per account basis, while cash management fees are related to fund subscriptions and redemptions. During the period ended December 31, 2020, the fund was charged $926 for transfer agency services, inclusive of earnings credit, if any. These fees are included in Shareholder servicing costs in the Statement of Operations.
The fund compensates The Bank of New York Mellon under a custody agreement for providing custodial services for the fund. These fees are determined based on net assets, geographic region and transaction activity. During the period ended December 31, 2020, the fund was charged $19,848 pursuant to the custody agreement.
During the period ended December 31, 2020, the fund was charged $13,982 for services performed by the Chief Compliance Officer and his staff. These fees are included in Chief Compliance Officer fees in the Statement of Operations.
The components of “Due to BNY Mellon Investment Adviser, Inc. and affiliates” in the Statement of Assets and Liabilities consist of: management fees of $611,724, Distribution Plan fees of $154,972, custodian fees of $4,709, Chief Compliance Officer fees of $2,903 and transfer agency fees of $214.
(c) Each Board member also serves as a Board member of other funds in the BNY Mellon Family of Funds complex. Annual retainer fees and attendance fees are allocated to each fund based on net assets.
NOTE 4—Securities Transactions:
The aggregate amount of purchases and sales of investment securities, excluding short-term securities and forward foreign currency exchange (“forward contract”) during the period ended December 31, 2020, amounted to $596,215,035 and $666,535,746, respectively.
24
Derivatives: A derivative is a financial instrument whose performance is derived from the performance of another asset. The fund enters into International Swaps and Derivatives Association, Inc. Master Agreements or similar agreements (collectively, “Master Agreements”) with its over-the-counter (“OTC”) derivative contract counterparties in order to, among other things, reduce its credit risk to counterparties. Master Agreements include provisions for general obligations, representations, collateral and events of default or termination. Under a Master Agreement, the fund may offset with the counterparty certain derivative financial instruments’ payables and/or receivables with collateral held and/or posted and create one single net payment in the event of default or termination.
Each type of derivative instrument that was held by the fund during the period ended December 31, 2020 is discussed below.
Forward Foreign Currency Exchange Contracts: The fund enters into forward contracts in order to hedge its exposure to changes in foreign currency exchange rates on its foreign portfolio holdings, to settle foreign currency transactions or as a part of its investment strategy. When executing forward contracts, the fund is obligated to buy or sell a foreign currency at a specified rate on a certain date in the future. With respect to sales of forward contracts, the fund incurs a loss if the value of the contract increases between the date the forward contract is opened and the date the forward contract is closed. The fund realizes a gain if the value of the contract decreases between those dates. With respect to purchases of forward contracts, the fund incurs a loss if the value of the contract decreases between the date the forward contract is opened and the date the forward contract is closed. The fund realizes a gain if the value of the contract increases between those dates. Any realized or unrealized gains or losses which occurred during the period are reflected in the Statement of Operations. The fund is exposed to foreign currency risk as a result of changes in value of underlying financial instruments. The fund is also exposed to credit risk associated with counterparty nonperformance on these forward contracts, which is generally limited to the unrealized gain on each open contract. This risk may be mitigated by Master Agreements, if any, between the fund and the counterparty and the posting of collateral, if any, by the counterparty to the fund to cover the fund’s exposure to the counterparty. At December 31, 2020, there were no forward contracts outstanding.
The following summarizes the average market value of derivatives outstanding during the period ended December 31, 2020:
| | | |
| | Average Market Value ($) |
Forward contracts | | 17,817 |
| | |
25
NOTES TO FINANCIAL STATEMENTS (continued)
At December 31, 2020, the cost of investments for federal income tax purposes was $574,950,770; accordingly, accumulated net unrealized appreciation on investments was $404,588,560, consisting of $411,997,179 gross unrealized appreciation and $7,408,619 gross unrealized depreciation.
26
REPORT OF INDEPENDENT REGISTERED PUBLIC ACCOUNTING FIRM
To the Shareholders and the Board of Trustees of Technology Growth Portfolio
Opinion on the Financial Statements
We have audited the accompanying statement of assets and liabilities of Technology Growth Portfolio (the “Fund”) (one of the funds constituting BNY Mellon Investment Portfolios), including the statements of investments and investments in affiliated issuers, as of December 31, 2020, and the related statement of operations for the year then ended, the statements of changes in net assets for each of the two years in the period then ended, the financial highlights for each of the five years in the period then ended and the related notes (collectively referred to as the “financial statements”). In our opinion, the financial statements present fairly, in all material respects, the financial position of the Fund (one of the funds constituting BNY Mellon Investment Portfolios) at December 31, 2020, the results of its operations for the year then ended, the changes in its net assets for each of the two years in the period then ended and its financial highlights for each of the five years in the period then ended, in conformity with U.S. generally accepted accounting principles.
Basis for Opinion
These financial statements are the responsibility of the Fund’s management. Our responsibility is to express an opinion on the Fund’s financial statements based on our audits. We are a public accounting firm registered with the Public Company Accounting Oversight Board (United States) (“PCAOB”) and are required to be independent with respect to the Fund in accordance with the U.S. federal securities laws and the applicable rules and regulations of the Securities and Exchange Commission and the PCAOB.
We conducted our audits in accordance with the standards of the PCAOB. Those standards require that we plan and perform the audit to obtain reasonable assurance about whether the financial statements are free of material misstatement, whether due to error or fraud. The Fund is not required to have, nor were we engaged to perform, an audit of the Fund’s internal control over financial reporting. As part of our audits, we are required to obtain an understanding of internal control over financial reporting, but not for the purpose of expressing an opinion on the effectiveness of the Fund’s internal control over financial reporting. Accordingly, we express no such opinion.
Our audits included performing procedures to assess the risks of material misstatement of the financial statements, whether due to error or fraud, and performing procedures that respond to those risks. Such procedures included examining, on a test basis, evidence regarding the amounts and disclosures in the financial statements. Our procedures included confirmation of securities owned as of December 31, 2020, by correspondence with the custodian and others or by other appropriate auditing procedures where replies from others were not received. Our audits also included evaluating the accounting principles used and significant estimates made by management, as well as evaluating the overall presentation of the financial statements. We believe that our audits provide a reasonable basis for our opinion.

We have served as the auditor of one or more investment companies in the BNY Mellon Family of Funds since at least 1957, but we are unable to determine the specific year.
New York, New York
February 9, 2021
27
IMPORTANT TAX INFORMATION (Unaudited)
For federal tax purposes, the portfolio hereby reports 99.51% of the ordinary dividends paid during the fiscal year ended December 31, 2020 as qualifying for the corporate dividends received deduction. Shareholders will receive notification in early 2021 of the percentage applicable to the preparation of their 2020 income tax returns. Also, the portfolio hereby reports $3.1527 per share as a long-term capital gain distribution paid on March 25, 2020.
28
INFORMATION ABOUT THE RENEWAL OF THE FUND’S MANAGEMENT AGREEMENT (Unaudited)
At a meeting of the fund’s Board of Trustees held on July 20-21, 2020, the Board considered the renewal of the fund’s Management Agreement pursuant to which the Adviser provides the fund with investment advisory and administrative services (the “Agreement”). The Board members, none of whom are “interested persons” (as defined in the Investment Company Act of 1940, as amended) of the fund, were assisted in their review by independent legal counsel and met with counsel in executive session separate from representatives of the Adviser. In considering the renewal of the Agreement, the Board considered several factors that it believed to be relevant, including those discussed below. The Board did not identify any one factor as dispositive, and each Board member may have attributed different weights to the factors considered.
Analysis of Nature, Extent, and Quality of Services Provided to the Fund. The Board considered information provided to it at the meeting and in previous presentations from representatives of the Adviser regarding the nature, extent, and quality of the services provided to funds in the BNY Mellon fund complex, including the fund. The Adviser provided the number of open accounts in the fund, the fund’s asset size and the allocation of fund assets among distribution channels. The Adviser also had previously provided information regarding the diverse intermediary relationships and distribution channels of funds in the BNY Mellon fund complex (such as retail direct or intermediary, in which intermediaries typically are paid by the fund and/or the Adviser) and the Adviser’s corresponding need for broad, deep, and diverse resources to be able to provide ongoing shareholder services to each intermediary or distribution channel, as applicable to the fund.
The Board also considered research support available to, and portfolio management capabilities of, the fund’s portfolio management personnel and that the Adviser also provides oversight of day-to-day fund operations, including fund accounting and administration and assistance in meeting legal and regulatory requirements. The Board also considered the Adviser’s extensive administrative, accounting and compliance infrastructures. The Board also considered portfolio management’s brokerage policies and practices (including policies and practices regarding soft dollars) and the standards applied in seeking best execution.
Comparative Analysis of the Fund’s Performance and Management Fee and Expense Ratio. The Board reviewed reports prepared by Broadridge Financial Solutions, Inc. (“Broadridge”), an independent provider of investment company data based on classifications provided by Thomson Reuters Lipper, which included information comparing (1) the performance of the fund’s Initial shares with the performance of a group of science and technology funds underlying variable insurance products (“VIPs”) selected by Broadridge as comparable to the fund (the “Performance Group”) and with a broader group of funds consisting of all science and technology funds underlying VIPs (the “Performance Universe”), all for various periods ended May 31st, and (2) the fund’s actual and contractual management fees and total expenses with those of the same group of funds in the Performance Group (the “Expense Group”) and with a broader group of all other science and technology funds underlying VIPs with similar 12b-
29
INFORMATION ABOUT THE RENEWAL OF THE FUND’S MANAGEMENT AGREEMENT (Unaudited) (continued)
1/non-12b-1 structures, excluding outliers (the “Expense Universe”), the information for which was derived in part from fund financial statements available to Broadridge as of the date of its analysis. The Adviser previously had furnished the Board with a description of the methodology Broadridge used to select the Performance Group and Performance Universe and the Expense Group and Expense Universe.
Performance Comparisons. Representatives of the Adviser stated that the usefulness of performance comparisons may be affected by a number of factors, including different investment limitations and policies that may be applicable to the fund and comparison funds and the end date selected. The Board discussed with representatives of the Adviser the results of the comparisons and considered that the fund’s total return performance was below the Performance Group and Performance Universe medians for all periods. The Board considered the relative proximity of the fund’s performance to the Performance Universe medians in certain periods. The Adviser also provided a comparison of the fund’s calendar year total returns to the returns of the fund’s benchmark indices, and it was noted that the fund’s returns were above the returns of the S&P 500 index in 5 of the 10 calendar years shown and above the returns of the NYSE Technology Index in 4 of the 10 calendar years shown. The Board also noted that an additional primary portfolio manager had been added in March 2019 and that the fund’s relative performance for the one-year period ended May 31, 2020 had improved, with the fund ranking higher within the Performance Group and Performance Universe than in certain other performance periods.
The Board reviewed and considered the contractual management fee rate payable by the fund to the Adviser in light of the nature, extent and quality of the management services provided by the Adviser. In addition, the Board reviewed and considered the actual management fee rate paid by the fund over the fund’s last fiscal year. The Board also reviewed the range of actual and contractual management fees and total expenses as a percentage of average net assets of the Expense Group and Expense Universe funds and discussed the results of the comparisons. The Board considered that the fund’s contractual management fee was lower than the Expense Group median contractual management fee, the fund’s actual management fee was lower than the Expense Group and Expense Universe actual management fee medians and the fund’s total expenses were lower than the Expense Group and Expense Universe total expenses medians.
Representatives of the Adviser noted that there were no other funds advised or administered by the Adviser that are in the same Lipper category as the fund or separate accounts and/or other types of client portfolios advised by the Adviser that are considered to have similar investment strategies and policies as the fund.
Analysis of Profitability and Economies of Scale. Representatives of the Adviser reviewed the expenses allocated and profit received by the Adviser and its affiliates and the resulting profitability percentage for managing the fund and the aggregate profitability percentage to the Adviser and its affiliates for managing the funds in the BNY Mellon fund complex, and the method used to determine the expenses and profit. The Board concluded that the profitability results were not excessive, given the services rendered and service levels provided by the Adviser and its affiliates. The Board also
30
had been provided with information prepared by an independent consulting firm regarding the Adviser’s approach to allocating costs to, and determining the profitability of, individual funds and the entire BNY Mellon fund complex. The consulting firm also had analyzed where any economies of scale might emerge in connection with the management of a fund.
The Board considered, on the advice of its counsel, the profitability analysis (1) as part of its evaluation of whether the fees under the Agreement, considered in relation to the mix of services provided by the Adviser, including the nature, extent and quality of such services, supported the renewal of the Agreement and (2) in light of the relevant circumstances for the fund and the extent to which economies of scale would be realized if the fund grows and whether fee levels reflect these economies of scale for the benefit of fund shareholders. Representatives of the Adviser also stated that, as a result of shared and allocated costs among funds in the BNY Mellon fund complex, the extent of economies of scale could depend substantially on the level of assets in the complex as a whole, so that increases and decreases in complex-wide assets can affect potential economies of scale in a manner that is disproportionate to, or even in the opposite direction from, changes in the fund’s asset level. The Board also considered potential benefits to the Adviser from acting as investment adviser and took into consideration the soft dollar arrangements in effect for trading the fund’s investments.
At the conclusion of these discussions, the Board agreed that it had been furnished with sufficient information to make an informed business decision with respect to the renewal of the Agreement. Based on the discussions and considerations as described above, the Board concluded and determined as follows.
· The Board concluded that the nature, extent and quality of the services provided by the Adviser are adequate and appropriate.
· The Board considered the Adviser’s efforts to improve fund performance and the other considerations described above, including comparisons to the fund’s benchmark indices.
· The Board concluded that the fee paid to the Adviser continued to be appropriate under the circumstances and in light of the factors and the totality of the services provided as discussed above.
· The Board determined that the economies of scale which may accrue to the Adviser and its affiliates in connection with the management of the fund had been adequately considered by the Adviser in connection with the fee rate charged to the fund pursuant to the Agreement and that, to the extent in the future it were determined that material economies of scale had not been shared with the fund, the Board would seek to have those economies of scale shared with the fund.
In evaluating the Agreement, the Board considered these conclusions and determinations and also relied on its previous knowledge, gained through meetings and other interactions with the Adviser and its affiliates, of the Adviser and the services provided to the fund by the Adviser. The Board also relied on information received on a
31
INFORMATION ABOUT THE RENEWAL OF THE FUND’S MANAGEMENT AGREEMENT (Unaudited) (continued)
routine and regular basis throughout the year relating to the operations of the fund and the investment management and other services provided under the Agreement, including information on the investment performance of the fund in comparison to similar mutual funds and benchmark performance indices; general market outlook as applicable to the fund; and compliance reports. In addition, the Board’s consideration of the contractual fee arrangements for the fund had the benefit of a number of years of reviews of the Agreement for the fund, or substantially similar agreements for other BNY Mellon funds that the Board oversees, during which lengthy discussions took place between the Board and representatives of the Adviser. Certain aspects of the arrangements may receive greater scrutiny in some years than in others, and the Board’s conclusions may be based, in part, on their consideration of the fund’s arrangements, or substantially similar arrangements for other BNY Mellon funds that the Board oversees, in prior years. The Board determined to renew the Agreement.
32
BOARD MEMBERS INFORMATION (Unaudited)
INDEPENDENT BOARD MEMBERS
Joseph S. DiMartino (77)
Chairman of the Board (1995)
Principal Occupation During Past 5 Years:
· Director or Trustee of funds in the BNY Mellon Family of Funds and certain other entities (as described in the fund’s Statement of Additional Information) (1995-Present)
Other Public Company Board Memberships During Past 5 Years:
· CBIZ, Inc., a public company providing professional business services, products and solutions, Director (1997-Present)
No. of Portfolios for which Board Member Serves: 109
———————
Francine J. Bovich (69)
Board Member (2015)
Principal Occupation During Past 5 Years:
· Trustee, The Bradley Trusts, private trust funds (2011-Present)
Other Public Company Board Memberships During Past 5 Years:
· Annaly Capital Management, Inc., a real estate investment trust, Director (2014-Present)
No. of Portfolios for which Board Member Serves: 66
———————
J. Charles Cardona (65)
Board Member (2014)
Principal Occupation During Past 5 Years:
· BNY Mellon Liquidity Funds, Director (2004-Present) and Chairman (since 2019)
· President and Director of the Adviser (2008-2016)
· Chief Executive Officer of Dreyfus Cash Investment Strategies, a division of the Adviser (2009-2016)
· Chairman (2013 – 2016) Director (2005-2016) and Executive Vice President (2006-2015) of the Distributor
Other Public Company Board Memberships During Past 5 Years:
· BNY Mellon ETF Trust, Chairman and Trustee (2020-Present)
No. of Portfolios for which Board Member Serves: 38
———————
Gordon J. Davis (79)
Board Member (2012)
Principal Occupation During Past 5 Years:
· Partner in the law firm of Venable LLP (2012-Present)
No. of Portfolios for which Board Member Serves: 48
———————
33
BOARD MEMBERS INFORMATION (Unaudited) (continued)
INDEPENDENT BOARD MEMBERS (continued)
Andrew J. Donohue (70)
Board Member (2019)
Principal Occupation During Past 5 Years:
· Of Counsel, Shearman & Sterling LLP (2017-2019)
· Chief of Staff to the Chair of the SEC (2015-2017)
· Managing Director and Investment Company General Counsel of Goldman Sachs (2012-2015)
· Attorney, Solo Law Practice (2019-Present)
Other Public Company Board Memberships During Past 5 Years:
· Oppenheimer Funds (58 funds), Director (2017-2019)
No. of Portfolios for which Board Member Serves: 52
———————
Isabel P. Dunst (73)
Board Member (2014)
Principal Occupation During Past 5 Years:
· Hogan Lovells LLP, a law firm, Senior Counsel (2018-2019); Of Counsel (2015-2018); Partner (1990-2014)
· Member of the Board of Governors, Hebrew Union College Jewish Institute of Religion (2015-Present)
· Board Member, Bend the ARC, a civil rights organization, (2016- Present)
No. of Portfolios for which Board Member Serves: 30
———————
Nathan Leventhal (77)
Board Member (2009)
Principal Occupation During Past 5 Years:
· President Emeritus of Lincoln Center for the Performing Arts (2001-Present)
· President of the Palm Beach Opera (2016-Present)
Other Public Company Board Memberships During Past 5 Years:
· Movado Group, Inc., a public company that designs, sources, markets and distributes watches Director (2003-Present)
No. of Portfolios for which Board Member Serves: 44
———————
34
Robin A. Melvin (57)
Board Member (2014)
Principal Occupation During Past 5 Years:
· Co-Chair, Mentor Illinois, a non-profit organization dedicated to increasing the quality of mentoring services in Illinois (2014 - 2020); Board member, Mentor Illinois (2013-2020)
· Trustee, Westover School, a private girls' boarding school in Middlebury, Connecticut (2019-Present)
No. of Portfolios for which Board Member Serves: 87
———————
Roslyn M. Watson (71)
Board Member (2014)
Principal Occupation During Past 5 Years:
· Principal, Watson Ventures, Inc., a real estate investment company (1993-Present)
Other Public Company Board Memberships During Past 5 Years:
· American Express Bank, FSB, Director (1993-2018)
No. of Portfolios for which Board Member Serves: 52
———————
Benaree Pratt Wiley (74)
Board Member (2009)
Principal Occupation During Past 5 Years:
· Principal, The Wiley Group, a firm specializing in strategy and business development (2005-Present)
Other Public Company Board Memberships During Past 5 Years:
· CBIZ, Inc., a public company providing professional business services, products and solutions, Director (2008-Present)
· Blue Cross Blue Shield of Massachusetts, Director (2004-Present)
No. of Portfolios for which Board Member Serves: 70
———————
Once elected all Board Members serve for an indefinite term, but achieve Emeritus status upon reaching age 80. The address of the Board Members and Officers is c/o BNY Mellon Investment Adviser, Inc. 240 Greenwich Street, New York, New York 10286. Additional information about the Board Members is available in the fund’s Statement of Additional Information which can be obtained from the Adviser free of charge by calling this toll free number: 1-800-373-9387.
Clifford L. Alexander, Jr., Emeritus Board Member
Whitney I. Gerard, Emeritus Board Member
George L. Perry, Emeritus Board Member
35
OFFICERS OF THE FUND (Unaudited)
DAVID DIPETRILLO, President since January 2021.
Head of North America Product, BNY Mellon Investment Management since January 2018, Director of Product Strategy, BNY Mellon Investment Management from January 2016 to December 2017; Head of US Retail Product and Channel Marketing, BNY Mellon Investment Management from January 2014 to December 2015. He is an officer of 62 investment companies (comprised of 117 portfolios) managed by the Adviser or an affiliate of the Adviser. He is 42 years old and has been an employee of BNY Mellon since 2005.
JAMES WINDELS, Treasurer since November 2001.
Director-BNY Mellon Fund Administration, and an officer of 63 investment companies (comprised of 140 portfolios) managed by the Adviser or an affiliate of the Adviser. He is 62 years old and has been an employee of the Adviser since April 1985.
BENNETT A. MACDOUGALL, Chief Legal Officer since October 2015.
Chief Legal Officer of the Adviser and Associate General Counsel and Managing Director of BNY Mellon since June 2015; Director and Associate General Counsel of Deutsche Bank–Asset & Wealth Management Division from June 2005 to June 2015, and as Chief Legal Officer of Deutsche Investment Management Americas Inc. from June 2012 to May 2015. He is an officer of 63 investment companies (comprised of 140 portfolios) managed by the Adviser or an affiliate of the Adviser. He is 49 years old and has been an employee of the Adviser since June 2015.
JAMES BITETTO, Vice President since August 2005 and Secretary since February 2018.
Senior Managing Counsel of BNY Mellon since December 2019; Managing Counsel of BNY Mellon from April 2014 to December 2019; Secretary of the Adviser, and an officer of 63 investment companies (comprised of 140 portfolios) managed by the Adviser or an affiliate of the Adviser. He is 54 years old and has been an employee of the Adviser since December 1996.
DEIRDRE CUNNANE, Vice President and Assistant Secretary since March 2019.
Counsel of BNY Mellon since August 2018; Senior Regulatory Specialist at BNY Mellon Investment Management Services from February 2016 to August 2018; Trustee Associate at BNY Mellon Trust Company (Ireland) Limited from August 2013 to February 2016. She is an officer of 63 investment companies (comprised of 140 portfolios) managed by the Adviser or an affiliate of the Adviser. She is 30 years old and has been an employee of the Adviser since August 2018.
SARAH S. KELLEHER, Vice President and Assistant Secretary since April 2014.
Managing Counsel of BNY Mellon since December 2017, Senior Counsel of BNY Mellon from March 2013 to December 2017. She is an officer of 63 investment companies (comprised of 140 portfolios) managed by the Adviser or an affiliate of the Adviser. She is 45 years old and has been an employee of the Adviser since March 2013.
JEFF PRUSNOFSKY, Vice President and Assistant Secretary since August 2005.
Senior Managing Counsel of BNY Mellon, and an officer of 63 investment companies (comprised of 140 portfolios) managed by the Adviser or an affiliate of the Adviser. He is 55 years old and has been an employee of the Adviser since October 1990.
AMANDA QUINN, Vice President and Assistant Secretary since March 2020.
Counsel of BNY Mellon since June 2019; Regulatory Administration Manager at BNY Mellon Investment Management Services from September 2018 to May 2019; Senior Regulatory Specialist at BNY Mellon Investment Management Services from April 2015 to August 2018. She is an officer of 63 investment companies (comprised of 140 portfolios) managed by the Adviser or an affiliate of the Adviser. She is 35 years old and has been an employee of the Adviser since June 2019.
PETER M. SULLIVAN, Vice President and Assistant Secretary since March 2019.
Senior Managing Counsel of BNY Mellon since December 2020; Managing Counsel of BNY Mellon from March 2009 to December 2020, and an officer of 63 investment companies (comprised of 140 portfolios) managed by the the Adviser or an affiliate of the the Adviser. He is 52 years old and has been an employee of the BNY Mellon since April 2004.
36
NATALYA ZELENSKY, Vice President and Assistant Secretary since March 2017.
Managing Counsel of BNY Mellon since December 2019; Counsel of BNY Mellon from May 2016 to December 2019; Assistant Secretary of the Adviser since 2018; Attorney at Wildermuth Endowment Strategy Fund/Wildermuth Advisory, LLC from November 2015 to May 2016 and Assistant General Counsel at RCS Advisory Services from July 2014 to November 2015. She is an officer of 63 investment companies (comprised of 140 portfolios) managed by the Adviser or an affiliate of the Adviser. She is 35 years old and has been an employee of the Adviser since May 2016.
GAVIN C. REILLY, Assistant Treasurer since December 2005.
Tax Manager-BNY Mellon Fund Administration, and an officer of 63 investment companies (comprised of 140 portfolios) managed by the Adviser or an affiliate of the Adviser. He is 52 years old and has been an employee of the Adviser since April 1991.
ROBERT S. ROBOL, Assistant Treasurer since August 2002.
Senior Accounting Manager-BNY Mellon Fund Administration, and an officer of 63 investment companies (comprised of 141 portfolios) managed by the Adviser or an affiliate of the Adviser. He is 56 years old and has been an employee of the Adviser since October 1988.
ROBERT SALVIOLO, Assistant Treasurer since July 2007.
Senior Accounting Manager–BNY Mellon Fund Administration, and an officer of 63 investment companies (comprised of 140 portfolios) managed by the Adviser or an affiliate of the Adviser. He is 53 years old and has been an employee of the Adviser since June 1989.
ROBERT SVAGNA, Assistant Treasurer since December 2002.
Senior Accounting Manager–BNY Mellon Fund Administration, and an officer of 63 investment companies (comprised of 140 portfolios) managed by the Adviser or an affiliate of the Adviser. He is 53 years old and has been an employee of the Adviser since November 1990.
JOSEPH W. CONNOLLY, Chief Compliance Officer since October 2004.
Chief Compliance Officer of the Adviser, the BNY Mellon Family of Funds and BNY Mellon Funds Trust (62 investment companies, comprised of 132 portfolios). He is 63 years old and has served in various capacities with the Adviser since 1980, including manager of the firm’s Fund Accounting Department from 1997 through October 2001.
CARIDAD M. CAROSELLA, Anti-Money Laundering Compliance Officer since January 2016.
Anti-Money Laundering Compliance Officer of the BNY Mellon Family of Funds and BNY Mellon Funds Trust since January 2016; from May 2015 to December 2015, Interim Anti-Money Laundering Compliance Officer of the BNY Mellon Family of Funds and BNY Mellon Funds Trust and the Distributor; from January 2012 to May 2015, AML Surveillance Officer of the Distributor. She is an officer of 56 investment companies (comprised of 133 portfolios) managed by the Adviser or an affiliate of the Adviser. She is 52 years old and has been an employee of the Distributor since 1997.
37
BNY Mellon Investment Portfolios, Technology Growth Portfolio
240 Greenwich Street
New York, NY 10286
Adviser
BNY Mellon Investment Adviser, Inc.
240 Greenwich Street
New York, NY 10286
Custodian
The Bank of New York Mellon
240 Greenwich Street
New York, NY 10286
Transfer Agent &
Dividend Disbursing Agent
BNY Mellon Transfer, Inc.
240 Greenwich Street
New York, NY 10286
Distributor
BNY Mellon Securities Corporation
240 Greenwich Street
New York, NY 10286
Telephone 1-800-258-4260 or 1-800-258-4261
Mail The BNY Mellon Family of Funds, 144 Glenn Curtiss Boulevard, Uniondale, NY 11556-0144 Attn: Institutional Services Department
E-mail Send your request to info@bnymellon.com
Internet Information can be viewed online or downloaded at www.im.bnymellon.com
The fund files its complete schedule of portfolio holdings with the Securities and Exchange Commission (“SEC”) for the first and third quarters of each fiscal year on Form N-PORT. The fund’s Forms N-PORT are available on the SEC’s website at www.sec.gov.
A description of the policies and procedures that the fund uses to determine how to vote proxies relating to portfolio securities and information regarding how the fund voted these proxies for the most recent 12-month period ended June 30 is available at www.im.bnymellon.com and on the SEC’s website at www.sec.gov and without charge, upon request, by calling 1-800-373-9387.
| | |
© 2021 BNY Mellon Securities Corporation
0175AR1220 | 
|
Item 2. Code of Ethics.
The Registrant has adopted a code of ethics that applies to the Registrant's principal executive officer, principal financial officer, principal accounting officer or controller, or persons performing similar functions. There have been no amendments to, or waivers in connection with, the Code of Ethics during the period covered by this Report.
Item 3. Audit Committee Financial Expert.
The Registrant's Board has determined that Joseph S. DiMartino, a member of the Audit Committee of the Board, is an audit committee financial expert as defined by the Securities and Exchange Commission (the "SEC"). Joseph S. DiMartino is "independent" as defined by the SEC for purposes of audit committee financial expert determinations.
Item 4. Principal Accountant Fees and Services.
(a) Audit Fees. The aggregate fees billed for each of the last two fiscal years (the "Reporting Periods") for professional services rendered by the Registrant's principal accountant (the "Auditor") for the audit of the Registrant's annual financial statements or services that are normally provided by the Auditor in connection with the statutory and regulatory filings or engagements for the Reporting Periods, were $145,352 in 2019 and $104,559 in 2020.
(b) Audit-Related Fees. The aggregate fees billed in the Reporting Periods for assurance and related services by the Auditor that are reasonably related to the performance of the audit of the Registrant's financial statements and are not reported under paragraph (a) of this Item 4 were $36,908 in 2019 and $31,456 in 2020. These services consisted of one or more of the following: (i) agreed upon procedures related to compliance with Internal Revenue Code section 817(h), (ii) security counts required by Rule 17f-2 under the Investment Company Act of 1940, as amended, (iii) advisory services as to the accounting or disclosure treatment of Registrant transactions or events and (iv) advisory services to the accounting or disclosure treatment of the actual or potential impact to the Registrant of final or proposed rules, standards or interpretations by the Securities and Exchange Commission, the Financial Accounting Standards Boards or other regulatory or standard-setting bodies.
The aggregate fees billed in the Reporting Periods for non-audit assurance and related services by the Auditor to the Registrant's investment adviser (not including any sub-investment adviser whose role is primarily portfolio management and is subcontracted with or overseen by another investment adviser), and any entity controlling, controlled by or under common control with the investment adviser that provides ongoing services to the Registrant ("Service Affiliates"), that were reasonably related to the performance of the annual audit of the Service Affiliate, which required pre-approval by the Audit Committee were $0 in 2019 and $0 in 2020.
(c) Tax Fees. The aggregate fees billed in the Reporting Periods for professional services rendered by the Auditor for tax compliance, tax advice, and tax planning ("Tax Services") were $12,160 in 2019 and $9,441 in 2020. These services consisted of: (i) review or preparation of U.S. federal, state, local and excise tax returns; (ii) U.S. federal, state and local tax planning, advice and assistance regarding statutory, regulatory or administrative developments; (iii) tax advice regarding tax qualification matters and/or treatment of various financial instruments held or proposed to be acquired or held, and (iv) determination of Passive Foreign Investment Companies. The aggregate fees billed in the Reporting Periods for Tax Services by the Auditor to Service Affiliates, which required pre-approval by the Audit Committee were $0 in 2019 and $0 in 2020.
(d) All Other Fees. The aggregate fees billed in the Reporting Periods for products and services provided by the Auditor, other than the services reported in paragraphs (a) through (c) of this Item, were $57 in 2019 and $0 in 2020. [These services consisted of a review of the Registrant's anti-money laundering program].
The aggregate fees billed in the Reporting Periods for Non-Audit Services by the Auditor to Service Affiliates, other than the services reported in paragraphs (b) through (c) of this Item, which required pre-approval by the Audit Committee, were $0 in 2019 and $0 in 2020.
(e)(1) Audit Committee Pre-Approval Policies and Procedures. The Registrant's Audit Committee has established policies and procedures (the "Policy") for pre-approval (within specified fee limits) of the Auditor's engagements for non-audit services to the Registrant and Service Affiliates without specific case-by-case consideration. The pre-approved services in the Policy can include pre-approved audit services, pre-approved audit-related services, pre-approved tax services and pre-approved all other services. Pre-approval considerations include whether the proposed services are compatible with maintaining the Auditor's independence. Pre-approvals pursuant to the Policy are considered annually.
(e)(2) Note. None of the services described in paragraphs (b) through (d) of this Item 4 were approved by the Audit Committee pursuant to paragraph (c)(7)(i)(C) of Rule 2-01 of Regulation S-X.
(f) None of the hours expended on the principal accountant's engagement to audit the registrant's financial statements for the most recent fiscal year were attributed to work performed by persons other than the principal accountant's full-time, permanent employees.
Non-Audit Fees. The aggregate non-audit fees billed by the Auditor for services rendered to the Registrant, and rendered to Service Affiliates, for the Reporting Periods were $605,259 in 2019 and $1,264,899 in 2020.
Auditor Independence. The Registrant's Audit Committee has considered whether the provision of non-audit services that were rendered to Service Affiliates, which were not pre-approved (not requiring pre-approval), is compatible with maintaining the Auditor's independence.
Item 5. Audit Committee of Listed Registrants.
Not applicable.
Item 6. Investments.
(a) Not applicable.
Item 7. Disclosure of Proxy Voting Policies and Procedures for Closed-End Management Investment Companies.
Not applicable.
Item 8. Portfolio Managers of Closed-End Management Investment Companies.
Not applicable.
Item 9. Purchases of Equity Securities by Closed-End Management Investment Companies and Affiliated Purchasers.
Not applicable.
Item 10. Submission of Matters to a Vote of Security Holders.
There have been no material changes to the procedures applicable to Item 10.
Item 11. Controls and Procedures.
(a) The Registrant's principal executive and principal financial officers have concluded, based on their evaluation of the Registrant's disclosure controls and procedures as of a date within 90 days of the filing date of this report, that the Registrant's disclosure controls and procedures are reasonably designed to ensure that information required to be disclosed by the Registrant on Form N-CSR is recorded, processed, summarized and reported within the required time periods and that information required to be disclosed by the Registrant in the reports that it files or submits on Form N-CSR is accumulated and communicated to the Registrant's management, including its principal executive and principal financial officers, as appropriate to allow timely decisions regarding required disclosure.
(b) There were no changes to the Registrant's internal control over financial reporting that occurred during the second fiscal quarter of the period covered by this report that have materially affected, or are reasonably likely to materially affect, the Registrant's internal control over financial reporting.
Item 12. Disclosure of Securities Lending Activities for Closed-End Management Investment Companies.
Not applicable.
Item 13. Exhibits.
(a)(1) Code of ethics referred to in Item 2.
(a)(2) Certifications of principal executive and principal financial officers as required by Rule 30a-2(a) under the Investment Company Act of 1940.
(a)(3) Not applicable.
(b) Certification of principal executive and principal financial officers as required by Rule 30a-2(b) under the Investment Company Act of 1940.
SIGNATURES
Pursuant to the requirements of the Securities Exchange Act of 1934 and the Investment Company Act of 1940, the Registrant has duly caused this Report to be signed on its behalf by the undersigned, thereunto duly authorized.
BNY Mellon Investment Portfolios
By: /s/ David DiPetrillo
David DiPetrillo
President (Principal Executive Officer)
Date: February 8, 2021
Pursuant to the requirements of the Securities Exchange Act of 1934 and the Investment Company Act of 1940, this Report has been signed below by the following persons on behalf of the Registrant and in the capacities and on the dates indicated.
By: /s/ David DiPetrillo
David DiPetrillo
President (Principal Executive Officer)
Date: February 8, 2021
By: /s/ James Windels
James Windels
Treasurer (Principal Financial Officer)
Date: February 8, 2021
EXHIBIT INDEX
(a)(1) Code of ethics referred to in Item 2.
(a)(2) Certifications of principal executive and principal financial officers as required by Rule 30a-2(a) under the Investment Company Act of 1940. (EX-99.CERT)
(b) Certification of principal executive and principal financial officers as required by Rule 30a-2(b) under the Investment Company Act of 1940. (EX-99.906CERT)