UNITED STATES
SECURITIES AND EXCHANGE COMMISSION
Washington, D.C. 20549
FORM N-CSR
CERTIFIED SHAREHOLDER REPORT OF REGISTERED MANAGEMENT
INVESTMENT COMPANIES
| Investment Company Act file number | 811-08673 |
| | |
| | BNY Mellon Investment Portfolios | |
| | (Exact name of Registrant as specified in charter) | |
| | | |
| | c/o BNY Mellon Investment Adviser, Inc. 240 Greenwich Street New York, New York 10286 | |
| | (Address of principal executive offices) (Zip code) | |
| | | |
| | Deirdre Cunnane, Esq. 240 Greenwich Street New York, New York 10286 | |
| | (Name and address of agent for service) | |
| |
| Registrant's telephone number, including area code: | (212) 922-6400 |
| | |
Date of fiscal year end: | 12/31 | |
| Date of reporting period: | 12/31/2022 | |
| | | | | | | |
FORM N-CSR
Item 1. Reports to Stockholders.
BNY Mellon Investment Portfolios, MidCap Stock Portfolio
| |
ANNUAL REPORT December 31, 2022 |

| |
Save time. Save paper. View your next shareholder report online as soon as it’s available. Log into www.im.bnymellon.com and sign up for eCommunications. It’s simple and only takes a few minutes. |
| |
The views expressed in this report reflect those of the portfolio manager(s) only through the end of the period covered and do not necessarily represent the views of BNY Mellon Investment Adviser, Inc. or any other person in the BNY Mellon Investment Adviser, Inc. organization. Any such views are subject to change at any time based upon market or other conditions and BNY Mellon Investment Adviser, Inc. disclaims any responsibility to update such views. These views may not be relied on as investment advice and, because investment decisions for a fund in the BNY Mellon Family of Funds are based on numerous factors, may not be relied on as an indication of trading intent on behalf of any fund in the BNY Mellon Family of Funds. |
| |
Not FDIC-Insured • Not Bank-Guaranteed • May Lose Value |
Contents
THE FUND
FOR MORE INFORMATION
Back Cover
DISCUSSION OF FUND PERFORMANCE (Unaudited)
For the period from January 1, 2022, through December 31, 2022, as provided by portfolio manager Peter D. Goslin, CFA of Newton Investment Management North America, LLC, sub-adviser.
Market and Fund Performance Overview
For the 12-month period ended December 31, 2022, BNY Mellon Investment Portfolios, MidCap Stock Portfolio (the “fund”) Initial shares produced a total return of −14.08%, and its Service shares produced a total return of −14.29%.1 In comparison, the fund’s benchmark, the S&P MidCap 400® Index (the “Index”), produced a total return of −13.06% for the same period.2
Equities lost ground during the reporting period under pressure from sharply increasing inflation, monetary tightening measures undertaken by the U.S. Federal Reserve (the “Fed”) and uncertainties related to Russia’s invasion of Ukraine. The fund underperformed the Index, largely due to the relatively weak performance of growth and earnings-quality factors.
The Fund’s Investment Approach
The fund seeks investment results that are greater than the total return performance of publicly traded common stocks of medium-sized domestic companies in the aggregate, as represented by the Index. To pursue this goal, the fund normally invests at least 80% of its net assets, plus any borrowings for investment purposes, in stocks of mid-cap companies.
The fund invests in growth and value stocks, which are chosen through a disciplined investment process that combines computer modeling techniques, fundamental analysis and risk management. Consistency of returns compared to the Index is a primary goal of the investment process.
The portfolio managers select stocks through a “bottom-up” structured approach that seeks to identify undervalued securities using a quantitative ranking process. The process is driven by a proprietary stock selection model that measures a diverse set of corporate characteristics to identify and rank stocks based on valuation, momentum, sentiment and earnings-quality measures.
Next, the fund’s portfolio managers construct the portfolio through a risk-controlled process, focusing on stock selection, as opposed to making proactive decisions as to industry and sector exposure. The portfolio managers seek to maintain a portfolio that has exposure to industries and market capitalizations that are generally similar to the fund’s benchmark. Finally, within each sector and style subset, the fund will seek to overweight the most attractive stocks and underweight or not hold the stocks that have been ranked least attractive.
A Challenging Environment Undermines Most Equities
The start of 2022 was the most challenging period faced by equity investors since the outbreak of the COVID-19 pandemic. While Russia’s invasion of Ukraine at the end of February was a defining geopolitical and economic event and an obvious catalyst for equity market weakness, equity indices had already come under considerable pressure. The proximate cause was tightening U.S. monetary policy, as the Fed, addressing inflationary pressures, signaled that U.S. interest-rate increases would come earlier and potentially be
2
more aggressive than previously indicated, a course of action that pressured higher-multiple equities. Inflation rose even faster than expected as commodity prices surged in the wake of the invasion of Ukraine, necessitating an even more hawkish approach by the Fed. As the pace of interest-rate increases accelerated in the late spring and summer, equities experienced extensive derating, with higher growth shares once again proving most vulnerable.
The investment environment remained volatile in the second half of the year, although many U.S. equity indices registered relatively mild losses, and some posted slight gains for the six months. Stock markets started the third quarter of 2022 on a firmer footing in response to better-than-expected corporate earnings and a less hawkish tone from the Fed during the announcement of a 0.75% increase in U.S. interest rates in July. However, subsequent Fed statements dashed investor’s hopes that a dovish policy pivot might soon materialize, driving stock markets lower again. Risk assets rose in October and November on encouraging signs of moderating inflationary pressures. Nevertheless, the Fed’s rhetoric and actions remained steadfastly hawkish, and stocks dipped again in December as the prospect of a possible recession loomed on the horizon.
Growth and Earnings-Quality Factors Underperform
Investors failed to reward the growth and earnings-quality factors employed by the fund, causing performance to lag that of the Index. While the fund’s systematic stock-selection approach is based on rankings of valuation, momentum, sentiment and earnings-quality measures rather than focusing on industry or sector exposure, some industries and sectors detracted from returns more than others. During the review period, the fund’s positions in the information technology and financials sectors detracted most significantly from returns relative to the Index. Notably disappointing performers in those two sectors included semiconductor manufacturer Semtech Corp. and regional bank PacWest Bancorp, both of which provided weaker-than-expected guidance regarding future financial performance. Other significant detractors among fund holdings included pet food maker Freshpet Inc. and steel producer Steel Dynamics Inc. While the above-mentioned holdings marginally detracted from relative returns, the performance of any individual holding had limited impact on overall fund performance as the fund invests in a large number of stocks.
Conversely, the fund’s relative returns benefited from the effectiveness of valuation and momentum in identifying strong-performing stocks. Strong-performing sectors included real estate, industrials and energy. In the real estate sector, selections among real estate investment trusts bolstered returns. Among industrials, construction services provider EMCOR Group Inc. led returns as the company guided higher on strong demand and improving margins. In energy, independent oil & gas exploration & production company Marathon Oil Corp. benefited from high oil and gas prices, a disciplined balance sheet and effective management. Other strong, individual contributors to relative performance included solar equipment maker Enphase Energy Inc., building products producer Trex Co. and regional bank Cathay General Bancorp.
Remaining Focused on a Systematic and Disciplined Investment Approach
As of December 31, 2022, we see signs that inflationary pressures are beginning to moderate as the inflation curve begins to bend in response to the Fed’s hawkish policies. Supply chains are beginning to heal as well. The economic cost of the current cycle remains restrained thus far, with the job market remaining unexpectedly resilient and corporate profits still generally
3
DISCUSSION OF FUND PERFORMANCE (Unaudited) (continued)
strong, aside from pockets of weakness in areas such as home builders. However, we may see wider indications of softness in corporate earnings as the impacts of rising interest rates filter through the economy. The question remains open as to whether the Fed will succeed in engineering a so-called “soft landing,” in which inflation declines nearer the 2% target rate, and monetary policy can be eased with minimal economic dislocation or lasting damage.
The fund’s investment strategy remains sharply focused on our systematic approach to evaluating securities and building portfolios. This approach has allowed us to create an investment process that participates in rising equity markets and helps protect capital during times of stress in the marketplace. As of the end of the review period, the fund holds a large number of individual securities characterized by attractive valuations and improving fundamentals. Sector weightings remain close to those of the Index, with slightly overweight exposure to real estate, materials and communication services, and slightly underweight exposure to information technology and industrials. As always, overweights and underweights are determined by our bottom-up, factor-driven stock selection process rather than by top-down macroeconomic opinions. We continue to control risks relative to the Index from a sector and market-capitalization standpoint, and believe the fund is well positioned to benefit from the prevailing market environment.
January 17, 2023
1 Total return includes reinvestment of dividends and any capital gains paid. Past performance is no guarantee of future results. Share price and investment return fluctuate such that upon redemption, fund shares may be worth more or less than their original cost. The fund’s performance does not reflect the deduction of additional charges and expenses imposed in connection with investing in variable insurance contracts, which will reduce returns. The fund’s return reflects the absorption of certain fund expenses by BNY Mellon Investment Adviser, Inc. pursuant to an agreement in effect through April 29, 2023, at which time it may be extended, modified or terminated. Had these expenses not been absorbed, returns would have been lower.
2 Source: Lipper Inc. — The S&P MidCap 400® Index provides investors with a benchmark for mid-sized companies. The Index measures the performance of mid-sized companies, reflecting the distinctive risk and return characteristics of this market segment. Investors cannot invest directly in any index.
Equities are subject generally to market, market sector, market liquidity, issuer and investment style risks, among other factors, to varying degrees, all of which are more fully described in the fund’s prospectus.
Recent market risks include pandemic risks related to COVID-19. The effects of COVID-19 have contributed to increased volatility in global markets and will likely affect certain countries, companies, industries and market sectors more dramatically than others. To the extent the fund may overweight its investments in certain countries, companies, industries or market sectors, such positions will increase the fund’s exposure to risk of loss from adverse developments affecting those countries, companies, industries or sectors.
Stocks of mid-cap companies often experience sharper price fluctuations than stocks of large-cap companies.
The fund is only available as a funding vehicle under variable life insurance policies or variable annuity contracts issued by insurance companies. Individuals may not purchase shares of the fund directly. A variable annuity is an insurance contract issued by an insurance company that enables investors to accumulate assets on a tax-deferred basis for retirement or other long-term goals. The investment objective and policies of BNY Mellon Investment Portfolios, MidCap Stock Portfolio made available through insurance products may be similar to those of other funds managed by BNY Mellon Investment Adviser, Inc. However, the investment results of the fund may be higher or lower than, and may not be comparable to, those of any other BNY Mellon Investment Adviser, Inc. fund.
4
FUND PERFORMANCE (Unaudited)
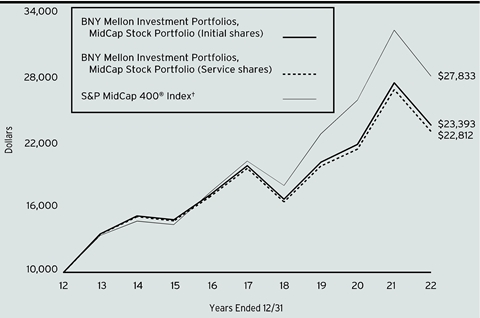
Comparison of change in value of a $10,000 investment in Initial shares and Service shares of BNY Mellon Investment Portfolios, MidCap Stock Portfolio with a hypothetical investment of $10,000 in the S&P MidCap 400® Index (the “Index”).
† Source: Lipper Inc.
Past performance is not predictive of future performance. The fund’s performance does not reflect the deduction of additional charges and expenses imposed in connection with investing in variable insurance contracts which will reduce returns.
The above graph compares a hypothetical investment of $10,000 investment made in each of the Initial shares and Service shares of BNY Mellon Investment Portfolios, MidCap Stock Portfolio on 12/31/12 to a hypothetical investment of $10,000 made in the Index on that date.
The fund’s performance shown in the line graph above takes into account all applicable fees and expenses. The Index provides investors with a benchmark for midsized companies. The Index measures the performance of midsized companies, reflecting the distinctive risk and return characteristics of this market segment. Unlike a mutual fund, the Index is not subject to charges, fees and other expenses. Investors cannot invest directly in any index. Further information relating to fund performance, including expense reimbursements, if applicable, is contained in the Financial Highlights section of the prospectus and elsewhere in this report.
| | | | |
Average Annual Total Returns as of 12/31/2022 |
| 1 Year | 5 Years | 10 Years |
Initial shares | -14.08% | 3.50% | 8.87% |
Service shares | -14.29% | 3.24% | 8.60% |
S&P MidCap 400® Index | -13.06% | 6.71% | 10.78% |
The performance data quoted represents past performance, which is no guarantee of future results. Share price and investment return fluctuate and an investor’s shares may be worth more or less than original cost upon redemption. Current performance may be lower or higher than the performance quoted. Go to www.im.bnymellon.com for the fund’s most recent month-end returns.
The fund’s Initial shares are not subject to a Rule 12b-1 fee. The fund’s Service shares are subject to a 0.25% annual Rule 12b-1 fee. All dividends and capital gain distributions are reinvested.
The fund’s performance shown in the graph and table does not reflect the deduction of taxes that a shareholder would pay on fund distributions or the redemption of fund shares.
5
UNDERSTANDING YOUR FUND’S EXPENSES (Unaudited)
As a mutual fund investor, you pay ongoing expenses, such as management fees and other expenses. Using the information below, you can estimate how these expenses affect your investment and compare them with the expenses of other funds. You also may pay one-time transaction expenses, including sales charges (loads), redemption fees and expenses associated with variable annuity or insurance contracts, which are not shown in this section and would have resulted in higher total expenses. For more information, see your fund’s prospectus or talk to your financial adviser.
Review your fund’s expenses
The table below shows the expenses you would have paid on a $1,000 investment in BNY Mellon Investment Portfolios, MidCap Stock Portfolio from July 1, 2022 to December 31, 2022. It also shows how much a $1,000 investment would be worth at the close of the period, assuming actual returns and expenses.
| | | | | |
Expenses and Value of a $1,000 Investment | |
Assume actual returns for the six months ended December 31, 2022 | |
| | | | |
| | Initial Shares | Service Shares | |
Expenses paid per $1,000† | $4.17 | $5.47 | |
Ending value (after expenses) | $1,068.80 | $1,067.90 | |
COMPARING YOUR FUND’S EXPENSES WITH THOSE OF OTHER FUNDS (Unaudited)
Using the SEC’s method to compare expenses
The Securities and Exchange Commission (“SEC”) has established guidelines to help investors assess fund expenses. Per these guidelines, the table below shows your fund’s expenses based on a $1,000 investment, assuming a hypothetical 5% annualized return. You can use this information to compare the ongoing expenses (but not transaction expenses or total cost) of investing in the fund with those of other funds. All mutual fund shareholder reports will provide this information to help you make this comparison. Please note that you cannot use this information to estimate your actual ending account balance and expenses paid during the period.
| | | | | |
Expenses and Value of a $1,000 Investment | |
Assuming a hypothetical 5% annualized return for the six months ended December 31, 2022 | |
| | | | |
| | Initial Shares | Service Shares | |
Expenses paid per $1,000† | $4.08 | $5.35 | |
Ending value (after expenses) | $1,021.17 | $1,019.91 | |
† | Expenses are equal to the fund’s annualized expense ratio of .80% for Initial Shares and 1.05% for Service Shares, multiplied by the average account value over the period, multiplied by 184/365 (to reflect the one-half year period). |
6
STATEMENT OF INVESTMENTS
December 31, 2022
| | | | | | | | |
| |
Description | | | | Shares | | Value ($) | |
Common Stocks - 99.9% | | | | | |
Automobiles & Components - 1.6% | | | | | |
Adient PLC | | | | 17,203 | a | 596,772 | |
Dana Inc. | | | | 5,307 | | 80,295 | |
Fox Factory Holding Corp. | | | | 853 | a | 77,819 | |
Harley-Davidson Inc. | | | | 10,495 | | 436,592 | |
The Goodyear Tire & Rubber Company | | | | 16,345 | a | 165,902 | |
Thor Industries Inc. | | | | 6,570 | b | 495,969 | |
Visteon Corp. | | | | 2,826 | a | 369,726 | |
| | | | | 2,223,075 | |
Banks - 7.2% | | | | | |
Associated Banc-Corp | | | | 61,965 | | 1,430,772 | |
Bank of Hawaii Corp. | | | | 2,860 | | 221,822 | |
Bank OZK | | | | 14,415 | | 577,465 | |
Cathay General Bancorp | | | | 16,592 | | 676,788 | |
East West Bancorp Inc. | | | | 19,585 | | 1,290,651 | |
Essent Group Ltd. | | | | 4,647 | | 180,675 | |
Hancock Whitney Corp. | | | | 23,747 | | 1,149,117 | |
MGIC Investment Corp. | | | | 24,186 | | 314,418 | |
PacWest Bancorp | | | | 30,647 | | 703,349 | |
Popular Inc. | | | | 2,024 | | 134,232 | |
Synovus Financial Corp. | | | | 29,182 | | 1,095,784 | |
UMB Financial Corp. | | | | 10,574 | | 883,140 | |
Valley National Bancorp | | | | 38,500 | | 435,435 | |
Washington Federal Inc. | | | | 19,629 | | 658,553 | |
Wintrust Financial Corp. | | | | 2,000 | | 169,040 | |
| | | | | 9,921,241 | |
Capital Goods - 11.8% | | | | | |
A.O. Smith Corp. | | | | 9,266 | | 530,386 | |
Acuity Brands Inc. | | | | 4,099 | | 678,835 | |
AECOM | | | | 18,159 | | 1,542,244 | |
Allison Transmission Holdings Inc. | | | | 3,047 | | 126,755 | |
Armstrong World Industries Inc. | | | | 523 | | 35,873 | |
Builders FirstSource Inc. | | | | 8,542 | a | 554,205 | |
Carlisle Cos. | | | | 1,775 | | 418,279 | |
Crane Holdings Co. | | | | 2,514 | | 252,531 | |
Dycom Industries Inc. | | | | 5,672 | a | 530,899 | |
EMCOR Group Inc. | | | | 11,960 | | 1,771,396 | |
Esab Corp. | | | | 3,215 | | 150,848 | |
Howmet Aerospace Inc. | | | | 6,100 | | 240,401 | |
Hubbell Inc. | | | | 4,361 | | 1,023,439 | |
ITT Inc. | | | | 5,179 | | 420,017 | |
Kennametal Inc. | | | | 34,098 | | 820,398 | |
7
STATEMENT OF INVESTMENTS (continued)
| | | | | | | | |
| |
Description | | | | Shares | | Value ($) | |
Common Stocks - 99.9% (continued) | | | | | |
Capital Goods - 11.8% (continued) | | | | | |
Lincoln Electric Holdings Inc. | | | | 5,046 | | 729,097 | |
Nordson Corp. | | | | 1,345 | | 319,733 | |
nVent Electric PLC | | | | 37,054 | | 1,425,467 | |
Owens Corning | | | | 3,758 | | 320,557 | |
Parker-Hannifin Corp. | | | | 1,127 | | 327,957 | |
Simpson Manufacturing Co. | | | | 7,866 | | 697,400 | |
Sunrun Inc. | | | | 4,494 | a | 107,946 | |
Terex Corp. | | | | 9,661 | | 412,718 | |
Textron Inc. | | | | 9,585 | | 678,618 | |
The Timken Company | | | | 11,028 | | 779,349 | |
Trex Co. | | | | 8,621 | a | 364,927 | |
Univar Solutions Inc. | | | | 6,146 | a | 195,443 | |
Watsco Inc. | | | | 1,100 | �� | 274,340 | |
Watts Water Technologies Inc., Cl. A | | | | 1,507 | | 220,369 | |
Westinghouse Air Brake Technologies Corp. | | | | 4,760 | | 475,096 | |
| | | | | 16,425,523 | |
Commercial & Professional Services - 3.3% | | | | | |
ASGN Inc. | | | | 6,214 | a | 506,317 | |
CACI International Inc., Cl. A | | | | 4,740 | a | 1,424,797 | |
Insperity Inc. | | | | 5,115 | | 581,064 | |
Science Applications International Corp. | | | | 7,536 | | 835,968 | |
Tetra Tech Inc. | | | | 7,161 | | 1,039,706 | |
The Brink's Company | | | | 4,400 | | 236,324 | |
| | | | | 4,624,176 | |
Consumer Durables & Apparel - 4.4% | | | | | |
Brunswick Corp. | | | | 7,226 | | 520,850 | |
Capri Holdings Ltd. | | | | 10,752 | a | 616,305 | |
Crocs Inc. | | | | 3,398 | a | 368,445 | |
Mattel Inc. | | | | 34,060 | a | 607,630 | |
NVR Inc. | | | | 63 | a | 290,593 | |
Polaris Inc. | | | | 3,100 | | 313,100 | |
PVH Corp. | | | | 7,413 | | 523,284 | |
Ralph Lauren Corp. | | | | 3,979 | | 420,461 | |
Skechers USA Inc., Cl. A | | | | 3,511 | a | 147,286 | |
Tapestry Inc. | | | | 12,391 | | 471,849 | |
Taylor Morrison Home Corp. | | | | 7,161 | a | 217,336 | |
Tempur Sealy International Inc. | | | | 8,424 | | 289,196 | |
Toll Brothers Inc. | | | | 6,274 | | 313,198 | |
TopBuild Corp. | | | | 2,747 | a | 429,878 | |
Under Armour Inc., Cl. A | | | | 47,322 | a | 480,792 | |
Whirlpool Corp. | | | | 750 | | 106,095 | |
| | | | | 6,116,298 | |
8
| | | | | | | | |
| |
Description | | | | Shares | | Value ($) | |
Common Stocks - 99.9% (continued) | | | | | |
Consumer Services - 4.5% | | | | | |
Boyd Gaming Corp. | | | | 10,875 | | 593,014 | |
Choice Hotels International Inc. | | | | 1,391 | | 156,682 | |
Churchill Downs Inc. | | | | 843 | | 178,235 | |
Cracker Barrel Old Country Store Inc. | | | | 2,761 | | 261,577 | |
Graham Holdings Co., Cl. B | | | | 586 | | 354,067 | |
Grand Canyon Education Inc. | | | | 8,305 | a | 877,506 | |
H&R Block Inc. | | | | 14,869 | | 542,867 | |
Marriott Vacations Worldwide Corp. | | | | 6,866 | | 924,095 | |
Service Corp. International | | | | 16,068 | | 1,110,942 | |
Texas Roadhouse Inc. | | | | 7,350 | | 668,482 | |
Wyndham Hotels & Resorts Inc. | | | | 8,059 | | 574,687 | |
| | | | | 6,242,154 | |
Diversified Financials - 3.3% | | | | | |
Bread Financial Holdings Inc. | | | | 5,534 | b | 208,410 | |
Federated Hermes Inc. | | | | 14,430 | | 523,953 | |
FirstCash Holdings Inc. | | | | 2,761 | | 239,959 | |
Janus Henderson Group PLC | | | | 21,621 | | 508,526 | |
Jefferies Financial Group Inc. | | | | 462 | | 15,837 | |
Rithm Capital Corp. | | | | 53,387 | c | 436,172 | |
SEI Investments Co. | | | | 22,268 | | 1,298,224 | |
Stifel Financial Corp. | | | | 18,120 | | 1,057,664 | |
Voya Financial Inc. | | | | 3,561 | | 218,966 | |
| | | | | 4,507,711 | |
Energy - 4.0% | | | | | |
Antero Resources Corp. | | | | 20,845 | a | 645,987 | |
Devon Energy Corp. | | | | 7,606 | | 467,845 | |
Diamondback Energy Inc. | | | | 558 | | 76,323 | |
Equitrans Midstream Corp. | | | | 16,103 | | 107,890 | |
HF Sinclair Corp. | | | | 11,800 | | 612,302 | |
Marathon Oil Corp. | | | | 7,998 | | 216,506 | |
Matador Resources Co. | | | | 13,549 | | 775,545 | |
Murphy Oil Corp. | | | | 28,181 | | 1,212,065 | |
Phillips 66 | | | | 3,162 | | 329,101 | |
Range Resources Corp. | | | | 28,914 | | 723,428 | |
Southwestern Energy Co. | | | | 72,598 | a | 424,698 | |
| | | | | 5,591,690 | |
Food & Staples Retailing - 2.6% | | | | | |
BJ's Wholesale Club Holdings Inc. | | | | 14,820 | a | 980,491 | |
Casey's General Stores Inc. | | | | 3,062 | | 686,960 | |
Performance Food Group Co. | | | | 17,938 | a | 1,047,400 | |
Sprouts Farmers Market Inc. | | | | 25,597 | a | 828,575 | |
| | | | | 3,543,426 | |
9
STATEMENT OF INVESTMENTS (continued)
| | | | | | | | |
| |
Description | | | | Shares | | Value ($) | |
Common Stocks - 99.9% (continued) | | | | | |
Food, Beverage & Tobacco - 1.3% | | | | | |
Coca-Cola Consolidated Inc. | | | | 635 | | 325,349 | |
Darling Ingredients Inc. | | | | 12,680 | a | 793,641 | |
Freshpet Inc. | | | | 5,601 | a,b | 295,565 | |
Post Holdings Inc. | | | | 1,600 | a | 144,416 | |
The Hershey Company | | | | 755 | | 174,835 | |
| | | | | 1,733,806 | |
Health Care Equipment & Services - 6.4% | | | | | |
Acadia Healthcare Co. | | | | 9,055 | a | 745,408 | |
Amedisys Inc. | | | | 3,659 | a | 305,673 | |
Chemed Corp. | | | | 2,638 | | 1,346,514 | |
Envista Holdings Corp. | | | | 10,150 | a | 341,750 | |
Globus Medical Inc., Cl. A | | | | 6,757 | a | 501,842 | |
Haemonetics Corp. | | | | 4,931 | a | 387,823 | |
Henry Schein Inc. | | | | 1,753 | a | 140,012 | |
Integra LifeSciences Holdings Corp. | | | | 15,486 | a | 868,300 | |
Lantheus Holdings Inc. | | | | 6,609 | a | 336,795 | |
LivaNova PLC | | | | 8,295 | a | 460,704 | |
Masimo Corp. | | | | 1,203 | a | 177,984 | |
Option Care Health Inc. | | | | 25,750 | a | 774,817 | |
Patterson Cos. | | | | 6,008 | | 168,404 | |
Progyny Inc. | | | | 2,126 | a | 66,225 | |
QuidelOrtho Corp. | | | | 1,567 | a | 134,245 | |
Shockwave Medical Inc. | | | | 2,613 | a | 537,259 | |
STAAR Surgical Co. | | | | 7,595 | a | 368,661 | |
Tandem Diabetes Care Inc. | | | | 9,400 | a | 422,530 | |
Teleflex Inc. | | | | 1,606 | | 400,906 | |
Tenet Healthcare Corp. | | | | 7,398 | a | 360,948 | |
| | | | | 8,846,800 | |
Household & Personal Products - .5% | | | | | |
Coty Inc., Cl. A | | | | 30,983 | a | 265,214 | |
Nu Skin Enterprises Inc., Cl. A | | | | 11,274 | | 475,312 | |
| | | | | 740,526 | |
Insurance - 4.7% | | | | | |
American Financial Group Inc. | | | | 1,900 | | 260,832 | |
Brighthouse Financial Inc. | | | | 2,742 | a | 140,582 | |
Brown & Brown Inc. | | | | 1,725 | | 98,273 | |
CNO Financial Group Inc. | | | | 31,874 | | 728,321 | |
Everest Re Group Ltd. | | | | 416 | | 137,808 | |
First American Financial Corp. | | | | 8,685 | | 454,573 | |
Kinsale Capital Group Inc. | | | | 1,015 | | 265,443 | |
Loews Corp. | | | | 8,582 | | 500,588 | |
Old Republic International Corp. | | | | 16,572 | | 400,214 | |
Primerica Inc. | | | | 5,465 | | 775,046 | |
10
| | | | | | | | |
| |
Description | | | | Shares | | Value ($) | |
Common Stocks - 99.9% (continued) | | | | | |
Insurance - 4.7% (continued) | | | | | |
RLI Corp. | | | | 5,031 | | 660,419 | |
The Hanover Insurance Group Inc. | | | | 4,705 | | 635,787 | |
The Hartford Financial Services Group Inc. | | | | 7,887 | | 598,071 | |
Unum Group | | | | 10,062 | | 412,844 | |
W.R. Berkley Corp. | | | | 2,244 | | 162,847 | |
Willis Towers Watson PLC | | | | 1,408 | | 344,369 | |
| | | | | 6,576,017 | |
Materials - 8.2% | | | | | |
Alcoa Corp. | | | | 19,896 | | 904,671 | |
Ashland Inc. | | | | 9,341 | | 1,004,438 | |
Avient Corp. | | | | 8,177 | | 276,056 | |
Cabot Corp. | | | | 7,828 | | 523,224 | |
Celanese Corp. | | | | 4,602 | | 470,508 | |
CF Industries Holdings Inc. | | | | 7,380 | | 628,776 | |
Cleveland-Cliffs Inc. | | | | 29,074 | a | 468,382 | |
Commercial Metals Co. | | | | 17,720 | | 855,876 | |
Eagle Materials Inc. | | | | 9,203 | | 1,222,619 | |
Greif Inc., Cl. A | | | | 12,201 | | 818,199 | |
Huntsman Corp. | | | | 5,003 | | 137,482 | |
Ingevity Corp. | | | | 7,926 | a | 558,307 | |
Louisiana-Pacific Corp. | | | | 1,474 | | 87,261 | |
LyondellBasell Industries NV, Cl. A | | | | 1,640 | | 136,169 | |
MP Materials Corp. | | | | 3,432 | a | 83,329 | |
Olin Corp. | | | | 10,623 | | 562,382 | |
Reliance Steel & Aluminum Co. | | | | 4,108 | | 831,624 | |
Steel Dynamics Inc. | | | | 6,185 | | 604,274 | |
The Chemours Company | | | | 14,766 | | 452,135 | |
The Mosaic Company | | | | 3,338 | | 146,438 | |
United States Steel Corp. | | | | 19,644 | | 492,082 | |
Westlake Corp. | | | | 1,190 | | 122,023 | |
| | | | | 11,386,255 | |
Media & Entertainment - 2.0% | | | | | |
Cable One Inc. | | | | 606 | | 431,387 | |
John Wiley & Sons Inc., Cl. A | | | | 10,085 | | 404,005 | |
Live Nation Entertainment Inc. | | | | 942 | a | 65,695 | |
News Corporation, Cl. A | | | | 22,963 | | 417,927 | |
The Interpublic Group of Companies | | | | 7,249 | | 241,464 | |
The New York Times Company, Cl. A | | | | 8,119 | | 263,543 | |
The Trade Desk Inc., Cl. A | | | | 1,307 | a | 58,593 | |
TripAdvisor Inc. | | | | 17,952 | a | 322,777 | |
World Wrestling Entertainment Inc., Cl. A | | | | 6,728 | | 461,003 | |
11
STATEMENT OF INVESTMENTS (continued)
| | | | | | | | |
| |
Description | | | | Shares | | Value ($) | |
Common Stocks - 99.9% (continued) | | | | | |
Media & Entertainment - 2.0% (continued) | | | | | |
Ziff Davis Inc. | | | | 1,474 | a | 116,593 | |
| | | | | 2,782,987 | |
Pharmaceuticals Biotechnology & Life Sciences - 3.8% | | | | | |
Bio-Techne Corp. | | | | 5,096 | | 422,356 | |
Bruker Corp. | | | | 8,676 | | 593,005 | |
Exelixis Inc. | | | | 40,876 | a | 655,651 | |
Halozyme Therapeutics Inc. | | | | 8,848 | a | 503,451 | |
Incyte Corp. | | | | 1,107 | a | 88,914 | |
Medpace Holdings Inc. | | | | 4,099 | a | 870,669 | |
QIAGEN NV | | | | 6,842 | a | 341,211 | |
Repligen Corp. | | | | 3,100 | a | 524,861 | |
Sarepta Therapeutics Inc. | | | | 3,123 | a | 404,678 | |
Sotera Health Co. | | | | 7,571 | a | 63,066 | |
Syneos Health Inc. | | | | 14,731 | a | 540,333 | |
United Therapeutics Corp. | | | | 492 | a | 136,820 | |
West Pharmaceutical Services Inc. | | | | 600 | | 141,210 | |
| | | | | 5,286,225 | |
Real Estate - 8.7% | | | | | |
Boston Properties Inc. | | | | 3,300 | c | 223,014 | |
Brixmor Property Group Inc. | | | | 41,122 | c | 932,236 | |
Camden Property Trust | | | | 2,676 | c | 299,391 | |
Corporate Office Properties Trust | | | | 2,811 | c | 72,917 | |
Douglas Emmett Inc. | | | | 36,807 | c | 577,134 | |
EastGroup Properties Inc. | | | | 7,009 | c | 1,037,753 | |
EPR Properties | | | | 6,989 | c | 263,625 | |
Extra Space Storage Inc. | | | | 3,053 | c | 449,341 | |
Federal Realty Investment Trust | | | | 5,416 | c | 547,233 | |
First Industrial Realty Trust Inc. | | | | 33,403 | c | 1,612,029 | |
Highwoods Properties Inc. | | | | 15,669 | c | 438,419 | |
JBG SMITH Properties | | | | 18,445 | c | 350,086 | |
Jones Lang LaSalle Inc. | | | | 1,258 | a | 200,487 | |
Kilroy Realty Corp. | | | | 16,596 | c | 641,767 | |
Lamar Advertising Co., Cl. A | | | | 5,475 | c | 516,840 | |
Life Storage Inc. | | | | 1,282 | c | 126,277 | |
Mid-America Apartment Communities Inc. | | | | 6,247 | c | 980,717 | |
National Retail Properties Inc. | | | | 36,694 | c | 1,679,117 | |
National Storage Affiliates Trust | | | | 11,304 | c | 408,300 | |
Omega Healthcare Investors Inc. | | | | 1,587 | c | 44,357 | |
Pebblebrook Hotel Trust | | | | 5,110 | b,c | 68,423 | |
Regency Centers Corp. | | | | 8,905 | c | 556,562 | |
| | | | | 12,026,025 | |
12
| | | | | | | | |
| |
Description | | | | Shares | | Value ($) | |
Common Stocks - 99.9% (continued) | | | | | |
Retailing - 3.4% | | | | | |
AutoNation Inc. | | | | 2,929 | a | 314,282 | |
Bath & Body Works Inc. | | | | 2,837 | | 119,551 | |
Dick's Sporting Goods Inc. | | | | 4,538 | | 545,876 | |
GameStop Corp., Cl. A | | | | 13,336 | a,b | 246,183 | |
Macy's Inc. | | | | 24,349 | | 502,807 | |
Murphy USA Inc. | | | | 3,901 | | 1,090,486 | |
Nordstrom Inc. | | | | 15,068 | | 243,198 | |
RH | | | | 547 | a,b | 146,153 | |
Ulta Beauty Inc. | | | | 1,212 | a | 568,513 | |
Victoria's Secret & Co. | | | | 7,245 | a | 259,226 | |
Williams-Sonoma Inc. | | | | 5,559 | b | 638,840 | |
| | | | | 4,675,115 | |
Semiconductors & Semiconductor Equipment - 3.4% | | | | | |
Allegro MicroSystems Inc. | | | | 1,165 | a | 34,973 | |
Enphase Energy Inc. | | | | 2,186 | a | 579,203 | |
Lattice Semiconductor Corp. | | | | 18,525 | a | 1,201,902 | |
MACOM Technology Solutions Holdings Inc. | | | | 8,360 | a | 526,513 | |
Power Integrations Inc. | | | | 7,502 | | 538,043 | |
Semtech Corp. | | | | 16,749 | a | 480,529 | |
Silicon Laboratories Inc. | | | | 1,983 | a | 269,034 | |
SiTime Corp. | | | | 2,234 | a,b | 227,019 | |
Synaptics Inc. | | | | 2,618 | a | 249,129 | |
Teradyne Inc. | | | | 3,071 | | 268,252 | |
Universal Display Corp. | | | | 2,584 | | 279,175 | |
Wolfspeed Inc. | | | | 571 | a | 39,422 | |
| | | | | 4,693,194 | |
Software & Services - 4.5% | | | | | |
Commvault Systems Inc. | | | | 3,871 | a | 243,254 | |
Concentrix Corp. | | | | 2,545 | | 338,892 | |
Datadog Inc., Cl. A | | | | 1,103 | a | 81,070 | |
Elastic NV | | | | 3,670 | a | 189,005 | |
Euronet Worldwide Inc. | | | | 4,908 | a | 463,217 | |
Fair Isaac Corp. | | | | 1,578 | a | 944,559 | |
Five9 Inc. | | | | 2,847 | a | 193,197 | |
Gartner Inc. | | | | 431 | a | 144,876 | |
Genpact Ltd. | | | | 5,021 | | 232,573 | |
HubSpot Inc. | | | | 1,050 | a | 303,586 | |
Manhattan Associates Inc. | | | | 5,494 | a | 666,972 | |
MongoDB Inc. | | | | 921 | a | 181,290 | |
Okta Inc. | | | | 2,766 | a | 189,001 | |
Paylocity Holding Corp. | | | | 1,677 | a | 325,774 | |
Pegasystems Inc. | | | | 5,740 | b | 196,538 | |
13
STATEMENT OF INVESTMENTS (continued)
| | | | | | | | |
| |
Description | | | | Shares | | Value ($) | |
Common Stocks - 99.9% (continued) | | | | | |
Software & Services - 4.5% (continued) | | | | | |
Qualys Inc. | | | | 2,905 | a | 326,028 | |
Teradata Corp. | | | | 11,890 | a | 400,217 | |
The Western Union Company | | | | 10,697 | | 147,298 | |
Twilio Inc., Cl. A | | | | 3,166 | a | 155,007 | |
WEX Inc. | | | | 2,200 | a | 360,030 | |
Zscaler Inc. | | | | 1,758 | a | 196,720 | |
| | | | | 6,279,104 | |
Technology Hardware & Equipment - 2.6% | | | | | |
Belden Inc. | | | | 5,356 | | 385,096 | |
Calix Inc. | | | | 3,749 | a | 256,544 | |
IPG Photonics Corp. | | | | 4,148 | a | 392,691 | |
Jabil Inc. | | | | 2,550 | | 173,910 | |
Littelfuse Inc. | | | | 3,245 | | 714,549 | |
Lumentum Holdings Inc. | | | | 10,362 | a | 540,586 | |
Pure Storage Inc., Cl. A | | | | 7,626 | a | 204,072 | |
Vishay Intertechnology Inc. | | | | 12,028 | | 259,444 | |
Vontier Corp. | | | | 14,031 | | 271,219 | |
Xerox Holdings Corp. | | | | 29,592 | | 432,043 | |
| | | | | 3,630,154 | |
Telecommunication Services - .5% | | | | | |
Iridium Communications Inc. | | | | 9,075 | | 466,455 | |
Lumen Technologies Inc. | | | | 44,578 | | 232,697 | |
| | | | | 699,152 | |
Transportation - 2.8% | | | | | |
Avis Budget Group Inc. | | | | 2,150 | a | 352,450 | |
GXO Logistics Inc. | | | | 9,952 | a | 424,851 | |
Kirby Corp. | | | | 8,128 | a | 523,037 | |
Knight-Swift Transportation Holdings Inc. | | | | 8,473 | | 444,070 | |
Landstar System Inc. | | | | 2,988 | | 486,745 | |
Old Dominion Freight Line Inc. | | | | 1,555 | | 441,278 | |
RXO Inc. | | | | 12,288 | a | 211,354 | |
Ryder System Inc. | | | | 2,870 | | 239,846 | |
Saia Inc. | | | | 3,033 | a | 635,959 | |
XPO Logistics Inc. | | | | 2,688 | a | 89,484 | |
| | | | | 3,849,074 | |
Utilities - 4.4% | | | | | |
Black Hills Corp. | | | | 7,142 | | 502,368 | |
Hawaiian Electric Industries Inc. | | | | 25,084 | | 1,049,765 | |
IDACORP Inc. | | | | 10,954 | | 1,181,389 | |
New Jersey Resources Corp. | | | | 22,306 | b | 1,106,824 | |
ONE Gas Inc. | | | | 4,932 | | 373,451 | |
Portland General Electric Co. | | | | 18,603 | b | 911,547 | |
14
| | | | | | | | |
| |
Description | | | | Shares | | Value ($) | |
Common Stocks - 99.9% (continued) | | | | | |
Utilities - 4.4% (continued) | | | | | |
PPL Corp. | | | | 3,504 | | 102,387 | |
Spire Inc. | | | | 12,902 | | 888,432 | |
| | | | | 6,116,163 | |
Total Common Stocks (cost $136,846,438) | | | | 138,515,891 | |
| | | 1-Day
Yield (%) | | | | | |
Investment Companies - .1% | | | | | |
Registered Investment Companies - .1% | | | | | |
Dreyfus Institutional Preferred Government Plus Money Market Fund, Institutional Shares
(cost $204,325) | | 4.37 | | 204,325 | d | 204,325 | |
| | | | | | | | |
Investment of Cash Collateral for Securities Loaned - .3% | | | | | |
Registered Investment Companies - .3% | | | | | |
Dreyfus Institutional Preferred Government Plus Money Market Fund, SL Shares
(cost $395,636) | | 4.37 | | 395,636 | d | 395,636 | |
Total Investments (cost $137,446,399) | | 100.3% | | 139,115,852 | |
Liabilities, Less Cash and Receivables | | (.3%) | | (428,990) | |
Net Assets | | 100.0% | | 138,686,862 | |
a Non-income producing security.
b Security, or portion thereof, on loan. At December 31, 2022, the value of the fund’s securities on loan was $3,716,659 and the value of the collateral was $3,818,145, consisting of cash collateral of $395,636 and U.S. Government & Agency securities valued at $3,422,509. In addition, the value of collateral may include pending sales that are also on loan.
c Investment in real estate investment trust within the United States.
d Investment in affiliated issuer. The investment objective of this investment company is publicly available and can be found within the investment company’s prospectus.
| | |
Portfolio Summary (Unaudited) † | Value (%) |
Industrials | 18.0 |
Financials | 15.2 |
Consumer Discretionary | 13.9 |
Information Technology | 10.5 |
Health Care | 10.2 |
Real Estate | 8.7 |
Materials | 8.2 |
Utilities | 4.4 |
Consumer Staples | 4.3 |
Energy | 4.0 |
Communication Services | 2.5 |
Investment Companies | .4 |
| | 100.3 |
† Based on net assets.
See notes to financial statements.
15
STATEMENT OF INVESTMENTS (continued)
| | | | | | | |
Affiliated Issuers | | | |
Description | Value ($) 12/31/2021 | Purchases ($)† | Sales ($) | Value ($) 12/31/2022 | Dividends/
Distributions ($) | |
Registered Investment Companies - .1% | | |
Dreyfus Institutional Preferred Government Plus Money Market Fund, Institutional Shares - .1% | 426,188 | 17,220,390 | (17,442,253) | 204,325 | 12,286 | |
Investment of Cash Collateral for Securities Loaned - .3% | | |
Dreyfus Institutional Preferred Government Plus Money Market Fund, SL Shares - .3% | 914,695 | 15,303,177 | (15,822,236) | 395,636 | 47,325 | †† |
Total - .4% | 1,340,883 | 32,523,567 | (33,264,489) | 599,961 | 59,611 | |
† Includes reinvested dividends/distributions.
†† Represents securities lending income earned from the reinvestment of cash collateral from loaned securities, net of fees and collateral investment expenses, and other payments to and from borrowers of securities.
See notes to financial statements.
16
STATEMENT OF ASSETS AND LIABILITIES
December 31, 2022
| | | | | | | |
| | | | | | |
| | | Cost | | Value | |
Assets ($): | | | | |
Investments in securities—See Statement of Investments
(including securities on loan, valued at $3,716,659)—Note 1(c): | | | |
Unaffiliated issuers | 136,846,438 | | 138,515,891 | |
Affiliated issuers | | 599,961 | | 599,961 | |
Dividends and securities lending income receivable | | 186,103 | |
Receivable for shares of Beneficial Interest subscribed | | 17,928 | |
Receivable for investment securities sold | | 19 | |
Prepaid expenses | | | | | 2,745 | |
| | | | | 139,322,647 | |
Liabilities ($): | | | | |
Due to BNY Mellon Investment Adviser, Inc. and affiliates—Note 3(b) | | 113,289 | |
Liability for securities on loan—Note 1(c) | | 395,636 | |
Payable for shares of Beneficial Interest redeemed | | 58,328 | |
Trustees’ fees and expenses payable | | 1,129 | |
Other accrued expenses | | | | | 67,403 | |
| | | | | 635,785 | |
Net Assets ($) | | | 138,686,862 | |
Composition of Net Assets ($): | | | | |
Paid-in capital | | | | | 131,722,907 | |
Total distributable earnings (loss) | | | | | 6,963,955 | |
Net Assets ($) | | | 138,686,862 | |
| | | | |
Net Asset Value Per Share | Initial Shares | Service Shares | |
Net Assets ($) | 66,521,517 | 72,165,345 | |
Shares Outstanding | 4,040,567 | 4,410,216 | |
Net Asset Value Per Share ($) | 16.46 | 16.36 | |
| | | |
See notes to financial statements. | | | |
17
STATEMENT OF OPERATIONS
Year Ended December 31, 2022
| | | | | | | |
| | | | | | |
| | | | | | |
Investment Income ($): | | | | |
Income: | | | | |
Cash dividends (net of $505 foreign taxes withheld at source): | |
Unaffiliated issuers | | | 2,312,871 | |
Affiliated issuers | | | 12,286 | |
Income from securities lending—Note 1(c) | | | 47,325 | |
Total Income | | | 2,372,482 | |
Expenses: | | | | |
Management fee—Note 3(a) | | | 1,129,091 | |
Distribution fees—Note 3(b) | | | 196,630 | |
Professional fees | | | 81,061 | |
Custodian fees—Note 3(b) | | | 20,937 | |
Prospectus and shareholders’ reports | | | 18,936 | |
Chief Compliance Officer fees—Note 3(b) | | | 17,082 | |
Trustees’ fees and expenses—Note 3(c) | | | 10,966 | |
Loan commitment fees—Note 2 | | | 3,257 | |
Shareholder servicing costs—Note 3(b) | | | 1,616 | |
Registration fees | | | 1,140 | |
Interest expense—Note 2 | | | 134 | |
Miscellaneous | | | 16,402 | |
Total Expenses | | | 1,497,252 | |
Less—reduction in expenses due to undertaking—Note 3(a) | | | (92,859) | |
Less—reduction in fees due to earnings credits—Note 3(b) | | | (118) | |
Net Expenses | | | 1,404,275 | |
Net Investment Income | | | 968,207 | |
Realized and Unrealized Gain (Loss) on Investments—Note 4 ($): | | |
Net realized gain (loss) on investments | 4,581,246 | |
Net change in unrealized appreciation (depreciation) on investments | (30,573,070) | |
Net Realized and Unrealized Gain (Loss) on Investments | | | (25,991,824) | |
Net (Decrease) in Net Assets Resulting from Operations | | (25,023,617) | |
| | | | | | |
See notes to financial statements. | | | | | |
18
STATEMENT OF CHANGES IN NET ASSETS
| | | | | | | | | | |
| | | | Year Ended December 31, |
| | | | 2022 | | 2021 | |
Operations ($): | | | | | | | | |
Net investment income | | | 968,207 | | | | 884,855 | |
Net realized gain (loss) on investments | | 4,581,246 | | | | 37,494,447 | |
Net change in unrealized appreciation
(depreciation) on investments | | (30,573,070) | | | | 574,376 | |
Net Increase (Decrease) in Net Assets
Resulting from Operations | (25,023,617) | | | | 38,953,678 | |
Distributions ($): | |
Distributions to shareholders: | | | | | | | | |
Initial Shares | | | (18,340,389) | | | | (1,082,003) | |
Service Shares | | | (20,055,380) | | | | (940,992) | |
Total Distributions | | | (38,395,769) | | | | (2,022,995) | |
Beneficial Interest Transactions ($): | |
Net proceeds from shares sold: | | | | | | | | |
Initial Shares | | | 3,695,708 | | | | 8,847,860 | |
Service Shares | | | 3,358,212 | | | | 13,852,574 | |
Distributions reinvested: | | | | | | | | |
Initial Shares | | | 18,340,389 | | | | 1,082,003 | |
Service Shares | | | 20,055,380 | | | | 940,992 | |
Cost of shares redeemed: | | | | | | | | |
Initial Shares | | | (12,103,935) | | | | (16,848,704) | |
Service Shares | | | (13,064,924) | | | | (16,490,420) | |
Increase (Decrease) in Net Assets
from Beneficial Interest Transactions | 20,280,830 | | | | (8,615,695) | |
Total Increase (Decrease) in Net Assets | (43,138,556) | | | | 28,314,988 | |
Net Assets ($): | |
Beginning of Period | | | 181,825,418 | | | | 153,510,430 | |
End of Period | | | 138,686,862 | | | | 181,825,418 | |
Capital Share Transactions (Shares): | |
Initial Shares | | | | | | | | |
Shares sold | | | 205,037 | | | | 390,569 | |
Shares issued for distributions reinvested | | | 981,820 | | | | 48,783 | |
Shares redeemed | | | (652,269) | | | | (729,080) | |
Net Increase (Decrease) in Shares Outstanding | 534,588 | | | | (289,728) | |
Service Shares | | | | | | | | |
Shares sold | | | 192,296 | | | | 620,993 | |
Shares issued for distributions reinvested | | | 1,078,246 | | | | 42,560 | |
Shares redeemed | | | (714,713) | | | | (732,921) | |
Net Increase (Decrease) in Shares Outstanding | 555,829 | | | | (69,368) | |
| | | | | | | | | |
See notes to financial statements. | | | | | | | | |
19
FINANCIAL HIGHLIGHTS
The following tables describe the performance for each share class for the fiscal periods indicated. All information (except portfolio turnover rate) reflects financial results for a single fund share. Net asset value total return is calculated assuming an initial investment made at the net asset value at the beginning of the period, reinvestment of all dividends and distributions at net asset value during the period, and redemption at net asset value on the last day of the period. Net asset value total return includes adjustments in accordance with accounting principles generally accepted in the United States of America and as such, the net asset value for financial reporting purposes and the returns based upon those net asset values may differ from the net asset value and returns for shareholder transactions. The fund’s total returns do not reflect expenses associated with variable annuity or insurance contracts. These figures have been derived from the fund’s financial statements.
| | | | | | | |
| | | |
| | | |
| | | Year Ended December 31, |
Initial Shares | | 2022 | 2021 | 2020 | 2019 | 2018 |
Per Share Data ($): | | | | | | |
Net asset value, beginning of period | | 24.77 | 19.93 | 18.64 | 16.80 | 22.56 |
Investment Operations: | | | | | | |
Net investment incomea | | .14 | .15 | .13 | .13 | .12 |
Net realized and unrealized
gain (loss) on investments | | (2.97) | 4.97 | 1.30 | 3.15 | (3.19) |
Total from Investment Operations | | (2.83) | 5.12 | 1.43 | 3.28 | (3.07) |
Distributions: | | | | | | |
Dividends from
net investment income | | (.16) | (.14) | (.14) | (.12) | (.13) |
Dividends from
net realized gain on investments | | (5.32) | (.14) | - | (1.32) | (2.56) |
Total Distributions | | (5.48) | (.28) | (.14) | (1.44) | (2.69) |
Net asset value, end of period | | 16.46 | 24.77 | 19.93 | 18.64 | 16.80 |
Total Return (%) | | (14.08) | 25.89 | 8.11 | 20.18 | (15.49) |
Ratios/Supplemental Data (%): | | | | | | |
Ratio of total expenses
to average net assets | | .86 | .86 | .87 | .86 | .86 |
Ratio of net expenses
to average net assets | | .80 | .85 | .87 | .86 | .86 |
Ratio of net investment income
to average net assets | | .77 | .63 | .81 | .73 | .59 |
Portfolio Turnover Rate | | 81.37 | 90.95 | 92.40 | 82.88 | 68.02 |
Net Assets, end of period ($ x 1,000) | | 66,522 | 86,837 | 75,649 | 76,835 | 72,374 |
a Based on average shares outstanding.
See notes to financial statements.
20
| | | | | | | |
| | | |
| | | |
| | | Year Ended December 31, |
Service Shares | | 2022 | 2021 | 2020 | 2019 | 2018 |
Per Share Data ($): | | | | | | |
Net asset value, beginning of period | | 24.64 | 19.84 | 18.53 | 16.71 | 22.45 |
Investment Operations: | | | | | | |
Net investment incomea | | .09 | .09 | .09 | .09 | .07 |
Net realized and unrealized
gain (loss) on investments | | (2.95) | 4.95 | 1.31 | 3.12 | (3.18) |
Total from Investment Operations | | (2.86) | 5.04 | 1.40 | 3.21 | (3.11) |
Distributions: | | | | | | |
Dividends from
net investment income | | (.10) | (.10) | (.09) | (.07) | (.07) |
Dividends from
net realized gain on investments | | (5.32) | (.14) | - | (1.32) | (2.56) |
Total Distributions | | (5.42) | (.24) | (.09) | (1.39) | (2.63) |
Net asset value, end of period | | 16.36 | 24.64 | 19.84 | 18.53 | 16.71 |
Total Return (%) | | (14.29) | 25.56 | 7.85 | 19.85 | (15.69) |
Ratios/Supplemental Data (%): | | | | | | |
Ratio of total expenses
to average net assets | | 1.11 | 1.11 | 1.12 | 1.11 | 1.11 |
Ratio of net expenses
to average net assets | | 1.05 | 1.10 | 1.12 | 1.11 | 1.11 |
Ratio of net investment income
to average net assets | | .52 | .38 | .56 | .48 | .34 |
Portfolio Turnover Rate | | 81.37 | 90.95 | 92.40 | 82.88 | 68.02 |
Net Assets, end of period ($ x 1,000) | | 72,165 | 94,989 | 77,862 | 74,454 | 63,202 |
a Based on average shares outstanding.
See notes to financial statements.
21
NOTES TO FINANCIAL STATEMENTS
NOTE 1—Significant Accounting Policies:
MidCap Stock Portfolio (the “fund”) is a separate diversified series of BNY Mellon Investment Portfolios (the “Trust”), which is registered under the Investment Company Act of 1940, as amended (the “Act”), as an open-end management investment company and operates as a series company currently offering three series, including the fund. The fund is only offered to separate accounts established by insurance companies to fund variable annuity contracts and variable life insurance policies. The fund’s investment objective is to seek investment results that are greater than the total return performance of publicly traded common stocks of medium-size domestic companies in the aggregate, as represented by the Standard & Poor’s MidCap 400® Index. BNY Mellon Investment Adviser, Inc. (the “Adviser”), a wholly-owned subsidiary of The Bank of New York Mellon Corporation (“BNY Mellon”), serves as the fund’s investment adviser. Newton Investment Management North America, LLC (the “Sub-Adviser”), a wholly-owned subsidiary of BNY Mellon and an affiliate of the Adviser, serves as the fund’s sub-adviser.
BNY Mellon Securities Corporation (the “Distributor”), a wholly-owned subsidiary of the Adviser, is the distributor of the fund’s shares, which are sold without a sales charge. The fund is authorized to issue an unlimited number of $.001 par value shares of Beneficial Interest in each of the following classes of shares: Initial and Service. Each class of shares has identical rights and privileges, except with respect to the Distribution Plan, and the expenses borne by each class, the allocation of certain transfer agency costs, and certain voting rights. Income, expenses (other than expenses attributable to a specific class), and realized and unrealized gains or losses on investments are allocated to each class of shares based on its relative net assets.
The Trust accounts separately for the assets, liabilities and operations of each series. Expenses directly attributable to each series are charged to that series’ operations; expenses which are applicable to all series are allocated among them on a pro rata basis.
The Financial Accounting Standards Board (“FASB”) Accounting Standards Codification (“ASC”) is the exclusive reference of authoritative U.S. generally accepted accounting principles (“GAAP”) recognized by the FASB to be applied by nongovernmental entities. Rules and interpretive releases of the SEC under authority of federal laws are also sources of authoritative GAAP for SEC registrants. The fund is an investment company and applies the accounting and reporting guidance of the FASB ASC Topic 946 Financial Services-Investment Companies. The fund’s
22
financial statements are prepared in accordance with GAAP, which may require the use of management estimates and assumptions. Actual results could differ from those estimates.
The Trust enters into contracts that contain a variety of indemnifications. The fund’s maximum exposure under these arrangements is unknown. The fund does not anticipate recognizing any loss related to these arrangements.
(a) Portfolio valuation: The fair value of a financial instrument is the amount that would be received to sell an asset or paid to transfer a liability in an orderly transaction between market participants at the measurement date (i.e., the exit price). GAAP establishes a fair value hierarchy that prioritizes the inputs of valuation techniques used to measure fair value. This hierarchy gives the highest priority to unadjusted quoted prices in active markets for identical assets or liabilities (Level 1 measurements) and the lowest priority to unobservable inputs (Level 3 measurements).
Additionally, GAAP provides guidance on determining whether the volume and activity in a market has decreased significantly and whether such a decrease in activity results in transactions that are not orderly. GAAP requires enhanced disclosures around valuation inputs and techniques used during annual and interim periods.
Various inputs are used in determining the value of the fund’s investments relating to fair value measurements. These inputs are summarized in the three broad levels listed below:
Level 1—unadjusted quoted prices in active markets for identical investments.
Level 2—other significant observable inputs (including quoted prices for similar investments, interest rates, prepayment speeds, credit risk, etc.).
Level 3—significant unobservable inputs (including the fund’s own assumptions in determining the fair value of investments).
The inputs or methodology used for valuing securities are not necessarily an indication of the risk associated with investing in those securities.
Changes in valuation techniques may result in transfers in or out of an assigned level within the disclosure hierarchy. Valuation techniques used to value the fund’s investments are as follows:
The Trust’s Board of Trustees (the “Board”) has designated the Adviser as the fund’s valuation designee, effective September 8, 2022, to make all fair
23
NOTES TO FINANCIAL STATEMENTS (continued)
value determinations with respect to the fund’s portfolio investments, subject to the Board’s oversight and pursuant to Rule 2a-5 under the Act.
Investments in equity securities are valued at the last sales price on the securities exchange or national securities market on which such securities are primarily traded. Securities listed on the National Market System for which market quotations are available are valued at the official closing price or, if there is no official closing price that day, at the last sales price. For open short positions, asked prices are used for valuation purposes. Bid price is used when no asked price is available. Registered investment companies that are not traded on an exchange are valued at their net asset value. All of the preceding securities are generally categorized within Level 1 of the fair value hierarchy.
Securities not listed on an exchange or the national securities market, or securities for which there were no transactions, are valued at the average of the most recent bid and asked prices. These securities are generally categorized within Level 2 of the fair value hierarchy.
Fair valuing of securities may be determined with the assistance of a pricing service using calculations based on indices of domestic securities and other appropriate indicators, such as prices of relevant American Depository Receipts and futures. Utilizing these techniques may result in transfers between Level 1 and Level 2 of the fair value hierarchy.
When market quotations or official closing prices are not readily available, or are determined not to accurately reflect fair value, such as when the value of a security has been significantly affected by events after the close of the exchange or market on which the security is principally traded, but before the fund calculates its net asset value, the fund may value these investments at fair value as determined in accordance with the procedures approved by the Board. Certain factors may be considered when fair valuing investments such as: fundamental analytical data, the nature and duration of restrictions on disposition, an evaluation of the forces that influence the market in which the securities are purchased and sold, and public trading in similar securities of the issuer or comparable issuers. These securities are either categorized within Level 2 or 3 of the fair value hierarchy depending on the relevant inputs used.
For securities where observable inputs are limited, assumptions about market activity and risk are used and such securities are generally categorized within Level 3 of the fair value hierarchy.
The following is a summary of the inputs used as of December 31, 2022 in valuing the fund’s investments:
24
| | | | | | | |
| | Level 1-Unadjusted Quoted Prices | Level 2- Other Significant Observable Inputs | | Level 3-Significant Unobservable Inputs | Total | |
Assets ($) | | |
Investments in Securities:† | | |
Equity Securities - Common Stocks | 138,515,891 | - | | - | 138,515,891 | |
Investment Companies | 599,961 | - | | - | 599,961 | |
† See Statement of Investments for additional detailed categorizations, if any.
(b) Foreign taxes: The fund may be subject to foreign taxes (a portion of which may be reclaimable) on income, stock dividends, realized and unrealized capital gains on investments or certain foreign currency transactions. Foreign taxes are recorded in accordance with the applicable foreign tax regulations and rates that exist in the foreign jurisdictions in which the fund invests. These foreign taxes, if any, are paid by the fund and are reflected in the Statement of Operations, if applicable. Foreign taxes payable or deferred or those subject to reclaims as of December 31, 2022, if any, are disclosed in the fund’s Statement of Assets and Liabilities.
(c) Securities transactions and investment income: Securities transactions are recorded on a trade date basis. Realized gains and losses from securities transactions are recorded on the identified cost basis. Dividend income is recognized on the ex-dividend date and interest income, including, where applicable, accretion of discount and amortization of premium on investments, is recognized on the accrual basis.
Pursuant to a securities lending agreement with BNY Mellon, the fund may lend securities to qualified institutions. It is the fund’s policy that, at origination, all loans are secured by collateral of at least 102% of the value of U.S. securities loaned and 105% of the value of foreign securities loaned. Collateral equivalent to at least 100% of the market value of securities on loan is maintained at all times. Collateral is either in the form of cash, which can be invested in certain money market mutual funds managed by the Adviser, or U.S. Government and Agency securities. The fund is entitled to receive all dividends, interest and distributions on securities loaned, in addition to income earned as a result of the lending transaction. Should a borrower fail to return the securities in a timely manner, BNY Mellon is required to replace the securities for the benefit of the fund or credit the fund with the market value of the unreturned securities and is subrogated to the fund’s rights against the borrower and the collateral. Additionally, the contractual maturity of security lending transactions are on an overnight and continuous basis. During the period
25
NOTES TO FINANCIAL STATEMENTS (continued)
ended December 31, 2022, BNY Mellon earned $6,450 from the lending of the fund’s portfolio securities, pursuant to the securities lending agreement.
(d) Affiliated issuers: Investments in other investment companies advised by the Adviser are considered “affiliated” under the Act.
(e) Market Risk: The value of the securities in which the fund invests may be affected by political, regulatory, economic and social developments, and developments that impact specific economic sectors, industries or segments of the market. The value of a security may also decline due to general market conditions that are not specifically related to a particular company or industry, such as real or perceived adverse economic conditions, changes in the general outlook for corporate earnings, changes in interest or currency rates, changes to inflation, adverse changes to credit markets or adverse investor sentiment generally. In addition, turbulence in financial markets and reduced liquidity in equity, credit and/or fixed income markets may negatively affect many issuers, which could adversely affect the fund. Global economies and financial markets are becoming increasingly interconnected, and conditions and events in one country, region or financial market may adversely impact issuers in a different country, region or financial market. These risks may be magnified if certain events or developments adversely interrupt the global supply chain; in these and other circumstances, such risks might affect companies world-wide. Recent examples include pandemic risks related to COVID-19 and aggressive measures taken world-wide in response by governments, including closing borders, restricting international and domestic travel, and the imposition of prolonged quarantines of large populations, and by businesses, including changes to operations and reducing staff.
(f) Dividends and distributions to shareholders: Dividends and distributions are recorded on the ex-dividend date. Dividends from net investment income and dividends from net realized capital gains, if any, are normally declared and paid annually, but the fund may make distributions on a more frequent basis to comply with the distribution requirements of the Internal Revenue Code of 1986, as amended (the “Code”). To the extent that net realized capital gains can be offset by capital loss carryovers, it is the policy of the fund not to distribute such gains. Income and capital gain distributions are determined in accordance with income tax regulations, which may differ from GAAP.
(g) Federal income taxes: It is the policy of the fund to continue to qualify as a regulated investment company, if such qualification is in the best interests of its shareholders, by complying with the applicable provisions of the Code, and to make distributions of taxable income and
26
net realized capital gain sufficient to relieve it from substantially all federal income and excise taxes.
As of and during the period ended December 31, 2022, the fund did not have any liabilities for any uncertain tax positions. The fund recognizes interest and penalties, if any, related to uncertain tax positions as income tax expense in the Statement of Operations. During the period ended December 31, 2022, the fund did not incur any interest or penalties.
Each tax year in the four-year period ended December 31, 2022 remains subject to examination by the Internal Revenue Service and state taxing authorities.
At December 31, 2022, the components of accumulated earnings on a tax basis were as follows: undistributed ordinary income $965,251, undistributed capital gains $4,685,347 and unrealized appreciation $1,313,357.
The tax character of distributions paid to shareholders during the fiscal years ended December 31, 2022 and December 31, 2021 were as follows: ordinary income $14,075,337 and $924,151, and long-term capital gains $24,320,432 and $1,098,844, respectively.
NOTE 2—Bank Lines of Credit:
The fund participates with other long-term open-end funds managed by the Adviser in a $823.5 million unsecured credit facility led by Citibank, N.A. (the “Citibank Credit Facility”) and a $300 million unsecured credit facility provided by BNY Mellon (the “BNYM Credit Facility”), each to be utilized primarily for temporary or emergency purposes, including the financing of redemptions (each, a “Facility”). The Citibank Credit Facility is available in two tranches: (i) Tranche A is in an amount equal to $688.5 million and is available to all long-term open-ended funds, including the fund, and (ii) Tranche B is an amount equal to $135 million and is available only to BNY Mellon Floating Rate Income Fund, a series of BNY Mellon Investment Funds IV, Inc. In connection therewith, the fund has agreed to pay its pro rata portion of commitment fees for Tranche A of the Citibank Credit Facility and the BNYM Credit Facility. Interest is charged to the fund based on rates determined pursuant to the terms of the respective Facility at the time of borrowing.
The average amount of borrowings outstanding under the Facilities during the period ended December 31, 2022 was approximately $12,055 with a related weighted average annualized rate of 1.11%.
27
NOTES TO FINANCIAL STATEMENTS (continued)
NOTE 3—Management Fee, Sub-Advisory Fee and Other Transactions with Affiliates:
(a) Pursuant to a management agreement with the Adviser, the management fee is computed at the annual rate of .75% of the value of the fund’s average daily net assets and is payable monthly. The Adviser has contractually agreed, from January 1, 2022 through April 29, 2023, to waive receipt of its fees and/or assume the direct expenses of the fund so that the direct expenses of neither class of fund shares (excluding Rule 12b-1 Distribution Plan fees, taxes, interest expense, brokerage commissions, commitment fees on borrowings and extraordinary expenses) exceed .80% of the value of the fund’s average daily net assets. On or after April 29, 2023, the Adviser may terminate this expense limitation at any time. The reduction in expense, pursuant to undertaking, amount to $92,859 during the period ended December 31, 2022.
Pursuant to a sub-investment advisory agreement between the Adviser and the Sub-Adviser, the Adviser pays the Sub-Adviser a monthly fee at an annual rate of .36% of the value of the fund’s average daily net assets.
(b) Under the Distribution Plan adopted pursuant to Rule 12b-1 under the Act, Service shares pay the Distributor for distributing its shares, for servicing and/or maintaining Service shares’ shareholder accounts and for advertising and marketing for Service shares. The Distribution Plan provides for payments to be made at an annual rate of .25% of the value of the Service shares’ average daily net assets. The Distributor may make payments to Participating Insurance Companies and to brokers and dealers acting as principal underwriter for their variable insurance products. The fees payable under the Distribution Plan are payable without regard to actual expenses incurred. During the period ended December 31, 2022, Service shares were charged $196,630 pursuant to the Distribution Plan.
The fund has an arrangement with BNY Mellon Transfer, Inc., (the “Transfer Agent”), a subsidiary of BNY Mellon and an affiliate of the Adviser, whereby the fund may receive earnings credits when positive cash balances are maintained, which are used to offset Transfer Agent fees. For financial reporting purposes, the fund includes transfer agent net earnings credits, if any, as an expense offset in the Statement of Operations.
The fund has an arrangement with The Bank of New York Mellon (the “Custodian”), a subsidiary of BNY Mellon and an affiliate of the Adviser, whereby the fund will receive interest income or be charged overdraft fees when cash balances are maintained. For financial reporting purposes, the fund includes this interest income and overdraft fees, if any, as interest income in the Statement of Operations.
28
The fund compensates the Transfer Agent, under a transfer agency agreement, for providing transfer agency and cash management services for the fund. The majority of Transfer Agent fees are comprised of amounts paid on a per account basis, while cash management fees are related to fund subscriptions and redemptions. During the period ended December 31, 2022, the fund was charged $1,412 for transfer agency services. These fees are included in Shareholder servicing costs in the Statement of Operations. These fees were partially offset by earnings credits of $118.
The fund compensates the Custodian, under a custody agreement, for providing custodial services for the fund. These fees are determined based on net assets, geographic region and transaction activity. During the period ended December 31, 2022, the fund was charged $20,937 pursuant to the custody agreement.
During the period ended December 31, 2022, the fund was charged $17,082 for services performed by the fund’s Chief Compliance Officer and his staff. These fees are included in Chief Compliance Officer fees in the Statement of Operations.
The components of “Due to BNY Mellon Investment Adviser, Inc. and affiliates” in the Statement of Assets and Liabilities consist of: management fee of $89,971, Distribution Plan fees of $15,616, Custodian fees of $10,252, Chief Compliance Officer fees of $4,082 and Transfer Agent fees of $201, which are offset against an expense reimbursement currently in effect in the amount of $6,833.
(c) Each board member also serves as a board member of other funds in the BNY Mellon Family of Funds complex. Annual retainer fees and attendance fees are allocated to each fund based on net assets.
NOTE 4—Securities Transactions:
The aggregate amount of purchases and sales of investment securities, excluding short-term securities, during the period ended December 31, 2022, amounted to $122,971,659 and $139,750,191, respectively.
At December 31, 2022, the cost of investments for federal income tax purposes was $137,802,495; accordingly, accumulated net unrealized appreciation on investments was $1,313,357, consisting of $15,496,410 gross unrealized appreciation and $14,183,053 gross unrealized depreciation.
29
REPORT OF INDEPENDENT REGISTERED PUBLIC ACCOUNTING FIRM
To the Shareholders and the Board of Trustees of MidCap Stock Portfolio
Opinion on the Financial Statements
We have audited the accompanying statement of assets and liabilities of MidCap Stock Portfolio (the “Fund”) (one of the funds constituting BNY Mellon Investment Portfolios), including the statement of investments, as of December 31, 2022, and the related statement of operations for the year then ended, the statements of changes in net assets for each of the two years in the period then ended, the financial highlights for each of the five years in the period then ended and the related notes (collectively referred to as the “financial statements”). In our opinion, the financial statements present fairly, in all material respects, the financial position of the Fund (one of the funds constituting BNY Mellon Investment Portfolios) at December 31, 2022, the results of its operations for the year then ended, the changes in its net assets for each of the two years in the period then ended and its financial highlights for each of the five years in the period then ended, in conformity with U.S. generally accepted accounting principles.
Basis for Opinion
These financial statements are the responsibility of the Fund’s management. Our responsibility is to express an opinion on the Fund’s financial statements based on our audits. We are a public accounting firm registered with the Public Company Accounting Oversight Board (United States) (“PCAOB”) and are required to be independent with respect to the Fund in accordance with the U.S. federal securities laws and the applicable rules and regulations of the Securities and Exchange Commission and the PCAOB.
We conducted our audits in accordance with the standards of the PCAOB. Those standards require that we plan and perform the audit to obtain reasonable assurance about whether the financial statements are free of material misstatement, whether due to error or fraud. The Fund is not required to have, nor were we engaged to perform, an audit of the Fund’s internal control over financial reporting. As part of our audits, we are required to obtain an understanding of internal control over financial reporting, but not for the purpose of expressing an opinion on the effectiveness of the Fund’s internal control over financial reporting. Accordingly, we express no such opinion.
Our audits included performing procedures to assess the risks of material misstatement of the financial statements, whether due to error or fraud, and performing procedures that respond to those risks. Such procedures included examining, on a test basis, evidence regarding the amounts and disclosures in the financial statements. Our procedures included confirmation of securities owned as of December 31, 2022, by correspondence with the custodian, brokers and others; when replies were not received from brokers and others, we performed other auditing procedures. Our audits also included evaluating the accounting principles used and significant estimates made by management, as well as evaluating the overall presentation of the financial statements. We believe that our audits provide a reasonable basis for our opinion.

We have served as the auditor of one or more investment companies in the BNY Mellon Family of Funds since at least 1957, but we are unable to determine the specific year.
New York, New York
February 9, 2023
30
IMPORTANT TAX INFORMATION (Unaudited)
For federal tax purposes, the fund hereby reports 13.41% of the ordinary dividends paid during the fiscal year ended December 31, 2022 as qualifying for the corporate dividends received deduction. Shareholders will receive notification in early 2023 of the percentage applicable to the preparation of their 2022 income tax returns. Also, the fund hereby reports $3.4467 per share as a long-term capital gain distribution and $1.8693 per share as a short-term capital gain distribution paid on March 30, 2022.
31
INFORMATION ABOUT THE RENEWAL OF THE FUND’S MANAGEMENT AND SUB-INVESTMENT ADVISORY AGREEMENTS (Unaudited)
At a meeting of the fund’s Board of Trustees held on August 1-2, 2022, the Board considered the renewal of the fund’s Management Agreement, pursuant to which the Adviser provides the fund with investment advisory and administrative services, and the Sub-Investment Advisory Agreement (together with the Management Agreement, the “Agreements”), pursuant to which Newton Investment Management North America, LLC (the “Sub-Adviser”) provides day-to-day management of the fund’s investments. The Board members, none of whom are “interested persons” (as defined in the Investment Company Act of 1940, as amended) of the fund, were assisted in their review by independent legal counsel and met with counsel in executive session separate from representatives of the Adviser and the Sub-Adviser. In considering the renewal of the Agreements, the Board considered several factors that it believed to be relevant, including those discussed below. The Board did not identify any one factor as dispositive, and each Board member may have attributed different weights to the factors considered.
Analysis of Nature, Extent, and Quality of Services Provided to the Fund. The Board considered information provided to it at the meeting and in previous presentations from representatives of the Adviser regarding the nature, extent, and quality of the services provided to funds in the BNY Mellon fund complex, including the fund. The Adviser provided the number of open accounts in the fund, the fund’s asset size and the allocation of fund assets among distribution channels. The Adviser also had previously provided information regarding the diverse intermediary relationships and distribution channels of funds in the BNY Mellon fund complex (such as intermediary, in which intermediaries typically are paid by the fund and/or the Adviser) and the Adviser’s corresponding need for broad, deep, and diverse resources to be able to provide ongoing shareholder services to each intermediary or distribution channel, as applicable to the fund.
The Board also considered research support available to, and portfolio management capabilities of, the fund’s portfolio management personnel and that the Adviser also provides oversight of day-to-day fund operations, including fund accounting and administration and assistance in meeting legal and regulatory requirements. The Board also considered the Adviser’s extensive administrative, accounting and compliance infrastructures, as well as the Adviser’s supervisory activities over the Sub-Adviser. The Board also considered portfolio management’s brokerage policies and practices (including policies and practices regarding soft dollars) and the standards applied in seeking best execution.
Comparative Analysis of the Fund’s Performance and Management Fee and Expense Ratio. The Board reviewed reports prepared by Broadridge Financial Solutions, Inc. (“Broadridge”), an independent provider of investment company data based on classifications provided by Thomson Reuters Lipper, which included information comparing (1) the performance of the fund’s Initial shares with the performance of a group of small-cap core funds underlying variable insurance products (“VIPs”) selected by Broadridge as comparable to the fund (the “Performance Group”) and with a
32
broader group of funds consisting of all small-cap core funds underlying VIPs (the “Performance Universe”), all for various periods ended June 30, 2022, (2) the fund’s actual and contractual management fees and total expenses with those of the same group of funds in the Performance Group (the “Expense Group”) and with a broader group of all small-cap core funds underlying VIPs with similar 12b-1/non-12b-1 structures, excluding outliers (the “Expense Universe”), and (3) at the request of the Adviser, the total expenses of the fund’s Service shares with those of the Expense Group and the Expense Universe, the information for which was derived in part from fund financial statements available to Broadridge as of the date of its analysis. The Adviser previously had furnished the Board with a description of the methodology Broadridge used to select the Performance Group and Performance Universe and the Expense Group and Expense Universe.
Performance Comparisons. Representatives of the Adviser stated that the usefulness of performance comparisons may be affected by a number of factors, including different investment limitations and policies that may be applicable to the fund and comparison funds and the end date selected. The Board also considered the fund’s performance in light of overall financial market conditions. The Board discussed with representatives of the Adviser and the Sub-Adviser the results of the comparisons and considered that the fund’s total return performance was below the Performance Group median for all periods, except the one- and two-year periods when the fund’s total return performance was above or at the median, respectively, and was below the Performance Universe median for all periods, except the one- and four-year periods when the fund’s total return performance was above the median. The Adviser also provided a comparison of the fund’s calendar year total returns to the returns of the fund’s benchmark index.
Management Fee and Expense Ratio Comparisons. The Board reviewed and considered the contractual management fee rate payable by the fund to the Adviser in light of the nature, extent and quality of the management services and the sub-advisory services provided by the Adviser and the Sub-Adviser, respectively. In addition, the Board reviewed and considered the actual management fee rate paid by the fund over the fund’s last fiscal year, which included reductions for an expense limitation arrangement in place that reduced the management fee paid to the Adviser. The Board also reviewed the range of actual and contractual management fees and total expenses as a percentage of average net assets of the Expense Group and Expense Universe funds and discussed the results of the comparisons.
The Board considered that the fund’s contractual management fee was equal to the Expense Group median contractual management fee, the fund’s actual management fee was slightly below the Expense Group median and slightly below the Expense Universe median actual management fee and the total expenses of the fund’s Initial shares were equal to the Expense Group median and equal to the Expense Universe median total expenses. The Board also considered that the total expenses of the fund’s Service shares were higher than the Expense Universe median total expenses.
Representatives of the Adviser stated that the Adviser has contractually agreed, until April 29, 2023, to waive receipt of its fees and/or assume the direct expenses of the
33
INFORMATION ABOUT THE RENEWAL OF THE FUND’S MANAGEMENT AND SUB-INVESTMENT ADVISORY AGREEMENTS (Unaudited) (continued)
fund so that the direct expenses of neither class of fund shares (excluding Rule 12b-1 fees, taxes, interest, brokerage commissions, commitment fees on borrowings and extraordinary expenses) exceed .80% of the fund’s average daily net assets.
Representatives of the Adviser reviewed with the Board the management or investment advisory fees paid by funds advised by the Adviser that are in the same Lipper category as the fund (the “Similar Funds”), and explained the nature of the Similar Funds. They discussed differences in fees paid and the relationship of the fees paid in light of any differences in the services provided and other relevant factors. The Board considered the relevance of the fee information provided for the Similar Funds to evaluate the appropriateness of the fund’s management fee. Representatives of the Adviser noted that there were no separate accounts and/or other types of client portfolios advised by the Adviser or the Sub-Adviser that are considered to have similar investment strategies and policies as the fund.
The Board considered the fee payable to the Sub-Adviser in relation to the fee payable to the Adviser by the fund and the respective services provided by the Sub-Adviser and the Adviser. The Board also took into consideration that the Sub-Adviser’s fee is paid by the Adviser, out of its fee from the fund, and not the fund.
Analysis of Profitability and Economies of Scale. Representatives of the Adviser reviewed the expenses allocated and profit received by the Adviser and its affiliates and the resulting profitability percentage for managing the fund and the aggregate profitability percentage to the Adviser and its affiliates for managing the funds in the BNY Mellon fund complex, and the method used to determine the expenses and profit. The Board concluded that the profitability results were not excessive, given the services rendered and service levels provided by the Adviser and its affiliates. The Board also considered the expense limitation arrangement and its effect on the profitability of the Adviser and its affiliates. The Board also had been provided with information prepared by an independent consulting firm regarding the Adviser’s approach to allocating costs to, and determining the profitability of, individual funds and the entire BNY Mellon fund complex. The consulting firm also had analyzed where any economies of scale might emerge in connection with the management of a fund.
The Board considered, on the advice of its counsel, the profitability analysis (1) as part of its evaluation of whether the fees under the Agreements, considered in relation to the mix of services provided by the Adviser and the Sub-Adviser, including the nature, extent and quality of such services, supported the renewal of the Agreements and (2) in light of the relevant circumstances for the fund and the extent to which economies of scale would be realized if the fund grows and whether fee levels reflect these economies of scale for the benefit of fund shareholders. Representatives of the Adviser stated that a discussion of economies of scale is predicated on a fund having achieved a substantial size with increasing assets and that, if a fund’s assets had been stable or decreasing, the possibility that the Adviser may have realized any economies of scale would be less. Representatives of the Adviser also stated that, as a result of shared and allocated costs among funds in the BNY Mellon fund complex, the extent of economies of scale could depend substantially on the level of assets in the complex as a whole, so that increases
34
and decreases in complex-wide assets can affect potential economies of scale in a manner that is disproportionate to, or even in the opposite direction from, changes in the fund’s asset level. The Board also considered potential benefits to the Adviser and the Sub-Adviser from acting as investment adviser and sub-investment adviser, respectively, and took into consideration that there were no soft dollar arrangements in effect for trading the fund’s investments.
At the conclusion of these discussions, the Board agreed that it had been furnished with sufficient information to make an informed business decision with respect to the renewal of the Agreements. Based on the discussions and considerations as described above, the Board concluded and determined as follows.
· The Board concluded that the nature, extent and quality of the services provided by the Adviser and the Sub-Adviser are adequate and appropriate.
· The Board was satisfied with the fund’s recent performance.
· The Board concluded that the fees paid to the Adviser and the Sub-Adviser continued to be appropriate under the circumstances and in light of the factors and the totality of the services provided as discussed above.
· The Board determined that the economies of scale which may accrue to the Adviser and its affiliates in connection with the management of the fund had been adequately considered by the Adviser in connection with the fee rate charged to the fund pursuant to the Management Agreement and that, to the extent in the future it were determined that material economies of scale had not been shared with the fund, the Board would seek to have those economies of scale shared with the fund.
In evaluating the Agreements, the Board considered these conclusions and determinations and also relied on its previous knowledge, gained through meetings and other interactions with the Adviser and its affiliates and the Sub-Adviser, of the Adviser and the Sub-Adviser and the services provided to the fund by the Adviser and the Sub-Adviser. The Board also relied on information received on a routine and regular basis throughout the year relating to the operations of the fund and the investment management and other services provided under the Agreements, including information on the investment performance of the fund in comparison to similar mutual funds and benchmark performance indices; general market outlook as applicable to the fund; and compliance reports. In addition, the Board’s consideration of the contractual fee arrangements for the fund had the benefit of a number of years of reviews of the Agreements for the fund, or substantially similar agreements for other BNY Mellon funds that the Board oversees, during which lengthy discussions took place between the Board and representatives of the Adviser. Certain aspects of the arrangements may receive greater scrutiny in some years than in others, and the Board’s conclusions may be based, in part, on its consideration of the fund’s arrangements, or substantially similar arrangements for other BNY Mellon funds that the Board oversees, in prior years. The Board determined to renew the Agreements.
35
BOARD MEMBERS INFORMATION (Unaudited)
Independent Board Members
Joseph S. DiMartino (79)
Chairman of the Board (1998)
Principal Occupation During Past 5 Years:
· Director or Trustee of funds in the BNY Mellon Family of Funds and certain other entities (as described in the fund’s Statement of Additional Information) (1995-Present)
Other Public Company Board Memberships During Past 5 Years:
· CBIZ, Inc., a public company providing professional business services, products and solutions, Director (1997-Present)
No. of Portfolios for which Board Member Serves: 92
———————
Francine J. Bovich (71)
Board Member (2015)
Principal Occupation During Past 5 Years:
· The Bradley Trusts, private trust funds, Trustee (2011-Present)
Other Public Company Board Memberships During Past 5 Years:
· Annaly Capital Management, Inc., a real estate investment trust, Director (2014-Present)
No. of Portfolios for which Board Member Serves: 53
———————
J. Charles Cardona (67)
Board Member (2014)
Principal Occupation During Past 5 Years:
· BNY Mellon ETF Trust, Chairman and Trustee (2020-Present)
· BNY Mellon Liquidity Funds, Director (2004-Present) and Chairman (2019-2021)
No. of Portfolios for which Board Member Serves: 37
———————
Andrew J. Donohue (72)
Board Member (2019)
Principal Occupation During Past 5 Years:
· Attorney, Solo Law Practice (2019-Present)
· Shearman & Sterling LLP, a law firm, Of Counsel (2017-2019)
· Chief of Staff to the Chair of the SEC (2015-2017)
Other Public Company Board Memberships During Past 5 Years:
· Oppenheimer Funds (58 funds), Director (2017-2019)
No. of Portfolios for which Board Member Serves: 43
———————
36
Isabel P. Dunst (75)
Board Member (2014)
Principal Occupation During Past 5 Years:
· Hogan Lovells LLP, a law firm, Retired (2019-Present); Senior Counsel (2018-2019); Of Counsel (2015-2018)
· Hebrew Union College Jewish Institute of Religion, Member of the Board of Governors (2015-Present)
· Bend the ARC, a civil rights organization, Board Member (2016-Present)
No. of Portfolios for which Board Member Serves: 22
———————
Nathan Leventhal (79)
Board Member (2009)
Principal Occupation During Past 5 Years:
· Lincoln Center for the Performing Arts, President Emeritus (2001-Present)
· Palm Beach Opera, President (2016-Present)
Other Public Company Board Memberships During Past 5 Years:
· Movado Group, Inc., a public company that designs, sources, markets and distributes watches Director (2003-2020)
No. of Portfolios for which Board Member Serves: 32
———————
Robin A. Melvin (59)
Board Member (2014)
Principal Occupation During Past 5 Years:
· Westover School, a private girls' boarding school in Middlebury, Connecticut, Trustee (2019-Present)
· Mentor Illinois, a non-profit organization dedicated to increasing the quantity and quality of mentoring services in Illinois, Co-Chair (2014-2020); Board Member, Mentor Illinois (2013-2020)
· JDRF, a non-profit juvenile diabetes research foundation, Board Member (June 2021-June 2022)
Other Public Company Board Memberships During Past 5 Years:
· HPS Corporate Lending Fund, a closed-end management investment company regulated as a business development company, Trustee (August 2021-Present)
No. of Portfolios for which Board Member Serves: 71
———————
Roslyn M. Watson (73)
Board Member (2014)
Principal Occupation During Past 5 Years:
· Watson Ventures, Inc., a real estate investment company. Principal (1993-Present)
Other Public Company Board Memberships During Past 5 Years:
· American Express Bank, FSB, Director (1993-2018)
No. of Portfolios for which Board Member Serves: 43
———————
37
BOARD MEMBERS INFORMATION (Unaudited) (continued)
Benaree Pratt Wiley (76)
Board Member (2009)
Principal Occupation During Past 5 Years:
· The Wiley Group, a firm specializing in strategy and business development, Principal (2005-Present)
Other Public Company Board Memberships During Past 5 Years:
· CBIZ, Inc., a public company providing professional business services, products and solutions, Director (2008-Present)
· Blue Cross Blue Shield of Massachusetts, Director (2004-2020)
No. of Portfolios for which Board Member Serves: 60
———————
Tamara Belinfanti (47)
Advisory Board Member (2021)
Principal Occupation During Past 5 Years:
· New York Law School, Lester Martin Professor of Law (2009-Present)
No. of Portfolios for which Advisory Board Member Serves: 22
———————
Gordon J. Davis (81)
Advisory Board Member (2021)
Principal Occupation During Past 5 Years:
· Venable LLP, a law firm, Partner (2012-Present)
Other Public Company Board Memberships During Past 5 Years:
· BNY Mellon Family of Funds (53 funds), Board Member (1995-August 2021)
No. of Portfolios for which Advisory Board Member Serves: 39
———————
The address of the Board Members and Officers is c/o BNY Mellon Investment Adviser, Inc., 240 Greenwich Street, New York, New York 10286. Additional information about each Board Member is available in the fund’s Statement of Additional Information which can be obtained from the Adviser free of charge by calling this toll free number: 1-800-373-9387.
38
OFFICERS OF THE FUND (Unaudited)
DAVID DIPETRILLO, President since January 2021.
Vice President and Director of the Adviser since February 2021; Head of North America Product, BNY Mellon Investment Management since January 2018; and Director of Product Strategy, BNY Mellon Investment Management from January 2016 to December 2017. He is an officer of 54 investment companies (comprised of 107 portfolios) managed by the Adviser or an affiliate of the Adviser. He is 44 years old and has been an employee of BNY Mellon since 2005.
JAMES WINDELS, Treasurer since November 2001.
Vice President of the Adviser since September 2020; and Director–BNY Mellon Fund Administration. He is an officer of 55 investment companies (comprised of 127 portfolios) managed by the Adviser or an affiliate of the Adviser. He is 64 years old and has been an employee of the Adviser since April 1985.
PETER M. SULLIVAN, Chief Legal Officer since July 2021 and Vice President and Assistant Secretary since March 2019.
Chief Legal Officer of the Adviser and Associate General Counsel of BNY Mellon since July 2021; Senior Managing Counsel of BNY Mellon from December 2020 to July 2021; and Managing Counsel of BNY Mellon from March 2009 to December 2020. He is an officer of 55 investment companies (comprised of 127 portfolios) managed by the Adviser or an affiliate of the Adviser. He is 54 years old and has been an employee of BNY Mellon since April 2004.
JAMES BITETTO, Vice President since August 2005 and Secretary since February 2018.
Senior Managing Counsel of BNY Mellon since December 2019; Managing Counsel of BNY Mellon from April 2014 to December 2019; and Secretary of the Adviser. He is an officer of 55 investment companies (comprised of 127 portfolios) managed by the Adviser or an affiliate of the Adviser. He is 56 years old and has been an employee of the Adviser since December 1996.
DEIRDRE CUNNANE, Vice President and Assistant Secretary since March 2019.
Managing Counsel of BNY Mellon since December 2021, Counsel of BNY Mellon from August 2018 to December 2021; and Senior Regulatory Specialist at BNY Mellon Investment Management Services from February 2016 to August 2018. She is an officer of 55 investment companies (comprised of 127 portfolios) managed by the Adviser or an affiliate of the Adviser. She is 32 years old and has been an employee of the Adviser since August 2018.
SARAH S. KELLEHER, Vice President and Assistant Secretary since April 2014.
Vice President of BNY Mellon ETF Investment Adviser; LLC since February 2020; Senior Managing Counsel of BNY Mellon since September 2021; Managing Counsel of BNY Mellon from December 2017 to September 2021; and Senior Counsel of BNY Mellon from March 2013 to December 2017. She is an officer of 55 investment companies (comprised of 127 portfolios) managed by the Adviser or an affiliate of the Adviser. She is 47 years old and has been an employee of the Adviser since March 2013.
JEFF PRUSNOFSKY, Vice President and Assistant Secretary since August 2005.
Senior Managing Counsel of BNY Mellon. He is an officer of 55 investment companies (comprised of 127 portfolios) managed by the Adviser or an affiliate of the Adviser. He is 57 years old and has been an employee of the Adviser since October 1990.
AMANDA QUINN, Vice President and Assistant Secretary since March 2020.
Counsel of BNY Mellon since June 2019; Regulatory Administration Manager at BNY Mellon Investment Management Services from September 2018 to May 2019; and Senior Regulatory Specialist at BNY Mellon Investment Management Services from April 2015 to August 2018. She is an officer of 55 investment companies (comprised of 127 portfolios) managed by the Adviser or an affiliate of the Adviser. She is 37 years old and has been an employee of the Adviser since June 2019.
39
OFFICERS OF THE FUND (Unaudited) (continued)
NATALYA ZELENSKY, Vice President and Assistant Secretary since March 2017.
Chief Compliance Officer since August 2021 and Vice President since February 2020 of BNY Mellon ETF Investment Adviser, LLC; Chief Compliance Officer since August 2021 and Vice President and Assistant Secretary since February 2020 of BNY Mellon ETF Trust; Managing Counsel of BNY Mellon from December 2019 to August 2021; Counsel of BNY Mellon from May 2016 to December 2019; and Assistant Secretary of the Adviser from April 2018 to August 2021. She is an officer of 55 investment companies (comprised of 127 portfolios) managed by the Adviser or an affiliate of the Adviser. She is 37 years old and has been an employee of BNY Mellon since May 2016.
DANIEL GOLDSTEIN, Vice President since March 2022.
Vice President and Head of Product Development of North America Product, BNY Mellon Investment Management since January 2018; Co-Head of Product Management, Development & Oversight of North America Product, BNY Mellon Investment Management from January 2010 to January 2018; and Senior Vice President, Development & Oversight of North America Product, BNY Mellon Investment Management since 2010. He is an officer of 54 investment companies (comprised of 107 portfolios) managed by the Adviser or an affiliate of the Adviser. He is 53 years old and has been an employee of the Distributor since 1991.
JOSEPH MARTELLA, Vice President since March 2022.
Vice President of the Adviser since December 2022, Head of Product Management of North America Product, BNY Mellon Investment Management since January 2018; Director of Product Research and Analytics of North America Product, BNY Mellon Investment Management from January 2010 to January 2018; and Senior Vice President of North America Product, BNY Mellon Investment Management since 2010. He is an officer of 54 investment companies (comprised of 107 portfolios) managed by the Adviser or an affiliate of the Adviser. He is 46 years old and has been an employee of the Distributor since 1999.
GAVIN C. REILLY, Assistant Treasurer since December 2005.
Tax Manager–BNY Mellon Fund Administration. He is an officer of 55 investment companies (comprised of 127 portfolios) managed by the Adviser or an affiliate of the Adviser. He is 54 years old and has been an employee of the Adviser since April 1991.
ROBERT SALVIOLO, Assistant Treasurer since July 2007.
Senior Accounting Manager–BNY Mellon Fund Administration. He is an officer of 55 investment companies (comprised of 127 portfolios) managed by the Adviser or an affiliate of the Adviser. He is 55 years old and has been an employee of the Adviser since June 1989.
ROBERT SVAGNA, Assistant Treasurer since December 2002.
Senior Accounting Manager–BNY Mellon Fund Administration. He is an officer of 55 investment companies (comprised of 127 portfolios) managed by the Adviser or an affiliate of the Adviser. He is 55 years old and has been an employee of the Adviser since November 1990.
JOSEPH W. CONNOLLY, Chief Compliance Officer since October 2004.
Chief Compliance Officer of the BNY Mellon Family of Funds and BNY Mellon Funds Trust since 2004; and Chief Compliance Officer of the Adviser from 2004 until June 2021. He is the Chief Compliance Officer of 54 investment companies (comprised of 112 portfolios) managed by the Adviser. He is 65 years old.
CARIDAD M. CAROSELLA, Anti-Money Laundering Compliance Officer since January 2016.
Anti-Money Laundering Compliance Officer of the BNY Mellon Family of Funds and BNY Mellon Funds Trust. She is an officer of 48 investment companies (comprised of 120 portfolios) managed by the Adviser or an affiliate of the Adviser. She is 54 years old and has been an employee of the Distributor since 1997.
40
This page intentionally left blank.
41
BNY Mellon Investment Portfolios, MidCap Stock Portfolio
240 Greenwich Street
New York, NY 10286
Adviser
BNY Mellon Investment Adviser, Inc.
240 Greenwich Street
New York, NY 10286
Sub-Adviser
Newton Investment Management
North America, LLC
BNY Mellon Center
201 Washington Street
Boston, MA 02108
Custodian
The Bank of New York Mellon
240 Greenwich Street
New York, NY 10286
Transfer Agent &
Dividend Disbursing Agent
BNY Mellon Transfer, Inc.
240 Greenwich Street
New York, NY 10286
Distributor
BNY Mellon Securities Corporation
240 Greenwich Street
New York, NY 10286
Telephone 1-800-258-4260 or 1-800-258-4261
Mail The BNY Mellon Family of Funds, 144 Glenn Curtiss Boulevard, Uniondale, NY 11556-0144 Attn: Institutional Services Department
E-mail Send your request to info@bnymellon.com
Internet Information can be viewed online or downloaded at www.im.bnymellon.com
The fund files its complete schedule of portfolio holdings with the Securities and Exchange Commission (“SEC”) for the first and third quarters of each fiscal year on Form N-PORT. The fund’s Forms N-PORT are available on the SEC’s website at www.sec.gov.
A description of the policies and procedures that the fund uses to determine how to vote proxies relating to portfolio securities and information regarding how the fund voted these proxies for the most recent 12-month period ended June 30 is available at www.im.bnymellon.com and on the SEC’s website at www.sec.gov and without charge, upon request, by calling 1-800-373-9387.
| | |
© 2023 BNY Mellon Securities Corporation
0174AR1222 | 
|
BNY Mellon Investment Portfolios, Small Cap Stock Index Portfolio
| |
ANNUAL REPORT December 31, 2022 |

| |
Save time. Save paper. View your next shareholder report online as soon as it’s available. Log into www.im.bnymellon.com and sign up for eCommunications. It’s simple and only takes a few minutes. |
| |
The views expressed in this report reflect those of the portfolio manager(s) only through the end of the period covered and do not necessarily represent the views of BNY Mellon Investment Adviser, Inc. or any other person in the BNY Mellon Investment Adviser, Inc. organization. Any such views are subject to change at any time based upon market or other conditions and BNY Mellon Investment Adviser, Inc. disclaims any responsibility to update such views. These views may not be relied on as investment advice and, because investment decisions for a fund in the BNY Mellon Family of Funds are based on numerous factors, may not be relied on as an indication of trading intent on behalf of any fund in the BNY Mellon Family of Funds. |
| |
Not FDIC-Insured • Not Bank-Guaranteed • May Lose Value |
Contents
THE FUND
FOR MORE INFORMATION
Back Cover
DISCUSSION OF FUND PERFORMANCE (Unaudited)
For the period from January 1, 2022, through December 31, 2022, as provided by portfolio managers David France, Todd Frysinger, Vlasta Sheremeta, Michael Stoll and Marlene Walker Smith at BNYM Investment Adviser.
Market and Fund Performance Overview
For the 12-month period ended December 31, 2022, BNY Mellon Investment Portfolios, Small Cap Stock Index Portfolio (the “fund”) produced a total return of −16.65%.1 In comparison, the fund’s benchmark, the S&P SmallCap 600® Index (the “Index”), produced a −16.10% total return for the same period.2,3
Equities lost ground during the reporting period under pressure from sharply increasing inflation, monetary tightening measures undertaken by the U.S. Federal Reserve (the “Fed”) and uncertainties related to Russia’s invasion of Ukraine. The difference in returns between the fund and the Index was primarily the result of transaction costs and operating expenses that are not reflected in the Index’s results.
The Fund’s Investment Approach
The fund seeks to match the performance of the Index. To pursue its goal, the fund generally invests in all of the stocks that comprise the Index. The fund generally invests in all 600 stocks in the Index in proportion to their weighting in the Index; however, at times, the fund may invest in a representative sample of stocks included in the Index. Under these circumstances, the fund expects to invest in approximately 500 or more of the stocks in the Index.
A Challenging Environment Undermines Most Equities
The start of 2022 was the most challenging period faced by equity investors since the outbreak of the COVID-19 pandemic. While Russia’s invasion of Ukraine at the end of February was a defining geopolitical and economic event and an obvious catalyst for equity market weakness, equity indices had already come under considerable pressure. The proximate cause was tightening U.S. monetary policy, as the Fed, addressing inflationary pressures, signaled that U.S. interest-rate increases would come earlier and potentially be more aggressive than previously indicated, a course of action that pressured higher-multiple equities. Inflation rose even faster than expected as commodity prices surged in the wake of the invasion of Ukraine, necessitating an even more hawkish approach by the Fed. As the pace of interest-rate increases accelerated in the late spring and summer, equities experienced extensive derating, with higher growth shares once again proving most vulnerable.
The investment environment remained volatile in the second half of the year, although many equity indices registered mild gains for the six months, with the Index rising 3.51%. Stock markets started the third quarter of 2022 on a firmer footing in response to better-than-expected corporate earnings and a less hawkish tone from the Fed during the announcement of a 0.75% increase in U.S. interest rates in July. However, subsequent Fed statements dashed investor’s hopes that a dovish policy pivot might soon materialize, driving stock markets lower again. Risk assets rose in October and November on encouraging signs of moderating inflationary pressures. Nevertheless, the Fed’s rhetoric and actions remained steadfastly hawkish, and stocks dipped again in December as the prospect of a possible recession loomed on the horizon.
Small-Cap Stocks Decline Broadly Under Pressure
In response to inflationary pressures and growing uncertainty regarding economic prospects, the Index declined along with the broader market. However, unlike most periods characterized by high levels of volatility and falling markets, small-cap issues tended to outperform large-cap equities, as some of the largest, growth-oriented technology and communications companies experienced particularly acute valuation compressions. Nevertheless, cyclical and growth-oriented small-cap shares were harder hit than value-oriented small-cap equities. Communication services stocks suffered particularly steep losses, with technology-oriented, economically sensitive industries within the sector bearing the brunt of the declines. The real estate sector provided the next-worst performance as cracks started to show
2
from the housing market slowdown. Consumer discretionary stocks were hurt by concerns regarding consumer spending ahead of a possible recession, and by inventory pressures felt by retailers. Health care, particularly in the more speculative biotechnology and health life sciences areas, also underperformed the broader market.
Conversely, energy stocks generated strongly positive returns, with the sector rising by 47.87% in the Index. Energy companies benefited from oil and gas prices that remained at historically high levels, even after declines from their mid-year highs. Energy equipment & services providers provided the strongest gains, followed by oil, gas & fuel producers. No other sector in the Index provided positive returns. Those declining the least included utilities (−1.84%), materials (−6.09%) and consumer staples (−6.47%).
Easing Pressures with Potential Upside
As of December 31, 2022, we see signs that inflationary pressures are beginning to moderate as the inflation curve begins to bend in response to the Fed’s hawkish policies. Supply chains are beginning to heal as well. The economic cost of the current cycle remains restrained thus far, with the job market remaining unexpectedly resilient and corporate profits still generally strong, aside from pockets of weakness in areas such as home builders. However, we may see wider indications of softness in corporate earnings as the impacts of still-rising interest rates filter through the economy. With additional rate increases expected in 2023, the question remains open as to whether the Fed will succeed in engineering a so-called “soft landing,” in which inflation declines nearer the central bank’s 2% target rate, and monetary policy can be eased with minimal economic dislocation or lasting damage to growth. If a soft landing is achieved, we believe the small-cap equity universe may benefit disproportionately, bolstered by the asset class’s relatively attractive valuations, leverage to domestic growth trends and lack of exposure to potential economic weakness and geopolitical turmoil abroad.
January 17, 2023
1 Total return includes reinvestment of dividends and any capital gains paid. Past performance is no guarantee of future results. Share price and investment return fluctuate such that upon redemption, fund shares may be worth more or less than their original cost. The fund’s performance does not reflect the deduction of additional charges and expenses imposed in connection with investing in variable insurance contracts, which will reduce returns. The fund’s returns reflect the absorption of certain fund expenses by BNY Mellon Investment Adviser, Inc. pursuant to an agreement in effect that may be extended, terminated or modified at any time. Had these expenses not been absorbed, returns would have been lower.
2 Source: Lipper Inc. — The S&P SmallCap 600® Index measures the small-cap segment of the U.S. equity market. The index is designed to track companies that meet specific inclusion criteria to ensure that they are liquid and financially viable. Investors cannot invest directly in any index.
3 “Standard & Poor’s®,” “S&P®,” and “Standard & Poor’s® SmallCap 600 Index” are trademarks of Standard & Poor’s Financial Services LLC (“Standard & Poor’s”) and have been licensed for use by the fund. The fund is not sponsored, endorsed, sold or promoted by Standard & Poor’s, and Standard & Poor’s makes no representation regarding the advisability of investing in the fund.
Equities are subject generally to market, market sector, market liquidity, issuer and investment style risks, among other factors, to varying degrees, all of which are more fully described in the fund’s prospectus. Stocks of small- and/or mid-cap companies often experience sharper price fluctuations than stocks of large-cap companies.
Recent market risks include pandemic risks related to COVID-19. The effects of COVID-19 have contributed to increased volatility in global markets and will likely affect certain countries, companies, industries and market sectors more dramatically than others. To the extent the fund may overweight its investments in certain countries, companies, industries or market sectors, such positions will increase the fund’s exposure to risk of loss from adverse developments affecting those countries, companies, industries or sectors.
The fund may, but is not required to, use derivative instruments. A small investment in derivatives could have a potentially large impact on the fund’s performance. The use of derivatives involves risks different from, or possibly greater than, the risks associated with investing directly in the underlying assets.
The fund is only available as a funding vehicle under variable life insurance policies or variable annuity contracts issued by insurance companies. Individuals may not purchase shares of the fund directly. A variable annuity is an insurance contract issued by an insurance company that enables investors to accumulate assets on a tax-deferred basis for retirement or other long-term goals. The investment objective and policies of BNY Mellon Investment Portfolios, Small Cap Stock Index Portfolio made available through insurance products may be similar to those of other funds managed by BNY Mellon Investment Adviser, Inc. However, the investment results of the fund may be higher or lower than, and may not be comparable to, those of any other BNY Mellon Investment Adviser, Inc. fund.
3
FUND PERFORMANCE (Unaudited)
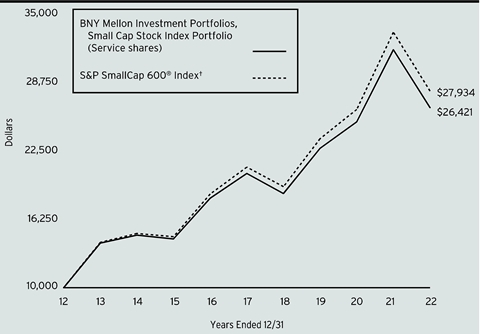
Comparison of change in value of a $10,000 investment in BNY Mellon Investment Portfolios, Small Cap Stock Index Portfolio’s Service shares with a hypothetical investment of $10,000 in the S&P SmallCap 600® Index (the “Index”).
† Source: Lipper Inc.
Past performance is not predictive of future performance. The fund’s performance does not reflect the deduction of additional charges and expenses imposed in connection with investing in variable insurance contracts which will reduce returns.
The above graph compares a hypothetical $10,000 investment made in Service shares of BNY Mellon Investment Portfolios, Small Cap Stock Index Portfolio on 12/31/12 to a hypothetical investment of $10,000 made in the Index on that date.
The fund’s performance shown in the line graph above takes into account all applicable fees and expenses. The Index measures the small-cap segment of the U.S. equity market. The Index is designed to track companies that meet specific inclusion criteria to ensure that they are liquid and financially viable. Unlike a mutual fund, the Index is not subject to charges, fees and other expenses. Investors cannot invest directly in any index. Further information relating to fund performance, including expense reimbursements, if applicable, is contained in the Financial Highlights section of the prospectus and elsewhere in this report.
4
| | | | |
Average Annual Total Returns as of 12/31/2022 | |
| 1 Year | 5 Years | 10 Years |
Portfolio | -16.65% | 5.29% | 10.20% |
S&P SmallCap 600® Index | -16.10% | 5.88% | 10.82% |
The performance data quoted represents past performance, which is no guarantee of future results. Share price and investment return fluctuate and an investor’s shares may be worth more or less than original cost upon redemption. Current performance may be lower or higher than the performance quoted. Go to www.im.bnymellon.com for the fund’s most recent month-end returns.
The fund is subject to a 0.25% annual Rule 12b-1 fee. All dividends and capital gain distributions are reinvested.
The fund’s performance shown in the graph and table does not reflect the deduction of taxes that a shareholder would pay on fund distributions or the redemption of fund shares.
5
UNDERSTANDING YOUR FUND’S EXPENSES (Unaudited)
As a mutual fund investor, you pay ongoing expenses, such as management fees and other expenses. Using the information below, you can estimate how these expenses affect your investment and compare them with the expenses of other funds. You also may pay one-time transaction expenses, including sales charges (loads), redemption fees and expenses associated with variable annuity or insurance contracts, which are not shown in this section and would have resulted in higher total expenses. For more information, see your fund’s prospectus or talk to your financial adviser.
Review your fund’s expenses
The table below shows the expenses you would have paid on a $1,000 investment in BNY Mellon Investment Portfolios, Small Cap Stock Index Portfolio from July 1, 2022 to December 31, 2022. It also shows how much a $1,000 investment would be worth at the close of the period, assuming actual returns and expenses.
| | | | |
Expenses and Value of a $1,000 Investment | |
Assume actual returns for the six months ended December 31, 2022 | |
| | | |
| | | |
Expenses paid per $1,000† | $3.07 | |
Ending value (after expenses) | $1,031.70 | |
COMPARING YOUR FUND’S EXPENSES WITH THOSE OF OTHER FUNDS (Unaudited)
Using the SEC’s method to compare expenses
The Securities and Exchange Commission (“SEC”) has established guidelines to help investors assess fund expenses. Per these guidelines, the table below shows your fund’s expenses based on a $1,000 investment, assuming a hypothetical 5% annualized return. You can use this information to compare the ongoing expenses (but not transaction expenses or total cost) of investing in the fund with those of other funds. All mutual fund shareholder reports will provide this information to help you make this comparison. Please note that you cannot use this information to estimate your actual ending account balance and expenses paid during the period.
| | | | |
Expenses and Value of a $1,000 Investment | |
Assuming a hypothetical 5% annualized return for the six months ended December 31, 2022 | |
| | | |
| | | |
Expenses paid per $1,000† | $3.06 | |
Ending value (after expenses) | $1,022.18 | |
† | Expenses are equal to the fund’s annualized expense ratio of .60%, multiplied by the average account value over the period, multiplied by 184/365 (to reflect the one-half year period). |
6
STATEMENT OF INVESTMENTS
December 31, 2022
| | | | | | | | |
| |
Description | | | | Shares | | Value ($) | |
Common Stocks - 98.5% | | | | | |
Automobiles & Components - 1.4% | | | | | |
American Axle & Manufacturing Holdings Inc. | | | | 68,565 | a | 536,178 | |
Dorman Products Inc. | | | | 16,725 | a | 1,352,551 | |
Gentherm Inc. | | | | 19,693 | a | 1,285,756 | |
LCI Industries | | | | 15,019 | | 1,388,507 | |
Motorcar Parts of America Inc. | | | | 11,014 | a | 130,626 | |
Patrick Industries Inc. | | | | 12,841 | | 778,165 | |
Standard Motor Products Inc. | | | | 10,964 | | 381,547 | |
Winnebago Industries Inc. | | | | 18,057 | | 951,604 | |
XPEL Inc. | | | | 11,610 | a,b | 697,297 | |
| | | | | 7,502,231 | |
Banks - 12.3% | | | | | |
Ameris Bancorp | | | | 38,410 | | 1,810,647 | |
Axos Financial Inc. | | | | 31,582 | a | 1,207,064 | |
Banc of California Inc. | | | | 33,457 | | 532,970 | |
BancFirst Corp. | | | | 10,336 | b | 911,428 | |
BankUnited Inc. | | | | 45,652 | | 1,550,798 | |
Banner Corp. | | | | 20,315 | | 1,283,908 | |
Berkshire Hills Bancorp Inc. | | | | 26,582 | | 794,802 | |
Brookline Bancorp Inc. | | | | 45,281 | | 640,726 | |
Capitol Federal Financial Inc. | | | | 76,373 | | 660,626 | |
Central Pacific Financial Corp. | | | | 16,582 | | 336,283 | |
City Holding Co. | | | | 8,749 | | 814,444 | |
Columbia Banking System Inc. | | | | 46,223 | | 1,392,699 | |
Community Bank System Inc. | | | | 31,841 | | 2,004,391 | |
Customers Bancorp Inc. | | | | 17,852 | a | 505,926 | |
CVB Financial Corp. | | | | 77,513 | | 1,995,960 | |
Dime Community Bancshares Inc. | | | | 19,282 | | 613,746 | |
Eagle Bancorp Inc. | | | | 18,741 | | 825,916 | |
FB Financial Corp. | | | | 20,850 | | 753,519 | |
First Bancorp | | | | 21,268 | | 911,121 | |
First Bancorp/Puerto Rico | | | | 109,423 | | 1,391,861 | |
First Commonwealth Financial Corp. | | | | 54,903 | | 766,995 | |
First Financial Bancorp | | | | 55,929 | | 1,355,160 | |
First Hawaiian Inc. | | | | 75,564 | | 1,967,687 | |
Hanmi Financial Corp. | | | | 18,072 | | 447,282 | |
Heritage Financial Corp. | | | | 20,512 | | 628,488 | |
Hilltop Holdings Inc. | | | | 27,155 | | 814,922 | |
HomeStreet Inc. | | | | 10,654 | | 293,837 | |
Hope Bancorp Inc. | | | | 70,356 | | 901,260 | |
Independent Bank Corp. | | | | 27,131 | | 2,290,670 | |
7
STATEMENT OF INVESTMENTS (continued)
| | | | | | | | |
| |
Description | | | | Shares | | Value ($) | |
Common Stocks - 98.5% (continued) | | | | | |
Banks - 12.3% (continued) | | | | | |
Independent Bank Group Inc. | | | | 21,036 | b | 1,263,843 | |
Lakeland Financial Corp. | | | | 14,954 | | 1,091,193 | |
Mr. Cooper Group Inc. | | | | 41,741 | a | 1,675,066 | |
National Bank Holdings Corp., Cl. A | | | | 22,006 | | 925,792 | |
NBT Bancorp Inc. | | | | 25,450 | | 1,105,039 | |
NMI Holdings Inc., Cl. A | | | | 49,433 | a | 1,033,150 | |
Northfield Bancorp Inc. | | | | 24,745 | | 389,239 | |
Northwest Bancshares Inc. | | | | 74,555 | | 1,042,279 | |
OFG Bancorp | | | | 28,254 | | 778,680 | |
Pacific Premier Bancorp Inc. | | | | 55,944 | | 1,765,593 | |
Park National Corp. | | | | 8,545 | | 1,202,709 | |
Pathward Financial Inc. | | | | 17,022 | | 732,797 | |
Preferred Bank | | | | 7,801 | | 582,111 | |
Provident Financial Services Inc. | | | | 44,586 | | 952,357 | |
Renasant Corp. | | | | 33,018 | | 1,241,147 | |
S&T Bancorp Inc. | | | | 23,184 | | 792,429 | |
Seacoast Banking Corp. of Florida | | | | 41,549 | | 1,295,913 | |
ServisFirst Bancshares Inc. | | | | 28,959 | | 1,995,565 | |
Simmons First National Corp., Cl. A | | | | 75,182 | | 1,622,428 | |
Southside Bancshares Inc. | | | | 17,916 | | 644,797 | |
Stellar Bancorp Inc. | | | | 26,122 | b | 769,554 | |
The Bancorp Inc. | | | | 33,018 | a | 937,051 | |
Tompkins Financial Corp. | | | | 7,518 | | 583,246 | |
Triumph Financial Inc. | | | | 13,645 | a | 666,831 | |
TrustCo Bank Corp. | | | | 11,353 | | 426,759 | |
Trustmark Corp. | | | | 35,857 | | 1,251,768 | |
United Community Banks Inc. | | | | 62,682 | | 2,118,652 | |
Veritex Holdings Inc. | | | | 32,041 | | 899,711 | |
Walker & Dunlop Inc. | | | | 18,153 | | 1,424,647 | |
Westamerica Bancorporation | | | | 15,785 | | 931,473 | |
WSFS Financial Corp. | | | | 36,608 | | 1,659,807 | |
| | | | | 64,206,762 | |
Capital Goods - 11.4% | | | | | |
3D Systems Corp. | | | | 77,624 | a,b | 574,418 | |
AAON Inc. | | | | 24,928 | | 1,877,577 | |
AAR Corp. | | | | 19,667 | a | 883,048 | |
Aerojet Rocketdyne Holdings Inc. | | | | 44,764 | a | 2,503,651 | |
AeroVironment Inc. | | | | 14,778 | a,b | 1,265,883 | |
Alamo Group Inc. | | | | 6,096 | | 863,194 | |
Albany International Corp., Cl. A | | | | 18,332 | | 1,807,352 | |
American Woodmark Corp. | | | | 9,929 | a | 485,131 | |
Apogee Enterprises Inc. | | | | 13,078 | | 581,448 | |
Applied Industrial Technologies Inc. | | | | 22,824 | | 2,876,509 | |
8
| | | | | | | | |
| |
Description | | | | Shares | | Value ($) | |
Common Stocks - 98.5% (continued) | | | | | |
Capital Goods - 11.4% (continued) | | | | | |
Arcosa Inc. | | | | 28,610 | | 1,554,667 | |
Astec Industries Inc. | | | | 13,285 | | 540,168 | |
AZZ Inc. | | | | 14,585 | | 586,317 | |
Barnes Group Inc. | | | | 30,040 | | 1,227,134 | |
Boise Cascade Co. | | | | 23,365 | | 1,604,475 | |
CIRCOR International Inc. | | | | 12,372 | a | 296,433 | |
Comfort Systems USA Inc. | | | | 21,155 | | 2,434,517 | |
DXP Enterprises Inc. | | | | 9,409 | a | 259,218 | |
Encore Wire Corp. | | | | 10,881 | | 1,496,790 | |
Enerpac Tool Group Corp. | | | | 33,579 | | 854,586 | |
EnPro Industries Inc. | | | | 12,362 | | 1,343,626 | |
ESCO Technologies Inc. | | | | 15,367 | | 1,345,227 | |
Federal Signal Corp. | | | | 35,645 | | 1,656,423 | |
Franklin Electric Co. | | | | 23,048 | | 1,838,078 | |
Gibraltar Industries Inc. | | | | 18,320 | a | 840,522 | |
GMS Inc. | | | | 24,978 | a | 1,243,904 | |
Granite Construction Inc. | | | | 25,682 | | 900,668 | |
Griffon Corp. | | | | 28,083 | | 1,005,091 | |
Hillenbrand Inc. | | | | 41,083 | | 1,753,012 | |
Insteel Industries Inc. | | | | 11,574 | | 318,516 | |
John Bean Technologies Corp. | | | | 18,820 | | 1,718,831 | |
Kaman Corp. | | | | 16,760 | | 373,748 | |
Lindsay Corp. | | | | 6,460 | | 1,052,011 | |
Masterbrand Inc. | | | | 75,934 | a | 573,302 | |
Moog Inc., Cl. A | | | | 17,007 | | 1,492,534 | |
Mueller Industries Inc. | | | | 33,605 | | 1,982,695 | |
MYR Group Inc. | | | | 9,908 | a | 912,230 | |
National Presto Industries Inc. | | | | 2,906 | | 198,945 | |
NOW Inc. | | | | 65,321 | a | 829,577 | |
Park Aerospace Corp. | | | | 12,005 | | 160,987 | |
PGT Innovations Inc. | | | | 35,888 | a | 644,548 | |
Powell Industries Inc. | | | | 5,470 | | 192,435 | |
Proto Labs Inc. | | | | 16,268 | a | 415,322 | |
Quanex Building Products Corp. | | | | 19,305 | | 457,142 | |
Resideo Technologies Inc. | | | | 86,018 | a | 1,414,996 | |
SPX Technologies Inc. | | | | 26,601 | a | 1,746,356 | |
Standex International Corp. | | | | 7,082 | | 725,268 | |
Tennant Co. | | | | 10,923 | | 672,529 | |
The Greenbrier Companies | | | | 19,310 | | 647,464 | |
Titan International Inc. | | | | 30,145 | a | 461,821 | |
Trinity Industries Inc. | | | | 48,124 | b | 1,423,027 | |
Triumph Group Inc. | | | | 38,876 | a | 408,976 | |
UFP Industries Inc. | | | | 36,461 | | 2,889,534 | |
9
STATEMENT OF INVESTMENTS (continued)
| | | | | | | | |
| |
Description | | | | Shares | | Value ($) | |
Common Stocks - 98.5% (continued) | | | | | |
Capital Goods - 11.4% (continued) | | | | | |
Veritiv Corp. | | | | 7,981 | | 971,368 | |
Wabash National Corp. | | | | 28,104 | | 635,150 | |
| | | | | 59,818,379 | |
Commercial & Professional Services - 3.6% | | | | | |
ABM Industries Inc. | | | | 39,144 | | 1,738,776 | |
Brady Corp., Cl. A | | | | 27,434 | | 1,292,141 | |
CoreCivic Inc. | | | | 67,955 | a | 785,560 | |
Deluxe Corp. | | | | 25,465 | | 432,396 | |
Exponent Inc. | | | | 29,983 | | 2,971,015 | |
Forrester Research Inc. | | | | 6,484 | a | 231,868 | |
Harsco Corp. | | | | 46,222 | a | 290,736 | |
Healthcare Services Group Inc. | | | | 43,900 | | 526,800 | |
Heidrick & Struggles International Inc. | | | | 11,649 | | 325,823 | |
HNI Corp. | | | | 24,638 | | 700,458 | |
Interface Inc. | | | | 33,810 | | 333,705 | |
KAR Auction Services Inc. | | | | 64,359 | a | 839,885 | |
Kelly Services Inc., Cl. A | | | | 20,568 | | 347,599 | |
Korn Ferry | | | | 31,583 | | 1,598,731 | |
Matthews International Corp., Cl. A | | | | 18,281 | | 556,474 | |
MillerKnoll Inc. | | | | 45,030 | | 946,080 | |
NV5 Global Inc. | | | | 7,357 | a | 973,478 | |
Pitney Bowes Inc. | | | | 94,726 | b | 359,959 | |
Resources Connection Inc. | | | | 19,115 | | 351,334 | |
The GEO Group Inc. | | | | 73,781 | a,b | 807,902 | |
TrueBlue Inc. | | | | 19,326 | a | 378,403 | |
UniFirst Corp. | | | | 8,892 | | 1,716,067 | |
Viad Corp. | | | | 12,270 | a | 299,265 | |
| | | | | 18,804,455 | |
Consumer Durables & Apparel - 3.5% | | | | | |
Cavco Industries Inc. | | | | 4,903 | a | 1,109,304 | |
Century Communities Inc. | | | | 16,692 | | 834,767 | |
Ethan Allen Interiors Inc. | | | | 13,589 | | 359,021 | |
G-III Apparel Group Ltd. | | | | 25,154 | a | 344,861 | |
Green Brick Partners Inc. | | | | 16,256 | a,b | 393,883 | |
Installed Building Products Inc. | | | | 13,953 | | 1,194,377 | |
iRobot Corp. | | | | 15,960 | a | 768,155 | |
Kontoor Brands Inc. | | | | 29,087 | b | 1,163,189 | |
La-Z-Boy Inc. | | | | 25,263 | | 576,502 | |
LGI Homes Inc. | | | | 12,150 | a,b | 1,125,090 | |
M.D.C. Holdings Inc. | | | | 33,509 | | 1,058,884 | |
M/I Homes Inc. | | | | 16,192 | a | 747,747 | |
Meritage Homes Corp. | | | | 21,670 | a | 1,997,974 | |
Movado Group Inc. | | | | 9,228 | | 297,603 | |
10
| | | | | | | | |
| |
Description | | | | Shares | | Value ($) | |
Common Stocks - 98.5% (continued) | | | | | |
Consumer Durables & Apparel - 3.5% (continued) | | | | | |
Oxford Industries Inc. | | | | 8,881 | | 827,532 | |
Sonos Inc. | | | | 75,408 | a,b | 1,274,395 | |
Steven Madden Ltd. | | | | 43,350 | | 1,385,466 | |
Sturm Ruger & Co. | | | | 10,323 | b | 522,550 | |
Tri Pointe Homes Inc. | | | | 59,521 | a | 1,106,495 | |
Universal Electronics Inc. | | | | 7,190 | a | 149,624 | |
Vista Outdoor Inc. | | | | 33,179 | a,b | 808,572 | |
Wolverine World Wide Inc. | | | | 46,692 | | 510,344 | |
| | | | | 18,556,335 | |
Consumer Services - 2.7% | | | | | |
Adtalem Global Education Inc. | | | | 26,843 | a | 952,927 | |
BJ's Restaurants Inc. | | | | 13,795 | a | 363,912 | |
Bloomin' Brands Inc. | | | | 51,882 | | 1,043,866 | |
Brinker International Inc. | | | | 25,941 | a | 827,777 | |
Chuy's Holdings Inc. | | | | 10,743 | a | 304,027 | |
Dave & Buster's Entertainment Inc. | | | | 24,805 | a | 879,089 | |
Dine Brands Global Inc. | | | | 9,359 | b | 604,591 | |
El Pollo Loco Holdings Inc. | | | | 11,421 | a | 113,753 | |
Frontdoor Inc. | | | | 48,258 | a | 1,003,766 | |
Golden Entertainment Inc. | | | | 12,906 | a | 482,684 | |
Jack in the Box Inc. | | | | 12,378 | | 844,551 | |
Mister Car Wash Inc. | | | | 46,678 | a | 430,838 | |
Monarch Casino & Resort Inc. | | | | 7,840 | a | 602,818 | |
Perdoceo Education Corp. | | | | 40,078 | a | 557,084 | |
Ruth's Hospitality Group Inc. | | | | 17,723 | | 274,352 | |
Shake Shack Inc., Cl. A | | | | 22,192 | a | 921,634 | |
Six Flags Entertainment Corp. | | | | 44,012 | a,b | 1,023,279 | |
Strategic Education Inc. | | | | 13,126 | | 1,028,028 | |
Stride Inc. | | | | 24,091 | a | 753,566 | |
The Cheesecake Factory Inc. | | | | 28,230 | b | 895,173 | |
WW International Inc. | | | | 32,870 | a | 126,878 | |
| | | | | 14,034,593 | |
Diversified Financials - 3.1% | | | | | |
Apollo Commercial Real Estate Finance Inc. | | | | 77,120 | c | 829,811 | |
ARMOUR Residential REIT Inc. | | | | 75,325 | b,c | 424,080 | |
B. Riley Financial Inc. | | | | 9,420 | | 322,164 | |
Blucora Inc. | | | | 28,465 | a | 726,711 | |
Bread Financial Holdings Inc. | | | | 29,373 | b | 1,106,187 | |
Brightsphere Investment Group Inc. | | | | 19,361 | | 398,449 | |
Donnelley Financial Solutions Inc. | | | | 14,758 | a | 570,397 | |
Ellington Financial Inc. | | | | 33,960 | c | 420,085 | |
Encore Capital Group Inc. | | | | 13,797 | a | 661,428 | |
11
STATEMENT OF INVESTMENTS (continued)
| | | | | | | | |
| |
Description | | | | Shares | | Value ($) | |
Common Stocks - 98.5% (continued) | | | | | |
Diversified Financials - 3.1% (continued) | | | | | |
Enova International Inc. | | | | 18,577 | a | 712,799 | |
EZCORP Inc., Cl. A | | | | 31,702 | a | 258,371 | |
Franklin BSP Realty Trust Inc. | | | | 49,106 | c | 633,467 | |
Granite Point Mortgage Trust Inc. | | | | 31,452 | b,c | 168,583 | |
Green Dot Corp., Cl. A | | | | 27,527 | a | 435,477 | |
Invesco Mortgage Capital Inc. | | | | 20,528 | c | 261,321 | |
KKR Real Estate Finance Trust Inc. | | | | 33,998 | b,c | 474,612 | |
LendingTree Inc. | | | | 6,615 | a | 141,098 | |
New York Mortgage Trust Inc. | | | | 217,975 | c | 558,016 | |
PennyMac Mortgage Investment Trust | | | | 52,502 | c | 650,500 | |
Piper Sandler Cos. | | | | 8,308 | | 1,081,619 | |
PRA Group Inc. | | | | 23,097 | a | 780,217 | |
PROG Holdings Inc. | | | | 29,964 | a | 506,092 | |
Ready Capital Corp. | | | | 58,537 | b,c | 652,102 | |
Redwood Trust Inc. | | | | 66,928 | c | 452,433 | |
StoneX Group Inc. | | | | 10,214 | a | 973,394 | |
Two Harbors Investment Corp. | | | | 51,516 | c | 812,407 | |
Virtus Investment Partners Inc. | | | | 4,061 | | 777,438 | |
WisdomTree Inc. | | | | 67,234 | | 366,425 | |
World Acceptance Corp. | | | | 1,952 | a | 128,715 | |
| | | | | 16,284,398 | |
Energy - 4.6% | | | | | |
Archrock Inc. | | | | 78,797 | | 707,597 | |
Bristow Group Inc. | | | | 14,114 | a | 382,913 | |
Callon Petroleum Co. | | | | 30,181 | a,b | 1,119,413 | |
Civitas Resources Inc. | | | | 30,842 | b | 1,786,677 | |
CONSOL Energy Inc. | | | | 19,286 | | 1,253,590 | |
Core Laboratories NV | | | | 27,136 | | 550,047 | |
DMC Global Inc. | | | | 11,361 | a | 220,858 | |
Dorian LPG Ltd. | | | | 18,483 | | 350,253 | |
Dril-Quip Inc. | | | | 19,829 | a | 538,754 | |
Green Plains Inc. | | | | 35,123 | a,b | 1,071,251 | |
Helix Energy Solutions Group Inc. | | | | 84,247 | a | 621,743 | |
Helmerich & Payne Inc. | | | | 62,396 | | 3,092,970 | |
Laredo Petroleum Inc. | | | | 9,814 | a,b | 504,636 | |
Nabors Industries Ltd. | | | | 5,313 | a | 822,824 | |
Oceaneering International Inc. | | | | 59,064 | a | 1,033,029 | |
Oil States International Inc. | | | | 37,911 | a | 282,816 | |
Par Pacific Holdings Inc. | | | | 32,714 | a | 760,601 | |
Patterson-UTI Energy Inc. | | | | 128,544 | | 2,164,681 | |
ProPetro Holding Corp. | | | | 56,687 | a | 587,844 | |
Ranger Oil Corp., Cl. A | | | | 11,343 | | 458,597 | |
REX American Resources Corp. | | | | 9,159 | a | 291,806 | |
12
| | | | | | | | |
| |
Description | | | | Shares | | Value ($) | |
Common Stocks - 98.5% (continued) | | | | | |
Energy - 4.6% (continued) | | | | | |
RPC Inc. | | | | 48,369 | | 430,000 | |
SM Energy Co. | | | | 72,610 | | 2,529,006 | |
Talos Energy Inc. | | | | 38,334 | a | 723,746 | |
U.S. Silica Holdings Inc. | | | | 45,111 | a | 563,888 | |
World Fuel Services Corp. | | | | 36,743 | | 1,004,186 | |
| | | | | 23,853,726 | |
Food & Staples Retailing - .8% | | | | | |
PriceSmart Inc. | | | | 14,782 | | 898,450 | |
SpartanNash Co. | | | | 20,894 | | 631,835 | |
The Andersons Inc. | | | | 18,424 | | 644,656 | |
The Chefs' Warehouse Inc. | | | | 20,182 | a | 671,657 | |
United Natural Foods Inc. | | | | 34,565 | a | 1,338,011 | |
| | | | | 4,184,609 | |
Food, Beverage & Tobacco - 2.7% | | | | | |
B&G Foods Inc. | | | | 42,409 | b | 472,860 | |
Calavo Growers Inc. | | | | 10,470 | | 307,818 | |
Cal-Maine Foods Inc. | | | | 22,445 | | 1,222,130 | |
Fresh Del Monte Produce Inc. | | | | 18,225 | | 477,313 | |
Hostess Brands Inc. | | | | 79,366 | a | 1,780,973 | |
J&J Snack Foods Corp. | | | | 8,853 | | 1,325,383 | |
John B. Sanfilippo & Son Inc. | | | | 5,280 | | 429,370 | |
MGP Ingredients Inc. | | | | 9,083 | | 966,250 | |
National Beverage Corp. | | | | 13,756 | a | 640,067 | |
Seneca Foods Corp., Cl. A | | | | 3,247 | a | 197,905 | |
The Hain Celestial Group Inc. | | | | 53,119 | a | 859,465 | |
The Simply Good Foods Company | | | | 49,828 | a | 1,894,959 | |
Tootsie Roll Industries Inc. | | | | 10,553 | | 449,241 | |
TreeHouse Foods Inc. | | | | 29,975 | a | 1,480,165 | |
Universal Corp. | | | | 14,617 | | 771,924 | |
Vector Group Ltd. | | | | 77,986 | | 924,914 | |
| | | | | 14,200,737 | |
Health Care Equipment & Services - 6.5% | | | | | |
AdaptHealth Corp. | | | | 45,476 | a,b | 874,049 | |
Addus HomeCare Corp. | | | | 9,602 | a | 955,303 | |
Agiliti Inc. | | | | 19,267 | a,b | 314,245 | |
AMN Healthcare Services Inc. | | | | 25,642 | a | 2,636,510 | |
AngioDynamics Inc. | | | | 23,102 | a | 318,115 | |
Apollo Medical Holdings Inc. | | | | 23,250 | a,b | 687,968 | |
Artivion Inc. | | | | 24,141 | a | 292,589 | |
Avanos Medical Inc. | | | | 27,463 | a | 743,149 | |
Cardiovascular Systems Inc. | | | | 25,091 | a | 341,739 | |
Community Health Systems Inc. | | | | 72,497 | a | 313,187 | |
Computer Programs & Systems Inc. | | | | 8,476 | a | 230,717 | |
13
STATEMENT OF INVESTMENTS (continued)
| | | | | | | | |
| |
Description | | | | Shares | | Value ($) | |
Common Stocks - 98.5% (continued) | | | | | |
Health Care Equipment & Services - 6.5% (continued) | | | | | |
CONMED Corp. | | | | 18,037 | b | 1,598,800 | |
CorVel Corp. | | | | 5,383 | a | 782,311 | |
Cross Country Healthcare Inc. | | | | 20,939 | a | 556,349 | |
Cutera Inc. | | | | 10,533 | a | 465,769 | |
Embecta Corp. | | | | 34,180 | b | 864,412 | |
Enhabit Inc. | | | | 29,031 | a | 382,048 | |
Fulgent Genetics Inc. | | | | 11,614 | a,b | 345,865 | |
Glaukos Corp. | | | | 28,157 | a | 1,229,898 | |
HealthStream Inc. | | | | 14,135 | a | 351,113 | |
Heska Corp. | | | | 6,054 | a | 376,317 | |
Inogen Inc. | | | | 13,394 | a | 263,996 | |
Integer Holdings Corp. | | | | 19,522 | a | 1,336,476 | |
LeMaitre Vascular Inc. | | | | 11,557 | | 531,853 | |
Meridian Bioscience Inc. | | | | 25,621 | a | 850,873 | |
Merit Medical Systems Inc. | | | | 33,778 | a | 2,385,402 | |
Mesa Laboratories Inc. | | | | 2,974 | b | 494,309 | |
ModivCare Inc. | | | | 7,561 | a | 678,449 | |
NextGen Healthcare Inc. | | | | 32,624 | a | 612,679 | |
NuVasive Inc. | | | | 30,442 | a | 1,255,428 | |
OptimizeRx Corp. | | | | 10,098 | a | 169,646 | |
OraSure Technologies Inc. | | | | 44,496 | a | 214,471 | |
Orthofix Medical Inc. | | | | 12,196 | a | 250,384 | |
Owens & Minor Inc. | | | | 45,222 | a | 883,186 | |
Pediatrix Medical Group Inc. | | | | 48,312 | a | 717,916 | |
RadNet Inc. | | | | 28,604 | a | 538,613 | |
Select Medical Holdings Corp. | | | | 61,822 | | 1,535,040 | |
Simulations Plus Inc. | | | | 9,443 | b | 345,331 | |
SurModics Inc. | | | | 8,497 | a | 289,918 | |
The Ensign Group Inc. | | | | 32,760 | | 3,099,424 | |
The Joint Corp. | | | | 8,903 | a | 124,464 | |
The Pennant Group Inc. | | | | 16,704 | a | 183,410 | |
U.S. Physical Therapy Inc. | | | | 7,617 | b | 617,206 | |
Varex Imaging Corp. | | | | 23,615 | a | 479,385 | |
Veradigm Inc. | | | | 64,614 | a | 1,139,791 | |
Zimvie Inc. | | | | 12,803 | a | 119,580 | |
Zynex Inc. | | | | 12,686 | b | 176,462 | |
| | | | | 33,954,145 | |
Household & Personal Products - 1.6% | | | | | |
Central Garden & Pet Co. | | | | 5,996 | a | 224,550 | |
Central Garden & Pet Co., Cl. A | | | | 24,208 | a | 866,646 | |
e.l.f. Beauty Inc. | | | | 29,589 | a | 1,636,272 | |
Edgewell Personal Care Co. | | | | 30,760 | | 1,185,490 | |
Inter Parfums Inc. | | | | 10,532 | | 1,016,549 | |
14
| | | | | | | | |
| |
Description | | | | Shares | | Value ($) | |
Common Stocks - 98.5% (continued) | | | | | |
Household & Personal Products - 1.6% (continued) | | | | | |
Medifast Inc. | | | | 6,403 | | 738,586 | |
Nu Skin Enterprises Inc., Cl. A | | | | 29,174 | | 1,229,976 | |
USANA Health Sciences Inc. | | | | 6,678 | a | 355,270 | |
WD-40 Co. | | | | 8,003 | | 1,290,164 | |
| | | | | 8,543,503 | |
Insurance - 2.7% | | | | | |
Ambac Financial Group Inc. | | | | 26,133 | a | 455,760 | |
American Equity Investment Life Holding Co. | | | | 41,033 | | 1,871,925 | |
AMERISAFE Inc. | | | | 11,313 | | 587,937 | |
Assured Guaranty Ltd. | | | | 35,470 | | 2,208,362 | |
Employers Holdings Inc. | | | | 16,148 | | 696,463 | |
Genworth Financial Inc., Cl. A | | | | 293,201 | a | 1,551,033 | |
HCI Group Inc. | | | | 4,248 | b | 168,178 | |
Horace Mann Educators Corp. | | | | 24,282 | | 907,418 | |
James River Group Holdings Ltd. | | | | 22,385 | | 468,070 | |
Mercury General Corp. | | | | 15,560 | | 532,152 | |
Palomar Holdings Inc. | | | | 14,803 | a | 668,503 | |
ProAssurance Corp. | | | | 31,909 | | 557,450 | |
Safety Insurance Group Inc. | | | | 8,825 | | 743,595 | |
SiriusPoint Ltd. | | | | 51,441 | a | 303,502 | |
Stewart Information Services Corp. | | | | 15,994 | | 683,424 | |
Trupanion Inc. | | | | 20,934 | a,b | 994,993 | |
United Fire Group Inc. | | | | 12,810 | | 350,482 | |
Universal Insurance Holdings Inc. | | | | 15,957 | | 168,985 | |
| | | | | 13,918,232 | |
Materials - 5.6% | | | | | |
AdvanSix Inc. | | | | 16,126 | | 613,111 | |
American Vanguard Corp. | | | | 16,571 | | 359,756 | |
Arconic Corp. | | | | 59,959 | a | 1,268,732 | |
ATI Inc. | | | | 76,621 | a | 2,287,903 | |
Balchem Corp. | | | | 18,995 | | 2,319,479 | |
Carpenter Technology Corp. | | | | 28,538 | | 1,054,194 | |
Century Aluminum Co. | | | | 31,121 | a | 254,570 | |
Clearwater Paper Corp. | | | | 9,927 | a | 375,340 | |
Compass Minerals International Inc. | | | | 19,976 | | 819,016 | |
FutureFuel Corp. | | | | 14,870 | | 120,893 | |
H.B. Fuller Co. | | | | 31,398 | | 2,248,725 | |
Hawkins Inc. | | | | 11,195 | | 432,127 | |
Haynes International Inc. | | | | 7,350 | | 335,822 | |
Innospec Inc. | | | | 14,656 | | 1,507,516 | |
Kaiser Aluminum Corp. | | | | 9,432 | | 716,455 | |
Koppers Holdings Inc. | | | | 12,538 | | 353,572 | |
15
STATEMENT OF INVESTMENTS (continued)
| | | | | | | | |
| |
Description | | | | Shares | | Value ($) | |
Common Stocks - 98.5% (continued) | | | | | |
Materials - 5.6% (continued) | | | | | |
Livent Corp. | | | | 106,112 | a,b | 2,108,445 | |
Materion Corp. | | | | 12,124 | b | 1,060,971 | |
Mativ Holdings Inc. | | | | 32,158 | b | 672,102 | |
Mercer International Inc. | | | | 23,743 | | 276,369 | |
Minerals Technologies Inc. | | | | 19,100 | | 1,159,752 | |
Myers Industries Inc. | | | | 21,680 | | 481,946 | |
O-I Glass Inc. | | | | 91,323 | a | 1,513,222 | |
Olympic Steel Inc. | | | | 5,491 | | 184,388 | |
Quaker Chemical Corp. | | | | 8,066 | b | 1,346,215 | |
Rayonier Advanced Materials Inc. | | | | 37,509 | a | 360,086 | |
Stepan Co. | | | | 12,437 | | 1,324,043 | |
SunCoke Energy Inc. | | | | 48,979 | | 422,689 | |
Sylvamo Corp. | | | | 19,651 | | 954,842 | |
TimkenSteel Corp. | | | | 23,496 | a | 426,922 | |
Tredegar Corp. | | | | 15,257 | | 155,927 | |
Trinseo PLC | | | | 20,710 | | 470,324 | |
Warrior Met Coal Inc. | | | | 30,339 | | 1,050,943 | |
| | | | | 29,036,397 | |
Media & Entertainment - 1.2% | | | | | |
AMC Networks Inc., Cl. A | | | | 16,585 | a | 259,887 | |
Cars.com Inc. | | | | 36,066 | a | 496,629 | |
Cinemark Holdings Inc. | | | | 63,586 | a | 550,655 | |
Gannett Co. | | | | 87,883 | a | 178,402 | |
QuinStreet Inc. | | | | 29,852 | a | 428,376 | |
Scholastic Corp. | | | | 17,520 | | 691,339 | |
Shutterstock Inc. | | | | 14,232 | | 750,311 | |
TechTarget Inc. | | | | 15,896 | a | 700,378 | |
The E.W. Scripps Company, Cl. A | | | | 34,252 | a | 451,784 | |
The Marcus Corp. | | | | 14,038 | b | 202,007 | |
Thryv Holdings Inc. | | | | 18,589 | a | 353,191 | |
Yelp Inc. | | | | 41,203 | a | 1,126,490 | |
| | | | | 6,189,449 | |
Pharmaceuticals Biotechnology & Life Sciences - 4.5% | | | | | |
Amphastar Pharmaceuticals Inc. | | | | 22,265 | a | 623,865 | |
ANI Pharmaceuticals Inc. | | | | 7,218 | a,b | 290,380 | |
Anika Therapeutics Inc. | | | | 8,900 | a | 263,440 | |
Arcus Biosciences Inc. | | | | 30,676 | a | 634,380 | |
Avid Bioservices Inc. | | | | 36,659 | a,b | 504,794 | |
BioLife Solutions Inc. | | | | 20,146 | a | 366,657 | |
Cara Therapeutics Inc. | | | | 26,631 | a,b | 286,017 | |
Catalyst Pharmaceuticals Inc. | | | | 56,162 | a | 1,044,613 | |
Coherus Biosciences Inc. | | | | 37,785 | a | 299,257 | |
Collegium Pharmaceutical Inc. | | | | 19,582 | a | 454,302 | |
16
| | | | | | | | |
| |
Description | | | | Shares | | Value ($) | |
Common Stocks - 98.5% (continued) | | | | | |
Pharmaceuticals Biotechnology & Life Sciences - 4.5% (continued) | | | | | |
Corcept Therapeutics Inc. | | | | 56,321 | a | 1,143,880 | |
Cytokinetics Inc. | | | | 56,095 | a | 2,570,273 | |
Dynavax Technologies Corp. | | | | 70,840 | a | 753,738 | |
Eagle Pharmaceuticals Inc. | | | | 5,987 | a | 175,000 | |
Emergent BioSolutions Inc. | | | | 26,410 | a | 311,902 | |
Enanta Pharmaceuticals Inc. | | | | 11,528 | a | 536,283 | |
Harmony Biosciences Holdings Inc. | | | | 17,514 | a | 965,021 | |
Innoviva Inc. | | | | 37,562 | a | 497,697 | |
Ironwood Pharmaceuticals Inc. | | | | 79,063 | a | 979,591 | |
iTeos Therapeutics Inc. | | | | 14,455 | a | 282,306 | |
Ligand Pharmaceuticals Inc. | | | | 9,544 | a | 637,539 | |
Myriad Genetics Inc. | | | | 47,889 | a | 694,869 | |
Nektar Therapeutics | | | | 113,744 | a | 257,061 | |
NeoGenomics Inc. | | | | 74,403 | a | 687,484 | |
OmniAb Inc. | | | | 3,619 | a,d | 0 | |
OmniAb Inc. | | | | 3,619 | a,d | 0 | |
Organogenesis Holdings Inc. | | | | 43,175 | a | 116,141 | |
Pacira Biosciences Inc. | | | | 27,058 | a | 1,044,709 | |
Phibro Animal Health Corp., Cl. A | | | | 12,562 | | 168,456 | |
Prestige Consumer Healthcare Inc. | | | | 29,330 | a | 1,836,058 | |
REGENXBIO Inc. | | | | 22,436 | a | 508,848 | |
Supernus Pharmaceuticals Inc. | | | | 31,818 | a | 1,134,948 | |
uniQure NV | | | | 24,352 | a | 552,060 | |
Vanda Pharmaceuticals Inc. | | | | 33,096 | a | 244,579 | |
Vericel Corp. | | | | 27,671 | a | 728,854 | |
Vir Biotechnology Inc. | | | | 44,601 | a | 1,128,851 | |
Xencor Inc. | | | | 35,398 | a | 921,764 | |
| | | | | 23,645,617 | |
Real Estate - 7.7% | | | | | |
Acadia Realty Trust | | | | 56,693 | c | 813,545 | |
Agree Realty Corp. | | | | 52,234 | c | 3,704,958 | |
Alexander & Baldwin Inc. | | | | 43,217 | c | 809,454 | |
American Assets Trust Inc. | | | | 30,984 | c | 821,076 | |
Anywhere Real Estate Inc. | | | | 64,555 | a | 412,506 | |
Armada Hoffler Properties Inc. | | | | 40,143 | c | 461,645 | |
Brandywine Realty Trust | | | | 102,165 | c | 628,315 | |
CareTrust REIT Inc. | | | | 57,322 | c | 1,065,043 | |
Centerspace | | | | 8,855 | c | 519,523 | |
Chatham Lodging Trust | | | | 28,850 | c | 353,990 | |
Community Healthcare Trust Inc. | | | | 14,062 | c | 503,420 | |
Cushman & Wakefield PLC | | | | 94,816 | a | 1,181,407 | |
DiamondRock Hospitality Co. | | | | 123,403 | c | 1,010,671 | |
17
STATEMENT OF INVESTMENTS (continued)
| | | | | | | | |
| |
Description | | | | Shares | | Value ($) | |
Common Stocks - 98.5% (continued) | | | | | |
Real Estate - 7.7% (continued) | | | | | |
Douglas Elliman Inc. | | | | 40,429 | | 164,546 | |
Easterly Government Properties Inc. | | | | 53,257 | c | 759,977 | |
Elme Communities | | | | 51,413 | c | 915,151 | |
Essential Properties Realty Trust Inc. | | | | 83,819 | c | 1,967,232 | |
Four Corners Property Trust Inc. | | | | 49,408 | c | 1,281,149 | |
Franklin Street Properties Corp. | | | | 53,489 | c | 146,025 | |
Getty Realty Corp. | | | | 25,070 | c | 848,620 | |
Global Net Lease Inc. | | | | 61,718 | c | 775,795 | |
Hersha Hospitality Trust, Cl. A | | | | 20,401 | c | 173,817 | |
Hudson Pacific Properties Inc. | | | | 75,108 | c | 730,801 | |
Industrial Logistics Properties Trust | | | | 39,276 | c | 128,433 | |
Innovative Industrial Properties Inc. | | | | 16,476 | b,c | 1,669,843 | |
iStar Inc. | | | | 50,836 | c | 387,879 | |
LTC Properties Inc. | | | | 23,923 | c | 849,984 | |
LXP Industrial Trust | | | | 162,995 | c | 1,633,210 | |
Marcus & Millichap Inc. | | | | 14,873 | b | 512,375 | |
NexPoint Residential Trust Inc. | | | | 13,449 | c | 585,300 | |
Office Properties Income Trust | | | | 29,203 | c | 389,860 | |
Orion Office REIT Inc. | | | | 33,319 | c | 284,544 | |
Outfront Media Inc. | | | | 86,794 | c | 1,439,045 | |
RE/MAX Holdings Inc., Cl. A | | | | 10,950 | | 204,108 | |
Retail Opportunity Investments Corp. | | | | 74,239 | c | 1,115,812 | |
RPT Realty | | | | 50,287 | c | 504,881 | |
Safehold Inc. | | | | 14,107 | c | 403,742 | |
Saul Centers Inc. | | | | 7,678 | c | 312,341 | |
Service Properties Trust | | | | 97,611 | c | 711,584 | |
SITE Centers Corp. | | | | 108,994 | c | 1,488,858 | |
Summit Hotel Properties Inc. | | | | 63,884 | c | 461,242 | |
Sunstone Hotel Investors Inc. | | | | 124,288 | c | 1,200,622 | |
Tanger Factory Outlet Centers Inc. | | | | 61,380 | c | 1,101,157 | |
The St. Joe Company | | | | 20,041 | b | 774,585 | |
Uniti Group Inc. | | | | 139,650 | c | 772,265 | |
Universal Health Realty Income Trust | | | | 7,605 | c | 362,987 | |
Urban Edge Properties | | | | 69,010 | c | 972,351 | |
Urstadt Biddle Properties Inc., Cl. A | | | | 17,660 | c | 334,657 | |
Veris Residential Inc. | | | | 46,987 | a,c | 748,503 | |
Whitestone REIT | | | | 27,129 | c | 261,524 | |
Xenia Hotels & Resorts Inc. | | | | 67,170 | c | 885,301 | |
| | | | | 40,545,659 | |
Retailing - 4.8% | | | | | |
Abercrombie & Fitch Co., Cl. A | | | | 29,195 | a | 668,857 | |
Academy Sports & Outdoors Inc. | | | | 47,182 | | 2,478,942 | |
American Eagle Outfitters Inc. | | | | 102,765 | a,b | 1,434,599 | |
18
| | | | | | | | |
| |
Description | | | | Shares | | Value ($) | |
Common Stocks - 98.5% (continued) | | | | | |
Retailing - 4.8% (continued) | | | | | |
America's Car-Mart Inc. | | | | 3,375 | a,b | 243,878 | |
Asbury Automotive Group Inc. | | | | 13,092 | a | 2,346,741 | |
Bed Bath & Beyond Inc. | | | | 46,715 | a,b | 117,255 | |
Big Lots Inc. | | | | 17,209 | b | 252,972 | |
Boot Barn Holdings Inc. | | | | 17,588 | a | 1,099,602 | |
Caleres Inc. | | | | 21,786 | | 485,392 | |
Chico's FAS Inc. | | | | 72,625 | a | 357,315 | |
Designer Brands Inc., Cl. A | | | | 30,036 | | 293,752 | |
Genesco Inc. | | | | 7,327 | a | 337,189 | |
Group 1 Automotive Inc. | | | | 8,632 | | 1,556,954 | |
Guess? Inc. | | | | 17,953 | | 371,448 | |
Haverty Furniture Cos. | | | | 7,900 | | 236,210 | |
Hibbett Inc. | | | | 7,659 | | 522,497 | |
Leslie's Inc. | | | | 87,359 | a | 1,066,653 | |
Liquidity Services Inc. | | | | 15,961 | a | 224,412 | |
MarineMax Inc. | | | | 12,974 | a | 405,048 | |
Monro Inc. | | | | 18,572 | | 839,454 | |
National Vision Holdings Inc. | | | | 46,680 | a | 1,809,317 | |
PetMed Express Inc. | | | | 12,184 | b | 215,657 | |
Rent-A-Center Inc. | | | | 29,594 | | 667,345 | |
Sally Beauty Holdings Inc. | | | | 63,400 | a | 793,768 | |
Shoe Carnival Inc. | | | | 10,152 | | 242,734 | |
Signet Jewelers Ltd. | | | | 27,343 | b | 1,859,324 | |
Sleep Number Corp. | | | | 12,823 | a | 333,142 | |
Sonic Automotive Inc., Cl. A | | | | 9,890 | | 487,280 | |
The Aaron's Company | | | | 18,505 | | 221,135 | |
The Buckle Inc. | | | | 17,620 | | 799,067 | |
The Children's Place Inc. | | | | 7,747 | a | 282,146 | |
The ODP Corp. | | | | 23,822 | a | 1,084,854 | |
Urban Outfitters Inc. | | | | 35,178 | a | 838,995 | |
Zumiez Inc. | | | | 9,292 | a | 202,008 | |
| | | | | 25,175,942 | |
Semiconductors & Semiconductor Equipment - 3.4% | | | | | |
Alpha & Omega Semiconductor Ltd. | | | | 12,962 | a | 370,324 | |
Axcelis Technologies Inc. | | | | 19,399 | a | 1,539,505 | |
CEVA Inc. | | | | 13,735 | a | 351,341 | |
Cohu Inc. | | | | 28,207 | a | 904,034 | |
Diodes Inc. | | | | 26,896 | a | 2,047,861 | |
FormFactor Inc. | | | | 45,513 | a | 1,011,754 | |
Ichor Holdings Ltd. | | | | 17,104 | a | 458,729 | |
Kulicke & Soffa Industries Inc. | | | | 34,353 | b | 1,520,464 | |
MaxLinear Inc. | | | | 42,955 | a | 1,458,322 | |
Onto Innovation Inc. | | | | 29,321 | a | 1,996,467 | |
19
STATEMENT OF INVESTMENTS (continued)
| | | | | | | | |
| |
Description | | | | Shares | | Value ($) | |
Common Stocks - 98.5% (continued) | | | | | |
Semiconductors & Semiconductor Equipment - 3.4% (continued) | | | | | |
PDF Solutions Inc. | | | | 17,736 | a | 505,831 | |
Photronics Inc. | | | | 36,674 | a | 617,223 | |
Rambus Inc. | | | | 63,593 | a | 2,277,901 | |
Semtech Corp. | | | | 37,024 | a | 1,062,219 | |
SMART Global Holdings Inc. | | | | 28,599 | a | 425,553 | |
Ultra Clean Holdings Inc. | | | | 26,829 | a | 889,381 | |
Veeco Instruments Inc. | | | | 30,418 | a | 565,166 | |
| | | | | 18,002,075 | |
Software & Services - 3.6% | | | | | |
8x8 Inc. | | | | 65,745 | a | 284,018 | |
A10 Networks Inc. | | | | 37,953 | | 631,158 | |
Adeia Inc. | | | | 62,865 | | 595,960 | |
Agilysys Inc. | | | | 11,692 | a | 925,305 | |
Alarm.com Holdings Inc. | | | | 29,614 | a | 1,465,301 | |
Cerence Inc. | | | | 23,485 | a | 435,177 | |
Consensus Cloud Solutions Inc. | | | | 10,374 | a | 557,706 | |
CSG Systems International Inc. | | | | 17,992 | | 1,029,142 | |
Digital Turbine Inc. | | | | 53,243 | a | 811,423 | |
Ebix Inc. | | | | 14,041 | | 280,258 | |
EVERTEC Inc. | | | | 38,549 | | 1,248,217 | |
InterDigital Inc. | | | | 17,579 | | 869,809 | |
LivePerson Inc. | | | | 40,807 | a | 413,783 | |
Liveramp Holdings Inc. | | | | 39,038 | a | 915,051 | |
OneSpan Inc. | | | | 21,069 | a | 235,762 | |
Payoneer Global Inc. | | | | 118,801 | a | 649,841 | |
Perficient Inc. | | | | 20,535 | a | 1,433,959 | |
Progress Software Corp. | | | | 25,536 | | 1,288,291 | |
Sabre Corp. | | | | 195,230 | a | 1,206,521 | |
SPS Commerce Inc. | | | | 21,318 | a | 2,737,871 | |
TTEC Holdings Inc. | | | | 11,058 | | 487,990 | |
Unisys Corp. | | | | 40,044 | a | 204,625 | |
Xperi Inc. | | | | 24,556 | a | 211,427 | |
| | | | | 18,918,595 | |
Technology Hardware & Equipment - 5.7% | | | | | |
ADTRAN Holdings Inc. | | | | 41,902 | | 787,339 | |
Advanced Energy Industries Inc. | | | | 22,020 | | 1,888,876 | |
Arlo Technologies Inc. | | | | 52,159 | a | 183,078 | |
Avid Technology Inc. | | | | 19,576 | a,b | 520,526 | |
Badger Meter Inc. | | | | 17,251 | | 1,880,877 | |
Benchmark Electronics Inc. | | | | 21,045 | | 561,691 | |
Clearfield Inc. | | | | 6,730 | a | 633,562 | |
Comtech Telecommunications Corp. | | | | 16,274 | | 197,566 | |
20
| | | | | | | | |
| |
Description | | | | Shares | | Value ($) | |
Common Stocks - 98.5% (continued) | | | | | |
Technology Hardware & Equipment - 5.7% (continued) | | | | | |
Corsair Gaming Inc. | | | | 22,511 | a | 305,474 | |
CTS Corp. | | | | 18,679 | | 736,326 | |
Digi International Inc. | | | | 21,049 | a | 769,341 | |
ePlus Inc. | | | | 16,004 | a | 708,657 | |
Extreme Networks Inc. | | | | 77,616 | a | 1,421,149 | |
Fabrinet | | | | 21,664 | a | 2,777,758 | |
FARO Technologies Inc. | | | | 10,786 | a | 317,216 | |
Harmonic Inc. | | | | 61,786 | a | 809,397 | |
Insight Enterprises Inc. | | | | 17,942 | a | 1,799,044 | |
Itron Inc. | | | | 26,800 | a | 1,357,420 | |
Knowles Corp. | | | | 53,609 | a,b | 880,260 | |
Methode Electronics Inc. | | | | 21,490 | | 953,511 | |
NETGEAR Inc. | | | | 17,239 | a | 312,198 | |
NETSCOUT Systems Inc. | | | | 40,346 | a | 1,311,648 | |
OSI Systems Inc. | | | | 9,205 | a | 731,982 | |
PC Connection Inc. | | | | 6,769 | | 317,466 | |
Plexus Corp. | | | | 16,308 | a | 1,678,582 | |
Rogers Corp. | | | | 11,111 | a | 1,325,987 | |
Sanmina Corp. | | | | 33,994 | a | 1,947,516 | |
ScanSource Inc. | | | | 14,787 | a | 432,076 | |
TTM Technologies Inc. | | | | 60,829 | a | 917,301 | |
Viavi Solutions Inc. | | | | 133,749 | a | 1,405,702 | |
| | | | | 29,869,526 | |
Telecommunication Services - .7% | | | | | |
ATN International Inc. | | | | 6,171 | | 279,608 | |
Cogent Communications Holdings Inc. | | | | 25,210 | | 1,438,987 | |
Consolidated Communications Holdings Inc. | | | | 44,216 | a | 158,293 | |
Gogo Inc. | | | | 37,902 | a | 559,434 | |
Shenandoah Telecommunications Co. | | | | 30,138 | | 478,591 | |
Telephone and Data Systems Inc. | | | | 58,508 | | 613,749 | |
| | | | | 3,528,662 | |
Transportation - 1.9% | | | | | |
Allegiant Travel Co. | | | | 9,301 | a | 632,375 | |
ArcBest Corp. | | | | 14,338 | | 1,004,234 | |
Atlas Air Worldwide Holdings Inc. | | | | 15,232 | a | 1,535,386 | |
Forward Air Corp. | | | | 15,772 | | 1,654,325 | |
Hawaiian Holdings Inc. | | | | 30,493 | a | 312,858 | |
Heartland Express Inc. | | | | 27,628 | | 423,814 | |
Hub Group Inc., Cl. A | | | | 19,373 | a | 1,539,960 | |
Marten Transport Ltd. | | | | 34,162 | | 675,724 | |
Matson Inc. | | | | 22,353 | | 1,397,286 | |
SkyWest Inc. | | | | 29,505 | a | 487,128 | |
21
STATEMENT OF INVESTMENTS (continued)
| | | | | | | | |
| |
Description | | | | Shares | | Value ($) | |
Common Stocks - 98.5% (continued) | | | | | |
Transportation - 1.9% (continued) | | | | | |
Sun Country Airlines Holdings Inc. | | | | 18,945 | a,b | 300,468 | |
| | | | | 9,963,558 | |
Utilities - 2.5% | | | | | |
American States Water Co. | | | | 21,809 | b | 2,018,423 | |
Avista Corp. | | | | 43,622 | | 1,934,199 | |
California Water Service Group | | | | 32,393 | | 1,964,312 | |
Chesapeake Utilities Corp. | | | | 10,446 | | 1,234,508 | |
Middlesex Water Co. | | | | 10,455 | | 822,495 | |
Northwest Natural Holding Co. | | | | 20,902 | | 994,726 | |
SJW Group | | | | 15,573 | | 1,264,372 | |
South Jersey Industries Inc. | | | | 72,415 | | 2,572,905 | |
Unitil Corp. | | | | 9,563 | | 491,156 | |
| | | | | 13,297,096 | |
Total Common Stocks (cost $388,181,358) | | | | 516,034,681 | |
| | | | | | | | |
Exchange-Traded Funds - 1.1% | | | | | |
Registered Investment Companies - 1.1% | | | | | |
iShares Core S&P Small-Cap ETF
(cost $5,461,098) | | | | 57,979 | | 5,487,133 | |
| | | 1-Day
Yield (%) | | | | | |
Investment Companies - .5% | | | | | |
Registered Investment Companies - .5% | | | | | |
Dreyfus Institutional Preferred Government Plus Money Market Fund, Institutional Shares
(cost $2,521,914) | | 4.37 | | 2,521,914 | e | 2,521,914 | |
22
| | | | | | | | |
| |
Description | | 1-Day
Yield (%) | | Shares | | Value ($) | |
Investment of Cash Collateral for Securities Loaned - .8% | | | | | |
Registered Investment Companies - .8% | | | | | |
Dreyfus Institutional Preferred Government Plus Money Market Fund, SL Shares
(cost $4,363,084) | | 4.37 | | 4,363,084 | e | 4,363,084 | |
Total Investments (cost $400,527,454) | | 100.9% | | 528,406,812 | |
Liabilities, Less Cash and Receivables | | (.9%) | | (4,517,487) | |
Net Assets | | 100.0% | | 523,889,325 | |
ETF—Exchange-Traded Fund
REIT—Real Estate Investment Trust
a Non-income producing security.
b Security, or portion thereof, on loan. At December 31, 2022, the value of the fund’s securities on loan was $36,733,153 and the value of the collateral was $37,670,423, consisting of cash collateral of $4,363,084 and U.S. Government & Agency securities valued at $33,307,339. In addition, the value of collateral may include pending sales that are also on loan.
c Investment in real estate investment trust within the United States.
d The fund held Level 3 securities at December 31, 2022. These securities were valued at $0 or .0% of net assets.
e Investment in affiliated issuer. The investment objective of this investment company is publicly available and can be found within the investment company’s prospectus.
| | |
Portfolio Summary (Unaudited) † | Value (%) |
Financials | 18.0 |
Industrials | 16.9 |
Information Technology | 12.8 |
Consumer Discretionary | 12.5 |
Health Care | 11.0 |
Real Estate | 7.7 |
Materials | 5.5 |
Consumer Staples | 5.1 |
Energy | 4.6 |
Utilities | 2.5 |
Investment Companies | 2.4 |
Communication Services | 1.9 |
Consumer, Non-cyclical | .0 |
| | 100.9 |
† Based on net assets.
See notes to financial statements.
23
STATEMENT OF INVESTMENTS (continued)
| | | | | | | |
Affiliated Issuers | | | |
Description | Value ($) 12/31/2021 | Purchases ($)† | Sales ($) | Value ($) 12/31/2022 | Dividends/
Distributions ($) | |
Registered Investment Companies - .5% | | |
Dreyfus Institutional Preferred Government Plus Money Market Fund, Institutional Shares - .5% | 2,920,647 | 81,148,272 | (81,547,005) | 2,521,914 | 35,500 | |
Investment of Cash Collateral for Securities Loaned - .8% | | |
Dreyfus Institutional Preferred Government Plus Money Market Fund, SL Shares - .8% | 5,553,518 | 94,741,212 | (95,931,646) | 4,363,084 | 80,680 | †† |
Total - 1.3% | 8,474,165 | 175,889,484 | (177,478,651) | 6,884,998 | 116,180 | |
† Includes reinvested dividends/distributions.
†† Represents securities lending income earned from the reinvestment of cash collateral from loaned securities, net of fees and collateral investment expenses, and other payments to and from borrowers of securities.
See notes to financial statements.
| | | | | | | |
Futures | | | |
Description | Number of
Contracts | Expiration | Notional
Value ($) | Market
Value ($) | Unrealized (Depreciation) ($) | |
Futures Long | | |
E-mini Russell 2000 | 29 | 3/17/2023 | 2,627,092 | 2,567,805 | (59,287) | |
Gross Unrealized Depreciation | | (59,287) | |
See notes to financial statements.
24
STATEMENT OF ASSETS AND LIABILITIES
December 31, 2022
| | | | | | | |
| | | | | | |
| | | Cost | | Value | |
Assets ($): | | | | |
Investments in securities—See Statement of Investments
(including securities on loan, valued at $36,733,153)—Note 1(c): | | | |
Unaffiliated issuers | 393,642,456 | | 521,521,814 | |
Affiliated issuers | | 6,884,998 | | 6,884,998 | |
Cash | | | | | 4,550 | |
Dividends and securities lending income receivable | | 702,106 | |
Cash collateral held by broker—Note 4 | | 199,000 | |
Receivable for shares of Beneficial Interest subscribed | | 109,794 | |
| | | | | 529,422,262 | |
Liabilities ($): | | | | |
Due to BNY Mellon Investment Adviser, Inc. and affiliates—Note 3(b) | | 268,338 | |
Liability for securities on loan—Note 1(c) | | 4,363,084 | |
Payable for investment securities purchased | | 573,548 | |
Payable for shares of Beneficial Interest redeemed | | 315,685 | |
Payable for futures variation margin—Note 4 | | 8,990 | |
Trustees’ fees and expenses payable | | 3,292 | |
| | | | | 5,532,937 | |
Net Assets ($) | | | 523,889,325 | |
Composition of Net Assets ($): | | | | |
Paid-in capital | | | | | 375,546,267 | |
Total distributable earnings (loss) | | | | | 148,343,058 | |
Net Assets ($) | | | 523,889,325 | |
| | | | | |
Shares Outstanding | | |
(unlimited number of $.001 par value shares of Beneficial Interest authorized) | 30,346,182 | |
Net Asset Value Per Share ($) | | 17.26 | |
| | | | |
See notes to financial statements. | | | | |
25
STATEMENT OF OPERATIONS
Year Ended December 31, 2022
| | | | | | | |
| | | | | | |
| | | | | | |
Investment Income ($): | | | | |
Income: | | | | |
Cash dividends (net of $7,650 foreign taxes withheld at source): | |
Unaffiliated issuers | | | 8,819,978 | |
Affiliated issuers | | | 35,500 | |
Income from securities lending—Note 1(c) | | | 80,680 | |
Interest | | | 2,657 | |
Total Income | | | 8,938,815 | |
Expenses: | | | | |
Management fee—Note 3(a) | | | 1,989,898 | |
Distribution fees—Note 3(b) | | | 1,421,355 | |
Trustees’ fees—Note 3(a,c) | | | 31,040 | |
Loan commitment fees—Note 2 | | | 10,229 | |
Interest expense—Note 2 | | | 5,011 | |
Total Expenses | | | 3,457,533 | |
Less—Trustees’ fees reimbursed by
BNY Mellon Investment Adviser, Inc.—Note 3(a) | | | (31,040) | |
Net Expenses | | | 3,426,493 | |
Net Investment Income | | | 5,512,322 | |
Realized and Unrealized Gain (Loss) on Investments—Note 4 ($): | | |
Net realized gain (loss) on investments | 33,256,387 | |
Net realized gain (loss) on futures | (654,693) | |
Net Realized Gain (Loss) | | | 32,601,694 | |
Net change in unrealized appreciation (depreciation) on investments | (149,715,212) | |
Net change in unrealized appreciation (depreciation) on futures | (116,173) | |
Net Change in Unrealized Appreciation (Depreciation) | | | (149,831,385) | |
Net Realized and Unrealized Gain (Loss) on Investments | | | (117,229,691) | |
Net (Decrease) in Net Assets Resulting from Operations | | (111,717,369) | |
| | | | | | |
See notes to financial statements. | | | | | |
26
STATEMENT OF CHANGES IN NET ASSETS
| | | | | | | | | | |
| | | | Year Ended December 31, |
| | | | 2022 | | 2021 | |
Operations ($): | | | | | | | | |
Net investment income | | | 5,512,322 | | | | 5,199,289 | |
Net realized gain (loss) on investments | | 32,601,694 | | | | 68,976,512 | |
Net change in unrealized appreciation
(depreciation) on investments | | (149,831,385) | | | | 83,881,426 | |
Net Increase (Decrease) in Net Assets
Resulting from Operations | (111,717,369) | | | | 158,057,227 | |
Distributions ($): | |
Distributions to shareholders | | | (76,196,225) | | | | (14,696,730) | |
Beneficial Interest Transactions ($): | |
Net proceeds from shares sold | | | 57,585,244 | | | | 133,850,453 | |
Distributions reinvested | | | 76,196,225 | | | | 14,696,730 | |
Cost of shares redeemed | | | (145,001,712) | | | | (186,869,361) | |
Increase (Decrease) in Net Assets
from Beneficial Interest Transactions | (11,220,243) | | | | (38,322,178) | |
Total Increase (Decrease) in Net Assets | (199,133,837) | | | | 105,038,319 | |
Net Assets ($): | |
Beginning of Period | | | 723,023,162 | | | | 617,984,843 | |
End of Period | | | 523,889,325 | | | | 723,023,162 | |
Capital Share Transactions (Shares): | |
Shares sold | | | 3,075,378 | | | | 5,937,501 | |
Shares issued for distributions reinvested | | | 3,865,866 | | | | 668,337 | |
Shares redeemed | | | (7,296,870) | | | | (8,328,118) | |
Net Increase (Decrease) in Shares Outstanding | (355,626) | | | | (1,722,280) | |
| | | | | | | | | |
See notes to financial statements. | | | | | | | | |
27
FINANCIAL HIGHLIGHTS
The following table describes the performance for the fiscal periods indicated. Net asset value total return is calculated assuming an initial investment made at the net asset value at the beginning of the period, reinvestment of all dividends and distributions at net asset value during the period, and redemption at net asset value on the last day of the period. Net asset value total return includes adjustments in accordance with accounting principles generally accepted in the United States of America and as such, the net asset value for financial reporting purposes and the returns based upon those net asset values may differ from the net asset value and returns for shareholder transactions. The fund’s total returns do not reflect expenses associated with variable annuity or insurance contracts. These figures have been derived from the fund’s financial statements.
| | | | | | | | | | | |
| | | | | |
| | |
| | Year Ended December 31, |
| | | 2022 | 2021 | 2020 | 2019 | 2018 |
Per Share Data ($): | | | | | | |
Net asset value, beginning of period | | 23.55 | 19.06 | 19.06 | 17.17 | 20.12 |
Investment Operations: | | | | | | |
Net investment incomea | | .18 | .16 | .14 | .17 | .17 |
Net realized and unrealized
gain (loss) on investments | | (3.76) | 4.79 | 1.04 | 3.48 | (1.82) |
Total from Investment Operations | | (3.58) | 4.95 | 1.18 | 3.65 | (1.65) |
Distributions: | | | | | | |
Dividends from
net investment income | | (.19) | (.15) | (.18) | (.17) | (.17) |
Dividends from net realized
gain on investments | | (2.52) | (.31) | (1.00) | (1.59) | (1.13) |
Total Distributions | | (2.71) | (.46) | (1.18) | (1.76) | (1.30) |
Net asset value, end of period | | 17.26 | 23.55 | 19.06 | 19.06 | 17.17 |
Total Return (%) | | (16.65) | 26.14 | 10.64 | 22.21 | (8.98) |
Ratios/Supplemental Data (%): | | | | | | |
Ratio of total expenses
to average net assets | | .61 | .61 | .61 | .61 | .61 |
Ratio of net expenses
to average net assets | | .60 | .60 | .60 | .60 | .60 |
Ratio of net investment income
to average net assets | | .97 | .73 | .95 | .94 | .82 |
Portfolio Turnover Rate | | 28.27 | 46.01 | 47.77 | 28.13 | 23.26 |
Net Assets, end of period ($ x 1,000) | | 523,889 | 723,023 | 617,985 | 576,508 | 509,695 |
a Based on average shares outstanding.
See notes to financial statements.
28
NOTES TO FINANCIAL STATEMENTS
NOTE 1—Significant Accounting Policies:
Small Cap Stock Index Portfolio (the “fund”) is a separate diversified series of BNY Mellon Investment Portfolios (the “Trust”), which is registered under the Investment Company Act of 1940, as amended (the “Act”), as an open-end management investment company and operates as a series company currently offering three series, including the fund. The fund is only offered to separate accounts established by insurance companies to fund variable annuity contracts and variable life insurance policies. The fund’s investment objective is to seek to match the performance of the Standard & Poor’s® SmallCap 600 Index. BNY Mellon Investment Adviser, Inc. (the “Adviser”), a wholly-owned subsidiary of The Bank of New York Mellon Corporation (“BNY Mellon”), serves as the fund’s investment adviser. BNY Mellon Securities Corporation (the “Distributor”), a wholly-owned subsidiary of the Adviser, is the distributor of the fund’s shares, which are sold to the public without a sales charge.
The Trust accounts separately for the assets, liabilities and operations of each series. Expenses directly attributable to each series are charged to that series’ operations; expenses which are applicable to all series are allocated among them on a pro rata basis.
The Financial Accounting Standards Board (“FASB”) Accounting Standards Codification (“ASC”) is the exclusive reference of authoritative U.S. generally accepted accounting principles (“GAAP”) recognized by the FASB to be applied by nongovernmental entities. Rules and interpretive releases of the SEC under authority of federal laws are also sources of authoritative GAAP for SEC registrants. The fund is an investment company and applies the accounting and reporting guidance of the FASB ASC Topic 946 Financial Services-Investment Companies. The fund’s financial statements are prepared in accordance with GAAP, which may require the use of management estimates and assumptions. Actual results could differ from those estimates.
The Trust enters into contracts that contain a variety of indemnifications. The fund’s maximum exposure under these arrangements is unknown. The fund does not anticipate recognizing any loss related to these arrangements.
(a) Portfolio valuation: The fair value of a financial instrument is the amount that would be received to sell an asset or paid to transfer a liability in an orderly transaction between market participants at the measurement date (i.e., the exit price). GAAP establishes a fair value hierarchy that prioritizes the inputs of valuation techniques used to measure fair value. This hierarchy gives the highest priority to unadjusted quoted prices in
29
NOTES TO FINANCIAL STATEMENTS (continued)
active markets for identical assets or liabilities (Level 1 measurements) and the lowest priority to unobservable inputs (Level 3 measurements).
Additionally, GAAP provides guidance on determining whether the volume and activity in a market has decreased significantly and whether such a decrease in activity results in transactions that are not orderly. GAAP requires enhanced disclosures around valuation inputs and techniques used during annual and interim periods.
Various inputs are used in determining the value of the fund’s investments relating to fair value measurements. These inputs are summarized in the three broad levels listed below:
Level 1—unadjusted quoted prices in active markets for identical investments.
Level 2—other significant observable inputs (including quoted prices for similar investments, interest rates, prepayment speeds, credit risk, etc.).
Level 3—significant unobservable inputs (including the fund’s own assumptions in determining the fair value of investments).
The inputs or methodology used for valuing securities are not necessarily an indication of the risk associated with investing in those securities.
Changes in valuation techniques may result in transfers in or out of an assigned level within the disclosure hierarchy. Valuation techniques used to value the fund’s investments are as follows:
The Trust’s Board of Trustees (the “Board”) has designated the Adviser as the fund’s valuation designee, effective September 8, 2022, to make all fair value determinations with respect to the fund’s portfolio investments, subject to the Board’s oversight and pursuant to Rule 2a-5 under the Act.
Investments in equity securities are valued at the last sales price on the securities exchange or national securities market on which such securities are primarily traded. Securities listed on the National Market System for which market quotations are available are valued at the official closing price or, if there is no official closing price that day, at the last sales price. For open short positions, asked prices are used for valuation purposes. Bid price is used when no asked price is available. Registered investment companies that are not traded on an exchange are valued at their net asset value. All of the preceding securities are generally categorized within Level 1 of the fair value hierarchy.
Securities not listed on an exchange or the national securities market, or securities for which there were no transactions, are valued at the average of
30
the most recent bid and asked prices. These securities are generally categorized within Level 2 of the fair value hierarchy.
Fair valuing of securities may be determined with the assistance of a pricing service using calculations based on indices of domestic securities and other appropriate indicators, such as prices of relevant American Depository Receipts and futures. Utilizing these techniques may result in transfers between Level 1 and Level 2 of the fair value hierarchy.
When market quotations or official closing prices are not readily available, or are determined not to accurately reflect fair value, such as when the value of a security has been significantly affected by events after the close of the exchange or market on which the security is principally traded, but before the fund calculates its net asset value, the fund may value these investments at fair value as determined in accordance with the procedures approved by the Board. Certain factors may be considered when fair valuing investments such as: fundamental analytical data, the nature and duration of restrictions on disposition, an evaluation of the forces that influence the market in which the securities are purchased and sold, and public trading in similar securities of the issuer or comparable issuers. These securities are either categorized within Level 2 or 3 of the fair value hierarchy depending on the relevant inputs used.
For securities where observable inputs are limited, assumptions about market activity and risk are used and such securities are generally categorized within Level 3 of the fair value hierarchy.
Futures, which are traded on an exchange, are valued at the last sales price on the securities exchange on which such securities are primarily traded or at the last sales price on the national securities market on each business day and are generally categorized within Level 1 of the fair value hierarchy.
The following is a summary of the inputs used as of December 31, 2022 in valuing the fund’s investments:
| | | | | | | |
| | Level 1-Unadjusted Quoted Prices | Level 2- Other Significant Observable Inputs | | Level 3-Significant Unobservable Inputs | Total | |
Assets ($) | | |
Investments in Securities:† | | |
Equity Securities - Common Stocks | 516,034,681 | - | | 0 | 516,034,681 | |
Exchange-Traded Funds | 5,487,133 | - | | - | 5,487,133 | |
Investment Companies | 6,884,998 | - | | - | 6,884,998 | |
31
NOTES TO FINANCIAL STATEMENTS (continued)
| | | | | | | |
| | Level 1-Unadjusted Quoted Prices | Level 2- Other Significant Observable Inputs | | Level 3-Significant Unobservable Inputs | Total | |
Liabilities ($) | | |
Other Financial Instruments: | | |
Futures†† | (59,287) | - | | - | (59,287) | |
† See Statement of Investments for additional detailed categorizations, if any.
†† Amount shown represents unrealized appreciation (depreciation) at period end, but only variation margin on exchange-traded and centrally cleared derivatives, if any, are reported in the Statement of Assets and Liabilities.
The following is a reconciliation of Level 3 assets for which significant unobservable inputs were used to determine fair value:
| | |
| | Equity Securities-Common Stocks ($) |
Balance as of 12/31/2021 | - |
Purchases/Issuances | - |
Sales/Dispositions | - |
Net realized gain (loss) | - |
Change in unrealized appreciation (depreciation) | - |
Transfers into Level 3† | 0 |
Transfers out of Level 3 | - |
Balances as of 12/31/2022†† | 0 |
The amount of total net realized gains (loss) for the period included in earnings attributable to the net change in unrealized appreciation (depreciation) relating to investments still held at 12/31/2022 | - |
† Transfers into Level 3 represent the value at the date of transfer.
†† Securities deemed as Level 3 due to the lack of observable inputs by management assessment.
(b) Foreign taxes: The fund may be subject to foreign taxes (a portion of which may be reclaimable) on income, stock dividends, realized and unrealized capital gains on investments or certain foreign currency transactions. Foreign taxes are recorded in accordance with the applicable foreign tax regulations and rates that exist in the foreign jurisdictions in which the fund invests. These foreign taxes, if any, are paid by the fund and are reflected in the Statement of Operations, if applicable. Foreign taxes payable or deferred or those subject to reclaims as of December 31, 2022, if any, are disclosed in the fund’s Statement of Assets and Liabilities.
(c) Securities transactions and investment income: Securities transactions are recorded on a trade date basis. Realized gains and losses from securities transactions are recorded on the identified cost basis. Dividend income is recognized on the ex-dividend date and interest income, including, where applicable, accretion of discount and
32
amortization of premium on investments, is recognized on the accrual basis.
Pursuant to a securities lending agreement with BNY Mellon, the fund may lend securities to qualified institutions. It is the fund’s policy that, at origination, all loans are secured by collateral of at least 102% of the value of U.S. securities loaned and 105% of the value of foreign securities loaned. Collateral equivalent to at least 100% of the market value of securities on loan is maintained at all times. Collateral is either in the form of cash, which can be invested in certain money market mutual funds managed by the Adviser, or U.S. Government and Agency securities. The fund is entitled to receive all dividends, interest and distributions on securities loaned, in addition to income earned as a result of the lending transaction. Should a borrower fail to return the securities in a timely manner, BNY Mellon is required to replace the securities for the benefit of the fund or credit the fund with the market value of the unreturned securities and is subrogated to the fund’s rights against the borrower and the collateral. Additionally, the contractual maturity of security lending transactions are on an overnight and continuous basis. During the period ended December 31, 2022, BNY Mellon earned $10,990 from the lending of the fund’s portfolio securities, pursuant to the securities lending agreement.
(d) Affiliated issuers: Investments in other investment companies advised by the Adviser are considered “affiliated” under the Act.
(e) Market Risk: The value of the securities in which the fund invests may be affected by political, regulatory, economic and social developments, and developments that impact specific economic sectors, industries or segments of the market. The value of a security may also decline due to general market conditions that are not specifically related to a particular company or industry, such as real or perceived adverse economic conditions, changes in the general outlook for corporate earnings, changes in interest or currency rates, changes to inflation, adverse changes to credit markets or adverse investor sentiment generally. In addition, turbulence in financial markets and reduced liquidity in equity, credit and/or fixed income markets may negatively affect many issuers, which could adversely affect the fund. Global economies and financial markets are becoming increasingly interconnected, and conditions and events in one country, region or financial market may adversely impact issuers in a different country, region or financial market. These risks may be magnified if certain events or developments adversely interrupt the global supply chain; in these and other circumstances, such risks might affect companies world-wide. Recent examples include pandemic risks related to COVID-19 and
33
NOTES TO FINANCIAL STATEMENTS (continued)
aggressive measures taken world-wide in response by governments, including closing borders, restricting international and domestic travel, and the imposition of prolonged quarantines of large populations, and by businesses, including changes to operations and reducing staff.
(f) Dividends and distributions to shareholders: Dividends and distributions are recorded on the ex-dividend date. Dividends from net investment income and dividends from net realized capital gains, if any, are normally declared and paid annually, but the fund may make distributions on a more frequent basis to comply with the distribution requirements of the Internal Revenue Code of 1986, as amended (the “Code”). To the extent that net realized capital gains can be offset by capital loss carryovers, it is the policy of the fund not to distribute such gains. Income and capital gain distributions are determined in accordance with income tax regulations, which may differ from GAAP.
(g) Federal income taxes: It is the policy of the fund to continue to qualify as a regulated investment company, if such qualification is in the best interests of its shareholders, by complying with the applicable provisions of the Code, and to make distributions of taxable income and net realized capital gain sufficient to relieve it from substantially all federal income and excise taxes.
As of and during the period ended December 31, 2022, the fund did not have any liabilities for any uncertain tax positions. The fund recognizes interest and penalties, if any, related to uncertain tax positions as income tax expense in the Statement of Operations. During the period ended December 31, 2022, the fund did not incur any interest or penalties.
Each tax year in the four-year period ended December 31, 2022 remains subject to examination by the Internal Revenue Service and state taxing authorities.
At December 31, 2022, the components of accumulated earnings on a tax basis were as follows: undistributed ordinary income $5,618,057, undistributed capital gains $29,351,025 and unrealized appreciation $113,373,976.
The tax character of distributions paid to shareholders during the fiscal years ended December 31, 2022 and December 31, 2021 were as follows: ordinary income $13,586,552 and $6,792,687, and long-term capital gains $62,609,673 and $7,904,043, respectively.
NOTE 2—Bank Lines of Credit:
The fund participates with other long-term open-end funds managed by the Adviser in a $823.5 million unsecured credit facility led by Citibank,
34
N.A. (the “Citibank Credit Facility”) and a $300 million unsecured credit facility provided by BNY Mellon (the “BNYM Credit Facility”), each to be utilized primarily for temporary or emergency purposes, including the financing of redemptions (each, a “Facility”). The Citibank Credit Facility is available in two tranches: (i) Tranche A is in an amount equal to $688.5 million and is available to all long-term open-ended funds, including the fund, and (ii) Tranche B is an amount equal to $135 million and is available only to BNY Mellon Floating Rate Income Fund, a series of BNY Mellon Investment Funds IV, Inc. In connection therewith, the fund has agreed to pay its pro rata portion of commitment fees for Tranche A of the Citibank Credit Facility and the BNYM Credit Facility. Interest is charged to the fund based on rates determined pursuant to the terms of the respective Facility at the time of borrowing.
The average amount of borrowings outstanding under the Facilities during the period ended December 31, 2022 was approximately $373,973 with a related weighted average annualized rate of 1.34%.
NOTE 3—Management Fee and Other Transactions with Affiliates:
(a) Pursuant to a management agreement with the Adviser, the management fee is computed at the annual rate of .35% of the value of the fund’s average daily net assets and is payable monthly. The Adviser has agreed in its management agreement to pay all of the fund’s direct expenses, except management fees, Rule 12b-1 Distribution Plan fees, taxes, interest expense, brokerage commissions, commitment fees on borrowings, fees and expenses of non-interested board members (including counsel fees), and extraordinary expenses. The Adviser has also agreed to reduce its management fee in an amount equal to the fund’s allocable portion of the fees and expenses of the non-interested board members (including counsel fees). These provisions in the management agreement may not be amended without the approval of the fund’s shareholders. During the period ended December 31, 2022, fees reimbursed by the Adviser amounted to $31,040.
(b) Under the Distribution Plan adopted pursuant to Rule 12b-1 under the Act, the fund pays the Distributor for distributing its shares, for servicing and/or maintaining shareholder accounts and for advertising and marketing. The Distribution Plan provides for payments to be made at an annual rate of .25% of the value of the fund’s average daily net assets. The Distributor may make payments to Participating Insurance Companies and to brokers and dealers acting as principal underwriter for their variable insurance products. The fees payable under the Distribution Plan are payable without regard to actual expenses incurred. During the period
35
NOTES TO FINANCIAL STATEMENTS (continued)
ended December 31, 2022, the fund was charged $1,421,355 pursuant to the Distribution Plan.
The components of “Due to BNY Mellon Investment Adviser, Inc. and affiliates” in the Statement of Assets and Liabilities consist of: management fee of $158,339 and Distribution Plan fees of $113,099, which are offset against an expense reimbursement currently in effect in the amount of $3,100.
(c) Each board member also serves as a board member of other funds in the BNY Mellon Family of Funds complex. Annual retainer fees and attendance fees are allocated to each fund based on net assets.
NOTE 4—Securities Transactions:
The aggregate amount of purchases and sales of investment securities, excluding short-term securities and futures, during the period ended December 31, 2022, amounted to $161,741,659 and $250,113,471, respectively.
Derivatives: A derivative is a financial instrument whose performance is derived from the performance of another asset. The SEC recently adopted Rule 18f-4 under the Act, which, effective August 18, 2022, regulates the use of derivatives transactions for certain funds registered under the Act. The fund is deemed a “limited” derivatives user under the rule and is required to limit its derivatives exposure so that the total notional value of derivatives does not exceed 10% of fund’s net assets, and is subject to certain reporting requirements. Each type of derivative instrument that was held by the fund during the period ended December 31, 2022 is discussed below.
Futures: In the normal course of pursuing its investment objective, the fund is exposed to market risk, including equity price risk, as a result of changes in value of underlying financial instruments. The fund invests in futures in order to manage its exposure to or protect against changes in the market. A futures contract represents a commitment for the future purchase or a sale of an asset at a specified date. Upon entering into such contracts, these investments require initial margin deposits with a counterparty, which consist of cash or cash equivalents. The amount of these deposits is determined by the exchange or Board of Trade on which the contract is traded and is subject to change. Accordingly, variation margin payments are received or made to reflect daily unrealized gains or losses which are recorded in the Statement of Operations. When the contracts are closed, the fund recognizes a realized gain or loss which is reflected in the Statement of Operations. There is minimal counterparty credit risk to the fund with futures since they are exchange traded, and the
36
exchange guarantees the futures against default. Futures open at December 31, 2022 are set forth in the Statement of Investments.
The following summarizes the average market value of derivatives outstanding during the period ended December 31, 2022:
| | | |
| | Average Market Value ($) |
Equity futures | | 2,918,071 |
At December 31, 2022, the cost of investments for federal income tax purposes was $415,032,836; accordingly, accumulated net unrealized appreciation on investments was $113,373,976, consisting of $182,493,071 gross unrealized appreciation and $69,119,095 gross unrealized depreciation.
37
REPORT OF INDEPENDENT REGISTERED PUBLIC ACCOUNTING FIRM
To the Shareholders and the Board of Trustees of Small Cap Stock Index Portfolio
Opinion on the Financial Statements
We have audited the accompanying statement of assets and liabilities of Small Cap Stock Index Portfolio (the “Fund”) (one of the funds constituting BNY Mellon Investment Portfolios), including the statement of investments, as of December 31, 2022, and the related statement of operations for the year then ended, the statements of changes in net assets for each of the two years in the period then ended, the financial highlights for each of the five years in the period then ended and the related notes (collectively referred to as the “financial statements”). In our opinion, the financial statements present fairly, in all material respects, the financial position of the Fund (one of the funds constituting BNY Mellon Investment Portfolios) at December 31, 2022, the results of its operations for the year then ended, the changes in its net assets for each of the two years in the period then ended and its financial highlights for each of the five years in the period then ended, in conformity with U.S. generally accepted accounting principles.
Basis for Opinion
These financial statements are the responsibility of the Fund’s management. Our responsibility is to express an opinion on the Fund’s financial statements based on our audits. We are a public accounting firm registered with the Public Company Accounting Oversight Board (United States) (“PCAOB”) and are required to be independent with respect to the Fund in accordance with the U.S. federal securities laws and the applicable rules and regulations of the Securities and Exchange Commission and the PCAOB.
We conducted our audits in accordance with the standards of the PCAOB. Those standards require that we plan and perform the audit to obtain reasonable assurance about whether the financial statements are free of material misstatement, whether due to error or fraud. The Fund is not required to have, nor were we engaged to perform, an audit of the Fund’s internal control over financial reporting. As part of our audits, we are required to obtain an understanding of internal control over financial reporting, but not for the purpose of expressing an opinion on the effectiveness of the Fund’s internal control over financial reporting. Accordingly, we express no such opinion.
Our audits included performing procedures to assess the risks of material misstatement of the financial statements, whether due to error or fraud, and performing procedures that respond to those risks. Such procedures included examining, on a test basis, evidence regarding the amounts and disclosures in the financial statements. Our procedures included confirmation of securities owned as of December 31, 2022, by correspondence with the custodian, brokers and others; when replies were not received from brokers and others, we performed other auditing procedures. Our audits also included evaluating the accounting principles used and significant estimates made by management, as well as evaluating the overall presentation of the financial statements. We believe that our audits provide a reasonable basis for our opinion.

We have served as the auditor of one or more investment companies in the BNY Mellon Family of Funds since at least 1957, but we are unable to determine the specific year.
New York, New York
February 9, 2023
38
IMPORTANT TAX INFORMATION (Unaudited)
For federal tax purposes, the fund hereby reports 47.51% of the ordinary dividends paid during the fiscal year ended December 31, 2022 as qualifying for the corporate dividends received deduction. Shareholders will receive notification in early 2023 of the percentage applicable to the preparation of their 2022 income tax returns. Also, the fund hereby reports $.2944 per share as a short-term capital gain distribution and $2.223 per share as a long-term capital gain distribution paid on March 30, 2022.
39
INFORMATION ABOUT THE RENEWAL OF THE FUND’S MANAGEMENT AGREEMENT (Unaudited)
At a meeting of the fund’s Board of Trustees held on August 1-2, 2022, the Board considered the renewal of the fund’s Management Agreement pursuant to which the Adviser provides the fund with investment advisory and administrative services (the “Agreement”). The Board members, none of whom are “interested persons” (as defined in the Investment Company Act of 1940, as amended) of the fund, were assisted in their review by independent legal counsel and met with counsel in executive session separate from representatives of the Adviser. In considering the renewal of the Agreement, the Board considered several factors that it believed to be relevant, including those discussed below. The Board did not identify any one factor as dispositive, and each Board member may have attributed different weights to the factors considered.
Analysis of Nature, Extent, and Quality of Services Provided to the Fund. The Board considered information provided to it at the meeting and in previous presentations from representatives of the Adviser regarding the nature, extent, and quality of the services provided to funds in the BNY Mellon fund complex, including the fund. The Adviser provided the number of open accounts in the fund, the fund’s asset size and the allocation of fund assets among distribution channels. The Adviser also had previously provided information regarding the diverse intermediary relationships and distribution channels of funds in the BNY Mellon fund complex (such as intermediary, in which intermediaries typically are paid by the fund and/or the Adviser) and the Adviser’s corresponding need for broad, deep, and diverse resources to be able to provide ongoing shareholder services to each intermediary or distribution channel, as applicable to the fund.
The Board also considered research support available to, and portfolio management capabilities of, the fund’s portfolio management personnel and that the Adviser also provides oversight of day-to-day fund operations, including fund accounting and administration and assistance in meeting legal and regulatory requirements. The Board also considered the Adviser’s extensive administrative, accounting and compliance infrastructures.
Comparative Analysis of the Fund’s Performance and Management Fee and Expense Ratio. The Board reviewed reports prepared by Broadridge Financial Solutions, Inc. (“Broadridge”), an independent provider of investment company data based on classifications provided by Thomson Reuters Lipper, which included information comparing (1) the performance of the fund’s Service shares with the performance of a group of small-cap core pure index funds underlying variable insurance products (“VIPs”) benchmarked against the S&P SmallCap Index selected by Broadridge as comparable to the fund (the “Performance Group”) and with a broader group of funds consisting of all small-cap core funds underlying VIPs (the “Performance Universe”), all for various periods ended June 30, 2022, and (2) the fund’s actual and contractual management fees and total expenses with those of the same group of funds in the Performance Group (the “Expense Group”) and with a broader group of all small-cap core funds underlying VIPs with similar 12b-1/non-12b-1 structures, excluding outliers (the “Expense Universe”), the information for which was derived in part from fund
40
financial statements available to Broadridge as of the date of its analysis. The Adviser previously had furnished the Board with a description of the methodology Broadridge used to select the Performance Group and Performance Universe and the Expense Group and Expense Universe.
Performance Comparisons. Representatives of the Adviser stated that the usefulness of performance comparisons may be affected by a number of factors, including different investment limitations and policies that may be applicable to the fund and comparison funds and the end date selected. The Board discussed with representatives of the Adviser the results of the comparisons and considered that the fund’s total return performance was slightly above the Performance Group median for all periods, except for the five- and ten-year periods when it was slightly below the Performance Group median, and was above the Performance Universe median for all periods, except for the one-year period when it was below the Performance Universe median. It was noted that there were only three other funds in the Performance Group. The Adviser also provided a comparison of the fund’s calendar year total returns to the returns of the fund’s benchmark index. The Board also noted that the fund had a four-star overall rating from Morningstar and a four-star rating for the ten-year period based on Morningstar’s risk-adjusted return measures.
Management Fee and Expense Ratio Comparisons. The Board reviewed and considered the contractual management fee rate payable by the fund to the Adviser in light of the nature, extent and quality of the management services provided by the Adviser. In addition, the Board reviewed and considered the actual management fee rate paid by the fund over the fund’s last fiscal year. The Board also reviewed the range of actual and contractual management fees and total expenses as a percentage of average net assets of the Expense Group and Expense Universe funds and discussed the results of the comparisons.
The Board noted that the Adviser pays all fund expenses, other than the actual management fee, Rule 12b-1 fees and certain other expenses. Because of the fund’s “unitary fee” structure, the Board recognized that the fund’s fees and expenses will vary within a much smaller range and the Adviser will bear the risk that fund expenses may increase over time. On the other hand, the Board noted that it is possible that the Adviser could earn a profit on the fees charged under the Agreement and would benefit from any price decreases in third-party services covered by the Agreement. Taking into account the fund’s “unitary” fee structure, the Board considered that the fund’s contractual management fee was higher than the Expense Group median contractual management fee, the fund’s actual management fee was slightly higher than the Expense Group median and slightly higher than the Expense Universe median actual management fee and the fund’s total expenses were higher than the Expense Group median and slightly lower than the Expense Universe median total expenses. It was noted that there were only three other funds in the Expense Group, two of which had no 12b-1 fees.
Representatives of the Adviser reviewed with the Board the management or investment advisory fees paid by funds advised by the Adviser that are in the same Lipper category
41
INFORMATION ABOUT THE RENEWAL OF THE FUND’S MANAGEMENT AGREEMENT (Unaudited) (continued)
as the fund (the “Similar Funds”), and explained the nature of the Similar Funds. They discussed differences in fees paid and the relationship of the fees paid in light of any differences in the services provided and other relevant factors, noting the fund’s “unitary” fee structure. The Board considered the relevance of the fee information provided for the Similar Funds to evaluate the appropriateness of the fund’s management fee. Representatives of the Adviser noted that there were no separate accounts and/or other types of client portfolios advised by the Adviser that are considered to have similar investment strategies and policies as the fund.
Analysis of Profitability and Economies of Scale. Representatives of the Adviser reviewed the expenses allocated and profit received by the Adviser and its affiliates and the resulting profitability percentage for managing the fund and the aggregate profitability percentage to the Adviser and its affiliates for managing the funds in the BNY Mellon fund complex, and the method used to determine the expenses and profit. The Board concluded that the profitability results were not excessive, given the services rendered and service levels provided by the Adviser and its affiliates. The Board also had been provided with information prepared by an independent consulting firm regarding the Adviser’s approach to allocating costs to, and determining the profitability of, individual funds and the entire BNY Mellon fund complex. The consulting firm also had analyzed where any economies of scale might emerge in connection with the management of a fund.
The Board considered, on the advice of its counsel, the profitability analysis (1) as part of its evaluation of whether the fee under the Agreement, considered in relation to the mix of services provided by the Adviser, including the nature, extent and quality of such services, supported the renewal of the Agreement and (2) in light of the relevant circumstances for the fund and the extent to which economies of scale would be realized if the fund grows and whether fee levels reflect these economies of scale for the benefit of fund shareholders. Representatives of the Adviser stated that, as a result of shared and allocated costs among funds in the BNY Mellon fund complex, the extent of economies of scale could depend substantially on the level of assets in the complex as a whole, so that increases and decreases in complex-wide assets can affect potential economies of scale in a manner that is disproportionate to, or even in the opposite direction from, changes in the fund’s asset level. The Board also considered potential benefits to the Adviser from acting as investment adviser and took into consideration that there were no soft dollar arrangements in effect for trading the fund’s investments.
At the conclusion of these discussions, the Board agreed that it had been furnished with sufficient information to make an informed business decision with respect to the renewal of the Agreement. Based on the discussions and considerations as described above, the Board concluded and determined as follows.
· The Board concluded that the nature, extent and quality of the services provided by the Adviser are adequate and appropriate.
· The Board generally was satisfied with the fund’s overall performance.
42
· The Board concluded that the fee paid to the Adviser continued to be appropriate under the circumstances and in light of the factors and the totality of the services provided as discussed above.
· The Board determined that the economies of scale which may accrue to the Adviser and its affiliates in connection with the management of the fund had been adequately considered by the Adviser in connection with the fee rate charged to the fund pursuant to the Agreement and that, to the extent in the future it were determined that material economies of scale had not been shared with the fund, the Board would seek to have those economies of scale shared with the fund.
In evaluating the Agreement, the Board considered these conclusions and determinations and also relied on its previous knowledge, gained through meetings and other interactions with the Adviser and its affiliates, of the Adviser and the services provided to the fund by the Adviser. The Board also relied on information received on a routine and regular basis throughout the year relating to the operations of the fund and the investment management and other services provided under the Agreement, including information on the investment performance of the fund in comparison to similar mutual funds and benchmark performance indices; general market outlook as applicable to the fund; and compliance reports. In addition, the Board’s consideration of the contractual fee arrangements for the fund had the benefit of a number of years of reviews of the Agreement for the fund, or substantially similar agreements for other BNY Mellon funds that the Board oversees, during which lengthy discussions took place between the Board and representatives of the Adviser. Certain aspects of the arrangements may receive greater scrutiny in some years than in others, and the Board’s conclusions may be based, in part, on its consideration of the fund’s arrangements, or substantially similar arrangements for other BNY Mellon funds that the Board oversees, in prior years. The Board determined to renew the Agreement.
43
BOARD MEMBERS INFORMATION (Unaudited)
Independent Board Members
Joseph S. DiMartino (79)
Chairman of the Board (1998)
Principal Occupation During Past 5 Years:
· Director or Trustee of funds in the BNY Mellon Family of Funds and certain other entities (as described in the fund’s Statement of Additional Information) (1995-Present)
Other Public Company Board Memberships During Past 5 Years:
· CBIZ, Inc., a public company providing professional business services, products and solutions, Director (1997-Present)
No. of Portfolios for which Board Member Serves: 92
———————
Francine J. Bovich (71)
Board Member (2015)
Principal Occupation During Past 5 Years:
· The Bradley Trusts, private trust funds, Trustee (2011-Present)
Other Public Company Board Memberships During Past 5 Years:
· Annaly Capital Management, Inc., a real estate investment trust, Director (2014-Present)
No. of Portfolios for which Board Member Serves: 53
———————
J. Charles Cardona (67)
Board Member (2014)
Principal Occupation During Past 5 Years:
· BNY Mellon ETF Trust, Chairman and Trustee (2020-Present)
· BNY Mellon Liquidity Funds, Director (2004-Present) and Chairman (2019-2021)
No. of Portfolios for which Board Member Serves: 37
———————
Andrew J. Donohue (72)
Board Member (2019)
Principal Occupation During Past 5 Years:
· Attorney, Solo Law Practice (2019-Present)
· Shearman & Sterling LLP, a law firm, Of Counsel (2017-2019)
· Chief of Staff to the Chair of the SEC (2015-2017)
Other Public Company Board Memberships During Past 5 Years:
· Oppenheimer Funds (58 funds), Director (2017-2019)
No. of Portfolios for which Board Member Serves: 43
———————
44
Isabel P. Dunst (75)
Board Member (2014)
Principal Occupation During Past 5 Years:
· Hogan Lovells LLP, a law firm, Retired (2019-Present); Senior Counsel (2018-2019); Of Counsel (2015-2018)
· Hebrew Union College Jewish Institute of Religion, Member of the Board of Governors (2015-Present)
· Bend the ARC, a civil rights organization, Board Member (2016-Present)
No. of Portfolios for which Board Member Serves: 22
———————
Nathan Leventhal (79)
Board Member (2009)
Principal Occupation During Past 5 Years:
· Lincoln Center for the Performing Arts, President Emeritus (2001-Present)
· Palm Beach Opera, President (2016-Present)
Other Public Company Board Memberships During Past 5 Years:
· Movado Group, Inc., a public company that designs, sources, markets and distributes watches Director (2003-2020)
No. of Portfolios for which Board Member Serves: 32
———————
Robin A. Melvin (59)
Board Member (2014)
Principal Occupation During Past 5 Years:
· Westover School, a private girls' boarding school in Middlebury, Connecticut, Trustee (2019-Present)
· Mentor Illinois, a non-profit organization dedicated to increasing the quantity and quality of mentoring services in Illinois, Co-Chair (2014-2020); Board Member, Mentor Illinois (2013-2020)
· JDRF, a non-profit juvenile diabetes research foundation, Board Member (June 2021-June 2022)
Other Public Company Board Memberships During Past 5 Years:
· HPS Corporate Lending Fund, a closed-end management investment company regulated as a business development company, Trustee (August 2021-Present)
No. of Portfolios for which Board Member Serves: 71
———————
Roslyn M. Watson (73)
Board Member (2014)
Principal Occupation During Past 5 Years:
· Watson Ventures, Inc., a real estate investment company. Principal (1993-Present)
Other Public Company Board Memberships During Past 5 Years:
· American Express Bank, FSB, Director (1993-2018)
No. of Portfolios for which Board Member Serves: 43
———————
45
BOARD MEMBERS INFORMATION (Unaudited) (continued)
Benaree Pratt Wiley (76)
Board Member (2009)
Principal Occupation During Past 5 Years:
· The Wiley Group, a firm specializing in strategy and business development, Principal (2005-Present)
Other Public Company Board Memberships During Past 5 Years:
· CBIZ, Inc., a public company providing professional business services, products and solutions, Director (2008-Present)
· Blue Cross Blue Shield of Massachusetts, Director (2004-2020)
No. of Portfolios for which Board Member Serves: 60
———————
Tamara Belinfanti (47)
Advisory Board Member (2021)
Principal Occupation During Past 5 Years:
· New York Law School, Lester Martin Professor of Law (2009-Present)
No. of Portfolios for which Advisory Board Member Serves: 22
———————
Gordon J. Davis (81)
Advisory Board Member (2021)
Principal Occupation During Past 5 Years:
· Venable LLP, a law firm, Partner (2012-Present)
Other Public Company Board Memberships During Past 5 Years:
· BNY Mellon Family of Funds (53 funds), Board Member (1995-August 2021)
No. of Portfolios for which Advisory Board Member Serves: 39
———————
The address of the Board Members and Officers is c/o BNY Mellon Investment Adviser, Inc., 240 Greenwich Street, New York, New York 10286. Additional information about each Board Member is available in the fund’s Statement of Additional Information which can be obtained from the Adviser free of charge by calling this toll free number: 1-800-373-9387.
46
OFFICERS OF THE FUND (Unaudited)
DAVID DIPETRILLO, President since January 2021.
Vice President and Director of the Adviser since February 2021; Head of North America Product, BNY Mellon Investment Management since January 2018; and Director of Product Strategy, BNY Mellon Investment Management from January 2016 to December 2017. He is an officer of 54 investment companies (comprised of 107 portfolios) managed by the Adviser or an affiliate of the Adviser. He is 44 years old and has been an employee of BNY Mellon since 2005.
JAMES WINDELS, Treasurer since November 2001.
Vice President of the Adviser since September 2020; and Director–BNY Mellon Fund Administration. He is an officer of 55 investment companies (comprised of 127 portfolios) managed by the Adviser or an affiliate of the Adviser. He is 64 years old and has been an employee of the Adviser since April 1985.
PETER M. SULLIVAN, Chief Legal Officer since July 2021 and Vice President and Assistant Secretary since March 2019.
Chief Legal Officer of the Adviser and Associate General Counsel of BNY Mellon since July 2021; Senior Managing Counsel of BNY Mellon from December 2020 to July 2021; and Managing Counsel of BNY Mellon from March 2009 to December 2020. He is an officer of 55 investment companies (comprised of 127 portfolios) managed by the Adviser or an affiliate of the Adviser. He is 54 years old and has been an employee of BNY Mellon since April 2004.
JAMES BITETTO, Vice President since August 2005 and Secretary since February 2018.
Senior Managing Counsel of BNY Mellon since December 2019; Managing Counsel of BNY Mellon from April 2014 to December 2019; and Secretary of the Adviser. He is an officer of 55 investment companies (comprised of 127 portfolios) managed by the Adviser or an affiliate of the Adviser. He is 56 years old and has been an employee of the Adviser since December 1996.
DEIRDRE CUNNANE, Vice President and Assistant Secretary since March 2019.
Managing Counsel of BNY Mellon since December 2021, Counsel of BNY Mellon from August 2018 to December 2021; and Senior Regulatory Specialist at BNY Mellon Investment Management Services from February 2016 to August 2018. She is an officer of 55 investment companies (comprised of 127 portfolios) managed by the Adviser or an affiliate of the Adviser. She is 32 years old and has been an employee of the Adviser since August 2018.
SARAH S. KELLEHER, Vice President and Assistant Secretary since April 2014.
Vice President of BNY Mellon ETF Investment Adviser; LLC since February 2020; Senior Managing Counsel of BNY Mellon since September 2021; Managing Counsel of BNY Mellon from December 2017 to September 2021; and Senior Counsel of BNY Mellon from March 2013 to December 2017. She is an officer of 55 investment companies (comprised of 127 portfolios) managed by the Adviser or an affiliate of the Adviser. She is 47 years old and has been an employee of the Adviser since March 2013.
JEFF PRUSNOFSKY, Vice President and Assistant Secretary since August 2005.
Senior Managing Counsel of BNY Mellon. He is an officer of 55 investment companies (comprised of 127 portfolios) managed by the Adviser or an affiliate of the Adviser. He is 57 years old and has been an employee of the Adviser since October 1990.
AMANDA QUINN, Vice President and Assistant Secretary since March 2020.
Counsel of BNY Mellon since June 2019; Regulatory Administration Manager at BNY Mellon Investment Management Services from September 2018 to May 2019; and Senior Regulatory Specialist at BNY Mellon Investment Management Services from April 2015 to August 2018. She is an officer of 55 investment companies (comprised of 127 portfolios) managed by the Adviser or an affiliate of the Adviser. She is 37 years old and has been an employee of the Adviser since June 2019.
47
OFFICERS OF THE FUND (Unaudited) (continued)
NATALYA ZELENSKY, Vice President and Assistant Secretary since March 2017.
Chief Compliance Officer since August 2021 and Vice President since February 2020 of BNY Mellon ETF Investment Adviser, LLC; Chief Compliance Officer since August 2021 and Vice President and Assistant Secretary since February 2020 of BNY Mellon ETF Trust; Managing Counsel of BNY Mellon from December 2019 to August 2021; Counsel of BNY Mellon from May 2016 to December 2019; and Assistant Secretary of the Adviser from April 2018 to August 2021. She is an officer of 55 investment companies (comprised of 127 portfolios) managed by the Adviser or an affiliate of the Adviser. She is 37 years old and has been an employee of BNY Mellon since May 2016.
DANIEL GOLDSTEIN, Vice President since March 2022.
Vice President and Head of Product Development of North America Product, BNY Mellon Investment Management since January 2018; Co-Head of Product Management, Development & Oversight of North America Product, BNY Mellon Investment Management from January 2010 to January 2018; and Senior Vice President, Development & Oversight of North America Product, BNY Mellon Investment Management since 2010. He is an officer of 54 investment companies (comprised of 107 portfolios) managed by the Adviser or an affiliate of the Adviser. He is 53 years old and has been an employee of the Distributor since 1991.
JOSEPH MARTELLA, Vice President since March 2022.
Vice President of the Adviser since December 2022, Head of Product Management of North America Product, BNY Mellon Investment Management since January 2018; Director of Product Research and Analytics of North America Product, BNY Mellon Investment Management from January 2010 to January 2018; and Senior Vice President of North America Product, BNY Mellon Investment Management since 2010. He is an officer of 54 investment companies (comprised of 107 portfolios) managed by the Adviser or an affiliate of the Adviser. He is 46 years old and has been an employee of the Distributor since 1999.
GAVIN C. REILLY, Assistant Treasurer since December 2005.
Tax Manager–BNY Mellon Fund Administration. He is an officer of 55 investment companies (comprised of 127 portfolios) managed by the Adviser or an affiliate of the Adviser. He is 54 years old and has been an employee of the Adviser since April 1991.
ROBERT SALVIOLO, Assistant Treasurer since July 2007.
Senior Accounting Manager–BNY Mellon Fund Administration. He is an officer of 55 investment companies (comprised of 127 portfolios) managed by the Adviser or an affiliate of the Adviser. He is 55 years old and has been an employee of the Adviser since June 1989.
ROBERT SVAGNA, Assistant Treasurer since December 2002.
Senior Accounting Manager–BNY Mellon Fund Administration. He is an officer of 55 investment companies (comprised of 127 portfolios) managed by the Adviser or an affiliate of the Adviser. He is 55 years old and has been an employee of the Adviser since November 1990.
JOSEPH W. CONNOLLY, Chief Compliance Officer since October 2004.
Chief Compliance Officer of the BNY Mellon Family of Funds and BNY Mellon Funds Trust since 2004; and Chief Compliance Officer of the Adviser from 2004 until June 2021. He is the Chief Compliance Officer of 54 investment companies (comprised of 112 portfolios) managed by the Adviser. He is 65 years old.
CARIDAD M. CAROSELLA, Anti-Money Laundering Compliance Officer since January 2016.
Anti-Money Laundering Compliance Officer of the BNY Mellon Family of Funds and BNY Mellon Funds Trust. She is an officer of 48 investment companies (comprised of 120 portfolios) managed by the Adviser or an affiliate of the Adviser. She is 54 years old and has been an employee of the Distributor since 1997.
48
This page intentionally left blank.
49
BNY Mellon Investment Portfolios, Small Cap Stock Index Portfolio
240 Greenwich Street
New York, NY 10286
Adviser
BNY Mellon Investment Adviser, Inc.
240 Greenwich Street
New York, NY 10286
Custodian
The Bank of New York Mellon
240 Greenwich Street
New York, NY 10286
Transfer Agent &
Dividend Disbursing Agent
BNY Mellon Transfer, Inc.
240 Greenwich Street
New York, NY 10286
Distributor
BNY Mellon Securities Corporation
240 Greenwich Street
New York, NY 10286
Telephone 1-800-258-4260 or 1-800-258-4261
Mail The BNY Mellon Family of Funds, 144 Glenn Curtiss Boulevard, Uniondale, NY 11556-0144 Attn: Institutional Services Department
E-mail Send your request to info@bnymellon.com
Internet Information can be viewed online or downloaded at www.im.bnymellon.com
The fund files its complete schedule of portfolio holdings with the Securities and Exchange Commission (“SEC”) for the first and third quarters of each fiscal year on Form N-PORT. The fund’s Forms N-PORT are available on the SEC’s website at www.sec.gov.
A description of the policies and procedures that the fund uses to determine how to vote proxies relating to portfolio securities and information regarding how the fund voted these proxies for the most recent 12-month period ended June 30 is available at www.im.bnymellon.com and on the SEC’s website at www.sec.gov and without charge, upon request, by calling 1-800-373-9387.
| | |
© 2023 BNY Mellon Securities Corporation
0410AR1222 | 
|
BNY Mellon Investment Portfolios, Technology Growth Portfolio
| |
ANNUAL REPORT December 31, 2022 |

| |
Save time. Save paper. View your next shareholder report online as soon as it’s available. Log into www.im.bnymellon.com and sign up for eCommunications. It’s simple and only takes a few minutes. |
| |
The views expressed in this report reflect those of the portfolio manager(s) only through the end of the period covered and do not necessarily represent the views of BNY Mellon Investment Adviser, Inc. or any other person in the BNY Mellon Investment Adviser, Inc. organization. Any such views are subject to change at any time based upon market or other conditions and BNY Mellon Investment Adviser, Inc. disclaims any responsibility to update such views. These views may not be relied on as investment advice and, because investment decisions for a fund in the BNY Mellon Family of Funds are based on numerous factors, may not be relied on as an indication of trading intent on behalf of any fund in the BNY Mellon Family of Funds. |
| |
Not FDIC-Insured • Not Bank-Guaranteed • May Lose Value |
Contents
THE FUND
FOR MORE INFORMATION
Back Cover
DISCUSSION OF FUND PERFORMANCE (Unaudited)
For the period from January 1, 2022, through December 31, 2022, as provided by portfolio managers Jonathan Piskorowski, CFA and Robert Zeuthen, CFA of Newton Investment Management North America, LLC, sub-adviser.
Market and Fund Performance Overview
For the 12-month period ended December 31, 2022, BNY Mellon Investment Portfolios, Technology Growth Portfolio’s (the “fund”) Initial shares produced a total return of −46.39%, and its Service shares produced a total return of −46.52%.1 The fund’s benchmarks, the NYSE® Technology Index (the “Index”) and the S&P 500® Index, produced total returns of −40.81% and −18.10%, respectively, over the same period.2,3
Technology stocks lost ground during the reporting period as inflation, higher interest rates and negative earnings revisions weighed on valuations. The fund lagged the Index, due largely to exposure to high-growth, high-valuation stocks, which were sold off during the period.
The Fund’s Investment Approach
The fund seeks capital appreciation. To pursue its goal, the fund normally invests at least 80% of its net assets in the stocks of growth companies of any size that BNY Mellon Investment Adviser, Inc. believes to be leading producers or beneficiaries of technological innovation. Up to 25% of the fund’s assets may be invested in foreign securities.
In choosing stocks, the fund looks for technology companies with the potential for strong earnings or revenue growth rates, although some of the fund’s investments may currently be experiencing losses. The fund’s investment process centers on a multidimensional approach that looks for opportunities across emerging-growth, cyclical or stable-growth companies. The fund’s investment approach seeks companies that appear to have strong earnings momentum, positive earnings revisions, favorable growth, product, or market cycles and/or favorable valuations.
Inflation, Monetary Policy and Potential Economic Slowdown Weigh on Markets
The reporting period was defined by a significant shift from positive to negative investor sentiment. This was initially driven by high inflation, dramatically tightening monetary policy from the Federal Reserve (the “Fed”) and the Russia-Ukraine War. Later in the period, the possibility of an economic slowdown and negative earnings revisions weighed on markets, though investors also increasingly looked ahead to a potential easing in the Fed’s tightening policy.
As 2022 progressed, inflation data and central bank monetary tightening policies dominated the market narrative. Slower growth prospects, supply-chain concerns and expectations that interest rates would be higher for a longer period negatively impacted stock valuations, especially in the information technology sector. Across Europe, a broad monetary tightening effort by the Bank of England and the European Central Bank was implemented. In the EU, high inflation readings dampened the growth outlook, while soaring energy prices became a focus for European policymakers. In contrast to monetary normalization and reopening trends worldwide, China continued to implement more accommodative monetary policies to
2
address lackluster economic growth stemming from a weak macroeconomic environment and strict COVID-19 lockdown policies.
Geopolitical forces also weighed on markets. In addition to the war in Ukraine, China’s “Zero-COVID” policies continued to hamper supply chains, adding uncertainty to the global economic landscape.
As the reporting period progressed, markets responded in rollercoaster fashion to tightening monetary policy, mixed economic data and geopolitical uncertainties. Midway through the year, the market appeared to reach a bottom and began to rebound before descending again. Late in the period, the possibility that the Fed would ease the pace of interest-rate hikes provided some support to equities markets.
Broad Sell-off Hindered Returns
The fund lagged the Index primarily due to three causes. First, the fund’s lack of exposure to more mature technology companies detracted from performance. This accounted for approximately 300 basis points of the underperformance. Second, another 200 basis points of underperformance arose from the sell-off in high-growth, high-volatility companies that came under pressure as interest rates rose, and their fundamentals weakened. We exited these positions during the period. Finally, underperformance also stemmed from low exposure to e-commerce companies serving consumers in Asia. Certain selections, including Marvell Technology Inc. in the semiconductor industry and Bill.com Holdings in the software industry, were particularly detrimental.
On a more positive note, the fund outperformed in the automobile industry. A decision to sell shares of Tesla, Inc. was beneficial. Growing competition from Chinese electric vehicle makers and the potential for the acquisition of Twitter, Inc. to be a distraction for Tesla CEO Elon Musk led the fund to sell shares as the period progressed. The fund also benefited from an overweight in the communications services sector, which consisted mostly of a relatively large position in Alphabet, Inc. parent of Google. Exiting higher-risk positions in this sector was also advantageous.
A Focus on Long-Term Prospects
We continue to anticipate a potential global economic slowdown, which is likely to lead to additional downward earnings revisions. Any pullback in interest-rate hikes would probably be supportive of growth stocks, however.
In addition, though the short-term environment may be challenging, the secular growth themes remain intact, and we remain optimistic about the prospects for technology and growth-oriented companies. The fund continues to position itself to capitalize on a secular shift that is resulting in digitization across all sectors of the economy.
3
DISCUSSION OF FUND PERFORMANCE (Unaudited) (continued)
While valuations among growth and technology stocks have pulled back, the sell-off has created buying opportunities for companies exposed to secular growth trends, and we are prepared to take advantage at the appropriate time.
January 17, 2023
1 Total return includes reinvestment of dividends and any capital gains paid. Past performance is no guarantee of future results. Share price and investment return fluctuate such that upon redemption, fund shares may be worth more or less than their original cost. The fund’s performance does not reflect the deduction of additional charges and expenses imposed in connection with investing in variable insurance contracts, which will reduce returns.
2 Source: Bloomberg L.P. — The NYSE® Technology Index is an equal-dollar-weighted index designed to objectively represent the technology sector by holding 35 of the leading U.S., technology-related companies. Investors cannot invest directly in any index.
3 Source: Lipper Inc. — The S&P 500® Index is widely regarded as the best single gauge of large-cap U.S. equities. The Index includes 500 leading companies and captures approximately 80% coverage of available market capitalization. Investors cannot invest directly in any index.
Please note: the position in any security highlighted with italicized typeface was sold during the reporting period.
The technology sector has been among the most volatile sectors of the stock market. Technology companies involve greater risk because their revenue and/or earnings tend to be less predictable, and some companies may be experiencing significant losses.
Equities are subject generally to market, market sector, market liquidity, issuer and investment style risks, among other factors, to varying degrees, all of which are more fully described in the fund’s prospectus.
Investing internationally involves special risks, including changes in currency exchange rates, political, economic, and social instability, a lack of comprehensive company information, differing auditing and legal standards, and less market liquidity.
The fund is only available as a funding vehicle under variable life insurance policies or variable annuity contracts issued by insurance companies. Individuals may not purchase shares of the fund directly. A variable annuity is an insurance contract issued by an insurance company that enables investors to accumulate assets on a tax-deferred basis for retirement or other long-term goals. The investment objective and policies of BNY Mellon Investment Portfolios, Technology Growth Portfolio made available through insurance products may be similar to those of other funds managed or advised by BNY Mellon Investment Adviser, Inc. However, the investment results of the fund may be higher or lower than, and may not be comparable to, those of any other BNY Mellon fund.
Recent market risks include pandemic risks related to COVID-19. The effects of COVID-19 have contributed to increased volatility in global markets and will likely affect certain countries, companies, industries and market sectors more dramatically than others. To the extent the fund may overweight its investments in certain countries, companies, industries or market sectors, such positions will increase the fund’s exposure to risk of loss from adverse developments affecting those countries, companies, industries or sectors.
4
FUND PERFORMANCE (Unaudited)
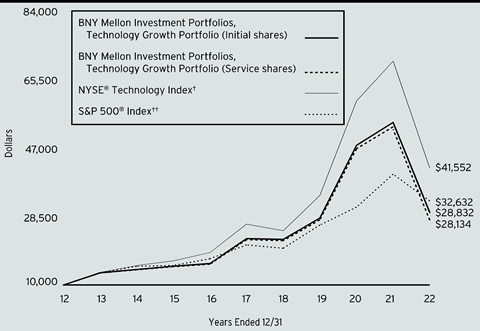
Comparison of change in value of a $10,000 investment in Initial shares and Service shares of BNY Mellon Investment Portfolios, Technology Growth Portfolio with a hypothetical investment of $10,000 in the NYSE® Technology Index and S&P 500® Index.
† Source: Bloomberg L.P.
†† Source: Lipper Inc.
Past performance is not predictive of future performance. The fund’s performance does not reflect the deduction of additional charges and expenses imposed in connection with investing in variable insurance contracts which will reduce returns.
The above graph compares a hypothetical investment of $10,000 made in each of the Initial shares and Service shares of BNY Mellon Investment Portfolios, Technology Growth Portfolio on 12/31/12 to a hypothetical investment of $10,000 made in the NYSE® Technology Index and S&P 500® Index on that date.
The fund’s performance shown in the line graph above takes into account all applicable fees and expenses. The NYSE® Technology Index is an equal-dollar weighted index designed to objectively represent the technology sector by holding 35 of the leading U.S. technology-related companies. The S&P 500® Index is widely regarded as the best single gauge of large-cap U.S. equities. The index includes 500 leading companies and captures approximately 80% coverage of available market capitalization. Unlike a mutual fund, the indices are not subject to charges, fees and other expenses. Investors cannot invest directly in any index. Further information relating to fund performance, including expense reimbursements, if applicable, is contained in the Financial Highlights section of the prospectus and elsewhere in this report.
5
FUND PERFORMANCE (Unaudited) (continued)
| | | | |
Average Annual Total Returns as of 12/31/2022 |
| 1 Year | 5 Years | 10 Years |
Initial shares | -46.39% | 5.09% | 11.17% |
Service shares | -46.52% | 4.83% | 10.90% |
NYSE® Technology Index | -40.81% | 9.52% | 15.30% |
S&P 500® Index | -18.10% | 9.42% | 12.55% |
The performance data quoted represents past performance, which is no guarantee of future results. Share price and investment return fluctuate and an investor’s shares may be worth more or less than original cost upon redemption. Current performance may be lower or higher than the performance quoted. Go to www.im.bnymellon.com for the fund’s most recent month-end returns.
The fund’s Initial shares are not subject to a Rule 12b-1 fee. The fund’s Service shares are subject to a 0.25% annual Rule 12b-1 fee. All dividends and capital gain distributions are reinvested.
The fund’s performance shown in the graph and table does not reflect the deduction of taxes that a shareholder would pay on fund distributions or the redemption of fund shares.
6
UNDERSTANDING YOUR FUND’S EXPENSES (Unaudited)
As a mutual fund investor, you pay ongoing expenses, such as management fees and other expenses. Using the information below, you can estimate how these expenses affect your investment and compare them with the expenses of other funds. You also may pay one-time transaction expenses, including sales charges (loads), redemption fees and expenses associated with variable annuity or insurance contracts, which are not shown in this section and would have resulted in higher total expenses. For more information, see your fund’s prospectus or talk to your financial adviser.
Review your fund’s expenses
The table below shows the expenses you would have paid on a $1,000 investment in BNY Mellon Investment Portfolios, Technology Growth Portfolio from July 1, 2022 to December 31, 2022. It also shows how much a $1,000 investment would be worth at the close of the period, assuming actual returns and expenses.
| | | | | |
Expenses and Value of a $1,000 Investment | |
Assume actual returns for the six months ended December 31, 2022 | |
| | | | |
| | Initial Shares | Service Shares | |
Expenses paid per $1,000† | $3.79 | $5.00 | |
Ending value (after expenses) | $925.20 | $924.10 | |
COMPARING YOUR FUND’S EXPENSES WITH THOSE OF OTHER FUNDS (Unaudited)
Using the SEC’s method to compare expenses
The Securities and Exchange Commission (“SEC”) has established guidelines to help investors assess fund expenses. Per these guidelines, the table below shows your fund’s expenses based on a $1,000 investment, assuming a hypothetical 5% annualized return. You can use this information to compare the ongoing expenses (but not transaction expenses or total cost) of investing in the fund with those of other funds. All mutual fund shareholder reports will provide this information to help you make this comparison. Please note that you cannot use this information to estimate your actual ending account balance and expenses paid during the period.
| | | | | |
Expenses and Value of a $1,000 Investment | |
Assuming a hypothetical 5% annualized return for the six months ended December 31, 2022 | |
| | | | |
| | Initial Shares | Service Shares | |
Expenses paid per $1,000† | $3.97 | $5.24 | |
Ending value (after expenses) | $1,021.27 | $1,020.01 | |
† | Expenses are equal to the fund’s annualized expense ratio of .78% for Initial Shares and 1.03% for Service Shares, multiplied by the average account value over the period, multiplied by 184/365 (to reflect the one-half year period). |
7
STATEMENT OF INVESTMENTS
December 31, 2022
| | | | | | | | |
| |
Description | | | | Shares | | Value ($) | |
Common Stocks - 94.8% | | | | | |
Application Software - 12.3% | | | | | |
Adobe Inc. | | | | 67,543 | a | 22,730,246 | |
DoubleVerify Holdings Inc. | | | | 247,265 | a | 5,429,939 | |
HubSpot Inc. | | | | 43,491 | a | 12,574,553 | |
Intuit Inc. | | | | 36,833 | | 14,336,140 | |
Salesforce Inc. | | | | 225,199 | a | 29,859,135 | |
| | | | | 84,930,013 | |
Auto Parts & Equipment - .1% | | | | | |
Mobileye Global Inc., Cl. A | | | | 23,723 | a | 831,728 | |
Communications Equipment - 3.1% | | | | | |
Nokia OYJ, ADR | | | | 4,567,224 | b | 21,191,919 | |
Data Processing & Outsourced Services - 6.4% | | | | | |
Block Inc. | | | | 116,716 | a | 7,334,433 | |
PayPal Holdings Inc. | | | | 327,375 | a | 23,315,648 | |
Visa Inc., Cl. A | | | | 63,113 | b | 13,112,357 | |
| | | | | 43,762,438 | |
Hotels, Resorts & Cruise Lines - 4.2% | | | | | |
Booking Holdings Inc. | | | | 14,268 | a | 28,754,015 | |
Interactive Media & Services - 6.0% | | | | | |
Alphabet Inc., Cl. C | | | | 461,300 | a | 40,931,149 | |
Internet & Direct Marketing Research - 1.8% | | | | | |
Amazon.com Inc. | | | | 147,375 | a | 12,379,500 | |
Internet Services & Infrastructure - 6.2% | | | | | |
Shopify Inc., Cl. A | | | | 859,774 | a | 29,842,756 | |
Twilio Inc., Cl. A | | | | 266,395 | a | 13,042,699 | |
| | | | | 42,885,455 | |
Life Sciences Tools & Services - 1.9% | | | | | |
Illumina Inc. | | | | 64,529 | a | 13,047,764 | |
Movies & Entertainment - 4.1% | | | | | |
Netflix Inc. | | | | 95,135 | a | 28,053,409 | |
Research & Consulting Services - 1.0% | | | | | |
CoStar Group Inc. | | | | 85,314 | a | 6,593,066 | |
Semiconductor Equipment - 11.1% | | | | | |
Applied Materials Inc. | | | | 376,019 | | 36,616,730 | |
Lam Research Corp. | | | | 76,027 | | 31,954,148 | |
MKS Instruments Inc. | | | | 95,283 | b | 8,073,329 | |
| | | | | 76,644,207 | |
Semiconductors - 16.4% | | | | | |
Diodes Inc. | | | | 56,040 | a | 4,266,886 | |
Marvell Technology Inc. | | | | 171,843 | | 6,365,065 | |
Micron Technology Inc. | | | | 301,894 | | 15,088,662 | |
NVIDIA Corp. | | | | 97,337 | | 14,224,829 | |
8
| | | | | | | | |
| |
Description | | | | Shares | | Value ($) | |
Common Stocks - 94.8% (continued) | | | | | |
Semiconductors - 16.4% (continued) | | | | | |
ON Semiconductor Corp. | | | | 112,913 | a | 7,042,384 | |
Qualcomm Inc. | | | | 282,827 | | 31,094,000 | |
Taiwan Semiconductor Manufacturing Co., ADR | | | | 465,931 | | 34,707,200 | |
| | | | | 112,789,026 | |
Systems Software - 14.1% | | | | | |
JFrog Ltd. | | | | 668,335 | a | 14,255,586 | |
Microsoft Corp. | | | | 203,733 | | 48,859,248 | |
ServiceNow Inc. | | | | 86,417 | a | 33,553,129 | |
| | | | | 96,667,963 | |
Technology Hardware, Storage & Equipment - 4.7% | | | | | |
Apple Inc. | | | | 249,854 | | 32,463,530 | |
Trucking - 1.4% | | | | | |
Uber Technologies Inc. | | | | 402,134 | a | 9,944,774 | |
Total Common Stocks (cost $635,082,808) | | | | 651,869,956 | |
| | | | | | | | |
Private Equity - .4% | | | | | |
Real Estate - .1% | | | | | |
Roofstock | | | | 83,989 | a,c | 936,477 | |
Software - .3% | | | | | |
Databricks Inc. | | | | 71,556 | a,c | 2,026,466 | |
Total Private Equity (cost $7,734,655) | | | | 2,962,943 | |
| | | 1-Day
Yield (%) | | | | | |
Investment Companies - 4.1% | | | | | |
Registered Investment Companies - 4.1% | | | | | |
Dreyfus Institutional Preferred Government Plus Money Market Fund, Institutional Shares
(cost $28,162,576) | | 4.37 | | 28,162,576 | d | 28,162,576 | |
Total Investments (cost $670,980,039) | | 99.3% | | 682,995,475 | |
Cash and Receivables (Net) | | .7% | | 4,688,439 | |
Net Assets | | 100.0% | | 687,683,914 | |
ADR—American Depository Receipt
a Non-income producing security.
b Security, or portion thereof, on loan. At December 31, 2022, the value of the fund’s securities on loan was $24,560,509 and the value of the collateral was $25,163,922, consisting of U.S. Government & Agency securities. In addition, the value of collateral may include pending sales that are also on loan.
c The fund held Level 3 securities at December 31, 2022. These securities were valued at $2,962,943 or ..4% of net assets.
d Investment in affiliated issuer. The investment objective of this investment company is publicly available and can be found within the investment company’s prospectus.
9
STATEMENT OF INVESTMENTS (continued)
| | |
Portfolio Summary (Unaudited) † | Value (%) |
Information Technology | 74.4 |
Communication Services | 10.0 |
Consumer Discretionary | 6.1 |
Investment Companies | 4.1 |
Industrials | 2.4 |
Health Care | 1.9 |
Technology | .3 |
Real Estate | .1 |
| | 99.3 |
† Based on net assets.
See notes to financial statements.
| | | | | | | |
Affiliated Issuers | | | |
Description | Value ($) 12/31/2021 | Purchases ($)† | Sales ($) | Value ($) 12/31/2022 | Dividends/
Distributions ($) | |
Registered Investment Companies - 4.1% | | |
Dreyfus Institutional Preferred Government Plus Money Market Fund, Institutional Shares - 4.1% | 35,847,292 | 344,135,387 | (351,820,103) | 28,162,576 | 643,804 | |
Investment of Cash Collateral for Securities Loaned - .0% | | |
Dreyfus Institutional Preferred Government Plus Money Market Fund, SL Shares - .0% | 362,002 | 40,361,094 | (40,723,096) | - | 22,993 | †† |
Total - 4.1% | 36,209,294 | 384,496,481 | (392,543,199) | 28,162,576 | 666,797 | |
† Includes reinvested dividends/distributions.
†† Represents securities lending income earned from the reinvestment of cash collateral from loaned securities, net of fees and collateral investment expenses, and other payments to and from borrowers of securities.
See notes to financial statements.
10
STATEMENT OF ASSETS AND LIABILITIES
December 31, 2022
| | | | | | | |
| | | | | | |
| | | Cost | | Value | |
Assets ($): | | | | |
Investments in securities—See Statement of Investments
(including securities on loan, valued at $24,560,509)—Note 1(c): | | | |
Unaffiliated issuers | 642,817,463 | | 654,832,899 | |
Affiliated issuers | | 28,162,576 | | 28,162,576 | |
Cash | | | | | 4,849,200 | |
Cash denominated in foreign currency | | | 53,099 | | 53,244 | |
Dividends and securities lending income receivable | | 423,131 | |
Tax reclaim receivable—Note 1(b) | | 46,092 | |
Receivable for shares of Beneficial Interest subscribed | | 27,530 | |
Prepaid expenses | | | | | 5,312 | |
| | | | | 688,399,984 | |
Liabilities ($): | | | | |
Due to BNY Mellon Investment Adviser, Inc. and affiliates—Note 3(b) | | 579,401 | |
Payable for shares of Beneficial Interest redeemed | | 71,600 | |
Trustees’ fees and expenses payable | | 1,344 | |
Other accrued expenses | | | | | 63,725 | |
| | | | | 716,070 | |
Net Assets ($) | | | 687,683,914 | |
Composition of Net Assets ($): | | | | |
Paid-in capital | | | | | 771,301,202 | |
Total distributable earnings (loss) | | | | | (83,617,288) | |
Net Assets ($) | | | 687,683,914 | |
| | | | |
Net Asset Value Per Share | Initial Shares | Service Shares | |
Net Assets ($) | 163,978,619 | 523,705,295 | |
Shares Outstanding | 9,331,528 | 33,085,407 | |
Net Asset Value Per Share ($) | 17.57 | 15.83 | |
| | | |
See notes to financial statements. | | | |
11
STATEMENT OF OPERATIONS
Year Ended December 31, 2022
| | | | | | | |
| | | | | | |
| | | | | | |
Investment Income ($): | | | | |
Income: | | | | |
Cash dividends (net of $206,729 foreign taxes withheld at source): | |
Unaffiliated issuers | | | 3,423,666 | |
Affiliated issuers | | | 643,804 | |
Income from securities lending—Note 1(c) | | | 22,993 | |
Total Income | | | 4,090,463 | |
Expenses: | | | | |
Management fee—Note 3(a) | | | 6,044,516 | |
Distribution fees—Note 3(b) | | | 1,529,883 | |
Professional fees | | | 79,641 | |
Trustees’ fees and expenses—Note 3(c) | | | 60,473 | |
Custodian fees—Note 3(b) | | | 26,675 | |
Chief Compliance Officer fees—Note 3(b) | | | 17,082 | |
Loan commitment fees—Note 2 | | | 14,383 | |
Prospectus and shareholders’ reports | | | 13,605 | |
Shareholder servicing costs—Note 3(b) | | | 1,142 | |
Miscellaneous | | | 27,739 | |
Total Expenses | | | 7,815,139 | |
Less—reduction in fees due to earnings credits—Note 3(b) | | | (83) | |
Net Expenses | | | 7,815,056 | |
Net Investment (Loss) | | | (3,724,593) | |
Realized and Unrealized Gain (Loss) on Investments—Note 4 ($): | | |
Net realized gain (loss) on investments | (94,905,075) | |
Net change in unrealized appreciation (depreciation) on investments
and foreign currency transactions | (444,413,574) | |
Net Realized and Unrealized Gain (Loss) on Investments | | | (539,318,649) | |
Net (Decrease) in Net Assets Resulting from Operations | | (543,043,242) | |
| | | | | | |
See notes to financial statements. | | | | | |
12
STATEMENT OF CHANGES IN NET ASSETS
| | | | | | | | | | |
| | | | Year Ended December 31, |
| | | | 2022 | | 2021 | |
Operations ($): | | | | | | | | |
Net investment (loss) | | | (3,724,593) | | | | (7,280,526) | |
Net realized gain (loss) on investments | | (94,905,075) | | | | 82,695,383 | |
Net change in unrealized appreciation
(depreciation) on investments | | (444,413,574) | | | | 50,070,915 | |
Net Increase (Decrease) in Net Assets
Resulting from Operations | (543,043,242) | | | | 125,485,772 | |
Distributions ($): | |
Distributions to shareholders: | | | | | | | | |
Initial Shares | | | (18,328,459) | | | | (32,359,709) | |
Service Shares | | | (64,142,065) | | | | (111,542,791) | |
Total Distributions | | | (82,470,524) | | | | (143,902,500) | |
Beneficial Interest Transactions ($): | |
Net proceeds from shares sold: | | | | | | | | |
Initial Shares | | | 41,299,031 | | | | 38,635,032 | |
Service Shares | | | 106,323,778 | | | | 69,994,785 | |
Distributions reinvested: | | | | | | | | |
Initial Shares | | | 18,328,459 | | | | 32,359,709 | |
Service Shares | | | 64,142,065 | | | | 111,542,791 | |
Cost of shares redeemed: | | | | | | | | |
Initial Shares | | | (13,680,329) | | | | (29,954,495) | |
Service Shares | | | (22,753,772) | | | | (48,205,685) | |
Increase (Decrease) in Net Assets
from Beneficial Interest Transactions | 193,659,232 | | | | 174,372,137 | |
Total Increase (Decrease) in Net Assets | (431,854,534) | | | | 155,955,409 | |
Net Assets ($): | |
Beginning of Period | | | 1,119,538,448 | | | | 963,583,039 | |
End of Period | | | 687,683,914 | | | | 1,119,538,448 | |
Capital Share Transactions (Shares): | |
Initial Shares | | | | | | | | |
Shares sold | | | 1,802,628 | | | | 1,082,297 | |
Shares issued for distributions reinvested | | | 671,126 | | | | 1,048,937 | |
Shares redeemed | | | (618,088) | | | | (852,079) | |
Net Increase (Decrease) in Shares Outstanding | 1,855,666 | | | | 1,279,155 | |
Service Shares | | | | | | | | |
Shares sold | | | 5,281,754 | | | | 2,177,251 | |
Shares issued for distributions reinvested | | | 2,603,168 | | | | 3,962,443 | |
Shares redeemed | | | (1,127,749) | | | | (1,499,462) | |
Net Increase (Decrease) in Shares Outstanding | 6,757,173 | | | | 4,640,232 | |
| | | | | | | | | |
See notes to financial statements. | | | | | | | | |
13
FINANCIAL HIGHLIGHTS
The following tables describe the performance for each share class for the fiscal periods indicated. All information (except portfolio turnover rate) reflects financial results for a single fund share. Net asset value total return is calculated assuming an initial investment made at the net asset value at the beginning of the period, reinvestment of all dividends and distributions at net asset value during the period, and redemption at net asset value on the last day of the period. Net asset value total return includes adjustments in accordance with accounting principles generally accepted in the United States of America and as such, the net asset value for financial reporting purposes and the returns based upon those net asset values may differ from the net asset value and returns for shareholder transactions. The fund’s total returns do not reflect expenses associated with variable annuity or insurance contracts. These figures have been derived from the fund’s financial statements.
| | | | | | | | |
| | | |
| | Year Ended December 31, |
Initial Shares | | 2022 | 2021 | 2020 | 2019 | 2018 |
Per Share Data ($): | | | | | | |
Net asset value,
beginning of period | | 35.59 | 36.68 | 25.26 | 22.56 | 23.95 |
Investment Operations: | | | | | | |
Net investment income (loss)a | | (.06) | (.17) | (.03) | .08 | .04 |
Net realized and unrealized gain
(loss) on investments | | (15.61) | 4.14 | 14.68 | 5.55 | (.11) |
Total from Investment Operations | | (15.67) | 3.97 | 14.65 | 5.63 | (.07) |
Distributions: | | | | | | |
Dividends from net investment
income | | - | - | (.08) | - | - |
Dividends from net realized
gain on investments | | (2.35) | (5.06) | (3.15) | (2.93) | (1.32) |
Total Distributions | | (2.35) | (5.06) | (3.23) | (2.93) | (1.32) |
Net asset value, end of period | | 17.57 | 35.59 | 36.68 | 25.26 | 22.56 |
Total Return (%) | | (46.39) | 12.93 | 69.92 | 25.82 | (.98) |
Ratios/Supplemental Data (%): | | | | | | |
Ratio of total expenses
to average net assets | | .78 | .78 | .78 | .79 | .79 |
Ratio of net expenses
to average net assets | | .78 | .78 | .78 | .79 | .79 |
Ratio of net investment income
(loss) to average net assets | | (.27) | (.49) | (.10) | .33 | .14 |
Portfolio Turnover Rate | | 51.13 | 38.70 | 80.81 | 77.56 | 55.34 |
Net Assets,
end of period ($ x 1,000) | | 163,979 | 266,078 | 227,325 | 140,591 | 119,470 |
a Based on average shares outstanding.
See notes to financial statements.
14
| | | | | | | | |
| | | |
| | Year Ended December 31, |
Service Shares | | 2022 | 2021 | 2020 | 2019 | 2018 |
Per Share Data ($): | | | | | | |
Net asset value,
beginning of period | | 32.42 | 33.95 | 23.63 | 21.31 | 22.75 |
Investment Operations: | | | | | | |
Net investment income (loss)a | | (.10) | (.24) | (.09) | .02 | (.03) |
Net realized and unrealized gain
(loss) on investments | | (14.14) | 3.77 | 13.58 | 5.23 | (.09) |
Total from Investment Operations | | (14.24) | 3.53 | 13.49 | 5.25 | (.12) |
Distributions: | | | | | | |
Dividends from net investment
income | | - | - | (.02) | - | - |
Dividends from net realized
gain on investments | | (2.35) | (5.06) | (3.15) | (2.93) | (1.32) |
Total Distributions | | (2.35) | (5.06) | (3.17) | (2.93) | (1.32) |
Net asset value, end of period | | 15.83 | 32.42 | 33.95 | 23.63 | 21.31 |
Total Return (%) | | (46.52) | 12.64 | 69.57 | 25.51 | (1.27) |
Ratios/Supplemental Data (%): | | | | | | |
Ratio of total expenses
to average net assets | | 1.03 | 1.03 | 1.03 | 1.04 | 1.04 |
Ratio of net expenses
to average net assets | | 1.03 | 1.03 | 1.03 | 1.04 | 1.04 |
Ratio of net investment income (loss)
to average net assets | | (.52) | (.74) | (.34) | .08 | (.11) |
Portfolio Turnover Rate | | 51.13 | 38.70 | 80.81 | 77.56 | 55.34 |
Net Assets,
end of period ($ x 1,000) | | 523,705 | 853,460 | 736,258 | 475,148 | 388,151 |
a Based on average shares outstanding.
See notes to financial statements.
15
NOTES TO FINANCIAL STATEMENTS
NOTE 1—Significant Accounting Policies:
Technology Growth Portfolio (the “fund”) is a separate diversified series of BNY Mellon Investment Portfolios (the “Trust”), which is registered under the Investment Company Act of 1940, as amended (the “Act”), as an open-end management investment company and operates as a series company currently offering three series, including the fund. The fund is only offered to separate accounts established by insurance companies to fund variable annuity contracts and variable life insurance policies. The fund’s investment objective is to seek capital appreciation. BNY Mellon Investment Adviser, Inc. (the “Adviser”), a wholly-owned subsidiary of The Bank of New York Mellon Corporation (“BNY Mellon”), serves as the fund’s investment adviser. Newton Investment Management North America, LLC (the “Sub-Adviser”), a wholly-owned subsidiary of BNY Mellon and an affiliate of the Adviser, serves as the fund’s sub-adviser.
BNY Mellon Securities Corporation (the “Distributor”), a wholly-owned subsidiary of the Adviser, is the distributor of the fund’s shares, which are sold without a sales charge. The fund is authorized to issue an unlimited number of $.001 par value shares of Beneficial Interest in each of the following classes of shares: Initial and Service. Each class of shares has identical rights and privileges, except with respect to the Distribution Plan, and the expenses borne by each class, the allocation of certain transfer agency costs, and certain voting rights. Income, expenses (other than expenses attributable to a specific class), and realized and unrealized gains or losses on investments are allocated to each class of shares based on its relative net assets.
The Trust accounts separately for the assets, liabilities and operations of each series. Expenses directly attributable to each series are charged to that series’ operations; expenses which are applicable to all series are allocated among them on a pro rata basis.
The Financial Accounting Standards Board (“FASB”) Accounting Standards Codification (“ASC”) is the exclusive reference of authoritative U.S. generally accepted accounting principles (“GAAP”) recognized by the FASB to be applied by nongovernmental entities. Rules and interpretive releases of the SEC under authority of federal laws are also sources of authoritative GAAP for SEC registrants. The fund is an investment company and applies the accounting and reporting guidance of the FASB ASC Topic 946 Financial Services-Investment Companies. The fund’s financial statements are prepared in accordance with GAAP, which may require the use of management estimates and assumptions. Actual results could differ from those estimates.
16
The Trust enters into contracts that contain a variety of indemnifications. The fund’s maximum exposure under these arrangements is unknown. The fund does not anticipate recognizing any loss related to these arrangements.
(a) Portfolio valuation: The fair value of a financial instrument is the amount that would be received to sell an asset or paid to transfer a liability in an orderly transaction between market participants at the measurement date (i.e., the exit price). GAAP establishes a fair value hierarchy that prioritizes the inputs of valuation techniques used to measure fair value. This hierarchy gives the highest priority to unadjusted quoted prices in active markets for identical assets or liabilities (Level 1 measurements) and the lowest priority to unobservable inputs (Level 3 measurements).
Additionally, GAAP provides guidance on determining whether the volume and activity in a market has decreased significantly and whether such a decrease in activity results in transactions that are not orderly. GAAP requires enhanced disclosures around valuation inputs and techniques used during annual and interim periods.
Various inputs are used in determining the value of the fund’s investments relating to fair value measurements. These inputs are summarized in the three broad levels listed below:
Level 1—unadjusted quoted prices in active markets for identical investments.
Level 2—other significant observable inputs (including quoted prices for similar investments, interest rates, prepayment speeds, credit risk, etc.).
Level 3—significant unobservable inputs (including the fund’s own assumptions in determining the fair value of investments).
The inputs or methodology used for valuing securities are not necessarily an indication of the risk associated with investing in those securities.
Changes in valuation techniques may result in transfers in or out of an assigned level within the disclosure hierarchy. Valuation techniques used to value the fund’s investments are as follows:
The Trust’s Board of Trustees (the “Board”) has designated the Adviser as the fund’s valuation designee, effective September 8, 2022, to make all fair value determinations with respect to the fund’s portfolio investments, subject to the Board’s oversight and pursuant to Rule 2a-5 under the Act.
Investments in equity securities are valued at the last sales price on the securities exchange or national securities market on which such securities
17
NOTES TO FINANCIAL STATEMENTS (continued)
are primarily traded. Securities listed on the National Market System for which market quotations are available are valued at the official closing price or, if there is no official closing price that day, at the last sales price. For open short positions, asked prices are used for valuation purposes. Bid price is used when no asked price is available. Registered investment companies that are not traded on an exchange are valued at their net asset value. All of the preceding securities are generally categorized within Level 1 of the fair value hierarchy.
Securities not listed on an exchange or the national securities market, or securities for which there were no transactions, are valued at the average of the most recent bid and asked prices. These securities are generally categorized within Level 2 of the fair value hierarchy.
Fair valuing of securities may be determined with the assistance of a pricing service using calculations based on indices of domestic securities and other appropriate indicators, such as prices of relevant ADRs and futures. Utilizing these techniques may result in transfers between Level 1 and Level 2 of the fair value hierarchy.
When market quotations or official closing prices are not readily available, or are determined not to accurately reflect fair value, such as when the value of a security has been significantly affected by events after the close of the exchange or market on which the security is principally traded (for example, a foreign exchange or market), but before the fund calculates its net asset value, the fund may value these investments at fair value as determined in accordance with the procedures approved by the Board. Certain factors may be considered when fair valuing investments such as: fundamental analytical data, the nature and duration of restrictions on disposition, an evaluation of the forces that influence the market in which the securities are purchased and sold, and public trading in similar securities of the issuer or comparable issuers. These securities are either categorized within Level 2 or 3 of the fair value hierarchy depending on the relevant inputs used.
For securities where observable inputs are limited, assumptions about market activity and risk are used and such securities are generally categorized within Level 3 of the fair value hierarchy.
Investment in private equity securities will be fair valued by the Board in accordance with valuation procedures approved by the Board. Those portfolio valuations will be based on unobservable inputs and certain assumptions about how market participants would price the instrument. The fund expects that inputs into the determination of fair value of those investments will require significant management judgment or estimation.
18
Because valuations may fluctuate over short periods of time and may be based on estimates, fair value determinations may differ materially from the value received in an actual transaction. Additionally, valuations of private companies are inherently uncertain. The fund’s net asset value could be adversely affected if the fund’s determinations regarding the fair value of those investments were materially higher or lower than the values that it ultimately realized upon the disposal of such investments. These securities are categorized within Level 3 of the fair value hierarchy.
Investments denominated in foreign currencies are translated to U.S. dollars at the prevailing rates of exchange.
The following is a summary of the inputs used as of December 31, 2022 in valuing the fund’s investments:
| | | | | | | |
| | Level 1-Unadjusted Quoted Prices | Level 2- Other Significant Observable Inputs | | Level 3-Significant Unobservable Inputs | Total | |
Assets ($) | | |
Investments in Securities:† | | |
Equity Securities - Common Stocks | 651,869,956 | - | | - | 651,869,956 | |
Equity Securities - Private Equity | - | - | | 2,962,943 | 2,962,943 | |
Investment Companies | 28,162,576 | - | | - | 28,162,576 | |
† See Statement of Investments for additional detailed categorizations, if any.
19
NOTES TO FINANCIAL STATEMENTS (continued)
The following is a reconciliation of Level 3 assets for which significant unobservable inputs were used to determine fair value:
| | |
| | Equity Securities- Private Equity ($) |
Balance as of 12/31/2021† | 5,556,562 |
Purchases/Issuances | 2,476,424 |
Sales/Dispositions | - |
Net realized gain (loss) | - |
Change in unrealized appreciation (depreciation) | (5,070,043) |
Transfers into Level 3 | - |
Transfers out of Level 3 | - |
Balances as of 12/31/2022† | 2,962,943 |
The amount of total net realized gains (losses) for the period included in earnings attributable to the net change in unrealized appreciation (depreciation) relating to investments still held at 12/31/2022 | (5,070,043) |
† Securities deemed as Level 3 due to the lack of observable inputs by management assessment.
The following table summarizes the significant unobservable inputs the fund used to value its investment categorized within Level 3 as of December 31, 2022. In addition to the techniques and inputs noted in the table below, according to the fund’s valuation policy, other valuation techniques and methodologies when determining the fund’s fair value measurements may be used. The below table is not intended to be all-inclusive, but rather provide information on the significant unobservable inputs as they are to the fund’s determination of fair values.
| | | | | | |
Asset Category- Issuer Name | Value ($) | Valuation
Technologies/
Methodologies | Unobservable
Inputs | Range | Weighted
Average |
Private Equity: | | | | | |
Databricks | 2,026,466 | Public Comparables/ Enterprise Value | Enterprise Value as Multiple of Revenue | 7.1x-19.7x | 11.9x |
Roofstock | 936,477 | Public Comparables/ Enterprise Value | Enterprise Value as Multiple of Revenue | .1x-12.5x | 3.3x |
(b) Foreign currency transactions: The fund does not isolate that portion of the results of operations resulting from changes in foreign exchange rates on investments from the fluctuations arising from changes
20
in the market prices of securities held. Such fluctuations are included with the net realized and unrealized gain or loss on investments.
Net realized foreign exchange gains or losses arise from sales of foreign currencies, currency gains or losses realized on securities transactions between trade and settlement date, and the difference between the amounts of dividends, interest and foreign withholding taxes recorded on the fund’s books and the U.S. dollar equivalent of the amounts actually received or paid. Net unrealized foreign exchange gains and losses arise from changes in the value of assets and liabilities other than investments resulting from changes in exchange rates. Foreign currency gains and losses on foreign currency transactions are also included with net realized and unrealized gain or loss on investments.
Foreign taxes: The fund may be subject to foreign taxes (a portion of which may be reclaimable) on income, stock dividends, realized and unrealized capital gains on investments or certain foreign currency transactions. Foreign taxes are recorded in accordance with the applicable foreign tax regulations and rates that exist in the foreign jurisdictions in which the fund invests. These foreign taxes, if any, are paid by the fund and are reflected in the Statement of Operations, if applicable. Foreign taxes payable or deferred or those subject to reclaims as of December 31, 2022, if any, are disclosed in the fund’s Statement of Assets and Liabilities.
(c) Securities transactions and investment income: Securities transactions are recorded on a trade date basis. Realized gains and losses from securities transactions are recorded on the identified cost basis. Dividend income is recognized on the ex-dividend date and interest income, including, where applicable, accretion of discount and amortization of premium on investments, is recognized on the accrual basis.
Pursuant to a securities lending agreement with BNY Mellon, the fund may lend securities to qualified institutions. It is the fund’s policy that, at origination, all loans are secured by collateral of at least 102% of the value of U.S. securities loaned and 105% of the value of foreign securities loaned. Collateral equivalent to at least 100% of the market value of securities on loan is maintained at all times. Collateral is either in the form of cash, which can be invested in certain money market mutual funds managed by the Adviser, or U.S. Government and Agency securities. The fund is entitled to receive all dividends, interest and distributions on securities loaned, in addition to income earned as a result of the lending transaction. Should a borrower fail to return the securities in a timely manner, BNY Mellon is required to replace the securities for the benefit of the fund or credit the fund with the market value of the unreturned
21
NOTES TO FINANCIAL STATEMENTS (continued)
securities and is subrogated to the fund’s rights against the borrower and the collateral. Additionally, the contractual maturity of security lending transactions are on an overnight and continuous basis. During the period ended December 31, 2022, BNY Mellon earned $3,135 from the lending of the fund’s portfolio securities, pursuant to the securities lending agreement.
(d) Affiliated issuers: Investments in other investment companies advised by the Adviser are considered “affiliated” under the Act.
(e) Market Risk: The value of the securities in which the fund invests may be affected by political, regulatory, economic and social developments, and developments that impact specific economic sectors, industries or segments of the market. The value of a security may also decline due to general market conditions that are not specifically related to a particular company or industry, such as real or perceived adverse economic conditions, changes in the general outlook for corporate earnings, changes in interest or currency rates, changes to inflation, adverse changes to credit markets or adverse investor sentiment generally. In addition, turbulence in financial markets and reduced liquidity in equity, credit and/or fixed income markets may negatively affect many issuers, which could adversely affect the fund. Global economies and financial markets are becoming increasingly interconnected, and conditions and events in one country, region or financial market may adversely impact issuers in a different country, region or financial market. These risks may be magnified if certain events or developments adversely interrupt the global supply chain; in these and other circumstances, such risks might affect companies world-wide. Recent examples include pandemic risks related to COVID-19 and aggressive measures taken world-wide in response by governments, including closing borders, restricting international and domestic travel, and the imposition of prolonged quarantines of large populations, and by businesses, including changes to operations and reducing staff.
Foreign Investment Risk: To the extent the fund invests in foreign securities, the fund’s performance will be influenced by political, social and economic factors affecting investments in foreign issuers. Special risk associated with investments in foreign issuers include exposure to currency fluctuations, less liquidity, less developed or less efficient trading markets, lack of comprehensive company information, political and economic instability and differing auditing and legal standards.
Technology Company Risk: The technology sector has been among the most volatile sectors of the stock market. Because the fund’s investments are concentrated in the technology sector, its performance will be significantly affected by developments in that sector. Technology companies, especially small-cap technology companies, involve greater risk
22
because their revenue and/or earnings tend to be less predictable (and some companies may be experiencing significant losses) and their share prices tend to be more volatile. Certain technology companies may have limited product lines, markets or financial resources, or may depend on a limited management group. In addition, these companies are strongly affected by worldwide technological developments, and their products and services may not be economically successful or may quickly become outdated. Investor perception may play a greater role in determining the day-to-day value of tech stocks than it does in other sectors. Fund investments made in anticipation of future products and services may decline dramatically in value if the anticipated products or services are delayed or cancelled. The risks associated with technology companies are magnified in the case of small-cap technology companies. The shares of smaller technology companies tend to trade less frequently than those of larger, more established companies, which can have an adverse effect on the pricing of these securities and on the fund’s ability to sell these securities.
(f) Dividends and distributions to shareholders: Dividends and distributions are recorded on the ex-dividend date. Dividends from net investment income and dividends from net realized capital gains, if any, are normally declared and paid annually, but the fund may make distributions on a more frequent basis to comply with the distribution requirements of the Internal Revenue Code of 1986, as amended (the “Code”). To the extent that net realized capital gains can be offset by capital loss carryovers, it is the policy of the fund not to distribute such gains. Income and capital gain distributions are determined in accordance with income tax regulations, which may differ from GAAP.
(g) Federal income taxes: It is the policy of the fund to continue to qualify as a regulated investment company, if such qualification is in the best interests of its shareholders, by complying with the applicable provisions of the Code, and to make distributions of taxable income and net realized capital gain sufficient to relieve it from substantially all federal income and excise taxes.
As of and during the period ended December 31, 2022, the fund did not have any liabilities for any uncertain tax positions. The fund recognizes interest and penalties, if any, related to uncertain tax positions as income tax expense in the Statement of Operations. During the period ended December 31, 2022, the fund did not incur any interest or penalties.
Each tax year in the four-year period ended December 31, 2022 remains subject to examination by the Internal Revenue Service and state taxing authorities.
23
NOTES TO FINANCIAL STATEMENTS (continued)
At December 31, 2022, the components of accumulated earnings on a tax basis were as follows: accumulated capital losses $94,302,488 and unrealized appreciation $10,685,200.
The fund is permitted to carry forward capital losses for an unlimited period. Furthermore, capital loss carryovers retain their character as either short-term or long-term capital losses.
The accumulated capital loss carryover is available for federal income tax purposes to be applied against future net realized capital gains, if any, realized subsequent to December 31, 2022. The fund has $94,302,488 of short-term capital losses which can be carried forward for an unlimited period.
The tax character of distributions paid to shareholders during the fiscal years ended December 31, 2022 and December 31, 2021 were as follows: ordinary income $0 and $65,968,826, and long-term capital gains $82,470,524 and $77,933,674, respectively.
During the period ended December 31, 2022, as a result of permanent book to tax differences, primarily due to the tax treatment for net operating losses, the fund increased total distributable earnings (loss) by $3,725,205 and decreased paid-in capital by the same amount. Net assets and net asset value per share were not affected by this reclassification.
NOTE 2—Bank Lines of Credit:
The fund participates with other long-term open-end funds managed by the Adviser in a $823.5 million unsecured credit facility led by Citibank, N.A. (the “Citibank Credit Facility”) and a $300 million unsecured credit facility provided by BNY Mellon (the “BNYM Credit Facility”), each to be utilized primarily for temporary or emergency purposes, including the financing of redemptions (each, a “Facility”). The Citibank Credit Facility is available in two tranches: (i) Tranche A is in an amount equal to $688.5 million and is available to all long-term open-ended funds, including the fund, and (ii) Tranche B is an amount equal to $135 million and is available only to BNY Mellon Floating Rate Income Fund, a series of BNY Mellon Investment Funds IV, Inc. In connection therewith, the fund has agreed to pay its pro rata portion of commitment fees for Tranche A of the Citibank Credit Facility and the BNYM Credit Facility. Interest is charged to the fund based on rates determined pursuant to the terms of the respective Facility at the time of borrowing. During the period ended December 31, 2022, the fund did not borrow under the Facilities.
24
NOTE 3—Management Fee, Sub-Advisory Fee and Other Transactions with Affiliates:
(a) Pursuant to a management agreement with the Adviser, the management fee is computed at the annual rate of .75% of the value of the fund’s average daily net assets and is payable monthly.
Pursuant to a sub-investment advisory agreement between the Adviser and the Sub-Adviser, the Adviser pays the Sub-Adviser a monthly fee at an annual rate of .36% of the value of the fund’s average daily net assets.
(b) Under the Distribution Plan adopted pursuant to Rule 12b-1 under the Act, Service shares pay the Distributor for distributing its shares, for servicing and/or maintaining Service shares’ shareholder accounts and for advertising and marketing for Service shares. The Distribution Plan provides for payments to be made at an annual rate of .25% of the value of the Service shares’ average daily net assets. The Distributor may make payments to Participating Insurance Companies and to brokers and dealers acting as principal underwriter for their variable insurance products. The fees payable under the Distribution Plan are payable without regard to actual expenses incurred. During the period ended December 31, 2022, Service shares were charged $1,529,883 pursuant to the Distribution Plan.
The fund has an arrangement with BNY Mellon Transfer, Inc., (the “Transfer Agent”), a subsidiary of BNY Mellon and an affiliate of the Adviser, whereby the fund may receive earnings credits when positive cash balances are maintained, which are used to offset Transfer Agent fees. For financial reporting purposes, the fund includes transfer agent net earnings credits, if any, as an expense offset in the Statement of Operations.
The fund has an arrangement with The Bank of New York Mellon (the “Custodian”), a subsidiary of BNY Mellon and an affiliate of the Adviser, whereby the fund will receive interest income or be charged overdraft fees when cash balances are maintained. For financial reporting purposes, the fund includes this interest income and overdraft fees, if any, as interest income in the Statement of Operations.
The fund compensates the Transfer Agent, under a transfer agency agreement, for providing transfer agency and cash management services for the fund. The majority of Transfer Agent fees are comprised of amounts paid on a per account basis, while cash management fees are related to fund subscriptions and redemptions. During the period ended December 31, 2022, the fund was charged $1,007 for transfer agency services. These fees are included in Shareholder servicing costs in the Statement of Operations. These fees were partially offset by earnings credits of $83.
25
NOTES TO FINANCIAL STATEMENTS (continued)
The fund compensates the Custodian, under a custody agreement, for providing custodial services for the fund. These fees are determined based on net assets, geographic region and transaction activity. During the period ended December 31, 2022, the fund was charged $26,675 pursuant to the custody agreement.
During the period ended December 31, 2022, the fund was charged $17,082 for services performed by the fund’s Chief Compliance Officer and his staff. These fees are included in Chief Compliance Officer fees in the Statement of Operations.
The components of “Due to BNY Mellon Investment Adviser, Inc. and affiliates” in the Statement of Assets and Liabilities consist of: management fee of $450,823, Distribution Plan fees of $114,265, Custodian fees of $10,081, Chief Compliance Officer fees of $4,082 and Transfer Agent fees of $150.
(c) Each board member also serves as a board member of other funds in the BNY Mellon Family of Funds complex. Annual retainer fees and attendance fees are allocated to each fund based on net assets.
NOTE 4—Securities Transactions:
The aggregate amount of purchases and sales of investment securities, excluding short-term securities during the period ended December 31, 2022, amounted to $512,301,004 and $402,524,503, respectively.
At December 31, 2022, the cost of investments for federal income tax purposes was $672,310,420; accordingly, accumulated net unrealized appreciation on investments was $10,685,055, consisting of $85,669,996 gross unrealized appreciation and $74,984,941 gross unrealized depreciation.
26
REPORT OF INDEPENDENT REGISTERED PUBLIC ACCOUNTING FIRM
To the Shareholders and the Board of Trustees of Technology Growth Portfolio
Opinion on the Financial Statements
We have audited the accompanying statement of assets and liabilities of Technology Growth Portfolio (the “Fund”) (one of the funds constituting BNY Mellon Investment Portfolios), including the statement of investments, as of December 31, 2022, and the related statement of operations for the year then ended, the statements of changes in net assets for each of the two years in the period then ended, the financial highlights for each of the five years in the period then ended and the related notes (collectively referred to as the “financial statements”). In our opinion, the financial statements present fairly, in all material respects, the financial position of the Fund (one of the funds constituting BNY Mellon Investment Portfolios) at December 31, 2022, the results of its operations for the year then ended, the changes in its net assets for each of the two years in the period then ended and its financial highlights for each of the five years in the period then ended, in conformity with U.S. generally accepted accounting principles.
Basis for Opinion
These financial statements are the responsibility of the Fund’s management. Our responsibility is to express an opinion on the Fund’s financial statements based on our audits. We are a public accounting firm registered with the Public Company Accounting Oversight Board (United States) (“PCAOB”) and are required to be independent with respect to the Fund in accordance with the U.S. federal securities laws and the applicable rules and regulations of the Securities and Exchange Commission and the PCAOB.
We conducted our audits in accordance with the standards of the PCAOB. Those standards require that we plan and perform the audit to obtain reasonable assurance about whether the financial statements are free of material misstatement, whether due to error or fraud. The Fund is not required to have, nor were we engaged to perform, an audit of the Fund’s internal control over financial reporting. As part of our audits, we are required to obtain an understanding of internal control over financial reporting, but not for the purpose of expressing an opinion on the effectiveness of the Fund’s internal control over financial reporting. Accordingly, we express no such opinion.
Our audits included performing procedures to assess the risks of material misstatement of the financial statements, whether due to error or fraud, and performing procedures that respond to those risks. Such procedures included examining, on a test basis, evidence regarding the amounts and disclosures in the financial statements. Our procedures included confirmation of securities owned as of December 31, 2022, by correspondence with the custodian, brokers and others; when replies were not received from brokers and others, we performed other auditing procedures. Our audits also included evaluating the accounting principles used and significant estimates made by management, as well as evaluating the overall presentation of the financial statements. We believe that our audits provide a reasonable basis for our opinion.

We have served as the auditor of one or more investment companies in the BNY Mellon Family of Funds since at least 1957, but we are unable to determine the specific year.
New York, New York
February 9, 2023
27
IMPORTANT TAX INFORMATION (Unaudited)
The fund hereby reports $2.3485 per share as a long-term capital gain distribution on March 30, 2022.
28
INFORMATION ABOUT THE RENEWAL OF THE FUND’S MANAGEMENT AND SUB- INVESTMENT ADVISORY AGREEMENTS (Unaudited)
At a meeting of the fund’s Board of Trustees held on August 1-2, 2022, the Board considered the renewal of the fund’s Management Agreement, pursuant to which the Adviser provides the fund with investment advisory and administrative services, and the Sub-Investment Advisory Agreement (together with the Management Agreement, the “Agreements”), pursuant to which Newton Investment Management North America, LLC (the “Sub-Adviser”) provides day-to-day management of the fund’s investments. The Board members, none of whom are “interested persons” (as defined in the Investment Company Act of 1940, as amended) of the fund, were assisted in their review by independent legal counsel and met with counsel in executive session separate from representatives of the Adviser and the Sub-Adviser. In considering the renewal of the Agreements, the Board considered several factors that it believed to be relevant, including those discussed below. The Board did not identify any one factor as dispositive, and each Board member may have attributed different weights to the factors considered.
Analysis of Nature, Extent, and Quality of Services Provided to the Fund. The Board considered information provided to it at the meeting and in previous presentations from representatives of the Adviser regarding the nature, extent, and quality of the services provided to funds in the BNY Mellon fund complex, including the fund. The Adviser provided the number of open accounts in the fund, the fund’s asset size and the allocation of fund assets among distribution channels. The Adviser also had previously provided information regarding the diverse intermediary relationships and distribution channels of funds in the BNY Mellon fund complex (such as intermediary, in which intermediaries typically are paid by the fund and/or the Adviser) and the Adviser’s corresponding need for broad, deep, and diverse resources to be able to provide ongoing shareholder services to each intermediary or distribution channel, as applicable to the fund.
The Board also considered research support available to, and portfolio management capabilities of, the fund’s portfolio management personnel and that the Adviser also provides oversight of day-to-day fund operations, including fund accounting and administration and assistance in meeting legal and regulatory requirements. The Board also considered the Adviser’s extensive administrative, accounting and compliance infrastructures, as well as the Adviser’s supervisory activities over the Sub-Adviser. The Board also considered portfolio management’s brokerage policies and practices (including policies and practices regarding soft dollars) and the standards applied in seeking best execution.
Comparative Analysis of the Fund’s Performance and Management Fee and Expense Ratio. The Board reviewed reports prepared by Broadridge Financial Solutions, Inc. (“Broadridge”), an independent provider of investment company data based on classifications provided by Thomson Reuters Lipper, which included information comparing (1) the performance of the fund’s Initial shares with the performance of a group of science and technology funds underlying variable insurance products (“VIPs”) selected by Broadridge as comparable to the fund (the “Performance Group”) and with
29
INFORMATION ABOUT THE RENEWAL OF THE FUND’S MANAGEMENT AND SUB- INVESTMENT ADVISORY AGREEMENTS (Unaudited) (continued)
a broader group of funds consisting of all science and technology funds underlying VIPs (the “Performance Universe”), all for various periods ended June 30, 2022, (2) the fund’s actual and contractual management fees and total expenses with those of the same group of funds in the Performance Group (the “Expense Group”) and with a broader group of all science and technology funds underlying VIPs with similar 12b-1/non-12b-1 structures, excluding outliers (the “Expense Universe”), and (3) at the request of the Adviser, the total expenses of the fund’s Service shares with those of the Expense Group and the Expense Universe, the information for which was derived in part from fund financial statements available to Broadridge as of the date of its analysis. The Adviser previously had furnished the Board with a description of the methodology Broadridge used to select the Performance Group and Performance Universe and the Expense Group and Expense Universe.
Performance Comparisons. Representatives of the Adviser stated that the usefulness of performance comparisons may be affected by a number of factors, including different investment limitations and policies that may be applicable to the fund and comparison funds and the end date selected. The Board also considered the fund’s performance in light of overall financial market conditions. The Board discussed with representatives of the Adviser and the Sub-Adviser the results of the comparisons and considered that the fund’s total return performance was below the Performance Group and the Performance Universe medians for all periods. The Adviser also provided a comparison of the fund’s calendar year total returns to the returns of the fund’s benchmark index, and it was noted that the fund’s returns were above the returns of the index in five of the ten calendar years shown. The Board discussed with representatives of the Adviser and the Sub-Adviser the reasons for the fund’s underperformance versus the Performance Group and Performance Universe during the periods under review and noted that, effective in March 2022, the fund appointed new primary portfolio managers.
Management Fee and Expense Ratio Comparisons. The Board reviewed and considered the contractual management fee rate payable by the fund to the Adviser in light of the nature, extent and quality of the management services and the sub-advisory services provided by the Adviser and the Sub-Adviser, respectively. In addition, the Board reviewed and considered the actual management fee rate paid by the fund over the fund’s last fiscal year. The Board also reviewed the range of actual and contractual management fees and total expenses as a percentage of average net assets of the Expense Group and Expense Universe funds and discussed the results of the comparisons.
The Board considered that the fund’s contractual management fee was lower than the Expense Group median contractual management fee, the fund’s actual management fee was lower than the Expense Group median and slightly lower than the Expense Universe median actual management fee and the total expenses of the fund’s Initial shares were lower than the Expense Group median and lower than the Expense Universe median total expenses. The Board also considered that the total expenses of the fund’s Service shares were higher than the Expense Universe median total expenses.
30
Representatives of the Adviser noted that there were no other funds advised by the Adviser that are in the same Lipper category as the fund or separate accounts and/or other types of client portfolios advised by the Adviser or the Sub-Adviser that are considered to have similar investment strategies and policies as the fund.
The Board considered the fee payable to the Sub-Adviser in relation to the fee payable to the Adviser by the fund and the respective services provided by the Sub-Adviser and the Adviser. The Board also took into consideration that the Sub-Adviser’s fee is paid by the Adviser, out of its fee from the fund, and not the fund.
Analysis of Profitability and Economies of Scale. Representatives of the Adviser reviewed the expenses allocated and profit received by the Adviser and its affiliates and the resulting profitability percentage for managing the fund and the aggregate profitability percentage to the Adviser and its affiliates for managing the funds in the BNY Mellon fund complex, and the method used to determine the expenses and profit. The Board concluded that the profitability results were not excessive, given the services rendered and service levels provided by the Adviser and its affiliates. The Board also had been provided with information prepared by an independent consulting firm regarding the Adviser’s approach to allocating costs to, and determining the profitability of, individual funds and the entire BNY Mellon fund complex. The consulting firm also had analyzed where any economies of scale might emerge in connection with the management of a fund.
The Board considered, on the advice of its counsel, the profitability analysis (1) as part of its evaluation of whether the fees under the Agreements, considered in relation to the mix of services provided by the Adviser and the Sub-Adviser, including the nature, extent and quality of such services, supported the renewal of the Agreements and (2) in light of the relevant circumstances for the fund and the extent to which economies of scale would be realized if the fund grows and whether fee levels reflect these economies of scale for the benefit of fund shareholders. Representatives of the Adviser stated that, as a result of shared and allocated costs among funds in the BNY Mellon fund complex, the extent of economies of scale could depend substantially on the level of assets in the complex as a whole, so that increases and decreases in complex-wide assets can affect potential economies of scale in a manner that is disproportionate to, or even in the opposite direction from, changes in the fund’s asset level. The Board also considered potential benefits to the Adviser and the Sub-Adviser from acting as investment adviser and sub-investment adviser, respectively, and took into consideration the soft dollar arrangements in effect for trading the fund’s investments.
At the conclusion of these discussions, the Board agreed that it had been furnished with sufficient information to make an informed business decision with respect to the renewal of the Agreements. Based on the discussions and considerations as described above, the Board concluded and determined as follows.
· The Board concluded that the nature, extent and quality of the services provided by the Adviser and the Sub-Adviser are adequate and appropriate.
31
INFORMATION ABOUT THE RENEWAL OF THE FUND’S MANAGEMENT AND SUB- INVESTMENT ADVISORY AGREEMENTS (Unaudited) (continued)
· The Board agreed to closely monitor performance and determined to approve renewal of the Agreements only through the first quarter of 2023.
· The Board concluded that the fees paid to the Adviser and the Sub-Adviser continued to be appropriate under the circumstances and in light of the factors and the totality of the services provided as discussed above, subject to review no later than the next renewal consideration.
· The Board determined that the economies of scale which may accrue to the Adviser and its affiliates in connection with the management of the fund had been adequately considered by the Adviser in connection with the fee rate charged to the fund pursuant to the Management Agreement and that, to the extent in the future it were determined that material economies of scale had not been shared with the fund, the Board would seek to have those economies of scale shared with the fund.
In evaluating the Agreements, the Board considered these conclusions and determinations and also relied on its previous knowledge, gained through meetings and other interactions with the Adviser and its affiliates and the Sub-Adviser, of the Adviser and the Sub-Adviser and the services provided to the fund by the Adviser and the Sub-Adviser. The Board also relied on information received on a routine and regular basis throughout the year relating to the operations of the fund and the investment management and other services provided under the Agreements, including information on the investment performance of the fund in comparison to similar mutual funds and benchmark performance indices; general market outlook as applicable to the fund; and compliance reports. In addition, the Board’s consideration of the contractual fee arrangements for the fund had the benefit of a number of years of reviews of the Agreements for the fund, or substantially similar agreements for other BNY Mellon funds that the Board oversees, during which lengthy discussions took place between the Board and representatives of the Adviser. Certain aspects of the arrangements may receive greater scrutiny in some years than in others, and the Board’s conclusions may be based, in part, on its consideration of the fund’s arrangements, or substantially similar arrangements for other BNY Mellon funds that the Board oversees, in prior years. The Board determined to renew the Agreements through the first quarter of 2023.
32
BOARD MEMBERS INFORMATION (Unaudited)
Independent Board Members
Joseph S. DiMartino (79)
Chairman of the Board (1998)
Principal Occupation During Past 5 Years:
· Director or Trustee of funds in the BNY Mellon Family of Funds and certain other entities (as described in the fund’s Statement of Additional Information) (1995-Present)
Other Public Company Board Memberships During Past 5 Years:
· CBIZ, Inc., a public company providing professional business services, products and solutions, Director (1997-Present)
No. of Portfolios for which Board Member Serves: 92
———————
Francine J. Bovich (71)
Board Member (2015)
Principal Occupation During Past 5 Years:
· The Bradley Trusts, private trust funds, Trustee (2011-Present)
Other Public Company Board Memberships During Past 5 Years:
· Annaly Capital Management, Inc., a real estate investment trust, Director (2014-Present)
No. of Portfolios for which Board Member Serves: 53
———————
J. Charles Cardona (67)
Board Member (2014)
Principal Occupation During Past 5 Years:
· BNY Mellon ETF Trust, Chairman and Trustee (2020-Present)
· BNY Mellon Liquidity Funds, Director (2004-Present) and Chairman (2019-2021)
No. of Portfolios for which Board Member Serves: 37
———————
Andrew J. Donohue (72)
Board Member (2019)
Principal Occupation During Past 5 Years:
· Attorney, Solo Law Practice (2019-Present)
· Shearman & Sterling LLP, a law firm, Of Counsel (2017-2019)
· Chief of Staff to the Chair of the SEC (2015-2017)
Other Public Company Board Memberships During Past 5 Years:
· Oppenheimer Funds (58 funds), Director (2017-2019)
No. of Portfolios for which Board Member Serves: 43
———————
33
BOARD MEMBERS INFORMATION (Unaudited) (continued)
Isabel P. Dunst (75)
Board Member (2014)
Principal Occupation During Past 5 Years:
· Hogan Lovells LLP, a law firm, Retired (2019-Present); Senior Counsel (2018-2019); Of Counsel (2015-2018)
· Hebrew Union College Jewish Institute of Religion, Member of the Board of Governors (2015-Present)
· Bend the ARC, a civil rights organization, Board Member (2016-Present)
No. of Portfolios for which Board Member Serves: 22
———————
Nathan Leventhal (79)
Board Member (2009)
Principal Occupation During Past 5 Years:
· Lincoln Center for the Performing Arts, President Emeritus (2001-Present)
· Palm Beach Opera, President (2016-Present)
Other Public Company Board Memberships During Past 5 Years:
· Movado Group, Inc., a public company that designs, sources, markets and distributes watches Director (2003-2020)
No. of Portfolios for which Board Member Serves: 32
———————
Robin A. Melvin (59)
Board Member (2014)
Principal Occupation During Past 5 Years:
· Westover School, a private girls' boarding school in Middlebury, Connecticut, Trustee (2019-Present)
· Mentor Illinois, a non-profit organization dedicated to increasing the quantity and quality of mentoring services in Illinois, Co-Chair (2014-2020); Board Member, Mentor Illinois (2013-2020)
· JDRF, a non-profit juvenile diabetes research foundation, Board Member (June 2021-June 2022)
Other Public Company Board Memberships During Past 5 Years:
· HPS Corporate Lending Fund, a closed-end management investment company regulated as a business development company, Trustee (August 2021-Present)
No. of Portfolios for which Board Member Serves: 71
———————
Roslyn M. Watson (73)
Board Member (2014)
Principal Occupation During Past 5 Years:
· Watson Ventures, Inc., a real estate investment company. Principal (1993-Present)
Other Public Company Board Memberships During Past 5 Years:
· American Express Bank, FSB, Director (1993-2018)
No. of Portfolios for which Board Member Serves: 43
———————
34
Benaree Pratt Wiley (76)
Board Member (2009)
Principal Occupation During Past 5 Years:
· The Wiley Group, a firm specializing in strategy and business development, Principal (2005-Present)
Other Public Company Board Memberships During Past 5 Years:
· CBIZ, Inc., a public company providing professional business services, products and solutions, Director (2008-Present)
· Blue Cross Blue Shield of Massachusetts, Director (2004-2020)
No. of Portfolios for which Board Member Serves: 60
———————
Tamara Belinfanti (47)
Advisory Board Member (2021)
Principal Occupation During Past 5 Years:
· New York Law School, Lester Martin Professor of Law (2009-Present)
No. of Portfolios for which Advisory Board Member Serves: 22
———————
Gordon J. Davis (81)
Advisory Board Member (2021)
Principal Occupation During Past 5 Years:
· Venable LLP, a law firm, Partner (2012-Present)
Other Public Company Board Memberships During Past 5 Years:
· BNY Mellon Family of Funds (53 funds), Board Member (1995-August 2021)
No. of Portfolios for which Advisory Board Member Serves: 39
———————
The address of the Board Members and Officers is c/o BNY Mellon Investment Adviser, Inc., 240 Greenwich Street, New York, New York 10286. Additional information about each Board Member is available in the fund’s Statement of Additional Information which can be obtained from the Adviser free of charge by calling this toll free number: 1-800-373-9387.
35
OFFICERS OF THE FUND (Unaudited)
DAVID DIPETRILLO, President since January 2021.
Vice President and Director of the Adviser since February 2021; Head of North America Product, BNY Mellon Investment Management since January 2018; and Director of Product Strategy, BNY Mellon Investment Management from January 2016 to December 2017. He is an officer of 54 investment companies (comprised of 107 portfolios) managed by the Adviser or an affiliate of the Adviser. He is 44 years old and has been an employee of BNY Mellon since 2005.
JAMES WINDELS, Treasurer since November 2001.
Vice President of the Adviser since September 2020; and Director–BNY Mellon Fund Administration. He is an officer of 55 investment companies (comprised of 127 portfolios) managed by the Adviser or an affiliate of the Adviser. He is 64 years old and has been an employee of the Adviser since April 1985.
PETER M. SULLIVAN, Chief Legal Officer since July 2021 and Vice President and Assistant Secretary since March 2019.
Chief Legal Officer of the Adviser and Associate General Counsel of BNY Mellon since July 2021; Senior Managing Counsel of BNY Mellon from December 2020 to July 2021; and Managing Counsel of BNY Mellon from March 2009 to December 2020. He is an officer of 55 investment companies (comprised of 127 portfolios) managed by the Adviser or an affiliate of the Adviser. He is 54 years old and has been an employee of BNY Mellon since April 2004.
JAMES BITETTO, Vice President since August 2005 and Secretary since February 2018.
Senior Managing Counsel of BNY Mellon since December 2019; Managing Counsel of BNY Mellon from April 2014 to December 2019; and Secretary of the Adviser. He is an officer of 55 investment companies (comprised of 127 portfolios) managed by the Adviser or an affiliate of the Adviser. He is 56 years old and has been an employee of the Adviser since December 1996.
DEIRDRE CUNNANE, Vice President and Assistant Secretary since March 2019.
Managing Counsel of BNY Mellon since December 2021, Counsel of BNY Mellon from August 2018 to December 2021; and Senior Regulatory Specialist at BNY Mellon Investment Management Services from February 2016 to August 2018. She is an officer of 55 investment companies (comprised of 127 portfolios) managed by the Adviser or an affiliate of the Adviser. She is 32 years old and has been an employee of the Adviser since August 2018.
SARAH S. KELLEHER, Vice President and Assistant Secretary since April 2014.
Vice President of BNY Mellon ETF Investment Adviser; LLC since February 2020; Senior Managing Counsel of BNY Mellon since September 2021; Managing Counsel of BNY Mellon from December 2017 to September 2021; and Senior Counsel of BNY Mellon from March 2013 to December 2017. She is an officer of 55 investment companies (comprised of 127 portfolios) managed by the Adviser or an affiliate of the Adviser. She is 47 years old and has been an employee of the Adviser since March 2013.
JEFF PRUSNOFSKY, Vice President and Assistant Secretary since August 2005.
Senior Managing Counsel of BNY Mellon. He is an officer of 55 investment companies (comprised of 127 portfolios) managed by the Adviser or an affiliate of the Adviser. He is 57 years old and has been an employee of the Adviser since October 1990.
AMANDA QUINN, Vice President and Assistant Secretary since March 2020.
Counsel of BNY Mellon since June 2019; Regulatory Administration Manager at BNY Mellon Investment Management Services from September 2018 to May 2019; and Senior Regulatory Specialist at BNY Mellon Investment Management Services from April 2015 to August 2018. She is an officer of 55 investment companies (comprised of 127 portfolios) managed by the Adviser or an affiliate of the Adviser. She is 37 years old and has been an employee of the Adviser since June 2019.
36
NATALYA ZELENSKY, Vice President and Assistant Secretary since March 2017.
Chief Compliance Officer since August 2021 and Vice President since February 2020 of BNY Mellon ETF Investment Adviser, LLC; Chief Compliance Officer since August 2021 and Vice President and Assistant Secretary since February 2020 of BNY Mellon ETF Trust; Managing Counsel of BNY Mellon from December 2019 to August 2021; Counsel of BNY Mellon from May 2016 to December 2019; and Assistant Secretary of the Adviser from April 2018 to August 2021. She is an officer of 55 investment companies (comprised of 127 portfolios) managed by the Adviser or an affiliate of the Adviser. She is 37 years old and has been an employee of BNY Mellon since May 2016.
DANIEL GOLDSTEIN, Vice President since March 2022.
Vice President and Head of Product Development of North America Product, BNY Mellon Investment Management since January 2018; Co-Head of Product Management, Development & Oversight of North America Product, BNY Mellon Investment Management from January 2010 to January 2018; and Senior Vice President, Development & Oversight of North America Product, BNY Mellon Investment Management since 2010. He is an officer of 54 investment companies (comprised of 107 portfolios) managed by the Adviser or an affiliate of the Adviser. He is 53 years old and has been an employee of the Distributor since 1991.
JOSEPH MARTELLA, Vice President since March 2022.
Vice President of the Adviser since December 2022, Head of Product Management of North America Product, BNY Mellon Investment Management since January 2018; Director of Product Research and Analytics of North America Product, BNY Mellon Investment Management from January 2010 to January 2018; and Senior Vice President of North America Product, BNY Mellon Investment Management since 2010. He is an officer of 54 investment companies (comprised of 107 portfolios) managed by the Adviser or an affiliate of the Adviser. He is 46 years old and has been an employee of the Distributor since 1999.
GAVIN C. REILLY, Assistant Treasurer since December 2005.
Tax Manager–BNY Mellon Fund Administration. He is an officer of 55 investment companies (comprised of 127 portfolios) managed by the Adviser or an affiliate of the Adviser. He is 54 years old and has been an employee of the Adviser since April 1991.
ROBERT SALVIOLO, Assistant Treasurer since July 2007.
Senior Accounting Manager–BNY Mellon Fund Administration. He is an officer of 55 investment companies (comprised of 127 portfolios) managed by the Adviser or an affiliate of the Adviser. He is 55 years old and has been an employee of the Adviser since June 1989.
ROBERT SVAGNA, Assistant Treasurer since December 2002.
Senior Accounting Manager–BNY Mellon Fund Administration. He is an officer of 55 investment companies (comprised of 127 portfolios) managed by the Adviser or an affiliate of the Adviser. He is 55 years old and has been an employee of the Adviser since November 1990.
JOSEPH W. CONNOLLY, Chief Compliance Officer since October 2004.
Chief Compliance Officer of the BNY Mellon Family of Funds and BNY Mellon Funds Trust since 2004; and Chief Compliance Officer of the Adviser from 2004 until June 2021. He is the Chief Compliance Officer of 54 investment companies (comprised of 112 portfolios) managed by the Adviser. He is 65 years old.
CARIDAD M. CAROSELLA, Anti-Money Laundering Compliance Officer since January 2016.
Anti-Money Laundering Compliance Officer of the BNY Mellon Family of Funds and BNY Mellon Funds Trust. She is an officer of 48 investment companies (comprised of 120 portfolios) managed by the Adviser or an affiliate of the Adviser. She is 54 years old and has been an employee of the Distributor since 1997.
37
BNY Mellon Investment Portfolios, Technology Growth Portfolio
240 Greenwich Street
New York, NY 10286
Adviser
BNY Mellon Investment Adviser, Inc.
240 Greenwich Street
New York, NY 10286
Sub-Adviser
Newton Investment Management
North America, LLC
BNY Mellon Center
201 Washington Street
Boston, MA 02108
Custodian
The Bank of New York Mellon
240 Greenwich Street
New York, NY 10286
Transfer Agent &
Dividend Disbursing Agent
BNY Mellon Transfer, Inc.
240 Greenwich Street
New York, NY 10286
Distributor
BNY Mellon Securities Corporation
240 Greenwich Street
New York, NY 10286
Telephone 1-800-258-4260 or 1-800-258-4261
Mail The BNY Mellon Family of Funds, 144 Glenn Curtiss Boulevard, Uniondale, NY 11556-0144 Attn: Institutional Services Department
E-mail Send your request to info@bnymellon.com
Internet Information can be viewed online or downloaded at www.im.bnymellon.com
The fund files its complete schedule of portfolio holdings with the Securities and Exchange Commission (“SEC”) for the first and third quarters of each fiscal year on Form N-PORT. The fund’s Forms N-PORT are available on the SEC’s website at www.sec.gov.
A description of the policies and procedures that the fund uses to determine how to vote proxies relating to portfolio securities and information regarding how the fund voted these proxies for the most recent 12-month period ended June 30 is available at www.im.bnymellon.com and on the SEC’s website at www.sec.gov and without charge, upon request, by calling 1-800-373-9387.
| | |
© 2023 BNY Mellon Securities Corporation
0175AR1222 | 
|
Item 2. Code of Ethics.
The Registrant has adopted a code of ethics that applies to the Registrant's principal executive officer, principal financial officer, principal accounting officer or controller, or persons performing similar functions. There have been no amendments to, or waivers in connection with, the Code of Ethics during the period covered by this Report.
Item 3. Audit Committee Financial Expert.
The Registrant's Board has determined that J. Charles Cardona, a member of the Audit Committee of the Board, is an audit committee financial expert as defined by the Securities and Exchange Commission (the "SEC"). J. Charles Cardona is "independent" as defined by the SEC for purposes of audit committee financial expert determinations.
Item 4. Principal Accountant Fees and Services.
(a) Audit Fees. The aggregate fees billed for each of the last two fiscal years (the "Reporting Periods") for professional services rendered by the Registrant's principal accountant (the "Auditor") for the audit of the Registrant's annual financial statements or services that are normally provided by the Auditor in connection with the statutory and regulatory filings or engagements for the Reporting Periods, were $104,559 in 2021 and $106,650 in 2022.
(b) Audit-Related Fees. The aggregate fees billed in the Reporting Periods for assurance and related services by the Auditor that are reasonably related to the performance of the audit of the Registrant's financial statements and are not reported under paragraph (a) of this Item 4 were $21,239 in 2021 and $21,515 in 2022. These services consisted of one or more of the following: (i) agreed upon procedures related to compliance with Internal Revenue Code section 817(h), (ii) security counts required by Rule 17f-2 under the Investment Company Act of 1940, as amended, (iii) advisory services as to the accounting or disclosure treatment of Registrant transactions or events and (iv) advisory services to the accounting or disclosure treatment of the actual or potential impact to the Registrant of final or proposed rules, standards or interpretations by the Securities and Exchange Commission, the Financial Accounting Standards Boards or other regulatory or standard-setting bodies.
The aggregate fees billed in the Reporting Periods for non-audit assurance and related services by the Auditor to the Registrant's investment adviser (not including any sub-investment adviser whose role is primarily portfolio management and is subcontracted with or overseen by another investment adviser), and any entity controlling, controlled by or under common control with the investment adviser that provides ongoing services to the Registrant ("Service Affiliates"), that were reasonably related to the performance of the annual audit of the Service Affiliate, which required pre-approval by the Audit Committee were $0 in 2021 and $0 in 2022.
(c) Tax Fees. The aggregate fees billed in the Reporting Periods for professional services rendered by the Auditor for tax compliance, tax advice, and tax planning ("Tax Services") were $15,207 in 2021 and $14,289 in 2022. These services consisted of: (i) review or preparation of U.S. federal, state, local and excise tax returns; (ii) U.S. federal, state and local tax planning, advice and assistance regarding statutory, regulatory or administrative developments; (iii) tax advice regarding tax qualification matters and/or treatment of various financial instruments held or proposed to be acquired or held, and (iv) determination of Passive Foreign Investment Companies. The aggregate fees billed in the Reporting Periods for Tax Services by the Auditor to Service Affiliates, which required pre-approval by the Audit Committee were $8,211 in 2021 and $11,211 in 2022.
(d) All Other Fees. The aggregate fees billed in the Reporting Periods for products and services provided by the Auditor, other than the services reported in paragraphs (a) through (c) of this Item, were $142 in 2021 and $80 in 2022. These services consisted of a review of the Registrant's anti-money laundering program.
The aggregate fees billed in the Reporting Periods for Non-Audit Services by the Auditor to Service Affiliates, other than the services reported in paragraphs (b) through (c) of this Item, which required pre-approval by the Audit Committee, were $0 in 2021 and $0 in 2022.
(e)(1) Audit Committee Pre-Approval Policies and Procedures. The Registrant's Audit Committee has established policies and procedures (the "Policy") for pre-approval (within specified fee limits) of the Auditor's engagements for non-audit services to the Registrant and Service Affiliates without specific case-by-case consideration. The pre-approved services in the Policy can include pre-approved audit services, pre-approved audit-related services, pre-approved tax services and pre-approved all other services. Pre-approval considerations include whether the proposed services are compatible with maintaining the Auditor's independence. Pre-approvals pursuant to the Policy are considered annually.
(e)(2) Note. None of the services described in paragraphs (b) through (d) of this Item 4 were approved by the Audit Committee pursuant to paragraph (c)(7)(i)(C) of Rule 2-01 of Regulation S-X.
(f) None of the hours expended on the principal accountant's engagement to audit the registrant's financial statements for the most recent fiscal year were attributed to work performed by persons other than the principal accountant's full-time, permanent employees.
Non-Audit Fees. The aggregate non-audit fees billed by the Auditor for services rendered to the Registrant, and rendered to Service Affiliates, for the Reporting Periods were $3,095,435 in 2021 and $1,803,830 in 2022.
Auditor Independence. The Registrant's Audit Committee has considered whether the provision of non-audit services that were rendered to Service Affiliates, which were not pre-approved (not requiring pre-approval), is compatible with maintaining the Auditor's independence.
(j) Not applicable.
Item 5. Audit Committee of Listed Registrants.
Not applicable.
Item 6. Investments.
(a) Not applicable.
| Item 7. | Disclosure of Proxy Voting Policies and Procedures for Closed-End Management Investment Companies. |
Not applicable.
Item 8. Portfolio Managers of Closed-End Management Investment Companies.
Not applicable.
| Item 9. | Purchases of Equity Securities by Closed-End Management Investment Companies and Affiliated Purchasers. |
Not applicable.
| Item 10. | Submission of Matters to a Vote of Security Holders. |
There have been no material changes to the procedures applicable to Item 10.
| Item 11. | Controls and Procedures. |
(a) The Registrant's principal executive and principal financial officers have concluded, based on their evaluation of the Registrant's disclosure controls and procedures as of a date within 90 days of the filing date of this report, that the Registrant's disclosure controls and procedures are reasonably designed to ensure that information required to be disclosed by the Registrant on Form N-CSR is recorded, processed, summarized and reported within the required time periods and that information required to be disclosed by the Registrant in the reports that it files or submits on Form N-CSR is accumulated and communicated to the Registrant's management, including its principal executive and principal financial officers, as appropriate to allow timely decisions regarding required disclosure.
(b) There were no changes to the Registrant's internal control over financial reporting that occurred during the period covered by this report that have materially affected, or are reasonably likely to materially affect, the Registrant's internal control over financial reporting.
| Item 12. | Disclosure of Securities Lending Activities for Closed-End Management Investment Companies. |
Not applicable.
(a)(1) Code of ethics referred to in Item 2.
(a)(2) Certifications of principal executive and principal financial officers as required by Rule 30a-2(a) under the Investment Company Act of 1940.
(a)(3) Not applicable.
(b) Certification of principal executive and principal financial officers as required by Rule 30a-2(b) under the Investment Company Act of 1940.
SIGNATURES
Pursuant to the requirements of the Securities Exchange Act of 1934 and the Investment Company Act of 1940, the Registrant has duly caused this Report to be signed on its behalf by the undersigned, thereunto duly authorized.
BNY Mellon Investment Portfolios
By: /s/ David J. DiPetrillo
David J. DiPetrillo
President (Principal Executive Officer)
Date: February 8, 2023
Pursuant to the requirements of the Securities Exchange Act of 1934 and the Investment Company Act of 1940, this Report has been signed below by the following persons on behalf of the Registrant and in the capacities and on the dates indicated.
By: /s/ David J. DiPetrillo
David J. DiPetrillo
President (Principal Executive Officer)
Date: February 8, 2023
By: /s/ James Windels
James Windels
Treasurer (Principal Financial Officer)
Date: February 8, 2023
EXHIBIT INDEX
(a)(1) Code of ethics referred to in Item 2.
(a)(2) Certifications of principal executive and principal financial officers as required by Rule 30a-2(a) under the Investment Company Act of 1940. (EX-99.CERT)
(b) Certification of principal executive and principal financial officers as required by Rule 30a-2(b) under the Investment Company Act of 1940. (EX-99.906CERT)