The Registrant has adopted a code of ethics that applies to the Registrant's principal executive officer, principal financial officer, principal accounting officer or controller, or persons performing similar functions. There have been no amendments to, or waivers in connection with, the Code of Ethics during the period covered by this Report.
| Item 3. | Audit Committee Financial Expert. |
The Registrant's Board has determined that J. Charles Cardona, a member of the Audit Committee of the Board, is an audit committee financial expert as defined by the Securities and Exchange Commission (the "SEC"). J. Charles Cardona is "independent" as defined by the SEC for purposes of audit committee financial expert determinations.
| Item 4. | Principal Accountant Fees and Services. |
(a) Audit Fees. The aggregate fees billed for each of the last two fiscal years (the "Reporting Periods") for professional services rendered by the Registrant's principal accountant (the "Auditor") for the audit of the Registrant's annual financial statements or services that are normally provided by the Auditor in connection with the statutory and regulatory filings or engagements for the Reporting Periods, were $108,783 in 2023 and $110,958 in 2024.
(b) Audit-Related Fees. The aggregate fees billed in the Reporting Periods for assurance and related services by the Auditor that are reasonably related to the performance of the audit of the Registrant's financial statements and are not reported under paragraph (a) of this Item 4 were $22,009 in 2023 and $21,996 in 2024. These services consisted of one or more of the following: (i) agreed upon procedures related to compliance with Internal Revenue Code section 817(h), (ii) security counts required by Rule 17f-2 under the Investment Company Act of 1940, as amended, (iii) advisory services as to the accounting or disclosure treatment of Registrant transactions or events and (iv) advisory services to the accounting or disclosure treatment of the actual or potential impact to the Registrant of final or proposed rules, standards or interpretations by the Securities and Exchange Commission, the Financial Accounting Standards Boards or other regulatory or standard-setting bodies.
The aggregate fees billed in the Reporting Periods for non-audit assurance and related services by the Auditor to the Registrant's investment adviser (not including any sub-investment adviser whose role is primarily portfolio management and is subcontracted with or overseen by another investment adviser), and any entity controlling, controlled by or under common control with the investment adviser that provides ongoing services to the Registrant ("Service Affiliates"), that were reasonably related to the performance of the annual audit of the Service Affiliate, which required pre-approval by the Audit Committee were $0 in 2023 and $0 in 2024.
(c) Tax Fees. The aggregate fees billed in the Reporting Periods for professional services rendered by the Auditor for tax compliance, tax advice, and tax planning ("Tax Services") were $14,289 in 2023 and $14,289 in 2024. These services consisted of: (i) review or preparation of U.S. federal, state, local and excise tax returns; (ii) U.S. federal, state and local tax planning, advice and assistance regarding statutory, regulatory or administrative developments; (iii) tax advice regarding tax qualification matters and/or treatment of various financial instruments held or proposed to be acquired or held, and (iv) determination of Passive Foreign Investment Companies. The aggregate fees billed in the Reporting Periods for Tax Services by the Auditor to Service Affiliates, which required pre-approval by the Audit Committee were $11,211 in 2023 and $9,582 in 2024.
(d) All Other Fees. The aggregate fees billed in the Reporting Periods for products and services provided by the Auditor, other than the services reported in paragraphs (a) through (c) of this Item,
were $101 in 2023 and $122 in 2024. These services consisted of a review of the Registrant's anti-money laundering program.
The aggregate fees billed in the Reporting Periods for Non-Audit Services by the Auditor to Service Affiliates, other than the services reported in paragraphs (b) through (c) of this Item, which required pre-approval by the Audit Committee, were $0 in 2023 and $0 in 2024.
(e)(1) Audit Committee Pre-Approval Policies and Procedures. The Registrant's Audit Committee has established policies and procedures (the "Policy") for pre-approval (within specified fee limits) of the Auditor's engagements for non-audit services to the Registrant and Service Affiliates without specific case-by-case consideration. The pre-approved services in the Policy can include pre-approved audit services, pre-approved audit-related services, pre-approved tax services and pre-approved all other services. Pre-approval considerations include whether the proposed services are compatible with maintaining the Auditor's independence. Pre-approvals pursuant to the Policy are considered annually.
(e)(2) Note. None of the services described in paragraphs (b) through (d) of this Item 4 were approved by the Audit Committee pursuant to paragraph (c)(7)(i)(C) of Rule 2-01 of Regulation S-X.
(f) None of the hours expended on the principal accountant's engagement to audit the registrant's financial statements for the most recent fiscal year were attributed to work performed by persons other than the principal accountant's full-time, permanent employees.
Non-Audit Fees. The aggregate non-audit fees billed by the Auditor for services rendered to the Registrant, and rendered to Service Affiliates, for the Reporting Periods were $1,865,667 in 2023 and $1,429,804 in 2024.
Auditor Independence. The Registrant's Audit Committee has considered whether the provision of non-audit services that were rendered to Service Affiliates, which were not pre-approved (not requiring pre-approval), is compatible with maintaining the Auditor's independence.
| Item 5. | Audit Committee of Listed Registrants. |
Not applicable.
Not applicable.
BNY Mellon Investment Portfolios, MidCap Stock Portfolio
ANNUAL FINANCIALS AND OTHER INFORMATION
IMPORTANT NOTICE – CHANGES TO ANNUAL AND SEMI-ANNUAL REPORTS
The Securities and Exchange Commission (the “SEC”) has adopted rule and form amendments which have resulted in changes to the design and delivery of annual and semi-annual fund reports (“Reports”). Reports are now streamlined to highlight key information. Certain information previously included in Reports, including financial statements, no longer appear in the Reports but will be available online within the Semi-Annual and Annual Financials and Other Information, delivered free of charge to shareholders upon request, and filed with the SEC.
Save time. Save paper. View your next shareholder report online as soon as it’s available. Log into www.bny.com/investments and sign up for eCommunications. It’s simple and only takes a few minutes.
The views expressed in this report reflect those of the portfolio manager(s) only through the end of the period covered and do not necessarily represent the views of BNY Mellon Investment Adviser, Inc. or any other person in the BNY Mellon Investment Adviser, Inc. organization. Any such views are subject to change at any time based upon market or other conditions and BNY Mellon Investment Adviser, Inc. disclaims any responsibility to update such views. These views may not be relied on as investment advice and, because investment decisions for a fund in the BNY Mellon Family of Funds are based on numerous factors, may not be relied on as an indication of trading intent on behalf of any fund in the BNY Mellon
Family of Funds.
Not FDIC-Insured • Not Bank-Guaranteed • May Lose Value
Contents
Please note the Annual Financials and Other Information only contains Items 7-11 required in Form N-CSR. All other required items will be filed with the SEC.
Item 7. Financial Statements and Financial Highlights for Open-End Management Investment Companies. MidCap Stock PortfolioStatement of Investments
| | | | | |
|
Automobiles & Components — 1.5% |
| | | | | |
| | | | | |
Fox Factory Holding Corp. (a) | | | | | |
| | | | | |
| | | | | |
| | | | | |
| | | | | |
|
| | | | | |
Columbia Banking System, Inc. | | | | | |
Commerce Bancshares, Inc. | | | | | |
| | | | | |
First Financial Bankshares, Inc. (b) | | | | | |
| | | | | |
Flagstar Financial, Inc. (b) | | | | | |
| | | | | |
International Bancshares Corp. | | | | | |
| | | | | |
| | | | | |
| | | | | |
| | | | | |
|
| | | | | |
Advanced Drainage Systems, Inc. | | | | | |
Allison Transmission Holdings, Inc. | | | | | |
Applied Industrial Technologies, Inc. | | | | | |
Armstrong World Industries, Inc. | | | | | |
Axon Enterprise, Inc. (a) | | | | | |
| | | | | |
| | | | | |
Comfort Systems USA, Inc. | | | | | |
Core & Main, Inc., Cl. A (a) | | | | | |
| | | | | |
| | | | | |
| | | | | |
| | | | | |
| | | | | |
| | | | | |
Fortune Brands Innovations, Inc. | | | | | |
Gates Industrial Corp. PLC (a) | | | | | |
Generac Holdings, Inc. (a) | | | | | |
| | | | | |
| | | | | |
| | | | | |
Lennox International, Inc. (b) | | | | | |
Lincoln Electric Holdings, Inc. | | | | | |
| | | | | |
MSC Industrial Direct Co., Inc., Cl. A (b) | | | | | |
Statement of Investments (continued)
| | | | | |
Common Stocks — 99.5% (continued) |
Capital Goods — 17.0% (continued) |
NEXTracker, Inc., Cl. A (a) | | | | | |
| | | | | |
| | | | | |
| | | | | |
| | | | | |
| | | | | |
Watts Water Technologies, Inc., Cl. A | | | | | |
WESCO International, Inc. | | | | | |
| | | | | |
Commercial & Professional Services — 2.0% |
Booz Allen Hamilton Holding Corp. | | | | | |
ExlService Holdings, Inc. (a) | | | | | |
| | | | | |
| | | | | |
| | | | | |
| | | | | |
| | | | | |
| | | | | |
| | | | | |
Consumer Discretionary Distribution & Retail — 3.7% |
Abercrombie & Fitch Co., Cl. A (a) | | | | | |
| | | | | |
| | | | | |
Burlington Stores, Inc. (a) | | | | | |
| | | | | |
Dick’s Sporting Goods, Inc. | | | | | |
| | | | | |
| | | | | |
| | | | | |
Williams-Sonoma, Inc. (b) | | | | | |
| | | | | |
Consumer Durables & Apparel — 4.2% |
| | | | | |
Columbia Sportswear Co. (b) | | | | | |
| | | | | |
Deckers Outdoor Corp. (a) | | | | | |
| | | | | |
| | | | | |
| | | | | |
| | | | | |
| | | | | |
Tempur Sealy International, Inc. | | | | | |
| | | | | |
| | | | | |
| | | | | |
| | | | | |
|
| | | | | |
| | | | | |
| | | | | |
Common Stocks — 99.5% (continued) |
Consumer Services — 3.9% (continued) |
| | | | | |
| | | | | |
| | | | | |
Graham Holdings Co., Cl. B | | | | | |
Grand Canyon Education, Inc. (a) | | | | | |
| | | | | |
| | | | | |
| | | | | |
| | | | | |
| | | | | |
Consumer Staples Distribution & Retail — 3.2% |
Casey’s General Stores, Inc. | | | | | |
Performance Food Group Co. (a) | | | | | |
Sprouts Farmers Market, Inc. (a) | | | | | |
US Foods Holding Corp. (a) | | | | | |
| | | | | |
|
| | | | | |
| | | | | |
CNX Resources Corp. (a),(b) | | | | | |
| | | | | |
| | | | | |
| | | | | |
| | | | | |
| | | | | |
| | | | | |
Range Resources Corp. (b) | | | | | |
| | | | | |
Weatherford International PLC | | | | | |
| | | | | |
Equity Real Estate Investment Trusts — 7.3% |
Brixmor Property Group, Inc. (c) | | | | | |
Camden Property Trust (c) | | | | | |
COPT Defense Properties (c) | | | | | |
Cousins Properties, Inc. (c) | | | | | |
| | | | | |
EastGroup Properties, Inc. (c) | | | | | |
Equity LifeStyle Properties, Inc. (c) | | | | | |
First Industrial Realty Trust, Inc. (c) | | | | | |
Gaming & Leisure Properties, Inc. (b),(c) | | | | | |
Highwoods Properties, Inc. (c) | | | | | |
| | | | | |
Lamar Advertising Co., Cl. A (c) | | | | | |
National Storage Affiliates Trust (b),(c) | | | | | |
| | | | | |
Park Hotels & Resorts, Inc. (b),(c) | | | | | |
| | | | | |
Statement of Investments (continued)
| | | | | |
Common Stocks — 99.5% (continued) |
Equity Real Estate Investment Trusts — 7.3% (continued) |
STAG Industrial, Inc. (c) | | | | | |
Vornado Realty Trust (b),(c) | | | | | |
| | | | | |
Financial Services — 4.9% |
| | | | | |
| | | | | |
| | | | | |
Euronet Worldwide, Inc. (a) | | | | | |
| | | | | |
| | | | | |
Janus Henderson Group PLC | | | | | |
| | | | | |
| | | | | |
| | | | | |
| | | | | |
T. Rowe Price Group, Inc. | | | | | |
The Western Union Company (b) | | | | | |
| | | | | |
| | | | | |
Food, Beverage & Tobacco — 1.9% |
Celsius Holdings, Inc. (a),(b) | | | | | |
Coca-Cola Consolidated, Inc. | | | | | |
| | | | | |
| | | | | |
| | | | | |
| | | | | |
The Boston Beer Company, Inc., Cl. A (a) | | | | | |
| | | | | |
Health Care Equipment & Services — 4.7% |
| | | | | |
| | | | | |
| | | | | |
| | | | | |
Doximity, Inc., Cl. A (a) | | | | | |
| | | | | |
Envista Holdings Corp. (a),(b) | | | | | |
| | | | | |
| | | | | |
IDEXX Laboratories, Inc. (a) | | | | | |
Lantheus Holdings, Inc. (a),(b) | | | | | |
| | | | | |
| | | | | |
| | | | | |
Option Care Health, Inc. (a) | | | | | |
| | | | | |
| | | | | |
| | | | | |
STAAR Surgical Co. (a),(b) | | | | | |
| | | | | |
Common Stocks — 99.5% (continued) |
Health Care Equipment & Services — 4.7% (continued) |
| | | | | |
Tenet Healthcare Corp. (a) | | | | | |
| | | | | |
Household & Personal Products — .8% |
BellRing Brands, Inc. (a) | | | | | |
e.l.f Beauty, Inc. (a),(b) | | | | | |
| | | | | |
| | | | | |
|
CNO Financial Group, Inc. | | | | | |
Fidelity National Financial, Inc. | | | | | |
Kinsale Capital Group, Inc. | | | | | |
| | | | | |
| | | | | |
Reinsurance Group of America, Inc. | | | | | |
RenaissanceRe Holdings Ltd. | | | | | |
Ryan Specialty Holdings, Inc. | | | | | |
| | | | | |
| | | | | |
|
| | | | | |
| | | | | |
Axalta Coating Systems Ltd. (a) | | | | | |
| | | | | |
Cleveland-Cliffs, Inc. (a),(b) | | | | | |
| | | | | |
| | | | | |
| | | | | |
| | | | | |
| | | | | |
| | | | | |
| | | | | |
| | | | | |
| | | | | |
| | | | | |
| | | | | |
The Scotts Miracle-Gro Company | | | | | |
| | | | | |
Media & Entertainment — 1.6% |
Match Group, Inc. (a),(b) | | | | | |
Nexstar Media Group, Inc. (b) | | | | | |
Pinterest, Inc., Cl. A (a) | | | | | |
| | | | | |
| | | | | |
The New York Times Company, Cl. A | | | | | |
ZoomInfo Technologies, Inc. (a) | | | | | |
| | | | | |
Pharmaceuticals, Biotechnology & Life Sciences — 5.2% |
Agilent Technologies, Inc. | | | | | |
Statement of Investments (continued)
| | | | | |
Common Stocks — 99.5% (continued) |
Pharmaceuticals, Biotechnology & Life Sciences — 5.2% (continued) |
| | | | | |
| | | | | |
BioMarin Pharmaceutical, Inc. (a) | | | | | |
| | | | | |
Halozyme Therapeutics, Inc. (a) | | | | | |
| | | | | |
Jazz Pharmaceuticals PLC (a) | | | | | |
Medpace Holdings, Inc. (a) | | | | | |
Neurocrine Biosciences, Inc. (a) | | | | | |
Sarepta Therapeutics, Inc. (a) | | | | | |
United Therapeutics Corp. (a) | | | | | |
| | | | | |
Real Estate Management & Development — .4% |
Jones Lang LaSalle, Inc. (a) | | | | | |
Semiconductors & Semiconductor Equipment — 2.4% |
| | | | | |
| | | | | |
| | | | | |
Monolithic Power Systems, Inc. | | | | | |
| | | | | |
| | | | | |
| | | | | |
| | | | | |
Software & Services — 3.4% |
| | | | | |
AppFolio, Inc., Cl. A (a) | | | | | |
| | | | | |
| | | | | |
Commvault Systems, Inc. (a) | | | | | |
Dolby Laboratories, Inc., Cl. A | | | | | |
| | | | | |
| | | | | |
Manhattan Associates, Inc. (a) | | | | | |
| | | | | |
| | | | | |
Smartsheet, Inc., Cl. A (a) | | | | | |
| | | | | |
| | | | | |
Technology Hardware & Equipment — 3.1% |
| | | | | |
| | | | | |
| | | | | |
| | | | | |
| | | | | |
| | | | | |
| | | | | |
Pure Storage, Inc., Cl. A (a) | | | | | |
| | | | | |
Common Stocks — 99.5% (continued) |
Technology Hardware & Equipment — 3.1% (continued) |
| | | | | |
| | | | | |
| | | | | |
Telecommunication Services — .3% |
Iridium Communications, Inc. | | | | | |
Lumen Technologies, Inc. (a) | | | | | |
| | | | | |
|
Avis Budget Group, Inc. (a),(b) | | | | | |
Hertz Global Holdings, Inc. (a),(b) | | | | | |
| | | | | |
| | | | | |
| | | | | |
| | | | | |
|
| | | | | |
| | | | | |
New Jersey Resources Corp. | | | | | |
Northwestern Energy Group, Inc. | | | | | |
| | | | | |
| | | | | |
| | | | | |
| | | | | |
Total Common Stocks
(cost $130,797,083) | | | | | |
| | | | | |
Investment Companies — .6% |
Registered Investment Companies — .6% |
Dreyfus Institutional Preferred Government Plus Money Market Fund, Institutional (cost $974,635) | | | | | |
Investment of Cash Collateral for Securities Loaned — .1% | | | | | |
Registered Investment Companies — .1% | | | | | |
Dreyfus Institutional Preferred Government Plus Money Market Fund, Institutional (cost $217,524) | | | | | |
Total Investments (cost $131,989,242) | | | | | |
Liabilities, Less Cash and Receivables | | | | | |
| | | | | |
REIT—Real Estate Investment Trust |
| Non-income producing security. |
| Security, or portion thereof, on loan. At December 31, 2024, the value of the fund’s securities on loan was $15,247,452 and the value of the collateral was $15,655,921, consisting of cash collateral of $217,524 and U.S. Government & Agency securities valued at $15,438,397. In addition, the value of collateral may include pending sales that are also on loan. |
Statement of Investments (continued)
| Investment in real estate investment trust within the United States. |
| Investment in affiliated issuer. The investment objective of this investment company is publicly available and can be found within the investment company’s prospectus. |
|
| | | | | Dividends/
Distributions ($) |
Registered Investment Companies - .6% |
Dreyfus Institutional Preferred Government Plus Money Market Fund, Institutional Shares - .6% | | | | | |
Investment of Cash Collateral for Securities Loaned - .1% | |
Dreyfus Institutional Preferred Government Plus Money Market Fund, Institutional Shares - .1% | | | | | |
| | | | | |
| Includes reinvested dividends/distributions. |
| Represents securities lending income earned from the reinvestment of cash collateral from loaned securities, net of fees and collateral investment expenses, and other payments to and from borrowers of securities. |
See notes to financial statements.
STATEMENT OF ASSETS AND LIABILITIES
December 31, 2024
| | |
| | |
Investments in securities—See Statement of Investments
(including securities on loan, valued at $15,247,452)—Note 1(c): | | |
| | |
| | |
Dividends and securities lending income receivable | | |
Receivable for shares of Beneficial Interest subscribed | | |
| | |
| | |
| | |
Due to BNY Mellon Investment Adviser, Inc. and affiliates—Note 3(b) | | |
Liability for securities on loan—Note 1(c) | | |
Payable for shares of Beneficial Interest redeemed | | |
Trustees’ fees and expenses payable | | |
| | |
| | |
| | |
Composition of Net Assets ($): | | |
| | |
Total distributable earnings (loss) | | |
| | |
Net Asset Value Per Share | | |
| | |
| | |
Net Asset Value Per Share ($) | | |
See notes to financial statements.
Year Ended December 31, 2024
| |
| |
| |
Cash dividends (net of $725 foreign taxes withheld at source): | |
| |
| |
Income from securities lending—Note 1(c) | |
| |
| |
| |
Distribution fees—Note 3(b) | |
| |
| |
Chief Compliance Officer fees—Note 3(b) | |
Prospectus and shareholders’ reports | |
Trustees’ fees and expenses—Note 3(c) | |
Loan commitment fees—Note 2 | |
| |
Shareholder servicing costs—Note 3(b) | |
| |
| |
Less—reduction in expenses due to undertaking—Note 3(a) | |
Less—reduction in fees due to earnings credits—Note 3(b) | |
| |
| |
Realized and Unrealized Gain (Loss) on Investments—Note 4 ($): | |
Net realized gain (loss) on investments | |
Net change in unrealized appreciation (depreciation) on investments | |
Net Realized and Unrealized Gain (Loss) on Investments | |
Net Increase in Net Assets Resulting from Operations | |
See notes to financial statements.
STATEMENT OF CHANGES IN NET ASSETS
| |
| | |
| | |
| | |
Net realized gain (loss) on investments | | |
Net change in unrealized appreciation (depreciation) on investments | | |
Net Increase (Decrease) in Net Assets Resulting from Operations | | |
| | |
Distributions to shareholders: | | |
| | |
| | |
| | |
Beneficial Interest Transactions ($): | | |
Net proceeds from shares sold: | | |
| | |
| | |
Distributions reinvested: | | |
| | |
| | |
| | |
| | |
| | |
Increase (Decrease) in Net Assets from Beneficial Interest Transactions | | |
Total Increase (Decrease) in Net Assets | | |
| | |
| | |
| | |
| |
| | |
Capital Share Transactions (Shares): | | |
| | |
| | |
Shares issued for distributions reinvested | | |
| | |
Net Increase (Decrease) in Shares Outstanding | | |
| | |
| | |
Shares issued for distributions reinvested | | |
| | |
Net Increase (Decrease) in Shares Outstanding | | |
See notes to financial statements.
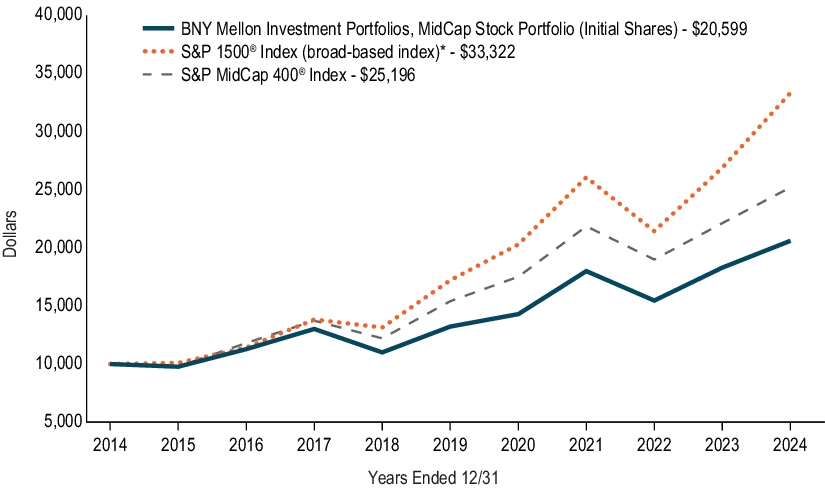
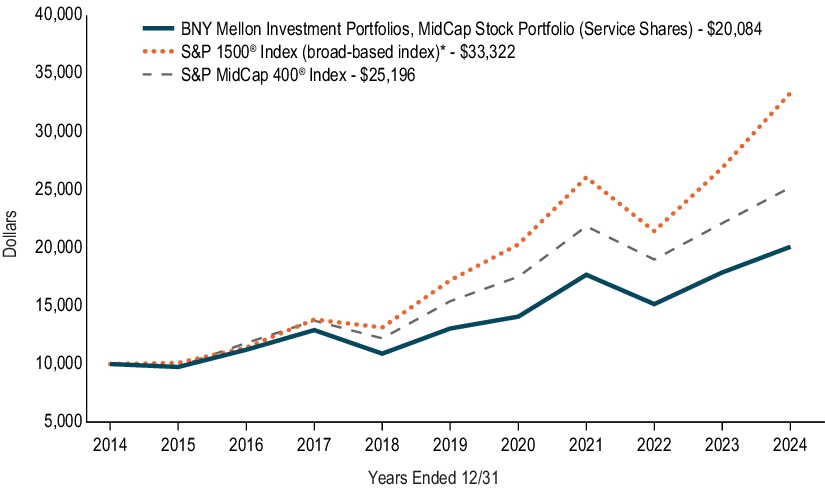
The following tables describe the performance for each share class for the fiscal periods indicated. All information (except portfolio turnover rate) reflects financial results for a single fund share. Net asset value total return is calculated assuming an initial investment made at the net asset value at the beginning of the period, reinvestment of all dividends and distributions at net asset value during the period, and redemption at net asset value on the last day of the period. Net asset value total return includes adjustments in accordance with accounting principles generally accepted in the United States of America and as such, the net asset value for financial reporting purposes and the returns based upon those net asset values may differ from the net asset value and returns for shareholder transactions. The fund’s total returns do not reflect expenses associated with variable annuity or insurance contracts.
| |
| | | | | |
| | | | | |
Net asset value, beginning of period | | | | | |
| | | | |
| | | | | |
Net realized and unrealized gain (loss) on investments | | | | | |
Total from Investment Operations | | | | | |
| | | | | |
Dividends from net investment income | | | | | |
Dividends from net realized gain on investments | | | | | |
| | | | | |
Net asset value, end of period | | | | | |
| | | | | |
Ratios/Supplemental Data (%): | | | | |
Ratio of total expenses to average net assets | | | | | |
Ratio of net expenses to average net assets | | | | | |
Ratio of net investment income to average net assets | | | | | |
| | | | | |
Net Assets, end of period ($ x 1,000) | | | | | |
| Based on average shares outstanding. |
See notes to financial statements.
NOTES TO FINANCIAL STATEMENTS
NOTE 1—
Significant Accounting Policies:
MidCap Stock Portfolio (the “fund”) is a separate diversified series of BNY Mellon Investment Portfolios (the “Trust”), which is registered under the Investment Company Act of 1940, as amended (the “Act”), as an open-end management investment company and operates as a series company currently offering three series, including the fund. The fund is only offered to separate accounts established by insurance companies to fund variable annuity contracts and variable life insurance policies. The fund’s investment objective is to seek investment results that are greater than the total return performance of publicly traded common stocks of medium-size domestic companies in the aggregate, as represented by the Standard & Poor’s MidCap 400® Index. BNY Mellon Investment Adviser, Inc. (the “Adviser”), a wholly-owned subsidiary of The Bank of New York Mellon Corporation (“BNY”), serves as the fund’s investment adviser. Newton Investment Management North America, LLC (the “Sub-Adviser” or “NIMNA”), an indirect wholly-owned subsidiary of BNY and an affiliate of the Adviser, serves as the fund’s sub-adviser. NIMNA has entered into a sub-sub-investment advisory agreement with its affiliate, Newton Investment Management Limited (“NIM”), which enables NIM to provide certain advisory services to the Sub-Adviser for the benefit of the fund, including, but not limited to, portfolio management services. NIM is subject to the supervision of NIMNA and the Adviser. NIM is also an affiliate of the Adviser. NIM, located at 160 Queen Victoria Street, London, EC4V, 4LA, England, was formed in 1978. NIM is an indirect subsidiary of BNY.
BNY Mellon Securities Corporation (the “Distributor”), a wholly-owned subsidiary of the Adviser, is the distributor of the fund’s shares, which are sold without a sales charge. The fund is authorized to issue an unlimited number of $.001 par value shares of Beneficial Interest in each of the following classes of shares: Initial and Service. Each class of shares has identical rights and privileges, except with respect to the Distribution Plan and the expenses borne by each class, the allocation of certain transfer agency costs and certain voting rights. Income, expenses (other than expenses attributable to a specific class), and realized and unrealized gains or losses on investments are allocated to each class of shares based on its relative net assets.
The Trust accounts separately for the assets, liabilities and operations of each series. Expenses directly attributable to each series are charged to that series’ operations; expenses which are applicable to all series are allocated among them on a pro rata basis.
The Financial Accounting Standards Board (“FASB”) Accounting Standards Codification (“ASC”) is the exclusive reference of authoritative U.S. generally accepted accounting principles (“GAAP”) recognized by the FASB to be applied by nongovernmental entities. Rules and interpretive releases of the SEC under authority of federal laws are also sources of authoritative GAAP for SEC registrants. The fund is an investment company and applies the accounting and reporting guidance of the FASB ASC Topic 946 Financial Services-Investment Companies. The fund’s financial statements are prepared in accordance with GAAP, which may require the use of management estimates and assumptions. Actual results could differ from those estimates.
The Trust enters into contracts that contain a variety of indemnifications. The fund’s maximum exposure under these arrangements is unknown. The fund does not anticipate recognizing any loss related to these arrangements.
(a) Portfolio valuation: The fair value of a financial instrument is the amount that would be received to sell an asset or paid to transfer a liability in an orderly transaction between market participants at the measurement date (i.e., the exit price). GAAP establishes a fair value hierarchy that prioritizes the inputs of valuation techniques used to measure fair value. This hierarchy gives the highest priority to unadjusted quoted prices in active markets for identical assets or liabilities (Level 1 measurements) and the lowest priority to unobservable inputs (Level 3 measurements).
Additionally, GAAP provides guidance on determining whether the volume and activity in a market has decreased significantly and whether such a decrease in activity results in transactions that are not orderly. GAAP requires enhanced disclosures around valuation inputs and techniques used during annual and interim periods.
Various inputs are used in determining the value of the fund’s investments relating to fair value measurements. These inputs are summarized in the three broad levels listed below:
Level 1—unadjusted quoted prices in active markets for identical investments.
Level 2—other significant observable inputs (including quoted prices for similar investments, interest rates, prepayment speeds, credit risk, etc.).
Level 3—significant unobservable inputs (including the fund’s own assumptions in determining the fair value of investments).
The inputs or methodology used for valuing securities are not necessarily an indication of the risk associated with investing in those securities.
NOTES TO FINANCIAL STATEMENTS (continued)
Changes in valuation techniques may result in transfers in or out of an assigned level within the disclosure hierarchy. Valuation techniques used to value the fund’s investments are as follows:
The Trust’s Board of Trustees (the “Board”) has designated the Adviser as the fund’s valuation designee to make all fair value determinations with respect to the fund’s portfolio investments, subject to the Board’s oversight and pursuant to Rule 2a-5 under the Act.
Investments in equity securities are valued at the last sales price on the securities exchange or national securities market on which such securities are primarily traded. Securities listed on the National Market System for which market quotations are available are valued at the official closing price or, if there is no official closing price that day, at the last sales price. For open short positions, asked prices are used for valuation purposes. Bid price is used when no asked price is available. Registered investment companies that are not traded on an exchange are valued at their net asset value. All of the preceding securities are generally categorized within Level 1 of the fair value hierarchy.
Securities not listed on an exchange or the national securities market, or securities for which there were no transactions, are valued at the average of the most recent bid and asked prices. These securities are generally categorized within Level 2 of the fair value hierarchy.
Fair valuing of securities may be determined with the assistance of a pricing service using calculations based on indices of domestic securities and other appropriate indicators, such as prices of relevant American Depositary Receipts and futures. Utilizing these techniques may result in transfers between Level 1 and Level 2 of the fair value hierarchy.
When market quotations or official closing prices are not readily available, or are determined not to accurately reflect fair value, such as when the value of a security has been significantly affected by events after the close of the exchange or market on which the security is principally traded, but before the fund calculates its net asset value, the fund may value these investments at fair value as determined in accordance with the procedures approved by the Board. Certain factors may be considered when fair valuing investments such as: fundamental analytical data, the nature and duration of restrictions on disposition, an evaluation of the forces that influence the market in which the securities are purchased and sold, and public trading in similar securities of the issuer or comparable issuers. These securities are either categorized within Level 2 or 3 of the fair value hierarchy depending on the relevant inputs used.
For securities where observable inputs are limited, assumptions about market activity and risk are used and such securities are generally categorized within Level 3 of the fair value hierarchy.
The following is a summary of the inputs used as of December 31, 2024 in valuing the fund’s investments:
| Level 1 -
Unadjusted
Quoted Prices | Level 2- Other
Significant
Observable Inputs | Level 3-
Significant
Unobservable
Inputs | |
| | | | |
Investments in Securities:† | | | | |
Equity Securities -
Common Stocks | | | | |
| | | | |
| See Statement of Investments for additional detailed categorizations, if any. |
(b) Foreign taxes: The fund may be subject to foreign taxes (a portion of which may be reclaimable) on income, stock dividends, realized and unrealized capital gains on investments or certain foreign currency transactions. Foreign taxes are recorded in accordance with the applicable foreign tax regulations and rates that exist in the foreign jurisdictions in which the fund invests. These foreign taxes, if any, are paid by the fund and are reflected in the Statement of Operations, if applicable. Foreign taxes payable or deferred or those subject to reclaims as of December 31, 2024, if any, are disclosed in the fund’s Statement of Assets and Liabilities.
(c) Securities transactions and investment income: Securities transactions are recorded on a trade date basis. Realized gains and losses from securities transactions are recorded on the identified cost basis. Dividend income is recognized on the ex-dividend date and interest income, including, where applicable, accretion of discount and amortization of premium on investments, is recognized on the accrual basis.
Pursuant to a securities lending agreement with BNY, the fund may lend securities to qualified institutions. It is the fund’s policy that, at origination, all loans are secured by collateral of at least 102% of the value of U.S. securities loaned and 105% of the value of foreign securities loaned. Collateral equivalent to at least 100% of the market value of securities on loan is maintained at all times. Collateral is
NOTES TO FINANCIAL STATEMENTS (continued)
either in the form of cash, which can be invested in certain money market mutual funds managed by the Adviser, or U.S. Government and Agency securities. Any non-cash collateral received cannot be sold or re-pledged by the fund, except in the event of borrower default, and is not reflected in the Statement of Assets and Liabilities. The securities on loan, if any, are also disclosed in the fund’s Statement of Investments. The fund is entitled to receive all dividends, interest and distributions on securities loaned, in addition to income earned as a result of the lending transaction. Should a borrower fail to return the securities in a timely manner, BNY is required to replace the securities for the benefit of the fund or credit the fund with the market value of the unreturned securities and is subrogated to the fund’s rights against the borrower and the collateral. Additionally, the contractual maturity of security lending transactions are on an overnight and continuous basis. During the period ended December 31, 2024, BNY earned $1,637 from the lending of the fund’s portfolio securities, pursuant to the securities lending agreement.
For financial reporting purposes, the fund elects not to offset assets and liabilities subject to a securities lending agreement, if any, in the Statement of Assets and Liabilities. Therefore, all qualifying transactions are presented on a gross basis in the Statement of Assets and Liabilities. As of December 31, 2024, the fund had securities lending and the impact of netting of assets and liabilities and the offsetting of collateral pledged or received, if any, based on contractual netting/set-off provisions in the securities lending agreement are detailed in the following table:
| | |
Gross amount of securities loaned, at value, as disclosed in the Statement
of Assets and Liabilities | | |
Collateral (received)/posted not offset
in the Statement of
Assets and Liabilities | | |
| | |
| The value of the related collateral received by the fund exceeded the value of the securities loaned by the fund pursuant to the securities lending agreement. In addition, the value of collateral may include pending sales that are also on loan. See Statement of Investments for detailed information regarding collateral received for open securities lending. |
(d) Affiliated issuers: Investments in other investment companies advised by the Adviser are considered “affiliated” under the Act.
(e) Market Risk: The value of the securities in which the fund invests may be affected by political, regulatory, economic and social developments, and developments that impact specific economic sectors, industries or segments of the market. In addition, turbulence in financial markets and reduced liquidity in equity, credit and/or fixed-income markets may negatively affect many issuers, which could adversely affect the fund. Global economies and financial markets are becoming increasingly interconnected, and conditions and events in one country, region or financial market may adversely impact issuers in a different country, region or financial market. These risks may be magnified if certain events or developments adversely interrupt the global supply chain; in these and other circumstances, such risks might affect companies world-wide.
(f) Dividends and distributions to shareholders: Dividends and distributions are recorded on the ex-dividend date. Dividends from net investment income and dividends from net realized capital gains, if any, are normally declared and paid annually, but the fund may make distributions on a more frequent basis to comply with the distribution requirements of the Internal Revenue Code of 1986, as amended (the “Code”). To the extent that net realized capital gains can be offset by capital loss carryovers, it is the policy of the fund not to distribute such gains. Income and capital gain distributions are determined in accordance with income tax regulations, which may differ from GAAP.
(g) Federal income taxes: It is the policy of the fund to continue to qualify as a regulated investment company, if such qualification is in the best interests of its shareholders, by complying with the applicable provisions of the Code, and to make distributions of taxable income and net realized capital gain sufficient to relieve it from substantially all federal income and excise taxes.
As of and during the period ended December 31, 2024, the fund did not have any liabilities for any uncertain tax positions. The fund recognizes interest and penalties, if any, related to uncertain tax positions as income tax expense in the Statement of Operations. During the period ended December 31, 2024, the fund did not incur any interest or penalties.
Each tax year in the four-year period ended December 31, 2024 remains subject to examination by the Internal Revenue Service and state taxing authorities.
NOTES TO FINANCIAL STATEMENTS (continued)
At December 31, 2024, the components of accumulated earnings on a tax basis were as follows: undistributed ordinary income $3,019,028, undistributed capital gains $11,695,475 and unrealized appreciation $25,892,659.
The tax character of distributions paid to shareholders during the fiscal years ended December 31, 2024 and December 31, 2023 were as follows: ordinary income $1,222,452 and $970,208, and long-term capital gains $2,120,302 and $4,690,255, respectively.
(h) Operating segment reporting: In this reporting period, the fund adopted FASB Accounting Standards Update 2023-07, Segment Reporting (Topic 280) - Improvements to Reportable Segment Disclosures (“ASU 2023-07”). Adoption of the new standard impacted financial statement disclosures only and did not affect the fund’s financial position or the results of its operations. The ASU 2023-07 is effective for public entities for fiscal years beginning after December 15, 2023, and requires retrospective application for all prior periods presented within the financial statements.
Since its commencement, the fund operates and is managed as a single reportable segment deriving returns in the form of dividends, interest and/or gains from the investments made in pursuit of its single stated investment objective as outlined in the fund’s prospectus. The accounting policies of the fund are consistent with those described in these Notes to Financial Statements. The chief operating decision maker (“CODM”) is represented by BNY Investments, the management of the fund’s Adviser, comprising of Senior Management and Directors. The CODM considers net increase in net assets resulting from operations in deciding whether to purchase additional investments or to make distributions to its shareholders. Detailed financial information for the fund is disclosed within these financial statements with total assets and liabilities disclosed on the Statement of Assets and Liabilities, investments held on the Statement of Investments, results of operations and significant segment expenses on the Statement of Operations and other information about the fund’s performance, including total return, portfolio turnover and ratios within the Financial Highlights.
NOTE 2—
Bank Lines of Credit:
The fund participates with other long-term open-end funds managed by the Adviser in a $738 million unsecured credit facility led by Citibank, N.A. (the “Citibank Credit Facility”) and a $300 million unsecured credit facility provided by BNY (the “BNY Credit Facility”), each to be utilized primarily for temporary or emergency purposes, including the financing of redemptions (each, a “Facility”). The Citibank Credit Facility is available in two tranches: (i) Tranche A is in an amount equal to $618 million and is available to all long-term open-ended funds, including the fund, and (ii) Tranche B is an amount equal to $120 million and is available only to BNY Mellon Floating Rate Income Fund, a series of BNY Mellon Investment Funds IV, Inc. In connection therewith, the fund has agreed to pay its pro rata portion of commitment fees for Tranche A of the Citibank Credit Facility and the BNY Credit Facility. Interest is charged to the fund based on rates determined pursuant to the terms of the respective Facility at the time of borrowing.
During the period ended December 31, 2024, the fund was charged $2,635 for interest expense. These fees are included in Interest expense in the Statement of Operations. The average amount of borrowings outstanding under the Citibank Credit Facility during the period ended December 31, 2024 was approximately $41,257 with a related weighted average annualized interest rate of 6.39%. As of December 31, 2024, the fund has no outstanding loan balance from either Facility.
NOTE 3—
Management Fee, Sub-Advisory Fee and Other Transactions with Affiliates:
(a) Pursuant to a management agreement with the Adviser, the management fee is computed at the annual rate of .75% of the value of the fund’s average daily net assets and is payable monthly. The Adviser has contractually agreed, from January 1, 2024 through May 1, 2025, to waive receipt of its fees and/or assume the direct expenses of the fund so that the direct expenses of neither class of fund shares (excluding Rule 12b-1 Distribution Plan fees, taxes, interest expense, brokerage commissions, commitment fees on borrowings and extraordinary expenses) exceed .80% of the value of the fund’s average daily net assets. On or after May 1, 2025, the Adviser may terminate this expense limitation at any time. The reduction in expenses, pursuant to the undertaking, amounted to $112,877 during the period ended December 31, 2024.
Pursuant to a sub-investment advisory agreement between the Adviser and the Sub-Adviser, the Adviser pays the Sub-Adviser a monthly fee at an annual rate of .36% of the value of the fund’s average daily net assets.
(b) Under the Distribution Plan adopted pursuant to Rule 12b-1 under the Act, Service shares pay the Distributor for distributing its shares, for servicing and/or maintaining Service shares’ shareholder accounts and for advertising and marketing for Service shares. The Distribution Plan provides for payments to be made at an annual rate of .25% of the value of the Service shares’ average daily net assets. The Distributor may make payments to Participating Insurance Companies and to brokers and dealers acting as principal underwriter for their variable insurance products. The fees payable under the Distribution Plan are payable without regard to actual expenses incurred. During the period ended December 31, 2024, Service shares were charged $210,450 pursuant to the Distribution Plan.
NOTES TO FINANCIAL STATEMENTS (continued)
The fund has an arrangement with BNY Mellon Transfer, Inc., (the “Transfer Agent”), a subsidiary of BNY and an affiliate of the Adviser, whereby the fund may receive earnings credits when positive cash balances are maintained, which are used to offset Transfer Agent fees. For financial reporting purposes, the fund includes transfer agent net earnings credits, if any, as an expense offset in the Statement of Operations.
The fund has an arrangement with The Bank of New York Mellon (the “Custodian”), a subsidiary of BNY and an affiliate of the Adviser, whereby the fund will receive interest income or be charged overdraft fees when cash balances are maintained. For financial reporting purposes, the fund includes this interest income and overdraft fees, if any, as interest income in the Statement of Operations.
The fund compensates the Transfer Agent, under a transfer agency agreement, for providing transfer agency and cash management services for the fund. The majority of Transfer Agent fees are comprised of amounts paid on a per account basis, while cash management fees are related to fund subscriptions and redemptions. During the period ended December 31, 2024, the fund was charged $1,365 for transfer agency services. These fees are included in Shareholder servicing costs in the Statement of Operations. These fees were partially offset by earnings credits of $429.
The fund compensates the Custodian, under a custody agreement, for providing custodial services for the fund. These fees are determined based on net assets, geographic region and transaction activity. During the period ended December 31, 2024, the fund was charged $26,561 pursuant to the custody agreement.
During the period ended December 31, 2024, the fund was charged $24,960 for services performed by the fund’s Chief Compliance Officer and his staff. These fees are included in Chief Compliance Officer fees in the Statement of Operations.
The components of “Due to BNY Mellon Investment Adviser, Inc. and affiliates” in the Statement of Assets and Liabilities consist of: Management fee of $104,255, Distribution Plan fees of $18,704, Custodian fees of $3,600, Chief Compliance Officer fees of $5,818 and Transfer Agent fees of $302, which are offset against an expense reimbursement currently in effect in the amount of $13,726.
(c) Each board member of the fund also serves as a board member of other funds in the BNY Mellon Family of Funds complex. Annual retainer fees and attendance fees are allocated to each fund based on net assets.
NOTE 4—
Securities Transactions:
The aggregate amount of purchases and sales of investment securities, excluding short-term securities, during the period ended December 31, 2024, amounted to $92,575,928 and $106,777,818, respectively.
At December 31, 2024, the cost of investments for federal income tax purposes was $132,415,648; accordingly, accumulated net unrealized appreciation on investments was $25,892,659, consisting of $33,954,131 gross unrealized appreciation and $8,061,472 gross unrealized depreciation.
REPORT OF INDEPENDENT REGISTERED PUBLIC ACCOUNTING FIRM
To the Shareholders and the Board of Trustees of MidCap Stock Portfolio
Opinion on the Financial Statements
We have audited the accompanying statement of assets and liabilities of MidCap Stock Portfolio (the “Fund”) (one of the funds constituting BNY Mellon Investment Portfolios (the “Trust”)), including the statement of investments, as of December 31, 2024, and the related statement of operations for the year then ended, the statements of changes in net assets for each of the two years in the period then ended, the financial highlights for each of the five years in the period then ended and the related notes (collectively referred to as the “financial statements”). In our opinion, the financial statements present fairly, in all material respects, the financial position of the Fund (one of the funds constituting BNY Mellon Investment Portfolios) at December 31, 2024, the results of its operations for the year then ended, the changes in its net assets for each of the two years in the period then ended and its financial highlights for each of the five years in the period then ended, in conformity with U.S. generally accepted accounting principles.
These financial statements are the responsibility of the Trust’s management. Our responsibility is to express an opinion on the Fund’s financial statements based on our audits. We are a public accounting firm registered with the Public Company Accounting Oversight Board (United States) (“PCAOB”) and are required to be independent with respect to the Trust in accordance with the U.S. federal securities laws and the applicable rules and regulations of the Securities and Exchange Commission and the PCAOB.
We conducted our audits in accordance with the standards of the PCAOB. Those standards require that we plan and perform the audit to obtain reasonable assurance about whether the financial statements are free of material misstatement, whether due to error or fraud. The Trust is not required to have, nor were we engaged to perform, an audit of the Trust’s internal control over financial reporting. As part of our audits, we are required to obtain an understanding of internal control over financial reporting but not for the purpose of expressing an opinion on the effectiveness of the Trust’s internal control over financial reporting. Accordingly, we express no such opinion.
Our audits included performing procedures to assess the risks of material misstatement of the financial statements, whether due to error or fraud, and performing procedures that respond to those risks. Such procedures included examining, on a test basis, evidence regarding the amounts and disclosures in the financial statements. Our procedures included confirmation of securities owned as of December 31, 2024, by correspondence with the custodian, brokers and others; when replies were not received from brokers and others, we performed other auditing procedures. Our audits also included evaluating the accounting principles used and significant estimates made by management, as well as evaluating the overall presentation of the financial statements. We believe that our audits provide a reasonable basis for our opinion. 
We have served as the auditor of one or more investment companies in the BNY Mellon Family of Funds since at least 1957, but we are unable to determine the specific year.
New York, New York
February 11, 2025
IMPORTANT TAX INFORMATION (Unaudited)
For federal tax purposes, the fund hereby reports 99.79% of the ordinary dividends paid during the fiscal year ended December 31, 2024 as qualifying for the corporate dividends received deduction. Shareholders will receive notification in early 2025 of the percentage applicable to the preparation of their 2024 income tax returns.The fund also hereby reports $.2688 per share as a long-term capital gain distribution and $.0141 per share as a short-term capital gain distribution paid March 26, 2024.
Item 8. Changes in and Disagreements with Accountants for Open-End Management Investment Companies (Unaudited)
Item 9. Proxy Disclosures for Open-End Management Investment Companies (Unaudited)
Item 10. Remuneration Paid to Directors, Officers, and Others of Open-End Management Investment Companies (Unaudited)
Each board member also serves as a board member of other funds in the BNY Mellon Family of Funds complex. Annual retainer fees and attendance fees are allocated to each fund based on net assets. Trustees fees paid by the fund are within Item 7. Statement of Operations as Trustees’ fees and expenses.
Item 11. Statement Regarding Basis for Approval of Investment Advisory Contracts (Unaudited)
At a meeting of the fund’s Board of Trustees held on August 14-15, 2024, the Board considered the renewal of the fund’s Management Agreement, pursuant to which the Adviser provides the fund with investment advisory and administrative services, the Sub-Investment Advisory Agreement, pursuant to which Newton Investment Management North America, LLC (the “Sub-Adviser” or “NIMNA”) provides day-to-day management of the fund’s investments, and the Sub-Sub-Investment Advisory Agreement (collectively with the Management Agreement and the Sub-Investment Advisory Agreement, the “Agreements”) between NIMNA and Newton Investment Management Limited (“NIM”), pursuant to which NIMNA may use the investment advisory personnel, resources and capabilities available at its sister company, NIM, in providing the day-to-day management of the fund’s investments. The Board members, none of whom are “interested persons” (as defined in the Investment Company Act of 1940, as amended) of the fund, were assisted in their review by independent legal counsel and met with counsel in executive session separate from representatives of the Adviser and the Sub-Adviser. In considering the renewal of the Agreements, the Board considered several factors that it believed to be relevant, including those discussed below. The Board did not identify any one factor as dispositive, and each Board member may have attributed different weights to the factors considered.
Analysis of Nature, Extent, and Quality of Services Provided to the Fund. The Board considered information provided to it at the meeting and in previous presentations from representatives of the Adviser regarding the nature, extent, and quality of the services provided to funds in the BNY Mellon fund complex, including the fund. The Adviser provided the number of open accounts in the fund, the fund’s asset size and the allocation of fund assets among distribution channels. The Adviser also had previously provided information regarding the diverse intermediary relationships and distribution channels of funds in the BNY Mellon fund complex (such as intermediary, in which intermediaries typically are paid by the fund and/or the Adviser) and the Adviser’s corresponding need for broad, deep, and diverse resources to be able to provide ongoing shareholder services to each intermediary or distribution channel, as applicable to the fund.
The Board also considered research support available to, and portfolio management capabilities of, the fund’s portfolio management personnel and that the Adviser also provides oversight of day-to-day fund operations, including fund accounting and administration and assistance in meeting legal and regulatory requirements. The Board also considered the Adviser’s extensive administrative, accounting and compliance infrastructures, as well as the Adviser’s supervisory activities over the Sub-Adviser. The Board also considered portfolio management’s brokerage policies and practices (including policies and practices regarding soft dollars) and the standards applied in seeking best execution.
Comparative Analysis of the Fund’s Performance and Management Fee and Expense Ratio. The Board reviewed reports prepared by Broadridge Financial Solutions, Inc. (“Broadridge”), an independent provider of investment company data based on classifications provided by Thomson Reuters Lipper (“Lipper”), which included information comparing (1) the performance of the fund’s Initial shares with the performance of a group of small-cap core funds underlying variable insurance products (“VIPs”) selected by Broadridge as comparable to the fund (the “Performance Group”) and with a broader group of funds consisting of all small-cap core funds underlying VIPs (the “Performance Universe”), all for various periods ended June 30, 2024, and (2) the fund’s actual and contractual management fees and total expenses with those of the same group of funds in the Performance Group (the “Expense Group”) and with a broader group of funds consisting of all small-cap core funds underlying VIPs, excluding outliers (the “Expense Universe”), the information for which was derived in part from fund financial statements available to Broadridge as of the date of its analysis. The Adviser previously had furnished the Board with a description of the methodology Broadridge used to select the Performance Group and Performance Universe and the Expense Group and Expense Universe.
Performance Comparisons. Representatives of the Adviser stated that the usefulness of performance comparisons may be affected by a number of factors, including different investment limitations and policies that may be applicable to the fund and comparison funds and the end date selected. The Board also considered the fund’s performance in light of overall financial market conditions. The Board discussed with representatives of the Adviser and the Sub-Adviser the results of the comparisons and considered that the fund’s total return performance was above the Performance Group median for each period, except for the ten-year period when the fund’s total return performance was below the Performance Group median, and was above the Performance Universe median for all periods. The Adviser also provided a comparison of the fund’s calendar year total returns to the returns of the fund’s benchmark index.
Management Fee and Expense Ratio Comparisons. The Board reviewed and considered the contractual management fee rate payable by the fund to the Adviser in light of the nature, extent and quality of the management services and the sub-advisory services provided by
the Adviser and the Sub-Adviser, respectively. In addition, the Board reviewed and considered the actual management fee rate paid by the fund over the fund’s last fiscal year, which included reductions for an expense limitation arrangement in place that reduced the management fee paid to the Adviser. The Board also reviewed the range of actual and contractual management fees and total expenses as a percentage of average net assets of the Expense Group and Expense Universe funds and discussed the results of the comparisons.
The Board considered that the fund’s contractual management fee was below the Expense Group median contractual management fee, the fund’s actual management fee was equal to the Expense Group median and lower than the Expense Universe median actual management fee, and the fund’s total expenses were lower than the Expense Group median and lower than the Expense Universe median total expenses.
Representatives of the Adviser stated that the Adviser has contractually agreed, until May 1, 2025, to waive receipt of its fees and/or assume the direct expenses of the fund so that the direct expenses of neither class of fund shares (excluding Rule 12b-1 fees, taxes, interest expense, brokerage commissions, commitment fees on borrowings and extraordinary expenses) exceed .80% of the fund’s average daily net assets.
Representatives of the Adviser reviewed with the Board the management or investment advisory fees paid by funds advised by the Adviser that are in the same Lipper category as the fund (the “Similar Funds”), and explained the nature of the Similar Funds. They discussed differences in fees paid and the relationship of the fees paid in light of any differences in the services provided and other relevant factors. The Board considered the relevance of the fee information provided for the Similar Funds to evaluate the appropriateness of the fund’s management fee. Representatives of the Adviser noted that there were no separate accounts and/or other types of client portfolios advised by the Adviser or the Sub-Adviser that are considered to have similar investment strategies and policies as the fund.
The Board considered the fee payable to the Sub-Adviser in relation to the fee payable to the Adviser by the fund and the respective services provided by the Sub-Adviser and the Adviser. The Board also took into consideration that the Sub-Adviser’s fee is paid by the Adviser, out of its fee from the fund, and not the fund.
Analysis of Profitability and Economies of Scale. Representatives of the Adviser reviewed the expenses allocated and profit received by the Adviser and its affiliates and the resulting profitability percentage for managing the fund and the aggregate profitability percentage to the Adviser and its affiliates for managing the funds in the BNY Mellon fund complex, and the method used to determine the expenses and profit. The Board concluded that the profitability results were not excessive, given the services rendered and service levels provided by the Adviser and its affiliates. The Board also considered the expense limitation arrangement and its effect on the profitability of the Adviser and its affiliates. The Board also had been provided with information prepared by an independent consulting firm regarding the Adviser’s approach to allocating costs to, and determining the profitability of, individual funds and the entire BNY Mellon fund complex. The consulting firm also had analyzed where any economies of scale might emerge in connection with the management of a fund.
The Board considered, on the advice of its counsel, the profitability analysis (1) as part of its evaluation of whether the fees under the Agreements, considered in relation to the mix of services provided by the Adviser and the Sub-Adviser, including the nature, extent and quality of such services, supported the renewal of the Agreements and (2) in light of the relevant circumstances for the fund and the extent to which economies of scale would be realized if the fund grows and whether fee levels reflect these economies of scale for the benefit of fund shareholders. Representatives of the Adviser stated that a discussion of economies of scale is predicated on a fund having achieved a substantial size with increasing assets and that, if a fund’s assets had been stable or decreasing, the possibility that the Adviser may have realized any economies of scale would be less. Representatives of the Adviser also stated that, as a result of shared and allocated costs among funds in the BNY Mellon fund complex, the extent of economies of scale could depend substantially on the level of assets in the complex as a whole, so that increases and decreases in complex-wide assets can affect potential economies of scale in a manner that is disproportionate to, or even in the opposite direction from, changes in the fund’s asset level. The Board also considered potential benefits to the Adviser and the Sub-Adviser from acting as investment adviser and sub-investment adviser, respectively, and took into consideration that there were no soft dollar arrangements in effect for trading the fund’s investments.
Item 11. Statement Regarding Basis for Approval of Investment Advisory Contracts (Unaudited) (continued)
At the conclusion of these discussions, the Board agreed that it had been furnished with sufficient information to make an informed business decision with respect to the renewal of the Agreements. Based on the discussions and considerations as described above, the Board concluded and determined as follows.
●The Board concluded that the nature, extent and quality of the services provided by the Adviser and the Sub-Adviser are adequate and appropriate.
●The Board was satisfied with the fund’s performance.
●The Board concluded that the fees paid to the Adviser and the Sub-Adviser continued to be appropriate under the circumstances and in light of the factors and the totality of the services provided as discussed above.
●The Board determined that the economies of scale which may accrue to the Adviser and its affiliates in connection with the management of the fund had been adequately considered by the Adviser in connection with the fee rate charged to the fund pursuant to the Management Agreement and that, to the extent in the future it were determined that material economies of scale had not been shared with the fund, the Board would seek to have those economies of scale shared with the fund.
In evaluating the Agreements, the Board considered these conclusions and determinations and also relied on its previous knowledge, gained through meetings and other interactions with the Adviser and its affiliates and the Sub-Adviser, of the Adviser and the Sub-Adviser and the services provided to the fund by the Adviser and the Sub-Adviser. The Board also relied on information received on a routine and regular basis throughout the year relating to the operations of the fund and the investment management and other services provided under the Agreements, including information on the investment performance of the fund in comparison to similar mutual funds and benchmark performance indices; general market outlook as applicable to the fund; and compliance reports. In addition, the Board’s consideration of the contractual fee arrangements for the fund had the benefit of a number of years of reviews of the Agreements for the fund, or substantially similar agreements for other BNY Mellon funds that the Board oversees, during which lengthy discussions took place between the Board and representatives of the Adviser. Certain aspects of the arrangements may receive greater scrutiny in some years than in others, and the Board’s conclusions may be based, in part, on its consideration of the fund’s arrangements, or substantially similar arrangements for other BNY Mellon funds that the Board oversees, in prior years. The Board determined to renew the Agreements.
© 2025 BNY Mellon Securities CorporationCode-0174NCSRAR1224
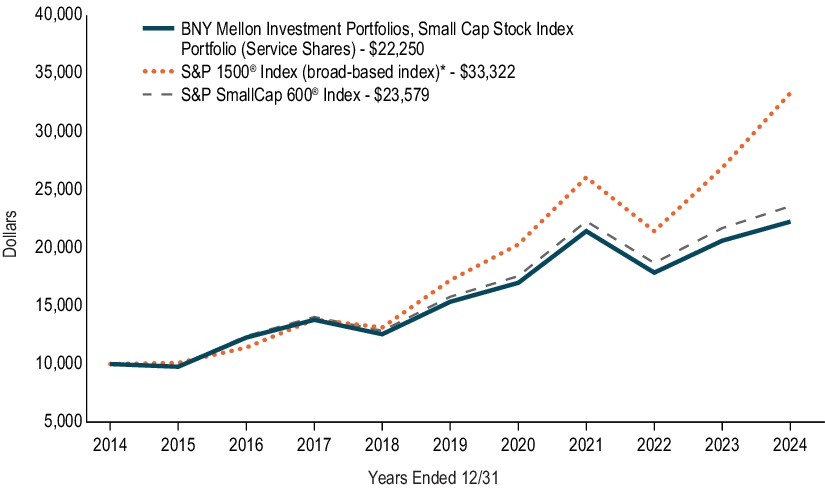
BNY Mellon Investment Portfolios, Small Cap Stock Index Portfolio
ANNUAL FINANCIALS AND OTHER INFORMATION
IMPORTANT NOTICE – CHANGES TO ANNUAL AND SEMI-ANNUAL REPORTS
The Securities and Exchange Commission (the “SEC”) has adopted rule and form amendments which have resulted in changes to the design and delivery of annual and semi-annual fund reports (“Reports”). Reports are now streamlined to highlight key information. Certain information previously included in Reports, including financial statements, no longer appear in the Reports but will be available online within the Semi-Annual and Annual Financials and Other Information, delivered free of charge to shareholders upon request, and filed with the SEC.
Save time. Save paper. View your next shareholder report online as soon as it’s available. Log into www.bny.com/investments and sign up for eCommunications. It’s simple and only takes a few minutes.
The views expressed in this report reflect those of the portfolio manager(s) only through the end of the period covered and do not necessarily represent the views of BNY Mellon Investment Adviser, Inc. or any other person in the BNY Mellon Investment Adviser, Inc. organization. Any such views are subject to change at any time based upon market or other conditions and BNY Mellon Investment Adviser, Inc. disclaims any responsibility to update such views. These views may not be relied on as investment advice and, because investment decisions for a fund in the BNY Mellon Family of Funds are based on numerous factors, may not be relied on as an indication of trading intent on behalf of any fund in the BNY Mellon
Family of Funds.
Not FDIC-Insured • Not Bank-Guaranteed • May Lose Value
Contents
Please note the Annual Financials and Other Information only contains Items 7-11 required in Form N-CSR. All other required items will be filed with the SEC.
Item 7. Financial Statements and Financial Highlights for Open-End Management Investment Companies. Small Cap Stock Index PortfolioStatement of Investments
| | | | | |
|
Automobiles & Components — 1.5% |
| | | | | |
American Axle & Manufacturing Holdings, Inc. (a) | | | | | |
| | | | | |
Dorman Products, Inc. (a) | | | | | |
Fox Factory Holding Corp. (a) | | | | | |
| | | | | |
| | | | | |
| | | | | |
| | | | | |
Standard Motor Products, Inc. | | | | | |
Winnebago Industries, Inc. (b) | | | | | |
| | | | | |
| | | | | |
|
| | | | | |
Atlantic Union Bankshares Corp. (b) | | | | | |
| | | | | |
| | | | | |
| | | | | |
| | | | | |
| | | | | |
| | | | | |
Berkshire Hills Bancorp, Inc. | | | | | |
| | | | | |
Capitol Federal Financial, Inc. | | | | | |
| | | | | |
Central Pacific Financial Corp. | | | | | |
| | | | | |
Community Financial System, Inc. | | | | | |
Customers Bancorp, Inc. (a) | | | | | |
| | | | | |
Dime Community Bancshares, Inc. | | | | | |
| | | | | |
| | | | | |
First BanCorp/Puerto Rico | | | | | |
First Bancorp/Southern Pines NC | | | | | |
First Commonwealth Financial Corp. | | | | | |
| | | | | |
| | | | | |
| | | | | |
| | | | | |
| | | | | |
| | | | | |
| | | | | |
| | | | | |
Independent Bank Group, Inc. | | | | | |
Lakeland Financial Corp. (b) | | | | | |
National Bank Holdings Corp., Cl. A | | | | | |
Statement of Investments (continued)
| | | | | |
Common Stocks — 99.0% (continued) |
|
| | | | | |
Northwest Bancshares, Inc. | | | | | |
| | | | | |
Pacific Premier Bancorp, Inc. | | | | | |
| | | | | |
| | | | | |
| | | | | |
Provident Financial Services, Inc. | | | | | |
| | | | | |
| | | | | |
Seacoast Banking Corp. of Florida | | | | | |
ServisFirst Bancshares, Inc. (b) | | | | | |
Simmons First National Corp., Cl. A | | | | | |
Southside Bancshares, Inc. | | | | | |
| | | | | |
| | | | | |
| | | | | |
Triumph Financial, Inc. (a),(b) | | | | | |
| | | | | |
| | | | | |
United Community Banks, Inc. | | | | | |
| | | | | |
| | | | | |
| | | | | |
| | | | | |
| | | | | |
|
| | | | | |
| | | | | |
| | | | | |
| | | | | |
Albany International Corp., Cl. A | | | | | |
American Woodmark Corp. (a) | | | | | |
| | | | | |
| | | | | |
Armstrong World Industries, Inc. | | | | | |
| | | | | |
| | | | | |
| | | | | |
| | | | | |
| | | | | |
| | | | | |
DXP Enterprises, Inc. (a) | | | | | |
Dycom Industries, Inc. (a) | | | | | |
| | | | | |
| | | | | |
| | | | | |
Everus Construction Group, Inc. (a) | | | | | |
| | | | | |
| | | | | |
Common Stocks — 99.0% (continued) |
Capital Goods — 11.2% (continued) |
Franklin Electric Co., Inc. | | | | | |
Gates Industrial Corp. PLC (a) | | | | | |
Gibraltar Industries, Inc. (a) | | | | | |
| | | | | |
Granite Construction, Inc. (b) | | | | | |
| | | | | |
Hayward Holdings, Inc. (a) | | | | | |
| | | | | |
| | | | | |
John Bean Technologies Corp. (b) | | | | | |
| | | | | |
| | | | | |
| | | | | |
Mercury Systems, Inc. (a) | | | | | |
| | | | | |
| | | | | |
National Presto Industries, Inc. | | | | | |
Powell Industries, Inc. (b) | | | | | |
| | | | | |
Quanex Building Products Corp. | | | | | |
Resideo Technologies, Inc. (a) | | | | | |
Rush Enterprises, Inc., Cl. A | | | | | |
SPX Technologies, Inc. (a) | | | | | |
Standex International Corp. | | | | | |
| | | | | |
| | | | | |
The Greenbrier Cos., Inc. | | | | | |
Titan International, Inc. (a),(b) | | | | | |
| | | | | |
| | | | | |
| | | | | |
| | | | | |
Zurn Elkay Water Solutions Corp. | | | | | |
| | | | | |
Commercial & Professional Services — 3.7% |
| | | | | |
Amentum Holdings, Inc. (a) | | | | | |
| | | | | |
| | | | | |
CSG Systems International, Inc. | | | | | |
| | | | | |
| | | | | |
Healthcare Services Group, Inc. (a) | | | | | |
Heidrick & Struggles International, Inc. | | | | | |
| | | | | |
| | | | | |
| | | | | |
Liquidity Services, Inc. (a) | | | | | |
Matthews International Corp., Cl. A | | | | | |
Statement of Investments (continued)
| | | | | |
Common Stocks — 99.0% (continued) |
Commercial & Professional Services — 3.7% (continued) |
| | | | | |
| | | | | |
| | | | | |
| | | | | |
| | | | | |
| | | | | |
| | | | | |
| | | | | |
| | | | | |
| | | | | |
| | | | | |
Consumer Discretionary Distribution & Retail — 4.6% |
Academy Sports & Outdoors, Inc. (b) | | | | | |
Advance Auto Parts, Inc. (b) | | | | | |
American Eagle Outfitters, Inc. | | | | | |
Asbury Automotive Group, Inc. (a) | | | | | |
| | | | | |
Boot Barn Holdings, Inc. (a),(b) | | | | | |
| | | | | |
| | | | | |
| | | | | |
| | | | | |
| | | | | |
| | | | | |
| | | | | |
| | | | | |
| | | | | |
National Vision Holdings, Inc. (a) | | | | | |
Sally Beauty Holdings, Inc. (a) | | | | | |
| | | | | |
| | | | | |
Sonic Automotive, Inc., Cl. A | | | | | |
| | | | | |
| | | | | |
| | | | | |
Urban Outfitters, Inc. (a) | | | | | |
Victoria’s Secret & Co. (a) | | | | | |
| | | | | |
Consumer Durables & Apparel — 5.1% |
| | | | | |
Cavco Industries, Inc. (a) | | | | | |
Century Communities, Inc. | | | | | |
| | | | | |
Dream Finders Homes, Inc., Cl. A (a),(b) | | | | | |
Ethan Allen Interiors, Inc. | | | | | |
G-III Apparel Group Ltd. (a) | | | | | |
Green Brick Partners, Inc. (a) | | | | | |
Hanesbrands, Inc. (a),(b) | | | | | |
| | | | | |
| | | | | |
Common Stocks — 99.0% (continued) |
Consumer Durables & Apparel — 5.1% (continued) |
Installed Building Products, Inc. (b) | | | | | |
| | | | | |
| | | | | |
| | | | | |
| | | | | |
| | | | | |
| | | | | |
| | | | | |
Oxford Industries, Inc. (b) | | | | | |
| | | | | |
| | | | | |
| | | | | |
| | | | | |
Topgolf Callaway Brands Corp. (a),(b) | | | | | |
Tri Pointe Homes, Inc. (a) | | | | | |
| | | | | |
Wolverine World Wide, Inc. | | | | | |
Worthington Enterprises, Inc. | | | | | |
| | | | | |
|
Adtalem Global Education, Inc. (a) | | | | | |
BJ’s Restaurants, Inc. (a) | | | | | |
| | | | | |
Brinker International, Inc. (a) | | | | | |
Cracker Barrel Old Country Store, Inc. (b) | | | | | |
Dave & Buster’s Entertainment, Inc. (a),(b) | | | | | |
| | | | | |
Golden Entertainment, Inc. | | | | | |
Jack in the Box, Inc. (b) | | | | | |
Mister Car Wash, Inc. (a) | | | | | |
Monarch Casino & Resort, Inc. | | | | | |
Papa John’s International, Inc. (b) | | | | | |
Penn Entertainment, Inc. (a) | | | | | |
| | | | | |
| | | | | |
Shake Shack, Inc., Cl. A (a) | | | | | |
Six Flags Entertainment Corp. | | | | | |
Strategic Education, Inc. | | | | | |
| | | | | |
The Cheesecake Factory, Inc. (b) | | | | | |
| | | | | |
Consumer Staples Distribution & Retail — .7% |
Grocery Outlet Holding Corp. (a),(b) | | | | | |
| | | | | |
| | | | | |
| | | | | |
The Chefs’ Warehouse, Inc. (a) | | | | | |
United Natural Foods, Inc. (a) | | | | | |
| | | | | |
Statement of Investments (continued)
| | | | | |
Common Stocks — 99.0% (continued) |
|
| | | | | |
Atlas Energy Solutions, Inc. (b) | | | | | |
| | | | | |
| | | | | |
California Resources Corp. | | | | | |
Comstock Resources, Inc. (a),(b) | | | | | |
| | | | | |
Core Laboratories, Inc. (b) | | | | | |
Crescent Energy Co., Cl. A | | | | | |
| | | | | |
| | | | | |
| | | | | |
Helix Energy Solutions Group, Inc. (a) | | | | | |
Helmerich & Payne, Inc. (b) | | | | | |
Innovex International, Inc. (a) | | | | | |
International Seaways, Inc. | | | | | |
| | | | | |
Magnolia Oil & Gas Corp., Cl. A (b) | | | | | |
Nabors Industries Ltd. (a),(b) | | | | | |
| | | | | |
Oceaneering International, Inc. (a) | | | | | |
Par Pacific Holdings, Inc. (a) | | | | | |
Patterson-UTI Energy, Inc. (b) | | | | | |
| | | | | |
ProPetro Holding Corp. (a) | | | | | |
REX American Resources Corp. (a) | | | | | |
| | | | | |
| | | | | |
| | | | | |
| | | | | |
| | | | | |
| | | | | |
| | | | | |
Equity Real Estate Investment Trusts — 6.9% |
| | | | | |
Alexander & Baldwin, Inc. (c) | | | | | |
American Assets Trust, Inc. (c) | | | | | |
Apple Hospitality REIT, Inc. (c) | | | | | |
Armada Hoffler Properties, Inc. (c) | | | | | |
Brandywine Realty Trust (c) | | | | | |
| | | | | |
| | | | | |
Curbline Properties Corp. (c) | | | | | |
DiamondRock Hospitality Co. (c) | | | | | |
| | | | | |
Easterly Government Properties, Inc. (b),(c) | | | | | |
| | | | | |
Essential Properties Realty Trust, Inc. (b),(c) | | | | | |
Four Corners Property Trust, Inc. (c) | | | | | |
| | | | | |
Common Stocks — 99.0% (continued) |
Equity Real Estate Investment Trusts — 6.9% (continued) |
| | | | | |
Global Net Lease, Inc. (b),(c) | | | | | |
Highwoods Properties, Inc. (c) | | | | | |
Innovative Industrial Properties, Inc. (b),(c) | | | | | |
| | | | | |
| | | | | |
| | | | | |
Medical Properties Trust, Inc. (b),(c) | | | | | |
NexPoint Residential Trust, Inc. (c) | | | | | |
| | | | | |
Pebblebrook Hotel Trust (b),(c) | | | | | |
Phillips Edison & Co., Inc. (c) | | | | | |
Retail Opportunity Investments Corp. (c) | | | | | |
| | | | | |
| | | | | |
| | | | | |
SL Green Realty Corp. (c) | | | | | |
Summit Hotel Properties, Inc. (c) | | | | | |
Sunstone Hotel Investors, Inc. (c) | | | | | |
| | | | | |
Terreno Realty Corp. (b),(c) | | | | | |
| | | | | |
| | | | | |
Universal Health Realty Income Trust (c) | | | | | |
Urban Edge Properties (c) | | | | | |
Veris Residential, Inc. (c) | | | | | |
| | | | | |
Xenia Hotels & Resorts, Inc. (c) | | | | | |
| | | | | |
Financial Services — 7.2% |
Apollo Commercial Real Estate Finance, Inc. (b),(c) | | | | | |
Arbor Realty Trust, Inc. (b),(c) | | | | | |
ARMOUR Residential REIT, Inc. (b),(c) | | | | | |
Artisan Partners Asset Management, Inc., Cl. A | | | | | |
| | | | | |
Blackstone Mortgage Trust, Inc., Cl. A (b),(c) | | | | | |
Bread Financial Holdings, Inc. | | | | | |
Brightsphere Investment Group, Inc. (b) | | | | | |
| | | | | |
Donnelley Financial Solutions, Inc. (a) | | | | | |
Ellington Financial, Inc. (b),(c) | | | | | |
Encore Capital Group, Inc. (a) | | | | | |
Enova International, Inc. (a) | | | | | |
| | | | | |
| | | | | |
Franklin BSP Realty Trust, Inc. (c) | | | | | |
Green Dot Corp., Cl. A (a) | | | | | |
HA Sustainable Infrastructure Capital, Inc. (b) | | | | | |
Jackson Financial, Inc., Cl. A | | | | | |
Statement of Investments (continued)
| | | | | |
Common Stocks — 99.0% (continued) |
Financial Services — 7.2% (continued) |
KKR Real Estate Finance Trust, Inc. (c) | | | | | |
| | | | | |
Mr. Cooper Group, Inc. (a) | | | | | |
| | | | | |
| | | | | |
New York Mortgage Trust, Inc. (b),(c) | | | | | |
| | | | | |
Payoneer Global, Inc. (a) | | | | | |
PennyMac Mortgage Investment Trust (b),(c) | | | | | |
| | | | | |
PJT Partners, Inc., Cl. A | | | | | |
| | | | | |
| | | | | |
| | | | | |
Ready Capital Corp. (b),(c) | | | | | |
| | | | | |
StepStone Group, Inc., Cl. A | | | | | |
| | | | | |
Two Harbors Investment Corp. (b),(c) | | | | | |
Virtu Financial, Inc., Cl. A | | | | | |
Virtus Investment Partners, Inc. | | | | | |
| | | | | |
| | | | | |
World Acceptance Corp. (a) | | | | | |
| | | | | |
Food, Beverage & Tobacco — 1.4% |
| | | | | |
| | | | | |
Fresh Del Monte Produce, Inc. | | | | | |
J & J Snack Foods Corp. (b) | | | | | |
John B Sanfilippo & Son, Inc. | | | | | |
MGP Ingredients, Inc. (b) | | | | | |
| | | | | |
The Hain Celestial Group, Inc. (a) | | | | | |
The Simply Good Foods Co. (a) | | | | | |
Tootsie Roll Industries, Inc. (b) | | | | | |
TreeHouse Foods, Inc. (a) | | | | | |
| | | | | |
| | | | | |
| | | | | |
Health Care Equipment & Services — 6.7% |
| | | | | |
| | | | | |
AMN Healthcare Services, Inc. (a),(b) | | | | | |
| | | | | |
| | | | | |
| | | | | |
| | | | | |
Concentra Group Holdings Parent, Inc. | | | | | |
| | | | | |
Common Stocks — 99.0% (continued) |
Health Care Equipment & Services — 6.7% (continued) |
| | | | | |
| | | | | |
| | | | | |
Fulgent Genetics, Inc. (a) | | | | | |
| | | | | |
| | | | | |
Hims & Hers Health, Inc. (a) | | | | | |
| | | | | |
| | | | | |
Inspire Medical Systems, Inc. (a) | | | | | |
Integer Holdings Corp. (a),(b) | | | | | |
Integra LifeSciences Holdings Corp. (a) | | | | | |
| | | | | |
Merit Medical Systems, Inc. (a) | | | | | |
National HealthCare Corp. | | | | | |
| | | | | |
| | | | | |
| | | | | |
| | | | | |
Pediatrix Medical Group, Inc. (a) | | | | | |
| | | | | |
Privia Health Group, Inc. (a) | | | | | |
| | | | | |
| | | | | |
| | | | | |
| | | | | |
Select Medical Holdings Corp. | | | | | |
| | | | | |
STAAR Surgical Co. (a),(b) | | | | | |
Tandem Diabetes Care, Inc. (a) | | | | | |
TransMedics Group, Inc. (a),(b) | | | | | |
UFP Technologies, Inc. (a),(b) | | | | | |
US Physical Therapy, Inc. | | | | | |
| | | | | |
Household & Personal Products — .9% |
Central Garden & Pet Co. (a),(b) | | | | | |
Central Garden & Pet Co., Cl. A (a) | | | | | |
Edgewell Personal Care Co. | | | | | |
| | | | | |
| | | | | |
USANA Health Sciences, Inc. (a) | | | | | |
| | | | | |
| | | | | |
|
Ambac Financial Group, Inc. (a) | | | | | |
| | | | | |
| | | | | |
| | | | | |
Genworth Financial, Inc. (a) | | | | | |
Statement of Investments (continued)
| | | | | |
Common Stocks — 99.0% (continued) |
Insurance — 2.4% (continued) |
Goosehead Insurance, Inc., Cl. A (a) | | | | | |
| | | | | |
Horace Mann Educators Corp. | | | | | |
| | | | | |
| | | | | |
Palomar Holdings, Inc. (a) | | | | | |
| | | | | |
Safety Insurance Group, Inc. | | | | | |
| | | | | |
Stewart Information Services Corp. | | | | | |
| | | | | |
| | | | | |
| | | | | |
|
| | | | | |
Alpha Metallurgical Resources, Inc. (a),(b) | | | | | |
| | | | | |
| | | | | |
| | | | | |
| | | | | |
| | | | | |
| | | | | |
| | | | | |
| | | | | |
| | | | | |
| | | | | |
| | | | | |
| | | | | |
| | | | | |
Minerals Technologies, Inc. | | | | | |
MP Materials Corp. (a),(b) | | | | | |
| | | | | |
| | | | | |
| | | | | |
Sensient Technologies Corp. | | | | | |
| | | | | |
| | | | | |
| | | | | |
| | | | | |
| | | | | |
| | | | | |
Media & Entertainment — 2.5% |
| | | | | |
| | | | | |
| | | | | |
Cinemark Holdings, Inc. (a) | | | | | |
EchoStar Corp., Cl. A (a),(b) | | | | | |
| | | | | |
John Wiley & Sons, Inc., Cl. A | | | | | |
| | | | | |
Common Stocks — 99.0% (continued) |
Media & Entertainment — 2.5% (continued) |
Madison Square Garden Sports Corp. (a) | | | | | |
| | | | | |
| | | | | |
| | | | | |
| | | | | |
| | | | | |
| | | | | |
| | | | | |
| | | | | |
| | | | | |
| | | | | |
Pharmaceuticals, Biotechnology & Life Sciences — 4.4% |
| | | | | |
| | | | | |
Amphastar Pharmaceuticals, Inc. (a),(b) | | | | | |
ANI Pharmaceuticals, Inc. (a) | | | | | |
Arcus Biosciences, Inc. (a) | | | | | |
| | | | | |
BioLife Solutions, Inc. (a) | | | | | |
Catalyst Pharmaceuticals, Inc. (a) | | | | | |
Collegium Pharmaceutical, Inc. (a),(b) | | | | | |
Corcept Therapeutics, Inc. (a),(b) | | | | | |
Cytek Biosciences, Inc. (a) | | | | | |
Dynavax Technologies Corp. (a),(b) | | | | | |
Fortrea Holdings, Inc. (a) | | | | | |
Harmony Biosciences Holdings, Inc. (a) | | | | | |
| | | | | |
Ironwood Pharmaceuticals, Inc. (a) | | | | | |
Krystal Biotech, Inc. (a) | | | | | |
Ligand Pharmaceuticals, Inc. (a) | | | | | |
| | | | | |
Myriad Genetics, Inc. (a) | | | | | |
| | | | | |
Pacira BioSciences, Inc. (a),(b) | | | | | |
Phibro Animal Health Corp., Cl. A | | | | | |
Prestige Consumer Healthcare, Inc. (a) | | | | | |
Protagonist Therapeutics, Inc. (a) | | | | | |
Supernus Pharmaceuticals, Inc. (a) | | | | | |
TG Therapeutics, Inc. (a),(b) | | | | | |
| | | | | |
Vir Biotechnology, Inc. (a) | | | | | |
| | | | | |
| | | | | |
Real Estate Management & Development — .6% |
Cushman & Wakefield PLC (a),(b) | | | | | |
eXp World Holdings, Inc. (b) | | | | | |
Kennedy-Wilson Holdings, Inc. | | | | | |
Statement of Investments (continued)
| | | | | |
Common Stocks — 99.0% (continued) |
Real Estate Management & Development — .6% (continued) |
| | | | | |
| | | | | |
| | | | | |
Semiconductors & Semiconductor Equipment — 3.2% |
Alpha & Omega Semiconductor Ltd. (a),(b) | | | | | |
Axcelis Technologies, Inc. (a) | | | | | |
| | | | | |
| | | | | |
| | | | | |
| | | | | |
| | | | | |
| | | | | |
Kulicke & Soffa Industries, Inc. (b) | | | | | |
| | | | | |
| | | | | |
Penguin Solutions, Inc. (a),(b) | | | | | |
| | | | | |
| | | | | |
| | | | | |
| | | | | |
SolarEdge Technologies, Inc. (a),(b) | | | | | |
Ultra Clean Holdings, Inc. (a) | | | | | |
Veeco Instruments, Inc. (a),(b) | | | | | |
| | | | | |
| | | | | |
Software & Services — 4.4% |
| | | | | |
| | | | | |
| | | | | |
| | | | | |
Alarm.com Holdings, Inc. (a) | | | | | |
| | | | | |
| | | | | |
Clear Secure, Inc., Cl. A | | | | | |
DigitalOcean Holdings, Inc. (a),(b) | | | | | |
DoubleVerify Holdings, Inc. (a) | | | | | |
DXC Technology Co. (a),(b) | | | | | |
Grid Dynamics Holdings, Inc. (a) | | | | | |
| | | | | |
LiveRamp Holdings, Inc. (a) | | | | | |
MARA Holdings, Inc. (a),(b) | | | | | |
| | | | | |
| | | | | |
| | | | | |
| | | | | |
Sprinklr, Inc., Cl. A (a),(b) | | | | | |
| | | | | |
| | | | | |
| | | | | |
Common Stocks — 99.0% (continued) |
Technology Hardware & Equipment — 4.3% |
Advanced Energy Industries, Inc. | | | | | |
Arlo Technologies, Inc. (a) | | | | | |
| | | | | |
Benchmark Electronics, Inc. | | | | | |
| | | | | |
| | | | | |
| | | | | |
Digi International, Inc. (a) | | | | | |
| | | | | |
Extreme Networks, Inc. (a) | | | | | |
| | | | | |
Insight Enterprises, Inc. (a),(b) | | | | | |
| | | | | |
| | | | | |
NetScout Systems, Inc. (a) | | | | | |
OSI Systems, Inc. (a),(b) | | | | | |
| | | | | |
| | | | | |
| | | | | |
| | | | | |
| | | | | |
TTM Technologies, Inc. (a) | | | | | |
| | | | | |
Viavi Solutions, Inc. (a) | | | | | |
Vishay Intertechnology, Inc. | | | | | |
| | | | | |
| | | | | |
Telecommunication Services — 1.0% |
Cogent Communications Holdings, Inc. | | | | | |
| | | | | |
Lumen Technologies, Inc. (a) | | | | | |
Shenandoah Telecommunications Co. | | | | | |
Telephone and Data Systems, Inc. | | | | | |
| | | | | |
|
Alaska Air Group, Inc. (a) | | | | | |
| | | | | |
| | | | | |
| | | | | |
| | | | | |
Hertz Global Holdings, Inc. (a),(b) | | | | | |
| | | | | |
JetBlue Airways Corp. (a),(b) | | | | | |
| | | | | |
| | | | | |
| | | | | |
Schneider National, Inc., Cl. B (b) | | | | | |
| | | | | |
Statement of Investments (continued)
| | | | | |
Common Stocks — 99.0% (continued) |
Transportation — 2.6% (continued) |
Sun Country Airlines Holdings, Inc. (a) | | | | | |
Werner Enterprises, Inc. (b) | | | | | |
| | | | | |
|
American States Water Co. | | | | | |
| | | | | |
California Water Service Group | | | | | |
Chesapeake Utilities Corp. | | | | | |
Clearway Energy, Inc., Cl. A | | | | | |
Clearway Energy, Inc., Cl. C | | | | | |
MDU Resources Group, Inc. | | | | | |
| | | | | |
| | | | | |
Northwest Natural Holding Co. | | | | | |
| | | | | |
| | | | | |
| | | | | |
| | | | | |
Total Common Stocks
(cost $409,971,376) | | | | | |
| | | | | |
|
Health Care Equipment & Services — .0% |
Omniab Operations, Inc.-Earnout 12.5 | | | | | |
Omniab Operations, Inc.-Earnout 15.0 | | | | | |
Total Rights
(cost $12,944) | | | | | |
| | | | | |
Exchange-Traded Funds — .7% |
Registered Investment Companies — .7% |
iShares Core S&P Small-Cap ETF
(cost $3,704,017) | | | | | |
| | | | | |
Investment Companies — .5% |
Registered Investment Companies — .5% |
Dreyfus Institutional Preferred Government Plus Money Market Fund, Institutional (cost $2,877,181) | | | | | |
| | | | | |
Investment of Cash Collateral for Securities Loaned — 1.1% | | | | | |
Registered Investment Companies — 1.1% | | | | | |
Dreyfus Institutional Preferred Government Plus Money Market Fund, Institutional (cost $6,591,083) | | | | | |
Total Investments (cost $423,156,601) | | | | | |
Liabilities, Less Cash and Receivables | | | | | |
| | | | | |
|
REIT—Real Estate Investment Trust |
| Non-income producing security. |
| Security, or portion thereof, on loan. At December 31, 2024, the value of the fund’s securities on loan was $88,294,857 and the value of the collateral was $90,659,227, consisting of cash collateral of $6,591,083 and U.S. Government & Agency securities valued at $84,068,144. In addition, the value of collateral may include pending sales that are also on loan. |
| Investment in real estate investment trust within the United States. |
| Investment in affiliated issuer. The investment objective of this investment company is publicly available and can be found within the investment company’s prospectus. |
|
| | | | | Dividends/
Distributions ($) |
Registered Investment Companies - .5% |
Dreyfus Institutional Preferred Government Plus Money Market Fund, Institutional Shares - .5% | | | | | |
Investment of Cash Collateral for Securities Loaned - 1.1% | |
Dreyfus Institutional Preferred Government Plus Money Market Fund, Institutional Shares - 1.1% | | | | | |
| | | | | |
| Includes reinvested dividends/distributions. |
| Represents securities lending income earned from the reinvestment of cash collateral from loaned securities, net of fees and collateral investment expenses, and other payments to and from borrowers of securities. |
| | | | | |
| | | | | Unrealized
(Depreciation) ($) |
| | | | | |
| | | | | |
Gross Unrealized Depreciation | | | | | |
See notes to financial statements.
STATEMENT OF ASSETS AND LIABILITIES
December 31, 2024
| | |
| | |
Investments in securities—See Statement of Investments
(including securities on loan, valued at $88,294,857)—Note 1(c): | | |
| | |
| | |
Cash collateral held by broker—Note 4 | | |
Dividends and securities lending income receivable | | |
Receivable for investment securities sold | | |
Receivable for shares of Beneficial Interest subscribed | | |
Receivable for futures variation margin—Note 4 | | |
| | |
| | |
Due to BNY Mellon Investment Adviser, Inc. and affiliates—Note 3(b) | | |
Cash overdraft due to Custodian | | |
Liability for securities on loan—Note 1(c) | | |
Payable for investment securities purchased | | |
Payable for shares of Beneficial Interest redeemed | | |
Trustees’ fees and expenses payable | | |
| | |
| | |
| | |
Composition of Net Assets ($): | | |
| | |
Total distributable earnings (loss) | | |
| | |
| | |
(unlimited number of $.001 par value shares of Beneficial Interest authorized) | | |
Net Asset Value Per Share ($) | | |
See notes to financial statements.
Year Ended December 31, 2024
| |
| |
| |
Cash dividends (net of $9,722 foreign taxes withheld at source): | |
| |
| |
Income from securities lending—Note 1(c) | |
| |
| |
| |
| |
Distribution fees—Note 3(b) | |
| |
Trustees’ fees—Notes 3(a) and 3(c) | |
Loan commitment fees—Note 2 | |
| |
Less—Trustees’ fees reimbursed by
BNY Mellon Investment Adviser, Inc.—Note 3(a) | |
| |
| |
Realized and Unrealized Gain (Loss) on Investments—Note 4 ($): | |
Net realized gain (loss) on investments | |
Net realized gain (loss) on futures | |
| |
Net change in unrealized appreciation (depreciation) on investments | |
Net change in unrealized appreciation (depreciation) on futures | |
Net Change in Unrealized Appreciation (Depreciation) | |
Net Realized and Unrealized Gain (Loss) on Investments | |
Net Increase in Net Assets Resulting from Operations | |
See notes to financial statements.
STATEMENT OF CHANGES IN NET ASSETS
| |
| | |
| | |
| | |
Net realized gain (loss) on investments | | |
Net change in unrealized appreciation (depreciation) on investments | | |
Net Increase (Decrease) in Net Assets Resulting from Operations | | |
| | |
Distributions to shareholders | | |
Beneficial Interest Transactions ($): | | |
Net proceeds from shares sold | | |
| | |
| | |
Increase (Decrease) in Net Assets from Beneficial Interest Transactions | | |
Total Increase (Decrease) in Net Assets | | |
| | |
| | |
| | |
Capital Share Transactions (Shares): | | |
| | |
Shares issued for distributions reinvested | | |
| | |
Net Increase (Decrease) in Shares Outstanding | | |
See notes to financial statements.
The following table describes the performance for the fiscal periods indicated. Net asset value total return is calculated assuming an initial investment made at the net asset value at the beginning of the period, reinvestment of all dividends and distributions at net asset value during the period, and redemption at net asset value on the last day of the period. Net asset value total return includes adjustments in accordance with accounting principles generally accepted in the United States of America and as such, the net asset value for financial reporting purposes and the returns based upon those net asset values may differ from the net asset value and returns for shareholder transactions. The fund’s total returns do not reflect expenses associated with variable annuity or insurance contracts.
| |
| | | | | |
| | | | | |
Net asset value, beginning of period | | | | | |
| | | | |
| | | | | |
Net realized and unrealized gain (loss) on investments | | | | | |
Total from Investment Operations | | | | | |
| | | | | |
Dividends from net investment income | | | | | |
Dividends from net realized gain on investments | | | | | |
| | | | | |
Net asset value, end of period | | | | | |
| | | | | |
Ratios/Supplemental Data (%): | | | | |
Ratio of total expenses to average net assets | | | | | |
Ratio of net expenses to average net assets | | | | | |
Ratio of net investment income to average net assets | | | | | |
| | | | | |
Net Assets, end of period ($ x 1,000) | | | | | |
| Based on average shares outstanding. |
See notes to financial statements.
NOTES TO FINANCIAL STATEMENTS
NOTE 1—
Significant Accounting Policies:
Small Cap Stock Index Portfolio (the “fund”) is a separate diversified series of BNY Mellon Investment Portfolios (the “Trust”), which is registered under the Investment Company Act of 1940, as amended (the “Act”), as an open-end management investment company and operates as a series company currently offering three series, including the fund. The fund is only offered to separate accounts established by insurance companies to fund variable annuity contracts and variable life insurance policies.The fund’s investment objective is to seek to match the performance of the Standard & Poor’s® SmallCap 600 Index. BNY Mellon Investment Adviser, Inc. (the “Adviser”), a wholly-owned subsidiary of The Bank of New York Mellon Corporation (“BNY”), serves as the fund’s investment adviser.
BNY Mellon Securities Corporation (the “Distributor”), a wholly-owned subsidiary of the Adviser, is the distributor of the fund’s shares, which are sold without a sales charge.The fund is authorized to issue an unlimited number of $.001 par value shares of Beneficial Interest in Service Shares which bears a Distribution Plan.
The Trust accounts separately for the assets, liabilities and operations of each series. Expenses directly attributable to each series are charged to that series’ operations; expenses which are applicable to all series are allocated among them on a pro rata basis.
The Financial Accounting Standards Board (“FASB”) Accounting Standards Codification (“ASC”) is the exclusive reference of authoritative U.S. generally accepted accounting principles (“GAAP”) recognized by the FASB to be applied by nongovernmental entities. Rules and interpretive releases of the SEC under authority of federal laws are also sources of authoritative GAAP for SEC registrants. The fund is an investment company and applies the accounting and reporting guidance of the FASB ASC Topic 946 Financial Services-Investment Companies. The fund’s financial statements are prepared in accordance with GAAP, which may require the use of management estimates and assumptions. Actual results could differ from those estimates.
The Trust enters into contracts that contain a variety of indemnifications. The fund’s maximum exposure under these arrangements is unknown. The fund does not anticipate recognizing any loss related to these arrangements.
(a) Portfolio valuation: The fair value of a financial instrument is the amount that would be received to sell an asset or paid to transfer a liability in an orderly transaction between market participants at the measurement date (i.e., the exit price). GAAP establishes a fair value hierarchy that prioritizes the inputs of valuation techniques used to measure fair value. This hierarchy gives the highest priority to unadjusted quoted prices in active markets for identical assets or liabilities (Level 1 measurements) and the lowest priority to unobservable inputs (Level 3 measurements).
Additionally, GAAP provides guidance on determining whether the volume and activity in a market has decreased significantly and whether such a decrease in activity results in transactions that are not orderly. GAAP requires enhanced disclosures around valuation inputs and techniques used during annual and interim periods.
Various inputs are used in determining the value of the fund’s investments relating to fair value measurements. These inputs are summarized in the three broad levels listed below:
Level 1—unadjusted quoted prices in active markets for identical investments.
Level 2—other significant observable inputs (including quoted prices for similar investments, interest rates, prepayment speeds, credit risk, etc.).
Level 3—significant unobservable inputs (including the fund’s own assumptions in determining the fair value of investments).
The inputs or methodology used for valuing securities are not necessarily an indication of the risk associated with investing in those securities.
Changes in valuation techniques may result in transfers in or out of an assigned level within the disclosure hierarchy. Valuation techniques used to value the fund’s investments are as follows:
The Trust’s Board of Trustees (the “Board”) has designated the Adviser as the fund’s valuation designee to make all fair value determinations with respect to the fund’s portfolio investments, subject to the Board’s oversight and pursuant to Rule 2a-5 under the Act.
Investments in equity securities and exchange-traded funds are valued at the last sales price on the securities exchange or national securities market on which such securities are primarily traded. Securities listed on the National Market System for which market quotations are available are valued at the official closing price or, if there is no official closing price that day, at the last sales price. For open short positions, asked prices are used for valuation purposes. Bid price is used when no asked price is available. Registered investment companies that are not traded on an exchange are valued at their net asset value. All of the preceding securities are generally categorized within Level 1 of the fair value hierarchy.
NOTES TO FINANCIAL STATEMENTS (continued)
Securities not listed on an exchange or the national securities market, or securities for which there were no transactions, are valued at the average of the most recent bid and asked prices. These securities are generally categorized within Level 2 of the fair value hierarchy.
Fair valuing of securities may be determined with the assistance of a pricing service using calculations based on indices of domestic securities and other appropriate indicators, such as prices of relevant American Depositary Receipts and futures. Utilizing these techniques may result in transfers between Level 1 and Level 2 of the fair value hierarchy.
When market quotations or official closing prices are not readily available, or are determined not to accurately reflect fair value, such as when the value of a security has been significantly affected by events after the close of the exchange or market on which the security is principally traded, but before the fund calculates its net asset value, the fund may value these investments at fair value as determined in accordance with the procedures approved by the Board. Certain factors may be considered when fair valuing investments such as: fundamental analytical data, the nature and duration of restrictions on disposition, an evaluation of the forces that influence the market in which the securities are purchased and sold, and public trading in similar securities of the issuer or comparable issuers. These securities are either categorized within Level 2 or 3 of the fair value hierarchy depending on the relevant inputs used.
For securities where observable inputs are limited, assumptions about market activity and risk are used and such securities are generally categorized within Level 3 of the fair value hierarchy.
Futures, which are traded on an exchange, are valued at the last sales price on the securities exchange on which such securities are primarily traded or at the last sales price on the national securities market on each business day and are generally categorized within Level 1 of the fair value hierarchy.
The following is a summary of the inputs used as of December 31, 2024 in valuing the fund’s investments:
| Level 1 -
Unadjusted
Quoted Prices | Level 2- Other
Significant
Observable Inputs | Level 3-
Significant
Unobservable
Inputs | |
| | | | |
Investments in Securities:† | | | | |
Equity Securities -
Common Stocks | | | | |
| | | | |
| | | | |
| | | | |
| | | | |
Other Financial Instruments: | | | | |
| | | | |
| See Statement of Investments for additional detailed categorizations, if any. |
| Amount shown represents unrealized appreciation (depreciation) at period end, but only variation margin on exchange-traded and centrally cleared derivatives, if any, are reported in the Statement of Assets and Liabilities. |
(b) Foreign taxes: The fund may be subject to foreign taxes (a portion of which may be reclaimable) on income, stock dividends, realized and unrealized capital gains on investments or certain foreign currency transactions. Foreign taxes are recorded in accordance with the applicable foreign tax regulations and rates that exist in the foreign jurisdictions in which the fund invests. These foreign taxes, if any, are paid by the fund and are reflected in the Statement of Operations, if applicable. Foreign taxes payable or deferred or those subject to reclaims as of December 31, 2024, if any, are disclosed in the fund’s Statement of Assets and Liabilities.
(c) Securities transactions and investment income: Securities transactions are recorded on a trade date basis. Realized gains and losses from securities transactions are recorded on the identified cost basis. Dividend income is recognized on the ex-dividend date and interest income, including, where applicable, accretion of discount and amortization of premium on investments, is recognized on the accrual basis.
Pursuant to a securities lending agreement with BNY, the fund may lend securities to qualified institutions. It is the fund’s policy that, at origination, all loans are secured by collateral of at least 102% of the value of U.S. securities loaned and 105% of the value of foreign securities loaned. Collateral equivalent to at least 100% of the market value of securities on loan is maintained at all times. Collateral is
NOTES TO FINANCIAL STATEMENTS (continued)
either in the form of cash, which can be invested in certain money market mutual funds managed by the Adviser, or U.S. Government and Agency securities. Any non-cash collateral received cannot be sold or re-pledged by the fund, except in the event of borrower default, and is not reflected in the Statement of Assets and Liabilities. The securities on loan, if any, are also disclosed in the fund’s Statement of Investments. The fund is entitled to receive all dividends, interest and distributions on securities loaned, in addition to income earned as a result of the lending transaction. Should a borrower fail to return the securities in a timely manner, BNY is required to replace the securities for the benefit of the fund or credit the fund with the market value of the unreturned securities and is subrogated to the fund’s rights against the borrower and the collateral. Additionally, the contractual maturity of security lending transactions are on an overnight and continuous basis. During the period ended December 31, 2024, BNY earned $23,955 from the lending of the fund’s portfolio securities, pursuant to the securities lending agreement.
For financial reporting purposes, the fund elects not to offset assets and liabilities subject to a securities lending agreement, if any, in the Statement of Assets and Liabilities. Therefore, all qualifying transactions are presented on a gross basis in the Statement of Assets and Liabilities. As of December 31, 2024, the fund had securities lending and the impact of netting of assets and liabilities and the offsetting of collateral pledged or received, if any, based on contractual netting/set-off provisions in the securities lending agreement are detailed in the following table:
| | |
Gross amount of securities loaned, at value, as disclosed in the Statement
of Assets and Liabilities | | |
Collateral (received)/posted not offset
in the Statement of
Assets and Liabilities | | |
| | |
| The value of the related collateral received by the fund exceeded the value of the securities loaned by the fund pursuant to the securities lending agreement. In addition, the value of collateral may include pending sales that are also on loan. See Statement of Investments for detailed information regarding collateral received for open securities lending. |
(d) Affiliated issuers: Investments in other investment companies advised by the Adviser are considered “affiliated” under the Act.
(e) Market Risk: The value of the securities in which the fund invests may be affected by political, regulatory, economic and social developments, and developments that impact specific economic sectors, industries or segments of the market. In addition, turbulence in financial markets and reduced liquidity in equity, credit and/or fixed-income markets may negatively affect many issuers, which could adversely affect the fund. Global economies and financial markets are becoming increasingly interconnected, and conditions and events in one country, region or financial market may adversely impact issuers in a different country, region or financial market. These risks may be magnified if certain events or developments adversely interrupt the global supply chain; in these and other circumstances, such risks might affect companies world-wide.
Indexing Strategy Risk: The fund uses an indexing strategy. It does not attempt to manage market volatility, use defensive strategies or reduce the effects of any long-term periods of poor index performance. The correlation between fund and index performance may be affected by the fund’s expenses and/or use of sampling techniques, changes in securities markets, changes in the composition of the index and the timing of purchases and redemptions of fund shares.
(f) Dividends and distributions to shareholders: Dividends and distributions are recorded on the ex-dividend date. Dividends from net investment income and dividends from net realized capital gains, if any, are normally declared and paid annually, but the fund may make distributions on a more frequent basis to comply with the distribution requirements of the Internal Revenue Code of 1986, as amended (the “Code”). To the extent that net realized capital gains can be offset by capital loss carryovers, it is the policy of the fund not to distribute such gains. Income and capital gain distributions are determined in accordance with income tax regulations, which may differ from GAAP.
(g) Federal income taxes: It is the policy of the fund to continue to qualify as a regulated investment company, if such qualification is in the best interests of its shareholders, by complying with the applicable provisions of the Code, and to make distributions of taxable income and net realized capital gain sufficient to relieve it from substantially all federal income and excise taxes.
NOTES TO FINANCIAL STATEMENTS (continued)
As of and during the period ended December 31, 2024, the fund did not have any liabilities for any uncertain tax positions. The fund recognizes interest and penalties, if any, related to uncertain tax positions as income tax expense in the Statement of Operations. During the period ended December 31, 2024, the fund did not incur any interest or penalties.
Each tax year in the four-year period ended December 31, 2024 remains subject to examination by the Internal Revenue Service and state taxing authorities.
At December 31, 2024, the components of accumulated earnings on a tax basis were as follows: undistributed ordinary income $7,145,904, undistributed capital gains $54,425,022 and unrealized appreciation $152,304,992.
The tax character of distributions paid to shareholders during the fiscal years ended December 31, 2024 and December 31, 2023 were as follows: ordinary income $6,649,877 and $5,623,692, and long-term capital gains $13,027,757 and $29,357,478, respectively.
(h) Operating segment reporting: In this reporting period, the fund adopted FASB Accounting Standards Update 2023-07, Segment Reporting (Topic 280) - Improvements to Reportable Segment Disclosures (“ASU 2023-07”). Adoption of the new standard impacted financial statement disclosures only and did not affect the fund’s financial position or the results of its operations. The ASU 2023-07 is effective for public entities for fiscal years beginning after December 15, 2023, and requires retrospective application for all prior periods presented within the financial statements.
Since its commencement, the fund operates and is managed as a single reportable segment deriving returns in the form of dividends, interest and/or gains from the investments made in pursuit of its single stated investment objective as outlined in the fund’s prospectus. The accounting policies of the fund are consistent with those described in these Notes to Financial Statements. The chief operating decision maker (“CODM”) is represented by BNY Investments, the management of the fund’s Adviser, comprising of Senior Management and Directors. The CODM considers net increase in net assets resulting from operations in deciding whether to purchase additional investments or to make distributions to its shareholders. Detailed financial information for the fund is disclosed within these financial statements with total assets and liabilities disclosed on the Statement of Assets and Liabilities, investments held on the Statement of Investments, results of operations and significant segment expenses on the Statement of Operations and other information about the fund’s performance, including total return, portfolio turnover and ratios within the Financial Highlights.
NOTE 2—
Bank Lines of Credit:
The fund participates with other long-term open-end funds managed by the Adviser in a $738 million unsecured credit facility led by Citibank, N.A. (the “Citibank Credit Facility”) and a $300 million unsecured credit facility provided by BNY (the “BNY Credit Facility”), each to be utilized primarily for temporary or emergency purposes, including the financing of redemptions (each, a “Facility”). The Citibank Credit Facility is available in two tranches: (i) Tranche A is in an amount equal to $618 million and is available to all long-term open-ended funds, including the fund, and (ii) Tranche B is an amount equal to $120 million and is available only to BNY Mellon Floating Rate Income Fund, a series of BNY Mellon Investment Funds IV, Inc. In connection therewith, the fund has agreed to pay its pro rata portion of commitment fees for Tranche A of the Citibank Credit Facility and the BNY Credit Facility. Interest is charged to the fund based on rates determined pursuant to the terms of the respective Facility at the time of borrowing.
During the period ended December 31, 2024, the fund was charged $33,317 for interest expense. These fees are included in Interest expense in the Statement of Operations. The average amount of borrowings outstanding under the Citibank Credit Facility during the period ended December 31, 2024 was approximately $550,000 with a related weighted average annualized interest rate of 6.06%. As of December 31, 2024, the fund has no outstanding loan balance from either Facility.
NOTE 3—
Management Fee and Other Transactions with Affiliates:
(a) Pursuant to a management agreement with the Adviser, the management fee is computed at the annual rate of .35% of the value of the fund’s average daily net assets and is payable monthly. The fund’s Adviser has agreed in its management agreement with the fund to pay all of the fund’s direct expenses, except management fees, Rule 12b-1 Distribution Plan fees and certain other expenses, including the fees and expenses of the non-interested board members and their counsel. The Adviser has further agreed to reduce it’s fees in an amount equal to the fund’s allocable portion of the fees and expenses of the non-interested board members and their counsel. These provisions in the management agreement may not be amended without the approval of the fund’s shareholders. During the period ended December 31, 2024, fees reimbursed by the Adviser amounted to $25,890.
(b) Under the Distribution Plan adopted pursuant to Rule 12b-1 under the Act, the fund pays the Distributor for distributing its shares, for servicing and/or maintaining shareholder accounts and for advertising and marketing. The Distribution Plan provides for payments to be made at an annual rate of .25% of the value of the fund’s average daily net assets. The Distributor may make payments
NOTES TO FINANCIAL STATEMENTS (continued)
to Participating Insurance Companies and to brokers and dealers acting as principal underwriter for their variable insurance products. The fees payable under the Distribution Plan are payable without regard to actual expenses incurred. During the period ended December 31, 2024, the fund was charged $1,442,965 pursuant to the Distribution Plan.
The components of “Due to BNY Mellon Investment Adviser, Inc. and affiliates” in the Statement of Assets and Liabilities consist of: Management fee of $180,710, Distribution Plan fees of $129,078, which are offset against an expense reimbursement currently in effect in the amount of $1,860.
(c) Each board member of the fund also serves as a board member of other funds in the BNY Mellon Family of Funds complex. Annual retainer fees and attendance fees are allocated to each fund based on net assets.
NOTE 4—
Securities Transactions:
The aggregate amount of purchases and sales of investment securities, excluding short-term securities and derivatives, during the period ended December 31, 2024, amounted to $450,020,919 and $485,181,694, respectively.
Derivatives: A derivative is a financial instrument whose performance is derived from the performance of another asset. Rule 18f-4 under the Act regulates the use of derivatives transactions for certain funds registered under the Act. The fund is deemed a “limited” derivatives user under the rule and is required to limit its derivatives exposure so that the total notional value of applicable derivatives does not exceed 10% of fund’s net assets, and is subject to certain reporting requirements. Each type of derivative instrument that was held by the fund during the period ended December 31, 2024 is discussed below.
Deposits with Broker: The amount included in deposits held with broker represents cash balances that are held by a broker including collateral required for derivative contracts within Cash collateral held by broker in the Statement of Asset and Liabilities. Any income earned on cash balances held by a broker is recorded as interest income to the fund.
Futures: In the normal course of pursuing its investment objective, the fund is exposed to market risk, including equity price risk, as a result of changes in value of underlying financial instruments. The fund invests in futures in order to manage its exposure to or protect against changes in the market. A futures contract represents a commitment for the future purchase or a sale of an asset at a specified date. Upon entering into such contracts, these investments require initial margin deposits with a counterparty, which consist of cash or cash equivalents. The amount of these deposits is determined by the exchange or Board of Trade on which the contract is traded and is subject to change. Accordingly, variation margin payments are received or made to reflect daily unrealized gains or losses which are recorded in the Statement of Operations. When the contracts are closed, the fund recognizes a realized gain or loss which is reflected in the Statement of Operations. There is minimal counterparty credit risk to the fund with futures since they are exchange traded, and the exchange guarantees the futures against default. Futures open at December 31, 2024 are set forth in the Statement of Investments.
The following tables show the fund’s exposure to different types of market risk as it relates to the Statement of Assets and Liabilities and the Statement of Operations, respectively.
Fair value of derivative instruments as of December 31, 2024 is shown below:
| | | Derivative
Liabilities ($) |
| | | |
Gross fair value of derivative contracts | | | |
Statement of Assets and Liabilities location: |
| Includes cumulative appreciation (depreciation) on futures as reported in the Statement of Investments, but only the unpaid variation margin is reported in the Statement of Assets and Liabilities. |
The effect of derivative instruments in the Statement of Operations during the period ended December 31, 2024 is shown below:
Amount of realized gain (loss) on derivatives recognized in income ($) |
| | |
| | |
| | |
NOTES TO FINANCIAL STATEMENTS (continued)
Net change in unrealized appreciation (depreciation) on derivatives recognized in income ($) |
| | |
| | |
| | |
Statement of Operations location: |
| Net realized gain (loss) on futures. |
| Net change in unrealized appreciation (depreciation) on futures. |
The following table summarizes the monthly average market value of derivatives outstanding during the period ended December 31, 2024:
At December 31, 2024, the cost of investments for federal income tax purposes was $436,736,331; accordingly, accumulated net unrealized appreciation on investments was $152,304,992, consisting of $207,838,922 gross unrealized appreciation and $55,533,930 gross unrealized depreciation.
REPORT OF INDEPENDENT REGISTERED PUBLIC ACCOUNTING FIRM
To the Shareholders and the Board of Trustees of Small Cap Stock Index Portfolio
Opinion on the Financial Statements
We have audited the accompanying statement of assets and liabilities of Small Cap Stock Index Portfolio (the “Fund”) (one of the funds constituting BNY Mellon Investment Portfolios (the “Trust”)), including the statement of investments, as of December 31, 2024, and the related statement of operations for the year then ended, the statements of changes in net assets for each of the two years in the period then ended, the financial highlights for each of the five years in the period then ended and the related notes (collectively referred to as the “financial statements”). In our opinion, the financial statements present fairly, in all material respects, the financial position of the Fund (one of the funds constituting BNY Mellon Investment Portfolios) at December 31, 2024, the results of its operations for the year then ended, the changes in its net assets for each of the two years in the period then ended and its financial highlights for each of the five years in the period then ended, in conformity with U.S. generally accepted accounting principles.
These financial statements are the responsibility of the Trust’s management. Our responsibility is to express an opinion on the Fund’s financial statements based on our audits. We are a public accounting firm registered with the Public Company Accounting Oversight Board (United States) (“PCAOB”) and are required to be independent with respect to the Trust in accordance with the U.S. federal securities laws and the applicable rules and regulations of the Securities and Exchange Commission and the PCAOB.
We conducted our audits in accordance with the standards of the PCAOB. Those standards require that we plan and perform the audit to obtain reasonable assurance about whether the financial statements are free of material misstatement, whether due to error or fraud. The Trust is not required to have, nor were we engaged to perform, an audit of the Trust’s internal control over financial reporting. As part of our audits, we are required to obtain an understanding of internal control over financial reporting but not for the purpose of expressing an opinion on the effectiveness of the Trust’s internal control over financial reporting. Accordingly, we express no such opinion.
Our audits included performing procedures to assess the risks of material misstatement of the financial statements, whether due to error or fraud, and performing procedures that respond to those risks. Such procedures included examining, on a test basis, evidence regarding the amounts and disclosures in the financial statements. Our procedures included confirmation of securities owned as of December 31, 2024, by correspondence with the custodian, brokers and others; when replies were not received from brokers and others, we performed other auditing procedures. Our audits also included evaluating the accounting principles used and significant estimates made by management, as well as evaluating the overall presentation of the financial statements. We believe that our audits provide a reasonable basis for our opinion. 
We have served as the auditor of one or more investment companies in the BNY Mellon Family of Funds since at least 1957, but we are unable to determine the specific year.
New York, New York
February 11, 2025
IMPORTANT TAX INFORMATION (Unaudited)
For federal tax purposes, the fund hereby reports 94.17% of the ordinary dividends paid during the fiscal year ended December 31, 2024 as qualifying for the corporate dividends received deduction. Shareholders will receive notification in early 2025 of the percentage applicable to the preparation of their 2024 income tax returns.The fund also hereby reports $.4167 per share as a long-term capital gain distribution paid on March 26, 2024.
Item 8. Changes in and Disagreements with Accountants for Open-End Management Investment Companies (Unaudited)
Item 9. Proxy Disclosures for Open-End Management Investment Companies (Unaudited)
Item 10. Remuneration Paid to Directors, Officers, and Others of Open-End Management Investment Companies (Unaudited)
Each board member also serves as a board member of other funds in the BNY Mellon Family of Funds complex. Annual retainer fees and attendance fees are allocated to each fund based on net assets. Trustees fees paid by the fund are within Item 7. Statement of Operations as Trustees’ fees and expenses.
Item 11. Statement Regarding Basis for Approval of Investment Advisory Contracts (Unaudited)
At a meeting of the fund’s Board of Trustees held on August 14-15, 2024, the Board considered the renewal of the fund’s Management Agreement pursuant to which the Adviser provides the fund with investment advisory and administrative services (the “Agreement”). The Board members, none of whom are “interested persons” (as defined in the Investment Company Act of 1940, as amended) of the fund, were assisted in their review by independent legal counsel and met with counsel in executive session separate from representatives of the Adviser. In considering the renewal of the Agreement, the Board considered several factors that it believed to be relevant, including those discussed below. The Board did not identify any one factor as dispositive, and each Board member may have attributed different weights to the factors considered.
Analysis of Nature, Extent, and Quality of Services Provided to the Fund. The Board considered information provided to it at the meeting and in previous presentations from representatives of the Adviser regarding the nature, extent, and quality of the services provided to funds in the BNY Mellon fund complex, including the fund. The Adviser provided the number of open accounts in the fund, the fund’s asset size and the allocation of fund assets among distribution channels. The Adviser also had previously provided information regarding the diverse intermediary relationships and distribution channels of funds in the BNY Mellon fund complex (such as intermediary, in which intermediaries typically are paid by the fund and/or the Adviser) and the Adviser’s corresponding need for broad, deep, and diverse resources to be able to provide ongoing shareholder services to each intermediary or distribution channel, as applicable to the fund.
The Board also considered research support available to, and portfolio management capabilities of, the fund’s portfolio management personnel and that the Adviser also provides oversight of day-to-day fund operations, including fund accounting and administration and assistance in meeting legal and regulatory requirements. The Board also considered the Adviser’s extensive administrative, accounting and compliance infrastructures.
Comparative Analysis of the Fund’s Performance and Management Fee and Expense Ratio. The Board reviewed reports prepared by Broadridge Financial Solutions, Inc. (“Broadridge”), an independent provider of investment company data based on classifications provided by Thomson Reuters Lipper (“Lipper”), which included information comparing (1) the performance of the fund’s Service shares with the performance of two other small-cap core pure index funds underlying variable insurance products (“VIPs”) benchmarked against the S&P SmallCap Index selected by Broadridge as comparable to the fund (the “Performance Group”) and with a broader group of funds consisting of all small-cap core funds underlying VIPs (the “Performance Universe”), all for various periods ended June 30, 2024, and (2) the fund’s actual and contractual management fees and total expenses with those of the same two funds in the Performance Group (the “Expense Group”) and with a broader group of funds consisting of all small-cap core funds underlying VIPs with similar 12b-1/non-12b-1 structures, excluding outliers (the “Expense Universe”), the information for which was derived in part from fund financial statements available to Broadridge as of the date of its analysis. The Adviser previously had furnished the Board with a description of the methodology Broadridge used to select the Performance Group and Performance Universe and the Expense Group and Expense Universe.
Performance Comparisons. Representatives of the Adviser stated that the usefulness of performance comparisons may be affected by a number of factors, including different investment limitations and policies that may be applicable to the fund and comparison funds and the end date selected. The Board also considered the fund’s performance in light of overall financial market conditions. The Board discussed with representatives of the Adviser the results of the comparisons and considered that the fund’s total return performance was at the Performance Group median for all periods and was below the Performance Universe median for all periods, except for the ten-year period when the fund’s total return performance was above the Performance Universe median. It was noted that there were only two other funds in the Performance Group. The Adviser also provided a comparison of the fund’s calendar year total returns to the returns of the fund’s benchmark index.
Management Fee and Expense Ratio Comparisons. The Board reviewed and considered the contractual management fee rate payable by the fund to the Adviser in light of the nature, extent and quality of the management services provided by the Adviser. In addition, the Board reviewed and considered the actual management fee rate paid by the fund over the fund’s last fiscal year. The Board also reviewed the range of actual and contractual management fees and total expenses as a percentage of average net assets of the Expense Group and Expense Universe funds and discussed the results of the comparisons.
The Board noted that the Adviser pays all fund expenses, other than the actual management fee and certain other expenses. Because of the fund’s “unitary fee” structure, the Board recognized that the fund’s fees and expenses will vary within a much smaller range and the
Item 11. Statement Regarding Basis for Approval of Investment Advisory Contracts (Unaudited) (continued)
Adviser will bear the risk that fund expenses may increase over time. On the other hand, the Board noted that it is possible that the Adviser could earn a profit on the fees charged under the Agreement and would benefit from any price decreases in third party services covered by the Agreement. Taking into account the fund’s unitary fee structure, the Board considered that the fund’s contractual management fee was higher than the Expense Group median contractual management fee, the fund’s actual management fee was higher than the Expense Group median and higher than the Expense Universe median actual management fee, and the fund’s total expenses were higher than the Expense Group median and slightly lower than the Expense Universe median total expenses.
Representatives of the Adviser reviewed with the Board the management or investment advisory fees paid by funds advised by the Adviser that are in the same Lipper category as the fund (the “Similar Funds”), and explained the nature of the Similar Funds. They discussed differences in fees paid and the relationship of the fees paid in light of any differences in the services provided and other relevant factors, noting the fund’s “unitary” fee structure. The Board considered the relevance of the fee information provided for the Similar Funds to evaluate the appropriateness of the fund’s management fee. Representatives of the Adviser noted that there were no separate accounts and/or other types of client portfolios advised by the Adviser that are considered to have similar investment strategies and policies as the fund.
Analysis of Profitability and Economies of Scale. Representatives of the Adviser reviewed the expenses allocated and profit received by the Adviser and its affiliates and the resulting profitability percentage for managing the fund and the aggregate profitability percentage to the Adviser and its affiliates for managing the funds in the BNY Mellon fund complex, and the method used to determine the expenses and profit. The Board concluded that the profitability results were not excessive, given the services rendered and service levels provided by the Adviser and its affiliates. The Board also had been provided with information prepared by an independent consulting firm regarding the Adviser’s approach to allocating costs to, and determining the profitability of, individual funds and the entire BNY Mellon fund complex. The consulting firm also had analyzed where any economies of scale might emerge in connection with the management of a fund.
The Board considered, on the advice of its counsel, the profitability analysis (1) as part of its evaluation of whether the fee under the Agreement, considered in relation to the mix of services provided by the Adviser, including the nature, extent and quality of such services, supported the renewal of the Agreement and (2) in light of the relevant circumstances for the fund and the extent to which economies of scale would be realized if the fund grows and whether fee levels reflect these economies of scale for the benefit of fund shareholders. Representatives of the Adviser stated that, as a result of shared and allocated costs among funds in the BNY Mellon fund complex, the extent of economies of scale could depend substantially on the level of assets in the complex as a whole, so that increases and decreases in complex-wide assets can affect potential economies of scale in a manner that is disproportionate to, or even in the opposite direction from, changes in the fund’s asset level. The Board also considered potential benefits to the Adviser from acting as investment adviser and took into consideration that there were no soft dollar arrangements in effect for trading the fund’s investments.
At the conclusion of these discussions, the Board agreed that it had been furnished with sufficient information to make an informed business decision with respect to the renewal of the Agreement. Based on the discussions and considerations as described above, the Board concluded and determined as follows.
●The Board concluded that the nature, extent and quality of the services provided by the Adviser are adequate and appropriate.
●The Board generally was satisfied with the fund’s overall relative performance.
●The Board concluded that the fee paid to the Adviser continued to be appropriate under the circumstances and in light of the factors and the totality of the services provided as discussed above.
●The Board determined that the economies of scale which may accrue to the Adviser and its affiliates in connection with the management of the fund had been adequately considered by the Adviser in connection with the fee rate charged to the fund pursuant to the Agreement and that, to the extent in the future it were determined that material economies of scale had not been shared with the fund, the Board would seek to have those economies of scale shared with the fund.
In evaluating the Agreement, the Board considered these conclusions and determinations and also relied on its previous knowledge, gained through meetings and other interactions with the Adviser and its affiliates, of the Adviser and the services provided to the fund by the Adviser. The Board also relied on information received on a routine and regular basis throughout the year relating to the operations of the fund and the investment management and other services provided under the Agreement, including information on the
investment performance of the fund in comparison to similar mutual funds and benchmark performance indices; general market outlook as applicable to the fund; and compliance reports. In addition, the Board’s consideration of the contractual fee arrangements for the fund had the benefit of a number of years of reviews of the Agreement for the fund, or substantially similar agreements for other BNY Mellon funds that the Board oversees, during which lengthy discussions took place between the Board and representatives of the Adviser. Certain aspects of the arrangements may receive greater scrutiny in some years than in others, and the Board’s conclusions may be based, in part, on its consideration of the fund’s arrangements, or substantially similar arrangements for other BNY Mellon funds that the Board oversees, in prior years. The Board determined to renew the Agreement.
© 2025 BNY Mellon Securities CorporationCode-0410NCSRAR1224
BNY Mellon Investment Portfolios, Technology Growth Portfolio
ANNUAL FINANCIALS AND OTHER INFORMATION
IMPORTANT NOTICE – CHANGES TO ANNUAL AND SEMI-ANNUAL REPORTS
The Securities and Exchange Commission (the “SEC”) has adopted rule and form amendments which have resulted in changes to the design and delivery of annual and semi-annual fund reports (“Reports”). Reports are now streamlined to highlight key information. Certain information previously included in Reports, including financial statements, no longer appear in the Reports but will be available online within the Semi-Annual and Annual Financials and Other Information, delivered free of charge to shareholders upon request, and filed with the SEC.
Save time. Save paper. View your next shareholder report online as soon as it’s available. Log into www.bny.com/investments and sign up for eCommunications. It’s simple and only takes a few minutes.
The views expressed in this report reflect those of the portfolio manager(s) only through the end of the period covered and do not necessarily represent the views of BNY Mellon Investment Adviser, Inc. or any other person in the BNY Mellon Investment Adviser, Inc. organization. Any such views are subject to change at any time based upon market or other conditions and BNY Mellon Investment Adviser, Inc. disclaims any responsibility to update such views. These views may not be relied on as investment advice and, because investment decisions for a fund in the BNY Mellon Family of Funds are based on numerous factors, may not be relied on as an indication of trading intent on behalf of any fund in the BNY Mellon
Family of Funds.
Not FDIC-Insured • Not Bank-Guaranteed • May Lose Value
Contents
Please note the Annual Financials and Other Information only contains Items 7-11 required in Form N-CSR. All other required items will be filed with the SEC.
Item 7. Financial Statements and Financial Highlights for Open-End Management Investment Companies. Technology Growth PortfolioStatement of Investments
| | | | | |
|
Aerospace & Defense — 2.5% |
Axon Enterprise, Inc. (a) | | | | | |
Application Software — 10.4% |
| | | | | |
| | | | | |
| | | | | |
| | | | | |
| | | | | |
| | | | | |
|
| | | | | |
PDD Holdings, Inc., ADR (a) | | | | | |
| | | | | |
|
| | | | | |
Health Care Equipment — .5% |
Intuitive Surgical, Inc. (a) | | | | | |
Hotels, Resorts & Cruise Lines — 1.2% |
| | | | | |
Interactive Media & Services — 11.0% |
| | | | | |
Meta Platforms, Inc., Cl. A | | | | | |
Pinterest, Inc., Cl. A (a) | | | | | |
Tencent Holdings Ltd., ADR (b) | | | | | |
| | | | | |
Internet Services & Infrastructure — 6.9% |
Akamai Technologies, Inc. (a) | | | | | |
| | | | | |
| | | | | |
| | | | | |
Movies & Entertainment — 6.0% |
| | | | | |
Spotify Technology SA (a) | | | | | |
| | | | | |
Real Estate Services — 1.8% |
| | | | | |
Semiconductor Materials & Equipment — 5.8% |
| | | | | |
| | | | | |
| | | | | |
Onto Innovation, Inc. (a) | | | | | |
| | | | | |
|
Infineon Technologies AG, ADR | | | | | |
| | | | | |
| | | | | |
| | | | | |
| | | | | |
Taiwan Semiconductor Manufacturing Co. Ltd., ADR | | | | | |
Statement of Investments (continued)
| | | | | |
Common Stocks — 95.7% (continued) |
Semiconductors — 23.9% (continued) |
| | | | | |
|
| | | | | |
| | | | | |
| | | | | |
| | | | | |
| | | | | |
Technology Hardware, Storage & Peripherals — 5.8% |
| | | | | |
Pure Storage, Inc., Cl. A (a) | | | | | |
| | | | | |
Total Common Stocks
(cost $676,517,469) | | | | | |
|
Real Estate Services — .1% |
Roofstock, Ser. E (a),(c) | | | | | |
|
Databricks, Inc., Ser. H (a),(c) | | | | | |
Databricks, Inc., Ser. I (a),(c) | | | | | |
Databricks, Inc., Ser. J (a),(c) | | | | | |
| | | | | |
Total Private Equity
(cost $14,055,911) | | | | | |
| | | | | |
Investment Companies — 3.3% | | | | | |
Registered Investment Companies — 3.3% | | | | | |
Dreyfus Institutional Preferred Government Plus Money Market Fund, Institutional (cost $40,404,102) | | | | | |
Investment of Cash Collateral for Securities Loaned — .9% | | | | | |
Registered Investment Companies — .9% | | | | | |
Dreyfus Institutional Preferred Government Plus Money Market Fund, Institutional (cost $11,669,070) | | | | | |
Total Investments (cost $742,646,552) | | | | | |
Liabilities, Less Cash and Receivables | | | | | |
| | | | | |
ADR—American Depositary Receipt |
| Non-income producing security. |
| Security, or portion thereof, on loan. At December 31, 2024, the value of the fund’s securities on loan was $11,525,651 and the value of the collateral was $11,768,583, consisting of cash collateral of $11,669,070 and U.S. Government & Agency securities valued at $99,513. In addition, the value of collateral may include pending sales that are also on loan. |
| The fund held Level 3 securities at December 31, 2024. These securities were valued at $12,943,684 or 1.0% of net assets. |
| Investment in affiliated issuer. The investment objective of this investment company is publicly available and can be found within the investment company’s prospectus. |
|
| | | | | Dividends/
Distributions ($) |
Registered Investment Companies - 3.3% |
Dreyfus Institutional Preferred Government Plus Money Market Fund, Institutional Shares - 3.3% | | | | | |
Investment of Cash Collateral for Securities Loaned - .9% | |
Dreyfus Institutional Preferred Government Plus Money Market Fund, Institutional Shares - .9% | | | | | |
| | | | | |
| Includes reinvested dividends/distributions. |
| Represents securities lending income earned from the reinvestment of cash collateral from loaned securities, net of fees and collateral investment expenses, and other payments to and from borrowers of securities. |
See notes to financial statements.
STATEMENT OF ASSETS AND LIABILITIES
December 31, 2024
| | |
| | |
Investments in securities—See Statement of Investments
(including securities on loan, valued at $11,525,651)—Note 1(c): | | |
| | |
| | |
Cash denominated in foreign currency | | |
Dividends and securities lending income receivable | | |
Receivable for shares of Beneficial Interest subscribed | | |
Tax reclaim receivable—Note 1(b) | | |
| | |
| | |
| | |
Due to BNY Mellon Investment Adviser, Inc. and affiliates—Note 3(b) | | |
Liability for securities on loan—Note 1(c) | | |
Payable for shares of Beneficial Interest redeemed | | |
Trustees’ fees and expenses payable | | |
| | |
| | |
| | |
Composition of Net Assets ($): | | |
| | |
Total distributable earnings (loss) | | |
| | |
Net Asset Value Per Share | | |
| | |
| | |
Net Asset Value Per Share ($) | | |
See notes to financial statements.
Year Ended December 31, 2024
| |
| |
| |
Cash dividends (net of $229,927 foreign taxes withheld at source): | |
| |
| |
Income from securities lending—Note 1(c) | |
| |
| |
| |
| |
Distribution fees—Note 3(b) | |
| |
Trustees’ fees and expenses—Note 3(c) | |
Loan commitment fees—Note 2 | |
Chief Compliance Officer fees—Note 3(b) | |
| |
Prospectus and shareholders’ reports | |
Shareholder servicing costs—Note 3(b) | |
| |
| |
| |
Less—reduction in fees due to earnings credits—Note 3(b) | |
| |
| |
Realized and Unrealized Gain (Loss) on Investments—Note 4 ($): | |
Net realized gain (loss) on investments | |
Net change in unrealized appreciation (depreciation) on investments and foreign currency transactions | |
Net Realized and Unrealized Gain (Loss) on Investments | |
Net Increase in Net Assets Resulting from Operations | |
See notes to financial statements.
STATEMENT OF CHANGES IN NET ASSETS
| |
| | |
| | |
| | |
Net realized gain (loss) on investments | | |
Net change in unrealized appreciation (depreciation) on investments | | |
Net Increase (Decrease) in Net Assets Resulting from Operations | | |
Beneficial Interest Transactions ($): | | |
Net proceeds from shares sold: | | |
| | |
| | |
| | |
| | |
| | |
Increase (Decrease) in Net Assets from Beneficial Interest Transactions | | |
Total Increase (Decrease) in Net Assets | | |
| | |
| | |
| | |
| |
| | |
Capital Share Transactions (Shares): | | |
| | |
| | |
| | |
Net Increase (Decrease) in Shares Outstanding | | |
| | |
| | |
| | |
Net Increase (Decrease) in Shares Outstanding | | |
See notes to financial statements.
The following tables describe the performance for each share class for the fiscal periods indicated. All information (except portfolio turnover rate) reflects financial results for a single fund share. Net asset value total return is calculated assuming an initial investment made at the net asset value at the beginning of the period, reinvestment of all dividends and distributions at net asset value during the period, and redemption at net asset value on the last day of the period. Net asset value total return includes adjustments in accordance with accounting principles generally accepted in the United States of America and as such, the net asset value for financial reporting purposes and the returns based upon those net asset values may differ from the net asset value and returns for shareholder transactions. The fund’s total returns do not reflect expenses associated with variable annuity or insurance contracts.
| |
| | | | | |
| | | | | |
Net asset value, beginning of period | | | | | |
| | | | |
| | | | | |
Net realized and unrealized gain (loss) on investments | | | | | |
Total from Investment Operations | | | | | |
| | | | | |
Dividends from net investment income | | | | | |
Dividends from net realized gain on investments | | | | | |
| | | | | |
Net asset value, end of period | | | | | |
| | | | | |
Ratios/Supplemental Data (%): | | | | |
Ratio of total expenses to average net assets | | | | | |
Ratio of net expenses to average net assets | | | | | |
Ratio of net investment (loss) to average net assets | | | | | |
| | | | | |
Net Assets, end of period ($ x 1,000) | | | | | |
| Based on average shares outstanding. |
See notes to financial statements.
FINANCIAL HIGHLIGHTS (continued)
| |
| | | | | |
| | | | | |
Net asset value, beginning of period | | | | | |
| | | | |
| | | | | |
Net realized and unrealized gain (loss) on investments | | | | | |
Total from Investment Operations | | | | | |
| | | | | |
Dividends from net investment income | | | | | |
Dividends from net realized gain on investments | | | | | |
| | | | | |
Net asset value, end of period | | | | | |
| | | | | |
Ratios/Supplemental Data (%): | | | | |
Ratio of total expenses to average net assets | | | | | |
Ratio of net expenses to average net assets | | | | | |
Ratio of net investment (loss) to average net assets | | | | | |
| | | | | |
Net Assets, end of period ($ x 1,000) | | | | | |
| Based on average shares outstanding. |
See notes to financial statements.
NOTES TO FINANCIAL STATEMENTS
NOTE 1—
Significant Accounting Policies:
Technology Growth Portfolio (the “fund”) is a separate diversified series of BNY Mellon Investment Portfolios (the “Trust”), which is registered under the Investment Company Act of 1940, as amended (the “Act”), as an open-end management investment company and operates as a series company currently offering three series, including the fund. The fund is only offered to separate accounts established by insurance companies to fund variable annuity contracts and variable life insurance policies. The fund’s investment objective is to seek capital appreciation. BNY Mellon Investment Adviser, Inc. (the “Adviser”), a wholly-owned subsidiary of The Bank of New York Mellon Corporation (“BNY”), serves as the fund’s investment adviser. Newton Investment Management North America, LLC (the “Sub-Adviser” or “NIMNA”), an indirect wholly-owned subsidiary of BNY and an affiliate of the Adviser, serves as the fund’s sub-adviser. NIMNA has entered into a sub-sub-investment advisory agreement with its affiliate, Newton Investment Management Limited (“NIM”), which enables NIM to provide certain advisory services to the Sub-Adviser for the benefit of the fund, including, but not limited to, portfolio management services. NIM is subject to the supervision of NIMNA and the Adviser. NIM is also an affiliate of the Adviser. NIM, located at 160 Queen Victoria Street, London, EC4V, 4LA, England, was formed in 1978. NIM is an indirect subsidiary of BNY.
BNY Mellon Securities Corporation (the “Distributor”), a wholly-owned subsidiary of the Adviser, is the distributor of the fund’s shares, which are sold without a sales charge. The fund is authorized to issue an unlimited number of $.001 par value shares of Beneficial Interest in each of the following classes of shares: Initial and Service. Each class of shares has identical rights and privileges, except with respect to the Distribution Plan and the expenses borne by each class, the allocation of certain transfer agency costs and certain voting rights. Income, expenses (other than expenses attributable to a specific class), and realized and unrealized gains or losses on investments are allocated to each class of shares based on its relative net assets.
The Trust accounts separately for the assets, liabilities and operations of each series. Expenses directly attributable to each series are charged to that series’ operations; expenses which are applicable to all series are allocated among them on a pro rata basis.
The Financial Accounting Standards Board (“FASB”) Accounting Standards Codification (“ASC”) is the exclusive reference of authoritative U.S. generally accepted accounting principles (“GAAP”) recognized by the FASB to be applied by nongovernmental entities. Rules and interpretive releases of the SEC under authority of federal laws are also sources of authoritative GAAP for SEC registrants. The fund is an investment company and applies the accounting and reporting guidance of the FASB ASC Topic 946 Financial Services-Investment Companies. The fund’s financial statements are prepared in accordance with GAAP, which may require the use of management estimates and assumptions. Actual results could differ from those estimates.
The Trust enters into contracts that contain a variety of indemnifications. The fund’s maximum exposure under these arrangements is unknown. The fund does not anticipate recognizing any loss related to these arrangements.
(a) Portfolio valuation: The fair value of a financial instrument is the amount that would be received to sell an asset or paid to transfer a liability in an orderly transaction between market participants at the measurement date (i.e., the exit price). GAAP establishes a fair value hierarchy that prioritizes the inputs of valuation techniques used to measure fair value. This hierarchy gives the highest priority to unadjusted quoted prices in active markets for identical assets or liabilities (Level 1 measurements) and the lowest priority to unobservable inputs (Level 3 measurements).
Additionally, GAAP provides guidance on determining whether the volume and activity in a market has decreased significantly and whether such a decrease in activity results in transactions that are not orderly. GAAP requires enhanced disclosures around valuation inputs and techniques used during annual and interim periods.
Various inputs are used in determining the value of the fund’s investments relating to fair value measurements. These inputs are summarized in the three broad levels listed below:
Level 1—unadjusted quoted prices in active markets for identical investments.
Level 2—other significant observable inputs (including quoted prices for similar investments, interest rates, prepayment speeds, credit risk, etc.).
Level 3—significant unobservable inputs (including the fund’s own assumptions in determining the fair value of investments).
The inputs or methodology used for valuing securities are not necessarily an indication of the risk associated with investing in those securities.
Changes in valuation techniques may result in transfers in or out of an assigned level within the disclosure hierarchy. Valuation techniques used to value the fund’s investments are as follows:
NOTES TO FINANCIAL STATEMENTS (continued)
The Trust’s Board of Trustees (the “Board”) has designated the Adviser as the fund’s valuation designee to make all fair value determinations with respect to the fund’s portfolio investments, subject to the Board’s oversight and pursuant to Rule 2a-5 under the Act.
Investments in equity securities are valued at the last sales price on the securities exchange or national securities market on which such securities are primarily traded. Securities listed on the National Market System for which market quotations are available are valued at the official closing price or, if there is no official closing price that day, at the last sales price. For open short positions, asked prices are used for valuation purposes. Bid price is used when no asked price is available. Registered investment companies that are not traded on an exchange are valued at their net asset value. All of the preceding securities are generally categorized within Level 1 of the fair value hierarchy.
Securities not listed on an exchange or the national securities market, or securities for which there were no transactions, are valued at the average of the most recent bid and asked prices. These securities are generally categorized within Level 2 of the fair value hierarchy.
Fair valuing of securities may be determined with the assistance of a pricing service using calculations based on indices of domestic securities and other appropriate indicators, such as prices of relevant ADRs and futures. Utilizing these techniques may result in transfers between Level 1 and Level 2 of the fair value hierarchy.
When market quotations or official closing prices are not readily available, or are determined not to accurately reflect fair value, such as when the value of a security has been significantly affected by events after the close of the exchange or market on which the security is principally traded (for example, a foreign exchange or market), but before the fund calculates its net asset value, the fund may value these investments at fair value as determined in accordance with the procedures approved by the Board. Certain factors may be considered when fair valuing investments such as: fundamental analytical data, the nature and duration of restrictions on disposition, an evaluation of the forces that influence the market in which the securities are purchased and sold, and public trading in similar securities of the issuer or comparable issuers. These securities are either categorized within Level 2 or 3 of the fair value hierarchy depending on the relevant inputs used.
For securities where observable inputs are limited, assumptions about market activity and risk are used and such securities are generally categorized within Level 3 of the fair value hierarchy.
Investment in private equity securities will be fair valued by the Board in accordance with valuation procedures approved by the Board. Those portfolio valuations will be based on unobservable inputs and certain assumptions about how market participants would price the instrument. The fund expects that inputs into the determination of fair value of those investments will require significant management judgment or estimation. Because valuations may fluctuate over short periods of time and may be based on estimates, fair value determinations may differ materially from the value received in an actual transaction. Additionally, valuations of private companies are inherently uncertain. The fund’s net asset value could be adversely affected if the fund’s determinations regarding the fair value of those investments were materially higher or lower than the values that it ultimately realized upon the disposal of such investments. These securities are categorized within Level 3 of the fair value hierarchy.
Investments denominated in foreign currencies are translated to U.S. dollars at the prevailing rates of exchange.
The following is a summary of the inputs used as of December 31, 2024 in valuing the fund’s investments:
| Level 1 -
Unadjusted
Quoted Prices | Level 2- Other
Significant
Observable Inputs | Level 3-
Significant
Unobservable
Inputs | |
| | | | |
Investments in Securities:† | | | | |
Equity Securities -
Common Stocks | | | | |
Equity Securities -
Private Equity | | | | |
| | | | |
| See Statement of Investments for additional detailed categorizations, if any. |
NOTES TO FINANCIAL STATEMENTS (continued)
The following is a reconciliation of Level 3 assets for which significant unobservable inputs were used to determine fair value:
| Equity Securities-Private Equity ($) |
Balance as of 12/31/2023† | |
| |
| |
| |
Change in unrealized appreciation (depreciation) | |
| |
| |
Balance as of 12/31/2024† | |
The amount of total gains (losses) for the period included in earnings attributable to the change in unrealized appreciation (depreciation) relating to investments still held at 12/31/2024 | |
| Securities deemed as Level 3 due to the lack of observable inputs by management assessment. |
The following table summarizes the significant unobservable inputs the fund used to value its investment categorized within Level 3 as of December 31, 2024. In addition to the techniques and inputs noted in the table below, according to the fund’s valuation policy, other valuation techniques and methodologies when determining the fund’s fair value measurements may be used. The below table is not intended to be all-inclusive, but rather provide information on the significant unobservable inputs as they are to the fund’s determination of fair values.
| | Valuation Techniques/
Methodologies | | Amount or Range/
Weighted Average |
| | Market Comparables/
Companies | Changes in Enterprise Market
Value of Comparables during
the quarter | (-4.6%)-(-12.0%)/(-4.87%) |
| | | | | |
(b) Foreign currency transactions: The fund does not isolate that portion of the results of operations resulting from changes in foreign exchange rates on investments from the fluctuations arising from changes in the market prices of securities held. Such fluctuations are included with the net realized and unrealized gain or loss on investments.
Net realized foreign exchange gains or losses arise from sales of foreign currencies, currency gains or losses realized on securities transactions between trade and settlement date, and the difference between the amounts of dividends, interest and foreign withholding taxes recorded on the fund’s books and the U.S. dollar equivalent of the amounts actually received or paid. Net unrealized foreign exchange gains and losses arise from changes in the value of assets and liabilities other than investments resulting from changes in exchange rates. Foreign currency gains and losses on foreign currency transactions are also included with net realized and unrealized gain or loss on investments.
Foreign taxes: The fund may be subject to foreign taxes (a portion of which may be reclaimable) on income, stock dividends, realized and unrealized capital gains on investments or certain foreign currency transactions. Foreign taxes are recorded in accordance with the applicable foreign tax regulations and rates that exist in the foreign jurisdictions in which the fund invests. These foreign taxes, if any, are paid by the fund and are reflected in the Statement of Operations, if applicable. Foreign taxes payable or deferred or those subject to reclaims as of December 31, 2024, if any, are disclosed in the fund’s Statement of Assets and Liabilities.
(c) Securities transactions and investment income: Securities transactions are recorded on a trade date basis. Realized gains and losses from securities transactions are recorded on the identified cost basis. Dividend income is recognized on the ex-dividend date and interest income, including, where applicable, accretion of discount and amortization of premium on investments, is recognized on the accrual basis.
Pursuant to a securities lending agreement with BNY, the fund may lend securities to qualified institutions. It is the fund’s policy that, at origination, all loans are secured by collateral of at least 102% of the value of U.S. securities loaned and 105% of the value of foreign securities loaned. Collateral equivalent to at least 100% of the market value of securities on loan is maintained at all times. Collateral is either in the form of cash, which can be invested in certain money market mutual funds managed by the Adviser, or U.S. Government and Agency securities. Any non-cash collateral received cannot be sold or re-pledged by the fund, except in the event of borrower
NOTES TO FINANCIAL STATEMENTS (continued)
default, and is not reflected in the Statement of Assets and Liabilities. The securities on loan, if any, are also disclosed in the fund’s Statement of Investments. The fund is entitled to receive all dividends, interest and distributions on securities loaned, in addition to income earned as a result of the lending transaction. Should a borrower fail to return the securities in a timely manner, BNY is required to replace the securities for the benefit of the fund or credit the fund with the market value of the unreturned securities and is subrogated to the fund’s rights against the borrower and the collateral. Additionally, the contractual maturity of security lending transactions are on an overnight and continuous basis. During the period ended December 31, 2024, BNY earned $4,644 from the lending of the fund’s portfolio securities, pursuant to the securities lending agreement.
For financial reporting purposes, the fund elects not to offset assets and liabilities subject to a securities lending agreement, if any, in the Statement of Assets and Liabilities. Therefore, all qualifying transactions are presented on a gross basis in the Statement of Assets and Liabilities. As of December 31, 2024, the fund had securities lending and the impact of netting of assets and liabilities and the offsetting of collateral pledged or received, if any, based on contractual netting/set-off provisions in the securities lending agreement are detailed in the following table:
| | |
Gross amount of securities loaned, at value, as disclosed in the Statement
of Assets and Liabilities | | |
Collateral (received)/posted not offset
in the Statement of
Assets and Liabilities | | |
| | |
| The value of the related collateral received by the fund exceeded the value of the securities loaned by the fund pursuant to the securities lending agreement. In addition, the value of collateral may include pending sales that are also on loan. See Statement of Investments for detailed information regarding collateral received for open securities lending. |
(d) Affiliated issuers: Investments in other investment companies advised by the Adviser are considered “affiliated” under the Act.
(e) Market Risk: The value of the securities in which the fund invests may be affected by political, regulatory, economic and social developments, and developments that impact specific economic sectors, industries or segments of the market. In addition, turbulence in financial markets and reduced liquidity in equity, credit and/or fixed-income markets may negatively affect many issuers, which could adversely affect the fund. Global economies and financial markets are becoming increasingly interconnected, and conditions and events in one country, region or financial market may adversely impact issuers in a different country, region or financial market. These risks may be magnified if certain events or developments adversely interrupt the global supply chain; in these and other circumstances, such risks might affect companies world-wide.
Foreign Investment Risk: To the extent the fund invests in foreign securities, the fund’s performance will be influenced by political, social and economic factors affecting investments in foreign issuers. Special risks associated with investments in foreign issuers include exposure to currency fluctuations, less liquidity, less developed or less efficient trading markets, lack of comprehensive company information, political and economic instability and differing auditing and legal standards.
Technology Company Risk: The technology sector has been among the most volatile sectors of the stock market. Because the fund’s investments are concentrated in the technology sector, its performance will be significantly affected by developments in that sector. Technology companies, especially small-cap technology companies, involve greater risk because their revenue and/or earnings tend to be less predictable (and some companies may be experiencing significant losses) and their share prices tend to be more volatile. Certain technology companies may have limited product lines, markets or financial resources, or may depend on a limited management group. In addition, these companies are strongly affected by worldwide technological developments, and their products and services may not be economically successful or may quickly become outdated. Investor perception may play a greater role in determining the day-to-day value of tech stocks than it does in other sectors. Fund investments made in anticipation of future products and services may decline dramatically in value if the anticipated products or services are delayed or cancelled. The risks associated with technology companies are magnified in the case of small-cap technology companies. The shares of smaller technology companies tend to trade less frequently than those of larger, more established companies, which can have an adverse effect on the pricing of these securities and on the fund’s ability to sell these securities.
(f) Dividends and distributions to shareholders: Dividends and distributions are recorded on the ex-dividend date. Dividends from net investment income and dividends from net realized capital gains, if any, are normally declared and paid annually, but the fund may
NOTES TO FINANCIAL STATEMENTS (continued)
make distributions on a more frequent basis to comply with the distribution requirements of the Internal Revenue Code of 1986, as amended (the “Code”). To the extent that net realized capital gains can be offset by capital loss carryovers, it is the policy of the fund not to distribute such gains. Income and capital gain distributions are determined in accordance with income tax regulations, which may differ from GAAP.
(g) Federal income taxes: It is the policy of the fund to continue to qualify as a regulated investment company, if such qualification is in the best interests of its shareholders, by complying with the applicable provisions of the Code, and to make distributions of taxable income and net realized capital gain sufficient to relieve it from substantially all federal income and excise taxes.
As of and during the period ended December 31, 2024, the fund did not have any liabilities for any uncertain tax positions. The fund recognizes interest and penalties, if any, related to uncertain tax positions as income tax expense in the Statement of Operations. During the period ended December 31, 2024, the fund did not incur any interest or penalties.
Each tax year in the four-year period ended December 31, 2024 remains subject to examination by the Internal Revenue Service and state taxing authorities.
At December 31, 2024, the components of accumulated earnings on a tax basis were as follows: undistributed capital gains $78,053,615 and unrealized appreciation $503,206,041.
During the period ended December 31, 2024, as a result of permanent book to tax differences, primarily due to tax treatment for net operating losses, the fund increased total distributable earnings (loss) by $6,263,376 and decreased paid-in capital by the same amount. Net assets and net asset value per share were not affected by this reclassification.
(h) Operating segment reporting: In this reporting period, the fund adopted FASB Accounting Standards Update 2023-07, Segment Reporting (Topic 280) - Improvements to Reportable Segment Disclosures (“ASU 2023-07”). Adoption of the new standard impacted financial statement disclosures only and did not affect the fund’s financial position or the results of its operations. The ASU 2023-07 is effective for public entities for fiscal years beginning after December 15, 2023, and requires retrospective application for all prior periods presented within the financial statements.
Since its commencement, the fund operates and is managed as a single reportable segment deriving returns in the form of dividends, interest and/or gains from the investments made in pursuit of its single stated investment objective as outlined in the fund’s prospectus. The accounting policies of the fund are consistent with those described in these Notes to Financial Statements. The chief operating decision maker (“CODM”) is represented by BNY Investments, the management of the fund’s Adviser, comprising of Senior Management and Directors. The CODM considers net increase in net assets resulting from operations in deciding whether to purchase additional investments or to make distributions to its shareholders. Detailed financial information for the fund is disclosed within these financial statements with total assets and liabilities disclosed on the Statement of Assets and Liabilities, investments held on the Statement of Investments, results of operations and significant segment expenses on the Statement of Operations and other information about the fund’s performance, including total return, portfolio turnover and ratios within the Financial Highlights.
NOTE 2—
Bank Lines of Credit:
The fund participates with other long-term open-end funds managed by the Adviser in a $738 million unsecured credit facility led by Citibank, N.A. (the “Citibank Credit Facility”) and a $300 million unsecured credit facility provided by BNY (the “BNY Credit Facility”), each to be utilized primarily for temporary or emergency purposes, including the financing of redemptions (each, a “Facility”). The Citibank Credit Facility is available in two tranches: (i) Tranche A is in an amount equal to $618 million and is available to all long-term open-ended funds, including the fund, and (ii) Tranche B is an amount equal to $120 million and is available only to BNY Mellon Floating Rate Income Fund, a series of BNY Mellon Investment Funds IV, Inc. In connection therewith, the fund has agreed to pay its pro rata portion of commitment fees for Tranche A of the Citibank Credit Facility and the BNY Credit Facility. Interest is charged to the fund based on rates determined pursuant to the terms of the respective Facility at the time of borrowing.
During the period ended December 31, 2024, the fund was charged $1,219 for interest expense. These fees are included in Interest expense in the Statement of Operations. The average amount of borrowings outstanding under the Citibank Credit Facility during the period ended December 31, 2024 was approximately $19,126 with a related weighted average annualized interest rate of 6.37%. As of December 31, 2024, the fund has no outstanding loan balance from either Facility.
NOTE 3—
Management Fee, Sub-Advisory Fee and Other Transactions with Affiliates:
(a) Pursuant to a management agreement with the Adviser, the management fee is computed at the annual rate of .75% of the value of
NOTES TO FINANCIAL STATEMENTS (continued)
the fund’s average daily net assets and is payable monthly.
Pursuant to a sub-investment advisory agreement between the Adviser and the Sub-Adviser, the Adviser pays the Sub-Adviser a monthly fee at an annual rate of .36% of the value of the fund’s average daily net assets.
(b) Under the Distribution Plan adopted pursuant to Rule 12b-1 under the Act, Service shares pay the Distributor for distributing its shares, for servicing and/or maintaining Service shares’ shareholder accounts and for advertising and marketing for Service shares. The Distribution Plan provides for payments to be made at an annual rate of .25% of the value of the Service shares’ average daily net assets. The Distributor may make payments to Participating Insurance Companies and to brokers and dealers acting as principal underwriter for their variable insurance products. The fees payable under the Distribution Plan are payable without regard to actual expenses incurred. During the period ended December 31, 2024, Service shares were charged $2,135,942 pursuant to the Distribution Plan.
The fund has an arrangement with BNY Mellon Transfer, Inc., (the “Transfer Agent”), a subsidiary of BNY and an affiliate of the Adviser, whereby the fund may receive earnings credits when positive cash balances are maintained, which are used to offset Transfer Agent fees. For financial reporting purposes, the fund includes transfer agent net earnings credits, if any, as an expense offset in the Statement of Operations.
The fund has an arrangement with The Bank of New York Mellon (the “Custodian”), a subsidiary of BNY and an affiliate of the Adviser, whereby the fund will receive interest income or be charged overdraft fees when cash balances are maintained. For financial reporting purposes, the fund includes this interest income and overdraft fees, if any, as interest income in the Statement of Operations.
The fund compensates the Transfer Agent, under a transfer agency agreement, for providing transfer agency and cash management services for the fund. The majority of Transfer Agent fees are comprised of amounts paid on a per account basis, while cash management fees are related to fund subscriptions and redemptions. During the period ended December 31, 2024, the fund was charged $1,089 for transfer agency services. These fees are included in Shareholder servicing costs in the Statement of Operations. These fees were partially offset by earnings credits of $294.
The fund compensates the Custodian, under a custody agreement, for providing custodial services for the fund. These fees are determined based on net assets, geographic region and transaction activity. During the period ended December 31, 2024, the fund was charged $16,982 pursuant to the custody agreement.
During the period ended December 31, 2024, the fund was charged $19,715 for services performed by the fund’s Chief Compliance Officer and his staff. These fees are included in Chief Compliance Officer fees in the Statement of Operations.
The components of “Due to BNY Mellon Investment Adviser, Inc. and affiliates” in the Statement of Assets and Liabilities consist of: Management fee of $814,112, Distribution Plan fees of $200,909, Custodian fees of $4,500, Chief Compliance Officer fees of $4,124 and Transfer Agent fees of $224.
(c) Each board member of the fund also serves as a board member of other funds in the BNY Mellon Family of Funds complex. Annual retainer fees and attendance fees are allocated to each fund based on net assets.
NOTE 4—
Securities Transactions:
The aggregate amount of purchases and sales of investment securities, excluding short-term securities, during the period ended December 31, 2024, amounted to $395,304,226 and $480,623,451, respectively.
At December 31, 2024, the cost of investments for federal income tax purposes was $743,110,502; accordingly, accumulated net unrealized appreciation on investments was $503,205,630, consisting of $529,145,557 gross unrealized appreciation and $25,939,927 gross unrealized depreciation.
In-Kind Redemptions: Effective February 7, 2025 (the “Redemption Date”), the fund will transfer approximately 80% of the fund net assets in securities and cash to shareholders in connection with an in-kind redemption transaction. For financial reporting purposes, these transactions will be treated as sales of securities and the resulting gains and losses will be recognized based on the market value of the securities on the Redemption Date. For tax purposes, this will be a tax-free event, and no gains or losses will be recognized to the fund.
REPORT OF INDEPENDENT REGISTERED PUBLIC ACCOUNTING FIRM
To the Shareholders and the Board of Trustees of Technology Growth Portfolio
Opinion on the Financial Statements
We have audited the accompanying statement of assets and liabilities of Technology Growth Portfolio (the “Fund”) (one of the funds constituting BNY Mellon Investment Portfolios (the “Trust”)), including the statement of investments, as of December 31, 2024, and the related statement of operations for the year then ended, the statements of changes in net assets for each of the two years in the period then ended, the financial highlights for each of the five years in the period then ended and the related notes (collectively referred to as the “financial statements”). In our opinion, the financial statements present fairly, in all material respects, the financial position of the Fund (one of the funds constituting BNY Mellon Investment Portfolios) at December 31, 2024, the results of its operations for the year then ended, the changes in its net assets for each of the two years in the period then ended and its financial highlights for each of the five years in the period then ended, in conformity with U.S. generally accepted accounting principles.
These financial statements are the responsibility of the Trust’s management. Our responsibility is to express an opinion on the Fund’s financial statements based on our audits. We are a public accounting firm registered with the Public Company Accounting Oversight Board (United States) (“PCAOB”) and are required to be independent with respect to the Trust in accordance with the U.S. federal securities laws and the applicable rules and regulations of the Securities and Exchange Commission and the PCAOB.
We conducted our audits in accordance with the standards of the PCAOB. Those standards require that we plan and perform the audit to obtain reasonable assurance about whether the financial statements are free of material misstatement, whether due to error or fraud. The Trust is not required to have, nor were we engaged to perform, an audit of the Trust’s internal control over financial reporting. As part of our audits, we are required to obtain an understanding of internal control over financial reporting but not for the purpose of expressing an opinion on the effectiveness of the Trust’s internal control over financial reporting. Accordingly, we express no such opinion.
Our audits included performing procedures to assess the risks of material misstatement of the financial statements, whether due to error or fraud, and performing procedures that respond to those risks. Such procedures included examining, on a test basis, evidence regarding the amounts and disclosures in the financial statements. Our procedures included confirmation of securities owned as of December 31, 2024, by correspondence with the custodian, brokers and others; when replies were not received from brokers and others, we performed other auditing procedures. Our audits also included evaluating the accounting principles used and significant estimates made by management, as well as evaluating the overall presentation of the financial statements. We believe that our audits provide a reasonable basis for our opinion. 
We have served as the auditor of one or more investment companies in the BNY Mellon Family of Funds since at least 1957, but we are unable to determine the specific year.
New York, New York
February 11, 2025
Item 8. Changes in and Disagreements with Accountants for Open-End Management Investment Companies (Unaudited)
Item 9. Proxy Disclosures for Open-End Management Investment Companies (Unaudited)
Item 10. Remuneration Paid to Directors, Officers, and Others of Open-End Management Investment Companies (Unaudited)
Each board member also serves as a board member of other funds in the BNY Mellon Family of Funds complex. Annual retainer fees and attendance fees are allocated to each fund based on net assets. Trustees fees paid by the fund are within Item 7. Statement of Operations as Trustees’ fees and expenses.
Item 11. Statement Regarding Basis for Approval of Investment Advisory Contracts (Unaudited)
At a meeting of the fund’s Board of Trustees held on August 14-15, 2024, the Board considered the renewal of the fund’s Management Agreement, pursuant to which the Adviser provides the fund with investment advisory and administrative services, the Sub-Investment Advisory Agreement, pursuant to which Newton Investment Management North America, LLC (the “Sub-Adviser” or “NIMNA”) provides day-to-day management of the fund’s investments, and the Sub-Sub-Investment Advisory Agreement (collectively with the Management Agreement and the Sub-Investment Advisory Agreement, the “Agreements”) between NIMNA and Newton Investment Management Limited (“NIM”), pursuant to which NIMNA may use the investment advisory personnel, resources and capabilities available at its sister company, NIM, in providing the day-to-day management of the fund’s investments. The Board members, none of whom are “interested persons” (as defined in the Investment Company Act of 1940, as amended) of the fund, were assisted in their review by independent legal counsel and met with counsel in executive session separate from representatives of the Adviser and the Sub-Adviser. In considering the renewal of the Agreements, the Board considered several factors that it believed to be relevant, including those discussed below. The Board did not identify any one factor as dispositive, and each Board member may have attributed different weights to the factors considered.
Analysis of Nature, Extent, and Quality of Services Provided to the Fund. The Board considered information provided to it at the meeting and in previous presentations from representatives of the Adviser regarding the nature, extent, and quality of the services provided to funds in the BNY Mellon fund complex, including the fund. The Adviser provided the number of open accounts in the fund, the fund’s asset size and the allocation of fund assets among distribution channels. The Adviser also had previously provided information regarding the diverse intermediary relationships and distribution channels of funds in the BNY Mellon fund complex (such as intermediary, in which intermediaries typically are paid by the fund and/or the Adviser) and the Adviser’s corresponding need for broad, deep, and diverse resources to be able to provide ongoing shareholder services to each intermediary or distribution channel, as applicable to the fund.
The Board also considered research support available to, and portfolio management capabilities of, the fund’s portfolio management personnel and that the Adviser also provides oversight of day-to-day fund operations, including fund accounting and administration and assistance in meeting legal and regulatory requirements. The Board also considered the Adviser’s extensive administrative, accounting and compliance infrastructures, as well as the Adviser’s supervisory activities over the Sub-Adviser. The Board also considered portfolio management’s brokerage policies and practices (including policies and practices regarding soft dollars) and the standards applied in seeking best execution.
Comparative Analysis of the Fund’s Performance and Management Fee and Expense Ratio. The Board reviewed reports prepared by Broadridge Financial Solutions, Inc. (“Broadridge”), an independent provider of investment company data based on classifications provided by Thomson Reuters Lipper (“Lipper”), which included information comparing (1) the performance of the fund’s Initial shares with the performance of a group of science and technology funds underlying variable insurance products (“VIPs”) selected by Broadridge as comparable to the fund (the “Performance Group”) and with a broader group of funds consisting of all science and technology funds underlying VIPs (the “Performance Universe”), all for various periods ended June 30, 2024, and (2) the fund’s actual and contractual management fees and total expenses with those of the same group of funds in the Performance Group (the “Expense Group”) and with a broader group of funds consisting of all science and technology funds underlying VIPs with similar 12b-1/non-12b-1 structures, excluding outliers (the “Expense Universe”), the information for which was derived in part from fund financial statements available to Broadridge as of the date of its analysis. The Adviser previously had furnished the Board with a description of the methodology Broadridge used to select the Performance Group and Performance Universe and the Expense Group and Expense Universe.
Performance Comparisons. Representatives of the Adviser stated that the usefulness of performance comparisons may be affected by a number of factors, including different investment limitations and policies that may be applicable to the fund and comparison funds and the end date selected. The Board also considered the fund’s performance in light of overall financial market conditions. The Board discussed with representatives of the Adviser and the Sub-Adviser the results of the comparisons and considered that the fund’s total return performance was below the Performance Group median for all periods, except for the one-year period when the fund’s total return performance was equal to the Performance Group median, and was below the Performance Universe median for all periods, except for the one- and two-year periods when the fund’s total return performance was above and equal to, respectively, the Performance Universe median. The Board discussed with representatives of the Adviser and the Sub-Adviser the reasons for the fund’s underperformance versus the Performance Group and Performance Universe during the periods under review and noted that, effective in March
Item 11. Statement Regarding Basis for Approval of Investment Advisory Contracts (Unaudited) (continued)
2022 and May 2024, the fund appointed new primary portfolio managers. The Adviser also provided a comparison of the fund’s calendar year total returns to the returns of the fund’s benchmark index.
Management Fee and Expense Ratio Comparisons. The Board reviewed and considered the contractual management fee rate payable by the fund to the Adviser in light of the nature, extent and quality of the management services and the sub-advisory services provided by the Adviser and the Sub-Adviser, respectively. In addition, the Board reviewed and considered the actual management fee rate paid by the fund over the fund’s last fiscal year. The Board also reviewed the range of actual and contractual management fees and total expenses as a percentage of average net assets of the Expense Group and Expense Universe funds and discussed the results of the comparisons.
The Board considered that the fund’s contractual management fee was lower than the Expense Group median contractual management fee, the fund’s actual management fee was lower than the Expense Group median and slightly lower than the Expense Universe median actual management fee, and the fund’s total expenses were lower than the Expense Group median and lower than the Expense Universe median total expenses.
Representatives of the Adviser noted that there were no other funds advised by the Adviser that are in the same Lipper category as the fund or separate accounts and/or other types of client portfolios advised by the Adviser or the Sub-Adviser that are considered to have similar investment strategies and policies as the fund.
The Board considered the fee payable to the Sub-Adviser in relation to the fee payable to the Adviser by the fund and the respective services provided by the Sub-Adviser and the Adviser. The Board also took into consideration that the Sub-Adviser’s fee is paid by the Adviser, out of its fee from the fund, and not the fund.
Analysis of Profitability and Economies of Scale. Representatives of the Adviser reviewed the expenses allocated and profit received by the Adviser and its affiliates and the resulting profitability percentage for managing the fund and the aggregate profitability percentage to the Adviser and its affiliates for managing the funds in the BNY Mellon fund complex, and the method used to determine the expenses and profit. The Board concluded that the profitability results were not excessive, given the services rendered and service levels provided by the Adviser and its affiliates. The Board also had been provided with information prepared by an independent consulting firm regarding the Adviser’s approach to allocating costs to, and determining the profitability of, individual funds and the entire BNY Mellon fund complex. The consulting firm also had analyzed where any economies of scale might emerge in connection with the management of a fund.
The Board considered, on the advice of its counsel, the profitability analysis (1) as part of its evaluation of whether the fees under the Agreements, considered in relation to the mix of services provided by the Adviser and the Sub-Adviser, including the nature, extent and quality of such services, supported the renewal of the Agreements and (2) in light of the relevant circumstances for the fund and the extent to which economies of scale would be realized if the fund grows and whether fee levels reflect these economies of scale for the benefit of fund shareholders. Representatives of the Adviser also stated that, as a result of shared and allocated costs among funds in the BNY Mellon fund complex, the extent of economies of scale could depend substantially on the level of assets in the complex as a whole, so that increases and decreases in complex-wide assets can affect potential economies of scale in a manner that is disproportionate to, or even in the opposite direction from, changes in the fund’s asset level. The Board also considered potential benefits to the Adviser and the Sub-Adviser from acting as investment adviser and sub-investment adviser, respectively, and took into consideration the soft dollar arrangements in effect for trading the fund’s investments.
At the conclusion of these discussions, the Board agreed that it had been furnished with sufficient information to make an informed business decision with respect to the renewal of the Agreements. Based on the discussions and considerations as described above, the Board concluded and determined as follows.
●The Board concluded that the nature, extent and quality of the services provided by the Adviser and the Sub-Adviser are adequate and appropriate.
●The Board generally was satisfied with the fund’s recent relative performance and, noting the relatively recent appointment of the portfolio management team, determined to continue to monitor the fund’s performance.
●The Board concluded that the fees paid to the Adviser and the Sub-Adviser continued to be appropriate under the circumstances and in light of the factors and the totality of the services provided as discussed above.
●The Board determined that the economies of scale which may accrue to the Adviser and its affiliates in connection with the management of the fund had been adequately considered by the Adviser in connection with the fee rate charged to the fund pursuant to the Management Agreement and that, to the extent in the future it were determined that material economies of scale had not been shared with the fund, the Board would seek to have those economies of scale shared with the fund.
In evaluating the Agreements, the Board considered these conclusions and determinations and also relied on its previous knowledge, gained through meetings and other interactions with the Adviser and its affiliates and the Sub-Adviser, of the Adviser and the Sub-Adviser and the services provided to the fund by the Adviser and the Sub-Adviser. The Board also relied on information received on a routine and regular basis throughout the year relating to the operations of the fund and the investment management and other services provided under the Agreements, including information on the investment performance of the fund in comparison to similar mutual funds and benchmark performance indices; general market outlook as applicable to the fund; and compliance reports. In addition, the Board’s consideration of the contractual fee arrangements for the fund had the benefit of a number of years of reviews of the Agreements for the fund, or substantially similar agreements for other BNY Mellon funds that the Board oversees, during which lengthy discussions took place between the Board and representatives of the Adviser. Certain aspects of the arrangements may receive greater scrutiny in some years than in others, and the Board’s conclusions may be based, in part, on its consideration of the fund’s arrangements, or substantially similar arrangements for other BNY Mellon funds that the Board oversees, in prior years. The Board determined to renew the Agreements.
© 2025 BNY Mellon Securities CorporationCode-0175NCSRAR1224
| Item 12. | Disclosure of Proxy Voting Policies and Procedures for Closed-End Management Investment Companies. |
Not applicable.
| Item 13. | Portfolio Managers for Closed-End Management Investment Companies. |
Not applicable.
| Item 14. | Purchases of Equity Securities By Closed-End Management Investment Companies and Affiliated Purchasers. |
Not applicable.
| Item 15. | Submission of Matters to a Vote of Security Holders. |
There have been no material changes to the procedures applicable to Item 15.
| Item 16. | Controls and Procedures. |
| (a) | The Registrant's principal executive and principal financial officers have concluded, based on their evaluation of the Registrant's disclosure controls and procedures as of a date within 90 days of the filing date of this report, that the Registrant's disclosure controls and procedures are reasonably designed to ensure that information required to be disclosed by the Registrant on Form N-CSR is recorded, processed, summarized and reported within the required time periods and that information required to be disclosed by the Registrant in the reports that it files or submits on Form N-CSR is accumulated and communicated to the Registrant's management, including its principal executive and principal financial officers, as appropriate to allow timely decisions regarding required disclosure. |
| (b) | There were no changes to the Registrant's internal control over financial reporting that occurred during the period covered by this report that have materially affected, or are reasonably likely to materially affect, the Registrant's internal control over financial reporting. |
| Item 17. | Disclosure of Securities Lending Activities for Closed-End Management Investment Companies. |
Not applicable.
| Item 18. | Recovery of Erroneously Awarded Compensation. |
Not applicable.
(a)(1) Code of ethics referred to in Item 2.
(a)(3) Not applicable.
SIGNATURES
Pursuant to the requirements of the Securities Exchange Act of 1934 and the Investment Company Act of 1940, the Registrant has duly caused this Report to be signed on its behalf by the undersigned, thereunto duly authorized.
BNY Mellon Investment Portfolios
By: /s/ David J. DiPetrillo
David J. DiPetrillo
President (Principal Executive Officer)
Date: February 7, 2025
Pursuant to the requirements of the Securities Exchange Act of 1934 and the Investment Company Act of 1940, this Report has been signed below by the following persons on behalf of the Registrant and in the capacities and on the dates indicated.
By: /s/ David J. DiPetrillo
David J. DiPetrillo
President (Principal Executive Officer)
Date: February 7, 2025
By: /s/ James Windels
James Windels
Treasurer (Principal Financial Officer)
Date: February 7, 2025
EXHIBIT INDEX
| (a)(1) | Code of ethics referred to in Item 2. |
| (a)(2) | Certifications of principal executive and principal financial officers as required by Rule 30a-2(a) under the Investment Company Act of 1940. (EX-99.CERT) |
| (b) | Certification of principal executive and principal financial officers as required by Rule 30a-2(b) under the Investment Company Act of 1940. (EX-99.906CERT) |