UNITED STATES
SECURITIES AND EXCHANGE COMMISSION
Washington, D.C. 20549
FORM 10-Q
| x | QUARTERLY REPORT PURSUANT TO SECTION 13 OR 15(d) OF THE SECURITIES EXCHANGE ACT OF 1934 |
For the quarterly period ended September 30, 2007
OR
| ¨ | TRANSITION REPORT PURSUANT TO SECTION 13 OR 15(d) OF THE SECURITIES EXCHANGE ACT OF 1934 |
For the transition period from to
Commission File Number 0-30218
TIME WARNER TELECOM INC.
(Exact name of Registrant as specified in its charter)
| | |
| Delaware | | 84-1500624 |
(State or other jurisdiction of incorporation or organization) | | (I.R.S. Employer Identification Number) |
| |
10475 Park Meadows Drive Littleton, Colorado | | 80124 |
| (Address of principal executive offices) | | (Zip Code) |
Registrant’s telephone number, including area code: (303) 566-1000
Indicate by check mark whether the Registrant (1) has filed all reports required to be filed by Section 13 or 15(d) of the Securities Exchange Act of 1934 during the preceding 12 months (or for such shorter period that the registrant was required to file such reports), and (2) has been subject to such filing requirements for the past 90 days. Yes x No ¨
Indicate by check mark whether the Registrant is a large accelerated filer, an accelerated filer, or a non-accelerated filer. See definition of “accelerated filer and large accelerated filer” in Rule 12b-2 of the Exchange Act.
Large accelerated filer x Accelerated filer ¨ Non-accelerated filer ¨
Indicate by check mark whether the Registrant is a shell company (as defined in Rule 12b-2 of the Exchange Act). Yes ¨ No x
The number of shares outstanding of Time Warner Telecom Inc.’s common stock as of October 31, 2007 was:
Time Warner Telecom Inc. common stock—146,005,014 shares
INDEX TO FORM 10-Q
TIME WARNER TELECOM INC.
CONSOLIDATED BALANCE SHEETS
| | | | | | | | |
| | | September 30,
2007 | | | December 31,
2006 | |
| | | (unaudited) | | | | |
| | | (amounts in thousands, except share amounts) | |
| ASSETS | | | | | | | | |
Current assets: | | | | | | | | |
Cash and cash equivalents | | $ | 237,485 | | | $ | 221,553 | |
Investments | | | 69,593 | | | | 87,900 | |
Receivables, less allowances of $11,039 and $13,182, respectively | | | 80,291 | | | | 73,923 | |
Prepaid expenses and other current assets | | | 18,295 | | | | 18,504 | |
Deferred income taxes | | | 8,829 | | | | 12,793 | |
| | | | | | | | |
Total current assets | | | 414,493 | | | | 414,673 | |
| | | | | | | | |
Property, plant, and equipment | | | 2,959,945 | | | | 2,771,631 | |
Less accumulated depreciation | | | (1,669,005 | ) | | | (1,477,519 | ) |
| | | | | | | | |
| | | 1,290,940 | | | | 1,294,112 | |
| | | | | | | | |
Deferred income taxes | | | 49,921 | | | | 45,957 | |
Goodwill | | | 408,355 | | | | 405,638 | |
Intangible assets, net of accumulated amortization | | | 53,756 | | | | 69,454 | |
Other assets, net of accumulated amortization | | | 22,531 | | | | 23,403 | |
| | | | | | | | |
Total assets | | $ | 2,239,996 | | | $ | 2,253,237 | |
| | | | | | | | |
| LIABILITIES AND STOCKHOLDERS’ EQUITY | | | | | | | | |
Current liabilities: | | | | | | | | |
Accounts payable | | $ | 39,786 | | | $ | 41,388 | |
Deferred revenue | | | 24,986 | | | | 22,582 | |
Accrued taxes, franchise and other fees | | | 80,173 | | | | 78,795 | |
Accrued interest | | | 9,874 | | | | 16,984 | |
Accrued payroll and benefits | | | 37,216 | | | | 34,688 | |
Accrued carrier costs | | | 39,187 | | | | 49,806 | |
Current portion debt and capital lease obligations (note 3) | | | 6,950 | | | | 6,679 | |
Other current liabilities | | | 31,240 | | | | 33,584 | |
| | | | | | | | |
Total current liabilities | | | 269,412 | | | | 284,506 | |
| | | | | | | | |
Long-term debt and capital lease obligations (note 3) | | | 1,371,681 | | | | 1,375,958 | |
Long-term deferred revenue | | | 20,072 | | | | 20,357 | |
Other long-term liabilities | | | 20,322 | | | | 19,768 | |
Stockholders’ equity (note 1): | | | | | | | | |
Preferred stock, $0.01 par value, 20,000,000 shares authorized, no shares issued and outstanding | | | — | | | | — | |
Common stock, $0.01 par value, 439,800,000 and 277,300,000 shares authorized as of September 30, 2007 and December 31, 2006, respectively, 145,601,774 and 142,814,844 shares issued and outstanding as of September 30, 2007 and December 31, 2006, respectively | | | 1,456 | | | | 1,428 | |
Class B common stock, $0.01 par value, 0 and 162,500,000 shares authorized as of September 30, 2007 and December 31, 2006, respectively, no shares issued and outstanding | | | — | | | | — | |
Additional paid-in capital | | | 1,605,353 | | | | 1,564,543 | |
Accumulated deficit | | | (1,048,300 | ) | | | (1,013,323 | ) |
| | | | | | | | |
Total stockholders’ equity | | | 558,509 | | | | 552,648 | |
| | | | | | | | |
Total liabilities and stockholders’ equity | | $ | 2,239,996 | | | $ | 2,253,237 | |
| | | | | | | | |
See accompanying notes.
1
TIME WARNER TELECOM INC.
CONSOLIDATED STATEMENTS OF OPERATIONS
(Unaudited)
| | | | | | | | | | | | | | | | |
| | | Three Months Ended
September 30, | | | Nine Months Ended
September 30, | |
| | | 2007 | | | 2006 | | | 2007 | | | 2006 | |
| | | (amounts in thousands, except per share amounts) | |
Revenue (a): | | | | | | | | | | | | | | | | |
Network services | | $ | 98,669 | | | $ | 87,312 | | | $ | 296,229 | | | $ | 260,104 | |
Voice services | | | 82,475 | | | | 45,932 | | | | 242,700 | | | | 133,511 | |
Data and Internet services | | | 82,359 | | | | 53,995 | | | | 230,780 | | | | 153,570 | |
Intercarrier compensation | | | 11,290 | | | | 8,870 | | | | 34,494 | | | | 26,409 | |
| | | | | | | | | | | | | | | | |
Total revenue | | | 274,793 | | | | 196,109 | | | | 804,203 | | | | 573,594 | |
| | | | | | | | | | | | | | | | |
Costs and expenses (a)(b): | | | | | | | | | | | | | | | | |
Operating (exclusive of depreciation, amortization, and accretion shown separately below) | | | 118,412 | | | | 74,018 | | | | 350,859 | | | | 213,447 | |
Selling, general, and administrative | | | 75,695 | | | | 54,409 | | | | 223,792 | | | | 164,185 | |
Depreciation, amortization, and accretion | | | 71,580 | | | | 62,028 | | | | 206,325 | | | | 184,524 | |
| | | | | | | | | | | | | | | | |
Total costs and expenses | | | 265,687 | | | | 190,455 | | | | 780,976 | | | | 562,156 | |
| | | | | | | | | | | | | | | | |
Operating income | | | 9,106 | | | | 5,654 | | | | 23,227 | | | | 11,438 | |
Interest expense | | | (22,623 | ) | | | (21,759 | ) | | | (68,794 | ) | | | (74,921 | ) |
Debt extinguishment costs | | | — | | | | — | | | | — | | | | (25,777 | ) |
Interest income | | | 4,528 | | | | 4,754 | | | | 13,614 | | | | 15,243 | |
Other income (loss) | | | (2,415 | ) | | | — | | | | (2,415 | ) | | | — | |
| | | | | | | | | | | | | | | | |
Loss before income taxes | | | (11,404 | ) | | | (11,351 | ) | | | (34,368 | ) | | | (74,017 | ) |
Income tax expense | | | 179 | | | | — | | | | 609 | | | | 7 | |
| | | | | | | | | | | | | | | | |
Net loss | | $ | (11,583 | ) | | $ | (11,351 | ) | | $ | (34,977 | ) | | $ | (74,024 | ) |
| | | | | | | | | | | | | | | | |
Net loss per common share, basic and diluted | | $ | (0.08 | ) | | $ | (0.09 | ) | | $ | (0.24 | ) | | $ | (0.62 | ) |
| | | | | | | | | | | | | | | | |
Weighted average shares outstanding, basic and diluted | | | 145,174 | | | | 121,659 | | | | 144,564 | | | | 119,999 | |
| | | | | | | | | | | | | | | | |
| | | | | | | | | | | | | | | | |
| | |
(a) Includes revenue and expenses resulting from transactions with affiliates (note 4): | | | | | | | | | |
| | | | |
Revenue | | $ | — | | | $ | 4,750 | | | $ | — | | | $ | 13,109 | |
| | | | | | | | | | | | | | | | |
Operating | | $ | — | | | $ | 1,755 | | | $ | — | | | $ | 5,189 | |
| | | | | | | | | | | | | | | | |
Selling, general, and administrative | | $ | — | | | $ | 421 | | | $ | — | | | $ | 1,394 | |
| | | | | | | | | | | | | | | | |
(b) Includes non-cash stock-based employee compensation expense (note 1): | | | | | | | | | |
| | | | |
Operating | | $ | 897 | | | $ | 491 | | | $ | 2,607 | | | $ | 1,472 | |
| | | | | | | | | | | | | | | | |
Selling, general, and administrative | | $ | 4,848 | | | $ | 3,026 | | | $ | 13,583 | | | $ | 8,344 | |
| | | | | | | | | | | | | | | | |
See accompanying notes.
2
TIME WARNER TELECOM INC.
CONSOLIDATED STATEMENTS OF CASH FLOWS
(Unaudited)
| | | | | | | | |
| | | Nine Months Ended
September 30, | |
| | | 2007 | | | 2006 | |
| | | (amounts in thousands) | |
Cash flows from operating activities: | | | | | | | | |
Net loss | | $ | (34,977 | ) | | $ | (74,024 | ) |
Adjustments to reconcile net loss to net cash provided by operating activities: | | | | | | | | |
Depreciation, amortization, and accretion | | | 206,325 | | | | 184,524 | |
Stock-based compensation | | | 16,190 | | | | 9,816 | |
Amortization of deferred debt issue costs and other | | | 4,157 | | | | 28,371 | |
Changes in operating assets and liabilities: | | | | | | | | |
Receivables, prepaid expenses and other assets | | | (8,889 | ) | | | (17,233 | ) |
Accounts payable, deferred revenue and other liabilities | | | (14,450 | ) | | | (21,094 | ) |
| | | | | | | | |
Net cash provided by operating activities | | | 168,356 | | | | 110,360 | |
| | | | | | | | |
Cash flows from investing activities: | | | | | | | | |
Capital expenditures | | | (191,864 | ) | | | (136,495 | ) |
Cash paid for acquisitions, net of cash acquired | | | 2,397 | | | | — | |
Purchases of investments | | | (166,973 | ) | | | (338,359 | ) |
Proceeds from maturities of investments | | | 185,512 | | | | 421,508 | |
Other investing activities | | | (260 | ) | | | 16 | |
| | | | | | | | |
Net cash used in investing activities | | | (171,188 | ) | | | (53,330 | ) |
| | | | | | | | |
Cash flows from financing activities: | | | | | | | | |
Net proceeds from issuance of common stock upon exercise of stock options and in connection with the employee stock purchase plan | | | 24,648 | | | | 32,297 | |
Net (costs) proceeds from issuance of debt | | | (850 | ) | | | 362,293 | |
Retirement of debt obligations | | | — | | | | (420,252 | ) |
Payment of debt and capital lease obligations | | | (5,034 | ) | | | (3,081 | ) |
| | | | | | | | |
Net cash provided by (used in) financing activities | | | 18,764 | | | | (28,743 | ) |
| | | | | | | | |
Decrease in cash and cash equivalents | | | 15,932 | | | | 28,287 | |
Cash and cash equivalents at beginning of period | | | 221,553 | | | | 210,834 | |
| | | | | | | | |
Cash and cash equivalents at end of period | | $ | 237,485 | | | $ | 239,121 | |
| | | | | | | | |
Supplemental disclosures of cash flow information: | | | | | | | | |
Cash paid for interest | | $ | 75,957 | | | $ | 95,555 | |
| | | | | | | | |
Cash paid for debt extinguishment costs | | $ | — | | | $ | 20,252 | |
| | | | | | | | |
Addition of capital lease obligation | | $ | 1,076 | | | $ | 379 | |
| | | | | | | | |
See accompanying notes.
3
TIME WARNER TELECOM INC.
CONSOLIDATED STATEMENT OF CHANGES IN STOCKHOLDERS’ EQUITY
Nine Months Ended September 30, 2007
(Unaudited)
| | | | | | | | | | | | | | | | | | | | | |
| | | Stock | | Additional paid-in capital | | Accumulated deficit | | | Total stockholders’ equity | |
| | | Common Stock | | Class B Common Stock | | | |
| | | Shares | | Amount | | Shares | | Amount | | | |
| | | (amounts in thousands) | |
Balance at January 1, 2007 | | 142,815 | | $ | 1,428 | | — | | $ | — | | $ | 1,564,543 | | $ | (1,013,323 | ) | | $ | 552,648 | |
Net loss and comprehensive loss | | — | | | — | | — | | | — | | | — | | | (34,977 | ) | | | (34,977 | ) |
Shares issued for cash in connection with the exercise of stock options and the employee stock purchase plan | | 2,778 | | | 27 | | — | | | — | | | 24,621 | | | — | | | | 24,648 | |
Stock based compensation | | 9 | | | 1 | | — | | | — | | | 16,189 | | | — | | | | 16,190 | |
| | | | | | | | | | | | | | | | | | | | | |
Balance at September 30, 2007 | | 145,602 | | $ | 1,456 | | — | | $ | — | | $ | 1,605,353 | | $ | (1,048,300 | ) | | $ | 558,509 | |
| | | | | | | | | | | | | | | | | | | | | |
See accompanying notes.
4
TIME WARNER TELECOM INC.
NOTES TO CONSOLIDATED FINANCIAL STATEMENTS
| 1. | Organization and Summary of Significant Accounting Policies |
Description of Business and Capital Structure
Time Warner Telecom Inc. (the “Company”), a Delaware corporation, is a leading national provider of managed network services specializing in Ethernet and transport data networking, Internet access, local and long distance voice, VoIP and network security services, to enterprise organizations and communications services companies throughout the U.S.
From the Company’s formation until September 26, 2006, the Company had two classes of common stock outstanding, Class A common stock with one vote per share and Class B common stock with ten votes per share. Each share of Class B common stock was convertible, at the option of the holder, into one share of Class A common stock. The Class B common stock was collectively owned directly or indirectly by Time Warner Inc. (“Time Warner”), Advance Telecom Holdings Corporation and Newhouse Telecom Holdings Corporation (“Advance/Newhouse”) (collectively, the “Class B Stockholders”). On March 29, 2006 and September 26, 2006, the Class B Stockholders completed underwritten secondary offerings of 22,310,000 shares and 43,544,158 shares, respectively, of Class A common stock of the Company, which were converted from shares of Class B common stock to shares of Class A common stock immediately prior to the offerings. In connection with the closing of the September 26, 2006 offering, Advance/Newhouse converted all of its remaining shares of Class B common stock that were not sold in the offering to shares of Class A common stock. As a result, the Company has not had shares of Class B common stock outstanding since September 26, 2006. The Company did not receive any proceeds from the offerings nor did the Company’s total shares outstanding change as a result of the offerings. In June 2007, the Company’s stockholders approved an amendment to the Company’s Restated Certificate of Incorporation, which eliminated references to Class A and Class B common stock. As a result, no shares of Class B common stock were authorized as of September 30, 2007 and Class A common stock authorized and outstanding as of December 31, 2006 is classified as common stock as of September 30, 2007.
The Company also is authorized to issue shares of preferred stock. The Company’s Board of Directors has the authority to establish voting powers, preferences, and special rights for the preferred stock. No shares of preferred stock have been issued.
Basis of Presentation
The accompanying interim consolidated financial statements are unaudited, but in the opinion of management, reflect all adjustments necessary for a fair presentation of the results for the periods indicated. The results of operations for any interim period are not necessarily indicative of results for the full year. The accompanying financial statements should be read in conjunction with the audited consolidated financial statements and notes thereto for the year ended December 31, 2006.
The preparation of financial statements in conformity with U.S. generally accepted accounting principles requires management to make estimates and assumptions that affect the reported amounts of assets and liabilities at the date of the financial statements and the reported amounts of revenue and expenses during the reporting period. Actual results could differ from those estimates.
Basis of Consolidation
The consolidated financial statements include the accounts of the Company and all entities in which the Company has a controlling voting interest (“subsidiaries”). Significant intercompany accounts and transactions have been eliminated. Significant accounts and transactions with Time Warner, Advance/Newhouse and their affiliates through September 26, 2006 are disclosed as related party transactions.
5
TIME WARNER TELECOM INC.
NOTES TO CONSOLIDATED FINANCIAL STATEMENTS—Continued
On October 31, 2006, the Company completed the acquisition of Xspedius Communications, LLC (“Xspedius”). Xspedius’ results of operations, cash flows and financial position are included in the consolidated financial statements from the date of acquisition.
Change in Accounting Estimate
During the first quarter of 2007, the Company evaluated the depreciable life used for fiber assets and determined that to better reflect the economic utilization of those fiber assets the lives were extended from 15 years to 20 years, or the lease term, if shorter, for leased fiber assets. This change in estimate, effective as of January 1, 2007, was accounted for prospectively, in accordance with Financial Accounting Standards Board (“FASB”) Statement of Financial Accounting Standards (“SFAS”) No. 154,Accounting Changes and Error Corrections. This change lowered depreciation expense and reduced net loss by $4.8 million, or approximately $0.03 per share, for the three months ended September 30, 2007 and $14.4 million, or approximately $0.10 per share, for the nine months ended September 30, 2007.
Recent Accounting Pronouncements
In March 2006, the FASB’s Emerging Issues Task Force (“EITF”) issued Issue 06-3,How Sales Taxes Collected From Customers and Remitted to Governmental Authorities Should Be Presented in the Income Statement (“EITF 06-3”). A consensus was reached that entities may adopt a policy of presenting sales taxes in the income statement on either a gross or net basis. If taxes are significant, an entity should disclose its policy of presenting taxes and the amounts of taxes. The guidance was effective beginning on January 1, 2007. The Company’s adoption of this pronouncement is addressed below in“Revenue”.
The Company adopted FASB Interpretation No. 48,Accounting for Uncertainty in Tax Positions—an interpretation of FASB Statement No. 109(“FIN 48”) effective January 1, 2007. FIN 48 clarifies the accounting for uncertainty in income taxes recognized in financial statements and requires the impact of a tax position to be recognized in the financial statements if that position is more likely than not of being sustained on audit, based on technical merits of the position. The adoption of FIN 48 did not have an impact on the Company’s accumulated deficit, results of operations or net loss.
In September 2006, the FASB issued SFAS No. 157,Fair Value Measurement (“SFAS 157”), which defines fair value, establishes a framework for measuring fair value in generally accepted accounting principles and expands disclosures about fair value measurements. This statement applies to other accounting pronouncements that require or permit fair value measurements. The Company is required to adopt SFAS 157 effective January 1, 2008 on a prospective basis. The Company does not expect the adoption of SFAS 157 to have a material impact on its financial position and results of operations.
In February 2007, the FASB issued SFAS No. 159,The Fair Value Option for Financial Assets and Financial Liabilities(“SFAS 159”). The fair value option established by SFAS 159 permits entities to choose to measure eligible financial instruments at fair value. The unrealized gains and losses on items for which the fair value option has been elected should be reported in earnings. The decision to elect the fair value option is determined on an instrument by instrument basis and is irrevocable. Assets and liabilities measured at fair value pursuant to the fair value option should be reported separately in the balance sheet from those instruments measured using other measurement attributes. This statement is effective for fiscal years beginning after November 15, 2007. The Company is currently evaluating the potential impact of SFAS 159 on its financial position and results of operations.
6
TIME WARNER TELECOM INC.
NOTES TO CONSOLIDATED FINANCIAL STATEMENTS—Continued
Cash Equivalents
The Company considers all highly liquid debt instruments with an original maturity of three months or less, when purchased, to be cash equivalents.
Investments
Marketable debt securities, included in cash and cash equivalents and investments, are classified as held-to-maturity because the Company has the intent and ability to hold the securities to maturity. Held-to-maturity securities are carried at amortized cost, which was $314.2 million and $308.7 million at September 30, 2007 and December 31, 2006, respectively. The fair value of marketable debt securities is not materially different than the amortized cost. During the three months ended September 30, 2007, the Company recognized a loss of $2.4 million on commercial paper past its maturity date with exposure to sub-prime mortgages. The carrying value of these securities after recognition of the loss is $19.4 million at September 30, 2007. Subsequent to September 30, 2007, all of the Company’s other commercial paper investments were redeemed at par.
Receivables
The Company generally bills in advance for the majority of the services it provides and does not require significant collateral from its customers. The Company evaluates whether receivables are reasonably assured of collection by ongoing credit evaluations of significant customers’ financial condition, and provides an allowance for doubtful accounts based on the expected collectability of all receivables. The allowance for doubtful accounts was $11.0 million, or 12% of gross receivables, at September 30, 2007, and $13.2 million, or 15% of gross receivables, at December 31, 2006.
Revenue
The Company’s revenue is derived primarily from business communications services. Network services transmit voice, data and images as well as enable transmission for storage, using state-of-the-art fiber optics. Data and Internet services include services that enable customers to connect their internal computer networks and to access external networks, including Internet at high speeds using Ethernet protocol, such as metro and wide area Ethernet, virtual private network solutions and Internet access. Voice services include traditional and next generation voice capabilities, including voice services from stand alone and bundled products, long distance, 800 services, and voice over Internet protocol (“VoIP”). Intercarrier compensation is comprised of switched access services and reciprocal compensation. Switched access represents the compensation from another carrier for the delivery of traffic from a long distance carrier’s point of presence and an end-user’s premises provided through the Company’s switching facilities. The Federal Communications Commission (“FCC”) regulates interstate switched access rates. Reciprocal compensation represents compensation from local exchange carriers (“LECs”) for local exchange traffic originated on another LEC’s facilities and terminated on the Company’s facilities. Reciprocal compensation rates are established by interconnection agreements between the parties based on federal and state regulatory rulings.
The Company’s customers are principally enterprise organizations in the health care, finance, higher education, manufacturing and hospitality industries, state, local and federal government entities as well as long distance carriers, incumbent local exchange carriers (“ILECs”), competitive local exchange carriers (“CLECs”), wireless communications companies, and Internet service providers (“ISPs”).
Revenue for network, data and Internet, and the majority of voice services is generally billed in advance on a fixed rate basis and recognized over the period the services are provided. Revenue for the majority of
7
TIME WARNER TELECOM INC.
NOTES TO CONSOLIDATED FINANCIAL STATEMENTS—Continued
intercarrier compensation and long distance is generally billed on a transactional basis in arrears determined by customer usage with some fixed rate elements. The transactional elements of voice services are billed in arrears and estimates are used to recognize revenue in the period earned.
The Company evaluates whether receivables are reasonably assured of collection based on certain factors, including the likelihood of billing being disputed by customers. In situations where a customer files a billing dispute, revenue is not recognized until the dispute is resolved.
Pursuant to EITF 99-19,Reporting Revenue Gross as a Principal Versus Net as an Agent,the Company classifies certain taxes and fees billed to customers and remitted to government authorities on a gross versus net basis in revenue and expense. Beginning January 1, 2007 with the adoption of EITF 06-3, the Company added additional fees billed to customers and remitted to government authorities in its classification of gross versus net which resulted in an increase to revenue and expense of $3.8 million and $10.8 million in the consolidated statement of operations for the three and nine month periods ended September 30, 2007, respectively. Prior periods were not reclassified as the effect would not be material. The total amount classified as revenue associated with such fees was approximately $8.7 million and $3.4 million for the three months ended September 30, 2007 and 2006, respectively, and approximately $23.0 million and $9.9 million for the nine months ended September 30, 2007 and 2006, respectively, including the additional fees described above.
Significant Customers
The Company has substantial business relationships with a few large customers, including major long distance carriers. The Company’s top 10 customers accounted for an aggregate of 26% and 32% of the Company’s total consolidated revenue for the nine months ended September 30, 2007 and 2006, respectively. No customer accounted for 10% or more of total revenue for the three and nine months ended September 30, 2007 or 2006.
Operating Expenses
Operating expenses consist of costs directly related to the operation and maintenance of networks and the provisioning of services but exclude depreciation, amortization and accretion, which is reported separately. These costs include the salaries and related benefits and expenses, including stock-based compensation, of customer care, provisioning, network maintenance, technical field, network operations and engineering personnel, costs to repair and maintain the Company’s network, costs paid to other carriers to carry a portion of the Company’s traffic and to interconnect the Company’s networks and for facility leases.
Income Taxes
As of September 30, 2007, the Company had a deferred tax asset of $58.8 million, net of a valuation allowance of $342.8 million. The Company has concluded that it is more likely than not that the net deferred tax asset of $58.8 million will be realized because the Company could utilize tax-planning strategies in the event its net operating losses were to expire. However, the Company believes there may be risks in realizing amounts in excess of the $58.8 million through utilization of available tax planning strategies. Accordingly, the Company has established a valuation allowance for amounts in excess of $58.8 million.
At September 30, 2007, the Company had net operating losses for federal income tax purposes of approximately $1.0 billion. These net operating loss carryforwards, if not utilized to reduce taxable income in future periods, will expire in various amounts beginning in 2019 and ending in 2027.
8
TIME WARNER TELECOM INC.
NOTES TO CONSOLIDATED FINANCIAL STATEMENTS—Continued
The Tax Reform Act of 1986 contains provisions that limit the utilization of net operating losses if there has been a “change of ownership” as described in Section 382 of the Internal Revenue Code. As a result of the secondary offering by the Class B Stockholders in September 2006, the Company may have experienced such an ownership change during the three months ended September 30, 2006 which may limit the Company’s utilization of its net operating losses. The Company has evaluated the impact of these provisions on its financial statements and has concluded that the provisions do not have a material impact on the Company’s net deferred tax asset position as of September 30, 2007.
Asset Retirement Obligations
The Company accounts for asset retirement obligations under FASB Statement No. 143,Accounting for Asset Retirement Obligations (“SFAS 143”) as interpreted by FASB Interpretation No. 47,Accounting forConditional Asset Retirement Obligations. SFAS 143 requires that the estimated fair value of an asset retirement obligation be recorded when incurred. The associated asset retirement costs are capitalized as part of the carrying amount of the long-lived asset and depreciated over the asset’s estimated useful life. The Company has asset retirement obligations related to decommissioning of electronics in leased facilities and the removal of certain fiber and conduit systems upon the expiration or termination of certain agreements. Considerable management judgment is required in estimating these obligations. Important assumptions include estimates of retirement costs, the timing of the future retirement activities, and the likelihood of retirement provisions being enforced. Changes in these assumptions based on future information could result in adjustments to estimated liabilities.
The Company’s asset retirement obligations were $16.8 million and $15.8 million as of September 30, 2007 and December 31, 2006, respectively, and are included as a component of other long-term liabilities in the accompanying consolidated balance sheets.
Segment Reporting
The Company operates in markets across the United States. The Company’s management makes decisions on resource allocation and assesses performance based on total revenue, expenses, and capital spending of these operating locations. Each market offers similar products and services, has similar customers and networks, is regulated by the same type of authorities, and is managed directly by the Company’s executives, allowing the Company’s markets to be aggregated and resulting in one reportable line of business.
Loss Per Common Share and Potential Common Share
The Company computes loss per common share in accordance with the provisions of FASB Statement No. 128,Earnings Per Share, which requires companies with complex capital structures to present basic and diluted earnings per share (“EPS”). Basic EPS is measured as the income or loss available to common stockholders divided by the weighted average outstanding common shares for the period. Diluted EPS is similar to basic EPS but presents the dilutive effect on a per share basis of potential common shares (e.g., convertible securities, stock options, etc.) as if they had been converted at the beginning of the periods presented. Potential common shares that have an anti-dilutive effect (e.g., those that increase income per share or decrease loss per share) are excluded from diluted EPS.
Basic loss per share for all periods presented herein was computed by dividing the net loss by the weighted average shares outstanding for the period.
The diluted loss per common share for all periods presented was computed by dividing the net loss attributable to common shares by the weighted average common shares outstanding for the period. Stock options
9
TIME WARNER TELECOM INC.
NOTES TO CONSOLIDATED FINANCIAL STATEMENTS—Continued
to purchase shares of the Company’s common stock, restricted stock units for common stock to be issued upon vesting and convertible debt subject to conversion to the Company’s common stock totaled 33.0 million and 35.0 million shares at September 30, 2007 and 2006, respectively. These shares were excluded from the computation of weighted average shares outstanding because their inclusion would be anti-dilutive.
Stock-Based Compensation
Effective January 1, 2006, the Company adopted the fair value recognition provisions of FASB Statement No. 123R,Share-Based Payment (“SFAS 123R”), which requires the cost of share-based payments to be recognized as expense over the requisite service period.
The fair value of options was estimated at the date of grant using a Black-Scholes option pricing model. For purposes of the actual expense recognized in the nine months ended September 30, 2007 and 2006, the estimated fair value of the options is amortized to expense on a straight-line basis (net of estimated forfeitures) over the options vesting period which is equivalent to the requisite service period. The weighted-average fair value of options granted was $10.50 and $10.47 for the nine months ended September 30, 2007 and 2006, respectively, with the following weighted-average assumptions:
| | | | | | |
| | | Nine months
ended September 30, | |
| | | 2007 | | | 2006 | |
Expected volatility | | 58 | % | | 93 | % |
Risk-free interest rate | | 4.6 | % | | 4.9 | % |
Dividend yield | | 0 | % | | 0 | % |
Expected term | | 4 years | | | 4 years | |
Expected volatilities are based on historical volatility of the Company’s stock over a period generally commensurate with the expected term of the option. The risk-free rate for stock options granted during the period is determined by using the U.S. Treasury rate for the nearest period that coincides with the expected term. The expected term of stock options represents the weighted-average period the stock options are expected to remain outstanding. The expected term is based on a combination of historical data and a study of the expected term of options in the Company’s peer group.
As of September 30, 2007, there was $28.4 million of total unrecognized compensation expense related to unvested stock options, which is expected to be recognized over a weighted-average period of 2.5 years.
On October 31, 2006, the Company acquired Xspedius through a merger with a wholly owned subsidiary of the Company for an initial total purchase price of $552.7 million, including the payment of $216 million in cash, the issuance of 18,249,428 shares of the Company’s common stock valued at $326.9 million at closing and the assumption of certain liabilities. The resolution of a final working capital adjustment of $4.5 million and adjustments to severance and other directly related costs resulted in a net decrease in purchase price of $4.1 million to $548.5 million at September 30, 2007.
The assets acquired and liabilities assumed of Xspedius are based on a preliminary valuation as of the date of the merger. Changes to the initial purchase price allocations for Xspedius have occurred, and will continue to occur through the one year allocation period ending October 31, 2007, based on further analysis of certain assets,
10
TIME WARNER TELECOM INC.
NOTES TO CONSOLIDATED FINANCIAL STATEMENTS—Continued
liabilities and pre-acquisition contingencies. The following table summarizes changes to the initial allocation of fair value of the assets acquired and liabilities assumed at September 31, 2007 acquisition date:
| | | | | | | | | | | | |
| | | Allocation at
acquisition date
October 31, 2006 | | | Purchase price
adjustments | | | Allocation as of
September 30, 2007 | |
| | | (amounts in thousands) | |
Assets acquired | | | | | | | | | | | | |
Cash and other current assets | | $ | 29,893 | | | $ | (75 | ) | | $ | 29,818 | |
Property, plant and equipment | | | 127,728 | | | | 1,219 | | | | 128,947 | |
Intangible assets subject to amortization | | | 71,003 | | | | (8,012 | ) | | | 62,991 | |
Other | | | 916 | | | | — | | | | 916 | |
Goodwill | | | 378,865 | | | | 2,717 | | | | 381,582 | |
| | | | | | | | | | | | |
Total assets acquired | | | 608,405 | | | | (4,151 | ) | | | 604,254 | |
Liabilities assumed | | | | | | | | | | | | |
Accounts payable and other current liabilities | | | (50,038 | ) | | | 20 | | | | (50,018 | ) |
Other long term liabilities | | | (5,705 | ) | | | — | | | | (5,705 | ) |
| | | | | | | | | | | | |
Total liabilities assumed | | | (55,743 | ) | | | 20 | | | | (55,723 | ) |
Purchase price | | $ | 552,662 | | | $ | (4,131 | ) | | $ | 548,531 | |
| | | | | | | | | | | | |
In connection with the acquisition, the Company recorded severance and severance-related costs in the allocation of the cost of the acquisition in accordance with the Emerging Issues Task Force Issue No. 95-3,Recognition of Liabilities in Connection with a Purchase Business Combination (“EITF 95-3”). The following table summarizes the Company’s utilization of severance-related accruals for the nine months ended September 30, 2007:
| | | | | | | | | | | | | |
| | | December 31,
2006 | | Purchase Price
Accruals | | Payments/
Adjustments | | | September 30,
2007 |
| | | (amounts in thousands) |
Severance and severance-related costs | | $ | 1,408 | | $ | 411 | | $ | (1,627 | ) | | $ | 192 |
| 3. | Long-Term Debt and Capital Lease Obligations |
| | | | | | | | |
| | | September 30,
2007 | | | December 31,
2006 | |
| | | (amounts in thousands) | |
Term Loan B, due 2013 | | $ | 595,500 | | | $ | 600,000 | |
9 1/4% Senior Notes, due 2014 | | | 400,000 | | | | 400,000 | |
2.375% Convertible Senior Debentures, due 2026 | | | 373,750 | | | | 373,750 | |
Capital lease obligations | | | 9,027 | | | | 8,491 | |
| | | | | | | | |
Total obligations | | | 1,378,277 | | | | 1,382,241 | |
Unamortized premium | | | 354 | | | | 396 | |
Current portion | | | (6,950 | ) | | | (6,679 | ) |
| | | | | | | | |
Total long-term obligations | | $ | 1,371,681 | | | $ | 1,375,958 | |
| | | | | | | | |
As of December 31, 2006, the Company’s wholly owned subsidiary Time Warner Telecom Holdings Inc. (“Holdings”) had outstanding $400 million principal amount of 9 1/4% Senior Notes due February 2014 (the “2014 Notes”). The 2014 Notes are unsecured, unsubordinated obligations of Holdings and are guaranteed by the
11
TIME WARNER TELECOM INC.
NOTES TO CONSOLIDATED FINANCIAL STATEMENTS—Continued
Company and Holdings’ subsidiaries. The 2014 Notes are callable as of February 15, 2009, 2010, 2011 and 2012 at 104.625%, 103.083%, 101.542% and 100%, respectively. Interest is payable semi-annually on February 15 and August 15. Interest expense, including amortization of deferred debt issuance costs and premium relating to the 2014 Notes, was $28.4 million for both the nine months ended September 30, 2007 and 2006. At September 30, 2007, the fair market value of the $400 million of 2014 Notes was approximately $414 million. These notes have not been listed on any securities exchange or inter-dealer automated quotation system, and the estimated market value is based on indicative pricing published by investment banks. While the Company believes these approximations to be reasonably accurate at the time published, indicative pricing can vary widely depending on volume traded by any given investment bank and other factors.
On March 29, 2006, the Company completed an offering of $373.8 million principal amount of 2 3/8% Convertible Senior Debentures due April 1, 2026 (the “Convertible Debentures”). The Convertible Debentures are general, unsecured obligations of the Company. Interest is payable semi-annually on April 1 and October 1, commencing October 1, 2006. The Convertible Debentures are redeemable in whole or in part at the Company’s option at any time on or after April 6, 2013 at a redemption price equal to 100% of the principal amount of the debentures to be redeemed, plus accrued and unpaid interest. Holders of the debentures have the option, at any time prior to April 1, 2026, to convert the debentures into shares of the Company’s common stock at a conversion rate of 53.6466 per $1,000 principal amount of debentures representing a conversion price of $18.64 per share. Upon conversion, the Company will have the right to deliver, in lieu of shares of common stock, cash or a combination of cash and shares of common stock. Interest expense, including amortization of deferred debt issuance costs, was $7.1 million and $4.8 million for the nine months ended September 30, 2007 and 2006, respectively. As of September 30, 2007, none of the holders has converted any Convertible Debentures into common stock. At September 30, 2007, the fair market value of the $373.8 million of the Convertible Debentures was approximately $500 million. The Convertible Debentures have not been listed on any securities exchange or inter-dealer automated quotation system, and the estimated market value is based on indicative pricing published by investment banks. While the Company believes these approximations to be reasonably accurate at the time published, indicative pricing can vary widely depending on volume traded by any given investment bank and other factors.
On October 6, 2006, Holdings closed a $700 million senior secured credit facility (the “Credit Facility”) consisting of a $600 million Term Loan B (“Term Loan”) maturing in January 2013 and a $100 million revolving credit facility (the “Revolver”) maturing in October 2011. Components of the Credit Facility and related financing are detailed below:
| | • | | The Term Loan is a secured obligation, on a first lien basis, of Holdings. The Term Loan is guaranteed by the Company and Holdings’ subsidiaries. On October 6, 2006, Holdings drew $200 million on the Term Loan to extinguish its existing Term Loan. On October 31, 2006, Holdings drew the remaining $400 million on the Term Loan. Repayments of the Term Loan are due quarterly in an amount equal to 1/4 of 1% of the aggregate principal amount on the last day of each quarter beginning March 31, 2007, and the balance is payable on January 7, 2013. On February 15, 2007, the Term Loan was amended to reduce the interest rate by 25 basis points resulting in a rate based on a specified Eurodollar rate plus 1.75% to 2.0%. Interest will be reset periodically and payable at least quarterly. Based on the Eurodollar rate in effect at September 30, 2007, the rate was 7.1% and interest expense, including amortization of deferred debt issuance costs relating to the Term Loan, was $34.1 million for the nine months ended September 30, 2007. |
| | • | | The Revolver is secured and guaranteed in the same manner as the Term Loan. Interest on outstanding amounts, if any, will be computed based on a specified Eurodollar rate plus 2.0% to 2.75% and will be reset periodically and payable at least quarterly. The Company is required to pay a commitment fee on the undrawn commitment amounts on a quarterly basis of 0.5% per annum. If the Revolver were |
12
TIME WARNER TELECOM INC.
NOTES TO CONSOLIDATED FINANCIAL STATEMENTS—Continued
| | drawn, certain restrictive financial covenants would apply. As of September 30, 2007, the Revolver was undrawn. Commitment fee expense and amortization of deferred debt issuance costs relating to the Revolver was $476,000 for the nine months ended September 30, 2007. |
The 2014 Notes described above are governed by an indenture that contains certain restrictive covenants. These restrictions affect, and in many respects significantly limit or prohibit, among other things, the ability of the Company to incur indebtedness, make prepayments of certain indebtedness, pay dividends, make investments, engage in transactions with stockholders and affiliates, issue capital stock of subsidiaries, create liens, sell assets, and engage in mergers and consolidations. The credit agreement for the Company’s Term Loan contains similar restrictions. The Revolver covenants contain additional restrictions, as well as certain financial covenants that the Company must comply with if it draws on the Revolver.
As of September 30, 2007, the Company and Holdings were in compliance with all of their covenants.
| 4. | Transactions with Former Related Parties |
As a result of the secondary offering completed on September 26, 2006, the Class B Stockholders are no longer related parties. In the normal course of business, the Company has engaged in various transactions with affiliates of the former Class B Stockholders, generally on negotiated terms among the numerous affected operating units that, in management’s view, result in reasonable arms-length terms. Information is reported only for the three and nine months ended September 30, 2006 because the Class B Stockholders were not related parties in 2007.
| 5. | Commitments and Contingencies |
Pending legal proceedings are substantially limited to litigation incidental to the business of the Company. In the opinion of management, the ultimate resolution of these matters will not have a material adverse effect on the Company’s financial statements.
Management routinely reviews the Company’s exposure to liabilities incurred in the normal course of its business operations. Where a probable contingency exists and the amount can be reasonably estimated, the Company records the estimated liability. Considerable judgment is required in analyzing and recording such liabilities and actual results could vary significantly from the estimates.
| 6. | Supplemental Guarantor Information |
On February 20, 2004, Holdings (“Issuer”) issued $200 million principal amount of 9 1/4% Senior Notes due 2014 (the “2014 Notes”). On February 9, 2005, Holdings issued an additional $200 million principal amount of the 2014 Notes. The 2014 Notes are guaranteed by the Company (“Parent Guarantor”) and Holdings’ subsidiaries (“Combined Subsidiary Guarantors”). The guarantees are joint and several. A significant amount of the Issuer’s cash flow is generated by the Combined Subsidiary Guarantors. As a result, funds necessary to meet the Issuer’s debt service obligations are provided in large part by distributions or advances from the Combined Subsidiary Guarantors. Under certain circumstances, contractual and legal restrictions, as well as the Company’s financial condition and operating requirements and those of the Company’s subsidiaries, could limit the Issuer’s ability to obtain cash for the purpose of meeting its debt service obligations, including the payment of principal and interest on the 2014 Notes.
The following information sets forth the Company’s Condensed Consolidating Balance Sheets as of September 30, 2007 and December 31, 2006, Condensed Consolidating Statements of Operations for the three and nine months ended September 30, 2007 and 2006, and Condensed Consolidating Statements of Cash Flows for the nine months ended September 30, 2007 and 2006.
13
TIME WARNER TELECOM INC.
NOTES TO CONSOLIDATED FINANCIAL STATEMENTS—Continued
TIME WARNER TELECOM INC.
CONDENSED CONSOLIDATING BALANCE SHEET
September 30, 2007
| | | | | | | | | | | | | | | | | | | |
| | | Parent Guarantor | | | Issuer | | | Combined
Subsidiary
Guarantors | | | Eliminations | | | Consolidated |
| | | (amounts in thousands) |
| ASSETS | | | | | | | | | | | | | | | | | | | |
Current assets: | | | | | | | | | | | | | | | | | | | |
Cash and cash equivalents | | $ | 18,335 | | | $ | 223,052 | | | $ | (3,902 | ) | | $ | — | | | $ | 237,485 |
Investments | | | 1,992 | | | | 67,601 | | | | — | | | | — | | | | 69,593 |
Receivables, net | | | — | | | | — | | | | 80,291 | | | | — | | | | 80,291 |
Prepaid expenses and other current assets | | | 2,720 | | | | 7,996 | | | | 7,579 | | | | — | | | | 18,295 |
Deferred income taxes | | | — | | | | 8,829 | | | | — | | | | — | | | | 8,829 |
| | | | | | | | | | | | | | | | | | | |
Total current assets | | | 23,047 | | | | 307,478 | | | | 83,968 | | | | — | | | | 414,493 |
| | | | | | | | | | | | | | | | | | | |
Property, plant and equipment, net | | | — | | | | 28,465 | | | | 1,262,475 | | | | — | | | | 1,290,940 |
Deferred income taxes | | | — | | | | 49,921 | | | | — | | | | — | | | | 49,921 |
Goodwill | | | — | | | | — | | | | 408,355 | | | | — | | | | 408,355 |
Other assets, net of accumulated amortization | | | 10,491 | | | | 11,110 | | | | 54,686 | | | | — | | | | 76,287 |
| | | | | | | | | | | | | | | | | | | |
Total assets | | $ | 33,538 | | | $ | 396,974 | | | $ | 1,809,484 | | | $ | — | | | $ | 2,239,996 |
| | | | | | | | | | | | | | | | | | | |
| LIABILITIES AND STOCKHOLDERS’ EQUITY (DEFICIT) | | | | | | | | | | | | | | | | | | | |
Current liabilities: | | | | | | | | | | | | | | | | | | | |
Accounts payable | | $ | — | | | $ | 5,020 | | | $ | 34,766 | | | $ | — | | | $ | 39,786 |
Other current liabilities | | | 4,630 | | | | 40,781 | | | | 184,215 | | | | — | | | | 229,626 |
Intercompany payable (receivable) | | | (1,809,283 | ) | | | (719,141 | ) | | | 2,528,424 | | | | — | | | | — |
| | | | | | | | | | | | | | | | | | | |
Total current liabilities | | | (1,804,653 | ) | | | (673,340 | ) | | | 2,747,405 | | | | — | | | | 269,412 |
| | | | | | | | | | | | | | | | | | | |
Losses in subsidiary in excess of investment | | | 905,932 | | | | 1,113,020 | | | | — | | | | (2,018,952 | ) | | | — |
Long-term debt and capital lease obligations | | | 373,750 | | | | 990,513 | | | | 7,418 | | | | — | | | | 1,371,681 |
Long-term deferred revenue | | | — | | | | — | | | | 20,072 | | | | — | | | | 20,072 |
Other long-term liabilities | | | — | | | | 2,828 | | | | 17,494 | | | | — | | | | 20,322 |
Stockholders’ equity (deficit) | | | 558,509 | | | | (1,036,047 | ) | | | (982,905 | ) | | | 2,018,952 | | | | 558,509 |
| | | | | | | | | | | | | | | | | | | |
Total liabilities and stockholders’ equity (deficit) | | $ | 33,538 | | | $ | 396,974 | | | $ | 1,809,484 | | | $ | — | | | $ | 2,239,996 |
| | | | | | | | | | | | | | | | | | | |
14
TIME WARNER TELECOM INC.
NOTES TO CONSOLIDATED FINANCIAL STATEMENTS—Continued
TIME WARNER TELECOM INC.
CONDENSED CONSOLIDATING BALANCE SHEET
December 31, 2006
| | | | | | | | | | | | | | | | | | | |
| | | Parent
Guarantor | | | Issuer | | | Combined
Subsidiary
Guarantors | | | Eliminations | | | Consolidated |
| | | (amounts in thousands) |
| ASSETS | | | | | | | | | | | | | | | | | | | |
Current assets: | | | | | | | | | | | | | | | | | | | |
Cash and cash equivalents | | $ | 681 | | | $ | 223,116 | | | $ | (2,244 | ) | | $ | — | | | $ | 221,553 |
Investments | | | 14,921 | | | | 72,979 | | | | — | | | | — | | | | 87,900 |
Receivables, net | | | — | | | | — | | | | 73,923 | | | | — | | | | 73,923 |
Prepaid expenses and other current assets | | | 4,006 | | | | 6,108 | | | | 8,390 | | | | — | | | | 18,504 |
Deferred income taxes | | | — | | | | 12,793 | | | | — | | | | — | | | | 12,793 |
| | | | | | | | | | | | | | | | | | | |
Total current assets | | | 19,608 | | | | 314,996 | | | | 80,069 | | | | — | | | | 414,673 |
| | | | | | | | | | | | | | | | | | | |
Property, plant and equipment, net | | | — | | | | 27,665 | | | | 1,266,447 | | | | — | | | | 1,294,112 |
Deferred income taxes | | | — | | | | 45,957 | | | | — | | | | — | | | | 45,957 |
Goodwill | | | — | | | | — | | | | 405,638 | | | | — | | | | 405,638 |
Other assets, net of accumulated amortization | | | 10,916 | | | | 11,608 | | | | 70,333 | | | | — | | | | 92,857 |
| | | | | | | | | | | | | | | | | | | |
Total assets | | $ | 30,524 | | | $ | 400,226 | | | $ | 1,822,487 | | | $ | — | | | $ | 2,253,237 |
| | | | | | | | | | | | | | | | | | | |
| LIABILITIES AND STOCKHOLDERS’ EQUITY (DEFICIT) | | | | | | | | | | | | | | | | | | | |
Current liabilities: | | | | | | | | | | | | | | | | | | | |
Accounts payable | | $ | — | | | $ | 251 | | | $ | 41,137 | | | $ | — | | | $ | 41,388 |
Other current liabilities | | | 2,297 | | | | 54,915 | | | | 185,906 | | | | — | | | | 243,118 |
Intercompany payable (receivable) | | | (1,793,772 | ) | | | (704,365 | ) | | | 2,498,137 | | | | — | | | | — |
| | | | | | | | | | | | | | | | | | | |
Total current liabilities | | | (1,791,475 | ) | | | (649,199 | ) | | | 2,725,180 | | | | — | | | | 284,506 |
| | | | | | | | | | | | | | | | | | | |
Losses in subsidiary in excess of investment | | | 895,601 | | | | 1,053,397 | | | | — | | | | (1,948,998 | ) | | | — |
Long-term debt and capital lease obligations | | | 373,750 | | | | 994,396 | | | | 7,812 | | | | — | | | | 1,375,958 |
Long-term deferred revenue | | | — | | | | — | | | | 20,357 | | | | — | | | | 20,357 |
Other long-term liabilities | | | — | | | | 2,702 | | | | 17,066 | | | | — | | | | 19,768 |
Stockholders’ equity (deficit) | | | 552,648 | | | | (1,001,070 | ) | | | (947,928 | ) | | | 1,948,998 | | | | 552,648 |
| | | | | | | | | | | | | | | | | | | |
Total liabilities and stockholders’ equity (deficit) | | $ | 30,524 | | | $ | 400,226 | | | $ | 1,822,487 | | | $ | — | | | $ | 2,253,237 |
| | | | | | | | | | | | | | | | | | | |
15
TIME WARNER TELECOM INC.
NOTES TO CONSOLIDATED FINANCIAL STATEMENTS—Continued
TIME WARNER TELECOM INC.
CONDENSED CONSOLIDATING STATEMENT OF OPERATIONS
Three Months Ended September 30, 2007
| | | | | | | | | | | | | | | | | | | |
| | | Parent
Guarantor | | | Issuer | | | Combined
Subsidiary
Guarantors | | | Eliminations | | Consolidated | |
| | | (amounts in thousands) | |
Total revenue | | $ | — | | | $ | — | | | $ | 274,793 | | | $ | — | | $ | 274,793 | |
Costs and expenses: | | | | | | | | | | | | | | | | | | | |
Operating, selling, general and administrative | | | — | | | | 37,994 | | | | 156,113 | | | | — | | | 194,107 | |
Depreciation, amortization and accretion | | | — | | | | 3,330 | | | | 68,250 | | | | — | | | 71,580 | |
Corporate expense allocation | | | — | | | | (41,324 | ) | | | 41,324 | | | | — | | | — | |
| | | | | | | | | | | | | | | | | | | |
Total costs and expenses | | | — | | | | — | | | | 265,687 | | | | — | | | 265,687 | |
| | | | | | | | | | | | | | | | | | | |
Operating income | | | — | | | | — | | | | 9,106 | | | | — | | | 9,106 | |
Interest expense, net | | | (2,043 | ) | | | (11,853 | ) | | | (4,199 | ) | | | — | | | (18,095 | ) |
Interest expense allocation | | | 2,043 | | | | 14,268 | | | | (16,311 | ) | | | — | | | — | |
Other income (loss) | | | — | | | | (2,415 | ) | | | — | | | | — | | | (2,415 | ) |
| | | | | | | | | | | | | | | | | | | |
Loss before income taxes and equity in undistributed losses of subsidiaries | | | — | | | | — | | | | (11,404 | ) | | | — | | | (11,404 | ) |
Income tax expense | | | — | | | | — | | | | 179 | | | | — | | | 179 | |
| | | | | | | | | | | | | | | | | | | |
Net loss before equity in undistributed losses of subsidiaries | | | — | | | | — | | | | (11,583 | ) | | | — | | | (11,583 | ) |
Equity in undistributed losses of subsidiaries | | | (11,583 | ) | | | (11,583 | ) | | | — | | | | 23,166 | | | — | |
| | | | | | | | | | | | | | | | | | | |
Net loss | | $ | (11,583 | ) | | $ | (11,583 | ) | | $ | (11,583 | ) | | $ | 23,166 | | $ | (11,583 | ) |
| | | | | | | | | | | | | | | | | | | |
16
TIME WARNER TELECOM INC.
NOTES TO CONSOLIDATED FINANCIAL STATEMENTS—Continued
TIME WARNER TELECOM INC.
CONDENSED CONSOLIDATING STATEMENT OF OPERATIONS
Three Months Ended September 30, 2006
| | | | | | | | | | | | | | | | | | | |
| | | Parent
Guarantor | | | Issuer | | | Combined
Subsidiary
Guarantors | | | Eliminations | | Consolidated | |
| | | (amounts in thousands) | |
Total revenue | | $ | — | | | $ | — | | | $ | 196,109 | | | $ | — | | $ | 196,109 | |
Costs and expenses: | | | | | | | | | | | | | | | | | | | |
Operating, selling, general and administrative | | | — | | | | 35,518 | | | | 92,909 | | | | — | | | 128,427 | |
Depreciation, amortization and accretion | | | — | | | | 4,371 | | | | 57,657 | | | | — | | | 62,028 | |
Corporate expense allocation | | | — | | | | (39,889 | ) | | | 39,889 | | | | — | | | — | |
| | | | | | | | | | | | | | | | | | | |
Total costs and expenses | | | — | | | | — | | | | 190,455 | | | | — | | | 190,455 | |
| | | | | | | | | | | | | | | | | | | |
Operating income | | | — | | | | — | | | | 5,654 | | | | — | | | 5,654 | |
Interest expense, net | | | (2,155 | ) | | | (11,676 | ) | | | (3,174 | ) | | | — | | | (17,005 | ) |
Debt extinguishment costs | | | — | | | | — | | | | — | | | | — | | | — | |
Interest expense allocation | | | 2,155 | | | | 11,676 | | | | (13,831 | ) | | | — | | | — | |
| | | | | | | | | | | | | | | | | | | |
Loss before income taxes and equity in undistributed losses of subsidiaries | | | — | | | | — | | | | (11,351 | ) | | | — | | | (11,351 | ) |
Income tax expense | | | — | | | | | | | | — | | | | — | | | | |
| | | | | | | | | | | | | | | | | | | |
Net loss before equity in undistributed losses of subsidiaries | | | — | | | | — | | | | (11,351 | ) | | | — | | | (11,351 | ) |
Equity in undistributed losses of subsidiaries | | | (11,351 | ) | | | (11,351 | ) | | | — | | | | 22,702 | | | — | |
| | | | | | | | | | | | | | | | | | | |
Net loss | | $ | (11,351 | ) | | $ | (11,351 | ) | | $ | (11,351 | ) | | $ | 22,702 | | $ | (11,351 | ) |
| | | | | | | | | | | | | | | | | | | |
17
TIME WARNER TELECOM INC.
NOTES TO CONSOLIDATED FINANCIAL STATEMENTS—Continued
TIME WARNER TELECOM INC.
CONDENSED CONSOLIDATING STATEMENT OF OPERATIONS
Nine Months Ended September 30, 2007
| | | | | | | | | | | | | | | | | | | |
| | | Parent
Guarantor | | | Issuer | | | Combined
Subsidiary
Guarantors | | | Eliminations | | Consolidated | |
| | | (amounts in thousands) | |
Total revenue | | $ | — | | | $ | — | | | $ | 804,203 | | | $ | — | | $ | 804,203 | |
Costs and expenses: | | | | | | | | | | | | | | | | | | | |
Operating, selling, general and administrative | | | — | | | | 113,970 | | | | 460,681 | | | | — | | | 574,651 | |
Depreciation, amortization and accretion | | | — | | | | 10,711 | | | | 195,614 | | | | — | | | 206,325 | |
Corporate expense allocation | | | — | | | | (124,681 | ) | | | 124,681 | | | | — | | | — | |
| | | | | | | | | | | | | | | | | | | |
Total costs and expenses | | | — | | | | — | | | | 780,976 | | | | — | | | 780,976 | |
| | | | | | | | | | | | | | | | | | | |
Operating income | | | — | | | | — | | | | 23,227 | | | | — | | | 23,227 | |
Interest expense, net | | | (6,295 | ) | | | (37,418 | ) | | | (11,467 | ) | | | — | | | (55,180 | ) |
Interest expense allocation | | | 6,295 | | | | 39,833 | | | | (46,128 | ) | | | | | | — | |
Other income (loss) | | | — | | | | (2,415 | ) | | | — | | | | — | | | (2,415 | ) |
| | | | | | | | | | | | | | | | | | | |
Loss before income taxes and equity in undistributed losses of subsidiaries | | | — | | | | — | | | | (34,368 | ) | | | — | | | (34,368 | ) |
Income tax expense | | | — | | | | — | | | | 609 | | | | — | | | 609 | |
| | | | | | | | | | | | | | | | | | | |
Net loss before equity in undistributed losses of subsidiaries | | | — | | | | — | | | | (34,977 | ) | | | — | | | (34,977 | ) |
Equity in undistributed losses of subsidiaries | | | (34,977 | ) | | | (34,977 | ) | | | — | | | | 69,954 | | | — | |
| | | | | | | | | | | | | | | | | | | |
Net loss | | $ | (34,977 | ) | | $ | (34,977 | ) | | $ | (34,977 | ) | | $ | 69,954 | | $ | (34,977 | ) |
| | | | | | | | | | | | | | | | | | | |
18
TIME WARNER TELECOM INC.
NOTES TO CONSOLIDATED FINANCIAL STATEMENTS—Continued
TIME WARNER TELECOM INC.
CONDENSED CONSOLIDATING STATEMENT OF OPERATIONS
Nine Months Ended September 30, 2006
| | | | | | | | | | | | | | | | | | | |
| | | Parent
Guarantor | | | Issuer | | | Combined
Subsidiary
Guarantors | | | Eliminations | | Consolidated | |
| | | (amounts in thousands) | |
Total revenue | | $ | — | | | $ | — | | | $ | 573,594 | | | $ | — | | $ | 573,594 | |
Costs and expenses: | | | | | | | | | | | | | | | | | | | |
Operating, selling, general and administrative | | | — | | | | 106,510 | | | | 271,122 | | | | — | | | 377,632 | |
Depreciation, amortization and accretion | | | — | | | | 13,423 | | | | 171,101 | | | | — | | | 184,524 | |
Corporate expense allocation | | | — | | | | (119,933 | ) | | | 119,933 | | | | — | | | — | |
| | | | | | | | | | | | | | | | | | | |
Total costs and expenses | | | — | | | | — | | | | 562,156 | | | | — | | | 562,156 | |
| | | | | | | | | | | | | | | | | | | |
Operating income | | | — | | | | — | | | | 11,438 | | | | — | | | 11,438 | |
Interest expense, net | | | (16,215 | ) | | | (34,834 | ) | | | (8,629 | ) | | | — | | | (59,678 | ) |
Debt extinguishment costs | | | (25,777 | ) | | | — | | | | | | | | | | | (25,777 | ) |
Interest expense allocation | | | 41,992 | | | | 34,834 | | | | (76,826 | ) | | | — | | | — | |
| | | | | | | | | | | | | | | | | | | |
Loss before income taxes and equity in undistributed losses of subsidiaries | | | — | | | | — | | | | (74,017 | ) | | | — | | | (74,017 | ) |
Income tax expense | | | — | | | | 7 | | | | — | | | | — | | | 7 | |
| | | | | | | | | | | | | | | | | | | |
Net loss before equity in undistributed losses of subsidiaries | | | — | | | | (7 | ) | | | (74,017 | ) | | | — | | | (74,024 | ) |
Equity in undistributed losses of subsidiaries | | | (74,024 | ) | | | (74,017 | ) | | | — | | | | 148,041 | | | — | |
| | | | | | | | | | | | | | | | | | | |
Net loss | | $ | (74,024 | ) | | $ | (74,024 | ) | | $ | (74,017 | ) | | $ | 148,041 | | $ | (74,024 | ) |
| | | | | | | | | | | | | | | | | | | |
19
TIME WARNER TELECOM INC.
NOTES TO CONSOLIDATED FINANCIAL STATEMENTS—Continued
TIME WARNER TELECOM INC.
CONDENSED CONSOLIDATING STATEMENT OF CASH FLOWS
Nine Months Ended September 30, 2007
| | | | | | | | | | | | | | | | | | | | |
| | | Parent
Guarantor | | | Issuer | | | Combined
Subsidiary
Guarantors | | | Eliminations | | | Consolidated | |
| | | (amounts in thousands) | |
Cash flows from operating activities: | | | | | | | | | | | | | | | | | | | | |
Net loss | | $ | (34,977 | ) | | $ | (34,977 | ) | | $ | (34,977 | ) | | $ | 69,954 | | | $ | (34,977 | ) |
Adjustments to reconcile net loss to net cash provided by operating activities: | | | | | | | | | | | | | | | | | | | | |
Depreciation, amortization, and accretion | | | — | | | | 10,711 | | | | 195,614 | | | | — | | | | 206,325 | |
Intercompany change | | | 680 | | | | (14,776 | ) | | | 84,050 | | | | (69,954 | ) | | | — | |
Deferred debt issue, extinguishment costs and other | | | 425 | | | | 3,719 | | | | 13 | | | | — | | | | 4,157 | |
Stock based compensation | | | — | | | | — | | | | 16,190 | | | | — | | | | 16,190 | |
Changes in operating assets and liabilities | | | 13,778 | | | | 45,941 | | | | (83,058 | ) | | | — | | | | (23,339 | ) |
| | | | | | | | | | | | | | | | | | | | |
Net cash provided by (used in) operating activities | | | (20,094 | ) | | | 10,618 | | | | 177,832 | | | | — | | | | 168,356 | |
| | | | | | | | | | | | | | | | | | | | |
Cash flows from investing activities: | | | | | | | | | | | | | | | | | | | | |
Capital expenditures | | | — | | | | (12,994 | ) | | | (178,870 | ) | | | — | | | | (191,864 | ) |
Cash paid for acquisitions, net of cash acquired | | | — | | | | — | | | | 2,397 | | | | — | | | | 2,397 | |
Purchases of investments | | | (8,867 | ) | | | (158,106 | ) | | | — | | | | — | | | | (166,973 | ) |
Proceeds from maturities of investments | | | 21,967 | | | | 163,545 | | | | — | | | | — | | | | 185,512 | |
Other investing activities | | | — | | | | 2,561 | | | | (2,821 | ) | | | — | | | | (260 | ) |
| | | | | | | | | | | | | | | | | | | | |
Net cash provided by (used in) investing activities | | | 13,100 | | | | (4,994 | ) | | | (179,294 | ) | | | — | | | | (171,188 | ) |
| | | | | | | | | | | | | | | | | | | | |
Cash flows from financing activities: | | | | | | | | | | | | | | | | | | | | |
Net proceeds (costs) from issuance of debt | | | — | | | | (850 | ) | | | — | | | | — | | | | (850 | ) |
Net proceeds from issuance of common stock upon exercise of stock options and in connection with the employee stock purchase plan | | | 24,648 | | | | — | | | | — | | | | — | | | | 24,648 | |
Payment of debt and capital lease obligations | | | — | | | | (4,838 | ) | | | (196 | ) | | | — | | | | (5,034 | ) |
| | | | | | | | | | | | | | | | | | | | |
Net cash (used in) provided by financing activities | | | 24,648 | | | | (5,688 | ) | | | (196 | ) | | | — | | | | 18,764 | |
| | | | | | | | | | | | | | | | | | | | |
Increase (decrease) in cash and cash equivalents | | | 17,654 | | | | (64 | ) | | | (1,658 | ) | | | — | | | | 15,932 | |
Cash and cash equivalents at beginning of period | | | 681 | | | | 223,116 | | | | (2,244 | ) | | | — | | | | 221,553 | |
| | | | | | | | | | | | | | | | | | | | |
Cash and cash equivalents at end of period | | $ | 18,335 | | | $ | 223,052 | | | $ | (3,902 | ) | | $ | — | | | $ | 237,485 | |
| | | | | | | | | | | | | | | | | | | | |
20
TIME WARNER TELECOM INC.
NOTES TO CONSOLIDATED FINANCIAL STATEMENTS—Continued
TIME WARNER TELECOM INC.
CONDENSED CONSOLIDATING STATEMENT OF CASH FLOWS
Nine Months Ended September 30, 2006
| | | | | | | | | | | | | | | | | | | | |
| | | Parent
Guarantor | | | Issuer | | | Combined
Subsidiary
Guarantors | | | Eliminations | | | Consolidated | |
| | | (amounts in thousands) | |
Cash flows from operating activities: | | | | | | | | | | | | | | | | | | | | |
Net loss | | $ | (74,024 | ) | | $ | (74,024 | ) | | $ | (74,017 | ) | | $ | 148,041 | | | $ | (74,024 | ) |
Adjustments to reconcile net loss to net cash provided by operating activities: | | | | | | | | | | | | | | | | | | | | |
Depreciation, amortization, and accretion | | | — | | | | 13,423 | | | | 171,101 | | | | — | | | | 184,524 | |
Intercompany change | | | 42,532 | | | | (80,363 | ) | | | 185,872 | | | | (148,041 | ) | | | — | |
Deferred debt issue, extinguishment costs and other | | | 26,445 | | | | 1,926 | | | | — | | | | — | | | | 28,371 | |
Stock based compensation | | | — | | | | — | | | | 9,816 | | | | — | | | | 9,816 | |
Changes in operating assets and liabilities | | | 25,694 | | | | 102,076 | | | | (166,097 | ) | | | — | | | | (38,327 | ) |
| | | | | | | | | | | | | | | | | | | | |
Net cash provided by (used in) operating activities | | | 20,647 | | | | (36,962 | ) | | | 126,675 | | | | — | | | | 110,360 | |
| | | | | | | | | | | | | | | | | | | | |
Cash flows from investing activities: | | | | | | | | | | | | | | | | | | | | |
Capital expenditures | | | — | | | | (6,980 | ) | | | (129,515 | ) | | | — | | | | (136,495 | ) |
Purchases of investments | | | (24,615 | ) | | | (313,744 | ) | | | — | | | | — | | | | (338,359 | ) |
Proceeds from maturities of investments | | | 34,100 | | | | 387,408 | | | | — | | | | — | | | | 421,508 | |
Other investing activities | | | — | | | | (96 | ) | | | 112 | | | | — | | | | 16 | |
| | | | | | | | | | | | | | | | | | | | |
Net cash provided by (used in) investing activities | | | 9,485 | | | | 66,588 | | | | (129,403 | ) | | | — | | | | (53,330 | ) |
| | | | | | | | | | | | | | | | | | | | |
Cash flows from financing activities: | | | | | | | | | | | | | | | | | | | | |
Net proceeds from issuance of debt | | | 362,409 | | | | (116 | ) | | | — | | | | — | | | | 362,293 | |
Retirement of debt obligations | | | (420,252 | ) | | | — | | | | — | | | | | | | | (420,252 | ) |
Net proceeds from issuance of common stock upon exercise of stock options and in connection with the employee stock purchase plan | | | 32,297 | | | | — | | | | — | | | | — | | | | 32,297 | |
Payment of debt and capital lease obligations | | | — | | | | (2,628 | ) | | | (453 | ) | | | — | | | | (3,081 | ) |
| | | | | | | | | | | | | | | | | | | | |
Net cash used in financing activities | | | (25,546 | ) | | | (2,744 | ) | | | (453 | ) | | | — | | | | (28,743 | ) |
| | | | | | | | | | | | | | | | | | | | |
Increase (Decrease) in cash and cash equivalents | | | 4,586 | | | | 26,882 | | | | (3,181 | ) | | | — | | | | 28,287 | |
Cash and cash equivalents at beginning of year | | | 845 | | | | 210,791 | | | | (802 | ) | | | — | | | | 210,834 | |
| | | | | | | | | | | | | | | | | | | | |
Cash and cash equivalents at end of year | | $ | 5,431 | | | $ | 237,673 | | | $ | (3,983 | ) | | $ | — | | | $ | 239,121 | |
| | | | | | | | | | | | | | | | | | | | |
21
| Item 2. | Management’s Discussion and Analysis of Financial Condition and Results of Operations |
The following discussion and analysis provides information concerning the results of operations and financial condition of Time Warner Telecom Inc. and should be read in conjunction with the accompanying financial statements and notes thereto. Additionally, the following discussion and analysis should be read in conjunction withManagement’s Discussion and Analysis of Financial Condition and Results of Operations and the consolidated financial statements included in Part II of our Annual Report on Form 10-K for the year ended December 31, 2006.
Cautions Concerning Forward Looking Statements
This document contains certain “forward-looking statements,” within the meaning of the Private Securities Litigation Reform Act of 1995, including statements regarding, among other items, our expected financial position, expected capital expenditures, expected integration costs, integration plans, expected revenue mix, expected margins, expected branding costs, growth or stability from particular customer segments, building penetration plans, the effects of consolidation in the telecommunications industry, Modified EBITDA trends, expected network expansion, business, and financing plans. These forward-looking statements are based on management’s current expectations and are naturally subject to risks, uncertainties, and changes in circumstances, certain of which are beyond our control. Actual results may differ materially from those expressed or implied by such forward-looking statements.
The words “believe,” “plan,” “target,” “expect,” “intend,” and “anticipate,” and expressions of similar substance identify forward-looking statements. Although we believe that the expectations reflected in such forward-looking statements are reasonable, we can give no assurance that those expectations will prove to be correct. Important factors that could cause actual results to differ materially from the expectations described in this report are set forth under “Risk Factors” in Item 1A and elsewhere in our Annual Report on Form 10-K for the year ended December 31, 2006, in Item 1A in “Risk Factors” in Part II of our Quarterly Report on Form 10-Q for the quarter ended March 31, 2007 and elsewhere in this report. In addition, actual results may differ from our expectations due to increased customer disconnects, increased competition, inability to obtain rights to build networks into commercial buildings, an economic downturn, delays in launching new products, decreased demand for our existing products, further declines in the prices of and revenue from our services due to competitive pressures, industry consolidation and other industry conditions, increases in the price we pay for use of facilities of Incumbent Local Exchange Carriers, or “ILECs”, due to consolidation in the industry or further deregulation and adverse regulatory rulings or legislative developments, our inability to successfully integrate the business of Xspedius Communications, LLC (“Xspedius”) into ours or our failure to achieve the expected benefits of the Xspedius acquisition. Readers are cautioned not to place undue reliance on these forward-looking statements, which speak only as of their dates. We undertake no obligation to publicly update or revise any forward-looking statements, whether as a result of new information, future events, or otherwise.
Overview
We are a leading national provider of managed network services, specializing in Ethernet and transport data networking, Internet access, local and long distance voice, VoIP and network security services to enterprise organizations and communications services companies throughout the U.S., which include, among others, enterprise organizations in the distribution, health care, finance, and manufacturing industries, state, local and federal government entities as well as long distance carriers, ILECs, competitive local exchange carriers (“CLECs”), wireless communications companies, and Internet service providers (“ISPs”).
As of September 30, 2007, our fiber networks spanned 25,441 route miles directly connecting 8,109 buildings served entirely by our facilities (on-net). We continue to expand our footprint within our existing markets by connecting our network into additional buildings. We have also continued to expand our IP backbone data networking capability between markets supporting end-to-end Ethernet connections for customers and have
22
also selectively interconnected existing service areas within regional clusters with fiber optic facilities that we own or lease. In addition, we provide on-net inter-city switched services between our markets that offer customers a virtual presence in a remote city.
From our formation until September 26, 2006, we had two classes of common stock outstanding, Class A common stock with one vote per share and Class B common stock with ten votes per share. Each share of Class B common stock was convertible, at the option of the holder, into one share of Class A common stock. The Class B common stock was collectively owned directly or indirectly by Time Warner Inc. (“Time Warner”), Advance Telecom Holdings Corporation and Newhouse Telecom Holdings Corporation (“Advance/Newhouse”) (collectively, the “Class B Stockholders”). On March 29, 2006 and September 26, 2006, the Class B Stockholders completed underwritten secondary offerings of 22.3 million shares and 43.5 million shares, respectively, of Class A common stock of the Company, which were converted from shares of Class B common stock to shares of Class A common stock immediately prior to the offerings. In connection with the closing of the September 26, 2006 offering, Advance/Newhouse converted all of its remaining shares of Class B common stock that were not sold in the offering to shares of Class A common stock. As a result, we have not had shares of Class B common stock outstanding since September 26, 2006. We did not receive any proceeds from the offerings nor did our total shares outstanding change as a result of the offerings. In June 2007, our stockholders approved an amendment to our Restated Certificate of Incorporation, which eliminated references to Class A and Class B common stock. As a result, no shares of Class B common stock were authorized as of September 30, 2007 and Class A common stock authorized and outstanding as of December 31, 2006 is classified as common stock as of September 30, 2007.
On October 31, 2006, we acquired Xspedius, thereby expanding our markets served from 44 to 75 and increasing our market density in 12 markets that we already served. This acquisition provided us additional opportunities to serve multi-city and multi-location customers and provide our full product portfolio in additional markets. Our consolidated results of operations, cash flows and financial position include those of Xspedius since the acquisition date.
Our revenue is derived primarily from business communications services, including network, voice, data, and high-speed Internet access services. Our revenue mix by customer type by quarter in 2007 and 2006 is as follows:
| | | | | | | | | | | | | | | | | | | | | |
| | | For the Three Months Ended | |
| | | 2006 (1) | | | 2007 | |
| | | March 31, | | | June 30, | | | September 30, | | | December 31, | | | March 31, | | | June 30, | | | September 30, | |
Enterprise / End Users | | 60 | % | | 61 | % | | 61 | % | | 64 | % | | 67 | % | | 68 | % | | 70 | % |
Carrier | | 35 | % | | 34 | % | | 34 | % | | 31 | % | | 29 | % | | 28 | % | | 26 | % |
Intercarrier Compensation | | 5 | % | | 5 | % | | 5 | % | | 5 | % | | 4 | % | | 4 | % | | 4 | % |
| | | | | | | | | | | | | | | | | | | | | |
Total Revenue | | 100 | % | | 100 | % | | 100 | % | | 100 | % | | 100 | % | | 100 | % | | 100 | % |
| | | | | | | | | | | | | | | | | | | | | |
| (1) | Our former Class B Stockholders are no longer related parties and as such we have reclassified revenue from these customers into their respective enterprise and carrier categories for all periods presented. |
The key elements of our business strategy include:
| | • | | Leveraging our extensive local fiber networks, including those acquired through the Xspedius acquisition, and IP backbone networks to increase customer and building penetration in our existing markets; |
| | • | | Increasing revenue growth from new and expanded service offerings, including high-speed, high-quality data networking services such as local area networks, or LAN, native LAN, which are networks that do not require protocol conversion, and IP-based voice and data services, security, virtual private |
23
| | networks, managed services and developing future service applications to enhance our customers’ voice and data networking ability; |
| | • | | Continuing to diversify our customer base and increasing revenue from enterprise customers, including businesses and local and federal governments; |
| | • | | Pursuing selected opportunities to expand our network reach to serve new customers and additional locations for existing customers, as evidenced by our acquisition of Xspedius; and |
| | • | | Continuing our disciplined approach to capital and operating expenditures in order to increase operational efficiencies and drive us towards profitability. |
Enterprise Customer Revenue
Revenue from enterprise customers has increased for the past 21 consecutive quarters primarily through sales of our data and Internet products such as Ethernet and continues to grow with our acquisition of Xspedius. Revenue from enterprise customers represented 70% of our total revenue in the three months ended September 30, 2007 as compared to 61% for the same period in 2006. We expect a growing percentage of our revenue will come from our enterprise customer base as we expand the customer base for our existing products and expand our data and Internet product offerings to existing customers that are available in conjunction with the Ethernet and IP services our customers are buying from us today. Our expanded market footprint resulting from the acquired operations provides for new growth opportunities for us to extend our customer reach and product portfolio into new markets. Our ability to increase the rate of revenue growth from enterprise customers will depend in part upon the success of initiatives we have implemented to improve customer retention, the success of new product offerings targeted at enterprise customers, and our ability to compete for multi-location customers and the success of extending our product portfolio into our newly acquired markets. We may experience fluctuations in revenue due to the timing of installations, seasonality, customer disputes, disconnections and other factors. In addition, we are re-pricing certain services under existing enterprise contracts in order to obtain extensions of existing contracts. This could create downward pressure on revenue growth from this customer base.
Carrier Customer Revenue
Revenue from carrier customers has been essentially flat, except for increase attributable to the acquired operations, primarily as a result of growing consolidations in the industry. Carrier revenue represented a smaller percentage of our total revenue at 26% in the three months ended September 30, 2007 as compared to 34% for the same period in 2006 and has been declining in the past three quarters as a percentage of total revenue due to growth in revenue from enterprise customers, disconnections resulting from industry consolidations and the lower proportion of carrier revenue from the acquired business. We expect continued disconnects from carriers and ISPs related to industry consolidation and other factors, as discussed below under “Customer Disconnections and Pricing Trends”. In some cases, we are re-pricing certain services under existing carrier contracts in order to obtain extensions of existing contracts. This has created additional downward pressure on revenue growth from this customer base.
Intercarrier Compensation Revenue
Intercarrier compensation revenue consists of switched access and reciprocal compensation and has been relatively stable. Intercarrier compensation revenue increased 31% for the nine months ended September 30, 2007 over the same period last year due to the acquired operations but is declining as a percentage of total revenue because of the growth in revenue from enterprise customers. Intercarrier compensation represented 4% and 5% of our total revenue in the three months ended September 30, 2007 and 2006, respectively. Switched access represents the compensation we receive from other carriers for the delivery of traffic between a long distance carrier’s point of presence and an end user’s premises provided through our switching facilities and is regulated by the Federal Communications Commission (“FCC”).
24
Reciprocal compensation represents compensation from a local exchange carrier (“LEC”) for local exchange traffic originated on its facilities and terminated on our facilities. Reciprocal compensation rates are established by interconnection agreements between the parties based on federal and state regulatory and judicial rulings.
Xspedius Integration
We acquired Xspedius with the expectation that the acquisition would result in benefits to the combined companies. Achieving the benefits of the acquisition depends in part on the successful integration of Xspedius’ and our operations in a timely and efficient manner. To date, we achieved substantial progress integrating the Xspedius acquired operations with ours through three major integration initiatives:
| | • | | Organizational Integration—Our organizational integration is complete resulting in a single organization for sales, customer care, field operations, marketing and headquarter functions, and two integrated national operations centers, each with the capability to provision nationwide across our customers and our major products. |
| | • | | Systems Integration—We now have a common data and system infrastructure serving all customers nationwide. We completed our major systems integrations, including human resources, financial, sales, customer management, billing, provisioning, network and surveillance systems resulting in a common platform for these functions. These systems integrations were designed as a foundation to maximize operating efficiencies and expand our scalability to serve growing market demand. |
| | • | | Network Integration—We have fully integrated our transport, voice, IP, long distance and national SS7 signaling networks, enabling our full product suite in the majority of the acquired markets. We completed our rollout of additional product capabilities to our 12 overlap markets plus an additional ten new markets acquired through Xspedius and have begun selling our full product suite in these markets. In addition, we continue to optimize, groom and migrate network circuits. |
We incurred $4.3 million in expense and $25.3 million of integration capital expenditures for the nine months ended September 30, 2007 in connection with the integration of Xspedius. We expect to spend a total of $35 to $45 million in integration expenditures in 2007, of which we expect $30 to $38 million will be capital expenditures and the remainder operating expenditures. Various factors could result in differences in timing and the mix between capital and capital expenditures with respect to the anticipated integration spending. The remaining integration work will consist primarily of network optimization and grooming to reduce the costs of off-network services in the acquired operations, network enhancements and equipment to enable the deployment of our advanced services in certain additional acquired markets, and process refinement to optimize the integrated systems and organization. Although we have made substantial progress toward integration of the acquired operations with our operations, there are still risks that remaining integration work may not be completed in a timely and efficient manner or that the combined operations will not realize all of the anticipated benefits of the acquisition.
Pricing of Special Access Services
We provide special access services over our own fiber facilities in competition with ILECs, and we also purchase special access and other services from ILECs to extend the reach of our network. The ILECs have argued before the FCC that the broadband services that they sell, including special access services we buy from them, should no longer be subject to regulation governing price and quality of service. If the FCC were to agree with the ILECs on this issue or if the transmission services we buy from the ILECs were to be otherwise deregulated, in whole or in part, the ILECs would have a greater ability to increase the price and reduce the service quality of special access services they sell to us. Significant price increases could put margin pressure on the services we provide to customers and reduced service quality could degrade those services that we sell to customers through the use of these facilities.
25
We have advocated before the FCC that it should modify its special access pricing flexibility rules so that these services return to price-cap regulation to protect against unreasonable price increases. The FCC is reviewing its regulation of special access pricing in a pending proceeding. In addition, the ILECs have filed numerous petitions for forbearance from regulation of their broadband special access services, including Ethernet services offered as special access. In March 2006, the FCC allowed a Verizon forbearance petition seeking deregulation of its broadband services to be granted by operation of law and in October 2007 granted key portions of an AT&T petition to remove regulation of broadband services sold to business customers. Similar rulings were granted to several smaller ILECs. As a result, the Ethernet and OCn high capacity data services of these carriers are no longer regulated. We and several of our competitors have appealed the default grant of the Verizon petition and the grant of the AT&T petition. These FCC actions did not impact the availability of the tariffed TDM special access circuits that we use for off-net building access. We expect that the ILECs will continue to advocate deregulation of all forms of special access services, and we cannot predict the outcome of the FCC’s proceedings in this regard or the impact of that outcome on our business.
In 2005, we negotiated a five-year wholesale service agreement with AT&T Inc. (formerly SBC Communications Inc.) under which AT&T will supply us with special access and other services for end user access and transport with certain service level commitments through 2010 in SBC’s former 13 state local service territories. We have agreed to maintain certain volume levels in order to receive specified discounts and other terms and conditions, and are subject to certain penalties for early termination of the contract. We have a similar three year agreement with AT&T for the former BellSouth service area that commenced in 2005. However, we do not have similar agreements with the other ILECs and could be subject to significant price increases in the special access services we buy from these carriers.
Customer Disconnections and Pricing Trends
Increasing consolidation in the telecommunications industry has occurred in recent years, and in some cases has reduced our revenue from the customers involved. If any of our other customers are acquired or merge, we may lose a portion of their business, which could have a significant impact on our revenue. Consolidation could also result in other companies becoming more formidable competitors, which could also result in challenges to our revenue growth. The consolidation of AT&T, SBC and BellSouth has and may continue to result in the combined company buying less local transport service from us in SBC’s and BellSouth’s former local service areas. The impact of these consolidations may be mitigated by revenue commitments in our agreement with AT&T. As a result, we do not expect that the impact of these consolidations will materially affect our total revenue over the next several years. In addition, revenue from Cingular (now AT&T’s wireless unit), which became a wholly owned subsidiary of AT&T, has been declining and is expected to further decline. Revenue from AT&T’s wireless unit represented less than 2% of total revenue for the three and nine months ended September 30, 2007 compared with approximately 4% and 5% for the three and nine months ended September 30, 2006, respectively. AT&T’s total purchases from us, including AT&T’s wireless unit, represents approximately 7% and 8% of our total revenue for the three and nine months ended September 30, 2007, respectively.
We experience customer and service disconnects in the normal course of business primarily associated with industry consolidation, customer network optimization, cost cutting, business contractions, customer financial difficulties, or price competition from other providers. Disconnects averaged 1.0% and 1.1% of monthly revenue for the three and nine months ended September 30, 2007, respectively, which is slightly down from an average of 1.2% for 2006 and 2005, but significantly lower than 1.5% in 2004 and 2.0% in 2003. Included in these disconnects are some disconnects from customers in the financial services industry that have been negatively impacted by the subprime mortgage downturn. While we expect ongoing revenue churn, including disconnects from carrier customers related to their consolidations and network grooming and from enterprise customers either in the normal course or as a result of industry downturns, we cannot predict the total impact on revenue from these disconnects.
26
Our revenue and margins may also be reduced as a result of price-cutting by other telecommunications service providers or by pricing pressure on our more mature products, especially as existing contracts expire and we negotiate renewals.
Other Expense Trends
To increase our operating margins, we have undertaken several cost reduction measures including network grooming and pricing optimization to reduce the overall access costs paid to carriers and enhancing back office support systems to improve operating efficiencies. If our revenue declines in the future, we cannot predict whether continued cost management will be sufficient to maintain current operating margins.
Our acquisition of Xspedius resulted in lower consolidated margins as a result of higher operating costs in relationship to revenue in the acquired business and integration costs. The acquired operations sold a higher proportion of services utilizing the facilities of other carriers than our core operations have done resulting in lower gross margins and Modified EBITDA margins (Modified EBITDA as a percentage of revenue) than we experienced prior to the acquisition. In addition, the integration of the acquired operations, including our national IP and transport networks and back office and other support systems, to provide a common platform in which to offer our products and services in the acquired markets, resulted in higher costs. Further, as we integrate the acquired operations we incur higher network access costs as we connect our national IP and transport networks and add higher bandwidth capacity in anticipation of grooming the acquired network. The roll out of our products and services to the acquired markets has resulted in our incurring costs in advance of the anticipated additional revenue stream. We accelerated our product roll out to 10 additional acquired markets in the third quarter of 2007 incurring the cost of adding sales and operational employees. We have integrated the acquired operations with our operations with the expectation that we will achieve synergies through cost reductions. The impacts of our integration activities have been reflected in expanding Modified EBITDA margins over the past two quarters. We anticipate achieving mid 30% consolidated Modified EBITDA margins during the summer of 2008. However, as in the past, we expect our consolidated Modified EBITDA margins to continue to be impacted by integration costs and synergies as well as the timing of sales, installations, seasonality and other normal business fluctuations. As a result, there is no assurance that our Modified EBITDA margins will reach the targeted level when anticipated, or at all.
Consolidation in the telecommunications industry may also impact some of our purchases of the local and long haul transport services that we utilize to connect our local markets and reach customers that are not connected to our network. Some of the carriers that supply these services are in the process of integrating their systems with acquired systems. These integrations may cause delays in provisioning services to us and other customers of these carriers or may affect their service quality, which could in turn have an adverse impact on our revenue.
Former Related Party Revenue and Expense
As a result of the secondary offering completed on September 26, 2006, the Class B Stockholders are no longer related parties. In the normal course of business, we have engaged in various transactions with affiliates of our former Class B Stockholders, generally on negotiated terms that, in management’s view, result in reasonable arms-length terms. We provide network, data and Internet and voice services to affiliates of our former Class B Stockholders including Time Warner Cable, Time Warner Inc. and Bright House Networks, LLC. We do not expect the revenue generated from these entities to change materially because they are no longer related parties.
Since 1998, we have been party to a capacity license agreement with Time Warner Cable, an affiliate of one of our former Class B Stockholders, that provides us fiber capacity access to local rights-of-way and construction cost sharing until 2028. We have similar arrangements with Bright House Networks, LLC, an affiliate of Advance/Newhouse and with Comcast Corporation, as successor to Time Warner Cable’s cable systems in three markets. These arrangements were not impacted by the Class B Stockholders’ sale of their shares of our common
27
stock. We pay these providers negotiated fees for facility maintenance and reimburse them for our allocable share of pole rental costs on an ongoing basis. These maintenance and pole rental costs are included in our operating expenses. We believe that certain regulatory decisions regarding the pole rental rates that are passed through to us under the capacity license agreements pose a risk that our expense for these items could increase over time.
Name and Branding Change
We have amended our existing Trade Name License Agreement with Time Warner Inc. to extend the term of our license to use the name “Time Warner” until June 30, 2008. By that date we must change our name to TW Telecom or another name that does not include “Time Warner”. Effective September 12, 2006, Time Warner Inc. granted us a perpetual license to use “TW Telecom” and “TWTC” in our communications and related technologies and service business in North America. We are conducting a branding initiative to select a new name for our business and intend to continue to use the name “Time Warner Telecom” pursuant to the amended Trade Name License Agreement until we complete that initiative. We have incurred approximately $1.2 million in branding costs for the nine months ended September 30, 2007 and expect to spend up to an additional $1.0 million for that purpose for the balance of 2007.
Critical Accounting Policies and Estimates
We prepare our financial statements in accordance with accounting principles generally accepted in the United States, which require us to make estimates and assumptions that affect reported amounts and related disclosures. We consider an accounting estimate to be critical if:
| | • | | It requires assumptions to be made that were uncertain at the time the estimate was made; and |
| | • | | Changes in the estimate or different estimates that could have been selected could have a material impact on our consolidated results of operations or financial condition. |
Goodwill
We perform impairment tests at least annually on all goodwill and indefinite-lived intangible assets as required by Financial Accounting Standards Board (“FASB”) Statement No. 142,Goodwill and Other Intangible Assets (“SFAS 142”). Our goodwill and indefinite-lived intangible assets have grown significantly due to our acquisition of Xspedius and the purchase price allocation. SFAS 142 requires goodwill to be assigned to a reporting unit and tested using a consistent measurement date, which for us is the fourth quarter of each year or more frequently if impairment indicators arise. Potential impairment is indicated when the book value of a reporting unit, including goodwill, exceeds its fair value. If a potential impairment exists, the fair value of the reporting unit is compared to the fair value of its assets and liabilities, excluding goodwill, to estimate the implied value of the reporting unit’s goodwill. If an impairment charge is deemed necessary, a charge is recognized for any excess of the book value over the implied fair value. Considerable management judgment is necessary to estimate the fair value of assets; accordingly, actual results could vary significantly from estimates.
Valuation of Acquired Assets and Liabilities
In connection with our acquisition of Xspedius on October 31, 2006, as required by FASB Statement No. 141,Business Combinations, the purchase price was preliminarily allocated to the assets acquired and liabilities assumed based on their estimated fair values as of the closing of the merger, with the amounts exceeding the fair value recorded as goodwill. The preliminary fair values of the assets acquired and the liabilities assumed were determined using a cost approach, market approach or income approach. Under the cost approach, we have estimated the replacement cost of certain tangible assets and applied a depreciation factor to reflect economic deterioration. When appropriate, we have applied a market approach that utilizes available market rate information to assess fair value for specific tangible assets. Additionally, we have applied an income approach to value the business enterprise and certain intangible assets, which relies upon a discounted cash flow model that utilizes various estimates. These estimates include variables such as customer attrition rates, gross margin percentages,
28
synergies, economic useful lives of tangible assets, capital replacement costs, and discount rates. We have completed our valuation of tangible fixed assets which resulted in no material differences from the estimated values of tangible, intangible and goodwill. However, we continue to assess our assets, liabilities and pre-acquisition contingencies and may adjust these during the one year allocation period ending October 31, 2007.
Regulatory and Other Contingencies
We are subject to significant government regulation, some of which is uncertain due to legal challenges of existing rules. Such regulation is subject to different interpretations and inconsistent application, and has historically given rise to disputes with other carriers and municipalities regarding the classification of traffic, rights-of-way, rates and minutes of use.
Management estimates and reserves for the risk associated with regulatory and other carrier contingencies. These estimates are based on assumptions and other considerations including studies of traffic patterns, expectations regarding regulatory rulings, historic experience and ongoing negotiations. We evaluate these reserves on an ongoing basis and make adjustments as necessary.
Deferred Tax Accounting
We have a history of net operating losses (NOLs) for tax purposes. As a result, our balance sheet reflects a net deferred tax asset that represents the tax benefit of net operating loss carryforwards and timing differences between book and tax recognition of certain revenue and expense items, net of a valuation allowance. When it is more likely than not that all or some portion of deferred tax assets may not be realized, we establish a valuation allowance for the amount that may not be realized. At September 30, 2007, our net deferred tax asset after a valuation allowance of $342.8 million was $58.8 million.
We have concluded that it is more likely than not that the net deferred tax asset will be realized through the utilization of tax-planning strategies including the sale and leaseback of certain of our high-value, low-basis assets to generate gains to which the NOLs can be applied. We base our analysis on discounted expected future cash flows and our expectations regarding the size of transaction that would be allowable under financing agreements that may be in place at the time we implement strategies to utilize the benefit of the NOLs. The assumptions approximate our best estimates including market growth rates, future pricing, market acceptance of our products and services, future expected capital investments and discount rates. No material changes have been made to our estimates since December 31, 2006.
The Tax Reform Act of 1986 contains provisions that limit the utilization of net operating losses if there has been a “change of ownership” as described in Section 382 of the Internal Revenue Code. As a result of the secondary offering by the Class B Stockholders in September 2006, we may have experienced such an ownership change during the three months ended September 30, 2006 that may limit our utilization of net operating losses. We evaluated the impact of these provisions on our financial statements and have concluded that the provisions do not have a material impact on our net deferred tax asset position as of September 30, 2007.
Revenue and Receivables
Our services are complex and our tariffs and contracts may be correspondingly complex and subject to interpretations causing disputes over billing. In addition, changes in and interpretations of regulatory rulings create uncertainty and may cause disputes over minutes of use, rates or other provisions of our service. As such, we defer recognition of revenue until cash is collected on certain of our components of revenue, such as contract termination charges. Switched access and reciprocal compensation revenue is recognized on an accrual basis except in those cases where the revenue is under dispute or at risk, in which case we defer recognition of the revenue until the outstanding issue is resolved. We also reserve for customer billing disputes until they are resolved even if the customer has already paid the disputed amount.
We estimate the ability to collect our receivables by performing ongoing credit evaluations of our customers’ financial condition, and provide an allowance for doubtful accounts based on expected collection of
29
our receivables. Our estimates are based on assumptions and other considerations, including payment history, credit ratings, customer financial performance, industry financial performance and aging analysis. As a result of an improvement in our collection activities and our overall receivables management, our allowance for doubtful accounts as a percentage of gross receivables has improved from 19% as of December 31, 2005 to 15% at December 31, 2006 and 12% at September 30, 2007.
Results of Operations
The following table sets forth certain data from our unaudited consolidated financial statements and expressed as a percentage of total revenue. You should read this table together with our consolidated financial statements, including the notes thereto, appearing elsewhere in this report:
| | | | | | | | | | | | | | | | | | | | | | | | | | | | |
| | | Three Months Ended September 30, | | | Nine Months Ended September 30, | |
| | | 2007 | | | 2006 | | | 2007 | | | 2006 | |
| | | (amounts in thousands,
except per share amounts) | | | (amounts in thousands,
except per share amounts) | |
Statements of Operations Data: | | | | | | | | | | | | | | | | | | | | | | | | | | | | |
Revenue (1): | | | | | | | | | | | | | | | | | | | | | | | | | | | | |
Network services | | $ | 98,669 | | | 36 | % | | $ | 87,312 | | | 45 | % | | $ | 296,229 | | | 37 | % | | $ | 260,104 | | | 45 | % |
Voice Services | | | 82,475 | | | 30 | | | | 45,932 | | | 27 | | | | 242,700 | | | 30 | | | | 133,511 | | | 27 | |
Data and Internet services | | | 82,359 | | | 30 | | | | 53,995 | | | 23 | | | | 230,780 | | | 29 | | | | 153,570 | | | 23 | |
Intercarrier compensation | | | 11,290 | | | 4 | | | | 8,870 | | | 5 | | | | 34,494 | | | 4 | | | | 26,409 | | | 5 | |
| | | | | | | | | | | | | | | | | | | | | | | | | | | | |
Total revenue | | | 274,793 | | | 100 | | | | 196,109 | | | 100 | | | | 804,203 | | | 100 | | | | 573,594 | | | 100 | |
| | | | | | | | | | | | | | | | | | | | | | | | | | | | |
Costs and expenses (2): | | | | | | | | | | | | | | | | | | | | | | | | | | | | |
Operating (exclusive of depreciation, amortization, and accretion shown separately below) (3) | | | 118,412 | | | 43 | | | | 74,018 | | | 38 | | | | 350,859 | | | 43 | | | | 213,447 | | | 37 | |
Selling, general, and administrative (3) | | | 75,695 | | | 28 | | | | 54,409 | | | 28 | | | | 223,792 | | | 28 | | | | 164,185 | | | 29 | |
Depreciation, amortization, and accretion | | | 71,580 | | | 26 | | | | 62,028 | | | 31 | | | | 206,325 | | | 26 | | | | 184,524 | | | 32 | |
| | | | | | | | | | | | | | | | | | | | | | | | | | | | |
Total costs and expenses | | | 265,687 | | | 97 | | | | 190,455 | | | 97 | | | | 780,976 | | | 97 | | | | 562,156 | | | 98 | |
| | | | | | | | | | | | | | | | | | | | | | | | | | | | |
Operating income (loss) | | | 9,106 | | | 3 | | | | 5,654 | | | 3 | | | | 23,227 | | | 3 | | | | 11,438 | | | 2 | |
Interest expense | | | (22,623 | ) | | (8 | ) | | | (21,759 | ) | | (11 | ) | | | (68,794 | ) | | (9 | ) | | | (74,921 | ) | | (13 | ) |
Debt extinguishment costs | | | — | | | — | | | | — | | | — | | | | — | | | — | | | | (25,777 | ) | | (5 | ) |
Interest income | | | 4,528 | | | 2 | | | | 4,754 | | | 2 | | | | 13,614 | | | 2 | | | | 15,243 | | | 3 | |
Other income (loss) | | | (2,415 | ) | | (1 | ) | | | — | | | — | | | | (2,415 | ) | | — | | | | — | | | — | |
| | | | | | | | | | | | | | | | | | | | | | | | | | | | |
Loss before income taxes | | | (11,404 | ) | | (4 | ) | | | (11,351 | ) | | (6 | ) | | | (34,368 | ) | | (4 | ) | | | (74,017 | ) | | (13 | ) |
Income tax expense | | | 179 | | | — | | | | — | | | — | | | | 609 | | | — | | | | 7 | | | — | |
| | | | | | | | | | | | | | | | | | | | | | | | | | | | |
Net loss | | $ | (11,583 | ) | | (4 | )% | | $ | (11,351 | ) | | (6 | )% | | $ | (34,977 | ) | | (4 | )% | | $ | (74,024 | ) | | (13 | )% |
| | | | | | | | | | | | | | | | | | | | | | | | | | | | |
Basic and diluted loss per share | | $ | (0.08 | ) | | | | | $ | (0.09 | ) | | | | | $ | (0.24 | ) | | | | | $ | (0.62 | ) | | | |
| | | | | | | | | | | | | | | | | | | | | | | | | | | | |
Weighted average shares outstanding, basic and diluted | | | 145,174 | | | | | | | 121,659 | | | | | | | 144,564 | | | | | | | 119,999 | | | | |
Modified EBITDA (4)(5)(6) | | $ | 86,431 | | | 31 | % | | $ | 71,199 | | | 36 | % | | $ | 245,742 | | | 31 | % | | $ | 205,778 | | | 36 | % |
Net cash provided by operating activities | | | 58,365 | | | | | | | 50,001 | | | | | | | 168,356 | | | | | | | 110,360 | | | | |
Net cash (used in) provided by investing activities | | | (37,271 | ) | | | | | | 45,311 | | | | | | | (171,188 | ) | | | | | | (53,330 | ) | | | |
Net cash provided by (used in) financing activities | | | 5,250 | | | | | | | 12,983 | | | | | | | 18,764 | | | | | | | (28,743 | ) | | | |
| (1) | Includes revenue resulting from transactions with affiliates of $4.7 million and $13.1 million for the three and nine months ended September 30, 2006, respectively. |
30
| (2) | Includes expenses resulting from transactions with affiliates of $2.2 million and $6.6 million for the three and nine months ended September 30, 2006, respectively. |
| (3) | Includes the following non-cash stock-based employee compensation: |
| | | | | | | | | | | | |
| | | Three Months Ended
September 30, | | Nine Months Ended
September 30, |
| | | 2007 | | 2006 | | 2007 | | 2006 |
| | | (amounts in thousands) | | (amounts in thousands) |
Operating | | $ | 897 | | $ | 491 | | $ | 2,607 | | $ | 1,472 |
Selling, general, and administrative | | | 4,848 | | | 3,026 | | | 13,583 | | | 8,344 |
| (4) | “Modified EBITDA” is defined as net loss before depreciation, amortization, and accretion expense, interest expense, interest income, debt extinguishment costs, other gains (losses), impairment charges, income tax expense (benefit), cumulative effect of change in accounting principle, and non-cash stock-based compensation. Modified EBITDA is not intended to replace operating income (loss), net loss, cash flow and other measures of financial performance and liquidity reported in accordance with accounting principles generally accepted in the United States. Rather, Modified EBITDA is a measure of operating performance and liquidity that investors may consider in addition to such measures. Our management believes that Modified EBITDA is a standard measure of operating performance and liquidity that is commonly reported and widely used by analysts, investors, and other interested parties in the telecommunications industry because it eliminates many differences in financial, capitalization, and tax structures, as well as non-cash and non-operating charges to earnings. We believe that Modified EBITDA trends are a valuable indicator of whether our operations are able to produce sufficient operating cash flow to fund working capital needs, service debt obligations, and fund capital expenditures. We currently use Modified EBITDA for these purposes. Modified EBITDA also is used internally by our management to assess ongoing operations and is a measure used to test compliance with certain covenants of our senior notes, our revolving credit facility and our term loan. The definition of EBITDA under our revolving credit facility, our term loan and our senior notes differs from the definition of Modified EBITDA used in this table. The definition of EBITDA in our credit facility discussed below also eliminates certain non-cash losses within certain limits and certain extraordinary gains and the senior notes definition eliminates other non-cash items. However, the resulting calculation is not materially different for the periods presented. Modified EBITDA as used in this document may not be comparable to similarly titled measures reported by other companies due to differences in accounting policies. |
| (5) | The reconciliation between net loss and Modified EBITDA is as follows: |
| | | | | | | | | | | | | | | | |
| | | Three Months Ended
September 30, | | | Nine Months Ended
September 30, | |
| | | 2007 | | | 2006 | | | 2007 | | | 2006 | |
| | | (amounts in thousands) | | | (amounts in thousands) | |
Net loss | | $ | (11,583 | ) | | $ | (11,351 | ) | | $ | (34,977 | ) | | $ | (74,024 | ) |
Income tax expense | | | 179 | | | | — | | | | 609 | | | | 7 | |
Other (income) loss | | | 2,415 | | | | — | | | | 2,415 | | | | — | |
Interest income | | | (4,528 | ) | | | (4,754 | ) | | | (13,614 | ) | | | (15,243 | ) |
Interest expense | | | 22,623 | | | | 21,759 | | | | 68,794 | | | | 74,921 | |
Debt extinguishment costs | | | — | | | | — | | | | — | | | | 25,777 | |
Depreciation, amortization, and accretion | | | 71,580 | | | | 62,028 | | | | 206,325 | | | | 184,524 | |
Non-cash stock-based compensation | | | 5,745 | | | | 3,517 | | | | 16,190 | | | | 9,816 | |
| | | | | | | | | | | | | | | | |
Modified EBITDA | | $ | 86,431 | | | $ | 71,199 | | | $ | 245,742 | | | $ | 205,778 | |
| | | | | | | | | | | | | | | | |
| (6) | Modified EBITDA margin represents Modified EBITDA as a percentage of revenue. |
31
On October 31, 2006, we completed the acquisition of Xspedius. The results of operations, cash flows and financial position of the acquired operations are included in our consolidated financial statements for the three and nine months ended September 30, 2007. All amounts indicated are consolidated, including the results of the acquired operations, unless otherwise indicated.
Operating results include the impact of a reclassification of certain taxes and fees billed to customers and remitted to government authorities that are now presented on a gross versus net basis in revenue and operating expenses, which resulted in an increase in total revenue and operating expenses of $3.8 million and $10.8 million in the three and nine months ended September 30, 2007, respectively, over the same periods last year.
Three Months Ended September 30, 2007 Compared to Three Months Ended September 30, 2006
Revenue. Total revenue increased $78.7 million, or 40%, to $274.8 million for the three months ended September 30, 2007, from $196.1 million for the comparable period in 2006. Contributing to the growth in revenue was the impact of our acquired operations and increased data and Internet services revenue from sales to enterprise customers.
Data and Internet services revenue increased $28.4 million, or 53%, to $82.4 million for the three months ended September 30, 2007, from $54.0 million for the comparable period in 2006. The increase in data and Internet services revenue primarily resulted from growth from enterprise customers and our Ethernet and IP-based product sales and the impact of our acquired operations.
Revenue from network services increased $11.4 million, or 13%, to $98.7 million for the three months ended September 30, 2007 from $87.3 million for the comparable period in 2006. The increase in network services revenue was from our acquired operations which was partially offset by a decline in revenue from AT&T’s wireless unit resulting from consolidation within the industry as well as other disconnects. AT&T’s wireless unit represented less than 2% of our total revenue for the three months ended September 30, 2007 as compared to approximately 4% of our total revenue for the three months ended September 30, 2006.
Voice service revenue increased $36.5 million, or 80%, to $82.5 million for the three months ended September 30, 2007 from $45.9 million for the comparable period in 2006. The increase was predominately from the impact of the acquisition as well as growth in sales of bundled voice products.
Intercarrier compensation revenue, including reciprocal compensation and switched access, increased $2.4 million, or 27%, to $11.3 million for the three months ended September 30, 2007 from $8.9 million for the comparable period in 2006. The increase was predominately from the acquired operations.
Operating Expenses. Our operating expenses consist of costs directly related to the operation and maintenance of networks and the provisioning of services. These costs include the salaries and related expenses of customer care, provisioning, network maintenance, technical field and network operations and engineering personnel, costs to repair and maintain our network, and costs paid to other carriers for access to their facilities, interconnection, and facilities leased and associated utilities. We carry a significant portion of our traffic on our own fiber infrastructure, which enhances our ability to control access costs, which are the costs to purchase network services from other carriers. Operating expenses increased $44.4 million, or 60%, to $118.4 million for the three months ended September 30, 2007, from $74.0 million for the comparable period in 2006. The increase primarily reflects the impact of the acquisition and related higher access costs, higher access costs associated with serving our customers resulting from revenue growth, and the change in 2007 to present certain taxes and fees on a gross versus net basis. These increases were partially offset by integration synergies. Operating expenses were 43% of total revenue for the three months ended September 30, 2007 compared to 38% of total revenue for the same period in 2006. The increase in operating expense as a percentage of revenue compared to last year is attributable to the acquired operations, which sold a higher proportion of services utilizing the facilities of other carriers than our core business, thereby incurring higher access costs. We continue to expect to achieve cost synergies by migrating some of these facilities onto our own network and through other network grooming and optimization activities intended to reduce costs and increase margins in the acquired operations.
32
Selling, General, and Administrative Expenses. Selling, general, and administrative expenses consist of salaries and related costs for employees and other expenses related to sales and marketing, bad debt, information technology, billing, regulatory, administrative, and legal functions. Selling, general, and administrative expenses increased $21.3 million, or 39%, to $75.7 million for the three months ended September 30, 2007, from $54.4 million for the comparable period in 2006. The change is primarily due to our acquired operations and related integration costs and an increase in employee compensation costs, including higher sales incentive costs associated with revenue growth and non-cash stock-based compensation. Selling, general, and administrative expenses were 28% of revenue for both the three months ended September 30, 2007 and 2006.
Depreciation, Amortization, and Accretion Expense. Depreciation, amortization, and accretion expense increased $9.6 million, or 15%, to $71.6 million for the three months ended September 30, 2007, from $62.0 million for the comparable period in 2006. The increase was primarily attributable to additions to property, plant and equipment made during 2006 and 2007 as well as increased depreciation and amortization expense as a result of the acquired assets. These increases were partially offset by a reduction in depreciation as certain assets became fully depreciated and a reduction of $4.8 million from the extension of the depreciable life of our fiber assets from 15 years to 20 years. See “Change in Accounting Estimate” in Note 1 to our consolidated financial statements.
Interest Expense.Interest expense increased $0.9 million, or 4%, to $22.6 million for the three months ended September 30, 2007, from $21.8 million for the comparable period in 2006. The increase is due to the additional debt incurred in connection with the acquisition of Xspedius, and was partially offset by lower effective interest rates as a result of debt refinancings that were completed in 2006.
Interest Income. Interest income decreased $0.2 million, or 5%, to $4.5 million for the three months ended September 30, 2007, from $4.8 million for the comparable period in 2006. The decrease is due to lower average cash, cash equivalent and investment balances.
Other Income (Loss). During the three months ended September 30, 2007, we recognized a $2.4 million loss which represents impairment associated with commercial paper investments that we held past the maturity date with exposure to sub-prime mortgages. See “Investments” in Note 1 to our consolidated financial statements.
Net Loss and Modified EBITDA. Net loss increased $0.2 million, or 2%, to $11.6 million, a loss of $0.08 per share, for the three months ended September 30, 2007 from $11.4 million, a loss of $0.09 per share for the comparable period in 2006. The change primarily resulted from an increase in operating and selling, general and administrative expenses as described above, an increase in depreciation expense of $9.6 million resulting from continued additions to property, plant and equipment and the acquired assets, an increase of $2.2 million in non-cash stock-based compensation, and the $2.4 million other loss, partially offset by higher revenue. Modified EBITDA increased $15.2 million to $86.4 million, or 31% of revenue for the three months ended September 30, 2007, from $71.2 million, or 36% of revenue from the comparable period in 2006. The increase in Modified EBITDA resulted from higher revenue somewhat offset by higher operating and selling, general and administrative expenses associated with our acquired operations and selling, installing and maintaining the services that constitute the higher revenue stream. The decrease in Modified EBITDA margin was the result of higher operating costs in our acquired operations and related integration expenses and increased access costs resulting from revenue growth, as well as costs related to our branding initiative.
Modified EBITDA is defined as net income or loss before depreciation, amortization, accretion, impairment charges, interest expense, interest income, debt extinguishment costs, other gains and losses, income tax expense or benefit, cumulative effect of change in accounting principle, and non-cash stock-based compensation. We believe that Modified EBITDA is a standard measure of operating performance and liquidity that is commonly reported and widely used by analysts, investors, and other interested parties in the telecommunications industry because it eliminates many differences in financial, capitalization, and tax structures, as well as non-cash and non-operating income or charges to earnings. Modified EBITDA is not intended to replace operating income
33
(loss), net income (loss), cash flow, and other measures of financial performance and liquidity reported in accordance with generally accepted accounting principles. We use Modified EBITDA internally to assess on-going operations and it is the basis for various financial covenants contained in our debt agreements. Although we expect to continue to generate positive Modified EBITDA in the future as we expand our business in existing markets, there is no assurance that we will sustain the current level of Modified EBITDA or sufficient positive Modified EBITDA to meet our working capital requirements, comply with our debt agreements, and service our indebtedness. See Note 5 to the table under “Results of Operations” for a reconciliation between net loss and Modified EBITDA.
Nine Months Ended September 30, 2007 Compared to Nine Months Ended September 30, 2006
Revenue. Total revenue increased $230.6 million, or 40%, to $804.2 million for the nine months ended September 30, 2007, from $573.6 million for the comparable period in 2006. Contributing to the growth in revenue was the impact of our acquired operations and increased data and Internet services revenue from sales to enterprise customers.
Data and Internet services revenue increased $77.2 million, or 50%, to $230.8 million for the nine months ended September 30, 2007, from $153.6 million for the comparable period in 2006. The increase in data and Internet services primarily resulted from growth in revenue from enterprise customers and our Ethernet and IP-based product sales and the impact of our acquired operations.
Revenue from network services increased $36.1 million, or 14%, to $296.2 million for the nine months ended September 30, 2007 from $260.1 million for the comparable period in 2006. The increase in network services revenue was from our acquired operations partially offset by the loss of revenue from AT&T’s wireless unit through consolidation within the industry, other disconnects and re-pricing of expiring contracts to current rates. AT&T’s wireless unit represented less than 2% of our total revenue for the nine months ended September 30, 2007 as compared to less than 5% of our total revenue for the nine months ended September 30, 2006.
Voice service revenue increased $109.2 million or 82%, to $242.7 million for the nine months ended September 30, 2007 from $133.5 million for the comparable period in the preceding year. The increase was predominately from our acquired operations as well as growth in sales across our voice product portfolio.
Intercarrier compensation revenue, including reciprocal compensation and switched access, increased $8.1 million, or 31%, to $34.5 million for the nine months ended September 30, 2007 from $26.4 million for the comparable period in 2006. The increase was predominately from the acquired operations.
Operating Expenses. Operating expenses increased $137.4 million, or 64%, to $350.9 million for the nine months ended September 30, 2007, from $213.4 million for the comparable period in 2006. The increase is primarily due to our acquired operations, revenue growth that contributed to higher direct costs associated with serving our customers, an increase in employee costs related to annual merit-based salary increases that were effective in the first quarter and a larger employee base, and the change in 2007 to present certain taxes and fees on gross versus net basis. Operating expenses were 43% of total revenue for the nine months ended September 30, 2007 as compared to 37% of total revenue for the same period in 2006. The increase in operating expenses as a percentage of revenue as compared to last year is driven by the acquired operations, which sold a higher proportion of services utilizing the facilities of other carriers than our core business, thereby incurring higher access costs. These cost increases were somewhat offset by integration synergies. We expect to continue to achieve cost synergies by migrating some of these facilities onto our own network and through other network grooming and optimization activities intended to reduce costs and increase margins in the acquired operations.
Selling, General, and Administrative Expenses. Selling, general, and administrative expenses increased $59.6 million, or 36%, to $223.8 million for the nine months ended September 30, 2007, from $164.2 million for the comparable period in 2006. The change is primarily due to our acquired operations and related integration
34
costs, an increase in employee compensation costs due to annual merit-based salary increases, a larger employee base, grants of non-cash stock-based compensation, higher commissions due to increased revenue, and costs related to our branding initiative. Selling, general, and administrative expenses were 28% of revenue for the nine months ended September 30, 2007 as compared to 29% of revenue for the comparable period in 2006.
Depreciation, Amortization, and Accretion Expense. Depreciation, amortization, and accretion expense increased $21.8 million, or 12%, to $206.3 million for the nine months ended September 30, 2007, from $184.5 million for the comparable period in 2006. The increase was primarily attributable to additions to property, plant and equipment made during 2006 and 2007 as well as increased depreciation and amortization expense as a result of the acquired assets. These increases were partially offset by a reduction in depreciation as certain assets became fully depreciated and a reduction of $14.4 million from the extension of the depreciable life of our fiber assets from 15 years to 20 years. See “Change in Accounting Estimate” in Note 1 to our consolidated financial statements.
Interest Expense.Interest expense decreased $6.1 million, or 8%, to $68.8 million for the nine months ended September 30, 2007, from $74.9 million for the comparable period in 2006. The decrease is due to lower effective interest rates as a result of debt refinancings we completed in 2006 and was partially offset by an increase in total debt as a result of the acquisition of Xspedius.
Debt Extinguishment Costs. The early retirement of the $400 million 10 1/8% Senior Notes on May 1, 2006 resulted in debt extinguishment costs of $25.8 million for the nine months ended September 30, 2006. The debt extinguishment costs consisted of a call premium of $20.3 million and the write off of deferred debt issuance costs of $5.5 million. There were no debt extinguishment costs for the nine months ended September 30, 2007.
Interest Income. Interest income decreased $1.6 million, or 11%, to $13.6 million for the nine months ended September 30, 2007, from $15.2 million for the comparable period in 2006. The decrease is due to lower average cash, cash equivalent and investment balances offset by higher average interest rates.
Other Income (Loss). During the nine months ended September 30, 2007, we recognized a $2.4 million loss which represents an impairment associated with commercial paper investments that we held past the maturity date with exposure to sub-prime mortgages. See “Investments” in Note 1 to our consolidated financial statements.
Net Loss and Modified EBITDA. Net loss decreased $39.0 million, or 53%, to $35.0 million, a loss of $0.24 per share, for the nine months ended September 30, 2007 from $74.0 million, a loss of $0.62 per share for the comparable period in 2006. The change primarily resulted from an increase in revenue, a decrease in debt extinguishment costs of $25.8 million, a decrease in interest expense, net of interest income, of $4.5 million as a result of the 2006 debt refinancings, and other loss of $2.4 million. These factors were partially offset by increased operating and selling, general and administrative expense as described above, higher depreciation expense of $21.8 million resulting from continued investment in property, plant and equipment and the acquired assets, the $2.4 million investment loss and an increase of $6.4 million in non-cash stock-based compensation. Modified EBITDA increased $40.0 million to $245.7 million, or 31% of revenue for the nine months ended September 30, 2007, from $205.8 million, or 36% of revenue from the comparable period in 2006. The increase in Modified EBITDA resulted from higher revenue somewhat offset by higher operating and selling, general and administrative expenses associated with our acquired operations and selling, installing and maintaining the services that constitute the higher revenue stream. The decrease in Modified EBITDA margin was the result of higher operating costs in our acquired operations and related integration expenses and increased access costs resulting from revenue growth, as well as costs related to our branding initiative.
Liquidity and Capital Resources
Historically, we have generated cash flow from operations consisting primarily of payments received from customers for the provision of business communications services offset by payments to other
35
telecommunications carriers, payments to employees, and payments for interest and other operating, selling, general, and administrative costs. We have also generated cash from debt and equity financing activities and have used funds to service our debt obligations, fund acquisitions, and make capital expenditures to expand our networks.
At September 30, 2007, we had $1.4 billion of total debt and $307.1 million of cash and cash equivalents and short-term investments (net debt of $1.1 billion, defined as total debt less cash and cash equivalents and short-term investments) compared to $1.4 billion of total debt and $309.5 million of cash and cash equivalents and short-term investments (net debt of $1.1 billion) at December 31, 2006. These components of cash flow are discussed more fully below.
Working capital, defined as current assets less current liabilities, was $145.1 million as of September 30, 2007, an increase of $14.9 million from December 31, 2006. Our working capital ratio, defined as current assets divided by current liabilities, was 1.54 as of September 30, 2007 as compared to 1.46 as of December 31, 2006. The increase in working capital is a result of Modified EBITDA and cash provided by financing activities (primarily proceeds from the issuance of common stock upon exercise of stock options) exceeding net interest expense and capital expenditures.
Cash Flow Activity
Cash and cash equivalents were $237.5 million and $221.6 million as of September 30, 2007 and December 31, 2006, respectively. In addition, we had investments of $69.6 million and $87.9 million as of September 30, 2007 and December 31, 2006, respectively, which were short-term in nature and generally available to fund our operations, except for $19.4 million of commercial paper that is past its maturity date with exposure to sub-prime mortgages (see Note 1 to our consolidated financials statements). Subsequent to September 30, 2007, all of our other commercial paper investments were redeemed at par and reinvested in treasury bills, AAA rated funds and money market mutual funds comprised of government securities and treasury bills. The change in cash and cash equivalents during the periods presented were as follows:
| | | | | | | | |
| | | Nine months ended
September 30, | |
| | | 2007 | | | 2006 | |
| | | (amounts in thousands) | |
Cash provided by operating activities | | $ | 168,356 | | | $ | 110,360 | |
Cash used in investing activities | | | (171,188 | ) | | | (53,330 | ) |
Cash provided by (used in) financing activities | | | 18,764 | | | | (28,743 | ) |
| | | | | | | | |
Increase in cash and cash equivalents | | $ | 15,932 | | | $ | 28,287 | |
| | | | | | | | |
Operations. Cash provided by operating activities was $168.4 million for the nine months ended September 30, 2007 compared to cash provided by operating activities of $110.4 million for the same period in 2006. This increase in cash provided by operating activities primarily related to higher Modified EBITDA, as described above, and changes in working capital, primarily due to lower interest payments as a result of lower average rates and a change in the timing of interest payments as a result of the debt refinancings in 2006. The changes in components of working capital are generally subject to fluctuations based on the timing of cash transactions related to collection of receivables and payments to vendors and employees and interest payments, among other items.
Investing. Cash used in investing activities was $171.2 million for the nine months ended September 30, 2007 compared to cash used in investing activities of $53.3 million for the same period in 2006. The change is primarily a result of increased capital expenditures and a decrease in net redemptions of investments. Our balances of cash, cash equivalents and investments change over time based on our cash requirements and market interest yields. Capital expenditures in the nine months ended September 30, 2007 were $192.9 million, the
36
majority of which were used to expand our networks in our existing markets and to reach new customer buildings and to integrate our acquired operations, compared to $136.9 million in the nine months ended September 30, 2006.
Financing. Cash provided by financing activities was $18.8 million for the nine months ended September 30, 2007, primarily related to proceeds from the exercise of stock options and purchases of our common stock under our employee stock purchase plan, slightly offset by quarterly payments on the $600 million Term Loan B. Cash used in financing activities was $28.7 million for the nine months ended September 30, 2006, primarily related to net cash required to redeem $400 million principal amount of 10 1/8% Senior Notes and to issue $373.8 million principal amount of 2 3/8% Convertible Debentures as well as proceeds from the exercise of stock options.
During the past two years, we have refinanced several of our debt instruments to improve our effective interest costs and to extend the nearest debt maturities. In 2006, our financing and refinancing activity consisted of:
| | • | | Issuance in March 2006 of $373.8 million principal amount of 2 3/8% Convertible Senior Debentures due 2026 (the “Convertible Debentures”); |
| | • | | Redemption in May 2006 of the entire $400 million principal amount of 10 1/8% Senior Notes due February 2011 at a redemption price of 105.063% plus accrued interest; and |
| | • | | Execution in October 2006 of a $700 million senior secured credit facility (“Credit Facility”) consisting of: |
| | • | | a $600 million Term Loan B (“new Term Loan”) due 2013, which was fully drawn in October 2006, to repay our outstanding $200 million Term Loan B, to redeem in November 2006 our $240 million principal amount Second Priority Senior Secured Floating Rate Notes due February 2001 and partially finance the cash portion of the consideration for the Xspedius acquisition, and |
| | • | | a $100 million revolving credit facility (“new Revolver”) due October 2011, which remains undrawn and replaced our existing revolver. |
In 2005, our financing and refinancing activity consisted of:
| | • | | Issuance in February 2005 of an additional $200 million amount of 9 1/4% Senior Notes due February 15, 2014; |
| | • | | Redemption in March 2005 of $200 million of 9 3/4% Senior Notes due 2008 at a redemption price of 103.25% plus accrued interest; |
| | • | | Execution in November 2005 of a $200 million Term Loan B Facility (replaced in 2006 by the new Term Loan described below) and subsequent draw down in December 2005; and |
| | • | | Redemption in December 2005 of the remaining $200 million principal amount of 9 3/4% Senior Notes due 2008 at a redemption price of 101.625% plus accrued interest. |
After completion of these activities, we had outstanding $400 million principal amount of 9 1/4% Senior Notes due 2014, $373.8 million principal amount of Convertible Debentures due 2026, the $600 million new Term Loan due 2013 and the undrawn $100 million new Revolver maturing 2011. Significant terms of our outstanding indebtedness are detailed below:
| | • | | The $400 million principal amount of 9 1/4% Senior Notes due February 15, 2014 (the “2014 Notes”) are unsecured, unsubordinated obligations of our wholly owned subsidiary Time Warner Telecom Holdings Inc. (“Holdings”), guaranteed by us and Holdings’ restricted subsidiaries. Interest is payable semi-annually on February 15 and August 15. The 2014 Notes are callable as of February 15, 2009, 2010, 2011 and 2012 at 104.625%, 103.083%, 101.542% and 100%, respectively. Aggregate annual |
37
| | interest payments on the 2014 Notes are $37.0 million. The 2014 Notes are governed by an indenture that contains certain restrictive covenants and in certain circumstances may accelerate payment of the 2014 Notes. These restrictions affect, and in many respects significantly limit or prohibit, among other things, our ability to incur indebtedness, make prepayments of certain indebtedness, pay dividends, make investments, engage in transactions with shareholders and affiliates, issue capital stock of subsidiaries, create liens, sell assets, and engage in mergers and consolidations. We were in compliance with these covenants at September 30, 2007. |
| | • | | The $373.8 million principal amount of 2 3/8% Convertible Debentures due 2026 were issued on March 29, 2006, and are general, unsecured obligations of the Company. Interest is payable semi-annually on April 1 and October 1, commencing October 1, 2006. The Convertible Debentures are redeemable in whole or in part at any time on or after April 6, 2013 at a redemption price equal to 100% of the principal amount of the debentures to be redeemed, plus accrued and unpaid interest. Holders of the debentures have the option to convert the debentures into shares of our common stock at a conversion rate of 53.6466 per $1,000 principal amount of debentures representing a conversion price of $18.64 per share. Upon conversion, we will have the right to deliver, in lieu of shares of common stock, cash or a combination of cash and shares of common stock. Aggregate annual interest payments on the Convertible Debentures are approximately $8.9 million. As of September 30, 2007, none of the holders has converted the Convertible Debentures into common stock. |
| | • | | The $700 million Credit Facility closed on October 6, 2006 consists of a $600 million new Term Loan maturing in January 2013 and a $100 million revolving credit facility maturing in October 2011. Holdings drew $200 million on the new Term Loan on October 6, 2006, and drew the remaining $400 million on the new Term Loan on October 31, 2006. The new Term Loan is a secured obligation, on a first lien basis, of Holdings. The new Term Loan is guaranteed by us and Holdings’ subsidiaries, including Xspedius and its subsidiaries. Repayments on the new Term Loan are due quarterly on the last day of each quarter beginning March 31, 2007 in an amount equal to 1/4 of 1%, or $1.5 million, of the aggregate principal amount with the balance payable on January 7, 2013. Interest is computed based on a specified Eurodollar rate plus 1.75% to 2.0%, after giving effect to an amendment on February 15, 2007 that reduced the interest rate by 25 basis points. Interest will be reset periodically and payable at least quarterly. Based on the Eurodollar rate in effect at September 30, 2007, the rate was 7.1% and aggregate annual interest payments on $595.5 million of outstanding borrowings would be $42.3 million. The new Revolver is secured and guaranteed in the same manner as the new Term Loan and is presently undrawn. Interest on outstanding amounts, if any, will be computed based on a specified Eurodollar rate plus 2.0% to 2.75% and will be reset periodically and payable at least quarterly. We are required to pay a commitment fee on the undrawn commitment amounts on a quarterly basis of 0.5% per annum. The credit agreement for the new Term Loan contains essentially the same restrictions as the 2014 Notes. The new Revolver contains certain additional restrictions, as well as certain financial covenants that we must comply with if we draw on the new Revolver. We were in compliance with these covenants as of September 30, 2007. |
In order to reduce future cash interest payments, as well as future amounts due at maturity or mandatory redemption, we or our affiliates may, from time to time, purchase our outstanding series of senior notes for cash or equity securities in open market or privately negotiated transactions or engage in other transactions to reduce the amount of outstanding senior notes. We will evaluate any such transactions in light of market conditions, taking into account our liquidity and prospects for future access to capital, and contractual constraints.
38
The following diagram summarizes our corporate structure in relation to the outstanding indebtedness and Credit Facility as of September 30, 2007. The diagram does not depict all aspects of ownership structure among the operating and holding entities, but rather summarizes the significant elements relative to our debt in order to provide a basic overview.
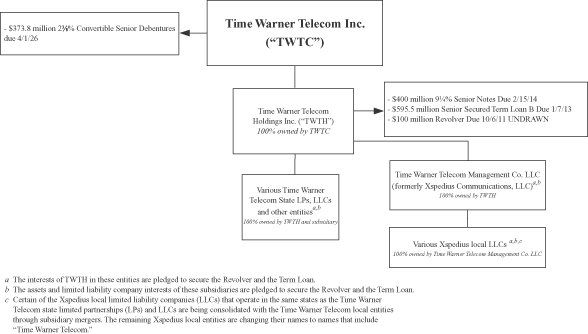
Capital Expenditures and Requirements
Our total capital expenditures were $192.9 million for the nine months ended September 30, 2007 compared to $136.9 million for the same period in 2006. We incur capital expenditures to develop and expand our network, products and systems and spent $25.3 million in connection with the integration of the acquired operations. Approximately 89% and 86% of capital expenditures, other than capital expenditures for integration, were success based for the nine months ended September 30, 2007 and 2006, respectively. Success based spending consists of short-to-medium term capital expenditures made primarily to enable near term revenue producing activities including costs to connect to new customer locations with our fiber network and increase capacity to our networks, IP backbone and central office infrastructure to serve growing customer demands. For 2007, we expect capital expenditures, excluding integration investments, to be approximately $230 to $240 million, which we expect will primarily be used to fund growth opportunities. Additionally, we also expect to invest $30 to $38 million of capital expenditures to integrate our acquired operations. We generally do not make long-term commitments for capital expenditures and have the ability to adjust our capital expenditures if our cash from operations is lower than anticipated.
Capital Resources
In 2007, we expect that cash from operations, along with cash, cash equivalents and investments will provide sufficient funds to meet our expected capital expenditure requirements and liquidity needs to operate our business and service our current debt. Based on current assumptions, we expect to generate sufficient cash from operations along with available cash on hand, including cash equivalents, investments, and borrowing capacity under the new Revolver to provide sufficient funds to meet our expected capital expenditure and liquidity needs to operate our business and service our debt for the foreseeable future. If our assumptions prove incorrect or if there are other factors that negatively affect our cash position such as material unanticipated losses, a significant
39
reduction in demand for our services or an acceleration of customer disconnects or other risk factors, we may need to seek additional sources of funds through financing or other means.
Our ability to draw upon the available commitments under the new Revolver is subject to compliance with all of the covenants contained in the Credit Facility and our continued ability to make certain representations and warranties. In the case of the new Revolver, the covenants include financial covenants, such as leverage and interest coverage ratios and limitations on capital expenditures, that are primarily derived from Modified EBITDA and debt levels. We are required to comply with these ratios as a condition to any borrowing under the new Revolver and for as long as any loans are outstanding. The representations and warranties include the absence of liens on our properties other than certain permitted liens, the absence of litigation or other developments that have or could reasonably be expected to have a material adverse effect on us and our subsidiaries as a whole, and continued effectiveness of the documents granting security for the loans. Although we presently meet all of the conditions for making draws under the new Revolver, factors beyond our control could cause us to fail to meet these conditions in the future.
A lack of revenue growth or an inability to control costs could negatively impact Modified EBITDA and cause our failure to meet the required minimum ratios. Although we currently believe that we will continue to be in compliance with the applicable covenants, factors outside our control, including deterioration of the economy, increased competition and loss of revenue from consolidation of large telecommunications companies, an acceleration of customer disconnects, a significant reduction in demand for our services without adequate reductions in capital expenditures and operating expenses, or an uninsured catastrophic loss of physical assets or other risk factors, could cause us to fail to meet our covenants. If our revenue growth is not sufficient to sustain the Modified EBITDA performance required to meet the debt covenants described above, and we have loans outstanding under the new Revolver or wish to draw on it, we would have to consider cost cutting or other measures to maintain required Modified EBITDA levels or to enhance liquidity.
The new Revolver and new Term Loan limit our ability to declare cash dividends, incur indebtedness, incur liens on property, and undertake mergers. The new Revolver and new Term Loan also include cross default provisions under which we are deemed to be in default if we default under any of our other material outstanding obligations, such as our 2014 Notes. In addition, each group of lenders under the new Revolver and new Term Loan may require a prepayment if a change of control occurs as defined in the credit agreement for the new Revolver and new Term Loan. If we do not comply with the covenants, we would not be able to draw funds under the new Revolver or the lenders could cancel the new Revolver unless the respective lenders agree to further modify the covenants. We also could potentially be subject to an acceleration of the repayment date if we have borrowed under the facilities and are in default under the covenants. Although we believe our relationships with our lenders are good, there is no assurance that we would be able to obtain the necessary covenant modifications on acceptable terms. If our plans or assumptions change or prove to be inaccurate, or the foregoing sources of funds prove to be insufficient to fund our growth and operations, or if we consummate acquisitions or joint ventures, we would be required to seek additional capital. Additional sources of financing may include public or private debt, equity financing by us or our subsidiaries, or other financing arrangements. There is no assurance that we would be able to obtain additional financing on terms acceptable to us or at all. Our revenue and costs are partially dependent upon factors that are outside our control, such as general economic conditions, regulatory changes, adverse changes in customers’ financial condition, changes in technology, and increased competition. Due to the uncertainty of these and other factors, actual revenue and costs may vary from expected amounts, possibly to a material degree, and these variations would likely affect the level of our future capital expenditures and expansion plans.
Commitments. Our long-term commitments have not materially changed from those disclosed in our Annual Report on Form 10-K for the year ended December 31, 2006.
Effects of Inflation
Historically, inflation has not had a material effect on us.
40
| Item 3. | Quantitative and Qualitative Disclosures About Market Risk |
Our interest income is sensitive to changes in the general level of interest rates. In this regard, changes in interest rates can affect the interest earned on our cash equivalents and marketable debt securities. To mitigate the impact of fluctuations in interest rates, we seek to enter into fixed rate investing arrangements to the extent possible.
At September 30, 2007, we held commercial paper of $19.4 million that is past its maturity date with exposure to sub-prime mortgages. Due to the current lack of liquidity of these investments, we recognized a loss of $2.4 million in the three months ended September 30, 2007. Subsequent to September 30, 2007, all of our other commercial paper investments were redeemed at par and reinvested in treasury bills, AAA rated funds and money market mutual funds comprised of government securities and treasury bills. We expect that cash from operations along with cash, cash equivalents and investments will provide sufficient funds to meet our capital expenditure requirements and liquidity needs to operate our business and service our current debt.
The following table provides information at September 30, 2007 about our investments that are sensitive to changes in interest rates. For these securities, the table presents related weighted-average annualized interest rates expected by the maturity dates. These investment securities will mature within one year. This table excludes $19.4 million of commercial paper which is past its maturity date.
| | | | |
| | | 2007 Maturities | |
| | | (dollar amounts
in thousands) | |
Assets | | | | |
Investments: | | | | |
Shares of money market mutual funds | | $ | 157,574 | |
Weighted average interest rate | | | 4.8 | % |
Commercial paper and treasury bills | | $ | 137,244 | |
Weighted average interest rate | | | 5.2 | % |
At September 30, 2007, the fair values of our fixed rate 9 1/4% Senior Notes due 2014 and our 2 3/8% Convertible Debentures due 2026 were approximately $414 million and $500 million, respectively, as compared to carrying values of $400 million and $373.8 million, respectively, each on September 30, 2007. These securities have not been listed on any securities exchange or inter-dealer automated quotation system, and the estimated market value is based on indicative pricing published by investment banks. While we believe these approximations to be reasonably accurate at the time published, indicative pricing can vary widely depending on volume traded by any given investment bank and other factors.
Interest on the new Term Loan varies based on a specified Eurodollar rate. Based on the $595.5 million outstanding balance as of September 30, 2007, a one-percent change in the applicable rate would change the amount of interest paid by $6.0 million annually.
| Item 4. | Controls and Procedures |
As of September 30, 2007, an evaluation was performed under the supervision and with the participation of our management, including the Chief Executive Officer and Chief Financial Officer, of the effectiveness of the design and operation of our disclosure controls and procedures. Based on that evaluation, our management, including the Chief Executive Officer and Chief Financial Officer, concluded that our disclosure controls and procedures were effective as of September 30, 2007.
There were no changes in our internal controls over financial reporting that occurred during the three months ended September 30, 2007 that have materially affected, or are reasonably likely to materially affect, our internal control over financial reporting. The customer ordering and billing processes of our acquired operations, which were previously excluded from our assessment of controls, were integrated into our existing technology platforms during the three months ended September 30, 2007. The activities under these processes are now monitored under our existing internal controls over financial reporting for these areas.
41
Part II. Other Information
We have no material legal proceedings pending.
The exhibits listed on the accompanying Exhibit Index are filed or incorporated by reference as part of this report and the Exhibit Index is incorporated herein by reference.
42
Signature
Pursuant to the requirements of the Securities Exchange Act of 1934, the Registrant has duly caused this report to be signed on its behalf by the undersigned thereunto duly authorized.
| | | | | | | | |
| | | | | | | | TIME WARNER TELECOM INC. |
| | | |
| Date: November 9, 2007 | | | | By: | | /s/ JILL R. STUART |
| | | | | | | | Jill R. Stuart |
| | | | | | | | Sr. Vice President, Accounting and Finance and Chief Accounting Officer |
43
EXHIBIT INDEX
| | | | |
Exhibit
Number | | | | Description of Exhibit |
| 2.4 | | — | | Agreement and Plan of Merger by and among Time Warner Telecom Inc., XPD Acquisition LLC, Xspedius Communications, LLC, Xspedius Management Co. LLC and Xspedius Holding Corp. dated as of July 27, 2006 (filed as Exhibit 2.1 to the Company’s Quarterly Report on Form 10-Q for the quarter ended June 30, 2006)* |
| | |
| 3.1 | | — | | Restated Certificate of Incorporation of the Company* |
| | |
| 3.2 | | — | | Amended By-laws of the Company (filed as Exhibit 99.1 to the Company’s Current Report on Form 8-K dated September 17, 2007)* |
| | |
| 4.1 | | — | | Indenture between Time Warner Telecom Holdings Inc., Time Warner Telecom Inc., Subsidiary Guarantors parties thereto and Wells Fargo Bank, National Association, as Trustee for 9¼% Senior Notes due 2014 (filed as Exhibit 4.7 to the Company’s Annual Report on Form 10-K for the year ended December 31, 2004)* |
| | |
| 4.2 | | — | | Indenture dated as of March 29, 2006 between Time Warner Telecom Inc. and Wells Fargo Bank, National Association, as Trustee (filed as Exhibit 4.1 to the Company’s Quarterly Report on Form 10-Q for the quarter ended March 31, 2006)* |
| | |
| 4.3 | | — | | First Supplemental Indenture dated as of March 29, 2006 between Time Warner Telecom Inc. and Wells Fargo Bank, National Association, creating 2.375% Convertible Senior Debentures due 2026 (filed as Exhibit 4.2 to the Company’s Quarterly Report on Form 10-Q for the quarter ended March 31, 2006)* |
| | |
| 4.4 | | — | | Credit Agreement dated October 6, 2006 between Time Warner Telecom, Inc., Time Warner Telecom Holdings Inc., the Several Lenders from Time to Time Party thereto, Lehman Commercial Paper Inc., as syndication agent, Bank of America, N.A., as documentation agent and Wachovia Bank, National Association, as administrative agent and as collateral agent (filed as Exhibit 99.1 to the Company’s Current Report on Form 8-K dated October 11, 2006)* |
| | |
| 10.1 | | — | | Employment Agreement dated September 28, 2007 between the Company and Mark Peters |
| | |
| 10.2 | | — | | Change of Control Employment Agreement dated September 28, 2007 between the Company and Mark Peters |
| | |
| 10.3 | | — | | Employment Agreement dated September 28, 2007 between the Company and Paul Jones |
| | |
| 10.4 | | — | | Change of Control Employment Agreement dated September 28, 2007 between the Company and Paul Jones |
| | |
| 10.5 | | — | | Employment Agreement dated September 28, 2007 between the Company and Jill Stuart |
| | |
| 10.6 | | — | | Change of Control Employment Agreement dated September 28, 2007 between the Company and Jill Stuart |
| | |
| 31.1 | | — | | Certification of Chief Executive Officer pursuant to Item 601(b)(31) of Regulation S-K, as adopted pursuant to Section 302 of the Sarbanes-Oxley Act of 2002 |
| | |
| 31.2 | | — | | Certification of Chief Financial Officer pursuant to Item 601(b)(31) of Regulation S-K, as adopted pursuant to Section 302 of the Sarbanes-Oxley Act of 2002 |
| | |
| 32.1 | | — | | Certification of Chief Executive Officer pursuant to 18 U.S.C. Section 1350, as adopted pursuant to Section 906 of the Sarbanes-Oxley Act of 2002 |
| | |
| 32.2 | | — | | Certification of Chief Financial Officer pursuant to 18 U.S.C. Section 1350, as adopted pursuant to Section 906 of the Sarbanes-Oxley Act of 2002 |
| * | Incorporated by reference |
44