UNITED STATES
SECURITIES AND EXCHANGE COMMISSION
WASHINGTON, D.C. 20549
FORM 10-K
| x | ANNUAL REPORT PURSUANT TO SECTION 13 or 15(d) OF THE SECURITIES EXCHANGE ACT OF 1934 |
For the fiscal year ended December 31, 2007
or
| ¨ | TRANSITION REPORT PURSUANT TO SECTION 13 OR 15(d) OF THE SECURITIES EXCHANGE ACT OF 1934 |
Commission file number 0-30218
TIME WARNER TELECOM INC.
(Exact name of Registrant as specified in its charter)
| | |
| Delaware | | 84-1500624 |
(State or other jurisdiction of incorporation or organization) | | (I.R.S. Employer Identification No.) |
10475 Park Meadows Drive
Littleton, CO 80124
(Address of principal executive offices)
(303) 566-1000
(Registrant’s telephone number, including area code)
Securities registered pursuant to Section 12(b) of the Act:
| | |
Title of each class | | Name of exchange on which registered |
| Common Stock $.01 par value | | Nasdaq Stock Market |
Securities registered pursuant to Section 12(g) of the Act: None
Indicate by check mark if the registrant is a well-known seasoned issuer, as defined in Rule 405 of the Securities Act. YES x NO ¨
Indicate by check mark if the registrant is not required to file reports pursuant to Section 13 or Section15(d) of the Act. YES ¨ NO x
Indicate by check mark whether the Registrant (1) has filed all reports required to be filed by Section 13 or 15(d) of the Securities Exchange Act of 1934 during the preceding 12 months (or for such shorter period that the Registrant was required to file such reports), and (2) has been subject to such filing requirements for the past 90 days. YES x NO ¨
Indicate by check mark if disclosure of delinquent filer pursuant to Item 405 of Regulation S-K is not contained herein, and will not be contained, to the best of Registrant’s knowledge, in definitive proxy or information statements incorporated by reference in Part III of this Form 10-K or any amendment to this Form 10-K. x
Indicate by check mark whether the registrant is a large accelerated filer, an accelerated filer, a non-accelerated filer or a smaller reporting company. See the definitions of “large accelerated filer,” “accelerated filer” and “smaller reporting company” in Rule 12b-2 of the Exchange Act (Check one):
Large accelerated filer x Accelerated filer ¨ Non-accelerated Filer ¨ Smaller Reporting Company ¨
Indicate by check mark whether the registrant is a shell company (as defined in Rule 12b-2 of the Act.) YES ¨ NO x
As of June 30, 2007, the aggregate market value of the Registrant’s voting stock held by non-affiliates of the Registrant was approximately $2.9 billion, based on the closing price of the Registrant’s common stock on the Nasdaq Stock Market reported for such date. Shares of common stock held by each executive officer and director have been excluded since those persons may under certain circumstances be deemed to be affiliates. This determination of executive officer or affiliate status is not necessarily a conclusive determination for other purposes.
The number of shares outstanding of Time Warner Telecom Inc.’s common stock as of January 31, 2008 was 146,867,392 shares.
DOCUMENTS INCORPORATED BY REFERENCE
Certain information required in Part III of this Annual Report on Form 10-K is incorporated herein by reference to our definitive proxy statement for the 2008 Annual Meeting of our stockholders, which we will file with the U.S. Securities and Exchange Commission on or before April 29, 2008.
CAUTION REGARDING FORWARD-LOOKING STATEMENTS
This document contains certain “forward-looking statements,” within the meaning of the Private Securities Litigation Reform Act of 1995, including statements regarding, among other items, our expected financial position, expected capital expenditures, expected integration costs, integration plans, activities and results, expected revenue mix, expected margins, expected branding costs, expected cost synergies, growth or stability from particular customer segments, building penetration plans, the effects of consolidation in the telecommunications industry, customer disconnections, Modified EBITDA trends, expected network expansion and grooming, business, and financing plans. These forward-looking statements are based on management’s current expectations and are naturally subject to risks, uncertainties, and changes in circumstances, certain of which are beyond our control. Actual results may differ materially from those expressed or implied by such forward-looking statements.
The words “believe,” “plan,” “target,” “expect,” “intend,” and “anticipate,” and expressions of similar substance identify forward-looking statements. Although we believe that the expectations reflected in such forward-looking statements are reasonable, we can give no assurance that those expectations will prove to be correct. Important factors that could cause actual results to differ materially from the expectations described in this report are set forth under “Risk Factors” in Item 1A. and elsewhere in this report. Readers are cautioned not to place undue reliance on these forward-looking statements, which speak only as of their dates. We undertake no obligation to publicly update or revise any forward-looking statements, whether as a result of new information, future events, or otherwise.
TELECOMMUNICATIONS DEFINITIONS
In order to assist the reader in understanding certain terms relating to the telecommunications business that are used in this report, a glossary is included following Part III.
1
PART I
Overview
Time Warner Telecom Inc. (the “Company”) is a leading national provider of managed network services, specializing in Ethernet and transport data networking, Internet access, local and long distance voice, voice over Internet protocol (“VoIP”) and network security services to enterprise organizations and communications services companies throughout the U.S. Our customers include, among others, enterprise organizations in the distribution, health care, finance, and manufacturing industries, state, local and federal government entities, and long distance carriers, incumbent local exchange carriers (“ILECs”), competitive local exchange carriers (“CLECs”), wireless communications companies, and Internet service providers (“ISPs”). Through our subsidiaries, we operate in 75 U.S. metropolitan markets. As of December 31, 2007, our fiber networks covered 25,753 route miles, directly connecting 8,355 buildings served entirely by our facilities (“on-net”). We continue to expand our footprint within our existing markets by connecting our network into additional buildings. We substantially expanded our footprint in 2006 through the acquisition of Xspedius Communications, LLC (“Xspedius”), which added network in 31 additional metropolitan markets. We also have continued to expand our Internet Protocol, or “IP”, backbone data networking capability between markets supporting end-to-end Ethernet and Virtual Private Network (“VPN”) connections for customers, and have selectively interconnected existing service areas within regional clusters with fiber optic facilities that we own or lease. In addition, we provide inter-city switched services between our markets that offer our customers a virtual presence in a remote city.
From our formation until September 26, 2006, we had two classes of common stock outstanding, Class A common stock with one vote per share and Class B common stock with ten votes per share. Each share of Class B common stock was convertible, at the option of the holder, into one share of Class A common stock. The Class B common stock was collectively owned directly or indirectly by Time Warner Inc. (“Time Warner”), Advance Telecom Holdings Corporation and Newhouse Telecom Holdings Corporation, (“Advance/Newhouse”) (collectively, the “Class B Stockholders”). On March 29, 2006 and September 26, 2006, the Class B Stockholders completed underwritten offerings of 22.3 million shares and 43.5 million shares, respectively, of our Class A common stock, which were converted from shares of Class B common stock to shares of Class A common stock immediately prior to the offerings. In connection with the closing of the September 26, 2006 offering, Advance/Newhouse converted all of its remaining shares of Class B common stock that were not sold in the offering to shares of Class A common stock. As a result, we have not had shares of Class B common stock outstanding since September 26, 2006. We did not receive any proceeds from the offerings nor did our total shares outstanding change as a result of the offerings. In June 2007, our stockholders approved an amendment to our Restated Certificate of Incorporation, which eliminated references to Class A and Class B common stock. As a result, no shares of Class B common stock were authorized as of December 31, 2007 and Class A common stock authorized and outstanding as of December 31, 2006 is classified as common stock.
We were organized as a Delaware limited liability company in 1998 and converted to a Delaware corporation in 1999. Our principal executive offices are located at 10475 Park Meadows Drive, Littleton, Colorado 80124, and our telephone number is (303) 566-1000. Our Internet address ishttp://www.twtelecom.com. The information contained on our website is not part of, nor is it incorporated by reference into, this Annual Report on Form 10-K. We make available free of charge through our website our Annual Report on Form 10-K, quarterly reports on Form 10-Q, and current reports on Form 8-K, and amendments to these reports, as soon as reasonably practicable after we electronically file such material with, or furnish such material to, the Securities and Exchange Commission. In addition, we have posted, and intend to disclose on our website any amendments to or waivers from, our Code of Ethics applicable to our principal executive officer, principal financial officer, chief accounting officer, controller and treasurer and other persons performing similar functions within five business days following the date of such amendment or waiver.
2
On October 31, 2006, we acquired Xspedius through a merger with our wholly owned subsidiary in which we ultimately paid $211.5 million in cash, after giving effect to resolution of a $4.5 million working capital adjustment, and issued 18.2 million shares of our common stock to the members of Xspedius. Xspedius was a facilities-based provider of integrated communications services primarily to enterprise businesses and carriers. Xspedius provided a comprehensive suite of high quality services, including metro Ethernet, local and long distance voice, data and dedicated Internet access services, in 43 markets (including 12 markets that we already served) across 19 states and the District of Columbia. The acquisition increased the number of markets we serve from 44 to 75, and further expands our network reach and market density for serving multi-city and multi-location enterprise customers. We have and expect to continue to realize cost synergies and efficiencies by integrating Xspedius’ operations with ours. We have made substantial progress toward the integration of the acquired operations with ours as of December 31, 2007. The remaining integration work will consist primarily of network optimization and grooming to reduce the volume and costs of off-network services in the acquired operations, network enhancements and equipment to enable the deployment of our advanced services in certain additional acquired markets, and process refinement to optimize the integrated systems and organization (see Item 1A “Risk Factors — We may not realize all of the anticipated benefits from the Xspedius acquisition”).
Business Strategy
Our primary objective is to be the leading provider of high quality managed data and telecommunications services in each of our service areas, on a national basis, principally utilizing our fiber facilities and our national multipurpose IP backbone network to offer high value voice, data, Internet, and dedicated services to become the carrier of choice for business enterprises, governmental agencies, and other carriers. By delivering to our customers a suite of scalable and integrated network solutions, we can meet the specific network management needs of those customers, location by location across the United States, and create efficiencies for the customer through the management of their disparate networks and services. The key elements of our business strategy include the following:
Leverage Existing Fiber Networks.We have built, licensed or acquired local and regional fiber networks to serve metropolitan geographic locations where management believes there are large numbers of potential customers. Our network architecture reflects a convergence of:
| | • | | Private line services — for dedicated high bandwidth metropolitan connectivity scalable to 10 gigabits per second (“Gbps”); |
| | • | | Traditional circuit switched (primarily using Time Division Multiplexing or “TDM”) technology, as used in the traditional public switched telephone network (“PSTN”); |
| | • | | IP technology with high availability, quality of service, redundancy and diversity maintained throughout the network; and |
| | • | | Ethernet technology for scalable metropolitan and inter-city data network connectivity up to 10 Gbps. |
We provide multi-site and -city solutions through our fully managed, nationwide IP backbone network with capacity ranging up to 10 Gbps on any particular link, depending on the specific route. We believe that our extensive network expertise and capacity allows us to:
| | • | | emphasize our fiber facilities-based services integrated with the IP backbone, which allows us to realize higher gross margins than carriers that do not operate their own fiber facilities; |
| | • | | focus on metro areas with a national reach, providing multi-locational and multi-city end-to-end solutions; |
| | • | | provide a truly diverse network and choice to customers seeking further network diversity after the reduction of choice as a result of consolidation among wireline carriers; and |
| | • | | design and deliver scalable and efficient solutions that allow our customers’ business applications to operate more effectively in their network environment. |
3
Pursue Selected Opportunities to Expand Our Network Reach. As local market opportunities grow, we continue to extend our network in our present markets in order to reach additional office buildings and business parks directly with our fiber facilities. In 2007, we extended our fiber network by approximately 1,100 route miles and into approximately 900 additional buildings in our markets. In addition, we have deployed technologies such as dense wave division multiplexing (“DWDM”) to provide additional bandwidth and higher speed without the need to add additional fiber capacity. We may expand our networks into additional markets beyond the 75 markets in which we already operate if we find attractive opportunities to do so organically or through acquisitions. We also provide services to locations outside our current market areas through our IP backbone and the use of leased facilities.
Focus Our Service Offerings on Meeting the Sophisticated Data Needs of Our Customers.We continue to place significant focus on serving the growing demand for high-speed, high-quality enhanced data networking services such as our Ethernet and IP business-to-business VPN services, our Internet-based services, and converged voice and data bundles. Our suite of Ethernet services are the foundation for customer networks, which provide multipoint connectivity for customers within and between given metropolitan areas. To further expand our multi-site and multi-city capabilities, in 2007, we:
| | • | | Enhanced our IP VPN service offering to include Class of Service functionality allowing our customers the ability to prioritize and differentiate various traffic types (e.g. voice vs. Internet), thereby managing mission critical business applications across the network more effectively, and |
| | • | | Continued to design more flexible and integrated solutions delivering VPN services across the enterprise network, combined with scalable fiber based Ethernet connectivity at high volume locations, including Internet access, for a total solution. |
We also provide a broad range of switched voice services throughout our service area. We utilize high-capacity digital end office switches that enable us to offer both local and toll services to our customers. Further, we have deployed digital switching equipment that uses packet access capability to combine Internet access in a bundle with voice and enable a dynamic bandwidth allocation feature which allows the customer to increase its use of voice or Internet bandwidth on demand, based upon its telecommunications usage and needs. Our customers can utilize our carrier grade VoIP network and product suite without costly upgrades to their voice premise equipment. This approach also enables multi-location organizations to experience a consistent user experience regardless of the equipment they maintain at each location and enables a variety of voice applications inside the network.
VoIP network elements are collectively smaller and more cost effective than traditional PSTN end office switches. Our local voice markets are interconnected using a private, VoIP enabled, IP backbone. This network allows us to manage all site-to-site, or “on-net” calls, between customer locations, which reduces our costs. In addition, the distributed voice/VoIP architecture supports complex disaster recovery services for customers with mission critical voice requirements.
Continue to Diversify Our Customer Base.Our sales strategy targets business enterprises and government entities as well as other carriers. We have sought to broaden our revenue base through an increased focus on enterprise customers and government customers, while continuing to focus on select national and regional carriers. To achieve revenue growth from end user customers, we target potential new and existing enterprise customers utilizing both local market and national sales groups. We have expanded our sales force with hires strategically targeted at particular customer segments. We are also expanding the types of services we offer to our carrier customers in order to create new revenue opportunities from that customer base.
Continue Disciplined Expenditure Program.Our approach for adding customers is designed to maximize revenue growth while maintaining attractive rates of return on capital invested to connect customers directly to our networks. Our strategy of primarily using our fiber facilities-based services, rather than reselling network capacity of other providers, requires that we make significant capital investments to reach some new customers.
4
We invest selectively in growth prospects that often require that we install fiber in buildings, purchase electronics, construct fiber distribution rings, and invest in product expansion. We also seek to increase operating efficiencies by investing selectively in strategic enhancements to our back office and network management systems. We have a disciplined approach to capital and operating expenditures. Our capital expenditure program requires that prior to making expenditures on a project, the project must be evaluated against certain financial criteria such as projected minimum recurring revenue, cash flow margins, and rate of return. Capital expenditures in 2007 were $259.5 million, including investment for the integration of Xspedius of $30.1 million, compared to $192.7 million in 2006. Our success-based capital spending increased to $202.8 million in 2007, or 88% of capital expenditures excluding integration spending for the year, from $168 million, or 87%, in 2006, as a result of our growth. Success-based capital spending consists of short-to-medium term capital expenditures made primarily to enable revenue producing activities, including costs to connect to new customer locations with our fiber network and increase capacity to our networks, IP backbone and central office infrastructure to serve growing customer demands. We expect our capital expenditures in 2008 to be approximately $250 million to $274 million, which we expect will be used to primarily fund growth opportunities, and includes $10 million to $14 million for investments related to the integration of the Xspedius operations and our branding initiative (see “Name and Branding Change”).
Services
We provide our customers with a wide range of telecommunications and managed data services, including network, local and long distance voice services, data transmission services, high-speed dedicated Internet access, and intercarrier services. Our revenue by major product categories for fiscal years ended December 31, 2007, 2006 and 2005 is as follows:
| | | | | | | | | | | | | | | | | | |
| | | Years Ended December 31, | |
| | | 2007 | | | 2006 | | | 2005 | |
| | | (amounts in thousands) | |
Revenue: | | | | | | | | | | | | | | | | | | |
Network services | | $ | 393,569 | | 36 | % | | $ | 355,996 | | 44 | % | | $ | 341,779 | | 48 | % |
Voice services | | | 327,246 | | 30 | | | | 201,968 | | 25 | | | | 166,808 | | 24 | |
Data and Internet services | | | 318,269 | | 30 | | | | 216,419 | | 26 | | | | 162,834 | | 23 | |
Intercarrier compensation | | | 44,595 | | 4 | | | | 37,992 | | 5 | | | | 37,306 | | 5 | |
| | | | | | | | | | | | | | | | | | |
Total revenue | | $ | 1,083,679 | | 100 | | | $ | 812,375 | | 100 | | | $ | 708,727 | | 100 | |
| | | | | | | | | | | | | | | | | | |
Our broad portfolio provides solutions to enterprise customers, ranging from small businesses through Fortune 500 companies, city, state and federal government entities, as well as communications service providers. To reduce the risk in bringing new and untested telecommunications services to a dynamically changing market, we introduce our services once market demand develops after a rigorous development process. The primary service offerings are:
Network Services
We provide a complete range of network access services with transmission speeds up to 10 Gbps to satisfy our customers’ needs for voice, data, image, and video transmission. Each uses technologically advanced fiber optics and is available as:
| | • | | Special Access.Dedicated telecommunications lines linking the points of presence (“POPs”) of one or more interexchange carriers (“IXC”), or between enterprise customers and the local POPs of IXCs. |
| | • | | Private Line.Dedicated telecommunications lines connecting various locations of a customer’s operations, suitable for transmitting voice and data traffic among customer locations. |
| | • | | Metropolitan and Regional Connectivity.Each transport service is available on our metropolitan fiber networks. Most are also available between cities on our inter-city, regional networks. |
5
| | • | | Transport Arrangements.Dedicated transport between the local exchange carrier (“LEC”) central offices and the IXC POP for voice and data applications. |
These services are available in a wide variety of configurations and capacities:
| | • | | SONET Services. Full duplex transmission of digital data on Synchronous Optical Network standards allowing multipoint transmission of voice, data, or video over protected fiber networks. Available capacities include DS-1, DS-3, STS-1, OC-3, OC-12, OC-48, and OC-192. |
| | • | | Private Network Transport Services. A premium quality, fully redundant, and diversely routed SONET service that is dedicated to the private use of individual customers with multiple locations. |
| | • | | Wavelength or “Lambda” Services. High capacity, point-to-point transmission services allowing customers to have access to multiple full-bandwidth channels of 2.5 Gbps and 10 Gbps. |
| | • | | Collocation Services. Secure space, climate and power collocation services where customers locate their equipment to connect to our network in facilities adjacent to our central offices. |
Voice Services
Our voice services provide business customers with local and long distance calling capabilities. We own, manage, and maintain the switches used to provide the services. Our voice services include the following:
| | • | | Business Access Line Service.This service provides customers with quality analog voice grade telephone lines for use at any time. |
| | • | | Access Trunks.Access trunks provide communication lines between two switching systems. These trunks, typically DS-1, are utilized by private branch exchange (“PBX”) customers that own and operate a switch on their own premises. PBX customers use these trunks to provide access to the local, regional, and long distance telephone networks. |
| | • | | IP Trunks. IP Trunks converge voice traffic with Internet traffic over a single connection for a more efficient and scalable access network. This service supports new IP PBX devices, and local and long distance calling to the PSTN. |
| | • | | Local Toll Service.This service provides customers with a competitive alternative to ILEC service for intraLATA toll calls. |
| | • | | Local Telephone Service.Local telephone calling areas are widely defined to provide ease of use for our customers. Additional features include operator and directory assistance services, and custom calling features such as call waiting and caller ID. |
| | • | | Long Distance Service.Long distance service provides the capability for a customer to place a voice call from one local calling area to another, including international calling. We offer long distance services bundled with voice and converged solutions as a packaged value to customers. We also offer usage-based rates for 1+, toll-free 800 with routing capabilities, and dedicated service, as well as package plans for various committed levels of usage. |
| | • | | Bundled Services.Our bundled offerings enable customers to purchase one to three DS-1 facilities that combine lines, trunks, long distance, and Internet services to provide an integrated service offering. This product can dynamically allocate bandwidth for maximum network efficiency, and eliminates the customer’s need for multiple vendors. An Integrated low-speed Ethernet routing feature is available in multi-site and city configurations. The service provides private data networking capabilities for customers to move data between their locations. |
| | • | | Other Services.Other services we offer include IP Foreign Exchange, on-demand conferencing, telephone numbers, directory listings, customized calling features, voice messaging, hunting, blocking services, and integrated services digital network or “ISDN.” |
6
Data Services
We offer our customers a broad array of enhanced data and Internet services that enable them to connect their own internal computer networks and access external computer networks and the Internet at very high speeds using the Ethernet protocol.
We offer the following range of Native LAN or “NLAN” services with speeds up to 10 Gbps:
| | • | | NLAN (Point-to-Point). The Point-to-Point NLAN service provides dedicated protected Ethernet transport service between two locations in a metropolitan area at speeds of 10, 100, 600, 1000 megabits per second (“Mbps”), and 10 Gbps. |
| | • | | NLAN (Point-to-Multipoint).This service is a protected multi-location Ethernet data service connecting multiple customer remote locations back to a single customer Ethernet port located at the main customer site. The available speeds are 10, 100, and 600 Mbps and 1 Gbps. |
| | • | | Multipoint NLAN.The Multipoint NLAN service provides a dedicated ring of Ethernet bandwidth, allowing the customer to share bandwidth between their multiple Ethernet locations over a metropolitan area. The customer can access the network at speeds of 10, 100, and 600 Mbps and 1 Gbps. |
| | • | | Customer-Direct NLAN.The Customer-Direct NLAN service is a point-to-point, non-network protected, unmanaged and not monitored, stand-alone service for both 100 Mbps and 1000 Mbps Ethernet connections that offers basic Ethernet connectivity at a lower cost of service. |
| | • | | Switched NLAN.The switched NLAN service incorporates data Ethernet switching technology into the NLAN product suite. This service allows multiple customer locations to interconnect using various bandwidth increments ranging from 10 Mbps to 1 Gbps interfaces over a shared metropolitan Ethernet infrastructure. This service allows us to compete with frame relay and ATM legacy services. |
| | • | | Extended NLAN. The extended NLAN service provides Ethernet connectivity between distant locations in the markets we serve through our national IP backbone and is available in either point-to-point or multi-point configurations. |
| | • | | Integrated NLAN. The integrated NLAN service converges voice and Internet service with an optional Ethernet feature to transfer private data between multiple locations locally or nationally. |
| | • | | Wholesale NLAN. Metro NLAN services are generally available to wholesale customers. The services include a variety of interconnection options and features that are important to carriers and other service providers. |
| | • | | Storage Transport Solutions. The service provides links offering a variety of industry-standard protocols including Fiber Channel, ESCON, FICON, and Gigabit Ethernet, allowing customers to avoid protocol translation while securely transporting their data to distant storage locations. |
| | • | | IP VPN Services. Our IP VPN connects multiple customer sites creating a virtual network for the customer within the U.S. utilizing our own national IP backbone and local metropolitan facilities. Class of Service is available on Premium IP VPN. Connection speeds are from 1.5 Mbps to 1 Gbps. |
Internet Services
| | • | | Internet Services.Dedicated high capacity Internet service enables customers to access the Internet and other external networks. We offer a wide range of Internet services to our business customers with bandwidth speeds ranging from 1.5 Mbps to 10 Gbps and transported via traditional TDM or Ethernet connectivity. Our traditional TDM-based Internet services are available via industry standard transport facilities: DS-1, DS-3, OC-3, OC-12 and OC-48 connectivity. Our Ethernet Internet services are delivered using Ethernet connections with offerings of Ethernet (10 Mbps), Fast Ethernet (100 Mbps), Gigabit Ethernet (1 Gbps), and 10 Gigabit Ethernet (10 Gbps). |
7
| | • | | Managed Security Service.This service uses security devices placed within our network to establish a firewall that prevents unauthorized traffic from entering a customer’s network. We also offer a customer premises equipment-based security solution that resides at the customer’s network perimeter. Both solutions offer a fully managed environment, securing customer networks through firewall and encrypted VPN functionality. |
Intercarrier Services
Because we are interconnected with other telecommunications carriers, we provide traffic origination and termination services to other carriers. These services consist of the origination and termination of long distance calls and the termination of local calls.
| | • | | Switched Access Service.The connection between a long distance carrier’s POP and an end user’s premises that is provided through the switching facilities of a LEC is referred to as switched access service. Switched access service provides long distance carriers with a switched connection to their customers for the origination and termination of long distance telephone calls or provides large end users with dedicated access to their carrier of choice. Under our tariffs or under agreements with certain long distance carriers, we receive per-minute terminating switched access compensation when our network is used for the origination or termination of the carriers’ traffic. |
| | • | | Local Traffic Termination Services. Pursuant to interconnection agreements with other carriers, we accept traffic that originates on another LEC’s facilities and carry that traffic over our facilities to our customers in order to complete calls. Generally, under applicable regulations, we are entitled to receive compensation — referred to as “reciprocal compensation” — from the originating LECs for those services. |
Telecommunications Networks and Facilities
Overview. We use advanced technologies and network architectures to develop a highly reliable infrastructure for delivering high-speed, quality digital transmissions of voice, data and Internet telecommunications services. Our basic transmission platform consists primarily of optical fiber built in diverse rings for high network availability. We use a variety of electronics that meet the requirements of our customers’ network applications, including SONET, DWDM and Ethernet equipment. These optically enabled rings give us the capability of routing customer traffic in both directions around the ring, thereby eliminating the loss of a service in the event of a fiber cut on a part of the ring. We have an advanced IP backbone using redundant core and edge routers to deliver Internet traffic to our customers. We have also added network based Ethernet switches in our markets to enable applications based services incorporated with our soft switches and media gateways. These applications, along with our VoIP services and metropolitan Ethernet switches, deliver Ethernet-based services directly to customer premises. Our networks are designed for remote automated provisioning, allowing us to meet customers’ real time service needs. We extend SONET rings or point-to-point links from our rings to each customer’s premises over our own fiber when financially attractive or use circuits obtained from other local carriers to connect the customer to our network. We also install diverse building entry points if a customer requires such redundancy. We place necessary customer-dedicated or shared electronic equipment at a location near or in the customer’s premises to terminate the link.
We serve our customers from one or more central offices strategically positioned throughout our networks. The central offices house the transmission, switching, and Internet equipment needed to interconnect customers with each other, the long distance carriers, and other local exchange and Internet networks. Redundant electronics and power supplies, with automatic switching to the backup equipment in the event of failure, protects against signal deterioration or outages. We continuously monitor system components from our network operations center and seek to focus proactively on avoiding problems.
We add switched and dedicated data services to our basic fiber transmission platform by installing sophisticated routers, soft switches, and digital electronics at our central offices and nodes at customer locations.
8
Our advanced digital telephone and packet voice gateways are connected to multiple ILECs and long distance carrier switches to provide our customers ubiquitous access to the PSTN. We also provide high-speed routers and switches for our Internet backbone, and Ethernet switches at our customers’ premises and in our central offices to supply LAN interconnection services. Our Internet backbone is connected to multiple networks around the nation at multiple connection points. Our newest offerings connect customer LANs together in a metropolitan area, and connect LANs in geographically dispersed areas across our Internet backbone.
To serve a new customer initially, we may use various transitional links, such as leased circuits from another LEC. When a customer’s communication volumes increase, we may build our own fiber connection between the customer’s premises and our network to accommodate the customer’s needs and increase our operating margins.
Infrastructure Migration.We continually evaluate new technologies and suppliers in order to achieve a balance between utilizing best of breed technologies at the best available price. We continue to expand IP capabilities throughout our network through the deployment of packet telephony systems such as media gateways and soft switches. In order to prepare to deliver the next generation voice and data services, we are using these new technologies to augment traditional circuit switched systems. We also have the capability to provide TDM services over our IP backbone and plan to further converge TDM and IP services by utilizing MPLS, a protocol that allows us to differentiate the multiple services traversing our IP backbone.
Capacity License Agreements. We currently license fiber capacity from Time Warner Cable in sixteen markets, Comcast Corporation as successor to Time Warner Cable in three markets, and Bright House Networks, LLC (“Bright House”), an affiliate of Advance/Newhouse, in four markets. Each of our local operations in those markets is party to a Capacity License Agreement with one of the local cable television operations of Time Warner Cable, Comcast Corporation or Bright House (collectively the “Cable Operations”) providing us with an exclusive right to use all of the capacity of specified fiber-optic cable owned by the Cable Operations. The Capacity License Agreements expire in 2028. The Class B Stockholders’ sale of their shares of our common stock in October 2006 did not affect the terms of the Capacity License Agreements. The Capacity License Agreements for networks that existed as of July 1998 have been fully paid and do not require additional license fees. However, we must pay maintenance fees and fees for splicing and similar services. We may request that the Cable Operations construct and provide additional fiber-optic cable capacity to meet our needs. The Cable Operations are not obligated to provide such fiber capacity and we are not obligated to take fiber capacity from them. If the Cable Operations provide additional capacity, we pay an allocable share of the cost of construction of the fiber upon which capacity is to be provided, plus permitting and other fees. We are permitted to use the capacity for telecommunications services and any other lawful purpose, but not for the provision of residential services and content services. If we violate the limitations on our business activities, the Cable Operations may terminate the Capacity License Agreements.
The Capacity License Agreements do not restrict us from licensing fiber-optic capacity from parties other than the Cable Operations. Although the Cable Operations have agreed to negotiate renewal or alternative provisions in good faith upon expiration of the Capacity License Agreements, we cannot assure that the parties will agree on the terms of any renewal or alternative provisions or that the terms of any renewal or alternative provisions will be favorable to us. If the Capacity License Agreements are not renewed in 2028, we will have no further interest in the fiber capacity covered by those agreements and may need to build, lease, or otherwise obtain transmission capacity to replace the capacity previously licensed under the Capacity License Agreements. The terms of such arrangements may be materially less favorable to us than the terms of the Capacity License Agreements. We have the right to terminate a Capacity License Agreement in whole or in part at any time upon 180 days notice. The Cable Operations have the right to terminate the Capacity License Agreements prior to their expiration under certain circumstances (see Item 1A Risk Factors “We must obtain access to rights-of-way and pole attachments on reasonable terms and conditions”).
9
Telecommunication Networks.The following map shows the areas where we have local fiber networks and offer services:
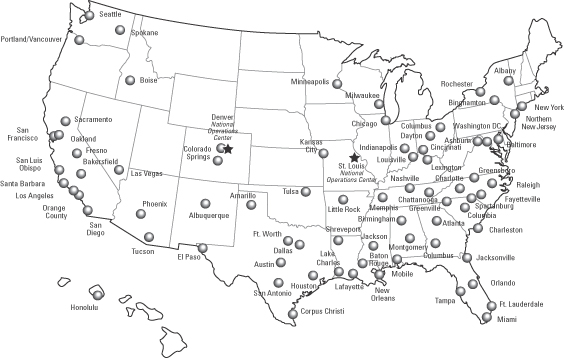
Network Monitoring and Management.We provide a single point of contact for our customers and consolidate our systems support, expertise, and technical training for the network at our two network operations centers in Greenwood Village, Colorado and O’Fallon, Missouri. These two centers offer capability for redundancy and overlap coverage for our customer networks. We provide 24 hours per day, 7 days a week surveillance and monitoring of networks to achieve a high level of network reliability and performance. Network analysts monitor real-time alarm, status, and performance information for network circuits, which allows them to react swiftly to repair network trouble.
Information Technology Solutions.We continue to focus on systems that provide high business value with a solid return on investment. Our strategy is to blend the purchase of proven, commercially available software that can be tailored to our business processes, and in-house developed applications that conform to our architectural framework. Where such commercially “off-the-shelf” products are not suitable for our business needs, we employ internal resources and contract with third party integrators to develop custom applications. All of our systems must be flexible enough to conform to a rapidly changing environment, while being scalable, and easily maintained and enhanced. We have integrated certain of our enterprise applications so that data flows through from one to the other, thereby improving data accuracy and increasing efficiency. We also use customized workflow software to manage the exchange of data in a timely manner between applications.
We offer a customer self care platform that uses web portal technology to provide automated customer service and schedule and establish security for teleconferences. The web portal enables customers to view and pay their bills on-line and record disputes.
10
Information Systems Infrastructure.We manage our desktop technology assets centrally to ensure software compatibility between all corporate locations and field offices. Our information systems infrastructure also provides real time support of network operations and delivers data to meet customer needs. Our systems utilize open system standards and architectures, allowing interoperability with third party systems.
Network Development and Application Laboratory.We have a laboratory located in Greenwood Village, Colorado, equipped with state of the art systems and equipment, including those we use in the operation of our local digital networks. The center is designed to provide a self-contained testing and integration environment, fully compatible with our digital networks, for the purposes of:
| | • | | verifying the technical and operational integrity of new equipment prior to installation in the networks; |
| | • | | developing new services and applications; |
| | • | | providing a realistic training environment for technicians, engineers, and others; and |
| | • | | providing a network simulation environment to assist in fault isolation and recovery. |
Billing Systems.We contract with outside vendors for customer billing. We have licensed software for end user billing that operates on our own equipment and have contracted with an outside vendor for operations support and development. In addition, we have a service bureau arrangement with another vendor for carrier and interconnection billing.
Customers and Sales and Marketing
Customers.Our customers are in telecommunications-intensive industries and are comprised of enterprises, government and public institutions, and carriers. For the year ended December 31, 2007, enterprise, government and public customers represented 69% of total revenue. The remaining customer revenue is derived from carriers at 27% and the balance from inter-carrier compensation. Our acquisition of Xspedius in late 2006 expanded our customer base by approximately 18,000 customers and the number of markets we serve with our own networks from 44 to 75. The acquisition increased and further diversified our enterprise customer base.
Our top ten customers accounted for 26% of our total revenue for the year ended December 31, 2007, and approximately 31% for the year ended December 31, 2006. The change was attributable to the impact of the acquired operations and the increase in new sales to enterprise customers. For the year ended December 31, 2007, AT&T Inc. (including the former SBC Communications Inc., BellSouth Corporation and Cingular Wireless) accounted for 8% of our total revenue. For the years ended December 31, 2006 and 2005, revenue from AT&T Inc. accounted for 11% and 9% of our total revenue, respectively. No customer accounted for over 10% of our total revenue in 2007. A portion of the revenue from our top ten customers includes inter-carrier compensation resulting from end users that have selected those customers as their long distance carriers. Our revenue from AT&T (which merged with SBC in 2005 and with BellSouth in 2006 and acquired Cingular Wireless in 2006) has been and may continue to be impacted by the combined company buying less local transport service from us in SBC’s and BellSouth’s former local service areas and by AT&T’s wireless unit disconnecting services. However, the impacts of the AT&T mergers with SBC and BellSouth may be mitigated by revenue commitments in our agreement with AT&T, new product opportunities and opportunities to sell additional local services to AT&T outside its local service regions.
Several other carrier customers falling within our ten largest customers were parties to industry mergers and consolidations in 2006. We experienced service disconnections as a result of network grooming and optimization from these customers in 2007 and expect additional disconnections combined with rate changes in connection with contract renewals as carriers determine their leased network strategies in 2008. However, while consolidations have compressed carrier revenue growth in this customer segment, consolidation has also resulted in additional opportunities to provide high quality fiber services to carriers as they begin to grow their enterprise business and seek redundancy in their networks.
11
Sales and Marketing. Our service offerings are part of a diversified portfolio of competitively priced products and solutions aimed to increase usage among our existing customers and to attract new customers. Our sales and marketing strategy emphasizes our:
| | • | | reliable, facilities-based metropolitan networks and national IP backbone; |
| | • | | converged data and IP solutions supporting customer network trends; |
| | • | | responsive national and local customer service orientation; |
| | • | | comprehensive product suite; |
| | • | | integrated operations, customer care, field operations, network monitoring, and management systems; and |
| | • | | multi-site and multi-city network solutions. |
We engage in direct sales in the majority of our local markets with certain resources in regional and adjacent areas, including national enterprise and carrier sales teams. These teams have sales engineering and support resources. Our national sales organization includes sales groups focused on four types of national customers: enterprise, carrier (including national and regional carriers, ISPs and wireless carriers), government and systems integrators. As of December 31, 2007, we had 508 sales account executives and customer relationship specialists. We continue to expand our sales force with hires strategically targeted at particular customer segments. Commissions for our sales representatives are linked to incremental revenue from services installed. We provide additional incentives for executing service contracts with terms of two years or greater and for certain products and solutions as well as for sales of services wholly on our fiber facilities. Beginning in 2004 we added Customer Relationship Specialists to our sales team for the purpose of specifically cultivating sales to existing customers, and increasing customer retention, freeing our primary sales force to focus on new accounts. We believe this initiative has and will continue to reduce customer and revenue churn.
In addition to our direct sales channels, we have also marketed our services through channel neutral teaming arrangements focused on data and IP products. We market our services through database marketing techniques, customer seminars, advertisements, trade journals, media relations, direct mail, and participation in conferences.
Customer Service
Our objective is to provide customers with an experience that is consistent, valuable, and differentiated from our competitors. To provide customer service, account representatives or customer relationship specialists are assigned to our customers to act as local points of contact. Our centrally managed customer support operations are designed to facilitate the processing of new orders as well as changes and upgrades in customer services. Technicians and other support personnel are available in each of our service areas to handle any network failures or problems. Our Customer Service Center is available to all of our customers to answer customers’ questions regarding billing, order status or maintenance concerns. In addition, our network operations centers provide 24 hours per day, 7 days a week surveillance and monitoring of networks to maintain network reliability and performance. See “Telecommunications Networks and Facilities — Network Monitoring and Management.”
Competition
We believe that the principal competitive factors affecting our business are:
| | • | | the ability to introduce new services and network technologies in a timely, competitive, and market acceptable manner; |
| | • | | customer service and network quality; |
12
| | • | | the ability to continuously evolve our operating systems, processes and data in a scalable, efficient, and cost effective manner; |
| | • | | regulatory decisions and policies that impact competition; and |
| | • | | the ability to connect customers’ multiple locations. |
We believe that we compete favorably with other companies in the industry with respect to each of these factors. Although we compete with other carriers primarily on service quality and customer service rather than price, significant price competition for certain products such as long distance service, inter-city point-to-point services, and POP to POP dedicated services has driven down prices for these products. Also, we typically price our services to be competitive to the local market for those services. We believe that the ILECs continue to be aggressive in pricing competition particularly for large enterprise customers that we also target. With several facilities-based carriers providing the same service in a given market, price competition is likely to continue but has stabilized in the past year for certain products. Since 2001, due to business failures, contractions and consolidations, the overall number of competitors has declined, and some competitors have slowed or stopped their build-out plans. The impact of competition on our business varies across local markets, depending on the number and type of competitors in the market.
The ILECs - Verizon Communications, Inc., Qwest Communications Inc., and AT&T Inc., among others — offer services substantially similar to those we offer. We believe that the ILECs may have competitive advantages over us, such as their long-standing relationships with customers, greater technical and financial resources, greater geographic coverage, wireless assets, and the potential to subsidize services of the type we offer from service revenue in unrelated businesses. In addition, industry consolidation through acquisitions and business combinations, such as the merger of AT&T Corp. and both SBC and BellSouth (now AT&T Inc.), and Verizon Communications’ acquisition of MCI Inc., both past and future, may result in fewer, but stronger competitors. However, we believe that our customers are increasingly interested in competitive facilities-based providers for critical business solutions, enhanced diversity and disaster recovery, and data and IP services. In light of consolidation among telecommunication providers, we believe that we have benefited and will continue to benefit from opportunities to provide services directly to larger enterprise customers.
We also face competition from fixed and mobile wireless telephone system operators, VoIP providers and private networks built by large end users using dark fiber providers, all of which currently and may in the future, offer services similar to those we offer. In addition, cable companies are increasingly competing with us and other traditional telecommunications providers for enterprise customers, and are beginning to compete for carrier customers as well.
Wireless consolidation has affected the market for our services and may continue to do so. The acquisition of Cingular by AT&T has resulted in the disconnection of some services we previously provided to Cingular and will likely result in additional disconnects in the future as Cingular’s local service needs are met by its new parent company.
Regulatory environments at both the state and federal level differ widely and have considerable influence on our market, economic opportunities and resulting investment decisions. We believe we must continually monitor regulatory developments and remain active in our participation in regulatory issues. Some regulatory decisions have or may in the future have negative impacts on our revenue or expenses, and may favor certain classes of competitors over us. See “Government Regulation.”
To the extent we interconnect with and use ILEC networks to service our customers, we depend on the technology and capabilities of the ILECs to meet certain telecommunications needs of our customers and to maintain our service standards. We also use ILEC special access services and unbundled network element (“UNE”) loops to reach certain customer locations that are not served by our network. Although regulation of ILEC performance standards exists with respect to UNE loops, there is minimal regulatory oversight of the quality of ILEC special access services.
13
Seasonality
Although our business is not inherently seasonal in nature, historically our revenue and expense in the first and third quarters of the year have been impacted by some seasonal factors that may cause fluctuations from the prior quarter. First quarter installations and, therefore, revenue may be impacted by the slowing of our customers’ purchasing activities at the end of the fourth quarter. In addition, revenue from our usage based services such as long distance may be subject to seasonal fluctuations in the first and third quarters resulting from seasonal changes in our customers’ usage patterns. Our expense is also impacted in the first quarter by the resetting of payroll taxes and granting of merit-based salary increases.
Name and Branding Change
We amended our existing Trade Name License Agreement with Time Warner Inc. to extend the term of our license to use the name “Time Warner” until June 30, 2008. By that date we must change our name to TW Telecom or another name that does not include “Time Warner.” Effective September 12, 2006, Time Warner Inc. granted us a perpetual license to use “TW Telecom” and “TWTC” in our communications and related technologies and service business in North America. We have been conducting a branding initiative to select a new name and brand for our business and intend to continue to use the name “Time Warner Telecom” pursuant to the amended Trade Name License Agreement until we select and change our name. We have incurred approximately $1 million in branding costs for the year ended December 31, 2007 and expect to spend an additional $6 to $7 million including $2 million in capital expenditures for that purpose throughout 2008, primarily in the second and third quarters.
Government Regulation
Historically, interstate and foreign communication services were subject to the regulatory jurisdiction of the Federal Communications Commission, or “FCC”, and intrastate and local telecommunications services were subject to regulation by state public service commissions. With enactment of the Telecommunications Act of 1996 (“the 1996 Act”), competition in all telecommunications market segments, including local, toll, and long distance, became matters of national policy even though the states continue to have a significant role in administering policy. We believe that the national policy fostered by the 1996 Act has contributed to significant market opportunities for us. However, since 1996, various ILEC legal challenges and lobbying efforts have resulted in state and federal regulatory decisions affecting implementation of the 1996 Act that favor the ILECs and other competitors. Since federal and state regulatory commissions have largely implemented the provisions of the 1996 Act, we believe that future regulatory activity relating to the 1996 Act will focus largely on enforcement of carrier-to-carrier requirements under the law and on consumer protection measures. Although we have described the principal regulatory factors that currently affect our business, the regulation of telecommunications services is still evolving and regulatory changes could occur in the future that we cannot presently anticipate.
Telecommunications Act of 1996. The 1996 Act is intended to increase competition in local telecommunications services by requiring ILECs to interconnect their networks with CLECs. The 1996 Act imposes a number of access and interconnection requirements on all LECs, including CLECs, with additional requirements imposed on ILECs. In August 1996, the FCC promulgated rules to govern interconnection, resale, dialing parity, UNEs, and the pricing of those facilities and services, including the Total Element Long Run Incremental Cost (“TELRIC”) standard for UNEs. Under the 1996 Act and the FCC rules, ILECs are required to attempt to negotiate with CLECs that want to interconnect with their networks. We have negotiated interconnection agreements with the ILECs in each of the markets in which we offer switched services and have negotiated, or are negotiating, secondary interconnection arrangements with carriers whose territories are adjacent to ours for intrastate intraLATA toll traffic and extended area services. As these agreements expire, we negotiate extensions or new agreements. Typically, expired agreements allow us to continue to exchange traffic with the other carrier pending execution of a new agreement.
14
Reciprocal compensation revenue is an element of intercarrier compensation revenue that represents compensation from LECs for local exchange traffic terminated on our facilities originated by other LECs. As a result of various regulatory rulings beginning in 2001 our reciprocal compensation revenue has generally been declining. Reciprocal compensation represented 1% of total revenue for the year ended December 31, 2007.
In 2001, the FCC adopted an interim carrier-to-carrier cost recovery scheme for such traffic that phased in reductions on the maximum compensation rate for dial-up Internet-bound traffic over a three-year period beginning in 2001 and capped the number of minutes for which ISP-bound traffic can be compensated. The interim Internet-bound cost recovery rule negatively impacted our revenue from reciprocal compensation during the three year reduction period. In October 2004, the FCC determined that it is no longer in the public interest to apply the cap on compensable minutes. This order had a slightly positive impact on our intercarrier compensation revenue.
As a result of the FCC’s triennial review of unbundling to determine which of the UNEs the ILECs must continue to provide under sections 251 and 252 of the 1996 Act, and litigation that followed its decision, the FCC adopted permanent rules governing the availability of UNEs in December 2004. These rules set forth specific marketplace “triggers” that will eliminate the ILECs’ obligation to provide unbundled loops and transport in particular locations. Several ILECs have filed petitions with the FCC for forbearance from the obligation to provide UNEs that would otherwise apply under these triggers. Qwest was granted partial forbearance for the Omaha market, and Verizon has a pending appeal of an FCC decision that denied its request to eliminate the obligation to provide loop and transport UNEs in several of its markets. Qwest has pending petitions in four additional markets that we serve seeking the same forbearance as with the Omaha market. The FCC also has pending a rulemaking to review TELRIC rules, which determine the prices for available UNEs, and the ILECs have argued that the FCC should change its TELRIC rules in ways that would likely yield higher UNE prices. While we have used UNEs very minimally in the past, the Xspedius operations have used UNEs more extensively than we have. It is therefore possible that the we will be more affected by changes in the regulation of UNEs than in the past.
Other Federal Regulation. Switched access is the connection between a long distance carrier’s POP and an end user’s premises provided through the switching facilities of a LEC. Switched access is a component of our intercarrier compensation revenue and represented 3% of total revenue for the year ended December 31, 2007. Historically, the FCC has regulated the access rates imposed by the ILECs while the CLEC access rates have been less regulated. The FCC subjected CLECs’ interstate switched access charges to regulation beginning in 2001. A 2000 ILEC access reform decision, as well as the CLEC access charge regulations, resulted in reductions in the per-minute rates we received for switched access service for the period June 2001 through June 2004. Our ongoing obligation to charge switched access rates that are no higher than those charged by the ILECs has and will continue to result in further reductions to our switched access revenue if the ILEC rates are reduced.
The FCC adopted a Further Notice of Proposed Rulemaking in March 2005 as part of its intercarrier compensation reform proceeding initiated in 2001. This proceeding has been highly complex and controversial. The FCC has considered numerous reform proposals, most of which seek to unify and lower intercarrier compensation rates. Implementation of a unified rate across all forms of intercarrier compensation is likely to require a transition period of several years. The outcome of this proceeding could further reduce our switched access revenue. However, at this time we cannot predict the likely outcome of an FCC intercarrier compensation proceeding or the impact on our revenues and costs.
In January 2005, the FCC commenced a broad examination of the regulatory framework applicable to LECs’ pricing of interstate special access services after June 30, 2005. The outcome of this proceeding could have an impact on the costs we pay for connectivity to other carriers’ facilities to reach our customers. If LEC price reductions were to occur, we would likely experience downward pressure on the prices we charge our customers for special access services and the prices we pay LECs for special access services that we purchase. If LEC special access prices increase, our cost may increase but we may experience less pricing pressure on our
15
special access services. In an order approving Verizon/MCI acquisition, the FCC conditioned its approval upon the combined company not increasing its rates for special access services for a period of 30 month ending July 2008, which has provided us with some price stability. The FCC’s Order that approved the merger of BellSouth Corporation into AT&T included a number of conditions that provide us with rate stability and modest cost savings for special access and UNEs for 42 to 48 months ending mid to late 2010, and provide a framework for a more manageable process for renegotiating our special access and interconnection contracts when they expire over the next few years. We have advocated before the FCC that it should modify its special access pricing flexibility rules so that these services return to price–cap regulation to protect against unreasonable price increases. The FCC is not expected to rule on this matter until after the change in administration that will result from the November 2008 election.
In addition, the ILECs have filed numerous petitions for forbearance from regulation of their broadband special access services, including Ethernet services offered as special access. In March 2006, the FCC allowed a Verizon forbearance petition seeking deregulation of its broadband services to be granted by operation of law and in October 2007 granted key portions of an AT&T petition to remove regulation of broadband services sold to business customers. Similar rulings were granted to several smaller ILECs with respect to specific markets. As a result, the Ethernet and OC-n high capacity data services of these carriers, which we do not currently use, are no longer regulated. Additional ILEC deregulation petitions related to some of the markets we serve are still pending. We and several of our competitors have appealed the default grant of the Verizon petition and the grant of the AT&T petition because we would like to have the ability to obtain broadband special access services on a reasonable basis to reach certain customers that are not on our network. These FCC actions did not impact the availability of the tariffed TDM special access circuits that we use for off-net building access. We expect that the ILECs will continue to advocate deregulation of all forms of special access services, and we cannot predict the outcome of the FCC’s proceedings in this regard or the impact of that outcome on our business.
In a February 1999 order, the FCC allowed for increases to commingled cable and telephony pole attachment rates beginning in February 2001. Since this order we have experienced higher pole attachment fees and could experience future rate increases if it is determined that we should pay the telephony rates in all areas where cable and telephony pole attachments are commingled, which are significantly higher than cable rates, either retroactively or in the future. We expect increased competition from cable companies for certain broadband services (see “Competition”). Under the FCC’s pole attachment regulations, cable companies are permitted to pay the lower cable rate for these services, while we are considered a telecommunications carrier subject to the higher telecommunications rate for the same services. In 2007, we filed a request with the FCC to eliminate this discriminatory rate treatment in its pole attachment regulations. The FCC has released a Notice of Proposed Rulemaking with a tentative conclusion that the pole attachment rates for all providers of broadband networks should be equal. We cannot predict the prospects for success on this initiative at this time.
State Regulation. We have obtained all state government authority needed to conduct our business as currently contemplated. Most state public service commissions require carriers that wish to provide local and other common carrier services provided within the state to be authorized to provide such services. Our operating subsidiaries and affiliates are authorized as common carriers in 33 states and the District of Columbia. These certifications cover the provision of switched services including local basic exchange service, point-to-point private line, competitive access services, and long distance services. Similar to the FCC’s rules regarding interstate switched access, a number of state public service commissions have ruled that CLEC intrastate switched access rates may not exceed the ILEC rates. Currently, 12 states in which we operate have benchmarking rules. We anticipate that additional states will promulgate similar rules in the future.
Local Government Authorizations. We may be required to obtain from municipal authorities street opening and construction permits and other rights-of-way to install and expand our networks in certain cities. In some cities, our affiliates or subcontractors already possess the requisite authorizations to construct or expand our networks. Any increase in the difficulty or cost of obtaining these authorizations and permits could adversely affect us, particularly where we must compete with companies that already have the necessary permits.
16
In some of the metropolitan areas where we provide network services, we pay right-of-way or franchise fees based on a percentage of gross revenue or other metrics such as access lines. Municipalities that do not currently impose fees may seek to impose fees in the future, and following the expiration of existing franchises, fees may be increased. Under the 1996 Act, municipalities are required to impose such fees on a competitively neutral and nondiscriminatory basis. Municipalities that have fee structures that currently favor the ILECs may or may not conform their practices in a timely manner or without legal challenges by us or other CLECs. Moreover, ILECs with which we compete may be exempted from such local franchise fee requirements by previously enacted legislation that allows the ILECs to utilize rights-of-way throughout their states without being required to pay franchise fees to local governments.
In certain markets in which we license fiber capacity from the Cable Operations, we obtain right-of-way through the Capacity License Agreements and have not been required to obtain separate franchises from municipalities. These municipalities could challenge our right to operate under cable franchises.
We are party to various regulatory and administrative proceedings. Subject to the discussion above, we do not believe that any such proceedings will have a material adverse effect on our business.
Employees
As of December 31, 2007, we had 2,859 employees compared to 2,784 employees at December 31, 2006. We believe that our relations with our employees are good. By succession to certain operations of Time Warner Cable at our inception, our operation in New York City is party to a collective bargaining agreement that covers nine of our technicians in New York City. We believe that our success will depend in part on our ability to attract and retain highly qualified employees and maintain good working relations with our current employees.
Financial Information
See Part II Item 8 for our financial results and information.
17
We may not realize all of the anticipated benefits from the Xspedius acquisition.
We acquired Xspedius with the expectation that the acquisition would result in benefits to the combined companies. Achieving the benefits of the acquisition depends in part on the successful integration of Xspedius’ and our operations in a timely and efficient manner. We have achieved substantial progress integrating the Xspedius acquired operations with ours. The remaining integration work will consist primarily of network optimization and grooming to reduce the costs of network services, network enhancements and equipment to enable the deployment of our advanced services in certain additional acquired markets, and process refinement to optimize the integrated systems and organization. There are still risks that remaining integration work may not be completed in an efficient manner, or that we will not generate additional revenue and Modified EBITDA from, and improve the margins in, the acquired business.
We may be unable to sustain our revenue and cash flow growth despite the implementation of several initiatives designed to do so.
We must expand our business and revenue in order to generate sufficient cash flow that, together with funds available under our credit facility, will be sufficient to fund our capital expenditures and our debt service requirements.We have pursued several growth initiatives, including:
| | • | | increasing network investments in existing markets to expand our network reach; |
| | • | | launching new products and services, especially products and services that support customers’ data and IP initiatives; and |
| | • | | increasing our network reach through the acquisition of Xspedius in 2006. |
Our ability to manage this expansion depends on many factors, including our ability to:
| | • | | attract new customers and sell new services to existing customers; |
| | • | | acquire and install transmission facilities and related equipment at reasonable costs; |
| | • | | employ new technologies; |
| | • | | obtain required permits and rights-of-way; |
| | • | | enhance our financial, operating, and information systems to effectively manage our growth; |
| | • | | accurately predict and manage the cost and timing of our capital expenditure programs; and |
| | • | | integrate the acquired operations. |
There is no assurance that our growth initiatives will continue to result in an improvement in our financial position or our results of operations. We have historically incurred net losses even during periods of increasing revenue, and while we are now closer to becoming net income positive, certain factors could cause continued losses including, among others, economic conditions, industry consolidations, decreased demand, customers disconnecting services, regulatory and contractual rate reductions, revenue disputes, and issuance of proposed accounting standards (see Part II, Item 7. “Management’s Discussion and Analysis of Financial Condition and Results of Operations — Proposed New Accounting Pronouncement”).
Several customers account for a significant portion of our revenue, and some of our customers’ purchases may not continue due to customer consolidations, financial difficulties or other factors.
We have substantial business relationships with a few large customers, especially other carriers. For the year ended December 31, 2007, our top ten customers accounted for approximately 26% of our total revenue. The highly competitive environment in the long haul carrier sector, including interexchange carriers, has challenged the financial condition and growth prospects of some of our carrier customers and could lead to further reductions in our revenue in the future.
18
Some of our service agreements with customers are subject to termination on short notice and do not require the customer to maintain the services at current levels. Customers may not continue to purchase the same services or level of services. Increasing consolidation in the telecommunications industry has occurred in recent years, and if any of our customers are acquired we may lose a significant portion of their business. SBC’s merger with AT&T Corp. (now AT&T Inc.) and subsequent acquisition of BellSouth Corp. has and may continue to result in the surviving company buying less local transport service from us in SBC’s and BellSouth Corp.’s service areas in the long run. In addition, revenue from Cingular which was party to consolidations in 2004 and 2006 and represented 5% of total revenue in 2004 has declined to less than 2% of total revenue in 2007, and is expected to further decline in 2008.
We continue to experience customer and service disconnects in the normal course of business primarily associated with industry consolidation, customer network optimization, price competition from other providers, cost cutting, business contractions, bankruptcies or other financial difficulties, including most recently, disconnections of service by a few customers in the mortgage industry adversely affected by the subprime mortgage downturn. Monthly revenue loss from disconnects averaged 1.2%, 1.2%, and 1.0% of monthly revenue in 2005, 2006 and 2007, respectively. While we expect that some customers will continue to disconnect services due to the reasons mentioned above, we cannot predict the total impact on revenue from these disconnects or the timing of such disconnects. Replacing this revenue with new revenue from other carrier customers or with enterprise customer revenue may be difficult. Among other factors, individual enterprise customers tend to place smaller service orders than some of our larger carrier customers. In addition, pricing pressure on some of our more mature products may challenge our ability to grow our revenue.
Our substantial existing debt and debt service requirements could impair our financial condition and our ability to fulfill our obligations under our debt.
We have been carrying substantial amounts of debt, and our level of debt may affect our operations and our ability to make payments on our outstanding indebtedness. Subject to certain covenants in our credit agreement and the indentures for our outstanding senior notes, we may incur significant additional indebtedness in the future. As of December 31, 2007, our total long term debt and capital lease obligations were approximately $1.4 billion.
Our substantial indebtedness could, for example:
| | • | | limit our ability to obtain additional financing in the future for working capital, capital expenditures, acquisitions or other corporate purposes; |
| | • | | make us more vulnerable to economic downturns or other adverse developments than less leveraged competitors; and |
| | • | | decrease our ability to withstand competitive pressures. |
The acquisition of Xspedius increased our indebtedness and decreased our liquidity.
The consideration for the Xspedius acquisition consisted, in part, of approximately $211.5 million in cash after giving effect to a final working capital adjustment of $4.5 million. In order to finance a portion of the cash consideration and to refinance our higher cost debt, we entered into a new $600 million secured term loan B in October 2006. After giving effect to the term loan B and use of proceeds to repay other outstanding indebtedness, our total debt increased by $161.5 million. In addition, we replaced our $110.0 million secured revolving credit facility with a $100 million secured revolving credit facility. The increased indebtedness and interest expense and decreased cash position has decreased our liquidity. Decreased liquidity could adversely affect our ability to fund capital expenditures for the expansion of our network in the future.
19
Our revolving credit facility and term loan B and the indenture relating to our senior notes contain restrictive covenants that may limit our flexibility, and breach of those covenants may cause us to be in default under those agreements.
The credit agreement for our revolving credit facility, term loan B, and the indenture relating to our senior notes limit, and in some circumstances prohibit, our ability to, among other things:
| | • | | make capital expenditures, investments or other restricted payments; |
| | • | | engage in sale-leaseback transactions; |
| | • | | engage in transactions with stockholders and affiliates; |
| | • | | issue or sell capital stock of subsidiaries; and |
| | • | | engage in mergers and acquisitions. |
These restrictions could limit our ability to obtain future financing, make acquisitions or needed capital expenditures, withstand a future downturn in our business or the economy in general, conduct operations or otherwise take advantage of business opportunities that may arise. In addition, if we do not comply with these covenants and financial covenants in our credit agreement that require us to maintain certain minimum financial ratios, the indebtedness outstanding under our credit agreement, and by reason of cross-acceleration or cross-default provisions, our senior notes and any other outstanding indebtedness we may then have, could become immediately due and payable. If we are unable to repay those amounts, the lenders under the credit agreement could initiate a bankruptcy proceeding or liquidation proceeding or proceed against the collateral granted to them to secure that indebtedness. If the lenders under our credit agreement were to accelerate the repayment of outstanding borrowings, we might not have sufficient assets to repay our indebtedness.
In addition, the lenders under our revolving credit facility could refuse to lend funds if we are not in compliance with our financial covenants, such as leverage and interest coverage ratios that are primarily derived from EBITDA (see note 7 to Item 6. “Selected Financial Data”) and debt levels. A lack of revenue growth or an inability to control costs could negatively impact our EBITDA margins and cause our failure to meet the minimum required ratios. We could fail to comply with the covenants in the future due to many factors, including losses of revenue due to customer disconnects or other factors or reduction in margins due to pricing pressures or rising costs or the inability to successfully integrate our acquired operations.
We will require substantial capital to expand our operations.
The development and expansion of our networks requires substantial capital investment. If this capital is not available when needed, our business will be adversely affected. Our 2007 capital expenditures were $259.5 million, and our estimate of our 2008 capital expenditures is $250 million to $274 million, including expenditures for integration and branding. We also expect to have substantial capital expenditures thereafter.
Our wholly-owned subsidiary has an unused senior secured revolving credit facility that, subject to certain conditions, allows us to borrow up to $100 million. We may be required to seek financing in addition to that facility if:
| | • | | our business plans and cost estimates are inaccurate; |
20
| | • | | we are not able to generate sufficient cash flow from operations to service our debt, fund our capital expenditures and finance our business operations; |
| | • | | we decide to significantly accelerate the expansion of our business and existing networks; or |
| | • | | we consummate acquisitions or joint ventures or other strategic transactions that require incremental capital. |
If we were to seek additional financing, the terms offered may place significant limits on our financial and operating flexibility, or may not be acceptable to us. The failure to raise sufficient funds if needed and on reasonable terms may require us to modify or significantly curtail our business plan. This could have a material adverse impact on our growth, ability to compete, and ability to service our debt.
We may complete a significant business combination or other transaction that could increase our shares outstanding, and may result in a change in control, and which may also affect our leverage.
We regularly evaluate potential acquisitions, joint ventures and other arrangements that would extend our geographic markets, expand our services, enlarge the capacity of our networks or increase the types of services provided through our networks. If we enter into a definitive agreement with respect to any acquisition, joint venture or other arrangement, we may require additional financing that could result in an increase in our leverage, result in a change of control, increase the number of outstanding shares, or all of these effects. A substantial transaction may require the consent of our lenders. There can be no assurance that we will enter into any transaction or, if we do, on what terms. In addition, the success of any significant acquisition or business combination is dependent, in part, on our ability to successfully integrate the acquired business into ours, which also carries substantial risks.
We have experienced reductions in switched access and reciprocal compensation revenue as a result of regulatory rate reform, and we may experience further such reductions in the future.
Over the past several years FCC and state regulations have reduced our switched access revenue as well as our reciprocal compensation revenue. The FCC has been considering proposals for an integrated intercarrier compensation regime under which all traffic exchanged between carriers would be subject to a unified rate. Such changes could materially reduce our switched access revenue from other carriers, but may create an opportunity for us to recover some, but not all, of that lost revenue directly from end users. We cannot predict the outcome of pending FCC rule makings related to inter-carrier compensation. Switched access and reciprocal compensation together have been declining over time and represented 5%, 5% and 4% of our 2005, 2006 and 2007 revenue, respectively. There can be no assurance that we will be able to compensate for the reduction in intercarrier compensation revenue with other revenue sources or increased volume.
We may be adversely affected by changes in the regulation of special access services.
We provide special access services in competition with ILECs, and we also purchase special access services from ILECs to extend the reach of our network. A significant change in the regulations governing special access services could result in either significant reductions in the special access prices charged by our ILEC competitors or in the elimination of regulations that increase the likelihood that ILECs will sell us special access on reasonable terms and conditions.
In January 2005, the FCC released a notice of proposed rulemaking in which it considers the adoption of new special access pricing regulations that could eventually result in reductions in ILEC special access prices or constraints on the degree of pricing flexibility ILECs will continue to have. We have advocated before the FCC that it should modify its special access pricing flexibility rules so that these services return to price-cap regulation to protect against unreasonable price increases. The FCC is not expected to rule on special access regulation until after the change in administration that will result from the November 2008 election. We cannot at this time predict the outcome of this proceeding. In an order approving the Verizon/MCI mergers, the FCC conditioned its
21
approval upon the combined company not increasing its rates for special access services for a period of 30 months ending July 2008, which has provided us with a period of price stability. The FCC’s Order that approved the merger of BellSouth Corporation into AT&T included a number of conditions that provide us with rate stability and modest cost savings for special access and UNEs for 42 to 48 months ending mid to late 2010, and provide a framework for a more manageable process for renegotiating our special access and interconnection contracts when they expire over the next few years. We cannot predict whether and the extent to which the special access pricing of these carriers will increase after the expiration of these merger conditions. If the prices that we must pay for special access services from these carriers increase materially, our margins could be adversely affected.
The ILECs have argued before the FCC that their broadband services, including special access services, should no longer be subject to regulation governing price and quality of service. In August 2005, the FCC adopted an order in the Wireline Broadband Internet Access proceeding that classified wireline broadband Internet access services, including the underlying transmission facilities, as unregulated services. Since the FCC specifically excluded from this classification special access and Ethernet transmission services we use for off-net building access, these services currently remain subject to regulation as telecommunications services. However, Verizon has filed a petition with the FCC seeking reconsideration of the FCC’s decision to continue to regulate these services. In addition, the ILECs have filed numerous petitions for forbearance from regulation of their broadband special access services, including Ethernet services offered as special access. In March 2006, the FCC allowed a Verizon forbearance petition seeking deregulation of its broadband services to be granted by operation of law and in October 2007 granted key portions of an AT&T petition to remove regulation of broadband services sold to business customers. Similar rulings were granted to several smaller ILECs. As a result, the Ethernet and OC-n high capacity data services of these carriers are no longer regulated. We and several of our competitors have appealed the default grant of the Verizon petition and the grant of the AT&T petition. While we do not currently use these services, their de-regulation may foreclose opportunities to reach additional customers in a manner that may otherwise be unavailable to us on a reasonable basis. These FCC actions did not impact the availability of the tariffed TDM special access circuits that we use for off-net building access. We expect that the ILECs will continue to advocate deregulation of all forms of special access services, and we cannot predict the outcome of the FCC’s proceedings in this regard or the likelihood of success of legislative proposals regarding deregulation. As a result, we cannot assure you that we will continue to be able to obtain special access services at reasonable rates, on a timely basis or that the quality of service we receive will be acceptable. In the event that we experience difficulties in obtaining high-quality, reliable, and reasonably priced service from the ILECs, the attractiveness of certain of our services to our customers could be impaired.
We may be adversely affected by changes to the Communications Act.
Congress may consider adopting significant revisions to the Communications Act at some point over the next several years. As part of that process, Congress may consider proposals for new statutory provisions requiring intercarrier compensation reform and the deregulation of ILEC broadband services (including the elimination of the incumbent local exchange carriers’ unbundling obligations and regulations governing special access services). The adoption of a new intercarrier compensation regime and the deregulation of ILEC broadband service would pose the risks described above regarding analogous FCC action. The 2008 presidential election will likely result in a change in the composition of the FCC. These changes could be either beneficial or detrimental for us, but cannot be predicted at this time.
The market for our services is highly competitive, and many of our competitors have significant advantages that may adversely affect our ability to compete with them.
We operate in an increasingly competitive environment and some companies may have competitive advantages over us. Most ILECs offer substantially the same services as we offer, in some cases at higher prices and in some cases at lower prices. ILECs benefit from:
| | • | | long-standing relationships with their customers; |
22
| | • | | greater financial and technical resources; |
| | • | | broader network coverage; |
| | • | | the ability to subsidize local services with revenue from unrelated businesses; and |
| | • | | recent regulatory decisions that decrease regulatory oversight of ILECs. |
Consolidations involving ILECs, CLECs and others may result in fewer, but stronger competitors. We also face competition from other CLECs, cable television companies and others. Our revenue and margins may also be reduced from price cutting by other telecommunications service providers that may pressure our pricing or require us to adjust prices for existing services upon contract renewals. In some of the markets in which we operate we may experience intense competition for particular customers, which could adversely affect our future revenue and margins.
Consolidation in the telecommunications industry may adversely affect our purchases of transport services.
Consolidation in the telecommunications industry may also impact some of our purchases of the local and long haul transport services that we utilize to connect our local markets and reach customers that are not connected to our network. Some of the carriers that supply these services are in the process of integrating their systems with acquired systems. These integrations may cause delays in provisioning services to us and other customers of these carriers or may affect their service quality, which could in turn have an adverse impact on our revenue.
We depend on key personnel for our current and future performance.
Our current and future performance depends to a significant degree upon the continued contributions of our senior management team and other key personnel. The loss or unavailability to us of members of our senior management team or key employees could significantly harm us. We cannot assure you that we would be able to locate or employ qualified replacements on acceptable terms for senior management or key employees if their services are no longer available.
We may be required to record impairment charges in the future.
Under U.S. generally accepted accounting principles, or U.S. GAAP, we are required to review the carrying amounts of our assets, including goodwill, to determine whether current events or circumstances warrant adjustments to those amounts. These determinations are based in part on our judgments regarding the cash flow potential of various assets, and involve projections that are inherently subject to change based on future events. If we conclude in the future that the cash flow potential of any of our assets, including those acquired in the Xspedius transaction, is significantly less than we believed at the time of purchase, and that conclusion is based on a long-term rather than short-term trend, we may need to record an impairment charge. In 2007, we recorded an impairment charge of $7.3 million on commercial paper investments with exposure to sub-prime mortgages that are past their maturity dates. The carrying value of these securities after recognition of the impairment is $14.5 million at December 31, 2007. Any additional impairment charges would have a negative impact on our earnings.
Terrorism, a general business downturn in the U.S. or other business disruptions could affect our future operating results.
Our operating results and financial condition could be materially and adversely affected in the event of a catastrophic event such as a terrorist attack on the United States, or a major earthquake, fire, hurricane or similar event that affects our central offices, corporate headquarters, network operations center or other facilities. Although we have implemented measures that are designed to mitigate the effects of a catastrophic event, we cannot predict the impact of such events. Our operating results and financial condition could be materially and
23
adversely affected if the U.S. economy is adversely affected by a recession or other business downturn that results in our customers buying less services, disconnecting services or in reduced prospects for the sale of new services.
We depend on third party vendors for information systems.
We have entered into agreements with vendors that provide for the development and operation of information technology systems such as billing systems. The failure of those vendors to perform their services in a timely and effective manner at acceptable costs could have a material adverse effect on our operations and our ability to monitor costs, bill customers, provision customer orders, and achieve operating efficiencies.
If we do not adapt to rapid changes in the telecommunications industry, we could lose customers or market share.
The telecommunications industry continues to experience rapid and significant changes in technologies and architectures to deliver new services to customers. We expect that trend to continue into the foreseeable future. Additionally, we expect that these new technologies, such as VoIP, will enable new applications that will facilitate new services both in the network as well as at customers’ premises. We believe that our future success will depend in part on our ability to anticipate or adapt to these changes and integrate them into the infrastructure and operations of our business, in order to offer on a timely basis a service that meets customer needs and demands. Our failure to obtain and integrate new technologies and applications could impact the breadth of our product portfolio resulting in product gaps, a less differentiated product suite and a less compelling offer to customers, as well as having a material adverse impact on our business, financial condition and results of operations.
We must obtain access to rights-of-way and pole attachments on reasonable terms and conditions.
The development, expansion, and maintenance of our networks depend on, among other things, our ability to obtain rights-of-way and pole attachments as well as certain governmental authorizations and permits. In order to compete effectively, we must obtain such rights, authorizations and permits in a timely manner, at reasonable costs, and on satisfactory terms and conditions. Any increase in the difficulty or cost of obtaining these rights, authorizations or permits could adversely affect us, particularly in areas where we must compete with companies that already have the necessary permits and access.
In certain cities and municipalities where we provide network services over our own fiber optic facilities, we pay license or franchise fees for the use of public rights-of-way. The 1996 Act permits municipalities to charge these fees only if they are competitively neutral and nondiscriminatory, but certain municipalities may not conform their practices to the requirements of the 1996 Act in a timely manner or without legal challenge. We also face the risks that other cities may start imposing fees, fees will be increased, or franchises will not be renewed. Some of our franchise agreements also provide for increases or renegotiation of fees at certain intervals. Increases in fees may have a negative impact on our financial condition. If any of our existing franchise or license agreements for a particular metropolitan area are terminated prior to their expiration date and we are forced to remove our fiber optic cables from the streets or abandon our network in place, even with compensation, such termination could have a material adverse effect on us.
We currently license fiber optic capacity from the Cable Operations in 23 of our markets, and we must reimburse the Cable Operations for the fees associated with the fiber optic capacity we license from them. In some cases pole owners have claimed that the Cable Operations must pay pole attachments fees at the higher telecommunications rate as a result of our license of capacity from the Cable Operations under the Capacity License Agreement. If the pole owners charge the higher telecommunications rate to the Cable Operations, we may be required to reimburse the Cable Operations for attachment fees at a higher rate. We have advocated changes in the Federal regulatory scheme affecting pole attachments that would , if adopted, result in rate
24
neutrality among various users of pole attachments. The prospects for success on this initiative are difficult to predict, especially in an election year.
The Cable Operations may terminate our Capacity License Agreements before expiration upon:
| | • | | a material impairment of the licensor’s ability to provide the license by law; |
| | • | | a material breach of the capacity license by us; or |
| | • | | the institution of any proceedings to impose any public utility or common carrier status or obligations on the licensor, or any other proceedings challenging the licensor’s operating authority as a result of the services provided to us under the capacity license. |
If the Capacity License Agreements are terminated prior to their scheduled expiration in 2028 or are not renewed, we may need to build, lease, or otherwise obtain fiber optic capacity. The terms of those arrangements may be materially less favorable to us than the terms of our existing capacity license. In addition, the Capacity License Agreements prohibit us from offering residential services or content services utilizing the licensed capacity.
Our ability to offer residential and content services is limited by our Capacity License Agreements.
Our Capacity License Agreements with the Cable Operations prohibit us from using facilities licensed under those agreements until 2028 to (i) engage in the business of providing, offering, packaging, marketing, promoting, or branding (alone or jointly with or as an agent for other parties) any residential services, or (ii) produce or otherwise provide entertainment, information, or other content services. Although we do not believe that these restrictions will materially affect our business and operations in the immediate future, we cannot predict the effect of such restrictions in the rapidly changing telecommunications industry. We do not currently have plans to offer residential or content services in our service areas not covered by the Capacity License Agreements.
We will discontinue the use of the “Time Warner” name, which may adversely affect us.
We use the name Time Warner Telecom under the terms of a Trade Name License with Time Warner Inc. On May 1, 2007 we extended the expiration date from July 13, 2007 to June 30, 2008, or earlier upon the occurrence of certain events. We have been conducting a branding initiative to select a new name and brand for our business. We have authorization to change our corporate name (and amend our Restated Certificate of Incorporation) to “TW Telecom Inc.” under the terms of an amendment to our Restated Certificate of Incorporation that was approved by our Board of Directors and a majority of our outstanding voting power on September 26, 2006, and must do so by July 1, 2008 unless we have changed our name to another name that does not include “Time Warner”. We intend to conduct business under “Time Warner Telecom” pursuant to the amended Trade Name License until we complete our branding initiative. As a result of our branding initiative, we could in the future adopt a different business name or seek to change our corporate name by amending our Restated Certificate of Incorporation. Although we believe that separate branding from Time Warner may be beneficial to our business and may, for example, eliminate previous confusion in markets also served by Time Warner Cable, the impact of a name change away from the well-established “Time Warner” name is uncertain and could be adverse.
| Item 1B. | Unresolved Staff Comments |
None
25
We lease network hub sites and other facility locations and sales and administrative offices in each of the cities in which we operate networks. During 2007, 2006, and 2005, rental expense for our facilities and offices totaled approximately $51.5 million, $33.6 million, and $29.5 million, respectively. We believe that our properties, taken as a whole, are in good operating condition and are adequate for our business operations. We currently lease approximately 116,000 square feet of space in Littleton, Colorado, where our corporate headquarters are located, approximately 130,000 square feet of space in Greenwood Village, Colorado, where our first national operations center and other administrative functions are located, and approximately 48,000 square feet of space in O’Fallon, Missouri, where our second national operations center is located.
We are party to various claims and legal and regulatory proceedings in the ordinary cause of business. We do not believe that these claims or proceedings, individually or in the aggregate, are material or will have a material adverse effect on our business, financial condition, or results of operations.
| Item 4. | Submission of Matters to a Vote of Security Holders |
No matters were submitted to a vote of security holders during the quarter ended December 31, 2007.
26
PART II
| Item 5. | Market for Registrant’s Common Equity, Related Stockholder Matters and Issuer Purchases of Equity Securities |
Market Information
Our common stock is traded on the Nasdaq Global Select Market of the Nasdaq Stock Market under the symbol “TWTC”. The following table sets forth the high and low sales prices for the common stock for each of the quarters of 2007 and 2006 as reported on the Nasdaq Stock Market:
| | | | | | |
Period | | High | | Low |
| 2007 | | | | | | |
First Quarter | | $ | 23.97 | | $ | 19.30 |
Second Quarter | | | 21.89 | | | 18.08 |
Third Quarter | | | 23.29 | | | 16.83 |
Fourth Quarter | | | 24.00 | | | 19.24 |
| | |
| 2006 | | | | | | |
First Quarter | | $ | 18.73 | | $ | 9.46 |
Second Quarter | | | 17.98 | | | 13.43 |
Third Quarter | | | 19.45 | | | 13.32 |
Fourth Quarter | | | 21.20 | | | 17.33 |
Dividends
We have never paid or declared any dividends and do not anticipate paying any dividends in the near term. The decision whether to pay dividends will be made by our Board of Directors in light of conditions then existing, including our results of operations, financial condition and requirements, business conditions, covenants under loan agreements and other contractual arrangements, and other factors. In addition, the indentures for our outstanding Senior Notes and the credit agreement governing our term loan contain covenants that may limit the amount of cash dividends on our common stock that we may pay. The credit agreement governing our unused revolving credit facility currently prevents us from paying cash dividends on our common stock.
Number of Stockholders
As of January 31, 2008, there were 609 holders of record of our common stock.
27
Performance Graph
The following graph compares total stockholder return on our common stock since December 31, 2002, with the Nasdaq Composite Index (U.S. and foreign companies) and the NASDAQ Telecommunications Index. The graph assumes that $100 was invested in our stock at the closing price of $2.11 on December 31, 2002, and that the same amount was invested in the NASDAQ Composite Index and the Nasdaq Telecommunications Index. Our closing price on December 31, 2007, the last trading day of our 2007 fiscal year, was $20.29.
Comparison of Cumulative Total Return on Investment
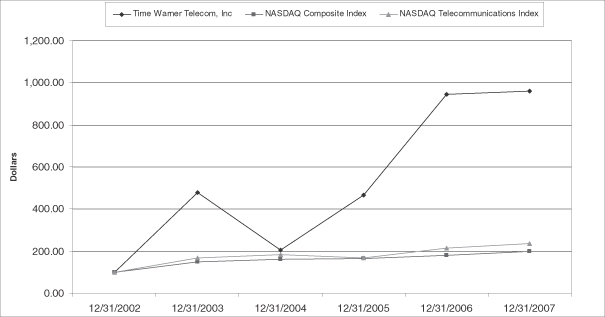
| | | | | | | | | | | | | | | | | | |
| | | Years Ended December 31, |
| | | 2002 | | 2003 | | 2004 | | 2005 | | 2006 | | 2007 |
Time Warner Telecom Inc | | $ | 100.00 | | $ | 480.09 | | $ | 206.64 | | $ | 466.82 | | $ | 944.55 | | $ | 961.61 |
Nasdaq Composite Index | | $ | 100.00 | | $ | 150.01 | | $ | 162.89 | | $ | 165.13 | | $ | 180.85 | | $ | 198.60 |
Nasdaq Telecommunications Index | | $ | 100.00 | | $ | 168.74 | | $ | 182.23 | | $ | 169.09 | | $ | 216.03 | | $ | 235.85 |
28
| Item 6. | Selected Financial Data |
Selected Consolidated and Combined Financial and Other Operating Data
The following table is derived in part from our audited consolidated financial statements. This information should be read in conjunction with “Management's Discussion and Analysis of Financial Condition and Results of Operations” and the audited consolidated financial statements and the notes thereto.
| | | | | | | | | | | | | | | | | | | | |
| | | Years Ended December 31, | |
| | | 2007 | | | 2006 | | | 2005 | | | 2004 | | | 2003 | |
| | | (in thousands, except per share and operating data amounts) | |
Statements of Operations Data: | | | | | | | | | | | | | | | | | | | | |
Revenue (1)(2): | | | | | | | | | | | | | | | | | | | | |
Network services | | $ | 393,569 | | | $ | 355,996 | | | $ | 341,779 | | | $ | 332,577 | | | $ | 361,038 | |
Voice services | | | 327,246 | | | | 201,968 | | | | 166,808 | | | | 157,905 | | | | 152,789 | |
Data and Internet services | | | 318,269 | | | | 216,419 | | | | 162,834 | | | | 124,805 | | | | 104,576 | |
Intercarrier compensation (3) | | | 44,595 | | | | 37,992 | | | | 37,306 | | | | 37,800 | | | | 51,188 | |
| | | | | | | | | | | | | | | | | | | | |
Total revenue | | | 1,083,679 | | | | 812,375 | | | | 708,727 | | | | 653,087 | | | | 669,591 | |
| | | | | | | | | | | | | | | | | | | | |
Costs and expenses (4): | | | | | | | | | | | | | | | | | | | | |
Operating (exclusive of depreciation, amortization and accretion shown separately below) (2)(5) | | | 470,038 | | | | 311,532 | | | | 264,517 | | | | 261,285 | | | | 264,322 | |
Selling, general, and administrative (5) | | | 296,638 | | | | 228,485 | | | | 193,052 | | | | 178,317 | | | | 172,925 | |
Depreciation, amortization, and accretion | | | 279,454 | | | | 256,091 | | | | 238,180 | | | | 230,688 | | | | 223,904 | |
| | | | | | | | | | | | | | | | | | | | |
Total costs and expenses | | | 1,046,130 | | | | 796,108 | | | | 695,749 | | | | 670,290 | | | | 661,151 | |
| | | | | | | | | | | | | | | | | | | | |
Operating income (loss) | | | 37,549 | | | | 16,267 | | | | 12,978 | | | | (17,203 | ) | | | 8,440 | |
Interest and other income (expense), net | | | (76,818 | ) | | | (115,058 | ) | | | (121,042 | ) | | | (115,198 | ) | | | (93,790 | ) |
| | | | | | | | | | | | | | | | | | | | |
Loss before income taxes and cumulative effect of change in accounting principle | | | (39,269 | ) | | | (98,791 | ) | | | (108,064 | ) | | | (132,401 | ) | | | (85,350 | ) |
Income tax expense | | | 1,000 | | | | 28 | | | | — | | | | 636 | | | | 1,021 | |
| | | | | | | | | | | | | | | | | | | | |
Net loss before cumulative effect of change in accounting principle | | | (40,269 | ) | | | (98,819 | ) | | | (108,064 | ) | | | (133,037 | ) | | | (86,371 | ) |
Cumulative effect of change in accounting
principle (6) | | | — | | | | — | | | | — | | | | — | | | | 2,965 | |
| | | | | | | | | | | | | | | | | | | | |
Net loss | | $ | (40,269 | ) | | $ | (98,819 | ) | | $ | (108,064 | ) | | $ | (133,037 | ) | | $ | (89,336 | ) |
| | | | | | | | | | | | | | | | | | | | |
Basic and diluted loss per share | | $ | (0.28 | ) | | $ | (0.80 | ) | | $ | (0.93 | ) | | $ | (1.15 | ) | | $ | (0.78 | ) |
| | | | | | | | | | | | | | | | | | | | |
| | | | | |
Other Operating Data: | | | | | | | | | | | | | | | | | | | | |
Modified EBITDA (3)(7)(8) | | $ | 339,003 | | | $ | 286,023 | | | $ | 251,158 | | | $ | 213,485 | | | $ | 232,344 | |
Modified EBITDA margin (3)(7)(9) | | | 31 | % | | | 35 | % | | | 35 | % | | | 33 | % | | | 35 | % |
Net cash provided by operating activities | | $ | 264,207 | | | $ | 174,558 | | | $ | 128,420 | | | $ | 86,541 | | | $ | 123,621 | |
Capital expenditures | | $ | 259,527 | | | $ | 192,679 | | | $ | 162,521 | | | $ | 171,833 | | | $ | 129,697 | |
| | | | | |
Operating Data (as of the end of each period presented): | | | | | | | | | | | | | | | | | | | | |
Operating networks | | | 75 | | | | 75 | | | | 44 | | | | 44 | | | | 44 | |
Route miles | | | 25,753 | | | | 24,670 | | | | 20,604 | | | | 19,169 | | | | 18,276 | |
Employees | | | 2,859 | | | | 2,784 | | | | 2,034 | | | | 1,986 | | | | 2,009 | |
| | | | | |
Balance Sheet Data (as of the end of each period presented): | | | | | | | | | | | | | | | | | | | | |
Cash and cash equivalents | | $ | 321,531 | | | $ | 221,553 | | | $ | 210,834 | | | $ | 130,052 | | | $ | 353,032 | |
Investments, short-term | | | — | | | | 87,900 | | | | 182,689 | | | | 302,454 | | | | 125,561 | |
Property, plant, and equipment, net | | | 1,294,900 | | | | 1,294,112 | | | | 1,226,950 | | | | 1,303,092 | | | | 1,363,247 | |
Total assets | | | 2,264,718 | | | | 2,253,237 | | | | 1,792,536 | | | | 1,905,588 | | | | 2,005,883 | |
Long-term debt and capital lease obligations | | | 1,370,318 | | | | 1,375,958 | | | | 1,246,362 | | | | 1,249,197 | | | | 1,203,383 | |
Total stockholders’ equity | | $ | 566,225 | | | $ | 552,648 | | | $ | 264,514 | | | $ | 367,158 | | | $ | 497,799 | |
29
| (1) | Includes revenue resulting from transactions with affiliates of $13.1 million, $16.9 million, $19.9 million, and $33.4 million in 2006, 2005, 2004, and 2003, respectively. See Note 6 to our consolidated financial statements appearing elsewhere in this report for an explanation of the 2006 and 2005 transactions with affiliates. |
| (2) | We classify certain taxes and fees billed to customers and remitted to government authorities in revenue on a gross versus net basis. Beginning January 1, 2007, we added additional fees billed to customers and remitted to government authorities in our gross revenue. This has no impact on Modified EBITDA or net loss, but increased revenue and operating expenses by $14.9 million for the year end December 31, 2007. See Note 1 “Revenue” to our consolidated financial statements appearing elsewhere in the report for further discussion. |
| (3) | Includes favorable reciprocal compensation settlements that totaled $3.9 million in 2003. |
| (4) | Includes expenses resulting from transactions with affiliates of $6.6 million, $8.0 million, $6.9 million, and $5.6 million in 2006, 2005, 2004, and 2003, respectively. See Note 6 to our consolidated financial statements appearing elsewhere in this report for an explanation of these expenses for 2006 and 2005. |
| (5) | Includes the following non-cash stock-based employee compensation: |
| | | | | | | | | | | |
| | | Years Ended December 31, |
| | | 2007 | | 2006 | | 2005 | | 2004 | | 2003 |
| | | (amounts in thousands) |
Operating…………………………………………… | | $ | 3,555 | | 2,075 | | — | | — | | — |
Selling, general, and administrative……………… | | | 18,445 | | 11,590 | | 915 | | 1,164 | | 1,481 |
| (6) | During 2003, we implemented Financial Accounting Standards Board Statement No. 143, Accounting for Asset Retirement Obligations. See Note 1 to our consolidated financial statements. |
| (7) | “Modified EBITDA” is defined as net income or loss before depreciation, amortization, and accretion expense, interest expense, interest income, debt extinguishment costs, investment gains (losses), other gains (losses), impairment charges, income tax expense (benefit), cumulative effect of change in accounting principle, and non-cash stock-based compensation. Modified EBITDA is not intended to replace operating income (loss), net loss, cash flow and other measures of financial performance and liquidity reported in accordance with accounting principles generally accepted in the United States. Rather, Modified EBITDA is a measure of operating performance and liquidity that investors may consider in addition to such measures. Our management believes that Modified EBITDA is a standard measure of operating performance and liquidity that is commonly reported and widely used by analysts, investors, and other interested parties in the telecommunications industry because it eliminates many differences in financial, capitalization, and tax structures, as well as non-cash and non-operating charges to earnings. We believe that Modified EBITDA trends are a valuable indicator of whether our operations are able to produce sufficient operating cash flow to fund working capital needs, service debt obligations, and fund capital expenditures. We currently use Modified EBITDA for these purposes. Modified EBITDA also is used internally by our management to assess ongoing operations and is a measure used to test compliance with certain covenants of our senior notes, our revolving credit facility and our term loan. The definition of EBITDA under our revolving credit facility, our term loan and our senior notes differs from the definition of Modified EBITDA used in this table. The definition of EBITDA in our credit facility discussed below also eliminates certain non-cash losses within certain limits and certain extraordinary gains and the senior notes definition eliminates other non-cash items. However, the resulting calculation is not materially different for the periods presented. Modified EBITDA as used in this document may not be comparable to similarly titled measures reported by other companies due to differences in accounting policies. |
(8) The reconciliation between net loss and Modified EBITDA is as follows:
| | | | | | | | | | | | | | | | |
| | | Year Ended December 31, | |
| | | 2007 | | | 2006 | | | 2005 | | | 2004 | | | 2003 | |
| | | (In thousands) | |
Net loss | | $ | (40,269 | ) | | (98,819 | ) | | (108,064 | ) | | (133,037 | ) | | (89,336 | ) |
Cumulative effect of change in accounting principle | | | — | | | — | | | — | | | — | | | 2,965 | |
Income tax expense | | | 1,000 | | | 28 | | | — | | | 636 | | | 1,021 | |
Interest income | | | (17,489 | ) | | (20,054 | ) | | (13,220 | ) | | (6,483 | ) | | (5,858 | ) |
Interest expense | | | 91,285 | | | 98,238 | | | 120,219 | | | 113,954 | | | 103,642 | |
Debt extinguishment costs | | | — | | | 36,874 | | | 14,043 | | | 8,437 | | | — | |
Other (income) loss | | | 3,022 | | | — | | | — | | | (710 | ) | | (3,994 | ) |
Depreciation, amortization and accretion | | | 279,454 | | | 256,091 | | | 238,180 | | | 230,688 | | | 223,904 | |
Non-cash stock-based compensation | | | 22,000 | | | 13,665 | | | — | | | — | | | — | |
| | | | | | | | | | | | | | | | |
Modified EBITDA | | $ | 339,003 | | | 286,023 | | | 251,158 | | | 213,485 | | | 232,344 | |
| | | | | | | | | | | | | | | | |
| (9) | Modified EBITDA margin represents Modified EBITDA as a percentage of revenue. |
30
| Item 7. | Management’s Discussion and Analysis of Financial Condition and Results of Operations |
You should read the following discussion and analysis in conjunction with our audited consolidated financial statements, including the notes thereto, appearing elsewhere in this report.
Overview
We are a leading national provider of managed network services, specializing in Ethernet and transport data networking, Internet access, local and long distance voice, VoIP and network security services to enterprise organizations and communications services companies throughout the U.S. Our customers include, among others, enterprise organizations in the distribution, health care, finance, and manufacturing industries, state, local and federal government entities and long distance carriers, ILECs, CLECs, wireless communications companies, and ISPs.
Through our subsidiaries, we operate in 75 U.S. metropolitan markets. As of December 31, 2007, our fiber networks spanned 25,753 route miles directly connecting 8,355 buildings served entirely by our facilities (on-net). We continue to expand our footprint within our existing markets by connecting our network into additional buildings. We have also continued to expand our IP backbone data networking capability between markets supporting end-to-end Ethernet and VPN connections for customers, and have also selectively interconnected existing service areas within regional clusters with fiber optic facilities that we own or lease. In addition, we provide on-net inter-city switched services between our markets that offer customers a virtual presence in a remote city.
On October 31, 2006, we acquired Xspedius, thereby expanding our markets served from 44 to 75 and increasing our market density in 12 markets that we already served. This acquisition provided us additional opportunities to serve multi-city and multi-location customers and provide our full product portfolio in additional markets. Our consolidated results of operations, cash flows and financial position include those of Xspedius since the acquisition date.
From our formation until September 26, 2006, we had two classes of common stock outstanding, Class A common stock with one vote per share and Class B common stock with ten votes per share. Each share of Class B common stock was convertible, at the option of the holder, into one share of Class A common stock. The Class B common stock was collectively owned directly or indirectly by the Class B Stockholders. On March 29, 2006 and September 26, 2006, the Class B Stockholders completed underwritten offerings of 22.3 million shares and 43.5 million shares, respectively, of our Class A common stock, which were converted from shares of Class B common stock to shares of Class A common stock immediately prior to the offerings. As a result, we have not had shares of Class B common stock outstanding since September 26, 2006. We did not receive any proceeds from the offerings nor did our total shares outstanding change as a result of the offerings. In June 2007, our stockholders approved an amendment to our Restated Certificate of Incorporation, which eliminated references to Class A and Class B common stock. As a result, no shares of Class B common stock were authorized as of December 31, 2007 and Class A common stock authorized and outstanding as of December 31, 2006 is classified as common stock.
Our revenue is derived primarily from business communications services, including network, voice, data, and high-speed Internet access services. Our customer revenue mix for each of the four fiscal years ended December 31, 2007 is as follows:
| | | | | | | | | | | | |
| | | Revenue | |
| | | 2007 | | | 2006 (1) | | | 2005 (1) | | | 2004 (1) | |
Enterprise / End Users | | 69 | % | | 62 | % | | 58 | % | | 53 | % |
Carrier / ISP | | 27 | % | | 33 | % | | 37 | % | | 41 | % |
Intercarrier Compensation | | 4 | % | | 5 | % | | 5 | % | | 6 | % |
| | | | | | | | | | | | |
| | 100 | % | | 100 | % | | 100 | % | | 100 | % |
| | | | | | | | | | | | |
31
| (1) | Our former Class B Stockholders were no longer related parties as of September 26, 2006 and as such we have reclassified revenue from these customers into their respective enterprise and carrier categories. |
Our primary objective is to be the leading provider of high quality managed data and telecommunications services in each of our service areas, on a national basis, principally utilizing our fiber facilities and our national multipurpose IP backbone network to offer high value voice, data, Internet, and dedicated services to become the carrier of choice for business enterprises, governmental agencies, and other carriers. The key elements of our business strategy include:
| | • | | Leveraging our extensive local and regional fiber networks, including those acquired through the Xspedius acquisition, and IP backbone networks to increase customer and building penetration in our existing markets; |
| | • | | Increasing revenue growth by focusing on service offerings that meet the sophisticated data needs of our customers, such as our Ethernet and IP business-to-business VPN services, Internet-based services and converged voice and data bundled services, and developing future service applications to enhance our customers' voice and data networking ability; |
| | • | | Continuing to diversify our customer base and increasing revenue from enterprise customers, including businesses and local and federal governments; |
| | • | | Pursuing selected opportunities to expand our network reach to serve new customers and additional locations for existing customers, as evidenced by our acquisition of Xspedius; and |
| | • | | Continuing our disciplined approach to capital and operating expenditures in order to increase operational efficiencies, preserve our liquidity and drive us towards profitability. |
Our annual revenue increased by 33% in 2007 compared to the prior year primarily as a result of the contribution from the acquired Xspedius operations for the full year in 2007 as well as organic growth. Annual revenue increased by 15% in 2006 and by 9% in 2005, each as compared to the prior year, due to revenue growth from our enterprise customer base across all lines of business in each of those years as well as the contribution from our acquired Xspedius operations of two months in 2006. Our revenue declined by 2% in 2004 and 4% in 2003, in each case compared to the prior years as a result of general economic conditions and the downturn in the telecommunication sector. The bankruptcy of MCI, which was our then largest customer, and the decline in intercarrier compensation as a result of mandated rate reductions were the largest contributors to our decline in revenue.
Increasing consolidation in the telecommunications industry has occurred in recent years, and in some cases has reduced our revenue from the customers involved. If any of our other customers are acquired or merge, we may lose a portion of their business, which could have a significant impact on our revenue. Consolidation could also result in other companies becoming more formidable competitors, which could result in pressure on our revenue growth. The consolidations involving AT&T over the past several years has and may continue to result in the combined company buying less local transport service from us in SBC’s and BellSouth’s former local service areas. In addition, revenue from what was formerly Cingular (now AT&T’s wireless unit), which became a wholly owned subsidiary of AT&T, has been declining since Cingular’s acquisition of AT&T Wireless in 2004 and Cingular’s acquisition by AT&T in 2006 and is expected to further decline. Revenue from AT&T’s wireless unit represented less than 2% of total revenue for the year ended December 31, 2007 compared with approximately 4% for the year ended December 31, 2006. AT&T’s total purchases from us, including AT&T’s wireless unit, represented approximately 8% and 11% of our total revenue for the years ended December 31, 2007 and 2006, respectively. The revenue impact of AT&T’s acquisitions of SBC and BellSouth may be mitigated by revenue commitments in our agreement with AT&T. As a result, we do not expect that the impact of these consolidations will materially affect our total revenue over the next several years.
32
We have and expect to continue to experience fluctuations in our revenue in the normal course of business from customer and service disconnects, the timing of sales and installations, seasonality, customer disputes and dispute resolutions and repricing of services upon contract renewals. However, we cannot predict the total impact on revenue from these items or their timing. Customer and service disconnects are primarily associated with industry consolidation, customer network optimization, cost cutting, business contractions, customer financial difficulties, or price competition from other providers. Monthly revenue loss from disconnects averaged 1.2%, 1.2%, and 1.0% of monthly revenue in 2005, 2006 and 2007, respectively. In 2007, our revenue growth was impacted by disconnects from customers that were negatively affected by the subprime mortgage downturn. We cannot predict whether we will experience further customer disconnects as a result of the subprime mortgage downturn.
Our revenue and margins may also be reduced as a result of price-cutting by other telecommunications service providers or by pricing pressure on certain more mature products such as long distance service, POP to POP dedicated services and inter-city point to point transport services, especially as existing contracts expire and we negotiate renewals. Furthermore, we expect to spend $6 to $7 million in 2008, which includes $2 million in capital expenditures, for branding related costs associated with our name change. We anticipate that these additional costs will depress our margins.
To increase our operating margins, we have undertaken several cost reduction measures including network grooming and pricing optimization to reduce as a percentage of revenue the overall access costs paid to carriers and enhancing back office support systems to improve operating efficiencies. If our revenue declines in the future, we cannot predict whether continued cost management will be sufficient to maintain current operating margins.
Due to successful collection efforts aided by system enhancements, internal controls and our revenue recognition policies, our bad debt expense remains low and represents less than 1% of our total revenue for 2007. There is no assurance that this trend will continue.
Enterprise Customer Revenue
Revenue from enterprise customers has increased for the past 22 consecutive quarters through December 31, 2007 primarily through sales of our data and Internet products such as Ethernet. Revenue from our enterprise customers represented 69% of our total revenue for the year ended December 31, 2007 as compared to 62% for the same period in 2006. We expect a growing percentage of our revenue will come from our enterprise customer base as we expand the customer base for our existing products and expand our data and Internet product offerings to existing customers. Our expanded market footprint resulting from the acquired operations provides for new growth opportunities for us to extend our customer reach and product portfolio into new markets. The success of initiatives we have implemented to improve customer retention, the success of product offerings targeted at enterprise customers, and our ability to compete for multi-location customers and the success of extending our product portfolio into our newly acquired markets will influence our future growth rates. We may experience fluctuations in revenue due to the timing of installations, seasonality, customer disputes, disconnections and other factors. In addition, in the normal course of business we are re-pricing certain services to current market pricing under existing enterprise contracts in order to obtain contract renewals. This could create downward pressure on revenue growth from this customer base.
Carrier Customer Revenue
Revenue from carrier customers increased 7% for the year ended December 31, 2007 as compared to the same period in 2006 due to the acquired operations. However, carrier revenue represented a smaller percentage of our total revenue at 27% for the year ended December 31, 2007 as compared to 33% for the same period in 2006 partly due to the lower proportion of carrier revenue from the acquired business, growth in revenue from enterprise customers, re-pricing of certain services under existing contracts, and disconnections resulting from industry consolidations. We experienced quarterly declines in carrier revenue throughout 2007 and we expect this trend may continue.
33
Intercarrier Compensation Revenue
Intercarrier compensation revenue consists of switched access and reciprocal compensation and represented 4% and 5% of our total revenue for the years ended December 31, 2007 and 2006, respectively. Intercarrier compensation revenue increased 17% for the year ended December 31, 2007 over the same period last year due to the acquired operations but is declining as a percentage of total revenue because of the growth in revenue from enterprise customers and a decline in switched access revenue. Switched access revenue is compensation we receive from other carriers for the delivery of traffic between a long distance carrier’s point of presence and an end user’s premises provided through our switching facilities. Switched access is regulated by the FCC and state public utility commissions. During the three month period ended December 31, 2007, we experienced a sequential decline of 11% as compared to the three month period ended September 30, 2007 in switched access revenue as a result of discontinuance of certain products from the acquired business and of regulatory and contractual rate reductions. We expect further rate reductions in intercarrier compensation in the first quarter of 2008 and we expect this trend to continue.
Pricing of Special Access Services
We provide special access services over our own fiber facilities in competition with ILECs, and we also purchase special access and other services from ILECs to extend the reach of our network. The ILECs have argued before the FCC that the broadband services that they sell, including special access services we buy from them, should no longer be subject to regulation governing price and quality of service. If the special access services we buy from the ILECs were to be deregulated, in whole or in part, the ILECs would have a greater ability to increase the price and reduce the service quality of special access services they sell to us.
We have advocated before the FCC that it should modify its special access pricing flexibility rules so that these services return to price-cap regulation to protect against unreasonable price increases. The FCC is reviewing its regulation of special access pricing in a pending proceeding. In addition, the ILECs have filed numerous petitions for forbearance from regulation of their broadband special access services, including Ethernet services offered as special access. The FCC has granted several of these petitions with the result that the Ethernet and OC-n high capacity data services of the petitioning carriers are no longer regulated. We and several of our competitors have appealed these FCC rulings. These FCC actions did not impact the availability of the tariffed TDM special access circuits that we use for off-net building access. We expect that the ILECs will continue to advocate deregulation of all forms of special access services, and we cannot predict the outcome of the FCC’s proceedings in this regard or the impact of that outcome on our business.
In 2005, we negotiated a five-year wholesale service agreement with AT&T Inc. (formerly SBC Communications Inc.) under which AT&T will supply us with special access and other services for end user access and transport with certain service level commitments through 2010 in SBC’s former 13 state local service territories. We have agreed to maintain certain volume levels in order to receive specified discounts and other terms and conditions, and are subject to certain penalties for early termination of the contract. We have a similar three year agreement with AT&T for the former BellSouth service area that commenced in 2005. However, we do not have similar agreements with the other ILECs and could be subject to significant price increases in the special access services we buy from these carriers.
Former Related Party Revenue and Expense
As a result of the secondary offering completed on September 26, 2006, the Class B Stockholders are no longer related parties. In the normal course of business, we have engaged in various transactions with affiliates of our former Class B Stockholders, generally on negotiated terms that, in management’s view, result in reasonable arms-length terms. We provide network, data and Internet and voice services to affiliates of our former Class B Stockholders including Time Warner Cable, Time Warner Inc. and Bright House Networks, LLC. We do not expect the revenue generated from these entities to change materially because they are no longer related parties.
34
Since 1998, we have been party to capacity license agreements with Time Warner Cable that provides us fiber capacity access to local rights-of-way and construction cost sharing until 2028. We have similar arrangements with Bright House and with Comcast Corporation, as successor to Time Warner Cable’s cable systems in three markets. These arrangements were not impacted by the Class B Stockholders’ sale of their shares of our common stock. We pay these providers negotiated fees for facility maintenance and reimburse them for our allocable share of pole rental costs on an ongoing basis. These maintenance and pole rental costs are included in our operating expenses.
Name and Branding Change
We amended our existing Trade Name License Agreement with Time Warner Inc. to extend the term of our license to use the name “Time Warner” until June 30, 2008. By that date we must change our name to TW Telecom or another name that does not include “Time Warner.” Effective September 12, 2006, Time Warner Inc. granted us a perpetual license to use “TW Telecom” and “TWTC” in our communications and related technologies and service business in North America. We are conducting a branding initiative to select a new name for our business and intend to continue to use the name “Time Warner Telecom” pursuant to the amended Trade Name License Agreement until we complete that initiative. We have incurred approximately $1 million in branding costs for the year ended December 31, 2007 and expect to spend an additional $6 to $7 million including $2 million in capital expenditures for that purpose throughout 2008, primarily in the second and third quarters.
Integration and Acquired Operations
We acquired Xspedius with the expectation that the acquisition would result in benefits to the combined companies. Achieving the benefits of the acquisition depends in part on the successful integration of Xspedius’ and our operations in a timely and efficient manner. To date, we achieved substantial progress integrating the Xspedius acquired operations with ours through three major integration initiatives:
| | • | | Organizational Integration— Our organizational integration is complete, resulting in a single organization for sales, customer care, field operations, marketing and headquarter functions, and two integrated national operations centers, each with the capability to provision nationwide across our customers and our major products. |
| | • | | Systems Integration— We now have a common data and system infrastructure serving all customers nationwide. We completed our major systems integrations, including human resources, financial, sales, customer management, billing, provisioning, network and surveillance systems resulting in a common platform for these functions. These systems integrations were designed as a foundation to maximize operating efficiencies and expand our scalability to serve growing market demand. |
| | • | | Network Integration— We have fully integrated our transport, voice, IP, long distance and national SS7 signaling networks, enabling our full product suite in the majority of the acquired markets. We completed our rollout of additional product capabilities to our 12 overlap markets plus an additional 10 new markets acquired through Xspedius and have begun selling our full product suite in these markets and have initiated rolling out service to 4 additional markets. In addition, we continue to optimize, groom and migrate network circuits. |
We incurred $5.6 million in expense and $30.1 million of integration capital expenditures for the year ended December 31, 2007 in connection with the integration of Xspedius. We expect to spend $8 to $12 million in integration capital expenditures in 2008. The remaining integration work will consist primarily of network optimization and grooming to reduce the volume and costs of off-network services in the acquired operations, network enhancements and equipment to enable the deployment of our advanced services in the 4 additional acquired markets, and process refinement to optimize the integrated systems and organization.
35
Our acquisition of Xspedius resulted in lower consolidated margins as a result of higher operating costs, especially network costs, in relationship to revenue in the acquired business and the integration costs discussed above. The acquired operations sold a higher proportion of services utilizing the facilities of other carriers than our historical operations have done, resulting in lower gross margins and Modified EBITDA margins (Modified EBITDA as a percentage of revenue) than we experienced prior to the acquisition. In addition, the integration of the acquired operations, including our national IP and transport networks and back office and other support systems, to provide a common platform in which to offer our products and services in the acquired markets, resulted in higher costs.
We have integrated the acquired operations with our operations with the expectation that we will achieve synergies through cost reductions. The impacts of our integration activities have been reflected in expanding Modified EBITDA margins over the past few quarters. We anticipate achieving mid 30% Modified EBITDA margins during the summer of 2008. However, as in the past, we expect our Modified EBITDA margins to continue to be impacted by integration costs and synergies as well as the timing of sales, installations, seasonality and other normal business fluctuations. As a result, there is no assurance that our Modified EBITDA margins will reach the targeted level when anticipated, or at all, or if reached will remain at that level.
Critical Accounting Policies and Estimates
We prepare our financial statements in accordance with accounting principles generally accepted in the United States, which require us to make estimates and assumptions that affect reported amounts and related disclosures. We consider an accounting estimate to be critical if:
| | • | | it requires assumptions to be made that were uncertain at the time the estimate was made; and |
| | • | | changes in the estimate or different estimates that could have been selected could have a material impact on our consolidated results of operations or financial condition. |
Goodwill
We perform impairment tests at least annually on all goodwill and indefinite-lived intangible assets as required by Financial Accounting Standards Board (“FASB”) Statement No. 142,Goodwill and Other Intangible Assets (“SFAS 142”). Our goodwill and indefinite-lived intangible assets have grown significantly due to our acquisition of Xspedius and the related purchase price allocation. SFAS 142 requires goodwill to be assigned to a reporting unit and tested using a consistent measurement date, which for us is the fourth quarter of each year or more frequently if impairment indicators arise. For purposes of testing goodwill for impairment, our goodwill has been assigned to our one consolidated reporting unit. Potential impairment is indicated when the book value of a reporting unit, including goodwill, exceeds its fair value. If a potential impairment exists, the fair value of the reporting unit is compared to the fair value of its assets and liabilities, excluding goodwill, to estimate the implied value of the reporting unit’s goodwill. If an impairment charge is deemed necessary, a charge is recognized for any excess of the book value over the implied fair value. We determine fair value by performing internal valuation analyses using discounted cash flow, which is a widely accepted valuation technique. Considerable management judgment is necessary to estimate the fair value of assets using inputs such as discount rate and terminal value, among others; accordingly, actual results could vary significantly from estimates. Our 2007 assessment resulted in the determination that the book value of our reporting unit does not exceed its fair value. A hypothetical 20% reduction in the projected Modified EBITDA would not result in an impairment as of December 31, 2007.
Impairment of Long-lived Assets
We periodically assess our ability to recover the carrying amount of property, plant and equipment and intangible assets, which requires an assessment of risk associated with our ability to generate sufficient future cash flows from these assets. If we determine that the future cash flows expected to be generated by a particular asset do not exceed the carrying value of that asset, we recognize a charge to write down the value of the asset to its fair value.
36
Estimates are used to determine whether sufficient cash flows will be generated to recover the carrying amount of our investments in long term assets. The estimates are made for each of our 8 regions. Expected future cash flows are based on historic experience and management’s expectations of future performance. The assumptions used represent our best estimates including market growth rates, future pricing, market acceptance of our products and services and the future capital investments necessary.
Our 2007 assessment resulted in the determination that the estimated future undiscounted cash flows for each region exceeded the carrying value of its long lived assets. If we were to change assumptions in such a way as to reduce the amount of future cash flows expected from any particular asset, in some cases we could be required to recognize asset impairment losses in our results of operations. A hypothetical 20% reduction in the projected Modified EBITDA for each region would not result in an impairment as of December 31, 2007.
Regulatory and Other Contingencies
We are subject to significant government regulation, some of which is uncertain due to legal challenges of existing rules. Such regulation is subject to different interpretations and inconsistent application, and has historically given rise to disputes with other carriers and municipalities regarding the classification of traffic, rights-of-way, rates and minutes of use.
Management estimates and reserves for the risk associated with regulatory and other contingencies. These estimates are based on assumptions and other considerations including expectations regarding regulatory rulings, historic experience and ongoing negotiations. We evaluate these reserves on an ongoing basis and make adjustments as necessary. A 10% unfavorable or favorable change in the estimates used for such reserves would have resulted in approximately a $9.2 million increase or $8.7 million decrease, respectively, in net loss for the year ended December 31, 2007.
Deferred Tax Accounting
We have a history of net operating losses (“NOLs”) for tax purposes. As a result, our balance sheet reflects a net deferred tax asset that represents the tax benefit of net operating loss carryforwards and timing differences between book and tax recognition of certain revenue and expense items, net of a valuation allowance. When it is more likely than not that all or some portion of deferred tax assets may not be realized, we establish a valuation allowance for the amount that may not be realized. At December 31, 2007, our net deferred tax asset after a valuation allowance of $331.7 million was $58.8 million.
We have concluded that it is more likely than not that the net deferred tax asset will be realized through the utilization of tax-planning strategies including the sale and leaseback of certain of our high-value, low-basis assets to generate gains to which the NOLs can be applied. We base our analysis on discounted expected future cash flows and our expectations regarding the size of transaction that would be allowable under financing agreements that may be in place at the time we implement strategies to utilize the benefit of the NOLs. The assumptions approximate our best estimates including market growth rates, future pricing, market acceptance of our products and services, future expected capital investments and discount rates.
At December 31, 2007 we had net operating loss carryforwards for federal income tax purposes of approximately $1.1 billion. These net operating loss carryforwards, if not utilized to reduce taxable income in future periods, will expire in various amounts beginning in 2019 and ending in 2026.
The Tax Reform Act of 1986 contains provisions that limit the utilization of net operating losses if there has been a “change of ownership” as described in Section 382 of the Internal Revenue Code. As a result of the sale of our common stock by the Class B Stockholders in September 2006, we experienced a change of ownership on September 26, 2006. We have evaluated the impact of these provisions on our financial statements, and have concluded that the Section 382 limitation does not have a material impact on our net deferred tax asset position.
37
Revenue and Receivables
Our services are complex and our tariffs and contracts may be correspondingly complex and subject to interpretations that cause disputes over billing. In addition, changes in and interpretations of regulatory rulings create uncertainty and may cause disputes over minutes of use, rates or other provisions of our service. As such, we defer recognition of revenue until cash is collected on certain of our components of revenue, such as contract termination charges. We also reserve for customer billing disputes until they are resolved even if the customer has already paid the disputed amount.
We estimate the ability to collect our receivables by performing ongoing credit evaluations of our customers’ financial condition, and provide an allowance for doubtful accounts based on expected collection of our receivables. Our estimates are based on assumptions and other considerations, including payment history, credit ratings, customer financial performance, industry financial performance and aging analysis. As a result of, among other things, an improvement in our collection activities and our overall receivables management, our allowance for doubtful accounts as a percentage of gross receivables has improved from 19% as of December 31, 2005 to 15% at December 31, 2006 and to 14% at December 31, 2007.
Stock-Based Compensation
During the first quarter of 2006, we adopted the fair value method of accounting for stock-based compensation using the modified prospective method of transition as outlined in Financial Accounting Standards Board Statement No. 123R,Share-Based Payment(“SFAS 123R”). Under SFAS 123R, the estimated fair value of stock-based compensation is recognized as compensation expense. The estimated fair value of stock options is expensed on a straight-line basis over the expected term of the grant. Prior to January 1, 2006, we accounted for stock-based employee compensation plans using the intrinsic value method of accounting in accordance with Accounting Principles Board Opinion No. 25,Accounting for Stock Issued to Employees(“APB 25”), and its related interpretations. Under the provisions of APB 25, no compensation expense was recognized when stock options were granted with exercise prices equal to or greater than market value on the date of grant.
Under the modified prospective method of transition that we adopted January 1, 2006, compensation expense recognized includes: (a) compensation cost for all share-based payments granted prior to, but not yet vested as of January 1, 2006, based on the grant date fair value estimated in accordance with the original provisions of Financial Accounting Standards Board Statement No. 123,Accounting for Stock-Based Compensation(“SFAS 123”), and (b) compensation costs for all share-based payments granted subsequent to January 1, 2006, based on the grant date fair value estimated in accordance with the provisions of SFAS 123R. Under the modified prospective method of transition, we did not restate our prior period financial statements to reflect expensing of stock-based compensation. Therefore, the results of December 31, 2007 and 2006 are not directly comparable to December 31, 2005; however, we provide comparative net loss and net loss per share on a pro-forma basis in Note 1 to the consolidated financial statements under the provisions of SFAS 123. We use the Black-Scholes pricing model to estimate the fair value of the stock-based compensation as of the grant date. The Black-Scholes model by its design is dependent upon key data inputs estimated by management such as expected volatility, expected term and expected dividend yield. See Note 1 and Note 8 to the consolidated financial statements for a complete discussion of our stock-based compensation plans.
Valuation of Acquired Assets and Liabilities
In connection with our acquisition of Xspedius on October 31, 2006, as required by FASB Statement No. 141,Business Combinations, the purchase price was allocated to the assets acquired and liabilities assumed based on their estimated fair values as of the closing of the merger, with the amounts exceeding the fair value recorded as goodwill. The fair values of the assets acquired and the liabilities assumed were determined using a cost approach, market approach or income approach. Under the cost approach, we have estimated the replacement cost of certain tangible assets and applied a depreciation factor to reflect economic deterioration. When appropriate, we have applied a market approach which utilizes available market rate information to assess
38
fair value for specific tangible assets. Additionally, we have applied an income approach to value the business enterprise and certain intangible assets which relies upon a discounted cash flow model that utilizes various estimates. These estimates include variables such as: customer attrition rates, gross margin percentages, synergies, economic useful lives of tangible assets, capital replacement costs, and discount rates.
Other Estimates
There are other accounting estimates reflected in our consolidated financial statements, including reserves for certain losses, compensation accruals, unpaid claims for medical and other self-insured plans and property and other tax exposures that require judgment but are not deemed critical in nature.
During the year ended December 31, 2007, we recognized a loss of $7.3 million on commercial paper with exposure to sub-prime mortgages that is past its maturity date. The carrying value of these securities after recognition of the loss is $14.5 million at December 31, 2007 and are classified as long term investments in the consolidated balance sheet. The carrying value of these securities represents an estimate of the fair value of the investments at December 31, 2007 based on data from financial advisors to fiduciaries for the commercial paper holders.
We perform reviews to determine depreciable lives for our property, plant and equipment. During the first quarter of 2007, we evaluated the depreciable life used for fiber assets and determined that to better reflect the economic utilization of those fiber assets, the lives were extended from 15 years to 20 years, or the lease term, if shorter, for leased fiber assets. This change in estimate, effective as of January 1, 2007, was accounted for prospectively, in accordance with FASB Statement of Financial Accounting Standards No. 154,Accounting Changes and Error Corrections. This change lowered depreciation expense and reduced net loss by $19.2 million, or approximately $0.13 per share, for the year ended December 31, 2007.
We believe the current assumptions and other considerations used to estimate amounts reflected in the consolidated financial statements are appropriate. However, if actual experience differs from the assumptions and other considerations used in estimating amounts reflected in the consolidated financial statements, the resulting changes could have a material adverse effect on our results of operations and, in certain situations, on our financial condition.
New Accounting Pronouncements
In August 2007, the FASB proposed FASB Staff Position (“FSP”) APB 14-a, “Accounting for Convertible Debt Instruments That May Be Settled in Cash (Including Partial Cash Settlement) upon Conversion.” The FSP would require certain convertible debt instruments to be separated into debt and equity components at issuance and a value to be assigned to each. The value assigned to the debt component would be the estimated fair value, as of the issuance date, of a similar bond without the conversion feature. The difference between the bond cash proceeds and this estimated fair value would be recorded as a debt discount and amortized to interest expense over the life of the bond. If adopted, this FSP would change the accounting treatment for our convertible debentures. Although FSP APB 14-a would have no impact on our actual past or future cash flows, this new accounting treatment is expected to materially impact our results of operations and non-cash interest expense beginning in fiscal year 2009 for financial statements covering past and future periods. It is expected that the proposed change in accounting treatment would be effective for calendar year companies in 2009, and applied retroactively if adopted in its current form. Until the final FSP is ultimately adopted and issued by the FASB in its final form, we cannot determine the precise impact of the change in accounting treatment, however in its current form is expected to be material.
In September 2006, the FASB issued SFAS No. 157,Fair Value Measurement(“SFAS 157”) which defines fair value, establishes a framework for measuring fair value in generally accepted accounting principles and expands disclosures about fair value measurements. This statement applies to other accounting pronouncements that require or permit fair value measurements. The Company is required to adopt SFAS 157 on a prospective
39
basis effective January 1, 2008. Subsequent to the issuance of SFAS 157, the FASB deferred the effective date for one year for all nonfinancial assets and nonfinancial liabilities, except for those items that are recognized or disclosed at fair value in the financial statements on a recurring basis. The Company does not expect the adoption of SFAS 157 will have a material impact on its financial position and results of operations.
In February 2007, the FASB issued SFAS No. 159,The Fair Value Option for Financial Assets and Financial Liabilities (“SFAS 159”). The fair value option established by SFAS 159 permits entities to choose to measure eligible financial instruments at fair value. The unrealized gains and losses on items for which the fair value option has been elected should be reported in earnings. The decision to elect the fair value option is determined on an instrument by instrument basis and is irrevocable. Assets and liabilities measured at fair value pursuant to the fair value option should be reported separately in the balance sheet from those instruments measured using other measurement attributes. This statement is effective beginning January 1, 2008. The Company currently does not plan to elect the fair value option on its existing financial assets and financial liabilities upon adoption of SFAS 159.
In December 2007, the FASB issued SFAS No. 141 (revised 2007), “Business Combinations” (“SFAS 141R”). SFAS 141R establishes the principles and requirements for how an acquirer: 1) recognizes and measures in its financial statements the identifiable assets acquired, the liabilities assumed, and any noncontrolling interest in the acquiree; 2) recognizes and measures the goodwill acquired in the business combination or a gain from a bargain purchase; and 3) discloses the business combination. The statement is effective beginning January 1, 2009. The provisions of SFAS 141(R) will only impact us if we are party to a business combination after the pronouncement has been adopted.
40
Results of Operations
The following table sets forth certain data from our consolidated financial statements presented in thousands of dollars and expressed as a percentage of total revenue. This table should be read together with our audited consolidated financial statements, including the notes thereto, appearing elsewhere in this report:
| | | | | | | | | | | | | | | | | | | | | |
| | | Years Ended December 31, | |
| | | 2007 | | | 2006 | | | 2005 | |
| | | (amounts in thousands, except per share amounts) | |
Statements of Operations Data: | | | | | | | | | | | | | | | | | | | | | |
Revenue (1)(2): | | | | | | | | | | | | | | | | | | | | | |
Network services | | $ | 393,569 | | | 36 | % | | $ | 355,996 | | | 44 | % | | $ | 341,779 | | | 48 | % |
Voice services | | | 327,246 | | | 30 | | | | 201,968 | | | 25 | | | | 166,808 | | | 24 | |
Data and Internet services | | | 318,269 | | | 30 | | | | 216,419 | | | 26 | | | | 162,834 | | | 23 | |
Intercarrier compensation | | | 44,595 | | | 4 | | | | 37,992 | | | 5 | | | | 37,306 | | | 5 | |
| | | | | | | | | | | | | | | | | | | | | |
Total revenue | | | 1,083,679 | | | 100 | | | | 812,375 | | | 100 | | | | 708,727 | | | 100 | |
| | | | | | | | | | | | | | | | | | | | | |
Costs and expenses (3): | | | | | | | | | | | | | | | | | | | | | |
Operating (exclusive of depreciation, amortization, and accretion shown separately below) (2)(4) | | | 470,038 | | | 43 | | | | 311,532 | | | 38 | | | | 264,517 | | | 37 | |
Selling, general, and administrative (4) | | | 296,638 | | | 27 | | | | 228,485 | | | 28 | | | | 193,052 | | | 27 | |
Depreciation, amortization, and accretion | | | 279,454 | | | 25 | | | | 256,091 | | | 32 | | | | 238,180 | | | 34 | |
| | | | | | | | | | | | | | | | | | | | | |
Total costs and expenses | | | 1,046,130 | | | 97 | | | | 796,108 | | | 98 | | | | 695,749 | | | 98 | |
| | | | | | | | | | | | | | | | | | | | | |
Operating income | | | 37,549 | | | 3 | | | | 16,267 | | | 2 | | | | 12,978 | | | 2 | |
Interest expense | | | (91,285 | ) | | (8 | ) | | | (98,238 | ) | | (12 | ) | | | (120,219 | ) | | (17 | ) |
Debt extinguishment costs | | | — | | | — | | | | (36,874 | ) | | (4 | ) | | | (14,043 | ) | | (2 | ) |
Interest income | | | 17,489 | | | 2 | | | | 20,054 | | | 2 | | | | 13,220 | | | 2 | |
Other income (loss), net | | | (3,022 | ) | | — | | | | — | | | — | | | | — | | | — | |
| | | | | | | | | | | | | | | | | | | | | |
Loss before income taxes | | | (39,269 | ) | | (4 | ) | | | (98,791 | ) | | (12 | ) | | | (108,064 | ) | | (15 | ) |
Income tax expense | | | 1,000 | | | — | | | | 28 | | | — | | | | — | | | — | |
| | | | | | | | | | | | | | | | | | | | | |
Net loss | | $ | (40,269 | ) | | (4 | )% | | $ | (98,819 | ) | | (12 | )% | | $ | (108,064 | ) | | (15 | )% |
| | | | | | | | | | | | | | | | | | | | | |
Basic and diluted loss per common share | | $ | (0.28 | ) | | | | | $ | (0.80 | ) | | | | | $ | (0.93 | ) | | | |
| | | | | | | | | | | | | | | | | | | | | |
Weighted average shares outstanding, basic and diluted | | | 144,956 | | | | | | | 124,078 | | | | | | | 116,315 | | | | |
| | | | | | |
Modified EBITDA (5)(6) | | $ | 339,003 | | | 31 | % | | $ | 286,023 | | | 35 | % | | $ | 251,158 | | | 35 | % |
Net cash provided by operating activities | | | 264,207 | | | | | | | 174,558 | | | | | | | 128,420 | | | | |
Net cash used in investing activities | | | (188,571 | ) | | | | | | (300,923 | ) | | | | | | (35,255 | ) | | | |
Net cash provided by (used in) financing activities | | | 24,342 | | | | | | | 137,084 | | | | | | | (12,383 | ) | | | |
| (1) | Includes revenue resulting from transactions with affiliates of $13.1 million and $16.9 million in 2006 and 2005, respectively. See Note 6 to our consolidated financial statements appearing elsewhere in this report for an explanation of these transactions. |
| (2) | We classify certain taxes and fees billed to customers and remitted to government authorities in revenue on a gross versus net basis. Beginning January 1, 2007, we added additional fees billed to customers and remitted to government authorities in our gross revenue. This has no impact on Modified EBITDA or net loss, but increased revenue and operating expenses by $14.9 million for the year end December 31, 2007. See Note 1 “Revenue” to our consolidated financial statements appearing elsewhere in the report for further discussion. |
| (3) | Includes expenses resulting from transactions with affiliates of $6.6 million and $8.0 million in 2006 and 2005, respectively. See Note 6 to our consolidated financial statements appearing elsewhere in this report for an explanation of these transactions. |
41
| (4) | Includes the following non-cash stock-based employee compensation: |
| | | | | | | |
| | | Years Ended December 31, |
| | | 2007 | | 2006 | | 2005 |
| | | (amounts in thousands) |
Operating | | $ | 3,555 | | 2,075 | | — |
Selling, general, and administrative | | | 18,445 | | 11,590 | | 915 |
| (5) | “Modified EBITDA” is defined as net income or loss before depreciation, amortization and accretion expense, interest expense, interest income, debt extinguishment costs, other gains (losses), impairment charges, income tax expense (benefit), cumulative effect of change in accounting principle, and non-cash stock-based compensation. Modified EBITDA is not intended to replace operating income (loss), net loss, cash flow and other measures of financial performance and liquidity reported in accordance with accounting principles generally accepted in the United States. Rather, Modified EBITDA is a measure of operating performance and liquidity that investors may consider in addition to such measures. Our management believes that Modified EBITDA is a standard measure of operating performance and liquidity that is commonly reported and widely used by analysts, investors, and other interested parties in the telecommunications industry because it eliminates many differences in financial, capitalization, and tax structures, as well as non-cash and non-operating charges to earnings. We believe that Modified EBITDA trends are a valuable indicator of whether our operations are able to produce sufficient operating cash flow to fund working capital needs, service debt obligations, and fund capital expenditures. We currently use Modified EBITDA for these purposes. Modified EBITDA also is used internally by our management to assess ongoing operations and is a measure used to test compliance with certain covenants of our senior notes, our revolving credit facility and our term loan. The definition of EBITDA under our revolving credit facility, our term loan and our senior notes differs from the definition of Modified EBITDA used in this table. The definition of EBITDA in our credit facility discussed below also eliminates certain non-cash losses within certain limits and certain extraordinary gains and the senior notes definition eliminates other non-cash items. However, the resulting calculation is not materially different for the periods presented. Modified EBITDA as used in this document may not be comparable to similarly titled measures reported by other companies due to differences in accounting policies. The reconciliation between net loss and Modified EBITDA is as follows: |
| | | | | | | | | | |
| | | Year Ended December 31, | |
| | | 2007 | | | 2006 | | | 2005 | |
| | | (In thousands) | |
Net loss | | $ | (40,269 | ) | | (98,819 | ) | | (108,064 | ) |
Income tax expense | | | 1,000 | | | 28 | | | — | |
Other (income) loss | | | 3,022 | | | — | | | — | |
Interest income | | | (17,489 | ) | | (20,054 | ) | | (13,220 | ) |
Interest expense | | | 91,285 | | | 98,238 | | | 120,219 | |
Debt extinguishment costs | | | — | | | 36,874 | | | 14,043 | |
Depreciation, amortization and accretion | | | 279,454 | | | 256,091 | | | 238,180 | |
Non-cash stock-based compensation | | | 22,000 | | | 13,665 | | | — | |
| | | | | | | | | | |
Modified EBITDA | | $ | 339,003 | | | 286,023 | | | 251,158 | |
| | | | | | | | | | �� |
| (6) | Modified EBITDA margin represents Modified EBITDA as a percentage of revenue. |
On October 31, 2006, we completed the acquisition of Xspedius. The results of operations, cash flows and financial position of the acquired operations are included in our consolidated financial statements for the full year ended December 31, 2007 and from the acquisition date for the year ended December 31, 2006. All amounts indicated are consolidated, including the results of the acquired operations, unless otherwise indicated.
42
Operating results include the impact of a reclassification of certain taxes and fees billed to customers and remitted to government authorities that are now presented on a gross versus net basis in revenue and operating expense, which resulted in an increase in total revenue and operating expenses of $14.9 million for the year ended December 31, 2007 over the same period last year.
Year Ended December 31, 2007 Compared to Year Ended December 31, 2006
Revenue. Total revenue increased $271.3 million, or 33%, to $1.1 billion for the year ended December 31, 2007 from $812.4 million for the comparable period in 2006. Contributing to the growth in revenue was the impact of our acquired operations and increased data and Internet services revenue from sales to enterprise customers and the change in 2007 to present certain additional taxes and fees on a gross versus net basis of $14.9 million.
Data and Internet services revenue increased $101.9 million, or 47%, to $318.3 million for the year ended December 31, 2007 from $216.4 million for the comparable period in 2006. The increase in data and Internet services revenue primarily resulted from growth from enterprise customers, our Ethernet and IP-based product sales and the impact of our acquired operations.
Revenue from network services increased $37.6 million, or 11%, to $393.6 million for the year ended December 31, 2007 from $356.0 million for the comparable period in 2006. The increase in network services revenue was primarily from our acquired operations, new sales to enterprise and carrier customers and the change in 2007 to present certain additional taxes and fees on a gross versus net basis of $5.8 million and was partially offset by a decline in revenue from AT&T’s wireless unit resulting from AT&T’s consolidation activity as well as other disconnects.
Voice services revenue increased $125.3 million, or 62%, to $327.2 million for the year ended December 31, 2007 from $202.0 million for the comparable period in 2006. The increase was predominately from the impact of the Xspedius acquisition as well as growth in sales of bundled voice products and the change in 2007 to present certain additional taxes and fees on a gross versus net basis of $9.1 million.
Intercarrier compensation revenue, including reciprocal compensation and switched access, increased $6.6 million, or 17%, to $44.6 million for the year ended December 31, 2007 from $38.0 million for the comparable period in 2006. The increase was predominately from the acquired operations somewhat offset by discontinued products from the acquired business and regulatory and contractual rate reductions.
Operating Expenses. Our operating expenses consist of costs directly related to the operation and maintenance of our networks and the provisioning of our services. These costs include the salaries and related expenses of customer care, provisioning, network maintenance, technical field and network operations and engineering personnel, costs to repair and maintain our network, and costs paid to other carriers for access to their facilities, interconnection, and facilities leased and associated utilities.We carry a significant portion of our traffic on our own fiber infrastructure, which enhances our ability to control access costs, which are the costs purchased network services from other carriers.Operating expenses increased $158.5 million, or 51%, to $470.0 million for the year ended December 31, 2007 from $311.5 million for the comparable period in 2006. The increase is primarily due to our acquired operations, revenue growth that contributed to higher direct costs associated with serving our customers, an increase in employee costs related to annual merit-based salary increases that were effective in the first quarter and a larger employee base, and the change in 2007 to present certain taxes and fees on a gross versus net basis. Operating expenses were 43% of total revenue for the year ended December 31, 2007 compared to 38% of total revenue for the same period in 2006. The increase in operating expenses as a percentage of revenue compared to last year is driven by the acquired operations, which sold a higher proportion of services utilizing the facilities of other carriers than our core business, thereby incurring higher access costs and the change in 2007 to present certain additional taxes and fees on a gross versus net basis. These cost increases were somewhat offset by integration synergies. We expect to continue to achieve
43
cost synergies by migrating some of these facilities onto our own network and through other network grooming and optimization activities intended to reduce costs and increase margins in the acquired operations.
Selling, General, and Administrative Expenses. Selling, general, and administrative expenses consist of salaries and related costs for employees and other expenses related to sales and marketing, bad debt, information technology, billing, regulatory, administrative, and legal functions. Selling, general, and administrative expenses increased $68.2 million, or 30%, to $296.6 million for the year ended December 31, 2007 from $228.5 million for the comparable period in 2006. The increase is primarily due to the acquired operations and related integration costs and an increase in employee compensation costs due to annual merit-based salary increases, a larger employee base, grants of non-cash stock-based compensation, higher commissions due to increased revenue, an increase in bad debt expense and costs related to our branding initiative. Selling, general, and administrative expenses were 27% of total revenue for the year ended December 31, 2007 as compared to 28% for the comparable period in 2006.
Depreciation, Amortization, and Accretion Expense. Depreciation, amortization, and accretion expense increased $23.4 million, or 9%, to $279.5 million for the year ended December 31, 2007 from $256.1 million for the comparable period in 2006. The increase was primarily attributable to additions to property, plant and equipment made during 2006 and 2007 as well as increased depreciation and amortization expense as a result of the acquired Xspedius assets. These increases were partially offset by a reduction in depreciation as certain assets became fully depreciated and a reduction of $19.2 million from the extension of the depreciable life of our fiber assets from 15 years to 20 years. See “Change in Accounting Estimate” in Note 1 to our consolidated financial statements.
Interest Expense.Interest expense decreased $7.0 million, or 7%, to $91.3 million for the year ended December 31, 2007 from $98.2 million for the comparable period in 2006. The decrease is due to lower effective interest rates as a result of debt refinancings we completed in 2006 and was partially offset by an increase in total debt as a result of the acquisition of Xspedius.
Debt Extinguishment Costs. There were no debt extinguishment costs for the year ended December 31, 2007. The debt extinguishment costs in 2006 resulted from the refinancings in 2006 and consist of $25.1 million in cash paid for call premiums and $11.8 million in non-cash write offs of deferred debt issuance costs from the early retirement of $400 million 10 1/8% Senior Notes, $240 million Senior Secured Floating Rate Notes, a $200 million term loan B Facility and the replacement of a $110 million revolving credit facility.
Interest Income. Interest income decreased $2.6 million, or 13%, to $17.5 million for the year ended December 31, 2007 from $20.1 million for the comparable period in 2006. The decrease is due to lower average investment balances partially offset by higher average interest rates on such balances.
Other Income (Loss). During the year ended December 31, 2007, we recognized a $7.3 million loss that represents an impairment associated with commercial paper investments we hold past the maturity date and have exposure to sub-prime mortgages. See Note 3 to our consolidated financial statements. This loss was partially offset by a $4.3 million deferred gain on the sale of assets.
Income Taxes. Income tax expense was $1.0 million for the year ended December 31, 2007 compared to $0.03 million for the comparable period in 2006 for state income taxes. During 2002, we established a valuation allowance for deferred taxes. As of December 31, 2007, our valuation allowance was $331.7 million, which reduces our net deferred tax asset. As of December 31, 2007, net deferred tax assets were $58.8 million. We believe that it is more likely than not that our net deferred tax assets will be realized through future taxable income. The $58.8 million in net deferred tax assets represents our best estimate of the assets that would be realizable utilizing tax planning strategies in the event that loss carryforwards were due to expire, which begins in 2019.
Net Loss and Modified EBITDA. Net loss decreased $58.6 million, or 59%, to $40.3 million, a loss of $0.28 per share, for the year ended December 31, 2007 from $98.8 million, a loss of $0.80 per share, for the
44
comparable period in 2006. The change primarily resulted from an increase in revenue of $271.3 million, a decrease in debt extinguishment costs of $36.9 million, a decrease in interest expense, net of interest income, of $4.4 million as a result of the 2006 debt refinancings, and the $4.3 million deferred gain on the sale of assets. These factors were partially offset by increased operating expenses and selling, general and administrative expenses as described above, higher depreciation, amortization and accretion expense of $23.4 million resulting from continued investment in property, plant and equipment and the acquired Xspedius assets, and the $7.3 million investment loss. Modified EBITDA increased $53.0 million to $339.0 million, or 31% of revenue for the year ended December 31, 2007, from $286.0 million, or 35% of revenue from the comparable period in 2006. The increase in Modified EBITDA resulted from higher revenue somewhat offset by higher operating expenses and selling, general and administrative expenses associated with the acquired operations and selling, installing and maintaining the services for the higher revenue stream. The decrease in Modified EBITDA margin was the result of higher operating expenses in our acquired operations and related integration expenses and increased access costs resulting from revenue growth, as well as costs related to integration and our branding initiative.
Modified EBITDA is defined as net income or loss before depreciation, amortization and accretion expense, interest expense, interest income, debt extinguishment costs, other gains (losses), impairment charges, income tax expense or benefit, cumulative effect of change in accounting principle, and non-cash stock-based compensation. We believe that Modified EBITDA is a standard measure of operating performance and liquidity that is commonly reported and widely used by analysts, investors, and other interested parties in the telecommunications industry because it eliminates many differences in financial, capitalization, and tax structures, as well as non-cash and non-operating income or charges to earnings. Modified EBITDA is not intended to replace operating income (loss), net income (loss), cash flow, and other measures of financial performance and liquidity reported in accordance with generally accepted accounting principles. We use Modified EBITDA internally to assess on-going operations and it is the basis for various financial covenants contained in our debt agreements. Although we expect to continue to generate positive Modified EBITDA in the future as we expand our business in existing markets, there is no assurance that we will sustain the current level of Modified EBITDA or sufficient positive Modified EBITDA to meet our working capital requirements, comply with our debt agreements, and service our indebtedness. See Note 8 to Item 6, “Selected Financial Data” for a reconciliation between net loss and Modified EBITDA.
Year Ended December 31, 2006 Compared to Year Ended December 31, 2005
On October 31, 2006, we completed the acquisition of Xspedius. Xspedius’ results of operations, cash flows and financial position are included in our consolidated financial statements from the date of acquisition. All amounts indicated are consolidated, including the results of the Xspedius operations, unless otherwise noted. Reference to organic results excludes the impact of the acquired operations and is referenced to provide further clarity to our financial performance.
Revenue. Total revenue increased $103.6 million, or 15%, to $812.4 million for the year ended December 31, 2006 from $708.7 million for the comparable period in 2005. Revenue excluding the impact of the acquired operations of Xspedius grew 9% organically. The largest increase was from data and Internet services which increased $53.6 million, or 33%, to $216.4 million for 2006 from $162.8 million for 2005. The increase in data and Internet services primarily resulted from growth in revenue from enterprise customers and our Ethernet and IP-based product sales which contributed to a 30% growth from our organic operations.
Voice services revenue increased $35.2 million, or 21%, to $202.0 million for the year ended December 31, 2006 from $166.8 million for the comparable period in 2005. The increase is the result of our acquisition of Xspedius and organic growth of 8% from growth in bundled voice product sales as compared to the prior year.
Revenue from network services increased $14.2 million, or 4%, to $356.0 million for 2006 from $341.8 million for 2005. The increase in network services revenue was primarily the result of our acquisition of Xspedius. Somewhat offsetting network services revenue growth was the loss of revenue from a wireless
45
customer through consolidation that represented 4% of total revenue in 2006 as compared to 5% of total revenue in 2005.
Intercarrier compensation revenue, which includes reciprocal compensation and switched access, increased $0.7 million, or 2%, to $38.0 million for 2006 from $37.3 million for 2005. Reciprocal compensation rates are established between the parties based on federal and state regulatory rulings. The increase is primarily the result of our acquisition of Xspedius and was partially offset by a decline in intercarrier compensation revenue in our organic operations.
Operating Expenses. Operating expenses increased $47.0 million, or 18%, to $311.5 million for 2006 from $264.5 million for 2005. The increase in operating expenses is primarily related to revenue growth that contributed to higher direct costs associated with serving our customers, higher maintenance costs to support continued investment in our network, an increase in employee costs related to merit increases, and as a result of our acquired operations. Additionally, in January 2006 we began recognition of expense for stock options under SFAS 123R which resulted in an increase to operating expense of $2.1 million. Operating expenses were 38% of total revenue in 2006 or 37% of total revenue in 2006 excluding the acquired operations, as compared to 37% in 2005.
Selling, General, and Administrative Expenses. Selling, general, and administrative expenses increased $35.4 million, or 18%, to $228.5 million for 2006 from $193.1 million for 2005. The increase in selling, general, and administrative expenses primarily resulted from higher employee compensation from merit increases, an increase in commissions from improved sales and customer retention and as a result of the Xspedius acquisition including $2.4 million in integration related costs. Additionally, in January 2006 we began recognition of expense for stock options under SFAS 123R, which resulted in an increase of $10.7 million from the prior year. These increases were somewhat offset by a reduction in bad debt expense due to improved collections. Selling, general, and administrative expenses were 28% of total revenue in 2006 as compared to 27% in 2005.
Depreciation, Amortization, and Accretion Expense. Depreciation, amortization, and accretion expense increased $17.9 million, or 8%, to $256.1 million for 2006 from $238.2 million for 2005. The increase was primarily attributable to additions to property, plant and equipment made during 2006 and 2005 as well as increased depreciation and amortization expense as a result of assets acquired. These increases were partially offset by a reduction in depreciation as assets become fully depreciated and from asset retirements.
Interest Expense.Interest expense decreased $22.0 million, or 18%, to $98.2 million in 2006 from $120.2 million for 2005. The decrease is due to lower effective interest rates as a result of debt refinancings in 2005 and 2006. This decrease was somewhat offset by an increase in net debt as a result of the acquisition of Xspedius.
Debt Extinguishment Costs.Debt extinguishment costs increased $22.8 million to $36.9 million for the year ended December 31, 2006, from $14.0 million for the comparable period in 2005. The debt extinguishment costs in 2006 resulted from the refinancings in 2006 and consist of $25.1 million in cash paid for call premiums and $11.8 million in non-cash write offs of deferred debt issuance costs from the early retirement of $400 million 10 1/8% Senior Notes, $240 million Senior Secured Floating Rate Notes, a $200 million term loan B Facility and the replacement of a $110 million revolving credit facility. The debt extinguishment costs in 2005 consist of $9.8 million in cash paid for call premiums and $4.2 million in non-cash write offs of deferred debt issuance costs from the early retirement of $400 million 9 3/4% Senior Notes and the reduction of the $150 million revolving credit facility.
Interest Income. Interest income increased $6.8 million to $20.1 million in 2006 from $13.2 million in 2005. The increase is due to higher average interest rates.
Income Taxes. Income tax expense was $0.03 million for 2006 for state income taxes. We incurred no income tax expense in 2005. We have established a valuation allowance for deferred taxes. As of December 31, 2006, our valuation allowance was $331.2 million, which reduces our net deferred tax asset. As of December 31, 2006, net deferred tax assets were $58.8 million. We believe that it is more likely than not that our net deferred
46
tax assets will be realized through future taxable income. The $58.8 million in net deferred tax assets represents our best estimate of the assets that would be realizable utilizing tax planning strategies in the event that loss carryforwards were due to expire, which begins in 2019.
Net Loss and Modified EBITDA. Net loss decreased $9.2 million, or 9%, to $98.8 million, a loss of $0.80 per share, for the year ended December 31, 2006 from $108.1 million, a loss of $0.93 per share for the comparable period in 2005. The change primarily resulted from an increase in Modified EBITDA of $34.9 million and a decrease in interest expense, net of interest income, of $28.8 million. These increases were partially offset by higher depreciation and amortization expense of $17.9 million resulting from continued capital investment and the acquired assets, a $22.8 million increase in debt extinguishment costs as a result of debt refinancings that were completed during 2006, and $12.8 million in non-cash stock-based compensation from the adoption of SFAS 123R as of January 1, 2006. Modified EBITDA increased $34.9 million to $286.0 million, or 35% of revenue for the year ended December 31, 2006, from $251.2 million, or 35% of revenue for the comparable period in 2005. The increase in Modified EBITDA resulted from higher revenue somewhat offset by higher operating and selling, general and administrative expenses associated with selling, installing and maintaining the higher revenue stream as well as from acquired operations.
Liquidity and Capital Resources
Historically, we have generated cash flow from operations consisting primarily of payments received from customers for the provision of business communications services offset by payments to other telecommunications carriers, payments to employees, and payments for interest and other operating, selling, general, and administrative costs. We have also generated cash from debt and equity financing activities and have used funds to service our debt obligations, fund acquisitions, and make capital expenditures to expand our networks.
At December 31, 2007, we had $1.4 billion of total debt and $321.5 million of cash and cash equivalents compared to $1.4 billion of debt and $309.5 million of cash and cash equivalents and short-term investments at December 31, 2006. Net debt (defined as total debt less cash and cash equivalents and short-term investments) decreased $17.1 million primarily due to cash provided by operating activities resulting from Modified EBITDA, interest income and proceeds from the issuance of common stock upon exercise of stock options and in connection with the employee stock purchase plan, offset by cash used for capital expenditures and cash interest payments.
Working capital, defined as current assets less current liabilities, was $131.4 million as of December 31, 2007, an increase of $1.2 million from December 31, 2006. Our working capital ratio, defined as current assets divided by current liabilities, was 1.46 as of December 31, 2007 and December 31, 2006.
Cash Flow Activity
Cash and cash equivalents were $321.5 million and $221.6 million as of December 31, 2007 and 2006, respectively. The change in cash and cash equivalents during the periods presented were as follows:
| | | | | | | | | | | | |
| | | Years ended December 31, | |
| | | 2007 | | | 2006 | | | 2005 | |
| | | (amounts in thousands) | |
Cash provided by operating activities | | $ | 264,207 | | | $ | 174,558 | | | $ | 128,420 | |
Cash used in investing activities | | | (188,571 | ) | | | (300,923 | ) | | | (35,255 | ) |
Cash provided by (used in) financing activities | | | 24,342 | | | | 137,084 | | | | (12,383 | ) |
| | | | | | | | | | | | |
Increase in cash and cash equivalents | | $ | 99,978 | | | $ | 10,719 | | | $ | 80,782 | |
| | | | | | | | | | | | |
Operations. Cash provided by operating activities was $264.2 million for the year ended December 31, 2007 compared to $174.6 million for the same period in 2006. This increase in cash provided by operating activities primarily related to higher Modified EBITDA and changes in working capital in 2006, primarily due to lower
47
interest payments as a result of lower average rates and a change in the timing of interest payments as a result of the debt refinancings in 2006. The changes in components of working capital are generally subject to fluctuations based on the timing of cash transactions related to collection of receivables and payments to vendors and employees and interest payments, among other items.
Cash provided by operating activities increased $46.1 million for 2006 compared to 2005, primarily related to higher Modified EBITDA and lower interest payments somewhat offset by a decrease in working capital.
Investing. Cash used in investing activities was $188.6 million in 2007 compared to $300.9 million for 2006. The change primarily relates to cash used for the acquisition of Xspedius of $212.4 million in 2006, somewhat offset by increased capital expenditures and a decrease in net redemptions of investments. Our balances of cash, cash equivalents and investments change over time based on our cash requirements, market interest yields and risk. Cash used for capital expenditures for the year ended December 31, 2007 was $257.9 million, the majority of which was used to expand our networks in our existing markets and to reach new customer buildings and to integrate our acquired operations, compared to $192.3 million for the year ended December 31, 2006.
Cash used in investing activities was $300.9 million in 2006 compared to $35.3 million for 2005. The increase primarily related to cash used for the acquisition of Xspedius of $212.4 million, net of cash acquired and an increase in cash used for capital expenditures from $161.0 million in 2005 to $192.3 million in 2006 as we continued to expand our network and to reach new customer buildings.
Financing. Cash provided by financing activities was $24.3 million for the year ended December 31, 2007, primarily related to proceeds from the exercise of stock options and sales of our common stock under our employee stock purchase plan, slightly offset by the quarterly payments on the $600 million term loan B.
Cash provided by financing activities was $137.1 million for the year ended December 31, 2006. Cash proceeds from the exercise of stock options and sales of common stock under our employee stock purchase plan were $46.4 million in 2006. Refinancing of debt resulted in net proceeds of $94.2 million, as described more fully below. Cash used in financing activities was $12.4 million for the year ended December 31, 2005 and primarily related to net cash used to redeem debt offset by the issuance of additional debt, as described more fully below.
During 2006 and 2005, we refinanced several of our debt instruments to improve our effective interest costs and to extend the nearest debt maturities. In 2006, our financing and refinancing activity consisted of:
| | • | | Issuance in March 2006 of $373.8 million principal amount of 2 3/8% Convertible Senior Debentures due 2026 (the “Convertible Debentures”); |
| | • | | Redemption in May 2006 of the entire $400 million principal amount of 10 1/8% Senior Notes due February 2011 at a redemption price of 105.063% plus accrued interest; and |
| | • | | Execution in October 2006 of a $700 million senior secured credit facility (“Credit Facility”) consisting of: |
| | • | | a $600 million term loan B (“new Term Loan”) due 2013, which was fully drawn in October 2006, to repay our outstanding $200 million term loan B, to redeem in November 2006 our $240 million principal amount Second Priority Senior Secured Floating Rate Notes due February 2011 and partially finance the cash portion of the consideration for the Xspedius acquisition, and |
| | • | | a $100 million revolving credit facility (“new Revolver”) due October 2011, which remains undrawn and replaced our existing revolver. |
In 2005, our financing and refinancing activity consisted of:
| | • | | Issuance in February 2005 of an additional $200 million principal amount of 9 1/4% Senior Notes due February 15, 2014 (“Senior Notes”); |
48
| | • | | Redemption in March 2005 of $200 million of the 9 3/4% Senior Notes due 2008 at a redemption price of 103.25% plus accrued interest; |
| | • | | Execution in November 2005 of a $200 million term loan B facility and subsequent draw down in December 2005; and |
| | • | | Redemption in December 2005 of the remaining $200 million principal amount of 9 3/4% Senior Notes due 2008 at a redemption price of 101.625% plus accrued interest. |
After completion of these activities, we had outstanding $400 million principal amount of 9 1/4% Senior Notes due 2014, $373.8 million principal amount of 2 3/8% Convertible Debentures due 2026, the $600 million new Term Loan due 2013, and the undrawn $100 million new Revolver maturing in 2011. The interest on the new Term Loan is computed based on a specified Eurodollar rate plus 1.75% to 2.0% after giving effect to an amendment on February 15, 2007 that reduced interest by 25 basis points. Aggregate annual interest payments on the 2014 Notes and the Convertible Debentures are $37.0 million and $8.9 million, respectively. Based on the Eurodollar rate of 6.9% in effect at December 31, 2007, aggregate annual interest payments on $594.0 million of borrowings outstanding under the new term loan would be $41.0 million. Significant terms of our outstanding indebtedness are detailed in Note 5 of our consolidated financial statements.
In order to reduce future cash interest payments, as well as future amounts due at maturity or mandatory redemption, we or our affiliates may, from time to time, purchase our outstanding Senior Notes for cash or equity securities in open market or privately negotiated transactions or engage in other transactions to reduce the amount of outstanding Senior Notes. We will evaluate any such transactions in light of market conditions, taking into account our liquidity and prospects for future access to capital, and contractual constraints.
The following diagram summarizes our corporate structure in relation to our outstanding indebtedness and credit facility as of December 31, 2007. The diagram does not depict all aspects of ownership structure among the operating and holding entities, but rather summarizes the significant elements relative to our debt in order to provide a basic overview.
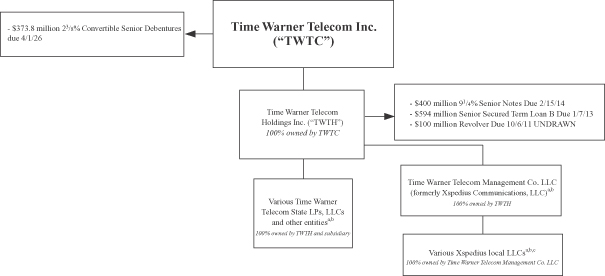
| a | The interests of TWTH in these entities are pledged to secure the new Revolver and the new Term Loan. |
| b | The assets and limited liability company interests of these subsidiaries are pledged to secure the new Revolver and the new Term Loan. |
| c | Certain of the Xspedius local limited liability companies (LLCs) that operate in the same states as the Time Warner Telecom state limited partnerships (LPs) and LLCs were consolidated with the Time Warner Telecom local entities through subsidiary mergers. The remaining Xspedius local entities have changed their names to names that include “Time Warner Telecom.” |
49
Capital Expenditures and Requirements
Our total capital expenditures were $259.5 million for the year ended December 31, 2007 compared to $192.7 million for the same period in 2006. We incur capital expenditures to develop and expand our network, products and systems and spent $30.1 million in connection with the integration of the acquired operations. Success based spending consists of short-to-medium term capital expenditures made primarily to enable revenue producing activities, including costs to connect to new customer locations with our fiber network and increase capacity to our networks, IP backbone and central office infrastructure to serve growing customer demands. Approximately 88% and 86% of capital expenditures, other than capital expenditures for integration, were success based for the years ended December 31, 2007 and 2006, respectively. For 2008, we expect capital expenditures of approximately $240 million to $260 million for our general operations, which we expect will primarily be used for success based spending, and approximately $10 million to $14 million for integration and branding. We generally do not make long-term commitments for capital expenditures and have the ability to adjust our capital expenditures if our cash from operations is lower than anticipated.
Capital Resources
In 2008, we expect that cash from operations, along with cash, cash equivalents and investments will provide sufficient funds to meet our expected capital expenditure requirements and liquidity needs to operate our business and service our current debt. Based on current assumptions, we expect to generate sufficient cash from operations along with available cash on hand, including cash equivalents, investments, and borrowing capacity under our new Revolver to provide sufficient funds to meet our expected capital expenditure and liquidity needs to operate our business and service our debt for the foreseeable future. If our assumptions prove incorrect or if there are other factors that negatively affect our cash position such as material unanticipated losses, a significant reduction in demand for our services or an acceleration of customer disconnects or other risk factors, we may need to seek additional sources of funds through financing or other means.
Our ability to draw upon the available commitments under our new Revolver is subject to compliance with all of the covenants contained in the credit agreement and our continued ability to make certain representations and warranties. In the case of the new Revolver, the covenants include financial covenants, such as leverage and interest coverage ratios and limitations on capital expenditures, that are primarily derived from Modified EBITDA and debt levels. We are required to comply with these ratios as a condition to any borrowing under the new Revolver and for as long as any loans are outstanding. The representations and warranties include the absence of liens on our properties other than certain permitted liens, the absence of litigation or other developments that have or could reasonably be expected to have a material adverse effect on us and our subsidiaries as a whole, and continued effectiveness of the documents granting security for the loans. Although we presently meet all of the conditions for making draws under the new Revolver, factors beyond our control could cause us to fail to meet these conditions in the future.
A lack of revenue growth or an inability to control costs could negatively impact Modified EBITDA and cause our failure to meet the required minimum ratios. Although we currently believe that we will continue to be in compliance with the covenants, factors outside our control, including deterioration of the economy, increased competition and loss of revenue from consolidation of large telecommunication companies, an acceleration of customer disconnects, a significant reduction in demand for our services without adequate reductions in capital expenditures and operating expenses, or an uninsured catastrophic loss of physical assets or other risk factors, could cause us to fail to meet our covenants. If our revenue growth is not sufficient to sustain the Modified EBITDA performance required to meet the debt covenants described above, and we have loans outstanding under the new Revolver or wish to draw on it, we would have to consider cost cutting measures to maintain required Modified EBITDA levels or to enhance liquidity.
The new Revolver and new Term Loan limit our ability to declare dividends, incur indebtedness, incur liens on property, and undertake mergers. The new Revolver and new Term Loan also include cross default provisions
50
under which we are deemed to be in default if we default under any of the other material outstanding obligations, such as our Senior Notes. In addition, each group of lenders (new Revolver and new Term Loan) may require a prepayment if a change of voting control occurs as defined in the new Revolver and new Term Loan agreements. If we do not comply with the covenants, we would not be able to draw funds under the new Revolver or the lenders could cancel the new Revolver unless the respective lenders agree to further modify the covenants. We could potentially be subject to an acceleration of the repayment date if we have borrowed under the facilities and are in default under the covenants. Although we believe our relationships with our lenders are good, there is no assurance that we would be able to obtain the necessary covenant modifications on acceptable terms or at all. If our plans or assumptions change or prove to be inaccurate, or the foregoing sources of funds prove to be insufficient to fund our growth and operations, or if we consummate acquisitions or joint ventures, we would be required to seek additional capital. Additional sources of financing may include public or private debt, equity financing by us or our subsidiaries, or other financing arrangements. There is no assurance that we would be able to obtain additional financing on terms acceptable to us or at all. Our revenue and costs are partially dependent upon factors that are outside our control, such as general economic conditions, regulatory changes, adverse changes in customers’ financial condition, changes in technology, and increased competition. Due to the uncertainty of these and other factors, actual revenue and costs may vary from expected amounts, possibly to a material degree, and these variations would likely affect the level of our future capital expenditures and expansion plans.
Commitments. The following table summarizes our long-term commitments as of December 31, 2007, including commitments pursuant to debt agreements, lease obligations, fixed maintenance contracts, and other purchase obligations.
| | | | | | | | | | | | | | | | | | | | | |
Contractual Obligations | | Total | | 2008 | | 2009 | | 2010 | | 2011 | | 2012 | | Thereafter |
| | | (amounts in thousands) |
Principal payments on long-term debt: | | | | | | | | | | | | | | | | | | | | | |
$600 million Term Loan B due 2013 | | $ | 594,000 | | $ | 6,000 | | $ | 6,000 | | $ | 6,000 | | $ | 6,000 | | $ | 6,000 | | $ | 564,000 |
$400 million 9 1/4% Senior Notes due 2014 | | | 400,000 | | | — | | | — | | | — | | | — | | | — | | | 400,000 |
$373.8 million 2.375% Convertible Senior Debentures due 2026 | | | 373,750 | | | — | | | — | | | — | | | — | | | — | | | 373,750 |
| | | | | | | | | | | | | | | | | | | | | |
Total principal payments | | $ | 1,367,750 | | $ | 6,000 | | $ | 6,000 | | $ | 6,000 | | $ | 6,000 | | $ | 6,000 | | $ | 1,337,750 |
| | | | | | | |
Interest payments on long-term debt (1) | | | 605,820 | | | 86,911 | | | 86,500 | | | 86,089 | | | 85,566 | | | 84,767 | | | 175,987 |
Capital lease obligations including interest (2) | | | 15,836 | | | 2,174 | | | 1,797 | | | 1,584 | | | 1,234 | | | 1,242 | | | 7,805 |
Operating lease obligations | | | 277,393 | | | 41,854 | | | 38,343 | | | 34,390 | | | 31,595 | | | 28,247 | | | 102,964 |
Fixed maintenance obligations | | | 58,547 | | | 3,503 | | | 3,503 | | | 3,503 | | | 3,503 | | | 3,503 | | | 41,032 |
Purchase obligations | | | | | | | | | | | | | | | | | | | | | |
Purchase orders (3) | | | 23,365 | | | 23,365 | | | — | | | — | | | — | | | — | | | — |
Network costs (4) | | | 158,790 | | | 54,870 | | | 48,979 | | | 34,334 | | | 18,470 | | | 2,105 | | | 32 |
| | | | | | | | | | | | | | | | | | | | | |
Total | | $ | 2,507,563 | | $ | 218,662 | | $ | 185,096 | | $ | 166,087 | | $ | 146,327 | | $ | 125,815 | | $ | 1,665,576 |
| | | | | | | | | | | | | | | | | | | | | |
| (1) | Interest payments on the Term Loan B are calculated using the rate in effect as of December 31, 2007. |
| (2) | Includes amounts representing interest of $6.3 million. |
| (3) | Includes outstanding purchase orders initiated in the ordinary course of business for operating and capital expenditures. |
| (4) | Includes services purchased from other carriers to transport a portion of our traffic to the end user, to interconnect with the ILECs, to lease our IP backbone, or to provide other ancillary services under contracts that can vary from month-to-month up to 60 months. Some services are purchased under volume plans that require us to maintain certain commitment levels to obtain favorable pricing. Some services may be purchased under contracts that are subject to contract termination costs, or penalties, if services are disconnected before the end of the term. |
Effects of Inflation
Historically, inflation has not had a material effect on us.
51
| Item 7A. | Quantitative and Qualitative Disclosures About Market Risk |
Our interest income is sensitive to changes in the general level of interest rates. In this regard, changes in interest rates can affect the interest earned on our cash equivalents. Based on our cash equivalents of $320.9 million at December 31, 2007, a one-percent change in the interest rate would change the interest earned by $3.2 million.
At December 31, 2007, we held commercial paper of $14.5 million, after giving effect to an impairment loss of $7.3 million in the year ended December 31, 2007, with exposure to sub-prime mortgages that is past its maturity date. These securities are classified as long term investments in the December 31, 2007 consolidated balance sheet. Prior to December 31, 2007, all of our other commercial paper investments were redeemed at par and reinvested in treasury bills, AAA rated funds and money market mutual funds comprised of government securities and treasury bills. We do not expect the current lack of liquidity of the commercial paper that is past its maturity to adversely impact our ability to meet capital expenditure and other liquidity needs.
We have fixed and variable rate debt. We had variable-rate debt instruments representing approximately 43% and 44% of our total debt at December 31, 2007 and 2006, respectively. Our largest exposure with respect to variable rate debt is from changes in the Eurodollar rate as interest on the new Term Loan varies based on a specified Eurodollar rate. Based on the $594 million outstanding balance as of December 31, 2007, a one-percent change in the applicable rate would change the annual amount of interest paid by $5.9 million.
At December 31, 2007, the fair values of our fixed rate 9 1/4% Senior Notes due 2014 and our 2 3/8% Convertible Debentures due 2026 were approximately $410 million and $475 million, respectively, as compared to carrying values of $400 million and $373.8 million, respectively, each on the same date. These notes have not been listed on any securities exchange or inter-dealer automated quotation systems, and the estimated market value is based on indicative pricing published by investment banks. While we believe these approximations to be reasonably accurate at the time published, indicative pricing can vary widely depending on volume traded by any given investment bank and other factors.
| Item 8. | Financial Statements and Supplementary Data |
See “Index to Consolidated Financial Statements” at page F-1.
| Item 9. | Changes in and Disagreements with Accountants on Accounting and Financial Disclosure |
None.
52
| Item 9A. | Controls and Procedures |
Disclosure Controls and Procedures
As of December 31, 2007, we conducted an evaluation, under the supervision and with the participation of our Chief Executive Officer and Chief Financial Officer, of the effectiveness of the design and operation of our disclosure controls and procedures. Based on that evaluation, the Chief Executive Officer and Chief Financial Officer concluded that our disclosure controls and procedures are effective to provide reasonable assurance that information required to be disclosed by us in reports that we file or submit under the Securities Exchange Act of 1934 is recorded, processed, summarized, and reported within the time periods specified in Securities and Exchange Commission rules and forms as of December 31, 2007.
Management’s Report on Internal Control over Financial Reporting
Our management is responsible for establishing and maintaining adequate internal control over financial reporting as defined in Rules 13a-15(f) and 15d-15(f) under the Securities Exchange Act of 1934 to provide reasonable assurance that the objectives of the control system are met. Our management conducted an assessment of our internal control over financial reporting based on the framework established by the Committee of Sponsoring Organizations of the Treadway Commission in Internal Control — Integrated Framework. Our management has concluded that our assessment provides reasonable assurance that, as of December 31, 2007, the Company’s internal control over financial reporting is effective.
Changes in Internal Control Over Financial Reporting
There has been no change in our internal control over financial reporting during the quarter ended December 31, 2007 that has materially affected, or is reasonably likely to materially affect, our internal control over financial reporting.
| Item 9B. | Other Information |
None
53
REPORT OF INDEPENDENT REGISTERED PUBLIC ACCOUNTING FIRM
The Board of Directors and Shareholders of Time Warner Telecom Inc.
We have audited Time Warner Telecom Inc.’s internal control over financial reporting as of December 31, 2007, based on criteria established in Internal Control — Integrated Framework issued by the Committee of Sponsoring Organizations of the Treadway Commission (the COSO criteria). Time Warner Telecom Inc.’s management is responsible for maintaining effective internal control over financial reporting, and for its assessment of the effectiveness of internal control over financial reporting included in the accompanying Management’s Report on Internal Control over Financial Reporting. Our responsibility is to express an opinion on the Company’s internal control over financial reporting based on our audit.
We conducted our audit in accordance with the standards of the Public Company Accounting Oversight Board (United States). Those standards require that we plan and perform the audit to obtain reasonable assurance about whether effective internal control over financial reporting was maintained in all material respects. Our audit included obtaining an understanding of internal control over financial reporting, assessing the risk that a material weakness exists, testing and evaluating the design and operating effectiveness of internal control based on the assessed risk, and performing such other procedures as we considered necessary in the circumstances. We believe that our audit provides a reasonable basis for our opinion.
A company’s internal control over financial reporting is a process designed to provide reasonable assurance regarding the reliability of financial reporting and the preparation of financial statements for external purposes in accordance with generally accepted accounting principles. A company’s internal control over financial reporting includes those policies and procedures that (1) pertain to the maintenance of records that, in reasonable detail, accurately and fairly reflect the transactions and dispositions of the assets of the company; (2) provide reasonable assurance that transactions are recorded as necessary to permit preparation of financial statements in accordance with generally accepted accounting principles, and that receipts and expenditures of the company are being made only in accordance with authorizations of management and directors of the company; and (3) provide reasonable assurance regarding prevention or timely detection of unauthorized acquisition, use, or disposition of the company’s assets that could have a material effect on the financial statements.
Because of its inherent limitations, internal control over financial reporting may not prevent or detect misstatements. Also, projections of any evaluation of effectiveness to future periods are subject to the risk that controls may become inadequate because of changes in conditions, or that the degree of compliance with the policies or procedures may deteriorate.
In our opinion, Time Warner Telecom Inc. maintained, in all material respects, effective internal control over financial reporting as of December 31, 2007, based on the COSO criteria.
We also have audited, in accordance with the standards of the Public Company Accounting Oversight Board (United States), the consolidated balance sheets of Time Warner Telecom Inc. as of December 31, 2007 and 2006, and the related consolidated statements of operations, changes in stockholders’ equity, and cash flows for each of the three years in the period ended December 31, 2007 and our report dated February 28, 2008 expressed an unqualified opinion thereon.
/s/ Ernst & Young LLP
Denver, Colorado
February 28, 2008
54
PART III
| Item 10. | Directors, Executive Officers and Corporate Governance |
The information with respect to directors if required by this Item will appear under the heading “Proposal 1: Election of Directors” and “Board Information” and the information with respect to executive officers, material changes to procedures by which security holders may recommend nominees to the board of directors and audit committee and financial experts required by this Item will appear in our definitive proxy statement for the 2008 Annual Meeting of Stockholders to be filed with the SEC no later than April 29, 2008 (the “Proxy Statement”) pursuant to Regulation 14A of the General Rules and Regulations under the Securities Exchange Act of 1934. These portions of the Proxy Statement are incorporated by reference.
Code of Ethics
We have adopted a Code of Ethics for directors and officers (including our principal executive officer, principal financial officer, chief accounting officer, controller and treasurer) which is available at our website atwww.twtelecom.com under “Investors.” Stockholders may request a free copy of the Code of Ethics from:
Time Warner Telecom Inc.
Attn: Investor Relations
10475 Park Meadows Drive
Littleton, CO 80124
| Item 11. | Executive Compensation |
The information required by this item will appear in our Proxy Statement under the heading “Executive Compensation”. This portion of our Proxy Statement is incorporated by reference.
| Item 12. | Security Ownership of Certain Beneficial Owners and Management and Related Stockholder Matters |
The information required by this item will appear under the headings “Time Warner Telecom Share Ownership” in our Proxy Statement. This portion of the Proxy Statement is incorporated by reference and under “Securities Authorized for Issuance under Equity Compensation Plans”.
| Item 13. | Certain Relationships and Related Transactions, and Director Independence |
The information required by this item will appear under the heading “Certain Relationships and Related Transactions” and “Corporate Governance” in our Proxy Statement and is incorporated by reference.
| Item 14. | Principal Accounting Fees and Services |
Information regarding our principal auditor fees and services will appear under “Proposal 2: Ratification of Appointment of Independent Auditors” in our Proxy Statement and is incorporated by reference.
55
GLOSSARY
Access Charges. The fees paid by long distance carriers for the local connections between the long distance carriers' networks and the long distance carriers’ customers.
Central Offices. A telecommunications center where switches and other telecommunications facilities are housed. CLECs may connect with ILEC networks either at this location or through a remote location.
Class of Service. A method of managing traffic on a network that allows customers to group types of traffic and assign each type a different priority level.
Collocation. The ability of a telecommunications carrier to interconnect its network to the ILEC’s network by extending its facilities to the ILEC’s central office. Physical collocation occurs when the interconnecting carrier places its network equipment within the ILEC’s central offices. Virtual collocation is an alternative to physical collocation under which the ILEC permits a carrier to interconnect its network to the ILEC’s network in a manner which is technically, operationally, and economically comparable to physical collocation, even though the interconnecting carrier's network connection equipment is not physically located within the central offices.
CLEC (Competitive Local Exchange Carrier). A company that provides local exchange services, including dedicated service, in competition with the ILEC.
Dedicated. Telecommunications lines dedicated to, or reserved for use by, a particular customer along predetermined routes (in contrast to links which are temporarily established).
Dedicated Transmission. The sending of electronic signals carrying information over a Dedicated Transport facility.
Dedicated Transport. A non-switched point-to-point telecommunications facility leased from a telecommunications provider by an end user and used exclusively by that end user.
Dense Wavelength Division Multiplexing (DWDM). A technology that multiplies the capacity of single fiber to 8, 16, 32, or 80 new transmission channels. Higher capacity multiples are under testing.
Digital. A means of storing, processing and transmitting information by using distinct electronic or optical pulses that represent the binary digits 0 and 1. Digital transmission and switching technologies use a sequence of these pulses to represent information as opposed to the continuously variable analog signal. The precise digital numbers preclude distortion (such as graininess or snow in the case of video transmission, or static or other background distortion in the case of audio transmission).
DS-0, DS-1, DS-3. Standard North American telecommunications industry digital signal formats, which are distinguishable by bit rate (the number of binary digits (0 and 1) transmitted per second). DS-0 service has a bit rate of 64 kilobits per second. DS-1 service has a bit rate of 1.544 megabits per second and DS-3 service has a bit rate of 44.736 megabits per second. A DS-0 can transmit a single uncompressed voice conversation.
ESCON (Enterprise System Connection Architecture). An IBM mainframe data protocol.
Ethernet. A network configuration in which data is separated into “frames” for transmission. Ethernet equipment scans the network to find the least-congested route for frames to travel from Point A to Point B, thus resulting in greater speed and fewer errors in frame transmission.
FCC. Federal Communications Commission.
56
Fiber Optics. Fiber optic technology involves sending laser light pulses across glass strands in order to transmit digital information. Fiber optic cable is the medium of choice for the telecommunications and cable industries. Fiber is immune to electrical interference and environmental factors that affect copper wiring and satellite transmission.
Gigabit Ethernet. A LAN transmission standard that provides a data rate of one billion bits per second (1 Gbps).
Gbps (Gigabits per second). One billion bits of information.The information-carrying capacity (i.e., bandwidth) of a circuit may be measured in “billions of bits per second.”
Grooming. The rearrangement or replacement of circuits used in a telecommunication provider’s network to reach end users or to constitute the network backbone to create lower cost, increased capacity or better network performance.
Hub. Collocation centers located centrally in an area where telecommunications traffic can be aggregated for transport and distribution.
ILECs (Incumbent Local Exchange Carriers). The local phone companies, either a BOC or an independent (such as Cincinnati Bell) which provides local exchange services.
Internet. The name used to describe the global open network of computers that permits a person with access to the Internet to exchange information with any other computer connected to the network.
IntraLATA.A call that originates and terminates within the same LATA.
ISDN (Integrated Services Digital Network). ISDN is an internationally agreed standard, which, through special equipment, allows two-way, simultaneous voice and data transmission in digital formats over the same transmission line. ISDN permits video conferencing over a single line, for example, and also supports a multitude of value added switched service applications such as Incoming Calling Line Identification. ISDN’s combined voice and data networking capabilities reduce costs for end users and result in more efficient use of available facilities. ISDN combines standards for highly flexible customer to network signaling with both voice and data within a common facility.
IXC (Interexchange Carrier). A long distance carrier.
Kbps (Kilobits per second). Kilobit means one thousand bits of information. The information-carrying capacity (i.e., bandwidth) of a circuit may be measured in “thousands of bits per second.”
LANs (Local Area Networks). The interconnection of computers for the purpose of sharing files, programs, and peripheral devices such as printers and high-speed modems. LANs may include dedicated computers or file servers that provide a centralized source of shared files and programs. LANs are generally confined to a single customer’s premises and may be extended or interconnected to other locations through the use of bridges and routers.
LATA (Local Access and Transport Area). The geographical areas within which a local telephone company may offer telecommunications services, as defined in the divestiture order known as the Modified Final Judgment unless and until refined by the FCC pursuant to the Telecommunications Act of 1996.
Local Exchange. A geographic area defined by the appropriate state regulatory authority in which telephone calls generally are transmitted without toll charges to the calling or called party.
57
Local Exchange Service/Local Exchange Telephone Service. Basic local telephone service, including the provision of telephone numbers, dial tone and calling within the local exchange area.
Long Distance Carriers (Interexchange Carriers or IXC). Long distance carriers providing services between LATAs, on an interstate or intrastate basis. A long distance carrier may be facilities-based or offer service by reselling the services of a facilities-based carrier.
Managed Service. Those services delivered by the Company where the interface provided to the customer requires no further protocol conversion and the Company monitors and manages the equipment providing the service and controls the network administration. Examples of managed services include, but are not limited to, the Company’s Native LAN suite, IP VPN, and the Company’s integrated access services.
Mbps (Megabits per second). Megabit means one million bits of information. The information carrying capacity (i.e., bandwidth) of a circuit may be measured in “millions of bits per second.”
MPLS (Multi Protocol Label Switching). A standards-approved technology for speeding up network traffic flow and making it easier to manage. MPLS involves setting up a specific path for a given sequence of packets, identified by a label put in each packet, thus saving the time needed for a router or switch to look up the address to the next node to forward the packet to.
Multiplexing. An electronic or optical process that combines a number of lower speed transmission signals into one higher speed signal. There are various techniques for multiplexing, including frequency division (splitting the total available frequency bandwidth into smaller frequency slices), time division (slicing a channel into timeslots and placing each signal into its assigned timeslot), and statistical (wherein multiplexed signals share the same channel and each transmits only when it has data to send).
NLAN (Native Local Area Network). Interconnection of computers for the purpose of sharing files that does not require protocol conversion between the networks.
Node. A point of connection into a fiber optic network.
OC-n. Optical carrier levels ranging from OC-1 (51.84 Mbps) to OC-192 (9.9 Gbps).
POPs (Points of Presence). Locations where an IXC has installed transmission equipment in a service area that serves as, or relays telephone calls to, a network switching center of the same IXC.
Primary Rate Interface (PRI). A transport mechanism provided currently over class 5 switches to terminate at managed modem pools. The primary application is for dial-up Internet access.
Private Line. A private, dedicated telecommunications link between different customer locations (excluding IXC POPs).
PSTN (Public Switched Telephone Network). The switched network available to all users generally on a shared basis (i.e., not dedicated to a particular user). The local exchange telephone service networks operated by ILECs are the largest and often the only public switched networks in a given locality.
Reciprocal Compensation. An arrangement in which two local exchange carriers agree to terminate traffic originating on each other's networks in exchange for a negotiated level of compensation.
Redundant Electronics. A telecommunications facility that uses two separate electronic devices to transmit a telecommunications signal so that if one device malfunctions, the signal may continue without interruption.
58
Route Mile. The number of miles along which fiber optic cables are installed.
SONET (Synchronous Optical Network). A set of standards for optical communications transmission systems that define the optical rates and formats, signal characteristics, performance, management and maintenance information to be embedded within the signals and the multiplexing techniques to be employed in optical communications transmission systems. SONET facilitates the interoperability of dissimilar vendors equipment. SONET benefits business customers by minimizing the equipment necessary for various telecommunications applications and supports networking diagnostic and maintenance features.
Special Access Services. The lease of private, dedicated telecommunications lines or circuits on an ILEC’s or a CLECs network, which run to or from another carrier’s POPs. Special access services do not require the use of switches. Examples of special access services are telecommunications circuits running between POPs of a single carrier, from one carrier’s POP to another carrier’s POP or from an end user to a carrier’s POP.
STS-1. This dedicated transmission service is carried over high-capacity channels for full duplex, synchronous optical transmission of digital data on SONET standards. This service eliminates the need to maintain and pay for multiple dedicated lines.
Switch. A mechanical or electronic device that opens or closes circuits or selects the paths or circuits to be used for the transmission of information. Switching is a process of linking different circuits to create a temporary transmission path between users. Within this document, switches generally refer to voice grade telecommunications switches unless specifically stated otherwise.
Switched Access Services. The connection between an IXC’s POP and an end user’s premises through the switching facilities of a local exchange carrier.
Switched Services. Telecommunications services that support the connection of one calling party with another calling party via use of a telephone switch (i.e., an electronic device that opens or closes circuits, completes or breaks an electrical path, or selects paths or circuits).
TDM (Time Division Multiplexing). A type of multiplexing that combines data streams by assigning each stream a different time slot in a set. TDM repeatedly transmits a fixed sequence of time slots over a single transmission channel.
Toll Services. Services otherwise known as EAS or intraLATA toll services which are those calls that are beyond the free local calling area but originate and terminate within the same LATA; such calls are usually priced on a measured basis.
VoIP (Voice over Internet Protocol). The technology used to transmit voice conversations over a data network using the Internet Protocol.
VPN (Virtual Private Network). A private network that operates securely within a public network (such as the Internet) by means of encrypting transmissions.
59
PART IV
| Item 15. | Exhibits, Financial Statement Schedules |
(a) (1), (2) The Financial Statements and Schedule II — Valuation and Qualifying Accounts listed on the index on Page F-1 following are included herein by reference. All other schedules are omitted, either because they are not applicable or because the required information is shown in the financial statements or the notes thereto.
(3) Exhibits: The Exhibit Index at the end of this report lists the exhibits filed with this report or incorporated herein by reference.
60
SIGNATURES
Pursuant to the requirements of Section 13 or 15(d) of the Securities Exchange Act of 1934, the Registrant has duly caused this report to be signed on its behalf by the undersigned, thereunto duly authorized, on February 28, 2008.
| | |
| TIME WARNER TELECOM INC. |
| |
By: | | /s/ MARK A. PETERS |
| | Mark A. Peters |
| | Executive Vice President and |
| | Chief Financial Officer |
Pursuant to the requirements of the Securities Exchange Act of 1934, this report has been signed below by the following persons on behalf of the Registrant in the capacities and on the dates indicated.
| | | | |
Signature | | Title | | Date |
| (i) Principal Executive Officer | | | | |
| | |
/s/ LARISSA L. HERDA Larissa L. Herda | | Chairman, President, and Chief Executive Officer | | February 28, 2008 |
| | |
| (ii) Principal Financial Officer | | | | |
| | |
/s/ MARK A. PETERS Mark A. Peters | | Executive Vice President and Chief Financial Officer | | February 28, 2008 |
| | |
| (iii) Principal Accounting Officer | | | | |
| | |
/s/ JILL R. STUART Jill R. Stuart | | Senior Vice President, Accounting and Finance and Chief Accounting Officer | | February 28, 2008 |
| | |
| (iv) Directors | | | | |
| | |
/s/ GREGORY J. ATTORRI Gregory J. Attorri | | Director | | February 28, 2008 |
| | |
/s/ SPENCER B. HAYS Spencer B. Hays | | Director | | February 28, 2008 |
| | |
/s/ LARISSA L. HERDA Larissa L. Herda | | Director | | February 28, 2008 |
| | |
/s/ KEVIN W. MOONEY Kevin W. Mooney | | Director | | February 28, 2008 |
| | |
/s/ KIRBY G. PICKLE Kirby G. Pickle | | Director | | February 28, 2008 |
| | |
/s/ ROSCOE C. YOUNG, II Roscoe C. Young, II | | Director | | February 28, 2008 |
61
Time Warner Telecom Inc.
Index to Consolidated Financial Statements
| | |
| | | PAGE |
Audited Financial Statements: | | |
| |
Report of Independent Registered Public Accounting Firm | | F-2 |
Consolidated Balance Sheets at December 31, 2007 and 2006 | | F-3 |
Consolidated Statements of Operations for the years ended December 31, 2007, 2006, and 2005 | | F-4 |
Consolidated Statements of Cash Flows for the years ended December 31, 2007, 2006, and 2005 | | F-5 |
Consolidated Statements of Changes in Stockholders’ Equity for the years ended December 31, 2007, 2006, and 2005 | | F-6 |
Notes to Consolidated Financial Statements | | F-7 |
| |
Schedule II — Valuation and Qualifying Accounts | | F-35 |
F-1
REPORT OF INDEPENDENT REGISTERED PUBLIC ACCOUNTING FIRM
To the Board of Directors and Shareholders of Time Warner Telecom Inc.:
We have audited the accompanying consolidated balance sheets of Time Warner Telecom Inc. (the “Company”) as of December 31, 2007 and 2006, and the related consolidated statements of operations, cash flows, and changes in stockholders’ equity for each of the three years in the period ended December 31, 2007. Our audits also included the financial statement schedule listed on the index at page F-1. These financial statements and schedule are the responsibility of the Company’s management. Our responsibility is to express an opinion on these financial statements and schedule based on our audits.
We conducted our audits in accordance with the standards of the Public Company Accounting Oversight Board (United States). Those standards require that we plan and perform the audit to obtain reasonable assurance about whether the financial statements are free of material misstatement. An audit includes examining, on a test basis, evidence supporting the amounts and disclosures in the financial statements. An audit also includes assessing the accounting principles used and significant estimates made by management, as well as evaluating the overall financial statement presentation. We believe that our audits provide a reasonable basis for our opinion.
In our opinion, the financial statements referred to above present fairly, in all material respects, the consolidated financial position of the Company at December 31, 2007 and 2006, and the consolidated results of its operations and its cash flows for each of the three years in the period ended December 31, 2007, in conformity with U.S. generally accepted accounting principles. Also, in our opinion, the related financial statement schedule, when considered in relation to the basic financial statements taken as a whole, presents fairly in all material respects the information set forth therein.
As discussed in Note 1 to the consolidated financials statements, effective January 1, 2006, the Company adopted Statement of Financial Accounting Standards No. 123(R) “Share Based Payment.”
We also have audited, in accordance with the standards of the Public Company Accounting Oversight Board (United States), Time Warner Telecom Inc.’s internal control over financial reporting as of December 31, 2007, based on criteria established in Internal Control — Integrated Framework issued by the Committee of Sponsoring Organizations of the Treadway Commission and our report dated February 28, 2008, expressed an unqualified opinion thereon.
/s/ Ernst & Young LLP
Denver, Colorado
February 28, 2008
F-2
TIME WARNER TELECOM INC.
CONSOLIDATED BALANCE SHEETS
December 31, 2007 and 2006
| | | | | | | | |
| | | 2007 | | | 2006 | |
| | | (amounts in thousands, except share and per share amounts) | |
ASSETS | | | | | | | | |
Current assets: | | | | | | | | |
Cash and cash equivalents | | $ | 321,531 | | | $ | 221,553 | |
Investments | | | — | | | | 87,900 | |
Receivables, less allowances of $12,018 and $13,182, respectively | | | 75,976 | | | | 73,923 | |
Prepaid expenses and other current assets | | | 13,461 | | | | 18,504 | |
Deferred income taxes | | | 8,703 | | | | 12,793 | |
| | | | | | | | |
Total current assets | | | 419,671 | | | | 414,673 | |
| | | | | | | | |
Long-term investments (note 3) | | | 14,456 | | | | — | |
Property, plant and equipment | | | 3,022,752 | | | | 2,771,631 | |
Less accumulated depreciation | | | (1,727,852 | ) | | | (1,477,519 | ) |
| | | | | | | | |
| | | 1,294,900 | | | | 1,294,112 | |
| | | | | | | | |
Deferred income taxes | | | 50,047 | | | | 45,957 | |
Goodwill | | | 412,694 | | | | 405,638 | |
Intangible assets, net of accumulated amortization | | | 51,002 | | | | 69,454 | |
Other assets, net of accumulated amortization | | | 21,948 | | | | 23,403 | |
| | | | | | | | |
Total assets | | $ | 2,264,718 | | | $ | 2,253,237 | |
| | | | | | | | |
LIABILITIES AND STOCKHOLDERS’ EQUITY | | | | | | | | |
| | |
Current liabilities: | | | | | | | | |
Accounts payable | | $ | 46,972 | | | $ | 41,388 | |
Deferred revenue | | | 26,015 | | | | 22,582 | |
Accrued taxes, franchise and other fees | | | 73,130 | | | | 78,795 | |
Accrued interest | | | 16,707 | | | | 16,984 | |
Accrued payroll and benefits | | | 36,560 | | | | 34,688 | |
Accrued carrier costs | | | 50,898 | | | | 49,806 | |
Current portion debt and capital lease obligations | | | 7,337 | | | | 6,679 | |
Other current liabilities | | | 30,647 | | | | 33,584 | |
| | | | | | | | |
Total current liabilities | | | 288,266 | | | | 284,506 | |
| | | | | | | | |
Long-term debt and capital lease obligations | | | 1,370,318 | | | | 1,375,958 | |
Long-term deferred revenue | | | 19,672 | | | | 20,357 | |
Other long-term liabilities | | | 20,237 | | | | 19,768 | |
Commitments and contingencies (note 9) | | | | | | | | |
Stockholders’ equity: | | | | | | | | |
Preferred stock, $0.01 par value, 20,000,000 shares authorized, no shares issued and outstanding | | | — | | | | — | |
Common stock, $0.01 par value, 439,800,000 shares authorized, 146,542,435 and 142,814,844 shares issued and outstanding, respectively | | | 1,465 | | | | 1,428 | |
Additional paid-in capital | | | 1,618,352 | | | | 1,564,543 | |
Accumulated deficit | | | (1,053,592 | ) | | | (1,013,323 | ) |
| | | | | | | | |
Total stockholders’ equity | | | 566,225 | | | | 552,648 | |
| | | | | | | | |
Total liabilities and stockholders’ equity | | $ | 2,264,718 | | | $ | 2,253,237 | |
| | | | | | | | |
See accompanying notes to the consolidated financial statements
F-3
TIME WARNER TELECOM INC.
CONSOLIDATED STATEMENTS OF OPERATIONS
Years Ended December 31, 2007, 2006, and 2005
| | | | | | | | | | | | |
| | | 2007 | | | 2006 | | | 2005 | |
| | | (amounts in thousands, except per share amounts) | |
Revenue (a): | | | | | | | | | | | | |
Network services | | $ | 393,569 | | | $ | 355,996 | | | $ | 341,779 | |
Voice services | | | 327,246 | | | | 201,968 | | | | 166,808 | |
Data and Internet services | | | 318,269 | | | | 216,419 | | | | 162,834 | |
Intercarrier compensation | | | 44,595 | | | | 37,992 | | | | 37,306 | |
| | | | | | | | | | | | |
Total revenue | | | 1,083,679 | | | | 812,375 | | | | 708,727 | |
| | | | | | | | | | | | |
Costs and expenses (a)(b): | | | | | | | | | | | | |
Operating (exclusive of depreciation, amortization, and accretion shown separately below) | | | 470,038 | | | | 311,532 | | | | 264,517 | |
Selling, general and administrative | | | 296,638 | | | | 228,485 | | | | 193,052 | |
Depreciation, amortization, and accretion | | | 279,454 | | | | 256,091 | | | | 238,180 | |
| | | | | | | | | | | | |
Total costs and expenses | | | 1,046,130 | | | | 796,108 | | | | 695,749 | |
| | | | | | | | | | | | |
Operating income | | | 37,549 | | | | 16,267 | | | | 12,978 | |
Interest expense | | | (91,285 | ) | | | (98,238 | ) | | | (120,219 | ) |
Debt extinguishment costs | | | — | | | | (36,874 | ) | | | (14,043 | ) |
Interest income | | | 17,489 | | | | 20,054 | | | | 13,220 | |
Other income (loss), net | | | (3,022 | ) | | | — | | | | — | |
| | | | | | | | | | | | |
Loss before income taxes | | | (39,269 | ) | | | (98,791 | ) | | | (108,064 | ) |
Income tax expense (note 7) | | | 1,000 | | | | 28 | | | | — | |
| | | | | | | | | | | | |
Net loss | | $ | (40,269 | ) | | $ | (98,819 | ) | | $ | (108,064 | ) |
| | | | | | | | | | | | |
Net loss per common share, basic and diluted | | $ | (0.28 | ) | | $ | (0.80 | ) | | $ | (0.93 | ) |
| | | | | | | | | | | | |
Weighted average shares outstanding, basic and diluted | | | 144,956 | | | | 124,078 | | | | 116,315 | |
| | | | | | | | | | | | |
(a) Includes revenue and expenses resulting from transactions with affiliates (note 6): | | | | | | | | | | | | |
Revenue | | $ | — | | | $ | 13,109 | | | $ | 16,946 | |
| | | | | | | | | | | | |
Operating | | $ | — | | | $ | 5,189 | | | $ | 5,577 | |
| | | | | | | | | | | | |
Selling, general and administrative | | $ | — | | | $ | 1,394 | | | $ | 2,426 | |
| | | | | | | | | | | | |
(b) Includes non-cash stock-based employee compensation expense (note 1): | | | | | | | | | | | | |
Operating | | $ | 3,555 | | | $ | 2,075 | | | $ | — | |
| | | | | | | | | | | | |
Selling, general and administrative | | $ | 18,445 | | | $ | 11,590 | | | $ | 915 | |
| | | | | | | | | | | | |
See accompanying notes to the consolidated financial statements
F-4
TIME WARNER TELECOM INC.
CONSOLIDATED STATEMENTS OF CASH FLOWS
Years Ended December 31, 2007, 2006, and 2005
| | | | | | | | | | | | |
| | | 2007 | | | 2006 | | | 2005 | |
| | | (amounts in thousands) | |
Cash flows from operating activities: | | | | | | | | | | | | |
Net loss | | $ | (40,269 | ) | | $ | (98,819 | ) | | $ | (108,064 | ) |
Adjustments to reconcile net loss to net cash provided by operating activities: | | | | | | | | | | | | |
Depreciation, amortization, and accretion | | | 279,454 | | | | 256,091 | | | | 238,180 | |
Investment impairment, amortization of deferred debt issue costs and other | | | 5,348 | | | | 3,289 | | | | 4,244 | |
Loss on debt extinuguishment | | | — | | | | 36,874 | | | | 14,044 | |
Stock based compensation | | | 22,000 | | | | 13,665 | | | | 915 | |
Changes in operating assets and liabilities, net of the effect of acquisitions: | | | | | | | | | | | | |
Receivables and other assets | | | (338 | ) | | | (18,161 | ) | | | (9,361 | ) |
Accounts payable | | | 137 | | | | 571 | | | | (7,717 | ) |
Accrued interest | | | (171 | ) | | | (18,207 | ) | | | (8,989 | ) |
Accrued payroll and benefits | | | 3,903 | | | | (3,236 | ) | | | 5,548 | |
Other liabilities | | | (5,857 | ) | | | 2,491 | | | | (380 | ) |
| | | | | | | | | | | | |
Net cash provided by operating activities | | | 264,207 | | | | 174,558 | | | | 128,420 | |
| | | | | | | | | | | | |
Cash flows from investing activities: | | | | | | | | | | | | |
Capital expenditures | | | (257,905 | ) | | | (192,269 | ) | | | (161,001 | ) |
Acquisitions, net of cash acquired | | | 2,580 | | | | (212,416 | ) | | | — | |
Purchases of investments | | | (166,973 | ) | | | (425,671 | ) | | | (367,693 | ) |
Proceeds from maturities of investments | | | 235,932 | | | | 528,201 | | | | 491,750 | |
Proceeds from sale of assets and other investing activities | | | (2,205 | ) | | | 1,232 | | | | 1,689 | |
| | | | | | | | | | | | |
Net cash used in investing activities | | | (188,571 | ) | | | (300,923 | ) | | | (35,255 | ) |
| | | | | | | | | | | | |
Cash flows from financing activities: | | | | | | | | | | | | |
Net proceeds from issuance of common stock upon exercise of stock options and in connection with the employee stock purchase plan | | | 31,846 | | | | 46,404 | | | | 4,505 | |
Retirement of debt obligations | | | — | | | | (863,552 | ) | | | (409,750 | ) |
Net (costs) proceeds from issuance of debt | | | (850 | ) | | | 957,800 | | | | 394,834 | |
Payment of debt and capital lease obligations | | | (6,654 | ) | | | (3,568 | ) | | | (1,972 | ) |
| | | | | | | | | | | | |
Net cash provided by (used in) financing activities | | | 24,342 | | | | 137,084 | | | | (12,383 | ) |
| | | | | | | | | | | | |
Increase in cash and cash equivalents | | | 99,978 | | | | 10,719 | | | | 80,782 | |
Cash and cash equivalents at beginning of year | | | 221,553 | | | | 210,834 | | | | 130,052 | |
| | | | | | | | | | | | |
Cash and cash equivalents at end of year | | $ | 321,531 | | | $ | 221,553 | | | $ | 210,834 | |
| | | | | | | | | | | | |
| | | |
Supplemental disclosures of cash flow information: | | | | | | | | | | | | |
Cash paid for interest | | $ | 91,631 | | | $ | 115,604 | | | $ | 127,669 | |
| | | | | | | | | | | | |
Cash paid for debt extinguishment costs | | $ | — | | | $ | 25,052 | | | $ | 9,750 | |
| | | | | | | | | | | | |
Addition of capital lease obligation | | $ | 1,622 | | | $ | 410 | | | $ | 1,520 | |
| | | | | | | | | | | | |
Shares issued in merger with Xspedius Communications, LLC | | $ | — | | | $ | 326,884 | | | $ | — | |
| | | | | | | | | | | | |
See accompanying notes to the consolidated financial statements
F-5
TIME WARNER TELECOM INC.
CONSOLIDATED STATEMENTS OF CHANGES IN STOCKHOLDER’S EQUITY
Years Ended December 31, 2007, 2006, and 2005
| | | | | | | | | | | | | | | | | | | | | | | |
| | | Common Stock | | | Additional
paid-in
capital | | Accumulated
deficit | | | Total
stockholders’
equity | |
| | | Class A | | Class B | | | | |
| | | Shares | | Amount | | Shares | | | Amount | | | | |
| | | (amounts in thousands) | |
Balance at January 1, 2005 | | 49,869 | | $ | 499 | | 65,937 | | | $ | 659 | | | $ | 1,172,440 | | $ | (806,440 | ) | | $ | 367,158 | |
Net loss and comprehensive loss | | — | | | — | | — | | | | — | | | | — | | | (108,064 | ) | | | (108,064 | ) |
Shares issued for cash in connection with the exercise of stock options and the employee stock purchase plan | | 1,489 | | | 14 | | — | | | | — | | | | 4,491 | | | — | | | | 4,505 | |
Stock-based compensation | | 87 | | | 1 | | — | | | | — | | | | 914 | | | — | | | | 915 | |
| | | | | | | | | | | | | | | | | | | | | | | |
Balance at December 31, 2005 | | 51,445 | | | 514 | | 65,937 | | | | 659 | | | | 1,177,845 | | | (914,504 | ) | | | 264,514 | |
| | | | | | | |
Net loss and comprehensive loss | | — | | | — | | — | | | | — | | | | — | | | (98,819 | ) | | | (98,819 | ) |
Shares issued for cash in connection with the exercise of stock options and the employee stock purchase plan | | 7,127 | | | 72 | | — | | | | — | | | | 46,332 | | | — | | | | 46,404 | |
Shares issued in connection with secondary offering | | 65,854 | | | 658 | | (65,854 | ) | | | (658 | ) | | | — | | | — | | | | — | |
Conversion of Class B shares to Class A shares | | 83 | | | 1 | | (83 | ) | | | (1 | ) | | | — | | | — | | | | — | |
Shares issued in merger with Xspedius Communications, LLC | | 18,249 | | | 182 | | — | | | | — | | | | 326,702 | | | — | | | | 326,884 | |
Stock-based compensation | | 57 | | | 1 | | — | | | | — | | | | 13,664 | | | — | | | | 13,665 | |
| | | | | | | | | | | | | | | | | | | | | | | |
Balance at December 31, 2006 | | 142,815 | | | 1,428 | | — | | | | — | | | | 1,564,543 | | | (1,013,323 | ) | | | 552,648 | |
| | | | | | | |
Net loss and comprehensive loss | | — | | | — | | — | | | | — | | | | — | | | (40,269 | ) | | | (40,269 | ) |
Shares issued for cash in connection with the exercise of stock options and the employee stock purchase plan | | 3,536 | | | 35 | | — | | | | — | | | | 31,811 | | | — | | | | 31,846 | |
Stock-based compensation | | 191 | | | 2 | | — | | | | — | | | | 21,998 | | | — | | | | 22,000 | |
| | | | | | | | | | | | | | | | | | | | | | | |
Balance at December 31, 2007 | | 146,542 | | $ | 1,465 | | — | | | $ | — | | | $ | 1,618,352 | | $ | (1,053,592 | ) | | $ | 566,225 | |
| | | | | | | | | | | | | | | | | | | | | | | |
See accompanying notes to the consolidated financial statements
F-6
TIME WARNER TELECOM INC.
NOTES TO CONSOLIDATED FINANCIAL STATEMENTS
1. Organization and Summary of Significant Accounting Policies
Description of Business and Capital Structure
Time Warner Telecom Inc. (the “Company”), a Delaware corporation, is a leading national provider of managed network services specializing in Ethernet and transport data networking, Internet access, local and long distance voice, VoIP and network security services, to enterprise organizations and communications services companies throughout the U.S.
From the Company’s formation until September 26, 2006, the Company had two classes of common stock outstanding, Class A common stock with one vote per share and Class B common stock with ten votes per share. Each share of Class B common stock was convertible, at the option of the holder, into one share of Class A common stock. The Class B common stock was collectively owned directly or indirectly by Time Warner Inc. (“Time Warner”), Advance Telecom Holdings Corporation and Newhouse Telecom Holdings Corporation (“Advance/Newhouse”) (collectively, the “Class B Stockholders”). On March 29, 2006 and September 26, 2006, the Class B Stockholders completed underwritten offerings of 22,310,000 shares and 43,544,158 shares, respectively, of Class A common stock of the Company, which were converted from shares of Class B common stock to shares of Class A common stock immediately prior to the offerings. In connection with the closing of the September 26, 2006 offering, Advance/Newhouse converted all of its remaining shares of Class B common stock that were not sold in the offering to shares of Class A common stock. As a result, the Company has not had shares of Class B common stock outstanding since September 26, 2006. In June 2007, the Company’s stockholders approved an amendment to the Company’s Restated Certificate of Incorporation, which eliminated references to Class A and Class B common stock. As a result, no shares of Class B common stock were authorized as of December 31, 2007 and Class A common stock authorized and outstanding as of December 31, 2006 is classified as common stock.
The Company also is authorized to issue shares of preferred stock. The Company’s Board of Directors has the authority to establish voting powers, preferences, and special rights for the preferred stock. No shares of preferred stock have been issued.
Basis of Consolidation
The consolidated financial statements include the accounts of the Company and all entities in which the Company has a controlling voting interest (“subsidiaries”). Significant intercompany accounts and transactions have been eliminated. Significant accounts and transactions with Time Warner, Advance/Newhouse and their affiliates through September 26, 2006 are disclosed as related party transactions.
On October 31, 2006, the Company completed the acquisition of Xspedius Communications, LLC (“Xspedius”). Xspedius’ results of operations, cash flows and financial position are included in the consolidated financial statements from the date of acquisition (see Note 2).
Change in Accounting Estimate
During the first quarter of 2007, the Company evaluated the depreciable life used for fiber assets and determined that to better reflect the economic utilization of those fiber assets, the lives were extended from 15 years to 20 years, or the lease term, if shorter, for leased fiber assets. This change in estimate, effective as of January 1, 2007, was accounted for prospectively, in accordance with Financial Accounting Standards Board (“FASB”) Statement of Financial Accounting Standards (“SFAS”) No. 154,Accounting Changes and Error Corrections. This change lowered depreciation expense and reduced net loss by $19.2 million, or approximately $0.13 per share, for the year ended December 31, 2007.
F-7
TIME WARNER TELECOM INC.
NOTES TO CONSOLIDATED FINANCIAL STATEMENTS—(Continued)
Estimates
The preparation of financial statements in conformity with U.S. generally accepted accounting principles requires management to make estimates and assumptions that affect the reported amounts of assets and liabilities at the date of the financial statements and the reported amounts of revenue and expenses during the reporting period. Actual results could differ from those estimates. Areas that require significant management judgments include taxes, revenue and receivables, impairment of investments and long-term assets, regulatory fees, asset retirement obligations, evaluation of impairment of goodwill, purchase price allocation, and carrier liabilities.
Segment Reporting
The Company operates in one segment across the United States.
Cash Equivalents
The Company considers all highly liquid debt instruments with an original maturity of three months or less, when purchased, to be cash equivalents.
Investments
At December 31, 2007, investments included in cash and cash equivalents of $320.9 million were comprised of money market funds, and long term investments of $14.5 million were comprised of commercial paper with exposure to sub-prime mortgages that is past its maturity date. At December 31, 2006, marketable securities, included in cash and cash equivalents and investments, were classified as held-to-maturity because the Company had the intent and ability to hold the securities to maturity. Held-to-maturity securities are carried at amortized cost, which was $308.7 million at December 31, 2006. The fair value of marketable debt securities was not materially different than the amortized cost. See Note 3 for more information on the Company’s investments.
At December 31, 2007 and 2006, the Company had certain funds held at financial institutions of $5.5 million and $10.6 million, respectively. These amounts were included in other current assets and are restricted because they secure primarily outstanding insurance bonds.
Receivables
The Company generally bills in advance for the majority of the services it provides and does not require significant collateral from its customers. The Company evaluates whether receivables are reasonably assured of collection by ongoing credit evaluations of significant customers’ financial condition, and provides an allowance for doubtful accounts based on the expected collectability of all receivables. The allowance for doubtful accounts was $12.0 million, or 14% of gross receivables at December 31, 2007, and $13.2 million, or 15% of gross receivables at December 31, 2006.
Property, Plant, and Equipment
Property, plant, and equipment are recorded at cost except for assets acquired through acquisition of businesses which are recorded at fair value. Construction costs, labor, applicable overhead related to the development, installation, and expansion of the Company’s networks, and interest costs related to construction are capitalized. Capitalized labor and applicable overhead was $52.0 million, $39.8 million, and $33.2 million for 2007, 2006, and 2005, respectively. Capitalized interest was $2.4 million, $2.4 million, and $2.9 million for
F-8
TIME WARNER TELECOM INC.
NOTES TO CONSOLIDATED FINANCIAL STATEMENTS—(Continued)
2007, 2006, and 2005, respectively. Repairs and maintenance costs are charged to expense when incurred. The Company disposes of assets that are no longer in use. Losses on such disposals are included as a component of depreciation expense and were $0.9 million, $1.7 million and $3.8 million in 2007, 2006, and 2005, respectively.
The Company licenses the right to use fiber optic capacity in 23 of its markets from either Time Warner Cable, Comcast Corporation (as successor to Time Warner Cable in three of those markets) or an affiliate of Bright House Networks, LLC. The Company pays its allocable share of the cost of fiber and construction incurred by Time Warner Cable, Comcast Corporation and the Bright House Networks, LLC affiliate in routes where the parties are in joint construction. See Note 6 for additional information.
Depreciation is provided on the straight-line method over estimated useful lives as follows:
| | |
Buildings and improvements | | 10-20 years or lease term, if shorter |
Communications network equipment | | 5-15 years |
Vehicles and other equipment | | 3-10 years |
Fiber and right to use | | 20 years or lease term, if shorter |
Depreciation expense was $279.5 million, $252.2 million, and $236.9 million in 2007, 2006, and 2005, respectively. During the first quarter of 2007, the Company evaluated the depreciable life used for fiber assets and determined that to better reflect the economic utilization of those fiber assets the lives were extended from 15 years to 20 years, or the lease term, if shorter, for leased fiber assets (see Change in Accounting Estimate above). Property, plant, and equipment consists of:
| | | | | | | | |
| | | December 31, | |
| | | 2007 | | | 2006 | |
| | | (amounts in thousands) | |
Land, buildings and improvements | | $ | 65,251 | | | $ | 64,377 | |
Communications networks equipment | | | 1,986,801 | | | | 1,799,312 | |
Vehicles and other equipment | | | 177,742 | | | | 159,450 | |
Fiber and right to use | | | 792,958 | | | | 748,492 | |
| | | | | | | | |
| | | 3,022,752 | | | | 2,771,631 | |
Less accumulated depreciation | | | (1,727,852 | ) | | | (1,477,519 | ) |
| | | | | | | | |
Total | | $ | 1,294,900 | | | $ | 1,294,112 | |
| | | | | | | | |
Income Taxes
Deferred income taxes are provided for temporary differences between the carrying amounts of assets and liabilities and the amounts used for tax purposes. The Company does not record a valuation allowance against net deferred tax assets when it is more likely than not the net deferred tax asset will be realized.
In July 2006, the FASB issued FASB Interpretation No. 48,Accounting for Uncertainty in Income Taxes-an Interpretation of FASB Statement No. 109(“FIN 48”) effective January 1, 2007. FIN 48 clarifies the accounting for uncertainty in income taxes recognized in financial statements and requires the impact of a tax position to be recognized in the financial statements if that position is more likely than not of being sustained on audit, based on technical merits of the position. The Company has evaluated the impact of FIN 48 on its financial statements and has concluded that it does not have a material impact on the Company’s accumulated deficit, results of operations or net loss.
F-9
TIME WARNER TELECOM INC.
NOTES TO CONSOLIDATED FINANCIAL STATEMENTS—(Continued)
Goodwill
The Company performs impairment tests at least annually on all goodwill and indefinite-lived intangible assets as required by FASB Statement No. 142,Goodwill and Other Intangible Assets (“SFAS 142”). SFAS 142 requires goodwill to be assigned to a reporting unit and tested using a consistent measurement date, which for the Company is the fourth quarter of each year or more frequently if impairment indicators arise. For purposes of testing goodwill for impairment, our goodwill has been assigned to our one consolidated reporting unit. Potential impairment is indicated when the book value of a reporting unit, including goodwill, exceeds its fair value. If a potential impairment exists, the fair value of the reporting unit is compared to the fair value of its assets and liabilities, excluding goodwill, to estimate the implied value of the reporting unit’s goodwill. If an impairment charge is deemed necessary, a charge is recognized for any excess of the book value over the implied fair value. Considerable management judgment is necessary to estimate the fair value of assets; accordingly, actual results could vary significantly from estimates. The Company has completed annual goodwill impairment tests which did not result in an impairment charge in 2007, 2006, or 2005.
Other Assets
Other assets primarily include deferred debt issuance costs which are amortized to interest expense over the life of their respective debt agreements.
Impairment of Long-Lived Assets
The Company periodically reviews the carrying amounts of property, plant, and equipment and its identifiable intangible assets to determine whether current events or circumstances warrant adjustments to the carrying amounts. If an impairment adjustment is deemed necessary (generally when the net book value of an asset exceeds the expected future undiscounted cash flows to be generated by that asset or group of assets), the loss is measured by the amount that the carrying value of the assets exceeds their fair value. Considerable management judgment is necessary to estimate the fair value of assets; accordingly, actual results could vary significantly from estimates. Assets to be disposed of are carried at the lower of their carrying amount or fair value less costs to sell. The Company’s annual asset impairment test did not result in an impairment charge in 2007, 2006 or 2005.
Asset Retirement Obligations
The Company accounts for asset retirement obligations under FASB Statement No. 143,Accounting for Asset Retirement Obligations (“SFAS 143”) as interpreted by FASB Interpretation No. 47,Accounting for Conditional Asset Retirement Obligations. SFAS 143 requires that the estimated fair value of an asset retirement obligation be recorded when incurred. The associated asset retirement costs are capitalized as part of the carrying amount of the long-lived asset and depreciated over the asset’s estimated useful life. The Company has asset retirement obligations related to decommissioning of electronics in leased facilities and the removal of certain fiber and conduit systems. Considerable management judgment is required in estimating these obligations. Important assumptions include estimates of retirement costs, the timing of the future retirement activities, and the likelihood of retirement provisions being enforced. Changes in these assumptions based on future information could result in adjustments to estimated liabilities.
The Company’s asset retirement obligations were $17.2 million and $15.8 million as of December 31, 2007 and 2006, respectively. The increase was primarily due to the accretion of the liability.
F-10
TIME WARNER TELECOM INC.
NOTES TO CONSOLIDATED FINANCIAL STATEMENTS—(Continued)
Regulatory and Other Contingencies
The Company is subject to significant government regulation, some of which is in a state of flux due to challenges of existing rules. Such regulation is subject to different interpretations, inconsistent application and has historically given rise to disputes with other carriers and municipalities regarding the classification of traffic, rights-of-way, rates and minutes of use.
Management estimates and reserves for the risk associated with regulatory and other carrier contingencies. These estimates are based on assumptions and other considerations including studies of traffic patterns, expectations regarding regulatory rulings, historic experience and ongoing negotiations. The Company evaluates these reserves on an ongoing basis and makes adjustments as necessary.
Revenue
The Company’s revenue is derived primarily from business communications services. Network services transmit voice, data and images as well as enable transmission for storage using state-of-the-art fiber optics. Data and Internet services include services that enable customers to connect their internal computer networks and to access external networks, including Internet at high speeds using Ethernet protocol, such as metro and wide area Ethernet, virtual private network solutions and Internet access. Voice services include traditional and next generation voice capabilities, including voice services from stand alone and bundled products, long distance, 800 services, and voice over Internet protocol (“VoIP”). Intercarrier compensation is comprised of switched access services and reciprocal compensation. Switched access represents the compensation from another carrier for the delivery of traffic from a long distance carrier’s point of presence and an end-user’s premises provided through the Company’s switching facilities. The Federal Communications Commission (“FCC”) and state public utility commissions regulate switched access rates in their respective jurisdictions. Reciprocal compensation represents compensation from local exchange carriers (“LECs”) for local exchange traffic originated on another LEC’s facilities and terminated on the Company’s facilities. Reciprocal compensation rates are established by interconnection agreements between the parties based on federal and state regulatory rulings.
The Company’s customers are principally enterprise organizations in the distribution, health care, finance, and manufacturing industries, state, local and federal government entities as well as long distance carriers, incumbent local exchange carriers (“ILECs”), and competitive local exchange carriers (“CLECs”), wireless communications companies, and Internet service providers (“ISPs”).
Revenue for network, data and Internet, and the majority of voice services is generally billed in advance on a fixed rate basis and recognized over the period the services are provided. Revenue for the majority of intercarrier compensation and long distance is generally billed on a transactional basis in arrears determined by customer usage with some fixed rate elements. The transactional elements of voice services are billed in arrears and estimates are used to recognize revenue in the period earned.
The Company evaluates whether receivables are reasonably assured of collection based on certain factors, including the likelihood of billing being disputed by customers. In situations where a billing dispute exists, revenue is not recognized until the dispute is resolved.
Pursuant to the FASB’s Emerging Issues Task Force (“EITF”) Issue 99-19,Reporting Revenue Gross as a Principal Versus Net as an Agent, the Company classifies certain taxes and fees billed to customers and remitted to government authorities on a gross versus net basis in revenue and expense. Beginning January 1, 2007 with the adoption of EITF Issue 06-3,How Sales Taxes Collected From Customers and Remitted to Governmental Authorities Should Be Presented in the Income Statement (“EITF 06-3”), the Company added additional fees billed
F-11
TIME WARNER TELECOM INC.
NOTES TO CONSOLIDATED FINANCIAL STATEMENTS—(Continued)
to customers and remitted to government authorities in its classification of gross versus net, which resulted in an increase to revenue and expense of $14.9 million in the consolidated statement of operations for the year ended December 31, 2007. Prior periods were not reclassified as the effect would not be material. The total amount classified as revenue associated with such fees was approximately $31.9 million, $13.0 million and $11.4 million for the years ended December 31, 2007, 2006 and 2005, respectively, including the additional fees described above.
Operating Expenses
Operating expenses consist of costs directly related to the operation and maintenance of networks and the provisioning of services but exclude depreciation, amortization and accretion, which is reported separately. These costs include the salaries and related benefits and expenses, including stock-based compensation, of customer care, provisioning, network maintenance, technical field, network operations and engineering personnel, costs to repair and maintain the Company’s network, and costs paid to other carriers to carry a portion of the Company’s traffic and to interconnect the Company’s networks, and for facility leases.
Significant Customers
The Company has substantial business relationships with a few large customers, including major long distance carriers. The Company’s top 10 customers accounted for an aggregate of 26%, 31%, and 32% of the Company’s total consolidated revenue for the years ended December 31, 2007, 2006, and 2005, respectively. No customer accounted for 10% or more of total revenue in 2007 and 2005. In 2006, revenue from AT&T Inc. and affiliates as of December 31, 2006 represented 11% of the Company’s consolidated revenue.
Loss Per Common Share and Potential Common Share
The Company computes loss per common share in accordance with the provisions of FASB Statement No. 128,Earnings Per Share, which requires companies with complex capital structures to present basic and diluted earnings per share (“EPS”). Basic EPS is measured as the income or loss available to common stockholders divided by the weighted average outstanding common shares for the period. Diluted EPS is similar to basic EPS but presents the dilutive effect on a per share basis of potential common shares (e.g., convertible securities, stock options, etc.) as if they had been converted at the beginning of the periods presented. Potential common shares that have an anti-dilutive effect (e.g., those that increase income per share or decrease loss per share) are excluded from diluted EPS.
Basic loss per share for all periods presented herein was computed by dividing the net loss by the weighted average shares outstanding for the period.
The diluted loss per common share for all periods presented was computed by dividing the net loss attributable to common shares by the weighted average common shares outstanding for the period. Options to purchase shares of the Company’s common stock, restricted stock units for common stock to be issued upon vesting and shares of common stock subject to issuance upon conversion of the Company’s convertible debt totaled 33.2 million, 34.8 million and 19.5 million shares at December 31, 2007, 2006, and 2005, respectively. These shares were excluded from the computation of weighted average shares outstanding because their inclusion would be anti-dilutive.
Stock Option Accounting
Prior to January 1, 2006, the Company followed FASB Statement No. 123,Accounting for Stock-Based Compensation (“SFAS 123”), which allowed companies to either expense the estimated fair value of options or continue to follow the intrinsic value method set forth in Accounting Principles Board Opinion No. 25,
F-12
TIME WARNER TELECOM INC.
NOTES TO CONSOLIDATED FINANCIAL STATEMENTS—(Continued)
Accounting for Stock Issued to Employees (“APB 25”), and disclose the pro-forma effect on net income (loss) as if the fair value of the options had been expensed. The Company elected to follow APB 25 and disclose the pro-forma effects on net income (loss) as if the fair value of the options had been expensed. Under APB 25, because the exercise price of options is generally equal to the market price of the underlying stock on the date of the grant, no compensation expense is recognized. The Company’s stock-based compensation expense prior to January 1, 2006 resulted primarily from the issuance of restricted stock.
Effective January 1, 2006, the Company adopted the fair value recognition provisions of FASB Statement No. 123R,Share-Based Payment(“SFAS 123R”), which requires the cost of share-based payments to be recognized as expense over the requisite service period. The Company adopted SFAS 123R using the modified prospective transition method. Under that transition method, compensation expense recognized in the year ended December 31, 2006 includes: (a) compensation cost for all share-based payments granted prior to, but not yet vested as of January 1, 2006, based on the grant date fair value estimated in accordance with the original provisions of SFAS 123, and (b) compensation costs for all share-based payments granted subsequent to January 1, 2006, based on the grant-date fair value estimated in accordance with the provisions of SFAS 123R. Results for prior periods have not been restated.
The adoption of SFAS 123R on January 1, 2006 increased the Company’s net loss by $13.5 million and $12.8 million and net loss per share by $0.09 and $0.10 for the years ended December 31, 2007 and 2006, respectively. There was no effect on cash flow or financial position as a result of the adoption of SFAS 123R. The following table illustrates the pro-forma effect if the Company had applied the fair value recognition provisions of SFAS 123 for the year ended December 31, 2005:
| | | | |
| | | Year ended
December 31, 2005 | |
| | | (amounts in thousands,
except per share amounts) | |
Net loss, as reported | | $ | (108,064 | ) |
Deduct: Total stock-based employee compensation expense determined under fair value based method for all awards | | | (15,627 | ) |
| | | | |
Pro-forma net loss | | $ | (123,691 | ) |
| | | | |
Basic and diluted loss per share, as reported | | $ | (0.93 | ) |
| | | | |
Pro-forma loss per share | | $ | (1.06 | ) |
| | | | |
The fair value of options was estimated at the date of grant using a Black-Scholes option pricing model. For purposes of the actual expense recognized in the years ended December 31, 2007 and 2006 and the pro-forma disclosure for the year ended December 31, 2005, the estimated fair value of the options is amortized to expense on a straight-line basis (net of estimated forfeitures beginning January 1, 2006) over the options vesting period which is equivalent to the requisite service period. The weighted-average fair value of options granted was $10.39, $10.08 and $4.34 for the years ended December 31, 2007, 2006 and 2005, respectively, with the following weighted-average assumptions:
| | | | | | | | | |
| | | Years ended December 31, | |
| | | 2007 | | | 2006 | | | 2005 | |
Expected volatility | | 56 | % | | 69 | % | | 106 | % |
Risk-free interest rate | | 4.1 | % | | 4.7 | % | | 4.2 | % |
Dividend yield | | 0 | % | | 0 | % | | 0 | % |
Expected term | | 4 years | | | 4 years | | | 4 years | |
F-13
TIME WARNER TELECOM INC.
NOTES TO CONSOLIDATED FINANCIAL STATEMENTS—(Continued)
Expected volatilities are based on historical volatility of the Company’s common stock over a period generally commensurate with the expected term of the option. The risk-free rate for stock options granted during the period is determined by using the U.S. Treasury rate for the nearest period that coincides with the expected term. The expected term of stock options represents the weighted-average period the stock options are expected to remain outstanding. The expected term is based on a combination of historical data and a study of the expected term of options in the Company’s peer group.
New Accounting Pronouncements
In September 2006, the FASB issued SFAS No. 157,Fair Value Measurement(“SFAS 157”) which defines fair value, establishes a framework for measuring fair value in generally accepted accounting principles and expands disclosures about fair value measurements. This statement applies to other accounting pronouncements that require or permit fair value measurements. The Company is required to adopt SFAS 157 on a prospective basis effective January 1, 2008. Subsequent to the issuance of SFAS 157, the FASB deferred the effective date for one year for all nonfinancial assets and nonfinancial liabilities, except for those items that are recognized or disclosed at fair value in the financial statements on a recurring basis. The Company does not expect the adoption of SFAS 157 will have a material impact on its financial position and results of operations.
In February 2007, the FASB issued SFAS No. 159,The Fair Value Option for Financial Assets and Financial Liabilities (“SFAS 159”). The fair value option established by SFAS 159 permits entities to choose to measure eligible financial instruments at fair value. The unrealized gains and losses on items for which the fair value option has been elected should be reported in earnings. The decision to elect the fair value option is determined on an instrument by instrument basis and is irrevocable. Assets and liabilities measured at fair value pursuant to the fair value option should be reported separately in the balance sheet from those instruments measured using other measurement attributes. This statement is effective beginning January 1, 2008. The Company currently does not plan to elect the fair value option on its existing financial assets and financial liabilities upon adoption of SFAS 159.
In December 2007, the FASB issued SFAS No. 141 (revised 2007), “Business Combinations” (“SFAS 141R”). SFAS 141R establishes the principles and requirements for how an acquirer: 1) recognizes and measures in its financial statements the identifiable assets acquired, the liabilities assumed, and any noncontrolling interest in the acquiree; 2) recognizes and measures the goodwill acquired in the business combination or a gain from a bargain purchase; and 3) discloses the business combination. The statement is effective beginning January 1, 2009. The provisions of SFAS 141(R) will only impact the Company if it is party to a business combination after the pronouncement has been adopted.
2. Acquisition
On October 31, 2006, the Company acquired Xspedius Communications, LLC (“Xspedius”) through a merger with a wholly owned subsidiary of the Company for an initial total purchase price of $552.7 million, including the payment of $216 million in cash, the issuance of 18,249,428 shares of the Company’s common stock, and the assumption of certain liabilities. The Company valued the 18,249,428 shares of common stock issued, for accounting purposes, at $17.912 per share, which was based on the average closing price on and for the two trading days before and after the measurement date of the transaction. The resolution of a final working capital adjustment of $4.5 million and adjustments to severance and other directly related costs resulted in a net decrease in purchase price of $4.2 million to $548.4 million at December 31, 2007.
Xspedius was a facilities-based provider of integrated telecommunications services to carriers and small and medium-sized businesses primarily in the southern United States. Xspedius offered a comprehensive suite of services, including local and long distance voice, data and dedicated Internet access. The acquisition extended the
F-14
TIME WARNER TELECOM INC.
NOTES TO CONSOLIDATED FINANCIAL STATEMENTS—(Continued)
Company’s footprint into 31 additional markets, provided the Company with additional fiber in 12 markets where it already operates and provided the opportunity for the Company to offer its advanced services in additional markets over Xspedius’ fiber networks. These factors contributed to a purchase price that was in excess of the fair value of Xspedius’ net tangible and intangible assets acquired, and as a result, the Company recorded goodwill in connection with this transaction.
The acquisition was accounted for using the purchase method in accordance with FASB SFAS No. 141,Business Combinations(“SFAS 141”). The results of operations attributable to Xspedius are included in the consolidated financial statements from the date of acquisition.
Purchase price allocation
In accordance with SFAS 141, the purchase price was preliminarily allocated to the assets acquired and liabilities assumed based on their estimated fair values as of the closing of the acquisition, with the amounts exceeding the net fair value recorded as goodwill. Changes to the initial purchase price allocations for Xspedius have occurred based on further analysis and final valuations of certain assets, liabilities and pre-acquisition contingencies, and are summarized in the table below.
| | | | | | | | | | | | |
| | | Allocation at
acquisition date
October 31, 2006 | | | Purchase price
adjustments | | | Allocation as of
December 31, 2007 | |
| | | (amounts in thousands) | |
Assets acquired | | | | | | | | | | | | |
Cash and other current assets | | $ | 29,893 | | | $ | (448 | ) | | $ | 29,445 | |
Property, plant and equipment | | | 127,728 | | | | 1,219 | | | | 128,947 | |
Intangible assets subject to amortization | | | 71,003 | | | | (8,012 | ) | | | 62,991 | |
Other | | | 916 | | | | — | | | | 916 | |
Goodwill | | | 378,865 | | | | 7,056 | | | | 385,921 | |
| | | | | | | | | | | | |
Total assets acquired | | | 608,405 | | | | (185 | ) | | | 608,220 | |
| | | |
Liabilities assumed | | | | | | | | | | | | |
Accounts payable and other current liabilities | | | (50,038 | ) | | | (4,033 | ) | | | (54,071 | ) |
Other long term liabilities | | | (5,705 | ) | | | — | | | | (5,705 | ) |
| | | | | | | | | | | | |
Total liabilities assumed | | | (55,743 | ) | | | (4,033 | ) | | | (59,776 | ) |
Purchase price | | $ | 552,662 | | | $ | (4,218 | ) | | $ | 548,444 | |
| | | | | | | | | | | | |
Identified intangible assets are being amortized using methods of amortization that correlate to the pattern in which the economic benefits are expected to be realized. The customer relationships intangible asset is being amortized using the sum of the years digits method over an estimated life of 10 years. Other intangible assets, including favorable operating leases and licenses and permits, are being amortized on a straight-line basis over expected lives ranging from two to 10 years. The Company allocated goodwill to its one consolidated reporting unit. The amount of goodwill expected to be deductible for tax purposes is estimated to be $383.6 million.
In connection with the acquisition, the Company recorded $2.3 million of severance and severance-related costs in the above allocation of the cost of the acquisition in accordance with EITF Issue No. 95-3,Recognition of Liabilities in Connection with a Purchase Business Combination (“EITF 95-3”). The following table summarizes the Company’s utilization of severance-related accruals for the year ended December 31, 2007:
| | | | | | | | | | | | | |
| | | December 31,
2006 | | Purchase Price
Accruals | | Payments/
Adjustments | | | December 31,
2007 |
| | | (amounts in thousands) |
Severance and severance-related costs | | $ | 1,408 | | $ | 411 | | $ | (1,737 | ) | | $ | 82 |
F-15
TIME WARNER TELECOM INC.
NOTES TO CONSOLIDATED FINANCIAL STATEMENTS—(Continued)
Pro Forma Information
The following unaudited pro forma consolidated results of operations of the Company for the years ended December 31, 2006 and 2005 assume that the acquisition occurred as of January 1 in each fiscal year shown below:
| | | | | | | | |
| | | Years ended December 31, | |
| | | 2006 | | | 2005 | |
| | | (amounts in thousands, except per share amounts) | |
Revenue | | $ | 1,003,435 | | | $ | 923,387 | |
Net loss | | | (133,465 | ) | | | (163,500 | ) |
Net loss per share, basic and diluted | | $ | (0.96 | ) | | $ | (1.22 | ) |
The pro forma amounts represent the historical operating results of Xspedius with appropriate adjustments that give effect to depreciation, amortization and interest expense. The pro forma amounts also give effect to the additional interest expense resulting from financing a portion of the cash consideration paid in the acquisition as well as elimination of interest income earned on the remaining cash consideration which was funded with cash on hand.
The unaudited pro forma results are presented for illustrative purposes only and do not reflect the realization of potential cost savings related to full network optimization and the redundant effect of selling, general and administrative expenses. These pro forma results do not purport to be indicative of the results that would have actually been obtained if the acquisition occurred as of the beginning of each period presented, nor does the pro forma data intend to be a projection of results that may be obtained in the future.
3. Investments
Investments are summarized as follows:
| | | | | |
| | | December 31, |
| | | 2007 | | 2006 |
| | | (amounts in thousands) |
Cash equivalents: | | | | | |
Shares of money market mutual funds | | $ | 320,852 | | 1,592 |
Corporate debt securities | | | — | | 219,243 |
| | | | | |
Total cash equivalents | | | 320,852 | | 220,835 |
Marketable debt securities — corporate debt securities | | | — | | 87,900 |
Long term investments | | | 14,456 | | — |
| | | | | |
Total cash equivalents and investments | | $ | 335,308 | | 308,735 |
| | | | | |
During the year ended December 31, 2007, the Company recognized an impairment loss of $7.3 million on commercial paper with exposure to sub-prime mortgages that is past its maturity date. The impairment loss was estimated based on data from financial advisors to fiduciaries for the commercial paper holders. The carrying value of these securities after recognition of the loss is $14.5 million at December 31, 2007. These securities are classified as long term investments in the December 31, 2007 consolidated balance sheet.
F-16
TIME WARNER TELECOM INC.
NOTES TO CONSOLIDATED FINANCIAL STATEMENTS—(Continued)
4. Intangible Assets
Indefinite Life Intangibles
The Company had goodwill of $412.7 million and $405.6 million as of December 31, 2007 and 2006, respectively. The increase in the carrying value of goodwill of $7.1 million during 2007 was the result of changes to the initial purchase price allocation for Xspedius based on further analysis and final valuations of certain assets, liabilities and pre-acquisition contingencies as discussed in Note 2.
Definite Life Intangibles
Definite life intangibles consist primarily of customer relationships which were acquired as a result of the Company’s acquisition of Xspedius. Definite life intangible assets are being amortized using methods of amortization which correlate to the pattern in which the economic benefits are expected to be realized. Customer relationships are amortized using the sum of the years digits method over an estimated life of 10 years. Other intangible assets, primarily intangible assets acquired as a result of the Company’s acquisition of Xspedius, are being amortized on a straight-line basis using expected lives ranging from two to 10 years. The decrease in the gross carrying value of definite life intangible assets of $8.1 million was the result of finalization of the valuation of acquired assets as discussed in Note 2. Definite life intangible assets subject to amortization were as follows:
| | | | | | | | | | | | | | | | | | | | | | |
| | | | | December 31, 2007 | | December 31, 2006 |
| | | Useful Lives | | Gross
Carrying
Value | | Accumulated
Amortization | | | Net
Carrying
Value | | Gross
Carrying
Value | | Accumulated
Amortization | | | Net
Carrying
Value |
| | | | | | | | | | (amounts in thousands) | | | | | |
Customer relationships | | 10 years | | $ | 59,086 | | $ | (12,354 | ) | | $ | 46,732 | | $ | 59,086 | | $ | (2,430 | ) | | $ | 56,656 |
Other | | 2 to 10 years | | | 6,363 | | | (2,093 | ) | | | 4,270 | | | 14,507 | | | (1,709 | ) | | | 12,798 |
| | | | | | | | | | | | | | | | | | | | | | |
| | | | $ | 65,449 | | $ | (14,447 | ) | | $ | 51,002 | | $ | 73,593 | | $ | (4,139 | ) | | $ | 69,454 |
| | | | | | | | | | | | | | | | | | | | | | |
Intangible asset amortization expense was $10.4 million, $2.6 million and $0.1 million for the years ended December 31, 2007, 2006 and 2005, respectively.
The amortization expense related to intangible assets recorded as of December 31, 2007, for each of the five succeeding years is estimated to be the following for the years ended December 31, 2008 — $9.9 million; 2009 — $8.9 million; 2010 — $7.8 million; 2011 — $6.7 million; and 2012 — $5.6 million.
5. Long-Term Debt
| | | | | | | | |
| | | December 31, | |
| | | 2007 | | | 2006 | |
| | | (amounts in thousands) | |
Term Loan B due 2013 | | $ | 594,000 | | | $ | 600,000 | |
9 1/4% Senior Notes due 2014 | | | 400,000 | | | | 400,000 | |
2.375% Convertible Senior Debentures due 2026 | | | 373,750 | | | | 373,750 | |
| | | | | | | | |
Total debt | | | 1,367,750 | | | | 1,373,750 | |
Unamortized premium | | | 340 | | | | 396 | |
Current portion | | | (6,000 | ) | | | (6,000 | ) |
| | | | | | | | |
Total long-term debt | | $ | 1,362,090 | | | $ | 1,368,146 | |
| | | | | | | | |
F-17
TIME WARNER TELECOM INC.
NOTES TO CONSOLIDATED FINANCIAL STATEMENTS—(Continued)
The schedule of principal payments on long-term debt as of December 31, 2007 is as follows (amounts in thousands):
| | | |
2008 | | $ | 6,000 |
2009 | | | 6,000 |
2010 | | | 6,000 |
2011 | | | 6,000 |
2012 | | | 6,000 |
Thereafter | | | 1,337,750 |
| | | |
Total payments | | $ | 1,367,750 |
| | | |
On May 1, 2006, the Company redeemed its $400 million principal amount 10 1/8% Senior Notes due February 2001 (the “10 1/8% Senior Notes”) at a total redemption price of $420.3 million. The call premium of $20.3 million and $5.5 million write off of deferred debt issuance costs related to the 10 1/8% Senior Notes have been classified as debt extinguishment costs in the accompanying consolidated statements of operations for the year ended December 31, 2006.
On November 6, 2006, the Company redeemed its $240 million principal amount of Second Priority Senior Secured Floating Rate Notes due February 2011 (the “2011 Notes”) at a total redemption price of $244.8 million. The call premium of $4.8 million and $3.6 million write off of deferred debt issuance costs related to the 2011 Notes have been classified as debt extinguishment costs in the accompanying consolidated statements of operations for the year ended December 31, 2006.
On October 6, 2006, the $150 million revolving credit facility maintained by the Company’s wholly-owned subsidiary, Time Warner Telecom Holdings Inc. (“Holdings”), was replaced by a new $100 million revolving credit facility as described below. The $1.2 million write off of deferred debt issuance costs related to the termination of the facility and the $582,000 write off of deferred debt issuance costs related to the reduction of the facility have been classified as debt extinguishment costs in the accompanying consolidated statements of operations for the years ended December 31, 2006 and 2005, respectively.
On October 6, 2006, Holdings extinguished its $200 million Term Loan B Facility. The $1.5 million write off of deferred debt issuance costs related to the extinguishment of that facility have been classified as debt extinguishment costs in the accompanying consolidated statements of operations for the year ended December 31, 2006.
As of December 31, 2007, Holdings had outstanding $400 million principal amount of 9 1/4% Senior Notes due February 2014 (the “2014 Notes”). The 2014 Notes are unsecured, unsubordinated obligations of Holdings and are guaranteed by the Company and Holdings’ subsidiaries. The 2014 Notes are callable as of February 15, 2009, 2010, 2011 and 2012 at 104.625%, 103.083%, 101.542% and 100%, respectively. Interest is payable semi-annually on February 15 and August 15. Interest expense including amortization of deferred debt issuance costs and premium relating to the 2014 Notes was $37.9 million, $37.9 million and $35.8 million for the years ended December 31, 2007, 2006 and 2005, respectively. At December 31, 2007, the fair market value of the $400 million of 2014 Notes was approximately $410 million. These notes have not been listed on any securities exchange or inter-dealer automated quotation system, and the estimated market value is based on indicative pricing published by investment banks. While the Company believes these approximations to be reasonably accurate at the time published, indicative pricing can vary widely depending on volume traded by any given investment bank and other factors.
F-18
TIME WARNER TELECOM INC.
NOTES TO CONSOLIDATED FINANCIAL STATEMENTS—(Continued)
As of December 31, 2007, the Company had outstanding $373.8 million principal amount 2 3/8% Convertible Senior Debentures due April 1, 2026 (the “Convertible Debentures”). Offering costs of $11.3 million were deferred and are being amortized to interest expense over the term of the Convertible Debentures. The Convertible Debentures are general, unsecured obligations of the Company. Interest is payable semi-annually on April 1 and October 1, commencing October 1, 2006. The Convertible Debentures are redeemable in whole or in part at the Company’s option at any time on or after April 6, 2013 at a redemption price equal to 100% of the principal amount of the debentures to be redeemed, plus accrued and unpaid interest. Holders of the debentures have the option, at any time prior to April 1, 2026, to convert the debentures into shares of the Company’s common stock at a conversion rate of 53.6466 per $1,000 principal amount of debentures representing a conversion price of $18.64 per share. Upon conversion, the Company will have the right to deliver, in lieu of shares of common stock, cash or a combination of cash and shares of common stock. Interest expense, including amortization of deferred debt issuance costs, was $9.4 million and $7.1 million for the years ended December 31, 2007 and 2006, respectively. As of December 31, 2007, none of the holders has converted any Convertible Debentures into common stock. At December 31, 2007, the fair market value of the $373.8 million of the Convertible Debentures was approximately $475 million. These notes have not been listed on any securities exchange or inter-dealer automated quotation system, and the estimated market value is based on indicative pricing published by investment banks. While the Company believes these approximations to be reasonably accurate at the time published, indicative pricing can vary widely depending on volume traded by any given investment bank and other factors.
As of December 31, 2007, Holdings had a $700 million senior secured credit facility (the “Credit Facility”) consisting of a $600 million Term Loan B (“Term Loan”) maturing in January 2013 and a $100 million revolving credit facility (the “Revolver”) maturing in October 2011. Components of the Credit Facility and related financing are detailed below:
| | • | | The Term Loan is a secured obligation, on a first lien basis, of Holdings. The Term Loan is guaranteed by the Company and Holdings’ subsidiaries. On October 6, 2006, Holdings drew $200 million on the Term Loan to extinguish its existing Term Loan. On October 31, 2006, Holdings drew the remaining $400 million on the Term Loan. Repayments of the Term Loan are due quarterly in an amount equal to 1/4 of 1% of the aggregate principal amount on the last day of each quarter beginning March 31, 2007, and the balance is payable on January 7, 2013. Interest is computed based on a specified Eurodollar rate plus 1.75% to 2.0%, after giving effect to an amendment on February 15, 2007 which reduced the interest rate by 25 basis points, and will be reset periodically and payable at least quarterly. Based on the Eurodollar rate in effect at December 31, 2007, the rate was 6.9% and interest expense including commitment fees and amortization of deferred debt issuance costs relating to the Term Loan was $44.8 million and $9.0 million for the years ended December 31, 2007 and 2006, respectively. |
| | • | | The Revolver is secured and guaranteed in the same manner as the Term Loan. Interest on outstanding amounts, if any, will be computed based on a specified Eurodollar rate plus 2.0% to 2.75% and will be reset periodically and payable at least quarterly. The Company is required to pay a commitment fee on the undrawn commitment amounts on a quarterly basis of 0.5% per annum. If the facility were drawn, certain restrictive financial covenants would apply. As of December 31, 2007, the Revolver was undrawn. Commitment fee expense and amortization of deferred debt issuance costs relating to the Revolver was $636,000 and $153,000 for the years ended December 31, 2007 and 2006, respectively. |
The 2014 Notes described above are governed by an indenture that contains certain restrictive covenants. These restrictions affect, and in many respects significantly limit or prohibit, among other things, the ability of the Company to incur indebtedness, make prepayments of certain indebtedness, pay dividends, make investments, engage in transactions with stockholders and affiliates, issue capital stock of subsidiaries, create
F-19
TIME WARNER TELECOM INC.
NOTES TO CONSOLIDATED FINANCIAL STATEMENTS—(Continued)
liens, sell assets, and engage in mergers and consolidations. The credit agreement for the Company’s Term Loan contains similar restrictions. The Revolver covenants contain additional restrictions, as well as certain financial covenants that the Company must comply with if it draws on the Revolver.
As of December 31, 2007, the Company and Holdings were in compliance with all of their covenants.
6. Transactions with Former Related Parties
As a result of the secondary offering completed on September 26, 2006, the former Class B Stockholders are no longer related parties. In the normal course of business, the Company has engaged in various transactions with affiliates of the former Class B Stockholders, generally on negotiated terms among the numerous affected operating units that, in management’s view, result in reasonable arms-length terms. Information is reported only for the years ended December 31, 2006 and 2005 because the former Class B Stockholders were not related parties after September 26, 2006. The capacity license agreements and the other arrangements described below were not impacted by the former Class B Stockholders’ sales of their shares of the Company.
Since 1998, the Company has been party to capacity license agreements with Time Warner Cable, an affiliate of Time Warner, that provide access to local rights-of-way and construction cost-sharing until 2028. The Company has similar arrangements with Bright House Networks, LLC (“Bright House”), an affiliate of Advance/Newhouse, that manages certain cable systems in Florida and Indiana and with Comcast Corporation as successor to Time Warner Cable in three markets. Twenty-three of the Company’s 75 markets use fiber capacity licensed from Time Warner Cable, Comcast or Bright House (the “Cable Operations”). Under the terms of those agreements, if the Company wishes to license fiber capacity in addition to the initially licensed capacity, the Company must pay the Cable Operations an amount equal to the Company’s allocable share of the total cost of constructing the route in question, plus permitting and supervision fees as a license fee. The Company generally pays the license fee at the time the network is constructed. Under those agreements, the Company licenses the capacity of discrete fibers and attaches its own electronics. Pursuant to the licensing arrangements, the Company paid the Cable Operations $3.6 million and $4.9 million in 2006 and 2005, respectively. These fees are capitalized to property, plant, and equipment and amortized over their useful lives as depreciation and amortization expense. As of September 26, 2006, the Company’s gross property, plant, and equipment included $196.6 million in licenses of fiber capacity pursuant to the agreements.
Under the fiber capacity licensing agreements, the Company reimburses the Cable Operations for facility maintenance and pole and conduit rental costs. The reimbursements to the Cable Operations aggregated $5.2 million and $5.6 million in 2006 and 2005, respectively, and are a component of operating expenses in the consolidated statements of operations. In certain cases the Company’s operations are co-located with the Cable Operations facilities and are allocated a charge for various overhead expenses. Under the terms of leases and subleases between the Company and the Cable Operations, allocations for rent from the Cable Operations are typically based on square footage and allocations for utility charges are based on actual usage. Charges from the Cable Operations were $1.4 million for the period ended September 26, 2006 and $2.4 million for the year ended December 31, 2005, and are a component of selling, general, and administrative expenses in the consolidated statements of operations. The charges by these affiliates for rent and utilities do not differ materially from charges the Company incurs in locations where the Company leases space from unaffiliated parties.
Affiliates of the former Class B Stockholders purchase services from the Company. Revenue from these affiliates, which includes network, data and Internet and voice services, aggregated $13.1 million for the period from January 1, 2006 to September 26, 2006 and $16.9 million for the year ended December 31, 2005.
F-20
TIME WARNER TELECOM INC.
NOTES TO CONSOLIDATED FINANCIAL STATEMENTS—(Continued)
7. Income Taxes
Income tax expense for the year ended December 31, 2007 is comprised solely of current state income taxes. Income tax expense for the year ended December 31, 2006 is comprised solely of deferred state income taxes.
Total income tax expense differed from the amounts computed by applying the federal statutory income tax rate of 35% to loss before income taxes as a result of the following items for the years ended December 31, 2007, 2006, and 2005:
| | | | | | | | | |
| | | 2007 | | | 2006 | | | 2005 | |
Federal statutory income tax (benefit) | | (35.0 | )% | | (35.0 | )% | | (35.0 | )% |
State income tax expense (benefit), net of federal income tax | | 0.1 | | | (4.2 | ) | | (5.9 | ) |
Change in valuation allowance | | 34.1 | | | 39.0 | | | 40.1 | |
Other | | 3.4 | | | 0.3 | | | 0.8 | |
| | | | | | | | | |
Income tax expense | | 2.6 | % | | 0.1 | % | | 0.0 | % |
| | | | | | | | | |
The tax effects of temporary differences that give rise to significant components of the Company’s deferred tax assets and liabilities at December 31, 2007 and 2006 are as follows:
| | | | | | | |
| | | 2007 | | | 2006 | |
| | | (amounts in thousands) | |
Current deferred tax assets (liabilities): | | | | | | | |
Accrued liabilities | | $ | 27,236 | | | 37,846 | |
Allowance for doubtful accounts | | | 2,529 | | | 5,178 | |
Deferred revenue | | | 6,076 | | | 8,217 | |
Other | | | — | | | — | |
Valuation allowance | | | (27,138 | ) | | (38,448 | ) |
| | | | | | | |
Current deferred tax asset, net | | | 8,703 | | | 12,793 | |
| | |
Non-current deferred tax assets (liabilities): | | | | | | | |
Depreciation and amortization | | | (47,225 | ) | | (51,203 | ) |
Net operating loss carryforwards | | | 392,445 | | | 383,935 | |
Other | | | 9,367 | | | 5,952 | |
Valuation allowance | | | (304,540 | ) | | (292,727 | ) |
| | | | | | | |
Non-current deferred tax asset, net | | | 50,047 | | | 45,957 | |
| | | | | | | |
Deferred tax asset, net | | $ | 58,750 | | | 58,750 | |
| | | | | | | |
At December 31, 2007, the Company had net operating loss carryforwards for federal income tax purposes of approximately $1.1 billion. These net operating loss carryforwards, if not utilized to reduce taxable income in future periods, will expire in various amounts beginning in 2019 and ending in 2026.
The Tax Reform Act of 1986 contains provisions that limit the utilization of net operating losses if there has been a “change of ownership” as described in Section 382 of the Internal Revenue Code. As a result of the sale of shares of common stock by the Class B Stockholders in September 2006, the Company experienced a change in ownership on September 26, 2006. The Company has evaluated the impact of these provisions on its financial statements, and has concluded that the Section 382 limitation does not have a material impact on the Company’s net deferred tax asset.
F-21
TIME WARNER TELECOM INC.
NOTES TO CONSOLIDATED FINANCIAL STATEMENTS—(Continued)
In 2002, the Company began to establish a valuation allowance for deferred taxes that reduced its net deferred tax asset. The additional allowance recorded was $0.5 million and $51.5 million for 2007 and 2006 respectively. At December 31, 2007, $3.6 million of the valuation allowance is related to the exercise of non-qualified stock options for which subsequently recognized tax benefits will be allocated directly to additional paid in capital. As of December 31, 2007, net deferred tax assets totaled $58.8 million. The Company has concluded that it is more likely than not that the net deferred tax asset of $58.8 million will be realized because it could utilize tax-planning strategies to realize this amount. However, the Company believes there may be risks in realizing amounts in excess of the $58.8 million through utilization of available tax planning strategies. Accordingly, the Company has established a valuation allowance for amounts in excess of $58.8 million. The Company’s treatment of deferred taxes and its tax planning strategies are based on certain assumptions that the Company believes are reasonable. However, actual results could vary significantly from current assumptions and could result in changes to the accounting treatment of these items, including, but not limited to, the necessity to record a greater valuation allowance.
8. Option Plans — Common Stock and Stock Options
Time Warner Telecom 1998 Employee Stock Option Plan
The Company maintains the Time Warner Telecom 1998 Employee Stock Option Plan that reserved 9.0 million shares of common stock to be issued to officers and eligible employees under terms and conditions to be set by the Company’s Board of Directors. As of December 31, 2007, approximately 3.0 million shares of common stock were reserved for issuance upon exercise of outstanding options and approximately 1.3 million shares of common stock were available for grant under the plan. Generally, the options vest over periods of up to four years and expire seven or ten years from the date of issuance. These options have been granted to employees of the Company with an exercise price at market value at the date of grant, and accordingly, no compensation cost has been recognized by the Company relating to these options prior to January 1, 2006. See Note 1 for a discussion of compensation expense recognized on stock options beginning January 1, 2006 upon adoption of SFAS 123R.
Time Warner Telecom 2000 Employee Stock Plan
The Company maintains a Time Warner Telecom 2000 Employee Stock Plan that permits up to 24.5 million shares of common stock to be issued pursuant to stock options and stock awards granted to officers, directors, and eligible employees under terms and conditions to be set by the Company’s Board of Directors. As of December 31, 2007, approximately 10.2 million shares of common stock were reserved for issuance upon exercise of outstanding options and vesting of stock awards and approximately 4.0 million shares of common stock were available for grant under the plan. Generally, the options and awards vest over periods of up to four years and expire either seven or ten years from the date of issuance.
The options have been granted to employees of the Company with an exercise price at market value of the underlying stock at the date of grant, and accordingly, no compensation expense has been recognized by the Company relating to these options prior to January 1, 2006. See Note 1 for a discussion of compensation expense recognized on stock options beginning January 1, 2006 upon adoption of SFAS 123R and the valuation of options.
The fair value of the restricted stock awards and restricted stock units granted was measured based on the market value of the shares on the date of grant and the resulting expense related to these awards is being recorded over their vesting periods, generally up to four years. The Company granted performance based awards to certain officers of the Company that vest at the end of a two year period if the Company attains certain performance
F-22
TIME WARNER TELECOM INC.
NOTES TO CONSOLIDATED FINANCIAL STATEMENTS—(Continued)
measures during the vesting period. The Company believes it is probable such measures will be met and recognizes compensation expense accordingly. If such measures are not met, no compensation expense is recognized and any recognized compensation expense is reversed.
The table below summarizes the Company’s stock option activity and related information for the year ended December 31, 2007.
| | | | | | | | | | | |
| | | Options | | | Weighted
Avg
Exercise
Price | | Weighted
Avg
Remaining
Contractual
Life | | Aggregate
Intrinsic Value |
| | | | | | | | (in years) | | (thousands) |
Options outstanding at January 1, 2007 | | 13,737,381 | | | $ | 22.34 | | | | | |
Granted | | 1,992,772 | | | | 22.08 | | | | | |
Exercised | | (3,344,491 | ) | | | 8.57 | | | | | |
Forfeited | | (877,848 | ) | | | 26.56 | | | | | |
| | | | | | | | | | | |
Options outstanding at December 31, 2007 | | 11,507,814 | | | | 26.04 | | 4.23 | | $ | 49,359 |
| | | | | | | | | | | |
| | | | |
Vested and expected to vest at December 31, 2007 | | 9,994,827 | | | | 27.59 | | 3.99 | | $ | 41,430 |
| | | | | | | | | | | |
Exercisable at December 31, 2007 | | 7,195,018 | | | | 31.94 | | 3.27 | | $ | 28,061 |
| | | | | | | | | | | |
The total intrinsic value of stock options exercised during the years ended December 31, 2007, 2006 and 2005 was $44.5 million, $69.2 million and $6.2 million, respectively. As of December 31, 2007, there was $32.8 million of total unrecognized compensation expense related to unvested stock options, which is expected to be recognized over a weighted-average period of 2.6 years.
The table below summarizes the Company’s restricted stock and restricted stock units and related information for the year ended December 31, 2007.
| | | | | | |
| | | Shares | | | Weighted
Average
Grant Date
Fair Value |
Nonvested at January 1, 2007 | | 1,185,107 | | | $ | 14.40 |
Granted | | 1,028,740 | | | | 22.36 |
Vested | | (262,476 | ) | | | 16.79 |
Forfeited | | (114,431 | ) | | | 13.99 |
| | | | | | |
Nonvested at December 31, 2007 | | 1,836,940 | | | | 18.54 |
| | | | | | |
The total fair value of restricted stock and restricted stock units vested during the years ended December 31, 2007, 2006 and 2005 was $5.7 million, $0.3 million and $0.6 million, respectively. As of December 31, 2007, there was $26.5 million of total unrecognized compensation expense related to non-vested restricted stock awards and restricted stock units, which is expected to be recognized over a weighted-average period of 1.7 years.
F-23
TIME WARNER TELECOM INC.
NOTES TO CONSOLIDATED FINANCIAL STATEMENTS—(Continued)
9. Commitments and Contingencies
Leases and Fixed Obligations
The Company leases office space and furniture, switching facilities, and fiber optic use rights. Certain of these leases contain renewal clauses. The Company also enters into fixed maintenance agreements for maintenance of its networks.
At December 31, 2007, commitments under capital and non-cancelable operating leases and maintenance agreements with terms in excess of one year were as follows:
| | | | | | | | | | |
| | | Capital
Leases | | | Operating
Leases | | Fixed
Maintenance
Obligations |
| | | (amounts in thousands) |
Year ended December 31: | | | | | | | | | | |
2008 | | $ | 2,174 | | | $ | 41,854 | | $ | 3,503 |
2009 | | | 1,797 | | | | 38,343 | | | 3,503 |
2010 | | | 1,584 | | | | 34,390 | | | 3,503 |
2011 | | | 1,234 | | | | 31,595 | | | 3,503 |
2012 | | | 1,242 | | | | 28,247 | | | 3,503 |
Thereafter | | | 7,805 | | | | 102,964 | | | 41,032 |
| | | | | | | | | | |
Total minimum lease payments | | $ | 15,836 | | | $ | 277,393 | | $ | 58,547 |
| | | | | | | | | | |
Less amount representing interest | | | (6,271 | ) | | | | | | |
| | | | | | | | | | |
Present value of obligations under capital leases | | | 9,565 | | | | | | | |
Less current portion of obligations under capital leases | | | (1,337 | ) | | | | | | |
| | | | | | | | | | |
Obligations under capital leases, excluding current portion | | $ | 8,228 | | | | | | | |
| | | | | | | | | | |
As of December 31, 2007 and 2006, assets under capital lease obligations, which primarily consist of fiber optic network components, were $12.6 million and $12.3 million, respectively, with related accumulated depreciation of $6.5 million and $7.1 million, respectively. Depreciation expense related to assets under capital lease obligations was $0.8 million, $2.0 million, and $2.0 million in 2007, 2006, and 2005, respectively. The obligations under capital leases have been discounted at an average imputed interest rate of 9.4%. Rental expense under operating leases aggregated $61.6 million, $40.9 million, and $35.1 million for 2007, 2006, and 2005, respectively.
Other Contingencies
Management routinely reviews the Company’s exposure to liabilities incurred in the normal course of its business operations. Where a probable contingency exists and the amount of the loss can be reasonably estimated, the Company records the estimated liability. Considerable judgment is required in analyzing and recording such liabilities, and actual results could vary from the estimates.
Pending legal proceedings are substantially limited to litigation incidental to the business of the Company. In the opinion of management, the ultimate resolution of these matters will not have a material adverse effect on the Company’s financial statements.
F-24
TIME WARNER TELECOM INC.
NOTES TO CONSOLIDATED FINANCIAL STATEMENTS—(Continued)
10. Employee Benefit Plans
Effective January 1, 1999, the Company adopted the Time Warner Telecom 401(k) Plan (the “401(k) Plan”). Employees who meet certain eligibility requirements may contribute up to 60% of their eligible compensation, subject to statutory limitations, to a trust for investment in several diversified investment choices, as directed by the employee. The Company makes a matching contribution of 100% of each employee’s contribution up to a maximum of 5% of the employee’s eligible compensation. The Company’s contributions to the 401(k) Plan aggregated $10.0 million, $7.3 million, and $6.9 million for 2007, 2006 and 2005, respectively.
Effective October 1, 2004, the Company adopted the Time Warner Telecom 2004 Qualified Stock Purchase Plan (the “2004 Stock Purchase Plan”). Employees who met certain eligibility requirements could elect to designate up to 15% of their eligible compensation, up to an annual limit of $25,000, to purchase shares of the Company’s common stock at a 15% discount to fair market value. Stock purchases occurred semi-annually, with the price per share equaling the lower of 85% of the market price at the beginning or end of the offering period. The Company is authorized to issue a total of 600,000 shares of the Company’s common stock to participants in the 2004 Stock Purchase Plan. During 2007 and 2006, the Company had issued approximately 192,000 and 191,000 shares of common stock under the 2004 Stock Purchase Plan for net proceeds of $3.2 million and $2.0 million, respectively.
11. Quarterly Results of Operations (Unaudited)
The following summarizes the Company’s unaudited quarterly results of operations for 2007 and 2006:
| | | | | | | | | | | | | | | | |
| | | Three Months Ended | |
| | | March 31 | | | June 30 | | | September 30 | | | December 31 | |
| | | (amounts in thousands, except per share amounts) | |
Year Ended December 31, 2007 | | | | | | | | | | | | | | | | |
Total revenue | | $ | 261,392 | | | $ | 268,018 | | | $ | 274,793 | | | $ | 279,476 | |
Operating income | | | 5,399 | | | | 8,722 | | | | 9,106 | | | | 14,322 | |
Net loss | | | (13,809 | ) | | | (9,585 | ) | | | (11,583 | ) | | | (5,292 | ) |
Basic and diluted loss per common share | | $ | (0.10 | ) | | $ | (0.07 | ) | | $ | (0.08 | ) | | $ | (0.04 | ) |
| | | | |
Year Ended December 31, 2006 | | | | | | | | | | | | | | | | |
Total revenue | | $ | 186,187 | | | $ | 191,298 | | | $ | 196,109 | | | $ | 238,781 | |
Operating income (loss) | | | 2,038 | | | | 3,746 | | | | 5,654 | | | | 4,829 | |
Net loss | | | (22,261 | ) | | | (40,412 | ) | | | (11,351 | ) | | | (24,795 | ) |
Basic and diluted loss per common share | | $ | (0.19 | ) | | $ | (0.34 | ) | | $ | (0.09 | ) | | $ | (0.18 | ) |
The total net loss per share for the 2007 and 2006 quarters do not equal net loss per share for the respective years as the per share amounts for each quarter and for each year are computed based on their respective discrete periods.
12. Supplemental Guarantor Information
On February 20, 2004, Holdings (“Issuer”) issued $200 million principal amount of 9 1/4% Senior Notes due 2014 (the “2014 Notes”). On February 9, 2005, Holdings issued an additional $200 million principal amount of the 2014 Notes. The 2014 Notes are guaranteed by the Company (“Parent Guarantor”) and Holdings’ subsidiaries (“Combined Subsidiary Guarantors”). The guarantees are joint and several. A significant amount of the Issuer’s cash flow is generated by the Combined Subsidiary Guarantors. As a result, funds necessary to meet the Issuer’s
F-25
TIME WARNER TELECOM INC.
NOTES TO CONSOLIDATED FINANCIAL STATEMENTS—(Continued)
debt service obligations are provided in large part by distributions or advances from the Combined Subsidiary Guarantors. Under certain circumstances, contractual and legal restrictions, as well as the Company’s financial condition and operating requirements and those of the Company’s subsidiaries, could limit the Issuer’s ability to obtain cash for the purpose of meeting its debt service obligations, including the payment of principal and interest on the 2014 Notes.
The following information sets forth the Company’s Condensed Consolidating Balance Sheets as of December 31, 2007 and 2006, Condensed Consolidating Statements of Operations for the years ended December 31, 2007, 2006, and 2005 and Condensed Consolidating Statements of Cash Flows for the years ended December 31, 2007, 2006, and 2005.
F-26
TIME WARNER TELECOM INC.
NOTES TO CONSOLIDATED FINANCIAL STATEMENTS—(Continued)
TIME WARNER TELECOM INC.
CONDENSED CONSOLIDATING BALANCE SHEET
December 31, 2007
| | | | | | | | | | | | | | | | | | | |
| | | Parent Guarantor | | | Issuer | | | Combined
Subsidiary
Guarantors | | | Eliminations | | | Consolidated |
| | | (amounts in thousands) |
| ASSETS | | | | | | | | | | | | | | | | | | | |
Current assets: | | | | | | | | | | | | | | | | | | | |
Cash and cash equivalents | | $ | 20,563 | | | $ | 300,968 | | | $ | — | | | $ | — | | | $ | 321,531 |
Receivables, net | | | — | | | | — | | | | 75,976 | | | | — | | | | 75,976 |
Prepaid expenses and other current assets | | | 2,720 | | | | 7,148 | | | | 3,593 | | | | — | | | | 13,461 |
Deferred income taxes | | | — | | | | 8,703 | | | | — | | | | — | | | | 8,703 |
| | | | | | | | | | | | | | | | | | | |
Total current assets | | | 23,283 | | | | 316,819 | | | | 79,569 | | | | — | | | | 419,671 |
| | | | | | | | | | | | | | | | | | | |
Long-term investments | | | — | | | | 14,456 | | | | — | | | | — | | | | 14,456 |
Property, plant and equipment, net | | | — | | | | 36,454 | | | | 1,258,446 | | | | — | | | | 1,294,900 |
Deferred income taxes | | | — | | | | 50,047 | | | | — | | | | — | | | | 50,047 |
Goodwill | | | — | | | | — | | | | 412,694 | | | | — | | | | 412,694 |
Intangible and other assets, net | | | 10,349 | | | | 10,728 | | | | 51,873 | | | | — | | | | 72,950 |
| | | | | | | | | | | | | | | | | | | |
Total assets | | $ | 33,632 | | | $ | 428,504 | | | $ | 1,802,582 | | | $ | — | | | $ | 2,264,718 |
| | | | | | | | | | | | | | | | | | | |
| | | | | |
| LIABILITIES AND STOCKHOLDERS’ EQUITY (DEFICIT) | | | | | | | | | | | | | | | | | | | |
| | | | | |
Current liabilities: | | | | | | | | | | | | | | | | | | | |
Accounts payable | | $ | — | | | $ | 4,720 | | | $ | 42,252 | | | $ | — | | | $ | 46,972 |
Other current liabilities | | | 2,219 | | | | 62,881 | | | | 176,194 | | | | — | | | | 241,294 |
Intercompany payable (receivable) | | | (1,812,586 | ) | | | (715,560 | ) | | �� | 2,528,146 | | | | — | | | | — |
| | | | | | | | | | | | | | | | | | | |
Total current liabilities | | | (1,810,367 | ) | | | (647,959 | ) | | | 2,746,592 | | | | — | | | | 288,266 |
| | | | | | | | | | | | | | | | | | | |
Losses in subsidiary in excess of investment | | | 904,024 | | | | 1,125,511 | | | | — | | | | (2,029,535 | ) | | | — |
Long-term debt and capital lease obligations | | | 373,750 | | | | 989,246 | | | | 7,322 | | | | — | | | | 1,370,318 |
Long-term deferred revenue | | | — | | | | — | | | | 19,672 | | | | — | | | | 19,672 |
Other long-term liabilities | | | — | | | | 3,045 | | | | 17,192 | | | | — | | | | 20,237 |
| | | | | |
Stockholders’ equity (deficit) | | | 566,225 | | | | (1,041,339 | ) | | | (988,196 | ) | | | 2,029,535 | | | | 566,225 |
| | | | | | | | | | | | | | | | | | | |
Total liabilities and stockholders’ equity (deficit) | | $ | 33,632 | | | $ | 428,504 | | | $ | 1,802,582 | | | $ | — | | | $ | 2,264,718 |
| | | | | | | | | | | | | | | | | | | |
F-27
TIME WARNER TELECOM INC.
NOTES TO CONSOLIDATED FINANCIAL STATEMENTS—(Continued)
TIME WARNER TELECOM INC.
CONDENSED CONSOLIDATING BALANCE SHEET
December 31, 2006
| | | | | | | | | | | | | | | | | | | |
| | | Parent Guarantor | | | Issuer | | | Combined
Subsidiary
Guarantors | | | Eliminations | | | Consolidated |
| | | (amounts in thousands) |
ASSETS | | | | | | | | | | | | | | | | | | | |
Current assets: | | | | | | | | | | | | | | | | | | | |
Cash and cash equivalents | | $ | 681 | | | $ | 223,116 | | | $ | (2,244 | ) | | $ | — | | | $ | 221,553 |
Investments | | | 14,921 | | | | 72,979 | | | | — | | | | — | | | | 87,900 |
Receivables, net | | | — | | | | — | | | | 73,923 | | | | — | | | | 73,923 |
Prepaid expenses and other current assets | | | 4,006 | | | | 6,108 | | | | 8,390 | | | | — | | | | 18,504 |
Deferred income taxes | | | — | | | | 12,793 | | | | — | | | | — | | | | 12,793 |
| | | | | | | | | | | | | | | | | | | |
Total current assets | | | 19,608 | | | | 314,996 | | | | 80,069 | | | | — | | | | 414,673 |
| | | | | | | | | | | | | | | | | | | |
Property, plant and equipment, net | | | — | | | | 27,665 | | | | 1,266,447 | | | | — | | | | 1,294,112 |
| | | | | |
Deferred income taxes | | | — | | | | 45,957 | | | | — | | | | — | | | | 45,957 |
Goodwill | | | — | | | | — | | | | 405,638 | | | | — | | | | 405,638 |
Other assets, net of accumulated amortization | | | 10,916 | | | | 11,608 | | | | 70,333 | | | | — | | | | 92,857 |
| | | | | | | | | | | | | | | | | | | |
Total assets | | $ | 30,524 | | | $ | 400,226 | | | $ | 1,822,487 | | | $ | — | | | $ | 2,253,237 |
| | | | | | | | | | | | | | | | | | | |
LIABILITIES AND STOCKHOLDERS’ EQUITY (DEFICIT) | | | | | | | | | | | | | | | | | | | |
| | | | | |
Current liabilities: | | | | | | | | | | | | | | | | | | | |
Accounts payable | | $ | — | | | $ | 251 | | | $ | 41,137 | | | $ | — | | | $ | 41,388 |
Other current liabilities | | | 2,297 | | | | 54,915 | | | | 185,906 | | | | — | | | | 243,118 |
Intercompany payable (receivable) | | | (1,793,772 | ) | | | (704,365 | ) | | | 2,498,137 | | | | — | | | | — |
| | | | | | | | | | | | | | | | | | | |
Total current liabilities | | | (1,791,475 | ) | | | (649,199 | ) | | | 2,725,180 | | | | — | | | | 284,506 |
| | | | | | | | | | | | | | | | | | | |
Losses in subsidiary in excess of investment | | | 895,601 | | | | 1,053,397 | | | | — | | | | (1,948,998 | ) | | | — |
Long-term debt and capital lease obligations | | | 373,750 | | | | 994,396 | | | | 7,812 | | | | — | | | | 1,375,958 |
Long-term deferred revenue | | | — | | | | — | | | | 20,357 | | | | — | | | | 20,357 |
Other long-term liabilities | | | — | | | | 2,702 | | | | 17,066 | | | | — | | | | 19,768 |
| | | | | |
Stockholders’ equity (deficit) | | | 552,648 | | | | (1,001,070 | ) | | | (947,928 | ) | | | 1,948,998 | | | | 552,648 |
| | | | | | | | | | | | | | | | | | | |
Total liabilities and stockholders’ equity (deficit) | | $ | 30,524 | | | $ | 400,226 | | | $ | 1,822,487 | | | $ | — | | | $ | 2,253,237 |
| | | | | | | | | | | | | | | | | | | |
F-28
TIME WARNER TELECOM INC.
NOTES TO CONSOLIDATED FINANCIAL STATEMENTS—(Continued)
TIME WARNER TELECOM INC.
CONDENSED CONSOLIDATING STATEMENT OF OPERATIONS
Year Ended December 31, 2007
| | | | | | | | | | | | | | | | | | | |
| | | Parent Guarantor | | | Issuer | | | Combined
Subsidiary
Guarantors | | | Eliminations | | Consolidated | |
| | | (amounts in thousands) | |
Total revenue | | $ | | | | $ | — | | | $ | 1,083,679 | | | $ | — | | $ | 1,083,679 | |
| | | | | |
Costs and expenses: | | | | | | | | | | | | | | | | | | | |
Operating, selling, general and administrative | | | — | | | | 139,411 | | | | 627,265 | | | | — | | | 766,676 | |
Depreciation, amortization and accretion | | | — | | | | 14,417 | | | | 265,037 | | | | — | | | 279,454 | |
Corporate expense allocation | | | — | | | | (153,828 | ) | | | 153,828 | | | | — | | | — | |
| | | | | | | | | | | | | | | | | | | |
Total costs and expenses | | | — | | | | — | | | | 1,046,130 | | | | — | | | 1,046,130 | |
| | | | | | | | | | | | | | | | | | | |
Operating income | | | — | | | | — | | | | 37,549 | | | | — | | | 37,549 | |
| | | | | |
Interest expense, net | | | (8,419 | ) | | | (49,260 | ) | | | (16,117 | ) | | | — | | | (73,796 | ) |
Interest expense and other loss allocation | | | 8,419 | | | | 52,282 | | | | (60,701 | ) | | | | | | — | |
Other income (loss), net | | | — | | | | (3,022 | ) | | | — | | | | — | | | (3,022 | ) |
| | | | | | | | | | | | | | | | | | | |
Loss before income taxes and equity in undistributed losses of subsidiaries | | | — | | | | — | | | | (39,269 | ) | | | — | | | (39,269 | ) |
Income tax expense | | | — | | | | — | | | | 1,000 | | | | — | | | 1,000 | |
| | | | | | | | | | | | | | | | | | | |
Net loss before equity in undistributed losses of subsidiaries | | | — | | | | — | | | | (40,269 | ) | | | — | | | (40,269 | ) |
| | | | | |
Equity in undistributed losses of subsidiaries | | | (40,269 | ) | | | (40,269 | ) | | | — | | | | 80,538 | | | — | |
| | | | | | | | | | | | | | | | | | | |
Net loss | | $ | (40,269 | ) | | $ | (40,269 | ) | | $ | (40,269 | ) | | $ | 80,538 | | $ | (40,269 | ) |
| | | | | | | | | | | | | | | | | | | |
F-29
TIME WARNER TELECOM INC.
NOTES TO CONSOLIDATED FINANCIAL STATEMENTS—(Continued)
TIME WARNER TELECOM INC.
CONDENSED CONSOLIDATING STATEMENT OF OPERATIONS
Year Ended December 31, 2006
| | | | | | | | | | | | | | | | | | | |
| | | Parent Guarantor | | | Issuer | | | Combined
Subsidiary
Guarantors | | | Eliminations | | Consolidated | |
| | | (amounts in thousands) | |
Total revenue | | $ | — | | | $ | — | | | $ | 812,375 | | | $ | — | | $ | 812,375 | |
| | | | | |
Costs and expenses: | | | | | | | | | | | | | | | | | | | |
Operating, selling, general and administrative | | | — | | | | 141,880 | | | | 398,137 | | | | — | | | 540,017 | |
Depreciation, amortization and accretion | | | — | | | | 17,731 | | | | 238,360 | | | | — | | | 256,091 | |
Corporate expense allocation | | | — | | | | (159,611 | ) | | | 159,611 | | | | — | | | — | |
| | | | | | | | | | | | | | | | | | | |
Total costs and expenses | | | — | | | | — | | | | 796,108 | | | | — | | | 796,108 | |
| | | | | | | | | | | | | | | | | | | |
Operating income | | | — | | | | — | | | | 16,267 | | | | — | | | 16,267 | |
| | | | | |
Interest expense, net | | | (18,313 | ) | | | (47,905 | ) | | | (11,966 | ) | | | — | | | (78,184 | ) |
Debt extinguishment costs | | | (25,777 | ) | | | (11,097 | ) | | | | | | | | | | (36,874 | ) |
Interest expense allocation | | | 44,090 | | | | 59,002 | | | | (103,092 | ) | | | — | | | — | |
| | | | | | | | | | | | | | | | | | | |
Loss before income taxes and equity in undistributed losses of subsidiaries | | | — | | | | — | | | | (98,791 | ) | | | — | | | (98,791 | ) |
Income tax expense | | | — | | | | 28 | | | | — | | | | — | | | 28 | |
| | | | | | | | | | | | | | | | | | | |
Net loss before equity in undistributed losses of subsidiaries | | | — | | | | (28 | ) | | | (98,791 | ) | | | — | | | (98,819 | ) |
Equity in undistributed losses of subsidiaries | | | (98,819 | ) | | | (98,791 | ) | | | — | | | | 197,610 | | | — | |
| | | | | | | | | | | | | | | | | | | |
Net loss | | $ | (98,819 | ) | | $ | (98,819 | ) | | $ | (98,791 | ) | | $ | 197,610 | | $ | (98,819 | ) |
| | | | | | | | | | | | | | | | | | | |
F-30
TIME WARNER TELECOM INC.
NOTES TO CONSOLIDATED FINANCIAL STATEMENTS—(Continued)
TIME WARNER TELECOM INC.
CONDENSED CONSOLIDATING STATEMENT OF OPERATIONS
Year Ended December 31, 2005
| | | | | | | | | | | | | | | | | | | |
| | | Parent Guarantor | | | Issuer | | | Combined
Subsidiary
Guarantors | | | Eliminations | | Consolidated | |
| | | (amounts in thousands) | |
Total revenue | | $ | — | | | $ | — | | | $ | 708,727 | | | $ | — | | $ | 708,727 | |
| | | | | |
Costs and expenses: | | | | | | | | | | | | | | | | | | | |
Operating, selling, general and administrative | | | — | | | | 138,806 | | | | 318,763 | | | | — | | | 457,569 | |
Depreciation, amortization and accretion | | | — | | | | 22,681 | | | | 215,499 | | | | — | | | 238,180 | |
Corporate expense allocation | | | — | | | | (161,487 | ) | | | 161,487 | | | | — | | | — | |
| | | | | | | | | | | | | | | | | | | |
Total costs and expenses | | | — | | | | — | | | | 695,749 | | | | — | | | 695,749 | |
| | | | | | | | | | | | | | | | | | | |
Operating income | | | — | | | | — | | | | 12,978 | | | | — | | | 12,978 | |
Interest expense, net | | | (63,547 | ) | | | (35,341 | ) | | | (8,111 | ) | | | — | | | (106,999 | ) |
Debt extinguishment costs | | | (13,461 | ) | | | (582 | ) | | | — | | | | | | | (14,043 | ) |
Interest expense allocation | | | 77,008 | | | | 35,923 | | | | (112,931 | ) | | | — | | | — | |
| | | | | | | | | | | | | | | | | | | |
Loss before income taxes and equity in undistributed losses of subsidiaries | | | — | | | | — | | | | (108,064 | ) | | | — | | | (108,064 | ) |
Income tax expense | | | — | | | | — | | | | — | | | | — | | | — | |
| | | | | | | | | | | | | | | | | | | |
Net loss before equity in undistributed losses of subsidiaries | | | — | | | | — | | | | (108,064 | ) | | | — | | | (108,064 | ) |
Equity in undistributed losses of subsidiaries | | | (108,064 | ) | | | (48,459 | ) | | | — | | | | 156,523 | | | — | |
| | | | | | | | | | | | | | | | | | | |
Net loss | | $ | (108,064 | ) | | $ | (48,459 | ) | | $ | (108,064 | ) | | $ | 156,523 | | $ | (108,064 | ) |
| | | | | | | | | | | | | | | | | | | |
F-31
TIME WARNER TELECOM INC.
NOTES TO CONSOLIDATED FINANCIAL STATEMENTS—(Continued)
TIME WARNER TELECOM INC.
CONDENSED CONSOLIDATING STATEMENT OF CASH FLOWS
Year Ended December 31, 2007
| | | | | | | | | | | | | | | | | | | | |
| | | Parent Guarantor | | | Issuer | | | Combined
Subsidiary
Guarantors | | | Eliminations | | | Consolidated | |
| | | (amounts in thousands) | |
Cash flows from operating activities: | | | | | | | | | | | | | | | | | | | | |
Net loss | | $ | (40,269 | ) | | $ | (40,269 | ) | | $ | (40,269 | ) | | $ | 80,538 | | | $ | (40,269 | ) |
Adjustments to reconcile net loss to net cash provided by operating activities: | | | | | | | | | | | | | | | | | | | | |
Depreciation, amortization, and accretion | | | — | | | | 14,417 | | | | 265,037 | | | | — | | | | 279,454 | |
Intercompany change | | | 3,187 | | | | (11,195 | ) | | | 88,546 | | | | (80,538 | ) | | | — | |
Investment impairment, deferred debt issue and other | | | 567 | | | | 4,764 | | | | 17 | | | | — | | | | 5,348 | |
Stock based compensation | | | — | | | | — | | | | 22,000 | | | | — | | | | 22,000 | |
Changes in operating assets and liabilities | | | 9,451 | | | | 85,086 | | | | (96,863 | ) | | | — | | | | (2,326 | ) |
| | | | | | | | | | | | | | | | | | | | |
Net cash provided by (used in) operating activities | | | (27,064 | ) | | | 52,803 | | | | 238,468 | | | | — | | | | 264,207 | |
| | | | | | | | | | | | | | | | | | | | |
Cash flows from investing activities: | | | | | | | | | | | | | | | | | | | | |
Capital expenditures | | | — | | | | (21,579 | ) | | | (236,326 | ) | | | — | | | | (257,905 | ) |
Cash paid for acquisitions, net of cash acquired | | | — | | | | — | | | | 2,580 | | | | — | | | | 2,580 | |
Purchases of investments | | | (8,867 | ) | | | (158,106 | ) | | | — | | | | — | | | | (166,973 | ) |
Proceeds from maturities of investments | | | 23,967 | | | | 211,965 | | | | — | | | | — | | | | 235,932 | |
Other investing activities | | | — | | | | (3 | ) | | | (2,202 | ) | | | — | | | | (2,205 | ) |
| | | | | | | | | | | | | | | | | | | | |
Net cash provided by (used in) investing activities | | | 15,100 | | | | 32,277 | | | | (235,948 | ) | | | — | | | | (188,571 | ) |
| | | | | | | | | | | | | | | | | | | | |
Cash flows from financing activities: | | | | | | | | | | | | | | | | | | | | |
Net proceeds from issuance of common stock upon exercise of stock options and in connection with the employee stock purchase plan | | | 31,846 | | | | — | | | | — | | | | — | | | | 31,846 | |
Net costs from issuance of debt | | | — | | | | (850 | ) | | | — | | | | — | | | | (850 | ) |
Payment of debt and capital lease obligations | | | — | | | | (6,378 | ) | | | (276 | ) | | | — | | | | (6,654 | ) |
| | | | | | | | | | | | | | | | | | | | |
Net cash (used in) provided by financing activities | | | 31,846 | | | | (7,228 | ) | | | (276 | ) | | | — | | | | 24,342 | |
| | | | | | | | | | | | | | | | | | | | |
Increase in cash and cash equivalents | | | 19,882 | | | | 77,852 | | | | 2,244 | | | | — | | | | 99,978 | |
Cash and cash equivalents at beginning of period | | | 681 | | | | 223,116 | | | | (2,244 | ) | | | — | | | | 221,553 | |
| | | | | | | | | | | | | | | | | | | | |
Cash and cash equivalents at end of period | | $ | 20,563 | | | $ | 300,968 | | | $ | — | | | $ | — | | | $ | 321,531 | |
| | | | | | | | | | | | | | | | | | | | |
F-32
TIME WARNER TELECOM INC.
NOTES TO CONSOLIDATED FINANCIAL STATEMENTS—(Continued)
TIME WARNER TELECOM INC.
CONDENSED CONSOLIDATING STATEMENT OF CASH FLOWS
Year Ended December 31, 2006
| | | | | | | | | | | | | | | | | | | | |
| | | Parent Guarantor | | | Issuer | | | Combined
Subsidiary
Guarantors | | | Eliminations | | | Consolidated | |
| | | (amounts in thousands) | |
Cash flows from operating activities: | | | | | | | | | | | | | | | | | | | | |
Net loss | | $ | (98,819 | ) | | $ | (98,819 | ) | | $ | (98,791 | ) | | $ | 197,610 | | | $ | (98,819 | ) |
Adjustments to reconcile net loss to net cash provided by operating activities: | | | | | | | | | | | | | | | | | | | | |
Depreciation, amortization, and accretion | | | — | | | | 17,731 | | | | 238,360 | | | | — | | | | 256,091 | |
Intercompany change | | | 46,129 | | | | (94,815 | ) | | | 246,296 | | | | (197,610 | ) | | | — | |
Deferred debt issue, extinguishment costs and other | | | 26,589 | | | | 13,443 | | | | 131 | | | | — | | | | 40,163 | |
Stock-based compensation | | | — | | | | — | | | | 13,665 | | | | — | | | | 13,665 | |
Changes in operating assets and liabilities | | | 32,688 | | | | 149,124 | | | | (218,354 | ) | | | — | | | | (36,542 | ) |
| | | | | | | | | | | | | | | | | | | | |
Net cash provided by (used in) operating activities | | | 6,587 | | | | (13,336 | ) | | | 181,307 | | | | — | | | | 174,558 | |
| | | | | | | | | | | | | | | | | | | | |
Cash flows from investing activities: | | | | | | | | | | | | | | | | | | | | |
Capital expenditures | | | — | | | | (8,903 | ) | | | (183,366 | ) | | | — | | | | (192,269 | ) |
Cash paid for acquisitions, net of cash acquired | | | — | | | | (212,416 | ) | | | — | | | | — | | | | (212,416 | ) |
Purchases of investments | | | (39,413 | ) | | | (386,258 | ) | | | — | | | | — | | | | (425,671 | ) |
Proceeds from maturities of investments | | | 44,100 | | | | 484,101 | | | | — | | | | — | | | | 528,201 | |
Other investing activities | | | — | | | | 21 | | | | 1,211 | | | | — | | | | 1,232 | |
| | | | | | | | | | | | | | | | | | | | |
Net cash provided by (used in) investing activities | | | 4,687 | | | | (123,455 | ) | | | (182,155 | ) | | | — | | | | (300,923 | ) |
| | | | | | | | | | | | | | | | | | | | |
Cash flows from financing activities: | | | | | | | | | | | | | | | | | | | | |
Net proceeds from issuance of debt | | | 362,410 | | | | 595,390 | | | | — | | | | — | | | | 957,800 | |
Retirement of debt | | | (420,252 | ) | | | (443,300 | ) | | | — | | | | — | | | | (863,552 | ) |
Net proceeds from issuance of common stock upon exercise of stock options and in connection with the employee stock purchase plan | | | 46,404 | | | | — | | | | — | | | | — | | | | 46,404 | |
Payment of debt and capital lease obligations | | | — | | | | (2,974 | ) | | | (594 | ) | | | — | | | | (3,568 | ) |
| | | | | | | | | | | | | | | | | | | | |
Net cash (used in) provided by financing activities | | | (11,438 | ) | | | 149,116 | | | | (594 | ) | | | — | | | | 137,084 | |
| | | | | | | | | | | | | | | | | | | | |
Increase (decrease) in cash and cash equivalents | | | (164 | ) | | | 12,325 | | | | (1,442 | ) | | | — | | | | 10,719 | |
Cash and cash equivalents at beginning of year | | | 845 | | | | 210,791 | | | | (802 | ) | | | — | | | | 210,834 | |
| | | | | | | | | | | | | | | | | | | | |
Cash and cash equivalents at end of year | | $ | 681 | | | $ | 223,116 | | | $ | (2,244 | ) | | $ | — | | | $ | 221,553 | |
| | | | | | | | | | | | | | | | | | | | |
F-33
TIME WARNER TELECOM INC.
NOTES TO CONSOLIDATED FINANCIAL STATEMENTS—(Continued)
TIME WARNER TELECOM INC.
CONDENSED CONSOLIDATING STATEMENT OF CASH FLOWS
Year Ended December 31, 2005
| | | | | | | | | | | | | | | | | | | | |
| | | Parent Guarantor | | | Issuer | | | Combined
Subsidiary
Guarantors | | | Eliminations | | | Consolidated | |
| | | (amounts in thousands) | |
Cash flows from operating activities: | | | | | | | | | | | | | | | | | | | | |
Net loss | | $ | (108,064 | ) | | $ | (48,459 | ) | | $ | (108,064 | ) | | $ | 156,523 | | | $ | (108,064 | ) |
Adjustments to reconcile net loss to net cash provided by operating activities: | | | | | | | | | | | | | | | | | | | | |
Depreciation, amortization, and accretion | | | — | | | | 22,681 | | | | 215,499 | | | | — | | | | 238,180 | |
Intercompany change | | | 388,135 | | | | (426,610 | ) | | | 194,998 | | | | (156,523 | ) | | | — | |
Deferred debt issue, extinguishment costs and other | | | 15,329 | | | | 2,957 | | | | 2 | | | | — | | | | 18,288 | |
Stock-based compensation | | | — | | | | — | | | | 915 | | | | | | | | 915 | |
Changes in operating assets and liabilities | | | 105,060 | | | | 28,789 | | | | (154,748 | ) | | | — | | | | (20,899 | ) |
| | | | | | | | | | | | | | | | | | | | |
Net cash provided by (used in) operating activities | | | 400,460 | | | | (420,642 | ) | | | 148,602 | | | | — | | | | 128,420 | |
| | | | | | | | | | | | | | | | | | | | |
Cash flows from investing activities: | | | | | | | | | | | | | | | | | | | | |
Capital expenditures | | | — | | | | (11,463 | ) | | | (149,538 | ) | | | — | | | | (161,001 | ) |
Purchases of investments | | | (51,522 | ) | | | (316,170 | ) | | | (1 | ) | | | — | | | | (367,693 | ) |
Proceeds from maturities of investments | | | 57,000 | | | | 434,750 | | | | — | | | | — | | | | 491,750 | |
Other investing activities | | | — | | | | 212 | | | | 1,477 | | | | — | | | | 1,689 | |
| | | | | | | | | | | | | | | | | | | | |
Net cash provided by (used in) investing activities | | | 5,478 | | | | 107,329 | | | | (148,062 | ) | | | — | | | | (35,255 | ) |
| | | | | | | | | | | | | | | | | | | | |
Cash flows from financing activities: | | | | | | | | | | | | | | | | | | | | |
Net proceeds from issuance of debt | | | — | | | | 394,834 | | | | — | | | | — | | | | 394,834 | |
Retirement of debt | | | (409,750 | ) | | | — | | | | — | | | | — | | | | (409,750 | ) |
Net proceeds from issuance of common stock upon exercise of stock options and in connection with the employee stock purchase plan | | | 4,505 | | | | — | | | | — | | | | — | | | | 4,505 | |
Payment of capital lease obligations | | | — | | | | (1,391 | ) | | | (581 | ) | | | — | | | | (1,972 | ) |
| | | | | | | | | | | | | | | | | | | | |
Net cash (used in) provided by financing activities | | | (405,245 | ) | | | 393,443 | | | | (581 | ) | | | — | | | | (12,383 | ) |
| | | | | | | | | | | | | | | | | | | | |
Increase (decrease) in cash and cash equivalents | | | 693 | | | | 80,130 | | | | (41 | ) | | | — | | | | 80,782 | |
Cash and cash equivalents at beginning of year | | | 152 | | | | 130,661 | | | | (761 | ) | | | — | | | | 130,052 | |
| | | | | | | | | | | | | | | | | | | | |
Cash and cash equivalents at end of year | | $ | 845 | | | $ | 210,791 | | | $ | (802 | ) | | | — | | | $ | 210,834 | |
| | | | | | | | | | | | | | | | | | | | |
F-34
TIME WARNER TELECOM INC.
SCHEDULE II — VALUATION AND QUALIFYING ACCOUNTS
Years Ended December 31, 2007, 2006, and 2005
| | | | | | | | | | | | | | |
| | | Balance at
Beginning of
Period | | Additions due
to Acquisition | | Additions/
Charges to
Costs and
Expenses, net | | | Deductions | | | Balance at
End of
Period |
| | | (amounts in thousands) |
For the Year ended December 31, 2007: | | | | | | | | | | | | | | |
Allowance for doubtful accounts receivable | | $ | 13,182 | | — | | 5,858 | | | (7,022 | ) | | $ | 12,018 |
| | | | | | | | | | | | | | |
For the Year ended December 31, 2006: | | | | | | | | | | | | | | |
Allowance for doubtful accounts receivable | | $ | 10,936 | | 4,963 | | 607 | | | (3,324 | ) | | $ | 13,182 |
| | | | | | | | | | | | | | |
For the Year ended December 31, 2005: | | | | | | | | | | | | | | |
Allowance for doubtful accounts receivable | | $ | 11,415 | | — | | (157 | ) | | (322 | ) | | $ | 10,936 |
| | | | | | | | | | | | | | |
F-35
EXHIBIT INDEX
| | | | |
Exhibit
Number | | | | Description of Exhibit |
| 2.1 | | — | | Agreement and Plan of Merger, by and among Time Warner Telecom Inc., XPD Acquisition, LLC, Xspedius Communications, LLC, Xspedius Management Co. LLC and Xspedius Holding Corp., dated as of July 27, 2006 (filed as Exhibit 2.1 to the Company’s Quarterly Report on Form 10-Q for the quarter ended June 30, 2006)* |
| 3.1 | | — | | Restated Certificate of Incorporation of the Company (filed as Exhibit 3.1 to Company’s Quarterly Report on Form 10-Q for the quarter ended June 30, 2007) * |
| 3.2 | | — | | Amended By-laws of Time Warner Telecom Inc. (filed as Exhibit 99.1 to the Company’s Current Report on Form 8-K dated September 17, 2007).* |
| 4.1 | | — | | Indenture dated as of March 29, 2006 between Time Warner Telecom Inc. and Wells Fargo Bank, National Association, as trustee. (filed as Exhibit 4.1 to the Company’s Quarterly Report on Form 10-Q for the quarter ended March 31, 2006).* |
| 4.2 | | — | | First Supplement Indenture dated as of March 29, 2006, between Time Warner Telecom Inc. and Wells Fargo Bank, National Association, as trustee, creating 2.375% Convertible Senior Debentures due 2026. (filed as Exhibit 4.2 to the Company’s Quarterly Report on Form 10-Q for the quarter ended March 31, 2006)* |
| 4.3 | | — | | Indenture dated February 9, 2005 between Time Warner Telecom Holdings Inc., Time Warner Telecom Inc., Subsidiary Guarantors parties thereto and Wells Fargo Bank, National Association, as Trustee for 9 1/4% Senior Notes due 2014 (filed as Exhibit 4.7 to the Company’s Annual Report on Form 10-K for the year ended December 31, 2004)* |
| 10.1 | | — | | Lease between Carr America Real Estate Services LLC and Time Warner Telecom Holdings Inc. (filed as Exhibit 10.1 to the Company’s Annual Report on Form 10-K for the year ended December 31, 2004)* |
| **10.2 | | — | | Time Warner Telecom Inc. 1998 Stock Option Plan as amended December 8, 1999 (filed as Exhibit 10.4 to the Company’s Registration Statement on Form S-1/A (Registration No. 333-49439))* |
| **10.3 | | — | | Employment Agreement between the Company and Larissa L. Herda (filed as Exhibit 10.1 to the Company’s Quarterly Report on Form 10-Q for the quarter ended September 30, 2004)* |
| **10.4 | | — | | Employment Agreement between the Company and Paul B. Jones (filed as Exhibit 10.3 to the Company’s Quarterly Report on Form 10-Q for the quarter ended September 30, 2007).* |
| **10.5 | | — | | Employment Agreement between the Company and Jill R. Stuart (filed as Exhibit 10.5 to the Company’s Quarterly Report on Form 10-Q for the quarter ended September 30, 2007).* |
| **10.6 | | — | | Employment Agreement between the Company and John T. Blount (filed as Exhibit 10.8 to the Company’s Annual Report on Form 10-K for the year ended December 31, 2005).* |
| **10.7 | | — | | Employment Agreement between the Company and Mark Peters (filed as Exhibit 10.1 to the Company’s Quarterly Report on Form 10-Q for the quarter ended September 30, 2007).* |
| **10.8 | | — | | Change of Control Employment Agreement between the Company and Paul B. Jones (filed as Exhibit 10.4 to the Company’s Quarterly Report on Form 10-Q for the quarter ended September 30, 2007).* |
| **10.9 | | — | | Change of Control Employment Agreement between the Company and Jill R. Stuart (filed as Exhibit 10.6 to the Company’s Quarterly Report on Form 10-Q for the quarter ended September 30, 2007).* |
| **10.10 | | — | | Change of Control Employment Agreement between the Company and Mark Peters (filed as Exhibit 10.2 to the Company’s Quarterly Report on Form 10-Q for the quarter ended September 30, 2007).* |
| | |
| 10.11 | | — | | Capacity License Agreement (filed as Exhibit 10.3 to Quarterly Report on Form 10-Q for the quarter ended June 30, 1998)* |
E-1
| | | | |
Exhibit
Number | | | | Description of Exhibit |
| 10.12 | | — | | Trade Name License Agreement (filed as Exhibit 10.4 to the Company’s Quarterly Report on Form 10-Q for the quarter ended June 30, 1998)* |
| 10.13 | | — | | Amendment No. 2 to Trade Name License Agreement with Time Warner Inc. (filed as Exhibit 10.1 to Quarterly Report on Form 10-Q for the quarter ended September 30, 2003)* |
| 10.14 | | — | | Full Service Lease Agreement for Office dated July 31, 2007 between Summit Place I, LLC and Time Warner Telecom Holdings Inc. |
| 10.15 | | — | | Amendment No. 14 dated May 1, 2007 to Trade Name License Agreement between Time Warner Inc. and Time Warner Telecom Inc. (filed as Exhibit 10.1 to the Company’s Quarterly Report on Form 10-Q for the quarter ended June 30, 2007)* |
| 10.16 | | — | | Lease Agreement dated July 22, 1999 between Parkridge One LLC and Time Warner Telecom Holdings Inc. (filed as Exhibit 10.17 to the Company’s Annual Report on Form 10-K for the year ended December 31, 2004).* |
| 10.17 | | — | | Fifth Amendment to Lease Agreement between CLPF-Parkridge One, L.P. and Time Warner Telecom Holdings Inc. (filed as Exhibit 10.18 to the Company’s Annual Report on Form 10-K for the year ended December 31, 2004)* |
| 10.18 | | — | | Sixth Amendment to Lease Agreement between CLPF – Parkridge One, L.P. and Time Warner Telecom Holdings Inc. (filed as Exhibit 10.18.1 to Company’s Annual Report on Form 10-K for the year ended December 31, 2005).* |
| **10.19 | | — | | Time Warner Telecom Inc. 2000 Employee Stock Plan (filed as Exhibit 4.3 to the Company’s Registration Statement on Form S-8, Registration No. 333-48084)* |
| 10.20 | | — | | Credit Agreement dated as October 6, 2006 among Time Warner Telecom Inc., Time Warner Telecom Holdings Inc., Wachovia Bank, National Association, Lehman Commercial Paper Inc., and Bank of America, N.A. (filed as Exhibit 99.1 to Company’s Current Report on Form 8-K dated October 11, 2006).* |
| **10.21 | | — | | Summary of compensation arrangements for independent directors of Time Warner Telecom Inc. (filed as Exhibit 10.21 to the Company’s Annual Report on Form 10-K for the year ended December 31, 2006)* |
| †10.22 | | — | | Agreement, as amended between Time Warner Telecom Inc. and AT&T Corp. (filed as Exhibit 10.1 to Quarterly Report on Form 10-Q for the quarter ended June 30, 2005)* |
| †10.23 | | — | | Services Agreement by and among SBC Communications Inc., AT&T Corp., and Time Warner Telecom Holdings Inc. (filed as Exhibit 10.2 to Quarterly Report on Form 10-Q for the quarter ended June 30, 2005)* |
| 21 | | — | | Subsidiaries of the registrant |
| 23.1 | | — | | Consent of Independent Registered Public Accounting Firm |
| 31.1 | | — | | Certification of Chief Executive Officer pursuant to Item 601(b)(31) of Regulation S-K, as adopted pursuant to Section 302 of the Sarbanes-Oxley Act of 2002 |
| 31.2 | | — | | Certification of Chief Financial Officer pursuant to Item 601(b)(31) of Regulation S-K, as adopted pursuant to Section 302 of the Sarbanes-Oxley Act of 2002 |
| 32.1 | | — | | Certification of Chief Executive Officer pursuant to 18 U.S.C. Section 1350, as adopted pursuant to Section 906 of the Sarbanes-Oxley Act of 2002 |
| 32.2 | | — | | Certification of Chief Financial Officer pursuant to 18 U.S.C. Section 1350, as adopted pursuant to Section 906 of the Sarbanes-Oxley Act of 2002 |
| * | Incorporated by reference. |
| ** | Management contract or compensation plan or arrangement. |
| † | Portions of this exhibit have been redacted and filed separately with the Securities and Exchange Commission pursuant to a request for confidential treatment. |
E-2