UNITED STATES
SECURITIES AND EXCHANGE COMMISSION
WASHINGTON, D.C. 20549
FORM 10-K
| x | ANNUAL REPORT PURSUANT TO SECTION 13 OR 15(d) OF THE SECURITIES EXCHANGE ACT OF 1934 |
For the fiscal year ended December 31, 2010
or
| ¨ | TRANSITION REPORT PURSUANT TO SECTION 13 OR 15(d) OF THE SECURITIES EXCHANGE ACT OF 1934 |
Commission file number 1-34243
tw telecom inc.
(Exact name of Registrant as specified in its charter)
| | |
| Delaware | | 84-1500624 |
(State or other jurisdiction of incorporation or organization) | | (I.R.S. Employer Identification No.) |
10475 Park Meadows Drive
Littleton, CO 80124
(Address of principal executive offices)
(303) 566-1000
(Registrant’s telephone number, including area code)
Securities registered pursuant to Section 12(b) of the Act:
| | |
Title of each class | | Name of exchange on which registered |
| Common Stock $.01 par value | | Nasdaq Stock Market |
Securities registered pursuant to Section 12(g) of the Act: None
Indicate by check mark if the registrant is a well-known seasoned issuer, as defined in Rule 405 of the Securities Act. YES x NO ¨
Indicate by check mark if the registrant is not required to file reports pursuant to Section 13 or Section 15(d) of the Act. YES ¨ NO x
Indicate by check mark whether the registrant (1) has filed all reports required to be filed by Section 13 or 15(d) of the Securities Exchange Act of 1934 during the preceding 12 months (or for such shorter period that the registrant was required to file such reports), and (2) has been subject to such filing requirements for the past 90 days. YES x NO ¨
Indicate by check mark whether the registrant has submitted electronically and posted on its corporate Website, if any, every Interactive Data File required to be submitted and posted pursuant to Rule 405 of Regulation S-T (§232.405 of this chapter) during the preceding 12 months (or for such shorter period that the registrant was required to submit and post such files). YES x NO ¨
Indicate by check mark if disclosure of delinquent filers pursuant to Item 405 of Regulation S-K (§232.405) is not contained herein, and will not be contained, to the best of registrant’s knowledge, in definitive proxy or information statements incorporated by reference in Part III of this Form 10-K or any amendment to this Form 10-K. x
Indicate by check mark whether the registrant is a large accelerated filer, an accelerated filer, a non-accelerated filer or a smaller reporting company. See the definitions of “large accelerated filer,” “accelerated filer” and “smaller reporting company” in Rule 12b-2 of the Exchange Act (Check one):
| | | | | | |
Large accelerated filer x | | Accelerated filer ¨ | | Non-accelerated filer ¨ | | Smaller reporting company ¨ |
Indicate by check mark whether the registrant is a shell company (as defined in Rule 12b-2 of the Act.) YES ¨ NO x
As of June 30, 2010, the aggregate market value of the registrant’s voting stock held by non-affiliates was approximately $2.5 billion, based on the closing price of the registrant’s common stock on the NASDAQ Stock Market reported for such date. Shares of common stock held by each executive officer and director have been excluded since those persons may under certain circumstances be deemed to be affiliates. This determination of executive officer or affiliate status is not necessarily a conclusive determination for other purposes.
The number of shares outstanding oftw telecom inc.’s common stock as of January 31, 2011 was 150,553,406 shares.
DOCUMENTS INCORPORATED BY REFERENCE
Certain information required in Part III of this Annual Report on Form 10-K is incorporated herein by reference to our definitive proxy statement for the 2011 Annual Meeting of our stockholders, which we will file with the U.S. Securities and Exchange Commission on or before April 30, 2011.
CAUTION REGARDING FORWARD-LOOKING STATEMENTS
This document contains certain “forward-looking statements,” within the meaning of the Private Securities Litigation Reform Act of 1995, including statements regarding, among other items, our expected financial position, expected capital expenditures, the impact of the economic downturn, activities and results, expected revenue mix, expected revenue growth, the impact of accounting changes, future tax benefits and expense, expense trends, future liquidity and capital resources, product plans, growth or stability from particular customer segments, building penetration plans, the effects of consolidation in the telecommunications industry, anticipated customer disconnections and customer and revenue churn, Modified EBITDA trends, expected network expansion and grooming, potential changes in certain accounting reserves and allowances and business and financing plans. These forward-looking statements are based on management’s current expectations and are naturally subject to risks, uncertainties, and changes in circumstances, certain of which are beyond our control. Actual results may differ materially from those expressed or implied by such forward-looking statements.
The words “believe,” “plan,” “target,” “expect,” “intend,” and “anticipate,” and expressions of similar substance identify forward-looking statements. Although we believe that the expectations reflected in such forward-looking statements are reasonable, we can give no assurance that those expectations will prove to be correct. Important factors that could cause actual results to differ materially from the expectations described in this report are set forth under “Risk Factors” in Item 1A and elsewhere in this report. In addition, actual results may differ from our expectations due among other things, to the timing of disconnections and service installations which may affect the extent to which those factors impact our results in a particular period, increased customer disconnections and churn, increased competition, inability to obtain rights to build networks into commercial buildings, the current or a future economic downturn which may adversely affect our revenue growth or EBITDA, delays in launching new products that our customers desire, decreased demand for our products, further declines in the prices of and revenue from our services due to competitive pressures, industry consolidation and other industry conditions, an ownership change that results in limitations on our use of net operating loss carryforwards (“NOLs”) under Section 382 of the Internal Revenue Code, increases in the prices we pay for use of facilities of incumbent local exchange carriers (“ILECs”) ILECs, increased costs from healthcare reform and higher taxes or further deregulation of the ILECs that adversely affects the cost and availability of ILEC facilities that we use to reach certain customer locations, and adverse regulatory rulings or legislative developments. Readers are cautioned not to place undue reliance on these forward-looking statements, which speak only as of their dates. We undertake no obligation to publicly update or revise any forward-looking statements, whether as a result of new information, future events, or otherwise.
TELECOMMUNICATIONS DEFINITIONS
In order to assist the reader in understanding certain terms relating to the telecommunications business that are used in this report, a glossary is included following Part III.
2
INDEX
3
PART I
Overview
tw telecom inc. (“we” or the “Company”) is a leading national provider of managed network services, specializing in data, Internet Protocol or “IP”, voice and network access services to enterprise organizations, including public sector entities, and carriers throughout the U.S. Our revenue is derived primarily from business communication services, including data, high-speed Internet access, network and voice services.
Through our subsidiaries, we serve 75 U.S. metropolitan markets with our extensive fiber facilities that are connected by our regional fiber facilities and national IP backbone. As of December 31, 2010, our fiber network spanned approximately 28,000 route miles, connecting to 11,876 buildings served directly by our local fiber facilities. We continue to extend our fiber footprint within our existing markets by connecting our network into additional locations. Additionally, we have expanded our fiber footprint through acquisitions to increase our market density and reach. We continue to expand our data, voice, and IP networking capabilities between our markets, supporting secure end-to-end Ethernet and Virtual Private Network (“VPN”) connections for customers.
Our principal executive offices are located at 10475 Park Meadows Drive, Littleton, Colorado 80124, and our telephone number is (303) 566-1000. Our Internet address ishttp://www.twtelecom.com. The information contained on our website is not part of, nor is it incorporated by reference into, this Annual Report on Form 10-K. Our Annual Report on Form 10-K, quarterly reports on Form 10-Q, and current reports on Form 8-K, and amendments to these reports are available on our website free of charge, as soon as reasonably practicable after we electronically file such material with, or furnish such material to, the Securities and Exchange Commission. In addition, we have posted, and intend to disclose on our website, any amendments to or waivers from, our Code of Ethics applicable to our principal executive officer, principal financial officer, chief accounting officer, controller and treasurer and other persons performing similar functions within four business days following the date of such amendment or waiver.
We amended our Restated Certificate of Incorporation to change our corporate name from Time Warner Telecom Inc. totw telecom inc.in March 2008. On July 1, 2008, we began usingtw telecom inc. as our name andtw telecom as our brand.
Business Strategy
Our objective is to be the leading national provider of high quality business network solutions leveraging our integrated network, operational capabilities, dedicated people, local presence, personalized customer experience and advanced support systems to meet the complex and evolving needs of our customers and increase shareholder value. The key elements of our business strategy include the following:
Leverage Our Local Presence on a National Scale with Global Reach. We leverage our local fiber assets and our multi-purpose national IP backbone as well as integrate and manage facilities from other carriers, domestically and globally, to enable our customers to connect to any of their locations with our network solutions. We have a local presence in our markets with sales, sales engineering, customer support and operational resources, backed by a national organization, to provide personalized service and customized solutions for our customers. These local resources are led by market-based general managers who have accountability for the growth and profitability of their local markets.
Our local presence, local fiber based facilities, and national IP backbone enable us to:
| | • | | Realize higher margins than carriers that do not operate their own local fiber facilities; |
| | • | | Offer flexible products; |
| | • | | Focus on selling services in our local markets, but also provide a national reach with multi-site and multi-city end-to-end solutions for our national customers; |
4
| | • | | Provide a higher quality of service than other competitors; |
| | • | | Realize a competitive advantage over non-facilities based providers; and |
| | • | | Provide a reliable and diverse network. |
Focus Our Service Offerings to Meet the Complex and Evolving Needs of Our Customers.We deliver secure end-to-end managed solutions to our customers with a predictable, quality service experience. We design and deliver scalable and efficient solutions that enable our customers’ complex and evolving business applications, emphasizing our data networking service offerings, which include Ethernet and IP VPN data products with Class of Service (which allows customers to assign different priorities to various traffic types) and converged service offerings comprised of Internet, voice, security, remote access and managed routers. We also continue to provide a broad range of traditional services including a dedicated network service portfolio with private line, special access and private transport networks; local and long distance voice services, and secure Internet access with speeds up to 10 Gigabits per second (“Gbps”).
As the complex needs of our customers evolve, we are developing our intelligent network and service capabilities (see “Network and Facilities-Overview”) over the near and longer term to provide our customers with solutions that include:
| | • | | Visibility to network performance; |
| | • | | Control of their networks with the ability to manage through portals or application interfaces; and |
| | • | | Dynamic capabilities to allocate bandwidth as needed based on customers’ pre-defined business rules and parameters. |
Deliver a Customer Care Strategy that Differentiates Us from Our Competitors.We approach customer care from the customer’s viewpoint with:
| | • | | Our people: We seek to engage all of our employees, whether directly or indirectly, in providing the best possible customer experience. Two-thirds of our employees have customer facing responsibilities. |
| | • | | Customized service interaction: We use a coordinated approach leveraging both local resources and our national centers to deliver personalized customer service interactions, including providing timely status updates to resolve issues in the shortest possible timeframe. Customers choose the type of service interaction that works best for them: local, national, electronic or live support. In addition, customers can customize their view of our web-based customer portal to quickly view the information that is most important to them. |
| | • | | Voice of the customer: We listen to our customers by capturing feedback from customer interactions and customer survey responses and continually incorporate their feedback to deliver a better overall customer experience to them. |
My Portal is our tool to enable customer knowledge and decision making about their services. Customers can navigate through account information, network services, trouble tickets, order status, billing and payment information either through self-service or with the support of our customer service personnel.
We believe that our ongoing customer experience initiatives improved our customer loyalty and retention, contributed to a reduction in revenue churn and increased sales to existing customers. We plan to continue to innovate to enhance our customers’ experience and ease of doing business with us.
Enhance our Multi-Channel Sales Strategy.We take a multi-pronged approach to our sales strategy, which includes:
| | • | | Our direct sales channel consists of highly knowledgeable and tenured sales and technical support personnel who focus on medium to large enterprise customers in our local markets. Our national direct |
5
| | sales structure supports national enterprises, public sector entities and carriers. We continue to expand our direct sales organization and to invest in tools and training and other initiatives to maximize sales productivity. |
| | • | | Our customer relationship specialists specifically focus on sales to our smaller customers and increasing customer retention, freeing our primary sales force to focus on high potential existing and new customers. |
| | • | | Our indirect sales channel extends our sales coverage in our markets by leveraging our representatives’ customer relationships. We recently enhanced our indirect sales channel in size and scope by adding selected representatives such as value added resellers, cloud providers and system integrators, whose capabilities complement our network service offerings, and expanding the portfolio of services available for sale through this channel. |
Complement the New Information Technology (“IT”) Ecosystem By Enabling IT Strategies. Our strategy is to leverage our fiber network, data services portfolio and numerous third party and customer data centers connected to our network to enable the developing cloud computing, collaboration, disaster recovery and data center strategies that our customers are beginning to adopt by providing the secure and highly reliable network connectivity and capacity essential to these IT strategies. We believe that these areas of growing demand have been and will continue to be drivers of our growth.
Broaden Our Reach and Capabilities to Position Us for Longer-Term Growth and Operational Scale by Employing our Disciplined Capital Allocation Strategy.Our strategy is to invest for growth for the near and long term. We maintain a disciplined approach to capital spending to maximize revenue growth while maintaining attractive rates of return on capital invested to connect customers with our network. We continue to innovate and invest in our business throughout various economic cycles in order to position us for long term growth. These investments enable us to expand our market opportunity, extend our fiber network and increase both our operational and product capabilities to meet our customers’ growing and complex needs. Elements of our strategy include:
| | • | | Success-based investments—The majority of our investments are success-based, driven by customer sales, which include costs to expand our fiber-connected buildings and add equipment and capacity to our network, which must meet certain financial return criteria. In addition to funding current customer opportunities, these investments increase the number of fiber connected buildings that we leverage for future growth. This category of investments is intended to reach their incremental return thresholds within the short to medium term. |
| | • | | Long-term strategic investments—These investments fund geographic expansions within our markets, extension of our network into targeted locations, technological advancements of our network and product capabilities for future growth and enhancements to our back office support systems to increase employee productivity and enhance the customer experience. These investments include fiber construction, equipment purchases and IT system enhancements for platform deployments, among others, all of which have a longer term return on investment. |
Invest in our People to Drive the Execution of our Strategies. We have invested in our highly skilled, professional workforce that we believe allows us to differentiate ourselves from our competitors, innovate our services, advance our customer experience initiatives and make the necessary technological advancements to meet the complex and evolving needs of our customers. We have a multi-faceted approach to ensure our human resources are well aligned, capable and engaged in executing on our strategic business objectives. Elements of our approach include:
| | • | | Developing strategic people plans across the organization that prioritize our people investments; |
| | • | | Enhancing our organizational effectiveness through organizational design, workforce and talent planning, change management and leadership development to maximize employee productivity and engagement; |
6
| | • | | Optimizing our talent acquisition efforts through employment marketing, sourcing and recruiting to ensure we attract the best talent; |
| | • | | Developing our talent by providing technical training for sales, operations and engineering resources, leadership and management training and detailed orientation programs to assure that we have the skilled employees to remain an industry leader; |
| | • | | Continually improving employee job performance through various performance management techniques and aligning individual annual goals with our corporate strategies; and |
| | • | | Providing a performance-based compensation offering designed to incent and engage employees to execute on our business objectives and to create long term shareholder value. |
Services
We deliver a suite of scalable, integrated and managed network solutions serving customers’ complex network needs and IT requirements. These solutions comprehensively and efficiently solve customers’ network requirements. We are planning for additional capabilities for customers’ network visibility, control and management targeted at our customers’ next generation needs. Current services include data, Internet, network, converged, voice, and intercarrier services. Our revenue by major service categories for the years ended December 31, 2010, 2009 and 2008 was as follows:
| | | | | | | | | | | | | | | | | | | | | | | | |
| | | Years Ended December 31, | |
| | | 2010 | | | 2009 | | | 2008 | |
| | | (amounts in thousands) | |
Revenue: | | | | | | | | | | | | | | | | | | | | | | | | |
Data and Internet services (1)(5)(6) | | $ | 547,218 | | | | 43 | % | | $ | 472,647 | | | | 39 | % | | $ | 399,928 | | | | 35 | % |
Network services (2)(6) | | | 359,169 | | | | 28 | | | | 370,859 | | | | 31 | | | | 387,339 | | | | 33 | |
Voice services (3)(5) | | | 332,870 | | | | 26 | | | | 333,274 | | | | 27 | | | | 334,692 | | | | 29 | |
Intercarrier compensation (4) | | | 33,914 | | | | 3 | | | | 34,610 | | | | 3 | | | | 37,060 | | | | 3 | |
| | | | | | | | | | | | | | | | | | | | | | | | |
Total revenue | | $ | 1,273,171 | | | | 100 | | | $ | 1,211,390 | | | | 100 | | | $ | 1,159,019 | | | | 100 | |
| | | | | | | | | | | | | | | | | | | | | | | | |
| (1) | See Data Services and Internet Services below. |
| (2) | See Network Services below. |
| (3) | See Voice Services below. |
| (4) | See Intercarrier Compensation Services below. |
| (5) | See Converged and Integrated Services below. Revenue from the voice components of converged and integrated services are included in the Voice services revenue category above and revenue from all other components are included in the Data and Internet services revenue category. |
| (6) | See Managed Services below. Collocation services are included in the Network services revenue category above. All other Managed Services are reflected in the Data and Internet services revenue category above. |
7
Our portfolio provides solutions to enterprise customers, ranging from small businesses to Fortune 500 enterprises, city, state and federal government entities, as well as carriers and other communication service providers. We continue to enrich our service suite to meet our customers’ future networking demands, including new enterprise software applications, data storage, cloud computing, collaboration and security needs. Our primary service offerings are:
Data Services
Our data services enable customers to connect all their locations and internal local area networks together into a single managed solution. From these capabilities, customers have options to manage an array of IT, voice, Internet and other types of connectivity. We offer the following Ethernet and IP VPN services:
Local Solutions
| | • | | Switched NLAN. A local offering connecting multiple locations in speeds up to 10 Gbps. Five Class of Service options are offered that allow customers to group types of traffic and assign a different priority level to each traffic type. |
| | • | | Elite NLAN. A point-to-point metropolitan Ethernet service which provides dedicated protected Ethernet transport service between two locations at bandwidth speeds up to 10 Gbps. |
Wide Area Solutions
| | • | | E-LINE.An Ethernet virtual private line service supporting point-to-point and multipoint solutions available in select markets, with speeds up to 10 Gbps. |
| | • | | Extended NLAN. Provides Ethernet connectivity between the vast majority of the markets we serve and is available in either point-to-point or multi-point configurations, generally up to 1 Gbps, and includes Class of Service options. |
| | • | | Regional Ethernet. Provides point-to-point private lines between select markets with the advantage of Ethernet interfaces. |
| | • | | IP VPN Services. These services connect multiple customer sites by creating a virtual network for the customer within the U.S. and to 72 other countries. Class of Service functionality is available on Premium IP VPN service. Connection speeds are up to 1 Gbps. |
| | • | | Managed IP VPN. A turnkey VPN solution that provides connectivity to our secure Multi-Protocol Label Switching IP VPN network with customer premise-based routers that we procure, configure, maintain and manage. The service includes active monitoring and alarming, on-site installation and hardware maintenance. |
Converged and Integrated Services
| | • | | Converged Services fully integrate any combination of communication applications including IP VPN, voice, Internet, security and managed router service into a single managed IP solution to more than 100 markets across the U.S. This solution is scalable from 1.5 Mbps to 1 Gbps, and enables each communication application to dynamically share all subscribed bandwidth. Converged Services are available with Class of Service. |
| | • | | Integrated NLAN. Our traditional converged voice and Internet service with an optional Ethernet feature to transfer private data between multiple locations locally or nationally. |
| | • | | Integrated Services.Our bundled integrated offerings enable customers to purchase one to three DS-1 facilities that combine lines, trunks, long distance, and Internet services to provide an integrated service offering that can dynamically allocate bandwidth for maximum network efficiency, and eliminates the customer’s need for multiple vendors. |
8
Internet Services
Our dedicated high capacity Internet service enables customers to access the Internet and other external networks. We offer a wide range of Internet services with bandwidth speeds ranging from 1.5 Mbps to 10 Gbps transported via Ethernet or traditional Time Division Multiplexing (“TDM”) connectivity. Our traditional TDM-based Internet services are available via industry standard transport facilities: DS-1, DS-3, OC-3, OC-12 and OC-48 connectivity. Our Ethernet Internet services are available using Ethernet connections with offerings from 2 Mbps to multiples of 10 Gbps. We also provide Managed Internet, which bundles our Internet access service with customer premises-based routers that we procure and configure based on the customer’s requirements. This service includes active monitoring and alarming, and on-site installation and hardware maintenance.
Managed Services
We offer a suite of managed services described below that complement our customers’ data, Internet and converged solution offerings. These services allow our customers to reduce the overall management burden of their data systems and IT staff (also see Managed IP VPN and Managed Internet above):
| | • | | Distributed Denial of Service Mitigation.This service monitors, identifies and mitigates denial of service attacks that flood the target network with high volumes of unauthorized traffic taking down a customer’s business critical Internet-based applications (i.e., website, email servers, etc.). |
| | • | | Managed Security Services. This service uses security devices placed within our network to establish a firewall to prevent unauthorized traffic from entering a customer’s network. We also offer a managed security solution through equipment placed at the customer’s premises. |
| | • | | Collocation Services. We provide secure space with controlled climate and power where customers can locate their equipment to connect to our network in facilities equipped for enterprise IT environmental requirements. |
Network Services
We provide a complete range of network access services with transmission speeds up to 10 Gbps to satisfy our customers’ needs for voice, data, image and video transmission. Each service uses technologically advanced fiber optics and is available as:
| | • | | Private Line.Dedicated telecommunications lines connecting various locations of a customer’s operations, suitable for transmitting voice, data and Internet traffic among customer locations. |
| | • | | Special Access.Dedicated telecommunications lines linking the points of presence (“POPs”) of one or more interexchange carriers (“IXC”), or between enterprise customers and the local POPs of IXCs. |
| | • | | Transport Arrangements.Dedicated transport between the local exchange carrier (“LEC”) central offices and the IXC POP for voice and data applications. |
| | • | | Metropolitan and Regional Connectivity.Each transport service is available on our local fiber network and most are also available between cities on our inter-city, regional networks. |
These services are available in a wide variety of configurations and capacities:
| | • | | Private Network Transport Services. A premium quality, fully redundant, and diversely routed service on Synchronous Optical Network (“SONET”) standards that is dedicated to the private use of individual customers with multiple locations. |
| | • | | SONET Services. Full duplex transmission of digital data on SONET standards allowing multipoint transmission of voice, data or video over protected fiber networks. Available capacities include DS-1, DS-3, STS-1, OC-3, OC-12, OC-48 and OC-192. |
9
| | • | | Dense Wavelength Division Multiplexing Services (“DWDM”). High capacity, point-to-point transmission services allowing customers to have access to multiple full-bandwidth channels of 2.5 Gbps and 10 Gbps. |
| | • | | Storage Transport Solutions.This service offers a variety of industry standard protocols, allowing customers to avoid protocol translation while securely transporting their data to distant storage locations. |
Voice Services
Our voice services provide our customers with local and long distance calling capabilities. We own, manage and maintain the switches to provide the services. Our voice services can be provisioned over TDM or as Voice over Internet Protocol (“VoIP”) and include the following:
| | • | | Access Trunks. These trunks, typically DS-1, are utilized by private branch exchange (“PBX”) customers that own and operate a switch on their own premises to provide access to the local, regional, and long distance telephone networks. |
| | • | | Long Distance Service.Provides the capability for customers to place a voice call from one local calling area to another, including international calling, and is offered as a bundle with other voice and converged solutions as well as package plans for various committed levels of usage. |
| | • | | Local Toll Service.Provides customers with a competitive alternative to ILEC service for intraLATA toll calls. |
| | • | | Local Telephone Service.Local telephone calling areas are widely defined to provide ease of use for our customers. Additional features include operator and directory assistance services and custom calling features such as call waiting and caller identification. |
| | • | | Business Access Line Service.Provides customers with quality analog voice grade telephone lines. |
| | • | | IP Trunks. IP trunks converge voice traffic with Internet traffic over a single connection for a more efficient and scalable access network. This service supports new IP PBX devices and local and long distance calling to the public switched telephone network (“PSTN”). |
Intercarrier Services
We are interconnected with other telecommunications carriers, which enables us to originate and terminate long distance calls and terminate local calls for other carriers.
| | • | | Switched Access Service.The connection between a long distance carrier’s POP and an end-user’s premises that is provided through the switching facilities of a LEC is referred to as switched access service. Switched access service provides long distance carriers with a switched connection to their customers for the origination and termination of long distance telephone calls or provides large end-users with dedicated access to their carrier of choice. Under our tariffs, we receive per-minute terminating switched access compensation when our network is used for the origination or termination of the carriers’ traffic. |
| | • | | Local Traffic Termination Services. Pursuant to interconnection agreements with other carriers, we accept traffic that originates on another LEC’s facilities and carry that traffic over our facilities to our customers in order to complete calls. Generally, under applicable regulations, we are entitled to receive compensation—referred to as “reciprocal compensation”—from the originating LECs for those services. |
Network and Facilities
Overview. Our integrated network infrastructure combines physical fiber assets and equipment with logical capabilities that provides a cost effective platform for the logical layering of our services and enables us to manage our customers’ needs and to scale our customer service to support all of our customers. Our local,
10
regional and national network utilizes advanced architectures and technologies to deliver high capacity and scalable network services. Our local markets are interconnected through our IP backbone utilizing multiple standard protocols and operate on fully redundant routers which enable us to deliver services between markets and out to the public Internet.
We have designed and constructed our integrated network infrastructure over fiber rings generally using path diversity equipped with electronics that automatically re-route service if a network impairment such as a fiber cut occurs. Our integrated network supports our customers’ application needs through Ethernet services using state of the art Ethernet network equipment or SONET based services, using traditional SONET networking equipment.
Our VoIP services utilize our packet based soft switches and gateways located in our local markets. This equipment is smaller and more cost effective than traditional PSTN end office switches. Our soft switches are interconnected using a VoIP enabled, private IP backbone that operates on our foundational integrated network. Our VoIP network architecture also supports complex disaster recovery services for customers having mission critical voice requirements.
Our integrated network also provides the foundation for our evolving network services and capabilities that we refer to as the “intelligent network.” As it evolves, we expect the intelligent network to provide customers with the ability to manage their own network services using network management visibility and control, with decision making tools to manage how and when to make appropriate network services changes in real time, either manually through our customer portal or using automation through application program interfaces.
As we replace legacy equipment in our network in the normal course to enable new services we have installed and plan to continue to install new equipment that is cost effective and significantly more energy and space efficient as part of our green initiatives. This new equipment conserves energy, lowers our costs, frees up valuable space in our central offices and avoids costly central office expansions. We continually evaluate new technologies, applications and suppliers to assure that we are aligned with next generation technologies.
Local Market Technical Overview. We serve our customers from central offices that are strategically positioned throughout our local markets. The central offices house the network equipment needed to interconnect customers with each other and with other local exchange, Internet and Ethernet networks. We deploy Ethernet switches, routers, soft switches, gateways and other electronic network devices in our central offices that are configured with redundant electronics and power supplies capable of automatically switching to backup equipment in the event of hardware impairments or failures. This redundancy provides protection to our customers and helps to prevent service interruptions. We also install and manage our electronics on our customers’ premises to interface with their communications equipment.
Our network is interconnected with multiple ILECs, competitive local exchange carriers (“CLECs”), cable companies and interexchange carriers for voice services and our network backbone is connected directly with several external networks to increase our network reach and access. We have peering and transit connections with external network vendors that provide our customers an exit point from our network to the public Internet. We provide IP VPN service to international locations through arrangements with international network providers and provide a converged VPN solution to our customers’ locations outside of our network through the use of facilities provided by other carriers.
Fiber Lease and License Agreements. We provide a substantial portion of our services entirely on fiber network facilities that we constructed, purchased from other providers or obtained through acquisitions. We also license fiber network facilities through indefeasible rights of use agreements or other similar long term licensing or leasing arrangements (collectively “IRUs”) from other CLECs and cable companies. We typically paid for these IRUs upfront, and they generally have terms lasting over 20 years. Similarly, our Capacity License Agreements with Time Warner Cable, Comcast Corporation and Bright House Networks, LLC (collectively, the
11
“Cable Operations”), provide us with an exclusive right to use all of the capacity of specified fiber-optic cable owned by the Cable Operations in 23 markets for a term that expires in 2028. The Capacity License Agreements do not restrict us from constructing or licensing fiber-optic capacity from other parties in the markets where we license fiber network facilities from the Cable Operations, and we have done so over the past several years.
Network.
The following map shows our 75 markets:

Network Monitoring and Management.We provide a single point of contact for our customers and consolidate our systems support and technical expertise for management of our customer and internal networks at our two network operations centers in metropolitan locations in Colorado and Missouri. These two centers offer capability for redundancy and overlap coverage for our customer networks. We provide 24 hours per day, 7 days a week surveillance and monitoring of networks to achieve a high level of network reliability and performance. Network analysts monitor real-time alarm, status, and performance information for network circuits, which allows us to react swiftly to repair network trouble as well as proactively address network issues before becoming customer affecting.
Information Technology Solutions.We focus our efforts on creating and deploying applications, systems and technology that optimize our business and increase operational scale through the use of automation and customer self service portals. We have invested in applications and systems that increase our workforce productivity and decrease human touch points. This strategy has also enhanced our ability to manage our customer’s experience and increased the ease of doing business with us by making information available to our customers in a unified and comprehensive way. We blend the purchase of proven, commercially available software that can be tailored to our business processes, and in-house developed applications that conform to our architectural framework. All of our systems must be flexible enough to conform to a rapidly changing environment, while being scalable, and easily maintained and enhanced. We continue to evaluate and implement new technologies and applications to
12
further enhance the integration of our enterprise applications so that data flows efficiently and accurately between applications. Our systems utilize open system standards and architectures, allowing interoperability with third party systems and applications.
Information Systems Infrastructure. We maintain corporate data centers in Colorado and Texas to support our corporate applications and systems, and provide redundancy for our critical corporate applications and systems. Each of our data centers is equipped with state of the art computing capability, storage networks and high availability corporate voice and data services. We use blade server technology running virtual machine software that has increased computing capacity significantly while reducing environmental and space costs. We manage our desktop technology assets, corporate voice and data services centrally to ensure consistency and compatibility between all corporate facilities.
Network Development and Application Laboratory.We have a laboratory that is equipped with state of the art systems and equipment, including those we use in the operation of our network. The center is designed to provide a self-contained testing and integration environment, fully compatible with our network, for the purposes of:
| | • | | Verifying the technical and operational integrity of new equipment prior to installation in the network; |
| | • | | Developing new services and applications; |
| | • | | Providing a realistic training environment for technicians, engineers, and others; |
| | • | | Providing a network simulation environment to assist in fault isolation and recovery; and |
| | • | | Providing a network simulation environment to verify network load, scale, and overlay of our products and services. |
Billing Systems.We utilize a single billing system that is interfaced directly into our operational support systems and financial systems for all of our services other than intercarrier compensation. This integrated billing environment increases customer bill accuracy and customer satisfaction. This billing system software is licensed from a billing vendor that develops feature enhancements for us as needed and handles the daily support and maintenance of the system, which operates on our computing hardware.
Customers, Sales and Marketing
Customers.We serve both business enterprise and carrier customers. Our enterprise customers include businesses that are data and IT intensive and are primarily in financial services, technology and scientific, health care, professional services industries and public sector entities. Our carrier customers include ILECs, CLECs, wireless communications companies and Internet service providers (“ISPs”). As of December 31, 2010, we served approximately 27,000 customers. For the year ended December 31, 2010, enterprise customers, carriers and intercarrier compensation represented 75%, 22% and 3% of total revenue, respectively, and no customer accounted for 10% or more of total revenue. Our 10 largest customers accounted for 20% of our total revenue for the year ended December 31, 2010, and are primarily carriers. As our enterprise customer revenue continues to grow at a greater rate than our carrier customer revenue, the percentage of our total revenue represented by the carrier customers has been declining.
Sales and Marketing. Our service offerings are part of a comprehensive portfolio of services and solutions designed to support the current and next generation needs of our customers. Our sales and marketing strategy emphasizes our:
| | • | | Targeted market strategy focused on key industry verticals and large bandwidth applications originating from medium and large enterprises in proximity to our metropolitan fiber assets; |
| | • | | Comprehensive suite of multi-site large bandwidth data solutions applying IP VPN and Ethernet technology; |
13
| | • | | Flexible multi-product managed converged solutions that include voice, usage, Internet, data and network security services and managed customer premise routers; |
| | • | | Leading coordinated customer experience strategy, including local support in the customer’s city, a responsive national customer service orientation with strong network management capabilities and customizable self-help tools; and |
| | • | | Tenured sales professionals and sales engineering professionals with network design capabilities. |
We engage in direct sales in our local markets with specialized sales teams for enterprise, carrier and public sector customers. Our national sales organization is focused on three types of national customers— enterprise, carrier and public sector. As of December 31, 2010, we had a total of 555 sales account executives and customer relationship specialists. In 2010, we expanded our sales account executives, customer relationship specialists and sales support personnel by nearly 70. To expand our sales coverage we continue to hire people strategically targeted at high opportunity markets and industries, and provide tools and training to increase the productivity of our new and existing sales and sales support personnel. Commissions for our sales representatives are linked to incremental revenue from services installed. We provide additional incentives for executing service contracts with terms of greater than one year, for certain products and for sales of services provisioned on our fiber facilities. Our customer relationship specialists focus on sales to smaller existing customers and increasing customer retention, freeing our primary sales force to focus on high potential existing and new customers.
Our indirect sales channel further expands our sales coverage by leveraging our representatives’ customer relationships. In 2010, we enhanced our ability to market our entire portfolio of services through experienced representatives such as value added resellers, cloud providers and systems integrators that provide services and equipment that complement our services.
Customer Care
We strive to deliver a consistent, differentiated, valuable customer experience through local and national support. Our local account representatives and customer relationship specialists work with local operations teams, central network operations centers and customer care teams to support our customers. We process customer requests to order, upgrade or change their services through our coordinated local and national support teams, including customer project personnel who coordinate service installations. Our customer service center is available to all of our customers to answer their questions regarding billing, order status or maintenance concerns. In addition, our network operations centers provide 24 hours per day, 7 days a week trouble reporting and surveillance and monitoring of networks to maintain network reliability and performance (see “Network Monitoring and Management”).
Our online customer care self-help platform, MyPortal, offers our customers self-service capabilities that support our customer experience strategy. MyPortal enables customers to easily register on-line and choose various capabilities including the ability to view and pay their bills on-line, view orders, create and view billing disputes, receive scheduled maintenance notifications, alert us of their internal scheduled maintenance activities, create and view trouble tickets, create and view various accounts and enter certain types of service change requests. Customers can also access their own network performance and utilization data on a circuit level basis for certain services. We plan to incorporate additional data and network analytics in the future.
Competition
We believe that the principal factors affecting competition in our industry are:
| | • | | Network capabilities and reach; |
| | • | | Customer service and experience; |
| | • | | Network and operational quality; |
14
| | • | | Ability to provide customer specific solutions; |
| | • | | The regulatory environment. |
We compete with other carriers primarily on service offering, network capabilities, service quality and customer service. In addition, we must price our services competitively with the local market for those services. We are subject to significant price competition across our services, especially for integrated service bundles for small customers, long distance service, inter-city point-to-point services, POP to POP and POP to customer premise traditional dedicated services and high capacity Internet access. Competition varies across local markets and products which deliver national solutions, depending on the number and type of competitors in the market and customer segment. We believe that the ILECs and some CLECs continue to be aggressive in pricing competition, particularly for large enterprise and data center customers that we also target.
Our primary competition is from the ILECs, CLECs and cable companies. The ILECs, primarily AT&T Inc., Verizon Communications, Inc., and Qwest Communications International Inc., some of the other CLECs and some cable companies offer services that are substantially similar to some of those we offer. We believe that the ILECs may have some competitive advantages over us because of their name recognition, technical capabilities, greater financial resources, broader geographic coverage and potential to bundle and subsidize services of the type we offer with revenue from other services. However, we believe that customers are increasingly interested in competitive facilities-based solutions providers like us because of our flexibility in providing customer-specific critical business solutions, our robust data and IP capabilities, our enhanced service and operational capabilities, our interconnection with other carriers and diversity and our disaster recovery capabilities. Cable companies compete with us primarily for smaller business customers and selectively for larger enterprise customers. We believe that our focus on customer service and our operational execution provides us with a competitive advantage with respect to ILECs, other CLECs and cable companies. Our extensive fiber facilities connecting to multiple buildings in each of our markets, and between markets, also provide us with a competitive advantage over most other CLECs.
To the extent we interconnect with and use ILEC networks to service our customers, we depend on the technology and capabilities of the ILECs to meet certain telecommunications needs of our customers and to maintain our service standards. We also use ILEC special access services, unbundled network element (“UNE”) loops, Ethernet loops, ILEC and other carriers’ long haul and local circuits and out of market voice services to reach certain customer locations that are not served by our network. Although regulation of ILEC performance standards exists with respect to UNE loops, there is minimal regulatory oversight of the quality of ILEC special access and Ethernet services. We believe that ILEC headcount reductions related to certain ILECs’ cost-cutting initiatives and capacity constraints due to lack of investments in wireline networks have adversely affected their service delivery intervals and service quality. We also depend on large ISPs for Internet peering, which is unregulated, to allow our customers to connect with certain ISPs with which we do not directly connect, and we rely on carriers with international facilities to provide VPN connections in certain international locations. Our ability to compete for customer locations that we do not serve directly on our network is dependent in part on the quality of service we receive from these other carriers and our ability to obtain their services at a reasonable cost.
Regulatory environments at the state and federal level differ widely and may have considerable impacts on our costs, opportunities and resulting investment decisions. Some regulatory decisions have or may in the future have negative or positive impacts on our revenue or expense and may favor certain classes of competitors over us (see “Regulatory Environment” below).
15
Seasonality
Although our business is not inherently seasonal in nature, historically our revenue and expense in the first quarter of the year have been impacted by some seasonal factors that may cause fluctuations from the prior quarter. First quarter installations and the associated revenue may be impacted by the slowing of our customers’ purchasing activities at the end of the fourth quarter. Our expenses also are impacted in the first quarter by the resetting of payroll taxes and other employee-related cost increases.
Regulatory Environment
Overview. As a certified competitive telecommunications provider, we are subject to regulation by the Federal Communications Commission (“FCC”), state regulatory authorities and local government agencies. In most areas, we are subject to a less comprehensive set of rules designed for non-dominant or competitive providers.
ILECs typically operate under federal and state rules designed for dominant carriers. As competition has expanded, ILECs have gained some regulatory freedoms at both the federal and state levels. Because the larger ILECs are our major suppliers for local loops and are major competitors, we continue to advocate for meaningful regulatory oversight to promote competition and protect against unreasonable price increases.
Most of the former Regional Bell Operating Companies have sought regulatory freedom from pricing and access requirements applicable to them by requesting that the FCC forebear from regulating many of the products that are used by CLECs like us. To date, the FCC has granted forbearance requests for Ethernet and OCn high capacity services while denying forbearance requests for all products in a particular geographical area.
Recently, regulators have focused on broadband issues. The FCC delivered its National Broadband Plan to Congress in March 2010. The Plan sets an ambitious agenda to encourage more private innovation and investment to ensure the universal deployment of broadband. The Plan outlines a number of initiatives that will impact the telecommunications industry including a review of competitive policies and wholesale markets, allocation and management of government controlled assets such as rights of way and poles and reforms to universal service mechanisms. We cannot predict the impact on us of any of these initiatives.
Federal Regulation
Special Access. We purchase a substantial amount of special access services from ILECs to expand the reach of our network and also provide special access services over our fiber facilities in competition with the ILECs. The FCC is currently reviewing its regulation of special access services in a pending proceeding opened in 2005. We have advocated that the FCC modify its special access pricing flexibility rules to return these services to price–cap regulation to protect against unreasonable price increases for carriers such as us. If ILEC special access prices increase, our costs may increase but we may experience less pricing pressure on the special access services we sell. If ILEC price reductions were to occur, we would likely experience downward pressure on the prices we charge our customers for special access services and reductions in the prices we pay ILECs for special access services that we purchase. The FCC is collecting data in connection with its special access review, but we do not know when or if the FCC will act on interstate special access regulation in the near term.
We entered into a two year wholesale service agreement through May 2012 with a large ILEC under which the ILEC supplies us with tariffed special access and other services for end-user access and transport with certain service level commitments. This agreement replaced a prior agreement for these services that expired in May 2010 and results in higher prices for some special access services than we incurred under the prior agreement.
Intercarrier Compensation and Universal Service Fund.Switched access is a component of intercarrier compensation that long distance carriers are charged to originate and terminate long distance calls using our local network. Reciprocal compensation is the other component of intercarrier compensation that represents charges to LECs for local exchange traffic terminated on our facilities that their customers originate. Switched access and
16
reciprocal compensation represented 2% and less than 1%, respectively, of total revenue for the year ended December 31, 2010. We also pay switched access charges to other carriers to originate and terminate our customers’ long distance traffic and pay intercarrier compensation to other carriers for traffic that our customers terminate on their facilities. We, like other carriers, are required to make contributions to the federal Universal Service Fund (“USF”), which provides support to promote access to telecommunications services at reasonable rates for those living in rural and high-cost areas, income-eligible consumers, rural health care facilities, schools and libraries.
The FCC has been considering intercarrier compensation and universal service reforms since 2001. Consistent with its recommendations in its 2010 National Broadband Plan, the FCC issued a Notice of Proposed Rulemaking in February 2011 that addresses both intercarrier compensation and USF funding. As with prior FCC notices, this notice proposes gradual rate reductions for intercarrier compensation over time and changes to the USF contribution methodology. These potential changes are highly contentious, and previous FCC administrations have been unable to resolve them. The commencement and the length of the transition to reduced rates, if adopted, will not be known until the FCC issues an order following the comment period. We cannot predict the impact of any of these proposals on our financial results.
Pole Attachments.In a February 1999 order, the FCC allowed for increases to commingled cable and telephony pole attachment rates beginning in February 2001. Following this order, we experienced higher pole attachment fees and could experience future rate increases if it is determined that we should pay the telephony rates, which are significantly higher than cable rates either retroactively or in the future, in all areas where cable and telephony pole attachments are commingled. Under the FCC’s pole attachment regulations, cable companies are permitted to pay lower cable rates for pole attachments than the rates to which we are subject as a telecommunications carrier for the provision of some of the same services. At the same time, we are experiencing increased competition from cable companies for certain broadband services. In 2007, we filed a request with the FCC to eliminate this discriminatory rate treatment in its pole attachment regulations. The FCC has released a Notice of Proposed Rulemaking with a tentative conclusion that the pole attachment rates for all providers of broadband networks should be equal. There has been considerable public comment in the proceeding, but the FCC has not yet taken action. We cannot predict the outcome of this initiative at this time.
State and Local Regulation.
We have obtained the required authorizations to provide intrastate telecommunication services in 40 states and the District of Columbia. These authorizations cover traditional voice services, private line services as well as switched access. Additionally, where we have placed facilities in the public right-of-way, we have obtained the necessary permits, licenses and or franchises from local authorities.
Intercarrier Compensation. Most states continue to have jurisdiction over pricing of intrastate switched access. Increasingly, states have been reassessing this pricing for both ILECs and CLECs. Currently, 13 states in which we provide switched services have benchmarking rules that limit the switched access rates that we charge other carriers. We do not know whether additional states will promulgate similar rules in the future, which could result in a reduction of the switched access rates that we charge other carriers in those states.
Permits Licenses and Franchises. We may be required to obtain street opening and construction permits and other rights-of-way from municipal authorities in order to install and expand our network in certain municipalities. In some cities, our fiber licensors or subcontractors already possess the requisite authorizations to construct or expand our network. Any increase in the difficulty or cost of obtaining these authorizations and permits could adversely affect us, particularly in locations where we compete with companies that already have the necessary permits.
In some of the metropolitan areas where we provide network services, we pay right-of-way or franchise fees based on a percentage of gross revenue or other measures such as fees per linear foot of fiber that we install. Municipalities that do not currently impose fees may seek to do so, and renewals of existing franchises may
17
result in increased fees. Under the Telecommunications Act of 1996 (the “1996 Act”), municipalities are required to impose such fees on a competitively neutral and nondiscriminatory basis. Municipalities that have fee structures that currently favor the ILECs may or may not conform their practices in a timely manner or without legal challenges by us or other CLECs. Moreover, ILECs with which we compete may be exempted from such local franchise fee requirements by previously enacted legislation that allows the ILECs to utilize rights-of-way throughout their states without having to pay franchise fees to local governments.
We are party to various regulatory and administrative proceedings in the ordinary course of business. Subject to the discussion above, we do not believe that these proceedings will have a material adverse effect on our business.
Employees
As of December 31, 2010, we had 2,975 employees compared to 2,870 employees at December 31, 2009.
Financial Information
See Part II Item 8 for our financial results and information.
The economic environment in the U.S. and globally could affect our future operating results.
Beginning in late 2007 and throughout 2008 and 2009, the economic environment had varying degrees of impact on our business, reflected primarily in longer sales cycles, decreased sales and higher customer disconnections that dampened our revenue growth. Although there are indications that a slow economic recovery has begun to occur and we have experienced a decline in customer disconnections (see—“Several customers account for a significant portion of our revenue, and some of our customers may disconnect their services due to price competition, customer consolidations, financial difficulties or other factors”) and increased demand for our services resulting in slightly higher revenue growth in 2010 compared to 2009, there is no assurance that this recent trend will continue. If the economic recovery slows or stalls, there is risk that customer disconnections may increase along with bad debts, and prices and new sales may decline or sales may be delayed due to decreased demand for our services, customer cash flow constraints, customer credit deteriorations and other factors. Our operating results and financial condition could be materially and adversely affected if there were to be a material adverse change in any of these factors. Our revenue, margins and cash flow are subject to fluctuations in the ordinary course of business due to the timing of sales and installations, disputes and dispute resolutions, pricing declines upon contract renewals, expense and capital expenditures, and seasonality in sales and usage-based services. An extended economic recovery or a return to recession could amplify the effect of those normal fluctuations on our results. A slower economic recovery could also impact key vendors that supply critical equipment and software or other goods and services that we rely upon in the provision of our services. There is no assurance that we could replace key products or services with alternate providers on a timely and cost efficient basis if our key vendors experience a financial crisis.
We may be unable to sustain our revenue growth and increase our cash flow despite the implementation of several initiatives designed to do so.
We must grow our business and revenue in order to generate cash flow that, together with cash on hand and funds available under our credit facility, will be sufficient to fund our capital expenditures and our debt service requirements. We have pursued several growth initiatives, including:
| | • | | Increasing network investments in existing markets to expand our network reach; |
| | • | | Launching new products and services, especially products and services that support customers’ data and IP needs; |
| | • | | Targeting customer care initiatives to improve customer retention; |
18
| | • | | Enhancing our ability to compete for multi-location customers; |
| | • | | Increasing our network reach through acquisitions; |
| | • | | Increasing sales force productivity; and |
| | • | | Advancing our network and systems to create increased efficiencies, capabilities and customer control over their services. |
Our ability to manage and achieve the intended benefits of this expansion depends on many factors, including our ability to:
| | • | | Attract new customers and sell new services to existing customers; |
| | • | | Acquire and install transmission facilities and related equipment at reasonable costs; |
| | • | | Employ new technologies; |
| | • | | Obtain required permits and rights-of-way; |
| | • | | Enhance our financial, operating, and information systems to achieve the benefits of increased scale; |
| | • | | Manage the cost and timing of our capital expenditure programs; |
| | • | | Remain competitive against much larger, better-funded incumbent carriers; and |
| | • | | Acquire facilities from other carriers at a reasonable price with acceptable service quality to serve customers that are not directly connected to our network. |
There is no assurance that our growth initiatives will continue to result in an improvement in our results of operations. Factors such as customer disconnections and pricing declines upon contract renewals could adversely affect our ability to sustain revenue growth unless we can sell and install growing volumes of services to outpace those impacts. Prior to 2009, we incurred net losses even during periods of increasing revenue. Although we had net income in 2009 and 2010, certain factors could cause losses to occur in future periods including, among others, economic conditions, industry consolidations, decreased demand, customers disconnecting services, competition, regulatory and contractual rate reductions, revenue disputes, significant increases in our special access costs due to adverse regulatory changes or otherwise, other cost increases, catastrophic losses, increases in federal or state tax expense or changes in accounting standards or the impact of other risk factors.
Several customers account for a significant portion of our revenue, and some of our customers may disconnect their services due to price competition, customer consolidations, financial difficulties, or other factors.
We have substantial business relationships with a few large customers, especially other carriers. Our 10 largest customers accounted for approximately 20% of our total revenue in 2010. The highly competitive environment in the long haul carrier sector, including interexchange carriers, and changes in the local services market have challenged the financial condition and growth prospects of some of our carrier customers and could lead to reductions in our revenue in the future.
Our service agreements with customers that have already satisfied their initial terms are subject to termination by the customer on short notice and do not require the customer to maintain the services at current levels. After expiration of their current agreements, customers may not choose to continue to purchase the same services or level of services. Increasing consolidation in the telecommunications industry has occurred in recent years, and if any of our customers are acquired we may lose a significant portion of their business.
Our revenue churn, defined as the average lost recurring monthly billing from customers’ partial or complete service disconnections (excluding pricing declines upon contract renewals and lost usage revenue), was 1.0%, 1.3%, and 1.2% of total monthly revenue in 2010, 2009 and 2008, respectively. We experience customer and service disconnections in the normal course of business primarily associated with price competition from
19
other providers, customer network optimization, customers moving facilities to other locations, cost cutting, business contractions, customer financial difficulties and industry consolidation. We believe that the economic downturn contributed to an increase in churn beginning in late 2007. While we experienced an improvement in churn in 2010, we do not know whether the favorable churn results are sustainable and cannot predict the total impact on revenue from future customer disconnections or the timing of such disconnections. Replacing this revenue with new revenue from other customers may be difficult and more costly. In addition, competitive pricing pressure on our services, as well as customers’ heightened cost cutting initiatives due to the economy, may challenge our ability to grow our revenue. Further, we expect revenue will continue to be impacted by pricing declines to current market levels for existing customers that renew services with expired terms.
The market for our services is highly competitive, and many of our competitors have significant advantages that may adversely affect our ability to compete with them.
We operate in an increasingly competitive environment, and some companies may have competitive advantages over us. Most ILECs offer substantially the same services that we offer, in some cases at higher prices and in some cases at lower prices. ILECs benefit from:
| | • | | Their name recognition; |
| | • | | Greater financial and technical resources; |
| | • | | Larger networks and broader network coverage; |
| | • | | The ability to leverage a customers’ total expenditures with them by providing lower prices for bundled service offerings and subsidizing services that compete with ours; and |
| | • | | Regulatory decisions that decrease regulatory oversight of ILECs. |
Consolidations involving ILECs, CLECs and others may result in fewer, but much larger and more effective competitors. We also face competition from other CLECs and cable companies. While the cable companies are primarily competing for smaller business customers currently, they may be expanding their network coverage and product offerings to serve larger customers which could result in additional competition for the customers that we target. Price cutting or other aggressive attempts by other carriers to retain customers in the dampened economic environment may pressure our pricing or require us to reduce prices for existing services upon contract renewals, thereby reducing our revenue and margins. In some of the markets in which we operate, we may experience intense competition for particular customers, which could adversely affect our revenue and margins.
If we do not adapt to rapid changes in the telecommunications industry and continue to offer services that satisfy customers’ needs, we could lose customers or market share.
The telecommunications industry continues to experience rapid and significant changes in technologies and architectures to deliver new services to customers. We expect that new technologies will continue to enable advances in our customers’ IT environments that create new demand drivers. We believe that our future success will depend in part on our ability to anticipate and respond to the rapidly changing needs and demands of our customers on a timely basis. Our failure to obtain and integrate new technologies and applications, and develop new service offerings to meet those customer needs or to keep pace with or exceed the service capabilities of our competitors could impact the breadth of our service portfolio, resulting in less competitive and compelling offerings to customers that could impair our ability to attract and retain customers.
In addition to investing in new technologies, we must replace some of the equipment that supports our traditional services as that equipment ages, even though the revenue base from those services is not growing. If we do not properly manage this process, including the migration of customers to our newer technologies, we may lose customers and market share, and our margins and returns could be adversely affected.
20
We use the facilities of other carriers to reach some of our customer locations, and our ability to compete for those customers could be adversely affected by the cost of those facilities or by such carriers’ service issues.
Although we provide a substantial portion of our services entirely on our own network facilities, we must use the facilities of other carriers to connect our local markets, serve customer locations within our markets not served by our network and serve customer locations in U.S. markets outside of our service areas or outside of the U.S. Many of these carriers are also our competitors and if they cause delays in provisioning services, provide poor service quality or the cost of those facilities is unreasonable, our revenue and margins could be adversely affected. We have experienced service issues with some of these carriers from time to time.
We may be adversely affected by changes in the regulation of special access services.
We purchase special access circuits and other services from ILECs to expand the reach of our network. We also provide special access services to our customers over our fiber facilities in competition with the ILECs. If ILEC special access prices increase, our costs may increase but we may experience less pricing pressure on the special access services that we sell. We may not be able to pass those costs on to customers that have term contracts or due to competitive pressures. If ILEC price reductions were to occur, we would likely experience downward pressure on the prices we charge our customers for special access services. A change in the regulations governing special access services could also reduce the likelihood that ILECs will sell us special access on reasonable terms and conditions.
The FCC is currently reviewing its regulation of special access in a pending proceeding opened in 2005. We have advocated that the FCC modify its special access pricing flexibility rules to return these services to price-cap regulation to protect against unreasonable price increases. We do not know when or if the FCC will act on interstate special access regulation and how that action would impact us.
The FCC has also granted petitions for forbearance from regulation of certain special access services, including Ethernet services offered by ILECs as special access with the result that prices for the Ethernet and OC-n high capacity data services of the petitioning carriers are no longer regulated. We continue to pursue commercial arrangements with the ILECs for these services on acceptable terms and conditions, but there is no assurance that we will be able to obtain reasonable pricing, terms and conditions for these services that will allow us to competitively price our services that utilize unregulated ILEC services without some regulation of ILEC access services. We expect that the ILECs will continue to advocate deregulation of all forms of special access services, and we cannot predict the outcome of the FCC’s proceedings in this regard. As a result, we cannot assure that we will continue to be able to obtain special access services at reasonable rates or on a timely basis or that the service quality we receive will be acceptable. If we experience difficulties in obtaining high-quality, reliable, and reasonably priced service from the ILECs, and are unable to obtain the same services from other carriers, we may be at a competitive disadvantage or our margins may be adversely affected.
Our substantial existing debt and debt service requirements could impair our financial condition and our ability to fulfill our obligations under our debt.
As of December 31, 2010, our total long term debt and capital lease obligations were approximately $1.3 billion. Our level of debt may affect our operations and our ability to make payments on our outstanding indebtedness. Subject to certain covenants in our credit agreement and the indentures for our outstanding senior notes, we may incur significant additional indebtedness in the future. Our substantial indebtedness could, for example:
| | • | | Limit our ability to obtain additional financing in the future for working capital, capital expenditures, acquisitions or other corporate purposes; |
| | • | | Make us more vulnerable to the current and future economic downturns or other adverse developments than less leveraged competitors; and |
| | • | | Decrease our ability to withstand competitive pressures. |
21
Our revolving credit facility, Term Loan B and the indenture relating to our senior notes contain restrictive covenants that may limit our flexibility, and breach of those covenants may cause us to be in default under those agreements.
The credit agreement for our revolving credit facility (“Revolver”) and Term Loan B (“Term Loan”) and the indenture relating to our senior notes limit, and in some circumstances prohibit, our ability to, among other things:
| | • | | Make capital expenditures, investments or other restricted payments; |
| | • | | Repurchase our common stock; and |
| | • | | Engage in mergers and acquisitions. |
These restrictions could limit our ability to obtain future financing, make acquisitions or needed capital expenditures, withstand future economic downturns, conduct operations or otherwise take advantage of business opportunities that may arise. In addition, if we do not comply with these restrictions and financial covenants in our credit agreement that require us to maintain certain minimum financial ratios if we draw on our Revolver, the indebtedness outstanding under our credit agreement, and by reason of cross-acceleration or cross-default provisions, our senior notes and any other outstanding indebtedness we may then have, could become immediately due and payable. If we are unable to repay those amounts, our lenders or bondholders could initiate a bankruptcy or liquidation proceeding or the secured lenders could foreclose on the collateral granted to them to secure that indebtedness. If our lenders or bondholders were to accelerate the repayment of outstanding indebtedness, we may not have sufficient assets to repay that indebtedness.
We will require substantial capital to expand our operations and may not be able to obtain additional financing.
The development and expansion of our network requires substantial capital investment. If this capital is not available when needed, our business could be adversely affected. Our 2010 capital expenditures were $321.8 million and our estimate of our 2011 capital expenditures is $310 million to $330 million. We also expect to have substantial capital expenditures thereafter. Based on current assumptions, we expect to generate sufficient cash from operations along with available cash on hand, including cash equivalents, investments and borrowing capacity under our Revolver to provide sufficient funds to meet our expected capital expenditure and liquidity needs to operate our business and service our debt for the foreseeable future. However, we may be required to seek financing in addition to the unused $80 million Revolver if:
| | • | | Our business plans and cost estimates are inaccurate; |
| | • | | We are not able to generate sufficient cash flow from operations to service our debt, fund our capital expenditures and finance our business operations; |
| | • | | We experience a significant reduction in demand for our products or an acceleration of customer disconnections; |
| | • | | We decide to significantly accelerate the expansion of our business and existing network; or |
| | • | | We wish to consummate acquisitions or joint ventures or other strategic transactions that require incremental capital. |
22
Disruptions in the commercial credit market caused a tightening of credit markets in 2008 worldwide, making it more difficult and costly to obtain new lines of credit and access the equity markets. Although the debt and equity markets began to improve in 2009 and 2010 and we completed two refinancings in 2010, it is difficult to predict whether this trend will continue and whether we will be able to obtain additional financing, if needed, on terms acceptable to us or at all. Depending upon market conditions, any additional financing we might seek could be with rates and terms significantly less favorable than those contained in our current Revolver, Term Loan or other outstanding debt instruments. Other factors, such as a rating downgrade could further impact our potential access to financing sources. The failure to raise sufficient funds if needed on reasonable terms may require us to modify or significantly curtail our business plan. This could have a material adverse impact on our growth, ability to compete and ability to service our debt.
In addition, the lenders under our Revolver could refuse to lend funds if we are not in compliance with our financial covenants, such as leverage and interest coverage ratios that are primarily derived from the financial measure that we define as M-EBITDA (see note 6 to Item 6. “Selected Financial Data”), debt levels and interest expense. A lack of revenue growth, revenue losses, pricing declines or rising costs could negatively impact our M-EBITDA margins and cause our failure to meet the minimum required ratios. Even if we meet the conditions for borrowing under the Revolver, we may be unable to draw upon the entire commitment if any of our lenders are unable to perform their obligations to advance funds due to their own financial difficulties.
We may be adversely impacted by deterioration in the financial condition of financial institutions or mutual funds that hold our investments.
As of December 31, 2010, our cash, cash equivalents and investments are held in financial institutions, U.S. Treasury money market mutual funds, debt securities issued by U.S. government agencies and corporate debt securities, some of which are guaranteed by the federal government’s Temporary Liquidity Guarantee Program. From time to time, we also invest in U.S. Treasury securities. We are exposed to risks resulting from deterioration in the financial condition or failure of financial institutions holding our cash deposits, decisions of our investment advisors and the investment managers of the money market funds and defaults in securities underlying the funds and investments, which could adversely impact our ability to access these cash balances. We actively monitor the depository institutions and the performance and quality of our investments and the mutual funds that hold our cash and cash equivalents and adjust the cash balances in our accounts as appropriate. We prioritize safety over investment return in choosing the investment vehicles for cash and cash equivalents and investments and have diversified these investments to the extent practical to minimize our exposure to any one investment vehicle or financial institution. This strategy generally results in lower interest income from investments included in cash and cash equivalents and investments. We may change the nature of our cash, cash equivalent and short-term investments as market conditions change.
Balances in our accounts with financial institutions in the U.S. exceed the FDIC insurance limit when it is impractical to spread these amounts over multiple institutions. We cannot assure that access to our cash, cash equivalents and investments will not be impacted by additional and yet unforeseeable adverse conditions in the financial markets. In 2008, we recorded an impairment charge of $7.8 million on commercial paper investments with exposure to sub-prime mortgages that were past their maturity dates.
We may complete a significant business combination or other transaction that could increase our shares outstanding, and may result in a change in control, and increase our debt.
We regularly evaluate potential acquisitions, joint ventures and other arrangements that would extend our geographic markets, expand our services, enlarge the capacity of our network or expand the types of services provided through our network. If we enter into a definitive agreement for any acquisition, joint venture or other arrangement, we may require additional financing that could result in an increase in our debt, result in a change of control, increase the number of outstanding shares or all of these effects. A substantial transaction may
23
require the consent of our lenders and a change of control with a ratings decline could trigger prepayment obligations under our debt agreements. There can be no assurance that we will enter into any transaction or, if we do, on what terms. In addition, the success of any significant acquisition or business combination is dependent, in part, on our ability to successfully integrate the acquired business into ours, which also carries substantial risks.
Our ability to use net operating loss carryforwards to reduce future tax payments could be negatively impacted if there is an “ownership change” as defined under Section 382 of the Internal Revenue Code and our Section 382 stockholder rights plan, which is intended to help preserve our NOLs, may not be effective.
We have substantial NOLs for U.S. federal income tax purposes and, under the Internal Revenue Code, we may “carry forward” these NOLs in certain circumstances to offset any current and future taxable income and thus reduce our federal income tax liability, subject to certain requirements and restrictions. If we experience an “ownership change,” as defined in Section 382 of the Internal Revenue Code and related Treasury regulations at a time when our market capitalization is below a certain level, our ability to use the NOLs could be substantially limited. This limit could impact the timing of the usage of the NOLs, thus accelerating cash tax payments or causing NOLs to expire prior to their use, which could affect the ultimate realization of that asset.
In January 2009, we adopted a rights plan (the “Rights Plan”) that was approved by our stockholders at our 2009 annual meeting of stockholders. The Rights Plan is intended to protect our NOLs from the potential negative consequence of an ownership change as defined under Section 382 of the Internal Revenue Code. The Rights Plan is designed to deter acquisitions of our common stock that would (i) result in a stockholder owning 4.9% or more of our outstanding shares, or (ii) increase an existing 4.9% or greater stockholder’s percentage ownership of our stock as of January 20, 2009 by greater than 0.5% of our outstanding shares, by diluting the ownership interest of a stockholder whose ownership after the adoption of the Rights Plan exceeds those thresholds, unless the stockholder obtains an exemption from our Board of Directors.
Although the Rights Plan is intended to reduce the likelihood of an ownership change that could adversely affect us, we cannot assure that it would prevent all transfers that could result in such an ownership change. In particular, it would not protect against ownership changes resulting from sales by certain greater than 5% stockholders that may trigger limitations on our use of NOLs under Section 382. Because the Rights Plan may restrict a stockholder’s ability to acquire our stock, the liquidity and market value of our stock might be affected. The Rights Plan will terminate upon the earliest of (1) our Board of Directors’ determination that the Rights Plan is no longer needed for the preservation of NOLs due to the implementation of legislative changes, or any other reason; (2) January 20, 2012 or (3) certain other events described in the Rights Plan, including our Board of Directors’ determination that termination is in our best interest. Our Board of Directors could determine to extend the term of the Rights Plan upon the expiration of its current term or adopt another Rights Plan, subject to subsequent ratification by our stockholders, if it determines that our substantial NOLs are at risk of limitation under Section 382 or that such action otherwise is in the best interests of our stockholders.
We have experienced reductions in switched access and reciprocal compensation revenue as a result of regulatory rate reform, and we may experience further such reductions in the future.
Over time, FCC and state regulations have had the result of reducing our switched access and reciprocal compensation revenue. The FCC has been considering proposals for an integrated intercarrier compensation regime under which all traffic exchanged between carriers would be subject to a unified rate or to “bill and keep,” meaning that the exchange of traffic would generate no revenue or expense. Such changes could materially reduce our intercarrier compensation revenue. We cannot predict the outcome of the pending FCC rule-making related to intercarrier compensation. In addition, some states have adopted, and other states are considering, rules that cap CLECs’ switched access rates. Switched access and reciprocal compensation have both been declining over time and together represented 3% of our total revenue in each of the years ended 2008, 2009 and 2010. There can be no assurance that we will be able to compensate for the reduction in intercarrier compensation revenue with other revenue sources.
24
We may be adversely affected by the exhaustion of IP Version 4 (“IPv4”) IP addresses.
The Internet Protocol is designed to interconnect networks and transmit data back and forth over various telecommunications infrastructures by routing data packets from end-to-end across disparate networks. Routing of these packets is based on the destination IP address. IPv4 is the Internet Protocol presently in use by most providers and has space for over 4 billion unique IP addresses. Providers of Internet services and VoIP like us must assign IP addresses to customers in connection with the services they provide. The proliferation of these services with their associated endpoint devices has increased demand for IP addresses, and numbering registries that manage the available IPv4 addresses have announced that allocations of publicly available IPv4 addresses are no longer available. To offset this exhaustion and add new capacity for service expansion, the industry has developed IPv6 that provides vastly increased IP address space. The transition from IPv4 to IPv6 can be cumbersome which could prevent customers from migrating to this new addressing format, and there is no fixed date by which it must be achieved. While we currently have enough IPv4 addresses for the foreseeable future, depending on the length of time it takes for customers to adopt an IPv6 addressing format, we may not be able to obtain sufficient IPv4 addresses to meet our customers’ demand for our Internet access services that require IP addresses, which may adversely impact our ability to sell certain of our services, our revenue and other financial results.
We are increasingly dependent on automation and systems.
As we grow our business we have increased our dependency on automation and systems in order to scale our business. If our key systems become impaired for any significant period of time, our ability to service our customers at current levels or provision or bill for our services could be adversely affected.
We depend on key personnel for our current and future performance.
Our senior management team has performed effectively as a team over a considerable period of time. Our current and future performance depends to a significant degree upon the continued contributions of our senior management team and other key personnel. We have not experienced significant turnover among these employees. The loss or unavailability of members of our senior management team or key employees could cause disruption to our business. We cannot assure that we would be able to successfully implement our succession plans or identify or employ qualified replacements for senior management or key employees on acceptable terms if their services are no longer available. Unanticipated turnover may also adversely affect the performance of our senior management team or other internal organizations.
We must obtain access to rights-of-way and pole attachments on reasonable terms and conditions; IRUs of fiber and capacity that are important to our operations may not be renewed.
The development, expansion, and maintenance of our network depend, in part, on our ability to obtain rights-of-way and pole attachments as well as certain governmental authorizations and permits. In order to compete effectively, we must obtain such rights, authorizations and permits in a timely manner, at reasonable costs, and on satisfactory terms and conditions. Any increase in the difficulty or cost of obtaining these rights, authorizations or permits could adversely affect us, particularly in areas where we must compete with companies that already have the necessary permits and access.
In certain cities and municipalities where we provide network services over our own fiber optic facilities, we pay license or franchise fees for the use of public rights-of-way. The 1996 Act permits municipalities to charge these fees only if they are competitively neutral and nondiscriminatory, but certain municipalities may not conform their practices to the requirements of the 1996 Act in a timely manner or without legal challenge. We also face the risk that other cities may start imposing new fees, existing fees will be increased or franchises will not be renewed. Some of our franchise agreements also provide for increases or renegotiation of fees at certain intervals. Increases in fees may have a negative impact on our financial condition. If any of our existing franchise
25
or license agreements for a particular metropolitan area are terminated prior to their expiration date and we are forced to remove our fiber optic cables from the streets or abandon our network in place, even with compensation, such termination could have a material adverse effect on us.
A portion of our services are provided on network fiber facilities licensed or leased from cable companies and other CLECs through IRUs or similar arrangements. Most of the facilities under these agreements have terms of over 20 years and can be terminated earlier by the grantors if we materially breach the agreements or other events of default occur as defined in the agreements. Prior to expiration of the terms of these IRUs, we likely will have to negotiate for their renewal. We cannot assure that the parties will agree on the terms of any renewal or that the terms of any renewal will be favorable to us. If these agreements are not renewed or are terminated for default, we will have no further interest in the fiber capacity covered by those agreements and will likely need to build, lease or otherwise obtain alternative fiber network capacity.
Recently enacted health care reform legislation and state and local tax charges may increase our costs.
Congress recently enacted sweeping health care reform legislation that will be implemented on a staggered basis over the next eight years. Health care reform as mandated and implemented under the legislation and any future federal or state mandated health care reform may increase the costs of our employer-sponsored medical plans either directly or as a result of providers passing through their increased costs. If the cost increase is material, our financial condition could be adversely affected.
Our tax burden has increased and could continue to increase, possibly to a significant degree, due to changes in state and local tax laws imposed by these jurisdictions in an attempt to reduce their budget deficits. These changes could include rate increases, removal of exemptions, suspension of the use of NOLs and other measures to raise their revenue. We cannot predict the degree to which these tax changes will affect our net income, M-EBITDA and cash flow.
Terrorism or other business disruptions could affect our future operating results.
Our operating results and financial condition could be materially and adversely affected if there is a catastrophic event such as a terrorist attack on the United States, or a major earthquake, fire, hurricane, flood or similar event that affects our central offices, corporate headquarters, network operations centers or other facilities. Although we have implemented measures that are designed to mitigate the effects of a catastrophic event, we cannot predict the impact of such events.
Our ability to offer residential and content services is limited by our Capacity License Agreements.
Our Capacity License Agreements with the Cable Operations prohibit us from using facilities licensed under those agreements until 2028 to (i) engage in the business of providing, offering, packaging, marketing, promoting, or branding (alone or jointly with or as an agent for other parties) any residential services, or (ii) produce or otherwise provide entertainment, information, or other content services. Although we do not believe that these restrictions will materially affect our business and operations in the immediate future, we cannot predict the effect of such restrictions in the rapidly changing telecommunications industry. We do not currently have plans to offer residential or content services in any of our service areas.
We depend on third party vendors for information systems and other operational functions.
We have agreements with vendors that provide for the development and operation of IT systems such as billing systems and operational functions such as centralized equipment and spares management. The failure of these vendors to perform their services in a timely and effective manner at acceptable costs could have a material adverse effect on our operations and our ability to monitor costs, bill customers, provision services, deploy equipment and achieve operating efficiencies.
26
We may be required to record impairment charges in the future.
Under U.S. generally accepted accounting principles, we are required to review the carrying amounts of our assets, including goodwill, to determine whether current events or circumstances warrant adjustments to those amounts. These determinations are based in part on our judgments regarding the cash flow potential of various assets, and involve projections that are inherently subject to change based on future events. If we determine in the future that the cash flow potential of any of our assets, including acquired assets, is significantly less than we believed at the time of purchase, and that conclusion is based on a long-term rather than short-term trend, we may need to record an impairment charge.
| Item 1B. | Unresolved Staff Comments |
None.
We lease network hub sites, central office sites, other facility locations and sales and administrative offices in the cities in which we operate our network. During 2010, 2009 and 2008, rental expense for our facilities and offices totaled approximately $61.0 million, $61.1 million and $57.7 million, respectively. We believe that our properties, taken as a whole, are in good operating condition and are adequate for our business operations. We currently lease approximately 138,000 square feet of space in Littleton, Colorado, where our corporate headquarters are located, approximately 130,000 square feet of space in Greenwood Village, Colorado, where one national operations center and other administrative functions are located, and approximately 48,000 square feet of space in O’Fallon, Missouri, where another national operations center is located.
We are party to various claims and legal and regulatory proceedings in the ordinary course of business. We do not believe that these claims or proceedings, individually or in the aggregate, are material or are likely to have a material adverse effect on our business, financial condition, or results of operations.
27
PART II
| Item 5. | Market for Registrant’s Common Equity, Related Stockholder Matters and Issuer Purchases of Equity Securities |
Market Information
Our common stock is traded on the NASDAQ Global Select Market of the NASDAQ Stock Market under the symbol “TWTC”. The following table sets forth the intraday high and low sales prices for our common stock for each of the quarters of 2009 and 2010 as reported on the NASDAQ Stock Market:
| | | | | | | | |
Period | | High | | | Low | |
| 2009 | | | | | | | | |
First Quarter | | $ | 10.05 | | | $ | 6.46 | |
Second Quarter | | | 12.78 | | | | 8.33 | |
Third Quarter | | | 14.07 | | | | 8.55 | |
Fourth Quarter | | | 17.65 | | | | 11.51 | |
| | |
| 2010 | | | | | | | | |
First Quarter | | $ | 18.57 | | | $ | 14.36 | |
Second Quarter | | | 18.80 | | | | 15.98 | |
Third Quarter | | | 19.63 | | | | 16.32 | |
Fourth Quarter | | | 19.07 | | | | 16.19 | |
Dividends
We have never paid or declared any dividends and do not anticipate paying any dividends in the near term. The decision whether to pay dividends will be made by our Board of Directors in light of conditions then existing, including our results of operations, financial condition and requirements, business conditions, covenants under loan agreements and other contractual arrangements, and other factors. In addition, the indentures for our outstanding senior notes and the credit agreement governing our Term Loan and our unused Revolver contain covenants that may limit the amount of cash dividends that we may pay on our common stock.
Number of Stockholders
As of January 31, 2011, there were 511 holders of record of our common stock.
28
Performance Graph
The following graph compares total stockholder return on our common stock since December 31, 2005, with the NASDAQ Composite Index (U.S. and foreign companies) and the NASDAQ Telecommunications Index. The graph assumes that $100 was invested in our stock at the closing price of $9.85 on December 31, 2005, and that the same amount was invested in the NASDAQ Composite Index and the NASDAQ Telecommunications Index. Our closing price on December 31, 2010 was $17.05.
Comparison of Cumulative Total Return on Investment
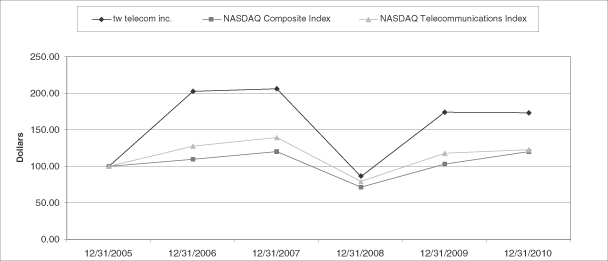
| | | | | | | | | | | | | | | | | | | | | | | | |
| | | Years Ended December 31, | |
| | | 2005 | | | 2006 | | | 2007 | | | 2008 | | | 2009 | | | 2010 | |
tw telecom inc. | | $ | 100.00 | | | $ | 202.34 | | | $ | 205.99 | | | $ | 85.99 | | | $ | 174.11 | | | $ | 173.10 | |
NASDAQComposite Index | | $ | 100.00 | | | $ | 109.52 | | | $ | 120.27 | | | $ | 71.51 | | | $ | 102.89 | | | $ | 120.29 | |
NASDAQ Telecommunications Index | | $ | 100.00 | | | $ | 127.76 | | | $ | 139.48 | | | $ | 79.53 | | | $ | 117.89 | | | $ | 122.52 | |
29
Purchases of Equity Securities By the Issuer and Affiliated Purchasers
The following table presents our purchases of equity securities reportable during the three months ended December 31, 2010:
ISSUER PURCHASES OF EQUITY SECURITIES
| | | | | | | | | | | | | | | | |
Period | | (a) Total Number of
Shares (or Units)
Purchased | | | (b) Average
Price Paid per
Share (or Unit) | | | (c) Total Number of
Shares (or Units)
Purchased as Part of
Publicly Announced
Plans or Programs (1) | | | (d) Maximum Number (or
Approximate Dollar
Value) of Shares (or
Units) that May Yet Be
Purchased Under the
Plans or Programs (1) | |
October 1—October 31, 2010 | | | — | | | $ | — | | | | — | | | $ | 38,294,987 | |
November 1—November 30, 2010 | | | 2,042,743 | | | | 16.75 | | | | 2,042,743 | | | | 4,005,889 | |
December 1—December 31, 2010 | | | 238,230 | | | | 16.78 | | | | 238,230 | | | | 1,015 | |
| | | | | | | | | | | | | | | | |
Total | | | 2,280,973 | | | | | | | | 2,280,973 | | | | | |
| | | | | | | | | | | | | | | | |
| (1) | On June 11, 2010, we announced that our Board of Directors authorized the repurchase of up to $50 million of our common stock and as of December 31, 2010 approximately $50 million, including fees, had been repurchased. On February 7, 2011, we announced that our Board of Directors authorized the repurchase of up to an additional $50 million of our common stock from time to time using a variety of methods, including open market purchases, block trades and privately negotiated transactions. The authorization has no expiration date, and may be suspended or discontinued at any time. |
30
| Item 6. | Selected Financial Data |
Selected Consolidated and Combined Financial and Other Operating Data
The following table is derived in part from our audited consolidated financial statements. This information should be read in conjunction with “Management’s Discussion and Analysis of Financial Condition and Results of Operations” and the audited consolidated financial statements and the notes thereto.
| | | | | | | | | | | | | | | | | | | | |
| | | Years Ended December 31, | |
| | | 2010 | | | 2009 | | | 2008 | | | 2007 | | | 2006 | |
| | | (amounts in thousands, except per share and operating data amounts
and ratios) | |
Statements of Operations Data: | | | | | | | | | | | | | | | | | | | | |
Revenue (1)(2): | | | | | | | | | | | | | | | | | | | | |
Data and Internet services | | $ | 547,218 | | | $ | 472,647 | | | $ | 399,928 | | | $ | 318,269 | | | $ | 216,419 | |
Network services | | | 359,169 | | | | 370,859 | | | | 387,339 | | | | 393,569 | | | | 355,996 | |
Voice services | | | 332,870 | | | | 333,274 | | | | 334,692 | | | | 327,246 | | | | 201,968 | |
Intercarrier compensation | | | 33,914 | | | | 34,610 | | | | 37,060 | | | | 44,595 | | | | 37,992 | |
| | | | | | | | | | | | | | | | | | | | |
Total revenue | | | 1,273,171 | | | | 1,211,390 | | | | 1,159,019 | | | | 1,083,679 | | | | 812,375 | |
| | | | | | | | | | | | | | | | | | | | |
Costs and expenses (3): | | | | | | | | | | | | | | | | | | | | |
Operating (exclusive of depreciation, amortization and accretion shown separately below) (2)(4) | | | 528,965 | | | | 503,960 | | | | 491,375 | | | | 470,038 | | | | 311,532 | |
Selling, general, and administrative (4) | | | 308,470 | | | | 297,290 | | | | 291,985 | | | | 296,638 | | | | 228,485 | |
Depreciation, amortization, and accretion | | | 289,564 | | | | 296,167 | | | | 285,783 | | | | 279,454 | | | | 256,091 | |
| | | | | | | | | | | | | | | | | | | | |
Total costs and expenses | | | 1,126,999 | | | | 1,097,417 | | | | 1,069,143 | | | | 1,046,130 | | | | 796,108 | |
| | | | | | | | | | | | | | | | | | | | |
Operating income | | | 146,172 | | | | 113,973 | | | | 89,876 | | | | 37,549 | | | | 16,267 | |
Interest expense, net | | | (80,344 | ) | | | (83,641 | ) | | | (87,028 | ) | | | (88,347 | ) | | | (88,345 | ) |
Debt extinguishment costs | | | (17,070 | ) | | | — | | | | — | | | | — | | | | (36,874 | ) |
Other income (loss), net | | | 825 | | | | — | | | | (7,767 | ) | | | (3,022 | ) | | | — | |
| | | | | | | | | | | | | | | | | | | | |
Income (loss) before income taxes | | | 49,583 | | | | 30,332 | | | | (4,919 | ) | | | (53,820 | ) | | | (108,952 | ) |
Income tax (benefit) expense (5) | | | (221,851 | ) | | | 2,746 | | | | 2,347 | | | | 1,000 | | | | 28 | |
| | | | | | | | | | | | | | | | | | | | |
Net income (loss) | | $ | 271,434 | | | $ | 27,586 | | | $ | (7,266 | ) | | $ | (54,820 | ) | | $ | (108,980 | ) |
| | | | | | | | | | | | | | | | | | | | |
Basic income (loss) per share | | $ | 1.80 | | | $ | 0.19 | | | $ | (0.05 | ) | | $ | (0.38 | ) | | $ | (0.88 | ) |
| | | | | | | | | | | | | | | | | | | | |
Diluted income (loss) per share | | $ | 1.72 | | | $ | 0.18 | | | $ | (0.05 | ) | | $ | (0.38 | ) | | $ | (0.88 | ) |
| | | | | | | | | | | | | | | | | | | | |
Weighted average shares outstanding, basic | | | 149,156 | | | | 148,087 | | | | 147,251 | | | | 144,956 | | | | 124,078 | |
Weighted average shares outstanding, diluted | | | 171,456 | | | | 149,852 | | | | 147,251 | | | | 144,956 | | | | 124,078 | |
| | | | | |
Other Operating Data: | | | | | | | | | | | | | | | | | | | | |
Modified EBITDA (6)(7) | | $ | 463,568 | | | $ | 436,658 | | | $ | 399,016 | | | $ | 339,003 | | | $ | 286,023 | |
Modified EBITDA margin (6)(7)(8) | | | 36 | % | | | 36 | % | | | 34 | % | | | 31 | % | | | 35 | % |
Net cash provided by operating activities | | $ | 385,752 | | | $ | 390,478 | | | $ | 305,520 | | | $ | 264,207 | | | $ | 174,558 | |
Capital expenditures | | $ | 321,844 | | | $ | 274,890 | | | $ | 276,857 | | | $ | 259,527 | | | $ | 192,679 | |
Net interest coverage ratio (9) | | | 7.9 | | | | 6.8 | | | | 5.8 | | | | 4.7 | | | | 4.9 | |
| | | | | |
Operating Data (as of the end of each period presented): | | | | | | | | | | | | | | | | | | | | |
Operating networks | | | 75 | | | | 75 | | | | 75 | | | | 75 | | | | 75 | |
Fiber connected buildings, on-net | | | 11,876 | | | | 10,407 | | | | 9,422 | | | | 8,355 | | | | 7,457 | |
Employees | | | 2,975 | | | | 2,870 | | | | 2,844 | | | | 2,859 | | | | 2,784 | |
| | | | | |
Balance Sheet Data (as of the end of each period presented): | | | | | | | | | | | | | | | | | | | | |
Cash and cash equivalents | | $ | 356,922 | | | $ | 445,907 | | | $ | 352,176 | | | $ | 321,531 | | | $ | 221,553 | |
Investments, short-term | | | 118,672 | | | | 24,865 | | | | — | | | | — | | | | 87,900 | |
Property, plant, and equipment, net | | | 1,356,612 | | | | 1,294,372 | | | | 1,306,910 | | | | 1,294,900 | | | | 1,294,112 | |
Total assets | | | 2,669,162 | | | | 2,374,200 | | | | 2,281,890 | | | | 2,260,134 | | | | 2,249,184 | |
Long-term debt and capital lease obligations | | | 1,338,297 | | | | 1,300,370 | | | | 1,284,178 | | | | 1,273,640 | | | | 1,265,260 | |
Total debt and capital lease obligations | | | 1,345,499 | | | | 1,307,939 | | | | 1,291,399 | | | | 1,280,977 | | | | 1,271,939 | |
Total stockholders’ equity | | $ | 984,849 | | | $ | 732,040 | | | $ | 673,193 | | | $ | 658,319 | | | $ | 659,293 | |
Leverage ratios (10): | | | | | | | | | | | | | | | | | | | | |
Gross | | | 3.0 | | | | 3.1 | | | | 3.4 | | | | 4.1 | | | | 4.8 | |
Net | | | 2.0 | | | | 2.1 | | | | 2.6 | | | | 3.1 | | | | 3.8 | |
31
| (1) | Includes revenue from transactions with affiliates of $13.1 million in 2006. There was no revenue from transactions with affiliates in 2010, 2009, 2008 or 2007. |
| (2) | We classify certain taxes and fees billed to customers and remitted to government authorities on a gross versus net basis in revenue and expense. Beginning January 1, 2007, we added additional fees billed to customers and remitted to government authorities in our gross revenue. This had no impact on Modified EBITDA or net income (loss), but increased revenue and operating expenses by $17.3 million, $16.8 million, $17.0 million and $14.9 million for the years ending December 31, 2010, 2009, 2008 and 2007, respectively. |
| (3) | Includes expenses from transactions with affiliates of $6.6 million in 2006. There were no expenses from transactions with affiliates in 2010, 2009, 2008 or 2007. |
| (4) | Includes the following non-cash stock-based employee compensation expense: |
| | | | | | | | | | | | | | | | | | | | |
| | | Years Ended December 31, | |
| | | 2010 | | | 2009 | | | 2008 | | | 2007 | | | 2006 | |
| | | (amounts in thousands) | |
Operating | | $ | 3,261 | | | $ | 3,654 | | | $ | 3,758 | | | $ | 3,555 | | | $ | 2,075 | |
Selling, general, and administrative | | | 24,571 | | | | 22,864 | | | | 19,599 | | | | 18,445 | | | | 11,590 | |
| (5) | Includes a non-cash income tax benefit of $227.3 million for the year ending December 31, 2010 to recognize the value of tax assets. |
| (6) | “Modified EBITDA” is a non-GAAP financial measure that we define as net income (loss) before depreciation, amortization and accretion expense, interest expense, interest income, debt extinguishment costs, other income (loss), impairment charges, income tax expense (benefit), cumulative effect of change in accounting principle, and non-cash stock-based compensation. Modified EBITDA is not intended to replace operating income (loss), net income (loss), cash flow and other measures of financial performance and liquidity reported in accordance with accounting principles generally accepted in the United States. Rather, Modified EBITDA is a measure of operating performance and liquidity that investors may consider in addition to such measures. Our management believes that Modified EBITDA is a standard measure of operating performance and liquidity that is commonly reported and widely used by analysts, investors, and other interested parties in the telecommunications industry because it eliminates many differences in financial, capitalization, and tax structures, as well as non-cash and non-operating charges to earnings. We believe that Modified EBITDA trends are a valuable indicator of whether our operations are able to produce sufficient operating cash flow to fund working capital needs, service debt obligations, and fund capital expenditures. We currently use Modified EBITDA for these purposes. Modified EBITDA also is used internally by our management to assess ongoing operations and is a measure used to test compliance with certain covenants of our senior notes, our Revolver and our Term Loan. The definition of EBITDA under our Revolver, our Term Loan and our senior notes differs from the definition of Modified EBITDA used in this table. The definition of EBITDA under our Revolver and Term Loan, discussed below, and senior notes also excludes certain non-cash items. However, the resulting calculation is not materially different from the calculation of Modified EBITDA as defined for the periods presented. Modified EBITDA as used in this document may not be comparable to similarly titled measures reported by other companies due to differences in accounting and disclosure policies. |
| (7) | The reconciliation between net income (loss) and Modified EBITDA is as follows: |
| | | | | | | | | | | | | | | | | | | | |
| | | Years Ended December 31, | |
| | | 2010 | | | 2009 | | | 2008 | | | 2007 | | | 2006 | |
| | | (amounts in thousands) | |
Net income (loss) | | $ | 271,434 | | | $ | 27,586 | | | $ | (7,266 | ) | | $ | (54,820 | ) | | $ | (108,980 | ) |
Income tax (benefit) expense | | | (221,851 | ) | | | 2,746 | | | | 2,347 | | | | 1,000 | | | | 28 | |
Interest income | | | (608 | ) | | | (360 | ) | | | (6,308 | ) | | | (17,489 | ) | | | (20,054 | ) |
Interest expense | | | 80,952 | | | | 84,001 | | | | 93,336 | | | | 105,836 | | | | 108,399 | |
Debt extinguishment costs | | | 17,070 | | | | — | | | | — | | | | — | | | | — | |
Other (income) loss, net | | | (825 | ) | | | — | | | | 7,767 | | | | 3,022 | | | | 36,874 | |
Depreciation, amortization and accretion | | | 289,564 | | | | 296,167 | | | | 285,783 | | | | 279,454 | | | | 256,091 | |
Non-cash stock-based compensation | | | 27,832 | | | | 26,518 | | | | 23,357 | | | | 22,000 | | | | 13,665 | |
| | | | | | | | | | | | | | | | | | | | |
Modified EBITDA | | $ | 463,568 | | | $ | 436,658 | | | $ | 399,016 | | | $ | 339,003 | | | $ | 286,023 | |
| | | | | | | | | | | | | | | | | | | | |
32
The reconciliation between net cash provided by operations and Modified EBITDA is as follows:
| | | | | | | | | | | | | | | | | | | | |
| | | Years Ended December 31, | |
| | | 2010 | | | 2009 | | | 2008 | | | 2007 | | | 2006 | |
| | | (amounts in thousands) | |
Net cash provided by operations | | $ | 385,752 | | | $ | 390,478 | | | $ | 305,520 | | | $ | 264,207 | | | $ | 174,558 | |
Income tax (benefit) expense | | | (221,851 | ) | | | 2,746 | | | | 2,347 | | | | 1,000 | | | | 28 | |
Deferred income taxes | | | 224,085 | | | | — | | | | — | | | | — | | | | — | |
Interest income | | | (608 | ) | | | (360 | ) | | | (6,308 | ) | | | (17,489 | ) | | | (20,054 | ) |
Interest expense | | | 80,952 | | | | 84,001 | | | | 93,336 | | | | 105,836 | | | | 108,399 | |
Discount on debt, amortization of deferred debt issue costs and other | | | (21,404 | ) | | | (20,036 | ) | | | (19,580 | ) | | | (16,877 | ) | | | (13,450 | ) |
Changes in operating assets and liabilities | | | 16,642 | | | | (20,171 | ) | | | 23,701 | | | | 2,326 | | | | 36,542 | |
| | | | | | | | | | | | | | | | | | | | |
Modified EBITDA | | $ | 463,568 | | | $ | 436,658 | | | $ | 399,016 | | | $ | 339,003 | | | $ | 286,023 | |
| | | | | | | | | | | | | | | | | | | | |
| (8) | Modified EBITDA margin represents Modified EBITDA as a percentage of revenue. |
| (9) | Our net interest coverage ratio is calculated by dividing net cash interest expense by Modified EBITDA. We believe that our net interest coverage ratio provides a measurement of our ability to cover our interest payments on our debt and capital lease obligations. For this purpose, the net cash interest expense excludes non-cash interest expense. The reconciliation between interest expense and net cash interest expense is as follows: |
| | | | | | | | | | | | | | | | | | | | |
| | | Years Ended December 31, | |
| | | 2010 | | | 2009 | | | 2008 | | | 2007 | | | 2006 | |
| | | (amounts in thousands) | |
Interest expense | | $ | 80,952 | | | $ | 84,001 | | | $ | 93,336 | | | $ | 105,836 | | | $ | 108,399 | |
Discount on debt and amortization of deferred debt issue costs | | | (21,417 | ) | | | (19,418 | ) | | | (18,025 | ) | | | (16,785 | ) | | | (13,376 | ) |
Interest income | | | (608 | ) | | | (360 | ) | | | (6,308 | ) | | | (17,489 | ) | | | (20,054 | ) |
| | | | | | | | | | | | | | | | | | | | |
Net cash interest expense | | $ | 58,927 | | | $ | 64,223 | | | $ | 69,003 | | | $ | 71,562 | | | $ | 74,969 | |
| | | | | | | | | | | | | | | | | | | | |
| (10) | Our gross leverage ratio is calculated by dividing the principal amount of our total debt and capital lease obligations by Modified EBITDA. Our net leverage ratio is calculated by dividing the principal amount of our total debt and capital lease obligations less cash and cash equivalents and short-term investments by Modified EBITDA. We believe that our leverage ratios provide a measurement of our ability to cover our total debt and capital lease obligations. |
33
| Item 7. | Management’s Discussion and Analysis of Financial Condition and Results of Operations |
You should read the following discussion and analysis in conjunction with our audited consolidated financial statements, including the notes thereto, appearing elsewhere in this report.
Overview
We are a leading national provider of managed network services, specializing in data, IP, voice and network access services to enterprise organizations, including public sector entities, and carriers throughout the U.S. Our customers include, among others, enterprise organizations in the distribution, health care, finance, service and manufacturing industries, state, local and federal government entities, system integrators, and communications service providers including ILECs, CLECs, wireless communications companies and ISPs.
Through our subsidiaries, we serve 75 metropolitan markets that are connected by our regional fiber facilities and national IP backbone. As of December 31, 2010, our fiber network spanned approximately 28,000 route miles connecting to 11,876 buildings served directly by our local fiber facilities. We continue to extend our fiber footprint within our existing markets by connecting our network into additional locations. Additionally, we have expanded our fiber footprint through acquisitions to increase our network density and reach. We continue to expand our data, voice, and IP networking capabilities between our markets, supporting secure end-to-end Ethernet and VPN connections for customers.
Our objective is to be the leading national provider of high quality business network solutions leveraging our integrated network, operational capabilities, dedicated people, local presence, personalized customer experience and advanced support systems to meet the complex and evolving needs of our customers and increase shareholder value. The key elements of our business strategy include:
| | • | | Leveraging our local fiber assets and national IP backbone and integrating other carriers’ facilities to enable our customers to connect to any of their locations with our network solutions, and using our local presence and local sales, sales engineering, customer support and operational resources, backed by a national organization, to provide personalized service and customized solutions for our customers; |
| | • | | Focusing our service offerings to deliver secure end-to-end managed solutions to our customers with a predictable, quality service experience, emphasizing Ethernet and IP VPN services, Internet-based services and converged service offerings and developing our intelligent network and service capabilities to meet the complex and evolving needs of our customers; |
| | • | | Delivering a differentiated customer care strategy by engaging all of our employees and continually incorporating customer feedback to provide the best possible customer service; |
| | • | | Enhancing our multi-channel sales strategy; |
| | • | | Enabling enterprise cloud computing and other developing IT strategies by leveraging our fiber network and data services portfolio and the numerous third party and customer data centers connected to our network; |
| | • | | Employing a disciplined capital allocation strategy to invest for growth in the near and long term to broaden our reach and capabilities and increase operational efficiencies; and |
| | • | | Investing in our people to drive the execution of our strategies. |
34
Our revenue is derived primarily from business communications services, including network, voice, data, and high-speed Internet access services. We serve both business enterprise and carrier customers. Although we analyze revenue by customer type, we present our financial results as one segment across the U.S. because our business is centrally managed. Our revenue by customer type for each of the past three years is as follows:
| | | | | | | | | | | | |
| | | Revenue | |
| | | 2010 | | | 2009 | | | 2008 | |
Enterprise / End Users | | | 75 | % | | | 75 | % | | | 73 | % |
Carrier / ISP | | | 22 | % | | | 22 | % | | | 24 | % |
Intercarrier Compensation | | | 3 | % | | | 3 | % | | | 3 | % |
| | | | | | | | | | | | |
| | | 100 | % | | | 100 | % | | | 100 | % |
| | | | | | | | | | | | |
Total Revenue
Our revenue has grown for the past consecutive 25 quarters through December 31, 2010 including throughout the latest recession. Our revenue growth is dependent upon selling services to new and existing customers, retaining revenue from existing customers through retention programs aimed at reducing disconnections, renewing customers contracts upon contract expiration and upselling services to existing customers to mitigate the impact of price reductions associated with contract renewals. Our rate of growth was 5.1% in 2010, 4.5% in 2009, and 7.0% in 2008, each as compared to the prior year, primarily due to revenue growth from our enterprise customer base and, in 2010, contribution from our carrier customer base. Our rate of growth declined in three of the past four years, each as compared to the prior year, primarily because of customer disconnections due to the impact of the economic environment and slow recovery resulting in less demand, among other factors, and repricing to current market levels of some renewed customer contracts. We experienced a reversal in this trend in 2010 with an increase in demand and lower revenue churn that we believe is due to improving economic conditions, an increase in demand for our new and enhanced services and our customer experience initiatives to increase customer loyalty and retention to reduce churn.
In the ordinary course of business, there is often a time lag between the time a sale is made (i.e., signed contract or service order) and the time revenue commences due to the time required to obtain or build necessary facilities, obtain rights to install equipment in multi-tenant buildings and other factors related to service installation, some of which are not within our control. Our installation timeframes are generally longer for the more complex solutions delivered to our customers. In some situations, the timing of service installations may be subject to factors that customers control, such as their readiness for us to install equipment on their premises or the readiness of their equipment. Due to all of these factors, installation timeframes may range between one month for single-site, less complex services to as long as 12 months for the more complex solutions.
Enterprise Customer Revenue
Revenue from enterprise customers has increased for the past 34 consecutive quarters through December 31, 2010 and increased 6% for the twelve months ended December 31, 2010 as compared to the prior year primarily through sales of our data and Internet services such as Ethernet and IP based services. Revenue from our enterprise customers represented 75% of our total revenue for the past seven consecutive quarters. We expect our future revenue growth to come primarily from our enterprise customer base and to be driven in part by the increasingly web-based economy and developing IT strategies such as cloud computing, collaboration, data center connectivity and disaster recovery that requires the reliable connectivity and network capacity that we provide. Our national fiber footprint and new and enhanced service capabilities enable us to serve customers with multi-point, multi-city locations.
Carrier Customer Revenue
Revenue from carrier customers increased 2% in 2010 as compared to the prior year. Our carrier revenue base has been relatively stable, representing 22% of total revenue for the past seven consecutive quarters. The
35
increase in carrier revenue in 2010 was primarily due to an increase in installed sales to carrier customers, including wireless providers; however, carrier revenue historically has been impacted by pricing declines in connection with carrier customer contract renewals, disconnections resulting from price competition from other carriers, customer cost cutting measures and carrier consolidation, among other factors. We expect demand from our carrier customers to be driven in part by the provision of services for wireless backhaul facilities. We cannot assure that future new installed sales will continue to outpace the revenue declines from carrier repricing and disconnections.
Intercarrier Compensation Revenue
Intercarrier compensation revenue, which consists of switched access and reciprocal compensation, represented 3% of our total revenue for the past 11 consecutive quarters, and may decline in the future as a percentage of total revenue due to growth in revenue from enterprise customers, federal and state mandated rate reductions and possible changes in the regulatory regime for intercarrier compensation. Intercarrier compensation revenue also may fluctuate from quarter to quarter based on variations in minutes of use originating and terminating on our network and changes in customer dispute activity.
Revenue and Customer Churn
Revenue churn, defined as the average lost recurring monthly billing from a customer’s partial or complete disconnection of services (excluding pricing declines upon contract renewals and lost usage revenue) compared to reported revenue was 1.0%, 1.3% and 1.2% of monthly revenue in 2010, 2009 and 2008, respectively. As a component of revenue churn, revenue lost from customers fully disconnecting services was 0.2% for 2010 and 0.3% for 2009 and 2008. Customer and service disconnections occur as part of the normal course of business and are primarily associated with price competition from other providers, customer network optimization, customers moving facilities to other locations, cost cutting, business contractions, customer financial difficulties and industry consolidation. We also believe that the economic environment contributed to an increase in disconnections beginning in late 2007. While we experienced an improvement in revenue churn in 2010 that we believe was in part due to an improving economy and our customer experience initiatives to increase customer loyalty and reduce churn, we cannot predict whether these favorable churn results will continue or the total impact on revenue from future customer disconnections or the timing of such disconnections.
Customer churn, defined as the average monthly customer turnover compared to the average monthly customer count, was 1.1%, 1.3% and 1.4% for 2010, 2009 and 2008, respectively. The majority of this churn came from our smaller customers, which we expect to continue.
Pricing
We experience significant price competition across our service categories that impacts our revenue, which is particularly intense for traditional TDM inter-city point-to-point services, POP to POP and POP to customer premise legacy dedicated services, data center to data center dedicated services, medium and high capacity Internet access, long distance service and integrated service bundles. We also believe that technology advancements in the telecommunications industry have resulted in lower unit costs for some electronics and equipment that drives customer demand for higher bandwidth at the same or lower prices.
In our industry, service agreements typically range from two to five years, with fixed pricing for the contract term. When contracts are renewed with no changes to the services, pricing may be reduced to current market levels as a renewal incentive. In addition, during the terms of agreements, customers often purchase additional services or increase or decrease the capacity of existing services. During the recent recession, we experienced a reduction in such service additions that resulted in a greater impact to our total revenue from pricing declines to current market levels upon contract renewals. This impact may continue if the economic recovery slows or stalls or may ease if economic conditions generally improve.
36
Pricing of Special Access Services
We provide special access services to customers over our own fiber facilities in competition with ILECs, and we also purchase special access and other services from ILECs to extend the reach of our network. The ILECs have argued before the FCC that the high capacity telecommunications services that they sell, including special access services we buy from them, should no longer be subject to regulations governing price and quality of service. We have advocated that the FCC should modify its special access pricing flexibility rules to return these services to price-cap regulation to protect against unreasonable price increases. The FCC is reviewing its regulation of special access pricing in a pending proceeding and is collecting data for that purpose, but we do not know when or if the FCC will act on interstate special access pricing regulation in the near term. If the special access services we buy from the ILECs were to be further deregulated, ILECs would have a greater ability to increase the price and reduce the service quality of special access services they sell to us. If the prices we must pay for special access services increase materially, our margins could be adversely affected.
We entered into a two year wholesale service agreement through May 31, 2012 with a large ILEC under which that ILEC supplies us with tariffed special access and other services for end-user access and transport with certain service level commitments. This agreement replaced a prior agreement for these services that expired in May 2010. This new agreement resulted in higher costs for some special access services than under the expiring agreement. This increased cost has not been material to our consolidated financial statements.
In addition, the FCC has granted petitions for forbearance from regulation of certain special access services, including Ethernet services offered by the ILECs as special access with the result that prices we would pay for the Ethernet and OC-n high capacity data services of the petitioning carriers are no longer price regulated. We continue to pursue commercial arrangements with the ILECs for these services on acceptable terms and conditions.
Quarterly and Other Financial Trends
Although our business is not inherently seasonal in nature, historically our revenue and expense in the first quarter of the year has been impacted by some seasonal factors that may cause fluctuations from the prior quarter. First quarter installations and the associated revenue may be impacted by the slowing of our customers’ purchasing activities at the end of the fourth quarter. Our expenses also are impacted in the first quarter by the resetting of payroll taxes and other employee-related cost increases.
Because we generally do not recognize revenue subject to billing disputes until the dispute is resolved, the timing of filing disputes and dispute resolutions may positively or negatively affect our revenue in a particular quarter. The timing of disconnections may also impact our results in a particular quarter, with disconnections early in the quarter generally having a greater impact. The timing of capital and other expenditures may affect our margins or cash flow. The convergence of any of these or other factors such as fluctuations in usage or pricing declines upon contract renewals in a particular quarter may result in our revenue growing more or less than previous trends, may impact our other financial results and may not be indicative of future financial performance.
We have undertaken a number of initiatives to increase revenue growth, margins and cash flows, including expansion of our sales and sales support staff and training and retention programs, revenue assurance and cost reduction measures such as network grooming and cost optimization intended to reduce the overall access costs paid to carriers, enhancing back office support systems to improve operating efficiencies and network investment initiatives to reduce the cost of equipment and increase overall capital efficiency. We increased our capital spending in 2010 to fund new service portfolio enhancements, incremental success-based expenditures related to specific sales opportunities, including sales to wireless providers, and corporate and IT initiatives that support our service evolution, enable our customer experience and drive increased scale and efficiency. We cannot predict the exact timing of revenue recognition of these sales and whether these and other initiatives will be sufficient to maintain our current financial performance or increase revenue growth, margins and cash flows.
37
Due to the quality of our customer base, successful collection efforts, internal controls, bad debt recoveries, and our revenue recognition policies, including recognition of contract termination charges upon cash receipt, our bad debt expense remained at less than 1% of our total revenue for 2010, comparable to 2009. We cannot assure that we will be able to maintain bad debt expense at this low level over the long term, particularly if economic conditions worsen.
Critical Accounting Policies and Estimates
We prepare our financial statements in accordance with accounting principles generally accepted in the United States, which require us to make estimates and assumptions that affect reported amounts and related disclosures. We consider an accounting estimate to be critical if:
| | • | | it requires assumptions to be made that were uncertain at the time the estimate was made; and |
| | • | | changes in the estimate or different estimates that could have been selected could have a material impact on our consolidated results of operations or financial condition. |
Goodwill
We perform impairment tests at least annually on all goodwill and indefinite-lived intangible assets as required by relevant accounting standards, which require goodwill to be assigned to a reporting unit and tested using a consistent measurement date. For purposes of testing goodwill for impairment, our goodwill has been assigned to our one consolidated reporting unit and our test is performed in the fourth quarter of each year or more frequently if impairment indicators arise.
Goodwill is reviewed for impairment utilizing a two-step process. The first step is to identify if a potential impairment exists by comparing the fair value of the reporting unit to its carrying amount. If the fair value of the reporting unit exceeds its carrying amount, goodwill is not considered to have a potential impairment and the second step of the impairment test is not necessary. However, if a potential impairment exists, the fair value of the reporting unit is compared to the fair value of its assets and liabilities, excluding goodwill, to estimate the implied value of the reporting unit’s goodwill. If an impairment charge is deemed necessary, a charge is recognized for any excess of the carrying amount of the reporting unit’s goodwill over the implied fair value.
Considerable management judgment is necessary to estimate the fair value of our reporting unit and goodwill. We determine the fair value of our reporting unit based on the income approach, using a discounted projection of future cash flows which includes a five-year annual discounted cash flow (“DCF”) analysis with a terminal value to value the long-term future cash flows. This DCF analysis was used solely for the purpose of evaluating our goodwill for impairment and should not be interpreted as our prediction of future performance. The assumptions used in our DCF analysis are consistent with the assumptions we believe hypothetical marketplace participants would use. With respect to our DCF analysis, the timing and amount of future cash flows requires critical management assumptions, including estimates of expected future revenue growth rates, Modified EBITDA contributions, expected capital expenditures and an appropriate discount rate and terminal value. Our growth rate assumptions for this purpose are based on product and technology investments, fiber network expansions, changes in our underlying cost structure, market trends and historical results, among other items. In determining the fair value of our reporting unit for purposes of our 2010 assessment, we considered our five-year historical cumulative annualized growth rates for unlevered free cash flow (Modified EBITDA less capital expenditures) of 9.8%, excluding integration and branding costs that are not expected to recur. We applied a terminal multiple to estimated year five Modified EBITDA based on our long term cash flow growth expectations, which considers our expected operating performance and industry performance, to determine terminal value. The terminal value represents a significant portion of the resulting fair value of our reporting unit and therefore we compared the results to a growth model that estimates the value of future cash flow to perpetuity to assess the reasonableness. Projected cash flows were discounted to their present value using a discount rate of 10%, which represents a market-based participant weighted average cost of capital and reflects the rate of return an outside investor would expect to earn. To corroborate the reasonableness of the resulting fair value of our reporting unit, we also considered our market capitalization at the date the test was performed.
38
The determination of fair value requires significant estimates and assumptions, which are subject to inherent uncertainties. Although our cash flow projections over the most recent three-year period have been reasonable compared to our actual results, actual results may vary significantly from estimates. Our methodology for our 2010 assessment was consistent with the methodology used in the prior year period. Our 2010 assessment resulted in the determination that the carrying value of our reporting unit does not exceed its fair value.
To assess the sensitivity of the assumptions used in our DCF analysis, we applied reductions of 20% to our critical estimates to test for impairment which we believe represents a reasonable change to our assumptions. When we applied a hypothetical two percentage point increase in the weighted average cost of capital, the resultant reduction in our fair value calculation would not have resulted in an impairment under our 2010 assessment. To assess the sensitivity of our future cash flow estimates including terminal value used to derive the reporting unit’s fair value, we applied a hypothetical reduction of 20% to the estimated fair value of our reporting unit. The resultant reduction in fair value would not have resulted in an impairment under our 2010 assessment. We are not aware of any reasonably likely changes in our assumptions that would result in an impairment.
Impairment of Long-lived Assets
We periodically assess our ability to recover the carrying amount of property, plant and equipment and intangible assets, which requires an assessment of risk associated with our ability to generate sufficient future cash flows from these assets. If we determine that the future cash flows expected to be generated by a particular asset do not exceed the carrying value of that asset, we recognize a charge to write down the value of the asset to its fair value.
Estimates are used to determine whether sufficient cash flows will be generated to recover the carrying amount of our investments in long term assets. The estimates are made for each of our seven regions. Expected future cash flows are based on historical experience and management’s expectations of future performance. The assumptions used represent our best estimates including market growth rates, future pricing, market acceptance of our products and services and the future capital investments necessary.
Our 2010 assessment did not result in any impairment charges. If we were to change assumptions in such a way as to reduce the amount of future cash flows expected from any particular asset, in some cases we could be required to recognize asset impairment losses in our results of operations. A hypothetical 20% reduction in our projected Modified EBITDA for each region would not have resulted in an impairment as of December 31, 2010.
Regulatory and Other Contingencies
We are subject to significant government and jurisdictional regulation, some of which is uncertain due to legal challenges of existing rules. Such regulation is subject to differing interpretations and inconsistent application, and has historically resulted in disputes with other carriers, regulatory authorities, and municipalities regarding the classification of traffic, rates, minutes of use and right-of-way fees.
Management estimates and accrues for its estimate of probable losses associated with regulatory and other contingencies. These estimates are based on assumptions and other considerations including expectations regarding regulatory rulings, historic experience and ongoing negotiations. We evaluate these reserves on an ongoing basis and make adjustments as necessary. A 10% unfavorable or favorable change in the estimates used for such reserves would have resulted in approximately a $14.8 million decrease or $11.0 million increase, respectively, in net income for the year ended December 31, 2010.
Deferred Tax Accounting
We have had a history of NOLs for tax purposes. When it is more likely than not that all or some portion of deferred tax assets may not be realized, we establish a valuation allowance for the amount that may not be realized. Each quarter we evaluate the need to retain all or a portion of the valuation allowance on our net
39
deferred tax assets. During 2010, we determined that it is more likely than not that the vast majority of our deferred tax assets, including NOLs, will be realized, and as a result reversed $227.3 million of the valuation allowance. In making this determination, we analyzed, among other things, our recent history of earnings, cumulative earnings for the last 12 quarters, and forecasts of future earnings. The reversal of the valuation allowance recorded during 2010 resulted in an income tax benefit of $227.3 million, or $1.50 per basic share and $1.46 per diluted share, for the year ended December 31, 2010, and an increase in the current and non-current deferred tax assets on the consolidated balance sheet as of December 30, 2010. We expect our 2011 effective tax rate to be approximately 45%. Beginning in the first quarter of 2011, we anticipate that net income and earnings per share will be impacted by greater income tax expense, which may fluctuate from period to period.
We continue to maintain a valuation allowance against certain deferred tax assets totaling $18.0 million. We believe it is more likely than not that deferred tax assets resulting from NOLs subject to certain limitations and those that require future income of special character will not be realized. Additionally, we have certain deferred tax assets attributable to stock option deductions for which the related valuation allowance cannot be reversed due to relevant accounting guidance concerning tax benefits related to the exercise of non-qualified stock options prior to the adoption of such accounting guidance.
As of December 31, 2010, we had NOLs for federal income tax purposes of $1.1 billion. These NOLs, if not utilized to reduce taxable income in future periods, generally expire in various amounts beginning in 2020 and ending in 2026. We utilized NOLs to offset income tax obligations in each of the years ended December 31, 2009, 2008 and 2007. The Tax Reform Act of 1986 contains provisions that limit the utilization of NOLs if there has been an “ownership change” as described in Section 382 of the Internal Revenue Code. In general, this would occur if certain ownership changes related to our stock that is held by 5% or greater stockholders, exceeds 50 percent measured over a rolling three year period. If we experience such an ownership change, our utilization of NOLs to reduce future federal income tax obligations could be limited. In order to reduce the likelihood of an ownership change as defined by Section 382, we adopted the Rights Plan in January 2009 that was approved by our stockholders in June 2009 (see “Risk Factors—Our ability to use net operating loss carryforwards to reduce future tax payments could be negatively impacted if there is an “ownership change” as defined under Section 382 of the Internal Revenue Code and our Section 382 stockholder rights plan, which is intended to help preserve our NOLs, may not be effective”). Although the purpose of the Rights Plan is to deter stockholders from acquiring shares that would trigger an ownership change under Section 382, the Rights Plan does not prevent an ownership change from occurring. An ownership change could result from a stockholder selling a large block of shares, which the Rights Plan does not prevent or deter. The Rights Plan will terminate upon the earliest of (1) our Board of Directors’ determination that the Rights Plan is no longer needed for the preservation of NOLs due to the implementation of legislative changes, or any other reason; (2) January 20, 2012 or (3) certain other events described in the Rights Plan, including our Board of Directors’ determination that termination is in our best interest. Our Board of Directors could determine to extend the term of the Rights Plan upon the expiration of its current term or adopt another Rights Plan, subject to subsequent ratification by our stockholders, if it determines that our substantial NOLs are at risk of limitation under Section 382 or that such action otherwise is in the best interests of our stockholders.
Revenue and Receivables
Our services are complex and our tariffs and contracts may be correspondingly complex and subject to interpretations that cause disputes regarding amounts billed. In addition, changes in and interpretations of regulatory rulings create uncertainty and may cause disputes over minutes of use, rates or other provisions of our service. As such, we defer recognition of revenue until cash is collected on certain components of revenue, such as contract termination charges. We also reserve for customer billing disputes until they are resolved even if the customer has already paid the disputed amount.
We estimate the ability to collect our receivables by performing ongoing credit evaluations of our customers’ financial condition, and provide an allowance for doubtful accounts based on expected collection of our receivables. Our estimates are based on assumptions and other considerations, including payment history,
40
credit ratings, customer financial performance, industry financial performance and aging analysis. As a result of an improvement in our collection activities, our overall receivables management and an improving economy, our allowance for doubtful accounts as a percentage of gross receivables has improved from 12% as of December 31, 2008 to 11% at December 31, 2009 to 9% at December 31, 2010. A 10% change in the estimates used for our allowance for doubtful accounts would not have resulted in a material change in net income for the year ended December 31, 2010.
Stock-Based Compensation
We recognize the cost of share-based payments as compensation expense over the requisite service period, which is generally the vesting period of the award. The fair value of restricted stock awards and restricted stock units granted is determined based on the market price of our common stock at the date of grant. We use the Black-Scholes pricing model to estimate the fair value of options as of the grant date. The Black-Scholes model by its design is dependent upon key data inputs estimated by management such as expected volatility, expected term and expected dividend yield. See Note 1 and Note 8 to the consolidated financial statements for a further discussion of our stock-based compensation plans.
Other Estimates
There are other accounting estimates reflected in our consolidated financial statements, including contingent loss accruals, compensation accruals, unpaid claims for medical and other self-insured plans and property and other tax exposures that require judgment but are not deemed critical in nature.
We believe that the current assumptions and other considerations used to estimate amounts reflected in the consolidated financial statements are appropriate. However, if actual experience differs from the assumptions and other considerations used in estimating amounts reflected in the consolidated financial statements, the resulting changes could have a material adverse effect on our results of operations and, in certain situations, on our financial condition.
41
Results of Operations
The following table sets forth certain data from our consolidated financial statements presented in thousands of dollars and expressed as a percentage of total revenue. This table should be read together with our audited consolidated financial statements, including the notes thereto, appearing elsewhere in this report:
| | | | | | | | | | | | | | | | | | | | | | | | |
| | | Years Ended December 31, | |
| | | 2010 | | | 2009 | | | 2008 | |
| | | (amounts in thousands, except per share amounts) | |
Statements of Operations Data: | | | | | | | | | | | | | | | | | | | | | | | | |
Revenue: | | | | | | | | | | | | | | | | | | | | | | | | |
Data and Internet services | | $ | 547,218 | | | | 43 | % | | $ | 472,647 | | | | 39 | % | | $ | 399,928 | | | | 35 | % |
Network services | | | 359,169 | | | | 28 | | | | 370,859 | | | | 31 | | | | 387,339 | | | | 33 | |
Voice services | | | 332,870 | | | | 26 | | | | 333,274 | | | | 27 | | | | 334,692 | | | | 29 | |
Intercarrier compensation | | | 33,914 | | | | 3 | | | | 34,610 | | | | 3 | | | | 37,060 | | | | 3 | |
| | | | | | | | | | | | | | | | | | | | | | | | |
Total revenue | | | 1,273,171 | | | | 100 | | | | 1,211,390 | | | | 100 | | | | 1,159,019 | | | | 100 | |
| | | | | | | | | | | | | | | | | | | | | | | | |
Costs and expenses: | | | | | | | | | | | | | | | | | | | | | | | | |
Operating (exclusive of depreciation, amortization, and accretion shown separately below) (1) | | | 528,965 | | | | 42 | | | | 503,960 | | | | 42 | | | | 491,375 | | | | 42 | |
Selling, general, and administrative (1) | | | 308,470 | | | | 24 | | | | 297,290 | | | | 25 | | | | 291,985 | | | | 25 | |
Depreciation, amortization, and accretion | | | 289,564 | | | | 23 | | | | 296,167 | | | | 24 | | | | 285,783 | | | | 25 | |
| | | | | | | | | | | | | | | | | | | | | | | | |
Total costs and expenses | | | 1,126,999 | | | | 89 | | | | 1,097,417 | | | | 91 | | | | 1,069,143 | | | | 92 | |
| | | | | | | | | | | | | | | | | | | | | | | | |
Operating income | | | 146,172 | | | | 11 | | | | 113,973 | | | | 9 | | | | 89,876 | | | | 8 | |
Interest expense | | | (80,952 | ) | | | (6 | ) | | | (84,001 | ) | | | (7 | ) | | | (93,336 | ) | | | (8 | ) |
Debt extinguishment costs | | | (17,070 | ) | | | (1 | ) | | | — | | | | — | | | | — | | | | — | |
Interest income | | | 608 | | | | — | | | | 360 | | | | — | | | | 6,308 | | | | 1 | |
Other income (loss), net | | | 825 | | | | — | | | | — | | | | — | | | | (7,767 | ) | | | (1 | ) |
| | | | | | | | | | | | | | | | | | | | | | | | |
Income (loss) before income taxes | | | 49,583 | | | | 4 | | | | 30,332 | | | | 2 | | | | (4,919 | ) | | | — | |
Income tax (benefit) expense | | | (221,851 | ) | | | (17 | ) | | | 2,746 | | | | — | | | | 2,347 | | | | — | |
| | | | | | | | | | | | | | | | | | | | | | | | |
Net income (loss) | | $ | 271,434 | | | | 21 | % | | $ | 27,586 | | | | 2 | % | | $ | (7,266 | ) | | | (1 | )% |
| | | | | | | | | | | | | | | | | | | | | | | | |
Basic income (loss) per common share | | $ | 1.80 | | | | | | | $ | 0.19 | | | | | | | $ | (0.05 | ) | | | | |
| | | | | | | | | | | | | | | | | | | | | | | | |
Diluted income (loss) per common share | | $ | 1.72 | | | | | | | $ | 0.18 | | | | | | | $ | (0.05 | ) | | | | |
| | | | | | | | | | | | | | | | | | | | | | | | |
Weighted average shares outstanding, basic | | | 149,156 | | | | | | | | 148,087 | | | | | | | | 147,251 | | | | | |
| | | | | | | | | | | | | | | | | | | | | | | | |
Weighted average shares outstanding, diluted | | | 171,456 | | | | | | | | 149,852 | | | | | | | | 147,251 | | | | | |
| | | | | | | | | | | | | | | | | | | | | | | | |
Modified EBITDA and Modified EBITDA margin (2)(3) | | $ | 463,568 | | | | 36 | % | | $ | 436,658 | | | | 36 | % | | $ | 399,016 | | | | 34 | % |
Net cash provided by operating activities | | | 385,752 | | | | | | | | 390,478 | | | | | | | | 305,520 | | | | | |
Net cash used in investing activities | | | (418,049 | ) | | | | | | | (290,589 | ) | | | | | | | (273,759 | ) | | | | |
Net cash used in financing activities | | | (56,688 | ) | | | | | | | (6,158 | ) | | | | | | | (1,116 | ) | | | | |
| (1) | Includes the following non-cash stock-based employee compensation expense: |
| | | | | | | | | | | | |
| | | Years Ended December 31, | |
| | | 2010 | | | 2009 | | | 2008 | |
| | | (amounts in thousands) | |
Operating | | $ | 3,261 | | | $ | 3,654 | | | $ | 3,758 | |
Selling, general, and administrative | | | 24,571 | | | | 22,864 | | | | 19,599 | |
| (2) | See Note 6 and 7 in “Item 6. Selected Financial Data” for a definition of “Modified EBITDA” and for reconciliations of Modified EBITDA to net income (loss), the most comparable GAAP measure for operating performance, and Modified EBITDA, as a measure of liquidity, to net cash provided by operating activities. |
| (3) | Modified EBITDA margin represents Modified EBITDA as a percentage of revenue. |
42
Year Ended December 31, 2010 Compared to Year Ended December 31, 2009
Revenue. Total revenue increased $61.8 million, or 5%, to $1.27 billion for the year ended December 31, 2010 from $1.21 billion in 2009. The primary driver of this growth in revenue was increased data and Internet services revenue from installed services to enterprise customers.
Data and Internet services revenue increased $74.6 million, or 16%, to $547.2 million for the year ended December 31, 2010 from $472.6 million in 2009. The increase in data and Internet services revenue primarily resulted from installed Ethernet and IP-based product sales to enterprise customers slightly offset by disconnections.
Revenue from network services decreased $11.7 million, or 3%, to $359.2 million for the year ended December 31, 2010 from $370.9 million in 2009. The decrease in network services revenue was primarily from disconnections and repricing of renewing customer contracts partially offset by growth primarily in high capacity and collocation services revenue as well as increased installations of transport services to wireless providers.
Voice services revenue decreased $0.4 million, to $332.9 million for the year ended December 31, 2010 from $333.3 million in 2009. The decrease in voice services revenue resulted primarily from service disconnections including a reduction in usage-based services offset by growth in new installed sales and certain taxes and fees remitted to government authorities that we classify on a gross versus net basis in revenue and expense. Revenue based on the minutes of service used by customers included in voice services was 4% of our total revenue for each of the years ended December 31, 2010 and 2009.
Intercarrier compensation revenue, including switched access and reciprocal compensation, decreased $0.7 million, or 2%, to $33.9 million for the year ended December 31, 2010 from $34.6 million in 2009. The decrease was primarily due to fluctuations in dispute settlements and a decline in minutes of use terminated on our network.
Operating Expenses. Our operating expenses consist of costs directly related to the operation and maintenance of our network and the provisioning of our services. These costs, which are net of costs capitalized for labor and overhead on capital projects, include the salaries and related expenses of customer care, provisioning, network maintenance, technical field and network operations and engineering personnel, costs to repair and maintain our network, and costs paid to other carriers for access to their facilities, interconnection, and facilities leased and associated utilities. We carry a significant portion of our traffic on our own fiber infrastructure, which enhances our ability to minimize and control access costs, which are the costs to purchase network services from other carriers. Operating expenses increased $25.0 million, or 5%, to $529.0 million for the year ended December 31, 2010 from $504.0 million in 2009. The increase in operating expenses is primarily due to higher network access costs associated with higher revenue, increased field related and employee costs, and an increase in certain taxes and fees partially offset by network cost efficiencies. Higher field related costs primarily resulted from maintenance, lease costs, and utilities. Operating expenses represented 42% of total revenue for each of the years ended December 31, 2010 and 2009.
Selling, General, and Administrative Expenses. Selling, general, and administrative expenses consist of salaries and related costs for employees and other expenses related to sales and marketing, bad debt, IT, billing, regulatory, administrative, and legal functions. Selling, general, and administrative expenses increased $11.2 million, or 4%, to $308.5 million for the year ended December 31, 2010 from $297.3 million in 2009. The increase was primarily due to higher employee costs partially offset by lower bad debt expense. Higher employee costs primarily resulted from an expansion of our sales force, annual merit-based salary increases, and higher non-cash stock-based compensation. Selling, general, and administrative expenses represented 24% and 25% of total revenue for the years ended December 31, 2010 and 2009, respectively.
43
Depreciation, Amortization, and Accretion Expense. Depreciation, amortization, and accretion expense decreased $6.6 million, or 2%, to $289.6 million for the year ended December 31, 2010 from $296.2 million in 2009. The decrease was primarily attributable to fully depreciated and retired assets partially offset by additions to property, plant and equipment in 2010 and 2009.
Interest Expense.Interest expense decreased $3.0 million, or 4%, to $81.0 million for the year ended December 31, 2010 from $84.0 million in 2009. The decrease is primarily due to lower effective interest rates on the variable rate Term Loan and as a result of a debt refinancing of senior notes that we completed in the first quarter of 2010 partially offset by an increase in non-cash interest expense associated with our 2 3/8% Convertible Senior Debentures due 2026 (“Convertible Debentures”). We expect interest expense to increase approximately $7 million for the year ended December 31, 2011 primarily as a result of the amendment and restatement of our 2006 Credit Agreement (see “Liquidity and Capital Resources”).
Debt Extinguishment Costs. Debt extinguishment costs were $17.1 million for the year ended December 31, 2010, which resulted from the early retirement of $400 million principal amount of our 9 1/4% Senior Notes due February 2014 (the “2014 Notes”) and primarily consisted of $13.7 million in cash paid for call premiums and $3.6 million in non-cash write offs of deferred debt issuance costs.
Other Income. During the year ended December 31, 2010, we recognized a gain of $0.8 million related to proceeds received upon liquidation of previously impaired commercial paper. There was no such gain during the year ended December 31, 2009. See Note 2 to our consolidated financial statements.
Income Tax (Benefit) Expense. Income tax benefit was $221.9 million for the year ended December 31, 2010 compared to income tax expense of $2.7 million for the comparable period in 2009. This change primarily related to a $227.3 million non-cash income tax benefit recognized during the three months ended June 30, 2010 resulting from the recognition of the value of deferred tax assets that we believe are realizable (see Note 7 to the consolidated financial statements). Although we did not recognize significant federal income tax expense for the remainder of 2010, we expect our income tax expense to increase beginning in 2011 and may fluctuate from period to period (see “Critical Accounting Policies and Estimates-Deferred Tax Accounting”). We expect our 2011 effective tax rate to be approximately 45%.
Net Income and Modified EBITDA. Net income was $271.4 million for the year ended December 31, 2010 compared to $27.6 million in 2009. The increase in net income of $243.8 million resulted from the non-cash income tax benefit of $227.3 million, an increase in Modified EBITDA, a decrease in depreciation, amortization and accretion, and lower interest expense partially offset by $17.1 million in debt extinguishment costs as described above. Modified EBITDA increased $26.9 million to $463.6 million, or 36% of total revenue for the year ended December 31, 2010, from $436.7 million, or 36% of total revenue in 2009. The increase in Modified EBITDA was primarily the result of the contribution from revenue growth, network cost efficiencies, and lower bad debt expense, partially offset by an increase in employee and field related costs. While we anticipate achieving additional efficiencies in our business, we expect any significant future improvement in our Modified EBITDA margin will result from revenue growth rather than cost reductions, given the substantial efficiencies we accomplished over the last several years. For the years ended December 31, 2010 and 2009, Modified EBITDA has been sufficient to cover our capital expenditures and service our debt, and we expect to generate sufficient Modified EBITDA in the foreseeable future to cover our expected capital expenditures and interest expense. See “Item 6. Selected Financial Data” Note 6 for a definition of Modified EBITDA and Note 7 for reconciliations of Modified EBITDA to net income (loss), the most comparable GAAP measure for operating performance, and Modified EBITDA, as a measure of liquidity, to net cash provided by operations.
Year Ended December 31, 2009 Compared to Year Ended December 31, 2008
Revenue. Total revenue increased $52.4 million, or 5%, to $1.21 billion for the year ended December 31, 2009 from $1.16 billion in 2008. Contributing to the growth in revenue was a net increase in installations of data and Internet services to enterprise customers.
44
Data and Internet services revenue increased $72.7 million, or 18%, to $472.6 million for the year ended December 31, 2009 from $399.9 million in 2008. The increase in data and Internet services revenue primarily resulted from growth in Ethernet and IP-based product sales to enterprise customers partially offset by service disconnections.
Revenue from network services decreased $16.5 million, or 4%, to $370.9 million for the year ended December 31, 2009 from $387.3 million in 2008. The decrease in network services revenue was primarily from repricing of some renewed customer contracts and disconnections predominantly from carrier customers. These decreases were partially offset by increases in collocation and high capacity services revenue.
Voice services revenue decreased $1.4 million, to $333.3 million for the year ended December 31, 2009 from $334.7 million in 2008. The decrease in voice services revenue resulted primarily from customer disconnections particularly in our acquired customer base offset by growth in bundled and other local product sales. Revenue based on the minutes of service used by a customer included in voice services was 4% of our total revenue for each of the years ended December 31, 2009 and 2008.
Intercarrier compensation revenue, including switched access and reciprocal compensation, decreased $2.5 million, or 7%, to $34.6 million for the year ended December 31, 2009 from $37.1 million in 2008. The decrease was primarily due to rate reductions and a decline in minutes of use terminated on our network partially offset by an increase in revenue due to favorable settlements.
Operating Expenses. Operating expenses increased $12.6 million, or 3%, to $504.0 million for the year ended December 31, 2009 from $491.4 million in 2008. The increase in operating expenses is primarily due to higher network access costs associated with higher revenue, higher employee expense related to annual merit-based salary increases and a decrease in favorable cost settlements partially offset by network optimization and other cost efficiencies. Operating expenses represented 42% of total revenue for the years ended December 31, 2009 and 2008.
Selling, General, and Administrative Expenses. Selling, general, and administrative expenses increased $5.3 million, or 2%, to $297.3 million for the year ended December 31, 2009 from $292.0 million in 2008. The increase is primarily due to higher transactional tax settlements in the prior year that were favorable and branding expense associated with our name change in the prior year that did not recur, higher property taxes and employee costs in the current year partially offset by lower bad debt expense. Higher employee costs resulted primarily from non-cash stock-based compensation and annual merit-based salary increases. Selling, general, and administrative expenses represented 25% of total revenue for the years ended December 31, 2009 and 2008.
Depreciation, Amortization, and Accretion Expense. Depreciation, amortization, and accretion expense increased $10.4 million, or 4%, to $296.2 million for the year ended December 31, 2009 from $285.8 million in 2008. The increase was primarily attributable to additions to property, plant and equipment made during 2009 and 2008.
Interest Expense.Interest expense decreased $9.3 million, or 10%, to $84.0 million for the year ended December 31, 2009 from $93.3 million in 2008. The decrease is primarily due to lower interest rates on the variable rate Term Loan partially offset by an increase in non-cash interest expense associated with our Convertible Debentures.
Interest Income. Interest income decreased $5.9 million, or 94%, to $0.4 million for the year ended December 31, 2009 from $6.3 million in 2008. The decrease is due to a decline in interest rates earned on investments. As of December 31, 2009, our investments included in cash, cash equivalents and investments were comprised of U.S. treasury money market funds, treasury securities and corporate debt securities guaranteed by the federal government’s Temporary Liquidity Guarantee Program.
45
Other Loss. During the year ended December 31, 2008, we recognized a $7.8 million loss resulting from an impairment of commercial paper investments that we hold past the maturity date and upon liquidation of one of those securities. There was no such loss during the year ended December 31, 2009. See Note 2 to our consolidated financial statements.
Income Tax Expense. Income tax expense was $2.7 million for the year ended December 31, 2009 compared to $2.3 million for the comparable period in 2008.
Net Income (Loss) and Modified EBITDA. Net income was $27.6 million, or $0.19 earnings per share, for the year ended December 31, 2009 compared to a net loss of $7.3 million, or $0.05 loss per share, in 2008. The increase of $34.9 million was primarily the result of the contribution from revenue growth partially offset by an increase in operating, selling, general and administrative and depreciation expenses, and a $7.8 million other loss in 2008 as described above that did not recur. Modified EBITDA increased $37.6 million to $436.7 million, or 36% of total revenue for the year ended December 31, 2009, from $399.0 million, or 34% of total revenue from the comparable period in 2008. The increase in Modified EBITDA and Modified EBITDA margin was primarily the result of the contribution from revenue growth and cost efficiencies from network and other optimization efforts partially offset by cost settlements in the prior year that did not recur and increases in employee costs.
Liquidity and Capital Resources
Historically, we have generated cash flow from operations consisting primarily of payments received from customers for the provision of business communications services offset by payments to other telecommunications carriers, payments to employees, and payments for interest and other operating, selling, general, and administrative costs. We have also generated cash from debt and equity financing activities and have used funds to service or repay our debt obligations, make capital expenditures to expand our network and fund acquisitions. In 2010, we also used cash to repurchase our common stock and may do so in the future.
At December 31, 2010, we had approximately $1.3 billion of total debt and capital lease obligations and $475.6 million of cash, cash equivalents and short-term investments compared to approximately $1.3 billion of total debt and capital lease obligations and $470.8 million of cash, cash equivalents and short-term investments at December 31, 2009. Net debt of $869.9 million (defined as total debt and capital lease obligations less cash, cash equivalents and short-term investments) increased $32.7 million primarily due to a net increase in our total debt resulting from issuance of $430 million principal amount of 8% Senior Notes due 2018 (“2018 Notes”) and retirement of the 2014 Notes, accretion of the discount on our Convertible Debentures, capital expenditures and repurchases of our common stock, partially offset by cash provided by operating activities resulting from higher Modified EBITDA.
Working capital, defined as current assets less current liabilities, was $314.8 million as of December 31, 2010, an increase of $18.0 million from December 31, 2009. Our working capital ratio, defined as current assets divided by current liabilities, was 2.04 as of December 31, 2010 as compared to 2.01 as of December 31, 2009. The increase in working capital is primarily a result of recognition of the value of deferred tax assets and cash provided by operating activities resulting from higher Modified EBITDA.
46
Cash Flow Activity
Cash and cash equivalents were $356.9 million and $445.9 million as of December 31, 2010 and 2009, respectively. In addition, we had investments of $118.7 and $24.9 million as of December 31, 2010 and 2009, respectively, which were short-term in nature and generally available to fund our operations. The change in cash and cash equivalents during the periods presented were as follows:
| | | | | | | | | | | | |
| | | Years ended December 31, | |
| | | 2010 | | | 2009 | | | 2008 | |
| | | (amounts in thousands) | |
Cash provided by operating activities | | $ | 385,752 | | | $ | 390,478 | | | $ | 305,520 | |
Cash used in investing activities | | | (418,049 | ) | | | (290,589 | ) | | | (273,759 | ) |
Cash used in financing activities | | | (56,688 | ) | | | (6,158 | ) | | | (1,116 | ) |
| | | | | | | | | | | | |
(Decrease) increase in cash and cash equivalents | | $ | (88,985 | ) | | $ | 93,731 | | | $ | 30,645 | |
| | | | | | | | | | | | |
Operations.Cash provided by operating activities was $385.8 million for the year ended December 31, 2010 compared to $390.5 million in 2009. This decrease in cash provided by operating activities primarily related to changes in working capital, which were largely due to the timing of payments to vendors and employees and collection of receivables, and were somewhat offset by higher Modified EBITDA.
Cash provided by operating activities was $390.5 million for the year ended December 31, 2009 compared to $305.5 million in 2008. This increase in cash provided by operating activities primarily related to higher Modified EBITDA, lower interest payments as a result of lower average interest rates on the Term Loan and changes in working capital, primarily due to the timing of payments to vendors. The changes in components of working capital, excluding cash, are generally subject to fluctuations based on the timing of cash transactions related to collection of receivables and payments to vendors and employees and interest payments, among other items.
Investing. Cash used in investing activities was $418.0 million in 2010 compared to $290.6 million in 2009. The change is primarily a result of purchases of investments in 2010 and capital expenditures. Our balances of cash, cash equivalents and investments fluctuate over time based on our cash requirements and market interest yields. Cash used for capital expenditures for the year ended December 31, 2010 was $321.8 million, the majority of which was used to reach new customer buildings and for longer term strategic investments including new service enhancements and corporate and IT initiatives, compared to $267.0 million for the year ended December 31, 2009.
Cash used in investing activities was $290.6 million in 2009 compared to $273.8 million in 2008. The change is primarily a result of purchases of investments somewhat offset by decreased cash used for capital expenditures resulting from integration and branding capital expenditures of $10.6 million in 2008 that did not recur in 2009. Cash used for capital expenditures for the year ended December 31, 2009 was $267.0 million, the majority of which was used to expand our network in our existing markets and to reach new customer buildings, compared to $274.5 million for the year ended December 31, 2008.
Financing. Cash used in financing activities was $56.7 million for the year ended December 31, 2010, primarily consisting of repurchases of $49.9 million of our common stock and payments of $7.2 million on the Term Loan and capital lease obligations. Cash used in financing activities was $6.2 million for the year ended December 31, 2009, primarily for payments on the Term Loan and capital lease obligations, somewhat offset by proceeds from the exercise of stock options. Cash used in financing activities was $1.1 million for the year ended December 31, 2008, primarily for payments on the Term Loan and capital lease obligations, somewhat offset by proceeds from the exercise of stock options and sales of our common stock under our employee stock purchase plan.
47
In March 2010, we completed a private offering of the 2018 Notes at an offering price of 99.284% of the principal amount. The purpose of the 2018 Notes offering was to extend our debt maturities and reduce interest rates. The net proceeds from the offering were used to fund extinguishment of the 2014 Notes, of which $366.5 million principal amount were purchased at a price of 103.45% of the principal amount in a concurrent tender offer. Notes representing the remaining $33.5 million principal amount of the 2014 Notes were either tendered or redeemed at a price of 103.083% of the principal amount. For a description of the significant terms of the 2018 Notes and the exchange offer that was completed to allow holders of the 2018 Notes to exchange their unregistered notes for registered notes with identical terms, see Note 4 to the consolidated financial statements.
In December 2010, we amended and restated our 2006 Credit Agreement to extend $474.1 million of the total $577.5 million outstanding principal amount of our Term Loan at that date from January 2013 to December 2016 (the “extended tranche”). The January 2013 maturity of the remaining $103.4 million of outstanding principal was unchanged (the “January 2013 tranche”). The term of our undrawn Revolver was extended from October 2011 to December 2014. The interest rates on the two Term Loan tranches and the Revolver, if drawn, are as follows:
| | • | | Interest on the extended tranche of the Term Loan is computed based on a specified Eurodollar rate plus 3.25% and will be reset periodically and payable at least quarterly. |
| | • | | Interest on the January 2013 tranche of the Term Loan remains at a specified Eurodollar rate plus 1.75%-2.0%, of which 1.75% was in effect at December 31, 2010, and will be reset periodically and payable at least quarterly. |
| | • | | Interest on outstanding amounts of the Revolver, if any, will be computed based on a specified Eurodollar rate plus 2.5% to 3.5% and will be reset periodically and payable at least quarterly. |
As of December 31, 2010, we had the following instruments and principal amounts outstanding:
| | | | | | | | |
Instrument | | Principal amount
outstanding | | | Aggregate annual
estimated interest
payments | |
| | | (amounts in thousands) | |
8% Senior Notes due 2018 | | $ | 430,000 | | | $ | 34,400 | |
2 3/8% Convertible Senior Debentures due 2026 | | | 373,744 | | | | 8,876 | |
Term Loan, Eurodollar rate + 3.25% due 2016* | | | 472,870 | | | | 19,234 | |
Term Loan, Eurodollar rate + 1.75%-2.0% due 2013** | | | 103,130 | | | | 2,626 | |
Undrawn $80 million Revolver expires 2014 | | | — | | | | — | |
| * | The aggregate annual interest payments are based on the weighted average effective interest rate, including the interest rate swap described below, of 4.07% at December 31, 2010. |
| ** | As of December 31, 2010, a spread of 1.75% was in effect. The aggregate annual interest payments are based on the weighted average effective interest rate, including the interest rate swap described below, of 2.55% at December 31, 2010. |
On April 30, 2008, we entered into a two year interest rate swap with a 3.23% fixed interest rate that hedges the first $100 million principal amount of the initial $600 million principal amount of the variable rate Term Loan for a total rate, including the applicable spread, of 4.98% on a notional amount of $100 million. This interest rate swap expired on April 30, 2010. On November 5, 2008, we entered into a three year interest rate swap commencing November 28, 2008 with a 2.96% fixed interest rate that hedges the interest rate on the second $100 million of the Term Loan resulting in a total rate, based on a weighted average rate of the applicable spread for the January 2013 tranche and the extended tranche, of 5.94% on a notional amount of $100 million. We may consider additional interest rate swaps in order to reduce our exposure to variable rate debt when our current swap expires or otherwise, depending on market conditions.
48
The following diagram summarizes our corporate structure in relation to our outstanding indebtedness and credit facility as of December 31, 2010. The diagram does not depict all aspects of the ownership structure among the operating and holding entities, but rather summarizes the significant elements relative to our debt in order to provide a basic overview.

| a | TWTC and these subsidiaries guarantee the 2018 Notes on an unsecured basis and the Revolver and Term Loan on a secured basis. |
| b | The assets and equity interests of these subsidiaries are pledged to secure the Revolver and the Term Loan. |
| c | Approximately $472.9 million of the Term Loan matures in December 2016 and approximately $103.1 million matures in January 2013. |
Capital Expenditures and Requirements
Our total capital expenditures were $321.8 million for the year ended December 31, 2010 compared to $274.9 million in 2009. We incurred capital expenditures to develop and expand our network, services and systems. The increase in capital expenditures year over year was primarily due to ongoing success-based investments associated with higher sales, including certain large sales to the wireless sector, with the balance of the spending on service enhancements and corporate and technology initiatives. In each of the full years ended 2005 through 2010, over 75% of our total annual capital expenditures, excluding capital expenditures for integration and branding, were for success-based opportunities that were directly linked to new installations and capacity requirements. Success-based spending consists of short-to-medium length capital projects, in terms of anticipated time between capital spending to return on investment, driven by customer opportunities. This includes costs to connect to new customer locations with our fiber network and increase capacity to our network, IP backbone enhancements, collocation facility expansion and central office infrastructure to serve growing customer demands. These types of expenditures can fluctuate as our volume of service installations increases or decreases.
For 2011, we expect capital expenditures of approximately $310 million to $330 million (see “Capital Resources” below for discussion on anticipated funding sources), the majority of which we expect to be for new sales opportunities and the balance mainly for enhancements to our network capacity and service portfolio. Included in our expected capital expenditures are amounts we must spend to replace older network components, especially electronics, that we expect will continue to grow over time. We generally do not make long-term commitments for capital expenditures and have the ability to adjust our capital expenditures if our cash from operations is lower than anticipated or in response to lower demand.
49
Capital Resources
Based on current assumptions, we expect to generate sufficient cash from operations along with available cash on hand, including cash equivalents, investments, and borrowing capacity under our undrawn Revolver, to provide sufficient funds to meet our expected capital expenditure and liquidity needs to operate our business and service our debt for the foreseeable future. We believe that as of December 31, 2010, the absence of significant debt maturities until 2013, the extension of a significant portion of our Term Loan from January 2013 to December 2016, the replacement of our 2014 Notes with the 2018 Notes, the absence of financial maintenance covenants in our Term Loan, $356.9 million in cash and cash equivalents, $118.7 million in short-term investments, and an $80 million undrawn Revolver, provide us flexibility to make investments that we deem appropriate for ongoing operations. However, if our assumptions prove incorrect or if there are other factors that negatively affect our cash position such as material unanticipated losses, a significant reduction in demand for our products, an acceleration of customer disconnections or other adverse factors or if we make acquisitions or enter into joint ventures, we may need to seek additional sources of funds through financing or other means. There is no assurance that other sources of financing on acceptable terms will be available in the future.
Our ability to draw upon the available commitments under our Revolver is subject to compliance with all of the covenants contained in the credit agreement and our continued ability to make certain representations and warranties. In the case of the Revolver, the covenants include financial covenants, such as leverage and interest coverage ratios and limitations on capital expenditures that are primarily derived from Modified EBITDA and debt levels. We are required to comply with these ratios as a condition to any borrowing under the Revolver and for as long as any loans are outstanding under the Revolver. The representations and warranties include the absence of liens on our properties other than certain permitted liens, the absence of litigation or other developments that have or could reasonably be expected to have a material adverse effect on us and our subsidiaries as a whole, and continued effectiveness of the documents granting security for the loans.
A lack of revenue growth or an inability to control costs could negatively impact Modified EBITDA and cause our failure to meet the required minimum ratios under the Revolver if we have loans outstanding under the Revolver or wish to draw on it. Although we currently believe that we will continue to be in compliance with the covenants, various factors, including further deterioration of the economy, increased competition and pricing pressure and loss of revenue from significant customers, an acceleration of customer disconnections, a significant reduction in demand for our products without adequate reductions in capital expenditures and operating expenses, or an uninsured catastrophic loss of physical assets or other risk factors could cause us to fail to meet our covenants. If our revenue growth is not sufficient to sustain the Modified EBITDA performance required to meet the debt covenants described above, and we have loans outstanding under the Revolver or wish to draw on it, we would have to consider cost cutting or other measures to maintain required Modified EBITDA levels or to enhance liquidity.
The Revolver, Term Loan and 2018 Notes limit our ability to declare cash dividends, incur indebtedness, incur liens on property and undertake acquisitions, among other things. The Revolver, Term Loan and 2018 Notes also include cross default provisions under which we are deemed to be in default if we default under any of the other material outstanding obligations. If we are in default under any of the covenants under the Term Loan and Revolver, we also could potentially be subject to an acceleration of the repayment date of the Term Loan and the Revolver if we have borrowed under that facility. Covenant defaults under the Revolver and Term Loan agreements also may constitute an event of default under the indenture for the 2018 Notes. In addition, the lenders under the Revolver may require prepayment of outstanding revolving loans if a change of control and ratings decline occurs as defined in the Revolver agreement. We are required to offer to prepay the 2018 Notes and the Term Loans on an individual basis if a change of control and a debt rating decline occurs as defined in the indenture for the 2018 Notes and the Term Loan agreement. If we do not comply with the covenants under the Revolver, we would not be able to draw funds under the Revolver or the lenders could cancel the Revolver unless the respective lenders agree to further modify the covenants. Although we believe our relationships with our lenders are good, there is no assurance that we would be able to obtain the necessary covenant modifications on acceptable terms or at all. As of December 31, 2010, we were in compliance with all of our debt covenants. If
50
our plans or assumptions change or prove to be inaccurate, or the foregoing sources of funds prove to be insufficient to fund our growth and operations, or if we consummate acquisitions or joint ventures, we would be required to seek additional capital. Additional sources of financing may include public or private debt, equity financing by us or our subsidiaries, or other financing arrangements. There is no assurance that we would be able to obtain additional financing on terms acceptable to us or at all. Other risks, such as a rating downgrade on our debt, could further impact our potential access to financing sources.
Our revenue and costs are partially dependent upon factors that are outside our control, including, among other factors, general economic conditions, regulatory changes, adverse changes in customers’ financial condition, changes in technology, and increased competition. As a result, our actual revenue and costs may vary from expected amounts, possibly to a material degree, and these variations would likely affect the level of our future capital expenditures and expansion plans.
Possible Future Uses of Cash.Our financial performance and cash, cash equivalent and short-term investments of $475.6 million allow us flexibility to make strategic choices in the use of our cash. In order to reduce future cash interest payments, as well as future amounts due at maturity or mandatory redemption and reduce our leverage, we or our affiliates may, from time to time, enter into additional interest rate swap agreements or purchase or redeem our outstanding 2018 Notes or Convertible Debentures for cash or equity securities in the open market or privately negotiated transactions or engage in other transactions to reduce the principal amount of outstanding 2018 Notes or Convertible Debentures. We also may seek to refinance or otherwise replace all or a portion of our Term Loan and Revolver. Under the terms of our Revolver, which is more restrictive than our Term Loan and the indenture for the 2018 Notes, we currently may repurchase a portion of our 2018 Notes or Convertible Debentures if we meet a minimum current liquidity test of $300 million and other tests, which we met as of December 31, 2010, and do not use the Revolver proceeds for this purpose. In addition, we may consider repurchasing shares of our common stock in public or private transactions. On June 10, 2010, our Board of Directors authorized us to repurchase up to $50 million of our common stock, of which approximately $50 million, including fees, was repurchased as of December 31, 2010. See Part II, Item 2, “Unregistered Shares of Equity Securities and Use of Proceeds” for repurchases through December 31, 2010. On February 4, 2011, our Board of Directors authorized us to repurchase up to an additional $50 million of our common stock. Our Revolver permits annual repurchases of up to $50 million of our common stock in the aggregate if after the transaction we have a minimum of $225 million in cash and cash equivalents, have not used that basket for other permissible purposes and meet certain other conditions, which conditions we met as of December 31, 2010. Unused amounts under this covenant can be carried over to subsequent years. This test under the Revolver is also more restrictive than our other debt agreements. We also have the right to prepay our Term Loan in whole or in part. Additionally, we may consider merger and acquisition opportunities that could impact our cash usage. We will evaluate any such transactions in light of market conditions, taking into account our liquidity and prospects for access to capital, benefits to us of any such transaction and contractual constraints.
Risk Management.As of December 31, 2010, our cash, cash equivalents and short-term investments were held in financial institutions, U.S. Treasury money market mutual funds, debt securities issued by U.S. government agencies, and corporate debt securities, some of which are guaranteed by the federal government’s Temporary Liquidity Guarantee Program. Although we actively monitor the depository institutions and the performance and quality of our investments and the mutual funds that hold our cash and cash equivalents, we are exposed to risks resulting from deterioration in the financial condition or failure of financial institutions holding our cash deposits, decisions of our investment advisors and the investment managers of the money market funds and defaults in securities underlying the funds and investments. We prioritize safety over investment return in choosing the investment vehicles for cash, cash equivalents and investments and have diversified these investments to the extent practical in an effort to minimize our exposure to any one investment vehicle or financial institution. We may change the nature of our cash, cash equivalent and short-term investments as market conditions change.
Off-Balance Sheet Arrangements.As of December 31, 2010, we did not have any off-balance sheet arrangements, as defined in Item 303(a)(4)(ii) of SEC Regulation S-K.
51
Commitments. The following table summarizes our long-term commitments as of December 31, 2010, including commitments pursuant to debt agreements, lease obligations, fixed maintenance contracts, and other purchase obligations.
| | | | | | | | | | | | | | | | | | | | | | | | | | | | |
Contractual Obligations | | Total | | | 2011 | | | 2012 | | | 2013 | | | 2014 | | | 2015 | | | Thereafter | |
| | | (amounts in thousands) | |
Principal payments on long-term debt: | | | | | | | | | | | | | | | | | | | | | | | | | | | | |
Term Loan B (January 2013 tranche) due 2013 | | $ | 103,130 | | | $ | 1,074 | | | $ | 1,074 | | | $ | 100,982 | | | $ | — | | | $ | — | | | $ | — | |
Term Loan B (extended tranche) due 2016 | | | 472,870 | | | | 4,926 | | | | 4,926 | | | | 4,926 | | | | 4,926 | | | | 4,926 | | | | 448,240 | |
8% Senior Notes due 2018 | | | 430,000 | | | | — | | | | — | | | | — | | | | — | | | | — | | | | 430,000 | |
2.375% Convertible Senior Debentures due 2026 (1) | | | 373,744 | | | | — | | | | — | | | | 373,744 | | | | — | | | | — | | | | — | |
| | | | | | | | | | | | | | | | | | | | | | | | | | | | |
Total principal payments | | $ | 1,379,744 | | | $ | 6,000 | | | $ | 6,000 | | | $ | 479,652 | | | $ | 4,926 | | | $ | 4,926 | | | $ | 878,240 | |
Interest payments on long-term debt (2) | | | 384,483 | | | | 64,706 | | | | 61,736 | | | | 55,581 | | | | 50,460 | | | | 50,287 | | | | 101,713 | |
Capital lease obligations including interest (3) | | | 23,563 | | | | 2,376 | | | | 2,009 | | | | 2,021 | | | | 1,970 | | | | 2,047 | | | | 13,140 | |
Operating lease obligations | | | 317,660 | | | | 48,296 | | | | 47,454 | | | | 42,554 | | | | 37,338 | | | | 30,569 | | | | 111,449 | |
Fixed maintenance obligations | | | 49,734 | | | | 3,242 | | | | 3,242 | | | | 3,242 | | | | 3,242 | | | | 3,242 | | | | 33,524 | |
Purchase obligations | | | | | | | | | | | | | | | | | | | | | | | | | | | | |
Purchase orders (4) | | | 29,274 | | | | 29,274 | | | | — | | | | — | | | | — | | | | — | | | | — | |
Network costs (5) | | | 219,475 | | | | 66,129 | | | | 56,385 | | | | 47,608 | | | | 33,464 | | | | 15,127 | | | | 762 | |
| | | | | | | | | | | | | | | | | | | | | | | | | | | | |
Total | | $ | 2,403,933 | | | $ | 220,023 | | | $ | 176,826 | | | $ | 630,658 | | | $ | 131,400 | | | $ | 106,198 | | | $ | 1,138,828 | |
| | | | | | | | | | | | | | | | | | | | | | | | | | | | |
| (1) | Holders of the Convertible Debentures have the option to require the Company to purchase all or part of the Convertible Debentures on April 1, 2013, April 1, 2016, or April 1, 2021, or at any time prior to April 1, 2026 to convert the debentures into shares of our common stock (see Note 4 to the consolidated financial statements); therefore, the repayment obligation is presented in full at the earliest maturity date. The amount presented in the table above assumes that the repayment obligation is repaid at par value. If the price of our common stock exceeds $18.64 per share when the Convertible Debentures are converted, then for every $1,000 in principal amount of the Convertible Debentures surrendered for conversion, the holder will receive (i) $1,000 for the principal value of the Convertible Debentures, and (ii) the amount by which the conversion value (calculated as the product of the initial conversion rate and the average closing price of our common stock as described in the indenture) exceeds $1,000. Upon conversion, we have the right to deliver, in lieu of common stock, cash or a combination of cash and shares of common stock. |
52
Assuming we hold the Convertible Debentures to maturity, we will consider all alternatives available to us to settle our obligations under the Convertible Debenture. The examples illustrated below are hypothetical only and should not be construed to mean that we will consider only the combinations of cash and shares of our common stock demonstrated in the examples. The table shown below illustrates two hypothetical examples of settlement scenarios upon conversion for stock prices ranging from $18.64-$43.64 whereby (i) the principal amount of the notes, $373.7 million, is paid in cash and the incremental value is delivered in shares of our common stock, and (ii) both the principal value of the notes and the incremental value is delivered in shares of our common stock:
| | | | | | | | | | |
Per
Share
Price | | Obligation | | Incremental
Value Over
Par Value | | Hypothetical Settlement Scenarios |
| | | | Scenario 1 | | Scenario 2 |
| | | | Principal
amount
paid in cash | | Incremental
value settled
in shares | | Principal amount
and incremental
value
settled in shares |
| | | | Cash | | No. of Shares | | No. of Shares |
| (amounts in thousands except per share price) |
| $18.64 | | $373,744 | | $ — | | $373,744 | | — | | 20,050 |
| 23.64 | | 473,984 | | 100,240 | | 373,744 | | 4,240 | | 20,050 |
| 28.64 | | 574,235 | | 200,491 | | 373,744 | | 7,000 | | 20,050 |
| 33.64 | | 674,485 | | 300,741 | | 373,744 | | 8,940 | | 20,050 |
| 38.64 | | 774,736 | | 400,992 | | 373,744 | | 10,377 | | 20,050 |
| 43.64 | | 874,986 | | 501,242 | | 373,744 | | 11,486 | | 20,050 |
| (2) | Interest payments on the Term Loan are calculated using the rates in effect as of December 31, 2010, including our interest rate swap agreement. |
| (3) | Includes amounts representing interest of $8.3 million. |
| (4) | Includes outstanding purchase orders initiated in the ordinary course of business for operating and capital expenditures. |
| (5) | Includes services purchased from other carriers to transport a portion of our traffic to the end-user, to interconnect with the ILECs, to lease our IP backbone, or to provide other ancillary services under contracts that can vary from month-to-month up to 60 months. Some services are purchased under volume plans that require us to maintain certain commitment levels to obtain favorable pricing. Some services are purchased under contracts that are subject to contract termination costs, or penalties, if services are disconnected before the end of the term. |
Effects of Inflation
Historically, inflation has not had a material effect on us.
| Item 7A. | Quantitative and Qualitative Disclosures About Market Risk |
Our interest income is sensitive to changes in the general level of interest rates. In this regard, changes in interest rates can affect the interest earned on our cash, cash equivalents and short-term investments. Based on our cash, cash equivalents and short-term investments of approximately $475.6 million at December 31, 2010, a one percent increase in the interest rate would change our annual interest earned by $4.8 million. At December 31, 2010, investments included in cash, cash equivalents and short-term investments were comprised of U.S. Treasury money market funds, debt securities issued by U.S. government agencies, and corporate debt securities, some of which are guaranteed by the federal government’s Temporary Liquidity Guarantee Program. We currently prioritize safety over investment return in choosing the investment vehicles for cash, cash equivalents and short-term investments, and have diversified these investments to the extent practical in an effort to minimize our exposure to any one investment vehicle or financial institution. We may change the nature of our cash, cash equivalents and investments as market conditions change.
53
We have fixed and variable rate debt. Our exposure to variable rate debt is from changes in the Eurodollar rate as interest on the Term Loan varies based on a specified Eurodollar rate. We have entered into interest rate swap agreements to mitigate interest fluctuations on our variable rate Term Loan. On April 30, 2008, we entered into a two-year interest rate swap with a 3.23% fixed interest rate that hedges the interest rate on the first $100 million of our variable rate Term Loan resulting in a total rate, including the applicable spread as of April 30, 2010, of 4.98% on a notional amount of $100 million. This interest rate swap expired on April 30, 2010. On November 5, 2008, we entered into a three-year interest rate swap commencing November 28, 2008 with a 2.96% fixed interest rate that hedges the interest rate on the second $100 million of our Term Loan resulting in a total rate, based on a weighted average for the applicable spread on the January 2013 tranche and the extended tranche as of December 31, 2010, of 5.94% on a notional amount of $100 million. Variable rate debt instruments represented approximately 34% and 28% of our total debt at December 31, 2010 and 2009, respectively. As of December 31, 2010, based on the $576 million outstanding balance on the Term Loan and the interest rate swap in effect as of December 31, 2010, a one percent change in the applicable rate would change the annual amount of interest we pay by $4.8 million.
At December 31, 2010, the fair values of our Term Loan, 2018 Notes, and Convertible Debentures were $574.7 million, $459.0 million, and $413.0 million, respectively, as compared to carrying values of $576.0 million, $427.2 million and $327.0 million, respectively. These notes and debentures are not listed on any securities exchange or inter-dealer automated quotation systems, and the estimated market value is based on indicative pricing published by certain investment banks. While we believe these approximations to be reasonably accurate at the time published, indicative pricing can vary widely depending on volume traded by any given investment bank and other factors.
| Item 8. | Financial Statements and Supplementary Data |
See “Index to Consolidated Financial Statements” on page F-1.
| Item 9. | Changes in and Disagreements with Accountants on Accounting and Financial Disclosure |
None
| Item 9A. | Controls and Procedures |
Disclosure Controls and Procedures
As of December 31, 2010, we conducted an evaluation, under the supervision and with the participation of our Chief Executive Officer and Chief Financial Officer, of the effectiveness of the design and operation of our disclosure controls and procedures. Based on that evaluation, the Chief Executive Officer and Chief Financial Officer concluded that as of December 31, 2010 our disclosure controls and procedures were effective to provide reasonable assurance that information required to be disclosed by us in reports that we file or submit under the Securities Exchange Act of 1934 is recorded, processed, summarized, and reported within the time periods specified in Securities and Exchange Commission rules and forms.
Management’s Report on Internal Control over Financial Reporting
Our management is responsible for establishing and maintaining adequate internal control over financial reporting, as defined in Rules 13a-15(f) and 15d-15(f) under the Securities Exchange Act of 1934, to provide reasonable assurance that the objectives of the control system are met. Our management conducted an assessment of our internal control over financial reporting based on the framework established by the Committee of Sponsoring Organizations of the Treadway Commission in Internal Control—Integrated Framework. Our management has concluded that our assessment provides reasonable assurance that, as of December 31, 2010, our internal control over financial reporting was effective.
54
Our independent registered public accounting firm, Ernst & Young LLP, has issued an attestation report on our internal control over financial reporting as of December 31, 2010.
Changes in Internal Control over Financial Reporting
There has been no change in our internal control over financial reporting during the quarter ended December 31, 2010 that has materially affected, or is reasonably likely to materially affect, our internal control over financial reporting.
| Item 9B. | Other Information |
None
55
REPORT OF INDEPENDENT REGISTERED PUBLIC ACCOUNTING FIRM
The Board of Directors and Stockholders oftw telecom inc.
We have auditedtw telecom inc.’s internal control over financial reporting as of December 31, 2010, based on criteria established in Internal Control—Integrated Framework issued by the Committee of Sponsoring Organizations of the Treadway Commission (the COSO criteria).tw telecom inc.’s management is responsible for maintaining effective internal control over financial reporting, and for its assessment of the effectiveness of internal control over financial reporting included in the accompanying Management’s Report on Internal Control over Financial Reporting. Our responsibility is to express an opinion on the Company’s internal control over financial reporting based on our audit.
We conducted our audit in accordance with the standards of the Public Company Accounting Oversight Board (United States). Those standards require that we plan and perform the audit to obtain reasonable assurance about whether effective internal control over financial reporting was maintained in all material respects. Our audit included obtaining an understanding of internal control over financial reporting, assessing the risk that a material weakness exists, testing and evaluating the design and operating effectiveness of internal control based on the assessed risk, and performing such other procedures as we considered necessary in the circumstances. We believe that our audit provides a reasonable basis for our opinion.
A company’s internal control over financial reporting is a process designed to provide reasonable assurance regarding the reliability of financial reporting and the preparation of financial statements for external purposes in accordance with generally accepted accounting principles. A company’s internal control over financial reporting includes those policies and procedures that (1) pertain to the maintenance of records that, in reasonable detail, accurately and fairly reflect the transactions and dispositions of the assets of the company; (2) provide reasonable assurance that transactions are recorded as necessary to permit preparation of financial statements in accordance with generally accepted accounting principles, and that receipts and expenditures of the company are being made only in accordance with authorizations of management and directors of the company; and (3) provide reasonable assurance regarding prevention or timely detection of unauthorized acquisition, use or disposition of the company’s assets that could have a material effect on the financial statements.
Because of its inherent limitations, internal control over financial reporting may not prevent or detect misstatements. Also, projections of any evaluation of effectiveness to future periods are subject to the risk that controls may become inadequate because of changes in conditions, or that the degree of compliance with the policies or procedures may deteriorate.
In our opinion,tw telecom inc.maintained, in all material respects, effective internal control over financial reporting as of December 31, 2010, based on the COSO criteria.
We also have audited, in accordance with the standards of the Public Company Accounting Oversight Board (United States), the consolidated balance sheets oftw telecom inc. as of December 31, 2010 and 2009 and the related consolidated statements of operations, cash flows and changes in stockholders’ equity for each of the three years in the period ended December 31, 2010 of tw telecom inc. and our report dated February 24, 2011 expressed an unqualified opinion thereon.
/s/ Ernst & Young LLP
Denver, Colorado
February 24, 2011
56
PART III
| Item 10. | Directors, Executive Officers and Corporate Governance |
The information with respect to directors if required by this Item will appear under the heading “Proposal 1: Election of Directors” and “Board Information” and the information with respect to executive officers, material changes to procedures by which security holders may recommend nominees to the board of directors, and audit committee and financial experts required by this item will appear in our definitive proxy statement for the 2011 Annual Meeting of Stockholders to be filed with the SEC no later than April 30, 2011 (the “Proxy Statement”) pursuant to Regulation 14A of the General Rules and Regulations under the Securities Exchange Act of 1934. These portions of the Proxy Statement are incorporated by reference.
Code of Ethics
We have adopted a Code of Ethics for directors and officers (including our principal executive officer, principal financial officer, chief accounting officer, controller and treasurer) which is available at our website atwww.twtelecom.com under “Investors.” Stockholders also may request a free copy of the Code of Ethics from:
tw telecom inc.
Attn: Investor Relations
10475 Park Meadows Drive
Littleton, CO 80124
| Item 11. | Executive Compensation |
The information required by this item will appear in our Proxy Statement under the heading “Executive Compensation”. This portion of our Proxy Statement is incorporated by reference.
| Item 12. | Security Ownership of Certain Beneficial Owners and Management and Related Stockholder Matters |
The information required by this item will appear under the headings “tw telecom Share Ownership” and “Securities Authorized for Issuance under Equity Compensation Plans” in our Proxy Statement. These portions of the Proxy Statement are incorporated by reference.
| Item 13. | Certain Relationships and Related Transactions, and Director Independence |
The information required by this item will appear under the headings “Certain Relationships and Related Transactions” and “Corporate Governance” in our Proxy Statement. These portions of the Proxy Statement are incorporated by reference.
| Item 14. | Principal Accountant Fees and Services |
Information regarding our principal auditor fees and services will appear under “Ratification of Appointment of Independent Auditors” in our Proxy Statement. These portions of the Proxy Statement are incorporated by reference.
57
GLOSSARY
Access Charges. The fees paid by long distance carriers for the local connections between the long distance carriers’ networks and the long distance carriers’ customers.
ATM (Asynchronous Transfer Mode). High speed transmission technology using packet-like switching and multiplexing techniques in order to transmit data.
Central Offices.A telecommunications center where switches and other telecommunications facilities are housed. CLECs may connect with ILEC networks either at this location or through a remote location.
Class of Service. A method of managing traffic on a network that allows customers to group types of traffic and assign each type a different priority level.
Collaboration. An application, platform or device which generally leverages verbal, video media (e.g., telepresence, multimedia web conferencing) and data or presentation files which are designed to help people with a common task achieve a business objective. Collaboration usually involves network services including voice conferencing, video conferencing, local, metro or wide area data networks and the Internet.
Collocation.The ability of a telecommunications carrier to interconnect its network to the ILEC’s network by extending its facilities to the ILEC’s central office. Collocation with an ILEC can be physical where the interconnecting carrier places its network equipment within the ILEC’s central offices or virtual where the ILEC permits a carrier to interconnect its network to the ILEC’s network in a manner which is technically, operationally, and economically comparable to physical collocation, but without physically locating equipment within the central offices. Telecommunication carriers also allow customers to interconnect with their networks by placing equipment in space adjacent to the carrier’s central office.
CLEC (Competitive Local Exchange Carrier). A company that provides local exchange services, including dedicated service, in competition with the ILEC.
Cloud Computing.A style of computing where scalable and elastic IT enabled capabilities are provided as a service to external customers using Internet protocol technologies.
Dedicated. Telecommunications lines dedicated to, or reserved for use by, a particular customer along predetermined routes (in contrast to links which are temporarily established).
Dedicated Transmission. The sending of electronic signals carrying information over a Dedicated Transport facility.
Dedicated Transport.A non-switched point-to-point telecommunications facility leased from a telecommunications provider by an end-user and used exclusively by that end-user.
Digital.A means of storing, processing and transmitting information by using distinct electronic or optical pulses that represent the binary digits 0 and 1. Digital transmission and switching technologies use a sequence of these pulses to represent information as opposed to the continuously variable analog signal. The precise digital numbers preclude distortion (such as graininess or snow in the case of video transmission, or static or other background distortion in the case of audio transmission).
DS-0, DS-1, DS-3. Standard North American telecommunications industry digital signal formats, which are distinguishable by bit rate (the number of binary digits (0 and 1) transmitted per second). DS-0 service has a bit rate of 64 kilobits per second. DS-1 service has a bit rate of 1.544 megabits per second and DS-3 service has a bit rate of 44.736 megabits per second. A DS-0 can transmit a single uncompressed voice conversation.
58
Ethernet.A network configuration in which data is separated into “frames” for transmission. Ethernet equipment scans the network to find the least-congested route for frames to travel from Point A to Point B, thus resulting in greater speed and fewer errors in frame transmission.
Fiber Optics. Fiber optic technology involves sending laser light pulses across glass strands in order to transmit digital information. Fiber optic cable is the medium of choice for the telecommunications and cable industries. Fiber is immune to electrical interference and environmental factors that affect copper wiring and satellite transmission.
Gbps (Gigabits per second).One billion bits of information. The information-carrying capacity (i.e., bandwidth) of a circuit may be measured in “billions of bits per second.”
Grooming. The rearrangement or replacement of circuits used in a telecommunication provider’s network to reach end-users or to constitute the network backbone to create lower cost, increased capacity or better network performance.
Hub.Collocation centers located centrally in an area where telecommunications traffic can be aggregated for transport and distribution.
ILECs (Incumbent Local Exchange Carriers). The local phone companies, including regional bell operating companies and independent operating companies (such as Cincinnati Bell), which provide local exchange services.
Internet. The name used to describe the global open network of computers that permits a person with access to the Internet to exchange information with any other computer connected to the network.
Internet Protocol (IP).The method or protocol by which data is sent from one computer or network to another on the Internet. Each computer or network has at least one IP address that uniquely identifies it from all other computers and networks that are connected to the Internet.
IntraLATA.A call that originates and terminates within the same LATA.
ISDN (Integrated Services Digital Network). ISDN is an internationally agreed standard, which, through special equipment, allows two-way, simultaneous voice and data transmission in digital formats over the same transmission line. ISDN permits video conferencing over a single line, for example, and also supports a multitude of value added switched service applications such as Incoming Calling Line Identification. ISDN’s combined voice and data networking capabilities reduce costs for end-users and result in more efficient use of available facilities. ISDN combines standards for highly flexible customer to network signaling with both voice and data within a common facility.
IXC (Interexchange Carrier).A long distance carrier.
LANs (Local Area Networks). The interconnection of computers for the purpose of sharing files, programs, and peripheral devices such as printers and high-speed modems. LANs may include dedicated computers or file servers that provide a centralized source of shared files and programs. LANs are generally confined to a single customer’s premises and may be extended or interconnected to other locations through the use of bridges and routers.
LATA (Local Access and Transport Area). The geographical areas within which a local telephone company may offer telecommunications services, as defined in the divestiture order known as the Modified Final Judgment unless and until refined by the FCC pursuant to the Telecommunications Act of 1996.
LEC (Local Exchange Carrier). A telecommunications company that provides local telephone service in a geographic area. LECs included both ILECs and CLECs.
59
Local Exchange. A geographic area defined by the appropriate state regulatory authority in which telephone calls generally are transmitted without toll charges to the calling or called party.
Local Exchange Service/Local Exchange Telephone Service.Basic local telephone service, including the provision of telephone numbers, dial tone and calling within the local exchange area.
Long Distance Carriers (Interexchange Carriers or IXC).Long distance carriers providing services between LATAs, on an interstate or intrastate basis. A long distance carrier may be facilities-based or offer service by reselling the services of a facilities-based carrier.
Managed Service. Those services delivered by us where the interface provided to the customer requires no further protocol conversion and we monitor and manage the equipment providing the service and control the network administration.
Mbps (Megabits per second). Megabit means one million bits of information. The information carrying capacity (i.e., bandwidth) of a circuit may be measured in “millions of bits per second.”
MPLS (Multi Protocol Label Switching). A standards-approved technology for speeding up network traffic flow and making it easier to manage. MPLS involves setting up a specific path for a given sequence of packets, identified by a label put in each packet, thus saving the time needed for a router or switch to look up the address to the next node to forward the packet to.
Multiplexing. An electronic or optical process that combines a number of lower speed transmission signals into one higher speed signal. There are various techniques for multiplexing, including frequency division (splitting the total available frequency bandwidth into smaller frequency slices), time division (slicing a channel into timeslots and placing each signal into its assigned timeslot), and statistical (wherein multiplexed signals share the same channel and each transmits only when it has data to send).
NLAN (Native Local Area Network). Interconnection of computers for the purpose of sharing files that does not require protocol conversion between the networks.
Node.A point of connection into a fiber optic network.
OC-n. Optical carrier levels ranging from OC-1 (51.84 Mbps) to OC-192 (9.9 Gbps).
POPs (Points of Presence).Locations where an IXC has installed transmission equipment in a service area that serves as, or relays telephone calls to, a network switching center of the same IXC.
Private Line.A private, dedicated telecommunications link between different customer locations (excluding IXC POPs).
PSTN (Public Switched Telephone Network). The switched network available to all users generally on a shared basis (i.e., not dedicated to a particular user). The local exchange telephone service networks operated by ILECs are the largest and often the only public switched networks in a given locality.
Reciprocal Compensation. An arrangement in which two local exchange carriers agree to terminate traffic originating on each other’s networks in exchange for a negotiated level of compensation.
Redundant Electronics.A telecommunications facility that uses two separate electronic devices to transmit a telecommunications signal so that if one device malfunctions, the signal may continue without interruption.
60
Route Mile.The number of miles along which fiber optic cables are installed.
SONET (Synchronous Optical Network). A set of standards for optical communications transmission systems that define the optical rates and formats, signal characteristics, performance, management and maintenance information to be embedded within the signals and the multiplexing techniques to be employed in optical communications transmission systems. SONET facilitates the interoperability of dissimilar vendors equipment. SONET benefits business customers by minimizing the equipment necessary for various telecommunications applications and supports networking diagnostic and maintenance features.
Special Access Services. The lease of private, dedicated telecommunications lines or circuits on an ILEC’s or a CLEs’ network, which run to or from another carrier’s POPs. Special access services do not require the use of switches. Examples of special access services are telecommunications circuits running between POPs of a single carrier, from one carrier’s POP to another carrier’s POP or from an end-user to a carrier’s POP.
STS-1. This dedicated transmission service is carried over high-capacity channels for full duplex, synchronous optical transmission of digital data on SONET standards. This service eliminates the need to maintain and pay for multiple dedicated lines.
Switch.A mechanical or electronic device that opens or closes circuits or selects the paths or circuits to be used for the transmission of information. Switching is a process of linking different circuits to create a temporary transmission path between users. Within this document, switches generally refer to voice grade telecommunications switches unless specifically stated otherwise.
Switched Access Services. The connection between an IXC’s POP and an end-user’s premises through the switching facilities of a local exchange carrier.
Switched Services. Telecommunications services that support the connection of one calling party with another calling party via use of a telephone switch (i.e., an electronic device that opens or closes circuits, completes or breaks an electrical path or selects paths or circuits).
TDM (Time Division Multiplexing). A type of multiplexing that combines data streams by assigning each stream a different time slot in a set. TDM repeatedly transmits a fixed sequence of time slots over a single transmission channel.
Toll Services. Services otherwise known as EAS or intraLATA toll services which are those calls that are beyond the free local calling area but originate and terminate within the same LATA; such calls are usually priced on a measured basis.
Value Added Resellers.Companies that add features or services to an existing product, then resell it (usually to end-users) as an integrated product or “turn-key” solution. For example, the value added can come from professional services such as integrating, customizing, consulting, training and implementation or by developing a specific application for the product designed for the customer’s needs which is then resold as a combined product or service.
VoIP (Voice over Internet Protocol). The technology used to transmit voice conversations over a data network using the Internet Protocol.
VPN (Virtual Private Network). A private network that operates securely within a public network (such as the Internet) by means of encrypting transmissions.
61
PART IV
| Item 15. | Exhibits and Financial Statement Schedules |
(a) (1), (2) The Financial Statements and Schedule II—Valuation and Qualifying Accounts listed on the index on page F-1 following are included herein by reference. All other schedules are omitted, either because they are not applicable or because the required information is shown in the financial statements or the notes thereto.
(3) Exhibits: The Exhibit Index at the end of this report lists the exhibits filed with this report or incorporated herein by reference.
62
SIGNATURES
Pursuant to the requirements of Section 13 or 15(d) of the Securities Exchange Act of 1934, the registrant has duly caused this report to be signed on its behalf by the undersigned, thereunto duly authorized, on February 24, 2011.
| | |
| tw telecom inc. |
| |
| By: | | /S/ MARK A. PETERS |
| | | Mark A. Peters |
| | | Executive Vice President and |
| | | Chief Financial Officer |
Pursuant to the requirements of the Securities Exchange Act of 1934, this report has been signed below by the following persons on behalf of the registrant in the capacities and on the dates indicated.
| | | | |
Signature | | Title | | Date |
| | |
| (i) Principal Executive Officer | | | | |
| | |
/s/ LARISSA L. HERDA Larissa L. Herda | | Chairman, President, and
Chief Executive Officer | | February 24, 2011 |
| | |
| (ii) Principal Financial Officer | | | | |
| | |
/s/ MARK A. PETERS Mark A. Peters | | Executive Vice President and
Chief Financial Officer | | February 24, 2011 |
| | |
| (iii) Principal Accounting Officer | | | | |
| | |
/s/ JILL R. STUART Jill R. Stuart | | Senior Vice President, Accounting and Finance and Chief Accounting Officer | | February 24, 2011 |
| | |
| (iv) Directors | | | | |
| | |
/s/ GREGORY J. ATTORRI Gregory J. Attorri | | Director | | February 24, 2011 |
| | |
/s/ SPENCER B. HAYS Spencer B. Hays | | Director | | February 24, 2011 |
| | |
/s/ LARISSA L. HERDA Larissa L. Herda | | Director | | February 24, 2011 |
| | |
/s/ KEVIN W. MOONEY Kevin W. Mooney | | Director | | February 24, 2011 |
| | |
/s/ KIRBY G. PICKLE Kirby G. Pickle | | Director | | February 24, 2011 |
| | |
/s/ ROSCOE C. YOUNG, II Roscoe C. Young, II | | Director | | February 24, 2011 |
63
tw telecom inc.
Index to Consolidated Financial Statements
F-1
REPORT OF INDEPENDENT REGISTERED PUBLIC ACCOUNTING FIRM
The Board of Directors and Stockholders oftw telecom inc.
We have audited the accompanying consolidated balance sheets oftw telecom inc. (the “Company”) as of December 31, 2010 and 2009, and the related consolidated statements of operations, cash flows, and changes in stockholders’ equity for each of the three years in the period ended December 31, 2010. Our audits also included the financial statement schedule listed at page F-1. These financial statements and schedule are the responsibility of the Company’s management. Our responsibility is to express an opinion on these financial statements and schedule based on our audits.
We conducted our audits in accordance with the standards of the Public Company Accounting Oversight Board (United States). Those standards require that we plan and perform the audit to obtain reasonable assurance about whether the financial statements are free of material misstatement. An audit includes examining, on a test basis, evidence supporting the amounts and disclosures in the financial statements. An audit also includes assessing the accounting principles used and significant estimates made by management, as well as evaluating the overall financial statement presentation. We believe that our audits provide a reasonable basis for our opinion.
In our opinion, the financial statements referred to above present fairly, in all material respects, the consolidated financial position of the Company at December 31, 2010 and 2009, and the consolidated results of its operations and its cash flows for each of the three years in the period ended December 31, 2010, in conformity with U.S. generally accepted accounting principles. Also, in our opinion, the related financial statement schedule, when considered in relation to the basic financial statements taken as a whole, presents fairly in all material respects the information set forth therein.
We also have audited, in accordance with the standards of the Public Company Accounting Oversight Board (United States),tw telecom inc.’s internal control over financial reporting as of December 31, 2010, based on criteria established in Internal Control—Integrated Framework issued by the Committee of Sponsoring Organizations of the Treadway Commission and our report dated February 24, 2011 expressed an unqualified opinion thereon.
/s/ Ernst & Young LLP
Denver, Colorado
February 24, 2011
F-2
tw telecom inc.
CONSOLIDATED BALANCE SHEETS
December 31, 2010 and 2009
| | | | | | | | |
| | | 2010 | | | 2009 | |
| | | (amounts in thousands,
except per share amounts) | |
| ASSETS | | | | | | | | |
Current assets: | | | | | | | | |
Cash and cash equivalents | | $ | 356,922 | | | $ | 445,907 | |
Investments | | | 118,672 | | | | 24,865 | |
Receivables, less allowances of $7,898 and $9,449, respectively | | | 81,598 | | | | 78,016 | |
Prepaid expenses and other current assets | | | 16,935 | | | | 13,546 | |
Deferred income taxes | | | 42,433 | | | | 29,574 | |
| | | | | | | | |
Total current assets | | | 616,560 | | | | 591,908 | |
| | | | | | | | |
Long-term investments | | | — | | | | 2,990 | |
Property, plant and equipment | | | 3,732,050 | | | | 3,481,287 | |
Less accumulated depreciation | | | (2,375,438 | ) | | | (2,186,915 | ) |
| | | | | | | | |
| | | 1,356,612 | | | | 1,294,372 | |
| | | | | | | | |
Deferred income taxes | | | 240,998 | | | | 29,176 | |
Goodwill | | | 412,694 | | | | 412,694 | |
Intangible assets, net of accumulated amortization | | | 24,444 | | | | 32,220 | |
Other assets, net | | | 17,854 | | | | 10,840 | |
| | | | | | | | |
Total assets | | $ | 2,669,162 | | | $ | 2,374,200 | |
| | | | | | | | |
| LIABILITIES AND STOCKHOLDERS’ EQUITY | | | | | | | | |
Current liabilities: | | | | | | | | |
Accounts payable | | $ | 53,436 | | | $ | 51,088 | |
Deferred revenue | | | 37,888 | | | | 34,005 | |
Accrued taxes, franchise and other fees | | | 68,663 | | | | 68,669 | |
Accrued interest | | | 15,208 | | | | 16,219 | |
Accrued payroll and benefits | | | 41,772 | | | | 42,589 | |
Accrued carrier costs | | | 35,049 | | | | 35,890 | |
Current portion debt and capital lease obligations | | | 7,202 | | | | 7,569 | |
Other current liabilities | | | 42,570 | | | | 39,120 | |
| | | | | | | | |
Total current liabilities | | | 301,788 | | | | 295,149 | |
| | | | | | | | |
Long-term debt and capital lease obligations, net | | | 1,338,297 | | | | 1,300,370 | |
Long-term deferred revenue | | | 14,864 | | | | 15,988 | |
Other long-term liabilities | | | 29,364 | | | | 30,653 | |
Commitments and contingencies (note 9) | | | | | | | | |
Stockholders’ equity: | | | | | | | | |
Preferred stock, $0.01 par value, 20,000 shares authorized, no shares issued and outstanding | | | — | | | | — | |
Common stock, $0.01 par value, 439,800 shares authorized, 151,953 and 150,123 shares issued, respectively | | | 1,520 | | | | 1,501 | |
Additional paid-in capital | | | 1,821,154 | | | | 1,792,761 | |
Treasury stock, 2,707 and no shares, at cost, respectively | | | (45,821 | ) | | | — | |
Accumulated deficit | | | (790,175 | ) | | | (1,057,984 | ) |
Accumulated other comprehensive loss | | | (1,829 | ) | | | (4,238 | ) |
| | | | | | | | |
Total stockholders’ equity | | | 984,849 | | | | 732,040 | |
| | | | | | | | |
Total liabilities and stockholders’ equity | | $ | 2,669,162 | | | $ | 2,374,200 | |
| | | | | | | | |
See accompanying notes to the consolidated financial statements.
F-3
tw telecom inc.
CONSOLIDATED STATEMENTS OF OPERATIONS
Years Ended December 31, 2010, 2009 and 2008
| | | | | | | | | | | | |
| | | 2010 | | | 2009 | | | 2008 | |
| | | (amounts in thousands, except per share amounts) | |
Revenue: | | | | | | | | | | | | |
Data and Internet services | | $ | 547,218 | | | $ | 472,647 | | | $ | 399,928 | |
Network services | | | 359,169 | | | | 370,859 | | | | 387,339 | |
Voice services | | | 332,870 | | | | 333,274 | | | | 334,692 | |
Intercarrier compensation | | | 33,914 | | | | 34,610 | | | | 37,060 | |
| | | | | | | | | | | | |
Total revenue | | | 1,273,171 | | | | 1,211,390 | | | | 1,159,019 | |
| | | | | | | | | | | | |
Costs and expenses (a): | | | | | | | | | | | | |
Operating (exclusive of depreciation, amortization, and accretion shown separately below) | | | 528,965 | | | | 503,960 | | | | 491,375 | |
Selling, general and administrative | | | 308,470 | | | | 297,290 | | | | 291,985 | |
Depreciation, amortization, and accretion | | | 289,564 | | | | 296,167 | | | | 285,783 | |
| | | | | | | | | | | | |
Total costs and expenses | | | 1,126,999 | | | | 1,097,417 | | | | 1,069,143 | |
| | | | | | | | | | | | |
Operating income | | | 146,172 | | | | 113,973 | | | | 89,876 | |
| | | |
Interest expense | | | (80,952 | ) | | | (84,001 | ) | | | (93,336 | ) |
Debt extinguishment costs | | | (17,070 | ) | | | — | | | | — | |
Interest income | | | 608 | | | | 360 | | | | 6,308 | |
Other income (loss), net | | | 825 | | | | — | | | | (7,767 | ) |
| | | | | | | | | | | | |
Income (loss) before income taxes | | | 49,583 | | | | 30,332 | | | | (4,919 | ) |
Income tax (benefit) expense | | | (221,851 | ) | | | 2,746 | | | | 2,347 | |
| | | | | | | | | | | | |
Net income (loss) | | $ | 271,434 | | | $ | 27,586 | | | $ | (7,266 | ) |
| | | | | | | | | | | | |
Earnings per share: | | | | | | | | | | | | |
Basic | | $ | 1.80 | | | $ | 0.19 | | | $ | (0.05 | ) |
| | | | | | | | | | | | |
Diluted | | $ | 1.72 | | | $ | 0.18 | | | $ | (0.05 | ) |
| | | | | | | | | | | | |
Weighted average shares outstanding: | | | | | | | | | | | | |
Basic | | | 149,156 | | | | 148,087 | | | | 147,251 | |
| | | | | | | | | | | | |
Diluted | | | 171,456 | | | | 149,852 | | | | 147,251 | |
| | | | | | | | | | | | |
| | |
(a) Includes non-cash stock-based employee compensation expense (note 1): | | | | | | | | | |
Operating | | $ | 3,261 | | | $ | 3,654 | | | $ | 3,758 | |
| | | | | | | | | | | | |
Selling, general and administrative | | $ | 24,571 | | | $ | 22,864 | | | $ | 19,599 | |
| | | | | | | | | | | | |
See accompanying notes to the consolidated financial statements.
F-4
tw telecom inc.
CONSOLIDATED STATEMENTS OF CASH FLOWS
Years Ended December 31, 2010, 2009 and 2008
| | | | | | | | | | | | |
| | | 2010 | | | 2009 | | | 2008 | |
| | | (amounts in thousands) | |
Cash flows from operating activities: | | | | | | | | | | | | |
Net income (loss) | | $ | 271,434 | | | $ | 27,586 | | | $ | (7,266 | ) |
Adjustments to reconcile net income (loss) to net cash provided by operating activities: | | | | | | | | | | | | |
Depreciation, amortization, and accretion | | | 289,564 | | | | 296,167 | | | | 285,783 | |
Deferred income taxes | | | (224,085 | ) | | | — | | | | — | |
Stock-based compensation | | | 27,832 | | | | 26,518 | | | | 23,357 | |
Loss on debt extinguishment | | | 17,070 | | | | — | | | | — | |
Discount on debt, amortization of deferred debt issue costs and other | | | 20,579 | | | | 20,036 | | | | 19,580 | |
Investment impairment | | | — | | | | — | | | | 7,767 | |
Changes in operating assets and liabilities: | | | | | | | | | | | | |
Receivables and other assets | | | (5,264 | ) | | | 1,972 | | | | (3,404 | ) |
Accounts payable | | | (12,482 | ) | | | 4,689 | | | | (666 | ) |
Accrued interest | | | (1,039 | ) | | | (1,082 | ) | | | 605 | |
Accrued payroll and benefits | | | (817 | ) | | | 4,344 | | | | 1,685 | |
Other liabilities | | | 2,960 | | | | 10,248 | | | | (21,921 | ) |
| | | | | | | | | | | | |
Net cash provided by operating activities | | | 385,752 | | | | 390,478 | | | | 305,520 | |
| | | | | | | | | | | | |
Cash flows from investing activities: | | | | | | | | | | | | |
Capital expenditures | | | (321,844 | ) | | | (266,997 | ) | | | (274,519 | ) |
Purchases of investments | | | (246,575 | ) | | | (24,892 | ) | | | — | |
Proceeds from sale of investments | | | 154,786 | | | | — | | | | 3,699 | |
Proceeds from sale of assets and other investing activities, net | | | (4,416 | ) | | | 1,300 | | | | (2,939 | ) |
| | | | | | | | | | | | |
Net cash used in investing activities | | | (418,049 | ) | | | (290,589 | ) | | | (273,759 | ) |
| | | | | | | | | | | | |
Cash flows from financing activities: | | | | | | | | | | | | |
Net proceeds (tax withholdings) from issuance of common stock upon exercise of stock options and vesting of restricted stock awards and units | | | 1,045 | | | | 1,834 | | | | 5,930 | |
Purchases of treasury stock | | | (49,911 | ) | | | — | | | | — | |
Retirement of debt obligations | | | (413,683 | ) | | | — | | | | — | |
Net proceeds from issuance of debt | | | 413,069 | | | | — | | | | — | |
Payment of debt and capital lease obligations | | | (7,208 | ) | | | (7,992 | ) | | | (7,046 | ) |
| | | | | | | | | | | | |
Net cash used in financing activities | | | (56,688 | ) | | | (6,158 | ) | | | (1,116 | ) |
| | | | | | | | | | | | |
(Decrease) increase in cash and cash equivalents | | | (88,985 | ) | | | 93,731 | | | | 30,645 | |
Cash and cash equivalents at beginning of year | | | 445,907 | | | | 352,176 | | | | 321,531 | |
| | | | | | | | | | | | |
Cash and cash equivalents at end of year | | $ | 356,922 | | | $ | 445,907 | | | $ | 352,176 | |
| | | | | | | | | | | | |
Supplemental disclosures of cash flow information: | | | | | | | | | | | | |
Cash paid for interest | | $ | 63,169 | | | $ | 68,049 | | | $ | 77,006 | |
| | | | | | | | | | | | |
Cash paid for debt extinguishment costs | | $ | 13,677 | | | $ | — | | | $ | — | |
| | | | | | | | | | | | |
Cash paid for income taxes, net of refunds | | $ | 4,653 | | | $ | 3,001 | | | $ | 2,072 | |
| | | | | | | | | | | | |
Addition of capital lease obligation | | $ | — | | | $ | 7,893 | | | $ | 2,338 | |
| | | | | | | | | | | | |
See accompanying notes to the consolidated financial statements.
F-5
tw telecom inc.
CONSOLIDATED STATEMENTS OF CHANGES IN STOCKHOLDER’S EQUITY
Years Ended December 31, 2010, 2009 and 2008
| | | | | | | | | | | | | | | | | | | | | | | | | | | | | | | | |
| | | | | | Additional
paid-in
capital | | | Accumulated
deficit | | | Accumulated
other
comprehensive
income (loss) | | | Total
stockholders’
equity | |
| | | | | |
| | Common Stock | | | Treasury Stock | | | | | |
| | | Shares | | | Amount | | | Shares | | | Amount | | | | | |
| | | | | | | | | | | | (amounts in thousands) | | | | | | | |
Balance at January 1, 2008 | | | 146,542 | | | $ | 1,465 | | | | — | | | $ | — | | | $ | 1,735,158 | | | $ | (1,078,304 | ) | | $ | — | | | $ | 658,319 | |
Net loss | | | — | | | | — | | | | — | | | | — | | | | — | | | | (7,266 | ) | | | — | | | | (7,266 | ) |
Unrealized loss on cash flow hedging activities, net of tax | | | — | | | | — | | | | — | | | | — | | | | — | | | | — | | | | (7,147 | ) | | | (7,147 | ) |
| | | | | | | | | | | | | | | | | | | | | | | | | | | | | | | | |
Total comprehensive loss | | | — | | | | — | | | | — | | | | — | | | | — | | | | — | | | | — | | | | (14,413 | ) |
Shares issued for cash in connection with the exercise of stock options and the employee stock purchase plan | | | 725 | | | | 7 | | | | — | | | | — | | | | 5,923 | | | | — | | | | — | | | | 5,930 | |
Stock-based compensation | | | 507 | | | | 6 | | | | — | | | | — | | | | 23,351 | | | | — | | | | — | | | | 23,357 | |
| | | | | | | | | | | | | | | | | | | | | | | | | | | | | | | | |
Balance at December 31, 2008 | | | 147,774 | | | | 1,478 | | | | — | | | | — | | | | 1,764,432 | | | | (1,085,570 | ) | | | (7,147 | ) | | | 673,193 | |
Net income | | | — | | | | — | | | | — | | | | — | | | | — | | | | 27,586 | | | | — | | | | 27,586 | |
Unrealized gain on cash flow hedging activities, net of tax | | | — | | | | — | | | | — | | | | — | | | | — | | | | — | | | | 2,909 | | | | 2,909 | |
| | | | | | | | | | | | | | | | | | | | | | | | | | | | | | | | |
Total comprehensive income | | | — | | | | — | | | | — | | | | — | | | | — | | | | — | | | | — | | | | 30,495 | |
Exercise of stock options net of withholdings to satisfy employee tax obligations upon vesting of stock awards | | | 705 | | | | 7 | | | | — | | | | — | | | | 1,827 | | | | — | | | | — | | | | 1,834 | |
Stock-based compensation | | | 1,644 | | | | 16 | | | | — | | | | — | | | | 26,502 | | | | — | | | | — | | | | 26,518 | |
| | | | | | | | | | | | | | | | | | | | | | | | | | | | | | | | |
Balance at December 31, 2009 | | | 150,123 | | | | 1,501 | | | | — | | | | — | | | | 1,792,761 | | | | (1,057,984 | ) | | | (4,238 | ) | | | 732,040 | |
Net income | | | — | | | | — | | | | — | | | | — | | | | — | | | | 271,434 | | | | — | | | | 271,434 | |
Unrealized gain on cash flow hedging activities, net of tax of $703 | | | — | | | | — | | | | — | | | | — | | | | — | | | | — | | | | 2,421 | | | | 2,421 | |
Unrealized gain on available-for-sale securities, net of tax of $0 | | | — | | | | — | | | | — | | | | — | | | | — | | | | — | | | | (12 | ) | | | (12 | ) |
| | | | | | | | | | | | | | | | | | | | | | | | | | | | | | | | |
Total comprehensive income | | | — | | | | — | | | | — | | | | — | | | | — | | | | — | | | | — | | | | 273,843 | |
Purchases of treasury stock | | | — | | | | — | | | | (2,946 | ) | | | (49,911 | ) | | | — | | | | — | | | | — | | | | (49,911 | ) |
Exercise of stock options net of withholdings to satisfy employee tax obligations upon vesting of stock awards | | | 638 | | | | 7 | | | | 239 | | | | 4,090 | | | | 573 | | | | (3,625 | ) | | | — | | | | 1,045 | |
Stock-based compensation | | | 1,192 | | | | 12 | | | | — | | | | — | | | | 27,820 | | | | — | | | | — | | | | 27,832 | |
| | | | | | | | | | | | | | | | | | | | | | | | | | | | | | | | |
Balance at December 31, 2010 | | | 151,953 | | | $ | 1,520 | | | | (2,707 | ) | | | ($45,821 | ) | | $ | 1,821,154 | | | | ($790,175 | ) | | | ($1,829 | ) | | $ | 984,849 | |
| | | | | | | | | | | | | | | | | | | | | | | | | | | | | | | | |
See accompanying notes to the consolidated financial statements.
F-6
tw telecom inc.
NOTES TO CONSOLIDATED FINANCIAL STATEMENTS
1. Organization and Summary of Significant Accounting Policies
Description of Business and Capital Structure
tw telecom inc. (the “Company”), a Delaware corporation, is a leading national provider of managed network services, specializing in data, Internet Protocol (“IP”), voice, and network access services to enterprise organizations, including public sector entities, and carriers throughout the United States.
The Company has one class of common stock outstanding with one vote per share. The Company also is authorized to issue shares of preferred stock. The Company’s Board of Directors has the authority to establish voting powers, preferences, and special rights for the preferred stock. No shares of preferred stock have been issued.
Basis of Consolidation
The consolidated financial statements include the accounts of the Company and all entities in which the Company has a controlling voting interest (“subsidiaries”). Significant intercompany accounts and transactions have been eliminated.
Estimates
The preparation of financial statements in conformity with U.S. generally accepted accounting principles (“GAAP”) requires management to make estimates and assumptions that affect the reported amounts of assets and liabilities at the date of the financial statements and the reported amounts of revenue and expenses during the reporting period. Actual results could differ from those estimates. Areas that require significant management judgments include income and transactional taxes, revenue and receivables, stock-based compensation and long-lived assets, regulatory fees, asset retirement obligations, evaluation of impairment of goodwill, and carrier liabilities.
Segment Reporting
Because its business is centrally managed, the Company operates in one segment across the United States.
Cash Equivalents and Investments
The Company considers all highly liquid debt instruments with an original maturity of three months or less, when purchased, to be cash equivalents. The appropriate classification of securities is determined at the time of purchase and is reevaluated as of the end of each period. Debt securities are classified as held-to-maturity when the Company has the positive intent and ability to hold the securities to maturity and are carried at amortized cost. Debt securities not classified as held-to-maturity are classified as available-for-sale. Available-for-sale securities are carried at fair value, with the unrealized gains and losses, net of tax, reported in other comprehensive income or loss. Gains and losses on investments are calculated using the specific identification method and are recognized during the period the investment is sold. See Note 2 for further information.
At December 31, 2010 and 2009, the Company had restricted funds held at financial institutions of $2.1 million and $2.9 million, respectively. These amounts were included in other current assets and are restricted because they primarily secure outstanding surety bonds.
F-7
tw telecom inc.
NOTES TO CONSOLIDATED FINANCIAL STATEMENTS—(Continued)
Receivables
The Company generally bills in advance for the majority of the services it provides and does not require significant collateral from its customers. The Company evaluates whether receivables are reasonably assured of collection by evaluation of certain factors, including ongoing credit evaluations of significant customers’ financial condition, and provides an allowance for doubtful accounts based on the expected collectability of all receivables. The allowance for doubtful accounts was $7.9 million, or 9% of gross receivables, at December 31, 2010, and $9.4 million, or 11% of gross receivables, at December 31, 2009.
Property, Plant, and Equipment
Property, plant, and equipment are recorded at cost except for assets acquired through acquisition of businesses, which are recorded at fair value. Construction costs, labor, applicable overhead related to the development, installation, and expansion of the Company’s network, and interest costs related to construction are capitalized. Capitalized labor and applicable overhead was $64.0 million, $61.0 million and $60.3 million for 2010, 2009 and 2008, respectively. Capitalized interest was $2.8 million, $2.4 million and $2.9 million for 2010, 2009 and 2008, respectively. Repairs and maintenance costs are charged to expense when incurred. The Company disposes of assets that are no longer in use. Losses on such disposals are included as a component of depreciation expense and were $1.2 million, $3.0 million and $0.4 million in 2010, 2009 and 2008, respectively.
The Company licenses the right to use fiber optic capacity from Time Warner Cable, Inc. in 16 markets, Comcast Corporation (as successor to Time Warner Cable) in three markets and an affiliate of Bright House Networks, LLC in four markets. The Company pays and records as a component of property, plant and equipment its allocable share of the cost of fiber and construction incurred by Time Warner Cable, Inc., Comcast Corporation and the Bright House Networks, LLC affiliate on routes where the parties are in joint construction.
Depreciation is calculated on the straight-line method over estimated useful lives as follows:
| | |
Buildings and improvements | | 10-20 years or lease term, if shorter |
Communications network equipment | | 5-15 years |
Vehicles and other equipment | | 3-10 years |
Fiber and right to use | | 20 years or lease term, if shorter |
Depreciation expense was $279.9 million, $285.6 million and $274.3 million in 2010, 2009 and 2008, respectively. Property, plant, and equipment consists of:
| | | | | | | | |
| | | December 31, | |
| | | 2010 | | | 2009 | |
| | | (amounts in thousands) | |
Communications network equipment | | $ | 2,530,428 | | | $ | 2,350,481 | |
Fiber and right to use | | | 947,937 | | | | 893,089 | |
Vehicles and other equipment | | | 187,804 | | | | 170,593 | |
Land, buildings and improvements | | | 65,881 | | | | 67,124 | |
| | | | | | | | |
| | | 3,732,050 | | | | 3,481,287 | |
Less accumulated depreciation | | | (2,375,438 | ) | | | (2,186,915 | ) |
| | | | | | | | |
Total | | $ | 1,356,612 | | | $ | 1,294,372 | |
| | | | | | | | |
F-8
tw telecom inc.
NOTES TO CONSOLIDATED FINANCIAL STATEMENTS—(Continued)
Income Taxes
Deferred income taxes are provided for temporary differences between the carrying amounts of assets and liabilities and the amounts used for tax purposes. The impact of a tax position is recognized in the financial statements if that position is more likely than not to be sustained on audit, based on technical merits of the position. The Company does not record a valuation allowance against net deferred tax assets when it is more likely than not that the net deferred tax asset will be realized.
Goodwill
The Company performs impairment tests at least annually on all goodwill and indefinite-lived intangible assets pursuant to relevant accounting standards which require goodwill to be assigned to a reporting unit and tested using a consistent measurement date. For purposes of testing goodwill for impairment, the Company’s goodwill has been assigned to the Company’s one consolidated reporting unit and is tested in the fourth quarter of each year or more frequently if impairment indicators arise. Potential impairment is indicated when the book value of a reporting unit, including goodwill, exceeds its fair value. If a potential impairment exists, the fair value of the reporting unit is compared to the fair value of its assets and liabilities, excluding goodwill, to estimate the implied value of the reporting unit’s goodwill. If an impairment charge is deemed necessary, a charge is recognized for any excess of the carrying amount of the reporting unit’s goodwill over the implied fair value. Considerable management judgment is necessary to estimate the fair value of assets; accordingly, actual results could vary significantly from estimates. There were no goodwill impairment charges in 2010, 2009 or 2008.
Other Assets
Other assets primarily include deferred debt issuance costs, which are amortized to interest expense over the life of their respective debt agreements.
Impairment of Long-Lived Assets
The Company periodically reviews the carrying amounts of property, plant, and equipment and its identifiable intangible assets whenever current events or circumstances indicate the carrying amounts may not be recoverable. An impairment is required when the net book value of an asset exceeds the expected future undiscounted cash flows to be generated by that asset or group of assets and the loss is measured by the amount that the carrying value of the assets exceeds their fair value. Considerable management judgment is necessary to estimate the fair value of assets; accordingly, actual results could vary from estimates. Assets to be disposed of are carried at the lower of their carrying amount or fair value less costs to sell. The Company’s asset impairment tests did not result in any impairment charges in 2010, 2009 or 2008.
Asset Retirement Obligations
The Company records the estimated fair value of an asset retirement obligation when incurred. The associated asset retirement costs are capitalized as part of the carrying amount of the long-lived asset and depreciated over the asset’s estimated useful life. The Company has asset retirement obligations related to decommissioning of electronics in leased facilities and the removal of certain fiber and conduit systems. Considerable management judgment is required in estimating these obligations. Important assumptions include estimates of retirement costs, the timing of the future retirement activities and the likelihood of retirement provisions being enforced. Changes in these assumptions based on future information could result in adjustments to estimated liabilities.
F-9
tw telecom inc.
NOTES TO CONSOLIDATED FINANCIAL STATEMENTS—(Continued)
The Company’s asset retirement obligations are included as a component of other long-term liabilities in the consolidated balance sheets. The following table provides asset retirement obligation liability activity for the years ended December 31, 2010, 2009 and 2008:
| | | | | | | | | | | | |
| | | Years ended December 31, | |
| | | 2010 | | | 2009 | | | 2008 | |
| | | (amounts in thousands) | |
Asset retirement obligations: | | | | | | | | | | | | |
Balance at January 1 | | $ | 20,377 | | | $ | 18,701 | | | $ | 17,192 | |
Accretion expense | | | 1,876 | | | | 1,718 | | | | 1,542 | |
Liabilities incurred | | | 977 | | | | — | | | | — | |
Liabilities settled | | | (89 | ) | | | (42 | ) | | | (33 | ) |
| | | | | | | | | | | | |
Balance at December 31 | | $ | 23,141 | | | $ | 20,377 | | | $ | 18,701 | |
| | | | | | | | | | | | |
Derivative Financial Instruments
The Company utilizes derivative financial instruments, specifically interest rate swap agreements, to mitigate interest rate risk. These instruments have been executed with financial institutions deemed creditworthy, and the Company monitors its exposure to these counterparties. All derivatives are recognized in the Company’s consolidated balance sheets at fair value.
The Company’s interest rate swaps have been designated as cash flow hedges. In an interest rate swap, a borrower of variable interest debt agrees with another party to make fixed payments equivalent to paying fixed rate interest on debt in exchange for receiving payments from the other party equivalent to receiving variable rate interest on debt, the effect of which is to eliminate some portion of the variability in the borrower’s overall cash flows.
If certain correlation and risk reduction criteria are met, the derivative is deemed to be highly effective in offsetting the changes in cash flows of the hedged item on a retrospective and prospective basis, and may be specifically designated as a hedge of exposure to changes in cash flow. For derivative instruments that are designated and qualify as a cash flow hedge, the effective portion of the gain or loss on the derivative instrument is reported as a component of other comprehensive income or loss. Amounts excluded from the assessment of hedge effectiveness, if any, as well as the ineffective portion of the gain or loss, are reported in results of operations immediately. The Company performs a quarterly assessment to determine whether each derivative instrument is highly effective in offsetting changes in cash flows of the hedged item. If the derivative instrument is determined to be not highly effective as a hedge, or if a derivative instrument ceases to be a highly effective hedge, hedge accounting is discontinued prospectively with respect to that derivative instrument.
Regulation and Other Contingencies
The Company is subject to significant government and jurisdictional regulation, some of which is uncertain due to legal challenges of existing rules. Such regulation is subject to differing interpretations, inconsistent application and has resulted in disputes with other carriers and municipalities regarding the classification of traffic, rights-of-way, rates and minutes of use.
Management estimates and accrues for its estimate of probable losses associated with government and jurisdictional regulation and other carrier contingencies. These estimates are based on assumptions and other considerations including studies of traffic patterns, expectations regarding regulatory rulings, historic experience and ongoing negotiations. The Company evaluates these reserves on an ongoing basis and makes adjustments as necessary.
F-10
tw telecom inc.
NOTES TO CONSOLIDATED FINANCIAL STATEMENTS—(Continued)
Revenue
The Company’s revenue is derived primarily from metropolitan and wide area business communications services. Data and Internet services include services that enable customers to connect their internal computer networks and to access external networks, including Internet access at high speeds using Ethernet protocol, metropolitan and wide area Ethernet, and virtual private network solutions.
Network services are point-to-point services that transmit voice, data and images as well as enable transmission for storage using state-of-the-art fiber optics, and collocation services which provides secure space with controlled climate and power where customers can locate their equipment to connect to our network in facilities equipped for enterprise information technology environmental requirements. Voice services include traditional and next generation voice capabilities, including voice services from stand alone and bundled products, long distance, toll free services, and VoIP. Converged services fully integrate any combination of communication applications including IP VPN, voice, Internet, security and managed router service into a single managed IP solution, and the various components of this service are classified into the pertinent service categories in the consolidated statement of operations.
Intercarrier compensation is comprised of switched access services and reciprocal compensation. Switched access represents the compensation from another carrier for the delivery of traffic from a long distance carrier’s point of presence to an end-user’s premises provided through the Company’s switching facilities. The Federal Communications Commission (“FCC”) and state public utility commissions regulate switched access rates in their respective jurisdictions. Reciprocal compensation represents compensation from local exchange carriers (“LECs”) for local exchange traffic originated on another LEC’s facilities and terminated on the Company’s facilities.
The Company’s customers are principally enterprise organizations from a wide variety of business segments including, among others, financial services, technology and scientific, health care and professional services industries and public sector entities as well as carriers, including incumbent local exchange carriers (“ILECs”), competitive local exchange carriers (“CLECs”), wireless communications companies and Internet service providers (“ISPs”).
Revenue for network, data and Internet, and the majority of voice services is generally billed in advance on a monthly fixed rate basis and recognized over the period the services are provided. Revenue for the majority of intercarrier compensation and certain components of voice services, such as long distance, is generally billed on a transactional basis in arrears based on a customer’s actual usage, with some fixed rate elements, and estimates are used to recognize revenue in the period earned.
The Company evaluates whether receivables are reasonably assured of collection based on certain factors, including the likelihood of billing being disputed by customers. If there is a billing dispute with a customer, revenue generally is not recognized until the dispute is resolved. The Company does not recognize revenue associated with contract termination charges until cash is received.
The Company classifies certain taxes and fees billed to customers and remitted to government authorities on a gross versus net basis in revenue and expense. In making this determination, the Company assesses, among other things, whether the Company is the primary obligor or principal taxpayer for the taxes and fees assessed in each jurisdiction where the Company does business. In jurisdictions where the Company determines that it is the principal taxpayer, the Company records the taxes and fees on a gross basis, including the taxes and fees in revenue and expense. In jurisdictions where the Company determines that it is merely a collection agent for the government authority, the Company records the taxes on a net basis. The total amounts classified as revenue associated with such taxes and fees were approximately $51.3 million, $40.0 million and $36.9 million for the years ended December 31, 2010, 2009 and 2008, respectively.
F-11
tw telecom inc.
NOTES TO CONSOLIDATED FINANCIAL STATEMENTS—(Continued)
Operating Expenses
Operating expenses consist of costs directly related to the operation and maintenance of the Company’s network and the provisioning of services, but exclude depreciation, amortization and accretion, which is reported separately. These costs, which are net of costs capitalized for labor and overhead (see “Property, Plant, and Equipment” above), include the salaries and related benefits and expenses, including stock-based compensation, of customer care, provisioning, network maintenance, technical field, network operations and engineering personnel, costs to repair and maintain the Company’s network, and costs paid to other carriers to carry a portion of the Company’s traffic and to interconnect the Company’s network and costs for facility leases.
Significant Customers
The Company has substantial business relationships with a few large customers, including major telecommunications carriers. The Company’s 10 largest customers accounted for an aggregate of 20%, 21% and 23% of the Company’s total revenue for the years ended December 31, 2010, 2009 and 2008, respectively. No customer accounted for 10% or more of total revenue in 2010, 2009 and 2008.
Earnings (Loss) Per Common Share and Potential Common Share
Basic earnings per common share (“EPS”) is measured as the income or loss allocated to common stockholders divided by the weighted average outstanding common shares for the period. Diluted EPS is similar to basic EPS but presents the dilutive effect on a per share basis of potential common shares (e.g., convertible securities, stock options, etc.) as if they had been converted to shares at the beginning of the periods presented. Potential common shares that have an anti-dilutive effect (e.g., those that increase income per share or decrease loss per share) are excluded from diluted EPS.
The following is a reconciliation of the number of shares used in the basic and diluted EPS computations:
| | | | | | | | | | | | |
| | | Years ended December 31, | |
| | | 2010 | | | 2009 | | | 2008 | |
| | | (amounts in thousands, except per share amounts) | |
Numerator | | | | | | | | | | | | |
Net income (loss) | | $ | 271,434 | | | $ | 27,586 | | | $ | (7,266 | ) |
Allocation of net income to unvested restricted stock awards | | | (3,560 | ) | | | (189 | ) | | | — | |
| | | | | | | | | | | | |
Net income allocated to common stockholders, basic | | | 267,874 | | | | 27,397 | | | | (7,266 | ) |
Adjustment for assumed dilution: | | | | | | | | | | | | |
Interest expense on convertible debentures, net of tax | | | 26,443 | | | | — | | | | — | |
| | | | | | | | | | | | |
Net income allocated to common stockholders, diluted | | $ | 294,317 | | | $ | 27,397 | | | $ | (7,266 | ) |
| | | | | | | | | | | | |
Denominator | | | | | | | | | | | | |
Basic weighted average shares outstanding | | | 149,156 | | | | 148,087 | | | | 147,251 | |
Dilutive potential common shares: | | | | | | | | | | | | |
Shares from assumed conversion of convertible debentures | | | 20,050 | | | | — | | | | — | |
Stock options | | | 1,694 | | | | 883 | | | | — | |
Unvested restricted stock | | | 556 | | | | 882 | | | | — | |
| | | | | | | | | | | | |
Diluted weighted average shares outstanding | | | 171,456 | | | | 149,852 | | | | 147,251 | |
Basic earnings per share | | $ | 1.80 | | | $ | 0.19 | | | $ | (0.05 | ) |
| | | | | | | | | | | | |
Diluted earnings per share | | $ | 1.72 | | | $ | 0.18 | | | $ | (0.05 | ) |
| | | | | | | | | | | | |
F-12
tw telecom inc.
NOTES TO CONSOLIDATED FINANCIAL STATEMENTS—(Continued)
Options to purchase shares of the Company’s common stock, restricted stock awards and restricted stock units to be settled in common stock upon vesting and shares of common stock subject to issuance upon conversion of the Company’s convertible debentures, which were excluded from the computation of diluted weighted average shares outstanding if their inclusion would be anti-dilutive, totaled 8.4 million shares, 29.9 million shares and 33.1 million shares at December 31, 2010, 2009 and 2008, respectively.
Stock-Based Compensation
The Company recognizes the cost of share-based payments as expense over the requisite service period, which is generally the vesting period of the award. The fair value of restricted stock awards and restricted stock units granted is determined based on the market price of the Company’s common stock at the date of grant. The fair value of options was estimated at the date of grant using a Black-Scholes option pricing model. For purposes of the actual expense recognized in the years ended December 31, 2010, 2009 and 2008, the estimated fair value of the share-based payments is generally amortized to expense on a straight-line basis (net of estimated forfeitures) over the award’s vesting period.
Expected volatilities are based on the historical volatility of the Company’s common stock over a period generally commensurate with the expected term of the option. The risk-free rate for stock options granted during the period is determined by using the U.S. Treasury rate for the nearest period that coincides with the expected term. The expected term of stock options represents the weighted-average period the stock options are expected to remain outstanding and is based on historical data.
Recently Adopted Accounting Pronouncements
Effective January 1, 2010, the Company adopted the disclosure requirements within new authoritative guidance issued by the Financial Accounting Standards Board (“FASB”) which requires additional disclosure and clarifies existing disclosure requirements regarding fair value measurements. The adoption of the disclosure requirements did not have an impact on the Company’s consolidated financial position and results of operations.
2. Investments
The Company’s investments at December 31, 2010 and 2009 are summarized as follows:
| | | | | | | | |
| | | December 31, | |
| | | 2010 | | | 2009 | |
| | | (amounts in thousands) | |
Cash equivalents: | | | | | | | | |
U.S. Treasury money market mutual funds | | $ | 323,206 | | | $ | 425,259 | |
Corporate debt securities | | | 30,495 | | | | 20,000 | |
| | | | | | | | |
Total cash equivalents | | | 353,701 | | | | 445,259 | |
Debt securities issued by the U.S. Treasury | | | — | | | | 20,785 | |
Corporate debt securities | | | 88,471 | | | | 4,080 | |
Debt securities issued by U.S. Government agencies | | | 30,201 | | | | — | |
Long-term investments | | | — | | | | 2,990 | |
| | | | | | | | |
Total cash equivalents, investments and long-term investments | | $ | 472,373 | | | $ | 473,114 | |
| | | | | | | | |
At December 31, 2010 and December 31, 2009, the carrying values of investments included in cash and cash equivalents approximated fair value.
F-13
tw telecom inc.
NOTES TO CONSOLIDATED FINANCIAL STATEMENTS—(Continued)
At December 31, 2009, all of the Company’s investments were categorized as held-to-maturity and carried at amortized cost. The estimated fair value of the held-to-maturity investments was not materially different from their amortized cost. During the three months ended March 31, 2010, the Company’s investments were transferred from the held-to-maturity classification to the available-for-sale classification as a result of management’s decision to make the investments available to be sold prior to their maturity dates to purchase investments with a higher yield. At the date of transfer, the net carrying amount was $71.5 million and the Company recognized an immaterial amount of unrealized gain.
Proceeds from the sale and maturity of available-for-sale securities during the year ended December 31, 2010 were $154.8 million. The Company recognized no material unrealized or realized net gains or losses from available-for-sale securities during the year ended December 31, 2010. The amortized cost basis of the available-for-sale securities was not materially different from the aggregate fair value. The contractual maturities of the Company’s available-for-sale securities are all within one year.
During the year ended December 31, 2008, the Company recognized an impairment loss of $7.8 million on commercial paper investments purchased in 2007 with exposure to sub-prime mortgages that were past their maturity dates. There was no such loss during the year ended December 31, 2009. The carrying value of these securities was $3.0 million at December 31, 2009, and are classified as long-term investments in the December 31, 2009 consolidated balance sheet. The carrying value was estimated based principally on data from financial advisors to fiduciaries for the commercial paper holders (see Note 6). During the year ended December 31, 2010, the Company received $3.8 million in proceeds from liquidation of these securities, resulting in an $0.8 million realized gain recorded in other income.
3. Intangible Assets
Goodwill
The Company had goodwill of $412.7 million at both December 31, 2010 and 2009.
Definite Life Intangibles
Definite life intangibles consist primarily of acquired customer relationships. Definite life intangible assets are being amortized using methods of amortization that correlate to the pattern in which the economic benefits are expected to be realized. Customer relationships are amortized using the sum of the years digits method over an estimated life of 10 years. Other intangible assets, primarily acquired intangible assets, are being amortized on a straight-line basis using expected lives of 10 years. Definite life intangible assets subject to amortization were as follows:
| | | | | | | | | | | | | | | | | | | | | | | | |
| | | December 31, 2010 | | | December 31, 2009 | |
| | | Gross
Carrying
Value | | | Accumulated
Amortization | | | Net
Carrying
Value | | | Gross
Carrying
Value | | | Accumulated
Amortization | | | Net
Carrying
Value | |
| | | (amounts in thousands) | |
Customer relationships | | $ | 59,086 | | | $ | (37,600 | ) | | $ | 21,486 | | | $ | 59,086 | | | $ | (30,259 | ) | | $ | 28,827 | |
Other | | | 6,363 | | | | (3,405 | ) | | | 2,958 | | | | 6,363 | | | | (2,970 | ) | | | 3,393 | |
| | | | | | | | | | | | | | | | | | | | | | | | |
| | $ | 65,449 | | | $ | (41,005 | ) | | $ | 24,444 | | | $ | 65,449 | | | $ | (33,229 | ) | | $ | 32,220 | |
| | | | | | | | | | | | | | | | | | | | | | | | |
Intangible asset amortization expense was $7.8 million, $8.9 million and $9.9 million for the years ended December 31, 2010, 2009 and 2008, respectively.
F-14
tw telecom inc.
NOTES TO CONSOLIDATED FINANCIAL STATEMENTS—(Continued)
The amortization expense related to intangible assets recorded as of December 31, 2010 for each of the five succeeding years is estimated to be the following: 2011—$6.7 million; 2012—$5.6 million; 2013—$4.5 million; 2014—$3.4 million and 2015—$2.3 million.
4. Long-Term Debt
| | | | | | | | |
| | | December 31, | |
| | | 2010 | | | 2009 | |
| | | (amounts in thousands) | |
Term Loan B—January 2013 tranche, due 2013 | | $ | 103,130 | | | $ | 582,000 | |
Term Loan B—extended tranche, due 2016 | | | 472,870 | | | | — | |
9 1/4% Senior Notes, due 2014 | | | — | | | | 400,000 | |
8% Senior Notes, due 2018 | | | 430,000 | | | | — | |
2 3/8% Convertible Senior Debentures, due 2026 | | | 373,744 | | | | 373,750 | |
| | | | | | | | |
Total debt | | | 1,379,744 | | | | 1,355,750 | |
Unamortized premium | | | — | | | | 229 | |
Unamortized discounts | | | (49,505 | ) | | | (64,808 | ) |
Current portion | | | (6,000 | ) | | | (6,000 | ) |
| | | | | | | | |
Total long-term debt | | $ | 1,324,239 | | | $ | 1,285,171 | |
| | | | | | | | |
The schedule of principal payments on long-term debt as of December 31, 2010 is as follows (amounts in thousands):
| | | | |
2011 | | | 6,000 | |
2012 | | | 6,000 | |
2013 | | | 479,652 | |
2014 | | | 4,926 | |
2015 | | | 4,926 | |
Thereafter | | | 878,240 | |
| | | | |
Total payments | | $ | 1,379,744 | |
| | | | |
8% Senior Notes due 2018
In March 2010, the Company’s wholly owned subsidiary,tw telecom holdings inc.(“Holdings”) completed a private offering of $430 million aggregate principal amount of 8% Senior Notes due 2018 (the “2018 Notes”) at an offering price of 99.284% of the principal amount. The net proceeds from the offering were used to fund Holdings’ extinguishment of its 9 1/4% Senior Notes due February 2014 (the “2014 Notes”) through a concurrent tender offer (see discussion below). The 2018 Notes are unsecured obligations of Holdings and are guaranteed by the Company and substantially all of Holdings’ subsidiaries. Interest is payable semi-annually on September 1 and March 1, commencing on September 1, 2010. The 2018 Notes are redeemable in whole or in part, at Holdings’ option, at any time on or after March 1, 2014, 2015 and 2016 at redemption prices of 104%, 102% and 100%, respectively. In addition, prior to March 1, 2013, at Holdings’ option, Holdings may redeem up to 35% of the aggregate principal amount of the 2018 Notes with the net proceeds from one or more equity offerings by the Company at a redemption price of 108% of their principal amount, plus accrued and unpaid interest, if any. Offering costs of $9.5 million related to the 2018 Notes were deferred and are being amortized to interest expense over the term of the 2018 Notes. Interest expense, including amortization of deferred debt issuance costs and discount relating to the 2018 Notes, was $28.4 million for the year ended December 31, 2010.
F-15
tw telecom inc.
NOTES TO CONSOLIDATED FINANCIAL STATEMENTS—(Continued)
As required by a Registration Rights Agreement with the initial purchasers of the 2018 Notes, Holdings conducted an exchange offer in July 2010 to enable the holders of the 2018 Notes to exchange the unregistered 2018 Notes for notes registered under the Securities Act of 1933 with essentially identical terms. Pursuant to the exchange offer, $430 million in principal amount of unregistered 2018 Notes were exchanged for $430 million in principal amount of registered 2018 Notes. The exchange offer for the 2018 Notes did not have a material impact on the Company’s financial position or results of operation.
9 1/4% Senior Notes due 2014
As of December 31, 2009, Holdings had outstanding $400 million principal amount of the 2014 Notes. In connection with the March 2010 private offering of the 2018 Notes discussed above, Holdings purchased $366.5 million principal amount of 2014 Notes in a concurrent tender offer at a price of 103.45% of the principal amount, and the remaining $33.5 million principal amount of the 2014 Notes were either tendered or redeemed at a price of 103.083% of the principal amount. During the year ended December 31, 2010, the Company recognized debt extinguishment costs of $17.1 million, comprised of $13.7 million for premiums associated with the tender offer and redemption and $3.6 million for write off of deferred debt issuance costs net of a gain of $0.2 million for write off of issuance premium related to the 2014 Notes. Interest expense, including amortization of deferred debt issuance costs and premium relating to the 2014 Notes, was $8.2 million, $37.9 million and $37.9 million for the years ended December 31, 2010, 2009 and 2008, respectively.
2 3/8% Convertible Senior Debentures due 2026
As of December 31, 2010, the Company had outstanding $373.8 million principal amount 2 3/8% Convertible Senior Debentures due April 1, 2026 (the “Convertible Debentures”). The Convertible Debentures are general, unsecured obligations of the Company. Interest is payable semi-annually on April 1 and October 1, commencing October 1, 2006. The Convertible Debentures are redeemable in whole or in part at the Company’s option at any time on or after April 6, 2013 at a redemption price equal to 100% of the principal amount of the debentures to be redeemed, plus accrued and unpaid interest. Holders of the debentures have the option to require the Company to purchase all or part of the Convertible Debentures on April 1, 2013, April 1, 2016 or April 1, 2021 at 100% of the principal and unpaid interest, or at any time prior to April 1, 2026, to convert the debentures into shares of the Company’s common stock at a conversion rate of 53.6466 per $1,000 principal amount of debentures, representing a conversion price of $18.64 per share. Upon conversion, the Company will have the right to deliver, in lieu of shares of common stock, cash or a combination of cash and shares of common stock. As of December 31, 2010, an immaterial amount of Convertible Debentures had been converted and the Company delivered cash in lieu of common stock in connection with that conversion.
F-16
tw telecom inc.
NOTES TO CONSOLIDATED FINANCIAL STATEMENTS—(Continued)
In accordance with authoritative guidance issued by the FASB for convertible debt instruments, the Company separated the Convertible Debentures into debt and equity components at issuance and has assigned a value to each. The value assigned to the equity component was $120.5 million, net of an allocable portion of deferred debt issuance costs, as of December 31, 2010 and 2009, and is included as a component of additional paid in capital. The value assigned to the debt component was $253.3 million and represents the estimated fair value, as of the issuance date (March 29, 2006), of a similar instrument without the conversion feature. The unamortized discount will be amortized to interest expense using the interest rate method through March 31, 2013. The following table reflects the principal and discount included in the consolidated balance sheets as of December 31, 2010 and 2009:
| | | | | | | | |
| | | December 31, | |
| | | 2010 | | | 2009 | |
| | | (amounts in thousands) | |
Principal amount of Convertible Debentures | | $ | 373,744 | | | $ | 373,750 | |
Unamortized discount | | | (46,732 | ) | | | (64,808 | ) |
| | | | | | | | |
Net carrying amount of Convertible Debentures | | $ | 327,012 | | | $ | 308,942 | |
| | | | | | | | |
The Company recognized the following amounts to interest expense related to the Convertible Debentures for the years ended December 31, 2010, 2009 and 2008:
| | | | | | | | | | | | |
| | | Years ended December 31, | |
| | | 2010 | | | 2009 | | | 2008 | |
| | | (amounts in thousands) | |
Interest expense, contractual amount at 2 3/8% | | $ | 8,875 | | | $ | 8,877 | | | $ | 8,877 | |
Interest expense, amortization of discount | | | 18,077 | | | | 16,609 | | | | 15,260 | |
Interest expense, amortization of deferred debt issuance costs | | | 1,098 | | | | 1,098 | | | | 1,098 | |
| | | | | | | | | | | | |
Total interest expense for Convertible Debentures | | $ | 28,050 | | | $ | 26,584 | | | $ | 25,235 | |
| | | | | | | | | | | | |
Effective interest rate on liability component | | | 8.5 | % | | | 8.5 | % | | | 8.5 | % |
| | | | | | | | | | | | |
Term Loan B
As of December 31, 2010, Holdings had a $680 million senior secured credit facility (the “Credit Facility”) consisting of a $600 million Term Loan B (“Term Loan”) and an undrawn $80 million revolving credit facility (the “Revolver”). On December 2, 2010, Holdings amended and restated the Credit Facility agreement to extend from January 2013 to December 2016 the maturity of approximately $474.1 million (the “extended tranche”) of the $577.5 million in principal amount of the Term Loan then outstanding. The January 2013 maturity date of the remaining $103.4 million in principal amount (the “January 2013 tranche”) was unchanged. The term of Holdings’ undrawn Revolver was extended from October 2011 to December 2014. As of December 31, 2010, Holdings had outstanding $472.9 million principal amount of the extended tranche and $103.1 million of the January 2013 tranche. Components of the Credit Facility, as amended, and related financing are detailed below:
| | • | | The Term Loan is a secured obligation, on a first lien basis, of Holdings. The Term Loan is guaranteed by the Company and Holdings’ subsidiaries. Repayments of the Term Loan are due quarterly in an amount equal to 1/4 of 1% of the aggregate principal amount on the last day of each quarter. Interest on the January 2013 tranche is computed based on a specified Eurodollar rate plus 1.75% to 2.0%, of which 1.75% was in effect at December 31, 2010. Interest on the extended tranche is computed based on a specified Eurodollar rate plus 3.25%. Interest is reset periodically and payable at least quarterly. |
F-17
tw telecom inc.
NOTES TO CONSOLIDATED FINANCIAL STATEMENTS—(Continued)
| | Based on the Eurodollar rate and an interest rate swap (see Note 5) in effect at December 31, 2010, the weighted average effective interest rate was 3.8%. In accordance with applicable accounting guidance, the amended and restated Term Loan agreement was accounted for as a modification of the existing debt. The fees paid to the holders of the extended tranche of $3.8 million were added to the allocable share of existing debt issuance costs and will be amortized over the term of the extended tranche. Interest expense, including amortization of deferred debt issuance costs, the effect of interest rate swap agreements and commitment fees, was $17.0 million, $20.3 million and $30.9 million for the years ended December 31, 2010, 2009 and 2008, respectively. |
| | • | | The Revolver is secured and guaranteed in the same manner as the Term Loan. Interest on outstanding amounts, if any, will be computed based on a specified Eurodollar rate plus 2.5% to 3.5% and will be reset periodically and payable at least quarterly. The Company is required to pay a commitment fee on the undrawn commitment amounts on a quarterly basis of 0.5% per annum. If the Revolver were drawn, certain restrictive financial covenants would apply. The fees paid to the lenders of $0.5 million were added to the existing debt issuance costs and will be amortized through the expiration date. Commitment fee expense and amortization of deferred debt issuance costs relating to the Revolver was $0.5 million, $0.5 million and $0.6 million for the years ended December 31, 2010, 2009 and 2008, respectively. |
The Term Loan negative covenants were amended so that the amended Term Loan agreement contains similar restrictions to those contained in the indenture for the 2018 Notes. The Revolver covenants, which also were amended, contain additional restrictions, as well as certain financial covenants that the Company, Holdings and its subsidiaries must comply with if Holdings draws on the Revolver.
As of December 31, 2010, the Company and Holdings were in compliance with all of their covenants under the 2018 Notes, the Term Loan and the Revolver.
5. Derivative Financial Instruments
The variable rate Term Loan exposes the Company to variability in interest payments due to changes in interest rates. In order to mitigate interest rate fluctuations on the Term Loan, Holdings has entered into derivative instruments, specifically interest rate swap agreements. The interest rate swap agreements effectively convert a portion of Holdings’ floating-rate debt to a fixed-rate basis for the term of the agreement to reduce the impact of interest rate changes on future interest expense. The Company has designated its interest rate swap agreements as cash flow hedges.
The following table reflects the terms of Holdings’ interest rate swap agreement in effect at December 31, 2010:
| | | | | | | | | | | | |
Term | | Notional
amount | | Fixed
rate | | | Total weighted
average rate,
including spread | |
Beginning | | End | | | |
November 28, 2008 | | November 28, 2011 | | $100 million | | | 2.96 | % | | | 5.94 | % |
F-18
tw telecom inc.
NOTES TO CONSOLIDATED FINANCIAL STATEMENTS—(Continued)
The following table summarizes the fair value of derivatives reported in the consolidated balance sheets:
| | | | | | | | | | |
| | | Liability Derivatives | |
Derivatives- cash flow hedges | | Balance Sheet Location | | December 31, | |
| | | 2010 | | | 2009 | |
| | | | | (amounts in thousands) | |
Interest rate swap agreements | | Other current liabilities | | $ | 2,412 | | | $ | 988 | |
Interest rate swap agreements | | Other long-term liabilities | | | — | | | | 3,250 | |
| | | | | | | | | | |
Total fair value of derivatives designated as cash flow hedges | | $ | 2,412 | | | $ | 4,238 | |
| | | | | | | | | | |
The unrecognized losses for the interest rate swap agreements included in accumulated other comprehensive loss at December 31, 2010, 2009 and 2008 were $2.4 million, $4.2 million and $7.1 million, respectively. Based on the fair value of the interest rate swap of $2.4 million at December 31, 2010, the Company expects to recognize in interest expense $2.4 million of net losses on the interest rate swap agreement during the next 12 months upon payment of interest associated with the Term Loan. Actual amounts ultimately recognized in interest expense are dependent on the interest rates in effect when settlements on the interest rate swap agreement occur each month. The variable rate, including the applicable spread, in effect at December 31, 2010 for the Term Loan, excluding the impact of the interest rate swap agreement, was 2.04% on the January 2013 tranche and 3.54% on the extended tranche. The effect of the interest rate swaps on the consolidated statements of operations was as follows for the years ended December 31, 2010, 2009 and 2008:
| | | | | | | | | | | | |
| | | Years Ended December 31, | |
| | | 2010 | | | 2009 | | | 2008 | |
| | | (amounts in thousands) | |
Gain/(Loss) recognized in other comprehensive income/(loss) (effective portion) | | $ | (1,891 | ) | | $ | (2,653 | ) | | $ | (7,712 | ) |
| | | | | | | | | | | | |
Loss reclassified from accumulated other comprehensive loss into interest expense (effective portion) | | $ | (3,717 | ) | | $ | (5,562 | ) | | $ | (565 | ) |
| | | | | | | | | | | | |
Gain/(Loss) recognized in income (ineffective portion and amount excluded from effectiveness testing) | | $ | — | | | $ | — | | | $ | — | |
| | | | | | | | | | | | |
6. Fair Value Measurements
Fair value, as defined by relevant accounting standards, is the price that would be received from selling an asset or paid to transfer a liability in an orderly transaction between market participants at the measurement date. When determining the fair value measurements for assets and liabilities required to be recorded at fair value, the Company considers the principal or most advantageous market in which it would complete a transaction and considers assumptions that market participants would use when pricing the asset or liability, such as inherent risk, transfer restrictions, and risk of nonperformance.
F-19
tw telecom inc.
NOTES TO CONSOLIDATED FINANCIAL STATEMENTS—(Continued)
Fair Value Hierarchy
Relevant accounting standards set forth a fair value hierarchy that requires an entity to maximize the use of observable inputs and minimize the use of unobservable inputs when measuring fair value. A financial instrument’s categorization within the fair value hierarchy is based upon the lowest level of input that is significant to the fair value measurement. Relevant accounting standards establish three levels of inputs that may be used to measure fair value:
| | • | | Level 1—Quoted prices in active markets for identical assets or liabilities. Level 1 assets that are measured at fair value on a recurring basis consist of the Company’s investments in U.S. Treasury money market mutual funds that are traded in an active market with sufficient volume and frequency of transactions, and are included as a component of cash and cash equivalents in the consolidated balance sheets. |
| | • | | Level 2—Observable inputs other than Level 1 prices such as quoted prices for similar assets or liabilities; quoted prices in markets with insufficient volume or infrequent transactions (less active markets); or model-derived valuations in which all significant inputs are observable or can be derived principally from or corroborated by observable market data for substantially the full term of the assets or liabilities. Level 2 assets that are measured at fair value on a recurring basis consist of the Company’s investments in corporate debt securities and debt securities issued by U.S. government agencies using observable inputs in less active markets and are included as a component of investments in the consolidated balance sheets. Level 2 liabilities that are measured at fair value on a recurring basis include the Company’s interest rate swap agreement priced using discounted cash flow techniques that use observable market inputs, such as LIBOR-based yield curves, forward rates, and credit ratings and are included as a component of other current liabilities and other long-term liabilities in the consolidated balance sheets. |
| | • | | Level 3—Unobservable inputs to the valuation methodology that are significant to the measurement of fair value of assets or liabilities. Level 3 assets that are measured at fair value include the Company’s investment in commercial paper purchased in 2007 with exposure to sub-prime mortgages that is past its maturity date included in long-term investments in the consolidated balance sheets. The carrying value of the investments as of December 31, 2009 of $3.0 million was estimated based principally on data from financial advisors to fiduciaries for the commercial paper holders. The valuation considered a combination of (i) the present value of future principal and interest payments discounted at rates considered to reflect current market conditions; (ii) individual valuation estimates of the securities underlying the commercial paper using multiple indicators of value; and (iii) the probabilities of repayment of the underlying securities under various liquidation scenarios including inputs such as recoveries, estimated losses and default percentages. During the year ended December 31, 2010, the Company received proceeds of $3.8 million upon liquidation of these securities (see the table of changes in Level 3 assets below). |
F-20
tw telecom inc.
NOTES TO CONSOLIDATED FINANCIAL STATEMENTS—(Continued)
The following tables reflect assets and liabilities that are measured and carried at fair value on a recurring basis as of December 31, 2010 and 2009:
| | | | | | | | | | | | | | | | |
| | | Fair Value Measurements At
December 31, 2010 | | | Assets/Liabilities
at Fair Value | |
| | | Level 1 | | | Level 2 | | | Level 3 | | |
| | | (amounts in thousands) | |
Assets | | | | | | | | | | | | | | | | |
U.S. Treasury money market mutual funds | | $ | 323,206 | | | $ | — | | | $ | — | | | $ | 323,206 | |
Corporate debt securities | | | — | | | | 30,495 | | | | — | | | | 30,495 | |
| | | | | | | | | | | | | | | | |
Investments included in cash and cash equivalents | | $ | 323,206 | | | $ | 30,495 | | | $ | — | | | $ | 353,701 | |
Corporate debt securities | | | — | | | | 88,471 | | | | — | | | | 88,471 | |
Debt securities issued by U.S. Government agencies | | | — | | | | 30,201 | | | | — | | | | 30,201 | |
| | | | | | | | | | | | | | | | |
Short-term investments | | $ | — | | | $ | 118,672 | | | $ | — | | | $ | 118,672 | |
| | | | | | | | | | | | | | | | |
Total assets | | $ | 323,206 | | | $ | 149,167 | | | $ | — | | | $ | 472,373 | |
| | | | | | | | | | | | | | | | |
Liabilities | | | | | | | | | | | | | | | | |
Interest rate swap agreements | | $ | — | | | $ | 2,412 | | | $ | — | | | $ | 2,412 | |
| | | | | | | | | | | | | | | | |
Total liabilities | | $ | — | | | $ | 2,412 | | | $ | — | | | $ | 2,412 | |
| | | | | | | | | | | | | | | | |
| | | | | | | | | | | | | | | | |
| | | Fair Value Measurements At
December 31, 2009 | | | Assets/Liabilities
at Fair Value | |
| | | Level 1 | | | Level 2 | | | Level 3 | | |
| | | (amounts in thousands) | |
Assets | | | | | | | | | | | | | | | | |
U.S. Treasury money market mutual funds | | $ | 425,259 | | | $ | — | | | $ | — | | | $ | 425,259 | |
| | | | | | | | | | | | | | | | |
Investments included in cash and cash equivalents | | $ | 425,259 | | | $ | — | | | $ | — | | | $ | 425,259 | |
Long-term investments | | | — | | | | — | | | | 2,990 | | | | 2,990 | |
| | | | | | | | | | | | | | | | |
Total assets | | $ | 425,259 | | | $ | — | | | $ | 2,990 | | | $ | 428,249 | |
| | | | | | | | | | | | | | | | |
Liabilities | | | | | | | | | | | | | | | | |
Interest rate swap agreements | | $ | — | | | $ | 4,238 | | | $ | — | | | $ | 4,238 | |
| | | | | | | | | | | | | | | | |
Total liabilities | | $ | — | | | $ | 4,238 | | | $ | — | | | $ | 4,238 | |
| | | | | | | | | | | | | | | | |
The following table presents the changes in the Company’s assets previously measured at fair value using significant unobservable inputs (Level 3) as defined by relevant accounting guidance:
| | | | |
| | | Long-term
investments | |
| | | (amounts in thousands) | |
Balance at December 31, 2009 | | $ | 2,990 | |
Cash received on settlements | | | (3,815 | ) |
Realized gain included in other income | | | 825 | |
| | | | |
Balance at December 31, 2010 | | $ | — | |
| | | | |
F-21
tw telecom inc.
NOTES TO CONSOLIDATED FINANCIAL STATEMENTS—(Continued)
While the Company’s long-term debt has not been listed on any securities exchange or inter-dealer automated quotation system, the Company has estimated the fair value of its long-term debt based on indicative pricing published by certain investment banks. While the Company believes these approximations to be reasonably accurate at the time published, indicative pricing can vary widely depending on volume traded by any given investment bank and other factors. The following table summarizes the carrying amounts and estimated fair values of the Company’s long-term debt, including the current portion:
| | | | | | | | | | | | | | | | |
| | | December 31, 2010 | | | December 31, 2009 | |
| | | Carrying
Value | | | Fair Value | | | Carrying
Value | | | Fair Value | |
| | | (amounts in thousands) | |
Term Loan B—January 2013 tranche | | $ | 103,130 | | | $ | 101,841 | | | $ | 582,000 | | | $ | 556,718 | |
Term Loan B—Extended tranche | | | 472,870 | | | | 472,870 | | | | — | | | | — | |
9 1/4% Senior Notes, including premium | | | — | | | | — | | | | 400,229 | | | | 411,000 | |
8% Senior Notes, net of discount | | | 427,227 | | | | 459,025 | | | | — | | | | — | |
2 3/8% Convertible Senior Debentures, net of discount | | | 327,012 | | | | 412,987 | | | | 308,942 | | | | 412,059 | |
| | | | | | | | | | | | | | | | |
Total debt | | $ | 1,330,239 | | | $ | 1,446,723 | | | $ | 1,291,171 | | | $ | 1,379,777 | |
| | | | | | | | | | | | | | | | |
7. Income Taxes
Income tax (benefit) expense for the years ended December 31, 2010, 2009 and 2008 was as follows:
| | | | | | | | | | | | |
| | | Years ended December 31, | |
| | | 2010 | | | 2009 | | | 2008 | |
| | | (amounts in thousands) | |
Current: | | | | | | | | | | | | |
Federal | | $ | 270 | | | $ | 389 | | | | — | |
State | | | 1,965 | | | | 2,357 | | | | 2,347 | |
| | | | | | | | | | | | |
| | | 2,235 | | | | 2,746 | | | | 2,347 | |
Deferred: | | | | | | | | | | | | |
Federal | | | 20,872 | | | | — | | | | — | |
State | | | 651 | | | | — | | | | — | |
| | | | | | | | | | | | |
| | | 21,523 | | | | — | | | | — | |
| | | | | | | | | | | | |
Tax benefit of valuation allowance release (1) | | | (245,609 | ) | | | — | | | | — | |
| | | | | | | | | | | | |
Income tax (benefit) expense | | $ | (221,851 | ) | | $ | 2,746 | | | | 2,347 | |
| | | | | | | | | | | | |
| (1) | The decrease in the valuation allowance was comprised of (i) the portion related to future year’s earnings, which resulted in a reversal of $227.3 million in the valuation allowance in 2010 (see below), and (ii) the portion related to current year earnings. |
F-22
tw telecom inc.
NOTES TO CONSOLIDATED FINANCIAL STATEMENTS—(Continued)
Total income tax (benefit) expense differed from the amounts computed by applying the federal statutory income tax rate of 35% to income (loss) before income taxes as a result of the following items for the years ended December 31, 2010, 2009 and 2008:
| | | | | | | | | | | | |
| | | Years ended December 31, | |
| | | 2010 | | | 2009 | | | 2008 | |
Federal statutory income tax expense (benefit) | | | 35.0 | % | | | 35.0 | % | | | (35.0 | )% |
State income tax expense, net of federal income tax benefit | | | 5.3 | | | | 7.0 | | | | 18.7 | |
Change in valuation allowance | | | (495.3 | ) | | | (39.9 | ) | | | 41.6 | |
Other | | | 7.6 | | | | 7.0 | | | | 22.4 | |
| | | | | | | | | | | | |
Income tax (benefit) expense | | | (447.4 | )% | | | 9.1 | % | | | 47.7 | % |
| | | | | | | | | | | | |
The tax effects of temporary differences that give rise to significant components of the Company’s deferred tax assets and liabilities at December 31, 2010 and 2009 are as follows:
| | | | | | | | |
| | | December 31, | |
| | | 2010 | | | 2009 | |
| | | (amounts in thousands) | |
Deferred tax assets: | | | | | | | | |
Net operating loss carryforwards | | $ | 359,773 | | | $ | 375,820 | |
Accrued liabilities | | | 33,983 | | | | 34,631 | |
Stock options | | | 18,184 | | | | 17,313 | |
Deferred revenue | | | 6,377 | | | | 5,748 | |
Allowance for doubtful accounts | | | 3,041 | | | | 1,813 | |
Other | | | 8,058 | | | | 8,032 | |
| | | | | | | | |
Total deferred tax assets | | | 429,416 | | | | 443,357 | |
Deferred tax liabilities: | | | | | | | | |
Depreciation and amortization | | | (109,581 | ) | | | (81,227 | ) |
Discount on Convertible Debentures | | | (15,502 | ) | | | (24,705 | ) |
Prepaid expenses | | | (2,878 | ) | | | (1,903 | ) |
| | | | | | | | |
Total deferred tax liabilities | | | (127,961 | ) | | | (107,835 | ) |
Less: Valuation allowance | | | (18,024 | ) | | | (276,772 | ) |
| | | | | | | | |
Total deferred tax asset, net | | $ | 283,431 | | | $ | 58,750 | |
| | | | | | | | |
Balance sheet classification of deferred taxes: | | | | | | | | |
Deferred income tax asset, net—current | | $ | 42,433 | | | $ | 29,574 | |
Deferred income tax asset, net—non-current | | | 240,998 | | | | 29,176 | |
| | | | | | | | |
Total deferred tax asset, net | | $ | 283,431 | | | $ | 58,750 | |
| | | | | | | | |
Prior to 2008, the Company had a history of losses and, as a result, has historically recognized a valuation allowance for net deferred tax assets. Each quarter, the Company evaluates the need to retain all or a portion of the valuation allowance on its net deferred tax assets. During 2010, the Company determined that it was more likely than not that the vast majority of its deferred tax assets, including net operating loss carryforwards (“NOLs”), will be realized, and as a result reversed $227.3 million of the valuation allowance. In making this determination, the Company analyzed, among other things, its recent history of earnings, its cumulative earnings for the last 12 quarters, and forecasts of future earnings. The reversal of the valuation allowance resulted in an
F-23
tw telecom inc.
NOTES TO CONSOLIDATED FINANCIAL STATEMENTS—(Continued)
income tax benefit of $227.3 million, or $1.50 per basic share and $1.46 per diluted share for the year ended December 31, 2010, and an increase in the current and non-current deferred tax assets on the consolidated balance sheet as of December 31, 2010.
The Company continues to maintain a valuation allowance against certain deferred tax assets totaling $18.0 million. The Company believes it is more likely than not that certain deferred tax assets, including those resulting from NOLs subject to certain limitations and those that require future income of special character, will not be realized. Additionally, the Company has certain deferred tax assets attributable to stock option deductions for which the related valuation allowance cannot be reversed due to relevant accounting guidance concerning tax benefits related to the exercise of non-qualified stock options prior to the adoption of such accounting guidance. At December 31, 2010, $3.5 million of the valuation allowance related to stock compensation for which subsequently recognized tax benefits will be allocated directly to additional paid in capital.
As a result of certain realization requirements of applicable accounting guidance, the table of deferred tax assets and liabilities shown above does not include certain deferred tax assets that arose directly from (or the use of which was postponed by) tax deductions related to equity compensation in excess of compensation recognized for financial reporting. Equity will be increased by $44.5 million if and when such deferred tax assets are ultimately realized. The Company uses the ordering rules prescribed by relevant accounting guidance for purposes of determining when the excess tax benefits have been realized. The Company has $18.2 million in deferred tax assets related to stock-based compensation. If the actual future tax deductions are less than the deferred tax asset recorded, this will result in an increase to income tax expense.
At December 31, 2010, the Company had NOLs for federal income tax purposes of $1.1 billion. The Company’s NOLs, if not utilized to reduce taxable income in future periods, generally expire in various amounts beginning in 2020 and ending in 2026. The Company utilized NOLs to offset income tax obligations in each of the years ended December 31, 2009, 2008 and 2007. The Tax Reform Act of 1986 contains provisions that limit the utilization of NOLs if there has been an “ownership change” as described in Section 382 of the Internal Revenue Code. In general, this would occur if certain ownership changes related to the Company’s stock that are held by 5 percent or greater stockholders exceeds 50 percent measured over a rolling three year period. If the Company experiences such an ownership change, the utilization of its NOLs to reduce future federal income tax obligations could be limited. In an effort to reduce the likelihood of an ownership change as defined by Section 382, the Company adopted a stockholder rights plan in January 2009 that was ratified by the Company’s stockholders in June 2009.
As of December 31, 2010, the Company had no material uncertain tax positions.
8. Stock-Based Compensation
tw telecom 1998 Employee Stock Option Plan
The Company maintains thetw telecom1998 Employee Stock Option Plan that reserved 9.0 million shares of common stock to be issued to officers and eligible employees under terms and conditions to be set by the Company’s Board of Directors. As of December 31, 2010, approximately 1.9 million shares of common stock were reserved for issuance upon exercise of outstanding options under that plan. Generally, the options vest over periods of up to four years and expire seven or ten years from the date of issuance. These options have been granted to employees of the Company with an exercise price equal to market value at the date of grant. Thetw telecom1998 Employee Stock Option Plan expired in August 2008 and no additional awards may be granted under this plan.
F-24
tw telecom inc.
NOTES TO CONSOLIDATED FINANCIAL STATEMENTS—(Continued)
tw telecom2000 Employee Stock Plan
The Company maintains thetw telecom 2000 Employee Stock Plan (as amended in June 2009) that permits up to 39.0 million shares of common stock to be issued pursuant to stock options and stock awards granted to officers, directors, and eligible employees under terms and conditions to be set by the Company’s Board of Directors. As of December 31, 2010, approximately 8.3 million shares of common stock were reserved for issuance upon exercise of outstanding options and vesting of stock awards and approximately 15.1 million shares of common stock were available for grant under the plan. Generally, the options and awards vest over periods of up to four years and options expire either seven or ten years from the date of issuance.
The options have been granted to employees of the Company with an exercise price equal to market value of the underlying stock at the date of grant. The fair value of the restricted stock awards and restricted stock units granted was measured based on the market value of the shares on the date of grant and the resulting expense related to these awards is recorded over their vesting periods, generally up to four years. The weighted-average fair value of options granted was $7.61, $3.56 and $7.18 for the years ended December 31, 2010, 2009 and 2008, respectively, with the following weighted-average assumptions:
| | | | | | | | | | | | |
| | | Years ended December 31, | |
| | | 2010 | | | 2009 | | | 2008 | |
Expected volatility | | | 53% | | | | 56% | | | | 50% | |
Risk-free interest rate | | | 2.5% | | | | 1.7% | | | | 2.5% | |
Dividend yield | | | 0% | | | | 0% | | | | 0% | |
Expected term | | | 5.2 years | | | | 4 years | | | | 4 years | |
The table below summarizes the Company’s stock option activity and related information for the year ended December 31, 2010:
| | | | | | | | | | | | | | | | |
| | | Options | | | Weighted
Avg
Exercise
Price | | | Weighted
Avg
Remaining
Contractual
Life | | | Aggregate
Intrinsic
Value | |
| | | | | | | | | (in years) | | | (thousands) | |
Options outstanding at January 1, 2010 | | | 11,034,735 | | | $ | 22.61 | | | | | | | | | |
Granted | | | 611,019 | | | | 15.55 | | | | | | | | | |
Exercised | | | (698,096 | ) | | | 7.37 | | | | | | | | | |
Forfeited | | | (80,041 | ) | | | 16.28 | | | | | | | | | |
Expired | | | (1,713,940 | ) | | | 57.96 | | | | | | | | | |
| | | | | | | | | | | | | | | | |
Options outstanding at December 31, 2010 | | | 9,153,677 | | | | 16.72 | | | | 4.12 | | | $ | 30,296 | |
| | | | | | | | | | | | | | | | |
Vested and expected to vest at December 31, 2010 | | | 8,990,253 | | | $ | 16.79 | | | | 4.06 | | | $ | 29,430 | |
| | | | | | | | | | | | | | | | |
Exercisable at December 31, 2010 | | | 6,050,060 | | | $ | 18.26 | | | | 2.81 | | | $ | 17,583 | |
| | | | | | | | | | | | | | | | |
The total intrinsic value of stock options exercised during the years ended December 31, 2010, 2009 and 2008 was $7.1 million, $4.8 million and $5.8 million, respectively. As of December 31, 2010, there was $12.6 million of total unrecognized compensation expense related to unvested stock options, which is expected to be recognized over a weighted-average period of 1.8 years.
F-25
tw telecom inc.
NOTES TO CONSOLIDATED FINANCIAL STATEMENTS—(Continued)
The table below summarizes the Company’s restricted stock and restricted stock units and related information for the year ended December 31, 2010:
| | | | | | | | |
| | | Shares | | | Weighted
Average
Grant
Date Fair
Value | |
Nonvested at January 1, 2010 | | | 2,296,313 | | | $ | 10.65 | |
Granted | | | 1,715,851 | | | | 15.47 | |
Vested | | | (795,149 | ) | | | 13.09 | |
Forfeited | | | (55,457 | ) | | | 13.51 | |
| | | | | | | | |
Nonvested at December 31, 2010 | | | 3,161,558 | | | $ | 12.65 | |
| | | | | | | | |
The total fair value of restricted stock and restricted stock units vested during the years ended December 31, 2010, 2009 and 2008 was $12.8 million, $10.2 million and $7.9 million, respectively. As of December 31, 2010, there was $29.5 million of total unrecognized compensation expense related to non-vested restricted stock awards and restricted stock units, which is expected to be recognized over a weighted-average period of 1.3 years.
Effective October 1, 2004, the Company adopted thetw telecom 2004 Qualified Stock Purchase Plan (the “2004 Stock Purchase Plan”). Employees who met certain eligibility requirements could elect to designate up to 15% of their eligible compensation, up to an annual limit of $25,000, to purchase shares of the Company’s common stock at a 15% discount to fair market value. Stock purchases occurred semi-annually, with the price per share equaling the lower of 85% of the market price at the beginning or end of the offering period. The Company is authorized to issue a total of 600,000 shares of the Company’s common stock to participants in the 2004 Stock Purchase Plan. In September 2007, the 2004 Stock Purchase Plan was amended to authorize an additional 600,000 shares for issuance under the 2004 Stock Purchase Plan. During 2008, the Company issued approximately 14,000 shares of common stock under the 2004 Stock Purchase Plan for net proceeds of $0.2 million. During the years ended December 31, 2010 and 2009, no shares were issued under the amended 2004 Stock Purchase Plan because the Company has not made any offerings under the amended plan.
9. Commitments and Contingencies
Leases and Fixed Obligations
The Company leases office space and furniture, facilities housing telecommunications equipment, and fiber optic use rights. Certain of the leases contain renewal clauses. The Company also enters into fixed price maintenance agreements for maintenance of its network.
F-26
tw telecom inc.
NOTES TO CONSOLIDATED FINANCIAL STATEMENTS—(Continued)
At December 31, 2010, commitments under capital and non-cancelable operating leases and maintenance agreements with terms in excess of one year were as follows:
| | | | | | | | | | | | |
| | | Capital
Leases | | | Operating
Leases | | | Fixed
Maintenance
Obligations | |
| | | (amounts in thousands) | |
Year ended December 31: | | | | | | | | | | | | |
2011 | | $ | 2,376 | | | $ | 48,296 | | | $ | 3,242 | |
2012 | | | 2,009 | | | | 47,454 | | | | 3,242 | |
2013 | | | 2,021 | | | | 42,554 | | | | 3,242 | |
2014 | | | 1,970 | | | | 37,338 | | | | 3,242 | |
2015 | | | 2,047 | | | | 30,569 | | | | 3,242 | |
Thereafter | | | 13,140 | | | | 111,449 | | | | 33,524 | |
| | | | | | | | | | | | |
Total minimum lease payments | | $ | 23,563 | | | $ | 317,660 | | | $ | 49,734 | |
| | | | | | | | | | | | |
Less amount representing interest | | | (8,303 | ) | | | | | | | | |
| | | | | | | | | | | | |
Present value of obligations under capital leases | | | 15,260 | | | | | | | | | |
Less current portion of obligations under capital leases | | | (1,202 | ) | | | | | | | | |
| | | | | | | | | | | | |
Obligations under capital leases, excluding current portion | | $ | 14,058 | | | | | | | | | |
| | | | | | | | | | | | |
As of December 31, 2010 and 2009, assets under capital lease obligations, which primarily consist of fiber optic network components, were $17.9 million and $19.0 million, respectively, with related accumulated depreciation of $5.4 million and $5.1 million, respectively. Depreciation expense related to assets under capital lease obligations was $1.4 million, $1.4 million and $1.0 million in 2010, 2009 and 2008, respectively. The obligations under capital leases have been discounted at an average imputed interest rate of 7.4%. Rental expense under operating leases aggregated $73.9 million, $72.3 million and $67.3 million for 2010, 2009 and 2008, respectively.
Other Contingencies
Management routinely reviews the Company’s exposure to liabilities incurred in the normal course of its business operations. The Company is subject to significant government and jurisdictional regulation, some of which is uncertain due to legal challenges of existing rules. Such regulation is subject to differing interpretations and inconsistent application, and has historically resulted in disputes with other carriers, regulatory authorities and municipalities regarding the classification of traffic, rates, minutes of use and right-of-way fees. Where a probable contingency exists and the amount of the loss can be reasonably estimated, the Company records the estimated liability. Considerable judgment is required in analyzing and recording such liabilities and actual results may vary from the estimates.
The Company’s pending legal proceedings are limited to litigation incidental to its business. In the opinion of management, the ultimate resolution of these matters will not have a material adverse effect on the Company’s financial statements.
10. Employee Benefit Plans
Effective January 1, 1999, the Company adopted thetw telecom401(k) Plan (the “401(k) Plan”). Employees who meet certain eligibility requirements may contribute up to 60% of their eligible compensation, subject to statutory limitations, to a trust for investment in several diversified investment choices, as directed by
F-27
tw telecom inc.
NOTES TO CONSOLIDATED FINANCIAL STATEMENTS—(Continued)
the employee. The Company makes a matching contribution of 100% of each employee’s contribution up to a maximum of 5% of the employee’s eligible compensation. The Company’s contributions to the 401(k) Plan aggregated $10.7 million, $10.3 million and $10.6 million for 2010, 2009 and 2008, respectively.
11. Quarterly Results of Operations (Unaudited)
The following summarizes the Company’s unaudited quarterly results of operations for 2010 and 2009:
| | | | | | | | | | | | | | | | |
| | | Three Months Ended | |
| | | March 31 | | | June 30 | | | September 30 | | | December 31 | |
| | | (amounts in thousands, except per share amounts) | |
Year Ended December 31, 2010 | | | | | | | | | | | | | | | | |
Total revenue | | $ | 311,211 | | | $ | 316,849 | | | $ | 320,294 | | | $ | 324,817 | |
Operating income | | | 33,867 | | | | 35,689 | | | | 36,993 | | | | 39,623 | |
Net income (loss)(1) | | | (4,462 | ) | | | 242,323 | | | | 16,079 | | | | 17,494 | |
Basic income (loss) per common share | | $ | (0.03 | ) | | $ | 1.60 | | | $ | 0.11 | | | $ | 0.12 | |
Diluted income (loss) per common share | | $ | (0.03 | ) | | $ | 1.43 | | | $ | 0.10 | | | $ | 0.11 | |
| | | | |
Year Ended December 31, 2009 | | | | | | | | | | | | | | | | |
Total revenue | | $ | 297,631 | | | $ | 301,059 | | | $ | 304,766 | | | $ | 307,934 | |
Operating income | | | 24,889 | | | | 27,930 | | | | 28,720 | | | | 32,434 | |
Net income | | | 2,880 | | | | 5,912 | | | | 7,698 | | | | 11,096 | |
Basic and diluted income per common share | | $ | 0.02 | | | $ | 0.04 | | | $ | 0.05 | | | $ | 0.07 | |
| (1) | Includes a non-cash income tax benefit of $227.3 million in the three months ended June 30, 2010 to recognize the value of tax assets (see Note 7). |
The total net income per share for the 2010 and 2009 quarters do not equal net income per share for the respective years as the per share amounts for each quarter and for each year are computed based on their respective discrete periods.
12. Supplemental Guarantor Information
In March 2010, Holdings (“Issuer”) issued its 2018 Notes with a principal amount of $430 million. The 2018 Notes are unsecured obligations of the Issuer and are guaranteed by the Company (“Parent Guarantor”) and substantially all of the Issuer’s subsidiaries (“Combined Subsidiary Guarantors”). The guarantees are joint and several. A significant amount of the Issuer’s cash flow is generated by the Combined Subsidiary Guarantors. As a result, funds necessary to meet the Issuer’s debt service obligations are provided in large part by distributions or advances from the Combined Subsidiary Guarantors. The 2018 Notes are governed by an indenture that contains certain restrictive covenants. These restrictions affect, and in many respects significantly limit or prohibit, among other things, the ability of the Parent Guarantor, the Issuer and its subsidiaries to incur indebtedness, make prepayments of certain indebtedness, pay dividends, make investments, engage in transactions with stockholders and affiliates, issue capital stock of subsidiaries, create liens, sell assets, and engage in mergers and consolidations.
The following information sets forth the Company’s Condensed Consolidating Balance Sheets as of December 31, 2010 and 2009, Condensed Consolidating Statements of Operations for the years ended December 31, 2010, 2009 and 2008 and Condensed Consolidating Statements of Cash Flows for the years ended December 31, 2010, 2009 and 2008.
F-28
tw telecom inc.
NOTES TO CONSOLIDATED FINANCIAL STATEMENTS—(Continued)
tw telecom inc.
CONDENSED CONSOLIDATING BALANCE SHEET
December 31, 2010
| | | | | | | | | | | | | | | | | | | | |
| | | Parent
Guarantor | | | Issuer | | | Combined
Subsidiary
Guarantors | | | Eliminations | | | Consolidated | |
| | | (amounts in thousands) | |
| ASSETS | | | | | | | | | | | | | | | | | | | | |
Current assets: | | | | | | | | | | | | | | | | | | | | |
Cash and cash equivalents | | $ | 24,542 | | | $ | 332,380 | | | $ | — | | | $ | — | | | $ | 356,922 | |
Investments | | | — | | | | 118,672 | | | | — | | | | — | | | | 118,672 | |
Receivables, net | | | — | | | | — | | | | 81,598 | | | | — | | | | 81,598 | |
Prepaid expenses and other current assets | | | — | | | | 10,002 | | | | 6,933 | | | | — | | | | 16,935 | |
Deferred income taxes | | | — | | | | 42,413 | | | | 20 | | | | — | | | | 42,433 | |
| | | | | | | | | | | | | | | | | | | | |
Total current assets | | | 24,542 | | | | 503,467 | | | | 88,551 | | | | — | | | | 616,560 | |
| | | | | | | | | | | | | | | | | | | | |
Property, plant and equipment, net | | | — | | | | 42,063 | | | | 1,314,549 | | | | — | | | | 1,356,612 | |
Deferred income taxes | | | — | | | | 240,493 | | | | 505 | | | | — | | | | 240,998 | |
Goodwill | | | — | | | | — | | | | 412,694 | | | | — | | | | 412,694 | |
Intangible and other assets, net | | | 2,471 | | | | 15,326 | | | | 24,501 | | | | — | | | | 42,298 | |
| | | | | | | | | | | | | | | | | | | | |
Total assets | | $ | 27,013 | | | $ | 801,349 | | | $ | 1,840,800 | | | $ | — | | | $ | 2,669,162 | |
| | | | | | | | | | | | | | | | | | | | |
| LIABILITIES AND STOCKHOLDERS’ EQUITY (DEFICIT) | | | | | | | | | | | | | | | | | | | | |
Current liabilities: | | | | | | | | | | | | | | | | | | | | |
Accounts payable | | $ | — | | | $ | 6,179 | | | $ | 47,257 | | | $ | — | | | $ | 53,436 | |
Other current liabilities | | | 2,219 | | | | 65,719 | | | | 180,414 | | | | — | | | | 248,352 | |
Intercompany payable (receivable) | | | (1,869,183 | ) | | | (590,846 | ) | | | 2,460,029 | | | | — | | | | — | |
| | | | | | | | | | | | | | | | | | | | |
Total current liabilities | | | (1,866,964 | ) | | | (518,948 | ) | | | 2,687,700 | | | | — | | | | 301,788 | |
| | | | | | | | | | | | | | | | | | | | |
Losses in subsidiary in excess of investment | | | 582,116 | | | | 1,054,580 | | | | — | | | | (1,636,696 | ) | | | — | |
Long-term debt and capital lease obligations, net | | | 327,012 | | | | 997,227 | | | | 14,058 | | | | — | | | | 1,338,297 | |
Long-term deferred revenue | | | — | | | | — | | | | 14,864 | | | | — | | | | 14,864 | |
Other long-term liabilities | | | — | | | | 4,073 | | | | 25,291 | | | | — | | | | 29,364 | |
Stockholders’ equity (deficit) | | | 984,849 | | | | (735,583 | ) | | | (901,113 | ) | | | 1,636,696 | | | | 984,849 | |
| | | | | | | | | | | | | | | | | | | | |
Total liabilities and stockholders’ equity (deficit) | | $ | 27,013 | | | $ | 801,349 | | | $ | 1,840,800 | | | $ | — | | | $ | 2,669,162 | |
| | | | | | | | | | | | | | | | | | | | |
F-29
tw telecom inc.
NOTES TO CONSOLIDATED FINANCIAL STATEMENTS—(Continued)
tw telecom inc.
CONDENSED CONSOLIDATING BALANCE SHEET
December 31, 2009
| | | | | | | | | | | | | | | | | | | | |
| | | Parent
Guarantor | | | Issuer | | | Combined
Subsidiary
Guarantors | | | Eliminations | | | Consolidated | |
| | | (amounts in thousands) | |
| ASSETS | | | | | | | | | | | | | | | | | | | | |
Current assets: | | | | | | | | | | | | | | | | | | | | |
Cash and cash equivalents | | $ | 24,540 | | | $ | 421,367 | | | $ | — | | | $ | — | | | $ | 445,907 | |
Investments | | | — | | | | 24,865 | | | | — | | | | — | | | | 24,865 | |
Receivables, net | | | — | | | | — | | | | 78,016 | | | | — | | | | 78,016 | |
Prepaid expenses and other current assets | | | — | | | | 8,128 | | | | 5,418 | | | | — | | | | 13,546 | |
Deferred income taxes | | | — | | | | 29,574 | | | | — | | | | — | | | | 29,574 | |
| | | | | | | | | | | | | | | | | | | | |
Total current assets | | | 24,540 | | | | 483,934 | | | | 83,434 | | | | — | | | | 591,908 | |
| | | | | | | | | | | | | | | | | | | | |
Long-term investments | | | — | | | | 2,990 | | | | — | | | | — | | | | 2,990 | |
Property, plant and equipment, net | | | — | | | | 39,196 | | | | 1,255,176 | | | | — | | | | 1,294,372 | |
Deferred income taxes | | | — | | | | 29,176 | | | | — | | | | — | | | | 29,176 | |
Goodwill | | | — | | | | — | | | | 412,694 | | | | — | | | | 412,694 | |
Intangible and other assets, net | | | 3,569 | | | | 7,121 | | | | 32,370 | | | | — | | | | 43,060 | |
| | | | | | | | | | | | | | | | | | | | |
Total assets | | $ | 28,109 | | | $ | 562,417 | | | $ | 1,783,674 | | | $ | — | | | $ | 2,374,200 | |
| | | | | | | | | | | | | | | | | | | | |
| LIABILITIES AND STOCKHOLDERS’ EQUITY (DEFICIT) | | | | | | | | | | | | | | | | | | | | |
Current liabilities: | | | | | | | | | | | | | | | | | | | | |
Accounts payable | | $ | — | | | $ | 5,385 | | | $ | 45,703 | | | $ | — | | | $ | 51,088 | |
Other current liabilities | | | 2,219 | | | | 66,497 | | | | 175,345 | | | | — | | | | 244,061 | |
Intercompany payable (receivable) | | | (1,876,194 | ) | | | (584,900 | ) | | | 2,461,094 | | | | — | | | | — | |
| | | | | | | | | | | | | | | | | | | | |
Total current liabilities | | | (1,873,975 | ) | | | (513,018 | ) | | | 2,682,142 | | | | — | | | | 295,149 | |
| | | | | | | | | | | | | | | | | | | | |
Losses in subsidiary in excess of investment | | | 861,103 | | | | 1,100,448 | | | | — | | | | (1,961,551 | ) | | | — | |
Long-term debt and capital lease obligations, net | | | 308,941 | | | | 976,296 | | | | 15,133 | | | | — | | | | 1,300,370 | |
Long-term deferred revenue | | | — | | | | — | | | | 15,988 | | | | — | | | | 15,988 | |
Other long-term liabilities | | | — | | | | 8,117 | | | | 22,536 | | | | — | | | | 30,653 | |
Stockholders’ equity (deficit) | | | 732,040 | | | | (1,009,426 | ) | | | (952,125 | ) | | | 1,961,551 | | | | 732,040 | |
| | | | | | | | | | | | | | | | | | | | |
Total liabilities and stockholders’ equity (deficit) | | $ | 28,109 | | | $ | 562,417 | | | $ | 1,783,674 | | | $ | — | | | $ | 2,374,200 | |
| | | | | | | | | | | | | | | | | | | | |
F-30
tw telecom inc.
NOTES TO CONSOLIDATED FINANCIAL STATEMENTS—(Continued)
tw telecom inc.
CONDENSED CONSOLIDATING STATEMENT OF OPERATIONS
Year Ended December 31, 2010
| | | | | | | | | | | | | | | | | | | | |
| | | Parent Guarantor | | | Issuer | | | Combined
Subsidiary
Guarantors | | | Eliminations | | | Consolidated | |
| | | (amounts in thousands) | |
Total revenue | | $ | — | | | $ | — | | | $ | 1,273,171 | | | $ | — | | | $ | 1,273,171 | |
Costs and expenses: | | | | | | | | | | | | | | | | | | | | |
Operating, selling, general and administrative | | | — | | | | 185,465 | | | | 651,970 | | | | — | | | | 837,435 | |
Depreciation, amortization and accretion | | | — | | | | 19,510 | | | | 270,054 | | | | — | | | | 289,564 | |
Corporate expense allocation | | | — | | | | (204,975 | ) | | | 204,975 | | | | — | | | | — | |
| | | | | | | | | | | | | | | | | | | | |
Total costs and expenses | | | — | | | | — | | | | 1,126,999 | | | | — | | | | 1,126,999 | |
| | | | | | | | | | | | | | | | | | | | |
Operating income | | | — | | | | — | | | | 146,172 | | | | — | | | | 146,172 | |
Interest expense, net | | | (28,049 | ) | | | (39,884 | ) | | | (12,411 | ) | | | — | | | | (80,344 | ) |
Debt extinguishment costs | | | — | | | | (17,070 | ) | | | — | | | | — | | | | (17,070 | ) |
Other income | | | — | | | | 825 | | | | — | | | | | | | | 825 | |
Interest expense and other income allocation | | | 28,049 | | | | 56,129 | | | | (84,178 | ) | | | — | | | | — | |
| | | | | | | | | | | | | | | | | | | | |
Income before income taxes and equity in undistributed earnings of subsidiaries | | | — | | | | — | | | | 49,583 | | | | — | | | | 49,583 | |
Income tax benefit | | | — | | | | (220,421 | ) | | | (1,430 | ) | | | — | | | | (221,851 | ) |
| | | | | | | | | | | | | | | | | | | | |
Net income before equity in undistributed earnings of subsidiaries | | | — | | | | 220,421 | | | | 51,013 | | | | — | | | | 271,434 | |
Equity in undistributed earnings of subsidiaries | | | 271,434 | | | | 51,013 | | | | — | | | | (322,447 | ) | | | — | �� |
| | | | | | | | | | | | | | | | | | | | |
Net income (loss) | | $ | 271,434 | | | $ | 271,434 | | | $ | 51,013 | | | $ | (322,447 | ) | | $ | 271,434 | |
| | | | | | | | | | | | | | | | | | | | |
F-31
tw telecom inc.
NOTES TO CONSOLIDATED FINANCIAL STATEMENTS—(Continued)
tw telecom inc.
CONDENSED CONSOLIDATING STATEMENT OF OPERATIONS
Year Ended December 31, 2009
| | | | | | | | | | | | | | | | | | | | |
| | | Parent
Guarantor | | | Issuer | | | Combined
Subsidiary
Guarantors | | | Eliminations | | | Consolidated | |
| | | (amounts in thousands) | |
Total revenue | | $ | — | | | $ | — | | | $ | 1,211,390 | | | $ | — | | | $ | 1,211,390 | |
Costs and expenses: | | | | | | | | | | | | | | | | | | | | |
Operating, selling, general and administrative | | | — | | | | 174,416 | | | | 626,834 | | | | — | | | | 801,250 | |
Depreciation, amortization and accretion | | | — | | | | 16,641 | | | | 279,526 | | | | — | | | | 296,167 | |
Corporate expense allocation | | | — | | | | (191,057 | ) | | | 191,057 | | | | — | | | | — | |
| | | | | | | | | | | | | | | | | | | | |
Total costs and expenses | | | — | | | | — | | | | 1,097,417 | | | | — | | | | 1,097,417 | |
| | | | | | | | | | | | | | | | | | | | |
Operating income | | | — | | | | — | | | | 113,973 | | | | — | | | | 113,973 | |
Interest expense, net | | | (26,576 | ) | | | (45,080 | ) | | | (11,985 | ) | | | — | | | | (83,641 | ) |
Interest expense allocation | | | 26,576 | | | | 45,080 | | | | (71,656 | ) | | | — | | | | — | |
| | | | | | | | | | | | | | | | | | | | |
Income before income taxes and equity in undistributed earnings of subsidiaries | | | — | | | | — | | | | 30,332 | | | | — | | | | 30,332 | |
Income tax expense | | | — | | | | — | | | | 2,746 | | | | — | | | | 2,746 | |
| | | | | | | | | | | | | | | | | | | | |
Net income before equity in undistributed earnings of subsidiaries | | | — | | | | — | | | | 27,586 | | | | — | | | | 27,586 | |
Equity in undistributed earnings of subsidiaries | | | 27,586 | | | | 27,586 | | | | — | | | | (55,172 | ) | | | — | |
| | | | | | | | | | | | | | | | | | | | |
Net income | | $ | 27,586 | | | $ | 27,586 | | | $ | 27,586 | | | $ | (55,172 | ) | | $ | 27,586 | |
| | | | | | | | | | | | | | | | | | | | |
F-32
tw telecom inc.
NOTES TO CONSOLIDATED FINANCIAL STATEMENTS—(Continued)
tw telecom inc.
CONDENSED CONSOLIDATING STATEMENT OF OPERATIONS
Year Ended December 31, 2008
| | | | | | | | | | | | | | | | | | | | |
| | | Parent Guarantor | | | Issuer | | | Combined
Subsidiary
Guarantors | | | Eliminations | | | Consolidated | |
| | | (amounts in thousands) | |
Total revenue | | $ | — | | | $ | — | | | $ | 1,159,019 | | | $ | — | | | $ | 1,159,019 | |
Costs and expenses: | | | | | | | | | | | | | | | | | | | | |
Operating, selling, general and administrative | | | — | | | | 167,437 | | | | 615,923 | | | | — | | | | 783,360 | |
Depreciation, amortization and accretion | | | — | | | | 14,331 | | | | 271,452 | | | | — | | | | 285,783 | |
Corporate expense allocation | | | — | | | | (181,768 | ) | | | 181,768 | | | | — | | | | — | |
| | | | | | | | | | | | | | | | | | | | |
Total costs and expenses | | | — | | | | — | | | | 1,069,143 | | | | — | | | | 1,069,143 | |
| | | | | | | | | | | | | | | | | | | | |
Operating income | | | — | | | | — | | | | 89,876 | | | | — | | | | 89,876 | |
Interest expense, net | | | (24,765 | ) | | | (51,569 | ) | | | (10,694 | ) | | | — | | | | (87,028 | ) |
Other loss | | | — | | | | (7,767 | ) | | | — | | | | | | | | (7,767 | ) |
Interest expense and other loss allocation | | | 24,765 | | | | 59,336 | | | | (84,101 | ) | | | — | | | | — | |
| | | | | | | | | | | | | | | | | | | | |
Loss before income taxes and equity in undistributed losses of subsidiaries | | | — | | | | — | | | | (4,919 | ) | | | — | | | | (4,919 | ) |
Income tax expense | | | — | | | | — | | | | 2,347 | | | | — | | | | 2,347 | |
| | | | | | | | | | | | | | | | | | | | |
Net loss before equity in undistributed losses of subsidiaries | | | — | | | | — | | | | (7,266 | ) | | | — | | | | (7,266 | ) |
Equity in undistributed losses of subsidiaries | | | (7,266 | ) | | | (7,266 | ) | | | — | | | | 14,532 | | | | — | |
| | | | | | | | | | | | | | | | | | | | |
Net loss | | $ | (7,266 | ) | | $ | (7,266 | ) | | $ | (7,266 | ) | | $ | 14,532 | | | $ | (7,266 | ) |
| | | | | | | | | | | | | | | | | | | | |
F-33
tw telecom inc.
NOTES TO CONSOLIDATED FINANCIAL STATEMENTS—(Continued)
tw telecom inc.
CONDENSED CONSOLIDATING STATEMENT OF CASH FLOWS
Year Ended December 31, 2010
| | | | | | | | | | | | | | | | | | | | |
| | | Parent
Guarantor | | | Issuer | | | Combined
Subsidiary
Guarantors | | | Eliminations | | | Consolidated | |
| | | (amounts in thousands) | |
Cash flows from operating activities: | | | | | | | | | | | | | | | | | | | | |
Net income | | $ | 271,434 | | | $ | 271,434 | | | $ | 51,013 | | | $ | (322,447 | ) | | $ | 271,434 | |
Adjustments to reconcile net income to net cash provided by operating activities: | | | | | | | | | | | | | | | | | | | | |
Depreciation, amortization, and accretion | | | — | | | | 19,510 | | | | 270,054 | | | | — | | | | 289,564 | |
Deferred income taxes | | | — | | | | (223,560 | ) | | | (525 | ) | | | | | | | (224,085 | ) |
Intercompany change | | | 34,844 | | | | (5,946 | ) | | | (351,345 | ) | | | 322,447 | | | | — | |
Extinguishment costs, amortization of discount on debt and deferred debt issue costs and other | | | 19,174 | | | | 18,475 | | | | — | | | | — | | | | 37,649 | |
Stock-based compensation | | | — | | | | — | | | | 27,832 | | | | — | | | | 27,832 | |
Changes in operating assets and liabilities | | | (276,578 | ) | | | (47,336 | ) | | | 307,272 | | | | — | | | | (16,642 | ) |
| | | | | | | | | | | | | | | | | | | | |
Net cash provided by operating activities | | | 48,874 | | | | 32,577 | | | | 304,301 | | | | — | | | | 385,752 | |
| | | | | | | | | | | | | | | | | | | | |
Cash flows from investing activities: | | | | | | | | | | | | | | | | | | | | |
Capital expenditures | | | — | | | | (23,237 | ) | | | (298,607 | ) | | | — | | | | (321,844 | ) |
Purchases of investments | | | — | | | | (246,575 | ) | | | — | | | | — | | | | (246,575 | ) |
Proceeds from sale of investments | | | — | | | | 154,786 | | | | — | | | | — | | | | 154,786 | |
Proceeds from sale of assets and other investing activities, net | | | — | | | | 862 | | | | (5,278 | ) | | | — | | | | (4,416 | ) |
| | | | | | | | | | | | | | | | | | | | |
Net cash used in investing activities | | | — | | | | (114,164 | ) | | | (303,885 | ) | | | — | | | | (418,049 | ) |
| | | | | | | | | | | | | | | | | | | | |
Cash flows from financing activities: | | | | | | | | | | | | | | | | | | | | |
Net proceeds (tax withholdings) from issuance of common stock upon exercise of stock options and vesting of restricted stock awards and units | | | 1,045 | | | | — | | | | — | | | | — | | | | 1,045 | |
Purchases of treasury stock | | | (49,911 | ) | | | — | | | | — | | | | — | | | | (49,911 | ) |
Retirement of debt obligations | | | (6 | ) | | | (413,677 | ) | | | — | | | | — | | | | (413,683 | ) |
Net proceeds from issuance of debt | | | — | | | | 413,069 | | | | — | | | | — | | | | 413,069 | |
Payment of debt and capital lease obligations | | | — | | | | (6,792 | ) | | | (416 | ) | | | — | | | | (7,208 | ) |
| | | | | | | | | | | | | | | | | | | | |
Net cash used in financing activities | | | (48,872 | ) | | | (7,400 | ) | | | (416 | ) | | | — | | | | (56,688 | ) |
| | | | | | | | | | | | | | | | | | | | |
Increase (decrease) in cash and cash equivalents | | | 2 | | | | (88,987 | ) | | | — | | | | — | | | | (88,985 | ) |
Cash and cash equivalents at beginning of period | | | 24,540 | | | | 421,367 | | | | — | | | | — | | | | 445,907 | |
| | | | | | | | | | | | | | | | | | | | |
Cash and cash equivalents at end of period | | $ | 24,542 | | | $ | 332,380 | | | $ | — | | | $ | — | | | $ | 356,922 | |
| | | | | | | | | | | | | | | | | | | | |
F-34
tw telecom inc.
NOTES TO CONSOLIDATED FINANCIAL STATEMENTS—(Continued)
tw telecom inc.
CONDENSED CONSOLIDATING STATEMENT OF CASH FLOWS
Year Ended December 31, 2009
| | | | | | | | | | | | | | | | | | | | |
| | | Parent
Guarantor | | | Issuer | | | Combined
Subsidiary
Guarantors | | | Eliminations | | | Consolidated | |
| | | (amounts in thousands) | |
Cash flows from operating activities: | | | | | | | | | | | | | | | | | | | | |
Net income | | $ | 27,586 | | | $ | 27,586 | | | $ | 27,586 | | | $ | (55,172 | ) | | $ | 27,586 | |
Adjustments to reconcile net income to net cash provided by operating activities: | | | | | | | | | | | | | | | | | | | | |
Depreciation, amortization, and accretion | | | — | | | | 16,641 | | | | 279,526 | | | | — | | | | 296,167 | |
Intercompany change | | | (12,933 | ) | | | 122,907 | | | | (165,146 | ) | | | 55,172 | | | | — | |
Amortization of discount on debt and debt issue costs and other | | | 17,707 | | | | 1,799 | | | | 530 | | | | — | | | | 20,036 | |
Stock-based compensation | | | — | | | | — | | | | 26,518 | | | | — | | | | 26,518 | |
Changes in operating assets and liabilities | | | (30,687 | ) | | | (28,976 | ) | | | 79,834 | | | | — | | | | 20,171 | |
| | | | | | | | | | | | | | | | | | | | |
Net cash provided by operating activities | | | 1,673 | | | | 139,957 | | | | 248,848 | | | | — | | | | 390,478 | |
| | | | | | | | | | | | | | | | | | | | |
Cash flows from investing activities: | | | | | | | | | | | | | | | | | | | | |
Capital expenditures | | | — | | | | (31,508 | ) | | | (235,489 | ) | | | — | | | | (266,997 | ) |
Purchases of investments | | | — | | | | (24,892 | ) | | | — | | | | — | | | | (24,892 | ) |
Proceeds from sale of assets and other investing activities, net | | | — | | | | 13,882 | | | | (12,582 | ) | | | — | | | | 1,300 | |
| | | | | | | | | | | | | | | | | | | | |
Net cash used in investing activities | | | — | | | | (42,518 | ) | | | (248,071 | ) | | | — | | | | (290,589 | ) |
| | | | | | | | | | | | | | | | | | | | |
Cash flows from financing activities: | | | | | | | | | | | | | | | | | | | | |
Net proceeds (tax withholdings) from issuance of common stock upon exercise of stock options and vesting of restricted stock awards and units | | | 1,834 | | | | — | | | | — | | | | — | | | | 1,834 | |
Payment of debt and capital lease obligations | | | — | | | | (7,215 | ) | | | (777 | ) | | | — | | | | (7,992 | ) |
| | | | | | | | | | | | | | | | | | | | |
Net cash used in (provided by) financing activities | | | 1,834 | | | | (7,215 | ) | | | (777 | ) | | | — | | | | (6,158 | ) |
| | | | | | | | | | | | | | | | | | | | |
Increase in cash and cash equivalents | | | 3,507 | | | | 90,224 | | | | — | | | | — | | | | 93,731 | |
Cash and cash equivalents at beginning of period | | | 21,033 | | | | 331,143 | | | | — | | | | — | | | | 352,176 | |
| | | | | | | | | | | | | | | | | | | | |
Cash and cash equivalents at end of period | | $ | 24,540 | | | $ | 421,367 | | | $ | — | | | $ | — | | | $ | 445,907 | |
| | | | | | | | | | | | | | | | | | | | |
F-35
tw telecom inc.
NOTES TO CONSOLIDATED FINANCIAL STATEMENTS—(Continued)
tw telecom inc.
CONDENSED CONSOLIDATING STATEMENT OF CASH FLOWS
Year Ended December 31, 2008
| | | | | | | | | | | | | | | | | | | | |
| | | Parent
Guarantor | | | Issuer | | | Combined
Subsidiary
Guarantors | | | Eliminations | | | Consolidated | |
| | | (amounts in thousands) | |
Cash flows from operating activities: | | | | | | | | | | | | | | | | | | | | |
Net loss | | $ | (7,266 | ) | | $ | (7,266 | ) | | $ | (7,266 | ) | | $ | 14,532 | | | $ | (7,266 | ) |
Adjustments to reconcile net loss to net cash provided by operating activities: | | | | | | | | | | | | | | | | | | | | |
Depreciation, amortization, and accretion | | | — | | | | 14,331 | | | | 271,452 | | | | — | | | | 285,783 | |
Intercompany change | | | (800 | ) | | | 23,544 | | | | (8,212 | ) | | | (14,532 | ) | | | — | |
Amortization of discount on debt and deferred debt issue costs, investment impairment and other | | | 16,358 | | | | 9,520 | | | | 1,469 | | | | — | | | | 27,347 | |
Stock-based compensation | | | — | | | | — | | | | 23,357 | | | | — | | | | 23,357 | |
Changes in operating assets and liabilities | | | (13,752 | ) | | | 7,901 | | | | (17,850 | ) | | | — | | | | (23,701 | ) |
| | | | | | | | | | | | | | | | | | | | |
Net cash (used in) provided by operating activities | | | (5,460 | ) | | | 48,030 | | | | 262,950 | | | | — | | | | 305,520 | |
| | | | | | | | | | | | | | | | | | | | |
Cash flows from investing activities: | | | | | | | | | | | | | | | | | | | | |
Capital expenditures | | | — | | | | (13,678 | ) | | | (260,841 | ) | | | — | | | | (274,519 | ) |
Proceeds from maturities of investments | | | | | | | 3,699 | | | | — | | | | — | | | | 3,699 | |
Proceeds from sales of assets and other investing activities, net | | | — | | | | (1,374 | ) | | | (1,565 | ) | | | — | | | | (2,939 | ) |
| | | | | | | | | | | | | | | | | | | | |
Net cash used in investing activities | | | — | | | | (11,353 | ) | | | (262,406 | ) | | | — | | | | (273,759 | ) |
| | | | | | | | | | | | | | | | | | | | |
Cash flows from financing activities: | | | | | | | | | | | | | | | | | | | | |
Net proceeds (tax withholdings) from issuance of common stock upon exercise of stock options and in connection with the employee stock purchase plan | | | 5,930 | | | | — | | | | — | | | | — | | | | 5,930 | |
Payment of debt and capital lease obligations | | | — | | | | (6,502 | ) | | | (544 | ) | | | — | | | | (7,046 | ) |
| | | | | | | | | | | | | | | | | | | | |
Net cash provided by (used in) financing activities | | | 5,930 | | | | (6,502 | ) | | | (544 | ) | | | — | | | | (1,116 | ) |
| | | | | | | | | | | | | | | | | | | | |
Increase in cash and cash equivalents | | | 470 | | | | 30,175 | | | | — | | | | — | | | | 30,645 | |
Cash and cash equivalents at beginning of period | | | 20,563 | | | | 300,968 | | | | — | | | | — | | | | 321,531 | |
| | | | | | | | | | | | | | | | | | | | |
Cash and cash equivalents at end of period | | $ | 21,033 | | | $ | 331,143 | | | $ | — | | | $ | — | | | $ | 352,176 | |
| | | | | | | | | | | | | | | | | | | | |
F-36
tw telecom inc.
SCHEDULE II—VALUATION AND QUALIFYING ACCOUNTS
Years Ended December 31, 2010, 2009 and 2008
| | | | | | | | | | | | | | | | |
| | | Balance at
Beginning
of Period | | | Additions/
Charges to
Costs and
Expenses, net | | | Deductions | | | Balance at
End of
Period | |
| | | (amounts in thousands) | |
For the Year ended December 31, 2010: | | | | | | | | | | | | | | | | |
Allowance for doubtful accounts receivable | | $ | 9,449 | | | | 1,820 | | | | (3,371 | ) | | $ | 7,898 | |
| | | | | | | | | | | | | | | | |
For the Year ended December 31, 2009: | | | | | | | | | | | | | | | | |
Allowance for doubtful accounts receivable | | $ | 11,271 | | | | 6,595 | | | | (8,417 | ) | | $ | 9,449 | |
| | | | | | | | | | | | | | | | |
For the Year ended December 31, 2008: | | | | | | | | | | | | | | | | |
Allowance for doubtful accounts receivable | | $ | 12,018 | | | | 8,486 | | | | (9,233 | ) | | $ | 11,271 | |
| | | | | | | | | | | | | | | | |
F-37
EXHIBIT INDEX
| | | | |
Exhibit
Number | | | | Description of Exhibit |
| 2.1 | | — | | Agreement and Plan of Merger, by and among Time Warner Telecom Inc., XPD Acquisition, LLC, Xspedius Communications, LLC, Xspedius Management Co., LLC and Xspedius Holding Corp., dated as of July 27, 2006 (filed as Exhibit 2.1 to the Company’s Quarterly Report on Form 10-Q for the quarter ended June 30, 2006).* |
| 3.1 | | — | | Restated Certificate of Incorporation of the Company (filed as Exhibit 3.1 to the Company’s Quarterly Report on Form 10-Q for the quarter ended June 30, 2007).* |
| 3.2 | | — | | Amended By-laws of Time Warner Telecom Inc. (filed as Exhibit 99.1 to the Company’s Current Report on Form 8-K dated September 17, 2007).* |
| 3.3 | | — | | Certificate of Amendment to Restated Certificate of Incorporation (filed as Exhibit 3.2 to the Company’s Quarterly Report on Form 10-Q for the quarter ended March 31, 2008).* |
| 4.1 | | — | | Indenture, dated as of March 29, 2006, between Time Warner Telecom Inc. and Wells Fargo Bank, National Association, as trustee (filed as Exhibit 4.1 to the Company’s Quarterly Report on Form 10-Q for the quarter ended March 31, 2006).* |
| 4.2 | | — | | First Supplemental Indenture, dated as of March 29, 2006, between Time Warner Telecom Inc. and Wells Fargo Bank, National Association, as trustee, creating 2.375% Convertible Senior Debentures due 2026 (filed as Exhibit 4.2 to the Company’s Quarterly Report on Form 10-Q for the quarter ended March 31, 2006).* |
| 4.3 | | — | | Indenture, dated March 17, 2010, amongtw telecom holdings inc., the Company, Subsidiary Guarantors parties thereto and Wells Fargo Bank, National Association, as Trustee, for 8 % Senior Notes due 2018 (filed as Exhibit 4.1 to the Company’s Current Report on Form 8-K dated March 17, 2010).* |
| 4.4 | | — | | Rights Agreement, dated as of January 20, 2009, between the Company and Wells Fargo Bank, N.A. (filed as Exhibit 4.1 to the Company’s Current Report on Form 8-K dated January 20, 2009).* |
| 4.6 | | — | | Certificate of Designations of Series A Junior Participating Preferred Stock (filed as Exhibit 4.6 to the Company’s Quarterly Report on Form 10-Q for the quarter ended March 31, 2009).* |
| 10.1 | | — | | Lease, dated November 1, 2004, between Carr America Realty, L.P. and Time Warner Telecom Holdings Inc. (filed as Exhibit 10.1 to the Company’s Annual Report on Form 10-K for the year ended December 31, 2004).* |
| **10.2 | | — | | Time Warner Telecom Inc. 1998 Stock Option Plan as amended December 8, 1999 (filed as Exhibit 10.4 to the Company’s Registration Statement on Form S-1/A (Registration No. 333-49439)).* |
| **10.3 | | — | | Employment Agreement, dated November 4, 2009, between the Company and Larissa L. Herda (filed as Exhibit 10.3 to the Company’s Quarterly Report on Form 10-Q for the quarter ended September 30, 2009).* |
| **10.4 | | — | | Amended and Restated Employment Agreement, dated December 12, 2008, between the Company and Paul B. Jones. |
| **10.5 | | — | | Amended and Restated Employment Agreement, dated December 12, 2008, between the Company and Jill R. Stuart. |
| **10.6 | | — | | Amended and Restated Employment Agreement, dated December 12, 2008, between the Company and John T. Blount. |
| **10.7 | | — | | Amended and Restated Employment Agreement, dated December 12, 2008, between the Company and Mark Peters. |
| **10.8 | | — | | Amended and Restated Change of Control Employment Agreement, dated December 12, 2008, between the Company and Paul B. Jones. |
E-1
| | | | |
Exhibit
Number | | | | Description of Exhibit |
| **10.9 | | — | | Amended and Restated Change of Control Employment Agreement, dated December 12, 2008, between the Company and Jill R. Stuart. |
| **10.10 | | — | | Amended and Restated Change of Control Employment Agreement, dated December 12, 2008, between the Company and Mark Peters. |
| **10.11 | | — | | Amended and Restated Change of Control Employment Agreement, dated December 12, 2008, between the Company and John T. Blount. |
| **10.12 | | — | | Change of Control Employment Agreement, dated November 4, 2009, between the Company and Larissa L. Herda (filed as Exhibit 10.4 to the Company’s Quarterly Report on Form 10-Q for the quarter ended September 30, 2009).* |
| **10.13 | | — | | Amendment Number 1, dated August 6, 2010, to Amended and Restated Employment Agreement betweentw telecom holdings inc. and John Blount (filed as Exhibit 10.1 to the Company’s Quarterly Report on Form 10-Q for the quarter ended June 30, 2010).* |
| **10.14 | | — | | Amendment Number 2, dated August 6, 2010, to Amended and Restated Change of Control Employment Agreement between the Company and John Blount (filed as Exhibit 10.2 to the Company’s Quarterly Report on Form 10-Q for the quarter ended June 30, 2010).* |
| **10.15 | | — | | Amendment Number 1, dated August 6, 2010, to Amended and Restated Employment Agreement betweentw telecom holdings inc. and Mark Peters (filed as Exhibit 10.3 to the Company’s Quarterly Report on Form 10-Q for the quarter ended June 30, 2010).* |
| **10.16 | | — | | Amendment Number 2, dated August 6, 2010, to Amended and Restated Change of Control Employment Agreement between the Company and Mark Peters (filed as Exhibit 10.4 to the Company’s Quarterly Report on Form 10-Q for the quarter ended June 30, 2010).* |
| **10.17 | | — | | Amendment Number 1, dated August 6, 2010, to Amended and Restated Employment Agreement betweentw telecom holdings inc. and Paul Jones (filed as Exhibit 10.5 to the Company’s Quarterly Report on Form 10-Q for the quarter ended June 30, 2010).* |
| **10.18 | | — | | Amendment Number 2, dated August 6, 2010, to Amended and Restated Change of Control Employment Agreement between the Company and Paul Jones (filed as Exhibit 10.6 to the Company’s Quarterly Report on Form 10-Q for the quarter ended June 30, 2010).* |
| **10.19 | | — | | Amendment Number 1, dated August 6, 2010, to Amended and Restated Employment Agreement betweentw telecom holdings inc. and Jill Stuart (filed as Exhibit 10.7 to the Company’s Quarterly Report on Form 10-Q for the quarter ended June 30, 2010).* |
| **10.20 | | — | | Amendment Number 1, dated August 6, 2010, to Amended and Restated Change of Control Employment Agreement between the Company and Jill Stuart (filed as Exhibit 10.8 to the Company’s Quarterly Report on Form 10-Q for the quarter ended June 30, 2010).* |
| **10.21 | | — | | Amendment Number 1, dated November 4, 2009, to Amended and Restated Change of Control Employment Agreement between the Company and John Blount (filed as Exhibit 10.5 to the Company’s Quarterly Report on Form 10-Q for the quarter ended September 30, 2009).* |
| **10.22 | | — | | Amendment Number 1, dated November 4, 2009, to Amended and Restated Change of Control Employment Agreement between the Company and Mark Peters (filed as Exhibit 10.6 to the Company’s Quarterly Report on Form 10-Q for the quarter ended September 30, 2009).* |
| **10.23 | | — | | Amendment Number 1, dated November 4, 2009, to Amended and Restated Change of Control Employment Agreement between the Company and Paul Jones (filed as Exhibit 10.7 to the Company’s Quarterly Report on Form 10-Q for the quarter ended September 30, 2009).* |
| 10.24 | | — | | Capacity License Agreement (filed as Exhibit 10.3 to the Company’s Quarterly Report on Form 10-Q for the quarter ended June 30, 1998).* |
| †10.25 | | — | | Office Lease, dated October 25, 2010, between LBA Realty Fund III-Company II LLC andtw telecom holdings inc. |
E-2
| | | | |
Exhibit
Number | | | | Description of Exhibit |
| **10.26 | | — | | Amended and Restated 2000 Employee Stock Plan (filed as Annex A to the Company’s Schedule 14A Definitive Proxy Statement filed April 27, 2009).* |
| **10.27 | | — | | Summary of compensation arrangements for independent directors oftw telecom inc., revised as of December 15, 2010. |
| †10.28 | | — | | Agreement, as amended, dated January 1, 2001, between Time Warner Telecom Inc. and AT&T Corp. (filed as Exhibit 10.1 to the Company’s Quarterly Report on Form 10-Q for the quarter ended June 30, 2005).* |
| †10.29 | | — | | Services Agreement, dated June 1, 2005, among SBC Communications Inc., AT&T Corp., and Time Warner Telecom Holdings Inc. (filed as Exhibit 10.2 to the Company’s Quarterly Report on Form 10-Q for the quarter ended June 30, 2005).* |
| 10.30 | | — | | Form of Amended and Restated Indemnification Agreement (filed as Exhibit 10.1 to the Company’s Quarterly Report on Form 10-Q for the quarter ended September 30, 2009).* |
| 10.31 | | — | | Form of Indemnification Agreement (filed as Exhibit 10.2 to the Company’s Quarterly Report on Form 10-Q for the quarter ended September 30, 2009).* |
| 10.32 | | — | | Amendment and Restatement Agreement (including the Amended and Restated Credit Agreement), dated as of December 2, 2010, among the Company, tw telecom holdings inc., the Subsidiary Guarantors parties thereto, the Consenting Lenders and Wells Fargo Bank, National Association, as administrative agent and collateral agent (filed as Exhibit 99.1 to the Company’s Current Report on Form 8-K dated December 2, 2010).* |
| 21 | | — | | Subsidiaries of the registrant. |
| 23.1 | | — | | Consent of Independent Registered Public Accounting Firm. |
| 31.1 | | — | | Certification of Chief Executive Officer pursuant to Item 601(b)(31) of Regulation S-K, as adopted pursuant to Section 302 of the Sarbanes-Oxley Act of 2002. |
| 31.2 | | — | | Certification of Chief Financial Officer pursuant to Item 601(b)(31) of Regulation S-K, as adopted pursuant to Section 302 of the Sarbanes-Oxley Act of 2002. |
| 32.1 | | — | | Certification of Chief Executive Officer pursuant to 18 U.S.C. Section 1350, as adopted pursuant to Section 906 of the Sarbanes-Oxley Act of 2002. |
| 32.2 | | — | | Certification of Chief Financial Officer pursuant to 18 U.S.C. Section 1350, as adopted pursuant to Section 906 of the Sarbanes-Oxley Act of 2002. |
| 101.INS | | — | | XBRL Instance Document*** |
| 101.SCH | | — | | XBRL Taxonomy Extension Schema Document*** |
| 101.CAL | | — | | XBRL Taxonomy Extension Calculation Linkbase Document*** |
| 101.DEF | | — | | XBRL Taxonomy Extension Definition Linkbase Document*** |
| 101.LAB | | — | | XBRL Taxonomy Extension Label Linkbase Document*** |
| 101.PRE | | — | | XBRL Taxonomy Extension Presentation Linkbase Document*** |
| * | Incorporated by reference. |
| ** | Management contract or compensation plan or arrangement. |
| *** | Pursuant to Rule 406T of Regulation S-T, these Interactive Data Files are deemed not filed or part of a registration statement or prospectus for purposes of Sections 11 or 12 of the Securities Act of 1933, as amended, are deemed not filed for purposes of Section 18 of the Securities Exchange Act of 1934, as amended, and otherwise are not subject to the liability under these sections. |
| † | Portions of this exhibit have been redacted and filed separately with the Securities and Exchange Commission pursuant to a request for confidential treatment. |
E-3