Each Trustee serves until a successor is duly elected or qualified or until his death, resignation, retirement or removal from office. The address of each Trustee is 200 Berkeley Street, Boston, MA 02116. Each Trustee oversees 112 Evergreen funds.
Mr. Wagoner is an “interested person” of the fund because of his ownership of shares in Wachovia Corporation, the parent to the fund’s investment advisor.
The address of the Officer is 401 S. Tryon Street, 20th Floor, Charlotte, NC 28288.
The address of the Officer is 200 Berkeley Street, Boston, MA 02116.
The address of the Officer is 3435 Stelzer Road, Columbus, OH 43219.
Additional information about the fund’s Board of Trustees and Officers can be found in the Statement of Additional Information (SAI) and is available upon request without charge by calling 800.343.2898.
Investments that stand the test of time
Year in and year out, Evergreen Investments seeks to provide each client with sound, time-tested investment strategies designed for sustainable long-term success. With over $229 billion* in assets under management, we manage diverse investments from institutional portfolios to mutual funds, variable annuities to retirement plans, alternative investments to private accounts. Our commitment to every one of our clients is reflected in the rigor and discipline with which we manage investments.
We offer a complete family of mutual funds designed to help investors meet a wide range of financial goals. From money market funds that meet short-term needs to international funds that involve greater risk but seek potentially higher returns, Evergreen provides a broad array of flexible investment options. Across all investment styles, we are committed to providing investors with investment excellence day after day, quarter after quarter and year after year.
*As of April 30, 2003
Visit us online at EvergreenInvestments.com
F O R M O R E I N F O R M A T I O N
Evergreen Express Line 800.346.3858
Evergreen Investor Services 800.343.2898

| | For the fourth consecutive year, Evergreen Investments has earned the Dalbar Mutual Fund Service Award, which recognizes those firms that exceed industry norms in key service areas. The award symbolizes the achievement of the highest tier of shareholder service within our industry. For 2002, Evergreen Investments was ranked third overall. |
566661 6/2003 |

Evergreen Investments(SM)
MUTUAL FUNDS
Evergreen Investments
200 Berkeley Street
Boston, MA 02116-5034
Evergreen Strategic Income Fund
Evergreen Strategic Income Fund: Annual Report as of April 30, 2003
This annual report must be preceded or accompanied by a prospectus of the Evergreen fund contained herein. The prospectus contains more complete information, including fees and expenses, and should be read carefully before investing or sending money.
| Mutual Funds: |
| NOT FDIC INSURED | MAY LOSE VALUE | NOT BANK GUARANTEED |
Evergreen InvestmentsSM is a service mark of Evergreen Investment
Management Company, LLC. Copyright 2003.
Evergreen mutual funds are distributed by Evergreen Distributor, Inc.,
90 Park Avenue, 10th Floor, New York, NY 10016.
LETTER TO SHAREHOLDERS
June 2003
 |  |
William M. Ennis
President and Chief
Executive Officer | Dennis H. Ferro
President and Chief
Investment Officer |
Dear Evergreen Shareholder,
We are pleased to present the annual report for Evergreen Strategic Income Fund, which covers the twelve-month period ended April 30, 2003.
Market analysis
The past twelve months have proven to be an extraordinary period for investors in the financial markets. The uneven domestic recovery and accompanying profit weakness has been compounded by investor concern due to the geopolitical threats of war and terror. In addition, the corporate accounting irregularities have further eroded investor confidence. The result has been a volatile equity market, leading to increased investor attention on asset allocation and risk aversion. Those investors properly allocated within most fixed income securities have been able to generate higher relative returns than those emphasizing single sector or single asset class strategies.
Perhaps the wildest ride for investors has occurred within the U.S. government bond market. After the economy produced larger than expected job growth in the early spring of 2002, the yield on the 10-year Treasury bond surged to 5.4%. As the rumors of the death of higher unemployment proved premature, the yield on the 10-year gradually diminished throughout last summer. Rising unemployment and slower than expected economic growth were joined by fears of war and terror to result in a surge of interest in U.S. Government bonds. This flight to quality was due to the perceived safety of Treasury securities by investors. Indeed, by the end of the third quarter, the yield on the 10-year Treasury fell to 3.6%, which occurred despite the rising federal budget deficit. As economic growth remained slow throughout the second half of last year, dampened by geopolitical threats, the Federal Reserve surprised investors with a larger than expected 50-basis point cut in its target for the Federal Funds rate last November. A fter temporarily climbing above 4% early in 2003, the 10-year Treasury has once again exceeded last year's lows.
1
LETTER TO SHAREHOLDERS continued
Investors in government bonds were not the only beneficiaries of bond market performance within the past year. After a dismal start, the corporate bond market began a steady improvement in the second half of 2002, followed by improved momentum thus far in 2003. The corporate accounting scandals led to many rating downgrades and credibility issues for Corporate America, and bond investors demanded increased premiums to compensate for these risks. After painstaking steps on the part of many corporations to address their operating and credibility problems in late 2002, investors once again began nibbling in corporate bonds and spreads began to narrow by the end of last year. As investors became more comfortable with the strengthening of U.S. balance sheets in 2003, the corporate bond market continued to generate positive gains for investors.
These gains in the corporate fixed income markets were not limited to investment grade securities. The high yield market also enjoyed improved performance in late 2002 and into 2003. After under-performing most other fixed income vehicles in recent years, investors have rallied around the improving prospects for this sector. Periods of rising defaults have historically been followed by periods of out performance. In addition, these issues tend to be most leveraged to economic recoveries and therefore tend to trade like equities as the economy and the stock market recover. As a result of these fundamental and technical trends, investors in high yield bonds participated in solid gains over the past several months.
While government and corporate bonds have benefited in this environment of low rates, investors in mortgage-backed securities have experienced a challenging period. As interest rates fell, refinancing activity accelerated. Since a drop in rates generally benefits bond investors as prices move higher in response to rate declines, this has a negative effect on mortgage-backed security prices because falling rates typically precede a rise in prepayments. These occur when mortgage holders refinance their existing higher rate mortgage prior to the stated maturity date to obtain lower rates. As a result, the challenge for investors in this market is to focus on securities less likely to be affected by prepayment risk in a declining interest rate environment. As rates begin to increase, these risks should subside.
2
LETTER TO SHAREHOLDERS continued
Looking ahead, we project a gradual improvement for the U.S. economy for the remainder of 2003 and into next year. The potential for tighter monetary policy next year and further increases in the U.S. federal budget deficit will likely place upward pressure on the yields of U.S. treasury bonds. Inflation remains mild, which should enable monetary policymakers to keep interest rates steady into next year. In this environment, we believe investors will increase credit risk in an attempt to improve yields for their portfolios. As such, we expect further moderate gains within the corporate market as credit quality improves, highlighted by returns in the close-to-investment-grade high yield market.
As always, we encourage investors to remain dedicated to the long-term investment strategies. Proper diversification with your portfolio is essential in limiting risk while seeking rewards. While the current investment environment is challenging, we remind investors that the U.S. economy and the financial markets have a long history of adaptability and recovery. By focusing on the fundamentals, and not allowing oneself to get caught up in the day-to-day, news-related volatility, we continue to believe that the patient, long-term investor will be rewarded.
For more information
Please visit our Web site, EvergreenInvestments.com, for more information about our funds and other investment products available to you. From the Web site, you can also access our quarterly shareholder newsletter, Evergreen Events, through the "About Evergreen Investments" menu tab. Thank you for your continued support of Evergreen Investments.

William M. Ennis
President and Chief Executive Officer
Evergreen Investment Company, Inc.

Dennis H. Ferro
President and Chief Investment Officer
Evergreen Investment Management Company, LLC
3
FUND AT A GLANCE
as of April 30, 2003
MANAGEMENT TEAM

Prescott B. Crocker, CFA
High Yield Bond Team
Lead Manager
CURRENT INVESTMENT STYLE2

PERFORMANCE AND RETURNS1
Portfolio inception date: 4/14/1987
| Class A | Class B | Class C | Class I |
| Class inception date | 4/14/1987 | 2/1/1993 | 2/1/1993 | 1/13/1997 |
|
| Average annual return* |
|
| 1 year with sales charge | 13.16% | 12.87% | 15.70% | N/A |
|
| 1 year w/o sales charge | 18.79% | 17.87% | 17.89% | 19.09% |
|
| 5 year | 4.78% | 4.67% | 4.76% | 6.24% |
|
| 10 year | 6.39% | 6.13% | 6.01% | 6.96% |
|
| *Adjusted for maximum applicable sales charge, unless noted. |
LONG-TERM GROWTH
 Comparison of a $10,000 investment in Evergreen Strategic Income Fund Class A shares,1 versus a similar investment in the Lehman Brothers Aggregate Bond Index (LBABI) and the Consumer Price Index (CPI).
The LBABI is an unmanaged market index and does not include transaction costs associated with buying and selling securities, any mutual fund expenses or any taxes. The CPI is a commonly used measure of inflation and does not represent an investment return. It is not possible to invest directly in an index.
4
PORTFOLIO MANAGER COMMENTARY
The fund's Class A shares had a total return of 18.79% for the 12-month period ended April 30, 2003, excluding any applicable sales charges. During the same period, the Lehman Brothers Aggregate Bond Index returned 10.47%, while the median return of funds in the Lipper Multi-Sector classification was 11.13%. Lipper is an independent monitor of mutual fund performance.
During the 12-month period, we focused on monitoring and selecting credits, as well as market timing. Successful credit selection was critical within the high yield bond sector, especially in the first part of the period. At that time, our strategy was defensive-we avoided bankruptcies and limited price volatility. We continued to monitor credits and relative value as the period progressed, establishing positions that we believed were attractively priced and had the potential for significant price appreciation. Within the international sector, we took advantage of the higher yields provided by foreign bonds, diverting assets away from the U.S. dollar. We based our selections on quality, liquidity, relative value and the potential for price appreciation. The fund's U.S. government and agency sector benefited from the rally in U.S. Treasuries that took place early in the fiscal year. Consequently, we focused on the 10-year U.S. Treasury note, but reduced those holdings later in the period and redirected assets to the high yield sector.
1 Past performance is no guarantee of future results. The investment return and principal value of an investment will fluctuate so that investors' shares, when redeemed, may be worth more or less than their original cost. The performance of each class may vary based on differences in loads, fees and expenses paid by the shareholders investing in each class. Performance includes the reinvestment of income dividends and capital gain distributions. Performance shown does not reflect the deduction of taxes that a shareholder would pay on fund distributions or the redemption of fund shares.
Historical performance shown for Classes B, C and I prior to their inception is based on the performance of Class A, the original class offered. The historical returns for Classes B, C and I have not been adjusted to reflect the effect of each class' 12b-1 fee. These fees are 0.30% for Class A and 1.00% for Classes B and C. Class I does not pay a 12b-1 fee. If these fees had been reflected, returns for Classes B and C would have been lower while returns for Class I would have been higher. The advisor is reimbursing a portion of the 12b-1 fee for Class A. Had the fee not been reimbursed, returns would have been lower. Returns reflect expense limits previously in effect for all classes, without which returns would have been lower.
2 Source: Morningstar, Inc.
Morningstar's style box is based on a portfolio date as of 3/31/2003.
The fixed income style box placement is based on a fund's average effective maturity or duration and the average credit rating of the bond portfolio.
Class I shares are only offered to investment advisory clients of an investment advisor of an Evergreen fund (or its advisory affiliates), through special arrangements entered into on behalf of Evergreen funds with certain financial services firms, certain institutional investors and persons who owned Class Y shares in registered name in an Evergreen fund on or before December 31, 1994.
The fund's investment objective is nonfundamental and may be changed without the vote of the fund's shareholders.
U.S. government guarantees apply only to the underlying securities of the fund's portfolio and not to the fund's shares.
Funds that invest in high yield, lower-rated bonds may contain more risk due to the increased possibility of default.
Foreign investments may contain more risk due to the inherent risks associated with changing political climates, foreign market instability and foreign currency fluctuations. Risks of international investing are magnified in emerging or developing markets.
All data is as of April 30, 2003, and subject to change.
5
FINANCIAL HIGHLIGHTS
(For a share outstanding throughout each period)
| Year Ended April 30,
|
| 20031
| 20022
| 20011
| 2000
| 1999
|
| CLASS A |
Net asset value, beginning of period
| $5.83
| $5.74
| $6.12
| $6.79
| $7.21
|
| Income from investment operations |
| Net investment income | 0.38 | 0.35 | 0.52 | 0.53 | 0.51 |
Net realized and unrealized gains or losses
on securities and foreign currency
related transactions | 0.68
| 0.16
| -0.40
| -0.63
| -0.41
|
| Total from investment operations | 1.06
| 0.51
| 0.12
| -0.10
| 0.10
|
| Distributions to shareholders from |
| Net investment income | -0.39 | -0.32 | -0.40 | -0.49 | -0.52 |
| Tax basis return of capital | 0
| -0.10
| -0.10
| -0.08
| 0
|
| Total distributions to shareholders | -0.39
| -0.42
| -0.50
| -0.57
| -0.52
|
Net asset value, end of period
| $6.50
| $5.83
| $5.74
| $6.12
| $6.79
|
Total return3
| 18.79%
| 9.37%
| 2.09%
| -1.58%
| 1.58%
|
| Ratios and supplemental data |
| Net assets, end of period (thousands) | $173,842 | $130,934 | $122,223 | $129,885 | $162,192 |
| Ratios to average net assets |
| Expenses4 | 1.19% | 1.23% | 0.87% | 0.72% | 1.02% |
| Net investment income | 6.31% | 6.02% | 8.06% | 8.36% | 7.41% |
| Portfolio turnover rate | 129% | 304% | 322% | 187% | 222% |
|
1. Net investment income per share is based on average shares outstanding during the period.2. As required, effective May 1, 2001, the Fund has adopted the provisions of the AICPA Audit and Accounting Guide, Audits of Investment Companies, and began amortizing premium on its fixed-income securities. The effects of this change for the year ended April 30, 2002 was a decrease in net investment income per share of $0.02; an increase in net realized gains or losses per share of $0.02; and a decrease to the ratio of net investment income to average net assets of 0.45%. The above per share information, ratios and supplemental data for the periods prior to May 1, 2001 have not been restated to reflect this change in presentation.3. Excluding applicable sales charges4. The ratio of expenses to average net assets excludes expense reductions but includes fee waivers and/or expense reimbursements.
See Notes to Financial Statements |
6
FINANCIAL HIGHLIGHTS
(For a share outstanding throughout each period)
| Year Ended April 30,
|
| 2003
| 20021
| 20012
| 2000
| 1999
|
| CLASS B |
Net asset value, beginning of period
| $5.85
| $5.75
| $6.14
| $6.81
| $7.25
|
| Income from investment operations |
| Net investment income | 0.34 | 0.29 | 0.48 | 0.49 | 0.47 |
Net realized and unrealized gains or losses
on securities and foreign currency
related transactions | 0.67
| 0.19
| -0.41
| -0.64
| -0.44
|
| Total from investment operations | 1.01
| 0.48
| 0.07
| -0.15
| 0.03
|
| Distributions to shareholders from |
| Net investment income | -0.34 | -0.28 | -0.36 | -0.44 | -0.47 |
| Tax basis return of capital | 0
| -0.10
| -0.10
| -0.08
| 0
|
| Total distributions to shareholders | -0.34
| -0.38
| -0.46
| -0.52
| -0.47
|
Net asset value, end of period
| $6.52
| $5.85
| $5.75
| $6.14
| $6.81
|
Total return3
| 17.87%
| 8.74%
| 1.18%
| -2.29%
| 0.56%
|
| Ratios and supplemental data |
| Net assets, end of period (thousands) | $107,968 | $77,471 | $83,347 | $104,110 | $120,669 |
| Ratios to average net assets |
| Expenses4 | 1.94% | 1.98% | 1.61% | 1.47% | 1.76% |
| Net investment income | 5.54% | 5.27% | 7.34% | 7.60% | 6.68% |
| Portfolio turnover rate | 129% | 304% | 322% | 187% | 222% |
|
1. As required, effective May 1, 2001, the Fund has adopted the provisions of the AICPA Audit and Accounting Guide, Audits of Investment Companies, and began amortizing premium on its fixed-income securities. The effects of this change for the year ended April 30, 2002 was a decrease in net investment income per share of $0.03; an increase in net realized gains or losses per share of $0.03; and a decrease to the ratio of net investment income to average net assets of 0.45%. The above per share information, ratios and supplemental data for the periods prior to May 1, 2001 have not been restated to reflect this change in presentation.2. Net investment income per share is based on average shares outstanding during the period.3. Excluding applicable sales charges4. The ratio of expenses to average net assets excludes expense reductions but includes fee waivers and/or expense reimbursements.
See Notes to Financial Statements |
7
FINANCIAL HIGHLIGHTS
(For a share outstanding throughout each period)
| Year Ended April 30,
|
| 20031
| 20022
| 20011
| 2000
| 1999
|
| CLASS C |
Net asset value, beginning of period
| $5.84
| $5.75
| $6.13
| $6.80
| $7.24
|
| Income from investment operations |
| Net investment income | 0.34 | 0.32 | 0.46 | 0.49 | 0.45 |
Net realized and unrealized gains or losses
on securities and foreign currency
related transactions | 0.67
| 0.15
| -0.38
| -0.64
| -0.42
|
| Total from investment operations | 1.01
| 0.47
| 0.08
| -0.15
| 0.03
|
| Distributions to shareholders from |
| Net investment income | -0.34 | -0.28 | -0.36 | -0.44 | -0.47 |
| Tax basis return of capital | 0
| -0.10
| -0.10
| -0.08
| 0
|
| Total distributions to shareholders | -0.34
| -0.38
| -0.46
| -0.52
| -0.47
|
Net asset value, end of period
| $6.51
| $5.84
| $5.75
| $6.13
| $6.80
|
Total return3
| 17.89%
| 8.56%
| 1.35%
| -2.30%
| 0.55%
|
| Ratios and supplemental data |
| Net assets, end of period (thousands) | $68,207 | $22,554 | $16,746 | $14,655 | $16,265 |
| Ratios to average net assets |
| Expenses4 | 1.93% | 1.98% | 1.63% | 1.47% | 1.77% |
| Net investment income | 5.66% | 5.25% | 7.26% | 7.61% | 6.65% |
| Portfolio turnover rate | 129% | 304% | 322% | 187% | 222% |
|
1. Net investment income per share is based on average shares outstanding during the period.2. As required, effective May 1, 2001, the Fund has adopted the provisions of the AICPA Audit and Accounting Guide, Audits of Investment Companies, and began amortizing premium on its fixed-income securities. The effects of this change for the year ended April 30, 2002 was a decrease in net investment income per share of $0.02; an increase in net realized gains or losses per share of $0.02; and a decrease to the ratio of net investment income to average net assets of 0.45%. The above per share information, ratios and supplemental data for the periods prior to May 1, 2001 have not been restated to reflect this change in presentation.3. Excluding applicable sales charges4. The ratio of expenses to average net assets excludes expense reductions but includes fee waivers and/or expense reimbursements.
See Notes to Financial Statements |
8
FINANCIAL HIGHLIGHTS
(For a share outstanding throughout each period)
| Year Ended April 30,
|
| 20031
| 20022
| 20011
| 2000
| 1999
|
| CLASS I3 |
Net asset value, beginning of period
| $5.74
| $5.65
| $6.02
| $6.63
| $7.04
|
| Income from investment operations |
| Net investment income | 0.41 | 0.35 | 0.51 | 0.55 | 0.51 |
Net realized and unrealized gains or losses
on securities and foreign currency
related transactions | 0.64
| 0.17
| -0.37
| -0.59
| -0.39
|
| Total from investment operations | 1.05
| 0.52
| 0.14
| -0.04
| 0.12
|
| Distributions to shareholders from |
| Net investment income | -0.39 | -0.33 | -0.41 | -0.49 | -0.53 |
| Tax basis return of capital | 0
| -0.10
| -0.10
| -0.08
| 0
|
| Total distributions to shareholders | -0.39
| -0.43
| -0.51
| -0.57
| -0.53
|
Net asset value, end of period
| $6.40
| $5.74
| $5.65
| $6.02
| $6.63
|
Total return
| 19.09%
| 9.67%
| 2.41%
| -0.61%
| 1.83%
|
| Ratios and supplemental data |
| Net assets, end of period (thousands) | $13,406 | $1,779 | $1,584 | $1,386 | $1,647 |
| Ratios to average net assets |
| Expenses4 | 0.94% | 0.98% | 0.62% | 0.47% | 0.75% |
| Net investment income | 6.75% | 6.27% | 8.30% | 8.63% | 7.64% |
| Portfolio turnover rate | 129% | 304% | 322% | 187% | 222% |
|
1. Net investment income per share is based on average shares outstanding during the period.2. As required, effective May 1, 2001, the Fund has adopted the provisions of the AICPA Audit and Accounting Guide, Audits of Investment Companies, and began amortizing premium on its fixed-income securities. The effects of this change for the year ended April 30, 2002 was a decrease in net investment income per share of $0.03; an increase in net realized gains or losses per share of $0.03; and a decrease to the ratio of net investment income to average net assets of 0.45%. The above per share information, ratios and supplemental data for the periods prior to May 1, 2001 have not been restated to reflect this change in presentation.3. Effective at the close of business on May 11, 2001, Class Y shares were renamed as Institutional shares (Class I).4. The ratio of expenses to average net assets excludes expense reductions but includes fee waivers and/or expense reimbursements.
See Notes to Financial Statements |
9
SCHEDULE OF INVESTMENTS
April 30, 2003
| Credit
Rating (v) | Principal
Amount | Value |
|
| CORPORATE BONDS 31.8% |
| CONSUMER DISCRETIONARY 13.1% |
| Auto Components 1.1% |
| Collins & Aikman Corp., 10.75%, 12/31/2011 | B | $ 1,300,000 | $ 1,339,000 |
| Dana Corp., 9.00%, 08/15/2011 (p) | BB | 1,300,000 | 1,417,000 |
| Intermet Corp., 9.75%, 06/15/2009 | B+ | 600,000 | 592,500 |
| TRW Automotive, Inc., 11.00%, 02/15/2013 144A | B+ | 750,000 | 825,000 |
| 4,173,500 |
| Hotels, Restaurants & Leisure 4.6% |
| AMF Bowling Worldwide, Inc., 13.00%, 09/01/2008 | B3 | 1,300,000 | 1,413,750 |
| Argosy Gaming Co., 10.75%, 06/01/2009 | B+ | 1,100,000 | 1,221,000 |
| Chumash Casino & Resort Enterprise, 9.00%, 07/15/2010 144A | BB- | 290,000 | 311,750 |
| Cinemark USA, Inc.: |
| 9.00%, 02/01/2013 144A | B- | 150,000 | 162,750 |
| Ser. B, 9.625%, 08/01/2008 | B- | 1,200,000 | 1,222,500 |
| Coast Hotels & Casinos, Inc., 9.50%, 04/01/2009 | B | 1,100,000 | 1,188,000 |
| Isle of Capri Casinos, Inc., 8.75%, 04/15/2009 | B | 1,100,000 | 1,163,250 |
| John Q Hammons Hotels LP, Ser. B, 8.875%, 05/15/2012 | B | 1,000,000 | 1,040,000 |
| Mandalay Resort Group, Ser. B, 10.25%, 08/01/2007 | BB- | 1,000,000 | 1,110,000 |
| Motor Gaming Group, Inc., 9.75%, 04/01/2010 144A | B+ | 1,000,000 | 1,045,000 |
| Six Flags, Inc.: |
| 8.875%, 02/01/2010 | B | 640,000 | 643,200 |
| 9.75%, 04/15/2013 144A | B | 590,000 | 618,025 |
| Station Casinos, Inc., 9.875%, 07/01/2010 | B+ | 1,000,000 | 1,107,500 |
| Tricon Global Restaurants, Inc., 8.875%, 04/15/2011 | BB+ | 1,000,000 | 1,167,500 |
| Vail Resorts, Inc., 8.75%, 05/15/2009 | NA | 1,000,000 | 1,050,000 |
| Venetian Casino Resort LLC, 11.00%, 06/15/2010 | B- | 1,935,000 | 2,133,337 |
| 16,597,562 |
| Household Durables 2.6% |
| K. Hovnanian Enterprises, Inc., 10.50%, 10/01/2007 | BB- | 955,000 | 1,091,087 |
| MDC Holdings, Inc., 8.375%, 02/01/2008 | BB+ | 210,000 | 220,238 |
| Meritage Corp., 9.75%, 06/01/2011 | B | 500,000 | 548,750 |
| Schuler Homes, Inc., 10.50%, 07/15/2011 (p) | B+ | 1,565,000 | 1,752,800 |
| Sealy Mattress Co.: |
| 9.875%, 12/15/2007 (p) | B- | 100,000 | 103,500 |
| Ser. B, 9.875%, 12/15/2007 (p) 144A | B- | 1,200,000 | 1,242,000 |
| Simmons Co., Ser. B, 10.25%, 03/15/2009 (p) | B- | 1,600,000 | 1,736,000 |
| Standard Pacific Corp., 7.75%, 03/15/2013 | BB | 500,000 | 513,750 |
| Technical Olympic USA, Inc., 9.00%, 07/01/2010 | B+ | 850,000 | 884,000 |
| WCI Communities, Inc., 9.125%, 05/01/2012 | B | 1,300,000 | 1,319,500 |
| 9,411,625 |
| Leisure Equipment & Products 0.5% |
| Hockey Co., 11.25%, 04/15/2009 | B | 675,000 | 740,813 |
| ICON Health & Fitness, Inc., 11.25%, 04/01/2012 | B- | 1,100,000 | 1,149,500 |
| 1,890,313 |
See Notes to Financial Statements |
10
SCHEDULE OF INVESTMENTS continued
April 30, 2003
| Credit
Rating (v) | Principal
Amount | Value |
|
| CORPORATE BONDS continued |
| CONSUMER DISCRETIONARY continued |
| Media 2.2% |
| AMC Entertainment, Inc., 9.875%, 02/01/2012 (p) | CCC+ | $ 1,100,000 | $ 1,160,500 |
| CSC Holdings, Inc., 7.625%, 04/01/2011 (p) | BB- | 835,000 | 883,012 |
| EchoStar DBS Corp., 9.375%, 02/01/2009 | BB- | 2,360,000 | 2,557,650 |
| Emmis Communications, Sr. Disc. Note, Step Bond, 0.00%, 03/15/2011 (p) † | B- | 2,000,000 | 1,770,000 |
| Hollywood Entertainment Corp., 9.625%, 03/15/2011 | B- | 500,000 | 542,500 |
| LIN Television Corp., 8.375%, 03/01/2008 | B | 1,000,000 | 1,052,500 |
| 7,966,162 |
| Multi-line Retail 0.0% |
| Saks, Inc., 9.875%, 10/01/2011 (p) | BB | 135,000 | 151,875 |
| Specialty Retail 2.1% |
| Gap, Inc., 6.90%, 09/15/2007 | BB+ | 625,000 | 665,625 |
| Mothers Work, Inc., 11.25%, 08/01/2010 | B+ | 1,300,000 | 1,430,000 |
| Petco Animal Supplies, Inc., 10.75%, 11/01/2011 | B | 1,100,000 | 1,243,000 |
| Remington Arms, Inc., 10.50%, 02/01/2011 144A | B- | 1,010,000 | 1,095,850 |
| United Auto Group, Inc., 9.625%, 03/15/2012 | B | 1,300,000 | 1,378,000 |
| United Rentals, Inc., 10.75%, 04/15/2008 (p) | BB- | 1,600,000 | 1,736,000 |
| 7,548,475 |
| CONSUMER STAPLES 1.5% |
| Food & Drug Retailing 0.8% |
| Delhaize America, Inc., 8.125%, 04/15/2011 | BB+ | 830,000 | 883,950 |
| Rite Aid Corp.: |
| 9.50%, 02/15/2011 144A | B+ | 600,000 | 642,000 |
| 12.50%, 09/15/2006 | B- | 1,300,000 | 1,475,500 |
| 3,001,450 |
| Food Products 0.7% |
| Chiquita Brands International, Inc., 10.56%, 03/15/2009 | B- | 750,000 | 814,688 |
| Corn Products International, Inc.: |
| 8.25%, 07/15/2007 | BBB- | 1,500,000 | 1,558,803 |
| 8.45%, 08/15/2009 | BBB- | 250,000 | 263,163 |
| 2,636,654 |
| ENERGY 3.0% |
| Energy Equipment & Services 1.2% |
| Overseas Shipholding Group, Inc., 8.25%, 03/15/2013 144A | BB+ | 750,000 | 777,187 |
| Parker Drilling Co., Ser. B, 10.125%, 11/15/2009 (p) | B+ | 2,000,000 | 2,145,000 |
| SESI LLC, 8.875%, 05/15/2011 | BB- | 1,240,000 | 1,320,600 |
| 4,242,787 |
| Oil & Gas 1.8% |
| Chesapeake Energy Corp., 8.125%, 04/01/2011 | B+ | 1,100,000 | 1,193,500 |
| General Maritime Corp., 10.00%, 03/15/2013 144A | B+ | 1,115,000 | 1,209,775 |
| Pioneer Natural Resources Co., 9.625%, 04/01/2010 | BB+ | 1,200,000 | 1,478,170 |
See Notes to Financial Statements |
11
SCHEDULE OF INVESTMENTS continued
April 30, 2003
| Credit
Rating (v) | Principal
Amount | Value |
|
| CORPORATE BONDS continued |
| ENERGY continued |
| Oil & Gas continued |
| Plains Exploration & Production Co. LP, 8.75%, 07/01/2012 | B | $ 1,200,000 | $ 1,290,000 |
| Tri-Union Development Corp. 12.50%, 06/01/2006 (g) | D | 908,500 | 708,630 |
| Vintage Petroleum, Inc., 9.75%, 06/30/2009 | B+ | 700,000 | 752,500 |
| 6,632,575 |
| FINANCIALS 1.2% |
| Diversified Financials 0.4% |
| Madison River Capital Finance Corp., 13.25%, 03/01/2010 | CCC+ | 1,000,000 | 875,000 |
| Qwest Capital Funding, Inc., 7.25%, 02/15/2011 | CCC+ | 680,000 | 566,100 |
| 1,441,100 |
| Real Estate 0.8% |
| La Quinta Corp., 8.875%, 03/15/2011 REIT 144A | BB- | 520,000 | 547,300 |
| MeriStar Hospitality Corp., 9.125%, 01/15/2011 REIT | B- | 1,200,000 | 1,134,000 |
| Universal City Development Partners, 11.75%, 04/01/2010 144A | B- | 1,000,000 | 1,082,500 |
| 2,763,800 |
| HEALTH CARE 1.6% |
| Health Care Equipment & Supplies 0.6% |
| Advanced Medical Optics, Inc., 9.25%, 07/15/2010 | B | 1,120,000 | 1,192,800 |
| Rotech Healthcare, Inc., 9.50%, 04/01/2012 | B+ | 1,000,000 | 1,020,000 |
| 2,212,800 |
| Health Care Providers & Services 0.7% |
| Ameripath, Inc., 10.50%, 04/01/2013 144A | B- | 925,000 | 985,125 |
| Pacificare Health Systems, Inc., 10.75%, 06/01/2009 | B+ | 1,300,000 | 1,446,250 |
| 2,431,375 |
| Pharmaceuticals 0.3% |
| Alpharma, Inc., 8.625%, 05/01/2011 144A | B+ | 1,050,000 | 1,092,000 |
| INDUSTRIALS 2.2% |
| Aerospace & Defense 0.2% |
| BE Aerospace, Inc., 9.50%, 11/01/2008 (p) | B- | 745,000 | 536,400 |
| Commercial Services & Supplies 0.9% |
| Allied Waste, Inc., 10.00%, 08/01/2009 (p) | B+ | 2,500,000 | 2,684,375 |
| Coinmach Corp., 9.00%, 02/01/2010 | B | 560,000 | 599,200 |
| 3,283,575 |
| Machinery 0.9% |
| AGCO Corp., 8.50%, 03/15/2006 | BB- | 1,100,000 | 1,105,500 |
| SPX Corp., 7.50%, 01/01/2013 | BB+ | 665,000 | 728,175 |
| Terex Corp., 8.875%, 04/01/2008 (p) | B | 1,500,000 | 1,567,500 |
| 3,401,175 |
| Marine 0.2% |
| CP Ships, Ltd., 10.375%, 07/15/2012 | BB+ | 675,000 | 734,063 |
See Notes to Financial Statements |
12
SCHEDULE OF INVESTMENTS continued
April 30, 2003
| Credit
Rating (v) | Principal
Amount | Value |
|
| CORPORATE BONDS continued |
| INFORMATION TECHNOLOGY 0.0% |
| Semiconductor Equipment & Products 0.0% |
| Fairchild Semiconductor Corp., 10.375%, 10/01/2007 | B | $ 150,000 | $ 159,000 |
| MATERIALS 5.2% |
| Chemicals 2.0% |
| Acetex Corp., 10.875%, 08/01/2009 | B+ | 1,000,000 | 1,105,000 |
| Equistar Chemicals LP, 10.625%, 05/01/2011 144A | BB | 1,300,000 | 1,381,250 |
| Ethyl Corp., 8.875%, 05/01/2010 144A | B | 250,000 | 261,250 |
| FMC Corp., 10.25%, 11/01/2009 | BB+ | 920,000 | 1,039,600 |
| Huntsman International LLC, 9.875%, 03/01/2009 144A | B | 1,300,000 | 1,417,000 |
| Lyondell Chemical Co.: |
| 9.50%, 12/15/2008 (p) | BB | 50,000 | 51,250 |
| Ser. A, 9.625%, 05/01/2007 | BB | 1,050,000 | 1,086,750 |
| Noveon, Inc., Ser. B, 11.00%, 02/28/2011 | B | 940,000 | 1,066,900 |
| 7,409,000 |
| Containers & Packaging 1.4% |
| Four M Corp., Ser. B, 12.00%, 06/01/2006 | B | 1,045,000 | 1,071,125 |
| Jarden Corp., 9.75%, 05/01/2012 | B- | 1,300,000 | 1,404,000 |
| Owens-Brockway Glass Container, Inc., 8.75%, 11/15/2012 | BB | 1,300,000 | 1,394,250 |
| Owens-Illinois, Inc., 7.35%, 05/15/2008 (p) | B+ | 1,200,000 | 1,194,000 |
| 5,063,375 |
| Metals & Mining 1.0% |
| Freeport-McMoRan Copper & Gold, Inc.: |
| 7.50%, 11/15/2006 (p) | B- | 1,200,000 | 1,239,000 |
| 10.125%, 02/01/2010 144A (p) | B- | 1,300,000 | 1,410,500 |
| Peabody Energy Corp., 6.875%, 03/15/2013 144A | BB- | 440,000 | 459,800 |
| U.S. Steel Corp., 10.75%, 08/01/2008 | BB | 405,000 | 441,450 |
| 3,550,750 |
| Paper & Forest Products 0.8% |
| Buckeye Cellulose Corp., 8.50%, 12/15/2005 | B+ | 1,300,000 | 1,287,000 |
| Georgia Pacific Corp., 8.125%, 05/15/2011 (p) | BB+ | 1,600,000 | 1,592,000 |
| 2,879,000 |
| TELECOMMUNICATION SERVICES 3.6% |
| Diversified Telecommunication Services 1.4% |
| FairPoint Communications, Inc., 12.50%, 05/01/2010 | B- | 1,040,000 | 1,019,200 |
| Paxson Communications Corp.: |
| 10.75%, 07/15/2008 (p) | B- | 290,000 | 321,900 |
| Sr. Disc. Note, Step Bond, 12.25%, 01/15/2009 † | B- | 1,100,000 | 929,500 |
| Qwest Communications International, Inc., Ser. B, 7.50%, 11/01/2008 | CCC+ | 1,400,000 | 1,274,000 |
| RCN Corp., Sr. Disc. Note, Step Bond, 9.80%, 02/15/2008 † | CCC- | 4,625,000 | 1,503,125 |
| 5,047,725 |
See Notes to Financial Statements |
13
SCHEDULE OF INVESTMENTS continued
April 30, 2003
| Credit
Rating (v) | Principal
Amount | Value |
|
| CORPORATE BONDS continued |
| TELECOMMUNICATION SERVICES continued |
| Wireless Telecommunications Services 2.2% |
| AT&T Wireless Services, Inc., 7.875%, 03/01/2011 | BBB | $ 2,300,000 | $ 2,654,589 |
| Dobson Communications Corp., 10.875%, 07/01/2010 | CCC+ | 1,300,000 | 1,371,500 |
| Nextel Communications, Inc., 9.375%, 11/15/2009 (p) | B | 1,605,000 | 1,741,425 |
| Nextel Partners, Inc., 11.00%, 03/15/2010 (p) | CCC+ | 1,500,000 | 1,582,500 |
| Rogers Wireless, Inc., 9.625%, 05/01/2011 | BB+ | 745,000 | 824,156 |
| 8,174,170 |
| UTILITIES 0.4% |
| Gas Utilities 0.4% |
| El Paso Energy Partners LP, 8.50%, 06/01/2011 | BB- | 1,200,000 | 1,299,000 |
| Total Corporate Bonds | | | 115,731,286 |
| FOREIGN BONDS-CORPORATE (PRINCIPAL AMOUNT |
| DENOMINATED IN CURRENCY INDICATED) 2.2% |
| CONSUMER DISCRETIONARY 0.1% |
| Media 0.1% |
| Vivendi Universal, 9.50%, 04/15/2010, EUR 144A | B+ | 200,000 | 247,324 |
| FINANCIALS 1.4% |
| Banks 1.4% |
| Realkredit Danmark, 6.00%, 10/01/2032, DKK | AAA | 32,346,626 | 4,975,954 |
| INFORMATION TECHNOLOGY 0.3% |
| Electronic Equipment & Instruments 0.3% |
| Flextronics International, Ltd., 9.75%, 07/01/2010, EUR | NA | 1,115,000 | 1,337,403 |
| MATERIALS 0.4% |
| Containers & Packaging 0.4% |
| Crown European Holdings SA, 10.25%, 03/01/2011, EUR 144A | B+ | 1,300,000 | 1,511,672 |
| Total Foreign Bonds-Corporate | | | 8,072,353 |
| FOREIGN BONDS-GOVERNMENT (PRINCIPAL AMOUNT |
| DENOMINATED IN CURRENCY INDICATED) 24.7% |
| Australia: |
| 5.75%, 06/15/2011, AUD | AAA | 7,360,000 | 4,770,523 |
| 6.25%, 04/15/2015, AUD | AAA | 3,000,000 | 2,001,754 |
| 6.75%, 11/15/2006, AUD | AAA | 8,130,000 | 5,423,018 |
| Canada: |
| 4.40%, 03/15/2008, CAD | AAA | 5,200,000 | 3,619,439 |
| 5.25%, 06/01/2013, CAD | AAA | 10,960,000 | 7,794,669 |
| 6.00%, 06/01/2008, CAD | AAA | 8,870,000 | 6,636,480 |
| Hungary: |
| 7.75%, 04/12/2005, HUF | NA | 600,000,000 | 2,796,225 |
| 9.50%, 06/12/2003, HUF | NA | 1,886,800,000 | 8,609,575 |
| New Zealand, 7.00%, 07/15/2009, NZD | AAA | 33,210,000 | 19,860,461 |
See Notes to Financial Statements |
14
SCHEDULE OF INVESTMENTS continued
April 30, 2003
| Credit
Rating (v) | Principal
Amount | Value |
|
| FOREIGN BONDS-GOVERNMENT (PRINCIPAL AMOUNT |
| DENOMINATED IN CURRENCY INDICATED) continued |
| Norway: |
| 5.75%, 11/30/2004, NOK | AAA | 20,000,000 | $ 2,904,312 |
| 6.00%, 05/16/2011, NOK | AAA | 15,000,000 | 2,252,236 |
| Poland, 5.00%, 10/24/2013, PLN | A | 24,200,000 | 6,192,614 |
| Sweden: |
| 3.50%, 04/20/2006, SEK | AAA | 81,500,000 | 9,905,794 |
| 5.50%, 10/08/2012, SEK | AAA | 25,000,000 | 3,240,546 |
| United Kingdom, 7.25%, 12/07/2007, GBP | AAA | 2,000,000 | 3,632,577 |
| Total Foreign Bonds-Government | | | 89,640,223 |
| MORTGAGE-BACKED SECURITIES 0.3% |
| GNMA: |
| 6.00%, 06/15/2031-09/15/2031 | AAA | $ 295,012 | 309,093 |
| 7.50%, 04/15/2030-05/15/2031 | AAA | 803,358 | 857,998 |
| 8.00%, 10/15/2030 | AAA | 24,113 | 26,100 |
| Total Mortgage-Backed Securities | | | 1,193,191 |
| U.S. TREASURY OBLIGATIONS 8.5% |
| U.S. Treasury Notes: |
| 3.25%, 08/15/2007 | AAA | 13,074,000 | 13,434,568 |
| 3.50%, 11/15/2006 | AAA | 10,791,000 | 11,252,153 |
| 4.375%, 05/15/2007-08/15/2012 | AAA | 4,433,000 | 4,751,384 |
| 4.875%, 02/15/2012 | AAA | 800,000 | 867,563 |
| 5.875%, 11/15/2004 | AAA | 460,000 | 491,895 |
| Total U.S. Treasury Obligations | | | 30,797,563 |
| YANKEE OBLIGATIONS-CORPORATE 2.0% |
| CONSUMER DISCRETIONARY 0.5% |
| Media 0.5% |
| Imax Corp., 7.875%, 12/01/2005 | CCC | 1,200,000 | 1,080,000 |
| Vivendi Universal SA, 9.25%, 04/15/2010 144A | B+ | 835,000 | 941,462 |
| 2,021,462 |
| FINANCIALS 0.8% |
| Diversified Financials 0.8% |
| PTC International Finance, 11.25%, 12/01/2009 | B+ | 2,220,000 | 2,773,840 |
| MATERIALS 0.7% |
| Metals & Mining 0.0% |
| Bulong Operations Property, Ltd., 12.50%, 03/31/2012 (h) +(g) | NA | 2,000,000 | 50,000 |
| Paper & Forest Products 0.7% |
| Ainsworth Lumber, Ltd., 12.50%, 07/15/2007 | B- | 1,200,000 | 1,326,000 |
| Tembec Industries, Inc., 7.75%, 03/15/2012 | BB+ | 1,200,000 | 1,224,000 |
| 2,550,000 |
| Total Yankee Obligations-Corporate | | | 7,395,302 |
See Notes to Financial Statements |
15
SCHEDULE OF INVESTMENTS continued
April 30, 2003
| Credit
Rating (v) | Principal
Amount | Value |
|
| YANKEE OBLIGATIONS-GOVERNMENT 19.5% |
| Brazil, 8.00%, 04/15/2014 | B+ | $ 9,531,113 | $ 8,399,770 |
| Colombia: |
| 10.00%, 01/23/2012 | BB | 9,460,000 | 10,439,110 |
| 10.375%, 01/28/2033 | BB | 3,100,000 | 3,484,400 |
| El Salvador: |
| 7.75%, 01/24/2023 144A | BB+ | 1,800,000 | 1,917,000 |
| 8.25%, 04/10/2032 144A | BB+ | 1,720,000 | 1,728,600 |
| Mexico: |
| 8.30%, 08/15/2031 | BBB- | 3,045,000 | 3,453,030 |
| 8.375%, 01/14/2011 | BBB- | 3,985,000 | 4,762,075 |
| Peru: |
| 9.125%, 01/15/2008 | BB- | 4,180,000 | 4,650,250 |
| 9.875%, 02/06/2015 | BB- | 470,000 | 528,750 |
| Philippines: |
| 8.375%, 03/12/2009 | BB | 855,000 | 882,788 |
| 9.00%, 02/15/2013 | BB | 860,000 | 894,400 |
| 9.375%, 01/18/2017 | BB | 5,960,000 | 6,377,200 |
| Russia, Sr. Disc. Note, Step Bond, 5.00%, 03/31/2007 144A † | NA | 14,610,000 | 13,187,716 |
| United Kingdom, 5.00%, 03/07/2012 | AAA | 6,000,000 | 10,067,565 |
| Total Yankee Obligations-Government | | | 70,772,654 |
|
| | | Shares | Value |
|
| COMMON STOCKS 0.0% |
| ENERGY 0.0% |
| Oil & Gas 0.0% |
| Tri-Union Development Corp. * | | 590 | 6 |
| Tribo Petroleum Corp., Class A * | | 1,000 | 10 |
| 16 |
| INFORMATION TECHNOLOGY 0.0% |
| Computers & Peripherals 0.0% |
| Ampex Corp., Class A (h) +* | | 171,452 | 12,001 |
| MATERIALS 0.0% |
| Metals & Mining 0.0% |
| Bulong Operations Property, Ltd. (h) *+ | | 35,558,832 | 0 |
| Total Common Stocks | | | 12,017 |
| PREFERRED STOCKS 0.0% |
| INFORMATION TECHNOLOGY 0.0% |
| Computers & Peripherals 0.0% |
| Ampex Corp. (h) +* | | 384 | 0 |
See Notes to Financial Statements |
16
SCHEDULE OF INVESTMENTS continued
April 30, 2003
| Shares | Value |
|
| WARRANTS 0.0% |
| FINANCIALS 0.0% |
| Diversified Financials 0.0% |
| Ono Finance Plc, Expiring 3/16/2011*+ | 2,000 | $ 20 |
| Ono Finance Plc, Expiring 5/31/2009 144A*+ | 2,000 | 20 |
| Total Warrants | | 40 |
| SHORT-TERM INVESTMENTS 14.8% |
| MUTUAL FUND SHARES 14.8% |
| Evergreen Institutional Money Market Fund (o) | 31,688,956 | 31,688,956 |
| Navigator Prime Portfolio (pp) | 21,996,630 | 21,996,630 |
| Total Short-Term Investments | | 53,685,586 |
| Total Investments (cost $343,827,688) 103.8% | | 377,300,215 |
| Other Assets and Liabilities (3.8%) | | (13,877,592) |
| Net Assets 100.0% | | $ 363,422,623 |
| 144A | Security that may be sold to qualified institutional buyers under Rule 144A of the Securities Act of 1933, as amended. This security has been determined to be liquid under guidelines established by the Board of Trustees. |
| + | Security is deemed illiquid and is valued using market quotations where readily available. In the absence of market quotations, the security is valued based upon its fair value determined under procedures approved by the Board of Trustees. |
| * | Non-income producing security |
| (o) | Evergreen Investment Management Company, LLC is the investment advisor to both the fund and the money market fund. |
| † | Security initially issued in zero coupon form which converts to coupon form at a specified rate and date. An effective interest rate is applied to recognize interest income daily for the bond. This rate is based on total expected interest to be earned over the life of the bond which consists of the aggregate coupon-interest payments and discount at acquisition. The rate shown is the stated rate at the current period end. |
| (p) | All or a portion of this security is on loan. |
| (pp) | Represents investment of cash collateral received from securities on loan. |
| (v) | Credit ratings are unaudited and rated by Moody's Investors Service where Standard and Poor's ratings are not available. |
| (h) | No market quotation available. Valued at fair value as determined in good faith under procedures established by the Board of Trustees. |
| (g) | Security which has defaulted on payment of interest and/or principal. |
| |
| Summary of Abbreviations: |
| AUD | Australian Dollar |
| CAD | Canadian Dollar |
| EUR | Euro |
| DKK | Danish Krone |
| GBP | United Kingdom Pound Sterling |
| GNMA | Government National Mortgage Association |
| HUF | Hungarian Forint |
| NOK | Norwegian Krone |
| NZD | New Zealand Dollar |
| PLN | Polish Zloty |
| REIT | Real Estate Investment Trust |
| SEK | Swedish Krona |
See Notes to Financial Statements |
17
STATEMENT OF ASSETS AND LIABILITIES
April 30, 2003
|
| Assets |
| Identified cost of securities | $ 343,827,688 |
| Net unrealized gains on securities | 33,472,527 |
|
| Market value of securities | 377,300,215 |
| Receivable for securities sold | 201,425 |
| Receivable for Fund shares sold | 2,072,291 |
| Receivable for securities lending income | 1,820 |
| Interest receivable | 6,444,891 |
| Receivable for closed forward foreign currency exchange contracts | 1,606,182 |
| Prepaid expenses and other assets | 98,996 |
|
| Total assets | 387,725,820 |
|
| Liabilities |
| Dividends payable | 699,777 |
| Payable for securities purchased | 338,892 |
| Payable for Fund shares redeemed | 339,221 |
| Payable for closed forward foreign currency exchange contracts | 61,065 |
| Unrealized losses on forward foreign currency exchange contracts | 794,157 |
| Payable for securities on loan | 21,996,630 |
| Foreign currency due to custodian bank, at value (cost $11,190) | 11,628 |
| Advisory fee payable | 4,816 |
| Distribution Plan expenses payable | 3,235 |
| Due to other related parties | 986 |
| Accrued expenses and other liabilities | 52,790 |
|
| Total liabilities | 24,303,197 |
|
| Net assets | $ 363,422,623 |
|
| Net assets represented by |
| Paid-in capital | $ 411,298,655 |
| Undistributed net investment income | 6,166,568 |
| Accumulated net realized losses on securities and foreign currency related transactions | (86,788,134) |
| Net unrealized gains on securities and foreign currency related transactions | 32,745,534 |
|
| Total net assets | $ 363,422,623 |
|
| Net assets consists of |
| Class A | $ 173,841,613 |
| Class B | 107,967,662 |
| Class C | 68,206,938 |
| Class I | 13,406,410 |
|
| Total net assets | $ 363,422,623 |
|
| Shares outstanding |
| Class A | 26,759,197 |
| Class B | 16,570,096 |
| Class C | 10,484,109 |
| Class I | 2,096,196 |
|
| Net asset value per share |
| Class A | $ 6.50 |
| Class A -- Offering price (based on sales charge of 4.75%) | $ 6.82 |
| Class B | $ 6.52 |
| Class C | $ 6.51 |
| Class C -- Offering price (based on sales charge of 1.00%) | $ 6.58 |
| Class I | $ 6.40 |
|
See Notes to Financial Statements |
18
STATEMENT OF OPERATIONS
Year Ended April 30, 2003
|
| Investment income |
| Interest (net of foreign withholding taxes of $69,188) | $ 20,870,901 |
|
| Expenses |
| Advisory fee | 1,438,934 |
| Distribution Plan expenses |
| Class A | 368,144 |
| Class B | 879,302 |
| Class C | 389,651 |
| Administrative services fee | 277,805 |
| Transfer agent fees | 575,677 |
| Trustees' fees and expenses | 4,536 |
| Printing and postage expenses | 27,028 |
| Custodian fee | 220,906 |
| Registration and filing fees | 11,524 |
| Professional fees | 31,940 |
| Other | 17,197 |
|
| Total expenses | 4,242,644 |
| Less: Expense reductions | (4,532) |
| Expense reimbursements | (3,621) |
|
| Net expenses | 4,234,491 |
|
| Net investment income | 16,636,410 |
|
| Net realized and unrealized gains or losses on securities and foreign currency related transactions |
| Net realized gains on: |
| Securities | 4,649,289 |
| Foreign currency related transactions | 104,977 |
|
| Net realized gains on securities and foreign currency related transactions | 4,754,266 |
| Net change in unrealized gains or losses on securities and foreign currency related transactions | 28,219,401 |
|
| Net realized and unrealized gains or losses on securities and foreign currency related transactions | 32,973,667 |
|
| Net increase in net assets resulting from operations | $ 49,610,077 |
|
See Notes to Financial Statements |
19
STATEMENTS OF CHANGES IN NET ASSETS
| Year Ended April 30,
|
| 2003 | 2002 |
|
| Operations |
| Net investment income | | $ 16,636,410 | | $ 12,697,170 |
Net realized gains or losses on securities
and foreign currency related transactions | | 4,754,266 | | (10,549,354) |
Net change in unrealized gains or losses on securities
and foreign currency related transactions | | 28,219,401 | | 17,411,967 |
|
| Net increase in net assets resulting from operations | | 49,610,077 | | 19,559,783 |
|
| Distributions to shareholders from |
| Net investment income |
| Class A | | (9,217,057) | | (6,673,070) |
| Class B | | (4,966,809) | | (4,051,975) |
| Class C | | (2,202,780) | | (904,509) |
| Class I* | | (458,398) | | (97,168) |
| Tax basis return of capital |
| Class A | | 0 | | (2,318,169) |
| Class B | | 0 | | (1,407,622) |
| Class C | | 0 | | (314,219) |
| Class I* | | 0 | | (33,755) |
|
| Total distributions to shareholders | | (16,845,044) | | (15,800,487) |
|
| | Shares | | Shares |
| Capital share transactions |
| Proceeds from shares sold |
| Class A | 8,487,148 | 51,662,571 | 2,963,451 | 16,963,105 |
| Class B | 6,708,216 | 40,780,947 | 3,057,967 | 17,593,950 |
| Class C | 8,054,040 | 49,183,588 | 1,472,812 | 8,448,726 |
| Class I* | 840,724 | 5,020,580 | 58,874 | 331,390 |
|
| | | 146,647,686 | | 43,337,171 |
|
Net asset value of shares issued in reinvestment
of distributions |
| Class A | 975,606 | 5,929,744 | 1,003,114 | 5,727,223 |
| Class B | 459,976 | 2,804,647 | 535,062 | 3,064,118 |
| Class C | 183,976 | 1,129,873 | 102,956 | 589,023 |
| Class I* | 21,899 | 134,122 | 7,567 | 42,538 |
|
| | | 9,998,386 | | 9,422,902 |
|
Automatic conversion of Class B shares
to Class A shares |
| Class A | 540,589 | 3,247,744 | 1,695,229 | 9,788,829 |
| Class B | (538,733) | (3,247,744) | (1,688,252) | (9,788,829) |
|
| | | 0 | | 0 |
|
| Payment for shares redeemed |
| Class A | (5,697,864) | (34,377,442) | (4,514,684) | (25,795,810) |
| Class B | (3,299,332) | (19,950,381) | (3,151,402) | (18,084,184) |
| Class C | (1,615,262) | (9,838,968) | (629,182) | (3,592,366) |
| Class I* | (614,239) | (3,675,494) | (37,017) | (208,078) |
|
| | | (67,842,285) | | (47,680,438) |
|
| Net asset value of shares issued in acquisition |
| Class I* | 1,537,823 | 9,114,878 | 0 | 0 |
|
| * Effective at the close of business on May 11, 2001, Class Y shares were renamed as Institutional shares (Class I). |
See Notes to Financial Statements |
20
STATEMENTS OF CHANGES IN NET ASSETS continued
| Year Ended April 30,
|
| 2003 | 2002 |
|
| Net increase in net assets resulting from capital share transactions | | $ 97,918,665 | | $ 5,079,635 |
|
| Total increase in net assets | | 130,683,698 | | 8,838,931 |
| Net assets |
| Beginning of period | | 232,738,925 | | 223,899,994 |
|
| End of period | | $ 363,422,623 | | $ 232,738,925 |
|
| Undistributed (overdistributed) net investment income | | $ 6,166,568 | | $ (1,217,046) |
|
See Notes to Financial Statements |
21
NOTES TO FINANCIAL STATEMENTS
1. ORGANIZATION
Evergreen Strategic Income Fund (the "Fund") is a diversified series of Evergreen Fixed Income Trust (the "Trust"), a Delaware business trust organized on September 18, 1997. The Trust is an open-end management investment company registered under the Investment Company Act of 1940, as amended (the "1940 Act").
The Fund offers Class A, Class B, Class C and Institutional ("Class I") shares. Class A shares are sold with a front-end sales charge and pay an ongoing distribution fee. Class B shares are sold without a front-end sales charge but are subject to a contingent deferred sales charge that is payable upon redemption and decreases depending on how long the shares have been held. Class C shares are sold with a front-end sales charge and are subject to a contingent deferred sales charge that is payable upon redemption within one year after the month of purchase. Both Class B and Class C shares pay a higher ongoing distribution fee than Class A. Class I shares are sold without a front-end sales charge or contingent deferred sales charge and do not pay a distribution fee.
2. SIGNIFICANT ACCOUNTING POLICIES
The following is a summary of significant accounting policies consistently followed by the Fund in the preparation of its financial statements. The policies are in conformity with generally accepted accounting principles, which require management to make estimates and assumptions that affect amounts reported herein. Actual results could differ from these estimates.
a. Valuation of investments
Portfolio debt securities acquired with more than 60 days to maturity are valued at prices obtained from an independent pricing service which takes into consideration such factors as similar security prices, yields, maturities, liquidity and ratings. Securities for which valuations are not available from an independent pricing service may be valued by brokers which use prices provided by market makers or estimates of market value obtained from yield data relating to investments or securities with similar characteristics.
Listed equity securities are usually valued at the last sales price reported on the national securities exchange where the securities are principally traded.
Foreign securities traded on an established exchange are valued at the last sales price on the exchange where the security is primarily traded. If there has been no sale, the securities are valued at the mean between bid and asked prices.
Investments in other mutual funds are valued at net asset value. Securities for which market quotations are not available are valued at fair value as determined in good faith, according to procedures approved by the Board of Trustees.
b. Foreign currency translation
All assets and liabilities denominated in foreign currencies are translated into U.S. dollar amounts at the date of valuation. Purchases and sales of portfolio securities and income items denominated in foreign currencies are translated into U.S. dollar amounts on the respective dates of such trans-
22
NOTES TO FINANCIAL STATEMENTS continued
actions. The Fund does not separately account for that portion of the results of operations resulting from changes in foreign exchange rates on investments and the fluctuations arising from changes in market prices of securities held. Such fluctuations are included with the net realized and unrealized gains or losses on securities.
c. Foreign currency contracts
A foreign currency contract is an obligation to purchase or sell a specific currency for an agreed-upon price at a future date. The Fund enters into foreign currency contracts to facilitate transactions in foreign-denominated securities and to attempt to minimize the risk to the Fund from adverse changes in the relationship between currencies. Foreign currency contracts are recorded at the forward rate and marked-to-market daily. When the contracts are closed, realized gains and losses arising from such transactions are recorded as realized gains or losses on foreign currency related transactions. The Fund could be exposed to risks if the counterparties to the contracts are unable to meet the terms of their contracts or if the value of the foreign currency changes unfavorably.
d. Securities lending
The Fund may lend its securities to certain qualified brokers in order to earn additional income. The Fund receives compensation in the form of fees or interest earned on the investment of any cash collateral received. The Fund receives collateral in the form of cash or securities with a market value at least equal to the market value of the securities on loan, including accrued interest. In the event of default or bankruptcy by the borrower, the Fund could experience delays and costs in recovering the loaned securities or in gaining access to the collateral.
e. Security transactions and investment income
Security transactions are recorded no later than one business day after the trade date. Realized gains and losses are computed using the specific cost of the security sold. Interest income is recorded on the accrual basis and includes accretion of discounts and amortization of premiums. Dividend income is recorded on the ex-dividend date or in the case of some foreign securities, on the date when the Fund is made aware of the dividend. Foreign income and capital gains realized on some securities may be subject to foreign taxes, which are accrued as applicable.
f. Federal taxes
The Fund intends to continue to qualify as a regulated investment company and distribute all of its taxable income, including any net capital gains (which have already been offset by available capital loss carryovers). Accordingly, no provision for federal taxes is required.
g. Distributions
Distributions to shareholders from net investment income are accrued daily and paid monthly. Distributions from net realized gains, if any, are recorded on the ex-dividend date. Such distributions are determined in conformity with income tax regulations, which may differ from generally accepted accounting principles.
23
NOTES TO FINANCIAL STATEMENTS continued
Reclassifications have been made to the Fund's components of net assets to reflect income and gains available for distribution (or available capital loss carryovers, as applicable) under income tax regulations. The primary permanent differences causing such reclassifications are due to net realized foreign currency gains, expiration of capital loss carryovers and premium amortization.
h. Class allocations
Income, common expenses and realized and unrealized gains and losses are allocated to the classes based on the relative net assets of each class. Distribution fees, if any, are calculated daily at the class level based on the appropriate net assets of each class and the specific expense rates applicable to each class.
3. ADVISORY FEES AND OTHER TRANSACTIONS WITH AFFILIATES
Evergreen Investment Management Company, LLC ("EIMC"), an indirect, wholly-owned subsidiary of Wachovia Corporation ("Wachovia"), is the investment advisor to the Fund and is paid a fee at an annual rate of 2% of the Fund's gross investment income plus an amount determined by applying percentage rates to the average daily net assets of the Fund, starting at 0.41% and declining to 0.16% as average daily net assets increase.
From time to time, EIMC may voluntarily or contractually waive its fees and/or reimburse expenses in order to limit operating expenses. For any fee waivers and/or reimbursements made after January 1, 2003, EIMC may recoup any amounts waived and/or reimbursed up to a period of three years following the end of the fiscal year in which the fee waivers and/or reimbursements were made. Total amounts subject to recoupment as of April 30, 2003 were $3,621. During the year ended April 30, 2003, the investment advisor reimbursed expenses relating to Class A shares in the amount of $3,621, which represents 0.00% of the Fund's average daily net assets.
Evergreen Investment Services, Inc. ("EIS"), an indirect, wholly-owned subsidiary of Wachovia, is the administrator to the Fund. As administrator, EIS provides the Fund with facilities, equipment and personnel and is paid an annual administrative fee of 0.10% of the Fund's average daily net assets.
Evergreen Service Company, LLC ("ESC"), an indirect, wholly-owned subsidiary of Wachovia, is the transfer and dividend disbursing agent for the Fund. ESC receives account fees that vary based on the type of account held by the shareholders in the Fund. For the year ended April 30, 2003, the transfer agent fees were equivalent to an annual rate of 0.21% of the Fund's average daily net assets.
4. DISTRIBUTION PLANS
Evergreen Distributor, Inc. ("EDI"), a wholly-owned subsidiary of BISYS Fund Services, Inc., serves as principal underwriter to the Fund.
The Fund has adopted Distribution Plans, as allowed by Rule 12b-1 of the 1940 Act, for each class of shares, except Class I. Under the Distribution Plans, distribution fees are paid at an annual rate of 1.00% of the average daily net assets for Class B and Class C shares. On March 20, 2003,
24
NOTES TO FINANCIAL STATEMENTS continued
the Trustees of the Fund approved an increase to the annual maximum allowable charge for servicing and distribution fees on Class A shares from 0.25% to 0.30% of the average daily net assets of Class A shares. This increase became effective on March 27, 2003.
5. ACQUISITION
Effective on the close of business on November 8, 2002, the Fund acquired substantially all the assets and assumed certain liabilities of OFFIT Total Return Fund in a tax-free exchange for Class I shares of the Fund. The acquired net assets consisted primarily of portfolio securities with unrealized appreciation of $184,130. The aggregate net assets of the Fund and OFFIT Total Return Fund immediately prior to the acquisition were $269,123,098 and $9,114,878, respectively. The aggregate net assets of the Fund immediately after the acquisition were $278,237,976.
6. SECURITIES TRANSACTIONS
Cost of purchases and proceeds from sales of investment securities (excluding short-term securities) were as follows for the year ended April 30, 2003:
| Cost of Purchases | Proceeds from Sales |
|
| U.S. | Non-U.S. | U.S. | Non-U.S. |
| Government | Government | Government | Government |
|
| $ 92,668,161 | $ 307,969,702 | $ 108,435,483 | $ 225,159,127 |
|
At April 30, 2003, the Fund had forward foreign currency exchange contracts outstanding as follows:
Forward Foreign Currency Exchange Contracts to Sell:
| Exchange | | U.S. Value at | In Exchange | Unrealized |
| Date | Contracts to Deliver | April 30, 2003 | for U.S. $ | Loss |
|
| 8/4/2003 | 40,000,000 Euro | $ 44,580,557 | $ 43,786,400 | $ 794,157 |
|
The Fund loaned securities during the year ended April 30, 2003 to certain brokers. At April 30, 2003, the value of securities on loan and the value of collateral (including accrued interest) amounted to $21,552,792 and $21,996,630, respectively. During the year ended April 30, 2003, the Fund earned $40,511 in income from securities lending.
On April 30, 2003, the aggregate cost of securities for federal income tax purposes was $344,133,703. The gross unrealized appreciation and depreciation on securities based on tax cost was $36,406,307 and $3,239,795, respectively, with a net unrealized appreciation of $33,166,512.
As of April 30, 2003, the Fund had $81,352,258 in capital loss carryovers for federal income tax purposes expiring as follows:
| Expiration |
|
| 2004 | 2008 | 2009 | 2010 |
|
| $ 35,072,322 | $ 12,246,758 | $ 14,759,243 | $ 19,273,935 |
|
25
NOTES TO FINANCIAL STATEMENTS continued
For income tax purposes, capital losses incurred after October 31 within the Fund's fiscal year are deemed to arise on the first business day of the following fiscal year. The Fund has incurred and will elect to defer post-October losses of $5,129,861.
7. INTERFUND LENDING
Pursuant to an Exemptive Order issued by the SEC, the Fund, along with other certain funds in the Evergreen fund family may participate in an interfund lending program. This program allows the Fund to borrow from, or lend money to, other participating funds. During the year ended April 30, 2003, the Fund did not participate in the interfund lending program.
8. DISTRIBUTIONS TO SHAREHOLDERS
As of April 30, 2003, the components of distributable earnings on a tax basis were as follows:
| | Capital Loss |
| | Carryover |
| Undistributed | | and |
| Ordinary | Unrealized | Post-October |
| Income | Appreciation | Loss |
|
| $ 5,439,575 | $ 33,166,512 | $ 86,482,119 |
|
The differences between the components of distributable earnings on a tax basis and the amounts reflected in the Statement of Assets and Liabilities are primarily due to foreign currency losses and premium amortization.
The tax character of distributions paid were as follows:
| Year Ended April 30,
|
| 2003 | 2002 |
|
| Ordinary Income | $ 16,845,044 | $ 11,726,722 |
| Return of Capital | 0 | 4,073,765 |
|
9. EXPENSE REDUCTIONS
Through expense offset arrangements with ESC and the Fund's custodian, a portion of fund expenses has been reduced. The Fund received expense reductions from expense offset arrangements of $4,532, which represents 0.00% of its average daily net assets.
10. DEFERRED TRUSTEES' FEES
Each independent Trustee of the Fund may defer any or all compensation related to performance of their duties as Trustees. The Trustees' deferred balances are allocated to deferral accounts, which are included in the accrued expenses for the Fund. The investment performance of the deferral accounts are based on the investment performance of certain Evergreen funds. Any gains earned or losses incurred in the deferral accounts are reported in the Fund's Trustees' fees and expenses. At the election of the Trustees, the deferral account will be paid either in one lump sum or in quarterly installments for up to ten years.
26
NOTES TO FINANCIAL STATEMENTS continued
11. FINANCING AGREEMENT
The Fund and certain other Evergreen funds share in a $150 million unsecured revolving credit commitment for temporary and emergency purposes, including the funding of redemptions, as permitted by each Fund's borrowing restrictions. Borrowings under this facility bear interest at 0.50% per annum above the Federal Funds rate. All of the participating funds are charged an annual commitment fee of 0.09% of the unused balance, which is allocated pro rata.
During the year ended April 30, 2003, the Fund had no borrowings under this agreement.
27
INDEPENDENT AUDITORS' REPORT
Board of Trustees and Shareholders
Evergreen Fixed Income Trust
We have audited the accompanying statement of assets and liabilities, including the schedule of investments, of the Evergreen Strategic Income Fund, a series of Evergreen Fixed Income Trust, as of April 30, 2003, and the related statement of operations for the year then ended, statements of changes in net assets for each of the years in the two-year period then ended, and the financial highlights for each of the years in the five-year period then ended. These financial statements and financial highlights are the responsibility of the Fund's management. Our responsibility is to express an opinion on these financial statements and financial highlights based on our audits.
We conducted our audits in accordance with auditing standards generally accepted in the United States of America. Those standards require that we plan and perform the audit to obtain reasonable assurance about whether the financial statements and financial highlights are free of material misstatement. An audit includes examining, on a test basis, evidence supporting the amounts and disclosures in the financial statements. Our procedures included confirmation of securities owned as of April 30, 2003 by correspondence with the custodian. As to securities purchased or sold but not yet received or delivered, we performed other appropriate auditing procedures. An audit also includes assessing the accounting principles used and significant estimates made by management, as well as evaluating the overall financial statement presentation. We believe that our audits provide a reasonable basis for our opinion.
In our opinion, the financial statements and financial highlights referred to above present fairly, in all material respects, the financial position of the Evergreen Strategic Income Fund, as of April 30, 2003, the results of its operations, changes in its net assets and financial highlights for each of the years or periods described above in conformity with accounting principles generally accepted in the United States of America.
Boston, Massachusetts
June 6, 2003
28
This page left intentionally blank
29
This page left intentionally blank
30
This page left intentionally blank
31
TRUSTEES AND OFFICERS
TRUSTEES1
|
Charles A. Austin III
Trustee
DOB: 10/23/1934
Term of office since: 1991
Other directorships: None | Principal occupations: Investment Counselor, Anchor Capital Advisors, Inc. (investment advice); Director, The Andover Companies (insurance); Trustee, Arthritis Foundation of New England; The Francis Ouimet Society; Former Investment Counselor, Appleton Partners, Inc. (investment advice); Former Director, Executive Vice President and Treasurer, State Street Research & Management Company (investment advice); Former Director, Health Development Corp. (fitness-wellness centers); Former Director, Mentor Income Fund, Inc.; Former Trustee, Mentor Funds and Cash Resource Trust. |
|
K. Dun Gifford
Trustee
DOB: 10/23/1938
Term of office since: 1974
Other directorships: None | Principal occupations: Chairman and President, Oldways Preservation and Exchange Trust (education); Trustee, Treasurer and Chairman of the Finance Committee, Cambridge College; Former Managing Partner, Roscommon Capital Corp.; Former Chairman of the Board, Director, and Executive Vice President, The London Harness Company (leather goods purveyor); Former Chairman, Gifford, Drescher & Associates (environmental consulting); Former Director, Mentor Income Fund, Inc.; Former Trustee, Mentor Funds and Cash Resource Trust. |
|
Leroy Keith, Jr.
Trustee
DOB: 2/14/1939
Term of office since: 1983
Other directorships: Trustee, Phoenix Series Fund, Phoenix Multi-Portfolio Fund, and The Phoenix Big Edge Series Fund | Principal occupations: Partner, Stonington Partners, Inc. (private investment firm); Trustee of Phoenix Series Fund, Phoenix Multi-Portfolio Fund, and The Phoenix Big Edge Series Fund; Former Chairman of the Board and Chief Executive Officer, Carson Products Company (manufacturing); Former Director of Phoenix Total Return Fund and Equifax, Inc. (worldwide information management); Former President, Morehouse College; Former Director, Mentor Income Fund, Inc.; Former Trustee, Mentor Funds and Cash Resource Trust. |
|
Gerald M. McDonnell
Trustee
DOB: 7/14/1939
Term of office since: 1988
Other directorships: None | Principal occupations: Sales Manager, SMI-STEEL - South Carolina (steel producer); Former Sales and Marketing Management, Nucor Steel Company; Former Director, Mentor Income Fund, Inc.; Former Trustee, Mentor Funds and Cash Resource Trust. |
|
William Walt Pettit
Trustee
DOB: 8/26/1955
Term of office since: 1984
Other directorships: None | Principal occupations: Partner and Vice President in the law firm of Kellam & Pettit, P.A.; Former Director, Mentor Income Fund, Inc.; Former Trustee, Mentor Funds and Cash Resource Trust. |
|
David M. Richardson
Trustee
DOB: 9/19/1941
Term of office since: 1982
Other directorships: None | Principal occupations: President, Richardson, Runden & Company (new business development/consulting company); Managing Director, Kennedy Information, Inc. (executive recruitment information and research company); Trustee, 411 Technologies, LLP (communications); Director, J&M Cumming Paper Co. (paper merchandising); Columnist, Commerce and Industry Association of New Jersey; Former Vice Chairman, DHR International, Inc. (executive recruitment); Former Senior Vice President, Boyden International Inc. (executive recruitment); Former Director, Mentor Income Fund, Inc.; Former Trustee, Mentor Funds and Cash Resource Trust. |
|
Russell A. Salton III, MD
Trustee
DOB: 6/2/1947
Term of office since: 1984
Other directorships: None | Principal occupations: Medical Director, Healthcare Resource Associates, Inc.; Former Medical Director, U.S. Health Care/Aetna Health Services; Former Consultant, Managed Health Care; Former President, Primary Physician Care; Former Director, Mentor Income Fund, Inc.; Former Trustee, Mentor Funds and Cash Resource Trust. |
|
Michael S. Scofield
Trustee
DOB: 2/20/1943
Term of office since: 1984
Other directorships: None | Principal occupations: Attorney, Law Offices of Michael S. Scofield; Former Director, Mentor Income Fund, Inc.; Former Trustee, Mentor Funds and Cash Resource Trust. |
|
32
TRUSTEES AND OFFICERS continued
Richard J. Shima
Trustee
DOB: 8/11/1939
Term of office since: 1993
Other directorships: None | Principal occupations: Independent Consultant; Director, Trust Company of CT; Trustee, Saint Joseph College (CT); Director of Hartford Hospital, Old State House Association; Trustee, Greater Hartford YMCA; Former Chairman, Environmental Warranty, Inc. (insurance agency); Former Executive Consultant, Drake Beam Morin, Inc. (executive outplacement); Former Director of Enhance Financial Services, Inc.; Former Director of CTG Resources, Inc. (natural gas); Former Director Middlesex Mutual Assurance Company; Former Chairman, Board of Trustees, Hartford Graduate Center; Former Director, Mentor Income Fund, Inc.; Former Trustee, Mentor Funds and Cash Resource Trust. |
|
Richard K. Wagoner, CFA2
Trustee
DOB: 12/12/1937
Term of office since: 1999
Other directorships: None | Principal occupations: Current Member and Former President, North Carolina Securities Traders Association; Member, Financial Analysts Society; Former Chief Investment Officer, Executive Vice President and Head of Capital Management Group, First Union National Bank; Former Consultant to the Boards of Trustees of the Evergreen Funds; Former Member, New York Stock Exchange; Former Trustee, Mentor Funds and Cash Resource Trust. |
|
OFFICERS
|
William M. Ennis3
President
DOB: 6/26/1960
Term of office since: 1999 | President and Chief Executive Officer, Evergreen Investment Company, Inc. and Chief Operating Officer, Capital Management Group, Wachovia Bank, N.A. |
|
Carol Kosel4
Treasurer
DOB: 12/25/1963
Term of office since: 1999 | Senior Vice President, Evergreen Investment Services, Inc. and Treasurer, Vestaur Securities, Inc.; former Senior Manager, KPMG LLP. |
|
Michael H. Koonce4
Secretary
DOB: 4/20/1960
Term of office since: 2000 | Senior Vice President and General Counsel, Evergreen Investment Services, Inc.; Senior Vice President and Assistant General Counsel, Wachovia Corporation; former Senior Vice President and General Counsel, Colonial Management Associates, Inc.; former Vice President and Counsel, Colonial Management Associates, Inc. |
|
Nimish S. Bhatt5
Vice President and Assistant Treasurer
DOB: 6/6/1963
Term of office since: 1998 | Vice President, Tax, BISYS Fund Services; former Assistant Vice President, EAMC/First Union National Bank; former Senior Tax Consulting/Acting Manager, Investment Companies Group, PricewaterhouseCoopers LLP, New York. |
|
Bryan Haft5
Vice President
DOB: 1/23/1965
Term of office since: 1998 | Team Leader, Fund Administration, BISYS Fund Services. |
|
1 Each Trustee serves until a successor is duly elected or qualified or until his death, resignation, retirement or removal from office. The address of each Trustee is 200 Berkeley Street, Boston, MA 02116. Each Trustee oversees 112 Evergreen funds.
2 Mr. Wagoner is an "interested person" of the fund because of his ownership of shares in Wachovia Corporation, the parent to the fund's investment advisor.
3 The address of the Officer is 401 S. Tryon Street, 20th Floor, Charlotte, NC 28288.
4 The address of the Officer is 200 Berkeley Street, Boston, MA 02116.
5 The address of the Officer is 3435 Stelzer Road, Columbus, OH 43219.
Additional information about the fund's Board of Trustees and Officers can be found in the Statement of Additional Information (SAI) and is available upon request without charge by calling 800.343.2898. |
33
Investments that stand the test of time
Year in and year out, Evergreen Investments seeks to provide each client with sound, time-tested investment strategies designed for sustainable long-term success. With over $229 billion* in assets under management, we manage diverse investments from institutional portfolios to mutual funds, variable annuities to retirement plans, alternative investments to private accounts. Our commitment to every one of our clients is reflected in the rigor and discipline with which we manage investments.
We offer a complete family of mutual funds designed to help investors meet a wide range of financial goals. From money market funds that meet short-term needs to international funds that involve greater risk but seek potentially higher returns, Evergreen provides a broad array of flexible investment options. Across all investment styles, we are committed to providing investors with investment excellence day after day, quarter after quarter and year after year.
*As of April 30, 2003
Visit us online at EvergreenInvestments.com
FOR MORE INFORMATION
Evergreen Express Line 800.346.3858
Evergreen Investor Services 800.343.2898

For the fourth consecutive year, Evergreen Investments has earned the Dalbar Mutual Fund Service Award, which recognizes those firms that exceed industry norms in key service areas. The award symbolizes the achievement of the highest tier of shareholder service within our industry. For 2002, Evergreen Investments was ranked third overall.
566662 6/2003 | 
Evergreen Investments
200 Berkeley Street
Boston, MA 02116-5034
|
Evergreen U.S. Government Fund

1
table of contents
This annual report must be preceded or accompanied by a prospectus of the Evergreen fund contained herein. The prospectus contains more complete information, including fees and expenses, and should be read carefully before investing or sending money.
Mutual Funds:
| | | | |
|
|
|
|
|
NOT FDIC INSURED | | MAY LOSE VALUE | | NOT BANK GUARANTEED |
|
|
|
|
|
Evergreen Investments(SM) is a service mark of Evergreen Investment Management Company, LLC. Copyright 2003.
Evergreen mutual funds are distributed by Evergreen Distributor, Inc., 90 Park Avenue, 10th Floor, New York, NY 10016.
2
LETTER TO SHAREHOLDERS
June 2003
Dear Evergreen Shareholder,
We are pleased to present the annual report for Evergreen U.S. Government Fund, which covers the twelve-month period ended April 30, 2003.
Market analysis
The past twelve months have proven to be an extraordinary period for investors in the financial markets. The uneven domestic recovery and accompanying profit weakness has been compounded by investor concern due to the geopolitical threats of war and terror. In addition, the corporate accounting irregularities have further eroded investor confidence. The result has been a volatile equity market, leading to increased investor attention on asset allocation and risk aversion. Those investors properly allocated within most fixed income securities have been able to generate higher relative returns than those emphasizing single sector or single asset class strategies.

Perhaps the wildest ride for investors has occurred within the U.S. government bond market. After the economy produced larger than expected job growth in the early spring of 2002, the yield on the 10-year Treasury bond surged to 5.4%. As the rumors of the death of higher unemployment proved premature, the yield on the 10-year gradually diminished throughout last summer. Rising unemployment and slower than expected economic growth were joined by fears of war and terror to result in a surge of interest in U.S. Government bonds. This flight to quality was due to the perceived safety of Treasury securities by investors. Indeed, by the end of the third quarter, the yield on the 10-year Treasury fell to 3.6%, which occurred despite the rising federal budget deficit. As economic growth remained slow throughout the second half of last year, dampened by geopolitical threats, the Federal Reserve surprised investors with a larger than expected 50-basis point cut in its target for the Federal Funds rate last November. After temporarily climbing above 4% early in 2003, the 10-year Treasury has once again exceeded last year’s lows.
1
LETTER TO SHAREHOLDERS continued
Investors in government bonds were not the only beneficiaries of bond market performance within the past year. After a dismal start, the corporate bond market began a steady improvement in the second half of 2002, followed by improved momentum thus far in 2003. The corporate accounting scandals led to many rating downgrades and credibility issues for Corporate America, and bond investors demanded increased premiums to compensate for these risks. After painstaking steps on the part of many corporations to address their operating and credibility problems in late 2002, investors once again began nibbling in corporate bonds and spreads began to narrow by the end of last year. As investors became more comfortable with the strengthening of U.S. balance sheets in 2003, the corporate bond market continued to generate positive gains for investors.
These gains in the corporate fixed income markets were not limited to investment grade securities. The high yield market also enjoyed improved performance in late 2002 and into 2003. After under-performing most other fixed income vehicles in recent years, investors have rallied around the improving prospects for this sector.
Periods of rising defaults have historically been followed by periods of out performance. In addition, these issues tend to be most leveraged to economic recoveries and therefore tend to trade like equities as the economy and the stock market recover. As a result of these fundamental and technical trends, investors in high yield bonds participated in solid gains over the past several months.
While government and corporate bonds have benefited in this environment of low rates, investors in mortgage-backed securities have experienced a challenging period. As interest rates fell, refinancing activity accelerated. Since a drop in rates generally benefits bond investors as prices move higher in response to rate declines, this has a negative effect on mortgage-backed security prices because falling rates typically precede a rise in prepayments. These occur when mortgage holders refinance their existing higher rate mortgage prior to the stated maturity date to obtain lower rates. As a result, the challenge for investors in this market is to focus on securities less likely to be affected by prepayment risk in a declining interest rate environment. As rates begin to increase, these risks should subside.
2
LETTER TO SHAREHOLDERS continued
Looking ahead, we project a gradual improvement for the U.S. economy for the remainder of 2003 and into next year. The potential for tighter monetary policy next year and further increases in the U.S. federal budget deficit will likely place upward pressure on the yields of U.S. Treasury bonds. Inflation remains mild, which should enable monetary policymakers to keep interest rates steady into next year. In this environment, we believe investors will increase credit risk in an attempt to improve yields for their portfolios. As such, we expect further moderate gains within the corporate market as credit quality improves, highlighted by returns in the close-to-investment-grade high yield market.
As always, we encourage investors to remain dedicated to the long-term investment strategies. Proper diversification with your portfolio is essential in limiting risk while seeking rewards. While the current investment environment is challenging, we remind investors that the U.S. economy and the financial markets have a long history of adaptability and recovery. By focusing on the fundamentals, and not allowing oneself to get caught up in the day-to-day, news-related volatility, we continue to believe that the patient, long-term investor will be rewarded.
For more information
Please visit our Web site, EvergreenInvestments.com, for more information about our funds and other investment products available to you. From the Web site, you can also access our quarterly shareholder newsletter, Evergreen Events, through the “About Evergreen Investments” menu tab. Thank you for your continued support of Evergreen Investments.
| | | |

| | |

|
| | |
|
William M. Ennis
President and Chief Executive Officer
Evergreen Investment Company, Inc. | | | Dennis H. Ferro
President and Chief Investment Officer
Evergreen Investment Management Company, LLC |
3
FUND AT A GLANCE
as of April 30, 2003
MANAGEMENT TEAM

Lisa Brown Premo
Customized Fixed
Income Team
Lead Manager
CURRENT INVESTMENT STYLE (2)

PERFORMANCE AND RETURNS (1)
Portfolio inception date: 1/11/1993
Class inception date | | Class A
1/11/1993 | | Class B
1/11/1993 | | Class C
9/2/1994 | | Class I
9/2/1993 | |
| |
| |
| |
| |
| |
Average annual return* | | | | | | | | | |
1 year with sales charge | | 3.31 | % | 2.69 | % | 5.61 | % | N/A | |
| |
| |
| |
| |
| |
1 year w/o sales charge | | 8.50 | % | 7.69 | % | 7.69 | % | 8.77 | % |
| |
| |
| |
| |
| |
5 year | | 5.40 | % | 5.31 | % | 5.42 | % | 6.69 | % |
| |
| |
| |
| |
| |
10 year | | 5.66 | % | 5.43 | % | 5.39 | % | 6.44 | % |
| |
| |
| |
| |
| |
* Adjusted for maximum applicable sales charge, unless noted.
LONG TERM GROWTH
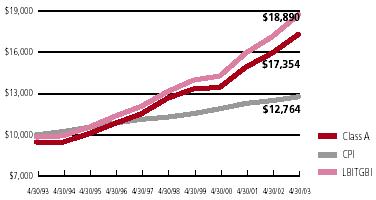
Comparison of a $10,000 investment in Evergreen U.S. Government Fund Class A shares,(1) versus a similar investment in the Lehman Brothers Intermediate Term Government Bond Index (LBITGBI) and the Consumer Price Index (CPI).
The LBITGBI is an unmanaged market index and does not include transaction costs associated with buying and selling securities, any mutual fund expenses or any taxes. The CPI is a commonly used measure of inflation and does not represent an investment return. It is not possible to invest directly in an index.
4
PORTFOLIO MANAGER COMMENTARY
The fund’s Class A shares had a total return of 8.50% for the 12-month period ended April 30, 2003, excluding any applicable sales charges. During the same period, the Lehman Brothers Intermediate Term Government Bond Index (LBITGBI) returned 9.22%, while the median return of funds in the Lipper General U.S. Government Funds classification was 8.63%. Lipper is an independent monitor of mutual fund performance.
We kept the fund’s duration longer than the benchmark LBITGBI. Duration measures a bond’s sensitivity to changes in interest rates. In a declining interest rate environment, a longer duration benefits the fund because prices on longer-duration bonds have the potential to appreciate more than those on shorter-duration bonds, which tend to be more stable. We maintained substantial positions in mortgage-backed securities. The mortgages in the fund were strong contributors to performance. We continue to expect strong relative performance from mortgages and plan to maintain an overweighted position, relative to the index, in these securities. At 6.2% of net assets, we overweighted the fund in corporate bonds, relative to the LBITGBI. With interest rates at very low levels and corporate balance sheets improving, the higher yields that corporate bonds offered were attractive to investors, and corporate bonds benefited from increased demand. The fund’s position in corporate bonds aided the fund’s results.
(1) Past performance is no guarantee of future results. The investment return and principal value of an investment will fluctuate so that investors’ shares, when redeemed, may be worth more or less than their original cost. The performance of each class may vary based on differences in loads, fees and expenses paid by the shareholders investing in each class. Performance includes the reinvestment of income dividends and capital gain distributions. Performance shown does not reflect the deduction of taxes that a shareholder would pay on fund distributions or the redemption of fund shares.
Historical performance shown for Classes C and I prior to their inception is based on the performance of Class A, one of the original classes offered along with Class B. The historical returns for Classes C and I have not been adjusted to reflect the effect of each class’ 12b-1 fee. These fees are 0.30% for Class A and 1.00% for Classes B and C. Class I does not pay a 12b-1 fee. If these fees had been reflected, returns for Class C would have been lower while returns for Class I would have been higher. The advisor is reimbursing a portion of the 12b-1 fee for Class A. Had the fee not been reimbursed, returns would have been lower. Returns reflect expense limits previously in effect for all classes, without which returns would have been lower.
(2) Source: Morningstar, Inc.
Morningstar’s style box is based on a portfolio date as of 3/31/2003.
The fixed income style box placement is based on a fund’s average effective maturity or duration and the average credit rating of the bond portfolio.
Class I shares are only offered to investment advisory clients of an investment advisor of an Evergreen fund (or its advisory affiliates), through special arrangements entered into on behalf of Evergreen funds with certain financial services firms, certain institutional investors and persons who owned Class Y shares in registered name in an Evergreen fund on or before December 31,1994.
The fund’s investment objective is nonfundamental and may be changed without the vote of the fund’s shareholders.
U.S. government guarantees apply only to the underlying securities of the fund’s portfolio and not to the fund’s shares.
All data is as of April 30, 2003, and subject to change.
5
FINANCIAL HIGHLIGHTS
(For a share outstanding throughout each period)
| | Year Ended April 30, | |
| |
| |
CLASS A | | 2003 | | 2002(1) | | 2001 | | 2000 | | 1999 | |
| |
| |
| |
| |
| |
| |
Net asset value, beginning of period | | $ | 9.75 | | $ | 9.59 | | $ | 9.15 | | $ | 9.63 | | $ | 9.68 | |
| |
|
| |
|
| |
|
| |
|
| |
|
| |
Income from investment operations | | | | | | | | | | | | | | | | |
Net investment income | | | 0.39 | | | 0.48 | | | 0.54 | | | 0.55 | | | 0.56 | |
Net realized and unrealized gains or losses on securities | | | 0.43 | | | 0.16 | | | 0.44 | | | (0.48 | ) | | (0.04 | ) |
| |
|
| |
|
| |
|
| |
|
| |
|
| |
Total from investment operations | | | 0.82 | | | 0.64 | | | 0.98 | | | 0.07 | | | 0.52 | |
| |
|
| |
|
| |
|
| |
|
| |
|
| |
Distributions to shareholders from | | | | | | | | | | | | | | | | |
Net investment income | | | (0.35 | ) | | (0.48 | ) | | (0.54 | ) | | (0.55 | ) | | (0.57 | ) |
| |
|
| |
|
| |
|
| |
|
| |
|
| |
Net asset value, end of period | | $ | 10.22 | | $ | 9.75 | | $ | 9.59 | | $ | 9.15 | | $ | 9.63 | |
| |
|
| |
|
| |
|
| |
|
| |
|
| |
Total return(2) | | | 8.50 | % | | 6.76 | % | | 10.98 | % | | 0.79 | % | | 5.39 | % |
| |
|
| |
|
| |
|
| |
|
| |
|
| |
Ratios and supplemental data | | | | | | | | | | | | | | | | |
Net assets, end of period (thousands) | | $ | 146,427 | | $ | 141,838 | | $ | 108,073 | | $ | 91,123 | | $ | 48,091 | |
Ratios to average net assets | | | | | | | | | | | | | | | | |
Expenses(3) | | | 0.95 | % | | 0.96 | % | | 1.00 | % | | 0.97 | % | | 0.95 | % |
Net investment income | | | 3.81 | % | | 4.91 | % | | 5.71 | % | | 5.89 | % | | 5.68 | % |
Portfolio turnover rate | | | 129 | % | | 121 | % | | 86 | % | | 58 | % | | 98 | % |
| |
|
| |
|
| |
|
| |
|
| |
|
| |
(1)
As required, effective May 1, 2001, the Fund has adopted the provisions of the AICPA Audit and Accounting Guide, Audits of Investment Companies, and began amortizing premium on its fixed-income securities. The effects of this change for the year ended April 30, 2002 was a decrease in net investment income per share of $0.02; an increase in net realized gains or losses per share of $0.02; and a decrease to the ratio of net investment income to average net assets of 0.22%. The above per share information, ratios and supplemental data for the periods prior to May 1, 2001 have not been restated to reflect this change in presentation.
(2)
Excluding applicable sales charges
(3)
The ratio of expenses to average net assets excludes expense reductions but includes fee waivers and/or expense reimbursements.
See Notes to Financial Statements
6
FINANCIAL HIGHLIGHTS
(For a share outstanding throughout each period)
| | Year Ended April 30, | |
| |
| |
CLASS B | | 2003 | | 2002(1) | | 2001 | | 2000 | | 1999 | |
| |
| |
| |
| |
| |
| |
Net asset value, beginning of period | | $ | 9.75 | | $ | 9.59 | | $ | 9.15 | | $ | 9.63 | | $ | 9.68 | |
| |
|
| |
|
| |
|
| |
|
| |
|
| |
Income from investment operations | | | | | | | | | | | | | | | | |
Net investment income | | | 0.31 | | | 0.42 | | | 0.47 | | | 0.48 | | | 0.49 | |
Net realized and unrealized gains or losses on securities | | | 0.43 | | | 0.15 | | | 0.44 | | | (0.48 | ) | | (0.05 | ) |
| |
|
| |
|
| |
|
| |
|
| |
|
| |
Total from investment operations | | | 0.74 | | | 0.57 | | | 0.91 | | | 0 | | | 0.44 | |
| |
|
| |
|
| |
|
| |
|
| |
|
| |
Distributions to shareholders from | | | | | | | | | | | | | | | | |
Net investment income | | | (0.27 | ) | | (0.41 | ) | | (0.47 | ) | | (0.48 | ) | | (0.49 | ) |
| |
|
| |
|
| |
|
| |
|
| |
|
| |
Net asset value, end of period | | $ | 10.22 | | $ | 9.75 | | $ | 9.59 | | $ | 9.15 | | $ | 9.63 | |
| |
|
| |
|
| |
|
| |
|
| |
|
| |
Total return(2) | | | 7.69 | % | | 5.97 | % | | 10.15 | % | | 0.03 | % | | 4.60 | % |
| |
|
| |
|
| |
|
| |
|
| |
|
| |
Ratios and supplemental data | | | | | | | | | | | | | | | | |
Net assets, end of period (thousands) | | $ | 59,362 | | $ | 47,016 | | $ | 65,533 | | $ | 82,665 | | $ | 122,919 | |
Ratios to average net assets | | | | | | | | | | | | | | | | |
Expenses(3) | | | 1.70 | % | | 1.71 | % | | 1.75 | % | | 1.71 | % | | 1.71 | % |
Net investment income | | | 3.04 | % | | 4.18 | % | | 4.98 | % | | 5.11 | % | | 4.99 | % |
Portfolio turnover rate | | | 129 | % | | 121 | % | | 86 | % | | 58 | % | | 98 | % |
| |
|
| |
|
| |
|
| |
|
| |
|
| |
(1)
As required, effective May 1, 2001, the Fund has adopted the provisions of the AICPA Audit and Accounting Guide, Audits of Investment Companies, and began amortizing premium on its fixed-income securities. The effects of this change for the year ended April 30, 2002 was a decrease in net investment income per share of $0.01; an increase in net realized gains or losses per share of $0.01; and a decrease to the ratio of net investment income to average net assets of 0.22%. The above per share information, ratios and supplemental data for the periods prior to May 1, 2001 have not been restated to reflect this change in presentation.
(2)
Excluding applicable sales charges
(3)
The ratio of expenses to average net assets excludes expense reductions but includes fee waivers and/or expense reimbursements.
See Notes to Financial Statements
7
FINANCIAL HIGHLIGHTS
(For a share outstanding throughout each period)
| | Year Ended April 30, | |
| |
| |
CLASS C | | 2003 | | 2002(1) | | 2001 | | 2000 | | 1999 | |
| |
| |
| |
| |
| |
| |
Net asset value, beginning of period | | $ | 9.75 | | $ | 9.59 | | $ | 9.15 | | $ | 9.63 | | $ | 9.68 | |
| |
|
| |
|
| |
|
| |
|
| |
|
| |
Income from investment operations | | | | | | | | | | | | | | | | |
Net investment income | | | 0.31 | | | 0.41 | | | 0.47 | | | 0.48 | | | 0.49 | |
Net realized and unrealized gains or losses on securities | | | 0.43 | | | 0.16 | | | 0.44 | | | (0.48 | ) | | (0.05 | ) |
| |
|
| |
|
| |
|
| |
|
| |
|
| |
Total from investment operations | | | 0.74 | | | 0.57 | | | 0.91 | | | 0 | | | 0.44 | |
| |
|
| |
|
| |
|
| |
|
| |
|
| |
Distributions to shareholders from | | | | | | | | | | | | | | | | |
Net investment income | | | (0.27 | ) | | (0.41 | ) | | (0.47 | ) | | (0.48 | ) | | (0.49 | ) |
| |
|
| |
|
| |
|
| |
|
| |
|
| |
Net asset value, end of period | | $ | 10.22 | | $ | 9.75 | | $ | 9.59 | | $ | 9.15 | | $ | 9.63 | |
| |
|
| |
|
| |
|
| |
|
| |
|
| |
Total return(2) | | | 7.69 | % | | 5.97 | % | | 10.15 | % | | 0.03 | % | | 4.60 | % |
| |
|
| |
|
| |
|
| |
|
| |
|
| |
Ratios and supplemental data | | | | | | | | | | | | | | | | |
Net assets, end of period (thousands) | | $ | 26,013 | | $ | 14,212 | | $ | 11,188 | | $ | 4,740 | | $ | 5,605 | |
Ratios to average net assets | | | | | | | | | | | | | | | | |
Expenses(3) | | | 1.70 | % | | 1.71 | % | | 1.74 | % | | 1.71 | % | | 1.70 | % |
Net investment income | | | 2.99 | % | | 4.15 | % | | 4.90 | % | | 5.12 | % | | 4.97 | % |
Portfolio turnover rate | | | 129 | % | | 121 | % | | 86 | % | | 58 | % | | 98 | % |
| |
|
| |
|
| |
|
| |
|
| |
|
| |
(1)
As required, effective May 1, 2001, the Fund has adopted the provisions of the AICPA Audit and Accounting Guide, Audits of Investment Companies, and began amortizing premium on its fixed-income securities. The effects of this change for the year ended April 30, 2002 was a decrease in net investment income per share of $0.02; an increase in net realized gains or losses per share of $0.02; and a decrease to the ratio of net investment income to average net assets of 0.22%. The above per share information, ratios and supplemental data for the periods prior to May 1, 2001 have not been restated to reflect this change in presentation.
(2)
Excluding applicable sales charges
(3)
The ratio of expenses to average net assets excludes expense reductions but includes fee waivers and/or expense reimbursements.
See Notes to Financial Statements
8
FINANCIAL HIGHLIGHTS
(For a share outstanding throughout each period)
| | Year Ended April 30, | |
| |
| |
CLASS I(2) | | 2003 | | 2002(1) | | 2001 | | 2000 | | 1999 | |
| |
| |
| |
| |
| |
| |
Net asset value, beginning of period | | $ | 9.75 | | $ | 9.59 | | $ | 9.15 | | $ | 9.63 | | $ | 9.68 | |
| |
|
| |
|
| |
|
| |
|
| |
|
| |
Income from investment operations | | | | | | | | | | | | | | | | |
Net investment income | | | 0.41 | | | 0.50 | | | 0.56 | | | 0.57 | | | 0.59 | |
Net realized and unrealized gains or losses on securities | | | 0.43 | | | 0.16 | | | 0.44 | | | (0.48 | ) | | (0.05 | ) |
| |
|
| |
|
| |
|
| |
|
| |
|
| |
Total from investment operations | | | 0.84 | | | 0.66 | | | 1.00 | | | 0.09 | | | 0.54 | |
| |
|
| |
|
| |
|
| |
|
| |
|
| |
Distributions to shareholders from | | | | | | | | | | | | | | | | |
Net investment income | | | (0.37 | ) | | (0.50 | ) | | (0.56 | ) | | (0.57 | ) | | (0.59 | ) |
| |
|
| |
|
| |
|
| |
|
| |
|
| |
Net asset value, end of period | | $ | 10.22 | | $ | 9.75 | | $ | 9.59 | | $ | 9.15 | | $ | 9.63 | |
| |
|
| |
|
| |
|
| |
|
| |
|
| |
Total return | | | 8.77 | % | | 7.02 | % | | 11.25 | % | | 1.04 | % | | 5.66 | % |
| |
|
| |
|
| |
|
| |
|
| |
|
| |
Ratios and supplemental data | | | | | | | | | | | | | | | | |
Net assets, end of period (thousands) | | $ | 489,565 | | $ | 327,753 | | $ | 263,619 | | $ | 231,417 | | $ | 222,876 | |
Ratios to average net assets | | | | | | | | | | | | | | | | |
Expenses(3) | | | 0.70 | % | | 0.71 | % | | 0.75 | % | | 0.71 | % | | 0.71 | % |
Net investment income | | | 4.02 | % | | 5.16 | % | | 5.97 | % | | 6.12 | % | | 5.96 | % |
Portfolio turnover rate | | | 129 | % | | 121 | % | | 86 | % | | 58 | % | | 98 | % |
| |
|
| |
|
| |
|
| |
|
| |
|
| |
(1)
As required, effective May 1, 2001, the Fund has adopted the provisions of the AICPA Audit and Accounting Guide, Audits of Investment Companies, and began amortizing premium on its fixed-income securities. The effects of this change for the year ended April 30, 2002 was a decrease in net investment income per share of $0.02; an increase in net realized gains or losses per share of $0.02; and a decrease to the ratio of net investment income to average net assets of 0.22%. The above per share information, ratios and supplemental data for the periods prior to May 1, 2001 have not been restated to reflect this change in presentation.
(2)
Effective at the close of business on May 11, 2001, Class Y shares were renamed as Institutional shares (Class I).
(3)
The ratio of expenses to average net assets excludes expense reductions but includes fee waivers and/or expense reimbursements.
See Notes to Financial Statements
9
SCHEDULE OF INVESTMENTS
April 30, 2003 | | Credit
Rating^ | | Principal
Amount | | Value | |
| |
| |
| |
| |
ASSET-BACKED SECURITIES 5.1% | | | | | | | | | |
Pinstripe I CDO, Ltd., Ser.1A, Class B1, 2.04%, 05/01/2036 144A | | | | Aa3 | | $ | 8,000,000 | | $ | 7,841,250 | |
SLMA: | | | | | | | | | |
Ser.1997-4, Class A2, FRN, 1.91%, 10/15/2010 | | AAA | | | 8,711,406 | | | 8,806,279 | |
Ser.1998-1, Class A2, FRN, 1.92%, 10/25/2011 | | AAA | | | 9,247,609 | | | 9,364,678 | |
Ser.1998-2, Class A2, FRN, 1.89%, 01/25/2014 | | AAA | | | 10,684,010 | | | 10,826,103 | |
| | | | | | |
|
| |
Total Asset-Backed Securities | | | | | | | | 36,838,310 | |
| | | | | | |
|
| |
COLLATERALIZED MORTGAGE OBLIGATIONS 31.4% | | | | | | | | | |
Banc America Large Loan, Inc., Ser.2001-7WTA, Class G, 2.82%, 01/27/2006 144A | | | | Ba2 | | | 8,000,000 | | | 7,555,000 | |
Credit Suisse First Boston Mtge. Securities Corp., Ser.2002-FL1, Class C, 2.61%, 01/11/2010 144A | | A | | | 6,000,000 | | | 6,010,494 | |
DLJ Comml. Mtge. Corp., Ser.1999-STF1, Class B2, 4.41%, 07/05/2008 144A | | | | Baa3 | | | 2,676,654 | | | 2,674,981 | |
FHLMC: | | | | | | | | | |
Ser.1616, Class FB, 3.11%, 11/15/2008 | | AAA | | | 4,704,112 | | | 4,741,435 | |
Ser.1671, Class TA, 1.81%, 02/15/2024 | | AAA | | | 3,557,585 | | | 3,577,336 | |
Ser.1933, Class PG, 6.15%, 12/15/2025 | | AAA | | | 437,631 | | | 439,825 | |
Ser.2380, Class FL, 1.91%, 11/15/2031 | | AAA | | | 18,870,441 | | | 18,954,922 | |
Ser.2395, Class FD, 1.91%, 05/15/2029 | | AAA | | | 8,609,348 | | | 8,649,673 | |
Ser.2412, Class D, 5.50%, 12/15/2009 | | AAA | | | 397,820 | | | 397,840 | |
Ser.2430, Class NB, 6.50%, 01/15/2027 | | AAA | | | 12,500,000 | | | 12,783,690 | |
Ser.2481, Class FE, 2.31%, 03/15/2032 | | AAA | | | 15,371,098 | | | 15,645,904 | |
Ser.H002, Class A6, 2.55%, 06/15/2007 | | | | AAA | | | 14,515,842 | | | 14,543,059 | |
FNMA: | | | | | | | | | |
Ser.1993-174, Class FD, 3.06%, 09/25/2008 | | AAA | | | 5,024,769 | | | 5,047,615 | |
Ser.1993-221, Class FH, 2.44%, 12/25/2008 | | AAA | | | 8,000,000 | | | 8,150,663 | |
Ser.1997-34, Class F, 1.99%, 10/25/2023 | | AAA | | | 16,800,753 | | | 16,914,912 | |
Ser.2001-31, Class FJ, 1.82%, 04/25/2029 | | AAA | | | 64,164 | | | 64,224 | |
Ser.2001-53, Class CF, 1.72%, 10/25/2031 | | AAA | | | 3,544,582 | | | 3,550,863 | |
Ser.2002-13, Class FE, 2.22%, 02/27/2031 | | AAA | | | 3,077,338 | | | 3,107,738 | |
Ser.2002-67, Class FA, 2.32%, 11/25/2032 | | | | AAA | | | 12,686,516 | | | 12,894,655 | |
Ser.2002-T1, Class A3, 7.50%, 11/25/2031 | | AAA | | | 10,431,765 | | | 11,455,434 | |
Ser.2002-T16, Class A1, 6.50%, 07/25/2042 | | | | AAA | | | 13,767,682 | | | 14,692,698 | |
Ser.2002-W5, Class A7, 6.25%, 08/25/2030 | | AAA | | | 19,480,000 | | | 20,575,456 | |
Ser.2003-W6, Class 3A, 6.50%, 09/25/2032 | | | | AAA | | | 10,000,000 | | | 10,671,875 | |
Greenwich Capital Acceptance, Inc., Ser.2001-ZC1A, Class A, 6.36%, 06/12/2006 144A | | | | A+ | | | 3,432,004 | | | 3,611,111 | |
Lehman Brothers Comml. Mtge. Trust, Ser.2002-LLFA, Class G, FRN, 2.31%, 06/14/2017 144A | | A | | | 6,785,000 | | | 6,783,643 | |
Morgan Stanley Dean Witter Capital I, Ser.2002-HQ, Class A1, 4.59%, 04/15/2034 | | AAA | | | 3,158,950 | | | 3,270,775 | |
PNC Mtge. Securities Corp.: | | | | | | | | | |
Ser.1998-4, Class CB3, 6.85%, 05/25/2028 | | NA | | | 3,427,126 | | | 3,576,844 | |
Ser.1999-1, Class CB2, 6.77%, 03/25/2029 | | NA | | | 3,176,906 | | | 3,350,269 | |
See Notes to Financial Statements
10
SCHEDULE OF INVESTMENTS continued
April 30, 2003 | | Credit
Rating ^ | | Principal
Amount | | Value | |
| |
| |
| |
| |
COLLATERALIZED MORTGAGE OBLIGATIONS continued | | | | | | | | | |
Residential Funding Mtge. Securities, Ser. 1995-J4, Class 1, 6.52%, 05/28/2025 | | | | AAA | | $ | 2,705,382 | | $ | 2,798,379 | |
| | | | | | |
|
| |
Total Collateralized Mortgage Obligations | | | | | | | | 226,491,313 | |
| | | | | | |
|
| |
CORPORATE BONDS 6.2% | | | | | | | | | |
FINANCIALS 5.2% | | | | | | | | | |
Banks 2.2% | | | | | | | | | |
Bank of America Corp., 4.875%, 01/15/2013p | | A+ | | | 5,000,000 | | | 5,143,200 | |
HSBC Holdings Plc, 5.25%, 12/12/2012 | | A | | | 3,000,000 | | | 3,127,125 | |
Landesbank Baden Wurttemberg, 6.35%, 04/01/2012 | | AAA | | | 5,000,000 | | | 5,667,935 | |
Suntrust Bank, 5.45%, 12/01/2017 | | A+ | | | 2,000,000 | | | 2,133,322 | |
| | | | | | |
|
| |
| | | | | | | | 16,071,582 | |
| | | | | | |
|
| |
Diversified Financials 1.6% | | | | | | | | | |
General Electric Capital Corp., 6.00%, 06/15/2012 | | AAA | | | 4,000,000 | | | 4,421,720 | |
Goldman Sachs Group, Inc., 7.80%, 01/28/2010 | | A+ | | | 2,000,000 | | | 2,399,366 | |
Morgan Stanley Group, Inc., 5.30%, 03/01/2013 | | A+ | | | 4,500,000 | | | 4,679,483 | |
| | | | | | |
|
| |
| | | | | | | | 11,500,569 | |
| | | | | | |
|
| |
Insurance 1.4% | | | | | | | | | |
AIG SunAmerica Global Financing VI, 6.30%, 05/10/2011 144A | | AAA | | | 4,000,000 | | | 4,507,800 | |
Allstate Corp., 6.125%, 02/15/2012 | | A+ | | | 5,000,000 | | | 5,552,500 | |
| | | | | | |
|
| |
| | | | | | | | 10,060,300 | |
| | | | | | |
|
| |
HEALTH CARE 0.3% | | | | | | | | | |
Pharmaceuticals 0.3% | | | | | | | | | |
Eli Lilly & Co., 4.50%, 03/15/2018 | | AA | | | 2,000,000 | | | 1,970,342 | |
| | | | | | |
|
| |
INDUSTRIALS 0.3% | | | | | | | | | |
Industrial Conglomerates 0.3% | | | | | | | | | |
General Electric Co., 5.00%, 02/01/2013 | | AAA | | | 2,000,000 | | | 2,071,138 | |
| | | | | | |
|
| |
INFORMATION TECHNOLOGY 0.4% | | | | | | | | | |
Computers & Peripherals 0.4% | | | | | | | | | |
International Business Machines Corp., 7.00%, 10/30/2025 | | A+ | | | 2,850,000 | | | 3,395,698 | |
| | | | | | |
|
| |
Total Corporate Bonds | | | | | | | | 45,069,629 | |
| | | | | | |
|
| |
MORTGAGE-BACKED SECURITIES 42.3% | | | | | | | | | |
FHLMC: | | | | | | | | | |
5.00%, TBA ±± | | AAA | | | 43,750,000 | | | 44,676,975 | |
5.50%, TBA # | | AAA | | | 27,000,000 | | | 27,624,375 | |
6.00%, TBA ±± | | AAA | | | 25,000,000 | | | 25,937,500 | |
6.50%, TBA ±± | | AAA | | | 38,000,000 | | | 39,938,144 | |
6.50%, 02/01/2010-08/01/2032 | | AAA | | | 28,744,073 | | | 30,243,964 | |
7.00%, TBA ±± | | AAA | | | 9,000,000 | | | 9,495,000 | |
7.00%, 12/01/2029-07/01/2032 | | AAA | | | 9,467,304 | | | 9,989,214 | |
7.50%, 05/01/2027-08/01/2028 | | AAA | | | 4,477,452 | | | 4,790,229 | |
9.00%, 01/01/2017 | | AAA | | | 444,815 | | | 496,496 | |
9.50%, 09/01/2020 | | AAA | | | 190,056 | | | 212,345 | |
See Notes to Financial Statements
11
SCHEDULE OF INVESTMENTS continued
April 30, 2003 | | Credit
Rating ^ | | Principal
Amount | | Value | |
| |
| |
| |
| |
MORTGAGE-BACKED SECURITIES continued | | | | | | | | | |
FHLMC: | | | | | | | | | |
10.00%, 12/01/2019-08/01/2021 | | AAA | | $ | 247,667 | | $ | 284,884 | |
10.50%, 12/01/2019 | | AAA | | | 664,772 | | | 773,136 | |
FNMA: | | | | | | | | | |
4.67%, 01/01/2010 | | | | AAA | | | 3,487,768 | | | 3,644,717 | |
5.00%, TBA ±± | | AAA | | | 10,000,000 | | | 10,265,620 | |
5.50%, TBA ±± | | AAA | | | 10,000,000 | | | 10,234,380 | |
5.99%, 11/01/2008 | | AAA | | | 3,607,630 | | | 3,949,349 | |
6.00%, TBA ±± | | AAA | | | 15,000,000 | | | 15,571,875 | |
6.00%, 02/01/2008-05/01/2011 | | AAA | | | 799,316 | | | 844,225 | |
6.09%, 12/01/2008 | | AAA | | | 4,089,615 | | | 4,493,309 | |
6.39%, 04/01/2008 | | AAA | | | 3,413,725 | | | 3,828,719 | |
6.40%, 08/01/2011 | | | | AAA | | | 2,575,959 | | | 2,918,884 | |
6.50%, TBA ±± | | AAA | | | 11,750,000 | | | 12,267,728 | |
6.50%, 03/01/2012-01/01/2024 | | AAA | | | 14,112,722 | | | 15,014,463 | |
7.00%, 11/01/2026-02/01/2032 | | AAA | | | 1,441,404 | | | 1,524,327 | |
7.50%, 07/01/2023-05/01/2027 | | AAA | | | 2,889,987 | | | 3,098,072 | |
9.50%, 06/01/2022 | | AAA | | | 216,290 | | | 241,336 | |
11.00%, 01/01/2016 | | AAA | | | 272,523 | | | 312,843 | |
11.25%, 02/01/2016 | | AAA | | | 391,947 | | | 455,664 | |
GNMA: | | | | | | | | | |
5.50%, TBA ±± | | AAA | | | 10,000,000 | | | 10,287,500 | |
6.00%, 11/15/2028 | | AAA | | | 3,906,165 | | | 4,098,568 | |
6.50%, 12/15/2025 | | AAA | | | 377,667 | | | 399,107 | |
7.00%, 12/15/2022-03/15/2028 | | AAA | | | 1,683,129 | | | 1,794,763 | |
7.34%, 10/20/2021-09/20/2022 | | AAA | | | 1,943,178 | | | 2,073,533 | |
7.50%, 02/15/2022-08/15/2023 | | AAA | | | 2,046,867 | | | 2,201,131 | |
8.00%, 09/15/2009 | | AAA | | | 56,553 | | | 61,134 | |
8.50%, 02/15/2023 | | AAA | | | 30,569 | | | 33,574 | |
9.50%, 01/15/2019-02/15/2021 | | AAA | | | 579,725 | | | 655,184 | |
10.00%, 12/15/2018 | | AAA | | | 160,610 | | | 185,271 | |
| | | | | | | |
| |
Total Mortgage-Backed Securities | | | | | | | | 304,917,538 | |
| | | | | | | |
| |
U.S. GOVERNMENT & AGENCY OBLIGATIONS 17.7% | | | | | | | | | |
FFCB, 5.125%, 03/06/2006 | | AAA | | | 5,000,000 | | | 5,413,155 | |
FHLB: | | | | | | | | | |
3.25%, 08/15/2005 p | | AAA | | | 5,000,000 | | | 5,162,730 | |
4.625%, 04/15/2005 | | AAA | | | 5,000,000 | | | 5,292,175 | |
4.75%, 06/28/2004 ## | | AAA | | | 20,000,000 | | | 20,800,540 | |
FHLMC: | | | | | | | | | |
2.875%, 09/15/2005 | | AAA | | | 5,500,000 | | | 5,631,857 | |
3.50%, 09/15/2007 p | | AAA | | | 10,000,000 | | | 10,290,610 | |
5.125%, 10/15/2008 p | | AAA | | | 4,000,000 | | | 4,391,364 | |
5.25%, 01/15/2006 p | | AAA | | | 4,000,000 | | | 4,339,784 | |
6.00%, 06/15/2011 | | AAA | | | 2,000,000 | | | 2,285,364 | |
6.875%, 09/15/2010 | | AAA | | | 5,000,000 | | | 6,001,205 | |
See Notes to Financial Statements
12
SCHEDULE OF INVESTMENTS continued
April 30, 2003 | | Credit
Rating ^ | | Principal
Amount | | Value | |
| |
| |
| |
| |
| | | | | | | | | |
| | | | | | | | | |
U.S. GOVERNMENT & AGENCY OBLIGATIONS continued | | | | | | | | | |
FNMA: | | | | | | | | | |
2.875%, 10/15/2005 p | | AAA | | $ | 5,000,000 | | $ | 5,124,565 | |
3.25%, 11/15/2007 p | | AAA | | | 5,000,000 | | | 5,084,510 | |
4.375%, 09/15/2012 p | | AAA | | | 8,000,000 | | | 8,109,816 | |
6.125%, 03/15/2012 | | AAA | | | 5,000,000 | | | 5,757,405 | |
6.50%, 08/15/2004 p | | AAA | | | 10,000,000 | | | 10,671,130 | |
7.125%, 03/15/2007 | | AAA | | | 10,000,000 | | | 11,672,480 | |
FRN, 1.125%, 01/01/2004 | | AAA | | | 11,776,224 | | | 11,778,379 | |
| | | | | | |
|
| |
Total U.S. Government & Agency Obligations | | | | | | | | 127,807,069 | |
| | | | | | |
|
| |
U.S. TREASURY OBLIGATIONS 16.9% | | | | | | | | | |
U.S. Treasury Bonds: | | | | | | | | | |
5.375%, 02/15/2031 p | | AAA | | | 10,000,000 | | | 10,914,850 | |
7.50%, 11/15/2016 p | | AAA | | | 7,000,000 | | | 9,220,316 | |
8.00%, 11/15/2021 p | | AAA | | | 2,000,000 | | | 2,806,172 | |
U.S. Treasury Notes: | | | | | | | | | |
1.50%, 02/28/2005 p | | AAA | | | 5,000,000 | | | 5,008,205 | |
1.625%, 01/31/2005 ## | | AAA | | | 10,000,000 | | | 10,041,020 | |
2.125%, 08/31/2004 p | | AAA | | | 15,000,000 | | | 15,178,140 | |
2.25%, 07/31/2004 p | | AAA | | | 9,000,000 | | | 9,117,774 | |
3.00%, 02/15/2008 p | | AAA | | | 12,500,000 | | | 12,632,825 | |
3.875%, 02/15/2013 p | | AAA | | | 8,000,000 | | | 8,013,128 | |
4.375%, 05/15/2007-08/15/2012 p | | AAA | | | 11,000,000 | | | 11,719,813 | |
5.00%, 08/15/2011 p | | AAA | | | 5,000,000 | | | 5,476,565 | |
5.875%, 11/15/2004 p | | AAA | | | 10,000,000 | | | 10,693,360 | |
6.50%, 08/15/2005 p | | AAA | | | 10,000,000 | | | 11,099,220 | |
| | | | | | |
|
| |
Total U.S. Treasury Obligations | | | | | | | | 121,921,388 | |
| | | | | | |
|
| |
YANKEE OBLIGATIONS-GOVERNMENT 0.3% | | | | | | | | | |
Austria, 5.25%, 10/05/2009 | | AAA | | | 1,850,000 | | | 2,033,612 | |
| | | | | | |
|
| |
| | | | Shares | | Value | |
| | | |
| |
| |
SHORT-TERM INVESTMENTS 29.3% | | | | | | | | | |
MUTUAL FUND SHARES 29.3% | | | | | | | | | |
Evergreen Institutional Money Market Fund ø ± | | | | | 57,676,263 | | | 57,676,263 | |
Navigator Prime Portfolio pp | | | | | 153,849,964 | | | 153,849,964 | |
| | | | | | |
|
| |
Total Short-Term Investments | | | | | | | | 211,526,227 | |
| | | | | | |
|
| |
Total Investments (cost $1, 063, 806, 870) 149.2% | | | | | | | | 1,076,605,086 | |
Other Assets and Liabilities (49.2%) | | | | | | | | (355,237,956 | ) |
| | | | | | |
|
| |
Net Assets 100.0% | | | | | | | $ | 721,367,130 | |
| | | | | | |
|
| |
See Notes to Financial Statements
13
SCHEDULE OF INVESTMENTS continued
April 30, 2003
^
Credit ratings are unaudited and rated by Moody’s Investors Service where Standard and Poor’s ratings are not available.
144A
Security that may be sold to qualified institutional buyers under Rule 144A of the Securities Act of 1933, as amended. This security has been determined to be liquid under the guidelines established by the Board of Trustees.
ø
Evergreen Investment Management Company, LLC is the investment advisor to both the fund and the money market fund.
| |
No market quotation available. Valued at fair value as determined in good faith under procedures established by the Board of Trustees.
±
All or a portion of the principal amount of this security was pledged as collateral for open mortgage dollar roll agreements.
±±
Security acquired under mortgage dollar roll agreement.
p
All or a portion of this security is on loan.
pp
Represents investment of cash collateral received from securities on loan.
#
When-issued security
##
All or a portion of the security has been segregated for when-issued securities.
Summary of Abbreviations:
FFCB | Federal Farm Credit Bank |
FHLB | Federal Home Loan Bank |
FHLMC | Federal Home Loan Mortgage Corp. |
FNMA | Federal National Mortgage Association |
FRN | Floating Rate Note |
GNMA | Government National Mortgage Association |
SLMA | Student Loan Marketing Association |
TBA | To Be Announced |
See Notes to Financial Statements
14
STATEMENT OF ASSETS AND LIABILITIES
April 30, 2003
ASSETS | | | | |
Identified cost of securities | | $ | 1,063,806,870 | |
Net unrealized gains on securities | | | 12,798,216 | |
| |
|
| |
Market value of securities | | | 1,076,605,086 | |
Receivable for securities sold | | | 145,643,756 | |
Principal paydown receivable | | | 1,117 | |
Receivable for Fund shares sold | | | 3,606,042 | |
Receivable for securities lending income | | | 16,131 | |
Interest receivable | | | 4,786,699 | |
Prepaid expenses and other assets | | | 149,943 | |
| |
|
| |
Total assets | | | 1,230,808,774 | |
| |
|
| |
LIABILITIES | | | | |
Dividends payable | | | 371,930 | |
Payable for securities purchased | | | 205,649,556 | |
Payable for open mortgage dollar rolls | | | 145,194,561 | |
Payable for Fund shares redeemed | | | 3,884,438 | |
Payable for securities on loan | | | 153,849,964 | |
Advisory fee payable | | | 8,270 | |
Due to other related parties | | | 1,969 | |
Accrued expenses and other liabilities | | | 480,956 | |
| |
|
| |
Total liabilities | | | 509,441,644 | |
| |
|
| |
Net assets | | $ | 721,367,130 | |
| |
|
| |
Net assets represented by | | | | |
Paid-in capital | | $ | 720,123,047 | |
Overdistributed net investment income | | | (399,150 | ) |
Accumulated net realized losses on securities | | | (11,154,983 | ) |
Net unrealized gains on securities | | | 12,798,216 | |
| |
|
| |
Total net assets | | $ | 721,367,130 | |
| |
|
| |
Net assets consists of | | | | |
Class A | | $ | 146,427,251 | |
Class B | | | 59,361,594 | |
Class C | | | 26,012,905 | |
Class I | | | 489,565,380 | |
| |
|
| |
Total net assets | | $ | 721,367,130 | |
| |
|
| |
Shares outstanding | | | | |
Class A | | | 14,334,058 | |
Class B | | | 5,811,144 | |
Class C | | | 2,546,523 | |
Class I | | | 47,923,396 | |
| |
|
| |
Net asset value per share | | | | |
Class A | | $ | 10.22 | |
Class A—Offering price (based on sales charge of 4.75%) | | $ | 10.73 | |
Class B | | $ | 10.22 | |
Class C | | $ | 10.22 | |
Class C—Offering price (based on sales charge of 1.00%) | | $ | 10.32 | |
Class I | | $ | 10.22 | |
| |
|
| |
See Notes to Financial Statements
15
STATEMENT OF OPERATIONS
Year Ended April 30, 2003
Investment income | | | | |
Interest | | $ | 24,832,063 | |
Mortgage dollar roll transactions | | | 4,812,716 | |
| |
|
| |
Total investment income | | | 29,644,779 | |
| |
|
| |
Expenses | | | | |
Advisory fee | | | 2,633,787 | |
Distribution Plan expenses | | | | |
Class A | | | 376,056 | |
Class B | | | 570,158 | |
Class C | | | 231,444 | |
Administrative services fee | | | 627,092 | |
Transfer agent fees | | | 840,049 | |
Trustees’ fees and expenses | | | 8,902 | |
Printing and postage expenses | | | 34,916 | |
Custodian fee | | | 164,766 | |
Registration and filing fees | | | 9,945 | |
Professional fees | | | 22,748 | |
Other | | | 24,291 | |
| |
|
| |
Total expenses | | | 5,544,154 | |
Less: Expense reductions | | | (2,539 | ) |
Expense reimbursements | | | (4,272 | ) |
| |
|
| |
Net expenses | | | 5,537,343 | |
| |
|
| |
Net investment income | | | 24,107,436 | |
| |
|
| |
Net realized and unrealized gains or losses on securities | | | | |
Net realized gains on securities | | | 17,673,872 | |
Net change in unrealized gains or losses on securities | | | 7,235,603 | |
| |
|
| |
Net realized and unrealized gains or losses on securities | | | 24,909,475 | |
| |
|
| |
Net increase in net assets resulting from operations | | $ | 49,016,911 | |
| |
|
| |
See Notes to Financial Statements
16
STATEMENTS OF CHANGES IN NET ASSETS
| | Year Ended April 30, | |
| |
| |
| | 2003 | | 2002 | |
| |
| |
| |
Operations | | | | | | | | | | | |
Net investment income | | | | $ | 24,107,436 | | | | $ | 24,461,665 | |
Net realized gains on securities | | | | | 17,673,872 | | | | | 5,362,487 | |
Net change in unrealized gains or losses on securities | | | | | 7,235,603 | | | | | 1,633,950 | |
| | | |
|
| | | |
|
| |
Net increase in net assets resulting from operations | | | | | 49,016,911 | | | | | 31,458,102 | |
| | | |
|
| | | |
|
| |
Distributions to shareholders from | | | | | | | | | | | |
Net investment income | | | | | | | | | | | |
Class A | | | | | (5,099,288 | ) | | | | (6,161,185 | ) |
Class B | | | | | (1,535,465 | ) | | | | (2,374,307 | ) |
Class C | | | | | (616,085 | ) | | | | (566,951 | ) |
Class I * | | | | | (14,724,478 | ) | | | | (15,163,917 | ) |
| | | |
|
| | | |
|
| |
Total distributions to shareholders | | | | | (21,975,316 | ) | | | | (24,266,360 | ) |
| | | |
|
| | | |
|
| |
| | Shares | | | | | Shares | | | | |
Capital share transactions | | | | | | | | | | | |
Proceeds from shares sold | | | | | | | | | | | |
Class A | | 17,049,018 | | | 170,302,635 | | 14,352,794 | | | 139,812,589 | |
Class B | | 2,882,631 | | | 28,877,383 | | 2,035,673 | | | 19,905,493 | |
Class C | | 2,223,637 | | | 22,247,604 | | 1,346,924 | | | 13,107,322 | |
Class I * | | 30,137,028 | | | 303,895,597 | | 18,268,591 | | | 178,290,080 | |
| |
| |
|
| |
| |
|
| |
| | | | | 525,323,219 | | | | | 351,115,484 | |
| | | |
|
| | | |
|
| |
Net asset value of shares issued in reinvestment of distributions | | | | | | | | | | | |
Class A | | 349,844 | | | 3,520,371 | | 426,196 | | | 4,164,549 | |
Class B | | 105,992 | | | 1,067,084 | | 156,089 | | | 1,524,936 | |
Class C | | 41,734 | | | 420,537 | | 44,309 | | | 433,663 | |
Class I * | | 1,335,306 | | | 13,447,251 | | 1,382,439 | | | 13,504,144 | |
| |
| |
|
| |
| |
|
| |
| | | | | 18,455,243 | | | | | 19,627,292 | |
| | | |
|
| | | |
|
| |
Automatic conversion of Class B shares to Class A shares | | | | | | | | | | | |
Class A | | 508,392 | | | 5,130,200 | | 2,661,180 | | | 25,838,430 | |
Class B | | (508,392 | ) | | (5,130,200 | ) | (2,659,847 | ) | | (25,838,430 | ) |
| |
| |
|
| |
| |
|
| |
| | | | | 0 | | | | | 0 | |
| | | |
|
| | | |
|
| |
Payment for shares redeemed | | | | | | | | | | | |
Class A | | (18,115,090 | ) | | (180,977,585 | ) | (14,162,342 | ) | | (137,981,140 | ) |
Class B | | (1,489,516 | ) | | (14,974,107 | ) | (1,542,159 | ) | | (15,022,341 | ) |
Class C | | (1,175,934 | ) | | (11,830,083 | ) | (1,100,275 | ) | | (10,704,033 | ) |
Class I * | | (17,152,118 | ) | | (172,490,229 | ) | (13,525,063 | ) | | (131,820,881 | ) |
| |
| |
|
| |
| |
|
| |
| | | | | (380,272,004 | ) | | | | (295,528,395 | ) |
| | | |
|
| | | |
|
| |
Net increase in net assets resulting from capital share transactions | | | | | 163,506,458 | | | | | 75,214,381 | |
| | | |
|
| | | |
|
| |
Total increase in net assets | | | | | 190,548,053 | | | | | 82,406,123 | |
Net assets | | | | | | | | | | | |
Beginning of period | | | | | 530,819,077 | | | | | 448,412,954 | |
| | | |
|
| | | |
|
| |
End of period | | | | $ | 721,367,130 | | | | $ | 530,819,077 | |
| | | |
|
| | | |
|
| |
Overdistributed net investment income | | | | $ | (399,150 | ) | | | $ | (339,367 | ) |
| | | |
|
| | | |
|
| |
*
Effective at the close of business on May 11, 2001, Class Y shares were renamed as Institutional shares (Class I).
See Notes to Financial Statements
17
STATEMENT OF CASH FLOWS
Year Ended April 30, 2003
Cash Flows from Operating Activities: | | | | |
Net increase in net assets from operations | | $ | 49,016,911 | |
Adjustments to reconcile net increase in net assets from operations to net cash used in operating activities: | | | | |
Purchase of investment securities | | | (1,340,558,607 | ) |
Proceeds from disposition of investment securities | | | 1,053,328,133 | |
Purchase of short-term investment securities, net | | | (129,471,461 | ) |
Decrease in interest receivable | | | 1,565 | |
Increase in receivable for securities sold | | | (79,854,085 | ) |
Increase in receivable for Fund shares sold | | | (2,549,719 | ) |
Increase in other assets | | | (58,369 | ) |
Increase in payable for securities purchased | | | 274,713,623 | |
Decrease in payable for Fund shares redeemed | | | (1,008,701 | ) |
Increase in accrued expenses | | | (31,236 | ) |
Unrealized appreciation on investments | | | (7,361,033 | ) |
Net realized gains from investments | | | (14,767,266 | ) |
| |
|
| |
Net cash used in operating activities | | | (198,600,245 | ) |
| |
|
| |
Cash Flows from Financing Activities: | | | | |
Increase in mortgage dollar roll transactions | | | 56,998,991 | |
Increase in additional paid-in capital | | | 145,051,215 | |
Cash distributions paid | | | (3,449,961 | ) |
| |
|
| |
Net cash provided by financing activities | | | 198,600,245 | |
| |
|
| |
Net increase in cash | | $ | 0 | |
| |
|
| |
Cash: | | | | |
Beginning of year | | $ | 0 | |
| |
|
| |
End of year | | $ | 0 | |
| |
|
| |
See Notes to Financial Statements
18
NOTES TO FINANCIAL STATEMENTS
1. ORGANIZATION
Evergreen U.S. Government Fund (the “Fund”) is a diversified series of Evergreen Fixed Income Trust (the “Trust”), a Delaware business trust organized on September 18, 1997. The Trust is an open-end management investment company registered under the Investment Company Act of 1940, as amended (the “1940 Act”).
The Fund offers Class A, Class B, Class C and Institutional (“Class I”) shares. Class A shares are sold with a front-end sales charge and pay an ongoing distribution fee. Class B shares are sold without a front-end sales charge but are subject to a contingent deferred sales charge that is payable upon redemption and decreases depending on how long the shares have been held. Class C shares are sold with a front-end sales charge and are subject to a contingent deferred sales charge that is payable upon redemption within one year after the month of purchase. Both Class B and Class C shares pay a higher ongoing distribution fee than Class A. Class I shares are sold without a front-end sales charge or contingent deferred sales charge and do not pay a distribution fee.
2. SIGNIFICANT ACCOUNTING POLICIES
The following is a summary of significant accounting policies consistently followed by the Fund in the preparation of its financial statements. The policies are in conformity with generally accepted accounting principles, which require management to make estimates and assumptions that affect amounts reported herein. Actual results could differ from these estimates.
a. Valuation of investments
Portfolio debt securities acquired with more than 60 days to maturity are valued at prices obtained from an independent pricing service which takes into consideration such factors as similar security prices, yields, maturities, liquidity and ratings. Securities for which valuations are not available from an independent pricing service may be valued by brokers which use prices provided by market makers or estimates of market value obtained from yield data relating to investments or securities with similar characteristics.
Investments in other mutual funds are valued at net asset value. Securities for which market quotations are not available are valued at fair value as determined in good faith, according to procedures approved by the Board of Trustees.
b. When-issued and delayed delivery transactions
The Fund records when-issued securities no later than one business day after the trade date and maintains security positions such that sufficient liquid assets will be available to make payment for the securities purchased. Securities purchased on a when-issued or delayed delivery basis are marked-to-market daily and begin earning interest on the settlement date. Losses may occur on these transactions due to changes in market conditions or the failure of counterparties to perform under the contract.
19
NOTES TO FINANCIAL STATEMENTS continued
c. Securities lending
The Fund may lend its securities to certain qualified brokers in order to earn additional income. The Fund receives compensation in the form of fees or interest earned on the investment of any cash collateral received. The Fund receives collateral in the form of cash or securities with a market value at least equal to the market value of the securities on loan, including accrued interest. In the event of default or bankruptcy by the borrower, the Fund could experience delays and costs in recovering the loaned securities or in gaining access to the collateral.
d. Dollar roll transactions
The Fund may enter into dollar roll transactions with respect to mortgage-backed securities. In a dollar roll transaction, the Fund sells mortgage-backed securities to financial institutions and simultaneously agrees to accept substantially similar (same type, coupon and maturity) securities at a later date at an agreed upon price. The Fund will use the proceeds generated from the transactions to invest in short-term investments, which may enhance the Fund’s current yield and total return.
e. Security transactions and investment income
Security transactions are recorded no later than one business day after the trade date. Realized gains and losses are computed using the specific cost of the security sold. Interest income is recorded on the accrual basis and includes accretion of discounts and amortization of premiums.
f. Federal taxes
The Fund intends to continue to qualify as a regulated investment company and distribute all of its taxable income, including any net capital gains (which have already been offset by available capital loss carryovers). Accordingly, no provision for federal taxes is required.
g. Distributions
Distributions to shareholders from net investment income are accrued daily and paid monthly. Distributions from net realized gains, if any, are recorded on the ex-dividend date. Such distributions are determined in conformity with income tax regulations, which may differ from generally accepted accounting principles.
Reclassifications have been made to the Fund’s components of net assets to reflect income and gains available for distribution (or available capital loss carryovers, as applicable) under income tax regulations. The primary permanent differences causing such reclassifications are due to expiration of capital loss carryovers, mortgage paydown gains and losses, premium amortization and mortgage dollar rolls.
h. Class allocations
Income, common expenses and realized and unrealized gains and losses are allocated to the classes based on the relative net assets of each class. Distribution fees, if any, are calculated daily at the class level based on the appropriate net assets of each class and the specific expense rates applicable to each class.
20
NOTES TO FINANCIAL STATEMENTS continued
3. ADVISORY FEES AND OTHER TRANSACTIONS WITH AFFILIATES
Evergreen Investment Management Company, LLC (“EIMC”), an indirect, wholly-owned subsidiary of Wachovia Corporation (“Wachovia”), is the investment advisor to the Fund and is paid an annual fee of 0.42% of the Fund’s average daily net assets.
From time to time, EIMC may voluntarily or contractually waive its fees and/or reimburse expenses in order to limit operating expenses. For any fee waivers and/or reimbursements made after January 1, 2003, EIMC may recoup any amounts waived and/or reimbursed up to a period of three years following the end of the fiscal year in which the fee waivers and/or reimbursements were made. Total amounts subject to recoupment as of April 30, 2003 were $4,272. During the year ended April 30, 2003, the investment advisor reimbursed expenses relating to Class A shares in the amount of $4,272, which represents 0.00% of the Fund’s average daily net assets.
Evergreen Investment Services, Inc. (“EIS”), an indirect, wholly-owned subsidiary of Wachovia, is the administrator to the Fund. As administrator, EIS provides the Fund with facilities, equipment and personnel and is paid an annual administrative fee of 0.10% of the Fund’s average daily net assets.
Evergreen Service Company, LLC (“ESC”), an indirect, wholly-owned subsidiary of Wachovia, is the transfer and dividend disbursing agent for the Fund. ESC receives account fees that vary based on the type of account held by the shareholders in the Fund. For the year ended April 30, 2003, the transfer agent fees were equivalent to an annual rate of 0.13% of the Fund’s average daily net assets.
4. DISTRIBUTION PLANS
Evergreen Distributor, Inc. (“EDI”), a wholly-owned subsidiary of BISYS Fund Services, Inc., serves as principal underwriter to the Fund.
The Fund has adopted Distribution Plans, as allowed by Rule 12b-1 of the 1940 Act, for each class of shares, except Class I. Under the Distribution Plans, distribution fees are paid at an annual rate of 1.00% of the average daily net assets for Class B and Class C shares. On March 20, 2003, the Trustees of the Fund approved an increase to the annual maximum allowable charge for servicing and distribution fees on Class A shares from 0.25% to 0.30% of the average daily net assets of Class A shares. This increase became effective on March 27, 2003.
5. SECURITIES TRANSACTIONS
Cost of purchases and proceeds from sales of investment securities (excluding short-term securities and mortgage dollar roll transactions) were as follows for the year ended April 30, 2003:
Cost of Purchases | | Proceeds from Sales | |
| |
| |
U.S.
Government | | Non-U.S.
Government | | U.S.
Government | | Non-U.S.
Government | |
| |
| |
| |
| |
$1,197,949,838 | | $139,623,984 | | $745,670,528 | | $191,446,062 | |
| |
| |
| |
| |
21
NOTES TO FINANCIAL STATEMENTS continued
The Fund loaned securities during the year ended April 30, 2003 to certain brokers. At April 30, 2003, the value of securities on loan and the value of collateral (including accrued interest) amounted to $151,620,607 and $153,849,964, respectively. During the year ended April 30, 2003, the Fund earned $58,322 in income from securities lending.
During the year ended April 30, 2003, the Fund entered into dollar roll transactions. At April 30, 2003, the Fund had the following dollar roll agreements outstanding:
Dollar Roll Amount | | Counterparty | | Settlement Date | |
| |
| |
| |
$ 34,817,871 | | Bear Stearns Securities Corp. | | 6/17/2003 | |
26,031,706 | | Lehman Brothers, Inc. | | 6/12/2003 | |
24,340,868 | | Merrill Lynch | | 5/19/2003 | |
15,692,630 | | UBS Warburg LLC | | 6/12/2003 | |
15,634,258 | | Chase Securities, Inc. | | 6/12/2003 | |
12,296,232 | | Deutsche Bank Securities, Inc. | | 6/12/2003 | |
10,328,212 | | Greenwich Capital | | 6/19/2003 | |
10,313,281 | | UBS Warburg LLC | | 6/17/2003 | |
10,268,299 | | Chase Securities, Inc. | | 6/12/2003 | |
10,261,267 | | Chase Securities, Inc. | | 6/12/2003 | |
9,496,656 | | Goldman Sachs & Co. | | 5/14/2003 | |
| |
| |
| |
On April 30, 2003, the aggregate cost of securities for federal income tax purposes was $1,065,437,800. The gross unrealized appreciation and depreciation on securities based on tax cost was $12,456,988 and $1,289,702, respectively, with a net unrealized appreciation of $11,167,286.
As of April 30, 2003, the Fund had $9,524,053 in capital loss carryovers for federal income tax purposes expiring as follows:
Expiration |
|
2004 | | 2005 | | 2007 | | 2008 | | 2009 |
| |
| |
| |
| |
|
$2,226,686 | | $724,690 | | $1,281,377 | | $4,853,705 | | $437,595 |
| |
| |
| |
| |
|
6. INTERFUND LENDING
Pursuant to an Exemptive Order issued by the SEC, the Fund, along with other certain funds in the Evergreen fund family may participate in an interfund lending program. This program allows the Fund to borrow from, or lend money to, other participating funds. During the year ended April 30, 2003, the Fund did not participate in the interfund lending program.
7. DISTRIBUTIONS TO SHAREHOLDERS
As of April 30, 2003, the components of distributable earnings on a tax basis were as follows:
Overdistributed
Ordinary Income | | Unrealized
Appreciation | | Capital Loss
Carryover |
| |
| |
|
$399,150 | | $11,167,286 | | $9,524,053 |
| |
| |
|
The differences between the components of distributable earnings on a tax basis and the amounts reflected in the Statement of Assets and Liabilities are primarily due to wash sales, mortgage dollar rolls and premium amortization.
22
NOTES TO FINANCIAL STATEMENTS continued
The tax character of distributions paid for the years ended April 30, 2003 and April 30, 2002 were $21,975,316 and $24,266,360, respectively, of ordinary income.
8. EXPENSE REDUCTIONS
Through expense offset arrangements with ESC and the Fund’s custodian, a portion of fund expenses has been reduced. The Fund received expense reductions from expense offset arrangements of $2,539, which represents 0.00% of its average daily net assets.
9. DEFERRED TRUSTEES’ FEES
Each independent Trustee of the Fund may defer any or all compensation related to performance of their duties as Trustees. The Trustees’ deferred balances are allocated to deferral accounts, which are included in the accrued expenses for the Fund. The investment performance of the deferral accounts are based on the investment performance of certain Evergreen funds. Any gains earned or losses incurred in the deferral accounts are reported in the Fund’s Trustees’ fees and expenses. At the election of the Trustees, the deferral account will be paid either in one lump sum or in quarterly installments for up to ten years.
10. FINANCING AGREEMENT
The Fund and certain other Evergreen funds share in a $150 million unsecured revolving credit commitment for temporary and emergency purposes, including the funding of redemptions, as permitted by each Fund’s borrowing restrictions. Borrowings under this facility bear interest at 0.50% per annum above the Federal Funds rate. All of the participating funds are charged an annual commitment fee of 0.09% of the unused balance, which is allocated pro rata.
During the year ended April 30, 2003, the Fund had no borrowings under this agreement.
23
INDEPENDENT AUDITORS’ REPORT
Board of Trustees and Shareholders
Evergreen Fixed Income Trust
We have audited the accompanying statement of assets and liabilities, including the schedule of investments, of the Evergreen U. S. Government Fund, a series of Evergreen Fixed Income Trust, as of April 30, 2003, and the related statement of operations for the year then ended, statements of changes in net assets for each of the years in the two-year period then ended, and the financial highlights for each of the years in the five-year period then ended. We also audited the statement of cash flows for the year ended April 30, 2003. These financial statements and financial highlights are the responsibility of the Fund’s management. Our responsibility is to express an opinion on these financial statements and financial highlights based on our audits.
We conducted our audits in accordance with auditing standards generally accepted in the United States of America. Those standards require that we plan and perform the audit to obtain reasonable assurance about whether the financial statements and financial highlights are free of material misstatement. An audit includes examining, on a test basis, evidence supporting the amounts and disclosures in the financial statements. Our procedures included confirmation of securities owned as of April 30, 2003 by correspondence with the custodian. As to securities purchased or sold but not yet received or delivered, we performed other appropriate auditing procedures. An audit also includes assessing the accounting principles used and significant estimates made by management, as well as evaluating the overall financial statement presentation. We believe that our audits provide a reasonable basis for our opinion.
In our opinion, the financial statements and financial highlights referred to above present fairly, in all material respects, the financial position of the Evergreen U. S. Government Fund, as of April 30, 2003, the results of its operations, its cash flows, changes in its net assets and financial highlights for each of the years or periods described above in conformity with accounting principles generally accepted in the United States of America.
| | | |
| | | |
| | |
Boston, Massachusetts
June 6, 2003 | | | |
24
This page left intentionally blank
25
This page left intentionally blank
26
This page left intentionally blank
27
TRUSTEES AND OFFICERS
TRUSTEES (1) | |
| |
Charles A. Austin III
Trustee
DOB: 10/23/1934
Term of office since: 1991
Other directorships: None | Principal occupations: Investment Counselor, Anchor Capital Advisors, Inc. (investment advice); Director, The Andover Companies (insurance); Trustee, Arthritis Foundation of New England; The Francis Ouimet Society; Former Investment Counselor, Appleton Partners, Inc. (investment advice); Former Director, Executive Vice President and Treasurer, State Street Research & Management Company (investment advice); Former Director, Health Development Corp. (fitness-wellness centers); Former Director, Mentor Income Fund, Inc.; Former Trustee, Mentor Funds and Cash Resource Trust. |
| |
|
|
| |
K. Dun Gifford
Trustee
DOB: 10/23/1938
Term of office since: 1974
Other directorships: None | Principal occupations: Chairman and President, Oldways Preservation and Exchange Trust (education); Trustee, Treasurer and Chairman of the Finance Committee, Cambridge College; Former Managing Partner, Roscommon Capital Corp.; Former Chairman of the Board, Director, and Executive Vice President, The London Harness Company (leather goods purveyor); Former Chairman, Gifford, Drescher & Associates (environmental consulting); Former Director, Mentor Income Fund, Inc.; Former Trustee, Mentor Funds and Cash Resource Trust. |
| |
|
|
| |
Leroy Keith, Jr.
Trustee
DOB: 2/14/1939
Term of office since: 1983
Other directorships: Trustee,
Phoenix Series Fund, Phoenix
Multi-Portfolio Fund, and The
Phoenix Big Edge Series Fund | Principal occupations: Partner, Stonington Partners, Inc. (private investment firm); Trustee of Phoenix Series Fund, Phoenix Multi-Portfolio Fund, and The Phoenix Big Edge Series Fund; Former Chairman of the Board and Chief Executive Officer, Carson Products Company (manufacturing); Former Director of Phoenix Total Return Fund and Equifax, Inc. (worldwide information management); Former President, Morehouse College; Former Director, Mentor Income Fund, Inc.; Former Trustee, Mentor Funds and Cash Resource Trust. |
| |
|
|
| |
Gerald M. McDonnell
Trustee
DOB: 7/14/1939
Term of office since: 1988
Other directorships: None | Principal occupations: Sales Manager, SMI-STEEL–South Carolina (steel producer); Former Sales and Marketing Management, Nucor Steel Company; Former Director, Mentor Income Fund, Inc.; Former Trustee, Mentor Funds and Cash Resource Trust. |
| |
|
|
| |
William Walt Pettit
Trustee
DOB: 8/26/1955
Term of office since: 1984
Other directorships: None | Principal occupations: Partner and Vice President in the law firm of Kellam & Pettit, P.A.; Former Director, Mentor Income Fund, Inc.; Former Trustee, Mentor Funds and Cash Resource Trust. |
| |
|
|
| |
David M. Richardson
Trustee
DOB: 9/19/1941
Term of office since: 1982
Other directorships: None | Principal occupations: President, Richardson, Runden & Company (new business development/consulting company); Managing Director, Kennedy Information, Inc. (executive recruitment information and research company); Trustee, 411 Technologies, LLP (communications); Director, J&M Cumming Paper Co. (paper merchandising); Columnist, Commerce and Industry Association of New Jersey; Former Vice Chairman, DHR International, Inc. (executive recruitment); Former Senior Vice President, Boyden International Inc. (executive recruitment); Former Director, Mentor Income Fund, Inc.; Former Trustee, Mentor Funds and Cash Resource Trust. |
| |
|
|
| |
Russell A. Salton III, MD
Trustee
DOB: 6/2/1947
Term of office since: 1984
Other directorships: None | Principal occupations: Medical Director, Healthcare Resource Associates, Inc.; Former Medical Director, U.S. Health Care/Aetna Health Services; Former Consultant, Managed Health Care; Former President, Primary Physician Care; Former Director, Mentor Income Fund, Inc.; Former Trustee, Mentor Funds and Cash Resource Trust. |
| |
|
|
| |
Michael S. Scofield
Trustee
DOB: 2/20/1943
Term of office since: 1984
Other directorships: None | Principal occupations: Attorney, Law Offices of Michael S. Scofield; Former Director, Mentor Income Fund, Inc.; Former Trustee, Mentor Funds and Cash Resource Trust. |
| |
|
|
| |
28
TRUSTEES AND OFFICERS continued
Richard J. Shima
Trustee
DOB: 8/11/1939
Term of office since: 1993
Other directorships: None | Principal occupations: Independent Consultant; Director, Trust Company of CT; Trustee, Saint Joseph College (CT); Director of Hartford Hospital, Old State House Association; Trustee, Greater Hartford YMCA; Former Chairman, Environmental Warranty, Inc. (insurance agency); Former Executive Consultant, Drake Beam Morin, Inc. (executive outplacement); Former Director of Enhance Financial Services, Inc.; Former Director of CTG Resources, Inc. (natural gas); Former Director Middlesex Mutual Assurance Company; Former Chairman, Board of Trustees, Hartford Graduate Center; Former Director, Mentor Income Fund, Inc.; Former Trustee, Mentor Funds and Cash Resource Trust. |
| |
|
|
| |
Richard K. Wagoner, CFA(2)
Trustee
DOB: 12/12/1937
Term of office since: 1999
Other directorships: None | Principal occupations: Current Member and Former President, North Carolina Securities Traders Association; Member, Financial Analysts Society; Former Chief Investment Officer, Executive Vice President and Head of Capital Management Group, First Union National Bank; Former Consultant to the Boards of Trustees of the Evergreen Funds; Former Member, New York Stock Exchange; Former Trustee, Mentor Funds and Cash Resource Trust. |
| |
|
|
| |
OFFICERS | |
| |
William M. Ennis(3)
President
DOB: 6/26/1960
Term of office since: 1999 | President and Chief Executive Officer, Evergreen Investment Company, Inc. and Chief Operating Officer, Capital Management Group,Wachovia Bank, N.A. |
| |
|
|
| |
Carol Kosel(4)
Treasurer
DOB: 12/25/1963
Term of office since: 1999 | Senior Vice President, Evergreen Investment Services, Inc. and Treasurer, Vestaur Securities, Inc.; former Senior Manager, KPMG LLP. |
| |
|
|
| |
Michael H. Koonce(4)
Secretary
DOB: 4/20/1960
Term of office since: 2000 | Senior Vice President and General Counsel, Evergreen Investment Services, Inc.; Senior Vice President and Assistant General Counsel,Wachovia Corporation; former Senior Vice President and General Counsel, Colonial Management Associates, Inc.; former Vice President and Counsel, Colonial Management Associates, Inc. |
| |
|
|
| |
Nimish S. Bhatt(5)
Vice President and Assistant
Treasurer
DOB: 6/6/1963
Term of office since: 1998 | Vice President, Tax, BISYS Fund Services; former Assistant Vice President, EAMC/First Union National Bank; former Senior Tax Consulting/Acting Manager, Investment Companies Group, PricewaterhouseCoopers LLP, New York. |
| |
|
|
| |
Bryan Haft(5)
Vice President
DOB: 1/23/1965
Term of office since: 1998 | Team Leader, Fund Administration, BISYS Fund Services. |
| |
|
|
| |
(1)
Each Trustee serves until a successor is duly elected or qualified or until his death, resignation, retirement or removal from office. The address of each Trustee is 200 Berkeley Street, Boston, MA 02116. Each Trustee oversees 112 Evergreen funds.
(2)
Mr. Wagoner is an “interested person” of the fund because of his ownership of shares in Wachovia Corporation, the parent to the fund’s investment advisor.
(3)
The address of the Officer is 401 S. Tryon Street, 20th Floor, Charlotte, NC 28288.
(4)
The address of the Officer is 200 Berkeley Street, Boston, MA 02116.
(5)
The address of the Officer is 3435 Stelzer Road, Columbus, OH 43219.
Additional information about the fund’s Board of Trustees and Officers can be found in the Statement of Additional Information (SAI) and is available upon request without charge by calling 800.343.2898.
29
Investments that stand the test of time
Year in and year out, Evergreen Investments seeks to provide each client with sound, time-tested investment strategies designed for sustainable long-term success. With over $229 billion* in assets under management, we manage diverse investments from institutional portfolios to mutual funds, variable annuities to retirement plans, alternative investments to private accounts. Our commitment to every one of our clients is reflected in the rigor and discipline with which we manage investments.
We offer a complete family of mutual funds designed to help investors meet a wide range of financial goals. From money market funds that meet short-term needs to international funds that involve greater risk but seek potentially higher returns, Evergreen provides a broad array of flexible investment options. Across all investment styles, we are committed to providing investors with investment excellence day after day, quarter after quarter and year after year.
* As of April 30, 2003
Visit us online at EvergreenInvestments.com
F O R M O R E I N F O R M A T I O N
Evergreen Express Line 800.346.3858
Evergreen Investor Services 800.343.2898

| | For the fourth consecutive year, Evergreen Investments has earned the Dalbar Mutual Fund Service Award, which recognizes those firms that exceed industry norms in key service areas. The award symbolizes the achievement of the highest tier of shareholder service within our industry. For 2002, Evergreen Investments was ranked third overall. |
566663 6/2003 |

Evergreen InvestmentsSM
MUTUAL FUNDS
Evergreen Investments
200 Berkeley Street
Boston, MA 02116-5034
| Item 2 - Code of Ethics |
| Not applicable.
|
| Item 3 - Audit Committee Financial Expert |
| Not applicable.
|
Items 4-8 [Reserved]
|
| Not applicable.
|
Item 9 - Controls and Procedures
|
| (a) | The Registrant's Principal Executive Officer and Principal Financial Officer have evaluated the Registrant's disclosure controls and procedures within 90 days of this filing and have concluded that the Registrant's disclosure controls and procedures were effective, as of that date, in ensuring that information required to be disclosed by the Registrant in this Form N-CSR was recorded, processed, summarized, and reported timely.
|
| (b) | There were no significant changes in the Registrant's internal controls or other factors that could significantly affect these controls subsequent to the date of their evaluation, including any corrective actions with regard to significant deficiencies and material weaknesses.
|
Item 10 - Exhibits
|
| (a) | Not applicable.
|
| (b)(1) | Separate certifications for the Registrant's principal executive officer and principal financial officer, as required by Section 302 of the Sarbanes-Oxley Act of 2002 and Rule 30a-2(a) under the Investment Company Act of 1940, are attached as EX99.CERT.
|
| (b)(2) | Separate certifications for the Registrant's principal executive officer and principal financial officer, as required by Section 1350 of Title 18 of United States Code, as adopted pursuant to Section 906 of the Sarbanes-Oxley Act of 2002, and Rule 30a-2(b) under the Investment Company Act of 1940, are attached as EX99.906CERT. The certifications furnished pursuant to this paragraph are not deemed to be "filed" for purposes of Section 18 of the Securities Exchange Act of 1934, or otherwise subject to the liability of that section. Such certifications are not deemed to be incorporated by reference into any filing under the Securities Act of 1933 or the Securities Exchange Act of 1934, except to the extent that the Registrant specifically incorporates them by reference.
|
Pursuant to the requirements of the Securities Exchange Act of 1934 and the Investment Company Act of 1940, the Registrant has duly caused this report to be signed on its behalf by the undersigned, thereunto duly authorized.
Evergreen Fixed Income Trust
|
| By: |
Dennis H. Ferro,
Principal Executive Officer/President
|
Date: June 30, 2003
Pursuant to the requirements of the Securities Exchange Act of 1934 and the Investment Company Act of 1940, this report has been signed below by the following persons on behalf of the Registrant and in the capacities and on the dates indicated.
|
| By: |
Dennis H. Ferro,
Principal Executive Officer/President
|
Date: June 30, 2003
|
| By: |
Carol A. Kosel
Principal Financial Officer/Treasurer
|
| Date: June 30, 2003 |