| OMB APPROVAL |
OMB Number: 3235-0570
Expires: Nov. 30, 2005
Estimated average burden hours per response: 5.0 |
UNITED STATES
SECURITIES AND EXCHANGE COMMISSION
Washington, D.C. 20549
FORM N-CSR
CERTIFIED SHAREHOLDER REPORT OF REGISTERED MANAGEMENT INVESTMENT COMPANIESInvestment Company Act file number 811-08415Evergreen Fixed Income Trust
_____________________________________________________________
(Exact name of registrant as specified in charter)
200 Berkeley Street
Boston, Massachusetts 02116
_____________________________________________________________
(Address of principal executive offices) (Zip code)
Michael H. Koonce, Esq.
200 Berkeley Street
Boston, Massachusetts 02116
____________________________________________________________
(Name and address of agent for service)Registrant's telephone number, including area code: (617) 210-3200
Date of fiscal year end: Registrant is making an annual filing for 5 of its series, Evergreen Diversified Bond Fund, Evergreen High Yield Bond Fund, Evergreen Institutional Mortgage Portfolio, Evergreen Strategic Income Fund and Evergreen U.S. Government Fund, for the year ended April 30, 2004. These 5 series have a 4/30 fiscal year end.
Date of reporting period: April 30, 2004Item 1 - Reports to Stockholders.Evergreen Diversified Bond Fund

Evergreen Diversified Bond Fund
This annual report must be preceded or accompanied by a prospectus of the Evergreen fund contained herein. The prospectus contains more
complete information, including fees and expenses, and should be read carefully before investing or sending money.A description of the Fund's proxy voting policies and procedures is available without charge, upon request, by calling 1.800.343.2898, by visiting our website
at EvergreenInvestments.com or by visiting the SEC's website at http://www.sec.gov.| Mutual Funds: |
| NOT FDIC INSURED | MAY LOSE VALUE | NOT BANK GUARANTEED |
Evergreen InvestmentsSM is a service mark of Evergreen Investment
Management Company, LLC. Copyright 2004.Evergreen mutual funds are distributed by Evergreen Investment Services, Inc.
200 Berkeley Street, Boston, MA 02116LETTER TO SHAREHOLDERS
June 2004
Dennis H. Ferro
President and Chief
Executive Officer | |
|
Dear Shareholder,
We are pleased to provide the annual report for the Evergreen Diversified Bond Fund, which covers the twelve-month period ended April 30, 2004.
Investors in the fixed income markets experienced alternating periods of risk and reward over the past twelve months. Geopolitical uncertainties, improving economic growth, changes in tax legislation, and an accommodative stance from the Federal Reserve managed to both excite and confuse bond market participants at varying points, and in varying sectors, since the beginning of the investment period in May 2003.
The period began with the financial markets focused on the war in Iraq. The associated uncertainty led to higher demand for bonds, particularly within the Treasury market, as investors sought solace in a flight to quality. This performance in government bonds carried over to many municipal and corporate issues, too, and the increased demand for bonds quickly became a sort of self-fulfilling prophecy, as total return potential climbed with higher prices and declining yields. This increasingly popular strategy, though, soon helped set the stage for a summer of volatility unmatched in recent history.
At the conclusion of its monetary policy meeting in May, the Federal Reserve had commented on the "possibility of an unwelcome, substantial fall in inflation." Many bond investors, convinced the Fed was taking rates to zero, drove yields down to 45-year lows in the U.S. Treasury market. Common market wisdom determined that since the Fed's primary concern was deflation, rates were likely headed lower. Yet when central bankers reduced their target for the federal funds rate by a less than expected 25 basis points in late June, many fixed income investors became alarmed. These
1
LETTER TO SHAREHOLDERS continued
worries were compounded by optimistic GDP (Gross Domestic Product) forecasts from Fed Chairman Alan Greenspan during congressional banking committee hearings in July. As a result of these events, the yield on the 10-year Treasury surged from a low of 3.1% in June to 4.6% in late July. Thus, the "deflation trade" in bonds had changed from a significant overbought condition to an oversold one in a matter of just six weeks.
The bond market began to stabilize as investors became more comfortable with the likelihood that monetary policy makers would keep rates low for the foreseeable future. This was a welcome respite for owners of Treasuries and municipal securities. In addition to the excitement in Treasuries, investors in municipal bonds also experienced heightened concerns related to the changes in the tax laws, which were initially perceived as a potential threat to their market. After careful consideration, though, many investors became convinced that capital preservation would remain a primary, if not dominant, theme for the future demand of these securities. A second concern involved the poor financial condition of many states and local governments. Yet just as these concerns were reaching a crescendo, economic growth picked up significantly and tax receipts climbed, improving the financial conditions of many of these entities.
As economic growth strengthened, investors in corporate bonds benefited from the combination of stronger balance sheets, improving credit quality, declining default rates, and the outlook for growth in GDP and corporate profits. In addition, the many steps taken to improve corporate credibility rallied many investors to the credit markets, where many risk appropriate investors successfully searched for improved returns in the high yield market.
Throughout the investment period, the Federal Reserve attempted to improve the clarity of its intentions for the financial markets. At the conclusion of its monetary policy meetings, the Fed's statements ranged from maintaining policy accommodation for a "considerable period" to one of being "measured" in its approach to remove this monetary stimulus. In addition,
2
LETTER TO SHAREHOLDERS continued
central bankers tried to be even more clear in a variety of speeches and public testimonies, as the Fed continued to display an unusually strong effort in clarifying its upcoming changes in monetary policy. Most recently, though, these attempts at clarity caused volatility throughout the fixed income markets, as investors feared a repeat of the experiences in 1994. Given the current level of interest rates, inflation, the dollar, and global economic growth, we believe these concerns are overblown. However, the price of oil remains a wild card, as sustained high oil prices will eventually embed a higher level of manufacturing and service cost in the economy.
We encourage investors to maintain their diversified, long-term strategies within their fixed income portfolios.
Please visit our website, EvergreenInvestments.com, for more information about our funds and other investment products available to you. From the website, you may also access a new feature that presents a detailed Q&A interview with the portfolio manager(s) for your fund. You can easily reach these interviews by following the link, EvergreenInvestments.com/Annual updates, from our website. Thank you for your continued support of Evergreen Investments.
Sincerely, Dennis H. Ferro
President and Chief Executive Officer
Evergreen Investment Company, Inc.
3
FUND AT A GLANCE
as of April 30, 2004MANAGEMENT TEAM

David K. Fowley, CFA
Customized Fixed Income Team
Lead Manager
CURRENT INVESTMENT STYLE

Source: Morningstar, Inc.
Morningstar's style box is based on a portfolio date as of 3/31/2004.
The fixed income style box placement is based on a fund's average effective maturity or duration and the average credit rating of the bond portfolio.PERFORMANCE AND RETURNS
Portfolio inception date: 9/11/1935
| Class A | Class B | Class C | Class I |
| Class inception date | 1/20/1998 | 9/11/1935 | 4/7/1998 | 2/11/1998 |
|
| Nasdaq symbol | EKDLX | EKDMX | EKDCX | EKDYX |
|
| Average annual return* |
|
| 1 year with sales charge | -3.02% | -3.74% | 0.13% | N/A |
|
| 1 year w/o sales charge | 1.82% | 1.10% | 1.10% | 2.12% |
|
| 5 year | 4.21% | 4.13% | 4.46% | 5.50% |
|
| 10 year | 5.52% | 5.54% | 5.54% | 6.13% |
|
| * Adjusted for maximum applicable sales charge, unless noted. |
Past performance is no guarantee of future results. The performance quoted represents past performance and current performance may be lower or higher. The investment return and principal value of an investment will fluctuate so that investors' shares, when redeemed, may be worth more or less than their original cost. To obtain performance information current to the most recent month-end for Class A, B, C or I shares, please go to EvergreenInvestments.com/fundperformance. The performance of each class may vary based on differences in loads, fees and expenses paid by the shareholders investing in each class. Performance includes the reinvestment of income dividends and capital gain distributions. Performance shown does not reflect the deduction of taxes that a shareholder would pay on fund distributions or the redemption of fund shares.
Historical performance shown for Classes A, C and I prior to their inception is based on the performance of Class B, the original class offered. The historical returns for Classes A and I have not been adjusted to reflect the effect of each class' 12b-1 fee. These fees are 0.30% for Class A and 1.00% for Classes B and C. Class I does not pay a 12b-1 fee. If these fees had been reflected, returns for Classes A and I would have been higher.
The advisor is waiving a portion of its advisory fee. Had the fee not been waived, returns would have been lower. Returns reflect expense limits previously in effect for Class A, without which returns for Class A would have been lower.LONG-TERM GROWTH
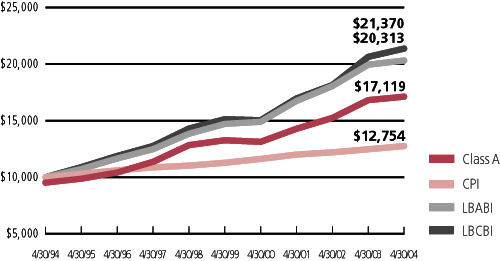 Comparison of a $10,000 investment in Evergreen Diversified Bond Fund Class A shares, versus a similar investment in the Lehman Brothers Aggregate Bond Index (LBABI), Lehman Brothers Corporate Bond Index (LBCBI) and the Consumer Price Index (CPI).
The LBABI and LBCBI are unmanaged market indexes and do not include transaction costs associated with buying and selling securities, any mutual fund expenses or any taxes. The CPI is a commonly used measure of inflation and does not represent an investment return. It is not possible to invest directly in an index.
4
PORTFOLIO MANAGER COMMENTARY
The fund's Class A shares returned 1.82% for the twelve-month period ended April 30, 2004, excluding any applicable sales charges. During the same period, the fund's benchmarks, Lehman Brothers Corporate Bond Index (LBCBI), returned 3.53%, and the Lehman Brothers Aggregate Bond Index, (LBABI), returned 1.82%.
The single largest determinant of bond market performance over the course of the fund's fiscal year was interest rate movement. With the exception of the very short end of the Treasury curve (3 and 6 month Treasury bills), rates rose significantly during the period. This upward shift in rates caused U.S. Treasuries to provide significantly less total return than other fixed income asset classes. Another bond market determinant was the strong performance of corporate bonds in both investment grade and high yield bonds. The increase in financial strength in corporate America, led by improving earnings and reduction of financial debt caused corporate credit to turn in a strong year from a performance perspective.
Given where interest rates were at the beginning of the fiscal period and the slow but steady economic improvement witnessed at the beginning of 2003, the fund was positioned short from a duration and maturity perspective. This stance was appropriate as it attempted to minimize the negative effect of rising interest rates on bond principal values. The only detractor of this positioning was the fact that longer maturity bonds offered significantly more yield than shorter ones. Some amount of the fund's yield was sacrificed in order to increase capital preservation.
Improvement in corporate credit quality was fairly transparent over the course of the fiscal period as companies paid down debt with proceeds from asset sales and benefited from the generally low level of interest rates. As such, the fund was positioned heavily in the lower quality segment of the corporate bond market. In an improving economy, we believed lower quality companies stood to benefit the most. The fund out-performed the LBABI, mostly as a result of lack of exposure to U.S. Treasuries and agencies (the worst performing components of the index) and by its overweight position in corporate bonds of all qualities. When compared to the LBCBI, the fund slightly under-performed due to the specific maturity structure of the portfolio.Class I shares are only offered to investment advisory clients of an investment advisor of an Evergreen fund (or its advisory affiliates), through special arrangements entered into on behalf of Evergreen funds with certain financial services firms, certain institutional investors and persons who owned Class Y shares in registered name in an Evergreen fund on or before December 31, 1994. Class I shares are only available to institutional shareholders with a minimum $1 million investment
The fund's investment objective is nonfundamental and may be changed without the vote of the fund's shareholders.
Funds that invest in high yield, lower-rated bonds may contain more risk due to the increased possibility of default.
Foreign investments may contain more risk due to the inherent risks associated with changing political climates, foreign market instability and foreign currency fluctuations.
The return of principal is not guaranteed due to fluctuation in the NAV of the fund caused by changes in the price of the individual bonds held by the fund and the buying and selling of bonds by the fund. Bond funds have the same inflation, interest rate, and credit risks that are associated with the individual bonds held by the fund.
All data is as of April 30, 2004, and subject to change.
5
FINANCIAL HIGHLIGHTS
(For a share outstanding throughout each period) | Year Ended April 30,
|
CLASS A
| 20041
| 2003
| 20022
| 20011
| 20001
|
Net asset value, beginning of period
| $15.25
| $14.63
| $14.53
| $14.28
| $15.48
|
| Income from investment operations |
| Net investment income | 0.70 | 0.82 | 0.83 | 0.97 | 0.97 |
Net realized and unrealized gains or losses
on securities, foreign currency related
transactions and futures contracts | -0.42
| 0.64
| 0.13
| 0.25
| -1.14
|
Total from investment operations
| 0.28
| 1.46
| 0.96
| 1.22
| -0.17
|
| Distributions to shareholders from |
Net investment income
| -0.76
| -0.84
| -0.86
| -0.97
| -1.03
|
Net asset value, end of period
| $14.77
| $15.25
| $14.63
| $14.53
| $14.28
|
Total return3
| 1.82%
| 10.31%
| 6.72%
| 8.81%
| -1.06%
|
| Ratios and supplemental data |
| Net assets, end of period (thousands) | $275,755 | $322,963 | $300,670 | $314,274 | $344,296 |
| Ratios to average net assets |
| Expenses4 | 1.12% | 1.09% | 1.13% | 1.15% | 1.19% |
| Net investment income | 4.58% | 5.51% | 5.68% | 6.73% | 6.65% |
| Portfolio turnover rate | 157% | 109% | 116% | 176% | 175% |
|
1 Net investment income per share is based on average shares outstanding during the period.2 As required, effective May 1, 2001, the Fund adopted the provisions of the AICPA Audit and Accounting Guide, Audits of Investment Companies , and began amortizing premium on its fixed-income securities. The effects of this change for the year ended April 30, 2002 was a decrease in net investment income per share of $0.02; an increase in net realized gains or losses per share of $0.02; and a decrease to the ratio of net investment income to average net assets of 0.16%. The above per share information, ratios and supplemental data for the periods prior to May 1, 2001 have not been restated to reflect this change in presentation.3 Excluding applicable sales charges4 The ratio of expenses to average net assets excludes expense reductions but includes fee waivers and/or expense reimbursements.
See Notes to Financial Statements |
6
FINANCIAL HIGHLIGHTS
(For a share outstanding throughout each period) | Year Ended April 30,
|
CLASS B
| 20041
| 20031
| 20021,2
| 20011
| 20001
|
Net asset value, beginning of period
| $15.25
| $14.63
| $14.53
| $14.28
| $15.48
|
| Income from investment operations |
| Net investment income | 0.59 | 0.70 | 0.72 | 0.86 | 0.84 |
Net realized and unrealized gains or losses
on securities, foreign currency related
transactions and futures contracts | -0.42
| 0.65
| 0.13
| 0.25
| -1.12
|
Total from investment operations
| 0.17
| 1.35
| 0.85
| 1.11
| -0.28
|
| Distributions to shareholders from |
Net investment income
| -0.65
| -0.73
| -0.75
| -0.86
| -0.92
|
Net asset value, end of period
| $14.77
| $15.25
| $14.63
| $14.53
| $14.28
|
Total return3
| 1.10%
| 9.50%
| 5.93%
| 8.00%
| -1.80%
|
| Ratios and supplemental data |
| Net assets, end of period (thousands) | $25,825 | $27,252 | $19,283 | $23,392 | $21,694 |
| Ratios to average net assets |
| Expenses4 | 1.82% | 1.84% | 1.88% | 1.90% | 1.94% |
| Net investment income | 3.87% | 4.75% | 4.92% | 5.97% | 5.86% |
| Portfolio turnover rate | 157% | 109% | 116% | 176% | 175% |
|
1 Net investment income per share is based on average shares outstanding during the period.2 As required, effective May 1, 2001 the Fund adopted the provisions of the AICPA Audit and Accounting Guide, Audits of Investment Companies , and began amortizing premium on its fixed-income securities. The effects of this change for the year ended April 30, 2002 was a decrease in net investment income per share of $0.03; an increase in net realized gains or losses per share of $0.03; and a decrease to the ratio of net investment income to average net assets of 0.16%. The above per share information, ratios and supplemental data for the periods prior to May 1, 2001 have not been restated to reflect this change in presentation.3 Excluding applicable sales charges4 The ratio of expenses to average net assets excludes expense reductions but includes fee waivers and/or expense reimbursements.
See Notes to Financial Statements |
7
FINANCIAL HIGHLIGHTS
(For a share outstanding throughout each period) | Year Ended April 30,
|
CLASS C
| 20041
| 20031
| 20022
| 20011
| 20001
|
Net asset value, beginning of period
| $15.25
| $14.63
| $14.53
| $14.28
| $15.48
|
| Income from investment operations |
| Net investment income | 0.59 | 0.70 | 0.74 | 0.81 | 0.88 |
Net realized and unrealized gains or losses
on securities, foreign currency related
transactions and futures contracts | -0.42
| 0.65
| 0.11
| 0.30
| -1.16
|
Total from investment operations
| 0.17
| 1.35
| 0.85
| 1.11
| -0.28
|
| Distributions to shareholders from |
Net investment income
| -0.65
| -0.73
| -0.75
| -0.86
| -0.92
|
Net asset value, end of period
| $14.77
| $15.25
| $14.63
| $14.53
| $14.28
|
Total return3
| 1.10%
| 9.50%
| 5.93%
| 8.00%
| -1.80%
|
| Ratios and supplemental data |
| Net assets, end of period (thousands) | $38,490 | $47,506 | $4,008 | $3,077 | $603 |
| Ratios to average net assets |
| Expenses4 | 1.83% | 1.84% | 1.88% | 1.90% | 1.93% |
| Net investment income | 3.88% | 4.78% | 4.91% | 5.82% | 5.92% |
| Portfolio turnover rate | 157% | 109% | 116% | 176% | 175% |
|
1 Net investment income per share is based on average shares outstanding during the period.2 As required, effective May 1, 2001, the Fund adopted the provisions of the AICPA Audit and Accounting Guide, Audits of Investment Companies , and began amortizing premium on its fixed-income securities. The effects of this change for the year ended April 30, 2002 was a decrease in net investment income per share of $0.02; an increase in net realized gains or losses per share of $0.02; and a decrease to the ratio of net investment income to average net assets of 0.16%. The above per share information, ratios and supplemental data for the periods prior to May 1, 2001 have not been restated to reflect this change in presentation.3 Excluding applicable sales charges4 The ratio of expenses to average net assets excludes expense reductions but includes fee waivers and/or expense reimbursements.
See Notes to Financial Statements |
8
FINANCIAL HIGHLIGHTS
(For a share outstanding throughout each period) | Year Ended April 30,
|
CLASS I1
| 20042
| 20032
| 20022,3
| 20012
| 20002
|
Net asset value, beginning of period
| $15.25
| $14.63
| $14.53
| $14.28
| $15.48
|
| Income from investment operations |
| Net investment income | 0.74 | 0.85 | 0.87 | 1.01 | 0.90 |
Net realized and unrealized gains or losses
on securities, foreign currency related
transactions and futures contracts | -0.42
| 0.65
| 0.12
| 0.25
| -1.04
|
Total from investment operations
| 0.32
| 1.50
| 0.99
| 1.26
| -0.14
|
| Distributions to shareholders from |
Net investment income
| -0.80
| -0.88
| -0.89
| -1.01
| -1.06
|
Net asset value, end of period
| $14.77
| $15.25
| $14.63
| $14.53
| $14.28
|
Total return
| 2.12%
| 10.59%
| 6.99%
| 9.08%
| -0.81%
|
| Ratios and supplemental data |
| Net assets, end of period (thousands) | $2,311 | $3,235 | $299 | $980 | $885 |
| Ratios to average net assets |
| Expenses4 | 0.82% | 0.87% | 0.88% | 0.90% | 0.95% |
| Net investment income | 4.87% | 5.76% | 5.91% | 6.97% | 6.89% |
| Portfolio turnover rate | 157% | 109% | 116% | 176% | 175% |
|
1 Effective at the close of business on May 11, 2001, Class Y shares were renamed as Institutional shares (Class I).2 Net investment income per share is based on average shares outstanding during the period.3 As required, effective May 1, 2001, the Fund adopted the provisions of the AICPA Audit and Accounting Guide, Audits of Investment Companies , and began amortizing premium on its fixed-income securities. The effects of this change for the year ended April 30, 2002 was a decrease in net investment income per share of $0.02; an increase in net realized gains or losses per share of $0.02; and a decrease to the ratio of net investment income to average net assets of 0.16%. The above per share information, ratios and supplemental data for the periods prior to May 1, 2001 have not been restated to reflect this change in presentation.4 The ratio of expenses to average net assets excludes expense reductions but includes fee waivers and/or expense reimbursements.
See Notes to Financial Statements |
9
SCHEDULE OF INVESTMENTS
April 30, 2004 | Principal
Amount | Value |
|
| ASSET-BACKED SECURITIES 1.7% |
Credit Suisse First Boston Mtge. Securities Corp., Ser. 1996-2, Class A-6,
7.18%, 02/25/2018 | $ 612,470 | $ 612,230 |
| Oakwood Mtge. Investors, Inc., Ser. 1996-C, Class A5, 7.35%, 04/15/2027 | 2,184,906 | 2,277,700 |
| Railcar Leasing LLC, Ser. 1, Class A-2, 7.125%, 01/15/2013 144A | 2,500,000 | 2,760,312 |
| Total Asset-Backed Securities (cost $5,631,687) | | 5,650,242 |
| COLLATERALIZED MORTGAGE OBLIGATIONS 5.0% |
| Banc America, Inc., Ser. 2001-7, 1.91%, 01/27/2006 144A (h) | 3,500,000 | 3,283,437 |
| Criimi Mae Finl. Corp., Ser. 1, Class A, 7.00%, 01/01/2033 | 1,643,315 | 1,644,600 |
Financial Asset Securitization, Inc., Ser. 1997-NAM2, Class B-2,
7.88%, 07/25/2027 | 1,226,182 | 1,229,934 |
| GE Capital Mtge. Svcs., Inc., Ser. 1999-H, Class A-7, 6.27%, 04/25/2029 | 1,345,643 | 1,388,058 |
Greenwich Capital Acceptance, Inc., Ser. 2001-ZC1A, Class A,
6.36%, 06/14/2006 144A (h) | 2,897,708 | 3,018,057 |
| Midland Realty Acceptance Corp., Ser. 1996-C1, Class E, 8.26%, 08/25/2028 | 2,784,000 | 3,173,751 |
| Morgan Stanley Capital I, Inc., Ser. 1997-ALIC, Class B, 6.71%, 01/15/2006 | 734,885 | 751,318 |
Residential Funding Mtge. Securities I, Inc., Ser. 1999-S2, Class M-1,
6.50%, 01/25/2029 | 2,586,601 | 2,581,611 |
| Total Collateralized Mortgage Obligations (cost $16,788,762) | | 17,070,766 |
| CORPORATE BONDS 72.8% |
| CONSUMER DISCRETIONARY 13.2% |
| Auto Components 0.1% |
| Dana Corp., 9.00%, 08/15/2011 | 200,000 | 237,000 |
| HLI Operating, Inc., 10.50%, 06/15/2010 | 130,000 | 147,550 |
| 384,550 |
| Automobiles 2.6% |
| DaimlerChrysler Holdings Corp., 7.30%, 01/15/2012 | 4,000,000 | 4,430,396 |
| General Motors Corp., 8.375%, 07/15/2033 | 4,000,000 | 4,338,468 |
| 8,768,864 |
| Distributors 0.1% |
| Roundy's, Inc., Ser. B, 8.875%, 06/15/2012 | 200,000 | 218,000 |
| Hotels, Restaurants & Leisure 0.2% |
| Chumash Casino & Resort Enterprise, 9.00%, 07/15/2010 144A | 175,000 | 195,125 |
| El Pollo Loco, Inc., 9.25%, 12/15/2009 144A | 40,000 | 41,000 |
| Friendly Ice Cream Corp., 8.375%, 06/15/2012 144A | 40,000 | 41,100 |
| John Q Hammons Hotels LP, Ser. B, 8.875%, 05/15/2012 | 175,000 | 193,375 |
| Mandalay Resort Group, 6.375%, 12/15/2011 | 200,000 | 206,000 |
| 676,600 |
| Household Durables 0.2% |
| Meritage Corp., 9.75%, 06/01/2011 | 175,000 | 195,781 |
| Standard Pacific Corp., 7.75%, 03/15/2013 | 175,000 | 182,438 |
| WCI Communities, Inc., 9.125%, 05/01/2012 | 400,000 | 438,000 |
| 816,219 |
See Notes to Financial Statements |
10
SCHEDULE OF INVESTMENTS continued
April 30, 2004 | Principal
Amount | Value |
|
| CORPORATE BONDS continued |
| CONSUMER DISCRETIONARY continued |
| Media 9.6% |
| Clear Channel Communications, 5.75%, 01/15/2013 (p) | $ 5,000,000 | $ 5,121,100 |
| Cox Communications, Inc., 7.125%, 10/01/2012 | 5,000,000 | 5,545,970 |
| CSC Holdings, Inc., 7.625%, 04/01/2011 | 200,000 | 209,000 |
| Dex Media West LLC, 8.50%, 08/15/2010 144A (p) | 285,000 | 310,650 |
| Emmis Communications Corp., Ser. B, 8.125%, 03/15/2009 | 175,000 | 183,531 |
| Emmis Operating Co., 6.875%, 05/15/2012 144A # | 90,000 | 90,225 |
| InterActiveCorp., 7.00%, 01/15/2013 (p) | 5,000,000 | 5,449,160 |
| Liberty Media Corp., 5.70%, 05/15/2013 (p) | 4,500,000 | 4,507,452 |
| LIN TV Corp., 6.50%, 05/15/2013 (p) | 200,000 | 198,000 |
| Mediacom LLC: |
| 7.875%, 02/15/2011 (p) | 110,000 | 106,700 |
| 9.50%, 01/15/2013 (p) | 135,000 | 135,000 |
| Medianews Group, Inc., 6.875%, 10/01/2013 | 175,000 | 174,125 |
| News America Holdings, Inc., 8.00%, 10/17/2016 | 5,000,000 | 5,966,420 |
| R.H. Donnelley Fin. Corp., 10.875%, 12/15/2012 | 175,000 | 209,125 |
| Time Warner, Inc.: |
| 6.95%, 01/15/2028 | 2,000,000 | 2,054,604 |
| 7.625%, 04/15/2031 | 2,500,000 | 2,744,185 |
| 33,005,247 |
| Specialty Retail 0.4% |
| Cole National Group, Inc., 8.875%, 05/15/2012 | 155,000 | 168,175 |
| CSK Auto, Inc., 7.00%, 01/15/2014 144A | 175,000 | 173,250 |
| Group 1 Automotive, Inc., 8.25%, 08/15/2013 | 200,000 | 219,500 |
| Michaels Stores, Inc., 9.25%, 07/01/2009 | 200,000 | 220,750 |
| Steinway Musical Instruments, Inc., 8.75%, 04/15/2011 (p) | 175,000 | 190,750 |
| United Auto Group, Inc., 9.625%, 03/15/2012 | 175,000 | 196,438 |
| Warnaco Group, Inc., 8.875%, 06/15/2013 | 175,000 | 189,000 |
| 1,357,863 |
| CONSUMER STAPLES 3.4% |
| Food & Staples Retailing 3.4% |
| Albertsons, Inc., 7.50%, 02/15/2011 (p) | 5,000,000 | 5,686,605 |
| Crown Cork & Seal Co., Inc., 7.375%, 12/15/2026 (p) | 175,000 | 158,375 |
| Delhaize America, Inc., 8.125%, 04/15/2011 | 5,000,000 | 5,601,445 |
| Rite Aid Corp., 8.125%, 05/01/2010 | 175,000 | 189,875 |
| 11,636,300 |
| Food Products 0.0% |
| Dole Food Co., Inc., 7.25%, 06/15/2010 | 175,000 | 177,188 |
| ENERGY 5.0% |
| Energy Equipment & Services 0.2% |
| Dresser, Inc., 9.375%, 04/15/2011 | 175,000 | 189,875 |
| NRG Energy, Inc., 8.00%, 12/15/2013 144A | 75,000 | 75,938 |
| Parker Drilling Co., Ser. B, 10.125%, 11/15/2009 | 175,000 | 188,563 |
See Notes to Financial Statements |
11
SCHEDULE OF INVESTMENTS continued
April 30, 2004 | Principal
Amount | Value |
|
| CORPORATE BONDS continued |
| ENERGY continued |
| Energy Equipment & Services continued |
| SESI LLC, 8.875%, 05/15/2011 | $ 175,000 | $ 190,312 |
| 644,688 |
| Oil & Gas 4.8% |
| Amerada Hess Corp., 6.65%, 08/15/2011 (p) | 5,000,000 | 5,337,395 |
| Chesapeake Energy Corp., 6.875%, 01/15/2016 | 175,000 | 178,500 |
| El Paso Energy Partners LP, 8.50%, 06/01/2011 | 175,000 | 194,250 |
| Evergreen Resources, Inc., 5.875%, 03/15/2012 144A | 15,000 | 14,925 |
| Exco Resources, Inc., 7.25%, 01/15/2011 144A | 30,000 | 30,450 |
| Ferrellgas Escrow LLC, 6.75%, 05/01/2014 144A | 160,000 | 160,800 |
| Forest Oil Corp., 7.75%, 05/01/2014 | 175,000 | 188,125 |
| Gulfterra Energy Partners LP, Ser. B, 6.25%, 06/01/2010 | 175,000 | 182,000 |
| Pemex Project Funding Master Trust, 8.625%, 02/01/2022 | 4,000,000 | 4,300,000 |
| Premcor Refining Group, Inc., 6.75%, 05/01/2014 | 175,000 | 175,000 |
| Stone Energy Corp., 8.25%, 12/15/2011 | 210,000 | 227,850 |
| Tesoro Petroleum Corp., Ser. B, 9.00%, 07/01/2008 (p) | 175,000 | 182,437 |
| Valero Energy Corp., 4.75%, 06/15/2013 | 5,000,000 | 4,788,205 |
| Westport Resources Corp., 8.25%, 11/01/2011 | 400,000 | 451,000 |
| 16,410,937 |
| FINANCIALS 29.8% |
| Capital Markets 7.7% |
| Bear Stearns, Inc., 5.70%, 11/15/2014 | 7,000,000 | 7,137,438 |
| Credit Suisse First Boston, 5.125%, 01/15/2014 | 6,000,000 | 5,882,934 |
| Goldman Sachs Group, Inc., 5.15%, 01/15/2014 | 7,000,000 | 6,825,105 |
| Morgan Stanley Co., Inc., 4.75%, 04/01/2014 | 7,000,000 | 6,552,665 |
| 26,398,142 |
| Commercial Banks 2.4% |
| Banco Bradesco SA, 8.75%, 10/24/2013 144A | 3,000,000 | 2,977,500 |
| FBOP Corp., 10.00%, 01/15/2009 144A | 1,000,000 | 1,110,000 |
| First Empire Capital Trust I, 8.23%, 02/01/2027 | 3,600,000 | 4,031,600 |
| 8,119,100 |
| Consumer Finance 11.4% |
| CIT Group, Inc., 5.00%, 02/13/2014 (p) | 5,000,000 | 4,784,950 |
| Ford Motor Credit Co., 6.50%, 01/25/2007 | 5,000,000 | 5,305,535 |
| General Electric Capital Corp., 5.45%, 01/15/2013 | 8,000,000 | 8,205,080 |
| HSBC Capital Funding LP, 4.61%, 12/29/2049 144A | 6,000,000 | 5,545,452 |
| Ohio National Financial Services, Inc., 6.35%, 04/01/2013 144A | 5,000,000 | 5,184,965 |
| SLM Corp., 5.00%, 10/01/2013 (p) | 4,000,000 | 3,921,196 |
| Sprint Capital Corp., 8.75%, 03/15/2032 | 5,000,000 | 5,989,980 |
| 38,937,158 |
| Diversified Financial Services 0.1% |
| Arch Western Finance LLC, 6.75%, 07/01/2013 144A | 200,000 | 207,000 |
| Couche Tard LP, 7.50%, 12/15/2013 | 40,000 | 42,200 |
See Notes to Financial Statements |
12
SCHEDULE OF INVESTMENTS continued
April 30, 2004 | Principal
Amount | Value |
|
| CORPORATE BONDS continued |
| FINANCIALS continued |
| Diversified Financial Services continued |
| Pemex Finance, Ltd., 10.61%, 08/15/2017 144A | $ 190,000 | $ 247,172 |
| 496,372 |
| Insurance 5.6% |
| Aon Capital Trust A, 8.21%, 01/01/2027 | 4,000,000 | 4,417,976 |
| Crum & Forster Holding Corp., 10.375%, 06/15/2013 | 175,000 | 194,250 |
| Fund American Companies, Inc., 5.875%, 05/15/2013 | 5,000,000 | 5,037,615 |
| Markel Corp., Ser. A, 6.80%, 02/15/2013 | 5,000,000 | 5,242,860 |
| RLI Corp., 5.95%, 01/15/2014 | 4,500,000 | 4,428,117 |
| 19,320,818 |
| Real Estate 2.6% |
| Crescent Real Estate Equities, 9.25%, 04/15/2009 REIT (p) | 185,000 | 205,350 |
| FelCor Suites LP, 7.625%, 10/01/2007 REIT | 175,000 | 180,250 |
| Health Care Property, Inc., 6.00%, 03/01/2015 REIT | 4,000,000 | 4,102,580 |
| Host Marriott Corp., 7.125%, 11/01/2013 REIT | 175,000 | 178,500 |
| LNR Property Corp., 7.625%, 07/15/2013 | 175,000 | 181,125 |
| Omega Healthcare Investors, Inc., 7.00%, 04/01/2014 144A REIT | 35,000 | 35,875 |
| Pan Pacific Retail Properties, Inc., 7.95%, 04/15/2011 REIT | 3,250,000 | 3,744,383 |
| Thornburg Mortgage, Inc., 8.00%, 05/15/2013 REIT | 175,000 | 180,688 |
| 8,808,751 |
| HEALTH CARE 1.8% |
| Health Care Equipment & Supplies 0.0% |
| NeighborCare, Inc., 6.875%, 11/15/2013 144A | 45,000 | 46,125 |
| Health Care Providers & Services 1.7% |
| Extendicare Health Services, Inc., 9.50%, 07/01/2010 (p) | 175,000 | 195,125 |
| Manor Care, Inc., 6.25%, 05/01/2013 | 5,000,000 | 5,168,750 |
| Omnicare, Inc., Ser. B, 8.125%, 03/15/2011 | 175,000 | 193,375 |
| Stewart Enterprises, Inc., 10.75%, 07/01/2008 | 200,000 | 227,000 |
| Triad Hospitals, Inc., 7.00%, 11/15/2013 | 200,000 | 194,500 |
| 5,978,750 |
| Pharmaceuticals 0.1% |
| Alpharma, Inc., 8.625%, 05/01/2011 144A | 200,000 | 211,000 |
| INDUSTRIALS 6.5% |
| Airlines 1.0% |
| Southwest Airlines Co., 8.70%, 07/01/2011 | 2,720,106 | 3,267,051 |
| Commercial Services & Supplies 0.5% |
| Allied Waste North America, Inc., 6.50%, 11/15/2010 144A | 200,000 | 201,000 |
| Coinmach Corp., 9.00%, 02/01/2010 | 200,000 | 213,000 |
| Geo Group, Inc., 8.25%, 07/15/2013 | 200,000 | 209,000 |
| Hines Nurseries, Inc., 10.25%, 10/01/2011 | 190,000 | 209,000 |
| Iron Mountain, Inc., 6.625%, 01/01/2016 | 175,000 | 163,625 |
| Mail Well I Corp., 7.875%, 12/01/2013 144A (p) | 200,000 | 190,000 |
| Manitowoc Co., Inc., 7.125%, 11/01/2013 | 200,000 | 210,000 |
See Notes to Financial Statements |
13
SCHEDULE OF INVESTMENTS continued
April 30, 2004 | Principal
Amount | Value |
|
| CORPORATE BONDS continued |
| INDUSTRIALS continued |
| Commercial Services & Supplies continued |
| NationsRent, Inc., 9.50%, 10/15/2010 144A | $ 175,000 | $ 188,562 |
| Service Corporation International, 6.75%, 04/01/2016 144A | 55,000 | 54,863 |
| United Rentals North America, Inc., 6.50%, 02/15/2012 144A | 200,000 | 194,000 |
| 1,833,050 |
| Construction & Engineering 1.6% |
| Centex Corp., Ser. E, FRN, 3.12%, 11/22/2004 | 500,000 | 504,533 |
| Pulte Homes, Inc., 5.25%, 01/15/2014 | 5,000,000 | 4,784,755 |
| 5,289,288 |
| Machinery 0.3% |
| AGCO Corp., 8.50%, 03/15/2006 (p) | 175,000 | 176,312 |
| CNH Global N.V., 9.25%, 08/01/2011 144A | 400,000 | 448,000 |
| Cummins, Inc., 9.50%, 12/01/2010 | 50,000 | 58,250 |
| Terex Corp., 7.375%, 01/15/2014 144A | 190,000 | 199,025 |
| Wolverine Tube, Inc., 7.375%, 08/01/2008 144A | 200,000 | 198,000 |
| 1,079,587 |
| Road & Rail 3.1% |
| Bombardier, Inc., 6.30%, 05/01/2014 144A (p) | 5,000,000 | 4,939,655 |
| Goodrich Corp., 7.625%, 12/15/2012 | 5,000,000 | 5,711,395 |
| 10,651,050 |
| INFORMATION TECHNOLOGY 0.1% |
| IT Services 0.1% |
| Stratus Technologies, Inc., 10.375%, 12/01/2008 144A | 200,000 | 200,000 |
| MATERIALS 2.2% |
| Chemicals 0.4% |
| Airgas, Inc., 9.125%, 10/01/2011 | 175,000 | 198,625 |
| Equistar Chemicals LP, 10.625%, 05/01/2011 | 200,000 | 225,000 |
| FMC Corp., 10.25%, 11/01/2009 | 175,000 | 207,375 |
| Huntsman Advanced Materials LLC, 11.625%, 10/15/2010 | 175,000 | 193,375 |
| Lyondell Chemical Co., 9.50%, 12/15/2008 | 175,000 | 183,750 |
| Nalco Co., 7.75%, 11/15/2011 144A | 165,000 | 174,487 |
| Noveon, Inc., Ser. B, 11.00%, 02/28/2011 | 175,000 | 204,750 |
| Scotts Co., 6.625%, 11/15/2013 144A | 200,000 | 207,000 |
| 1,594,362 |
| Containers & Packaging 0.2% |
| Graphic Packaging International, Inc., 8.50%, 08/15/2011 | 175,000 | 194,250 |
| Owens-Brockway Glass Container, Inc., 8.875%, 02/15/2009 | 175,000 | 190,969 |
| Stone Container Corp., 9.75%, 02/01/2011 | 200,000 | 223,000 |
| 608,219 |
| Metals & Mining 0.1% |
| Massey Energy Co., 6.625%, 11/15/2010 | 95,000 | 95,950 |
| Peabody Energy Corp., 5.875%, 04/15/2016 | 65,000 | 60,775 |
See Notes to Financial Statements |
14
SCHEDULE OF INVESTMENTS continued
April 30, 2004 | Principal
Amount | Value |
|
| CORPORATE BONDS continued |
| MATERIALS continued |
| Metals & Mining continued |
| U.S. Steel Corp., 10.75%, 08/01/2008 | $ 114,000 | $ 133,950 |
| 290,675 |
| Paper & Forest Products 1.5% |
| Georgia Pacific Corp., 8.125%, 05/15/2011 (p) | 200,000 | 226,500 |
| Weyerhaeuser Co., 8.50%, 01/15/2025 | 4,000,000 | 4,793,036 |
| 5,019,536 |
| TELECOMMUNICATION SERVICES 4.8% |
| Diversified Telecommunication Services 3.4% |
| Bellsouth Telecommunications, 6.125%, 09/23/2008 | 2,950,000 | 3,186,147 |
| Insight Midwest LP, 10.50%, 11/01/2010 | 175,000 | 191,625 |
| TCI Communications, Inc., 8.75%, 08/01/2015 | 3,000,000 | 3,676,683 |
| Verizon New York, Inc., Ser. A, 6.875%, 04/01/2012 | 4,000,000 | 4,381,780 |
| 11,436,235 |
| Wireless Telecommunications Services 1.4% |
| Intelsat, Ltd., 6.50%, 11/01/2013 (p) | 5,000,000 | 4,593,295 |
| Nextel Communications, Inc.: |
| 5.95%, 03/15/2014 (p) | 200,000 | 189,000 |
| 6.875%, 10/31/2013 | 79,000 | 80,185 |
| Rural Cellular Corp., 8.25%, 03/15/2012 144A | 15,000 | 15,563 |
| 4,878,043 |
| UTILITIES 6.0% |
| Aerospace & Defense 1.5% |
| Raytheon Co., 5.375%, 04/01/2013 | 5,000,000 | 5,021,500 |
| Electric Utilities 1.5% |
| FirstEnergy Corp., Ser. B, 6.45%, 11/15/2011 | 5,000,000 | 5,271,845 |
| Gas Utilities 0.1% |
| Western Gas Resources, Inc., 10.00%, 06/15/2009 | 400,000 | 422,000 |
| Multi-Utilities & Unregulated Power 2.9% |
| Constellation Energy Group, Inc., 4.55%, 06/15/2015 | 4,000,000 | 3,607,816 |
| Duke Energy Corp., 8.25%, 10/15/2004 | 3,000,000 | 3,077,421 |
| Niagara Mohawk Power Corp., 7.75%, 05/15/2006 | 2,000,000 | 2,190,126 |
| Pacific Gas & Electric Co., 4.80%, 03/01/2014 | 1,000,000 | 958,624 |
| Reliant Resources, Inc., 9.25%, 07/15/2010 | 175,000 | 188,125 |
| 10,022,112 |
| Total Corporate Bonds (cost $252,643,741) | | 249,297,225 |
| FOREIGN BONDS-GOVERNMENT (PRINCIPAL AMOUNT |
| DENOMINATED IN CURRENCY INDICATED) 1.0% |
| Hungary, 8.50%, 10/12/2004, HUF (cost $3,577,566) | 750,000,000 | 3,541,892 |
See Notes to Financial Statements |
15
SCHEDULE OF INVESTMENTS continued
April 30, 2004 | Principal
Amount | Value |
|
| MORTGAGE-BACKED SECURITIES 0.8% |
| FHLMC: |
| 6.00%, 01/01/2032 | $ 21,188 | $ 21,693 |
| 7.50%, 09/01/2013-05/01/2015 ## | 176,537 | 188,450 |
| FNMA: |
| 5.125%, 01/02/2014 (p) | 2,500,000 | 2,464,027 |
| 7.00%, 07/01/2029 | 11,146 | 11,796 |
| Total Mortgage-Backed Securities (cost $2,696,665) | | 2,685,966 |
| YANKEE OBLIGATIONS-CORPORATE 12.9% |
| CONSUMER STAPLES 1.2% |
| Beverages 1.2% |
| Cia Brasileira De Bebida, 8.75%, 09/15/2013 144A | 4,000,000 | 4,250,000 |
| ENERGY 1.5% |
| Oil & Gas 1.5% |
| Transocean, Inc., 7.375%, 04/15/2018 | 4,582,000 | 5,278,134 |
| FINANCIALS 2.8% |
| Insurance 2.8% |
| Axa SA, 8.60%, 12/15/2030 | 4,000,000 | 4,986,228 |
| Montpelier Re Holdings, Ltd, 6.125%, 08/15/2013 | 4,500,000 | 4,559,832 |
| 9,546,060 |
| INDUSTRIALS 3.0% |
| Industrial Conglomerates 3.0% |
| Hutchison Whampoa International, Ltd., 6.50%, 02/13/2013 144A | 5,000,000 | 5,044,880 |
| Tyco International Group SA, 6.00%, 11/15/2013 144A | 5,000,000 | 5,077,785 |
| 10,122,665 |
| MATERIALS 0.6% |
| Paper & Forest Products 0.6% |
| Millar Western Forest Products, 7.75%, 11/15/2013 144A | 20,000 | 21,100 |
| Nexfor, Inc., 7.25%, 07/01/2012 | 2,000,000 | 2,196,194 |
| 2,217,294 |
| TELECOMMUNICATION SERVICES 1.5% |
| Diversified Telecommunication Services 1.4% |
| Telecom Italia Capital, 5.25%, 11/15/2013 144A | 5,000,000 | 4,938,760 |
| Wireless Telecommunications Services 0.1% |
| Rogers Wireless, Inc., 6.375%, 03/01/2014 144A | 175,000 | 165,375 |
| UTILITIES 2.3% |
| Electric Utilities 1.5% |
| Transalta Corp, 5.75%, 12/15/2013 | 5,000,000 | 4,946,655 |
| Oil & Gas 0.8% |
| Petrobras International Finance Co., 8.375%, 12/10/2018 | 3,000,000 | 2,835,000 |
| Total Yankee Obligations-Corporate (cost $45,112,331) | | 44,299,943 |
| YANKEE OBLIGATIONS-GOVERNMENT 1.7% |
| United Mexican States, 5.875%, 01/15/2014 (p) (cost $5,868,037) | 6,000,000 | 5,823,000 |
See Notes to Financial Statements |
16
SCHEDULE OF INVESTMENTS continued
April 30, 2004 | Shares | Value |
|
| MUTUAL FUND SHARES 2.1% |
| PIMCO High Income Fund (cost $7,729,358) | 513,000 | $ 7,043,490 |
| PREFERRED STOCKS 0.1% |
| FINANCIALS 0.1% |
| Diversified Financial Services 0.1% |
| Fleet Capital Trust (cost $500,000) | 20,000 | 511,600 |
| SHORT-TERM INVESTMENTS 13.2% |
|
| Principal
Amount | Value |
|
| U.S. TREASURY OBLIGATIONS 0.6% |
| U.S. Treasury Bills, 1.08%, 08/12/2004 (f) † | $ 2,200,000 | 2,194,089 |
|
| Shares | Value |
|
| MUTUAL FUND SHARES 12.6% |
| Evergreen Institutional Money Market Fund (o) | 1,320,601 | 1,320,601 |
| Navigator Prime Portfolio (pp) | 41,618,310 | 41,618,310 |
| 42,938,911 |
| Total Short-Term Investments (cost $45,133,000) | | 45,133,000 |
| Total Investments (cost $385,681,147) 111.3% | | 381,057,124 |
| Other Assets and Liabilities (11.3%) | | (38,675,710) |
| Net Assets 100.0% | | $ 342,381,414 |
| 144A | Security that may be sold to qualified institutional buyers under Rule 144A of the Securities Act of 1933, as amended. This security has been determined to be liquid under guidelines established by the Board of Trustees. |
| (o) | Evergreen Investment Management Company, LLC is the investment advisor to both the Fund and the money market fund. |
| (h) | No market quotation available. Valued at fair value as determined in good faith under procedures established by the Board of Trustees. |
| (p) | All or a portion of this security is on loan. |
| (pp) | Represents investment of cash collateral received from securities on loan. |
| (f) | All or a portion of the principal amount of this security was pledged to cover initial margin requirements for open futures contracts. |
| † | Rate shown represents the yield to maturity at date of purchase. |
| # | When-issued or delayed delivery security. |
| ## | All or a portion of this security has been segregated for when-issued or delayed delivery securities. |
|
| Summary of Abbreviations: |
| FNMA | Federal National Mortgage Association |
| FHLMC | Federal Home Loan Mortgage Corp. |
| FRN | Floating Rate Note |
| HUF | Hungarian Forint |
| REIT | Real Estate Investment Trust |
See Notes to Financial Statements |
17
STATEMENT OF ASSETS AND LIABILITIES
April 30, 2004
|
| Assets |
| Investments in securities, at value (cost $385,681,147) including |
| $40,853,555 of securities loaned | $ 381,057,124 |
| Foreign currency, at value (cost $115) | 107 |
| Receivable for Fund shares sold | 81,956 |
| Interest and dividends receivable | 5,486,715 |
| Receivable for securities lending income | 4,491 |
| Prepaid expenses and other assets | 184,344 |
|
| Total assets | 386,814,737 |
|
| Liabilities |
| Dividends payable | 599,490 |
| Payable for securities purchased | 1,210,044 |
| Payable for Fund shares redeemed | 624,834 |
| Payable for securities on loan | 41,618,310 |
| Payable for daily variation margin on open futures contracts | 269,063 |
| Advisory fee payable | 9,943 |
| Distribution Plan expenses payable | 12,003 |
| Due to other related parties | 8,715 |
| Accrued expenses and other liabilities | 80,921 |
|
| Total liabilities | 44,433,323 |
|
| Net assets | $ 342,381,414 |
|
| Net assets represented by |
| Paid-in capital | $ 390,870,118 |
| Overdistributed net investment income | (483,222) |
Accumulated net realized losses on securities, foreign currency
related transactions and futures contracts | (44,275,458) |
Net unrealized gains or losses on securities, foreign currency
related transactions and futures contracts | (3,730,024) |
|
| Total net assets | $ 342,381,414 |
|
| Net assets consists of |
| Class A | $ 275,755,139 |
| Class B | 25,824,831 |
| Class C | 38,490,469 |
| Class I | 2,310,975 |
|
| Total net assets | $ 342,381,414 |
|
| Shares outstanding |
| Class A | 18,670,830 |
| Class B | 1,748,528 |
| Class C | 2,606,117 |
| Class I | 156,473 |
|
| Net asset value per share |
| Class A | $ 14.77 |
| Class A -- Offering price (based on sales charge of 4.75%) | $ 15.51 |
| Class B | $ 14.77 |
| Class C | $ 14.77 |
| Class I | $ 14.77 |
|
See Notes to Financial Statements |
18
STATEMENT OF OPERATIONS
Year Ended April 30, 2004
|
| Investment income |
| Interest | $ 21,326,539 |
| Dividends | 281,754 |
|
| Total investment income | 21,608,293 |
|
| Expenses |
| Advisory fee | 1,742,710 |
| Distribution Plan expenses |
| Class A | 912,599 |
| Class B | 276,742 |
| Class C | 442,215 |
| Administrative services fee | 378,933 |
| Transfer agent fees | 756,747 |
| Trustees' fees and expenses | 5,357 |
| Printing and postage expenses | 45,717 |
| Custodian and accounting fees | 108,700 |
| Registration and filing fees | 38,082 |
| Professional fees | 24,108 |
| Other | 37,129 |
|
| Total expenses | 4,769,039 |
| Less: Expense reductions | (3,705) |
| Fee waivers and expense reimbursements | (13,847) |
|
| Net expenses | 4,751,487 |
|
| Net investment income | 16,856,806 |
|
Net realized and unrealized gains or losses on securities,
foreign currency related transactions and futures contracts |
| Net realized gains or losses on: |
| Securities | 7,988,872 |
| Foreign currency related transactions | 33,627 |
| Futures contracts | (2,436,155) |
|
Net realized gains on securities, foreign currency related transactions
and futures contracts | 5,586,344 |
Net change in unrealized gains or losses on securities, foreign currency
related transactions and futures contracts | (15,614,330) |
|
Net realized and unrealized gains or losses on securities, foreign currency
related transactions and futures contracts | (10,027,986) |
|
| Net increase in net assets resulting from operations | $ 6,828,820 |
|
See Notes to Financial Statements |
19
STATEMENTS OF CHANGES IN NET ASSETS
| Year Ended April 30,
|
| 2004 | 2003 |
|
| Operations |
| Net investment income | | $ 16,856,806 | | $ 20,996,142 |
Net realized gains on securities, foreign
currency related transactions
and futures contracts | | 5,586,344 | | 9,731,009 |
Net change in unrealized gains or losses
on securities, foreign currency related
transactions and futures contracts | | (15,614,330) | | 7,310,653 |
|
Net increase in net assets resulting
from operations | | 6,828,820 | | 38,037,804 |
|
| Distributions to shareholders from |
| Net investment income |
| Class A | | (15,198,914) | | (18,272,267) |
| Class B | | (1,186,466) | | (1,184,413) |
| Class C | | (1,898,544) | | (2,206,336) |
| Class I | | (162,471) | | (67,251) |
|
| Total distributions to shareholders | | (18,446,395) | | (21,730,267) |
|
| | Shares | | Shares |
| Capital share transactions |
| Proceeds from shares sold |
| Class A | 362,207 | 5,511,500 | 1,481,355 | 21,845,129 |
| Class B | 451,342 | 6,871,941 | 677,706 | 10,000,437 |
| Class C | 307,989 | 4,687,644 | 426,470 | 6,296,087 |
| Class I | 69,019 | 1,049,350 | 352,088 | 5,201,827 |
|
| | | 18,120,435 | | 43,343,480 |
|
Net asset value of shares issued in
reinvestment of distributions |
| Class A | 611,529 | 9,254,418 | 741,379 | 10,963,641 |
| Class B | 44,009 | 665,861 | 45,204 | 669,071 |
| Class C | 81,748 | 1,237,149 | 96,774 | 1,431,987 |
| Class I | 1,518 | 22,947 | 774 | 11,455 |
|
| | | 11,180,375 | | 13,076,154 |
|
Automatic conversion of Class B shares
to Class A shares |
| Class A | 27,179 | 413,022 | 32,698 | 486,881 |
| Class B | (27,179) | (413,022) | (32,698) | (486,881) |
|
| | | 0 | | 0 |
|
| Payment for shares redeemed |
| Class A | (3,504,087) | (53,099,113) | (4,208,009) | (61,957,227) |
| Class B | (506,299) | (7,674,174) | (386,863) | (5,697,146) |
| Class C | (898,190) | (13,598,071) | (1,007,555) | (14,873,551) |
| Class I | (126,148) | (1,885,559) | (165,145) | (2,418,714) |
|
| | | (76,256,917) | | (84,946,638) |
|
Net asset value of shares issued
in acquisition |
| Class A | 0 | 0 | 2,579,947 | 37,764,120 |
| Class B | 0 | 0 | 165,564 | 2,423,469 |
| Class C | 0 | 0 | 3,325,020 | 48,669,466 |
| Class I | 0 | 0 | 3,931 | 57,540 |
|
| | | 0 | | 88,914,595 |
|
Net increase (decrease) in net assets
resulting from capital share transactions | | (46,956,107) | | 60,387,591 |
|
| Total increase (decrease) in net assets | | (58,573,682) | | 76,695,128 |
| Net assets |
| Beginning of period | | 400,955,096 | | 324,259,968 |
|
| End of period | | $ 342,381,414 | | $ 400,955,096 |
|
| Overdistributed net investment income | | $ (483,222) | | $ (558,241) |
|
See Notes to Financial Statements |
20
NOTES TO FINANCIAL STATEMENTS
1. ORGANIZATION
Evergreen Diversified Bond Fund (the "Fund") is a diversified series of Evergreen Fixed Income Trust (the "Trust"), a Delaware statutory trust organized on September 18, 1997. The Trust is an open-end management investment company registered under the Investment Company Act of 1940, as amended (the "1940 Act").
The Fund offers Class A, Class B, Class C and Institutional ("Class I") shares. Class A shares are sold with a front-end sales charge. Class B shares are sold without a front-end sales charge but are subject to a contingent deferred sales charge that is payable upon redemption and decreases depending on how long the shares have been held. Effective February 2, 2004, Class C shares are no longer sold with a front-end sales charge but are still subject to a contingent deferred sales charge that is payable upon redemption within one year after the month of purchase. Class I shares are sold without a front-end sales charge or contingent deferred sales charge. Each class of shares, except Class I shares, pays an ongoing distribution fee.
2. SIGNIFICANT ACCOUNTING POLICIES
The following is a summary of significant accounting policies consistently followed by the Fund in the preparation of its financial statements. The policies are in conformity with generally accepted accounting principles in the United States of America, which require management to make estimates and assumptions that affect amounts reported herein. Actual results could differ from these estimates.
a. Valuation of investments
Portfolio debt securities acquired with more than 60 days to maturity are valued at prices obtained from an independent pricing service which takes into consideration such factors as similar security prices, yields, maturities, liquidity and ratings. Securities for which valuations are not available from an independent pricing service may be valued by brokers which use prices provided by market makers or estimates of market value obtained from yield data relating to investments or securities with similar characteristics.
Listed equity securities are usually valued at the last sales price or official closing price on the national securities exchange where the securities are principally traded.
Short-term securities with remaining maturities of 60 days or less at the time of purchase are valued at amortized cost, which approximates market value.
Investments in other mutual funds are valued at net asset value. Securities for which market quotations are not available or not reflective of current market value are valued at fair value as determined in good faith, according to procedures approved by the Board of Trustees.
b. Foreign currency translation
All assets and liabilities denominated in foreign currencies are translated into U.S. dollar amounts at the date of valuation. Purchases and sales of portfolio securities and income items denominated in foreign currencies are translated into U.S. dollar amounts on the respective dates of such transactions. The Fund does not separately account for that portion of the results of operations
21
NOTES TO FINANCIAL STATEMENTS continued
resulting from changes in foreign exchange rates on investments and the fluctuations arising from changes in market prices of securities held. Such fluctuations are included with the net realized and unrealized gains or losses on securities.
c. Futures contracts
In order to gain exposure to or protect against changes in security values, the Fund may buy and sell futures contracts. The primary risks associated with the use of futures contracts are the imperfect correlation between changes in market values of securities held by the Fund and the prices of futures contracts, and the possibility of an illiquid market.
Futures contracts are valued based upon their quoted daily settlement prices. The aggregate principal amounts of the contracts are not recorded in the financial statements. Fluctuations in the value of the contracts are recorded in the Statement of Assets and Liabilities as an asset or liability and in the Statement of Operations as unrealized gains or losses until the contracts are closed, at which point they are recorded as net realized gains or losses on futures contracts.
d. Securities lending
The Fund may lend its securities to certain qualified brokers in order to earn additional income. The Fund receives compensation in the form of fees or interest earned on the investment of any cash collateral received. The Fund also continues to receive interest and dividends on the securities loaned. The Fund receives collateral in the form of cash or securities with a market value at least equal to the market value of the securities on loan, including accrued interest. In the event of default or bankruptcy by the borrower, the Fund could experience delays and costs in recovering the loaned securities or in gaining access to the collateral. The Fund has the right under the lending agreement to recover the securities from the borrower on demand.
e. Security transactions and investment income
Security transactions are recorded on trade date. Realized gains and losses are computed using the specific cost of the security sold. Interest income is recorded on the accrual basis and includes accretion of discounts and amortization of premiums. Dividend income is recorded on the ex-dividend date or in the case of some foreign securities, on the date when the Fund is made aware of the dividend.
f. Federal taxes
The Fund intends to continue to qualify as a regulated investment company and distribute all of its taxable income, including any net capital gains (which have already been offset by available capital loss carryovers). Accordingly, no provision for federal taxes is required.
g. Distributions
Distributions to shareholders from net investment income are accrued daily and paid monthly. Distributions from net realized gains, if any, are recorded on the ex-dividend date. Such distributions are determined in conformity with income tax regulations, which may differ from generally accepted accounting principles.
22
NOTES TO FINANCIAL STATEMENTS continued
Reclassifications have been made to the Fund's components of net assets to reflect income and gains available for distribution (or available capital loss carryovers, as applicable) under income tax regulations. The primary permanent differences causing such reclassifications are due to expiration of capital loss carryovers and premium amortization.
h. Class allocations
Income, common expenses and realized and unrealized gains and losses are allocated to the classes based on the relative net assets of each class. Distribution fees, if any, are calculated daily at the class level based on the appropriate net assets of each class and the specific expense rates applicable to each class.
3. ADVISORY FEE AND OTHER TRANSACTIONS WITH AFFILIATES
Evergreen Investment Management Company, LLC ("EIMC"), an indirect, wholly-owned subsidiary of Wachovia Corporation ("Wachovia"), is the investment advisor to the Fund and is paid a fee at an annual rate of 2% of the Fund's gross investment income plus an amount determined by applying percentage rates to the average daily net assets of the Fund, starting at 0.31% and declining to 0.16% as average daily net assets increase. Prior to April 1, 2004, the Fund paid a fee at an annual rate of 2% of the Fund's gross investment income plus an amount determined by applying percentage rates to the average daily net assets of the Fund, which started at 0.41% and declined to 0.16% as the Fund's average daily net assets increased.
From time to time, EIMC may voluntarily or contractually waive its fee and/or reimburse expenses in order to limit operating expenses. For any fee waivers and/or reimbursements made after January 1, 2003, EIMC may recoup certain amounts waived and/or reimbursed up to a period of three years following the end of the fiscal year in which the fee waivers and/or reimbursements were made. During the year ended April 30, 2004, EIMC waived its fee in the amount of $10,985 and reimbursed expenses relating to Class A shares in the amount of $2,862. Total amounts subject to recoupment as of April 30, 2004 were $19,540.
Evergreen Investment Services, Inc. ("EIS"), an indirect, wholly-owned subsidiary of Wachovia, is the administrator to the Fund. As administrator, EIS provides the Fund with facilities, equipment and personnel and is paid an annual rate determined by applying percentage rates to the aggregate average daily net assets of the Evergreen funds (excluding money market funds), starting at 0.10% and declining to 0.05% as the aggregate average daily net assets of the Evergreen funds (excluding money market funds) increase.
Evergreen Service Company, LLC ("ESC"), an indirect, wholly-owned subsidiary of Wachovia, is the transfer and dividend disbursing agent for the Fund. ESC receives account fees that vary based on the type of account held by the shareholders in the Fund. For the year ended April 30, 2004, the transfer agent fees were equivalent to an annual rate of 0.20% of the Fund's average daily net assets.
23
NOTES TO FINANCIAL STATEMENTS continued
4. DISTRIBUTION PLANS
Evergreen Distributor, Inc., a wholly-owned subsidiary of BISYS Fund Services, Inc., serves as principal underwriter to the Fund.
The Fund has adopted Distribution Plans, as allowed by Rule 12b-1 of the 1940 Act, for each class of shares, except Class I. Under the Distribution Plans, distribution fees are paid at an annual rate of 0.30% of the average daily net assets for Class A shares and 1.00% of the average daily net assets for each of Class B and Class C shares.
5. ACQUISITION
Effective at the close of business on June 7, 2002, the Fund acquired the net assets of Evergreen Quality Income Fund in a tax-free exchange for Class A, Class B, Class C and Class I shares of the Fund. Shares were issued to Class A, Class B, Class C and Class I shares of Evergreen Quality Income Fund at an exchange ratio of 0.87, 0.87, 0.87 and 0.90 for Class A, Class B, Class C and Class I shares, respectively, of the Fund. The acquired net assets consisted primarily of portfolio securities with unrealized appreciation of $599,698. The aggregate net assets of the Fund and Evergreen Quality Income Fund immediately prior to the acquisition were $321,141,608 and $88,914,595, respectively. The aggregate net assets of the Fund immediately after the acquisition were $410,056,203.
6. SECURITIES TRANSACTIONS
Cost of purchases and proceeds from sales of investment securities (excluding short-term securities) were as follows for the year ended April 30, 2004: | Cost of Purchases | Proceeds from Sales |
|
| U.S. | Non-U.S. | U.S. | Non-U.S. |
| Government | Government | Government | Government |
|
| $ 34,982,779 | $ 539,120,938 | $ 33,117,477 | $ 566,275,347 |
|
At April 30, 2004, the Fund had open short futures contracts outstanding as follows: | | | Initial Contract | Value at | Unrealized |
| Expiration | Contracts | Amount | April 30, 2004 | Gain |
|
| | 820 U.S. Treasury |
| June 30, 2004 | Bond Futures | $ 91,503,908 | $ 90,610,000 | $ 893,908 |
|
The Fund loaned securities during the year ended April 30, 2004 to certain brokers. At April 30, 2004, the value of securities on loan and the value of collateral amounted to $40,853,555 and $41,618,310, respectively. During the year ended April 30, 2004, the Fund earned $42,223 in income from securities lending which is included in interest income on the Statement of Operations.
On April 30, 2004, the aggregate cost of securities for federal income tax purposes was $386,428,133. The gross unrealized appreciation and depreciation on securities based on tax cost was $4,360,878 and $9,731,887, respectively, with a net unrealized depreciation of $5,371,009.
24
NOTES TO FINANCIAL STATEMENTS continued
As of April 30, 2004, the Fund had $42,634,473 in capital loss carryovers for federal income tax purposes expiring as follows: | Expiration |
|
| 2007 | 2008 | 2009 | 2010 |
|
| $ 7,055,922 | $ 19,652,642 | $ 11,338,929 | $ 4,586,980 |
|
7. INTERFUND LENDING
Pursuant to an Exemptive Order issued by the SEC, the Fund may participate in an interfund lending program with certain funds in the Evergreen fund family. This program allows the Fund to borrow from, or lend money to, other participating funds. During the year ended April 30, 2004, the Fund did not participate in the interfund lending program.
8. DISTRIBUTIONS TO SHAREHOLDERS
As of April 30, 2004, the components of distributable earnings on a tax basis were as follows: | Overdistributed | Unrealized | Capital Loss |
| Ordinary Income | Depreciation | Carryover |
|
| $ 483,222 | $ 5,371,009 | $ 42,634,473 |
|
The differences between the components of distributable earnings on a tax basis and the amounts reflected in the Statement of Assets and Liabilities are primarily due to wash sales, premium amortization adjustments and marked to market income on futures contracts.
The tax character of distributions paid was as follows: | | Year Ended April 30,
|
| | 2004 | 2003 |
|
| Ordinary Income | $ 18,446,395 | $ 21,730,267 |
|
9. EXPENSE REDUCTIONS
Through expense offset arrangements with ESC and the Fund's custodian, a portion of fund expenses has been reduced.
10. DEFERRED TRUSTEES' FEES
Each Trustee of the Fund may defer any or all compensation related to performance of their duties as Trustees. The Trustees' deferred balances are allocated to deferral accounts, which are included in the accrued expenses for the Fund. The investment performance of the deferral accounts are based on the investment performance of certain Evergreen funds. Any gains earned or losses incurred in the deferral accounts are reported in the Fund's Trustees' fees and expenses. At the election of the Trustees, the deferral account will be paid either in one lump sum or in quarterly installments for up to ten years.
25
NOTES TO FINANCIAL STATEMENTS continued
11. FINANCING AGREEMENT
The Fund and certain other Evergreen funds share in a $150 million unsecured revolving credit commitment for temporary and emergency purposes, including the funding of redemptions, as permitted by each Fund's borrowing restrictions. Borrowings under this facility bear interest at 0.50% per annum above the Federal Funds rate. All of the participating funds are charged an annual commitment fee of 0.09% of the unused balance, which is allocated pro rata. During the year ended April 30, 2004, the Fund had no borrowings under this agreement.
12. SUBSEQUENT EVENT
Effective May 1, 2004, EIS replaced Evergreen Distributor, Inc. as the distributor of the Fund's shares.
26
REPORT OF INDEPENDENT REGISTERED PUBLIC ACCOUNTING FIRM
Board of Trustees and Shareholders
Evergreen Fixed Income Trust
We have audited the accompanying statement of assets and liabilities, including the schedule of investments, of the Evergreen Diversified Bond Fund, a series of Evergreen Fixed Income Trust, as of April 30, 2004, and the related statement of operations for the year then ended, statements of changes in net assets for each of the years in the two-year period then ended, and the financial highlights for each of the years in the five-year period then ended. These financial statements and financial highlights are the responsibility of the Fund's management. Our responsibility is to express an opinion on these financial statements and financial highlights based on our audits.
We conducted our audits in accordance with the standards of the Public Company Accounting Oversight Board (United States). Those standards require that we plan and perform the audit to obtain reasonable assurance about whether the financial statements and financial highlights are free of material misstatement. An audit includes examining, on a test basis, evidence supporting the amounts and disclosures in the financial statements. Our procedures included confirmation of securities owned as of April 30, 2004 by correspondence with the custodian. As to securities purchased but not yet received, we performed other appropriate auditing procedures. An audit also includes assessing the accounting principles used and significant estimates made by management, as well as evaluating the overall financial statement presentation. We believe that our audits provide a reasonable basis for our opinion.
In our opinion, the financial statements and financial highlights referred to above present fairly, in all material respects, the financial position of the Evergreen Diversified Bond Fund, as of April 30, 2004, the results of its operations, changes in its net assets and financial highlights for each of the years described above in conformity with accounting principles generally accepted in the United States of America.
Boston, Massachusetts
June 4, 2004
27
ADDITIONAL INFORMATION (unaudited)
FEDERAL TAX DISTRIBUTIONS
For corporate shareholders, 1.50% of ordinary income dividends paid during the fiscal year ended April 30, 2004 qualified for the dividends received deduction.
With respect to dividends paid from investment company taxable income during the fiscal year ended April 30, 2004, the Fund designates 1.47% of ordinary income and short-term capital gain distributions as Qualified Dividend Income in accordance with the Internal Revenue Code. Complete 2004 year-end tax information will be reported to you on your 2004 Form 1099-DIV, which shall be provided to you in early 2005.
28
This page left intentionally blank
29
This page left intentionally blank
30
This page left intentionally blank
31
TRUSTEES AND OFFICERS
| TRUSTEES1 | |
Charles A. Austin III
Trustee
DOB: 10/23/1934
Term of office since: 1991
Other directorships: None | Principal occupations: Investment Counselor, Anchor Capital Advisors, Inc. (investment advice); Director, The Andover Companies (insurance); Trustee, Arthritis Foundation of New England; Director, The Francis Ouimet Society; Former Director, Health Development Corp. (fitness-wellness centers); Former Director, Mentor Income Fund, Inc.; Former Trustee, Mentor Funds and Cash Resource Trust; Former Investment Counselor, Appleton Partners, Inc. (investment advice); Former Director, Executive Vice President and Treasurer, State Street Research & Management Company (investment advice) |
|
Shirley L. Fulton
Trustee
DOB: 1/10/1952
Term of office since: 2004
Other directorships: None | Principal occupations: Partner, Helms, Henderson & Fulton, P.A. (law firm); Retired Senior Resident Superior Court Judge, 26th Judicial District, Charlotte, NC |
|
K. Dun Gifford
Trustee
DOB: 10/23/1938
Term of office since: 1974
Other directorships: None | Principal occupations: Chairman and President, Oldways Preservation and Exchange Trust (education); Trustee, Treasurer and Chairman of the Finance Committee, Cambridge College; Former Chairman of the Board, Director, and Executive Vice President, The London Harness Company (leather goods purveyor); Former Director, Mentor Income Fund, Inc.; Former Trustee, Mentor Funds and Cash Resource Trust |
|
Dr. Leroy Keith, Jr.
Trustee
DOB: 2/14/1939
Term of office since: 1983
Other directorships: Trustee, Phoenix Series Fund, Phoenix Multi-Portfolio Fund, and The Phoenix Big Edge Series Fund | Principal occupations: Partner, Stonington Partners, Inc. (private investment firm); Trustee of Phoenix Series Fund, Phoenix Multi-Portfolio Fund, and The Phoenix Big Edge Series Fund; Former Chairman of the Board and Chief Executive Officer, Carson Products Company (manufacturing); Director, Obagi Medical Products Co.; Director, Lincoln Educational Services; Director, Diversapack Co.; Former President, Morehouse College; Former Director, Mentor Income Fund, Inc.; Former Trustee, Mentor Funds and Cash Resource Trust |
|
Gerald M. McDonnell
Trustee
DOB: 7/14/1939
Term of office since: 1988
Other directorships: None | Principal occupations: Manager of Commercial Operations, SMI STEEL Co. - South Carolina (steel producer); Former Sales and Marketing Management, Nucor Steel Company; Former Director, Mentor Income Fund, Inc.; Former Trustee, Mentor Funds and Cash Resource Trust |
|
William Walt Pettit
Trustee
DOB: 8/26/1955
Term of office since: 1984
Other directorships: None | Principal occupations: Partner and Vice President, Kellam & Pettit, P.A. (law firm); Former Director, Mentor Income Fund, Inc.; Former Trustee, Mentor Funds and Cash Resource Trust |
|
David M. Richardson
Trustee
DOB: 9/19/1941
Term of office since: 1982
Other directorships: None | Principal occupations: President, Richardson, Runden & Company (executive recruitment business development/consulting company); Consultant, Kennedy Information, Inc. (executive recruitment information and research company); Consultant, AESC (The Association of Retained Executive Search Consultants); Trustee, NDI Technologies, LLP (communications); Director, J&M Cumming Paper Co. (paper merchandising); Former Vice Chairman, DHR International, Inc. (executive recruitment); Former Director, Mentor Income Fund, Inc.; Former Trustee, Mentor Funds and Cash Resource Trust |
|
Dr. Russell A. Salton III
Trustee
DOB: 6/2/1947
Term of office since: 1984
Other directorships: None | Principal occupations: President/CEO, AccessOne MedCard; Former Medical Director, Healthcare Resource Associates, Inc.; Former Medical Director, U.S. Health Care/Aetna Health Services; Former Director, Mentor Income Fund, Inc.; Former Trustee, Mentor Funds and Cash Resource Trust |
|
32
TRUSTEES AND OFFICERS continued
Michael S. Scofield
Trustee
DOB: 2/20/1943
Term of office since: 1984
Other directorships: None | Principal occupations: Attorney, Law Offices of Michael S. Scofield; Former Director, Mentor Income Fund, Inc.; Former Trustee, Mentor Funds and Cash Resource Trust |
|
Richard J. Shima
Trustee
DOB: 8/11/1939
Term of office since: 1993
Other directorships: None | Principal occupations: Independent Consultant; Director, Trust Company of CT; Trustee, Saint Joseph College (CT); Director, Hartford Hospital; Trustee, Greater Hartford YMCA; Former Director, Enhance Financial Services, Inc.; Former Director, Old State House Association; Former Director of CTG Resources, Inc. (natural gas); Former Director, Mentor Income Fund, Inc.; Former Trustee, Mentor Funds and Cash Resource Trust |
|
Richard K. Wagoner, CFA2
Trustee
DOB: 12/12/1937
Term of office since: 1999
Other directorships: None | Principal occupations: Member and Former President, North Carolina Securities Traders Association; Member, Financial Analysts Society; Former Consultant to the Boards of Trustees of the Evergreen funds; Former Trustee, Mentor Funds and Cash Resource Trust |
|
| OFFICERS |
|
Dennis H. Ferro3
President
DOB: 6/20/1945
Term of office since: 2003 | Principal occupations: President, Chief Executive Officer and Chief Investment Officer, Evergreen Investment Company, Inc. and Executive Vice President, Wachovia Bank, N.A. |
|
Carol Kosel4
Treasurer
DOB: 12/25/1963
Term of office since: 1999 | Principal occupations: Senior Vice President, Evergreen Investment Services, Inc. |
|
Michael H. Koonce4
Secretary
DOB: 4/20/1960
Term of office since: 2000 | Principal occupations: Senior Vice President and General Counsel, Evergreen Investment Services, Inc.; Senior Vice President and Assistant General Counsel, Wachovia Corporation |
|
1 Each Trustee serves until a successor is duly elected or qualified or until his death, resignation, retirement or removal from office. Each Trustee oversees 94 Evergreen funds. Correspondence for each Trustee may be sent to Evergreen Board of Trustees, P.O. Box 20083, Charlotte, North Carolina 28202.
2 Mr. Wagoner is an "interested person" of the Fund because of his ownership of shares in Wachovia Corporation, the parent to the Fund's investment advisor.
3 The address of the Officer is 401 S. Tryon Street, 20th Floor, Charlotte, NC 28288.
4 The address of the Officer is 200 Berkeley Street, Boston, MA 02116.
Additional information about the Fund's Board of Trustees and Officers can be found in the Statement of Additional Information (SAI) and is available upon request without charge by calling 800.343.2898. |
33
INVESTMENTS THAT STAND THE TEST OF TIME
At Evergreen Investments, we remain steadfastly dedicated to four core principles that lead to success in today's financial world.- Leadership -- With over $248 billion in assets under management as of March 31, 2004 and a history of innovation spanning more than 70 years, we offer the strength that comes with experience.
Excellence -- We have been consistently recognized for risk-adjusted historical performance through disciplined, rigorous management focused on achieving sustainable success.
Experience -- Our investment managers are seasoned professionals who share their diverse points of view and have the perspective that comes with weathering good markets and bad.
Commitment -- We are dedicated to helping investment professionals and their clients achieve important goals through the investments, service and education we offer.
Visit us online at EvergreenInvestments.com
FOR MORE INFORMATION
Evergreen Express Line 800.346.3858
Evergreen Investor Services 800.343.2898

For the fifth consecutive year, Evergreen Investments has earned the Dalbar Mutual Fund Service Award, which recognizes those firms that exceed industry norms in key areas. The award symbolizes the achievement of the highest tier of shareholder service within our industry. For 2003,Evergreen Investments was ranked third overall.
566659 rv1 6/2004 | 
Evergreen Investments
200 Berkeley Street
Boston, MA 02116-5034
|
Evergreen High Yield Bond Fund

Evergreen High Yield Bond Fund
This annual report must be preceded or accompanied by a prospectus of the Evergreen fund contained herein. The prospectus contains more
complete information, including fees and expenses, and should be read carefully before investing or sending money.A description of the Fund's proxy voting policies and procedures is available without charge, upon request, by calling 1.800.343.2898, by visiting our website
at EvergreenInvestments.com or by visiting the SEC's website at http://www.sec.gov.| Mutual Funds: |
| NOT FDIC INSURED | MAY LOSE VALUE | NOT BANK GUARANTEED |
Evergreen InvestmentsSM is a service mark of Evergreen Investment
Management Company, LLC. Copyright 2004.Evergreen mutual funds are distributed by Evergreen Investment Services, Inc.
200 Berkeley Street, Boston, MA 02116LETTER TO SHAREHOLDERS
June 2004
Dennis H. Ferro
President and Chief
Executive Officer | |
|
Dear Shareholder,
We are pleased to provide the annual report for the Evergreen High Yield Bond Fund, which covers the twelve-month period ended April 30, 2004.
Investors in the fixed income markets experienced alternating periods of risk and reward over the past twelve months. Geopolitical uncertainties, improving economic growth, changes in tax legislation, and an accommodative stance from the Federal Reserve managed to both excite and confuse bond market participants at varying points, and in varying sectors, since the beginning of the investment period in May 2003.
The period began with the financial markets focused on the war in Iraq. The associated uncertainty led to higher demand for bonds, particularly within the Treasury market, as investors sought solace in a flight to quality. This performance in government bonds carried over to many municipal and corporate issues, too, and the increased demand for bonds quickly became a sort of self-fulfilling prophecy, as total return potential climbed with higher prices and declining yields. This increasingly popular strategy, though, soon helped set the stage for a summer of volatility unmatched in recent history.
At the conclusion of its monetary policy meeting in May, the Federal Reserve had commented on the "possibility of an unwelcome, substantial fall in inflation." Many bond investors, convinced the Fed was taking rates to zero, drove yields down to 45-year lows in the U.S. Treasury market. Common market wisdom determined that since the Fed's primary concern was deflation, rates were likely headed lower. Yet when central bankers reduced their target for the federal funds rate by a less than expected 25 basis points in late June, many fixed income investors became alarmed. These
1
LETTER TO SHAREHOLDERS continued
worries were compounded by optimistic GDP (Gross Domestic Product) forecasts from Fed Chairman Alan Greenspan during congressional banking committee hearings in July. As a result of these events, the yield on the 10-year Treasury surged from a low of 3.1% in June to 4.6% in late July. Thus, the "deflation trade" in bonds had changed from a significant overbought condition to an oversold one in a matter of just six weeks.
The bond market began to stabilize as investors became more comfortable with the likelihood that monetary policy makers would keep rates low for the foreseeable future. This was a welcome respite for owners of Treasuries and municipal securities. In addition to the excitement in Treasuries, investors in municipal bonds also experienced heightened concerns related to the changes in the tax laws, which were initially perceived as a potential threat to their market. After careful consideration, though, many investors became convinced that capital preservation would remain a primary, if not dominant, theme for the future demand of these securities. A second concern involved the poor financial condition of many states and local governments. Yet just as these concerns were reaching a crescendo, economic growth picked up significantly and tax receipts climbed, improving the financial conditions of many of these entities.
As economic growth strengthened, investors in corporate bonds benefited from the combination of stronger balance sheets, improving credit quality, declining default rates, and the outlook for growth in GDP and corporate profits. In addition, the many steps taken to improve corporate credibility rallied many investors to the credit markets, where many risk appropriate investors successfully searched for improved returns in the high yield market.
Throughout the investment period, the Federal Reserve attempted to improve the clarity of its intentions for the financial markets. At the conclusion of its monetary policy meetings, the Fed's statements ranged from maintaining policy accommodation for a "considerable period" to one of being "measured" in its approach to remove this monetary stimulus. In addition,
2
LETTER TO SHAREHOLDERS continued
central bankers tried to be even more clear in a variety of speeches and public testimonies, as the Fed continued to display an unusually strong effort in clarifying its upcoming changes in monetary policy. Most recently, though, these attempts at clarity caused volatility throughout the fixed income markets, as investors feared a repeat of the experiences in 1994. Given the current level of interest rates, inflation, the dollar, and global economic growth, we believe these concerns are overblown. However, the price of oil remains a wild card, as sustained high oil prices will eventually embed a higher level of manufacturing and service cost in the economy.
We encourage investors to maintain their diversified, long-term strategies within their fixed income portfolios.
Please visit our website, EvergreenInvestments.com, for more information about our funds and other investment products available to you. From the website, you may also access a new feature that presents a detailed Q&A interview with the portfolio manager(s) for your fund. You can easily reach these interviews by following the link, EvergreenInvestments.com/Annual updates, from our website. Thank you for your continued support of Evergreen Investments.
Sincerely,Dennis H. Ferro
President and Chief Executive Officer
Evergreen Investment Company, Inc.
3
FUND AT A GLANCE
as of April 30, 2004MANAGEMENT TEAM

Dana Erikson, CFA
High Yield Bond Team
Lead Manager
CURRENT INVESTMENT STYLE
 Source: Morningstar, Inc.
Morningstar's style box is based on a portfolio date as of 3/31/2004.
The fixed income style box placement is based on a fund's average effective maturity or duration and the average credit rating of the bond portfolio.PERFORMANCE AND RETURNS
Portfolio inception date: 9/11/1935
| Class A | Class B | Class C | Class I |
| Class inception date | 1/20/1998 | 9/11/1935 | 1/21/1998 | 4/14/1998 |
|
| Nasdaq symbol | EKHAX | EKHBX | EKHCX | EKHYX |
|
| Average annual return* |
|
| 1 year with sales charge | 7.06% | 6.46% | 10.46% | N/A |
|
| 1 year w/o sales charge | 12.25% | 11.46% | 11.46% | 12.58% |
|
| 5 year | 4.48% | 4.43% | 4.71% | 5.76% |
|
| 10 year | 4.64% | 4.66% | 4.66% | 5.29% |
|
| * Adjusted for maximum applicable sales charge, unless noted. |
Past performance is no guarantee of future results. The performance quoted represents past performance and current performance may be lower or higher. The investment return and principal value of an investment will fluctuate so that investors' shares, when redeemed, may be worth more or less than their original cost. To obtain performance information current to the most recent month-end for Class A, B, C or I shares, please go to EvergreenInvestments.com/fundperformance. The performance of each class may vary based on differences in loads, fees and expenses paid by the shareholders investing in each class. Performance includes the reinvestment of income dividends and capital gain distributions. Performance shown does not reflect the deduction of taxes that a shareholder would pay on fund distributions or the redemption of fund shares.
Historical performance shown for Classes A, C and I prior to their inception is based on the performance of Class B, the original class offered. The historical returns for Classes A and I have not been adjusted to reflect the effect of each class' 12b-1 fee. These fees are 0.30% for Class A and 1.00% for Classes B and C. Class I does not pay a 12b-1 fee. If these fees had been reflected, returns for Classes A and I would have been higher.
Returns reflect expense limits previously in effect, without which returns would have been lower.LONG-TERM GROWTH
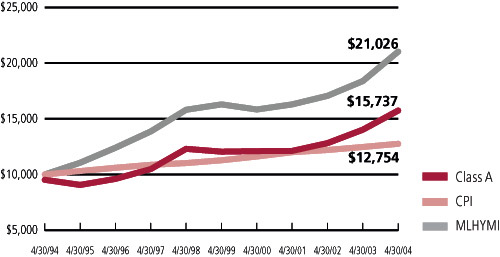 Comparison of a $10,000 investment in Evergreen High Yield Bond Fund Class A shares, versus a similar investment in the Merrill Lynch High Yield Master Index1 (MLHYMI) and the Consumer Price Index (CPI).
The MLHYMI is an unmanaged market index and does not include transaction costs associated with buying and selling securities, any mutual fund expenses or any taxes. The CPI is a commonly used measure of inflation and does not represent an investment return. It is not possible to invest directly in an index.1 Copyright 2004. Merrill Lynch, Pierce, Fenner & Smith Incorporated. All rights reserved.
4
PORTFOLIO MANAGER COMMENTARY
The fund's Class A shares returned 12.25% for the twelve-month period ended April 30, 2004, excluding any applicable sales charges. During the same period, the fund's benchmark, Merrill Lynch High Yield Master Index (MLHYMI), returned 14.37%.
The high yield market experienced strong returns during this fiscal period. The defining characteristic of this rally has been the strong performance by the least creditworthy securities. Most of the fiscal period saw large cash inflows to high yield mutual funds attracted by a dearth of yield bearing opportunities on the investment horizon and by solid improvements in the overall credit quality of high yield issuers. The rally, which began in November 2002, peaked in late January 2004 and was followed by generally weak returns.
The portfolio was overweighted in cyclical industries with the expectation that improving economic growth would enhance business conditions, positively impacting the creditworthiness of the portfolio holdings. Overweighted industries include Chemicals, Business Services, Retail, and Auto Parts. These cyclical industries performed especially well toward the end of the fiscal year as evidence of stronger growth became clear. By contrast the portfolio underweighted Utilities, Telecommunication, Technology, and Airlines.
The fund's returns lagged the MLHYMI for the fiscal period. This was largely a function of the high creditworthiness of the portfolio's holdings. The fund limited its investments in lower quality CCC bonds, which were the best performers. The rigorous security selection process by our team of high yield analysts kept us out of less creditworthy names, regardless of rating. In an environment where this sort of bond outperformed handsomely, this selective approach worked against short-term returns.Class I shares are only offered to investment advisory clients of an investment advisor of an Evergreen fund (or its advisory affiliates), through special arrangements entered into on behalf of Evergreen funds with certain financial services firms, certain institutional investors and persons who owned Class Y shares in registered name in an Evergreen fund on or before December 31, 1994. Class I shares are only available to institutional shareholders with a minimum $1 million investment.
The fund's investment objective is nonfundamental and may be changed without the vote of the fund's shareholders.
Funds that invest in high yield, lower-rated bonds may contain more risk due to the increased possibility of default.
Foreign investments may contain more risk due to the inherent risks associated with changing political climates, foreign market instability and foreign currency fluctuations.
The return of principal is not guaranteed due to fluctuation in the NAV of the fund caused by changes in the price of the individual bonds held by the fund and the buying and selling of bonds by the fund. Bond funds have the same inflation, interest rate, and credit risks that are associated with the individual bonds held by the fund.
All data is as of April 30, 2004, and subject to change.
5
FINANCIAL HIGHLIGHTS
(For a share outstanding throughout each period) | Year Ended April 30,
|
CLASS A
| 2004
| 20031
| 20022
| 2001
| 2000
|
Net asset value, beginning of period
| $3.30
| $3.29
| $3.39
| $3.72
| $4.06
|
| Income from investment operations |
| Net investment income | 0.25 | 0.27 | 0.27 | 0.33 | 0.34 |
Net realized and unrealized gains or losses
on securities and foreign currency
related transactions | 0.14
| 0.01
| -0.09
| -0.33
| -0.32
|
Total from investment operations
| 0.39
| 0.28
| 0.18
| 0
| 0.02
|
| Distributions to shareholders from |
| Net investment income | -0.26 | -0.27 | -0.28 | -0.33 | -0.33 |
| Tax basis return of capital | 0
| 0
| 0
| 0
| -0.03
|
Total distributions to shareholders
| -0.26
| -0.27
| -0.28
| -0.33
| -0.36
|
Net asset value, end of period
| $3.43
| $3.30
| $3.29
| $3.39
| $3.72
|
Total return3
| 12.25%
| 9.42%
| 5.77%
| 0.15%
| 0.38%
|
| Ratios and supplemental data |
| Net assets, end of period (thousands) | $530,526 | $484,346 | $321,830 | $322,330 | $291,575 |
| Ratios to average net assets |
| Expenses4 | 1.01% | 1.11% | 1.19% | 1.25% | 1.27% |
| Net investment income | 7.42% | 8.70% | 8.27% | 9.39% | 8.57% |
| Portfolio turnover rate | 71% | 80% | 138% | 140% | 107% |
|
1 Net investment income per share is based on average shares outstanding during the period.2 As required, effective May 1, 2001, the Fund adopted the provisions of the AICPA Audit and Accounting Guide, Audits of Investment Companies , and began amortizing premium on its fixed-income securities. The effects of this change for the year ended April 30, 2002 was a decrease in net investment income per share of $0.00; an increase in net realized gains or losses per share of $0.00; and a decrease to the ratio of net investment income to average net assets of 0.13%. The above per share information, ratios and supplemental data for the periods prior to May 1, 2001 have not been restated to reflect this change in presentation.3 Excluding applicable sales charges4 The ratio of expenses to average net assets excludes expense reductions but includes fee waivers and/or expense reimbursements.
See Notes to Financial Statements |
6
FINANCIAL HIGHLIGHTS
(For a share outstanding throughout each period) | Year Ended April 30,
|
CLASS B
| 20041
| 20031
| 20021,2
| 2001
| 20001
|
Net asset value, beginning of period
| $3.30
| $3.29
| $3.39
| $3.72
| $4.06
|
| Income from investment operations |
| Net investment income | 0.23 | 0.25 | 0.24 | 0.34 | 0.31 |
Net realized and unrealized gains or losses
on securities and foreign currency
related transactions | 0.14
| 0.01
| -0.08
| -0.37
| -0.32
|
Total from investment operations
| 0.37
| 0.26
| 0.16
| -0.03
| -0.01
|
| Distributions to shareholders from |
| Net investment income | -0.24 | -0.25 | -0.26 | -0.30 | -0.30 |
| Tax basis return of capital | 0
| 0
| 0
| 0
| -0.03
|
Total distributions to shareholders
| -0.24
| -0.25
| -0.26
| -0.30
| -0.33
|
Net asset value, end of period
| $3.43
| $3.30
| $3.29
| $3.39
| $3.72
|
Total return3
| 11.46%
| 8.61%
| 4.98%
| -0.60%
| -0.37%
|
| Ratios and supplemental data |
| Net assets, end of period (thousands) | $247,741 | $173,002 | $54,537 | $33,844 | $28,229 |
| Ratios to average net assets |
| Expenses4 | 1.72% | 1.84% | 1.92% | 2.00% | 2.02% |
| Net investment income | 6.71% | 7.99% | 7.49% | 8.61% | 7.79% |
| Portfolio turnover rate | 71% | 80% | 138% | 140% | 107% |
|
1 Net investment income per share is based on average shares outstanding during the period.2 As required, effective May 1, 2001, the Fund adopted the provisions of the AICPA Audit and Accounting Guide, Audits of Investment Companies , and began amortizing premium on its fixed-income securities. The effects of this change for the year ended April 30, 2002 was a decrease in net investment income per share of $0.01; an increase in net realized gains or losses per share of $0.01; and a decrease to the ratio of net investment income to average net assets of 0.13%. The above per share information, ratios and supplemental data for the periods prior to May 1, 2001 have not been restated to reflect this change in presentation.3 Excluding applicable sales charges4 The ratio of expenses to average net assets excludes expense reductions but includes fee waivers and/or expense reimbursements.
See Notes to Financial Statements |
7
FINANCIAL HIGHLIGHTS
(For a share outstanding throughout each period) | Year Ended April 30,
|
CLASS C
| 2004
| 20031
| 20022
| 2001
| 2000
|
Net asset value, beginning of period
| $3.30
| $3.29
| $3.39
| $3.72
| $4.06
|
| Income from investment operations |
| Net investment income | 0.23 | 0.25 | 0.26 | 0.29 | 0.32 |
Net realized and unrealized gains or losses
on securities and foreign currency
related transactions | 0.14
| 0.01
| -0.10
| -0.32
| -0.33
|
Total from investment operations
| 0.37
| 0.26
| 0.16
| -0.03
| -0.01
|
| Distributions to shareholders from |
| Net investment income | -0.24 | -0.25 | -0.26 | -0.30 | -0.30 |
| Tax basis return of capital | 0
| 0
| 0
| 0
| -0.03
|
Total distributions to shareholders
| -0.24
| -0.25
| -0.26
| -0.30
| -0.33
|
Net asset value, end of period
| $3.43
| $3.30
| $3.29
| $3.39
| $3.72
|
Total return3
| 11.46%
| 8.61%
| 4.98%
| -0.60%
| -0.37%
|
| Ratios and supplemental data |
| Net assets, end of period (thousands) | $381,525 | $290,914 | $105,753 | $80,753 | $3,172 |
| Ratios to average net assets |
| Expenses4 | 1.72% | 1.85% | 1.93% | 2.00% | 2.00% |
| Net investment income | 6.72% | 7.98% | 7.52% | 8.61% | 7.80% |
| Portfolio turnover rate | 71% | 80% | 138% | 140% | 107% |
|
1 Net investment income per share is based on average shares outstanding during the period.2 As required, effective May 1, 2001, the Fund adopted the provisions of the AICPA Audit and Accounting Guide, Audits of Investment Companies , and began amortizing premium on its fixed-income securities. The effects of this change for the year ended April 30, 2002 was a decrease in net investment income per share of $0.00; and increase in net realized gains or losses per share of $0.00; and a decrease to the ratio of net investment income to average net assets of 0.13%. The above per share information, ratios and supplemental data for the periods prior to May 1, 2001 have not been restated to reflect this change in presentation.3 Excluding applicable sales charges4 The ratio of expenses to average net assets excludes expense reductions but includes fee waivers and/or expense reimbursements.
See Notes to Financial Statements |
8
FINANCIAL HIGHLIGHTS
(For a share outstanding throughout each period) | Year Ended April 30,
|
CLASS I1
| 2004
| 20032
| 20023
| 2001
| 2000
|
Net asset value, beginning of period
| $3.30
| $3.29
| $3.39
| $3.72
| $4.06
|
| Income from investment operations |
| Net investment income | 0.26 | 0.28 | 0.29 | 0.34 | 0.35 |
Net realized and unrealized gains or losses
on securities and foreign currency
related transactions | 0.14
| 0.01
| -0.10
| -0.33
| -0.32
|
Total from investment operations
| 0.40
| 0.29
| 0.19
| 0.01
| 0.03
|
| Distributions to shareholders from |
| Net investment income | -0.27 | -0.28 | -0.29 | -0.34 | -0.34 |
| Tax basis return of capital | 0
| 0
| 0
| 0
| -0.03
|
Total distributions to shareholders
| -0.27
| -0.28
| -0.29
| -0.34
| -0.37
|
Net asset value, end of period
| $3.43
| $3.30
| $3.29
| $3.39
| $3.72
|
Total return
| 12.58%
| 9.69%
| 6.04%
| 0.40%
| 0.64%
|
| Ratios and supplemental data |
| Net assets, end of period (thousands) | $37,894 | $49,370 | $10,011 | $6,047 | $6,153 |
| Ratios to average net assets |
| Expenses4 | 0.72% | 0.84% | 0.92% | 1.00% | 1.01% |
| Net investment income | 7.73% | 9.05% | 8.53% | 9.63% | 8.87% |
| Portfolio turnover rate | 71% | 80% | 138% | 140% | 107% |
|
1 Effective at the close of business on May 11, 2001, Class Y shares were renamed as Institutional shares (Class I).2 Net investment income per share is based on average shares outstanding during the period.3 As required, effective May 1, 2001, the Fund adopted the provisions of the AICPA Audit and Accounting Guide, Audits of Investment Companies , and began amortizing premium on its fixed-income securities. The effects of this change for the year ended April 30, 2002 was a decrease in net investment income per share of $0.00; an increase in net realized gains or losses per share of $0.00; and a decrease to the ratio of net investment income to average net assets of 0.13%. The above per share information, ratios and supplemental data for the periods prior to May 1, 2001 have not been restated to reflect this change in presentation.4 The ratio of expenses to average net assets excludes expense reductions but includes fee waivers and/or expense reimbursements.
See Notes to Financial Statements |
9
SCHEDULE OF INVESTMENTS
April 30, 2004 | Principal
Amount | Value |
|
| CORPORATE BONDS 91.9% |
| CONSUMER DISCRETIONARY 29.0% |
| Auto Components 4.9% |
| Accuride Corp., 9.25%, 02/01/2008 (p) | $ 6,250,000 | $ 6,476,562 |
| Collins & Aikman Products Co.: |
| 10.75%, 12/31/2011 | 3,715,000 | 3,863,600 |
| 11.50%, 04/15/2006 (p) | 1,040,000 | 1,034,800 |
| Dana Corp., 9.00%, 08/15/2011 (p) | 8,000,000 | 9,480,000 |
| HLI Operating, Inc., 10.50%, 06/15/2010 (p) | 4,956,000 | 5,625,060 |
| Meritor Automotive, Inc., 6.80%, 02/15/2009 (p) | 8,998,000 | 9,222,950 |
| RJ Tower Corp., 12.00%, 06/01/2013 (p) | 4,150,000 | 4,077,375 |
| Tenneco Automotive, Inc., 10.25%, 07/15/2013 (p) | 6,540,000 | 7,570,050 |
| TRW Automotive, Inc., 9.375%, 02/15/2013 | 7,138,000 | 8,208,700 |
| United Components, Inc., 9.375%, 06/15/2013 | 2,400,000 | 2,568,000 |
| 58,127,097 |
| Hotels, Restaurants & Leisure 6.9% |
| Ameristar Casinos, Inc., 10.75%, 02/15/2009 | 5,500,000 | 6,407,500 |
| Chumash Casino & Resort Enterprise, 9.00%, 07/15/2010 144A | 1,220,000 | 1,360,300 |
| Coast Hotels & Casinos, Inc., 9.50%, 04/01/2009 (p) | 4,250,000 | 4,489,062 |
| El Pollo Loco, Inc., 9.25%, 12/15/2009 144A + | 100,000 | 102,500 |
| Friendly Ice Cream Corp., 8.375%, 06/15/2012 144A | 2,800,000 | 2,877,000 |
| Inn of the Mountain Gods Resort & Casino, 12.00%, 11/15/2010 144A | 13,000,000 | 14,300,000 |
| John Q Hammons Hotels LP, Ser. B, 8.875%, 05/15/2012 | 6,995,000 | 7,729,475 |
| Mandalay Resort Group: |
| 6.375%, 12/15/2011 | 2,190,000 | 2,255,700 |
| Ser. B, 10.25%, 08/01/2007 (p) | 6,000,000 | 7,005,000 |
| MTR Gaming Group, Inc., 9.75%, 04/01/2010 | 9,430,000 | 10,066,525 |
| Premier Entertainment Biloxi, LLC, 10.75%, 02/01/2012 144A | 6,000,000 | 6,510,000 |
| Regal Cinemas Corp., 9.375%, 02/01/2012 | 4,500,000 | 5,355,000 |
| Venetian Casino Resort, LLC, 11.00%, 06/15/2010 | 12,000,000 | 14,100,000 |
| 82,558,062 |
| Household Durables 3.9% |
| Amscan Holdings, Inc., 8.75%, 05/01/2014 144A | 1,915,000 | 1,953,300 |
| K. Hovnanian Enterprises, Inc., 10.50%, 10/01/2007 | 4,280,000 | 4,954,100 |
| KB Home, 8.625%, 12/15/2008 | 2,270,000 | 2,491,325 |
| Meritage Corp., 9.75%, 06/01/2011 | 5,400,000 | 6,041,250 |
| Schuler Homes, Inc., 10.50%, 07/15/2011 (p) | 5,000,000 | 5,775,000 |
| Standard Pacific Corp.: |
| 6.25%, 04/01/2014 | 4,500,000 | 4,230,000 |
| 7.75%, 03/15/2013 | 3,500,000 | 3,648,750 |
| Technical Olympic USA, Inc.: |
| 7.50%, 03/15/2011 144A | 1,000,000 | 965,000 |
| 9.00%, 07/01/2010 | 7,355,000 | 7,759,525 |
| 10.375%, 07/01/2012 | 1,200,000 | 1,326,000 |
| WCI Communities, Inc., 9.125%, 05/01/2012 (p) | 6,800,000 | 7,446,000 |
| 46,590,250 |
See Notes to Financial Statements |
10
SCHEDULE OF INVESTMENTS continued
April 30, 2004 | Principal
Amount | Value |
|
| CORPORATE BONDS continued |
| CONSUMER DISCRETIONARY continued |
| Leisure Equipment & Products 0.8% |
| Hockey Co., 11.25%, 04/15/2009 | $ 1,150,000 | $ 1,374,250 |
| ICON Health & Fitness, Inc., 11.25%, 04/01/2012 (p) | 7,000,000 | 7,910,000 |
| 9,284,250 |
| Machinery 0.3% |
| Terex Corp., 10.375%, 04/01/2011 (p) | 3,500,000 | 3,998,750 |
| Media 7.2% |
| Cablevision Systems Corp., 8.00%, 04/15/2012 144A | 8,615,000 | 8,679,613 |
| CCO Holdings, LLC, 8.75%, 11/15/2013 144A | 6,000,000 | 5,940,000 |
| Cinemark USA, Inc., 9.00%, 02/01/2013 (p) | 5,000,000 | 5,500,000 |
| Cinemark, Inc., Sr. Disc. Note, Step Bond, 0.00%, 03/15/2014 144A † | 5,860,000 | 3,699,125 |
| CSC Holdings, Inc., 7.625%, 04/01/2011 (p) | 6,530,000 | 6,823,850 |
| Dex Media East, LLC: |
| 9.875%, 11/15/2009 (p) | 3,000,000 | 3,378,750 |
| 12.125%, 11/15/2012 | 6,000,000 | 6,990,000 |
| Dex Media West, LLC, 9.875%, 08/15/2013 144A | 6,000,000 | 6,600,000 |
| EchoStar DBS Corp., 6.375%, 10/01/2011 144A | 10,000,000 | 10,162,500 |
| Emmis Communications Corp.: |
| Ser. B, 8.125%, 03/15/2009 (p) | 765,000 | 802,294 |
| Sr. Disc. Note, Step Bond, 0.00%, 03/15/2011 † | 10,000,000 | 10,050,000 |
| Emmis Operating Co., 6.875%, 05/15/2012 144A # | 5,835,000 | 5,849,587 |
| Lamar Media Corp., 7.25%, 01/01/2013 (p) | 1,000,000 | 1,080,000 |
| Paxson Communications Corp.: |
| 10.75%, 07/15/2008 | 9,815,000 | 10,403,900 |
| Sr. Disc. Note, Step Bond, 0.00%, 01/15/2009 † | 1,000,000 | 872,500 |
| 86,832,119 |
| Multi-line Retail 0.1% |
| Saks, Inc., 9.875%, 10/01/2011 | 815,000 | 975,963 |
| Specialty Retail 4.5% |
| Cole National Group, Inc., 8.875%, 05/15/2012 | 2,440,000 | 2,647,400 |
| General Nutrition Centers, Inc., 8.50%, 12/01/2010 144A | 7,000,000 | 7,350,000 |
| Group 1 Automotive, Inc., 8.25%, 08/15/2013 | 2,700,000 | 2,963,250 |
| Michaels Stores, Inc., 9.25%, 07/01/2009 | 9,565,000 | 10,557,369 |
| Mothers Work, Inc., 11.25%, 08/01/2010 | 2,180,000 | 2,305,350 |
| Office Depot, Inc., 10.00%, 07/15/2008 | 8,000,000 | 9,480,000 |
| PETCO Animal Supplies, Inc., 10.75%, 11/01/2011 | 5,730,000 | 6,589,500 |
| Tempur-Pedic, Inc., 10.25%, 08/15/2010 144A (p) | 1,300,000 | 1,491,750 |
| United Auto Group, Inc., 9.625%, 03/15/2012 (p) | 7,000,000 | 7,857,500 |
| Warnaco Group, Inc., 8.875%, 06/15/2013 | 3,000,000 | 3,240,000 |
| 54,482,119 |
| Textiles, Apparel & Luxury Goods 0.4% |
| Oxford Industries, Inc., 8.875%, 06/01/2011 144A | 4,000,000 | 4,290,000 |
See Notes to Financial Statements |
11
SCHEDULE OF INVESTMENTS continued
April 30, 2004 | Principal
Amount | Value |
|
| CORPORATE BONDS continued |
| CONSUMER STAPLES 7.1% |
| Food & Staples Retailing 1.9% |
| Michael Foods, Inc., 8.00%, 11/15/2013 144A | $ 2,500,000 | $ 2,640,625 |
| Rite Aid Corp.: |
| 9.50%, 02/15/2011 (p) | 1,920,000 | 2,164,800 |
| 12.50%, 09/15/2006 | 15,880,000 | 18,341,400 |
| 23,146,825 |
| Food Products 2.1% |
| Chiquita Brands International, Inc., 10.56%, 03/15/2009 (p) | 5,545,000 | 6,092,569 |
| Corn Products International, Inc., 8.45%, 08/15/2009 | 5,150,000 | 5,948,250 |
| Del Monte Foods Co., 8.625%, 12/15/2012 (p) | 3,000,000 | 3,330,000 |
| Dole Food Co., Inc., 7.25%, 06/15/2010 (p) | 5,465,000 | 5,533,312 |
| Seminis Vegetable Seeds, Inc., 10.25%, 10/01/2013 144A | 4,114,000 | 4,587,110 |
| 25,491,241 |
| Household Products 0.1% |
| Solo Cup Co., 8.50%, 02/15/2014 144A | 1,360,000 | 1,407,600 |
| Personal Products 1.4% |
| Playtex Products, Inc.: |
| 8.00%, 03/01/2011 144A | 8,000,000 | 8,440,000 |
| 9.375%, 06/01/2011 (p) | 8,000,000 | 7,960,000 |
| 16,400,000 |
| Tobacco 1.6% |
| Commonwealth Brands, Inc.: |
| 9.75%, 04/15/2008 144A | 2,500,000 | 2,712,500 |
| 10.625%, 09/01/2008 144A | 9,125,000 | 9,991,875 |
| North Atlantic Trading, Inc., 9.25%, 03/01/2012 144A | 6,105,000 | 6,211,838 |
| 18,916,213 |
| ENERGY 12.5% |
| Energy Equipment & Services 2.5% |
| Dresser, Inc., 9.375%, 04/15/2011 | 5,000,000 | 5,425,000 |
| General Maritime Corp., 10.00%, 03/15/2013 (p) | 5,990,000 | 6,768,700 |
| NRG Energy, Inc., 8.00%, 12/15/2013 144A | 4,160,000 | 4,212,000 |
| Parker Drilling Co., Ser. B, 10.125%, 11/15/2009 (p) | 8,300,000 | 8,943,250 |
| SESI LLC, 8.875%, 05/15/2011 | 4,150,000 | 4,513,125 |
| 29,862,075 |
| Oil & Gas 10.0% |
| Chesapeake Energy Corp., 6.875%, 01/15/2016 | 9,145,000 | 9,327,900 |
| El Paso Energy Corp., 6.75%, 05/15/2009 (p) | 17,000,000 | 15,087,500 |
| El Paso Energy Partners LP, 8.50%, 06/01/2011 | 1,994,000 | 2,213,340 |
| El Paso Production Holding Co., 7.75%, 06/01/2013 | 7,830,000 | 7,477,650 |
| Encore Acquisition Co., 6.25%, 04/15/2014 144A | 3,445,000 | 3,410,550 |
| Evergreen Resources, Inc., 5.875%, 03/15/2012 144A | 1,160,000 | 1,154,200 |
| Exco Resources, Inc., 7.25%, 01/15/2011 144A | 3,505,000 | 3,557,575 |
See Notes to Financial Statements |
12
SCHEDULE OF INVESTMENTS continued
April 30, 2004 | Principal
Amount | Value |
|
| CORPORATE BONDS continued |
| ENERGY continued |
| Oil & Gas continued |
| Gulfterra Energy Partners LP, Ser. B, 6.25%, 06/01/2010 | $ 6,500,000 | $ 6,760,000 |
| Overseas Shipholding Group, Inc., 8.25%, 03/15/2013 | 8,400,000 | 9,366,000 |
| Petroleum Geo Services, 10.00%, 11/05/2010 | 12,550,000 | 13,742,250 |
| Petroleum Helicopters, Inc., 9.375%, 05/01/2009 | 1,500,000 | 1,597,500 |
| Plains Exploration & Production Co., 8.75%, 07/01/2012 | 2,730,000 | 3,016,650 |
| Premcor Refining Group, Inc.: |
| 6.75%, 05/01/2014 | 8,000,000 | 8,000,000 |
| 9.50%, 02/01/2013 (p) | 5,250,000 | 6,037,500 |
| Pride Petroleum Services, Inc., 9.375%, 05/01/2007 (p) | 2,548,000 | 2,598,960 |
| Semco Energy, Inc., 7.75%, 05/15/2013 | 4,500,000 | 4,747,500 |
| Stone Energy Corp., 8.25%, 12/15/2011 | 4,200,000 | 4,557,000 |
| Tesoro Petroleum Corp., 9.625%, 04/01/2012 (p) | 9,000,000 | 10,192,500 |
| Tom Brown, Inc., 7.25%, 09/15/2013 | 4,000,000 | 4,560,000 |
| Tri-Union Development Corp., 12.50%, 06/01/2006 (g) * + | 3,112,062 | 2,334,046 |
| 119,738,621 |
| FINANCIALS 10.1% |
| Capital Markets 0.4% |
| Affinity Group, Inc., 9.00%, 02/15/2012 144A | 4,559,000 | 4,832,540 |
| Diversified Financial Services 4.1% |
| Arch Western Finance LLC, 6.75%, 07/01/2013 144A | 5,500,000 | 5,692,500 |
| Asat Finance, Ltd., 9.25%, 02/01/2011 144A | 2,000,000 | 2,120,000 |
| Nalco Finance Holdings LLC, Sr. Disc. Note, Step Bond, 0.00%, |
| 02/01/2009 144A † | 10,130,000 | 6,432,550 |
| Northern Telecom Capital Corp., 7.875%, 06/15/2026 (p) | 6,500,000 | 6,207,500 |
| Ship Finance International, Ltd., 8.50%, 12/15/2013 144A | 6,915,000 | 6,707,550 |
| Trac-X North America High Yield, 8.00%, 03/25/2009 (p) | 22,000,000 | 21,505,000 |
| 48,665,100 |
| Insurance 0.4% |
| Crum & Forster Holding Corp., 10.375%, 06/15/2013 | 4,100,000 | 4,551,000 |
| Real Estate 5.2% |
| CB Richard Ellis Services, Inc., 9.75%, 05/15/2010 | 3,000,000 | 3,360,000 |
| Choctaw Resort Development Enterprise, 9.25%, 04/01/2009 | 6,250,000 | 6,796,875 |
| Crescent Real Estate Equities, 9.25%, 04/15/2009 REIT | 5,600,000 | 6,216,000 |
| D.R. Horton, Inc., 8.50%, 04/15/2012 | 5,000,000 | 5,637,500 |
| HMH Properties, Inc., Ser. B, 7.875%, 08/01/2008 REIT (p) | 4,707,000 | 4,883,512 |
| Host Marriott Corp., Ser. J, 7.125%, 11/01/2013 REIT (p) | 4,000,000 | 4,080,000 |
| La Quinta Corp., 8.875%, 03/15/2011 REIT | 2,990,000 | 3,333,850 |
| LNR Property Corp., 7.625%, 07/15/2013 | 7,800,000 | 8,073,000 |
| Lyon William Homes, Inc., 7.50%, 02/15/2014 144A | 6,325,000 | 6,356,625 |
| Omega Healthcare Investors, Inc., 7.00%, 04/01/2014 REIT 144A | 1,200,000 | 1,230,000 |
| Thornburg Mortgage, Inc., 8.00%, 05/15/2013 REIT | 6,325,000 | 6,530,563 |
| Universal City Development Partners, 11.75%, 04/01/2010 | 5,315,000 | 6,165,400 |
| 62,663,325 |
See Notes to Financial Statements |
13
SCHEDULE OF INVESTMENTS continued
April 30, 2004 | Principal
Amount | Value |
|
| CORPORATE BONDS continued |
| HEALTH CARE 2.8% |
| Health Care Equipment & Supplies 0.9% |
| Kinetic Concepts, Inc., 7.375%, 05/15/2013 (p) | $ 975,000 | $ 1,028,625 |
| Norcross Safety Products LLC, Ser. B, 9.875%, 08/15/2011 | 2,000,000 | 2,150,000 |
| Rotech Healthcare, Inc., 9.50%, 04/01/2012 | 2,000,000 | 2,140,000 |
| Universal Hospital Services, Inc., 10.125%, 11/01/2011 144A | 5,370,000 | 5,745,900 |
| 11,064,525 |
| Health Care Providers & Services 1.9% |
| Extendicare Health Services, Inc., 9.50%, 07/01/2010 (p) | 5,000,000 | 5,575,000 |
| IASIS Healthcare Corp., 8.50%, 10/15/2009 | 5,000,000 | 5,375,000 |
| Pacificare Health Systems, Inc., 10.75%, 06/01/2009 | 5,535,000 | 6,462,112 |
| Team Health, Inc., 9.00%, 04/01/2012 144A | 4,805,000 | 4,636,825 |
| 22,048,937 |
| INDUSTRIALS 8.5% |
| Building Products 0.7% |
| Nortek Holdings, Inc., 9.875%, 06/15/2011 | 7,000,000 | 7,892,500 |
| Commercial Services & Supplies 4.6% |
| Allied Waste North America, Inc.: |
| 6.50%, 11/15/2010 144A | 3,595,000 | 3,612,975 |
| 7.375%, 04/15/2014 144A (p) | 11,890,000 | 11,860,275 |
| Coinmach Corp., 9.00%, 02/01/2010 | 5,000,000 | 5,325,000 |
| Corrections Corporation of America, 7.50%, 05/01/2011 | 3,000,000 | 3,157,500 |
| Geo Group, Inc., 8.25%, 07/15/2013 | 3,350,000 | 3,500,750 |
| Hines Nurseries, Inc., 10.25%, 10/01/2011 | 3,500,000 | 3,850,000 |
| JohnsonDiversey Holdings, Inc., Sr. Disc. Note, Step Bond, 0.00%, |
| 05/15/2013 † (p) | 5,000,000 | 3,825,000 |
| Mobile Mini, Inc., 9.50%, 07/01/2013 (p) | 1,750,000 | 1,968,750 |
| NationsRent, Inc., 9.50%, 10/15/2010 144A | 1,175,000 | 1,266,063 |
| Newpark Resource, Inc., 8.625%, 12/15/2007 | 3,500,000 | 3,613,750 |
| Service Corporation International: |
| 6.00%, 12/15/2005 | 244,000 | 256,200 |
| 6.75%, 04/01/2016 144A | 3,625,000 | 3,615,937 |
| United Rentals North America, Inc.: |
| 6.50%, 02/15/2012 144A | 5,000,000 | 4,850,000 |
| 7.75%, 11/15/2013 (p) | 4,410,000 | 4,277,700 |
| 54,979,900 |
| Construction & Engineering 0.4% |
| Transdigm, Inc., 8.375%, 07/15/2011 | 4,000,000 | 4,250,000 |
| Machinery 2.6% |
| CNH Global N.V., 9.25%, 08/01/2011 144A | 12,375,000 | 13,860,000 |
| Mueller Group, Inc., 10.00%, 05/01/2012 144A | 2,065,000 | 2,173,413 |
| SPX Corp., 7.50%, 01/01/2013 (p) | 2,815,000 | 2,990,937 |
| Terex Corp., 7.375%, 01/15/2014 144A | 1,920,000 | 2,011,200 |
| Wolverine Tube, Inc., 10.50%, 04/01/2009 (p) | 9,790,000 | 10,622,150 |
| 31,657,700 |
See Notes to Financial Statements |
14
SCHEDULE OF INVESTMENTS continued
April 30, 2004 | Principal
Amount | Value |
|
| CORPORATE BONDS continued |
| INDUSTRIALS continued |
| Transportation Infrastructure 0.2% |
| Aviall, Inc., 7.625%, 07/01/2011 (p) | $ 1,750,000 | $ 1,846,250 |
| Offshore Logistics, Inc., 6.125%, 06/15/2013 | 750,000 | 716,250 |
| 2,562,500 |
| INFORMATION TECHNOLOGY 0.6% |
| Communications Equipment 0.3% |
| Telex Communications, Inc., 11.50%, 10/15/2008 144A | 3,250,000 | 3,493,750 |
| IT Services 0.3% |
| Stratus Technologies, Inc., 10.375%, 12/01/2008 144A | 4,000,000 | 4,000,000 |
| MATERIALS 12.7% |
| Chemicals 6.4% |
| Acetex Corp., 10.875%, 08/01/2009 | 5,000,000 | 5,525,000 |
| Equistar Chemicals LP, 10.625%, 05/01/2011 (p) | 6,000,000 | 6,750,000 |
| Ethyl Corp., 8.875%, 05/01/2010 | 2,200,000 | 2,387,000 |
| FMC Corp., 10.25%, 11/01/2009 | 5,000,000 | 5,925,000 |
| HMP Equity Holdings Corp., 0.00%, 05/15/2008 144A (n) | 4,500,000 | 2,700,000 |
| Huntsman Advanced Materials LLC: |
| 11.00%, 07/15/2010 144A | 5,000,000 | 5,700,000 |
| 11.625%, 10/15/2010 | 8,000,000 | 8,840,000 |
| Huntsman International LLC, 9.875%, 03/01/2009 (p) | 4,280,000 | 4,782,900 |
| Lyondell Chemical Co., 10.50%, 06/01/2013 | 6,000,000 | 6,600,000 |
| Methanex Corp., 8.75%, 08/15/2012 | 4,795,000 | 5,514,250 |
| Millennium America, Inc., 9.25%, 06/15/2008 (p) | 2,000,000 | 2,190,000 |
| Nalco Co., 8.875%, 11/15/2013 144A (p) | 5,850,000 | 6,201,000 |
| OM Group, Inc., 9.25%, 12/15/2011 | 13,000,000 | 13,390,000 |
| 76,505,150 |
| Containers & Packaging 3.2% |
| Graphic Packaging International, Inc., 8.50%, 08/15/2011 | 7,000,000 | 7,770,000 |
| Jarden Corp., 9.75%, 05/01/2012 | 9,020,000 | 10,192,600 |
| Jefferson Smurfit Group, 7.50%, 06/01/2013 | 3,105,000 | 3,229,200 |
| Owens-Brockway Glass Container, Inc.: |
| 8.75%, 11/15/2012 (p) | 5,680,000 | 6,233,800 |
| 8.875%, 02/15/2009 | 5,000,000 | 5,456,250 |
| Stone Container Corp., 9.75%, 02/01/2011 (p) | 5,000,000 | 5,575,000 |
| 38,456,850 |
| Metals & Mining 2.0% |
| Freeport-McMoRan Copper & Gold, Inc.: |
| 7.20%, 11/15/2026 | 4,350,000 | 3,784,500 |
| 10.125%, 02/01/2010 | 5,285,000 | 5,839,925 |
| Massey Energy Co., 6.625%, 11/15/2010 (p) | 5,400,000 | 5,454,000 |
See Notes to Financial Statements |
15
SCHEDULE OF INVESTMENTS continued
April 30, 2004 | Principal
Amount | Value |
|
| CORPORATE BONDS continued |
| MATERIALS continued |
| Metals & Mining continued |
| Peabody Energy Corp.: |
| 5.875%, 04/15/2016 | $ 4,275,000 | $ 3,997,125 |
| 6.875%, 03/15/2013 | 2,380,000 | 2,487,100 |
| U.S. Steel Corp., 10.75%, 08/01/2008 (p) | 1,501,000 | 1,763,675 |
| 23,326,325 |
| Paper & Forest Products 1.1% |
| Georgia Pacific Corp.: |
| 8.00%, 01/15/2024 144A | 3,340,000 | 3,523,700 |
| 8.125%, 05/15/2011 (p) | 9,000,000 | 10,192,500 |
| 13,716,200 |
| TELECOMMUNICATION SERVICES 6.1% |
| Diversified Telecommunication Services 2.6% |
| Centennial Communications Corp., 8.125%, 02/01/2014 144A | 4,000,000 | 3,720,000 |
| FairPoint Communications, Inc.: |
| 11.875%, 03/01/2010 | 2,000,000 | 2,350,000 |
| 12.50%, 05/01/2010 (p) | 5,580,000 | 6,165,900 |
| Insight Midwest LP: |
| 9.75%, 10/01/2009 (p) | 2,305,000 | 2,443,300 |
| 10.50%, 11/01/2010 144A | 2,305,000 | 2,523,975 |
| Level 3 Communications, Inc., 9.125%, 05/01/2008 (p) | 2,800,000 | 2,016,000 |
| RCN Corp., 12.50%, 06/30/2008 (h) | 11,383,512 | 11,668,100 |
| 30,887,275 |
| Wireless Telecommunications Services 3.5% |
| American Towers, Inc., 7.25%, 12/01/2011 144A | 6,000,000 | 6,165,000 |
| metroPCS, Inc., 10.75%, 10/01/2011 | 8,000,000 | 8,480,000 |
| Nextel Communications, Inc.: |
| 6.875%, 10/31/2013 (p) | 4,162,000 | 4,224,430 |
| 7.375%, 08/01/2015 | 8,000,000 | 8,350,000 |
| 9.375%, 11/15/2009 | 7,325,000 | 7,956,781 |
| Rural Cellular Corp., 8.25%, 03/15/2012 144A | 1,170,000 | 1,213,875 |
| SpectraSite, Inc., 8.25%, 05/15/2010 | 6,000,000 | 6,330,000 |
| 42,720,086 |
| UTILITIES 2.5% |
| Electric Utilities 0.2% |
| MSW Energy Holdings LLC, 8.50%, 09/01/2010 (p) | 2,250,000 | 2,452,500 |
| Gas Utilities 0.4% |
| Semco Energy, Inc., 7.125%, 05/15/2008 | 3,500,000 | 3,657,500 |
| Western Gas Resources, Inc., 10.00%, 06/15/2009 | 1,500,000 | 1,582,500 |
| 5,240,000 |
| Multi-Utilities & Unregulated Power 1.9% |
| AES Corp., 9.50%, 06/01/2009 | 5,740,000 | 6,170,500 |
See Notes to Financial Statements |
16
SCHEDULE OF INVESTMENTS continued
April 30, 2004 | Principal
Amount | Value |
|
| CORPORATE BONDS continued |
| UTILITIES continued |
| Multi-Utilities & Unregulated Power continued |
| Reliant Resources, Inc.: |
| 9.25%, 07/15/2010 (p) | $ 4,000,000 | $ 4,300,000 |
| 9.50%, 07/15/2013 | 11,250,000 | 12,262,500 |
| 22,733,000 |
| Total Corporate Bonds (cost $1,040,964,440) | | 1,100,800,348 |
| FOREIGN BONDS-CORPORATE (PRINCIPAL AMOUNT |
| DENOMINATED IN CURRENCY INDICATED) 0.0% |
| MATERIALS 0.0% |
| Containers & Packaging 0.0% |
| Crown European Holdings SA, 10.25%, 03/01/2011, EUR (cost $514,013) | 480,000 | 640,983 |
| MORTGAGE-BACKED SECURITIES 0.0% |
| FNMA, 8.00%, 06/01/2030 (cost $139,671) | $ 141,484 | 153,117 |
| YANKEE OBLIGATIONS-CORPORATE 3.9% |
| CONSUMER DISCRETIONARY 0.7% |
| Media 0.7% |
| IMAX Corp., 9.625%, 12/01/2010 144A | 8,000,000 | 8,120,000 |
| INDUSTRIALS 1.0% |
| Marine 0.8% |
| CP Ships, Ltd., 10.375%, 07/15/2012 | 6,690,000 | 7,793,850 |
| Stena AB, 9.625%, 12/01/2012 | 2,000,000 | 2,260,000 |
| 10,053,850 |
| Transportation Infrastructure 0.2% |
| Sea Containers, Ltd., 10.50%, 05/15/2012 # | 2,355,000 | 2,325,563 |
| MATERIALS 1.6% |
| Containers & Packaging 1.0% |
| Crown European Holdings SA: |
| 9.50%, 03/01/2011 (p) | 3,250,000 | 3,660,312 |
| 10.875%, 03/01/2013 | 7,000,000 | 8,190,000 |
| 11,850,312 |
| Paper & Forest Products 0.6% |
| Ainsworth Lumber Co., Ltd, 6.75%, 03/15/2014 144A | 5,950,000 | 5,920,250 |
| Millar Western Forest Products, 7.75%, 11/15/2013 144A | 1,315,000 | 1,387,325 |
| 7,307,575 |
| TELECOMMUNICATION SERVICES 0.6% |
| Wireless Telecommunications Services 0.6% |
| Rogers Wireless, Inc.: |
| 6.375%, 03/01/2014 144A | 2,790,000 | 2,636,550 |
| 9.625%, 05/01/2011 | 3,475,000 | 4,026,656 |
| 6,663,206 |
| Total Yankee Obligations-Corporate (cost $43,595,437) | | 46,320,506 |
See Notes to Financial Statements |
17
SCHEDULE OF INVESTMENTS continued
April 30, 2004 | Shares | Value |
|
| COMMON STOCKS 0.7% |
| CONSUMER DISCRETIONARY 0.2% |
| Media 0.2% |
| IMAX Corp. * (p) | 531,485 | $ 2,640,949 |
| ENERGY 0.0% |
| Oil & Gas 0.0% |
| Tri-Union Development Corp. (h) * + | 2,020 | 0 |
| Tribo Petroleum Corp., Class A (h) * + | 3,425 | 0 |
| 0 |
| FINANCIALS 0.0% |
| Diversified Financial Services 0.0% |
| Ono Finance plc 144A * | 4,500 | 45 |
| INFORMATION TECHNOLOGY 0.0% |
| IT Services 0.0% |
| DecisionOne Corp. (h) * + | 331,000 | 0 |
| MATERIALS 0.2% |
| Metals & Mining 0.2% |
| United States Steel Corp. (p) | 84,000 | 2,404,920 |
| TELECOMMUNICATION SERVICES 0.3% |
| Wireless Telecommunications Services 0.3% |
| Crown Castle International Corp. * (p) | 211,000 | 2,943,450 |
| Total Common Stocks (cost $10,616,165) | | 7,989,364 |
| PREFERRED STOCKS 0.4% |
| CONSUMER DISCRETIONARY 0.4% |
| Media 0.4% |
| CSC Holdings, Inc., Ser. M (cost $3,410,625) | 40,000 | 4,190,000 |
| WARRANTS 0.1% |
| CONSUMER DISCRETIONARY 0.0% |
| Media 0.0% |
| Metricom, Inc., Expiring 2/15/2010 * | 1,500 | 15 |
| FINANCIALS 0.0% |
| Diversified Financial Services 0.0% |
| Asat Finance LLC, Expiring 11/01/2006 144A * | 4,000 | 6,500 |
| Ono Finance plc, Expiring 3/16/2011 144A * | 4,500 | 45 |
| 6,545 |
| MATERIALS 0.1% |
| Chemicals 0.1% |
| HMP Equity Holdings Corp., Expiring 5/15/2011 144A * | 4,500 | 857,250 |
See Notes to Financial Statements |
18
SCHEDULE OF INVESTMENTS continued
April 30, 2004 | Shares | Value |
|
| WARRANTS continued |
| TELECOMMUNICATION SERVICES 0.0% |
| Diversified Telecommunication Services 0.0% |
| RCN Corp., Expiring 06/30/2013 (h) * + | 1,500,000 | $ 0 |
| Wireless Telecommunications Services 0.0% |
| American Tower Escrow Corp., Expiring 08/01/2008 * | 4,250 | 677,875 |
| Total Warrants (cost $1,463,877) | | 1,541,685 |
| SHORT-TERM INVESTMENTS 20.2% |
| MUTUAL FUND SHARES 20.2% |
| Evergreen Institutional Money Market Fund (o) ## | 22,405,152 | 22,405,152 |
| Navigator Prime Portfolio (pp) | 219,217,479 | 219,217,479 |
| Total Short-Term Investments (cost $241,622,631) | | 241,622,631 |
| Total Investments (cost $1,342,326,859) 117.2% | | 1,403,258,634 |
| Other Assets and Liabilities (17.2%) | | (205,572,358) |
| Net Assets 100.0% | | $ 1,197,686,276 |
| 144A | Security that may be sold to qualified institutional buyers under Rule 144A of the Securities Act of 1933, as amended. This security has been determined to be liquid, unless otherwise noted, under the guidelines established by the Board of Trustees. |
| (o) | Evergreen Investment Management Company, LLC is the investment advisor to both the Fund and the money market fund. |
| (h) | No market quotation available. Valued at fair value as determined in good faith under procedures established by the Board of Trustees. |
| (p) | All or a portion of this security is on loan. |
| (pp) | Represents investment of cash collateral received from securities on loan. |
| * | Non-income producing security |
| (g) | Security which has defaulted on payment of interest and/or principal. The Fund has stopped accruing interest on this security. |
| (n) | Security issued in zero coupon form with no periodic interest payments but is acquired at a discount that results in a current yield to maturity. An effective interest rate is applied to recognize interest income daily for the bond. This rate is based on total expected income to be earned over the life of the bond from amortization of discount at acquisition. |
| † | Security initially issued in zero coupon form which converts to coupon form at a specified rate and date. An effective interest rate is applied to recognize interest income daily for the bond. This rate is based on total expected interest to be earned over the life of the bond which consists of the aggregate coupon-interest payments and discount at acquisition. The rate shown is the stated rate at the current period end. |
| + | Security is deemed illiquid and is valued using market quotations where readily available. In the absence of market quotations, the security is valued based on its fair value determined under procedures approved by the Board of the Trustees. |
| # | When-issued or delayed delivery security. |
| ## | All or a portion of this security has been segregated for when-issued or delayed delivery securities. |
|
| Summary of Abbreviations: |
| EUR | Euro |
| FNMA | Federal National Mortgage Association |
| REIT | Real Estate Investment Trust |
See Notes to Financial Statements |
19
STATEMENT OF ASSETS AND LIABILITIES
April 30, 2004
|
| Assets |
| Investments in securities, at value (cost $1,342,326,859) including $214,364,035 of |
| securities loaned | $ 1,403,258,634 |
| Receivable for Fund shares sold | 2,124,227 |
| Interest and dividends receivable | 27,420,756 |
| Receivable for securities lending income | 33,727 |
| Prepaid expenses and other assets | 259,093 |
|
| Total assets | 1,433,096,437 |
|
| Liabilities |
| Dividends payable | 3,312,135 |
| Payable for securities purchased | 8,128,040 |
| Payable for Fund shares redeemed | 4,531,376 |
| Payable for securities on loan | 219,217,479 |
| Advisory fee payable | 39,342 |
| Distribution Plan expenses payable | 64,504 |
| Due to other related parties | 4,690 |
| Accrued expenses and other liabilities | 112,595 |
|
| Total liabilities | 235,410,161 |
|
| Net assets | $ 1,197,686,276 |
|
| Net assets represented by |
| Paid-in capital | $ 1,297,489,599 |
| Overdistributed net investment income | (2,211,544) |
| Accumulated net realized losses on securities and foreign currency related transactions | (158,523,432) |
| Net unrealized gains on securites and foreign currency related transactions | 60,931,653 |
|
| Total net assets | $ 1,197,686,276 |
|
| Net assets consists of |
| Class A | $ 530,526,436 |
| Class B | 247,740,955 |
| Class C | 381,524,872 |
| Class I | 37,894,013 |
|
| Total net assets | $ 1,197,686,276 |
|
| Shares outstanding |
| Class A | 154,879,163 |
| Class B | 72,322,537 |
| Class C | 111,377,403 |
| Class I | 11,061,397 |
|
| Net asset value per share |
| Class A | $ 3.43 |
| Class A -- Offering price (based on sales charge of 4.75%) | $ 3.60 |
| Class B | $ 3.43 |
| Class C | $ 3.43 |
| Class I | $ 3.43 |
|
See Notes to Financial Statements |
20
STATEMENT OF OPERATIONS
Year Ended April 30, 2004
|
| Investment income |
| Interest | $ 97,973,172 |
| Dividends | 1,221,280 |
|
| Total investment income | 99,194,452 |
|
| Expenses |
| Advisory fee | 4,677,897 |
| Distribution Plan expenses |
| Class A | 1,575,047 |
| Class B | 2,304,763 |
| Class C | 3,831,948 |
| Administrative services fee | 1,175,122 |
| Transfer agent fees | 2,056,614 |
| Trustees' fees and expenses | 18,746 |
| Printing and postage expenses | 73,896 |
| Custodian and accounting fees | 293,497 |
| Registration and filing fees | 66,452 |
| Professional fees | 37,170 |
| Interest expense | 1,373 |
| Other | 36,245 |
|
| Total expenses | 16,148,770 |
| Less: Expense reductions | (6,971) |
| Expense reimbursements | (16,260) |
|
| Net expenses | 16,125,539 |
|
| Net investment income | 83,068,913 |
|
Net realized and unrealized gains or losses on securities and
foreign currency related transactions |
| Net realized gains on: |
| Securities | 29,122,816 |
| Foreign currency related transactions | 9,699 |
|
| Net realized gains on securities and foreign currency related transactions | 29,132,515 |
Net change in unrealized gains or losses on securities and foreign currency
related transactions | 14,738,536 |
|
Net realized and unrealized gains or losses on securities and foreign currency
related transactions | 43,871,051 |
|
| Net increase in net assets resulting from operations | $ 126,939,964 |
|
See Notes to Financial Statements |
21
STATEMENTS OF CHANGES IN NET ASSETS
| Year Ended April 30,
|
| 2004 | 2003 |
|
| Operations |
| Net investment income | | $ 83,068,913 | | $ 50,578,681 |
Net realized gains or losses on
securities and foreign currency
related transactions | | 29,132,515 | | (25,368,874) |
Net change in unrealized gains or
losses on securities and foreign
currency related transactions | | 14,738,536 | | 51,577,641 |
|
Net increase in net assets resulting
from operations | | 126,939,964 | | 76,787,448 |
|
Distributions to shareholders
from |
| Net investment income |
| Class A | | (40,401,265) | | (29,171,333) |
| Class B | | (16,064,645) | | (7,030,222) |
| Class C | | (26,727,023) | | (12,248,231) |
| Class I | | (2,971,340) | | (2,196,536) |
|
| Total distributions to shareholders | | (86,164,273) | | (50,646,322) |
|
| | Shares | | Shares |
| Capital share transactions |
| Proceeds from shares sold |
| Class A | 79,212,268 | 266,807,488 | 98,459,757 | 309,003,706 |
| Class B | 30,545,684 | 102,845,146 | 40,216,837 | 126,776,244 |
| Class C | 61,981,254 | 209,018,829 | 68,508,980 | 216,080,815 |
| Class I | 8,085,993 | 27,386,680 | 14,684,177 | 45,982,474 |
|
| | | 606,058,143 | | 697,843,239 |
|
Net asset value of shares issued in
reinvestment of distributions |
| Class A | 7,196,311 | 24,449,863 | 5,070,564 | 15,965,012 |
| Class B | 2,210,574 | 7,511,508 | 969,271 | 3,059,836 |
| Class C | 4,041,046 | 13,729,885 | 2,046,672 | 6,457,134 |
| Class I | 159,741 | 543,754 | 433,765 | 1,364,016 |
|
| | | 46,235,010 | | 26,845,998 |
|
Automatic conversion of Class B
shares to Class A shares |
| Class A | 509,358 | 1,742,465 | 325,688 | 1,024,351 |
| Class B | (509,358) | (1,742,465) | (325,688) | (1,024,351) |
|
| | | 0 | | 0 |
|
| Payment for shares redeemed |
| Class A | (78,644,025) | (265,409,349) | (55,100,425) | (173,201,047) |
| Class B | (12,288,949) | (41,821,246) | (5,076,630) | (15,967,964) |
| Class C | (42,704,221) | (145,376,642) | (14,649,266) | (46,097,501) |
| Class I | (12,128,118) | (40,408,191) | (3,218,386) | (10,062,770) |
|
| | | (493,015,428) | | (245,329,282) |
|
Net increase in net assets resulting
from capital share transactions | | 159,277,725 | | 479,359,955 |
|
| Total increase in net assets | | 200,053,416 | | 505,501,081 |
| Net assets |
| Beginning of period | | 997,632,860 | | 492,131,779 |
|
| End of period | | $ 1,197,686,276 | | $ 997,632,860 |
|
Overdistributed net investment
income | | $ (2,211,544) | | $ (784,638) |
|
See Notes to Financial Statements |
22
NOTES TO FINANCIAL STATEMENTS
1. ORGANIZATION
Evergreen High Yield Bond Fund (the "Fund") is a diversified series of Evergreen Fixed Income Trust (the "Trust"), a Delaware statutory trust organized on September 18, 1997. The Trust is an open-end management investment company registered under the Investment Company Act of 1940, as amended (the "1940 Act").
The Fund offers Class A, Class B, Class C and Institutional ("Class I") shares. Class A shares are sold with a front-end sales charge. Class B shares are sold without a front-end sales charge but are subject to a contingent deferred sales charge that is payable upon redemption and decreases depending on how long the shares have been held. Effective February 2, 2004, Class C shares are no longer sold with a front-end sales charge but are still subject to a contingent deferred sales charge that is payable upon redemption within one year after the month of purchase. Class I shares are sold without a front-end sales charge or contingent deferred sales charge. Each class of shares, except Class I shares, pays an ongoing distribution fee.
2. SIGNIFICANT ACCOUNTING POLICIES
The following is a summary of significant accounting policies consistently followed by the Fund in the preparation of its financial statements. The policies are in conformity with generally accepted accounting principles in the United States of America, which require management to make estimates and assumptions that affect amounts reported herein. Actual results could differ from these estimates.
a. Valuation of investments
Portfolio debt securities acquired with more than 60 days to maturity are valued at prices obtained from an independent pricing service which takes into consideration such factors as similar security prices, yields, maturities, liquidity and ratings. Securities for which valuations are not available from an independent pricing service may be valued by brokers which use prices provided by market makers or estimates of market value obtained from yield data relating to investments or securities with similar characteristics.
Listed equity securities are usually valued at the last sales price or official closing price on the national securities exchange where the securities are principally traded.
Foreign securities traded on an established exchange are valued at the last sales price on the exchange where the security is primarily traded. If there has been no sale, the securities are valued at the mean between bid and asked prices. Foreign securities may be valued at fair value according to procedures approved by the Board of Trustees if the closing price is not reflective of current market prices due to trading or events occurring in the foreign markets between the close of the established exchange and the valuation time of the Fund. In addition, substantial changes in values in the U.S. markets subsequent to the close of a foreign market may also affect the values of securities traded in the foreign market. The value of foreign securities may be adjusted if such movements in the U.S. market exceed a specified threshold.
23
NOTES TO FINANCIAL STATEMENTS continued
Short-term securities with remaining maturities of 60 days or less at the time of purchase are valued at amortized cost, which approximates market value.
Investments in other mutual funds are valued at net asset value. Securities for which market quotations are not available or not reflective of current market value are valued at fair value as determined in good faith, according to procedures approved by the Board of Trustees.
b. Foreign currency translation
All assets and liabilities denominated in foreign currencies are translated into U.S. dollar amounts at the date of valuation. Purchases and sales of portfolio securities and income items denominated in foreign currencies are translated into U.S. dollar amounts on the respective dates of such transactions. The Fund does not separately account for that portion of the results of operations resulting from changes in foreign exchange rates on investments and the fluctuations arising from changes in market prices of securities held. Such fluctuations are included with the net realized and unrealized gains or losses on securities.
c. Forward foreign currency contracts
A forward foreign currency contract is an agreement between two parties to purchase or sell a specific currency for an agreed-upon price at a future date. The Fund enters into forward foreign currency contracts to facilitate transactions in foreign-denominated securities and to attempt to minimize the risk to the Fund from adverse changes in the relationship between currencies. Forward foreign currency contracts are recorded at the forward rate and marked-to-market daily. When the contracts are closed, realized gains and losses arising from such transactions are recorded as realized gains or losses on foreign currency related transactions. The Fund could be exposed to risks if the counterparties to the contracts are unable to meet the terms of their contracts or if the value of the foreign currency changes unfavorably.
d. When-issued and delayed delivery transactions
The Fund records when-issued securities as of trade date and maintains security positions such that sufficient liquid assets will be available to make payment for the securities purchased. Securities purchased on a when-issued or delayed delivery basis are marked-to-market daily and begin earning interest on the settlement date. Losses may occur on these transactions due to changes in market conditions or the failure of counterparties to perform under the contract.
e. Securities lending
The Fund may lend its securities to certain qualified brokers in order to earn additional income. The Fund receives compensation in the form of fees or interest earned on the investment of any cash collateral received. The Fund also continues to receive interest and dividends on the securities loaned. The Fund receives collateral in the form of cash or securities with a market value at least equal to the market value of the securities on loan, including accrued interest. In the event of default or bankruptcy by the borrower, the Fund could experience delays and costs in recovering the loaned securities or in gaining access to the collateral. The Fund has the right under the lending agreement to recover the securities from the borrower on demand.
24
NOTES TO FINANCIAL STATEMENTS continued
f. Security transactions and investment income
Security transactions are recorded on trade date. Realized gains and losses are computed using the specific cost of the security sold. Interest income is recorded on the accrual basis and includes accretion of discounts and amortization of premiums. Dividend income is recorded on the ex-dividend date or in the case of some foreign securities, on the date when the Fund is made aware of the dividend. Foreign income and capital gains realized on some securities may be subject to foreign taxes, which are accrued as applicable.
g. Federal taxes
The Fund intends to continue to qualify as a regulated investment company and distribute all of its taxable income, including any net capital gains (which have already been offset by available capital loss carryovers). Accordingly, no provision for federal taxes is required.
h. Distributions
Distributions to shareholders from net investment income are accrued daily and paid monthly. Distributions from net realized gains, if any, are recorded on the ex-dividend date. Such distributions are determined in conformity with income tax regulations, which may differ from generally accepted accounting principles.
Reclassifications have been made to the Fund's components of net assets to reflect income and gains available for distribution (or available capital loss carryovers, as applicable) under income tax regulations. The primary permanent differences causing such reclassifications are due to bond premium amortization and consent fees on tendered bonds.
i. Class allocations
Income, common expenses and realized and unrealized gains and losses are allocated to the classes based on the relative net assets of each class. Distribution fees, if any, are calculated daily at the class level based on the appropriate net assets of each class and the specific expense rates applicable to each class.
3. ADVISORY FEE AND OTHER TRANSACTIONS WITH AFFILIATES
Evergreen Investment Management Company, LLC ("EIMC"), an indirect, wholly-owned subsidiary of Wachovia Corporation ("Wachovia"), is the investment advisor to the Fund and is paid a fee at an annual rate of 2% of the Fund's gross investment income plus an amount determined by applying percentage rates to the average daily net assets of the Fund, starting at 0.31% and declining to 0.16% as average daily net assets increase. Prior to April 1, 2004, the Fund paid a fee at an annual rate of 2% of the Fund's gross investment income plus an amount determined by applying percentage rates to the average daily net assets of the Fund, which started at 0.41% and declined to 0.16% as the Fund's average daily net assets increased.
From time to time, EIMC may voluntarily or contractually waive its fee and/or reimburse expenses in order to limit operating expenses. For any fee waivers and/or reimbursements made after January 1, 2003, EIMC may recoup certain amounts waived and/or reimbursed up to a period of three years following the end of the fiscal year in which the fee waivers and/or reimbursements were made. During the year ended April 30, 2004, EIMC reimbursed expenses
25
NOTES TO FINANCIAL STATEMENTS continued
relating to Class A shares in the amount of $16,260. Total amounts subject to recoupment as of April 30, 2004 were $15,614.
Evergreen Investment Services, Inc. ("EIS"), an indirect, wholly-owned subsidiary of Wachovia, is the administrator to the Fund. As administrator, EIS provides the Fund with facilities, equipment and personnel and is paid an annual rate determined by applying percentage rates to the aggregate average daily net assets of the Evergreen funds (excluding money market funds), starting at 0.10% and declining to 0.05% as the aggregate average daily net assets of the Evergreen funds (excluding money market funds) increase.
Evergreen Service Company, LLC ("ESC"), an indirect, wholly-owned subsidiary of Wachovia, is the transfer and dividend disbursing agent for the Fund. ESC receives account fees that vary based on the type of account held by the shareholders in the Fund. For the year ended April 30, 2004, the transfer agent fees were equivalent to an annual rate of 0.17% of the Fund's average daily net assets.
The Fund has placed a portion of its portfolio transactions with brokerage firms that are affiliates of Wachovia. During the year ended April 30, 2004, the Fund paid brokerage commissions of $173,425 to Wachovia Securities, LLC.
4. DISTRIBUTION PLANS
Evergreen Distributor, Inc., a wholly-owned subsidiary of BISYS Fund Services, Inc., serves as principal underwriter to the Fund.
The Fund has adopted Distribution Plans, as allowed by Rule 12b-1 of the 1940 Act, for each class of shares, except Class I. Under the Distribution Plans, distribution fees are paid at an annual rate of 0.30% of the average daily net assets for Class A shares and 1.00% of the average daily net assets for each of Class B and Class C shares.
5. SECURITIES TRANSACTIONS
Cost of purchases and proceeds from sales of investment securities (excluding short-term securities) were $1,121,107,521 and $791,159,239, respectively, for the year ended April 30, 2004.
During the year ended April 30, 2004, the Fund loaned securities to certain brokers. At April 30, 2004, the value of securities on loan and the value of collateral amounted to $214,364,035 and $219,217,479, respectively. During the year ended April 30, 2004, the Fund earned $333,494 in income from securities lending which is included in interest income on the Statement of Operations.
On April 30, 2004, the aggregate cost of securities for federal income tax purposes was $1,344,698,165. The gross unrealized appreciation and depreciation on securities based on tax cost was $69,439,915 and $10,879,446, respectively, with a net unrealized appreciation of $58,560,469.
26
NOTES TO FINANCIAL STATEMENTS continued
As of April 30, 2004, the Fund had $156,152,248 in capital loss carryovers for federal income tax purposes expiring as follows: | Expiration |
|
| 2007 | 2008 | 2009 | 2010 | 2011 |
|
| $ 11,246,425 | $ 33,005,032 | $ 38,451,200 | $ 57,513,490 | $ 15,936,101 |
|
6. INTERFUND LENDING
Pursuant to an Exemptive Order issued by the SEC, the Fund may participate in an interfund lending program with certain funds in the Evergreen fund family. This program allows the Fund to borrow from, or lend money to, other participating funds. During the year ended April 30, 2004, the Fund did not participate in the interfund lending program.
7. DISTRIBUTIONS TO SHAREHOLDERS
As of April 30, 2004, the components of distributable earnings on a tax basis were as follows: | Overdistributed | Unrealized | Capital Loss |
| Ordinary Income | Appreciation | Carryover |
|
| $ 2,211,544 | $ 58,560,469 | $ 156,152,248 |
|
The differences between the components of distributable earnings on a tax basis and the amounts reflected in the Statement of Assets and Liabilities are primarily due to wash sales and premium amortization.
The tax character of distributions paid for the years ended April 30, 2004 and April 30, 2003 were $86,164,273 and $50,646,322, respectively, of ordinary income.
8. EXPENSE REDUCTIONS
Through expense offset arrangements with ESC and the Fund's custodian, a portion of fund expenses has been reduced.
9. DEFERRED TRUSTEES' FEES
Each Trustee of the Fund may defer any or all compensation related to performance of their duties as Trustees. The Trustees' deferred balances are allocated to deferral accounts, which are included in the accrued expenses for the Fund. The investment performance of the deferral accounts are based on the investment performance of certain Evergreen funds. Any gains earned or losses incurred in the deferral accounts are reported in the Fund's Trustees' fees and expenses. At the election of the Trustees, the deferral account will be paid either in one lump sum or in quarterly installments for up to ten years.
10. FINANCING AGREEMENT
The Fund and certain other Evergreen funds share in a $150 million unsecured revolving credit commitment for temporary and emergency purposes, including the funding of redemptions, as permitted by each participating fund's borrowing restrictions. Borrowings under this facility bear
27
NOTES TO FINANCIAL STATEMENTS continued
interest at 0.50% per annum above the Federal Funds rate. All of the participating funds are charged an annual commitment fee of 0.09% of the unused balance, which is allocated pro rata.
During the year ended April 30, 2004, the Fund had average borrowings outstanding of $84,965 at a rate of 1.61% and paid interest of $1,373.
11. CONCENTRATION OF RISK
The Fund may invest a substantial portion of its assets in an industry or sector and, therefore, may be more affected by changes in that industry or sector than would be a comparable mutual fund that is not heavily weighted in any industry or sector.
12. SUBSEQUENT EVENT
Effective May 1, 2004, EIS replaced Evergreen Distributor, Inc. as the distributor of the Fund's shares.
28
REPORT OF INDEPENDENT REGISTERED PUBLIC ACCOUNTING FIRM
Board of Trustees and Shareholders
Evergreen Fixed Income Trust
We have audited the accompanying statement of assets and liabilities, including the schedule of investments, of the Evergreen High Yield Bond Fund, a series of Evergreen Fixed Income Trust, as of April 30, 2004, and the related statement of operations for the year then ended, statements of changes in net assets for each of the years in the two-year period then ended, and the financial highlights for each of the years in the five-year period then ended. These financial statements and financial highlights are the responsibility of the Fund's management. Our responsibility is to express an opinion on these financial statements and financial highlights based on our audits.
We conducted our audits in accordance with the standards of the Public Company Accounting Oversight Board (United States). Those standards require that we plan and perform the audit to obtain reasonable assurance about whether the financial statements and financial highlights are free of material misstatement. An audit includes examining, on a test basis, evidence supporting the amounts and disclosures in the financial statements. Our procedures included confirmation of securities owned as of April 30, 2004 by correspondence with the custodian. As to securities purchased but not yet received, we performed other appropriate auditing procedures. An audit also includes assessing the accounting principles used and significant estimates made by management, as well as evaluating the overall financial statement presentation. We believe that our audits provide a reasonable basis for our opinion.
In our opinion, the financial statements and financial highlights referred to above present fairly, in all material respects, the financial position of the Evergreen High Yield Bond Fund, as of April 30, 2004, the results of its operations, changes in its net assets and financial highlights for each of the years described above in conformity with accounting principles generally accepted in the United States of America.
Boston, Massachusetts
June 4, 2004
29
ADDITIONAL INFORMATION (unaudited)
FEDERAL TAX DISTRIBUTIONS
For corporate shareholders, 1.26% of ordinary income dividends paid during the fiscal year ended April 30, 2004 qualified for the dividends received deduction.
With respect to dividends paid from investment company taxable income during the fiscal year ended April 30, 2004, the Fund designates 1.27% of ordinary income and short-term capital gain distributions as Qualified Dividend Income in accordance with the Internal Revenue Code. Complete 2004 year-end tax information will be reported to you on your 2004 Form 1099-DIV, which shall be provided to you in early 2005.
30
This page left intentionally blank
31
TRUSTEES AND OFFICERS
| TRUSTEES1 | |
Charles A. Austin III
Trustee
DOB: 10/23/1934
Term of office since: 1991
Other directorships: None | Principal occupations: Investment Counselor, Anchor Capital Advisors, Inc. (investment advice); Director, The Andover Companies (insurance); Trustee, Arthritis Foundation of New England; Director, The Francis Ouimet Society; Former Director, Health Development Corp. (fitness-wellness centers); Former Director, Mentor Income Fund, Inc.; Former Trustee, Mentor Funds and Cash Resource Trust; Former Investment Counselor, Appleton Partners, Inc. (investment advice); Former Director, Executive Vice President and Treasurer, State Street Research & Management Company (investment advice) |
|
Shirley L. Fulton
Trustee
DOB: 1/10/1952
Term of office since: 2004
Other directorships: None | Principal occupations: Partner, Helms, Henderson & Fulton, P.A. (law firm); Retired Senior Resident Superior Court Judge, 26th Judicial District, Charlotte, NC |
|
K. Dun Gifford
Trustee
DOB: 10/23/1938
Term of office since: 1974
Other directorships: None | Principal occupations: Chairman and President, Oldways Preservation and Exchange Trust (education); Trustee, Treasurer and Chairman of the Finance Committee, Cambridge College; Former Chairman of the Board, Director, and Executive Vice President, The London Harness Company (leather goods purveyor); Former Director, Mentor Income Fund, Inc.; Former Trustee, Mentor Funds and Cash Resource Trust |
|
Dr. Leroy Keith, Jr.
Trustee
DOB: 2/14/1939
Term of office since: 1983
Other directorships: Trustee, Phoenix Series Fund, Phoenix Multi-Portfolio Fund, and The Phoenix Big Edge Series Fund | Principal occupations: Partner, Stonington Partners, Inc. (private investment firm); Trustee of Phoenix Series Fund, Phoenix Multi-Portfolio Fund, and The Phoenix Big Edge Series Fund; Former Chairman of the Board and Chief Executive Officer, Carson Products Company (manufacturing); Director, Obagi Medical Products Co.; Director, Lincoln Educational Services; Director, Diversapack Co.; Former President, Morehouse College; Former Director, Mentor Income Fund, Inc.; Former Trustee, Mentor Funds and Cash Resource Trust |
|
Gerald M. McDonnell
Trustee
DOB: 7/14/1939
Term of office since: 1988
Other directorships: None | Principal occupations: Manager of Commercial Operations, SMI STEEL Co. - South Carolina (steel producer); Former Sales and Marketing Management, Nucor Steel Company; Former Director, Mentor Income Fund, Inc.; Former Trustee, Mentor Funds and Cash Resource Trust |
|
William Walt Pettit
Trustee
DOB: 8/26/1955
Term of office since: 1984
Other directorships: None | Principal occupations: Partner and Vice President, Kellam & Pettit, P.A. (law firm); Former Director, Mentor Income Fund, Inc.; Former Trustee, Mentor Funds and Cash Resource Trust |
|
David M. Richardson
Trustee
DOB: 9/19/1941
Term of office since: 1982
Other directorships: None | Principal occupations: President, Richardson, Runden & Company (executive recruitment business development/consulting company); Consultant, Kennedy Information, Inc. (executive recruitment information and research company); Consultant, AESC (The Association of Retained Executive Search Consultants); Trustee, NDI Technologies, LLP (communications); Director, J&M Cumming Paper Co. (paper merchandising); Former Vice Chairman, DHR International, Inc. (executive recruitment); Former Director, Mentor Income Fund, Inc.; Former Trustee, Mentor Funds and Cash Resource Trust |
|
Dr. Russell A. Salton III
Trustee
DOB: 6/2/1947
Term of office since: 1984
Other directorships: None | Principal occupations: President/CEO, AccessOne MedCard; Former Medical Director, Healthcare Resource Associates, Inc.; Former Medical Director, U.S. Health Care/Aetna Health Services; Former Director, Mentor Income Fund, Inc.; Former Trustee, Mentor Funds and Cash Resource Trust |
|
32
TRUSTEES AND OFFICERS continued
Michael S. Scofield
Trustee
DOB: 2/20/1943
Term of office since: 1984
Other directorships: None | Principal occupations: Attorney, Law Offices of Michael S. Scofield; Former Director, Mentor Income Fund, Inc.; Former Trustee, Mentor Funds and Cash Resource Trust |
|
Richard J. Shima
Trustee
DOB: 8/11/1939
Term of office since: 1993
Other directorships: None | Principal occupations: Independent Consultant; Director, Trust Company of CT; Trustee, Saint Joseph College (CT); Director, Hartford Hospital; Trustee, Greater Hartford YMCA; Former Director, Enhance Financial Services, Inc.; Former Director, Old State House Association; Former Director of CTG Resources, Inc. (natural gas); Former Director, Mentor Income Fund, Inc.; Former Trustee, Mentor Funds and Cash Resource Trust |
|
Richard K. Wagoner, CFA2
Trustee
DOB: 12/12/1937
Term of office since: 1999
Other directorships: None | Principal occupations: Member and Former President, North Carolina Securities Traders Association; Member, Financial Analysts Society; Former Consultant to the Boards of Trustees of the Evergreen funds; Former Trustee, Mentor Funds and Cash Resource Trust |
|
| OFFICERS |
|
Dennis H. Ferro3
President
DOB: 6/20/1945
Term of office since: 2003 | Principal occupations: President, Chief Executive Officer and Chief Investment Officer, Evergreen Investment Company, Inc. and Executive Vice President, Wachovia Bank, N.A. |
|
Carol Kosel4
Treasurer
DOB: 12/25/1963
Term of office since: 1999 | Principal occupations: Senior Vice President, Evergreen Investment Services, Inc. |
|
Michael H. Koonce4
Secretary
DOB: 4/20/1960
Term of office since: 2000 | Principal occupations: Senior Vice President and General Counsel, Evergreen Investment Services, Inc.; Senior Vice President and Assistant General Counsel, Wachovia Corporation |
|
1 Each Trustee serves until a successor is duly elected or qualified or until his death, resignation, retirement or removal from office. Each Trustee oversees 94 Evergreen funds. Correspondence for each Trustee may be sent to Evergreen Board of Trustees, P.O. Box 20083, Charlotte, North Carolina 28202.
2 Mr. Wagoner is an "interested person" of the Fund because of his ownership of shares in Wachovia Corporation, the parent to the Fund's investment advisor.
3 The address of the Officer is 401 S. Tryon Street, 20th Floor, Charlotte, NC 28288.
4 The address of the Officer is 200 Berkeley Street, Boston, MA 02116.
Additional information about the Fund's Board of Trustees and Officers can be found in the Statement of Additional Information (SAI) and is available upon request without charge by calling 800.343.2898. |
33
INVESTMENTS THAT STAND THE TEST OF TIME
At Evergreen Investments, we remain steadfastly dedicated to four core principles that lead to success in today's financial world.- Leadership -- With over $248 billion in assets under management as of March 31, 2004 and a history of innovation spanning more than 70 years, we offer the strength that comes with experience.
Excellence -- We have been consistently recognized for risk-adjusted historical performance through disciplined, rigorous management focused on achieving sustainable success.
Experience -- Our investment managers are seasoned professionals who share their diverse points of view and have the perspective that comes with weathering good markets and bad.
Commitment -- We are dedicated to helping investment professionals and their clients achieve important goals through the investments, service and education we offer.
Visit us online at EvergreenInvestments.com
FOR MORE INFORMATION
Evergreen Express Line 800.346.3858
Evergreen Investor Services 800.343.2898
For the fifth consecutive year, Evergreen Investments has earned the Dalbar Mutual Fund Service Award, which recognizes those firms that exceed industry norms in key areas. The award symbolizes the achievement of the highest tier of shareholder service within our industry. For 2003, Evergreen Investments was ranked third overall.
566660 rv1 6/2004 |
Evergreen Investments
200 Berkeley Street
Boston, MA 02116-5034
|
Evergreen Institutional Mortgage Portfolio

Evergreen Institutional Mortgage Portfolio
| table of contents |
| 1 | |
| 4 | |
| 5 | |
| 6 | |
| 7 | |
| 10 | |
| 11 | |
| 12 | |
| 13 | |
| 17 | |
| 20 | |
This annual report must be preceded or accompanied by a prospectus of the Evergreen fund contained herein. The prospectus contains more complete information, including fees and expenses, and should be read carefully before investing or sending money.
A description of the Fund’s proxy voting policies and procedures is available without charge, upon request, by calling 1.800.343.2898, by visiting our website at EvergreenInvestments.com or by visiting the SEC’s website at http://www.sec.gov.
| Mutual Funds: |
| NOT FDIC INSURED | MAY LOSE VALUE | NOT BANK GUARANTEED |
Evergreen InvestmentsSM is a service mark of Evergreen Investment Management Company, LLC. Copyright 2004.
Evergreen mutual funds are distributed by Evergreen Investment Services, Inc.
200 Berkeley Street, Boston, MA 02116
LETTER TO SHAREHOLDERS
June 2004
Dennis H. Ferro
President and Chief
Executive Officer | |
|
Dear Shareholder,
We are pleased to provide the annual report for the Evergreen Institutional Mortgage Portfolio which covers the twelve-month period ended April 30, 2004.
Investors in the fixed income markets experienced alternating periods of risk and reward over the past twelve months. Geopolitical uncertainties, improving economic growth, changes in tax legislation, and an accommodative stance from the Federal Reserve managed to both excite and confuse bond market participants at varying points, and in varying sectors, since the beginning of the investment period in May 2003.
The period began with the financial markets focused on the war in Iraq. The associated uncertainty led to higher demand for bonds, particularly within the Treasury market, as investors sought solace in a flight to quality. This performance in government bonds carried over to many municipal and corporate issues, too, and the increased demand for bonds quickly became a sort of self-fulfilling prophecy, as total return potential climbed with higher prices and declining yields. This increasingly popular strategy, though, soon helped set the stage for a summer of volatility unmatched in recent history.
At the conclusion of its monetary policy meeting in May, the Federal Reserve had commented on the “possibility of an unwelcome, substantial fall in inflation.” Many bond investors, convinced the Fed was taking rates to zero, drove yields down to 45-year lows in the U.S. Treasury market. Common market wisdom determined that since the Fed’s primary concern was deflation, rates were likely headed lower. Yet when central bankers reduced their target for the federal funds rate by a less than expected 25 basis points in late June, many fixed income investors became alarmed. These
1
LETTER TO SHAREHOLDERS continued
worries were compounded by optimistic GDP (Gross Domestic Product) forecasts from Fed Chairman Alan Greenspan during congressional banking committee hearings in July. As a result of these events, the yield on the 10-year Treasury surged from a low of 3.1% in June to 4.6% in late July. Thus, the “deflation trade” in bonds had changed from a significant overbought condition to an oversold one in a matter of just six weeks.
The bond market began to stabilize as investors became more comfortable with the likelihood that monetary policy makers would keep rates low for the foreseeable future. This was a welcome respite for owners of Treasuries and municipal securities. In addition to the excitement in Treasuries, investors in municipal bonds also experienced heightened concerns related to the changes in the tax laws, which were initially perceived as a potential threat to their market. After careful consideration, though, many investors became convinced that capital preservation would remain a primary, if not dominant, theme for the future demand of these securities. A second concern involved the poor financial condition of many states and local governments. Yet just as these concerns were reaching a crescendo, economic growth picked up significantly and tax receipts climbed, improving the financial conditions of many of these entities.
As economic growth strengthened, investors in corporate bonds benefited from the combination of stronger balance sheets, improving credit quality, declining default rates, and the outlook for growth in GDP and corporate profits. In addition, the many steps taken to improve corporate credibility rallied many investors to the credit markets, where many risk appropriate investors successfully searched for improved returns in the high yield market.
Throughout the investment period, the Federal Reserve attempted to improve the clarity of its intentions for the financial markets. At the conclusion of its monetary policy meetings, the Fed’s statements ranged from maintaining policy accommodation for a “considerable period” to one of being “measured” in its approach to remove this monetary stimulus. In addition,
2
LETTER TO SHAREHOLDERS continued
central bankers tried to be even more clear in a variety of speeches and public testimonies, as the Fed continued to display an unusually strong effort in clarifying its upcoming changes in monetary policy. Most recently, though, these attempts at clarity caused volatility throughout the fixed income markets, as investors feared a repeat of the experiences in 1994. Given the current level of interest rates, inflation, the dollar, and global economic growth, we believe these concerns are overblown. However, the price of oil remains a wild card, as sustained high oil prices will eventually embed a higher level of manufacturing and service cost in the economy.
We encourage investors to maintain their diversified, long-term strategies within their fixed income portfolios.
Please visit our website, EvergreenInvestments.com, for more information about our funds and other investment products available to you. From the website, you may also access a new feature that presents a detailed Q&A interview with the portfolio manager(s) for your fund. You can easily reach these interviews by following the link, EvergreenInvestments.com/Annual updates, from our website. Thank you for your continued support of Evergreen Investments.
Sincerely,
Dennis H. Ferro
President and Chief Investment Officer
Evergreen Investment Management Company, LLC
3
FUND AT A GLANCE
as of April 30, 2004
MANAGEMENT TEAM
Tattersall Advisory Group, Inc.
CURRENT INVESTMENT STYLE

Source: Morningstar, Inc.
Morningstar's style box is based on a portfolio date as of 3/31/2004.
The fixed income style box placement is based on a fund's average effective maturity or duration and the average credit rating of the bond portfolio. |
PERFORMANCE AND RETURNS
Portfolio inception date: 6/19/2002
| Class I |
| Class inception date | 6/19/2002 |
|
| Nasdaq symbol | EMSFX |
|
| Average annual return |
|
| 1 year | 1.63% |
|
| Since portfolio inception | 4.31% |
|
Past performance is no guarantee of future results. The performance quoted represents past performance and current performance may be lower or higher. The investment return and principal value of an investment will fluctuate so that investors’ shares, when redeemed, may be worth more or less than their original cost. To obtain performance information as of the most recent month end for Class I shares, please go to EvergreenInvestments.com/fundperformance. Performance includes the reinvestment of income dividends and capital gain distributions. Performance shown does not reflect the deduction of taxes that a shareholder would pay on fund distributions or the redemption of fund shares.
The advisor is reimbursing the fund for a portion of other expenses. Had expenses not been reimbursed, returns would have been lower.
LONG-TERM GROWTH
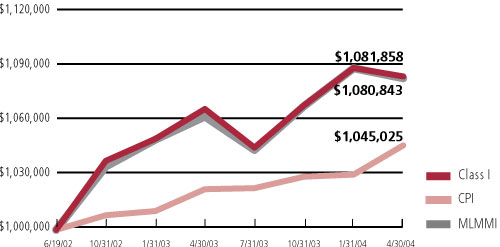
Comparison of a $1,000,000 investment in Evergreen Institutional Mortgage Portfolio Class I shares, versus a similar investment in the Merrill Lynch Mortgage Master Index1 (MLMMI) and the Consumer Price Index (CPI).
The MLMMI is an unmanaged market index and does not include transaction costs associated with buying and selling securities, any mutual fund expenses or any taxes. The CPI is a commonly used measure of inflation and does not represent an investment return. It is not possible to invest directly in an index.
1 Copyright 2004. Merrill Lynch, Pierce, Fenner & Smith Incorporated. All rights reserved.
4
PORTFOLIO MANAGER COMMENTARY
The fund’s Class I shares returned 1.63% for the twelve-month period ended April 30, 2004. During the same period, the fund’s benchmark, Merrill Lynch Mortgage Master Index (MLMMI), returned 1.93%.
Interest rates reached a cyclical low in June 2003, coinciding with the Federal Reserve Bank’s thirteenth reduction in the Federal Funds rate, and leading to the lowest interest rates seen in the last 45 years. Monetary policymakers professed their intention to maintain a stimulative policy until the output gap began to close, inflation increased to a level consistent with output, and employment increased. At the end of the fiscal year, with capacity utilization rising, employment increasing, and inflation showing signs of some revitalization, the prospect of less monetary accommodation became a reality.
In this environment of heightened yield volatility, mortgage prepayment experience varied over a wide range. The mortgage-refinancing index reached a record peak during the lows in rates before falling back to more normal levels as rates rose. Mortgage yield spreads remained wide, and mortgage volatility remained high during the fiscal period. In order to protect the mortgage portfolio from refinancing risk, we emphasized mortgages with a high degree of stability in prepayment experience, cash flows, average lives, and mortgage security prices. We maintained an underweight to the riskiest mortgage sectors of 30-year and 15-year pass-through mortgage securities. Mortgages were among the worst performing sectors in the bond market over the past year, but our focus on insulating the fund from much of the prepayment risk and volatility in the mortgage market benefited portfolio returns relative to the index. We remained focused on highly stable mortgage assets like Collateralized Mortgage Obligations with good cash flow characteristics, FNMA bonds with virtually no prepayment risk, and FHA/VA bonds, which prepay below and are more consistent than 30-year or 15-year mortgage securities.
Mortgage refinancing reached a peak in the early year, but rapidly declined as interest rates rose through the summer. We were overweight mortgage assets that were insensitive to mortgage prepayments in order to protect against prepayment risk. However, the transition out of those assets as mortgage prepayments fell detracted slightly from performance.
Class I shares are only offered to investment advisory clients of an investment advisor of an Evergreen fund (or its advisory affiliates), through special arrangements entered into on behalf of Evergreen funds with certain financial services firms. Class I shares have a minimum initial investment of $1 million, which may be waived in certain situations.
The fund’s investment objective is nonfundamental and may be changed without the vote of the fund’s shareholders.
U.S. government guarantees apply only to the underlying securities of the fund’s portfolio and not to the fund’s shares.
The return of principal is not guaranteed due to fluctuation in the NAV of the fund caused by changes in the price of the individual bonds held by the fund and the buying and selling of bonds by the fund. Bond funds have the same inflation, interest rate, and credit risks that are associated with the individual bonds held by the fund.
All data is as of April 30, 2004, and subject to change.
5
FINANCIAL HIGHLIGHTS
(For a share outstanding throughout each period) | Year Ended April 30,
|
CLASS I
| 2004
| 20031
|
Net asset value, beginning of period
| $10.18
| $10.00
|
| Income from investment operations |
| Net investment income | 0.35 | 0.40 |
| Net realized and unrealized gains or losses on securities | -0.18
| 0.23
|
Total from investment operations
| 0.17
| 0.63
|
| Distributions to shareholders from |
| Net investment income | -0.45 | -0.40 |
| Net realized gains | -0.01
| -0.05
|
Total distributions to shareholders
| -0.46
| -0.45
|
Net asset value, end of period
| $9.89
| $10.18
|
Total return
| 1.63%
| 6.45%
|
| Ratios and supplemental data |
| Net assets, end of period (thousands) | $48,032 | $28,423 |
| Ratios to average net assets |
| Expenses2 | 0.20% | 0.12%3 |
| Net investment income | 3.33% | 4.74%3 |
| Portfolio turnover rate | 327% | 148% |
|
1 For the period from June 19, 2002 (commencement of operations), to April 30, 2003.2 The ratio of expenses to average net assets excludes expense reductions but includes fee waivers and/or expense reimbursements.3 Annualized
See Notes to Financial Statements |
6
SCHEDULE OF INVESTMENTS
April 30, 2004 | Principal
Amount | Value |
|
| ASSET-BACKED SECURITIES 0.4% |
| Vanderbilt Mtge. & Fin., Inc., Ser. 2002-B, Class A3, 4.70%, 10/17/2018 |
| (cost $169,988) | $ 170,000 | $ 170,204 |
| COLLATERALIZED MORTGAGE OBLIGATIONS 43.3% |
| Asset Securitization Corp., Ser. 1997-D4, Class A1D, 7.49%, 04/14/2029 | 432,678 | 474,868 |
| Commerce 2000, Ser. 2000-C1, Class A2, 7.42%, 08/15/2033 | 335,000 | 381,904 |
| Comml. Mtge. Asset Trust, Ser. 1999-C2, Class A1, 7.29%, 11/17/2032 | 288,755 | 314,324 |
| FHLMC: |
| Ser. 2198, Class PG, 7.00%, 12/15/2028 | 7,909 | 7,926 |
| Ser. 2228, Class PE, 7.50%, 04/15/2030 | 393,500 | 411,084 |
| Ser. 2249, Class PG, 7.50%, 08/15/2030 | 39,170 | 40,980 |
| Ser. 2315, Class CK, 6.50%, 06/15/2030 | 87,927 | 88,784 |
| Ser. 2564, Class BQ, 5.50%, 10/15/2017 | 1,060,000 | 1,090,308 |
| Ser. 2691, Class NC, 5.00%, 04/15/2027 | 510,000 | 518,021 |
| Ser. 2762, Class LG, 5.00%, 09/15/2032 | 645,000 | 623,322 |
| Ser. 2774 Class PD, 5.00%, 08/15/2032 (h) | 265,000 | 254,215 |
| Ser. 2780 Class LC, 5.00%, 07/15/2027 (h) | 410,000 | 414,346 |
| Ser. 2780 Class QC, 4.50%, 04/15/2034 | 495,000 | 491,782 |
| Ser. 2780 Class TC, 5.00%, 05/15/2027 (h) | 1,020,000 | 1,030,812 |
| Ser. 2781 Class PC, 5.00%, 06/15/2029 (h) | 390,000 | 374,127 |
| Ser. T-55, Class 1A2, 7.00%, 03/25/2043 | 780,884 | 821,680 |
| FNMA: |
| Ser. 1993-G35, Class ZQ, 6.50%, 11/25/2023 | 363,439 | 382,839 |
| Ser. 2001-71, Class QE, 6.00%, 12/25/2016 | 460,000 | 484,872 |
| Ser. 2001-T10, Class A1, 7.00%, 12/25/2041 | 218,454 | 232,007 |
| Ser. 2002-2, Class MG, 6.00%, 02/25/2017 | 600,000 | 628,481 |
| Ser. 2002-26, Class A1, 7.00%, 01/25/2048 | 1,126,230 | 1,198,027 |
| Ser. 2002-T19, Class A1, 6.50%, 07/25/2042 | 2,326,435 | 2,439,849 |
| Ser. 2003-92, Class PD, 4.50%, 03/25/2017 | 480,000 | 474,792 |
| Ser. 2003-W2, Class 1A2, 7.00%, 07/25/2042 | 351,629 | 374,045 |
| Ser. 2003-W14, Class A6, 5.82%, 09/25/2043 | 345,000 | 359,078 |
| Ser. 2003-W19, Class A5, 5.50%, 11/25/2033 | 1,705,000 | 1,748,076 |
| Ser. 2004-W2, Class 2A2, 7.00%, 02/25/2044 | 542,086 | 576,643 |
| Ser. 2004-WI, Class 2A2, 7.00%, 12/25/2033 | 406,278 | 431,266 |
| GNMA, Ser. 2004-30 Class PB, 5.00%, 05/20/2029 (h) | 495,000 | 500,148 |
| LB-UBS Comml. Mtge. Trust: |
| Ser. 2000-C4, Class A1, 7.18%, 09/15/2019 | 409,939 | 449,263 |
| Ser. 2001-C2, Class A2, 6.65%, 11/15/2027 | 520,000 | 577,052 |
| Ser. 2004-C1, Class A4, 4.57%, 01/15/2031 | 360,000 | 343,849 |
| Merrill Lynch Mtge. Trust, Ser. 2003-Key 1, Class A3, 4.89%, 11/12/2035 | 440,000 | 442,422 |
| Morgan Stanley Dean Witter Capital I, Inc.: |
| Ser. 1997-XL1, Class A1, 6.59%, 10/03/2030 | 230,959 | 232,367 |
| Ser. 1998-XL1, Class A2, 6.45%, 06/03/2030 | 625,000 | 652,663 |
| Ser. 2002-IQ2, Class A3, 5.52%, 12/15/2035 | 495,000 | 518,825 |
| Ser. 2003-T11, Class A4, 5.15%, 06/13/2041 | 430,000 | 431,852 |
| Total Collateralized Mortgage Obligations (cost $21,105,744) | | 20,816,899 |
See Notes to Financial Statements |
SCHEDULE OF INVESTMENTS continued
April 30, 2004 | Principal
Amount | Value |
|
| MORTGAGE-BACKED SECURITIES 52.2% |
| FHLMC: |
| 5.00%, TBA # | $ 3,025,000 | $ 2,933,306 |
| 5.50%, 11/01/2033-03/01/2034 | 484,510 | 484,321 |
| 6.00%, 04/01/2014-05/01/2017 | 408,929 | 428,064 |
| 6.98%, 10/01/2010 (h) | 452,770 | 505,925 |
| 7.20%, 10/01/2006 (h) | 691,809 | 747,292 |
| FNMA: |
| 4.50%, TBA # | 4,695,000 | 4,486,362 |
| 4.83%, 03/01/2013 | 690,779 | 693,674 |
| 5.00%, TBA # | 925,000 | 930,493 |
| 5.50%, 04/01/2034 | 247,503 | 247,174 |
| 5.63%, 11/01/2005 | 674,164 | 695,363 |
| 6.00%, 02/01/2014-09/01/2031 | 3,326,009 | 3,463,424 |
| 6.01%, 02/01/2012 | 332,648 | 359,503 |
| 6.09%, 12/01/2008-05/01/2011 # | 614,854 | 663,153 |
| 6.50%, 07/01/2032-08/01/2032 | 2,027,866 | 2,111,715 |
| 6.60%, 10/01/2004 | 307,214 | 308,059 |
| 6.65%, 12/01/2007 | 231,414 | 251,662 |
| 6.79%, 07/01/2009 | 95,638 | 105,749 |
| 6.91%, 07/01/2009 | 287,266 | 319,071 |
| 7.00%, 05/01/2032 | 142,201 | 150,374 |
| 7.09%, 09/01/2006-07/01/2009 | 1,317,388 | 1,421,471 |
| 7.19%, 05/01/2007 | 423,390 | 461,755 |
| 7.32%, 12/01/2010 | 479,670 | 549,672 |
| 7.37%, 08/01/2006 | 368,438 | 396,096 |
| 7.44%, 07/01/2009 | 300,000 | 330,922 |
| 7.50%, 11/01/2029-12/01/2029 | 68,544 | 73,403 |
| GNMA: |
| 4.00%, 07/20/2030 | 565,976 | 571,303 |
| 5.50%, 11/15/2033-03/15/2034 | 1,363,847 | 1,365,951 |
| Total Mortgage-Backed Securities (cost $25,418,567) | | 25,055,257 |
| U.S. TREASURY OBLIGATIONS 0.4% |
| U.S. Treasury Bonds, 7.50%, 11/15/2016 | 20,000 | 24,871 |
| U.S. Treasury Notes, 2.38%, 08/15/2006 | 185,000 | 184,516 |
| Total U.S. Treasury Obligations (cost $211,198) | | 209,387 |
|
| Shares | Value |
|
| SHORT-TERM INVESTMENTS 20.8% |
| MUTUAL FUND SHARES 20.8% |
| Evergreen Institutional Money Market Fund (o) ## (cost $9,986,490) | 9,986,490 | 9,986,490 |
| Total Investments (cost $56,891,987) 117.1% | | 56,238,237 |
| Other Assets and Liabilities (17.1%) | | (8,205,848) |
| Net Assets 100.0% | | $ 48,032,389 |
See Notes to Financial Statements |
7
SCHEDULE OF INVESTMENTS continued
April 30, 2004| (o) | Evergreen Investment Management Company, LLC is the investment advisor to both the Fund and the money market fund. |
| (h) | No market quotation available. Valued at fair value as determined in good faith under procedures established by the Board of Trustees. |
| # | When-issued or delayed delivery security |
| ## | All or portion of the security has been segregated for when-issued or delayed delivery securities. |
|
| Summary of Abbreviations: |
| FHLMC | Federal Home Loan Mortgage Corp. |
| FNMA | Federal National Mortgage Association |
| GNMA | Government National Mortgage Association |
| TBA | To Be Announced |
9
STATEMENT OF ASSETS AND LIABILITIES
April 30, 2004
|
| Assets |
| Investments in securities, at value (cost $46,905,497) | $ 46,251,747 |
| Investments in affiliate, at value (cost $9,986,490) | 9,986,490 |
| Receivable for securities sold | 4,198,207 |
| Receivable for Fund shares sold | 313,816 |
| Interest receivable | 218,435 |
| Receivable from investment advisor | 509 |
|
| Total assets | 60,969,204 |
|
| Liabilities |
| Dividends payable | 111,810 |
| Payable for securities purchased | 12,682,873 |
| Payable for Fund shares redeemed | 123,066 |
| Due to related parties | 533 |
| Accrued expenses and other liabilities | 18,533 |
|
| Total liabilities | 12,936,815 |
|
| Net assets | $ 48,032,389 |
|
| Net assets represented by |
| Paid-in capital | $ 49,171,436 |
| Undistributed net investment income | 27,913 |
| Accumulated net realized losses on securities | (513,210) |
| Net unrealized losses on securities | (653,750) |
|
| Total net assets | $ 48,032,389 |
|
| Shares outstanding Class I | 4,858,548 |
|
| Net asset value per share Class I | $ 9.89 |
|
See Notes to Financial Statements |
10
STATEMENT OF OPERATIONS
Year Ended April 30, 2004
|
| Investment income |
| Interest |
| $ 1,419,409 |
| Income from affiliate | 84,403 |
|
| Total investment income | 1,503,812 |
|
| Expenses |
| Administrative services fee | 44,199 |
| Transfer agent fees | 1,553 |
| Trustees' fees and expenses | 381 |
| Printing and postage expenses | 34,544 |
| Custodian and accounting fees | 12,001 |
| Registration and filing fees | 11,556 |
| Professional fees | 18,441 |
| Other | 2,031 |
|
| Total expenses | 124,706 |
| Less: Expense reductions | (392) |
| Expense reimbursements | (35,853) |
|
| Net expenses | 88,461 |
|
| Net investment income | 1,415,351 |
|
| Net realized and unrealized gains or losses on securities |
| Net realized gains on securities | 39,480 |
| Net change in unrealized gains or losses on securities | (831,977) |
|
| Net realized and unrealized gains or losses on securities | (792,497) |
|
| Net increase in net assets resulting from operations | $ 622,854 |
|
See Notes to Financial Statements |
11
STATEMENTS OF CHANGES IN NET ASSETS
| Year Ended April 30,
|
| 2004 | 2003(a) |
|
|
| Operations |
| Net investment income | | $ 1,415,351 | | $ 742,250 |
| Net realized gains on securities | | 39,480 | | 136,383 |
| Net change in unrealized gains or losses |
| on securities | | (831,977) | | 178,227 |
|
| Net increase in net assets resulting |
| from operations | | 622,854 | | 1,056,860 |
|
| Distributions to shareholders from |
| Net investment income | | (1,955,655) | | (742,577) |
| Net realized gains | | (29,097) | | (91,432) |
|
| Total distributions to shareholders | | (1,984,752) | | (834,009) |
|
| | Shares | | Shares |
| Capital share transactions |
| Proceeds from shares sold | 4,337,076 | 43,802,985 | 3,308,206 | 33,420,179 |
| Net asset value of shares issued in |
| reinvestment of distributions | 77,764 | 778,751 | 37,752 | 383,776 |
| Payment for shares redeemed | (2,349,536) | (23,610,741) | (552,714) | (5,603,514) |
|
| Net increase in net assets resulting from |
| capital share transactions | | 20,970,995 | | 28,200,441 |
|
| Total increase in net assets | | 19,609,097 | | 28,423,292 |
| Net assets |
| Beginning of period | | 28,423,292 | | 0 |
|
| End of period | | $ 48,032,389 | | $ 28,423,292 |
|
| Undistributed net investment income | | $ 27,913 | | $ 32,400 |
|
(a) For the period from June 19, 2002 (commencement of operations), to April 30, 2003. |
See Notes to Financial Statements |
12
NOTES TO FINANCIAL STATEMENTS
1. ORGANIZATION
Evergreen Institutional Mortgage Portfolio, (formerly, Evergreen Mortgage Securities Fund) is a diversified series of Evergreen Fixed Income Trust (the “Trust”), a Delaware statutory trust organized on September 18, 1997. The Trust is an open-end management investment company registered under the Investment Company Act of 1940, as amended (the “1940 Act”).
The Fund offers Institutional (“Class I”) shares. Class I shares are sold without a front-end sales charge or contingent deferred sales charge.
2. SIGNIFICANT ACCOUNTING POLICIES
The following is a summary of significant accounting policies consistently followed by the Fund in the preparation of its financial statements. The policies are in conformity with generally accepted accounting principles in the United States of America, which require management to make estimates and assumptions that affect amounts reported herein. Actual results could differ from these estimates.
a. Valuation of investments
Portfolio debt securities acquired with more than 60 days to maturity are valued at prices obtained from an independent pricing service which takes into consideration such factors as similar security prices, yields, maturities, liquidity and ratings. Securities for which valuations are not available from an independent pricing service may be valued by brokers which use prices provided by market makers or estimates of market value obtained from yield data relating to investments or securities with similar characteristics.
Short-term securities with remaining maturities of 60 days or less at the time of purchase are valued at amortized cost, which approximates market value.
Investments in other mutual funds are valued at net asset value. Securities for which market quotations are not available or not reflective of current market value are valued at fair value as determined in good faith, according to procedures approved by the Board of Trustees.
b. When-issued and delayed delivery transactions
The Fund records when-issued securities as of trade date and maintains security positions such that sufficient liquid assets will be available to make payment for the securities purchased. Securities purchased on a when-issued or delayed delivery basis are marked-to-market daily and begin earning interest on the settlement date. Losses may occur on these transactions due to changes in market conditions or the failure of counterparties to perform under the contract.
c. Dollar roll transactions
The Fund may enter into dollar roll transactions with respect to mortgage-backed securities. In a dollar roll transaction, the Fund sells mortgage-backed securities to financial institutions and simultaneously agrees to accept substantially similar (same type, coupon and maturity) securities at a later date at an agreed upon price. The Fund will use the proceeds generated from the transactions to invest in short-term investments, which may enhance the Fund’s current yield and total return. The Fund accounts for dollar roll transactions as purchases and sales.
13
NOTES TO FINANCIAL STATEMENTS continued
d. Security transactions and investment income
Security transactions are recorded on trade date. Realized gains and losses are computed using the specific cost of the security sold. Interest income is recorded on the accrual basis and includes accretion of discounts and amortization of premiums.
e. Federal taxes
The Fund intends to continue to qualify as a regulated investment company and distribute all of its taxable income, including any net capital gains (which have already been offset by available capital loss carryovers). Accordingly, no provision for federal taxes is required.
f. Distributions
Distributions to shareholders from net investment income are accrued daily and paid monthly. Distributions from net realized gains, if any, are recorded on the ex-dividend date. Such distributions are determined in conformity with income tax regulations, which may differ from generally accepted accounting principles.
Reclassifications have been made to the Fund’s components of net assets to reflect income and gains available for distribution (or available capital loss carryovers, as applicable) under income tax regulations. The primary permanent differences causing such reclassifications are due to mortgage paydown gains and losses.
3. ADVISORY FEE AND OTHER TRANSACTIONS WITH AFFILIATES
Evergreen Investment Management Company, LLC (“EIMC”), an indirect, wholly-owned subsidiary of Wachovia Corporation (“Wachovia”), is the investment advisor to the Fund . The Fund does not pay a fee for the investment advisory service.
Tattersall Advisory Group, Inc., an indirect, wholly-owned subsidiary of Wachovia, is the investment sub-advisor to the Fund and is paid by EIMC for its services to the Fund.
From time to time, EIMC may voluntarily or contractually reimburse expenses in order to limit operating expenses. For any reimbursements made after January 1, 2003, EIMC may recoup certain amounts reimbursed up to a period of three years following the end of the fiscal year in which the reimbursements were made. During the year ended April 30, 2004, EIMC reimbursed expenses in the amount of $35,853 which represents 0.08% of the Fund’s average daily net assets. Total amounts subject to recoupment as of April 30, 2004 were $55,446.
Evergreen Investment Services, Inc. (“EIS”), an indirect, wholly-owned subsidiary of Wachovia, is the administrator to the Fund. As administrator, EIS provides the Fund with facilities, equipment and personnel and is paid an annual rate determined by applying percentage rates to the aggregate average daily net assets of the Evergreen funds (excluding money market funds), starting at 0.10% and declining to 0.05% as the aggregate average daily net assets of the Evergreen funds (excluding money market funds) increase.
Evergreen Service Company, LLC (“ESC”), an indirect, wholly-owned subsidiary of Wachovia, is the transfer and dividend disbursing agent for the Fund. ESC receives account fees that vary based on the type of account held by the shareholders in the Fund.
14
NOTES TO FINANCIAL STATEMENTS continued
Cost of Purchases | Proceeds from Sales |
|
U.S. | Non-U.S. | U.S. | Non-U.S. |
Government | Government | Government | Government |
|
| $ 168,453,997 | $ 4,043,290 | $ 134,907,018 | $ 1,333,750 |
|
On April 30, 2004, the aggregate cost of securities for federal income tax purposes was $56,892,260. The gross unrealized appreciation and depreciation on securities based on tax cost was $44,629 and $698,652, respectively, with a net unrealized depreciation of $654,023.
As of April 30, 2004, the Fund had $512,937 in capital loss carryovers for federal income tax purposes which expire in 2012.
5. INTERFUND LENDING
Pursuant to an Exemptive Order issued by the SEC, the Fund may participate in an interfund lending program with certain funds in the Evergreen fund family. This program allows the Fund to borrow from, or lend money to, other participating funds. During the year ended April 30, 2004, the Fund did not participate in the interfund lending program.
6. DISTRIBUTIONS TO SHAREHOLDERS
As of April 30, 2004, the components of distributable earnings on a tax basis were as follows:
| Undistributed | Unrealized | Capital Loss |
| Ordinary Loss | Depreciation | Carryover |
|
| $27,913 | $654,023 | $512,937 |
|
The differences between the components of distributable earnings on a tax basis and the amounts reflected in the Statement of Assets and Liabilities are primarily due to wash sales. Additionally, short-term capital gains are considered ordinary income for income tax purposes.
The tax character of distributions paid for the year ended April 30, 2004 was $1,984,752 of ordinary income. For the period from June 19, 2002 (commencement of operations) to April 30, 2003, the tax character of distributions paid was $834,009 of ordinary income.
7. EXPENSE REDUCTIONS
Through expense offset arrangements with ESC and the Fund’s custodian, a portion of fund expenses has been reduced.
8. DEFERRED TRUSTEES’ FEES
Each Trustee of the Fund may defer any or all compensation related to performance of their duties as Trustees. The Trustees’ deferred balances are allocated to deferral accounts, which are included in the accrued expenses for the Fund. The investment performance of the deferral accounts are based on the investment performance of certain Evergreen funds. Any gains earned or losses
NOTES TO FINANCIAL STATEMENTS continued
incurred in the deferral accounts are reported in the Fund’s Trustees’ fees and expenses. At the election of the Trustees, the deferral account will be paid either in one lump sum or in quarterly installments for up to ten years.
9. FINANCING AGREEMENT
The Fund and certain other Evergreen funds share in a $150 million unsecured revolving credit commitment for temporary and emergency purposes, including the funding of redemptions, as permitted by each participating fund’s borrowing restrictions. Borrowings under this facility bear interest at 0.50% per annum above the Federal Funds rate. All of the participating funds are charged an annual commitment fee of 0.09% of the unused balance, which is allocated pro rata. During the year ended April 30, 2004, the Fund had no borrowings under this agreement.
10. SUBSEQUENT EVENT
Effective May 1, 2004, EIS replaced Evergreen Distributor, Inc. as the distributor of the Fund’s shares.
16
REPORT OF INDEPENDENT REGISTERED PUBLIC ACCOUNTING FIRM
Board of Trustees and Shareholders
Evergreen Fixed Income Trust
We have audited the accompanying statement of assets and liabilities, including the schedule of investments, of the Evergreen Institutional Mortgage Portfolio (formerly, Evergreen Mortgage Securities Fund), a series of Evergreen Fixed Income Trust, as of April 30, 2004, and the related statement of operations for the year then ended, statements of changes in net assets for each of the years or periods in the two-year period then ended, and the financial highlights for each of the years or periods in the two-year period then ended. These financial statements and financial highlights are the responsibility of the Fund’s management. Our responsibility is to express an opinion on these financial statements and financial highlights based on our audits.
We conducted our audits in accordance with the standards of the Public Company Accounting Oversight Board (United States). Those standards require that we plan and perform the audit to obtain reasonable assurance about whether the financial statements and financial highlights are free of material misstatement. An audit includes examining, on a test basis, evidence supporting the amounts and disclosures in the financial statements. Our procedures included confirmation of securities owned as of April 30, 2004 by correspondence with the custodian. As to securities purchased or sold but not yet received or delivered, we performed other appropriate auditing procedures. An audit also includes assessing the accounting principles used and significant estimates made by management, as well as evaluating the overall financial statement presentation. We believe that our audits provide a reasonable basis for our opinion.
In our opinion, the financial statements and financial highlights referred to above present fairly, in all material respects, the financial position of the Evergreen Institutional Mortgage Portfolio, as of April 30, 2004, the results of its operations, changes in its net assets and financial highlights for each of the years or periods described above in conformity with accounting principles generally accepted in the United States of America.
Boston, Massachusetts
June 4, 2004
17
This page left intentionally blank
18
This page left intentionally blank
19
| TRUSTEES1 | |
Charles A. Austin III
Trustee
DOB: 10/23/1934
Term of office since: 1991
Other directorships: None | Principal occupations: Investment Counselor, Anchor Capital Advisors, Inc. (investment advice); Director, The Andover Companies (insurance); Trustee, Arthritis Foundation of New England; Director, The Francis Ouimet Society; Former Director, Health Development Corp. (fitness-wellness centers); Former Director, Mentor Income Fund, Inc.; Former Trustee, Mentor Funds and Cash Resource Trust; Former Investment Counselor, Appleton Partners, Inc. (investment advice); Former Director, Executive Vice President and Treasurer, State Street Research &Management Company (investment advice) |
|
Shirley L. Fulton
Trustee
DOB: 1/10/1952
Term of office since: 2004
Other directorships: None | Principal occupations: Partner, Helms, Henderson &Fulton, P.A. (law firm); Retired Senior Resident Superior Court Judge, 26th Judicial District, Charlotte, NC |
|
K. Dun Gifford
Trustee
DOB: 10/23/1938
Term of office since: 1974
Other directorships: None | Principal occupations: Chairman and President, Oldways Preservation and Exchange Trust (education); Trustee, Treasurer and Chairman of the Finance Committee, Cambridge College; Former Chairman of the Board, Director, and Executive Vice President, The London Harness Company (leather goods purveyor); Former Director, Mentor Income Fund, Inc.; Former Trustee, Mentor Funds and Cash Resource Trust |
|
Dr. Leroy Keith, Jr.
Trustee
DOB: 2/14/1939
Term of office since: 1983
Other directorships: Trustee, Phoenix Series Fund, Phoenix Multi-Portfolio Fund, and The Phoenix Big Edge Series Fund | Principal occupations: Partner, Stonington Partners, Inc. (private investment firm); Trustee of Phoenix Series Fund, Phoenix Multi-Portfolio Fund, and The Phoenix Big Edge Series Fund; Former Chairman of the Board and Chief Executive Officer, Carson Products Company (manufacturing); Director, Obagi Medical Products Co.; Director, Lincoln Educational Services; Director, Diversapack Co.; Former President, Morehouse College; Former Director, Mentor Income Fund, Inc.; Former Trustee, Mentor Funds and Cash Resource Trust |
|
Gerald M. McDonnell
Trustee
DOB: 7/14/1939
Term of office since: 1988
Other directorships: None | Principal occupations: Manager of Commercial Operations, SMI STEEL Co. - South Carolina (steel producer); Former Sales and Marketing Management, Nucor Steel Company; Former Director, Mentor Income Fund, Inc.; Former Trustee, Mentor Funds and Cash Resource Trust |
|
William Walt Pettit
Trustee
DOB: 8/26/1955
Term of office since: 1984
Other directorships: None | Principal occupations: Partner and Vice President, Kellam &Pettit, P.A. (law firm); Former Director, Mentor Income Fund, Inc.; Former Trustee, Mentor Funds and Cash Resource Trust |
|
David M. Richardson
Trustee
DOB: 9/19/1941
Term of office since: 1982
Other directorships: None | Principal occupations: President, Richardson, Runden &Company (executive recruitment business development/consulting company); Consultant, Kennedy Information, Inc. (executive recruitment information and research company); Consultant, AESC (The Association of Retained Executive Search Consultants); Trustee, NDI Technologies, LLP (communications); Director, J&M Cumming Paper Co. (paper merchandising); Former Vice Chairman, DHR International, Inc. (executive recruitment); Former Director, Mentor Income Fund, Inc.; Former Trustee, Mentor Funds and Cash Resource Trust |
|
Dr. Russell A. Salton III
Trustee
DOB: 6/2/1947
Term of office since: 1984
Other directorships: None | Principal occupations: President/CEO, AccessOne MedCard; Former Medical Director, Healthcare Resource Associates, Inc.; Former Medical Director, U.S. Health Care/Aetna Health Services; Former Director, Mentor Income Fund, Inc.; Former Trustee, Mentor Funds and Cash Resource Trust |
|
20
TRUSTEES AND OFFICERS continued
Michael S. Scofield
Trustee
DOB: 2/20/1943
Term of office since: 1984
Other directorships: None | Principal occupations: Attorney, Law Offices of Michael S. Scofield; Former Director, Mentor Income Fund, Inc.; Former Trustee, Mentor Funds and Cash Resource Trust |
|
Richard J. Shima
Trustee
DOB: 8/11/1939
Term of office since: 1993
Other directorships: None | Principal occupations: Independent Consultant; Director, Trust Company of CT; Trustee, Saint Joseph College (CT); Director, Hartford Hospital; Trustee, Greater Hartford YMCA; Former Director, Enhance Financial Services, Inc.; Former Director, Old State House Association; Former Director of CTG Resources, Inc. (natural gas); Former Director, Mentor Income Fund, Inc.; Former Trustee, Mentor Funds and Cash Resource Trust |
|
Richard K. Wagoner, CFA2
Trustee
DOB: 12/12/1937
Term of office since: 1999
Other directorships: None | Principal occupations: Member and Former President, North Carolina Securities Traders Association; Member, Financial Analysts Society; Former Consultant to the Boards of Trustees of the Evergreen funds; Former Trustee, Mentor Funds and Cash Resource Trust |
|
| OFFICERS |
|
Dennis H. Ferro3
President
DOB: 6/20/1945
Term of office since: 2003 | Principal occupations: President, Chief Executive Officer and Chief Investment Officer, Evergreen Investment Company, Inc. and Executive Vice President, Wachovia Bank, N.A. |
|
Carol Kosel4
Treasurer
DOB: 12/25/1963
Term of office since: 1999 | Principal occupations: Senior Vice President, Evergreen Investment Services, Inc. |
|
Michael H. Koonce4
Secretary
DOB: 4/20/1960
Term of office since: 2000 | Principal occupations: Senior Vice President and General Counsel, Evergreen Investment Services, Inc.; Senior Vice President and Assistant General Counsel, Wachovia Corporation |
|
1 Each Trustee serves until a successor is duly elected or qualified or until his death, resignation, retirement or removal from office. Each Trustee oversees 94 Evergreen funds. Correspondence for each Trustee may be sent to Evergreen Board of Trustees, P.O. Box 20083, Charlotte, North Carolina 28202.
2 Mr. Wagoner is an "interested person" of the Fund because of his ownership of shares in Wachovia Corporation, the parent to the Fund's investment advisor.
3 The address of the Officer is 401 S. Tryon Street, 20th Floor, Charlotte, NC 28288.
4 The address of the Officer is 200 Berkeley Street, Boston, MA 02116.
Additional information about the Fund's Board of Trustees and Officers can be found in the Statement of Additional Information (SAI) and is available upon request without charge by calling 800.343.2898. |
21
INVESTMENTS THAT STAND THE TEST OF TIME
At Evergreen Investments, we remain steadfastly dedicated to four core principles that lead to success in today's financial world.- Leadership -- With over $248 billion in assets under management as of March 31, 2004 and a history of innovation spanning more than 70 years, we offer the strength that comes with experience.
Excellence -- We have been consistently recognized for risk-adjusted historical performance through disciplined, rigorous management focused on achieving sustainable success.
Experience -- Our investment managers are seasoned professionals who share their diverse points of view and have the perspective that comes with weathering good markets and bad.
Commitment -- We are dedicated to helping investment professionals and their clients achieve important goals through the investments, service and education we offer.
Visit us online at EvergreenInvestments.com
FOR MORE INFORMATION
Evergreen Express Line 800.346.3858
Evergreen Investor Services 800.343.2898
For the fifth consecutive year, Evergreen Investments has earned the Dalbar Mutual Fund Service Award, which recognizes those firms that exceed industry norms in key areas. The award symbolizes the achievement of the highest tier of shareholder service within our industry. For 2003,Evergreen Investments was ranked third overall.
570142 6/2004 |
Evergreen Investments
200 Berkeley Street
Boston, MA 02116-5034
|
Evergreen Strategic Income Fund

Evergreen Strategic Income Fund
This annual report must be preceded or accompanied by a prospectus of the Evergreen fund contained herein. The prospectus contains more
complete information, including fees and expenses, and should be read carefully before investing or sending money.A description of the Fund's proxy voting policies and procedures is available without charge, upon request, by calling 1.800.343.2898, by visiting our website
at EvergreenInvestments.com or by visiting the SEC's website at http://www.sec.gov.| Mutual Funds: |
| NOT FDIC INSURED | MAY LOSE VALUE | NOT BANK GUARANTEED |
Evergreen InvestmentsSM is a service mark of Evergreen Investment
Management Company, LLC. Copyright 2004.Evergreen mutual funds are distributed by Evergreen Investment Services, Inc.
200 Berkeley Street, Boston, MA 02116LETTER TO SHAREHOLDERS
June 2004
Dennis H. Ferro
President and Chief
Executive Officer | |
|
Dear Shareholder,
We are pleased to provide the annual report for the Evergreen Strategic Income Fund, which covers the twelve-month period ended April 30, 2004.
Investors in the fixed income markets experienced alternating periods of risk and reward over the past twelve months. Geopolitical uncertainties, improving economic growth, changes in tax legislation, and an accommodative stance from the Federal Reserve managed to both excite and confuse bond market participants at varying points, and in varying sectors, since the beginning of the investment period in May 2003.
The period began with the financial markets focused on the war in Iraq. The associated uncertainty led to higher demand for bonds, particularly within the Treasury market, as investors sought solace in a flight to quality. This performance in government bonds carried over to many municipal and corporate issues, too, and the increased demand for bonds quickly became a sort of self-fulfilling prophecy, as total return potential climbed with higher prices and declining yields. This increasingly popular strategy, though, soon helped set the stage for a summer of volatility unmatched in recent history.
At the conclusion of its monetary policy meeting in May, the Federal Reserve had commented on the "possibility of an unwelcome, substantial fall in inflation." Many bond investors, convinced the Fed was taking rates to zero, drove yields down to 45-year lows in the U.S. Treasury market. Common market wisdom determined that since the Fed's primary concern was deflation, rates were likely headed lower. Yet when central bankers reduced their target for the federal funds rate by a less than expected 25 basis points in late June, many fixed income investors became alarmed. These
1
LETTER TO SHAREHOLDERS continued
worries were compounded by optimistic GDP (Gross Domestic Product) forecasts from Fed Chairman Alan Greenspan during congressional banking committee hearings in July. As a result of these events, the yield on the 10-year Treasury surged from a low of 3.1% in June to 4.6% in late July. Thus, the "deflation trade" in bonds had changed from a significant overbought condition to an oversold one in a matter of just six weeks.
The bond market began to stabilize as investors became more comfortable with the likelihood that monetary policy makers would keep rates low for the foreseeable future. This was a welcome respite for owners of Treasuries and municipal securities. In addition to the excitement in Treasuries, investors in municipal bonds also experienced heightened concerns related to the changes in the tax laws, which were initially perceived as a potential threat to their market. After careful consideration, though, many investors became convinced that capital preservation would remain a primary, if not dominant, theme for the future demand of these securities. A second concern involved the poor financial condition of many states and local governments. Yet just as these concerns were reaching a crescendo, economic growth picked up significantly and tax receipts climbed, improving the financial conditions of many of these entities.
As economic growth strengthened, investors in corporate bonds benefited from the combination of stronger balance sheets, improving credit quality, declining default rates, and the outlook for growth in GDP and corporate profits. In addition, the many steps taken to improve corporate credibility rallied many investors to the credit markets, where many risk appropriate investors successfully searched for improved returns in the high yield market.
Throughout the investment period, the Federal Reserve attempted to improve the clarity of its intentions for the financial markets. At the conclusion of its monetary policy meetings, the Fed's statements ranged from maintaining policy accommodation for a "considerable period" to one of being "measured" in its approach to remove this monetary stimulus. In addition,
2
LETTER TO SHAREHOLDERS continued
central bankers tried to be even more clear in a variety of speeches and public testimonies, as the Fed continued to display an unusually strong effort in clarifying its upcoming changes in monetary policy. Most recently, though, these attempts at clarity caused volatility throughout the fixed income markets, as investors feared a repeat of the experiences in 1994. Given the current level of interest rates, inflation, the dollar, and global economic growth, we believe these concerns are overblown. However, the price of oil remains a wild card, as sustained high oil prices will eventually embed a higher level of manufacturing and service cost in the economy.
We encourage investors to maintain their diversified, long-term strategies within their fixed income portfolios.
Please visit our website, EvergreenInvestments.com, for more information about our funds and other investment products available to you. From the website, you may also access a new feature that presents a detailed Q&A interview with the portfolio manager(s) for your fund. You can easily reach these interviews by following the link, EvergreenInvestments.com/Annual updates, from our website. Thank you for your continued support of Evergreen Investments.
Sincerely,Dennis H. Ferro
President and Chief Executive Officer
Evergreen Investment Company, Inc.Special Notice to Shareholders:
Effective August 1, 2004, the Fund's investment strategy will be amended to permit the following:- The portion of the Fund invested in US Government securities may engage in transactions that create leverage, including certain types of mortgage dollar rolls and TBA mortgage securities, with up to 30% of that portion of the Fund's assets. A mortgage dollar roll transaction allows the Fund to sell a mortgage-backed security to a dealer and simultaneously contract to repurchase a security that is substantially similar in type, coupon and maturity, on a specified future date.
- The portion of the Fund invested in developed market international bonds may also enter into foreign currency exchange contracts, including those entered into for the purposes of cross hedging, proxy hedging and creating a net long position versus a foreign currency. These transactions are designed to maximize risk-adjusted performance or to control risk.
The Fund's prospectus will be supplemented to include these changes. |
3
FUND AT A GLANCE
as of April 30, 2004MANAGEMENT TEAM
Dana Erikson, CFA
High Yield Bond Team
Lead Manager
CURRENT INVESTMENT STYLE
Source: Morningstar, Inc.
Morningstar's style box is based on a portfolio date as of 3/31/2004.
The fixed income style box placement is based on a fund's average effective maturity or duration and the average credit rating of the bond portfolio.PERFORMANCE AND RETURNS
Portfolio inception date: 4/14/1987
| Class A | Class B | Class C | Class I |
| Class inception date | 4/14/1987 | 2/1/1993 | 2/1/1993 | 1/13/1997 |
|
| Nasdaq symbol | EKSAX | EKSBX | EKSCX | EKSYX |
|
| Average annual return* |
|
| 1 year with sales charge | 1.25% | 0.58% | 4.51% | N/A |
|
| 1 year w/o sales charge | 6.24% | 5.49% | 5.49% | 6.56% |
|
| 5 year | 5.72% | 5.68% | 5.98% | 7.21% |
|
| 10 year | 5.82% | 5.55% | 5.53% | 6.43% |
|
| * Adjusted for maximum applicable sales charge, unless noted. |
Past performance is no guarantee of future results. The performance quoted represents past performance and current performance may be lower or higher. The investment return and principal value of an investment will fluctuate so that investors' shares, when redeemed, may be worth more or less than their original cost. To obtain performance information current to the most recent month-end for Class A, B, C or I shares, please go to EvergreenInvestments.com/fundperformance. The performance of each class may vary based on differences in loads, fees and expenses paid by the shareholders investing in each class. Performance includes the reinvestment of income dividends and capital gain distributions. Performance shown does not reflect the deduction of taxes that a shareholder would pay on fund distributions or the redemption of fund shares.
Historical performance shown for Classes B, C and I prior to their inception is based on the performance of Class A, the original class offered. The historical returns for Classes B, C and I have not been adjusted to reflect the effect of each class' 12b-1 fee. These fees are 0.30% for Class A and 1.00% for Classes B and C. Class I does not pay a 12b-1 fee. If these fees had been reflected, returns for Classes B and C would have been lower while returns for Class I would have been higher.
Returns reflect expense limits previously in effect, without which returns would have been lower.LONG-TERM GROWTH
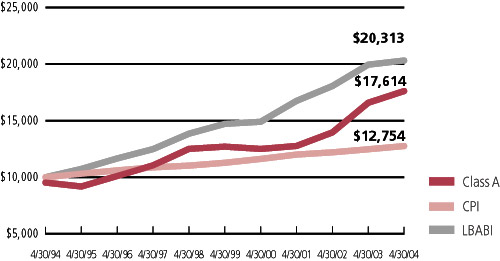 Comparison of a $10,000 investment in Evergreen Strategic Income Fund Class A shares, versus a similar investment in the Lehman Brothers Aggregate Bond Index (LBABI) and the Consumer Price Index (CPI).
The LBABI is an unmanaged market index and does not include transaction costs associated with buying and selling securities, any mutual fund expenses or any taxes. The CPI is a commonly used measure of inflation and does not represent an investment return. It is not possible to invest directly in an index.
4
PORTFOLIO MANAGER COMMENTARY
The fund's Class A shares returned 6.24% for the twelve-month period ended April 30, 2004, excluding any applicable sales charges. During the same period, the fund's benchmark, Lehman Brothers Aggregate Bond Index (LBABI), returned 1.82%.
The period was characterized as relatively volatile for U.S. high grade fixed income securities. However, it was quite positive for high-grade foreign government bonds denominated in local currencies, as well as for emerging market and high yield bonds, classes in which the fund participates. These asset classes benefited from the dearth of yield bearing opportunities on the investment horizon in the U.S. and by solid improvements in the overall credit quality of high yield and emerging market issuers. The rally in high yield, emerging market bonds and foreign currencies, peaked in mid-February 2004, and was followed by generally weak returns, with the most pertinent indexes providing negative returns in the last two and half months ended April 2004.
The fund's out-performance against the benchmark was largely a function of its exposure to the high yield bond market, emerging market bonds and foreign government bonds denominated in currencies other than the U.S. dollar. Throughout the fiscal year, the portfolio was overweighted in foreign government bonds denominated in local currencies, high yield and emerging market bonds, while remaining underweight in U.S. government bonds. The expectation was that low U.S. interest rates and a weakening U.S. dollar would improve global economic growth, positively impacting the fundamentals of commodity producing countries, prices of commodities and foreign currencies. All of these markets had very high returns for the fiscal year ended April 30, 2004, as they benefited from low interest rates in the U.S. and a weakening U.S. dollar. Although the fund underweighted U.S. government bonds, its required exposure to the sector detracted from the fund's performance relative to its benchmark.Class I shares are only offered to investment advisory clients of an investment advisor of an Evergreen fund (or its advisory affiliates), through special arrangements entered into on behalf of Evergreen funds with certain financial services firms, certain institutional investors and persons who owned Class Y shares in registered name in an Evergreen fund on or before December 31, 1994. Class I shares are only available to institutional shareholders with a minimum $1 million investment.
The fund's investment objective is nonfundamental and may be changed without the vote of the fund's shareholders.
Funds that invest in high yield, lower-rated bonds may contain more risk due to the increased possibility of default.
Foreign investments may contain more risk due to the inherent risks associated with changing political climates, foreign market instability and foreign currency fluctuations. Risks of international investing are magnified in emerging or developing markets.
U.S. government guarantees apply only to the underlying securities of the fund's portfolio and not to the fund's shares.
The return of principal is not guaranteed due to fluctuation in the NAV of the fund caused by changes in the price of the individual bonds held by the fund and the buying and selling of bonds by the fund. Bond funds have the same inflation, interest rate, and credit risks that are associated with the individual bonds held by the fund.
All data is as of April 30, 2004, and subject to change.
5
FINANCIAL HIGHLIGHTS
(For a share outstanding throughout each period) | Year Ended April 30,
|
CLASS A
| 20041
| 20031
| 20022
| 20011
| 2000
|
Net asset value, beginning of period
| $6.50
| $5.83
| $5.74
| $6.12
| $6.79
|
| Income from investment operations |
| Net investment income | 0.34 | 0.38 | 0.35 | 0.52 | 0.53 |
Net realized and unrealized gains or losses
on securities and foreign currency
related transactions | 0.07
| 0.68
| 0.16
| -0.40
| -0.63
|
Total from investment operations
| 0.41
| 1.06
| 0.51
| 0.12
| -0.10
|
| Distributions to shareholders from |
| Net investment income | -0.37 | -0.39 | -0.32 | -0.40 | -0.49 |
| Net realized gains | -0.16 | 0 | 0 | 0 | 0 |
| Tax basis return of capital | 0
| 0
| -0.10
| -0.10
| -0.08
|
Total distributions to shareholders
| -0.53
| -0.39
| -0.42
| -0.50
| -0.57
|
Net asset value, end of period
| $6.38
| $6.50
| $5.83
| $5.74
| $6.12
|
Total return3
| 6.24%
| 18.79%
| 9.37%
| 2.09%
| -1.58%
|
| Ratios and supplemental data |
| Net assets, end of period (thousands) | $202,017 | $173,842 | $130,934 | $122,223 | $129,885 |
| Ratios to average net assets |
| Expenses4 | 1.21% | 1.19% | 1.23% | 0.87% | 0.72% |
| Net investment income | 5.10% | 6.31% | 6.02% | 8.06% | 8.36% |
| Portfolio turnover rate | 129% | 129% | 304% | 322% | 187% |
|
1 Net investment income per share is based on average shares outstanding during the period.2 As required, effective May 1, 2001 the Fund adopted the provisions of the AICPA Audit and Accounting Guide, Audits of Investment Companies , and began amortizing premium on its fixed-income securities. The effects of this change for the year ended April 30, 2002 was a decrease in net investment income per share of $0.02; an increase in net realized gains or losses per share of $0.02; and a decrease to the ratio of net investment income to average net assets of 0.45%. The above per share information, ratios and supplemental data for the periods prior to May 1, 2001 have not been restated to reflect this change in presentation.3 Excluding applicable sales charges4 The ratio of expenses to average net assets excludes expense reductions but includes fee waivers and/or expense reimbursements.
See Notes to Financial Statements |
6
FINANCIAL HIGHLIGHTS
(For a share outstanding throughout each period) | Year Ended April 30,
|
CLASS B
| 20041
| 2003
| 20022
| 20011
| 2000
|
Net asset value, beginning of period
| $6.52
| $5.85
| $5.75
| $6.14
| $6.81
|
| Income from investment operations |
| Net investment income | 0.29 | 0.34 | 0.29 | 0.48 | 0.49 |
Net realized and unrealized gains or losses
on securities and foreign currency
related transactions | 0.07
| 0.67
| 0.19
| -0.41
| -0.64
|
Total from investment operations
| 0.36
| 1.01
| 0.48
| 0.07
| -0.15
|
| Distributions to shareholders from |
| Net investment income | -0.32 | -0.34 | -0.28 | -0.36 | -0.44 |
| Net realized gains | -0.16 | 0 | 0 | 0 | 0 |
| Tax basis return of capital | 0
| 0
| -0.10
| -0.10
| -0.08
|
Total distributions to shareholders
| -0.48
| -0.34
| -0.38
| -0.46
| -0.52
|
Net asset value, end of period
| $6.40
| $6.52
| $5.85
| $5.75
| $6.14
|
Total return3
| 5.49%
| 17.87%
| 8.74%
| 1.18%
| -2.29%
|
| Ratios and supplemental data |
| Net assets, end of period (thousands) | $113,115 | $107,968 | $77,471 | $83,347 | $104,110 |
| Ratios to average net assets |
| Expenses4 | 1.91% | 1.94% | 1.98% | 1.61% | 1.47% |
| Net investment income | 4.40% | 5.54% | 5.27% | 7.34% | 7.60% |
| Portfolio turnover rate | 129% | 129% | 304% | 322% | 187% |
|
1 Net investment income per share is based on average shares outstanding during the period.2 As required, effective May 1, 2001 the Fund adopted the provisions of the AICPA Audit and Accounting Guide, Audits of Investment Companies, and began amortizing premium on its fixed-income securities. The effects of this change for the year ended April 30, 2002 was a decrease in net investment income per share of $0.03; an increase in net realized gains or losses per share of $0.03; and a decrease to the ratio of net investment income to average net assets of 0.45%. The above per share information, ratios and supplemental data for the periods prior to May 1, 2001 have not been restated to reflect this change in presentation.3 Excluding applicable sales charges4 The ratio of expenses to average net assets excludes expense reductions but includes fee waivers and/or expense reimbursements.
See Notes to Financial Statements |
7
FINANCIAL HIGHLIGHTS
(For a share outstanding throughout each period) | Year Ended April 30,
|
CLASS C
| 20041
| 20031
| 20022
| 20011
| 2000
|
Net asset value, beginning of period
| $6.51
| $5.84
| $5.75
| $6.13
| $6.80
|
| Income from investment operations |
| Net investment income | 0.29 | 0.34 | 0.32 | 0.46 | 0.49 |
Net realized and unrealized gains or losses
on securities and foreign currency
related transactions | 0.07
| 0.67
| 0.15
| -0.38
| -0.64
|
Total from investment operations
| 0.36
| 1.01
| 0.47
| 0.08
| -0.15
|
| Distributions to shareholders from |
| Net investment income | -0.32 | -0.34 | -0.28 | -0.36 | -0.44 |
| Net realized gains | -0.16 | 0 | 0 | 0 | 0 |
| Tax basis return of capital | 0
| 0
| -0.10
| -0.10
| -0.08
|
Total distributions to shareholders
| -0.48
| -0.34
| -0.38
| -0.46
| -0.52
|
Net asset value, end of period
| $6.39
| $6.51
| $5.84
| $5.75
| $6.13
|
Total return3
| 5.49%
| 17.89%
| 8.56%
| 1.35%
| -2.30%
|
| Ratios and supplemental data |
| Net assets, end of period (thousands) | $89,236 | $68,207 | $22,554 | $16,746 | $14,655 |
| Ratios to average net assets |
| Expenses4 | 1.91% | 1.93% | 1.98% | 1.63% | 1.47% |
| Net investment income | 4.40% | 5.66% | 5.25% | 7.26% | 7.61% |
| Portfolio turnover rate | 129% | 129% | 304% | 322% | 187% |
|
1 Net investment income per share is based on average shares outstanding during the period.2 As required, effective May 1, 2001 the Fund adopted the provisions of the AICPA Audit and Accounting Guide, Audits of Investment Companies, and began amortizing premium on its fixed-income securities. The effects of this change for the year ended April 30, 2002 was a decrease in net investment income per share of $0.02; an increase in net realized gains or losses per share of $0.02; and a decrease to the ratio of net investment income to average net assets of 0.45%. The above per share information, ratios and supplemental data for the periods prior to May 1, 2001 have not been restated to reflect this change in presentation.3 Excluding applicable sales charges4 The ratio of expenses to average net assets excludes expense reductions but includes fee waivers and/or expense reimbursements.
See Notes to Financial Statements |
8
FINANCIAL HIGHLIGHTS
(For a share outstanding throughout each period) | Year Ended April 30,
|
CLASS I1
| 20042
| 20032
| 20023
| 20012
| 2000
|
Net asset value, beginning of period
| $6.40
| $5.74
| $5.65
| $6.02
| $6.63
|
| Income from investment operations |
| Net investment income | 0.35 | 0.41 | 0.35 | 0.51 | 0.55 |
Net realized and unrealized gains or losses
on securities and foreign currency
related transactions | 0.07
| 0.64
| 0.17
| -0.37
| -0.59
|
Total from investment operations
| 0.42
| 1.05
| 0.52
| 0.14
| -0.04
|
| Distributions to shareholders from |
| Net investment income | -0.38 | -0.39 | -0.33 | -0.41 | -0.49 |
| Net realized gains | -0.16 | 0 | 0 | 0 | 0 |
| Tax basis return of capital | 0
| 0
| -0.10
| -0.10
| -0.08
|
Total distributions to shareholders
| -0.54
| -0.39
| -0.43
| -0.51
| -0.57
|
Net asset value, end of period
| $6.28
| $6.40
| $5.74
| $5.65
| $6.02
|
Total return
| 6.56%
| 19.09%
| 9.67%
| 2.41%
| -0.61%
|
| Ratios and supplemental data |
| Net assets, end of period (thousands) | $26,711 | $13,406 | $1,779 | $1,584 | $1,386 |
| Ratios to average net assets |
| Expenses4 | 0.91% | 0.94% | 0.98% | 0.62% | 0.47% |
| Net investment income | 5.42% | 6.75% | 6.27% | 8.30% | 8.63% |
| Portfolio turnover rate | 129% | 129% | 304% | 322% | 187% |
|
1 Effective at the close of business on May 11, 2001, Class Y shares were renamed as Institutional shares (Class I).2 Net investment income per share is based on average shares outstanding during the period.3 As required, effective May 1, 2001 the Fund adopted the provisions of the AICPA Audit and Accounting Guide, Audits of Investment Companies, and began amortizing premium on its fixed-income securities. The effects of this change for the year ended April 30, 2002 was a decrease in net investment income per share of $0.03; an increase in net realized gains or losses per share of $0.03; and a decrease to the ratio of net investment income to average net assets of 0.45%. The above per share information, ratios and supplemental data for the periods prior to May 1, 2001 have not been restated to reflect this change in presentation.4 The ratio of expenses to average net assets excludes expense reductions but includes fee waivers and/or expense reimbursements.
See Notes to Financial Statements |
9
SCHEDULE OF INVESTMENTS
April 30, 2004 | Principal
Amount | Value |
|
| CORPORATE BONDS 35.3% |
| CONSUMER DISCRETIONARY 10.7% |
| Auto Components 1.7% |
| Collins & Aikman Products Co., 10.75%, 12/31/2011 | $ 1,580,000 | $ 1,643,200 |
| Dana Corp., 9.00%, 08/15/2011 | 1,300,000 | 1,540,500 |
| HLI Operating, Inc., 10.50%, 06/15/2010 | 975,000 | 1,106,625 |
| RJ Tower Corp., 12.00%, 06/01/2013 (p) | 580,000 | 569,850 |
| Tenneco Automotive, Inc., 10.25%, 07/15/2013 | 1,095,000 | 1,267,463 |
| TRW Automotive, Inc., 9.375%, 02/15/2013 | 1,160,000 | 1,334,000 |
| 7,461,638 |
| Hotels, Restaurants & Leisure 2.4% |
| Chumash Casino & Resort Enterprise, 9.00%, 07/15/2010 144A | 290,000 | 323,350 |
| Coast Hotels & Casinos, Inc., 9.50%, 04/01/2009 (p) | 1,100,000 | 1,161,875 |
| Equinox Holdings, Inc., 9.00%, 12/15/2009 144A (p) | 1,500,000 | 1,560,000 |
| Friendly Ice Cream Corp., 8.375%, 06/15/2012 144A | 1,005,000 | 1,032,637 |
| John Q. Hammons Hotels LP, Ser. B, 8.875%, 05/15/2012 | 1,135,000 | 1,254,175 |
| Mandalay Resort Group, Ser. B, 10.25%, 08/01/2007 | 1,000,000 | 1,167,500 |
| MTR Gaming Group, Inc., 9.75%, 04/01/2010 (p) | 1,000,000 | 1,067,500 |
| Premier Entertainment Biloxi LLC, 10.75%, 02/01/2012 144A | 280,000 | 303,800 |
| Venetian Casino Resort LLC, 11.00%, 06/15/2010 | 2,000,000 | 2,350,000 |
| 10,220,837 |
| Household Durables 1.0% |
| Amscan Holdings, Inc., 8.75%, 05/01/2014 144A | 700,000 | 714,000 |
| Meritage Corp., 9.75%, 06/01/2011 | 500,000 | 559,375 |
| Standard Pacific Corp., 7.75%, 03/15/2013 | 500,000 | 521,250 |
| Technical Olympic USA, Inc., 9.00%, 07/01/2010 | 850,000 | 896,750 |
| WCI Communities, Inc., 9.125%, 05/01/2012 (p) | 1,300,000 | 1,423,500 |
| 4,114,875 |
| Leisure Equipment & Products 0.5% |
| Hockey Co., 11.25%, 04/15/2009 | 675,000 | 806,625 |
| ICON Health & Fitness, Inc., 11.25%, 04/01/2012 | 1,100,000 | 1,243,000 |
| 2,049,625 |
| Media 3.3% |
| Affinity Group, Inc., 9.00%, 02/15/2012 144A | 1,620,000 | 1,717,200 |
| AMC Entertainment, Inc., 9.875%, 02/01/2012 | 1,100,000 | 1,193,500 |
| CCO Holdings LLC, 8.75%, 11/15/2013 144A | 2,000,000 | 1,980,000 |
| Cinemark USA, Inc., 9.00%, 02/01/2013 | 150,000 | 165,000 |
| CSC Holdings, Inc., 7.625%, 04/01/2011 | 835,000 | 872,575 |
| Dex Media East LLC, 12.125%, 11/15/2012 | 1,000,000 | 1,165,000 |
| Dex Media West LLC, 9.875%, 08/15/2013 144A | 1,000,000 | 1,100,000 |
| Emmis Communications Corp.: |
| Ser. B, 8.125%, 03/15/2009 | 170,000 | 178,288 |
| Sr. Disc. Note, Step Bond, 0.00%, 3/15/2011 † | 1,830,000 | 1,839,150 |
| Emmis Operations Co., 6.875%, 05/15/2012 144A # | 2,125,000 | 2,130,312 |
See Notes to Financial Statements |
10
SCHEDULE OF INVESTMENTS continued
April 30, 2004 | Principal
Amount | Value |
|
| CORPORATE BONDS continued |
| CONSUMER DISCRETIONARY continued |
| Media continued |
| Paxson Communications Corp.: |
| 10.75%, 07/15/2008 | $ 1,250,000 | $ 1,325,000 |
| Sr. Disc. Note, Step Bond, 0.00%, 01/15/2009 † | 650,000 | 567,125 |
| 14,233,150 |
| Multi-line Retail 0.0% |
| Saks, Inc., 9.875%, 10/01/2011 | 135,000 | 161,663 |
| Specialty Retail 1.8% |
| FTD, Inc., 7.75%, 02/15/2014 144A | 2,000,000 | 1,990,000 |
| General Nutrition Centers, Inc., 8.50%, 12/01/2010 144A | 1,500,000 | 1,575,000 |
| Group 1 Automotive, Inc., 8.25%, 08/15/2013 | 750,000 | 823,125 |
| Mothers Work, Inc., 11.25%, 08/01/2010 | 795,000 | 840,712 |
| PETCO Animal Supplies, Inc., 10.75%, 11/01/2011 | 1,100,000 | 1,265,000 |
| United Auto Group, Inc., 9.625%, 03/15/2012 | 1,300,000 | 1,459,250 |
| 7,953,087 |
| CONSUMER STAPLES 2.4% |
| Food & Staples Retailing 0.8% |
| Michael Foods, Inc., 8.00%, 11/15/2013 144A | 900,000 | 950,625 |
| Rite Aid Corp.: |
| 9.50%, 02/15/2011 | 600,000 | 676,500 |
| 12.50%, 09/15/2006 | 1,400,000 | 1,617,000 |
| 3,244,125 |
| Food Products 0.5% |
| Chiquita Brands International, Inc., 10.56%, 03/15/2009 | 750,000 | 824,062 |
| Dole Food Co., Inc., 7.25%, 06/15/2010 | 1,000,000 | 1,012,500 |
| Seminis Vegetable Seeds, Inc., 10.25%, 10/01/2013 144A | 285,000 | 317,775 |
| 2,154,337 |
| Household Products 0.1% |
| Solo Cup Co., 8.50%, 02/15/2014 144A | 490,000 | 507,150 |
| Personal Products 0.6% |
| Playtex Products, Inc., 8.00%, 03/01/2011 144A | 2,500,000 | 2,637,500 |
| Tobacco 0.4% |
| North Atlantic Trading, Inc., 9.25%, 03/01/2012 144A | 1,735,000 | 1,765,363 |
| ENERGY 4.1% |
| Energy Equipment & Services 1.1% |
| General Maritime Corp., 10.00%, 03/15/2013 | 1,115,000 | 1,259,950 |
| NRG Energy, Inc., 8.00%, 12/15/2013 144A | 1,450,000 | 1,468,125 |
| Parker Drilling Co., Ser. B, 10.125%, 11/15/2009 | 2,000,000 | 2,155,000 |
| 4,883,075 |
See Notes to Financial Statements |
11
SCHEDULE OF INVESTMENTS continued
April 30, 2004 | Principal
Amount | Value |
|
| CORPORATE BONDS continued |
| ENERGY continued |
| Oil & Gas 3.0% |
| Chesapeake Energy Corp., 6.875%, 01/15/2016 | $ 1,620,000 | $ 1,652,400 |
| El Paso Energy Partners LP, 8.50%, 06/01/2011 | 804,000 | 892,440 |
| El Paso Production Holding Co., 7.75%, 06/01/2013 | 1,300,000 | 1,241,500 |
| Evergreen Resources, Inc., 5.875%, 03/15/2012 144A | 420,000 | 417,900 |
| Exco Resources, Inc., 7.25%, 01/15/2011 144A | 225,000 | 228,375 |
| Gulfterra Energy Partners LP, Ser. B, 6.25%, 06/01/2010 | 1,200,000 | 1,248,000 |
| Overseas Shipholding Group, Inc., 8.25%, 03/15/2013 | 750,000 | 836,250 |
| Petroleum Geo Services, 10.00%, 11/05/2010 | 2,500,000 | 2,737,500 |
| Plains Exploration & Production Co., 8.75%, 07/01/2012 (p) | 1,300,000 | 1,436,500 |
| Premcor Refining Group, Inc., 6.75%, 05/01/2014 | 1,500,000 | 1,500,000 |
| Tri-Union Development Corp., 12.50%, 06/01/2006 + | 908,500 | 681,375 |
| 12,872,240 |
| FINANCIALS 5.2% |
| Diversified Financial Services 3.5% |
| Arch Western Finance LLC, 6.75%, 07/01/2013 144A | 1,500,000 | 1,552,500 |
| Nalco Finance Holdings LLC, Sr. Disc. Note, Step Bond, 0.00%, |
| 02/01/2009 144A † | 1,265,000 | 803,275 |
| Ship Finance International, Ltd., 8.50%, 12/15/2013 144A | 865,000 | 839,050 |
| Trac-X North America High Yield, 8.00%, 03/25/2009 144A (p) | 12,000,000 | 11,730,000 |
| 14,924,825 |
| Insurance 0.3% |
| Crum & Forster Holding Corp., 10.375%, 06/15/2013 | 1,300,000 | 1,443,000 |
| Real Estate 1.4% |
| HMH Properties, Inc., Ser. J, 7.125%, 11/01/2013 REIT | 1,500,000 | 1,530,000 |
| La Quinta Corp., 8.875%, 03/15/2011 REIT | 520,000 | 579,800 |
| LNR Property Corp., 7.625%, 07/15/2013 | 920,000 | 952,200 |
| Lyon William Homes, Inc., 7.50%, 02/15/2014 144A | 2,000,000 | 2,010,000 |
| Universal City Development Partners, 11.75%, 04/01/2010 | 885,000 | 1,026,600 |
| 6,098,600 |
| HEALTH CARE 1.3% |
| Health Care Equipment & Supplies 0.8% |
| Kinetic Concepts, Inc., 7.375%, 05/15/2013 | 325,000 | 342,875 |
| NeighborCare, Inc., 6.875%, 11/15/2013 144A | 1,125,000 | 1,153,125 |
| Norcross Safety Products LLC, Ser. B, 9.875%, 08/15/2011 | 700,000 | 752,500 |
| Universal Hospital Services, Inc., 10.125%, 11/01/2011 144A | 1,050,000 | 1,123,500 |
| 3,372,000 |
| Health Care Providers & Services 0.2% |
| Pacificare Health Systems, Inc., 10.75%, 06/01/2009 | 845,000 | 986,538 |
| Pharmaceuticals 0.3% |
| Alpharma, Inc., 8.625%, 05/01/2011 144A | 1,050,000 | 1,107,750 |
See Notes to Financial Statements |
12
SCHEDULE OF INVESTMENTS continued
April 30, 2004 | Principal
Amount | Value |
|
| CORPORATE BONDS continued |
| INDUSTRIALS 2.9% |
| Commercial Services & Supplies 1.5% |
| Allied Waste North America, Inc.: |
| 6.50%, 11/15/2010 144A | $ 450,000 | $ 452,250 |
| 7.375%, 04/15/2014 144A (p) | 4,370,000 | 4,359,075 |
| Coinmach Corp., 9.00%, 02/01/2010 | 560,000 | 596,400 |
| Geo Group, Inc., 8.25%, 07/15/2013 | 390,000 | 407,550 |
| United Rentals North America, Inc., 6.50%, 02/15/2012 144A | 900,000 | 873,000 |
| 6,688,275 |
| Machinery 1.2% |
| AGCO Corp., 8.50%, 03/15/2006 | 1,100,000 | 1,108,250 |
| CNH Global N.V., 9.25%, 08/01/2011 144A | 1,500,000 | 1,680,000 |
| SPX Corp., 7.50%, 01/01/2013 | 665,000 | 706,562 |
| Terex Corp., 7.375%, 01/15/2014 144A | 1,440,000 | 1,508,400 |
| 5,003,212 |
| Transportation Infrastructure 0.2% |
| Sea Containers, Ltd., 10.50%, 05/15/2012 # | 855,000 | 844,313 |
| INFORMATION TECHNOLOGY 0.2% |
| IT Services 0.2% |
| Stratus Technologies, Inc., 10.375%, 12/01/2008 144A | 1,000,000 | 1,000,000 |
| MATERIALS 5.0% |
| Chemicals 2.0% |
| Acetex Corp., 10.875%, 08/01/2009 | 1,000,000 | 1,105,000 |
| Equistar Chemicals LP, 10.625%, 05/01/2011 (p) | 745,000 | 838,125 |
| Ethyl Corp., 8.875%, 05/01/2010 | 250,000 | 271,250 |
| FMC Corp., 10.25%, 11/01/2009 | 920,000 | 1,090,200 |
| HMP Equity Holdings Corp., 0.00%, 05/15/2008 144A (n) | 1,000,000 | 600,000 |
| Huntsman Advanced Materials LLC, 11.625%, 10/15/2010 | 940,000 | 1,038,700 |
| Huntsman International LLC, 9.875%, 03/01/2009 | 1,300,000 | 1,452,750 |
| Lyondell Chemical Co., 9.50%, 12/15/2008 | 1,000,000 | 1,050,000 |
| Noveon, Inc., Ser. B, 11.00%, 02/28/2011 | 940,000 | 1,099,800 |
| 8,545,825 |
| Containers & Packaging 1.3% |
| Graphic Packaging International, Inc., 9.50%, 08/15/2013 | 1,000,000 | 1,130,000 |
| Jarden Corp., 9.75%, 05/01/2012 | 1,300,000 | 1,469,000 |
| Jefferson Smurfit Group, 7.50%, 06/01/2013 | 1,300,000 | 1,352,000 |
| Owens-Brockway Glass Container, Inc., 8.75%, 11/15/2012 | 1,300,000 | 1,426,750 |
| 5,377,750 |
| Metals & Mining 1.2% |
| Freeport-McMoRan Copper & Gold, Inc.: |
| 6.875%, 02/01/2014 144A (p) | 820,000 | 742,100 |
| 7.50%, 11/15/2006 (p) | 1,200,000 | 1,242,000 |
| 10.125%, 02/01/2010 | 1,680,000 | 1,856,400 |
See Notes to Financial Statements |
13
SCHEDULE OF INVESTMENTS continued
April 30, 2004 | Principal
Amount | Value |
|
| CORPORATE BONDS continued |
| MATERIALS continued |
| Metals & Mining continued |
| Massey Energy Co., 6.625%, 11/15/2010 | $ 670,000 | $ 676,700 |
| Peabody Energy Corp., 6.875%, 03/15/2013 | 440,000 | 459,800 |
| U.S. Steel Corp., 10.75%, 08/01/2008 (p) | 325,000 | 381,875 |
| 5,358,875 |
| Paper & Forest Products 0.5% |
| Georgia Pacific Corp.: |
| 8.00%, 01/15/2024 144A | 420,000 | 443,100 |
| 8.125%, 05/15/2011 (p) | 1,600,000 | 1,812,000 |
| 2,255,100 |
| TELECOMMUNICATION SERVICES 2.4% |
| Diversified Telecommunication Services 0.6% |
| FairPoint Communications, Inc., 12.50%, 05/01/2010 (p) | 1,040,000 | 1,149,200 |
| RCN Corp., 12.50%, 06/30/2008 (h) | 1,328,076 | 1,361,277 |
| 2,510,477 |
| Wireless Telecommunications Services 1.8% |
| American Towers, Inc., 7.25%, 12/01/2011 144A | 2,500,000 | 2,568,750 |
| AT&T Wireless Services, Inc., 7.875%, 03/01/2011 | 2,300,000 | 2,652,749 |
| Nextel Communications, Inc.: |
| 6.875%, 10/31/2013 (p) | 568,000 | 576,520 |
| 7.375%, 08/01/2015 | 2,000,000 | 2,087,500 |
| 7,885,519 |
| UTILITIES 1.1% |
| Multi-Utilities & Unregulated Power 1.1% |
| AES Corp., 9.50%, 06/01/2009 (p) | 2,005,000 | 2,155,375 |
| Reliant Resources, Inc.: |
| 9.25%, 07/15/2010 | 1,300,000 | 1,397,500 |
| 9.50%, 07/15/2013 | 1,000,000 | 1,090,000 |
| 4,642,875 |
| Total Corporate Bonds (cost $144,778,524) | | 152,303,599 |
| FOREIGN BONDS-CORPORATE (PRINCIPAL AMOUNT |
| DENOMINATED IN CURRENCY INDICATED) 4.8% |
| FINANCIALS 3.6% |
| Commercial Banks 3.6% |
| Realkredit Danmark, 4.00%, 01/01/2008, DKK | 94,333,000 | 15,501,013 |
| MATERIALS 1.2% |
| Chemicals 0.8% |
| Nalco Co., 9.00%, 11/15/2013, EUR | 3,000,000 | 3,618,103 |
| Containers & Packaging 0.4% |
| Crown European Holdings SA, 10.25%, 03/01/2011, EUR | 1,300,000 | 1,735,994 |
| Total Foreign Bonds-Corporate (cost $21,336,890) | | 20,855,110 |
See Notes to Financial Statements |
14
SCHEDULE OF INVESTMENTS continued
April 30, 2004 | Principal
Amount | Value |
|
FOREIGN BONDS-GOVERNMENT (PRINCIPAL AMOUNT
DENOMINATED IN CURRENCY INDICATED) 22.5% |
| Australia, 10.00%, 10/15/2007, AUD | 11,050,000 | $ 9,055,597 |
| Canada: |
| 4.40%, 03/15/2008, CAD | 5,200,000 | 3,898,369 |
| 5.75%, 09/01/2006, CAD | 3,800,000 | 2,950,973 |
| 6.00%, 06/01/2008, CAD | 8,870,000 | 7,053,364 |
| Hungary: |
| 7.75%, 04/12/2005, HUF | 600,000,000 | 2,790,204 |
| 8.50%, 10/12/2005, HUF | 2,355,500,000 | 10,954,575 |
| New Zealand: |
| 6.50%, 02/15/2005, NZD | 6,500,000 | 4,084,081 |
| 8.00%, 11/15/2006, NZD | 23,050,000 | 15,139,208 |
| Norway, 6.00%, 05/16/2011, NOK | 25,000,000 | 3,941,622 |
| Poland, 5.00%, 10/24/2013, PLN | 27,000,000 | 5,746,508 |
| Slovakia, 4.95%, 03/05/2008, SKK | 140,000,000 | 4,169,860 |
| Sweden: |
| 3.50%, 04/20/2006, SEK | 61,125,000 | 8,094,617 |
| 8.00%, 08/15/2007, SEK | 79,500,000 | 11,852,655 |
| United Kingdom, 4.50%, 03/07/2007, GBP | 4,000,000 | 7,061,320 |
| Total Foreign Bonds-Government (cost $94,603,573) | | 96,792,953 |
| MORTGAGE-BACKED SECURITIES 0.1% |
| GNMA: |
| 6.00%, 06/15/2031-09/15/2031 | $ 173,414 | 177,904 |
| 7.50%, 04/15/2030-02/15/2031 | 206,482 | 221,860 |
| 8.00%, 10/15/2030 | 3,878 | 4,233 |
| Total Mortgage-Backed Securities (cost $391,898) | | 403,997 |
| U.S. TREASURY OBLIGATIONS 15.9% |
| U.S. Treasury Notes: |
| 1.625%, 09/30/2005 | 26,000,000 | 25,907,596 |
| 2.625%, 05/15/2008 | 14,000,000 | 13,640,158 |
| 3.25%, 08/15/2007 | 13,074,000 | 13,186,358 |
| 4.25%, 11/15/2013 | 10,000,000 | 9,813,290 |
| 4.375%, 05/15/2007 ## | 5,246,000 | 5,472,029 |
| 5.875%, 11/15/2004 | 460,000 | 471,411 |
| Total U.S. Treasury Obligations (cost $69,041,504) | | 68,490,842 |
| YANKEE OBLIGATIONS-CORPORATE 4.1% |
| CONSUMER DISCRETIONARY 0.3% |
| Media 0.3% |
| IMAX Corp., 9.625%, 12/01/2010 144A | 1,300,000 | 1,319,500 |
| FINANCIALS 0.3% |
| Commercial Banks 0.3% |
| BBVA Bancomer Capital Trust, 10.50%, 02/16/2011 | 1,250,000 | 1,401,562 |
See Notes to Financial Statements |
15
SCHEDULE OF INVESTMENTS continued
April 30, 2004 | Principal
Amount | Value |
|
| YANKEE OBLIGATIONS-CORPORATE continued |
| INDUSTRIALS 0.7% |
| Commercial Services & Supplies 0.5% |
| Stena AB, 7.50%, 11/01/2013 | $ 2,000,000 | $ 2,090,000 |
| Marine 0.2% |
| CP Ships, Ltd., 10.375%, 07/15/2012 | 675,000 | 786,375 |
| MATERIALS 0.2% |
| Containers & Packaging 0.1% |
| Crown European Holdings SA, 9.50%, 03/01/2011 | 500,000 | 563,125 |
| Paper & Forest Products 0.1% |
| Millar Western Forest Products, 7.75%, 11/15/2013 144A | 165,000 | 174,075 |
| TELECOMMUNICATION SERVICES 0.3% |
| Wireless Telecommunications Services 0.3% |
| Rogers Wireless, Inc.: |
| 6.375%, 03/01/2014 144A | 465,000 | 439,425 |
| 9.625%, 05/01/2011 | 745,000 | 863,269 |
| 1,302,694 |
| UTILITIES 2.3% |
| Electric Utilities 0.4% |
| Enersis SA, 7.375%, 01/15/2014 144A | 1,800,000 | 1,775,297 |
| Gas Utilities 1.9% |
| Gazprom, 9.625%, 03/01/2013 144A | 7,900,000 | 8,156,750 |
| Total Yankee Obligations-Corporate (cost $17,543,598) | | 17,569,378 |
| YANKEE OBLIGATIONS-GOVERNMENT 10.3% |
| Brazil: |
| 9.25%, 10/22/2010 | 3,250,000 | 3,136,250 |
| 10.00%, 01/16/2007 | 1,000,000 | 1,047,500 |
| Ser. L, 8.00%, 04/15/2014 | 2,931,925 | 2,697,371 |
| Colombia: |
| 9.75%, 04/09/2011 | 3,168,858 | 3,501,589 |
| 10.75%, 01/15/2013 | 800,000 | 884,000 |
| Indonesia, 6.75%, 03/10/2014 144A | 3,000,000 | 2,707,500 |
| Mexico: |
| 7.50%, 01/14/2012 (p) | 800,000 | 874,000 |
| 8.30%, 08/15/2031 | 2,200,000 | 2,366,100 |
| 8.375%, 01/14/2011 | 2,985,000 | 3,440,212 |
| Peru, 9.125%, 01/15/2008 | 2,700,000 | 3,010,500 |
| Philippines, 9.375%, 01/18/2017 | 7,560,000 | 7,881,300 |
| Russia: |
| Ser. V, 3.00%, 05/14/2008 | 5,500,000 | 4,864,090 |
| Sr. Disc. Note, Step Bond, 5.00%, 03/31/2007 † | 3,000,000 | 2,752,650 |
| Venezuela: |
| 9.25%, 09/15/2027 | 1,000,000 | 835,000 |
| 10.75%, 09/19/2013 | 4,400,000 | 4,312,000 |
| Total Yankee Obligations-Government (cost $42,651,104) | | 44,310,062 |
See Notes to Financial Statements |
16
SCHEDULE OF INVESTMENTS continued
April 30, 2004 | Shares | Value |
|
| COMMON STOCKS 0.1% |
| CONSUMER DISCRETIONARY 0.1% |
| Media 0.1% |
| IMAX Corp. (p) * | 39,093 | $ 194,253 |
| ENERGY 0.0% |
| Oil & Gas 0.0% |
| Tri-Union Development Corp. (h) * + | 590 | 0 |
| Tribo Petroleum Corp., Class A (h) * + | 1,000 | 0 |
| 0 |
| FINANCIALS 0.0% |
| Diversified Financial Services 0.0% |
| Ono Finance plc 144A * + | 2,000 | 20 |
| Total Common Stocks (cost $305,808) | | 194,273 |
| WARRANTS 0.0% |
| FINANCIALS 0.0% |
| Diversified Financial Services 0.0% |
| Ono Finance plc, Expiring 3/16/2011 144A + * | 2,000 | 20 |
| MATERIALS 0.0% |
| Chemicals 0.0% |
| HMP Equity Holdings Corp., Expiring 5/15/2011 144A * | 1,000 | 190,500 |
| TELECOMMUNICATION SERVICES 0.0% |
| Diversified Telecommunication Services 0.0% |
| RCN Corp., Expiring 06/30/2013 (h) * + | 175,000 | 0 |
| Total Warrants (cost $382,867) | | 190,520 |
| SHORT-TERM INVESTMENTS 10.9% |
| MUTUAL FUND SHARES 10.9% |
| Evergreen Institutional Money Market Fund (o) | 15,357,666 | 15,357,666 |
| Navigator Prime Portfolio (pp) | 31,828,221 | 31,828,221 |
| Total Short-Term Investments (cost $47,185,887) | | 47,185,887 |
| Total Investments (cost $438,221,653) 104.0% | | 448,296,621 |
| Other Assets and Liabilities (4.0%) | | (17,217,296) |
| Net Assets 100.0% | | $ 431,079,325 |
See Notes to Financial Statements |
17
SCHEDULE OF INVESTMENTS continued
April 30, 2004| 144A | Security that may be sold to qualified institutional buyers under Rule 144A of the Securities Act of 1933, as amended. This security has been determined to be liquid, unless otherwise noted, under guidelines established by the Board of Trustees. |
| + | Security is deemed illiquid and is valued using market quotations where readily available. In the absence of market quotations, the security is valued based upon its fair value determined under procedures approved by the Board of Trustees. |
| (n) | Security issued in zero coupon form with no periodic interest payments but is acquired at a discount that results in a current yield to maturity. An effective interest rate is applied to recognize interest income daily for the bond. This rate is based on total expected income to be earned over the life of the bond from amortization of discount at acquisition. |
| (o) | Evergreen Investment Management Company, LLC is the investment advisor to both the Fund and the money market fund. |
| † | Security initially issued in zero coupon form which converts to coupon form at a specified rate and date. An effective interest rate is applied to recognize interest income daily for the bond. This rate is based on total expected interest to be earned over the life of the bond which consists of the aggregate coupon-interest payments and discount at acquisition. The rate shown is the stated rate at the current period end. |
| (p) | All or a portion of this security is on loan. |
| (pp) | Represents investment of cash collateral received from securities on loan. |
| * | Non-income producing security. |
| (h) | No market quotation available. Valued at fair value as determined in good faith under procedures established by the Board of Trustees. |
| # | When-issued or delayed delivery security |
| ## | All or a portion of this security has been segregated for when-issued or delayed delivery securities. |
|
| Summary of Abbreviations: |
| AUD | Australian Dollar |
| CAD | Canadian Dollar |
| EUR | Euro |
| DKK | Danish Krone |
| GBP | Pound Sterling |
| GNMA | Government National Mortgage Association |
| HUF | Hungarian Forint |
| NOK | Norwegian Krone |
| NZD | New Zealand Dollar |
| PLN | Polish Zloty |
| REIT | Real Estate Investment Trust |
| SEK | Swedish Krona |
| SKK | Slovakia Koruny |
See Notes to Financial Statements |
18
STATEMENT OF ASSETS AND LIABILITIES
April 30, 2004
|
| Assets |
| Investments in securities, at value (cost $438,221,653) including $31,138,735 |
| of securities loaned | $ 448,296,621 |
| Foreign currency, at value (cost $4,469,305) | 4,398,497 |
| Receivable for securities sold | 18,684,820 |
| Receivable for Fund shares sold | 733,831 |
| Interest receivable | 8,184,334 |
| Receivable for closed forward foreign currency exchange contracts | 215,197 |
| Unrealized gains on forward foreign currency exchange contracts | 187,141 |
| Receivable for securities lending income | 5,755 |
| Prepaid expenses and other assets | 87,766 |
|
| Total assets | 480,793,962 |
|
| Liabilities |
| Dividends payable | 851,637 |
| Payable for securities purchased | 12,268,602 |
| Payable for Fund shares redeemed | 3,920,295 |
| Payable for closed forward foreign currency exchange contracts | 128,477 |
| Unrealized losses on forward foreign currency exchange contracts | 581,880 |
| Payable for securities on loan | 31,828,221 |
| Advisory fee payable | 12,826 |
| Distribution Plan expenses payable | 21,594 |
| Due to other related parties | 16,395 |
| Accrued expenses and other liabilities | 84,710 |
|
| Total liabilities | 49,714,637 |
|
| Net assets | $ 431,079,325 |
|
| Net assets represented by |
| Paid-in capital | $ 473,906,343 |
| Undistributed net investment income | 4,013,098 |
| Accumulated net realized losses on securities and foreign currency related transactions | (56,368,428) |
| Net unrealized gains on securities and foreign currency related transactions | 9,528,312 |
|
| Total net assets | $ 431,079,325 |
|
| Net assets consists of |
| Class A | $ 202,017,470 |
| Class B | 113,115,346 |
| Class C | 89,235,666 |
| Class I | 26,710,843 |
|
| Total net assets | $ 431,079,325 |
|
| Shares outstanding |
| Class A | 31,672,714 |
| Class B | 17,679,032 |
| Class C | 13,969,422 |
| Class I | 4,254,065 |
|
| Net asset value per share |
| Class A | $ 6.38 |
| Class A -- Offering price (based on sales charge of 4.75%) | $ 6.70 |
| Class B | $ 6.40 |
| Class C | $ 6.39 |
| Class I | $ 6.28 |
|
See Notes to Financial Statements |
19
STATEMENT OF OPERATIONS
Year Ended April 30, 2004
|
| Investment income |
| Interest | $ 26,937,092 |
|
| Expenses |
| Advisory fee | 1,970,468 |
| Distribution Plan expenses |
| Class A | 590,298 |
| Class B | 1,167,188 |
| Class C | 869,841 |
| Administrative services fee | 426,439 |
| Transfer agent fees | 875,495 |
| Trustees' fees and expenses | 25,798 |
| Printing and postage expenses | 68,316 |
| Custodian and accounting fees | 359,346 |
| Registration and filing fees | 53,942 |
| Professional fees | 35,305 |
| Other | 65,886 |
|
| Total expenses | 6,508,322 |
| Less: Expense reductions | (3,617) |
| Expense reimbursements | (4,293) |
|
| Net expenses | 6,500,412 |
|
| Net investment income | 20,436,680 |
|
Net realized and unrealized gains or losses on securities and
foreign currency related transactions |
| Net realized gains or losses on: |
| Securities | 36,432,967 |
| Foreign currency related transactions | (7,180,303) |
|
| Net realized gains on securities and foreign currency related transactions | 29,252,664 |
Net change in unrealized gains or losses on securities and foreign currency related
transactions | (27,295,321) |
Net realized and unrealized gains or losses on securities and foreign currency related
transactions | 1,957,343 |
|
| Net increase in net assets resulting from operations | $ 22,394,023 |
|
See Notes to Financial Statements |
20
STATEMENTS OF CHANGES IN NET ASSETS
| Year Ended April 30,
|
| 2004 | 2003 |
|
| Operations |
| Net investment income | | $ 20,436,680 | | $ 16,636,410 |
Net realized gains on securities
and foreign currency related
transactions | | 29,252,664 | | 4,754,266 |
Net change in unrealized gains or
losses on securities and foreign
currency related transactions | | (27,295,321) | | 28,219,401 |
|
Net increase in net assets resulting
from operations | | 22,394,023 | | 49,610,077 |
|
Distributions to shareholders
from |
| Net investment income |
| Class A | | (10,999,622) | | (9,217,057) |
| Class B | | (5,696,610) | | (4,966,809) |
| Class C | | (4,247,112) | | (2,202,780) |
| Class I | | (1,546,157) | | (458,398) |
| Net realized gains |
| Class A | | (4,697,664) | | 0 |
| Class B | | (2,758,470) | | 0 |
| Class C | | (2,125,608) | | 0 |
| Class I | | (614,261) | | 0 |
|
| Total distributions to shareholders | | (32,685,504) | | (16,845,044) |
|
| | Shares | | Shares |
| Capital share transactions |
| Proceeds from shares sold |
| Class A | 10,558,043 | 69,375,473 | 8,487,148 | 51,662,571 |
| Class B | 5,160,616 | 33,950,532 | 6,708,216 | 40,780,947 |
| Class C | 7,780,021 | 51,216,021 | 8,054,040 | 49,183,588 |
| Class I | 1,433,762 | 9,306,633 | 840,724 | 5,020,580 |
|
| | | 163,848,659 | | 146,647,686 |
|
Net asset value of shares issued in
reinvestment of distributions |
| Class A | 1,604,686 | 10,521,676 | 975,606 | 5,929,744 |
| Class B | 788,248 | 5,188,607 | 459,976 | 2,804,647 |
| Class C | 537,515 | 3,532,884 | 183,976 | 1,129,873 |
| Class I | 145,931 | 940,548 | 21,899 | 134,122 |
|
| | | 20,183,715 | | 9,998,386 |
|
Automatic conversion of Class B
shares to Class A shares |
| Class A | 680,069 | 4,474,534 | 540,589 | 3,247,744 |
| Class B | (677,862) | (4,474,534) | (538,733) | (3,247,744) |
|
| | | 0 | | 0 |
|
| Payment for shares redeemed |
| Class A | (7,929,281) | (51,756,882) | (5,697,864) | (34,377,442) |
| Class B | (4,162,066) | (27,254,170) | (3,299,332) | (19,950,381) |
| Class C | (4,832,223) | (31,650,267) | (1,615,262) | (9,838,968) |
| Class I | (4,929,827) | (31,100,842) | (614,239) | (3,675,494) |
|
| | | (141,762,161) | | (67,842,285) |
|
Net asset value of shares issued
in acquisitions -- Class I | 5,508,003 | 35,677,970 | 1,537,823 | 9,114,878 |
|
Net increase in net assets resulting
from capital share transactions | | 77,948,183 | | 97,918,665 |
|
| Total increase in net assets | | 67,656,702 | | 130,683,698 |
| Net assets |
| Beginning of period | | 363,422,623 | | 232,738,925 |
|
| End of period | | $ 431,079,325 | | $ 363,422,623 |
|
| Undistributed net investment income | | $ 4,013,098 | | $ 6,166,568 |
|
See Notes to Financial Statements |
21
NOTES TO FINANCIAL STATEMENTS
1. ORGANIZATION
Evergreen Strategic Income Fund (the "Fund") is a diversified series of Evergreen Fixed Income Trust (the "Trust"), a Delaware statutory trust organized on September 18, 1997. The Trust is an open-end management investment company registered under the Investment Company Act of 1940, as amended (the "1940 Act").
The Fund offers Class A, Class B, Class C and Institutional ("Class I") shares. Class A shares are sold with a front-end sales charge. Class B shares are sold without a front-end sales charge but are subject to a contingent deferred sales charge that is payable upon redemption and decreases depending on how long the shares have been held. Effective February 2, 2004, Class C shares are no longer sold with a front-end sales charge but are still subject to a contingent deferred sales charge that is payable upon redemption within one year after the month of purchase. Class I shares are sold without a front-end sales charge or contingent deferred sales charge. Each class of shares, except Class I shares, pays an ongoing distribution fee.
2. SIGNIFICANT ACCOUNTING POLICIES
The following is a summary of significant accounting policies consistently followed by the Fund in the preparation of its financial statements. The policies are in conformity with generally accepted accounting principles in the United States of America, which require management to make estimates and assumptions that affect amounts reported herein. Actual results could differ from these estimates.
a. Valuation of investments
Portfolio debt securities acquired with more than 60 days to maturity are valued at prices obtained from an independent pricing service which takes into consideration such factors as similar security prices, yields, maturities, liquidity and ratings. Securities for which valuations are not available from an independent pricing service may be valued by brokers which use prices provided by market makers or estimates of market value obtained from yield data relating to investments or securities with similar characteristics.
Listed equity securities are usually valued at the last sales price or official closing price on the national securities exchange where the securities are principally traded.
Short-term securities with remaining maturities of 60 days or less at the time of purchase are valued at amortized cost, which approximates market value.
Investments in other mutual funds are valued at net asset value. Securities for which market quotations are not available or not reflective of current market value are valued at fair value as determined in good faith, according to procedures approved by the Board of Trustees.
b. Foreign currency translation
All assets and liabilities denominated in foreign currencies are translated into U.S. dollar amounts at the date of valuation. Purchases and sales of portfolio securities and income items denominated in foreign currencies are translated into U.S. dollar amounts on the respective dates of such transactions. The Fund does not separately account for that portion of the results of operations
22
NOTES TO FINANCIAL STATEMENTS continued
resulting from changes in foreign exchange rates on investments and the fluctuations arising from changes in market prices of securities held. Such fluctuations are included with the net realized and unrealized gains or losses on securities.
c. Forward foreign currency contracts
A forward foreign currency contract is an agreement between two parties to purchase or sell a specific currency for an agreed-upon price at a future date. The Fund enters into forward foreign currency contracts to facilitate transactions in foreign-denominated securities and to attempt to minimize the risk to the Fund from adverse changes in the relationship between currencies. Forward foreign currency contracts are recorded at the forward rate and marked-to-market daily. When the contracts are closed, realized gains and losses arising from such transactions are recorded as realized gains or losses on foreign currency related transactions. The Fund could be exposed to risks if the counterparties to the contracts are unable to meet the terms of their contracts or if the value of the foreign currency changes unfavorably.
d. When-issued and delayed delivery transactions
The Fund records when-issued securities as of trade date and maintains security positions such that sufficient liquid assets will be available to make payment for the securities purchased. Securities purchased on a when-issued or delayed delivery basis are marked-to-market daily and begin earning interest on the settlement date. Losses may occur on these transactions due to changes in market conditions or the failure of counterparties to perform under the contract.
e. Securities lending
The Fund may lend its securities to certain qualified brokers in order to earn additional income. The Fund receives compensation in the form of fees or interest earned on the investment of any cash collateral received. The Fund also continues to receive interest and dividends on the securities loaned. The Fund receives collateral in the form of cash or securities with a market value at least equal to the market value of the securities on loan, including accrued interest. In the event of default or bankruptcy by the borrower, the Fund could experience delays and costs in recovering the loaned securities or in gaining access to the collateral. The Fund has the right under the lending agreement to recover the securities from the borrower on demand.
f. Security transactions and investment income
Security transactions are recorded on trade date. Realized gains and losses are computed using the specific cost of the security sold. Interest income is recorded on the accrual basis and includes accretion of discounts and amortization of premiums.
g. Federal taxes
The Fund intends to continue to qualify as a regulated investment company and distribute all of its taxable income, including any net capital gains (which have already been offset by available capital loss carryovers). Accordingly, no provision for federal taxes is required.
h. Distributions
Distributions to shareholders from net investment income are accrued daily and paid monthly. Distributions from net realized gains, if any, are recorded on the ex-dividend date. Such distribu-
23
NOTES TO FINANCIAL STATEMENTS continued
tions are determined in conformity with income tax regulations, which may differ from generally accepted accounting principles.
Reclassifications have been made to the Fund's components of net assets to reflect income and gains available for distribution (or available capital loss carryovers, as applicable) under income tax regulations. The primary permanent differences causing such reclassifications are due to foreign currency gains or losses, certain capital loss carryovers assumed as a result of acquisitions, expiration of capital loss carryovers and premium amortization.
i. Class allocations
Income, common expenses and realized and unrealized gains and losses are allocated to the classes based on the relative net assets of each class. Distribution fees, if any, are calculated daily at the class level based on the appropriate net assets of each class and the specific expense rates applicable to each class.
3. ADVISORY FEE AND OTHER TRANSACTIONS WITH AFFILIATES
Evergreen Investment Management Company, LLC ("EIMC"), an indirect, wholly-owned subsidiary of Wachovia Corporation ("Wachovia"), is the investment advisor to the Fund and is paid a fee at an annual rate of 2% of the Fund's gross investment income plus an amount determined by applying percentage rates to the average daily net assets of the Fund, starting at 0.31% and declining to 0.16% as average daily net assets increase. Prior to April 1, 2004, the Fund paid a fee at an annual rate of 2% of the Fund's gross investment income plus an amount determined by applying percentage rates to the average daily net assets of the Fund, which started at 0.41% and declined to 0.16% as the Fund's average daily net assets increased.
From time to time, EIMC may voluntarily or contractually waive its fee and/or reimburse expenses in order to limit operating expenses. For any fee waivers and/or reimbursements made after January 1, 2003, EIMC may recoup certain amounts waived and/or reimbursed up to a period of three years following the end of the fiscal year in which the fee waivers and/or reimbursements were made. During the year ended April 30, 2004, EIMC reimbursed expenses relating to Class A shares in the amount of $4,293. Total amounts subject to recoupment as of April 30, 2004 were $4,485.
Evergreen Investment Services, Inc. ("EIS"), an indirect, wholly-owned subsidiary of Wachovia, is the administrator to the Fund. As administrator, EIS provides the Fund with facilities, equipment and personnel and is paid an annual rate determined by applying percentage rates to the aggregate average daily net assets of the Evergreen funds (excluding money market funds), starting at 0.10% and declining to 0.05% as the aggregate average daily net assets of the Evergreen funds (excluding money market funds) increase.
Evergreen Service Company, LLC ("ESC"), an indirect, wholly-owned subsidiary of Wachovia, is the transfer and dividend disbursing agent for the Fund. ESC receives account fees that vary based on the type of account held by the shareholders in the Fund. For the year ended April 30, 2004, the transfer agent fees were equivalent to an annual rate of 0.21% of the Fund's average daily net assets.
24
NOTES TO FINANCIAL STATEMENTS continued
The Fund has placed a portion of its portfolio transactions with brokerage firms that are affiliates of Wachovia. During the year ended April 30, 2004, the Fund paid brokerage commissions of $173 to Wachovia Securities, LLC.
4. DISTRIBUTION PLANS
Evergreen Distributor, Inc., a wholly-owned subsidiary of BISYS Fund Services, Inc., serves as principal underwriter to the Fund.
The Fund has adopted Distribution Plans, as allowed by Rule 12b-1 of the 1940 Act, for each class of shares, except Class I. Under the Distribution Plans, distribution fees are paid at an annual rate of 0.30% of the average daily net assets for Class A shares and 1.00% of the average daily net assets for each of Class B and Class C shares.
5. ACQUISITIONS
Effective at the close of business on July 11, 2003, the Fund acquired the net assets of Evergreen Offit Emerging Markets Bond Fund in a tax-free exchange for Class I shares of the Fund. Shares were issued to Class I shares of Evergreen Offit Emerging Markets Bond Fund at an exchange ratio of 1.21 for Class I shares of the Fund. The aggregate net assets of the Fund immediately prior to the acquisition were $404,982,531.
Effective at the close of business on November 8, 2002, the Fund acquired the net assets of OFFIT Total Return Fund in a tax-free exchange for Class I shares of the Fund. Shares were issued to Class I shares of OFFIT Total Return Fund at an exchange ratio of 1.68 for Class I shares of the Fund. The aggregate net assets of the Fund immediately prior to the acquisition were $269,123,098.
These acquisitions were accomplished by a tax-free exchange of the respective shares of the Fund. The value of net assets acquired, unrealized appreciation acquired and aggregate net assets of the Fund immediately after each acquisition were as follows: | | Value of Net | | Net Assets of the |
| Acquired | Assets | Unrealized | Fund After |
| Fund | Acquired | Appreciation | Acquisition |
|
| Evergreen Offit |
| Emerging Markets |
| Bond Fund | $ 35,677,970 | $ 4,059,467 | $ 440,660,501 |
|
OFFIT |
| Total Return Fund | 9,114,878 | 184,130 | 278,237,976 |
|
6. SECURITIES TRANSACTIONS
Cost of purchases and proceeds from sales of investment securities (excluding short-term securities) were as follows for the year ended April 30, 2004: | Cost of Purchases | Proceeds from Sales |
|
| U.S. | Non-U.S. | U.S. | Non-U.S. |
| Government | Government | Government | Government |
|
| $ 116,711,875 | $ 453,159,394 | $ 76,270,682 | $ 434,364,374 |
|
25
NOTES TO FINANCIAL STATEMENTS continued
At April 30, 2004, the Fund had forward foreign currency exchange contracts outstanding as follows:
Forward Foreign Currency Exchange Contracts to Buy: | Exchange | Contracts to | U.S. Value at | In Exchange | Unrealized |
| Date | Receive | April 30, 2004 | for U.S. $ | Gain |
|
| 07/23/2004 | 17,000,000 Euro | $ 20,315,566 | $ 20,128,425 | $ 187,141 |
|
Forward Foreign Currency Exchange Contracts to Sell: | Exchange | Contracts to | U.S. Value at | In Exchange | Unrealized |
| Date | Deliver | April 30, 2004 | for U.S. $ | Loss |
|
| 07/23/2004 | 28,900,000 Euro | $ 34,536,463 | $ 34,114,283 | $ 422,180 |
| 07/23/2004 | 12,000,000 Euro | 14,340,400 | 14,180,700 | 159,700 |
|
During the year ended April 30, 2004, the Fund loaned securities to certain brokers. At April 30, 2004, the value of securities on loan and the value of collateral amounted to $31,138,735 and $31,828,221, respectively. During the year ended April 30, 2004, the Fund earned $38,103 in income from securities lending which is included in interest income on the Statement of Operations.
On April 30, 2004, the aggregate cost of securities for federal income tax purposes was $439,249,226. The gross unrealized appreciation and depreciation on securities based on tax cost was $16,599,495 and $7,552,100, respectively, with a net unrealized appreciation of $9,047,395.
As of April 30, 2004, the Fund had $55,492,772 in capital loss carryovers for federal income tax purposes expiring as follows: | Expiration |
|
| 2005 | 2006 | 2007 | 2008 | 2009 | 2010 |
|
| $2,862,156 | $1,587,670 | $1,587,670 | $13,834,428 | $16,346,913 | $19,273,935 |
|
7. INTERFUND LENDING
Pursuant to an Exemptive Order issued by the SEC, the Fund may participate in an interfund lending program with certain funds in the Evergreen fund family. This program allows the Fund to borrow from, or lend money to, other participating funds. During the year ended April 30, 2004, the Fund did not participate in the interfund lending program.
8. DISTRIBUTIONS TO SHAREHOLDERS
As of April 30, 2004, the components of distributable earnings on a tax basis were as follows: | Undistributed | Unrealized | Capital Loss |
| Ordinary Income | Appreciation | Carryover |
|
| $ 3,618,359 | $ 9,047,395 | $ 55,492,772 |
|
26
NOTES TO FINANCIAL STATEMENTS continued
The differences between the components of distributable earnings on a tax basis and the amounts reflected in the Statement of Assets and Liabilities are primarily due to wash sales and premium amortization.
The tax character of distributions paid for the years ended April 30, 2004 and April 30, 2003 was $32,685,504 and $16,845,044, respectively, of ordinary income.
9. EXPENSE REDUCTIONS
Through expense offset arrangements with ESC and the Fund's custodian, a portion of fund expenses has been reduced.
10. DEFERRED TRUSTEES' FEES
Each Trustee of the Fund may defer any or all compensation related to performance of their duties as Trustees. The Trustees' deferred balances are allocated to deferral accounts, which are included in the accrued expenses for the Fund. The investment performance of the deferral accounts are based on the investment performance of certain Evergreen funds. Any gains earned or losses incurred in the deferral accounts are reported in the Fund's Trustees' fees and expenses. At the election of the Trustees, the deferral account will be paid either in one lump sum or in quarterly installments for up to ten years.
11. FINANCING AGREEMENT
The Fund and certain other Evergreen funds share in a $150 million unsecured revolving credit commitment for temporary and emergency purposes, including the funding of redemptions, as permitted by each participating fund's borrowing restrictions. Borrowings under this facility bear interest at 0.50% per annum above the Federal Funds rate. All of the participating funds are charged an annual commitment fee of 0.09% of the unused balance, which is allocated pro rata. During the year ended April 30, 2004, the Fund had no borrowings under this agreement.
12. SUBSEQUENT EVENT
Effective May 1, 2004, EIS replaced Evergreen Distributor, Inc. as the distributor of the Fund's shares
27
REPORT OF INDEPENDENT REGISTERED PUBLIC ACCOUNTING FIRM
Board of Trustees and Shareholders
Evergreen Fixed Income Trust
We have audited the accompanying statement of assets and liabilities, including the schedule of investments, of the Evergreen Strategic Income Fund, a series of Evergreen Fixed Income Trust, as of April 30, 2004, and the related statement of operations for the year then ended, statements of changes in net assets for each of the years in the two-year period then ended, and the financial highlights for each of the years in the five-year period then ended. These financial statements and financial highlights are the responsibility of the Fund's management. Our responsibility is to express an opinion on these financial statements and financial highlights based on our audits.
We conducted our audits in accordance with the standards of the Public Company Accounting Oversight Board (United States). Those standards require that we plan and perform the audit to obtain reasonable assurance about whether the financial statements and financial highlights are free of material misstatement. An audit includes examining, on a test basis, evidence supporting the amounts and disclosures in the financial statements. Our procedures included confirmation of securities owned as of April 30, 2004 by correspondence with the custodian. As to securities purchased or sold but not yet received or delivered, we performed other appropriate auditing procedures. An audit also includes assessing the accounting principles used and significant estimates made by management, as well as evaluating the overall financial statement presentation. We believe that our audits provide a reasonable basis for our opinion.
In our opinion, the financial statements and financial highlights referred to above present fairly, in all material respects, the financial position of the Evergreen Strategic Income Fund, as of April 30, 2004, the results of its operations, changes in its net assets and financial highlights for each of the years described above in conformity with accounting principles generally accepted in the United States of America.
Boston, Massachusetts
June 4, 2004
28
This page left intentionally blank
29
This page left intentionally blank
30
This page left intentionally blank
31
TRUSTEES AND OFFICERS
| TRUSTEES1 | |
Charles A. Austin III
Trustee
DOB: 10/23/1934
Term of office since: 1991
Other directorships: None | Principal occupations: Investment Counselor, Anchor Capital Advisors, Inc. (investment advice); Director, The Andover Companies (insurance); Trustee, Arthritis Foundation of New England; Director, The Francis Ouimet Society; Former Director, Health Development Corp. (fitness-wellness centers); Former Director, Mentor Income Fund, Inc.; Former Trustee, Mentor Funds and Cash Resource Trust; Former Investment Counselor, Appleton Partners, Inc. (investment advice); Former Director, Executive Vice President and Treasurer, State Street Research & Management Company (investment advice) |
|
Shirley L. Fulton
Trustee
DOB: 1/10/1952
Term of office since: 2004
Other directorships: None | Principal occupations: Partner, Helms, Henderson & Fulton, P.A. (law firm); Retired Senior Resident Superior Court Judge, 26th Judicial District, Charlotte, NC |
|
K. Dun Gifford
Trustee
DOB: 10/23/1938
Term of office since: 1974
Other directorships: None | Principal occupations: Chairman and President, Oldways Preservation and Exchange Trust (education); Trustee, Treasurer and Chairman of the Finance Committee, Cambridge College; Former Chairman of the Board, Director, and Executive Vice President, The London Harness Company (leather goods purveyor); Former Director, Mentor Income Fund, Inc.; Former Trustee, Mentor Funds and Cash Resource Trust |
|
Dr. Leroy Keith, Jr.
Trustee
DOB: 2/14/1939
Term of office since: 1983
Other directorships: Trustee, Phoenix Series Fund, Phoenix Multi-Portfolio Fund, and The Phoenix Big Edge Series Fund | Principal occupations: Partner, Stonington Partners, Inc. (private investment firm); Trustee of Phoenix Series Fund, Phoenix Multi-Portfolio Fund, and The Phoenix Big Edge Series Fund; Former Chairman of the Board and Chief Executive Officer, Carson Products Company (manufacturing); Director, Obagi Medical Products Co.; Director, Lincoln Educational Services; Director, Diversapack Co.; Former President, Morehouse College; Former Director, Mentor Income Fund, Inc.; Former Trustee, Mentor Funds and Cash Resource Trust |
|
Gerald M. McDonnell
Trustee
DOB: 7/14/1939
Term of office since: 1988
Other directorships: None | Principal occupations: Manager of Commercial Operations, SMI STEEL Co. - South Carolina (steel producer); Former Sales and Marketing Management, Nucor Steel Company; Former Director, Mentor Income Fund, Inc.; Former Trustee, Mentor Funds and Cash Resource Trust |
|
William Walt Pettit
Trustee
DOB: 8/26/1955
Term of office since: 1984
Other directorships: None | Principal occupations: Partner and Vice President, Kellam & Pettit, P.A. (law firm); Former Director, Mentor Income Fund, Inc.; Former Trustee, Mentor Funds and Cash Resource Trust |
|
David M. Richardson
Trustee
DOB: 9/19/1941
Term of office since: 1982
Other directorships: None | Principal occupations: President, Richardson, Runden & Company (executive recruitment business development/consulting company); Consultant, Kennedy Information, Inc. (executive recruitment information and research company); Consultant, AESC (The Association of Retained Executive Search Consultants); Trustee, NDI Technologies, LLP (communications); Director, J&M Cumming Paper Co. (paper merchandising); Former Vice Chairman, DHR International, Inc. (executive recruitment); Former Director, Mentor Income Fund, Inc.; Former Trustee, Mentor Funds and Cash Resource Trust |
|
Dr. Russell A. Salton III
Trustee
DOB: 6/2/1947
Term of office since: 1984
Other directorships: None | Principal occupations: President/CEO, AccessOne MedCard; Former Medical Director, Healthcare Resource Associates, Inc.; Former Medical Director, U.S. Health Care/Aetna Health Services; Former Director, Mentor Income Fund, Inc.; Former Trustee, Mentor Funds and Cash Resource Trust |
|
32
TRUSTEES AND OFFICERS continued
Michael S. Scofield
Trustee
DOB: 2/20/1943
Term of office since: 1984
Other directorships: None | Principal occupations: Attorney, Law Offices of Michael S. Scofield; Former Director, Mentor Income Fund, Inc.; Former Trustee, Mentor Funds and Cash Resource Trust |
|
Richard J. Shima
Trustee
DOB: 8/11/1939
Term of office since: 1993
Other directorships: None | Principal occupations: Independent Consultant; Director, Trust Company of CT; Trustee, Saint Joseph College (CT); Director, Hartford Hospital; Trustee, Greater Hartford YMCA; Former Director, Enhance Financial Services, Inc.; Former Director, Old State House Association; Former Director of CTG Resources, Inc. (natural gas); Former Director, Mentor Income Fund, Inc.; Former Trustee, Mentor Funds and Cash Resource Trust |
|
Richard K. Wagoner, CFA2
Trustee
DOB: 12/12/1937
Term of office since: 1999
Other directorships: None | Principal occupations: Member and Former President, North Carolina Securities Traders Association; Member, Financial Analysts Society; Former Consultant to the Boards of Trustees of the Evergreen funds; Former Trustee, Mentor Funds and Cash Resource Trust |
|
| OFFICERS |
|
Dennis H. Ferro3
President
DOB: 6/20/1945
Term of office since: 2003 | Principal occupations: President, Chief Executive Officer and Chief Investment Officer, Evergreen Investment Company, Inc. and Executive Vice President, Wachovia Bank, N.A. |
|
Carol Kosel4
Treasurer
DOB: 12/25/1963
Term of office since: 1999 | Principal occupations: Senior Vice President, Evergreen Investment Services, Inc. |
|
Michael H. Koonce4
Secretary
DOB: 4/20/1960
Term of office since: 2000 | Principal occupations: Senior Vice President and General Counsel, Evergreen Investment Services, Inc.; Senior Vice President and Assistant General Counsel, Wachovia Corporation |
|
1 Each Trustee serves until a successor is duly elected or qualified or until his death, resignation, retirement or removal from office. Each Trustee oversees 94 Evergreen funds. Correspondence for each Trustee may be sent to Evergreen Board of Trustees, P.O. Box 20083, Charlotte, North Carolina 28202.
2 Mr. Wagoner is an "interested person" of the Fund because of his ownership of shares in Wachovia Corporation, the parent to the Fund's investment advisor.
3 The address of the Officer is 401 S. Tryon Street, 20th Floor, Charlotte, NC 28288.
4 The address of the Officer is 200 Berkeley Street, Boston, MA 02116.
Additional information about the Fund's Board of Trustees and Officers can be found in the Statement of Additional Information (SAI) and is available upon request without charge by calling 800.343.2898. |
33
INVESTMENTS THAT STAND THE TEST OF TIME
At Evergreen Investments, we remain steadfastly dedicated to four core principles that lead to success in today's financial world.- Leadership -- With over $248 billion in assets under management as of March 31, 2004 and a history of innovation spanning more than 70 years, we offer the strength that comes with experience.
Excellence -- We have been consistently recognized for risk-adjusted historical performance through disciplined, rigorous management focused on achieving sustainable success.
Experience -- Our investment managers are seasoned professionals who share their diverse points of view and have the perspective that comes with weathering good markets and bad.
Commitment -- We are dedicated to helping investment professionals and their clients achieve important goals through the investments, service and education we offer.
Visit us online at EvergreenInvestments.com
FOR MORE INFORMATION
Evergreen Express Line 800.346.3858
Evergreen Investor Services 800.343.2898
For the fifth consecutive year, Evergreen Investments has earned the Dalbar Mutual Fund Service Award, which recognizes those firms that exceed industry norms in key areas. The award symbolizes the achievement of the highest tier of shareholder service within our industry. For 2003,Evergreen Investments was ranked third overall.
566662 rv1 6/2004 |
Evergreen Investments
200 Berkeley Street
Boston, MA 02116-5034
|
Evergreen U.S. Government Fund

Evergreen U.S. Government Fund
This annual report must be preceded or accompanied by a prospectus of the Evergreen fund contained herein. The prospectus contains more complete information, including fees and expenses, and should be read carefully before investing or sending money.
A description of the Fund's proxy voting policies and procedures is available without charge, upon request, by calling 1.800.343.2898, by visiting our website at EvergreenInvestments.com or by visiting the SEC's website at http://www.sec.gov.
| Mutual Funds: |
| NOT FDIC INSURED | MAY LOSE VALUE | NOT BANK GUARANTEED |
Evergreen InvestmentsSM is a service mark of Evergreen Investment Management Company, LLC. Copyright 2004.
Evergreen mutual funds are distributed by Evergreen Investment Services, Inc.
200 Berkeley Street, Boston, MA 02116
LETTER TO SHAREHOLDERS
June 2004
Dennis H. Ferro
President and Chief
Executive Officer | |
|
Dear Shareholder,
We are pleased to provide the annual report for the Evergreen U.S. Government Fund, which covers the twelve-month period ended April 30, 2004.
Investors in the fixed income markets experienced alternating periods of risk and reward over the past twelve months. Geopolitical uncertainties, improving economic growth, changes in tax legislation, and an accommodative stance from the Federal Reserve managed to both excite and confuse bond market participants at varying points, and in varying sectors, since the beginning of the investment period in May 2003.
The period began with the financial markets focused on the war in Iraq. The associated uncertainty led to higher demand for bonds, particularly within the Treasury market, as investors sought solace in a flight to quality. This performance in government bonds carried over to many municipal and corporate issues, too, and the increased demand for bonds quickly became a sort of self-fulfilling prophecy, as total return potential climbed with higher prices and declining yields. This increasingly popular strategy, though, soon helped set the stage for a summer of volatility unmatched in recent history.
At the conclusion of its monetary policy meeting in May, the Federal Reserve had commented on the "possibility of an unwelcome, substantial fall in inflation." Many bond investors, convinced the Fed was taking rates to zero, drove yields down to 45-year lows in the U.S. Treasury market. Common market wisdom determined that since the Fed's primary concern was deflation, rates were likely headed lower. Yet when central bankers reduced their target for the federal funds rate by a less than expected 25 basis points in late June, many fixed income investors became alarmed. These worries were compounded by
1
LETTER TO SHAREHOLDERS continued
optimistic GDP (Gross Domestic Product) forecasts from Fed Chairman Alan Greenspan during congressional banking committee hearings in July. As a result of these events, the yield on the 10-year Treasury surged from a low of 3.1% in June to 4.6% in late July. Thus, the "deflation trade" in bonds had changed from a significant overbought condition to an oversold one in a matter of just six weeks.
The bond market began to stabilize as investors became more comfortable with the likelihood that monetary policy makers would keep rates low for the foreseeable future. This was a welcome respite for owners of Treasuries and municipal securities. In addition to the excitement in Treasuries, investors in municipal bonds also experienced heightened concerns related to the changes in the tax laws, which were initially perceived as a potential threat to their market. After careful consideration, though, many investors became convinced that capital preservation would remain a primary, if not dominant, theme for the future demand of these securities. A second concern involved the poor financial condition of many states and local governments. Yet just as these concerns were reaching a crescendo, economic growth picked up significantly and tax receipts climbed, improving the financial conditions of many of these entities.
As economic growth strengthened, investors in corporate bonds benefited from the combination of stronger balance sheets, improving credit quality, declining default rates, and the outlook for growth in GDP and corporate profits. In addition, the many steps taken to improve corporate credibility rallied many investors to the credit markets, where many risk appropriate investors successfully searched for improved returns in the high yield market.
Throughout the investment period, the Federal Reserve attempted to improve the clarity of its intentions for the financial markets. At the conclusion of its monetary policy meetings, the Fed's statements ranged from maintaining policy accommodation for a "considerable period" to one of being "measured" in its approach to remove this monetary stimulus. In addition,
2
LETTER TO SHAREHOLDERS continued
central bankers tried to be even more clear in a variety of speeches and public testimonies, as the Fed continued to display an unusually strong effort in clarifying its upcoming changes in monetary policy. Most recently, though, these attempts at clarity caused volatility throughout the fixed income markets, as investors feared a repeat of the experiences in 1994. Given the current level of interest rates, inflation, the dollar, and global economic growth, we believe these concerns are overblown. However, the price of oil remains a wild card, as sustained high oil prices will eventually embed a higher level of manufacturing and service cost in the economy.
We encourage investors to maintain their diversified, long-term strategies within their fixed income portfolios.
Please visit our website, EvergreenInvestments.com, for more information about our funds and other investment products available to you. From the website, you may also access a new feature that presents a detailed Q&A interview with the portfolio manager(s) for your fund. You can easily reach these interviews by following the link, EvergreenInvestments.com/Annual updates, from our website. Thank you for your continued support of Evergreen Investments.
Sincerely,
Dennis H. Ferro
President and Chief Investment Officer
Evergreen Investment Management Company, LLC
3
FUND AT A GLANCE
as of April 30, 2004
MANAGEMENT TEAM

Lisa Brown Premo
Customized Fixed Income Team
Lead Manager
CURRENT INVESTMENT STYLE
| Source: Morningstar, Inc. |
| Morningstar's style box is based on a portfolio date as of 3/31/2004. |
| The fixed income style box placement is based on a fund's average effective maturity or duration and the average credit rating of the bond portfolio. |
PERFORMANCE AND RETURNS
Portfolio inception date: 1/11/1993
| Class A | Class B | Class C | Class I |
|
| Class inception date | 1/11/1993 | 1/11/1993 | 9/2/1994 | 9/2/1993 |
|
| Nasdaq symbol |
| EUSAX | EUSBX | EUSCX | EUSYX |
|
| Average annual return* |
| 1 year with sales charge | -4.46% | -5.27% | -1.38% | N/A |
|
| 1 year w/o sales charge | 0.30% | -0.40% | -0.40% | 0.60% |
|
| 5 year | 4.36% | 4.27% | 4.60% | 5.65% |
|
| 10 year | 5.71% | 5.45% | 5.46% | 6.50% |
|
| Adjusted for maximum applicable sales charge, unless noted. |
Past performance is no guarantee of future results. The performance quoted represents past performance and current performance may be lower or higher. The investment return and principal value of an investment will fluctuate so that investors' shares, when redeemed, may be worth more or less than their original cost. To obtain performance information current to the most recent month-end for Class A, B, C or I shares, please go to EvergreenInvestments.com/fundperformance. The performance of each class may vary based on differences in loads, fees and expenses paid by the shareholders investing in each class. Performance includes the reinvestment of income dividends and capital gain distributions. Performance shown does not reflect the deduction of taxes that a shareholder would pay on fund distributions or the redemption of fund shares.
Historical performance shown for Classes C and I prior to their inception is based on the performance of Class A, one of the original classes offered along with Class B. The historical returns for Classes C and I have not been adjusted to reflect the effect of each class' 12b-1 fee. These fees are 0.30% for Class A and 1.00% for Classes B and C. Class I does not pay a 12b-1 fee. If these fees had been reflected, returns for Class C would have been lower while returns for Class I would have been higher.
Returns reflect expense limits previously in effect, without which returns would have been lower.
LONG-TERM GROWTH

Comparison of a $10,000 investment in Evergreen U.S. Government Fund Class A shares, versus a similar investment in the Lehman Brothers Intermediate Term Government Bond Index (LBITGBI) and the Consumer Price Index (CPI).
The LBITGBI is an unmanaged market index and does not include transaction costs associated with buying and selling securities, any mutual fund expenses or any taxes. The CPI is a commonly used measure of inflation and does not represent an investment return. It is not possible to invest directly in an index.
4
PORTFOLIO MANAGER COMMENTARY
The fund's Class A shares returned 0.30% for the twelve-month period ended April 30, 2004, excluding any applicable sales charges. During the same period, the fund's benchmark, Lehman Brothers Intermediate Term Government Bond Index (LBITGBI), returned 0.99%.
In a difficult year for the bond market, the fund trailed the LBITGBI. For the fiscal year, returns on securities with maturities of 10 years or longer were negative, while shorter-maturity securities provided marginally positive total returns. However, in the several months during the period which saw evidence of job growth in the economy, the nation's employment expanded by more than 300,000 jobs during March 2004. At the same time, the Labor Department reported similar signs of an expanding economy. It also revised upwardly its estimates of job growth during the two previous months. As a consequence, the bond market began a sharp sell-off, which led to negative returns among virtually all maturities, with securities of maturities between one and five years posting their worst monthly performance in the last quarter century. At the close of the fiscal year, the fund's average maturity was 5 years.
Helping performance considerably was the fund's substantial positions in mortgage-backed securities, which continued to be overweighted relative to the index at the close of the fiscal year on April 30, 2004. We also overweighted corporate bonds, which also helped performance. In an environment of low interest rates and improving corporate balance sheets, the higher yields offered by corporate bonds were attractive to investors.
In a climate in which signs of a strengthened economy led to concerns that interest rates would increase, we underweighted Treasuries, a sector most vulnerable to price loss because of rising rates. At the end of the fiscal year, Treasuries accounted for nearly one fifth of the fund's assets. Another fifth of assets invested in government agency securities. Mortgage-backed securities, which are less vulnerable to rising interest rates, represented more than half of the fund's assets. Over the one-year period, the U.S. Government Fund's duration was, on average, slightly longer than the duration of the LBITGBI, which was a detractor to performance.
Class I shares are only offered to investment advisory clients of an investment advisor of an Evergreen fund (or its advisory affiliates), through special arrangements entered into on behalf of Evergreen funds with certain financial services firms, certain institutional investors and persons who owned Class Y shares in registered name in an Evergreen fund on or before December 31, 1994. Class I shares are only available to institutional shareholders with a minimum $1 million investment.
The fund's investment objective is nonfundamental and may be changed without the vote of the fund's shareholders.
U.S. government guarantees apply only to the underlying securities of the fund's portfolio and not to the fund's shares.
The return of principal is not guaranteed due to fluctuation in the NAV of the fund caused by changes in the price of the individual bonds held by the fund and the buying and selling of bonds by the fund. Bond funds have the same inflation, interest rate, and credit risks that are associated with the individual bonds held by the fund.
All data is as of April 30, 2004, and subject to change.
5
FINANCIAL HIGHLIGHTS
(For a share outstanding throughout each period) | Year Ended April 30,
|
CLASS A
| 20041
| 2003
| 20022
| 2001
| 2000
|
Net asset value, beginning of period
| $10.22
| $9.75
| $9.59
| $9.15
| $9.63
|
| Income from investment operations |
| Net investment income | 0.19 | 0.39 | 0.48 | 0.54 | 0.55 |
| Net realized and unrealized gains or losses on securities | -0.16
| 0.43
| 0.16
| 0.44
| -0.48
|
Total from investment operations
| 0.03
| 0.82
| 0.64
| 0.98
| 0.07
|
| Distributions to shareholders from |
Net investment income
| -0.29
| -0.35
| -0.48
| -0.54
| -0.55
|
Net asset value, end of period
| $9.96
| $10.22
| $9.75
| $9.59
| $9.15
|
Total return3
| 0.30%
| 8.50%
| 6.76%
| 10.98%
| 0.79%
|
| Ratios and supplemental data |
| Net assets, end of period (thousands) | $109,172 | $146,427 | $141,838 | $108,073 | $91,123 |
| Ratios to average net assets |
| Expenses4 | 1.01% | 0.95% | 0.96% | 1.00% | 0.97% |
| Net investment income | 1.86% | 3.81% | 4.91% | 5.71% | 5.89% |
| Portfolio turnover rate | 55% | 129% | 121% | 86% | 58% |
|
1 Net investment income per share is based on average shares outstanding during the period.2 As required, effective May 1, 2001, the Fund adopted the provisions of the AICPA Audit and Accounting Guide, Audits of Investment Companies, and began amortizing premium on its fixed-income securities. The effects of this change for the year ended April 30, 2002 was a decrease in net investment income per share of $0.02; an increase in net realized gains or losses per share of $0.02; and a decrease to the ratio of net investment income to average net assets of 0.22%. The above per share information, ratios and supplemental data for the periods prior to May 1, 2001 have not been restated to reflect this change in presentation.3 Excluding applicable sales charges4 The ratio of expenses to average net assets excludes expense reductions but includes fee waivers and/or expense reimbursements.
See Notes to Financial Statements |
6
FINANCIAL HIGHLIGHTS
(For a share outstanding throughout each period)
| Year Ended April 30,
|
CLASS B
| 20041
| 2003
| 20022
| 2001
| 2000
|
Net asset value, beginning of period
| $10.22
| $9.75
| $9.59
| $9.15
| $9.63
|
| Income from investment operations |
| Net investment income | 0.12 | 0.31 | 0.42 | 0.47 | 0.48 |
| Net realized and unrealized gains or losses on securities | -0.16
| 0.43
| 0.15
| 0.44
| -0.48
|
Total from investment operations
| -0.04
| 0.74
| 0.57
| 0.91
| 0
|
| Distributions to shareholders from |
Net investment income
| -0.22
| -0.27
| -0.41
| -0.47
| -0.48
|
Net asset value, end of period
| $9.96
| $10.22
| $9.75
| $9.59
| $9.15
|
Total return3
| -0.40%
| 7.69%
| 5.97%
| 10.15%
| 0.03%
|
| Ratios and supplemental data |
| Net assets, end of period (thousands) | $37,270 | $59,362 | $47,016 | $65,533 | $82,665 |
| Ratios to average net assets |
| Expenses4 | 1.71% | 1.70% | 1.71% | 1.75% | 1.71% |
| Net investment income | 1.16% | 3.04% | 4.18% | 4.98% | 5.11% |
| Portfolio turnover rate | 55% | 129% | 121% | 86% | 58% |
|
1 Net investment income per share is based on average shares outstanding during the period.2 As required, effective May 1, 2001, the Fund adopted the provisions of the AICPA Audit and Accounting Guide, Audits of Investment Companies, and began amortizing premium on its fixed-income securities. The effects of this change for the year ended April 30, 2002 was a decrease in net investment income per share of $0.01; an increase in net realized gains or losses per share of $0.01; and a decrease to the ratio of net investment income to average net assets of 0.22%. The above per share information, ratios and supplemental data for the periods prior to May 1, 2001 have not been restated to reflect this change in presentation.3 Excluding applicable sales charges4 The ratio of expenses to average net assets excludes expense reductions but includes fee waivers and/or expense reimbursements.
See Notes to Financial Statements |
7
FINANCIAL HIGHLIGHTS
(For a share outstanding throughout each period)
| Year Ended April 30,
|
CLASS C
| 20041
| 2003
| 20022
| 2001
| 2000
|
Net asset value, beginning of period
| $10.22
| $9.75
| $9.59
| $9.15
| $9.63
|
| Income from investment operations |
| Net investment income | 0.12 | 0.31 | 0.41 | 0.47 | 0.48 |
| Net realized and unrealized gains or losses on securities | -0.16
| 0.43
| 0.16
| 0.44
| -0.48
|
Total from investment operations
| -0.04
| 0.74
| 0.57
| 0.91
| 0
|
| Distributions to shareholders from |
Net investment income
| -0.22
| -0.27
| -0.41
| -0.47
| -0.48
|
Net asset value, end of period
| $9.96
| $10.22
| $9.75
| $9.59
| $9.15
|
Total return3
| -0.40%
| 7.69%
| 5.97%
| 10.15%
| 0.03%
|
| Ratios and supplemental data |
| Net assets, end of period (thousands) | $14,207 | $26,013 | $14,212 | $11,188 | $4,740 |
| Ratios to average net assets |
| Expenses4 | 1.71% | 1.70% | 1.71% | 1.74% | 1.71% |
| Net investment income | 1.17% | 2.99% | 4.15% | 4.90% | 5.12% |
| Portfolio turnover rate | 55% | 129% | 121% | 86% | 58% |
|
1 Net investment income per share is based on average shares outstanding during the period.2 As required, effective May 1, 2001, the Fund adopted the provisions of the AICPA Audit and Accounting Guide, Audits of Investment Companies, and began amortizing premium on its fixed-income securities. The effects of this change for the year ended April 30, 2002 was a decrease in net investment income per share of $0.02; an increase in net realized gains or losses per share of $0.02; and a decrease to the ratio of net investment income to average net assets of 0.22%. The above per share information, ratios and supplemental data for the periods prior to May 1, 2001 have not been restated to reflect this change in presentation.3 Excluding applicable sales charges4 The ratio of expenses to average net assets excludes expense reductions but includes fee waivers and/or expense reimbursements.
See Notes to Financial Statements |
8
FINANCIAL HIGHLIGHTS
(For a share outstanding throughout each period)
| Year Ended April 30,
|
CLASS I1
| 20042
| 2003
| 20023
| 2001
| 2000
|
Net asset value, beginning of period
| $10.22
| $9.75
| $9.59
| $9.15
| $9.63
|
| Income from investment operations |
| Net investment income | 0.22 | 0.41 | 0.50 | 0.56 | 0.57 |
| Net realized and unrealized gains or losses on securities | -0.16
| 0.43
| 0.16
| 0.44
| -0.48
|
Total from investment operations
| 0.06
| 0.84
| 0.66
| 1.00
| 0.09
|
| Distributions to shareholders from |
Net investment income
| -0.32
| -0.37
| -0.50
| -0.56
| -0.57
|
Net asset value, end of period
| $9.96
| $10.22
| $9.75
| $9.59
| $9.15
|
Total return
| 0.60%
| 8.77%
| 7.02%
| 11.25%
| 1.04%
|
| Ratios and supplemental data |
| Net assets, end of period (thousands) | $427,356 | $489,565 | $327,753 | $263,619 | $231,417 |
| Ratios to average net assets |
| Expenses4 | 0.71% | 0.70% | 0.71% | 0.75% | 0.71% |
| Net investment income | 2.15% | 4.02% | 5.16% | 5.97% | 6.12% |
| Portfolio turnover rate | 55% | 129% | 121% | 86% | 58% |
|
1 Effective at the close of business on May 11, 2001, Class Y shares were renamed as Institutional shares (Class I).2 Net investment income per share is based on average shares outstanding during the period.3 As required, effective May 1, 2001, the Fund adopted the provisions of the AICPA Audit and Accounting Guide, Audits of Investment Companies, and began amortizing premium on its fixed-income securities. The effects of this change for the year ended April 30, 2002 was a decrease in net investment income per share of $0.02; an increase in net realized gains or losses per share of $0.02; and a decrease to the ratio of net investment income to average net assets of 0.22%. The above per share information, ratios and supplemental data for the periods prior to May 1, 2001 have not been restated to reflect this change in presentation.4 The ratio of expenses to average net assets excludes expense reductions but includes fee waivers and/or expense reimbursements.
See Notes to Financial Statements |
9
SCHEDULE OF INVESTMENTS
April 30, 2004 | Principal
Amount | Value |
|
| ASSET-BACKED SECURITIES 3.4% |
| Pinstripe I CDO, Ltd., Ser. 1A, Class B1, 1.97%, 05/01/2036 144A (h) | $ 8,000,000 | $ 7,880,000 |
| SLMA: |
| Ser. 1997-4, Class A2, FRN, 1.699%, 10/25/2010 | 5,529,760 | 5,599,653 |
| Ser. 1998-1, Class A2, FRN, 1.709%, 10/25/2011 | 6,264,202 | 6,339,357 |
| Total Asset-Backed Securities (cost $19,795,253) | | 19,819,010 |
| COLLATERALIZED MORTGAGE OBLIGATIONS 35.5% |
| Banc America Large Loan, Inc., Ser. 2001-7WTA, Class G, 2.60%, |
| 01/27/2006 144A (h) | 8,000,000 | 7,435,000 |
| Commerce 2003, Ser. 2003-FL9, Class E, 2.09%, 11/15/2015 144A | 3,000,000 | 2,998,863 |
| Country Wide Alternative Loan Trust: |
| Class A6, 5.75%, 02/25/2034 (h) | 5,000,000 | 4,974,073 |
| Class M, 5.659%, 03/25/2034 (h) | 11,951,434 | 11,714,169 |
| Credit Suisse First Boston Mtge. Securities Corp., Ser. 2002-FL1, |
| Class C, 2.39%, 01/11/2010 144A | 5,103,684 | 5,113,217 |
| FHLMC: |
| Class A2, 2.503%, 11/15/2008 (h) | 7,639,694 | 7,562,229 |
| Ser. 1370, Class JA, 2.275%, 09/15/2022 | 553,690 | 564,091 |
| Ser. 1498, Class I, 2.275%, 04/15/2023 | 470,405 | 478,879 |
| Ser. 1533, Class FA, 2.225%, 06/15/2023 | 128,593 | 131,235 |
| Ser. 1616, Class FB, 2.741%, 11/15/2008 ## | 3,077,961 | 3,091,786 |
| Ser. 1671, Class TA, 1.625%, 02/15/2024 ## | 2,244,730 | 2,258,078 |
| Ser. 2030, Class F, 1.594%, 02/15/2028 ## | 2,399,669 | 2,410,308 |
| Ser. 2181, Class PF, 1.494%, 05/15/2029 ## | 1,233,263 | 1,238,282 |
| Ser. 2228, Class PE, 7.50%, 04/15/2030 | 383,662 | 400,807 |
| Ser. 2262, Class Z, 7.50%, 10/15/2030 | 451,773 | 471,531 |
| Ser. 2310, Class PC, 6.50%, 01/15/2030 | 182,390 | 182,809 |
| Ser. 2314, Class PC, 6.50%, 11/15/2029 | 136,697 | 137,124 |
| Ser. 2341, Class PE, 6.50%, 03/15/2030 | 239,364 | 240,691 |
| Ser. 2359, Class PC, 6.00%, 07/15/2015 | 655,142 | 667,184 |
| Ser. 2367, Class BC, 6.00%, 04/15/2016 | 344,014 | 353,265 |
| Ser. 2374, Class PD, 5.50%, 04/15/2014 | 136,180 | 137,205 |
| Ser. 2380, Class FL, 1.69%, 11/15/2031 ## | 9,216,935 | 9,397,606 |
| Ser. 2395, Class FD, 1.69%, 05/15/2029 ## | 3,606,076 | 3,656,074 |
| Ser. 2481, Class FE, 2.094%, 03/15/2032 (h) | 6,283,228 | 6,390,730 |
| Ser. 2691, Class FC, 1.794%, 10/15/2033 ## | 4,794,000 | 4,813,830 |
| Ser. SF1, Class A2, 2.383%, 11/15/2008 (h) | 11,000,000 | 10,836,694 |
| FNMA: |
| Ser. 1993-174, Class FD, 2.691%, 09/25/2008 | 954,905 | 954,053 |
| Ser. 1993-221, Class FH, 2.194%, 12/25/2008 ## | 4,872,518 | 4,968,162 |
| Ser. 1997-34, Class F, 1.744%, 10/25/2023 | 7,586,001 | 7,672,237 |
| Ser. 1997-49, Class F, 1.594%, 06/17/2027 | 1,625,711 | 1,633,915 |
| Ser. 1999-49, Class F, 1.49%, 05/25/2018 | 2,570,860 | 2,583,529 |
| Ser. 2000-32, Class FM, 1.54%, 10/18/2030 | 1,394,609 | 1,401,613 |
| Ser. 2001-53, Class CF, 1.49%, 10/25/2031 | 853,534 | 855,679 |
| Ser. 2002-13, Class FE, 1.99%, 02/27/2031 | 3,395,838 | 3,455,866 |
| Ser. 2002-67, Class FA, 2.09%, 11/25/2032 | 5,619,304 | 5,735,818 |
| Ser. 2002-T1, Class A3, 7.50%, 11/25/2031 | 6,865,284 | 7,393,052 |
See Notes to Financial Statements |
10
SCHEDULE OF INVESTMENTS continued
April 30, 2004 | Principal
Amount | Value |
|
| COLLATERALIZED MORTGAGE OBLIGATIONS continued |
| FNMA: |
| Ser. 2002-T16, Class A1, 6.50%, 07/25/2042 | $ 9,978,178 | $ 10,464,614 |
| Ser. 2002-W3, Class A5, 7.50%, 01/25/2028 | 1,325,121 | 1,426,990 |
| Ser. 2002-W5, Class A7, 6.25%, 08/25/2030 ## | 19,480,000 | 20,454,004 |
| Ser. 2002-W8, Class A4, 7.00%, 06/25/2017 | 9,725,461 | 10,345,459 |
| Ser. 2003-W1, Class 1A-1, 6.50%, 12/25/2042 | 3,073,027 | 3,209,504 |
| Ser. 2003-W6, Class 3A, 6.50%, 09/25/2042 # | 14,569,374 | 15,250,982 |
| Ser. G93, Class FH, 2.244%, 04/25/2023 | 395,753 | 406,369 |
| GNMA: |
| Ser. 2000-12, Class FQ, 1.74%, 06/16/2029 | 2,355,066 | 2,363,468 |
| Ser. 2000-36, Class FG, 1.591%, 11/20/2030 | 1,641,763 | 1,648,791 |
| Greenwich Capital Acceptance, Inc., Ser. 2001-ZC1A, Class A, |
| 6.355%, 06/12/2006 144A (h) | 3,380,660 | 3,521,067 |
| LB-UBS Comml. Mtge. Trust, Ser. 2000-C4, Class A1, 7.18%, |
| 09/15/2019 | 496,896 | 544,561 |
| Lehman Brothers Comml. Mtge. Trust, Ser. 2002-LLFA, Class G, 2.10%, |
| 06/14/2017 144A | 6,785,000 | 6,792,195 |
| Morgan Stanley Dean Witter Capital I: |
| Ser. 1998-XL1, Class A2, 6.45%, 06/03/2030 | 800,000 | 835,409 |
| Ser. 2002-HQ, Class A1, 4.59%, 04/15/2034 | 1,259,511 | 1,295,277 |
| PNC Mtge. Securities Corp.: |
| Ser. 1998-4, Class CB3, 6.85%, 05/25/2028 | 2,555,723 | 2,567,080 |
| Ser. 1999-1, Class CB2, 6.79%, 03/25/2029 | 2,498,288 | 2,554,900 |
| Residential Funding Mtge. Securities, Ser. 1995-J4, Class 1, |
| 6.567%, 05/28/2025 144A (h) | 686,921 | 686,921 |
| Total Collateralized Mortgage Obligations (cost $209,266,500) | | 208,677,275 |
| CORPORATE BONDS 7.4% |
| FINANCIALS 6.3% |
| Capital Markets 1.5% |
| Goldman Sachs & Co., Inc., 3.875%, 01/15/2009 | 4,000,000 | 3,942,336 |
| Morgan Stanley Co., Inc., 4.75%, 04/01/2014 | 5,000,000 | 4,680,475 |
| 8,622,811 |
| Commercial Banks 0.6% |
| Westpac Capital Trust IV, 5.256%, 12/29/2049 144A | 4,000,000 | 3,767,004 |
| Consumer Finance 0.1% |
| General Electric Capital Corp., 5.45%, 01/15/2013 | 500,000 | 512,817 |
| Diversified Financial Services 0.9% |
| Citigroup, Inc., 5.625%, 08/27/2012 | 5,000,000 | 5,222,405 |
| Insurance 2.4% |
| Aegon NV, 4.75%, 06/01/2013 | 5,000,000 | 4,868,970 |
| AIG SunAmerica Global Financing VI, 6.30%, 05/10/2011 144A | 4,000,000 | 4,329,532 |
| Berkshire Hathaway Finance Corp., 4.625%, 10/15/2013 144A | 5,000,000 | 4,844,215 |
| 14,042,717 |
| Thrifts & Mortgage Finance 0.8% |
| Meridian Capital Group LLC, 1.59%, 04/15/2009 144A | 5,000,000 | 4,999,565 |
See Notes to Financial Statements |
11
SCHEDULE OF INVESTMENTS continued
April 30, 2004 | Principal
Amount | Value |
|
| CORPORATE BONDS continued |
| TELECOMMUNICATION SERVICES 1.1% |
| Diversified Telecommunication Services 1.1% |
| Verizon Global Funding Corp., 6.875%, 06/15/2012 | $ 6,000,000 | $ 6,663,636 |
| Total Corporate Bonds (cost $45,000,201) | | 43,830,955 |
| MORTGAGE-BACKED SECURITIES 55.0% |
| FHLMC: |
| 2.85%, 02/23/2007 (p) | 10,000,000 | 9,888,890 |
| 5.00%, TBA # | 109,700,000 | 108,559,510 |
| 5.50%, TBA # | 61,500,000 | 61,753,125 |
| 6.00%, 12/01/2033 ## | 9,384,507 | 9,607,443 |
| 6.50%, 04/01/2011-09/01/2028 | 12,549,515 | 13,241,966 |
| 7.50%, 05/01/2027-08/01/2028 | 2,137,675 | 2,302,114 |
| 8.00%, 08/01/2023-11/01/2028 | 603,309 | 660,754 |
| 9.00%, 01/01/2017 | 215,890 | 241,159 |
| 9.50%, 09/01/2020 | 117,694 | 131,942 |
| 10.50%, 12/01/2019 | 420,529 | 476,921 |
| FNMA: |
| 2.634%, 01/01/2041 ## | 12,000,939 | 12,177,525 |
| 4.00%, 09/02/2008 (p) | 10,000,000 | 10,007,010 |
| 4.50%, TBA # | 10,000,000 | 9,843,750 |
| 5.125%, 01/02/2014 (p) | 6,000,000 | 5,913,666 |
| 5.29%, 04/01/2007 | 976,406 | 1,001,038 |
| 5.50%, TBA # | 20,000,000 | 19,956,240 |
| 5.897%, 04/01/2012 ## | 3,430,299 | 3,689,981 |
| 6.00%, 02/01/2008-09/01/2013 | 1,271,963 | 1,332,269 |
| 6.219%, 08/01/2012 ## | 4,177,288 | 4,580,561 |
| 6.28%, 05/01/2011 ## | 7,755,268 | 8,501,625 |
| 6.35%, 01/01/2011 ## | 2,000,000 | 2,195,584 |
| 6.40%, 08/01/2011 ## | 2,545,066 | 2,797,724 |
| 6.50%, 01/01/2024 | 303,445 | 317,478 |
| 6.634%, 06/01/2040 ## | 16,713,365 | 16,959,291 |
| 6.685%, 04/01/2009 | 82,973 | 83,232 |
| 6.80%, 01/01/2011 ## | 3,000,000 | 3,366,300 |
| 7.00%, 11/01/2026-02/01/2032 | 554,909 | 587,105 |
| 7.50%, 07/01/2023-05/01/2027 | 1,197,221 | 1,287,824 |
| 8.00%, 10/01/2026-09/01/2028 | 853,867 | 930,158 |
| 8.50%, 07/01/2029-08/01/2029 | 119,499 | 129,354 |
| 9.50%, 06/01/2022 | 145,474 | 163,310 |
| 11.00%, 01/01/2016 | 206,160 | 233,252 |
| 11.25%, 02/01/2016 | 246,698 | 280,932 |
| GNMA: |
| 6.00%, 02/15/2009-03/15/2033 | 2,806,717 | 2,891,444 |
| 6.50%, 12/15/2025-09/20/2033 | 1,940,314 | 2,024,773 |
| 7.00%, 12/15/2022-12/15/2032 | 1,925,409 | 2,052,641 |
| 7.34%, 10/20/2021-09/20/2022 | 1,166,602 | 1,256,254 |
| 7.50%, 02/15/2022-06/15/2032 | 1,721,282 | 1,854,507 |
See Notes to Financial Statements |
12
SCHEDULE OF INVESTMENTS continued
April 30, 2004 | Principal
Amount | Value |
|
| MORTGAGE-BACKED SECURITIES continued |
| GNMA: |
| 8.00%, 09/15/2009 | $ 20,144 | $ 21,487 |
| 10.00%, 12/15/2018 | 116,616 | 131,685 |
| Total Mortgage-Backed Securities (cost $325,968,077) | | 323,431,824 |
| U.S. GOVERNMENT & AGENCY OBLIGATIONS 11.5% |
| FHLB: |
| 3.25%, 08/15/2005 (p) | 5,000,000 | 5,087,075 |
| 5.125%, 03/06/2006 (p) | 14,000,000 | 14,695,674 |
| 5.80%, 09/02/2008 ## | 2,000,000 | 2,162,186 |
| FHLMC: |
| 2.875%, 09/15/2005 (p) | 5,500,000 | 5,566,401 |
| 5.25%, 01/15/2006 (p) | 4,000,000 | 4,196,008 |
| 5.50%, 07/15/2006 (p) | 15,000,000 | 15,927,315 |
| FNMA: |
| 2.125%, 04/15/2006 (p) | 15,000,000 | 14,897,235 |
| 2.875%, 10/15/2005 (p) | 5,000,000 | 5,057,945 |
| Total U.S. Government & Agency Obligations (cost $67,718,728) | | 67,589,839 |
| U.S. TREASURY OBLIGATIONS 8.9% |
| U.S. Treasury Bonds, 5.375%, 02/15/2031 (p) | 24,000,000 | 24,322,512 |
| U.S. Treasury Notes: |
| 2.00%, 08/31/2005 (p) | 1,000,000 | 1,002,266 |
| 2.125%, 08/31/2004 | 1,000,000 | 1,003,790 |
| 3.50%, 11/15/2006 (p) | 2,500,000 | 2,553,127 |
| 4.00%, 02/15/2014 (p) | 17,000,000 | 16,335,946 |
| 4.375%, 05/15/2007 (p) | 4,000,000 | 4,172,344 |
| 4.625%, 05/15/2006 (p) | 2,800,000 | 2,926,549 |
| Total U.S. Treasury Obligations (cost $53,431,365) | | 52,316,534 |
|
| Shares | Value |
|
| SHORT-TERM INVESTMENTS 36.4% |
| MUTUAL FUND SHARES 36.4% |
| Evergreen Institutional Money Market Fund (o) ## | 76,913,269 | 76,913,269 |
| Navigator Prime Portfolio (pp) | 137,008,812 | 137,008,812 |
| Total Short-Term Investments (cost $213,922,081) | | 213,922,081 |
| Total Investments (cost $935,102,205) 158.1% | | 929,587,518 |
| Other Assets and Liabilities (58.1%) | | (341,582,615) |
| Net Assets 100.0% | | $ 588,004,903 |
See Notes to Financial Statements |
13
SCHEDULE OF INVESTMENTS continued
April 30, 2004| 144A | Security that may be sold to qualified institutional buyers under Rule 144A of the Securities Act of 1933, as amended. This security has been determined to be liquid under the guidelines established by the Board of Trustees. |
| (o) | Evergreen Investment Management Company, LLC is the investment advisor to both the Fund and the money market fund. |
| (h) | No market quotation available. Valued at fair value as determined in good faith under procedures established by the Board of Trustees. |
| (p) | All or a portion of this security is on loan. |
| (pp) | Represents investment of cash collateral received from securities on loan. |
| # | When-issued security or delayed delivery security |
| ## | All or a portion of the security has been segregated for when-issued or delayed delivery securities. |
Summary of Abbreviations: |
| FHLB | Federal Home Loan Bank |
| FHLMC | Federal Home Loan Mortgage Corp. |
| FNMA | Federal National Mortgage Association |
| FRN | Floating Rate Note |
| GNMA | Government National Mortgage Association |
| SLMA | Student Loan Marketing Association |
| TBA | To Be Announced |
See Notes to Financial Statements |
14
STATEMENT OF ASSETS AND LIABILITIES
April 30, 2004
|
| Assets |
| Investments in securities, at value (cost $858,188,936) including |
| $134,256,735 of securities loaned | $ 852,674,249 |
| Investments in affiliate, at value (cost $76,913,269) | 76,913,269 |
| Receivable for securities sold | 7,926,447 |
| Principal paydown receivable | 238,515 |
| Receivable for Fund shares sold | 1,001,512 |
| Interest receivable | 3,633,964 |
| Receivable for securities lending income | 15,743 |
| Prepaid expenses and other assets | 143,638 |
|
| Total assets | 942,547,337 |
|
| Liabilities |
| Dividends payable | 357,514 |
| Payable for securities purchased | 216,395,190 |
| Payable for Fund shares redeemed | 650,744 |
| Payable for securities on loan | 137,008,812 |
| Advisory fee payable | 19,413 |
| Distribution Plan expenses payable | 6,892 |
| Due to other related parties | 5,631 |
| Accrued expenses and other liabilities | 98,238 |
|
| Total liabilities | 354,542,434 |
|
| Net assets | $ 588,004,903 |
|
| Net assets represented by |
| Paid-in capital | $ 602,989,195 |
| Overdistributed net investment income | (400,663) |
| Accumulated net realized losses on securities | (9,068,942) |
| Net unrealized losses on securities | (5,514,687) |
|
| Total net assets | $ 588,004,903 |
|
| Net assets consists of |
| Class A | $ 109,171,572 |
| Class B | 37,270,020 |
| Class C | 14,207,420 |
| Class I | 427,355,891 |
|
| Total net assets | $ 588,004,903 |
|
| Shares outstanding |
| Class A | 10,962,627 |
| Class B | 3,742,525 |
| Class C | 1,426,670 |
| Class I | 42,914,584 |
|
| Net asset value per share |
| Class A | $ 9.96 |
| Class A - Offering price (based on sales charge of 4.75%) | $ 10.46 |
| Class B | $ 9.96 |
| Class C | $ 9.96 |
| Class I | $ 9.96 |
|
See Notes to Financial Statements |
15
STATEMENT OF OPERATIONS
Year Ended April 30, 2004
|
| Investment income |
| Interest |
| $ 18,317,342 |
| Income from affiliate | 627,485 |
|
| Total investment income | 18,944,827 |
|
| Expenses |
| Advisory fee | 2,769,845 |
| Distribution Plan expenses |
| Class A | 381,877 |
| Class B | 487,636 |
| Class C | 194,337 |
| Administrative services fee | 661,181 |
| Transfer agent fees | 863,513 |
| Trustees' fees and expenses | 18,791 |
| Printing and postage expenses | 63,790 |
| Custodian and accounting fees | 203,966 |
| Registration and filing fees | 65,207 |
| Professional fees | 27,547 |
| Other | 25,822 |
|
| Total expenses | 5,763,512 |
| Less: Expense reductions | (2,494) |
| Expense reimbursements | (2,938) |
|
| Net expenses | 5,758,080 |
|
| Net investment income | 13,186,747 |
|
| Net realized and unrealized gains or losses on securities |
| Net realized gains on securities | 8,184,552 |
| Net change in unrealized gains or losses on securities | (18,847,170) |
|
| Net realized and unrealized gains or losses on securities | (10,662,618) |
|
| Net increase in net assets resulting from operations | $ 2,524,129 |
|
See Notes to Financial Statements |
16
STATEMENTS OF CHANGES IN NET ASSETS
| Year Ended April 30,
|
| 2004 | 2003 |
|
| Operations |
| Net investment income | | $ 13,186,747 | | $ 24,107,436 |
| Net realized gains on securities | | 8,184,552 | | 17,673,872 |
| Net change in unrealized gains or |
| losses on securities | | (18,847,170) | | 7,235,603 |
|
| Net increase in net assets resulting |
| from operations | | 2,524,129 | | 49,016,911 |
|
| Distributions to shareholders from |
| Net investment income |
| Class A | | (3,670,702) | | (5,099,288) |
| Class B | | (1,062,558) | | (1,535,465) |
| Class C | | (424,188) | | (616,085) |
| Class I | | (14,804,338) | | (14,724,478) |
|
| Total distributions to shareholders | | (19,961,786) | | (21,975,316) |
|
| | Shares | | Shares |
| Capital share transactions |
| Proceeds from shares sold |
| Class A | 2,075,217 | 21,083,132 | 17,049,018 | 170,302,635 |
| Class B | 556,807 | 5,657,033 | 2,882,631 | 28,877,383 |
| Class C | 296,648 | 2,997,880 | 2,223,637 | 22,247,604 |
| Class I | 11,828,100 | 120,167,632 | 30,137,028 | 303,895,597 |
|
| | | 149,905,677 | | 525,323,219 |
|
| Net asset value of shares issued in |
| reinvestment of distributions |
| Class A | 259,406 | 2,625,029 | 349,844 | 3,520,371 |
| Class B | 73,156 | 740,430 | 105,992 | 1,067,084 |
| Class C | 27,341 | 276,766 | 41,734 | 420,537 |
| Class I | 1,203,602 | 12,176,796 | 1,335,306 | 13,447,251 |
|
| | | 15,819,021 | | 18,455,243 |
|
| Automatic conversion of Class B shares |
| to Class A shares |
| Class A | 337,382 | 3,420,150 | 508,392 | 5,130,200 |
| Class B | (337,382) | (3,420,150) | (508,392) | (5,130,200) |
|
| | | 0 | | 0 |
|
| Payment for shares redeemed |
| Class A | (6,063,799) | (61,384,951) | (18,115,090) | (180,977,585) |
| Class B | (2,361,200) | (23,869,116) | (1,489,516) | (14,974,107) |
| Class C | (1,443,842) | (14,577,107) | (1,175,934) | (11,830,083) |
| Class I | (22,014,410) | (222,776,501) | (17,152,118) | (172,490,229) |
|
| | | (322,607,675) | | (380,272,004) |
|
| Net asset value of shares issued in |
| acquisitions |
| Class A | 20,363 | 208,806 | 0 | 0 |
| Class I | 3,973,896 | 40,749,601 | 0 | 0 |
|
| | | 40,958,407 | | 0 |
|
| Net increase (decrease) in net assets |
| resulting from capital share transactions | | (115,924,570) | | 163,506,458 |
|
| Total increase (decrease) in net assets | | (133,362,227) | | 190,548,053 |
| Net assets |
| Beginning of period | | 721,367,130 | | 530,819,077 |
|
| End of period | | $ 588,004,903 | | $ 721,367,130 |
|
| Overdistributed net investment income | | $ (400,663) | | $ (399,150) |
|
See Notes to Financial Statements |
17
STATEMENT OF CASH FLOWS
Year Ended April 30, 2004
|
| Increase in Cash |
| Cash Flows from Operating Activities: |
| Net increase in net assets from operations | $ 2,524,129 |
| Adjustments to reconcile net increase in net assets from operations to net cash |
| provided by operating activities: |
| Purchase of investment securities | (2,176,377,706) |
| Proceeds from disposition of investment securities | 2,305,534,289 |
| Purchase of short-term investment securities, net | 500,708 |
| Decrease in interest receivable | 1,153,123 |
| Decrease in receivable for securities sold | 137,479,911 |
| Decrease in receivable for Fund shares sold | 2,604,530 |
| Decrease in other assets | 6,305 |
| Decrease in payable for securities purchased | (151,676,208) |
| Decrease in payable for Fund shares redeemed | (3,233,694) |
| Increase in accrued expenses | 25,108 |
| Unrealized depreciation on investments | 18,294,610 |
| Net realized loss from investments | (934,333) |
|
| Net cash provided by operating activities | 135,900,772 |
|
| Cash Flows from Financing Activities: |
| Decrease in additional paid-in capital | (131,743,591) |
| Cash distributions paid | (4,157,181) |
|
| Net cash used in financing activities | (135,900,772) |
|
| Net increase in cash | $ 0 |
|
| Cash: |
| Beginning of year | $ 0 |
|
| End of year | $ 0 |
|
18
NOTES TO FINANCIAL STATEMENTS
1. ORGANIZATION
Evergreen U.S. Government Fund (the "Fund") is a diversified series of Evergreen Fixed Income Trust (the "Trust"), a Delaware statutory trust organized on September 18, 1997. The Trust is an open-end management investment company registered under the Investment Company Act of 1940, as amended (the "1940 Act").
The Fund offers Class A, Class B, Class C and Institutional ("Class I") shares. Class A shares are sold with a front-end sales charge. Class B shares are sold without a front-end sales charge but are subject to a contingent deferred sales charge that is payable upon redemption and decreases depending on how long the shares have been held. Effective February 2, 2004, Class C shares are no longer sold with a front-end sales charge but are still subject to a contingent deferred sales charge that is payable upon redemption within one year after the month of purchase. Class I shares are sold without a front-end sales charge or contingent deferred sales charge. Each class of shares, except Class I shares, pays an ongoing distribution fee.
2. SIGNIFICANT ACCOUNTING POLICIES
The following is a summary of significant accounting policies consistently followed by the Fund in the preparation of its financial statements. The policies are in conformity with generally accepted accounting principles in the United States of America, which require management to make estimates and assumptions that affect amounts reported herein. Actual results could differ from these estimates.
a. Valuation of investments
Portfolio debt securities acquired with more than 60 days to maturity are valued at prices obtained from an independent pricing service which takes into consideration such factors as similar security prices, yields, maturities, liquidity and ratings. Securities for which valuations are not available from an independent pricing service may be valued by brokers which use prices provided by market makers or estimates of market value obtained from yield data relating to investments or securities with similar characteristics.
Short-term securities with remaining maturities of 60 days or less at the time of purchase are valued at amortized cost, which approximates market value.
Investments in other mutual funds are valued at net asset value. Securities for which market quotations are not available or not reflective of current market value are valued at fair value as determined in good faith, according to procedures approved by the Board of Trustees.
b. When-issued and delayed delivery transactions
The Fund records when-issued securities as of trade date and maintains security positions such that sufficient liquid assets will be available to make payment for the securities purchased. Securities purchased on a when-issued or delayed delivery basis are marked-to-market daily and begin earning interest on the settlement date. Losses may occur on these transactions due to changes in market conditions or the failure of counterparties to perform under the contract.
19
NOTES TO FINANCIAL STATEMENTS continued
c. Securities lending
The Fund may lend its securities to certain qualified brokers in order to earn additional income. The Fund receives compensation in the form of fees or interest earned on the investment of any cash collateral received. The Fund also continues to receive interest and dividends on the securities loaned. The Fund receives collateral in the form of cash or securities with a market value at least equal to the market value of the securities on loan, including accrued interest. In the event of default or bankruptcy by the borrower, the Fund could experience delays and costs in recovering the loaned securities or in gaining access to the collateral. The Fund has the right under the lending agreement to recover the securities from the borrower on demand.
d. Dollar roll transactions
The Fund may enter into dollar roll transactions with respect to mortgage-backed securities. In a dollar roll transaction, the Fund sells mortgage-backed securities to financial institutions and simultaneously agrees to accept substantially similar (same type, coupon and maturity) securities at a later date at an agreed upon price. The Fund will use the proceeds generated from the transactions to invest in short-term investments, which may enhance the Fund's current yield and total return. The Fund accounts for dollar roll transactions as purchases and sales.
e. Security transactions and investment income
Security transactions are recorded on trade date. Realized gains and losses are computed using the specific cost of the security sold. Interest income is recorded on the accrual basis and includes accretion of discounts and amortization of premiums.
f. Federal taxes
The Fund intends to continue to qualify as a regulated investment company and distribute all of its taxable income, including any net capital gains (which have already been offset by available capital loss carryovers). Accordingly, no provision for federal taxes is required.
g. Distributions
Distributions to shareholders from net investment income are accrued daily and paid monthly. Distributions from net realized gains, if any, are recorded on the ex-dividend date. Such distributions are determined in conformity with income tax regulations, which may differ from generally accepted accounting principles.
Reclassifications have been made to the Fund's components of net assets to reflect income and gains available for distribution (or available capital loss carryovers, as applicable) under income tax regulations. The primary permanent differences causing such reclassifications are due to the expiration of capital loss carryovers, mortgage paydown gains and losses and premium amortization.
h. Class allocations
Income, common expenses and realized and unrealized gains and losses are allocated to the classes based on the relative net assets of each class. Distribution fees, if any, are calculated daily at the class level based on the appropriate net assets of each class and the specific expense rates applicable to each class.
20
NOTES TO FINANCIAL STATEMENTS continued
3. ADVISORY FEE AND OTHER TRANSACTIONS WITH AFFILIATES
Evergreen Investment Management Company, LLC ("EIMC"), an indirect, wholly-owned subsidiary of Wachovia Corporation ("Wachovia"), is the investment advisor to the Fund and is paid an annual fee starting at 0.42% and declining to 0.35% as average daily net assets increase. Prior to April 1, 2004, the Fund paid the investment advisor an annual fee of 0.42% of the Fund's average daily net assets.
From time to time, EIMC may voluntarily or contractually waive its fee and/or reimburse expenses in order to limit operating expenses. For any fee waivers and/or reimbursements made after January 1, 2003, EIMC may recoup certain amounts waived and/or reimbursed up to a period of three years following the end of the fiscal year in which the fee waivers and/or reimbursements were made. During the year ended April 30, 2004, EIMC reimbursed expenses relating to Class A shares in the amount of $2,938. Total amounts subject to recoupment as of April 30, 2004 were $6,412.
Evergreen Investment Services, Inc. ("EIS"), an indirect, wholly-owned subsidiary of Wachovia, is the administrator to the Fund. As administrator, EIS provides the Fund with facilities, equipment and personnel and is paid an annual rate determined by applying percentage rates to the aggregate average daily net assets of the Evergreen funds (excluding money market funds), starting at 0.10% and declining to 0.05% as the aggregate average daily net assets of the Evergreen funds (excluding money market funds) increase.
Evergreen Service Company, LLC ("ESC"), an indirect, wholly-owned subsidiary of Wachovia, is the transfer and dividend disbursing agent for the Fund. ESC receives account fees that vary based on the type of account held by the shareholders in the Fund. For the year ended April 30, 2004, the transfer agent fees were equivalent to an annual rate of 0.13% of the Fund's average daily net assets.
4. DISTRIBUTION PLANS
Evergreen Distributor, Inc., a wholly-owned subsidiary of BISYS Fund Services, Inc., serves as principal underwriter to the Fund.
The Fund has adopted Distribution Plans, as allowed by Rule 12b-1 of the 1940 Act, for each class of shares, except Class I. Under the Distribution Plans, distribution fees are paid at an annual rate of 0.30% of the average daily net assets for Class A shares and 1.00% of the average daily net assets for each of Class B and Class C shares.
5. ACQUISITIONS
Effective at the close of business on July 11, 2003, the Fund acquired the net assets of Evergreen Offit U.S. Government Securities Fund in a tax-free exchange for Class I shares of the Fund. Shares were issued to Class I shares of Evergreen Offit U.S. Government Securities Fund at an exchange ratio of 1.01 for Class I shares of the Fund. On the same date, the Fund also acquired the net assets of Evergreen Offit Mortgage Securities Fund in a tax-free exchange for Class A and Class I shares of the Fund. Shares were issued to Class A and Class I shares of Evergreen Offit
21
NOTES TO FINANCIAL STATEMENTS continued
Mortgage Securities Fund at an exchange ratio of 0.98 and 0.98 for Class A and Class I shares, respectively, of the Fund. The aggregate net assets of the Fund immediately prior to the acquisitions were $703,371,196.
The value of net assets acquired, unrealized appreciation acquired and number of shares issued were as follows:
|
| | Value of Net | Unrealized | Number of |
| Acquired Fund | Assets Acquired | Appreciation | Shares Issued |
|
| Evergreen Offit | $ 20,074,892 | $ 316,122 | 1,957,708 Class I |
| U.S. Government |
| Securities Fund |
| Evergreen Offit | 20,883,515 | 183,943 | 20,363 Class A |
| Mortgage Securities | | | 2,016,188 Class I |
| Fund |
|
The aggregate net assets of the Fund immediately after these acquisitions were $744,329,603.
6. SECURITIES TRANSACTIONS
Cost of purchases and proceeds from sales of investment securities (excluding short-term securities and mortgage dollar roll transactions) were as follows for the year ended April 30, 2004:
| Cost of Purchases | Proceeds from Sales |
|
| Non-U.S. | | Non-U.S. |
| U.S. Government | Government | U.S. Government | Government |
|
| $ 320,795,062 | $ 110,069,155 | $ 336,336,359 | $ 93,449,727 |
|
During the year ended April 30, 2004, the Fund loaned securities to certain brokers. At April 30, 2004, the value of securities on loan and the value of collateral amounted to $134,256,735 and $137,008,812, respectively. During the year ended April 30, 2004, the Fund earned $155,921 in income from securities lending which is included in interest income on the Statement of Operations.
On April 30, 2004, the aggregate cost of securities for federal income tax purposes was $936,872,578. The gross unrealized appreciation and depreciation on securities based on tax cost was $2,615,409 and $9,900,469, respectively, with a net unrealized depreciation of $7,285,060.
As of April 30, 2004, the Fund had $7,298,569 in capital loss carryovers for federal income tax purposes expiring as follows:
| Expiration |
|
| 2005 | 2007 | 2008 | 2009 | 2010 |
|
| $ 724,690 | $ 1,281,377 | $ 4,853,705 | $ 437,595 | $ 1,202 |
|
Certain portions of the capital loss carryovers of the Fund were assumed as a result of acquisitions.
22
NOTES TO FINANCIAL STATEMENTS continued
7. INTERFUND LENDING
Pursuant to an Exemptive Order issued by the SEC, the Fund may participate in an interfund lending program with certain funds in the Evergreen fund family. This program allows the Fund to borrow from, or lend money to, other participating funds. During the year ended April 30, 2004, the Fund did not participate in the interfund lending program.
8. DISTRIBUTIONS TO SHAREHOLDERS
As of April 30, 2004, the components of distributable earnings on a tax basis were as follows:
| Overdistributed | Unrealized | Capital Loss |
| Ordinary Income | Depreciation | Carryover |
|
| $ 400,663 | $ 7,285,060 | $ 7,298,569 |
|
The differences between the components of distributable earnings on a tax basis and the amounts reflected in the Statement of Assets and Liabilities are primarily due to wash sales and premium amortization.
The tax character of distributions paid for the years ended April 30, 2004 and April 30, 2003 were $19,961,786 and $21,975,316, respectively, of ordinary income.
9. EXPENSE REDUCTIONS
Through expense offset arrangements with ESC and the Fund's custodian, a portion of fund expenses has been reduced.
10. DEFERRED TRUSTEES' FEES
Each Trustee of the Fund may defer any or all compensation related to performance of their duties as Trustees. The Trustees' deferred balances are allocated to deferral accounts, which are included in the accrued expenses for the Fund. The investment performance of the deferral accounts are based on the investment performance of certain Evergreen funds. Any gains earned or losses incurred in the deferral accounts are reported in the Fund's Trustees' fees and expenses. At the election of the Trustees, the deferral account will be paid either in one lump sum or in quarterly installments for up to ten years.
11. FINANCING AGREEMENT
The Fund and certain other Evergreen funds share in a $150 million unsecured revolving credit commitment for temporary and emergency purposes, including the funding of redemptions, as permitted by each participating fund's borrowing restrictions. Borrowings under this facility bear interest at 0.50% per annum above the Federal Funds rate. All of the participating funds are charged an annual commitment fee of 0.09% of the unused balance, which is allocated pro rata. During the year ended April 30, 2004, the Fund had no borrowings under this agreement.
12. SUBSEQUENT EVENT
Effective May 1, 2004, EIS replaced Evergreen Distributor, Inc. as the distributor of the Fund's shares.
23
REPORT OF INDEPENDENT REGISTERED PUBLIC ACCOUNTING FIRM
Board of Trustees and Shareholders
Evergreen Fixed Income Trust
We have audited the accompanying statement of assets and liabilities, including the schedule of investments, of the Evergreen U.S. Government Fund, a series of Evergreen Fixed Income Trust, as of April 30, 2004, and the related statement of operations and statement of cash flows for the year then ended, statements of changes in net assets for each of the years in the two-year period then ended, and the financial highlights for each of the years in the five-year period then ended. These financial statements and financial highlights are the responsibility of the Fund's management. Our responsibility is to express an opinion on these financial statements and financial highlights based on our audits.
We conducted our audits in accordance with the standards of the Public Company Accounting Oversight Board (United States). Those standards require that we plan and perform the audit to obtain reasonable assurance about whether the financial statements and financial highlights are free of material misstatement. An audit includes examining, on a test basis, evidence supporting the amounts and disclosures in the financial statements. Our procedures included confirmation of securities owned as of April 30, 2004 by correspondence with the custodian. As to securities purchased or sold but not yet received or delivered, we performed other appropriate auditing procedures. An audit also includes assessing the accounting principles used and significant estimates made by management, as well as evaluating the overall financial statement presentation. We believe that our audits provide a reasonable basis for our opinion.
In our opinion, the financial statements and financial highlights referred to above present fairly, in all material respects, the financial position of the Evergreen U.S. Government Fund, as of April 30, 2004, the results of its operations, its cash flows, changes in its net assets and financial highlights for each of the years described above in conformity with accounting principles generally accepted in the United States of America.
Boston, Massachusetts
June 4, 2004
24
This page left intentionally blank
25
This page left intentionally blank
26
This page left intentionally blank
27
TRUSTEES AND OFFICERS
| TRUSTEES1 | |
Charles A. Austin III
Trustee
DOB: 10/23/1934
Term of office since: 1991
Other directorships: None | Principal occupations: Investment Counselor, Anchor Capital Advisors, Inc. (investment advice); Director, The Andover Companies (insurance); Trustee, Arthritis Foundation of New England; Director, The Francis Ouimet Society; Former Director, Health Development Corp. (fitness-wellness centers); Former Director, Mentor Income Fund, Inc.; Former Trustee, Mentor Funds and Cash Resource Trust; Former Investment Counselor, Appleton Partners, Inc. (investment advice); Former Director, Executive Vice President and Treasurer, State Street Research & Management Company (investment advice) |
|
Shirley L. Fulton
Trustee
DOB: 1/10/1952
Term of office since: 2004
Other directorships: None | Principal occupations: Partner, Helms, Henderson & Fulton, P.A. (law firm); Retired Senior Resident Superior Court Judge, 26th Judicial District, Charlotte, NC |
|
K. Dun Gifford
Trustee
DOB: 10/23/1938
Term of office since: 1974
Other directorships: None | Principal occupations: Chairman and President, Oldways Preservation and Exchange Trust (education); Trustee, Treasurer and Chairman of the Finance Committee, Cambridge College; Former Chairman of the Board, Director, and Executive Vice President, The London Harness Company (leather goods purveyor); Former Director, Mentor Income Fund, Inc.; Former Trustee, Mentor Funds and Cash Resource Trust |
|
Dr. Leroy Keith, Jr.
Trustee
DOB: 2/14/1939
Term of office since: 1983
Other directorships: Trustee, Phoenix Series Fund, Phoenix Multi-Portfolio Fund, and The Phoenix Big Edge Series Fund | Principal occupations: Partner, Stonington Partners, Inc. (private investment firm); Trustee of Phoenix Series Fund, Phoenix Multi-Portfolio Fund, and The Phoenix Big Edge Series Fund; Former Chairman of the Board and Chief Executive Officer, Carson Products Company (manufacturing); Director, Obagi Medical Products Co.; Director, Lincoln Educational Services; Director, Diversapack Co.; Former President, Morehouse College; Former Director, Mentor Income Fund, Inc.; Former Trustee, Mentor Funds and Cash Resource Trust |
|
Gerald M. McDonnell
Trustee
DOB: 7/14/1939
Term of office since: 1988
Other directorships: None | Principal occupations: Manager of Commercial Operations, SMI STEEL Co. - South Carolina (steel producer); Former Sales and Marketing Management, Nucor Steel Company; Former Director, Mentor Income Fund, Inc.; Former Trustee, Mentor Funds and Cash Resource Trust |
|
William Walt Pettit
Trustee
DOB: 8/26/1955
Term of office since: 1984
Other directorships: None | Principal occupations: Partner and Vice President, Kellam & Pettit, P.A. (law firm); Former Director, Mentor Income Fund, Inc.; Former Trustee, Mentor Funds and Cash Resource Trust |
|
David M. Richardson
Trustee
DOB: 9/19/1941
Term of office since: 1982
Other directorships: None | Principal occupations: President, Richardson, Runden & Company (executive recruitment business development/consulting company); Consultant, Kennedy Information, Inc. (executive recruitment information and research company); Consultant, AESC (The Association of Retained Executive Search Consultants); Trustee, NDI Technologies, LLP (communications); Director, J&M Cumming Paper Co. (paper merchandising); Former Vice Chairman, DHR International, Inc. (executive recruitment); Former Director, Mentor Income Fund, Inc.; Former Trustee, Mentor Funds and Cash Resource Trust |
|
Dr. Russell A. Salton III
Trustee
DOB: 6/2/1947
Term of office since: 1984
Other directorships: None | Principal occupations: President/CEO, AccessOne MedCard; Former Medical Director, Healthcare Resource Associates, Inc.; Former Medical Director, U.S. Health Care/Aetna Health Services; Former Director, Mentor Income Fund, Inc.; Former Trustee, Mentor Funds and Cash Resource Trust |
|
28
TRUSTEES AND OFFICERS continued
Michael S. Scofield
Trustee
DOB: 2/20/1943
Term of office since: 1984
Other directorships: None | Principal occupations: Attorney, Law Offices of Michael S. Scofield; Former Director, Mentor Income Fund, Inc.; Former Trustee, Mentor Funds and Cash Resource Trust |
|
Richard J. Shima
Trustee
DOB: 8/11/1939
Term of office since: 1993
Other directorships: None | Principal occupations: Independent Consultant; Director, Trust Company of CT; Trustee, Saint Joseph College (CT); Director, Hartford Hospital; Trustee, Greater Hartford YMCA; Former Director, Enhance Financial Services, Inc.; Former Director, Old State House Association; Former Director of CTG Resources, Inc. (natural gas); Former Director, Mentor Income Fund, Inc.; Former Trustee, Mentor Funds and Cash Resource Trust |
|
Richard K. Wagoner, CFA2
Trustee
DOB: 12/12/1937
Term of office since: 1999
Other directorships: None | Principal occupations: Member and Former President, North Carolina Securities Traders Association; Member, Financial Analysts Society; Former Consultant to the Boards of Trustees of the Evergreen funds; Former Trustee, Mentor Funds and Cash Resource Trust |
|
| OFFICERS |
|
Dennis H. Ferro3
President
DOB: 6/20/1945
Term of office since: 2003 | Principal occupations: President, Chief Executive Officer and Chief Investment Officer, Evergreen Investment Company, Inc. and Executive Vice President, Wachovia Bank, N.A. |
|
Carol Kosel4
Treasurer
DOB: 12/25/1963
Term of office since: 1999 | Principal occupations: Senior Vice President, Evergreen Investment Services, Inc. |
|
Michael H. Koonce4
Secretary
DOB: 4/20/1960
Term of office since: 2000 | Principal occupations: Senior Vice President and General Counsel, Evergreen Investment Services, Inc.; Senior Vice President and Assistant General Counsel, Wachovia Corporation |
|
1 Each Trustee serves until a successor is duly elected or qualified or until his death, resignation, retirement or removal from office. Each Trustee oversees 94 Evergreen funds. Correspondence for each Trustee may be sent to Evergreen Board of Trustees, P.O. Box 20083, Charlotte, North Carolina 28202.
2 Mr. Wagoner is an "interested person" of the Fund because of his ownership of shares in Wachovia Corporation, the parent to the Fund's investment advisor.
3 The address of the Officer is 401 S. Tryon Street, 20th Floor, Charlotte, NC 28288.
4 The address of the Officer is 200 Berkeley Street, Boston, MA 02116.
Additional information about the Fund's Board of Trustees and Officers can be found in the Statement of Additional Information (SAI) and is available upon request without charge by calling 800.343.2898. |
29
INVESTMENTS THAT STAND THE TEST OF TIME
At Evergreen Investments, we remain steadfastly dedicated to four core principles that lead to success in today's financial world.- Leadership -- With over $248 billion in assets under management as of March 31, 2004 and a history of innovation spanning more than 70 years, we offer the strength that comes with experience.
Excellence -- We have been consistently recognized for risk-adjusted historical performance through disciplined, rigorous management focused on achieving sustainable success.
Experience -- Our investment managers are seasoned professionals who share their diverse points of view and have the perspective that comes with weathering good markets and bad.
Commitment -- We are dedicated to helping investment professionals and their clients achieve important goals through the investments, service and education we offer.
Visit us online at EvergreenInvestments.com
FOR MORE INFORMATION
Evergreen Express Line 800.346.3858
Evergreen Investor Services 800.343.2898
For the fifth consecutive year, Evergreen Investments has earned the Dalbar Mutual Fund Service Award, which recognizes those firms that exceed industry norms in key areas. The award symbolizes the achievement of the highest tier of shareholder service within our industry. For 2003,Evergreen Investments was ranked third overall.
566663 rv1 6/2004 |
Evergreen Investments
200 Berkeley Street
Boston, MA 02116-5034
|
Item 2 - Code of Ethics
(a) The Registrant has adopted a code of ethics that applies to the Registrant's principal executive officer and principal financial officer.
(b) During the period covered by this report, there were no amendments to the provisions of the code of ethics adopted in 2.(a) above.
(c) During the period covered by this report, there were no implicit or explicit waivers to the provisions of the code of ethics adopted in 2.(a) above.
Item 3 - Audit Committee Financial Expert
Charles A. Austin III and K. Dun Gifford have been determined by the Registrant's Board of Trustees to be audit committee financial experts within the meaning of Section 407 of the Sarbanes-Oxley Act. These financial experts are independent of management.
Items 4 - Principal Accountant Fees and Services
Applicable for annual reports only. (For annuals update the items below in blue and remove the prior sentence, for semiannuals remove this sentence along with all information up to but not including Item 5 and just leave the prior sentence.)
The following table represents fees for professional audit services rendered by KPMG LLP, for the audits of each of the 5 series of the Registrant's annual financial statements for the fiscal years ended April 30, 2003 and April 30, 2004, and fees billed for other services rendered by KPMG LLP. | 2003 | 2004 |
| Audit fees | $152,909 | $182,500 |
| |
| Audit-related fees (1) | 16,495 | 0 |
| Audit and audit-related fees | 169,404 | 182,500 |
| |
| Tax fees (2) | 28,515 | 19,338 |
| | All other fees | 0 | 0 |
| |
| Total fees | $197,919 | $201,838 |
(1) Audit-related fees consists principally of fees for interfund lending procedures and any merger related activity.
(2) Tax fees consists of fees for tax consultation, tax compliance and tax review.Evergreen Funds
Evergreen Income Advantage Fund
Evergreen Managed Income FundAudit and Non-Audit Services Pre-Approval PolicyI. Statement of Principles
Under the Sarbanes-Oxley Act of 2002 (the "Act"), the Audit Committee of the Board of Trustees/Directors is responsible for the appointment, compensation and oversight of the work of the independent auditor. As part of this responsibility, the Audit Committee is required to pre-approve the audit and non-audit services performed by the independent auditor in order to assure that they do not impair the auditor's independence from the Funds. To implement these provisions of the Act, the Securities and Exchange Commission (the "SEC") has issued rules specifying the types of services that an independent auditor may not provide to its audit client, as well as the audit committee's administration of the engagement of the independent auditor. Accordingly, the Audit Committee has adopted, and the Board of Trustees/Directors has ratified, the Audit and Non-Audit Services Pre Approval Policy (the "Policy"), which sets forth the procedures and the conditions pursuant to which services proposed to be performed by the i ndependent auditor may be pre-approved.
The SEC's rules establish two different approaches to pre-approving services, which the SEC considers to be equally valid. Proposed services either: may be pre-approved without consideration of specific case-by-case services by the Audit Committee ("general pre-approval"); or require the specific pre-approval of the Audit Committee ("specified pre-approval"). The Audit Committee believes that the combination of these two approaches in this Policy will result in an effective and efficient procedure to pre-approve services performed by the independent auditor. As set forth in this Policy, unless a type of service has received general pre-approval, it will require specific pre-approval by the Audit Committee if it is to be provided by the independent auditor. Any proposed services exceeding pre-approved cost levels or budgeted amounts will also require specific pre-approval by the Audit Committee.
For both types of pre-approval, the Audit Committee will consider whether such services are consistent with the SEC's rules on auditor independence. The Audit Committee will also consider whether the independent auditor is best positioned to provide the most effective and efficient service, for reasons such as its familiarity with the Funds' business people, culture, accounting systems, risk profile and other factors, and whether the service might enhance the Funds' ability to manage or control risk or improve audit quality. All such factors will be considered as a whole, and no one factor should necessarily be determinative.
The Audit Committee is also mindful of the relationship between fees for audit and non-audit services in deciding whether to pre-approve any such services and may determine, for each fiscal year, the ratio between the total amount of fees for Audit, Audit-related and Tax services and the total amount of fees for certain permissible non-audit services classified as All Other services.
The appendices to this Policy describe the Audit, Audit-related, Tax and All Other services that have the general pre-approval of the Audit Committee. The term of any general pre-approval is 12 months from the date of pre-approval, unless the Audit Committee considers a different period and states otherwise. The Audit Committee will annually review and pre-approve the services that may be provided by the independent auditor without obtaining specific pre-approval from the Audit Committee. The Audit Committee will add or subtract to the list of general pre-approved services from time to time, based on subsequent determinations.
The purpose of this Policy is to set forth the procedures by which the Audit Committee intends to fulfill its responsibilities. It does not delegate the Audit Committee's responsibilities to pre-approve services performed by the independent auditor to management.
The independent auditor has reviewed this Policy and believes that implementation of the policy will not adversely affect the auditor's independence.
II. Delegation
As provided in the Act and the SEC's rules, the Audit Committee may delegate either type of pre-approval authority to one or more of its members. The member to whom such authority is delegated must report, for informational purposes only, any pre-approval decisions of the Audit Committee at its next scheduled meeting.
III. Audit Services
The annual Audit services engagement terms and fees will be subject to the specific pre-approval of the Audit Committee. Audit services include the annual financial statement audit and other procedures required to be performed by the independent auditor to be able to form an opinion on the Funds' financial statements. These other procedures include information systems and procedural reviews and testing performed in order to understand and place reliance on the systems of internal control, and consultations relating to the audit. Audit services also include the attestation engagement for the independent auditor's report on management's report on internal controls for financial reporting. The Audit Committee will monitor the Audit services engagement as necessary, but no less than on a quarterly basis, and will also approve, if necessary, any changes in terms, conditions and fees resulting from changes in audit scope, Fund service providers or other items.
In addition to the annual Audit services engagement approved by the Audit Committee, the Audit Committee may grant general pre-approval to other Audit services, which are those services that only the independent auditor reasonably can provide. Other Audit services may include services associated with SEC registration statements, periodic reports and other documents filed with the SEC or other documents issued in connection with mergers or acquisitions.
The Audit Committee has pre-approved the Audit services in Appendix A. All other audit services not listed in Appendix A must be specifically pre-approved by the Audit Committee.
IV. Audit-related Services
Audit -related services are assurance and related services that are reasonably related to the performance of the audit or review of the Funds' financial statements or that are traditionally performed by the independent auditor. Because the Audit Committee believes that the provision of Audit-related services does not impair the independence of the auditor and is consistent with SEC's rules on auditor independence, the Audit Committee may grant general pre-approval to Audit-related services. Audit-related services include, among others, due diligence services pertaining to potential business acquisitions/dispositions; accounting consultations related to accounting, financial reporting or disclosure matters not classified as "Audit services"; assistance with understanding and implementing new accounting and financial reporting guidance from rulemaking authorities; agreed-upon or expanded audit procedures related to accounting records required to respond to or comply with financial, accounting or regulatory rep orting matters; and assistance with internal control reporting requirements.
The Audit Committee has pre-approved the Audit-related services in Appendix B. All other Audit-related services not listed in appendix B must be specifically pre-approved by the Audit Committee.
V. Tax Services
The Audit Committee believes that the independent auditor can provide Tax services to the Funds such as tax compliance, tax planning and tax advice without impairing the auditor's independence, and the SEC has stated that the independent auditor may provide such services. Hence, the Audit Committee believes it may grant general pre-approval to those Tax services that have historically been provided by the auditor, that the Audit Committee has reviewed and believes would not impair the independence of the auditor, and that are consistent with the SEC's rules on auditor independence. The Audit Committee will not permit the retention of the independent auditor in connection with a transaction initially recommended by the independent auditor, the sole business purpose of which may be tax avoidance and the tax treatment of which may not be supported in the Internal Revenue Code and related regulations. The Audit Committee will consult with the Director of Fund Administration, the Vice President of Tax Services or outside counsel to determine that the tax planning and reporting positions are consistent with this policy.
Pursuant to the preceding paragraph, the Audit Committee has pre-approved the Tax services in Appendix C. All Tax services involving large and complex transactions not listed in Appendix C must be specifically pre-approved by the Audit Committee, including: tax services proposed to be provide by the independent auditor to any executive officer or director of the Funds, in his or her individual capacity, where such services are paid for by the Funds or the investment advisor.
VI. All Other Services
The Audit Committee believes, based on the SEC's rules prohibiting the independent auditor from providing specific non-audit services, that other types of non-audit services are permitted. Accordingly, the Audit Committee believes it may grant general pre-approval to those permissible non-audit services classified as All Other services that it believes are routine and recurring services, would not impair the independence of the auditor and are consistent with the SEC's rules on auditor independence.
The Audit Committee has pre-approved the All Other services in appendix D. Permissible All Other services not listed in Appendix D must be specifically pre-approved by the Audit Committee.
A list of the SEC's prohibited non-audit services is attached to this policy as Exhibit 1. The SEC's rules and relevant guidance should be consulted to determine the precise definitions of these services and the applicability of exceptions to certain of the prohibitions.
VII. Pre-Approval Fee Levels or Budgeted Amounts
Pre-approval fee levels or budgeted amounts for all services to be provided by the independent auditor will be established annually by the Audit Committee. Any proposed services exceeding these levels or amounts will require specific pre-approval by the Audit Committee. The Audit Committee is mindful of the overall relationship of fees for audit and non-audit services in determining whether to pre-approve any such services. For each fiscal year, the Audit Committee may determine to ratio between the total amount of fees for Audit, Audit-related and Tax services, and the total amount of fees for services classified as All Other services.
VIII. Procedures
All requests or applications for services to be provided by the independent auditor that do not require specific approval by the Audit Committee will be submitted to the Director of Fund Administration or Assistant Director of Fund Administration and must include a detailed description of the services to be rendered. The Director/Assistant Director of Fund Administration will determine whether such services are included within the list of services that have received the general pre-approval of the Audit Committee. The Audit Committee will be informed on a quarterly basis (or more frequent if requested by the audit committee) of any such services rendered by the independent auditor.
Request or applications to provide services that require specific approval by the Audit Committee will be submitted to the Audit Committee by both the independent auditor and the Director/Assistant Director of Fund Administration, and must include a joint statement as to whether, in their view, the request or application is consistent with the SEC's rules on auditor independence.
The Audit Committee has designated the Chief Compliance Officer to monitor the performance of all services provided by the independent auditor and to determine whether such services are in compliance with this policy. The Chief Compliance Officer will report to the Audit Committee on a periodic basis on the results of its monitoring. Both the Chief Compliance Officer and management will immediately report to the chairman of the Audit Committee any breach of this policy that comes to the attention of the Chief Compliance Officer or any member of management.
The Audit Committee will also review the internal auditor's annual internal audit plan to determine that the plan provides for the monitoring of the independent auditor's services.
IX. Additional Requirements
The Audit Committee has determined to take additional measures on an annual basis to meet its responsibility to oversee the work of the independent auditor and to assure the auditor's independence from the Funds, such as reviewing a formal written statement from the independent auditor delineating all relationships between the independent auditor and the Funds, the Funds' investment advisor and related parties of the investment advisor, consistent with Independence Standards Board Standard No. 1, and discussing with the independent auditor its methods and procedures for ensuring independence. Items 5 - Audit Committee of Listed Registrants
If applicable, not applicable at this time. Applicable for annual reports covering periods ending on or after the compliance date for the listing standards applicable to the particular issuer. Listed issuers must be in compliance with the new listing rules by the earlier of the registrant's first annual shareholders meeting after January 15, 2004 or October 31, 2004.
Item 6 - [Reserved]
Item 7 - Disclosure of Proxy Voting Policies and Procedures for Closed-End Management Investment Companies.
If applicable, not applicable at this time. Applicable for annual reports filed on or after July 1, 2003.
Item 8 - [Reserved]
Item 9 - Controls and Procedures
(a) The Registrant's Principal Executive Officer and Principal Financial Officer have evaluated the Registrant's disclosure controls and procedures within 90 days of this filing and have concluded that the Registrant's disclosure controls and procedures were effective, as of that date, in ensuring that information required to be disclosed by the Registrant in this Form N-CSR was recorded, processed, summarized, and reported timely.
(b) There were no significant changes in the Registrant's internal controls or other factors that could significantly affect these controls subsequent to the date of their evaluation, including any corrective actions with regard to significant deficiencies and material weaknesses.
Item 10 - Exhibits
File the exhibits listed below as part of this Form. Letter or number the exhibits in the sequence indicated.
(a) Any code of ethics, or amendment thereto, that is the subject of the disclosure required by Item 2, to the extent that the registrant intends to satisfy the Item 2 requirements through filing of an exhibit.
(b)(1) Separate certifications for the Registrant's principal executive officer and principal financial officer, as required by Section 302 of the Sarbanes-Oxley Act of 2002 and Rule 30a-2(a) under the Investment Company Act of 1940, are attached as EX99.CERT.
(b)(2) Separate certifications for the Registrant's principal executive officer and principal financial officer, as required by Section 1350 of Title 18 of United States Code, as adopted pursuant to Section 906 of the Sarbanes-Oxley Act of 2002, and Rule 30a-2(b) under the Investment Company Act of 1940, are attached as EX99.906CERT. The certifications furnished pursuant to this paragraph are not deemed to be "filed" for purposes of Section 18 of the Securities Exchange Act of 1934, or otherwise subject to the liability of that section. Such certifications are not deemed to be incorporated by reference into any filing under the Securities Act of 1933 or the Securities Exchange Act of 1934, except to the extent that the Registrant specifically incorporates them by reference.
Pursuant to the requirements of the Securities Exchange Act of 1934 and the Investment Company Act of 1940, the Registrant has duly caused this report to be signed on its behalf by the undersigned, thereunto duly authorized.
Evergreen Fixed Income Trust
By: _______________________
Dennis H. Ferro,
Principal Executive Officer
Date: 6/25/2004
Pursuant to the requirements of the Securities Exchange Act of 1934 and the Investment Company Act of 1940, this report has been signed below by the following persons on behalf of the Registrant and in the capacities and on the dates indicated.
By: _______________________
Dennis H. Ferro,
Principal Executive Officer
Date: 6/25/2004
By: ________________________
Carol A. Kosel
Principal Financial Officer
Date: 6/25/2004