| OMB APPROVAL |
OMB Number: 3235-0570
Expires: Nov. 30, 2005
Estimated average
burden hours per
response: 5.0 |
UNITED STATES
SECURITIES AND EXCHANGE COMMISSION
Washington, D.C. 20549
FORM N-CSR
CERTIFIED SHAREHOLDER REPORT OF REGISTERED MANAGEMENT INVESTMENT COMPANIES
Investment Company Act file number 811-08415
Evergreen Fixed Income Trust
_____________________________________________________________
(Exact name of registrant as specified in charter)
200 Berkeley Street
Boston, Massachusetts 02116
_____________________________________________________________
(Address of principal executive offices) (Zip code)
Michael H. Koonce, Esq.
200 Berkeley Street
Boston, Massachusetts 02116
____________________________________________________________
(Name and address of agent for service)
Registrant’s telephone number, including area code: (617) 210-3200
Date of fiscal year end: Registrant is making an annual filing for 5 of its series, Evergreen Diversified Bond Fund, Evergreen High Yield Bond Fund, Evergreen Institutional Mortgage Portfolio, Evergreen Strategic Income Fund and Evergreen U.S. Government Fund, for the year ended April 30, 2005. These 5 series have a 4/30 fiscal year end.
Date of reporting period: April 30, 2005
Item 1 - Reports to Stockholders.

| | | table of contents |
| 1 | | LETTER TO SHAREHOLDERS |
| 4 | | FUND AT A GLANCE |
| 5 | | PORTFOLIO MANAGER COMMENTARY |
| 6 | | ABOUT YOUR FUND’S EXPENSES |
| 7 | | FINANCIAL HIGHLIGHTS |
| 11 | | SCHEDULE OF INVESTMENTS |
| 20 | | STATEMENT OF ASSETS AND LIABILITIES |
| 21 | | STATEMENT OF OPERATIONS |
| 22 | | STATEMENTS OF CHANGES IN NET ASSETS |
| 23 | | NOTES TO FINANCIAL STATEMENTS |
| 30 | | REPORT OF INDEPENDENT REGISTERED PUBLIC ACCOUNTING FIRM |
| 31 | | ADDITIONAL INFORMATION |
| 32 | | TRUSTEES AND OFFICERS |
This annual report must be preceded or accompanied by a prospectus of the Evergreen fund contained herein. The prospectus contains more complete information, including fees and expenses, and should be read carefully before investing or sending money.
The fund will file its complete schedule of portfolio holdings with the SEC for the first and third quarters of each fiscal year on Form N-Q. The fund’s Form N-Q will be available on the SEC’s Web site at http://www.sec.gov. In addition, the fund’s Form N-Q may be reviewed and copied at the SEC’s Public Reference Room in Washington, D.C. Information on the operation of the Public Reference Room may be obtained by calling 800.SEC.0330.
A description of the fund’s proxy voting policies and procedures, as well as information regarding how the fund voted proxies relating to portfolio securities during the most recent 12-month period ended June 30, is available by visiting our Web site at EvergreenInvestments.com or by visiting the SEC’s Web site at http://www.sec.gov. The fund’s proxy voting policies and procedures are also available without charge, upon request, by calling 800.343.2898.
| Mutual Funds: | | | | |
| NOT FDIC INSURED | | MAY LOSE VALUE | | NOT BANK GUARANTEED |
Evergreen InvestmentsSM is a service mark of Evergreen Investment Management Company, LLC.
Copyright 2005, Evergreen Investment Management Company, LLC.
Evergreen mutual funds are distributed by Evergreen Investment Services, Inc.
200 Berkeley Street, Boston, MA 02116
LETTER TO SHAREHOLDERS
June 2005

Dennis H. Ferro
President and Chief
Executive Officer
Dear Shareholder,
We are pleased to provide the annual report for the Evergreen Diversified Bond Fund, which covers the twelve-month period ended April 30, 2005.
For those investors in the fixed income markets, the past year has provided a variety of challenges and opportunities. In anticipation of this environment, our fixed income portfolio management teams attempted to prepare for a market contending with moderating economic growth and less accommodation from the Federal Reserve (Fed). The question for the markets was no longer the direction of monetary policy, but rather the extent to which interest rates would rise. Using our outlook for a continued economic expansion, we positioned our fixed income portfolios for a gradual tightening of monetary policy.
The fiscal year began with a mixed message on the economy. Growth was good, but it was no longer great, and market interest rates declined on the perceived weakness. However, Fed officials continued to talk up their much anticipated “measured removal of policy accommodation.” Throughout the confusion, we maintained our belief that the economy had simply transitioned from recovery to expansion. As a result of this transition, a variety of economic reports pointed in different directions. For example, solid retail sales occurred in a month where consumer confidence declined. Historically, the maturation of the economic cycle had experienced similarly erratic behavior. Yet market interest rates began to fluctuate with seemingly every monthly data point. Moreover, the costs for commodities and energy were rising, and since inflation adjusted interest rates had remained low for such a lengthy period, the Fed seemed determined to prevent inflation from becoming a long-term problem. As job growth began to exceed expectations in the Spring of 2004, the market’s inflation fears accelerated, and yields headed higher in anticipation of tighter Fed policy.
The Fed finally began their “measured removal of policy accommodation” beginning in June of 2004. After three years of stimulative policy actions, monetary policymakers began the journey towards more moderate economic
1
LETTER TO SHAREHOLDERS continued
growth. Fed Chairman Alan Greenspan was very transparent in his public statements, attempting to assuage market anxiety. Market interest rates still remained quite volatile during the first half of the fiscal period. Only after the central bank’s first few rate increases did the long-end of the yield curve begin to recover, a process that would continue for the bulk of the fiscal year as the markets concluded that long-term inflation was under control. Chairman Greenspan, however, remained concerned about “complacency” within the bond market, as evidenced by his comments to congressional banking committees in February 2005 that it was a “conundrum” that long-term yields remained low.
Throughout the fiscal year, many of our fixed income managers utilized a variety of strategies within their specific portfolios in order to maximize the total return possibilities for our investors. For example, many of our municipal bond fund managers emphasized the long-end of the curve in an attempt to enhance total return. Other teams used a barbell strategy, seeking opportunities at the short and long end of the Treasury yield curve in an attempt to remain defensive throughout the volatile market activity. Our mortgage portfolio teams employed adjustable rate, commercial, and hybrid products while attempting to navigate the ever changing seas within that marketplace. Our fundamental emphasis on credit quality in the corporate and high yield sectors, however, was not always rewarded, as the markets often pursued riskier issues within a given universe as the yield curve continued to flatten. Finally, our global management teams bought foreign bonds from commodity rich nations such as Australia, New Zealand and Canada in an effort to sustain performance.
We encourage our investors to maintain their diversified, long-term strategies, including investment grade corporate debt securities, within their fixed income portfolios.
Please visit our Web site, EvergreenInvestments.com, for more information about our funds and other investment products available to you. From the Web site, you may also access a detailed Q & A interview with the portfolio manager(s) for your fund. You can easily reach these interviews by following the link, EvergreenInvestments.com/Annual Updates, from our Web site. Thank you for your continued support of Evergreen Investments.
Sincerely,

Dennis H. Ferro
President and Chief Executive Officer
Evergreen Investment Company, Inc.
2
Important Information About Your Fund
Effective at the close of business on May 20, 2005, Vestaur Securities Fund merged into Class I shares of your Fund. These funds had similar investment objectives and strategies. In conjunction with the merger, the portfolio managers of Vestaur Securities Fund began managing your Fund. The Fund adopted the performance and accounting history of Vestaur Securities Fund as a result of the merger. Therefore, you will notice some differences in the reporting of historic information for the Fund. For additional information regarding the merger, please see the Notes to the Financial Statements at the back of this report.
Notification of Investment Strategy Change:
Effective August 1, 2005, the Fund’s prospectus will be amended to make the following change to the Fund’s principal investment strategy:
The Fund may invest a portion of its assets in derivative instruments, such as Treasury futures, Eurodollar futures and interest rate swap agreements in order to manage its exposure to interest rate risk. Derivatives are financial contracts whose value depends on, or is derived from, the value of one or more underlying assets, reference rates or indexes. The various derivative instruments that the Fund may use are described in more detail under “Additional Information on Securities and Investment Practices” in the Statement of Additional Information. The Fund typically uses derivatives as a substitute for taking a position in the underlying asset and/or as part of a strategy designed to reduce exposure to other risks, such as interest rate or currency risk. The Fund’s use of derivative instruments involves risks different from, or possibly greater than, the risks associated with investing directly in securities and other traditional investments. Derivatives are subject to a number of risks such as liquidity risk, interest rate risk, market risk, credit risk and management risk.
The Fund’s prospectus will be supplemented to include this change.
Special Notice to Shareholders:
Please visit our Web site at EvergreenInvestments.com for statements from President and Chief Executive Officer, Dennis Ferro, and Chairman of the Board of the Evergreen Funds, Michael S. Scofield, addressing recent SEC actions involving the Evergreen Funds.
3
FUND AT A GLANCE
as of April 30, 2005
MANAGEMENT TEAM

Douglas Williams, CFA
Customized Fixed Income Team Lead Manager

Richard M. Cryan
High Yield Bond Team Lead Manager
CURRENT INVESTMENT STYLE

Source: Morningstar, Inc.
Morningstar’s style box is based on a portfolio date as of 3/31/2005.
The fixed income style box placement is based on a fund’s average effective maturity or duration and the average credit rating of the bond portfolio.
PERFORMANCE AND RETURNS
Portfolio inception date: 9/11/1935
| | | Class A | | Class B | | Class C | | Class I |
| Class inception date | | 1/20/1998 | | 9/11/1935 | | 4/7/1998 | | 2/11/1998 |
|
| Nasdaq symbol | | EKDLX | | EKDMX | | EKDCX | | EKDYX |
|
| Average annual return* | | | | | | | | |
|
| 1-year with sales charge | | 0.59% | | -0.10% | | 3.90% | | N/A |
|
| 1-year w/o sales charge | | 5.63% | | 4.90% | | 4.90% | | 5.95% |
|
| 5-year | | 5.59% | | 5.52% | | 5.84% | | 6.90% |
|
| 10-year | | 5.72% | | 5.67% | | 5.67% | | 6.36% |
|
| Maximum sales charge | | 4.75% | | 5.00% | | 1.00% | | N/A |
| | | Front-end | | CDSC | | CDSC | | |
|
* Adjusted for maximum applicable sales charge, unless noted.
Past performance is no guarantee of future results. The performance quoted represents past performance and current performance may be lower or higher. The investment return and principal value of an investment will fluctuate so that investors’ shares, when redeemed, may be worth more or less than their original cost. To obtain performance information current to the most recent month-end for Classes A, B, C or I, please go to EvergreenInvestments.com/fundperformance. The performance of each class may vary based on differences in loads, fees and expenses paid by the shareholders investing in each class. Performance includes the reinvestment of income dividends and capital gain distributions. Performance shown does not reflect the deduction of taxes that a shareholder would pay on fund distributions or the redemption of fund shares. Historical performance shown for Classes A, C and I prior to their inception is based on the performance of Class B, the original class offered. The historical returns for Classes A and I have not been adjusted to reflect the effect of each class' 12b-1 fee. These fees are 0.30% for Class A and 1.00% for Classes B and C. Class I does not pay a 12b-1 fee. If these fees had been reflected, returns for Classes A and I would have been higher.
The advisor is waiving a portion of its advisory fee. Had the fee not been waived, returns would have been lower. Returns reflect expense limits previously in effect for Class A, without which returns for Class A would have been lower.
LONG-TERM GROWTH
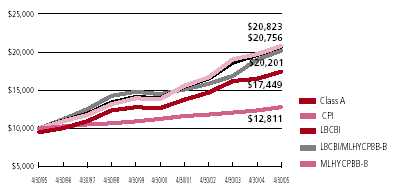
Comparison of a $10,000 investment in the Evergreen Diversified Bond Fund Class A shares, versus a similar investment in the Lehman Brothers Corporate Bond Index (LBCBI), the Merrill Lynch High Yield, Cash-Pay, BB-B Index† (MLHYCPBB-B), the LBCBI/MLHYCPBB-B Blend Index and the Consumer Price Index (CPI).
The LBCBI, the MLHYCPBB-B and the LBCBI/MLHYCPBB-B are unmanaged market indexes and do not include transaction costs associated with buying and selling securities, any mutual fund expenses or any taxes. The CPI is a commonly used measure of inflation and does not represent an investment return. It is not possible to invest directly in an index.
4
PORTFOLIO MANAGER COMMENTARY
The fund’s Class A shares returned 5.63% for the twelve-month period ended April 30, 2005, excluding any applicable sales charges. During the same period, the Lehman Brothers Corporate Bond Index (LBCBI) returned 5.52%, the Merrill Lynch High Yield, Cash-Pay, BB-B Index† (MLHYCPBB-B) returned 6.24% and the LBCBI/MLHYCPBB-B Blend Index returned 5.68%.
The fund seeks maximum income without undue risk of principal.
Performance was particularly strong during the first 10 months of the fiscal year, as the fund’s investment grade bonds produced good results in an environment of generally improving credit quality. As a well diversified fund focusing principally on the corporate bond market, the fund typically allocates 80% or more of its assets to a portfolio of investment-grade securities. For most of the twelve-month period, between 90% and 95% of assets were in investment-grade securities, with the remaining assets invested in a portfolio of high-yield, below-investment grade corporate bonds.
Early in the fiscal year, the fund was positioned aggressively, with emphasis on higher risk investment bonds, including bonds of highly cyclical companies, with some investments in U.S. dollar denominated foreign corporate and emerging market corporate debt. This relative positioning supported performance during this period, when investment grade corporates outperformed the overall bond market. However, this environment changed in the final two months of the fiscal year. While we had reduced the aggressiveness of the fund earlier in 2005, the more defensive positioning did not fully insulate the fund from the impact of the downturn in the corporate bond market. For most of the fiscal year, average credit quality of the investment grade portfolio was BBB, although it ended the year at BBB+ as a result of our decisions to position the fund more defensively. Within the below investment grade portfolio, the fund emphasized higher-quality securities in the high-yield universe. However, this detracted from performance during a year when lower quality securities, especially CCC-rated securities, posted the best returns in the high yield market.
In addition to the emphasis on corporate securities in the investment-grade portfolio, the positioning on the yield curve also added to results. We pursued a barbell approach, emphasizing both shorter and longer maturity bonds, while de-emphasizing intermediates.
Class I shares are only offered in the following manner: (1) to investment advisory clients of Evergreen Investment Management Company, LLC (or its advisory affiliates) when purchased by such advisor(s) on behalf of its clients, (2) through arrangements entered into on behalf of the Evergreen funds with certain financial services firms, (3) to certain institutional investors and (4) to persons who owned Class Y shares in registered name in an Evergreen fund on or before December 31, 1994 or who owned shares of any SouthTrust fund in registered name as of March 18, 2005 or shares of Vestaur Securities Fund as of May 20, 2005. Class I shares are only available to institutional shareholders with a minimum of $1 million investment, which may be waived in certain situations.
The fund's investment objective is nonfundamental and may be changed without the vote of the fund's shareholders.
Funds that invest in high yield, lower-rated bonds may contain more risk due to the increased possibility of default.
Foreign investments may contain more risk due to the inherent risks associated with changing political climates, foreign market instability and foreign currency fluctuations.
U.S. government guarantees apply only to certain securities held in the fund's portfolio and not to the fund's shares.
The return of principal is not guaranteed due to fluctuation in the NAV of the fund caused by changes in the price of the individual bonds held by the fund and the buying and selling of bonds by the fund. Bond funds have the same inflation, interest rate and credit risks that are associated with the individual bonds held by the fund. Generally, the value of bonds rise when prevailing interest rates fall and fall when interest rates rise.
† Copyright 2005. Merrill Lynch, Pierce, Fenner & Smith Incorporated. All rights reserved.
All data is as of April 30, 2005, and subject to change.
5
ABOUT YOUR FUND’S EXPENSES
The Example below is intended to describe the fees and expenses borne by shareholders and the impact of those costs on your investment.
Example
As a shareholder of the fund, you incur two types of costs: (1) transaction costs, including sales charges (loads), redemption fees and exchange fees; and (2) ongoing costs, including management fees, distribution (12b-1) fees and other fund expenses. This Example is intended to help you understand your ongoing costs (in dollars) of investing in the fund and to compare these costs with the ongoing costs of investing in other mutual funds. The Example is based on an investment of $1,000 invested at the beginning of the period and held for the entire period from November 1, 2004 to April 30, 2005.
The example illustrates your fund’s costs in two ways:
• Actual expenses
The section in the table under the heading “Actual” provides information about actual account values and actual expenses. You may use the information in these columns, together with the amount you invested, to estimate the expenses that you paid over the period. Simply divide your account value by $1,000 (for example, an $8,600 account value divided by $1,000 = 8.6), then multiply the result by the number in the appropriate column for your share class, in the column entitled “Expenses Paid During Period” to estimate the expenses you paid on your account during this period.
• Hypothetical example for comparison purposes
The section in the table under the heading “Hypothetical (5% return before expenses)” provides information about hypothetical account values and hypothetical expenses based on the fund’s actual expense ratio and an assumed rate of return of 5% per year before expenses, which is not the fund’s actual return. The hypothetical account values and expenses may not be used to estimate the actual ending account balance or expenses you paid for the period. You may use this information to compare the ongoing costs of investing in the fund and other funds. To do so, compare this 5% hypothetical example with the 5% hypothetical examples that appear in the shareholder reports of the other funds.
Please note that the expenses shown in the table are meant to highlight your ongoing costs only and do not reflect any transactional costs, such as sales charges (loads), redemption fees or exchange fees. Therefore, the section in the table under the heading “Hypothetical (5% return before expenses)” is useful in comparing ongoing costs only, and will not help you determine the relative total costs of owning different funds. In addition, if these transactional costs were included, your costs would have been higher.
| | | Beginning | | Ending | | | | |
| | | Account | | Account | | Expenses |
| | | Value | | Value | | Paid During |
| | | 11/1/2004 | | 4/30/2005 | | Period* |
|
| Actual | | | | | | | | |
| Class A | | $ 1,000.00 | | $ 1,011.47 | | $ | | 4.84 |
| Class B | | $ 1,000.00 | | $ 1,007.97 | | $ | | 8.31 |
| Class C | | $ 1,000.00 | | $ 1,007.97 | | $ | | 8.31 |
| Class I | | $ 1,000.00 | | $ 1,012.97 | | $ | | 3.34 |
| Hypothetical | | | | | | | | |
| (5% return | | | | | | | | |
| before expenses) | | | | | | | | |
| Class A | | $ 1,000.00 | | $ 1,019.98 | | $ | | 4.86 |
| Class B | | $ 1,000.00 | | $ 1,016.51 | | $ | | 8.35 |
| Class C | | $ 1,000.00 | | $ 1,016.51 | | $ | | 8.35 |
| Class I | | $ 1,000.00 | | $ 1,021.47 | | $ | | 3.36 |
|
* For each class of the Fund, expenses are equal to the annualized expense ratio of each class (0.97% for Class A, 1.67% for Class B, 1.67% for Class C and 0.67% for Class I), multiplied by the average account value over the period, multiplied by 181 / 365 days.
6
FINANCIAL HIGHLIGHTS
(For a share outstanding throughout each period)
| | | Year Ended April 30, |
| |
|
| CLASS A | | 2005 | | 2004 | | | | 2003 | | 20021 | | 2001 |
|
| Net asset value, beginning of period | | $ 14.77 | | $ 15.25 | | $ | | 14.63 | | $ 14.53 | | $ 14.28 |
|
| Income from investment operations | | | | | | | | | | | | |
| Net investment income (loss) | | 0.682 | | 0.702 | | | | 0.82 | | 0.83 | | 0.972 |
Net realized and unrealized gains or losses
on securities, foreign currency related | | | | | | | | | | | | |
| transactions and futures contracts | | 0.14 | | (0.42) | | | | 0.64 | | 0.13 | | 0.25 |
| |
|
| Total from investment operations | | 0.82 | | 0.28 | | | | 1.46 | | 0.96 | | 1.22 |
|
| Distributions to shareholders from | | | | | | | | | | | | |
| Net investment income | | (0.72) | | (0.76) | | | | (0.84) | | (0.86) | | (0.97) |
|
| Net asset value, end of period | | $ 14.87 | | $ 14.77 | | $ | | 15.25 | | $ 14.63 | | $ 14.53 |
|
| Total return3 | | 5.63% | | 1.82% | | | | 10.31% | | 6.72% | | 8.81% |
|
| Ratios and supplemental data | | | | | | | | | | | | |
| Net assets, end of period (thousands) | | $245,765 | | $275,755 | | $322,963 | | $300,670 | | $314,274 |
| Ratios to average net assets | | | | | | | | | | | | |
Expenses including waivers/reimbursements
and excluding expense reductions | | 0.98% | | 1.12% | | | | 1.09% | | 1.13% | | 1.15% |
Expenses excluding waivers/reimbursements
and expense reductions | | 1.10% | | 1.13% | | | | 1.09% | | 1.13% | | 1.15% |
| Net investment income (loss) | | 4.56% | | 4.58% | | | | 5.51% | | 5.68% | | 6.73% |
| Portfolio turnover rate | | 141% | | 157% | | | | 109% | | 116% | | 176% |
|
1 As required, effective May 1, 2001, the Fund adopted the provisions of the AICPA Audit and Accounting Guide Audits of Investment Companies, and began amortizing premium on its fixed-income securities . The effects of this change for the year ended April 30, 2002 was a decrease in net investment income per share of $0.02; an increase in net realized gains or losses per share of $0.02; and a decrease to the ratio of net investment income to average net assets of 0.16%. The above per share information, ratios and supplemental data for the periods prior to May 1, 2001 have not been restated to reflect this change in presentation.
2 Net investment income (loss) per share is based on average shares outstanding during the period.
3 Excluding applicable sales charges
See Notes to Financial Statements
7
FINANCIAL HIGHLIGHTS
(For a share outstanding throughout each period)
| | | Year Ended April 30, |
| |
|
| CLASS B | | 2005 | | 2004 | | | | 2003 | | 20021 | | 2001 |
|
| Net asset value, beginning of period | | $ 14.77 | | $ 15.25 | | $ | | 14.63 | | $ 14.53 | | $ 14.28 |
|
| Income from investment operations | | | | | | | | | | | | |
| Net investment income (loss) | | 0.572 | | 0.592 | | | | 0.702 | | 0.722 | | 0.862 |
Net realized and unrealized gains or losses
on securities, foreign currency related | | | | | | | | | | | | |
| transactions and futures contracts | | 0.14 | | (0.42) | | | | 0.65 | | 0.13 | | 0.25 |
| |
|
| Total from investment operations | | 0.71 | | 0.17 | | | | 1.35 | | 0.85 | | 1.11 |
|
| Distributions to shareholders from | | | | | | | | | | | | |
| Net investment income | | (0.61) | | (0.65) | | | | (0.73) | | (0.75) | | (0.86) |
|
| Net asset value, end of period | | $ 14.87 | | $ 14.77 | | $ | | 15.25 | | $ 14.63 | | $ 14.53 |
|
| Total return3 | | 4.90% | | 1.10% | | | | 9.50% | | 5.93% | | 8.00% |
|
| Ratios and supplemental data | | | | | | | | | | | | |
| Net assets, end of period (thousands) | | $22,355 | | $25,825 | | $27,252 | | $19,283 | | $23,392 |
| Ratios to average net assets | | | | | | | | | | | | |
Expenses including waivers/reimbursements
and excluding expense reductions | | 1.68% | | 1.82% | | | | 1.84% | | 1.88% | | 1.90% |
Expenses excluding waivers/reimbursements
and expense reductions | | 1.80% | | 1.83% | | | | 1.84% | | 1.88% | | 1.90% |
| Net investment income (loss) | | 3.86% | | 3.87% | | | | 4.75% | | 4.92% | | 5.97% |
| Portfolio turnover rate | | 141% | | 157% | | | | 109% | | 116% | | 176% |
|
1 As required, effective May 1, 2001 the Fund adopted the provisions of the AICPA Audit and Accounting Guide, Audits of Investment Companies, and began amortizing premium on its fixed-income securities . The effects of this change for the year ended April 30, 2002 was a decrease in net investment income per share of $0.03; an increase in net realized gains or losses per share of $0.03; and a decrease to the ratio of net investment income to average net assets of 0.16% . The above per share information, ratios and supplemental data for the periods prior to May 1, 2001 have not been restated to reflect this change in presentation.
2 Net investment income (loss) per share is based on average shares outstanding during the period.
3 Excluding applicable sales charges
See Notes to Financial Statements
8
FINANCIAL HIGHLIGHTS
(For a share outstanding throughout each period)
| | | Year Ended April 30, |
| |
|
| CLASS C | | 2005 | | 2004 | | | | 2003 | | 20021 | | 2001 |
|
| Net asset value, beginning of period | | $ 14.77 | | $ 15.25 | | $ | | 14.63 | | $14.53 | | $14.28 |
|
| Income from investment operations | | | | | | | | | | | | |
| Net investment income (loss) | | 0.572 | | 0.592 | | | | 0.702 | | 0.74 | | 0.812 |
Net realized and unrealized gains or losses
on securities, foreign currency related | | | | | | | | | | | | |
| transactions and futures contracts | | 0.14 | | (0.42) | | | | 0.65 | | 0.11 | | 0.30 |
| |
|
| Total from investment operations | | 0.71 | | 0.17 | | | | 1.35 | | 0.85 | | 1.11 |
|
| Distributions to shareholders from | | | | | | | | | | | | |
| Net investment income | | (0.61) | | (0.65) | | | | (0.73) | | (0.75) | | (0.86) |
|
| Net asset value, end of period | | $ 14.87 | | $ 14.77 | | $ | | 15.25 | | $14.63 | | $14.53 |
|
| Total return3 | | 4.90% | | 1.10% | | | | 9.50% | | 5.93% | | 8.00% |
|
| Ratios and supplemental data | | | | | | | | | | | | |
| Net assets, end of period (thousands) | | $31,216 | | $38,490 | | $47,506 | | $4,008 | | $3,077 |
| Ratios to average net assets | | | | | | | | | | | | |
Expenses including waivers/reimbursements
and excluding expense reductions | | 1.68% | | 1.83% | | | | 1.84% | | 1.88% | | 1.90% |
Expenses excluding waivers/reimbursements
and expense reductions | | 1.80% | | 1.83% | | | | 1.84% | | 1.88% | | 1.90% |
| Net investment income (loss) | | 3.87% | | 3.88% | | | | 4.78% | | 4.91% | | 5.82% |
| Portfolio turnover rate | | 141% | | 157% | | | | 109% | | 116% | | 176% |
|
1 As required, effective May 1, 2001, the Fund adopted the provisions of the AICPA Audit and Accounting Guide, Audits of Investment Companies, and began amortizing premium on its fixed-income securities . The effects of this change for the year ended April 30, 2002 was a decrease in net investment income per share of $0.02; an increase in net realized gains or losses per share of $0.02; and a decrease to the ratio of net investment income to average net assets of 0.16%. The above per share information, ratios and supplemental data for the periods prior to May 1, 2001 have not been restated to reflect this change in presentation.
2 Net investment income (loss) per share is based on average shares outstanding during the period.
3 Excluding applicable sales charges
See Notes to Financial Statements
9
FINANCIAL HIGHLIGHTS
(For a share outstanding throughout each period)
| | | Year Ended April 30, |
| |
|
| CLASS I1 | | 2005 | | 2004 | | 2003 | | 20022 | | 2001 |
|
| Net asset value, beginning of period | | $14.77 | | $15.25 | | $14.63 | | $14.53 | | $14.28 |
|
| Income from investment operations | | | | | | | | | | |
| Net investment income (loss) | | 0.723 | | 0.743 | | 0.853 | | 0.873 | | 1.013 |
Net realized and unrealized gains or losses
on securities, foreign currency related | | | | | | | | | | |
| transactions and futures contracts | | 0.14 | | (0.42) | | 0.65 | | 0.12 | | 0.25 |
| |
|
| Total from investment operations | | 0.86 | | 0.32 | | 1.50 | | 0.99 | | 1.26 |
|
| Distributions to shareholders from | | | | | | | | | | |
| Net investment income | | (0.76) | | (0.80) | | (0.88) | | (0.89) | | (1.01) |
|
| Net asset value, end of period | | $14.87 | | $14.77 | | $15.25 | | $14.63 | | $14.53 |
|
| Total return | | 5.95% | | 2.12% | | 10.59% | | 6.99% | | 9.08% |
|
| Ratios and supplemental data | | | | | | | | | | |
| Net assets, end of period (thousands) | | $2,829 | | $2,311 | | $3,235 | | $ 299 | | $ 980 |
| Ratios to average net assets | | | | | | | | | | |
Expenses including waivers/reimbursements
and excluding expense reductions | | 0.68% | | 0.82% | | 0.87% | | 0.88% | | 0.90% |
Expenses excluding waivers/reimbursements
and expense reductions | | 0.80% | | 0.83% | | 0.87% | | 0.88% | | 0.90% |
| Net investment income (loss) | | 4.85% | | 4.87% | | 5.76% | | 5.91% | | 6.97% |
| Portfolio turnover rate | | 141% | | 157% | | 109% | | 116% | | 176% |
|
1 Effective at the close of business on May 11, 2001, Class Y sh ares were renamed as Institutional shares (Class I).
2 As required, effective May 1, 2001, the Fund adopted the provisions of the AICPA Audit and Accounting Guide, Audits of Investment Companies, and began amortizing premium on its fixed-income securities . The effects of this change for the year ended April 30, 2002 was a decrease in net investment income per share of $0.02; an increase in net realized gains or losses per share of $0.02; and a decrease to the ratio of net investment income to average net assets of 0.16%. The above per share information, ratios and supplemental data for the periods prior to May 1, 2001 have not been restated to reflect this change in presentation.
3 Net investment income (loss) per share is based on average shares outstanding during the period.
See Notes to Financial Statements
10
SCHEDULE OF INVESTMENTS
April 30, 2005
| | | | | Principal | | | | |
| | | | | Amount | | | | Value |
|
| AGENCY MORTGAGE-BACKED PASS THROUGH SECURITIES 0.0% | | | | | | | | |
| FIXED-RATE 0.0% | | | | | | | | |
| FHLMC: | | | | | | | | |
| 6.00%, 01/01/2032 | | $ | | 12,161 | | $ | | 12,499 |
| 7.50%, 09/01/2013 - 05/01/2015 | | | | 125,821 | | | | 132,587 |
| |
|
| Total Agency Mortgage-Backed Pass Through Securities (cost $143,547) | | | | | | | | 145,086 |
| |
|
| ASSET-BACKED SECURITIES 3.9% | | | | | | | | |
| Credit Suisse First Boston Mtge. Securities Corp., Ser. 1996-2, Class A-6, | | | | | | | | |
| 7.18%, 02/25/2018 | | | | 264,585 | | | | 264,149 |
| GE Capital Mtge. Svcs., Inc., Ser. 1999-H, Class A-7, 6.27%, 04/25/2029 | | | | 827,909 | | | | 846,025 |
| Nautilus RMBS CDO, Ltd., Ser. 2005-1A, Class A3, 4.89%, 05/24/2035 144A # | | | | 3,500,000 | | | | 3,500,000 |
| Oakwood Mtge. Investors, Inc., Ser. 1996-C, Class A5, 7.35%, 04/15/2027 | | | | 1,506,504 | | | | 1,545,340 |
| Railcar Leasing LLC, Ser. 1, Class A-2, 7.125%, 01/15/2013 144A | | | | 2,500,000 | | | | 2,720,362 |
| Trapeza CDO LLC, Ser. 2004-7A, Class B1, FRN, 4.25%, 01/25/2035 144A | | | | 3,000,000 | | | | 3,019,020 |
| |
|
| Total Asset-Backed Securities (cost $11,847,533) | | | | | | | | 11,894,896 |
| |
|
| COMMERCIAL MORTGAGE-BACKED SECURITIES 1.9% | | | | | | | | |
| FIXED-RATE 0.9% | | | | | | | | |
| Commercial Mtge. Pass-Through Certificates, Ser. 2001-ZC1A, Class A, 6.36%, | | | | | | | | |
| 06/14/2006 144A (h) | | | | 2,849,539 | | | | 2,900,601 |
| |
|
| FLOATING-RATE 1.0% | | | | | | | | |
| Midland Realty Acceptance Corp., Ser. 1996-C1, Class E, 8.27%, 08/25/2028 | | | | 2,784,000 | | | | 2,913,316 |
| |
|
| Total Commercial Mortgage-Backed Securities (cost $5,769,803) | | | | | | | | 5,813,917 |
| |
|
| CORPORATE BONDS 70.7% | | | | | | | | |
| CONSUMER DISCRETIONARY 13.8% | | | | | | | | |
| Auto Components 0.0% | | | | | | | | |
| Dura Operating Corp., Ser. B, 8.625%, 04/15/2012 (p) | | | | 200,000 | | | | 171,000 |
| |
|
| Automobiles 1.4% | | | | | | | | |
| Daimler Chrysler Holdings: | | | | | | | | |
| FRN, 3.77%, 08/08/2006 | | | | 2,000,000 | | | | 2,011,638 |
| 8.50%, 01/18/2031 (p) | | | | 2,000,000 | | | | 2,290,472 |
| |
|
| | | | | | | | | 4,302,110 |
| |
|
| Hotels, Restaurants & Leisure 2.0% | | | | | | | | |
| Ameristar Casinos, Inc., 10.75%, 02/15/2009 | | | | 200,000 | | | | 218,500 |
| Chumash Casino & Resort Enterprise, 9.00%, 07/15/2010 144A | | | | 175,000 | | | | 188,125 |
| Isle of Capri Casinos, Inc., 7.00%, 03/01/2014 | | | | 200,000 | | | | 195,000 |
| John Q. Hammons Hotels LP, Ser. B, 8.875%, 05/15/2012 | | | | 175,000 | | | | 187,250 |
| Las Vegas Sands Corp., 6.375%, 02/15/2015 144A (p) | | | | 200,000 | | | | 188,500 |
| McDonald’s Corp., 7.31%, 09/15/2027 | | | | 3,000,000 | | | | 3,196,746 |
| MGM MIRAGE, Inc., 5.875%, 02/27/2014 | | | | 200,000 | | | | 188,250 |
| Seneca Gaming Corp., 7.25%, 05/01/2012 | | | | 200,000 | | | | 199,000 |
| Starwood Hotels & Resorts, Inc., 7.375%, 05/01/2007 | | | | 200,000 | | | | 208,000 |
| Station Casinos, Inc., 6.50%, 02/01/2014 | | | | 650,000 | | | | 651,625 |
| Wynn Resorts, Ltd., 6.625%, 12/01/2014 144A | | | | 700,000 | | | | 658,000 |
| |
|
| | | | | | | | | 6,078,996 |
| |
|
See Notes to Financial Statements
11
SCHEDULE OF INVESTMENTS continued
April 30, 2005
| | | | | Principal | | | | |
| | | | | Amount | | | | Value |
|
| CORPORATE BONDS continued | | | | | | | | |
| CONSUMER DISCRETIONARY continued | | | | | | | | |
| Household Durables 3.5% | | | | | | | | |
| K. Hovnanian Enterprises, Inc., 6.50%, 01/15/2014 (p) | | $ | | 750,000 | | $ | | 742,500 |
| Lennar Corp., FRN, 3.80%, 03/19/2009 (p) | | | | 4,000,000 | | | | 4,024,368 |
| M/I Homes, Inc., 6.875%, 04/01/2012 144A | | | | 650,000 | | | | 637,000 |
| Meritage Homes Corp., 6.25%, 03/15/2015 144A | | | | 200,000 | | | | 185,000 |
| Pulte Homes, Inc., 7.875%, 08/01/2011 | | | | 3,450,000 | | | | 3,919,266 |
| Technical Olympic USA, Inc., 7.50%, 01/15/2015 | | | | 650,000 | | | | 591,500 |
| WCI Communities, Inc., 9.125%, 05/01/2012 (p) | | | | 330,000 | | | | 346,500 |
| |
|
| | | | | | | | | 10,446,134 |
| |
|
| Internet & Catalog Retail 0.7% | | | | | | | | |
| InterActiveCorp, 7.00%, 01/15/2013 (p) | | | | 2,000,000 | | | | 2,126,562 |
| |
|
| Media 5.3% | | | | | | | | |
| Cox Communications, Inc., 5.45%, 12/15/2014 144A (p) | | | | 4,000,000 | | | | 3,992,344 |
| CSC Holdings, Inc., 7.625%, 04/01/2011 | | | | 200,000 | | | | 204,000 |
| Dex Media West LLC, 5.875%, 11/15/2011 | | | | 700,000 | | | | 679,000 |
| LIN TV Corp., 6.50%, 05/15/2013 (p) | | | | 200,000 | | | | 192,500 |
| Mediacom LLC, 9.50%, 01/15/2013 (p) | | | | 650,000 | | | | 625,625 |
| MediaNews Group, Inc., 6.375%, 04/01/2014 | | | | 175,000 | | | | 165,375 |
| News America Holdings, Inc., 9.50%, 07/15/2024 | | | | 3,500,000 | | | | 4,837,469 |
| R.H. Donnelley Corp., 10.875%, 12/15/2012 (p) | | | | 175,000 | | | | 200,812 |
| Rogers Cable, Inc., 5.50%, 03/15/2014 (p) | | | | 650,000 | | | | 578,500 |
| Time Warner, Inc., 8.375%, 07/15/2033 | | | | 3,500,000 | | | | 4,568,449 |
| |
|
| | | | | | | | | 16,044,074 |
| |
|
| Multi-line Retail 0.2% | | | | | | | | |
| J.C. Penney Co., Inc., 7.375%, 08/15/2008 (p) | | | | 650,000 | | | | 692,250 |
| |
|
| Specialty Retail 0.5% | | | | | | | | |
| Central Garden & Pet Co., 9.125%, 02/01/2013 | | | | 650,000 | | | | 702,000 |
| Group 1 Automotive, Inc., 8.25%, 08/15/2013 (p) | | | | 650,000 | | | | 653,250 |
| Payless ShoeSource, Inc., 8.25%, 08/01/2013 (p) | | | | 60,000 | | | | 61,500 |
| |
|
| | | | | | | | | 1,416,750 |
| |
|
| Textiles, Apparel & Luxury Goods 0.2% | | | | | | | | |
| Oxford Industries, Inc., 8.875%, 06/01/2011 | | | | 250,000 | | | | 260,000 |
| The Warnaco Group, Inc., 8.875%, 06/15/2013 | | | | 200,000 | | | | 217,000 |
| |
|
| | | | | | | | | 477,000 |
| |
|
| CONSUMER STAPLES 2.3% | | | | | | | | |
| Food & Staples Retailing 1.8% | | | | | | | | |
| Albertsons, Inc., 7.45%, 08/01/2029 | | | | 4,000,000 | | | | 4,400,064 |
| Alimentation Couche-Tard, Inc., 7.50%, 12/15/2013 | | | | 540,000 | | | | 556,200 |
| Ingles Markets, Inc., 8.875%, 12/01/2011 | | | | 200,000 | | | | 200,500 |
| NeighborCare, Inc., 6.875%, 11/15/2013 | | | | 45,000 | | | | 47,250 |
| Rite Aid Corp., 8.125%, 05/01/2010 | | | | 175,000 | | | | 171,500 |
| Roundy’s, Inc., Ser. B, 8.875%, 06/15/2012 (p) | | | | 200,000 | | | | 208,000 |
| |
|
| | | | | | | | | 5,583,514 |
| |
|
See Notes to Financial Statements
12
SCHEDULE OF INVESTMENTS continued
April 30, 2005
| | | | | Principal | | | | |
| | | | | Amount | | | | Value |
|
| CORPORATE BONDS continued | | | | | | |
| CONSUMER STAPLES continued | | | | | | |
| Food Products 0.3% | | | | | | | | |
| B&G Foods Holdings Corp., 8.00%, 10/01/2011 | | $ 200,000 | | $ | | 207,500 |
| Chiquita Brands International, Inc., 7.50%, 11/01/2014 | | 120,000 | | | | 110,400 |
| Del Monte Foods Co.: | | | | | | | | |
| 6.75%, 02/15/2015 144A | | 500,000 | | | | 482,500 |
| 8.625%, 12/15/2012 | | 19,000 | | | | 20,425 |
| |
|
| | | | | | | | | 820,825 |
| |
|
| Household Products 0.1% | | | | | | |
| Church & Dwight Co., Inc., 6.00%, 12/15/2012 144A | | 200,000 | | | | 195,000 |
| |
|
| Personal Products 0.1% | | | | | | |
| Alderwoods Group, Inc., 7.75%, 09/15/2012 144A | | 200,000 | | | | 208,000 |
| |
|
| ENERGY 6.5% | | | | | | | | |
| Energy Equipment & Services 0.4% | | | | | | |
| Dresser, Inc., 9.375%, 04/15/2011 | | 675,000 | | | | 708,750 |
| Hornbeck Offshore Services, Ser. B, 6.125%, 12/01/2014 | | 200,000 | | | | 198,250 |
| Offshore Logistics, Inc., 6.125%, 06/15/2013 | | 200,000 | | | | 189,500 |
| Parker Drilling Co., 9.625%, 10/01/2013 (p) | | 70,000 | | | | 77,350 |
| |
|
| | | | | | | | | 1,173,850 |
| |
|
| Oil, Gas & Consumable Fuels 6.1% | | | | | | |
| Amerada Hess Corp., 7.30%, 08/15/2031 | | 4,000,000 | | | | 4,586,548 |
| Chesapeake Energy Corp., 6.875%, 01/15/2016 | | 635,000 | | | | 635,000 |
| Exco Resources, Inc., 7.25%, 01/15/2011 | | 530,000 | | | | 524,700 |
| Ferrellgas Partners LP, 6.75%, 05/01/2014 (p) | | 160,000 | | | | 152,800 |
| Forest Oil Corp., 7.75%, 05/01/2014 (p) | | 175,000 | | | | 183,750 |
| Frontier Oil Corp., 6.625%, 10/01/2011 | | 50,000 | | | | 49,750 |
| Husky Energy, Inc., 6.15%, 06/15/2019 | | 4,000,000 | | | | 4,261,552 |
| Magellan Midstream Partners LP, 6.45%, 06/01/2014 | | 2,500,000 | | | | 2,716,817 |
| Plains All American Pipeline LP, 4.75%, 08/15/2009 | | 4,000,000 | | | | 4,005,096 |
| Plains Exploration & Production Co., 8.75%, 07/01/2012 | | 650,000 | | | | 705,250 |
| The Williams Companies, Inc., 7.125%, 09/01/2011 (p) | | 650,000 | | | | 680,875 |
| |
|
| | | | | | | | | 18,502,138 |
| |
|
| FINANCIALS 35.9% | | | | | | | | |
| Capital Markets 1.3% | | | | | | |
| Mellon Capital II, Ser. B, 7.995%, 01/15/2027 | | 3,500,000 | | | | 3,866,730 |
| |
|
| Commercial Banks 4.3% | | | | | | |
| FBOP Corp., 10.00%, 01/15/2009 144A | | 3,500,000 | | | | 3,920,000 |
| First Empire Capital Trust I, 8.23%, 02/01/2027 | | 3,600,000 | | | | 3,986,608 |
| HSBC American Capital Trust I, 7.81%, 12/15/2026 144A | | 1,000,000 | | | | 1,093,477 |
| Huntington National Bank, 4.375%, 01/15/2010 | | 4,000,000 | | | | 3,975,892 |
| |
|
| | | | | | | | | 12,975,977 |
| |
|
See Notes to Financial Statements
13
SCHEDULE OF INVESTMENTS continued
April 30, 2005
| | | | | Principal | | | | |
| | | | | Amount | | | | Value |
|
| CORPORATE BONDS continued | | | | | | | | |
| FINANCIALS continued | | | | | | | | |
| Consumer Finance 7.0% | | | | | | | | |
| American General Finance Corp., 4.00%, 03/15/2011 | | $ | | 2,000,000 | | $ | | 1,919,088 |
| Ford Motor Credit Co.: | | | | | | | | |
| 6.50%, 01/25/2007 | | | | 2,000,000 | | | | 2,000,606 |
| 7.00%, 10/01/2013 (p) | | | | 2,000,000 | | | | 1,802,702 |
| GMAC, 6.875%, 09/15/2011 | | | | 3,500,000 | | | | 3,070,203 |
| HSBC Finance Corp., 7.35%, 06/15/2022 | | | | 2,105,000 | | | | 2,176,429 |
| Ohio National Financial Services, Inc., 6.35%, 04/01/2013 144A | | | | 5,000,000 | | | | 5,379,340 |
| Sprint Capital Corp., 8.75%, 03/15/2032 | | | | 3,500,000 | | | | 4,720,870 |
| |
|
| | | | | | | | | 21,069,238 |
| |
|
| Diversified Financial Services 6.6% | | | | | | | | |
| Arch Western Finance LLC, 6.75%, 07/01/2013 | | | | 200,000 | | | | 201,500 |
| Citigroup, Inc., 5.00%, 09/15/2014 | | | | 4,000,000 | | | | 4,033,884 |
| Hutchison Whampoa Financial Services, Ltd., 7.45%, 08/01/2017 144A | | | | 4,000,000 | | | | 4,632,244 |
| Pemex Project Funding Master Trust, 8.625%, 02/01/2022 | | | | 4,000,000 | | | | 4,640,000 |
| Prudential Holdings LLC, Ser. C, 8.70%, 12/18/2023 144A | | | | 5,000,000 | | | | 6,505,470 |
| |
|
| | | | | | | | | 20,013,098 |
| |
|
| Insurance 8.7% | | | | | | | | |
| Assurant, Inc., 6.75%, 02/15/2034 | | | | 4,000,000 | | | | 4,434,872 |
| Axis Capital Holdings, Ltd., 5.75%, 12/01/2014 | | | | 4,000,000 | | | | 4,065,136 |
| Crum & Forster Holdings Corp., 10.375%, 06/15/2013 | | | | 675,000 | | | | 735,750 |
| Fund American Companies, Inc., 5.875%, 05/15/2013 | | | | 4,000,000 | | | | 4,078,768 |
| Markel Corp., 7.35%, 08/15/2034 | | | | 4,000,000 | | | | 4,520,192 |
| North Front Passthru Trust, 5.81%, 12/15/2024 144A | | | | 4,000,000 | | | | 4,109,536 |
| RLI Corp., 5.95%, 01/15/2014 | | | | 4,500,000 | | | | 4,539,236 |
| |
|
| | | | | | | | | 26,483,490 |
| |
|
| Real Estate 5.4% | | | | | | | | |
| Arden Realty LP, REIT, 5.20%, 09/01/2011 | | | | 4,000,000 | | | | 4,027,644 |
| CB Richard Ellis Group, Inc., 9.75%, 05/15/2010 | | | | 130,000 | | | | 145,600 |
| Health Care Property, Inc., REIT, 6.00%, 03/01/2015 | | | | 4,000,000 | | | | 4,185,156 |
| Host Marriott Corp., Ser. J, REIT, 7.125%, 11/01/2013 | | | | 675,000 | | | | 686,812 |
| iStar Financial, Inc., REIT, 5.15%, 03/01/2012 (p) | | | | 3,250,000 | | | | 3,181,763 |
| La Quinta Properties, Inc., 7.00%, 08/15/2012 (p) | | | | 200,000 | | | | 205,000 |
| Omega Healthcare Investors, Inc., REIT, 7.00%, 04/01/2014 | | | | 35,000 | | | | 33,950 |
| Pan Pacific Retail Properties, Inc., REIT, 7.95%, 04/15/2011 | | | | 3,250,000 | | | | 3,734,933 |
| Thornburg Mortgage, Inc., REIT, 8.00%, 05/15/2013 | | | | 175,000 | | | | 176,750 |
| |
|
| | | | | | | | | 16,377,608 |
| |
|
| Thrifts & Mortgage Finance 2.6% | | | | | | | | |
| Countrywide Home Loans, Inc., FRN, 3.25%, 04/12/2006 | | | | 4,000,000 | | | | 4,001,096 |
| Independence Community Bank Corp., 3.75%, 04/01/2014 | | | | 4,000,000 | | | | 3,829,672 |
| |
|
| | | | | | | | | 7,830,768 |
| |
|
See Notes to Financial Statements
14
SCHEDULE OF INVESTMENTS continued
April 30, 2005
| | | | | Principal | | | | |
| | | | | Amount | | | | Value |
|
| CORPORATE BONDS continued | | | | | | | | |
| HEALTH CARE 1.8% | | | | | | | | |
| Health Care Providers & Services 1.8% | | | | | | | | |
| Coventry Health Care, Inc., 6.125%, 01/15/2015 | | $ | | 550,000 | | $ | | 550,000 |
| Extendicare, Inc., 6.875%, 05/01/2014 (p) | | | | 200,000 | | | | 192,500 |
| HCA, Inc., 6.375%, 01/15/2015 | | | | 700,000 | | | | 706,026 |
| Omnicare, Inc., 6.125%, 06/01/2013 (p) | | | | 125,000 | | | | 121,875 |
| Triad Hospitals, Inc., 7.00%, 11/15/2013 | | | | 200,000 | | | | 200,500 |
| UnitedHealth Group, Inc., 5.00%, 08/15/2014 (p) | | | | 3,750,000 | | | | 3,809,580 |
| |
|
| | | | | | | | | 5,580,481 |
| |
|
| INDUSTRIALS 4.7% | | | | | | | | |
| Aerospace & Defense 0.3% | | | | | | | | |
| Aviall, Inc., 7.625%, 07/01/2011 | | | | 155,000 | | | | 159,650 |
| DRS Technologies, Inc., 6.875%, 11/01/2013 | | | | 700,000 | | | | 701,750 |
| |
|
| | | | | | | | | 861,400 |
| |
|
| Commercial Services & Supplies 2.6% | | | | | | | | |
| Adesa, Inc., 7.625%, 06/15/2012 | | | | 200,000 | | | | 196,000 |
| Allied Waste North America, Inc., 6.375%, 04/15/2011 (p) | | | | 650,000 | | | | 594,750 |
| Corrections Corporation of America, 6.25%, 03/15/2013 144A | | | | 550,000 | | | | 533,500 |
| Deluxe Corp., 5.00%, 12/15/2012 (p) | | | | 2,000,000 | | | | 1,943,824 |
| Geo Group, Inc., 8.25%, 07/15/2013 | | | | 200,000 | | | | 201,500 |
| NationsRent West, Inc., 9.50%, 10/15/2010 | | | | 175,000 | | | | 189,875 |
| Oakmont Asset Trust, 4.51%, 12/22/2008 144A | | | | 4,000,000 | | | | 3,995,308 |
| |
|
| | | | | | | | | 7,654,757 |
| |
|
| Machinery 0.3% | | | | | | | | |
| Case New Holland, Inc., 9.25%, 08/01/2011 144A | | | | 400,000 | | | | 410,000 |
| Manitowoc Co., Inc., 7.125%, 11/01/2013 | | | | 200,000 | | | | 205,000 |
| Navistar International Corp., 6.25%, 03/01/2012 144A | | | | 200,000 | | | | 177,000 |
| Terex Corp., 7.375%, 01/15/2014 | | | | 190,000 | | | | 191,900 |
| |
|
| | | | | | | | | 983,900 |
| |
|
| Road & Rail 0.2% | | | | | | | | |
| Progress Rail Services Corp., 7.75%, 04/01/2012 144A | | | | 650,000 | | | | 650,000 |
| |
|
| Trading Companies & Distributors 1.3% | | | | | | | | |
| Hughes Supply, Inc., 5.50%, 10/15/2014 144A | | | | 4,000,000 | | | | 3,949,208 |
| |
|
| INFORMATION TECHNOLOGY 0.3% | | | | | | | | |
| IT Services 0.3% | | | | | | | | |
| Stratus Technologies, Inc., 10.375%, 12/01/2008 | | | | 105,000 | | | | 102,900 |
| Unisys Corp., 6.875%, 03/15/2010 (p) | | | | 700,000 | | | | 673,750 |
| |
|
| | | | | | | | | 776,650 |
| |
|
See Notes to Financial Statements
15
SCHEDULE OF INVESTMENTS continued
April 30, 2005
| | | Principal | | | | |
| | | Amount | | | | Value |
|
| CORPORATE BONDS continued | | | | | | |
| MATERIALS 2.2% | | | | | | |
| Chemicals 0.9% | | | | | | |
| Equistar Chemicals LP, 10.625%, 05/01/2011 | | $ 700,000 | | $ | | 784,000 |
| Huntsman Advanced Materials LLC: | | | | | | |
| 11.00%, 07/15/2010 144A | | 38,000 | | | | 43,510 |
| 11.625%, 10/15/2010 (p) | | 114,000 | | | | 132,240 |
| Lyondell Chemical Co., 10.50%, 06/01/2013 | | 200,000 | | | | 231,500 |
| Millenium America, Inc., 9.25%, 06/15/2008 | | 700,000 | | | | 749,000 |
| Scotts Co., 6.625%, 11/15/2013 (p) | | 700,000 | | | | 710,500 |
| |
|
| | | | | | | 2,650,750 |
| |
|
| Containers & Packaging 0.2% | | | | | | |
| Jefferson Smurfit Corp., 7.50%, 06/01/2013 | | 200,000 | | | | 188,000 |
| Owens-Brockway Glass Containers, Inc., 6.75%, 12/01/2014 144A | | 200,000 | | | | 196,000 |
| Plastipak Holdings, Inc., 10.75%, 09/01/2011 | | 375,000 | | | | 410,625 |
| |
|
| | | | | | | 794,625 |
| |
|
| Metals & Mining 0.6% | | | | | | |
| Alaska Steel Corp., 7.75%, 06/15/2012 (p) | | 650,000 | | | | 581,750 |
| Century Aluminum Co., 7.50%, 08/15/2014 (p) | | 200,000 | | | | 197,000 |
| Foundation Pennsylvania Coal Co., 7.25%, 08/01/2014 | | 200,000 | | | | 206,500 |
| United States Steel Corp., 10.75%, 08/01/2008 | | 664,000 | | | | 750,320 |
| |
|
| | | | | | | 1,735,570 |
| |
|
| Paper & Forest Products 0.5% | | | | | | |
| Boise Cascade LLC, 7.125%, 10/15/2014 144A | | 525,000 | | | | 501,375 |
| Buckeye Technologies, Inc., 8.50%, 10/01/2013 | | 200,000 | | | | 209,000 |
| Georgia Pacific Corp., 8.125%, 05/15/2011 | | 700,000 | | | | 769,125 |
| |
|
| | | | | | | 1,479,500 |
| |
|
| TELECOMMUNICATION SERVICES 3.1% | | | | | | |
| Diversified Telecommunication Services 3.0% | | | | | | |
| BellSouth Corp., 4.75%, 11/15/2012 | | 4,000,000 | | | | 3,985,420 |
| Citizens Communications Co., 6.25%, 01/15/2013 | | 700,000 | | | | 656,250 |
| Insight Midwest LP, 10.50%, 11/01/2010 | | 175,000 | | | | 187,250 |
| New York Telephone Co., 6.70%, 11/01/2023 | | 4,000,000 | | | | 4,183,736 |
| Qwest Communications International, Inc., 7.875%, 09/01/2011 144A | | 190,000 | | | | 193,800 |
| |
|
| | | | | | | 9,206,456 |
| |
|
| Wireless Telecommunication Services 0.1% | | | | | | |
| Nextel Communications, Inc., 5.95%, 03/15/2014 | | 200,000 | | | | 203,500 |
| Rural Cellular Co., 8.25%, 03/15/2012 | | 15,000 | | | | 15,262 |
| |
|
| | | | | | | 218,762 |
| |
|
| UTILITIES 0.1% | | | | | | |
| Electric Utilities 0.1% | | | | | | |
| Reliant Energy, Inc., 6.75%, 12/15/2014 | | 200,000 | | | | 178,000 |
| |
|
See Notes to Financial Statements
16
SCHEDULE OF INVESTMENTS continued
April 30, 2005
| | | | | Principal | | | | |
| | | | | Amount | | | | Value |
|
| CORPORATE BONDS continued | | | | | | |
| UTILITIES continued | | | | | | | | |
| Multi-Utilities 0.0% | | | | | | | | |
| NRG Energy, Inc., 8.00%, 12/15/2013 144A | | $ 59,000 | | $ | | 59,885 |
| |
|
| Total Corporate Bonds (cost $212,777,147) | | | | | | 213,635,056 |
| |
|
| WHOLE LOAN SUBORDINATE COLLATERALIZED MORTGAGE | | | | | | |
| OBLIGATIONS 0.3% | | | | | | | | |
| FIXED-RATE 0.3% | | | | | | | | |
| Financial Asset Securitization, Inc., Ser. 1997-NAM2, Class B-2, 7.88%, | | | | | | |
| 07/25/2027 (cost $852,255) | | | | 829,635 | | | | 829,884 |
| |
|
| YANKEE OBLIGATIONS - CORPORATE 15.3% | | | | | | |
| CONSUMER DISCRETIONARY 0.1% | | | | | | |
| Hotels, Restaurants & Leisure 0.1% | | | | | | |
| Intrawest Corp., 7.50%, 10/15/2013 | | 200,000 | | | | 200,000 |
| |
|
| CONSUMER STAPLES 2.3% | | | | | | | | |
| Beverages 2.2% | | | | | | | | |
| Companhia Brasileira de Bebidas, 8.75%, 09/15/2013 | | 2,000,000 | | | | 2,300,000 |
| SABMiller plc, 6.625%, 08/15/2033 144A | | 4,000,000 | | | | 4,500,936 |
| |
|
| | | | | | | | | 6,800,936 |
| |
|
| Food & Staples Retailing 0.1% | | | | | | |
| The Jean Coutu Group, (PJC) Inc., 8.50%, 08/01/2014 (p) | | 200,000 | | | | 189,500 |
| |
|
| FINANCIALS 8.3% | | | | | | | | |
| Commercial Banks 6.1% | | | | | | | | |
| Barclays Bank plc, 8.55%, 09/29/2049 144A | | 4,000,000 | | | | 4,763,800 |
| Royal Bank of Scotland Group plc, FRN: | | | | | | |
| 2.94%, 12/29/2049 | | | | 4,000,000 | | | | 3,580,352 |
| 9.12%, 03/31/2049 | | | | 5,000,000 | | | | 5,964,415 |
| Standard Chartered plc, 3.56%, 07/29/2049 | | 5,000,000 | | | | 4,050,000 |
| |
|
| | | | | | | | | 18,358,567 |
| |
|
| Diversified Financial Services 0.7% | | | | | | |
| Preferred Term Securities, Ltd., FRN, 4.60%, 06/24/2034 144A | | 2,000,000 | | | | 2,026,940 |
| |
|
| Insurance 1.5% | | | | | | | | |
| Montpelier Re Holdings, Ltd., 6.125%, 08/15/2013 | | 4,500,000 | | | | 4,692,204 |
| |
|
| INFORMATION TECHNOLOGY 0.0% | | | | | | |
| Electronic Equipment & Instruments 0.0% | | | | | | |
| Celestica, Inc., 7.875%, 07/01/2011 | | 95,000 | | | | 95,000 |
| |
|
| MATERIALS 0.4% | | | | | | | | |
| Containers & Packaging 0.2% | | | | | | |
| Norampac, Inc., 6.75%, 06/01/2013 | | 650,000 | | | | 646,750 |
| |
|
| Metals & Mining 0.2% | | | | | | | | |
| Novelis, Inc., 7.25%, 02/15/2015 144A | | 650,000 | | | | 632,125 |
| |
|
See Notes to Financial Statements
17
SCHEDULE OF INVESTMENTS continued
April 30, 2005
| | | | | | | Principal | | | | |
| | | | | | | Amount | | | | Value |
|
| YANKEE OBLIGATIONS - CORPORATE continued | | | | | | |
| MATERIALS continued | | | | | | | | | | |
| Paper & Forest Products 0.0% | | | | | | | | |
| Millar Western Forest Products, Ltd., 7.75%, 11/15/2013 | | $ 20,000 | | $ | | 19,100 |
| |
|
| TELECOMMUNICATION SERVICES 2.8% | | | | | | |
| Diversified Telecommunication Services 2.8% | | | | | | |
| Deutsche Telekom, 8.50%, 06/15/2010 (p) | | | | 4,000,000 | | | | 4,643,904 |
| Telefonos De Mexico SA: | | | | | | | | | | |
| 4.50%, 11/19/2008 | | | | | | 1,000,000 | | | | 987,387 |
| 4.75%, 01/27/2010 144A | | | | | | 2,800,000 | | | | 2,754,662 |
| |
|
| | | | | | | | | | | 8,385,953 |
| |
|
| Wireless Telecommunication Services 0.0% | | | | | | |
| Rogers Wireless, Inc., 6.375%, 03/01/2014 | | | | 175,000 | | | | 168,438 |
| |
|
| UTILITIES 1.4% | | | | | | | | | | |
| Electric Utilities 1.4% | | | | | | | | | | |
| Transalta Corp., 5.75%, 12/15/2013 | | | | 4,000,000 | | | | 4,157,132 |
| |
|
| Total Yankee Obligations-Corporate (cost $45,835,171) | | | | | | 46,372,645 |
| | |
|
|
| | | | | | | Shares | | | | Value |
|
| PREFERRED STOCKS 4.5% | | | | | | | | | | |
| FINANCIALS 3.8% | | | | | | | | | | |
| Capital Markets 1.5% | | | | | | | | | | |
| Lehman Brothers, Inc. | | | | | | 180,000 | | | | 4,494,384 |
| |
|
| Diversified Financial Services 1.3% | | | | | | | | |
| Zurich Regcaps Funding Trust V 144A | | | | 4,000 | | | | 3,926,250 |
| |
|
| Thrifts & Mortgage Finance 1.0% | | | | | | | | |
| Fannie Mae | | | | | | 55,000 | | | | 3,067,971 |
| |
|
| UTILITIES 0.7% | | | | | | | | | | |
| Electric Utilities 0.7% | | | | | | | | | | |
| Southern California Edison | | | | | | 20,000 | | | | 2,023,126 |
| |
|
| Total Preferred Stocks (cost $13,364,908) | | | | | | 13,511,731 |
| |
|
| | | | | | | Principal | | | | |
| | | | | | | Amount | | | | Value |
|
| SHORT-TERM INVESTMENTS 10.4% | | | | | | | | |
| U.S. TREASURY OBLIGATIONS 0.2% | | | | | | | | |
| U.S. Treasury Bills, 2.46%, 05/12/2005 + ƒ | | | | $500,000 | | | | 499,658 |
| |
|
See Notes to Financial Statements
18
SCHEDULE OF INVESTMENTS continued
April 30, 2005
| | | Shares | | | | Value |
|
| SHORT-TERM INVESTMENTS continued | | | | | | |
| MUTUAL FUND SHARES 10.2% | | | | | | |
| Evergreen Institutional Money Market Fund ø ## | | 6,303,569 | | $ | | 6,303,569 |
| Navigator Prime Portfolio (pp) | | 24,446,738 | | | | 24,446,738 |
| |
|
| Total Short-Term Investments (cost $31,249,965) | | | | | | 31,249,965 |
| |
|
| Total Investments (cost $321,840,329) 107.0% | | | | | | 323,453,180 |
| Other Assets and Liabilities (7.0%) | | | | | | (21,288,781) |
| |
|
| Net Assets 100.0% | | | | $ | | 302,164,399 |
| |
|
| 144A | | Security that may be sold to qualified institutional buyers under Rule 144A of the Securities Act of 1933, as |
| | | amended. This security has been determined to be liquid under guidelines established by the Board of Trustees. |
| # | | When-issued or delayed delivery security |
| (h) | | Security is valued at fair value as determined in good faith under procedures established by the Board of Trustees. |
| (p) | | All or a portion of this security is on loan. |
| + | | Rate shown represents the yield to maturity at date of purchase. |
| ƒ | | All or a portion of this security was pledged to cover initial margin requirements for open futures contracts. |
| ø | | Evergreen Investment Management Company, LLC is the investment advisor to both the Fund and the money market |
| | | fund. |
| ## | | All or a portion of this security has been segregated for when-issued or delayed delivery securities. |
| (pp) | | Represents investment of cash collateral received from securities on loan. |
Summary of Abbreviations |
| CDO | | Collateralized Debt Obligation |
| FHLMC | | Federal Home Loan Mortgage Corp. |
| FRN | | Floating Rate Note |
| REIT | | Real Estate Investment Trust |
| The following table shows the percent of total bonds by credit quality based on Moody’s and Standard & Poor’s ratings as of |
| April 30, 2005 (unaudited): | | | |
| AAA | | 2.2% | |
| AA | | 3.3% | |
| A | | 28.9% | |
| BBB | | 49.7% | |
| BB | | 5.2% | |
| B | | 7.5% | |
| NR | | 3.2% | |
| |
| |
| | | 100.0% | |
| | |
| |
| |
| The following table shows the percent of total bonds by maturity as of April 30, 2005 (unaudited): |
| Less than 1 year | | 4.1% | |
| 1 to 3 year(s) | | 3.5% | |
| 3 to 5 years | | 13.0% | |
| 5 to 10 years | | 46.4% | |
| 10 to 20 years | | 11.5% | |
| 20 to 30 years | | 21.5% | |
| |
| |
| | | 100.0% | |
| | |
| |
See Notes to Financial Statements
19
STATEMENT OF ASSETS AND LIABILITIES
April 30, 2005
| Assets | | | | |
| Investments in securities, at value (cost $315,536,760) including $23,906,348 | | | | |
| of securities loaned | | $ | | 317,149,611 |
| Investments in affiliates, at value (cost $6,303,569) | | | | 6,303,569 |
| Receivable for securities sold | | | | 3,036,554 |
| Receivable for Fund shares sold | | | | 2,193 |
| Interest receivable | | | | 4,344,095 |
| Receivable for daily variation margin on open futures contracts | | | | 45,000 |
| Receivable for securities lending income | | | | 2,148 |
| Prepaid expenses and other assets | | | | 148,722 |
|
| Total assets | | | | 331,031,892 |
|
| Liabilities | | | | |
| Dividends payable | | | | 493,171 |
| Payable for securities purchased | | | | 3,511,399 |
| Payable for Fund shares redeemed | | | | 331,752 |
| Payable for securities on loan | | | | 24,446,738 |
| Advisory fee payable | | | | 7,647 |
| Distribution Plan expenses payable | | | | 10,467 |
| Due to other related parties | | | | 2,675 |
| Accrued expenses and other liabilities | | | | 63,644 |
|
| Total liabilities | | | | 28,867,493 |
|
| Net assets | | $ | | 302,164,399 |
|
| Net assets represented by | | | | |
| Paid-in capital | | $ | | 348,383,364 |
| Overdistributed net investment income | | | | (323,351) |
| Accumulated net realized losses on securities, foreign currency related | | | | |
| transactions and futures contracts | | | | (47,245,690) |
| Net unrealized gains on securities and futures contracts | | | | 1,350,076 |
|
| Total net assets | | $ | | 302,164,399 |
|
| Net assets consists of | | | | |
| Class A | | $ | | 245,765,368 |
| Class B | | | | 22,354,534 |
| Class C | | | | 31,215,928 |
| Class I | | | | 2,828,569 |
|
| Total net assets | | $ | | 302,164,399 |
|
| Shares outstanding (unlimited number of shares authorized) | | | | |
| Class A | | | | 16,529,014 |
| Class B | | | | 1,503,445 |
| Class C | | | | 2,099,421 |
| Class I | | | | 190,237 |
|
| Net asset value per share | | | | |
| Class A | | $ | | 14.87 |
| Class A — Offering price (based on sales charge of 4.75%) | | $ | | 15.61 |
| Class B | | $ | | 14.87 |
| Class C | | $ | | 14.87 |
| Class I | | $ | | 14.87 |
|
See Notes to Financial Statements
20
STATEMENT OF OPERATIONS
Year Ended April 30, 2005
| Investment income | | | | |
| Interest (net of foreign withholding taxes of $71) | | $ | | 17,000,155 |
| Dividends | | | | 674,165 |
| Income from affiliates | | | | 84,769 |
| Securities lending | | | | 24,285 |
|
| Total investment income | | | | 17,783,374 |
|
| Expenses | | | | |
| Advisory fee | | | | 1,372,469 |
| Distribution Plan expenses | | | | |
| Class A | | | | 778,497 |
| Class B | | | | 244,148 |
| Class C | | | | 346,718 |
| Administrative services fee | | | | 320,733 |
| Transfer agent fees | | | | 645,955 |
| Trustees’ fees and expenses | | | | 4,591 |
| Printing and postage expenses | | | | 43,370 |
| Custodian and accounting fees | | | | 99,450 |
| Registration and filing fees | | | | 49,311 |
| Professional fees | | | | 19,304 |
| Other | | | | 6,553 |
|
| Total expenses | | | | 3,931,099 |
| Less: Expense reductions | | | | (7,181) |
| Fee waivers and expense reimbursements | | | | (383,107) |
|
| Net expenses | | | | 3,540,811 |
|
| Net investment income | | | | 14,242,563 |
|
| Net realized and unrealized gains or losses on securities, foreign currency related | | | | |
| transactions and futures contracts | | | | |
| Net realized gains or losses on: | | | | |
| Securities | | | | (2,740,503) |
| Foreign currency related transactions | | | | 43,543 |
| Futures contracts | | | | 703,988 |
|
| Net realized losses on securities, foreign currency related transactions and futures contracts | | | | (1,992,972) |
| Net change in unrealized gains or losses on securities, foreign currency related transactions | | | | |
| and futures contracts | | | | 5,082,194 |
|
| Net realized and unrealized gains or losses on securities, foreign currency related transactions | | | | |
| and futures contracts | | | | 3,089,222 |
|
| Net increase in net assets resulting from operations | | $ | | 17,331,785 |
|
See Notes to Financial Statements
21
STATEMENTS OF CHANGES IN NET ASSETS
| | | Year Ended April 30, |
| |
|
| | | 2005 | | 2004 |
|
| Operations | | | | | | | | |
| Net investment income | | $ | | 14,242,563 | | $ | | 16,856,806 |
| Net realized gains or losses on securities, | | | | | | | | |
| foreign currency related transactions | | | | | | | | |
| and futures contracts | | | | (1,992,972) | | | | 5,586,344 |
| Net change in unrealized gains or losses | | | | | | | | |
| on securities, foreign currency related | | | | | | | | |
| transactions and futures contracts | | | | 5,082,194 | | | | (15,614,330) |
|
| Net increase in net assets resulting from | | | | | | | | |
| operations | | | | 17,331,785 | | | | 6,828,820 |
|
| Distributions to shareholders from | | | | | | | | |
| Net investment income | | | | | | | | |
| Class A | | | | (12,494,854) | | | | (15,198,914) |
| Class B | | | | (1,004,242) | | | | (1,186,466) |
| Class C | | | | (1,428,601) | | | | (1,898,544) |
| Class I | | | | (134,349) | | | | (162,471) |
|
| Total distributions to shareholders | | | | (15,062,046) | | | | (18,446,395) |
|
| | | Shares | | | | Shares | | |
| Capital share transactions | | | | | | | | |
| Proceeds from shares sold | | | | | | | | |
| Class A | | 288,197 | | 4,294,459 | | 362,207 | | 5,511,500 |
| Class B | | 177,985 | | 2,629,451 | | 451,342 | | 6,871,941 |
| Class C | | 89,787 | | 1,333,469 | | 307,989 | | 4,687,644 |
| Class I | | 44,397 | | 654,043 | | 69,019 | | 1,049,350 |
|
| | | | | 8,911,422 | | | | 18,120,435 |
|
| Net asset value of shares issued in | | | | | | | | |
| reinvestment of distributions | | | | | | | | |
| Class A | | 534,383 | | 7,942,766 | | 611,529 | | 9,254,418 |
| Class B | | 39,220 | | 582,878 | | 44,009 | | 665,861 |
| Class C | | 63,472 | | 942,977 | | 81,748 | | 1,237,149 |
| Class I | | 2,237 | | 33,263 | | 1,518 | | 22,947 |
|
| | | | | 9,501,884 | | | | 11,180,375 |
|
| Automatic conversion of Class B shares | | | | | | | | |
| to Class A shares | | | | | | | | |
| Class A | | 62,637 | | 935,790 | | 27,179 | | 413,022 |
| Class B | | (62,637) | | (935,790) | | (27,179) | | (413,022) |
|
| | | | | 0 | | | | 0 |
|
| Payment for shares redeemed | | | | | | | | |
| Class A | | (3,027,033) | | (44,983,108) | | (3,504,087) | | (53,099,113) |
| Class B | | (399,651) | | (5,925,515) | | (506,299) | | (7,674,174) |
| Class C | | (659,955) | | (9,802,598) | | (898,190) | | (13,598,071) |
| Class I | | (12,870) | | (188,839) | | (126,148) | | (1,885,559) |
|
| | | | | (60,900,060) | | | | (76,256,917) |
|
| Net decrease in net assets resulting from | | | | | | | | |
| capital share transactions | | | | (42,486,754) | | | | (46,956,107) |
|
| Total decrease in net assets | | | | (40,217,015) | | | | (58,573,682) |
| Net assets | | | | | | | | |
| Beginning of period | | | | 342,381,414 | | | | 400,955,096 |
|
| End of period | | $ 302,164,399 | | $ 342,381,414 |
|
| Overdistributed net investment income | | $ | | (323,351) | | $ | | (483,222) |
|
See Notes to Financial Statements
22
NOTES TO FINANCIAL STATEMENTS
1. ORGANIZATION
Evergreen Diversified Bond Fund (the “Fund”) is a diversified series of Evergreen Fixed Income Trust (the “Trust”), a Delaware statutory trust organized on September 18, 1997. The Trust is an open-end management investment company registered under the Investment Company Act of 1940, as amended (the “1940 Act”).
The Fund offers Class A, Class B, Class C and Institutional (“Class I”) shares. Class A shares are sold with a front-end sales charge. However, Class A share investments of $1 million or more are not subject to a front-end sales charge but will be subject to a contingent deferred sales charge of 1.00% upon redemption within one year. Class B shares are sold without a front-end sales charge but are subject to a contingent deferred sales charge that is payable upon redemption and decreases depending on how long the shares have been held. Class C shares are sold without a front-end sales charge but are subject to a contingent deferred sales charge that is payable upon redemption within one year. Class I shares are sold without a front-end sales charge or contingent deferred sales charge. Each class of shares, except Class I shares, pays an ongoing distribution fee.
2. SIGNIFICANT ACCOUNTING POLICIES
The following is a summary of significant accounting policies consistently followed by the Fund in the preparation of its financial statements. The policies are in conformity with generally accepted accounting principles in the United States of America, which require management to make estimates and assumptions that affect amounts reported herein. Actual results could differ from these estimates.
a. Valuation of investments
Portfolio debt securities acquired with more than 60 days to maturity are fair valued using matrix pricing methods determined by an independent pricing service which takes into consideration such factors as similar security prices, yields, maturities, liquidity and ratings. Securities for which valuations are not readily available from an independent pricing service may be valued by brokers which use prices provided by market makers or estimates of market value obtained from yield data relating to investments or securities with similar characteristics.
Listed equity securities are usually valued at the last sales price or official closing price on the national securities exchange where the securities are principally traded.
Short-term securities with remaining maturities of 60 days or less at the time of purchase are valued at amortized cost, which approximates market value.
Investments in other mutual funds are valued at net asset value. Securities for which market quotations are not readily available or not reflective of current market value are valued at fair value as determined in good faith, according to procedures approved by the Board of Trustees.
b. Foreign currency translation
All assets and liabilities denominated in foreign currencies are translated into U.S. dollar amounts at the date of valuation. Purchases and sales of portfolio securities and income items denominated in foreign currencies are translated into U.S. dollar amounts on the respective dates of such trans-
23
NOTES TO FINANCIAL STATEMENTS continued
actions. The Fund does not separately account for that portion of the results of operations resulting from changes in foreign exchange rates on investments and the fluctuations arising from changes in market prices of securities held. Such fluctuations are included with the net realized and unrealized gains or losses on securities.
c. Futures contracts
In order to gain exposure to or protect against changes in security values, the Fund may buy and sell futures contracts. The primary risks associated with the use of futures contracts are the imperfect correlation between changes in market values of securities held by the Fund and the prices of futures contracts, and the possibility of an illiquid market.
Futures contracts are valued based upon their quoted daily settlement prices. The aggregate principal amounts of the contracts are not recorded in the financial statements. Fluctuations in the value of the contracts are recorded in the Statement of Assets and Liabilities as an asset or liability and in the Statement of Operations as unrealized gains or losses until the contracts are closed, at which point they are recorded as net realized gains or losses on futures contracts.
d. When-issued and delayed delivery transactions
The Fund records when-issued or delayed delivery securities as of trade date and maintains security positions such that sufficient liquid assets will be available to make payment for the securities purchased. Securities purchased on a when-issued or delayed delivery basis are marked-to-market daily and begin earning interest on the settlement date. Losses may occur on these transactions due to changes in market conditions or the failure of counterparties to perform under the contract.
e. Securities lending
The Fund may lend its securities to certain qualified brokers in order to earn additional income. The Fund receives compensation in the form of fees or interest earned on the investment of any cash collateral received. The Fund also continues to receive interest and dividends on the securities loaned. The Fund receives collateral in the form of cash or securities with a market value at least equal to the market value of the securities on loan, including accrued interest. In the event of default or bankruptcy by the borrower, the Fund could experience delays and costs in recovering the loaned securities or in gaining access to the collateral. The Fund has the right under the lending agreement to recover the securities from the borrower on demand.
f. Security transactions and investment income
Security transactions are recorded on trade date. Realized gains and losses are computed using the specific cost of the security sold. Interest income is recorded on the accrual basis and includes accretion of discounts and amortization of premiums. Dividend income is recorded on the ex-dividend date. Foreign income and capital gains realized on some securities may be subject to foreign taxes, which are accrued as applicable.
24
NOTES TO FINANCIAL STATEMENTS continued
g. Federal taxes
The Fund intends to continue to qualify as a regulated investment company and distribute all of its taxable income, including any net capital gains (which have already been offset by available capital loss carryovers). Accordingly, no provision for federal taxes is required.
h. Distributions
Distributions to shareholders from net investment income are accrued daily and paid monthly. Distributions from net realized gains, if any, are recorded on the ex-dividend date. Such distributions are determined in conformity with income tax regulations, which may differ from generally accepted accounting principles.
Reclassifications have been made to the Fund’s components of net assets to reflect income and gains available for distribution (or available capital loss carryovers, as applicable) under income tax regulations. The primary permanent differences causing such reclassifications are due to premium amortization.
During the year ended April 30, 2005, the following amounts were reclassified:
|
| Overdistributed net investment income | | $1,696,942 |
| Accumulated net realized losses on securities, foreign | | |
| currency related transactions and futures contracts | | (1,696,942) |
|
i. Class allocations
Income, common expenses and realized and unrealized gains and losses are allocated to the classes based on the relative net assets of each class. Distribution fees, if any, are calculated daily at the class level based on the appropriate net assets of each class and the specific expense rates applicable to each class.
3. ADVISORY FEE AND OTHER TRANSACTIONS WITH AFFILIATES
Evergreen Investment Management Company, LLC (“EIMC”), an indirect, wholly-owned subsidiary of Wachovia Corporation (“Wachovia”), is the investment advisor to the Fund and is paid a fee at an annual rate of 2% of the Fund’s gross investment income plus an amount determined by applying percentage rates to the average daily net assets of the Fund, starting at 0.31% and declining to 0.16% as average daily net assets increase.
From time to time, EIMC may voluntarily or contractually waive its fee and/or reimburse expenses in order to limit operating expenses. During the year ended April 30, 2005, EIMC waived its advisory fee in the amount of $383,044 and reimbursed other expenses in the amount of $63 which combined represents 0.12% of the Fund’s average daily net assets.
Evergreen Investment Services, Inc. (“EIS”), an indirect, wholly-owned subsidiary of Wachovia, is the administrator to the Fund. As administrator, EIS provides the Fund with facilities, equipment and personnel and is paid an annual rate determined by applying percentage rates to the
25
NOTES TO FINANCIAL STATEMENTS continued
aggregate average daily net assets of the Evergreen funds (excluding money market funds), starting at 0.10% and declining to 0.05% as the aggregate average daily net assets of the Evergreen funds (excluding money market funds) increase.
Evergreen Service Company, LLC (“ESC”), an indirect, wholly-owned subsidiary of Wachovia, is the transfer and dividend disbursing agent for the Fund. ESC receives account fees that vary based on the type of account held by the shareholders in the Fund. For the year ended April 30, 2005, the transfer agent fees were equivalent to an annual rate of 0.20% of the Fund’s average daily net assets.
4. DISTRIBUTION PLANS
EIS also serves as distributor of the Fund’s shares. The Fund has adopted Distribution Plans, as allowed by Rule 12b-1 of the 1940 Act, for each class of shares, except Class I. Under the Distribution Plans, distribution fees are paid at an annual rate of 0.30% of the average daily net assets for Class A shares, and 1.00% of the average daily net assets for each of Class B and Class C shares.
For the year ended April 30, 2005, EIS received $6,658 from the sale of Class A shares and $85,738 and $6,109 in contingent deferred sales charges from redemptions of Class B and Class C shares, respectively.
5. SECURITIES TRANSACTIONS
Cost of purchases and proceeds from sales of investment securities (excluding short-term securities) were as follows for the year ended April 30, 2005:
| Cost of Purchases | | Proceeds from Sales |
|
| U.S. | | Non-U.S. | | U.S. | | Non-U.S. |
| Government | | Government | | Government | | Government |
|
| $9,057,566 | | $432,947,598 | | $11,500,905 | | $472,630,287 |
|
At April 30, 2005, the Fund had open short futures contracts outstanding as follows:
| | | | | Initial Contract | | Value at | | Unrealized |
| Expiration | | Contracts | | Amount | | April 30, 2005 | | Loss |
|
| June 2005 | | 180 U.S. Treasury | | | | | | |
| | | Notes Futures | | $19,793,163 | | $20,055,938 | | $262,775 |
|
During the year ended April 30, 2005, the Fund loaned securities to certain brokers. At April 30, 2005, the value of securities on loan and the value of collateral (including accrued interest) amounted to $23,906,348 and $24,446,738, respectively.
On April 30, 2005, the aggregate cost of securities for federal income tax purposes was $322,418,709. The gross unrealized appreciation and depreciation on securities based on tax cost was $4,348,600 and $3,314,129, respectively, with a net unrealized appreciation of $1,034,471.
26
NOTES TO FINANCIAL STATEMENTS continued
As of April 30, 2005, the Fund had $46,930,085 in capital loss carryovers for federal income tax purposes expiring as follows:
| Expiration |
|
| 2007 | | 2008 | | 2009 | | 2010 | | 2013 |
|
| $7,055,922 | | $19,652,642 | | $11,338,929 | | $4,586,980 | | $4,295,612 |
|
6. INTERFUND LENDING
Pursuant to an Exemptive Order issued by the SEC, the Fund may participate in an interfund lending program with certain funds in the Evergreen fund family. This program allows the Fund to borrow from, or lend money to, other participating funds. During the year ended April 30, 2005, the Fund did not participate in the interfund lending program.
7. DISTRIBUTIONS TO SHAREHOLDERS
As of April 30, 2005, the components of distributable earnings on a tax basis were as follows:
| Overdistributed | | Unrealized | | Capital Loss |
| Ordinary Income | | Appreciation | | Carryover |
|
| $323,351 | | $1,034,471 | | $46,930,085 |
|
The differences between the components of distributable earnings on a tax basis and the amounts reflected in the Statement of Assets and Liabilities are primarily due to wash sales, premium amortization adjustments and marked-to-market income on futures contracts.
The tax character of distributions paid were $15,062,046 and $18,446,395 of ordinary income for the years ended April 30, 2005 and April 30, 2004, respectively.
8. EXPENSE REDUCTIONS
Through expense offset arrangements with ESC and the Fund’s custodian, a portion of fund expenses has been reduced.
9. DEFERRED TRUSTEES’ FEES
Each Trustee of the Fund may defer any or all compensation related to performance of their duties as Trustees. The Trustees’ deferred balances are allocated to deferral accounts, which are included in the accrued expenses for the Fund. The investment performance of the deferral accounts are based on the investment performance of certain Evergreen funds. Any gains earned or losses incurred in the deferral accounts are reported in the Fund’s Trustees’ fees and expenses. At the election of the Trustees, the deferral account will be paid either in one lump sum or in quarterly installments for up to ten years.
27
NOTES TO FINANCIAL STATEMENTS continued
10. FINANCING AGREEMENT
The Fund and certain other Evergreen funds share in a $150 million unsecured revolving credit commitment for temporary and emergency purposes, including the funding of redemptions, as permitted by each participating fund’s borrowing restrictions. Borrowings under this facility bear interest at 0.50% per annum above the Federal Funds rate. All of the participating funds are charged an annual commitment fee of 0.09% of the unused balance, which is allocated pro rata. During the year ended April 30, 2005, the Fund had no borrowings under this agreement.
11. CONCENTRATION OF RISK
The Fund may invest a substantial portion of its assets in an industry or sector and, therefore, may be more affected by changes in that industry or sector than would be a comparable mutual fund that is not heavily weighted in any industry or sector.
12. REGULATORY MATTERS AND LEGAL PROCEEDINGS
Since September 2003, governmental and self-regulatory authorities have instituted numerous ongoing investigations of various practices in the mutual fund industry, including investigations relating to revenue sharing, market-timing, late trading and record retention, among other things. The investigations cover investment advisors, distributors and transfer agents to mutual funds, as well as other firms. EIMC, EIS and ESC (collectively, “Evergreen”) have received subpoenas and other requests for documents and testimony relating to these investigations, are endeavoring to comply with those requests, and are cooperating with the investigations. Evergreen is continuing its own internal review of policies, practices, procedures and personnel, and is taking remedial action where appropriate.
In connection with one of these investigations, on July 28, 2004, the staff of the Securities and Exchange Commission (“SEC”) informed Evergreen that the staff intends to recommend to the SEC that it institute an enforcement action against Evergreen. The SEC staff’s proposed allegations relate to (i) an arrangement pursuant to which a broker at one of EIMC’s affiliated broker-dealers had been authorized, apparently by an EIMC officer (no longer with EIMC), to engage in short-term trading, on behalf of a client, in Evergreen Mid Cap Growth Fund (formerly Evergreen Emerging Growth Fund and prior to that, known as Evergreen Small Company Growth Fund) during the period from December 2000 through April 2003, in excess of the limitations set forth in the fund’s prospectus, (ii) short-term trading from September 2001 through January 2003, by a former Evergreen portfolio manager, of Evergreen Precious Metals Fund, a fund he managed at the time, (iii) the sufficiency of systems for monitoring exchanges and enforcing exchange limitations as stated in the fund’s prospectuses, and (iv) the adequacy of e-mail retention practices. In connection with the activity in Evergreen Mid Cap Growth Fund, EIMC reimbursed the fund $378,905, plus an additional $25,242, representing what EIMC calculated at that time to be the client’s net gain and the fees earned by EIMC and the expenses incurred by this fund on the client’s account. In connection with the activity in Evergreen Precious Metals Fund, EIMC reimbursed the fund $70,878, plus an additional $3,075, representing what EIMC calculated at that time to be the portfolio manager’s net gain and the fees
28
NOTES TO FINANCIAL STATEMENTS continued
earned by EIMC and expenses incurred by the fund on the portfolio manager’s account. Evergreen is currently engaged in discussions with the staff of the SEC concerning its recommendation.
Any resolution of these matters with regulatory authorities may include, but not be limited to, sanctions, penalties or injunctions regarding Evergreen, restitution to mutual fund shareholders and/or other financial penalties and structural changes in the governance or management of Evergreen’s mutual fund business. Any penalties or restitution will be paid by Evergreen and not by the Evergreen funds.
In addition, the Evergreen funds and EIMC and certain of its affiliates are involved in various legal actions, including private litigation and class action lawsuits. EIMC does not expect that any of such legal actions currently pending or threatened will have a material adverse impact on the financial position or operations of any of the Evergreen funds or on EIMC’s ability to provide services to the Evergreen funds.
Although Evergreen believes that neither the foregoing investigations nor any pending or threatened legal actions will have a material adverse impact on the Evergreen funds, there can be no assurance that these matters and any publicity surrounding or resulting from them will not result in reduced sales or increased redemptions of Evergreen fund shares, which could increase Evergreen fund transaction costs or operating expenses, or have other adverse consequences on the Evergreen funds.
13. SUBSEQUENT EVENT
Effective at the close of business on May 20, 2005, the Fund acquired the assets and identified liabilities of Vestaur Securities Fund, a diversified closed-end management investment company, in a tax-free exchange for shares of the Fund. Upon completion of this transaction, the new combined fund adopted the accounting and performance history of Vestaur Securities Fund and shareholders of Vestaur Securities Fund became shareholders of Class I shares of the Fund. In addition, since Class A, Class B and Class C shares of Vestaur Securities Fund did not exist prior to the reorganization, the accounting and performance information of these respective classes of shares of the Fund will be presented in future shareholder reports with May 20, 2005 as the commencement of operations for each class.
29
REPORT OF INDEPENDENT REGISTERED PUBLIC ACCOUNTING FIRM
Board of Trustees and Shareholders
Evergreen Fixed Income Trust
We have audited the accompanying statement of assets and liabilities, including the schedule of investments, of the Evergreen Diversified Bond Fund, a series of Evergreen Fixed Income Trust, as of April 30, 2005, and the related statement of operations for the year then ended, statements of changes in net assets for each of the years in the two-year period then ended, and the financial highlights for each of the years in the five-year period then ended. These financial statements and financial highlights are the responsibility of the Fund’s management. Our responsibility is to express an opinion on these financial statements and financial highlights based on our audits.
We conducted our audits in accordance with the standards of the Public Company Accounting Oversight Board (United States). Those standards require that we plan and perform the audit to obtain reasonable assurance about whether the financial statements and financial highlights are free of material misstatement. An audit includes examining, on a test basis, evidence supporting the amounts and disclosures in the financial statements. Our procedures included confirmation of securities owned as of April 30, 2005 by correspondence with the custodian and brokers, or by other appropriate auditing procedures when replies from brokers were not received. An audit also includes assessing the accounting principles used and significant estimates made by management, as well as evaluating the overall financial statement presentation. We believe that our audits provide a reasonable basis for our opinion.
In our opinion, the financial statements and financial highlights referred to above present fairly, in all material respects, the financial position of the Evergreen Diversified Bond Fund as of April 30, 2005, the results of its operations, changes in its net assets and financial highlights for each of the years described above in conformity with U.S. generally accepted accounting principles.
Boston, Massachusetts
June 17, 2005
30
ADDITIONAL INFORMATION (unaudited)
FEDERAL TAX DISTRIBUTIONS
For corporate shareholders, 4.07% of ordinary income dividends paid during the fiscal year ended April 30, 2005 qualified for the dividends received deduction.
With respect to dividends paid from investment company taxable income during the fiscal year ended April 30, 2005, the Fund designates 4.48% of ordinary income and any short-term capital gain distributions as Qualified Dividend Income in accordance with the Internal Revenue Code. Complete 2005 year-end tax information will be reported to you on your 2005 Form 1099-DIV, which shall be provided to you in early 2006.
31
TRUSTEES AND OFFICERS
TRUSTEES1
| Charles A. Austin III | | Principal occupations: Investment Counselor, Anchor Capital Advisors, Inc. (investment advice); |
| Trustee | | Director, The Andover Companies (insurance); Trustee, Arthritis Foundation of New England; |
| DOB: 10/23/1934 | | Director, The Francis Ouimet Society; Former Director, Health Development Corp. |
| Term of office since: 1991 | | (fitness-wellness centers); Former Director, Mentor Income Fund, Inc.; Former Trustee, |
| | | Mentor Funds and Cash Resource Trust; Former Investment Counselor, Appleton Partners, Inc. |
| Other directorships: None | | (investment advice); Former Director, Executive Vice President and Treasurer, State Street |
| | | Research & Management Company (investment advice) |
|
| Shirley L. Fulton | | Principal occupations: Partner, Tin, Fulton, Greene & Owen, PLLC (law firm); Former Partner, |
| Trustee | | Helms, Henderson & Fulton, P.A. (law firm); Retired Senior Resident Superior Court Judge, |
| DOB: 1/10/1952 | | 26th Judicial District, Charlotte, NC |
| Term of office since: 2004 | | |
| Other directorships: None | | |
|
| K. Dun Gifford | | Principal occupations: Chairman and President, Oldways Preservation and Exchange Trust |
| Trustee | | (education); Trustee, Treasurer and Chairman of the Finance Committee, Cambridge College; |
| DOB: 10/23/1938 | | Former Chairman of the Board, Director, and Executive Vice President, The London Harness |
| Term of office since: 1974 | | Company (leather goods purveyor); Former Director, Mentor Income Fund, Inc.; Former Trustee, |
| | | Mentor Funds and Cash Resource Trust |
| Other directorships: None | | |
|
| Dr. Leroy Keith, Jr. | | Principal occupations: Partner, Stonington Partners, Inc. (private equity firm); Trustee, |
| Trustee | | The Phoenix Group of Mutual Funds; Director, Obagi Medical Products Co.; Director, |
| DOB: 2/14/1939 | | Diversapack Co.; Former Director, Lincoln Educational Services; Former Chairman of the Board |
| Term of office since: 1983 | | and Chief Executive Officer, Carson Products Company (manufacturing); Former Director, |
| | | Mentor Income Fund, Inc.; Former Trustee, Mentor Funds and Cash Resource Trust |
| Other directorships: Trustee, The | | |
| Phoenix Group of Mutual Funds | | |
|
| Gerald M. McDonnell | | Principal occupations: Manager of Commercial Operations, SMI Steel Co. – South Carolina |
| Trustee | | (steel producer); Former Sales and Marketing Manager, Nucor Steel Company; Former Director, |
| DOB: 7/14/1939 | | Mentor Income Fund, Inc.; Former Trustee, Mentor Funds and Cash Resource Trust |
| Term of office since: 1988 | | |
| Other directorships: None | | |
|
| William Walt Pettit | | Principal occupations: Vice President, Kellam & Pettit, P.A. (law firm); Director, Superior |
| Trustee | | Packaging Corp.; Director, National Kidney Foundation of North Carolina, Inc.; Former Director, |
| DOB: 8/26/1955 | | Mentor Income Fund, Inc.; Former Trustee, Mentor Funds and Cash Resource Trust |
| Term of office since: 1984 | | |
| Other directorships: None | | |
|
| David M. Richardson | | Principal occupations: President, Richardson, Runden LLC (executive recruitment business |
| Trustee | | development/consulting company); Consultant, Kennedy Information, Inc. (executive |
| DOB: 9/19/1941 | | recruitment information and research company); Consultant, AESC (The Association of |
| Term of office since: 1982 | | Executive Search Consultants); Director, J&M Cumming Paper Co. (paper merchandising); |
| | | Former Trustee, NDI Technologies, LLP (communications); Former Vice Chairman, DHR |
| Other directorships: None | | International, Inc. (executive recruitment); Former Director, Mentor Income Fund, Inc.; |
| | | Former Trustee, Mentor Funds and Cash Resource Trust |
|
| Dr. Russell A. Salton III | | Principal occupations: President/CEO, AccessOne MedCard; Former Medical Director, |
| Trustee | | Healthcare Resource Associates, Inc.; Former Medical Director, U.S. Health Care/Aetna Health |
| DOB: 6/2/1947 | | Services; Former Director, Mentor Income Fund, Inc.; Former Trustee, Mentor Funds and |
| Term of office since: 1984 | | Cash Resource Trust |
| Other directorships: None | | |
|
32
TRUSTEES AND OFFICERS continued
| Michael S. Scofield | | Principal occupations: Director, Branded Media Corporation (multi-media branding company); |
| Trustee | | Attorney, Law Offices of Michael S. Scofield; Former Director, Mentor Income Fund, Inc.; |
| DOB: 2/20/1943 | | Former Trustee, Mentor Funds and Cash Resource Trust |
| Term of office since: 1984 | | |
| Other directorships: None | | |
|
| Richard J. Shima | | Principal occupations: Independent Consultant; Director, Trust Company of CT; Trustee, |
| Trustee | | Saint Joseph College (CT); Director, Hartford Hospital; Trustee, Greater Hartford YMCA; |
| DOB: 8/11/1939 | | Former Director, Enhance Financial Services, Inc.; Former Director, Old State House Association; |
| Term of office since: 1993 | | Former Director of CTG Resources, Inc. (natural gas); Former Director, Mentor Income Fund, Inc.; |
| Other directorships: None | | Former Trustee, Mentor Funds and Cash Resource Trust |
|
| Richard K. Wagoner, CFA2 | | Principal occupations: Member and Former President, North Carolina Securities Traders |
| Trustee | | Association; Member, Financial Analysts Society; Former Consultant to the Boards of Trustees |
| DOB: 12/12/1937 | | of the Evergreen funds; Former Trustee, Mentor Funds and Cash Resource Trust |
| Term of office since: 1999 | | |
| Other directorships: None | | |
|
| OFFICERS | | |
| Dennis H. Ferro3 | | Principal occupations: President and Chief Executive Officer, Evergreen Investment Company, |
| President | | Inc. and Executive Vice President, Wachovia Bank, N.A.; former Chief Investment Officer, |
| DOB: 6/20/1945 | | Evergreen Investment Company, Inc. |
| Term of office since: 2003 | | |
|
| Carol Kosel4 | | Principal occupations: Senior Vice President, Evergreen Investment Services, Inc. |
| Treasurer | | |
| DOB: 12/25/1963 | | |
| Term of office since: 1999 | | |
|
| Michael H. Koonce4 | | Principal occupations: Senior Vice President and General Counsel, Evergreen Investment |
| Secretary | | Services, Inc.; Senior Vice President and Assistant General Counsel, Wachovia Corporation |
| DOB: 4/20/1960 | | |
| Term of office since: 2000 | | |
|
| James Angelos4 | | Principal occupations: Chief Compliance Officer and Senior Vice President, Evergreen Funds; |
| Chief Compliance Officer | | Former Director of Compliance, Evergreen Investment Services, Inc. |
| DOB: 9/2/1947 | | |
| Term of office since: 2004 | | |
|
1 Each Trustee serves until a successor is duly elected or qualified or until his death, resignation, retirement or removal from office. Each Trustee oversees 89 Evergreen funds. Correspondence for each Trustee may be sent to Evergreen Board of Trustees, P.O. Box 20083, Charlotte, NC 28202.
2 Mr. Wagoner is an “interested person” of the Fund because of his ownership of shares in Wachovia Corporation, the parent to the Fund’s investment advisor.
3 The address of the Officer is 401 S. Tryon Street, 20th Floor, Charlotte, NC 28288.
4 The address of the Officer is 200 Berkeley Street, Boston, MA 02116.
Additional information about the Fund’s Board of Trustees and Officers can be found in the Statement of Additional Information (SAI) and is available upon request without charge by calling 800.343.2898.
33
566659 rv2 6/2005

| | |
| | | table of contents |
| 1 | | LETTER TO SHAREHOLDERS |
| 4 | | FUND AT A GLANCE |
| 5 | | PORTFOLIO MANAGER COMMENTARY |
| 6 | | ABOUT YOUR FUND'S EXPENSES |
| 7 | | FINANCIAL HIGHLIGHTS |
| 11 | | SCHEDULE OF INVESTMENTS |
| 21 | | STATEMENT OF ASSETS AND LIABILITIES |
| 22 | | STATEMENT OF OPERATIONS |
| 23 | | STATEMENTS OF CHANGES IN NET ASSETS |
| 24 | | NOTES TO FINANCIAL STATEMENTS |
| 31 | | REPORT OF INDEPENDENT REGISTERED PUBLIC ACCOUNTING FIRM |
| 32 | | TRUSTEES AND OFFICERS |
This annual report must be preceded or accompanied by a prospectus of the Evergreen fund contained herein. The prospectus contains more complete information, including fees and expenses, and should be read carefully before investing or sending money.
The fund will file its complete schedule of portfolio holdings with the SEC for the first and third quarters of each fiscal year on Form N-Q. The fund's Form N-Q will be available on the SEC's Web site at http://www.sec.gov. In addition, the fund's Form N-Q may be reviewed and copied at the SEC's Public Reference Room in Washington, D.C. Information on the operation of the Public Reference Room may be obtained by calling 800.SEC.0330.
A description of the fund's proxy voting policies and procedures, as well as information regarding how the fund voted proxies relating to portfolio securities during the most recent 12-month period ended June 30, is available by visiting our Web site at EvergreenInvestments.com or by visiting the SEC's Web site at http://www.sec.gov. The fund's proxy voting policies and procedures are also available without charge, upon request, by calling 800.343.2898.
| | | | |
| Mutual Funds: | | | | |
| NOT FDIC INSURED | | MAY LOSE VALUE | | NOT BANK GUARANTEED |
Evergreen InvestmentsSM is a service mark of Evergreen Investment Management Company, LLC.
Copyright 2005, Evergreen Investment Management Company, LLC.
Evergreen mutual funds are distributed by Evergreen Investment Services, Inc.
200 Berkeley Street, Boston, MA 02116
LETTER TO SHAREHOLDERS
June 2005

Dennis H. Ferro
President and Chief
Executive Officer
Dear Shareholder,
We are pleased to provide the annual report for the Evergreen High Yield Bond Fund, which covers the twelve-month period ended April 30, 2005.
For those investors in the fixed income markets, the past year has provided a variety of challenges and opportunities. In anticipation of this environment, our fixed income portfolio management teams attempted to prepare for a market contending with moderating economic growth and less accommodation from the Federal Reserve (Fed). The question for the markets was no longer the direction of monetary policy, but rather the extent to which interest rates would rise. Using our outlook for a continued economic expansion, we positioned our fixed income portfolios for a gradual tightening of monetary policy.
The fiscal year began with a mixed message on the economy. Growth was good, but it was no longer great, and market interest rates declined on the perceived weakness. However, Fed officials continued to talk up their much anticipated "measured removal of policy accommodation."
Throughout the confusion, we maintained our belief that the economy had simply transitioned from recovery to expansion. As a result of this transition, a variety of economic reports pointed in different directions. For example, solid retail sales occurred in a month where consumer confidence declined. Historically, the maturation of the economic cycle had experienced similarly erratic behavior. Yet market interest rates began to fluctuate with seemingly every monthly data point. Moreover, the costs for commodities and energy were rising, and since inflation adjusted interest rates had remained low for such a lengthy period, the Fed seemed determined to prevent inflation from becoming a long-term problem. As job growth began to exceed expectations in the Spring of 2004, the market's inflation fears accelerated, and yields
1
LETTER TO SHAREHOLDERS continued
headed higher in anticipation of tighter Fed policy.
The Fed finally began their "measured removal of policy accommodation" beginning in June of 2004. After three years of stimulative policy actions, monetary policymakers began the journey towards more moderate economic growth. Fed Chairman Alan Greenspan was very transparent in his public statements, attempting to assuage market anxiety. Market interest rates still remained quite volatile during the first half of the fiscal period. Only after the central bank's first few rate increases did the long-end of the yield curve begin to recover, a process that would continue for the bulk of the fiscal year as the markets concluded that long-term inflation was under control. Chairman Greenspan, however, remained concerned about "complacency" within the bond market, as evidenced by his comments to congressional banking committees in February 2005 that it was a "conundrum" that long-term yields remained low.
Throughout the fiscal year, many of our fixed income managers utilized a variety of strategies within their specific portfolios in order to maximize the total return possibilities for our investors. For example, many of our municipal bond fund managers emphasized the long-end of the curve in an attempt to enhance total return. Other teams used a barbell strategy, seeking opportunities at the short and long end of the Treasury yield curve in an attempt to remain defensive throughout the volatile market activity. Our mortgage portfolio teams employed adjustable rate, commercial, and hybrid products while attempting to navigate the ever changing seas within that marketplace. Our fundamental emphasis on credit quality in the corporate and high yield sectors, however, was not always rewarded, as the markets often pursued riskier issues within a given universe as the yield curve continued to flatten. Finally, our global management teams bought foreign bonds from commodity rich nations such as Australia, New Zealand and Canada in an effort to sustain performance.
We encourage our investors to maintain their diversified, long-term strategies, including high yield securities, within their fixed income portfolios.
2
LETTER TO SHAREHOLDERS continued
Please visit our Web site, EvergreenInvestments.com, for more information about our funds and other investment products available to you. From the Web site, you may also access a detailed Q & A interview with the portfolio manager(s) for your fund. You can easily reach these interviews by following the link, EvergreenInvestments.com/Annual Updates, from our Web site. Thank you for your continued support of Evergreen Investments.
Sincerely,

Dennis H. Ferro
President and Chief Executive Officer
Evergreen Investment Company, Inc.
Notification of Investment Strategy Change:
Effective August 1, 2005, the Fund's prospectus will be amended to make the following change to the Fund's principal investment strategy:
The Fund may invest a portion of its assets in derivative instruments, such as Treasury futures, Eurodollar futures and interest rate swap agreements in order to manage its exposure to interest rate risk. Derivatives are financial contracts whose value depends on, or is derived from, the value of one or more underlying assets, reference rates or indexes. The various derivative instruments that the Fund may use are described in more detail under "Additional Information on Securities and Investment Practices" in the Statement of Additional Information. The Fund typically uses derivatives as a substitute for taking a position in the underlying asset and/or as part of a strategy designed to reduce exposure to other risks, such as interest rate or currency risk. The Fund's use of derivative instruments involves risks different from, or possibly greater than, the risks associated with investing directly in securities and other traditional investments. Derivatives are subject to a number of risks such as liquidity risk, interest rate risk, market risk, credit risk and management risk.
The Fund's prospectus will be supplemented to include this change.
Special Notice to Shareholders:
Please visit our Web site at EvergreenInvestments.com for statements from President and Chief Executive Officer, Dennis Ferro, and Chairman of the Board of the Evergreen Funds, Michael S. Scofield, addressing recent SEC actions involving the Evergreen Funds.
3
FUND AT A GLANCE
as of April 30, 2005
MANAGEMENT TEAM

Dana Erikson, CFA
High Yield Bond Team
Lead Manager
CURRENT INVESTMENT STYLE

Source: Morningstar, Inc.
Morningstar's style box is based on a portfolio date as of 3/31/2005.
The fixed income style box placement is based on a fund's average effective maturity or duration and the average credit rating of the bond portfolio.
PERFORMANCE AND RETURNS
Portfolio inception date: 9/11/1935
| | | | | | | | |
| | | Class A | | Class B | | Class C | | Class I |
| Class inception date | | 1/20/1998 | | 9/11/1935 | | 1/21/1998 | | 4/14/1998 |
|
| Nasdaq symbol | | EKHAX | | EKHBX | | EKHCX | | EKHYX |
|
| Average annual return* | | | | | | | | |
|
| 1-year with sales charge | | -0.78% | | -1.42% | | 2.45% | | N/A |
|
| 1-year w/o sales charge | | 4.14% | | 3.42% | | 3.42% | | 4.45% |
|
| 5-year | | 5.21% | | 5.20% | | 5.49% | | 6.55% |
|
| 10-year | | 5.58% | | 5.54% | | 5.54% | | 6.28% |
|
| Maximum sales charge | | 4.75% | | 5.00% | | 1.00% | | N/A |
| | | Front-end | | CDSC | | CDSC | | |
|
* Adjusted for maximum applicable sales charge, unless noted.
Past performance is no guarantee of future results. The performance quoted represents past performance and current performance may be lower or higher. The investment return and principal value of an investment will fluctuate so that investors' shares, when redeemed, may be worth more or less than their original cost. To obtain performance information current to the most recent month-end for Classes A, B, C or I, please go to EvergreenInvestments.com/fundperformance. The performance of each class may vary based on differences in loads, fees and expenses paid by the shareholders investing in each class. Performance includes the reinvestment of income dividends and capital gain distributions. Performance shown does not reflect the deduction of taxes that a shareholder would pay on fund distributions or the redemption of fund shares. Historical performance shown for Classes A, C and I prior to their inception is based on the performance of Class B, the original class offered. The historical returns for Classes A and I have not been adjusted to reflect the effect of each class' 12b-1 fee. These fees are 0.30% for Class A and 1.00% for Classes B and C. Class I does not pay a 12b-1 fee. If these fees had been reflected, returns for Classes A and I would have been higher.
Returns reflect expense limits previously in effect, without which returns would have been lower.
LONG-TERM GROWTH
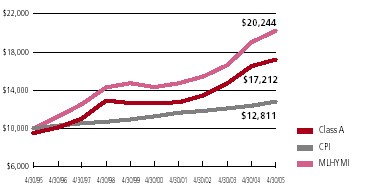
Comparison of a $10,000 investment in the Evergreen High Yield Bond Fund Class A shares, versus a similar investment in the Merrill Lynch High Yield Master Index† (MLHYMI) and the Consumer Price Index (CPI).
The MLHYMI is an unmanaged market index and does not include transaction costs associated with buying and selling securities, any mutual fund expenses or any taxes. The CPI is a commonly used measure of inflation and does not represent an investment return. It is not possible to invest directly in an index.
4
PORTFOLIO MANAGER COMMENTARY
The fund's Class A shares returned 4.14% for the twelve-month period ended April 30, 2005, excluding any applicable sales charges. During the same period, the Merrill Lynch High Yield Master Index (MLHYMI) returned 6.45%.
The fund seeks high income.
The fiscal year began in a relatively positive environment for investing in corporate high yield bonds. The economy was growing, corporate profits were rising and credit quality, as indicated by a relatively low level of defaults, seemed to be good. Investors were reassured when the Federal Reserve Board indicated that, while it would begin to raise short-term interest rates, it would do so in a gradual, measured manner. While high yield bonds posted positive results, their performance early in the period was restrained by some political uncertainties and continued questions about the sustainability of the economic recovery. These uncertainties declined in the final weeks of 2004, however, in the wake of the presidential election and the issuance of favorable economic and corporate earnings reports. During the final two months of 2004, high yield bonds staged a strong rally, led by bonds in the lowest credit tier, those rated CCC. This rally stalled during the first four months of 2005, however, amid new doubts about the strength of the economy.
Throughout the year, we tried to take advantage of the growing economy by overweighting bonds issued by more cyclical companies, especially those in basic industries, such as chemicals and steel. This strategy helped performance as cyclical bonds outperformed the overall high yield market.
Our focus on the higher quality tiers of the high yield universe detracted from performance, however. Normally, we do not invest more than 15% of the fund's assets in CCC-rated bonds. Moreover, we lowered our allocation to these more speculative bonds later in the period. This quality emphasis detracted from results during a period in which lower quality bonds had the best relative performance.
Class I shares are only offered in the following manner: (1) to investment advisory clients of Evergreen Investment Management Company, LLC (or its advisory affiliates) when purchased by such advisor(s) on behalf of its clients, (2) through arrangements entered into on behalf of the Evergreen funds with certain financial services firms, (3) to certain institutional investors and (4) to persons who owned Class Y shares in registered name in an Evergreen fund on or before December 31, 1994 or who owned shares of any SouthTrust fund in registered name as of March 18, 2005 or shares of Vestaur Securities Fund as of May 20, 2005. Class I shares are only available to institutional shareholders with a minimum of $1 million investment, which may be waived in certain situations.
The fund's investment objective is nonfundamental and may be changed without the vote of the fund's shareholders.
Funds that invest in high yield, lower-rated bonds may contain more risk due to the increased possibility of default.
Foreign investments may contain more risk due to the inherent risks associated with changing political climates, foreign market instability and foreign currency fluctuations.
The return of principal is not guaranteed due to fluctuation in the NAV of the fund caused by changes in the price of the individual bonds held by the fund and the buying and selling of bonds by the fund. Bond funds have the same inflation, interest rate and credit risks that are associated with the individual bonds held by the fund. Generally, the value of bonds rise when prevailing interest rates fall and fall when interest rates rise.
† Copyright 2005. Merrill Lynch, Pierce, Fenner & Smith Incorporated. All rights reserved.
All data is as of April 30, 2005, and subject to change.
5
ABOUT YOUR FUND'S EXPENSES
The Example below is intended to describe the fees and expenses borne by shareholders and the impact of those costs on your investment.
Example
As a shareholder of the fund, you incur two types of costs: (1) transaction costs, including sales charges (loads), redemption fees and exchange fees; and (2) ongoing costs, including management fees, distribution (12b-1) fees and other fund expenses. This Example is intended to help you understand your ongoing costs (in dollars) of investing in the fund and to compare these costs with the ongoing costs of investing in other mutual funds. The Example is based on an investment of $1,000 invested at the beginning of the period and held for the entire period from November 1, 2004 to April 30, 2005.
The example illustrates your fund's costs in two ways:
• Actual expenses
The section in the table under the heading "Actual" provides information about actual account values and actual expenses. You may use the information in these columns, together with the amount you invested, to estimate the expenses that you paid over the period. Simply divide your account value by $1,000 (for example, an $8,600 account value divided by $1,000 = 8.6), then multiply the result by the number in the appropriate column for your share class, in the column entitled "Expenses Paid During Period" to estimate the expenses you paid on your account during this period.
• Hypothetical example for comparison purposes
The section in the table under the heading "Hypothetical (5% return before expenses)" provides information about hypothetical account values and hypothetical expenses based on the fund's actual expense ratio and an assumed rate of return of 5% per year before expenses, which is not the fund's actual return. The hypothetical account values and expenses may not be used to estimate the actual ending account balance or expenses you paid for the period. You may use this information to compare the ongoing costs of investing in the fund and other funds. To do so, compare this 5% hypothetical example with the 5% hypothetical examples that appear in the shareholder reports of the other funds.
Please note that the expenses shown in the table are meant to highlight your ongoing costs only and do not reflect any transactional costs, such as sales charges (loads), redemption fees or exchange fees. Therefore, the section in the table under the heading "Hypothetical (5% return before expenses)" is useful in comparing ongoing costs only, and will not help you determine the relative total costs of owning different funds. In addition, if these transactional costs were included, your costs would have been higher.
| | | | | | |
| | | Beginning | | Ending | | |
| | | Account | | Account | | Expenses |
| | | Value | | Value | | Paid During |
| | | 11/1/2004 | | 4/30/2005 | | Period* |
|
| Actual | | | | | | |
| Class A | | $ 1,000.00 | | $ 991.45 | | $ 5.23 |
| Class B | | $ 1,000.00 | | $ 988.01 | | $ 8.68 |
| Class C | | $ 1,000.00 | | $ 988.01 | | $ 8.68 |
| Class I | | $ 1,000.00 | | $ 992.93 | | $ 3.76 |
| Hypothetical | | | | | | |
| (5% return | | | | | | |
| before expenses) | | | | | | |
| Class A | | $ 1,000.00 | | $ 1,019.54 | | $ 5.31 |
| Class B | | $ 1,000.00 | | $ 1,016.07 | | $ 8.80 |
| Class C | | $ 1,000.00 | | $ 1,016.07 | | $ 8.80 |
| Class I | | $ 1,000.00 | | $ 1,021.03 | | $ 3.81 |
|
| * | For each class of the Fund, expenses are equal to the annualized expense ratio of each class (1.06% for Class A, 1.76%
for Class B, 1.76% for Class C and 0.76% for Class I), multiplied by the average account value over the period,
multiplied by 181 / 365 days. |
| |
6
FINANCIAL HIGHLIGHTS
(For a share outstanding throughout each period)
| | | | | | | | | | |
| | | Year Ended April 30, |
| |
|
| CLASS A | | 2005 | | 2004 | | 2003 | | 2002 1 | | 2001 |
|
| Net asset value, beginning of period | | $ 3.43 | | $ 3.30 | | $ 3.29 | | $ 3.39 | | $ 3.72 |
|
| Income from investment operations | | | | | | | | | | |
| Net investment income (loss) | | 0.24 | | 0.25 | | 0.27 2 | | 0.27 | | 0.33 |
| Net realized and unrealized gains or losses on securities and | | | | | | | | | | |
| foreign currency related transactions | | (0.10) | | 0.14 | | 0.01 | | (0.09) | | (0.33) |
| |
| |
| |
| |
| |
|
| Total from investment operations | | 0.14 | | 0.39 | | 0.28 | | 0.18 | | 0 |
|
| Distributions to shareholders from | | | | | | | | | | |
| Net investment income | | (0.25) | | (0.26) | | (0.27) | | (0.28) | | (0.33) |
|
| Net asset value, end of period | | $ 3.32 | | $ 3.43 | | $ 3.30 | | $ 3.29 | | $ 3.39 |
|
| Total return 3 | | 4.14% | | 12.25 % | | 9.42% | | 5.77% | | 0.15% |
|
| Ratios and supplemental data | | | | | | | | | | |
| Net assets, end of period (thousands) | | $467,714 | | $530,526 | | $484,346 | | $321,830 | | $322,330 |
| Ratios to average net assets | | | | | | | | | | |
Expenses including waivers/reimbursements and
excluding expense reductions | | 1.04% | | 1.01% | | 1.11% | | 1.19% | | 1.25% |
Expenses excluding waivers/reimbursements and
expense reductions | | 1.04% | | 1.02% | | 1.11% | | 1.21% | | 1.25% |
| Net investment income (loss) | | 7.16% | | 7.42% | | 8.70% | | 8.27% | | 9.39% |
| Portfolio turnover rate | | 65% | | 71% | | 80% | | 138% | | 140% |
|
|
| 1As required, effective May 1, 2001, the Fund has adopted the provisions of the AICPA Audit and Accounting Guide, Audits of Investment Companies, |
| and began amortizing premium on its fixed-income securities. The effects of this change for the year ended April 30, 2002 was a decrease in net investment |
| income per share of $0.00; an increase in net realized gains or losses per share of $0.00; and a decrease to the ratio of net investment income to average |
| net assets of 0.13%. The above per share information, ratios and supplemental data for the periods prior to May 1, 2001 have not been restated to reflect |
| this change in presentation. |
| 2Net investment income (loss) per share is based on average shares outstanding during the period. |
| 3Excluding applicable sales charges |
See Notes to Financial Statements
7
FINANCIAL HIGHLIGHTS
(For a share outstanding throughout each period)
| | | | | | | | | | |
| | | Year Ended April 30, |
| |
|
| CLASS B | | 2005 | | 2004 | | 2003 | | 2002 1 | | 2001 |
|
| Net asset value, beginning of period | | $ 3.43 | | $ 3.30 | | $ 3.29 | | $ 3.39 | | $ 3.72 |
|
| Income from investment operations | | | | | | | | | | |
| Net investment income (loss) | | 0.22 | | 0.23 2 | | 0.25 2 | | 0.24 2 | | 0.34 |
| Net realized and unrealized gains or losses on securities and | | | | | | | | | | |
| foreign currency related transactions | | (0.10) | | 0.14 | | 0.01 | | (0.08) | | (0.37) |
| |
| |
| |
| |
| |
|
| Total from investment operations | | 0.12 | | 0.37 | | 0.26 | | 0.16 | | (0.03) |
|
| Distributions to shareholders from | | | | | | | | | | |
| Net investment income | | (0.23) | | (0.24) | | (0.25) | | (0.26) | | (0.30) |
|
| Net asset value, end of period | | $ 3.32 | | $ 3.43 | | $ 3.30 | | $ 3.29 | | $ 3.39 |
|
| Total return 3 | | 3.42% | | 11.46% | | 8.61% | | 4.98% | | (0.60%) |
|
| Ratios and supplemental data | | | | | | | | | | |
| Net assets, end of period (thousands) | | $211,950 | | $247,741 | | $173,002 | | $54,537 | | $33,844 |
| Ratios to average net assets | | | | | | | | | | |
Expenses including waivers/reimbursements and
excluding expense reductions | | 1.74% | | 1.72% | | 1.84% | | 1.92% | | 2.00% |
Expenses excluding waivers/reimbursements and
expense reductions | | 1.74% | | 1.72% | | 1.84% | | 1.95% | | 2.00% |
| Net investment income (loss) | | 6.46% | | 6.71% | | 7.99% | | 7.49% | | 8.61% |
| Portfolio turnover rate | | 65% | | 71% | | 80% | | 138% | | 140% |
|
|
| 1As required, effective May 1, 2001, the Fund has adopted the provisions of the AICPA Audit and Accounting Guide, Audits of Investment Companies, |
| and began amortizing premium on its fixed-income securities. The effects of this change for the year ended April 30, 2002 was a decrease in net investment |
| income per share of $0.01; an increase in net realized gains or losses per share of $0.01; and a decrease to the ratio of net investment income to average |
| net assets of 0.13%. The above per share information, ratios and supplemental data for the periods prior to May 1, 2001 have not been restated to reflect |
| this change in presentation. |
| 2Net investment income (loss) per share is based on average shares outstanding during the period. |
| 3Excluding applicable sales charges. |
See Notes to Financial Statements
8
FINANCIAL HIGHLIGHTS
(For a share outstanding throughout each period)
| | | | | | | | | | |
| | | Year Ended April 30, |
| |
|
| CLASS C | | 2005 | | 2004 | | 2003 | | 2002 1 | | 2001 |
|
| Net asset value, beginning of period | | $ 3.43 | | $ 3.30 | | $ 3.29 | | $ 3.39 | | $ 3.72 |
|
| Income from investment operations | | | | | | | | | | |
| Net investment income (loss) | | 0.22 | | 0.23 | | 0.25 2 | | 0.26 | | 0.29 |
| Net realized and unrealized gains or losses on securities and | | | | | | | | | | |
| foreign currency related transactions | | (0.10) | | 0.14 | | 0.01 | | (0.10) | | (0.32) |
| |
| |
| |
| |
| |
|
| Total from investment operations | | 0.12 | | 0.37 | | 0.26 | | 0.16 | | (0.03) |
|
| Distributions to shareholders from | | | | | | | | | | |
| Net investment income | | (0.23) | | (0.24) | | (0.25) | | (0.26) | | (0.30) |
|
| Net asset value, end of period | | $ 3.32 | | $ 3.43 | | $ 3.30 | | $ 3.29 | | $ 3.39 |
|
| Total return 3 | | 3.42% | | 11.46% | | 8.61% | | 4.98% | | (0.60%) |
|
| Ratios and supplemental data | | | | | | | | | | |
| Net assets, end of period (thousands) | | $281,810 | | $381,525 | | $290,914 | | $105,753 | | $80,753 |
| Ratios to average net assets | | | | | | | | | | |
Expenses including waivers/reimbursements and
excluding expense reductions | | 1.74% | | 1.72% | | 1.85% | | 1.93% | | 2.00% |
Expenses excluding waivers/reimbursements and
expense reductions | | 1.74% | | 1.72% | | 1.85% | | 1.95% | | 2.00% |
| Net investment income (loss) | | 6.47% | | 6.72% | | 7.98% | | 7.52% | | 8.61% |
| Portfolio turnover rate | | 65% | | 71% | | 80% | | 138% | | 140% |
|
|
| 1As required, effective May 1, 2001, the Fund has adopted the provisions of the AICPA Audit and Accounting Guide, Audits of Investment Companies, |
| and began amortizing premium on its fixed-income securities. The effects of this change for the year ended April 30, 2002 was a decrease in net investment |
| income per share of $0.00; and increase in net realized gains or losses per share of $0.00; and a decrease to the ratio of net investment income to average |
| net assets of 0.13%. The above per share information, ratios and supplemental data for the periods prior to May 1, 2001 have not been restated to reflect |
| this change in presentation. |
| 2Net investment income (loss) per share is based on average shares outstanding during the period. |
| 3Excluding applicable sales charges. |
See Notes to Financial Statements
9
FINANCIAL HIGHLIGHTS
(For a share outstanding throughout each period)
| | | | | | | | | | |
| | | Year Ended April 30, |
| |
|
| CLASS I 1 | | 2005 | | 2004 | | 2003 | | 2002 2 | | 2001 |
|
| Net asset value, beginning of period | | $ 3.43 | | $ 3.30 | | $ 3.29 | | $ 3.39 | | $ 3.72 |
|
| Income from investment operations | | | | | | | | | | |
| Net investment income (loss) | | 0.26 | | 0.26 | | 0.28 3 | | 0.29 | | 0.34 |
| Net realized and unrealized gains or losses on securities and | | | | | | | | | | |
| foreign currency related transactions | | (0.11) | | 0.14 | | 0.01 | | (0.10) | | (0.33) |
| |
| |
| |
| |
| |
|
| Total from investment operations | | 0.15 | | 0.40 | | 0.29 | | 0.19 | | 0.01 |
|
| Distributions to shareholders from | | | | | | | | | | |
| Net investment income | | (0.26) | | (0.27) | | (0.28) | | (0.29) | | (0.34) |
|
| Net asset value, end of period | | $ 3.32 | | $ 3.43 | | $ 3.30 | | $ 3.29 | | $ 3.39 |
|
| Total return | | 4.45% | | 12.58% | | 9.69% | | 6.04% | | 0.40% |
|
| Ratios and supplemental data | | | | | | | | | | |
| Net assets, end of period (thousands) | | $60,412 | | $37,894 | | $49,370 | | $10,011 | | $6,047 |
| Ratios to average net assets | | | | | | | | | | |
Expenses including waivers/reimbursements and
excluding expense reductions | | 0.74% | | 0.72% | | 0.84% | | 0.92 % | | 1.00% |
Expenses excluding waivers/reimbursements and
expense reductions | | 0.74% | | 0.72% | | 0.84% | | 0.94% | | 1.00% |
| Net investment income (loss) | | 7.46% | | 7.73% | | 9.05% | | 8.53% | | 9.63% |
| Portfolio turnover rate | | 65% | | 71% | | 80% | | 138% | | 140% |
|
|
| 1Effective at the close of business on May 11, 2001, Class Y shares were renamed as Institutional shares (Class I). |
| 2As required, effective May 1, 2001, the Fund has adopted the provisions of the AICPA Audit and Accounting Guide, Audits of Investment Companies, |
| and began amortizing premium on its fixed-income securities. The effects of this change for the year ended April 30, 2002 was a decrease in net investment |
| income per share of $0.00; an increase in net realized gains or losses per share of $0.00; and a decrease to the ratio of net investment income to average |
| net assets of 0.13%. The above per share information, ratios and supplemental data for the periods prior to May 1, 2001 have not been restated to reflect |
| this change in presentation. |
| 3Net investment income (loss) per share is based on average shares outstanding during the period. |
See Notes to Financial Statements
10
SCHEDULE OF INVESTMENTS
April 30, 2005
| | | | | | |
| | | Principal | | | | |
| | | Amount | | | | Value |
|
| AGENCY MORTGAGE-BACKED COLLATERALIZED MORTGAGE | | | | | | |
| OBLIGATIONS 0.0% | | | | | | |
| FIXED-RATE 0.0% | | | | | | |
| FNMA, 8.00%, 06/01/2030 (cost $93,561) | | $ 94,776 | | $ | | 103,508 |
| | | | | |
|
| CORPORATE BONDS 84.0% | | | | | | |
| CONSUMER DISCRETIONARY 24.9% | | | | | | |
| Auto Components 1.5% | | | | | | |
| Exide Technologies, 10.50%, 03/15/2013 (p) 144A | | 4,500,000 | | | | 3,836,250 |
| RJ Tower Corp., 12.00%, 06/01/2013 (p) • | | 2,320,000 | | | | 1,241,200 |
| Tenneco Automotive, Inc., 8.625%, 11/15/2014 (p) 144A | | 10,650,000 | | | | 9,771,375 |
| | | | | |
|
| | | | | | | 14,848,825 |
| | | | | |
|
| Hotels, Restaurants & Leisure 8.3% | | | | | | |
| Ameristar Casinos, Inc., 10.75%, 02/15/2009 | | 5,500,000 | | | | 6,008,750 |
| Gaylord Entertainment Co., 6.75%, 11/15/2014 144A | | 1,750,000 | | | | 1,627,500 |
| Herbst Gaming, Inc., 7.00%, 11/15/2014 144A | | 5,450,000 | | | | 5,368,250 |
| Inn of The Mountain Gods Resort & Casino, 12.00%, 11/15/2010 | | 13,000,000 | | | | 15,307,500 |
| Isle of Capri Casinos, Inc., 7.00%, 03/01/2014 (p) | | 5,500,000 | | | | 5,362,500 |
| John Q. Hammons Hotels LP, Ser. B, 8.875%, 05/15/2012 | | 6,995,000 | | | | 7,484,650 |
| La Quinta Corp., 8.875%, 03/15/2011 | | 2,990,000 | | | | 3,232,937 |
| Las Vegas Sands Corp., 6.375%, 02/15/2015 (p) 144A | | 4,320,000 | | | | 4,071,600 |
| Mandalay Resort Group, Ser. B, 10.25%, 08/01/2007 | | 6,000,000 | | | | 6,615,000 |
| MGM MIRAGE, Inc., 5.875%, 02/27/2014 | | 3,350,000 | | | | 3,153,188 |
| MTR Gaming Group, Inc., 9.75%, 04/01/2010 (h) | | 9,430,000 | | | | 10,325,850 |
| Station Casinos, Inc.: | | | | | | |
| 6.50%, 02/01/2014 | | 2,675,000 | | | | 2,681,688 |
| 6.875%, 03/01/2016 (p) | | 2,675,000 | | | | 2,715,125 |
| Universal City Florida Holdings Co., 8.375%, 05/01/2010 (p) 144A | | 2,500,000 | | | | 2,550,000 |
| Wynn Resorts, Ltd., 6.625%, 12/01/2014 144A | | 8,380,000 | | | | 7,877,200 |
| | | | | |
|
| | | | | | | 84,381,738 |
| | | | | |
|
| Household Durables 2.1% | | | | | | |
| Hovnanian Enterprises, Inc.: | | | | | | |
| 6.00%, 01/15/2010 | | 4,200,000 | | | | 4,116,000 |
| 6.375%, 12/15/2014 | | 3,000,000 | | | | 2,940,000 |
| Jarden Corp., 9.75%, 05/01/2012 | | 9,020,000 | | | | 9,651,400 |
| Meritage Homes Corp., 6.25%, 03/15/2015 144A | | 3,000,000 | | | | 2,775,000 |
| Technical Olympic USA, Inc.: | | | | | | |
| 7.50%, 03/15/2011 (p) | | 1,000,000 | | | | 935,000 |
| 10.375%, 07/01/2012 | | 1,200,000 | | | | 1,266,000 |
| | | | | |
|
| | | | | | | 21,683,400 |
| | | | | |
|
| Leisure Equipment & Products 0.4% | | | | | | |
| Riddell Bell Holdings, Inc., 8.375%, 10/01/2012 144A | | 4,510,000 | | | | 4,566,375 |
| | | | | |
|
| Media 9.1% | | | | | | |
| Cablevision Systems Corp., 8.00%, 04/15/2012 (p) 144A | | 8,615,000 | | | | 8,539,619 |
| CCO Holdings LLC, 8.75%, 11/15/2013 (p) | | 6,000,000 | | | | 5,805,000 |
| Charter Communications Holdings LLC, 8.625%, 04/01/2009 (p) | | 10,250,000 | | | | 7,456,875 |
See Notes to Financial Statements
11
SCHEDULE OF INVESTMENTS continued
April 30, 2005
| | | | | | |
| | Principal | | | | |
| | Amount | | | | Value |
|
| CORPORATE BONDS continued | | | | | | |
| CONSUMER DISCRETIONARY continued | | | | | | |
| Media continued | | | | | | |
| Cinemark USA, Inc.: | | | | | | |
| 9.00%, 02/01/2013 | | $ 5,000,000 | | $ | | 5,312,500 |
| Sr. Disc. Note, Step Bond, 0.00%, 03/15/2014 † | | 5,860,000 | | | | 4,058,050 |
| CSC Holdings, Inc., 7.625%, 04/01/2011 | | 6,530,000 | | | | 6,660,600 |
| Dex Media East LLC, 9.875%, 11/15/2009 | | 10,000,000 | | | | 11,000,000 |
| Emmis Communications Corp., 6.875%, 05/15/2012 | | 5,835,000 | | | | 5,791,237 |
| Marquee Holdings, Inc., Sr. Disc. Note, Step Bond, 0.00% 08/15/2014 144A † | | 9,500,000 | | | | 5,985,000 |
| Mediacom LLC, 9.50%, 01/15/2013 (p) | | 11,250,000 | | | | 10,828,125 |
| PRIMEDIA, Inc., 8.875%, 05/15/2011 | | 3,785,000 | | | | 3,936,400 |
| Sinclair Broadcast Group, Inc., 8.00%, 03/15/2012 (p) | | 5,250,000 | | | | 5,236,875 |
| Visant Corp., 7.625%, 10/01/2012 (p) | | 5,525,000 | | | | 5,552,625 |
| WMG Holdings Corp., 7.39%, 12/15/2011 144A | | 6,750,000 | | | | 6,986,250 |
| | | | | |
|
| | | | | | | 93,149,156 |
| | | | | |
|
| Specialty Retail 2.4% | | | | | | |
| CSK Auto, Inc., 7.00%, 01/15/2014 | | 8,500,000 | | | | 7,735,000 |
| FTD, Inc., 7.75%, 02/15/2014 | | 3,334,000 | | | | 3,334,000 |
| PETCO Animal Supplies, Inc., 10.75%, 11/01/2011 | | 5,730,000 | | | | 6,388,950 |
| United Auto Group, Inc., 9.625%, 03/15/2012 | | 7,000,000 | | | | 7,315,000 |
| | | | | |
|
| | | | | | | 24,772,950 |
| | | | | |
|
| Textiles, Apparel & Luxury Goods 1.1% | | | | | | |
| Norcross Safety Products LLC: | | | | | | |
| 11.75%, 01/01/2012 144A | | 1,500,000 | | | | 1,530,000 |
| Ser. B, 9.875%, 08/15/2011 | | 2,000,000 | | | | 2,120,000 |
| Oxford Industries, Inc., 8.875%, 06/01/2011 | | 4,000,000 | | | | 4,160,000 |
| The Warnaco Group, Inc., 8.875%, 06/15/2013 | | 3,000,000 | | | | 3,255,000 |
| | | | | |
|
| | | | | | | 11,065,000 |
| | | | | |
|
| CONSUMER STAPLES 3.6% | | | | | | |
| Food & Staples Retailing 0.2% | | | | | | |
| Rite Aid Corp., 9.50%, 02/15/2011 | | 1,920,000 | | | | 1,958,400 |
| | | | | |
|
| Food Products 1.1% | | | | | | |
| B&G Foods Holdings Corp., 8.00%, 10/01/2011 (p) | | 430,000 | | | | 446,125 |
| Chiquita Brands International, Inc., 7.50%, 11/01/2014 (p) | | 1,820,000 | | | | 1,674,400 |
| Del Monte Foods Co.: | | | | | | |
| 6.75%, 02/15/2015 144A | | 1,190,000 | | | | 1,148,350 |
| 8.625%, 12/15/2012 | | 4,547,000 | | | | 4,888,025 |
| Michael Foods, Inc., 8.00%, 11/15/2013 | | 2,500,000 | | | | 2,575,000 |
| | | | | |
|
| | | | | | | 10,731,900 |
| | | | | |
|
| Household Products 0.6% | | | | | | |
| Spectrum Brands, Inc., 7.375%, 02/01/2015 144A | | 5,945,000 | | | | 5,796,375 |
| | | | | |
|
| Personal Products 0.8% | | | | | | |
| Playtex Products, Inc., 8.00%, 03/01/2011 | | 8,000,000 | | | | 8,580,000 |
| | | | | |
|
See Notes to Financial Statements
12
SCHEDULE OF INVESTMENTS continued
April 30, 2005
| | | | | | |
| | Principal | | | | |
| | Amount | | | | Value |
|
| |
| CORPORATE BONDS continued | | | | | | |
| CONSUMER STAPLES continued | | | | | | |
| Tobacco 0.9% | | | | | | |
| Commonwealth Brands, Inc., 10.625%, 09/01/2008 144A | | $ 9,125,000 | | $ | | 9,581,250 |
| | | | | |
|
| ENERGY 10.1% | | | | | | |
| Energy Equipment & Services 3.2% | | | | | | |
| Dresser, Inc., 9.375%, 04/15/2011 | | 5,000,000 | | | | 5,250,000 |
| Grant Prideco, Inc., 9.625%, 12/01/2007 | | 7,500,000 | | | | 8,231,250 |
| Gulfmark Offshore, Inc., 7.75%, 07/15/2014 144A | | 3,025,000 | | | | 3,070,375 |
| Hornbeck Offshore Services, Ser. B, 6.125%, 12/01/2014 | | 1,700,000 | | | | 1,685,125 |
| Parker Drilling Co.: | | | | | | |
| 9.625%, 10/01/2013 (p) | | 2,830,000 | | | | 3,127,150 |
| 9.625%, 10/01/2013 144A | | 6,000,000 | | | | 6,630,000 |
| SESI LLC, 8.875%, 05/15/2011 (p) | | 4,150,000 | | | | 4,461,250 |
| | | | | |
|
| | | | | | | 32,455,150 |
| | | | | |
|
| Oil, Gas & Consumable Fuels 6.9% | | | | | | |
| Chesapeake Energy Corp.: | | | | | | |
| 6.375%, 06/15/2015 144A | | 3,750,000 | | | | 3,693,750 |
| 6.875%, 01/15/2016 | | 9,145,000 | | | | 9,145,000 |
| El Paso Corp.: | | | | | | |
| 7.75%, 01/15/2032 (p) | | 5,500,000 | | | | 5,087,500 |
| 7.875%, 06/15/2012 (p) | | 5,200,000 | | | | 5,109,000 |
| El Paso Production Holding Co., 7.75%, 06/01/2013 (p) | | 7,755,000 | | | | 7,851,937 |
| Encore Acquisition Co., 6.25%, 04/15/2014 (p) | | 3,445,000 | | | | 3,341,650 |
| Exco Resources, Inc., 7.25%, 01/15/2011 | | 3,505,000 | | | | 3,469,950 |
| Overseas Shipholding Group, Inc., 8.25%, 03/15/2013 | | 8,400,000 | | | | 8,946,000 |
| Petroleum Helicopters, Inc., 9.375%, 05/01/2009 (p) | | 1,500,000 | | | | 1,575,000 |
| Plains Exploration & Production Co., 8.75%, 07/01/2012 | | 2,730,000 | | | | 2,962,050 |
| Premcor Refining Group, Inc., 9.50%, 02/01/2013 | | 5,250,000 | | | | 5,985,000 |
| The Williams Companies, Inc.: | | | | | | |
| 7.50%, 01/15/2031 | | 5,000,000 | | | | 5,187,500 |
| 8.125%, 03/15/2012 (p) | | 7,250,000 | | | | 7,975,000 |
| | | | | |
|
| | | | | | | 70,329,337 |
| | | | | |
|
| FINANCIALS 5.0% | | | | | | |
| Consumer Finance 1.5% | | | | | | |
| GMAC, 6.125%, 09/15/2006 | | 10,500,000 | | | | 10,440,759 |
| Triad Financial Corp., 11.125%, 05/01/2013 144A | | 4,675,000 | | | | 4,657,469 |
| | | | | |
|
| | | | | | | 15,098,228 |
| | | | | |
|
| Diversified Financial Services 0.7% | | | | | | |
| Arch Western Finance LLC, 6.75%, 07/01/2013 | | 5,500,000 | | | | 5,541,250 |
| Borden US Finance Corp., 9.00%, 07/15/2014 144A | | 1,600,000 | | | | 1,608,000 |
| | | | | |
|
| | | | | | | 7,149,250 |
| | | | | |
|
| Insurance 0.4% | | | | | | |
| Crum & Forster Holdings Corp., 10.375%, 06/15/2013 | | 4,100,000 | | | | 4,469,000 |
| | | | | |
|
See Notes to Financial Statements
13
SCHEDULE OF INVESTMENTS continued
April 30, 2005
| | | | | | |
| | Principal | | | | |
| | Amount | | | | Value |
|
| |
| CORPORATE BONDS continued | | | | | | |
| FINANCIALS continued | | | | | | |
| Real Estate 2.4% | | | | | | |
| Crescent Real Estate Equities Co., REIT, 9.25%, 04/15/2009 | | $ 5,600,000 | | $ | | 5,908,946 |
| HMH Properties, Inc., Ser. B, 7.875%, 08/01/2008 (p) | | 907,000 | | | | 929,675 |
| Host Marriott Corp., Ser. J, REIT, 7.125%, 11/01/2013 (p) | | 7,000,000 | | | | 7,122,500 |
| Omega Healthcare Investors, Inc., REIT: | | | | | | |
| 6.95%, 08/01/2007 | | 3,300,000 | | | | 3,370,125 |
| 7.00%, 04/01/2014 | | 1,200,000 | | | | 1,164,000 |
| Thornburg Mortgage, Inc., REIT, 8.00%, 05/15/2013 | | 6,325,000 | | | | 6,388,250 |
| | | | | |
|
| | | | | | | 24,883,496 |
| | | | | |
|
| HEALTH CARE 4.9% | | | | | | |
| Health Care Equipment & Supplies 0.7% | | | | | | |
| Rotech Healthcare, Inc., 9.50%, 04/01/2012 | | 2,000,000 | | | | 2,160,000 |
| Universal Hospital Services, Inc., 10.125%, 11/01/2011 | | 5,370,000 | | | | 5,463,975 |
| | | | | |
|
| | | | | | | 7,623,975 |
| | | | | |
|
| Health Care Providers & Services 4.2% | | | | | | |
| Carriage Services, Inc., 7.875%, 01/15/2015 144A | | 2,650,000 | | | | 2,676,500 |
| Extendicare, Inc., 9.50%, 07/01/2010 | | 5,000,000 | | | | 5,456,250 |
| HCA, Inc., 6.375%, 01/15/2015 (p) | | 5,525,000 | | | | 5,572,559 |
| IASIS Healthcare Corp., 8.75%, 06/15/2014 | | 3,845,000 | | | | 3,969,962 |
| Select Medical Corp., 7.625%, 02/01/2015 144A | | 6,000,000 | | | | 5,925,000 |
| Service Corporation International, 6.75%, 04/01/2016 | | 3,625,000 | | | | 3,470,938 |
| Team Health, Inc., 9.00%, 04/01/2012 (p) | | 6,800,000 | | | | 6,800,000 |
| Tenet Healthcare Corp., 9.875%, 07/01/2014 | | 8,375,000 | | | | 8,647,188 |
| | | | | |
|
| | | | | | | 42,518,397 |
| | | | | |
|
| INDUSTRIALS 9.3% | | | | | | |
| Aerospace & Defense 0.5% | | | | | | |
| Argo-Tech Corp., 9.25%, 06/01/2011 | | 1,220,000 | | | | 1,311,500 |
| Moog, Inc., 6.25%, 01/15/2015 | | 3,476,000 | | | | 3,458,620 |
| | | | | |
|
| | | | | | | 4,770,120 |
| | | | | |
|
| Commercial Services & Supplies 4.6% | | | | | | |
| Allied Waste North America, Inc.: | | | | | | |
| 5.75%, 02/15/2011 (p) | | 3,000,000 | | | | 2,647,500 |
| 6.375%, 04/15/2011 (p) | | 3,000,000 | | | | 2,745,000 |
| American Color Graphics, Inc., 10.00%, 06/15/2010 | | 7,500,000 | | | | 4,837,500 |
| Clean Harbors, Inc., 11.25%, 07/15/2012 144A | | 3,700,000 | | | | 4,125,500 |
| Corrections Corporation of America: | | | | | | |
| 6.25%, 03/15/2013 144A | | 2,500,000 | | | | 2,425,000 |
| 7.50%, 05/01/2011 | | 3,000,000 | | | | 3,108,750 |
| Geo Group, Inc., 8.25%, 07/15/2013 | | 3,350,000 | | | | 3,375,125 |
| JohnsonDiversey Holdings, Inc., Sr. Disc. Note, Step Bond, 0.00% 05/15/2013 † | | 5,000,000 | | | | 3,975,000 |
| NationsRent West, Inc., 9.50%, 10/15/2010 | | 1,175,000 | | | | 1,274,875 |
| TriMas Corp., 9.875%, 06/15/2012 | | 8,250,000 | | | | 8,167,500 |
| United Rentals North America, Inc., 7.75%, 11/15/2013 (p) | | 11,250,000 | | | | 10,603,125 |
| | | | | |
|
| | | | | | | 47,284,875 |
| | | | | |
|
See Notes to Financial Statements
14
SCHEDULE OF INVESTMENTS continued
April 30, 2005
| | | | | | |
| | Principal | | | | |
| | Amount | | | | Value |
|
| |
| CORPORATE BONDS continued | | | | | | |
| INDUSTRIALS continued | | | | | | |
| Machinery 3.1% | | | | | | |
| Case New Holland, Inc., 9.25%, 08/01/2011 144A | | $12,375,000 | | $ | | 12,684,375 |
| Columbus McKinnon Corp., 8.50%, 04/01/2008 (p) | | 5,500,000 | | | | 5,527,500 |
| Douglas Dynamics LLC, 7.75%, 01/15/2012 144A | | 4,060,000 | | | | 3,999,100 |
| Dresser Rand Group, Inc., 7.375%, 11/01/2014 144A | | 4,715,000 | | | | 4,620,700 |
| Terex Corp., 7.375%, 01/15/2014 (p) | | 5,420,000 | | | | 5,474,200 |
| | | | | |
|
| | | | | | | 32,305,875 |
| | | | | |
|
| Marine 1.0% | | | | | | |
| Horizon Lines LLC, Sr. Disc. Note, Step Bond, 0.00% 04/01/2013 144A † | | 12,775,000 | | | | 9,932,562 |
| | | | | |
|
| Transportation Infrastructure 0.1% | | | | | | |
| Offshore Logistics, Inc., 6.125%, 06/15/2013 | | 1,000,000 | | | | 947,500 |
| | | | | |
|
| INFORMATION TECHNOLOGY 2.4% | | | | | | |
| Communications Equipment 1.3% | | | | | | |
| Lucent Technologies, Inc., 6.45%, 03/15/2029 | | 12,000,000 | | | | 10,185,000 |
| Telex Communications Holdings, Inc., 11.50%, 10/15/2008 | | 3,250,000 | | | | 3,542,500 |
| | | | | |
|
| | | | | | | 13,727,500 |
| | | | | |
|
| IT Services 1.1% | | | | | | |
| Computer Sciences Corp., 9.50%, 02/15/2013 144A | | 7,450,000 | | | | 7,189,250 |
| Stratus Technologies, Inc., 10.375%, 12/01/2008 | | 4,000,000 | | | | 3,920,000 |
| | | | | |
|
| | | | | | | 11,109,250 |
| | | | | |
|
| MATERIALS 15.5% | | | | | | |
| Chemicals 5.6% | | | | | | |
| Arco Chemical Co., 9.80%, 02/01/2020 (p) | | 3,020,000 | | | | 3,352,200 |
| Equistar Chemicals LP, 10.625%, 05/01/2011 | | 3,195,000 | | | | 3,578,400 |
| Ethyl Corp., 8.875%, 05/01/2010 | | 2,200,000 | | | | 2,326,500 |
| FMC Corp., 10.25%, 11/01/2009 | | 5,000,000 | | | | 5,550,000 |
| Huntsman Advanced Materials LLC, 11.00%, 07/15/2010 144A | | 5,000,000 | | | | 5,725,000 |
| Huntsman International LLC: | | | | | | |
| 9.875%, 03/01/2009 | | 4,280,000 | | | | 4,622,400 |
| 11.50%, 07/15/2012 144A | | 6,105,000 | | | | 7,051,275 |
| Lyondell Chemical Co., 10.50%, 06/01/2013 (p) | | 10,000,000 | | | | 11,575,000 |
| Nalco Co., 8.875%, 11/15/2013 (p) | | 5,850,000 | | | | 6,025,500 |
| PQ Corp., 7.50%, 02/15/2013 144A | | 5,625,000 | | | | 5,484,375 |
| Rockwood Specialties Group, 7.50%, 11/15/2014 144A | | 1,680,000 | | | | 1,638,000 |
| | | | | |
|
| | | | | | | 56,928,650 |
| | | | | |
|
| Containers & Packaging 3.2% | | | | | | |
| Graham Packaging Co., 9.875%, 10/15/2014 (p) 144A | | 2,750,000 | | | | 2,640,000 |
| Graphic Packaging International, Inc., 8.50%, 08/15/2011 | | 7,000,000 | | | | 7,000,000 |
| Owens-Brockway Glass Containers, Inc.: | | | | | | |
| 6.75%, 12/01/2014 144A | | 6,000,000 | | | | 5,880,000 |
| 8.25%, 05/15/2013 | | 7,850,000 | | | | 8,360,250 |
| 8.75%, 11/15/2012 (p) | | 3,835,000 | | | | 4,199,325 |
See Notes to Financial Statements
15
SCHEDULE OF INVESTMENTS continued
April 30, 2005
| | | | | | |
| | Principal | | | | |
| | Amount | | | | Value |
|
| |
| CORPORATE BONDS continued | | | | | | |
| MATERIALS continued | | | | | | |
| Containers & Packaging continued | | | | | | |
| Stone Container Corp., 9.75%, 02/01/2011 | | $5,000,000 | | $ | | 5,262,500 |
| | | | | |
|
| | | | | | | 33,342,075 |
| | | | | |
|
| Metals & Mining 3.9% | | | | | | |
| Alaska Steel Corp., 7.75%, 06/15/2012 (p) | | 8,000,000 | | | | 7,160,000 |
| Foundation Pennsylvania Coal Co., 7.25%, 08/01/2014 | | 6,400,000 | | | | 6,608,000 |
| Freeport-McMoRan Copper & Gold, Inc., 10.125%, 02/01/2010 | | 5,285,000 | | | | 5,813,500 |
| Oregon Steel Mills, Inc., 10.00%, 07/15/2009 (p) | | 7,625,000 | | | | 8,215,938 |
| Peabody Energy Corp.: | | | | | | |
| 5.875%, 04/15/2016 (p) | | 4,275,000 | | | | 4,168,125 |
| 6.875%, 03/15/2013 | | 2,380,000 | | | | 2,475,200 |
| United States Steel Corp., 10.75%, 08/01/2008 | | 4,526,000 | | | | 5,114,380 |
| | | | | |
|
| | | | | | | 39,555,143 |
| | | | | |
|
| Paper & Forest Products 2.8% | | | | | | |
| Amscan Holdings, Inc., 8.75%, 05/01/2014 (p) | | 5,515,000 | | | | 5,156,525 |
| Boise Cascade LLC: | | | | | | |
| 6.02%, 10/15/2012 144A | | 2,700,000 | | | | 2,686,500 |
| 7.125%, 10/15/2014 144A | | 2,500,000 | | | | 2,387,500 |
| Bowater, Inc., 6.50%, 06/15/2013 (p) | | 5,250,000 | | | | 4,790,625 |
| Georgia Pacific Corp.: | | | | | | |
| 8.00%, 01/15/2024 | | 3,340,000 | | | | 3,573,800 |
| 8.125%, 05/15/2011 | | 9,000,000 | | | | 9,888,750 |
| | | | | |
|
| | | | | | | 28,483,700 |
| | | | | |
|
| TELECOMMUNICATION SERVICES 4.0% | | | | | | |
| Diversified Telecommunication Services 1.9% | | | | | | |
| Consolidated Communications, Inc., 9.75%, 04/01/2012 144A | | 7,045,000 | | | | 7,432,475 |
| Hawaiian Telecom Communications, Inc.: | | | | | | |
| 8.71%, 05/01/2013 # | | 1,500,000 | | | | 1,492,500 |
| 9.75%, 05/01/2013 144A # | | 1,000,000 | | | | 998,750 |
| 12.50%, 05/01/2015 144A # | | 4,250,000 | | | | 4,228,750 |
| Qwest Communications International, Inc., 7.875%, 09/01/2011 144A | | 5,425,000 | | | | 5,533,500 |
| | | | | |
|
| | | | | | | 19,685,975 |
| | | | | |
|
| Wireless Telecommunication Services 2.1% | | | | | | |
| Alamosa Holdings, Inc., 8.50%, 01/31/2012 | | 2,750,000 | | | | 2,860,000 |
| Horizon PCS, Inc., 11.375%, 07/15/2012 144A | | 2,500,000 | | | | 2,775,000 |
| Nextel Communications, Inc., 7.375%, 08/01/2015 | | 8,000,000 | | | | 8,560,000 |
| Rural Cellular Co., 8.25%, 03/15/2012 | | 1,170,000 | | | | 1,190,475 |
| UbiquiTel, Inc., 9.875%, 03/01/2011 (p) | | 2,500,000 | | | | 2,718,750 |
| US Unwired, Inc., Ser. B, 10.00%, 06/15/2012 | | 2,500,000 | | | | 2,756,250 |
| | | | | |
|
| | | | | | | 20,860,475 |
| | | | | |
|
See Notes to Financial Statements
16
SCHEDULE OF INVESTMENTS continued
April 30, 2005
| | | | | | |
| | Principal | | | | |
| | Amount | | | | Value |
|
| CORPORATE BONDS continued | | | | | | |
| UTILITIES 4.3% | | | | | | |
| Electric Utilities 2.3% | | | | | | |
| MSW Energy Holdings LLC, 8.50%, 09/01/2010 | | $ 2,250,000 | | $ | | 2,328,750 |
| Reliant Energy, Inc.: | | | | | | |
| 6.75%, 12/15/2014 (p) | | 6,125,000 | | | | 5,451,250 |
| 9.25%, 07/15/2010 (p) | | 4,000,000 | | | | 4,110,000 |
| Texas Genco Holdings, Inc., 6.875%, 12/15/2014 144A | | 12,500,000 | | | | 12,312,500 |
| | | | | |
|
| | | | | | | 24,202,500 |
| | | | | |
|
| Gas Utilities 0.8% | | | | | | |
| SEMCO Energy, Inc.: | | | | | | |
| 7.125%, 05/15/2008 | | 3,500,000 | | | | 3,505,845 |
| 7.75%, 05/15/2013 (p) | | 4,500,000 | | | | 4,568,783 |
| | | | | |
|
| | | | | | | 8,074,628 |
| | | | | |
|
| Multi-Utilities 1.2% | | | | | | |
| AES Corp., 7.75%, 03/01/2014 | | 8,460,000 | | | | 8,671,500 |
| NRG Energy, Inc., 8.00%, 12/15/2013 (p) 144A | | 3,255,000 | | | | 3,303,825 |
| | | | | |
|
| | | | | | | 11,975,325 |
| | | | | |
|
| Total Corporate Bonds (cost $858,562,588) | | | | | | 858,828,355 |
| | | | | |
|
| YANKEE OBLIGATIONS - CORPORATE 11.1% | | | | | | |
| CONSUMER DISCRETIONARY 1.3% | | | | | | |
| Hotels, Restaurants & Leisure 0.5% | | | | | | |
| Intrawest Corp., 7.50%, 10/15/2013 | | 5,250,000 | | | | 5,250,000 |
| | | | | |
|
| Media 0.8% | | | | | | |
| IMAX Corp., 9.625%, 12/01/2010 (p) | | 8,000,000 | | | | 8,500,000 |
| | | | | |
|
| CONSUMER STAPLES 1.0% | | | | | | |
| Food & Staples Retailing 1.0% | | | | | | |
| The Jean Coutu Group, (PJC) Inc., 8.50%, 08/01/2014 (p) | | 11,000,000 | | | | 10,422,500 |
| | | | | |
|
| ENERGY 0.9% | | | | | | |
| Energy Equipment & Services 0.9% | | | | | | |
| Petroleum Geo-Services ASA, 10.00%, 11/05/2010 | | 8,050,000 | | | | 9,016,000 |
| | | | | |
|
| FINANCIALS 1.3% | | | | | | |
| Diversified Financial Services 1.3% | | | | | | |
| Northern Telecom Capital Corp., 7.875%, 06/15/2026 | | 6,500,000 | | | | 6,500,000 |
| Ship Finance International, Ltd., 8.50%, 12/15/2013 | | 6,915,000 | | | | 6,603,825 |
| | | | | |
|
| | | | | | | 13,103,825 |
| | | | | |
|
| INDUSTRIALS 1.3% | | | | | | |
| Marine 1.0% | | | | | | |
| CP Ships, Ltd., 10.375%, 07/15/2012 (p) | | 6,690,000 | | | | 7,542,975 |
| Stena AB, 9.625%, 12/01/2012 | | 2,000,000 | | | | 2,175,000 |
| | | | | |
|
| | | | | | | 9,717,975 |
| | | | | |
|
| Transportation Infrastructure 0.3% | | | | | | |
| Sea Containers, Ltd., 10.50%, 05/15/2012 | | 2,940,000 | | | | 3,087,000 |
| | | | | |
|
See Notes to Financial Statements
17
SCHEDULE OF INVESTMENTS continued
April 30, 2005
| | | | | | |
| | Principal | | | | |
| | Amount | | | | Value |
|
| |
| YANKEE OBLIGATIONS - CORPORATE continued | | | | | | |
| INFORMATION TECHNOLOGY 0.8% | | | | | | |
| Electronic Equipment & Instruments 0.6% | | | | | | |
| Celestica, Inc., 7.875%, 07/01/2011 (p) | | $ 5,885,000 | | $ | | 5,885,000 |
| | | | | |
|
| Semiconductors & Semiconductor Equipment 0.2% | | | | | | |
| Magnachip Semiconductor SA: | | | | | | |
| 6.875%, 12/15/2011 144A | | 1,300,000 | | | | 1,196,000 |
| FRN, 6.26%, 12/15/2011 144A | | 1,300,000 | | | | 1,222,000 |
| | | | | |
|
| | | | | | | 2,418,000 |
| | | | | |
|
| MATERIALS 3.2% | | | | | | |
| Chemicals 0.5% | | | | | | |
| Acetex Corp., 10.875%, 08/01/2009 | | 5,000,000 | | | | 5,300,000 |
| | | | | |
|
| Containers & Packaging 1.3% | | | | | | |
| Crown European Holdings: | | | | | | |
| 9.50%, 03/01/2011 | | 3,250,000 | | | | 3,526,250 |
| 10.875%, 03/01/2013 | | 7,000,000 | | | | 8,032,500 |
| Stone Container Finance Co., 7.375%, 07/15/2014 | | 1,225,000 | | | | 1,133,125 |
| | | | | |
|
| | | | | | | 12,691,875 |
| | | | | |
|
| Metals & Mining 1.1% | | | | | | |
| Gerdau Ameristeel Corp., 10.375%, 07/15/2011 | | 912,000 | | | | 998,640 |
| Novelis, Inc., 7.25%, 02/15/2015 144A | | 10,940,000 | | | | 10,639,150 |
| | | | | |
|
| | | | | | | 11,637,790 |
| | | | | |
|
| Paper & Forest Products 0.3% | | | | | | |
| Abitibi Consolidated, Inc., 6.00%, 06/20/2013 (p) | | 3,000,000 | | | | 2,475,000 |
| Tembec Industries, Inc., 7.75%, 03/15/2012 (p) | | 1,335,000 | | | | 1,014,600 |
| | | | | |
|
| | | | | | | 3,489,600 |
| | | | | |
|
| TELECOMMUNICATION SERVICES 1.0% | | | | | | |
| Wireless Telecommunication Services 1.0% | | | | | | |
| Rogers Wireless, Inc.: | | | | | | |
| 6.375%, 03/01/2014 | | 2,790,000 | | | | 2,685,375 |
| 7.50%, 03/15/2015 | | 3,250,000 | | | | 3,351,562 |
| 9.625%, 05/01/2011 | | 3,475,000 | | | | 3,961,500 |
| | | | | |
|
| | | | | | | 9,998,437 |
| | | | | |
|
| UTILITIES 0.3% | | | | | | |
| Multi-Utilities 0.3% | | | | | | |
| Calpine Canada Energy Finance, 8.50%, 05/01/2008 | | 5,000,000 | | | | 2,525,000 |
| | | | | |
|
| Total Yankee Obligations - Corporate (cost $111,840,272) | | | | | | 113,043,002 |
| | | | | |
|
See Notes to Financial Statements
18
SCHEDULE OF INVESTMENTS continued
April 30, 2005
| | | | | | | | |
| | | | | Shares | | | | Value |
|
| COMMON STOCKS 1.0% | | | | | | |
| CONSUMER DISCRETIONARY 0.4% | | | | | | |
| Auto Components 0.1% | | | | | | |
| Exide Technologies (p) | | 100,000 | | $ | | 1,040,000 |
| | | | | |
|
| Media 0.3% | | | | | | |
| Charter Communications, Inc., Class A (p) | | 425,000 | | | | 493,000 |
| IMAX Corp. (p) | | 372,332 | | | | 2,906,051 |
| | | | | |
|
| | | | | | | 3,399,051 |
| | | | | |
|
| ENERGY 0.4% | | | | | | |
| Energy Equipment & Services 0.4% | | | | | | |
| TexCal Energy LLC (h) + | | 3,112 | | | | 4,045,680 |
| | | | | |
|
| FINANCIALS 0.0% | | | | | | |
| Diversified Financial Services 0.0% | | | | | | |
| Ono Finance plc * 144A (h) + | | 4,500 | | | | 0 |
| | | | | |
|
| INFORMATION TECHNOLOGY 0.0% | | | | | | |
| IT Services 0.0% | | | | | | |
| DecisionOne Corp. * (h) + | | 331,000 | | | | 0 |
| | | | | |
|
| MATERIALS 0.2% | | | | | | |
| Chemicals 0.2% | | | | | | |
| Huntsman Corp | | 88,065 | | | | 1,852,888 |
| | | | | |
|
Total Common Stocks (cost $9,480,794) | | | | | | 10,337,619 |
| | | | | |
|
| WARRANTS 0.1% | | | | | | |
| CONSUMER DISCRETIONARY 0.0% | | | | | | |
| Media 0.0% | | | | | | |
| Metricom, Inc., Expiring 02/15/2010 * (h) + | | 1,500 | | | | 0 |
| RCN Corp., Expiring 06/30/2013 * (h) + | | 1,500,000 | | | | 0 |
| | | | | |
|
| | | | | | | 0 |
| | | | | |
|
| FINANCIALS 0.0% | | | | | | |
| Diversified Financial Services 0.0% | | | | | | |
| Asat Finance LLC, Expiring 11/01/2006 144A* (h) + | | 4,000 | | | | 0 |
| Ono Finance plc, Expiring 05/31/2009 144A* (h) + | | 4,500 | | | | 0 |
| | | | | |
|
| | | | | | | | | 0 |
| | | | | | | |
|
| TELECOMMUNICATION SERVICES 0.1% | | | | | | |
| Wireless Telecommunication Services0.1% | | | | | | |
| American Tower Escrow Corp., Expiring 08/01/2008* | | 4,250 | | | | 1,034,888 |
| | | | | |
|
Total Warrants (cost $842,945) | | | | | | 1,034,888 |
| | | | | |
|
See Notes to Financial Statements
19
SCHEDULE OF INVESTMENTS continued
April 30, 2005
| | | | |
| | | Shares | | Value |
|
| SHORT-TERM INVESTMENTS 15.2% | | | | |
| MUTUAL FUND SHARES 15.2% | | | | |
| Evergreen Institutional Money Market Fund ø ## | | 13,328,396 | | $ 13,328,396 |
| Navigator Prime Portfolio (p)(p) | | 142,169,018 | | 142,169,018 |
| | | |
|
| Total Short-Term Investments (cost $155,497,414) | | | | 155,497,414 |
| | | |
|
| Total Investments (cost $1,136,317,574) 111.4% | | | | 1,138,844,786 |
| Other Assets and Liabilities (11.4%) | | | | (116,959,299) |
| | | |
|
| Net Assets 100.0% | | | | $ 1,021,885,487 |
| | | |
|
| | |
| (p) | | All or a portion of this security is on loan. |
| 144A | | Security that may be sold to qualified institutional buyers under Rule 144A of the Securities Act of 1933, as amended. |
| | | This security has been determined to be liquid under guidelines established by the Board of Trustees unless otherwise |
| | | noted. |
| • | | Security which has defaulted on payment of interest and/or principal. The Fund has stopped accruing interest on this |
| | | security. |
| (h) | | Security is valued at fair value as determined in good faith under procedures established by the Board of Trustees. |
| † | | Security initially issued in zero coupon form which converts to coupon form at a specified rate and date. An effective |
| | | interest rate is applied to recognize interest income daily for the bond. This rate is based on total expected interest to be |
| | | earned over the life of the bond which consists of the aggregate coupon-interest payments and discount at acquisition. |
| | | The rate shown is the stated rate at the current period end. |
| # | | When-issued or delayed delivery security |
| + | | Security is deemed illiquid and is valued using market quotations when readily available. |
| * | | Non-income producing security |
| ø | | Evergreen Investment Management Company, LLC is the investment advisor to both the Fund and the money market |
| | | fund. |
| ## | | All or a portion of this security has been segregated for when-issued or delayed delivery securities. |
| (p)(p) | | Represents investment of cash collateral received from securities on loan. |
|
| Summary of Abbreviations |
| FNMA | Federal National Mortgage Association |
| FRN | Floating Rate Note |
| REIT | Real Estate Investment Trust |
The following table shows the percent of total bonds by credit quality based on Moody's and Standard & Poor's ratings as of April 30, 2005 (unaudited):
| | |
| AAA | | 0.1% |
| BBB | | 1.1% |
| BB | | 24.1% |
| B | | 66.7% |
| CCC | | 6.9% |
| NR | | 1.1% |
| |
|
| | | 100.0% |
| | |
|
The following table shows the percent of total bonds by maturity as of April 30, 2005 (unaudited):
| | |
| 1 to 3 year(s) | | 3.5% |
| 3 to 5 years | | 10.9% |
| 5 to 10 years | | 78.4% |
| 10 to 20 years | | 4.4% |
| 20 to 30 years | | 2.8% |
| |
|
| | | 100.0% |
| | |
|
See Notes to Financial Statements
20
STATEMENT OF ASSETS AND LIABILITIES
April 30, 2005
| | | | |
|
| Assets | | | | |
| Investments in securities, at value (cost $1,122,989,178) including $139,642,789 of | | | | |
| securities loaned | | $ | | 1,125,516,390 |
| Investments in affiliates, at value (cost $13,328,396) | | | | 13,328,396 |
| Receivable for securities sold | | | | 14,372,758 |
| Receivable for Fund shares sold | | | | 519,680 |
| Interest receivable | | | | 23,641,594 |
| Receivable for securities lending income | | | | 43,399 |
| Prepaid expenses and other assets | | | | 298,240 |
|
| Total assets | | | | 1,177,720,457 |
|
| Liabilities | | | | |
| Dividends payable | | | | 2,428,798 |
| Payable for securities purchased | | | | 6,750,000 |
| Payable for Fund shares redeemed | | | | 4,265,832 |
| Payable for securities on loan | | | | 142,169,018 |
| Advisory fee payable | | | | 33,514 |
| Distribution Plan expenses payable | | | | 52,267 |
| Due to other related parties | | | | 12,663 |
| Accrued expenses and other liabilities | | | | 122,878 |
|
| Total liabilities | | | | 155,834,970 |
|
| Net assets | | $ | | 1,021,885,487 |
|
| Net assets represented by | | | | |
| Paid-in capital | | $ | | 1,155,077,781 |
| Overdistributed net investment income | | | | (2,471,797) |
| Accumulated net realized losses on securities and foreign currency related transactions | | | | (133,247,709) |
| Net unrealized gains on securities | | | | 2,527,212 |
|
| Total net assets | | $ | | 1,021,885,487 |
|
| Net assets consists of | | | | |
| Class A | | $ | | 467,714,225 |
| Class B | | | | 211,949,622 |
| Class C | | | | 281,809,766 |
| Class I | | | | 60,411,874 |
|
| Total net assets | | $ | | 1,021,885,487 |
|
| Shares outstanding (unlimited number of shares authorized) | | | | |
| Class A | | | | 140,990,494 |
| Class B | | | | 63,890,652 |
| Class C | | | | 84,947,019 |
| Class I | | | | 18,209,773 |
|
| Net asset value per share | | | | |
| Class A | | $ | | 3.32 |
| Class A - Offering price (based on sales charge of 4.75%) | | $ | | 3.49 |
| Class B | | $ | | 3.32 |
| Class C | | $ | | 3.32 |
| Class I | | $ | | 3.32 |
|
See Notes to Financial Statements
21
STATEMENT OF OPERATIONS
Year Ended April 30, 2005
| | | | |
|
| Investment income | | | | |
| Interest (net of foreign withholding taxes of $5,042) | | $ | | 90,541,879 |
| Income from affiliates | | | | 677,569 |
| Securities lending income | | | | 427,837 |
| Dividends | | | | 43,264 |
|
| Total investment income | | | | 91,690,549 |
|
| Expenses | | | | |
| Advisory fee | | | | 4,424,216 |
| Distribution Plan expenses | | | | |
| Class A | | | | 1,516,213 |
| Class B | | | | 2,337,208 |
| Class C | | | | 3,345,367 |
| Administrative services fee | | | | 1,115,737 |
| Transfer agent fees | | | | 2,056,211 |
| Trustees' fees and expenses | | | | 15,781 |
| Printing and postage expenses | | | | 88,764 |
| Custodian and accounting fees | | | | 317,881 |
| Registration and filing fees | | | | 199,547 |
| Professional fees | | | | 35,829 |
| Interest expense | | | | 112 |
| Other | | | | 27,336 |
|
| Total expenses | | | | 15,480,202 |
| Less: Expense reductions | | | | (10,998) |
| Expense reimbursements | | | | (220) |
|
| Net expenses | | | | 15,468,984 |
|
| Net investment income | | | | 76,221,565 |
|
| Net realized and unrealized gains or losses on securities and | | | | |
| foreign currency related transactions | | | | |
| Net realized gains on: | | | | |
| Securities | | | | 25,825,501 |
| Foreign currency related transactions | | | | 8,512 |
|
| Net realized gains on securities and foreign currency related transactions | | | | 25,834,013 |
| Net change in unrealized gains or losses on securities and | | | | |
| foreign currency related transactions | | | | (58,429,108) |
|
| Net realized and unrealized gains or losses on securities and | | | | |
| foreign currency related transactions | | | | (32,595,095) |
|
| Net increase in net assets resulting from operations | | $ | | 43,626,470 |
|
See Notes to Financial Statements
22
STATEMENTS OF CHANGES IN NET ASSETS
| | | | | | | | |
| | | Year Ended April 30, |
| |
|
| | | 2005 | | 2004 |
|
| Operations | | | | | | | | |
| Net investment income | | $ | | 76,221,565 | | $ | | 83,068,913 |
| Net realized gains on securities | | | | | | | | |
| and foreign currency related | | | | | | | | |
| transactions | | | | 25,834,013 | | | | 29,132,515 |
| Net change in unrealized gains or | | | | | | | | |
| losses on securities and foreign | | | | | | | | |
| currency related transactions | | | | (58,429,108) | | | | 14,738,536 |
|
| Net increase in net assets | | | | | | | | |
| resulting from operations | | | | 43,626,470 | | | | 126,939,964 |
|
Distributions to shareholders | | | | | | | | |
| from | | | | | | | | |
| Net investment income | | | | | | | | |
| Class A | | | | (37,029,733) | | | | (40,401,265) |
| Class B | | | | (15,487,174) | | | | (16,064,645) |
| Class C | | | | (22,203,970) | | | | (26,727,023) |
| Class I | | | | (3,329,864) | | | | (2,971,340) |
|
| Total distributions to shareholders | | | | (78,050,741) | | | | (86,164,273) |
|
| | | Shares | | | | Shares | | |
| Capital share transactions | | | | | | | | |
| Proceeds from shares sold | | | | | | | | |
| Class A | | 35,421,081 | | 121,218,744 | | 79,212,268 | | 266,807,488 |
| Class B | | 7,948,374 | | 27,307,221 | | 30,545,684 | | 102,845,146 |
| Class C | | 10,841,400 | | 37,359,748 | | 61,981,254 | | 209,018,829 |
| Class I | | 12,543,483 | | 42,583,297 | | 8,085,993 | | 27,386,680 |
|
| | | | | 228,469,010 | | | | 606,058,143 |
|
| Net asset value of shares issued in | | | | | | | | |
| reinvestment of distributions | | | | | | | | |
| Class A | | 7,303,420 | | 25,011,324 | | 7,196,311 | | 24,449,863 |
| Class B | | 2,202,244 | | 7,541,103 | | 2,210,574 | | 7,511,508 |
| Class C | | 3,579,614 | | 12,258,383 | | 4,041,046 | | 13,729,885 |
| Class I | | 359,166 | | 1,232,162 | | 159,741 | | 543,754 |
|
| | | | | 46,042,972 | | | | 46,235,010 |
|
| Automatic conversion of Class B | | | | | | | | |
| shares to Class A shares | | | | | | | | |
| Class A | | 936,476 | | 3,224,666 | | 509,358 | | 1,742,465 |
| Class B | | (936,476) | | (3,224,666) | | (509,358) | | (1,742,465) |
|
| | | | | 0 | | | | 0 |
|
| Payment for shares redeemed | | | | | | | | |
| Class A | | (57,549,646) | | (196,416,528) | | (78,644,025) | | (265,409,349) |
| Class B | | (17,646,027) | | (60,266,215) | | (12,288,949) | | (41,821,246) |
| Class C | | (40,851,398) | | (139,522,820) | | (42,704,221) | | (145,376,642) |
| Class I | | (5,754,273) | | (19,682,937) | | (12,128,118) | | (40,408,191) |
|
| | | | | (415,888,500) | | | | (493,015,428) |
|
| Net increase (decrease) in net assets | | | | | | | | |
| resulting from capital share | | | | | | | | |
| transactions | | | | (141,376,518) | | | | 159,277,725 |
|
| Total increase (decrease) in net assets | | | | (175,800,789) | | | | 200,053,416 |
| Net assets | | | | | | | | |
| Beginning of period | | | | 1,197,686,276 | | | | 997,632,860 |
|
| End of period | | $ | | 1,021,885,487 | | $ | | 1,197,686,276 |
|
| Overdistributed net investment income | | $ | | (2,471,797) | | $ | | (2,211,544) |
|
See Notes to Financial Statements
23
NOTES TO FINANCIAL STATEMENTS
1. ORGANIZATION
Evergreen High Yield Bond Fund (the "Fund") is a diversified series of Evergreen Fixed Income Trust (the "Trust"), a Delaware statutory trust organized on September 18, 1997. The Trust is an open-end management investment company registered under the Investment Company Act of 1940, as amended (the "1940 Act").
The Fund offers Class A, Class B, Class C and Institutional ("Class I") shares. Class A shares are sold with a front-end sales charge. However, Class A share investments of $1 million or more are not subject to a front-end sales charge but will be subject to a contingent deferred sales charge of 1.00% upon redemption within one year. Class B shares are sold without a front-end sales charge but are subject to a contingent deferred sales charge that is payable upon redemption and decreases depending on how long the shares have been held. Class C shares are sold without a front-end sales charge but are subject to a contingent deferred sales charge that is payable upon redemption within one year. Class I shares are sold without a front-end sales charge or contingent deferred sales charge. Each class of shares, except Class I shares, pays an ongoing distribution fee.
2. SIGNIFICANT ACCOUNTING POLICIES
The following is a summary of significant accounting policies consistently followed by the Fund in the preparation of its financial statements. The policies are in conformity with generally accepted accounting principles in the United States of America, which require management to make estimates and assumptions that affect amounts reported herein. Actual results could differ from these estimates.
a. Valuation of investments
Portfolio debt securities acquired with more than 60 days to maturity are fair valued using matrix pricing methods determined by an independent pricing service which takes into consideration such factors as similar security prices, yields, maturities, liquidity and ratings. Securities for which valuations are not readily available from an independent pricing service may be valued by brokers which use prices provided by market makers or estimates of market value obtained from yield data relating to investments or securities with similar characteristics.
Listed equity securities are usually valued at the last sales price or official closing price on the national securities exchange where the securities are principally traded.
Foreign securities traded on an established exchange are valued at the last sales price on the exchange where the security is primarily traded. If there has been no sale, the securities are valued at the mean between bid and asked prices. Foreign securities may be valued at fair value according to procedures approved by the Board of Trustees if the closing price is not reflective of current market values due to trading or events occurring in the foreign markets between the close of the established exchange and the valuation time of the Fund. In addition, substantial changes in values in the U.S. markets subsequent to the close of a foreign market may also affect the values of securities traded in the foreign market. The value of foreign securities may be adjusted if such movements in the U.S. market exceed a specified threshold.
24
NOTES TO FINANCIAL STATEMENTS continued
Short-term securities with remaining maturities of 60 days or less at the time of purchase are valued at amortized cost, which approximates market value.
Investments in other mutual funds are valued at net asset value. Securities for which market quotations are not readily available or not reflective of current market value are valued at fair value as determined in good faith, according to procedures approved by the Board of Trustees.
b. Foreign currency translation
All assets and liabilities denominated in foreign currencies are translated into U.S. dollar amounts at the date of valuation. Purchases and sales of portfolio securities and income items denominated in foreign currencies are translated into U.S. dollar amounts on the respective dates of such transactions. The Fund does not separately account for that portion of the results of operations resulting from changes in foreign exchange rates on investments and the fluctuations arising from changes in market prices of securities held. Such fluctuations are included with the net realized and unrealized gains or losses on securities.
c. When-issued and delayed delivery transactions
The Fund records when-issued or delayed delivery securities as of trade date and maintains security positions such that sufficient liquid assets will be available to make payment for the securities purchased. Securities purchased on a when-issued or delayed delivery basis are marked-to-market daily and begin earning interest on the settlement date. Losses may occur on these transactions due to changes in market conditions or the failure of counterparties to perform under the contract.
d. Securities lending
The Fund may lend its securities to certain qualified brokers in order to earn additional income. The Fund receives compensation in the form of fees or interest earned on the investment of any cash collateral received. The Fund also continues to receive interest and dividends on the securities loaned. The Fund receives collateral in the form of cash or securities with a market value at least equal to the market value of the securities on loan, including accrued interest. In the event of default or bankruptcy by the borrower, the Fund could experience delays and costs in recovering the loaned securities or in gaining access to the collateral. The Fund has the right under the lending agreement to recover the securities from the borrower on demand.
e. Security transactions and investment income
Security transactions are recorded on trade date. Realized gains and losses are computed using the specific cost of the security sold. Interest income is recorded on the accrual basis and includes accretion of discounts and amortization of premiums. Dividend income is recorded on the ex-dividend date. Foreign income and capital gains realized on some securities may be subject to foreign taxes, which are accrued as applicable.
25
NOTES TO FINANCIAL STATEMENTS continued
f. Federal taxes
The Fund intends to continue to qualify as a regulated investment company and distribute all of its taxable income, including any net capital gains (which have already been offset by available capital loss carryovers). Accordingly, no provision for federal taxes is required.
g. Distributions
Distributions to shareholders from net investment income are accrued daily and paid monthly. Distributions from net realized gains, if any, are recorded on the ex-dividend date. Such distributions are determined in conformity with income tax regulations, which may differ from generally accepted accounting principles.
Reclassifications have been made to the Fund's components of net assets to reflect income and gains available for distribution (or available capital loss carryovers, as applicable) under income tax regulations. The primary permanent differences causing such reclassifications are due to excess distributions, consent fees on tendered bonds and premium amortization. During the year ended April 30, 2005, the following amounts were reclassified:
| | |
|
| Paid-in capital | | $(1,035,300) |
| Overdistributed net investment income | | 3,854,920 |
| Accumulated net realized losses on securities | | |
| and foreign currency related transactions | | (2,819,620) |
|
h. Class allocations
Income, common expenses and realized and unrealized gains and losses are allocated to the classes based on the relative net assets of each class. Distribution fees, if any, are calculated daily at the class level based on the appropriate net assets of each class and the specific expense rates applicable to each class.
3. ADVISORY FEE AND OTHER TRANSACTIONS WITH AFFILIATES
Evergreen Investment Management Company, LLC ("EIMC"), an indirect, wholly-owned subsidiary of Wachovia Corporation ("Wachovia"), is the investment advisor to the Fund and is paid a fee at an annual rate of 2% of the Fund's gross investment income plus an amount determined by applying percentage rates to the average daily net assets of the Fund, starting at 0.31% and declining to 0.16% as average daily net assets increase.
From time to time, EIMC may voluntarily or contractually waive its fee and/or reimburse expenses in order to limit operating expenses. During the year ended April 30, 2005, EIMC reimbursed other expenses in the amount of $220.
Evergreen Investment Services, Inc. ("EIS"), an indirect, wholly-owned subsidiary of Wachovia, is the administrator to the Fund. As administrator, EIS provides the Fund with facilities, equipment and personnel and is paid an annual rate determined by applying percentage rates to the aggregate average daily net assets of the Evergreen funds (excluding money market funds), starting
26
NOTES TO FINANCIAL STATEMENTS continued
at 0.10% and declining to 0.05% as the aggregate average daily net assets of the Evergreen funds (excluding money market funds) increase.
Evergreen Service Company, LLC ("ESC"), an indirect, wholly-owned subsidiary of Wachovia, is the transfer and dividend disbursing agent for the Fund. ESC receives account fees that vary based on the type of account held by the shareholders in the Fund. For the year ended April 30, 2005, the transfer agent fees were equivalent to an annual rate of 0.18% of the Fund's average daily net assets.
The Fund has placed a portion of its portfolio transactions with brokerage firms that are affiliates of Wachovia. During the year ended April 30, 2005, the Fund paid brokerage commissions of $2,387 to Wachovia Securities, LLC.
4. DISTRIBUTION PLANS
EIS also serves as distributor of the Fund's shares. The Fund has adopted Distribution Plans, as allowed by Rule 12b-1 of the 1940 Act, for each class of shares, except Class I. Under the Distribution Plans, distribution fees are paid at an annual rate of 0.30% of the average daily net assets for Class A shares and 1.00% of the average daily net assets for each of Class B and Class C shares.
For the year ended April 30, 2005, EIS received $80,794 from the sale of Class A shares and $1,107, $789,660 and $148,591 in contingent deferred sales charges from redemptions of Class A, Class B and Class C shares, respectively.
5. SECURITIES TRANSACTIONS
Cost of purchases and proceeds from sales of investment securities (excluding short-term securities) were $696,664,142 and $752,843,428, respectively, for the year ended April 30, 2005.
During the year ended April 30, 2005, the Fund loaned securities to certain brokers. At April 30, 2005, the value of securities on loan and the value of collateral amounted to $139,642,789 and $142,169,018, respectively.
On April 30, 2005, the aggregate cost of securities for federal income tax purposes was $1,138,496,263. The gross unrealized appreciation and depreciation on securities based on tax cost was $27,100,839 and $26,752,316, respectively, with a net unrealized appreciation of $348,523.
As of April 30, 2005, the Fund had $131,069,020 in capital loss carryovers for federal income tax purposes expiring as follows:
| | | | | | |
| Expiration |
|
| 2008 | | 2009 | | 2010 | | 2011 |
|
| $ 19,168,229 | | $ 38,451,200 | | $ 57,513,490 | | $15,936,101 |
|
27
NOTES TO FINANCIAL STATEMENTS continued
6. INTERFUND LENDING
Pursuant to an Exemptive Order issued by the SEC, the Fund may participate in an interfund lending program with certain funds in the Evergreen fund family. This program allows the Fund to borrow from, or lend money to, other participating funds. During the year ended April 30, 2005, the Fund did not participate in the interfund lending program.
7. DISTRIBUTIONS TO SHAREHOLDERS
As of April 30, 2005, the components of distributable earnings on a tax basis were as follows:
| | | | |
Overdistributed | | Unrealized | | Capital Loss |
Ordinary Income | | Appreciation | | Carryover |
|
| $ 2,471,797 | | $ 348,523 | | $ 131,069,020 |
|
The differences between the components of distributable earnings on a tax basis and the amounts reflected in the Statement of Assets and Liabilities are primarily due to wash sales and premium amortization.
The tax character of distributions paid were $78,050,741 and $86,164,273 of ordinary income for the years ended April 30, 2005 and April 30, 2004, respectively.
8. EXPENSE REDUCTIONS
Through expense offset arrangements with ESC and the Fund's custodian, a portion of fund expenses has been reduced.
9. DEFERRED TRUSTEES' FEES
Each Trustee of the Fund may defer any or all compensation related to performance of their duties as Trustees. The Trustees' deferred balances are allocated to deferral accounts, which are included in the accrued expenses for the Fund. The investment performance of the deferral accounts are based on the investment performance of certain Evergreen funds. Any gains earned or losses incurred in the deferral accounts are reported in the Fund's Trustees' fees and expenses. At the election of the Trustees, the deferral account will be paid either in one lump sum or in quarterly installments for up to ten years.
10. FINANCING AGREEMENT
The Fund and certain other Evergreen funds share in a $150 million unsecured revolving credit commitment for temporary and emergency purposes, including the funding of redemptions, as permitted by each participating fund's borrowing restrictions. Borrowings under this facility bear interest at 0.50% per annum above the Federal Funds rate. All of the participating funds are charged an annual commitment fee of 0.09% of the unused balance, which is allocated pro rata. During the year ended April 30, 2005, the Fund had average borrowings outstanding of $7,174 at an average rate of 1.56% and paid interest of $112.
28
NOTES TO FINANCIAL STATEMENTS continued
11. CONCENTRATION OF RISK
The Fund may invest a substantial portion of its assets in an industry or sector and, therefore, may be more affected by changes in that industry or sector than would be a comparable mutual fund that is not heavily weighted in any industry or sector.
12. REGULATORY MATTERS AND LEGAL PROCEEDINGS
Since September 2003, governmental and self-regulatory authorities have instituted numerous ongoing investigations of various practices in the mutual fund industry, including investigations relating to revenue sharing, market-timing, late trading and record retention, among other things. The investigations cover investment advisors, distributors and transfer agents to mutual funds, as well as other firms. EIMC, EIS and ESC (collectively, "Evergreen") have received subpoenas and other requests for documents and testimony relating to these investigations, are endeavoring to comply with those requests, and are cooperating with the investigations. Evergreen is continuing its own internal review of policies, practices, procedures and personnel, and is taking remedial action where appropriate.
In connection with one of these investigations, on July 28, 2004, the staff of the Securities and Exchange Commission ("SEC") informed Evergreen that the staff intends to recommend to the SEC that it institute an enforcement action against Evergreen. The SEC staff's proposed allegations relate to (i) an arrangement pursuant to which a broker at one of EIMC's affiliated broker-dealers had been authorized, apparently by an EIMC officer (no longer with EIMC), to engage in short-term trading, on behalf of a client, in Evergreen Mid Cap Growth Fund (formerly Evergreen Emerging Growth Fund and prior to that, known as Evergreen Small Company Growth Fund) during the period from December 2000 through April 2003, in excess of the limitations set forth in the fund's prospectus, (ii) short-term trading from September 2001 through January 2003, by a former Evergreen portfolio manager, of Evergreen Precious Metals Fund, a fund he managed at the time, (iii) the sufficiency of systems for monitoring exchanges and enforcing exchange limitations as stated in the fund's prospectuses, and (iv) the adequacy of e-mail retention practices. In connection with the activity in Evergreen Mid Cap Growth Fund, EIMC reimbursed the fund $378,905, plus an additional $25,242, representing what EIMC calculated at that time to be the client's net gain and the fees earned by EIMC and the expenses incurred by this fund on the client's account. In connection with the activity in Evergreen Precious Metals Fund, EIMC reimbursed the fund $70,878, plus an additional $3,075, representing what EIMC calculated at that time to be the portfolio manager's net gain and the fees earned by EIMC and expenses incurred by the fund on the portfolio manager's account. Evergreen is currently engaged in discussions with the staff of the SEC concerning its recommendation.
Any resolution of these matters with regulatory authorities may include, but not be limited to, sanctions, penalties or injunctions regarding Evergreen, restitution to mutual fund shareholders and/or other financial penalties and structural changes in the governance or management of Evergreen's mutual fund business. Any penalties or restitution will be paid by Evergreen and not by the Evergreen funds.
29
NOTES TO FINANCIAL STATEMENTS continued
In addition, the Evergreen funds and EIMC and certain of its affiliates are involved in various legal actions, including private litigation and class action lawsuits. EIMC does not expect that any of such legal actions currently pending or threatened will have a material adverse impact on the financial position or operations of any of the Evergreen funds or on EIMC's ability to provide services to the Evergreen funds.
Although Evergreen believes that neither the foregoing investigations nor any pending or threatened legal actions will have a material adverse impact on the Evergreen funds, there can be no assurance that these matters and any publicity surrounding or resulting from them will not result in reduced sales or increased redemptions of Evergreen fund shares, which could increase Evergreen fund transaction costs or operating expenses, or have other adverse consequences on the Evergreen funds.
30
REPORT OF INDEPENDENT REGISTERED PUBLIC ACCOUNTING FIRM
Board of Trustees and Shareholders
Evergreen Fixed Income Trust
We have audited the accompanying statement of assets and liabilities, including the schedule of investments, of the Evergreen High Yield Bond Fund, a series of Evergreen Fixed Income Trust, as of April 30, 2005, and the related statement of operations for the year then ended, statements of changes in net assets for each of the years in the two-year period then ended, and the financial highlights for each of the years in the five-year period then ended. These financial statements and financial highlights are the responsibility of the Fund's management. Our responsibility is to express an opinion on these financial statements and financial highlights based on our audits.
We conducted our audits in accordance with the standards of the Public Company Accounting Oversight Board (United States). Those standards require that we plan and perform the audit to obtain reasonable assurance about whether the financial statements and financial highlights are free of material misstatement. An audit includes examining, on a test basis, evidence supporting the amounts and disclosures in the financial statements. Our procedures included confirmation of securities owned as of April 30, 2005 by correspondence with the custodian and brokers, or by other appropriate auditing procedures when replies from brokers were not received. An audit also includes assessing the accounting principles used and significant estimates made by management, as well as evaluating the overall financial statement presentation. We believe that our audits provide a reasonable basis for our opinion.
In our opinion, the financial statements and financial highlights referred to above present fairly, in all material respects, the financial position of the Evergreen High Yield Bond Fund as of April 30, 2005, the results of its operations, changes in its net assets and financial highlights for each of the years described above in conformity with U.S. generally accepted accounting principles.

Boston, Massachusetts
June 17, 2005
31
TRUSTEES AND OFFICERS
TRUSTEES1
| | |
| Charles A. Austin III | | Principal occupations: Investment Counselor, Anchor Capital Advisors, Inc. (investment advice); |
| Trustee | | Director, The Andover Companies (insurance); Trustee, Arthritis Foundation of New England; |
| DOB: 10/23/1934 | | Director, The Francis Ouimet Society; Former Director, Health Development Corp. |
| Term of office since: 1991 | | (fitness-wellness centers); Former Director, Mentor Income Fund, Inc.; Former Trustee, |
| Other directorships: None | | Mentor Funds and Cash Resource Trust; Former Investment Counselor, Appleton Partners, Inc. |
| | | (investment advice); Former Director, Executive Vice President and Treasurer, State Street |
| | | Research & Management Company (investment advice) |
|
| Shirley L. Fulton | | Principal occupations: Partner, Tin, Fulton, Greene & Owen, PLLC (law firm); Former Partner, |
| Trustee | | Helms, Henderson & Fulton, P.A. (law firm); Retired Senior Resident Superior Court Judge, |
| DOB: 1/10/1952 | | 26th Judicial District, Charlotte, NC |
| Term of office since: 2004 | | |
| Other directorships: None | | |
|
| K. Dun Gifford | | Principal occupations: Chairman and President, Oldways Preservation and Exchange Trust |
| Trustee | | (education); Trustee, Treasurer and Chairman of the Finance Committee, Cambridge College; |
| DOB: 10/23/1938 | | Former Chairman of the Board, Director, and Executive Vice President, The London Harness |
| Term of office since: 1974 | | Company (leather goods purveyor); Former Director, Mentor Income Fund, Inc.; Former Trustee, |
|
| Dr. Leroy Keith, Jr. | | Principal occupations: Partner, Stonington Partners, Inc. (private equity firm); Trustee, |
| Trustee | | The Phoenix Group of Mutual Funds; Director, Obagi Medical Products Co.; Director, |
| DOB: 2/14/1939 | | Diversapack Co.; Former Director, Lincoln Educational Services; Former Chairman of the Board |
| Term of office since: 1983 | | and Chief Executive Officer, Carson Products Company (manufacturing); Former Director, |
| Other directorships: Trustee, The | | Mentor Income Fund, Inc.; Former Trustee, Mentor Funds and Cash Resource Trust |
| Phoenix Group of Mutual Funds | | |
|
| Gerald M. McDonnell | | Principal occupations: Manager of Commercial Operations, SMI Steel Co. – South Carolina |
| Trustee | | (steel producer); Former Sales and Marketing Manager, Nucor Steel Company; Former Director, |
| DOB: 7/14/1939 | | Mentor Income Fund, Inc.; Former Trustee, Mentor Funds and Cash Resource Trust |
| Term of office since: 1988 | | |
| Other directorships: None | | |
|
| William Walt Pettit | | Principal occupations: Vice President, Kellam & Pettit, P.A. (law firm); Director, Superior |
| Trustee | | Packaging Corp.; Director, National Kidney Foundation of North Carolina, Inc.; Former Director, |
| DOB: 8/26/1955 | | Mentor Income Fund, Inc.; Former Trustee, Mentor Funds and Cash Resource Trust |
| Term of office since: 1984 | | |
| Other directorships: None | | |
|
| David M. Richardson | | Principal occupations: President, Richardson, Runden LLC (executive recruitment business |
| Trustee | | development/consulting company); Consultant, Kennedy Information, Inc. (executive |
| DOB: 9/19/1941 | | recruitment information and research company); Consultant, AESC (The Association of |
| Term of office since: 1982 | | Executive Search Consultants); Director, J&M Cumming Paper Co. (paper merchandising); |
| Other directorships: None | | Former Trustee, NDI Technologies, LLP (communications); Former Vice Chairman, DHR |
| | | International, Inc. (executive recruitment); Former Director, Mentor Income Fund, Inc.; |
| | | Former Trustee, Mentor Funds and Cash Resource Trust |
|
| Dr. Russell A. Salton III | | Principal occupations: President/CEO, AccessOne MedCard; Former Medical Director, |
| Trustee | | Healthcare Resource Associates, Inc.; Former Medical Director, U.S. Health Care/Aetna Health |
| DOB: 6/2/1947 | | Services; Former Director, Mentor Income Fund, Inc.; Former Trustee, Mentor Funds and |
| Term of office since: 1984 | | Cash Resource Trust |
| Other directorships: None | | |
|
32
TRUSTEES AND OFFICERS continued
| | |
| Michael S. Scofield | | Principal occupations: Director, Branded Media Corporation (multi-media branding company); |
| Trustee | | Attorney, Law Offices of Michael S. Scofield; Former Director, Mentor Income Fund, Inc.; |
| DOB: 2/20/1943 | | Former Trustee, Mentor Funds and Cash Resource Trust |
| Term of office since: 1984 | | |
| Other directorships: None | | |
|
| Richard J. Shima | | Principal occupations: Independent Consultant; Director, Trust Company of CT; Trustee, |
| Trustee | | Saint Joseph College (CT); Director, Hartford Hospital; Trustee, Greater Hartford YMCA; |
| DOB: 8/11/1939 | | Former Director, Enhance Financial Services, Inc.; Former Director, Old State House Association; |
| Term of office since: 1993 | | Former Director of CTG Resources, Inc. (natural gas); Former Director, Mentor Income Fund, Inc.; |
| Other directorships: None | | Former Trustee, Mentor Funds and Cash Resource Trust |
| | | |
|
| Richard K. Wagoner, CFA 2 | | Principal occupations: Member and Former President, North Carolina Securities Traders |
| Trustee | | Association; Member, Financial Analysts Society; Former Consultant to the Boards of Trustees |
| DOB: 12/12/1937 | | of the Evergreen funds; Former Trustee, Mentor Funds and Cash Resource Trust |
| Term of office since: 1999 | | |
| Other directorships: None | | |
|
| |
| OFFICERS | | |
| |
| Dennis H. Ferro 3 | | Principal occupations: President and Chief Executive Officer, Evergreen Investment Company, |
| President | | Inc. and Executive Vice President, Wachovia Bank, N.A.; former Chief Investment Officer, |
| DOB: 6/20/1945 | | Evergreen Investment Company, Inc. |
| Term of office since: 2003 | | |
|
| Carol Kosel4 | | Principal occupations: Senior Vice President, Evergreen Investment Services, Inc. |
| Treasurer | | |
| DOB: 12/25/1963 | | |
| Term of office since: 1999 | | |
|
| Michael H. Koonce 4 | | Principal occupations: Senior Vice President and General Counsel, Evergreen Investment |
| Secretary | | Services, Inc.; Senior Vice President and Assistant General Counsel, Wachovia Corporation |
| DOB: 4/20/1960 | | |
| Term of office since: 2000 | | |
|
| James Angelos4 | | Principal occupations: Chief Compliance Officer and Senior Vice President, Evergreen Funds; |
| Chief Compliance Officer | | Former Director of Compliance, Evergreen Investment Services, Inc. |
| DOB: 9/2/1947 | | |
| Term of office since: 2004 | | |
|
|
| 1Each Trustee serves until a successor is duly elected or qualified or until his death, resignation, retirement or removal from office. |
| Each Trustee oversees 89 Evergreen funds. Correspondence for each Trustee may be sent to Evergreen Board of Trustees, |
| P.O. Box 20083, Charlotte, NC 28202. |
| 2Mr. Wagoner is an "interested person" of the Fund because of his ownership of shares in Wachovia Corporation, the parent to the |
| Fund's investment advisor. |
| 3The address of the Officer is 401 S. Tryon Street, 20th Floor, Charlotte, NC 28288. |
| 4The address of the Officer is 200 Berkeley Street, Boston, MA 02116. |
Additional information about the Fund's Board of Trustees and Officers can be found in the Statement of Additional Information (SAI) and is available upon request without charge by calling 800.343.2898.
33

566660 rv2 6/2005

| | | table of contents |
| 1 | | LETTER TO SHAREHOLDERS |
| 4 | | FUND AT A GLANCE |
| 5 | | PORTFOLIO MANAGER COMMENTARY |
| 6 | | ABOUT YOUR FUND’S EXPENSES |
| 7 | | FINANCIAL HIGHLIGHTS |
| 8 | | SCHEDULE OF INVESTMENTS |
| 13 | | STATEMENT OF ASSETS AND LIABILITIES |
| 14 | | STATEMENT OF OPERATIONS |
| 15 | | STATEMENTS OF CHANGES IN NET ASSETS |
| 16 | | NOTES TO FINANCIAL STATEMENTS |
| 21 | | REPORT OF INDEPENDENT REGISTERED PUBLIC ACCOUNTING FIRM |
| 24 | | TRUSTEES AND OFFICERS |
This annual report must be preceded or accompanied by a prospectus of the Evergreen fund contained herein. The prospectus contains more complete information, including fees and expenses, and should be read carefully before investing or sending money.
The fund will file its complete schedule of portfolio holdings with the SEC for the first and third quarters of each fiscal year on Form N-Q. The fund’s Form N-Q will be available on the SEC’s Web site at http://www.sec.gov. In addition, the fund’s Form N-Q may be reviewed and copied at the SEC’s Public Reference Room in Washington, D.C. Information on the operation of the Public Reference Room may be obtained by calling 800.SEC.0330.
A description of the fund’s proxy voting policies and procedures, as well as information regarding how the fund voted proxies relating to portfolio securities during the most recent 12-month period ended June 30, is available by visiting our Web site at EvergreenInvestments.com or by visiting the SEC’s Web site at http://www.sec.gov. The fund’s proxy voting policies and procedures are also available without charge, upon request, by calling 800.343.2898.
| Mutual Funds: | | | | |
| NOT FDIC INSURED | | MAY LOSE VALUE | | NOT BANK GUARANTEED |
Evergreen InvestmentsSM is a service mark of Evergreen Investment Management Company, LLC.
Copyright 2005, Evergreen Investment Management Company, LLC.
Evergreen mutual funds are distributed by Evergreen Investment Services, Inc.
200 Berkeley Street, Boston, MA 02116
LETTER TO SHAREHOLDERS
June 2005

Dennis H. Ferro
President and Chief Executive Officer
Dear Shareholder,
We are pleased to provide the annual report for the Evergreen Institutional Mortgage Portfolio, which covers the twelve-month period ended April 30, 2005.
For those investors in the fixed income markets, the past year has provided a variety of challenges and opportunities. In anticipation of this environment, our fixed income portfolio management teams attempted to prepare for a market contending with moderating economic growth and less accommodation from the Federal Reserve (Fed). The question for the markets was no longer the direction of monetary policy, but rather the extent to which interest rates would rise. Using our outlook for a continued economic expansion, we positioned our fixed income portfolios for a gradual tightening of monetary policy.
The fiscal year began with a mixed message on the economy. Growth was good, but it was no longer great, and market interest rates declined on the perceived weakness. However, Fed officials continued to talk up their much anticipated “measured removal of policy accommodation.”
Throughout the confusion, we maintained our belief that the economy had simply transitioned from recovery to expansion. As a result of this transition, a variety of economic reports pointed in different directions. For example, solid retail sales occurred in a month where consumer confidence declined. Historically, the maturation of the economic cycle had experienced similarly erratic behavior. Yet market interest rates began to fluctuate with seemingly every monthly data point. Moreover, the costs for commodities and energy were rising, and since inflation adjusted interest rates had remained low for such a lengthy period, the Fed seemed determined to prevent inflation from becoming a long-term problem. As job growth began to exceed expectations in the Spring of 2004, the market’s inflation fears accelerated, and yields
1
LETTER TO SHAREHOLDERS continued
headed higher in anticipation of tighter Fed policy.
The Fed finally began their “measured removal of policy accommodation” beginning in June of 2004. After three years of stimulative policy actions, monetary policymakers began the journey towards more moderate economic growth. Fed Chairman Alan Greenspan was very transparent in his public statements, attempting to assuage market anxiety. Market interest rates still remained quite volatile during the first half of the fiscal period. Only after the central bank’s first few rate increases did the long-end of the yield curve begin to recover, a process that would continue for the bulk of the fiscal year as the markets concluded that long-term inflation was under control. Chairman Greenspan, however, remained concerned about “complacency” within the bond market, as evidenced by his comments to congressional banking committees in February 2005 that it was a “conundrum” that long-term yields remained low.
Throughout the fiscal year, many of our fixed income managers utilized a variety of strategies within their specific portfolios in order to maximize the total return possibilities for our investors. For example, many of our municipal bond fund managers emphasized the long-end of the curve in an attempt to enhance total return. Other teams used a barbell strategy, seeking opportunities at the short and long end of the Treasury yield curve in an attempt to remain defensive throughout the volatile market activity. Our mortgage portfolio teams employed adjustable rate, commercial, and hybrid products while attempting to navigate the ever changing seas within that marketplace. Our fundamental emphasis on credit quality in the corporate and high yield sectors, however, was not always rewarded, as the markets often pursued riskier issues within a given universe as the yield curve continued to flatten. Finally, our global management teams bought foreign bonds from commodity rich nations such as Australia, New Zealand and Canada in an effort to sustain performance.
We encourage our investors to maintain their diversified, long-term strategies, including mortgage-backed and other asset-backed securities.
2
LETTER TO SHAREHOLDERS continued
Please visit our Web site, EvergreenInvestments.com, for more information about our funds and other investment products available to you. From the Web site, you may also access a detailed Q & A interview with the portfolio manager(s) for your fund. You can easily reach these interviews by following the link, EvergreenInvestments.com/AnnualUpdates, from our Web site. Thank you for your continued support of Evergreen Investments.
Sincerely,

Dennis H. Ferro
President and Chief Executive Officer
Evergreen Investment Company, Inc.
Special Notice to Shareholders:
Please visit our Web site at EvergreenInvestments.com for statements from President and Chief Executive Officer, Dennis Ferro, and Chairman of the Board of the Evergreen Funds, Michael S. Scofield, addressing recent SEC actions involving the Evergreen Funds.
3
FUND AT A GLANCE
as of April 30, 2005
MANAGEMENT TEAM
Tattersall Advisory Group, Inc.
CURRENT INVESTMENT STYLE

Source: Morningstar, Inc.
Morningstar’s style box is based on a portfolio date as of 3/31/2005.
The fixed income style box placement is based on a fund’s average effective maturity or duration and the average credit rating of the bond portfolio.
PERFORMANCE AND RETURNS
Portfolio inception date: 6/19/2002
| | | Class I |
| Class inception date | | 6/19/2002 |
|
| Nasdaq symbol | | EMSFX |
|
| Average annual return | | |
|
| 1-year | | 4.66% |
|
| Since portfolio inception | | 4.43% |
|
| Maximum sales charge | | N/A |
|
Past performance is no guarantee of future results. The performance quoted represents past performance and current performance may be lower or higher. The investment return and principal value of an investment will fluctuate so that investors’ shares, when redeemed, may be worth more or less than their original cost. To obtain performance information current to the most recent month-end, please go to EvergreenInvestments.com/fundperformance. Performance includes the reinvestment of income dividends and capital gain distributions. Performance shown does not reflect the deduction of taxes that a shareholder would pay on fund distributions or the redemption of fund shares.
The advisor is reimbursing the fund for a portion of other expenses. Had expenses not been reimbursed, returns would have been lower.
LONG-TERM GROWTH

Comparison of a $1,000,000 investment in the Evergreen Institutional Mortgage Portfolio Class I shares, versus a similar investment in the Merrill Lynch Mortgage Master Index† (MLMMI) and the Consumer Price Index (CPI).
The MLMMI is an unmanaged market index and does not include transaction costs associated with buying and selling securities, any mutual fund expenses or any taxes. The CPI is a commonly used measure of inflation and does not represent an investment return. It is not possible to invest directly in an index.
4
PORTFOLIO MANAGER COMMENTARY
The fund’s Class I shares returned 4.66% for the twelve-month period ended April 30, 2005. During the same period, the Merrill Lynch Mortgage Master Index (MLMMI) returned 5.65% .
The fund seeks to maximize total return through a combination of current income and capital growth.
Mortgage securities produced positive returns for the fiscal year, outperforming the U.S. Treasury market. While there were some concerns that higher short-term rates could have a negative effect on the housing market as a result of tightening by the Federal Reserve Board, the feared impacts did not materialize during the period. Sales of new and existing homes remained strong throughout the twelve months, while new home construction remained brisk. Additionally, applications for both new mortgages and refinancings remained healthy.
The structure of the mortgage securities market has changed over the last few years, as interest rates have moved higher and home prices have appreciated. The market share of adjustable rate mortgages and other types of hybrid mortgage products has grown dramatically. These products accounted for more than 50% of all new mortgage applications by the end of the fund’s fiscal year.
Our positions in commercial mortgage backed securities (CMBS) added to performance during the period, as they outperformed most residential mortgages throughout the year, benefiting from persistently strong investor demand. In addition, fund performance was helped by our overweight position in new, hybrid mortgage securities. Because of the significant increase in such products, many securities were attractively priced relative to the fixed rate mortgage sector. As more adjustable rate and hybrid mortgage products became available, the yield differences between different types of mortgage products narrowed and hybrids outperformed.
The unanticipated decline in the volatility of interest rates during the year detracted from fund results. Higher volatility tends to have a more negative impact on pass through securities than other mortgage structures, such as commercial mortgage-backed securities. Because we anticipated more interest rate volatility than occurred, we underweighted pass through mortgages, a decision which held back results for the twelve-month period.
Class I shares are only offered to investment advisory clients of an investment advisor of an Evergreen fund (or its advisory affiliates) and through special arrangements entered into on behalf of Evergreen funds with certain financial services firms. Class I shares have a minimum initial investment of $1 million, which may be waived in certain situations.
The fund’s investment objective is nonfundamental and may be changed without the vote of the fund’s shareholders.
U.S. government guarantees apply only to certain securities held in the fund’s portfolio and not to the fund’s shares.
The return of principal is not guaranteed due to fluctuation in the NAV of the fund caused by changes in the price of the individual bonds held by the fund and the buying and selling of bonds by the fund. Bond funds have the same inflation, interest rate and credit risks that are associated with the individual bonds held by the fund. Generally, the value of bonds rise when prevailing interest rates fall and fall when interest rates rise.
† Copyright 2005. Merrill Lynch, Pierce, Fenner & Smith Incorporated. All rights reserved.
All data is as of April 30, 2005, and subject to change.
5
ABOUT YOUR FUND’S EXPENSES
The Example below is intended to describe the fees and expenses borne by shareholders and the impact of those costs on your investment.
Example
As a shareholder of the fund, you incur two types of costs: (1) transaction costs, including sales charges (loads), redemption fees and exchange fees; and (2) ongoing costs, including management fees, distribution (12b-1) fees and other fund expenses. This Example is intended to help you understand your ongoing costs (in dollars) of investing in the fund and to compare these costs with the ongoing costs of investing in other mutual funds. The Example is based on an investment of $1,000 invested at the beginning of the period and held for the entire period from November 1, 2004 to April 30, 2005.
The example illustrates your fund’s costs in two ways:
• Actual expenses
The section in the table under the heading “Actual” provides information about actual account values and actual expenses. You may use the information in these columns, together with the amount you invested, to estimate the expenses that you paid over the period. Simply divide your account value by $1,000 (for example, an $8,600 account value divided by $1,000 = 8.6), then multiply the result by the number in the appropriate column for your share class, in the column entitled “Expenses Paid During Period” to estimate the expenses you paid on your account during this period.
• Hypothetical example for comparison purposes
The section in the table under the heading “Hypothetical (5% return before expenses)” provides information about hypothetical account values and hypothetical expenses based on the fund’s actual expense ratio and an assumed rate of return of 5% per year before expenses, which is not the fund’s actual return. The hypothetical account values and expenses may not be used to estimate the actual ending account balance or expenses you paid for the period. You may use this information to compare the ongoing costs of investing in the fund and other funds. To do so, compare this 5% hypothetical example with the 5% hypothetical examples that appear in the shareholder reports of the other funds.
Please note that the expenses shown in the table are meant to highlight your ongoing costs only and do not reflect any transactional costs, such as sales charges (loads), redemption fees or exchange fees. Therefore, the section in the table under the heading “Hypothetical (5% return before expenses)” is useful in comparing ongoing costs only, and will not help you determine the relative total costs of owning different funds. In addition, if these transactional costs were included, your costs would have been higher.
| | | Beginning | | Ending | | |
| | | Account | | Account | | Expenses |
| | | Value | | Value | | Paid During |
| | | 11/1/2004 | | 4/30/2005 | | Period* |
|
| Actual | | | | | | |
| Class I | | $ 1,000.00 | | $ 1,009.62 | | $ 1.00 |
| Hypothetical | | | | | | |
| (5% return | | | | | | |
| before expenses) | | | | | | |
| Class I | | $ 1,000.00 | | $ 1,023.80 | | $ 1.00 |
|
* Expenses are equal to the Fund’s annualized expense ratio (0.20% for Class I), multiplied by the average account value over the period, multiplied by 181 / 365 days.
6
FINANCIAL HIGHLIGHTS
(For a share outstanding throughout each period)
| | | Year Ended April 30, |
| |
|
| CLASS I | | 2005 | | | | 2004 | | 20031 |
|
| Net asset value, beginning of period | | $ 9.89 | | $ | | 10.18 | | $ 10.00 |
|
| Income from investment operations | | | | | | | | |
| Net investment income (loss) | | 0.35 | | | | 0.35 | | 0.40 |
Net realized and unrealized gains
or losses on securities | | 0.10 | | | | (0.18) | | 0.23 |
| |
|
| Total from investment operations | | 0.45 | | | | 0.17 | | 0.63 |
|
| Distributions to shareholders from | | | | | | | | |
| Net investment income | | (0.45) | | | | (0.45) | | (0.40) |
| Net realized gains | | 0 | | | | (0.01) | | (0.05) |
| |
|
| Total distributions to shareholders | | (0.45) | | | | (0.46) | | (0.45) |
|
| Net asset value, end of period | | $ 9.89 | | $ | | 9.89 | | $ 10.18 |
|
| Total return | | 4.66% | | | | 1.63% | | 6.45% |
|
| Ratios and supplemental data | | | | | | | | |
| Net assets, end of period (thousands) | | $45,997 | | $48,032 | | $28,423 |
| Ratios to average net assets | | | | | | | | |
Expenses including waivers/reimbursements
and excluding expense reductions | | 0.20% | | | | 0.20% | | 0.12%2 |
Expenses excluding waivers/reimbursements
and expense reductions | | 0.24% | | | | 0.28% | | 0.45%2 |
| Net investment income (loss) | | 3.44% | | | | 3.33% | | 4.74%2 |
| Portfolio turnover rate | | 177% | | | | 327% | | 148% |
|
1 For the period from June 19, 2002 (commencement of operations), to April 30, 2003.
2 Annualized
See Notes to Financial Statements
7
SCHEDULE OF INVESTMENTS
April 30, 2005
| | | | | Principal | | | | |
| | | | | Amount | | | | Value |
|
| AGENCY COMMERCIAL MORTGAGE-BACKED SECURITIES 12.1% | | | | | | |
| FIXED-RATE 12.1% | | | | | | | | |
| FHLMC: | | | | | | | | |
| 6.90%, 12/01/2010 (h) | | | | $ 545,000 | | $ | | 604,242 |
| 6.98%, 10/01/2010 (h) | | | | 448,458 | | | | 495,815 |
| FNMA: | | | | | | | | |
| 4.83%, 03/01/2013 | | | | 681,585 | | | | 690,879 |
| 5.63%, 11/01/2005 | | | | 661,734 | | | | 661,512 |
| 5.65%, 02/01/2009 | | | | 240,593 | | | | 245,730 |
| 6.01%, 02/01/2012 | | | | 328,898 | | | | 353,751 |
| 6.09%, 05/01/2011 | | | | 381,725 | | | | 409,688 |
| 6.65%, 12/01/2007 | | | | 227,614 | | | | 238,007 |
| 6.79%, 07/01/2009 | | | | 94,489 | | | | 101,923 |
| 6.91%, 07/01/2009 | | | | 283,901 | | | | 307,385 |
| 7.09%, 07/01/2009 | | | | 281,381 | | | | 306,111 |
| 7.19%, 05/01/2007 | | | | 271,362 | | | | 281,943 |
| 7.29%, 12/01/2010 | | | | 421,866 | | | | 474,133 |
| 7.37%, 08/01/2006 | | | | 362,609 | | | | 371,914 |
| |
|
Total Agency Commercial Mortgage-Backed Securities
(cost $5,782,873) | | | | | | 5,543,033 |
| |
|
| AGENCY MORTGAGE-BACKED COLLATERALIZED | | | | | | | | |
| MORTGAGE OBLIGATIONS 15.3% | | | | | | | | |
| FIXED-RATE 15.3% | | | | | | | | |
| FHLMC: | | | | | | | | |
| Ser. 2264, Class PL, 7.00%, 10/15/2030 | | | | 610,447 | | | | 625,988 |
| Ser. 2748, Class LE, 4.50%, 12/15/2017 | | | | 710,000 | | | | 701,942 |
| Ser. 2780, Class BD, 4.50%, 10/15/2017 | | | | 335,000 | | | | 335,728 |
| Ser. 2840, Class NC, 5.50%, 03/15/2028 | | | | 445,000 | | | | 455,850 |
| Ser. 2841, Class PC, 5.50%, 07/15/2030 | | | | 870,000 | | | | 891,083 |
| Ser. 2923, Class QC, 5.50%, 05/15/2028 | | | | 425,000 | | | | 435,367 |
| Ser. 2962, Class XB, 5.50%, 05/15/2029 (h) | | | | 1,230,000 | | | | 1,257,429 |
| FNMA: | | | | | | | | |
| Ser. 2001-71, Class QE, 6.00%, 12/25/2016 | | | | 460,000 | | | | 476,677 |
| Ser. 2004-26, Class PA, 4.50%, 09/25/2025 | | | | 550,000 | | | | 553,858 |
| Ser. 2005-7, Class AC, 4.00%, 02/25/2020 | | | | 380,000 | | | | 350,397 |
| Ser. 2005-25, Class PC, 5.50%, 07/25/2028 | | | | 415,000 | | | | 424,508 |
| Ser. 2005-40, Class AC, 4.50%, 02/25/2031 | | | | 525,000 | | | | 522,247 |
| |
|
| Total Agency Mortgage-Backed Collateralized Mortgage Obligations | | | | | | |
| (cost $7,027,527) | | | | | | | | 7,031,074 |
| |
|
| AGENCY MORTGAGE-BACKED PASS THROUGH SECURITIES 25.2% | | | | | | |
| FIXED-RATE 25.2% | | | | | | | | |
| FHLMC: | | | | | | | | |
| 4.50%, TBA # | | | | 1,325,000 | | | | 1,278,625 |
| 6.50%, TBA # | | | | 830,000 | | | | 863,979 |
See Notes to Financial Statements
8
SCHEDULE OF INVESTMENTS continued
April 30, 2005
| | | Principal | | | | |
| | | Amount | | | | Value |
|
| AGENCY MORTGAGE-BACKED PASS THROUGH SECURITIES continued | | | | | | |
| FIXED-RATE continued | | | | | | |
| FNMA: | | | | | | |
| 4.50%, TBA # | | $ 3,675,000 | | $ | | 3,635,953 |
| 5.00%, TBA # | | 375,000 | | | | 377,695 |
| 5.50%, TBA # | | 3,600,000 | | | | 3,634,877 |
| 6.50%, 07/01/2032 - 08/01/2032 | | 1,226,314 | | | | 1,276,909 |
| 7.00%, 05/01/2032 | | 86,994 | | | | 91,945 |
| 7.50%, 11/01/2029 - 12/01/2029 | | 39,649 | | | | 42,530 |
| GNMA, 3.50%, 07/20/2030 | | 389,518 | | | | 394,060 |
| |
|
| Total Agency Mortgage-Backed Pass Through Securities | | | | | | |
| (cost $11,536,922) | | | | | | 11,596,573 |
| |
|
| AGENCY REPERFORMING MORTGAGE-BACKED COLLATERALIZED | | | | | | |
| MORTGAGE OBLIGATIONS 4.6% | | | | | | |
| FNMA: | | | | | | |
| Ser. 2003-W14, Class 1A6, 5.82%, 09/25/2043 | | 345,000 | | | | 353,752 |
| Ser. 2003-W19, Class 1A5, 5.50%, 11/25/2033 | | 1,705,000 | | | | 1,739,799 |
| |
|
| Total Agency Reperforming Mortgage-Backed Collateralized | | | | | | |
| Mortgage Obligations (cost $2,133,657) | | | | | | 2,093,551 |
| |
|
| AGENCY REPERFORMING MORTGAGE-BACKED PASS | | | | | | |
| THROUGH SECURITIES 7.8% | | | | | | |
| FHLMC, Ser. T-55, Class 1A2, 7.00%, 03/25/2043 | | 527,721 | | | | 550,890 |
| FNMA: | | | | | | |
| Ser. 2001-T10, Class A1, 7.00%, 12/25/2041 | | 147,596 | | | | 154,562 |
| Ser. 2002-26, Class A1, 7.00%, 01/25/2048 | | 767,753 | | | | 812,379 |
| Ser. 2003-W2, Class 1A2, 7.00%, 07/25/2042 | | 226,780 | | | | 238,261 |
| Ser. 2003-W6, Class 3A, 6.50%, 09/25/2042 | | 330,718 | | | | 349,308 |
| Ser. 2004-W1, Class 2A2, 7.00%, 12/25/2033 | | 579,051 | | | | 609,988 |
| Ser. 2004-W9, Class 2A1, 6.50%, 02/25/2044 | | 338,810 | | | | 351,101 |
| Ser. 2004-W12, Class 1A1, 6.00%, 07/25/2044 | | 518,426 | | | | 538,572 |
| |
|
| Total Agency Reperforming Mortgage-Backed Pass Through Securities | | | | | | |
| (cost $3,650,577) | | | | | | 3,605,061 |
| |
|
| ASSET-BACKED SECURITIES 0.4% | | | | | | |
| Vanderbilt Mtge. & Fin., Inc., Ser. 2002-B, Class A3, 4.70%, 10/17/2018 | | | | | | |
| (cost $169,989) | | 170,000 | | | | 169,569 |
| |
|
| COMMERCIAL MORTGAGE-BACKED SECURITIES 10.7% | | | | | | |
| FIXED-RATE 10.7% | | | | | | |
| Asset Securitization Corp., Ser. 1997-D4, Class A-1D, 7.49%, 04/14/2029 | | 412,343 | | | | 434,978 |
| Bear Stearns Comml. Mtge. Securities, Inc., Ser. 2001-TOP2, Class A1, 6.08%, | | | | | | |
| 02/15/2035 | | 228,564 | | | | 236,242 |
| Commercial Mtge. Pass-Through Cert., Ser. 2004-LB3A, Class A5, 5.44%, | | | | | | |
| 11/25/2033 | | 620,000 | | | | 643,507 |
See Notes to Financial Statements
9
SCHEDULE OF INVESTMENTS continued
April 30, 2005
| | | Principal | | | | |
| | | Amount | | | | Value |
|
| COMMERCIAL MORTGAGE-BACKED SECURITIES continued | | | | | | |
| FIXED-RATE continued | | | | | | |
| Credit Suisse First Boston Mtge. Securities Corp., Ser. 2003-CK2, Class A1, 3.01%, | | | | | | |
| 03/15/2036 | | $ 416,988 | | $ | | 407,612 |
| JPMorgan Chase & Co. Comml. Mtge. Securities Corp., Ser. 2004-PNC1, Class A4, | | | | | | |
| 5.55%, 06/12/2041 | | 345,000 | | | | 359,453 |
| LB-UBS Comml. Mtge. Trust: | | | | | | |
| Ser. 2000-C4, Class A1, 7.18%, 09/15/2009 | | 310,615 | | | | 329,531 |
| Ser. 2003-C5, Class A2, 3.48%, 07/15/2027 | | 455,000 | | | | 444,934 |
| Lehman Brothers Comml. Conduit Mtge. Trust, Ser. 1999-C1, Class A1, 6.41%, | | | | | | |
| 06/15/2031 | | 440,544 | | | | 451,535 |
| Morgan Stanley Capital I, Inc.: | | | | | | |
| Ser. 1998-XL1, Class A2, 6.45%, 06/03/2030 | | 625,000 | | | | 625,392 |
| Ser. 2003-T11, Class A4, 5.15%, 06/13/2041 | | 670,000 | | | | 685,483 |
| Wachovia Bank Comml. Mtge. Trust, Ser. 2003-C8, Class A1, 3.44%, | | | | | | |
| 11/15/2035 | | 318,287 | | | | 311,260 |
| |
|
| Total Commercial Mortgage-Backed Securities (cost $5,043,020) | | | | | | 4,929,927 |
| |
|
| U.S. TREASURY OBLIGATIONS 1.1% | | | | | | |
| U.S. Treasury Notes: | | | | | | |
| 2.25%, 02/15/2007 | | 30,000 | | | | 29,306 |
| 3.375%, 01/15/2007 - 11/15/2008 | | 351,771 | | | | 360,437 |
| 5.00%, 08/15/2011 | | 100,000 | | | | 105,606 |
| |
|
| Total U.S. Treasury Obligations (cost $495,675) | | | | | | 495,349 |
| |
|
| WHOLE LOAN MORTGAGE-BACKED COLLATERALIZED | | | | | | |
| MORTGAGE OBLIGATIONS 11.1% | | | | | | |
| FIXED-RATE 10.2% | | | | | | |
| Banc of America Mtge. Securities, Inc., Ser. 2005-D, Class 2A6, 4.81%, | | | | | | |
| 05/25/2035 (h) | | 230,000 | | | | 230,207 |
| GSR Mtge. Loan Trust, Ser. 2004-12, Class 3A6, 4.50%, 12/25/2034 | | 465,000 | | | | 452,042 |
| MASTR Adjustable Rate Mtge. Trust, Ser. 2004-13, Class 3A7, 3.79%, | | | | | | |
| 12/21/2034 | | 420,000 | | | | 402,923 |
| Structured Adjustable Rate Mtge. Loan Trust, Ser. 2004-8, Class 5A3, 4.72%, | | | | | | |
| 07/25/2034 | | 460,000 | | | | 453,885 |
| Washington Mutual, Inc.: | | | | | | |
| Ser. 2004-AR4, Class A6, 3.81%, 06/25/2034 | | 915,000 | | | | 894,620 |
| Ser. 2004-AR7, Class A6, 3.95%, 07/25/2034 | | 1,460,000 | | | | 1,434,522 |
| Ser. 2005-AR5, Class A5, 4.69%, 05/25/2035 (h) | | 415,000 | | | | 413,631 |
| Wells Fargo Mtge. Backed Securities Trust, Ser. 2004-S, Class A7, 3.54%, | | | | | | |
| 09/25/2034 | | 440,000 | | | | 425,834 |
| |
|
| | | | | | | 4,707,664 |
| |
|
| FLOATING-RATE 0.9% | | | | | | |
| Washington Mutual, Inc., Ser. 2005-AR6, Class 2AB3, 3.30%, 04/25/2045 (h) | | 415,000 | | | | 415,000 |
| |
|
| Total Whole Loan Mortgage-Backed Collateralized Mortgage | | | | | | |
| Obligations (cost $5,109,065) | | | | | | 5,122,664 |
| |
|
See Notes to Financial Statements
10
SCHEDULE OF INVESTMENTS continued
April 30, 2005
| | | | | Principal | | | | |
| | | | | Amount | | | | Value |
|
| WHOLE LOAN MORTGAGE-BACKED PASS THROUGH SECURITIES 5.1% | | | | | | |
| FIXED-RATE 3.9% | | | | | | | | |
| MASTR Adjustable Rate Mtge. Trust: | | | | | | | | |
| Ser. 2004-13, Class 2A1, 3.82%, 12/21/2034 | | | | $ 528,685 | | $ | | 522,051 |
| Ser. 2004-13, Class 3A1, 3.79%, 12/21/2034 | | | | 285,000 | | | | 281,106 |
| Morgan Stanley Mtge. Loan Trust, Ser. 2004-8AR, Class 4A1, 5.44%, | | | | | | | | |
| 10/25/2034 | | | | 394,434 | | | | 400,860 |
| Washington Mutual, Inc., Ser. 2005-AR3, Class A1, 4.66%, 03/25/2035 (h) | | | | 204,297 | | | | 203,970 |
| Wells Fargo Mtge. Backed Securities Trust, Ser. 2005-AR1, Class 1A1, 4.57%, | | | | | | |
| 02/25/2035 (h) | | | | 403,831 | | | | 402,499 |
| |
|
| | | | | | | | | 1,810,486 |
| |
|
| FLOATING-RATE 1.2% | | | | | | | | |
| IndyMac Index Mtge. Loan Trust: | | | | | | | | |
| Ser. 2004-AR5, Class 2A1A, 3.45%, 08/25/2034 | | | | 346,389 | | | | 346,389 |
| Ser. 2004-AR7, Class A2, 3.45%, 09/25/2034 | | | | 209,260 | | | | 209,869 |
| |
|
| | | | | | | | | 556,258 |
| |
|
| Total Whole Loan Mortgage-Backed Pass Through Securities | | | | | | | | |
| (cost $2,371,898) | | | | | | | | 2,366,744 |
| | |
|
|
| | | | | Shares | | | | Value |
|
| SHORT-TERM INVESTMENTS 27.5% | | | | | | | | |
| MUTUAL FUND SHARES 27.5% | | | | | | | | |
| Evergreen Institutional Money Market Fund ø ## (cost $12,666,217) | | | | 12,666,217 | | | | 12,666,217 |
| |
|
| Total Investments (cost $55,987,420) 120.9% | | | | | | | | 55,619,762 |
| Other Assets and Liabilities (20.9%) | | | | | | | | (9,622,332) |
| |
|
| Net Assets 100.0% | | | | | | $ | | 45,997,430 |
| |
|
| (h) | | Security is valued at fair value as determined in good faith under procedures established by the Board of Trustees. |
| # | | When-issued or delayed delivery security |
| ø | | Evergreen Investment Management Company, LLC is the investment advisor to both the Fund and the money market |
| | | fund. |
| ## | | All or a portion of this security has been segregated for when-issued or delayed delivery securities. |
Summary of Abbreviations |
| FHLMC | | Federal Home Loan Mortgage Corp. |
| FNMA | | Federal National Mortgage Association |
| GNMA | | Government National Mortgage Association |
| MASTR | | Mortgage Asset Securitization Transactions, Inc. |
| TBA | | To Be Announced |
See Notes to Financial Statements
11
SCHEDULE OF INVESTMENTS continued
April 30, 2005
| The following table shows the percent of total bonds by credit quality based on Moody’s and Standard & Poor’s ratings as of |
| April 30, 2005 (unaudited): | | | |
| AAA | | 100.0% | |
| | |
| |
| |
| The following table shows the percent of total bonds by maturity as of April 30, 2005 (unaudited): |
| Less than 1 year | | 3.0% | |
| 1 to 3 year(s) | | 21.9% | |
| 3 to 5 years | | 30.4% | |
| 5 to 10 years | | 42.9% | |
| 10 to 20 years | | 1.8% | |
| |
| |
| | | 100.0% | |
| | |
| |
See Notes to Financial Statements
12
STATEMENT OF ASSETS AND LIABILITIES
April 30, 2005
| Assets | | | | |
| Investments in securities, at value (cost $43,321,203) | | $ | | 42,953,545 |
| Investments in affiliates, at value (cost $12,666,217) | | | | 12,666,217 |
| Receivable for securities sold | | | | 2,744,577 |
| Interest receivable | | | | 192,863 |
| Receivable from investment advisor | | | | 127 |
| Prepaid expenses and other assets | | | | 1,021 |
|
| Total assets | | | | 58,558,350 |
|
| Liabilities | | | | |
| Dividends payable | | | | 105,756 |
| Payable for securities purchased | | | | 12,436,796 |
| Due to custodian bank | | | | 109 |
| Due to related parties | | | | 428 |
| Accrued expenses and other liabilities | | | | 17,831 |
|
| Total liabilities | | | | 12,560,920 |
|
| Net assets | | $ | | 45,997,430 |
|
| Net assets represented by | | | | |
| Paid-in capital | | $ | | 47,105,457 |
| Undistributed net investment income | | | | 15,514 |
| Accumulated net realized losses on securities | | | | (755,883) |
| Net unrealized losses on securities | | | | (367,658) |
|
| Total net assets | | $ | | 45,997,430 |
|
| Shares outstanding (unlimited number of shares authorized) Class I | | | | 4,649,155 |
|
| Net asset value per share Class I | | $ | | 9.89 |
|
See Notes to Financial Statements
13
STATEMENT OF OPERATIONS
Year Ended April 30, 2005
| Investment income | | | | |
| Interest | | $ | | 1,467,400 |
| Income from affiliates | | | | 132,277 |
|
| Total investment income | | | | 1,599,677 |
|
| Expenses | | | | |
| Administrative services fee | | | | 43,854 |
| Transfer agent fees | | | | 1,654 |
| Trustees’ fees and expenses | | | | 3,494 |
| Printing and postage expenses | | | | 23,728 |
| Custodian and accounting fees | | | | 14,350 |
| Registration and filing fees | | | | 3,493 |
| Professional fees | | | | 14,778 |
| Other | | | | 1,134 |
|
| Total expenses | | | | 106,485 |
| Less: Expense reductions | | | | (636) |
| Expense reimbursements | | | | (18,010) |
|
| Net expenses | | | | 87,839 |
|
| Net investment income | | | | 1,511,838 |
|
| Net realized and unrealized gains or losses on securities | | | | |
| Net realized gains on securities | | | | 238,855 |
| Net change in unrealized gains or losses on securities | | | | 286,092 |
|
| Net realized and unrealized gains or losses on securities | | | | 524,947 |
|
| Net increase in net assets resulting from operations | | $ | | 2,036,785 |
|
See Notes to Financial Statements
14
STATEMENTS OF CHANGES IN NET ASSETS
| | | Year Ended April 30, |
| |
|
| | | 2005 | | 2004 |
|
| Operations | | | | | | | | | | |
| Net investment income | | $ | | 1,511,838 | | | | $ | | 1,415,351 |
| Net realized gains on securities | | | | 238,855 | | | | | | 39,480 |
| Net change in unrealized gains or losses | | | | | | | | | | |
| on securities | | | | 286,092 | | | | | | (831,977) |
|
| Net increase in net assets resulting | | | | | | | | | | |
| from operations | | | | 2,036,785 | | | | | | 622,854 |
|
| Distributions to shareholders from | | | | | | | | | | |
| Net investment income | | | | (2,005,765) | | | | | | (1,955,655) |
| Net realized gains | | | | 0 | | | | | | (29,097) |
|
| Total distributions to shareholders | | | | (2,005,765) | | | | | | (1,984,752) |
|
| | | Shares | | | | Shares | | | | |
| Capital share transactions | | | | | | | | | | |
| Proceeds from shares sold | | 1,761,382 | | 17,425,251 | | 4,337,076 | | | | 43,802,985 |
| Net asset value of shares issued in | | | | | | | | | | |
| reinvestment of distributions | | 77,323 | | 766,452 | | 77,764 | | | | 778,751 |
| Payment for shares redeemed | | (2,048,098) | | (20,257,682) | | (2,349,536) | | | | (23,610,741) |
|
| Net increase (decrease) in net assets | | | | | | | | | | |
| resulting from capital share | | | | | | | | | | |
| transactions | | | | (2,065,979) | | | | | | 20,970,995 |
|
| Total increase (decrease) in net assets | | | | (2,034,959) | | | | | | 19,609,097 |
| Net assets | | | | | | | | | | |
| Beginning of period | | | | 48,032,389 | | | | | | 28,423,292 |
|
| End of period | | $ | | 45,997,430 | | | | $ | | 48,032,389 |
|
| Undistributed net investment income | | $ | | 15,514 | | | | $ | | 27,913 |
|
See Notes to Financial Statements
15
NOTES TO FINANCIAL STATEMENTS
1. ORGANIZATION
Evergreen Institutional Mortgage Portfolio (the “Fund”) is a diversified series of Evergreen Fixed Income Trust (the “Trust”), a Delaware statutory trust organized on September 18, 1997. The Trust is an open-end management investment company registered under the Investment Company Act of 1940, as amended (the “1940 Act”).
The Fund offers Institutional (“Class I”) shares. Class I shares are sold without a front-end sales charge or contingent deferred sales charge. Shares of the Fund are only offered to investment advisory clients of an investment advisor of an Evergreen fund (or its advisory affiliates) and through special arrangements entered into on behalf of the Evergreen funds with certain financial services firms.
2. SIGNIFICANT ACCOUNTING POLICIES
The following is a summary of significant accounting policies consistently followed by the Fund in the preparation of its financial statements. The policies are in conformity with generally accepted accounting principles in the United States of America, which require management to make estimates and assumptions that affect amounts reported herein. Actual results could differ from these estimates.
a. Valuation of investments
Portfolio debt securities acquired with more than 60 days to maturity are fair valued using matrix pricing methods determined by an independent pricing service which takes into consideration such factors as similar security prices, yields, maturities, liquidity and ratings. Securities for which valuations are not readily available from an independent pricing service may be valued by brokers which use prices provided by market makers or estimates of market value obtained from yield data relating to investments or securities with similar characteristics.
Short-term securities with remaining maturities of 60 days or less at the time of purchase are valued at amortized cost, which approximates market value.
Investments in other mutual funds are valued at net asset value. Securities for which market quotations are not readily available or not reflective of current market value are valued at fair value as determined in good faith, according to procedures approved by the Board of Trustees.
b. When-issued and delayed delivery transactions
The Fund records when-issued or delayed delivery securities as of trade date and maintains security positions such that sufficient liquid assets will be available to make payment for the securities purchased. Securities purchased on a when-issued or delayed delivery basis are marked-to-market daily and begin earning interest on the settlement date. Losses may occur on these transactions due to changes in market conditions or the failure of counterparties to perform under the contract.
c. Dollar roll transactions
The Fund may enter into dollar roll transactions with respect to mortgage-backed securities. In a dollar roll transaction, the Fund sells mortgage-backed securities to financial institutions and
16
NOTES TO FINANCIAL STATEMENTS continued
simultaneously agrees to accept substantially similar (same type, coupon and maturity) securities at a later date at an agreed upon price. The Fund will use the proceeds generated from the transactions to invest in short-term investments, which may enhance the Fund’s current yield and total return. The Fund accounts for dollar roll transactions as purchases and sales. The Fund could be exposed to risks if the counterparty defaults on its obligation to perform under the terms of the agreement, if the Fund receives inferior securities in comparison to what was sold to the counterparty at redelivery or if there are variances in paydown speed between the mortgage-related pools.
d. Security transactions and investment income
Security transactions are recorded on trade date. Realized gains and losses are computed using the specific cost of the security sold. Interest income is recorded on the accrual basis and includes accretion of discounts and amortization of premiums.
e. Federal taxes
The Fund intends to continue to qualify as a regulated investment company and distribute all of its taxable income, including any net capital gains (which have already been offset by available capital loss carryovers). Accordingly, no provision for federal taxes is required.
f. Distributions
Distributions to shareholders from net investment income are accrued daily and paid monthly. Distributions from net realized gains, if any, are recorded on the ex-dividend date. Such distributions are determined in conformity with income tax regulations, which may differ from generally accepted accounting principles.
Reclassifications have been made to the Fund’s components of net assets to reflect income and gains available for distribution (or available capital loss carryovers, as applicable) under income tax regulations. The primary permanent differences causing such reclassifications are due to mortgage paydown gains and losses. During the year ended April 30, 2005, the following amounts were reclassified:
|
| Accumulated net realized losses on securities | | $ | | (481,528) |
| Undistributed net investment income | | | | 481,528 |
|
3. ADVISORY FEE AND OTHER TRANSACTIONS WITH AFFILIATES
Evergreen Investment Management Company, LLC (“EIMC”), an indirect, wholly-owned subsidiary of Wachovia Corporation (“Wachovia”), is the investment advisor to the Fund. The Fund does not pay a fee for the investment advisory service.
Tattersall Advisory Group, Inc., an indirect, wholly-owned subsidiary of Wachovia, is the investment sub-advisor to the Fund and is paid by EIMC for its services to the Fund.
From time to time, EIMC may voluntarily or contractually reimburse other expenses in order to limit operating expenses. During the year ended April 30, 2005, EIMC reimbursed other expenses in the amount of $18,010 which represents 0.04% of the Fund’s average daily net assets.
17
NOTES TO FINANCIAL STATEMENTS continued
Evergreen Investment Services, Inc. (“EIS”), an indirect, wholly-owned subsidiary of Wachovia, is the administrator to the Fund. As administrator, EIS provides the Fund with facilities, equipment and personnel and is paid an annual rate determined by applying percentage rates to the aggregate average daily net assets of the Evergreen funds (excluding money market funds), starting at 0.10% and declining to 0.05% as the aggregate average daily net assets of the Evergreen funds (excluding money market funds) increase.
Evergreen Service Company, LLC (“ESC”), an indirect, wholly-owned subsidiary of Wachovia, is the transfer and dividend disbursing agent for the Fund. ESC receives account fees that vary based on the type of account held by the shareholders in the Fund.
4. SECURITIES TRANSACTIONS
Cost of purchases and proceeds from sales of investment securities (excluding short-term securities and mortgage dollar roll transactions) were as follows for the year ended April 30, 2005:
| Cost of Purchases | | Proceeds from Sales |
|
| | | Non-U.S. | | | | Non-U.S. |
| U.S. Government | | Government | | U.S. Government | | Government |
|
| $ 65,085,777 | | $ 16,010,113 | | $ 69,444,713 | | $ 6,506,731 |
|
On April 30, 2005, the aggregate cost of securities for federal income tax purposes was $55,989,897. The gross unrealized appreciation and depreciation on securities based on tax cost was $161,949 and $532,084, respectively, with a net unrealized depreciation of $370,135.
As of April 30, 2005, the Fund had $590,832 in capital loss carryovers for federal income tax purposes with $512,937 expiring in 2012 and $77,895 expiring in 2013.
For income tax purposes, capital losses incurred after October 31 within the Fund’s fiscal year are deemed to arise on the first business day of the following fiscal year. As of April 30, 2005, the Fund incurred and will elect to defer post-October losses of $162,574.
5. INTERFUND LENDING
Pursuant to an Exemptive Order issued by the SEC, the Fund may participate in an interfund lending program with certain funds in the Evergreen fund family. This program allows the Fund to borrow from, or lend money to, other participating funds. During the year ended April 30, 2005, the Fund did not participate in the interfund lending program.
6. DISTRIBUTIONS TO SHAREHOLDERS
As of April 30, 2005, the components of distributable earnings on a tax basis were as follows:
| | | | | Capital Loss |
| Undistributed | | Unrealized | | Carryovers and |
| Ordinary Income | | Depreciation | | Post-October Loss |
|
| $ 15,514 | | $ 370,135 | | $ 753,406 |
|
18
NOTES TO FINANCIAL STATEMENTS continued
The differences between the components of distributable earnings on a tax basis and the amounts reflected in the Statement of Assets and Liabilities are primarily due to wash sales.
The tax character of distributions paid were $2,005,765 and $1,984,752 of ordinary income for the years ended April 30, 2005 and April 30, 2004, respectively.
7. EXPENSE REDUCTIONS
Through expense offset arrangements with ESC and the Fund’s custodian, a portion of fund expenses has been reduced.
8. DEFERRED TRUSTEES’ FEES
Each Trustee of the Fund may defer any or all compensation related to performance of their duties as Trustees. The Trustees’ deferred balances are allocated to deferral accounts, which are included in the accrued expenses for the Fund. The investment performance of the deferral accounts are based on the investment performance of certain Evergreen funds. Any gains earned or losses incurred in the deferral accounts are reported in the Fund’s Trustees’ fees and expenses. At the election of the Trustees, the deferral account will be paid either in one lump sum or in quarterly installments for up to ten years.
9. FINANCING AGREEMENT
The Fund and certain other Evergreen funds share in a $150 million unsecured revolving credit commitment for temporary and emergency purposes, including the funding of redemptions, as permitted by each participating fund’s borrowing restrictions. Borrowings under this facility bear interest at 0.50% per annum above the Federal Funds rate. All of the participating funds are charged an annual commitment fee of 0.09% of the unused balance, which is allocated pro rata. During the year ended April 30, 2005, the Fund had no borrowings under this agreement.
10. REGULATORY MATTERS AND LEGAL PROCEEDINGS
Since September 2003, governmental and self-regulatory authorities have instituted numerous ongoing investigations of various practices in the mutual fund industry, including investigations relating to revenue sharing, market-timing, late trading and record retention, among other things. The investigations cover investment advisors, distributors and transfer agents to mutual funds, as well as other firms. EIMC, EIS and ESC (collectively, “Evergreen”) have received subpoenas and other requests for documents and testimony relating to these investigations, are endeavoring to comply with those requests, and are cooperating with the investigations. Evergreen is continuing its own internal review of policies, practices, procedures and personnel, and is taking remedial action where appropriate.
In connection with one of these investigations, on July 28, 2004, the staff of the Securities and Exchange Commission (“SEC”) informed Evergreen that the staff intends to recommend to the SEC that it institute an enforcement action against Evergreen. The SEC staff’s proposed allegations relate to (i) an arrangement pursuant to which a broker at one of EIMC’s affiliated broker-dealers had been authorized, apparently by an EIMC officer (no longer with EIMC), to
19
NOTES TO FINANCIAL STATEMENTS continued
engage in short-term trading, on behalf of a client, in Evergreen Mid Cap Growth Fund (formerly Evergreen Emerging Growth Fund and prior to that, known as Evergreen Small Company Growth Fund) during the period from December 2000 through April 2003, in excess of the limitations set forth in the fund’s prospectus, (ii) short-term trading from September 2001 through January 2003, by a former Evergreen portfolio manager, of Evergreen Precious Metals Fund, a fund he managed at the time, (iii) the sufficiency of systems for monitoring exchanges and enforcing exchange limitations as stated in the fund’s prospectuses, and (iv) the adequacy of e-mail retention practices. In connection with the activity in Evergreen Mid Cap Growth Fund, EIMC reimbursed the fund $378,905, plus an additional $25,242, representing what EIMC calculated at that time to be the client’s net gain and the fees earned by EIMC and the expenses incurred by this fund on the client’s account. In connection with the activity in Evergreen Precious Metals Fund, EIMC reimbursed the fund $70,878, plus an additional $3,075, representing what EIMC calculated at that time to be the portfolio manager’s net gain and the fees earned by EIMC and expenses incurred by the fund on the portfolio manager’s account. Evergreen is currently engaged in discussions with the staff of the SEC concerning its recommendation.
Any resolution of these matters with regulatory authorities may include, but not be limited to, sanctions, penalties or injunctions regarding Evergreen, restitution to mutual fund shareholders and/or other financial penalties and structural changes in the governance or management of Evergreen’s mutual fund business. Any penalties or restitution will be paid by Evergreen and not by the Evergreen funds.
In addition, the Evergreen funds and EIMC and certain of its affiliates are involved in various legal actions, including private litigation and class action lawsuits. EIMC does not expect that any of such legal actions currently pending or threatened will have a material adverse impact on the financial position or operations of any of the Evergreen funds or on EIMC’s ability to provide services to the Evergreen funds.
Although Evergreen believes that neither the foregoing investigations nor any pending or threatened legal actions will have a material adverse impact on the Evergreen funds, there can be no assurance that these matters and any publicity surrounding or resulting from them will not result in reduced sales or increased redemptions of Evergreen fund shares, which could increase Evergreen fund transaction costs or operating expenses, or have other adverse consequences on the Evergreen funds.
20
REPORT OF INDEPENDENT REGISTERED PUBLIC ACCOUNTING FIRM
Board of Trustees and Shareholders
Evergreen Fixed Income Trust
We have audited the accompanying statement of assets and liabilities, including the schedule of investments, of the Evergreen Institutional Mortgage Portfolio, a series of Evergreen Fixed Income Trust, as of April 30, 2005, and the related statement of operations for the year then ended, statements of changes in net assets for each of the years in the two-year period then ended, and the financial highlights for each of the years or periods in the three-year period then ended. These financial statements and financial highlights are the responsibility of the Fund’s management. Our responsibility is to express an opinion on these financial statements and financial highlights based on our audits.
We conducted our audits in accordance with the standards of the Public Company Accounting Oversight Board (United States). Those standards require that we plan and perform the audit to obtain reasonable assurance about whether the financial statements and financial highlights are free of material misstatement. An audit includes examining, on a test basis, evidence supporting the amounts and disclosures in the financial statements. Our procedures included confirmation of securities owned as of April 30, 2005 by correspondence with the custodian and brokers. As to securities purchased or sold but not yet received or delivered, we performed other appropriate auditing procedures when replies from brokers were not received. An audit also includes assessing the accounting principles used and significant estimates made by management, as well as evaluating the overall financial statement presentation. We believe that our audits provide a reasonable basis for our opinion.
In our opinion, the financial statements and financial highlights referred to above present fairly, in all material respects, the financial position of the Evergreen Institutional Mortgage Portfolio as of April 30, 2005, the results of its operations, changes in its net assets and financial highlights for each of the years or periods described above in conformity with U.S. generally accepted accounting principles.
Boston, Massachusetts
June 17, 2005
21
This page left intentionally blank
22
This page left intentionally blank
23
TRUSTEES AND OFFICERS
TRUSTEES1
| Charles A. Austin III | | Principal occupations: Investment Counselor, Anchor Capital Advisors, Inc. (investment advice); |
| Trustee | | Director, The Andover Companies (insurance); Trustee, Arthritis Foundation of New England; |
| DOB: 10/23/1934 | | Director, The Francis Ouimet Society; Former Director, Health Development Corp. |
| Term of office since: 1991 | | (fitness-wellness centers); Former Director, Mentor Income Fund, Inc.; Former Trustee, |
| | | Mentor Funds and Cash Resource Trust; Former Investment Counselor, Appleton Partners, Inc. |
| Other directorships: None | | (investment advice); Former Director, Executive Vice President and Treasurer, State Street |
| | | Research & Management Company (investment advice) |
|
| Shirley L. Fulton | | Principal occupations: Partner, Tin, Fulton, Greene & Owen, PLLC (law firm); Former Partner, |
| Trustee | | Helms, Henderson & Fulton, P.A. (law firm); Retired Senior Resident Superior Court Judge, |
| DOB: 1/10/1952 | | 26th Judicial District, Charlotte, NC |
| Term of office since: 2004 | | |
| Other directorships: None | | |
|
| K. Dun Gifford | | Principal occupations: Chairman and President, Oldways Preservation and Exchange Trust |
| Trustee | | (education); Trustee, Treasurer and Chairman of the Finance Committee, Cambridge College; |
| DOB: 10/23/1938 | | Former Chairman of the Board, Director, and Executive Vice President, The London Harness |
| Term of office since: 1974 | | Company (leather goods purveyor); Former Director, Mentor Income Fund, Inc.; Former Trustee, |
| | | Mentor Funds and Cash Resource Trust |
| Other directorships: None | | |
|
| Dr. Leroy Keith, Jr. | | Principal occupations: Partner, Stonington Partners, Inc. (private equity firm); Trustee, |
| Trustee | | The Phoenix Group of Mutual Funds; Director, Obagi Medical Products Co.; Director, |
| DOB: 2/14/1939 | | Diversapack Co.; Former Director, Lincoln Educational Services; Former Chairman of the Board |
| Term of office since: 1983 | | and Chief Executive Officer, Carson Products Company (manufacturing); Former Director, |
| | | Mentor Income Fund, Inc.; Former Trustee, Mentor Funds and Cash Resource Trust |
| Other directorships: Trustee, The | | |
| Phoenix Group of Mutual Funds | | |
|
| Gerald M. McDonnell | | Principal occupations: Manager of Commercial Operations, SMI Steel Co. – South Carolina |
| Trustee | | (steel producer); Former Sales and Marketing Manager, Nucor Steel Company; Former Director, |
| DOB: 7/14/1939 | | Mentor Income Fund, Inc.; Former Trustee, Mentor Funds and Cash Resource Trust |
| Term of office since: 1988 | | |
| Other directorships: None | | |
|
| William Walt Pettit | | Principal occupations: Vice President, Kellam & Pettit, P.A. (law firm); Director, Superior |
| Trustee | | Packaging Corp.; Director, National Kidney Foundation of North Carolina, Inc.; Former Director, |
| DOB: 8/26/1955 | | Mentor Income Fund, Inc.; Former Trustee, Mentor Funds and Cash Resource Trust |
| Term of office since: 1984 | | |
| Other directorships: None | | |
|
| David M. Richardson | | Principal occupations: President, Richardson, Runden LLC (executive recruitment business |
| Trustee | | development/consulting company); Consultant, Kennedy Information, Inc. (executive |
| DOB: 9/19/1941 | | recruitment information and research company); Consultant, AESC (The Association of |
| Term of office since: 1982 | | Executive Search Consultants); Director, J&M Cumming Paper Co. (paper merchandising); |
| | | Former Trustee, NDI Technologies, LLP (communications); Former Vice Chairman, DHR |
| Other directorships: None | | International, Inc. (executive recruitment); Former Director, Mentor Income Fund, Inc.; |
| | | Former Trustee, Mentor Funds and Cash Resource Trust |
|
| Dr. Russell A. Salton III | | Principal occupations: President/CEO, AccessOne MedCard; Former Medical Director, |
| Trustee | | Healthcare Resource Associates, Inc.; Former Medical Director, U.S. Health Care/Aetna Health |
| DOB: 6/2/1947 | | Services; Former Director, Mentor Income Fund, Inc.; Former Trustee, Mentor Funds and |
| Term of office since: 1984 | | Cash Resource Trust |
| Other directorships: None | | |
|
24
TRUSTEES AND OFFICERS continued
| Michael S. Scofield | | Principal occupations: Director, Branded Media Corporation (multi-media branding company); |
| Trustee | | Attorney, Law Offices of Michael S. Scofield; Former Director, Mentor Income Fund, Inc.; |
| DOB: 2/20/1943 | | Former Trustee, Mentor Funds and Cash Resource Trust |
| Term of office since: 1984 | | |
| Other directorships: None | | |
|
| Richard J. Shima | | Principal occupations: Independent Consultant; Director, Trust Company of CT; Trustee, |
| Trustee | | Saint Joseph College (CT); Director, Hartford Hospital; Trustee, Greater Hartford YMCA; |
| DOB: 8/11/1939 | | Former Director, Enhance Financial Services, Inc.; Former Director, Old State House Association; |
| Term of office since: 1993 | | Former Director of CTG Resources, Inc. (natural gas); Former Director, Mentor Income Fund, Inc.; |
| Other directorships: None | | Former Trustee, Mentor Funds and Cash Resource Trust |
|
| Richard K. Wagoner, CFA2 | | Principal occupations: Member and Former President, North Carolina Securities Traders |
| Trustee | | Association; Member, Financial Analysts Society; Former Consultant to the Boards of Trustees |
| DOB: 12/12/1937 | | of the Evergreen funds; Former Trustee, Mentor Funds and Cash Resource Trust |
| Term of office since: 1999 | | |
| Other directorships: None | | |
|
| OFFICERS | | |
| Dennis H. Ferro3 | | Principal occupations: President and Chief Executive Officer, Evergreen Investment Company, |
| President | | Inc. and Executive Vice President, Wachovia Bank, N.A.; former Chief Investment Officer, |
| DOB: 6/20/1945 | | Evergreen Investment Company, Inc. |
| Term of office since: 2003 | | |
|
| Carol Kosel4 | | Principal occupations: Senior Vice President, Evergreen Investment Services, Inc. |
| Treasurer | | |
| DOB: 12/25/1963 | | |
| Term of office since: 1999 | | |
|
| Michael H. Koonce4 | | Principal occupations: Senior Vice President and General Counsel, Evergreen Investment |
| Secretary | | Services, Inc.; Senior Vice President and Assistant General Counsel, Wachovia Corporation |
| DOB: 4/20/1960 | | |
| Term of office since: 2000 | | |
|
| James Angelos4 | | Principal occupations: Chief Compliance Officer and Senior Vice President, Evergreen Funds; |
| Chief Compliance Officer | | Former Director of Compliance, Evergreen Investment Services, Inc. |
| DOB: 9/2/1947 | | |
| Term of office since: 2004 | | |
|
1 Each Trustee serves until a successor is duly elected or qualified or until his death, resignation, retirement or removal from office. Each Trustee oversees 89 Evergreen funds. Correspondence for each Trustee may be sent to Evergreen Board of Trustees, P.O. Box 20083, Charlotte, NC 28202.
2 Mr. Wagoner is an “interested person” of the Fund because of his ownership of shares in Wachovia Corporation, the parent to the Fund’s investment advisor.
3 The address of the Officer is 401 S. Tryon Street, 20th Floor, Charlotte, NC 28288.
4 The address of the Officer is 200 Berkeley Street, Boston, MA 02116.
Additional information about the Fund’s Board of Trustees and Officers can be found in the Statement of Additional Information (SAI) and is available upon request without charge by calling 800.343.2898.
25

573633 6/2005

| | | table of contents |
| 1 | | LETTER TO SHAREHOLDERS |
| 4 | | FUND AT A GLANCE |
| 5 | | PORTFOLIO MANAGER COMMENTARY |
| 6 | | ABOUT YOUR FUND’S EXPENSES |
| 7 | | FINANCIAL HIGHLIGHTS |
| 11 | | SCHEDULE OF INVESTMENTS |
| 26 | | STATEMENT OF ASSETS AND LIABILITIES |
| 27 | | STATEMENT OF OPERATIONS |
| 28 | | STATEMENTS OF CHANGES IN NET ASSETS |
| 29 | | NOTES TO FINANCIAL STATEMENTS |
| 36 | | REPORT OF INDEPENDENT REGISTERED PUBLIC ACCOUNTING FIRM |
| 40 | | TRUSTEES AND OFFICERS |
This annual report must be preceded or accompanied by a prospectus of the Evergreen fund contained herein. The prospectus contains more complete information, including fees and expenses, and should be read carefully before investing or sending money.
The fund will file its complete schedule of portfolio holdings with the SEC for the first and third quarters of each fiscal year on Form N-Q. The fund’s Form N-Q will be available on the SEC’s Web site at http://www.sec.gov. In addition, the fund’s Form N-Q may be reviewed and copied at the SEC’s Public Reference Room in Washington, D.C. Information on the operation of the Public Reference Room may be obtained by calling 800.SEC.0330.
A description of the fund’s proxy voting policies and procedures, as well as information regarding how the fund voted proxies relating to portfolio securities during the most recent 12-month period ended June 30, is available by visiting our Web site at EvergreenInvestments.com or by visiting the SEC’s Web site at http://www.sec.gov. The fund’s proxy voting policies and procedures are also available without charge, upon request, by calling 800.343.2898.
| Mutual Funds: | | | | |
| NOT FDIC INSURED | | MAY LOSE VALUE | | NOT BANK GUARANTEED |
Evergreen InvestmentsSM is a service mark of Evergreen Investment Management Company, LLC.
Copyright 2005, Evergreen Investment Management Company, LLC.
Evergreen mutual funds are distributed by Evergreen Investment Services, Inc.
200 Berkeley Street, Boston, MA 02116
LETTER TO SHAREHOLDERS
June 2005

Dennis H. Ferro
President and Chief Executive Officer
Dear Shareholder,
We are pleased to provide the annual report for the Evergreen Strategic Income Fund, which covers the twelve-month period ended April 30, 2005.
For those investors in the fixed income markets, the past year has provided a variety of challenges and opportunities. In anticipation of this environment, our fixed income portfolio management teams attempted to prepare for a market contending with moderating economic growth and less accommodation from the Federal Reserve (Fed). The question for the markets was no longer the direction of monetary policy, but rather the extent to which interest rates would rise. Using our outlook for a continued economic expansion, we positioned our fixed income portfolios for a gradual tightening of monetary policy.
The fiscal year began with a mixed message on the economy. Growth was good, but it was no longer great, and market interest rates declined on the perceived weakness. However, Fed officials continued to talk up their much anticipated “measured removal of policy accommodation.”
Throughout the confusion, we maintained our belief that the economy had simply transitioned from recovery to expansion. As a result of this transition, a variety of economic reports pointed in different directions. For example, solid retail sales occurred in a month where consumer confidence declined. Historically, the maturation of the economic cycle had experienced similarly erratic behavior. Yet market interest rates began to fluctuate with seemingly every monthly data point. Moreover, the costs for commodities and energy were rising, and since inflation adjusted interest rates had remained low for such a lengthy period, the Fed seemed determined to prevent inflation from becoming a long-term problem. As job growth began to exceed expectations in the Spring of 2004, the market’s inflation fears accelerated, and yields
1
LETTER TO SHAREHOLDERS continued
headed higher in anticipation of tighter Fed policy.
The Fed finally began their “measured removal of policy accommodation” beginning in June of 2004. After three years of stimulative policy actions, monetary policymakers began the journey towards more moderate economic growth. Fed Chairman Alan Greenspan was very transparent in his public statements, attempting to assuage market anxiety. Market interest rates still remained quite volatile during the first half of the fiscal period. Only after the central bank’s first few rate increases did the long-end of the yield curve begin to recover, a process that would continue for the bulk of the fiscal year as the markets concluded that long-term inflation was under control. Chairman Greenspan, however, remained concerned about “complacency” within the bond market, as evidenced by his comments to congressional banking committees in February 2005 that it was a “conundrum” that long-term yields remained low.
Throughout the fiscal year, many of our fixed income managers utilized a variety of strategies within their specific portfolios in order to maximize the total return possibilities for our investors. For example, many of our municipal bond fund managers emphasized the long-end of the curve in an attempt to enhance total return. Other teams used a barbell strategy, seeking opportunities at the short and long end of the Treasury yield curve in an attempt to remain defensive throughout the volatile market activity. Our mortgage portfolio teams employed adjustable rate, commercial, and hybrid products while attempting to navigate the ever changing seas within that marketplace. Our fundamental emphasis on credit quality in the corporate and high yield sectors, however, was not always rewarded, as the markets often pursued riskier issues within a given universe as the yield curve continued to flatten. Finally, our global management teams bought foreign bonds from commodity rich nations such as Australia, New Zealand and Canada in an effort to sustain performance.
We encourage our investors to maintain their diversified fixed income strategies in their long-term investment portfolios.
2
LETTER TO SHAREHOLDERS continued
Please visit our Web site, EvergreenInvestments.com, for more information about our funds and other investment products available to you. From the Web site, you may also access a detailed Q & A interview with the portfolio manager(s) for your fund. You can easily reach these interviews by following the link, EvergreenInvestments.com/AnnualUpdates, from our Web site. Thank you for your continued support of Evergreen Investments.
Sincerely,

Dennis H. Ferro
President and Chief Executive Officer
Evergreen Investment Company, Inc.
Notification of Investment Strategy Change:
Effective August 1, 2005, the Fund’s prospectus will be amended to make the following change to the Fund’s principal investment strategy:
The Fund may invest a portion of its assets in derivative instruments, such as Treasury futures, Eurodollar futures and interest rate swap agreements in order to manage its exposure to interest rate risk. Derivatives are financial contracts whose value depends on, or is derived from, the value of one or more underlying assets, reference rates or indexes. The various derivative instruments that the Fund may use are described in more detail under “Additional Information on Securities and Investment Practices” in the Statement of Additional Information. The Fund typically uses derivatives as a substitute for taking a position in the underlying asset and/or as part of a strategy designed to reduce exposure to other risks, such as interest rate or currency risk. The Fund’s use of derivative instruments involves risks different from, or possibly greater than, the risks associated with investing directly in securities and other traditional investments. Derivatives are subject to a number of risks such as liquidity risk, interest rate risk, market risk, credit risk and management risk.
The Fund’s prospectus will be supplemented to include this change.
Special Notice to Shareholders:
Please visit our Web site at EvergreenInvestments.com for statements from President and Chief Executive Officer, Dennis Ferro, and Chairman of the Board of the Evergreen Funds, Michael S. Scofield, addressing recent SEC actions involving the Evergreen Funds.
3
FUND AT A GLANCE
as of April 30, 2005
MANAGEMENT TEAM

Dana Erikson, CFA
High Yield Bond Team Lead Manager

Lisa Brown-Premo
Customized Fixed Income Team

Anthony Norris
International Advisors Team
CURRENT INVESTMENT STYLE

Source: Morningstar, Inc.
Morningstar’s style box is based on a portfolio date as of 3/31/2005.
The fixed income style box placement is based on a fund’s average effective maturity or duration and the average credit rating of the bond portfolio.
PERFORMANCE AND RETURNS
Portfolio inception date: 4/14/1987
| | | Class A | | Class B | | Class C | | Class I |
| Class inception date | | 4/14/1987 | | 2/1/1993 | | 2/1/1993 | | 1/13/1997 |
|
| Nasdaq symbol | | EKSAX | | EKSBX | | EKSCX | | EKSYX |
|
| Average annual return* | | | | | | | | |
|
| 1-year with sales charge | | 3.05% | | 2.46% | | 6.46% | | N/A |
|
| 1-year w/o sales charge | | 8.22% | | 7.46% | | 7.46% | | 8.58% |
|
| 5-year | | 7.74% | | 7.72% | | 8.02% | | 9.13% |
|
| 10-year | | 7.06% | | 6.78% | | 6.78% | | 7.63% |
|
| Maximum sales charge | | 4.75% | | 5.00% | | 1.00% | | N/A |
| | | Front-end | | CDSC | | CDSC | | |
|
* Adjusted for maximum applicable sales charge, unless noted.
Past performance is no guarantee of future results. The performance quoted represents past performance and current performance may be lower or higher. The investment return and principal value of an investment will fluctuate so that investors’ shares, when redeemed, may be worth more or less than their original cost. To obtain performance information current to the most recent month-end for Classes A, B, C or I, please go to EvergreenInvestments.com/fundperformance. The performance of each class may vary based on differences in loads, fees and expenses paid by the shareholders investing in each class. Performance includes the reinvestment of income dividends and capital gain distributions. Performance shown does not reflect the deduction of taxes that a shareholder would pay on fund distributions or the redemption of fund shares.
Historical performance shown for Classes B, C and I prior to their inception is based on the performance of Class A, the original class offered. The historical returns for Classes B, C and I have not been adjusted to reflect the effect of each class’ 12b-1 fee. These fees are 0.30% for Class A and 1.00% for Classes B and C. Class I does not pay a 12b-1 fee. If these fees had been reflected, returns for Classes B and C would have been lower while returns for Class I would have been higher.
Returns reflect expense limits previously in effect, without which returns would have been lower.
LONG-TERM GROWTH

Comparison of a $10,000 investment in the Evergreen Strategic Income Fund Class A shares, versus a similar investment in the Lehman Brothers Aggregate Bond Index (LBABI), J.P. Morgan Global Government Bond Index excluding U.S. (JPMGXUS), Merrill Lynch High Yield Master Index† (MLHYMI) and the Consumer Price Index (CPI).
The LBABI, JPMGXUS and MLHYMI1 are unmanaged market indexes and do not include transaction costs associated with buying and selling securities, any mutual fund expenses or any taxes. The CPI is a commonly used measure of inflation and does not represent an investment return. It is not possible to invest directly in an index.
4
PORTFOLIO MANAGER COMMENTARY
The fund’s Class A shares returned 8.22% for the twelve-month period ended April 30, 2005, excluding any applicable sales charges. During the same period, the Lehman Brothers Aggregate Bond Index (LBABI) returned 5.26%, the J.P. Morgan Global Government Bond Index excluding U.S. (JPMGXUS) returned 13.75% and the Merrill Lynch High Yield Master Index (MLHYMI) returned 6.45% .
The fund seeks high current income from interest on debt securities and secondarily, considers potential for growth of capital in selecting securities.
During a period in which virtually all parts of the global fixed income markets experienced significant short-term volatility, the fund maintained relatively consistent allocations to different areas of the market throughout the period.
In the domestic high yield portfolio, the largest concentration of the fund’s assets during the period, we held to a relatively conservative strategy, keeping our investments in the lowest tiers of below investment grade holdings to 15% or less. Throughout the period, we overweighted cyclical sectors, including materials, with emphasis on basic industries such as chemicals, metals and mining. At the same time, we underweighted bonds from the telecommunications services and utilities sectors. The emphasis on bonds of cyclical companies and basic industries helped performance, but the de-emphasis on the telecommunications services sector detracted from the fund’s performance.
In investing in foreign debt from developed nations, we focused on opportunities to benefit from the expanding global economy, with overweights in commodity linked economies such as Australia, New Zealand and Canada. This emphasis contributed positively to fund performance. At the heart of our emerging market’s investments, we also emphasized commodity producing nations, especially energy producers such as Russia and Venezuela.
Within the fund’s domestic high grade allocation, we increased our allocation to U.S. Treasury Bonds during the period in order to reduce the fund’s exposure to credit risk. However, U.S. Treasury bonds underperformed other sectors during most of the year, subsequently holding back results.
Class I shares are only offered in the following manner: (1) to investment advisory clients of Evergreen Investment Management Company, LLC (or its advisory affiliates) when purchased by such advisor(s) on behalf of its clients, (2) through arrangements entered into on behalf of the Evergreen funds with certain financial services firms, (3) to certain institutional investors and (4) to persons who owned Class Y shares in registered name in an Evergreen fund on or before December 31, 1994 or who owned shares of any SouthTrust fund in registered name as of March 18, 2005 or shares of Vestaur Securities Fund as of May 20, 2005. Class I shares are only available to institutional shareholders with a minimum of $1 million investment, which may be waived in certain situations.
The fund’s investment objective is nonfundamental and may be changed without the vote of the fund’s shareholders.
Funds that invest in high yield, lower-rated bonds may contain more risk due to the increased possibility of default.
Foreign investments may contain more risk due to the inherent risks associated with changing political climates, foreign market instability and foreign currency fluctuations. Risks of international investing are magnified in emerging or developing markets.
U.S. government guarantees apply only to certain securities held in the fund’s portfolio and not to the fund’s shares.
The return of principal is not guaranteed due to fluctuation in the NAV of the fund caused by changes in the price of the individual bonds held by the fund and the buying and selling of bonds by the fund. Bond funds have the same inflation, interest rate and credit risks that are associated with the individual bonds held by the fund. Generally, the value of bonds rise when prevailing interest rates fall and fall when interest rates rise.
† Copyright 2005. Merrill Lynch, Pierce, Fenner & Smith Incorporated. All rights reserved.
All data is as of April 30, 2005, and subject to change.
5
ABOUT YOUR FUND’S EXPENSES
The Example below is intended to describe the fees and expenses borne by shareholders and the impact of those costs on your investment.
Example
As a shareholder of the fund, you incur two types of costs: (1) transaction costs, including sales charges (loads), redemption fees and exchange fees; and (2) ongoing costs, including management fees, distribution (12b-1) fees and other fund expenses. This Example is intended to help you understand your ongoing costs (in dollars) of investing in the fund and to compare these costs with the ongoing costs of investing in other mutual funds. The Example is based on an investment of $1,000 invested at the beginning of the period and held for the entire period from November 1, 2004 to April 30, 2005.
The example illustrates your fund’s costs in two ways:
• Actual expenses
The section in the table under the heading “Actual” provides information about actual account values and actual expenses. You may use the information in these columns, together with the amount you invested, to estimate the expenses that you paid over the period. Simply divide your account value by $1,000 (for example, an $8,600 account value divided by $1,000 = 8.6), then multiply the result by the number in the appropriate column for your share class, in the column entitled “Expenses Paid During Period” to estimate the expenses you paid on your account during this period.
• Hypothetical example for comparison purposes
The section in the table under the heading “Hypothetical (5% return before expenses)” provides information about hypothetical account values and hypothetical expenses based on the fund’s actual expense ratio and an assumed rate of return of 5% per year before expenses, which is not the fund’s actual return. The hypothetical account values and expenses may not be used to estimate the actual ending account balance or expenses you paid for the period. You may use this information to compare the ongoing costs of investing in the fund and other funds. To do so, compare this 5% hypothetical example with the 5% hypothetical examples that appear in the shareholder reports of the other funds.
Please note that the expenses shown in the table are meant to highlight your ongoing costs only and do not reflect any transactional costs, such as sales charges (loads), redemption fees or exchange fees. Therefore, the section in the table under the heading “Hypothetical (5% return before expenses)” is useful in comparing ongoing costs only, and will not help you determine the relative total costs of owning different funds. In addition, if these transactional costs were included, your costs would have been higher.
| | | Beginning | | Ending | | |
| | | Account | | Account | | Expenses |
| | | Value | | Value | | Paid During |
| | | 11/1/2004 | | 4/30/2005 | | Period* |
|
| Actual | | | | | | |
| Class A | | $ 1,000.00 | | $ 1,014.22 | | $ 5.54 |
| Class B | | $ 1,000.00 | | $ 1,010.74 | | $ 9.02 |
| Class C | | $ 1,000.00 | | $ 1,010.73 | | $ 9.02 |
| Class I | | $ 1,000.00 | | $ 1,015.55 | | $ 4.05 |
| Hypothetical | | | | | | |
| (5% return | | | | | | |
| before expenses) | | | | | | |
| Class A | | $ 1,000.00 | | $ 1,019.29 | | $ 5.56 |
| Class B | | $ 1,000.00 | | $ 1,015.82 | | $ 9.05 |
| Class C | | $ 1,000.00 | | $ 1,015.82 | | $ 9.05 |
| Class I | | $ 1,000.00 | | $ 1,020.78 | | $ 4.06 |
|
* For each class of the Fund, expenses are equal to the annualized expense ratio of each class (1.11% for Class A, 1.81% for Class B, 1.81% for Class C and 0.81% for Class I), multiplied by the average account value over the period, multiplied by 181 / 365 days.
6
FINANCIAL HIGHLIGHTS
(For a share outstanding throughout each period)
| | | Year Ended April 30, |
| |
|
| CLASS A | | 2005 | | 2004 | | | | 2003 | | 20021 | | 2001 |
|
| Net asset value, beginning of period | | $ 6.38 | | $ 6.50 | | $ | | 5.83 | | $ 5.74 | | $ 6.12 |
|
| Income from investment operations | | | | | | | | | | | | |
| Net investment income (loss) | | 0.33 | | 0.342 | | | | 0.382 | | 0.35 | | 0.522 |
Net realized and unrealized gains or losses on
securities and foreign currency related | | | | | | | | | | | | |
| transactions | | 0.19 | | 0.07 | | | | 0.68 | | 0.16 | | (0.40) |
| |
|
| Total from investment operations | | 0.52 | | 0.41 | | | | 1.06 | | 0.51 | | 0.12 |
|
| Distributions to shareholders from | | | | | | | | | | | | |
| Net investment income | | (0.35) | | (0.37) | | | | (0.39) | | (0.32) | | (0.40) |
| Net realized gains | | (0.02) | | (0.16) | | | | 0 | | 0 | | 0 |
| Tax basis return of capital | | 0 | | 0 | | | | 0 | | (0.10) | | (0.10) |
| |
|
| Total distributions to shareholders | | (0.37) | | (0.53) | | | | (0.39) | | (0.42) | | (0.50) |
|
| Net asset value, end of period | | $ 6.53 | | $ 6.38 | | $ | | 6.50 | | $ 5.83 | | $ 5.74 |
|
| Total return3 | | 8.22% | | 6.24% | | | | 18.79% | | 9.37% | | 2.09% |
|
| Ratios and supplemental data | | | | | | | | | | | | |
| Net assets, end of period (thousands) | | $214,776 | | $202,017 | | $173,842 | | $130,934 | | $122,223 |
| Ratios to average net assets | | | | | | | | | | | | |
Expenses including waivers/reimbursements
and excluding expense reductions | | 1.12% | | 1.21% | | | | 1.19% | | 1.23% | | 0.87% |
Expenses excluding waivers/reimbursements
and expense reductions | | 1.12% | | 1.21% | | | | 1.19% | | 1.24% | | 1.24% |
| Net investment income (loss) | | 5.03% | | 5.10% | | | | 6.31% | | 6.02% | | 8.06% |
| Portfolio turnover rate | | 130% | | 129% | | | | 129% | | 304% | | 322% |
|
1 As required, effective May 1, 2001 the Fund adopted the provisions of the AICPA Audit and Accounting Guide, Audits of Investment Companies and began amortizing premium on its fixed-income securities . The effects of this change for the year ended April 30, 2002 was a decrease in net investment income per share of $0.02; an increase in net realized gains or losses per share of $0.02; and a decrease to the ratio of net investment income to average net assets of 0.45% . The above per share information, ratios and supplemental data for the periods prior to May 1, 2001 have not been restated to reflect this change in presentation.
2 Net investment income (loss) per share is based on average shares outstanding during the period.
3 Excluding applicable sales charges
See Notes to Financial Statements
7
FINANCIAL HIGHLIGHTS
(For a share outstanding throughout each period)
| | | Year Ended April 30, |
| |
|
| CLASS B | | 2005 | | 2004 | | | | 2003 | | 20021 | | 2001 |
|
| Net asset value, beginning of period | | $ 6.40 | | $ 6.52 | | $ | | 5.85 | | $ 5.75 | | $ 6.14 |
|
| Income from investment operations | | | | | | | | | | | | |
| Net investment income (loss) | | 0.29 | | 0.292 | | | | 0.34 | | 0.29 | | 0.482 |
Net realized and unrealized gains or losses on
securities and foreign currency related | | | | | | | | | | | | |
| transactions | | 0.19 | | 0.07 | | | | 0.67 | | 0.19 | | (0.41) |
| |
|
| Total from investment operations | | 0.48 | | 0.36 | | | | 1.01 | | 0.48 | | 0.07 |
|
| Distributions to shareholders from | | | | | | | | | | | | |
| Net investment income | | (0.31) | | (0.32) | | | | (0.34) | | (0.28) | | (0.36) |
| Net realized gains | | (0.02) | | (0.16) | | | | 0 | | 0 | | 0 |
| Tax basis return of capital | | 0 | | 0 | | | | 0 | | (0.10) | | (0.10) |
| |
|
| Total distributions to shareholders | | (0.33) | | (0.48) | | | | (0.34) | | (0.38) | | (0.46) |
|
| Net asset value, end of period | | $ 6.55 | | $ 6.40 | | $ | | 6.52 | | $ 5.85 | | $ 5.75 |
|
| Total return3 | | 7.46% | | 5.49% | | | | 17.87% | | 8.74% | | 1.18% |
|
| Ratios and supplemental data | | | | | | | | | | | | |
| Net assets, end of period (thousands) | | $98,852 | | $113,115 | | $107,968 | | $77,471 | | $83,347 |
| Ratios to average net assets | | | | | | | | | | | | |
Expenses including waivers/reimbursements
and excluding expense reductions | | 1.83% | | 1.91% | | | | 1.94% | | 1.98% | | 1.61% |
Expenses excluding waivers/reimbursements
and expense reductions | | 1.83% | | 1.91% | | | | 1.94% | | 1.99% | | 1.99% |
| Net investment income (loss) | | 4.34% | | 4.40% | | | | 5.54% | | 5.27% | | 7.34% |
| Portfolio turnover rate | | 130% | | 129% | | | | 129% | | 304% | | 322% |
|
1 As required, effective May 1, 2001 the Fund adopted the provisions of the AICPA Audit and Accounting Guide, Audits of Investment Companies and began amortizing premium on its fixed-income securities . The effects of this change for the year ended April 30, 2002 was a decrease in net investment income per share of $0.03; an increase in net realized gains or losses per share of $0.03; and a decrease to the ratio of net investment income to average net assets of 0.45% . The above per share information, ratios and supplemental data for the periods prior to May 1, 2001 have not been restated to reflect this change in presentation.
2 Net investment income (loss) per share is based on average shares outstanding during the period.
3 Excluding applicable sales charges
See Notes to Financial Statements
8
FINANCIAL HIGHLIGHTS
(For a share outstanding throughout each period)
| | | Year Ended April 30, |
| |
|
| CLASS C | | 2005 | | 2004 | | | | 2003 | | 20021 | | 2001 |
|
| Net asset value, beginning of period | | $ 6.39 | | $ 6.51 | | $ | | 5.84 | | $ 5.75 | | $ 6.13 |
|
| Income from investment operations | | | | | | | | | | | | |
| Net investment income (loss) | | 0.29 | | 0.292 | | | | 0.342 | | 0.32 | | 0.462 |
Net realized and unrealized gains or losses on
securities and foreign currency related | | | | | | | | | | | | |
| transactions | | 0.19 | | 0.07 | | | | 0.67 | | 0.15 | | (0.38) |
| |
|
| Total from investment operations | | 0.48 | | 0.36 | | | | 1.01 | | 0.47 | | 0.08 |
|
| Distributions to shareholders from | | | | | | | | | | | | |
| Net investment income | | (0.31) | | (0.32) | | | | (0.34) | | (0.28) | | (0.36) |
| Net realized gains | | (0.02) | | (0.16) | | | | 0 | | 0 | | 0 |
| Tax basis return of capital | | 0 | | 0 | | | | 0 | | (0.10) | | (0.10) |
| |
|
| Total distributions to shareholders | | (0.33) | | (0.48) | | | | (0.34) | | (0.38) | | (0.46) |
|
| Net asset value, end of period | | $ 6.54 | | $ 6.39 | | $ | | 6.51 | | $ 5.84 | | $ 5.75 |
|
| Total return3 | | 7.46% | | 5.49% | | | | 17.89% | | 8.56% | | 1.35% |
|
| Ratios and supplemental data | | | | | | | | | | | | |
| Net assets, end of period (thousands) | | $79,539 | | $89,236 | | $68,207 | | $22,554 | | $16,746 |
| Ratios to average net assets | | | | | | | | | | | | |
Expenses including waivers/reimbursements
and excluding expense reductions | | 1.83% | | 1.91% | | | | 1.93% | | 1.98% | | 1.63% |
Expenses excluding waivers/reimbursements
and expense reductions | | 1.83% | | 1.91% | | | | 1.93% | | 1.98% | | 1.99% |
| Net investment income (loss) | | 4.34% | | 4.40% | | | | 5.66% | | 5.25% | | 7.26% |
| Portfolio turnover rate | | 130% | | 129% | | | | 129% | | 304% | | 322% |
|
1 As required, effective May 1, 2001 the Fund adopted the provisions of the AICPA Audit and Accounting Guide, Audits of Investment Companies and began amortizing premium on its fixed-income securities . The effects of this change for the year ended April 30, 2002 was a decrease in net investment income per share of $0.02; an increase in net realized gains or losses per share of $0.02; and a decrease to the ratio of net investment income to average net assets of 0.45% . The above per share information, ratios and supplemental data for the periods prior to May 1, 2001 have not been restated to reflect this change in presentation.
2 Net investment income (loss) per share is based on average shares outstanding during the period.
3 Excluding applicable sales charges
See Notes to Financial Statements
9
FINANCIAL HIGHLIGHTS
(For a share outstanding throughout each period)
| | | Year Ended April 30, |
| |
|
| CLASS I1 | | 2005 | | 2004 | | | | 2003 | | 20022 | | 2001 |
|
| Net asset value, beginning of period | | $ 6.28 | | $ 6.40 | | $ | | 5.74 | | $ 5.65 | | $ 6.02 |
|
| Income from investment operations | | | | | | | | | | | | |
| Net investment income (loss) | | 0.34 | | 0.353 | | | | 0.413 | | 0.35 | | 0.513 |
Net realized and unrealized gains or losses on
securities and foreign currency related | | | | | | | | | | | | |
| transactions | | 0.19 | | 0.07 | | | | 0.64 | | 0.17 | | (0.37) |
| |
|
| Total from investment operations | | 0.53 | | 0.42 | | | | 1.05 | | 0.52 | | 0.14 |
|
| Distributions to shareholders from | | | | | | | | | | | | |
| Net investment income | | (0.36) | | (0.38) | | | | (0.39) | | (0.33) | | (0.41) |
| Net realized gains | | (0.02) | | (0.16) | | | | 0 | | 0 | | 0 |
| Tax basis return of capital | | 0 | | 0 | | | | 0 | | (0.10) | | (0.10) |
| |
|
| Total distributions to shareholders | | (0.38) | | (0.54) | | | | (0.39) | | (0.43) | | (0.51) |
|
| Net asset value, end of period | | $ 6.43 | | $ 6.28 | | $ | | 6.40 | | $ 5.74 | | $ 5.65 |
|
| Total return | | 8.58% | | 6.56% | | | | 19.09% | | 9.67% | | 2.41% |
|
| Ratios and supplemental data | | | | | | | | | | | | |
| Net assets, end of period (thousands) | | $19,216 | | $26,711 | | $13,406 | | $1,779 | | $1,584 |
| Ratios to average net assets | | | | | | | | | | | | |
Expenses including waivers/reimbursements
and excluding expense reductions | | 0.82% | | 0.91% | | | | 0.94% | | 0.98% | | 0.62% |
Expenses excluding waivers/reimbursements
and expense reductions | | 0.82% | | 0.91% | | | | 0.94% | | 0.99% | | 0.99% |
| Net investment income (loss) | | 5.33% | | 5.42% | | | | 6.75% | | 6.27% | | 8.30% |
| Portfolio turnover rate | | 130% | | 129% | | | | 129% | | 304% | | 322% |
|
1 Effective at the close of business on May 11, 2001, Class Y shares were renamed as Institutional shares (Class I).
2 As required, effective May 1, 2001 the Fund adopted the provisions of the AICPA Audit and Accounting Guide, Audits of Investment Companies and began amortizing premium on its fixed-income securities . The effects of this change for the year ended April 30, 2002 was a decrease in net investment income per share of $0.03; an increase in net realized gains or losses per share of $0.03; and a decrease to the ratio of net investment income to average net assets of 0.45%. The above per share information, ratios and supplemental data for the periods prior to May 1, 2001 have not been restated to reflect this change in presentation.
3 Net investment income (loss) per share is based on average shares outstanding during the period.
See Notes to Financial Statements
10
SCHEDULE OF INVESTMENTS
April 30, 2005
| | | | | Principal | | | | |
| | | | | Amount | | | | Value |
|
| AGENCY COMMERCIAL MORTGAGE-BACKED SECURITIES 2.6% | | | | | | |
| FIXED-RATE 2.6% | | | | | | | | |
| FNMA: | | | | | | | | |
| 4.44%, 04/01/2014 | | | | $ 2,676,413 | | $ | | 2,640,933 |
| 6.21%, 09/01/2008 | | | | 1,290,202 | | | | 1,351,543 |
| 7.50%, 07/01/2010 | | | | 790,578 | | | | 864,491 |
| Ser. 2001-M2, Class A, 6.22%, 01/25/2009 | | | | 585,867 | | | | 596,720 |
| Ser. 2002-M1, Class C, 6.17%, 02/25/2016 | | | | 1,875,000 | | | | 2,071,194 |
| Ser. 2003-M1, Class B, 4.91%, 07/25/2020 | | | | 3,000,000 | | | | 3,013,650 |
| |
|
| Total Agency Commercial Mortgage-Backed Securities | | | | | | | | |
| (cost $10,356,131) | | | | | | | | 10,538,531 |
| |
|
| AGENCY MORTGAGE-BACKED COLLATERALIZED MORTGAGE | | | | | | |
| OBLIGATIONS 4.1% | | | | | | | | |
| FIXED-RATE 0.2% | | | | | | | | |
| FNMA: | | | | | | | | |
| Ser. 2004-W2, Class 2A2, 7.00%, 02/25/2044 | | | | 450,287 | | | | 474,363 |
| Ser. 2004-W2, Class 5A, 7.50%, 03/25/2044 | | | | 324,068 | | | | 345,226 |
| |
|
| | | | | | | | | 819,589 |
| |
|
| FLOATING-RATE 3.9% | | | | | | | | |
| FHLMC: | | | | | | | | |
| Ser. 1689, Class F, 3.46%, 03/15/2024 | | | | 2,441,173 | | | | 2,458,211 |
| Ser. 1695, Class GA, 3.46%, 03/15/2024 | | | | 1,151,714 | | | | 1,156,755 |
| Ser. 2372, Class F, 3.31%, 10/15/2031 | | | | 835,613 | | | | 839,375 |
| Ser. 2710, Class FY, 3.21%, 10/15/2018 | | | | 450,781 | | | | 445,910 |
| FNMA: | | | | | | | | |
| Ser. 1997-76, Class FO, 3.34%, 09/17/2027 | | | | 2,175,966 | | | | 2,190,118 |
| Ser. 1998-40, Class F, 3.13%, 06/17/2028 | | | | 986,001 | | | | 989,782 |
| Ser. 2002-41, Class F, 3.40%, 07/25/2032 | | | | 5,154,876 | | | | 5,213,454 |
| GNMA, Ser. 2001-59, Class FB, 3.32%, 08/16/2026 | | | | 2,760,205 | | | | 2,787,084 |
| |
|
| | | | | | | | | 16,080,689 |
| |
|
| Total Agency Mortgage-Backed Collateralized Mortgage Obligations | | | | | | |
| (cost $16,891,817) | | | | | | | | 16,900,278 |
| |
|
| AGENCY MORTGAGE-BACKED PASS THROUGH SECURITIES 12.1% | | | | | | |
| FIXED-RATE 11.8% | | | | | | | | |
| FHLMC: | | | | | | | | |
| 5.00%, TBA # | | | | 2,500,000 | | | | 2,518,750 |
| 5.50%, TBA # | | | | 15,100,000 | | | | 15,350,398 |
| 6.00%, TBA # | | | | 5,920,000 | | | | 6,077,247 |
| FNMA: | | | | | | | | |
| 5.50%, TBA # | | | | 12,550,000 | | | | 12,720,397 |
| 6.00%, TBA # | | | | 8,000,000 | | | | 8,215,000 |
| 6.50%, 04/01/2017 | | | | 709,536 | | | | 807,391 |
| 6.50%, TBA # | | | | 2,465,000 | | | | 2,563,600 |
| GNMA: | | | | | | | | |
| 6.00%, 06/15/2031 - 09/15/2031 | | | | 135,560 | | | | 140,040 |
| 7.50%, 12/15/2030 | | | | 61,512 | | | | 66,096 |
| 8.00%, 10/15/2030 | | | | 2,420 | | | | 2,624 |
| |
|
| | | | | | | | | 48,461,543 |
| |
|
| See Notes to Financial Statements | | |
11
SCHEDULE OF INVESTMENTS continued
April 30, 2005
| | | | | Principal | | | | |
| | | | | Amount | | | | Value |
|
| AGENCY MORTGAGE-BACKED PASS THROUGH SECURITIES continued | | | | | | |
| FLOATING-RATE 0.3% | | | | | | | | |
| FNMA, 3.09%, 07/01/2044 | | | | $ 1,223,123 | | $ | | 1,240,284 |
| |
|
| Total Agency Mortgage-Backed Pass Through Securities | | | | | | | | |
| (cost $49,459,113) | | | | | | | | 49,701,827 |
| |
|
| ASSET-BACKED SECURITIES 1.5% | | | | | | | | |
| C-Bass, Ltd., Ser. 11A, Class C, 4.36%, 09/15/2039 144A | | | | 4,315,000 | | | | 4,348,312 |
| Ocean Star plc, Ser. 2004-A, Class C, 4.04%, 11/12/2018 144A | | | | 1,040,000 | | | | 1,048,531 |
| Trapeza CDO LLC, Ser. 2004-7A, Class B1, 4.25%, 01/25/2035 144A | | | | 875,000 | | | | 880,547 |
| |
|
| Total Asset-Backed Securities (cost $6,230,000) | | | | | | | | 6,277,390 |
| |
|
| COMMERCIAL MORTGAGE-BACKED SECURITIES 0.4% | | | | | | | | |
| FLOATING-RATE 0.4% | | | | | | | | |
| GS Mtge. Securities Corp. II, Ser. 2001-ROCK, Class BFL, 3.35%, 05/03/2018 144A | | | | | | |
| (cost $1,469,258) | | | | 1,450,000 | | | | 1,484,821 |
| |
|
| CORPORATE BONDS 28.4% | | | | | | | | |
| CONSUMER DISCRETIONARY 8.5% | | | | | | | | |
| Auto Components 0.6% | | | | | | | | |
| Exide Technologies, 10.50%, 03/15/2013 144A | | | | 700,000 | | | | 596,750 |
| RJ Tower Corp., 12.00%, 06/01/2013 • | | | | 365,000 | | | | 195,275 |
| Tenneco Automotive, Inc., 8.625%, 11/15/2014 144A | | | | 1,675,000 | | | | 1,536,812 |
| |
|
| | | | | | | | | 2,328,837 |
| |
|
| Hotels, Restaurants & Leisure 2.0% | | | | | | | | |
| Gaylord Entertainment Co., 6.75%, 11/15/2014 144A | | | | 275,000 | | | | 255,750 |
| Herbst Gaming, Inc., 7.00%, 11/15/2014 144A | | | | 850,000 | | | | 837,250 |
| Isle of Capri Casinos, Inc., 7.00%, 03/01/2014 | | | | 850,000 | | | | 828,750 |
| John Q. Hammons Hotels LP, Ser. B, 8.875%, 05/15/2012 | | | | 1,135,000 | | | | 1,214,450 |
| La Quinta Corp., 8.875%, 03/15/2011 | | | | 520,000 | | | | 562,250 |
| Las Vegas Sands Corp., 6.375%, 02/15/2015 144A | | | | 685,000 | | | | 645,612 |
| Mandalay Resort Group, Ser. B, 10.25%, 08/01/2007 | | | | 1,000,000 | | | | 1,102,500 |
| MGM MIRAGE, Inc., 5.875%, 02/27/2014 | | | | 525,000 | | | | 494,156 |
| MTR Gaming Group, Inc., 9.75%, 04/01/2010 (h) | | | | 1,200,000 | | | | 1,314,000 |
| Station Casinos, Inc.: | | | | | | | | |
| 6.50%, 02/01/2014 | | | | 425,000 | | | | 426,063 |
| 6.875%, 03/01/2016 | | | | 425,000 | | | | 431,375 |
| |
|
| | | | | | | | | 8,112,156 |
| |
|
| Household Durables 0.8% | | | | | | | | |
| Hovnanian Enterprises, Inc.: | | | | | | | | |
| 6.00%, 01/15/2010 | | | | 675,000 | | | | 661,500 |
| 6.375%, 12/15/2014 | | | | 465,000 | | | | 455,700 |
| Jarden Corp., 9.75%, 05/01/2012 | | | | 1,525,000 | | | | 1,631,750 |
| Meritage Homes Corp., 6.25%, 03/15/2015 144A | | | | 500,000 | | | | 462,500 |
| |
|
| | | | | | | | | 3,211,450 |
| |
|
| Leisure Equipment & Products 0.2% | | | | | | | | |
| Riddell Bell Holdings, Inc., 8.375%, 10/01/2012 144A | | | | 760,000 | | | | 769,500 |
| |
|
See Notes to Financial Statements
12
SCHEDULE OF INVESTMENTS continued
April 30, 2005
| | | Principal | | | | |
| | | Amount | | | | Value |
|
| CORPORATE BONDS continued | | | | | | |
| CONSUMER DISCRETIONARY continued | | | | | | |
| Media 2.7% | | | | | | |
| Cablevision Systems Corp., 8.00%, 04/15/2012 144A | | $ 1,400,000 | | $ | | 1,387,750 |
| CCO Holdings LLC, 8.75%, 11/15/2013 | | 850,000 | | | | 822,375 |
| Charter Communications Holdings LLC, 8.625%, 04/01/2009 | | 1,600,000 | | | | 1,164,000 |
| Cinemark USA, Inc.: | | | | | | |
| 9.00%, 02/01/2013 | | 150,000 | | | | 159,375 |
| Sr. Disc. Note, Step Bond, 0.00%, 03/15/2014 † | | 2,000,000 | | | | 1,385,000 |
| CSC Holdings, Inc., 7.625%, 04/01/2011 | | 835,000 | | | | 851,700 |
| Emmis Communications Corp., 6.875%, 05/15/2012 | | 775,000 | | | | 769,188 |
| Marquee Holdings, Inc., Sr. Disc. Note, Step Bond, 0.00%, 08/15/2014 144A † | | 1,500,000 | | | | 945,000 |
| Mediacom LLC, 9.50%, 01/15/2013 | | 1,850,000 | | | | 1,780,625 |
| Visant Corp., 7.625%, 10/01/2012 | | 925,000 | | | | 929,625 |
| WMG Holdings Corp., 7.39%, 12/15/2011 144A | | 1,050,000 | | | | 1,086,750 |
| |
|
| | | | | | | 11,281,388 |
| |
|
| Multi-line Retail 0.4% | | | | | | |
| J.C. Penney Co., Inc., 7.375%, 08/15/2008 | | 1,650,000 | | | | 1,757,250 |
| |
|
| Specialty Retail 1.4% | | | | | | |
| CSK Auto, Inc., 7.00%, 01/15/2014 | | 1,500,000 | | | | 1,365,000 |
| FTD, Inc., 7.75%, 02/15/2014 | | 1,944,000 | | | | 1,944,000 |
| PETCO Animal Supplies, Inc., 10.75%, 11/01/2011 | | 1,100,000 | | | | 1,226,500 |
| United Auto Group, Inc., 9.625%, 03/15/2012 | | 1,300,000 | | | | 1,358,500 |
| |
|
| | | | | | | 5,894,000 |
| |
|
| Textiles, Apparel & Luxury Goods 0.4% | | | | | | |
| Norcross Safety Products LLC, Ser. B, 9.875%, 08/15/2011 | | 700,000 | | | | 742,000 |
| Oxford Industries, Inc., 8.875%, 06/01/2011 | | 400,000 | | | | 416,000 |
| The Warnaco Group, Inc., 8.875%, 06/15/2013 | | 385,000 | | | | 417,725 |
| |
|
| | | | | | | 1,575,725 |
| |
|
| CONSUMER STAPLES 1.4% | | | | | | |
| Food & Staples Retailing 0.4% | | | | | | |
| NeighborCare, Inc., 6.875%, 11/15/2013 | | 1,125,000 | | | | 1,181,250 |
| Rite Aid Corp., 9.50%, 02/15/2011 | | 600,000 | | | | 612,000 |
| |
|
| | | | | | | 1,793,250 |
| |
|
| Food Products 0.5% | | | | | | |
| B&G Foods Holdings Corp., 8.00%, 10/01/2011 | | 75,000 | | | | 77,812 |
| Chiquita Brands International, Inc., 7.50%, 11/01/2014 | | 305,000 | | | | 280,600 |
| Del Monte Foods Co.: | | | | | | |
| 6.75%, 02/15/2015 144A | | 190,000 | | | | 183,350 |
| 8.625%, 12/15/2012 | | 330,000 | | | | 354,750 |
| Michael Foods, Inc., 8.00%, 11/15/2013 | | 900,000 | | | | 927,000 |
| |
|
| | | | | | | 1,823,512 |
| |
|
| Household Products 0.2% | | | | | | |
| Spectrum Brands, Inc., 7.375%, 02/01/2015 144A | | 945,000 | | | | 921,375 |
| |
|
See Notes to Financial Statements
13
SCHEDULE OF INVESTMENTS continued
April 30, 2005
| | | | | Principal | | | | |
| | | | | Amount | | | | Value |
|
| CORPORATE BONDS continued | | | | | | |
| CONSUMER STAPLES continued | | | | | | |
| Personal Products 0.3% | | | | | | |
| Playtex Products, Inc., 8.00%, 03/01/2011 | | $ 1,250,000 | | $ | | 1,340,625 |
| |
|
| ENERGY 3.3% | | | | | | | | |
| Energy Equipment & Services 0.9% | | | | | | |
| Dresser, Inc., 9.375%, 04/15/2011 | | 775,000 | | | | 813,750 |
| Grant Prideco, Inc., 9.625%, 12/01/2007 | | 750,000 | | | | 823,125 |
| Gulfmark Offshore, Inc., 7.75%, 07/15/2014 144A | | 525,000 | | | | 532,875 |
| Parker Drilling Co.: | | | | | | | | |
| 9.625%, 10/01/2013 | | 450,000 | | | | 497,250 |
| 9.625%, 10/01/2013 144A | | 950,000 | | | | 1,049,750 |
| |
|
| | | | | | | | | 3,716,750 |
| |
|
| Oil, Gas & Consumable Fuels 2.4% | | | | | | |
| Chesapeake Energy Corp.: | | | | | | |
| 6.875%, 01/15/2016 | | 1,620,000 | | | | 1,620,000 |
| 7.75%, 01/15/2015 | | 400,000 | | | | 423,000 |
| El Paso Corp.: | | | | | | | | |
| 7.75%, 01/15/2032 | | 850,000 | | | | 786,250 |
| 7.875%, 06/15/2012 | | 825,000 | | | | 810,562 |
| El Paso Production Holding Co., 7.75%, 06/01/2013 | | 1,225,000 | | | | 1,240,312 |
| Encore Acquisition Co., 6.25%, 04/15/2014 | | 535,000 | | | | 518,950 |
| Exco Resources, Inc., 7.25%, 01/15/2011 | | 225,000 | | | | 222,750 |
| Overseas Shipholding Group, Inc., 8.25%, 03/15/2013 | | 750,000 | | | | 798,750 |
| Plains Exploration & Production Co., 8.75%, 07/01/2012 | | 1,300,000 | | | | 1,410,500 |
| The Williams Companies, Inc.: | | | | | | |
| 7.50%, 01/15/2031 | | 775,000 | | | | 804,063 |
| 8.125%, 03/15/2012 | | 1,125,000 | | | | 1,237,500 |
| |
|
| | | | | | | | | 9,872,637 |
| |
|
| FINANCIALS 1.9% | | | | | | | | |
| Consumer Finance 0.6% | | | | | | |
| General Motors Acceptance Corp.: | | | | | | |
| 6.125%, 09/15/2006 | | 1,675,000 | | | | 1,665,550 |
| FRN, 3.56%, 01/16/2007 | | 700,000 | | | | 668,564 |
| |
|
| | | | | | | | | 2,334,114 |
| |
|
| Diversified Financial Services 0.4% | | | | | | |
| Arch Western Finance LLC, 6.75%, 07/01/2013 | | 1,500,000 | | | | 1,511,250 |
| Borden US Finance Corp., 9.00%, 07/15/2014 144A | | 250,000 | | | | 251,250 |
| |
|
| | | | | | | | | 1,762,500 |
| |
|
| Insurance 0.3% | | | | | | | | |
| Crum & Forster Holdings Corp., 10.375%, 06/15/2013 | | 1,300,000 | | | | 1,417,000 |
| |
|
| Real Estate 0.6% | | | | | | | | |
| Crescent Real Estate Equities Co., REIT, 9.25%, 04/15/2009 | | 750,000 | | | | 791,377 |
| Host Marriott Corp., Ser. J, REIT, 7.125%, 11/01/2013 | | 1,500,000 | | | | 1,526,250 |
| |
|
| | | | | | | | | 2,317,627 |
| |
|
See Notes to Financial Statements
14
SCHEDULE OF INVESTMENTS continued
April 30, 2005
| | | Principal | | | | |
| | | Amount | | | | Value |
|
| CORPORATE BONDS continued | | | | | | |
| HEALTH CARE 1.5% | | | | | | |
| Health Care Equipment & Supplies 0.3% | | | | | | |
| Universal Hospital Services, Inc., 10.125%, 11/01/2011 | | $ 1,050,000 | | $ | | 1,068,375 |
| |
|
| Health Care Providers & Services 1.2% | | | | | | |
| Carriage Services, Inc., 7.875%, 01/15/2015 144A | | 425,000 | | | | 429,250 |
| HCA, Inc., 6.375%, 01/15/2015 | | 850,000 | | | | 857,317 |
| IASIS Healthcare Corp., 8.75%, 06/15/2014 | | 590,000 | | | | 609,175 |
| Select Medical Corp., 7.625%, 02/01/2015 144A | | 950,000 | | | | 938,125 |
| Service Corporation International, 6.75%, 04/01/2016 | | 1,000,000 | | | | 957,500 |
| Tenet Healthcare Corp., 9.875%, 07/01/2014 | | 1,325,000 | | | | 1,368,062 |
| |
|
| | | | | | | 5,159,429 |
| |
|
| INDUSTRIALS 2.9% | | | | | | |
| Aerospace & Defense 0.2% | | | | | | |
| Argo-Tech Corp., 9.25%, 06/01/2011 | | 190,000 | | | | 204,250 |
| Moog, Inc., 6.25%, 01/15/2015 | | 540,000 | | | | 537,300 |
| |
|
| | | | | | | 741,550 |
| |
|
| Commercial Services & Supplies 1.3% | | | | | | |
| Allied Waste North America, Inc.: | | | | | | |
| 5.75%, 02/15/2011 | | 480,000 | | | | 423,600 |
| 6.375%, 04/15/2011 | | 475,000 | | | | 434,625 |
| American Color Graphics, Inc., 10.00%, 06/15/2010 | | 850,000 | | | | 548,250 |
| Clean Harbors, Inc., 11.25%, 07/15/2012 144A | | 570,000 | | | | 635,550 |
| Corrections Corporation of America, 6.25%, 03/15/2013 144A | | 400,000 | | | | 388,000 |
| Geo Group, Inc., 8.25%, 07/15/2013 | | 390,000 | | | | 392,925 |
| JohnsonDiversey Holdings, Inc., Sr. Disc. Note, Step Bond, 0.00% 05/15/2013 † | | 1,815,000 | | | | 1,442,925 |
| TriMas Corp., 9.875%, 06/15/2012 | | 850,000 | | | | 841,500 |
| |
|
| | | | | | | 5,107,375 |
| |
|
| Machinery 1.0% | | | | | | |
| Case New Holland, Inc., 9.25%, 08/01/2011 144A | | 1,675,000 | | | | 1,716,875 |
| Douglas Dynamics LLC, 7.75%, 01/15/2012 144A | | 325,000 | | | | 320,125 |
| Dresser Rand Group, Inc., 7.375%, 11/01/2014 144A | | 785,000 | | | | 769,300 |
| Terex Corp., 7.375%, 01/15/2014 | | 1,440,000 | | | | 1,454,400 |
| |
|
| | | | | | | 4,260,700 |
| |
|
| Trading Companies & Distributors 0.4% | | | | | | |
| United Rentals North America, Inc., 7.75%, 11/15/2013 | | 1,875,000 | | | | 1,767,188 |
| |
|
| INFORMATION TECHNOLOGY 0.5% | | | | | | |
| IT Services 0.5% | | | | | | |
| Computer Sciences Corp., 9.50%, 02/15/2013 144A | | 1,200,000 | | | | 1,158,000 |
| Stratus Technologies, Inc., 10.375%, 12/01/2008 | | 850,000 | | | | 833,000 |
| |
|
| | | | | | | 1,991,000 |
| |
|
See Notes to Financial Statements
15
SCHEDULE OF INVESTMENTS continued
April 30, 2005
| | | | | Principal | | | | |
| | | | | Amount | | | | Value |
|
| CORPORATE BONDS continued | | | | | | | | |
| MATERIALS 6.5% | | | | | | | | |
| Chemicals 2.6% | | | | | | | | |
| Arco Chemical Co., 9.80%, 02/01/2020 | | $ | | 485,000 | | $ | | 538,350 |
| Equistar Chemicals LP, 10.625%, 05/01/2011 | | | | 875,000 | | | | 980,000 |
| Ethyl Corp., 8.875%, 05/01/2010 | | | | 250,000 | | | | 264,375 |
| FMC Corp., 10.25%, 11/01/2009 | | | | 920,000 | | | | 1,021,200 |
| Huntsman Advanced Materials LLC, 11.00%, 07/15/2010 144A | | | | 750,000 | | | | 858,750 |
| Huntsman International LLC: | | | | | | | | |
| 9.875%, 03/01/2009 | | | | 1,300,000 | | | | 1,404,000 |
| 11.50%, 07/15/2012 144A | | | | 924,000 | | | | 1,067,220 |
| Lyondell Chemical Co.: | | | | | | | | |
| 9.50%, 12/15/2008 | | | | 1,750,000 | | | | 1,874,688 |
| 10.50%, 06/01/2013 | | | | 800,000 | | | | 926,000 |
| Nalco Co., 8.875%, 11/15/2013 | | | | 800,000 | | | | 824,000 |
| PQ Corp., 7.50%, 02/15/2013 144A | | | | 885,000 | | | | 862,875 |
| |
|
| | | | | | | | | 10,621,458 |
| |
|
| Containers & Packaging 1.0% | | | | | | | | |
| Graham Packaging Co., 9.875%, 10/15/2014 144A | | | | 450,000 | | | | 432,000 |
| Graphic Packaging International, Inc., 9.50%, 08/15/2013 | | | | 1,000,000 | | | | 1,000,000 |
| Owens-Brockway Glass Containers, Inc.: | | | | | | | | |
| 8.25%, 05/15/2013 | | | | 1,335,000 | | | | 1,421,775 |
| 8.75%, 11/15/2012 | | | | 1,025,000 | | | | 1,122,375 |
| |
|
| | | | | | | | | 3,976,150 |
| |
|
| Metals & Mining 1.8% | | | | | | | | |
| Alaska Steel Corp., 7.75%, 06/15/2012 | | | | 1,275,000 | | | | 1,141,125 |
| Foundation Pennsylvania Coal Co., 7.25%, 08/01/2014 | | | | 1,100,000 | | | | 1,135,750 |
| Freeport-McMoRan Copper & Gold, Inc., 10.125%, 02/01/2010 | | | | 1,680,000 | | | | 1,848,000 |
| Oregon Steel Mills, Inc., 10.00%, 07/15/2009 | | | | 1,300,000 | | | | 1,400,750 |
| Peabody Energy Corp.: | | | | | | | | |
| 5.875%, 04/15/2016 | | | | 500,000 | | | | 487,500 |
| 6.875%, 03/15/2013 | | | | 440,000 | | | | 457,600 |
| United States Steel Corp., 10.75%, 08/01/2008 | | | | 750,000 | | | | 847,500 |
| |
|
| | | | | | | | | 7,318,225 |
| |
|
| Paper & Forest Products 1.1% | | | | | | | | |
| Amscan Holdings, Inc., 8.75%, 05/01/2014 | | | | 1,000,000 | | | | 935,000 |
| Boise Cascade LLC: | | | | | | | | |
| 5.54%, 10/15/2012 144A | | | | 425,000 | | | | 422,875 |
| 7.125%, 10/15/2014 144A | | | | 400,000 | | | | 382,000 |
| Bowater, Inc., 6.50%, 06/15/2013 | | | | 850,000 | | | | 775,625 |
| Georgia Pacific Corp.: | | | | | | | | |
| 8.00%, 01/15/2024 | | | | 420,000 | | | | 449,400 |
| 8.125%, 05/15/2011 | | | | 1,600,000 | | | | 1,758,000 |
| |
|
| | | | | | | | | 4,722,900 |
| |
|
See Notes to Financial Statements
16
SCHEDULE OF INVESTMENTS continued
April 30, 2005
| | | | | Principal | | | | |
| | | | | Amount | | | | Value |
|
| CORPORATE BONDS continued | | | | | | | | |
| TELECOMMUNICATION SERVICES 0.8% | | | | | | | | |
| Wireless Telecommunication Services 0.8% | | | | | | | | |
| Alamosa Holdings, Inc., 8.50%, 01/31/2012 | | $ | | 425,000 | | $ | | 442,000 |
| Horizon PCS, Inc., 11.375%, 07/15/2012 144A | | | | 400,000 | | | | 444,000 |
| Nextel Communications, Inc., 7.375%, 08/01/2015 | | | | 1,200,000 | | | | 1,284,000 |
| Rural Cellular Co., 8.25%, 03/15/2012 | | | | 450,000 | | | | 457,875 |
| UbiquiTel, Inc., 9.875%, 03/01/2011 | | | | 400,000 | | | | 435,000 |
| US Unwired, Inc., Ser. B, 10.00%, 06/15/2012 | | | | 400,000 | | | | 441,000 |
| |
|
| | | | | | | | | 3,503,875 |
| |
|
| UTILITIES 1.1% | | | | | | | | |
| Electric Utilities 0.5% | | | | | | | | |
| Reliant Energy, Inc.: | | | | | | | | |
| 6.75%, 12/15/2014 | | | | 975,000 | | | | 867,750 |
| 9.25%, 7/15/2010 | | | | 1,300,000 | | | | 1,335,750 |
| |
|
| | | | | | | | | 2,203,500 |
| |
|
| Multi-Utilities 0.6% | | | | | | | | |
| AES Corp., 7.75%, 03/01/2014 | | | | 1,350,000 | | | | 1,383,750 |
| NRG Energy, Inc., 8.00%, 12/15/2013 144A | | | | 1,134,000 | | | | 1,151,010 |
| |
|
| | | | | | | | | 2,534,760 |
| |
|
| Total Corporate Bonds (cost $117,248,660) | | | | | | | | 117,206,181 |
| |
|
| FOREIGN BONDS-CORPORATE (PRINCIPAL AMOUNT DENOMINATED IN | | | | | | | | |
| CURRENCY INDICATED) 14.9% | | | | | | | | |
| CONSUMER DISCRETIONARY 0.9% | | | | | | | | |
| Automobiles 0.3% | | | | | | | | |
| Renault SA, 6.125%, 06/26/2009 EUR | | | | 720,000 | | | | 1,030,792 |
| |
|
| Hotels, Restaurants & Leisure 0.2% | | | | | | | | |
| Sodexho Alliance SA, 5.875%, 03/25/2009 EUR | | | | 720,000 | | | | 1,015,368 |
| |
|
| Internet & Catalog Retail 0.2% | | | | | | | | |
| Great University Stores, 5.625%, 12/12/2013 GBP | | | | 450,000 | | | | 849,459 |
| |
|
| Specialty Retail 0.2% | | | | | | | | |
| LVMH Moet Hennessy-Louis Vuitton SA, 6.125%, 06/25/2008 EUR | | | | 650,000 | | | | 918,157 |
| |
|
| CONSUMER STAPLES 0.5% | | | | | | | | |
| Food & Staples Retailing 0.3% | | | | | | | | |
| Tesco plc, 4.75%, 04/13/2010 EUR | | | | 750,000 | | | | 1,037,941 |
| |
|
| Tobacco 0.2% | | | | | | | | |
| British American Tobacco plc, 4.875%, 02/25/2009 EUR | | | | 720,000 | | | | 982,620 |
| |
|
| ENERGY 0.3% | | | | | | | | |
| Oil, Gas & Consumable Fuels 0.3% | | | | | | | | |
| Transco plc, 7.00%, 12/15/2008 AUD | | | | 1,500,000 | | | | 1,207,503 |
| |
|
See Notes to Financial Statements
17
SCHEDULE OF INVESTMENTS continued
April 30, 2005
| | | Principal | | | | |
| | | Amount | | | | Value |
|
| FOREIGN BONDS-CORPORATE (PRINCIPAL AMOUNT DENOMINATED IN | | | | | | |
| CURRENCY INDICATED) continued | | | | | | |
| FINANCIALS 10.4% | | | | | | |
| Capital Markets 0.4% | | | | | | |
| Deutsche Bank AG, FRN, 2.71%, 08/09/2007 CAD | | $ 1,900,000 | | $ | | 1,505,140 |
| |
|
| Commercial Banks 4.8% | | | | | | |
| Australia & New Zealand Bank, 4.875%, 12/22/2008 GBP | | 450,000 | | | | 857,059 |
| Banco Santander-Chile, 4.00%, 09/10/2010 EUR | | 2,200,000 | | | | 2,966,784 |
| BOS International Australia, 3.50%, 01/22/2007 CAD | | 1,890,000 | | | | 1,505,763 |
| BSCH Issuances, Ltd., 5.125%, 07/06/2009 EUR | | 1,350,000 | | | | 1,882,536 |
| DnB NOR ASA, MTN, 2.82%, 12/08/2008 CAD | | 1,000,000 | | | | 794,043 |
| Eurofima: | | | | | | |
| 5.50%, 09/15/2009 AUD | | 55,000 | | | | 42,612 |
| MTN, 6.50%, 08/22/2011 AUD | | 1,500,000 | | | | 1,217,794 |
| European Investment Bank: | | | | | | |
| 4.00%, 04/15/2009 SEK | | 5,000,000 | | | | 731,554 |
| 4.25%, 12/07/2010 GBP | | 590,000 | | | | 1,097,467 |
| MTN: | | | | | | |
| 5.75%, 09/15/2009 AUD | | 100,000 | | | | 78,488 |
| 6.50%, 09/10/2014 NZD | | 4,600,000 | | | | 3,371,259 |
| Kreditanstalt fur Wiederaufbau, MTN, 4.75%, 12/07/2010 GBP | | 580,000 | | | | 1,103,934 |
| Landwirtschaftliche Rentenbank, 6.00%, 09/15/2009 AUD | | 1,550,000 | | | | 1,222,680 |
| Rabobank Nederland, FRN, 2.73%, 06/18/2007 CAD | | 1,500,000 | | | | 1,189,934 |
| Royal Bank of Canada, FRN, 5.02%, 04/08/2010 GBP | | 1,036,000 | | | | 1,977,534 |
| |
|
| | | | | | | 20,039,441 |
| |
|
| Consumer Finance 0.4% | | | | | | |
| Toyota Credit Canada, 4.75%, 12/30/2008 CAD | | 2,150,000 | | | | 1,768,161 |
| |
|
| Diversified Financial Services 2.9% | | | | | | |
| Bank Nederlandse Gemeenten NV, MTN, 4.875%, 04/21/2010 GBP | | 580,000 | | | | 1,109,357 |
| Cedulas TDA, 3.25%, 06/19/2010 EUR | | 2,600,000 | | | | 3,397,407 |
| General Electric Capital Corp.: | | | | | | |
| FRN, 2.19%, 03/31/2008 EUR | | 500,000 | | | | 643,196 |
| MTN: | | | | | | |
| 5.25%, 12/10/2013 GBP | | 570,000 | | | | 1,099,802 |
| 6.625%, 02/04/2010 NZD | | 2,870,000 | | | | 2,094,862 |
| HSBC Finance Corp., 5.125%, 06/24/2009 EUR | | 1,000,000 | | | | 1,393,729 |
| Nationwide Building Society, FRN, 2.27%, 11/01/2008 EUR | | 975,000 | | | | 1,254,735 |
| Network Rail Finance plc, FRN, 2.14%, 02/27/2007 EUR | | 800,000 | | | | 1,029,629 |
| |
|
| | | | | | | 12,022,717 |
| |
|
| Thrifts & Mortgage Finance 1.9% | | | | | | |
| Nykredit: | | | | | | |
| 4.00%, 10/01/2020 DKK | | 8,803,958 | | | | 1,536,680 |
| 5.00%, 10/01/2022 DKK | | 7,286,552 | | | | 1,285,992 |
| 6.00%, 10/01/2022 DKK | | 2,837,823 | | | | 508,934 |
| Totalkredit, FRN, 2.65%, 01/01/2015 DKK | | 25,000,000 | | | | 4,341,571 |
| |
|
| | | | | | | 7,673,177 |
| |
|
See Notes to Financial Statements
18
SCHEDULE OF INVESTMENTS continued
April 30, 2005
| | | | | Principal | | | | |
| | | | | Amount | | | | Value |
|
| FOREIGN BONDS-CORPORATE (PRINCIPAL AMOUNT DENOMINATED IN | | | | | | |
| CURRENCY INDICATED) continued | | | | | | |
| INDUSTRIALS 0.3% | | | | | | | | |
| Construction & Engineering 0.3% | | | | | | |
| Deutsche Bahn Finance BV, 4.875%, 07/06/2009 EUR | | 750,000 | | $ | | 1,043,393 |
| |
|
| INFORMATION TECHNOLOGY 1.8% | | | | | | |
| Internet Software & Services 1.8% | | | | | | |
| Aries Vermogensverwaltung, 7.75%, 10/25/2009 EUR | | 5,000,000 | | | | 7,442,628 |
| |
|
| MATERIALS 0.5% | | | | | | | | |
| Chemicals 0.5% | | | | | | | | |
| Nalco Co., 9.00%, 11/15/2013 EUR | | 1,500,000 | | | | 2,126,640 |
| |
|
| UTILITIES 0.2% | | | | | | | | |
| Electric Utilities 0.2% | | | | | | | | |
| International Endesa BV, 4.375%, 06/18/2009 EUR | | 700,000 | | | | 947,985 |
| |
|
| Total Foreign Bonds-Corporate (Principal Amount Denominated in | | | | | | |
| Currency Indicated) (cost $58,271,466) | | | | | | 61,611,122 |
| |
|
| FOREIGN BONDS-GOVERNMENT (PRINCIPAL AMOUNT DENOMINATED IN | | | | | | |
| CURRENCY INDICATED) 11.4% | | | | | | |
| Argentina, 2.00%, 09/30/2008 ARS | | 6,000,000 | | | | 1,664,633 |
| Australia: | | | | | | | | |
| 5.32%, 08/20/2015 AUD | | | | 3,808,000 | | | | 4,415,285 |
| 8.75%, 08/15/2008 AUD | | | | 1,250,000 | | | | 1,075,985 |
| British Columbia, 6.375%, 08/23/2010 CAD | | 1,925,000 | | | | 1,711,062 |
| France, 1.61%, 07/25/2015 EUR | | | | 1,000,000 | | | | 1,315,600 |
| Hungary, 8.50%, 10/12/2005 HUF | | | | 300,000,000 | | | | 1,531,384 |
| Mexico: | | | | | | | | |
| 8.00%, 12/24/2008 MXN | | | | 13,500,000 | | | | 1,142,871 |
| 9.00%, 12/20/2012 MXN | | | | 5,500,000 | | | | 461,266 |
| 10.50%, 07/14/2011 MXN | | | | 12,500,000 | | | | 1,168,405 |
| Norway, 6.50%, 05/15/2013 NOK | | | | 33,000,000 | | | | 6,266,255 |
| Ontario, 6.50%, 12/01/2005 CAD | | | | 66,000 | | | | 53,459 |
| Poland, 5.00%, 10/24/2013 PLN | | | | 7,000,000 | | | | 2,023,205 |
| Slovakia, 4.95%, 03/05/2008 SKK | | | | 70,000,000 | | | | 2,421,279 |
| South Africa: | | | | | | | | |
| 7.00%, 04/10/2008 EUR | | | | 750,000 | | | | 1,067,518 |
| 13.00%, 08/31/2010 ZAR | | | | 7,000,000 | | | | 1,405,533 |
| Spain, 4.00%, 01/31/2010 EUR | | | | 3,440,000 | | | | 4,670,795 |
| Sweden: | | | | | | | | |
| 3.81%, 12/01/2015 SEK | | | | 29,055,000 | | | | 5,272,337 |
| 5.25%, 03/15/2011 SEK | | | | 26,500,000 | | | | 4,162,021 |
| United Kingdom: | | | | | | | | |
| 5.00%, 03/07/2012 GBP | | | | 1,250,000 | | | | 2,454,833 |
| 6.41%, 08/23/2011 GBP | | | | 500,000 | | | | 2,508,329 |
| |
|
| Total Foreign Bonds-Government (Principal Amount Denominated in | | | | | | |
| Currency Indicated) (cost $44,305,278) | | | | | | 46,792,055 |
| |
|
See Notes to Financial Statements
19
SCHEDULE OF INVESTMENTS continued
April 30, 2005
| | | | | Principal | | | | |
| | | | | Amount | | | | Value |
|
| U.S. GOVERNMENT & AGENCY OBLIGATIONS 0.7% | | | | | | |
| FNMA, 4.625%, 10/15/2014 (cost $2,908,560) | | $ 2,875,000 | | $ | | 2,891,937 |
| |
|
| U.S. TREASURY OBLIGATIONS 5.2% | | | | | | |
| U.S. Treasury Bonds, 5.375%, 02/15/2031 ## | | 7,965,000 | | | | 8,998,586 |
| U.S. Treasury Notes: | | | | | | | | |
| 3.25%, 01/15/2009 ## | | | | 3,340,000 | | | | 3,277,509 |
| 4.00%, 02/15/2015 ## | | | | 8,455,000 | | | | 8,320,582 |
| 4.25%, 08/15/2014 | | | | 800,000 | | | | 803,626 |
| |
|
| Total U.S. Treasury Obligations (cost $20,339,079) | | | | | | 21,400,303 |
| |
|
| WHOLE LOAN MORTGAGE-BACKED COLLATERALIZED MORTGAGE | | | | | | |
| OBLIGATIONS 3.5% | | | | | | | | |
| FIXED-RATE 1.2% | | | | | | | | |
| Credit Suisse First Boston Mtge. Securities Corp., Ser. 2002-26, | | | | | | |
| Class 4A1, 7.00%, 10/25/2017 | | 1,012,032 | | | | 1,030,014 |
| Structured Asset Securities Corp.: | | | | | | | | |
| Ser. 2004-20, Class 5A-1, 6.25%, 11/25/2034 | | 2,722,642 | | | | 2,818,333 |
| Ser. 2005-RM1, Class A, IO, 5.00%, 03/25/2045 144A | | 5,120,000 | | | | 1,262,200 |
| |
|
| | | | | | | | | 5,110,547 |
| |
|
| FLOATING-RATE 2.3% | | | | | | | | |
| Bear Stearns Adjustable Rate Mtge. Trust, Ser. 2004-10, | | | | | | |
| Class 12A3, 4.73%, 01/25/2035 | | 935,704 | | | | 938,095 |
| Countrywide Alternative Loan Trust, Ser. 2004-J4, | | | | | | |
| Class 1A1, 3.00%, 06/25/2034 | | 25,868 | | | | 25,883 |
| Countrywide Home Loans: | | | | | | | | |
| Ser. 2004-HYB8, Class 1-M1, 4.37%, 01/20/2035 (h) | | 5,325,964 | | | | 5,422,484 |
| Ser. 2004-R1, Class 1-AF, 2.24%, 10/25/2034 144A | | 682,909 | | | | 684,254 |
| MASTR Adjustable Rate Mtge. Trust, Ser. 2005-1, Class 7A3, 5.02%, | | | | | | |
| 02/25/2035 | | | | 1,657,748 | | | | 1,664,670 |
| William Street Funding Corp., Ser. 2004-3, Class A, 2.30%, 09/23/2009 | | | | | | |
| 144A (h) | | | | 750,000 | | | | 751,418 |
| |
|
| | | | | | | | | 9,486,804 |
| |
|
| Total Whole Loan Mortgage-Backed Collateralized Mortgage Obligations | | | | | | |
| (cost $14,632,338) | | | | | | | | 14,597,351 |
| |
|
| WHOLE LOAN SUBORDINATE COLLATERALIZED MORTGAGE | | | | | | |
| OBLIGATIONS 0.5% | | | | | | | | |
| FIXED-RATE 0.5% | | | | | | | | |
| MASTR Resecuritization Trust: | | | | | | | | |
| Ser. 2004-3, 5.00%, 03/25/2034 | | 799,631 | | | | 783,388 |
| Ser. 2005-2, 4.75%, 03/20/2034 | | 1,265,000 | | | | 1,241,417 |
| |
|
| Total Whole Loan Subordinate Collateralized Mortgage Obligations | | | | | | |
| (cost $2,031,999) | | | | | | | | 2,024,805 |
| |
|
| YANKEE OBLIGATIONS-CORPORATE 5.8% | | | | | | |
| CONSUMER DISCRETIONARY 0.5% | | | | | | |
| Hotels, Restaurants & Leisure 0.2% | | | | | | |
| Intrawest Corp., 7.50%, 10/15/2013 | | 825,000 | | | | 825,000 |
| |
|
See Notes to Financial Statements
20
SCHEDULE OF INVESTMENTS continued
April 30, 2005
| | | Principal | | | | |
| | | Amount | | | | Value |
|
| YANKEE OBLIGATIONS-CORPORATE continued | | | | | | |
| CONSUMER DISCRETIONARY continued | | | | | | |
| Media 0.3% | | | | | | |
| IMAX Corp., 9.625%, 12/01/2010 | | $ 1,300,000 | | $ | | 1,381,250 |
| |
|
| CONSUMER STAPLES 0.3% | | | | | | |
| Food & Staples Retailing 0.3% | | | | | | |
| The Jean Coutu Group (PJC), Inc., 8.50%, 08/01/2014 | | 1,350,000 | | | | 1,279,125 |
| |
|
| ENERGY 0.4% | | | | | | |
| Energy Equipment & Services 0.4% | | | | | | |
| Petroleum Geo-Services ASA, 10.00%, 11/05/2010 | | 1,425,000 | | | | 1,596,000 |
| |
|
| FINANCIALS 0.8% | | | | | | |
| Consumer Finance 0.4% | | | | | | |
| Stone Container Finance Co., 7.375%, 07/15/2014 | | 1,750,000 | | | | 1,618,750 |
| |
|
| Diversified Financial Services 0.4% | | | | | | |
| Preferred Term Securities, Ltd., FRN: | | | | | | |
| 4.60%, 06/24/2034 144A | | 220,000 | | | | 222,963 |
| 4.65%, 12/24/2033 144A | | 500,000 | | | | 506,265 |
| Ship Finance International, Ltd., 8.50%, 12/15/2013 | | 865,000 | | | | 826,075 |
| |
|
| | | | | | | 1,555,303 |
| |
|
| INDUSTRIALS 1.0% | | | | | | |
| Commercial Services & Supplies 0.4% | | | | | | |
| Stena AB, 7.50%, 11/01/2013 | | 2,000,000 | | | | 1,920,000 |
| |
|
| Marine 0.3% | | | | | | |
| CP Ships, Ltd., 10.375%, 07/15/2012 | | 1,090,000 | | | | 1,228,975 |
| |
|
| Transportation Infrastructure 0.3% | | | | | | |
| Sea Containers, Ltd., 10.50%, 05/15/2012 | | 1,070,000 | | | | 1,123,500 |
| |
|
| INFORMATION TECHNOLOGY 0.2% | | | | | | |
| Electronic Equipment & Instruments 0.2% | | | | | | |
| Celestica, Inc., 7.875%, 07/01/2011 | | 900,000 | | | | 900,000 |
| |
|
| MATERIALS 1.3% | | | | | | |
| Chemicals 0.3% | | | | | | |
| Acetex Corp., 10.875%, 08/01/2009 | | 1,000,000 | | | | 1,060,000 |
| |
|
| Containers & Packaging 0.4% | | | | | | |
| Crown European Holdings: | | | | | | |
| 9.50%, 03/01/2011 | | 500,000 | | | | 542,500 |
| 10.875%, 03/01/2013 | | 1,000,000 | | | | 1,147,500 |
| |
|
| | | | | | | 1,690,000 |
| |
|
| Metals & Mining 0.5% | | | | | | |
| Gerdau Ameristeel Corp., 10.375%, 07/15/2011 | | 141,000 | | | | 154,395 |
| Novelis, Inc., 7.25%, 02/15/2015 144A | | 1,740,000 | | | | 1,692,150 |
| |
|
| | | | | | | 1,846,545 |
| |
|
See Notes to Financial Statements
21
SCHEDULE OF INVESTMENTS continued
April 30, 2005
| | | | | | | | | Principal | | | | |
| | | | | | | | | Amount | | | | Value |
|
| YANKEE OBLIGATIONS-CORPORATE continued | | | | | | | | |
| MATERIALS continued | | | | | | | | | | | | |
| Paper & Forest Products 0.1% | | | | | | | | | | |
| Abitibi-Consolidated, Inc., 6.00%, 06/20/2013 | | $ | | 475,000 | | $ | | 391,875 |
| Tembec Industries, Inc., 7.75%, 03/15/2012 | | | | | | 200,000 | | | | 152,000 |
| |
|
| | | | | | | | | | | | | 543,875 |
| |
|
| TELECOMMUNICATION SERVICES 0.3% | | | | | | | | |
| Wireless Telecommunication Services 0.3% | | | | | | | | |
| Rogers Wireless, Inc.: | | | | | | | | | | | | |
| 6.375%, 03/01/2014 | | | | | | | | 465,000 | | | | 447,562 |
| 9.625%, 05/01/2011 | | | | | | | | 745,000 | | | | 849,300 |
| |
|
| | | | | | | | | | | | | 1,296,862 |
| |
|
| UTILITIES 1.0% | | | | | | | | | | | | |
| Electric Utilities 0.4% | | | | | | | | | | | | |
| Enersis SA, 7.375%, 01/15/2014 | | | | | | | | 1,500,000 | | | | 1,583,603 |
| |
|
| Gas Utilities 0.6% | | | | | | | | | | | | |
| Gazprom, 9.625%, 03/01/2013 144A | | | | | | 2,000,000 | | | | 2,355,000 |
| |
|
| Total Yankee Obligations-Corporate (cost $23,595,704) | | | | | | | | 23,803,788 |
| |
|
| YANKEE OBLIGATIONS-GOVERNMENT 6.6% | | | | | | | | |
| Brazil: | | | | | | | | | | | | |
| 9.25%, 10/22/2010 | | | | | | | | 2,000,000 | | | | 2,165,000 |
| Ser. L, 8.00%, 04/15/2014 | | | | | | | | 1,504,076 | | | | 1,497,383 |
| Colombia, 9.75%, 04/09/2011 | | | | | | | | 2,834,717 | | | | 3,157,874 |
| Indonesia, 6.75%, 03/10/2014 | | | | | | | | 2,250,000 | | | | 2,165,625 |
| Mexico, 8.375%, 01/14/2011 | | | | | | | | 2,000,000 | | | | 2,294,000 |
| Peru, 9.125%, 01/15/2008 | | | | | | | | 1,500,000 | | | | 1,657,500 |
| Philippines, 9.375%, 01/18/2017 | | | | | | | | 3,500,000 | | | | 3,727,500 |
| Russia: | | | | | | | | | | | | |
| 3.00%, 05/14/2008 | | | | | | | | 4,900,000 | | | | 4,575,620 |
| Sr. Disc. Note, Step Bond, 5.00%, 03/31/2030 † | | | | 2,100,000 | | | | 2,233,875 |
| Venezuela: | | | | | | | | | | | | |
| 10.75%, 09/19/2013 | | | | | | | | 1,000,000 | | | | 1,120,000 |
| FRN, 4.15%, 04/20/2011 | | | | | | | | 3,000,000 | | | | 2,675,832 |
| |
|
| Total Yankee Obligations-Government (cost $25,825,425) | | | | | | | | 27,270,209 |
| |
|
| | | | | | | | | Shares | | | | Value |
|
| COMMON STOCKS 0.4% | | | | | | | | | | | | |
| CONSUMER DISCRETIONARY 0.0% | | | | | | | | | | |
| Media 0.0% | | | | | | | | | | | | |
| IMAX Corp. * | | | | | | | | 27,389 | | | | 213,771 |
| |
|
| ENERGY 0.3% | | | | | | | | | | | | |
| Energy Equipment & Services 0.3% | | | | | | | | | | |
| TexCal Energy LLC * (h) + | | | | | | | | 909 | | | | 1,181,050 |
| |
|
See Notes to Financial Statements
22
SCHEDULE OF INVESTMENTS continued
April 30, 2005
| | | Shares | | | | Value |
|
| MATERIALS 0.1% | | | | | | |
| Chemicals 0.1% | | | | | | |
| Huntsman Corp. * | | 19,570 | | $ | | 411,753 |
| |
|
| Total Common Stocks (cost $1,129,801) | | | | | | 1,806,574 |
| |
|
| WARRANTS 0.0% | | | | | | |
| CONSUMER DISCRETIONARY 0.0% | | | | | | |
| Media 0.0% | | | | | | |
| RCN Corp., Expiring 06/30/2013 * (h) + | | 175,000 | | | | 0 |
| |
|
| FINANCIALS 0.0% | | | | | | |
| Diversified Financial Services 0.0% | | | | | | |
| Ono Finance plc: | | | | | | |
| Expiring 03/16/2011 144A * + | | 2,000 | | | | 20 |
| Expiring 05/31/2009 144A * (h) + | | 2,000 | | | | 0 |
| |
|
| Total Warrants (cost $244,882) | | | | | | 20 |
| | |
|
|
| | | Principal | | | | |
| | | Amount | | | | Value |
|
| SHORT-TERM INVESTMENTS 10.2% | | | | | | |
| COMMERCIAL PAPER 3.4% | | | | | | |
| ASAP Funding, Ltd., 2.96%, 05/12/2005 | | $ 2,850,000 | | | | 2,847,657 |
| Chesham Financial Corp., 2.88%, 05/11/2005 | | 2,790,000 | | | | 2,787,991 |
| Giro Balanced Funding Corp., 2.88%, 05/12/2005 | | 2,780,000 | | | | 2,777,776 |
| Perry Global Funding, 2.88%, 09/12/2005 | | 2,780,000 | | | | 2,777,776 |
| UBS AG, 2.95%, 05/12/2005 | | 2,850,000 | | | | 2,847,664 |
| |
|
| | | | | | | 14,038,864 |
| | |
|
|
| | | Shares | | | | Value |
|
| MUTUAL FUND SHARES 6.8% | | | | | | |
| Evergreen Institutional Money Market Fund ø ## | | 28,190,881 | | | | 28,190,881 |
| |
|
| Total Short-Term Investments (cost $42,229,745) | | | | | | 42,229,745 |
| |
|
| Total Investments (cost $437,169,256) 108.3% | | | | | | 446,536,937 |
| Other Assets and Liabilities (8.3%) | | | | | | (34,154,070) |
| |
|
| Net Assets 100.0% | | | | $ | | 412,382,867 |
| |
|
See Notes to Financial Statements
23
SCHEDULE OF INVESTMENTS continued
April 30, 2005
| |
| # | | When-issued or delayed delivery security |
| 144A | | Security that may be sold to qualified institutional buyers under Rule 144A of the Securities Act of 1933, as amended. |
| | | This security has been determined to be liquid under guidelines established by the Board of Trustees, unless otherwise |
| | | noted. |
| • | | Security which has defaulted on payment of interest and/or principal. The Fund has stopped accruing interest on this |
| | | security. |
| (h) | | Security is valued at fair value as determined in good faith under procedures established by the Board of Trustees. |
| † | | Security initially issued in zero coupon form which converts to coupon form at a specified rate and date. An effective |
| | | interest rate is applied to recognize interest income daily for the bond. This rate is based on total expected interest to |
| | | be earned over the life of the bond which consists of the aggregate coupon-interest payments and discount at |
| | | acquisition. The rate shown is the stated rate at the current period end. |
| ## | | All or a portion of this security has been segregated for when-issued or delayed delivery securities. |
| * | | Non-income producing security |
| + | | Security is deemed illiquid and is valued using market quotations when readily available. |
| ø | | Evergreen Investment Management Company, LLC is the investment advisor to both the Fund and the money market |
| | | fund. |
| |
| Summary of Abbreviations |
| ARS | | Argentina Peso |
| AUD | | Australian Dollar |
| CAD | | Canadian Dollar |
| CDO | | Collateralized Debt Obligation |
| DKK | | Danish Krone |
| EUR | | Euro |
| FHLMC | | Federal Home Loan Mortgage Corp. |
| FNMA | | Federal National Mortgage Association |
| FRN | | Floating Rate Note |
| GBP | | Great British Pound |
| GNMA | | Government National Mortgage Association |
| HUF | | Hungarian Forint |
| IO | | Interest Only |
| MASTR | | Mortgage Asset Securitization Transactions, Inc. |
| MTN | | Medium-Term Note |
| MXN | | Mexican Peso |
| NOK | | Norwegian Krone |
| NZD | | New Zealand Dollar |
| PLN | | Polish Zloty |
| REIT | | Real Estate Investment Trust |
| SEK | | Swedish Krona |
| SKK | | Slovakian Koruny |
| TBA | | To Be Announced |
| ZAR | | South African Rand |
See Notes to Financial Statements
24
SCHEDULE OF INVESTMENTS continued
April 30, 2005
| The following table shows the percent of total bonds by credit quality based on Moody’s and Standard & Poor’s ratings as of |
| April 30, 2005 (unaudited): | | | |
| AAA | | 45.2% | |
| AA | | 2.8% | |
| A | | 14.5% | |
| BBB | | 1.9% | |
| BB | | 9.4% | |
| B | | 23.7% | |
| CCC | | 1.9% | |
| NR | | 0.6% | |
| |
| |
| | | 100.0% | |
| | |
| |
| |
| The following table shows the percent of total bonds by maturity as of April 30, 2005 (unaudited): |
| Less than 1 year | | 13.1% | |
| 1 to 3 year(s) | | 6.6% | |
| 3 to 5 years | | 29.5% | |
| 5 to 10 years | | 42.8% | |
| 10 to 20 years | | 5.5% | |
| 20 to 30 years | | 2.5% | |
| |
| |
| | | 100.0% | |
| | |
| |
See Notes to Financial Statements
25
STATEMENT OF ASSETS AND LIABILITIES
April 30, 2005
| Assets | | | | |
| Investments in securities, at value (cost $408,978,375) | | $ | | 418,346,056 |
| Investments in affiliates, at value (cost $28,190,881) | | | | 28,190,881 |
| Foreign currency, at value (cost $446,825) | | | | 446,657 |
| Receivable for securities sold | | | | 17,886,747 |
| Receivable for Fund shares sold | | | | 254,172 |
| Interest receivable | | | | 6,369,290 |
| Unrealized gains on forward foreign currency exchange contracts | | | | 1,102,270 |
| Prepaid expenses and other assets | | | | 54,563 |
|
| Total assets | | | | 472,650,636 |
|
| Liabilities | | | | |
| Dividends payable | | | | 592,436 |
| Payable for securities purchased | | | | 57,868,410 |
| Payable for Fund shares redeemed | | | | 721,120 |
| Payable for closed forward foreign currency exchange contracts | | | | 983,104 |
| Advisory fee payable | | | | 14,630 |
| Distribution Plan expenses payable | | | | 19,922 |
| Due to other related parties | | | | 3,754 |
| Accrued expenses and other liabilities | | | | 64,393 |
|
| Total liabilities | | | | 60,267,769 |
|
| Net assets | | $ | | 412,382,867 |
|
| Net assets represented by | | | | |
| Paid-in capital | | $ | | 448,131,508 |
| Undistributed net investment income | | | | 5,870,529 |
| Accumulated net realized losses on securities and foreign currency related transactions | | | | (52,087,205) |
| Net unrealized gains on securities and foreign currency related transactions | | | | 10,468,035 |
|
| Total net assets | | $ | | 412,382,867 |
|
| Net assets consists of | | | | |
| Class A | | $ | | 214,776,333 |
| Class B | | | | 98,851,717 |
| Class C | | | | 79,539,126 |
| Class I | | | | 19,215,691 |
|
| Total net assets | | $ | | 412,382,867 |
|
| Shares outstanding (unlimited number of shares authorized) | | | | |
| Class A | | | | 32,875,145 |
| Class B | | | | 15,085,473 |
| Class C | | | | 12,155,128 |
| Class I | | | | 2,986,487 |
|
| Net asset value per share | | | | |
| Class A | | $ | | 6.53 |
| Class A — Offering price (based on sales charge of 4.75%) | | $ | | 6.86 |
| Class B | | $ | | 6.55 |
| Class C | | $ | | 6.54 |
| Class I | | $ | | 6.43 |
|
See Notes to Financial Statements
26
STATEMENT OF OPERATIONS
Year Ended April 30, 2005
| Investment income | | | | |
| Interest (net of foreign withholding taxes of $59,926) | | $ | | 25,354,505 |
| Income from affiliates | | | | 197,965 |
| Securities lending | | | | 1,331 |
|
| Total investment income | | | | 25,553,801 |
|
| Expenses | | | | |
| Advisory fee | | | | 1,829,933 |
| Distribution Plan expenses | | | | |
| Class A | | | | 616,209 |
| Class B | | | | 1,040,661 |
| Class C | | | | 817,731 |
| Administrative services fee | | | | 414,408 |
| Transfer agent fees | | | | 719,056 |
| Trustees’ fees and expenses | | | | 12,051 |
| Printing and postage expenses | | | | 51,828 |
| Custodian and accounting fees | | | | 262,723 |
| Registration and filing fees | | | | 66,699 |
| Professional fees | | | | 27,150 |
| Other | | | | 39,429 |
|
| Total expenses | | | | 5,897,878 |
| Less: Expense reductions | | | | (2,645) |
| Expense reimbursements | | | | (82) |
|
| Net expenses | | | | 5,895,151 |
|
| Net investment income | | | | 19,658,650 |
|
| Net realized and unrealized gains or losses on securities and foreign | | | | |
| currency related transactions | | | | |
| Net realized gains or losses on: | | | | |
| Securities | | | | 12,276,542 |
| Foreign currency related transactions | | | | (1,263,527) |
|
| Net realized gains on securities and foreign currency related transactions | | | | 11,013,015 |
| Net change in unrealized gains or losses on securities and foreign currency | | | | |
| related transactions | | | | 942,567 |
|
| Net realized and unrealized gains or losses on securities and foreign currency | | | | |
| related transactions | | | | 11,955,582 |
|
| Net increase in net assets resulting from operations | | $ | | 31,614,232 |
|
See Notes to Financial Statements
27
STATEMENTS OF CHANGES IN NET ASSETS
| | | Year Ended April 30, |
| |
|
| | | 2005 | | 2004 |
|
| Operations | | | | | | | | |
| Net investment income | | $ | | 19,658,650 | | $ | | 20,436,680 |
| Net realized gains on securities and | | | | | | | | |
| foreign currency related transactions | | | | 11,013,015 | | | | 29,252,664 |
| Net change in unrealized gains or | | | | | | | | |
| losses on securities and foreign | | | | | | | | |
| currency related transactions | | | | 942,567 | | | | (27,295,321) |
|
| Net increase in net assets resulting | | | | | | | | |
| from operations | | | | 31,614,232 | | | | 22,394,023 |
|
| Distributions to shareholders from | | | | | | | | |
| Net investment income | | | | | | | | |
| Class A | | | | (11,021,445) | | | | (10,999,622) |
| Class B | | | | (4,861,302) | | | | (5,696,610) |
| Class C | | | | (3,819,193) | | | | (4,247,112) |
| Class I | | | | (1,350,463) | | | | (1,546,157) |
| Net realized gains | | | | | | | | |
| Class A | | | | (467,235) | | | | (4,697,664) |
| Class B | | | | (231,303) | | | | (2,758,470) |
| Class C | | | | (183,256) | | | | (2,125,608) |
| Class I | | | | (52,197) | | | | (614,261) |
|
| Total distributions to shareholders | | | | (21,986,394) | | | | (32,685,504) |
|
| | | Shares | | | | Shares | | |
| Capital share transactions | | | | | | | | |
| Proceeds from shares sold | | | | | | | | |
| Class A | | 6,307,048 | | 41,432,078 | | 10,558,043 | | 69,375,473 |
| Class B | | 2,284,706 | | 15,044,683 | | 5,160,616 | | 33,950,532 |
| Class C | | 1,974,634 | | 13,016,637 | | 7,780,021 | | 51,216,021 |
| Class I | | 586,221 | | 3,820,552 | | 1,433,762 | | 9,306,633 |
|
| | | | | 73,313,950 | | | | 163,848,659 |
|
| Net asset value of shares issued in | | | | | | | | |
| reinvestment of distributions | | | | | | | | |
| Class A | | 1,213,973 | | 7,954,122 | | 1,604,686 | | 10,521,676 |
| Class B | | 441,246 | | 2,897,973 | | 788,248 | | 5,188,607 |
| Class C | | 331,818 | | 2,176,653 | | 537,515 | | 3,532,884 |
| Class I | | 98,635 | | 634,960 | | 145,931 | | 940,548 |
|
| | | | | 13,663,708 | | | | 20,183,715 |
|
| Automatic conversion of Class B | | | | | | | | |
| shares to Class A shares | | | | | | | | |
| Class A | | 745,934 | | 4,900,250 | | 680,069 | | 4,474,534 |
| Class B | | (743,600) | | (4,900,250) | | (677,862) | | (4,474,534) |
|
| | | | | 0 | | | | 0 |
|
| Payment for shares redeemed | | | | | | | | |
| Class A | | (7,064,524) | | (46,098,782) | | (7,929,281) | | (51,756,882) |
| Class B | | (4,575,911) | | (29,821,678) | | (4,162,066) | | (27,254,170) |
| Class C | | (4,120,746) | | (26,755,342) | | (4,832,223) | | (31,650,267) |
| Class I | | (1,952,434) | | (12,626,152) | | (4,926,827) | | (31,100,842) |
|
| | | | | (115,301,954) | | | | (141,762,161) |
|
| Net asset value of shares issued in | | | | | | | | |
| acquisition — Class I | | 0 | | 0 | | 5,508,003 | | 35,677,970 |
|
| Net increase (decrease) in net assets | | | | | | | | |
| resulting from capital share transactions | | | | (28,324,296) | | | | 77,948,183 |
|
| Total increase (decrease) in net assets | | | | (18,696,458) | | | | 67,656,702 |
| Net assets | | | | | | | | |
| Beginning of period | | | | 431,079,325 | | | | 363,422,623 |
|
| End of period | | $ 412,382,867 | | $ 431,079,325 |
|
| Undistributed net investment income | | $ | | 5,870,529 | | $ | | 4,013,098 |
|
See Notes to Financial Statements
28
NOTES TO FINANCIAL STATEMENTS
1. ORGANIZATION
Evergreen Strategic Income Fund (the “Fund”) is a diversified series of Evergreen Fixed Income Trust (the “Trust”), a Delaware statutory trust organized on September 18, 1997. The Trust is an open-end management investment company registered under the Investment Company Act of 1940, as amended (the “1940 Act”).
The Fund offers Class A, Class B, Class C and Institutional (“Class I”) shares. Class A shares are sold with a front-end sales charge. However, Class A share investments of $1 million or more are not subject to a front-end sales charge but will be subject to a contingent deferred sales charge of 1.00% upon redemption within one year. Class B shares are sold without a front-end sales charge but are subject to a contingent deferred sales charge that is payable upon redemption and decreases depending on how long the shares have been held. Class C shares are sold without a front-end sales charge but are subject to a contingent deferred sales charge that is payable upon redemption within one year. Class I shares are sold without a front-end sales charge or contingent deferred sales charge. Each class of shares, except Class I shares, pays an ongoing distribution fee.
2. SIGNIFICANT ACCOUNTING POLICIES
The following is a summary of significant accounting policies consistently followed by the Fund in the preparation of its financial statements. The policies are in conformity with generally accepted accounting principles in the United States of America, which require management to make estimates and assumptions that affect amounts reported herein. Actual results could differ from these estimates.
a. Valuation of investments
Portfolio debt securities acquired with more than 60 days to maturity are fair valued using matrix pricing methods determined by an independent pricing service which takes into consideration such factors as similar security prices, yields, maturities, liquidity and ratings. Securities for which valuations are not readily available from an independent pricing service may be valued by brokers which use prices provided by market makers or estimates of market value obtained from yield data relating to investments or securities with similar characteristics.
Listed equity securities are usually valued at the last sales price or official closing price on the national securities exchange where the securities are principally traded.
Short-term securities with remaining maturities of 60 days or less at the time of purchase are valued at amortized cost, which approximates market value.
Investments in other mutual funds are valued at net asset value. Securities for which market quotations are not readily available or not reflective of current market value are valued at fair value as determined in good faith, according to procedures approved by the Board of Trustees.
b. Foreign currency translation
All assets and liabilities denominated in foreign currencies are translated into U.S. dollar amounts at the date of valuation. Purchases and sales of portfolio securities and income items denominated
29
NOTES TO FINANCIAL STATEMENTS continued
in foreign currencies are translated into U.S. dollar amounts on the respective dates of such transactions. The Fund does not separately account for that portion of the results of operations resulting from changes in foreign exchange rates on investments and the fluctuations arising from changes in market prices of securities held. Such fluctuations are included with the net realized and unrealized gains or losses on securities.
c. Forward foreign currency contracts
A forward foreign currency contract is an agreement between two parties to purchase or sell a specific currency for an agreed-upon price at a future date. The Fund enters into forward foreign currency contracts to facilitate transactions in foreign-denominated securities and to attempt to minimize the risk to the Fund from adverse changes in the relationship between currencies. Forward foreign currency contracts are recorded at the forward rate and marked-to-market daily. When the contracts are closed, realized gains and losses arising from such transactions are recorded as realized gains or losses on foreign currency related transactions. The Fund could be exposed to risks if the counterparties to the contracts are unable to meet the terms of their contracts or if the value of the foreign currency changes unfavorably.
d. When-issued and delayed delivery transactions
The Fund records when-issued or delayed delivery securities as of trade date and maintains security positions such that sufficient liquid assets will be available to make payment for the securities purchased. Securities purchased on a when-issued or delayed delivery basis are marked-to-market daily and begin earning interest on the settlement date. Losses may occur on these transactions due to changes in market conditions or the failure of counterparties to perform under the contract.
e. Securities lending
The Fund may lend its securities to certain qualified brokers in order to earn additional income. The Fund receives compensation in the form of fees or interest earned on the investment of any cash collateral received. The Fund also continues to receive interest and dividends on the securities loaned. The Fund receives collateral in the form of cash or securities with a market value at least equal to the market value of the securities on loan, including accrued interest. In the event of default or bankruptcy by the borrower, the Fund could experience delays and costs in recovering the loaned securities or in gaining access to the collateral. The Fund has the right under the lending agreement to recover the securities from the borrower on demand.
f. Dollar roll transactions
The Fund may enter into dollar roll transactions with respect to mortgage-backed securities. In a dollar roll transaction, the Fund sells mortgage-backed securities to financial institutions and simultaneously agrees to accept substantially similar (same type, coupon and maturity) securities at a later date at an agreed upon price. The Fund will use the proceeds generated from the transactions to invest in short-term investments, which may enhance the Fund’s current yield and total return. The Fund accounts for dollar roll transactions as purchases and sales. The Fund could be exposed to risks if the counterparty defaults on its obligation to perform under the terms of the
30
NOTES TO FINANCIAL STATEMENTS continued
agreement, if the Fund receives inferior securities in comparison to what was sold to the counter-party at redelivery or if there are variances in paydown speed between the mortgage-related pools.
g. Security transactions and investment income
Security transactions are recorded on trade date. Realized gains and losses are computed using the specific cost of the security sold. Interest income is recorded on the accrual basis and includes accretion of discounts and amortization of premiums. Foreign income and capital gains realized on some securities may be subject to foreign taxes, which are accrued as applicable.
h. Federal taxes
The Fund intends to continue to qualify as a regulated investment company and distribute all of its taxable income, including any net capital gains (which have already been offset by available capital loss carryovers). Accordingly, no provision for federal taxes is required.
i. Distributions
Distributions to shareholders from net investment income are accrued daily and paid monthly. Distributions from net realized gains, if any, are recorded on the ex-dividend date. Such distributions are determined in conformity with income tax regulations, which may differ from generally accepted accounting principles.
Reclassifications have been made to the Fund’s components of net assets to reflect income and gains available for distribution (or available capital loss carryovers, as applicable) under income tax regulations. The primary permanent differences causing such reclassifications are due to net realized foreign currency gains or losses, dividends paid through share redemptions, reinstated capital loss carryovers acquired through a fund merger and premium amortization. During the year ended April 30, 2005, the following amounts were reclassified:
|
| Paid-in capital | | $ | | 2,549,461 |
| Undistributed net investment income | | | | 4,123,996 |
| Accumulated net realized losses on securities | | | | |
| and foreign currency related transactions | | | | (6,673,457) |
|
j. Class allocations
Income, common expenses and realized and unrealized gains and losses are allocated to the classes based on the relative net assets of each class. Distribution fees, if any, are calculated daily at the class level based on the appropriate net assets of each class and the specific expense rates applicable to each class.
3. ADVISORY FEE AND OTHER TRANSACTIONS WITH AFFILIATES
Evergreen Investment Management Company, LLC (“EIMC”), an indirect, wholly-owned subsidiary of Wachovia Corporation (“Wachovia”), is the investment advisor to the Fund and is paid a fee at an annual rate of 2% of the Fund’s gross investment income plus an amount determined by applying percentage rates to the average daily net assets of the Fund, starting at 0.31% and declining to 0.16% as average daily net assets increase.
31
NOTES TO FINANCIAL STATEMENTS continued
From time to time, EIMC may voluntarily or contractually waive its fee and/or reimburse expenses in order to limit operating expenses. During the year ended April 30, 2005, EIMC reimbursed other expenses in the amount of $82.
Evergreen Investment Services, Inc. (“EIS”), an indirect, wholly-owned subsidiary of Wachovia, is the administrator to the Fund. As administrator, EIS provides the Fund with facilities, equipment and personnel and is paid an annual rate determined by applying percentage rates to the aggregate average daily net assets of the Evergreen funds (excluding money market funds), starting at 0.10% and declining to 0.05% as the aggregate average daily net assets of the Evergreen funds (excluding money market funds) increase.
Evergreen Service Company, LLC (“ESC”), an indirect, wholly-owned subsidiary of Wachovia, is the transfer and dividend disbursing agent for the Fund. ESC receives account fees that vary based on the type of account held by the shareholders in the Fund. For the year ended April 30, 2005, the transfer agent fees were equivalent to an annual rate of 0.17% of the Fund’s average daily net assets.
The Fund has placed a portion of its portfolio transactions with brokerage firms that are affiliates of Wachovia. During the year ended April 30, 2005, the Fund paid brokerage commissions of $176 to Wachovia Securities, LLC.
4. DISTRIBUTION PLANS
EIS also serves as distributor of the Fund’s shares. The Fund has adopted Distribution Plans, as allowed by Rule 12b-1 of the 1940 Act, for each class of shares, except Class I. Under the Distribution Plans, distribution fees are paid at an annual rate of 0.30% of the average daily net assets for Class A shares and 1.00% of the average daily net assets for each of Class B and Class C shares.
For the year ended April 30, 2005, EIS received $33,882 from the sale of Class A shares and $323,709 and $27,600 in contingent deferred sales charges from redemptions of Class B and Class C shares, respectively.
5. ACQUISITION
Effective at the close of business on July 11, 2003, the Fund acquired the net assets of Evergreen Offit Emerging Markets Bond Fund in a tax-free exchange for Class I shares of the Fund. Shares were issued to Class I shares of Evergreen Offit Emerging Markets Bond Fund at an exchange ratio of 1.21 for Class I shares of the Fund. The acquired net assets consisted primarily of portfolio securities with unrealized appreciation of $4,059,467. The aggregate net assets of the Fund and Evergreen Offit Emerging Markets Bond Fund immediately prior to the acquisition were $404,982,531 and $35,677,970, respectively. The aggregate net assets of the Fund immediately after the acquisition were $440,660,501.
32
NOTES TO FINANCIAL STATEMENTS continued
6. SECURITIES TRANSACTIONS
Cost of purchases and proceeds from sales of investment securities (excluding short-term securities) were as follows for the year ended April 30, 2005:
| Cost of Purchases | | Proceeds from Sales |
|
| | | Non- | | | | Non- |
| U.S. Government | | U.S. Government | | U.S. Government | | U.S. Government |
|
| $ 192,441,799 | | $ 341,025,137 | | $ 151,506,743 | | $ 392,036,011 |
|
At April 30, 2005, the Fund had forward foreign currency exchange contracts outstanding as follows:
Forward Foreign Currency Exchange Contracts to Sell:
| Exchange | | Contracts to | | U.S. Value at | | | | U.S. Value at | | Unrealized |
| Date | | Deliver | | April 30, 2005 | | In Exchange for | | April 30, 2005 | | Gain |
|
| 7/11/2005 | | 24,350,155 EUR | | $31,396,114 | | 3,385,889,000 JPY | | $32,498,384 | | $1,102,270 |
|
On April 30, 2005, the aggregate cost of securities for federal income tax purposes was $438,134,554. The gross unrealized appreciation and depreciation on securities based on tax cost was $12,997,367 and $4,594,984, respectively, with a net unrealized appreciation of $8,402,383.
As of April 30, 2005, the Fund had $51,140,188 in capital loss carryovers for federal income tax purposes with $6,306,504 expiring in 2008, $14,759,243 expiring in 2009 and $30,074,441 expiring in 2010. These losses are subject to certain limitations prescribed by the Internal Revenue Code.
7. INTERFUND LENDING
Pursuant to an Exemptive Order issued by the SEC, the Fund may participate in an interfund lending program with certain funds in the Evergreen fund family. This program allows the Fund to borrow from, or lend money to, other participating funds. During the year ended April 30, 2005, the Fund did not participate in the interfund lending program.
8. DISTRIBUTIONS TO SHAREHOLDERS
As of April 30, 2005, the components of distributable earnings on a tax basis were as follows:
| Undistributed | | Unrealized | | Capital Loss |
| Ordinary Income | | Appreciation | | Carryover |
|
| $ 6,989,164 | | $ 8,402,383 | | $ 51,140,188 |
|
The differences between the components of distributable earnings on a tax basis and the amounts reflected in the Statement of Assets and Liabilities are primarily due to wash sales, premium amortization and foreign currency gains on open forward contracts.
The tax character of distributions paid were $21,986,394 and $32,685,504 of ordinary income for the years ended April 30, 2005 and April 30, 2004, respectively.
33
NOTES TO FINANCIAL STATEMENTS continued
9. EXPENSE REDUCTIONS
Through expense offset arrangements with ESC and the Fund’s custodian, a portion of fund expenses has been reduced.
10. DEFERRED TRUSTEES’ FEES
Each Trustee of the Fund may defer any or all compensation related to performance of their duties as Trustees. The Trustees’ deferred balances are allocated to deferral accounts, which are included in the accrued expenses for the Fund. The investment performance of the deferral accounts are based on the investment performance of certain Evergreen funds. Any gains earned or losses incurred in the deferral accounts are reported in the Fund’s Trustees’ fees and expenses. At the election of the Trustees, the deferral account will be paid either in one lump sum or in quarterly installments for up to ten years.
11. FINANCING AGREEMENT
The Fund and certain other Evergreen funds share in a $150 million unsecured revolving credit commitment for temporary and emergency purposes, including the funding of redemptions, as permitted by each participating fund’s borrowing restrictions. Borrowings under this facility bear interest at 0.50% per annum above the Federal Funds rate. All of the participating funds are charged an annual commitment fee of 0.09% of the unused balance, which is allocated pro rata. During the year ended April 30, 2005, the Fund had no borrowings under this agreement.
12. REGULATORY MATTERS AND LEGAL PROCEEDINGS
Since September 2003, governmental and self-regulatory authorities have instituted numerous ongoing investigations of various practices in the mutual fund industry, including investigations relating to revenue sharing, market-timing, late trading and record retention, among other things. The investigations cover investment advisors, distributors and transfer agents to mutual funds, as well as other firms. EIMC, EIS and ESC (collectively, “Evergreen”) have received subpoenas and other requests for documents and testimony relating to these investigations, are endeavoring to comply with those requests, and are cooperating with the investigations. Evergreen is continuing its own internal review of policies, practices, procedures and personnel, and is taking remedial action where appropriate.
In connection with one of these investigations, on July 28, 2004, the staff of the Securities and Exchange Commission (“SEC”) informed Evergreen that the staff intends to recommend to the SEC that it institute an enforcement action against Evergreen. The SEC staff’s proposed allegations relate to (i) an arrangement pursuant to which a broker at one of EIMC’s affiliated broker-dealers had been authorized, apparently by an EIMC officer (no longer with EIMC), to engage in short-term trading, on behalf of a client, in Evergreen Mid Cap Growth Fund (formerly Evergreen Emerging Growth Fund and prior to that, known as Evergreen Small Company Growth Fund) during the period from December 2000 through April 2003, in excess of the limitations set forth in the fund’s prospectus, (ii) short-term trading from September 2001 through January 2003, by a former Evergreen portfolio manager, of Evergreen Precious Metals Fund, a
34
NOTES TO FINANCIAL STATEMENTS continued
fund he managed at the time, (iii) the sufficiency of systems for monitoring exchanges and enforcing exchange limitations as stated in the fund’s prospectuses, and (iv) the adequacy of e-mail retention practices. In connection with the activity in Evergreen Mid Cap Growth Fund, EIMC reimbursed the fund $378,905, plus an additional $25,242, representing what EIMC calculated at that time to be the client’s net gain and the fees earned by EIMC and the expenses incurred by this fund on the client’s account. In connection with the activity in Evergreen Precious Metals Fund, EIMC reimbursed the fund $70,878, plus an additional $3,075, representing what EIMC calculated at that time to be the portfolio manager’s net gain and the fees earned by EIMC and expenses incurred by the fund on the portfolio manager’s account. Evergreen is currently engaged in discussions with the staff of the SEC concerning its recommendation.
Any resolution of these matters with regulatory authorities may include, but not be limited to, sanctions, penalties or injunctions regarding Evergreen, restitution to mutual fund shareholders and/or other financial penalties and structural changes in the governance or management of Evergreen’s mutual fund business. Any penalties or restitution will be paid by Evergreen and not by the Evergreen funds.
In addition, the Evergreen funds and EIMC and certain of its affiliates are involved in various legal actions, including private litigation and class action lawsuits. EIMC does not expect that any of such legal actions currently pending or threatened will have a material adverse impact on the financial position or operations of any of the Evergreen funds or on EIMC’s ability to provide services to the Evergreen funds.
Although Evergreen believes that neither the foregoing investigations nor any pending or threatened legal actions will have a material adverse impact on the Evergreen funds, there can be no assurance that these matters and any publicity surrounding or resulting from them will not result in reduced sales or increased redemptions of Evergreen fund shares, which could increase Evergreen fund transaction costs or operating expenses, or have other adverse consequences on the Evergreen funds.
35
REPORT OF INDEPENDENT REGISTERED PUBLIC ACCOUNTING FIRM
Board of Trustees and Shareholders
Evergreen Fixed Income Trust
We have audited the accompanying statement of assets and liabilities, including the schedule of investments, of the Evergreen Strategic Income Fund, a series of Evergreen Fixed Income Trust, as of April 30, 2005, and the related statement of operations for the year then ended, statements of changes in net assets for each of the years in the two-year period then ended, and the financial highlights for each of the years or periods in the five-year period then ended. These financial statements and financial highlights are the responsibility of the Fundís management. Our responsibility is to express an opinion on these financial statements and financial highlights based on our audits.
We conducted our audits in accordance with the standards of the Public Company Accounting Oversight Board (United States). Those standards require that we plan and perform the audit to obtain reasonable assurance about whether the financial statements and financial highlights are free of material misstatement. An audit includes examining, on a test basis, evidence supporting the amounts and disclosures in the financial statements. Our procedures included confirmation of securities owned as of April 30, 2005 by correspondence with the custodian and brokers, or by other appropriate auditing procedures when replies from brokers were not received. An audit also includes assessing the accounting principles used and significant estimates made by management, as well as evaluating the overall financial statement presentation. We believe that our audits provide a reasonable basis for our opinion.
In our opinion, the financial statements and financial highlights referred to above present fairly, in all material respects, the financial position of the Evergreen Strategic Income Fund as of April 30, 2005, the results of its operations, changes in its net assets and financial highlights for each of the years or periods described above in conformity with U.S. generally accepted accounting principles.
Boston, Massachusetts
June 17, 2005
36
This page left intentionally blank
37
This page left intentionally blank
38
This page left intentionally blank
39
TRUSTEES AND OFFICERS
TRUSTEES1
| Charles A. Austin III | | Principal occupations: Investment Counselor, Anchor Capital Advisors, Inc. (investment advice); |
| Trustee | | Director, The Andover Companies (insurance); Trustee, Arthritis Foundation of New England; |
| DOB: 10/23/1934 | | Director, The Francis Ouimet Society; Former Director, Health Development Corp. |
| Term of office since: 1991 | | (fitness-wellness centers); Former Director, Mentor Income Fund, Inc.; Former Trustee, |
| | | Mentor Funds and Cash Resource Trust; Former Investment Counselor, Appleton Partners, Inc. |
| Other directorships: None | | (investment advice); Former Director, Executive Vice President and Treasurer, State Street |
| | | Research & Management Company (investment advice) |
|
| Shirley L. Fulton | | Principal occupations: Partner, Tin, Fulton, Greene & Owen, PLLC (law firm); Former Partner, |
| Trustee | | Helms, Henderson & Fulton, P.A. (law firm); Retired Senior Resident Superior Court Judge, |
| DOB: 1/10/1952 | | 26th Judicial District, Charlotte, NC |
| Term of office since: 2004 | | |
| Other directorships: None | | |
|
| K. Dun Gifford | | Principal occupations: Chairman and President, Oldways Preservation and Exchange Trust |
| Trustee | | (education); Trustee, Treasurer and Chairman of the Finance Committee, Cambridge College; |
| DOB: 10/23/1938 | | Former Chairman of the Board, Director, and Executive Vice President, The London Harness |
| Term of office since: 1974 | | Company (leather goods purveyor); Former Director, Mentor Income Fund, Inc.; Former Trustee, |
| | | Mentor Funds and Cash Resource Trust |
| Other directorships: None | | |
|
| Dr. Leroy Keith, Jr. | | Principal occupations: Partner, Stonington Partners, Inc. (private equity firm); Trustee, |
| Trustee | | The Phoenix Group of Mutual Funds; Director, Obagi Medical Products Co.; Director, |
| DOB: 2/14/1939 | | Diversapack Co.; Former Director, Lincoln Educational Services; Former Chairman of the Board |
| Term of office since: 1983 | | and Chief Executive Officer, Carson Products Company (manufacturing); Former Director, |
| | | Mentor Income Fund, Inc.; Former Trustee, Mentor Funds and Cash Resource Trust |
| Other directorships: Trustee, The | | |
| Phoenix Group of Mutual Funds | | |
|
| Gerald M. McDonnell | | Principal occupations: Manager of Commercial Operations, SMI Steel Co. – South Carolina |
| Trustee | | (steel producer); Former Sales and Marketing Manager, Nucor Steel Company; Former Director, |
| DOB: 7/14/1939 | | Mentor Income Fund, Inc.; Former Trustee, Mentor Funds and Cash Resource Trust |
| Term of office since: 1988 | | |
| Other directorships: None | | |
|
| William Walt Pettit | | Principal occupations: Vice President, Kellam & Pettit, P.A. (law firm); Director, Superior |
| Trustee | | Packaging Corp.; Director, National Kidney Foundation of North Carolina, Inc.; Former Director, |
| DOB: 8/26/1955 | | Mentor Income Fund, Inc.; Former Trustee, Mentor Funds and Cash Resource Trust |
| Term of office since: 1984 | | |
| Other directorships: None | | |
|
| David M. Richardson | | Principal occupations: President, Richardson, Runden LLC (executive recruitment business |
| Trustee | | development/consulting company); Consultant, Kennedy Information, Inc. (executive |
| DOB: 9/19/1941 | | recruitment information and research company); Consultant, AESC (The Association of |
| Term of office since: 1982 | | Executive Search Consultants); Director, J&M Cumming Paper Co. (paper merchandising); |
| | | Former Trustee, NDI Technologies, LLP (communications); Former Vice Chairman, DHR |
| Other directorships: None | | International, Inc. (executive recruitment); Former Director, Mentor Income Fund, Inc.; |
| | | Former Trustee, Mentor Funds and Cash Resource Trust |
|
| Dr. Russell A. Salton III | | Principal occupations: President/CEO, AccessOne MedCard; Former Medical Director, |
| Trustee | | Healthcare Resource Associates, Inc.; Former Medical Director, U.S. Health Care/Aetna Health |
| DOB: 6/2/1947 | | Services; Former Director, Mentor Income Fund, Inc.; Former Trustee, Mentor Funds and |
| Term of office since: 1984 | | Cash Resource Trust |
| Other directorships: None | | |
|
40
TRUSTEES AND OFFICERS continued
| Michael S. Scofield | | Principal occupations: Director, Branded Media Corporation (multi-media branding company); |
| Trustee | | Attorney, Law Offices of Michael S. Scofield; Former Director, Mentor Income Fund, Inc.; |
| DOB: 2/20/1943 | | Former Trustee, Mentor Funds and Cash Resource Trust |
| Term of office since: 1984 | | |
| Other directorships: None | | |
|
| Richard J. Shima | | Principal occupations: Independent Consultant; Director, Trust Company of CT; Trustee, |
| Trustee | | Saint Joseph College (CT); Director, Hartford Hospital; Trustee, Greater Hartford YMCA; |
| DOB: 8/11/1939 | | Former Director, Enhance Financial Services, Inc.; Former Director, Old State House Association; |
| Term of office since: 1993 | | Former Director of CTG Resources, Inc. (natural gas); Former Director, Mentor Income Fund, Inc.; |
| Other directorships: None | | Former Trustee, Mentor Funds and Cash Resource Trust |
|
| Richard K. Wagoner, CFA2 | | Principal occupations: Member and Former President, North Carolina Securities Traders |
| Trustee | | Association; Member, Financial Analysts Society; Former Consultant to the Boards of Trustees |
| DOB: 12/12/1937 | | of the Evergreen funds; Former Trustee, Mentor Funds and Cash Resource Trust |
| Term of office since: 1999 | | |
| Other directorships: None | | |
|
| OFFICERS | | |
| Dennis H. Ferro3 | | Principal occupations: President and Chief Executive Officer, Evergreen Investment Company, |
| President | | Inc. and Executive Vice President, Wachovia Bank, N.A.; former Chief Investment Officer, |
| DOB: 6/20/1945 | | Evergreen Investment Company, Inc. |
| Term of office since: 2003 | | |
|
| Carol Kosel4 | | Principal occupations: Senior Vice President, Evergreen Investment Services, Inc. |
| Treasurer | | |
| DOB: 12/25/1963 | | |
| Term of office since: 1999 | | |
|
| Michael H. Koonce4 | | Principal occupations: Senior Vice President and General Counsel, Evergreen Investment |
| Secretary | | Services, Inc.; Senior Vice President and Assistant General Counsel, Wachovia Corporation |
| DOB: 4/20/1960 | | |
| Term of office since: 2000 | | |
|
| James Angelos4 | | Principal occupations: Chief Compliance Officer and Senior Vice President, Evergreen Funds; |
| Chief Compliance Officer | | Former Director of Compliance, Evergreen Investment Services, Inc. |
| DOB: 9/2/1947 | | |
| Term of office since: 2004 | | |
|
1 Each Trustee serves until a successor is duly elected or qualified or until his death, resignation, retirement or removal from office. Each Trustee oversees 89 Evergreen funds. Correspondence for each Trustee may be sent to Evergreen Board of Trustees, P.O. Box 20083, Charlotte, NC 28202.
2 Mr. Wagoner is an “interested person” of the Fund because of his ownership of shares in Wachovia Corporation, the parent to the Fund’s investment advisor.
3 The address of the Officer is 401 S. Tryon Street, 20th Floor, Charlotte, NC 28288.
4 The address of the Officer is 200 Berkeley Street, Boston, MA 02116.
Additional information about the Fund’s Board of Trustees and Officers can be found in the Statement of Additional Information (SAI) and is available upon request without charge by calling 800.343.2898.
41

566662 rv2 6/2005

| | | table of contents |
| 1 | | LETTER TO SHAREHOLDERS |
| 4 | | FUND AT A GLANCE |
| 5 | | PORTFOLIO MANAGER COMMENTARY |
| 6 | | ABOUT YOUR FUND’S EXPENSES |
| 7 | | FINANCIAL HIGHLIGHTS |
| 11 | | SCHEDULE OF INVESTMENTS |
| 17 | | STATEMENT OF ASSETS AND LIABILITIES |
| 18 | | STATEMENT OF OPERATIONS |
| 19 | | STATEMENTS OF CHANGES IN NET ASSETS |
| 20 | | STATEMENT OF CASH FLOWS |
| 21 | | NOTES TO FINANCIAL STATEMENTS |
| 28 | | REPORT OF INDEPENDENT REGISTERED PUBLIC ACCOUNTING FIRM |
| 32 | | TRUSTEES AND OFFICERS |
This annual report must be preceded or accompanied by a prospectus of the Evergreen fund contained herein. The prospectus contains more complete information, including fees and expenses, and should be read carefully before investing or sending money.
The fund will file its complete schedule of portfolio holdings with the SEC for the first and third quarters of each fiscal year on Form N-Q. The fund’s Form N-Q will be available on the SEC’s Web site at http://www.sec.gov. In addition, the fund’s Form N-Q may be reviewed and copied at the SEC’s Public Reference Room in Washington, D.C. Information on the operation of the Public Reference Room may be obtained by calling 800.SEC.0330.
A description of the fund’s proxy voting policies and procedures, as well as information regarding how the fund voted proxies relating to portfolio securities during the most recent 12-month period ended June 30, is available by visiting our Web site at EvergreenInvestments.com or by visiting the SEC’s Web site at http://www.sec.gov. The fund’s proxy voting policies and procedures are also available without charge, upon request, by calling 800.343.2898.
| Mutual Funds: | | | | |
| NOT FDIC INSURED | | MAY LOSE VALUE | | NOT BANK GUARANTEED |
Evergreen InvestmentsSM is a service mark of Evergreen Investment Management Company, LLC.
Copyright 2005, Evergreen Investment Management Company, LLC.
Evergreen mutual funds are distributed by Evergreen Investment Services, Inc.
200 Berkeley Street, Boston, MA 02116
LETTER TO SHAREHOLDERS
June 2005

Dennis H. Ferro
President and Chief Executive Officer
Dear Shareholder,
We are pleased to provide the annual report for the Evergreen U.S. Government Fund, which covers the twelve-month period ended April 30, 2005.
For those investors in the fixed income markets, the past year has provided a variety of challenges and opportunities. In anticipation of this environment, our fixed income portfolio management teams attempted to prepare for a market contending with moderating economic growth and less accommodation from the Federal Reserve (Fed). The question for the markets was no longer the direction of monetary policy, but rather the extent to which interest rates would rise. Using our outlook for a continued economic expansion, we positioned our fixed income portfolios for a gradual tightening of monetary policy.
The fiscal year began with a mixed message on the economy. Growth was good, but it was no longer great, and market interest rates declined on the perceived weakness. However, Fed officials continued to talk up their much anticipated “measured removal of policy accommodation.”
Throughout the confusion, we maintained our belief that the economy had simply transitioned from recovery to expansion. As a result of this transition, a variety of economic reports pointed in different directions. For example, solid retail sales occurred in a month where consumer confidence declined. Historically, the maturation of the economic cycle had experienced similarly erratic behavior. Yet market interest rates began to fluctuate with seemingly every monthly data point. Moreover, the costs for commodities and energy were rising, and since inflation adjusted interest rates had remained low for such a lengthy period, the Fed seemed determined to prevent inflation from becoming a long-term problem. As job growth began to exceed expectations in the Spring of 2004, the market’s inflation fears accelerated, and yields
1
LETTER TO SHAREHOLDERS continued
headed higher in anticipation of tighter Fed policy.
The Fed finally began their “measured removal of policy accommodation” beginning in June of 2004. After three years of stimulative policy actions, monetary policymakers began the journey towards more moderate economic growth. Fed Chairman Alan Greenspan was very transparent in his public statements, attempting to assuage market anxiety. Market interest rates still remained quite volatile during the first half of the fiscal period. Only after the central bank’s first few rate increases did the long-end of the yield curve begin to recover, a process that would continue for the bulk of the fiscal year as the markets concluded that long-term inflation was under control. Chairman Greenspan, however, remained concerned about “complacency” within the bond market, as evidenced by his comments to congressional banking committees in February 2005 that it was a “conundrum” that long-term yields remained low.
Throughout the fiscal year, many of our fixed income managers utilized a variety of strategies within their specific portfolios in order to maximize the total return possibilities for our investors. For example, many of our municipal bond fund managers emphasized the long-end of the curve in an attempt to enhance total return. Other teams used a barbell strategy, seeking opportunities at the short and long end of the Treasury yield curve in an attempt to remain defensive throughout the volatile market activity. Our mortgage portfolio teams employed adjustable rate, commercial, and hybrid products while attempting to navigate the ever changing seas within that marketplace. Our fundamental emphasis on credit quality in the corporate and high yield sectors, however, was not always rewarded, as the markets often pursued riskier issues within a given universe as the yield curve continued to flatten. Finally, our global management teams bought foreign bonds from commodity rich nations such as Australia, New Zealand and Canada in an effort to sustain performance.
We encourage our investors to maintain their diversified fixed income strategies in their long-term investment portfolios.
2
LETTER TO SHAREHOLDERS continued
Please visit our Web site, EvergreenInvestments.com, for more information about our funds and other investment products available to you. From the Web site, you may also access a detailed Q & A interview with the portfolio manager(s) for your fund. You can easily reach these interviews by following the link, EvergreenInvestments.com/AnnualUpdates, from our Web site. Thank you for your continued support of Evergreen Investments.
Sincerely,

Dennis H. Ferro
President and Chief Executive Officer
Evergreen Investment Company, Inc.
Notification of Investment Strategy Change:
Effective August 1, 2005, the Fund’s prospectus will be amended to make the following change to the Fund’s principal investment strategy:
The Fund may invest a portion of its assets in derivative instruments, such as Treasury futures, Eurodollar futures and interest rate swap agreements in order to manage its exposure to interest rate risk. Derivatives are financial contracts whose value depends on, or is derived from, the value of one or more underlying assets, reference rates or indexes. The various derivative instruments that the Fund may use are described in more detail under “Additional Information on Securities and Investment Practices” in the Statement of Additional Information. The Fund typically uses derivatives as a substitute for taking a position in the underlying asset and/or as part of a strategy designed to reduce exposure to other risks, such as interest rate or currency risk. The Fund’s use of derivative instruments involves risks different from, or possibly greater than, the risks associated with investing directly in securities and other traditional investments. Derivatives are subject to a number of risks such as liquidity risk, interest rate risk, market risk, credit risk and management risk.
The Fund’s prospectus will be supplemented to include this change.
Special Notice to Shareholders:
Please visit our Web site at EvergreenInvestments.com for statements from President and Chief Executive Officer, Dennis Ferro, and Chairman of the Board of the Evergreen Funds, Michael S. Scofield, addressing recent SEC actions involving the Evergreen Funds.
3
FUND AT A GLANCE
as of April 30, 2005
MANAGEMENT TEAM

Lisa Brown-Premo
Customized Fixed Income Team Lead Manager
CURRENT INVESTMENT STYLE

Morningstar’s style box is based on a portfolio date as of 3/31/2005.
The fixed income style box placement is based on a fund’s average effective maturity or duration and the average credit rating of the bond portfolio.
PERFORMANCE AND RETURNS
Portfolio inception date: 1/11/1993
| | | Class A | | Class B | | Class C | | Class I |
| Class inception date | | 1/11/1993 | | 1/11/1993 | | 9/2/1994 | | 9/2/1993 |
|
| Nasdaq symbol | | EUSAX | | EUSBX | | EUSCX | | EUSYX |
|
| Average annual return* | | | | | | | | |
|
| 1-year with sales charge | | -0.62% | | -1.36% | | 2.64% | | N/A |
|
| 1-year w/o sales charge | | 4.37% | | 3.64% | | 3.64% | | 4.68% |
|
| 5-year | | 5.08% | | 5.02% | | 5.35% | | 6.40% |
|
| 10-year | | 5.50% | | 5.23% | | 5.23% | | 6.29% |
|
| Maximum sales charge | | 4.75% | | 5.00% | | 1.00% | | N/A |
| | | Front-end | | CDSC | | CDSC | | |
|
* Adjusted for maximum applicable sales charge, unless noted.
Past performance is no guarantee of future results. The performance quoted represents past performance and current performance may be lower or higher. The investment return and principal value of an investment will fluctuate so that investors’ shares, when redeemed, may be worth more or less than their original cost. To obtain performance information current to the most recent month-end for Classes A, B, C or I, please go to EvergreenInvestments.com/fundperformance. The performance of each class may vary based on differences in loads, fees and expenses paid by the shareholders investing in each class. Performance includes the reinvestment of income dividends and capital gain distributions. Performance shown does not reflect the deduction of taxes that a shareholder would pay on fund distributions or the redemption of fund shares.
The fund incurs a 12b-1 fee of 0.30% for Class A and 1.00% for Classes B and C. Class I does not pay a 12B-1 fee.
Returns reflect expense limits previously in effect, without which returns would have been lower.
LONG-TERM GROWTH
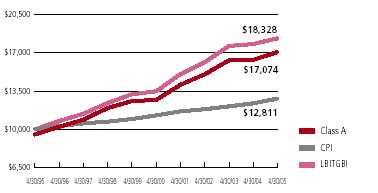
Comparison of a $10,000 investment in the Evergreen U.S. Government Fund Class A shares, versus a similar investment in the Lehman Brothers Intermediate Term Government Bond Index (LBITGBI) and the Consumer Price Index (CPI).
The LBITGBI is an unmanaged market index and does not include transaction costs associated with buying and selling securities, any mutual fund expenses or any taxes. The CPI is a commonly used measure of inflation and does not represent an investment return. It is not possible to invest directly in an index.
4
PORTFOLIO MANAGER COMMENTARY
The fund’s Class A shares returned 4.37% for the twelve-month period ended April 30, 2005, excluding any applicable sales charges. During the same period, the Lehman Brothers Intermediate Term Government Bond Index (LBITGBI) returned 2.91% .
The fund seeks a high level of current income consistent with stability of principal.
The dominant influence on the government securities market during the period was the dramatic flattening of the U.S. Treasury yield curve. While yields of shorter-term securities rose substantially, intermediate yields finished the period only modestly higher than at the start, while the yields of ten and thirty year bonds declined.
In a period in which the steady strengthening of the economy led to concerns that interest rates would continue to rise, we underweighted U.S. Treasury bonds, the sector most vulnerable to price loss because of rising interest rates. At the end of the fiscal year, U.S. Treasury bonds accounted for roughly 5% of the fund’s portfolio, compared to a 64% weighting within the benchmark. In contrast, mortgage-backed securities, which are less vulnerable to rising interest rates, represented the majority of the fund’s portfolio. The fund also had a small allocation to corporate bonds.
As a result of the yield curve flattening, we maintained a barbell portfolio structure, with greater emphasis on both shorter and longer term maturities than on intermediates during the period. This helped performance substantially, and the fund significantly surpassed the median average of general government funds as well as the benchmark.
The fund’s substantial overweight position in mortgage-backed securities, relative to the benchmark, also supported performance, as did the allocation to corporate bonds. Relative to other funds in the general government funds’ universe, the fund’s somewhat shorter duration than the competitive universe was a detractor to its performance during the period.
Class I shares are only offered in the following manner: (1) to investment advisory clients of Evergreen Investment Management Company, LLC (or its advisory affiliates) when purchased by such advisor(s) on behalf of its clients, (2) through arrangements entered into on behalf of the Evergreen funds with certain financial services firms, (3) to certain institutional investors and (4) to persons who owned Class Y shares in registered name in an Evergreen fund on or before December 31, 1994 or who owned shares of any SouthTrust fund in registered name as of March 18, 2005 or shares of Vestaur Securities Fund as of May 20, 2005. Class I shares are only available to institutional shareholders with a minimum of $1 million investment, which may be waived in certain situations.
The fund’s investment objective is nonfundamental and may be changed without the vote of the fund’s shareholders.
U.S. government guarantees apply only to certain securities held in the fund’s portfolio and not to the fund’s shares.
The return of principal is not guaranteed due to fluctuation in the NAV of the fund caused by changes in the price of the individual bonds held by the fund and the buying and selling of bonds by the fund. Bond funds have the same inflation, interest rate and credit risks that are associated with the individual bonds held by the fund. Generally, the value of bonds rise when prevailing interest rates fall and fall when interest rates rise.
All data is as of April 30, 2005, and subject to change.
5
ABOUT YOUR FUND’S EXPENSES
The Example below is intended to describe the fees and expenses borne by shareholders and the impact of those costs on your investment.
Example
As a shareholder of the fund, you incur two types of costs: (1) transaction costs, including sales charges (loads), redemption fees and exchange fees; and (2) ongoing costs, including management fees, distribution (12b-1) fees and other fund expenses. This Example is intended to help you understand your ongoing costs (in dollars) of investing in the fund and to compare these costs with the ongoing costs of investing in other mutual funds. The Example is based on an investment of $1,000 invested at the beginning of the period and held for the entire period from November 1, 2004 to April 30, 2005.
The example illustrates your fund’s costs in two ways:
• Actual expenses
The section in the table under the heading “Actual” provides information about actual account values and actual expenses. You may use the information in these columns, together with the amount you invested, to estimate the expenses that you paid over the period. Simply divide your account value by $1,000 (for example, an $8,600 account value divided by $1,000 = 8.6), then multiply the result by the number in the appropriate column for your share class, in the column entitled “Expenses Paid During Period” to estimate the expenses you paid on your account during this period.
• Hypothetical example for comparison purposes
The section in the table under the heading “Hypothetical (5% return before expenses)” provides information about hypothetical account values and hypothetical expenses based on the fund’s actual expense ratio and an assumed rate of return of 5% per year before expenses, which is not the fund’s actual return. The hypothetical account values and expenses may not be used to estimate the actual ending account balance or expenses you paid for the period. You may use this information to compare the ongoing costs of investing in the fund and other funds. To do so, compare this 5% hypothetical example with the 5% hypothetical examples that appear in the shareholder reports of the other funds.
Please note that the expenses shown in the table are meant to highlight your ongoing costs only and do not reflect any transactional costs, such as sales charges (loads), redemption fees or exchange fees. Therefore, the section in the table under the heading “Hypothetical (5% return before expenses)” is useful in comparing ongoing costs only, and will not help you determine the relative total costs of owning different funds. In addition, if these transactional costs were included, your costs would have been higher.
| | | Beginning | | Ending | | |
| | | Account | | Account | | Expenses |
| | | Value | | Value | | Paid During |
| | | 11/1/2004 | | 4/30/2005 | | Period* |
|
| Actual | | | | | | |
| Class A | | $ 1,000.00 | | $ 1,011.40 | | $ 4.99 |
| Class B | | $ 1,000.00 | | $ 1,007.90 | | $ 8.46 |
| Class C | | $ 1,000.00 | | $ 1,007.90 | | $ 8.46 |
| Class I | | $ 1,000.00 | | $ 1,012.91 | | $ 3.49 |
| Hypothetical | | | | | | |
| (5% return | | | | | | |
| before expenses) | | | | | | |
| Class A | | $ 1,000.00 | | $ 1,019.84 | | $ 5.01 |
| Class B | | $ 1,000.00 | | $ 1,016.36 | | $ 8.50 |
| Class C | | $ 1,000.00 | | $ 1,016.36 | | $ 8.50 |
| Class I | | $ 1,000.00 | | $ 1,021.32 | | $ 3.51 |
|
* For each class of the Fund, expenses are equal to the annualized expense ratio of each class (1.00% for Class A, 1.70% for Class B, 1.70% for Class C and 0.70% for Class I), multiplied by the average account value over the period, multiplied by 181 / 365 days.
6
FINANCIAL HIGHLIGHTS
(For a share outstanding throughout each period)
| | | Year Ended April 30, |
| |
|
| CLASS A | | 2005 | | 2004 | | | | 2003 | | 20021 | | 2001 |
|
| Net asset value, beginning of period | | $ 9.96 | | $ 10.22 | | $ | | 9.75 | | $ 9.59 | | $ 9.15 |
|
| Income from investment operations | | | | | | | | | | | | |
| Net investment income (loss) | | 0.242 | | 0.192 | | | | 0.39 | | 0.48 | | 0.54 |
Net realized and unrealized gains
or losses on securities | | 0.19 | | (0.16) | | | | 0.43 | | 0.16 | | 0.44 |
| |
|
| Total from investment operations | | 0.43 | | 0.03 | | | | 0.82 | | 0.64 | | 0.98 |
|
| Distributions to shareholders from | | | | | | | | | | | | |
| Net investment income | | (0.30) | | (0.29) | | | | (0.35) | | (0.48) | | (0.54) |
|
| Net asset value, end of period | | $ 10.09 | | $ 9.96 | | $ | | 10.22 | | $ 9.75 | | $ 9.59 |
|
| Total return3 | | 4.37% | | 0.30% | | | | 8.50% | | 6.76% | | 10.98% |
|
| Ratios and supplemental data | | | | | | | | | | | | |
| Net assets, end of period (thousands) | | $93,826 | | $109,172 | | $146,427 | | $141,838 | | $108,073 |
| Ratios to average net assets | | | | | | | | | | | | |
Expenses including waivers/reimbursements
and excluding expense reductions | | 1.00% | | 1.01% | | | | 0.95% | | 0.96% | | 1.00% |
Expenses excluding waivers/reimbursements
and expense reductions | | 1.00% | | 1.01% | | | | 0.95% | | 0.96% | | 1.00% |
| Net investment income (loss) | | 2.38% | | 1.86% | | | | 3.81% | | 4.91% | | 5.71% |
| Portfolio turnover rate | | 110% | | 55% | | | | 129% | | 121% | | 86% |
|
1 As required, effective May 1, 2001, the Fund adopted the provisions of the AICPA Audit and Accounting Guide, Audits of Investment Companies and began amortizing premium on its fixed-income securities. The effects of this change for the year ended April 30, 2002 was a decrease in net investment income per share of $0.02; an increase in net realized gains or losses per share of $0.02; and a decrease to the ratio of net investment income to average net assets of 0.22%. The above per share information, ratios and supplemental data for the periods prior to May 1, 2001 have not been restated to reflect this change in presentation.
2 Net investment income (loss) per share is based on average shares outstanding during the period.
3 Excluding applicable sales charges
See Notes to Financial Statements
7
FINANCIAL HIGHLIGHTS
(For a share outstanding throughout each period)
| | | Year Ended April 30, |
| |
|
| CLASS B | | 2005 | | 2004 | | | | 2003 | | 20021 | | 2001 |
|
| Net asset value, beginning of period | | $ 9.96 | | $ 10.22 | | $ | | 9.75 | | $ 9.59 | | $ 9.15 |
|
| Income from investment operations | | | | | | | | | | | | |
| Net investment income (loss) | | 0.172 | | 0.122 | | | | 0.31 | | 0.42 | | 0.47 |
Net realized and unrealized gains
or losses on securities | | 0.19 | | (0.16) | | | | 0.43 | | 0.15 | | 0.44 |
| |
|
| Total from investment operations | | 0.36 | | (0.04) | | | | 0.74 | | 0.57 | | 0.91 |
|
| Distributions to shareholders from | | | | | | | | | | | | |
| Net investment income | | (0.23) | | (0.22) | | | | (0.27) | | (0.41) | | (0.47) |
|
| Net asset value, end of period | | $ 10.09 | | $ 9.96 | | $ | | 10.22 | | $ 9.75 | | $ 9.59 |
|
| Total return3 | | 3.64% | | (0.40%) | | | | 7.69% | | 5.97% | | 10.15% |
|
| Ratios and supplemental data | | | | | | | | | | | | |
| Net assets, end of period (thousands) | | $25,452 | | $37,270 | | $59,362 | | $47,016 | | $65,533 |
| Ratios to average net assets | | | | | | | | | | | | |
Expenses including waivers/reimbursements
and excluding expense reductions | | 1.70% | | 1.71% | | | | 1.70% | | 1.71% | | 1.75% |
Expenses excluding waivers/reimbursements
and expense reductions | | 1.70% | | 1.71% | | | | 1.70% | | 1.71% | | 1.75% |
| Net investment income (loss) | | 1.67% | | 1.16% | | | | 3.04% | | 4.18% | | 4.98% |
| Portfolio turnover rate | | 110% | | 55% | | | | 129% | | 121% | | 86% |
|
1 As required, effective May 1, 2001, the Fund adopted the provisions of the AICPA Audit and Accounting Guide, Audits of Investment Companies and began amortizing premium on its fixed-income securities. The effects of this change for the year ended April 30, 2002 was a decrease in net investment income per share of $0.01; an increase in net realized gains or losses per share of $0.01; and a decrease to the ratio of net investment income to average net assets of 0.22%. The above per share information, ratios and supplemental data for the periods prior to May 1, 2001 have not been restated to reflect this change in presentation.
2 Net investment income (loss) per share is based on average shares outstanding during the period.
3 Excluding applicable sales charges
See Notes to Financial Statements
8
FINANCIAL HIGHLIGHTS
(For a share outstanding throughout each period)
| | | Year Ended April 30, |
| |
|
| CLASS C | | 2005 | | 2004 | | | | 2003 | | 20021 | | 2001 |
|
| Net asset value, beginning of period | | $ 9.96 | | $ 10.22 | | $ | | 9.75 | | $ 9.59 | | $ 9.15 |
|
| Income from investment operations | | | | | | | | | | | | |
| Net investment income (loss) | | 0.172 | | 0.122 | | | | 0.31 | | 0.41 | | 0.47 |
Net realized and unrealized gains
or losses on securities | | 0.19 | | (0.16) | | | | 0.43 | | 0.16 | | 0.44 |
| |
|
| Total from investment operations | | 0.36 | | (0.04) | | | | 0.74 | | 0.57 | | 0.91 |
|
| Distributions to shareholders from | | | | | | | | | | | | |
| Net investment income | | (0.23) | | (0.22) | | | | (0.27) | | (0.41) | | (0.47) |
|
| Net asset value, end of period | | $10.09 | | $ 9.96 | | $ | | 10.22 | | $ 9.75 | | $ 9.59 |
|
| Total return3 | | 3.64% | | (0.40%) | | | | 7.69% | | 5.97% | | 10.15% |
|
| Ratios and supplemental data | | | | | | | | | | | | |
| Net assets, end of period (thousands) | | $9,820 | | $14,207 | | $26,013 | | $14,212 | | $11,188 |
| Ratios to average net assets | | | | | | | | | | | | |
Expenses including waivers/reimbursements
and excluding expense reductions | | 1.70% | | 1.71% | | | | 1.70% | | 1.71% | | 1.74% |
Expenses excluding waivers/reimbursements
and expense reductions | | 1.70% | | 1.71% | | | | 1.70% | | 1.71% | | 1.74% |
| Net investment income (loss) | | 1.67% | | 1.17% | | | | 2.99% | | 4.15% | | 4.90% |
| Portfolio turnover rate | | 110% | | 55% | | | | 129% | | 121% | | 86% |
|
1 As required, effective May 1, 2001 the Fund adopted the provisions of the AICPA Audit and Accounting Guide, Audits of Investment Companies and began amortizing premium on its fixed-income securities. The effects of this change for the year ended April 30, 2002 was a decrease in net investment income per share of $0.02; an increase in net realized gains or losses per share of $0.02; and a decrease to the ratio of net investment income to average net assets of 0.22% . The above per share information, ratios and supplemental data for the periods prior to May 1, 2001 have not been restated to reflect this change in presentation.
2 Net investment income (loss) per share is based on average shares outstanding during the period.
3 Excluding applicable sales charges
See Notes to Financial Statements
9
FINANCIAL HIGHLIGHTS
(For a share outstanding throughout each period)
| | | Year Ended April 30, |
| |
|
| CLASS I1 | | 2005 | | 2004 | | | | 2003 | | 20022 | | 2001 |
|
| Net asset value, beginning of period | | $ 9.96 | | $ 10.22 | | $ | | 9.75 | | $ 9.59 | | $ 9.15 |
|
| Income from investment operations | | | | | | | | | | | | |
| Net investment income (loss) | | 0.273 | | 0.223 | | | | 0.41 | | 0.50 | | 0.56 |
Net realized and unrealized gains
or losses on securities | | 0.19 | | (0.16) | | | | 0.43 | | 0.16 | | 0.44 |
| |
|
| Total from investment operations | | 0.46 | | 0.06 | | | | 0.84 | | 0.66 | | 1.00 |
|
| Distributions to shareholders from | | | | | | | | | | | | |
| Net investment income | | (0.33) | | (0.32) | | | | (0.37) | | (0.50) | | (0.56) |
|
| Net asset value, end of period | | $ 10.09 | | $ 9.96 | | $ | | 10.22 | | $ 9.75 | | $ 9.59 |
|
| Total return | | 4.68% | | 0.60% | | | | 8.77% | | 7.02% | | 11.25% |
|
| Ratios and supplemental data | | | | | | | | | | | | |
| Net assets, end of period (thousands) | | $436,431 | | $427,356 | | $489,565 | | $327,753 | | $263,619 |
| Ratios to average net assets | | | | | | | | | | | | |
Expenses including waivers/reimbursements
and excluding expense reductions | | 0.70% | | 0.71% | | | | 0.70% | | 0.71% | | 0.75% |
Expenses excluding waivers/reimbursements
and expense reductions | | 0.70% | | 0.71% | | | | 0.70% | | 0.71% | | 0.75% |
| Net investment income (loss) | | 2.69% | | 2.15% | | | | 4.02% | | 5.16% | | 5.97% |
| Portfolio turnover rate | | 110% | | 55% | | | | 129% | | 121% | | 86% |
|
1 Effective at the close of business on May 11, 2001, Class Y shares were renamed as Institutional shares (Class I).
2 As required, effective May 1, 2001, the Fund adopted the provisions of the AICPA Audit and Accounting Guide, Audits of Investment Companies, and began amortizing premium on its fixed-income securities. The effects of this change for the year ended April 30, 2002 was a decrease in net investment income per share of $0.02; an increase in net realized gains or losses per share of $0.02; and a decrease to the ratio of net investment income to average net assets of 0.22%. The above per share information, ratios and supplemental data for the periods prior to May 1, 2001 have not been restated to reflect this change in presentation.
3 Net investment income (loss) per share is based on average shares outstanding during the period.
See Notes to Financial Statements
10
SCHEDULE OF INVESTMENTS
April 30, 2005
| | | | | Principal | | | | |
| | | | | Amount | | | | Value |
|
| AGENCY COMMERCIAL MORTGAGE-BACKED SECURITIES 1.4% | | | | | | |
| FIXED-RATE 1.4% | | | | | | | | |
| FNMA: | | | | | | | | |
| 6.22%, 08/01/2012 ## | | | | $ 4,134,533 | | $ | | 4,494,757 |
| 6.80%, 01/01/2011 ## | | | | 3,000,000 | | | | 3,337,680 |
| |
|
| Total Agency Commercial Mortgage-Backed Securities | | | | | | | | |
| (cost $7,993,701) | | | | | | | | 7,832,437 |
| |
|
| AGENCY MORTGAGE-BACKED COLLATERALIZED MORTGAGE | | | | | | |
| OBLIGATIONS 14.3% | | | | | | | | |
| FIXED-RATE 6.3% | | | | | | | | |
| FHLMC: | | | | | | | | |
| Ser. 2262, Class Z, 7.50%, 10/15/2030 | | | | 235,140 | | | | 242,136 |
| Ser. 2359, Class PC, 6.00%, 07/15/2015 | | | | 217,260 | | | | 219,017 |
| Ser. 2367, Class BC, 6.00%, 04/15/2016 | | | | 172,845 | | | | 174,642 |
| Ser. H012, Class A2, 2.50%, 11/15/2008 ## | | | | 4,427,177 | | | | 4,279,960 |
| Ser. SF1, Class A2, 2.38%, 11/15/2008 ## | | | | 10,911,761 | | | | 10,765,423 |
| FNMA, Ser. 2002-W5, Class A7, 6.25%, 08/25/2030 ## | | | | 19,480,000 | | | | 19,903,684 |
| |
|
| | | | | | | | | 35,584,862 |
| |
|
| FLOATING-RATE 8.0% | | | | | | | | |
| FHLMC: | | | | | | | | |
| Ser. 1370, Class JA, 4.15%, 09/15/2022 | | | | 374,426 | | | | 378,315 |
| Ser. 1498, Class I, 4.15%, 04/15/2023 | | | | 313,466 | | | | 318,771 |
| Ser. 1533, Class FA, 4.10%, 06/15/2023 | | | | 81,862 | | | | 83,018 |
| Ser. 1616, Class FB, 3.22%, 11/15/2008 ## | | | | 1,923,573 | | | | 1,907,071 |
| Ser. 1671, Class TA, 3.50%, 02/15/2024 ## | | | | 1,495,241 | | | | 1,503,740 |
| Ser. 2030, Class F, 3.45%, 02/15/2028 ## | | | | 1,555,220 | | | | 1,565,824 |
| Ser. 2181, Class PF, 3.35%, 05/15/2029 | | | | 767,652 | | | | 771,938 |
| Ser. 2380, Class FL, 3.55%, 11/15/2031 ## | | | | 6,325,361 | | | | 6,422,581 |
| Ser. 2395, Class FD, 3.55%, 05/15/2029 ## | | | | 2,367,595 | | | | 2,405,051 |
| Ser. 2481, Class FE, 3.95%, 03/15/2032 ## | | | | 4,139,193 | | | | 4,263,038 |
| Ser. 2691, Class FC, 3.65%, 10/15/2033 ## | | | | 3,748,684 | | | | 3,760,043 |
| FNMA: | | | | | | | | |
| Ser. 1993-174, Class FD, 3.03%, 09/25/2008 | | | | 140,165 | | | | 139,220 |
| Ser. 1993-221, Class FH, 4.13%, 12/25/2008 ## | | | | 4,402,412 | | | | 4,465,157 |
| Ser. 1997-34, Class F, 3.68%, 10/25/2023 ## | | | | 5,185,937 | | | | 5,259,370 |
| Ser. 1997-49, Class F, 3.50%, 06/17/2027 | | | | 876,166 | | | | 882,823 |
| Ser. 1999-49, Class F, 3.42%, 05/25/2018 ## | | | | 1,662,429 | | | | 1,671,481 |
| Ser. 2000-32, Class FM, 3.42%, 10/18/2030 | | | | 882,159 | | | | 888,904 |
| Ser. 2001-53, Class CF, 3.42%, 10/25/2031 | | | | 356,615 | | | | 357,430 |
| Ser. 2002-13, Class FE, 3.92%, 02/27/2031 ## | | | | 2,203,026 | | | | 2,257,154 |
| Ser. 2002-67, Class FA, 4.02%, 11/25/2032 ## | | | | 3,666,117 | | | | 3,737,312 |
| Ser. G93, Class FH, 4.18%, 04/25/2023 | | | | 266,230 | | | | 273,378 |
See Notes to Financial Statements
11
SCHEDULE OF INVESTMENTS continued
April 30, 2005
| | | | | Principal | | | | |
| | | | | Amount | | | | Value |
|
| AGENCY MORTGAGE-BACKED COLLATERALIZED MORTGAGE | | | | | | |
| OBLIGATIONS continued | | | | | | | | |
| FLOATING-RATE continued | | | | | | | | |
| GNMA: | | | | | | | | |
| Ser. 1999-40, Class FL, 3.57%, 02/17/2029 | | | | $ 408,852 | | $ | | 413,075 |
| Ser. 2000-12, Class FQ, 3.62%, 06/16/2029 | | | | 759,853 | | | | 761,008 |
| Ser. 2000-36, Class FG, 3.49%, 11/20/2030 | | | | 868,189 | | | | 874,343 |
| |
|
| | | | | | | | | 45,360,045 |
| |
|
| Total Agency Mortgage-Backed Collateralized Mortgage Obligations | | | | | | |
| (cost $81,055,492) | | | | | | | | 80,944,907 |
| |
|
| AGENCY MORTGAGE-BACKED PASS THROUGH SECURITIES 63.2% | | | | | | |
| FIXED-RATE 45.8% | | | | | | | | |
| FHLMC: | | | | | | | | |
| 5.50%, TBA # | | | | 85,155,000 | | | | 86,569,806 |
| 6.00%, TBA # | | | | 49,795,000 | | | | 51,117,655 |
| 6.50%, 04/01/2011 - 09/01/2028 | | | | 5,569,262 | | | | 5,802,781 |
| 6.50%, 01/01/2017 - 04/01/2022 ## | | | | 2,671,539 | | | | 2,779,315 |
| 7.50%, 05/01/2027 - 08/01/2028 | | | | 1,433,475 | | | | 1,543,307 |
| 8.00%, 08/01/2023 - 11/01/2028 | | | | 414,887 | | | | 452,211 |
| 9.00%, 01/01/2017 | | | | 152,171 | | | | 165,400 |
| 9.50%, 09/01/2020 | | | | 86,488 | | | | 95,392 |
| 10.50%, 12/01/2019 | | | | 237,855 | | | | 272,025 |
| FNMA: | | | | | | | | |
| 4.50%, TBA # | | | | 10,000,000 | | | | 9,893,750 |
| 5.50%, TBA # | | | | 44,900,000 | | | | 45,677,366 |
| 5.55%, 09/01/2019 (h) | | | | 8,113,344 | | | | 8,229,974 |
| 6.00%, 02/01/2008 - 09/01/2013 | | | | 824,498 | | | | 854,841 |
| 6.50%, 01/01/2024 | | | | 226,230 | | | | 236,734 |
| 6.50%, TBA # | | | | 27,190,000 | | | | 28,277,600 |
| 7.00%, 11/01/2026 - 02/01/2032 | | | | 339,624 | | | | 359,392 |
| 7.50%, 07/01/2023 - 05/01/2027 | | | | 855,299 | | | | 920,448 |
| 8.00%, 10/01/2026 - 09/01/2028 | | | | 531,920 | | | | 580,162 |
| 8.50%, 07/01/2029 - 08/01/2029 | | | | 78,925 | | | | 86,230 |
| 9.50%, 02/01/2023 | | | | 93,715 | | | | 103,176 |
| 11.00%, 01/01/2016 | | | | 147,147 | | | | 162,644 |
| 11.25%, 02/01/2016 | | | | 149,852 | | | | 166,769 |
| GNMA: | | | | | | | | |
| 6.00%, 02/15/2009 - 05/20/2034 | | | | 673,312 | | | | 695,981 |
| 6.00%, 08/20/2034 ## | | | | 8,941,845 | | | | 9,209,402 |
| 6.50%, 12/15/2025 - 09/20/2033 | | | | 1,238,908 | | | | 1,296,909 |
| 7.00%, 12/15/2022 - 05/15/2032 | | | | 1,149,646 | | | | 1,221,500 |
| 7.34%, 10/20/2021 - 09/20/2022 | | | | 793,079 | | | | 842,868 |
| 7.50%, 02/15/2022 - 06/15/2032 | | | | 967,073 | | | | 1,042,073 |
| 8.00%, 09/15/2009 | | | | 17,009 | | | | 17,873 |
| 10.00%, 12/15/2018 | | | | 109,609 | | | | 124,299 |
| |
|
| | | | | | | | | 258,797,883 |
| |
|
See Notes to Financial Statements
12
SCHEDULE OF INVESTMENTS continued
April 30, 2005
| | | Principal | | | | |
| | | Amount | | | | Value |
|
| AGENCY MORTGAGE-BACKED PASS THROUGH SECURITIES continued | | | | | | |
| FLOATING-RATE 17.4% | | | | | | |
| FNMA: | | | | | | |
| 3.22%, 07/01/2044 ## | | $ 23,521,597 | | $ | | 23,851,604 |
| 3.27%, 09/01/2041 ## | | 18,000,070 | | | | 18,255,760 |
| 3.42%, 06/01/2040 - 01/01/2041 ## | | 20,495,247 | | | | 20,883,196 |
| 3.88%, 11/01/2033 ## | | 15,810,330 | | | | 16,042,803 |
| SBA, 3.16%, 10/25/2029 - 11/25/2029 ## | | 19,581,888 | | | | 19,573,453 |
| |
|
| | | | | | | 98,606,816 |
| |
|
| Total Agency Mortgage-Backed Pass Through Securities | | | | | | |
| (cost $355,850,076) | | | | | | 357,404,699 |
| |
|
| AGENCY REPERFORMING MORTGAGE-BACKED PASS | | | | | | |
| THROUGH SECURITIES 5.5% | | | | | | |
| FIXED-RATE 5.5% | | | | | | |
| FNMA: | | | | | | |
| Ser. 2002-T1, Class A3, 7.50%, 11/25/2031 ## | | 4,556,992 | | | | 4,807,475 |
| Ser. 2002-T16, Class A1, 6.50%, 07/25/2042 ## | | 6,819,293 | | | | 7,093,707 |
| Ser. 2002-W3, Class A5, 7.50%, 01/25/2028 | | 853,405 | | | | 907,119 |
| Ser. 2002-W8, Class A4, 7.00%, 06/25/2017 ## | | 5,486,871 | | | | 5,805,795 |
| Ser. 2003-W1, Class 1A-1, 6.50%, 12/25/2042 ## | | 2,003,142 | | | | 2,081,154 |
| Ser. 2003-W6, Class 3A, 6.50%, 09/25/2032 ## | | 9,534,188 | | | | 10,070,105 |
| |
|
| Total Agency Reperforming Mortgage-Backed Pass Through Securities | | | | | | |
| (cost $31,020,068) | | | | | | 30,765,355 |
| |
|
| ASSET-BACKED SECURITIES 1.3% | | | | | | |
| SLMA: | | | | | | |
| Ser. 1997-4, Class A2, FRN, 3.69%, 10/25/2010 ## | | 3,246,999 | | | | 3,283,710 |
| Ser. 1998-1, Class A2, FRN, 3.70%, 10/25/2011 ## | | 4,035,105 | | | | 4,082,159 |
| |
|
| Total Asset-Backed Securities (cost $7,333,307) | | | | | | 7,365,869 |
| |
|
| COMMERCIAL MORTGAGE-BACKED SECURITIES 0.8% | | | | | | |
| FIXED-RATE 0.8% | | | | | | |
| Commercial Mtge. Pass-Through Certificates, Ser. 2001-ZC1A, | | | | | | |
| Class A, 6.36%, 06/12/2006 144A (h) | | 3,324,462 | | | | 3,384,035 |
| LB-UBS Comml. Mtge. Trust, Ser. 2000-C4, Class A1, 7.18%, 09/15/2019 | | 376,503 | | | | 399,432 |
| Morgan Stanley Capital I, Ser. 1998-XL1, Class A2, 6.45%, 06/03/2030 | | 800,000 | | | | 800,501 |
| |
|
| Total Commercial Mortgage-Backed Securities (cost $4,598,831) | | | | | | 4,583,968 |
| |
|
| CORPORATE BONDS 6.2% | | | | | | |
| FINANCIALS 4.9% | | | | | | |
| Capital Markets 1.6% | | | | | | |
| Goldman Sachs Capital I, 6.35%, 02/15/2034 | | 5,000,000 | | | | 5,252,170 |
| JPMorgan Chase Capital XV, Ser. O, 5.875%, 03/15/2035 | | 4,000,000 | | | | 3,989,044 |
| |
|
| | | | | | | 9,241,214 |
| |
|
| Commercial Banks 0.7% | | | | | | |
| Westpac Capital Trust IV, 5.26%, 12/29/2049 144A | | 4,000,000 | | | | 3,993,556 |
| |
|
See Notes to Financial Statements
13
SCHEDULE OF INVESTMENTS continued
April 30, 2005
| | | | | Principal | | | | |
| | | | | Amount | | | | Value |
|
| CORPORATE BONDS continued | | | | | | | | |
| FINANCIALS continued | | | | | | | | |
| Diversified Financial Services 0.7% | | | | | | | | |
| Prudential Holdings LLC, 8.70%, 12/18/2023 144A | | | | $ 3,000,000 | | $ | | 3,903,282 |
| |
|
| Insurance 0.9% | | | | | | | | |
| MBIA, Inc., 5.70%, 12/01/2034 (p) | | | | 5,000,000 | | | | 4,945,570 |
| |
|
| Real Estate 1.0% | | | | | | | | |
| Weingarten Realty Investors, 5.25%, 03/02/2015 | | | | 5,600,000 | | | | 5,553,699 |
| |
|
| TELECOMMUNICATION SERVICES 1.3% | | | | | | | | |
| Diversified Telecommunication Services 1.3% | | | | | | | | |
| Verizon Global Funding Corp., 7.75%, 12/01/2030 (p) | | | | 6,000,000 | | | | 7,489,218 |
| |
|
| Total Corporate Bonds (cost $34,378,179) | | | | | | | | 35,126,539 |
| |
|
| U.S. GOVERNMENT & AGENCY OBLIGATIONS 20.1% | | | | | | |
| FHLB: | | | | | | | | |
| 3.625%, 11/14/2008 (p) | | | | 10,000,000 | | | | 9,858,180 |
| 4.50%, 02/18/2015 (p) | | | | 5,000,000 | | | | 4,977,245 |
| 5.125%, 03/06/2006 | | | | 14,000,000 | | | | 14,181,650 |
| FHLMC: | | | | | | | | |
| 2.85%, 02/23/2007 | | | | 10,000,000 | | | | 9,821,740 |
| 2.875%, 09/15/2005 | | | | 5,500,000 | | | | 5,494,946 |
| 5.25%, 01/15/2006 | | | | 4,000,000 | | | | 4,048,972 |
| 5.50%, 07/15/2006 | | | | 15,000,000 | | | | 15,314,970 |
| 5.80%, 09/02/2008 | | | | 2,000,000 | | | | 2,105,660 |
| 6.00%, 06/15/2011 | | | | 4,000,000 | | | | 4,349,876 |
| 6.875%, 09/15/2010 (p) | | | | 5,000,000 | | | | 5,618,630 |
| FNMA: | | | | | | | | |
| 2.125%, 04/15/2006 | | | | 15,000,000 | | | | 14,801,130 |
| 2.875%, 10/15/2005 | | | | 5,000,000 | | | | 4,990,945 |
| 4.625%, 10/15/2013 (p) | | | | 6,000,000 | | | | 6,050,958 |
| 6.08%, 01/01/2019 | | | | 11,618,879 | | | | 12,088,398 |
| |
|
| Total U.S. Government & Agency Obligations (cost $114,435,852) | | | | | | 113,703,300 |
| |
|
| U.S. TREASURY OBLIGATIONS 6.8% | | | | | | | | |
| U.S. Treasury Bonds, 5.375%, 02/15/2031 (p) | | | | 4,800,000 | | | | 5,422,877 |
| U.S. Treasury Notes: | | | | | | | | |
| 2.00%, 08/31/2005 (p) | | | | 1,000,000 | | | | 997,071 |
| 3.50%, 11/15/2006 (p) | | | | 2,500,000 | | | | 2,499,122 |
| 3.78%, 01/15/2015 (p) | | | | 2,510,225 | | | | 2,517,972 |
| 3.875%, 05/15/2009 (p) | | | | 5,500,000 | | | | 5,510,533 |
| 4.00%, 02/15/2015 (p) | | | | 15,000,000 | | | | 14,761,530 |
| 4.375%, 05/15/2007 (p) | | | | 4,000,000 | | | | 4,057,660 |
| 4.625%, 05/15/2006 (p) | | | | 2,800,000 | | | | 2,835,221 |
| |
|
| Total U.S. Treasury Obligations (cost $38,309,760) | | | | | | 38,601,986 |
| |
|
See Notes to Financial Statements
14
SCHEDULE OF INVESTMENTS continued
April 30, 2005
| | | | | | | Principal | | | | |
| | | | | | | Amount | | | | Value |
|
| WHOLE LOAN MORTGAGE-BACKED COLLATERALIZED | | | | | | |
| MORTGAGE OBLIGATIONS 0.9% | | | | | | | | |
| FIXED-RATE 0.9% | | | | | | | | | | |
| Countrywide Alternative Loan Trust, Ser. 2004-1T1, Class A6, 5.75%, 02/25/2034 | | | | | | |
| (cost $5,134,961) | | | | | | $ 5,000,000 | | $ | | 5,131,445 |
| |
|
| WHOLE LOAN SUBORDINATE COLLATERALIZED | | | | | | |
| MORTGAGE OBLIGATIONS 2.1% | | | | | | | | |
| FIXED-RATE 2.1% | | | | | | | | | | |
| Countrywide Alternative Loan Trust, Ser. 2004-2CB, Class M, 5.66%, 03/25/2034 | | | | | | |
| (cost $11,697,047) | | | | | | 11,731,875 | | | | 11,950,904 |
| |
|
| SHORT-TERM INVESTMENTS 37.1% | | | | | | | | |
| U.S. GOVERNMENT & AGENCY OBLIGATIONS 19.9% | | | | | | |
| FNMA: | | | | | | | | | | |
| 2.68%, 5/2/2005† | | | | | | 56,514,886 | | | | 56,514,886 |
| 3.02%, 6/1/2005† | | | | | | 56,236,609 | | | | 56,095,549 |
| |
|
| | | | | | | | | | | 112,610,435 |
| | |
|
|
| | | | | | | Shares | | | | Value |
|
| MUTUAL FUND SHARES 17.2% | | | | | | | | |
| Evergreen Institutional Money Market Fund ## ø | | | | 32,038,636 | | | | 32,038,636 |
| Navigator Prime Portfolio (pp) | | | | | | 64,925,706 | | | | 64,925,706 |
| |
|
| | | | | | | | | | | 96,964,342 |
| |
|
| Total Short-Term Investments (cost $209,574,777) | | | | | | 209,574,777 |
| |
|
| Total Investments (cost $901,382,051) 159.7% | | | | | | 902,986,186 |
| Other Assets and Liabilities (59.7%) | | | | | | | | (337,457,239) |
| |
|
| Net Assets 100.0% | | | | | | | | $ | | 565,528,947 |
| |
|
| ## | | All or a portion of this security has been segregated for when-issued or delayed delivery securities. |
| # | | When-issued or delayed delivery security |
| (h) | | Security is valued at fair value as determined in good faith under procedures established by the Board of Trustees. |
| 144A | | Security that may be sold to qualified institutional buyers under Rule 144A of the Securities Act of 1933, as amended. |
| | | This security has been determined to be liquid under guidelines established by the Board of Trustees. |
| (p) | | All or a portion of this security is on loan. |
| † | | Rate shown represents the yield to maturity at date of purchase. |
| ø | | Evergreen Investment Management Company, LLC is the investment advisor to both the Fund and the money market |
| | | fund. |
| (pp) | | Represents investment of cash collateral received from securities on loan. |
Summary of Abbreviations |
| FHLB | | Federal Home Loan Bank |
| FHLMC | | Federal Home Loan Mortgage Corp. |
| FNMA | | Federal National Mortgage Association |
| FRN | | Floating Rate Note |
| GNMA | | Government National Mortgage Association |
| SBA | | Small Business Administration |
| SLMA | | Student Loan Marketing Association |
| TBA | | To Be Announced |
| See Notes to Financial Statements |
15
SCHEDULE OF INVESTMENTS continued
April 30, 2005
| The following table shows the percent of total bonds by credit quality based on Moody’s and Standard & Poor’s ratings as of |
| April 30, 2005 (unaudited): | | | |
| AAA | | 93.3% | |
| AA | | 2.7% | |
| A | | 4.0% | |
| |
| |
| | | 100.0% | |
| | |
| |
The following table shows the percent of total bonds by maturity as of April 30, 2005 (unaudited): |
| Less than 1 year(s) | | 18.8% | |
| 1 to 3 years | | 21.4% | |
| 3 to 5 years | | 41.6% | |
| 5 to 10 years | | 11.5% | |
| 10 to 20 years | | 2.7% | |
| 20 to 30 years | | 3.5% | |
| 30+ years | | 0.5% | |
| |
| |
| | | 100.0% | |
| | |
| |
See Notes to Financial Statements
16
STATEMENT OF ASSETS AND LIABILITIES
April 30, 2005
| Assets | | | | |
| Investments in securities, at value (cost $869,343,415) including | | | | |
| $63,536,180 of securities loaned | | $ | | 870,947,550 |
| Investments in affiliates, at value (cost $32,038,636) | | | | 32,038,636 |
| Receivable for securities sold | | | | 51,164,233 |
| Principal paydown receivable | | | | 540 |
| Receivable for Fund shares sold | | | | 1,516,374 |
| Interest receivable | | | | 3,667,009 |
| Receivable for securities lending income | | | | 6,033 |
| Prepaid expenses and other assets | | | | 91,967 |
|
| Total assets | | | | 959,432,342 |
|
| Liabilities | | | | |
| Dividends payable | | | | 388,184 |
| Payable for securities purchased | | | | 328,195,111 |
| Payable for Fund shares redeemed | | | | 225,446 |
| Payable for securities on loan | | | | 64,925,706 |
| Advisory fee payable | | | | 18,790 |
| Distribution Plan expenses payable | | | | 5,211 |
| Due to other related parties | | | | 46,962 |
| Accrued expenses and other liabilities | | | | 97,985 |
|
| Total liabilities | | | | 393,903,395 |
|
| Net assets | | $ | | 565,528,947 |
|
| Net assets represented by | | | | |
| Paid-in capital | | $ | | 573,620,965 |
| Overdistributed net investment income | | | | (366,631) |
| Accumulated net realized losses on securities | | | | (9,329,522) |
| Net unrealized gains on securities | | | | 1,604,135 |
|
| Total net assets | | $ | | 565,528,947 |
|
| Net assets consists of | | | | |
| Class A | | $ | | 93,826,414 |
| Class B | | | | 25,452,152 |
| Class C | | | | 9,819,837 |
| Class I | | | | 436,430,544 |
|
| Total net assets | | $ | | 565,528,947 |
|
| Shares outstanding (unlimited number of shares authorized) | | | | |
| Class A | | | | 9,302,285 |
| Class B | | | | 2,523,417 |
| Class C | | | | 973,569 |
| Class I | | | | 43,269,505 |
|
| Net asset value per share | | | | |
| Class A | | $ | | 10.09 |
| Class A — Offering price (based on sales charge of 4.75%) | | $ | | 10.59 |
| Class B | | $ | | 10.09 |
| Class C | | $ | | 10.09 |
| Class I | | $ | | 10.09 |
|
See Notes to Financial Statements
17
STATEMENT OF OPERATIONS
Year Ended April 30, 2005
| Investment income | | | | |
| Interest | | $ | | 17,731,369 |
| Income from affiliates | | | | 1,043,266 |
| Securities lending | | | | 98,438 |
|
| Total investment income | | | | 18,873,073 |
|
| Expenses | | | | |
| Advisory fee | | | | 2,259,133 |
| Distribution Plan expenses | | | | |
| Class A | | | | 298,381 |
| Class B | | | | 309,497 |
| Class C | | | | 117,219 |
| Administrative services fee | | | | 555,822 |
| Transfer agent fees | | | | 763,250 |
| Trustees’ fees and expenses | | | | 17,043 |
| Printing and postage expenses | | | | 40,196 |
| Custodian and accounting fees | | | | 155,363 |
| Registration and filing fees | | | | 72,746 |
| Professional fees | | | | 22,906 |
| Other | | | | 14,880 |
|
| Total expenses | | | | 4,626,436 |
| Less: Expense reductions | | | | (4,538) |
| Expense reimbursements | | | | (109) |
|
| Net expenses | | | | 4,621,789 |
|
| Net investment income | | | | 14,251,284 |
|
| Net realized and unrealized gains or losses on securities | | | | |
| Net realized gains on securities | | | | 3,159,369 |
| Net change in unrealized gains or losses on securities | | | | 7,118,825 |
|
| Net realized and unrealized gains or losses on securities | | | | 10,278,194 |
|
| Net increase in net assets resulting from operations | | $ | | 24,529,478 |
|
See Notes to Financial Statements
18
STATEMENTS OF CHANGES IN NET ASSETS
| | | Year Ended April 30, |
| |
|
| | | 2005 | | 2004 |
|
| Operations | | | | | | | | |
| Net investment income | | $ | | 14,251,284 | | $ | | 13,186,747 |
| Net realized gains on securities | | | | 3,159,369 | | | | 8,184,552 |
| Net change in unrealized gains or losses | | | | | | | | |
| on securities | | | | 7,118,825 | | | | (18,847,170) |
|
| Net increase in net assets resulting from | | | | | | | | |
| operations | | | | 24,529,478 | | | | 2,524,129 |
|
| Distributions to shareholders from | | | | | | | | |
| Net investment income | | | | | | | | |
| Class A | | | | (2,965,158) | | | | (3,670,702) |
| Class B | | | | (704,088) | | | | (1,062,558) |
| Class C | | | | (266,828) | | | | (424,188) |
| Class I | | | | (13,622,059) | | | | (14,804,338) |
|
| Total distributions to shareholders | | | | (17,558,133) | | | | (19,961,786) |
|
| | | Shares | | | | Shares | | |
| Capital share transactions | | | | | | | | |
| Proceeds from shares sold | | | | | | | | |
| Class A | | 765,453 | | 7,679,760 | | 2,075,217 | | 21,083,132 |
| Class B | | 189,529 | | 1,894,320 | | 556,807 | | 5,657,033 |
| Class C | | 76,240 | | 764,033 | | 296,648 | | 2,997,880 |
| Class I | | 9,710,308 | | 97,626,122 | | 11,828,100 | | 120,167,632 |
|
| | | | | 107,964,235 | | | | 149,905,677 |
|
| Net asset value of shares issued in | | | | | | | | |
| reinvestment of distributions | | | | | | | | |
| Class A | | 216,905 | | 2,178,168 | | 259,406 | | 2,625,029 |
| Class B | | 49,250 | | 494,475 | | 73,156 | | 740,430 |
| Class C | | 18,317 | | 183,925 | | 27,341 | | 276,766 |
| Class I | | 1,072,774 | | 10,774,687 | | 1,203,602 | | 12,176,796 |
|
| | | | | 13,631,255 | | | | 15,819,021 |
|
| Automatic conversion of Class B shares | | | | | | | | |
| to Class A shares | | | | | | | | |
| Class A | | 201,243 | | 2,018,070 | | 337,382 | | 3,420,150 |
| Class B | | (201,243) | | (2,018,070) | | (337,382) | | (3,420,150) |
|
| | | | | 0 | | | | 0 |
|
| Payment for shares redeemed | | | | | | | | |
| Class A | | (2,843,943) | | (28,505,120) | | (6,063,799) | | (61,384,951) |
| Class B | | (1,256,644) | | (12,576,689) | | (2,361,200) | | (23,869,116) |
| Class C | | (547,658) | | (5,485,159) | | (1,443,842) | | (14,577,107) |
| Class I | | (10,428,161) | | (104,475,823) | | (22,014,410) | | (222,776,501) |
|
| | | | | (151,042,791) | | | | (322,607,675) |
|
| Net asset value of shares issued in | | | | | | | | |
| acquisitions | | | | | | | | |
| Class A | | 0 | | 0 | | 20,363 | | 208,806 |
| Class I | | 0 | | 0 | | 3,973,896 | | 40,749,601 |
|
| | | | | 0 | | | | 40,958,407 |
|
| Net decrease in net assets resulting | | | | | | | | |
| from capital share transactions | | | | (29,447,301) | | | | (115,924,570) |
|
| Total decrease in net assets | | | | (22,475,956) | | | | (133,362,227) |
| Net assets | | | | | | | | |
| Beginning of period | | | | 588,004,903 | | | | 721,367,130 |
|
| End of period | | | $ | 565,528,947 | | | $ | 588,004,903 |
|
| Overdistributed net investment income | | | $ | (366,631) | | | $ | (400,663) |
|
See Notes to Financial Statements
19
STATEMENT OF CASH FLOWS
Year Ended April 30, 2005
| Increase in Cash | | | | |
| Cash Flows from Operating Activities: | | | | |
| Net increase in net assets from operations | | $ | | 24,529,478 |
| Adjustments to reconcile net increase in net assets from operations to net cash | | | | |
| provided by operating activities: | | | | |
| Purchase of investment securities (including mortgage dollar rolls) | | | | (3,045,227,692) |
| Proceeds from disposition of investment securities (including mortgage dollar rolls) | | | | 3,077,752,904 |
| Purchase of short-term investment securities | | | | 4,354,314 |
| Increase in interest receivable | | | | (23,335) |
| Increase in receivable for securities sold | | | | (42,999,811) |
| Increase in receivable for Fund shares sold | | | | (514,862) |
| Decrease in other assets | | | | 51,671 |
| Increase in payable for securities purchased | | | | 39,716,815 |
| Decrease in payable for Fund shares redeemed | | | | (425,298) |
| Increase in accrued expenses | | | | 38,774 |
| Unrealized depreciation on investments | | | | (7,118,825) |
| Net realized gains from investments | | | | (3,159,369) |
|
| Net cash provided by operating activities | | | | 46,974,764 |
|
| Cash Flows from Financing Activities: | | | | |
| Decrease in additional paid-in capital | | | | (43,078,556) |
| Cash distributions paid | | | | (3,896,208) |
|
| Net cash used in financing activities | | | | (46,974,764) |
|
| Net increase in cash | | $ | | 0 |
|
| Cash: | | | | |
| Beginning of year | | $ | | 0 |
|
| End of year | | $ | | 0 |
|
See Notes to Financial Statements
20
NOTES TO FINANCIAL STATEMENTS
1. ORGANIZATION
Evergreen U.S. Government Fund (the “Fund”) is a diversified series of Evergreen Fixed Income Trust (the “Trust”), a Delaware statutory trust organized on September 18, 1997. The Trust is an open-end management investment company registered under the Investment Company Act of 1940, as amended (the “1940 Act”).
The Fund offers Class A, Class B, Class C and Institutional (“Class I”) shares. Class A shares are sold with a front-end sales charge. However, Class A share investments of $1 million or more are not subject to a front-end sales charge but will be subject to a contingent deferred sales charge of 1.00% upon redemption within one year. Class B shares are sold without a front-end sales charge but are subject to a contingent deferred sales charge that is payable upon redemption and decreases depending on how long the shares have been held. Class C shares are sold without a front-end sales charge but are subject to a contingent deferred sales charge that is payable upon redemption within one year. Class I shares are sold without a front-end sales charge or contingent deferred sales charge. Each class of shares, except Class I shares, pays an ongoing distribution fee.
2. SIGNIFICANT ACCOUNTING POLICIES
The following is a summary of significant accounting policies consistently followed by the Fund in the preparation of its financial statements. The policies are in conformity with generally accepted accounting principles in the United States of America, which require management to make estimates and assumptions that affect amounts reported herein. Actual results could differ from these estimates.
a. Valuation of investments
Portfolio debt securities acquired with more than 60 days to maturity are fair valued using matrix pricing methods determined by an independent pricing service which takes into consideration such factors as similar security prices, yields, maturities, liquidity and ratings. Securities for which valuations are not readily available from an independent pricing service may be valued by brokers which use prices provided by market makers or estimates of market value obtained from yield data relating to investments or securities with similar characteristics.
Short-term securities with remaining maturities of 60 days or less at the time of purchase are valued at amortized cost, which approximates market value.
Investments in other mutual funds are valued at net asset value. Securities for which market quotations are not available or not reflective of current market value are valued at fair value as determined in good faith, according to procedures approved by the Board of Trustees.
b. When-issued and delayed delivery transactions
The Fund records when-issued or delayed delivery securities as of trade date and maintains security positions such that sufficient liquid assets will be available to make payment for the securities purchased. Securities purchased on a when-issued or delayed delivery basis are marked-to-market
21
NOTES TO FINANCIAL STATEMENTS continued
daily and begin earning interest on the settlement date. Losses may occur on these transactions due to changes in market conditions or the failure of counterparties to perform under the contract.
c. Securities lending
The Fund may lend its securities to certain qualified brokers in order to earn additional income. The Fund receives compensation in the form of fees or interest earned on the investment of any cash collateral received. The Fund also continues to receive interest and dividends on the securities loaned. The Fund receives collateral in the form of cash or securities with a market value at least equal to the market value of the securities on loan, including accrued interest. In the event of default or bankruptcy by the borrower, the Fund could experience delays and costs in recovering the loaned securities or in gaining access to the collateral. The Fund has the right under the lending agreement to recover the securities from the borrower on demand.
d. Dollar roll transactions
The Fund may enter into dollar roll transactions with respect to mortgage-backed securities. In a dollar roll transaction, the Fund sells mortgage-backed securities to financial institutions and simultaneously agrees to accept substantially similar (same type, coupon and maturity) securities at a later date at an agreed upon price. The Fund will use the proceeds generated from the transactions to invest in short-term investments, which may enhance the Fund’s current yield and total return. The Fund accounts for dollar roll transactions as purchases and sales. The Fund could be exposed to risks if the counterparty defaults on its obligation to perform under the terms of the agreement, if the Fund receives inferior securities in comparison to what was sold to the coun-terparty at redelivery or if there are variances in paydown speed between the mortgage-related pools.
e. Security transactions and investment income
Security transactions are recorded on trade date. Realized gains and losses are computed using the specific cost of the security sold. Interest income is recorded on the accrual basis and includes accretion of discounts and amortization of premiums.
f. Federal taxes
The Fund intends to continue to qualify as a regulated investment company and distribute all of its taxable income, including any net capital gains (which have already been offset by available capital loss carryovers). Accordingly, no provision for federal taxes is required.
g. Distributions
Distributions to shareholders from net investment income are accrued daily and paid monthly. Distributions from net realized gains, if any, are recorded on the ex-dividend date. Such distributions are determined in conformity with income tax regulations, which may differ from generally accepted accounting principles.
22
NOTES TO FINANCIAL STATEMENTS continued
Reclassifications have been made to the Fund’s components of net assets to reflect income and gains available for distribution (or available capital loss carryovers, as applicable) under income tax regulations. The primary permanent differences causing such reclassifications are due to mortgage paydown gains and losses and premium amortization.
During the year ended April 30, 2005, the following amounts were reclassified:
|
| Paid-in capital | | $ | | 79,071 |
| Overdistributed net investment income | | | | 4,250,534 |
| Accumulated net realized losses on securities | | | | (4,329,605) |
|
h. Class allocations
Income, common expenses and realized and unrealized gains and losses are allocated to the classes based on the relative net assets of each class. Distribution fees, if any, are calculated daily at the class level based on the appropriate net assets of each class and the specific expense rates applicable to each class.
3. ADVISORY FEE AND OTHER TRANSACTIONS WITH AFFILIATES
Evergreen Investment Management Company, LLC (“EIMC”), an indirect, wholly-owned subsidiary of Wachovia Corporation (“Wachovia”), is the investment advisor to the Fund and is paid an annual fee starting at 0.42% and declining to 0.35% as average daily net assets increase.
From time to time, EIMC may voluntarily or contractually waive its fee and/or reimburse expenses in order to limit operating expenses. During the year ended April 30, 2005, EIMC reimbursed other expenses in the amount of $109.
Evergreen Investment Services, Inc. (“EIS”), an indirect, wholly-owned subsidiary of Wachovia, is the administrator to the Fund. As administrator, EIS provides the Fund with facilities, equipment and personnel and is paid an annual rate determined by applying percentage rates to the aggregate average daily net assets of the Evergreen funds (excluding money market funds), starting at 0.10% and declining to 0.05% as the aggregate average daily net assets of the Evergreen funds (excluding money market funds) increase.
Evergreen Service Company, LLC (“ESC”), an indirect, wholly-owned subsidiary of Wachovia, is the transfer and dividend disbursing agent for the Fund. ESC receives account fees that vary based on the type of account held by the shareholders in the Fund. For the year ended April 30, 2005, the transfer agent fees were equivalent to an annual rate of 0.14% of the Fund’s average daily net assets.
4. DISTRIBUTION PLANS
EIS also serves as distributor of the Fund’s shares. The Fund has adopted Distribution Plans, as allowed by Rule 12b-1 of the 1940 Act, for each class of shares, except Class I. Under the Distribution Plans, distribution fees are paid at an annual rate of 0.30% of the average daily net assets for Class A shares and 1.00% of the average daily net assets for each of Class B and Class C shares.
23
NOTES TO FINANCIAL STATEMENTS continued
For the year ended April 30, 2005, EIS received $5,654 from the sale of Class A shares and $125,782 and $4,588 in contingent deferred sales charges from redemptions of Class B and Class C shares, respectively.
5. ACQUISITIONS
Effective at the close of business on July 11, 2003, the Fund acquired the net assets of Evergreen Offit U.S. Government Securities Fund in a tax-free exchange for Class I shares of the Fund. Shares were issued to Class I shares of Evergreen Offit U.S. Government Securities Fund at an exchange ratio of 1.01 for Class I shares of the Fund. On the same date, the Fund also acquired the net assets of Evergreen Offit Mortgage Securities Fund in a tax-free exchange for Class A and Class I shares of the Fund. Shares were issued to Class A and Class I shares of Evergreen Offit Mortgage Securities Fund at an exchange ratio of 0.98 and 0.98 for Class A and Class I shares, respectively, of the Fund. The aggregate net assets of the Fund immediately prior to the acquisitions were $703,371,196.
The value of net assets acquired, unrealized appreciation acquired and number of shares issued were as follows:
| | | Value of Net | | Unrealized | | Number of |
| Acquired Fund | | Assets Acquired | | Appreciation | | Shares Issued |
|
| Evergreen Offit | | | | | | | | |
| U.S. Government | | | | | | | | |
| Securities Fund | | $ 20,074,892 | | $316,122 | | 1,957,708 | | Class I |
| | | | | | | | | |
| Evergreen Offit | | | | | | | | |
| Mortgage Securities | | | | | | | | |
| Fund | | 20,883,515 | | 183,943 | | 20,363 | | Class A |
| | | | | | | 2,016,188 | | Class I |
|
The aggregate net assets of the Fund immediately after these acquisitions were $744,329,603.
6. SECURITIES TRANSACTIONS
Cost of purchases and proceeds from sales of investment securities (excluding short-term securities and mortgage dollar roll transactions) were as follows for the year ended April 30, 2005:
| Cost of Purchases | | Proceeds from Sales |
|
| | | Non-U.S. | | | | Non-U.S. |
| U.S. Government | | Government | | U.S. Government | | Government |
|
| $ 738,075,357 | | $ 95,213,966 | | $ 638,651,271 | | $ 131,475,194 |
|
During the year ended April 30, 2005, the Fund loaned securities to certain brokers. At April 30, 2005, the value of securities on loan and the value of collateral (including accrued interest) amounted to $63,536,180 and $64,925,706, respectively.
On April 30, 2005, the aggregate cost of securities for federal income tax purposes was $903,403,092. The gross unrealized appreciation and depreciation on securities based on tax cost was $3,671,116 and $4,088,022, respectively, with a net unrealized depreciation of $416,906.
24
NOTES TO FINANCIAL STATEMENTS continued
As of April 30, 2005, the Fund had $6,570,885 in capital loss carryovers for federal income tax purposes expiring as follows:
| Expiration |
|
| 2007 | | 2008 | | 2009 | | 2010 |
|
| $1,278,383 | | $ 4,853,705 | | $ 437,595 | | $1,202 |
|
For income tax purposes, capital losses incurred after October 31 within the Fund’s fiscal year are deemed to arise on the first business day of the following fiscal year. As of April 30, 2005, the Fund incurred and will elect to defer post-October losses of $737,596.
7. INTERFUND LENDING
Pursuant to an Exemptive Order issued by the SEC, the Fund may participate in an interfund lending program with certain funds in the Evergreen fund family. This program allows the Fund to borrow from, or lend money to, other participating funds. During the year ended April 30, 2005, the Fund did not participate in the interfund lending program.
8. DISTRIBUTIONS TO SHAREHOLDERS
As of April 30, 2005, the components of distributable earnings on a tax basis were as follows:
| | | | | Capital Loss |
| Overdistributed | | Unrealized | | Carryover and |
| Ordinary Income | | Depreciation | | Post-October Loss |
|
| $ 366,631 | | $ 416,906 | | $7,308,481 |
|
The differences between the components of distributable earnings on a tax basis and the amounts reflected in the Statement of Assets and Liabilities are primarily due to wash sales and premium amortization.
The tax character of distributions paid were $17,558,133 and $19,961,786 of ordinary income for the years ended April 30, 2005 and April 30, 2004, respectively.
9. EXPENSE REDUCTIONS
Through expense offset arrangements with ESC and the Fund’s custodian, a portion of fund expenses has been reduced.
10. DEFERRED TRUSTEES’ FEES
Each Trustee of the Fund may defer any or all compensation related to performance of their duties as Trustees. The Trustees’ deferred balances are allocated to deferral accounts, which are included in the accrued expenses for the Fund. The investment performance of the deferral accounts are based on the investment performance of certain Evergreen funds. Any gains earned or losses incurred in the deferral accounts are reported in the Fund’s Trustees’ fees and expenses. At the election of the Trustees, the deferral account will be paid either in one lump sum or in quarterly installments for up to ten years.
25
NOTES TO FINANCIAL STATEMENTS continued
11. FINANCING AGREEMENT
The Fund and certain other Evergreen funds share in a $150 million unsecured revolving credit commitment for temporary and emergency purposes, including the funding of redemptions, as permitted by each participating fund’s borrowing restrictions. Borrowings under this facility bear interest at 0.50% per annum above the Federal Funds rate. All of the participating funds are charged an annual commitment fee of 0.09% of the unused balance, which is allocated pro rata. During the year ended April 30, 2005, the Fund had no borrowings under this agreement.
12. REGULATORY MATTERS AND LEGAL PROCEEDINGS
Since September 2003, governmental and self-regulatory authorities have instituted numerous ongoing investigations of various practices in the mutual fund industry, including investigations relating to revenue sharing, market-timing, late trading and record retention, among other things. The investigations cover investment advisors, distributors and transfer agents to mutual funds, as well as other firms. EIMC, EIS and ESC (collectively, “Evergreen”) have received subpoenas and other requests for documents and testimony relating to these investigations, are endeavoring to comply with those requests, and are cooperating with the investigations. Evergreen is continuing its own internal review of policies, practices, procedures and personnel, and is taking remedial action where appropriate.
In connection with one of these investigations, on July 28, 2004, the staff of the Securities and Exchange Commission (“SEC”) informed Evergreen that the staff intends to recommend to the SEC that it institute an enforcement action against Evergreen. The SEC staff’s proposed allegations relate to (i) an arrangement pursuant to which a broker at one of EIMC’s affiliated broker-dealers had been authorized, apparently by an EIMC officer (no longer with EIMC), to engage in short-term trading, on behalf of a client, in Evergreen Mid Cap Growth Fund (formerly Evergreen Emerging Growth Fund and prior to that, known as Evergreen Small Company Growth Fund) during the period from December 2000 through April 2003, in excess of the limitations set forth in the fund’s prospectus, (ii) short-term trading from September 2001 through January 2003, by a former Evergreen portfolio manager, of Evergreen Precious Metals Fund, a fund he managed at the time, (iii) the sufficiency of systems for monitoring exchanges and enforcing exchange limitations as stated in the fund’s prospectuses, and (iv) the adequacy of e-mail retention practices. In connection with the activity in Evergreen Mid Cap Growth Fund, EIMC reimbursed the fund $378,905, plus an additional $25,242, representing what EIMC calculated at that time to be the client’s net gain and the fees earned by EIMC and the expenses incurred by this fund on the client’s account. In connection with the activity in Evergreen Precious Metals Fund, EIMC reimbursed the fund $70,878, plus an additional $3,075, representing what EIMC calculated at that time to be the portfolio manager’s net gain and the fees earned by EIMC and expenses incurred by the fund on the portfolio manager’s account. Evergreen is currently engaged in discussions with the staff of the SEC concerning its recommendation.
26
NOTES TO FINANCIAL STATEMENTS continued
Any resolution of these matters with regulatory authorities may include, but not be limited to, sanctions, penalties or injunctions regarding Evergreen, restitution to mutual fund shareholders and/or other financial penalties and structural changes in the governance or management of Evergreen’s mutual fund business. Any penalties or restitution will be paid by Evergreen and not by the Evergreen funds.
In addition, the Evergreen funds and EIMC and certain of its affiliates are involved in various legal actions, including private litigation and class action lawsuits. EIMC does not expect that any of such legal actions currently pending or threatened will have a material adverse impact on the financial position or operations of any of the Evergreen funds or on EIMC’s ability to provide services to the Evergreen funds.
Although Evergreen believes that neither the foregoing investigations nor any pending or threatened legal actions will have a material adverse impact on the Evergreen funds, there can be no assurance that these matters and any publicity surrounding or resulting from them will not result in reduced sales or increased redemptions of Evergreen fund shares, which could increase Evergreen fund transaction costs or operating expenses, or have other adverse consequences on the Evergreen funds.
27
REPORT OF INDEPENDENT REGISTERED PUBLIC ACCOUNTING FIRM
Board of Trustees and Shareholders
Evergreen Fixed Income Trust
We have audited the accompanying statement of assets and liabilities, including the schedule of investments, of the Evergreen U.S. Government Fund, a series of Evergreen Fixed Income Trust, as of April 30, 2005, and the related statement of operations and statement of cash flows for the year then ended, statements of changes in net assets for each of the years in the two-year period then ended, and the financial highlights for each of the years or periods in the five-year period then ended. These financial statements and financial highlights are the responsibility of the Fund’s management. Our responsibility is to express an opinion on these financial statements and finan-cial highlights based on our audits.
We conducted our audits in accordance with the standards of the Public Company Accounting Oversight Board (United States). Those standards require that we plan and perform the audit to obtain reasonable assurance about whether the financial statements and financial highlights are free of material misstatement. An audit includes examining, on a test basis, evidence supporting the amounts and disclosures in the financial statements. Our procedures included confirmation of securities owned as of April 30, 2005 by correspondence with the custodian and brokers, or by other appropriate auditing procedures when replies from brokers were not received. An audit also includes assessing the accounting principles used and significant estimates made by management, as well as evaluating the overall financial statement presentation. We believe that our audits provide a reasonable basis for our opinion.
In our opinion, the financial statements and financial highlights referred to above present fairly, in all material respects, the financial position of the Evergreen U.S. Government Fund as of April 30, 2005, the results of its operations, its cash flows, changes in its net assets and financial highlights for each of the years or periods described above in conformity with U.S. generally accepted accounting principles.
Boston, Massachusetts
June 17, 2005
28
This page left intentionally blank
29
This page left intentionally blank
30
This page left intentionally blank
31
TRUSTEES AND OFFICERS
TRUSTEES1
| Charles A. Austin III | | Principal occupations: Investment Counselor, Anchor Capital Advisors, Inc. (investment advice); |
| Trustee | | Director, The Andover Companies (insurance); Trustee, Arthritis Foundation of New England; |
| DOB: 10/23/1934 | | Director, The Francis Ouimet Society; Former Director, Health Development Corp. |
| Term of office since: 1991 | | (fitness-wellness centers); Former Director, Mentor Income Fund, Inc.; Former Trustee, |
| | | Mentor Funds and Cash Resource Trust; Former Investment Counselor, Appleton Partners, Inc. |
| Other directorships: None | | (investment advice); Former Director, Executive Vice President and Treasurer, State Street |
| | | Research & Management Company (investment advice) |
|
| Shirley L. Fulton | | Principal occupations: Partner, Tin, Fulton, Greene & Owen, PLLC (law firm); Former Partner, |
| Trustee | | Helms, Henderson & Fulton, P.A. (law firm); Retired Senior Resident Superior Court Judge, |
| DOB: 1/10/1952 | | 26th Judicial District, Charlotte, NC |
| Term of office since: 2004 | | |
| Other directorships: None | | |
|
| K. Dun Gifford | | Principal occupations: Chairman and President, Oldways Preservation and Exchange Trust |
| Trustee | | (education); Trustee, Treasurer and Chairman of the Finance Committee, Cambridge College; |
| DOB: 10/23/1938 | | Former Chairman of the Board, Director, and Executive Vice President, The London Harness |
| Term of office since: 1974 | | Company (leather goods purveyor); Former Director, Mentor Income Fund, Inc.; Former Trustee, |
| | | Mentor Funds and Cash Resource Trust |
| Other directorships: None | | |
|
| Dr. Leroy Keith, Jr. | | Principal occupations: Partner, Stonington Partners, Inc. (private equity firm); Trustee, |
| Trustee | | The Phoenix Group of Mutual Funds; Director, Obagi Medical Products Co.; Director, |
| DOB: 2/14/1939 | | Diversapack Co.; Former Director, Lincoln Educational Services; Former Chairman of the Board |
| Term of office since: 1983 | | and Chief Executive Officer, Carson Products Company (manufacturing); Former Director, |
| | | Mentor Income Fund, Inc.; Former Trustee, Mentor Funds and Cash Resource Trust |
| Other directorships: Trustee, The | | |
| Phoenix Group of Mutual Funds | | |
|
| Gerald M. McDonnell | | Principal occupations: Manager of Commercial Operations, SMI Steel Co. – South Carolina |
| Trustee | | (steel producer); Former Sales and Marketing Manager, Nucor Steel Company; Former Director, |
| DOB: 7/14/1939 | | Mentor Income Fund, Inc.; Former Trustee, Mentor Funds and Cash Resource Trust |
| Term of office since: 1988 | | |
| Other directorships: None | | |
|
| William Walt Pettit | | Principal occupations: Vice President, Kellam & Pettit, P.A. (law firm); Director, Superior |
| Trustee | | Packaging Corp.; Director, National Kidney Foundation of North Carolina, Inc.; Former Director, |
| DOB: 8/26/1955 | | Mentor Income Fund, Inc.; Former Trustee, Mentor Funds and Cash Resource Trust |
| Term of office since: 1984 | | |
| Other directorships: None | | |
|
| David M. Richardson | | Principal occupations: President, Richardson, Runden LLC (executive recruitment business |
| Trustee | | development/consulting company); Consultant, Kennedy Information, Inc. (executive |
| DOB: 9/19/1941 | | recruitment information and research company); Consultant, AESC (The Association of |
| Term of office since: 1982 | | Executive Search Consultants); Director, J&M Cumming Paper Co. (paper merchandising); |
| | | Former Trustee, NDI Technologies, LLP (communications); Former Vice Chairman, DHR |
| Other directorships: None | | International, Inc. (executive recruitment); Former Director, Mentor Income Fund, Inc.; |
| | | Former Trustee, Mentor Funds and Cash Resource Trust |
|
| Dr. Russell A. Salton III | | Principal occupations: President/CEO, AccessOne MedCard; Former Medical Director, |
| Trustee | | Healthcare Resource Associates, Inc.; Former Medical Director, U.S. Health Care/Aetna Health |
| DOB: 6/2/1947 | | Services; Former Director, Mentor Income Fund, Inc.; Former Trustee, Mentor Funds and |
| Term of office since: 1984 | | Cash Resource Trust |
| Other directorships: None | | |
|
32
TRUSTEES AND OFFICERS continued
| Michael S. Scofield | | Principal occupations: Director, Branded Media Corporation (multi-media branding company); |
| Trustee | | Attorney, Law Offices of Michael S. Scofield; Former Director, Mentor Income Fund, Inc.; |
| DOB: 2/20/1943 | | Former Trustee, Mentor Funds and Cash Resource Trust |
| Term of office since: 1984 | | |
| Other directorships: None | | |
|
| Richard J. Shima | | Principal occupations: Independent Consultant; Director, Trust Company of CT; Trustee, |
| Trustee | | Saint Joseph College (CT); Director, Hartford Hospital; Trustee, Greater Hartford YMCA; |
| DOB: 8/11/1939 | | Former Director, Enhance Financial Services, Inc.; Former Director, Old State House Association; |
| Term of office since: 1993 | | Former Director of CTG Resources, Inc. (natural gas); Former Director, Mentor Income Fund, Inc.; |
| Other directorships: None | | Former Trustee, Mentor Funds and Cash Resource Trust |
|
| Richard K. Wagoner, CFA2 | | Principal occupations: Member and Former President, North Carolina Securities Traders |
| Trustee | | Association; Member, Financial Analysts Society; Former Consultant to the Boards of Trustees |
| DOB: 12/12/1937 | | of the Evergreen funds; Former Trustee, Mentor Funds and Cash Resource Trust |
| Term of office since: 1999 | | |
| Other directorships: None | | |
|
| OFFICERS | | |
| Dennis H. Ferro3 | | Principal occupations: President and Chief Executive Officer, Evergreen Investment Company, |
| President | | Inc. and Executive Vice President, Wachovia Bank, N.A.; former Chief Investment Officer, |
| DOB: 6/20/1945 | | Evergreen Investment Company, Inc. |
| Term of office since: 2003 | | |
|
| Carol Kosel4 | | Principal occupations: Senior Vice President, Evergreen Investment Services, Inc. |
| Treasurer | | |
| DOB: 12/25/1963 | | |
| Term of office since: 1999 | | |
|
| Michael H. Koonce4 | | Principal occupations: Senior Vice President and General Counsel, Evergreen Investment |
| Secretary | | Services, Inc.; Senior Vice President and Assistant General Counsel, Wachovia Corporation |
| DOB: 4/20/1960 | | |
| Term of office since: 2000 | | |
|
| James Angelos4 | | Principal occupations: Chief Compliance Officer and Senior Vice President, Evergreen Funds; |
| Chief Compliance Officer | | Former Director of Compliance, Evergreen Investment Services, Inc. |
| DOB: 9/2/1947 | | |
| Term of office since: 2004 | | |
|
1 Each Trustee serves until a successor is duly elected or qualified or until his death, resignation, retirement or removal from office. Each Trustee oversees 89 Evergreen funds. Correspondence for each Trustee may be sent to Evergreen Board of Trustees, P.O. Box 20083, Charlotte, NC 28202.
2 Mr. Wagoner is an “interested person” of the Fund because of his ownership of shares in Wachovia Corporation, the parent to the Fund’s investment advisor.
3 The address of the Officer is 401 S. Tryon Street, 20th Floor, Charlotte, NC 28288.
4 The address of the Officer is 200 Berkeley Street, Boston, MA 02116.
Additional information about the Fund’s Board of Trustees and Officers can be found in the Statement of Additional Information (SAI) and is available upon request without charge by calling 800.343.2898.
33
566663 rv2 6/2005
Item 2 - Code of Ethics
(a) The Registrant has adopted a code of ethics that applies to the Registrant’s principal executive officer and principal financial officer.
(b) During the period covered by this report, there were no amendments to the provisions of the code of ethics adopted in 2.(a) above.
(c) During the period covered by this report, there were no implicit or explicit waivers to the provisions of the code of ethics adopted in 2.(a) above.
Item 3 - Audit Committee Financial Expert
Charles A. Austin III and K. Dun Gifford have been determined by the Registrant’s Board of Trustees to be audit committee financial experts within the meaning of Section 407 of the Sarbanes-Oxley Act. These financial experts are independent of management.
Items 4 – Principal Accountant Fees and Services
The following table represents fees for professional audit services rendered by KPMG LLP, for the audits of each of the 5 series of the Registrant’s annual financial statements for the fiscal years ended April 30, 2005 and April 30, 2004, and fees billed for other services rendered by KPMG LLP.
| | | 2005 | | 2004 |
| Audit fees | | | | $103,196 | | | | $115,000 |
| Audit-related fees (1) | | | | 0 | | | | 0 |
| |
|
| Audit and audit-related fees | | | | 103,196 | | | | 115,000 |
| Tax fees (2) | | | | 0 | | | | 11,529 |
| All other fees | | | | 0 | | | | 0 |
| |
|
| Total fees | | | | $103,196 | | | | $126,529 |
| |
|
(1) Audit-related fees consists principally of fees for interfund lending procedures and any merger related activity. (2) Tax fees consists of fees for tax consultation, tax compliance and tax review.
Evergreen Funds
Evergreen Income Advantage Fund
Evergreen Managed Income Fund
Audit and Non-Audit Services Pre-Approval Policy
I. Statement of Principles
Under the Sarbanes-Oxley Act of 2002 (the “Act”), the Audit Committee of the Board of Trustees/Directors is responsible for the appointment, compensation and oversight of the work of the independent auditor. As part of this responsibility, the Audit Committee is required to pre-approve the audit and non-audit services performed by the independent auditor in order to assure that they do not impair the auditor’s independence from the Funds. To implement these provisions of the Act, the Securities and Exchange Commission (the “SEC”) has issued rules specifying the types of services that an independent auditor may not provide to its audit client, as well as the audit committee’s administration of the engagement of the independent auditor. Accordingly, the Audit Committee has adopted, and the Board of
Trustees/Directors has ratified, the Audit and Non-Audit Services Pre Approval Policy (the “Policy”), which sets forth the procedures and the conditions pursuant to which services proposed to be performed by the independent auditor may be pre-approved.
The SEC’s rules establish two different approaches to pre-approving services, which the SEC considers to be equally valid. Proposed services either: may be pre-approved without consideration of specific case-by-case services by the Audit Committee (“general pre-approval”); or require the specific pre-approval of the Audit Committee (“specified pre-approval”). The Audit Committee believes that the combination of these two approaches in this Policy will result in an effective and efficient procedure to pre-approve services performed by the independent auditor. As set forth in this Policy, unless a type of service has received general pre-approval, it will require specific pre-approval by the Audit Committee if it is to be provided by the independent auditor. Any proposed services exceeding pre-approved cost levels or budgeted amounts will also require specific pre-approval by the Audit Committee.
For both types of pre-approval, the Audit Committee will consider whether such services are consistent with the SEC’s rules on auditor independence. The Audit Committee will also consider whether the independent auditor is best positioned to provide the most effective and efficient service, for reasons such as its familiarity with the Funds’ business people, culture, accounting systems, risk profile and other factors, and whether the service might enhance the Funds’ ability to manage or control risk or improve audit quality. All such factors will be considered as a whole, and no one factor should necessarily be determinative.
The Audit Committee is also mindful of the relationship between fees for audit and non-audit services in deciding whether to pre-approve any such services and may determine, for each fiscal year, the ratio between the total amount of fees for Audit, Audit-related and Tax services and the total amount of fees for certain permissible non-audit services classified as All Other services.
The appendices to this Policy describe the Audit, Audit-related, Tax and All Other services that have the general pre-approval of the Audit Committee. The term of any general pre-approval is 12 months from the date of pre-approval, unless the Audit Committee considers a different period and states otherwise. The Audit Committee will annually review and pre-approve the services that may be provided by the independent auditor without obtaining specific pre-approval from the Audit Committee. The Audit Committee will add or subtract to the list of general pre-approved services from time to time, based on subsequent determinations.
The purpose of this Policy is to set forth the procedures by which the Audit Committee intends to fulfill its responsibilities. It does not delegate the Audit Committee’s responsibilities to pre-approve services performed by the independent auditor to management.
The independent auditor has reviewed this Policy and believes that implementation of the policy will not adversely affect the auditor’s independence.
II. Delegation
As provided in the Act and the SEC’s rules, the Audit Committee may delegate either type of pre-approval authority to one or more of its members. The member to whom such authority is delegated must report, for informational purposes only, any pre-approval decisions of the Audit Committee at its next scheduled meeting.
III. Audit Services
The annual Audit services engagement terms and fees will be subject to the specific pre-approval of the Audit Committee. Audit services include the annual financial statement audit and other procedures required to be performed by the independent auditor to be able to form an opinion on the Funds’ financial statements. These other procedures include information systems and procedural reviews and testing performed in order to understand and place reliance on the systems of internal control, and consultations
relating to the audit. Audit services also include the attestation engagement for the independent auditor’s report on management’s report on internal controls for financial reporting. The Audit Committee will monitor the Audit services engagement as necessary, but no less than on a quarterly basis, and will also approve, if necessary, any changes in terms, conditions and fees resulting from changes in audit scope, Fund service providers or other items.
In addition to the annual Audit services engagement approved by the Audit Committee, the Audit Committee may grant general pre-approval to other Audit services, which are those services that only the independent auditor reasonably can provide. Other Audit services may include services associated with SEC registration statements, periodic reports and other documents filed with the SEC or other documents issued in connection with mergers or acquisitions.
The Audit Committee has pre-approved the Audit services in Appendix A. All other audit services not listed in Appendix A must be specifically pre-approved by the Audit Committee.
IV. Audit-related Services
Audit –related services are assurance and related services that are reasonably related to the performance of the audit or review of the Funds’ financial statements or that are traditionally performed by the independent auditor. Because the Audit Committee believes that the provision of Audit-related services does not impair the independence of the auditor and is consistent with SEC’s rules on auditor independence, the Audit Committee may grant general pre-approval to Audit-related services. Audit-related services include, among others, due diligence services pertaining to potential business acquisitions/dispositions; accounting consultations related to accounting, financial reporting or disclosure matters not classified as “Audit services”; assistance with understanding and implementing new accounting and financial reporting guidance from rulemaking authorities; agreed-upon or expanded audit procedures related to accounting records required to respond to or comply with financial, accounting or regulatory reporting matters; and assistance with internal control reporting requirements.
The Audit Committee has pre-approved the Audit-related services in Appendix B. All other Audit-related services not listed in appendix B must be specifically pre-approved by the Audit Committee.
V. Tax Services
The Audit Committee believes that the independent auditor can provide Tax services to the Funds such as tax compliance, tax planning and tax advice without impairing the auditor’s independence, and the SEC has stated that the independent auditor may provide such services. Hence, the Audit Committee believes it may grant general pre-approval to those Tax services that have historically been provided by the auditor, that the Audit Committee has reviewed and believes would not impair the independence of the auditor, and that are consistent with the SEC’s rules on auditor independence. The Audit Committee will not permit the retention of the independent auditor in connection with a transaction initially recommended by the independent auditor, the sole business purpose of which may be tax avoidance and the tax treatment of which may not be supported in the Internal Revenue Code and related regulations. The Audit Committee will consult with the Director of Fund Administration, the Vice President of Tax Services or outside counsel to determine that the tax planning and reporting positions are consistent with this policy.
Pursuant to the preceding paragraph, the Audit Committee has pre-approved the Tax services in Appendix C. All Tax services involving large and complex transactions not listed in Appendix C must be specifically pre-approved by the Audit Committee, including: tax services proposed to be provide by the independent auditor to any executive officer or director of the Funds, in his or her individual capacity, where such services are paid for by the Funds or the investment advisor.
VI. All Other Services
The Audit Committee believes, based on the SEC’s rules prohibiting the independent auditor from providing specific non-audit services, that other types of non-audit services are permitted. Accordingly, the
Audit Committee believes it may grant general pre-approval to those permissible non-audit services classified as All Other services that it believes are routine and recurring services, would not impair the independence of the auditor and are consistent with the SEC’s rules on auditor independence.
The Audit Committee has pre-approved the All Other services in appendix D. Permissible All Other services not listed in Appendix D must be specifically pre-approved by the Audit Committee.
A list of the SEC’s prohibited non-audit services is attached to this policy as Exhibit 1. The SEC’s rules and relevant guidance should be consulted to determine the precise definitions of these services and the applicability of exceptions to certain of the prohibitions.
VII. Pre-Approval Fee Levels or Budgeted Amounts
Pre-approval fee levels or budgeted amounts for all services to be provided by the independent auditor will be established annually by the Audit Committee. Any proposed services exceeding these levels or amounts will require specific pre-approval by the Audit Committee. The Audit Committee is mindful of the overall relationship of fees for audit and non-audit services in determining whether to pre-approve any such services. For each fiscal year, the Audit Committee may determine to ratio between the total amount of fees for Audit, Audit-related and Tax services, and the total amount of fees for services classified as All Other services.
VIII. Procedures
All requests or applications for services to be provided by the independent auditor that do not require specific approval by the Audit Committee will be submitted to the Director of Fund Administration or Assistant Director of Fund Administration and must include a detailed description of the services to be rendered. The Director/Assistant Director of Fund Administration will determine whether such services are included within the list of services that have received the general pre-approval of the Audit Committee. The Audit Committee will be informed on a quarterly basis (or more frequent if requested by the audit committee) of any such services rendered by the independent auditor.
Request or applications to provide services that require specific approval by the Audit Committee will be submitted to the Audit Committee by both the independent auditor and the Director/Assistant Director of Fund Administration, and must include a joint statement as to whether, in their view, the request or application is consistent with the SEC’s rules on auditor independence.
The Audit Committee has designated the Chief Compliance Officer to monitor the performance of all services provided by the independent auditor and to determine whether such services are in compliance with this policy. The Chief Compliance Officer will report to the Audit Committee on a periodic basis on the results of its monitoring. Both the Chief Compliance Officer and management will immediately report to the chairman of the Audit Committee any breach of this policy that comes to the attention of the Chief Compliance Officer or any member of management.
The Audit Committee will also review the internal auditor’s annual internal audit plan to determine that the plan provides for the monitoring of the independent auditor’s services.
IX. Additional Requirements
The Audit Committee has determined to take additional measures on an annual basis to meet its responsibility to oversee the work of the independent auditor and to assure the auditor’s independence from the Funds, such as reviewing a formal written statement from the independent auditor delineating all relationships between the independent auditor and the Funds, the Funds’ investment advisor and related parties of the investment advisor, consistent with Independence Standards Board Standard No. 1, and discussing with the independent auditor its methods and procedures for ensuring independence.
Items 5 – Audit Committee of Listed Registrants
If applicable, not applicable at this time. Applicable for annual reports covering periods ending on or after the compliance date for the listing standards applicable to the particular issuer. Listed issuers must be in compliance with the new listing rules by the earlier of the registrant’s first annual shareholders meeting after January 15, 2004 or October 31, 2004.
Item 6 – [Reserved]
Item 7 – Disclosure of Proxy Voting Policies and Procedures for Closed-End Management Investment Companies.
If applicable, not applicable at this time. Applicable for annual reports filed on or after July 1, 2003.
Item 8 – [Reserved]
Item 9 - Controls and Procedures
(a) The Registrant’s Principal Executive Officer and Principal Financial Officer have evaluated the Registrant’s disclosure controls and procedures within 90 days of this filing and have concluded that the Registrant’s disclosure controls and procedures were effective, as of that date, in ensuring that information required to be disclosed by the Registrant in this Form N-CSR was recorded, processed, summarized, and reported timely.
(b) There were no significant changes in the Registrant’s internal controls or other factors that could significantly affect these controls subsequent to the date of their evaluation, including any corrective actions with regard to significant deficiencies and material weaknesses.
Item 10 - Exhibits
File the exhibits listed below as part of this Form. Letter or number the exhibits in the sequence indicated.
(a) Any code of ethics, or amendment thereto, that is the subject of the disclosure required by Item 2, to the extent that the registrant intends to satisfy the Item 2 requirements through filing of an exhibit.
(b)(1) Separate certifications for the Registrant’s principal executive officer and principal financial officer, as required by Section 302 of the Sarbanes-Oxley Act of 2002 and Rule 30a-2(a) under the Investment Company Act of 1940, are attached as EX99.CERT.
(b)(2) Separate certifications for the Registrant’s principal executive officer and principal financial officer, as required by Section 1350 of Title 18 of United States Code, as adopted pursuant to Section 906 of the Sarbanes-Oxley Act of 2002, and Rule 30a-2(b) under the Investment Company Act of 1940, are attached as EX99.906CERT. The certifications furnished pursuant to this paragraph are not deemed to be "filed" for purposes of Section 18 of the Securities Exchange Act of 1934, or otherwise subject to the liability of that section. Such certifications are not deemed to be incorporated by reference into any filing under the Securities Act of 1933 or the Securities Exchange Act of 1934, except to the extent that the Registrant specifically incorporates them by reference.
Pursuant to the requirements of the Securities Exchange Act of 1934 and the Investment Company Act of 1940, the Registrant has duly caused this report to be signed on its behalf by the undersigned, thereunto duly authorized.
Evergreen Fixed Income Trust
By: _______________________
Dennis H. Ferro,
Principal Executive Officer
Date: 6/30/2005
Pursuant to the requirements of the Securities Exchange Act of 1934 and the Investment Company Act of 1940, this report has been signed below by the following persons on behalf of the Registrant and in the capacities and on the dates indicated.
By: _______________________
Dennis H. Ferro,
Principal Executive Officer
Date: 6/30/2005
By: ________________________
Carol A. Kosel
Principal Financial Officer
Date: 6/30/2005


