UNITED STATES
SECURITIES AND EXCHANGE COMMISSION
Washington, D.C. 20549
FORM N-CSR
CERTIFIED SHAREHOLDER REPORT OF REGISTERED MANAGEMENT INVESTMENT COMPANIES
Investment Company Act file number 811-08769
Badgley Funds, Inc.
(Exact name of registrant as specified in charter)
P.O. Box 701, Milwaukee, Wisconsin 53201-0701
(Address of principal executive offices) (Zip code)
Kirkland & Ellis LLP, 200 East Randolph Drive, Chicago, IL 60601
(Name and address of agent for service)
1-877-BADGLEY (1-877-223-4539)
Registrant's telephone number, including area code
Date of fiscal year end: May 31, 2005
Date of reporting period: November 30, 2004
Item 1. Report to Stockholders.
S E M I - A N N U A L R E P O R T
November 30, 2004

Badgley Funds, Inc.

Badgley Balanced Fund
Ticker BMFBX

Badgley Growth Fund
Ticker BMFGX
P.O. Box 701, Milwaukee, Wisconsin 53201-0701 1-877-BADGLEY
www.badgleyfunds.com
TABLE OF CONTENTS
3 | Letter to Shareholders |
4 | Performance Graphs |
6 | Expense Example |
7 | Sector Allocation of Portfolio Holdings |
8 | Statements of Assets and Liabilities |
9 | Statements of Operations |
10 | Statements of Changes in Net Assets |
12 | Financial Highlights |
14 | Schedule of Investments |
25 | Notes to the Financial Statements |
30 | Additional Information |
This semi-annual report is not authorized unless accompanied or preceded by a prospectus for Badgley Funds, Inc. The Badgley Funds are distributed by Rafferty Capital Markets, LLC. The date of first use of this semi-annual report is January 31, 2005.
| 2 | ||
Badgley Funds, Inc.
LETTER TO SHAREHOLDERS
November 30, 2004
Dear Fellow Shareholders:
We thank you for the trust you place in Badgley Funds, Inc., (the “Funds”), and your confidence in the team of portfolio managers at the Funds’ investment adviser, Seattle-based Badgley, Phelps and Bell, Inc. (“BP&B”).
Investment Summary
This Semi-Annual Report summarizes the activities of the Badgley Growth Fund (BMFGX) and the Badgley Balanced Fund (BMFBX) for the six-month period ending November 30, 2004. The stocks in both Funds ended this period with positive returns, benefiting from continued economic growth, which buoyed stock values against a host of economic and geopolitical concerns. At the same time, these very same concerns helped keep the bonds in the Balanced Fund in positive territory for the period. For detailed performance information, please refer to the table below and the reports on the following pages.
Equity and Fixed Income Market Undercurrents
Investors had plenty of news to consider while managing their assets over the past six months. Energy prices were a primary concern as consumers shifted into the summer driving season. After rising from $30 per barrel on January 1, 2004 to $38 on May 31st, the price of oil continued its ascent to over $50 in November. Additionally, worries from 2003 persisted into 2004 on topics that included the U.S. federal debt, the U.S. dollar’s value versus other currencies, terrorist attacks, Iraq, and corporate scandals. Investor unease over these concerns during a presidential election year also constrained the growth potential of the stock market. However, through this period of uncertainty the economy has grown at a strong pace as companies benefited from strong demand for p roducts and services.
Another area of unease was the possibility of rising interest rates. Short-term interest rates began to rise in mid-2004 as the Federal Reserve implemented increases for the Federal Funds rate. Interest rate increases of 0.25% in each of June, August, September, and November resulted in a Federal Funds rate of 2.0% as of November 30, 2004. The tempo of future Federal Reserve actions will most likely depend on how the economic fundamentals unfold.
Fixed income returns were stronger to date in 2004 than had been expected. Buffeted by big deficits, a weaker dollar and four increases in official rates, bond yields have refused to sink. Ten-year Treasury yields are about 0.2% lower than they were when the Fed started to raise the benchmark rate in late June. Reasons why rates in general have remained low even as the Fed started to tighten include a continuing benign U.S. inflationary outlook supported by strong productivity growth and increased global competition.
Consistent Management
It can be said that uncertainty is the only guarantee the market provides. The unpredictable economic, geopolitical, and resulting market uncertainty described above remain today, as always, the impetus for the long-term, high-quality-focused investment philosophy applied to the management of the Badgley Funds. BP&B remains firmly committed to this investment mandate, confident of its ability to preserve and grow wealth over time.
We again thank you for your confidence in our abilities and your investment in the Badgley Funds. Please visit www.badgleyfunds.com for additional information. We welcome your comments, suggestions and questions. Please contact us toll free at 1.877.223.4539, in writing or via email.
Sincerely,
BADGLEY FUNDS, INC.
/s/ J. Kevin Callaghan
J. Kevin Callaghan
J. Kevin Callaghan
President and Director
/s/ Lisa P. Guzman
Lisa P. Guzman
Secretary and Treasurer
| Investment Returns | |
Cumulative 6-month Returns through November 30, 2004 | |
| Badgley Growth Fund | 3.60% |
| Badgley Balanced Fund | 2.84% |
Lehman Brothers Intermediate Govt./Credit Bond Index | 2.76% |
| S&P 500 Index | 5.86% |
RETURNS QUOTED ABOVE REPRESENT PAST PERFORMANCE. PAST PERFORMANCE CANNOT GUARANTEE FUTURE RESULTS. INVESTMENT RETURN AND PRINCIPAL VALUE OF AN INVESTMENT WILL FLUCTUATE SO THAT AN INVESTOR’S SHARES, WHEN REDEEMED, MAY BE WORTH MORE OR LESS THAN THE ORIGINAL COST. CURRENT PERFORMANCE MAY BE LOWER OR HIGHER THAN THE PERFORMANCE DATA SHOWN HERE. FOR PERFORMANCE CURRENT THROUGH THE MOST RECENT MONTH-END, PLEASE CALL 1-877-BADGLEY (1-877-223-4539).
LEHMAN BROTHERS INTERMEDIATE GOV'T./CREDIT BOND INDEX - An unmanaged market-value weighed index composed of all bonds that are investmenet grade (rated Baa or higher by Moody's or BBB or higher by S&P, if unrated by Moody's). All issues have maturities between one and ten years and outstanding par value of at least $150 million.
S&P 500 INDEX - An unmanaged capitalization-weighted index of 500 stocks designed to measure performance of the broad domestic economy through changes in the aggregate market value of the 500 stocks which represent all major industries.
| 3 | ||
Badgley Funds, Inc.
PERFORMANCE GRAPHS
November 30, 2004
Badgley Balanced Fund
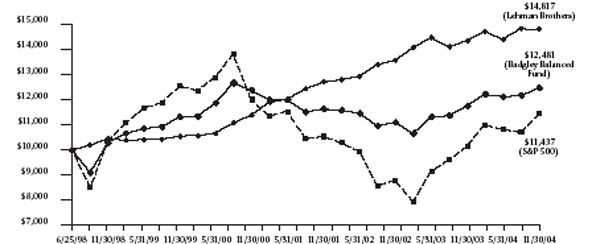
This chart assumes an initial gross investment of $10,000 made on 6/25/98 (commencement of operations). Returns shown include the reinvestment of all dividends and distributions. In the absence of fee waivers and reimbursements, total return would be reduced. This chart and table below do not reflect the deduction of taxes that a shareholder would pay on fund distributions or the redemption of fund shares.
RETURNS SHOWN REPRESENT PAST PERFORMANCE. PAST PERFORMANCE CANNOT GUARANTEE FUTURE RESULTS. INVESTMENT RETURN AND PRINCIPAL VALUE OF AN INVESTMENT WILL FLUCTUATE SO THAT AN INVESTOR’S SHARES, WHEN REDEEMED, MAY BE WORTH MORE OR LESS THAN THE ORIGINAL COST. CURRENT PERFORMANCE MAY BE LOWER OR HIGHER THAN THE PERFORMANCE DATA SHOWN HERE. FOR PERFORMANCE CURRENT THROUGH THE MOST RECENT MONTH-END, PLEASE CALL 1-877-BADGLEY (1-877-223-4539).
LEHMAN BROTHERS INTERMEDIATE GOV’T./CREDIT BOND INDEX — An unmanaged market value-weighted index composed of all bonds that are investment grade (rated Baa or higher by Moody’s or BBB or higher by S&P, if unrated by Moody’s). All issues have maturities between one and ten years and outstanding par value of at least $150 million.
S&P 500 INDEX — An unmanaged capitalization-weighted index of 500 stocks designed to measure performance of the broad domestic economy through changes in the aggregate market value of the 500 stocks which represent all major industries.
For the period 6/25/98 through 6/30/98 the returns for the S&P 500 Index and Lehman Brothers Intermediate Gov’t./Credit Bond Index were calculated by prorating the total return for June 1998.
Total Returns through November 30, 2004 | ||||
Average Annual | ||||
Six Months | One Year | Five Years | Since Inception June 25, 1998 | |
| Badgley Balanced Fund | 2.84% | 6.17% | 1.97% | 3.51% |
| Lehman Brothers Intermediate Gov’t./Credit Bond Index | 2.76% | 3.24% | 7.00% | 6.30% |
| S&P 500 Index | 5.68% | 12.86% | -1.83% | 2.10% |
| 4 | ||
Badgley Funds, Inc.
PERFORMANCE GRAPHS
November 30, 2004
Badgley Growth Fund
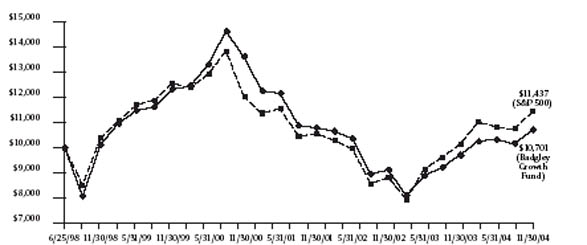
This chart assumes an initial gross investment of $10,000 made on 6/25/98 (commencement of operations). Returns shown include the reinvestment of all dividends and distributions. In the absence of fee waivers and reimbursements, total return would be reduced. This chart and table below do not reflect the deduction of taxes that a shareholder would pay on fund distributions or the redemption of fund shares.
RETURNS SHOWN REPRESENT PAST PERFORMANCE. PAST PERFORMANCE CANNOT GUARANTEE FUTURE RESULTS. INVESTMENT RETURN AND PRINCIPAL VALUE OF AN INVESTMENT WILL FLUCTUATE SO THAT AN INVESTOR’S SHARES, WHEN REDEEMED, MAY BE WORTH MORE OR LESS THAN THE ORIGINAL COST. CURRENT PERFORMANCE MAY BE LOWER OR HIGHER THAN THE PERFORMANCE DATA SHOWN HERE. FOR PERFORMANCE CURRENT THROUGH THE MOST RECENT MONTH-END, PLEASE CALL 1-877-BADGLEY (1-877-223-4539).
S&P 500 INDEX — An unmanaged capitalization-weighted index of 500 stocks designed to measure performance of the broad domestic economy through changes in the aggregate market value of the 500 stocks which represent all major industries.
For the period 6/25/98 through 6/30/98 the returns for the S&P 500 Index were calculated by prorating the total return for June 1998.
Total Returns through November 30, 2004 | ||||
Average Annual | ||||
Six Months | One Year | Five Years | Since Inception June 25, 1998 | |
| Badgley Growth Fund | 3.60% | 10.24% | -2.76% | 1.06% |
| S&P 500 Index | 5.68% | 12.86% | -1.83% | 2.10% |
| 5 | ||
Badgley Funds, Inc.
EXPENSE EXAMPLE
November 30, 2004
As a shareholder of the Funds you incur two types of costs: (1) transaction costs, and (2) ongoing costs, including advisory fees and other Fund expenses. This Example is intended to help you understand your ongoing costs (in dollars) of investing in the Funds and to compare these costs with the ongoing costs of investing in other mutual funds. The Example is based on an investment of $1,000 invested at the beginning of the period and held for the entire period (6/1/04 - 11/30/04).
Actual Expenses
The first line of each table below provides information about actual account values and actual expenses. Although the Funds charge no sales load or transaction fees, you will be assessed fees for outgoing wire transfers, returned checks and stop payment orders at prevailing rates charged by U.S. Bancorp Fund Services, LLC, the Funds’ transfer agent. If you request that a redemption be made by wire transfer, currently a $15.00 fee is charged by the Funds’ transfer agent. IRA accounts will be charged a $15.00 annual maintenance fee and a $25.00 distribution fee. These expenses are not included in the example below. The example below includes, but is not limited to, advisory fees, shareholder servicing fees, fund accounting and custody fees. However, the example below does not include portfolio trading commissi ons and related expenses, and other extraordinary expenses as determined under generally accepted accounting principles. You may use the information in this line, together with the amount you invested, to estimate the expenses that you paid over the period. Simply divide your account value by $1,000 (for example, an $8,600 account value divided by $1,000 = 8.6), then multiply the result by the number in the first line under the heading entitled “Expenses Paid During Period” to estimate the expenses you paid on your account during this period.
Hypothetical Example for Comparison Purposes
The second line of each table below provides information about hypothetical account values and hypothetical expenses based on the Funds’ actual expense ratios and an assumed rate of return of 5% per year before expenses, which are not the Funds’ actual returns. The hypothetical account values and expenses may not be used to estimate the actual ending account balance or expenses you paid for the period. You may use the information to compare the ongoing costs of investing in the Funds and other funds. To do so, compare this 5% hypothetical example with the 5% hypothetical examples that appear in the shareholder reports of the other funds. Please note that the expenses shown in the table are meant to highlight your ongoing costs only and do not reflect any transactional costs, such as redemption fees. Therefor e, the second line of the table is useful in comparing ongoing costs only, and will not help you determine the relative total costs of owning different funds. In addition, if these transactional costs were included, your costs would have been higher.
Badgley Balanced Fund | |||
Beginning Account Value 6/1/04 | Ending Account Value 11/30/04 | Expenses Paid During Period 6/1/04 - 11/30/041 | |
| Actual | $1,000.00 | $1,028.40 | $ 6.61 |
| Hypothetical (5% return | |||
| before expenses) | 1,000.00 | 1,018.55 | 6.58 |
| 1 | Expenses are equal to the Fund’s annualized expense ratio of 1.30%, multiplied by the average account value over the period, multiplied by 183/365 to reflect the one-half year period. |
Badgley Growth Fund | |||
Beginning Account Value 6/1/04 | Ending Account Value 11/30/04 | Expenses Paid During Period 6/1/04 - 11/30/041 | |
| Actual | $1,000.00 | $1,036.00 | $ 7.66 |
| Hypothetical (5% return | |||
| before expenses) | 1,000.00 | 1,017.55 | 7.59 |
| 1 | Expenses are equal to the Fund’s annualized expense ratio of 1.50%, multiplied by the average account value over the period, multiplied by 183/365 to reflect the one-half year period. |
| 6 | ||
Badgley Funds, Inc.
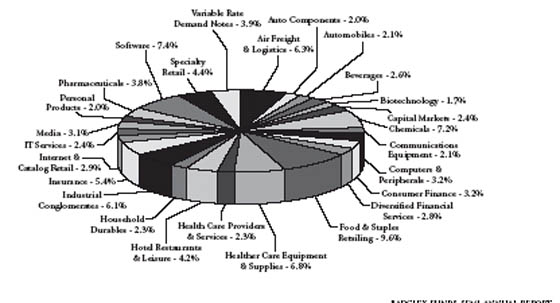
SECTOR ALLOCATION OF PORTFOLIO HOLDINGS
November 30, 2004
Percentages represent market value as a percentage of total net assets. Excludes net liabilities.
Badgley Balanced Fund

Badgley Growth Fund
| 7 | ||
Badgley Funds, Inc.
STATEMENTS OF ASSETS AND LIABILITIES (UNAUDITED)
November 30, 2004
Balanced Fund | Growth Fund | |||
ASSETS: | ||||
| Investments, at market value | ||||
| (cost of $30,039,479 and $13,785,512, respectively) | $ | 33,985,866 | $ | 17,437,521 |
| Interest receivable | 226,031 | 408 | ||
| Dividends receivable | 43,212 | 41,650 | ||
| Receivable for Fund shares sold | 20,000 | — | ||
| Other assets | 27,153 | 17,240 | ||
| Total assets | 34,302,262 | 17,496,819 | ||
LIABILITIES: | ||||
| Payable for securities purchased | 387,142 | 373,243 | ||
| Payable for Fund shares repurchased | 2,000 | — | ||
| Payable to Adviser | 31,775 | 3,605 | ||
| Payable for distribution fees | 14,161 | 2,903 | ||
| Accrued expenses and other liabilities | 49,212 | 50,201 | ||
| Total liabilities | 484,290 | 429,952 | ||
NET ASSETS | $ | 33,817,972 | $ | 17,066,867 |
NET ASSETS CONSIST OF: | ||||
| Capital stock | $ | 32,951,787 | $ | 18,272,810 |
| Undistributed net investment income (loss) | 96,974 | (14,678) | ||
| Undistributed net realized loss on investments | (3,177,176) | (4,843,274) | ||
| Net unrealized appreciation on investments | 3,946,387 | 3,652,009 | ||
| Total net assets | $ | 33,817,972 | $ | 17,066,867 |
| Shares outstanding (par value of $.01, 500,000,000 shares authorized) | 3,039,083 | 1,600,560 | ||
| Net Asset Value, Redemption Price and Offering Price Per Share | $ | 11.13 | $ | 10.66 |
| 8 | See Notes to the Financial Statements | |
Badgley Funds, Inc.
STATEMENTS OF OPERATIONS (UNAUDITED)
For the Six-Months Ended November 30, 2004
Balanced Fund | Growth Fund | ||
INVESTMENT INCOME: | |||
| Interest income | $ 359,485 | $ | 2,467 |
| Dividend income (net of withholding tax of $196 and $191, respectively) | 109,527 | 107,077 | |
| Total investment income | 469,012 | 109,544 | |
EXPENSES: | |||
| Investment advisory fees | 146,916 | 82,814 | |
| Shareholder servicing and accounting fees | 29,538 | 26,295 | |
| Professional fees | 24,954 | 25,170 | |
| Administration fees | 16,611 | 16,377 | |
| Distribution fees | 14,088 | 20,704 | |
| Federal and state registration fees | 9,930 | 9,063 | |
| Directors’ fees and expenses | 5,193 | 5,274 | |
| Reports to shareholders | 4,455 | 5,007 | |
| Custody fees | 4,254 | 4,041 | |
| Other | 12,276 | 8,046 | |
| Total expenses before waiver and reimbursement | 268,215 | 202,791 | |
| Less: Waiver of expenses and reimbursement from Adviser | (56,003) | (78,569) | |
| Net expenses | 212,212 | 124,222 | |
NET INVESTMENT INCOME (LOSS) | 256,800 | (14,678) | |
REALIZED AND UNREALIZED GAIN ON INVESTMENTS: | |||
| Net realized gain on investments | 434,308 | 259,120 | |
| Change in net unrealized appreciation/depreciation on investments | 234,893 | 345,981 | |
| Net realized and unrealized gain on investments | 669,201 | 605,101 | |
NET INCREASE IN NET ASSETS RESULTING FROM OPERATIONS | $ 926,001 | $ | 590,423 |
| See Notes to the Financial Statements | 9 | |
Badgley Funds, Inc.
STATEMENTS OF CHANGES IN NET ASSETS
Badgley Balanced FundSix-Months Ended | ||||
November 30, 2004 | Year Ended | |||
(Unaudited) | May 31, 2004 | |||
OPERATIONS: | ||||
| Net investment income | $ | 256,800 | $ | 431,456 |
| Net realized gain on investments | 434,308 | 229,743 | ||
| Change in net unrealized appreciation/depreciation on investments | 234,893 | 1,383,055 | ||
| Net increase in net assets resulting from operations | 926,001 | 2,044,254 | ||
DISTRIBUTIONS TO SHAREHOLDERS: | ||||
| From net investment income | (229,387) | (431,375) | ||
| Total dividends and distributions | (229,387) | (431,375) | ||
CAPITAL SHARE TRANSACTIONS: | ||||
| Proceeds from shares sold | 2,914,142 | 6,024,638 | ||
| Proceeds from shares issued to holders in reinvestment of dividends | 205,100 | 399,838 | ||
| Cost of shares redeemed | (1,868,511) | (5,362,575) | ||
| Net increase in net assets resulting from | ||||
| capital share transactions | 1,250,731 | 1,061,901 | ||
TOTAL INCREASE IN NET ASSETS | 1,947,345 | 2,674,780 | ||
NET ASSETS: | ||||
| Beginning of period | 31,870,627 | 29,195,847 | ||
| End of period (including undistributed net investment income | ||||
| of $96,974 and $69,561, respectively) | $ | 33,817,972 | $ | 31,870,627 |
| 10 | See Notes to the Financial Statements | |
Badgley Funds, Inc.
STATEMENTS OF CHANGES IN NET ASSETS
Badgley Growth FundSix-Months Ended | ||||
November 30, 2004 | Year Ended | |||
(Unaudited) | May 31, 2004 | |||
OPERATIONS: | ||||
| Net investment loss | $ | (14,678) | $ | (86,634) |
| Net realized gain on investments | 259,120 | 571,184 | ||
| Change in net unrealized appreciation/depreciation on investments | 345,981 | 2,186,727 | ||
| Net increase in net assets resulting from operations | 590,423 | 2,671,277 | ||
CAPITAL SHARE TRANSACTIONS: | ||||
| Proceeds from shares sold | 1,095,122 | 5,062,819 | ||
| Cost of shares redeemed | (850,627) | (8,180,294) | ||
| Net increase (decrease) in net assets resulting from | ||||
| capital share transactions | 244,495 | (3,117,475) | ||
TOTAL INCREASE (DECREASE) IN NET ASSETS | 834,918 | (446,198) | ||
NET ASSETS: | ||||
| Beginning of period | 16,231,949 | 16,678,147 | ||
| End of period (including undistributed net investment income (loss) | ||||
| of ($14,678) and $0, respectively) | $ | 17,066,867 | $ | 16,231,949 |
| See Notes to the Financial Statements | 11 | |
Badgley Funds, Inc.
FINANCIAL HIGHLIGHTS
For a fund share outstanding throughout the period
Badgley Balanced FundSix-Months Ended November 30, 2004 | Year Ended May 31, 2004 | Year Ended May 31, 2003 | Year Ended May 31, 2002 | Year Ended May 31, 2001 | Year Ended May 31, 2000 | |||||||||||||||||
PER SHARE DATA: | ||||||||||||||||||||||
| Net asset value, beginning of period | $ | 10.90 | $ | 10.31 | $ | 10.65 | $ | 11.36 | $ | 11.47 | $ | 10.69 | ||||||||||
| Income from investment operations: | ||||||||||||||||||||||
| Net investment income | 0.09 | 0.15 | 0.18 | 0.21 | 0.24 | 0.20 | ||||||||||||||||
| Net realized and unrealized | ||||||||||||||||||||||
| gain (loss) on investments | 0.22 | 0.59 | (0.33 | ) | (0.71 | ) | (0.11 | ) | 0.78 | |||||||||||||
| Total from investment | ||||||||||||||||||||||
| operations | 0.31 | 0.74 | (0.15 | ) | (0.50 | ) | 0.13 | 0.98 | ||||||||||||||
| Less: | ||||||||||||||||||||||
| Dividends from | ||||||||||||||||||||||
| net investment income | (0.08 | ) | (0.15 | ) | (0.19 | ) | (0.21 | ) | (0.24 | ) | (0.20 | ) | ||||||||||
| Dividends from | ||||||||||||||||||||||
| net realized gains | — | — | — | — | (0.00 | ) | 1 | — | ||||||||||||||
| Total dividends | (0.08 | ) | (0.15 | ) | (0.19 | ) | (0.21 | ) | (0.24 | ) | (0.20 | ) | ||||||||||
| Net asset value, end of period | $ | 11.13 | $ | 10.90 | $ | 10.31 | $ | 10.65 | $ | 11.36 | $ | 11.47 | ||||||||||
TOTAL RETURN | 2.84 | % | 7.25 | % | -1.33 | % | -4.44 | % | 1.13 | % | 9.23 | % | ||||||||||
SUPPLEMENTAL DATA AND RATIOS: | ||||||||||||||||||||||
| Net assets, end of period | $ | 33,817,972 | $ | 31,870,627 | $ | 29,195,847 | $ | 28,588,070 | $ | 30,017,183 | $ | 24,286,086 | ||||||||||
| Ratio of net expense to average | ||||||||||||||||||||||
| net assets: | ||||||||||||||||||||||
| Before expense reimbursement | 1.64 | % | 1.86 | % | 1.82 | % | 1.72 | % | 1.80 | % | 1.98 | % | ||||||||||
| After expense reimbursement | 1.30 | % | 1.30 | % | 1.30 | % | 1.30 | % | 1.30 | % | 1.30 | % | ||||||||||
| Ratio of net investment income | ||||||||||||||||||||||
| to average net assets: | ||||||||||||||||||||||
| Before expense reimbursement | 1.23 | % | 0.86 | % | 1.26 | % | 1.48 | % | 1.57 | % | 1.24 | % | ||||||||||
| After expense reimbursement | 1.57 | % | 1.42 | % | 1.78 | % | 1.90 | % | 2.07 | % | 1.92 | % | ||||||||||
| Portfolio turnover rate | 14.51 | % | 29.27 | % | 32.08 | % | 35.98 | % | 35.70 | % | 28.78 | % | ||||||||||
| 12 | See Notes to the Financial Statements | |
Badgley Funds, Inc.
FINANCIAL HIGHLIGHTS
For a fund share outstanding throughout the period
Badgley Growth FundSix-Months Ended November 30, 2004 | Year Ended May 31, 2004 | Year Ended May 31, 2003 | Year Ended May 31, 2002 | Year Ended May 31, 2001 | Year Ended May 31, 2000 | ||||||||||||||||||||
PER SHARE DATA: | |||||||||||||||||||||||||
| Net asset value, beginning of period | $ | 10.29 | $ | 8.85 | $ | 10.31 | $ | 12.10 | $ | 13.23 | $ | 11.42 | |||||||||||||
| Income from investment operations: | |||||||||||||||||||||||||
| Net investment loss | (0.01 | ) | (0.05 | ) | (0.04 | ) | (0.07 | ) | (0.07 | ) | (0.08 | ) | |||||||||||||
| Net realized and unrealized | |||||||||||||||||||||||||
| gain (loss) on investments | 0.38 | 1.49 | (1.42 | ) | (1.72 | ) | (1.06 | ) | 1.89 | ||||||||||||||||
| Total from investment | |||||||||||||||||||||||||
| operations | 0.37 | 1.44 | (1.46 | ) | (1.79 | ) | (1.13 | ) | 1.81 | ||||||||||||||||
| Less: | |||||||||||||||||||||||||
| Dividends from | |||||||||||||||||||||||||
| net investment income | — | — | — | — | — | (0.00)1 | |||||||||||||||||||
| Net asset value, end of period | $ | 10.66 | $ | 10.29 | $ | 8.85 | $ | 10.31 | $ | 12.10 | $ | 13.23 | |||||||||||||
TOTAL RETURN | 3.60 | % | 16.27 | % | -14.16 | % | -14.79 | % | -8.54 | % | 15.86 | % | |||||||||||||
SUPPLEMENTAL DATA AND RATIOS: | |||||||||||||||||||||||||
| Net assets, end of period | $ | 17,066,867 | $ | 16,231,949 | $ | 16,678,147 | $ | 17,539,824 | $ | 18,784,323 | $ | 12,251,424 | |||||||||||||
| Ratio of net expense to average | |||||||||||||||||||||||||
| net assets: | |||||||||||||||||||||||||
| Before expense reimbursement | 2.45 | % | 2.51 | % | 2.43 | % | 2.23 | % | 2.33 | % | 2.84 | % | |||||||||||||
| After expense reimbursement | 1.50 | % | 1.50 | % | 1.50 | % | 1.50 | % | 1.50 | % | 1.50 | % | |||||||||||||
| Ratio of net investment loss to average | |||||||||||||||||||||||||
| net assets: | |||||||||||||||||||||||||
| Before expense reimbursement | (1.13 | )% | (1.52 | )% | (1.42 | )% | (1.41 | )% | (1.57 | )% | (2.06 | )% | |||||||||||||
| After expense reimbursement | (0.18 | )% | (0.51 | )% | (0.49 | )% | (0.68 | )% | (0.74 | )% | (0.72 | )% | |||||||||||||
| Portfolio turnover rate | 15.63 | % | 45.58 | % | 29.52 | % | 39.51 | % | 27.21 | % | 25.88 | % | |||||||||||||
| 1 | Dividend amount less than $0.01 per share. |
| See Notes to the Financial Statements | 13 | |
Badgley Funds, Inc.
SCHEDULE OF INVESTMENTS (UNAUDITED)
November 30, 2004
Badgley Balanced FundShares | Value | ||
COMMON STOCKS — 51.1% | |||
Air Freight & Logistics — 3.3% | |||
| 7,875 | Expeditors International of Washington, Inc. | $ | 419,423 |
| 7,275 | FedEx Corp. | 691,343 | |
| 1,110,766 | |||
Auto Components — 1.1% | |||
| 5,825 | Johnson Controls, Inc. | 357,655 | |
Automobiles — 1.0% | |||
| 6,150 | Harley-Davidson, Inc. | 355,593 | |
Beverages — 1.3% | |||
| 9,075 | PepsiCo, Inc. | 452,933 | |
Biotechnology — 0.9% | |||
| 4,950 | Amgen, Inc. (a) | 297,198 | |
Capital Markets — 1.3% | |||
| 9,675 | State Street Corp. | 431,118 | |
Chemicals — 3.7% | |||
| 21,000 | Ecolab, Inc. | 734,580 | |
| 11,700 | Praxair, Inc. | 525,330 | |
| 1,259,910 | |||
Communications Equipment — 1.1% | |||
| 19,875 | Cisco Systems, Inc. (a) | 371,861 | |
Computers & Peripherals — 1.7% | |||
| 13,875 | Dell, Inc. (a) | 562,215 | |
Consumer Finance — 1.7% | |||
| 21,337 | MBNA Corp. | 566,711 | |
Diversified Financial Services — 1.4% | |||
| 10,975 | Citigroup, Inc. | 491,131 |
| 14 | See Notes to the Financial Statements | |
Badgley Funds, Inc.
SCHEDULE OF INVESTMENTS (UNAUDITED) — (CONTINUED)
November 30, 2004
Badgley Balanced FundShares | Value | ||
Food & Staples Retailing — 5.0% | |||
| 9,875 | Costco Wholesale Corp. | $ | 479,925 |
| 14,950 | Sysco Corp. | 519,513 | |
| 10,400 | Walgreen Co. | 397,072 | |
| 5,500 | Wal-Mart Stores, Inc. | 286,330 | |
| 1,682,840 | |||
Health Care Equipment & Supplies — 3.5% | |||
| 8,550 | Medtronic, Inc. | 410,827 | |
| 9,550 | Stryker Corp. | 420,105 | |
| 8,200 | Varian Medical Systems, Inc. (a) | 345,056 | |
| 1,175,988 | |||
Health Care Providers & Services — 1.2% | |||
| 4,200 | Quest Diagnostics Inc. | 393,750 | |
Hotels Restaurants & Leisure — 2.2% | |||
| 13,025 | Starbucks Corp. (a) | 732,787 | |
Household Durables — 1.2% | |||
| 4,700 | Mohawk Industries, Inc. (a) | 412,190 | |
Industrial Conglomerates — 3.1% | |||
| 6,800 | 3M Co. | 541,212 | |
| 14,750 | General Electric Co. | 521,560 | |
| 1,062,772 | |||
Insurance — 2.8% | |||
| 9,100 | American International Group, Inc. | 576,485 | |
| 12,550 | Arthur J. Gallagher & Co. | 384,657 | |
| 961,142 | |||
Internet & Catalog Retail — 1.5% | |||
| 4,500 | eBay, Inc. (a) | 506,025 | |
IT Services — 1.3% | |||
| 7,200 | Affiliated Computer Services, Inc. — Class A (a) | 426,096 |
| See Notes to the Financial Statements | 15 | |
Badgley Funds, Inc.
SCHEDULE OF INVESTMENTS (UNAUDITED) — (CONTINUED)
November 30, 2004
Badgley Balanced FundShares or | ||||
Principal | ||||
Amount | Value | |||
Media — 1.6% | ||||
| 6,800 | Omnicom Group Inc. | $ | 550,800 | |
Personal Products — 1.0% | ||||
| 7,760 | The Estee Lauder Cos. Inc. | 338,646 | ||
Pharmaceuticals — 2.0% | ||||
| 12,150 | Pfizer, Inc. | 337,406 | ||
| 12,575 | Teva Pharmaceutical Industries, Ltd. ADR | 343,046 | ||
| 680,452 | ||||
Software — 3.9% | ||||
| 9,150 | Electronic Arts, Inc. (a) | 447,435 | ||
| 11,800 | Microsoft Corp. | 316,358 | ||
| 8,700 | Symantec Corp. (a) | 555,147 | ||
| 1,318,940 | ||||
Specialty Retail — 2.3% | ||||
| 8,725 | Bed Bath & Beyond, Inc. (a) | 348,372 | ||
| 15,196 | Michaels Stores, Inc. | 415,306 | ||
| 763,678 | ||||
Total Common Stocks (Cost $13,568,444) | 17,263,197 | |||
U.S. TREASURY OBLIGATIONS — 12.1% | ||||
U.S. Treasury Notes — 12.1% | ||||
| $ | 575,000 | 4.375% due 08/15/2012 | 583,063 | |
| 650,000 | 5.50% due 02/15/2008 | 692,783 | ||
| 250,000 | 5.75% due 08/15/2010 | 274,219 | ||
| 750,000 | 6.00% due 08/15/2009 | 825,234 | ||
| 355,000 | 6.50% due 02/15/2010 | 400,734 | ||
| 250,000 | 3.25% due 08/15/2008 | 248,330 | ||
| 230,000 | 4.25% due 08/15/2013 | 229,488 | ||
| 350,000 | 5.625% due 02/15/2006 | 361,908 | ||
| 450,000 | 6.50% due 08/15/2005 | 462,533 | ||
| 4,078,292 | ||||
Total U.S. Treasury Obligations (Cost $3,999,459) | 4,078,292 |
| 16 | See Notes to the Financial Statements | |
Badgley Funds, Inc.
SCHEDULE OF INVESTMENTS (UNAUDITED) — (CONTINUED)
November 30, 2004
Badgley Balanced FundPrincipal | ||||
Amount | Value | |||
U.S. GOVERNMENT AGENCY ISSUES — 9.9% | ||||
Federal Home Loan Bank — 2.4% | ||||
| $ | 330,000 | 4.50% due 09/16/2013 | $ | 328,621 |
| 450,000 | 5.75% due 05/15/2012 | 487,219 | ||
| 815,840 | ||||
Federal Home Loan Mortgage Corporation — 2.7% | ||||
| 875,000 | 5.25% due 01/15/2006 | 896,632 | ||
Federal National Mortgage Association — 3.6% | ||||
| 820,000 | 5.25% due 04/15/2007 to 01/15/2009 | 856,679 | ||
| 325,000 | 6.625% due 09/15/2009 | 361,792 | ||
| 1,218,471 | ||||
Freddie Mac — 1.2% | ||||
| 425,000 | 3.50% due 02/13/2008 | 419,941 | ||
Total U.S. Government Agency Issues (Cost $3,342,074) | 3,350,884 | |||
CORPORATE BONDS — 21.7% | ||||
Auto Components — 0.8% | ||||
| 250,000 | Johnson Controls, Inc. | |||
| 4.875% due 09/15/2013 | 251,135 | |||
Bottled And Canned Soft Drinks And Carbonated Waters — 0.3% | ||||
| 100,000 | PepsiCo, Inc. | |||
| 5.75% due 01/15/2008 | 106,261 | |||
Chemicals — 2.1% | ||||
| 400,000 | Ecolab, Inc. | |||
| 6.875% due 02/01/2011 | 442,944 | |||
| 300,000 | Praxair, Inc. | |||
| 3.95% due 06/01/2013 | 281,283 | |||
| 724,227 |
| See Notes to the Financial Statements | 17 | |
Badgley Funds, Inc.
SCHEDULE OF INVESTMENTS (UNAUDITED) — (CONTINUED)
November 30, 2004
Badgley Balanced FundPrincipal | ||||
Amount | Value | |||
Commercial Banks — 1.5% | ||||
| $ | 200,000 | Bank of America Corp. | ||
| 4.75% due 10/15/2006 | $ | 205,053 | ||
| 300,000 | Bank of America Corp. | |||
| 5.25% due 02/01/2007 | 311,001 | |||
| 516,054 | ||||
Diversified Financial Services — 2.2% | ||||
| 170,000 | American General Finance Corp. | |||
| 5.375% due 09/01/2009 | 176,417 | |||
| 500,000 | Citigroup, Inc. | |||
| 6.50% due 01/18/2011 | 554,852 | |||
| 731,269 | ||||
Durable Goods, Not Elsewhere Classified — 1.2% | ||||
| 400,000 | Costco Wholesale Corp. | |||
| 7.125% due 06/15/2005 | 408,727 | |||
Electrical Equipment — 0.7% | ||||
| 255,000 | Emerson Electric Co. | |||
| 4.50% due 05/01/2013 | 249,920 | |||
Food & Staples Retailing — 2.4% | ||||
| 500,000 | Sysco Corp. | |||
| 7.00% due 05/01/2006 | 525,777 | |||
| 300,000 | Wal-Mart Stores, Inc. | |||
| 4.55% due 05/01/2013 | 298,763 | |||
| 824,540 | ||||
Insurance — 1.6% | ||||
| 500,000 | Aflac, Inc. | |||
| 6.50% due 04/15/2009 | 543,225 |
| 18 | See Notes to the Financial Statements | |
Badgley Funds, Inc.
SCHEDULE OF INVESTMENTS (UNAUDITED) — (CONTINUED)
November 30, 2004
Badgley Balanced FundPrincipal | ||||
Amount | Value | |||
Laundry And Garment Services — 0.4% | ||||
| $ | 125,000 | Cintas Corp. No. 2 | ||
| 5.125% due 06/01/2007 | $ | 129,903 | ||
Multi-line Retail — 1.4% | ||||
| 425,000 | Target Corp. | |||
| 6.35% due 01/15/2011 | 468,998 | |||
Perfumes, Cosmetics, And Other Toilet Preparations — 0.8% | ||||
| 250,000 | The Estee Lauder Cos. Inc. | |||
| 6.00% due 01/15/2012 | 271,621 | |||
Personal Credit Institutions — 3.1% | ||||
| 525,000 | General Electric Capital Corp. | |||
| 7.375% due 01/19/2010 | 598,630 | |||
| 300,000 | Slm Corp. | |||
| 5.125% due 08/27/2012 | 304,465 | |||
| 140,000 | Wells Fargo Financial, Inc. | |||
| 5.50% due 08/01/2012 | 146,391 | |||
| 1,049,486 | ||||
Pharmaceuticals — 0.9% | ||||
| 300,000 | Abbott Laboratories | |||
| 5.625% due 07/01/2006 | 310,927 | |||
Specialty Retail — 0.7% | ||||
| 225,000 | Home Depot, Inc. | |||
| 5.375% due 04/01/2006 | 231,479 | |||
Telephone Communications, Except Radiotelephone — 1.6% | ||||
| 500,000 | Southwestern Bell Telephone | |||
| 6.625% due 07/15/2007 | 534,609 | |||
Total Corporate Bonds (Cost $7,188,390) | 7,352,381 |
| See Notes to the Financial Statements | 19 | |
Badgley Funds, Inc.
SCHEDULE OF INVESTMENTS (UNAUDITED) — (CONTINUED)
November 30, 2004
Badgley Balanced FundPrincipal | ||||
Amount | Value | |||
SHORT TERM INVESTMENTS — 5.7% | ||||
Variable Rate Demand Notes* — 5.7% | ||||
| $ | 287,071 | American Family Demand Note — 1.7735% | $ | 287,071 |
| 1,254,041 | U.S. Bank, N.A. — 1.93% | 1,254,041 | ||
| 400,000 | Wisconsin Corporate Central Credit Union — 1.85% | 400,000 | ||
| 1,941,112 | ||||
Total Short Term Investments (Cost $1,941,112) | 1,941,112 | |||
TOTAL INVESTMENTS — 100.5% | ||||
(Cost $30,039,479) | 33,985,866 | |||
Liabilities in Excess of Other Assets — (0.5)% | (167,894) | |||
TOTAL NET ASSETS — 100.0% | $ | 33,817,972 |
Percentages are stated as a percent of net assets.
ADR — American Depository Receipt.
(a) — Non-income producing security.
| * | — Variable rate security. Rate listed is as of November 30, 2004. |
| 20 | See Notes to the Financial Statements | |
Badgley Funds, Inc.
SCHEDULE OF INVESTMENTS (UNAUDITED)
November 30, 2004
Badgley Growth FundShares | Value | ||
COMMON STOCKS — 98.3% | |||
Air Freight & Logistics — 6.3% | |||
| 7,650 | Expeditors International of Washington, Inc. | $ | 407,439 |
| 7,075 | FedEx Corp. | 672,337 | |
| 1,079,776 | |||
Auto Components — 2.0% | |||
| 5,475 | Johnson Controls, Inc. | 336,165 | |
Automobiles — 2.1% | |||
| 6,075 | Harley-Davidson, Inc. | 351,257 | |
Beverages — 2.6% | |||
| 8,875 | PepsiCo, Inc. | 442,951 | |
Biotechnology — 1.7% | |||
| 4,925 | Amgen, Inc. (a) | 295,697 | |
Capital Markets — 2.4% | |||
| 9,300 | State Street Corp. | 414,408 | |
Chemicals — 7.2% | |||
| 20,275 | Ecolab, Inc. | 709,219 | |
| 11,425 | Praxair, Inc. | 512,983 | |
| 1,222,202 | |||
Communications Equipment — 2.1% | |||
| 19,325 | Cisco Systems, Inc. (a) | 361,571 | |
Computers & Peripherals — 3.2% | |||
| 13,400 | Dell, Inc. (a) | 542,968 | |
Consumer Finance — 3.2% | |||
| 20,512 | MBNA Corp. | 544,799 | |
Diversified Financial Services — 2.8% | |||
| 10,850 | Citigroup, Inc. | 485,537 |
| See Notes to the Financial Statements | 21 | |
Badgley Funds, Inc.
SCHEDULE OF INVESTMENTS (UNAUDITED) — (CONTINUED)
November 30, 2004
Badgley Growth FundShares | Value | ||
Food & Staples Retailing — 9.6% | |||
| 9,500 | Costco Wholesale Corp. | $ | 461,700 |
| 14,600 | Sysco Corp. | 507,350 | |
| 10,025 | Walgreen Co. | 382,755 | |
| 5,375 | Wal-Mart Stores, Inc. | 279,822 | |
| 1,631,627 | |||
Health Care Equipment & Supplies — 6.8% | |||
| 8,375 | Medtronic, Inc. | 402,419 | |
| 9,475 | Stryker Corp. | 416,805 | |
| 7,950 | Varian Medical Systems, Inc. (a) | 334,536 | |
| 1,153,760 | |||
Health Care Providers & Services — 2.3% | |||
| 4,175 | Quest Diagnostics Inc. | 391,406 | |
Hotels Restaurants & Leisure — 4.2% | |||
| 12,650 | Starbucks Corp. (a) | 711,689 | |
Household Durables — 2.3% | |||
| 4,550 | Mohawk Industries, Inc. (a) | 399,035 | |
Industrial Conglomerates — 6.1% | |||
| 6,650 | 3M Co. | 529,273 | |
| 14,425 | General Electric Co. | 510,068 | |
| 1,039,341 | |||
Insurance — 5.4% | |||
| 8,750 | American International Group, Inc. | 554,312 | |
| 11,900 | Arthur J. Gallagher & Co. | 364,735 | |
| 919,047 | |||
Internet & Catalog Retail — 2.9% | |||
| 4,425 | eBay, Inc. (a) | 497,591 |
| 22 | See Notes to the Financial Statements | |
Badgley Funds, Inc.
SCHEDULE OF INVESTMENTS (UNAUDITED) — (CONTINUED)
November 30, 2004
Badgley Growth FundShares | Value | ||
IT Services — 2.4% | |||
| 7,050 | Affiliated Computer Services, Inc. — Class A (a) | $ | 417,219 |
Media — 3.1% | |||
| 6,500 | Omnicom Group Inc. | 526,500 | |
Personal Products — 2.0% | |||
| 7,679 | The Estee Lauder Cos. Inc. | 335,112 | |
Pharmaceuticals — 3.8% | |||
| 11,675 | Pfizer, Inc. | 324,215 | |
| 12,200 | Teva Pharmaceutical Industries, Ltd. ADR | 332,816 | |
| 657,031 | |||
Software — 7.4% | |||
| 8,650 | Electronic Arts, Inc. (a) | 422,985 | |
| 11,325 | Microsoft Corp. | 303,623 | |
| 8,375 | Symantec Corp. (a) | 534,409 | |
| 1,261,017 | |||
Specialty Retail — 4.4% | |||
| 8,600 | Bed Bath & Beyond, Inc. (a) | 343,381 | |
| 14,966 | Michaels Stores, Inc. | 409,021 | |
| 752,402 | |||
Total Common Stocks (Cost $13,118,099) | 16,770,108 |
| See Notes to the Financial Statements | 23 | |
Badgley Funds, Inc.
SCHEDULE OF INVESTMENTS (UNAUDITED) — (CONTINUED)
November 30, 2004
Badgley Growth Fund| Principal | Value | ||
| Amount | |||
| SHORT TERM INVESTMENTS — 3.9% | |||
| Variable Rate Demand Notes* — 3.9% | |||
| $ 667,413 | U.S. Bank, N.A. — 1.93% | $ | 667,413 |
| Total Short Term Investments (Cost $667,413) | 667,413 | ||
| TOTAL INVESTMENTS — 102.2% | |||
| (Cost $13,785,512) | 17,437,521 | ||
| Liabilities in Excess of Other Assets — (2.2)% | (370,654) | ||
| TOTAL NET ASSETS — 100.0% | $ | 17,066,867 | |
Percentages are stated as a percent of net assets.
ADR — American Depository Receipt.
(a) — Non-income producing security.
* — Variable rate security. Rate listed is as of November 30, 2004.
| 24 | See Notes to the Financial Statements | |
Badgley Funds, Inc.
NOTES TO THE FINANCIAL STATEMENTS (UNAUDITED)
November 30, 2004
1. Organization
Badgley Funds, Inc. (the “Corporation”) was incorporated on April 28, 1998, as a Maryland Corporation and is registered as an open-end management investment company under the Investment Company Act of 1940. The Badgley Balanced Fund (the “Balanced Fund”) and the Badgley Growth Fund (the “Growth Fund”) (collectively referred to as the “Funds”) are separate, diversified investment portfolios of the Corporation. The principal investment objective of the Balanced Fund is to seek long-term capital appreciation and income. The principal investment objective of the Growth Fund is to seek long-term capital appreciation. The Funds commenced operations on June 25, 1998.
| 2. | Significant Accounting Policies |
The following is a summary of significant accounting policies consistently followed by the Funds in the preparation of their financial statements. These policies are in conformity with accounting principles generally accepted in the United States of America.
a) Investment Valuation — Securities listed on the NASDAQ National Market are valued at the NASDAQ Official Closing Price (“NOCP”). Other securities traded on a national securities exchange (including options on indices so traded) are valued at the last sales price at the close of that exchange where primarily traded. Exchange-traded securities for which there were no transactions and NASDAQ-traded securities for which there is no NOCP are valued at the mean of the bid and ask prices. Securities for which market quotations are not readily available are valued at fair value as determined in good faith by the Board of Directors. De bt securities maturing in 60 days or less are valued at amortized cost, which approximates fair value. Debt securities having maturities over 60 days or for which amortized cost is not deemed to reflect fair value may be priced by independent pricing services that use prices provided by market makers or estimates of market values obtained from yield data relating to instruments or securities with similar characteristics.
b) Federal Income Taxes — No provision for federal income taxes has been made since the Funds have complied to date with the provisions of the Internal Revenue Code applicable to regulated investment companies and intend to continue to so comply in future years and to distribute substantially all of the Funds’ investment company net taxable income and net realized gains to shareholders.
c) Income and Expenses — The Funds are charged for those expenses that are directly attributable to each portfolio, such as advisory, administration and certain shareholder service fees. Expenses that are not directly attributable to a portfolio are typically allocated among the Funds in proportion to their respective net assets, number of shareholder accounts or net sales, where applicable.
d) Distributions to Shareholders — Dividends from net investment income of the Balanced Fund are declared and paid quarterly. Dividends from net investment income of the Growth Fund are declared and paid annually. The Funds’ net realized capital gains, if any, are distributed at least annually.
| 25 | ||
Badgley Funds, Inc.
NOTES TO THE FINANCIAL STATEMENTS (UNAUDITED) — (CONTINUED)
November 30, 2004
e) Use of Estimates — The preparation of financial statements in conformity with accounting principles generally accepted in the United States of America requires management to make estimates and assumptions that affect the amounts reported in the financial statements. Actual results could differ from those estimates.
f) Guarantees and Indemnifications — In the normal course of business the Funds enter into contracts with service providers that contain general indemnification clauses. The Funds’ maximum exposure under these arrangements is unknown as this would involve future claims that may be made against the Funds that have not yet occurred. Based on experience, however, the Funds expect the risk of loss to be remote.
g) Other — Investment and shareholder transactions are recorded on trade date. The Funds determine the gain or loss realized from the investment transactions by comparing the original cost of the security lot sold with the net sales proceeds. Dividend income is recognized on the ex-dividend date, and interest income is recognized on an accrual basis. Premiums and discounts on the purchase of fixed income securities are amortized using the yield to call method.
| 3. | Capital Share Transactions |
Transactions in shares of the Funds for the six months ended November 30, 2004, were as follows:
3. Capital Share Transactions | ||
| Transactions in shares of the Funds for the six months ended November 30, 2004, were as follows: | ||
Balanced Fund | Growth Fund | |
| Shares sold | 265,884 | 105,496 |
| Shares issued to holders in reinvestment of dividends | 18,746 | — |
| Shares redeemed | (170,429) | (82,377) |
| Net increase | 114,201 | 23,119 |
| Transactions in shares of the Funds for the year ended May 31, 2004, were as follows: | ||
Balanced Fund | Growth Fund | |
| Shares sold | 559,171 | 527,042 |
| Shares issued to holders in reinvestment of dividends | 37,714 | — |
| Shares redeemed | (502,592) | (835,110) |
| Net increase (decrease) | 94,293 | (308,068) |
| 26 | ||
Badgley Funds, Inc.
NOTES TO THE FINANCIAL STATEMENTS (UNAUDITED) — (CONTINUED)
November 30, 2004
| 4. | Investment Transactions and Income Tax Information |
The aggregate purchases and sales of investments, excluding short-term investments, by the Funds for the six months ended November 30, 2004, were as follows:
Balanced Fund | Growth Fund | |||
| Purchases | ||||
| U.S. Government | $ | 129,595 | $ | — |
| Other | 4,638,035 | 3,276,399 | ||
| Sales | ||||
| U.S. Government | 651,557 | — | ||
| Other | 3,889,105 | 2,526,559 | ||
| As of May 31, 2004, the components of accumulated earnings (losses) on a tax basis were as follows: | ||||
Balanced Fund | Growth Fund | |||
| Cost of Investments(a) | $ | 28,152,275 | $ | 12,706,240 |
| Gross unrealized appreciation | 3,828,960 | 3,237,332 | ||
| Gross unrealized depreciation | (288,064) | (89,873) | ||
| Net unrealized appreciation | 3,540,896 | 3,147,459 | ||
| Undistributed ordinary income | 69,561 | — | ||
| Undistributed long-term capital gain | — | — | ||
| Total distributable earnings | 69,561 | — | ||
| Other accumulated gains (losses) | (3,440,886) | (4,943,825) | ||
| Total accumulated earnings (losses) | $ | 169,571 | $ | (1,796,366) |
(a) Represents cost for federal income tax purposes and differs from the cost for financial reporting purposes due to wash sales.
At May 31, 2004, the Balanced Fund and the Growth Fund had accumulated net realized capital loss carryovers of $3,440,886 and $4,943,825, respectively. The capital loss carryovers for the Balanced Fund of $61,004, $731,270, $2,096,325, and $552,287 expire in 2009, 2010, 2011, and 2012, respectively. The capital loss carryovers for the Growth Fund of $1,864, $50,467, $57,182, $1,343,882, $2,533,832 and $956,598 expire in 2007, 2008, 2009, 2010, 2011, and 2012, respectively. The above losses will be offset by any future realized capital gains.
| 27 | ||
Badgley Funds, Inc.
NOTES TO THE FINANCIAL STATEMENTS (UNAUDITED) — (CONTINUED)
November 30, 2004
For the six months ended November 30, 2004, the components of distributions on a tax basis were as follows:
Balanced Fund | Growth Fund | |||
| Ordinary income | $ | 229,387 | $ | — |
| Long-term capital gains | — | — | ||
| Total distributions paid | $ | 229,387 | $ | — |
| For the year ended May 31, 2004, the components of distributions on a tax basis were as follows: | ||||
Balanced Fund | Growth Fund | |||
| Ordinary income | $ | 431,375 | $ | — |
| Long-term capital gains | — | — | ||
| Total distributions paid | $ | 431,375 | $ | — |
For the fiscal year ended May 31, 2004 certain dividends paid by the Funds may be subject to a maximum tax rate of 15%, as provided for by the Jobs and Growth Tax Relief Reconciliation Act of 2003. The percentage of dividends declared from net investment income designated as qualified dividend income were as follows (unaudited):
Balanced Fund . . . . . . . . . . . . . . . . . . . . . . . . . . . . . . 5%
Growth Fund . . . . . . . . . . . . . . . . . . . . . . . . . . . . . . . 0%
For corporate shareholders, the percent of ordinary income distributions qualifying for the corporate dividends received deduction for the fiscal year ended May 31, 2004 were as follows (unaudited):
Balanced Fund . . . . . . . . . . . . . . . . . . . . . . . . . . . . . . 34%
Growth Fund . . . . . . . . . . . . . . . . . . . . . . . . . . . . . . . 0%
| 5. | Investment Advisory and Other Agreements |
The Corporation has an Investment Advisory Agreement (the “Agreement”) with Badgley, Phelps and Bell, Inc. (the “Adviser”), with whom certain Officers and Directors of the Corporation are affiliated, to furnish investment advisory services to the Funds. Under the terms of the Agreement, the Corporation, on behalf of the Funds, compensates the Adviser for its management services at the annual rate of 0.90% of the Balanced Fund’s average daily net assets and 1.00% of the Growth Fund’s average daily net assets. The advisory fee is accrued daily and paid monthly.
The Adviser has agreed to waive its management fee and/or reimburse the Funds’ other expenses to the extent necessary to ensure that the Balanced Fund’s total operating expenses do not exceed 1.30% of its average daily net assets and that the Growth Fund’s total operating expenses do not exceed 1.50% of its average daily net assets. Any such waiver or reimbursement is subject to later adjustment during the term of the Agreement to allow the Adviser to recoup amounts waived or reimbursed to the extent actual fees and expenses for a period are less than the expense limitation caps, provided, however, that the Adviser shall only be entitled to recoup such amounts for the period of three years from the date s uch amount was waived or reimbursed. For the six months ended November 30, 2004, the Adviser waived/reimbursed expenses of $56,003 and $78,569 for the Balanced Fund and Growth Fund, respectively. Waived/reimbursed expenses subject to potential recovery by year of expiration are as follows:
| 28 | ||
Badgley Funds, Inc.
NOTES TO THE FINANCIAL STATEMENTS (UNAUDITED) — (CONTINUED)
November 30, 2004
| Year of Expiration | Balanced Fund | Growth Fund |
| 5/31/2005 | $ 123,485 | $ 127,555 |
| 5/31/2006 | 145,963 | 148,381 |
| 5/31/2007 | 170,562 | 172,985 |
| 5/31/2008* | 56,003 | 78,569 |
| * | Represents waived expenses for the six months ended November 30, 2004. |
The Funds have adopted an amended and restated plan of distribution under Rule 12b-1 under the 1940 Act (the “12b-1 Plan”) allowing for the reimbursement or payment of distribution and marketing expenses in any amount not to exceed an annual rate of 0.25% of each Fund’s average daily net assets. An amended and restated plan of distribution became effective in July 2004. The 12b-1 Plan authorizes the Funds to pay Rafferty Capital Markets, LLC, an unaffiliated distributor, (the “Distributor”) a maximum allowable distribution and shareholder servicing fee of 0.25% of each Fund’s average daily net assets (computed on an annual basis) subject to a minimum of $18,000 for the Corporation, which is allocated to the Funds based on each of their net assets. All or a portion of the f ee may be used by the Distributor to pay costs of printing reports and prospectuses for potential investors and the costs of other distribution and shareholder servicing expenses. Currently, the Adviser has a Related Party Agreement with Rafferty Capital Markets, LLC, which allows the Adviser to be reimbursed for the cost of marketing the Funds. The Adviser incurred marketing related expenses for the Balanced Fund and the Growth Fund in the amount of $24,482 and $16,857, respectively. The Adviser was reimbursed $34,740 and $23,890 for the Balanced Fund and Growth Fund, respectively. During the six months ended November 30, 2004 the Balanced Fund and Growth Fund incurred expenses of $14,088 and $20,704, respectively, pursuant to the 12b-1 Plan.
U.S. Bank, N.A., a subsidiary of U.S. Bancorp, a publicly held bank holding company, serves as custodian for the Funds. U.S. Bancorp Fund Services, LLC, a wholly owned limited liability company of U.S. Bank, N.A., serves as transfer agent, administrator and accounting services agent for the Funds.
| 29 | ||
Badgley Funds, Inc.
ADDITIONAL INFORMATION
November 30, 2004
The Badgley Funds have adopted proxy voting policies and procedures that delegate to Badgley, Phelps and Bell, Inc., the Funds’ investment adviser, the authority to vote proxies. A description of the Badgley Funds proxy voting policies and procedures is available without charge, upon request, by calling the Funds toll free at 1-877-BADGLEY or by e-mail at ProxyVotes@badgleyfunds.com. A description of these policies and procedures is also included in the Funds’ Statement of Additional Information, which is available on the SEC’s website at www.sec.gov and the Funds’ website at www.badgleyfunds.com.
The actual voting records relating to portfolio securities during the twelve month period ended June 30, 2004 (as filed with the SEC on Form N-PX) are available without charge, upon request, by calling the Funds toll free at 1-877-BADGLEY or by accessing the SEC’s website at www.sec.gov.
The Funds’ are required to file complete schedules of portfolio holdings with the SEC for the first and third fiscal quarters on Form N-Q. Once filed, the Funds’ Form N-Q is available without charge, upon request on the SEC’s website (http://www.sec.gov) and may be available by calling 1-877-BADGLEY. You can also obtain copies of Form N-Q by (i) visiting the SEC’s Public Reference Room in Washington, DC (information on the operation of the Public Reference Room may be obtained by calling 1-800-SEC-0330); (ii) sending your request and a duplicating fee to the SEC’s Public Reference Room, Washington, DC 20549-0102; or (iii) sending your request electronically to publicinfosec.gov.
| 30 | ||
| DIRECTORS | CUSTODIAN |
| Graham S. Anderson | U.S. Bank, N.A. |
| Frank S. Bayley | 425 Walnut Street |
| J. Kevin Callaghan | Cincinnati, Ohio 45202 |
| Victor E. Parker | |
| Steven C. Phelps | ADMINISTRATOR, TRANSFER AGENT AND DIVIDEND-DISBURSING AGENT |
| Madelyn B. Smith | |
| U.S. Bancorp Fund Services, LLC | |
| PRINCIPAL OFFICERS | Third Floor |
| 615 East Michigan Street | |
| J. Kevin Callaghan, President | Milwaukee, Wisconsin 53202 |
| Lisa P. Guzman, Chief Compliance Officer, Treasurer and Secretary | |
| INDEPENDENT ACCOUNTANTS | |
| INVESTMENT ADVISER | |
| PricewaterhouseCoopers LLP | |
| Badgley, Phelps and Bell, Inc. | 1300 SW Fifth Avenue, Suite 3100 |
| 1420 Fifth Avenue | Portland, Oregon 97201 |
| Seattle, Washington 98101 | |
| LEGAL COUNSEL | |
| DISTRIBUTOR | |
| Kirkland & Ellis LLP | |
| Rafferty Capital Markets, LLC | 200 East Randolph Drive |
| 59 Hilton Avenue, Suite 101 | Chicago, Illinois 60601 |
| Garden City, New York 11530 | |
| 31 | ||
S E M I - A N N U A L R E P O R T
November 30, 2004


Item 2. Code of Ethics.
Not applicable for semi-annual reports.
Item 3. Audit Committee Financial Expert.
Not applicable for semi-annual reports.
Item 4. Principal Accountant Fees and Services.
Not applicable for semi-annual reports.
Item 5. Audit Committee of Listed Registrants.
Not applicable to open-end investment companies.
Item 6. Schedule of Investments.
Schedule of Investments is included as part of the report to shareholders filed under Item 1 of this Form.
Item 7. Disclosure of Proxy Voting Policies and Procedures for Closed-End Management Investment Companies.
Not applicable to open-end investment companies.
Item 8. Purchases of Equity Securities by Closed-End Management Investment Company and Affiliated Purchases.
Not applicable to open-end investment companies.
Item 9. Submission of Matters to a Vote of Security Holders.
Not Applicable to open-end investment companies.
Item 10. Controls and Procedures.
| (a) | The Registrant’s President/Chief Executive Officer and Treasurer/Chief Financial Officer have concluded that the Registrant's disclosure controls and procedures (as defined in Rule 30a-3(c) under the Investment Company Act of 1940 (the “1940 Act”)) are effective as of a date within 90 days of the filing date of the report that includes the disclosure required by this paragraph, based on the evaluation of these controls and procedures required by Rule 30a-3(b) under the 1940 Act and Rules 15d-15(b) under the Securities Exchange Act of 1934, as amended. |
| (b) | There were no significant changes in the Registrant's internal controls over financial reporting that occurred during the Registrant's last fiscal half-year that has materially affected, or is reasonably likely to materially affect, the Registrant's internal control over financial reporting. |
Item 11. Exhibits.
| (a) | (1) Any code of ethics or amendment thereto, that is subject of the disclosure required by Item 2, to the extent that the registrant intends to satisfy Item 2 requirements through filing an exhibit. Incorporated by reference to Registrant's Form N-CSR as filed with the Commission on August 10, 2004. |
(2) Certifications pursuant to Section 302 of the Sarbanes-Oxley Act of 2002. Filed herewith.
(3) Any written solicitation to purchase securities under Rule 23c-1 under the Act sent or given during the period covered by the report by or on behalf of the registrant to 10 or more persons. Not applicable to open-end investment companies.
| (b) | Certification pursuant to Section 906 of the Sarbanes-Oxley Act of 2002. Furnished herewith. |
SIGNATURES
Pursuant to the requirements of the Securities Exchange Act of 1934 and the Investment Company Act of 1940, the registrant has duly caused this report to be signed on its behalf by the undersigned, thereunto duly authorized.
(Registrant) Badgley Funds, Inc.
By (Signature and Title) /s/ J. Kevin Callaghan, President
J. Kevin Callaghan, President
Date February 8, 2005
Pursuant to the requirements of the Securities Exchange Act of 1934 and the Investment Company Act of 1940, this report has been signed below by the following persons on behalf of the registrant and in the capacities and on the dates indicated.
By (Signature and Title) /s/ J. Kevin Callaghan, President
J. Kevin Callaghan, President
Date 2/8/05
By (Signature and Title)* /s/ Lisa P. Guzman, Treasurer
Lisa P. Guzman, Treasurer
Date 2/8/05
* Print the name and title of each signing officer under his or her signature.