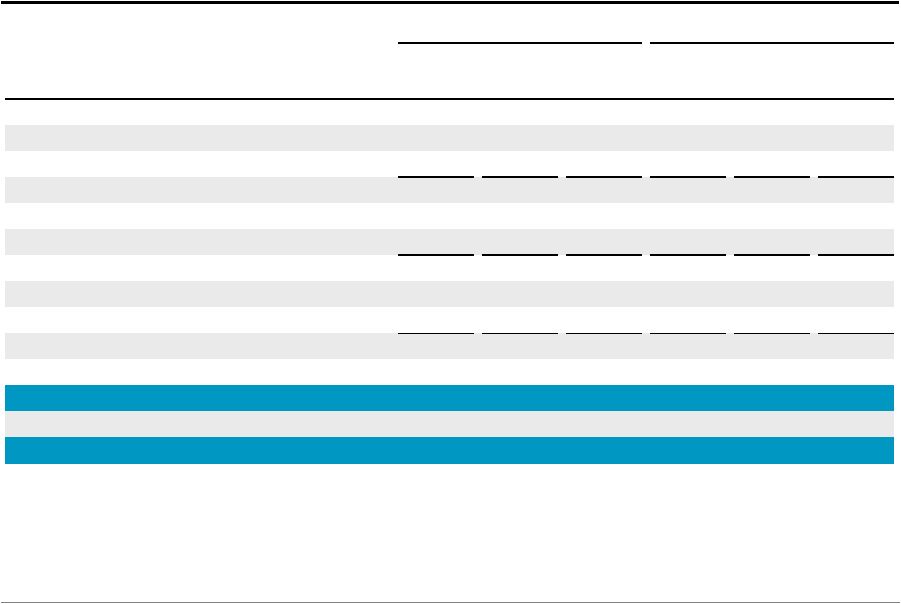
Blackstone Mortgage Trust Consolidated Statement of Operations Three Months Ended June 30, Six Months Ended June 30, (Dollars in Thousands, Except Share and per Share Data) 2013 2012 2013 2012 Income from loans and other investments: Interest and related income 6,017 $ 6,763 $ 7,473 $ 21,479 $ Less: Interest and related expenses 1,306 5,413 2,083 28,754 Income (loss) from loans and other investments, net 4,711 1,350 5,390 (7,275) Other expenses: General and administrative 3,427 1,567 5,465 2,323 Total other expenses 3,427 1,567 5,465 2,323 Impairments, provisions, and valuation adjustments 6,000 3,704 5,800 7,506 Gain on extinguishment of debt 38 - 38 - Gain on deconsolidation of subsidiaries - - - 146,380 Income from equity investments in unconsolidated subsidiaries - 205 - 901 Income before income taxes 7,322 3,692 5,763 145,189 Income tax provision 554 - 593 301 Income from continuing operations 6,768 $ 3,692 $ 5,170 $ 144,888 $ Loss from discontinued operations, net of tax - (341) - (914) Net income 6,768 $ 3,351 $ 5,170 $ 143,974 $ Net income attributable to noncontrolling interests (4,020) (1,068) (5,537) (75,137) Net income (loss) attributable to Blackstone Mortgage Trust, Inc. 2,748 $ 2,283 $ (367) $ 68,837 $ Per share information (Basic) Income (loss) from continuing operations per share of common stock 0.22 $ 1.15 $ (0.05) $ 30.50 $ Loss from discontinued operations per share of common stock - $ (0.15) $ - $ (0.40) $ Net income (loss) per share of common stock 0.22 $ 1.00 $ (0.05) $ 30.10 $ Weighted average shares of common stock outstanding 12,401,274 2,289,352 7,734,774 2,286,582 Per share information (Diluted) Income (loss) from continuing operations per share of common stock 0.22 $ 1.08 $ (0.05) $ 28.67 $ Loss from discontinued operations per share of common stock - $ (0.15) $ - $ (0.40) $ Net income (loss) per share of common stock 0.22 $ 0.93 $ (0.05) $ 28.27 $ Weighted average shares of common stock outstanding 12,401,274 2,442,686 7,734,774 2,435,339 11 |