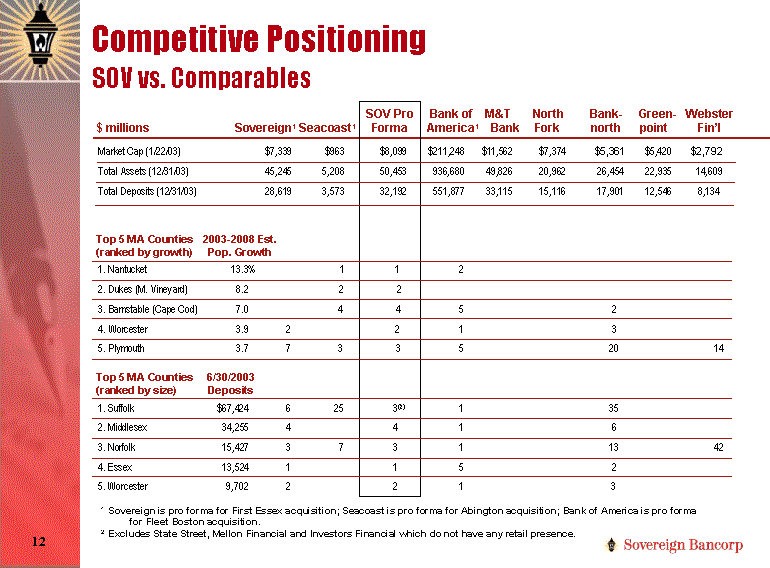
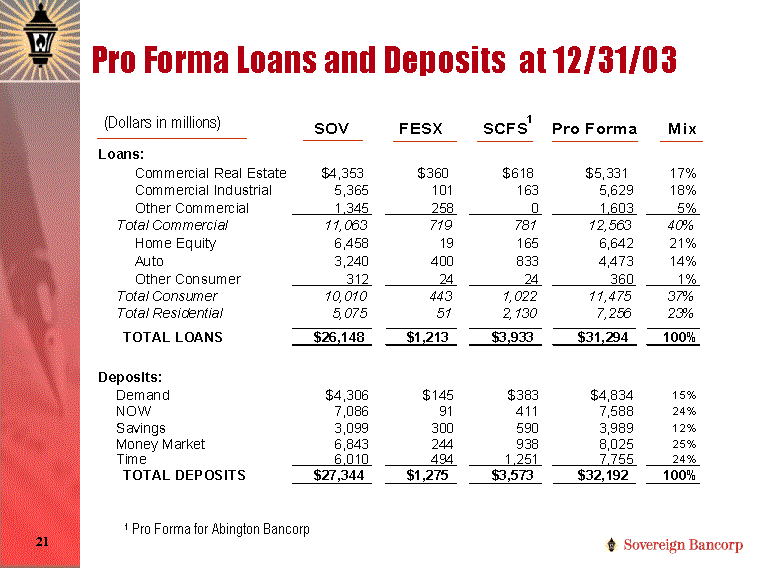
| Market Cap (1/22/03) $7,339 $963 $8,099 $211,248 $11,562 $7,374 $5,361 $5,420 $2,792 Total Assets (12/31/03) 45,245 5,208 50,453 936,680 49,826 20,962 26,454 22,935 14,609 Total Deposits (12/31/03) 28,619 3,573 32,192 551,877 33,115 15,116 17,901 12,546 8,134 1. Nantucket 13.3 % 1 1 2 2. Dukes (M. Vineyard) 8.2 2 2 3. Barnstable (Cape Cod) 7.0 4 4 5 2 4. Worcester 3.9 2 2 1 3 5. Plymouth 3.7 7 3 3 5 20 14 Suffolk $67,424 6 25 3(2) 1 35 Middlesex 34,255 4 4 1 6 Norfolk 15,427 3 7 3 1 13 42 Essex 13,524 1 1 5 2 Worcester 9,702 2 2 1 3 SOV Pro Bank of M&T North Bank- Green- Webster $ millions Sovereign1 Seacoast1 Forma America1 Bank Fork north point Fin'l 1 Sovereign is pro forma for First Essex acquisition; Seacoast is pro forma for Abington acquisition; Bank of America is pro forma for Fleet Boston acquisition. 2 Excludes State Street, Mellon Financial and Investors Financial which do not have any retail presence. Competitive Positioning SOV vs. Comparables Top 5 MA Counties 2003-2008 Est. (ranked by growth) Pop. Growth Top 5 MA Counties 6/30/2003 (ranked by size) Deposits |
