UNITED STATES
SECURITIES AND EXCHANGE COMMISSION
Washington, D.C. 20549
FORM N-CSR
CERTIFIED SHAREHOLDER REPORT OF REGISTERED
MANAGEMENT INVESTMENT COMPANIES
Investment Company Act file number 811-08789
VALIC Company II
(Exact name of registrant as specified in charter)
2929 Allen Parkway, Houston, TX 77019
(Address of principal executive offices) (Zip code)
Kurt W. Bernlohr
Senior Vice President
The Variable Annuity Life Insurance Company
2929 Allen Parkway
Houston, TX 77019
(Name and address of agent for service)
Registrant’s telephone number, including area code: (713) 831-6133
Date of fiscal year end: August 31
Date of reporting period: August 31, 2009
Item 1. Reports to Stockholders
VALIC Company II, Annual Report at August 31, 2009.

VALIC Company II
Annual Report, August 31, 2009
SAVING :INVESTING :PLANNING
VALIC Company II
ANNUAL REPORT AUGUST 31, 2009
TABLE OF CONTENTS
VALIC Company II
PRESIDENT’S LETTER
Dear Valued Investor:
We are pleased to provide you with the Annual Report for VALIC Company II. The report contains the investment portfolio information and the financial statements of VALIC Company II for the twelve-month period ending August 31, 2009.
The reporting period was one of extreme volatility divided roughly into two equal periods that experienced radically different market results. The total return for the Standard & Poor’s (S&P) 500® Index* was -18.25% for the entire twelve-month period, -41.82 for the first six-months of the period (September 1, 2008 through February 28, 2009) and +40.52% for the second six-months (March 1, 2009 through August 31, 2009). These results mirrored the mood of many investors during the period, with fear and pessimism gradually giving way to hope and optimism that perhaps the market had bottomed and was on its way to a sustainable recovery.
Beginning with the “Great September Crash of 2008” and continuing into the early months of 2009, the U.S. and global economy continued to deteriorate. Unemployment rose, housing prices plunged, credit markets deteriorated and consumer confidence eroded. Despite massive government bailouts, stimulus programs, interest rate reductions and other interventions — both in the U.S. and abroad — lower investment values were generally experienced across virtually all assets classes.
March saw markets abruptly reverse course and experience strong gains throughout most asset classes. Constant talk of “green shoots” — which, while not demonstrating economic growth, suggested that the economy was stabilizing. During this time, the Federal government also continued to actively participate in the economy. Among other things, the government initiated bankruptcy filings by Chrysler and General Motors, introduced a wide ranging proposal to reform regulations for the financial markets and created an “executive pay czar” for firms receiving TARP funds.
But as the reporting period came to a close, lingering concerns remained whether the economy would continue to stabilize or return to declining growth, as much of the recent improvements occurred in the face of continuing weak economic data. Job losses increased more than expected with the unemployment rate rising to 9.5%. Consumer confidence and spending remained sluggish. Housing markets generally continued to disappoint. And even many touted improvements in certain economic indicators often took the form of slower rates of decline rather than demonstrations of fundamental, sustainable growth.
The continued market uncertainty has understandably shaken the confidence of many investors who may question their ability to make the right investment decisions. But now, more than ever, it is important to stick to investment fundamentals and have a long-term investment strategy. Meet with your financial advisor. Review your goals and time horizons. Now is as good of time as any to take greater control of your financial future.
Thank you for your continued confidence in our ability to help you meet your investment goals.
Sincerely,

Kurt W. Bernlohr, President
VALIC Company II
| * | The Standard & Poor’s (S&P) 500 includes a representative sample of leading companies in leading industries that reflect the U.S. stock market. It is not a managed fund, has no identifiable objective and cannot be purchased. It does not provide an indication of how individual investments performed in the past or how they will perform in the future. Past performance of an index does not guarantee the future performance of any investment. |
1
VALIC Company II
EXPENSE EXAMPLE — August 31, 2009 (Unaudited)
Disclosure of Fund Expenses in Shareholder Reports
As a shareholder of a Fund in VALIC Company II (“VC II”), you incur ongoing costs, including management fees and other Fund expenses. This Example is intended to help you understand your ongoing costs (in dollars) of investing in the Funds and to compare these costs with the ongoing costs of investing in other mutual funds. The Example is based on an investment of $1,000 invested at March 1, 2009 and held until August 31, 2009. Shares of VC II are currently issued and redeemed only in connection with investments in and payments under variable annuity contracts and variable life insurance policies (“Variable Contracts”) and qualified retirement plans (the “Plans”) offered by The Variable Annuity Life Insurance Company (“VALIC”), the investment adviser to VC II and other life insurance companies affiliated with VALIC. The fees and expenses associated with the Variable Contracts and Plans are not included in these Examples, and had such fees and expenses been included your costs would have been higher. Please see your Variable Contract prospectus or Plan document for more details on the fees associated with the Variable Contract or Plans.
Actual Expenses
The “Actual” section of the table provides information about your actual account values and actual expenses. You may use the information in these columns, together with the amount you invested, to estimate the expenses that you paid over the period. Simply divide your account value by $1,000 (for example, an $8,600 account value divided by $1,000 = 8.6), then multiply the result by the number in the column under the heading entitled “Expenses Paid During the Six Months Ended August 31, 2009” to estimate the expenses you paid on your account during this period. The “Expenses Paid During the Six Months Ended August 31, 2009” column and the “Expense Ratio as of August 31, 2009” column do not include fees and expenses that may be charged by the Variable Contracts or Plans, in which the Funds are offered. Had these fees and expenses been included, the “Expenses Paid During the Six Months Ended August 31, 2009” column would have been higher and the “Ending Account Value” would have been lower.
Hypothetical Example for Comparison Purposes
The “Hypothetical” section of the table provides information about hypothetical account values and hypothetical expenses based on the Fund’s actual expense ratio and an assumed rate of return of 5% per year before expenses, which is not the Fund’s actual return. The hypothetical account values and expenses may not be used to estimate the actual ending account balance or expenses you paid for the period. You may use this information to compare the ongoing costs of investing in the Funds and other funds. To do so, compare this 5% hypothetical example with the 5% hypothetical examples that appear in the shareholder reports of other funds. The “Expenses Paid During the Six Months Ended August 31, 2009” column and the “Expense Ratio as of August 31, 2009” column do not include fees and expenses that may be charged by the Variable Contracts or Plans, in which the Funds are offered. Had these fees and expenses been included, the “Expenses Paid During the Six Months Ended August 31, 2009” column would have been higher and the “Ending Account Value” would have been lower.
Please note that the expenses shown in the table are meant to highlight your ongoing costs only and do not reflect any fees and expenses that may be charged by the Variable Contracts or Plans. Please refer to your Variable Contract prospectus or Plan document for more information. Therefore, the “hypothetical” example is useful in comparing ongoing costs and will not help you determine the relative total costs of owning different funds. In addition, if these fees and expenses were included, your costs would have been higher.
2
VALIC Company II
EXPENSE EXAMPLE — August 31, 2009 (Unaudited) — (continued)
| | | | | | | | | | | | | | | |
| | | Actual
| | Hypothetical
| | | |
Fund
| | Beginning
Account Value
at March 1,
2009
| | Ending
Account Value
Using Actual
Return at
August 31,
2009
| | Expenses Paid
During the Six
Months Ended
August 31,
2009*
| | Beginning
Account Value
at March 1,
2009
| | Ending
Account Value
Using a
Hypothetical
5% Assumed
Return at
August 31,
2009
| | Expenses Paid
During the
Six Months Ended
August 31,
2009*
| | Expense
Ratio
as of
August 31,
2009*
| |
Aggressive Growth Lifestyle# | | $1,000.00 | | $1,356.73 | | $0.59 | | $1,000.00 | | $1,024.70 | | $0.51 | | 0.10 | % |
Capital Appreciation# | | $1,000.00 | | $1,301.56 | | $4.93 | | $1,000.00 | | $1,020.92 | | $4.33 | | 0.85 | % |
Conservative Growth Lifestyle# | | $1,000.00 | | $1,227.62 | | $0.56 | | $1,000.00 | | $1,024.70 | | $0.51 | | 0.10 | % |
Core Bond# | | $1,000.00 | | $1,127.97 | | $4.13 | | $1,000.00 | | $1,021.32 | | $3.92 | | 0.77 | % |
High Yield Bond# | | $1,000.00 | | $1,276.84 | | $5.68 | | $1,000.00 | | $1,020.21 | | $5.04 | | 0.99 | % |
International Small Cap Equity# | | $1,000.00 | | $1,412.90 | | $6.08 | | $1,000.00 | | $1,020.16 | | $5.09 | | 1.00 | % |
Large Cap Value#@ | | $1,000.00 | | $1,310.49 | | $4.72 | | $1,000.00 | | $1,021.12 | | $4.13 | | 0.81 | % |
Mid Cap Growth#@ | | $1,000.00 | | $1,415.65 | | $5.18 | | $1,000.00 | | $1,020.92 | | $4.33 | | 0.85 | % |
Mid Cap Value#@ | | $1,000.00 | | $1,511.30 | | $6.65 | | $1,000.00 | | $1,019.91 | | $5.35 | | 1.05 | % |
Moderate Growth Lifestyle# | | $1,000.00 | | $1,302.45 | | $0.58 | | $1,000.00 | | $1,024.70 | | $0.51 | | 0.10 | % |
Money Market II# | | $1,000.00 | | $1,001.87 | | $2.78 | | $1,000.00 | | $1,022.43 | | $2.80 | | 0.55 | % |
Small Cap Growth #@ | | $1,000.00 | | $1,489.60 | | $7.28 | | $1,000.00 | | $1,019.36 | | $5.90 | | 1.16 | % |
Small Cap Value#@ | | $1,000.00 | | $1,490.20 | | $5.96 | | $1,000.00 | | $1,020.42 | | $4.84 | | 0.95 | % |
Socially Responsible#@ | | $1,000.00 | | $1,428.80 | | $3.43 | | $1,000.00 | | $1,022.38 | | $2.85 | | 0.56 | % |
Strategic Bond# | | $1,000.00 | | $1,197.90 | | $4.93 | | $1,000.00 | | $1,020.72 | | $4.53 | | 0.89 | % |
| * | Expenses are equal to the Fund’s annualized expense ratio multiplied by the average account value over the period, multiplied by 184 days then divided by 365 days. These ratios do not reflect fees and expenses associated with the Variable Contracts or Plans. If such fees and expenses had been included, the expenses would have been higher. Please refer to your Variable Contract prospectus for details on the expenses that apply to the Variable Contracts or your Plan document for details on the administration fees charged by your Plan sponsor. |
| # | During the stated period, the investment adviser waived a portion of or all fees and assumed a portion of or all expenses for the Fund. As a result, if these fees and expenses had not been waived or assumed, the “Actual/Hypothetical Ending Account Value” would have been lower and the “Actual/Hypothetical Expenses Paid During the Six Months Ended August 31, 2009” and the “Expense Ratios” would have been higher. |
| @ | Through expense offset arrangements resulting from broker commission recapture, a portion of the Fund's expenses has been reduced. Had the expense reductions been taken into account, the Expense Example would have been as follows: |
| | | | | | | | | | | | | | |
| | | Actual
| | Hypothetical
| | |
Fund
| | Beginning
Account Value
at March 1,
2009
| | Ending
Account Value
Using Actual
Return at
August 31,
2009
| | Expenses Paid
During the Six
Months Ended
August 31,
2009*
| | Beginning
Account Value
at March 1,
2009
| | Ending
Account Value
Using a
Hypothetical
5% Assumed
Return at
August 31,
2009
| | Expenses Paid
During the
Six Months Ended
August 31,
2009*
| | Expense
Ratio
as of
August 31,
2009*
|
Large Cap Value# | | $1,000.00 | | $1,310.49 | | $4.66 | | $1,000.00 | | $1,021.17 | | $4.08 | | 0.80% |
Mid Cap Growth# | | $1,000.00 | | $1,415.65 | | $4.75 | | $1,000.00 | | $1,021.27 | | $3.97 | | 0.78% |
Mid Cap Value# | | $1,000.00 | | $1,511.30 | | $6.46 | | $1,000.00 | | $1,020.06 | | $5.19 | | 1.02% |
Small Cap Growth# | | $1,000.00 | | $1,489.60 | | $7.15 | | $1,000.00 | | $1,019.46 | | $5.80 | | 1.14% |
Small Cap Value# | | $1,000.00 | | $1,490.20 | | $5.96 | | $1,000.00 | | $1,020.42 | | $4.84 | | 0.95% |
Socially Responsible# | | $1,000.00 | | $1,428.80 | | $3.31 | | $1,000.00 | | $1,022.48 | | $2.75 | | 0.54% |
3
VALIC Company II Aggressive Growth Lifestyle Fund
PORTFOLIO PROFILE — August 31, 2009 (Unaudited)
Industry Allocation*
| | | |
Domestic Equity Investment Companies | | 57.1 | % |
Fixed Income Investment Companies | | 17.3 | |
International Equity Investment Companies | | 25.7 | |
| | |
|
|
| | | 100.1 | % |
| | |
|
|
| * | Calculated as a percentage of net assets |
4
VALIC Company II Aggressive Growth Lifestyle Fund
PORTFOLIO OF INVESTMENTS — August 31, 2009
| | | | | | | |
| | |
| Security Description | | Shares | | | Market Value
(Note 2) | |
| |
AFFILIATED REGISTERED INVESTMENT COMPANIES#(1) — 100.1% | |
Domestic Equity Investment Companies — 57.1% | |
VALIC Co. I Blue Chip Growth Fund | | 775,682 | | | $ | 6,174,429 | |
VALIC Co. I Small Cap Special Values Fund | | 997,070 | | | | 7,009,402 | |
VALIC Co. I Stock Index Fund | | 369,082 | | | | 7,872,522 | |
VALIC Co. I Value Fund | | 736,674 | | | | 5,974,425 | |
VALIC Co. II Capital Appreciation Fund | | 1,286,086 | | | | 9,658,506 | |
VALIC Co. II Large Cap Value Fund | | 343,370 | | | | 3,217,378 | |
VALIC Co. II Mid Cap Value Fund | | 517,611 | | | | 6,578,832 | |
VALIC Co. II Small Cap Growth Fund† | | 122,866 | | | | 1,143,881 | |
VALIC Co. II Small Cap Value Fund | | 595,865 | | | | 5,887,149 | |
| | | | | |
|
|
|
Total Domestic Equity Investment Companies | |
(cost $46,311,287) | | | | | | 53,516,524 | |
| | | | | |
|
|
|
Fixed Income Investment Companies — 17.3% | |
VALIC Co. II Core Bond Fund | | 335,230 | | | | 3,338,893 | |
VALIC Co. II High Yield Bond Fund | | 636,094 | | | | 4,319,081 | |
VALIC Co. II Strategic Bond Fund | | 832,779 | | | | 8,577,627 | |
| | | | | |
|
|
|
Total Fixed Income Investment Companies | |
(cost $14,411,902) | | | | | | 16,235,601 | |
| | | | | |
|
|
|
International Equity Investment Companies — 25.7% | |
VALIC Co. I Foreign Value Fund | | 630,123 | | | | 5,255,229 | |
VALIC Co. I Global Real Estate Fund | | 1,184,169 | | | | 8,928,629 | |
VALIC Co. I International Equities Fund | | 1,212,640 | | | | 7,106,070 | |
VALIC Co. I International Growth I Fund | | 297,516 | | | | 2,737,143 | |
| | | | | |
|
|
|
Total International Equity Investment Companies | |
(cost $19,643,655) | | | | | | 24,027,071 | |
| | | | | |
|
|
|
TOTAL INVESTMENTS | | | | | | | |
(cost $80,366,844)(2) | | 100.1 | % | | | 93,779,196 | |
Liabilities in excess of other assets | | (0.1 | ) | | | (83,387 | ) |
| | |
|
| |
|
|
|
NET ASSETS — | | 100.0 | % | | $ | 93,695,809 | |
| | |
|
| |
|
|
|
| † | Non-income producing security |
| # | The Aggressive Growth Lifestyle Fund invests in various VALIC Company I or VALIC Company II Funds, some of which are not presented in this report. Additional information on the underlying funds including such fund’s prospectuses and shareholder reports, is available at our website, www.valic.com. |
| (2) | See Note 5 for cost of investments on a tax basis. |
The following is a summary of the inputs used to value the Fund’s net assets as of August 31, 2009 (see Note 2):
| | | | | | | | | | | | |
| | | Level 1 -
Unadjusted
Quoted
Prices
| | Level 2 -
Other
Observable
Inputs
| | Level 3 -
Significant
Unobservable
Inputs
| | Total
|
Affiliated Registered Investment Companies: | | | | | | | | | | | | |
Domestic Equity Investment Companies | | $ | 53,516,524 | | $ | – | | $ | – | | $ | 53,516,524 |
Fixed Income Investment Companies | | | 16,235,601 | | | – | | | – | | | 16,235,601 |
International Equity Investment Companies | | | 24,027,071 | | | – | | | – | | | 24,027,071 |
| | |
|
| |
|
| |
|
| |
|
|
Total | | $ | 93,779,196 | | $ | – | | $ | – | | $ | 93,779,196 |
| | |
|
| |
|
| |
|
| |
|
|
See Notes to Financial Statements
5
VALIC Company II Capital Appreciation Fund
PORTFOLIO PROFILE — August 31, 2009 (Unaudited)
Industry Allocation*
| | | |
Computers | | 8.4 | % |
Medical — Biomedical/Gene | | 7.6 | |
Applications Software | | 6.2 | |
Medical Products | | 5.9 | |
Medical — Drugs | | 5.7 | |
Retail — Discount | | 4.5 | |
Enterprise Software/Service | | 4.5 | |
E-Commerce/Services | | 3.7 | |
Oil Field Machinery & Equipment | | 3.1 | |
Computers — Memory Devices | | 3.0 | |
Savings & Loans/Thrifts | | 3.0 | |
Pharmacy Services | | 2.8 | |
Web Portals/ISP | | 2.8 | |
Transport — Rail | | 2.6 | |
Retail — Auto Parts | | 2.5 | |
Oil & Gas Drilling | | 2.4 | |
Aerospace/Defense | | 2.2 | |
Schools | | 2.2 | |
E-Commerce/Products | | 2.1 | |
Retail — Restaurants | | 2.0 | |
Banks — Fiduciary | | 1.9 | |
Athletic Footwear | | 1.9 | |
Electronic Components — Semiconductors | | 1.8 | |
Energy — Alternate Sources | | 1.7 | |
Retail — Major Department Stores | | 1.5 | |
Commercial Services — Finance | | 1.5 | |
Distribution/Wholesale | | 1.4 | |
Transport — Services | | 1.4 | |
Oil Companies — Exploration & Production | | 1.4 | |
Cable/Satellite TV | | 1.3 | |
Beverages — Non-alcoholic | | 1.3 | |
Chemicals — Specialty | | 1.3 | |
Medical — Generic Drugs | | 1.3 | |
Retail — Apparel/Shoe | | 1.1 | |
Telecommunication Equipment | | 1.1 | |
Banks — Super Regional | | 1.0 | |
| | |
|
|
| | | 100.1 | % |
| | |
|
|
| * | Calculated as a percentage of net assets |
6
VALIC Company II Capital Appreciation Fund
PORTFOLIO OF INVESTMENTS — August 31, 2009
| | | | | |
| | |
| Security Description | | Shares | | Market Value
(Note 2) |
|
COMMON STOCK — 100.1% | | | |
Aerospace/Defense — 2.2% | | | | | |
Lockheed Martin Corp. | | 14,400 | | $ | 1,079,712 |
| | | | |
|
|
Applications Software — 6.2% | | | | | |
Intuit, Inc.† | | 28,100 | | | 780,337 |
Microsoft Corp. | | 52,100 | | | 1,284,265 |
Salesforce.com, Inc.† | | 18,200 | | | 944,034 |
| | | | |
|
|
| | | | | | 3,008,636 |
| | | | |
|
|
Athletic Footwear — 1.9% | | | | | |
NIKE, Inc., Class B | | 16,200 | | | 897,318 |
| | | | |
|
|
Banks - Fiduciary — 1.9% | | | | | |
State Street Corp. | | 17,500 | | | 918,400 |
| | | | |
|
|
Banks - Super Regional — 1.0% | | | | | |
Wells Fargo & Co. | | 17,800 | | | 489,856 |
| | | | |
|
|
Beverages - Non - alcoholic — 1.3% | | | | | |
The Coca - Cola Co. | | 13,100 | | | 638,887 |
| | | | |
|
|
Cable/Satellite TV — 1.3% | | | | | |
Comcast Corp., Class A | | 42,000 | | | 643,440 |
| | | | |
|
|
Chemicals - Specialty — 1.3% | | | | | |
Ecolab, Inc. | | 14,900 | | | 630,121 |
| | | | |
|
|
Commercial Services - Finance — 1.5% | | | | | |
Mastercard, Inc., Class A | | 3,500 | | | 709,205 |
| | | | |
|
|
Computers — 8.4% | | | | | |
Apple, Inc.† | | 8,500 | | | 1,429,785 |
Hewlett - Packard Co. | | 32,600 | | | 1,463,414 |
International Business Machines Corp. | | 10,200 | | | 1,204,110 |
| | | | |
|
|
| | | | | | 4,097,309 |
| | | | |
|
|
Computers - Memory Devices — 3.0% | | | | | |
EMC Corp.† | | 93,000 | | | 1,478,700 |
| | | | |
|
|
Distribution/Wholesale — 1.4% | | | | | |
WW Grainger, Inc. | | 7,900 | | | 691,013 |
| | | | |
|
|
E - Commerce/Products — 2.1% | | | | | |
Amazon.com, Inc.† | | 12,600 | | | 1,022,994 |
| | | | |
|
|
E - Commerce/Services — 3.7% | | | | | |
eBay, Inc.† | | 54,100 | | | 1,197,774 |
Priceline.com, Inc.† | | 4,000 | | | 615,920 |
| | | | |
|
|
| | | | | | 1,813,694 |
| | | | |
|
|
Electronic Components - Semiconductors — 1.8% | | | |
Intel Corp. | | 42,200 | | | 857,504 |
| | | | |
|
|
Energy - Alternate Sources — 1.7% | | | | | |
First Solar, Inc.† | | 6,700 | | | 814,586 |
| | | | |
|
|
Enterprise Software/Service — 4.5% | | | | | |
CA, Inc. | | 40,000 | | | 891,600 |
Oracle Corp. | | 58,400 | | | 1,277,208 |
| | | | |
|
|
| | | | | | 2,168,808 |
| | | | |
|
|
Medical Products — 5.9% | | | | | |
Johnson & Johnson | | 21,200 | | | 1,281,328 |
Stryker Corp. | | 22,100 | | | 916,266 |
Varian Medical Systems, Inc.† | | 15,200 | | | 654,664 |
| | | | |
|
|
| | | | | | 2,852,258 |
| | | | |
|
|
Medical - Biomedical/Gene — 7.6% | | | | | |
Amgen, Inc.† | | 21,100 | | | 1,260,514 |
Biogen Idec, Inc.† | | 16,900 | | | 848,549 |
Gilead Sciences, Inc.† | | 26,700 | | | 1,203,102 |
Life Technologies Corp.† | | 7,900 | | | 351,787 |
| | | | |
|
|
| | | | | | 3,663,952 |
| | | | |
|
|
| | | | | |
| | |
| Security Description | | Shares | | Market Value
(Note 2) |
|
| | | | | | |
Medical - Drugs — 5.7% | | | | | |
Abbott Laboratories | | 10,900 | | $ | 493,007 |
Bristol - Myers Squibb Co. | | 39,000 | | | 863,070 |
Forest Laboratories, Inc.† | | 23,700 | | | 693,699 |
Merck & Co., Inc. | | 21,800 | | | 706,974 |
Myriad Pharmaceuticals, Inc.† | | 4,500 | | | 20,250 |
| | | | |
|
|
| | | | | | 2,777,000 |
| | | | |
|
|
Medical - Generic Drugs — 1.3% | | | | | |
Mylan, Inc.† | | 42,600 | | | 624,942 |
| | | | |
|
|
Oil & Gas Drilling — 2.4% | | | | | |
Diamond Offshore Drilling, Inc. | | 6,300 | | | 563,346 |
Noble Corp. | | 16,800 | | | 588,504 |
| | | | |
|
|
| | | | | | 1,151,850 |
| | | | |
|
|
Oil Companies - Exploration & Production — 1.4% | | | |
Southwestern Energy Co.† | | 18,000 | | | 663,480 |
| | | | |
|
|
Oil Field Machinery & Equipment — 3.1% | | | | | |
Cameron International Corp.† | | 22,000 | | | 785,620 |
National - Oilwell Varco, Inc.† | | 19,400 | | | 705,190 |
| | | | |
|
|
| | | | | | 1,490,810 |
| | | | |
|
|
Pharmacy Services — 2.8% | | | | | |
Express Scripts, Inc.† | | 18,700 | | | 1,350,514 |
| | | | |
|
|
Retail - Apparel/Shoe — 1.1% | | | | | |
Ross Stores, Inc. | | 11,900 | | | 555,016 |
| | | | |
|
|
Retail - Auto Parts — 2.5% | | | | | |
AutoZone, Inc.† | | 4,400 | | | 647,900 |
O’Reilly Automotive, Inc.† | | 14,800 | | | 566,544 |
| | | | |
|
|
| | | | | | 1,214,444 |
| | | | |
|
|
Retail - Discount — 4.5% | | | | | |
Dollar Tree, Inc.† | | 3,700 | | | 184,778 |
Family Dollar Stores, Inc. | | 23,200 | | | 702,496 |
Wal - Mart Stores, Inc. | | 25,300 | | | 1,287,011 |
| | | | |
|
|
| | | | | | 2,174,285 |
| | | | |
|
|
Retail - Major Department Stores — 1.5% | | | | | |
TJX Cos., Inc. | | 20,500 | | | 736,975 |
| | | | |
|
|
Retail - Restaurants — 2.0% | | | | | |
McDonald’s Corp. | | 17,200 | | | 967,328 |
| | | | |
|
|
Savings & Loans/Thrifts — 3.0% | | | | | |
Hudson City Bancorp, Inc. | | 68,500 | | | 898,720 |
New York Community Bancorp, Inc. | | 51,800 | | | 551,152 |
| | | | |
|
|
| | | | | | 1,449,872 |
| | | | |
|
|
Schools — 2.2% | | | | | |
Apollo Group, Inc., Class A† | | 7,600 | | | 492,632 |
ITT Educational Services, Inc.† | | 5,400 | | | 566,946 |
| | | | |
|
|
| | | | | | 1,059,578 |
| | | | |
|
|
Telecom Services — 0.0% | | | | | |
Harris Stratex Networks, Inc.† | | 3,875 | | | 23,483 |
| | | | |
|
|
Telecommunication Equipment — 1.1% | | | | | |
Harris Corp. | | 15,600 | | | 541,788 |
| | | | |
|
|
Transport - Rail — 2.6% | | | | | |
Burlington Northern Santa Fe Corp. | | 7,600 | | | 630,952 |
Union Pacific Corp. | | 10,600 | | | 633,986 |
| | | | |
|
|
| | | | | | 1,264,938 |
| | | | |
|
|
Transport - Services — 1.4% | | | | | |
C.H. Robinson Worldwide, Inc. | | 12,200 | | | 686,372 |
| | | | |
|
|
7
VALIC Company II Capital Appreciation Fund
PORTFOLIO OF INVESTMENTS — August 31, 2009 — (continued)
| | | | | | | |
| | |
| Security Description | | Shares | | | Market Value
(Note 2) | |
| |
COMMON STOCK (continued) | | | | | | | |
Web Portals/ISP — 2.8% | | | | | | | |
Google, Inc., Class A† | | 2,900 | | | $ | 1,338,843 | |
| | | | | |
|
|
|
TOTAL LONG-TERM INVESTMENT SECURITIES | | | | | | | |
(cost $49,591,308)(1) | | 100.1 | % | | | 48,547,911 | |
Liabilities in excess of other assets | | (0.1 | ) | | | (38,008 | ) |
| | |
|
| |
|
|
|
NET ASSETS — | | 100.0 | % | | $ | 48,509,903 | |
| | |
|
| |
|
|
|
| † | Non-income producing security |
| (1) | See Note 5 for cost of investments on a tax basis. |
The following is a summary of the inputs used to value the Fund’s net assets as of August 31, 2009 (see Note 2):
| | | | | | | | | | | | |
| | | Level 1 -
Unadjusted
Quoted
Prices
| | Level 2 -
Other
Observable
Inputs
| | Level 3 -
Significant
Unobservable
Inputs
| | Total
|
Long-Term Investment Securities: | | | | | | | | | | | | |
Common Stock: | | | | | | | | | | | | |
Applications Software | | $ | 3,008,636 | | $ | – | | $ | – | | $ | 3,008,636 |
Computers | | | 4,097,309 | | | – | | | – | | | 4,097,309 |
Medical Products | | | 2,852,258 | | | – | | | – | | | 2,852,258 |
Medical — Biomedical/Gene | |
| 3,663,952
| | | – | | | – | | | 3,663,952 |
Medical — Drugs | | | 2,777,000 | | | – | | | – | | | 2,777,000 |
Other Industries* | | | 32,148,756 | | | – | | | – | | | 32,148,756 |
| | |
|
| |
|
| |
|
| |
|
|
Total | | $ | 48,547,911 | | $ | – | | $ | – | | $ | 48,547,911 |
| | |
|
| |
|
| |
|
| |
|
|
| * | Sum of all other industries each of which individually has an aggregate market value of less than 5% of net assets. |
See Notes to Financial Statements
8
VALIC Company II Conservative Growth Lifestyle Fund
PORTFOLIO PROFILE — August 31, 2009 (Unaudited)
Industry Allocation*
| | | |
Fixed Income Investment Companies | | 56.2 | % |
Domestic Equity Investment Companies | | 30.8 | |
International Equity Investment Companies | | 13.1 | |
| | |
|
|
| | | 100.1 | % |
| | |
|
|
| * | Calculated as a percentage of net assets |
9
VALIC Company II Conservative Growth Lifestyle Fund
PORTFOLIO OF INVESTMENTS — August 31, 2009
| | | | | | | |
| | |
| Security Description | | Shares | | | Market
Value
(Note 2) | |
| |
AFFILIATED REGISTERED INVESTMENT COMPANIES#(1) — 100.1% | |
Domestic Equity Investment Companies — 30.8% | |
VALIC Co. I Blue Chip Growth Fund | | 107,853 | | | $ | 858,510 | |
VALIC Co. I Small Cap Special Values Fund | | 452,644 | | | | 3,182,086 | |
VALIC Co. I Stock Index Fund | | 151,871 | | | | 3,239,418 | |
VALIC Co. I Value Fund | | 220,235 | | | | 1,786,108 | |
VALIC Co. II Capital Appreciation Fund | | 304,117 | | | | 2,283,918 | |
VALIC Co. II Large Cap Value Fund | | 79,344 | | | | 743,450 | |
VALIC Co. II Mid Cap Value Fund | | 249,031 | | | | 3,165,180 | |
VALIC Co. II Small Cap Growth Fund† | | 25,360 | | | | 236,098 | |
VALIC Co. II Small Cap Value Fund | | 231,620 | | | | 2,288,401 | |
| | | | | |
|
|
|
Total Domestic Equity Investment Companies | |
(cost $14,398,891) | | | | | | 17,783,169 | |
| | | | | |
|
|
|
Fixed Income Investment Companies — 56.2% | |
VALIC Co. I Government Securities Fund | | 270,849 | | | | 2,914,332 | |
VALIC Co. II Core Bond Fund | | 1,401,290 | | | | 13,956,853 | |
VALIC Co. II High Yield Bond Fund | | 943,696 | | | | 6,407,693 | |
VALIC Co. II Strategic Bond Fund | | 884,083 | | | | 9,106,057 | |
| | | | | |
|
|
|
Total Fixed Income Investment Companies | |
(cost $29,691,054) | | | | | | 32,384,935 | |
| | | | | |
|
|
|
International Equity Investment Companies — 13.1% | |
VALIC Co. I Foreign Value Fund | | 259,883 | | | | 2,167,428 | |
VALIC Co. I Global Real Estate Fund | | 256,327 | | | | 1,932,708 | |
VALIC Co. I International Equities Fund | | 591,900 | | | | 3,468,535 | |
| | | | | |
|
|
|
Total International Equity Investment Companies | |
(cost $6,100,112) | | | | | | 7,568,671 | |
| | | | | |
|
|
|
TOTAL INVESTMENTS | |
(cost $50,190,057)(2) | | 100.1 | % | | | 57,736,775 | |
Liabilities in excess of other assets | | (0.1 | ) | | | (78,195 | ) |
| | |
|
| |
|
|
|
NET ASSETS — | | 100.0 | % | | $ | 57,658,580 | |
| | |
|
| |
|
|
|
| † | Non-income producing security |
| # | The Conservative Growth Lifestyle Fund invests in various VALIC Company I or VALIC Company II Funds, some of which are not presented in this report. Additional information on the underlying funds including such fund’s prospectuses and shareholder reports, is available at our website, www.valic.com. |
| (2) | See Note 5 for cost of investments on a tax basis. |
The following is a summary of the inputs used to value the Fund’s net assets as of August 31, 2009 (see Note 2):
| | | | | | | | | | | | |
| | | Level 1 -
Unadjusted
Quoted
Prices
| | Level 2 -
Other
Observable
Inputs
| | Level 3 -
Significant
Unobservable
Inputs
| | Total
|
Affiliated Registered Investment Companies: | | | | | | | | | | | | |
Domestic Equity Investment Companies | | $ | 17,783,169 | | $ | – | | $ | – | | $ | 17,783,169 |
Fixed Income Investment Companies | | | 32,384,935 | | | – | | | – | | | 32,384,935 |
International Equity Investment Companies | | | 7,568,671 | | | – | | | – | | | 7,568,671 |
| | |
|
| |
|
| |
|
| |
|
|
Total | | $ | 57,736,775 | | $ | – | | $ | – | | $ | 57,736,775 |
| | |
|
| |
|
| |
|
| |
|
|
See Notes to Financial Statements
10
VALIC Company II Core Bond Fund
PORTFOLIO PROFILE — August 31, 2009 (Unaudited)
Industry Allocation*
| | | |
Federal Home Loan Mtg. Corp. | | 24.1 | % |
Repurchase Agreements | | 7.6 | |
Federal National Mtg. Assoc. | | 6.8 | |
Diversified Financial Services | | 6.7 | |
United States Treasury Notes | | 6.4 | |
Electric — Integrated | | 4.3 | |
Diversified Banking Institutions | | 3.9 | |
Banks — Commercial | | 3.2 | |
United States Treasury Bonds | | 3.1 | |
Government National Mtg. Assoc. | | 2.3 | |
Telephone — Integrated | | 2.0 | |
Oil Companies — Exploration & Production | | 2.0 | |
Special Purpose Entities | | 1.8 | |
Cable/Satellite TV | | 1.5 | |
Pipelines | | 1.4 | |
Finance — Investment Banker/Broker | | 1.4 | |
Banks — Super Regional | | 1.3 | |
Insurance — Multi-line | | 1.0 | |
Transport — Rail | | 0.7 | |
Medical — Drugs | | 0.7 | |
Cellular Telecom | | 0.7 | |
Oil Companies — Integrated | | 0.7 | |
Medical — Hospitals | | 0.6 | |
Telecom Services | | 0.6 | |
Medical Products | | 0.5 | |
Banks — Money Center | | 0.4 | |
Steel — Producers | | 0.5 | |
Non — Hazardous Waste Disposal | | 0.5 | |
Electric — Generation | | 0.4 | |
Multimedia | | 0.4 | |
Beverages — Non-alcoholic | | 0.4 | |
Office Automation & Equipment | | 0.4 | |
Insurance — Mutual | | 0.4 | |
Cable TV | | 0.4 | |
Chemicals — Diversified | | 0.4 | |
Diversified Minerals | | 0.3 | |
Insurance — Life/Health | | 0.3 | |
Airlines | | 0.3 | |
Finance — Auto Loans | | 0.3 | |
Finance — Other Services | | 0.3 | |
Food — Misc. | | 0.3 | |
Transport — Air Freight | | 0.3 | |
Containers — Metal/Glass | | 0.3 | |
Satellite Telecom | | 0.3 | |
Electronic Components — Semiconductors | | 0.3 | |
Brewery | | 0.2 | |
Medical — Biomedical/Gene | | 0.2 | |
Finance — Commercial | | 0.2 | |
Gas — Distribution | | 0.2 | |
Insurance — Property/Casualty | | 0.2 | |
Property Trust | | 0.2 | |
Finance — Mortgage Loan/Banker | | 0.2 | |
Medical — Generic Drugs | | 0.2 | |
Medical — HMO | | 0.2 | |
Metal — Copper | | 0.2 | |
Pharmacy Services | | 0.2 | |
Metal — Aluminum | | 0.2 | |
Paper & Related Products | | 0.2 | |
Independent Power Producers | | 0.2 | |
Cruise Lines | | 0.2 | |
Banks — Fiduciary | | 0.2 | |
Transport — Services | | 0.2 | |
Schools | | 0.2 | |
Finance — Credit Card | | 0.2 | |
Diversified Manufacturing Operations | | 0.2 | |
Investment Companies | | 0.1 | |
Metal — Diversified | | 0.1 | |
Casino Hotels | | 0.1 | |
Chemicals — Specialty | | 0.1 | |
| | | |
Consumer Products — Misc. | | 0.1 | |
Food — Meat Products | | 0.1 | |
Insurance Brokers | | 0.1 | |
Retail — Discount | | 0.1 | |
Oil & Gas Drilling | | 0.1 | |
Aerospace/Defense | | 0.1 | |
Oil Refining & Marketing | | 0.1 | |
Enterprise Software/Service | | 0.1 | |
Medical Labs & Testing Services | | 0.1 | |
Agricultural Chemicals | | 0.1 | |
Finance — Consumer Loans | | 0.1 | |
Distribution/Wholesale | | 0.1 | |
Casino Services | | 0.1 | |
Decision Support Software | | 0.1 | |
Funeral Services & Related Items | | 0.1 | |
Research & Development | | 0.1 | |
Broadcast Services/Program | | 0.1 | |
Electronics — Military | | 0.1 | |
Gambling (Non-Hotel) | | 0.1 | |
Transactional Software | | 0.1 | |
| | |
|
|
| | | 98.9 | % |
| | |
|
|
| * | Calculated as a percentage of net assets |
Credit Quality†#
| | | |
Government — Agency | | 36.5 | % |
Government — Treasury | | 10.4 | |
AAA | | 3.6 | |
AA | | 3.9 | |
A | | 15.8 | |
BBB | | 16.4 | |
BB | | 4.5 | |
B | | 3.2 | |
CCC | | 1.7 | |
CC | | 0.2 | |
C | | 0.1 | |
Below C | | 0.5 | |
Not Rated@ | | 3.2 | |
| | |
|
|
| | | 100.0 | % |
| | |
|
|
| * | Calculated as a percentage of net assets. |
| @ | Represents debt issues that either have no rating, or the rating is unavailable from the data source. |
| † | Source: Standard and Poors |
| # | Calculated as percentage of total debt issues, excluding short-term securities. |
11
VALIC Company II Core Bond Fund
PORTFOLIO OF INVESTMENTS — August 31, 2009
| | | | | | |
| | |
| Security Description | | Principal
Amount | | Market Value
(Note 2) |
|
ASSET BACKED SECURITIES — 6.0% |
Diversified Financial Services — 6.0% |
Banc of America Commercial Mtg., Inc.
Series 2006-6, Class AM
5.39% due 10/10/45(1) | | $ | 660,000 | | $ | 422,452 |
Bear Stearns Commercial Mtg. Securities, Inc.
Series 2007-PW15, Class A2
5.21% due 02/11/44 | | | 390,000 | | | 383,836 |
Chase Funding Mtg. Loan Asset-Backed Certs.
Series 2003-6, Class 1A6
4.59% due 05/25/15(1) | | | 162,129 | | | 149,476 |
Chase Mtg. Finance Corp.
Series 2007-A2, Class 1A1
4.05% due 07/25/37(2)(3) | | | 931,809 | | | 790,535 |
Citigroup Commercial Mtg. Trust
Series 2008-C7, Class AM
6.30% due 12/01/49(1)(3) | | | 870,000 | | | 590,951 |
Commercial Mtg. Asset Trust
Series 1999-C1, Class D
7.35% due 01/17/32(1) | | | 1,377,000 | | | 1,464,072 |
Commercial Mtg. Pass Through Certs.
Series 2006-CN2A, Class A2FL
0.50% due 02/05/19*(1)(4) | | | 1,035,000 | | | 767,332 |
GE Capital Commercial Mtg. Corp.
Series 2004-C2, Class A4
4.89% due 03/10/40(1) | | | 340,000 | | | 326,817 |
GMAC Commercial Mtg. Securities, Inc.
Series 2003-C2, Class A2
5.67% due 05/10/40(1)(3) | | | 100,000 | | | 102,687 |
JP Morgan Chase Commercial Mtg. Securities Corp.
Series 2006-LDP9, Class AM
5.37% due 05/15/47(1) | | | 1,330,000 | | | 870,465 |
JP Morgan Chase Commercial Mtg. Securities Corp.
Series 2008-C2, Class AM
6.80% due 02/12/51(1)(3) | | | 1,698,000 | | | 846,786 |
LB Commercial Conduit Mtg. Trust
Series 1998-C1, Class E
7.00% due 02/18/30(1) | | | 285,000 | | | 309,378 |
Residential Asset Securities Corp.
Series 2003-KS10, Class AI6
4.54% due 12/25/33 | | | 166,896 | | | 142,444 |
Swift Master Auto Receivables Trust
Series 2007-2, Class A
0.92% due 10/15/12(4) | | | 2,260,734 | | | 2,145,075 |
Wells Fargo Mtg. Backed Securities Trust
Series 2006-AR12, Class 2A1
6.10% due 09/25/36(2) | | | 380,867 | | | 289,225 |
| | | | | |
|
|
Total Asset Backed Securities | | | | | | |
(cost $11,855,302) | | | | | | 9,601,531 |
| | | | | |
|
|
CONVERTIBLE BONDS & NOTES — 0.0% |
Telecom Services — 0.0% |
ICO North America, Inc.
7.50% due 08/15/09†(6)(10)(11)(12)(13)(14)
(cost $28,000) | | | 28,000 | | | 9,800 |
| | | | | |
|
|
U.S.CORPORATE BONDS & NOTES — 34.1% |
Advertising Services — 0.0% |
Visant Holding Corp.
Company Guar. Notes
7.63% due 10/01/12 | | | 25,000 | | | 25,125 |
| | | | | |
|
|
Aerospace/Defense — 0.1% |
Meccanica Holdings USA
Company Guar. Notes
7.38% due 07/15/39* | | | 148,000 | | | 168,530 |
| | | | | |
|
|
| | | | | | |
| | |
| Security Description | | Principal
Amount | | Market Value
(Note 2) |
|
| | | | | | | |
Agricultural Chemicals — 0.1% |
Terra Capital, Inc.
Company Guar. Notes
7.00% due 02/01/17 | | $ | 160,000 | | $ | 150,800 |
| | | | | |
|
|
Airlines — 0.3% |
American Airlines, Inc.
Pass Through Certs.
Series 2001-1, Class A-2
6.82% due 05/23/11 | | | 145,000 | | | 124,700 |
American Airlines, Inc.
Pass Through Certs.
Series 2001-2, Class A-2
7.86% due 04/01/13 | | | 18,000 | | | 17,190 |
Continental Airlines, Inc.
Pass Through Certs.
Series 2001-1, Class A-2
6.50% due 06/15/11 | | | 80,000 | | | 76,000 |
Delta Air Lines, Inc.
Pass Through Certs.
Series 2001-1, Class A2
7.11% due 03/18/13 | | | 75,000 | | | 72,375 |
Northwest Airlines, Inc.
Pass Through Certs.
Series 2002-1, Class G2
6.26% due 11/20/21 | | | 158,539 | | | 112,167 |
United AirLines, Inc.
Pass Through Certs.
Series 2001-1 Class B
6.93% due 09/01/11 | | | 82,000 | | | 108,650 |
| | | | | |
|
|
| | | | | | | 511,082 |
| | | | | |
|
|
Banks - Commercial — 1.3% |
BB&T Corp.
Senior Notes
3.10% due 07/28/11 | | | 310,000 | | | 313,059 |
CoBank ACB
Sub. Notes
7.88% due 04/16/18* | | | 80,000 | | | 77,372 |
Credit Suisse/New York
Sub. Notes
6.00% due 02/15/18 | | | 460,000 | | | 473,103 |
KeyBank NA
Sub. Notes
5.45% due 03/03/16 | | | 258,000 | | | 226,186 |
KeyBank NA
Sub. Notes
7.41% due 10/15/27 | | | 82,000 | | | 81,891 |
PNC Bank NA
Sub. Notes
6.88% due 04/01/18 | | | 170,000 | | | 180,434 |
Sovereign Bank
Sub. Notes
8.75% due 05/30/18 | | | 106,000 | | | 115,420 |
Union Bank of California NA
Sub. Notes
5.95% due 05/11/16 | | | 170,000 | | | 165,815 |
Wachovia Bank NA
Sub. Notes
5.00% due 08/15/15 | | | 446,000 | | | 429,702 |
Wachovia Bank NA
Sub. Notes
5.60% due 03/15/16 | | | 90,000 | | | 91,097 |
| | | | | |
|
|
| | | | | | | 2,154,079 |
| | | | | |
|
|
12
VALIC Company II Core Bond Fund
PORTFOLIO OF INVESTMENTS — August 31, 2009 — (continued)
| | | | | | |
| | |
| Security Description | | Principal
Amount | | Market Value
(Note 2) |
|
U.S. CORPORATE BONDS & NOTES (continued) |
Banks - Fiduciary — 0.2% |
State Street Capital Trust IV
Company Guar. Notes
1.63% due 06/15/37(4) | | $ | 420,000 | | $ | 262,279 |
| | | | | |
|
|
Banks - Money Center — 0.0% |
Chase Capital III
Company Guar. Notes
0.91% due 03/01/27(4) | | | 92,000 | | | 57,920 |
| | | | | |
|
|
Banks - Super Regional — 1.2% |
BAC Capital Trust XIII
Bank Guar. Notes
0.70% due 03/15/12(4)(5) | | | 822,000 | | | 397,716 |
Bank of America Corp.
Senior Notes
4.90% due 05/01/13 | | | 439,000 | | | 443,181 |
National City Corp.
Senior Notes
4.90% due 01/15/15 | | | 99,000 | | | 99,117 |
PNC Preferred Funding Trust I
Jr. Sub. Notes
6.11% due 03/15/12*(4)(5) | | | 250,000 | | | 145,173 |
USB Capital IX
Company Guar. Notes
6.19% due 04/15/11(4)(5) | | | 523,000 | | | 376,560 |
Wachovia Corp.
Sub. Notes
5.63% due 10/15/16 | | | 155,000 | | | 154,587 |
Wells Fargo Bank NA
Sub. Notes
5.75% due 05/16/16 | | | 311,000 | | | 318,654 |
| | | | �� | |
|
|
| | | | | | | 1,934,988 |
| | | | | |
|
|
Beverages - Non-alcoholic — 0.4% |
Bottling Group LLC
Company Guar. Notes
6.95% due 03/15/14 | | | 304,000 | | | 356,086 |
The Coca-Cola Co.
Senior Notes
4.88% due 03/15/19 | | | 320,000 | | | 335,537 |
| | | | | |
|
|
| | | | | | | 691,623 |
| | | | | |
|
|
Brewery — 0.2% |
Anheuser-Busch InBev Worldwide, Inc.
Company Guar. Notes
7.75% due 01/15/19* | | | 336,000 | | | 393,420 |
| | | | | |
|
|
Broadcast Services/Program — 0.1% |
Nexstar Broadcasting, Inc.
Company Guar. Notes
0.50% due 01/15/14*(16) | | | 179,648 | | | 70,063 |
Nexstar Broadcasting, Inc.
Company Guar. Notes
7.00% due 01/15/14 | | | 60,000 | | | 23,700 |
| | | | | |
|
|
| | | | | | | 93,763 |
| | | | | |
|
|
Building Products-Cement — 0.0% |
Texas Industries, Inc.
Company Guar. Notes
7.25% due 07/15/13 | | | 50,000 | | | 46,750 |
| | | | | |
|
|
Cable TV — 0.4% |
Comcast Corp.
Company Guar. Notes
5.90% due 03/15/16 | | | 550,000 | | | 586,717 |
| | | | | |
|
|
| | | | | | |
| | |
| Security Description | | Principal
Amount | | Market Value
(Note 2) |
|
| | | | | | | |
Cable/Satellite TV — 1.5% |
CCH II LLC/CCH II Capital Corp.
Senior Notes
10.25% due 09/15/10†(6)(7) | | $ | 34,000 | | $ | 37,782 |
CCH II LLC/CCH II Capital Corp.
Company Guar. Notes
10.25% due 10/01/13†*(6)(7) | | | 309,000 | | | 323,291 |
CCO Holdings LLC/CCO Holdings Capital Corp.
Senior Notes
8.75% due 11/15/13†(6)(7) | | | 30,000 | | | 30,300 |
Charter Communications Operating LLC/Charter Communications Operating Capital
Senior Notes
10.38% due 04/30/14†*(6)(7) | | | 338,000 | | | 342,225 |
Comcast Corp.
Company Guar. Notes
5.85% due 11/15/15 | | | 236,000 | | | 255,840 |
COX Communications, Inc.
Senior Notes
6.95% due 06/01/38* | | | 125,000 | | | 136,596 |
COX Communications, Inc.
Notes
7.13% due 10/01/12 | | | 156,000 | | | 172,947 |
COX Communications, Inc.
Senior Notes
9.38% due 01/15/19* | | | 348,000 | | | 443,583 |
CSC Holdings, Inc.
Senior Notes
8.50% due 06/15/15* | | | 125,000 | | | 126,250 |
DirecTV Holdings LLC/DirecTV Financing Co.
Company Guar. Notes
7.63% due 05/15/16 | | | 340,000 | | | 357,850 |
Time Warner Cable, Inc.
Company Guar. Notes
6.75% due 06/15/39 | | | 190,000 | | | 203,176 |
| | | | | |
|
|
| | | | | | | 2,429,840 |
| | | | | |
|
|
Casino Hotels — 0.1% |
MGM Mirage, Inc.
Senior Sec. Notes
11.13% due 11/15/17* | | | 75,000 | | | 80,719 |
Turning Stone Resort Casino Enterprise
Senior Notes
9.13% due 09/15/14* | | | 118,000 | | | 108,265 |
| | | | | |
|
|
| | | | | | | 188,984 |
| | | | | |
|
|
Casino Services — 0.1% |
Indianapolis Downs LLC & Capital Corp.
Senior Sec. Notes
11.00% due 11/01/12* | | | 75,000 | | | 53,250 |
Snoqualmie Entertainment Authority
Senior Sec. Notes
9.13% due 02/01/15* | | | 120,000 | | | 66,000 |
| | | | | |
|
|
| | | | | | | 119,250 |
| | | | | |
|
|
Cellular Telecom — 0.6% |
Cingular Wireless Services, Inc.
Senior Notes
7.88% due 03/01/11 | | | 594,000 | | | 644,392 |
Cricket Communications, Inc.
Company Guar. Notes
9.38% due 11/01/14 | | | 28,000 | | | 26,390 |
Cricket Communications, Inc.
Company Guar. Notes
10.00% due 07/15/15 | | | 115,000 | | | 111,262 |
13
VALIC Company II Core Bond Fund
PORTFOLIO OF INVESTMENTS — August 31, 2009 — (continued)
| | | | | | |
| | |
| Security Description | | Principal
Amount | | Market Value
(Note 2) |
|
U.S. CORPORATE BONDS & NOTES (continued) |
Cellular Telecom (continued) |
Nextel Communications, Inc.
Company Guar. Notes
5.95% due 03/15/14 | | $ | 200,000 | | $ | 168,000 |
| | | | | |
|
|
| | | | | | | 950,044 |
| | | | | |
|
|
Chemicals - Diversified — 0.4% |
E.I. du Pont de Nemours & Co.
Senior Notes
4.75% due 03/15/15 | | | 160,000 | | | 170,714 |
Olin Corp.
Senior Notes
8.88% due 08/15/19 | | | 45,000 | | | 45,450 |
The Dow Chemical Co.
Senior Notes
5.90% due 02/15/15 | | | 155,000 | | | 154,725 |
The Dow Chemical Co.
Senior Notes
8.55% due 05/15/19 | | | 193,000 | | | 210,226 |
| | | | | |
|
|
| | | | | | | 581,115 |
| | | | | |
|
|
Chemicals - Specialty — 0.1% |
Huntsman International LLC
Company Guar. Notes
7.88% due 11/15/14 | | | 85,000 | | | 75,650 |
Momentive Performance Materials, Inc.
Company Guar. Notes
9.75% due 12/01/14 | | | 75,000 | | | 48,750 |
Momentive Performance Materials, Inc.
Company Guar. Notes
12.50% due 06/15/14* | | | 66,000 | | | 62,370 |
| | | | | |
|
|
| | | | | | | 186,770 |
| | | | | |
|
|
Computer Services — 0.0% |
Compucom Systems, Inc.
Senior Sub. Notes
12.50% due 10/01/15* | | | 65,000 | | | 58,500 |
| | | | | |
|
|
Consumer Products - Misc. — 0.1% |
American Achievement Corp.
Company Guar. Notes
8.25% due 04/01/12* | | | 185,000 | | | 181,300 |
| | | | | |
|
|
Containers - Metal/Glass — 0.1% |
Ball Corp.
Company Guar. Notes
7.13% due 09/01/16 | | | 176,000 | | | 176,000 |
| | | | | |
|
|
Decision Support Software — 0.1% |
Vangent, Inc.
Company Guar. Notes
9.63% due 02/15/15 | | | 125,000 | | | 116,250 |
| | | | | |
|
|
Direct Marketing — 0.0% |
Affinity Group, Inc.
Company Guar. Notes
9.00% due 02/15/12 | | | 95,000 | | | 60,800 |
| | | | | |
|
|
Distribution/Wholesale — 0.1% |
KAR Holdings, Inc.
Company Guar. Notes
4.48% due 05/01/14(4) | | | 108,000 | | | 89,100 |
KAR Holdings, Inc.
Company Guar. Notes
8.75% due 05/01/14 | | | 42,000 | | | 39,585 |
| | | | | |
|
|
| | | | | | | 128,685 |
| | | | | |
|
|
| | | | | | |
| | |
| Security Description | | Principal
Amount | | Market Value
(Note 2) |
|
| | | | | | | |
Diversified Banking Institutions — 3.8% |
Bank of America Corp.
Sub. Notes
5.75% due 08/15/16 | | $ | 391,000 | | $ | 373,821 |
Bank of America Corp.
Senior Notes
5.75% due 12/01/17 | | | 318,000 | | | 309,331 |
Bank of America Corp.
Notes
6.50% due 08/01/16 | | | 318,000 | | | 327,696 |
Bank of America Corp.
Sub. Notes
7.25% due 10/15/25 | | | 75,000 | | | 72,643 |
Citigroup, Inc.
Sub. Notes
5.00% due 09/15/14 | | | 669,000 | | | 612,945 |
Citigroup, Inc.
Senior Notes
5.50% due 04/11/13 | | | 211,000 | | | 210,019 |
Citigroup, Inc.
Senior Notes
5.85% due 07/02/13 | | | 385,000 | | | 387,319 |
Citigroup, Inc.
Senior Notes
6.13% due 05/15/18 | | | 336,000 | | | 315,923 |
Citigroup, Inc.
Sub. Notes
6.13% due 08/25/36 | | | 168,000 | | | 131,541 |
Citigroup, Inc.
Senior Notes
6.88% due 03/05/38 | | | 202,000 | | | 182,440 |
GMAC LLC
Senior Notes
6.00% due 12/15/11 | | | 250,000 | | | 228,750 |
GMAC LLC
Company Guar. Notes
6.88% due 09/15/11* | | | 278,000 | | | 256,455 |
GMAC LLC
Sub. Notes
8.00% due 12/31/18* | | | 295,000 | | | 214,613 |
JP Morgan Chase & Co.
Sub. Notes
4.89% due 09/01/15(4) | | | 317,000 | | | 286,175 |
Morgan Stanley
Sub. Notes
4.75% due 04/01/14 | | | 158,000 | | | 156,857 |
Morgan Stanley
Senior Notes
6.00% due 04/28/15 | | | 888,000 | | | 938,017 |
The Goldman Sachs Group, Inc.
Senior Notes
5.13% due 01/15/15 | | | 363,000 | | | 376,191 |
The Goldman Sachs Group, Inc.
Senior Notes
5.95% due 01/18/18 | | | 260,000 | | | 270,662 |
The Goldman Sachs Group, Inc.
Sub. Notes
6.75% due 10/01/37 | | | 401,000 | | | 401,473 |
| | | | | |
|
|
| | | | | | | 6,052,871 |
| | | | | |
|
|
Diversified Financial Services — 0.6% |
General Electric Capital Corp.
Senior Notes
5.88% due 01/14/38 | | | 344,000 | | | 305,371 |
14
VALIC Company II Core Bond Fund
PORTFOLIO OF INVESTMENTS — August 31, 2009 — (continued)
| | | | | | |
| | |
| Security Description | | Principal
Amount | | Market Value
(Note 2) |
|
U.S. CORPORATE BONDS & NOTES (continued) |
Diversified Financial Services (continued) |
General Electric Capital Corp.
Senior Notes
6.88% due 01/10/39 | | $ | 568,000 | | $ | 563,329 |
USAA Capital Corp.
Notes
3.50% due 07/17/14* | | | 126,000 | | | 125,430 |
| | | | | |
|
|
| | | | | | | 994,130 |
| | | | | |
|
|
Diversified Manufacturing Operations — 0.1% |
General Electric Co.
Senior Notes
5.25% due 12/06/17 | | | 119,000 | | | 121,497 |
| | | | | |
|
|
Electric - Generation — 0.4% |
Edison Mission Energy
Senior Notes
7.20% due 05/15/19 | | | 280,000 | | | 203,000 |
The AES Corp.
Senior Notes
8.00% due 10/15/17 | | | 320,000 | | | 306,400 |
The AES Corp.
Senior Notes
8.88% due 02/15/11 | | | 190,000 | | | 195,700 |
| | | | | |
|
|
| | | | | | | 705,100 |
| | | | | |
|
|
Electric - Integrated — 3.5% |
Ameren Corp.
Senior Notes
8.88% due 05/15/14 | | | 259,000 | | | 282,001 |
CenterPoint Energy Houston Electric LLC
General and Refunding Mtg. Notes
7.00% due 03/01/14 | | | 266,000 | | | 295,757 |
Commonwealth Edison Co.
1st Mtg. Notes
6.15% due 09/15/17 | | | 181,000 | | | 199,011 |
Dominion Resources, Inc.
Jr. Sub Notes
6.30% due 09/30/66(4) | | | 506,000 | | | 369,380 |
Energy East Corp.
Notes
6.75% due 07/15/36 | | | 365,000 | | | 402,103 |
Entergy Gulf States Louisiana LLC
1st Mtg. Bonds
6.00% due 05/01/18 | | | 479,000 | | | 496,853 |
Entergy Texas, Inc.
1st Mtg. Notes
7.13% due 02/01/19 | | | 30,000 | | | 33,085 |
FirstEnergy Corp.
Senior Notes
7.38% due 11/15/31 | | | 248,000 | | | 273,779 |
FirstEnergy Solutions Corp.
Company Guar. Notes
6.05% due 08/15/21* | | | 201,000 | | | 203,191 |
FirstEnergy Solutions Corp.
Company Guar. Notes
6.80% due 08/15/39* | | | 371,000 | | | 378,950 |
Mirant Americas Generation LLC
Senior Notes
8.30% due 05/01/11 | | | 395,000 | | | 396,975 |
Mirant Mid - Atlantic LLC
Pass Through Certs., Series B
9.13% due 06/30/17 | | | 89,453 | | | 89,117 |
Nevada Power Co.
General and Refunding Mtg. Notes
7.13% due 03/15/19 | | | 442,000 | | | 503,491 |
| | | | | | |
| | |
| Security Description | | Principal
Amount | | Market Value
(Note 2) |
|
| | | | | | | |
Electric - Integrated (continued) |
Pepco Holdings, Inc.
Senior Notes
6.13% due 06/01/17 | | $ | 90,000 | | $ | 91,789 |
Pepco Holdings, Inc.
Senior Notes
6.45% due 08/15/12 | | | 490,000 | | | 521,312 |
PPL Electric Utilities Corp.
1st Mtg. Bonds
6.25% due 05/15/39 | | | 195,000 | | | 219,872 |
PSEG Power LLC
Company Guar. Notes
7.75% due 04/15/11 | | | 115,000 | | | 123,969 |
Sierra Pacific Power Co.
General and Refunding Mtg. Notes
6.75% due 07/01/37 | | | 359,000 | | | 390,844 |
Texas Competitive Electric Holdings Co., LLC
Company Guar. Notes, Series A
10.25% due 11/01/15 | | | 165,000 | | | 109,312 |
Texas Competitive Electric Holdings Co., LLC
Company Guar. Notes, Series B
10.25% due 11/01/15 | | | 25,000 | | | 16,562 |
Toledo Edison Co.
1st Mtg. Notes
7.25% due 05/01/20 | | | 153,000 | | | 178,394 |
| | | | | |
|
|
| | | | | | | 5,575,747 |
| | | | | |
|
|
Electronic Components - Semiconductors — 0.3% |
Amkor Technology, Inc.
Senior Notes
7.75% due 05/15/13 | | | 90,000 | | | 89,100 |
National Semiconductor Corp.
Senior Notes
6.60% due 06/15/17 | | | 215,000 | | | 198,186 |
Spansion LLC
Senior Sec. Notes
5.33% due 06/01/13†*(4)(6)(7) | | | 145,000 | | | 128,688 |
| | | | | |
|
|
| | | | | | | 415,974 |
| | | | | |
|
|
Electronics - Military — 0.1% |
L - 3 Communications Corp.
Company Guar. Notes
6.38% due 10/15/15 | | | 95,000 | | | 89,538 |
| | | | | |
|
|
Enterprise Software/Service — 0.1% |
Oracle Corp.
Senior Notes
3.75% due 07/08/14 | | | 160,000 | | | 165,298 |
| | | | | |
|
|
Finance - Auto Loans — 0.3% |
Ford Motor Credit Co. LLC
Senior Notes
7.38% due 02/01/11 | | | 275,000 | | | 265,845 |
Ford Motor Credit Co. LLC
Notes
7.88% due 06/15/10 | | | 222,000 | | | 221,537 |
| | | | | |
|
|
| | | | | | | 487,382 |
| | | | | |
|
|
Finance - Commercial — 0.2% |
CIT Group, Inc.
Senior Notes
5.80% due 07/28/11 | | | 38,000 | | | 22,633 |
15
VALIC Company II Core Bond Fund
PORTFOLIO OF INVESTMENTS — August 31, 2009 — (continued)
| | | | | | |
| | |
| Security Description | | Principal
Amount | | Market Value
(Note2) |
|
U.S. CORPORATE BONDS & NOTES (continued) |
Finance - Commercial (continued) |
Textron Financial Corp.
Senior Notes
5.40% due 04/28/13 | | $ | 410,000 | | $ | 361,482 |
| | | | | |
|
|
| | | | | | | 384,115 |
| | | | | |
|
|
Finance - Consumer Loans — 0.1% |
SLM Corp.
Senior Notes
5.13% due 08/27/12 | | | 174,000 | | | 136,590 |
| | | | | |
|
|
Finance - Credit Card — 0.2% |
FIA Card Services NA
Sub. Notes
7.13% due 11/15/12 | | | 230,000 | | | 238,597 |
| | | | | |
|
|
Finance - Investment Banker/Broker — 1.2% |
Lehman Brothers Holdings Capital Trust VII
Company Guar. Notes
5.86% due 05/31/12†(4)(5)(6)(7) | | | 148,000 | | | 15 |
Lehman Brothers Holdings, Inc.
Sub. Notes
6.75% due 12/28/17†(6)(7) | | | 179,000 | | | 18 |
Lehman Brothers Holdings, Inc.
Sub. Notes
7.50% due 05/11/38†(6)(7) | | | 230,000 | | | 23 |
Merrill Lynch & Co., Inc.
Sub. Notes
5.70% due 05/02/17 | | | 187,000 | | | 175,018 |
Merrill Lynch & Co., Inc.
Sub. Notes
6.22% due 09/15/26 | | | 215,000 | | | 193,916 |
Merrill Lynch & Co., Inc.
Senior Notes
6.40% due 08/28/17 | | | 176,000 | | | 173,447 |
The Bear Stearns Cos., Inc.
Senior Notes
5.30% due 10/30/15 | | | 355,000 | | | 359,809 |
The Bear Stearns Cos., Inc.
Senior Notes
5.70% due 11/15/14 | | | 283,000 | | | 303,717 |
The Bear Stearns Cos., Inc.
Senior Notes
6.40% due 10/02/17 | | | 595,000 | | | 645,672 |
| | | | | |
|
|
| | | | | | | 1,851,635 |
| | | | | |
|
|
Finance - Mortgage Loan/Banker — 0.2% |
Countrywide Financial Corp.
Sub. Notes
6.25% due 05/15/16 | | | 150,000 | | | 145,511 |
Countrywide Home Loans, Inc.
Company Guar. Notes
4.00% due 03/22/11 | | | 190,000 | | | 191,842 |
| | | | | |
|
|
| | | | | | | 337,353 |
| | | | | |
|
|
Food - Meat Products — 0.0% |
Smithfield Foods, Inc.
Senior Sec. Notes
10.00% due 07/15/14* | | | 75,000 | | | 76,500 |
| | | | | |
|
|
Food - Misc. — 0.3% |
HJ Heinz Finance Co.
Company Guar. Notes
7.13% due 08/01/39* | | | 148,000 | | | 173,788 |
| | | | | | |
| | |
| Security Description | | Principal
Amount | | Market Value
(Note 2) |
|
| | | | | | | |
Food - Misc. (continued) | | | | | | |
Kraft Foods, Inc.
Senior Notes
6.75% due 02/19/14 | | $ | 256,000 | | $ | 290,536 |
| | | | | |
|
|
| | | | | | | 464,324 |
| | | | | |
|
|
Funeral Services & Related Items — 0.1% | | | | | | |
Carriage Services, Inc.
Senior Notes
7.88% due 01/15/15 | | | 125,000 | | | 112,500 |
| | | | | |
|
|
Gambling (Non-Hotel) — 0.1% | | | | | | |
Downstream Development Authority
Senior Sec. Notes
12.00% due 10/15/15* | | | 140,000 | | | 88,550 |
| | | | | |
|
|
Gas - Distribution — 0.2% | | | | | | |
Sempra Energy
Senior Notes
6.50% due 06/01/16 | | | 340,000 | | | 373,942 |
| | | | | |
|
|
Home Furnishings — 0.0% | | | | | | |
Simmons Co.
Senior Disc. Notes
10.00% due 12/15/14(8) | | | 7,000 | | | 2,170 |
| | | | | |
|
|
Independent Power Producers — 0.2% | | | | | | |
NRG Energy, Inc.
Company Guar. Notes
7.38% due 02/01/16 | | | 280,000 | | | 267,750 |
| | | | | |
|
|
Insurance Brokers — 0.1% | | | | | | |
Marsh & McLennan Cos., Inc.
Senior Notes
5.15% due 09/15/10 | | | 145,000 | | | 145,222 |
USI Holdings Corp.
Senior Sub. Notes
9.75% due 05/15/15* | | | 40,000 | | | 32,650 |
| | | | | |
|
|
| | | | | | | 177,872 |
| | | | | |
|
|
Insurance - Life/Health — 0.3% | | | | | | |
Americo Life, Inc.
Notes
7.88% due 05/01/13* | | | 109,000 | | | 77,390 |
Monumental Global Funding II
Senior Sec. Notes
5.65% due 07/14/11* | | | 120,000 | | | 122,645 |
Prudential Financial, Inc.
Senior Notes
6.20% due 01/15/15 | | | 302,000 | | | 316,362 |
| | | | | |
|
|
| | | | | | | 516,397 |
| | | | | |
|
|
Insurance - Multi - line — 0.7% | | | | | | |
Hartford Financial Services Group, Inc.
Senior Notes
5.95% due 10/15/36 | | | 349,000 | | | 255,789 |
Metlife, Inc.
Senior Notes
6.13% due 12/01/11 | | | 200,000 | | | 213,749 |
MetLife, Inc.
Senior Notes
6.75% due 06/01/16 | | | 175,000 | | | 191,431 |
Metropolitan Life Global Funding I
Notes
5.13% due 06/10/14* | | | 380,000 | | | 395,992 |
| | | | | |
|
|
| | | | | | | 1,056,961 |
| | | | | |
|
|
16
VALIC Company II Core Bond Fund
PORTFOLIO OF INVESTMENTS — August 31, 2009 — (continued)
| | | | | | |
| | |
| Security Description | | Principal
Amount | | Market Value
(Note 2) |
|
U.S. CORPORATE BONDS & NOTES (continued) |
Insurance - Mutual — 0.4% | | | | | | |
Liberty Mutual Group, Inc.
Company Guar. Bonds
10.75% due 06/15/58*(4) | | $ | 384,000 | | $ | 337,920 |
Massachusetts Mutual Life Insurance Co.
Notes
8.88% due 06/01/39* | | | 228,000 | | | 255,859 |
| | | | | |
|
|
| | | | | | | 593,779 |
| | | | | |
|
|
Insurance - Property/Casualty — 0.2% | | | | | | |
ACE INA Holdings, Inc.
Company Guar. Notes
5.60% due 05/15/15 | | | 269,000 | | | 288,077 |
W.R. Berkley Corp.
Senior Notes
6.25% due 02/15/37 | | | 95,000 | | | 74,820 |
| | | | | |
|
|
| | | | | | | 362,897 |
| | | | | |
|
|
Investment Management/Advisor Services — 0.0% | | | | | | |
Ameriprise Financial, Inc.
Senior Notes
5.35% due 11/15/10 | | | 8,000 | | | 8,015 |
| | | | | |
|
|
Medical Labs & Testing Services — 0.1% | | | | | | |
Howard Hughes Medical Institute
Senior Notes
3.45% due 09/01/14 | | | 155,000 | | | 157,197 |
| | | | | |
|
|
Medical Products — 0.5% | | | | | | |
Baxter International, Inc.
Senior Notes
5.90% due 09/01/16 | | | 500,000 | | | 558,392 |
CareFusion Corp.
Senior Notes
4.13% due 08/01/12* | | | 180,000 | | | 183,426 |
LVB Acquisition Holding LLC
Company Guar. Notes
10.38% due 10/15/17(10) | | | 54,000 | | | 56,295 |
| | | | | |
|
|
| | | | | | | 798,113 |
| | | | | |
|
|
Medical - Biomedical/Gene — 0.2% | | | | | | |
Amgen, Inc.
Senior Notes
5.85% due 06/01/17 | | | 350,000 | | | 386,533 |
| | | | | |
|
|
Medical - Drugs — 0.6% | | | | | | |
Axcan Intermediate Holdings, Inc.
Senior Notes
9.25% due 03/01/15 | | | 75,000 | | | 77,063 |
Merck & Co., Inc.
Senior Notes
4.00% due 06/30/15 | | | 128,000 | | | 133,408 |
Wyeth Bonds
5.50% due 02/01/14 | | | 693,000 | | | 757,768 |
| | | | | |
|
|
| | | | | | | 968,239 |
| | | | | |
|
|
Medical - Generic Drugs — 0.2% | | | | | | |
Watson Pharmaceuticals, Inc.
Senior Notes
6.13% due 08/15/19 | | | 336,000 | | | 345,447 |
| | | | | |
|
|
Medical - HMO — 0.2% | | | | | | |
UnitedHealth Group, Inc.
Senior Notes
5.25% due 03/15/11 | | | 195,000 | | | 201,779 |
| | | | | | |
| | |
| Security Description | | Principal
Amount | | Market Value
(Note 2) |
|
| |
Medical - HMO (continued) | | | | | | |
WellPoint, Inc.
Senior Notes
5.00% due 01/15/11 | | $ | 117,000 | | $ | 120,929 |
| | | | | |
|
|
| | | | | | | 322,708 |
| | | | | |
|
|
Medical - Hospitals — 0.6% | | | | | | |
Community Health Systems, Inc.
Company Guar. Notes
8.88% due 07/15/15 | | | 120,000 | | | 120,450 |
HCA, Inc.
Senior Notes
7.50% due 11/15/95 | | | 250,000 | | | 163,928 |
HCA, Inc.
Senior Notes
8.50% due 04/15/19* | | | 375,000 | | | 379,687 |
HCA, Inc.
Senior Sec. Notes
9.25% due 11/15/16 | | | 175,000 | | | 177,187 |
IASIS Healthcare LLC/IASIS Capital Corp.
Company Guar. Notes
8.75% due 06/15/14 | | | 125,000 | | | 122,188 |
| | | | | |
|
|
| | | | | | | 963,440 |
| | | | | |
|
|
Metal - Aluminum — 0.2% | | | | | | |
Alcoa, Inc.
Senior Notes
6.50% due 06/15/18 | | | 224,000 | | | 213,193 |
Noranda Aluminum Acquisition Corp.
Company Guar. Notes
5.41% due 11/15/14(10) | | | 108,856 | | | 66,402 |
| | | | | |
|
|
| | | | | | | 279,595 |
| | | | | |
|
|
Metal - Copper — 0.2% | | | | | | |
Freeport-McMoRan Corp.
Company Guar. Notes
8.75% due 06/01/11 | | | 301,000 | | | 321,517 |
| | | | | |
|
|
Multimedia — 0.4% | | | | | | |
News America, Inc.
Company Guar. Notes
6.15% due 03/01/37 | | | 205,000 | | | 198,022 |
News America, Inc. Company
Guar. Notes
6.90% due 08/15/39* | | | 185,000 | | | 194,698 |
Time Warner Entertainment Co. LP
Senior Notes
8.38% due 07/15/33 | | | 256,000 | | | 308,296 |
| | | | | |
|
|
| | | | | | | 701,016 |
| | | | | |
|
|
Non - Hazardous Waste Disposal — 0.5% | | | | | | |
Allied Waste North America, Inc.
Company Guar. Notes
7.38% due 04/15/14 | | | 125,000 | | | 130,298 |
Republic Services, Inc.
Senior Notes
5.50% due 09/15/19* | | | 120,000 | | | 119,807 |
Republic Services, Inc.
Notes
6.09% due 03/15/35* | | | 75,000 | | | 68,298 |
Waste Management, Inc.
Company Guar. Notes
6.38% due 11/15/12 | | | 162,000 | | | 177,301 |
17
VALIC Company II Core Bond Fund
PORTFOLIO OF INVESTMENTS — August 31, 2009 — (continued)
| | | | | | |
| | |
| Security Description | | Principal
Amount | | Market Value
(Note 2) |
|
U.S. CORPORATE BONDS & NOTES (continued) | | | | | | |
Non - Hazardous Waste Disposal (continued) | | | | | | |
Waste Management, Inc.
Company Guar. Notes
7.75% due 05/15/32 | | $ | 205,000 | | $ | 237,049 |
| | | | | |
|
|
| | | | | | | 732,753 |
| | | | | |
|
|
Office Automation & Equipment — 0.4% | | | | | | |
Pitney Bowes, Inc.
Senior Notes
5.25% due 01/15/37 | | | 510,000 | | | 507,324 |
Xerox Corp.
Senior Notes
6.35% due 05/15/18 | | | 165,000 | | | 168,840 |
| | | | | |
|
|
| | | | | | | 676,164 |
| | | | | |
|
|
Oil & Gas Drilling — 0.1% | | | | | | |
Rowan Cos., Inc.
Senior Notes
7.88% due 08/01/19 | | | 160,000 | | | 168,656 |
| | | | | |
|
|
Oil Companies - Exploration & Production — 1.3% | | | | | | |
Chesapeake Energy Corp.
Senior Notes
7.25% due 12/15/18 | | | 100,000 | | | 91,500 |
Chesapeake Energy Corp.
Company Guar. Notes
7.50% due 09/15/13 | | | 665,000 | | | 651,700 |
Devon Financing Corp. ULC
Company Guar. Notes
6.88% due 09/30/11 | | | 550,000 | | | 600,173 |
Hilcorp Energy I LP
Senior Notes
7.75% due 11/01/15* | | | 145,000 | | | 133,763 |
Kerr-McGee Corp.
Company Guar. Notes
6.95% due 07/01/24 | | | 168,000 | | | 173,486 |
Sabine Pass LNG LP
Senior Sec. Notes
7.50% due 11/30/16 | | | 515,000 | | | 417,150 |
| | | | | |
|
|
| | | | | | | 2,067,772 |
| | | | | |
|
|
Oil Companies - Integrated — 0.7% | | | | | | |
ConocoPhillips Holding Co.
Senior Notes
6.95% due 04/15/29 | | | 196,000 | | | 225,963 |
Hess Corp.
Senior Notes
7.13% due 03/15/33 | | | 195,000 | | | 216,395 |
Hess Corp.
Senior Notes
7.88% due 10/01/29 | | | 265,000 | | | 314,535 |
Phillips Petroleum Co.
Debentures
7.00% due 03/30/29 | | | 293,000 | | | 328,277 |
| | | | | |
|
|
| | | | | | | 1,085,170 |
| | | | | |
|
|
Oil Refining & Marketing — 0.1% | | | | | | |
Valero Energy Corp.
Senior Notes
6.63% due 06/15/37 | | | 191,000 | | | 166,017 |
| | | | | |
|
|
Paper & Related Products — 0.2% | | | | | | |
Georgia - Pacific LLC
Company Guar. Notes
7.00% due 01/15/15* | | | 90,000 | | | 86,625 |
| | | | | | |
| | |
| Security Description | | Principal
Amount | | Market Value
(Note 2) |
|
| | | | | | | |
Paper & Related Products (continued) | | | | | | |
Georgia - Pacific LLC
Company Guar. Notes
7.13% due 01/15/17* | | $ | 20,000 | | $ | 19,200 |
MeadWestvaco Corp.
Senior Notes
7.38% due 09/01/19 | | | 170,000 | | | 172,810 |
| | | | | |
|
|
| | | | | | | 278,635 |
| | | | | |
|
|
Pharmacy Services — 0.2% | | | | | | |
Express Scripts, Inc.
Senior Notes
6.25% due 06/15/14 | | | 175,000 | | | 191,256 |
Express Scripts, Inc.
Senior Notes
7.25% due 06/15/19 | | | 112,000 | | | 129,885 |
| | | | | |
|
|
| | | | | | | 321,141 |
| | | | | |
|
|
Physicians Practice Management — 0.0% | | | | | | |
US Oncology, Inc.
Senior Sec. Notes
9.13% due 08/15/17* | | | 75,000 | | | 78,000 |
| | | | | |
|
|
Pipelines — 1.4% | | | | | | |
Boardwalk Pipelines LLC
Company Guar. Notes
5.75% due 09/15/19 | | | 297,000 | | | 294,300 |
Copano Energy LLC
Company Guar. Notes
8.13% due 03/01/16 | | | 545,000 | | | 521,838 |
Copano Energy LLC / Copano Energy Finance Corp.
Company Guar. Notes
7.75% due 06/01/18 | | | 50,000 | | | 46,250 |
Dynegy - Roseton Danskammer
Pass Through Certs., Series B
7.67% due 11/08/16 | | | 215,000 | | | 192,425 |
Enterprise Products Operating LLC
Company Guar. Notes
4.60% due 08/01/12 | | | 175,000 | | | 181,587 |
ONEOK, Inc.
Senior Notes
6.00% due 06/15/35 | | | 159,000 | | | 152,277 |
Plains All American Pipeline, LP
Senior Notes
4.25% due 09/01/12 | | | 249,000 | | | 254,235 |
Williams Cos., Inc.
Senior Notes
7.88% due 09/01/21 | | | 540,000 | | | 584,730 |
| | | | | |
|
|
| | | | | | | 2,227,642 |
| | | | | |
|
|
Property Trust — 0.2% | | | | | | |
WEA Finance LLC / WT Finance Australia Property, Ltd.
Company Guar. Notes
6.75% due 09/02/19* | | | 360,000 | | | 354,592 |
| | | | | |
|
|
Publishing - Periodicals — 0.0% | | | | | | |
The Reader’s Digest Association, Inc.
Company Guar. Notes
9.00% due 02/15/17†(6)(7) | | | 120,000 | | | 2,850 |
| | | | | |
|
|
Recycling — 0.0% | | | | | | |
Aleris International, Inc.
Company Guar. Notes
9.00% due 12/15/14†(6)(7)(10) | | | 100,000 | | | 510 |
| | | | | |
|
|
18
VALIC Company II Core Bond Fund
PORTFOLIO OF INVESTMENTS — August 31, 2009 — (continued)
| | | | | | |
| | |
| Security Description | | Principal
Amount | | Market Value
(Note 2) |
|
U.S. CORPORATE BONDS & NOTES (continued) |
Research & Development — 0.1% | | | | | | |
Alion Science and Technology Corp.
Company Guar. Notes
10.25% due 02/01/15 | | $ | 155,000 | | $ | 102,300 |
| | | | | |
|
|
Retail - Discount — 0.1% | | | | | | |
Wal - Mart Stores, Inc.
Senior Notes
3.20% due 05/15/14 | | | 170,000 | | | 173,450 |
| | | | | |
|
|
Retail - Regional Department Stores — 0.0% | | | | | | |
Macy’s Retail Holdings, Inc.
Company Guar. Notes
6.65% due 07/15/24 | | | 22,000 | | | 17,013 |
| | | | | |
|
|
Schools — 0.2% | | | | | | |
Princeton University
Senior Notes
5.70% due 03/01/39 | | | 226,000 | | | 241,896 |
| | | | | |
|
|
Special Purpose Entities — 1.0% | | | | | | |
CCM Merger, Inc.
Notes
8.00% due 08/01/13* | | | 150,000 | | | 121,500 |
CDX North America High
Yield Credit Linked Certificates,
Series 10-T
8.88% due 06/29/13*(15) | | | 496,770 | | | 458,891 |
Chukchansi Economic Development Authority
Senior Notes
8.00% due 11/15/13* | | | 120,000 | | | 96,000 |
Citicorp Lease Pass - Through Trust 1999-1
Pass Thru Certs.
8.04% due 12/15/19* | | | 239,000 | | | 214,184 |
Principal Life Global Funding I
Senior Sec. Notes
5.25% due 01/15/13* | | | 739,000 | | | 751,126 |
| | | | | |
|
|
| | | | | | | 1,641,701 |
| | | | | |
|
|
Steel - Producers — 0.4% |
Reliance Steel & Aluminum Co.
Company Guar. Notes
6.85% due 11/15/36 | | | 690,000 | | | 538,373 |
Ryerson, Inc.
Company Guar. Notes
7.86% due 11/01/14(4) | | | 125,000 | | | 106,250 |
| | | | | |
|
|
| | | | | | | 644,623 |
| | | | | |
|
|
Telecom Services — 0.6% |
Bellsouth Telecommunications, Inc.
Senior Notes
7.00% due 12/01/95 | | | 357,000 | | | 357,762 |
Embarq Corp.
8.00% due 06/01/36 | | | 76,000 | | | 78,213 |
PAETEC Holding Corp.
Company Guar. Notes
9.50% due 07/15/15 | | | 210,000 | | | 181,125 |
Qwest Corp.
Senior Notes
6.50% due 06/01/17 | | | 200,000 | | | 184,000 |
Qwest Corp.
Senior Notes
7.50% due 10/01/14 | | | 135,000 | | | 133,819 |
| | | | | |
|
|
| | | | | | | 934,919 |
| | | | | |
|
|
| | | | | | |
| | |
| Security Description | | Principal
Amount | | Market Value
(Note 2) |
|
| | | | | | | |
Telephone - Integrated — 1.0% |
AT&T, Inc.
Senior Notes
5.63% due 06/15/16 | | $ | 155,000 | | $ | 167,425 |
BellSouth Corp.
Senior Notes
6.88% due 10/15/31 | | | 185,000 | | | 202,646 |
Cincinnati Bell, Inc.
Company Guar. Notes
7.00% due 02/15/15 | | | 14,000 | | | 13,160 |
Citizens Communications Co.
Senior Notes
9.00% due 08/15/31 | | | 125,000 | | | 115,156 |
Pacific Bell Telephone Co.
Company Guar. Notes
7.13% due 03/15/26 | | | 450,000 | | | 498,397 |
Sprint Capital Corp.
Company Guar. Notes
8.75% due 03/15/32 | | | 335,000 | | | 278,050 |
Verizon Pennsylvania, Inc.
Senior Bonds
8.35% due 12/15/30 | | | 160,000 | | | 179,591 |
Verizon Virginia, Inc.
Senior Notes
4.63% due 03/15/13 | | | 155,000 | | | 159,758 |
| | | | | |
|
|
| | | | | | | 1,614,183 |
| | | | | |
|
|
Television — 0.0% |
Allbritton Communications Co.
Senior Sub. Notes
7.75% due 12/15/12 | | | 65,000 | | | 55,575 |
Paxson Communications Corp.
Senior Sec. Notes
8.38% due 01/15/13†*(4)(6)(7)(10) | | | 226,373 | | | 6,791 |
Young Broadcasting, Inc.
Company Guar. Notes
10.00% due 03/01/11†(6)(7) | | | 105,000 | | | 12 |
| | | | | |
|
|
| | | | | | | 62,378 |
| | | | | |
|
|
Transactional Software — 0.1% |
Open Solutions, Inc.
Company Guar. Notes
9.75% due 02/01/15* | | | 120,000 | | | 78,600 |
| | | | | |
|
|
Transport - Air Freight — 0.3% |
Atlas Air, Inc.
Pass Through Certs.
Series 1991-1, Class A-1
7.20% due 01/02/19 | | | 258,710 | | | 175,923 |
Atlas Air, Inc.
Pass Through Certs.
Series 1991-1, Class B
7.63% due 01/02/15 | | | 190,663 | | | 112,491 |
Atlas Air, Inc.
Pass Through Certs.
Series 2000-1, Class A
8.71% due 01/02/19 | | | 226,674 | | | 158,672 |
| | | | | |
|
|
| | | | | | | 447,086 |
| | | | | |
|
|
Transport - Rail — 0.6% |
CSX Corp.
Senior Notes
6.15% due 05/01/37 | | | 185,000 | | | 187,952 |
CSX Corp.
Debentures
7.90% due 05/01/17 | | | 292,000 | | | 342,548 |
19
VALIC Company II Core Bond Fund
PORTFOLIO OF INVESTMENTS — August 31, 2009 — (continued)
| | | | | | |
| | |
| Security Description | | Principal
Amount | | Market Value
(Note 2) |
|
U.S. CORPORATE BONDS & NOTES (continued) | | | | | | |
Transport - Rail (continued) |
Union Pacific Corp.
Senior Notes
5.75% due 11/15/17 | | $ | 455,000 | | $ | 487,136 |
| | | | | |
|
|
| | | | | | | 1,017,636 |
| | | | | |
|
|
Transport - Services — 0.2% |
PHI, Inc.
Company Guar. Notes
7.13% due 04/15/13 | | | 275,000 | | | 255,063 |
| | | | | |
|
|
Total U.S. Corporate Bonds & Notes | | | | | | |
(cost $54,518,175) | | | | | | 54,546,653 |
| | | | | |
|
|
FOREIGN CORPORATE BONDS & NOTES — 7.6% |
Banks - Commercial — 1.7% |
Australia & New Zealand Banking Group, Ltd.
Sub. Notes
1.71% due 10/30/09(4)(5) | | | 390,000 | | | 195,000 |
Barclays Bank PLC
Jr. Sub. Notes
5.93% due 12/15/16*(4)(5) | | | 390,000 | | | 269,100 |
Barclays Bank PLC
Sub. Notes
6.05% due 12/04/17* | | | 342,000 | | | 337,537 |
Caisse Nationale des Caisses d’Epargne et de Prevoyance
Senior Notes
3.82% due 12/30/09(4)(5) | | | 132,000 | | | 80,520 |
Lloyds Banking Group PLC
Jr. Sub. Notes
5.92% due 10/01/15*(4)(5) | | | 205,000 | | | 86,100 |
Rabobank Nederland NV
Senior Notes
4.20% due 05/13/14* | | | 410,000 | | | 424,645 |
Standard Chartered PLC
Senior Notes
5.50% due 11/18/14* | | | 400,000 | | | 429,346 |
Svenska Handelsbanken AB
Senior Notes
4.88% due 06/10/14* | | | 250,000 | | | 261,720 |
Westpac Banking Corp.
Sub. Notes
1.91% due 03/31/10(4)(5) | | | 820,000 | | | 430,500 |
Westpac Banking Corp.
Senior Notes
4.20% due 02/27/15 | | | 155,000 | | | 155,980 |
| | | | | |
|
|
| | | | | | | 2,670,448 |
| | | | | |
|
|
Banks - Money Center — 0.2% |
Bank of Scotland PLC
Senior Sub. Notes
1.50% due 11/30/09(4)(5) | | | 590,000 | | | 265,500 |
KBC Internationale Financieringsmaatschappij NV
Bank Guar. Notes
6.00% due 02/07/10(3)(17) | | | 177,000 | | | 110,183 |
| | | | | |
|
|
| | | | | | | 375,683 |
| | | | | |
|
|
Cellular Telecom — 0.1% |
Vodafone Group PLC
Senior Notes
4.15% due 06/10/14 | | | 88,000 | | | 90,139 |
Vodafone Group PLC
Senior Notes
5.38% due 01/30/15 | | | 98,000 | | | 103,128 |
| | | | | |
|
|
| | | | | | | 193,267 |
| | | | | |
|
|
| | | | | | |
| | |
| Security Description | | Principal
Amount | | Market Value
(Note 2) |
|
| | | | | | | |
Containers - Metal/Glass — 0.2% |
Rexam PLC
Senior Notes
6.75% due 06/01/13* | | $ | 254,000 | | $ | 265,743 |
| | | | | |
|
|
Cruise Lines — 0.2% |
Royal Caribbean Cruises, Ltd.
Senior Notes
7.00% due 06/15/13 | | | 300,000 | | | 266,250 |
| | | | | |
|
|
Diversified Banking Institutions — 0.1% |
Credit Agricole SA
Jr. Sub. Notes
6.64% due 05/31/17*(4)(5) | | | 350,000 | | | 231,000 |
| | | | | |
|
|
Diversified Manufacturing Operations — 0.1% |
Bombardier, Inc.
Senior Notes
8.00% due 11/15/14* | | | 103,000 | | | 100,554 |
| | | | | |
|
|
Diversified Minerals — 0.3% |
Anglo American Capital PLC
Company Guar. Notes
9.38% due 04/08/19* | | | 332,000 | | | 388,440 |
Teck Resources, Ltd.
Senior Sec. Notes
10.25% due 05/15/16 | | | 80,000 | | | 88,400 |
Teck Resources, Ltd.
Senior Sec. Notes
10.75% due 05/15/19 | | | 60,000 | | | 68,325 |
| | | | | |
|
|
| | | | | | | 545,165 |
| | | | | |
|
|
Electric - Integrated — 0.8% |
Electricite de France
Notes
6.50% due 01/26/19* | | | 500,000 | | | 570,933 |
Electricite de France
Notes
6.95% due 01/26/39* | | | 412,000 | | | 503,143 |
Empresa Nacional de Electricidad SA
Bonds
7.33% due 02/01/37 | | | 210,000 | | | 214,780 |
| | | | | |
|
|
| | | | | | | 1,288,856 |
| | | | | |
|
|
Finance - Investment Banker/Broker — 0.2% |
Macquarie Group, Ltd.
Notes
7.30% due 08/01/14* | | | 292,000 | | | 303,565 |
| | | | | |
|
|
Finance - Other Services — 0.3% |
BP Capital Markets PLC
Company Guar. Notes
3.88% due 03/10/15 | | | 465,000 | | | 480,220 |
| | | | | |
|
|
Food - Meat Products — 0.1% |
JBS SA
Company Guar. Notes
9.38% due 02/07/11 | | | 100,000 | | | 101,500 |
| | | | | |
|
|
Insurance - Multi-line — 0.3% |
Aegon NV
Senior Notes
3.60% due 07/15/14(4)(5) | | | 104,000 | | | 43,680 |
XL Capital, Ltd.
Senior Notes
5.25% due 09/15/14 | | | 297,000 | | | 269,495 |
20
VALIC Company II Core Bond Fund
PORTFOLIO OF INVESTMENTS — August 31, 2009 — (continued)
| | | | | | |
| | |
| Security Description | | Principal
Amount | | Market Value
(Note 2) |
|
FOREIGN CORPORATE BONDS & NOTES (continued) |
Insurance - Multi-line (continued) |
XL Capital, Ltd.
Senior Notes
6.38% due 11/15/24 | | $ | 194,000 | | $ | 153,376 |
| | | | | |
|
|
| | | | | | | 466,551 |
| | | | | |
|
|
Investment Companies — 0.1% |
Xstrata Finance Canada, Ltd.
Company Guar. Notes
6.90% due 11/15/37* | | | 223,000 | | | 196,016 |
| | | | | |
|
|
Medical Products — 0.0% |
Angiotech Pharmaceuticals, Inc.
Company Guar. Notes
4.22% due 12/01/13(4) | | | 60,000 | | | 50,400 |
| | | | | |
|
|
Medical - Drugs — 0.1% |
Elan Finance PLC
Company Guar. Bonds
7.75% due 11/15/11 | | | 196,000 | | | 190,120 |
| | | | | |
|
|
Metal - Diversified — 0.1% |
Noranda, Inc.
Notes
6.00% due 10/15/15 | | | 200,000 | | | 190,262 |
| | | | | |
|
|
Oil Companies - Exploration & Production — 0.7% |
Nexen, Inc.
Senior Notes
5.88% due 03/10/35 | | | 235,000 | | | 206,675 |
Nexen, Inc.
Senior Notes
7.50% due 07/30/39 | | | 185,000 | | | 193,779 |
OPTI Canada, Inc.
Senior Sec. Notes
7.88% due 12/15/14 | | | 190,000 | | | 121,600 |
OPTI Canada, Inc.
Senior Notes
8.25% due 12/15/14 | | | 10,000 | | | 6,500 |
Talisman Energy, Inc.
Senior Notes
7.75% due 06/01/19 | | | 340,000 | | | 395,646 |
Woodside Finance, Ltd.
Company Guar. Notes
8.13% due 03/01/14* | | | 155,000 | | | 171,722 |
| | | | | |
|
|
| | | | | | | 1,095,922 |
| | | | | |
|
|
Printing - Commercial — 0.0% |
Quebecor World Capital Corp.
Company Guar. Notes
8.75% due 03/15/16†*(6)(7) | | | 165,000 | | | 14,850 |
| | | | | |
|
|
Satellite Telecom — 0.3% |
Intelsat Intermediate Holding Co., Ltd.
Company Guar. Notes
9.50% due 02/01/15(8) | | | 65,000 | | | 63,375 |
Intelsat Subsidiary Holding Co., Ltd.
Company Guar. Notes
8.50% due 01/15/13 | | | 215,000 | | | 216,612 |
Intelsat Subsidiary Holding Co., Ltd.
Company Guar. Notes
8.88% due 01/15/15 | | | 145,000 | | | 146,088 |
| | | | | |
|
|
| | | | | | | 426,075 |
| | | | | |
|
|
Special Purpose Entities — 0.5% |
Aries Vermoegensverwaltungs GmbH
Sec. Notes
9.60% due 10/25/14 | | | 500,000 | | | 627,500 |
| | | | | | |
| | |
| Security Description | | Principal
Amount | | Market Value
(Note 2) |
|
| | | | | | | |
Special Purpose Entities (continued) |
SMFG Preferred Capital, Ltd.
Sub. Notes
6.08% due 01/25/17(4)(5) | | $ | 272,000 | | $ | 236,482 |
| | | | | |
|
|
| | | | | | | 863,982 |
| | | | | |
|
|
Steel - Producers — 0.1% |
ArcelorMittal
Senior Notes
6.13% due 06/01/18 | | | 128,000 | | | 122,512 |
| | | | | |
|
|
Telephone - Integrated — 1.0% |
Telecom Italia Capital SA
Company Guar. Notes
4.95% due 09/30/14 | | | 1,192,000 | | | 1,230,242 |
Telefonica Emisiones SAU
Company Guar. Notes
5.88% due 07/15/19 | | | 310,000 | | | 337,221 |
| | | | | |
|
|
| | | | | | | 1,567,463 |
| | | | | |
|
|
Transport - Rail — 0.1% |
Canadian National Railway Co.
Senior Notes
6.38% due 10/15/11 | | | 180,000 | | | 197,497 |
| | | | | |
|
|
Total Foreign Corporate Bonds & Notes | | | | | | |
(cost $12,132,861) | | | | | | 12,203,901 |
| | | | | |
|
|
FOREIGN GOVERNMENT AGENCIES — 0.0% |
Sovereign — 0.0% |
United Mexican States
Notes
6.75% due 09/27/34
(cost $2,126) | | | 2,000 | | | 2,075 |
| | | | | |
|
|
U.S. GOVERNMENT AGENCIES — 33.2% |
Federal Home Loan Mtg. Corp. — 24.1% |
4.50% due 11/01/18 | | | 368,349 | | | 386,498 |
4.50% due 02/01/19 | | | 392,887 | | | 410,772 |
4.50% due 01/01/39 | | | 1,300,658 | | | 1,308,841 |
5.00% due 03/01/19 | | | 165,768 | | | 174,631 |
5.00% due 10/01/33 | | | 51,376 | | | 53,034 |
5.00% due 06/01/34 | | | 981,112 | | | 1,012,020 |
5.00% due 12/01/34 | | | 332,891 | | | 343,378 |
5.00% due 07/01/35 | | | 506,924 | | | 522,419 |
5.00% due 08/01/35 | | | 1,126,183 | | | 1,160,607 |
5.00% due 10/01/35 | | | 766,628 | | | 790,061 |
5.00% due 11/01/35 | | | 705,724 | | | 727,296 |
5.00% due 11/01/36 | | | 399,231 | | | 410,873 |
5.00% due 01/01/37 | | | 464,036 | | | 477,567 |
5.00% due 04/01/37 | | | 1,267,693 | | | 1,303,471 |
5.00% due 11/01/37 | | | 1,590,203 | | | 1,635,083 |
5.00% due 03/01/38 | | | 841,643 | | | 865,396 |
5.48% due 03/01/36(4) | | | 333,884 | | | 349,645 |
5.50% due 11/01/18 | | | 195,790 | | | 208,645 |
5.50% due 10/01/33 | | | 487,084 | | | 510,344 |
5.50% due 07/01/34 | | | 305,803 | | | 320,215 |
5.50% due 02/01/35 | | | 468,514 | | | 490,155 |
5.50% due 07/01/35 | | | 13,600 | | | 14,229 |
5.50% due 05/01/37 | | | 1,117,818 | | | 1,166,483 |
5.50% due 09/01/37 | | | 1,598,306 | | | 1,667,888 |
5.50% due 10/01/37 | | | 6,439,532 | | | 6,719,879 |
5.50% due 07/01/38 | | | 326,679 | | | 340,901 |
5.81% due 01/01/37(4) | | | 460,934 | | | 485,851 |
5.94% due 10/01/36(4) | | | 1,904,527 | | | 1,999,864 |
6.00% due 07/01/35 | | | 432,824 | | | 457,957 |
6.00% due 12/01/36 | | | 495,709 | | | 523,874 |
21
VALIC Company II Core Bond Fund
PORTFOLIO OF INVESTMENTS — August 31, 2009 — (continued)
| | | | | | |
| | |
| Security Description | | Principal
Amount | | Market Value
(Note 2) |
|
U.S. GOVERNMENT AGENCIES (continued) |
Federal Home Loan Mtg. Corp. (continued) |
6.00% due 08/01/37 | | $ | 2,939,172 | | $ | 3,102,491 |
6.50% due 12/01/32 | | | 440,269 | | | 472,833 |
6.50% due 02/01/36 | | | 158,313 | | | 168,910 |
6.50% due 09/01/36 | | | 5,624 | | | 5,996 |
6.50% due 05/01/37 | | | 685,389 | | | 730,584 |
6.50% due 11/01/37 | | | 1,898,542 | | | 2,023,731 |
7.00% due 11/01/16 | | | 22,278 | | | 23,927 |
7.00% due 07/01/32 | | | 48,724 | | | 53,331 |
7.50% due 12/01/30 | | | 5,912 | | | 6,615 |
7.50% due 04/01/31 | | | 49,546 | | | 55,445 |
8.00% due 02/01/30 | | | 5,038 | | | 5,708 |
8.00% due 07/01/30 | | | 1,419 | | | 1,608 |
Federal Home Loan Mtg. Corp. REMIC
Series 3102, Class PG
5.00% due 11/15/28 | | | 475,000 | | | 497,990 |
Series 3317, Class PD 5.00% due 09/15/31 | | | 610,000 | | | 641,601 |
Series 3116, Class PD 5.00% due 10/15/34 | | | 2,740,000 | | | 2,835,166 |
Series 3349, Class HB 5.50% due 06/15/31 | | | 1,106,000 | | | 1,164,296 |
| | | | | |
|
|
| | | | | | | 38,628,109 |
| | | | | |
|
|
Federal National Mtg. Assoc. — 6.8% |
4.50% due 06/01/18 | | | 93,111 | | | 97,804 |
4.77% due 10/01/35(4) | | | 237,068 | | | 244,135 |
5.00% due 03/15/16 | | | 248,000 | | | 271,757 |
5.00% due 09/01/18 | | | 31,962 | | | 33,811 |
5.00% due 10/01/18 | | | 30,618 | | | 32,389 |
5.00% due 02/01/20 | | | 52,479 | | | 55,367 |
5.00% due 06/01/22 | | | 1,613,650 | | | 1,685,306 |
5.00% due 03/01/37 | | | 329,601 | | | 338,852 |
5.00% due 06/01/37 | | | 120,624 | | | 124,009 |
5.00% due 07/01/37 | | | 694,705 | | | 714,203 |
5.50% due 10/01/17 | | | 68,766 | | | 73,388 |
5.50% due 05/01/18 | | | 59,676 | | | 63,632 |
5.50% due 11/01/19 | | | 60,307 | | | 64,304 |
5.50% due 11/01/22 | | | 393,013 | | | 414,211 |
5.50% due 12/01/33 | | | 372,328 | | | 389,991 |
5.50% due 05/01/34 | | | 179,233 | | | 187,736 |
5.50% due 12/01/35 | | | 72,843 | | | 76,162 |
5.50% due 02/01/36(4) | | | 306,670 | | | 323,040 |
5.50% due 11/01/36 | | | 599,176 | | | 625,543 |
6.00% due 09/01/16 | | | 88,823 | | | 95,044 |
6.00% due 12/01/16 | | | 21,726 | | | 23,247 |
6.00% due 12/01/33 | | | 388,521 | | | 412,417 |
6.00% due 07/01/34 | | | 335,546 | | | 356,020 |
6.00% due 10/01/36 | | | 1,319,566 | | | 1,393,302 |
6.00% due 10/01/37 | | | 690,671 | | | 728,402 |
6.50% due 02/01/17 | | | 36,339 | | | 39,170 |
6.50% due 03/01/17 | | | 44,669 | | | 48,149 |
6.50% due 04/01/29 | | | 45,089 | | | 48,776 |
6.50% due 06/01/29 | | | 110,962 | | | 120,037 |
6.50% due 07/01/32 | | | 48,186 | | | 52,006 |
6.50% due 02/01/37 | | | 940,406 | | | 1,007,906 |
7.00% due 09/01/31 | | | 115,352 | | | 126,830 |
Federal National Mtg. Assoc. REMIC
Series 2005 - 12, Class BE
5.00% due 11/25/30 | | | 600,000 | | | 629,436 |
| | | | | |
|
|
| | | | | | | 10,896,382 |
| | | | | |
|
|
| | | | | | |
| | |
| Security Description | | Shares/
Principal
Amount | | Market Value
(Note 2) |
|
| | | | | | | |
Government National Mtg. Assoc. — 2.3% |
5.00% due 05/15/34 | | $ | 1,257,358 | | $ | 1,302,493 |
6.00% due 09/15/38 | | | 2,158,637 | | | 2,279,766 |
6.50% due 06/15/29 | | | 14,876 | | | 16,099 |
7.00% due 09/15/28 | | | 13,046 | | | 14,370 |
| | | | | |
|
|
| | | | | | | 3,612,728 |
| | | | | |
|
|
Total U.S. Government Agencies | | | | | | |
(cost $51,011,954) | | | | | | 53,137,219 |
| | | | | |
|
|
U.S. GOVERNMENT TREASURIES — 9.5% |
United States Treasury Bonds — 3.1% |
3.50% due 02/15/39 | | | 2,545,000 | | | 2,248,350 |
4.25% due 05/15/39 | | | 558,000 | | | 564,190 |
4.38% due 02/15/38 | | | 674,000 | | | 695,168 |
4.50% due 05/15/38 | | | 588,000 | | | 619,238 |
5.25% due 11/15/28 | | | 559,000 | | | 640,229 |
8.13% due 08/15/19 | | | 158,000 | | | 218,188 |
| | | | | |
|
|
| | | | | | | 4,985,363 |
| | | | | |
|
|
United States Treasury Notes — 6.4% |
0.88% due 03/31/11 | | | 600,000 | | | 601,336 |
1.00% due 07/31/11 | | | 2,000,000 | | | 2,002,812 |
1.13% due 01/15/12 | | | 750,000 | | | 748,301 |
2.25% due 05/31/14 | | | 181,000 | | | 180,562 |
2.38% due 08/31/14 | | | 186,000 | | | 185,869 |
2.63% due 06/30/14 | | | 1,156,000 | | | 1,171,082 |
2.63% due 02/29/16 | | | 2,750,000 | | | 2,701,875 |
2.75% due 02/15/19 | | | 760,000 | | | 719,447 |
3.13% due 05/15/19 | | | 262,000 | | | 255,778 |
3.63% due 08/15/19 | | | 295,000 | | | 300,531 |
3.75% due 11/15/18 | | | 505,000 | | | 518,572 |
4.25% due 08/15/15 | | | 750,000 | | | 813,046 |
| | | | | |
|
|
| | | | | | | 10,199,211 |
| | | | | |
|
|
Total U.S. Government Treasuries | | | | | | |
(cost $15,512,405) | | | | | | 15,184,574 |
| | | | | |
|
|
COMMON STOCK — 0.0% |
Independent Power Producers — 0.0% |
Mirant Corp.†
(cost $0) | | | 186 | | | 3,134 |
| | | | | |
|
|
PREFERRED STOCK — 0.9% |
Banks - Commercial — 0.2% |
CoBank ACB
11.00%* | | | 7,302 | | | 358,711 |
| | | | | |
|
|
Banks - Money Center — 0.2% |
Santander Finance Preferred SA
4.00%(4) | | | 23,200 | | | 364,936 |
| | | | | |
|
|
Banks-Super Regional — 0.1% |
Wachovia Capital Trust IX
6.38% | | | 10,650 | | | 215,130 |
| | | | | |
|
|
Diversified Financial Services — 0.1% |
General Electric Capital Corp.
8.00%(8) | | | 6,441 | | | 144,278 |
| | | | | |
|
|
Finance-Mortgage Loan/Banker — 0.0% |
Freddie Mac
0.00%(4) | | | 6,900 | | | 14,766 |
| | | | | |
|
|
22
VALIC Company II Core Bond Fund
PORTFOLIO OF INVESTMENTS — August 31, 2009 — (continued)
| | | | | | | |
| | |
| Security Description | | Shares/
Principal
Amount | | | Market Value
(Note 2) |
|
PREFERRED STOCK (continued) |
Special Purpose Entity — 0.3% |
Structured Repackaged Asset-Backed Trust Securities
3.00%(4) | | | 21,200 | | | $ | 381,600 |
| | | | | | |
|
|
Total Preferred Stock | | | | | | | |
(cost $1,983,332) | | | | | | | 1,479,421 |
| | | | | | |
|
|
Total Long-Term Investment Securities | | | | | | | |
(cost $147,044,155) | | | | | | | 146,168,308 |
| | | | | | |
|
|
REPURCHASE AGREEMENT — 7.6% |
Agreement with State Street Bank & Trust Co.,
bearing interest at 0.01%, dated 08/31/09, to be repurchased 09/01/09 in the amount of $12,099,003
and collateralized by $12,470,000 of United States Treasury Bills, bearing interest at 0.15% due 12/31/09 and having approximate value of $12,462,518
(cost $12,099,000) | | $ | 12,099,000 | | | | 12,099,000 |
| | | | | | |
|
|
TOTAL INVESTMENTS | | | | | | | |
(cost $159,143,155)(9) | | | 98.9 | % | | | 158,267,308 |
Other assets less liabilities | | | 1.1 | | | | 1,703,894 |
| | |
|
|
| |
|
|
NET ASSETS — | | | 100.0 | % | | $ | 159,971,202 |
| | |
|
|
| |
|
|
| * | Securities exempt from registration under Rule 144A of the Securities Act of 1933. These securities may be sold in transactions exempt from registration, normally to qualified institutional buyers. The Fund has no right to demand registration of these securities. At August 31, 2009, the aggregate value of these securities was $14,731,173 representing 9.2% of net assets. Unless otherwise indicated these securities are not considered to be illiquid. |
| † | Non-income producing security |
| (1) | Commercial Mortgage Backed Security |
| (2) | Collateralized Mortgage Obligation |
| (3) | Variable Rate Security — the rate reflected is as of August 31, 2009, maturity date reflects the stated maturity date. |
| (4) | Floating rate security where the rate fluctuates. The rate moves up or down at each reset date. The rate reflected is as of August 31, 2009. |
| (5) | Perpetual maturity — maturity date reflects the next call date. |
| (6) | Company has filed for Chapter 11 bankruptcy protection. |
| (8) | “Step-up” security where the rate increases (“steps-up”) at a predetermined rate. Rate shown reflects the increased rate. |
| (9) | See Note 5 for cost of investments on a tax basis. |
| (10) | Income may be received in cash or additional bonds at the discretion of the issuer. |
| (11) | Illiquid security. At August 31,2009, the aggregate value of these securities was $9,800 representing 0.0% of net assets. |
| (12) | Fair valued security. Securities are classified as Level 3 based on the securities valuation inputs; see Note 2. |
| (13) | Denotes a restricted security that: (a) cannot be offered for public sale without first being registered, or being able to take advantage of an exemption from registration, under the Securities Act of 1933, as amended (the “1933 Act”); (b) is subject to a contactual restriction on public sales; or (c) is otherwise subject to a restriction on sales by operation of applicable law. Restricted securities are valued pursuant to Note 2. Certain restricted securities held by a Fund may not be sold except in exempt transactions or in a public offering registered under the 1933 Act. The Fund has no right to demand registration of these securities. The risk of investing in certain restricted securities is greater than the risk of investing in the securities of widely held, publicly traded companies. To the extent |
| | applicable, lack of a secondary market and resale restrictions may result in the inability of a Fund to sell a security at a fair price and may substantially delay the sale of the security. In addition, certain restricted securities may exhibit greater price volatility than securities for which secondary markets exist. As of August 31, 2009, the Core Bond Fund held the following restricted securities: |
| | | | | | | | | | | | | | | | | |
Name
| | Acquisition
Date
| | Principal
Amount
| | Acquisition
Cost
| | Market
Value
| | Value
Per
Share
| | % of
Net
Assets
| |
ICO North America, Inc. 7.50% due 08/15/09 | | 08/11/05 | | $ | 25,000 | | $ | 25,000 | | | | | | | | | |
| | | 02/15/08 | | | 1,000 | | | 1,000 | | | | | | | | | |
| | | 09/11/08 | | | 1,000 | | | 1,000 | | | | | | | | | |
| | | 02/27/09 | | | 1,000 | | | 1,000 | | | | | | | | | |
| | | | |
|
| |
|
| | | | | | | | | |
| | | | | $ | 28,000 | | $ | 28,000 | | $ | 9,800 | | $ | 35.00 | | 0.00 | % |
| | | | |
|
| |
|
| |
|
| | | | |
|
|
| (14) | Bond in default and did not pay principal at maturity. |
| (15) | The structured security is an investment in a trust that is linked to entities included in the CDX.NA.HY.10 index as published by CDS IndexCo LLC. Generally described, investors in the structured security are taking credit risk, and are providing credit protection to the trust, in respect of the entities included in the CDX.NA.HY.10 index. The trust, in turn, is taking credit risk with respect to the entities included in the CDX.NA.HY.10 index in the trust’s transactions with credit default swap counterparties and, through credit default swap agreements, is providing credit protection to credit default swap counterparties; see Note 2 |
| (16) | PIK (“Payment-in-Kind”) security. Bond or preferred stock that pays interest/dividends in the form of additional bonds or preferred stocks. |
| (17) | Variable Rate Security — the rate reflected is as of August 31, 2009, maturity date reflects the next reset date. |
| REMIC—Real | Estate Mortgage Investment Conduit |
The following is a summary of the inputs used to value the Fund’s net assets as of August 31, 2009 (see Note 2):
| | | | | | | | | | | | |
| | | Level 1 -
Unadjusted
Quoted
Prices
| | Level 2 -
Other
Observable
Inputs
| | Level 3 -
Significant
Unobservable
Inputs
| | Total
|
Long-Term Investment Securities: | | | | | | | | | | | | |
Asset Backed Securities | | $ | – | | $ | 9,601,531 | | $ | – | | $ | 9,601,531 |
Convertible Bonds & Notes | | | – | | | – | | | 9,800 | | | 9,800 |
U.S. Corporate Bonds & Notes | | | – | | | 53,934,002 | | | 612,651 | | | 54,546,653 |
Foreign Corporate Bonds & Notes | | | – | | | 12,203,901 | | | – | | | 12,203,901 |
Foreign Government Agencies | | | – | | | 2,075 | | | – | | | 2,075 |
U.S. Government Agencies | | | – | | | 53,137,219 | | | – | | | 53,137,219 |
U.S. Government Treasuries | | | 15,184,574 | | | – | | | – | | | 15,184,574 |
Common Stock | | | 3,134 | | | – | | | – | | | 3,134 |
Preferred Stock | | | 1,120,710 | | | 358,711 | | | – | | | 1,479,421 |
Repurchase Agreement | | | | | | 12,099,000 | | | | | | 12,099,000 |
| | |
|
| |
|
| |
|
| |
|
|
Total | | $ | 16,308,418 | | $ | 141,336,439 | | $ | 622,451 | | $ | 158,267,308 |
| | |
|
| |
|
| |
|
| |
|
|
The following is a reconciliation of Level 3 assets which significant unobservable inputs were used to determine fair value:
| | | | | | | | |
| | | Convertible
Bonds & Notes
| | | U.S. Corporate
Bonds & Notes
| |
Balance as of 8/31/2008 | | $ | 20,800 | | | $ | 440,000 | |
Accrued discounts/premiums | | | – | | | | 2,097 | |
Realized gain(loss) | | | – | | | | 8,190 | |
Change in unrealized appreciation(depreciation) | | | (13,000 | ) | | | (118,331 | ) |
Net purchases(sales) | | | 2,000 | | | | (391,692 | ) |
Transfers in and/or out of Level 3 | | | – | | | | 672,387 | |
| | |
|
|
| |
|
|
|
Balance as of 8/31/2009 | | $ | 9,800 | | | $ | 612,651 | |
| | |
|
|
| |
|
|
|
See Notes to Financial Statements
23
VALIC Company II High Yield Bond Fund
PORTFOLIO OF INVESTMENTS — August 31, 2009 (Unaudited)
Industry Allocation*
| | | |
Cable/Satellite TV | | 5.8 | % |
Medical — Hospitals | | 5.5 | |
Oil Companies — Exploration & Production | | 4.7 | |
Telecom Services | | 4.1 | |
Pipelines | | 3.8 | |
Diversified Banking Institutions | | 3.7 | |
Telephone — Integrated | | 3.2 | |
Finance — Auto Loans | | 3.0 | |
Repurchase Agreements | | 2.7 | |
Electric — Generation | | 2.5 | |
Electric — Integrated | | 2.3 | |
Theaters | | 1.9 | |
Medical — Drugs | | 1.9 | |
Diversified Financial Services | | 1.9 | |
Chemicals — Specialty | | 1.8 | |
Airlines | | 1.8 | |
Banks — Super Regional | | 1.7 | |
Satellite Telecom | | 1.7 | |
Independent Power Producers | | 1.6 | |
Casino Services | | 1.6 | |
Computer Services | | 1.3 | |
Medical — HMO | | 1.2 | |
Medical Products | | 1.1 | |
Cellular Telecom | | 1.0 | |
Diversified Manufacturing Operations | | 1.0 | |
Tobacco | | 1.0 | |
Metal — Aluminum | | 1.0 | |
Food — Retail | | 1.0 | |
Diversified Minerals | | 0.9 | |
Casino Hotels | | 0.9 | |
Paper & Related Products | | 0.9 | |
Oil — Field Services | | 0.9 | |
Auto/Truck Parts & Equipment — Original | | 0.9 | |
Containers — Metal/Glass | | 0.8 | |
Retail — Regional Department Stores | | 0.8 | |
Auto/Truck Parts & Equipment — Replacement | | 0.7 | |
Food — Meat Products | | 0.7 | |
Machinery — General Industrial | | 0.7 | |
Rubber — Tires | | 0.7 | |
Decision Support Software | | 0.7 | |
Gambling (Non-Hotel) | | 0.7 | |
Retail — Apparel/Shoe | | 0.6 | |
Auto — Cars/Light Trucks | | 0.6 | |
Machinery — Farming | | 0.6 | |
Storage/Warehousing | | 0.6 | |
Transactional Software | | 0.6 | |
Special Purpose Entities | | 0.6 | |
Music | | 0.6 | |
Real Estate Investment Trusts | | 0.6 | |
Funeral Services & Related Items | | 0.5 | |
Containers — Paper/Plastic | | 0.5 | |
Retail — Petroleum Products | | 0.5 | |
Steel — Producers | | 0.5 | |
Electronics — Military | | 0.5 | |
Agricultural Chemicals | | 0.5 | |
Broadcast Services/Program | | 0.5 | |
Diagnostic Kits | | 0.5 | |
Distribution/Wholesale | | 0.5 | |
Diversified Operations/Commercial Services | | 0.4 | |
Hotels/Motels | | 0.4 | |
Metal — Copper | | 0.4 | |
Printing — Commercial | | 0.4 | |
Advertising Services | | 0.4 | |
Beverages — Wine/Spirits | | 0.4 | |
Human Resources | | 0.3 | |
Transport — Air Freight | | 0.3 | |
Direct Marketing | | 0.3 | |
Applications Software | | 0.3 | |
Finance — Commercial | | 0.3 | |
| | | |
Building & Construction Products — Misc. | | 0.3 | |
Rental Auto/Equipment | | 0.3 | |
Publishing — Periodicals | | 0.3 | |
Electronic Components — Semiconductors | | 0.3 | |
Real Estate Management/Services | | 0.3 | |
Retail — Drug Store | | 0.3 | |
Transport — Services | | 0.3 | |
Building Products — Cement | | 0.2 | |
Non — Hazardous Waste Disposal | | 0.2 | |
Private Corrections | | 0.2 | |
Steel — Specialty | | 0.2 | |
Building — Residential/Commercial | | 0.2 | |
Retail — Sporting Goods | | 0.2 | |
Multimedia | | 0.2 | |
Retail — Restaurants | | 0.2 | |
Oil Refining & Marketing | | 0.2 | |
Medical — Biomedical/Gene | | 0.2 | |
Investment Management/Advisor Services | | 0.2 | |
Leisure Products | | 0.1 | |
Electronic Components — Misc. | | 0.1 | |
Hazardous Waste Disposal | | 0.1 | |
Wireless Equipment | | 0.1 | |
Consulting Services | | 0.1 | |
Television | | 0.1 | |
Specified Purpose Acquisitions | | 0.1 | |
Consumer Products — Misc. | | 0.1 | |
Textile — Home Furnishings | | 0.1 | |
Gas — Distribution | | 0.1 | |
Food — Misc. | | 0.1 | |
Transport — Rail | | 0.1 | |
Medical Information Systems | | 0.1 | |
Beverages — Non-alcoholic | | 0.1 | |
| | |
|
|
| | | 95.0 | % |
| | |
|
|
Credit Quality†#
| | | |
A | | 2.5 | % |
BBB | | 4.2 | |
BB | | 29.3 | |
B | | 38.5 | |
CCC | | 17.3 | |
CC | | 1.3 | |
C | | 1.1 | |
Below C | | 4.4 | |
Not Rated@ | | 1.4 | |
| | |
|
|
| | | 100.0 | % |
| | |
|
|
| * | Calculated as a percentage of net assets |
| @ | Represents debt issues that either have no rating, or the rating is unavailable from source. |
| † | Source Standard and Poors |
| # | Calculated as percentage of total debt issues, excluding short-term securities. |
24
VALIC Company II High Yield Bond Fund
PORTFOLIO OF INVESTMENTS — August 31, 2009
| | | | | | |
| | |
| Security Description | | Principal
Amount | | Market Value
(Note 2) |
|
CONVERTIBLE BONDS & NOTES — 0.1% | | | |
Drug Delivery Systems — 0.0% | | | |
Nektar Therapeutics
Sub. Notes
3.25% due 09/28/12 | | $ | 75,000 | | $ | 62,625 |
| | | | | |
|
|
Telecom Services — 0.1% | | | |
ICO North America, Inc.
Notes
7.50% due 08/15/09†(2)(3)(4)(8)(12) | | | 281,000 | | | 98,350 |
| | | | | |
|
|
Total Convertible Bonds & Notes | | | | | | |
(cost $355,376) | | | | | | 160,975 |
| | | | | |
|
|
U.S. CORPORATE BONDS & NOTES — 80.7% | | | |
Advertising Services — 0.4% | | | |
Visant Holding Corp.
Senior Notes
8.75% due 12/01/13 | | | 85,000 | | | 85,850 |
Visant Holding Corp.
Senior Notes
10.25% due 12/01/13(1) | | | 640,000 | | | 646,400 |
| | | | | |
|
|
| | | | | | | 732,250 |
| | | | | |
|
|
Agricultural Chemicals — 0.5% | | | |
Terra Capital, Inc.
Company Guar. Notes
7.00% due 02/01/17 | | | 970,000 | | | 914,225 |
| | | | | |
|
|
Airlines — 1.8% | | | |
American Airlines, Inc.
Pass Through Certs.
Series 1999-1, Class B
7.32% due 10/15/09 | | | 25,000 | | | 24,625 |
American Airlines, Inc.
Pass Through Certs.
Series 2001-2, Class A-2
7.86% due 04/01/13 | | | 506,000 | | | 483,230 |
Continental Airlines, Inc.
Pass Through Certs.
Series 2001-1, Class A-2
6.50% due 06/15/11 | | | 250,000 | | | 237,500 |
Continental Airlines, Inc.
Pass Through Certs.
Series 1991, Class A
6.55% due 02/02/19 | | | 388,880 | | | 369,436 |
Delta Air Lines, Inc.
Pass Through Certs.
Series 2001-1, Class A2
7.11% due 09/18/11 | | | 675,000 | | | 651,375 |
Delta Air Lines, Inc.
Pass Through Certs.
Series 2000-1, Class A-2
7.57% due 11/18/10 | | | 150,000 | | | 146,250 |
United AirLines, Inc.
Pass Through Certs.
Series 2001-1, Class A-2
6.20% due 03/29/49 | | | 3,175 | | | 3,127 |
United AirLines, Inc.
Pass Through Certs.
Series 2001-1 Class B
6.93% due 09/01/11 | | | 873,000 | | | 1,156,725 |
United AirLines, Inc.
Pass Through Certs.
Series 2000-2, Class A-2
7.19% due 04/01/11 | | | 303,771 | | | 299,974 |
| | | | | |
|
|
| | | | | | | 3,372,242 |
| | | | | |
|
|
| | | | | | |
| | |
| Security Description | | Principal
Amount | | Market Value
(Note 2) |
|
| |
Applications Software — 0.3% | | | |
SS&C Technologies, Inc.
Company Guar. Notes
11.75% due 12/01/13 | | $ | 600,000 | | $ | 618,750 |
| | | | | |
|
|
Auto - Cars/Light Trucks — 0.6% | | | |
Ford Motor Co.
Notes
7.45% due 07/16/31 | | | 1,550,000 | | | 1,185,750 |
| | | | | |
|
|
Auto/Truck Parts & Equipment - Original — 0.4% | | | |
Cooper-Standard Automotive, Inc.
Company Guar. Notes
8.38% due 12/15/14†(4)(5) | | | 720,000 | | | 39,600 |
TRW Automotive, Inc.
Company Guar. Notes
7.25% due 03/15/17* | | | 925,000 | | | 777,000 |
| | | | | |
|
|
| | | | | | | 816,600 |
| | | | | |
|
|
Auto/Truck Parts & Equipment - Replacement — 0.7% |
Affinia Group, Inc.
Senior Sec. Notes
10.75% due 08/15/16* | | | 910,000 | | | 939,575 |
Allison Transmission
Senior Notes
11.00% due 11/01/15* | | | 525,000 | | | 472,500 |
Exide Corp.
Notes
10.00% due 03/15/25†(2)(3) | | | 300,000 | | | 0 |
| | | | | |
|
|
| | | | | | | 1,412,075 |
| | | | | |
|
|
Banks - Super Regional — 1.7% | | | |
BAC Capital Trust XI
Bank Guar.
6.63% due 05/23/36 | | | 385,000 | | | 302,084 |
Wells Fargo & Co.
Jr. Sub. Notes
7.98% due 03/29/49(7) | | | 3,250,000 | | | 2,925,000 |
| | | | | |
|
|
| | | | | | | 3,227,084 |
| | | | | |
|
|
Beverages - Wine/Spirits — 0.4% | | | |
Constellation Brands, Inc.
Company Guar. Notes
7.25% due 05/15/17 | | | 750,000 | | | 725,625 |
| | | | | |
|
|
Broadcast Services/Program — 0.5% | | | |
Fisher Communications, Inc.
Senior Notes
8.63% due 09/15/14 | | | 806,000 | | | 733,460 |
Nexstar Broadcasting, Inc.
Company Guar. Notes
0.50% due 01/15/14*(6) | | | 324,559 | | | 126,578 |
Nexstar Broadcasting, Inc.
Company Guar. Notes
7.00% due 01/15/14 | | | 108,000 | | | 42,660 |
| | | | | |
|
|
| | | | | | | 902,698 |
| | | | | |
|
|
Building & Construction Products - Misc. — 0.3% | | | |
Interline Brands, Inc.
Senior Sub. Notes
8.13% due 06/15/14 | | | 583,000 | | | 575,713 |
| | | | | |
|
|
Building Products - Cement — 0.2% | | | |
Texas Industries, Inc.
Company Guar. Notes
7.25% due 07/15/13 | | | 450,000 | | | 420,750 |
| | | | | |
|
|
25
VALIC Company II High Yield Bond Fund
PORTFOLIO OF INVESTMENTS — August 31, 2009 — (continued)
| | | | | | |
| | |
| Security Description | | Principal
Amount | | Market Value
(Note 2) |
|
U.S. CORPORATE BONDS & NOTES (continued) |
Cable/Satellite TV — 5.8% |
CCH II LLC/CCH II Capital Corp.
Senior Notes
10.25% due 09/15/10†(4)(5) | | $ | 930,000 | | $ | 1,033,463 |
CCH II LLC/CCH II Capital Corp.
Senior Notes, Series B
10.25% due 09/15/10†(4)(5) | | | 505,000 | | | 561,181 |
CCH II LLC/CCH II Capital Corp.
Company Guar. Notes
10.25% due 10/01/13*†(4)(5) | | | 57,000 | | | 59,636 |
CCO Holdings LLC/CCO Holdings Capital Corp.
Senior Notes
8.75% due 11/15/13†(4)(5) | | | 2,299,000 | | | 2,321,990 |
Charter Communications Operating LLC
Senior Notes
12.88% due 09/15/14*†(4)(5) | | | 1,009,000 | | | 1,094,765 |
Charter Communications Operating LLC/Charter Communications Operating Capital
Senior Notes
10.38% due 04/30/14*†(4)(5) | | | 1,349,000 | | | 1,365,862 |
CSC Holdings, Inc.
Senior Notes
7.63% due 04/01/11 | | | 1,185,000 | | | 1,199,813 |
DirecTV Holdings LLC/DirecTV Financing Co.
Company Guar.
Notes 7.63% due 05/15/16 | | | 990,000 | | | 1,041,975 |
Mediacom LLC / Mediacom Capital Corp.
Senior Notes
9.13% due 08/15/19* | | | 2,405,000 | | | 2,380,950 |
| | | | | |
|
|
| | | | | | | 11,059,635 |
| | | | | |
|
|
Casino Hotels — 0.9% |
Eldorado Casino Corp. (Shreveport)
Sec. Bonds
10.00% due 08/01/12(6) | | | 429,222 | | | 364,839 |
Eldorado Resorts LLC
Senior Notes
9.00% due 04/15/14(2)(3) | | | 475,000 | | | 438,211 |
MGM Mirage, Inc.
Senior Sec. Notes
11.13% due 11/15/17* | | | 900,000 | | | 968,625 |
| | | | | |
|
|
| | | | | | | 1,771,675 |
| | | | | |
|
|
Casino Services — 0.8% |
Indianapolis Downs LLC & Capital Corp.
Senior Sec. Notes
11.00% due 11/01/12* | | | 510,000 | | | 362,100 |
Peninsula Gaming LLC
Senior Sec. Notes
8.38% due 08/15/15* | | | 770,000 | | | 754,600 |
Peninsula Gaming LLC
Senior Notes
10.75% due 08/15/17* | | | 460,000 | | | 439,300 |
| | | | | |
|
|
| | | | | | | 1,556,000 |
| | | | | |
|
|
Cellular Telecom — 1.0% |
Cricket Communications, Inc.
Senior Sec. Notes
7.75% due 05/15/16* | | | 750,000 | | | 727,500 |
MetroPCS Wireless, Inc.
Company Guar. Notes
9.25% due 11/01/14 | | | 904,000 | | | 887,050 |
Nextel Communications, Inc.
Senior Notes
7.38% due 08/01/15 | | | 429,000 | | | 366,259 |
| | | | | |
|
|
| | | | | | | 1,980,809 |
| | | | | |
|
|
| | | | | | |
| | |
| Security Description | | Principal
Amount | | Market Value
(Note 2) |
|
| |
Chemicals - Specialty — 1.8% |
Huntsman International LLC
Senior Sub. Notes
7.38% due 01/01/15 | | $ | 910,000 | | $ | 782,600 |
Huntsman International LLC
Company Guar. Notes
7.88% due 11/15/14 | | | 110,000 | | | 97,900 |
Johnsondiversey Holdings, Inc.
Company Guar. Notes
9.63% due 05/15/12 | | | 1,280,000 | | | 1,299,200 |
Momentive Performance Materials, Inc.
Company Guar. Notes
9.75% due 12/01/14 | | | 1,180,000 | | | 767,000 |
Momentive Performance Materials, Inc.
Company Guar. Notes
12.50% due 06/15/14* | | | 403,000 | | | 380,835 |
Tronox Worldwide LLC
Company Guar. Notes
9.50% due 12/01/12†(4)(5) | | | 677,000 | | | 196,330 |
| | | | | |
|
|
| | | | | | | 3,523,865 |
| | | | | |
|
|
Computer Services — 1.3% |
Sungard Data Systems, Inc.
Company Guar. Notes
9.13% due 08/15/13 | | | 490,000 | | | 485,100 |
Sungard Data Systems, Inc.
Senior Notes
10.63% due 05/15/15* | | | 175,000 | | | 181,125 |
Unisys Corp.
Senior Sec. Notes
12.75% due 10/15/14* | | | 1,850,000 | | | 1,898,562 |
| | | | | |
|
|
| | | | | | | 2,564,787 |
| | | | | |
|
|
Consulting Services — 0.1% |
FTI Consulting, Inc.
Company Guar. Notes
7.75% due 10/01/16 | | | 250,000 | | | 243,750 |
| | | | | |
|
|
Consumer Products - Misc. — 0.1% |
Prestige Brands, Inc.
Senior Sub. Notes
9.25% due 04/15/12 | | | 200,000 | | | 202,000 |
| | | | | |
|
|
Containers - Metal/Glass — 0.8% |
Ball Corp.
Company Guar. Notes
7.13% due 09/01/16 | | | 125,000 | | | 125,000 |
Ball Corp.
Company Guar. Notes
7.38% due 09/01/19 | | | 185,000 | | | 184,537 |
Crown Cork & Seal Co., Inc.
Debentures
7.38% due 12/15/26 | | | 275,000 | | | 237,875 |
Crown Cork & Seal Co., Inc.
Debentures
8.00% due 04/15/23 | | | 285,000 | | | 265,050 |
Owens - Brockway Glass Container, Inc.
Company Guar. Notes
8.25% due 05/15/13 | | | 735,000 | | | 742,350 |
| | | | | |
|
|
| | | | | | | 1,554,812 |
| | | | | |
|
|
Containers - Paper/Plastic — 0.5% |
Graphic Packaging International, Inc.
Company Guar. Notes
9.50% due 06/15/17* | | | 600,000 | | | 615,000 |
Sealed Air Corp.
Senior Notes
7.88% due 06/15/17* | | | 375,000 | | | 393,814 |
| | | | | |
|
|
| | | | | | | 1,008,814 |
| | | | | |
|
|
26
VALIC Company II High Yield Bond Fund
PORTFOLIO OF INVESTMENTS — August 31, 2009 — (continued)
| | | | | | |
| | |
| Security Description | | Principal
Amount | | Market Value
(Note 2) |
|
U.S. CORPORATE BONDS & NOTES (continued) |
Decision Support Software — 0.7% |
Vangent, Inc.
Company Guar. Notes
9.63% due 02/15/15 | | $ | 1,435,000 | | $ | 1,334,550 |
| | | | | |
|
|
Diagnostic Kits — 0.5% |
Inverness Medical Innovations, Inc.
Senior Notes
7.88% due 02/01/16 | | | 935,000 | | | 902,275 |
| | | | | |
|
|
Direct Marketing — 0.3% |
Affinity Group, Inc.
Company Guar. Notes
9.00% due 02/15/12† | | | 975,000 | | | 624,000 |
| | | | | |
|
|
Distribution/Wholesale — 0.5% |
KAR Holdings, Inc.
Company Guar. Notes
4.48% due 05/01/14(7) | | | 435,000 | | | 358,875 |
KAR Holdings, Inc.
Company Guar. Notes
8.75% due 05/01/14 | | | 535,000 | | | 504,238 |
| | | | | |
|
|
| | | | | | | 863,113 |
| | | | | |
|
|
Diversified Banking Institutions — 3.7% |
Citigroup, Inc.
Senior Sub. Notes
5.88% due 02/22/33 | | | 1,005,000 | | | 763,263 |
GMAC LLC
Company Guar. Notes
6.00% due 04/01/11* | | | 2,937,000 | | | 2,687,355 |
GMAC LLC
Company Guar. Notes
6.88% due 09/15/11* | | | 2,703,000 | | | 2,493,517 |
GMAC LLC
Sub. Notes
8.00% due 12/31/18* | | | 1,475,000 | | | 1,073,063 |
| | | | | |
|
|
| | | | | | | 7,017,198 |
| | | | | |
|
|
Diversified Financial Services — 1.0% |
Citigroup Capital XXI
Company Guar. Bonds
8.30% due 12/21/77 | | | 2,340,000 | | | 1,971,450 |
| | | | | |
|
|
Diversified Manufacturing Operations — 0.8% |
Harland Clarke Holdings Corp.
Notes
6.00% due 05/15/15(7) | | | 400,000 | | | 287,000 |
Harland Clarke Holdings Corp.
Notes
9.50% due 05/15/15 | | | 875,000 | | | 745,937 |
SPX Corp.
Senior Notes
7.63% due 12/15/14 | | | 400,000 | | | 401,500 |
| | | | | |
|
|
| | | | | | | 1,434,437 |
| | | | | |
|
|
Diversified Operations/Commercial Services — 0.4% |
ARAMARK Corp.
Company Guar. Notes
8.50% due 02/01/15 | | | 875,000 | | | 848,750 |
| | | | | |
|
|
Electric - Generation — 2.5% |
Edison Mission Energy
Senior Notes
7.63% due 05/15/27 | | | 630,000 | | | 422,100 |
Homer City Funding LLC
Senior Notes
8.14% due 10/01/19 | | | 389,880 | | | 366,487 |
| | | | | | |
| | |
| Security Description | | Principal
Amount | | Market Value
(Note 2) |
|
| |
Electric - Generation (continued) |
Midwest Generation LLC
Pass Thru Certs.,
Series B
8.56% due 01/02/16 | | $ | 396,530 | | $ | 392,565 |
Reliant Energy Mid - Atlantic Power Holdings LLC
Pass Through Certs., Series B
9.24% due 07/02/17 | | | 542,245 | | | 536,822 |
Reliant Energy Mid - Atlantic Power Holdings LLC
Pass Through Certs., Series C
9.68% due 07/02/26 | | | 450,000 | | | 445,500 |
Sithe/Independence Funding Corp.
Senior Notes
9.00% due 12/30/13 | | | 503,441 | | | 499,509 |
The AES Corp.
Senior Notes
8.00% due 10/15/17 | | | 1,175,000 | | | 1,125,063 |
The AES Corp.
Senior Notes
8.00% due 06/01/20 | | | 450,000 | | | 420,750 |
The AES Corp.
Senior Sec. Notes
Notes 8.75% due 05/15/13* | | | 508,000 | | | 515,620 |
| | | | | |
|
|
| | | | | | | 4,724,416 |
| | | | | |
|
|
Electric - Integrated — 2.1% |
CMS Energy Corp.
Senior Notes
8.75% due 06/15/19 | | | 125,000 | | | 132,637 |
Mirant Americas Generation LLC
Senior Notes
8.30% due 05/01/11 | | | 550,000 | | | 552,750 |
Mirant Americas Generation LLC
Senior Notes
8.50% due 10/01/21 | | | 1,100,000 | | | 907,500 |
Mirant Mid - Atlantic LLC
Pass Through Certs., Series B
9.13% due 06/30/17 | | | 328,292 | | | 327,061 |
Texas Competitive Electric Holdings Co., LLC
Company Guar. Notes, Series A
10.25% due 11/01/15 | | | 2,060,000 | | | 1,364,750 |
Texas Competitive Electric Holdings Co., LLC
Company Guar. Notes, Series B
10.25% due 11/01/15 | | | 110,000 | | | 72,875 |
Texas Competitive Electric Holdings Co., LLC
Company Guar. Notes
10.50% due 11/01/16(8) | | | 1,014,000 | | | 593,190 |
| | | | | |
|
|
| | | | | | | 3,950,763 |
| | | | | |
|
|
Electronic Components - Misc. — 0.2% |
Jabil Circuit, Inc.
Senior Notes
7.75% due 07/15/16 | | | 170,000 | | | 167,238 |
Sanmina - SCI Corp.
Company Guar. Notes
6.75% due 03/01/13 | | | 125,000 | | | 114,375 |
| | | | | |
|
|
| | | | | | | 281,613 |
| | | | | |
|
|
Electronic Components - Semiconductors — 0.3% |
Amkor Technology, Inc.
Senior Notes
7.75% due 05/15/13 | | | 535,000 | | | 529,650 |
| | | | | |
|
|
Electronics - Military — 0.5% |
L-3 Communications Corp.
Company Guar. Notes
6.13% due 07/15/13 | | | 960,000 | | | 931,200 |
| | | | | |
|
|
27
VALIC Company II High Yield Bond Fund
PORTFOLIO OF INVESTMENTS — August 31, 2009 — (continued)
| | | | | | |
| | |
| Security Description | | Principal
Amount | | Market Value
(Note 2) |
|
U.S. CORPORATE BONDS & NOTES (continued) |
Finance - Auto Loans — 3.0% |
Ford Motor Credit Co. LLC
Senior Notes
7.38% due 02/01/11 | | $ | 3,225,000 | | $ | 3,117,643 |
Ford Motor Credit Co. LLC
Notes
7.88% due 06/15/10 | | | 223,000 | | | 222,535 |
Ford Motor Credit Co., LLC
Senior Notes
9.75% due 09/15/10 | | | 2,450,000 | | | 2,473,701 |
| | | | | |
|
|
| | | | | | | 5,813,879 |
| | | | | |
|
|
Finance - Commercial — 0.3% |
CIT Group, Inc.
Senior Notes
5.80% due 07/28/11 | | | 994,000 | | | 592,026 |
| | | | | |
|
|
Food - Meat Products — 0.3% |
Smithfield Foods, Inc.
Senior Sec. Notes
10.00% due 07/15/14* | | | 625,000 | | | 637,500 |
| | | | | |
|
|
Food - Retail — 0.4% |
Ingles Markets, Inc.
Senior Notes
8.88% due 05/15/17 | | | 550,000 | | | 552,750 |
SUPERVALU, Inc.
Senior Notes
8.00% due 05/01/16 | | | 275,000 | | | 271,563 |
| | | | | |
|
|
| | | | | | | 824,313 |
| | | | | |
|
|
Funeral Services & Related Items — 0.5% |
Carriage Services, Inc.
Senior Notes
7.88% due 01/15/15 | | | 1,125,000 | | | 1,012,500 |
| | | | | |
|
|
Gambling (Non-Hotel) — 0.1% |
Greektown Holdings LLC
Senior Notes
10.75% due 12/01/13*†(4)(5) | | | 930,000 | | | 199,950 |
| | | | | |
|
|
Gas - Distribution — 0.1% |
MXEnergy Holdings, Inc.
Senior Notes
8.43% due 08/01/11(7) | | | 450,000 | | | 178,875 |
| | | | | |
|
|
Hazardous Waste Disposal — 0.1% |
Clean Harbors, Inc.
Senior Sec. Notes
7.63% due 08/15/16* | | | 280,000 | | | 280,700 |
| | | | | |
|
|
Hotels/Motels — 0.4% |
Gaylord Entertainment Co.
Company Guar. Notes
6.75% due 11/15/14 | | | 617,000 | | | 519,823 |
Gaylord Entertainment Co.
Company Guar. Notes
8.00% due 11/15/13 | | | 350,000 | | | 319,375 |
| | | | | |
|
|
| | | | | | | 839,198 |
| | | | | |
|
|
Human Resources — 0.3% |
Team Health, Inc.
Company Guar. Notes
11.25% due 12/01/13 | | | 646,000 | | | 662,150 |
| | | | | |
|
|
Independent Power Producers — 1.6% |
Mirant North America LLC
Senior Notes
7.38% due 12/31/13 | | | 725,000 | | | 696,000 |
| | | | | | |
| | |
| Security Description | | Principal
Amount | | Market Value
(Note 2) |
|
| |
Independent Power Producers (continued) |
NRG Energy, Inc.
Company Guar. Notes
7.38% due 02/01/16 | | $ | 1,440,000 | | $ | 1,377,000 |
Orion Power Holdings, Inc.
Senior Notes
12.00% due 05/01/10 | | | 450,000 | | | 464,625 |
RRI Energy, Inc.
Senior Notes
7.88% due 12/31/17 | | | 690,000 | | | 612,375 |
| | | | | |
|
|
| | | | | | | 3,150,000 |
| | | | | |
|
|
Investment Management/Advisor Services — 0.2% |
Janus Capital Group, Inc.
Notes
6.95% due 06/15/17 | | | 323,000 | | | 299,352 |
| | | | | |
|
|
Leisure Products — 0.2% |
Brunswick Corp.
Senior Sec. Notes
11.25% due 11/01/16* | | | 270,000 | | | 282,825 |
| | | | | |
|
|
Machinery - Farming — 0.6% |
Case New Holland, Inc.
Company Guar. Notes
7.75% due 09/01/13* | | | 1,175,000 | | | 1,157,375 |
| | | | | |
|
|
Machinery - General Industrial — 0.7% |
CPM Holdings, Inc.
Senior Sec. Notes
10.63% due 09/01/14* | | | 1,390,000 | | | 1,403,900 |
| | | | | |
|
|
Medical Information Systems — 0.1% |
Spheris, Inc.
Senior Sub. Notes
11.00% due 12/15/12 | | | 300,000 | | | 127,500 |
| | | | | |
|
|
Medical Products — 1.1% |
DJO Finance LLC/DJO Finance Corp.
Company Guar. Notes
10.88% due 11/15/14 | | | 325,000 | | | 312,000 |
LVB Acquisition Holding LLC
Company Guar. Notes
10.00% due 10/15/17 | | | 1,133,000 | | | 1,189,650 |
LVB Acquisition Holding LLC
Company Guar. Notes
10.38% due 10/15/17(8) | | | 636,000 | | | 663,030 |
| | | | | |
|
|
| | | | 2,164,680 |
| | | | | |
|
|
Medical - Biomedical/Gene — 0.2% |
Bio - Rad Laboratories, Inc.
Senior Sub. Notes
8.00% due 09/15/16* | | | 300,000 | | | 306,000 |
| | | | | |
|
|
Medical - Drugs — 0.9% |
Axcan Intermediate Holdings, Inc.
Senior Notes
9.25% due 03/01/15 | | | 825,000 | | | 847,687 |
Valeant Pharmaceuticals International
Senior Notes
8.38% due 06/15/16* | | | 900,000 | | | 913,500 |
| | | | | |
|
|
| | | | | | | 1,761,187 |
| | | | | |
|
|
Medical - HMO — 1.2% |
CIGNA Corp.
Senior Notes
8.50% due 05/01/19 | | | 650,000 | | | 713,396 |
Multiplan, Inc.
Senior Sub. Notes
10.38% due 04/15/16* | | | 1,705,000 | | | 1,653,850 |
| | | | | |
|
|
| | | | | | | 2,367,246 |
| | | | | |
|
|
28
VALIC Company II High Yield Bond Fund
PORTFOLIO OF INVESTMENTS — August 31, 2009 — (continued)
| | | | | | |
| | |
| Security Description | | Principal
Amount | | Market Value
(Note 2) |
|
U.S. CORPORATE BONDS & NOTES (continued) |
Medical - Hospitals — 5.0% |
Community Health Systems, Inc.
Company Guar. Notes
8.88% due 07/15/15 | | $ | 1,800,000 | | $ | 1,806,750 |
HCA, Inc.
Senior Notes
6.25% due 02/15/13 | | | 900,000 | | | 834,750 |
HCA, Inc.
Senior Notes
7.88% due 02/01/11 | | | 725,000 | | | 728,625 |
HCA, Inc.
Senior Sec. Notes
7.88% due 02/15/20* | | | 1,400,000 | | | 1,365,000 |
HCA, Inc.
Senior Notes
8.50% due 04/15/19* | | | 750,000 | | | 759,375 |
HCA, Inc.
Senior Notes
8.75% due 09/01/10 | | | 360,000 | | | 362,700 |
HCA, Inc.
Senior Sec. Notes
9.25% due 11/15/16 | | | 1,189,000 | | | 1,203,862 |
IASIS Healthcare LLC/IASIS Capital Corp.
Company Guar. Notes
8.75% due 06/15/14 | | | 795,000 | | | 777,113 |
Tenet Healthcare Corp.
Senior Sec. Notes
9.00% due 05/01/15* | | | 1,720,000 | | | 1,763,000 |
| | | | | |
|
|
| | | | | | | 9,601,175 |
| | | | | |
|
|
Metal - Aluminum — 0.5% |
Noranda Aluminum Acquisition Corp.
Company Guar. Notes
5.41% due 11/15/14(7)(8) | | | 1,130,030 | | | 689,318 |
Noranda Aluminum Holding Corp.
Senior Notes
7.16% due 11/15/14(7)(8) | | | 496,600 | | | 213,538 |
| | | | | |
|
|
| | | | | | | 902,856 |
| | | | | |
|
|
Metal - Copper — 0.4% |
Freeport-McMoRan Copper & Gold, Inc.
Senior Notes
8.38% due 04/01/17 | | | 780,000 | | | 813,150 |
| | | | | |
|
|
Multimedia — 0.0% |
Haights Cross Operating Co.
Senior Notes
11.75% due 08/15/11(10) | | | 175,000 | | | 75,250 |
| | | | | |
|
|
Music — 0.6% |
WMG Acquisition Corp.
Senior Notes
9.50% due 06/15/16* | | | 1,050,000 | | | 1,086,750 |
| | | | | |
|
|
Non-Ferrous Metals — 0.0% |
Renco Metals, Inc.
Bonds
11.50% due 07/01/03†(2)(3)(9)(12) | | | 210,000 | | | 0 |
| | | | | |
|
|
Non-Hazardous Waste Disposal — 0.2% |
Waste Services, Inc.
Senior Sub. Notes
9.50% due 04/15/14 | | | 400,000 | | | 396,000 |
| | | | | |
|
|
Oil Companies - Exploration & Production — 3.9% |
Atlas Energy Resources LLC
Senior Notes
10.75% due 02/01/18* | | | 900,000 | | | 909,000 |
| | | | | | |
| | |
| Security Description | | Principal
Amount | | Market Value
(Note 2) |
|
| |
Oil Companies - Exploration & Production (continued) |
Belden & Blake Corp.
Company Guar. Sec. Notes
8.75% due 07/15/12 | | $ | 110,000 | | $ | 98,450 |
Chesapeake Energy Corp.
Senior Notes
6.63% due 01/15/16 | | | 1,650,000 | | | 1,499,437 |
Chesapeake Energy Corp.
Senior Notes
9.50% due 02/15/15 | | | 425,000 | | | 433,500 |
Encore Acquisition Co.
Senior Sub. Notes
6.00% due 07/15/15 | | | 655,000 | | | 563,300 |
Encore Acquisition Co.
Senior Sub. Notes
6.25% due 04/15/14 | | | 350,000 | | | 311,500 |
Exco Resources, Inc.
Company Guar. Notes
7.25% due 01/15/11 | | | 845,000 | | | 828,100 |
Hilcorp Energy I LP
Senior Notes
7.75% due 11/01/15* | | | 730,000 | | | 673,425 |
Plains Exploration & Production Co.
Company Guar. Notes
7.75% due 06/15/15 | | | 450,000 | | | 436,500 |
Plains Exploration & Production Co.
Company Guar. Notes
10.00% due 03/01/16 | | | 475,000 | | | 503,500 |
Quicksilver Resources, Inc.
Company Guar. Notes
7.13% due 04/01/16 | | | 200,000 | | | 166,000 |
Quicksilver Resources, Inc.
Senior Notes
8.25% due 08/01/15 | | | 900,000 | | | 846,000 |
Quicksilver Resources, Inc.
Senior Notes
11.75% due 01/01/16 | | | 125,000 | | | 132,500 |
| | | | | |
|
|
| | | | | | | 7,401,212 |
| | | | | |
|
|
Oil Refining & Marketing — 0.2% |
Western Refining, Inc.
Senior Sec. Notes
11.25% due 06/15/17* | | | 350,000 | | | 309,750 |
| | | | | |
|
|
Oil - Field Services — 0.8% |
Helix Energy Solutions Group, Inc.
Senior Notes
9.50% due 01/15/16* | | | 675,000 | | | 634,500 |
Hornbeck Offshore Services, Inc.
Senior Notes
8.00% due 09/01/17* | | | 830,000 | | | 813,400 |
Oslo Seismic Services, Inc.
1st Mtg. Bonds
8.28% due 06/01/11 | | | 100,712 | | | 102,154 |
| | | | | |
|
|
| | | | | | | 1,550,054 |
| | | | | |
|
|
Paper & Related Products — 0.8% |
Caraustar Industries, Inc.
Senior Sec. Notes
10.00% due 08/15/14(2)(8) | | | 227,314 | | | 227,314 |
Cellu Tissue Holdings, Inc.
Sec. Notes
11.50% due 06/01/14* | | | 225,000 | | | 235,125 |
Georgia-Pacific LLC
Company Guar. Notes
7.00% due 01/15/15* | | | 163,000 | | | 156,887 |
Georgia-Pacific LLC
Company Guar. Notes
7.13% due 01/15/17* | | | 205,000 | | | 196,800 |
29
VALIC Company II High Yield Bond Fund
PORTFOLIO OF INVESTMENTS — August 31, 2009 — (continued)
| | | | | | |
| | |
| Security Description | | Principal
Amount | | Market Value
(Note 2) |
|
U.S. CORPORATE BONDS & NOTES (continued) |
Paper & Related Products (continued) |
Georgia-Pacific LLC
Senior Notes
7.75% due 11/15/29 | | $ | 214,000 | | $ | 188,320 |
Georgia-Pacific LLC
Company Guar. Notes
8.25% due 05/01/16* | | | 550,000 | | | 555,500 |
| | | | | |
|
|
| | | | | | | 1,559,946 |
| | | | | |
|
|
Pipelines — 3.8% |
Copano Energy LLC
Company Guar. Notes
8.13% due 03/01/16 | | | 1,445,000 | | | 1,383,587 |
Dynegy-Roseton Danskammer
Pass Through Certs., Series B
7.67% due 11/08/16 | | | 2,085,000 | | | 1,866,075 |
El Paso Corp.
Senior Sub. Notes
6.88% due 06/15/14 | | | 775,000 | | | 756,010 |
El Paso Corp.
Senior Notes
12.00% due 12/12/13 | | | 125,000 | | | 141,250 |
Energy Transfer Partners LP
Senior Notes
9.00% due 04/15/19 | | | 250,000 | | | 301,116 |
Kinder Morgan, Inc.
Senior Notes
6.50% due 09/01/12 | | | 271,000 | | | 275,743 |
MarkWest Energy Partners LP/MarkWest Energy
Finance Corp.
Senior Notes
6.88% due 11/01/14 | | | 600,000 | | | 549,000 |
MarkWest Energy Partners LP/MarkWest Energy
Finance Corp.
Company Guar. Notes
8.50% due 07/15/16 | | | 305,000 | | | 288,225 |
MarkWest Energy Partners LP/MarkWest Energy
Finance Corp.
Senior Notes
8.75% due 04/15/18 | | | 400,000 | | | 380,000 |
NGC Corp. Capital Trust
Company Guar. Bonds
8.32% due 06/01/27 | | | 970,000 | | | 460,750 |
Regency Energy Partners LP/Regency Energy
Finance Corp.
Company Guar. Notes
8.38% due 12/15/13 | | | 275,000 | | | 270,188 |
Williams Cos., Inc.
Senior Notes
7.88% due 09/01/21 | | | 500,000 | | | 541,417 |
| | | | | |
|
|
| | | | | | | 7,213,361 |
| | | | | |
|
|
Printing - Commercial — 0.4% |
Valassis Communications, Inc.
Senior Notes
8.25% due 03/01/15 | | | 855,000 | | | 748,125 |
| | | | | |
|
|
Private Corrections — 0.2% |
Corrections Corp. of America
Company Guar. Notes
7.75% due 06/01/17 | | | 400,000 | | | 395,000 |
| | | | | |
|
|
Publishing - Periodicals — 0.3% |
Nielsen Finance LLC/Nielsen
Finance Co.
Company Guar. Notes
11.50% due 05/01/16 | | | 525,000 | | | 522,375 |
| | | | | | |
| | |
| Security Description | | Principal
Amount | | Market Value
(Note 2) |
|
| |
Publishing - Periodicals (continued) |
The Reader’s Digest Association, Inc.
Company Guar. Notes
9.00% due 02/15/17†(4)(5) | | $ | 1,415,000 | | $ | 33,606 |
| | | | | |
|
|
| | | | | | | 555,981 |
| | | | | |
|
|
Real Estate Investment Trusts — 0.6% |
Omega Healthcare Investors, Inc.
Senior Notes
7.00% due 04/01/14 | | | 1,155,000 | | | 1,079,925 |
| | | | | |
|
|
Real Estate Management/Services — 0.3% |
CB Richard Ellis Services, Inc.
Senior Sub. Notes
11.63% due 06/15/17* | | | 500,000 | | | 520,000 |
| | | | | |
|
|
Recycling — 0.0% |
Aleris International, Inc.
Company Guar. Notes
9.00% due 12/15/14†(4)(5)(8) | | | 2,565,000 | | | 13,082 |
| | | | | |
|
|
Rental Auto/Equipment — 0.3% |
RSC Equipment Rental, Inc.
Senior Sec. Notes
10.00% due 07/15/17* | | | 550,000 | | | 572,000 |
| | | | | |
|
|
Retail - Apparel/Shoe — 0.6% |
Limited Brands, Inc.
Senior Notes
5.25% due 11/01/14 | | | 508,000 | | | 459,280 |
Limited Brands, Inc.
Senior Notes
6.95% due 03/01/33 | | | 651,000 | | | 466,682 |
Limited Brands, Inc.
Senior Notes
8.50% due 06/15/19* | | | 275,000 | | | 278,584 |
| | | | | |
|
|
| | | | | | | 1,204,546 |
| | | | | |
|
|
Retail - Drug Store — 0.3% |
Rite Aid Corp.
Company Guar. Notes
9.50% due 06/15/17 | | | 465,000 | | | 334,800 |
Rite Aid Corp.
Senior Sec. Notes
9.75% due 06/12/16* | | | 150,000 | | | 158,625 |
| | | | | |
|
|
| | | | | | | 493,425 |
| | | | | |
|
|
Retail - Music Store — 0.0% |
MTS, Inc.
Senior Notes
10.00% due 03/15/09†(2)(3)(4)(5)(6) | | | 15,273 | | | 305 |
| | | | | |
|
|
Retail - Petroleum Products — 0.5% |
Ferrellgas Partners LP
Senior Notes
6.75% due 05/01/14 | | | 376,000 | | | 344,980 |
Ferrellgas Partners LP
Senior Notes
6.75% due 05/01/14* | | | 75,000 | | | 68,813 |
Inergy LP/Inergy Finance Corp.
Company Guar. Notes
8.25% due 03/01/16 | | | 525,000 | | | 519,750 |
| | | | | |
|
|
| | | | | | | 933,543 |
| | | | | |
|
|
Retail - Regional Department Stores — 0.8% |
JC Penney Corp., Inc.
Senior Notes
7.40% due 04/01/37 | | | 359,000 | | | 301,560 |
Macy’s Retail Holdings, Inc.
Company Guar. Notes
5.90% due 12/01/16 | | | 532,000 | | | 468,956 |
30
VALIC Company II High Yield Bond Fund
PORTFOLIO OF INVESTMENTS — August 31, 2009 — (continued)
| | | | | | |
| | |
| Security Description | | Principal
Amount | | Market Value
(Note 2) |
|
U.S. CORPORATE BONDS & NOTES (continued) |
Retail - Regional Department Stores (continued) |
Macy’s Retail Holdings, Inc.
Company Guar. Notes
6.38% due 03/15/37 | | $ | 329,000 | | $ | 242,227 |
Macy’s Retail Holdings, Inc.
Company Guar. Notes
6.65% due 07/15/24 | | | 308,000 | | | 238,176 |
Macy’s Retail Holdings, Inc.
Company Guar. Notes
6.90% due 04/01/29 | | | 314,000 | | | 237,273 |
| | | | | |
|
|
| | | | | | | 1,488,192 |
| | | | | |
|
|
Retail - Restaurants — 0.2% |
Wendy’s/Arby’s Restaurants LLC
Senior Notes
10.00% due 07/15/16* | | | 325,000 | | | 333,125 |
| | | | | |
|
|
Retail - Sporting Goods — 0.2% |
Freedom Group, Inc.
Senior Sec. Notes
10.25% due 08/01/15* | | | 325,000 | | | 334,750 |
| | | | | |
|
|
Rubber - Tires — 0.7% |
The Goodyear Tire & Rubber Co.
Senior Notes
9.00% due 07/01/15 | | | 500,000 | | | 507,500 |
The Goodyear Tire & Rubber Co.
Senior Notes
10.50% due 05/15/16 | | | 825,000 | | | 880,688 |
| | | | | |
|
|
| | | | | | | 1,388,188 |
| | | | | |
|
|
Rubber/Plastic Products — 0.0% |
Venture Holdings Co. LLC
Company Guar. Notes
11.00% due 06/01/07†(2)(3)(9)(12) | | | 50,000 | | | 0 |
| | | | | |
|
|
Special Purpose Entities — 0.5% |
Fox Acquisition Sub LLC
Senior Notes
13.38% due 07/15/16* | | | 775,000 | | | 465,000 |
Local TV Finance LLC
Senior Notes
9.25% due 06/15/15*(8) | | | 456,750 | | | 123,323 |
Southern Star Central Corp.
Senior Notes
6.75% due 03/01/16 | | | 400,000 | | | 374,000 |
| | | | | |
|
|
| | | | | | | 962,323 |
| | | | | |
|
|
Specified Purpose Acquisitions — 0.1% |
ESI Tractebel Acquisition Corp.
Company Guar. Bonds
7.99% due 12/30/11 | | | 219,000 | | | 213,525 |
| | | | | |
|
|
Steel - Producers — 0.5% |
AK Steel Corp.
Company Guar. Notes
7.75% due 06/15/12 | | | 350,000 | | | 349,563 |
Steel Dynamics, Inc.
Company Guar. Notes
6.75% due 04/01/15 | | | 625,000 | | | 582,812 |
| | | | | |
|
|
| | | | | | | 932,375 |
| | | | | |
|
|
Steel - Specialty — 0.2% |
Allegheny Technologies, Inc.
Senior Notes
9.38% due 06/01/19 | | | 350,000 | | | 383,805 |
| | | | | |
|
|
| | | | | | |
| | |
| Security Description | | Principal
Amount | | Market Value
(Note 2) |
|
| |
Storage/Warehousing — 0.6% |
Mobile Mini, Inc.
Notes
6.88% due 05/01/15 | | $ | 535,000 | | $ | 473,475 |
Mobile Mini, Inc.
Company Guar. Notes
9.75% due 08/01/14 | | | 660,000 | | | 660,000 |
| | | | | |
|
|
| | | | | | | 1,133,475 |
| | | | | |
|
|
Telecom Services — 3.0% |
PAETEC Holding Corp.
Senior Sec. Notes
8.88% due 06/30/17* | | | 625,000 | | | 595,313 |
PAETEC Holding Corp.
Company Guar. Notes
9.50% due 07/15/15 | | | 1,446,000 | | | 1,247,175 |
Qwest Corp.
Senior Notes
8.38% due 05/01/16* | | | 425,000 | | | 429,250 |
Qwest Corp.
Senior Notes
8.88% due 03/15/12 | | | 1,125,000 | | | 1,158,750 |
Time Warner Telecom Holdings, Inc.
Company Guar. Notes
9.25% due 02/15/14 | | | 234,000 | | | 238,095 |
West Corp.
Company Guar. Notes
9.50% due 10/15/14 | | | 1,975,000 | | | 1,821,937 |
West Corp.
Company Guar. Notes
11.00% due 10/15/16 | | | 210,000 | | | 193,725 |
| | | | | |
|
|
| | | | | | | 5,684,245 |
| | | | | |
|
|
Telephone - Integrated — 3.2% |
Citizens Communications Co.
Senior Notes
7.13% due 03/15/19 | | | 475,000 | | | 432,250 |
Citizens Communications Co.
Senior Notes
9.00% due 08/15/31 | | | 738,000 | | | 679,882 |
Level 3 Financing, Inc.
Company Guar. Notes
8.75% due 02/15/17 | | | 725,000 | | | 565,500 |
Level 3 Financing, Inc.
Senior Notes
12.25% due 03/15/13 | | | 1,152,000 | | | 1,123,200 |
Qwest Communications International, Inc.
Company Guar. Notes, Series B
7.50% due 02/15/14 | | | 513,000 | | | 495,045 |
Sprint Capital Corp.
Company Guar. Notes
8.75% due 03/15/32 | | | 3,123,000 | | | 2,592,090 |
Valor Telecommunications Enterprises LLC
Company Guar. Notes
7.75% due 02/15/15 | | | 250,000 | | | 252,188 |
| | | | | |
|
|
| | | | | | | 6,140,155 |
| | | | | |
|
|
Television — 0.1% |
Allbritton Communications Co.
Senior Sub. Notes
7.75% due 12/15/12 | | | 148,000 | | | 126,540 |
Bonten Media Acquisition Co.
Company Guar. Notes
9.00% due 06/01/15*(8) | | | 131,093 | | | 42,278 |
Paxson Communications Corp.
Senior Sec. Notes
8.38% due 01/15/13*†(4)(5)(7)(8) | | | 1,738,595 | | | 52,158 |
31
VALIC Company II High Yield Bond Fund
PORTFOLIO OF INVESTMENTS — August 31, 2009 — (continued)
| | | | | | |
| | |
| Security Description | | Principal
Amount | | Market Value
(Note 2) |
|
U.S. CORPORATE BONDS & NOTES (continued) |
Television (continued) |
Young Broadcasting, Inc.
Senior Sub. Notes
8.75% due 01/15/14†(4)(5) | | $ | 385,000 | | $ | 42 |
Young Broadcasting, Inc.
Company Guar. Notes
10.00% due 03/01/11†(4)(5) | | | 540,000 | | | 59 |
| | | | | |
|
|
| | | | | | | 221,077 |
| | | | | |
|
|
Textile - Home Furnishings — 0.1% |
Mohawk Industries, Inc.
Senior Notes
7.20% due 04/15/12 | | | 183,000 | | | 184,192 |
| | | | | |
|
|
Theaters — 1.8% |
AMC Entertainment, Inc.
Senior Sub. Notes
8.00% due 03/01/14 | | | 1,558,000 | | | 1,464,520 |
AMC Entertainment, Inc.
Senior Notes
8.75% due 06/01/19 | | | 550,000 | | | 545,875 |
AMC Entertainment, Inc.
Senior Sub Notes
11.00% due 02/01/16 | | | 475,000 | | | 491,625 |
Marquee Holdings, Inc.
Senior Disc. Notes
12.00% due 08/15/14(1) | | | 1,055,000 | | | 879,606 |
| | | | | |
|
|
| | | | | | | 3,381,626 |
| | | | | |
|
|
Tobacco — 1.0% |
Alliance One International, Inc.
Senior Notes
10.00% due 07/15/16* | | | 1,890,000 | | | 1,866,375 |
| | | | | |
|
|
Transactional Software — 0.6% |
Open Solutions, Inc.
Company Guar. Notes
9.75% due 02/01/15* | | | 1,715,000 | | | 1,123,325 |
| | | | | |
|
|
Transport - Air Freight — 0.3% |
Atlas Air, Inc.
Pass Through Certs.
Series 1991-1, Class B
7.63% due 01/02/15 | | | 777,807 | | | 458,907 |
Atlas Air, Inc.
Pass Through Certs.
Series 1991-1, Class C
8.77% due 01/02/11 | | | 87,400 | | | 34,960 |
Atlas Air, Inc.
Pass Through Certs.
Series 2000-1, Class B
9.06% due 07/02/17 | | | 180,748 | | | 142,791 |
| | | | | |
|
|
| | | | | | | 636,658 |
| | | | | |
|
|
Transport - Services — 0.3% |
Bristow Group, Inc.
Senior Notes
7.50% due 09/15/17 | | | 500,000 | | | 472,500 |
| | | | | |
|
|
Wireless Equipment — 0.1% | | | | | | |
CC Holdings GS V LLC/Crown Castle GS III Corp.
Senior Notes
7.75% due 05/01/17* | | | 275,000 | | | 277,750 |
| | | | | |
|
|
Total U.S. Corporate Bonds & Notes | | | | | | |
(cost $161,531,998) | | | | | | 154,427,577 |
| | | | | |
|
|
| | | | | | |
| | |
| Security Description | | Principal
Amount | | Market Value
(Note 2) |
|
| |
| |
FOREIGN CORPORATE BONDS & NOTES — 6.3% |
Diversified Financial Services — 0.3% |
CIT Group Funding Co. of Canada
Company Guar. Notes
5.20% due 06/01/15 | | $ | 799,000 | | $ | 576,338 |
| | | | | |
|
|
Diversified Manufacturing Operations — 0.2% |
Bombardier, Inc.
Senior Notes
8.00% due 11/15/14* | | | 460,000 | | | 449,075 |
| | | | | |
|
|
Diversified Minerals — 0.9% |
Rio Tinto Finance USA, Ltd.
Company Guar. Notes
9.00% due 05/01/19 | | | 350,000 | | | 419,224 |
Teck Resources, Ltd.
Senior Sec. Notes
10.25% due 05/15/16 | | | 725,000 | | | 801,125 |
Teck Resources, Ltd.
Senior Sec. Notes
10.75% due 05/15/19 | | | 500,000 | | | 569,375 |
| | | | | |
|
|
| | | | | | | 1,789,724 |
| | | | | |
|
|
Food - Meat Products — 0.4% |
JBS SA
Company Guar. Notes
9.38% due 02/07/11 | | | 438,000 | | | 444,570 |
JBS SA
Senior Notes
10.50% due 08/04/16* | | | 325,000 | | | 325,000 |
| | | | | |
|
|
| | | | | | | 769,570 |
| | | | | |
|
|
Independent Power Producers — 0.0% |
AES Drax Energy, Ltd.
Sec. Notes
11.50% due 08/30/10†(5)(11) | | | 475,000 | | | 475 |
| | | | | |
|
|
Medical - Drugs — 0.5% |
Elan Finance PLC
Company Guar. Bonds
7.75% due 11/15/11 | | | 971,000 | | | 941,870 |
| | | | | |
|
|
Metal - Aluminum — 0.5% |
Novelis, Inc.
Senior Notes
11.50% due 02/15/15* | | | 955,000 | | | 923,962 |
| | | | | |
|
|
Multimedia — 0.1% |
Quebecor Media, Inc.
Senior Notes
7.75% due 03/15/16 | | | 275,000 | | | 259,188 |
| | | | | |
|
|
Oil Companies - Exploration & Production — 0.8% |
OPTI Canada, Inc.
Senior Sec. Notes
7.88% due 12/15/14 | | | 865,000 | | | 553,600 |
OPTI Canada, Inc.
Senior Notes
8.25% due 12/15/14 | | | 1,490,000 | | | 968,500 |
| | | | | |
|
|
| | | | | | | 1,522,100 |
| | | | | |
|
|
32
VALIC Company II High Yield Bond Fund
PORTFOLIO OF INVESTMENTS — August 31, 2009 — (continued)
| | | | | | |
| | |
| Security Description | | Principal
Amount | | Market Value
(Note 2) |
|
FOREIGN CORPORATE BONDS & NOTES (continued) |
Satellite Telecom — 1.7% |
Intelsat Intermediate Holding Co., Ltd.
Company Guar. Notes
9.50% due 02/01/15(1) | | $ | 759,000 | | $ | 740,025 |
Intelsat Subsidiary Holding Co., Ltd.
Company Guar. Notes
8.50% due 01/15/13 | | | 910,000 | | | 916,825 |
Intelsat Subsidiary Holding Co., Ltd.
Company Guar. Notes
8.88% due 01/15/15 | | | 1,531,000 | | | 1,542,482 |
| | | | | |
|
|
| | | | | | | 3,199,332 |
| | | | | |
|
|
Special Purpose Entity — 0.1% |
Hellas Telecommunications Luxembourg II
Sub. Notes
6.26% due 01/15/15*(7) | | | 925,000 | | | 157,250 |
| | | | | |
|
|
Telecom Services — 0.7% |
Wind Acquisition Finance SA
Company Guar. Bonds
10.75% due 12/01/15* | | | 252,000 | | | 270,900 |
Wind Acquisition Finance SA
Senior Notes
11.75% due 07/15/17* | | | 1,000,000 | | | 1,085,000 |
| | | | | |
|
|
| | | | | | | 1,355,900 |
| | | | | |
|
|
Transport - Rail — 0.1% |
TFM SA de CV
Senior Notes
9.38% due 05/01/12 | | | 137,000 | | | 134,945 |
| | | | | |
|
|
Total Foreign Corporate Bonds & Notes |
(cost $12,789,961) | | | | | | 12,079,729 |
| | | | | |
|
|
LOANS — 4.9%(13)(14) |
Auto/Truck Parts & Equipment - Original — 0.4% |
Lear Corp.
10.49% due 04/25/12(3)(4) | | | 1,000,000 | | | 817,917 |
| | | | | |
|
|
Beverages - Non-alcoholic — 0.1% |
Le-Natures, Inc.
9.36% due 03/01/11†(3)(4)(5) | | | 600,000 | | | 127,000 |
| | | | | |
|
|
Building - Residential/Commercial — 0.2% |
TOUSA, Inc.
12.25% due 08/15/13(3) | | | 1,258,451 | | | 377,535 |
| | | | | |
|
|
Casino Services — 0.8% |
Herbst Gaming, Inc.
9.75% due 12/02/11†(3)(4)(5) | | | 726,922 | | | 379,817 |
Herbst Gaming, Inc.
12.50% due 12/02/11†(3)(4)(5) | | | 265,517 | | | 138,732 |
Holding Gaming Borrower LP
9.25% due 02/19/13(3) | | | 1,000,000 | | | 940,000 |
| | | | | |
|
|
| | | | | | | 1,458,549 |
| | | | | |
|
|
Diversified Financial Services — 0.5% |
Wind Finance SL S.A
7.99% due 11/26/14(3) | | | 1,000,000 | | | 1,003,500 |
| | | | | |
|
|
Electric - Integrated — 0.3% |
Texas Competitive Electric Holdings Co. LLC
3.82% due 10/10/14(3) | | | 683,262 | | | 519,645 |
| | | | | |
|
|
Food - Retail — 0.5% |
Dole Foods, Inc.
8.00% due 04/12/13(3) | | | 988,891 | | | 999,399 |
| | | | | |
|
|
| | | | | | |
| | |
| Security Description | | Shares/
Principal
Amount | | Market Value
(Note 2) |
|
| |
Gambling (Non-Hotel) — 0.5% |
Greektown Holdings LLC
16.75% due 09/09/09†(3)(4)(5) | | $ | 1,026,324 | | $ | 1,021,834 |
| | | | | |
|
|
Medical - Drugs — 0.5% |
Triax Pharmaceuticals LLC
16.50% due 08/30/11(2)(3)(15) | | | 1,056,418 | | | 961,341 |
| | | | | |
|
|
Medical - Hospitals — 0.5% |
Capella Healthcare, Inc.
13.00% due 02/29/16(3) | | | 1,000,000 | | | 975,000 |
| | | | | |
|
|
Telecom Services — 0.4% |
Fairpoint Communications, Inc.
3.35% due 03/31/15(3) | | | 1,000,000 | | | 774,444 |
| | | | | |
|
|
Theaters — 0.2% |
AMC Entertainment Holdings, Inc.
5.62% due 06/15/12(3) | | | 355,858 | | | 312,265 |
| | | | | |
|
|
Total Loans |
(cost $10,859,802) | | | | | | 9,348,429 |
| | | | | |
|
|
COMMON STOCK — 0.3% |
Building Products - Doors & Windows — 0.0% |
Masonite Worldwide Holdings† | | | 754 | | | 30,499 |
| | | | | |
|
|
Cellular Telecom — 0.0% |
iPCS, Inc.†(10) | | | 1 | | | 16 |
| | | | | |
|
|
Energy - Alternate Sources — 0.0% |
VeraSun Energy Corp.†(2)(3) | | | 65,000 | | | 0 |
| | | | | |
|
|
Food - Misc. — 0.1% |
Wornick Co.†(2)(3) | | | 3,444 | | | 172,200 |
| | | | | |
|
|
Gambling (Non-Hotel) — 0.0% |
Shreveport Gaming Holdings, Inc.†(2)(3) | | | 2,501 | | | 37,615 |
| | | | | |
|
|
Medical - Drugs — 0.0% |
Triax Pharmaceuticals LLC†(2) | | | 85,612 | | | 856 |
| | | | | |
|
|
Medical - Outpatient/Home Medical — 0.0% |
Critical Care Systems International, Inc.†(2)(3) | | | 13,262 | | | 3,316 |
| | | | | |
|
|
Oil - Field Services — 0.1% |
Trico Marine Services, Inc.† | | | 16,259 | | | 110,561 |
| | | | | |
|
|
Paper & Related Products — 0.1% |
Caraustar Industries, Inc.†(2) | | | 80 | | | 134,160 |
| | | | | |
|
|
Retail - Music Store — 0.0% |
MTS, Inc.†(2)(3) | | | 3,863 | | | 0 |
| | | | | |
|
|
Total Common Stock | | | | | | |
(cost $1,601,293) | | | | | | 489,223 |
| | | | | |
|
|
PREFERRED STOCK — 0.0% |
Medical - Drugs — 0.0% |
Triax Pharmaceuticals LLC,
Class C
14.70%(2)(16)
(cost $52,235) | | | 26,117 | | | 261 |
| | | | | |
|
|
WARRANTS — 0.0% |
Building Products - Doors & Windows — 0.0% |
Masonite Worldwide Holdings
Expires 06/09/14
(Strike price $55.31) | | | 3,658 | | | 12,803 |
Masonite Worldwide Holdings
Expires 06/09/16
(Strike price $55.31) | | | 2,743 | | | 9,601 |
| | | | | |
|
|
| | | | | | | 22,404 |
| | | | | |
|
|
33
VALIC Company II High Yield Bond Fund
PORTFOLIO OF INVESTMENTS — August 31, 2009 — (continued)
| | | | | | | |
| | |
| Security Description | | Shares/
Principal
Amount | | | Market Value
(Note 2) |
|
WARRANTS (continued) |
Oil Companies - Exploration & Production — 0.0% |
Transmeridian Exploration, Inc.
Expires 12/15/10
(Strike price $4.31)(2) | | | 13,811 | | | $ | 0 |
| | | | | | |
|
|
Total Warrants | | | | | | | |
(cost $37,979) | | | | | | | 22,404 |
| | | | | | |
|
|
Total Long-Term Investment Securities | | | | | | | |
(cost $187,228,644) | | | | | | | 176,528,598 |
| | | | | | |
|
|
REPURCHASE AGREEMENT — 2.7% |
Agreement with State Street Bank & Trust Co.,
bearing interest at 0.01%, dated 08/31/09, to be repurchased 09/01/09 in the amount of $5,234,001
and collateralized by $5,395,000 of United States Treasury Bills, bearing interest at 0.15% due 12/31/09 and having approximate value of $5,391,763
(cost $5,234,000) | | $ | 5,234,000 | | | | 5,234,000 |
| | | | | | |
|
|
TOTAL INVESTMENTS | | | | | | | |
(cost $192,462,644)(17) | | | 95.0 | % | | | 181,762,598 |
Other assets less liabilities | | | 5.0 | | | | 9,483,411 |
| | |
|
|
| |
|
|
NET ASSETS — | | | 100.0 | % | | $ | 191,246,009 |
| | |
|
|
| |
|
|
| † | Non-income producing security |
| * | Securities exempt from registration under Rule 144A of the Securities Act of 1933. These securities may be sold in transactions exempt from registration, normally to qualified institutional buyers. The Fund has no right to demand registration of these securities. At August 31, 2009, the aggregate value of these securities was $47,453,850 representing 24.8% of net assets. Unless otherwise indicated these securities are not considered to be illiquid. |
| (1) | “Step-up” security where the rate increases (“steps-up”) at a predetermined rate. Rate shown reflects the increased rate. |
| (2) | Fair valued security. Securities are classified as Level 3 based on the securities valuation inputs; see Note 2. |
| (3) | Illiquid security. At August 31, 2009, the aggregate value of these securities was $10,098,426 representing 5.2% of net assets. |
| (4) | Company has filed for Chapter 11 bankruptcy protection. |
| (6) | PIK (“Payment-in-Kind”) security. Bond or preferred stock that pays interest/dividends in the form of additional bonds or preferred stocks. |
| (7) | Floating rate security where the rate fluctuates. The rate moves up or down at each reset date. The rate reflected is as of August 31, 2009. |
| (8) | Income may be received in cash or additional shares at the discretion of the issuer. |
| (9) | Company has filed for Chapter 7 bankruptcy. |
| (10) | Bond is in default of interest subsequent to August 31, 2009. |
| (11) | Company has filed bankruptcy in the country of issuance |
| (12) | Bond is in default and did not pay principal at maturity. |
| (13) | The Fund invests in Senior Loans which generally pay interest at rates which are periodically re-determined by reference to a base lending rate plus a premium. These base lending rates are generally either the lending rate offered by one or more major United States banks, or the certificate of deposit rate. Senior Loans are generally considered to be restrictive in that the Fund is ordinarily contractually obligated to receive approval from the Agent Bank and/or borrower prior to the disposition of a Senior Loan. |
| (14) | Senior Loans in the Fund’s Portfolio are generally subject to mandatory and/or optional prepayment. Because of these mandatory prepayment conditions and because there may be significant economic incentives for a borrower to prepay, prepayments may occur. As a result, the actual remaining maturity may be substantially less than the stated maturities. |
| (15) | A portion of the interests is paid in the form of additional bonds. |
| (16) | Consists of more than one class of securities traded together as a unit. |
| (17) | See Note 5 for cost of investments on a tax basis. |
The following is a summary of the inputs used to value the Fund’s net assets as of August 31, 2009 (see Note 2):
| | | | | | | | | | | | |
| | | Level 1 -
Unadjusted
Quoted
Prices
| | Level 2-
Other
Observable
Inputs
| | Level 3 -
Significant
Unobservable
Inputs
| | Total
|
Long-Term Investment Securities: | | | | | | | | | | | | |
Convertible Bonds & Notes | | $ | – | | $ | 62,625 | | $ | 98,350 | | $ | 160,975 |
U.S. Corporate Bonds & Notes | | | – | | | 151,209,546 | | | 3,218,031 | | | 154,427,577 |
Foreign Corporate Bonds & Notes | | | – | | | 12,079,729 | | | – | | | 12,079,729 |
Loans | | | – | | | 4,114,905 | | | 5,233,524 | | | 9,348,429 |
Common Stock | | | 141,076 | | | – | | | 348,147 | | | 489,223 |
Preferred Stock | | | – | | | – | | | 261 | | | 261 |
Warrants | | | 22,404 | | | – | | | 0 | | | 22,404 |
Repurchase Agreements | | | – | | | 5,234,000 | | | – | | | 5,234,000 |
| | |
|
| |
|
| |
|
| |
|
|
Total | | $ | 163,480 | | $ | 172,700,805 | | $ | 8,898,313 | | $ | 181,762,598 |
| | |
|
| |
|
| |
|
| |
|
|
The following is a reconciliation of Level 3 assets which significant unobservable inputs were used to determine fair value:
| | | | | | | | | | | | | | | | | | | | | | | | |
| | | Convertible
Bonds &
Notes
| | | U.S.
Corporate
Bonds &
Notes
| | | Loans
| | | Common
Stock
| | | Preferred
Stock
| | | Warrants
| |
Balance as of 8/31/2008 | | $ | 208,000 | | | $ | 475,834 | | | $ | 8,922,917 | | | $ | 256,584 | | | $ | 234,795 | | | $ | 138 | |
Accrued discounts/ premiums | | | – | | | | 1,707 | | | | 105,634 | | | | – | | | | – | | | | – | |
Realized gain (loss) | | | – | | | | (187,592 | ) | | | (562,429 | ) | | | 2 | | | | (233,356 | ) | | | – | |
Change in unrealized appreciation (depreciation) | | | (130,650 | ) | | | (603,195 | ) | | | (850,745 | ) | | | 91,563 | | | | (1,178 | ) | | | (138 | ) |
Net purchases (sales) | | | 21,000 | | | | 803,049 | | | | (1,284,186 | ) | | | (2 | ) | | | 0 | | | | – | |
Transfers in and/or out of Level 3 | | | – | | | | 2,728,228 | | | | (1,097,667 | ) | | | – | | | | – | | | | – | |
| | |
|
|
| |
|
|
| |
|
|
| |
|
|
| |
|
|
| |
|
|
|
Balance as of 8/31/2009 | | $ | 98,350 | | | $ | 3,218,031 | | | $ | 5,233,524 | | | $ | 348,147 | | | $ | 261 | | | $ | 0 | |
| | |
|
|
| |
|
|
| |
|
|
| |
|
|
| |
|
|
| |
|
|
|
See Notes to Financial Statements
34
VALIC Company II International Small Cap Equity
PORTFOLIO PROFILE — August 31, 2009 (Unaudited)
Industry Allocation*
| | | |
Banks — Commercial | | 5.6 | % |
Investment Management/Advisor Services | | 4.2 | |
Machinery — General Industrial | | 3.4 | |
Insurance — Life/Health | | 3.0 | |
Chemicals — Specialty | | 2.9 | |
Finance — Investment Banker/Broker | | 2.5 | |
Cosmetics & Toiletries | | 2.4 | |
Repurchase Agreements | | 2.4 | |
Diversified Operations | | 2.2 | |
Chemicals — Diversified | | 2.2 | |
Medical Products | | 2.2 | |
Medical — Drugs | | 2.0 | |
Finance — Other Services | | 2.0 | |
Real Estate Management/Services | | 1.9 | |
Cellular Telecom | | 1.9 | |
Diversified Manufacturing Operations | | 1.9 | |
Auto/Truck Parts & Equipment — Original | | 1.9 | |
Web Portals/ISP | | 1.4 | |
Oil & Gas Drilling | | 1.4 | |
Oil Companies — Exploration & Production | | 1.4 | |
Insurance — Reinsurance | | 1.3 | |
Diversified Operations/Commercial Services | | 1.3 | |
Metal — Copper | | 1.2 | |
Diagnostic Kits | | 1.2 | |
Telecom Services | | 1.2 | |
Apparel Manufacturers | | 1.2 | |
Retail — Pubs | | 1.1 | |
Food — Misc. | | 1.1 | |
Oil — Field Services | | 1.1 | |
Metal — Diversified | | 1.1 | |
Commercial Services | | 1.1 | |
Electric — Integrated | | 1.1 | |
Transport — Rail | | 1.1 | |
Cable TV | | 1.1 | |
Transport — Services | | 1.0 | |
Silver Mining | | 0.9 | |
Beverages — Wine/Spirits | | 0.9 | |
Medical Instruments | | 0.9 | |
Retail — Discount | | 0.9 | |
Internet Content — Information/News | | 0.9 | |
Batteries/Battery Systems | | 0.8 | |
Electric Products — Misc. | | 0.8 | |
Miscellaneous Manufacturing | | 0.8 | |
Alternative Waste Technology | | 0.7 | |
Television | | 0.7 | |
Electronic Components — Semiconductors | | 0.7 | |
Retail — Restaurants | | 0.7 | |
Diversified Financial Services | | 0.7 | |
Capacitors | | 0.7 | |
Machinery — Material Handling | | 0.7 | |
Transport — Truck | | 0.7 | |
Auto/Truck Parts & Equipment — Replacement | | 0.7 | |
Containers — Paper/Plastic | | 0.7 | |
Metal Processors & Fabrication | | 0.7 | |
Rubber/Plastic Products | | 0.7 | |
Water | | 0.7 | |
Telephone — Integrated | | 0.6 | |
Food — Retail | | 0.6 | |
Computers — Integrated Systems | | 0.6 | |
Electronic Components — Misc. | | 0.6 | |
Finance — Leasing Companies | | 0.6 | |
Computers — Periphery Equipment | | 0.5 | |
Gold Mining | | 0.5 | |
Machinery — Electrical | | 0.5 | |
Printing — Commercial | | 0.5 | |
Building Products — Air & Heating | | 0.5 | |
Real Estate Operations & Development | | 0.4 | |
Direct Marketing | | 0.4 | |
Coatings/Paint | | 0.4 | |
| | | |
Coal | | 0.4 | |
E-Commerce/Services | | 0.4 | |
Internet Infrastructure Software | | 0.4 | |
Applications Software | | 0.4 | |
Oil Refining & Marketing | | 0.4 | |
Office Supplies & Forms | | 0.4 | |
Medical — Wholesale Drug Distribution | | 0.4 | |
Communications Software | | 0.3 | |
Beverages — Non-alcoholic | | 0.3 | |
Advanced Materials | | 0.3 | |
Import/Export | | 0.3 | |
Retail — Bookstores | | 0.3 | |
Retail — Apparel/Shoe | | 0.3 | |
Auto — Cars/Light Trucks | | 0.3 | |
Machine Tools & Related Products | | 0.2 | |
Electronic Connectors | | 0.2 | |
Machinery — Construction & Mining | | 0.2 | |
Transport — Marine | | 0.2 | |
Travel Services | | 0.2 | |
Engineering/R&D Services | | 0.2 | |
Finance — Credit Card | | 0.2 | |
Computers | | 0.2 | |
Food — Dairy Products | | 0.2 | |
Internet Connectivity Services | | 0.2 | |
Retail — Sporting Goods | | 0.2 | |
Power Converter/Supply Equipment | | 0.2 | |
Athletic Footwear | | 0.2 | |
Retail — Regional Department Stores | | 0.1 | |
Building — Maintance & Services | | 0.1 | |
Entertainment Software | | 0.1 | |
Internet Content — Entertainment | | 0.1 | |
Machinery — Thermal Process | | 0.1 | |
Tools — Hand Held | | 0.1 | |
Engines — Internal Combustion | | 0.1 | |
Brewery | | 0.1 | |
Agricultural Operations | | 0.1 | |
Hotels/Motels | | 0.1 | |
Semiconductor Components — Integrated Circuits | | 0.1 | |
Pipelines | | 0.1 | |
Transactional Software | | 0.1 | |
Building — Heavy Construction | | 0.1 | |
Building & Construction — Misc. | | 0.1 | |
| | |
|
|
| | | 97.7 | % |
| | |
|
|
| * | Calculated as a percentage of net assets |
35
VALIC Company II International Small Cap Equity
PORTFOLIO PROFILE — August 31, 2009 (Unaudited)
Country Allocation*
| | | |
Japan | | 28.6 | % |
United Kingdom | | 15.8 | |
Italy | | 7.7 | |
Germany | | 4.7 | |
United States | | 4.6 | |
Switzerland | | 4.1 | |
Luxembourg | | 3.6 | |
Ireland | | 3.5 | |
France | | 3.0 | |
Bermuda | | 2.3 | |
South Korea | | 2.0 | |
Spain | | 1.9 | |
Sweden | | 1.9 | |
Jersey | | 1.7 | |
Greece | | 1.6 | |
Taiwan | | 1.6 | |
Cayman Islands | | 1.5 | |
Hong Kong | | 1.4 | |
Cyprus | | 1.2 | |
Australia | | 1.1 | |
Netherlands | | 1.0 | |
China | | 0.7 | |
Denmark | | 0.7 | |
Portugal | | 0.6 | |
Indonesia | | 0.3 | |
Singapore | | 0.2 | |
Malaysia | | 0.2 | |
Mauritius | | 0.1 | |
Thailand | | 0.1 | |
| | |
|
|
| | | 97.7 | % |
| | |
|
|
| * | Calculated as a percentage of net assets |
36
VALIC Company II International Small Cap Equity Fund
PORTFOLIO OF INVESTMENTS — August 31, 2009
| | | | | |
| | |
| Security Description | | Shares | | Market Value
(Note 2) |
|
COMMON STOCK — 95.3% | | | | | |
Australia — 1.1% | | | | | |
Ansell, Ltd.(1) | | 122,251 | | $ | 994,255 |
Bendigo & Adelaide Bank, Ltd.(1) | | 87,528 | | | 613,669 |
carsales.com.au, Ltd.(1) | | 5,626 | | | 16,643 |
Crane Group, Ltd.(1) | | 102,708 | | | 905,603 |
Felix Resources, Ltd.(1) | | 135,626 | | | 1,976,324 |
MacArthur Coal, Ltd.(1) | | 60,781 | | | 441,796 |
Nufarm, Ltd.(1) | | 77,110 | | | 697,073 |
The Reject Shop, Ltd.(1) | | 28,614 | | | 322,850 |
| | | | |
|
|
| | | | | | 5,968,213 |
| | | | |
|
|
Bermuda — 2.3% | | | | | |
China Gas Holdings, Ltd.(1) | | 1,418,000 | | | 384,884 |
China Yurun Food Group, Ltd.(1) | | 548,000 | | | 948,056 |
CNPC Hong Kong, Ltd.(1) | | 1,860,000 | | | 1,559,100 |
Huabao International Holdings, Ltd.(1) | | 1,070,000 | | | 1,113,537 |
Pacific Basin Shipping, Ltd.(1) | | 1,515,000 | | | 1,006,349 |
Peace Mark Holdings, Ltd.†(2) | | 686,000 | | | 0 |
Seadrill, Ltd.†(1) | | 427,329 | | | 7,648,880 |
| | | | |
|
|
| | | | | | 12,660,806 |
| | | | |
|
|
Cayman Islands — 1.5% | | | | | |
AAC Acoustic Technologies Holdings, Inc.(1) | | 1,036,000 | | | 858,915 |
Agile Property Holdings, Ltd.(1) | | 1,938,000 | | | 2,183,852 |
China Dongxiang Group Co.(1) | | 1,538,000 | | | 962,474 |
China High Speed Transmission Equipment Group Co., Ltd.(1) | | 435,000 | | | 940,189 |
China Mengniu Dairy Co., Ltd.†(1) | | 527,000 | | | 1,246,607 |
Li Ning Co., Ltd.(1) | | 327,500 | | | 913,740 |
Shui On Land, Ltd.(1) | | 215,000 | | | 119,209 |
Xinyi Glass Holding Co., Ltd.(1) | | 1,918,000 | | | 1,407,417 |
| | | | |
|
|
| | | | | | 8,632,403 |
| | | | |
|
|
China — 0.7% | | | | | |
Weichai Power Co., Ltd.(1) | | 551,800 | | | 2,465,952 |
Zhuzhou CSR Times Electric Co., Ltd.(1) | | 969,000 | | | 1,649,734 |
| | | | |
|
|
| | | | | | 4,115,686 |
| | | | |
|
|
Cyprus — 1.2% | | | | | |
Bank of Cyprus Public Co., Ltd.(1) | | 989,428 | | | 6,885,160 |
| | | | |
|
|
Denmark — 0.7% | | | | | |
DSV A/S†(1) | | 223,809 | | | 3,465,792 |
SimCorp A/S(1) | | 2,159 | | | 363,766 |
| | | | |
|
|
| | | | | | 3,829,558 |
| | | | |
|
|
France — 3.0% | | | | | |
Iliad SA(1) | | 2,527 | | | 259,309 |
Nexity(1) | | 175,289 | | | 6,624,556 |
SCOR SE(1) | | 256,760 | | | 6,759,863 |
Societe BIC SA(1) | | 35,141 | | | 2,160,997 |
SOITEC†(1) | | 124,177 | | | 1,139,976 |
| | | | |
|
|
| | | | | | 16,944,701 |
| | | | |
|
|
Germany — 4.7% | | | | | |
Freenet AG†(1) | | 264,277 | | | 3,541,961 |
Rheinmetall AG(1) | | 203,879 | | | 9,952,770 |
Sky Deutschland AG†(1) | | 1,247,706 | | | 5,965,054 |
United Internet AG†(1) | | 502,587 | | | 7,121,504 |
| | | | |
|
|
| | | | | | 26,581,289 |
| | | | |
|
|
Greece — 1.6% | | | | | |
Piraeus Bank SA†(1) | | 571,088 | | | 9,009,228 |
| | | | |
|
|
Hong Kong — 1.4% | | | | | |
Bank of East Asia, Ltd.(1) | | 66,140 | | | 213,915 |
China Everbright International, Ltd.(1) | | 10,410,000 | | | 3,812,465 |
Denway Motors, Ltd.(1) | | 3,122,000 | | | 1,409,054 |
| | | | | |
| | |
| Security Description | | Shares | | Market Value
(Note 2) |
|
| | | | | | |
Hong Kong (continued) | | | | | |
Shanghai Industrial Holdings, Ltd.(1) | | 234,000 | | $ | 1,126,824 |
Techtronic Industries Co.(1) | | 1,422,000 | | | 1,393,604 |
| | | | |
|
|
| | | | | | 7,955,862 |
| | | | |
|
|
Indonesia — 0.3% | | | | | |
PT United Tractors Tbk(1) | | 1,018,666 | | | 1,373,621 |
| | | | |
|
|
Ireland — 3.5% | | | | | |
Allied Irish Banks PLC†(1) | | 739,837 | | | 2,962,543 |
DCC PLC(1) | | 426,448 | | | 10,429,226 |
Greencore Group PLC(1) | | 955,278 | | | 2,159,961 |
Irish Life & Permanent PLC(1) | | 610,372 | | | 3,995,544 |
| | | | |
|
|
| | | | | | 19,547,274 |
| | | | |
|
|
Italy — 7.7% | | | | | |
Ansaldo STS SpA(1) | | 297,115 | | | 6,011,295 |
Azimut Holding SpA(1) | | 863,978 | | | 9,974,946 |
Davide Campari—Milano SpA(1) | | 490,091 | | | 4,160,701 |
DiaSorin SpA(1) | | 214,371 | | | 6,745,956 |
Hera SpA(1) | | 2,473,570 | | | 6,116,781 |
Mediolanum SpA(1) | | 1,614,247 | | | 10,248,113 |
| | | | |
|
|
| | | | | | 43,257,792 |
| | | | |
|
|
Japan — 28.6% | | | | | |
Alpha Systems, Inc.(1) | | 88,300 | | | 1,937,473 |
Asahi Diamond Industrial Co., Ltd.(1) | | 91,000 | | | 679,588 |
Axell Corp.(1) | | 38,700 | | | 1,534,117 |
Chugoku Marine Paints, Ltd.(1) | | 387,000 | | | 2,437,045 |
Credit Saison Co., Ltd.(1) | | 95,400 | | | 1,277,911 |
Dai-ichi Seiko Co., Ltd.(1) | | 31,000 | | | 1,389,538 |
Daihatsu Diesel Manufacturing Co., Ltd.(1) | | 116,000 | | | 667,160 |
Daiseki Co., Ltd.(1) | | 129,000 | | | 2,780,810 |
Daito Trust Construction Co., Ltd.(1) | | 38,700 | | | 1,837,138 |
Dena Co., Ltd.(1) | | 290 | | | 915,437 |
Don Quijote Co., Ltd.(1) | | 189,600 | | | 4,546,870 |
en-japan, Inc.(1) | | 1,160 | | | 1,395,330 |
EPS Co., Ltd.(1) | | 645 | | | 2,647,467 |
Exedy Corp.(1) | | 140,600 | | | 2,973,217 |
Ferrotec Corp.(1) | | 122,500 | | | 1,494,797 |
FP Corp.(1) | | 79,300 | | | 3,767,139 |
Fujimi, Inc.(1) | | 168,700 | | | 2,619,875 |
Funai Electric Co., Ltd.(1) | | 51,600 | | | 2,049,904 |
GS Yuasa Corp.(1) | | 187,000 | | | 1,623,348 |
HIS Co., Ltd.(1) | | 64,500 | | | 1,370,336 |
Hisaka Works, Ltd.(1) | | 64,000 | | | 689,523 |
Internet Initiative Japan, Inc.(1) | | 468 | | | 1,114,054 |
Kakaku.com, Inc.(1) | | 1,290 | | | 4,822,250 |
Koito Manufacturing Co., Ltd.(1) | | 232,000 | | | 3,062,358 |
Kureha Corp.(1) | | 451,000 | | | 2,727,153 |
Kyoritsu Maintenance Co., Ltd.(1) | | 47,900 | | | 791,682 |
Lintec Corp.(1) | | 225,700 | | | 4,728,942 |
Mani, Inc.(1) | | 27,700 | | | 1,874,888 |
Mitsubishi Gas Chemical Co., Inc.(1) | | 193,000 | | | 1,128,658 |
Mitsubishi UFJ Lease & Finance Co., Ltd.(1) | | 100,650 | | | 3,167,884 |
Moshi Moshi Hotline, Inc.(1) | | 128,900 | | | 2,508,898 |
Nabtesco Corp.(1) | | 193,000 | | | 2,135,554 |
Nichicon Corp.(1) | | 290,200 | | | 3,993,971 |
Nichii Gakkan Co.(1) | | 77,400 | | | 895,418 |
Nippon Mining Holdings, Inc.(1) | | 449,000 | | | 2,223,372 |
Nippon Shokubai Co., Ltd.(1) | | 193,000 | | | 1,817,967 |
Nishimatsuya Chain Co., Ltd.(1) | | 141,900 | | | 1,416,209 |
Nissha Printing Co., Ltd.(1) | | 49,600 | | | 2,612,617 |
Nomura Real Estate Holdings, Inc.(1) | | 127,000 | | | 2,212,934 |
NPC, Inc(1) | | 51,600 | | | 1,413,319 |
Oenon Holdings, Inc.(1) | | 432,000 | | | 981,218 |
Okasan Securities Group, Inc.(1) | | 290,000 | | | 1,430,857 |
37
VALIC Company II International Small Cap Equity Fund
PORTFOLIO OF INVESTMENTS — August 31, 2009 — (continued)
| | | | | |
| | |
| Security Description | | Shares | | Market Value
(Note 2) |
|
COMMON STOCK (continued) | | | | | |
Japan (continued) | | | | | |
Osaka Securities Exchange Co., Ltd.(1) | | 929 | | $ | 4,238,299 |
Otsuka Corp.(1) | | 58,000 | | | 3,497,915 |
Pigeon Corp.(1) | | 141,900 | | | 5,854,307 |
Rinnai Corp.(1) | | 51,600 | | | 2,551,847 |
Saint Marc Holdings Co., Ltd.(1) | | 51,600 | | | 1,657,708 |
Seven Bank, Ltd.(1) | | 1,096 | | | 2,779,676 |
Shima Seiki Manufacturing, Ltd.(1) | | 32,200 | | | 745,705 |
Shimadzu Corp.(1) | | 322,000 | | | 2,327,054 |
So-net M3, Inc.(1) | | 774 | | | 2,508,537 |
Sojitz Corp.(1) | | 710,600 | | | 1,507,078 |
Suruga Bank, Ltd.(1) | | 374,000 | | | 3,651,101 |
Sysmex Corp.(1) | | 61,900 | | | 2,796,943 |
Taiko Pharmaceutical Co., Ltd.(1) | | 65,800 | | | 3,102,899 |
Taiyo Ink Manufacturing Co., Ltd.(1) | | 104,400 | | | 2,651,624 |
Telepark Corp.(1) | | 1,934 | | | 3,399,056 |
The Japan Steel Works, Ltd.(1) | | 322,000 | | | 3,980,610 |
Toho Holdings Co., Ltd.(1) | | 141,900 | | | 2,105,837 |
Toridoll.corp.(1) | | 1,109 | | | 2,352,108 |
Toshiba Plant Systems & Services Corp.(1) | | 97,000 | | | 1,312,578 |
Towa Corp.†(1) | | 203,600 | | | 1,442,859 |
Toyo Tanso Co., Ltd.(1) | | 49,600 | | | 2,777,400 |
Tsumura & Co.(1) | | 116,000 | | | 4,107,257 |
Unicharm Petcare Corp.(1) | | 89,000 | | | 3,188,780 |
Union Tool Co.(1) | | 87,000 | | | 2,659,447 |
Village Vanguard Co., Ltd.(1) | | 400 | | | 1,452,340 |
Works Applications Co., Ltd.(1) | | 3,463 | | | 2,265,108 |
Yamaguchi Financial Group, Inc.(1) | | 148,000 | | | 1,699,296 |
Zappallas, Inc.(1) | | 387 | | | 733,174 |
| | | | |
|
|
| | | | | | 161,040,769 |
| | | | |
|
|
Jersey — 1.7% | | | | | |
Henderson Group PLC(1) | | 3,295,079 | | | 6,862,790 |
Randgold Resources, Ltd.(1) | | 47,166 | | | 2,778,831 |
| | | | |
|
|
| | | | | | 9,641,621 |
| | | | |
|
|
Luxembourg — 3.6% | | | | | |
Acergy SA(1) | | 622,188 | | | 6,292,143 |
Millicom International Cellular SA† | | 100,913 | | | 7,120,421 |
Oriflame Cosmetics SA SDR(1) | | 138,155 | | | 6,732,560 |
| | | | |
|
|
| | | | | | 20,145,124 |
| | | | |
|
|
Malaysia — 0.2% | | | | | |
IJM Corp. BHD(1) | | 574,400 | | | 971,331 |
Public Bank BHD(1) | | 117,200 | | | 330,224 |
| | | | |
|
|
| | | | | | 1,301,555 |
| | | | |
|
|
Mauritius — 0.1% | | | | | |
Golden Agri-Resources, Ltd.†(1) | | 1,790,474 | | | 589,339 |
| | | | |
|
|
Netherlands — 1.0% | | | | | |
Koninklijke Vopak NV†(1) | | 90,948 | | | 5,855,609 |
| | | | |
|
|
Portugal — 0.6% | | | | | |
Jeronimo Martins SGPS SA(1) | | 452,511 | | | 3,534,571 |
| | | | |
|
|
Singapore — 0.2% | | | | | |
City Developments, Ltd.(1) | | 83,000 | | | 571,696 |
Venture Corp., Ltd.(1) | | 128,000 | | | 762,899 |
| | | | |
|
|
| | | | | | 1,334,595 |
| | | | |
|
|
South Korea — 2.0% | | | | | |
Cheil Industries, Inc.(1) | | 18,150 | | | 743,672 |
Digitech Systems Co., Ltd.†(1) | | 34,317 | | | 739,713 |
Glovis Co., Ltd.(1) | | 5,828 | | | 485,007 |
Hite Brewery Co., Ltd.(1) | | 5,017 | | | 655,948 |
Hyundai Mobis(1) | | 9,032 | | | 957,523 |
Korean Reinsurance Co.(1) | | 91,640 | | | 832,247 |
| | | | | |
| | |
| Security Description | | Shares | | Market Value
(Note 2) |
|
| | | | | | |
South Korea (continued) | | | | | |
LG Dacom Corp.(1) | | 24,720 | | $ | 364,045 |
LG Electronics, Inc.(1) | | 4,721 | | | 540,088 |
LG Household & Health Care, Ltd.(1) | | 6,347 | | | 1,100,733 |
SODIFF Advanced Materials Co., Ltd.(1) | | 25,709 | | | 1,752,885 |
Sungwoo Hitech Co., Ltd.(1) | | 11,712 | | | 106,810 |
Synopex, Inc.†(1) | | 235,868 | | | 1,126,670 |
Taewoong Co., Ltd.(1) | | 23,143 | | | 1,486,307 |
Taeyoung Engineering & Construction(1) | | 67,670 | | | 336,248 |
| | | | |
|
|
| | | | | | 11,227,896 |
| | | | |
|
|
Spain — 1.9% | | | | | |
Bolsas y Mercados Espanoles(1) | | 195,716 | | | 6,956,085 |
Sociedad General de Aguas de Barcelona SA, Class A(1) | | 161,583 | | | 3,681,539 |
| | | | |
|
|
| | | | | | 10,637,624 |
| | | | |
|
|
Sweden — 1.9% | | | | | |
Hexagon AB(1) | | 613,184 | | | 6,361,783 |
Modern Times Group AB, Class B(1) | | 100,462 | | | 4,109,125 |
| | | | |
|
|
| | | | | | 10,470,908 |
| | | | |
|
|
Switzerland — 4.1% | | | | | |
Actelion, Ltd.†(1) | | 28,090 | | | 1,622,629 |
Clariant AG†(1) | | 871,851 | | | 7,910,264 |
EFG International AG(1) | | 203,400 | | | 3,308,530 |
Sonova Holding AG(1) | | 107,697 | | | 10,317,982 |
| | | | |
|
|
| | | | | | 23,159,405 |
| | | | |
|
|
Taiwan — 1.6% | | | | | |
Chicony Electronics Co., Ltd.(1) | | 319,819 | | | 765,124 |
Everlight Electronics Co., Ltd.†(1) | | 509,499 | | | 1,403,164 |
Far Eastern Department Stores Co., Ltd.(1) | | 914,640 | | | 793,756 |
InnoLux Display Corp.(1) | | 493,370 | | | 550,520 |
International Games System Co., Ltd.(1) | | 91,693 | | | 740,327 |
L&K Engineering Co., Ltd.(1) | | 415,000 | | | 324,436 |
Shin Zu Shing Co., Ltd.(1) | | 246,620 | | | 1,339,842 |
Simplo Technology Co., Ltd.(1) | | 281,600 | | | 1,267,639 |
Transcend Information, Inc.(1) | | 158,000 | | | 525,258 |
Wistron Corp.(1) | | 647,985 | | | 1,250,596 |
| | | | |
|
|
| | | | | | 8,960,662 |
| | | | |
|
|
Thailand — 0.1% | | | | | |
Thoresen Thai Agencies PCL NVDR(1) | | 531,260 | | | 364,246 |
TMB Bank PCL† | | 17,899,200 | | | 231,569 |
| | | | |
|
|
| | | | | | 595,815 |
| | | | |
|
|
United Kingdom — 15.8% | | | | | |
ARM Holdings PLC(1) | | 489 | | | 1,040 |
Ashmore Group PLC(1) | | 1,772,879 | | | 6,892,743 |
Britvic PLC(1) | | 342,491 | | | 1,915,753 |
Burberry Group PLC(1) | | 830,614 | | | 6,501,264 |
Cookson Group PLC(1) | | 1,532,099 | | | 9,754,092 |
Croda International PLC(1) | | 613,038 | | | 6,237,024 |
Dana Petroleum PLC†(1) | | 264,867 | | | 6,044,553 |
Enterprise Inns PLC(1) | | 2,390,534 | | | 6,470,225 |
Fresnillo PLC(1) | | 523,446 | | | 5,274,909 |
ICAP PLC(1) | | 797,294 | | | 5,531,080 |
Kazakhmys PLC(1) | | 436,363 | | | 6,927,137 |
Legal & General Group PLC(1) | | 5,178,920 | | | 6,430,599 |
London Stock Exchange Group PLC(1) | | 542,773 | | | 7,074,502 |
Rentokil Initial PLC†(1) | | 4,187,573 | | | 7,437,588 |
Vedanta Resources PLC(1) | | 216,689 | | | 6,263,223 |
| | | | |
|
|
| | | | | | 88,755,732 |
| | | | |
|
|
38
VALIC Company II International Small Cap Equity Fund
PORTFOLIO OF INVESTMENTS — August 31, 2009 — (continued)
| | | | | | | |
| | |
| Security Description | | Shares/
Principal
Amount | | | Market Value
(Note 2) |
|
United States — 2.2% | | | | | | | |
AsiaInfo Holdings, Inc.† | | | 132,300 | | | $ | 2,278,206 |
Autoliv, Inc. | | | 104,564 | | | | 3,353,367 |
Virgin Media, Inc. | | | 586,243 | | | | 6,700,758 |
| | | | | | |
|
|
| | | | | | | | 12,332,331 |
| | | | | | |
|
|
Total Common Stock | | | | | | | |
(cost $460,345,845) | | | | | | | 536,345,149 |
| | | | | | |
|
|
WARRANTS — 0.0% | | | | | | | |
Republic of Mauritius — 0.0% | | | | | | | |
Golden Agri-Resources, Ltd.
Expires 07/24/12 (Strike price 0.54 SGD)†
(cost $0) | | | 104,061 | | | | 10,832 |
| | | | | | |
|
|
Total Long-Term Investment Securities | | | | | | | |
(cost $460,345,845) | | | | | | | 536,355,981 |
| | | | | | |
|
|
REPURCHASE AGREEMENT — 2.4% | | | | |
Agreement with State Street Bank & Trust Co., bearing interest at 0.01%, dated 08/31/09, to be repurchased 09/01/09 in the amount of $13,602,004 and collateralized by $13,220,000 of Federal Home Loan Bank Bonds, bearing interest at 4.38%, due 09/17/10 and having an approximate value of $14,011,878
(cost $13,602,000) | | $ | 13,602,000 | | | | 13,602,000 |
| | | | | | |
|
|
TOTAL INVESTMENTS | | | | | | | |
(cost $473,947,845)(3) | | | 97.7 | % | | | 549,957,981 |
Other assets less liabilities | | | 2.3 | | | | 12,767,351 |
| | |
|
|
| |
|
|
NET ASSETS — | | | 100.0 | % | | $ | 562,725,332 |
| | |
|
|
| |
|
|
| † | Non-income producing security |
| (1) | Security was valued using fair value procedures at August 31, 2009. The aggregate value of these securities was $516,644,185 representing 91.8% of net assets. Securities are classified as Level 2 based on the securities valuation inputs. See Note 2 regarding fair value pricing for foreign equity securities. |
| (2) | Fair valued security. Securities are classified as Level 3 based on the securities valuation inputs; see Note 2. |
| (3) | See Note 5 for cost of investments on a tax basis. |
SDR—Swedish Depository Receipt
NVDR—Non Voting Depository Receipt
Currency Legend
SGD—Singapore Dollar
The following is a summary of the inputs used to value the Fund’s net assets as of August 31, 2009 (see Note 2):
| | | | | | | | | | | | | |
| | | Level 1 -
Unadjusted
Quoted
Prices
| | Level 2 -
Other
Observable
Inputs
| | | Level 3 -
Significant
Unobservable
Inputs
| | Total
|
Long-Term Investment Securities: | | | | | | | | | | | | | |
Common Stock: | | | | | | | | | | | | | |
Italy | | $ | – | | $ | 43,257,792 | # | | $ | – | | $ | 43,257,792 |
Japan | | | – | | | 161,040,769 | # | | | – | | | 161,040,769 |
United Kingdom | | | – | | | 88,755,732 | # | | | – | | | 88,755,732 |
Other Countries* | | | 19,684,321 | | | 223,589,892 | # | | | 16,643 | | | 243,290,856 |
Warrants | | | 10,832 | | | – | | | | – | | | 10,832 |
Repurchase Agreement | | | – | | | 13,602,000 | | | | – | | | 13,602,000 |
| | |
|
| |
|
|
| |
|
| |
|
|
Total | | $ | 19,695,153 | | $ | 530,246,185 | | | $ | 16,643 | | $ | 549,957,981 |
| | |
|
| |
|
|
| |
|
| |
|
|
| * | Sum of all other countries each of which individually has an aggregate market value of less than 5% of net assets. |
| # | Includes foreign equity securities whose values were adjusted for fair value pricing procedures for foreign equity securities; therefore these investment securities were classified as Level 2 instead of Level 1. (See Note 2) |
The following is a reconciliation of Level 3 assets which significant unobservable inputs were used to determine fair value:
| | | | |
| | | Common Stock
Other Countries
| |
Balance as of 8/31/2008 | | $ | 131,845 | |
Accrued discounts/premiums | | | – | |
Realized gain(loss) | | | – | |
Change in unrealized appreciation(depreciation) | | | (131,587 | ) |
Net purchases(sales) | | | 16,385 | |
Transfers in and/or out of Level 3 | | | – | |
| | |
|
|
|
Balance as of 8/31/2009 | | $ | 16,643 | |
| | |
|
|
|
See Notes to Financial Statements
39
VALIC Company II Large Cap Value Fund
PORTFOLIO PROFILE — August 31, 2009 (Unaudited)
Industry Allocation*
| | | |
Diversified Banking Institutions | | 11.2 | % |
Oil Companies — Integrated | | 9.6 | |
Medical — Drugs | | 5.9 | |
Diversified Manufacturing Operations | | 5.3 | |
Banks — Super Regional | | 5.0 | |
Telephone — Integrated | | 4.6 | |
Oil Companies — Exploration & Production | | 3.7 | |
Medical — HMO | | 2.8 | |
Insurance — Life/Health | | 2.5 | |
Computers — Memory Devices | | 2.5 | |
Gas — Distribution | | 2.4 | |
Computers | | 2.3 | |
Multimedia | | 2.0 | |
Agricultural Operations | | 1.5 | |
Human Resources | | 1.4 | |
Electric — Integrated | | 1.3 | |
Real Estate Investment Trusts | | 1.3 | |
Oil Field Machinery & Equipment | | 1.3 | |
Finance — Investment Banker/Broker | | 1.3 | |
Retail — Automobile | | 1.3 | |
Insurance — Multi-line | | 1.2 | |
Computer Services | | 1.2 | |
Banks — Fiduciary | | 1.2 | |
Medical — Wholesale Drug Distribution | | 1.2 | |
Finance — Credit Card | | 1.1 | |
Distribution/Wholesale | | 1.1 | |
Cable/Satellite TV | | 1.1 | |
Paper & Related Products | | 1.0 | |
Chemicals — Specialty | | 1.0 | |
Beverages — Non-alcoholic | | 1.0 | |
Home Decoration Products | | 1.0 | |
Transport — Rail | | 0.9 | |
Retail — Regional Department Stores | | 0.9 | |
Retail — Petroleum Products | | 0.9 | |
Building — Residential/Commercial | | 0.9 | |
Food — Meat Products | | 0.8 | |
Oil & Gas Drilling | | 0.8 | |
Retail — Major Department Stores | | 0.8 | |
Retail — Consumer Electronics | | 0.8 | |
Vitamins & Nutrition Products | | 0.8 | |
Food — Dairy Products | | 0.8 | |
Electric — Generation | | 0.8 | |
Apparel Manufacturers | | 0.7 | |
Containers — Paper/Plastic | | 0.7 | |
Oil Refining & Marketing | | 0.7 | |
Tobacco | | 0.7 | |
Home Furnishings | | 0.6 | |
Containers — Metal/Glass | | 0.6 | |
Registered Investment Companies | | 0.6 | |
Aerospace/Defense | | 0.6 | |
Medical — Generic Drugs | | 0.6 | |
Electronic Connectors | | 0.6 | |
Auto — Heavy Duty Trucks | | 0.6 | |
Independent Power Producers | | 0.5 | |
Electronic Components — Misc. | | 0.4 | |
Wire & Cable Products | | 0.4 | |
Food — Canned | | 0.4 | |
Steel — Producers | | 0.4 | |
Cosmetics & Toiletries | | 0.4 | |
| | |
|
|
| | | 100.0 | % |
| | |
|
|
| * | Calculated as a percentage of net assets |
40
VALIC Company II Large Cap Value Fund
PORTFOLIO OF INVESTMENTS — August 31, 2009
| | | | | |
| | |
| Security Description | | Shares | | Market Value
(Note 2) |
|
COMMON STOCK — 99.4% |
Aerospace/Defense — 0.6% |
Raytheon Co. | | 19,900 | | $ | 938,882 |
| | | | |
|
|
Agricultural Operations — 1.5% |
Archer - Daniels - Midland Co. | | 80,592 | | | 2,323,467 |
| | | | |
|
|
Apparel Manufacturers — 0.7% |
Polo Ralph Lauren Corp. | | 17,200 | | | 1,141,736 |
| | | | |
|
|
Auto - Heavy Duty Trucks — 0.6% |
Oshkosh Corp. | | 26,200 | | | 880,320 |
| | | | |
|
|
Banks - Fiduciary — 1.2% |
The Bank of New York Mellon Corp. | | 63,670 | | | 1,885,269 |
| | | | |
|
|
Banks - Super Regional — 5.0% |
Fifth Third Bancorp | | 101,800 | | | 1,113,692 |
PNC Financial Services Group, Inc. | | 13,144 | | | 559,803 |
US Bancorp | | 82,504 | | | 1,866,240 |
Wells Fargo & Co. | | 158,594 | | | 4,364,507 |
| | | | |
|
|
| | | | | | 7,904,242 |
| | | | |
|
|
Beverages - Non - alcoholic — 1.0% |
Coca - Cola Enterprises, Inc. | | 76,600 | | | 1,548,086 |
| | | | |
|
|
Building - Residential/Commercial — 0.9% |
NVR, Inc.† | | 2,007 | | | 1,355,227 |
| | | | |
|
|
Cable/Satellite TV — 1.1% |
Comcast Corp., Class A | | 109,200 | | | 1,672,944 |
| | | | |
|
|
Chemicals - Specialty — 1.0% |
Ashland, Inc. | | 24,200 | | | 887,656 |
OM Group, Inc.† | | 24,800 | | | 674,808 |
| | | | |
|
|
| | | | | | 1,562,464 |
| | | | |
|
|
Computer Services — 1.2% |
Computer Sciences Corp.† | | 38,600 | | | 1,885,610 |
| | | | |
|
|
Computers — 2.3% |
Hewlett - Packard Co. | | 36,500 | | | 1,638,485 |
International Business Machines Corp. | | 17,200 | | | 2,030,460 |
| | | | |
|
|
| | | | | | 3,668,945 |
| | | | |
|
|
Computers - Memory Devices — 2.5% |
EMC Corp.† | | 129,700 | | | 2,062,230 |
Western Digital Corp.† | | 55,100 | | | 1,888,828 |
| | | | |
|
|
| | | | | | 3,951,058 |
| | | | |
|
|
Containers - Metal/Glass — 0.6% |
Owens - Illinois, Inc.† | | 29,600 | | | 1,004,624 |
| | | | |
|
|
Containers - Paper/Plastic — 0.7% |
Pactiv Corp.† | | 45,600 | | | 1,133,160 |
| | | | |
|
|
Cosmetics & Toiletries — 0.4% |
The Procter & Gamble Co. | | 11,231 | | | 607,709 |
| | | | |
|
|
Distribution/Wholesale — 1.1% |
Ingram Micro, Inc., Class A† | | 52,500 | | | 879,900 |
Tech Data Corp.† | | 21,100 | | | 803,910 |
| | | | |
|
|
| | | | | | 1,683,810 |
| | | | |
|
|
Diversified Banking Institutions — 11.2% |
Bank of America Corp. | | 305,146 | | | 5,367,518 |
Citigroup, Inc. | | 160,300 | | | 801,500 |
JPMorgan Chase & Co. | | 151,631 | | | 6,589,884 |
Morgan Stanley | | 36,223 | | | 1,049,018 |
The Goldman Sachs Group, Inc. | | 23,298 | | | 3,854,887 |
| | | | |
|
|
| | | | | | 17,662,807 |
| | | | |
|
|
| | | | | |
| | |
| Security Description | | Shares | | Market Value
(Note 2) |
|
| | | | | | |
Diversified Manufacturing Operations — 5.3% | | | |
Cooper Industries, Ltd., Class A | | 27,700 | | $ | 893,325 |
General Electric Co. | | 333,086 | | | 4,629,895 |
Illinois Tool Works, Inc. | | 50,300 | | | 2,103,546 |
ITT Corp. | | 15,700 | | | 786,256 |
| | | | |
|
|
| | | | | | 8,413,022 |
| | | | |
|
|
Electric - Generation — 0.8% | | | | | |
The AES Corp.† | | 87,400 | | | 1,194,758 |
| | | | |
|
|
Electric - Integrated — 1.3% | | | | | |
Edison International | | 44,700 | | | 1,493,427 |
FPL Group, Inc. | | 11,000 | | | 617,980 |
| | | | |
|
|
| | | | | | 2,111,407 |
| | | | |
|
|
Electronic Components - Misc. — 0.4% | | | | | |
Garmin, Ltd. | | 20,900 | | | 686,983 |
| | | | |
|
|
Electronic Connectors — 0.6% | | | | | |
Thomas & Betts Corp.† | | 31,988 | | | 885,748 |
| | | | |
|
|
Finance - Credit Card — 1.1% | | | | | |
American Express Co. | | 50,600 | | | 1,711,292 |
| | | | |
|
|
Finance - Investment Banker/Broker — 1.3% | | | |
Knight Capital Group, Inc., Class A† | | 102,550 | | | 2,063,306 |
| | | | |
|
|
Food - Canned — 0.4% | | | | | |
Del Monte Foods Co. | | 60,600 | | | 635,694 |
| | | | |
|
|
Food - Dairy Products — 0.8% | | | | | |
Dean Foods Co.† | | 66,048 | | | 1,198,111 |
| | | | |
|
|
Food - Meat Products — 0.8% | | | | | |
Tyson Foods, Inc., Class A | | 110,900 | | | 1,329,691 |
| | | | |
|
|
Gas - Distribution — 2.4% | | | | | |
Sempra Energy | | 46,158 | | | 2,315,747 |
UGI Corp. | | 57,886 | | | 1,476,672 |
| | | | |
|
|
| | | | | | 3,792,419 |
| | | | |
|
|
Home Decoration Products — 1.0% | | | | | |
Newell Rubbermaid, Inc. | | 108,300 | | | 1,507,536 |
| | | | |
|
|
Home Furnishings — 0.6% | | | | | |
Tempur - Pedic International, Inc.† | | 68,200 | | | 1,009,360 |
| | | | |
|
|
Human Resources — 1.4% | | | | | |
Manpower, Inc. | | 41,882 | | | 2,165,299 |
| | | | |
|
|
Independent Power Producers — 0.5% | | | | | |
Mirant Corp.† | | 50,700 | | | 854,295 |
| | | | |
|
|
Insurance - Life/Health — 2.5% | | | | | |
Aflac, Inc. | | 24,800 | | | 1,007,376 |
Prudential Financial, Inc. | | 17,700 | | | 895,266 |
Unum Group | | 91,400 | | | 2,059,242 |
| | | | |
|
|
| | | | | | 3,961,884 |
| | | | |
|
|
Insurance - Multi - line — 1.2% | | | | | |
American Financial Group, Inc. | | 75,730 | | | 1,942,474 |
| | | | |
|
|
Medical - Drugs — 5.9% | | | | | |
Eli Lilly & Co. | | 33,112 | | | 1,107,927 |
Endo Pharmaceuticals Holdings, Inc.† | | 42,200 | | | 952,454 |
Forest Laboratories, Inc.† | | 82,062 | | | 2,401,955 |
Pfizer, Inc. | | 293,027 | | | 4,893,551 |
| | | | |
|
|
| | | | | | 9,355,887 |
| | | | |
|
|
Medical - Generic Drugs — 0.6% | | | | | |
Watson Pharmaceuticals, Inc.† | | 26,200 | | | 924,598 |
| | | | |
|
|
41
VALIC Company II Large Cap Value Fund
PORTFOLIO OF INVESTMENTS — August 31, 2009 — (continued)
| | | | | |
| | |
| Security Description | | Shares | | Market Value
(Note 2) |
|
COMMON STOCK (continued) |
Medical - HMO — 2.8% | | | | | |
Coventry Health Care, Inc.† | | 100,800 | | $ | 2,200,464 |
UnitedHealth Group, Inc. | | 81,280 | | | 2,275,840 |
| | | | |
|
|
| | | | | | 4,476,304 |
| | | | |
|
|
Medical - Wholesale Drug Distribution — 1.2% | | | |
McKesson Corp. | | 33,000 | | | 1,876,380 |
| | | | |
|
|
Multimedia — 2.0% | | | | | |
Time Warner, Inc. | | 58,504 | | | 1,632,847 |
Viacom, Inc., Class B† | | 61,200 | | | 1,532,448 |
| | | | |
|
|
| | | | | | 3,165,295 |
| | | | |
|
|
Oil & Gas Drilling — 0.8% | | | | | |
Transocean, Ltd.† | | 17,081 | | | 1,295,423 |
| | | | |
|
|
Oil Companies - Exploration & Production — 3.7% | | | |
Anadarko Petroleum Corp. | | 15,100 | | | 798,337 |
Encore Acquisition Co.† | | 33,700 | | | 1,270,153 |
Occidental Petroleum Corp. | | 50,307 | | | 3,677,442 |
| | | | |
|
|
| | | | | | 5,745,932 |
| | | | |
|
|
Oil Companies - Integrated — 9.6% | | | | | |
Chevron Corp. | | 50,152 | | | 3,507,631 |
ConocoPhillips | | 17,819 | | | 802,390 |
Exxon Mobil Corp. | | 119,883 | | | 8,289,909 |
Marathon Oil Corp. | | 20,400 | | | 629,748 |
Murphy Oil Corp. | | 32,900 | | | 1,875,300 |
| | | | |
|
|
| | | | | | 15,104,978 |
| | | | |
|
|
Oil Field Machinery & Equipment — 1.3% | | | | | |
National - Oilwell Varco, Inc.† | | 57,300 | | | 2,082,855 |
| | | | |
|
|
Oil Refining & Marketing — 0.7% | | | | | |
Tesoro Corp. | | 77,800 | | | 1,095,424 |
| | | | |
|
|
Paper & Related Products — 1.0% | | | | | |
International Paper Co. | | 69,600 | | | 1,597,320 |
| | | | |
|
|
Real Estate Investment Trusts — 1.3% | | | | | |
Annaly Capital Management, Inc. | | 121,627 | | | 2,109,012 |
| | | | |
|
|
Retail - Automobile — 1.3% | | | | | |
AutoNation, Inc.† | | 104,845 | | | 1,989,958 |
| | | | |
|
|
Retail - Consumer Electronics — 0.8% | | | | | |
RadioShack Corp. | | 84,200 | | | 1,273,946 |
| | | | |
|
|
Retail - Major Department Stores — 0.8% | | | | | |
Sears Holdings Corp.† | | 20,300 | | | 1,288,035 |
| | | | |
|
|
Retail - Petroleum Products — 0.9% | | | | | |
World Fuel Services Corp. | | 30,700 | | | 1,379,658 |
| | | | |
|
|
Retail - Regional Department Stores — 0.9% | | | |
Macy’s, Inc. | | 90,400 | | | 1,403,008 |
| | | | |
|
|
Steel - Producers — 0.4% | | | | | |
Reliance Steel & Aluminum Co. | | 16,800 | | | 620,592 |
| | | | |
|
|
Telephone - Integrated — 4.6% | | | | | |
AT&T, Inc. | | 150,310 | | | 3,915,575 |
CenturyTel, Inc. | | 31,524 | | | 1,016,019 |
Qwest Communications International, Inc. | | 167,800 | | | 602,402 |
Verizon Communications, Inc. | | 53,954 | | | 1,674,732 |
| | | | |
|
|
| | | | | | 7,208,728 |
| | | | |
|
|
Tobacco — 0.7% | | | | | |
Reynolds American, Inc. | | 22,600 | | | 1,033,046 |
| | | | |
|
|
| | | | | | |
| | |
| Security Description | | Shares | | | Market Value
(Note 2) |
|
| | | | | | | |
Transport - Rail — 0.9% | | | | | | |
CSX Corp. | | 35,000 | | | $ | 1,487,500 |
| | | | | |
|
|
Vitamins & Nutrition Products — 0.8% | | | | | | |
Herbalife, Ltd. | | 41,600 | | | | 1,259,648 |
| | | | | |
|
|
Wire & Cable Products — 0.4% | | | | | | |
General Cable Corp.† | | 19,200 | | | | 677,376 |
| | | | | |
|
|
Total Long - Term Investment Securities | | | | |
(cost $147,546,849) | | | | | | 156,724,542 |
| | | | | |
|
|
SHORT-TERM INVESTMENT SECURITIES — 0.6% |
Registered Investment Companies — 0.6% |
VALIC Co. I Money Market I Fund
(cost $958,928) | | 958,928 | | | | 958,928 |
| | | | | |
|
|
TOTAL INVESTMENTS | | | | | | |
(cost $148,505,777)(1) | | 100.0 | % | | | 157,683,470 |
Other assets less liabilities | | 0.0 | | | | 27,339 |
| | |
|
| |
|
|
NET ASSETS — | | 100.0 | % | | $ | 157,710,809 |
| | |
|
| |
|
|
| † | Non-income producing security |
| (1) | See Note 5 for cost of investments on a tax basis. |
The following is a summary of the inputs used to value the Fund’s net assets as of August 31, 2009 (see Note 2):
| | | | | | | | | | | | |
| | | Level 1 -
Unadjusted
Quoted
Prices
| | Level 2-
Other
Observable
Inputs
| | Level 3 -
Significant
Unobservable
Inputs
| | Total
|
Long-Term Investment Securities: | | | | | | | | | | | | |
Common Stock: | | | | | | | | | | | | |
Banks — Super Regional | | $ | 7,904,242 | | $ | – | | $ | – | | $ | 7,904,242 |
Diversified Banking Institutions | | | 17,662,807 | | | – | | | – | | | 17,662,807 |
Diversified Manufacturing Operations | | | 8,413,022 | | | – | | | – | | | 8,413,022 |
Medical — Drugs | | | 9,355,887 | | | – | | | – | | | 9,355,887 |
Oil Companies — Integrated | | | 15,104,978 | | | – | | | – | | | 15,104,978 |
Other Industries* | | | 98,283,606 | | | – | | | – | | | 98,283,606 |
Short-Term Investment Securities: | | | | | | | | | | | | |
Registered Investment Companies | | | – | | | 958,928 | | | – | | | 958,928 |
| | |
|
| |
|
| |
|
| |
|
|
Total | | $ | 156,724,542 | | $ | 958,928 | | $ | – | | $ | 157,683,470 |
| | |
|
| |
|
| |
|
| |
|
|
| * | Sum of all other industries each of which individually has an aggregate market value of less than 5% of net assets. |
See Notes to Financial Statements
42
VALIC Company II Mid Cap Growth Fund
PORTFOLIO PROFILE — August 31, 2009 (Unaudited)
Industry Allocation*
| | | |
Electronic Components — Semiconductors | | 5.8 | % |
Oil Companies — Exploration & Production | | 3.8 | |
Transport — Truck | | 3.7 | |
Semiconductor Equipment | | 3.5 | |
Apparel Manufacturers | | 3.4 | |
Schools | | 3.2 | |
Repurchase Agreements | | 3.1 | |
Retail — Apparel/Shoe | | 2.9 | |
Computer Services | | 2.8 | |
Computers — Memory Devices | | 2.4 | |
Finance — Investment Banker/Broker | | 2.4 | |
Oil — Field Services | | 2.2 | |
Oil & Gas Drilling | | 2.2 | |
Commercial Services | | 2.0 | |
Metal — Copper | | 1.8 | |
Distribution/Wholesale | | 1.8 | |
Pharmacy Services | | 1.8 | |
Private Corrections | | 1.7 | |
Insurance — Life/Health | | 1.6 | |
Investment Management/Advisor Services | | 1.5 | |
Cosmetics & Toiletries | | 1.5 | |
Banks — Super Regional | | 1.4 | |
Applications Software | | 1.4 | |
Coal | | 1.4 | |
Banks — Fiduciary | | 1.3 | |
Consumer Products — Misc. | | 1.3 | |
Transactional Software | | 1.3 | |
Real Estate Management/Services | | 1.3 | |
Rubber — Tires | | 1.2 | |
Medical — Biomedical/Gene | | 1.2 | |
Semiconductor Components — Integrated Circuits | | 1.1 | |
Tools — Hand Held | | 1.1 | |
Aerospace/Defense — Equipment | | 1.1 | |
Casino Services | | 1.1 | |
Batteries/Battery Systems | | 1.1 | |
Electronic Connectors | | 1.0 | |
Hotels/Motels | | 1.0 | |
Human Resources | | 1.0 | |
Computer Aided Design | | 1.0 | |
Retail — Automobile | | 1.0 | |
Instruments — Scientific | | 1.0 | |
Medical Products | | 1.0 | |
Wireless Equipment | | 1.0 | |
Non — Hazardous Waste Disposal | | 1.0 | |
Electronic Forms | | 1.0 | |
Steel — Producers | | 1.0 | |
Physical Therapy/Rehabilitation Centers | | 1.0 | |
Containers — Paper/Plastic | | 1.0 | |
Independent Power Producers | | 1.0 | |
Dialysis Centers | | 0.9 | |
Retail — Consumer Electronics | | 0.9 | |
Engineering/R&D Services | | 0.9 | |
Containers — Metal/Glass | | 0.9 | |
Veterinary Diagnostics | | 0.9 | |
Internet Security | | 0.9 | |
Transport — Services | | 0.9 | |
Entertainment Software | | 0.8 | |
Retail — Perfume & Cosmetics | | 0.7 | |
Medical — Wholesale Drug Distribution | | 0.6 | |
Medical — HMO | | 0.6 | |
Research & Development | | 0.6 | |
Agricultural Chemicals | | 0.6 | |
Chemicals — Specialty | | 0.6 | |
Machinery — Electrical | | 0.5 | |
Medical — Drugs | | 0.5 | |
Respiratory Products | | 0.5 | |
Retail — Auto Parts | | 0.5 | |
Transport — Marine | | 0.4 | |
Networking Products | | 0.2 | |
| | |
|
|
| | | 99.8 | % |
| | |
|
|
| * | Calculated as a percentage of net assets |
43
VALIC Company II Mid Cap Growth Fund
PORTFOLIO OF INVESTMENTS — August 31, 2009
| | | | | |
| | |
| Security Description | | Shares | | Market Value
(Note 2) |
|
COMMON STOCK — 96.7% |
Aerospace/Defense - Equipment — 1.1% |
BE Aerospace, Inc.† | | 99,974 | | $ | 1,712,555 |
| | | | |
|
|
Agricultural Chemicals — 0.6% |
Intrepid Potash, Inc.† | | 39,243 | | | 921,818 |
| | | | |
|
|
Apparel Manufacturers — 3.4% |
Carter’s, Inc.† | | 64,398 | | | 1,620,254 |
Coach, Inc. | | 53,981 | | | 1,527,122 |
Hanesbrands, Inc.† | | 110,750 | | | 2,332,395 |
| | | | |
|
|
| | | | | | 5,479,771 |
| | | | |
|
|
Applications Software — 1.4% |
Check Point Software Technologies, Ltd.† | | 79,985 | | | 2,229,182 |
| | | | |
|
|
Banks - Fiduciary — 1.3% |
State Street Corp. | | 39,893 | | | 2,093,585 |
| | | | |
|
|
Banks - Super Regional — 1.4% |
Capital One Financial Corp. | | 60,096 | | | 2,240,980 |
| | | | |
|
|
Batteries/Battery Systems — 1.1% |
Energizer Holdings, Inc.† | | 25,876 | | | 1,693,067 |
| | | | |
|
|
Casino Services — 1.1% |
International Game Technology | | 81,728 | | | 1,709,750 |
| | | | |
|
|
Chemicals - Specialty — 0.6% |
Albemarle Corp. | | 28,425 | | | 916,138 |
| | | | |
|
|
Coal — 1.4% |
CONSOL Energy, Inc. | | 18,159 | | | 679,328 |
Walter Energy, Inc. | | 28,325 | | | 1,470,351 |
| | | | |
|
|
| | | | | | 2,149,679 |
| | | | |
|
|
Commercial Services — 2.0% |
Alliance Data Systems Corp.† | | 33,780 | | | 1,876,817 |
Quanta Services, Inc.† | | 56,245 | | | 1,244,139 |
| | | | |
|
|
| | | | | | 3,120,956 |
| | | | |
|
|
Computer Aided Design — 1.0% |
Autodesk, Inc.† | | 69,449 | | | 1,627,190 |
| | | | |
|
|
Computer Services — 2.8% |
Cognizant Technology Solutions Corp., Class A† | | 65,593 | | | 2,287,884 |
IHS, Inc., Class A† | | 44,087 | | | 2,133,811 |
| | | | |
|
|
| | | | | | 4,421,695 |
| | | | |
|
|
Computers - Memory Devices — 2.4% |
NetApp, Inc.† | | 90,436 | | | 2,057,419 |
Western Digital Corp.† | | 50,657 | | | 1,736,522 |
| | | | |
|
|
| | | | | | 3,793,941 |
| | | | |
|
|
Consumer Products - Misc. — 1.3% |
Jarden Corp.† | | 85,620 | | | 2,084,847 |
| | | | |
|
|
Containers - Metal/Glass — 0.9% |
Crown Holdings, Inc.† | | 57,340 | | | 1,423,752 |
| | | | |
|
|
Containers - Paper/Plastic — 1.0% |
Pactiv Corp.† | | 62,174 | | | 1,545,024 |
| | | | |
|
|
Cosmetics & Toiletries — 1.5% |
Chattem, Inc.† | | 12,489 | | | 764,826 |
The Estee Lauder Cos., Inc., Class A | | 44,536 | | | 1,596,616 |
| | | | |
|
|
| | | | | | 2,361,442 |
| | | | |
|
|
Dialysis Centers — 0.9% |
Fresenius Medical Care AG(1) | | 33,428 | | | 1,503,255 |
| | | | |
|
|
| | | | | |
| | |
| Security Description | | Shares | | Market Value
(Note 2) |
|
| | | | | | |
Distribution/Wholesale — 1.8% |
Fastenal Co. | | 37,328 | | $ | 1,351,274 |
LKQ Corp.† | | 87,920 | | | 1,526,291 |
| | | | |
|
|
| | | | | | 2,877,565 |
| | | | |
|
|
Electronic Components - Semiconductors — 5.8% |
Altera Corp. | | 100,821 | | | 1,936,771 |
Avago Technologies, Ltd.† | | 155,273 | | | 2,825,969 |
Broadcom Corp., Class A† | | 53,768 | | | 1,529,700 |
ON Semiconductor Corp.† | | 202,729 | | | 1,636,023 |
QLogic Corp.† | | 54,004 | | | 853,803 |
Xilinx, Inc. | | 21,650 | | | 481,496 |
| | | | |
|
|
| | | | | | 9,263,762 |
| | | | |
|
|
Electronic Connectors — 1.0% |
Amphenol Corp., Class A | | 47,468 | | | 1,659,481 |
| | | | |
|
|
Electronic Forms — 1.0% |
Adobe Systems, Inc.† | | 49,555 | | | 1,557,018 |
| | | | |
|
|
Engineering/R&D Services — 0.9% |
The Shaw Group, Inc.† | | 48,599 | | | 1,425,409 |
| | | | |
|
|
Entertainment Software — 0.8% |
Activision Blizzard, Inc.† | | 111,611 | | | 1,295,804 |
| | | | |
|
|
Finance - Investment Banker/Broker — 2.4% |
Lazard, Ltd., Class A | | 42,991 | | | 1,671,060 |
TD Ameritrade Holding Corp.† | | 109,382 | | | 2,104,510 |
| | | | |
|
|
| | | | | | 3,775,570 |
| | | | |
|
|
Hotel/Motels — 1.0% |
Starwood Hotels & Resorts Worldwide, Inc. | | 55,095 | | | 1,640,729 |
| | | | |
|
|
Human Resources — 1.0% |
Robert Half International, Inc. | | 62,369 | | | 1,639,681 |
| | | | |
|
|
Independent Power Producers — 1.0% |
NRG Energy, Inc.† | | 57,065 | | | 1,532,195 |
| | | | |
|
|
Instruments - Scientific — 1.0% |
Thermo Fisher Scientific, Inc.† | | 35,822 | | | 1,619,513 |
| | | | |
|
|
Insurance - Life/Health — 1.6% |
Aflac, Inc. | | 41,750 | | | 1,695,885 |
Lincoln National Corp. | | 36,638 | | | 924,743 |
| | | | |
|
|
| | | | | | 2,620,628 |
| | | | |
|
|
Internet Security — 0.9% |
McAfee, Inc.† | | 35,282 | | | 1,403,518 |
| | | | |
|
|
Investment Management/Advisor Services — 1.5% |
Affiliated Managers Group, Inc.† | | 37,340 | | | 2,439,422 |
| | | | |
|
|
Machinery - Electrical — 0.5% |
Baldor Electric Co. | | 31,106 | | | 873,145 |
| | | | |
|
|
Medical Products — 1.0% |
American Medical Systems Holdings, Inc.† | | 80,472 | | | 1,226,393 |
Covidien PLC | | 9,808 | | | 388,103 |
| | | | |
|
|
| | | | | | 1,614,496 |
| | | | |
|
|
Medical - Biomedical/Gene — 1.2% |
Illumina, Inc.† | | 18,645 | | | 657,609 |
United Therapeutics Corp.† | | 12,999 | | | 1,189,539 |
| | | | |
|
|
| | | | | | 1,847,148 |
| | | | |
|
|
Medical - Drugs — 0.5% |
Shire PLC(1) | | 52,212 | | | 865,533 |
| | | | |
|
|
44
VALIC Company II Mid Cap Growth Fund
PORTFOLIO OF INVESTMENTS — August 31, 2009 — (continued)
| | | | | |
| | |
| Security Description | | Shares | | Market Value
(Note 2) |
|
COMMON STOCK (continued) |
Medical - HMO — 0.6% |
CIGNA Corp. | | 32,036 | | $ | 942,819 |
| | | | |
|
|
Medical - Wholesale Drug Distribution — 0.6% |
McKesson Corp. | | 17,534 | | | 996,983 |
| | | | |
|
|
Metal - Copper — 1.8% |
Freeport - McMoRan Copper & Gold, Inc. | | 30,249 | | | 1,905,082 |
Southern Copper Corp. | | 34,953 | | | 987,772 |
| | | | |
|
|
| | | | | | 2,892,854 |
| | | | |
|
|
Networking Products — 0.2% |
3Com Corp.† | | 80,984 | | | 352,280 |
| | | | |
|
|
Non - Hazardous Waste Disposal — 1.0% |
Republic Services, Inc. | | 61,923 | | | 1,585,848 |
| | | | |
|
|
Oil & Gas Drilling — 2.2% |
Atlas America, Inc. | | 33,113 | | | 734,446 |
Noble Corp. | | 58,815 | | | 2,060,290 |
Patterson - UTI Energy, Inc. | | 55,014 | | | 731,136 |
| | | | |
|
|
| | | | | | 3,525,872 |
| | | | |
|
|
Oil Companies - Exploration & Production — 3.8% |
Continental Resources, Inc.† | | 79,351 | | | 2,801,090 |
EXCO Resources, Inc.† | | 112,746 | | | 1,652,856 |
Southwestern Energy Co.† | | 43,458 | | | 1,601,862 |
| | | | |
|
|
| | | | | | 6,055,808 |
| | | | |
|
|
Oil - Field Services — 2.2% |
Key Energy Services, Inc.† | | 222,684 | | | 1,592,190 |
Weatherford International, Ltd.† | | 97,321 | | | 1,941,554 |
| | | | |
|
|
| | | | | | 3,533,744 |
| | | | |
|
|
Pharmacy Services — 1.8% |
Express Scripts, Inc.† | | 28,491 | | | 2,057,620 |
Omnicare, Inc. | | 34,174 | | | 782,243 |
| | | | |
|
|
| | | | | | 2,839,863 |
| | | | |
|
|
Physical Therapy/Rehabilitation Centers — 1.0% |
Psychiatric Solutions, Inc.† | | 57,734 | | | 1,546,694 |
| | | | |
|
|
Private Corrections — 1.7% |
Corrections Corp. of America† | | 132,692 | | | 2,632,609 |
| | | | |
|
|
Real Estate Management/Services — 1.3% |
Jones Lang LaSalle, Inc. | | 43,152 | | | 2,022,966 |
| | | | |
|
|
Research & Development — 0.6% |
Pharmaceutical Product Development, Inc. | | 46,097 | | | 927,011 |
| | | | |
|
|
Respiratory Products — 0.5% |
ResMed, Inc.† | | 17,200 | | | 789,652 |
| | | | |
|
|
Retail - Apparel/Shoe — 2.9% |
Aeropostale, Inc.† | | 42,870 | | | 1,678,360 |
American Eagle Outfitters, Inc. | | 90,917 | | | 1,227,380 |
Nordstrom, Inc. | | 61,744 | | | 1,731,302 |
| | | | |
|
|
| | | | | | 4,637,042 |
| | | | |
|
|
Retail - Auto Parts — 0.5% |
O’Reilly Automotive, Inc.† | | 18,691 | | | 715,491 |
| | | | |
|
|
Retail - Automobile — 1.0% |
Copart, Inc.† | | 45,969 | | | 1,624,544 |
| | | | |
|
|
Retail - Consumer Electronics — 0.9% |
Best Buy Co., Inc. | | 40,505 | | | 1,469,521 |
| | | | |
|
|
Retail - Perfume & Cosmetics — 0.7% |
Ulta Salon Cosmetics & Fragrance, Inc.† | | 91,075 | | | 1,049,184 |
| | | | |
|
|
| | | | | | | |
| | |
| Security Description | | Shares/
Principal
Amount | | | Market Value
(Note 2) |
|
| | | | | | | | |
Rubber - Tires — 1.2% |
The Goodyear Tire & Rubber Co.† | | | 115,673 | | | $ | 1,907,448 |
| | | | | | |
|
|
Schools — 3.2% |
Apollo Group, Inc., Class A† | | | 11,386 | | | | 738,040 |
Capella Education Co.† | | | 36,353 | | | | 2,302,963 |
ITT Educational Services, Inc.† | | | 18,845 | | | | 1,978,537 |
| | | | | | |
|
|
| | | | | | | | 5,019,540 |
| | | | | | |
|
|
Semiconductor Components - Integrated Circuits — 1.1% |
Marvell Technology Group, Ltd.† | | | 113,559 | | | | 1,731,775 |
| | | | | | |
|
|
Semiconductor Equipment — 3.5% |
ASML Holding NV(1) | | | 70,304 | | | | 1,932,940 |
KLA - Tencor Corp. | | | 51,600 | | | | 1,609,920 |
Lam Research Corp.† | | | 67,335 | | | | 2,067,184 |
| | | | | | |
|
|
| | | | | | | | 5,610,044 |
| | | | | | |
|
|
Steel - Producers — 1.0% |
Steel Dynamics, Inc. | | | 93,662 | | | | 1,550,106 |
| | | | | | |
|
|
Tools - Hand Held — 1.1% |
The Stanley Works | | | 41,896 | | | | 1,714,803 |
| | | | | | |
|
|
Transactional Software — 1.3% |
Solera Holdings, Inc.† | | | 77,802 | | | | 2,049,305 |
| | | | | | |
|
|
Transport - Marine — 0.4% |
Diana Shipping, Inc. | | | 43,836 | | | | 569,430 |
| | | | | | |
|
|
Transport - Services — 0.9% |
UTi Worldwide, Inc.† | | | 109,194 | | | | 1,403,143 |
| | | | | | |
|
|
Transport - Truck — 3.7% |
Con - way, Inc. | | | 38,652 | | | | 1,614,107 |
J.B. Hunt Transport Services, Inc. | | | 53,869 | | | | 1,509,948 |
Knight Transportation, Inc. | | | 82,036 | | | | 1,352,774 |
Landstar System, Inc. | | | 41,309 | | | | 1,440,445 |
| | | | | | |
|
|
| | | | | | | | 5,917,274 |
| | | | | | |
|
|
Veterinary Diagnostics — 0.9% |
VCA Antech, Inc.† | | | 57,008 | | | | 1,410,948 |
| | | | | | |
|
|
Wireless Equipment — 1.0% |
Crown Castle International Corp.† | | | 59,225 | | | | 1,590,783 |
| | | | | | |
|
|
Total Long-Term Investment Securities |
(cost $138,504,926) | | | | | | | 153,594,628 |
| | | | | | |
|
|
REPURCHASE AGREEMENT — 3.1% |
Agreement with State Street Bank & Trust Co.,
bearing interest at 0.01%, dated 08/31/09, to be repurchased 09/01/09 in the amount of $4,984,001 and collateralized by $5,140,000 of United States Treasury Bills, bearing interest at 0.15% due 12/31/09 and having approximate value of $5,135,916
(cost $4,984,000) | | $ | 4,984,000 | | | | 4,984,000 |
| | | | | | |
|
|
TOTAL INVESTMENTS |
(cost $143,488,926)(2) | | | 99.8 | % | | | 158,578,628 |
Other assets less liabilities | | | 0.2 | | | | 262,410 |
| | |
|
|
| |
|
|
NET ASSETS — | | | 100.0 | % | | $ | 158,841,038 |
| | |
|
|
| |
|
|
| † | Non-income producing security |
| (1) | Security was valued using fair value procedures at August 31, 2009. The aggregate value of these securities was $4,301,728 representing 2.7% of net assets. Securities are classified as Level 2 based on the securities valuation inputs. See Note 2 regarding fair value pricing for foreign equity securities. |
| (2) | See Note 5 for cost of investments on a tax basis. |
45
VALIC Company II Mid Cap Growth Fund
PORTFOLIO OF INVESTMENTS — August 31, 2009 — (continued)
The following is a summary of the inputs used to value the Fund’s net assets as of August 31, 2009 (see Note 2):
| | | | | | | | | | | | | |
| | | Level 1 -
Unadjusted
Quoted
Prices
| | Level 2 -
Other
Observable
Inputs
| | | Level 3 -
Significant
Unobservable
Inputs
| | Total
|
Long-Term Investment Securities: | | | | | | | | | | | | | |
Common Stock: | | | | | | | | | | | | | |
Electronic Components —Semiconductors | | $ | 9,263,762 | | $ | – | | | $ | – | | $ | 9,263,762 |
Other Industries* | | | 140,029,138 | | | 4,301,728 | # | | | – | | | 144,330,866 |
Repurchase Agreement | | | – | | | 4,984,000 | | | | – | | | 4,984,000 |
| | |
|
| |
|
|
| |
|
| |
|
|
Total | | $ | 149,292,900 | | $ | 9,285,728 | | | $ | – | | $ | 158,578,628 |
| | |
|
| |
|
|
| |
|
| |
|
|
| * | Sum of all other industries each of which individually has an aggregate market value of less than 5% of net assets. |
| # | Includes foreign equity securities whose values were adjusted for fair value pricing procedures for foreign equity securities; therefore these investment securities were classified as Level 2 instead of Level 1. (See Note 2) |
See Notes to Financial Statements
46
VALIC Company II Mid Cap Value Fund
PORTFOLIO PROFILE — August 31, 2009 (Unaudited)
Industry Allocation*
| | | |
Electric — Integrated | | 7.4 | % |
Insurance — Reinsurance | | 4.8 | |
Real Estate Investment Trusts | | 3.9 | |
Oil Companies — Exploration & Production | | 3.8 | |
Investment Management/Advisor Services | | 3.7 | |
Insurance — Life/Health | | 3.2 | |
Diversified Manufacturing Operations | | 3.2 | |
Building — Residential/Commercial | | 3.1 | |
Banks — Super Regional | | 2.5 | |
Containers — Metal/Glass | | 2.3 | |
Electronic Parts Distribution | | 2.3 | |
Semiconductor Equipment | | 2.2 | |
Commercial Services | | 1.9 | |
Electronic Components — Misc. | | 1.7 | |
Medical — HMO | | 1.6 | |
Banks — Commercial | | 1.6 | |
Gas — Distribution | | 1.5 | |
Telecom Services | | 1.4 | |
Chemicals — Diversified | | 1.4 | |
Finance — Investment Banker/Broker | | 1.3 | |
Medical — Wholesale Drug Distribution | | 1.3 | |
Oil — Field Services | | 1.3 | |
Retail — Major Department Stores | | 1.3 | |
Apparel Manufacturers | | 1.2 | |
Food — Misc. | | 1.2 | |
Retail — Apparel/Shoe | | 1.2 | |
Medical — Drugs | | 1.1 | |
Airlines | | 1.1 | |
Coal | | 1.0 | |
Medical Labs & Testing Services | | 1.0 | |
Food — Meat Products | | 1.0 | |
Computer Services | | 1.0 | |
Engineering/R&D Services | | 1.0 | |
Auto/Truck Parts & Equipment — Original | | 1.0 | |
Semiconductor Components — Integrated Circuits | | 0.9 | |
Containers — Paper/Plastic | | 0.9 | |
Medical — Generic Drugs | | 0.9 | |
Agricultural Operations | | 0.8 | |
Internet Security | | 0.8 | |
Repurchase Agreements | | 0.8 | |
Electronic Connectors | | 0.7 | |
Insurance Brokers | | 0.7 | |
Enterprise Software/Service | | 0.7 | |
Industrial Gases | | 0.7 | |
Metal — Iron | | 0.7 | |
Electric Products — Misc. | | 0.7 | |
Transport — Truck | | 0.7 | |
Insurance — Property/Casualty | | 0.6 | |
Finance — Credit Card | | 0.6 | |
Agricultural Chemicals | | 0.6 | |
E-Commerce/Services | | 0.6 | |
Cable TV | | 0.6 | |
Toys | | 0.6 | |
Computer Graphics | | 0.6 | |
Steel — Producers | | 0.6 | |
Computers — Memory Devices | | 0.6 | |
Printing — Commercial | | 0.6 | |
Machine Tools & Related Products | | 0.6 | |
Distribution/Wholesale | | 0.5 | |
Aerospace/Defense — Equipment | | 0.5 | |
Aerospace/Defense | | 0.5 | |
Food — Retail | | 0.5 | |
Chemicals — Specialty | | 0.5 | |
Tools — Hand Held | | 0.5 | |
Consumer Products — Misc. | | 0.5 | |
Time Deposits | | 0.4 | |
Oil Companies — Integrated | | 0.4 | |
Diversified Operations | | 0.4 | |
Oil & Gas Drilling | | 0.4 | |
| | | |
Medical — Hospitals | | 0.4 | |
Advertising Agencies | | 0.4 | |
Transport — Services | | 0.4 | |
Fisheries | | 0.4 | |
Food — Confectionery | | 0.4 | |
Tobacco | | 0.4 | |
Electronic Components — Semiconductors | | 0.4 | |
Computers — Integrated Systems | | 0.4 | |
Commercial Services — Finance | | 0.4 | |
Retail — Regional Department Stores | | 0.4 | |
Telephone — Integrated | | 0.4 | |
Telecom Equipment — Fiber Optics | | 0.4 | |
Real Estate Management/Services | | 0.4 | |
Banks — Fiduciary | | 0.4 | |
Retail — Auto Parts | | 0.3 | |
Leisure Products | | 0.3 | |
Therapeutics | | 0.3 | |
Non — Hazardous Waste Disposal | | 0.3 | |
Cosmetics & Toiletries | | 0.3 | |
Coatings/Paint | | 0.3 | |
Pipelines | | 0.2 | |
Finance — Other Services | | 0.2 | |
Savings & Loans/Thrifts | | 0.1 | |
| | |
|
|
| | | 100.1 | % |
| | |
|
|
| * | Calculated as a percentage of net assets |
47
VALIC Company II Mid Cap Value Fund
PORTFOLIO OF INVESTMENTS — August 31, 2009
| | | | | |
| | |
| Security Description | | Shares | | Market Value
(Note 2) |
|
COMMON STOCK — 98.9% |
Advertising Agencies — 0.4% |
Omnicom Group, Inc. | | 57,695 | | $ | 2,095,482 |
| | | | |
|
|
Aerospace/Defense — 0.5% |
Teledyne Technologies, Inc.† | | 74,300 | | | 2,508,368 |
| | | | |
|
|
Aerospace/Defense - Equipment — 0.5% |
Alliant Techsystems, Inc.† | | 19,700 | | | 1,522,416 |
Goodrich Corp. | | 18,588 | | | 1,025,314 |
| | | | |
|
|
| | | | | | 2,547,730 |
| | | | |
|
|
Agricultural Chemicals — 0.6% |
Agrium, Inc. | | 62,200 | | | 2,967,562 |
| | | | |
|
|
Agricultural Operations — 0.8% |
Bunge, Ltd. | | 44,700 | | | 2,995,347 |
Chaoda Modern Agriculture Holdings, Ltd.(1) | | 1,339,040 | | | 798,870 |
| | | | |
|
|
| | | | | | 3,794,217 |
| | | | |
|
|
Airlines — 1.1% |
Delta Air Lines, Inc.† | | 726,575 | | | 5,245,871 |
| | | | |
|
|
Apparel Manufacturers — 1.2% |
VF Corp. | | 84,482 | | | 5,876,568 |
| | | | |
|
|
Auto/Truck Parts & Equipment - Original — 1.0% |
Magna International, Inc., Class A | | 31,859 | | | 1,456,275 |
TRW Automotive Holdings Corp.† | | 174,900 | | | 3,086,985 |
| | | | |
|
|
| | | | | | 4,543,260 |
| | | | |
|
|
Banks - Commercial — 1.6% |
BOK Financial Corp. | | 37,628 | | | 1,702,291 |
M&T Bank Corp. | | 20,700 | | | 1,278,432 |
Popular, Inc. | | 562,309 | | | 1,208,964 |
Regions Financial Corp. | | 161,659 | | | 947,322 |
TCF Financial Corp. | | 167,673 | | | 2,307,180 |
| | | | |
|
|
| | | | | | 7,444,189 |
| | | | |
|
|
Banks - Fiduciary — 0.4% |
Northern Trust Corp. | | 30,411 | | | 1,777,827 |
| | | | |
|
|
Banks - Super Regional — 2.5% |
Comerica, Inc. | | 190,526 | | | 5,081,328 |
Fifth Third Bancorp | | 193,672 | | | 2,118,772 |
Huntington Bancshares, Inc. | | 342,700 | | | 1,562,712 |
SunTrust Banks, Inc. | | 142,300 | | | 3,325,551 |
| | | | |
|
|
| | | | | | 12,088,363 |
| | | | |
|
|
Building - Residential/Commercial — 3.1% |
D.R. Horton, Inc. | | 136,872 | | | 1,835,454 |
M.D.C Holdings, Inc. | | 187,900 | | | 7,038,734 |
Toll Brothers, Inc.† | | 268,546 | | | 6,106,736 |
| | | | |
|
|
| | | | | | 14,980,924 |
| | | | |
|
|
Cable TV — 0.6% |
Cablevision Systems Corp., Class A | | 130,549 | | | 2,916,465 |
| | | | |
|
|
Chemicals - Diversified — 1.4% |
Celanese Corp., Class A | | 93,352 | | | 2,377,675 |
FMC Corp. | | 90,200 | | | 4,302,540 |
| | | | |
|
|
| | | | | | 6,680,215 |
| | | | |
|
|
Chemicals - Specialty — 0.5% |
Cytec Industries, Inc. | | 82,000 | | | 2,368,980 |
| | | | |
|
|
Coal — 1.0% |
Alpha Natural Resources, Inc.† | | 67,834 | | | 2,191,717 |
CONSOL Energy, Inc. | | 74,200 | | | 2,775,822 |
| | | | |
|
|
| | | | | | 4,967,539 |
| | | | |
|
|
| | | | | |
| | |
| Security Description | | Shares | | Market Value
(Note 2) |
|
| | | | | | |
Coatings/Paint — 0.3% |
The Sherwin - Williams Co. | | 21,727 | | $ | 1,307,965 |
| | | | |
|
|
Commercial Services — 1.9% |
PHH Corp.† | | 429,900 | | | 9,139,674 |
| | | | |
|
|
Commercial Services - Finance — 0.4% |
The Western Union Co. | | 104,000 | | | 1,876,160 |
| | | | |
|
|
Computer Graphics — 0.6% |
Compagnie Generale de Geophysique - Veritas ADR† | | 128,100 | | | 2,750,307 |
| | | | |
|
|
Computer Services — 1.0% |
CACI International, Inc., Class A† | | 32,800 | | | 1,507,488 |
Computer Sciences Corp.† | | 65,719 | | | 3,210,373 |
| | | | |
|
|
| | | | | | 4,717,861 |
| | | | |
|
|
Computers - Integrated Systems — 0.4% |
Teradata Corp.† | | 70,000 | | | 1,885,100 |
| | | | |
|
|
Computers - Memory Devices — 0.6% |
NetApp, Inc.† | | 118,000 | | | 2,684,500 |
| | | | |
|
|
Consumer Products - Misc. — 0.5% |
Jarden Corp.† | | 88,513 | | | 2,155,292 |
| | | | |
|
|
Containers - Metal/Glass — 2.3% |
Greif, Inc., Class A | | 66,400 | | | 3,289,456 |
Owens - Illinois, Inc.† | | 146,500 | | | 4,972,210 |
Rexam PLC(1) | | 672,326 | | | 2,921,638 |
| | | | |
|
|
| | | | | | 11,183,304 |
| | | | |
|
|
Containers - Paper/Plastic — 0.9% |
Packaging Corp. of America | | 109,619 | | | 2,231,843 |
Sonoco Products Co. | | 79,132 | | | 2,052,684 |
| | | | |
|
|
| | | | | | 4,284,527 |
| | | | |
|
|
Cosmetics & Toiletries — 0.3% |
Alberto - Culver Co. | | 52,801 | | | 1,393,418 |
| | | | |
|
|
Distribution/Wholesale — 0.5% |
Genuine Parts Co. | | 18,200 | | | 674,128 |
WW Grainger, Inc. | | 21,826 | | | 1,909,120 |
| | | | |
|
|
| | | | | | 2,583,248 |
| | | | |
|
|
Diversified Manufacturing Operations — 3.2% |
Dover Corp. | | 64,200 | | | 2,220,678 |
Ingersoll - Rand PLC | | 47,821 | | | 1,477,191 |
ITT Corp. | | 37,873 | | | 1,896,680 |
Parker Hannifin Corp. | | 74,048 | | | 3,603,175 |
Pentair, Inc. | | 161,800 | | | 4,583,794 |
SPX Corp. | | 24,963 | | | 1,389,940 |
| | | | |
|
|
| | | | | | 15,171,458 |
| | | | |
|
|
Diversified Operations — 0.4% |
First Pacific Co.(1) | | 3,336,000 | | | 2,130,258 |
| | | | |
|
|
E - Commerce/Services — 0.6% |
Expedia, Inc.† | | 127,032 | | | 2,928,088 |
| | | | |
|
|
Electric Products - Misc. — 0.7% |
AMETEK, Inc. | | 100,200 | | | 3,154,296 |
| | | | |
|
|
Electric - Integrated — 7.4% |
Allegheny Energy, Inc. | | 116,000 | | | 3,063,560 |
American Electric Power Co., Inc. | | 50,736 | | | 1,594,632 |
CMS Energy Corp. | | 245,306 | | | 3,289,553 |
Edison International | | 137,785 | | | 4,603,397 |
Entergy Corp. | | 21,193 | | | 1,674,247 |
Northeast Utilities | | 262,400 | | | 6,242,496 |
NV Energy, Inc. | | 460,800 | | | 5,557,248 |
48
VALIC Company II Mid Cap Value Fund
PORTFOLIO OF INVESTMENTS — August 31, 2009 — (continued)
| | | | | |
| | |
| Security Description | | Shares | | Market Value
(Note 2) |
|
COMMON STOCK (continued) |
Electric - Integrated (continued) |
Wisconsin Energy Corp. | | 155,650 | | $ | 7,077,406 |
Xcel Energy, Inc. | | 118,430 | | | 2,338,993 |
| | | | |
|
|
| | | | | | 35,441,532 |
| | | | |
|
|
Electronic Components - Misc. — 1.7% |
Flextronics International, Ltd.† | | 676,462 | | | 4,011,420 |
Kingboard Laminates Holdings, Ltd.(1) | | 6,213,000 | | | 3,891,251 |
| | | | |
|
|
| | | | | | 7,902,671 |
| | | | |
|
|
Electronic Components - Semiconductors — 0.4% |
Altera Corp. | | 100,576 | | | 1,932,065 |
| | | | |
|
|
Electronic Connectors — 0.7% |
Amphenol Corp., Class A | | 49,771 | | | 1,739,994 |
Thomas & Betts Corp.† | | 65,600 | | | 1,816,464 |
| | | | |
|
|
| | | | | | 3,556,458 |
| | | | |
|
|
Electronic Parts Distribution — 2.3% |
Arrow Electronics, Inc.† | | 303,292 | | | 8,382,991 |
Avnet, Inc.† | | 94,787 | | | 2,526,073 |
| | | | |
|
|
| | | | | | 10,909,064 |
| | | | |
|
|
Engineering/R&D Services — 1.0% |
URS Corp.† | | 105,213 | | | 4,548,358 |
| | | | |
|
|
Enterprise Software/Service — 0.7% |
BMC Software, Inc.† | | 69,602 | | | 2,481,312 |
Sybase, Inc.† | | 23,252 | | | 810,332 |
| | | | |
|
|
| | | | | | 3,291,644 |
| | | | |
|
|
Finance - Credit Card — 0.6% |
Discover Financial Services | | 216,347 | | | 2,974,771 |
| | | | |
|
|
Finance - Investment Banker/Broker — 1.3% |
TD Ameritrade Holding Corp.† | | 326,336 | | | 6,278,705 |
| | | | |
|
|
Finance - Other Services — 0.2% |
Solar Cayman Ltd.†*(2)(3)(4)(5) | | 120,200 | | | 1,121,466 |
| | | | |
|
|
Fisheries — 0.4% |
Marine Harvest†(1) | | 2,846,000 | | | 2,025,748 |
| | | | |
|
|
Food - Confectionery — 0.4% |
The J.M. Smucker Co. | | 38,397 | | | 2,007,011 |
| | | | |
|
|
Food - Meat Products — 1.0% |
BRF - Brazil Foods SA ADR | | 14,000 | | | 618,520 |
Marfrig Frigorificos e Comercio de Alimentos SA† | | 170,600 | | | 1,430,190 |
Perdigao SA | | 124,000 | | | 2,763,305 |
| | | | |
|
|
| | | | | | 4,812,015 |
| | | | |
|
|
Food - Misc. — 1.2% |
ConAgra Foods, Inc. | | 187,943 | | | 3,858,470 |
Corn Products International, Inc. | | 67,670 | | | 2,007,092 |
| | | | |
|
|
| | | | | | 5,865,562 |
| | | | |
|
|
Food - Retail — 0.5% |
The Kroger Co. | | 111,368 | | | 2,404,435 |
| | | | |
|
|
Gas - Distribution — 1.5% |
Sempra Energy | | 66,265 | | | 3,324,515 |
UGI Corp. | | 158,216 | | | 4,036,090 |
| | | | |
|
|
| | | | | | 7,360,605 |
| | | | |
|
|
Industrial Gases — 0.7% |
Air Products & Chemicals, Inc. | | 43,611 | | | 3,272,133 |
| | | | |
|
|
Insurance Brokers — 0.7% |
AON Corp. | | 78,879 | | | 3,293,987 |
| | | | |
|
|
| | | | | |
| | |
| Security Description | | Shares | | Market Value
(Note 2) |
|
| | | | | | |
Insurance - Life/Health — 3.2% |
Lincoln National Corp. | | 38,545 | | $ | 972,876 |
Principal Financial Group, Inc. | | 109,100 | | | 3,098,440 |
Unum Group | | 495,932 | | | 11,173,348 |
| | | | |
|
|
| | | | | | 15,244,664 |
| | | | |
|
|
Insurance - Property/Casualty — 0.6% |
Fidelity National Financial, Inc., Class A | | 96,400 | | | 1,447,928 |
First American Corp. | | 48,600 | | | 1,531,872 |
| | | | |
|
|
| | | | | | 2,979,800 |
| | | | |
|
|
Insurance - Reinsurance — 4.8% |
Everest Re Group, Ltd. | | 82,758 | | | 6,977,327 |
PartnerRe, Ltd. | | 67,729 | | | 5,005,850 |
Platinum Underwriters Holdings, Ltd. | | 123,855 | | | 4,489,744 |
Reinsurance Group of America, Inc. | | 145,259 | | | 6,253,400 |
| | | | |
|
|
| | | | | | 22,726,321 |
| | | | |
|
|
Internet Security — 0.8% |
McAfee, Inc.† | | 92,500 | | | 3,679,650 |
| | | | |
|
|
Investment Management/Advisor Services — 3.7% |
Affiliated Managers Group, Inc.† | | 48,476 | | | 3,166,937 |
Ameriprise Financial, Inc. | | 265,751 | | | 7,980,503 |
Invesco, Ltd. | | 316,264 | | | 6,562,478 |
| | | | |
|
|
| | | | | | 17,709,918 |
| | | | |
|
|
Leisure Products — 0.3% |
WMS Industries, Inc.† | | 37,368 | | | 1,581,787 |
| | | | |
|
|
Machine Tools & Related Products — 0.6% |
Kennametal, Inc. | | 120,100 | | | 2,648,205 |
| | | | |
|
|
Medical Labs & Testing Services — 1.0% |
Laboratory Corp. of America Holdings† | | 41,400 | | | 2,889,306 |
Quest Diagnostics, Inc. | | 37,051 | | | 1,999,272 |
| | | | |
|
|
| | | | | | 4,888,578 |
| | | | |
|
|
Medical - Drugs — 1.1% |
Endo Pharmaceuticals Holdings, Inc.† | | 105,812 | | | 2,388,177 |
King Pharmaceuticals, Inc.† | | 298,000 | | | 3,093,240 |
| | | | |
|
|
| | | | | | 5,481,417 |
| | | | |
|
|
Medical - Generic Drugs — 0.9% |
Impax Laboratories, Inc.† | | 557,515 | | | 4,231,539 |
| | | | |
|
|
Medical - HMO — 1.6% |
CIGNA Corp. | | 264,150 | | | 7,773,934 |
| | | | |
|
|
Medical - Hospitals — 0.4% |
Universal Health Services, Inc., Class B | | 35,672 | | | 2,096,087 |
| | | | |
|
|
Medical - Wholesale Drug Distribution — 1.3% |
AmerisourceBergen Corp. | | 294,466 | | | 6,275,070 |
| | | | |
|
|
Metal - Iron — 0.7% |
Cliffs Natural Resources, Inc. | | 128,221 | | | 3,245,274 |
| | | | |
|
|
Non - Hazardous Waste Disposal — 0.3% |
Republic Services, Inc. | | 56,412 | | | 1,444,711 |
| | | | |
|
|
Oil & Gas Drilling — 0.4% |
Nabors Industries, Ltd.† | | 44,624 | | | 788,952 |
Noble Corp. | | 38,229 | | | 1,339,162 |
| | | | |
|
|
| | | | | | 2,128,114 |
| | | | |
|
|
Oil Companies - Exploration & Production — 3.8% |
EOG Resources, Inc. | | 27,569 | | | 1,984,968 |
Newfield Exploration Co.† | | 231,537 | | | 8,958,167 |
49
VALIC Company II Mid Cap Value Fund
PORTFOLIO OF INVESTMENTS — August 31, 2009 — (continued)
| | | | | |
| | |
| Security Description | | Shares | | Market Value
(Note 2) |
|
COMMON STOCK (continued) |
Oil Companies - Exploration & Production (continued) |
Noble Energy, Inc. | | 98,419 | | $ | 5,950,413 |
Pioneer Natural Resources Co. | | 46,390 | | | 1,343,454 |
| | | | |
|
|
| | | | | | 18,237,002 |
| | | | |
|
|
Oil Companies - Integrated — 0.4% |
Murphy Oil Corp. | | 37,453 | | | 2,134,821 |
| | | | |
|
|
Oil - Field Services — 1.3% |
SBM Offshore NV(1) | | 79,312 | | | 1,649,572 |
Smith International, Inc. | | 45,500 | | | 1,254,435 |
Weatherford International, Ltd.† | | 159,300 | | | 3,178,035 |
| | | | |
|
|
| | | | | | 6,082,042 |
| | | | |
|
|
Pipelines — 0.2% |
El Paso Corp. | | 126,384 | | | 1,166,524 |
| | | | |
|
|
Printing - Commercial — 0.6% |
R.R. Donnelley & Sons Co. | | 149,337 | | | 2,664,172 |
| | | | |
|
|
Real Estate Investment Trusts — 3.9% |
Boston Properties, Inc. | | 26,027 | | | 1,576,716 |
Chimera Investment Corp. | | 1,747,516 | | | 6,640,561 |
Essex Property Trust, Inc. | | 25,990 | | | 1,939,114 |
Federal Realty Investment Trust | | 40,184 | | | 2,506,276 |
Liberty Property Trust | | 64,362 | | | 2,109,143 |
Ventas, Inc. | | 69,050 | | | 2,707,450 |
Vornado Realty Trust | | 19,968 | | | 1,148,559 |
| | | | |
|
|
| | | | | | 18,627,819 |
| | | | |
|
|
Real Estate Management/Services — 0.4% |
BR Malls Participacoes SA† | | 176,700 | | | 1,800,096 |
| | | | |
|
|
Retail - Apparel/Shoe — 1.2% |
American Eagle Outfitters, Inc. | | 265,200 | | | 3,580,200 |
The Gap, Inc. | | 103,510 | | | 2,033,971 |
| | | | |
|
|
| | | | | | 5,614,171 |
| | | | |
|
|
Retail - Auto Parts — 0.3% |
Advance Auto Parts, Inc. | | 38,099 | | | 1,611,588 |
| | | | |
|
|
Retail - Major Department Stores — 1.3% |
J.C. Penney Co., Inc. | | 62,856 | | | 1,888,194 |
TJX Cos., Inc. | | 114,900 | | | 4,130,655 |
| | | | |
|
|
| | | | | | 6,018,849 |
| | | | |
|
|
Retail - Regional Department Stores — 0.4% |
Kohl’s Corp.† | | 35,059 | | | 1,808,694 |
| | | | |
|
|
Savings & Loans/Thrifts — 0.1% |
Beneficial Mutual Bancorp, Inc.† | | 53,004 | | | 471,206 |
| | | | |
|
|
Semiconductor Components - Integrated Circuits — 0.9% |
Analog Devices, Inc. | | 70,225 | | | 1,983,856 |
Linear Technology Corp. | | 87,100 | | | 2,314,247 |
| | | | |
|
|
| | | | | | 4,298,103 |
| | | | |
|
|
| | | | | | | | |
| | |
| Security Description | | Shares/
Principal
Amount | | | Market Value
(Note 2) | |
| |
| | |
Semiconductor Equipment — 2.2% | |
Teradyne, Inc.† | | | 363,500 | | | $ | 2,998,875 | |
Varian Semiconductor Equipment Associates, Inc.† | | | 244,850 | | | | 7,485,064 | |
| | | | | | |
|
|
|
| | | | | | | | 10,483,939 | |
| | | | | | |
|
|
|
Steel - Producers — 0.6% | |
Schnitzer Steel Industries, Inc., Class A | | | 50,261 | | | | 2,714,597 | |
| | | | | | |
|
|
|
Telecom Equipment - Fiber Optics — 0.4% | |
JDS Uniphase Corp.† | | | 262,700 | | | | 1,804,749 | |
| | | | | | |
|
|
|
Telecom Services — 1.4% | |
Virgin Media, Inc. | | | 585,900 | | | | 6,696,837 | |
| | | | | | |
|
|
|
Telephone - Integrated — 0.4% | |
Windstream Corp. | | | 210,982 | | | | 1,808,116 | |
| | | | | | |
|
|
|
Therapeutics — 0.3% | |
Theravance, Inc.† | | | 92,971 | | | | 1,447,558 | |
| | | | | | |
|
|
|
Tobacco — 0.4% | |
Lorillard, Inc. | | | 27,415 | | | | 1,994,990 | |
| | | | | | |
|
|
|
Tools - Hand Held — 0.5% | |
The Stanley Works | | | 54,047 | | | | 2,212,144 | |
| | | | | | |
|
|
|
Toys — 0.6% | |
Mattel, Inc. | | | 158,000 | | | | 2,842,420 | |
| | | | | | |
|
|
|
Transport - Services — 0.4% | |
Ryder System, Inc. | | | 55,076 | | | | 2,092,888 | |
| | | | | | |
|
|
|
Transport - Truck — 0.7% | |
Con - way, Inc. | | | 33,000 | | | | 1,378,080 | |
Werner Enterprises, Inc. | | | 101,365 | | | | 1,771,861 | |
| | | | | | |
|
|
|
| | | | | | | | 3,149,941 | |
| | | | | | |
|
|
|
Total Long-Term Investment Securities | |
(cost $458,736,996) | | | | | | | 473,065,581 | |
| | | | | | |
|
|
|
SHORT-TERM INVESTMENT SECURITIES — 0.4% | |
Time Deposits — 0.4% | |
Euro Time Deposit with State Street Bank & Trust Co.
0.01% due 09/01/09
(cost $2,136,000) | | $ | 2,136,000 | | | | 2,136,000 | |
| | | | | | |
|
|
|
REPURCHASE AGREEMENT — 0.8% | |
Agreement with State Street Bank & Trust Co., bearing interest at 0.01%, dated 08/31/09, to be repurchased 09/01/09 in the amount of $3,654,001 and collateralized by $3,770,000 of United States Treasury Bills, bearing interest at 0.15% due 12/31/09 and having approximate value of $3,767,738
(cost $3,654,000) | | | 3,654,000 | | | | 3,654,000 | |
| | | | | | |
|
|
|
TOTAL INVESTMENTS | |
(cost $464,526,996)(6) | | | 100.1 | % | | | 478,855,581 | |
Liabilities in excess of other assets | | | (0.1 | ) | | | (398,342 | ) |
| | |
|
|
| |
|
|
|
NET ASSETS — | | | 100.0 | % | | $ | 478,457,239 | |
| | |
|
|
| |
|
|
|
50
VALIC Company II Mid Cap Value Fund
PORTFOLIO OF INVESTMENTS — August 31, 2009 — (continued)
| † | Non-income producing security |
| * | Securities exempt from registration under Rule 144A of the Securities Act of 1933. These securities may be sold in transactions exempt from registration, normally to qualified institutional buyers. The Fund has no right to demand registration of these securities. At August 31, 2009, the aggregate value of these securities was $1,121,466 representing 0.2% of net assets. Unless otherwise indicated these securities are not considered to be illiquid. |
| (1) | Security was valued using fair value procedures at August 31, 2009. The aggregate value of these securities was $13,417,337 representing 2.8% of net assets. Securities are classified as Level 2 based on the securities valuation inputs. See Note 2 regarding fair value pricing for foreign equity securities. |
| (2) | Fair valued security. Securities are classified as Level 3 based on the securities valuation inputs; see Note 2. |
| (3) | Consists of more than one type of securities traded together as a unit. |
| (4) | Denotes a restricted security that: (a) cannot be offered for public sale without first being registered, or being able to take advantage of an exemption from registration, under the Securities Act of 1933, as amended (the “1933 Act”); (b) is subject to a contactual restriction on public sales; or (c) is otherwise subject to a restriction on sales by operation of applicable law. Restricted securities are valued pursuant to Note 2. Certain restricted securities held by a Fund may not be sold except in exempt transactions or in a public offering registered under the 1933 Act. The Fund has no right to demand registration of these securities. The risk of investing in certain restricted securities is greater than the risk of investing in the securities of widely held, publicly traded companies. To the extent applicable, lack of a secondary market and resale restrictions may result in the inability of a Fund to sell a security at a fair price and may substantially delay the sale of the security. In addition, certain restricted securities may exhibit greater price volatility than securities for which secondary markets exist. As of August 31, 2009, the Mid Cap Value Fund held the following restricted securities: |
| | | | | | | | | | | | | | | |
Name
| | Acquisition
Date
| | Shares
| | Acquisition
Cost
| | Market
Value
| | Market
Value
Per Share
| | Value as a
% of
Net Assets
| |
Solar Cayman Ltd.
Common Stock | | 03/09/07 | | 120,200 | | 1,803,000 | | $ | 1,121,466 | | $ | 9.33 | | 0.23 | % |
| | | | | | | | |
|
| | | | |
|
|
| (5) | Illiquid security. At August 31, 2009, the aggregate value of these securities was $1,121,466 representing 0.2% of net assets. |
| (6) | See Note 5 for cost of investments on a tax basis. |
ADR—American Depository Receipt
The following is a summary of the inputs used to value the Fund’s net assets as of August 31, 2009 (see Note 2):
| | | | | | | | | | | | | |
| | | Level 1 -
Unadjusted
Quoted
Prices
| | Level 2 -
Other
Observable
Inputs
| | | Level 3 -
Significant
Unobservable
Inputs
| | Total
|
Long-Term Investment Securities: | | | | | | | | | | | | | |
Common Stock: | | | | | | | | | | | | | |
Electric — Integrated | | $ | 35,441,532 | | $ | – | | | $ | – | | $ | 35,441,532 |
Other Industries* | | | 423,085,246 | | | 13,417,337 | # | | | 1,121,466 | | | 437,624,049 |
Short-Term Investment Securities: | | | | | | | | | | | | | |
Time Deposit | | | – | | | 2,136,000 | | | | – | | | 2,136,000 |
Repurchase Agreement | | | – | | | 3,654,000 | | | | – | | | 3,654,000 |
| | |
|
| |
|
|
| |
|
| |
|
|
Total | | $ | 458,526,778 | | $ | 19,207,337 | | | $ | 1,121,466 | | $ | 478,855,581 |
| | |
|
| |
|
|
| |
|
| |
|
|
| * | Sum of all other industries each of which individually has an aggregate market value of less than 5% of net assets. |
| # | Includes foreign equity securities whose values were adjusted for fair value pricing procedures for foreign equity securities; therefore these investment securities were classified as Level 2 instead of Level 1. (See Note 2) |
The following is a reconciliation of Level 3 assets which significant unobservable inputs were used to determine fair value:
| | | | |
| | | Common Stock
Other Industries
| |
Balance as of 8/31/2008 | | $ | 8,253,189 | |
Accrued discounts/premiums | | | – | |
Realized gain (loss) | | | – | |
Change in unrealized appreciation (depreciation) | | | (868,087 | ) |
Net purchases (sales) | | | (2,032,097 | ) |
Transfers in and/or out of Level 3 | | | (4,231,539 | ) |
| | |
|
|
|
Balance as of 8/31/2009 | | $ | 1,121,466 | |
| | |
|
|
|
See Notes to Financial Statements
51
VALIC Company II Moderate Growth Lifestyle Fund
PORTFOLIO PROFILE — August 31, 2009 (Unaudited)
Industry Allocation*
| | | |
Domestic Equity Investment Companies | | 44.9 | % |
Fixed Income Investment Companies | | 36.4 | |
International Equity Investment Companies | | 18.8 | |
| | |
|
|
| | | 100.1 | % |
| | |
|
|
| * | Calculated as a percentage of net assets |
52
VALIC Company II Moderate Growth Lifestyle Fund
PORTFOLIO OF INVESTMENTS — August 31, 2009
| | | | | | | |
| | |
| Security Description | | Shares | | | Market Value
(Note 2) | |
| |
AFFILIATED REGISTERED INVESTMENT COMPANIES#(1) — 100.1% | |
Domestic Equity Investment Companies — 44.9% | |
VALIC Co. I Blue Chip Growth Fund | | 1,033,354 | | | $ | 8,225,501 | |
VALIC Co. I Small Cap Special Values Fund | | 1,240,010 | | | | 8,717,270 | |
VALIC Co. I Stock Index Fund | | 418,954 | | | | 8,936,280 | |
VALIC Co. I Value Fund | | 881,232 | | | | 7,146,795 | |
VALIC Co. II Capital Appreciation Fund | | 1,365,983 | | | | 10,258,532 | |
VALIC Co. II Large Cap Value Fund | | 305,048 | | | | 2,858,297 | |
VALIC Co. II Mid Cap Value Fund | | 689,961 | | | | 8,769,398 | |
VALIC Co. II Small Cap Growth Fund† | | 152,951 | | | | 1,423,970 | |
VALIC Co. II Small Cap Value Fund | | 740,911 | | | | 7,320,200 | |
| | | | | |
|
|
|
Total Domestic Equity Investment Companies | | | | | | | |
(cost $51,183,174) | | | | | | 63,656,243 | |
| | | | | |
|
|
|
Fixed Income Investment Companies — 36.4% | |
VALIC Co. I Government Securities Fund | | 90,034 | | | | 968,770 | |
VALIC Co. II Core Bond Fund | | 2,150,432 | | | | 21,418,304 | |
VALIC Co. II High Yield Bond Fund | | 1,625,847 | | | | 11,039,499 | |
VALIC Co. II Strategic Bond Fund | | 1,770,719 | | | | 18,238,406 | |
| | | | | |
|
|
|
Total Fixed Income Investment Companies | | | | | | | |
(cost $46,651,784) | | | | | | 51,664,979 | |
| | | | | |
|
|
|
International Equity Investment Companies — 18.8% | |
VALIC Co. I Foreign Value Fund | | 802,638 | | | | 6,693,997 | |
VALIC Co. I Global Real Estate Fund | | 1,228,500 | | | | 9,262,890 | |
VALIC Co. I International Equities Fund | | 1,757,598 | | | | 10,299,525 | |
VALIC Co. I International Growth I Fund | | 38,484 | | | | 354,058 | |
| | | | | |
|
|
|
Total International Equity Investment Companies | | | | | | | |
(cost $21,068,162) | | | | | | 26,610,470 | |
| | | | | |
|
|
|
TOTAL INVESTMENTS | | | | | | | |
(cost $118,903,120)(2) | | 100.1 | % | | | 141,931,692 | |
Liabilities in excess of other assets | | (0.1 | ) | | | (145,365 | ) |
| | |
|
| |
|
|
|
NET ASSETS — | | 100.0 | % | | $ | 141,786,327 | |
| | |
|
| |
|
|
|
| † | Non-income producing security |
| # | The Moderate Growth Lifestyle Fund invests in various VALIC Company I or VALIC Company II Funds, some of which are not presented in this report. Additional information on the underlying funds including such fund’s prospectuses and shareholder reports, is available at our website, www.valic.com. |
| (2) | See Note 5 for cost of investments on a tax basis. |
The following is a summary of the inputs used to value the Portfolio’s net assets as of August 31, 2009 (see Note 2):
| | | | | | | | | | |
| | | Level 1 -
Unadjusted
Quoted
Prices
| | Level 2 -
Other
Observable
Inputs
| | Level 3 -
Significant
Unobservable
Inputs
| | Total
|
Affiliated Registered Investment Companies: | | | | | | | | | | |
Domestic Equity Investment Companies | | $ | 63,656,243 | | $– | | $– | | $ | 63,656,243 |
Fixed Income Investment Companies | | | 51,664,979 | | – | | – | | | 51,664,979 |
International Equity Investment Companies | | | 26,610,470 | | – | | – | | | 26,610,470 |
| | |
|
| |
| |
| |
|
|
Total | | $ | 141,931,692 | | $– | | $– | | $ | 141,931,692 |
| | |
|
| |
| |
| |
|
|
See Notes to Financial Statements
53
VALIC Company II Money Market II Fund
PORTFOLIO PROFILE — August 31, 2009 (Unaudited)
Industry Allocation*
| | | |
U.S. Government Agencies | | 67.4 | % |
Repurchase Agreements | | 14.5 | |
Super — Regional Banks-US | | 5.7 | |
Foreign Bank | | 4.6 | |
Diversified Financial Services | | 4.0 | |
Money Center Banks | | 3.5 | |
Finance | | 2.0 | |
| | |
|
|
| | | 101.7 | % |
| | |
|
|
| |
Weighted Average Days to Maturity | | 48.1 | |
Credit Quality@#
| * | Calculated as a percentage of net assets. |
| @ | Source: Standard & Poors. |
| # | Calculated as a percentage of total debt issues. |
54
VALIC Company II Money Market II Fund
PORTFOLIO OF INVESTMENTS — August 31, 2009
| | | | | | |
| | |
| Security Description | | Principal
Amount | | Market Value
(Note 2) |
|
SHORT - TERM INVESTMENT SECURITIES — 87.2% |
Certificates of Deposit — 6.1% |
Barclays Bank PLC
1.40% due 11/04/09(1) | | $ | 3,700,000 | | $ | 3,700,000 |
Calyon
1.56% due 10/19/09(1) | | | 4,000,000 | | | 4,000,597 |
Deutsche Bank AG
0.64% due 09/01/09(1) | | | 4,000,000 | | | 4,000,297 |
Rabobank Nederland NV
1.01% due 09/04/09(1) | | | 3,800,000 | | | 3,800,003 |
| | | | | |
|
|
Total Certificates of Deposit | | | | | | |
(amortized cost $15,500,897) | | | | | | 15,500,897 |
| | | | | |
|
|
Commercial Paper — 3.2% |
Bank of America Corp.
0.17% due 09/01/09 | | | 4,000,000 | | | 4,000,000 |
Lloyds TSB Bank PLC
0.17% due 09/01/09 | | | 4,000,000 | | | 4,000,000 |
| | | | | |
|
|
Total Commercial Paper | | | | | | |
(amortized cost $8,000,000) | | | | | | 8,000,000 |
| | | | | |
|
|
U.S. Corporate Bonds & Notes — 7.8% |
Bank of America NA
FDIC Guar. Notes
0.66% due 09/14/09(1) | | | 7,500,000 | | | 7,500,000 |
Bank of America Corp.
Senior Notes
0.72% due 09/25/09(1) | | | 3,000,000 | | | 3,001,022 |
Citigroup Funding, Inc.
FDIC Guar. Notes
0.59% due 10/30/09(1) | | | 3,300,000 | | | 3,304,254 |
General Electric Capital Corp.
Senior Notes
0.61% due 10/04/09(1) | | | 1,500,000 | | | 1,499,814 |
General Electric Capital Corp.
FDIC Guar. Notes
1.26% due 09/09/09(1) | | | 3,500,000 | | | 3,537,543 |
JPMorgan Chase & Co.
FDIC Guar. Notes
0.49% due 11/23/09(1) | | | 1,000,000 | | | 1,000,000 |
| | | | | |
|
|
Total Corporate Bonds & Notes |
(amortized cost $19,842,633) | | | | | | 19,842,633 |
| | | | | |
|
|
Medium Term Notes — 2.7% |
Bear Stearns Co., Inc.
0.90% due 09/09/09(1) | | | 3,000,000 | | | 2,999,800 |
Citigroup Funding, Inc.
1.52% due 11/09/09(1) | | | 3,800,000 | | | 3,770,108 |
| | | | | |
|
|
Total Medium Term Notes | | | | | | |
(amortized cost $6,769,908) | | | | | | 6,769,908 |
| | | | | |
|
|
U.S. Government Agencies — 67.4% |
Federal Farm Credit Bank | | | | | | |
0.26% due 09/27/09(1) | | | 4,000,000 | | | 3,999,448 |
0.68% due 09/10/09(1) | | | 3,800,000 | | | 3,800,000 |
Federal Home Loan Bank | | | | | | |
0.19% due 09/23/09 | | | 5,000,000 | | | 4,999,435 |
0.25% due 09/21/09(1) | | | 8,000,000 | | | 8,000,000 |
0.41% due 10/13/09(1) | | | 15,500,000 | | | 15,498,198 |
0.45% due 09/16/09 | | | 3,800,000 | | | 3,799,288 |
0.50% due 10/08/09(1) | | | 5,000,000 | | | 5,000,271 |
0.59% due 09/02/09 | | | 10,000,000 | | | 9,999,836 |
0.80% due 11/20/09 | | | 8,000,000 | | | 7,985,778 |
0.90% due 04/07/10 | | | 1,500,000 | | | 1,499,548 |
1.00% due 02/12/10 | | | 8,000,000 | | | 7,963,556 |
1.02% due 02/26/10 | | | 6,500,000 | | | 6,497,331 |
1.05% due 02/23/10 | | | 3,800,000 | | | 3,798,149 |
1.05% due 03/05/10 | | | 3,800,000 | | | 3,798,810 |
| | | | | | | | |
| | |
| Security Description | | Principal
Amount | | | Market Value
(Note 2) | |
| |
| | | | | | | | | |
U.S. Government Agencies (continued) | |
Federal Home Loan Mtg. Corp. | | | | | | | | |
0.24% due 12/22/09 | | $ | 4,000,000 | | | $ | 3,997,013 | |
0.25% due 10/20/09 | | | 7,000,000 | | | | 6,997,618 | |
0.28% due 12/14/09 | | | 4,000,000 | | | | 3,996,764 | |
0.34% due 11/04/09(1) | | | 6,000,000 | | | | 6,000,000 | |
0.41% due 10/12/09(1) | | | 3,000,000 | | | | 2,999,955 | |
0.61% due 10/07/09(1) | | | 3,500,000 | | | | 3,499,441 | |
0.62% due 09/10/09(1) | | | 7,000,000 | | | | 6,999,070 | |
0.68% due 09/30/09 | | | 11,000,000 | | | | 10,993,974 | |
Federal National Mtg. Assoc. | | | | | | | | |
0.31% due 01/11/10 | | | 4,000,000 | | | | 3,995,453 | |
0.33% due 02/01/10 | | | 4,000,000 | | | | 3,994,390 | |
0.40% due 10/13/09(1) | | | 15,000,000 | | | | 14,999,352 | |
0.40% due 11/12/09(1) | | | 7,885,000 | | | | 7,885,282 | |
0.42% due 11/05/09(1) | | | 3,800,000 | | | | 3,799,583 | |
1.55% due 09/02/09 | | | 4,000,000 | | | | 3,999,828 | |
| | | | | | |
|
|
|
Total U.S. Government Agencies | | | | | | | | |
(amortized cost $170,797,371) | | | | | | | 170,797,371 | |
| | | | | | |
|
|
|
Total Short - Term Investment Securities — 87.2% | |
(amortized cost $220,910,809) | | | | | | | 220,910,809 | |
| | | | | | |
|
|
|
REPURCHASE AGREEMENT — 14.5% | |
UBS Securities LLC Joint Repurchase Agreement(2)
(amortized cost $36,736,000) | | | 36,736,000 | | | | 36,736,000 | |
| | | | | | |
|
|
|
TOTAL INVESTMENTS | |
(amortized cost $257,646,809)(3) | | | 101.7 | % | | | 257,646,809 | |
Liabilities in excess of other assets | | | (1.7 | ) | | | (4,404,967 | ) |
| | |
|
|
| |
|
|
|
NET ASSETS — | | | 100.0 | % | | $ | 253,241,842 | |
| | |
|
|
| |
|
|
|
| (1) | Floating rate security where the rate fluctuates. The rate moves up or down at each reset date. The rate reflected is as of August 31, 2009; maturity date reflects the next reset date. |
| (2) | See Note 2 for details of Joint Repurchase Agreements. |
| (3) | See Note 5 for cost of investments on a tax basis. |
| FDIC—Federal | | Deposit Insurance Corp. |
The following is a summary of the inputs used to value the Fund’s net assets as of August 31, 2009 (see Note 2):
| | | | | | | | | | | | |
| | | Level 1 -
Unadjusted
Quoted
Prices
| | Level 2 -
Other
Observable
Inputs
| | Level 3 -
Significant
Unobservable
Inputs
| | Total
|
Short-Term Investment Securities: | | | | | | | | | | | | |
Certificates of Deposit | | $ | – | | $ | 15,500,897 | | $ | – | | $ | 15,500,897 |
Commercial Paper | | | – | | | 8,000,000 | | | – | | | 8,000,000 |
U.S. Corporate Bonds & Notes | | | – | | | 19,842,633 | | | – | | | 19,842,633 |
Medium Term Notes | | | – | | | 6,769,908 | | | – | | | 6,769,908 |
U.S. Government Agencies | | | – | | | 170,797,371 | | | – | | | 170,797,371 |
Repurchase Agreement | | | – | | | 36,736,000 | | | – | | | 36,736,000 |
| | |
|
| |
|
| |
|
| |
|
|
Total | | $ | – | | $ | 257,646,809 | | $ | – | | $ | 257,646,809 |
| | |
|
| |
|
| |
|
| |
|
|
See Notes to Financial Statements
55
VALIC Company II Small Cap Growth Fund
PORTFOLIO PROFILE — August 31, 2009 (Unaudited)
Industry Allocation*
| | | |
Enterprise Software/Service | | 4.8 | % |
Medical — Biomedical/Gene | | 4.7 | |
Oil Companies — Exploration & Production | | 3.6 | |
Time Deposits | | 3.3 | |
Applications Software | | 3.1 | |
Schools | | 2.8 | |
Medical — Drugs | | 2.6 | |
Medical Labs & Testing Services | | 2.6 | |
Insurance — Property/Casualty | | 2.4 | |
Footwear & Related Apparel | | 2.4 | |
Retail — Apparel/Shoe | | 2.3 | |
Transport — Truck | | 2.3 | |
Medical Instruments | | 2.3 | |
Recreational Centers | | 2.1 | |
Internet Application Software | | 2.1 | |
Telecom Services | | 1.8 | |
Patient Monitoring Equipment | | 1.8 | |
Commercial Services — Finance | | 1.7 | |
Medical — HMO | | 1.6 | |
Semiconductor Equipment | | 1.6 | |
Retirement/Aged Care | | 1.6 | |
Physical Therapy/Rehabilitation Centers | | 1.5 | |
Therapeutics | | 1.5 | |
Educational Software | | 1.5 | |
Retail — Perfume & Cosmetics | | 1.4 | |
Networking Products | | 1.4 | |
Computers — Integrated Systems | | 1.4 | |
Wireless Equipment | | 1.4 | |
Computers — Periphery Equipment | | 1.4 | |
Computer Services | | 1.3 | |
Machinery — General Industrial | | 1.3 | |
Diversified Manufacturing Operations | | 1.3 | |
Consulting Services | | 1.2 | |
Investment Management/Advisor Services | | 1.2 | |
Building Products — Air & Heating | | 1.2 | |
Building & Construction Products — Misc. | | 1.2 | |
Electronic Components — Semiconductors | | 1.1 | |
Decision Support Software | | 1.1 | |
Finance — Investment Banker/Broker | | 1.0 | |
Vitamins & Nutrition Products | | 1.0 | |
Private Corrections | | 1.0 | |
Medical Imaging Systems | | 1.0 | |
Metal Processors & Fabrication | | 1.0 | |
Machinery — Pumps | | 0.9 | |
Aerospace/Defense — Equipment | | 0.9 | |
Semiconductor Components — Integrated Circuits | | 0.9 | |
Internet Security | | 0.9 | |
Drug Delivery Systems | | 0.9 | |
Entertainment Software | | 0.9 | |
Consumer Products — Misc. | | 0.9 | |
Chemicals — Diversified | | 0.8 | |
Computer Aided Design | | 0.8 | |
Machinery — Electrical | | 0.7 | |
Distribution/Wholesale | | 0.7 | |
Non — Hazardous Waste Disposal | | 0.7 | |
Batteries/Battery Systems | | 0.7 | |
Building Products — Cement | | 0.7 | |
Satellite Telecom | | 0.7 | |
Theaters | | 0.7 | |
E-Marketing/Info | | 0.6 | |
Internet Infrastructure Software | | 0.6 | |
Retail — Appliances | | 0.6 | |
Communications Software | | 0.6 | |
Oil — Field Services | | 0.5 | |
Medical — Outpatient/Home Medical | | 0.5 | |
Power Converter/Supply Equipment | | 0.5 | |
Medical Information Systems | | 0.5 | |
Savings & Loans/Thrifts | | 0.5 | |
Retail — Restaurants | | 0.5 | |
| | | |
Diagnostic Kits | | 0.5 | |
Casino Hotels | | 0.4 | |
Diagnostic Equipment | | 0.3 | |
Pharmacy Services | | 0.2 | |
| | |
|
|
| | | 100.5 | % |
| | |
|
|
| * | Calculated as a percentage of net assets |
56
VALIC Company II Small Cap Growth Fund
PORTFOLIO OF INVESTMENTS — August 31, 2009
| | | | | |
| | |
| Security Description | | Shares | | Market Value
(Note 2) |
|
COMMON STOCK — 97.2% |
Aerospace/Defense - Equipment — 0.9% |
HEICO Corp. | | 10,480 | | $ | 388,389 |
| | | | |
|
|
Applications Software — 3.1% |
NetSuite, Inc.† | | 40,250 | | | 551,827 |
Nuance Communications, Inc.† | | 62,690 | | | 772,968 |
| | | | |
|
|
| | | | | | 1,324,795 |
| | | | |
|
|
Batteries/Battery Systems — 0.7% |
EnerSys† | | 14,900 | | | 296,361 |
| | | | |
|
|
Building & Construction Products - Misc. — 1.2% |
Simpson Manufacturing Co., Inc. | | 8,670 | | | 222,819 |
Trex Co., Inc.† | | 14,000 | | | 266,140 |
| | | | |
|
|
| | | | | | 488,959 |
| | | | |
|
|
Building Products - Air & Heating — 1.2% |
Lennox International, Inc. | | 13,650 | | | 489,762 |
| | | | |
|
|
Building Products - Cement — 0.7% |
Eagle Materials, Inc. | | 11,200 | | | 294,896 |
| | | | |
|
|
Casino Hotels — 0.4% |
Boyd Gaming Corp.† | | 16,500 | | | 169,620 |
| | | | |
|
|
Chemicals - Diversified — 0.8% |
Innospec, Inc. | | 25,690 | | | 351,439 |
| | | | |
|
|
Commercial Services - Finance — 1.7% |
Bankrate, Inc.† | | 10,300 | | | 293,447 |
Coinstar, Inc.† | | 5,300 | | | 174,953 |
Morningstar, Inc.† | | 6,090 | | | 269,787 |
| | | | |
|
|
| | | | | | 738,187 |
| | | | |
|
|
Communications Software — 0.6% |
SolarWinds, Inc.† | | 12,520 | | | 233,623 |
| | | | |
|
|
Computer Aided Design — 0.8% |
ANSYS, Inc.† | | 9,410 | | | 330,667 |
| | | | |
|
|
Computer Services — 1.3% |
Syntel, Inc. | | 13,810 | | | 553,367 |
| | | | |
|
|
Computers - Integrated Systems — 1.4% |
NCI, Inc.† | | 11,730 | | | 344,275 |
Riverbed Technology, Inc.† | | 12,500 | | | 241,000 |
| | | | |
|
|
| | | | | | 585,275 |
| | | | |
|
|
Computers - Periphery Equipment — 1.4% |
Compellent Technologies Inc† | | 25,500 | | | 380,460 |
Synaptics, Inc.† | | 7,880 | | | 203,146 |
| | | | |
|
|
| | | | | | 583,606 |
| | | | |
|
|
Consulting Services — 1.2% |
FTI Consulting, Inc.† | | 6,090 | | | 265,159 |
Watson Wyatt Worldwide, Inc., Class A | | 5,460 | | | 238,602 |
| | | | |
|
|
| | | | | | 503,761 |
| | | | |
|
|
Consumer Products - Misc. — 0.9% |
Central Garden & Pet Co.† | | 31,000 | | | 376,340 |
| | | | |
|
|
Decision Support Software — 1.1% |
MSCI, Inc., Class A† | | 15,450 | | | 454,539 |
| | | | |
|
|
Diagnostic Equipment — 0.3% |
Hansen Medical, Inc.† | | 32,600 | | | 111,166 |
| | | | |
|
|
Diagnostic Kits — 0.5% |
Meridian Bioscience, Inc. | | 8,020 | | | 193,282 |
| | | | |
|
|
Distribution/Wholesale — 0.7% |
Beacon Roofing Supply, Inc.† | | 17,940 | | | 301,751 |
| | | | |
|
|
| | | | | |
| | |
| Security Description | | Shares | | Market Value
(Note 2) |
|
| |
Diversified Manufacturing Operations — 1.3% |
Carlisle Cos., Inc. | | 16,240 | | $ | 535,758 |
| | | | |
|
|
Drug Delivery Systems — 0.9% |
Nektar Therapeutics† | | 46,300 | | | 383,827 |
| | | | |
|
|
E - Marketing/Info — 0.6% |
Digital River, Inc.† | | 7,790 | | | 275,143 |
| | | | |
|
|
Educational Software — 1.5% |
Blackboard, Inc.† | | 17,940 | | | 617,315 |
| | | | |
|
|
Electronic Components - Semiconductors — 1.1% |
Microsemi Corp.† | | 34,490 | | | 486,654 |
| | | | |
|
|
Enterprise Software/Service — 4.8% |
Concur Technologies, Inc.† | | 5,800 | | | 205,088 |
MedAssets, Inc.† | | 35,650 | | | 796,064 |
Omnicell, Inc.† | | 46,560 | | | 511,229 |
Taleo Corp., Class A† | | 28,240 | | | 510,862 |
| | | | |
|
|
| | | | | | 2,023,243 |
| | | | |
|
|
Entertainment Software — 0.9% |
Take - Two Interactive Software, Inc. | | 36,000 | | | 378,000 |
| | | | |
|
|
Finance - Investment Banker/Broker — 1.0% |
Broadpoint Gleacher Securities, Inc.† | | 56,500 | | | 426,575 |
| | | | |
|
|
Footwear & Related Apparel — 2.4% |
Iconix Brand Group, Inc.† | | 27,510 | | | 472,622 |
Skechers USA, Inc., Class A† | | 29,680 | | | 528,601 |
| | | | |
|
|
| | | | | | 1,001,223 |
| | | | |
|
|
Insurance - Property/Casualty — 2.4% |
HCC Insurance Holdings, Inc. | | 11,740 | | | 310,406 |
ProAssurance Corp.�� | | 7,000 | | | 367,500 |
Tower Group, Inc. | | 13,592 | | | 326,072 |
| | | | |
|
|
| | | | | | 1,003,978 |
| | | | |
|
|
Internet Application Software — 2.1% |
Art Technology Group, Inc.† | | 130,600 | | | 527,624 |
DealerTrack Holdings, Inc.† | | 17,440 | | | 351,939 |
| | | | |
|
|
| | | | | | 879,563 |
| | | | |
|
|
Internet Infrastructure Software — 0.6% |
F5 Networks, Inc.† | | 7,470 | | | 257,640 |
| | | | |
|
|
Internet Security — 0.9% |
Sourcefire, Inc.† | | 20,220 | | | 384,180 |
| | | | |
|
|
Investment Management/Advisor Services — 1.2% |
Affiliated Managers Group, Inc.† | | 4,530 | | | 295,945 |
Calamos Asset Management, Inc., Class A | | 18,370 | | | 207,214 |
| | | | |
|
|
| | | | | | 503,159 |
| | | | |
|
|
Machinery - Electrical — 0.7% |
Baldor Electric Co. | | 11,160 | | | 313,261 |
| | | | |
|
|
Machinery - General Industrial — 1.3% |
Wabtec Corp. | | 14,500 | | | 543,025 |
| | | | |
|
|
Machinery - Pumps — 0.9% |
Graco, Inc. | | 15,900 | | | 399,249 |
| | | | |
|
|
Medical Imaging Systems — 1.0% |
Vital Images, Inc.† | | 32,070 | | | 407,610 |
| | | | |
|
|
Medical Information Systems — 0.5% |
athenahealth, Inc.† | | 5,180 | | | 208,391 |
| | | | |
|
|
Medical Instruments — 2.3% |
Bruker BioSciences Corp.† | | 56,350 | | | 571,952 |
Thoratec Corp.† | | 15,520 | | | 407,245 |
| | | | |
|
|
| | | | | | 979,197 |
| | | | |
|
|
57
VALIC Company II Small Cap Growth Fund
PORTFOLIO OF INVESTMENTS — August 31, 2009 — (continued)
| | | | | |
| | |
| Security Description | | Shares | | Market Value
(Note 2) |
|
COMMON STOCK (continued) |
Medical Labs & Testing Services — 2.6% |
Genoptix, Inc.† | | 17,880 | | $ | 512,977 |
ICON PLC ADR† | | 26,230 | | | 567,093 |
| | | | |
|
|
| | | | | | 1,080,070 |
| | | | |
|
|
Medical - Biomedical/Gene — 4.7% |
Acorda Therapeutics, Inc.† | | 4,300 | | | 97,266 |
Alexion Pharmaceuticals, Inc.† | | 4,690 | | | 211,706 |
ARIAD Pharmaceuticals, Inc.† | | 69,800 | | | 152,862 |
Enzo Biochem, Inc.† | | 73,110 | | | 372,130 |
Exelixis, Inc.† | | 46,630 | | | 265,325 |
Halozyme Therapeutics, Inc.† | | 56,530 | | | 420,583 |
Human Genome Sciences, Inc.† | | 13,800 | | | 272,964 |
Incyte Corp.† | | 29,600 | | | 195,064 |
| | | | |
|
|
| | | | | | 1,987,900 |
| | | | |
|
|
Medical - Drugs — 2.6% |
Cumberland Pharmaceuticals, Inc.† | | 25,200 | | | 421,848 |
Medivation, Inc.† | | 9,790 | | | 247,883 |
Myriad Pharmaceuticals, Inc.† | | 2,065 | | | 9,292 |
Sucampo Pharmaceuticals, Inc. Class A† | | 36,720 | | | 205,999 |
ViroPharma, Inc.† | | 29,600 | | | 236,800 |
| | | | |
|
|
| | | | | | 1,121,822 |
| | | | |
|
|
Medical - HMO — 1.6% |
Health Net, Inc.† | | 23,200 | | | 355,424 |
Healthspring, Inc.† | | 25,730 | | | 340,408 |
| | | | |
|
|
| | | | | | 695,832 |
| | | | |
|
|
Medical - Outpatient/Home Medical — 0.5% |
Gentiva Health Services, Inc.† | | 10,117 | | | 223,080 |
| | | | |
|
|
Metal Processors & Fabrication — 1.0% |
Commercial Metals Co. | | 23,880 | | | 404,288 |
| | | | |
|
|
Networking Products — 1.4% |
Infinera Corp.† | | 20 | | | 140 |
Switch & Data Facilities Co., Inc.† | | 43,080 | | | 585,457 |
| | | | |
|
|
| | | | | | 585,597 |
| | | | |
|
|
Non - Hazardous Waste Disposal — 0.7% |
Waste Connections, Inc.† | | 10,900 | | | 298,115 |
| | | | |
|
|
Oil Companies - Exploration & Production — 3.6% |
Comstock Resources, Inc.† | | 12,150 | | | 429,259 |
Concho Resources, Inc.† | | 12,440 | | | 405,420 |
Forest Oil Corp.† | | 23,090 | | | 362,975 |
Swift Energy Co.† | | 16,400 | | | 334,068 |
| | | | |
|
|
| | | | | | 1,531,722 |
| | | | |
|
|
Oil - Field Services — 0.5% |
Oceaneering International, Inc.† | | 4,360 | | | 227,461 |
| | | | |
|
|
Patient Monitoring Equipment — 1.8% |
Insulet Corp.† | | 37,590 | | | 346,204 |
Masimo Corp.† | | 16,345 | | | 410,586 |
| | | | |
|
|
| | | | | | 756,790 |
| | | | |
|
|
Pharmacy Services — 0.2% |
Clarient, Inc.† | | 21,100 | | | 82,923 |
| | | | |
|
|
Physical Therapy/Rehabilitation Centers — 1.5% |
Psychiatric Solutions, Inc.† | | 24,230 | | | 649,122 |
| | | | |
|
|
Power Converter/Supply Equipment — 0.5% |
Energy Conversion Devices, Inc.† | | 5,630 | | | 63,000 |
Powell Industries, Inc.† | | 3,970 | | | 150,145 |
| | | | |
|
|
| | | | | | 213,145 |
| | | | |
|
|
| | | | | |
| | |
| Security Description | | Shares | | Market Value
(Note 2) |
|
| |
Private Corrections — 1.0% |
The Geo Group, Inc.† | | 22,320 | | $ | 408,902 |
| | | | |
|
|
Recreational Centers — 2.1% |
Life Time Fitness, Inc.† | | 29,080 | | | 904,970 |
| | | | |
|
|
Retail - Apparel/Shoe — 2.3% |
J Crew Group, Inc.† | | 18,630 | | | 635,097 |
Lululemon Athletica, Inc.† | | 17,900 | | | 359,074 |
| | | | |
|
|
| | | | | | 994,171 |
| | | | |
|
|
Retail - Appliances — 0.6% |
Hhgregg, Inc.† | | 14,300 | | | 247,104 |
| | | | |
|
|
Retail - Perfume & Cosmetics — 1.4% |
Ulta Salon Cosmetics & Fragrance, Inc.† | | 52,390 | | | 603,533 |
| | | | |
|
|
Retail - Restaurants — 0.5% |
The Cheesecake Factory, Inc.† | | 10,780 | | | 198,029 |
| | | | |
|
|
Retirement/Aged Care — 1.6% |
Emeritus Corp.† | | 37,530 | | | 676,666 |
| | | | |
|
|
Satellite Telecom — 0.7% |
DigitalGlobe, Inc.† | | 14,580 | | | 292,475 |
| | | | |
|
|
Savings & Loans/Thrifts — 0.5% |
WSFS Financial Corp. | | 7,440 | | | 206,237 |
| | | | |
|
|
Schools — 2.8% |
American Public Education, Inc.† | | 6,970 | | | 241,510 |
K12 ,Inc.† | | 9,500 | | | 195,605 |
Lincoln Educational Services Corp.† | | 34,010 | | | 754,342 |
| | | | |
|
|
| | | | | | 1,191,457 |
| | | | |
|
|
Semiconductor Components - Integrated Circuits — 0.9% |
Hittite Microwave Corp.† | | 11,240 | | | 386,881 |
| | | | |
|
|
Semiconductor Equipment — 1.6% |
Varian Semiconductor Equipment Associates, Inc.† | | 12,970 | | | 396,493 |
Verigy, Ltd.† | | 26,600 | | | 284,354 |
| | | | |
|
|
| | | | | | 680,847 |
| | | | |
|
|
Telecom Services — 1.8% |
Cbeyond, Inc.† | | 19,540 | | | 280,594 |
Neutral Tandem, Inc.† | | 19,600 | | | 490,196 |
| | | | |
|
|
| | | | | | 770,790 |
| | | | |
|
|
Theaters — 0.7% |
National CineMedia, Inc. | | 19,490 | | | 292,350 |
| | | | |
|
|
Therapeutics — 1.5% |
BioMarin Pharmaceutical, Inc.† | | 18,290 | | | 301,236 |
Onyx Pharmaceuticals, Inc.† | | 5,100 | | | 163,557 |
Theravance, Inc.† | | 11,710 | | | 182,325 |
| | | | |
|
|
| | | | | | 647,118 |
| | | | |
|
|
Transport - Truck — 2.3% |
Landstar System, Inc. | | 13,060 | | | 455,402 |
Marten Transport, Ltd.† | | 7,100 | | | 120,416 |
Old Dominion Freight Lines, Inc.† | | 11,370 | | | 406,819 |
| | | | |
|
|
| | | | | | 982,637 |
| | | | |
|
|
Vitamins & Nutrition Products — 1.0% |
NBTY, Inc.† | | 11,180 | | | 414,331 |
| | | | |
|
|
Wireless Equipment — 1.4% |
Viasat, Inc.† | | 24,140 | | | 584,912 |
| | | | |
|
|
Total Long-Term Investment Securities | | | | | |
(cost $40,440,366) | | | | | 41,118,053 |
| | | | |
|
|
58
VALIC Company II Small Cap Growth Fund
PORTFOLIO OF INVESTMENTS — August 31, 2009 — (continued)
| | | | | | | | |
| | |
| Security Description | | Principal
Amount | | | Market Value
(Note 2) | |
| |
SHORT-TERM INVESTMENT SECURITIES — 3.3% | |
Time Deposits — 3.3% | |
Euro Time Deposit with State Street Bank & Trust Co. 0.01% due 09/01/09
(cost $1,390,000) | | $ | 1,390,000 | | | $ | 1,390,000 | |
| | | | | | |
|
|
|
TOTAL INVESTMENTS | | | | | | | | |
(cost $41,830,366)(1) | | | 100.5 | % | | | 42,508,053 | |
Liabilities in excess of other assets | | | (0.5 | ) | | | (198,149 | ) |
| | |
|
|
| |
|
|
|
NET ASSETS — | | | 100.0 | % | | $ | 42,309,904 | |
| | |
|
|
| |
|
|
|
| † | Non-income producing security |
| (1) | See Note 5 for cost of investments on a tax basis. |
ADR—American Depository Receipt
The following is a summary of the inputs used to value the Fund’s net assets as of August 31, 2009 (see Note 2):
| | | | | | | | | | | | |
| | | Level 1 -
Unadjusted
Quoted
Prices
| | Level 2 -
Other
Observable
Inputs
| | Level 3 -
Significant
Unobservable
Inputs
| | Total
|
Long-Term Investment Securities: | | | | | | | | | | | | |
Common Stock* | | $ | 41,118,053 | | $ | – | | $ | – | | $ | 41,118,053 |
Short-Term Investment Securities: | | | | | | | | | | | | |
Time Deposit | | | – | | | 1,390,000 | | | – | | | 1,390,000 |
| | |
|
| |
|
| |
|
| |
|
|
Total | | $ | 41,118,053 | | $ | 1,390,000 | | $ | – | | $ | 42,508,053 |
| | |
|
| |
|
| |
|
| |
|
|
| * | All industries individually have an aggregate market value of less than 5% of net assets. |
See Notes to Financial Statements
59
VALIC Company II Small Cap Value Fund
PORTFOLIO PROFILE — August 31, 2009 (Unaudited)
Industry Allocation*
| | | |
Banks — Commercial | | 9.9 | % |
Real Estate Investment Trusts | | 9.6 | |
Electric — Integrated | | 3.5 | |
Consumer Products — Misc. | | 3.1 | |
Diversified Manufacturing Operations | | 2.8 | |
Repurchase Agreements | | 2.8 | |
Gas — Distribution | | 2.3 | |
Insurance — Life/Health | | 2.3 | |
Insurance — Property/Casualty | | 2.1 | |
Retail — Apparel/Shoe | | 1.9 | |
Oil — Field Services | | 1.6 | |
Distribution/Wholesale | | 1.5 | |
Commercial Services — Finance | | 1.4 | |
Oil Companies — Exploration & Production | | 1.4 | |
Insurance — Reinsurance | | 1.3 | |
Data Processing/Management | | 1.3 | |
Finance — Consumer Loans | | 1.2 | |
Finance — Investment Banker/Broker | | 1.2 | |
Metal Processors & Fabrication | | 1.2 | |
Engineering/R&D Services | | 1.1 | |
Chemicals — Specialty | | 1.1 | |
Chemicals — Plastics | | 1.0 | |
Airlines | | 1.0 | |
Batteries/Battery Systems | | 1.0 | |
Transport — Marine | | 1.0 | |
Machinery — General Industrial | | 0.9 | |
Containers — Paper/Plastic | | 0.9 | |
Electronic Components — Misc. | | 0.9 | |
Oil & Gas Drilling | | 0.9 | |
Transport — Truck | | 0.9 | |
Networking Products | | 0.8 | |
Semiconductor Components — Integrated Circuits | | 0.8 | |
Computer Aided Design | | 0.8 | |
Commercial Services | | 0.8 | |
Telecommunication Equipment | | 0.8 | |
Enterprise Software/Service | | 0.8 | |
Retail — Restaurants | | 0.7 | |
Medical — HMO | | 0.7 | |
Office Furnishings — Original | | 0.7 | |
Toys | | 0.7 | |
Auto/Truck Parts & Equipment — Original | | 0.7 | |
Telephone — Integrated | | 0.7 | |
Paper & Related Products | | 0.7 | |
Investment Management/Advisor Services | | 0.7 | |
Building & Construction Products — Misc. | | 0.7 | |
Lasers — System/Components | | 0.7 | |
Medical Products | | 0.6 | |
Apparel Manufacturers | | 0.6 | |
Medical — Drugs | | 0.6 | |
Savings & Loans/Thrifts | | 0.6 | |
Human Resources | | 0.6 | |
Semiconductor Equipment | | 0.6 | |
Insurance — Multi-line | | 0.6 | |
Aerospace/Defense — Equipment | | 0.6 | |
Machinery — Farming | | 0.6 | |
Applications Software | | 0.6 | |
Computers — Periphery Equipment | | 0.5 | |
Pharmacy Services | | 0.5 | |
Medical — Biomedical/Gene | | 0.5 | |
Electronic Components — Semiconductors | | 0.5 | |
Medical — Outpatient/Home Medical | | 0.5 | |
Retail — Bookstores | | 0.5 | |
United States Treasury Notes | | 0.4 | |
Computer Services | | 0.4 | |
Retail — Automobile | | 0.4 | |
Food — Wholesale/Distribution | | 0.4 | |
Industrial Automated/Robotic | | 0.4 | |
Internet Infrastructure Software | | 0.4 | |
Finance — Auto Loans | | 0.4 | |
| | |
Financial Guarantee Insurance | | 0.4 |
Retail — Discount | | 0.4 |
Circuit Boards | | 0.3 |
Containers — Metal/Glass | | 0.3 |
Aerospace/Defense | | 0.3 |
Television | | 0.3 |
Food — Canned | | 0.3 |
Building Products — Air & Heating | | 0.3 |
Machinery — Material Handling | | 0.3 |
Footwear & Related Apparel | | 0.3 |
Retail — Hair Salons | | 0.3 |
Funeral Services & Related Items | | 0.3 |
Office Supplies & Forms | | 0.3 |
Chemicals — Diversified | | 0.3 |
Finance — Leasing Companies | | 0.3 |
Medical — Generic Drugs | | 0.3 |
Water | | 0.2 |
Telecom Services | | 0.2 |
Retail — Regional Department Stores | | 0.2 |
Home Furnishings | | 0.2 |
Satellite Telecom | | 0.2 |
Printing — Commercial | | 0.2 |
Retail — Leisure Products | | 0.2 |
Auto/Truck Parts & Equipment — Replacement | | 0.2 |
Rental Auto/Equipment | | 0.2 |
Rubber/Plastic Products | | 0.2 |
Internet Infrastructure Equipment | | 0.2 |
Medical Imaging Systems | | 0.2 |
Auto Repair Centers | | 0.2 |
Building Products — Light Fixtures | | 0.2 |
Steel Pipe & Tube | | 0.2 |
Finance — Credit Card | | 0.2 |
Recycling | | 0.2 |
Entertainment Software | | 0.2 |
Hotels/Motels | | 0.2 |
Retail — Home Furnishings | | 0.2 |
Retail — Perfume & Cosmetics | | 0.2 |
Computers — Memory Devices | | 0.2 |
Transport — Services | | 0.2 |
Therapeutics | | 0.2 |
Beverages — Non-alcoholic | | 0.2 |
Building Products — Doors & Windows | | 0.2 |
Web Hosting/Design | | 0.2 |
Publishing — Books | | 0.1 |
Web Portals/ISP | | 0.1 |
Multilevel Direct Selling | | 0.1 |
Multimedia | | 0.1 |
Research & Development | | 0.1 |
Linen Supply & Related Items | | 0.1 |
Radio | | 0.1 |
Retirement/Aged Care | | 0.1 |
Schools | | 0.1 |
Transport — Air Freight | | 0.1 |
Building & Construction — Misc. | | 0.1 |
Retail — Jewelry | | 0.1 |
Retail — Convenience Store | | 0.1 |
Platinum | | 0.1 |
E-Services/Consulting | | 0.1 |
Insurance Brokers | | 0.1 |
Retail — Toy Stores | | 0.1 |
Investment Companies | | 0.1 |
Gambling (Non-Hotel) | | 0.1 |
Pipelines | | 0.1 |
Non-Ferrous Metals | | 0.1 |
Leisure Products | | 0.1 |
Real Estate Operations & Development | | 0.1 |
Food — Misc. | | 0.1 |
Educational Software | | 0.1 |
Communications Software | | 0.1 |
60
VALIC Company II Small Cap Value Fund
PORTFOLIO PROFILE — August 31, 2009 (Unaudited) — (continued)
Industry Allocation* (continued)
| | | |
Wire & Cable Products | | 0.1 | % |
Oil Field Machinery & Equipment | | 0.1 | |
Wireless Equipment | | 0.1 | |
| | |
|
|
| | | 100.0 | % |
| | |
|
|
| * | Calculated as a percentage of net assets |
61
VALIC Company II Small Cap Value Fund
PORTFOLIO OF INVESTMENTS — August 31, 2009
| | | | | |
| | |
| Security Description | | Shares | | Market Value
(Note 2) |
|
COMMON STOCK — 96.7% | | | | | |
Aerospace/Defense — 0.3% |
Cubic Corp. | | 31,200 | | $ | 1,108,224 |
| | | | |
|
|
Aerospace/Defense - Equipment — 0.6% |
Orbital Sciences Corp.† | | 141,100 | | | 2,086,869 |
| | | | |
|
|
Airlines — 1.0% |
Hawaiian Holdings, Inc.† | | 42,300 | | | 309,636 |
Republic Airways Holdings, Inc.† | | 79,000 | | | 727,590 |
Skywest, Inc. | | 158,700 | | | 2,451,915 |
| | | | |
|
|
| | | | | | 3,489,141 |
| | | | |
|
|
Apparel Manufacturers — 0.6% |
Jones Apparel Group, Inc. | | 107,800 | | | 1,680,602 |
Maidenform Brands, Inc.† | | 33,300 | | | 537,462 |
| | | | |
|
|
| | | | | | 2,218,064 |
| | | | |
|
|
Applications Software — 0.5% |
EPIQ Systems, Inc.† | | 116,600 | | | 1,747,834 |
| | | | |
|
|
Audio/Video Products — 0.0% |
Audiovox Corp., Class A† | | 19,400 | | | 136,964 |
| | | | |
|
|
Auto Repair Centers — 0.2% |
Midas, Inc.† | | 79,261 | | | 716,519 |
| | | | |
|
|
Auto/Truck Parts & Equipment - Original — 0.7% |
ArvinMeritor, Inc. | | 146,900 | | | 1,073,839 |
Autoliv, Inc. | | 14,100 | | | 452,187 |
Modine Manufacturing Co. | | 59,100 | | | 500,577 |
Superior Industries International, Inc. | | 25,700 | | | 365,454 |
| | | | |
|
|
| | | | | | 2,392,057 |
| | | | |
|
|
Auto/Truck Parts & Equipment - Replacement — 0.2% |
ATC Technology Corp.† | | 36,300 | | | 759,396 |
| | | | |
|
|
Banks - Commercial — 9.9% |
1st Source Corp. | | 41,930 | | | 679,266 |
Alliance Financial Corp. | | 2,000 | | | 54,800 |
Bancfirst Corp. | | 34,200 | | | 1,251,036 |
Bank of Hawaii Corp. | | 70,700 | | | 2,789,115 |
Cardinal Financial Corp. | | 13,400 | | | 105,860 |
Cathay General Bancorp | | 65,200 | | | 602,448 |
Centerstate Banks of Florida, Inc. | | 24,600 | | | 205,656 |
Central Pacific Financial Corp. | | 113,000 | | | 314,140 |
Century Bancorp, Inc., Class A | | 1,500 | | | 35,475 |
Chemical Financial Corp. | | 31,300 | | | 655,109 |
Citizens Republic Bancorp† | | 135,200 | | | 101,400 |
City Holding Co. | | 75,200 | | | 2,394,368 |
Community Bank Systems, Inc. | | 59,000 | | | 1,051,970 |
Community Trust Bancorp, Inc. | | 49,600 | | | 1,327,296 |
Cullen/Frost Bankers, Inc. | | 19,800 | | | 975,744 |
F.N.B. Corp. | | 201,800 | | | 1,428,744 |
Financial Institutions, Inc. | | 26,000 | | | 314,600 |
First BanCorp Puerto Rico | | 75,700 | | | 241,483 |
First Citizens BancShares, Inc., Class A | | 3,800 | | | 525,996 |
First Community Bancshares, Inc. | | 18,900 | | | 236,628 |
First Financial Bancorp | | 96,000 | | | 810,240 |
First Financial Bankshares, Inc. | | 9,000 | | | 448,560 |
First Merchants Corp. | | 9,700 | | | 68,870 |
First South Bancorp, Inc. | | 9,300 | | | 113,925 |
FirstMerit Corp. | | 172,717 | | | 3,103,724 |
Fulton Financial Corp. | | 1,099 | | | 8,067 |
Guaranty Bancorp† | | 37,400 | | | 63,580 |
Heartland Financial USA, Inc. | | 23,700 | | | 354,789 |
Lakeland Bancorp, Inc. | | 45,762 | | | 405,451 |
Lakeland Financial Corp. | | 12,100 | | | 240,669 |
MB Financial, Inc. | | 16,700 | | | 231,295 |
Northrim BanCorp, Inc. | | 1,900 | | | 28,690 |
| | | | | |
| | |
| Security Description | | Shares | | Market Value
(Note 2) |
|
| | | | | | |
Banks - Commercial (continued) |
Old National Bancorp | | 13,800 | | $ | 146,832 |
Old Second Bancorp, Inc. | | 9,200 | | | 50,784 |
Pacific Capital Bancorp | | 42,400 | | | 103,032 |
Santander Bancorp† | | 28,000 | | | 256,200 |
SCBT Financial Corp. | | 7,760 | | | 199,044 |
Sierra Bancorp | | 7,300 | | | 93,294 |
Simmons First National Corp., Class A | | 41,900 | | | 1,180,323 |
Southwest Bancorp, Inc. | | 23,400 | | | 302,562 |
Suffolk Bancorp | | 7,000 | | | 202,650 |
Sun Bancorp, Inc.† | | 29,300 | | | 162,908 |
TCF Financial Corp. | | 171,600 | | | 2,361,216 |
The South Financial Group, Inc. | | 673,400 | | | 1,185,184 |
Tompkins Trustco, Inc. | | 15,280 | | | 667,736 |
UMB Financial Corp. | | 81,300 | | | 3,254,439 |
Umpqua Holdings Corp. | | 44,200 | | | 455,702 |
Washington Trust Bancorp, Inc. | | 28,400 | | | 495,580 |
Westamerica Bancorp | | 24,000 | | | 1,234,320 |
Whitney Holding Corp. | | 87,250 | | | 786,123 |
| | | | |
|
|
| | | | | | 34,306,923 |
| | | | |
|
|
Batteries/Battery Systems — 1.0% |
EnerSys† | | 169,900 | | | 3,379,311 |
| | | | |
|
|
Beverages - Non - alcoholic — 0.2% |
National Beverage Corp.† | | 52,100 | | | 528,294 |
| | | | |
|
|
Building & Construction Products - Misc. — 0.7% |
Gibraltar Industries, Inc. | | 138,400 | | | 1,666,336 |
Interline Brands, Inc.† | | 14,500 | | | 242,295 |
NCI Building Systems, Inc.† | | 26,600 | | | 71,554 |
Trex Co., Inc.† | | 18,700 | | | 355,487 |
| | | | |
|
|
| | | | | | 2,335,672 |
| | | | |
|
|
Building & Construction - Misc. — 0.1% |
Dycom Industries, Inc.† | | 32,800 | | | 368,016 |
| | | | |
|
|
Building Products - Air & Heating — 0.3% |
Lennox International, Inc. | | 30,500 | | | 1,094,340 |
| | | | |
|
|
Building Products - Cement — 0.0% |
US Concrete, Inc.† | | 69,300 | | | 107,415 |
| | | | |
|
|
Building Products - Doors & Windows — 0.2% |
Quanex Building Products Corp. | | 39,150 | | | 527,351 |
| | | | |
|
|
Building Products - Light Fixtures — 0.2% |
LSI Industries, Inc. | | 96,200 | | | 711,880 |
| | | | |
|
|
Building - Maintenance & Services — 0.0% |
Integrated Electrical Services, Inc.† | | 15,200 | | | 126,768 |
| | | | |
|
|
Building - Residential/Commercial — 0.0% |
Amrep Corp.† | | 6,500 | | | 76,505 |
| | | | |
|
|
Chemicals - Diversified — 0.3% |
Innophos Holdings, Inc. | | 45,900 | | | 876,231 |
| | | | |
|
|
Chemicals - Plastics — 1.0% |
A. Schulman, Inc. | | 14,600 | | | 293,314 |
PolyOne Corp.† | | 172,100 | | | 877,710 |
Spartech Corp. | | 206,700 | | | 2,385,318 |
| | | | |
|
|
| | | | | | 3,556,342 |
| | | | |
|
|
Chemicals - Specialty — 1.1% |
H.B. Fuller Co. | | 141,400 | | | 2,791,236 |
ICO, Inc.† | | 28,300 | | | 116,030 |
Minerals Technologies, Inc. | | 6,500 | | | 291,460 |
Zep, Inc. | | 29,450 | | | 470,611 |
| | | | |
|
|
| | | | | | 3,669,337 |
| | | | |
|
|
62
VALIC Company II Small Cap Value Fund
PORTFOLIO OF INVESTMENTS — August 31, 2009 — (continued)
| | | | | |
| | |
| Security Description | | Shares | | Market Value
(Note 2) |
|
COMMON STOCK (continued) | | | | | |
Circuit Boards — 0.3% |
DDi Corp.† | | 400 | | $ | 1,624 |
Park Electrochemical Corp. | | 54,100 | | | 1,165,314 |
| | | | |
|
|
| | | | | | 1,166,938 |
| | | | |
|
|
Coal — 0.0% |
Westmoreland Coal Co.† | | 6,500 | | | 55,250 |
| | | | |
|
|
Commerce — 0.0% | | | | | |
i2 Technologies, Inc.† | | 4,500 | | | 67,500 |
| | | | |
|
|
Commercial Services — 0.8% |
Alliance Data Systems Corp.† | | 2,500 | | | 138,900 |
ICT Group, Inc.† | | 6,700 | | | 73,700 |
PHH Corp.† | | 115,500 | | | 2,455,530 |
| | | | |
|
|
| | | | | | 2,668,130 |
| | | | |
|
|
Commercial Services - Finance — 1.4% |
Advance America Cash Advance Centers, Inc. | | 23,900 | | | 137,186 |
Coinstar, Inc.† | | 11,400 | | | 376,314 |
Deluxe Corp. | | 140,800 | | | 2,352,768 |
Dollar Financial Corp.† | | 95,648 | | | 1,667,145 |
Global Cash Access Holdings, Inc.† | | 15,000 | | | 108,750 |
Jackson Hewitt Tax Service, Inc. | | 53,200 | | | 297,388 |
| | | | |
|
|
| | | | | | 4,939,551 |
| | | | |
|
|
Communications Software — 0.1% |
SolarWinds, Inc.† | | 11,900 | | | 222,054 |
| | | | |
|
|
Computer Aided Design — 0.8% |
Aspen Technology, Inc.† | | 277,700 | | | 2,777,000 |
| | | | |
|
|
Computer Services — 0.4% |
CIBER, Inc.† | | 114,600 | | | 446,940 |
COMSYS IT Partners, Inc.† | | 20,200 | | | 151,096 |
Unisys Corp.† | | 294,500 | | | 718,580 |
| | | | |
|
|
| | | | | | 1,316,616 |
| | | | |
|
|
Computers - Integrated Systems — 0.0% |
Agilysys, Inc. | | 3,900 | | | 24,726 |
| | | | |
|
|
Computers - Memory Devices — 0.2% |
Imation Corp. | | 35,900 | | | 308,740 |
Quantum Corp.† | | 1,400 | | | 1,722 |
Silicon Storage Technology, Inc.† | | 155,500 | | | 284,565 |
| | | | |
|
|
| | | | | | 595,027 |
| | | | |
|
|
Computers - Periphery Equipment — 0.5% |
Electronics for Imaging, Inc.† | | 168,200 | | | 1,789,648 |
| | | | |
|
|
Consumer Products - Misc. — 3.1% |
American Greetings Corp., Class A | | 203,300 | | | 2,823,837 |
Blyth, Inc. | | 46,600 | | | 2,120,300 |
Central Garden and Pet Co., Class A† | | 81,100 | | | 892,100 |
Helen of Troy, Ltd.† | | 83,600 | | | 1,807,432 |
Jarden Corp.† | | 30,700 | | | 747,545 |
Prestige Brands Holdings, Inc.† | | 177,600 | | | 1,316,016 |
Tupperware Brands Corp. | | 28,300 | | | 1,046,817 |
| | | | |
|
|
| | | | | | 10,754,047 |
| | | | |
|
|
Containers - Metal/Glass — 0.3% |
Silgan Holdings, Inc. | | 23,300 | | | 1,132,846 |
| | | | |
|
|
Containers - Paper/Plastic — 0.9% |
Rock - Tenn Co., Class A | | 61,900 | | | 3,174,851 |
| | | | |
|
|
Data Processing/Management — 1.3% |
Acxiom Corp.† | | 140,700 | | | 1,283,184 |
CSG Systems International, Inc.† | | 165,500 | | | 2,494,085 |
Fair Isaac Corp. | | 28,600 | | | 637,780 |
| | | | |
|
|
| | | | | | 4,415,049 |
| | | | |
|
|
| | | | | |
| | |
| Security Description | | Shares | | Market Value
(Note 2) |
|
| | | | | | |
Distribution/Wholesale — 1.5% |
BlueLinx Holdings, Inc.† | | 18,600 | | $ | 100,998 |
Houston Wire & Cable Co. | | 4,800 | | | 55,248 |
Tech Data Corp.† | | 40,900 | | | 1,558,290 |
United Stationers, Inc.† | | 27,900 | | | 1,274,751 |
WESCO International, Inc.† | | 94,000 | | | 2,258,820 |
| | | | |
|
|
| | | | | | 5,248,107 |
| | | | |
|
|
Diversified Manufacturing Operations — 2.8% |
Acuity Brands, Inc. | | 59,000 | | | 1,894,490 |
GenTek, Inc.† | | 9,400 | | | 257,842 |
GP Strategies Corp.† | | 125 | | | 919 |
Koppers Holdings, Inc. | | 33,000 | | | 900,900 |
Leggett & Platt, Inc. | | 145,000 | | | 2,646,250 |
Standex International Corp. | | 43,100 | | | 737,441 |
Teleflex, Inc. | | 33,700 | | | 1,526,610 |
Tredegar Corp. | | 121,200 | | | 1,815,576 |
| | | | |
|
|
| | | | | | 9,780,028 |
| | | | |
|
|
E - Services/Consulting — 0.1% |
Perficient, Inc.† | | 42,100 | | | 326,696 |
| | | | |
|
|
Educational Software — 0.1% |
Rosetta Stone, Inc.† | | 10,200 | | | 224,910 |
| | | | |
|
|
Electric - Distribution — 0.0% |
Florida Public Utilities Co. | | 2,100 | | | 26,460 |
| | | | |
|
|
Electric - Integrated — 3.5% |
Avista Corp. | | 178,800 | | | 3,490,176 |
Black Hills Corp. | | 34,600 | | | 885,068 |
El Paso Electric Co.† | | 154,000 | | | 2,608,760 |
NorthWestern Corp. | | 146,600 | | | 3,516,934 |
Unisource Energy Corp. | | 52,600 | | | 1,538,024 |
| | | | |
|
|
| | | | | | 12,038,962 |
| | | | |
|
|
Electronic Components - Misc. — 0.9% |
Benchmark Electronics, Inc.† | | 55,100 | | | 903,640 |
CTS Corp. | | 43,500 | | | 385,410 |
Methode Electronics, Inc. | | 115,400 | | | 995,902 |
OSI Systems, Inc.† | | 13,200 | | | 222,684 |
Stoneridge, Inc.† | | 24,200 | | | 128,744 |
Technitrol, Inc. | | 61,000 | | | 502,640 |
| | | | |
|
|
| | | | | | 3,139,020 |
| | | | |
|
|
Electronic Components - Semiconductors — 0.5% |
DSP Group, Inc.† | | 57,200 | | | 451,880 |
Lattice Semiconductor Corp.† | | 160,000 | | | 393,600 |
MIPS Technologies, Inc.† | | 52,700 | | | 184,977 |
Semtech Corp.† | | 28,100 | | | 513,387 |
Zoran Corp.† | | 6,800 | | | 75,140 |
| | | | |
|
|
| | | | | | 1,618,984 |
| | | | |
|
|
Energy - Alternate Sources — 0.0% |
Headwaters, Inc.† | | 28,500 | | | 109,440 |
| | | | |
|
|
Engineering/R&D Services — 1.1% |
EMCOR Group, Inc.† | | 158,500 | | | 3,672,445 |
| | | | |
|
|
Enterprise Software/Service — 0.8% |
MedAssets, Inc.† | | 18,200 | | | 406,406 |
MicroStrategy, Inc., Class A† | | 19,100 | | | 1,179,425 |
Open Text Corp.† | | 4,022 | | | 141,454 |
Sybase, Inc.† | | 25,500 | | | 888,675 |
| | | | |
|
|
| | | | | | 2,615,960 |
| | | | |
|
|
Entertainment Software — 0.2% |
Take - Two Interactive Software, Inc. | | 64,200 | | | 674,100 |
| | | | |
|
|
63
VALIC Company II Small Cap Value Fund
PORTFOLIO OF INVESTMENTS — August 31, 2009 — (continued)
| | | | | |
| | |
| Security Description | | Shares | | Market Value
(Note 2) |
|
COMMON STOCK (continued) | | | | | |
Finance - Auto Loans — 0.4% |
AmeriCredit Corp.† | | 54,900 | | $ | 947,574 |
Credit Acceptance Corp.† | | 10,026 | | | 305,893 |
| | | | |
|
|
| | | | | | 1,253,467 |
| | | | |
|
|
Finance - Consumer Loans — 1.2% |
Ocwen Financial Corp.† | | 71,400 | | | 738,990 |
World Acceptance Corp.† | | 132,000 | | | 3,435,960 |
| | | | |
|
|
| | | | | | 4,174,950 |
| | | | |
|
|
Finance - Credit Card — 0.2% |
Compucredit Holdings Corp.† | | 156,900 | | | 685,653 |
| | | | |
|
|
Finance - Investment Banker/Broker — 1.2% | | | | | |
Investment Technology Group, Inc.† | | 44,200 | | | 1,089,088 |
Oppenheimer Holdings, Inc. | | 28,900 | | | 746,198 |
Piper Jaffray Cos., Inc.† | | 44,800 | | | 2,270,464 |
| | | | |
|
|
| | | | | | 4,105,750 |
| | | | |
|
|
Finance - Leasing Companies — 0.3% |
Financial Federal Corp. | | 36,800 | | | 861,856 |
| | | | |
|
|
Financial Guarantee Insurance — 0.4% |
Ambac Financial Group, Inc. | | 86,700 | | | 152,592 |
MGIC Investment Corp.† | | 97,900 | | | 795,927 |
PMI Group, Inc. | | 90,200 | | | 301,268 |
| | | | |
|
|
| | | | | | 1,249,787 |
| | | | |
|
|
Food - Canned — 0.3% |
Del Monte Foods Co. | | 104,900 | | | 1,100,401 |
| | | | |
|
|
Food - Misc. — 0.1% |
M&F Worldwide Corp.† | | 11,600 | | | 227,592 |
| | | | |
|
|
Food - Wholesale/Distribution — 0.4% |
Nash Finch Co. | | 47,600 | | | 1,291,864 |
| | | | |
|
|
Footwear & Related Apparel — 0.3% |
Timberland Co., Class A† | | 47,200 | | | 611,712 |
Wolverine World Wide, Inc. | | 15,700 | | | 391,087 |
| | | | |
|
|
| | | | | | 1,002,799 |
| | | | |
|
|
Funeral Services & Related Items — 0.3% |
Stewart Enterprises, Inc., Class A | | 171,700 | | | 911,727 |
| | | | |
|
|
Gambling (Non - Hotel) — 0.1% |
Isle of Capri Casinos, Inc.† | | 26,200 | | | 268,026 |
| | | | |
|
|
Gas - Distribution — 2.3% |
National Fuel Gas Co. | | 4,500 | | | 201,105 |
New Jersey Resources Corp. | | 36,500 | | | 1,341,375 |
Nicor, Inc. | | 105,900 | | | 3,835,698 |
Piedmont Natural Gas, Inc. | | 22,000 | | | 528,440 |
Southwest Gas Corp. | | 77,800 | | | 1,894,430 |
UGI Corp. | | 5,900 | | | 150,509 |
| | | | |
|
|
| | | | | | 7,951,557 |
| | | | |
|
|
Home Furnishings — 0.2% |
Furniture Brands International, Inc.† | | 73,800 | | | 412,542 |
Tempur - Pedic International, Inc.† | | 26,600 | | | 393,680 |
| | | | |
|
|
| | | | | | 806,222 |
| | | | |
|
|
Hotel/Motels — 0.2% |
Wyndham Worldwide Corp. | | 44,300 | | | 671,145 |
| | | | |
|
|
Human Resources — 0.6% |
Emergency Medical Services Corp., Class A† | | 9,800 | | | 444,430 |
Kforce, Inc.† | | 42,200 | | | 472,640 |
MPS Group, Inc.† | | 31,400 | | | 309,604 |
Spherion Corp.†† | | 167,000 | | | 905,140 |
| | | | |
|
|
| | | | | | 2,131,814 |
| | | | |
|
|
| | | | | |
| | |
| Security Description | | Shares | | Market Value
(Note 2) |
|
| | | | | | |
Identification Systems — 0.0% |
Checkpoint Systems, Inc.† | | 1,900 | | $ | 31,673 |
| | | | |
|
|
Industrial Automated/Robotic — 0.4% |
Cognex Corp. | | 80,400 | | | 1,288,008 |
| | | | |
|
|
Insurance Brokers — 0.1% |
Crawford & Co., Class B† | | 69,200 | | | 320,396 |
| | | | |
|
|
Insurance - Life/Health — 2.3% |
American Equity Investment Life Holding Co. | | 344,900 | | | 2,783,343 |
Conseco, Inc.† | | 213,200 | | | 914,628 |
Delphi Financial Group, Inc., Class A | | 112,750 | | | 2,634,967 |
FBL Financial Group, Inc., Class A | | 12,000 | | | 204,000 |
StanCorp Financial Group, Inc. | | 33,300 | | | 1,260,405 |
| | | | |
|
|
| | | | | | 7,797,343 |
| | | | |
|
|
Insurance - Multi - line — 0.6% |
Horace Mann Educators Corp. | | 171,100 | | | 2,095,975 |
| | | | |
|
|
Insurance - Property/Casualty — 2.1% |
Arch Capital Group, Ltd.† | | 17,400 | | | 1,130,478 |
First Mercury Financial Corp. | | 18,300 | | | 265,167 |
Harleysville Group, Inc. | | 87,300 | | | 2,829,393 |
Meadowbrook Insurance Group, Inc. | | 52,600 | | | 419,222 |
PMA Capital Corp., Class A† | | 42,000 | | | 231,420 |
ProAssurance Corp.† | | 30,000 | | | 1,575,000 |
Selective Insurance Group, Inc. | | 49,700 | | | 845,894 |
| | | | |
|
|
| | | | | | 7,296,574 |
| | | | |
|
|
Insurance - Reinsurance — 1.3% |
Aspen Insurance Holdings, Ltd. | | 14,000 | | | 355,600 |
Axis Capital Holdings, Ltd. | | 33,500 | | | 1,021,080 |
Platinum Underwriters Holdings, Ltd. | | 86,500 | | | 3,135,625 |
| | | | |
|
|
| | | | | | 4,512,305 |
| | | | |
|
|
Internet Application Software — 0.0% |
S1 Corp.† | | 24,200 | | | 152,218 |
| | | | |
|
|
Internet Infrastructure Equipment — 0.2% |
Avocent Corp.† | | 45,200 | | | 737,664 |
| | | | |
|
|
Internet Infrastructure Software — 0.4% |
TIBCO Software, Inc.† | | 145,200 | | | 1,287,924 |
| | | | |
|
|
Investment Companies — 0.1% |
PennyMac Mortgage Investment Trust† | | 15,700 | | | 310,075 |
| | | | |
|
|
Investment Management/Advisor Services — 0.7% |
Affiliated Managers Group, Inc.† | | 20,500 | | | 1,339,265 |
Federated Investors, Inc., Class B | | 16,200 | | | 425,250 |
Janus Capital Group, Inc. | | 34,900 | | | 443,928 |
Pzena Investment Management, Inc., Class A | | 19,900 | | | 136,514 |
| | | | |
|
|
| | | | | | 2,344,957 |
| | | | |
|
|
Lasers - System/Components — 0.7% |
Coherent, Inc.† | | 101,500 | | | 2,269,540 |
Newport Corp.† | | 3,500 | | | 24,815 |
| | | | |
|
|
| | | | | | 2,294,355 |
| | | | |
|
|
Leisure Products — 0.1% |
Brunswick Corp. | | 27,500 | | | 255,475 |
| | | | |
|
|
Linen Supply & Related Items — 0.1% |
G&K Services, Inc., Class A | | 18,600 | | | 437,100 |
| | | | |
|
|
Machinery - Farming — 0.6% |
AGCO Corp.† | | 66,300 | | | 2,071,212 |
| | | | |
|
|
64
VALIC Company II Small Cap Value Fund
PORTFOLIO OF INVESTMENTS — August 31, 2009 — (continued)
| | | | | |
| | |
| Security Description | | Shares | | Market Value
(Note 2) |
|
COMMON STOCK (continued) | | | | | |
Machinery - General Industrial — 0.9% |
Applied Industrial Technologies, Inc. | | 81,400 | | $ | 1,679,282 |
Wabtec Corp. | | 41,500 | | | 1,554,175 |
| | | | |
|
|
| | | | | | 3,233,457 |
| | | | |
|
|
Machinery - Material Handling — 0.3% |
NACCO Industries, Inc., Class A | | 17,700 | | | 1,035,450 |
| | | | |
|
|
Machinery - Pumps — 0.0% |
Tecumseh Products Co., Class A† | | 12,400 | | | 112,220 |
| | | | |
|
|
Medical Imaging Systems — 0.2% |
Vital Images, Inc.† | | 57,200 | | | 727,012 |
| | | | |
|
|
Medical Information Systems — 0.0% |
Medidata Solutions, Inc.† | | 8,700 | | | 137,982 |
| | | | |
|
|
Medical Products — 0.6% |
Cantel Medical Corp.† | | 9,100 | | | 122,304 |
Invacare Corp. | | 97,000 | | | 2,101,020 |
| | | | |
|
|
| | | | | | 2,223,324 |
| | | | |
|
|
Medical - Biomedical/Gene — 0.5% |
Arena Pharmaceuticals, Inc.† | | 39,300 | | | 182,745 |
ARIAD Pharmaceuticals, Inc.† | | 82,900 | | | 181,551 |
Arqule, Inc.† | | 38,100 | | | 206,502 |
Halozyme Therapeutics, Inc.† | | 18,700 | | | 139,128 |
Harvard Bioscience, Inc.† | | 37,600 | | | 127,088 |
Incyte Corp.† | | 42,500 | | | 280,075 |
InterMune, Inc.† | | 7,200 | | | 109,296 |
Protalix BioTherapeutics, Inc.† | | 37,200 | | | 238,080 |
Seattle Genetics, Inc.† | | 21,300 | | | 260,925 |
| | | | |
|
|
| | | | | | 1,725,390 |
| | | | |
|
|
Medical - Drugs — 0.6% |
Auxilium Pharmaceuticals, Inc.† | | 7,050 | | | 202,969 |
Cumberland Pharmaceuticals, Inc.† | | 31,000 | | | 518,940 |
Pharmasset, Inc.† | | 24,500 | | | 452,270 |
PharMerica Corp.† | | 25,600 | | | 513,280 |
Rigel Pharmaceuticals, Inc.† | | 36,200 | | | 255,210 |
Valeant Pharmaceuticals International† | | 5,700 | | | 147,573 |
XenoPort, Inc.† | | 7,000 | | | 127,610 |
| | | | |
|
|
| | | | | | 2,217,852 |
| | | | |
|
|
Medical - Generic Drugs — 0.3% |
Perrigo Co. | | 29,100 | | | 859,032 |
| | | | |
|
|
Medical - HMO — 0.7% |
Magellan Health Services, Inc.† | | 78,700 | | | 2,525,483 |
| | | | |
|
|
Medical - Outpatient/Home Medical — 0.5% |
Gentiva Health Services, Inc.† | | 73,300 | | | 1,616,265 |
| | | | |
|
|
Metal Processors & Fabrication — 1.2% |
Ampco - Pittsburgh Corp. | | 28,900 | | | 690,132 |
CIRCOR International, Inc. | | 9,600 | | | 247,776 |
Mueller Industries, Inc. | | 13,600 | | | 328,984 |
Worthington Industries, Inc. | | 205,600 | | | 2,707,752 |
| | | | |
|
|
| | | | | | 3,974,644 |
| | | | |
|
|
Metal - Iron — 0.1% |
Globe Specialty Metals, Inc.† | | 32,100 | | | 262,899 |
| | | | |
|
|
Multilevel Direct Selling — 0.1% |
Nu Skin Enterprises, Inc., Class A | | 27,400 | | | 472,650 |
| | | | |
|
|
Multimedia — 0.1% |
Journal Communications, Inc., Class A | | 125,300 | | | 463,610 |
| | | | |
|
|
| | | | | |
| | |
| Security Description | | Shares | | Market Value
(Note 2) |
|
| | | | | | |
Networking Products — 0.8% |
3Com Corp.† | | 318,200 | | $ | 1,384,170 |
Black Box Corp. | | 55,800 | | | 1,397,232 |
LogMeIn, Inc.† | | 7,600 | | | 123,880 |
| | | | |
|
|
| | | | | | 2,905,282 |
| | | | |
|
|
Office Furnishings - Original — 0.7% |
HNI Corp. | | 61,000 | | | 1,310,280 |
Knoll, Inc. | | 28,300 | | | 272,529 |
Steelcase, Inc., Class A | | 131,000 | | | 818,750 |
| | | | |
|
|
| | | | | | 2,401,559 |
| | | | |
|
|
Office Supplies & Forms — 0.3% |
ACCO Brands Corp.† | | 99,800 | | | 558,880 |
The Standard Register Co. | | 78,800 | | | 340,416 |
| | | | |
|
|
| | | | | | 899,296 |
| | | | |
|
|
Oil & Gas Drilling — 0.9% |
Hercules Offshore, Inc.† | | 678,100 | | | 3,119,260 |
| | | | |
|
|
Oil Companies - Exploration & Production — 1.4% |
Brigham Exploration Co.† | | 6,400 | | | 41,920 |
Delta Petroleum Corp.† | | 14,700 | | | 26,460 |
Endeavour International Corp.† | | 188,600 | | | 209,346 |
Gulfport Energy Corp.† | | 2,800 | | | 21,000 |
Mariner Energy, Inc.† | | 37,591 | | | 455,979 |
PrimeEnergy Corp.† | | 600 | | | 16,428 |
Stone Energy Corp.† | | 85,900 | | | 1,096,084 |
Swift Energy Co.† | | 25,900 | | | 527,583 |
Vaalco Energy, Inc. | | 238,200 | | | 1,124,304 |
W&T Offshore, Inc. | | 143,100 | | | 1,413,828 |
| | | | |
|
|
| | | | | | 4,932,932 |
| | | | |
|
|
Oil Field Machinery & Equipment — 0.1% |
Complete Production Services, Inc.† | | 19,600 | | | 176,400 |
| | | | |
|
|
Oil - Field Services — 1.6% |
Cal Dive International, Inc.† | | 103,200 | | | 1,076,376 |
Helix Energy Solutions Group, Inc.† | | 71,600 | | | 837,720 |
Key Energy Services, Inc.† | | 517,800 | | | 3,702,270 |
| | | | |
|
|
| | | | | | 5,616,366 |
| | | | |
|
|
Paper & Related Products — 0.7% |
Buckeye Technologies, Inc.† | | 167,600 | | | 1,689,408 |
Neenah Paper, Inc. | | 58,900 | | | 668,515 |
| | | | |
|
|
| | | | | | 2,357,923 |
| | | | |
|
|
Pharmacy Services — 0.5% |
Omnicare, Inc. | | 76,600 | | | 1,753,374 |
| | | | |
|
|
Pipelines — 0.1% |
ONEOK, Inc. | | 7,900 | | | 267,652 |
| | | | |
|
|
Platinum — 0.1% |
Stillwater Mining Co.† | | 53,600 | | | 343,576 |
| | | | |
|
|
Printing - Commercial — 0.2% |
Valassis Communications, Inc.† | | 51,000 | | | 800,700 |
| | | | |
|
|
Publishing - Books — 0.1% |
John Wiley & Sons, Inc., Class A | | 15,500 | | | 497,085 |
| | | | |
|
|
Radio — 0.1% |
Cumulus Media, Inc., Class A† | | 111,500 | | | 154,985 |
Entercom Communications Corp., Class A† | | 56,200 | | | 274,818 |
| | | | |
|
|
| | | | | | 429,803 |
| | | | |
|
|
65
VALIC Company II Small Cap Value Fund
PORTFOLIO OF INVESTMENTS — August 31, 2009 — (continued)
| | | | | |
| | |
| Security Description | | Shares | | Market Value
(Note 2) |
|
COMMON STOCK (continued) | | | | | |
Real Estate Investment Trusts — 9.6% |
Anworth Mortgage Asset Corp. | | 255,800 | | $ | 1,915,942 |
Apartment Investment & Management Co., Class A | | 101,603 | | | 1,236,508 |
Ashford Hospitality Trust, Inc. | | 122,100 | | | 376,068 |
Brandywine Realty Trust | | 19,146 | | | 203,139 |
CBL & Associates Properties, Inc. | | 90,100 | | | 844,237 |
Cypress Sharpridge Investments, Inc.† | | 25,400 | | | 355,600 |
DCT Industrial Trust, Inc. | | 265,300 | | | 1,400,784 |
Developers Diversified Realty Corp. | | 165,900 | | | 1,300,656 |
DiamondRock Hospitality Co.† | | 125,100 | | | 856,935 |
Dupont Fabros Technology, Inc. | | 22,300 | | | 291,684 |
Education Realty Trust, Inc. | | 110,200 | | | 644,670 |
Home Properties, Inc. | | 45,800 | | | 1,739,026 |
Hospitality Properties Trust | | 81,000 | | | 1,475,820 |
Invesco Mortgage Capital, Inc.† | | 8,100 | | | 162,891 |
LaSalle Hotel Properties | | 41,400 | | | 685,170 |
Lexington Realty Trust | | 356,157 | | | 1,659,692 |
LTC Properties, Inc. | | 104,000 | | | 2,648,880 |
MFA Mtg. Investments, Inc. | | 380,200 | | | 3,011,184 |
Mission West Properties, Inc. | | 95,500 | | | 658,950 |
Pennsylvania Real Estate Investment Trust | | 6,000 | | | 39,780 |
PS Business Parks, Inc. | | 68,400 | | | 3,620,412 |
Ramco - Gershenson Properties Trust | | 104,200 | | | 1,096,184 |
Senior Housing Properties Trust | | 109,800 | | | 2,202,588 |
Strategic Hotels & Resorts, Inc. | | 44,100 | | | 60,417 |
Sunstone Hotel Investors, Inc. | | 224,072 | | | 1,402,691 |
Taubman Centers, Inc. | | 52,000 | | | 1,646,840 |
Universal Health Realty Income Trust | | 44,200 | | | 1,484,678 |
| | | | |
|
|
| | | | | | 33,021,426 |
| | | | |
|
|
Real Estate Operations & Development — 0.1% |
Government Properties Income Trust† | | 11,100 | | | 236,763 |
| | | | |
|
|
Recycling — 0.2% |
Metalico, Inc.† | | 166,900 | | | 677,614 |
| | | | |
|
|
Rental Auto/Equipment — 0.2% |
Electro Rent Corp. | | 17,800 | | | 181,382 |
Rent - A - Center, Inc.† | | 28,900 | | | 570,197 |
| | | | |
|
|
| | | | | | 751,579 |
| | | | |
|
|
Research & Development — 0.1% |
Kendle International, Inc.† | | 33,900 | | | 445,446 |
| | | | |
|
|
Retail - Apparel/Shoe — 1.9% |
Cache, Inc.† | | 66,900 | | | 349,887 |
Cato Corp., Class A | | 29,600 | | | 505,568 |
Charlotte Russe Holding, Inc.† | | 99,900 | | | 1,737,261 |
Charming Shoppes, Inc.† | | 297,200 | | | 1,557,328 |
Pacific Sunwear of California, Inc.† | | 191,800 | | | 847,756 |
The Children’s Place Retail Stores, Inc.† | | 26,800 | | | 812,844 |
The Finish Line, Inc., Class A | | 106,100 | | | 875,325 |
| | | | |
|
|
| | | | | | 6,685,969 |
| | | | |
|
|
Retail - Automobile — 0.4% |
Sonic Automotive, Inc. | | 102,000 | | | 1,307,640 |
| | | | |
|
|
Retail - Bookstores — 0.5% |
Barnes & Noble, Inc. | | 49,800 | | | 1,030,362 |
Borders Group, Inc.† | | 166,000 | | | 526,220 |
| | | | |
|
|
| | | | | | 1,556,582 |
| | | | |
|
|
Retail - Convenience Store — 0.1% |
The Pantry, Inc.† | | 23,100 | | | 349,965 |
| | | | |
|
|
| | | | | |
| | |
| Security Description | | Shares | | Market Value
(Note 2) |
|
| | | | | | |
Retail - Discount — 0.4% |
Big Lots, Inc.† | | 23,700 | | $ | 602,454 |
Fred’s, Inc. | | 48,000 | | | 627,840 |
| | | | |
|
|
| | | | | | 1,230,294 |
| | | | |
|
|
Retail - Hair Salons — 0.3% |
Regis Corp. | | 59,300 | | | 959,474 |
| | | | |
|
|
Retail - Home Furnishings — 0.2% |
Haverty Furniture Cos., Inc.† | | 57,500 | | | 671,025 |
| | | | |
|
|
Retail - Jewelry — 0.1% |
Signet Jewelers, Ltd. | | 14,500 | | | 351,335 |
| | | | |
|
|
Retail - Leisure Products — 0.2% |
MarineMax, Inc.† | | 111,800 | | | 788,190 |
| | | | |
|
|
Retail - Perfume & Cosmetics — 0.2% |
Sally Beauty Holdings, Inc.† | | 93,700 | | | 666,207 |
| | | | |
|
|
Retail - Regional Department Stores — 0.2% |
Dillard’s, Inc., Class A | | 72,300 | | | 824,943 |
| | | | |
|
|
Retail - Restaurants — 0.7% |
Denny’s Corp.† | | 270,700 | | | 690,285 |
O’Charley’s, Inc. | | 117,300 | | | 897,345 |
Ruby Tuesday, Inc.† | | 84,000 | | | 613,200 |
Ruth’s Chris Steak House, Inc.† | | 90,100 | | | 356,796 |
| | | | |
|
|
| | | | | | 2,557,626 |
| | | | |
|
|
Retail - Toy Stores — 0.1% |
Build - A - Bear Workshop, Inc.† | | 67,700 | | | 316,159 |
| | | | |
|
|
Retirement/Aged Care — 0.1% |
Brookdale Senior Living, Inc. | | 25,300 | | | 402,017 |
| | | | |
|
|
Rubber/Plastic Products — 0.2% |
Myers Industries, Inc. | | 72,900 | | | 747,225 |
| | | | |
|
|
Satellite Telecom — 0.2% |
DigitalGlobe, Inc.† | | 40,000 | | | 802,400 |
| | | | |
|
|
Savings & Loans/Thrifts — 0.6% |
Astoria Financial Corp. | | 81,500 | | | 839,450 |
First Financial Holdings, Inc. | | 10,600 | | | 190,164 |
First Niagara Financial Group, Inc. | | 61,400 | | | 803,112 |
Waterstone Financial, Inc.† | | 11,300 | | | 54,240 |
WSFS Financial Corp. | | 9,900 | | | 274,428 |
| | | | |
|
|
| | | | | | 2,161,394 |
| | | | |
|
|
Schools — 0.1% |
Bridgepoint Education, Inc.† | | 21,800 | | | 400,466 |
| | | | |
|
|
Seismic Data Collection — 0.0% |
T.G.C. Industries, Inc.† | | 28,700 | | | 110,782 |
| | | | |
|
|
Semiconductor Components - Integrated Circuits — 0.8% |
Cirrus Logic, Inc.† | | 354,500 | | | 1,758,320 |
Emulex Corp.† | | 60,500 | | | 586,245 |
Integrated Device Technology, Inc.† | | 75,500 | | | 515,665 |
| | | | |
|
|
| | | | | | 2,860,230 |
| | | | |
|
|
Semiconductor Equipment — 0.6% |
Brooks Automation, Inc.† | | 71,800 | | | 466,700 |
Cohu, Inc. | | 29,900 | | | 354,913 |
Novellus Systems, Inc.† | | 60,600 | | | 1,161,096 |
Rudolph Technologies, Inc.† | | 20,200 | | | 129,684 |
| | | | |
|
|
| | | | | | 2,112,393 |
| | | | |
|
|
66
VALIC Company II Small Cap Value Fund
PORTFOLIO OF INVESTMENTS — August 31, 2009 — (continued)
| | | | | |
| | |
| Security Description | | Shares | | Market Value
(Note 2) |
|
COMMON STOCK (continued) | | | | | |
Software Tools — 0.0% |
Emdeon, Inc. Class A† | | 9,100 | | $ | 158,704 |
| | | | |
|
|
Steel Pipe & Tube — 0.2% |
Mueller Water Products, Inc., Class A | | 152,400 | | | 701,040 |
| | | | |
|
|
Telecom Services — 0.2% |
Consolidated Communications Holdings, Inc. | | 17,485 | | | 246,538 |
RCN Corp.† | | 62,800 | | | 588,436 |
| | | | |
|
|
| | | | | | 834,974 |
| | | | |
|
|
Telecommunication Equipment — 0.8% |
Arris Group, Inc.† | | 100,800 | | | 1,336,608 |
CommScope, Inc.† | | 48,900 | | | 1,318,344 |
| | | | |
|
|
| | | | | | 2,654,952 |
| | | | |
|
|
Telephone - Integrated — 0.7% |
CenturyTel, Inc. | | 36,000 | | | 1,160,280 |
Frontier Communications Corp. | | 171,756 | | | 1,221,185 |
| | | | |
|
|
| | | | | | 2,381,465 |
| | | | |
|
|
Television — 0.3% |
Belo Corp., Class A | | 102,000 | | | 340,680 |
Sinclair Broadcast Group, Inc., Class A | | 270,900 | | | 766,647 |
| | | | |
|
|
| | | | | | 1,107,327 |
| | | | |
|
|
Theaters — 0.0% |
Carmike Cinemas, Inc.† | | 7,000 | | | 70,980 |
| | | | |
|
|
Therapeutics — 0.2% |
Cypress Bioscience, Inc.† | | 20,800 | | | 144,768 |
Nabi Biopharmaceuticals† | | 28,700 | | | 87,535 |
Onyx Pharmaceuticals, Inc.† | | 10,300 | | | 330,321 |
| | | | |
|
|
| | | | | | 562,624 |
| | | | |
|
|
Toys — 0.7% |
Hasbro, Inc. | | 60,800 | | | 1,726,112 |
Jakks Pacific, Inc.† | | 50,400 | | | 675,360 |
| | | | |
|
|
| | | | | | 2,401,472 |
| | | | |
|
|
Transport - Air Freight — 0.1% |
Atlas Air Worldwide Holdings, Inc.† | | 15,400 | | | 384,076 |
| | | | |
|
|
Transport - Marine — 1.0% |
Frontline, Ltd. | | 12,700 | | | 282,829 |
General Maritime Corp. | | 42,626 | | | 338,877 |
Horizon Lines, Inc., Class A | | 257,800 | | | 1,397,276 |
International Shipholding Corp. | | 30,000 | | | 899,400 |
Overseas Shipholding Group, Inc. | | 12,900 | | | 456,273 |
| | | | |
|
|
| | | | | | 3,374,655 |
| | | | |
|
|
Transport - Services — 0.2% |
Pacer International, Inc. | | 136,300 | | | 564,282 |
| | | | |
|
|
| | | | | | | |
| | |
| Security Description | | Shares/
Principal
Amount | | | Market Value
(Note 2) |
|
| | | | | | | | |
Transport - Truck — 0.9% |
Arkansas Best Corp. | | | 29,700 | | | $ | 947,430 |
Celadon Group, Inc.† | | | 25,900 | | | | 253,561 |
Heartland Express, Inc. | | | 20,700 | | | | 293,112 |
Saia, Inc.† | | | 43,100 | | | | 762,870 |
Werner Enterprises, Inc. | | | 39,200 | | | | 685,216 |
| | | | | | |
|
|
| | | | | | | | 2,942,189 |
| | | | | | |
|
|
Water — 0.2% |
American Water Works Co. | | | 11,200 | | | | 225,120 |
California Water Service Group | | | 16,600 | | | | 617,852 |
| | | | | | |
|
|
| | | | | | | | 842,972 |
| | | | | | |
|
|
Web Hosting/Design — 0.2% |
Web.Com Group, Inc.† | | | 93,900 | | | | 512,694 |
| | | | | | |
|
|
Web Portals/ISP — 0.1% |
United Online, Inc. | | | 68,800 | | | | 481,600 |
| | | | | | |
|
|
Wire & Cable Products — 0.1% |
Insteel Industries, Inc. | | | 18,000 | | | | 205,560 |
| | | | | | |
|
|
Wireless Equipment — 0.1% |
InterDigital, Inc.† | | | 8,400 | | | | 176,064 |
| | | | | | |
|
|
Total Common Stock | | | | | | | |
(cost $364,514,823) | | | | | | | 334,262,914 |
| | | | | | |
|
|
U.S. GOVERNMENT TREASURIES — 0.5% |
United States Treasury Notes — 0.5% |
3.13% due 11/30/09(1)
(cost $1,539,201) | | $ | 1,505,000 | | | | 1,515,758 |
| | | | | | |
|
|
Total Long-Term Investment Securities | | | | |
(cost $366,054,024) | | | | | | | 335,778,672 |
| | | | | | |
|
|
REPURCHASE AGREEMENT — 2.8% |
Agreement with State Street Bank & Trust Co., bearing interest at 0.01%, dated 08/31/09, to be repurchased 09/01/09 in the amount of $9,715,000 and collateralized by $10,015,000 of United States Treasury Bills, bearing interest at 0.15% due 12/31/09 and having approximate value of $10,008,991
(cost $9,715,000) | | | 9,715,000 | | | | 9,715,000 |
| | | | | | |
|
|
TOTAL INVESTMENTS | | | | | | | |
(cost $375,769,024)(2) | | | 100.0 | % | | | 345,493,672 |
Other assets less liabilities | | | 0.0 | | | | 57,732 |
| | |
|
|
| |
|
|
NET ASSETS — | | | 100.0 | % | | $ | 345,551,404 |
| | |
|
|
| |
|
|
| † | Non-income producing security |
| (1) | The security or a portion thereof was pledged as collateral to cover margin requirements for open futures contracts. |
| (2) | See Note 5 for cost of investments on a tax basis. |
| | | | | | | | | | | | | | | |
| Open Futures Contracts | | | | | | |
Number of
Contracts | | Type | | Description | | Expiration
Month | | Market
Value at
Trade Date | | Market
Value as of
August 31, 2009 | | Unrealized
Appreciation
(Depreciation) |
| 186 | | Long | | Russell 2000 Mini Index | | September 2009 | | $ | 9,843,631 | | $ | 10,633,620 | | $ | 789,989 |
| | | | | | | | | | | | | | |
|
|
67
VALIC Company II Small Cap Value Fund
PORTFOLIO OF INVESTMENTS — August 31, 2009 — (continued)
The following is a summary of the inputs used to value the Fund’s net assets as of August 31, 2009 (see Note 2):
| | | | | | | | | | | | |
| | | Level 1 -
Unadjusted
Quoted
Prices
| | Level 2 -
Other
Observable
Inputs
| | Level 3 -
Significant
Unobservable
Inputs
| | Total
|
Long-Term Investment Securities: | | | | | | | | | | | | |
Common Stock: | | | | | | | | | | | | |
Banks — Commercial | | $ | 34,306,923 | | $ | – | | $ | – | | $ | 34,306,923 |
Real Estate Investment Trust | | | 33,021,426 | | | – | | | – | | | 33,021,426 |
Other Industries* | | | 266,934,565 | | | – | | | – | | | 266,934,565 |
U.S. Government Treasuries | | | 1,515,758 | | | – | | | – | | | 1,515,758 |
Repurchase Agreement | | | – | | | 9,715,000 | | | – | | | 9,715,000 |
Other Financial Instruments:† | | | | | | | | | | | | |
Futures Contracts — Appreciation | | | 789,989 | | | – | | | – | | | 789,989 |
| | |
|
| |
|
| |
|
| |
|
|
Total | | $ | 336,568,661 | | $ | 9,715,000 | | $ | – | | $ | 346,283,661 |
| | |
|
| |
|
| |
|
| |
|
|
| * | Sum of all other industries each of which individually has an aggregate market value of less than 5% of net assets. |
| † | Other financial instruments are derivative instruments not reflected in the Portfolio of Investments, such as futures, forward and swap contracts, which are valued at the unrealized appreciation (depreciation) on the instrument. |
See Notes to Financial Statements
68
VALIC Company II Socially Responsible Fund
PORTFOLIO PROFILE — August 31, 2009 (Unaudited)
Industry Allocation*
| | | |
Medical — Drugs | | 7.0 | % |
Diversified Banking Institutions | | 5.9 | |
Computers | | 4.9 | |
Oil Companies — Exploration & Production | | 4.6 | |
Commercial Paper | | 3.7 | |
Applications Software | | 3.2 | |
Multimedia | | 2.9 | |
Wireless Equipment | | 2.4 | |
Medical — Biomedical/Gene | | 2.4 | |
Retail — Drug Store | | 2.3 | |
Networking Products | | 2.3 | |
Industrial Gases | | 2.2 | |
Medical Instruments | | 2.2 | |
Beverages — Non-alcoholic | | 2.2 | |
Oil — Field Services | | 2.0 | |
Enterprise Software/Service | | 2.0 | |
Food — Misc. | | 1.9 | |
Web Portals/ISP | | 1.9 | |
Telephone — Integrated | | 1.8 | |
Retail — Discount | | 1.8 | |
Retail — Restaurants | | 1.8 | |
Pipelines | | 1.8 | |
Banks — Super Regional | | 1.8 | |
Electric — Integrated | | 1.7 | |
Commercial Services — Finance | | 1.7 | |
Consumer Products — Misc. | | 1.6 | |
Cosmetics & Toiletries | | 1.5 | |
Diversified Manufacturing Operations | | 1.4 | |
Insurance — Property/Casualty | | 1.4 | |
Oil Companies — Integrated | | 1.4 | |
Banks — Fiduciary | | 1.4 | |
Transport — Rail | | 1.2 | |
Medical — HMO | | 1.2 | |
Insurance — Multi-line | | 1.1 | |
Machinery — Construction & Mining | | 0.9 | |
Metal Processors & Fabrication | | 0.9 | |
Real Estate Investment Trusts | | 0.9 | |
Retail — Building Products | | 0.8 | |
Semiconductor Equipment | | 0.8 | |
Finance — Credit Card | | 0.8 | |
Athletic Footwear | | 0.7 | |
Insurance — Life/Health | | 0.7 | |
Machinery — Farming | | 0.6 | |
Repurchase Agreements | | 0.6 | |
Food — Wholesale/Distribution | | 0.6 | |
Medical Products | | 0.6 | |
U.S. Government Treasuries | | 0.5 | |
Auto — Heavy Duty Trucks | | 0.5 | |
Computers — Memory Devices | | 0.5 | |
Telecom Equipment — Fiber Optics | | 0.5 | |
Pharmacy Services | | 0.5 | |
Metal — Copper | | 0.4 | |
Investment Management/Advisor Services | | 0.4 | |
Finance — Other Services | | 0.4 | |
Gas — Distribution | | 0.4 | |
Food — Retail | | 0.4 | |
Finance — Investment Banker/Broker | | 0.3 | |
Agricultural Operations | | 0.3 | |
Insurance Brokers | | 0.3 | |
Cable/Satellite TV | | 0.3 | |
Transport — Services | | 0.3 | |
Computer Services | | 0.3 | |
Chemicals — Specialty | | 0.3 | |
E-Commerce/Services | | 0.3 | |
Electric — Generation | | 0.3 | |
Electronic Components — Semiconductors | | 0.3 | |
E-Commerce/Products | | 0.2 | |
Engineering/R&D Services | | 0.2 | |
Banks — Commercial | | 0.2 | |
| | | |
Engines — Internal Combustion | | 0.2 | |
Containers — Metal/Glass | | 0.2 | |
Retail — Regional Department Stores | | 0.2 | |
Oil Field Machinery & Equipment | | 0.2 | |
Agricultural Chemicals | | 0.2 | |
Oil & Gas Drilling | | 0.2 | |
Independent Power Producers | | 0.1 | |
Medical — Wholesale Drug Distribution | | 0.1 | |
Airlines | | 0.1 | |
Distribution/Wholesale | | 0.1 | |
Medical — Generic Drugs | | 0.1 | |
Retail — Consumer Electronics | | 0.1 | |
Retail — Office Supplies | | 0.1 | |
Coatings/Paint | | 0.1 | |
Advertising Agencies | | 0.1 | |
Retail — Major Department Stores | | 0.1 | |
Quarrying | | 0.1 | |
Retail — Apparel/Shoe | | 0.1 | |
| | |
|
|
| | | 100.0 | % |
| | |
|
|
| * | Calculated as a percentage of net assets |
69
VALIC Company II Socially Responsible Fund
PORTFOLIO OF INVESTMENTS — August 31, 2009
| | | | | |
| | |
| Security Description | | Shares | | Market Value
(Note 2) |
|
COMMON STOCK — 95.2% | | | | | |
Advertising Agencies — 0.1% | | | | | |
Omnicom Group, Inc. | | 15,623 | | $ | 567,427 |
| | | | |
|
|
Agricultural Chemicals — 0.2% | | | | | |
The Mosaic Co. | | 21,187 | | | 1,026,934 |
| | | | |
|
|
Agricultural Operations — 0.3% | | | | | |
Archer - Daniels - Midland Co. | | 80,182 | | | 2,311,647 |
| | | | |
|
|
Airlines — 0.1% | | | | | |
Southwest Airlines Co. | | 109,097 | | | 892,413 |
| | | | |
|
|
Applications Software — 3.2% | | | | | |
Microsoft Corp. | | 846,055 | | | 20,855,256 |
| | | | |
|
|
Athletic Footwear — 0.7% | | | | | |
NIKE, Inc., Class B | | 85,950 | | | 4,760,770 |
| | | | |
|
|
Auto - Heavy Duty Trucks — 0.5% | | | | | |
PACCAR, Inc. | | 93,178 | | | 3,370,248 |
| | | | |
|
|
Banks - Commercial — 0.2% | | | | | |
BB&T Corp. | | 41,107 | | | 1,148,530 |
Regions Financial Corp. | | 61,886 | | | 362,652 |
| | | | |
|
|
| | | | | | 1,511,182 |
| | | | |
|
|
Banks - Fiduciary — 1.4% | | | | | |
State Street Corp. | | 60,350 | | | 3,167,168 |
The Bank of New York Mellon Corp. | | 193,211 | | | 5,720,978 |
| | | | |
|
|
| | | | | | 8,888,146 |
| | | | |
|
|
Banks - Super Regional — 1.8% | | | | | |
Capital One Financial Corp. | | 50,968 | | | 1,900,597 |
PNC Financial Services Group, Inc. | | 47,682 | | | 2,030,776 |
SunTrust Banks, Inc. | | 49,269 | | | 1,151,417 |
US Bancorp | | 293,950 | | | 6,649,149 |
| | | | |
|
|
| | | | | | 11,731,939 |
| | | | |
|
|
Beverages - Non - alcoholic — 2.2% | | | | | |
The Coca - Cola Co. | | 291,455 | | | 14,214,260 |
| | | | |
|
|
Cable/Satellite TV — 0.3% | | | | | |
The DIRECTV Group, Inc.† | | 85,796 | | | 2,124,309 |
| | | | |
|
|
Chemicals - Specialty — 0.3% | | | | | |
Ecolab, Inc. | | 46,285 | | | 1,957,393 |
| | | | |
|
|
Coatings/Paint — 0.1% | | | | | |
The Sherwin — Williams Co. | | 9,810 | | | 590,562 |
| | | | |
|
|
Commercial Services - Finance — 1.7% | | | | | |
Automatic Data Processing, Inc. | | 148,160 | | | 5,681,936 |
Mastercard, Inc., Class A | | 8,640 | | | 1,750,723 |
Paychex, Inc. | | 25,968 | | | 734,635 |
The Western Union Co. | | 67,173 | | | 1,211,801 |
Visa, Inc., Class A | | 23,219 | | | 1,650,871 |
| | | | |
|
|
| | | | | | 11,029,966 |
| | | | |
|
|
Computer Services — 0.3% | | | | | |
Accenture, Ltd., Class A | | 60,562 | | | 1,998,546 |
| | | | |
|
|
Computers — 4.9% | | | | | |
Apple, Inc.† | | 83,477 | | | 14,041,666 |
Dell, Inc.† | | 188,070 | | | 2,977,148 |
Hewlett - Packard Co. | | 340,433 | | | 15,282,038 |
| | | | |
|
|
| | | | | | 32,300,852 |
| | | | |
|
|
Computers - Memory Devices — 0.5% | | | | | |
EMC Corp.† | | 196,488 | | | 3,124,159 |
Seagate Technology(1)(2)(3) | | 510 | | | 0 |
| | | | |
|
|
| | | | | | 3,124,159 |
| | | | |
|
|
| | | | | |
| | |
| Security Description | | Shares | | Market Value
(Note 2) |
|
| | | | | | |
Consumer Products - Misc. — 1.6% | | | | | |
Clorox Co. | | 16,554 | | $ | 978,176 |
Kimberly - Clark Corp. | | 153,402 | | | 9,274,685 |
| | | | |
|
|
| | | | | | 10,252,861 |
| | | | |
|
|
Containers - Metal/Glass — 0.2% | | | | | |
Ball Corp. | | 15,133 | | | 733,345 |
Owens - Illinois, Inc.† | | 14,999 | | | 509,066 |
| | | | |
|
|
| | | | | | 1,242,411 |
| | | | |
|
|
Cosmetics & Toiletries — 1.5% | | | | | |
Colgate - Palmolive Co. | | 137,897 | | | 10,025,112 |
| | | | |
|
|
Distribution/Wholesale — 0.1% | | | | | |
Genuine Parts Co. | | 9,600 | | | 355,584 |
WW Grainger, Inc. | | 5,952 | | | 520,621 |
| | | | |
|
|
| | | | | | 876,205 |
| | | | |
|
|
Diversified Banking Institutions — 5.9% | | | | | |
Bank of America Corp.(4) | | 756,088 | | | 13,299,588 |
Citigroup, Inc.(4) | | 1,193,929 | | | 5,969,645 |
JPMorgan Chase & Co. | | 446,396 | | | 19,400,370 |
| | | | |
|
|
| | | | | | 38,669,603 |
| | | | |
|
|
Diversified Manufacturing Operations — 1.4% |
Cooper Industries, Ltd., Class A | | 63,329 | | | 2,042,360 |
Danaher Corp. | | 123,481 | | | 7,496,532 |
| | | | |
|
|
| | | | | | 9,538,892 |
| | | | |
|
|
E - Commerce/Products — 0.2% | | | | | |
Amazon.com, Inc.† | | 20,397 | | | 1,656,032 |
| | | | |
|
|
E - Commerce/Services — 0.3% | | | | | |
eBay, Inc.† | | 85,055 | | | 1,883,118 |
| | | | |
|
|
Electric - Generation — 0.3% | | | | | |
The AES Corp.† | | 131,997 | | | 1,804,399 |
| | | | |
|
|
Electric - Integrated — 1.7% | | | | | |
Allegheny Energy, Inc. | | 95,467 | | | 2,521,283 |
Northeast Utilities | | 118,838 | | | 2,827,156 |
NSTAR | | 50,039 | | | 1,583,234 |
Pepco Holdings, Inc. | | 241,059 | | | 3,454,376 |
TECO Energy, Inc. | | 52,375 | | | 697,635 |
| | | | |
|
|
| | | | | | 11,083,684 |
| | | | |
|
|
Electronic Components - Semiconductors — 0.3% |
Broadcom Corp., Class A† | | 62,501 | | | 1,778,153 |
| | | | |
|
|
Engineering/R&D Services — 0.2% | | | | | |
Fluor Corp. | | 22,195 | | | 1,174,115 |
Jacobs Engineering Group, Inc.† | | 9,213 | | | 405,188 |
| | | | |
|
|
| | | | | | 1,579,303 |
| | | | |
|
|
Engines - Internal Combustion — 0.2% | | | | | |
Cummins, Inc. | | 28,112 | | | 1,274,036 |
| | | | |
|
|
Enterprise Software/Service — 2.0% | | | | | |
Oracle Corp. | | 600,945 | | | 13,142,667 |
| | | | |
|
|
Finance - Credit Card — 0.8% | | | | | |
American Express Co. | | 149,746 | | | 5,064,410 |
| | | | |
|
|
Finance - Investment Banker/Broker — 0.3% |
The Charles Schwab Corp. | | 128,184 | | | 2,315,003 |
| | | | |
|
|
Finance - Other Services — 0.4% | | | | | |
CME Group, Inc. | | 6,527 | | | 1,899,618 |
NYSE Euronext | | 22,496 | | | 637,537 |
| | | | |
|
|
| | | | | | 2,537,155 |
| | | | |
|
|
70
VALIC Company II Socially Responsible Fund
PORTFOLIO OF INVESTMENTS — August 31, 2009 — (continued)
| | | | | |
| | |
| Security Description | | Shares | | Market Value
(Note 2) |
|
COMMON STOCK (continued) | | | | | |
Food - Misc. — 1.9% | | | | | |
General Mills, Inc. | | 94,281 | | $ | 5,631,404 |
H.J. Heinz Co. | | 65,224 | | | 2,511,124 |
Kellogg Co. | | 84,163 | | | 3,963,236 |
Sara Lee Corp. | | 57,519 | | | 557,359 |
| | | | |
|
|
| | | | | | 12,663,123 |
| | | | |
|
|
Food - Retail — 0.4% | | | | | |
Safeway, Inc. | | 124,828 | | | 2,377,973 |
| | | | |
|
|
Food - Wholesale/Distribution — 0.6% | | | | | |
Sysco Corp. | | 144,176 | | | 3,675,046 |
| | | | |
|
|
Gas - Distribution — 0.4% | | | | | |
CenterPoint Energy, Inc. | | 200,970 | | | 2,492,028 |
| | | | |
|
|
Independent Power Producers — 0.1% | | | | | |
Dynegy, Inc., Class A† | | 184,193 | | | 349,966 |
Mirant Corp.† | | 38,095 | | | 641,901 |
| | | | |
|
|
| | | | | | 991,867 |
| | | | |
|
|
Industrial Gases — 2.2% | | | | | |
Air Products & Chemicals, Inc. | | 76,145 | | | 5,713,159 |
Praxair, Inc. | | 114,876 | | | 8,801,799 |
| | | | |
|
|
| | | | | | 14,514,958 |
| | | | |
|
|
Insurance Brokers — 0.3% | | | | | |
Marsh & McLennan Cos., Inc. | | 96,903 | | | 2,281,097 |
| | | | |
|
|
Insurance - Life/Health — 0.7% | | | | | |
Aflac, Inc. | | 50,772 | | | 2,062,359 |
Prudential Financial, Inc. | | 52,395 | | | 2,650,139 |
| | | | |
|
|
| | | | | | 4,712,498 |
| | | | |
|
|
Insurance - Multi - line — 1.1% | | | | | |
Loews Corp. | | 50,413 | | | 1,721,604 |
MetLife, Inc. | | 103,635 | | | 3,913,258 |
The Allstate Corp. | | 65,583 | | | 1,927,484 |
| | | | |
|
|
| | | | | | 7,562,346 |
| | | | |
|
|
Insurance - Property/Casualty — 1.4% | | | | | |
Chubb Corp. | | 51,099 | | | 2,523,779 |
The Travelers Cos., Inc. | | 138,033 | | | 6,959,624 |
| | | | |
|
|
| | | | | | 9,483,403 |
| | | | |
|
|
Investment Management/Advisor Services — 0.4% |
Franklin Resources, Inc. | | 23,480 | | | 2,191,388 |
T. Rowe Price Group, Inc. | | 8,271 | | | 374,842 |
| | | | |
|
|
| | | | | | 2,566,230 |
| | | | |
|
|
Machinery - Construction & Mining — 0.9% | | | | | |
Caterpillar, Inc. | | 134,930 | | | 6,113,678 |
| | | | |
|
|
Machinery - Farming — 0.6% | | | | | |
Deere & Co. | | 87,438 | | | 3,812,297 |
| | | | |
|
|
Medical Instruments — 2.2% | | | | | |
Boston Scientific Corp.† | | 197,709 | | | 2,323,081 |
Medtronic, Inc. | | 282,571 | | | 10,822,469 |
St. Jude Medical, Inc.† | | 31,422 | | | 1,211,004 |
| | | | |
|
|
| | | | | | 14,356,554 |
| | | | |
|
|
Medical Products — 0.6% | | | | | |
Stryker Corp. | | 74,686 | | | 3,096,481 |
Zimmer Holdings, Inc.† | | 12,068 | | | 571,420 |
| | | | |
|
|
| | | | | | 3,667,901 |
| | | | |
|
|
Medical - Biomedical/Gene — 2.4% | | | | | |
Amgen, Inc.† | | 154,645 | | | 9,238,492 |
Celgene Corp.† | | 21,422 | | | 1,117,586 |
| | | | | |
| | |
| Security Description | | Shares | | Market Value
(Note 2) |
|
| | | | | | |
Medical - Biomedical/Gene (continued) | | | | | |
Gilead Sciences, Inc.† | | 114,934 | | $ | 5,178,926 |
| | | | |
|
|
| | | | | | 15,535,004 |
| | | | |
|
|
Medical - Drugs — 7.0% | | | | | |
Abbott Laboratories | | 274,504 | | | 12,415,816 |
Allergan, Inc. | | 20,429 | | | 1,142,390 |
Bristol - Myers Squibb Co. | | 389,596 | | | 8,621,759 |
Eli Lilly & Co. | | 246,574 | | | 8,250,366 |
Merck & Co., Inc. | | 327,040 | | | 10,605,907 |
Schering - Plough Corp. | | 170,103 | | | 4,793,503 |
| | | | |
|
|
| | | | | | 45,829,741 |
| | | | |
|
|
Medical - Generic Drugs — 0.1% | | | | | |
Teva Pharmaceutical Industries, Ltd. ADR | | 14,219 | | | 732,279 |
| | | | |
|
|
Medical - HMO — 1.2% | | | | | |
Aetna, Inc. | | 22,075 | | | 629,137 |
UnitedHealth Group, Inc. | | 149,296 | | | 4,180,288 |
WellPoint, Inc.† | | 61,601 | | | 3,255,613 |
| | | | |
|
|
| | | | | | 8,065,038 |
| | | | |
|
|
Medical - Wholesale Drug Distribution — 0.1% |
Cardinal Health, Inc. | | 28,425 | | | 982,937 |
| | | | |
|
|
Metal Processors & Fabrication — 0.9% | | | | | |
Precision Castparts Corp. | | 65,752 | | | 6,001,843 |
| | | | |
|
|
Metal - Copper — 0.4% | | | | | |
Southern Copper Corp. | | 100,246 | | | 2,832,952 |
| | | | |
|
|
Multimedia — 2.9% | | | | | |
News Corp., Class A | | 300,821 | | | 3,224,801 |
The Walt Disney Co. | | 302,101 | | | 7,866,710 |
Time Warner, Inc. | | 229,663 | | | 6,409,894 |
Viacom, Inc., Class B† | | 66,587 | | | 1,667,339 |
| | | | |
|
|
| | | | | | 19,168,744 |
| | | | |
|
|
Networking Products — 2.3% | | | | | |
Cisco Systems, Inc.† | | 704,983 | | | 15,227,633 |
| | | | |
|
|
Oil & Gas Drilling — 0.2% | | | | | |
Transocean, Ltd.† | | 13,388 | | | 1,015,346 |
| | | | |
|
|
Oil Companies - Exploration & Production — 4.6% | | | | | |
Apache Corp. | | 108,449 | | | 9,212,743 |
Chesapeake Energy Corp. | | 127,704 | | | 2,916,759 |
Devon Energy Corp. | | 148,826 | | | 9,134,940 |
EOG Resources, Inc. | | 69,657 | | | 5,015,304 |
Noble Energy, Inc. | | 28,893 | | | 1,746,871 |
Questar Corp. | | 15,595 | | | 526,487 |
Southwestern Energy Co.† | | 36,080 | | | 1,329,909 |
| | | | |
|
|
| | | | | | 29,883,013 |
| | | | |
|
|
Oil Companies - Integrated — 1.4% | | | | | |
Hess Corp. | | 101,414 | | | 5,130,534 |
Murphy Oil Corp. | | 67,751 | | | 3,861,807 |
| | | | |
|
|
| | | | | | 8,992,341 |
| | | | |
|
|
Oil Field Machinery & Equipment — 0.2% | | | | | |
National - Oilwell Varco, Inc.† | | 30,190 | | | 1,097,407 |
| | | | |
|
|
Oil - Field Services — 2.0% | | | | | |
Halliburton Co. | | 114,976 | | | 2,726,081 |
Schlumberger, Ltd. | | 187,727 | | | 10,550,257 |
| | | | |
|
|
| | | | | | 13,276,338 |
| | | | |
|
|
Pharmacy Services — 0.5% | | | | | |
Express Scripts, Inc.† | | 6,001 | | | 433,392 |
Medco Health Solutions, Inc.† | | 46,073 | | | 2,544,151 |
| | | | |
|
|
| | | | | | 2,977,543 |
| | | | |
|
|
71
VALIC Company II Socially Responsible Fund
PORTFOLIO OF INVESTMENTS — August 31, 2009 — (continued)
| | | | | |
| | |
| Security Description | | Shares | | Market Value
(Note 2) |
|
COMMON STOCK (continued) | | | | | |
Pipelines — 1.8% | | | | | |
El Paso Corp. | | 140,825 | | $ | 1,299,815 |
Spectra Energy Corp. | | 362,008 | | | 6,812,991 |
The Williams Cos., Inc. | | 225,887 | | | 3,713,582 |
| | | | |
|
|
| | | | | | 11,826,388 |
| | | | |
|
|
Quarrying — 0.1% | | | | | |
Vulcan Materials Co. | | 8,669 | | | 433,797 |
| | | | |
|
|
Real Estate Investment Trusts — 0.9% | | | | | |
Annaly Capital Management, Inc. | | 53,734 | | | 931,748 |
Equity Residential | | 29,459 | | | 804,525 |
Public Storage | | 6,920 | | | 488,206 |
Simon Property Group, Inc. | | 35,732 | | | 2,273,270 |
Vornado Realty Trust | | 22,576 | | | 1,298,571 |
| | | | |
|
|
| | | | | | 5,796,320 |
| | | | |
|
|
Retail - Apparel/Shoe — 0.1% | | | | | |
The Gap, Inc. | | 18,138 | | | 356,412 |
| | | | |
|
|
Retail - Building Products — 0.8% | | | | | |
Lowe’s Cos., Inc. | | 238,690 | | | 5,131,835 |
| | | | |
|
|
Retail - Consumer Electronics — 0.1% | | | | | |
Best Buy Co., Inc. | | 20,014 | | | 726,108 |
| | | | |
|
|
Retail - Discount — 1.8% | | | | | |
Costco Wholesale Corp. | | 80,745 | | | 4,116,380 |
Target Corp. | | 164,781 | | | 7,744,707 |
| | | | |
|
|
| | | | | | 11,861,087 |
| | | | |
|
|
Retail - Drug Store — 2.3% | | | | | |
CVS Caremark Corp. | | 253,093 | | | 9,496,049 |
Walgreen Co. | | 175,309 | | | 5,939,469 |
| | | | |
|
|
| | | | | | 15,435,518 |
| | | | |
|
|
Retail - Major Department Stores — 0.1% | | | | | |
TJX Cos., Inc. | | 14,517 | | | 521,886 |
| | | | |
|
|
Retail - Office Supplies — 0.1% | | | | | |
Staples, Inc. | | 30,156 | | | 651,671 |
| | | | |
|
|
Retail - Regional Department Stores — 0.2% |
Kohl’s Corp.† | | 23,415 | | | 1,207,980 |
| | | | |
|
|
Retail - Restaurants — 1.8% | | | | | |
McDonald’s Corp. | | 210,745 | | | 11,852,299 |
| | | | |
|
|
Semiconductor Equipment — 0.8% | | | | | |
Applied Materials, Inc. | | 386,432 | | | 5,093,174 |
| | | | |
|
|
Telecom Equipment - Fiber Optics — 0.5% | | | | | |
Corning, Inc. | | 201,978 | | | 3,045,828 |
| | | | |
|
|
Telephone - Integrated — 1.8% | | | | | |
CenturyTel, Inc. | | 244,108 | | | 7,867,601 |
Qwest Communications International, Inc. | | 313,495 | | | 1,125,447 |
Sprint Nextel Corp.† | | 509,687 | | | 1,865,454 |
Windstream Corp. | | 135,277 | | | 1,159,324 |
| | | | |
|
|
| | | | | | 12,017,826 |
| | | | |
|
|
Transport - Rail — 1.2% | | | | | |
CSX Corp. | | 66,351 | | | 2,819,917 |
Norfolk Southern Corp. | | 117,657 | | | 5,396,927 |
| | | | |
|
|
| | | | | | 8,216,844 |
| | | | |
|
|
| | | | | | | | |
| | |
| Security Description | | Shares/
Principal
Amount | | | Market Value
(Note 2) | |
| |
| | | | | | | | | |
Transport - Services — 0.3% | | | | | | | | |
C.H. Robinson Worldwide, Inc. | | | 25,996 | | | $ | 1,462,535 | |
Expeditors International of Washington, Inc. | | | 17,190 | | | | 561,425 | |
| | | | | | |
|
|
|
| | | | | | | | 2,023,960 | |
| | | | | | |
|
|
|
Web Portals/ISP — 1.9% | | | | | | | | |
Google, Inc., Class A† | | | 24,164 | | | | 11,155,794 | |
Yahoo!, Inc.† | | | 73,368 | | | | 1,071,906 | |
| | | | | | |
|
|
|
| | | | | | | | 12,227,700 | |
| | | | | | |
|
|
|
Wireless Equipment — 2.4% | | | | | | | | |
American Tower Corp., Class A† | | | 91,176 | | | | 2,885,721 | |
QUALCOMM, Inc. | | | 275,686 | | | | 12,797,344 | |
| | | | | | |
|
|
|
| | | | | | | | 15,683,065 | |
| | | | | | |
|
|
|
Total Long-Term Investment Securities | | | | | | | | |
(cost $619,388,652) | | | | | | | 624,977,909 | |
| | | | | | |
|
|
|
SHORT-TERM INVESTMENT SECURITIES — 4.2% | |
Commercial Paper — 3.7% | | | | | | | | |
Erste Finance LLC | | | | | | | | |
0.18% due 09/01/09 | | $ | 24,000,000 | | | | 24,000,000 | |
| | | | | | |
|
|
|
U.S. Government Treasuries — 0.5% | | | | | |
United States Treasury Bills | | | | | | | | |
0.12% due 09/03/09(4) | | | 1,300,000 | | | | 1,299,992 | |
0.16% due 10/08/09(4) | | | 2,200,000 | | | | 2,199,638 | |
| | | | | | |
|
|
|
| | | | | | | | 3,499,630 | |
| | | | | | |
|
|
|
Total Short-Term Investment Securities | |
(cost $27,499,630) | | | | | | | 27,499,630 | |
| | | | | | |
|
|
|
REPURCHASE AGREEMENT — 0.6% | | | | | |
Agreement with State Street Bank & Trust Co., bearing interest at 0.01%, dated 08/31/09, to be repurchased 09/01/09 in the amount of $3,730,001 and collateralized by $3,845,000 of United States Treasury Bills, bearing interest at 0.15% due 12/31/09 and having approximate value of $3,842,693
(cost $3,730,000) | | | 3,730,000 | | | | 3,730,000 | |
| | | | | | |
|
|
|
TOTAL INVESTMENTS | | | | | | | | |
(cost $650,618,282)(5) | | | 100.0 | % | | | 656,207,539 | |
Liabilities in excess of other assets | | | 0.0 | | | | (75,355 | ) |
| | |
|
|
| |
|
|
|
NET ASSETS — | | | 100.0 | % | | $ | 656,132,184 | |
| | |
|
|
| |
|
|
|
72
VALIC Company II Socially Responsible Fund
PORTFOLIO OF INVESTMENTS — August 31, 2009 — (continued)
| † | Non-income producing security |
| (1) | Fair valued security. Securities are classified as Level 2 based on the securities valuation inputs; see Note 2. |
| (2) | Illiquid security. At August 31, 2009, the aggregate value of these securities was $0 representing 0.0% of net assets. |
| (3) | Denotes a restricted security that: (a) cannot be offered for public sale without first being registered, or being able to take advantage of an exemption from registration, under the Securities Act of 1933, as amended (the “1933 Act”); (b) is subject to a contactual restriction on public sales; or (c) is otherwise subject to a restriction on sales by operation of applicable law. Restricted securities are valued pursuant to Note 2. Certain restricted securities held by a Fund may not be sold except in exempt transactions or in a public offering registered under the 1933 Act. The Fund has no right to demand registration of these securities. The risk of investing in certain restricted securities is greater than the risk of investing in the securities of widely held, publicly traded companies. To the extent applicable, lack of a secondary market and resale restrictions may result in the inability of a Fund to sell a security at a fair price and may substantially delay the sale of the security. |
| | In addition, certain restricted securities may exhibit greater price volatility than securities for which secondary markets exist. As of August 31, 2009, the Socially Responsible Fund held the following restricted securities: |
| | | | | | | | | | | | | | | | |
Name
| | Acquisition
Date
| | Shares
| | Acquisition
Cost
| | Market
Value
| | Market
Value
Per
Share
| | % of
Net
Assets
| |
Seagate Technology Common Stock | | 11/22/2000 | | 510 | | $ | 0.00 | | $ | 0.00 | | $ | 0.00 | | 0.00 | % |
| | | | | | | | | |
|
| | | | |
|
|
| (4) | The security or a portion thereof was pledged as collateral to cover margin requirements for open futures contracts. |
| (5) | See Note 5 for cost of investments on a tax basis. |
ADR—American Depository Receipt
| | | | | | | | | | | | | | | |
| Open Futures Contracts |
Number of
Contracts | | Type | | Description | | Expiration
Month | | Market
Value at
Trade Date | | Market
Value as of
August 31, 2009 | | Unrealized
Appreciation
(Depreciation) |
| 123 | | Long | | S&P 500 Index | | Sept 2009 | | $ | 28,259,012 | | $ | 31,355,775 | | $ | 3,096,763 |
| | | | | | | | | | | | | | |
|
|
The following is a summary of the inputs used to value the Portfolio’s net assets as of August 31, 2009 (see Note 2):
| | | | | | | | | | | | |
| | | Level 1 -
Unadjusted
Quoted
Prices
| | Level 2-
Other
Observable
Inputs
| | Level 3 -
Significant
Unobservable
Inputs
| | Total
|
Long-Term Investment Securities: | | | | | | | | | | | | |
Common Stock: | | | | | | | | | | | | |
Diversified Banking Institutions | | $ | 38,669,603 | | $ | – | | $ | – | | $ | 38,669,603 |
Medical — Drugs | | | 45,829,741 | | | – | | | – | | | 45,829,741 |
Other Industries* | | | 540,478,565 | | | – | | | 0 | | | 540,478,565 |
Short-Term Investment Securities: | | | | | | | | | | | | |
Commercial Paper | | | – | | | 24,000,000 | | | – | | | 24,000,000 |
U.S. Government Treasuries | | | – | | | 3,499,630 | | | – | | | 3,499,630 |
Repurchase Agreement | | | – | | | 3,730,000 | | | – | | | 3,730,000 |
Other Financial Instruments:# | | | | | | | | | | | | |
Futures Contracts — Appreciation | | | 3,096,763 | | | – | | | – | | | 3,096,763 |
| | |
|
| |
|
| |
|
| |
|
|
Total | | $ | 628,074,672 | | $ | 31,229,630 | | $ | 0 | | $ | 659,304,302 |
| | |
|
| |
|
| |
|
| |
|
|
| * | Sum of all other industries each of which individually has an aggregate market value of less than 5% of net assets. |
| # | Other financial instruments are derivative instruments not reflected in the Portfolio of Investments, such as futures, forward and swap contracts, which are valued at the unrealized appreciation (depreciation) on the instrument. |
The following is a reconciliation of Level 3 assets which significant unobservable inputs were used to determine fair value:
| | | |
| | | Common Stock -
Other Industries
|
Balance as of 8/31/2008 | | $ | 0 |
Accrued discounts/premiums | | | – |
Realized gain (loss) | | | – |
Change in unrealized appreciation (depreciation) | | | – |
Net purchases (sales) | | | – |
Transfers in and/or out of Level 3 | | | – |
| | |
|
|
Balance as of 8/31/2009 | | $ | 0 |
| | |
|
|
See Notes to Financial Statements
73
VALIC Company II Strategic Bond Fund
PORTFOLIO PROFILE — August 31, 2009 (Unaudited)
Industry Allocation*
| | | |
Sovereign | | 24.2 | % |
Repurchase Agreements | | 9.1 | |
Federal Home Loan Mtg. Corp. | | 6.4 | |
Federal National Mtg. Assoc. | | 4.8 | |
United States Treasury Notes | | 4.3 | |
Oil Companies — Exploration & Production | | 3.1 | |
Diversified Banking Institutions | | 2.5 | |
Cable/Satellite TV | | 2.3 | |
Telephone — Integrated | | 2.2 | |
Diversified Financial Services | | 2.0 | |
Electric — Integrated | | 1.9 | |
Medical — Hospitals | | 1.7 | |
Telecom Services | | 1.5 | |
Pipelines | | 1.5 | |
Finance — Auto Loans | | 1.2 | |
Banks — Commercial | | 1.1 | |
Special Purpose Entities | | 1.1 | |
Cellular Telecom | | 1.0 | |
Electric — Generation | | 0.9 | |
Airlines | | 0.9 | |
United States Treasury Bonds | | 0.9 | |
Paper & Related Products | | 0.7 | |
Satellite Telecom | | 0.7 | |
Casino Hotels | | 0.7 | |
Medical — Drugs | | 0.6 | |
Chemicals — Diversified | | 0.6 | |
Oil Companies — Integrated | | 0.6 | |
Chemicals — Specialty | | 0.5 | |
Government National Mtg. Assoc. | | 0.5 | |
Independent Power Producers | | 0.5 | |
Steel — Producers | | 0.5 | |
Medical Products | | 0.5 | |
Medical — HMO | | 0.5 | |
Oil — Field Services | | 0.5 | |
Auto/Truck Parts & Equipment — Original | | 0.4 | |
Food — Meat Products | | 0.4 | |
Transport — Rail | | 0.4 | |
Finance — Investment Banker/Broker | | 0.4 | |
Computer Services | | 0.4 | |
Transport — Air Freight | | 0.4 | |
Containers — Metal/Glass | | 0.4 | |
Diversified Minerals | | 0.3 | |
Electronic Components — Semiconductors | | 0.3 | |
Diversified Manufacturing Operations | | 0.3 | |
Banks — Super Regional | | 0.3 | |
Insurance — Multi-line | | 0.3 | |
Retail — Regional Department Stores | | 0.3 | |
Casino Services | | 0.3 | |
Metal — Copper | | 0.3 | |
Insurance Brokers | | 0.3 | |
Decision Support Software | | 0.3 | |
Rubber — Tires | | 0.3 | |
Advertising Services | | 0.3 | |
Theaters | | 0.3 | |
Gambling (Non — Hotel) | | 0.3 | |
Metal — Aluminum | | 0.3 | |
Agricultural Chemicals | | 0.3 | |
Retail — Apparel/Shoe | | 0.2 | |
Television | | 0.2 | |
Hotels/Motels | | 0.2 | |
Auto — Cars/Light Trucks | | 0.2 | |
Non-Hazardous Waste Disposal | | 0.2 | |
Printing — Commercial | | 0.2 | |
Music | | 0.2 | |
Transactional Software | | 0.2 | |
Funeral Services & Related Items | | 0.2 | |
Finance — Commercial | | 0.2 | |
Broadcast Services/Program | | 0.2 | |
Consumer Products — Misc. | | 0.2 | |
| | | |
Food — Retail | | 0.2 | |
Rental Auto/Equipment | | 0.2 | |
Distribution/Wholesale | | 0.2 | |
Auto/Truck Parts & Equipment — Replacement | | 0.2 | |
Building & Construction Products — Misc. | | 0.2 | |
Physicians Practice Management | | 0.2 | |
Retail — Petroleum Products | | 0.2 | |
Gas — Distribution | | 0.2 | |
Banks — Money Center | | 0.2 | |
Multimedia | | 0.1 | |
Transport — Services | | 0.1 | |
Beverages — Non-alcoholic | | 0.1 | |
Beverages — Wine/Spirits | | 0.1 | |
Real Estate Investment Trusts | | 0.1 | |
Storage/Warehousing | | 0.1 | |
Building Products — Cement | | 0.1 | |
Medical — Biomedical/Gene | | 0.1 | |
Food — Misc. | | 0.1 | |
Research & Development | | 0.1 | |
Containers — Paper/Plastic | | 0.1 | |
Insurance — Mutual | | 0.1 | |
Applications Software | | 0.1 | |
Publishing — Periodicals | | 0.1 | |
Brewery | | 0.1 | |
Direct Marketing | | 0.1 | |
Electronics — Military | | 0.1 | |
Medical Information Systems | | 0.1 | |
Hazardous Waste Disposal | | 0.1 | |
Finance — Other Services | | 0.1 | |
Retail — Drug Store | | 0.1 | |
Real Estate Management/Services | | 0.1 | |
Seismic Data Collection | | 0.1 | |
Office Automation & Equipment | | 0.1 | |
Oil Refining & Marketing | | 0.1 | |
Insurance — Life/Health | | 0.1 | |
Retail — Restaurants | | 0.1 | |
Human Resources | | 0.1 | |
Property Trust | | 0.1 | |
Coal | | 0.1 | |
Steel — Specialty | | 0.1 | |
Finance — Mortgage Loan/Banker | | 0.1 | |
Private Corrections | | 0.1 | |
Machinery — Farming | | 0.1 | |
Insurance — Property/Casualty | | 0.1 | |
Retail — Sporting Goods | | 0.1 | |
Pharmacy Services | | 0.1 | |
Warehousing & Harbor Transportation Services | | 0.1 | |
Consulting Services | | 0.1 | |
Investment Management/Advisor Services | | 0.1 | |
Wireless Equipment | | 0.1 | |
Schools | | 0.1 | |
| | |
|
|
| | | 98.0 | % |
| | |
|
|
| * | Calculated as a percentage of net assets |
74
VALIC Company II Strategic Bond Fund
PORTFOLIO PROFILE — August 31, 2009 (Unaudited)
Credit Quality†#
| | | |
Government — Agency | | 12.9 | % |
Government — Treasury | | 5.8 | |
AAA | | 10.9 | |
AA | | 4.2 | |
A | | 7.1 | |
BBB | | 16.0 | |
BB | | 15.8 | |
B | | 15.3 | |
CCC | | 7.6 | |
CC | | 0.7 | |
C | | 0.3 | |
Below C | | 1.8 | |
Not Rated@ | | 1.6 | |
| | |
|
|
| | | 100.0 | % |
| | |
|
|
| * | Calculated as a percentage of net assets. |
| @ | Represents debt issues that either have no rating, or the rating is unavailable from the data source. |
| † | Source: Standard and Poors |
| # | Calculated as percentage of total debt issues, excluding short-term securities. |
Country Allocation*
| | | |
United States | | 68.3 | % |
Canada | | 2.7 | |
Brazil | | 2.5 | |
Japan | | 2.4 | |
United Kingdom | | 2.5 | |
Australia | | 2.0 | |
Russia | | 2.0 | |
Mexico | | 1.8 | |
Sweden | | 1.5 | |
Norway | | 1.5 | |
Turkey | | 1.2 | |
Philippines | | 1.0 | |
Venezuela | | 0.9 | |
Luxembourg | | 0.7 | |
Germany | | 0.7 | |
Bermuda | | 0.7 | |
Colombia | | 0.7 | |
Spain | | 0.6 | |
Netherlands | | 0.5 | |
Indonesia | | 0.4 | |
South Korea | | 0.5 | |
Italy | | 0.4 | |
Greece | | 0.3 | |
Argentina | | 0.3 | |
Uruguay | | 0.3 | |
Peru | | 0.2 | |
France | | 0.2 | |
Cayman Islands | | 0.2 | |
Poland | | 0.2 | |
Panama | | 0.1 | |
South Africa | | 0.1 | |
Trinidad and Tobago | | 0.1 | |
Malaysia | | 0.1 | |
Austria | | 0.1 | |
Qatar | | 0.1 | |
Ireland | | 0.1 | |
United Arab Emirates | | 0.1 | |
| | |
|
|
| | | 98.0 | % |
| | |
|
|
75
VALIC Company II Strategic Bond Fund
PORTFOLIO OF INVESTMENTS — August 31, 2009
| | | | | | |
| | |
| Security Description | | Principal
Amount(12) | | Market Value
(Note 2) |
|
ASSET BACKED SECURITIES — 1.7% | | | | | | |
Diversified Financial Services — 1.7% | | | | | | |
Banc of America Commercial Mtg., Inc.
Series 2006-6, Class AM
5.39% due 10/10/45(1) | | $ | 108,000 | | $ | 69,128 |
Chase Mtg. Finance Corp.
Series 2007-A2, Class 1A1
4.05% due 07/25/37(2)(3) | | | 542,005 | | | 459,830 |
Citigroup Commercial Mtg. Trust
Series 2008-C7, Class AM
6.30% due 12/10/49(1)(3) | | | 180,000 | | | 122,266 |
Commercial Mtg. Asset Trust
Series 1999-C1, Class D
7.35% due 01/17/32(1) | | | 270,000 | | | 287,073 |
Commercial Mtg. Pass Through Certs.
Series 2006-CN2A, Class A2FL
0.50% due 02/05/19*(1)(4) | | | 550,000 | | | 407,761 |
CS First Boston Mtg. Securities Corp.
Series 2002-CKN2, Class A3
6.13% due 04/15/37(1) | | | 800,000 | | | 838,723 |
Goldman Sachs Mtg. Securities Trust
Series 2007-GG10, Class A4
6.00% due 08/10/45(1)(3) | | | 2,900,000 | | | 2,267,091 |
JP Morgan Chase Commercial Mtg. Securities Corp.
Series 2006-LDP9, Class AM
5.37% due 05/15/47(1) | | | 310,000 | | | 202,890 |
LB Commercial Conduit Mtg. Trust
Series 1998-C1, Class E
7.00% due 02/18/30(1) | | | 155,000 | | | 168,258 |
Swift Master Auto Receivables Trust
Series 2007-2, Class A
0.92% due 10/15/12(4) | | | 975,707 | | | 925,790 |
Wells Fargo Mtg. Backed Securities Trust
Series 2006-AR12, Class 2A1
6.10% due 09/25/36(2) | | | 161,136 | | | 122,365 |
| | | | | |
|
|
Total Asset Backed Securities
(cost $6,938,231) | | | | | | 5,871,175 |
| | | | | |
|
|
CONVERTIBLE BONDS & NOTES — 0.0% | | | | | | |
Drug Delivery Systems — 0.0% | | | | | | |
Nektar Therapeutics
Sub. Notes
3.25% due 09/28/12 | | | 50,000 | | | 41,750 |
| | | | | |
|
|
Telecom Services — 0.0% | | | | | | |
ICO North America, Inc.
Notes
7.50% due 08/15/09†(5)(6)(7)(11)(19)(20) | | | 140,000 | | | 49,000 |
| | | | | |
|
|
Total Convertible Bonds & Notes
(cost $189,529) | | | | | | 90,750 |
| | | | | |
|
|
U.S. CORPORATE BONDS & NOTES — 39.3% | | | | | | |
Advertising Services — 0.3% | | | | | | |
Visant Holding Corp.
Company Guar. Notes
7.63% due 10/01/12 | | | 495,000 | | | 497,475 |
Visant Holding Corp.
Senior Notes
10.25% due 12/01/13(8) | | | 453,000 | | | 457,530 |
| | | | | |
|
|
| | | | | | | 955,005 |
| | | | | |
|
|
Aerospace/Defense — 0.0% | | | | | | |
Meccanica Holdings USA
Company Guar. Notes
7.38% due 07/15/39* | | | 116,000 | | | 132,091 |
| | | | | |
|
|
| | | | | | |
| | |
| Security Description | | Principal
Amount(12) | | Market Value
(Note 2) |
|
| | | | | | | |
Agricultural Chemicals — 0.3% | | | | | | |
Terra Capital, Inc.
Company Guar. Notes
7.00% due 02/01/17 | | $ | 935,000 | | $ | 881,237 |
| | | | | |
|
|
Airlines — 0.9% | | | | | | |
American Airlines, Inc.
Pass Through Certs.
Series 2001-1, Class A-2
6.82% due 05/23/11 | | | 645,000 | | | 554,700 |
American Airlines, Inc.
Pass Through Certs.
Series 1999-1, Class B
7.32% due 10/15/09 | | | 25,000 | | | 24,625 |
American Airlines, Inc.
Pass Through Certs.
Series 2001-2, Class A-2
7.86% due 04/01/13 | | | 455,000 | | | 434,525 |
Continental Airlines, Inc.
Pass Through Certs.
Series 2001-1, Class A-2
6.50% due 06/15/11 | | | 300,000 | | | 285,000 |
Continental Airlines, Inc.
Pass Through Certs.
Series 1991, Class A
6.55% due 02/02/19 | | | 209,397 | | | 198,927 |
Continental Airlines, Inc.
Pass Through Certs.
Series 2000-2, Class C
8.31% due 04/02/11 | | | 29,820 | | | 24,751 |
Delta Air Lines, Inc.
Pass Through Certs.
Series 2001-1, Class A2
7.11% due 09/18/11 | | | 500,000 | | | 482,500 |
Delta Air Lines, Inc.
Pass Through Certs.
Series 2000-1, Class A-2
7.57% due 11/18/10 | | | 85,000 | | | 82,875 |
Northwest Airlines, Inc.
Pass Through Certs.
Series 2002-1, Class G2
6.26% due 11/20/21 | | | 75,306 | | | 53,279 |
United AirLines, Inc.
Pass Through Certs.
Series 2001-1, Class A-2
6.20% due 03/29/49 | | | 2,117 | | | 2,085 |
United AirLines, Inc.
Pass Through Certs.
Series 2001-1 Class B
6.93% due 09/01/11 | | | 595,000 | | | 788,375 |
United AirLines, Inc.
Pass Through Certs.
Series 2000-2, Class A-2
7.19% due 04/01/11 | | | 212,709 | | | 210,050 |
| | | | | |
|
|
| | | | | | | 3,141,692 |
| | | | | |
|
|
Applications Software — 0.1% | | | | | | |
SS&C Technologies, Inc.
Company Guar. Notes
11.75% due 12/01/13 | | | 385,000 | | | 397,031 |
| | | | | |
|
|
Auto - Cars/Light Trucks — 0.2% | | | | | | |
Ford Motor Co. Notes
7.45% due 07/16/31 | | | 1,075,000 | | | 822,375 |
| | | | | |
|
|
76
VALIC Company II Strategic Bond Fund
PORTFOLIO OF INVESTMENTS — August 31, 2009 — (continued)
| | | | | | |
| | |
| Security Description | | Principal
Amount(12) | | Market Value
(Note 2) |
|
U.S. CORPORATE BONDS & NOTES (continued) | | | | | | |
Auto/Truck Parts & Equipment - Original — 0.2% | | | | | | |
ArvinMeritor, Inc.
Senior Notes
8.13% due 09/15/15 | | $ | 915,000 | | $ | 686,250 |
Cooper - Standard Automotive, Inc.
Company Guar. Notes
8.38% due 12/15/14†(18)(20) | | | 455,000 | | | 25,025 |
| | | | | |
|
|
| | | | | | | 711,275 |
| | | | | |
|
|
Auto/Truck Parts & Equipment - Replacement — 0.2% | | | | | | |
Allison Transmission
Senior Notes
11.00% due 11/01/15* | | | 650,000 | | | 585,000 |
Exide Corp.
Notes
10.00% due 04/15/05†(6)(7) | | | 150,000 | | | 0 |
| | | | | |
|
|
| | | | | | | 585,000 |
| | | | | |
|
|
Banks - Commercial — 0.4% | | | | | | |
BB&T Corp.
Senior Notes
3.10% due 07/28/11 | | | 240,000 | | | 242,369 |
CoBank ACB
Sub. Notes
7.88% due 04/16/18* | | | 45,000 | | | 43,522 |
Credit Suisse/New York
Sub. Notes
6.00% due 02/15/18 | | | 362,000 | | | 372,311 |
KeyBank NA
Sub. Notes
5.45% due 03/03/16 | | | 132,000 | | | 115,723 |
KeyBank NA
Sub. Notes
7.41% due 10/15/27 | | | 52,000 | | | 51,931 |
PNC Bank NA
Sub. Notes
6.88% due 04/01/18 | | | 120,000 | | | 127,365 |
Sovereign Bank
Sub. Notes
8.75% due 05/30/18 | | | 77,000 | | | 83,843 |
Union Bank of California NA
Sub. Notes
5.95% due 05/11/16 | | | 100,000 | | | 97,538 |
Wachovia Bank NA
Sub. Notes
5.00% due 08/15/15 | | | 306,000 | | | 294,818 |
Wachovia Bank NA
Sub. Notes
5.60% due 03/15/16 | | | 51,000 | | | 51,621 |
| | | | | |
|
|
| | | | | | | 1,481,041 |
| | | | | |
|
|
Banks - Fiduciary — 0.0% | | | | | | |
State Street Capital Trust IV
Company Guar. Notes
1.63% due 06/15/37(4) | | | 230,000 | | | 143,629 |
| | | | | |
|
|
Banks - Super Regional — 0.3% | | | | | | |
BAC Capital Trust XI
Bank Guar.
6.63% due 05/23/36 | | | 196,000 | | | 153,789 |
BAC Capital Trust XIII
Bank Guar. Notes
1.03% due 03/15/12(4)(9) | | | 575,000 | | | 278,208 |
National City Corp.
Senior Notes
4.90% due 01/15/15 | | | 78,000 | | | 78,092 |
USB Capital IX
Company Guar. Notes
6.19% due 04/15/11(4)(9) | | | 373,000 | | | 268,560 |
| | | | | | |
| | |
| Security Description | | Principal
Amount(12) | | Market Value
(Note 2) |
|
| | | | | | | |
Banks - Super Regional (continued) | | | | | | |
Wachovia Corp.
Sub. Notes
5.63% due 10/15/16 | | $ | 120,000 | | $ | 119,680 |
Wells Fargo Bank NA
Sub. Notes
5.75% due 05/16/16 | | | 146,000 | | | 149,593 |
| | | | | |
|
|
| | | | | | | 1,047,922 |
| | | | | |
|
|
Beverages - Non - alcoholic — 0.1% | | | | | | |
Bottling Group LLC
Company Guar. Notes
6.95% due 03/15/14 | | | 227,000 | | | 265,893 |
The Coca - Cola Co.
Senior Notes
4.88% due 03/15/19 | | | 240,000 | | | 251,653 |
| | | | | |
|
|
| | | | | | | 517,546 |
| | | | | |
|
|
Beverages - Wine/Spirits — 0.1% | | | | | | |
Constellation Brands, Inc.
Company Guar. Notes
7.25% due 05/15/17 | | | 525,000 | | | 507,938 |
| | | | | |
|
|
Brewery — 0.1% | | | | | | |
Anheuser - Busch InBev Worldwide, Inc.
Company Guar. Notes
7.75% due 01/15/19* | | | 336,000 | | | 393,420 |
| | | | | |
|
|
Broadcast Services/Program — 0.2% | | | | | | |
Fisher Communications, Inc.
Senior Notes
8.63% due 09/15/14 | | | 562,000 | | | 511,420 |
Nexstar Broadcasting, Inc.
Company Guar. Notes
0.50% due 01/15/14*(10) | | | 190,566 | | | 74,321 |
Nexstar Broadcasting, Inc.
Company Guar. Notes
7.00% due 01/15/14 | | | 63,000 | | | 24,885 |
| | | | | |
|
|
| | | | | | | 610,626 |
| | | | | |
|
|
Building & Construction Products - Misc. — 0.2% | | | | | | |
Interline Brands, Inc.
Senior Sub. Notes
8.13% due 06/15/14 | | | 400,000 | | | 395,000 |
USG Corp.
Company Guar. Notes
9.75% due 08/01/14* | | | 150,000 | | | 154,125 |
| | | | | |
|
|
| | | | | | | 549,125 |
| | | | | |
|
|
Building Products - Cement — 0.1% | | | | | | |
Texas Industries, Inc.
Company Guar. Notes
7.25% due 07/15/13 | | | 525,000 | | | 490,875 |
| | | | | |
|
|
Cable/Satellite TV — 2.3% | | | | | | |
CCH II LLC/CCH II Capital Corp.
Senior Notes
10.25% due 09/15/10†(18)(20) | | | 661,000 | | | 734,536 |
CCH II LLC/CCH II Capital Corp.
Senior Notes, Series B
10.25% due 09/15/10†(18)(20) | | | 344,000 | | | 382,270 |
CCH II LLC/CCH II Capital Corp.
Company Guar. Notes
10.25% due 10/01/13†*(18)(20) | | | 35,000 | | | 36,619 |
CCO Holdings LLC/CCO Holdings Capital Corp.
Senior Notes
8.75% due 11/15/13†(18)(20) | | | 1,005,000 | | | 1,015,050 |
Charter Communications Operating LLC
Senior Notes
12.88% due 09/15/14†*(18)(20) | | | 730,000 | | | 792,050 |
77
VALIC Company II Strategic Bond Fund
PORTFOLIO OF INVESTMENTS — August 31, 2009 — (continued)
| | | | | | |
| | |
| Security Description | | Principal
Amount(12) | | Market Value
(Note 2) |
|
U.S. CORPORATE BONDS & NOTES (continued) | | | | | | |
Cable/Satellite TV (continued) | | | | | | |
Charter Communications Operating LLC/Charter Communications Operating Capital
Senior Notes
10.38% due 04/30/14†*(18)(20) | | $ | 1,035,000 | | $ | 1,047,938 |
Comcast Corp.
Company Guar. Notes
5.85% due 11/15/15 | | | 334,000 | | | 362,078 |
Comcast Corp.
Company Guar. Notes
5.90% due 03/15/16 | | | 800,000 | | | 853,406 |
COX Communications, Inc.
Senior Notes
6.95% due 06/01/38* | | | 83,000 | | | 90,700 |
COX Communications, Inc.
Notes
7.13% due 10/01/12 | | | 125,000 | | | 138,579 |
COX Communications, Inc.
Senior Notes
9.38% due 01/15/19* | | | 276,000 | | | 351,807 |
CSC Holdings, Inc.
Senior Notes
7.63% due 04/01/11 | | | 390,000 | | | 394,875 |
CSC Holdings, Inc.
Senior Notes
8.50% due 06/15/15* | | | 600,000 | | | 606,000 |
DirecTV Holdings LLC/DirecTV Financing Co.
Company Guar. Notes
7.63% due 05/15/16 | | | 620,000 | | | 652,550 |
DISH DBS Corp.
Company Guar. Notes
7.75% due 05/31/15 | | | 375,000 | | | 367,500 |
Time Warner Cable, Inc.
Company Guar. Notes
6.75% due 06/15/39 | | | 155,000 | | | 165,749 |
| | | | | |
|
|
| | | | | | | 7,991,707 |
| | | | | |
|
|
Casino Hotels — 0.7% | | | | | | |
Eldorado Casino Corp.(Shreveport)
Sec. Bonds
10.00% due 08/01/12(6)(10) | | | 362,426 | | | 308,062 |
Eldorado Resorts LLC
Senior Notes
9.00% due 04/15/14(6)(7) | | | 250,000 | | | 230,638 |
Harrahs Entertainment, Inc.
Senior Sec. Notes
11.25% due 06/01/17* | | | 800,000 | | | 814,000 |
MGM Mirage, Inc.
Senior Sec. Notes
11.13% due 11/15/17* | | | 625,000 | | | 672,656 |
Turning Stone Resort Casino Enterprise
Senior Notes
9.13% due 09/15/14* | | | 345,000 | | | 316,537 |
| | | | | |
|
|
| | | | | | | 2,341,893 |
| | | | | |
|
|
Casino Services — 0.3% | | | | | | |
Indianapolis Downs LLC & Capital Corp.
Senior Sec. Notes
11.00% due 11/01/12* | | | 805,000 | | | 571,550 |
Snoqualmie Entertainment Authority
Senior Sec. Notes
4.68% due 02/01/14*(4) | | | 185,000 | | | 90,650 |
Snoqualmie Entertainment Authority
Senior Sec. Notes
9.13% due 02/01/15* | | | 620,000 | | | 341,000 |
| | | | | |
|
|
| | | | | | | 1,003,200 |
| | | | | |
|
|
| | | | | | |
| | |
| Security Description | | Principal
Amount(12) | | Market Value
(Note 2) |
|
| | | | | | | |
Cellular Telecom — 1.0% | | | | | | |
Centennial Communications Corp.
Senior Notes
10.13% due 06/15/13 | | $ | 1,325,000 | | $ | 1,351,500 |
Cingular Wireless Services, Inc.
Senior Notes
7.88% due 03/01/11 | | | 457,000 | | | 495,770 |
Cricket Communications, Inc.
Company Guar. Notes
9.38% due 11/01/14 | | | 285,000 | | | 268,613 |
Cricket Communications, Inc.
Company Guar. Notes
10.00% due 07/15/15 | | | 815,000 | | | 788,512 |
MetroPCS Wireless, Inc.
Company Guar. Notes
9.25% due 11/01/14 | | | 556,000 | | | 545,575 |
Nextel Communications, Inc.
Company Guar. Notes
5.95% due 03/15/14 | | | 112,000 | | | 94,080 |
| | | | | |
|
|
| | | | | | | 3,544,050 |
| | | | | |
|
|
Chemicals - Diversified — 0.6% | | | | | | |
E.I. du Pont de Nemours & Co.
Senior Notes
4.75% due 03/15/15 | | | 120,000 | | | 128,035 |
Olin Corp.
Senior Notes
8.88% due 08/15/19 | | | 535,000 | | | 540,350 |
The Dow Chemical Co.
Senior Notes
5.90% due 02/15/15 | | | 120,000 | | | 119,787 |
The Dow Chemical Co.
Senior Notes
8.55% due 05/15/19 | | | 1,104,000 | | | 1,202,538 |
| | | | | |
|
|
| | | | | | | 1,990,710 |
| | | | | |
|
|
Chemicals - Specialty — 0.5% | | | | | | |
Huntsman International LLC
Senior Sub. Notes
7.38% due 01/01/15 | | | 440,000 | | | 378,400 |
Huntsman International LLC
Company Guar. Notes
7.88% due 11/15/14 | | | 285,000 | | | 253,650 |
Johnsondiversey Holdings, Inc.
Company Guar. Notes
9.63% due 05/15/12 | | | 485,000 | | | 492,275 |
Momentive Performance Materials, Inc.
Company Guar. Notes
9.75% due 12/01/14 | | | 550,000 | | | 357,500 |
Momentive Performance Materials, Inc.
Company Guar. Notes
12.50% due 06/15/14* | | | 269,000 | | | 254,205 |
Tronox Worldwide LLC
Company Guar. Notes
9.50% due 12/01/12†(18)(20) | | | 430,000 | | | 124,700 |
| | | | | |
|
|
| | | | | | | 1,860,730 |
| | | | | |
|
|
Coal — 0.1% | | | | | | |
Arch Coal, Inc.
Senior Notes
8.75% due 08/01/16* | | | 275,000 | | | 275,000 |
| | | | | |
|
|
Computer Services — 0.4% | | | | | | |
Compucom Systems, Inc.
Senior Sub. Notes
12.50% due 10/01/15* | | | 670,000 | | | 603,000 |
Sungard Data Systems, Inc.
Company Guar. Notes
9.13% due 08/15/13 | | | 681,000 | | | 674,190 |
| | | | | |
|
|
| | | | | | | 1,277,190 |
| | | | | |
|
|
78
VALIC Company II Strategic Bond Fund
PORTFOLIO OF INVESTMENTS — August 31, 2009 — (continued)
| | | | | | |
| | |
| Security Description | | Principal
Amount(12) | | Market Value
(Note 2) |
|
U.S. CORPORATE BONDS & NOTES (continued) | | | | | | |
Consulting Services — 0.1% | | | | | | |
FTI Consulting, Inc.
Company Guar.Notes
7.75% due 10/01/16 | | $ | 225,000 | | $ | 219,375 |
| | | | | |
|
|
Consumer Products - Misc. — 0.2% | | | | | | |
American Achievement Corp.
Company Guar. Notes
8.25% due 04/01/12* | | | 543,000 | | | 532,140 |
Prestige Brands, Inc.
Senior Sub. Notes
9.25% due 04/15/12 | | | 75,000 | | | 75,750 |
| | | | | |
|
|
| | | | | | | 607,890 |
| | | | | |
|
|
Containers - Metal/Glass — 0.3% | | | | | | |
Ball Corp.
Company Guar. Notes
7.38% due 09/01/19 | | | 400,000 | | | 399,000 |
Crown Cork & Seal Co., Inc.
Debentures
7.38% due 12/15/26 | | | 140,000 | | | 121,100 |
Crown Cork & Seal Co., Inc.
Debentures
8.00% due 04/15/23 | | | 230,000 | | | 213,900 |
Owens - Brockway Glass Container, Inc.
Company Guar. Notes
8.25% due 05/15/13 | | | 245,000 | | | 247,450 |
| | | | | |
|
|
| | | | | | | 981,450 |
| | | | | |
|
|
Containers - Paper/Plastic — 0.1% | | | | | | |
Graphic Packaging International, Inc.
Company Guar. Notes
9.50% due 06/15/17* | | | 400,000 | | | 410,000 |
| | | | | |
|
|
Decision Support Software — 0.3% | | | | | | |
Vangent, Inc.
Company Guar. Notes
9.63% due 02/15/15 | | | 1,045,000 | | | 971,850 |
| | | | | |
|
|
Direct Marketing — 0.1% | | | | | | |
Affinity Group, Inc.
Company Guar. Notes
9.00% due 02/15/12 | | | 601,000 | | | 384,640 |
| | | | | |
|
|
Distribution/Wholesale — 0.2% | | | | | | |
KAR Holdings, Inc.
Company Guar. Notes
4.48% due 05/01/14(4) | | | 275,000 | | | 226,875 |
KAR Holdings, Inc.
Company Guar. Notes
8.75% due 05/01/14 | | | 385,000 | | | 362,863 |
| | | | | |
|
|
| | | | | | | 589,738 |
| | | | | |
|
|
Diversified Banking Institutions — 2.5% | | | | | | |
Bank of America Corp.
Senior Notes
4.90% due 05/01/13 | | | 321,000 | | | 324,057 |
Bank of America Corp.
Sub. Notes
5.75% due 08/15/16 | | | 278,000 | | | 265,786 |
Bank of America Corp.
Senior Notes
5.75% due 12/01/17 | | | 202,000 | | | 196,493 |
Bank of America Corp.
Notes
6.50% due 08/01/16 | | | 161,000 | | | 165,909 |
Bank of America Corp.
Sub. Notes
7.25% due 10/15/25 | | | 49,000 | | | 47,460 |
| | | | | | |
| | |
| Security Description | | Principal
Amount(12) | | Market Value
(Note 2) |
|
| | | | | | | |
Diversified Banking Institutions (continued) | | | | | | |
Citigroup, Inc.
Sub. Notes
5.00% due 09/15/14 | | $ | 531,000 | | $ | 486,508 |
Citigroup, Inc.
Senior Notes
5.50% due 04/11/13 | | | 184,000 | | | 183,144 |
Citigroup, Inc.
Senior Notes
5.85% due 07/02/13 | | | 500,000 | | | 503,012 |
Citigroup, Inc.
Senior Notes
6.13% due 05/15/18 | | | 257,000 | | | 241,643 |
Citigroup, Inc.
Sub. Notes
6.13% due 08/25/36 | | | 132,000 | | | 103,354 |
Citigroup, Inc.
Senior Notes
6.88% due 03/05/38 | | | 158,000 | | | 142,701 |
GMAC LLC
Company Guar. Notes
6.00% due 04/01/11* | | | 1,615,000 | | | 1,477,725 |
GMAC LLC
Company Guar. Notes
6.88% due 09/15/11* | | | 1,404,000 | | | 1,295,190 |
GMAC LLC
Sub. Notes
8.00% due 12/31/18* | | | 1,725,000 | | | 1,254,938 |
JP Morgan Chase & Co.
Sub. Notes
4.89% due 09/01/15(4) | | | 162,000 | | | 146,247 |
Morgan Stanley
Sub. Notes
4.75% due 04/01/14 | | | 129,000 | | | 128,067 |
Morgan Stanley
Senior Notes
6.00% due 04/28/15 | | | 878,000 | | | 927,454 |
The Goldman Sachs Group, Inc.
Senior Notes
5.13% due 01/15/15 | | | 288,000 | | | 298,465 |
The Goldman Sachs Group, Inc.
Senior Notes
5.95% due 01/18/18 | | | 210,000 | | | 218,612 |
The Goldman Sachs Group, Inc.
Sub. Notes
6.75% due 10/01/37 | | | 303,000 | | | 303,357 |
| | | | | |
|
|
| | | | | | | 8,710,122 |
| | | | | |
|
|
Diversified Financial Services — 0.3% | | | | | | |
General Electric Capital Corp.
Senior Notes
5.88% due 01/14/38 | | | 162,000 | | | 143,808 |
General Electric Capital Corp.
Senior Notes
6.88% due 01/10/39 | | | 768,000 | | | 761,685 |
USAA Capital Corp.
Notes
3.50% due 07/17/14* | | | 100,000 | | | 99,547 |
| | | | | |
|
|
| | | | | | | 1,005,040 |
| | | | | |
|
|
Diversified Manufacturing Operations — 0.2% | | | | | | |
General Electric Co.
Senior Notes
5.25% due 12/06/17 | | | 85,000 | | | 86,783 |
Harland Clarke Holdings Corp.
Notes
6.00% due 05/15/15(4) | | | 125,000 | | | 89,688 |
79
VALIC Company II Strategic Bond Fund
PORTFOLIO OF INVESTMENTS — August 31, 2009 — (continued)
| | | | | | |
| | |
| Security Description | | Principal
Amount(12) | | Market Value
(Note 2) |
|
U.S. CORPORATE BONDS & NOTES (continued) | | | | | | |
Diversified Manufacturing Operations (continued) | | | | | | |
Harland Clarke Holdings Corp.
Notes
9.50% due 05/15/15 | | $ | 445,000 | | $ | 379,362 |
SPX Corp.
Senior Notes
7.63% due 12/15/14 | | | 300,000 | | | 301,125 |
| | | | | |
|
|
| | | | | | | 856,958 |
| | | | | |
|
|
Electric - Generation — 0.9% | | | | | | |
Edison Mission Energy
Senior Notes
7.63% due 05/15/27 | | | 370,000 | | | 247,900 |
Homer City Funding LLC
Senior Notes
8.14% due 10/01/19 | | | 247,000 | | | 232,180 |
Midwest Generation LLC
Pass Thru Certs., Series B
8.56% due 01/02/16 | | | 271,310 | | | 268,597 |
Reliant Energy Mid-Atlantic Power Holdings LLC
Pass Through Certs., Series B
9.24% due 07/02/17 | | | 421,746 | | | 417,528 |
Reliant Energy Mid-Atlantic Power Holdings LLC
Pass Through Certs., Series C
9.68% due 07/02/26 | | | 300,000 | | | 297,000 |
Sithe/Independence Funding Corp.
Senior Notes
9.00% due 12/30/13 | | | 406,625 | | | 403,449 |
The AES Corp.
Senior Notes
8.00% due 10/15/17 | | | 715,000 | | | 684,613 |
The AES Corp.
Senior Notes
8.00% due 06/01/20 | | | 225,000 | | | 210,375 |
The AES Corp.
Senior Sec. Notes
8.75% due 05/15/13* | | | 532,000 | | | 539,980 |
| | | | | |
|
|
| | | | | | | 3,301,622 |
| | | | | |
|
|
Electric - Integrated — 1.5% | | | | | | |
CenterPoint Energy Houston Electric LLC
General and Refunding Mtg. Notes
7.00% due 03/01/14 | | | 208,000 | | | 231,268 |
Commonwealth Edison Co.
1st Mtg. Notes
6.15% due 09/15/17 | | | 141,000 | | | 155,031 |
Dominion Resources, Inc.
Jr. Sub Notes
6.30% due 09/30/66(4) | | | 115,000 | | | 83,950 |
Energy East Corp.
Notes
6.75% due 07/15/36 | | | 253,000 | | | 278,718 |
Entergy Gulf States Louisiana LLC
1st Mtg. Bonds
6.00% due 05/01/18 | | | 396,000 | | | 410,759 |
Entergy Texas, Inc.
1st Mtg. Notes
7.13% due 02/01/19 | | | 22,000 | | | 24,262 |
FirstEnergy Corp.
Senior Notes
7.38% due 11/15/31 | | | 183,000 | | | 202,022 |
FirstEnergy Solutions Corp.
Company Guar. Notes
6.05% due 08/15/21* | | | 156,000 | | | 157,700 |
FirstEnergy Solutions Corp.
Company Guar. Notes
6.80% due 08/15/39* | | | 291,000 | | | 297,236 |
| | | | | | |
| | |
| Security Description | | Principal
Amount(12) | | Market Value
(Note 2) |
|
| | | | | | | |
Electric - Integrated (continued) | | | | | | |
Mirant Americas Generation LLC
Senior Notes
8.50% due 10/01/21 | | $ | 680,000 | | $ | 561,000 |
Mirant Mid - Atlantic LLC
Pass Through Certs., Series B
9.13% due 06/30/17 | | | 237,050 | | | 236,161 |
Nevada Power Co.
General and Refunding Mtg. Notes
7.13% due 03/15/19 | | | 337,000 | | | 383,884 |
Pepco Holdings, Inc.
Senior Notes
6.13% due 06/01/17 | | | 72,000 | | | 73,431 |
Pepco Holdings, Inc.
Senior Notes
6.45% due 08/15/12 | | | 345,000 | | | 367,046 |
PPL Electric Utilities Corp.
1st Mtg. Bonds
6.25% due 05/15/39 | | | 138,000 | | | 155,602 |
PSEG Power LLC
Company Guar. Notes
7.75% due 04/15/11 | | | 40,000 | | | 43,120 |
Sierra Pacific Power Co.
General and Refunding Mtg. Notes
6.75% due 07/01/37 | | | 226,000 | | | 246,047 |
Texas Competitive Electric Holdings Co., LLC
Company Guar. Notes, Series A
10.25% due 11/01/15 | | | 1,480,000 | | | 980,500 |
Texas Competitive Electric Holdings Co., LLC
Company Guar. Notes
10.50% due 11/01/16(11) | | | 570,375 | | | 333,669 |
Toledo Edison Co.
1st Mtg. Notes
7.25% due 05/01/20 | | | 110,000 | | | 128,257 |
| | | | | |
|
|
| | | | | | | 5,349,663 |
| | | | | |
|
|
Electronic Components - Misc. — 0.0% | | | | | | |
Sanmina-SCI Corp.
Company Guar. Notes
6.75% due 03/01/13 | | | 75,000 | | | 68,625 |
| | | | | |
|
|
Electronic Components - Semiconductors — 0.3% | | | | | | |
Amkor Technology, Inc.
Senior Notes
7.75% due 05/15/13 | | | 510,000 | | | 504,900 |
National Semiconductor Corp.
Senior Notes
6.60% due 06/15/17 | | | 102,000 | | | 94,023 |
Spansion LLC
Senior Sec. Notes
5.33% due 06/01/13†*(4)(18)(20) | | | 690,000 | | | 612,375 |
| | | | | |
|
|
| | | | | | | 1,211,298 |
| | | | | |
|
|
Electronics - Military — 0.1% | | | | | | |
L-3 Communications Corp.
Company Guar. Notes
6.13% due 07/15/13 | | | 395,000 | | | 383,150 |
| | | | | |
|
|
Enterprise Software/Service — 0.0% | | | | | | |
Oracle Corp.
Senior Notes
3.75% due 07/08/14 | | | 125,000 | | | 129,139 |
| | | | | |
|
|
Finance - Auto Loans — 1.2% | | | | | | |
Ford Motor Credit Co. LLC
Senior Notes
7.38% due 02/01/11 | | | 2,775,000 | | | 2,682,623 |
80
VALIC Company II Strategic Bond Fund
PORTFOLIO OF INVESTMENTS — August 31, 2009 — (continued)
| | | | | | |
| | |
| Security Description | | Principal
Amount(12) | | Market Value
(Note 2) |
|
U.S. CORPORATE BONDS & NOTES (continued) | | | | | | |
Finance - Auto Loans (continued) | | | | | | |
Ford Motor Credit Co. LLC
Senior Notes
7.50% due 08/01/12 | | $ | 725,000 | | $ | 667,304 |
Ford Motor Credit Co., LLC
Senior Notes
9.75% due 09/15/10 | | | 725,000 | | | 732,014 |
| | | | | |
|
|
| | | | | | | 4,081,941 |
| | | | | |
|
|
Finance - Commercial — 0.2% | | | | | | |
CIT Group, Inc.
Senior Notes
5.80% due 07/28/11 | | | 685,000 | | | 407,986 |
Textron Financial Corp.
Senior Notes
5.40% due 04/28/13 | | | 260,000 | | | 229,233 |
| | | | | |
|
|
| | | | | | | 637,219 |
| | | | | |
|
|
Finance - Credit Card — 0.0% | | | | | | |
FIA Card Services NA
Sub. Notes
7.13% due 11/15/12 | | | 114,000 | | | 118,261 |
| | | | | |
|
|
Finance - Investment Banker/Broker — 0.3% | | | | | | |
Lehman Brothers Holdings Capital Trust VII
Company Guar. Notes
5.86% due 05/31/12†(4)(9)(18)(20) | | | 101,000 | | | 10 |
Lehman Brothers Holdings, Inc.
Senior Notes
5.50% due 04/04/16†(18)(20) | | | 97,000 | | | 16,975 |
Lehman Brothers Holdings, Inc.
Sub. Notes
6.75% due 12/28/17†(18)(20) | | | 111,000 | | | 11 |
Lehman Brothers Holdings, Inc.
Sub. Notes
7.50% due 05/11/38†(18)(20) | | | 143,000 | | | 14 |
Merrill Lynch & Co., Inc.
Sub. Notes
5.70% due 05/02/17 | | | 143,000 | | | 133,837 |
Merrill Lynch & Co., Inc.
Sub. Notes
6.22% due 09/15/26 | | | 160,000 | | | 144,310 |
Merrill Lynch & Co., Inc.
Senior Notes
6.40% due 08/28/17 | | | 139,000 | | | 136,984 |
The Bear Stearns Cos., Inc.
Senior Notes
5.30% due 10/30/15 | | | 240,000 | | | 243,251 |
The Bear Stearns Cos., Inc.
Senior Notes
5.70% due 11/15/14 | | | 192,000 | | | 206,055 |
The Bear Stearns Cos., Inc.
Senior Notes
6.40% due 10/02/17 | | | 232,000 | | | 251,758 |
| | | | | |
|
|
| | | | | | | 1,133,205 |
| | | | | |
|
|
Finance - Mortgage Loan/Banker — 0.1% | | | | | | |
Countrywide Financial Corp.
Sub. Notes
6.25% due 05/15/16 | | | 120,000 | | | 116,409 |
Countrywide Home Loans, Inc.
Company Guar. Notes
4.00% due 03/22/11 | | | 145,000 | | | 146,406 |
| | | | | |
|
|
| | | | | | | 262,815 |
| | | | | |
|
|
| | | | | | |
| | |
| Security Description | | Principal
Amount(12) | | Market Value
(Note 2) |
|
| | | | | | | |
Food - Meat Products — 0.2% | | | | | | |
Smithfield Foods, Inc.
Senior Sec. Notes
10.00% due 07/15/14* | | $ | 700,000 | | $ | 714,000 |
Tyson Foods, Inc.
Senior Notes
10.50% due 03/01/14 | | | 125,000 | | | 139,375 |
| | | | | |
|
|
| | | | | | | 853,375 |
| | | | | |
|
|
Food - Misc. — 0.1% | | | | | | |
HJ Heinz Finance Co.
Company Guar. Notes
7.13% due 08/01/39* | | | 116,000 | | | 136,212 |
Kraft Foods, Inc.
Senior Notes
6.75% due 02/19/14 | | | 208,000 | | | 236,061 |
| | | | | |
|
|
| | | | | | | 372,273 |
| | | | | |
|
|
Food - Retail — 0.2% | | | | | | |
Ingles Markets, Inc.
Senior Notes
8.88% due 05/15/17 | | | 400,000 | | | 402,000 |
SUPERVALU, Inc.
Senior Notes
8.00% due 05/01/16 | | | 200,000 | | | 197,500 |
| | | | | |
|
|
| | | | | | | 599,500 |
| | | | | |
|
|
Funeral Services & Related Items — 0.2% | | | | | | |
Carriage Services, Inc.
Senior Notes
7.88% due 01/15/15 | | | 750,000 | | | 675,000 |
| | | | | |
|
|
Gambling (Non - Hotel) — 0.3% | | | | | | |
Downstream Development Authority
Senior Sec. Notes
12.00% due 10/15/15* | | | 700,000 | | | 442,750 |
Greektown Holdings LLC
Senior Notes
10.75% due 12/01/13†*(18)(20) | | | 50,000 | | | 10,750 |
Waterford Gaming LLC
Senior Notes
8.63% due 09/15/14* | | | 654,000 | | | 444,720 |
| | | | | |
|
|
| | | | | | | 898,220 |
| | | | | |
|
|
Gas - Distribution — 0.1% | | | | | | |
Sempra Energy
Senior Notes
6.50% due 06/01/16 | | | 230,000 | | | 252,961 |
| | | | | |
|
|
Hazardous Waste Disposal — 0.1% | | | | | | |
Clean Harbors, Inc.
Senior Sec. Notes
7.63% due 08/15/16* | | | 375,000 | | | 375,938 |
| | | | | |
|
|
Home Furnishings — 0.0% | | | | | | |
Simmons Co.
Senior Disc. Notes
10.00% due 12/15/14(8) | | | 45,000 | | | 13,950 |
| | | | | |
|
|
Hotels/Motels — 0.2% | | | | | | |
Gaylord Entertainment Co.
Company Guar. Notes
6.75% due 11/15/14 | | | 695,000 | | | 585,537 |
Gaylord Entertainment Co.
Company Guar. Notes
8.00% due 11/15/13 | | | 265,000 | | | 241,813 |
| | | | | |
|
|
| | | | | | | 827,350 |
| | | | | |
|
|
81
VALIC Company II Strategic Bond Fund
PORTFOLIO OF INVESTMENTS — August 31, 2009 — (continued)
| | | | | | |
| | |
| Security Description | | Principal
Amount(12) | | Market Value
(Note 2) |
|
U.S. CORPORATE BONDS & NOTES (continued) | | | | | | |
Human Resources — 0.1% | | | | | | |
Team Health, Inc.
Company Guar. Notes
11.25% due 12/01/13 | | $ | 300,000 | | $ | 307,500 |
| | | | | |
|
|
Independent Power Producers — 0.5% | | | | | | |
NRG Energy, Inc.
Company Guar. Notes
7.38% due 02/01/16 | | | 1,165,000 | | | 1,114,031 |
Orion Power Holdings, Inc.
Senior Notes
12.00% due 05/01/10 | | | 405,000 | | | 418,163 |
RRI Energy, Inc.
Senior Notes
7.88% due 12/31/17 | | | 310,000 | | | 275,125 |
| | | | | |
|
|
| | | | | | | 1,807,319 |
| | | | | |
|
|
Insurance Brokers — 0.3% | | | | | | |
Marsh & McLennan Cos., Inc.
Senior Notes
5.15% due 09/15/10 | | | 65,000 | | | 65,099 |
USI Holdings Corp.
Senior Sub. Notes
9.75% due 05/15/15* | | | 1,115,000 | | | 910,119 |
| | | | | |
|
|
| | | | | | | 975,218 |
| | | | | |
|
|
Insurance - Life/Health — 0.1% | | | | | | |
Americo Life, Inc.
Notes
7.88% due 05/01/13* | | | 28,000 | | | 19,880 |
Monumental Global Funding II
Senior Sec. Notes
5.65% due 07/14/11* | | | 60,000 | | | 61,323 |
Prudential Financial, Inc.
Senior Notes
6.20% due 01/15/15 | | | 234,000 | | | 245,127 |
| | | | | |
|
|
| | | | | | | 326,330 |
| | | | | |
|
|
Insurance - Multi-line — 0.2% | | | | | | |
Hartford Financial Services Group, Inc.
Senior Notes
5.95% due 10/15/36 | | | 274,000 | | | 200,820 |
Metlife, Inc.
Senior Notes
6.13% due 12/01/11 | | | 143,000 | | | 152,830 |
MetLife, Inc.
Senior Notes
6.75% due 06/01/16 | | | 125,000 | | | 136,737 |
Metropolitan Life Global Funding I
Notes
5.13% due 06/10/14* | | | 266,000 | | | 277,195 |
| | | | | |
|
|
| | | | | | | 767,582 |
| | | | | |
|
|
Insurance - Mutual — 0.1% | | | | | | |
Liberty Mutual Group, Inc.
Company Guar. Bonds
10.75% due 06/15/58*(4) | | | 256,000 | | | 225,280 |
Massachusetts Mutual Life Insurance Co.
Notes
8.88% due 06/01/39* | | | 159,000 | | | 178,428 |
| | | | | |
|
|
| | | | | | | 403,708 |
| | | | | |
|
|
Insurance - Property/Casualty — 0.1% | | | | | | |
ACE INA Holdings, Inc.
Company Guar. Notes
5.60% due 05/15/15 | | | 177,000 | | | 189,553 |
| | | | | | |
| | |
| Security Description | | Principal
Amount(12) | | Market Value
(Note 2) |
|
| | | | | | | |
Insurance - Property/Casualty (continued) | | | | | | |
W.R. Berkley Corp.
Senior Notes
6.25% due 02/15/37 | | $ | 65,000 | | $ | 51,192 |
| | | | | |
|
|
| | | | | | | 240,745 |
| | | | | |
|
|
| | | | | | | |
Investment Management/Advisor Services — 0.1% | | | | | | |
Ameriprise Financial, Inc.
Senior Notes
5.35% due 11/15/10 | | | 5,000 | | | 5,009 |
Janus Capital Group, Inc.
Notes
6.70% due 06/15/17 | | | 220,000 | | | 203,893 |
| | | | | |
|
|
| | | | | | | 208,902 |
| | | | | |
|
|
Machinery - Farming — 0.1% | | | | | | |
Case New Holland, Inc.
Company Guar. Notes
7.75% due 09/01/13* | | | 250,000 | | | 246,250 |
| | | | | |
|
|
Medical Information Systems — 0.1% | | | | | | |
Spheris, Inc.
Senior Sub. Notes
11.00% due 12/15/12 | | | 890,000 | | | 378,250 |
| | | | | |
|
|
Medical Labs & Testing Services — 0.0% | | | | | | |
Howard Hughes Medical Institute
Senior Notes
3.45% due 09/01/14 | | | 120,000 | | | 121,701 |
| | | | | |
|
|
Medical Products — 0.4% | | | | | | |
Baxter International, Inc.
Senior Notes
5.90% due 09/01/16 | | | 400,000 | | | 446,714 |
CareFusion Corp.
Senior Notes
4.13% due 08/01/12* | | | 145,000 | | | 147,760 |
DJO Finance LLC/DJO Finance Corp.
Company Guar. Notes
10.88% due 11/15/14 | | | 250,000 | | | 240,000 |
LVB Acquisition Holding LLC
Company Guar. Notes
10.38% due 10/15/17(11) | | | 465,000 | | | 484,762 |
| | | | | |
|
|
| | | | | | | 1,319,236 |
| | | | | |
|
|
Medical - Biomedical/Gene — 0.1% | | | | | | |
Amgen, Inc.
Senior Notes
5.85% due 06/01/17 | | | 240,000 | | | 265,051 |
Bio-Rad Laboratories, Inc.
Senior Sub. Notes
8.00% due 09/15/16* | | | 200,000 | | | 204,000 |
| | | | | |
|
|
| | | | | | | 469,051 |
| | | | | |
|
|
Medical - Drugs — 0.5% | | | | | | |
Axcan Intermediate Holdings, Inc.
Senior Notes
9.25% due 03/01/15 | | | 550,000 | | | 565,125 |
Merck & Co., Inc.
Senior Notes
4.00% due 06/30/15 | | | 104,000 | | | 108,394 |
Valeant Pharmaceuticals International
Senior Notes
8.38% due 06/15/16* | | | 650,000 | | | 659,750 |
Wyeth
Bonds
5.50% due 02/01/14 | | | 478,000 | | | 522,674 |
| | | | | |
|
|
| | | | | | | 1,855,943 |
| | | | | |
|
|
82
VALIC Company II Strategic Bond Fund
PORTFOLIO OF INVESTMENTS — August 31, 2009 — (continued)
| | | | | | |
| | |
| Security Description | | Principal
Amount(12) | | Market Value
(Note 2) |
|
U.S. CORPORATE BONDS & NOTES (continued) | | | |
Medical - HMO — 0.5% | | | | | | |
CIGNA Corp.
Senior Notes
8.50% due 05/01/19 | | $ | 500,000 | | $ | 548,766 |
Multiplan, Inc.
Senior Sub. Notes
10.38% due 04/15/16* | | | 970,000 | | | 940,900 |
UnitedHealth Group, Inc.
Senior Notes
5.25% due 03/15/11 | | | 145,000 | | | 150,041 |
WellPoint, Inc.
Senior Notes
5.00% due 01/15/11 | | | 87,000 | | | 89,922 |
| | | | | |
|
|
| | | | | | | 1,729,629 |
| | | | | |
|
|
Medical - Hospitals — 1.7% | | | | | | |
Community Health Systems, Inc.
Company Guar. Notes
8.88% due 07/15/15 | | | 845,000 | | | 848,169 |
HCA, Inc.
Senior Notes
7.50% due 11/15/95 | | | 1,075,000 | | | 704,889 |
HCA, Inc.
Senior Notes
7.88% due 02/01/11 | | | 525,000 | | | 527,625 |
HCA, Inc.
Senior Notes
8.50% due 04/15/19* | | | 1,250,000 | | | 1,265,625 |
HCA, Inc.
Senior Notes
8.75% due 09/01/10 | | | 280,000 | | | 282,100 |
HCA, Inc.
Senior Sec. Notes
9.25% due 11/15/16 | | | 1,675,000 | | | 1,695,938 |
IASIS Healthcare LLC/IASIS Capital Corp.
Company Guar. Notes
8.75% due 06/15/14 | | | 490,000 | | | 478,975 |
| | | | | |
|
|
| | | | | | | 5,803,321 |
| | | | | |
|
|
Metal - Aluminum — 0.3% | | | | | | |
Alcoa, Inc.
Senior Notes
6.50% due 06/15/18 | | | 386,000 | | | 367,377 |
Noranda Aluminum Acquisition Corp.
Company Guar. Notes
5.41% due 11/15/14(4)(11) | | | 782,727 | | | 477,463 |
Noranda Aluminum Holding Corp.
Senior Notes
7.16% due 11/15/14(4)(11) | | | 156,821 | | | 67,433 |
| | | | | |
|
|
| | | | | | | 912,273 |
| | | | | |
|
|
Metal - Copper — 0.3% | | | | | | |
Freeport - McMoRan Copper & Gold, Inc.
Senior Notes
8.25% due 04/01/15 | | | 190,000 | | | 198,075 |
Freeport - McMoRan Copper & Gold, Inc.
Senior Notes
8.38% due 04/01/17 | | | 525,000 | | | 547,313 |
Freeport - McMoRan Corp.
Company Guar. Notes
8.75% due 06/01/11 | | | 233,000 | | | 248,882 |
| | | | | |
|
|
| | | | | | | 994,270 |
| | | | | |
|
|
Multimedia — 0.1% | | | | | | |
Haights Cross Operating Co.
Senior Notes
11.75% due 08/15/11(23) | | | 100,000 | | | 43,000 |
| | | | | | |
| | |
| Security Description | | Principal
Amount(12) | | Market Value
(Note 2) |
|
| | | | | | | |
News America, Inc.
Company Guar. Notes
6.15% due 03/01/37 | | $ | 147,000 | | $ | 141,997 |
News America, Inc.
Company Guar. Notes
6.90% due 08/15/39* | | | 145,000 | | | 152,601 |
Time Warner Entertainment Co. LP
Senior Notes
8.38% due 07/15/33 | | | 87,000 | | | 104,772 |
| | | | | |
|
|
| | | | | | | 442,370 |
| | | | | |
|
|
Music — 0.2% | | | | | | |
WMG Acquisition Corp.
Senior Notes
9.50% due 06/15/16* | | | 750,000 | | | 776,250 |
| | | | | |
|
|
Non - Ferrous Metals — 0.0% | | | | | | |
Renco Metals, Inc.
Bonds
11.50% due 07/01/03†(6)(7)(19)(21) | | | 75,000 | | | 0 |
| | | | | |
|
|
Non - Hazardous Waste Disposal — 0.2% | | | |
Allied Waste North America, Inc.
Company Guar. Notes
7.38% due 04/15/14 | | | 100,000 | | | 104,239 |
Casella Waste Systems, Inc.
Senior Sec. Notes
11.00% due 07/15/14* | | | 175,000 | | | 180,687 |
Republic Services, Inc.
Senior Notes
5.50% due 09/15/19* | | | 95,000 | | | 94,847 |
Waste Management, Inc.
Company Guar. Notes
6.38% due 11/15/12 | | | 121,000 | | | 132,428 |
Waste Management, Inc.
Company Guar. Notes
7.75% due 05/15/32 | | | 135,000 | | | 156,106 |
Waste Services, Inc.
Senior Sub. Notes
9.50% due 04/15/14 | | | 140,000 | | | 138,600 |
| | | | | |
|
|
| | | | | | | 806,907 |
| | | | | |
|
|
Office Automation & Equipment — 0.1% | | | | | | |
Pitney Bowes, Inc.
Senior Notes
5.25% due 01/15/37 | | | 219,000 | | | 217,851 |
Xerox Corp.
Senior Notes
6.35% due 05/15/18 | | | 115,000 | | | 117,676 |
| | | | | |
|
|
| | | | | | | 335,527 |
| | | | | |
|
|
Oil & Gas Drilling — 0.0% | | | | | | |
Rowan Cos., Inc.
Senior Notes
7.88% due 08/01/19 | | | 115,000 | | | 121,222 |
| | | | | |
|
|
Oil Companies - Exploration & Production — 2.2% | | | | | | |
Atlas Energy Resources LLC
Senior Notes
10.75% due 02/01/18* | | | 400,000 | | | 404,000 |
Belden & Blake Corp.
Company Guar. Sec. Notes
8.75% due 07/15/12 | | | 80,000 | | | 71,600 |
Brigham Exploration Co.
Company Guar. Notes
9.63% due 05/01/14 | | | 780,000 | | | 694,200 |
Chaparral Energy, Inc.
Company Guar. Notes
8.50% due 12/01/15 | | | 260,000 | | | 174,200 |
83
VALIC Company II Strategic Bond Fund
PORTFOLIO OF INVESTMENTS — August 31, 2009 — (continued)
| | | | | | |
| | |
| Security Description | | Principal
Amount(12) | | Market Value
(Note 2) |
|
U.S. CORPORATE BONDS & NOTES (continued) | | | | | | |
Oil Companies - Exploration & Production (continued) | | | |
Chesapeake Energy Corp.
Senior Notes
6.63% due 01/15/16 | | $ | 685,000 | | $ | 622,494 |
Chesapeake Energy Corp.
Senior Notes
7.25% due 12/15/18 | | | 275,000 | | | 251,625 |
Chesapeake Energy Corp.
Senior Notes
9.50% due 02/15/15 | | | 325,000 | | | 331,500 |
Encore Acquisition Co.
Senior Sub. Notes
6.00% due 07/15/15 | | | 770,000 | | | 662,200 |
Encore Acquisition Co.
Senior Sub. Notes
6.25% due 04/15/14 | | | 260,000 | | | 231,400 |
Energy Partners, Ltd.
Senior Notes
9.75% due 04/15/14†(18)(20) | | | 415,000 | | | 236,550 |
Hilcorp Energy I LP
Senior Notes
7.75% due 11/01/15* | | | 670,000 | | | 618,075 |
Hilcorp Energy I LP
Senior Notes
9.00% due 06/01/16* | | | 200,000 | | | 191,000 |
Kerr - McGee Corp.
Company Guar. Notes
6.95% due 07/01/24 | | | 24,000 | | | 24,784 |
MXEnergy Holdings, Inc.
Senior Notes
8.43% due 08/01/11(4) | | | 245,000 | | | 97,387 |
Plains Exploration & Production Co.
Company Guar. Notes
7.75% due 06/15/15 | | | 250,000 | | | 242,500 |
Plains Exploration & Production Co.
Company Guar. Notes
10.00% due 03/01/16 | | | 325,000 | | | 344,500 |
Quicksilver Resources, Inc.
Company Guar. Notes
7.13% due 04/01/16 | | | 160,000 | | | 132,800 |
Quicksilver Resources, Inc.
Senior Notes
8.25% due 08/01/15 | | | 600,000 | | | 564,000 |
Quicksilver Resources, Inc.
Senior Notes
9.13% due 08/15/19 | | | 375,000 | | | 365,625 |
Quicksilver Resources, Inc.
Senior Notes
11.75% due 01/01/16 | | | 75,000 | | | 79,500 |
Sabine Pass LNG LP
Company Guar. Senior Notes
7.25% due 11/30/13 | | | 185,000 | | | 159,100 |
Sabine Pass LNG LP
Senior Sec. Notes
7.50% due 11/30/16 | | | 1,455,000 | | | 1,178,550 |
| | | | | |
|
|
| | | | | | | 7,677,590 |
| | | | | |
|
|
Oil Companies - Integrated — 0.3% | | | | | | |
ConocoPhillips Holding Co.
Senior Notes
6.95% due 04/15/29 | | | 148,000 | | | 170,625 |
Hess Corp.
Senior Notes
7.13% due 03/15/33 | | | 145,000 | | | 160,909 |
Hess Corp.
Senior Notes
7.88% due 10/01/29 | | | 330,000 | | | 391,685 |
| | | | | | |
| | |
| Security Description | | Principal
Amount(12) | | Market Value
(Note 2) |
|
| | | | | | | |
Oil Companies - Integrated (continued) | | | | | | |
Phillips Petroleum Co.
Debentures
7.00% due 03/30/29 | | $ | 290,000 | | $ | 324,916 |
| | | | | |
|
|
| | | | | | | 1,048,135 |
| | | | | |
|
|
Oil Refining & Marketing — 0.1% | | | | | | |
Valero Energy Corp.
Senior Notes
6.63% due 06/15/37 | | | 150,000 | | | 130,380 |
Western Refining, Inc.
Senior Sec. Notes
11.25% due 06/15/17* | | | 225,000 | | | 199,125 |
| | | | | |
|
|
| | | | | | | 329,505 |
| | | | | |
|
|
Oil - Field Services — 0.3% | | | | | | |
Basic Energy Services, Inc.
Senior Sec. Notes
11.63% due 08/01/14* | | | 425,000 | | | 433,500 |
Helix Energy Solutions Group, Inc.
Senior Notes
9.50% due 01/15/16* | | | 700,000 | | | 658,000 |
Oslo Seismic Services, Inc.
1st Mtg. Bonds
8.28% due 06/01/11 | | | 62,946 | | | 63,847 |
| | | | | |
|
|
| | | | | | | 1,155,347 |
| | | | | |
|
|
Paper & Related Products — 0.6% | | | | | | |
Caraustar Industries, Inc.
Senior Sec. Notes
10.00% due 08/15/14(7)(11) | | | 120,457 | | | 120,457 |
Cellu Tissue Holdings, Inc.
Sec. Notes
11.50% due 06/01/14* | | | 150,000 | | | 156,750 |
Georgia - Pacific LLC
Company Guar. Notes
7.00% due 01/15/15* | | | 425,000 | | | 409,062 |
Georgia - Pacific LLC
Company Guar. Notes
7.13% due 01/15/17* | | | 130,000 | | | 124,800 |
Georgia - Pacific LLC
Senior Notes
7.75% due 11/15/29 | | | 155,000 | | | 136,400 |
International Paper Co.
Senior Notes
7.95% due 06/15/18 | | | 150,000 | | | 159,208 |
International Paper Co.
Senior Notes
9.38% due 05/15/19 | | | 920,000 | | | 1,033,810 |
| | | | | |
|
|
| | | | | | | 2,140,487 |
| | | | | |
|
|
Pharmacy Services — 0.1% | | | | | | |
Express Scripts, Inc.
Senior Notes
6.25% due 06/15/14 | | | 125,000 | | | 136,612 |
Express Scripts, Inc.
Senior Notes
7.25% due 06/15/19 | | | 78,000 | | | 90,455 |
| | | | | |
|
|
| | | | | | | 227,067 |
| | | | | |
|
|
Physicians Practice Management — 0.2% | | | | | | |
US Oncology, Inc.
Senior Sec. Notes
9.13% due 08/15/17* | | | 525,000 | | | 546,000 |
| | | | | |
|
|
Pipelines — 1.5% | | | | | | |
Boardwalk Pipelines LLC
Company Guar. Notes
5.75% due 09/15/19 | | | 233,000 | | | 230,882 |
84
VALIC Company II Strategic Bond Fund
PORTFOLIO OF INVESTMENTS — August 31, 2009 — (continued)
| | | | | | |
| | |
| Security Description | | Principal
Amount(12) | | Market Value
(Note 2) |
|
U.S. CORPORATE BONDS & NOTES (continued) | | | | | | |
Pipelines (continued) | | | | | | |
Copano Energy LLC
Company Guar. Notes
8.13% due 03/01/16 | | $ | 1,060,000 | | $ | 1,014,950 |
Copano Energy LLC / Copano Energy Finance Corp.
Company Guar. Notes
7.75% due 06/01/18 | | | 175,000 | | | 161,875 |
Dynegy - Roseton Danskammer
Pass Through Certs., Series B
7.67% due 11/08/16 | | | 1,625,000 | | | 1,454,375 |
El Paso Corp.
Senior Sub. Notes
6.88% due 06/15/14 | | | 300,000 | | | 292,649 |
El Paso Corp.
Senior Notes
12.00% due 12/12/13 | | | 100,000 | | | 113,000 |
Enterprise Products Operating LLC
Company Guar. Notes
4.60% due 08/01/12 | | | 125,000 | | | 129,705 |
MarkWest Energy Partners LP / MarkWest Energy Finance Corp.
Senior Notes
6.88% due 11/01/14 | | | 245,000 | | | 224,175 |
MarkWest Energy Partners LP / MarkWest Energy Finance Corp.
Company Guar. Notes
8.50% due 07/15/16 | | | 300,000 | | | 283,500 |
MarkWest Energy Partners LP / MarkWest Energy Finance Corp.
Senior Notes
8.75% due 04/15/18 | | | 200,000 | | | 190,000 |
NGC Corp. Capital Trust
Company Guar. Bonds
8.32% due 06/01/27 | | | 475,000 | | | 225,625 |
ONEOK, Inc.
Senior Notes
6.00% due 06/15/35 | | | 135,000 | | | 129,292 |
Plains All American Pipeline, LP
Senior Notes
4.25% due 09/01/12 | | | 199,000 | | | 203,184 |
Regency Energy Partners LP/Regency Energy Finance Corp.
Company Guar. Notes
8.38% due 12/15/13 | | | 200,000 | | | 196,500 |
Williams Cos., Inc.
Senior Notes
7.88% due 09/01/21 | | | 365,000 | | | 395,234 |
| | | | | |
|
|
| | | | | | | 5,244,946 |
| | | | | |
|
|
Printing - Commercial — 0.2% | | | | | | |
Valassis Communications, Inc.
Senior Notes
8.25% due 03/01/15 | | | 805,000 | | | 704,375 |
| | | | | |
|
|
Private Corrections — 0.1% | | | | | | |
Corrections Corp. of America
Company Guar. Notes
7.75% due 06/01/17 | | | 275,000 | | | 271,563 |
| | | | | |
|
|
Property Trust — 0.1% | | | | | | |
WEA Finance LLC / WT Finance Australia Property, Ltd.
Company Guar. Notes
6.75% due 09/02/19* | | | 280,000 | | | 275,794 |
| | | | | |
|
|
Publishing - Newspapers — 0.0% | | | | | | |
Knight Ridder, Inc.
Debentures
6.88% due 03/15/29 | | | 146,000 | | | 48,545 |
| | | | | |
|
|
| | | | | | |
| | |
| Security Description | | Principal
Amount(12) | | Market Value
(Note 2) |
|
| | | | | | | |
Publishing - Periodicals — 0.1% | | | | | | |
Nielsen Finance LLC / Nielsen Finance Co.
Company Guar. Notes
11.50% due 05/01/16 | | $ | 375,000 | | $ | 373,125 |
The Reader’s Digest Association, Inc.
Company Guar. Notes
9.00% due 02/15/17†(18)(20) | | | 955,000 | | | 22,681 |
| | | | | |
|
|
| | | | | | | 395,806 |
| | | | | |
|
|
Real Estate Investment Trusts — 0.1% | | | |
Omega Healthcare Investors, Inc.
Senior Notes
7.00% due 04/01/14 | | | 540,000 | | | 504,900 |
| | | | | |
|
|
Real Estate Management/Services — 0.1% | | | |
CB Richard Ellis Services, Inc.
Senior Sub. Notes
11.63% due 06/15/17* | | | 350,000 | | | 364,000 |
| | | | | |
|
|
Recycling — 0.0% | | | | | | |
Aleris International, Inc.
Company Guar. Notes
9.00% due 12/15/14†(11)(18)(20) | | | 1,625,000 | | | 8,288 |
| | | | | |
|
|
Rental Auto/Equipment — 0.2% | | | | | | |
RSC Equipment Rental, Inc.
Notes
9.50% due 12/01/14 | | | 230,000 | | | 205,850 |
RSC Equipment Rental, Inc.
Senior Sec. Notes
10.00% due 07/15/17* | | | 375,000 | | | 390,000 |
| | | | | |
|
|
| | | | | | | 595,850 |
| | | | | |
|
|
Research & Development — 0.1% | | | | | | |
Alion Science and Technology Corp.
Company Guar. Notes
10.25% due 02/01/15 | | | 625,000 | | | 412,500 |
| | | | | |
|
|
Retail - Apparel/Shoe — 0.2% | | | | | | |
Limited Brands, Inc.
Senior Notes
5.25% due 11/01/14 | | | 360,000 | | | 325,474 |
Limited Brands, Inc.
Senior Notes
6.95% due 03/01/33 | | | 470,000 | | | 336,929 |
Limited Brands, Inc.
Senior Notes
8.50% due 06/15/19* | | | 210,000 | | | 212,737 |
| | | | | |
|
|
| | | | | | | 875,140 |
| | | | | |
|
|
Retail - Discount — 0.0% | | | | | | |
Wal - Mart Stores, Inc.
Senior Notes
3.20% due 05/15/14 | | | 115,000 | | | 117,334 |
| | | | | |
|
|
Retail - Drug Store — 0.1% | | | | | | |
Rite Aid Corp.
Company Guar. Notes
9.50% due 06/15/17 | | | 365,000 | | | 262,800 |
Rite Aid Corp.
Senior Sec. Notes
9.75% due 06/12/16* | | | 100,000 | | | 105,750 |
| | | | | |
|
|
| | | | | | | 368,550 |
| | | | | |
|
|
Retail - Major Department Stores — 0.0% | | | |
Saks, Inc.
Company Guar. Notes
9.88% due 10/01/11 | | | 150,000 | | | 147,000 |
| | | | | |
|
|
85
VALIC Company II Strategic Bond Fund
PORTFOLIO OF INVESTMENTS — August 31, 2009 — (continued)
| | | | | | |
| | |
| Security Description | | Principal
Amount(12) | | Market Value
(Note 2) |
|
U.S. CORPORATE BONDS & NOTES (continued) | | | | | | |
Retail - Music Store — 0.0% | | | | | | |
MTS, Inc.
Senior Notes
10.00% due 03/15/09†(5)(6)(7)(10)(19)(20) | | $ | 15,273 | | $ | 305 |
| | | | | |
|
|
Retail - Petroleum Products — 0.2% | | | | | | |
Ferrellgas LP
Senior Notes
6.75% due 05/01/14 | | | 275,000 | | | 252,313 |
Ferrellgas Partners LP
Senior Notes
6.75% due 05/01/14* | | | 50,000 | | | 45,875 |
Inergy LP/Inergy Finance Corp.
Company Guar. Notes
8.25% due 03/01/16 | | | 250,000 | | | 247,500 |
| | | | | |
|
|
| | | | | | | 545,688 |
| | | | | |
|
|
Retail - Regional Department Stores — 0.3% | | | |
JC Penney Corp., Inc.
Senior Notes
7.40% due 04/01/37 | | | 250,000 | | | 210,000 |
Macy’s Retail Holdings, Inc.
Company Guar. Notes
5.90% due 12/01/16 | | | 360,000 | | | 317,339 |
Macy’s Retail Holdings, Inc.
Company Guar. Notes
6.38% due 03/15/37 | | | 225,000 | | | 165,657 |
Macy’s Retail Holdings, Inc.
Company Guar. Notes
6.65% due 07/15/24 | | | 215,000 | | | 166,259 |
Macy’s Retail Holdings, Inc.
Company Guar. Notes
6.90% due 04/01/29 | | | 215,000 | | | 162,464 |
| | | | | |
|
|
| | | | | | | 1,021,719 |
| | | | | |
|
|
Retail - Restaurants — 0.1% | | | | | | |
Brinker International, Inc.
Senior Notes
5.75% due 06/01/14 | | | 195,000 | | | 184,228 |
Wendy’s/Arby’s Restaurants LLC
Senior Notes
10.00% due 07/15/16* | | | 125,000 | | | 128,125 |
| | | | | |
|
|
| | | | | | | 312,353 |
| | | | | |
|
|
Retail - Sporting Goods — 0.1% | | | | | | |
Freedom Group, Inc.
Senior Sec. Notes
10.25% due 08/01/15* | | | 225,000 | | | 231,750 |
| | | | | |
|
|
Rubber - Tires — 0.3% | | | | | | |
The Goodyear Tire & Rubber Co.
Senior Notes
9.00% due 07/01/15 | | | 350,000 | | | 355,250 |
The Goodyear Tire & Rubber Co.
Senior Notes
10.50% due 05/15/16 | | | 575,000 | | | 613,812 |
| | | | | |
|
|
| | | | | | | 969,062 |
| | | | | |
|
|
Rubber/Plastic Products — 0.0% | | | | | | |
Venture Holdings Co. LLC
Company Guar. Notes
11.00% due 06/01/07†(6)(7)(19)(21) | | | 25,000 | | | 0 |
| | | | | |
|
|
Schools — 0.1% | | | | | | |
Princeton University
Senior Notes
5.70% due 03/01/39 | | | 179,000 | | | 191,590 |
| | | | | |
|
|
| | | | | | |
| | |
| Security Description | | Principal
Amount(12) | | Market Value
(Note 2) |
|
| | | | | | | |
Seismic Data Collection — 0.1% | | | | | | |
Seitel, Inc.
Senior Notes
9.75% due 02/15/14 | | $ | 570,000 | | $ | 342,000 |
| | | | | |
|
|
Special Purpose Entities — 0.8% | | | | | | |
AAC Group Holding Corp.
Senior Notes
10.25% due 10/01/12*(8) | | | 175,000 | | | 146,125 |
Buffalo Thunder Development Authority
Senior Notes
9.38% due 12/15/14†*(18) | | | 1,790,000 | | | 317,725 |
CCM Merger, Inc.
Notes
8.00% due 08/01/13* | | | 345,000 | | | 279,450 |
Chukchansi Economic Development Authority
Senior Notes
8.00% due 11/15/13* | | | 890,000 | | | 712,000 |
Citicorp Lease Pass-Through Trust 1999-1
Pass Thru Certs.
8.04% due 12/15/19* | | | 160,000 | | | 143,387 |
FireKeepers Development Authority
Senior Notes
13.88% due 05/15/15* | | | 420,000 | | | 426,300 |
Fox Acquisition Sub LLC
Senior Notes
13.38% due 07/15/16* | | | 375,000 | | | 225,000 |
ING USA Global Funding Trust
Notes
4.50% due 10/01/10 | | | 80,000 | | | 81,097 |
Local TV Finance LLC
Senior Notes
10.00% due 06/15/15*(11) | | | 367,500 | | | 99,225 |
Principal Life Global Funding I
Senior Sec. Notes
5.25% due 01/15/13* | | | 163,000 | | | 165,674 |
Southern Star Central Corp.
Senior Notes
6.75% due 03/01/16 | | | 300,000 | | | 280,500 |
| | | | | |
|
|
| | | | | | | 2,876,483 |
| | | | | |
|
|
Specified Purpose Acquisitions — 0.0% | | | |
ESI Tractebel Acquisition Corp.
Company Guar. Bonds
7.99% due 12/30/11 | | | 150,000 | | | 146,250 |
| | | | | |
|
|
Steel - Producers — 0.5% | | | | | | |
AK Steel Corp.
Company Guar. Notes
7.75% due 06/15/12 | | | 250,000 | | | 249,688 |
Reliance Steel & Aluminum Co.
Company Guar. Notes
6.85% due 11/15/36 | | | 380,000 | | | 296,495 |
Ryerson, Inc.
Company Guar. Notes
7.86% due 11/01/14(4) | | | 390,000 | | | 331,500 |
Ryerson, Inc.
Senior Sec. Notes
12.00% due 11/01/15 | | | 450,000 | | | 414,000 |
Steel Dynamics, Inc.
Company Guar. Notes
6.75% due 04/01/15 | | | 450,000 | | | 419,625 |
| | | | | |
|
|
| | | | | | | 1,711,308 |
| | | | | |
|
|
Steel - Specialty — 0.1% | | | | | | |
Allegheny Technologies, Inc.
Senior Notes
9.38% due 06/01/19 | | | 250,000 | | | 274,147 |
| | | | | |
|
|
86
VALIC Company II Strategic Bond Fund
PORTFOLIO OF INVESTMENTS — August 31, 2009 — (continued)
| | | | | | |
| | |
| Security Description | | Principal
Amount(12) | | Market Value
(Note 2) |
|
U.S. CORPORATE BONDS & NOTES (continued) | | | | | | |
Storage/Warehousing — 0.1% | | | | | | |
Mobile Mini, Inc.
Notes
6.88% due 05/01/15 | | $ | 290,000 | | $ | 256,650 |
Mobile Mini, Inc.
Company Guar. Notes
9.75% due 08/01/14 | | | 245,000 | | | 245,000 |
| | | | | |
|
|
| | | | | | | 501,650 |
| | | | | |
|
|
Telecom Services — 0.8% | | | | | | |
Bellsouth Telecommunications, Inc.
Senior Notes
7.00% due 12/01/95 | | | 90,000 | | | 90,192 |
Cincinnati Bell Telephone Co. LLC
Company Guar. Notes
7.18% due 12/15/23 | | | 25,000 | | | 19,188 |
Cincinnati Bell Telephone Co. LLC
Company Guar. Notes
7.20% due 11/29/23 | | | 125,000 | | | 95,000 |
Embarq Corp.
Senior Notes
8.00% due 06/01/36 | | | 62,000 | | | 63,806 |
PAETEC Holding Corp.
Senior Sec. Notes
8.88% due 06/30/17* | | | 425,000 | | | 404,812 |
PAETEC Holding Corp.
Company Guar. Notes
9.50% due 07/15/15 | | | 845,000 | | | 728,812 |
Qwest Corp.
Senior Notes
6.50% due 06/01/17 | | | 190,000 | | | 174,800 |
Qwest Corp.
Senior Notes
8.38% due 05/01/16* | | | 250,000 | | | 252,500 |
Qwest Corp.
Senior Notes
8.88% due 03/15/12 | | | 600,000 | | | 618,000 |
SBA Telecommunications, Inc.
Company Guar. Notes
8.25% due 08/15/19* | | | 500,000 | | | 502,500 |
| | | | | |
|
|
| | | | | | | 2,949,610 |
| | | | | |
|
|
Telephone - Integrated — 1.7% | | | | | | |
AT&T, Inc.
Senior Notes
5.63% due 06/15/16 | | | 120,000 | | | 129,619 |
BellSouth Corp.
Senior Notes
6.88% due 10/15/31 | | | 145,000 | | | 158,830 |
Cincinnati Bell, Inc.
Senior Notes
7.25% due 06/15/23 | | | 25,000 | | | 19,500 |
Level 3 Financing, Inc.
Company Guar. Notes
8.75% due 02/15/17 | | | 820,000 | | | 639,600 |
Level 3 Financing, Inc.
Senior Notes
12.25% due 03/15/13 | | | 1,350,000 | | | 1,316,250 |
Pacific Bell Telephone Co.
Company Guar. Notes
7.13% due 03/15/26 | | | 200,000 | | | 221,510 |
Qwest Capital Funding, Inc.
Notes
7.25% due 02/15/11 | | | 525,000 | | | 517,125 |
Qwest Communications International, Inc.
Company Guar. Notes
7.50% due 02/15/14 | | | 120,000 | | | 115,800 |
| | | | | | |
| | |
| Security Description | | Principal
Amount(12) | | Market Value
(Note 2) |
|
| | | | | | | |
Telephone - Integrated (continued) | | | | | | |
Qwest Communications International, Inc.
Company Guar. Notes, Series B
7.50% due 02/15/14 | | $ | 105,000 | | $ | 101,325 |
Sprint Capital Corp.
Company Guar. Notes
8.75% due 03/15/32 | | | 2,810,000 | | | 2,332,300 |
Valor Telecommunications Enterprises LLC
Company Guar. Notes
7.75% due 02/15/15 | | | 200,000 | | | 201,750 |
Verizon Pennsylvania, Inc.
Senior Bonds
8.35% due 12/15/30 | | | 125,000 | | | 140,306 |
Verizon Virginia, Inc.
Senior Notes
4.63% due 03/15/13 | | | 125,000 | | | 128,837 |
| | | | | |
|
|
| | | | | | | 6,022,752 |
| | | | | |
|
|
Television — 0.2% | | | | | | |
Allbritton Communications Co.
Senior Sub. Notes
7.75% due 12/15/12 | | | 955,000 | | | 816,525 |
Bonten Media Acquisition Co.
Company Guar. Notes
9.75% due 06/01/15*(11) | | | 57,681 | | | 18,602 |
Paxson Communications Corp.
Senior Sec. Notes
8.38% due 01/15/13†*(4)(11)(18)(20) | | | 895,500 | | | 26,865 |
Young Broadcasting, Inc.
Senior Sub. Notes
8.75% due 01/15/14†(18)(20) | | | 230,000 | | | 26 |
Young Broadcasting, Inc.
Company Guar. Notes
10.00% due 03/01/11†(18)(20) | | | 510,000 | | | 56 |
| | | | | |
|
|
| | | | | | | 862,074 |
| | | | | |
|
|
Textile - Home Furnishings — 0.0% | | | | | | |
Mohawk Industries, Inc.
Senior Notes
7.20% due 04/15/12 | | | 135,000 | | | 135,879 |
| | | | | |
|
|
Theaters — 0.3% | | | | | | |
AMC Entertainment, Inc.
Senior Sub. Notes
8.00% due 03/01/14 | | | 580,000 | | | 545,200 |
AMC Entertainment, Inc.
Senior Notes
8.75% due 06/01/19 | | | 400,000 | | | 397,000 |
| | | | | |
|
|
| | | | | | | 942,200 |
| | | | | |
|
|
Transactional Software — 0.2% | | | | | | |
Open Solutions, Inc.
Company Guar. Notes
9.75% due 02/01/15* | | | 1,180,000 | | | 772,900 |
| | | | | |
|
|
Transport - Air Freight — 0.4% | | | | | | |
Atlas Air, Inc.
Pass Through Certs.
Series 1991-1, Class A-2
6.88% due 01/02/11 | | | 122,789 | | | 105,598 |
Atlas Air, Inc.
Pass Through Certs.
Series 1991-1, Class A-1
7.20% due 01/02/19 | | | 435,427 | | | 296,091 |
Atlas Air, Inc.
Pass Through Certs.
Series 1991-1, Class B
7.63% due 01/02/15 | | | 478,651 | | | 282,404 |
87
VALIC Company II Strategic Bond Fund
PORTFOLIO OF INVESTMENTS — August 31, 2009 — (continued)
| | | | | | |
| | |
| Security Description | | Principal
Amount(12) | | Market Value
(Note 2) |
|
U.S. CORPORATE BONDS & NOTES (continued) | | | |
Transport - Air Freight (continued) | | | |
Atlas Air, Inc.
Pass Through Certs.
Series 2000-1, Class A
8.71% due 01/02/19 | | $ | 566,685 | | $ | 396,679 |
Atlas Air, Inc.
Pass Through Certs.
Series 1991-1, Class C
8.77% due 01/02/11 | | | 37,457 | | | 14,983 |
Atlas Air, Inc.
Pass Through Certs.
Series 2000-1, Class B
9.06% due 07/02/17 | | | 180,748 | | | 142,791 |
| | | | | |
|
|
| | | | | | | 1,238,546 |
| | | | | |
|
|
Transport - Rail — 0.2% | | | | | | |
CSX Corp.
Senior Notes
6.15% due 05/01/37 | | | 145,000 | | | 147,313 |
CSX Corp.
Debentures
7.90% due 05/01/17 | | | 206,000 | | | 241,661 |
Union Pacific Corp.
Senior Notes
5.75% due 11/15/17 | | | 338,000 | | | 361,872 |
| | | | | |
|
|
| | | | | | | 750,846 |
| | | | | |
|
|
Transport - Services — 0.1% | | | | | | |
Bristow Group, Inc.
Senior Notes
7.50% due 09/15/17 | | | 355,000 | | | 335,475 |
PHI, Inc.
Company Guar. Notes
7.13% due 04/15/13 | | | 200,000 | | | 185,500 |
| | | | | |
|
|
| | | | | | | 520,975 |
| | | | | |
|
|
Wireless Equipment — 0.1% | | | | | | |
CC Holdings GS V LLC/Crown Castle GS III Corp.
Senior Notes
7.75% due 05/01/17* | | | 200,000 | | | 202,000 |
| | | | | |
|
|
Total U.S. Corporate Bonds & Notes | | | | | | |
(cost $141,260,718) | | | | | | 138,265,189 |
| | | | | |
|
|
FOREIGN CORPORATE BONDS & NOTES — 6.1% | | | | | | |
Banks - Commercial — 0.6% | | | | | | |
Australia & New Zealand Banking Group, Ltd.
Sub. Notes
1.71% due 10/30/09(4)(9) | | | 280,000 | | | 140,000 |
Barclays Bank PLC
Jr. Sub. Notes
5.93% due 12/15/16*(4)(9) | | | 260,000 | | | 179,400 |
Barclays Bank PLC
Sub. Notes
6.05% due 12/04/17* | | | 252,000 | | | 248,712 |
Caisse Nationale des Caisses d’Epargne et de Prevoyance
Senior Notes
3.82% due 12/30/09(4)(9) | | | 78,000 | | | 47,580 |
Lloyds Banking Group PLC
Jr. Sub. Notes
5.92% due 10/01/15*(4)(9) | | | 130,000 | | | 54,600 |
Rabobank Nederland NV
Senior Notes
4.20% due 05/13/14* | | | 270,000 | | | 279,644 |
Standard Chartered PLC
Senior Notes
5.50% due 11/18/14* | | | 200,000 | | | 214,673 |
| | | | | | |
| | |
| Security Description | | Principal
Amount(12) | | Market Value
(Note 2) |
|
| | | | | | | |
Banks - Commercial (continued) | | | | | | |
Svenska Handelsbanken AB
Senior Notes
4.88% due 06/10/14* | | $ | 140,000 | | $ | 146,563 |
Westpac Banking Corp.
Sub. Notes
1.91% due 03/31/10(4)(9) | | | 570,000 | | | 299,250 |
Westpac Banking Corp.
Senior Notes
4.20% due 02/27/15 | | | 120,000 | | | 120,759 |
Woori Bank
Notes
7.00% due 02/02/15* | | | 300,000 | | | 317,072 |
| | | | | |
|
|
| | | | | | | 2,048,253 |
| | | | | |
|
|
Banks - Money Center — 0.1% | | | | | | |
Bank of Scotland PLC
Senior Sub. Notes
1.50% due 11/30/09(4)(9) | | | 310,000 | | | 139,500 |
KBC Internationale Financieringsmaatschappij NV
Bank Guar. Notes
6.00% due 02/07/10(24) | | | 132,000 | | | 82,170 |
| | | | | |
|
|
| | | | | | | 221,670 |
| | | | | |
|
|
Cellular Telecom — 0.0% | | | | | | |
Vodafone Group PLC
Senior Notes
4.15% due 06/10/14 | | | 60,000 | | | 61,458 |
Vodafone Group PLC
Senior Notes
5.38% due 01/30/15 | | | 67,000 | | | 70,506 |
| | | | | |
|
|
| | | | | | | 131,964 |
| | | | | |
|
|
Containers - Metal/Glass — 0.1% | | | | | | |
Rexam PLC
Senior Notes
6.75% due 06/01/13* | | | 173,000 | | | 180,998 |
| | | | | |
|
|
Diversified Banking Institutions — 0.0% | | | | | | |
Credit Agricole SA
Jr. Sub. Notes
6.64% due 05/31/17*(4)(9) | | | 175,000 | | | 115,500 |
| | | | | |
|
|
Diversified Manufacturing Operations — 0.1% | | | |
Bombardier, Inc.
Senior Notes
8.00% due 11/15/14* | | | 335,000 | | | 327,044 |
| | | | | |
|
|
Diversified Minerals — 0.3% | | | | | | |
Anglo American Capital PLC
Company Guar. Notes
9.38% due 04/08/19* | | | 243,000 | | | 284,310 |
Teck Resources, Ltd.
Senior Sec. Notes
10.25% due 05/15/16 | | | 500,000 | | | 552,500 |
Teck Resources, Ltd.
Senior Sec. Notes
10.75% due 05/15/19 | | | 355,000 | | | 404,256 |
| | | | | |
|
|
| | | | | | | 1,241,066 |
| | | | | |
|
|
Diversified Operations — 0.0% | | | | | | |
Hutchison Whampoa International, Ltd.
Company Guar. Notes
7.63% due 04/09/19* | | | 100,000 | | | 114,864 |
| | | | | |
|
|
88
VALIC Company II Strategic Bond Fund
PORTFOLIO OF INVESTMENTS — August 31, 2009 — (continued)
| | | | | | |
| | |
| Security Description | | Principal
Amount(12) | | Market Value
(Note 2) |
|
FOREIGN CORPORATE BONDS & NOTES (continued) | | | | | | |
Electric - Integrated — 0.4% | | | | | | |
Electricite de France
Notes
6.50% due 01/26/19* | | $ | 592,000 | | $ | 675,985 |
Electricite de France
Notes
6.95% due 01/26/39* | | | 360,000 | | | 439,640 |
Empresas Publicas de Medellin E.S.P.
Senior Notes
7.63% due 07/29/19* | | | 200,000 | | | 212,000 |
| | | | | |
|
|
| | | | | | | 1,327,625 |
| | | | | |
|
|
Finance - Investment Banker/Broker — 0.1% | | | | | | |
Macquarie Group, Ltd.
Notes
7.30% due 08/01/14* | | | 228,000 | | | 237,030 |
| | | | | |
|
|
Finance - Other Services — 0.1% | | | | | | |
BP Capital Markets PLC
Company Guar. Notes
3.88% due 03/10/15 | | | 360,000 | | | 371,783 |
| | | | | |
|
|
Food - Meat Products — 0.2% | | | | | | |
JBS SA
Company Guar. Notes
9.38% due 02/07/11 | | | 375,000 | | | 380,625 |
JBS SA
Senior Notes
10.50% due 08/04/16* | | | 200,000 | | | 200,000 |
| | | | | |
|
|
| | | | | | | 580,625 |
| | | | | |
|
|
Gas - Distribution — 0.1% | | | | | | |
Korea Gas Corp.
Senior Notes
6.00% due 07/15/14* | | | 200,000 | | | 209,234 |
| | | | | |
|
|
Independent Power Producers — 0.0% | | | | | | |
AES Drax Energy, Ltd.
Sec. Notes
11.50% due 08/30/10†(6)(18)(22) | | | 175,000 | | | 175 |
| | | | | |
|
|
Insurance - Multi - line — 0.1% | | | | | | |
Aegon NV
Senior Notes
3.60% due 07/15/14(4)(9) | | | 62,000 | | | 26,040 |
XL Capital, Ltd.
Senior Notes
5.25% due 09/15/14 | | | 219,000 | | | 198,719 |
XL Capital, Ltd.
Senior Notes
6.38% due 11/15/24 | | | 142,000 | | | 112,265 |
| | | | | |
|
|
| | | | | | | 337,024 |
| | | | | |
|
|
Investment Companies — 0.0% | | | | | | |
Xstrata Finance Canada, Ltd.
Company Guar. Notes
6.90% due 11/15/37* | | | 91,000 | | | 79,989 |
| | | | | |
|
|
Medical Products — 0.1% | | | | | | |
Angiotech Pharmaceuticals, Inc.
Company Guar. Notes
4.42% due 12/01/13(4) | | | 560,000 | | | 470,400 |
| | | | | |
|
|
Medical - Drugs — 0.1% | | | | | | |
Elan Finance PLC
Company Guar. Bonds
7.75% due 11/15/11 | | | 240,000 | | | 232,800 |
| | | | | |
|
|
| | | | | | |
| | |
| Security Description | | Principal
Amount(12) | | Market Value
(Note 2) |
|
| | | | | | | |
Metal - Diversified — 0.0% | | | | | | |
Noranda, Inc.
Notes
6.00% due 10/15/15 | | $ | 156,000 | | $ | 148,405 |
| | | | | |
|
|
Multimedia — 0.0% | | | | | | |
Quebecor Media, Inc.
Senior Notes
7.75% due 03/15/16 | | | 125,000 | | | 117,812 |
| | | | | |
|
|
Oil Companies - Exploration & Production — 0.7% | | | | | | |
Compton Petroleum Finance Corp.
Company Guar. Notes
7.63% due 12/01/13 | | | 945,000 | | | 652,050 |
KazMunaiGaz Finance Sub BV
Company Guar. Notes
11.75% due 01/23/15* | | | 250,000 | | | 270,313 |
Nexen, Inc.
Senior Notes
5.88% due 03/10/35 | | | 159,000 | | | 139,835 |
Nexen, Inc.
Senior Notes
7.50% due 07/30/39 | | | 145,000 | | | 151,881 |
OPTI Canada, Inc.
Senior Sec. Notes
7.88% due 12/15/14 | | | 1,350,000 | | | 864,000 |
OPTI Canada, Inc.
Senior Notes
8.25% due 12/15/14 | | | 235,000 | | | 152,750 |
Talisman Energy, Inc.
Senior Notes
7.75% due 06/01/19 | | | 240,000 | | | 279,279 |
Woodside Finance, Ltd.
Company Guar. Notes
8.13% due 03/01/14* | | | 124,000 | | | 137,377 |
| | | | | |
|
|
| | | | | | | 2,647,485 |
| | | | | |
|
|
Oil Companies - Integrated — 0.3% | | | | | | |
Ecopetrol SA
Notes
7.63% due 07/23/19* | | | 200,000 | | | 213,260 |
Petroleum Co. of Trinidad & Tobago, Ltd.
Senior Notes
9.75% due 08/14/19* | | | 350,000 | | | 380,187 |
Petronas Capital, Ltd.
Company Guar. Notes
5.25% due 08/12/19* | | | 350,000 | | | 348,355 |
| | | | | |
|
|
| | | | | | | 941,802 |
| | | | | |
|
|
Oil - Field Services — 0.2% | | | | | | |
North American Energy Partners, Inc.
Senior Notes
8.75% due 12/01/11 | | | 590,000 | | | 542,800 |
| | | | | |
|
|
Paper & Related Products — 0.1% | | | | | | |
PE Paper Escrow GmbH
Senior Sec. Notes
12.00% due 08/01/14* | | | 275,000 | | | 284,136 |
| | | | | |
|
|
Pipelines — 0.0% | | | | | | |
Kinder Morgan Finance Co. ULC
Company Guar. Notes
5.70% due 01/05/16 | | | 78,000 | | | 71,370 |
| | | | | |
|
|
Printing - Commercial — 0.0% | | | | | | |
Quebecor World Capital Corp.
Company Guar. Notes
8.75% due 03/15/16†*(18)(20) | | | 800,000 | | | 72,000 |
| | | | | |
|
|
89
VALIC Company II Strategic Bond Fund
PORTFOLIO OF INVESTMENTS — August 31, 2009 — (continued)
| | | | | | |
| | |
| Security Description | | Principal
Amount(12) | | Market Value
(Note 2) |
|
FOREIGN CORPORATE BONDS & NOTES (continued) | | | | | | |
Real Estate Operations & Development — 0.0% | | | | | | |
Atlantic Finance, Ltd.
Notes
8.75% due 05/27/14* | | $ | 140,000 | | $ | 138,592 |
| | | | | |
|
|
Satellite Telecom — 0.7% | | | | | | |
Intelsat Intermediate Holding Co., Ltd.
Company Guar. Notes
9.50% due 02/01/15(8) | | | 600,000 | | | 585,000 |
Intelsat Subsidiary Holding Co., Ltd.
Company Guar. Notes
8.50% due 01/15/13 | | | 475,000 | | | 478,562 |
Intelsat Subsidiary Holding Co., Ltd.
Company Guar. Notes
8.88% due 01/15/15 | | | 275,000 | | | 277,063 |
Intelsat Subsidiary Holding Co., Ltd.
Senior Notes
8.88% due 01/15/15* | | | 1,000,000 | | | 1,002,500 |
| | | | | |
|
|
| | | | | | | 2,343,125 |
| | | | | |
|
|
Special Purpose Entities — 0.2% | | | | | | |
CCL Finance, Ltd.
Company Guar. Notes
9.50% due 08/15/14* | | | 210,000 | | | 216,300 |
Grupo Petrotemex SA de CV
Senior Notes
9.50% due 08/19/14* | | | 230,000 | | | 237,475 |
Hellas Telecommunications Luxembourg II
Sub. Notes
6.26% due 01/15/15*(4) | | | 560,000 | | | 95,200 |
SMFG Preferred Capital, Ltd.
Sub. Notes
6.08% due 01/25/17*(4)(9) | | | 121,000 | | | 105,200 |
| | | | | |
|
|
| | | | | | | 654,175 |
| | | | | |
|
|
Steel - Producers — 0.0% | | | | | | |
ArcelorMittal
Senior Notes
6.13% due 06/01/18 | | | 100,000 | | | 95,713 |
| | | | | |
|
|
Telecom Services — 0.7% | | | | | | |
Alestra SA
Senior Notes
11.75% due 08/11/14* | | | 110,000 | | | 117,232 |
Global Crossing UK Finance PLC
Company Guar. Notes
10.75% due 12/15/14 | | | 676,000 | | | 608,400 |
Wind Acquisition Finance SA
Company Guar. Bonds
10.75% due 12/01/15* | | | 310,000 | | | 333,250 |
Wind Acquisition Finance SA
Senior Notes
11.75% due 07/15/17* | | | 1,235,000 | | | 1,339,975 |
| | | | | |
|
|
| | | | | | | 2,398,857 |
| | | | | |
|
|
Telephone - Integrated — 0.5% | | | | | | |
British Telecommunications PLC
Bonds
9.63% due 12/15/30 | | | 170,000 | | | 213,771 |
Q - Tel International Finance, Ltd.
Company Guar. Notes
6.50% due 06/10/14* | | | 215,000 | | | 232,967 |
Telecom Italia Capital SA
Company Guar. Notes
4.95% due 09/30/14 | | | 831,000 | | | 857,660 |
Telefonica Emisiones SAU
Company Guar. Notes
5.88% due 07/15/19 | | | 240,000 | | | 261,074 |
| | | | | | | | |
| | | |
| Security Description | | | | Principal
Amount(12) | | Market Value
(Note 2) |
|
| | | | | | | | | |
Telephone - Integrated (continued) | | | | | | | | |
Telemar Norte Leste SA
Senior Notes
9.50% due 04/23/19* | | | | $ | 100,000 | | $ | 117,743 |
| | | | | | | |
|
|
| | | | | | | | | 1,683,215 |
| | | | | | | |
|
|
Transport - Marine — 0.0% | | | | | | | | |
BW Group, Ltd.
Notes
6.63% due 06/28/17 | | | | | 100,000 | | | 87,000 |
| | | | | | | |
|
|
Transport - Rail — 0.2% | | | | | | | | |
Canadian National Railway Co.
Senior Notes
6.38% due 10/15/11 | | | | | 315,000 | | | 345,620 |
Canadian Pacific Railway Co.
Notes
6.50% due 05/15/18 | | | | | 300,000 | | | 320,685 |
| | | | | | | |
|
|
| | | | | | | | | 666,305 |
| | | | | | | |
|
|
Warehousing & Harbor Transportation Services — 0.1% | | | | | | |
DP World, Ltd.
Notes
6.85% due 07/02/37 | | | | | 290,000 | | | 224,025 |
| | | | | | | |
|
|
Total Foreign Corporate Bonds & Notes | | | | | | | | |
(cost $21,712,972) | | | | | | | | 21,344,861 |
| | | | | | | |
|
|
FOREIGN GOVERNMENT AGENCIES — 22.3% | | | | | | | | |
Sovereign — 22.3% | | | | | | | | |
Banco Nacional de Desenvolvimento Economico e Social | | | |
Notes
6.50% due 06/10/19* | | | | | 100,000 | | | 104,250 |
Credit Suisse First Boston International for City of Kiev Ukraine
Bonds
8.00% due 11/06/15 | | | | | 230,000 | | | 162,173 |
Federal Republic of Brazil
Notes
5.88% due 01/15/19 | | | | | 650,000 | | | 671,125 |
Federal Republic of Brazil
Bonds
6.00% due 01/17/17 | | | | | 540,000 | | | 564,300 |
Federal Republic of Brazil
Bonds
7.13% due 01/20/37 | | | | | 250,000 | | | 276,250 |
Federal Republic of Brazil
Notes
8.00% due 01/15/18 | | | | | 1,142,778 | | | 1,299,910 |
Federal Republic of Brazil
Bonds
8.25% due 01/20/34 | | | | | 900,000 | | | 1,111,500 |
Federal Republic of Brazil
Notes
8.75% due 02/04/25 | | | | | 875,000 | | | 1,097,250 |
Federal Republic of Brazil
Bonds
8.88% due 10/14/19 | | | | | 670,000 | | | 835,155 |
Federal Republic of Brazil
Notes
11.00% due 08/17/40 | | | | | 1,165,000 | | | 1,531,392 |
Federal Republic of Brazil
Bonds
12.50% due 01/05/22 | | BRL | | | 910,000 | | | 535,947 |
Federal Republic of Germany
Bonds
4.25% due 07/04/14 | | EUR | | | 230,000 | | | 356,264 |
90
VALIC Company II Strategic Bond Fund
PORTFOLIO OF INVESTMENTS — August 31, 2009 — (continued)
| | | | | | | |
| | | |
| Security Description | | | | Principal
Amount(12) | | Market Value
(Note 2) |
|
FOREIGN GOVERNMENT AGENCIES (continued) | | | | | | | |
Sovereign (continued) | | | | | | | |
Federal Republic of Germany
Bonds
4.25% due 07/04/39 | | EUR | | 510,000 | | $ | 767,649 |
Federal Republic of Germany
Bonds
5.25% due 07/04/10 | | EUR | | 975,000 | | | 1,450,860 |
Government of Australia
Bonds
6.00% due 02/15/17 | | AUD | | 1,630,000 | | | 1,431,240 |
Government of Australia
Bonds
6.25% due 06/15/14 | | AUD | | 1,800,000 | | | 1,581,971 |
Government of Australia
Bonds
6.50% due 05/15/13 | | AUD | | 2,280,000 | | | 2,009,341 |
Government of Canada
Notes
3.00% due 06/01/14 | | CAD | | 1,425,000 | | | 1,329,887 |
Government of Canada
Bonds
3.75% due 06/01/12 | | CAD | | 2,188,000 | | | 2,104,237 |
Government of Canada
Notes
4.25% due 06/01/18 | | CAD | | 1,560,000 | | | 1,535,932 |
Government of Japan
Bonds
1.30% due 06/20/12 | | JPY | | 157,000,000 | | | 1,732,971 |
Government of Japan
Bonds
1.40% due 06/20/12 | | JPY | | 23,300,000 | | | 257,953 |
Government of Japan
Bonds
1.40% due 12/20/15 | | JPY | | 237,000,000 | | | 2,640,903 |
Government of Japan
Bonds
1.70% due 09/20/17 | | JPY | | 219,000,000 | | | 2,472,292 |
Government of Japan
Bonds
2.10% due 03/20/27 | | JPY | | 81,000,000 | | | 884,173 |
Government of Netherlands
Bonds
3.25% due 07/15/15 | | EUR | | 933,000 | | | 1,365,837 |
Government of Poland
Bonds
6.38% due 07/15/19 | | | | 545,000 | | | 584,715 |
Kingdom of Norway
Bonds
5.00% due 05/15/15 | | NOK | | 16,460,000 | | | 2,902,172 |
Kingdom of Norway
Bonds
6.50% due 05/15/13 | | NOK | | 13,250,000 | | | 2,441,775 |
Kingdom of Spain
Bonds
3.15% due 01/31/16 | | EUR | | 1,060,000 | | | 1,522,898 |
Kingdom of Sweden
Bonds
4.00% due 12/01/09 | | SEK | | 5,600,000 | | | 794,004 |
Kingdom of Sweden
Bonds
5.39% due 08/12/15 | | SEK | | 18,475,000 | | | 2,810,135 |
Kingdom of Sweden
Bonds
5.50% due 10/08/12 | | SEK | | 11,100,000 | | | 1,712,439 |
Perusahaan Penerbit SBSN
Notes
8.80% due 04/23/14* | | | | 130,000 | | | 146,250 |
| | | | | | | |
| | | |
| Security Description | | | | Principal
Amount(12) | | Market Value
(Note 2) |
|
| | | | | | | | |
Sovereign (continued) | | | | | | | |
Republic of Argentina
Notes
2.50% due 12/31/38(13) | | SEK | | 1,647,637 | | $ | 448,981 |
Republic of Argentina
Bonds
5.77% due 12/31/33 | | | | 1,017,578 | | | 590,195 |
Republic of Colombia
Notes
7.38% due 01/27/17 | | | | 300,000 | | | 329,700 |
Republic of Colombia
Notes
7.38% due 03/18/19 | | | | 657,000 | | | 717,444 |
Republic of Colombia
Bonds
7.38% due 09/18/37 | | | | 975,000 | | | 1,018,875 |
Republic of Columbia
Bonds
8.13% due 05/21/24 | | | | 250,000 | | | 281,250 |
Republic of Georgia
Bonds
7.50% due 04/15/13 | | | | 1,300,000 | | | 1,218,750 |
Republic of Greece
Bonds
6.00% due 07/19/19 | | EUR | | 675,000 | | | 1,081,324 |
Republic of Indonesia
Bonds
6.63% due 02/17/37 | | | | 565,000 | | | 522,698 |
Republic of Indonesia
Senior Bonds
8.50% due 10/12/35 | | | | 810,000 | | | 911,250 |
Republic of Italy
Bonds
4.75% due 02/01/13 | | EUR | | 970,000 | | | 1,491,159 |
Republic of Panama
Bonds
6.70% due 01/26/36 | | | | 450,000 | | | 457,875 |
Republic of Peru
Bonds
6.55% due 03/14/37 | | | | 60,000 | | | 59,700 |
Republic of Peru
Notes
7.35% due 07/21/25 | | | | 429,000 | | | 467,610 |
Republic of Peru
Bonds
8.75% due 11/21/33 | | | | 380,000 | | | 468,350 |
Republic of Philippines
Bonds
7.75% due 01/14/31 | | | | 480,000 | | | 523,800 |
Republic of Philippines
Bonds
8.38% due 06/17/19 | | | | 1,253,000 | | | 1,464,444 |
Republic of Philippines
Senior Notes
9.50% due 02/02/30 | | | | 325,000 | | | 416,000 |
Republic of Philippines
Notes
10.63% due 03/16/25 | | | | 415,000 | | | 561,806 |
Republic of South Africa
Bonds
6.88% due 05/27/19 | | | | 425,000 | | | 456,344 |
Republic of South Korea
Bonds
7.13% due 04/16/19 | | | | 900,000 | | | 1,017,314 |
Republic of the Philippines
Bonds
6.50% due 01/20/20 | | | | 660,000 | | | 674,025 |
91
VALIC Company II Strategic Bond Fund
PORTFOLIO OF INVESTMENTS — August 31, 2009 — (continued)
| | | | | | | |
| | | |
| Security Description | | | | Principal
Amount(12) | | Market Value
(Note 2) |
|
FOREIGN GOVERNMENT AGENCIES (continued) | | | | | | | |
Sovereign (continued) | | | | | | | |
Republic of the Philippines
Bonds
8.38% due 06/17/19 | | EUR | | 132,000 | | $ | 154,275 |
Republic of Turkey
Notes
6.88% due 03/17/36 | | | | 330,000 | | | 316,388 |
Republic of Turkey
Bonds
7.00% due 09/26/16 | | | | 465,000 | | | 491,738 |
Republic of Turkey
Notes
7.00% due 06/05/20 | | | | 540,000 | | | 560,925 |
Republic of Turkey
Notes
7.38% due 02/05/25 | | | | 550,000 | | | 579,563 |
Republic of Turkey
Bonds
7.50% due 11/07/19 | | | | 325,000 | | | 351,000 |
Republic of Turkey
Notes
8.00% due 02/14/34 | | | | 467,000 | | | 509,614 |
Republic of Turkey
Notes
9.50% due 01/15/14 | | | | 480,000 | | | 561,600 |
Republic of Turkey
Senior Bonds
11.88% due 01/15/30 | | | | 440,000 | | | 686,400 |
Republic of Uruguay
Notes
7.63% due 03/21/36 | | | | 200,000 | | | 204,500 |
Republic of Uruguay
Bonds
8.00% due 11/18/22 | | | | 740,000 | | | 795,500 |
Republic of Venezuela
Bonds
5.75% due 02/26/16 | | | | 570,000 | | | 390,450 |
Republic of Venezuela
Bonds
7.65% due 04/21/25 | | | | 360,000 | | | 214,200 |
Republic of Venezuela
Notes
8.50% due 10/08/14 | | | | 390,000 | | | 327,600 |
Republic of Venezuela
Bonds
9.00% due 05/07/23 | | | | 520,000 | | | 348,400 |
Republic of Venezuela
Bonds
9.25% due 09/15/27 | | | | 1,960,000 | | | 1,435,700 |
Republic of Venezuela
Bonds
9.25% due 05/07/28 | | | | 860,000 | | | 589,100 |
Republic of Venezuela
Bonds
9.38% due 01/13/34 | | | | 370,000 | | | 251,600 |
Russian Federation
Senior Bonds
7.50% due 03/31/30(13) | | | | 5,438,400 | | | 5,574,360 |
Russian Federation
Notes
12.75% due 06/24/28 | | | | 190,000 | | | 283,309 |
United Mexican States
Notes
5.63% due 01/15/17 | | | | 1,024,000 | | | 1,036,800 |
United Mexican States
Notes
5.88% due 02/17/14 | | | | 550,000 | | | 580,250 |
| | | | | | |
| | |
| Security Description | | Principal
Amount(12) | | Market Value
(Note 2) |
|
| | | | | | | |
Sovereign (continued) | | | | | | |
United Mexican States
Notes
5.95% due 03/19/19 | | $ | 1,630,000 | | $ | 1,656,080 |
United Mexican States
Notes
6.05% due 01/11/40 | | | 250,000 | | | 234,375 |
United Mexican States
Notes
6.75% due 09/27/34 | | | 625,000 | | | 648,437 |
United Mexican States
Bonds
7.50% due 04/08/33 | | | 340,000 | | | 382,925 |
United Mexican States
Notes
8.13% due 12/30/19 | | | 570,000 | | | 679,440 |
United Mexican States
Bonds
8.30% due 08/15/31 | | | 310,000 | | | 378,200 |
| | | | | |
|
|
Total Foreign Government Agencies | | | | | | |
(cost $74,184,204) | | | | | | 78,426,773 |
| | | | | |
|
|
FOREIGN GOVERNMENT TREASURIES — 1.9% | | | | | | |
Sovereign — 1.9% | | | | | | |
New South Wales Treasury Corp.
Government Guar. Bonds
6.00% due 05/01/12 | | | 1,790,000 | | | 1,539,863 |
United Kingdom Gilt Treasury
Bonds
4.50% due 03/07/13 | | | 1,135,000 | | | 1,987,524 |
United Kingdom Gilt Treasury
Bonds
5.00% due 03/07/12 | | | 1,080,000 | | | 1,897,137 |
United Kingdom Gilt Treasury
Bonds
5.00% due 03/07/18 | | | 740,000 | | | 1,358,944 |
| | | | | |
|
|
Total Foreign Government Treasuries | | | | | | |
(cost $6,437,784) | | | | | | 6,783,468 |
| | | | | |
|
|
LOANS — 0.2% | | | | | | |
Auto/Truck Parts & Equipment - Original — 0.2% | | | |
Lear Corp.
10.49% due 04/25/12(5)(14)(15)(20)
(cost $580,000) | | | 1,000,000 | | | 817,917 |
| | | | | |
|
|
U.S. GOVERNMENT AGENCIES — 11.7% | | | |
Federal Home Loan Mtg. Corp. — 6.4% | | | |
4.13% due 07/12/10 | | | 200,000 | | | 206,381 |
4.50% due 02/01/20 | | | 284,796 | | | 296,158 |
4.50% due 08/01/20 | | | 98,199 | | | 102,117 |
4.50% due 03/01/23 | | | 812,257 | | | 836,667 |
4.50% due 01/01/39 | | | 650,329 | | | 654,420 |
5.00% due 09/01/18 | | | 371,816 | | | 392,859 |
5.00% due 07/01/20 | | | 258,916 | | | 271,951 |
5.00% due 05/01/34 | | | 484,218 | | | 499,473 |
5.00% due 02/01/35 | | | 74,648 | | | 77,000 |
5.00% due 07/01/35 | | | 302,119 | | | 311,354 |
5.00% due 10/01/35 | | | 203,340 | | | 209,555 |
5.00% due 11/01/35 | | | 725,676 | | | 747,857 |
5.00% due 11/01/37 | | | 349,738 | | | 359,609 |
5.00% due 03/01/38 | | | 510,505 | | | 524,913 |
5.33% due 12/01/35(4) | | | 314,844 | | | 329,892 |
5.50% due 06/01/22 | | | 540,469 | | | 569,537 |
5.50% due 07/01/35 | | | 230,062 | | | 240,689 |
5.50% due 05/01/37 | | | 550,917 | | | 574,901 |
5.50% due 06/01/37 | | | 21,398 | | | 22,330 |
5.50% due 10/01/37 | | | 3,129,065 | | | 3,265,289 |
92
VALIC Company II Strategic Bond Fund
PORTFOLIO OF INVESTMENTS — August 31, 2009 — (continued)
| | | | | | |
| | |
| Security Description | | Principal
Amount(12) | | Market Value
(Note 2) |
|
U.S. GOVERNMENT AGENCIES (continued) | | | | | | |
Federal Home Loan Mtg. Corp. (continued) | | | | | | |
5.50% due 12/01/37 | | $ | 389,361 | | $ | 406,312 |
5.50% due 01/01/38 | | | 518,847 | | | 541,678 |
5.50% due 02/01/38 | | | 604,650 | | | 630,973 |
5.81% due 01/01/37(4) | | | 237,939 | | | 250,802 |
5.95% due 10/01/36(4) | | | 2,019,978 | | | 2,121,095 |
6.00% due 01/01/30 | | | 20,944 | | | 22,311 |
6.00% due 02/01/32 | | | 118,507 | | | 126,092 |
6.00% due 07/01/35 | | | 166,904 | | | 176,595 |
6.00% due 05/01/37 | | | 18,137 | | | 19,145 |
6.00% due 10/01/37 | | | 345,854 | | | 365,072 |
6.00% due 12/01/37 | | | 3,010,785 | | | 3,178,084 |
6.16% due 09/01/36(4) | | | 50,881 | | | 53,438 |
6.50% due 07/01/29 | | | 3,456 | | | 3,720 |
6.50% due 12/01/35 | | | 1,435 | | | 1,531 |
6.50% due 02/01/36 | | | 117,209 | | | 125,054 |
6.50% due 11/01/37 | | | 414,529 | | | 441,863 |
6.88% due 09/15/10 | | | 772,000 | | | 822,587 |
7.00% due 06/01/29 | | | 13,038 | | | 14,316 |
Federal Home Loan Mtg. Corp. REMIC | | | | | | |
Series 3102, Class PG 5.00% due 11/15/28 | | | 280,000 | | | 293,552 |
Series 3317, Class PD 5.00% due 09/15/31 | | | 360,000 | | | 378,650 |
Series 3116, Class PD 5.00% due 10/15/34 | | | 1,310,000 | | | 1,355,499 |
Series 3349, Class HB 5.50% due 06/15/31 | | | 642,000 | | | 675,839 |
| | | | | |
|
|
| | | | | | | 22,497,160 |
| | | | | |
|
|
Federal National Mtg. Assoc. — 4.8% | | | | | | |
4.50% due 06/01/19 | | | 257,760 | | | 269,655 |
4.50% due 01/01/39 | | | 239,733 | | | 241,391 |
4.75% due 12/15/10 | | | 251,000 | | | 264,522 |
5.00% due 03/15/16 | | | 163,000 | | | 178,614 |
5.00% due 01/01/23 | | | 696,622 | | | 727,190 |
5.00% due 04/01/23 | | | 510,378 | | | 532,774 |
5.00% due 10/01/35 | | | 843,154 | | | 868,663 |
5.00% due 01/01/37 | | | 102,478 | | | 105,354 |
5.00% due 03/01/37 | | | 120,622 | | | 124,007 |
5.00% due 05/01/37 | | | 23,145 | | | 23,795 |
5.00% due 06/01/37 | | | 443,159 | | | 455,597 |
5.00% due 07/01/37 | | | 695,695 | | | 715,220 |
5.00% due 09/01/37 | | | 756,330 | | | 777,557 |
5.00% due 05/01/38 | | | 3,029,194 | | | 3,113,569 |
5.37% due 01/01/37(4) | | | 873,043 | | | 911,231 |
5.50% due 03/01/18 | | | 15,200 | | | 16,222 |
5.50% due 11/01/22 | | | 199,236 | | | 209,982 |
5.50% due 01/01/29 | | | 48,098 | | | 50,620 |
5.50% due 05/01/29 | | | 16,227 | | | 17,052 |
5.50% due 06/01/34 | | | 279,138 | | | 292,119 |
5.50% due 02/01/36(4) | | | 153,335 | | | 161,520 |
5.50% due 09/01/36 | | | 1,781,840 | | | 1,860,247 |
5.50% due 11/01/36 | | | 6,195 | | | 6,467 |
5.50% due 11/01/36 | | | 45,618 | | | 47,625 |
5.50% due 04/01/37 | | | 496,942 | | | 518,266 |
5.50% due 03/01/38 | | | 326,149 | | | 340,024 |
5.50% due 03/01/38 | | | 207,805 | | | 216,645 |
6.00% due 02/01/32 | | | 56,149 | | | 59,690 |
6.00% due 10/01/34 | | | 2,574 | | | 2,727 |
6.00% due 10/01/34 | | | 2,516 | | | 2,666 |
6.00% due 07/01/37 | | | 243,697 | | | 257,010 |
6.00% due 08/01/37 | | | 647,102 | | | 682,453 |
6.00% due 10/01/37 | | | 589,793 | | | 622,013 |
6.50% due 12/01/31 | | | 66,413 | | | 71,720 |
6.50% due 02/01/35 | | | 71,315 | | | 76,501 |
| | | | | | |
| | |
| Security Description | | Principal
Amount/
Shares(12) | | Market Value
(Note 2) |
|
| | | | | | | |
Federal National Mtg. Assoc. (continued) | | | | | | |
6.50% due 07/01/36 | | $ | 230,002 | | $ | 246,511 |
6.50% due 11/01/37 | | | 1,310,788 | | | 1,404,258 |
8.50% due 08/01/31 | | | 10,111 | | | 11,550 |
Federal National Mtg. Assoc. REMIC
| | | | | | |
Series 2005 - 12, Class BE 5.00% due 11/25/30 | | | 350,000 | | | 367,171 |
| | | | | |
|
|
| | | | | | | 16,850,198 |
| | | | | |
|
|
Government National Mtg. Assoc. — 0.5% | | | |
6.00% due 09/15/38 | | | 1,756,180 | | | 1,854,725 |
| | | | | |
|
|
Total U.S. Government Agencies
| | | | | | |
(cost $39,564,723) | | | | | | 41,202,083 |
| | | | | |
|
|
U.S. GOVERNMENT TREASURIES — 5.2% | | | |
United States Treasury Bonds — 0.9% | | | |
3.50% due 02/15/39 | | | 394,000 | | | 348,074 |
3.63% due 04/15/28 TIPS(16) | | | 586,612 | | | 707,051 |
4.25% due 05/15/39 | | | 412,000 | | | 416,571 |
4.38% due 02/15/38 | | | 604,000 | | | 622,969 |
4.50% due 05/15/38 | | | 503,000 | | | 529,722 |
5.25% due 11/15/28 | | | 127,000 | | | 145,455 |
8.13% due 08/15/19 | | | 117,000 | | | 161,570 |
| | | | | |
|
|
| | | | | | | 2,931,412 |
| | | | | |
|
|
United States Treasury Notes — 4.3% | | | |
0.88% due 05/31/11 | | | 1,500,000 | | | 1,501,465 |
2.00% due 11/30/13 | | | 328,000 | | | 327,001 |
2.13% due 01/31/10 | | | 500,000 | | | 503,887 |
2.25% due 05/31/14 | | | 2,106,000 | | | 2,100,899 |
2.38% due 08/31/14 | | | 144,000 | | | 143,899 |
2.63% due 06/30/14 | | | 2,127,000 | | | 2,154,751 |
2.75% due 02/28/13 | | | 105,000 | | | 108,773 |
2.75% due 02/15/19 | | | 860,000 | | | 814,111 |
3.25% due 05/31/16 | | | 2,000,000 | | | 2,035,468 |
3.38% due 07/31/13 | | | 449,000 | | | 474,011 |
3.50% due 02/15/18 | | | 234,000 | | | 236,998 |
3.63% due 12/31/12 | | | 900,000 | | | 959,062 |
3.63% due 08/15/19 | | | 220,000 | | | 224,125 |
3.88% due 05/15/18 | | | 57,000 | | | 59,262 |
4.00% due 02/15/15 | | | 500,000 | | | 536,289 |
4.25% due 08/15/15 | | | 90,000 | | | 97,566 |
4.50% due 11/15/15 | | | 536,000 | | | 588,176 |
4.63% due 11/15/16 | | | 130,000 | | | 143,295 |
4.88% due 04/30/11 | | | 1,700,000 | | | 1,814,485 |
6.50% due 02/15/10 | | | 300,000 | | | 308,449 |
| | | | | |
|
|
| | | | | | | 15,131,972 |
| | | | | |
|
|
Total U.S. Government Treasuries | | | | | | |
(cost $18,005,191) | | | | | | 18,063,384 |
| | | | | |
|
|
COMMON STOCK — 0.2% | | | | | | |
Building Products - Doors & Windows — 0.0% | | | | | | |
Masonite Worldwide Holdings† | | | 407 | | | 16,463 |
| | | | | |
|
|
Energy - Alternate Sources — 0.0% | | | | | | |
VeraSun Energy Corp.†(7) | | | 50,000 | | | 0 |
| | | | | |
|
|
Food - Misc. — 0.0% | | | | | | |
Wornick Co.†(5)(6)(7) | | | 1,722 | | | 86,100 |
| | | | | |
|
|
Gambling (Non - Hotel) — 0.0% | | | | | | |
Shreveport Gaming Holdings, Inc.†(5)(6)(7) | | | 1,280 | | | 19,251 |
| | | | | |
|
|
Independent Power Producers — 0.0% | | | |
Mirant Corp.† | | | 902 | | | 15,199 |
| | | | | |
|
|
Medical - Outpatient/Home Medical — 0.0% | | | | | | |
Critical Care Systems International, Inc.†(5)(6)(7) | | | 5,372 | | | 1,343 |
| | | | | |
|
|
93
VALIC Company II Strategic Bond Fund
PORTFOLIO OF INVESTMENTS — August 31, 2009 — (continued)
| | | | | | | |
| | |
| Security Description | | Principal
Amount/
Shares(12) | | | Market Value
(Note 2) |
|
COMMON STOCK (continued) | | | | | | | |
Oil Companies - Exploration & Production — 0.2% | | | | |
EXCO Resources, Inc.† | | | 41,578 | | | $ | 609,534 |
| | | | | | |
|
|
Paper & Related Products — 0.0% | | | | |
Caraustar Industries, Inc.†(7) | | | 42 | | | | 70,434 |
| | | | | | |
|
|
Retail - Music Store — 0.0% | | | | | | | |
MTS, Inc.†(5)(6)(7) | | | 3,863 | | | | 0 |
| | | | | | |
|
|
Total Common Stock | | | | | | | |
(cost $1,460,377) | | | | | | | 818,324 |
| | | | | | |
|
|
PREFERRED STOCK — 0.3% | | | | | | | |
Banks - Commercial — 0.1% | | | | | | | |
CoBank ACB
11.00%* | | | 5,396 | | | | 265,079 |
| | | | | | |
|
|
Banks - Money Center — 0.1% | | | | | | | |
Santander Finance Preferred SA
4.00%(4) | | | 11,600 | | | | 182,468 |
| | | | | | |
|
|
Banks - Super Regional — 0.0% | | | | | | | |
Wachovia Capital Trust IX
6.38% | | | 4,350 | | | | 87,870 |
| | | | | | |
|
|
Diversified Financial Services — 0.0% | | | | |
General Electric Capital Corp.
8.00%(8) | | | 6,436 | | | | 144,166 |
| | | | | | |
|
|
Finance - Mortgage Loan/Banker — 0.0% | | | | |
Freddie Mac
0.00%(4) | | | 5,100 | | | | 10,914 |
| | | | | | |
|
|
Special Purpose Entity — 0.1% | | | | | | | |
Structured Repackaged Asset - Backed Trust Securities
3.00%(4) | | | 9,200 | | | | 165,600 |
| | | | | | |
|
|
Total Preferred Stock | | | | | | | |
(cost $1,126,254) | | | | | | | 856,097 |
| | | | | | |
|
|
WARRANTS — 0.0% | | | | | | | |
Building Products - Doors & Windows — 0.0% | | | | | | | |
Masonite Worldwide Holdings
Expires 06/09/14
(strike price $55.31)† | | | 1,970 | | | | 6,895 |
Masonite Worldwide Holdings
Expires 06/09/16
(strike price $55.31)† | | | 1,477 | | | | 5,169 |
| | | | | | |
|
|
| | | | | | | | 12,064 |
| | | | | | |
|
|
Oil Companies - Exploration & Production — 0.0% | | | | |
Transmeridian Exploration, Inc.
Expires 12/15/10
(strike price $4.31)†(7) | | | 6,905 | | | | 0 |
| | | | | | |
|
|
Total Warrants | | | | | | | |
(cost $18,990) | | | | | | | 12,064 |
| | | | | | |
|
|
Total Long - Term Investment Securities | | | | | | | |
(cost $311,478,973) | | | | | | | 312,552,085 |
| | | | | | |
|
|
REPURCHASE AGREEMENT — 9.1% | | | | |
Agreement with State Street Bank & Trust Co., bearing interest at 0.01%, dated 08/31/09, to be repurchased 09/01/09 in the amount of $32,087,009 and collateralized by $33,070,000 of United States Treasury Bills, bearing interest at 0.35% due 12/31/09 and having an approximate value of $33,050,158
(cost $32,087,000) | | $ | 32,087,000 | | | | 32,087,000 |
| | | | | | |
|
|
TOTAL INVESTMENTS | | | | | | | |
(cost $343,565,973)(17) | | | 98.0 | % | | | 344,639,085 |
Other assets less liabilities | | | 2.0 | | | | 6,858,737 |
| | |
|
|
| |
|
|
NET ASSETS | | | 100.0 | % | | $ | 351,497,822 |
| | |
|
|
| |
|
|
| * | Securities exempt from registration under Rule 144A of the Securities Act of 1933. These securities may be sold in transactions exempt from registration, normally to qualified institutional buyers. The Fund has no right to demand registration of these securities. At August 31, 2009, the aggregate value of these securities was $44,660,355 representing 12.7% of net assets. Unless otherwise indicated these securities are not considered to be illiquid. |
| † | Non-income producing security |
| (1) | Commercial Mortgage Backed Security |
| (2) | Collateralized Mortgage Obligation |
| (3) | Variable Rate Security—the rate reflected is as of August 31, 2009, maturity date reflects the stated maturity date. |
| (4) | Floating rate security where the rate fluctuates. The rate moves up or down at each reset date. The rate reflected is as of August 31, 2009. |
| (5) | Denotes a restricted security that: (a) cannot be offered for public sale without first being registered, or being able to take advantage of an exemption from registration, under the Securities Act of 1933, as amended (the “1933 Act”); (b) is subject to a contactual restriction on public sales; or (c) is otherwise subject to a restriction on sales by operation of applicable law. Restricted securities are valued pursuant to Note 2. Certain restricted securities held by a Fund may not be sold except in exempt transactions or in a public offering registered under the 1933 Act. The Fund has no right to demand registration of these securities. The risk of investing in certain restricted securities is greater than the risk of investing in the securities of widely held, publicly traded companies. To the extent applicable, lack of a secondary market and resale restrictions may result in the inability of a Fund to sell a security at a fair price and may substantially delay the sale of the security. In addition, certain restricted securities may exhibit greater price volatility than securities for which secondary markets exist. As of August 31, 2009, the Strategic Bond Fund held the following restricted securities: |
| | | | | | | | | | | | | | | | | |
Name
| | Acquisi-
tion Date
| | Principal
Amount/
Shares
| | Acquisi-
tion Cost
| | Market
Value
| | Market
Value
Per
Share
| | Value
as a
% of
Net
Assets
| |
Critical Care Systems International, Inc.
Common Stock | | 06/17/04 | | | 635 | | $ | 0 | | | | | | | | | |
| | | 11/09/04 | | | 4,737 | | | 0 | | | | | | | | | |
| | | | |
|
| |
|
| | | | | | | | | |
| | | | | | 5,372 | | | 0 | | $ | 1,343 | | $ | 0.25 | | 0.00 | % |
| | | | |
|
| |
|
| | | | | | | | | |
ICO North America, Inc.
Notes
7.50% due 08/15/09 | | 08/11/05 | | $ | 125,000 | | | 125,000 | | | | | | | | | |
| | | 02/15/08 | | | 5,000 | | | 5,000 | | | | | | | | | |
| | | 09/11/08 | | | 5,000 | | | 5,000 | | | | | | | | | |
| | | 02/15/09 | | | 5,000 | | | 5,000 | | | | | | | | | |
| | | | |
|
| |
|
| | | | | | | | | |
| | | | | | 140,000 | | | 140,000 | | | 49,000 | | | 35.00 | | 0.01 | |
| | | | |
|
| |
|
| | | | | | | | | |
Lear Corp.
Loan Agreement
10.49% due 04/25/12 | | 05/13/09 | | $ | 1,000,000 | | | 580,000 | | | 817,917 | | | 81.79 | | 0.23 | |
| | | | | | |
MTS, Inc.
Senior Notes
10.00% due 03/15/09 | | 03/16/04 | | $ | 12,337 | | | 44,410 | | | | | | | | | |
| | | 09/03/04 | | | 681 | | | 681 | | | | | | | | | |
| | | 03/19/05 | | | 715 | | | 143 | | | | | | | | | |
| | | 09/04/05 | | | 751 | | | 195 | | | | | | | | | |
| | | 03/04/06 | | | 789 | | | 205 | | | | | | | | | |
| | | | |
|
| |
|
| | | | | | | | | |
| | | | | | 15,273 | | | 45,634 | | | 305 | | | 2.00 | | 0.00 | |
| | | | |
|
| |
|
| | | | | | | | | |
MTS, Inc.
Common Stock | | 03/16/04 | | | 3,863 | | | 0 | | | 0 | | | 0.00 | | 0.00 | |
Shreveport Gaming Holdings, Inc.
Common Stock | | 07/21/05 | | | 257 | | | 5,885 | | | | | | | | | |
| | | 07/29/05 | | | 1,023 | | | 23,552 | | | | | | | | | |
| | | | |
|
| |
|
| | | | | | | | | |
| | | | | | 1,280 | | | 29,437 | | | 19,251 | | | 15.04 | | 0.01 | |
| | | | |
|
| |
|
| | | | | | | | | |
Wornick Co.
Common Stock | | 08/08/08 | | | 1,722 | | | 225,265 | | | 86,100 | | | 50.00 | | 0.02 | |
| | | | | | | | | | |
|
| | | | |
|
|
| | | | | | | | | | | $ | 973,916 | | | | | 0.27 | % |
| | | | | | | | | | |
|
| | | | |
|
|
94
VALIC Company II Strategic Bond Fund
PORTFOLIO OF INVESTMENTS — August 31, 2009 — (continued)
| (6) | Illiquid security. At August 31, 2009, the aggregate value of these securities was $694,874 representing 0.2% of net assets. |
| (7) | Fair valued security. Securities are classified as Level 3 based on the securities valuation inputs; see Note 2. |
| (8) | “Step-up” security where the rate increases (“steps-up”) at a predetermined rate. Rate shown reflects the increased rate. |
| (9) | Perpetual maturity—maturity date reflects the next call date. |
| (10) | PIK (“Payment-in-Kind”) security. Bond or preferred stock that pays interest/dividends in the form of additional bonds or preferred stocks. |
| (11) | Income may be received in cash or additional bonds at the discretion of the issuer. |
| (12) | Denominated in United States dollars unless otherwise indicated. |
| (13) | “Step-up” security where the rate increases (“steps-up”) at a predetermined rate. Rate shown reflects the stated rate. |
| (14) | The Fund invests in Senior Loans which generally pay interest at rates which are periodically re-determined by reference to a base lending rate plus a premium. These base lending rates are generally either the lending rate offered by one or more major United States banks, or the certificate of deposit rate. Senior Loans are generally considered to be restrictive in that the Fund is ordinarily contractually obligated to receive approval from the Agent Bank and/or borrower prior to the disposition of a Senior Loan. |
| (15) | Senior Loans in the Fund’s Portfolio are generally subject to mandatory and/or optional prepayment. Because of these mandatory prepayment conditions and because there may be significant economic incentives for a borrower to prepay, prepayments may occur. As a result, the actual remaining maturity may be substantially less than the stated maturities. |
| (16) | Principal amount of security is adjusted for inflation. |
| (17) | See Note 5 for cost of investments on a tax basis. |
| (19) | Bond is in default and did not pay principal at maturity. |
| (20) | Company has filed for Chapter 11 bankruptcy protection. |
| (21) | Company has filed for Chapter 7 bankruptcy protection. |
| (22) | Company has filed for bankruptcy in country of issuance. |
| (23) | Bond is in default of interest subsequent to August 31, 2009. |
| (24) | Variable Rate Security—the rate reflected is as of August 31, 2009, maturity date reflects the next reset date. |
TIPS—Treasury Inflation Protected Securities
REMIC—Real Estate Mortgage Investment Conduit
Currency Legend
AUD—Australian Dollar
BRL—Brazilian Real
CAD—Canadian Dollar
EUR—Euro Dollar
JPY—Japanese Yen
NOK—Norwegian Krone
SEK—Swedish Krona
The following is a summary of the inputs used to value the Fund’s net assets as of August 31, 2009 (see Note 2):
| | | | | | | | | | | | |
| | | Level 1 -
Unadjusted
Quoted
Prices
| | Level 2 -
Other
Observable
Inputs
| | Level 3 -
Significant
Unobservable
Inputs
| | Total
|
Long-Term Investment Securities: | | | | | | | | | | | | |
Asset Backed Securities | | $ | – | | $ | 5,871,175 | | $ | – | | $ | 5,871,175 |
Convertible Bonds & Notes | | | – | | | 41,750 | | | 49,000 | | | 90,750 |
U.S. Corporate Bonds & Notes | | | – | | | 135,139,955 | | | 3,125,234 | | | 138,265,189 |
Foreign Corporate Bonds & Notes | | | – | | | 21,344,861 | | | – | | | 21,344,861 |
Foreign Government Agencies | | | – | | | 78,426,773 | | | – | | | 78,426,773 |
Foreign Government Treasuries | | | – | | | 6,783,468 | | | – | | | 6,783,468 |
Loans | | | – | | | 817,917 | | | – | | | 817,917 |
U.S. Government Agencies | | | – | | | 41,202,083 | | | – | | | 41,202,083 |
U.S. Government Treasuries | | | 18,063,384 | | | – | | | – | | | 18,063,384 |
Common Stock | | | 641,196 | | | – | | | 177,128 | | | 818,324 |
Preferred Stock | | | 591,018 | | | 265,079 | | | – | | | 856,097 |
Warrants | | | 12,064 | | | – | | | 0 | | | 12,064 |
Repurchase Agreement | | | – | | | 32,087,000 | | | – | | | 32,087,000 |
| | |
|
| |
|
| |
|
| |
|
|
Total | | $ | 19,307,662 | | $ | 321,980,061 | | $ | 3,351,362 | | $ | 344,639,085 |
| | |
|
| |
|
| |
|
| |
|
|
The following is a reconciliation of Level 3 assets which significant unobservable inputs were used to determine fair value:
| | | | | | | | | | | | | | | | | | | | | | | | |
| | | Convertible
Bonds &
Notes
| | | U.S.
Corporate
Bonds &
Notes
| | | Loans
| | | Common
Stock
| | | Preferred
Stock
| | | Warrants
| |
Balance as of 8/31/2008 | | $ | 104,000 | | | $ | 470,831 | | | $ | 1,217,669 | | | $ | 110,871 | | | $ | 91,210 | | | $ | 69 | |
Accrued discounts/
premiums | | | – | | | | (311 | ) | | | 427 | | | | – | | | | – | | | | – | |
Realized gain(loss) | | | – | | | | 35,555 | | | | (24,916 | ) | | | (15 | ) | | | (116,546 | ) | | | – | |
Change in unrealized appreciation (depreciation) | | | (65,000 | ) | | | (531,330 | ) | | | 117,742 | | | | 66,274 | | | | 25,336 | | | | (69 | ) |
Net purchases (sales) | | | 10,000 | | | | 1,198,529 | | | | (1,310,922 | ) | | | (2 | ) | | | (0 | ) | | | – | |
Transfers in and/or out of Level 3 | | | – | | | | 1,951,960 | | | | – | | | | – | | | | – | | | | – | |
| | |
|
|
| |
|
|
| |
|
|
| |
|
|
| |
|
|
| |
|
|
|
Balance as of 8/31/2009 | | $ | 49,000 | | | $ | 3,125,234 | | | $ | – | | | $ | 177,128 | | | $ | – | | | $ | 0 | |
| | |
|
|
| |
|
|
| |
|
|
| |
|
|
| |
|
|
| |
|
|
|
See Notes to Financial Statements
95
VALIC Company II
STATEMENT OF ASSETS AND LIABILITIES — August 31, 2009
| | | | | | | | | | | | | | | | | | | | | | | | |
| | | AGGRESSIVE
GROWTH
LIFESTYLE
FUND | | | CAPITAL
APPRECIATION
FUND | | | CONSERVATIVE
GROWTH
LIFESTYLE
FUND | | | CORE BOND
FUND | | | HIGH YIELD
BOND FUND | | | INTERNATIONAL
SMALL CAP
EQUITY | |
ASSETS: | | | | | | | | | | | | | | | | | | | | | | | | |
Long-term investment securities, at market value (unaffiliated)* | | $ | – | | | $ | 48,547,911 | | | $ | – | | | $ | 146,168,308 | | | $ | 176,528,598 | | | $ | 536,355,981 | |
Long-term investment securities, at market value (affiliated)* | | | 93,779,196 | | | | – | | | | 57,736,775 | | | | – | | | | – | | | | – | |
Short-term investment securities, at market value (unaffiliated)* | | | – | | | | – | | | | – | | | | – | | | | – | | | | – | |
Short-term investment securities, at market value (affiliated)* | | | – | | | | – | | | | – | | | | – | | | | – | | | | – | |
Repurchase agreements (cost approximates market value) | | | – | | | | – | | | | – | | | | 12,099,000 | | | | 5,234,000 | | | | 13,602,000 | |
| | |
|
|
| |
|
|
| |
|
|
| |
|
|
| |
|
|
| |
|
|
|
Total Investments | | | 93,779,196 | | | | 48,547,911 | | | | 57,736,775 | | | | 158,267,308 | | | | 181,762,598 | | | | 549,957,981 | |
| | |
|
|
| |
|
|
| |
|
|
| |
|
|
| |
|
|
| |
|
|
|
Cash | | | 15,497 | | | | 22,088 | | | | 9,185 | | | | 886 | | | | 40,673 | | | | 355 | |
Foreign cash* | | | – | | | | – | | | | – | | | | – | | | | – | | | | 1,964,427 | |
Receivable for: | | | | | | | | | | | | | | | | | | | | | | | | |
Trust shares sold | | | 140,802 | | | | 27,667 | | | | 34,524 | | | | 385,818 | | | | 496,985 | | | | 196,696 | |
Dividends and interest | | | – | | | | 74,323 | | | | – | | | | 1,592,377 | | | | 4,423,040 | | | | 478,828 | |
Investments sold | | | – | | | | – | | | | – | | | | 2,641,732 | | | | 6,487,507 | | | | 35,181,107 | |
Prepaid expenses and other assets | | | 6,977 | | | | 10,487 | | | | 6,627 | | | | 10,729 | | | | 10,093 | | | | 16,738 | |
Due from investment adviser for expense reimbursements/fee waivers | | | 20,576 | | | | 8,096 | | | | 21,001 | | | | 15,912 | | | | – | | | | 8,623 | |
| | |
|
|
| |
|
|
| |
|
|
| |
|
|
| |
|
|
| |
|
|
|
TOTAL ASSETS | | | 93,963,048 | | | | 48,690,572 | | | | 57,808,112 | | | | 162,914,762 | | | | 193,220,896 | | | | 587,804,755 | |
| | |
|
|
| |
|
|
| |
|
|
| |
|
|
| |
|
|
| |
|
|
|
LIABILITIES: | | | | | | | | | | | | | | | | | | | | | | | | |
Payable for: | | | | | | | | | | | | | | | | | | | | | | | | |
Trust shares reacquired | | | 5,514 | | | | 1,531 | | | | 3,307 | | | | 16,935 | | | | 23,035 | | | | 109,160 | |
Investments purchased | | | 135,287 | | | | – | | | | 31,217 | | | | 2,546,741 | | | | 1,567,492 | | | | 23,785,539 | |
Investment advisory and management fees | | | 7,811 | | | | 23,522 | | | | 4,826 | | | | 66,228 | | | | 102,751 | | | | 385,830 | |
Shareholder services fee | | | – | | | | 10,692 | | | | – | | | | 33,114 | | | | 40,159 | | | | 117,918 | |
Administrative service fee | | | – | | | | 2,994 | | | | – | | | | 9,272 | | | | 11,244 | | | | 33,017 | |
Transfer agent fees and expenses | | | 289 | | | | 480 | | | | 343 | | | | 504 | | | | 496 | | | | 486 | |
Trustees’ fees and expenses | | | 69,262 | | | | 80,828 | | | | 57,877 | | | | 157,880 | | | | 134,419 | | | | 366,832 | |
Other accrued expenses | | | 49,076 | | | | 60,622 | | | | 51,962 | | | | 112,886 | | | | 95,291 | | | | 280,641 | |
Variation margin on futures contracts | | | – | | | | – | | | | – | | | | – | | | | – | | | | – | |
Due to custodian | | | – | | | | – | | | | – | | | | – | | | | – | | | | – | |
| | |
|
|
| |
|
|
| |
|
|
| |
|
|
| |
|
|
| |
|
|
|
TOTAL LIABILITIES | | | 267,239 | | | | 180,669 | | | | 149,532 | | | | 2,943,560 | | | | 1,974,887 | | | | 25,079,423 | |
| | |
|
|
| |
|
|
| |
|
|
| |
|
|
| |
|
|
| |
|
|
|
NET ASSETS | | $ | 93,695,809 | | | $ | 48,509,903 | | | $ | 57,658,580 | | | $ | 159,971,202 | | | $ | 191,246,009 | | | $ | 562,725,332 | |
| | |
|
|
| |
|
|
| |
|
|
| |
|
|
| |
|
|
| |
|
|
|
NET ASSETS REPRESENTED BY: | | | | | | | | | | | | | | | | | | | | | | | | |
Trust shares at par value of $0.01 per share | | $ | 134,544 | | | $ | 64,563 | | | $ | 60,040 | | | $ | 160,539 | | | $ | 281,886 | | | $ | 513,888 | |
Additional paid-in capital | | | 123,436,595 | | | | 75,539,221 | | | | 61,532,285 | | | | 162,047,716 | | | | 231,238,891 | | | | 782,244,043 | |
Accumulated undistributed net investment income (loss) | | | 1,563,756 | | | | 378,294 | | | | 1,881,837 | | | | 8,644,148 | | | | 17,716,611 | | | | 6,587,486 | |
Accumulated undistributed net realized gain (loss) on investments, futures contracts, securities sold short, foreign exchange transactions and capital gain distributions received from underlying funds | | | (44,851,438 | ) | | | (26,428,778 | ) | | | (13,362,300 | ) | | | (10,005,354 | ) | | | (47,291,333 | ) | | | (302,575,094 | ) |
Unrealized appreciation (depreciation) on investments | | | 13,412,352 | | | | (1,043,397 | ) | | | 7,546,718 | | | | (875,847 | ) | | | (10,700,046 | ) | | | 76,010,136 | |
Unrealized appreciation (depreciation) on futures contracts and options contracts | | | – | | | | – | | | | – | | | | – | | | | – | | | | – | |
Unrealized foreign exchange gain (loss) on other assets and liabilities | | | – | | | | – | | | | – | | | | – | | | | – | | | | (55,127 | ) |
| | |
|
|
| |
|
|
| |
|
|
| |
|
|
| |
|
|
| |
|
|
|
NET ASSETS | | $ | 93,695,809 | | | $ | 48,509,903 | | | $ | 57,658,580 | | | $ | 159,971,202 | | | $ | 191,246,009 | | | $ | 562,725,332 | |
| | |
|
|
| |
|
|
| |
|
|
| |
|
|
| |
|
|
| |
|
|
|
SHARES OF BENEFICIAL INTEREST: | | | | | | | | | | | | | | | | | | | | | | | | |
Authorized (Par value $0.01 per share) | | | 1,000,000,000 | | | | 1,000,000,000 | | | | 1,000,000,000 | | | | 1,000,000,000 | | | | 1,000,000,000 | | | | 1,000,000,000 | |
Outstanding | | | 13,454,410 | | | | 6,456,326 | | | | 6,003,955 | | | | 16,053,912 | | | | 28,188,555 | | | | 51,388,795 | |
NET ASSET VALUE, OFFERING AND REDEMPTION PRICE PER SHARE | | $ | 6.96 | | | $ | 7.51 | | | $ | 9.60 | | | $ | 9.96 | | | $ | 6.78 | | | $ | 10.95 | |
| | |
|
|
| |
|
|
| |
|
|
| |
|
|
| |
|
|
| |
|
|
|
* Cost | | | | | | | | | | | | | | | | | | | | | | | | |
Long-term investment securities (unaffiliated) | | $ | – | | | $ | 49,591,308 | | | $ | – | | | $ | 147,044,155 | | | $ | 187,228,644 | | | $ | 460,345,845 | |
| | |
|
|
| |
|
|
| |
|
|
| |
|
|
| |
|
|
| |
|
|
|
Long-term investment securities (affiliated) | | $ | 80,366,844 | | | $ | – | | | $ | 50,190,057 | | | $ | – | | | $ | – | | | $ | – | |
| | |
|
|
| |
|
|
| |
|
|
| |
|
|
| |
|
|
| |
|
|
|
Short-term investment securities (unaffiliated) | | $ | – | | | $ | – | | | $ | – | | | $ | – | | | $ | – | | | $ | – | |
| | |
|
|
| |
|
|
| |
|
|
| |
|
|
| |
|
|
| |
|
|
|
Short-term investment securities (affiliated) | | $ | – | | | $ | – | | | $ | – | | | $ | – | | | $ | – | | | $ | – | |
| | |
|
|
| |
|
|
| |
|
|
| |
|
|
| |
|
|
| |
|
|
|
Foreign cash | | $ | – | | | $ | – | | | $ | – | | | $ | – | | | $ | – | | | $ | 1,966,120 | |
| | |
|
|
| |
|
|
| |
|
|
| |
|
|
| |
|
|
| |
|
|
|
See Notes to Financial Statements
96
VALIC Company II
STATEMENT OF ASSETS AND LIABILITIES — August 31, 2009 — (continued)
| | | | | | | | | | | | | | | | | | | | |
| | | LARGE CAP
VALUE FUND | | | MID CAP GROWTH
FUND | | | MID CAP VALUE
FUND | | | MODERATE
GROWTH
LIFESTYLE
FUND | | | MONEY MARKET II
FUND | |
ASSETS: | | | | | | | | | | | | | | | | | | | | |
Long-term investment securities, at market value (unaffiliated)* | | $ | 156,724,542 | | | $ | 153,594,628 | | | $ | 473,065,581 | | | $ | – | | | $ | – | |
Long-term investment securities, at market value (affiliated)* | | | – | | | | – | | | | – | | | | 141,931,692 | | | | – | |
Short-term investment securities, at market value (unaffiliated)* | | | – | | | | – | | | | 2,136,000 | | | | – | | | | 220,910,809 | |
Short-term investment securities, at market value (affiliated)* | | | 958,928 | | | | – | | | | – | | | | – | | | | – | |
Repurchase agreements (cost approximates market value) | | | – | | | | 4,984,000 | | | | 3,654,000 | | | | – | | | | 36,736,000 | |
| | |
|
|
| |
|
|
| |
|
|
| |
|
|
| |
|
|
|
Total Investments | | | 157,683,470 | | | | 158,578,628 | | | | 478,855,581 | | | | 141,931,692 | | | | 257,646,809 | |
| | |
|
|
| |
|
|
| |
|
|
| |
|
|
| |
|
|
|
Cash | | | – | | | | 872 | | | | 683 | | | | 14,627 | | | | 8,364 | |
Foreign cash* | | | – | | | | 2 | | | | 38 | | | | – | | | | – | |
Receivable for: | | | | | | | | | | | | | | | | | | | | |
Trust shares sold | | | 139,462 | | | | 126,096 | | | | 306,017 | | | | 224,328 | | | | 48,176 | |
Dividends and interest | | | 300,614 | | | | 57,283 | | | | 684,690 | | | | – | | | | 180,285 | |
Investments sold | | | – | | | | 1,204,082 | | | | 3,672,496 | | | | – | | | | – | |
Prepaid expenses and other assets | | | 14,629 | | | | 59,612 | | | | 57,475 | | | | 8,031 | | | | 19,017 | |
Due from investment adviser for expense reimbursements/fee waivers | | | 5,568 | | | | 34,261 | | | | – | | | | 17,229 | | | | 16,859 | |
| | |
|
|
| |
|
|
| |
|
|
| |
|
|
| |
|
|
|
TOTAL ASSETS | | | 158,143,743 | | | | 160,060,836 | | | | 483,576,980 | | | | 142,195,907 | | | | 257,919,510 | |
| | |
|
|
| |
|
|
| |
|
|
| |
|
|
| |
|
|
|
LIABILITIES: | | | | | | | | | | | | | | | | | | | | |
Payable for: | | | | | | | | | | | | | | | | | | | | |
Trust shares reacquired | | | 9,369 | | | | 41,904 | | | | 28,418 | | | | 8,464 | | | | 1,165,048 | |
Investments purchased | | | 20 | | | | 854,915 | | | | 4,108,372 | | | | 215,864 | | | | 3,004,929 | |
Investment advisory and management fees | | | 66,092 | | | | 100,789 | | | | 288,541 | | | | 11,827 | | | | 54,633 | |
Shareholder services fee | | | 33,046 | | | | 33,721 | | | | 100,397 | | | | – | | | | 54,633 | |
Administrative service fee | | | 9,253 | | | | 9,442 | | | | 28,111 | | | | – | | | | 15,297 | |
Transfer agent fees and expenses | | | 476 | | | | 447 | | | | 1,573 | | | | 289 | | | | 173 | |
Trustees’ fees and expenses | | | 205,406 | | | | 97,425 | | | | 405,556 | | | | 115,205 | | | | 223,825 | |
Other accrued expenses | | | 109,272 | | | | 81,155 | | | | 158,773 | | | | 57,931 | | | | 159,130 | |
Variation margin on futures contracts | | | – | | | | – | | | | – | | | | – | | | | – | |
Due to custodian | | | – | | | | – | | | | – | | | | – | | | | – | |
| | |
|
|
| |
|
|
| |
|
|
| |
|
|
| |
|
|
|
TOTAL LIABILITIES | | | 432,934 | | | | 1,219,798 | | | | 5,119,741 | | | | 409,580 | | | | 4,677,668 | |
| | |
|
|
| |
|
|
| |
|
|
| |
|
|
| |
|
|
|
NET ASSETS | | $ | 157,710,809 | | | $ | 158,841,038 | | | $ | 478,457,239 | | | $ | 141,786,327 | | | $ | 253,241,842 | |
| | |
|
|
| |
|
|
| |
|
|
| |
|
|
| |
|
|
|
NET ASSETS REPRESENTED BY: | | | | | | | | | | | | | | | | | | | | |
Trust shares at par value of $0.01 per share | | $ | 168,254 | | | $ | 274,549 | | | $ | 376,344 | | | $ | 140,087 | | | $ | 2,538,295 | |
Additional paid-in capital | | | 277,595,530 | | | | 212,952,656 | | | | 619,774,482 | | | | 159,312,844 | | | | 251,288,511 | |
Accumulated undistributed net investment income (loss) | | | 2,644,385 | | | | (123,818 | ) | | | 4,668,055 | | | | 3,282,609 | | | | 26,499 | |
Accumulated undistributed net realized gain (loss) on investments, futures contracts, securities sold short, foreign exchange transactions and capital gain distributions received from underlying funds | | | (131,875,053 | ) | | | (69,352,215 | ) | | | (160,692,256 | ) | | | (43,977,785 | ) | | | (611,463 | ) |
Unrealized appreciation (depreciation) on investments | | | 9,177,693 | | | | 15,089,702 | | | | 14,328,585 | | | | 23,028,572 | | | | – | |
Unrealized appreciation (depreciation) on futures contracts and options contracts | | | – | | | | – | | | | – | | | | – | | | | – | |
Unrealized foreign exchange gain (loss) on other assets and liabilities | | | – | | | | 164 | | | | 2,029 | | | | – | | | | – | |
| | |
|
|
| |
|
|
| |
|
|
| |
|
|
| |
|
|
|
NET ASSETS | | $ | 157,710,809 | | | $ | 158,841,038 | | | $ | 478,457,239 | | | $ | 141,786,327 | | | $ | 253,241,842 | |
| | |
|
|
| |
|
|
| |
|
|
| |
|
|
| |
|
|
|
SHARES OF BENEFICIAL INTEREST: | | | | | | | | | | | | | | | | | | | | |
Authorized (Par value $0.01 per share) | | | 1,000,000,000 | | | | 1,000,000,000 | | | | 1,000,000,000 | | | | 1,000,000,000 | | | | 1,000,000,000 | |
Outstanding | | | 16,825,382 | | | | 27,454,908 | | | | 37,634,357 | | | | 14,008,703 | | | | 253,829,528 | |
NET ASSET VALUE, OFFERING AND REDEMPTION PRICE PER SHARE | | $ | 9.37 | | | $ | 5.79 | | | $ | 12.71 | | | $ | 10.12 | | | $ | 1.00 | |
| | |
|
|
| |
|
|
| |
|
|
| |
|
|
| |
|
|
|
* Cost | | | | | | | | | | | | | | | | | | | | |
Long-term investment securities (unaffiliated) | | $ | 147,546,849 | | | $ | 138,504,926 | | | $ | 458,736,996 | | | $ | 118,903,120 | | | $ | – | |
| | |
|
|
| |
|
|
| |
|
|
| |
|
|
| |
|
|
|
Long-term investment securities (affiliated) | | $ | – | | | $ | – | | | $ | – | | | $ | – | | | $ | – | |
| | |
|
|
| |
|
|
| |
|
|
| |
|
|
| |
|
|
|
Short-term investment securities (unaffiliated) | | $ | – | | | $ | – | | | $ | 2,136,000 | | | $ | – | | | $ | 220,910,809 | |
| | |
|
|
| |
|
|
| |
|
|
| |
|
|
| |
|
|
|
Short-term investment securities (affiliated) | | $ | 958,928 | | | $ | – | | | $ | – | | | $ | – | | | $ | – | |
| | |
|
|
| |
|
|
| |
|
|
| |
|
|
| |
|
|
|
Foreign cash | | $ | – | | | $ | 2 | | | $ | 38 | | | $ | – | | | $ | – | |
| | |
|
|
| |
|
|
| |
|
|
| |
|
|
| |
|
|
|
See Notes to Financial Statements
97
VALIC Company II
STATEMENT OF ASSETS AND LIABILITIES — August 31, 2009 — (continued)
| | | | | | | | | | | | | | | | |
| | | SMALL CAP
GROWTH FUND | | | SMALL CAP
VALUE FUND | | | SOCIALLY
RESPONSIBLE
FUND | | | STRATEGIC
BOND FUND | |
ASSETS: | | | | | | | | | | | | | | | | |
Long-term investment securities, at market value (unaffiliated)* | | $ | 41,118,053 | | | $ | 335,778,672 | | | $ | 624,977,909 | | | $ | 312,552,085 | |
Long-term investment securities, at market value (affiliated)* | | | – | | | | – | | | | – | | | | – | |
Short-term investment securities, at market value (unaffiliated)* | | | 1,390,000 | | | | – | | | | 27,499,630 | | | | – | |
Short-term investment securities, at market value (affiliated)* | | | – | | | | – | | | | – | | | | – | |
Repurchase agreements (cost approximates market value) | | | – | | | | 9,715,000 | | | | 3,730,000 | | | | 32,087,000 | |
| | |
|
|
| |
|
|
| |
|
|
| |
|
|
|
Total Investments | | | 42,508,053 | | | | 345,493,672 | | | | 656,207,539 | | | | 344,639,085 | |
| | |
|
|
| |
|
|
| |
|
|
| |
|
|
|
Cash | | | 2,065 | | | | 752 | | | | 759 | | | | – | |
Foreign cash* | | | – | | | | – | | | | – | | | | 1,093,854 | |
Receivable for: | | | | | | | | | | | | | | | | |
Trust shares sold | | | 39,528 | | | | 412,592 | | | | 5,256 | | | | 427,928 | |
Dividends and interest | | | 5,717 | | | | 423,892 | | | | 970,912 | | | | 5,601,501 | |
Investments sold | | | – | | | | 850,187 | | | | – | | | | 3,693,844 | |
Prepaid expenses and other assets | | | 10,571 | | | | 14,045 | | | | 221,534 | | | | 11,217 | |
Due from investment adviser for expense reimbursements/fee waivers | | | 12,537 | | | | 22,959 | | | | 3,473 | | | | – | |
| | |
|
|
| |
|
|
| |
|
|
| |
|
|
|
TOTAL ASSETS | | | 42,578,471 | | | | 347,218,099 | | | | 657,409,473 | | | | 355,467,429 | |
| | |
|
|
| |
|
|
| |
|
|
| |
|
|
|
LIABILITIES: | | | | | | | | | | | | | | | | |
Payable for: | | | | | | | | | | | | | | | | |
Trust shares reacquired | | | 10,527 | | | | 64,690 | | | | 111,007 | | | | 19,535 | |
Investments purchased | | | 88,851 | | | | 876,031 | | | | – | | | | 3,165,933 | |
Investment advisory and management fees | | | 30,218 | | | | 192,451 | | | | 138,498 | | | | 162,003 | |
Shareholder services fee | | | 8,888 | | | | 72,386 | | | | 138,498 | | | | 72,508 | |
Administrative service fee | | | 2,488 | | | | 20,268 | | | | 38,779 | | | | 20,302 | |
Transfer agent fees and expenses | | | 513 | | | | 439 | | | | 567 | | | | 810 | |
Trustee’s fees and expenses | | | 65,708 | | | | 178,927 | | | | 422,170 | | | | 208,346 | |
Other accrued expenses | | | 61,374 | | | | 123,863 | | | | 190,995 | | | | 216,584 | |
Variation margin on futures contracts | | | – | | | | 137,640 | | | | 236,775 | | | | – | |
Due to custodian | | | – | | | | – | | | | – | | | | 103,586 | |
| | |
|
|
| |
|
|
| |
|
|
| |
|
|
|
TOTAL LIABILITIES | | | 268,567 | | | | 1,666,695 | | | | 1,277,289 | | | | 3,969,607 | |
| | |
|
|
| |
|
|
| |
|
|
| |
|
|
|
NET ASSETS | | $ | 42,309,904 | | | $ | 345,551,404 | | | $ | 656,132,184 | | | $ | 351,497,822 | |
| | |
|
|
| |
|
|
| |
|
|
| |
|
|
|
NET ASSETS REPRESENTED BY: | | | | | | | | | | | | | | | | |
Trust shares at par value of $0.01 per share | | $ | 45,456 | | | $ | 349,814 | | | $ | 734,795 | | | $ | 341,439 | |
Additional paid-in capital | | | 54,079,373 | | | | 416,445,523 | | | | 953,123,292 | | | | 370,372,184 | |
Accumulated undistributed net investment income (loss) | | | (70,938 | ) | | | 3,540,183 | | | �� | 10,826,622 | | | | 17,992,786 | |
Accumulated undistributed net realized gain (loss) on investments, futures contracts, securities sold short, foreign exchange transactions and capital gain distributions received from underlying funds | | | (12,421,674 | ) | | | (45,298,753 | ) | | | (317,238,545 | ) | | | (38,329,535 | ) |
Unrealized appreciation (depreciation) on investments | | | 677,687 | | | | (30,275,352 | ) | | | 5,589,257 | | | | 1,073,112 | |
Unrealized appreciation (depreciation) on futures contracts and options contracts | | | – | | | | 789,989 | | | | 3,096,763 | | | | – | |
Unrealized foreign exchange gain (loss) on other assets and liabilities | | | – | | | | – | | | | – | | | | 47,836 | |
| | |
|
|
| |
|
|
| |
|
|
| |
|
|
|
NET ASSETS | | $ | 42,309,904 | | | $ | 345,551,404 | | | $ | 656,132,184 | | | $ | 351,497,822 | |
| | |
|
|
| |
|
|
| |
|
|
| |
|
|
|
SHARES OF BENEFICIAL INTEREST: | | | | | | | | | | | | | | | | |
Authorized (Par value $0.01 per share) | | | 1,000,000,000 | | | | 1,000,000,000 | | | | 1,000,000,000 | | | | 1,000,000,000 | |
Outstanding | | | 4,545,636 | | | | 34,981,421 | | | | 73,479,474 | | | | 34,143,883 | |
NET ASSET VALUE, OFFERING AND REDEMPTION PRICE PER SHARE | | $ | 9.31 | | | $ | 9.88 | | | $ | 8.93 | | | $ | 10.29 | |
| | |
|
|
| |
|
|
| |
|
|
| |
|
|
|
* Cost | | | | | | | | | | | | | | | | |
Long-term investment securities (unaffiliated) | | $ | 40,440,366 | | | $ | 366,054,024 | | | $ | 619,388,652 | | | $ | 311,478,973 | |
| | |
|
|
| |
|
|
| |
|
|
| |
|
|
|
Long-term investment securities (affiliated) | | $ | – | | | $ | – | | | $ | – | | | $ | – | |
| | |
|
|
| |
|
|
| |
|
|
| |
|
|
|
Short-term investment securities (unaffiliated) | | $ | 1,390,000 | | | $ | – | | | $ | 27,499,630 | | | $ | – | |
| | |
|
|
| |
|
|
| |
|
|
| |
|
|
|
Short-term investment securities (affiliated) | | $ | – | | | $ | – | | | $ | – | | | $ | – | |
| | |
|
|
| |
|
|
| |
|
|
| |
|
|
|
Foreign cash | | $ | – | | | $ | – | | | $ | – | | | $ | 1,068,719 | |
| | |
|
|
| |
|
|
| |
|
|
| |
|
|
|
See Notes to Financial Statements
98
VALIC Company II
STATEMENT OF OPERATIONS — For the Year Ended August 31, 2009
| | | | | | | | | | | | | | | | | | | | |
| | | AGGRESSIVE
GROWTH
LIFESTYLE FUND | | | CAPITAL
APPRECIATION
FUND | | | CONSERVATIVE
GROWTH
LIFESTYLE FUND | | | CORE BOND
FUND | | | HIGH YIELD
BOND FUND | |
INVESTMENT INCOME: | | | | | | | | | | | | | | | | | | | | |
Dividends (unaffiliated) | | $ | – | | | $ | 947,438 | | | $ | – | | | $ | 105,118 | | | $ | 41,500 | |
Dividends (affiliated) | | | 1,701,163 | | | | – | | | | 1,990,008 | | | | – | | | | – | |
Interest (unaffiliated) | | | 163 | | | | 4,181 | | | | – | | | | 9,842,137 | | | | 19,640,624 | |
| | |
|
|
| |
|
|
| |
|
|
| |
|
|
| |
|
|
|
Total investment income* | | | 1,701,326 | | | | 951,619 | | | | 1,990,008 | | | | 9,947,255 | | | | 19,682,124 | |
| | |
|
|
| |
|
|
| |
|
|
| |
|
|
| |
|
|
|
EXPENSES: | | | | | | | | | | | | | | | | | | | | |
Investment advisory and management fees | | | 75,124 | | | | 328,862 | | | | 50,461 | | | | 808,526 | | | | 1,123,823 | |
Administrative service fee | | | – | | | | 41,855 | | | | – | | | | 113,224 | | | | 113,610 | |
Shareholder services fee | | | – | | | | 149,483 | | | | – | | | | 404,371 | | | | 405,752 | |
Transfer agent fees and expenses | | | 1,193 | | | | 1,874 | | | | 1,254 | | | | 1,901 | | | | 1,892 | |
Registration fees | | | 641 | | | | 641 | | | | 641 | | | | 641 | | | | 641 | |
Custodian and accounting fees | | | 14,529 | | | | 10,846 | | | | 14,749 | | | | 80,217 | | | | 51,318 | |
Reports to shareholders | | | 26,279 | | | | 16,059 | | | | 16,853 | | | | 65,208 | | | | 61,459 | |
Audit and tax fees | | | 28,655 | | | | 30,535 | | | | 33,183 | | | | 34,632 | | | | 33,302 | |
Legal fees | | | 18,977 | | | | 17,807 | | | | 16,536 | | | | 29,203 | | | | 33,989 | |
Trustees’ fees and expenses | | | 16,445 | | | | 27,106 | | | | 9,075 | | | | 41,596 | | | | 53,246 | |
Interest expense | | | 58 | | | | 1,582 | | | | – | | | | 1,850 | | | | – | |
Interest expense on securities sold short | | | – | | | | – | | | | – | | | | – | | | | 39,190 | |
Other expenses | | | 10,137 | | | | 5,940 | | | | 13,447 | | | | 9,336 | | | | 8,447 | |
| | |
|
|
| |
|
|
| |
|
|
| |
|
|
| |
|
|
|
Total expenses before fee waivers, expense reimbursements, and fees paid indirectly | | | 192,038 | | | | 632,590 | | | | 156,199 | | | | 1,590,705 | | | | 1,926,669 | |
| | |
|
|
| |
|
|
| |
|
|
| |
|
|
| |
|
|
|
Fees waived and expenses reimbursed by investment advisor (Note 3) | | | (116,916 | ) | | | (124,348 | ) | | | (105,738 | ) | | | (345,242 | ) | | | (280,702 | ) |
Fees paid indirectly (Note 7) | | | – | | | | – | | | | – | | | | – | | | | – | |
| | |
|
|
| |
|
|
| |
|
|
| |
|
|
| |
|
|
|
Net expenses | | | 75,122 | | | | 508,242 | | | | 50,461 | | | | 1,245,463 | | | | 1,645,967 | |
| | |
|
|
| |
|
|
| |
|
|
| |
|
|
| |
|
|
|
Net investment income (loss) | | | 1,626,204 | | | | 443,377 | | | | 1,939,547 | | | | 8,701,792 | | | | 18,036,157 | |
| | |
|
|
| |
|
|
| |
|
|
| |
|
|
| |
|
|
|
NET REALIZED AND UNREALIZED GAIN (LOSS) ON INVESTMENTS AND FOREIGN CURRENCIES: | | | | | | | | | | | | | | | | | | | | |
Net realized gain (loss) on investments (unaffiliated) | | | – | | | | (16,022,420 | ) | | | – | | | | (6,920,989 | ) | | | (41,288,465 | ) |
Net realized gain (loss) on investments (affiliated) | | | (30,379,452 | ) | | | – | | | | (12,555,353 | ) | | | – | | | | – | |
Net realized gain (loss) from capital gain distributions from underlying funds (affiliated) | | | 2,124,571 | | | | – | | | | 987,611 | | | | – | | | | – | |
Net realized gain (loss) on futures contracts | | | – | | | | – | | | | – | | | | – | | | | – | |
Net realized gain (loss) on securities sold short | | | – | | | | – | | | | – | | | | – | | | | (177,938 | ) |
Net realized foreign exchange gain (loss) on other assets and liabilities | | | – | | | | – | | | | – | | | | – | | | | 2,622 | |
| | |
|
|
| |
|
|
| |
|
|
| |
|
|
| |
|
|
|
Net realized gain (loss) on investments and foreign currencies | | | (28,254,881 | ) | | | (16,022,420 | ) | | | (11,567,742 | ) | | | (6,920,989 | ) | | | (41,463,781 | ) |
| | |
|
|
| |
|
|
| |
|
|
| |
|
|
| |
|
|
|
Change in unrealized appreciation (depreciation) on investments (unaffiliated) | �� | | – | | | | (10,135,724 | ) | | | – | | | | 6,557,132 | | | | 10,088,701 | |
Change in unrealized appreciation (depreciation) on investments (affiliated) | | | 18,732,132 | | | | – | | | | 8,830,618 | | | | – | | | | – | |
Change in unrealized appreciation (depreciation) on futures contracts | | | – | | | | – | | | | – | | | | – | | | | – | |
Change in unrealized foreign exchange gain (loss) on other assets and liabilities | | | – | | | | – | | | | – | | | | – | | | | (3,580 | ) |
Change in unrealized appreciation (depreciation) on securities sold short | | | – | | | | – | | | | – | | | | – | | | | – | |
Change in accrued capital gains tax on unrealized appreciation (depreciation) | | | – | | | | – | | | | – | | | | – | | | | – | |
| | |
|
|
| |
|
|
| |
|
|
| |
|
|
| |
|
|
|
Net unrealized gain (loss) on investments and foreign currencies | | | 18,732,132 | | | | (10,135,724 | ) | | | 8,830,618 | | | | 6,557,132 | | | | 10,085,121 | |
| | |
|
|
| |
|
|
| |
|
|
| |
|
|
| |
|
|
|
Net realized and unrealized gain (loss) on investments and foreign currencies | | | (9,522,749 | ) | | | (26,158,144 | ) | | | (2,737,124 | ) | | | (363,857 | ) | | | (31,378,660 | ) |
| | |
|
|
| |
|
|
| |
|
|
| |
|
|
| |
|
|
|
NET INCREASE (DECREASE) IN NET ASSETS RESULTING FROM OPERATIONS | | $ | (7,896,545 | ) | | $ | (25,714,767 | ) | | $ | (797,577 | ) | | $ | 8,337,935 | | | $ | (13,342,503 | ) |
| | |
|
|
| |
|
|
| |
|
|
| |
|
|
| |
|
|
|
* Net of foreign withholding taxes on interest and dividends of | | $ | – | | | $ | 585 | | | $ | – | | | $ | – | | | $ | 10,469 | |
| | |
|
|
| |
|
|
| |
|
|
| |
|
|
| |
|
|
|
See Notes to Financial Statements
99
VALIC Company II
STATEMENT OF OPERATIONS — For the Year Ended August 31, 2009 — (continued)
| | | | | | | | | | | | | | | | | | | | | | | | |
| | | INTERNATIONAL
SMALL CAP
EQUITY | | | LARGE CAP
VALUE FUND | | | MID CAP
GROWTH
FUND | | | MID CAP
VALUE FUND | | | MODERATE
GROWTH
LIFESTYLE FUND | | | MONEY MARKET
II FUND | |
INVESTMENT INCOME: | | | | | | | | | | | | | | | | | | | | | | | | |
Dividends (unaffiliated) | | $ | 13,146,224 | | | $ | 4,113,564 | | | $ | 775,138 | | | $ | 9,177,634 | | | $ | – | | | $ | – | |
Dividends (affiliated) | | | – | | | | – | | | | – | | | | – | | | | 3,513,387 | | | | – | |
Interest (unaffiliated) | | | 77,470 | | | | 5,409 | | | | 11,253 | | | | 18,561 | | | | – | | | | 4,466,301 | |
| | |
|
|
| |
|
|
| |
|
|
| |
|
|
| |
|
|
| |
|
|
|
Total investment income* | | | 13,223,694 | | | | 4,118,973 | | | | 786,391 | | | | 9,196,195 | | | | 3,513,387 | | | | 4,466,301 | |
| | |
|
|
| |
|
|
| |
|
|
| |
|
|
| |
|
|
| |
|
|
|
EXPENSES: | | | | | | | | | | | | | | | | | | | | | | | | |
Investment advisory and management fees | | | 4,000,608 | | | | 828,008 | | | | 1,050,949 | | | | 2,971,971 | | | | 120,920 | | | | 751,656 | |
Administrative service fee | | | 341,303 | | | | 115,921 | | | | 97,595 | | | | 288,625 | | | | – | | | | 210,464 | |
Shareholder services fee | | | 1,218,940 | | | | 414,004 | | | | 348,553 | | | | 1,030,802 | | | | – | | | | 751,656 | |
Transfer agent fees and expenses | | | 1,720 | | | | 1,715 | | | | 1,682 | | | | 5,509 | | | | 1,193 | | | | 690 | |
Registration fees | | | 641 | | | | 641 | | | | 641 | | | | 641 | | | | 641 | | | | – | |
Custodian and accounting fees | | | 359,398 | | | | 47,328 | | | | 45,490 | | | | 153,418 | | | | 13,483 | | | | 46,665 | |
Reports to shareholders | | | 179,280 | | | | 61,674 | | | | 97,799 | | | | 136,869 | | | | 44,810 | | | | 139,321 | |
Audit and tax fees | | | 43,384 | | | | 32,472 | | | | 32,462 | | | | 32,998 | | | | 28,655 | | | | 40,400 | |
Legal fees | | | 52,891 | | | | 25,859 | | | | 27,351 | | | | 53,208 | | | | 23,394 | | | | 93,913 | |
Trustees’ fees and expenses | | | 203,854 | | | | 69,693 | | | | 34,664 | | | | 136,867 | | | | 22,084 | | | | 97,202 | |
Interest expense | | | – | | | | – | | | | – | | | | 26 | | | | 167 | | | | – | |
Interest expense on securities sold short | | | – | | | | – | | | | – | | | | – | | | | – | | | | – | |
Other expenses | | | 16,760 | | | | 12,428 | | | | 6,730 | | | | 13,158 | | | | 10,400 | | | | 137,799 | |
| | |
|
|
| |
|
|
| |
|
|
| |
|
|
| |
|
|
| |
|
|
|
Total expenses before fee waivers, expense reimbursements, and fees paid indirectly | | | 6,418,779 | | | | 1,609,743 | | | | 1,743,916 | | | | 4,824,092 | | | | 265,747 | | | | 2,269,766 | |
| | |
|
|
| |
|
|
| |
|
|
| |
|
|
| |
|
|
| |
|
|
|
Fees waived and expenses reimbursed by investment advisor (Note 3) | | | (1,543,020 | ) | | | (268,372 | ) | | | (558,835 | ) | | | (494,725 | ) | | | (144,828 | ) | | | (616,123 | ) |
Fees paid indirectly (Note 7) | | | – | | | | (9,377 | ) | | | (69,765 | ) | | | (118,529 | ) | | | – | | | | – | |
| | |
|
|
| |
|
|
| |
|
|
| |
|
|
| |
|
|
| |
|
|
|
Net expenses | | | 4,875,759 | | | | 1,331,994 | | | | 1,115,316 | | | | 4,210,838 | | | | 120,919 | | | | 1,653,643 | |
| | |
|
|
| |
|
|
| |
|
|
| |
|
|
| |
|
|
| |
|
|
|
Net investment income (loss) | | | 8,347,935 | | | | 2,786,979 | | | | (328,925 | ) | | | 4,985,357 | | | | 3,392,468 | | | | 2,812,658 | |
| | |
|
|
| |
|
|
| |
|
|
| |
|
|
| |
|
|
| |
|
|
|
NET REALIZED AND UNREALIZED GAIN (LOSS) ON INVESTMENTS AND FOREIGN CURRENCIES: | | | | | | | | | | | | | | | | | | | | | | | | |
Net realized gain (loss) on investments (unaffiliated) | | | (237,008,281 | ) | | | (93,421,179 | ) | | | (55,272,212 | ) | | | (133,820,859 | ) | | | – | | | | 122,315 | |
Net realized gain (loss) on investments (affiliated) | | | – | | | | – | | | | – | | | | – | | | | (42,187,627 | ) | | | – | |
Net realized gain (loss) from capital gain distributions from underlying funds (affiliated) | | | – | | | | – | | | | – | | | | – | | | | 2,554,372 | | | | – | |
Net realized gain (loss) on futures contracts | | | – | | | | – | | | | – | | | | – | | | | – | | | | – | |
Net realized gain (loss) on securities sold short | | | – | | | | – | | | | – | | | | – | | | | – | | | | – | |
Net realized foreign exchange gain (loss) on other assets and liabilities | | | (1,689,206 | ) | | | – | | | | (51,766 | ) | | | 2,508 | | | | – | | | | – | |
| | |
|
|
| |
|
|
| |
|
|
| |
|
|
| |
|
|
| |
|
|
|
Net realized gain (loss) on investments and foreign currencies | | | (238,697,487 | ) | | | (93,421,179 | ) | | | (55,323,978 | ) | | | (133,818,351 | ) | | | (39,633,255 | ) | | | 122,315 | |
| | |
|
|
| |
|
|
| |
|
|
| |
|
|
| |
|
|
| |
|
|
|
Change in unrealized appreciation (depreciation) on investments (unaffiliated) | | | 121,468,678 | | | | 20,093,536 | | | | 8,448,927 | | | | 31,672,803 | | | | – | | | | – | |
Change in unrealized appreciation (depreciation) on investments (affiliated) | | | – | | | | – | | | | – | | | | – | | | | 28,745,258 | | | | – | |
Change in unrealized appreciation (depreciation) on futures contracts | | | – | | | | – | | | | – | | | | – | | | | – | | | | – | |
Change in unrealized foreign exchange gain (loss) on other assets and liabilities | | | 2,084 | | | | – | | | | 168 | | | | (18 | ) | | | – | | | | – | |
Change in unrealized appreciation (depreciation) on securities sold short | | | – | | | | – | | | | – | | | | – | | | | – | | | | – | |
Change in accrued capital gains tax on unrealized appreciation (depreciation) | | | 4,037 | | | | – | | | | – | | | | – | | | | – | | | | – | |
| | |
|
|
| |
|
|
| |
|
|
| |
|
|
| |
|
|
| |
|
|
|
Net unrealized gain (loss) on investments and foreign currencies | | | 121,474,799 | | | | 20,093,536 | | | | 8,449,095 | | | | 31,672,785 | | | | 28,745,258 | | | | – | |
| | |
|
|
| |
|
|
| |
|
|
| |
|
|
| |
|
|
| |
|
|
|
Net realized and unrealized gain (loss) on investments and foreign currencies | | | (117,222,688 | ) | | | (73,327,643 | ) | | | (46,874,883 | ) | | | (102,145,566 | ) | | | (10,887,997 | ) | | | 122,315 | |
| | |
|
|
| |
|
|
| |
|
|
| |
|
|
| |
|
|
| |
|
|
|
NET INCREASE (DECREASE) IN NET ASSETS RESULTING FROM OPERATIONS | | $ | (108,874,753 | ) | | $ | (70,540,664 | ) | | $ | (47,203,808 | ) | | $ | (97,160,209 | ) | | $ | (7,495,529 | ) | | $ | 2,934,973 | |
| | |
|
|
| |
|
|
| |
|
|
| |
|
|
| |
|
|
| |
|
|
|
* Net of foreign withholding taxes on interest and dividends of | | $ | 841,472 | | | $ | – | | | $ | 13,460 | | | $ | 20,414 | | | $ | – | | | $ | – | |
| | |
|
|
| |
|
|
| |
|
|
| |
|
|
| |
|
|
| |
|
|
|
See Notes to Financial Statements
100
VALIC Company II
STATEMENT OF OPERATIONS — For the Year Ended August 31, 2009 — (continued)
| | | | | | | | | | | | | | | | |
| | | SMALL CAP
GROWTH
FUND | | | SMALL CAP
VALUE FUND | | | SOCIALLY
RESPONSIBLE
FUND | | | STRATEGIC
BOND FUND | |
INVESTMENT INCOME: | | | | | | | | | | | | | | | | |
Dividends (unaffiliated) | | $ | 95,026 | | | $ | 6,040,456 | | | $ | 14,164,114 | | | $ | 84,884 | |
Dividends (affiliated) | | | – | | | | – | | | | – | | | | – | |
Interest (unaffiliated) | | | 1,482 | | | | 43,623 | | | | 134,762 | | | | 22,700,133 | |
| | |
|
|
| |
|
|
| |
|
|
| |
|
|
|
Total investment income* | | | 96,508 | | | | 6,084,079 | | | | 14,298,876 | | | | 22,785,017 | |
| | |
|
|
| |
|
|
| |
|
|
| |
|
|
|
EXPENSES: | | | | | | | | | | | | | | | | |
Investment advisory and management fees | | | 296,061 | | | | 1,703,767 | | | | 1,522,194 | | | | 1,641,613 | |
Administrative service fee | | | 24,381 | | | | 178,098 | | | | 426,214 | | | | 201,826 | |
Shareholder services fee | | | 87,077 | | | | 636,064 | | | | 1,522,194 | | | | 720,806 | |
Transfer agent fees and expenses | | | 1,912 | | | | 1,672 | | | | 1,735 | | | | 3,364 | |
Registration fees | | | 641 | | | | 641 | | | | – | | | | 641 | |
Custodian and accounting fees | | | 28,225 | | | | 67,129 | | | | 118,099 | | | | 167,930 | |
Reports to shareholders | | | 16,580 | | | | 94,504 | | | | 220,904 | | | | 107,210 | |
Audit and tax fees | | | 31,171 | | | | 32,461 | | | | 32,472 | | | | 33,302 | |
Legal fees | | | 17,096 | | | | 36,485 | | | | 68,599 | | | | 42,280 | |
Trustees’ fees and expenses | | | 9,875 | | | | 73,776 | | | | 256,961 | | | | 96,322 | |
Interest expense | | | 10 | | | | – | | | | – | | | | – | |
Interest expense on securities sold short | | | – | | | | – | | | | – | | | | – | |
Other expenses | | | 5,711 | | | | 8,929 | | | | 25,009 | | | | 10,371 | |
| | |
|
|
| |
|
|
| |
|
|
| |
|
|
|
Total expenses before fee waivers, expense reimbursements, and fees paid indirectly | | | 518,740 | | | | 2,833,526 | | | | 4,194,381 | | | | 3,025,665 | |
| | |
|
|
| |
|
|
| |
|
|
| |
|
|
|
Fees waived and expenses reimbursed by investment advisor (Note 3) | | | (114,705 | ) | | | (416,481 | ) | | | (784,666 | ) | | | (459,595 | ) |
Fees paid indirectly (Note 7) | | | (4,066 | ) | | | (8,037 | ) | | | (110,252 | ) | | | – | |
| | |
|
|
| |
|
|
| |
|
|
| |
|
|
|
Net expenses | | | 399,969 | | | | 2,409,008 | | | | 3,299,463 | | | | 2,566,070 | |
| | |
|
|
| |
|
|
| |
|
|
| |
|
|
|
Net investment income (loss) | | | (303,461 | ) | | | 3,675,071 | | | | 10,999,413 | | | | 20,218,947 | |
| | |
|
|
| |
|
|
| |
|
|
| |
|
|
|
NET REALIZED AND UNREALIZED GAIN (LOSS) ON INVESTMENTS AND FOREIGN CURRENCIES: | | | | | | | | | | | | | | | | |
Net realized gain (loss) on investments (unaffiliated) | | | (10,731,731 | ) | | | (40,726,168 | ) | | | (224,073,945 | ) | | | (36,013,397 | ) |
Net realized gain (loss) on investments (affiliated) | | | – | | | | – | | | | – | | | | – | |
Net realized gain (loss) from capital gain distributions from underlying funds (affiliated) | | | – | | | | – | | | | – | | | | – | |
Net realized gain (loss) on futures contracts | | | – | | | | (2,776,951 | ) | | | (8,574,521 | ) | | | – | |
Net realized gain (loss) on securities sold short | | | – | | | | – | | | | – | | | | – | |
Net realized foreign exchange gain (loss) on other assets and liabilities | | | – | | | | (628 | ) | | | – | | | | 39,195 | |
| | |
|
|
| |
|
|
| |
|
|
| |
|
|
|
Net realized gain (loss) on investments and foreign currencies | | | (10,731,731 | ) | | | (43,503,747 | ) | | | (232,648,466 | ) | | | (35,974,202 | ) |
| | |
|
|
| |
|
|
| |
|
|
| |
|
|
|
Change in unrealized appreciation (depreciation) on investments (unaffiliated) | | | 3,158,863 | | | | (7,027,046 | ) | | | 37,376,624 | | | | 16,436,086 | |
Change in unrealized appreciation (depreciation) on investments (affiliated) | | | – | | | | – | | | | – | | | | – | |
Change in unrealized appreciation (depreciation) on futures contracts | | | – | | | | 239,705 | | | | 3,253,626 | | | | – | |
Change in unrealized foreign exchange gain (loss) on other assets and liabilities | | | – | | | | – | | | | – | | | | 27,499 | |
Change in unrealized appreciation (depreciation) on securities sold short | | | – | | | | – | | | | – | | | | – | |
Change in accrued capital gains tax on unrealized appreciation (depreciation) | | | – | | | | – | | | | – | | | | – | |
| | |
|
|
| |
|
|
| |
|
|
| |
|
|
|
Net unrealized gain (loss) on investments and foreign currencies | | | 3,158,863 | | | | (6,787,341 | ) | | | 40,630,250 | | | | 16,463,585 | |
| | |
|
|
| |
|
|
| |
|
|
| |
|
|
|
Net realized and unrealized gain (loss) on investments and foreign currencies | | | (7,572,868 | ) | | | (50,291,088 | ) | | | (192,018,216 | ) | | | (19,510,617 | ) |
| | |
|
|
| |
|
|
| |
|
|
| |
|
|
|
NET INCREASE (DECREASE) IN NET ASSETS RESULTING FROM OPERATIONS | | $ | (7,876,329 | ) | | $ | (46,616,017 | ) | | $ | (181,018,803 | ) | | $ | 708,330 | |
| | |
|
|
| |
|
|
| |
|
|
| |
|
|
|
* Net of foreign withholding taxes on interest and dividends of | | $ | – | | | $ | 2,495 | | | $ | 1,269 | | | $ | 7,816 | |
| | |
|
|
| |
|
|
| |
|
|
| |
|
|
|
See Notes to Financial Statements
101
VALIC Company II
STATEMENTS OF CHANGES IN NET ASSETS
| | | | | | | | | | | | | | | | | | | | | | | | | | | | | | | | |
| | | AGGRESSIVE GROWTH
LIFESTYLE FUND
| | | CAPITAL
APPRECIATION FUND
| | | CONSERVATIVE GROWTH
LIFESTYLE FUND
| | | CORE BOND FUND
| |
| | | For the
Year Ended
August 31,
2009
| | | For the
Year Ended
August 31,
2008
| | | For the
Year Ended
August 31,
2009
| | | For the
Year Ended
August 31,
2008
| | | For the
Year Ended
August 31,
2009
| | | For the
Year Ended
August 31,
2008
| | | For the
Year Ended
August 31,
2009
| | | For the
Year Ended
August 31,
2008
| |
INCREASE (DECREASE) IN NET ASSETS | | | | | | | | | | | | | | | | | | | | | | | | | | | | | | | | |
OPERATIONS: | | | | | | | | | | | | | | | | | | | | | | | | | | | | | | | | |
Net investment income (loss) | | $ | 1,626,204 | | | $ | 1,912,845 | | | $ | 443,377 | | | $ | 46,275 | | | $ | 1,939,547 | | | $ | 1,428,512 | | | $ | 8,701,792 | | | $ | 11,188,598 | |
Net realized gain (loss) on investments and
foreign currencies | | | (28,254,881 | ) | | | 75,562 | | | | (16,022,420 | ) | | | 547,946 | | | | (11,567,742 | ) | | | (824,429 | ) | | | (6,920,989 | ) | | | (1,112,408 | ) |
Net unrealized gain (loss) on investments and foreign currencies | | | 18,732,132 | | | | (10,620,104 | ) | | | (10,135,724 | ) | | | (6,137,877 | ) | | | 8,830,618 | | | | (3,199,506 | ) | | | 6,557,132 | | | | (4,521,211 | ) |
| | �� |
|
|
| |
|
|
| |
|
|
| |
|
|
| |
|
|
| |
|
|
| |
|
|
| |
|
|
|
Net increase (decrease) in net assets resulting from operations | | | (7,896,545 | ) | | | (8,631,697 | ) | | | (25,714,767 | ) | | | (5,543,656 | ) | | | (797,577 | ) | | | (2,595,423 | ) | | | 8,337,935 | | | | 5,554,979 | |
| | |
|
|
| |
|
|
| |
|
|
| |
|
|
| |
|
|
| |
|
|
| |
|
|
| |
|
|
|
DISTRIBUTIONS TO SHAREHOLDERS FROM: | | | | | | | | | | | | | | | | | | | | | | | | | | | | | | | | |
Net investment income | | | (1,922,321 | ) | | | (1,354,973 | ) | | | (56,733 | ) | | | (293,483 | ) | | | (1,434,347 | ) | | | (750,110 | ) | | | (11,242,372 | ) | | | (7,643,239 | ) |
Net realized gain on securities | | | (16,646,026 | ) | | | (5,384,479 | ) | | | – | | | | – | | | | (936,600 | ) | | | (2,156,674 | ) | | | – | | | | – | |
| | |
|
|
| |
|
|
| |
|
|
| |
|
|
| |
|
|
| |
|
|
| |
|
|
| |
|
|
|
Total distributions to shareholders | | | (18,568,347 | ) | | | (6,739,452 | ) | | | (56,733 | ) | | | (293,483 | ) | | | (2,370,947 | ) | | | (2,906,784 | ) | | | (11,242,372 | ) | | | (7,643,239 | ) |
| | |
|
|
| |
|
|
| |
|
|
| |
|
|
| |
|
|
| |
|
|
| |
|
|
| |
|
|
|
Net increase (decrease) in net assets resulting from
capital share transactions (Note 6) | | | 28,696,809 | | | | 24,614,065 | | | | (15,492,949 | ) | | | 11,342,708 | | | | 2,382,030 | | | | 15,050,507 | | | | (46,176,230 | ) | | | 818,223 | |
| | |
|
|
| |
|
|
| |
|
|
| |
|
|
| |
|
|
| |
|
|
| |
|
|
| |
|
|
|
TOTAL INCREASE (DECREASE) IN NET ASSETS | | | 2,231,917 | | | | 9,242,916 | | | | (41,264,449 | ) | | | 5,505,569 | | | | (786,494 | ) | | | 9,548,300 | | | | (49,080,667 | ) | | | (1,270,037 | ) |
NET ASSETS: | | | | | | | | | | | | | | | | | | | | | | | | | | | | | | | | |
Beginning of period | | | 91,463,892 | | | | 82,220,976 | | | | 89,774,352 | | | | 84,268,783 | | | | 58,445,074 | | | | 48,896,774 | | | | 209,051,869 | | | | 210,321,906 | |
| | |
|
|
| |
|
|
| |
|
|
| |
|
|
| |
|
|
| |
|
|
| |
|
|
| |
|
|
|
End of period† | | $ | 93,695,809 | | | $ | 91,463,892 | | | $ | 48,509,903 | | | $ | 89,774,352 | | | $ | 57,658,580 | | | $ | 58,445,074 | | | $ | 159,971,202 | | | $ | 209,051,869 | |
| | |
|
|
| |
|
|
| |
|
|
| |
|
|
| |
|
|
| |
|
|
| |
|
|
| |
|
|
|
† Includes accumulated undistributed net
investment income (loss) of | | $ | 1,563,756 | | | $ | 1,859,873 | | | $ | 378,294 | | | $ | (8,350 | ) | | $ | 1,881,837 | | | $ | 1,376,637 | | | $ | 8,644,148 | | | $ | 11,099,829 | |
| | |
|
|
| |
|
|
| |
|
|
| |
|
|
| |
|
|
| |
|
|
| |
|
|
| |
|
|
|
See Notes to Financial Statements
102
VALIC Company II
STATEMENTS OF CHANGES IN NET ASSETS — (continued)
| | | | | | | | | | | | | | | | | | | | | | | | | | | | | | | | |
| | | HIGH YIELD BOND FUND
| | | INTERNATIONAL
SMALL CAP EQUITY FUND
| | | LARGE CAP VALUE FUND
| | | MID CAP GROWTH FUND
| |
| | | For the
Year Ended
August 31,
2009
| | | For the
Year Ended
August 31,
2008
| | | For the
Year Ended
August 31,
2009
| | | For the
Year Ended
August 31,
2008
| | | For the
Year Ended
August 31,
2009
| | | For the
Year Ended
August 31,
2008
| | | For the
Year Ended
August 31,
2009
| | | For the
Year Ended
August 31,
2008
| |
INCREASE (DECREASE) IN NET ASSETS | | | | | | | | | | | | | | | | | | | | | | | | | | | | | | | | |
OPERATIONS: | | | | | | | | | | | | | | | | | | | | | | | | | | | | | | | | |
Net investment income (loss) | | $ | 18,036,157 | | | $ | 17,238,531 | | | $ | 8,347,935 | | | $ | 6,889,118 | | | $ | 2,786,979 | | | $ | 5,254,969 | | | $ | (328,925 | ) | | $ | (390,941 | ) |
Net realized gain (loss) on investments and foreign currencies | | | (41,463,781 | ) | | | (5,786,953 | ) | | | (238,697,487 | ) | | | (26,585,391 | ) | | | (93,421,179 | ) | | | (37,948,519 | ) | | | (55,323,978 | ) | | | (12,874,328 | ) |
Net unrealized gain (loss) on investments and foreign currencies | | | 10,085,121 | | | | (15,325,877 | ) | | | 121,474,799 | | | | (125,664,932 | ) | | | 20,093,536 | | | | (29,832,747 | ) | | | 8,449,095 | | | | (696,457 | ) |
| | |
|
|
| |
|
|
| |
|
|
| |
|
|
| |
|
|
| |
|
|
| |
|
|
| |
|
|
|
Net increase (decrease) in net assets resulting from operations | | | (13,342,503 | ) | | | (3,874,299 | ) | | | (108,874,753 | ) | | | (145,361,205 | ) | | | (70,540,664 | ) | | | (62,526,297 | ) | | | (47,203,808 | ) | | | (13,961,726 | ) |
| | |
|
|
| |
|
|
| |
|
|
| |
|
|
| |
|
|
| |
|
|
| |
|
|
| |
|
|
|
DISTRIBUTIONS TO SHAREHOLDERS FROM: | | | | | | | | | | | | | | | | | | | | | | | | | | | | | | | | |
Net investment income | | | (16,902,354 | ) | | | (11,547,138 | ) | | | (7,222,320 | ) | | | (4,197,999 | ) | | | (5,298,743 | ) | | | (4,004,916 | ) | | | – | | | | – | |
Net realized gain on securities | | | – | | | | (418,421 | ) | | | (37,148,329 | ) | | | (64,539,195 | ) | | | – | | | | (21,726,382 | ) | | | (869,715 | ) | | | (9,204,742 | ) |
| | |
|
|
| |
|
|
| |
|
|
| |
|
|
| |
|
|
| |
|
|
| |
|
|
| |
|
|
|
Total distributions to shareholders | | | (16,902,354 | ) | | | (11,965,559 | ) | | | (44,370,649 | ) | | | (68,737,194 | ) | | | (5,298,743 | ) | | | (25,731,298 | ) | | | (869,715 | ) | | | (9,204,742 | ) |
| | |
|
|
| |
|
|
| |
|
|
| |
|
|
| |
|
|
| |
|
|
| |
|
|
| |
|
|
|
Net increase (decrease) in net assets resulting from capital share transactions (Note 6) | | | 14,778,758 | | | | 29,425,377 | | | | 89,619,614 | | | | 104,605,997 | | | | (75,085,149 | ) | | | (21,614,897 | ) | | | (7,285,965 | ) | | | 152,602,228 | |
| | |
|
|
| |
|
|
| |
|
|
| |
|
|
| |
|
|
| |
|
|
| |
|
|
| |
|
|
|
TOTAL INCREASE (DECREASE) IN NET ASSETS | | | (15,466,099 | ) | | | 13,585,519 | | | | (63,625,788 | ) | | | (109,492,402 | ) | | | (150,924,556 | ) | | | (109,872,492 | ) | | | (55,359,488 | ) | | | 129,435,760 | |
NET ASSETS: | | | | | | | | | | | | | | | | | | | | | | | | | | | | | | | | |
Beginning of period | | | 206,712,108 | | | | 193,126,589 | | | | 626,351,120 | | | | 735,843,522 | | | | 308,635,365 | | | | 418,507,857 | | | | 214,200,526 | | | | 84,764,766 | |
| | |
|
|
| |
|
|
| |
|
|
| |
|
|
| |
|
|
| |
|
|
| |
|
|
| |
|
|
|
End of period† | | $ | 191,246,009 | | | $ | 206,712,108 | | | $ | 562,725,332 | | | $ | 626,351,120 | | | $ | 157,710,809 | | | $ | 308,635,365 | | | $ | 158,841,038 | | | $ | 214,200,526 | |
| | |
|
|
| |
|
|
| |
|
|
| |
|
|
| |
|
|
| |
|
|
| |
|
|
| |
|
|
|
† Includes accumulated undistributed net
investment income (loss) of | | $ | 17,716,611 | | | $ | 16,579,000 | | | $ | 6,587,486 | | | $ | 7,041,614 | | | $ | 2,644,385 | | | $ | 5,158,193 | | | $ | (123,818 | ) | | $ | (77,308 | ) |
| | |
|
|
| |
|
|
| |
|
|
| |
|
|
| |
|
|
| |
|
|
| |
|
|
| |
|
|
|
See Notes to Financial Statements
103
VALIC Company II
STATEMENTS OF CHANGES IN NET ASSETS — (continued)
| | | | | | | | | | | | | | | | | | | | | | | | | | | | | | | | |
| | | MID CAP VALUE FUND
| | | MODERATE GROWTH
LIFESTYLE FUND
| | | MONEY MARKET II FUND
| | | SMALL CAP GROWTH FUND
| |
| | | For the
Year Ended
August 31,
2009
| | | For the
Year Ended
August 31,
2008
| | | For the
Year Ended
August 31,
2009
| | | For the
Year Ended
August 31,
2008
| | | For the
Year Ended
August 31,
2009
| | | For the
Year Ended
August 31,
2008
| | | For the
Year Ended
August 31,
2009
| | | For the
Year Ended
August 31,
2008
| |
INCREASE (DECREASE) IN NET ASSETS | | | | | | | | | | | | | | | | | | | | | | | | | | | | | | | | |
OPERATIONS: | | | | | | | | | | | | | | | | | | | | | | | | | | | | | | | | |
Net investment income (loss) | | $ | 4,985,357 | | | $ | 2,357,782 | | | $ | 3,392,468 | | | $ | 3,290,471 | | | $ | 2,812,658 | | | $ | 10,308,158 | | | $ | (303,461 | ) | | $ | (385,324 | ) |
Net realized gain (loss) on investments and foreign currencies | | | (133,818,351 | ) | | | (15,953,974 | ) | | | (39,633,255 | ) | | | (427,885 | ) | | | 122,315 | | | | (710,001 | ) | | | (10,731,731 | ) | | | (958,492 | ) |
Net unrealized gain (loss) on investments and
foreign currencies | | | 31,672,785 | | | | (74,783,922 | ) | | | 28,745,258 | | | | (12,546,586 | ) | | | – | | | | – | | | | 3,158,863 | | | | (8,131,161 | ) |
| | |
|
|
| |
|
|
| |
|
|
| |
|
|
| |
|
|
| |
|
|
| |
|
|
| |
|
|
|
Net increase (decrease) in net assets resulting from operations | | | (97,160,209 | ) | | | (88,380,114 | ) | | | (7,495,529 | ) | | | (9,684,000 | ) | | | 2,934,973 | | | | 9,598,157 | | | | (7,876,329 | ) | | | (9,474,977 | ) |
| | |
|
|
| |
|
|
| |
|
|
| |
|
|
| |
|
|
| |
|
|
| |
|
|
| |
|
|
|
DISTRIBUTIONS TO SHAREHOLDERS FROM: | | | | | | | | | | | | | | | | | | | | | | | | | | | | | | | | |
Net investment income | | | (2,455,687 | ) | | | (2,292,818 | ) | | | (3,304,776 | ) | | | (1,727,644 | ) | | | (2,812,871 | ) | | | (10,307,945 | ) | | | – | | | | – | |
Net realized gain on securities | | | (10,286,997 | ) | | | (41,513,324 | ) | | | (3,892,788 | ) | | | (6,928,952 | ) | | | – | | | | – | | | | (493,157 | ) | | | (3,340,790 | ) |
| | |
|
|
| |
|
|
| |
|
|
| |
|
|
| |
|
|
| |
|
|
| |
|
|
| |
|
|
|
Total distributions to shareholders | | | (12,742,684 | ) | | | (43,806,142 | ) | | | (7,197,564 | ) | | | (8,656,596 | ) | | | (2,812,871 | ) | | | (10,307,945 | ) | | | (493,157 | ) | | | (3,340,790 | ) |
| | |
|
|
| |
|
|
| |
|
|
| |
|
|
| |
|
|
| |
|
|
| |
|
|
| |
|
|
|
Net increase (decrease) in net assets resulting from capital share transactions (Note 6) | | | (29,789,926 | ) | | | 225,217,503 | | | | 10,774,203 | | | | 41,494,524 | | | | (76,092,412 | ) | | | (7,127,812 | ) | | | 2,618,493 | | | | 4,198,513 | |
| | |
|
|
| |
|
|
| |
|
|
| |
|
|
| |
|
|
| |
|
|
| |
|
|
| |
|
|
|
TOTAL INCREASE (DECREASE) IN NET ASSETS | | | (139,692,819 | ) | | | 93,031,247 | | | | (3,918,890 | ) | | | 23,153,928 | | | | (75,970,310 | ) | | | (7,837,600 | ) | | | (5,750,993 | ) | | | (8,617,254 | ) |
NET ASSETS: | | | | | | | | | | | | | | | | | | | | | | | | | | | | | | | | |
Beginning of period | | | 618,150,058 | | | | 525,118,811 | | | | 145,705,217 | | | | 122,551,289 | | | | 329,212,152 | | | | 337,049,752 | | | | 48,060,897 | | | | 56,678,151 | |
| | |
|
|
| |
|
|
| |
|
|
| |
|
|
| |
|
|
| |
|
|
| |
|
|
| |
|
|
|
End of period† | | $ | 478,457,239 | | | $ | 618,150,058 | | | $ | 141,786,327 | | | $ | 145,705,217 | | | $ | 253,241,842 | | | $ | 329,212,152 | | | $ | 42,309,904 | | | $ | 48,060,897 | |
| | |
|
|
| |
|
|
| |
|
|
| |
|
|
| |
|
|
| |
|
|
| |
|
|
| |
|
|
|
† Includes accumulated undistributed net
investment income (loss) of | | $ | 4,668,055 | | | $ | 2,133,327 | | | $ | 3,282,609 | | | $ | 3,194,917 | | | $ | 26,499 | | | $ | 2,935 | | | $ | (70,938 | ) | | $ | (68,219 | ) |
| | |
|
|
| |
|
|
| |
|
|
| |
|
|
| |
|
|
| |
|
|
| |
|
|
| |
|
|
|
See Notes to Financial Statements
104
VALIC Company II
STATEMENTS OF CHANGES IN NET ASSETS — (continued)
| | | | | | | | | | | | | | | | | | | | | | | | |
| | | SMALL CAP VALUE FUND
| | | SOCIALLY RESPONSIBLE FUND
| | | STRATEGIC BOND FUND
| |
| | | For the
Year Ended
August 31,
2009
| | | For the
Year Ended
August 31,
2008
| | | For the
Year Ended
August 31,
2009
| | | For the
Year Ended
August 31,
2008
| | | For the
Year Ended
August 31,
2009
| | | For the
Year Ended
August 31,
2008
| |
INCREASE (DECREASE) IN NET ASSETS | | | | | | | | | | | | | | | | | | | | | | | | |
OPERATIONS: | | | | | | | | | | | | | | | | | | | | | | | | |
Net investment income (loss) | | $ | 3,675,071 | | | $ | 2,737,636 | | | $ | 10,999,413 | | | $ | 14,048,666 | | | $ | 20,218,947 | | | $ | 18,937,658 | |
Net realized gain (loss) on investments and foreign currencies | | | (43,503,747 | ) | | | 13,451,096 | | | | (232,648,466 | ) | | | (80,483,327 | ) | | | (35,974,202 | ) | | | 1,321,006 | |
Net unrealized gain (loss) on investments and foreign currencies | | | (6,787,341 | ) | | | (27,447,509 | ) | | | 40,630,250 | | | | (37,068,935 | ) | | | 16,463,585 | | | | (11,583,267 | ) |
| | |
|
|
| |
|
|
| |
|
|
| |
|
|
| |
|
|
| |
|
|
|
Net Increase (decrease) in net assets resulting from operations | | | (46,616,017 | ) | | | (11,258,777 | ) | | | (181,018,803 | ) | | | (103,503,596 | ) | | | 708,330 | | | | 8,675,397 | |
| | |
|
|
| |
|
|
| |
|
|
| |
|
|
| |
|
|
| |
|
|
|
DISTRIBUTIONS TO SHAREHOLDERS FROM: | | | | | | | | | | | | | | | | | | | | | | | | |
Net investment income | | | (2,764,873 | ) | | | (1,520,081 | ) | | | (14,145,313 | ) | | | (9,110,635 | ) | | | (24,084,315 | ) | | | (13,699,386 | ) |
Net realized gain on securities | | | (14,835,780 | ) | | | (11,979,931 | ) | | | (2,733,593 | ) | | | (53,348,629 | ) | | | – | | | | (2,092,167 | ) |
| | |
|
|
| |
|
|
| |
|
|
| |
|
|
| |
|
|
| |
|
|
|
Total distributions to shareholders | | | (17,600,653 | ) | | | (13,500,012 | ) | | | (16,878,906 | ) | | | (62,459,264 | ) | | | (24,084,315 | ) | | | (15,791,553 | ) |
| | |
|
|
| |
|
|
| |
|
|
| |
|
|
| |
|
|
| |
|
|
|
Net increase (decrease) in net assets resulting from capital share transactions
(Note 6) | | | 103,411,217 | | | | 71,411,193 | | | | (58,962,191 | ) | | | 153,048,571 | | | | 19,978,350 | | | | 70,284,184 | |
| | |
|
|
| |
|
|
| |
|
|
| |
|
|
| |
|
|
| |
|
|
|
TOTAL INCREASE (DECREASE) IN NET ASSETS | | | 39,194,547 | | | | 46,652,404 | | | | (256,859,900 | ) | | | (12,914,289 | ) | | | (3,397,635 | ) | | | 63,168,028 | |
NET ASSETS: | | | | | | | | | | | | | | | | | | | | | | | | |
Beginning of period | | $ | 306,356,857 | | | | 259,704,453 | | | $ | 912,992,084 | | | | 925,906,373 | | | $ | 354,895,457 | | | | 291,727,429 | |
| | |
|
|
| |
|
|
| |
|
|
| |
|
|
| |
|
|
| |
|
|
|
End of period† | | $ | 345,551,404 | | | $ | 306,356,857 | | | $ | 656,132,184 | | | $ | 912,992,084 | | | $ | 351,497,822 | | | $ | 354,895,457 | |
| | |
|
|
| |
|
|
| |
|
|
| |
|
|
| |
|
|
| |
|
|
|
† Includes accumulated undistributed net investment income (loss) of | | $ | 3,540,183 | | | $ | 2,635,052 | | | $ | 10,826,622 | | | $ | 13,972,523 | | | $ | 17,992,786 | | | $ | 23,731,037 | |
| | |
|
|
| |
|
|
| |
|
|
| |
|
|
| |
|
|
| |
|
|
|
See Notes to Financial Statements
105
VALIC Company II
NOTES TO FINANCIAL STATEMENTS
Note 1 — Organization
VALIC Company II, formerly known as AIG Retirement Company II, (“VC II”) was organized as a Delaware business trust on May 6, 1998, by The Variable Annuity Life Insurance Company (“VALIC” or the “Adviser”). VALIC, the investment adviser to VC II, is an indirect wholly-owned subsidiary of American International Group, Inc. (“AIG”). VC II is registered under the Investment Company Act of 1940, as amended (the “1940 Act”), as an open-end, management investment company. VC II consists of 15 separate mutual funds (collectively the “Funds” or each a “Fund”), each of which issues its own class of shares of beneficial interest:
| | |
| Aggressive Growth Lifestyle Fund* | | Mid Cap Value Fund |
| Capital Appreciation Fund | | Moderate Growth Lifestyle Fund* |
| Conservative Growth Lifestyle Fund* | | Money Market II Fund |
| Core Bond Fund | | Small Cap Growth Fund |
| High Yield Bond Fund | | Small Cap Value Fund |
| International Small Cap Equity Fund | | Socially Responsible Fund |
| Large Cap Value Fund | | Strategic Bond Fund |
| Mid Cap Growth Fund | | |
| * | The Lifestyle Funds represent “Fund of Funds” which invest in either the VALIC Company I (“VC I”) or VC II Mutual Funds. |
Each Fund is diversified with the exception of Aggressive Growth Lifestyle Fund, Conservative Growth Lifestyle Fund and Moderate Growth Lifestyle Fund, which are non-diversified as defined by the 1940 Act.
Indemnifications. Under the Funds organizational documents, its officers and trustees are indemnified against certain liabilities arising out of the performance of their duties to the Funds. In addition, in the normal course of business the Funds enter into contracts that contain the obligation to indemnify others. The Funds maximum exposure under these arrangements is unknown. Currently, however, the Funds expect the risk of loss to be remote.
Note 2 — Significant Accounting Policies
The preparation of financial statements in accordance with U.S. generally accepted accounting principles (“GAAP”) requires management to make estimates and assumptions that affect the reported amounts and disclosures in the financial statements. Actual results could differ from these estimates. The following is a summary of the significant accounting policies followed by the Funds in the preparation of their financial statements:
A. Security Valuation
Stocks are generally valued based upon closing sales prices reported on recognized securities exchanges. Stocks listed on the NASDAQ are valued using the NASDAQ Official Closing Price (“NOCP”). Generally, the NOCP will be the last sale price unless the reported trade for the stock is outside the range of the bid/ask price. In such cases, the NOCP will be normalized to the nearer of the bid or ask price. For listed securities having no sales reported and for unlisted securities, such securities will be valued based upon the last reported bid price.
As of the close of regular trading on the New York Stock Exchange, securities traded primarily on security exchanges outside the United States are valued at the last sale price on such exchanges on the day of valuation, or if there is no sale on the day of valuation, at the last-reported bid price. If a security’s price is available from more than one exchange, the Fund uses the exchange that is the primary market for the security. However, depending on the foreign market, closing prices may be up to 15 hours old when they are used to price the Fund’s shares, and the Fund may determine that certain closing prices do not reflect the fair value of securities. This determination will be based on review of a number of factors, including developments in foreign markets, the performance of U.S. securities markets, and the performance of instruments trading in U. S. markets that represent foreign securities and baskets of foreign securities. If the Fund determines that closing prices do not reflect the fair value of the securities, the Fund will adjust the previous closing prices in accordance with pricing procedures approved by the Board to reflect what it believes to be the fair value of the securities as of the close of regular trading on the New York Stock Exchange. The Fund may also fair value securities in other situations, for example, when a particular foreign market is closed but the Fund is open. For foreign equity securities, the Fund uses an outside pricing service to provide it with closing market prices and information used for adjusting those prices.
Non-convertible bonds and debentures, other long-term debt securities, and short term debt securities with maturities in excess of 60 days, are valued at bid prices obtained for the day of valuation from a bond pricing service, when such prices are available. If a vendor quote is unavailable the securities may be priced at the mean of two independent quotes obtained from brokers.
Short-term securities with 60 days or less to maturity are amortized to maturity based on their cost to the Fund if acquired within 60 days of maturity or, if already held by the Fund on the 60th day, are amortized to maturity based on the value determined on the 61st day.
Futures contracts and options traded on national securities exchanges are valued as of the close of the exchange upon which they trade. Forward contracts are valued at the 4:00 p.m. eastern time forward rate. Other securities are valued on the basis of last sale or bid price (if a last sale price is not available) in what is, in the opinion of the Adviser, the broadest and most representative market, that may be either a securities exchange or the over-the-counter market. Investments in open-end and closed-end registered investment companies that do not trade on an exchange are valued at the end of day net asset value per share.
Investments in open-end and closed-end registered investment companies that trade on an exchange are valued at the last sales price or official closing price as of the close of the customary trading session on the exchange where the security is principally traded. Senior Secured Floating Rate Loans (“Loans”) for which an active secondary market exists to a reliable degree, will be valued at the mean of the last available bid and ask prices in the market for such Loans, as provided by a third party pricing service.
106
VALIC Company II
NOTES TO FINANCIAL STATEMENTS — (continued)
For the Money Market II Fund, securities are valued at amortized cost, which approximates market value. The amortized cost method involves valuing a security at its cost on the date of purchase and thereafter assuming a constant amortization to maturity of any discount or premium. In accordance with rule 2a-7 under the 1940 Act, the Trust’s Board of Trustees (the “Board” or the “Trustees”) has adopted procedures intended to stabilize the Money Market II Fund’s net asset value per share at $1.00. These procedures include the determination, at such intervals as the Board deems appropriate and reasonable in light of current market conditions, of the extent, if any, to which the Money Market II Fund’s market-based net asset value per share deviates from the Fund’s amortized cost per share. The calculation of such deviation is referred to as “shadow pricing.” For purposes of these market-based valuations, securities for which market quotations are not readily available are fair valued, as determined pursuant to procedures adopted in good faith by the Board.
Securities for which market quotations are not readily available or if a development/significant event occurs that may significantly impact the value of the security, then these securities are valued, as determined pursuant to procedures adopted in good faith by the Board. There is no single standard for making fair value determinations, which may result in prices that vary from those of other funds.
The various inputs that may be used to determine the value of the Funds’ investments are summarized into three broad levels listed below:
Level 1 — Unadjusted quoted prices in active markets for identical securities
Level 2 — Other significant observable inputs (including quoted prices for similar securities, interest rates, prepayment speeds, credit risk, quoted prices in inactive markets, etc.)
Level 3 — Significant unobservable inputs (includes inputs that reflect the Funds’ own assumptions about the assumptions market participants would use in pricing the security, developed based on the best information available under the circumstances)
The inputs or methodology used for valuing securities are not necessarily an indication of the risk associated with investing in those securities.
The summary of the inputs used to value the Funds’ net assets as of August 31, 2009 are reported on a schedule following the Portfolio of Investments.
B. Derivative Instruments
The following tables present the value of derivatives held as of August 31, 2009, by their primary underlying risk exposure and respective location on the Statement of Assets and Liabilities and the effect of derivatives on the Statement of Operations for the six month period ending August 31, 2009:
| | | | | | | | |
| |
| | | Small Cap Value Fund
|
| | | Asset Derivatives 2009
| | Liability Derivatives 2009
|
Derivative Contracts(1)
| | Statements of Assets and Liabilities Location
| | Fair Value
| | Statements of Assets and Liabilities Location
| | Fair Value
|
Equity contracts | | | | | | Variation margin on futures contracts | | $137,640 |
| | | | | | | | |
|
| | | | | | | | |
| | | |
Derivative Contracts(1)
| | Location of Gain (Loss) on
Derivatives Recognized in Statement of Operations
| | Realized Gain
(Loss) on
Derivatives
Recognized in
Statement of
Operations
| | Change in
Unrealized
Appreciation
(Depreciation) on
Derivatives
Recognized in
Statement of
Operations
|
Equity contracts(2) | | Net realized gain (loss) on futures/Change in unrealized appreciation (depreciation) on futures contracts | | $ | 2,167,156 | | $ | 1,064,871 |
| | | | |
|
| |
|
|
| | | | | | | | | |
| |
| | | Socially Responsible Fund
|
| | | Asset Derivatives 2009
| | Liability Derivatives 2009
|
Derivative Contracts(1)
| | Statements of Assets and Liabilities Location
| | Fair Value
| | Statements of Assets and Liabilities Location
| | Fair Value
|
Equity contracts | | | | | | Variation margin on futures contracts | | $ | 236,775 |
| | | | | | | | |
|
|
| | | | | | | | |
| | | |
Derivative Contracts(1)
| | Location of Gain (Loss) on
Derivatives Recognized in Statement of Operations
| | Realized Gain
(Loss) on
Derivatives
Recognized in
Statement of
Operations
| | Change in
Unrealized
Appreciation
(Depreciation) on
Derivatives
Recognized in
Statement of
Operations
|
Equity contracts(3) | | Net realized gain (loss) on futures/Change in unrealized appreciation (depreciation) on futures contracts | | $ | 3,204,635 | | $ | 8,023,203 |
| | | | |
|
| |
|
|
| (1) | The Fund’s derivative contracts held during the six months ended August 31, 2009, are not accounted for as hedging instruments under accounting principles generally accepted in the United States of America. |
| (2) | The average notional par amount outstanding of futures contracts was $33,533 |
| (3) | The average notional par amount outstanding of futures contracts was $70,375 |
107
VALIC Company II
NOTES TO FINANCIAL STATEMENTS — (continued)
Forward Foreign Currency Contracts. Certain Funds may enter into forward foreign currency contracts (“forward contracts”) for various purposes, including to facilitate settlement of foreign currency denominated Fund transactions, to attempt to protect securities and related receivables and payables against changes in future foreign exchange rates or to enhance return. As of August 31, 2009, none of the Funds had open forward contracts which are reported on a schedule following each Fund’s Portfolio of Investments.
A forward contract is an agreement between two parties to buy or sell currency at a set price on a future date. The market value of the contract will fluctuate with changes in currency exchange rates. The contract is marked-to-market daily using the forward rate and the change in market value is recorded by the Fund as unrealized gain or loss on the Statement of Assets and Liabilities. On the settlement date, the Fund records either realized gains or losses equal to the difference between the value of the contract at the time it was opened and the value at the time it was closed.
Risks to the Funds of entering into forward contracts include credit risk and market risk. Credit risk arises upon entering into these contracts from the potential inability of counterparties to meet the terms of their contracts. If the counterparty defaults, the Fund’s loss will generally consist of the net amount of contractual payments that the Fund has not yet received though the Fund’s maximum risk due to counterparty credit risk could extend to the notional amount of the contract. Market risk is the risk that the value of the forward contract will depreciate due to unfavorable changes in the exchange rates. These contracts may involve market risk in excess of the unrealized gain or loss reflected on the Statement of Assets and Liabilities. Currency transactions are also subject to risks different from those of other Fund transactions. Because currency control is of great importance to the issuing governments and influences economic planning and policy, purchases and sales of currency and related instruments can be adversely affected by government exchange controls, limitations or restrictions on repatriation of currency, and manipulations or exchange restrictions imposed by governments.
Futures Contracts. Certain of the Funds may enter into futures contracts for various purposes, including to increase or decrease exposure to equity or bond markets, or to hedge against changes in interest rates, prices of stocks, bonds or other instruments, or currency rates, or to enhance income or total return. As of August 31, 2009, the following Funds had open futures contracts: Small Value Fund and Socially Responsible Fund, which are reported on a schedule following each Fund’s Portfolio of Investments.
A futures contract is an agreement between two parties to buy and sell a financial instrument at a set price on a future date. Upon entering into a futures transaction, a Fund will be required to segregate an initial margin payment of cash or other liquid securities with the Futures Commission Merchant (the “broker”). Common futures contracts include interest rate futures, single stock futures, stock index futures and currency futures. An interest rate futures contract is a contract to buy or sell specified debt securities at a future time for a fixed price. A single stock futures contract is a contract to buy a single stock at a future time for a fixed price. A stock index futures contract is similar in economic effect to a single stock futures contract, except that rather than being based on a specific security it is based on a specified index of stocks and not the stocks themselves. A currency futures contract is a contract to buy or sell a specific foreign currency at a future time for a fixed price.
A Fund’s participation in the futures markets involves certain risks, including imperfect correlation between movements in the price of futures contracts and movements in the price of the securities hedged or used for cover. Pursuant to a contract, the Funds agree to receive from or pay to the broker an amount of cash equal to the daily fluctuation in value of the contract. Such receipts or payments are known as “variation margin” and are recorded by the Funds as unrealized appreciation or depreciation on the Statement of Assets and Liabilities. When a contract is closed, the Funds record a realized gain or loss equal to the difference between the value of the contract at the time it was opened and the value at the time it was closed. Futures contracts are generally conducted through regulated exchanges, which minimize counterparty credit risks.
The primary risk to the Funds of entering into futures contracts is market risk. Market risk is the risk that there will be an unfavorable change in the interest rate, value or currency rate of the underlying security(ies). Futures contracts involve, to varying degrees, risk of loss in excess of the variation margin disclosed on the Statement of Assets and Liabilities.
Swap Contracts. Certain Funds may enter into credit default, interest rate, equity and/or total return swap contracts. Generally, a swap contract is a privately negotiated agreement between a Fund and a counterparty to exchange or swap investment cash flows, assets, foreign currencies or market-linked returns at specified, future intervals. Swap contracts are either marked-to-market daily based upon quotations from market makers or are calculated using standard models and current market data. Any change, in market value is recorded as an unrealized gain or loss. In connection with these contracts, securities or cash may be identified as collateral in accordance with the terms of the respective swap contract to provide assets of value and recourse in the event of default or bankruptcy/insolvency. The Funds amortize upfront payments and receipts on the swap contracts on a daily basis. A liquidation payment received or made at the termination of the swap is recorded as realized gain or loss. Net periodic payments made or received by the Funds are included as part of realized gain (loss).
Credit Default Swap Agreements. Certain Funds may enter into credit default swap agreements (“credit default swaps”) for various purposes, including managing credit risk (i.e., hedging), enhancing returns or speculation. As of August 31, 2009, none of the Funds had open credit default swaps.
Credit default swaps are bilateral contracts in which one party makes periodic fixed-rate payments or a one time premium payment (referred to as the buyer of protection) to another party (the seller of protection) in exchange for the right to receive a specified payment in the event of a default or other credit event for the referenced entity, obligation or index. As a seller of protection on credit default swaps, a Fund will generally receive from the buyer of protection a fixed rate of income throughout the term of the swap provided that there is no credit event. As the seller, a Fund would effectively add leverage to its portfolio because, in addition to its total net assets, a Fund would be subject to investment exposure on the notional amount of the swap.
If a Fund is a seller of protection and a credit event occurs, as defined under the terms of that particular swap agreement, a Fund will either (i) pay to the buyer of protection an amount equal to the notional amount of the swap and take delivery of the referenced obligation, other deliverable obligations or underlying securities comprising the referenced index or (ii) pay a net settlement amount in the form of cash or securities equal to the notional amount of the swap less the recovery value of the referenced obligation or underlying securities comprising the referenced index.
As a buyer of protection on credit default swaps, a Fund will make periodic payments, similar to an insurance premium, the seller of protection agrees to compensate the Fund for future potential losses as a result of a credit event on the reference bond or other asset. The Fund effectively transfers the credit event risk of the reference bond or asset from it to the seller of protection.
108
VALIC Company II
NOTES TO FINANCIAL STATEMENTS — (continued)
If a Fund is a buyer of protection and a credit event occurs, as defined under the terms of that particular swap agreement, a Fund will either (i) receive from the seller of protection an amount equal to the notional amount of the swap and deliver the referenced obligation, other deliverable obligations or underlying securities comprising the referenced index or (ii) receive a net settlement amount in the form of cash or securities equal to the notional amount of the swap less the recovery value of the referenced obligation or underlying securities comprising the referenced index. Recovery values are assumed by market makers considering either industry standard recovery rates or entity specific factors and considerations until a credit event occurs. If a credit event has occurred, the recovery value is determined by a facilitated auction whereby a minimum number of allowable broker bids, together with a specified valuation method, are used to calculate the settlement value.
Credit default swaps on corporate issues or sovereign issues of an emerging country are bilateral contracts in which the buyer of protection makes periodic fixed payments or a one time premium payment to the seller of protection in exchange for the right to receive a specified payment in the event of a default or other credit event. If a credit event occurs and cash settlement is not elected, a variety of other deliverable obligations may be delivered in lieu of the specific referenced obligation. The ability to deliver other obligations may result in a cheapest-to-deliver option (the buyer of protection’s right to choose the deliverable obligation with the lowest value following a credit event). A Fund may use credit default swaps on corporate issues or sovereign issues of an emerging country to provide a measure of protection against defaults of the issuers (i.e., to reduce credit risk where a Fund owns or has exposure to the referenced obligation) or to take a speculative credit position with an active long or short position with respect to the likelihood of a particular issuer’s default.
Credit default swaps on asset-backed securities are bilateral contracts in which the buyer of protection makes periodic fixed-rate payments or a one time premium payment to the seller of protection in exchange for the right to receive a specified payment in the event of a default or other credit event. Unlike credit default swaps on corporate issues or sovereign issues of an emerging country, deliverable obligations in most instances would be limited to the specific referenced obligation as performance for asset-backed securities can vary across deals. Prepayments, principal paydowns, and other writedown or loss events on the underlying mortgage loans will reduce the outstanding principal balance of the referenced obligation. These reductions may be temporary or permanent as defined under the terms of the swap agreement and the notional amount for the swap agreement will be adjusted by corresponding amounts. A Fund may use credit default swaps on asset-backed securities to provide a measure of protection against defaults of the referenced obligation or to take a speculative credit position with an active long or short position with respect to the likelihood of a particular referenced obligation’s default.
Credit default swaps on credit indices are bilateral contracts in which the buyer of protection makes periodic fixed-rate payments or a one time premium payment to the seller of protection in exchange for the right to receive a specified payment in the event of a write-down, principal shortfall, interest shortfall or default of all or part of the referenced entities comprising the credit index. A credit index is a list of a basket of credit instruments or exposures designed to be representative of some part of the credit market as a whole. These indices are made up of reference credits that are judged by a poll of dealers to be the most liquid entities in the credit default swap market based on the sector of the index. Components of the indices may include, but are not limited to, investment grade securities, high yield securities, assetbacked securities, emerging markets, and/or various credit ratings within each sector. Credit indices are traded using credit default swaps with standardized terms including a fixed spread and standard maturity dates. An index credit default swap references all the names in the index, and if there is a default, the credit event is settled based on that name’s weight in the index. The composition of the indices changes periodically, usually every six months, and for most indices, each name has an equal weight in the index. A Fund may use credit default swaps on credit indices to hedge a portfolio of credit default swaps or bonds which is less expensive than it would be to enter into many credit default swaps to achieve a similar effect. Credit-default swaps on indices are used for protecting investors owning bonds against default, and also to speculate on changes in credit quality.
Implied credit spreads, represented in absolute terms, utilized in determining the market value of credit default swaps on corporate issues or sovereign issues of an emerging country as of period end are disclosed in the footnotes to the Schedules of Investments and serve as an indicator of the current status of the payment/performance risk and represent the likelihood or risk of default for the credit derivative. The implied credit spread of a particular referenced entity reflects the cost of buying/selling protection and may include upfront payments required to be made to enter into the agreement. For credit default swaps on asset-based securities and credit indices, the quoted market prices and resulting values serve as the indicator of the current status of the payment/performance risk. Wider credit spreads and increasing market values, in absolute terms when compared to the notional amount of the swap, represent a deterioration of the referenced entity’s credit soundness and a greater likelihood or risk of default or other credit event occurring as defined under the terms of the agreement.
The maximum potential amount of future payments (undiscounted) that a Fund as a seller of protection could be required to make under a credit default swap would be an amount equal to the notional amount of the agreement. Notional amounts of all credit default swaps outstanding as of August 31, 2009 for which a Fund is the seller of protection, if any, are disclosed in the footnotes to the Portfolio of Investments. These potential amounts would be partially offset by any recovery values of the respective referenced obligations, upfront payments received upon entering into the agreement, or net amounts received from the settlement of buy protection credit default swaps entered into by a Fund for the same referenced entity or entities.
C. Structured Securities
Certain of the Funds may invest in structured securities for various purposes, including managing exposure to fluctuations in currency exchange rates, interest rates, commodity prices, indices or other financial indicators or for speculation. As of August 31, 2009, the Core Bond Fund held two structured securities and the Strategic Bond Fund held one structured security.
Structured securities include notes, bonds or debentures that provide for the payment of principal of, and/or interest in, amounts determined by reference to changes in the value of specific currencies, interest rates, commodities, indices or other financial indicators (the “Reference”) or the relative change in two or more References. The interest rate or the principal amount payable upon maturity or redemption may be increased or decreased depending upon changes in the applicable Reference. The terms of structured securities may provide that under certain circumstances no principal is due at maturity and, therefore, may result in the loss of a Fund’s entire investment in the structured security. Structured securities may be positively or negatively indexed, so that appreciation of the Reference may produce an increase or decrease in the interest rate or value of the security at maturity. In addition, the change in interest rate or the value of the security at maturity may be a multiple of the change in the value of the Reference (i.e. leveraged structured securities). Consequently, leveraged structured securities entail a greater degree of market risk than other types of debt obligations. Structured securities may also be more volatile, less liquid and more difficult to accurately price than less complex fixed income investments (i.e. investment grade corporate bonds).
109
VALIC Company II
NOTES TO FINANCIAL STATEMENTS — (continued)
The risks of investing in a particular structured security will depend on the terms of the investment; however, structured securities generally will expose the Fund to credit risk, illiquidity risk and market risk. Credit risk arises from the potential inability of counterparties to meet the terms of their contract. Structured securities are typically sold in private placement transactions with no active trading market. Market risk is the risk that there will be an unfavorable change in the Reference. Investments in structured securities may be more volatile than their underlying instruments; however, generally any loss is limited to the amount of the original investment.
D. Short Sales
All Funds, except for the Money Market II Fund and the three Lifestyle Funds, may engage in “short sales against the box.” This technique involves selling either a security that a Fund owns, or a security equivalent in kind and amount to the security sold short. A Fund may enter into a short sale against the box to hedge against anticipated declines in the market price of that security. The High Yield Bond Fund and Strategic Bond Fund may also engage in “naked” short sales. To complete such transactions, the Fund must borrow the security to make delivery to the buyer. The Fund then is obligated to replace the security borrowed by purchasing it at market price at the time of replacement. The price at such time may be more or less than the price at which the security was sold by the Fund. Until the security is replaced, the Fund is required to pay to the lender any dividends or interest that accrue during the period of the loan. To borrow the security, the Fund also may be required to pay a premium, which would increase the cost of the security sold. The proceeds of the short sale will be retained by the broker, to the extent necessary to meet margin requirements, until the short position is closed out. Until the Fund replaces a borrowed security, the Fund will maintain daily a segregated account, containing cash or liquid securities, at such a level that (i) the amount deposited in the account plus the amount deposited with the broker as collateral will equal the current value of the security sold short and (ii) the amount deposited in the segregated account plus the amount deposited with the broker as collateral will not be less than the market value of the security at the time it was sold short. Liabilities for securities sold short are reported at market value in the financial statements. Such liabilities are subject to off balance sheet risk to the extent of any future increases in market value of the securities sold short. The ultimate liability for securities sold short could exceed the liabilities recorded in the Statement of Assets and Liabilities. The Fund bears the risk of potential inability of the broker to meet their obligation to perform.
E. Repurchase Agreements
The Funds, along with other affiliated registered investment companies, pursuant to exemptive relief granted by the Securities and Exchange Commission, may transfer uninvested cash balances into a single joint account, the daily aggregate balance of which is invested in one or more repurchase agreements collateralized by U.S. Treasury or federal agency obligations. For repurchase agreements and joint repurchase agreements, the Funds’ custodian takes possession of the collateral pledged for investments in such repurchase agreements. The underlying collateral is valued daily on a mark-to-market basis, plus accrued interest, to ensure that the value, at the time the agreement is entered into, is equal to at least 102% of the repurchase price, including accrued interest. In the event of default of the obligation to repurchase, a Fund has the right to liquidate the collateral and apply the proceeds in satisfaction of the obligation. If the seller defaults and the value of the collateral declines or if bankruptcy proceedings are commenced with respect to the seller of the security, realization of the collateral by the Fund may be delayed or limited.
As of August 31, 2009, the following funds held an undivided interest in the joint repurchase agreement with UBS Securities, LLC:
| | | | | | |
Fund
| | Percentage
Ownership
| | | Principal
Amount
|
Money Market II | | 9.18 | % | | $ | 36,736,000 |
As of such date, the repurchase agreement in that joint account and the collateral therefore were as follows:
UBS Securities, LLC, dated August 31, 2009, bearing interest at a rate of 0.18% per annum, with a principal amount of $400,000,000, a repurchase price of $400,002,000, and maturity date of September 1, 2009. The repurchase agreement is collateralized by the following:
| | | | | | | | | | | |
Type of Collateral
| | Interest
Rate
| | | Maturity
Date
| | Principal
Amount
| | Market
Value
|
U.S. Treasury Inflation Index Notes | | 2.38 | % | | 01/15/25 | | $ | 347,603,900 | | $ | 408,000,078 |
F. Foreign Currency Translation
The books and records of VC II are maintained in U.S. dollars. Assets and liabilities denominated in foreign currencies and commitments under forward foreign currency contracts are translated into U.S. dollars based on the exchange rate of such currencies against U.S. dollars on the date of valuation.
VC II does not isolate that portion of the results of operations arising as a result of changes in the foreign exchange rates from the changes in the market prices of securities held at the end of the period. Similarly, VC II does not isolate the effect of changes in foreign exchange rates from the changes in the market prices of portfolio securities sold during the period.
Realized foreign exchange gains and losses on other assets and liabilities and change in unrealized foreign exchange gains and losses on other assets and liabilities located in the Statement of Operations include realized foreign exchange gains and losses from currency gains or losses between the trade and the settlement dates of securities transactions, the difference between the amounts of interest, dividends and foreign withholding taxes recorded on VC II’s books and the U.S. dollar equivalent amounts actually received or paid and changes in the unrealized foreign exchange gains and losses relating to the other assets and liabilities arising as a result of changes in the exchange rate.
110
VALIC Company II
NOTES TO FINANCIAL STATEMENTS — (continued)
G. Securities Transactions, Investment Income, Expenses, Dividends and Distributions to Shareholders
Security transactions are recorded on a trade date basis. Realized gains and losses on securities sold are determined on the basis of identified cost. Dividend income and capital gain distributions received are recorded on the ex-dividend date except for certain dividends from foreign securities, which are recorded as soon as VC II is informed after the ex-dividend date. Interest income is accrued daily except when collection is not expected. For financial statement purposes, VC II amortizes all premiums and accretes all discounts on fixed income securities. Funds which earn foreign income and capital gains may be subject to foreign withholding taxes and capital gains taxes at various rates. Under applicable foreign law, a withholding of tax may be imposed on interest, dividends and capital gains at various rates. India, Thailand and certain other countries tax regulations require that taxes be paid on capital gains realized by the Fund.
Common expenses incurred by VC II are allocated among the Funds based upon relative net assets or other appropriate allocation methods. In all other respects, expenses are charged to each Fund as incurred on a specific identification basis. For the Lifestyle Funds, the expenses included in the accompanying financial statements reflect the expenses of the Lifestyle Funds and do not include any expenses associated with the underlying Funds.
Dividends from net investment income, if any, are normally declared and paid annually, except for the Money Market II Fund, which declares daily and pays monthly. Distributions from net realized capital gains, if any, are normally declared and paid annually.
The Funds record dividends and distributions to their shareholders on the ex-dividend date. The amount of dividends and distributions from net investment income and net realized gains are determined and presented in accordance with federal income tax regulations, which may differ from U.S. generally accepted accounting principles. These “book/ tax” differences are either considered temporary or permanent in nature. To the extent these differences are permanent in nature, such amounts are reclassified within the capital accounts at fiscal year end based on their federal tax-basis treatment; temporary differences do not require reclassification. Net investment income (loss), net realized gain (loss) and net assets are not affected by these reclassifications.
Each Fund intends to comply with the requirements of the Internal Revenue Code, as amended, applicable to regulated investment companies and distribute all of its taxable income, including any net realized gain on investments, to its shareholders. Therefore, no federal tax provision is required. Each Fund is considered a separate entity for tax purposes. With few exceptions, the Funds are no longer subject to U.S. federal and state tax examinations by tax authorities for returns ending before 2005.
Note 3 — Advisory Fees and Other Transactions with Affiliates
VALIC, serves as investment adviser to VC II. Certain officers and trustees of VC II are officers and directors of VALIC or affiliates of VALIC. VALIC receives from VC II a monthly fee based on each Fund’s average daily net asset value at the following annual rates:
| | |
| Aggressive Growth Lifestyle Fund | | 0.10% |
| Capital Appreciation Fund | | 0.55% |
| Conservative Growth Lifestyle Fund | | 0.10% |
| Core Bond Fund | | 0.50% on the first $200 million |
| | | 0.45% on the next $300 million |
| | | 0.40% on assets over $500 million |
| High Yield Bond Fund* | | 0.65% on the first $150 million |
| | | 0.60% on the next $350 million |
| | | 0.55% on assets over $500 million |
| International Small Cap Equity Fund | | 0.90% on the first $100 million |
| | | 0.80% on assets over $100 million |
| Large Cap Value Fund | | 0.50% |
| Mid Cap Growth Fund | | 0.80% on the first $50 million |
| | | 0.75% on the next $50 million |
| | | 0.70% on the next $150 million |
| | | 0.65% on the next $250 million |
| | | 0.60% on assets over $500 million |
| Mid Cap Value Fund | | 0.75% on the first $100 million |
| | | 0.725% on the next $150 million |
| | | 0.70% on the next $250 million |
| | | 0.675% on the next $250 million |
| | | 0.65% on the assets over $750 million |
| Moderate Growth Lifestyle Fund | | 0.10% |
| Money Market II Fund | | 0.25% |
111
VALIC Company II
NOTES TO FINANCIAL STATEMENTS — (continued)
| | |
| Small Cap Growth Fund | | 0.85% on the first $100 million |
| | | 0.80% on assets over $100 million |
| Small Cap Value Fund | | 0.75% on the first $50 million |
| | | 0.65% on the assets over $50 million |
| Socially Responsible Fund | | 0.25% |
| Strategic Bond Fund | | 0.60% on the first $200 million |
| | | 0.50% on the next $300 million |
| | | 0.45% on assets over $500 million |
| * | Prior to July 24, 2009, the management fee for High Yield Bond Fund was 0.70% on the first $200 million, 0.60% on the next $300 million, and 0.55% on assets over $500 million. |
VALIC entered into sub-advisory agreements with the following:
AIG Global Investment Corp. (“AIGGIC”)—subadviser for the International Small Cap Equity Fund, Socially Responsible Fund, Strategic Bond Fund, Core Bond Fund, Aggressive, Moderate and Conservative Growth Lifestyle Funds.
Bridgeway Capital Management, Inc.—subadviser for the Capital Appreciation Fund.
FAF Advisors, Inc.—subadviser for a portion of the Mid Cap Value Fund.
Invesco Aim Capital Management, Inc.—subadviser for the Mid Cap Growth Fund.
JP Morgan Investment Advisors Inc.—subadviser for Small Cap Value Fund.
J.P. Morgan Investment Management Inc.—subadviser for the Small Cap Growth Fund.
SSgA Funds Management, Inc.—subadviser for the Large Cap Value Fund.
SunAmerica Asset Management Corp. (“SunAmerica”)—subadviser for the Money Market II Fund.
Wellington Management Co. LLP*—subadviser for the High Yield Bond Fund and a portion of the Mid Cap Value Fund.
| * | Effective July 24, 2009 Wellington Management Co. LLP replaced AIGGIC as subadviser of the High Yield Bond Fund. |
The subadvisers are compensated for their services by VALIC.
VALIC contractually agreed to waive fees and/or reimburse expenses, if necessary, at or below the following percentages of each Fund’s average net assets through December 31, 2009. Annual fund operating expenses shall not include extraordinary expenses, as determined under generally accepted accounting principles, or acquired fund fees and expenses. The contractual expense waivers and fee reimbursements will continue indefinitely, subject to termination by the Board, including a majority of the Directors who are not deemed to be interested persons of the Fund or VALIC as defined by Section 2(a)(19) of the 1940 Act (“the Disinterested Directors”).
| | | |
Fund
| | Maximum Expense
Limitation
| |
Aggressive Growth Lifestyle | | 0.10 | % |
Capital Appreciation | | 0.85 | % |
Conservative Growth Lifestyle | | 0.10 | % |
Core Bond | | 0.77 | % |
High Yield Bond | | 0.99 | % |
International Small Cap Equity | | 1.00 | % |
Large Cap Value | | 0.81 | % |
Mid Cap Growth | | 0.85 | % |
Mid Cap Value | | 1.05 | % |
Moderate Growth Lifestyle | | 0.10 | % |
Money Market II | | 0.55 | % |
Small Cap Growth | | 1.16 | % |
Small Cap Value | | 0.95 | % |
Socially Responsible | | 0.56 | % |
Strategic Bond | | 0.89 | % |
112
VALIC Company II
NOTES TO FINANCIAL STATEMENTS — (continued)
For the period ended August 31, 2009, VALIC has agreed to reimburse expenses as follows:
| | | |
Fund
| | Amount
|
Aggressive Growth Lifestyle | | $ | 116,916 |
Capital Appreciation | | | 124,348 |
Conservative Growth Lifestyle | | | 105,738 |
Core Bond | | | 345,242 |
High Yield Bond | | | 280,702 |
International Small Cap Equity | | | 1,543,020 |
Large Cap Value | | | 268,372 |
Mid Cap Growth | | | 558,835 |
Mid Cap Value | | | 494,725 |
Moderate Growth Lifestyle | | | 144,828 |
Money Market II | | | 616,123 |
Small Cap Growth | | | 114,705 |
Small Cap Value | | | 416,481 |
Socially Responsible | | | 784,666 |
Strategic Bond | | | 459,595 |
VC II, on behalf of each Fund, has entered into an Administrative Services Agreement with SunAmerica. SunAmerica receives from each Fund, other than the Lifestyle Funds, annual fee of 0.07% based on the average daily net asset value of the Fund. Pursuant to the Administrative Services Agreement, SunAmerica provides administrative services to the Board of Trustees, regulatory reporting, internal legal and compliance services, fund accounting and related portfolio accounting services, all necessary office space, equipment, personnel, compensation and facilities for handling the affairs of the Funds and other services. Without limiting the generality of the foregoing, the Administrator (or its appointed service provider): assists with the preparation of prospectuses, statements of additional information, registration statements, and proxy materials; develops and prepares communications to shareholders, including the annual and semi-annual reports to shareholders; coordinates and supervises the preparation and filing of Fund tax returns; assists with the design, development, and operation of the Funds; prepares the Funds’ financial statements; determines the net asset value of the Funds’ shares; supervises the Funds’ transfer agent with respect to the payment of dividends and other distributions to shareholders; and calculates performance data of the Funds. During the period ended August 31, 2009, VC II accrued $2,153,116 for accounting and administrative services.
VC II, on behalf of each Fund, has entered into a Transfer Agency and Services Agreement with VALIC. Under this agreement, VALIC provides services which include the issuance and redemption of shares, payment of dividends between VC II and their “Institutional” shareholders and certain shareholder reporting services including confirmation of transactions, statements of accounts and tax reporting. In addition to the above, VALIC provides “Blue Sky” registration and reporting for the Fund to offer shares in applicable states and to effect and maintain, as the case may be, including but not limited to, the qualification of shares of the Fund that are sold outside of the variable annuity or variable universal life and are for sale under the securities laws of the jurisdictions to qualified plans. For the period ended August 31, 2009, VC II accrued $29,306 in transfer agency and services fees.
VC II, on behalf of each Fund, has entered into a Shareholder Services Agreement with VALIC. Under the agreement, VALIC provides record keeping, account maintenance, and other administrative and shareholder services for contract owners and participants. VALIC receives from each Fund, other than the Lifestyle Funds, an annual fee of 0.25% based on average daily net assets of the Fund. For the period ended August 31, 2009, VC II accrued $7,689,702 in shareholder service expenses.
On January 23, 2001, the Board of Trustees ratified a Deferred Compensation Plan for its independent trustees who are not officers, directors, or employees of VALIC, or an affiliate of VALIC. The effective date of the plan was January 1, 2001. The first deferred payment was made in March of 2001. Under the deferred compensation plan, trustees may elect to defer all or a portion of their compensation. Amounts deferred may be invested in up to six different affiliated mutual funds that are specified in the plan as selected by the trustees. Obligations under the deferred compensation plan represents unsecured claims against the general assets of the Funds. For the period ended August 31, 2009, VC II has deferred $12,221 of trustee compensation.
On January 23, 2001, the Board of Trustees approved a retirement plan for its independent trustees who are not officers, directors, or employees of VALIC or an affiliate of VALIC. VC II is responsible for the payment of the retirement benefits, as well as all administration expenses of the plan. Generally, benefits vested under the plan are payable for a ten-year period upon retirement and are based upon each Trustee’s years of service. In the event of a Trustee’s death prior to complete distribution of benefits, the Trustee’s beneficiary or estate will be entitled to receive installment payments or a discounted lump-sum payments of the remaining benefits.
Effective April 27, 2009, the Retirement Plan was terminated. As a result of terminating the retirement plan, (1) the Retirement Plan was frozen as to future accruals for active Participants as of December 31, 2008, and (2) permits active Participants to elect to receive a distribution of their entire Retirement Plan account balance in 2010. The freeze on future accruals does not apply to Participants that have commenced receiving benefits under the Retirement Plan on or before December 31, 2008.
The following amounts for the retirement plan liability are included in the Trustees’ fees and expenses line on the Statement of Assets and Liabilities and the amounts for the retirement plan expenses are included in the Trustees’ fees and expenses on the Statement of Operations:
| | | | | | | | | |
| | | Retirement Plan
Liability as of
August 31,
2009
| | Retirement Plan
Expense
| | Retirement Plan
Payments
|
Fund
| | | For the period ended
August 31, 2009
|
Aggressive Growth Lifestyle | | $ | 63,846 | | $ | 2,329 | | $ | 10,769 |
Capital Appreciation | | | 75,285 | | | 14,980 | | | 12,930 |
Conservative Growth Lifestyle | | | 54,407 | | | — | | | 8,161 |
113
VALIC Company II
NOTES TO FINANCIAL STATEMENTS — (continued)
| | | | | | | | | |
| | | Retirement Plan
Liability as of
August 31,
2009
| | Retirement Plan
Expense
| | Retirement Plan
Payments
|
Fund
| | | For the period ended
August 31, 2009
|
Core Bond | | $ | 139,131 | | $ | 3,019 | | $ | 23,434 |
High Yield Bond | | | 120,530 | | | 19,551 | | | 20,237 |
International Small Cap Equity | | | 340,021 | | | 116,476 | | | 55,427 |
Large Cap Value | | | 193,871 | | | 37,041 | | | 32,415 |
Mid Cap Growth | | | 94,235 | | | 15,010 | | | 16,013 |
Mid Cap Value | | | 382,247 | | | 67,470 | | | 64,076 |
Moderate Growth Lifestyle | | | 106,995 | | | — | | | 17,239 |
Money Market II | | | 195,641 | | | 30,515 | | | 33,278 |
Small Cap Growth | | | 61,046 | | | 2,590 | | | 10,594 |
Small Cap Value | | | 162,547 | | | 27,676 | | | 27,364 |
Socially Responsible | | | 401,916 | | | 152,207 | | | 67,339 |
Strategic Bond | | | 191,286 | | | 44,622 | | | 32,047 |
At August 31, 2009, VALIC, through their insurance company separate accounts, owned over five percent of the outstanding shares of the following Funds:
| | | |
Fund
| | VALIC
| |
Aggressive Growth Lifestyle | | 100.00 | % |
Capital Appreciation | | 100.00 | % |
Conservative Growth Lifestyle | | 100.00 | % |
Core Bond | | 100.00 | % |
High Yield Bond | | 99.90 | % |
International Small Cap Equity | | 100.00 | % |
Large Cap Value | | 100.00 | % |
Mid Cap Growth | | 100.00 | % |
Mid Cap Value | | 99.07 | % |
Moderate Growth Lifestyle | | 100.00 | % |
Money Market II | | 100.00 | % |
Small Cap Growth | | 100.00 | % |
Small Cap Value | | 100.00 | % |
Socially Responsible | | 100.00 | % |
Strategic Bond | | 99.78 | % |
As disclosed in the schedule of investments, certain Funds own securities issued by AIG or an affiliate thereof. As of August 31, 2009, the following Funds recorded realized gains (losses) and income on security transactions of AIG and subsidiaries of AIG as follows:
| | | | | | | | |
Fund
| | Security
| | Income
| | Capital Gain Distribution
Received
|
Aggressive Growth Lifestyle | | Various VC II Funds* | | $ | 1,701,163 | | $ | 2,124,571 |
Conservative Growth Lifestyle | | Various VC II Funds* | | | 1,990,008 | | | 987,611 |
Moderate Growth Lifestyle | | Various VC II Funds* | | | 3,513,387 | | | 2,554,372 |
| | | | | | | | | | | | | | | | | | | | |
Fund
| | Security
| | Market Value
at 08/31/08
| | Cost of
Purchases†
| | Proceeds
from Sales
| | Realized
Gain/(Loss)
| | | Change in
Unrealized
Gain/(Loss)
| | Market Value
at 08/31/09
|
Aggressive Growth Lifestyle | | Various VC II Funds* | | $ | 91,616,795 | | $ | 130,626,566 | | $ | 116,816,845 | | $ | (30,379,452 | ) | | 18,732,132 | | $ | 93,779,196 |
Conservative Growth Lifestyle | | Various VC II Funds* | | | 58,567,566 | | | 95,250,436 | | | 92,356,492 | | | (12,555,353 | ) | | 8,830,618 | | $ | 57,736,775 |
Moderate Growth Lifestyle | | Various VC II Funds* | | | 145,945,620 | | | 225,773,298 | | | 216,344,857 | | | (42,187,627 | ) | | 28,745,258 | | $ | 141,931,692 |
| * | See Portfolio of Investments for details. |
| † | Includes reinvestment of distributions paid. |
On various days from September 24, 2008 through March 4, 2009, the Large Cap Value Fund invested in a State Street Time Deposit. Since SSgA Funds Management, Inc., the subadviser for the Large Cap Value Fund, is an affiliate of the Fund’s custodian bank, State Street Bank and Trust Company, the Fund’s investment in the State Street Time Deposit was not permitted. On March 5, 2009, the Fund ceased investing in State Street Time Deposits, resulting in no gain or loss to the Fund.
On March 4, 2009, AIG, the ultimate parent of VALIC, the Funds’ investment adviser, American General Distributors, Inc., the Funds’ distributor, SunAmerica, the subadvisor to the Money Market II Fund and the Funds’ administrator and AIGGIC, subadviser to certain Funds, issued and sold to the AIG Credit Facility Trust, a trust established for the sole benefit of the United States Treasury (the “Trust”), 100,000 shares of AIG’s Series C Perpetual, Convertible, Participating Preferred Stock (the “Stock”) for an aggregate purchase price of $500,000, with an understanding that additional and independently sufficient consideration was also furnished to AIG by the Federal Reserve Bank of New York (the “FRBNY”) in the form of its lending commitment (the “Credit Facility”) under the Credit Agreement, dated as of September 22, 2008, between AIG and the FRBNY. The Stock has
114
VALIC Company II
NOTES TO FINANCIAL STATEMENTS — (continued)
preferential liquidation rights over AIG common stock, and, to the extent permitted by law, votes with AIG’s common stock on all matters submitted to AIG’s shareholders. The Trust has approximately 79.9% of the aggregate voting power of AIG’s common stock and is entitled to approximately 79.9% of all dividends paid on AIG’s common stock, in each case treating the Stock as if converted. The Stock will remain outstanding even if the Credit Facility is repaid in full or otherwise terminates.
Note 4 — Investment Activity
The cost of purchases and proceeds from sales and maturities of long-term investments, during the period ended August 31, 2009, were as follows:
| | | | | | | | | | | | |
Fund
| | Purchases of
Investment
Securities
(Excluding U.S.
Government
Securities)
| | Sales of
Investment
Securities
(Excluding U.S.
Government
Securities)
| | Purchase of U.S.
Government
Securities
| | Sales of U.S.
Government
Securities
|
Aggressive Growth Lifestyle | | $ | 130,626,566 | | $ | 116,816,845 | | $ | — | | $ | — |
Capital Appreciation | | | 32,635,129 | | | 47,132,787 | | | — | | | — |
Conservative Growth Lifestyle | | | 95,250,436 | | | 92,356,492 | | | — | | | — |
Core Bond | | | 172,341,653 | | | 198,907,783 | | | 37,969,985 | | | 64,768,636 |
High Yield Bond | | | 167,514,146 | | | 140,365,350 | | | — | | | — |
International Small Cap Equity | | | 662,795,181 | | | 625,480,584 | | | — | | | — |
Large Cap Value | | | 312,503,442 | | | 386,410,391 | | | — | | | — |
Mid Cap Growth | | | 161,166,962 | | | 164,511,344 | | | — | | | — |
Mid Cap Value | | | 351,346,002 | | | 377,019,606 | | | — | | | — |
Moderate Growth Lifestyle | | | 225,773,299 | | | 216,344,857 | | | — | | | — |
Small Cap Growth | | | 31,449,069 | | | 29,160,206 | | | — | | | — |
Small Cap Value | | | 177,583,740 | | | 81,531,287 | | | 1,875,608 | | | 1,140,000 |
Socially Responsible | | | 512,657,635 | | | 561,814,872 | | | — | | | — |
Strategic Bond | | | 327,502,265 | | | 312,116,364 | | | 31,138,812 | | | 43,361,234 |
Note 5 — Federal Income Taxes
The following tables detail the tax basis of distributions as well as the components of distributable earnings. The tax basis components of distributable earnings differ from the amounts reflected in the Statements of Assets and Liabilities due to temporary book/tax differences primarily arising from wash sales, post October losses, investments in passive foreign investment companies, and derivative transactions. Also included in the following tables are the capital loss carryforwards at August 31, 2009.
The information in the following table is presented on the basis of cost for federal income tax purposes at August 31, 2009:
| | | | | | | | | | | | | | |
Fund
| | Identified Cost
of Investments
Owned
| | Gross
Unrealized
Appreciation
| | Gross
Unrealized
Depreciation
| | | Net Unrealized
Appreciation
(Depreciation)
| |
Aggressive Growth Lifestyle | | $ | 116,072,728 | | $ | 13,412,352 | | $ | (35,705,884 | ) | | $ | (22,293,532 | ) |
Capital Appreciation | | | 49,591,308 | | | 4,101,497 | | | (5,144,894 | ) | | | (1,043,397 | ) |
Conservative Growth Lifestyle | | | 58,190,521 | | | 7,546,718 | | | (8,000,464 | ) | | | (453,746 | ) |
Core Bond | | | 159,311,619 | | | 5,985,448 | | | (7,029,759 | ) | | | (1,044,311 | ) |
High Yield Bond | | | 193,196,284 | | | 8,773,541 | | | (20,207,227 | ) | | | (11,433,686 | ) |
International Small Cap Equity | | | 477,894,959 | | | 91,389,190 | | | (19,326,168 | ) | | | 72,063,022 | |
Large Cap Value | | | 158,775,532 | | | 15,146,275 | | | (16,238,337 | ) | | | (1,092,062 | ) |
Mid Cap Growth | | | 143,960,688 | | | 21,550,320 | | | (6,932,380 | ) | | | 14,617,940 | |
Mid Cap Value | | | 475,077,710 | | | 48,023,287 | | | (44,245,416 | ) | | | 3,777,871 | |
Moderate Growth Lifestyle | | | 144,256,616 | | | 23,028,572 | | | (25,353,496 | ) | | | (2,324,924 | ) |
Money Market II | | | 257,646,809 | | | — | | | — | | | | — | |
Small Cap Growth | | | 42,997,231 | | | 5,058,692 | | | (5,547,870 | ) | | | (489,178 | ) |
Small Cap Value | | | 380,330,831 | | | 31,498,717 | | | (66,335,876 | ) | | | (34,837,159 | ) |
Socially Responsible | | | 725,390,881 | | | 45,657,259 | | | (114,840,601 | ) | | | (69,183,342 | ) |
Strategic Bond | | | 344,871,615 | | | 17,331,975 | | | (17,564,505 | ) | | | (232,530 | ) |
The tax character of distributions paid may differ from the Statement of Changes in Net Assets due to short-term capital gains being treated as ordinary income distributions for tax purposes. The tax basis distributable earnings at August 31, 2009 and the tax character of distributions paid during the year ended August 31, 2009 were as follows:
| | | | | | | | | | | | | | | | | |
| | | Distributable Earnings
| | | Tax Distributions
|
Fund
| | Ordinary
Income
| | Long-
term Gains/
Capital Loss
Carryover and
Other Losses
| | | Unrealized
Appreciation
(Depreciation)*
| | | Ordinary
Income
| | Long-Term
Capital
Gains
|
Aggressive Growth Lifestyle | | $ | 1,628,806 | | $ | (1,066,859 | ) | | $ | (22,293,532 | ) | | $ | 14,114,539 | | $ | 4,453,808 |
Capital Appreciation | | | 458,586 | | | (12,435,107 | ) | | | (1,043,397 | ) | | | 56,733 | | | — |
115
VALIC Company II
NOTES TO FINANCIAL STATEMENTS — (continued)
| | | | | | | | | | | | | | | | | |
| | | Distributable Earnings
| | | Tax Distributions
|
Fund
| | Ordinary
Income
| | Long-
term Gains/
Capital Loss
Carryover and
Other Losses
| | | Unrealized
Appreciation
(Depreciation)*
| | | Ordinary
Income
| | Long-Term
Capital
Gains
|
Conservative Growth Lifestyle | | $ | 1,939,732 | | $ | (1,938,895 | ) | | $ | (453,746 | ) | | $ | 1,451,543 | | $ | 919,404 |
Core Bond | | | 8,876,771 | | | (5,402,964 | ) | | | (1,044,311 | ) | | | 11,242,372 | | | — |
High Yield Bond | | | 18,592,117 | | | (8,191,111 | ) | | | (11,433,686 | ) | | | 16,902,354 | | | — |
International Small Cap Equity | | | 8,411,268 | | | (92,725,555 | ) | | | 72,036,739 | | | | 19,860,497 | | | 24,510,152 |
Large Cap Value | | | 2,822,618 | | | (61,955,403 | ) | | | (1,092,062 | ) | | | 5,298,743 | | | — |
Mid Cap Growth | | | — | | | (26,766,815 | ) | | | 14,618,104 | | | | — | | | 869,715 |
Mid Cap Value | | | 5,491,988 | | | (64,571,883 | ) | | | 3,779,900 | | | | 3,026,404 | | | 9,716,280 |
Moderate Growth Lifestyle | | | 3,392,906 | | | (2,577,826 | ) | | | (2,324,924 | ) | | | 3,320,144 | | | 3,877,420 |
Money Market II | | | 214,603 | | | (611,463 | ) | | | — | | | | 2,812,871 | | | — |
Small Cap Growth | | | — | | | (2,808,475 | ) | | | (489,178 | ) | | | — | | | 493,157 |
Small Cap Value | | | 3,699,201 | | | (5,812,436 | ) | | | (34,837,159 | ) | | | 4,356,332 | | | 13,244,321 |
Socially Responsible | | | 11,153,884 | | | (98,423,478 | ) | | | (69,183,342 | ) | | | 14,145,314 | | | 2,733,592 |
Strategic Bond | | | 19,122,627 | | | (9,500,229 | ) | | | (184,694 | ) | | | 24,084,315 | | | — |
| * | Unrealized appreciation (depreciation) includes amounts for derivatives and other assets and liabilities denominated in foreign currency. |
The tax character of distributions paid during the year ended August 31, 2008 were as follows:
| | | | | | |
| | | Tax Distributions
|
Fund
| | Ordinary
Income
| | Long-Term
Capital
Gains
|
Aggressive Growth Lifestyle | | $ | 1,704,533 | | $ | 5,034,919 |
Capital Appreciation | | | 293,483 | | | — |
Conservative Growth Lifestyle | | | 1,039,974 | | | 1,866,810 |
Core Bond | | | 7,643,239 | | | — |
High Yield Bond | | | 11,547,138 | | | 418,421 |
International Small Cap Equity | | | 30,991,372 | | | 37,745,822 |
Large Cap Value | | | 17,023,310 | | | 8,707,988 |
Mid Cap Growth | | | 2,729,499 | | | 6,475,243 |
Mid Cap Value | | | 13,215,384 | | | 30,590,758 |
Moderate Growth Lifestyle | | | 2,475,944 | | | 6,180,652 |
Money Market II | | | 10,307,945 | | | — |
Small Cap Growth | | | — | | | 3,340,790 |
Small Cap Value | | | 5,112,231 | | | 8,387,781 |
Socially Responsible | | | 51,293,942 | | | 11,165,322 |
Strategic Bond | | | 14,683,243 | | | 1,108,310 |
As of August 31, 2009, the Funds indicated below have capital loss carryforwards, which expire in the year indicated and are available to offset future capital gains, if any:
| | | | | | | | | | | | | | | | | | | | | | | | |
| | | Capital Loss Carryforward
|
Fund
| | 2010
| | 2011
| | 2012
| | 2013
| | 2014
| | 2015
| | 2016
| | 2017
|
Aggressive Growth Lifestyle | | $ | — | | $ | — | | $ | — | | $ | — | | $ | — | | $ | — | | $ | — | | $ | 1,066,859 |
Capital Appreciation | | | 1,614,514 | | | 6,282,529 | | | 2,100,734 | | | 408,479 | | | — | | | — | | | — | | | 2,028,851 |
Conservative Growth Lifestyle | | | — | | | — | | | — | | | — | | | — | | | — | | | — | | | 1,938,895 |
Core Bond | | | — | | | — | | | — | | | — | | | 348,311 | | | 1,248,815 | | | 17,884 | | | 3,787,954 |
High Yield Bond | | | — | | | — | | | — | | | — | | | — | | | — | | | 463,115 | | | 7,727,996 |
International Small Cap Equity | | | — | | | — | | | — | | | — | | | — | | | — | | | — | | | 92,725,555 |
Large Cap Value | | | — | | | — | | | — | | | — | | | — | | | — | | | 4,785,556 | | | 57,169,847 |
Mid Cap Growth | | | — | | | — | | | — | | | — | | | — | | | — | | | — | | | 26,766,815 |
Mid Cap Value | | | — | | | — | | | — | | | — | | | — | | | — | | | — | | | 64,571,883 |
Moderate Growth Lifestyle | | | — | | | — | | | — | | | — | | | — | | | — | | | — | | | 2,577,826 |
Money Market II | | | — | | | — | | | — | | | — | | | — | | | — | | | — | | | 611,463 |
Small Cap Growth | | | — | | | — | | | — | | | — | | | — | | | — | | | — | | | 2,808,475 |
Small Cap Value | | | — | | | — | | | — | | | — | | | — | | | — | | | — | | | 5,812,436 |
Socially Responsible | | | — | | | — | | | — | | | — | | | — | | | — | | | — | | | 98,423,478 |
Strategic Bond | | | — | | | — | | | — | | | — | | | — | | | — | | | 87,486 | | | 9,412,743 |
116
VALIC Company II
NOTES TO FINANCIAL STATEMENTS — (continued)
The Funds indicated below utilized capital loss carryforwards, which offset net taxable gains realized in the current year.
| | | |
Fund
| | Capital Loss
Carryforward
Utilized
|
Aggressive Growth Lifestyle | | $ | — |
Capital Appreciation | | | — |
Conservative Growth Lifestyle | | | — |
Core Bond | | | — |
High Yield Bond | | | — |
International Small Cap Equity | | | — |
Large Cap Value | | | — |
Mid Cap Growth | | | — |
Mid Cap Value | | | — |
Moderate Growth Lifestyle | | | — |
Money Market II | | | — |
Small Cap Growth | | | — |
Small Cap Value | | | — |
Socially Responsible | | | — |
Strategic Bond | | | — |
Under the tax law, capital losses related to securities and foreign currency realized after October 31 and prior to the Fund’s fiscal year end may be deferred as occurring on the first day of the following year. For the fiscal year ended August 31, 2009, the Funds elected to defer capital losses as follows:
| | | | | | |
Fund
| | Deferred Post-October
Capital Loss
| | Deferred Post-October
Currency Loss
|
Aggressive Growth Lifestyle | | $ | 8,078,695 | | $ | — |
Capital Appreciation | | | 13,993,671 | | | — |
Conservative Growth Lifestyle | | | 3,422,941 | | | — |
Core Bond | | | 4,433,925 | | | — |
High Yield Bond | | | 38,359,142 | | | — |
International Small Cap Equity | | | 206,202,157 | | | 1,241,420 |
Large Cap Value | | | 59,649,894 | | | — |
Mid Cap Growth | | | 42,104,205 | | | 40,410 |
Mid Cap Value | | | 86,002,825 | | | — |
Moderate Growth Lifestyle | | | 16,046,459 | | | — |
Money Market II | | | — | | | — |
Small Cap Growth | | | 8,446,334 | | | — |
Small Cap Value | | | 34,134,519 | | | 628 |
Socially Responsible | | | 140,945,706 | | | — |
Strategic Bond | | | 27,523,664 | | | 469,555 |
For the period ended August 31, 2009, the reclassifications arising from book/tax differences resulted in increases (decreases) that were primarily due to tax treatment of net investment losses, principal paydown adjustments, non-deductible expenses, disposition of passive foreign investment companies securities, dispositions of partnership interests, and foreign currency transactions to the components of net assets as follows:
| | | | | | | | | | | | |
Fund
| | Accumulated
Undistributed Net
Investment Income
(Loss)
| | | Accumulated
Undistributed Net
Realized Gain
(Loss)
| | | Capital
Paid-in
| |
Aggressive Growth Lifestyle | | $ | — | | | $ | — | | | $ | — | |
Capital Appreciation | | | — | | | | — | | | | — | |
Conservative Growth Lifestyle | | | — | | | | — | | | | — | |
Core Bond | | | 84,899 | | | | (84,899 | ) | | | — | |
High Yield Bond | | | 3,808 | | | | (3,808 | ) | | | — | |
International Small Cap Equity | | | (1,579,743 | ) | | | 1,579,743 | | | | — | |
Large Cap Value | | | (2,044 | ) | | | — | | | | 2,044 | |
Mid Cap Growth | | | 282,415 | | | | 11,915 | | | | (294,330 | ) |
Mid Cap Value | | | 5,058 | | | | (5,058 | ) | | | — | |
Moderate Growth Lifestyle | | | — | | | | — | | | | — | |
Money Market II | | | 23,777 | | | | (23,777 | ) | | | — | |
Small Cap Growth | | | 300,742 | | | | — | | | | (300,742 | ) |
Small Cap Value | | | (5,067 | ) | | | 5,067 | | | | — | |
Socially Responsible | | | (1 | ) | | | 1 | | | | — | |
Strategic Bond | | | (1,872,883 | ) | | | 1,872,883 | | | | — | |
117
VALIC Company II
NOTES TO FINANCIAL STATEMENTS — (continued)
Note 6 — Capital Share Transactions
Transactions in capital shares of each Fund were as follows:
| | | | | | | | | | | | | | | | | | | | | | | | | | | | |
| | | Aggressive Growth Lifestyle
| | | Capital Appreciation
| |
| | | For the year ended
August 31, 2009
| | | For the year ended
August 31, 2008
| | | For the year ended
August 31, 2009
| | | For the year ended
August 31, 2008
| |
| | | Shares
| | | Amount
| | | Shares
| | | Amount
| | | Shares
| | | Amount
| | | Shares
| | | Amount
| |
Shares sold | | 3,637,116 | | | $ | 24,145,585 | | | 3,667,472 | | | $ | 42,768,939 | | | 6,042,880 | | | $ | 42,025,732 | | | 7,552,349 | | | $ | 81,750,758 | |
Reinvested dividends | | 3,246,215 | | | | 18,568,347 | | | 560,687 | | | | 6,739,452 | | | 9,077 | | | | 56,733 | | | 25,432 | | | | 293,483 | |
Shares redeemed | | (2,031,987 | ) | | | (14,017,123 | ) | | (2,155,304 | ) | | | (24,894,326 | ) | | (8,358,861 | ) | | | (57,575,414 | ) | | (6,593,258 | ) | | | (70,701,533 | ) |
| | |
|
| |
|
|
| |
|
| |
|
|
| |
|
| |
|
|
| |
|
| |
|
|
|
Net increase (decrease) | | 4,851,344 | | | $ | 28,696,809 | | | 2,072,855 | | | $ | 24,614,065 | | | (2,306,904 | ) | | $ | (15,492,949 | ) | | 984,523 | | | $ | 11,342,708 | |
| | |
|
| |
|
|
| |
|
| |
|
|
| |
|
| |
|
|
| |
|
| |
|
|
|
| | |
| | | Conservative Growth Lifestyle
| | | Core Bond
| |
| | | For the year ended
August 31, 2009
| | | For the year ended
August 31, 2008
| | | For the year ended
August 31, 2009
| | | For the year ended
August 31, 2008
| |
| | | Shares
| | | Amount
| | | Shares
| | | Amount
| | | Shares
| | | Amount
| | | Shares
| | | Amount
| |
Shares sold | | 2,324,504 | | | $ | 20,426,844 | | | 2,692,820 | | | $ | 28,928,353 | | | 8,848,969 | | | $ | 81,631,099 | | | 13,294,040 | | | $ | 135,644,719 | |
Reinvested dividends | | 283,606 | | | | 2,370,947 | | | 265,702 | | | | 2,906,784 | | | 1,273,202 | | | | 11,242,372 | | | 758,258 | | | | 7,643,239 | |
Shares redeemed | | (2,318,797 | ) | | | (20,415,761 | ) | | (1,575,838 | ) | | | (16,784,630 | ) | | (14,798,816 | ) | | | (139,049,701 | ) | | (13,992,688 | ) | | | (142,469,735 | ) |
| | |
|
| |
|
|
| |
|
| |
|
|
| |
|
| |
|
|
| |
|
| |
|
|
|
Net increase (decrease) | | 289,313 | | | $ | 2,382,030 | | | 1,382,684 | | | $ | 15,050,507 | | | (4,676,645 | ) | | $ | (46,176,230 | ) | | 59,610 | | | $ | 818,223 | |
| | |
|
| |
|
|
| |
|
| |
|
|
| |
|
| |
|
|
| |
|
| |
|
|
|
| | |
| | | High Yield Bond
| | | International Small Cap Equity
| |
| | | For the year ended
August 31, 2009
| | | For the year ended
August 31, 2008
| | | For the year ended
August 31, 2009
| | | For the year ended
August 31, 2008
| |
| | | Shares
| | | Amount
| | | Shares
| | | Amount
| | | Shares
| | | Amount
| | | Shares
| | | Amount
| |
Shares sold | | 8,118,492 | | | $ | 48,446,436 | | | 9,109,967 | | | $ | 80,115,160 | | | 12,654,204 | | | $ | 130,918,500 | | | 9,442,440 | | | $ | 165,694,088 | |
Reinvested dividends | | 3,394,047 | | | | 16,902,354 | | | 1,378,521 | | | | 11,965,559 | | | 4,935,556 | | | | 44,370,649 | | | 4,089,066 | | | | 68,737,194 | |
Shares redeemed | | (7,839,847 | ) | | | (50,570,032 | ) | | (7,197,434 | ) | | | (62,655,342 | ) | | (9,157,588 | ) | | | (85,669,535 | ) | | (7,779,781 | ) | | | (129,825,285 | ) |
| | |
|
| |
|
|
| |
|
| |
|
|
| |
|
| |
|
|
| |
|
| |
|
|
|
Net increase (decrease) | | 3,672,692 | | | $ | 14,778,758 | | | 3,291,054 | | | $ | 29,425,377 | | | 8,432,172 | | | $ | 89,619,614 | | | 5,751,725 | | | $ | 104,605,997 | |
| | |
|
| |
|
|
| |
|
| |
|
|
| |
|
| |
|
|
| |
|
| |
|
|
|
| | |
| | | Large Cap Value
| | | Mid Cap Growth
| |
| | | For the year ended
August 31, 2009
| | | For the year ended
August 31, 2008
| | | For the year ended
August 31, 2009
| | | For the year ended
August 31, 2008
| |
| | | Shares
| | | Amount
| | | Shares
| | | Amount
| | | Shares
| | | Amount
| | | Shares
| | | Amount
| |
Shares sold | | 3,410,696 | | | $ | 31,880,879 | | | 6,858,111 | | | $ | 98,210,693 | | | 3,834,838 | | | $ | 18,810,279 | | | 22,051,824 | | | $ | 170,228,034 | |
Reinvested dividends | | 616,133 | | | | 5,298,743 | | | 1,760,007 | | | | 25,731,298 | | | 198,113 | | | | 869,715 | | | 1,070,319 | | | | 9,204,742 | |
Shares redeemed | | (11,876,207 | ) | | | (112,264,771 | ) | | (10,532,062 | ) | | | (145,556,888 | ) | | (5,451,442 | ) | | | (26,965,959 | ) | | (3,300,761 | ) | | | (26,830,548 | ) |
| | |
|
| |
|
|
| |
|
| |
|
|
| |
|
| |
|
|
| |
|
| |
|
|
|
Net increase (decrease) | | (7,849,378 | ) | | $ | (75,085,149 | ) | | (1,913,944 | ) | | $ | (21,614,897 | ) | | (1,418,491 | ) | | $ | (7,285,965 | ) | | 19,821,382 | | | $ | 152,602,228 | |
| | |
|
| |
|
|
| |
|
| |
|
|
| |
|
| |
|
|
| |
|
| |
|
|
|
| | |
| | | Mid Cap Value
| | | Moderate Growth Lifestyle
| |
| | | For the year ended
August 31, 2009
| | | For the year ended
August 31, 2008
| | | For the year ended
August 31, 2009
| | | For the year ended
August 31, 2008
| |
| | | Shares
| | | Amount
| | | Shares
| | | Amount
| | | Shares
| | | Amount
| | | Shares
| | | Amount
| |
Shares sold | | 6,510,404 | | | $ | 70,686,565 | | | 18,468,891 | | | $ | 297,945,454 | | | 3,243,677 | | | $ | 29,608,043 | | | 5,356,467 | | | $ | 65,504,176 | |
Reinvested dividends | | 1,308,284 | | | | 12,742,684 | | | 2,549,834 | | | | 43,806,142 | | | 847,770 | | | | 7,197,564 | | | 688,671 | | | | 8,656,596 | |
Shares redeemed | | (10,556,581 | ) | | | (113,219,175 | ) | | (6,785,192 | ) | | | (116,534,093 | ) | | (2,866,116 | ) | | | (26,031,404 | ) | | (2,663,219 | ) | | | (32,666,248 | ) |
| | |
|
| |
|
|
| |
|
| |
|
|
| |
|
| |
|
|
| |
|
| |
|
|
|
Net increase (decrease) | | (2,737,893 | ) | | $ | (29,789,926 | ) | | 14,233,533 | | | $ | 225,217,503 | | | 1,225,331 | | | $ | 10,774,203 | | | 3,381,919 | | | $ | 41,494,524 | |
| | |
|
| |
|
|
| |
|
| |
|
|
| |
|
| |
|
|
| |
|
| |
|
|
|
| | |
| | | Money Market II
| | | Small Cap Growth
| |
| | | For the year ended
August 31, 2009
| | | For the year ended
August 31, 2008
| | | For the year ended
August 31, 2009
| | | For the year ended
August 31, 2008
| |
| | | Shares
| | | Amount
| | | Shares
| | | Amount
| | | Shares
| | | Amount
| | | Shares
| | | Amount
| |
Shares sold | | 141,264,764 | | | $ | 141,264,764 | | | 324,079,374 | | | $ | 324,079,374 | | | 1,577,913 | | | $ | 12,168,853 | | | 1,334,056 | | | $ | 16,992,503 | |
Reinvested dividends | | 2,812,871 | | | | 2,812,871 | | | 10,307,945 | | | | 10,307,945 | | | 68,781 | | | | 493,157 | | | 249,685 | | | | 3,340,790 | |
Shares redeemed | | (220,170,046 | ) | | | (220,170,046 | ) | | (341,515,131 | ) | | | (341,515,131 | ) | | (1,295,696 | ) | | | (10,043,517 | ) | | (1,273,361 | ) | | | (16,134,780 | ) |
| | |
|
| |
|
|
| |
|
| |
|
|
| |
|
| |
|
|
| |
|
| |
|
|
|
Net increase (decrease) | | (76,092,412 | ) | | $ | (76,092,412 | ) | | (7,127,812 | ) | | $ | (7,127,812 | ) | | 350,998 | | | $ | 2,618,493 | | | 310,380 | | | $ | 4,198,513 | |
| | |
|
| |
|
|
| |
|
| |
|
|
| |
|
| |
|
|
| |
|
| |
|
|
|
118
VALIC Company II
NOTES TO FINANCIAL STATEMENTS — (continued)
| | | | | | | | | | | | | | | | | | | | | | | | | | | | |
| | |
| | | Small Cap Value
| | | Socially Responsible
| |
| | | For the year ended
August 31, 2009
| | | For the year ended
August 31, 2008
| | | For the year ended
August 31, 2009
| | | For the year ended
August 31, 2008
| |
| | | Shares
| | | Amount
| | | Shares
| | | Amount
| | | Shares
| | | Amount
| | | Shares
| | | Amount
| |
Shares sold | | 13,117,309 | | | $ | 109,310,853 | | | 9,631,386 | | | $ | 129,073,247 | | | 7,569,714 | | | $ | 60,850,253 | | | 22,156,419 | | | $ | 278,444,392 | |
Reinvested dividends | | 2,133,412 | | | | 17,600,653 | | | 994,842 | | | | 13,500,012 | | | 2,309,016 | | | | 16,878,906 | | | 5,008,762 | | | | 62,459,264 | |
Shares redeemed | | (2,543,446 | ) | | | (23,500,289 | ) | | (5,270,030 | ) | | | (71,162,066 | ) | | (16,526,587 | ) | | | (136,691,350 | ) | | (15,688,784 | ) | | | (187,855,085 | ) |
| | |
|
| |
|
|
| |
|
| |
|
|
| |
|
| |
|
|
| |
|
| |
|
|
|
Net increase (decrease) | | 12,707,275 | | | $ | 103,411,217 | | | 5,356,198 | | | $ | 71,411,193 | | | (6,647,857 | ) | | $ | (58,962,191 | ) | | 11,476,397 | | | $ | 153,048,571 | |
| | |
|
| |
|
|
| |
|
| |
|
|
| |
|
| |
|
|
| |
|
| |
|
|
|
| | |
| | | Strategic Bond
| | | | |
| | | For the year ended
August 31, 2009
| | | For the year ended
August 31, 2008
| | | | | | | |
| | | Shares
| | | Amount
| | | Shares
| | | Amount
| | | | | | | | | | | | | |
Shares sold | | 8,671,352 | | | $ | 83,320,957 | | | 9,891,159 | | | $ | 111,918,441 | | | | | | | | | | | | | | | |
Reinvested dividends | | 2,843,485 | | | | 24,084,315 | | | 1,426,518 | | | | 15,791,553 | | | | | | | | | | | | | | | |
Shares redeemed | | (9,334,223 | ) | | | (87,426,922 | ) | | (5,097,882 | ) | | | (57,425,810 | ) | | | | | | | | | | | | | | |
| | |
|
| |
|
|
| |
|
| |
|
|
| | | | | | | | | | | | | | |
Net increase (decrease) | | 2,180,614 | | | $ | 19,978,350 | | | 6,219,795 | | | $ | 70,284,184 | | | | | | | | | | | | | | | |
| | |
|
| |
|
|
| |
|
| |
|
|
| | | | | | | | | | | | | | |
Note 7 — Expense Reductions
Through expense offset arrangements, resulting from broker commission recapture, a portion of the Fund’s expenses have been reduced. For the period ended August 31, 2009, the amount of expense reductions received by each fund, used to offset the Fund’s non-affiliated expenses, were as follows:
| | | |
Fund
| | Expense Reductions
|
Large Cap Value | | $ | 9,377 |
Mid Cap Growth | | | 69,765 |
Mid Cap Value | | | 118,529 |
Small Cap Growth | | | 4,066 |
Small Cap Value | | | 8,037 |
Socially Responsible | | | 110,252 |
Note 8 — Investment Concentration
The High Yield Bond Fund’s investment in high yield securities, whether rated or unrated, may be considered speculative and subject to greater market fluctuations and risk of loss of income and principal than lower-yielding, higher-rated, fixed-income securities. The risk of loss due to default by the issuer may be significantly greater for the holders of high yield securities, because such securities are generally unsecured and are often subordinated to other creditors of the issuer.
The Funds may invest in obligations issued by agencies and instrumentalities of the U.S. Government that may vary in the level of support they receive from the government. The government may choose not to provide financial support to government sponsored agencies or instrumentalities if it is not legally obligated to do so. In this case, if the issuer defaulted, the fund holding securities of such issuer might not be able to recover its investment from the U.S. Government. As a result of the Core Bond Fund and Strategic Bond Fund’s concentration in such investments, it may be subject to risks associated with the U.S. Government agencies or instrumentalities. At the end of the period, the Funds had 33.2% and 11.7%, respectively, of their total net assets invested in such securities.
Some of the Funds may invest internationally, including in “emerging market” countries. Emerging market securities involve risks not typically associated with investing in securities of issuers in more developed markets. These investments are subject to various risk factors including market, credit, exchange rate and sovereign risk. The markets in which these securities trade can be volatile and at times illiquid. These securities may be denominated in currencies other than U.S. dollars. While investing internationally may reduce portfolio risk by increasing the diversification of portfolio investments, the value of the investment may be affected by fluctuating currency values, changing local and regional economic, political and social conditions, and greater market volatility. These risks are primary risks of the International Small Cap Equity Fund and Strategic Bond Fund. At the end of the period, the International Small Cap Equity Fund had 28.6% of its net assets invested in equity securities domiciled in Japan. At the end of the period, Strategic Bond Fund had 22.3% of its net assets invested in securities issued by foreign government agencies.
Note 9 — Lines of Credit
Except for the VC II Large Cap Value Fund, VC I and VC II have established an $85 million committed and a $40 million uncommitted line of credit with State Street Bank and Trust Company (“State Street”), the Funds’ custodian. Interest is currently payable at the Federal Funds Rate plus 50 basis points on the committed line and State Street’s discretionary bid rate on the uncommitted line of credit. There is also a commitment fee of 10 basis points per annum for the daily unused portion of the committed line of credit, which is included in interest expense on the Statement of Operations. Borrowings under the line of credit will commence when the Fund’s cash shortfall exceeds $100,000.
119
VALIC Company II
NOTES TO FINANCIAL STATEMENTS — (continued)
For the period ended August 31, 2009, the following Funds had borrowings:
| | | | | | | | | | | |
Fund
| | Days
Outstanding
| | Interest
Charges
| | Average
Debt
Utilized
| | Weighted
Average
Interest
| |
Aggressive Growth Lifestyle | | 26 | | $ | 58 | | $ | 111,360 | | 0.72 | % |
Capital Appreciation | | 62 | | | 1,582 | | | 1,292,437 | | 0.71 | % |
Core Bond | | 35 | | | 1,850 | | | 1,105,552 | | 1.32 | % |
Mid Cap Value | | 3 | | | 26 | | | 450,176 | | 0.69 | % |
Moderate Growth Lifestyle | | 51 | | | 167 | | | 165,222 | | 0.71 | % |
Small Cap Growth | | 5 | | | 10 | | | 98,142 | | 0.71 | % |
As of August 31, 2009, none of the Funds had outstanding borrowings.
Note 10 — Interfund Lending Agreement
Pursuant to the exemptive relief granted by the Securities and Exchange Commission, the Funds are permitted to participate in an interfund lending program among investment companies advised by VALIC or an affiliate. The interfund lending program allows the participating Funds to borrow money from and lend money to each other for temporary or emergency purposes. An interfund loan will be made under this facility only if the participating funds receive a more favorable interest rate than would otherwise be available from a typical bank for a comparable transaction. For the period ended August 31, 2009, none of the Funds participated in this program.
Note 11 — Security Transactions with Affiliated Portfolios
The Funds are permitted to transfer securities by purchasing from and/or selling to other affiliated Funds under certain conditions approved by the Board of Trustees of VALIC Company II. The affiliated Funds involved in such transactions must have a common investment adviser (or affiliated investment adviser), common Trustees, and/or common officers in compliance with Rule 17a-7 of the 1940 Act. Pursuant to the Act, such a transaction must be either a purchase or a sale, for no consideration other than cash payment against prompt delivery of the security at the current market price. No brokerage commission or fee (except for customary transfer fees), or other remuneration is paid in connection with such transaction. For the period ended August 31, 2009, the following Funds engaged in security transactions with affiliated Funds:
| | | | | | | | | | |
Fund
| | Cost of
Purchases
| | Proceed
from Sales
| | Realized
Gain/
Loss
| |
High Yield Bond | | $ | 5,078,303 | | $ | — | | $ | — | |
Mid Cap Growth | | | 1,797,655 | | | 1,304,795 | | | (887,130 | ) |
Strategic Bond | | | — | | | 5,078,303 | | | (2,036,798 | ) |
Note 12 — Other Matters
On March 31, 2009, the U.S. Department of the Treasury (“Treasury”) announced an extension of the Treasury’s Temporary Guarantee Program for Money Market II Fund (the “Program”) until September 18, 2009. On April 3, 2009, the Board of Trustees (the ”Board”) of the Fund approved the continued participation of the Money Market II Fund in the Program. The Program’s guarantee only applies to shareholders of the Money Market II Fund as of the close of business on September 19, 2008. Subject to certain conditions and limitations, share amounts held by investors in the Money Market II Fund as of the close of business on September 19, 2008 are guaranteed against loss under the Program in the event the per share net asset value falls below $0.995 (a “Guarantee Event”) and a Fund subsequently liquidates. Upon declaration of a Guarantee Event, the Money Market II Fund will be required to suspend redemptions, cease sales, and cease declaration and payment of dividends. The Program guarantee only covers the amount a shareholder held in the Money Market II Fund as of the close of business on September 19, 2008 or the amount a shareholder holds if and when a Guarantee Event occurs, whichever is less. A shareholder who has continuously maintained an account with the Funds since September 19, 2008 would receive a payment for each protected share equal to the shortfall between the amount received in the liquidation and $1.00 per share in the case of a Guarantee Event. The Program is subject to an overall limit of approximately $50 billion for all money market funds participating in the Program.
The extension of the Program began on May 1, 2009 and continues through September 18, 2009. Continued participation in the Program until September 18, 2009 required an additional payment to the Treasury in the amount of 0.015% of the net asset value of the Money Market II Fund, as of the close of business on September 19, 2008. The cost to participate in the extension of the Program was borne by the Money Market II Fund, subject to the expense limitations currently in effect.
Note 13 — Subsequent Event
The Funds have performed an evaluation of subsequent events through October 29, 2009, which is the date the financial statements were issued. The following subsequent events were noted:
Aggressive Growth Lifestyle Fund, Conservative Growth Lifestyle Fund, Core Bond Fund, International Small Cap Equity Fund, Moderate Growth Lifestyle Fund and Strategic Bond Fund
On September 5, 2009, American International Group, Inc. (“AIG”) entered into an agreement to sell a portion of AIG Investments, including its interests in AIG Global Investment Corp. (“AIGGIC”) to Bridge Partners, L.P. (“Bridge”), a partnership owned by Pacific Century Group (“Pacific”), a Hong Kong-based private investment firm (the “Transaction”). The Transaction is anticipated to close on or about December 1, 2009, and is subject to the receipt of the requisite regulatory approvals and the satisfaction of other conditions to closing. As part of an internal restructuring in anticipation of the sale, AIGGIC was transferred from AIG Global Asset Management Holdings Corp.
120
VALIC Company II
NOTES TO FINANCIAL STATEMENTS — (continued)
(“AIGGAMHC”) to Bridge Investments LLC, a direct subsidiary of AIGGAMHC. Prior to the sale, AIGGIC will be merged with and into a Delaware limited liability company that is a wholly owned subsidiary of AIG (the surviving entity, PineBridge Investments LLC, being referred to herein as “PineBridge”). As part of the sale, AIG will cause the indirect transfer of PineBridge to Bridge Partners, L.P., through the direct conveyance of Bridge Investments LLC. PineBridge, which, as successor to AIGGIC, will remain a registered investment adviser pursuant to the Investment Advisers Act of 1940, as amended. In connection with the Transaction, AIG will cause the indirect transfer of PineBridge to a subsidiary of Bridge through the direct conveyance of Bridge Investments, LLC (“Bridge Investments”), as the immediate parent of PineBridge. Furthermore, upon the closing of the Transaction, the existing investment sub-advisory agreement between The Variable Annuity Life Insurance Company (“VALIC”) and AIGGIC will terminate.
In advance of the termination of the existing sub-advisory agreement with AIGGIC, the Boards of Trustees (the “Board”) of VALIC Company II (“VC II”) held a meeting on October 27, 2009, wherein they appointed PineBridge, as the successor to both AIGGIC, to serve as sub-adviser to the Aggressive Growth Lifestyle Fund, Conservative Growth Lifestyle Fund, Core Bond Fund, International Small Cap Equity Fund, Moderate Growth Lifestyle Fund and Strategic Bond Fund (each, a “Fund” and collectively, the “Funds”), each pursuant to a new sub-advisory agreement between VALIC, each Fund’s investment adviser, and PineBridge (the “PineBridge Sub-advisory Agreement”), subject to approval by each Fund’s shareholders.
The Board also approved an interim sub-advisory agreement between VALIC and PineBridge (the “Interim PineBridge Sub-advisory Agreement”) that will go into effect upon the closing of the Transaction, and will remain in effect for 150 days from its effective date or until the PineBridge Sub-advisory Agreement is approved by shareholders, whichever is earlier. On March 16, 2010, the Funds expect to convene a special meeting of shareholders with respect to the proposal to approve the PineBridge Sub-advisory Agreement. Shareholders of record as of December 27, 2009 will receive proxy materials describing the PineBridge Sub-advisory Agreement in greater detail.
Socially Responsible Fund
At the meeting on October 27, 2009, the Board approved the termination of AIGGIC as the sub-adviser of the Socially Responsible Fund and appointed SunAmerica as the sub-adviser of the Fund, pursuant to a new sub-advisory agreement between VALIC and SunAmerica, subject to approval by the Fund’s shareholders (the “SunAmerica Sub-advisory Agreement”).
The Board also approved interim sub-advisory agreements between VALIC and SunAmerica (“Interim SunAmerica Sub-advisory Agreements”) that will go into effect upon or prior to the change of control of AIGGIC, and will remain in effect for 150 days from its effective date or until the SunAmerica Sub-advisory Agreement is approved by shareholders, whichever is earlier. On March 16, 2010, the Socially Responsible Fund expects to convene a special meeting of shareholders with respect to the proposal to approve the SunAmerica Sub-advisory Agreement. Shareholders of record as of December 27, 2009 will receive proxy materials describing the SunAmerica Sub-advisory Agreement in greater detail.
In connection with the approval of SunAmerica as the sub-adviser of the Fund, the Board approved a new advisory fee schedule to the investment advisory agreements that institutes breakpoints for fees payable to VALIC. The amended investment advisory agreements would become effective upon the effective date of the Interim SunAmerica Sub-advisory Agreement.
International Small Cap Equity Fund. At the meeting on October 27, 2009, the Board approved the addition of Invesco Aim Capital Management, LLC (“Invesco Aim”) as a sub-adviser to the International Small Cap Equity Fund to manage a portion of the Fund’s assets and approved the sub-advisory agreement between VALIC and Invesco Aim (the “Invesco Aim Sub-advisory Agreement”). In addition, the Board approved Invesco Asset Management, Ltd. (“IAML”) as a sub-sub-adviser to the Fund and approved a new sub-sub-advisory agreement between Invesco Aim and IAML (the “IAML Sub-Sub-advisory Agreement”). The Invesco Aim Sub-advisory Agreement and IAML Sub-Sub-Advisory Agreement will become effective on or about December 11, 2009. AIGGIC, the current sub-adviser of the Fund (or its successor, PineBridge), will continue to serve as a sub-adviser to the Fund.
The Board has authority, pursuant to an exemptive order granted by the Securities and Exchange Commission, to enter into the Invesco Aim Sub-Advisory Agreement and the IAML Sub-Sub-advisory Agreement without a shareholder vote; however, an information statement explaining the sub-adviser and sub-sub-adviser additions will be mailed to the Fund’s shareholders.
Small Cap Value Fund. At the meeting on October 27, 2009, the Board approved the addition of Metropolitan West Capital Management, LLC (“MetWest Capital”) and SunAmerica as sub-advisers to the Small Cap Value Fund. The Board approved a new sub-advisory agreement between VALIC and MetWest Capital (“MetWest Capital Sub-advisory Agreement”) and an amendment to the current sub-advisory agreement between VALIC and SunAmerica (“SunAmerica Sub-advisory Agreement”). J.P. Morgan Investment Advisers, Inc., the current sub-adviser of the Small Cap Value Fund, will continue to co-sub-advise a portion of the Fund’s assets.
Shareholders of record of the Fund as of November 13, 2009 are scheduled to vote on the proposed SunAmerica Sub-advisory Agreement at a special meeting of shareholders to be held on or about February 5, 2010. Before the meeting, shareholders of the Fund will receive a proxy statement containing information about the proposed SunAmerica Sub-advisory Agreement and information regarding the Fund. If approved by shareholders, the SunAmerica Sub-advisory Agreement with respect to the Small Cap Value Fund would become effective upon the open of business on February 8, 2010.
With respect to the MetWest Capital Sub-advisory Agreement, the Board has authority, pursuant to an exemptive order granted by the Securities and Exchange Commission, to enter into sub-advisory agreements without a shareholder vote; however, an information statement explaining the sub-adviser change will be mailed to the Small Cap Value Fund’s shareholders. The effective date of the MetWest Capital Sub-advisory Agreement will coincide with the effective date of the SunAmerica Sub-advisory Agreement, if such agreement is approved by shareholders of the Fund.
121
VALIC Company II
FINANCIAL HIGHLIGHTS
Per share data is for a share of beneficial interest outstanding throughout the period. Total return includes reinvestment of distributions on the reinvestment date.
| | | | | | | | | | | | | | | | | | | | | | | | | | | | | | | | | | | | | | | | |
| | | Aggressive Growth Lifestyle Fund
| | | Capital Appreciation Fund
| |
| | | Year Ended August 31,
| | | Year Ended August 31,
| |
| | | 2009
| | | 2008
| | | 2007
| | | 2006
| | | 2005
| | | 2009
| | | 2008
| | | 2007
| | | 2006
| | | 2005
| |
| | | | | | | | | | |
PER SHARE DATA | | | | | | | | | | | | | | | | | | | | | | | | | | | | | | | | | | | | | | | | |
Net asset value at beginning of period | | $ | 10.63 | | | $ | 12.59 | | | $ | 11.71 | | | $ | 10.98 | | | $ | 9.10 | | | $ | 10.24 | | | $ | 10.83 | | | $ | 8.90 | | | $ | 8.90 | | | $ | 7.79 | |
| | |
|
|
| |
|
|
|
Income (loss) from investment operations: | | | | | | | | | | | | | | | | | | | | | | | | | | | | | | | | | | | | | | | | |
Net investment income (loss)(d) | | | 0.14 | | | | 0.24 | | | | 0.23 | | | | 0.15 | | | | 0.08 | | | | 0.05 | | | | 0.01 | | | | 0.04 | | | | 0.02 | | �� | | 0.03 | |
Net realized and unrealized gain (loss) on investments and foreign currencies | | | (1.71 | ) | | | (1.25 | ) | | | 1.64 | | | | 1.00 | | | | 1.88 | | | | (2.77 | ) | | | (0.57 | ) | | | 1.91 | | | | (0.01 | ) | | | 1.11 | |
Net increase from payments by affiliates | | | – | | | | – | | | | – | | | | – | | | | – | | | | – | | | | – | | | | 0.00 | | | | – | | | | – | |
| | |
|
|
| |
|
|
|
Total income (loss) from investment operations | | | (1.57 | ) | | | (1.01 | ) | | | 1.87 | | | | 1.15 | | | | 1.96 | | | | (2.72 | ) | | | (0.56 | ) | | | 1.95 | | | | 0.01 | | | | 1.14 | |
| | |
|
|
| |
|
|
|
Distributions from: | | | | | | | | | | | | | | | | | | | | | | | | | | | | | | | | | | | | | | | | |
Net investment income | | | (0.22 | ) | | | (0.19 | ) | | | – | | | | (0.18 | ) | | | (0.08 | ) | | | (0.01 | ) | | | (0.03 | ) | | | (0.02 | ) | | | (0.01 | ) | | | (0.03 | ) |
Net realized gain on securities | | | (1.88 | ) | | | (0.76 | ) | | | (0.99 | ) | | | (0.24 | ) | | | – | | | | – | | | | – | | | | – | | | | – | | | | – | |
| | |
|
|
| |
|
|
|
Total distributions | | | (2.10 | ) | | | (0.95 | ) | | | (0.99 | ) | | | (0.42 | ) | | | (0.08 | ) | | | (0.01 | ) | | | (0.03 | ) | | | (0.02 | ) | | | (0.01 | ) | | | (0.03 | ) |
| | |
|
|
| |
|
|
|
Net asset value at end of period | | $ | 6.96 | | | $ | 10.63 | | | $ | 12.59 | | | $ | 11.71 | | | $ | 10.98 | | | $ | 7.51 | | | $ | 10.24 | | | $ | 10.83 | | | $ | 8.90 | | | $ | 8.90 | |
| | |
|
|
| |
|
|
|
TOTAL RETURN(a) | | | (10.48 | )% | | | (8.92 | )% | | | 16.53 | % | | | 10.65 | % | | | 21.62 | % | | | (26.59 | )% | | | (5.18 | )% | | | 21.90 | %(e) | | | 0.06 | % | | | 14.58 | % |
| | |
|
|
| |
|
|
|
| | | | | | | | | | |
RATIOS/SUPPLEMENTAL DATA | | | | | | | | | | | | | | | | | | | | | | | | | | | | | | | | | | | | | | | | |
Ratio of expenses to average net assets(b) | | | 0.10 | %(f) | | | 0.10 | %(f) | | | 0.10 | %(f) | | | 0.10 | %(f) | | | 0.10 | %(f) | | | 0.85 | % | | | 0.85 | % | | | 0.85 | % | | | 0.85 | % | | | 0.85 | % |
Ratio of expenses to average net assets(c) | | | 0.26 | %(f) | | | 0.23 | %(f) | | | 0.23 | %(f) | | | 0.29 | %(f) | | | 0.30 | %(f) | | | 1.06 | % | | | 1.01 | % | | | 1.03 | % | | | 1.03 | % | | | 1.13 | % |
Ratio of expense reductions to average net assets | | | – | | | | – | | | | – | | | | – | | | | – | | | | – | | | | – | | | | 0.00 | % | | | – | | | | – | |
Ratio of net investment income (loss) to average net assets(b) | | | 2.16 | %(f) | | | 2.15 | %(f) | | | 1.93 | %(f) | | | 1.31 | %(f) | | | 0.80 | %(f) | | | 0.74 | % | | | 0.05 | % | | | 0.38 | % | | | 0.21 | % | | | 0.34 | % |
Ratio of net investment income (loss) to average net assets(c) | | | 2.01 | %(f) | | | 2.02 | %(f) | | | 1.80 | %(f) | | | 1.12 | %(f) | | | 0.60 | %(f) | | | 0.53 | % | | | (0.11 | )% | | | 0.19 | % | | | 0.03 | % | | | 0.06 | % |
Portfolio turnover rate | | | 151 | % | | | 119 | % | | | 53 | % | | | 79 | % | | | 40 | % | | | 54 | % | | | 57 | % | | | 32 | % | | | 169 | % | | | 105 | % |
Number of shares outstanding at end of period (000’s) | | | 13,454 | | | | 8,603 | | | | 6,530 | | | | 4,612 | | | | 3,700 | | | | 6,456 | | | | 8,763 | | | | 7,779 | | | | 7,797 | | | | 5,499 | |
Net assets at the end of period (000’s) | | $ | 93,696 | | | $ | 91,464 | | | $ | 82,221 | | | $ | 53,987 | | | $ | 40,623 | | | $ | 48,510 | | | $ | 89,774 | | | $ | 84,269 | | | $ | 69,412 | | | $ | 48,939 | |
| (a) | Total return is not annualized. It does include, if any, expense reimbursements and expense reductions. The effect of fees and charges incurred at the separate account level are not reflected in these performance figures. If such expenses had been included, the total return would have been lower for each period presented. |
| (b) | Includes expense reimbursements, but excludes expense reductions. |
| (c) | Excludes expense reimbursements and expense reductions. |
| (d) | The per share amounts are calculated using the average share method. |
| (e) | The Fund’s performance was increased by less than 0.01% from a reimbursement by an affiliate. |
| (f) | Does not include underlying fund expenses that the Funds bear indirectly. |
122
VALIC Company II
FINANCIAL HIGHLIGHTS — (continued)
Per share data is for a share of beneficial interest outstanding throughout the period. Total return includes reinvestment of distributions on the reinvestment date.
| | | | | | | | | | | | | | | | | | | | | | | | | | | | | | | | | | | | | | | | |
| | | Conservative Growth Lifestyle Fund
| | | Core Bond Fund
| |
| | | Year Ended August 31,
| | | Year Ended August 31,
| |
| | | 2009
| | | 2008
| | | 2007
| | | 2006
| | | 2005
| | | 2009
| | | 2008
| | | 2007
| | | 2006
| | | 2005
| |
| | | | | | | | | | |
PER SHARE DATA | | | | | | | | | | | | | | | | | | | | | | | | | | | | | | | | | | | | | | | | |
Net asset value at beginning of period | | $ | 10.23 | | | $ | 11.29 | | | $ | 10.70 | | | $ | 10.81 | | | $ | 9.79 | | | $ | 10.08 | | | $ | 10.17 | | | $ | 10.09 | | | $ | 10.06 | | | $ | 10.00 | |
| | |
|
|
| |
|
|
|
Income (loss) from investment operations: | | | | | | | | | | | | | | | | | | | | | | | | | | | | | | | | | | | | | | | | |
Net investment income (loss)(d) | | | 0.33 | | | | 0.27 | | | | 0.19 | | | | 0.15 | | | | 0.24 | | | | 0.51 | | | | 0.51 | | | | 0.48 | | | | 0.49 | | | | 0.42 | |
Net realized and unrealized gain (loss) on investments and foreign currencies | | | (0.53 | ) | | | (0.72 | ) | | | 0.99 | | | | 0.42 | | | | 1.03 | | | | 0.09 | | | | (0.28 | ) | | | (0.11 | ) | | | (0.31 | ) | | | 0.08 | |
Net increase from payments by affiliates | | | – | | | | – | | | | – | | | | – | | | | – | | | | – | | | | – | | | | – | | | | – | | | | – | |
| | |
|
|
| |
|
|
|
Total income (loss) from investment operations | | | (0.20 | ) | | | (0.45 | ) | | | 1.18 | | | | 0.57 | | | | 1.27 | | | | 0.60 | | | | 0.23 | | | | 0.37 | | | | 0.18 | | | | 0.50 | |
| | |
|
|
| |
|
|
|
Distributions from: | | | | | | | | | | | | | | | | | | | | | | | | | | | | | | | | | | | | | | | | |
Net investment income | | | (0.26 | ) | | | (0.16 | ) | | | – | | | | (0.18 | ) | | | (0.25 | ) | | | (0.72 | ) | | | (0.32 | ) | | | (0.29 | ) | | | (0.13 | ) | | | (0.41 | ) |
Net realized gain on securities | | | (0.17 | ) | | | (0.45 | ) | | | (0.59 | ) | | | (0.50 | ) | | | – | | | | – | | | | – | | | | – | | | | (0.02 | ) | | | (0.03 | ) |
| | |
|
|
| |
|
|
|
Total distributions | | | (0.43 | ) | | | (0.61 | ) | | | (0.59 | ) | | | (0.68 | ) | | | (0.25 | ) | | | (0.72 | ) | | | (0.32 | ) | | | (0.29 | ) | | | (0.15 | ) | | | (0.44 | ) |
| | |
|
|
| |
|
|
|
Net asset value at end of period | | $ | 9.60 | | | $ | 10.23 | | | $ | 11.29 | | | $ | 10.70 | | | $ | 10.81 | | | $ | 9.96 | | | $ | 10.08 | | | $ | 10.17 | | | $ | 10.09 | | | $ | 10.06 | |
| | |
|
|
| |
|
|
|
TOTAL RETURN(a) | | | (1.36 | )% | | | (4.36 | )% | | | 11.28 | % | | | 5.50 | % | | | 13.03 | % | | | 6.87 | % | | | 2.24 | % | | | 3.67 | % | | | 1.82 | % | | | 5.05 | % |
| | |
|
|
| |
|
|
|
| | | | | | | | | | |
RATIOS/SUPPLEMENTAL DATA | | | | | | | | | | | | | | | | | | | | | | | | | | | | | | | | | | | | | | | | |
Ratio of expenses to average net assets(b) | | | 0.10 | %(f) | | | 0.10 | %(f) | | | 0.10 | %(f) | | | 0.10 | %(f) | | | 0.10 | %(f) | | | 0.77 | % | | | 0.77 | % | | | 0.77 | % | | | 0.77 | % | | | 0.77 | % |
Ratio of expenses to average net assets(c) | | | 0.31 | %(f) | | | 0.27 | %(f) | | | 0.28 | %(f) | | | 0.33 | %(f) | | | 0.31 | %(f) | | | 0.98 | % | | | 0.93 | % | | | 0.93 | % | | | 1.03 | % | | | 1.00 | % |
Ratio of expense reductions to average net assets | | | – | | | | – | | | | – | | | | – | | | | – | | | | – | | | | – | | | | – | | | | – | | | | – | |
Ratio of net investment income (loss) to average net assets(b) | | | 3.84 | %(f) | | | 2.58 | %(f) | | | 1.75 | %(f) | | | 1.38 | %(f) | | | 2.35 | %(f) | | | 5.38 | % | | | 4.97 | % | | | 4.84 | % | | | 4.91 | % | | | 4.23 | % |
Ratio of net investment income (loss) to average net assets(c) | | | 3.63 | %(f) | | | 2.40 | %(f) | | | 1.57 | %(f) | | | 1.15 | %(f) | | | 2.14 | %(f) | | | 5.17 | % | | | 4.80 | % | | | 4.68 | % | | | 4.66 | % | | | 3.99 | % |
Portfolio turnover rate | | | 180 | % | | | 107 | % | | | 75 | % | | | 81 | % | | | 46 | % | | | 134 | % | | | 158 | % | | | 180 | %(g) | | | 206 | %(g) | | | 216 | %(e)(g) |
Number of shares outstanding at end of period (000’s) | | | 6,004 | | | | 5,715 | | | | 4,332 | | | | 3,488 | | | | 3,190 | | | | 16,054 | | | | 20,731 | | | | 20,671 | | | | 10,802 | | | | 10,072 | |
Net assets at the end of period (000’s) | | $ | 57,659 | | | $ | 58,445 | | | $ | 48,897 | | | $ | 37,309 | | | $ | 34,468 | | | $ | 159,971 | | | $ | 209,052 | | | $ | 210,322 | | | $ | 109,007 | | | $ | 101,299 | |
| (a) | Total return is not annualized. It does include, if any, expense reimbursements and expense reductions. The effect of fees and charges incurred at the separate account level are not reflected in these performance figures. If such expenses had been included, the total return would have been lower for each period presented. |
| (b) | Includes expense reimbursements, but excludes expense reductions. |
| (c) | Excludes expense reimbursements and expense reductions. |
| (d) | The per share amounts are calculated using the average share method. |
| (e) | Portfolio turnover includes paydowns on securities. Previously, portfolio turnover was calculated prior to including paydowns on securities and was as follows: |
| (f) | Does not include underlying fund expenses that the Funds bear indirectly. |
| (g) | Portfolio turnover includes “to be announced” (“TBA”) transactions. Previously, portfolio turnover was calculated prior to including TBA transactions and was as follows: |
| | | | | | | | | |
Fund
| | 2007
| | | 2006
| | | 2005
| |
Core Bond | | 155 | % | | 202 | % | | 212 | % |
123
VALIC Company II
FINANCIAL HIGHLIGHTS — (continued)
Per share data is for a share of beneficial interest outstanding throughout the period. Total return includes reinvestment of distributions on the reinvestment date.
| | | | | | | | | | | | | | | | | | | | | | | | | | | | | | | | | | | | | | | | |
| | | High Yield Bond Fund
| | | International Small Cap Equity Fund
| |
| | | Year Ended August 31,
| | | Year Ended August 31,
| |
| | | 2009
| | | 2008
| | | 2007
| | | 2006
| | | 2005
| | | 2009
| | | 2008
| | | 2007
| | | 2006
| | | 2005
| |
| | | | | | | | | | |
PER SHARE DATA | | | | | | | | | | | | | | | | | | | | | | | | | | | | | | | | | | | | | | | | |
Net asset value at beginning of period | | $ | 8.43 | | | $ | 9.10 | | | $ | 9.32 | | | $ | 8.87 | | | $ | 8.28 | | | $ | 14.58 | | | $ | 19.78 | | | $ | 16.80 | | | $ | 14.05 | | | $ | 10.36 | |
| | |
|
|
| |
|
|
|
Income (loss) from investment operations: | | | | | | | | | | | | | | | | | | | | | | | | | | | | | | | | | | | | | | | | |
Net investment income (loss)(d) | | | 0.68 | | | | 0.72 | | | | 0.69 | | | | 0.63 | | | | 0.62 | | | | 0.16 | | | | 0.16 | | | | 0.16 | | | | 0.11 | | | | 0.12 | |
Net realized and unrealized gain (loss) on investments and foreign currencies | | | (1.61 | ) | | | (0.87 | ) | | | (0.26 | ) | | | 0.07 | | | | 0.78 | | | | (2.92 | ) | | | (3.62 | ) | | | 3.68 | | | | 2.87 | | | | 3.68 | |
Net increase from payments by affiliates | | | – | | | | – | | | | – | | | | 0.00 | | | | – | | | | – | | | | – | | | | 0.00 | | | | 0.00 | | | | – | |
| | |
|
|
| |
|
|
|
Total income (loss) from investment operations | | | (0.93 | ) | | | (0.15 | ) | | | 0.43 | | | | 0.70 | | | | 1.40 | | | | (2.76 | ) | | | (3.46 | ) | | | 3.84 | | | | 2.98 | | | | 3.80 | |
| | |
|
|
| |
|
|
|
Distributions from: | | | | | | | | | | | | | | | | | | | | | | | | | | | | | | | | | | | | | | | | |
Net investment income | | | (0.72 | ) | | | (0.50 | ) | | | (0.44 | ) | | | (0.16 | ) | | | (0.63 | ) | | | (0.14 | ) | | | (0.11 | ) | | | (0.06 | ) | | | (0.03 | ) | | | (0.04 | ) |
Net realized gain on securities | | | – | | | | (0.02 | ) | | | (0.21 | ) | | | (0.09 | ) | | | (0.18 | ) | | | (0.73 | ) | | | (1.63 | ) | | | (0.80 | ) | | | (0.20 | ) | | | (0.07 | ) |
| | |
|
|
| |
|
|
|
Total distributions | | | (0.72 | ) | | | (0.52 | ) | | | (0.65 | ) | | | (0.25 | ) | | | (0.81 | ) | | | (0.87 | ) | | | (1.74 | ) | | | (0.86 | ) | | | (0.23 | ) | | | (0.11 | ) |
| | |
|
|
| |
|
|
|
Net asset value at end of period | | $ | 6.78 | | | $ | 8.43 | | | $ | 9.10 | | | $ | 9.32 | | | $ | 8.87 | | | $ | 10.95 | | | $ | 14.58 | | | $ | 19.78 | | | $ | 16.80 | | | $ | 14.05 | |
| | |
|
|
| |
|
|
|
TOTAL RETURN(a) | | | (7.97 | )% | | | (1.79 | )% | | | 4.62 | % | | | 8.16 | %(g) | | | 17.45 | % | | | (17.61 | )% | | | (18.68 | )% | | | 23.44 | %(h) | | | 21.36 | %(e) | | | 36.89 | %(e) |
| | |
|
|
| |
|
|
|
| | | | | | | | | | |
RATIOS/SUPPLEMENTAL DATA | | | | | | | | | | | | | | | | | | | | | | | | | | | | | | | | | | | | | | | | |
Ratio of expenses to average net assets(b) | | | 0.99 | % | | | 0.99 | % | | | 0.99 | % | | | 0.99 | % | | | 0.99 | % | | | 1.00 | % | | | 1.00 | % | | | 1.00 | % | | | 1.00 | % | | | 1.00 | % |
Ratio of expenses to average net assets(c) | | | 1.16 | % | | | 1.13 | % | | | 1.16 | % | | | 1.19 | % | | | 1.27 | % | | | 1.32 | % | | | 1.31 | % | | | 1.29 | % | | | 1.37 | % | | | 1.57 | % |
Ratio of expense reductions to average net assets | | | – | | | | – | | | | – | | | | – | | | | – | | | | – | | | | – | | | | – | | | | – | | | | – | |
Ratio of net investment income (loss) to average net assets(b) | | | 11.11 | % | | | 8.25 | % | | | 7.63 | % | | | 7.07 | % | | | 7.30 | % | | | 1.71 | % | | | 0.97 | % | | | 0.84 | % | | | 0.72 | % | | | 0.99 | % |
Ratio of net investment income (loss) to average net assets(c) | | | 10.94 | % | | | 8.12 | % | | | 7.46 | % | | | 6.87 | % | | | 7.01 | % | | | 1.40 | % | | | 0.66 | % | | | 0.55 | % | | | 0.35 | % | | | 0.42 | % |
Portfolio turnover rate | | | 91 | % | | | 57 | % | | | 47 | % | | | 53 | % | | | 58 | %(f) | | | 132 | % | | | 101 | % | | | 72 | % | | | 69 | % | | | 143 | % |
Number of shares outstanding at end of period (000’s) | | | 28,189 | | | | 24,516 | | | | 21,225 | | | | 11,377 | | | | 9,090 | | | | 51,389 | | | | 42,957 | | | | 37,205 | | | | 25,445 | | | | 7,405 | |
Net assets at the end of period (000’s) | | $ | 191,246 | | | $ | 206,712 | | | $ | 193,127 | | | $ | 106,070 | | | $ | 80,665 | | | $ | 562,725 | | | $ | 626,351 | | | $ | 735,844 | | | $ | 427,437 | | | $ | 104,030 | |
| (a) | Total return is not annualized. It does include, if any, expense reimbursements and expense reductions. The effect of fees and charges incurred at the separate account level are not reflected in these performance figures. If such expenses had been included, the total return would have been lower for each period presented. |
| (b) | Includes expense reimbursements, but excludes expense reductions. |
| (c) | Excludes expense reimbursements and expense reductions. |
| (d) | The per share amounts are calculated using the average share method. |
| (e) | The Fund’s performance figure was increased by less than 0.01% from reimbursements for losses realized on the disposal of investments in violation of investment restrictions. |
| (f) | Portfolio turnover includes paydowns on securities. Previously, portfolio turnover was calculated prior to including paydowns on securities and was as follows: |
| | | |
Fund
| | 2005
| |
High Yield Bond | | 57 | % |
| (g) | The Fund’s performance figure was increased by less than 0.01% from a reimbursement by an affiliate. |
| (h) | The Fund’s performance figure was increased by 0.06% from a reimbursement for losses realized on the disposal of investments in violation of investment restrictions. |
124
VALIC Company II
FINANCIAL HIGHLIGHTS — (continued)
Per share data is for a share of beneficial interest outstanding throughout the period. Total return includes reinvestment of distributions on the reinvestment date.
| | | | | | | | | | | | | | | | | | | | | | | | | | | | | | | | | | | | | | | | |
| | | Large Cap Value Fund
| | | Mid Cap Growth Fund
| |
| | | Year Ended August 31,
| | | Year Ended August 31,
| |
| | | 2009
| | | 2008
| | | 2007
| | | 2006
| | | 2005
| | | 2009
| | | 2008
| | | 2007
| | | 2006
| | | 2005
| |
| | | | | | | | | | |
PER SHARE DATA | | | | | | | | | | | | | | | | | | | | | | | | | | | | | | | | | | | | | | | | |
Net asset value at beginning of period | | $ | 12.51 | | | $ | 15.74 | | | $ | 14.58 | | | $ | 13.72 | | | $ | 12.18 | | | $ | 7.42 | | | $ | 9.36 | | | $ | 8.15 | | | $ | 7.56 | | | $ | 5.94 | |
| | |
|
|
| |
|
|
|
Income (loss) from investment operations: | | | | | | | | | | | | | | | | | | | | | | | | | | | | | | | | | | | | | | | | |
Net investment income (loss)(d) | | | 0.15 | | | | 0.20 | | | | 0.18 | | | | 0.21 | | | | 0.18 | | | | (0.01 | ) | | | (0.02 | ) | | | (0.02 | ) | | | (0.01 | ) | | | (0.01 | ) |
Net realized and unrealized gain (loss) on investments and foreign currencies | | | (3.00 | ) | | | (2.51 | ) | | | 1.67 | | | | 1.50 | | | | 2.05 | | | | (1.59 | ) | | | (0.97 | ) | | | 1.80 | | | | 0.60 | | | | 1.63 | |
Net increase from payments by affiliates | | | – | | | | – | | | | – | | | | 0.00 | | | | – | | | | – | | | | – | | | | – | | | | – | | | | – | |
| | |
|
|
| |
|
|
|
Total income (loss) from investment operations | | | (2.85 | ) | | | (2.31 | ) | | | 1.85 | | | | 1.71 | | | | 2.23 | | | | (1.60 | ) | | | (0.99 | ) | | | 1.78 | | | | 0.59 | | | | 1.62 | |
| | |
|
|
| |
|
|
|
Distributions from: | | | | | | | | | | | | | | | | | | | | | | | | | | | | | | | | | | | | | | | | |
Net investment income | | | (0.29 | ) | | | (0.14 | ) | | | (0.07 | ) | | | (0.06 | ) | | | (0.17 | ) | | | – | | | | – | | | | – | | | | – | | | | – | |
Net realized gain on securities | | | – | | | | (0.78 | ) | | | (0.62 | ) | | | (0.79 | ) | | | (0.52 | ) | | | (0.03 | ) | | | (0.95 | ) | | | (0.57 | ) | | | – | | | | – | |
| | |
|
|
| |
|
|
|
Total distributions | | | (0.29 | ) | | | (0.92 | ) | | | (0.69 | ) | | | (0.85 | ) | | | (0.69 | ) | | | (0.03 | ) | | | (0.95 | ) | | | (0.57 | ) | | | – | | | | – | |
| | |
|
|
| |
|
|
|
Net asset value at end of period | | $ | 9.37 | | | $ | 12.51 | | | $ | 15.74 | | | $ | 14.58 | | | $ | 13.72 | | | $ | 5.79 | | | $ | 7.42 | | | $ | 9.36 | | | $ | 8.15 | | | $ | 7.56 | |
| | |
|
|
| |
|
|
|
TOTAL RETURN(a) | | | (22.55 | )% | | | (15.47 | )% | | | 12.89 | % | | | 12.98 | %(e) | | | 18.62 | % | | | (21.43 | )% | | | (11.98 | )% | | | 22.57 | % | | | 7.80 | % | | | 27.27 | % |
| | |
|
|
| |
|
|
|
| | | | | | | | | | |
RATIOS/SUPPLEMENTAL DATA | | | | | | | | | | | | | | | | | | | | | | | | | | | | | | | | | | | | | | | | |
Ratio of expenses to average net assets(b) | | | 0.81 | % | | | 0.81 | % | | | 0.81 | % | | | 0.81 | % | | | 0.81 | % | | | 0.85 | % | | | 0.85 | % | | | 0.85 | % | | | 0.85 | % | | | 0.85 | % |
Ratio of expenses to average net assets(c) | | | 0.97 | % | | | 0.92 | % | | | 0.89 | % | | | 0.97 | % | | | 1.01 | % | | | 1.25 | % | | | 1.17 | % | | | 1.25 | % | | | 1.34 | % | | | 1.37 | % |
Ratio of expense reductions to average net assets | | | 0.01 | % | | | 0.01 | % | | | – | | | | – | | | | – | | | | 0.05 | % | | | 0.02 | % | | | 0.01 | % | | | – | | | | – | |
Ratio of net investment income (loss) to average net assets(b) | | | 1.70 | % | | | 1.41 | % | | | 1.16 | % | | | 1.54 | % | | | 1.41 | % | | | (0.29 | )% | | | (0.28 | )% | | | (0.26 | )% | | | (0.15 | )% | | | (0.18 | )% |
Ratio of net investment income (loss) to average net assets(c) | | | 1.53 | % | | | 1.30 | % | | | 1.08 | % | | | 1.38 | % | | | 1.21 | % | | | (0.69 | )% | | | (0.60 | )% | | | (0.66 | )% | | | (0.64 | )% | | | (0.70 | )% |
Portfolio turnover rate | | | 182 | % | | | 183 | % | | | 105 | % | | | 103 | % | | | 84 | % | | | 116 | % | | | 125 | % | | | 121 | % | | | 142 | % | | | 125 | % |
Number of shares outstanding at end of period (000’s) | | | 16,825 | | | | 24,675 | | | | 26,589 | | | | 12,192 | | | | 6,476 | | | | 27,455 | | | | 28,873 | | | | 9,052 | | | | 7,929 | | | | 6,920 | |
Net assets at the end of period (000’s) | | $ | 157,711 | | | $ | 308,635 | | | $ | 418,508 | | | $ | 177,737 | | | $ | 88,853 | | | $ | 158,841 | | | $ | 214,201 | | | $ | 84,765 | | | $ | 64,583 | | | $ | 52,335 | |
| (a) | Total return is not annualized. It does include, if any, expense reimbursements and expense reductions. The effect of fees and charges incurred at the separate account level are not reflected in these performance figures. If such expenses had been included, the total return would have been lower for each period presented. |
| (b) | Includes expense reimbursements, but excludes expense reductions. |
| (c) | Excludes expense reimbursements and expense reductions. |
| (d) | The per share amounts are calculated using the average share method. |
| (e) | The Fund’s performance figure was increased by less than 0.01% from reimbursements for losses realized on the disposal of investments in violation of investment restrictions. |
125
VALIC Company II
FINANCIAL HIGHLIGHTS — (continued)
Note 14 — Subsequent Event
Per share data is for a share of beneficial interest outstanding throughout the period. Total return includes reinvestment of distributions on the reinvestment date.
| | | | | | | | | | | | | | | | | | | | | | | | | | | | | | | | | | | | | | | | |
| | | Mid Cap Value Fund
| | | Moderate Growth Lifestyle Fund
| |
| | | Year Ended August 31,
| | | Year Ended August 31,
| |
| | | 2009
| | | 2008
| | | 2007
| | | 2006
| | | 2005
| | | 2009
| | | 2008
| | | 2007
| | | 2006
| | | 2005
| |
| | | | | | | | | | |
PER SHARE DATA | | | | | | | | | | | | | | | | | | | | | | | | | | | | | | | | | | | | | | | | |
Net asset value at beginning of period | | $ | 15.31 | | | $ | 20.09 | | | $ | 18.75 | | | $ | 18.27 | | | $ | 16.18 | | | $ | 11.40 | | | $ | 13.04 | | | $ | 12.44 | | | $ | 12.04 | | | $ | 10.46 | |
| | |
|
|
| |
|
|
|
Income (loss) from investment operations: | | | | | | | | | | | | | | | | | | | | | | | | | | | | | | | | | | | | | | | | |
Net investment income (loss)(d) | | | 0.13 | | | | 0.07 | | | | 0.10 | | | | 0.08 | | | | 0.01 | | | | 0.25 | | | | 0.29 | | | | 0.21 | | | | 0.16 | | | | 0.18 | |
Net realized and unrealized gain (loss) on investments and foreign currencies | | | (2.40 | ) | | | (3.11 | ) | | | 3.14 | | | | 1.79 | | | | 3.63 | | | | (0.96 | ) | | | (1.08 | ) | | | 1.49 | | | | 0.70 | | | | 1.58 | |
Net increase from payments by affiliates | | | – | | | | – | | | | – | | | | – | | | | – | | | | – | | | | – | | | | – | | | | – | | | | – | |
| | |
|
|
| |
|
|
|
Total income (loss) from investment operations | | | (2.27 | ) | | | (3.04 | ) | | | 3.24 | | | | 1.87 | | | | 3.64 | | | | (0.71 | ) | | | (0.79 | ) | | | 1.70 | | | | 0.86 | | | | 1.76 | |
| | |
|
|
| |
|
|
|
Distributions from: | | | | | | | | | | | | | | | | | | | | | | | | | | | | | | | | | | | | | | | | |
Net investment income | | | (0.06 | ) | | | (0.09 | ) | | | (0.07 | ) | | | (0.01 | ) | | | (0.01 | ) | | | (0.26 | ) | | | (0.17 | ) | | | (0.12 | ) | | | (0.06 | ) | | | (0.18 | ) |
Net realized gain on securities | | | (0.27 | ) | | | (1.65 | ) | | | (1.83 | ) | | | (1.38 | ) | | | (1.54 | ) | | | (0.31 | ) | | | (0.68 | ) | | | (0.98 | ) | | | (0.40 | ) | | | – | |
| | |
|
|
| |
|
|
|
Total distributions | | | (0.33 | ) | | | (1.74 | ) | | | (1.90 | ) | | | (1.39 | ) | | | (1.55 | ) | | | (0.57 | ) | | | (0.85 | ) | | | (1.10 | ) | | | (0.46 | ) | | | (0.18 | ) |
| | |
|
|
| |
|
|
|
Net asset value at end of period | | $ | 12.71 | | | $ | 15.31 | | | $ | 20.09 | | | $ | 18.75 | | | $ | 18.27 | | | $ | 10.12 | | | $ | 11.40 | | | $ | 13.04 | | | $ | 12.44 | | | $ | 12.04 | |
| | |
|
|
| |
|
|
|
TOTAL RETURN(a) | | | (14.17 | )% | | | (16.05 | )% | | | 18.15 | % | | | 10.74 | % | | | 23.18 | % | | | (5.33 | )% | | | (6.70 | )% | | | 14.18 | % | | | 7.21 | % | | | 16.88 | % |
| | |
|
|
| |
|
|
|
| | | | | | | | | | |
RATIOS/SUPPLEMENTAL DATA | | | | | | | | | | | | | | | | | | | | | | | | | | | | | | | | | | | | | | | | |
Ratio of expenses to average net assets(b) | | | 1.05 | % | | | 1.05 | % | | | 1.05 | % | | | 1.05 | % | | | 1.05 | % | | | 0.10 | %(e) | | | 0.10 | %(e) | | | 0.10 | %(e) | | | 0.10 | %(e) | | | 0.10 | %(e) |
Ratio of expenses to average net assets(c) | | | 1.17 | % | | | 1.13 | % | | | 1.11 | % | | | 1.20 | % | | | 1.18 | % | | | 0.22 | %(e) | | | 0.20 | %(e) | | | 0.20 | %(e) | | | 0.24 | %(e) | | | 0.25 | %(e) |
Ratio of expense reductions to average net assets | | | 0.03 | % | | | 0.01 | % | | | 0.02 | % | | | 0.01 | % | | | 0.02 | % | | | – | | | | – | | | | – | | | | – | | | | – | |
Ratio of net investment income (loss) to average net assets(b) | | | 1.22 | % | | | 0.43 | % | | | 0.47 | % | | | 0.40 | % | | | 0.01 | % | | | 2.81 | %(e) | | | 2.42 | %(e) | | | 1.64 | %(e) | | | 1.35 | %(e) | | | 1.58 | %(e) |
Ratio of net investment income (loss) to average net assets(c) | | | 1.10 | % | | | 0.35 | % | | | 0.41 | % | | | 0.25 | % | | | (0.11 | )% | | | 2.69 | %(e) | | | 2.32 | %(e) | | | 1.54 | %(e) | | | 1.21 | %(e) | | | 1.44 | %(e) |
Portfolio turnover rate | | | 84 | % | | | 72 | % | | | 59 | % | | | 76 | % | | | 46 | % | | | 175 | % | | | 108 | % | | | 64 | % | | | 70 | % | | | 38 | % |
Number of shares outstanding at end of period (000’s) | | | 37,634 | | | | 40,372 | | | | 26,139 | | | | 19,331 | | | | 16,528 | | | | 14,009 | | | | 12,783 | | | | 9,401 | | | | 7,122 | | | | 6,129 | |
Net assets at the end of period (000’s) | | $ | 478,457 | | | $ | 618,150 | | | $ | 525,119 | | | $ | 362,379 | | | $ | 302,014 | | | $ | 141,786 | | | $ | 145,705 | | | $ | 122,551 | | | $ | 88,558 | | | $ | 73,804 | |
| (a) | Total return is not annualized. It does include, if any, expense reimbursements and expense reductions. The effect of fees and charges incurred at the separate account level are not reflected in these performance figures. If such expenses had been included, the total return would have been lower for each period presented. |
| (b) | Includes expense reimbursements, but excludes expense reductions. |
| (c) | Excludes expense reimbursements and expense reductions. |
| (d) | The per share amounts are calculated using the average share method. |
| (e) | Does not include underlying fund expenses that the Funds bear indirectly. |
126
VALIC Company II
FINANCIAL HIGHLIGHTS — (continued)
Per share data is for a share of beneficial interest outstanding throughout the period. Total return includes reinvestment of distributions on the reinvestment date.
| | | | | | | | | | | | | | | | | | | | | | | | | | | | | | | | | | | | | | | | |
| | | Money Market II Fund
| | | Small Cap Growth Fund
| |
| | | Year Ended August 31,
| | | Year Ended August 31,
| |
| | | 2009
| | | 2008
| | | 2007
| | | 2006
| | | 2005
| | | 2009
| | | 2008
| | | 2007
| | | 2006
| | | 2005
| |
| | | | | | | | | | |
PER SHARE DATA | | | | | | | | | | | | | | | | | | | | | | | | | | | | | | | | | | | | | | | | |
Net asset value at beginning of period | | $ | 1.00 | | | $ | 1.00 | | | $ | 1.00 | | | $ | 1.00 | | | $ | 1.00 | | | $ | 11.46 | | | $ | 14.59 | | | $ | 12.68 | | | $ | 12.19 | | | $ | 10.20 | |
| | |
|
|
| |
|
|
|
Income (loss) from investment operations: | | | | | | | | | | | | | | | | | | | | | | | | | | | | | | | | | | | | | | | | |
Net investment income (loss)(d) | | | 0.01 | | | | 0.03 | | | | 0.05 | | | | 0.04 | | | | 0.02 | | | | (0.07 | ) | | | (0.09 | ) | | | (0.09 | ) | | | (0.07 | ) | | | (0.09 | ) |
Net realized and unrealized gain (loss) on investments and foreign currencies | | | (0.00 | ) | | | (0.00 | ) | | | – | | | | – | | | | – | | | | (1.96 | ) | | | (2.20 | ) | | | 2.00 | | | | 0.56 | | | | 2.08 | |
Net increase from payments by affiliates | | | – | | | | – | | | | – | | | | – | | | | – | | | | – | | | | – | | | | – | | | | – | | | | – | |
| | |
|
|
| |
|
|
|
Total income (loss) from investment operations | | | 0.01 | | | | 0.03 | | | | 0.05 | | | | 0.04 | | | | 0.02 | | | | (2.03 | ) | | | (2.29 | ) | | | 1.91 | | | | 0.49 | | | | 1.99 | |
| | |
|
|
| |
|
|
|
Distributions from: | | | | | | | | | | | | | | | | | | | | | | | | | | | | | | | | | | | | | | | | |
Net investment income | | | (0.01 | ) | | | (0.03 | ) | | | (0.05 | ) | | | (0.04 | ) | | | (0.02 | ) | | | – | | | | – | | | | – | | | | – | | | | – | |
Net realized gain on securities | | | – | | | | – | | | | – | | | | – | | | | – | | | | (0.12 | ) | | | (0.84 | ) | | | – | | | | – | | | | – | |
| | |
|
|
| |
|
|
|
Total distributions | | | (0.01 | ) | | | (0.03 | ) | | | (0.05 | ) | | | (0.04 | ) | | | (0.02 | ) | | | (0.12 | ) | | | (0.84 | ) | | | – | | | | – | | | | – | |
| | |
|
|
| |
|
|
|
Net asset value at end of period | | $ | 1.00 | | | $ | 1.00 | | | $ | 1.00 | | | $ | 1.00 | | | $ | 1.00 | | | $ | 9.31 | | | $ | 11.46 | | | $ | 14.59 | | | $ | 12.68 | | | $ | 12.19 | |
| | |
|
|
| |
|
|
|
TOTAL RETURN(a) | | | 0.89 | % | | | 3.08 | % | | | 4.88 | % | | | 4.09 | % | | | 1.99 | % | | | (17.44 | )% | | | (16.52 | )% | | | 15.06 | % | | | 4.02 | % | | | 19.51 | % |
| | |
|
|
| |
|
|
|
| | | | | | | | | | |
RATIOS/SUPPLEMENTAL DATA | | | | | | | | | | | | | | | | | | | | | | | | | | | | | | | | | | | | | | | | |
Ratio of expenses to average net assets(b) | | | 0.55 | % | | | 0.55 | % | | | 0.55 | % | | | 0.56 | % | | | 0.56 | % | | | 1.16 | % | | | 1.16 | % | | | 1.16 | % | | | 1.16 | % | | | 1.16 | % |
Ratio of expenses to average net assets(c) | | | 0.75 | % | | | 0.67 | % | | | 0.64 | % | | | 0.67 | % | | | 0.75 | % | | | 1.49 | % | | | 1.39 | % | | | 1.35 | % | | | 1.40 | % | | | 1.44 | % |
Ratio of expense reduction to average net assets | | | – | | | | – | | | | – | | | | – | | | | – | | | | 0.01 | %. | | | 0.00 | % | | | 0.01 | % | | | – | | | | – | |
Ratio of net investment income (loss) to average net assets(b) | | | 0.94 | % | | | 3.04 | % | | | 4.78 | % | | | 4.13 | % | | | 1.98 | % | | | (0.88 | )% | | | (0.75 | )% | | | (0.67 | )% | | | (0.55 | )% | | | (0.81 | )% |
Ratio of net investment income (loss) to average net assets(c) | | | 0.73 | % | | | 2.93 | % | | | 4.69 | % | | | 4.02 | % | | | 1.78 | % | | | (1.21 | )% | | | (0.98 | )% | | | (0.86 | )% | | | (0.79 | )% | | | (1.09 | )% |
Portfolio turnover rate | | | N/A | | | | N/A | | | | N/A | | | | N/A | | | | N/A | | | | 83 | % | | | 158 | % | | | 58 | % | | | 69 | % | | | 46 | % |
Number of shares outstanding at end of period (000’s) | | | 253,830 | | | | 329,922 | | | | 337,050 | | | | 151,326 | | | | 75,836 | | | | 4,546 | | | | 4,195 | | | | 3,884 | | | | 3,892 | | | | 3,779 | |
Net assets at the end of period (000’s) | | $ | 253,242 | | | $ | 329,212 | | | $ | 337,050 | | | $ | 151,326 | | | $ | 75,836 | | | $ | 42,310 | | | $ | 48,061 | | | $ | 56,678 | | | $ | 49,354 | | | $ | 46,088 | |
| (a) | Total return is not annualized. It does include, if any, expense reimbursements and expense reductions. The effect of fees and charges incurred at the separate account level are not reflected in these performance figures. If such expenses had been included, the total return would have been lower for each period presented. |
| (b) | Includes expense reimbursements, but excludes expense reductions. |
| (c) | Excludes expense reimbursements and expense reductions. |
| (d) | The per share amounts are calculated using the average share method. |
127
VALIC Company II
FINANCIAL HIGHLIGHTS — (continued)
Per share data is for a share of beneficial interest outstanding throughout the period. Total return includes reinvestment of distributions on the reinvestment date.
| | | | | | | | | | | | | | | | | | | | | | | | | | | | | | | | | | | | | | | | |
| | | Small Cap Value Fund
| | | Socially Responsible Fund
| |
| | | Year Ended August 31,
| | | Year Ended August 31,
| |
| | | 2009
| | | 2008
| | | 2007
| | | 2006
| | | 2005
| | | 2009
| | | 2008
| | | 2007
| | | 2006
| | | 2005
| |
| | | | | | | | | | |
PER SHARE DATA | | | | | | | | | | | | | | | | | | | | | | | | | | | | | | | | | | | | | | | | |
Net asset value at beginning of period | | $ | 13.75 | | | $ | 15.35 | | | $ | 15.06 | | | $ | 15.61 | | | $ | 13.68 | | | $ | 11.39 | | | $ | 13.49 | | | $ | 12.06 | | | $ | 11.21 | | | $ | 10.25 | |
| | |
|
|
| |
|
|
|
Income (loss) from investment operations: | | | | | | | | | | | | | | | | | | | | | | | | | | | | | | | | | | | | | | | | |
Net investment income (loss)(d) | | | 0.15 | | | | 0.17 | | | | 0.12 | | | | 0.11 | | | | 0.12 | | | | 0.14 | | | | 0.18 | | | | 0.19 | | | | 0.17 | | | | 0.15 | |
Net realized and unrealized gain (loss) on investments and foreign currencies | | | (3.28 | ) | | | (0.98 | ) | | | 1.27 | | | | 1.25 | | | | 2.68 | | | | (2.37 | ) | | | (1.46 | ) | | | 1.51 | | | | 0.96 | | | | 0.96 | |
Net increase from payments by affiliates | | | – | | | | – | | | | 0.00 | | | | – | | | | – | | | | – | | | | – | | | | 0.00 | | | | – | | | | 0.00 | |
| | |
|
|
| |
|
|
|
Total income (loss) from investment operations | | | (3.13 | ) | | | (0.81 | ) | | | 1.39 | | | | 1.36 | | | | 2.80 | | | | (2.23 | ) | | | (1.28 | ) | | | 1.70 | | | | 1.13 | | | | 1.11 | |
| | |
|
|
| |
|
|
|
Distributions from: | | | | | | | | | | | | | | | | | | | | | | | | | | | | | | | | | | | | | | | | |
Net investment income | | | (0.12 | ) | | | (0.09 | ) | | | (0.07 | ) | | | (0.02 | ) | | | (0.13 | ) | | | (0.19 | ) | | | (0.12 | ) | | | (0.06 | ) | | | (0.05 | ) | | | (0.15 | ) |
Net realized gain on securities | | | (0.62 | ) | | | (0.70 | ) | | | (1.03 | ) | | | (1.89 | ) | | | (0.74 | ) | | | (0.04 | ) | | | (0.70 | ) | | | (0.21 | ) | | | (0.23 | ) | | | – | |
| | |
|
|
| |
|
|
|
Total distributions | | | (0.74 | ) | | | (0.79 | ) | | | (1.10 | ) | | | (1.91 | ) | | | (0.87 | ) | | | (0.23 | ) | | | (0.82 | ) | | | (0.27 | ) | | | (0.28 | ) | | | (0.15 | ) |
| | |
|
|
| |
|
|
|
Net asset value at end of period | | $ | 9.88 | | | $ | 13.75 | | | $ | 15.35 | | | $ | 15.06 | | | $ | 15.61 | | | $ | 8.93 | | | $ | 11.39 | | | $ | 13.49 | | | $ | 12.06 | | | $ | 11.21 | |
| | |
|
|
| |
|
|
|
TOTAL RETURN(a) | | | (21.71 | )% | | | (5.23 | )% | | | 9.22 | %(g) | | | 9.69 | % | | | 20.84 | % | | | (19.20 | )% | | | (10.04 | )% | | | 14.22 | %(f) | | | 10.16 | % | | | 10.85 | %(e) |
| | |
|
|
| |
|
|
|
| | | | | | | | | | |
RATIOS/SUPPLEMENTAL DATA | | | | | | | | | | | | | | | | | | | | | | | | | | | | | | | | | | | | | | | | |
Ratio of expenses to average net assets(b) | | | 0.95 | % | | | 0.95 | % | | | 0.95 | % | | | 0.95 | % | | | 0.95 | % | | | 0.56 | % | | | 0.56 | % | | | 0.56 | % | | | 0.56 | % | | | 0.56 | % |
Ratio of expenses to average net assets(c) | | | 1.11 | % | | | 1.11 | % | | | 1.11 | % | | | 1.21 | % | | | 1.22 | % | | | 0.69 | % | | | 0.65 | % | | | 0.63 | % | | | 0.71 | % | | | 0.71 | % |
Ratio of expense reductions to average net assets | | | 0.00 | % | | | 0.01 | % | | | 0.00 | % | | | – | | | | – | | | | 0.02 | % | | | 0.02 | % | | | 0.03 | % | | | – | | | | – | |
Ratio of net investment income (loss) to average net assets(b) | | | 1.77 | % | | | 1.02 | % | | | 0.77 | % | | | 0.74 | % | | | 0.83 | % | | | 1.79 | % | | | 1.46 | % | | | 1.45 | % | | | 1.52 | % | | | 1.47 | % |
Ratio of net investment income (loss) to average net assets(c) | | | 1.60 | % | | | 0.86 | % | | | 0.61 | % | | | 0.49 | % | | | 0.56 | % | | | 1.67 | % | | | 1.37 | % | | | 1.38 | % | | | 1.37 | % | | | 1.32 | % |
Portfolio turnover rate | | | 32 | % | | | 39 | % | | | 33 | % | | | 58 | % | | | 85 | % | | | 86 | % | | | 120 | % | | | 152 | % | | | 172 | % | | | 74 | % |
Number of shares outstanding at end of period (000’s) | | | 34,981 | | | | 22,274 | | | | 16,918 | | | | 7,622 | | | | 6,235 | | | | 73,479 | | | | 80,127 | | | | 68,651 | | | | 24,486 | | | | 17,180 | |
Net assets at the end of period (000’s) | | $ | 345,551 | | | $ | 306,357 | | | $ | 259,704 | | | $ | 114,809 | | | $ | 97,314 | | | $ | 656,132 | | | $ | 912,992 | | | $ | 925,906 | | | $ | 295,231 | | | $ | 192,604 | |
| (a) | Total return is not annualized. It does include, if any, expense reimbursements and expense reductions. The effect of fees and charges incurred at the separate account level are not reflected in these performance figures. If such expenses had been included, the total return would have been lower for each period presented. |
| (b) | Includes expense reimbursements, but excludes expense reductions. |
| (c) | Excludes expense reimbursements and expense reductions. |
| (d) | The per share amounts are calculated using the average share method. |
| (e) | The Fund’s performance figure was increased by less than 0.01% from reimbursements for losses realized on the disposal of investments in violation of investment restrictions. |
| (f) | The Fund’s performance was increased by less than 0.01% from a reimbursement by an affiliate. |
| (g) | The Fund’s performance figure was increased by less than 0.01% from a gain realized on the disposal of investments in violation of investment restrictions. |
128
VALIC Company II
FINANCIAL HIGHLIGHTS — (continued)
Per share data is for a share of beneficial interest outstanding throughout the period. Total return includes reinvestment of distributions on the reinvestment date.
| | | | | | | | | | | | | | | | | | | | |
| | | Strategic Bond Fund
| |
| | | Year Ended August 31,
| |
| | | 2009
| | | 2008
| | | 2007
| | | 2006
| | | 2005
| |
| | | | | |
PER SHARE DATA | | | | | | | | | | | | | | | | | | | | |
Net asset value at beginning of period | | $ | 11.10 | | | $ | 11.33 | | | $ | 11.36 | | | $ | 11.08 | | | $ | 10.66 | |
| | |
|
|
|
Income (loss) from investment operations: | | | | | | | | | | | | | | | | | | | | |
Net investment income (loss)(d) | | | 0.66 | | | | 0.65 | | | | 0.61 | | | | 0.58 | | | | 0.56 | |
Net realized and unrealized gain (loss) on investments and foreign currencies | | | (0.60 | ) | | | (0.29 | ) | | | (0.12 | ) | | | 0.04 | | | | 0.65 | |
Net increase from payments by affiliates | | | – | | | | – | | | | – | | | | 0.00 | | | | – | |
| | |
|
|
|
Total income (loss) from investment operations | | | 0.06 | | | | 0.36 | | | | 0.49 | | | | 0.62 | | | | 1.21 | |
| | |
|
|
|
Distributions from: | | | | | | | | | | | | | | | | | | | | |
Net investment income | | | (0.87 | ) | | | (0.51 | ) | | | (0.40 | ) | | | (0.16 | ) | | | (0.54 | ) |
Net realized gain on securities | | | – | | | | (0.08 | ) | | | (0.12 | ) | | | (0.18 | ) | | | (0.25 | ) |
| | |
|
|
|
Total distributions | | | (0.87 | ) | | | (0.59 | ) | | | (0.52 | ) | | | (0.34 | ) | | | (0.79 | ) |
| | |
|
|
|
Net asset value at end of period | | $ | 10.29 | | | $ | 11.10 | | | $ | 11.33 | | | $ | 11.36 | | | $ | 11.08 | |
| | |
|
|
|
TOTAL RETURN(a) | | | 2.23 | % | | | 3.13 | % | | | 4.32 | % | | | 5.75 | %(g) | | | 11.66 | %(e) |
| | |
|
|
|
| | | | | |
RATIOS/SUPPLEMENTAL DATA | | | | | | | | | | | | | | | | | | | | |
Ratio of expenses to average net assets(b) | | | 0.89 | % | | | 0.89 | % | | | 0.89 | % | | | 0.89 | % | | | 0.89 | % |
Ratio of expenses to average net assets(c) | | | 1.05 | % | | | 1.00 | % | | | 1.02 | % | | | 1.12 | % | | | 1.09 | % |
Ratio of expense reductions to average net assets | | | – | | | | – | | | | – | | | | – | | | | – | |
Ratio of net investment income (loss) to average net assets(b) | | | 7.01 | % | | | 5.81 | % | | | 5.49 | % | | | 5.38 | % | | | 5.21 | % |
Ratio of net investment income (loss) to average net assets(c) | | | 6.85 | % | | | 5.70 | % | | | 5.35 | % | | | 5.16 | % | | | 5.01 | % |
Portfolio turnover rate | | | 129 | % | | | 127 | % | | | 126 | %(h) | | | 105 | %(h) | | | 159 | %(f)(h) |
Number of shares outstanding at end of period (000’s) | | | 34,144 | | | | 31,963 | | | | 25,743 | | | | 17,195 | | | | 12,302 | |
Net assets at the end of period (000’s) | | $ | 351,498 | | | $ | 354,895 | | | $ | 291,727 | | | $ | 195,413 | | | $ | 136,295 | |
| (a) | Total return is not annualized. It does include, if any, expense reimbursements and expense reductions. The effect of fees and charges incurred at the separate account level are not reflected in these performance figures. If such expenses had been included, the total return would have been lower for each period presented. |
| (b) | Includes expense reimbursements, but excludes expense reductions. |
| (c) | Excludes expense reimbursements and expense reductions. |
| (d) | The per share amounts are calculated using the average share method. |
| (e) | The Fund’s performance figure increased by 0.10% from a gain realized on the disposal of investments in violation of investment restrictions. |
| (f) | Portfolio turnover includes paydowns on securities. Previously, portfolio turnover was calculated prior to including paydowns on securities and was as follows: |
| | | |
Fund
| | 2005
| |
Strategic Bond | | 153 | % |
| (g) | The Fund’s performance figure was increased by less than 0.01% from a reimbursement by an affiliate. |
| (h) | Portfolio turnover includes “to be announced” (“TBA”) transactions. Previously, portfolio turnover was calculated prior to including TBA transactions and was as follows: |
| | | | | | | | | |
Fund
| | 2007
| | | 2006
| | | 2005
| |
Strategic Bond | | 120 | % | | 104 | % | | 155 | % |
129
VALIC Company II
REPORT OF INDEPENDENT REGISTERED PUBLIC ACCOUNTING FIRM
To the Board of Trustees and Shareholders of VALIC Company II:
In our opinion, the accompanying statements of assets and liabilities, including the portfolios of investments, and the related statements of operations and of changes in net assets and the financial highlights present fairly, in all material respects, the financial position of each of the fifteen funds constituting VALIC Company II, formerly known as AIG Retirement Company II (hereafter referred to as the “Series”) at August 31, 2009, the results of each of their operations for the year then ended, and the changes in each of their net assets and the financial highlights for each of the two years in the period then ended, in conformity with accounting principles generally accepted in the United States of America. These financial statements and financial highlights (hereafter referred to as “financial statements”) are the responsibility of the Series’ management; our responsibility is to express an opinion on these financial statements based on our audits. We conducted our audits of these financial statements in accordance with the standards of the Public Company Accounting Oversight Board (United States). Those standards require that we plan and perform the audit to obtain reasonable assurance about whether the financial statements are free of material misstatement. An audit includes examining, on a test basis, evidence supporting the amounts and disclosures in the financial statements, assessing the accounting principles used and significant estimates made by management, and evaluating the overall financial statement presentation. We believe that our audits, which included confirmation of securities at August 31, 2009 by correspondence with the custodian and brokers, provide a reasonable basis for our opinion. The financial highlights for each of the years ended on or before August 31, 2007 were audited by another independent registered public accounting firm whose report, dated October 25, 2007, expressed an unqualified opinion on those financial highlights.
PricewaterhouseCoopers LLP
Houston, Texas
October 28, 2009
130
VALIC Company II
APPROVAL OF ADVISORY AGREEMENTS (Unaudited)
At meetings held on July 14-15, 2009 and August 3-4, 2009, the Board of Trustees (the “Board”), including the Directors that are not interested persons of VC II, as such term is defined in the Investment Company Act of 1940, as amended (the “1940 Act”) (the “Independent Directors”), approved with respect to each Fund the Investment Advisory Agreement between The Variable Annuity Life Insurance Company (“VALIC”) and VC II (the “Advisory Agreement”) and the investment sub-advisory agreements between VALIC and each of the following sub-advisers (collectively, the “Sub-advisory Agreements”): AIG Global Investment Corp. (“AIGGIC”); SunAmerica Asset Management Corp. (“SAAMCo”); Bridgeway Capital Management, Inc. (“Bridgeway Capital”); FAF Advisors, Inc. (“FAF”); Invesco Aim Capital Management, Inc. (“Invesco Aim”); JPMorgan Investment Advisors Inc. (“JPMIA”); J.P. Morgan Investment Management Inc. (“JPMIM”); SSgA Funds Management, Inc. (“SSgA FM”); SunAmerica Asset Management Corp. (“SAAMCo”); and Wellington Management Company, LLP (“Wellington Management”) (collectively referred to as the “Sub-advisers”).
In addition, at the July 2009 meeting, the Board approved an amendment to the Investment Sub-Advisory Agreement between VALIC and Wellington Management (the “WMC Sub-Advisory Agreement”) that engages Wellington Management as the sub-adviser of the High Yield Bond Fund. In connection with such approval, the Board approved the termination of AIGGIC as the sub-adviser of the High Yield Bond Fund.
The Investment Advisory Agreement and Investment Sub-advisory Agreements, including the WMC Sub-Advisory Agreement are collectively referred to as the “Advisory Contracts.”
In connection with the approval of the Advisory Contracts, the Board received materials related to certain factors the Board considered in determining to renew such Advisory Contracts. Those factors included: (1) the nature, extent and quality of services provided by VALIC and the Sub-advisers; (2) the investment performance of the Funds compared to performance of comparable funds as selected by an independent third-party provider of investment company data (“Performance Group/Universe”) and against each Fund’s benchmarks; (3) the costs of services and the benefits potentially derived by VALIC and the Sub-advisers; (4) whether the Funds will benefit from possible economies of scale from engaging the Sub-advisers; (5) the profitability of VALIC and the Sub-advisers and their affiliates; (6) the advisory fee and sub-advisory fees charged in connection with VALIC’s and the Sub-advisers’ management of the Funds, compared to advisory fee rates and sub-advisory fee rates of a group of funds with similar investment objectives (respectively, the “Expense Group/Universe” and the “Sub-Advisor Expense Group/Universe”), as selected an independent third-party provider of investment company data; (7) the terms of the Advisory Contracts, and (8) information regarding VALIC’s and the Sub-advisers’ compliance and regulatory history.
The Independent Directors were separately represented by counsel that is independent of VALIC in connection with their consideration of approval of the Advisory Contracts. The matters discussed below were also considered separately by the Independent Directors in executive sessions during which such independent counsel provided guidance to the Independent Directors.
The Advisory Contracts approved at the July 2009 meeting were approved for a one-year term ending July 15, 2010. All Advisory Contracts were re-approved at the August 2009 for a one-year term beginning September 1, 2009 and ending August 31, 2010, with the exception of the WMC Sub-Advisory Agreement, which was approved for an initial two-year term.
Nature, Extent and Quality of Services. The Board considered the nature, quality and extent of services to be provided to the Funds by VALIC and the Sub-advisers. The Board reviewed information provided by VALIC relating to its operations and personnel. The Board also took into account their familiarity with VALIC’s management through Board meetings, discussions and reports during the preceding year and through their long history of service to the Funds. The Board considered that VALIC is responsible for the management of the day-to-day operations of the Funds, including but not limited to, general supervision of and coordination of the services provided by the Sub-advisers, and is also responsible for monitoring and reviewing the activities of the Sub-advisers and other third-party service providers. The Board also noted that VALIC’s and the Sub-advisers’ management of the Funds is subject to the oversight of the Board, and must be made in accordance with the investment objectives, policies and restrictions set forth in the Funds’ prospectus and statement of additional information.
The Board noted that VALIC personnel meet on a regular basis to discuss the performance of the Funds, as well as the positioning of the insurance products, employer-sponsored retirement plans and the Funds generally vis-à-vis competitors. In addition, it was considered that VALIC works to develop marketing strategies to promote an identity for the Funds separate and apart from the insurance products and the employer-sponsored retirement plans. The Board also considered VALIC’s financial condition and whether it had the financial wherewithal to provide the services under the Investment Advisory Agreement with respect to each Fund.
With respect to the services provided by the Sub-advisers, the Board considered information provided to them regarding the services provided by each Sub-adviser, including information presented throughout the previous year. The Board noted that each Sub-adviser (i) determines the securities to be purchased or sold on behalf of the Funds it manages as may be necessary in connection therewith; (ii) provides VALIC with records concerning its activities, which VALIC or the Funds are required to maintain; and (iii) renders regular reports to VALIC and to officers and Directors of the Funds concerning its discharge of the foregoing responsibilities. The Board reviewed each Sub-adviser’s history and investment experience as well as information regarding the qualifications, background and responsibilities of the Sub-advisers investment and compliance personnel who provide services to the Funds. The Board also took into account the financial condition of each Sub-adviser. The Board also reviewed each Sub-adviser’s brokerage practices.
The Board reviewed VALIC’s and the administrator’s, SAAMCo, an affiliate of VALIC’s, compliance program and personnel. It also considered VALIC’s and each Sub-adviser’s regulatory history, including information regarding whether it was currently involved in any regulatory actions or investigations as well as material litigation. The Board concluded that there was no information provided to the Board that would have a material adverse effect on VALIC’s or the Sub-advisers’ ability to provide services to the Funds.
The Board concluded that the scope and quality of the advisory services provided by VALIC and Sub-advisers were satisfactory and that there was a reasonable basis on which to conclude that each would provide a high quality of investment services to the Funds.
Fees and Expenses; Investment Performance. The Board received and reviewed information regarding each Fund’s total expenses, advisory and sub-advisory fees, and other expenses compared against the expenses and fees of the funds in its Expense Group, Expense Universe and Subadvisor Expense Group and, in some cases as noted below, the Subadvisor Expense Universe. It was noted that VALIC negotiates the sub-advisory fees with each of the unaffiliated Sub-advisers at arms-length. The Board also considered that
131
VALIC Company II
APPROVAL OF ADVISORY AGREEMENTS (Unaudited) — (continued)
the sub-advisory fees are paid by VALIC out of its advisory fees it receives from the Funds and is not paid by the Funds, and that sub-advisory fees may vary widely within the Subadvisor Expense Group/Universe for various reasons, including market pricing demands, existing relationships, experience and success, and individual client needs. The Board noted the affiliation of the Sub-Advisor to certain of the Funds with VALIC, noting any potential conflicts of interest. The Board also noted that VALIC annually waives a portion of its advisory fee and/or reimburses the expenses of several Funds as noted below.
The total expense information, advisory fee information, and sub-advisory fee information considered by the Board, among other fee and expense data, is summarized below. It was noted that expense ratio data included in the independent third-party reports was based on unaudited data from the semi-annual report dated February 28, 2009.
The Board received and reviewed information prepared by management and by an independent third-party regarding the Funds’ investment performance compared against their benchmarks and their respective Performance Groups/Universes. It was noted that performance information provided by the independent third party was for the period ended April 30, 2009 and that benchmark information presented by management was through the period June 30, 2009.
| | • | | Aggressive Growth Lifestyle Fund (sub-advised by AIGGIC). The Board considered that total expenses and actual advisory fees were at or below the medians of its Expense Group/Universe. The Board also noted that the Fund’s sub-advisory fees were above the median of its Subadvisor Expense Universe. The Board also noted that the expense limitation on total expenses would be extended contractually through December 31, 2010. |
The Board considered that the Fund’s performance was below the median of its Performance Universe and that it underperformed the Lipper VUF Global Core Index for the one-year period but was above the median and outperformed the Lipper Index for the three- and five-year periods. The Board also noted that the Fund underformed its blended benchmark for the one-year period, was in line with the benchmark for the three-year period and outperformed the benchmark for the five-year periods and slightly trailed the benchmark for the one-year period. The blended benchmark consists of the Dow Jones Wilshire 5000 Total Market Index (“Wilshire 5000”) (65%), Barclays Capital U.S. Aggregate Index (10%) and the Morgan Stanley Capital International Europe, Australasia, Far East Index (“MSCI EAFE Index”) (25%). The Board took into account management’s discussion of the Fund’s performance, including the effect of the peer universe chosen for comparison on the Fund’s rankings. The Board concluded that the Fund’s performance has been satisfactory in light of all factors considered.
| | • | | Capital Appreciation Fund (sub-advised by Bridgeway Capital). The Board considered that the Fund’s actual advisory fees and total expenses were below the medians of its Expense Group/Universe. The Board also noted that the Fund’s sub-advisory fees were below the median of its Subadvisor Expense Universe. The Board also noted that the expense limitation on total expenses would be extended contractually through December 31, 2010. |
The Board considered that the Fund was below the median of its Performance Group/Universe and underperformed the Lipper VUF Large-Cap Growth Index and its benchmark, the Russell 1000® Growth Index, for the one-, three- and five-year periods. The Board took into account management’s discussion of the Fund’s performance and its plans to address the Fund’s performance. The Board also noted the Fund’s more recent performance. The Board concluded that appropriate action has been taken to address the Fund’s performance.
| | • | | Conservative Growth Lifestyle Fund (sub-advised by AIGGIC). The Board considered that actual advisory fees were at the median of its Expense Group/Universe and that the Fund’s total expenses were above the median of its Expense Group and above the median of its Expense Universe. The Board also noted that the expense limitation on total expenses would be extended contractually through December 31, 2010. |
The Board considered that the Fund’s performance was in line with or above the median of its Performance Group/Universe and outperformed the Lipper VUF Mixed Asset Target Allocation Conservative Index for the one- and five-year periods and trailed the medians of its Performance Group/Universe and underperformed the Lipper Index for the three-year period. The Board noted that the Fund underperformed its blended benchmark for the one-, three- and five-year periods. The Fund’s blended benchmark consists of the Wilshire 5000 (42%), Barclays Capital U.S. Aggregate Index (50%) and the MSCI EAFE Index (8%). The Board concluded that the Fund’s performance was satisfactory in light of all factors considered.
| | • | | Core Bond Fund (sub-advised by AIGGIC). The Board considered that the Fund’s actual advisory fees were at or above the medians of its Expense Group/Universe and that total expenses were below the median of its Expense Group but above the median of its Expense Universe. In addition, the Board noted that the Fund’s sub-advisory fees were above the median of its Subadvisor Expense Universe. The Board also noted that the expense limitation on total expenses would be extended contractually through December 31, 2010. |
The Board noted that the Fund was at or exceeded the median of its Performance Group for the one-, three- and five-year periods. The Board considered that the Fund was below the median of its Performance Universe for the one-, three- and five-year periods. The Board also noted that the Fund underperformed the Lipper VUF Corporate A-Rated Bond Index and its benchmark, Barclays Capital U.S. Aggregate Index, for the one-, three- and five-year periods. The Board took into account management’s discussion of the Fund’s performance, recent changes to the Fund’s investment strategy, and its continued monitoring of the Fund and concluded that management is taking appropriate action with respect to the Fund.
| | • | | High Yield Bond Fund (sub-advised by AIGGIC through July 24, 2009; sub-advised by Wellington Management thereafter). At the July 2009 meeting, the Board approved the engagement of Wellington Management to replace Putnam as the Fund’s sub-adviser. |
The Board considered that the Fund’s actual advisory fees and total expense were in line with the median of its Performance Group and were above the median of its Performance Universe. The Board considered that the Fund’s sub-advisory fees were above the medians of its Subadvisor Expense Group/Universe. The Board also considered that the advisory fees and sub-advisory fees would be reduced and noted that the reduction in such fees would not result in VALIC retaining any more or any less of its advisory fees. The Board also noted management agreed to lower the Fund’s contractual expense limitation and that the new expense limitation, which would take effect on January 2010, would last through December 31, 2010.
132
VALIC Company II
APPROVAL OF ADVISORY AGREEMENTS (Unaudited) — (continued)
The Board considered that management was proposing the hiring of Wellington Management to address the short- and mid-term performance of the Fund. The Trustees next took into consideration management’s presentation regarding the performance of a comparable fund managed by Wellington Management portfolio manager who would be responsible for managing the Fund. It was noted that for the period ended May 31, 2009, the comparable Fund had outperformed the Fund, its Lipper Category and its benchmark, the Citigroup High Yield Index, for the one-, three- and five-year periods.
The Board considered that the Fund’s performance was below the medians of its Performance Group/Universe and that it underperformed the Lipper VUF High Yield Bond Index and its benchmark, the Citigroup High Yield Index for the one-, three- and five-year periods. The Board took into account management’s discussion of the Fund’s performance. The Board concluded that the Fund’s performance was satisfactory in light of all factors considered.
| | • | | International Small Cap Equity Fund (sub-advised by AIGGIC). The Board considered that the Fund’s actual advisory fees were below the median of its Expense Group and in line with the median of its Expense Universe and that the Fund’s total expenses were below the medians of its Expense Group/Universe. The Board also noted that the Fund’s sub-advisory fees were above the medians of its Subadvisor Expense Group/Universe. The Board also noted that the expense limitation on total expenses would be extended contractually through December 31, 2010. |
The Board considered that the Fund’s performance was at or above the medians of its Performance Group/Universe and the Lipper VUF International Core Index for the one- and five-year periods but that it was below the median and that it underperformed the Lipper Index for the three-year period. The Board took into consideration management’s discussion of the Fund’s performance, including that Lipper’s comparative Index focused on international multi-cap growth funds and not on international small-cap core funds. Management further noted that the Fund underperformed its benchmark, the MSCI EAFE Small Cap Index, for the one- and three-year periods and outperformed the benchmark for the five-year period. The Board concluded that the Fund’s performance was satisfactory in light of all factors considered.
| | • | | Large Cap Value Fund (sub-advised by SSgA FM). The Board considered that the Fund’s actual advisory fees and total expenses were below the medians of its Expense Group/Universe. The Board also noted that the Fund’s sub-advisory fees were below the medians of its Subadvisor Expense Universe. The Board also noted that the expense limitation on total expenses would be extended contractually through December 31, 2010. |
The Board considered that the Fund was in line with the median of its Performance Group for the one- and three-year periods and was above median for the five-year period. It further noted that the Fund was below the median of its Performance Universe for the one- and three-year periods and was in line with the median for the five-year period. The Board considered that Fund underperformed the Lipper VUF Multi-Cap Value Index for the one- and three-year periods and outperformed the Lipper Index for the five-year period. It also noted that the Fund underperformed its benchmark, the Russell 1000® Value Index, for the one-, three- and five-year periods. The Board took into account management’s discussion of the Fund’s performance. The Board concluded that the Fund’s performance was satisfactory in light of all factors considered.
| | • | | Mid Cap Growth Fund (sub-advised by Invesco Aim). The Board considered that the Fund’s actual advisory fees were in line with the medians of its Expense Group/Universe and total expenses were below the medians of its Expense Group/Universe. The Board also noted that the Fund’s sub-advisory fees were above the median of its Subadvisor Expense Universe. The Board also noted that the expense limitation on total expenses would be extended contractually through December 31, 2010. |
The Board also considered that the Fund’s performance was in line with the medians of its Performance Group/Universe and the Lipper VUF Mid-Cap Growth Index for the one-year period but was below the medians and underperformed the Lipper Index for the three- and five-year periods. Management reported that the Fund underperformed its benchmark, the Russell Midcap® Growth Index, for the one-, three- and five-year periods. The Board took into account management’s discussion of the Fund’s performance and its continued monitoring of the Fund. The Board also noted the Fund’s improved more recent performance. The Board concluded that management is taking appropriate action with respect to the Fund.
| | • | | Mid Cap Value Fund (sub-advised by FAF and Wellington). The Board considered that the Fund’s actual advisory fees were below the median of its Expense Group/Universe and that the Fund’s total expenses were below the median of its Expense Group and above the median of its Expense Universe. The Board also noted that the Fund’s sub-advisory fees were above the median of its Subadvisor Expense Universe. The Board also noted that the expense limitation on total expenses would be extended contractually through December 31, 2010. |
The Board considered that the Fund’s performance was above the median of its Performance Group/Universe and that it outperformed the Lipper VUF Mid Cap Value Index and its benchmark, the Russell 2500® Value Index, for the one-, three- and five-year periods. The Board concluded that the Fund’s performance was satisfactory.
| | • | | Moderate Growth Lifestyle Fund (sub-advised by AIGGIC). The Board considered that actual advisory fees were in line with the medians of its Expense Group/Universe. The Board considered that the Fund’s total expenses were above the median of its Expense Group and below the median of its Expense Universe. The Board also considered that the Fund’s sub-advisory fees were in line with the median of its Subadvisor Expense Universe. The Board also noted that the expense limitation on total expenses would be extended contractually through December 31, 2010. |
The Board considered that the Fund’s performance was below the medians of its Performance Group/Universe and underperformed the Lipper VUF Mixed-Asset Target Allocation Moderate Index for the one- and three-year periods and was above the median and outperformed the Lipper Index for the five-year period. In addition, the Board noted that the Fund underperformed its blended benchmark for the one- and three-year periods and was in line with the benchmark for the five-year period. The Fund’s blended benchmark consists of the Wilshire 5000 (55%), Barclays Capital U.S. Aggregate Index (30%) and the MSCI EAFE Index (15%). The Board took into account management’s discussion of the Fund’s performance, including with respect to its peer group. The Board concluded that the Fund’s performance has been satisfactory in light of all factors considered.
| | • | | Money Market II Fund (sub-advised by SAAMCo). The Board considered that the Fund’s actual advisory fees and total expenses were below the medians of its Expense Group/Universe. The Board also noted that the Fund’s sub-advisory fees were above the median of its Subadvisor Expense Universe. The Board also noted that the expense limitation on total expenses would be extended contractually through December 31, 2010. |
133
VALIC Company II
APPROVAL OF ADVISORY AGREEMENTS (Unaudited) — (continued)
The Board considered that the Fund’s performance was above the medians of its Performance Group/Universe for the one-year period and was in line with the medians for the three- and five-year periods. It also noted that the Fund outperformed the Lipper VUF Money Market Index for the one-year period but slightly trailed the Lipper Index for the three- and five-year periods. Management also reported that the Fund slightly outperformed its benchmark, the Treasury Bill 3 Month Index, for the one- and three-year periods and was in line with the Index for the five-year period. The Board took into account the relatively small range in performance returns among the Performance Group/Universe. The Board concluded that the Fund’s performance was satisfactory in light of all factors considered.
| | • | | Small Cap Growth Fund (sub-advised by JPMIM). The Board considered that the Fund’s actual advisory fees were at the median of its Expense Group/Universe and that the Fund’s total expenses were below the median of its Expense Group and above the median of its Expense Universe. The Board also noted that the Fund’s sub-advisory fees were above the median of its Subadvisor Expense Group/Universe. The Board also noted that the expense limitation on total expenses would be extended contractually through December 31, 2010. |
The Board noted that the Fund was at or slightly below the medians of its Performance Group/Universe and underperformed the Lipper VUF Small Cap Growth Index for the one-, three- and five-year periods. In addition, management reported that the Fund outperformed its benchmark, the Russell 2000® Growth Index, for the one-year period but trailed the benchmark for the three- and five-year periods. The Trustees took into account the change of sub-adviser that took place on December 10, 2007. The Board concluded that appropriate action has been taken to address the Fund’s performance.
| | • | | Small Cap Value Fund (sub-advised by JPMIA). The Board considered that the Fund’s actual advisory fees and total expenses were below the medians of its Expense Group/Universe. The Board also noted that the Fund’s sub-advisory fees were slightly below the medians of its Subadvisor Expense Group/Universe. The Board also noted that the expense limitation on total expenses would be extended contractually through December 31, 2010. |
The Board considered that the Fund’s performance was in line with the medians of its Performance Group/Universe for the one-year period and that it was below the medians of its Performance Group/Universe for the three- and five-year periods. In addition, the Board noted that the Fund outperformed the Lipper VUF Small Cap Value Index for the one- and three-year periods but underperformed the Lipper Index for the five-year period. Management reported that the Fund outperformed its benchmark, the Russell 2000® Value Index, for the three- and five-year periods but underperformed the benchmark for the one-year period. The Board concluded that the Fund’s recent performance has been satisfactory in light of all factors considered.
| | • | | Socially Responsible Fund (sub-advised by AIGGIC). The Board considered that the Fund’s actual advisory fees and total expenses were below the medians of its Expense Group/Universe. The Board also noted that the Fund’s sub-advisory fees were below the medians of its Subadvisor Expense Group/Universe. The Board also noted that the expense limitation on total expenses would be extended contractually through December 31, 2010. |
The Board noted that the Fund’s performance was below the medians of its Performance Group/Universe and underperformed for Lipper VUF Large Cap Core Index the one- and five-year periods and was above the medians and outperformed its Lipper Index for the three-year period. In addition, management reported that the Fund slightly underperformed its benchmark, the S&P 500® Index, for the one-, three- and five-year periods. The Board took into consideration Management’s discussion of its peer group and index noting the social criteria in which the Fund must adhere and concluded that the Fund’s performance was satisfactory in light of all factors considered.
| | • | | Strategic Bond Fund (sub-advised by AIGGIC). The Board noted that the Fund’s actual advisory fees were below the medians of its Expense Group/Universe. The Board also considered that the Fund’s total expenses were below the median of its Expense Group and above the median of its Expense Universe. In addition, the Board considered that the Fund’s sub-advisory fees were above the median of its Subadvisor Expense Universe. The Board also noted that the expense limitation on total expenses would be extended contractually through December 31, 2010. |
The Board considered that the Fund’s performance was below the medians of its Performance Group/ Universe and the Lipper VUF General Bond Index for the one- and three-year periods and that it was above or at the medians of its Performance Group/Universe and outperformed its Lipper Index for the five-year period. In addition, the Board considered that the Fund underperformed its benchmark, the Barclays Capital Aggregate Bond Index, for the one-, and three-year periods and was in line with the benchmark for the five-year period. The Board took into account management’s discussion of the Fund’s performance, including with respect to the Fund’s performance over the longer term. The Board noted that management was closely monitoring the Fund. The Board concluded that the Fund’s overall performance was satisfactory and that the Fund’s shorter term performance was being addressed.
The Board concluded that the advisory fee and sub-advisory fee for each Fund are fair and reasonable in light of the usual and customary charges made for services of the same nature and quality and the other factors considered.
Cost of Services and Indirect Benefits/Profitability. The Board was provided information related to the cost of services and profits realized in connection with the Advisory Agreement. The Board considered the costs that are borne by the Funds. For its services, VALIC receives a fee, payable monthly from each Fund in an amount that is calculated as a percentage of the average daily net assets of the respective Fund.
It was noted that VALIC reviewed a number of factors in determining appropriate fee levels for the Funds as well as the fee VALIC pays each Sub-adviser. Such factors include review of (1) style class peers primarily within the variable annuity and qualified plan universe; (2) key competitor analysis; (3) clone fund analysis; (4) product suitability; and (5) special considerations such as competitor sub-account characteristics, uniqueness of the product and prestige of the manager.
The Board considered that VALIC will receive benefits in addition to the advisory fee to be paid by the Funds, which include transfer agency fees paid or to be paid by the Funds. The Board considered that VC II also pays VALIC a fee for the provision of record keeping and shareholder services to contract owners and participants, which is provided at cost. Such payment is allocated to each Fund based on the number of accounts serviced. Finally, it was noted that the Funds pay SAAMCo, an affiliate of VALIC, an annual fee of approximately 0.07% based on each Fund’s average daily net assets, for the provision of certain accounting and administrative services. Out of the fee SAAMCo receives from
134
VALIC Company II
APPROVAL OF ADVISORY AGREEMENTS (Unaudited) — (continued)
the Funds, SAAMCo compensates VALIC for certain administrative services (0.02% of daily net assets), and the Funds’ custodian, State Street Bank and Trust Company for calculation of the daily net asset value (0.01% of daily net assets). The Board also considered that VC II pays VALIC an annual fee of 0.25% on average daily net assets of each Fund (other than the Lifestyle Funds) pursuant to a Shareholder Services Agreement.
The Board also considered that VALIC may exclude from its taxable income a portion of the ordinary dividends paid by underlying U.S. equities in the Funds to the same extent the Funds receive certain dividends with respect to shares of stock issued by domestic corporations, subject to applicable tax laws and regulations. In addition, it was noted that VALIC may receive foreign tax credits with respect to certain foreign securities held or to be held in certain Funds that benefit VALIC. These benefits can be material.
In considering the profitability to VALIC and its affiliates in connection with their relationship with the Funds, the Board reviewed information provided by VALIC setting forth the revenues and other benefits, both direct and indirect, received by VALIC and its affiliates attributable to managing each Fund, the cost of providing such services and the resulting profitability to VALIC and its affiliates from these relationships. The Board also reviewed VALIC’s profitability on a Fund-by-Fund basis. The Board received and reviewed information prepared by VALIC that reflects an allocation of costs that result in a reasonable determination of profitability of VALIC, as adviser and transfer agent and as the shareholder servicing agent. In addition, the Board considered the profitability of SAAMCo in its role as the administrator of the Funds and as sub-adviser to certain Funds. The Board concluded that the profitability to VALIC and its affiliates from their relationship with the Funds was reasonable.
In considering the profitability to the Sub-advisers in connection with their relationship to the Funds, the Directors noted that the fees under the Sub-Advisory Agreements are paid by VALIC out of the advisory fees that VALIC receives under the Advisory Agreement. With respect to the unaffiliated Sub-advisers, the Board also relied on the ability of VALIC to negotiate the Sub-Advisory Agreements and the fees thereunder at arm’s length.
For each of the above reasons, the Directors determined that the profitability to the Sub-advisers from their relationship with the Funds was not a material factor in their deliberations with respect to consideration of approval of the Investment Sub-Advisory Agreements.
Economies of Scale. The Board noted that the advisory fee rate and sub-advisory fee rates payable to VALIC and each of the Sub-advisers with respect to most of the Funds contain breakpoints, which allows the Funds to participate in any economies of scale. The Board also took into account management’s discussion of the Funds’ advisory fee and sub-advisory fee structure, including with respect to those Funds that do not currently have breakpoints. The Board also considered the effect of each Fund’s growth and size on its performance and fees, noting that it the Funds’ assets increase overtime, the Funds may realize other economies of scale if assets increase proportionally more than expenses. The Board concluded that no changes to the advisory fee structure of the Funds were necessary.
For similar reasons as stated above with respect to the Sub-advisers’ profitability and the costs of their providing services, the Board concluded that the potential for economies of scale in the Sub-advisers’ management of the Funds are not a material factor to the approval of the Sub-advisory Agreements, although it was noted that most of the Funds have breakpoints at the sub-advisory fee level.
Terms of the Advisory Contracts. The Board reviewed the terms of the Advisory Contracts including the duties and responsibilities undertaken. The Board also reviewed the terms of payment for services rendered by VALIC and the Sub-advisers and noted that VALIC would compensate the Sub-advisers out of the advisory fees it receives from the Funds. The Board noted that the Sub-Advisory Agreements provide that each Sub-adviser will pay all of its own expenses in connection with the performance of their respective duties as well as the cost of maintaining the staff and personnel as necessary for it to perform its obligations. The Board also considered the termination and liability provisions of the Advisory Contracts and other terms contained therein.
The Board reviewed the terms of the WMC Sub-Advisory Agreement, the BlackRock Sub-Advisory Agreement, and the Dreman Sub-Advisory Agreement, including the duties and responsibilities undertaken by Wellington Management, BlackRock Financial and Dreman, respectively. It also noted that each of these Sub-Advisory Agreements were generally the same in all material respects as the previous Sub-Advisory Agreements with respect to each Fund, except for the name of the sub-adviser, the term of the agreements and the sub-advisory fee rate.
The Board concluded that the terms of each of the Advisory Contracts were reasonable.
Compliance. The Board reviewed VALIC’s and the Sub-advisers’ compliance personnel, regulatory history, including information whether it was currently involved in any regulatory actions or investigations. In addition, the Board reviewed information concerning each entities’ compliance staff that would be responsible for providing compliance functions on behalf of the Fund and concluded that there was no information provided that would have a material adverse effect on their abilities to provide services to the Funds.
Conclusions. In reaching its decision to approve the Advisory Contracts, the Board did not identify any single factor as being controlling, but based its recommendation on each of the factors it considered and each Director may have contributed different weight to the various factors. Based upon the materials it reviewed, the representations made to it and the considerations described above, and as part of their deliberations, the Board, including the Independent Directors, concluded that VALIC and each Sub-adviser possess the capability and resources to perform the duties required of them under their respective Advisory Contracts.
Further, based upon its review of the Advisory Contracts, the materials provided, and the considerations described above, the Board, including the Independent Directors, concluded that (1) the terms of the Advisory Contracts are reasonable, fair and in the best interests of each of the Funds and its respective shareholders, and (2) the fee rates payable under the Advisory Contracts are fair and reasonable in light of the usual and customary charges made for services of the same nature and quality.
135
VALIC Company II
TRUSTEE AND OFFICER INFORMATION (Unaudited) — August 31, 2009
| | | | | | | | | | |
Name, Birth Date
and Address*
| | Position
Held With
VALIC Complex | | Term of Office
and Length of
Time Served(4) | | Principal Occupations During Past Five Years | | Number of
Funds in
Fund Complex
Overseen by
Director(2) | | Other Directorships
Held by Director(3) |
Independent Directors | | | | | | | | | | |
Thomas J. Brown
DOB: December 24, 1945 | | Trustee | | 2005-
Present | | Retired. Formerly, Chief Operating Officer and Chief Financial Officer, American General Asset Management (Investment Management) (2000-2002). | | 48 | | Trustee, Merrimac Funds, a mutual fund company
(2004-Present). |
Dr. Judith L. Craven
DOB: October 6, 1945 | | Trustee | | 1998-
Present | | Retired Administrator. | | 87 | | Director, Belo Corporation, a media company (1992-Present); Director SYSCO Corporation, a food marketing and distribution company (1996-Present). Director, Luby’s Inc., a restaurant chain (1998-Present). |
William F. Devin
DOB: December 30, 1938 | | Chairman and Trustee(5) | | 2001-
Present | | Retired. | | 88 | | Member, Board of Governors, Boston Stock Exchange
(1985-Present) |
Dr. Timothy J. Ebner
DOB: July 15, 1949 | | Trustee | | 1998-
Present | | Professor and Head, Department of Neuroscience (1980-Present), and Visscher Chair of Physiology, University of Minnesota (1999-Present). | | 48 | | None. |
Judge Gustavo E. Gonzales, Jr.
DOB: July 27, 1940 | | Trustee | | 1998-
Present | | Attorney At Law, General Practice (2005-Present) Formerly, Municipal Court Judge, Dallas, TX (1995-2004) | | 48 | | None. |
Dr. John Wm. Lancaster
DOB: December 15, 1923 | | Trustee | | 1984-
Present | | Pastor Emeritus (1998-Present) and formerly Director of Planned Giving (1997-2005), First Presbyterian Church, Houston, TX. | | 48 | | None. |
Kenneth J. Lavery
DOB: December 30, 1949 | | Trustee | | 2001-
Present | | Vice President, Massachusetts Capital Resources Co. (1982-Present). | | 48 | | None. |
Dr. John E. Maupin, Jr.
DOB: October 28, 1946 | | Trustee | | 1998-
Present | | President, Morehouse School of Medicine, Atlanta, Georgia (2006-Present). Formerly, President, Meharry Medical College, Nashville, Tennessee (1994-2006). | | 48 | | Director, LifePoint Hospitals, Inc. (2005-Present); Director, HealthSouth Corp. (2004-Present). |
Interested Directors | | | | | | | | | | |
Peter A. Harbeck(1)
DOB: January 23, 1954 | | Trustee | | 2001-
Present | | President, CEO and Director, SAAMCo (1995-Present); Director, SunAmerica Capital Services, Inc. (“SACS”) (1993-Present); Chairman, President and CEO, AIG Advisor Group, Inc. (2004-Present) | | 96 | | None. |
Officers | | | | | | | | | | |
Kurt Bernlohr
DOB: May 27, 1961 | | President and Principal Executive Officer | | 2009-
Present | | President VALIC Financial Advisors, Inc. (2009-Present); President, VALIC Retirement Services Company (2009-Present); Senior Vice President (2009-Present); Vice President (2004-2009), Associate General Counsel (2000-2004), VALIC | | N/A | | N/A |
136
VALIC Company II
TRUSTEE AND OFFICER INFORMATION (Unaudited) — August 31, 2009 — (continued)
| | | | | | | | | | |
Name, Birth Date
and Address*
| | Position Held With
VALIC Complex | | Term of Office
and Length of
Time Served(4) | | Principal Occupations During Past Five Years | | Number of
Funds in
Fund Complex
Overseen by
Director(2) | | Other Directorships
Held by Director(3) |
Officers | | | | | | | | | | |
John Packs DOB: December 9, 1955 | | Vice President and Senior Investment Officer | | 2001-
Present | | Senior Investment Officer, VALIC (2001-Present). | | N/A | | N/A |
Gregory R. Kingston
DOB: January 18, 1966 | | Treasurer and Principal Financial Officer | | 2000-
Present | | Vice President, SAAMCo (2001-Present). | | N/A
| | N/A
|
Nori L. Gabert
DOB: August 15, 1953 | | Vice President, Chief Legal Officer and Secretary | | 2000-
Present | | Vice President and Deputy General Counsel, SAAMCo (2005-Present);
Vice President and Senior Counsel SAAMCo (2001-2005). | | N/A | | N/A |
Gregory N. Bressler DOB: November 17, 1966 | | Vice President | | 2005-
Present | | Senior Vice President and General Counsel, SAAMCo (June 2005 to Present); Formerly Vice President and Director of U.S. Asset Management Compliance, Goldman Sachs Asset Management (June 2004 to June 2005); Deputy General Counsel, Credit Suisse Asset Management LLC (2002-2004). | | N/A | | N/A |
Cynthia A. Skrehot DOB: December 6, 1967 | | Vice President and Chief Compliance Officer (“CCO”) | | 2002-
Present | | Vice President, SAAMCo and VALIC (2002-Present). | | N/A | | N/A |
Matthew J. Hackethal DOB: December 31, 1971 | | Anti-Money Laundering Compliance Officer | | 2007-
Present | | Senior Compliance Manager, SAAMCo (2006-Present); Formerly Vice President, Credit Suisse Asset Management (May 2001 to October 2006); CCO, Credit Suisse Alternative Funds (November 2005 to October 2006); Credit Suisse Asset Management Securities, LLC (April 2004 to August 2005) | | N/A | | N/A |
Donna M. Handel DOB: June 25, 1966 | | Vice President and Assistant Treasurer | | 2001-
Present | | Senior Vice President, SAAMCo (2004-Present); Vice President, SAAMCo (1997-2004). | | N/A | | N/A |
Thomas M. Ward DOB: November 7, 1966 | | Vice President | | 2008 | | Director, VALIC (1991-Present) | | N/A | | N/A |
| * | The business address for each Trustee and Officer is 2929 Allen Parkway, Houston, TX, 77019. |
| (1) | Interested Trustee, as defined within the Investment Company Act of 1940 (the “1940 Act”), because of current employment with SAAMCo, an affiliated company with VALIC. |
| (2) | The “Fund Complex” consists of all registered investment company portfolios for which VALIC or an affiliated person of VALIC serves as investment adviser or administrator. The “Fund Complex” includes the AIG Series Trust, Inc. (3 funds), SunAmerica Equity Funds (9 funds), SunAmerica Income Funds (5 funds), SunAmerica Money Market Funds, Inc. (2 funds), SunAmerica Senior Floating Rate Fund, Inc. (1 fund), SunAmerica Focused Series, Inc. (17 portfolios), SunAmerica Focused Alpha Growth Fund, Inc. (1 fund), SunAmerica Focused Alpha Large-Cap Fund, Inc. (1 fund), Anchor Series Trust (9 portfolios), Seasons Series Trust (24 portfolios), SunAmerica Series Trust (35 portfolios), VALIC Company I (33 funds), VALIC Company II (15 funds), AIG Strategic Hedge Fund of Funds (1 fund) and Brazos Mutual Funds (4 funds). |
| (3) | Directorships of companies required to report to the Securities and Exchange Commission under the Securities Exchange Act of 1934 (i.e. “public companies”) or other investment companies registered under the 1940 Act. |
| (4) | Trustees serve until their successors are duly elected and qualified. |
| (5) | Effective July 27, 2005, Mr. Devin became Chairman of the Board. |
Additional Information concerning the Trustees and Officers is contained in the Statement of Additional Information and is available without charge by calling 1-800-448-2542.
137
VALIC Company II
SHAREHOLDERS TAX INFORMATION — August 31, 2009 (Unaudited)
Certain tax information regarding VC II is required to be provided to the shareholders based upon each Fund’s income and capital gain distributions for the taxable year ended August 31, 2009.
The information and distributions reported herein may differ from the information and distributions taxable to the shareholders for the calendar year ending December 31, 2009, which will be made available after the end of the calendar year.
During the year ended August 31, 2009 the Funds paid the following long-term capital gains dividends along with the percentage of ordinary income dividends that qualified for the 70% dividends received deductions for corporations:
| | | | | | | | | | | | |
Fund
| �� | Net
Long-term
Capital Gains
| | Foreign
Tax Credit*
| | Foreign
Source Income
| | Qualifying % for the
70% Dividends
Received Deduction
| |
Aggressive Growth Lifestyle | | $ | 4,453,808 | | $ | — | | $ | — | | 2.71 | % |
Capital Appreciation | | | — | | | — | | | — | | 100.00 | |
Conservative Growth Lifestyle | | | 919,404 | | | — | | | — | | 16.09 | |
Core Bond | | | — | | | — | | | — | | 0.64 | |
High Yield Bond | | | — | | | — | | | — | | 1.04 | |
International Small Cap Equity | | | 24,510,152 | | | 766,091 | | | 13,987,695 | | — | |
Large Cap Value | | | — | | | — | | | — | | 100.00 | |
Mid Cap Growth | | | 869,715 | | | — | | | — | | — | |
Mid Cap Value | | | 9,716,280 | | | — | | | — | | 100.00 | |
Moderate Growth Lifestyle | | | 3,877,420 | | | — | | | — | | 18.08 | |
Money Market II | | | — | | | — | | | — | | — | |
Small Cap Growth | | | 493,157 | | | — | | | — | | — | |
Small Cap Value | | | 13,244,321 | | | — | | | — | | 85.49 | |
Socially Responsible | | | 2,733,592 | | | — | | | — | | 100.00 | |
Strategic Bond | | | — | | | — | �� | | — | | 0.51 | |
| * | The Funds make an election under the Internal Revenue Code Section 853 to pass through foreign taxes paid to the shareholders. |
138
VALIC Company II
COMPARISONS: FUNDS VS. INDEXES (Unaudited)
In the following pages, we have included graphs that compare the Fund’s performance with certain market indices. These graphs show the hypothetical growth of a $10,000 investment in each Fund versus the same $10,000 investment in comparable market indices. Descriptions of these market indices are provided below the individual graphs. It is important to note that the VC II Funds are professionally managed mutual funds while the indices are not available for investment and are unmanaged.
Please note that the graphs and tables that accompany the following investment comments include all fund expenses, but do not reflect the charges imposed by the variable annuity contract or variable life insurance policy (collectively, the “Contracts”), a qualifying employer-sponsored retirement plan (the “Plans”), or Individual Retirement Accounts (“IRAs”). All dividends are assumed to be reinvested. No expenses are deducted from the performance of the indices.
Investments in stocks and bonds are subject to risk, including stock market and interest rate fluctuations. Investments in non-U.S. stocks are subject to additional risks, including political and social instability, differing securities regulations and accounting standards, and limited public information. Mortgage-backed securities are subject to prepayment, which can result in reinvestment of principal at lower yields. Money market instruments generally offer stability and income, but an investment in these securities, like investments in other portfolios, are not guaranteed by the U.S. government or any other federal government entity. Lower rated high yield, high-risk securities generally involve more credit risk. These securities may also be subject to greater market price fluctuations than lower yielding, higher rated debt securities. The common stocks of medium-sized companies may be more volatile than those of larger, more established companies. Investing in real estate involves special risks, which may not be associated with investing in stocks, including possible declines in real estate values, adverse economic conditions, and changes in interest rates. Investments in small capitalization and emerging growth companies involve greater than average risk. Such securities may have limited marketability and the issuers may have limited product lines, markets and financial resources. The value of such investments may fluctuate more widely than investments in larger, more established companies. The technology industry can be significantly affected by obsolescence, short product cycles, falling prices and profits, and competition from new market participants. Funding choices that primarily invest in one sector are more volatile than those that diversify across many industry sectors and companies.
139
VALIC Company II Aggressive Growth Lifestyle Fund
COMPARISON: FUND VS. INDEX (Unaudited)
MANAGEMENT OVERVIEW
A discussion with AIG Global Investment Corp. (“AIGGIC”)
For the twelve months ending August 31, 2009, the Aggressive Growth Lifestyle Fund returned -10.48%, compared to - -18.25% for the S&P 500® Index and -11.49% for the blended index.
Over the period, equity markets and real estate markets had significant negative returns while the fixed income markets were positive. The Russell 3000® Index was down 18.62%, the Morgan Stanley Capital International Europe, Australasia, and Far East (“MSCI EAFE”) Index was down 14.95%, the Financial Times Stock Exchange European Public Real Estate Association/National Association of Real Estate Investment Trusts (“FTSE EPRA/NAREIT”) Index was down 23.06%, and the Barclay’s Capital U.S. Aggregate Bond Index was up 7.94%. Within domestic equities the Russell 1000® Growth Index outperformed the Russell 1000® Value Index by 3.51%.
The Fund began the fiscal year in a defensive posture with overweights in large cap growth equities and bond funds. After September 2008, the Fund was positioned even more defensively by adding more weight to the VCI Government Securities Fund and to the VCII Core Bond Fund throughout 2008, which had a positive impact on performance.
In late January, the Fund started migrating equity weightings away from large cap toward small cap and away from growth toward value. In the spring, the Fund’s exposure to the VCI Global Real Estate Fund moved from a defensive underweight to an opportunistic overweight. These changes were positive contributors to performance.
More recently, the Fund has modestly increased exposure to international equities through the VCI International Equities Fund and the VCI Foreign Value Fund. This move enhanced performance. Exposure to the VCI Government Securities Fund was significantly reduced in favor of VCII High Yield Bond Fund, VCII Strategic Bond Fund, and VCII Core Bond Fund. This move also enhanced performance.
140
VALIC Company II Aggressive Growth Lifestyle Fund
COMPARISON: FUND VS. INDEX (Unaudited) — (continued)
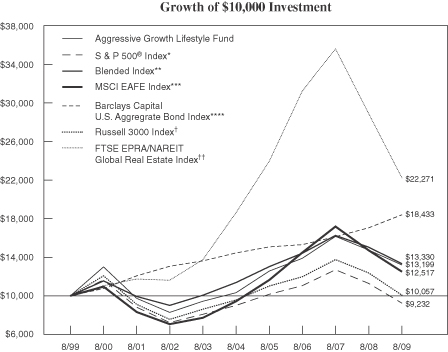
For the year ended August 31, 2009, the Aggressive Growth Lifestyle Fund returned -10.48% compared to -18.25% for the S&P 500® Index and -11.49% for the Blended Index.
| * | The S&P 500® Index consists of 500 stocks chosen for market size, liquidity, and industry group representation. It is a market-value weighted index, with each stock’s percentage in the Index in proportion to its market value. |
| ** | The Fund’s blended index consists of the Russell 3000 Index (54%), Morgan Stanley Capital International® Europe, Australasia, Far East (“MSCI EAFE”) Index (13%), the Barclays Capital U.S. Aggregate Bond Index (25%) and the FTSE European Public Real Estate Association (“EPRA”)/National Association of Real Estate Investment Trust (“NAREIT”) Global Real Estate Index (8%). |
| *** | The MSCI EAFE Index is comprised of 21 Morgan Stanley Capital International country indices and measures the performance of approximately 1,000 large-cap stocks. |
| **** | The Barclays Capital U.S. Aggregate Bond Index is an unmanaged index that is composed of securities from Barclays Capital Government/Corporate Bond Index, Mortgage-Backed Securities Index, and the Asset-Backed Securities Index. |
| † | The Russell 3000 Index follows the 3,000 largest U.S. companies, based on total market capitalization. |
| †† | The FTSE EPRA/NAREIT Global Real Estate Index is a global market capitalization weighted index composed of listed real estate securities in the North American, European and Asian real estate markets. |
| | | | |
| Average Annual Total Return |
| 1 Year | | 5 Years | | 10 Years |
| -10.48% | | 5.04% | | 2.81% |
Past performance is not predictive of future performance. The performance data quoted represents past performance; past performance does not guarantee future results; the investment return and principal value of an investment will fluctuate so that an investor’s shares, when redeemed, may be worth more or less than their original cost; current performance may be lower or higher than the performance data quoted.
The Fund’s returns reflect investment management fees and other Fund expenses. The Fund’s returns do not reflect charges included in the Variable Contract, Plan or IRA for mortality and expense guarantees, administrative fees or surrender charges.
141
VALIC Company II Capital Appreciation Fund
COMPARISON: FUND VS. INDEX (Unaudited)
MANAGEMENT OVERVIEW
A discussion with Bridgeway Capital Management, Inc.
The Capital Appreciation Fund posted a return of -26.59% for the twelve-month period ending August 31, 2009, compared to a return of -16.76% for the Russell 1000® Growth Index.
Top contributors included Intel Corp., Fluor, Amgen, Inc., and Schering-Plough. Our best stock selection for the period was Intel Corp. (up 50.0%). Top detractors included First Solar, Inc., Potash Corp. of Saskatchewan, AGCO Corp. and Intuitive Surgical, Inc. Overall, stock selection detracted from performance.
All Russell 1000 Growth sectors delivered negative returns during the period. The fund was underweight Information Technology, the best performing sector in the benchmark, for the majority of the period. It ended the fiscal period with a market weight in the Technology sector.

For the year ended August 31, 2009, the Capital Appreciation Fund returned -26.59% compared to -16.76% for the Russell 1000® Growth Index.
| * | The Russell 1000® Growth Index measures the performance of those Russell 1000 companies with higher price-to-book ratios and higher forecasted growth values. |
| | | | |
| Average Annual Total Return |
| 1 Year | | 5 Years | | 10 Years |
| -26.59% | | -0.55% | | -5.09% |
Past performance is not predictive of future performance. The performance data quoted represents past performance; past performance does not guarantee future results; the investment return and principal value of an investment will fluctuate so that an investor’s shares, when redeemed, may be worth more or less than their original cost; current performance may be lower or higher than the performance data quoted.
The Fund’s returns reflect investment management fees and other Fund expenses. The Fund’s returns do not reflect charges included in the Variable Contract, Plan or IRA for mortality and expense guarantees, administrative fees or surrender charges.
142
VALIC Company II Conservative Growth Lifestyle Fund
COMPARISON: FUND VS. INDEX (Unaudited)
MANAGEMENT OVERVIEW
A discussion with AIG Global Investment Corp. (“AIGGIC”)
For the twelve-months ending August 31, 2009, the Conservative Growth Lifestyle Fund returned -1.36%, compared to - -18.25% for the S&P 500® Index and -0.80% for the blended index.
Over the period, equity markets and real estate markets had significant negative returns while the fixed income markets were positive. The Russell 3000® Index was down 18.62%, the Morgan Stanley Capital International Europe, Australasia, and Far East (“MSCI EAFE”) Index was down 14.95%, the Financial Times Stock Exchange European Public Real Estate Association/National Association of Real Estate Investment Trusts (“FTSE EPRA/NAREIT”) Index was down 23.06%, and the Barclay’s Capital U.S. Aggregate Bond Index was up 7.94%. Within domestic equities the Russell 1000® Growth® Index outperformed the Russell 1000® Value Index by 3.51%.
The Fund began the fiscal year in a defensive posture with overweights in large cap growth equities and in bond funds. After September 2008, the Fund was positioned even more defensively by adding more weight to the VCI Government Securities Fund and to the VCII Core Bond Fund throughout 2008, which had a positive impact on performance.
In late January, the Fund started migrating equity weightings away from large cap toward small cap and away from growth toward value. In the spring, the Fund’s exposure to the VCI Global Real Estate Fund moved from a defensive underweight to an opportunistic overweight. These changes were positive contributors to performance.
More recently, the Fund has modestly increased exposure to international equities through the VCI International Equities Fund and the VCI Foreign Value Fund. This move enhanced performance. Exposure to the VCI Government Securities Fund was significantly reduced in favor of VCII High Yield Bond Fund, VCII Strategic Bond Fund, and VCII Core Bond Fund. This move also enhanced performance.
143
VALIC Company II Conservative Growth Lifestyle Fund
COMPARISON: FUND VS. INDEX (Unaudited) — (continued)
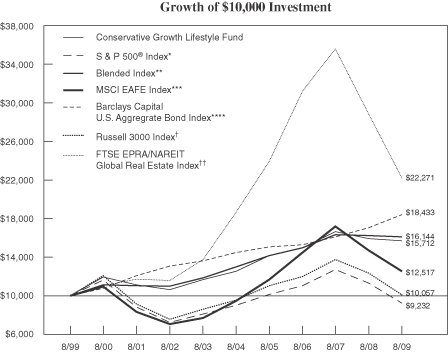
For the year ended August 31, 2009, the Conservative Growth Lifestyle Fund returned -1.36% compared to -18.25% for the S&P 500® Index and -0.80% for the Blended Index.
| * | The S&P 500® Index consists of 500 stocks chosen for market size, liquidity, and industry group representation. It is a market-value weighted index, with each stock’s percentage in the Index in proportion to its market value. |
| ** | The Fund’s blended index consists of the Russell 3000 Index (24%), Morgan Stanley Capital International® Europe, Australasia, Far East (“MSCI EAFE”) Index (8%), the Barclays Capital U.S. Aggregate Bond Index (65%) and the FTSE European Public Real Estate Association (“EPRA”)/National Association of Real Estate Investment Trust (“NAREIT”) Global Real Estate Index (3%). |
| *** | The MSCI EAFE Index is comprised of 21 Morgan Stanley Capital International country indices and measures the performance of approximately 1,000 large-cap stocks. |
| **** | The Barclays Capital U.S. Aggregate Bond Index is an unmanaged index that is composed of securities from Barclays Capital Government/Corporate Bond Index, Mortgage-Backed Securities Index, and the Asset-Backed Securities Index. |
| † | The Russell 3000 Index follows the 3,000 largest U.S. companies, based on total market capitalization. |
| †† | The FTSE EPRA/NAREIT Global Real Estate Index is a global market capitalization weighted index composed of listed real estate securities in the North American, European and Asian real estate markets. |
| | | | |
| Average Annual Total Return |
| 1 Year | | 5 Years | | 10 Years |
| -1.36% | | 4.60% | | 4.62% |
Past performance is not predictive of future performance. The performance data quoted represents past performance; past performance does not guarantee future results; the investment return and principal value of an investment will fluctuate so that an investor’s shares, when redeemed, may be worth more or less than their original cost; current performance may be lower or higher than the performance data quoted.
The Fund’s returns reflect investment management fees and other Fund expenses. The Fund’s returns do not reflect charges included in the Variable Contract, Plan or IRA for mortality and expense guarantees, administrative fees or surrender charges.
144
VALIC Company II Core Bond Fund
COMPARISON: FUND VS. INDEX (Unaudited)
MANAGEMENT OVERVIEW
A discussion with AIG Global Investment Corp. (“AIGGIC”)
The Core Bond Fund posted a return of 6.87% for the twelve-month period ending August 31, 2009, compared to a return of 7.94% for the Barclays Capital U.S. Aggregate Bond Index.
Sector selection had an adverse impact on the relative performance of the Fund versus the benchmark. Exposure to industrials and financials proved the largest detractors from performance. Reduced exposure in the beginning of 2009 to the banking sector, contributed to relative performance.
High yield issues such as Smurfit Stone Container and Paxson Communications Corp. were the largest detractors from performance. In addition, exposure to Lehman Brothers negatively impacted performance.
The higher yielding nature of the Fund versus the benchmark was the largest positive contributor to the performance of the Fund.
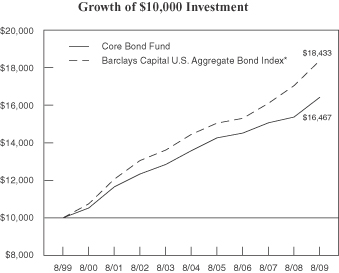
For the year ended August 31, 2009, the Core Bond Fund returned 6.87% compared to 7.94% for the Barclays Capital U.S. Aggregate Bond Index.
| * | The Barclays Capital U.S. Aggregate Bond Index is an unmanaged index that is composed of securities from Barclays Capital Government/Corporate Bond Index, Mortgage-Backed Securities Index, and the Asset-Backed Securities Index. |
| | | | |
| Average Annual Total Return |
| 1 Year | | 5 Years | | 10 Years |
| 6.87% | | 3.91% | | 5.11% |
Past performance is not predictive of future performance. The performance data quoted represents past performance; past performance does not guarantee future results; the investment return and principal value of an investment will fluctuate so that an investor’s shares, when redeemed, may be worth more or less than their original cost; current performance may be lower or higher than the performance data quoted.
The Fund’s returns reflect investment management fees and other Fund expenses. The Fund’s returns do not reflect charges included in the Variable Contract, Plan or IRA for mortality and expense guarantees, administrative fees or surrender charges.
145
VALIC Company II High Yield Bond Fund
COMPARISON: FUND VS. INDEX (Unaudited)
MANAGEMENT OVERVIEW
The High Yield Bond Fund posted a return of -7.97% for the twelve-month period ending August 31, 2009, compared to its benchmark, the Citigroup High-Yield Market Index, which returned 5.31%.
A discussion with AIG Global Investment Corp. (“AIGGIC”)
Credit selection was the primary source of underperformance during the period. Security selection was particularly weak in the finance-other sector, which includes insurance companies, securities firms, real estate investment trusts and other non-bank financial firms. Other sectors where credit selection was a notable detraction include automotive supplies, paper and forest product and diversified telecom. Credit selection in the leisure, pharmaceuticals and technology sectors contributed to performance. Overweighting the healthcare, pharmaceutical and underweighting publishing also contributed to performance.
Effective July 24, 2009 Wellington Management Company, LLP replaced AIG Global Investment Corp. as investment sub-adviser of the Fund.
A discussion with Wellington Management Company, LLP
During this period, security selection in transportation, media-non cable and pharmaceutical sectors was the primary driver of under-performance. The Fund was also hurt by underweight to the technology, retail stores and home construction sectors. The Fund benefited from strong security selection in utilities and an underweight to the wireless sector, and an overweight to financial services.
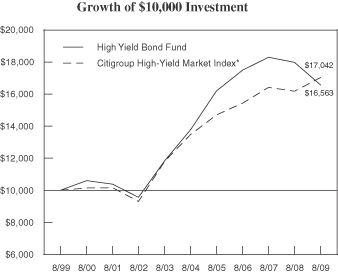
For the year ended August 31, 2009, the High Yield Bond Fund returned -7.97% compared to 5.31% for the Citigroup High-Yield Market Index.
| * | The Citigroup High Yield Market Index measures the performance of below investment grade debt issued by corporations domiciled in the United States or Canada. All of the bonds in such index are publicly placed, have a fixed coupon, and are nonconvertible. |
| | | | |
| Average Annual Total Return |
| 1 Year | | 5 Years | | 10 Years |
| -7.97% | | 3.76% | | 5.18% |
Past performance is not predictive of future performance. The performance data quoted represents past performance; past performance does not guarantee future results; the investment return and principal value of an investment will fluctuate so that an investor’s shares, when redeemed, may be worth more or less than their original cost; current performance may be lower or higher than the performance data quoted.
The Fund’s returns reflect investment management fees and other Fund expenses. The Fund’s returns do not reflect charges included in the Variable Contract, Plan or IRA for mortality and expense guarantees, administrative fees or surrender charges.
146
VALIC Company II International Small Cap Equity Fund
COMPARISON: FUND VS. INDEX (Unaudited)
MANAGEMENT OVERVIEW
A discussion with AIG Global Investment Corp. (“AIGGIC”)
The International Small Cap Equity Fund posted a return of -17.61% for the twelve-month period ending August 31, 2009, compared to a return of -8.88% for the Morgan Stanley Capital International (“MSCI”) Europe, Australasia, and Far East (“EAFE”) Small Cap Index.
The positive contributions to performance were from positions in the Japanese healthcare and consumer staples sectors and south-east Asian financial. Stocks sector bets in European industrials and energy stocks had a negative effect on performance.
Security selection had a negative effect on performance. The top five contributors were: Henderson Group PLC, Mediolanum, United Internet AG, Pigeon Corp. and Sonova Holding AG. The bottom five detractors were: Lamprell PLC, SGL Carbon AG, K&S AG, Boskalis Westminster and Bekaert SA.
Overweight positions in China, Taiwan and Ireland, and underweight positions in Australia, Norway and France were positive contributors to performance.
Stock selection in China, Denmark, and Netherlands was a positive contributor to performance. Stock selection in Japan and the UK were the main detractors from performance.
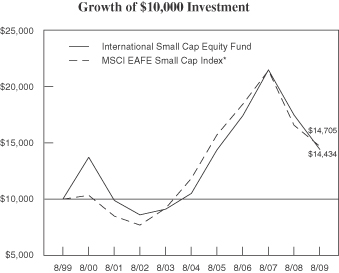
For the year ended August 31, 2009, the International Small Cap Equity Fund returned -17.61% compared to -8.88% for the MSCI EAFE Small Cap Index.
| * | The Morgan Stanley Capital International Europe, Australasia, and the Far East Index (“MSCI EAFE”) Small Cap Index is comprised of 40% of the full market capitalization of the eligible small cap universe with each industry group and each country in the MSCI EAFE Index. |
| | | | |
| Average Annual Total Return |
| 1 Year | | 5 Years | | 10 Years |
| -17.61% | | 6.56% | | 3.74% |
Past performance is not predictive of future performance. The performance data quoted represents past performance; past performance does not guarantee future results; the investment return and principal value of an investment will fluctuate so that an investor’s shares, when redeemed, may be worth more or less than their original cost; current performance may be lower or higher than the performance data quoted.
The Fund’s returns reflect investment management fees and other Fund expenses. The Fund’s returns do not reflect charges included in the Variable Contract, Plan or IRA for mortality and expense guarantees, administrative fees or surrender charges.
147
VALIC Company II Large Cap Value Fund
COMPARISON: FUND VS. INDEX (Unaudited)
MANAGEMENT OVERVIEW
A discussion with SSgA Funds Management, Inc.
The Large Cap Value Fund posted a return of -22.55% for the twelve-month period ending August 31, 2009, compared to a return of -20.27% for the Russell 1000® Value Index.
Poor stock selection was the main driver of the under-performance resulting in under-performance within seven of ten economic sectors. Industrials, consumer staples, and utilities were among the biggest detractors. Positions in United Rentals and Graftech detracted from results. An overweight position in dairy product maker Dean Foods lead to poor returns in consumer staples. The portfolio did have success in the financials and consumer discretionary sectors. Overweights to AutoZone Inc., Ross Stores, and NVR Inc. drove excess performance within the consumer discretionary sector.
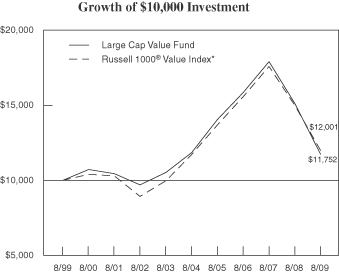
For the year ended August 31, 2009, the Large Cap Value Fund returned -22.55% as compared to -20.27% for the Russell 1000® Value Index.
| * | The Russell 1000® Value Index measures the performance of those Russell 1000 companies with lower price-to-book ratios and lower forecasted growth values. |
| | | | |
| Average Annual Total Return |
| 1 Year | | 5 Years | | 10 Years |
| -22.55% | | -0.19% | | 1.63% |
Past performance is not predictive of future performance. The performance data quoted represents past performance; past performance does not guarantee future results; the investment return and principal value of an investment will fluctuate so that an investor’s shares, when redeemed, may be worth more or less than their original cost; current performance may be lower or higher than the performance data quoted.
The Fund’s returns reflect investment management fees and other Fund expenses. The Fund’s returns do not reflect charges included in the Variable Contract, Plan or IRA for mortality and expense guarantees, administrative fees or surrender charges.
148
VALIC Company II Mid Cap Growth Fund
COMPARISON: FUND VS. INDEX (Unaudited)
MANAGEMENT OVERVIEW
A discussion with Invesco Aim Capital Management, Inc.
The Mid Cap Growth Fund posted a return of -21.43% for the twelve-month period ending August 31, 2009, compared to a return of -20.21% for the Russell MidCap® Growth Index.
The Fund’s greatest contribution to performance was in the consumer discretionary sector, driven by solid stock selection. Examples of holdings that made key contributions to performance included O’Reilly Automotive Inc. The Fund also outperformed in other sectors, including materials, energy, financials and information technology. The Fund’s holdings in each of these sectors generally outperformed those of the benchmark.
Under-performance was concentrated in four sectors: industrials, health care, telecommunication services and consumer staples. The Fund underperformed by the widest margin in the industrials sector, driven by stock selection. The leading detractor to fund performance was industrials company Bucyrus International Inc.
At the close of the period, the Fund’s largest overweight positions were in the financials and materials sectors. The Fund’s largest underweight positions were in the more defensive consumer staples, health care and utilities sectors.
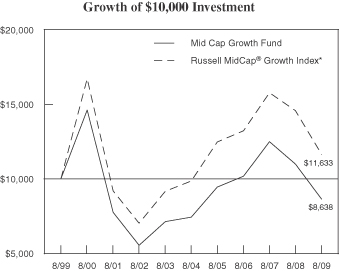
For the year ended August 31, 2009, the Mid Cap Growth Fund returned -21.43% compared to -20.21% for the Russell Midcap® Growth Index.
| * | The Russell MidCap® Growth Index measures the performance of those mid cap companies with higher price-to-book ratios and higher forecasted growth values. The stocks are also members of the Russell 1000® Growth Index. |
| | | | |
| Average Annual Total Return |
| 1 Year | | 5 Years | | 10 Years |
| -21.43% | | 3.07% | | -1.45% |
Past performance is not predictive of future performance. The performance data quoted represents past performance; past performance does not guarantee future results; the investment return and principal value of an investment will fluctuate so that an investor’s shares, when redeemed, may be worth more or less than their original cost; current performance may be lower or higher than the performance data quoted.
The Fund’s returns reflect investment management fees and other Fund expenses. The Fund’s returns do not reflect charges included in the Variable Contract, Plan or IRA for mortality and expense guarantees, administrative fees or surrender charges.
149
VALIC Company II Mid Cap Value Fund
COMPARISON: FUND VS. INDEX (Unaudited)
MANAGEMENT OVERVIEW
The Mid Cap Value Fund posted a return of -14.17% for the twelve-month period ending August 31, 2009, compared to a return of -18.66% for the Russell 2500® Value Index.
A discussion with FAF Advisors, Inc. — regarding their portion of the Fund (the “portfolio”)
Sector selection contributed 2.4% to relative excess performance as the portfolio benefited from its overweight position in the consumer discretionary and consumer staples sectors as well as its underweight position in financials. A modest allocation toward cash also helped performance given significant negative returns for the benchmark. Stock selection/interaction contributed 2.6% to relative performance due to positive stock selection in the utility, consumer discretionary and energy sectors, which was partially offset by adverse stock selection in the technology and telecommunication services sectors.
Stocks which most positively impacted performance during the period included Ford Motor Company (F), Kohl’s (KSS), and Gap (GPS) in the consumer discretionary sector. Celanese (CE) and Freeport McMoran Copper & Gold (FCX) outperformed within the materials sector. Enterprise software provider BMC Software (BMC), utility PG&E (PCG), specialty insurance underwriter WR Berkley (WRB), soft drink bottler Pepsi Bottling Group (PBG) and pharmaceutical distributor AmerisourceBergen (ABC) also contributed positively to performance during the period.
Stocks which most negatively impacted performance during the period included financial sector holdings Assurant (AIZ), Regions Financial (RF) and Fifth Third Bancorp (FITB). In the materials sector, Eastman Chemical (EMN) and Owens Illinois (OI) underperformed while El Paso (EP) and Nabors Industries (NBR) underperformed in the energy sector. Telecom carrier TW Telecom (TWTC), airline Southwest Airlines (LUV), retailer JC Penney (JCP) and semiconductor manufacturer Fairchild Semiconductor (FCS) also contributed negatively to performance.
A discussion with Wellington Management Company, LLP — regarding their portion of the Fund (the “portfolio”)
The portfolio’s security selection was the primary driver of excess performance during the period. Security selection in financials, health care, and energy contributed the most to relative results. PHH Corporation, Annaly Capital Management, and Huntington Bancshares were among the top contributors on an individual basis in the financials sector and in the portfolio. Health care name Barr Pharmaceuticals was also among the top relative contributors to portfolio performance. Within the energy sector, the position in Weatherford International and avoidance of Forest Oil and Helmerich & Payne helped performance. Among the top relative detractors from performance were Cliffs Natural Resources in the materials sector), Sovereign Bancorp in the financials sector, and SeaGate Technology in the information technology sector.
Overall, sector allocation contributed positively to relative results, helped by overweights to the energy, consumer staples, and health care sectors. An underweight to the financials sector and an overweight to the materials sector partially offset positive results in other sectors.
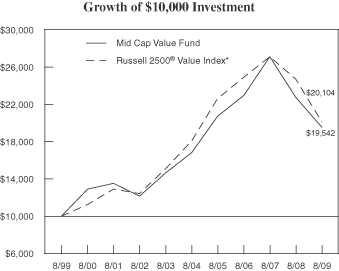
For the year ended August 31, 2009, the Mid Cap Value Fund returned -14.17% compared to -18.66% for the Russell 2500® Value Index.
| * | The Russell 2500® Value Index measures the performance of those Russell 2500® companies (the 2500 smallest companies, by market capitalization in the Russell 3000® Index) with lower price-to-book ratios and lower forecasted growth values. |
| | | | |
| Average Annual Total Return |
| 1 Year | | 5 Years | | 10 Years |
| -14.17% | | 3.04% | | 6.93% |
Past performance is not predictive of future performance. The performance data quoted represents past performance; past performance does not guarantee future results; the investment return and principal value of an investment will fluctuate so that an investor’s shares, when redeemed, may be worth more or less than their original cost; current performance may be lower or higher than the performance data quoted.
The Fund’s returns reflect investment management fees and other Fund expenses. The Fund’s returns do not reflect charges included in the Variable Contract, Plan or IRA for mortality and expense guarantees, administrative fees or surrender charges.
150
VALIC Company II Moderate Growth Lifestyle Fund
COMPARISON: FUND VS. INDEX (Unaudited)
MANAGEMENT OVERVIEW
A discussion with AIG Global Investment Corp. (“AIGGIC”)
For the twelve-months ending August 31, 2009, the Moderate Growth Lifestyle Fund returned -5.33%, compared to -18.25% for the S&P 500® Index and -6.12% for the blended index.
Over this period, equity markets and real estate markets had significant negative returns while the fixed income markets were positive. The Russell 3000® Index was down 18.62%, the Morgan Stanley Capital International Europe, Australasia, and Far East (“MSCI EAFE”) Index was down 14.95%, the Financial Times Stock Exchange European Public Real Estate Association/National Association of Real Estate Investment Trusts (“FTSE/EPRA NAREIT”) Index was down 23.06%, and the Barclay’s Capital U.S. Aggregate Bond Index was up 7.94%. Within domestic equities the Russell 1000® Growth Index outperformed the Russell 1000® Value Index by 3.51%.
The Fund began the year in a defensive posture with overweights in large cap growth equities and in bond funds. After September 2008, the Fund was positioned even more defensively by adding more weight to the VCI Government Securities Fund and to the VCII Core Bond Fund throughout 2008, which had a positive impact on performance.
In late January, the Fund started migrating equity weightings away from large cap toward small cap and away from growth toward value. In the spring, the Fund’s exposure to the VCI Global Real Estate Fund moved from a defensive underweight to an opportunistic overweight. These changes were positive contributors to performance.
More recently, the Fund has modestly increased exposure to international equities through the VCI International Equities Fund and the VCI Foreign Value Fund. This move enhanced performance. Exposure to the VCI Government Securities Fund was significantly reduced in favor of VCII High Yield Bond Fund, VCII Strategic Bond Fund, and VCII Core Bond Fund. This move also enhanced performance.
151
VALIC Company II Moderate Growth Lifestyle Fund
COMPARISON: FUND VS. INDEX (Unaudited) — (continued)
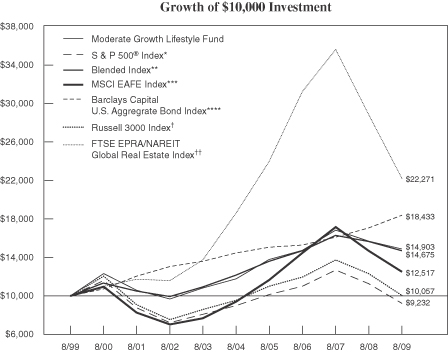
For the year ended August 31, 2009, the Moderate Growth Lifestyle Fund returned -5.33% compared to -18.25% for the S&P 500® Index and -6.12% for the Blended Index.
| * | The S&P 500® Index consists of 500 stocks chosen for market size, liquidity, and industry group representation. It is a market-value weighted index, with each stock’s percentage in the Index in proportion to its market value. |
| ** | The blended index consists of the Russell 3000 Index (40%), Morgan Stanley Capital International® Europe, Australasia, Far East (“MSCI EAFE”) Index (10%), the Barclays Capital U.S. Aggregate Bond Index (45%) and the FTSE European Public Real Estate Association (“EPRA”)/National Association of Real Estate Investment Trust (“NAREIT”) Global Real Estate Index (5%). |
| *** | The MSCI EAFE Index is comprised of 21 Morgan Stanley Capital International country indices and measures the performance of approximately 1,000 large-cap stocks. |
| **** | The Barclays Capital U.S. Aggregate Bond Index is an unmanaged index that is composed of securities from Barclays Capital Government/Corporate Bond Index, Mortgage-Backed Securities Index, and the Asset-Backed Securities Index. |
| † | The Russell 3000 Index follows the 3,000 largest U.S. companies, based on total market capitalization. |
| †† | The FTSE EPRA/NAREIT Global Real Estate Index is a global market capitalization weighted index composed of listed real estate securities in the North American, European and Asian real estate markets. |
| | | | |
| Average Annual Total Return |
| 1 Year | | 5 Years | | 10 Years |
| -5.33% | | 4.79% | | 4.07% |
Past performance is not predictive of future performance. The performance data quoted represents past performance; past performance does not guarantee future results; the investment return and principal value of an investment will fluctuate so that an investor’s shares, when redeemed, may be worth more or less than their original cost; current performance may be lower or higher than the performance data quoted.
The Fund’s returns reflect investment management fees and other Fund expenses. The Fund’s returns do not reflect charges included in the Variable Contract, Plan or IRA for mortality and expense guarantees, administrative fees or surrender charges.
152
VALIC Company II Money Market II Fund
COMPARISON: FUND VS. INDEX (Unaudited)
MANAGEMENT OVERVIEW
A discussion with SunAmerica Asset Management Corp.
The Money Market II Fund posted a return of 0.89% for the twelve-month period ending August 31, 2009, compared to a return of 0.31% for its benchmark, the Treasury Bill Three-Month Index.
The fiscal period began with the Fed Funds Target Rate at 2%. Following the dramatic events of September 2008, among them Fannie Mae and Freddie Mac entering government conservatorship and Lehman Brothers filing for bankruptcy, the Federal Reserve acted in early October 2008 by lowering the Federal Funds Target Rate by 0.50% to 1.50%. At the end of October, the Federal Reserve implemented an additional 0.50% reduction to bring the Target Rate to 1.00%. The Federal Reserve made this cut, noting the markedly slowing pace of economic activity, owing significantly to a decline in consumer expenditures. At the December 2008 meeting, the Federal Reserve continued its aggressive actions setting a Federal Funds Rate Target between 0% and 0.25%. The Federal Reserve has maintained its accommodative stance throughout their 2009 policy meetings keeping interest rates steady. They have stated that they will employ all available tools to promote economic recovery and to preserve price stability.
The other major event impacting money market investing occurred on September 17, 2008 when the Reserve Management Corporation’s Reserve Primary Fund wrote off $785 million in Lehman Holdings and broke the $1 net asset value traditionally held by money market funds. In response to this event, on September 19, 2008 the Federal Reserve announced the Asset Backed Commercial Paper Money Market Mutual Fund Liquidity Facility to bring stability back into the short-term credit markets. On the same day, the U.S. Treasury announced the establishment of Treasury’s Temporary Guarantee Program for the money market industry. In this program, the Treasury agreed to issue the holdings of any publicly eligible money market mutual fund, both retail and institutional, that pays a fee to participate in the program. The Fund participates in this program which expired on September 18, 2009.
As one would expect, yields on Money Market securities decreased steadily throughout the fiscal year. Yields on 1-month CDs have declined from 2.575% at the beginning of the fiscal period to approximately 0.25% at the end of the period. In order to preserve yields, value was added through active management of the Fund’s duration, specifically by purchasing longer-dated fixed rate instruments as well as floating rate notes.
Sector selection had an impact on the portfolio. Given our outlook for continued decreases in the Federal Funds rate, we continued to emphasize longer rate fixed rate and floating rate securities while selectively purchasing short-dated securities when relative value opportunities were discovered. In these challenging times, we strive to preserve yield while maintaining our emphasis on liquidity and quality.
| | | | |
| Average Annual Total Return |
| 1 Year | | 5 Years | | 10 Years |
| 0.89% | | 2.97% | | 2.85% |
Past performance is not predictive of future performance. The performance data quoted represents past performance; past performance does not guarantee future results; the investment return and principal value of an investment will fluctuate so that an investor’s shares, when redeemed, may be worth more or less than their original cost; current performance may be lower or higher than the performance data quoted.
The Fund’s returns reflect investment management fees and other Fund expenses. The Fund’s returns do not reflect charges included in the Variable Contract, Plan or IRA for mortality and expense guarantees, administrative fees or surrender charges.
153
VALIC Company II Small Cap Growth Fund
COMPARISON: FUND VS. INDEX (Unaudited)
MANAGEMENT OVERVIEW
A discussion with JPMorgan Investment Management, Inc. (“JP Morgan”)
The Small Cap Growth Fund posted a return of -17.44% for the twelve-month period ending August 31, 2009, compared to a return of -22.02% for the Russell 2000® Growth Index.
Stock selection in the energy sector and an underweight in the producer durable sector contributed to results. Negatively impacting returns was stock selection in the material/ processing sector and an underweight in the consumer staple sector.
Among the largest contributors to performance was THQ Inc., a video game publisher, whose shares advanced as its results topped expectations. Data Domain, contributed to performance as well.
On the negative side, Penn Virginia Corp. was among the detractors from performance. The natural gas and oil producer fell as a result of a decline in oil prices, particularly earlier in the period. Century Aluminum Co. also hurt returns, as the aluminum producer was hurt by weakness in commodities.
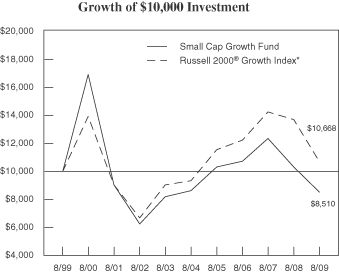
For the year ended August 31, 2009, the Small Cap Growth Fund returned -17.44% compared to -22.02% for the Russell 2000® Growth Index.
| * | The Russell 2000® Growth Index measures the performance of those Russell 2000® companies with higher price-to-book ratios and higher forecasted growth values. |
| | | | |
| Average Annual Total Return |
| 1 Year | | 5 Years | | 10 Years |
| -17.44% | | -0.28% | | -1.60% |
Past performance is not predictive of future performance. The performance data quoted represents past performance; past performance does not guarantee future results; the investment return and principal value of an investment will fluctuate so that an investor’s shares, when redeemed, may be worth more or less than their original cost; current performance may be lower or higher than the performance data quoted.
The Fund’s returns reflect investment management fees and other Fund expenses. The Fund’s returns do not reflect charges included in the Variable Contract, Plan or IRA for mortality and expense guarantees, administrative fees or surrender charges.
154
VALIC Company II Small Cap Value Fund
COMPARISON: FUND VS. INDEX (Unaudited)
MANAGEMENT OVERVIEW
A discussion with JPMorgan Investment Advisors, Inc.
The Small Cap Value Fund posted a return of -21.71% for the twelve-month period ending August 31, 2009, compared to a return of -20.68% for the Russell 2000® Value Index.
Security selection in the systems hardware, insurance, and semiconductor sectors detracted the most from performance, while the financial, Real Estate Investment Trust (REIT), and media sectors provided the largest contributions to performance.
The Fund’s top detractors during the period were transportation broker Pacer International Inc. and real estate investment trust Lexington Realty Trust.
Two top contributors to Fund performance were EPIQ Systems Inc., a developer of software used in bankruptcy filings, and packaging maker Rock-Tenn Co. Other top contributors to performance were overweight positions in Charming Shoppes Inc. and American Equity Investment Life Holding Co. Not holding Colonial Bancgroup, which declined 98.5%, helped performance relative to the benchmark.
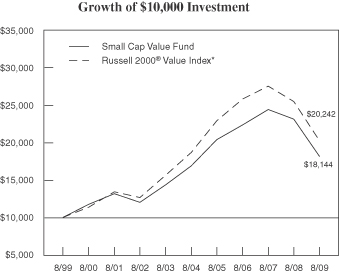
For the year ended August 31, 2009, the Small Cap Value Fund returned -21.71% compared to -20.68% for the Russell 2000® Value Index.
| * | The Russell 2000® Value Index measures the performance of those Russell 2000 companies with lower price-to-book ratios and lower forecasted growth values. |
| | | | |
| Average Annual Total Return |
| 1 Year | | 5 Years | | 10 Years |
| -21.71% | | 1.44% | | 6.14% |
Past performance is not predictive of future performance. The performance data quoted represents past performance; past performance does not guarantee future results; the investment return and principal value of an investment will fluctuate so that an investor’s shares, when redeemed, may be worth more or less than their original cost; current performance may be lower or higher than the performance data quoted.
The Fund’s returns reflect investment management fees and other Fund expenses. The Fund’s returns do not reflect charges included in the Variable Contract, Plan or IRA for mortality and expense guarantees, administrative fees or surrender charges.
155
VALIC Company II Socially Responsible Fund
COMPARISON: FUND VS. INDEX (Unaudited)
MANAGEMENT OVERVIEW
A discussion with AIG Global Investment Corp. (“AIGGIC”)
The Socially Responsible Fund posted a return of -19.20% for the twelve-month period ending August 31, 2009, compared to its benchmark, the S&P 500 Index, which returned -18.25%.
Under-performance was due to two conflicting factors, stock selection and sector weightings. The sector weights benefited the Fund, while stock selection detracted by a similar amount. Over the past year, underweighting of the industrial sector benefited the Fund significantly. The industrial sector has numerous companies that do not pass the social mandate. As a result, the Fund is usually underweight industrials, given that largest names, including GE, 3M, and Texas Industries Inc. are not compliant with the social criteria. Unfortunately, the strong performance of the sector weightings was off-set by negative stock selection. One name on the positive side that warrants mentioning is JP Morgan. JP Morgan which was up more than 15% over the past year, while the financial sector was down over 28%, contributed most significantly to performance. The credit melt down in the financial sector was very influential over the past year. The leading laggards of the Fund were a pair of financial companies, Citigroup and Hartford Financial which were down 73% and 60%, respectively.
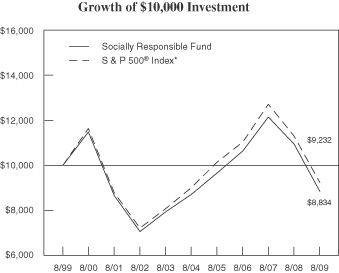
For the year ended August 31, 2009, the Socially Responsible Fund returned -19.20% compared to -18.25% for the S&P 500® Index.
| * | The S&P 500® Index consists of 500 stocks chosen for market size, liquidity, and industry group representation. It is a market-value weighted index (stock price times number of shares outstanding), with each stock’s weight in the index proportionate to its market value. |
| | | | |
| Average Annual Total Return |
| 1 Year | | 5 Years | | 10 Years |
| -19.20% | | 0.27% | | -1.23% |
Past performance is not predictive of future performance. The performance data quoted represents past performance; past performance does not guarantee future results; the investment return and principal value of an investment will fluctuate so that an investor’s shares, when redeemed, may be worth more or less than their original cost; current performance may be lower or higher than the performance data quoted.
The Fund’s returns reflect investment management fees and other Fund expenses. The Fund’s returns do not reflect charges included in the Variable Contract, Plan or IRA for mortality and expense guarantees, administrative fees or surrender charges.
156
VALIC Company II Strategic Bond Fund
COMPARISON: FUND VS. INDEX (Unaudited)
MANAGEMENT OVERVIEW
A discussion with AIG Global Investment Corp. (“AIGGIC”)
The Strategic Bond Fund posted a return of 2.23% for the twelve-month period ending August 31, 2009, compared to its benchmark, the Barclays Capital U.S. Aggregate Bond Index, which returned 7.94%.
Sector selection had an adverse impact on the relative performance of the Fund versus the benchmark. Exposure to industrials and utilities proved the largest detractors from performance. Reduced exposure to bank and financial sectors in the beginning of 2009, contributed to relative performance.
Sovereign bonds, specifically those issued by Sweden and Australia were the top contributors to performance. High yield issues such as Smurfit Stone Container and Paxson Communications were the largest detractors from performance.
The higher yielding nature of the Fund versus the benchmark was the largest positive contributor to the performance of the Fund.
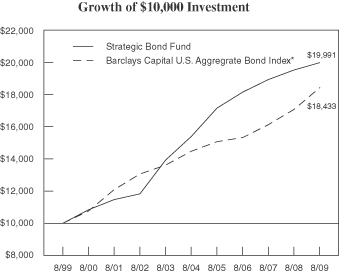
For the year ended August 31, 2009, the Strategic Bond Fund returned 2.23% compared to 7.94% for the Barclays Capital U.S. Aggregate Bond Index.
| * | The Barclays Capital U.S. Aggregate Bond Index is an unmanaged index that is composed of securities from Barclays Capital Government/Corporate Bond Index, Mortgage-Backed Securities Index, and the Asset-Backed Securities Index. |
| | | | |
| Average Annual Total Return |
| 1 Year | | 5 Years | | 10 Years |
| 2.23% | | 5.37% | | 7.17% |
Past performance is not predictive of future performance. The performance data quoted represents past performance; past performance does not guarantee future results; the investment return and principal value of an investment will fluctuate so that an investor’s shares, when redeemed, may be worth more or less than their original cost; current performance may be lower or higher than the performance data quoted.
The Fund’s returns reflect investment management fees and other Fund expenses. The Fund’s returns do not reflect charges included in the Variable Contract, Plan or IRA for mortality and expense guarantees, administrative fees or surrender charges.
157
VALIC Company II
SUPPLEMENT TO PROSPECTUS (Unaudited)
Supplement to Prospectus dated January 1, 2009
Mid Cap Value Fund. In the section titled “About VC II’s Management – Investment Sub-Advisers – FAF Advisers, Inc.,” the disclosure with respect to Terry Sloan is deleted in its entirety. Kevin Earley and Brett Mellum will continue to serve as co-lead portfolio managers of the Fund.
Date: September 28, 2009
158
VALIC Company II
BOARD OF TRUSTEES
Thomas J. Brown
Judith L. Craven
William F. Devin
Timothy J. Ebner
Gustavo E. Gonzales, Jr.
Peter A. Harbeck
John W. Lancaster
Kenneth J. Lavery
John E. Maupin, Jr.
CUSTODIAN
State Street Bank and Trust Company
225 Franklin Street
Boston, Massachusetts 02110
INVESTMENT ADVISER
The Variable Annuity Life Insurance Company (VALIC)
2929 Allen Parkway
Houston, Texas 77019
INVESTMENT SUBADVISERS
AIG Global Investment Corp.
70 Pine Street
New York, New York 10270
SunAmerica Asset Management Corp.
Haborside Financial Center
3200 Plaza 5
Jersey City, New Jersey 07311
Invesco Aim Capital Management, Inc.
11 Greenway Plaza
Houston, Texas 77046
Bridgeway Capital Management, Inc.
5615 Kirby Dr., Suite 518
Houston, Texas 77005
FAF Advisors, Inc.
800 Nicollet Mall
Minneapolis, Minnesota 55402
JPMorgan Investment Advisors Inc.
1111 Polaris Parkway
Columbus, Ohio 43271-0211
J.P. Morgan Investment Management Inc.
245 Park Avenue
New York, New York 10167
SSgA Funds Management, Inc.
State Street Financial Center
One Lincoln Street
Boston, Massachusetts 02111-2900
Wellington Management Co. LLP
75 State Street
Boston, Massachusetts 02109
INDEPENDENT REGISTERED PUBLIC ACCOUNTING FIRM
PricewaterhouseCoopers LLP
1201 Louisiana Street, Suite 2900
Houston, Texas 77002
TRANSFER AND SHAREHOLDER SERVICE AGENT
The Variable Annuity Life
Insurance Company (VALIC)
2929 Allen Parkway
Houston, Texas 77019
OFFICERS
Kurt Bernlohr,
President and Principal Executive Officer
John Packs,
Vice President and Senior Investment Officer
Gregory R. Kingston,
Treasurer and Principal Financial Officer
Nori L. Gabert,
Vice President, Chief Legal Officer and Secretary
Gregory N. Bressler,
Vice President
Cynthia A. Skrehot,
Vice President and Chief Compliance Officer
Donna Handel,
Vice President and Assistant Treasurer
Diedre L. Shepherd,
Assistant Treasurer
Mark Matthes,
Assistant Secretary
Matthew J. Hackethal,
Anti-Money Laundering Compliance Officer
Thomas M. Ward,
Vice President
DISCLOSURE OF QUARTERLY FUND PORTFOLIO HOLDINGS
VC II is required to file its complete schedule of portfolio holdings with the U.S. Securities and Exchange Commission for its first and third fiscal quarters on Form N-Q. VC II’s Forms N-Q are available on the U.S. Securities and Exchange Commission’s website at www.sec.gov. You can also review and obtain copies of Forms N-Q at the U.S. Securities and Exchange Commission’s Public Reference Room in Washington, DC (information on the operation of the Public Reference Room may be obtained by calling 1-800-SEC-0330).
VOTING PROXIES ON VALIC COMPANY II PORTFOLIO SECURITIES
A description of the policies and procedures that VC II uses to determine how to vote proxies related to securities held in the Fund’s portfolios, which is available in VC II’s Statement of Additional Information, may be obtained without charge upon request, by calling 800-448-2542. This information is also available from the EDGAR database on the U.S. Securities and Exchange Commission’s website at http://www.sec.gov.
PROXY VOTING RECORD ON VALIC COMPANY II PORTFOLIO SECURITIES
Information regarding how VC II voted proxies relating to securities held in the VC II Funds portfolios during the most recent twelve month period ended June 30, is available, once filed with the U.S. Securities and Exchange Commission without charge, upon request, by calling 800-448-2542 or on the U.S. Securities and Exchange Commission’s website at http://www.sec.gov.
This report is for the information of the shareholders and variable contract owners investing in VC II. It is authorized for distribution to other persons only when preceded or accompanied by an effective prospectus which contains information on how to purchase shares and other pertinent information.
If you would like further information about this material or products issued by VALIC or American General Life Insurance Company, please contact your financial professional.
VALIC ONLINE
Account Access
| | |
You must establish a
Unique User Identification
(ID) and Password; create your security profile by using
the online account services. By using a numeric Personal Identification Number (PIN)
you can also access
VALIC’s toll-free
automated phone line
at 800.448.2542 to obtain
24-hour access to your account. | | Manage your account on the Web through VALIC Online! Enjoy quick, easy and secure access — now or anytime. Go to www.valic.com and click on Access Your Account in the “Links to Login” section. You’ll find these powerful features: • View your account portfolio including values, graphs and charts • View, download or print account, transaction confirmation and tax statements • View current and historical fund performance and unit values • View personal performance for your account • View transaction history • Download transaction history to Quicken using Direct ConnectSM • View your financial advisor’s contact information • Reset your Password and update the information on your security profile • Change your contact information such as telephone, address or e-mail • Update your Investor Profile • Initiate account transactions including: > Allocation changes > Transfer money among investment options > Rebalance account to your desired allocation mix > Change contributions • Review account information on your cell phone or mobile device • Request forms for a variety of services • Display information from other accounts in addition to VALIC accounts using the Account Aggregation Feature • Enroll in the electronic document delivery service (Personal Deliver-e®) Start exploring VALIC Online today! To set up access to VALIC Online: • Go to www.valic.com • Click on Access Your Account in the “Links to Login” section • Click “Register Now” to begin the registration process • Enter the information to set up your security profile • Click “I Agree” to accept VALIC’s access agreement (required) • Verify and/or update your address, e-mail and telephone number • Click “Continue” to update your record and proceed to the Summary screen You can also access your account using VALIC’s toll-free automated account information line by calling 800-448-2542. |
| | |
VALIC Company II P.O. Box 3206 Houston, TX 77253-3206 | | PRSRT STD U.S. POSTAGE PAID PONTIAC, IL PERMIT NO. 97 |
VC 11288 (08/2009) J74500
VALIC Company II (“the registrant”) has adopted a Code of Ethics applicable to its Principal Executive and Principal Accounting Officers pursuant to Section 406 of the Sarbanes-Oxley Act of 2002. During the fiscal year 2009, there were no reportable amendments, waivers, or implicit waivers to a provision of the Code of Ethics that applies to the registrant’s Principle Executives and Principal Accounting Officers.
| Item 3. | Audit Committee Financial Expert. |
The registrant’s Board of Trustees has determined that Thomas J. Brown qualifies as an audit committee financial expert, as defined in instructions to Item 3(a) of Form N-CSR. Mr. Brown is considered to be “independent” for purposes of Item 3(a)(2) of Form N-CSR.
| Item 4. | Principal Accountant Fees and Services. |
(a) - (d) Aggregate fees billed to the registrant for the last two fiscal years for professional services rendered by the registrant’s principal accountant were as follows:
| | | | | | |
| | | 2009 | | 2008 |
(a) Audit Fees | | $ | 289,500 | | $ | 289,500 |
(b) Audit-Related Fees | | $ | 0 | | $ | 0 |
(c) Tax Fees | | $ | 2,281 | | $ | 0 |
(d) All Other Fees | | $ | 0 | | $ | 0 |
Audit Fees include amounts related to the audit of the registrant’s annual financial statements and services normally provided by the principal accountant in connection with statutory and regulatory filings. Tax Fees principally include tax advice and tax planning.
Aggregate fees billed to the investment adviser and Adviser Affiliates (as defined below in Item 4(e)) that are required to be pre-approved pursuant to paragraph (c)(7)(ii) of Rule 2-01 of Regulation S-X for the last two fiscal years for services rendered by the registrant’s principal accountant were as follows:
| | | | | | |
| | | 2009 | | 2008 |
(b) Audit-Related Fees | | $ | 0 | | $ | 0 |
(c) Tax Fees | | $ | 0 | | $ | 0 |
(d) All Other Fees | | $ | 0 | | $ | 0 |
In addition, Ernst & Young, LLP is performing tax services for the Trust. For the fiscal years ended 2009 and 2008, the fees for these tax services were $133,456 and $136,500, respectively.
| | (e) (1) | The registrant’s audit committee pre-approves all audit services provided by the registrant’s principal accountant for the registrant and all non-audit services provided by the registrant’s principal accountant for the |
| | registrant, its investment adviser and any entity controlling, controlled by, or under common control with the investment adviser (“Adviser Affiliates”) that provides ongoing services to the registrant, if the engagement by the investment adviser or Adviser Affiliate relates directly to the operations and financial reporting of the registrant. The audit committee has not presently established any pre-approval policies and procedures that permit the pre-approval of the above services other than by the full audit committee. Certain de minimis exceptions are allowed for non-audit services in accordance with Rule 2-01(c)(7)(i)(C) of Regulation S-X as set forth in the Registrant's audit committee charter. |
| | (2) | No services included in (b) - (d) above in connection with fees billed to the registrant or the investment adviser or Adviser Affiliates were approved pursuant to paragraph (c)(7)(i)(c) of Rule 2-01 of Regulation S-X. |
| | (g) | The aggregate fees billed for the most recent fiscal year and the preceding fiscal year by the registrant’s principal accountant for non-audit services rendered to the registrant, its investment adviser, and Adviser Affiliates that provides ongoing services to the registrant for 2009 and 2008 were $814,461 and $461,499, respectively. |
| | (h) | Non-audit services rendered to the registrant’s investment adviser and any Adviser Affiliates that provides ongoing services to the registrant that were not pre-approved pursuant to paragraph (c)(7)(ii) of Rule 2-01 of Regulation S-X were considered by the registrant’s audit committee as to whether they were compatible with maintaining the principal accountant’s independence. |
| Item 5. | Audit Committee of Listed Registrants. |
Not applicable.
Included in Item 1 to the Form.
| Item 7. | Disclosure of Proxy Voting Policies and Procedures for Closed-End Management Investment Companies. |
Not applicable.
| Item 8. | Portfolio Managers of Closed-End Management Investment Companies. |
Not applicable.
| Item 9. | Purchases of Equity Securities by Closed-End Management Investment Company and Affiliated Purchasers. |
Not applicable.
| Item 10. | Submission of Matters to a Vote of Security Holders. |
There were no material changes to the procedures by which shareholders may recommend nominees to the registrant’s Board of Trustees that were implemented after the registrant last provided disclosure in response to the requirements of Item 407(c)(2)(iv) of Regulation S-K (17 CFR 229.407) (as required by 22(b)(15)) of Schedule 14A (17 CFR 240.14a-101), or this Item 10.
| Item 11. | Controls and Procedures. |
| | (a) | An evaluation was performed within 90 days of the filing of this report, under the supervision and with the participation of the registrant’s management, including the President and Treasurer, of the effectiveness of the design and operation of the registrant’s disclosure controls and procedures as defined under Rule 30a-3(c) under the Investment Company Act of 1940 (17 CFR 270.30a-3(c)). Based on that evaluation, the registrant’s management, including the President and Treasurer, concluded that the registrant’s disclosure controls and procedures are effective. |
| | (b) | There was no change in the registrant’s internal control over financial reporting (as defined in Rule 30a-3(d) under the Investment Company Act of 1940 (17 CFR 270.3a-3(d))) that occurred during the registrant’s the last fiscal quarter of the period covered by this report that has materially affected, or is reasonably likely to materially affect, the registrant’s internal control over financial reporting. |
| | (a) | (1) Code of Ethics applicable to its Principal Executive and Principal Accounting Officers pursuant to Section 406 of the Sarbanes-Oxley Act of 2002 attached hereto as Exhibit 99.406.Code of Ethics. |
| | | (2) Certifications pursuant to Rule 30a-2(a) under the Investment Company Act of 1940 (17 CFR 270.30a-2(a)) attached hereto as Exhibit 99.CERT. |
| | (b) | Certification pursuant to Rule 30a-2 (b) under the Investment Company Act of 1940 (17 CFR 270.30a-2 (a)) and Section 906 of the Sarbanes-Oxley Act of 2002 attached hereto as Exhibit 99.906.CERT. |
SIGNATURES
Pursuant to the requirements of the Securities Exchange Act of 1934 and the Investment Company Act of 1940, the registrant has duly caused this report to be signed on its behalf by the undersigned, thereunto duly authorized.
| | |
| VALIC Company II |
| |
| By: | | /s/ Kurt W. Bernlohr |
| | Kurt W. Bernlohr |
| | President |
Date: November 06, 2009
Pursuant to the requirements of the Securities Exchange Act of 1934 and the Investment Company Act of 1940, this report has been signed below by the following persons on behalf of the registrant and in the capacities and on the dates indicated.
| | |
| By: | | /s/ Kurt W. Bernlohr |
| | Kurt W. Bernlohr |
| | President |
Date: November 06, 2009
| | |
| By: | | /s/ Gregory R. Kingston |
| | Gregory R. Kingston |
| | Treasurer |
Date: November 06, 2009