UNITED STATES
SECURITIES AND EXCHANGE COMMISSION
Washington, D.C. 20549
FORM N-CSR
CERTIFIED SHAREHOLDER REPORT OF REGISTERED
MANAGEMENT INVESTMENT COMPANIES
Investment Company Act file number 811-08789
VALIC Company II
(Exact name of registrant as specified in charter)
2929 Allen Parkway, Houston, TX 77019
(Address of principal executive offices) (Zip code)
Kurt W. Bernlohr
Senior Vice President
The Variable Annuity Life Insurance Company
2929 Allen Parkway
Houston, TX 77019
(Name and address of agent for service)
Registrant’s telephone number, including area code: (713) 831-6133
Date of fiscal year end: August 31
Date of reporting period: August 31, 2010
Item 1. Reports to Stockholders
VALIC Company II, Annual Report at August 31, 2010.

VALIC Company II
Annual Report, August 31, 2010
SAVING :INVESTING :PLANNING
VALIC Company II
ANNUAL REPORT AUGUST 31, 2010
TABLE OF CONTENTS
VALIC Company II
PRESIDENT’S LETTER
Dear Valued Investor:
We are pleased to provide you with the following Annual Report for VALIC Company II. The report contains the investment portfolio information and the financial statements of VALIC Company II for the twelve-month period ending August 31, 2010. We encourage you to carefully read this report and hope you find it informative and helpful.
The reporting period showed continued improvement in general economic conditions over the prior year. As confirmed by some of the major market barometers, most U.S. equity and bond markets continued for the most part the recovery that began early in 2009, although improvements in equity markets overseas were more modest and showed slightly negative returns for the reporting period. The twelve-months ending August 31, 2010 saw total returns of 4.91% for the S&P 500® Index*, 9.18% for the Barclays Capital U.S. Aggregate Bond Index**, and -1.93% for the MSCI EAFE Index (gross)***. Among the factors driving this improvement were interest rates at near record lows, modest inflation and manufacturing and corporate earnings that mostly exceeded expectations. The various government stimulus programs and central bank interventions put in place throughout the world in the last few years were also believed to have had a positive impact as the effects of their increased liquidity continued to work their way through the financial system.
Events both at home and abroad, however, demonstrated that U.S. and overseas economies remain fragile and continue to face important challenges. Domestically, the real estate market remained weak, unemployment high and consumers wary. The massive oil spill in the Gulf of Mexico and the uncertainty surrounding the financial effects of health care and financial reform legislation further illustrated the fragility of any recovery. Overseas, a sovereign debt crisis in Europe late in the period, highlighted by events in Greece, brought structural budget deficits to the forefront and highlighted the unsustainable budget trajectories of many countries, including the U.S. and its states and municipalities. Clearly, questions remain about the sustainability of any long-term global recovery.
Challenging times like these highlight the importance for investors to stay focused on the long-term and stick to tried-and-true investment fundamentals. We believe a well-diversified portfolio across assets classes, investment styles and geographic borders is one such fundamental. Another is staying invested consistent with your risk tolerance, time horizon and long-term investment strategy. Your financial advisor can assist with other fundamentals to help you take greater control of your financial future.
Thank you for your investment with VALIC Company II. We appreciate your ongoing confidence in us and look forward to helping you meet your investment goals in the years ahead.
Sincerely,

Kurt W. Bernlohr, President
VALIC Company II
| * | The S&P 500® Index, widely regarded as the best single gauge of the U.S. Equity market, is an index of the stocks of 500 major large-cap U.S. corporations, chosen for market size, liquidity, and industry group representation. It is a market-value weighted index, with each stock’s percentage in the Index in proportion to its market value. |
| ** | The Barclays Capital U.S. Aggregate Bond Index, a broad measure of the bond market, is an unmanaged index that is composed of securities from Barclays Capital Government/Corporate Bond Index, Mortgage-Backed Securities Index, and the Asset-Backed Securities Index. |
| *** | The Morgan Stanley Capital International (MSCI), Europe, Australasia, Far East (EAFE) Index (gross) is a free float-adjusted market capitalization index that is designed to measure the equity market performance of developed markets, excluding the U.S. and Canada. The gross index approximates the maximum possible dividend reinvestment and assumes that the amount reinvested is the entire dividend distributed to individuals resident in the country of the company, but does not include tax credits. |
Past performance of an index does not guarantee the future performance of any investment.
1
VALIC Company II
EXPENSE EXAMPLE — August 31, 2010 (Unaudited)
Disclosure of Fund Expenses in Shareholder Reports
As a shareholder of a Fund in VALIC Company II (“VC II”), you incur ongoing costs, including management fees and other Fund expenses. This Example is intended to help you understand your ongoing costs (in dollars) of investing in the Funds and to compare these costs with the ongoing costs of investing in other mutual funds. The Example is based on an investment of $1,000 invested at March 1, 2010 and held until August 31, 2010. Shares of VC II are currently issued and redeemed only in connection with investments in and payments under variable annuity contracts and variable life insurance policies (“Variable Contracts”) and qualified retirement plans (the “Plans”) offered by The Variable Annuity Life Insurance Company (“VALIC”), the investment adviser to VC II and other life insurance companies affiliated with VALIC. The fees and expenses associated with the Variable Contracts and Plans are not included in these Examples, and had such fees and expenses been included your costs would have been higher. Please see your Variable Contract prospectus or Plan document for more details on the fees associated with the Variable Contract or Plans.
Actual Expenses
The “Actual” section of the table provides information about your actual account values and actual expenses. You may use the information in these columns, together with the amount you invested, to estimate the expenses that you paid over the period. Simply divide your account value by $1,000 (for example, an $8,600 account value divided by $1,000 = 8.6), then multiply the result by the number in the column under the heading entitled “Expenses Paid During the Six Months Ended August 31, 2010” to estimate the expenses you paid on your account during this period. The “Expenses Paid During the Six Months Ended August 31, 2010” column and the “Expense Ratio as of August 31, 2010” column do not include fees and expenses that may be charged by the Variable Contracts or Plans, in which the Funds are offered. Had these fees and expenses been included, the “Expenses Paid During the Six Months Ended August 31, 2010” column would have been higher and the “Ending Account Value” would have been lower.
Hypothetical Example for Comparison Purposes
The “Hypothetical” section of the table provides information about hypothetical account values and hypothetical expenses based on the Fund’s actual expense ratio and an assumed rate of return of 5% per year before expenses, which is not the Fund’s actual return. The hypothetical account values and expenses may not be used to estimate the actual ending account balance or expenses you paid for the period. You may use this information to compare the ongoing costs of investing in the Funds and other funds. To do so, compare this 5% hypothetical example with the 5% hypothetical examples that appear in the shareholder reports of other funds. The “Expenses Paid During the Six Months Ended August 31, 2010” column and the “Expense Ratio as of August 31, 2010” column do not include fees and expenses that may be charged by the Variable Contracts or Plans, in which the Funds are offered. Had these fees and expenses been included, the “Expenses Paid During the Six Months Ended August 31, 2010” column would have been higher and the “Ending Account Value” would have been lower.
Please note that the expenses shown in the table are meant to highlight your ongoing costs only and do not reflect any fees and expenses that may be charged by the Variable Contracts or Plans. Please refer to your Variable Contract prospectus or Plan document for more information. Therefore, the “hypothetical” example is useful in comparing ongoing costs and will not help you determine the relative total costs of owning different funds. In addition, if these fees and expenses were included, your costs would have been higher.
2
VALIC Company II
EXPENSE EXAMPLE — August 31, 2010 (Unaudited) — (continued)
| | | | | | | | | | | | | | | | | | | | | | | | |
| | | Actual
| | | Hypothetical
| | | | |
Fund#
| | Beginning
Account Value
at March 1,
2010
| | Ending
Account Value
Using Actual
Return at
August 31,
2010
| | | Expenses Paid
During the Six
Months Ended
August 31,
2010*
| | | Beginning
Account Value
at March 1,
2010
| | Ending
Account Value
Using a
Hypothetical
5% Assumed
Return at
August 31,
2010
| | | Expenses Paid
During the
Six Months Ended
August 31,
2010*
| | | Expense
Ratio
as of
August 31,
2010*
| |
Aggressive Growth Lifestyle | | $1,000.00 | | $ | 1,001.35 | | | $ | 0.50 | | | $1,000.00 | | $ | 1,024.70 | | | $ | 0.51 | | | | 0.10 | % |
Capital Appreciation | | $1,000.00 | | $ | 942.35 | | | $ | 4.16 | | | $1,000.00 | | $ | 1,020.92 | | | $ | 4.33 | | | | 0.85 | % |
Conservative Growth Lifestyle | | $1,000.00 | | $ | 1,031.00 | | | $ | 0.51 | | | $1,000.00 | | $ | 1,024.70 | | | $ | 0.51 | | | | 0.10 | % |
Core Bond | | $1,000.00 | | $ | 1,068.00 | | | $ | 4.01 | | | $1,000.00 | | $ | 1,021.32 | | | $ | 3.92 | | | | 0.77 | % |
High Yield Bond | | $1,000.00 | | $ | 1,057.47 | | | $ | 4.98 | | | $1,000.00 | | $ | 1,020.37 | | | $ | 4.89 | | | | 0.96 | % |
International Small Cap Equity | | $1,000.00 | | $ | 1,007.17 | | | $ | 5.06 | | | $1,000.00 | | $ | 1,020.16 | | | $ | 5.09 | | | | 1.00 | % |
Large Cap Value@ | | $1,000.00 | | $ | 949.74 | | | $ | 3.98 | | | $1,000.00 | | $ | 1,021.12 | | | $ | 4.13 | | | | 0.81 | % |
Mid Cap Growth@ | | $1,000.00 | | $ | 944.36 | | | $ | 4.17 | | | $1,000.00 | | $ | 1,020.92 | | | $ | 4.33 | | | | 0.85 | % |
Mid Cap Value@ | | $1,000.00 | | $ | 972.14 | | | $ | 5.22 | | | $1,000.00 | | $ | 1,019.91 | | | $ | 5.35 | | | | 1.05 | % |
Moderate Growth Lifestyle | | $1,000.00 | | $ | 1,012.17 | | | $ | 0.51 | | | $1,000.00 | | $ | 1,024.70 | | | $ | 0.51 | | | | 0.10 | % |
Money Market II | | $1,000.00 | | $ | 1,000.05 | | | $ | 1.41 | | | $1,000.00 | | $ | 1,023.79 | | | $ | 1.43 | | | | 0.28 | % |
Small Cap Growth@ | | $1,000.00 | | $ | 991.25 | | | $ | 5.82 | | | $1,000.00 | | $ | 1,019.36 | | | $ | 5.90 | | | | 1.16 | % |
Small Cap Value@ | | $1,000.00 | | $ | 953.57 | | | $ | 4.68 | | | $1,000.00 | | $ | 1,020.42 | | | $ | 4.84 | | | | 0.95 | % |
Socially Responsible | | $1,000.00 | | $ | 960.91 | | | $ | 2.77 | | | $1,000.00 | | $ | 1,022.38 | | | $ | 2.85 | | | | 0.56 | % |
Strategic Bond | | $1,000.00 | | $ | 1,067.55 | | | $ | 4.64 | | | $1,000.00 | | $ | 1,020.72 | | | $ | 4.53 | | | | 0.89 | % |
| * | Expenses are equal to the Fund’s annualized expense ratio multiplied by the average account value over the period, multiplied by 184 days then divided by 365 days. These ratios do not reflect fees and expenses associated with the Variable Contracts or Plans. If such fees and expenses had been included, the expenses would have been higher. Please refer to your Variable Contract prospectus for details on the expenses that apply to the Variable Contracts or your Plan document for details on the administration fees charged by your Plan sponsor. |
| # | During the stated period, the investment adviser waived a portion of or all fees and assumed a portion of or all expenses for the Fund. As a result, if these fees and expenses had not been waived or assumed, the “Actual/Hypothetical Ending Account Value” would have been lower and the “Actual/Hypothetical Expenses Paid During the Six Months Ended August 31, 2010” and the “Expense Ratios” would have been higher. |
| @ | Through expense offset arrangements resulting from broker commission recapture, a portion of the Fund's expenses has been reduced. Had the expense reductions been taken into account, the Expense Example would have been as follows: |
| | | | | | | | | | | | | | | | | | | | | | | | | | | | |
| | | Actual
| | | Hypothetical
| | | | |
Fund#
| | Beginning
Account Value
at March 1,
2010
| | | Ending
Account Value
Using Actual
Return at
August 31,
2010
| | | Expenses Paid
During the Six
Months Ended
August 31,
2010*
| | | Beginning
Account Value
at March 1,
2010
| | | Ending
Account Value
Using a
Hypothetical
5% Assumed
Return at
August 31,
2010
| | | Expenses Paid
During the
Six Months Ended
August 31,
2010*
| | | Expense
Ratio
as of
August 31,
2010*
| |
Large Cap Value Fund | | | $1,000.00 | | | | $949.74 | | | | $3.98 | | | | $1,000.00 | | | | $1,021.12 | | | | $4.13 | | | | 0.81 | % |
Mid Cap Growth Fund | | | $1,000.00 | | | | $944.36 | | | | $4.12 | | | | $1,000.00 | | | | $1,020.97 | | | | $4.28 | | | | 0.84 | % |
Mid Cap Value Fund | | | $1,000.00 | | | | $972.14 | | | | $5.12 | | | | $1,000.00 | | | | $1,020.01 | | | | $5.24 | | | | 1.03 | % |
Small Cap Growth Fund | | | $1,000.00 | | | | $991.25 | | | | $5.77 | | | | $1,000.00 | | | | $1,019.41 | | | | $5.85 | | | | 1.15 | % |
Small Cap Value Fund | | | $1,000.00 | | | | $953.57 | | | | $4.63 | | | | $1,000.00 | | | | $1,020.47 | | | | $4.79 | | | | 0.94 | % |
3
VALIC Company II Aggressive Growth Lifestyle Fund
PORTFOLIO PROFILE — August 31, 2010 (Unaudited)
Industry Allocation*
| | | | |
Domestic Equity Investment Companies | | | 51.3 | % |
Fixed Income Investment Companies | | | 29.0 | |
International Equity Investment Companies | | | 11.7 | |
Real Estate Investment Companies | | | 7.9 | |
| | |
|
|
|
| | | | 99.9 | % |
| | |
|
|
|
| * | Calculated as a percentage of net assets |
4
VALIC Company II Aggressive Growth Lifestyle Fund
PORTFOLIO OF INVESTMENTS — August 31, 2010
| | | | | | | | |
| | |
| Security Description | | Shares | | | Value (Note 2) | |
| |
AFFILIATED REGISTERED INVESTMENT COMPANIES#(1) — 99.9% | |
Domestic Equity Investment Companies — 51.3% | |
VALIC Co. I Blue Chip Growth Fund | | | 752,753 | | | $ | 6,255,381 | |
VALIC Co. I Science & Technology Fund | | | 442,740 | | | | 5,565,241 | |
VALIC Co. I Small Cap Special Values Fund | | | 981,533 | | | | 7,116,114 | |
VALIC Co. I Stock Index Fund | | | 609,793 | | | | 12,939,806 | |
VALIC Co. I Value Fund | | | 662,995 | | | | 5,270,814 | |
VALIC Co. II Capital Appreciation Fund | | | 718,910 | | | | 5,758,466 | |
VALIC Co. II Mid Cap Value Fund | | | 783,942 | | | | 10,669,455 | |
VALIC Co. II Small Cap Growth Fund† | | | 234,233 | | | | 2,389,172 | |
VALIC Co. II Small Cap Value Fund | | | 678,503 | | | | 6,968,223 | |
| | | | | | |
|
|
|
Total Domestic Equity Investment Companies | |
(cost $57,806,714) | | | | | | | 62,932,672 | |
| | | | | | |
|
|
|
Fixed Income Investment Companies — 29.0% | |
VALIC Co. II Core Bond Fund | | | 316,479 | | | | 3,380,000 | |
VALIC Co. II High Yield Bond Fund | | | 2,023,012 | | | | 14,889,370 | |
VALIC Co. II Strategic Bond Fund | | | 1,544,773 | | | | 17,332,357 | |
| | | | | | |
|
|
|
Total Fixed Income Investment Companies | |
(cost $32,170,484) | | | | | | | 35,601,727 | |
| | | | | | |
|
|
|
| | | | | | | | |
| | |
| Security Description | | Shares | | | Value (Note 2) | |
| |
| | | | | | | | | |
International Equity Investment Companies — 11.7% | |
VALIC Co. I Foreign Value Fund | | | 870,067 | | | $ | 7,004,038 | |
VALIC Co. I International Equities Fund | | | 1,298,976 | | | | 7,300,243 | |
| | | | | | |
|
|
|
Total International Equity Investment Companies | |
(cost $13,920,478) | | | | | | | 14,304,281 | |
| | | | | | |
|
|
|
Real Estate Investment Companies — 7.9% | |
VALIC Co. I Global Real Estate Fund
(cost $7,302,987) | | | 1,234,947 | | | | 9,719,027 | |
| | | | | | |
|
|
|
TOTAL INVESTMENTS | |
(cost $111,200,663)(2) | | | 99.9 | % | | | 122,557,707 | |
Other assets less liabilities | | | 0.1 | | | | 97,714 | |
| | |
|
|
| |
|
|
|
NET ASSETS — | | | 100.0 | % | | $ | 122,655,421 | |
| | |
|
|
| |
|
|
|
| † | Non-income producing security |
| # | The Aggressive Growth Lifestyle Fund invests in various VALIC Company I or VALIC Company II Funds, some of which are not presented in this report. Additional information on the underlying funds including such fund’s prospectuses and shareholder reports is available at our website, www.valic.com. |
| (2) | See Note 5 for cost of investments on a tax basis. |
The following is a summary of the inputs used to value the Fund’s net assets as of August 31, 2010 (see Note 2):
| | | | | | | | | | | | | | | | |
| | | Level 1 - Unadjusted Quoted
Prices
| | | Level 2 - Other Observable
Inputs
| | | Level 3 - Significant
Unobservable Inputs
| | | Total
| |
Affiliated Registered Investment Companies: | | | | | | | | | | | | | | | | |
Domestic Equity Investment Companies | | $ | 62,932,672 | | | $ | — | | | $ | — | | | $ | 62,932,672 | |
Fixed Income Investment Companies | | | 35,601,727 | | | | — | | | | — | | | | 35,601,727 | |
International Equity Investment Companies | | | 14,304,281 | | | | — | | | | — | | | | 14,304,281 | |
Real Estate Investment Companies | | | 9,719,027 | | | | — | | | | — | | | | 9,719,027 | |
| | |
|
|
| |
|
|
| |
|
|
| |
|
|
|
Total | | $ | 122,557,707 | | | $ | — | | | $ | — | | | $ | 122,557,707 | |
| | |
|
|
| |
|
|
| |
|
|
| |
|
|
|
See Notes to Financial Statements
5
VALIC Company II Capital Appreciation Fund
PORTFOLIO PROFILE — August 31, 2010 (Unaudited)
Industry Allocation*
| | | | |
Computers | | | 6.5 | % |
Retail — Discount | | | 5.1 | |
Retail — Restaurants | | | 4.6 | |
Aerospace/Defense | | | 4.3 | |
Chemicals — Specialty | | | 3.9 | |
Cosmetics & Toiletries | | | 3.8 | |
Medical Products | | | 3.1 | |
Auto/Truck Parts & Equipment — Original | | | 3.0 | |
Medical — Biomedical/Gene | | | 2.9 | |
Internet Infrastructure Software | | | 2.8 | |
Time Deposits | | | 2.7 | |
Medical — Drugs | | | 2.6 | |
Retail — Apparel/Shoe | | | 2.4 | |
Toys | | | 2.4 | |
Oil Companies — Integrated | | | 2.1 | |
Retail — Major Department Stores | | | 2.1 | |
Distribution/Wholesale | | | 2.1 | |
Coffee | | | 2.0 | |
Savings & Loans/Thrifts | | | 1.9 | |
Electronic Components — Semiconductors | | | 1.8 | |
Medical — Generic Drugs | | | 1.8 | |
Medical Instruments | | | 1.8 | |
E-Commerce/Services | | | 1.8 | |
Telecommunication Equipment | | | 1.6 | |
Oil Companies — Exploration & Production | | | 1.4 | |
Web Portals/ISP | | | 1.4 | |
Pharmacy Services | | | 1.4 | |
Insurance — Life/Health | | | 1.3 | |
Computers — Memory Devices | | | 1.3 | |
Transport — Services | | | 1.2 | |
Energy — Alternate Sources | | | 1.2 | |
Beverages — Wine/Spirits | | | 1.2 | |
Schools | | | 1.1 | |
Coatings/Paint | | | 1.1 | |
Food — Misc. | | | 1.1 | |
Apparel Manufacturers | | | 1.1 | |
Retail — Auto Parts | | | 1.1 | |
Cellular Telecom | | | 1.1 | |
Gold Mining | | | 1.1 | |
Insurance — Property/Casualty | | | 1.1 | |
Transport — Rail | | | 1.1 | |
Disposable Medical Products | | | 1.1 | |
Software Tools | | | 1.0 | |
Banks — Super Regional | | | 1.0 | |
Medical — Wholesale Drug Distribution | | | 1.0 | |
Commercial Services — Finance | | | 1.0 | |
Electronic Parts Distribution | | | 1.0 | |
Diversified Manufacturing Operations | | | 1.0 | |
Enterprise Software/Service | | | 1.0 | |
Electronic Connectors | | | 1.0 | |
Applications Software | | | 1.0 | |
Engines — Internal Combustion | | | 1.0 | |
Medical Labs & Testing Services | | | 1.0 | |
Retail — Drug Store | | | 0.9 | |
| | |
|
|
|
| | | | 102.4 | % |
| | |
|
|
|
| * | Calculated as a percentage of net assets |
6
VALIC Company II Capital Appreciation Fund
PORTFOLIO OF INVESTMENTS — August 31, 2010
| | | | | | | | |
| | |
| Security Description | | Shares | | | Value
(Note 2) | |
| |
COMMON STOCK — 99.7% | | | | | | | | |
Aerospace/Defense — 4.3% | | | | | | | | |
Lockheed Martin Corp. | | | 14,400 | | | $ | 1,001,088 | |
Northrop Grumman Corp. | | | 7,000 | | | | 378,840 | |
Raytheon Co. | | | 8,500 | | | | 373,320 | |
| | | | | | |
|
|
|
| | | | | | | | 1,753,248 | |
| | | | | | |
|
|
|
Apparel Manufacturers — 1.1% | | | | | | | | |
Coach, Inc. | | | 12,300 | | | | 440,832 | |
| | | | | | |
|
|
|
Applications Software — 1.0% | | | | | | | | |
Microsoft Corp. | | | 17,000 | | | | 399,160 | |
| | | | | | |
|
|
|
Auto/Truck Parts & Equipment - Original — 3.0% | | | | | | | | |
TRW Automotive Holdings Corp.† | | | 35,200 | | | | 1,223,552 | |
| | | | | | |
|
|
|
Banks - Super Regional — 1.0% | | | | | | | | |
Wells Fargo & Co. | | | 17,800 | | | | 419,190 | |
| | | | | | |
|
|
|
Beverages - Wine/Spirits — 1.2% | | | | | | | | |
Brown - Forman Corp., Class B | | | 7,900 | | | | 484,191 | |
| | | | | | |
|
|
|
Cellular Telecom — 1.1% | | | | | | | | |
MetroPCS Communications, Inc.† | | | 48,800 | | | | 436,272 | |
| | | | | | |
|
|
|
Chemicals - Specialty — 3.9% | | | | | | | | |
Ashland, Inc. | | | 8,600 | | | | 399,556 | |
Ecolab, Inc. | | | 10,400 | | | | 492,960 | |
Lubrizol Corp. | | | 7,300 | | | | 681,163 | |
| | | | | | |
|
|
|
| | | | | | | | 1,573,679 | |
| | | | | | |
|
|
|
Coatings/Paint — 1.1% | | | | | | | | |
The Sherwin - Williams Co. | | | 6,400 | | | | 450,432 | |
| | | | | | |
|
|
|
Coffee — 2.0% | | | | | | | | |
Green Mountain Coffee Roasters, Inc.† | | | 25,800 | | | | 795,156 | |
| | | | | | |
|
|
|
Commercial Services - Finance — 1.0% | | | | | | | | |
Mastercard, Inc., Class A | | | 2,100 | | | | 416,556 | |
| | | | | | |
|
|
|
Computers — 6.5% | | | | | | | | |
Apple, Inc.† | | | 5,100 | | | | 1,241,187 | |
Hewlett - Packard Co. | | | 15,000 | | | | 577,200 | |
International Business Machines Corp. | | | 6,600 | | | | 813,318 | |
| | | | | | |
|
|
|
| | | | | | | | 2,631,705 | |
| | | | | | |
|
|
|
Computers - Memory Devices — 1.3% | | | | | | | | |
SanDisk Corp.† | | | 15,300 | | | | 508,572 | |
| | | | | | |
|
|
|
Cosmetics & Toiletries — 3.8% | | | | | | | | |
The Estee Lauder Cos., Inc., Class A | | | 18,600 | | | | 1,042,902 | |
The Procter & Gamble Co. | | | 8,400 | | | | 501,228 | |
| | | | | | |
|
|
|
| | | | | | | | 1,544,130 | |
| | | | | | |
|
|
|
Disposable Medical Products — 1.1% | | | | | | | | |
C.R. Bard, Inc. | | | 5,600 | | | | 430,248 | |
| | | | | | |
|
|
|
Distribution/Wholesale — 2.1% | | | | | | | | |
WW Grainger, Inc. | | | 7,900 | | | | 835,741 | |
| | | | | | |
|
|
|
Diversified Manufacturing Operations — 1.0% | | | | | | | | |
General Electric Co. | | | 28,300 | | | | 409,784 | |
| | | | | | |
|
|
|
E - Commerce/Services — 1.8% | | | | | | | | |
Expedia, Inc. | | | 18,100 | | | | 413,766 | |
NetFlix, Inc.† | | | 2,400 | | | | 301,248 | |
| | | | | | |
|
|
|
| | | | | | | | 715,014 | |
| | | | | | |
|
|
|
Electronic Components - Semiconductors — 1.8% | | | | | | | | |
Intel Corp. | | | 42,200 | | | | 747,784 | |
| | | | | | |
|
|
|
Electronic Connectors — 1.0% | | | | | | | | |
Thomas & Betts Corp.† | | | 11,000 | | | | 406,450 | |
| | | | | | |
|
|
|
Electronic Parts Distribution — 1.0% | | | | | | | | |
Arrow Electronics, Inc.† | | | 18,100 | | | | 414,128 | |
| | | | | | |
|
|
|
| | | | | | | | |
| | |
| Security Description | | Shares | | | Value
(Note 2) | |
| |
| | | | | | | | | |
Energy - Alternate Sources — 1.2% | | | | | | | | |
First Solar, Inc.† | | | 3,800 | | | $ | 485,830 | |
| | | | | | |
|
|
|
Engines - Internal Combustion — 1.0% | | | | | | | | |
Cummins, Inc. | | | 5,300 | | | | 394,373 | |
| | | | | | |
|
|
|
Enterprise Software/Service — 1.0% | | | | | | | | |
Oracle Corp. | | | 18,600 | | | | 406,968 | |
| | | | | | |
|
|
|
Food - Misc. — 1.1% | | | | | | | | |
General Mills, Inc. | | | 12,200 | | | | 441,152 | |
| | | | | | |
|
|
|
Gold Mining — 1.1% | | | | | | | | |
Newmont Mining Corp. | | | 7,100 | | | | 435,372 | |
| | | | | | |
|
|
|
Insurance - Life/Health — 1.3% | | | | | | | | |
Aflac, Inc. | | | 11,200 | | | | 529,200 | |
| | | | | | |
|
|
|
Insurance - Property/Casualty — 1.1% | | | | | | | | |
The Travelers Cos., Inc. | | | 8,800 | | | | 431,024 | |
| | | | | | |
|
|
|
Internet Infrastructure Software — 2.8% | | | | | | | | |
Akamai Technologies, Inc.† | | | 15,200 | | | | 700,264 | |
F5 Networks, Inc.† | | | 4,900 | | | | 428,407 | |
| | | | | | |
|
|
|
| | | | | | | | 1,128,671 | |
| | | | | | |
|
|
|
Medical Instruments — 1.8% | | | | | | | | |
Intuitive Surgical, Inc.† | | | 1,400 | | | | 371,042 | |
Medtronic, Inc. | | | 11,300 | | | | 355,724 | |
| | | | | | |
|
|
|
| | | | | | | | 726,766 | |
| | | | | | |
|
|
|
Medical Labs & Testing Services — 1.0% | | | | | | | | |
Quest Diagnostics, Inc. | | | 9,000 | | | | 391,500 | |
| | | | | | |
|
|
|
Medical Products — 3.1% | | | | | | | | |
Johnson & Johnson | | | 7,600 | | | | 433,352 | |
Varian Medical Systems, Inc.† | | | 15,200 | | | | 809,248 | |
| | | | | | |
|
|
|
| | | | | | | | 1,242,600 | |
| | | | | | |
|
|
|
Medical - Biomedical/Gene — 2.9% | | | | | | | | |
Gilead Sciences, Inc.† | | | 26,700 | | | | 850,662 | |
Life Technologies Corp.† | | | 7,900 | | | | 337,883 | |
| | | | | | |
|
|
|
| | | | | | | | 1,188,545 | |
| | | | | | |
|
|
|
Medical - Drugs — 2.6% | | | | | | | | |
Bristol - Myers Squibb Co. | | | 15,975 | | | | 416,628 | |
Forest Laboratories, Inc.† | | | 23,700 | | | | 646,773 | |
| | | | | | |
|
|
|
| | | | | | | | 1,063,401 | |
| | | | | | |
|
|
|
Medical - Generic Drugs — 1.8% | | | | | | | | |
Mylan, Inc.† | | | 42,600 | | | | 731,016 | |
| | | | | | |
|
|
|
Medical - Wholesale Drug Distribution — 1.0% | | | | | | | | |
AmerisourceBergen Corp. | | | 15,300 | | | | 417,384 | |
| | | | | | |
|
|
|
Oil Companies - Exploration & Production — 1.4% | | | | | | | | |
Southwestern Energy Co.† | | | 18,000 | | | | 588,960 | |
| | | | | | |
|
|
|
Oil Companies - Integrated — 2.1% | |
Chevron Corp. | | | 5,600 | | | | 415,296 | |
Exxon Mobil Corp. | | | 7,300 | | | | 431,868 | |
| | | | | | |
|
|
|
| | | | | | | | 847,164 | |
| | | | | | |
|
|
|
Pharmacy Services — 1.4% | |
Express Scripts, Inc.† | | | 13,400 | | | | 570,840 | |
| | | | | | |
|
|
|
Retail - Apparel/Shoe — 2.4% | |
Ross Stores, Inc. | | | 11,900 | | | | 590,597 | |
The Gap, Inc. | | | 23,900 | | | | 403,671 | |
| | | | | | |
|
|
|
| | | | | | | | 994,268 | |
| | | | | | |
|
|
|
Retail - Auto Parts — 1.1% | |
AutoZone, Inc.† | | | 2,100 | | | | 440,538 | |
| | | | | | |
|
|
|
7
VALIC Company II Capital Appreciation Fund
PORTFOLIO OF INVESTMENTS — August 31, 2010 — (continued)
| | | | | | | | |
| | |
| Security Description | | Shares | | | Value
(Note 2) | |
| |
COMMON STOCK (continued) | | | | | | | | |
Retail - Discount — 5.1% | |
Big Lots, Inc.† | | | 12,600 | | | $ | 393,876 | |
Dollar Tree, Inc.† | | | 5,550 | | | | 251,581 | |
Family Dollar Stores, Inc. | | | 23,200 | | | | 992,728 | |
Wal-Mart Stores, Inc. | | | 8,600 | | | | 431,204 | |
| | | | | | |
|
|
|
| | | | | | | | 2,069,389 | |
| | | | | | |
|
|
|
Retail - Drug Store — 0.9% | |
CVS Caremark Corp. | | | 14,000 | | | | 378,000 | |
| | | | | | |
|
|
|
Retail - Major Department Stores — 2.1% | |
TJX Cos., Inc. | | | 21,200 | | | | 841,428 | |
| | | | | | |
|
|
|
Retail - Restaurants — 4.6% | |
McDonald’s Corp. | | | 17,200 | | | | 1,256,632 | |
Starbucks Corp. | | | 26,500 | | | | 609,235 | |
| | | | | | |
|
|
|
| | | | | | | | 1,865,867 | |
| | | | | | |
|
|
|
Savings & Loans/Thrifts — 1.9% | |
Hudson City Bancorp, Inc. | | | 68,500 | | | | 789,463 | |
| | | | | | |
|
|
|
Schools — 1.1% | |
Apollo Group, Inc., Class A† | | | 4,100 | | | | 174,168 | |
ITT Educational Services, Inc.† | | | 5,400 | | | | 287,604 | |
| | | | | | |
|
|
|
| | | | | | | | 461,772 | |
| | | | | | |
|
|
|
Software Tools — 1.0% | |
VMware, Inc. Class A† | | | 5,400 | | | | 424,278 | |
| | | | | | |
|
|
|
Telecommunication Equipment — 1.6% | |
Harris Corp. | | | 15,600 | | | | 656,292 | |
| | | | | | |
|
|
|
| | | | | | | | |
| | |
| Security Description | | Shares/
Principal
Amount | | | Value
(Note 2) | |
| |
| | | | | | | | | |
Toys — 2.4% | |
Hasbro, Inc. | | | 24,400 | | | $ | 984,784 | |
| | | | | | |
|
|
|
Transport - Rail — 1.1% | |
Union Pacific Corp. | | | 5,900 | | | | 430,346 | |
| | | | | | |
|
|
|
Transport - Services — 1.2% | |
C.H. Robinson Worldwide, Inc. | | | 7,800 | | | | 506,922 | |
| | | | | | |
|
|
|
Web Portals/ISP — 1.4% | |
Google, Inc., Class A† | | | 1,300 | | | | 585,026 | |
| | | | | | |
|
|
|
Total Long - Term Investment Securities | |
(cost $39,794,391) | | | | | | | 40,484,963 | |
| | | | | | |
|
|
|
SHORT - TERM INVESTMENT SECURITIES — 2.7% | |
Time Deposits — 2.7% | |
Euro Time Deposit with State Street Bank & Trust Co.
0.01% due 09/01/10
(cost $1,078,000) | | $ | 1,078,000 | | | | 1,078,000 | |
| | | | | | |
|
|
|
TOTAL INVESTMENTS | |
(cost $40,872,391)(1) | | | 102.4 | % | | | 41,562,963 | |
Liabilities in excess of other assets | | | (2.4 | ) | | | (961,591 | ) |
| | |
|
|
| |
|
|
|
NET ASSETS — | | | 100.0 | % | | $ | 40,601,372 | |
| | |
|
|
| |
|
|
|
| † | Non-income producing security |
| (1) | See Note 5 for cost of investments on a tax basis. |
The following is a summary of the inputs used to value the Fund’s net assets as of August 31, 2010 (see Note 2):
| | | | | | | | | | | | | | | | |
| | | Level 1 - Unadjusted Quoted
Prices
| | | Level 2 - Other Observable
Inputs
| | | Level 3 - Significant
Unobservable Inputs
| | | Total
| |
Long-Term Investment Securities: | | | | | | | | | | | | | | | | |
Common Stock: | | | | | | | | | | | | | | | | |
Computers | | $ | 2,631,705 | | | $ | — | | | $ | — | | | $ | 2,631,705 | |
Retail - Discount | | | 2,069,389 | | | | — | | | | — | | | | 2,069,389 | |
Other Industries* | | | 35,783,869 | | | | — | | | | — | | | | 35,783,869 | |
Short-Term Investment Securities: | | | | | | | | | | | | | | | | |
Time Deposits | | | — | | | | 1,078,000 | | | | — | | | | 1,078,000 | |
| | |
|
|
| |
|
|
| |
|
|
| |
|
|
|
Total | | $ | 40,484,963 | | | $ | 1,078,000 | | | $ | — | | | $ | 41,562,963 | |
| | |
|
|
| |
|
|
| |
|
|
| |
|
|
|
| * | Sum of all other industries each of which individually has an aggregate market value of less than 5% of net assets. For a detailed presentation of common stocks by industry classification, please refer to the Portfolio of Investments. |
See Notes to Financial Statements
8
VALIC Company II Conservative Growth Lifestyle Fund
PORTFOLIO PROFILE — August 31, 2010 (Unaudited)
Industry Allocation*
| | | | |
Fixed Income Investment Companies | | | 64.5 | % |
Domestic Equity Investment Companies | | | 27.8 | |
International Equity Investment Companies | | | 5.6 | |
Real Estate Investment Companies | | | 2.0 | |
| | |
|
|
|
| | | | 99.9 | % |
| | |
|
|
|
| * | Calculated as a percentage of net assets |
9
VALIC Company II Conservative Growth Lifestyle Fund
PORTFOLIO OF INVESTMENTS — August 31, 2010
| | | | | | | | |
| | |
| Security Description | | Shares | | | Value
(Note 2) | |
| |
AFFILIATED REGISTERED INVESTMENT COMPANIES#(1) — 99.9% | |
Domestic Equity Investment Companies — 27.8% | |
VALIC Co. I Blue Chip Growth Fund | | | 157,105 | | | $ | 1,305,546 | |
VALIC Co. I Science & Technology Fund | | | 170,021 | | | | 2,137,165 | |
VALIC Co. I Small Cap Special Values Fund | | | 410,288 | | | | 2,974,589 | |
VALIC Co. I Stock Index Fund | | | 266,203 | | | | 5,648,825 | |
VALIC Co. I Value Fund | | | 149,330 | | | | 1,187,172 | |
VALIC Co. II Capital Appreciation Fund | | | 237,283 | | | | 1,900,639 | |
VALIC Co. II Mid Cap Value Fund | | | 450,262 | | | | 6,128,068 | |
VALIC Co. II Small Cap Value Fund | | | 159,461 | | | | 1,637,669 | |
| | | | | | |
|
|
|
Total Domestic Equity Investment Companies | | | | | | | | |
(cost $21,091,050) | | | | | | | 22,919,673 | |
| | | | | | |
|
|
|
Fixed Income Investment Companies — 64.5% | |
VALIC Co. II Core Bond Fund | | | 2,081,506 | | | | 22,230,482 | |
VALIC Co. II High Yield Bond Fund | | | 2,133,868 | | | | 15,705,272 | |
VALIC Co. II Strategic Bond Fund | | | 1,363,137 | | | | 15,294,399 | |
| | | | | | |
|
|
|
Total Fixed Income Investment Companies | | | | | | | | |
(cost $48,545,203) | | | | | | | 53,230,153 | |
| | | | | | |
|
|
|
| | | | | | | | |
| | |
| Security Description | | Shares | | | Value
(Note 2) | |
| |
| | | | | | | | | |
International Equity Investment Companies — 5.6% | |
VALIC Co. I Foreign Value Fund | | | 264,979 | | | $ | 2,133,073 | |
VALIC Co. I International Equities Fund | | | 446,287 | | | | 2,508,130 | |
| | | | | | |
|
|
|
Total International Equity Investment Companies | | | | | | | | |
(cost $4,255,007) | | | | | | | 4,641,203 | |
| | | | | | |
|
|
|
Real Estate Investment Companies — 2.0% | |
VALIC Co. I Global Real Estate Fund
(cost $1,251,329) | | | 209,928 | | | | 1,652,131 | |
| | | | | | |
|
|
|
TOTAL INVESTMENTS | | | | | | | | |
(cost $75,142,589)(2) | | | 99.9 | % | | | 82,443,160 | |
Other assets less liabilities | | | 0.1 | | | | 65,228 | |
| | |
|
|
| |
|
|
|
NET ASSETS — | | | 100.0 | % | | $ | 82,508,388 | |
| | |
|
|
| |
|
|
|
| # | The Conservative Growth Lifestyle Fund invests in various VALIC Company I or VALIC Company II Funds, some of which are not presented in this report. Additional information on the underlying funds including such fund’s prospectuses and shareholder reports is available at our website, www.valic.com. |
| (2) | See Note 5 for cost of investments on a tax basis. |
The following is a summary of the inputs used to value the Fund’s net assets as of August 31, 2010 (see Note 2):
| | | | | | | | | | | | | | | | |
| | | Level 1 - Unadjusted Quoted
Prices
| | | Level 2 - Other Observable
Inputs
| | | Level 3 - Significant
Unobservable Inputs
| | | Total
| |
Affiliated Registered Investment Companies: | | | | | | | | | | | | | | | | |
Domestic Equity Investment Companies | | $ | 22,919,673 | | | $ | — | | | $ | — | | | $ | 22,919,673 | |
Fixed Income Investment Companies | | | 53,230,153 | | | | — | | | | — | | | | 53,230,153 | |
International Equity Investment Companies | | | 4,641,203 | | | | — | | | | — | | | | 4,641,203 | |
Real Estate Investment Companies | | | 1,652,131 | | | | — | | | | — | | | | 1,652,131 | |
| | |
|
|
| |
|
|
| |
|
|
| |
|
|
|
Total | | $ | 82,443,160 | | | $ | — | | | $ | — | | | $ | 82,443,160 | |
| | |
|
|
| |
|
|
| |
|
|
| |
|
|
|
See Notes to Financial Statements
10
VALIC Company II Core Bond Fund
PORTFOLIO PROFILE — August 31, 2010 (Unaudited)
Industry Allocation*
| | | | |
Federal Home Loan Mtg. Corp. | | | 17.4 | % |
United States Treasury Notes | | | 13.0 | |
Federal National Mtg. Assoc. | | | 12.5 | |
Diversified Financial Services | | | 8.9 | |
Government National Mtg. Assoc. | | | 4.9 | |
Repurchase Agreements | | | 4.1 | |
United States Treasury Bonds | | | 3.2 | |
Sovereign | | | 2.8 | |
Diversified Banking Institutions | | | 2.5 | |
Banks — Commercial | | | 2.4 | |
Pipelines | | | 1.7 | |
Oil Companies — Exploration & Production | | | 1.5 | |
Banks — Super Regional | | | 1.5 | |
Special Purpose Entities | | | 1.2 | |
Cable/Satellite TV | | | 1.2 | |
Electric — Integrated | | | 1.0 | |
Telephone — Integrated | | | 0.9 | |
Finance — Investment Banker/Broker | | | 0.9 | |
Oil Companies — Integrated | | | 0.8 | |
Insurance — Multi-line | | | 0.8 | |
Multimedia | | | 0.8 | |
Insurance — Life/Health | | | 0.7 | |
Non-Hazardous Waste Disposal | | | 0.6 | |
Telecom Services | | | 0.5 | |
Electric — Generation | | | 0.5 | |
Retail — Drug Store | | | 0.4 | |
Food — Misc. | | | 0.4 | |
Medical — Hospitals | | | 0.4 | |
Wireless Equipment | | | 0.4 | |
Advertising Agencies | | | 0.4 | |
Computer Services | | | 0.4 | |
Insurance — Mutual | | | 0.4 | |
Transport — Air Freight | | | 0.3 | |
Cellular Telecom | | | 0.3 | |
Steel — Producers | | | 0.3 | |
Oil & Gas Drilling | | | 0.3 | |
Satellite Telecom | | | 0.3 | |
Medical Products | | | 0.3 | |
Medical — Drugs | | | 0.3 | |
Paper & Related Products | | | 0.3 | |
Independent Power Producers | | | 0.2 | |
Distribution/Wholesale | | | 0.2 | |
Banks — Fiduciary | | | 0.2 | |
Finance — Auto Loans | | | 0.2 | |
Brewery | | | 0.2 | |
Diversified Minerals | | | 0.2 | |
Consumer Products — Misc. | | | 0.2 | |
Chemicals — Diversified | | | 0.2 | |
Television | | | 0.2 | |
Enterprise Software/Service | | | 0.2 | |
Finance — Credit Card | | | 0.2 | |
Gas — Transportation | | | 0.2 | |
Diversified Manufacturing Operations | | | 0.2 | |
Medical — HMO | | | 0.2 | |
Transport — Equipment & Leasing | | | 0.2 | |
Food — Retail | | | 0.2 | |
Casino Hotels | | | 0.2 | |
Real Estate Investment Trusts | | | 0.2 | |
Finance — Commercial | | | 0.2 | |
Oil — Field Services | | | 0.2 | |
Gambling (Non-Hotel) | | | 0.2 | |
Airlines | | | 0.2 | |
Electronic Components — Semiconductors | | | 0.2 | |
Finance — Consumer Loans | | | 0.2 | |
Transport — Services | | | 0.2 | |
E-Commerce/Services | | | 0.1 | |
Medical — Biomedical/Gene | | | 0.1 | |
Coal | | | 0.1 | |
Retail — Regional Department Stores | | | 0.1 | |
| | | | |
Finance — Other Services | | | 0.1 | |
Funeral Services & Related Items | | | 0.1 | |
Medical Instruments | | | 0.1 | |
Computers — Periphery Equipment | | | 0.1 | |
Telecom Equipment — Fiber Optics | | | 0.1 | |
Transport — Rail | | | 0.1 | |
Electronic Components — Misc. | | | 0.1 | |
Metal — Diversified | | | 0.1 | |
Retail — Restaurants | | | 0.1 | |
Auto/Truck Parts & Equipment — Original | | | 0.1 | |
Food — Confectionery | | | 0.1 | |
Medical — Generic Drugs | | | 0.1 | |
Energy — Alternate Sources | | | 0.1 | |
Electronic Measurement Instruments | | | 0.1 | |
Publishing — Periodicals | | | 0.1 | |
SupraNational Banks | | | 0.1 | |
Insurance — Reinsurance | | | 0.1 | |
Physicians Practice Management | | | 0.1 | |
Commercial Services | | | 0.1 | |
Chemicals — Plastics | | | 0.1 | |
Rental Auto/Equipment | | | 0.1 | |
Containers — Paper/Plastic | | | 0.1 | |
Savings & Loans/Thrifts | | | 0.1 | |
Tools — Hand Held | | | 0.1 | |
Auto — Heavy Duty Trucks | | | 0.1 | |
Retail — Toy Stores | | | 0.1 | |
Hotels/Motels | | | 0.1 | |
Machinery — Farming | | | 0.1 | |
Rubber — Tires | | | 0.1 | |
Building — Residential/Commercial | | | 0.1 | |
Broadcast Services/Program | | | 0.1 | |
Decision Support Software | | | 0.1 | |
Municipal Bonds | | | 0.1 | |
Hazardous Waste Disposal | | | 0.1 | |
Printing — Commercial | | | 0.1 | |
Web Hosting/Design | | | 0.1 | |
Firearms & Ammunition | | | 0.1 | |
Aerospace/Defense | | | 0.1 | |
Retail — Propane Distribution | | | 0.1 | |
Photo Equipment & Supplies | | | 0.1 | |
| | |
|
|
|
| | | | 100.9 | % |
| | |
|
|
|
Credit Quality†#
| | | | |
Government — Agency | | | 36.2 | % |
Government — Treasury | | | 16.9 | |
AAA | | | 0.9 | |
AA | | | 2.3 | |
A | | | 10.9 | |
BBB | | | 15.8 | |
BB | | | 8.4 | |
B | | | 4.8 | |
CCC | | | 0.9 | |
Not Rated@ | | | 2.9 | |
| | |
|
|
|
| | | | 100.0 | % |
| | |
|
|
|
| * | Calculated as a percentage of net assets. |
| @ | Represent debt issues that either have no rating, or the rating is unavailable from the data source. |
| † | Source: Standard and Poors |
| # | Calculated as percentage of total debt issues, excluding short-term securities. |
11
VALIC Company II Core Bond Fund
PORTFOLIO OF INVESTMENTS — August 31, 2010
| | | | | | | | |
| | |
| Security Description | | Principal
Amount | | | Value
(Note 2) | |
| |
ASSET BACKED SECURITIES — 8.1% | | | | | | | | |
Diversified Financial Services — 8.1% | | | | | | | | |
Applebee’s Enterprises LLC
Series 2007-1A, Class A22A
6.43% due 12/20/37* | | $ | 973,338 | | | $ | 906,421 | |
Banc of America Commercial Mtg., Inc.
Series 2007-1, Class AJ
5.52% due 01/15/49(1)(2) | | | 1,000,000 | | | | 573,322 | |
Bank One Issuance Trust
Series 2003-C3, Class C3
4.77% due 02/16/16 | | | 690,000 | | | | 732,319 | |
Bear Stearns Commercial Mtg. Securities
Series 2006-T24, Class AM
5.57% due 10/12/41(1)(2) | | | 1,000,000 | | | | 961,581 | |
Bear Stearns Commercial Mtg. Securities, Inc.
Series 2007-PW17, Class AM
5.92% due 06/11/50(1)(2) | | | 1,150,000 | | | | 1,028,791 | |
Citigroup Commercial Mtg. Trust
Series 2007-FL3A, Class A1
0.35% due 04/15/22*(1)(4) | | | 746,240 | | | | 670,958 | |
Citigroup Commercial Mtg. Trust
Series 2006-C5, Class AM
5.46% due 10/15/49(1) | | | 500,000 | | | | 486,799 | |
Commercial Mtg. Pass Through Certs.
Series 2006-CN2A, Class A2FL
0.52% due 02/05/19*(1)(4) | | | 1,035,000 | | | | 922,217 | |
Commercial Mtg. Pass Through Certs.
Series 2006-C7, Class AM
5.99% due 06/10/46(1)(2) | | | 1,500,000 | | | | 1,462,202 | |
Dominos Pizza Master Issuer LLC
Series 2007-1, Class A2
5.26% due 04/25/37* | | | 1,817,000 | | | | 1,766,723 | |
GMAC Mortgage Corp Loan Trust
Series 2010-1, Class A
4.25% due 07/25/40*(5) | | | 1,226,577 | | | | 1,250,035 | |
GS Mortgage Securities Trust
Series 2007-GG10, Class A4
6.00% due 08/10/45(1)(2) | | | 1,000,000 | | | | 1,033,538 | |
Merrill Lynch Mtg. Trust
Series 2006-C2, Class AM
5.78% due 08/12/43(1)(2) | | | 1,000,000 | | | | 976,923 | |
Merrill Lynch/Countrywide
Commercial Mortgage Trust
Series 2007-8, Class AJ
6.18% due 08/12/49(1)(2) | | | 1,000,000 | | | | 722,487 | |
Morgan Stanley Capital I
Series 2007-T27, Class AM
5.65% due 06/11/42(1)(2) | | | 1,000,000 | | | | 955,146 | |
Morgan Stanley Capital I
Series 2007-IQ15, Class AM
6.08% due 06/11/49(1)(2) | | | 2,500,000 | | | | 2,159,943 | |
Morgan Stanley Capital I Pass Through Certs.
Series 2006-HQ9, Class B
5.83% due 07/12/44(1)(2) | | | 500,000 | | | | 379,981 | |
Morgan Stanley Capital I,
Series 2006-HQ9, Class AJ
5.79% due 07/12/44(1)(2) | | | 2,000,000 | | | | 1,747,362 | |
Sonic Capital LLC
Series 2006-1A, Class A2
5.10% due 12/20/31* | | | 904,081 | | | | 895,703 | |
| | | | | | |
|
|
|
Total Asset Backed Securities | | | | | | | | |
(cost $18,487,790) | | | | | | | 19,632,451 | |
| | | | | | |
|
|
|
| | | | | | | | |
| | |
| Security Description | | Principal
Amount | | | Value
(Note 2) | |
| |
CONVERTIBLE BONDS & NOTES — 0.0% | | | | | | | | |
Telecom Services — 0.0% | | | | | | | | |
ICO North America, Inc.
Senior Sec. Notes
7.50% due 08/15/09†(3)(6)(8)(9)(11)
(cost $28,000) | | $ | 28,000 | | | $ | 24,360 | |
| | | | | | |
|
|
|
U.S. CORPORATE BONDS & NOTES — 29.3% | | | | | | | | |
Advertising Agencies — 0.4% | | | | | | | | |
The Interpublic Group of Cos., Inc. Notes
6.25% due 11/15/14 | | | 919,000 | | | | 955,760 | |
| | | | | | |
|
|
|
Advertising Services — 0.0% | | | | | | | | |
Visant Holding Corp.
Senior Notes
10.25% due 12/01/13(12) | | | 95,000 | | | | 96,900 | |
| | | | | | |
|
|
|
Aerospace/Defense — 0.1% | | | | | | | | |
Spirit Aerosystems, Inc.
Company Guar. Notes
7.50% due 10/01/17 | | | 113,000 | | | | 116,108 | |
| | | | | | |
|
|
|
Agricultural Chemicals — 0.0% | | | | | | | | |
Incitec Pivot Finance LLC
Company Guar. Notes
6.00% due 12/10/19* | | | 33,000 | | | | 35,096 | |
| | | | | | |
|
|
|
Airlines — 0.2% | | | | | | | | |
Delta Air Lines, Inc.
Senior Sec. Notes
9.50% due 09/15/14* | | | 287,000 | | | | 307,807 | |
United AirLines, Inc.
Pass Through Certs.
Series 2009-2, Class A
9.75% due 01/15/17 | | | 66,621 | | | | 73,283 | |
| | | | | | |
|
|
|
| | | | | | | | 381,090 | |
| | | | | | |
|
|
|
Auto - Heavy Duty Trucks — 0.1% | | | | | | | | |
Navistar International Corp.
Company Guar. Notes
8.25% due 11/01/21 | | | 170,000 | | | | 178,075 | |
| | | | | | |
|
|
|
Auto/Truck Parts & Equipment - Original — 0.1% | | | | | | | | |
Cooper - Standard Automotive, Inc.
Senior Notes
8.50% due 05/01/18* | | | 65,000 | | | | 66,463 | |
Lear Corp.
Company Guar. Notes
7.88% due 03/15/18 | | | 50,000 | | | | 51,750 | |
Lear Corp.
Company Guar. Notes
8.13% due 03/15/20 | | | 140,000 | | | | 145,250 | |
| | | | | | |
|
|
|
| | | | | | | | 263,463 | |
| | | | | | |
|
|
|
Banks - Commercial — 1.0% | | | | | | | | |
Branch Banking & Trust Co.
Sub. Notes
0.64% due 05/23/17(4) | | | 217,000 | | | | 193,620 | |
CIT Group, Inc.
Senior Sec. Notes
7.00% due 05/01/17 | | | 141,833 | | | | 133,367 | |
Credit Suisse New York
Sub. Notes
6.00% due 02/15/18 | | | 804,000 | | | | 876,600 | |
HSBC Bank USA NA
Sub. Notes
4.88% due 08/24/20 | | | 270,000 | | | | 278,959 | |
KeyBank NA
Sub. Notes
7.41% due 10/15/27 | | | 82,000 | | | | 91,886 | |
12
VALIC Company II Core Bond Fund
PORTFOLIO OF INVESTMENTS — August 31, 2010 — (continued)
| | | | | | | | |
| | |
| Security Description | | Principal
Amount | | | Value
(Note 2) | |
| |
U.S. CORPORATE BONDS & NOTES (continued) | | | | | | | | |
Banks - Commercial (continued) | | | | | | | | |
Regions Financial Corp.
Senior Notes
5.75% due 06/15/15 | | $ | 272,000 | | | $ | 276,281 | |
US Bank NA
Sub. Notes
3.78% due 04/29/20(4) | | | 230,000 | | | | 238,922 | |
Wachovia Bank NA
Sub. Notes
6.00% due 11/15/17 | | | 329,000 | | | | 371,258 | |
| | | | | | |
|
|
|
| | | | | | | | 2,460,893 | |
| | | | | | |
|
|
|
Banks - Fiduciary — 0.2% | | | | | | | | |
State Street Capital Trust IV
Ltd. Guar. Notes
1.54% due 06/15/37(4) | | | 784,000 | | | | 579,594 | |
| | | | | | |
|
|
|
Banks - Money Center — 0.0% | | | | | | | | |
Chase Capital III
Ltd. Guar. Notes
1.09% due 03/01/27(4) | | | 92,000 | | | | 69,818 | |
| | | | | | |
|
|
|
Banks - Super Regional — 1.2% | | | | | | | | |
BAC Capital Trust XIII
Ltd. Guar. Notes
0.94% due 03/15/12(4)(13) | | | 822,000 | | | | 522,679 | |
BAC Capital Trust XV
Ltd. Guar. Notes
1.34% due 06/01/56(4) | | | 205,000 | | | | 126,686 | |
JPMorgan Chase Bank NA
Sub. Notes
6.00% due 10/01/17 | | | 474,000 | | | | 534,712 | |
PNC Preferred Funding Trust II
Jr. Sub. Bonds
6.11% due 03/15/12*(4)(13) | | | 250,000 | | | | 181,469 | |
SunTrust Banks, Inc.
Senior Notes
6.00% due 09/11/17 | | | 190,000 | | | | 208,324 | |
SunTrust Banks, Inc.
Sub. Notes
6.00% due 02/15/26 | | | 45,000 | | | | 43,699 | |
USB Capital IX
Ltd. Guar. Notes
6.19% due 04/15/11(4)(13) | | | 168,000 | | | | 131,040 | |
Wachovia Capital Trust III
Ltd. Guar. Notes
5.80% due 03/15/11(4)(13) | | | 738,000 | | | | 625,455 | |
Wells Fargo & Co.
Jr. Sub. Bonds
7.98% due 03/15/18(4)(13) | | | 235,000 | | | | 242,637 | |
Wells Fargo Bank NA
Sub. Notes
5.75% due 05/16/16 | | | 311,000 | | | | 347,370 | |
| | | | | | |
|
|
|
| | | | | | | | 2,964,071 | |
| | | | | | |
|
|
|
Beverages - Wine/Spirits — 0.0% | | | | | | | | |
Constellation Brands, Inc.
Company Guar. Notes
7.25% due 05/15/17 | | | 100,000 | | | | 104,750 | |
| | | | | | |
|
|
|
Brewery — 0.2% | | | | | | | | |
Anheuser - Busch InBev Worldwide, Inc.
Company Guar. Notes
7.75% due 01/15/19* | | | 425,000 | | | | 544,327 | |
| | | | | | |
|
|
|
| | | | | | | | |
| | |
| Security Description | | Principal
Amount | | | Value
(Note 2) | |
| |
| | | | | | | | | |
Broadcast Services/Program — 0.1% | | | | | | | | |
Clear Channel Communications, Inc.
Company Guar. Notes
10.75% due 08/01/16 | | $ | 75,000 | | | $ | 55,312 | |
Nexstar Broadcasting, Inc./Mission Broadcasting, Inc.
Senior Sec. Notes
8.88% due 04/15/17* | | | 75,000 | | | | 76,219 | |
| | | | | | |
|
|
|
| | | | | | | | 131,531 | |
| | | | | | |
|
|
|
Building - Residential/Commercial — 0.1% | | | | | | | | |
KB Home
Company Guar. Notes
9.10% due 09/15/17 | | | 25,000 | | | | 25,250 | |
Standard Pacific Corp.
Sec. Notes
8.38% due 05/15/18 | | | 125,000 | | | | 120,313 | |
| | | | | | |
|
|
|
| | | | | | | | 145,563 | |
| | | | | | |
|
|
|
Cable/Satellite TV — 1.2% | | | | | | | | |
Comcast Corp.
Company Guar. Notes
5.90% due 03/15/16 | | | 550,000 | | | | 635,275 | |
Comcast Corp.
Company Guar. Notes
6.45% due 03/15/37 | | | 260,000 | | | | 296,046 | |
COX Communications, Inc.
Notes
7.13% due 10/01/12 | | | 156,000 | | | | 173,457 | |
CSC Holdings LLC
Senior Notes
8.63% due 02/15/19 | | | 105,000 | | | | 117,075 | |
DIRECTV Holdings LLC / DIRECTV Financing Co, Inc.
Company Guar. Notes
3.13% due 02/15/16 | | | 250,000 | | | | 249,178 | |
DIRECTV Holdings LLC/DIRECTTV Financing Co., Inc.
Company Guar. Notes
6.38% due 06/15/15 | | | 215,000 | | | | 222,525 | |
DIRECTV Holdings LLC/DIRECTV Financing Co., Inc.
Company Guar. Notes
7.63% due 05/15/16 | | | 215,000 | | | | 237,037 | |
DISH DBS Corp.
Company Guar. Notes
7.75% due 05/31/15 | | | 104,000 | | | | 108,680 | |
Echostar DBS Corp.
Company Guar. Notes
7.13% due 02/01/16 | | | 354,000 | | | | 361,965 | |
Time Warner Cable, Inc.
Company Guar. Notes
5.85% due 05/01/17 | | | 466,000 | | | | 531,461 | |
| | | | | | |
|
|
|
| | | | | | | | 2,932,699 | |
| | | | | | |
|
|
|
Capacitors — 0.0% | | | | | | | | |
Kemet Corp.
Sec. Notes
10.50% due 05/01/18* | | | 100,000 | | | | 104,500 | |
| | | | | | |
|
|
|
Casino Hotels — 0.2% | | | | | | | | |
Harrah’s Operating Co., Inc.
Senior Sec. Notes
11.25% due 06/01/17 | | | 164,000 | | | | 175,480 | |
MGM Resorts International
Senior Sec. Notes
11.13% due 11/15/17 | | | 187,000 | | | | 208,972 | |
Turning Stone Resort Casino Enterprise
Senior Notes
9.13% due 09/15/14* | | | 84,000 | | | | 84,840 | |
| | | | | | |
|
|
|
| | | | | | | | 469,292 | |
| | | | | | |
|
|
|
13
VALIC Company II Core Bond Fund
PORTFOLIO OF INVESTMENTS — August 31, 2010 — (continued)
| | | | | | | | |
| | |
| Security Description | | Principal
Amount | | | Value
(Note 2) | |
| |
U.S. CORPORATE BONDS & NOTES (continued) | | | | | | | | |
Cellular Telecom — 0.3% | | | | | | | | |
AT&T Wireless Services, Inc.
Senior Notes
7.88% due 03/01/11 | | $ | 594,000 | | | $ | 615,412 | |
Nextel Communications, Inc.
Senior Notes
7.38% due 08/01/15 | | | 91,000 | | | | 90,090 | |
| | | | | | |
|
|
|
| | | | | | | | 705,502 | |
| | | | | | |
|
|
|
Chemicals - Diversified — 0.2% | | | | | | | | |
Momentive Performance Materials, Inc.
Company Guar. Notes
9.75% due 12/01/14 | | | 112,000 | | | | 109,340 | |
Solutia, Inc.
Company Guar. Notes
7.88% due 03/15/20 | | | 175,000 | | | | 182,875 | |
Union Carbide Corp.
Senior Notes
7.75% due 10/01/96 | | | 144,000 | | | | 129,060 | |
| | | | | | |
|
|
|
| | | | | | | | 421,275 | |
| | | | | | |
|
|
|
Chemicals - Plastics — 0.1% | | | | | | | | |
Hexion US Finance Corp./Hexion Nova Scotia Finance ULC
Senior Sec. Notes
8.88% due 02/01/18 | | | 205,000 | | | | 189,625 | |
| | | | | | |
|
|
|
Coal — 0.1% | | | | | | | | |
Arch Coal, Inc.
Company Guar. Notes
8.75% due 08/01/16 | | | 105,000 | | | | 113,662 | |
Consol Energy, Inc.
Company Guar. Notes
8.25% due 04/01/20* | | | 111,000 | | | | 117,799 | |
Drummond Co., Inc.
Senior Notes
9.00% due 10/15/14* | | | 23,000 | | | | 24,064 | |
Patriot Coal Corp.
Company Guar. Notes
8.25% due 04/30/18 | | | 75,000 | | | | 74,437 | |
| | | | | | |
|
|
|
| | | | | | | | 329,962 | |
| | | | | | |
|
|
|
Commercial Services — 0.1% | | | | | | | | |
Ceridian Corp.
Company Guar. Notes
11.25% due 11/15/15 | | | 215,000 | | | | 199,144 | |
| | | | | | |
|
|
|
Computer Services — 0.4% | | | | | | | | |
Affiliated Computer Services, Inc.
Senior Notes
5.20% due 06/01/15 | | | 206,000 | | | | 222,663 | |
Compucom Systems, Inc.
Senior Sub. Notes
12.50% due 10/01/15* | | | 82,000 | | | | 86,202 | |
International Business Machines Corp.
Senior Notes
6.22% due 08/01/27 | | | 475,000 | | | | 576,061 | |
SunGard Data Systems, Inc.
Company Guar. Notes
9.13% due 08/15/13 | | | 54,000 | | | | 55,147 | |
| | | | | | |
|
|
|
| | | | | | | | 940,073 | |
| | | | | | |
|
|
|
Computers - Periphery Equipment — 0.1% | | | | | | | | |
Lexmark International, Inc.
Senior Notes
6.65% due 06/01/18 | | | 244,000 | | | | 276,336 | |
| | | | | | |
|
|
|
| | | | | | | | |
| | |
| Security Description | | Principal
Amount | | | Value
(Note 2) | |
| |
| | | | | | | | | |
Consulting Services — 0.0% | | | | | | | | |
FTI Consulting, Inc.
Company Guar. Notes
7.75% due 10/01/16 | | $ | 95,000 | | | $ | 98,563 | |
| | | | | | |
|
|
|
Consumer Products - Misc. — 0.2% | | | | | | | | |
SC Johnson & Son, Inc.
Senior Notes
4.80% due 09/01/40* | | | 550,000 | | | | 537,900 | |
| | | | | | |
|
|
|
Containers - Metal/Glass — 0.0% | | | | | | | | |
Ball Corp.
Company Guar. Notes
7.38% due 09/01/19 | | | 67,000 | | | | 71,858 | |
Crown Cork & Seal Co., Inc.
Debentures
7.38% due 12/15/26 | | | 32,000 | | | | 30,240 | |
| | | | | | |
|
|
|
| | | | | | | | 102,098 | |
| | | | | | |
|
|
|
Containers - Paper/Plastic — 0.1% | | | | | | | | |
Berry Plastics Corp.
Senior Sec. Notes
9.50% due 05/15/18* | | | 100,000 | | | | 92,000 | |
Graphic Packaging International, Inc.
Company Guar. Notes
9.50% due 06/15/17 | | | 89,000 | | | | 94,785 | |
| | | | | | |
|
|
|
| | | | | | | | 186,785 | |
| | | | | | |
|
|
|
Cosmetics & Toiletries — 0.0% | |
Revlon Consumer Products Corp.
Notes
9.75% due 11/15/15 | | | 105,000 | | | | 109,069 | |
| | | | | | |
|
|
|
Decision Support Software — 0.1% | |
Vangent, Inc.
Company Guar. Notes
9.63% due 02/15/15 | | | 139,000 | | | | 127,533 | |
| | | | | | |
|
|
|
Direct Marketing — 0.0% | |
Affinity Group, Inc.
Company Guar. Notes
9.00% due 02/15/12 | | | 120,000 | | | | 89,700 | |
| | | | | | |
|
|
|
Distribution/Wholesale — 0.2% | |
American Tire Distributors, Inc.
Senior Sec. Notes
9.75% due 06/01/17* | | | 150,000 | | | | 156,750 | |
Ingram Micro, Inc.
Senior Notes
5.25% due 09/01/17 | | | 250,000 | | | | 255,535 | |
McJunkin Red Man Corp.
Senior Sec. Notes
9.50% due 12/15/16* | | | 200,000 | | | | 176,500 | |
| | | | | | |
|
|
|
| | | | | | | | 588,785 | |
| | | | | | |
|
|
|
Diversified Banking Institutions — 2.2% | |
Bank of America Corp.
Sub. Notes
5.42% due 03/15/17 | | | 8,000 | | | | 8,189 | |
Bank of America Corp.
Sub. Notes
7.25% due 10/15/25 | | | 75,000 | | | | 82,821 | |
Bank of America Corp.
Jr. Sub. Bonds
8.00% due 01/30/18(4)(13) | | | 475,000 | | | | 484,548 | |
Citigroup, Inc.
Sub. Notes
5.00% due 09/15/14 | | | 188,000 | | | | 193,171 | |
14
VALIC Company II Core Bond Fund
PORTFOLIO OF INVESTMENTS — August 31, 2010 — (continued)
| | | | | | | | |
| | |
| Security Description | | Principal
Amount | | | Value
(Note 2) | |
| |
U.S. CORPORATE BONDS & NOTES (continued) | | | | | | | | |
Diversified Banking Institutions (continued) | |
Citigroup, Inc.
Notes
5.38% due 08/09/20 | | $ | 510,000 | | | $ | 514,704 | |
Citigroup, Inc.
Sub. Notes
5.50% due 02/15/17 | | | 800,000 | | | | 821,973 | |
Citigroup, Inc.
Senior Notes
6.00% due 12/13/13 | | | 225,000 | | | | 242,740 | |
Citigroup, Inc.
Global Sub. Notes
6.00% due 10/31/33 | | | 225,000 | | | | 213,837 | |
GMAC, Inc.
Company Guar. Notes
8.30% due 02/12/15* | | | 169,000 | | | | 175,760 | |
JP Morgan Chase & Co.
Sub. Notes
4.89% due 09/01/15(4) | | | 317,000 | | | | 315,198 | |
JP Morgan Chase & Co.
Jr. Sub Notes
7.90% due 04/30/18(4)(13) | | | 250,000 | | | | 262,930 | |
Morgan Stanley
Senior Notes
5.55% due 04/27/17 | | | 611,000 | | | | 640,181 | |
Morgan Stanley
Senior Notes
5.63% due 09/23/19 | | | 315,000 | | | | 320,563 | |
The Goldman Sachs Group, Inc.
Senior Notes
5.13% due 01/15/15 | | | 236,000 | | | | 253,608 | |
The Goldman Sachs Group, Inc.
Sub. Notes
5.63% due 01/15/17 | | | 388,000 | | | | 406,647 | |
The Goldman Sachs Group, Inc.
Sub. Notes
6.75% due 10/01/37 | | | 463,000 | | | | 472,856 | |
| | | | | | |
|
|
|
| | | | | | | | 5,409,726 | |
| | | | | | |
|
|
|
Diversified Financial Services — 0.7% | |
Citigroup Capital XXI
Company Guar. Bonds
8.30% due 12/21/57(4) | | | 362,000 | | | | 375,575 | |
General Electric Capital Corp.
Senior Notes
2.80% due 01/08/13 | | | 370,000 | | | | 380,394 | |
General Electric Capital Corp.
Senior Notes
5.88% due 01/14/38 | | | 344,000 | | | | 353,716 | |
General Electric Capital Corp.
Senior Notes
6.15% due 08/07/37 | | | 547,000 | | | | 581,431 | |
| | | | | | |
|
|
|
| | | | | | | | 1,691,116 | |
| | | | | | |
|
|
|
Diversified Manufacturing Operations — 0.1% | |
General Electric Co.
Senior Notes
5.25% due 12/06/17 | | | 119,000 | | | | 133,495 | |
Harland Clarke Holdings Corp.
Notes
9.50% due 05/15/15 | | | 46,000 | | | | 43,815 | |
| | | | | | |
|
|
|
| | | | | | | | 177,310 | |
| | | | | | |
|
|
|
E - Commerce/Services — 0.1% | |
Expedia, Inc.
Company Guar. Notes
5.95% due 08/15/20* | | | 344,000 | | | | 351,310 | |
| | | | | | |
|
|
|
| | | | | | | | |
| | |
| Security Description | | Principal
Amount | | | Value
(Note 2) | |
| |
| | | | | | | | | |
Electric - Generation — 0.5% | |
Allegheny Energy Supply Co. LLC
Senior Notes
6.75% due 10/15/39* | | $ | 540,000 | | | $ | 551,426 | |
Edison Mission Energy
Senior Notes
7.20% due 05/15/19 | | | 317,000 | | | | 210,805 | |
The AES Corp.
Senior Notes
8.00% due 10/15/17 | | | 354,000 | | | | 372,585 | |
| | | | | | |
|
|
|
| | | | | | | | 1,134,816 | |
| | | | | | |
|
|
|
Electric - Integrated — 1.0% | | | | | | | | |
Ameren Energy Generating Co.
Senior Notes
6.30% due 04/01/20 | | | 252,000 | | | | 253,260 | |
CenterPoint Energy Houston Electric LLC
General Refunding Mtg.
7.00% due 03/01/14 | | | 266,000 | | | | 315,216 | |
Dominion Resources, Inc.
Senior Notes
2.25% due 09/01/15 | | | 93,000 | | | | 93,126 | |
Dominion Resources, Inc.
Senior Notes
5.25% due 08/01/33 | | | 439,000 | | | | 491,420 | |
Georgia Power Co.
Senior Notes
4.75% due 09/01/40 | | | 215,000 | | | | 214,147 | |
Great Plains Energy, Inc.
Senior Notes
2.75% due 08/15/13 | | | 250,000 | | | | 250,653 | |
Idaho Power Co.
1st Mtg. Bonds
4.85% due 08/15/40 | | | 176,000 | | | | 176,557 | |
Mirant Americas Generation LLC
Senior Notes
8.50% due 10/01/21 | | | 215,000 | | | | 194,037 | |
Mirant Mid - Atlantic LLC
Pass Through Certs.,
Series B
9.13% due 06/30/17 | | | 111,816 | | | | 116,009 | |
Southern California Edison Co.
1st Mtg. Bonds
4.50% due 09/01/40 | | | 159,000 | | | | 159,130 | |
Southern Energy, Inc.
Escrow Notes
7.90% due 07/15/09†(6)(11) | | | 150,000 | | | | 0 | |
Texas Competitive Electric Holdings Co. LLC
Company Guar. Notes
Series A
10.25% due 11/01/15 | | | 205,000 | | | | 130,688 | |
Texas Competitive Electric Holdings Co. LLC
Company Guar. Notes
Series B
10.25% due 11/01/15 | | | 28,000 | | | | 17,850 | |
| | | | | | |
|
|
|
| | | | | | | | 2,412,093 | |
| | | | | | |
|
|
|
Electronic Components - Misc. — 0.1% | | | | | | | | |
Jabil Circuit, Inc.
Senior Notes
7.75% due 07/15/16 | | | 109,000 | | | | 117,448 | |
Jabil Circuit, Inc.
Senior Notes
8.25% due 03/15/18 | | | 143,000 | | | | 155,512 | |
| | | | | | |
|
|
|
| | | | | | | | 272,960 | |
| | | | | | |
|
|
|
15
VALIC Company II Core Bond Fund
PORTFOLIO OF INVESTMENTS — August 31, 2010 — (continued)
| | | | | | | | |
| | |
| Security Description | | Principal
Amount | | | Value
(Note 2) | |
| |
U.S. CORPORATE BONDS & NOTES (continued) | | | | | | | | |
Electronic Components - Semiconductors — 0.2% | | | | | | | | |
Freescale Semiconductor, Inc.
Company Guar. Notes
9.13% due 12/15/14(10) | | $ | 77,000 | | | $ | 71,417 | |
Freescale Semiconductor, Inc.
Senior Sec. Notes
9.25% due 04/15/18* | | | 71,000 | | | | 71,177 | |
Freescale Semiconductor, Inc.
Senior Sec. Notes
10.13% due 03/15/18* | | | 57,000 | | | | 58,568 | |
National Semiconductor Corp.
Senior Notes
6.15% due 06/15/12 | | | 168,000 | | | | 179,468 | |
| | | | | | |
|
|
|
| | | | | | | | 380,630 | |
| | | | | | |
|
|
|
Electronic Measurement Instruments — 0.1% | | | | | | | | |
Agilent Technologies, Inc.
Senior Notes
5.50% due 09/14/15 | | | 207,000 | | | | 231,906 | |
| | | | | | |
|
|
|
Energy - Alternate Sources — 0.1% | | | | | | | | |
Headwaters, Inc.
Senior Sec. Notes
11.38% due 11/01/14 | | | 220,000 | | | | 232,100 | |
| | | | | | |
|
|
|
Enterprise Software/Service — 0.2% | | | | | | | | |
Mantech International Corp.
Company Guar. Notes
7.25% due 04/15/18 | | | 205,000 | | | | 209,100 | |
Oracle Corp.
Senior Notes
5.38% due 07/15/40* | | | 285,000 | | | | 308,937 | |
| | | | | | |
|
|
|
| | | | | | | | 518,037 | |
| | | | | | |
|
|
|
Finance - Auto Loans — 0.2% | | | | | | | | |
Ford Motor Credit Co. LLC
Senior Notes
8.00% due 12/15/16 | | | 350,000 | | | | 380,077 | |
Ford Motor Credit Co. LLC
Senior Notes
12.00% due 05/15/15 | | | 150,000 | | | | 177,273 | |
| | | | | | |
|
|
|
| | | | | | | | 557,350 | |
| | | | | | |
|
|
|
Finance - Commercial — 0.2% | | | | | | | | |
Textron Financial Corp.
Senior Notes
5.40% due 04/28/13 | | | 410,000 | | | | 429,053 | |
| | | | | | |
|
|
|
Finance - Consumer Loans — 0.2% | | | | | | | | |
SLM Corp.
Senior Notes
5.13% due 08/27/12 | | | 174,000 | | | | 170,731 | |
SLM Corp.
Senior Notes
8.00% due 03/25/20 | | | 235,000 | | | | 205,625 | |
| | | | | | |
|
|
|
| | | | | | | | 376,356 | |
| | | | | | |
|
|
|
Finance - Credit Card — 0.2% | | | | | | | | |
Discover Financial Services
Senior Notes
6.45% due 06/12/17 | | | 465,000 | | | | 496,264 | |
| | | | | | |
|
|
|
Finance - Investment Banker/Broker — 0.7% | | | | | | | | |
JP Morgan Chase Capital XXIII
Ltd. Guar. Bonds
1.38% due 05/15/77(4) | | | 103,000 | | | | 73,850 | |
| | | | | | | | |
| | |
| Security Description | | Principal
Amount | | | Value
(Note 2) | |
| |
| | | | | | | | | |
Finance - Investment Banker/Broker (continued) | | | | | | | | |
Lehman Brothers Holdings Capital Trust VII
Ltd. Guar. Notes
0.00% due 05/31/12†(4)(7)(9)(13) | | $ | 148,000 | | | $ | 15 | |
Lehman Brothers Holdings, Inc.
Sub. Notes
6.75% due 12/28/17†(7)(9) | | | 179,000 | | | | 56 | |
Lehman Brothers Holdings, Inc.
Sub. Notes
7.50% due 05/11/38†(7)(9) | | | 230,000 | | | | 71 | |
Merrill Lynch & Co., Inc.
Sub. Notes
6.05% due 05/16/16 | | | 807,000 | | | | 854,828 | |
Merrill Lynch & Co., Inc.
Senior Notes
6.88% due 11/15/18 | | | 338,000 | | | | 384,068 | |
TD Ameritrade Holding Corp.
Company Guar. Notes
4.15% due 12/01/14 | | | 383,000 | | | | 403,933 | |
| | | | | | |
|
|
|
| | | | | | | | 1,716,821 | |
| | | | | | |
|
|
|
Finance - Other Services — 0.1% | | | | | | | | |
Cantor Fitzgerald LP Notes
6.38% due 06/26/15* | | | 245,000 | | | | 250,948 | |
SquareTwo Financial Corp.
Senior Sec. Notes
11.63% due 04/01/17* | | | 70,000 | | | | 61,775 | |
| | | | | | |
|
|
|
| | | | | | | | 312,723 | |
| | | | | | |
|
|
|
Financial Guarantee Insurance — 0.0% | | | | | | | | |
MBIA, Inc.
Senior Notes
5.70% due 12/01/34 | | | 75,000 | | | | 49,186 | |
| | | | | | |
|
|
|
Firearms & Ammunition — 0.1% | | | | | | | | |
Freedom Group, Inc.
Senior Sec. Notes
10.25% due 08/01/15* | | | 114,000 | | | | 118,845 | |
| | | | | | |
|
|
|
Food - Confectionery — 0.1% | | | | | | | | |
WM Wrigley Jr Co.
Company Guar. Notes
3.70% due 06/30/14* | | | 245,000 | | | | 253,897 | |
| | | | | | |
|
|
|
Food - Meat Products — 0.0% | | | | | | | | |
Smithfield Foods, Inc.
Senior Sec. Notes
10.00% due 07/15/14* | | | 89,000 | | | | 99,346 | |
| | | | | | |
|
|
|
Food - Misc. — 0.4% | | | | | | | | |
Kraft Foods, Inc.
Senior Notes
6.50% due 02/09/40 | | | 450,000 | | | | 533,812 | |
Kraft Foods, Inc.
Senior Notes
6.75% due 02/19/14 | | | 256,000 | | | | 296,938 | |
Sara Lee Corp.
Senior Notes
4.10% due 09/15/20 | | | 245,000 | | | | 246,405 | |
| | | | | | |
|
|
|
| | | | | | | | 1,077,155 | |
| | | | | | |
|
|
|
Food - Retail — 0.2% | | | | | | | | |
Ahold Finance USA LLC
Company Guar. Notes
6.88% due 05/01/29 | | | 194,000 | | | | 237,249 | |
16
VALIC Company II Core Bond Fund
PORTFOLIO OF INVESTMENTS — August 31, 2010 — (continued)
| | | | | | | | |
| | |
| Security Description | | Principal
Amount | | | Value
(Note 2) | |
| |
U.S. CORPORATE BONDS & NOTES (continued) | | | | | | | | |
Food - Retail (continued) | | | | | | | | |
SUPERVALU, Inc.
Senior Notes
8.00% due 05/01/16 | | $ | 235,000 | | | $ | 235,588 | |
| | | | | | |
|
|
|
| | | | | | | | 472,837 | |
| | | | | | |
|
|
|
Funeral Services & Related Items — 0.1% | | | | | | | | |
Carriage Services, Inc.
Senior Notes
7.88% due 01/15/15 | | | 139,000 | | | | 136,220 | |
Service Corp. International
Senior Notes
8.00% due 11/15/21 | | | 164,000 | | | | 173,020 | |
| | | | | | |
|
|
|
| | | | | | | | 309,240 | |
| | | | | | |
|
|
|
Gambling (Non - Hotel) — 0.2% | | | | | | | | |
Downstream Development Authority
Senior Sec. Notes
12.00% due 10/15/15* | | | 407,000 | | | | 388,685 | |
| | | | | | |
|
|
|
Gas - Transportation — 0.2% | | | | | | | | |
Sabine Pass LNG LP
Senior Sec. Notes
7.50% due 11/30/16 | | | 557,000 | | | | 493,641 | |
| | | | | | |
|
|
|
Hazardous Waste Disposal — 0.1% | | | | | | | | |
Clean Harbors, Inc.
Senior Sec. Notes
7.63% due 08/15/16 | | | 120,000 | | | | 123,000 | |
| | | | | | |
|
|
|
Home Furnishings — 0.0% | | | | | | | | |
Norcraft Cos LP/Norcraft Finance Corp.
Senior Sec. Notes
10.50% due 12/15/15 | | | 95,000 | | | | 98,088 | |
| | | | | | |
|
|
|
Hotel/Motels — 0.1% | | | | | | | | |
Starwood Hotels & Resorts Worldwide, Inc.
Senior Notes
6.75% due 05/15/18 | | | 156,000 | | | | 164,970 | |
| | | | | | |
|
|
|
Independent Power Producers — 0.2% | | | | | | | | |
Calpine Corp.
Senior Sec. Notes
7.88% due 07/31/20* | | | 75,000 | | | | 75,188 | |
Calpine Corp.
Escrow Notes
8.75% due 07/15/13†(6)(11) | | | 380,000 | | | | 0 | |
Dynegy - Roseton / Danskammer
Pass Through Certs.
Series B
7.67% due 11/08/16 | | | 240,000 | | | | 218,400 | |
NRG Energy, Inc.
Company Guar. Notes
7.38% due 02/01/16 | | | 206,000 | | | | 207,545 | |
RRI Energy, Inc.
Senior Notes
7.88% due 06/15/17 | | | 105,000 | | | | 96,862 | |
| | | | | | |
|
|
|
| | | | | | | | 597,995 | |
| | | | | | |
|
|
|
Insurance - Life/Health — 0.7% | |
Jefferson - Pilot Corp.
Senior Notes
4.75% due 01/30/14 | | | 186,000 | | | | 196,475 | |
Lincoln National Corp.
Jr. Sub. Bonds
7.00% due 05/17/66(4) | | | 250,000 | | | | 227,500 | |
Nationwide Financial Services, Inc.
Senior Notes
5.90% due 07/01/12 | | | 256,000 | | | | 271,336 | |
| | | | | | | | |
| | |
| Security Description | | Principal
Amount | | | Value
(Note 2) | |
| |
| | | | | | | | | |
Insurance - Life/Health (continued) | |
Principal Life Income Funding Trusts
Senior Sec. Notes
0.60% due 11/08/13(4) | | $ | 291,000 | | | $ | 286,806 | |
Protective Life Corp.
Senior Notes
8.45% due 10/15/39 | | | 636,000 | | | | 704,286 | |
| | | | | | |
|
|
|
| | | | | | | | 1,686,403 | |
| | | | | | |
|
|
|
Insurance - Multi-line — 0.6% | |
Genworth Financial, Inc.
Senior Notes
4.95% due 10/01/15 | | | 240,000 | | | | 238,535 | |
Hartford Financial Services Group, Inc.
Senior Notes
5.50% due 10/15/16 | | | 275,000 | | | | 289,419 | |
MetLife, Inc.
Senior Notes
6.75% due 06/01/16 | | | 175,000 | | | | 207,769 | |
Metropolitan Life Global Funding I
Notes
2.88% due 09/17/12* | | | 360,000 | | | | 370,436 | |
Nationwide Mutual Insurance Co.
Notes
9.38% due 08/15/39* | | | 279,000 | | | | 338,911 | |
| | | | | | |
|
|
|
| | | | | | | | 1,445,070 | |
| | | | | | |
|
|
|
Insurance - Mutual — 0.4% | |
Liberty Mutual Group, Inc.
Notes
5.75% due 03/15/14* | | | 220,000 | | | | 230,743 | |
Liberty Mutual Group, Inc.
Senior Notes
6.50% due 03/15/35* | | | 247,000 | | | | 226,418 | |
Liberty Mutual Group, Inc.
Company Guar. Notes
7.80% due 03/07/87* | | | 441,000 | | | | 388,080 | |
| | | | | | |
|
|
|
| | | | | | | | 845,241 | |
| | | | | | |
|
|
|
Machinery - Farming — 0.1% | |
Case New Holland, Inc.
Senior Notes
7.88% due 12/01/17* | | | 120,000 | | | | 126,300 | |
CNH America LLC
Notes
7.25% due 01/15/16 | | | 20,000 | | | | 20,650 | |
| | | | | | |
|
|
|
| | | | | | | | 146,950 | |
| | | | | | |
|
|
|
Medical Instruments — 0.1% | |
Accellent, Inc.
Senior Sec. Notes
8.38% due 02/01/17 | | | 40,000 | | | | 39,800 | |
Medtronic, Inc.
Senior Notes
3.00% due 03/15/15 | | | 255,000 | | | | 269,404 | |
| | | | | | |
|
|
|
| | | | | | | | 309,204 | |
| | | | | | |
|
|
|
Medical Products — 0.3% | |
Johnson & Johnson
Notes
2.95% due 09/01/20 | | | 125,000 | | | | 126,951 | |
Johnson & Johnson
Senior Notes
4.50% due 09/01/40 | | | 257,000 | | | | 269,169 | |
17
VALIC Company II Core Bond Fund
PORTFOLIO OF INVESTMENTS — August 31, 2010 — (continued)
| | | | | | | | |
| | |
| Security Description | | Principal
Amount | | | Value
(Note 2) | |
| |
U.S. CORPORATE BONDS & NOTES (continued) | | | | | | | | |
Medical Products (continued) | | | | | | | | |
Universal Hospital Services, Inc.
Senior Sec. Notes
8.50% due 06/01/15(10) | | $ | 235,000 | | | $ | 236,175 | |
| | | | | | |
|
|
|
| | | | | | | | 632,295 | |
| | | | | | |
|
|
|
Medical - Biomedical/Gene — 0.1% | |
Bio - Rad Laboratories, Inc.
Senior Sub. Notes
8.00% due 09/15/16 | | | 110,000 | | | | 117,975 | |
Life Technologies Corp.
Senior Notes
3.38% due 03/01/13 | | | 225,000 | | | | 231,493 | |
| | | | | | |
|
|
|
| | | | | | | | 349,468 | |
| | | | | | |
|
|
|
Medical - Drugs — 0.3% | |
Schering - Plough Corp
Senior Notes
6.00% due 09/15/17 | | | 339,000 | | | | 412,185 | |
Valeant Pharmaceuticals International
Company Guar. Notes
8.38% due 06/15/16 | | | 185,000 | | | | 209,975 | |
| | | | | | |
|
|
|
| | | | | | | | 622,160 | |
| | | | | | |
|
|
|
Medical - Generic Drugs — 0.1% | |
Watson Pharmaceuticals, Inc.
Senior Notes
6.13% due 08/15/19 | | | 205,000 | | | | 240,870 | |
| | | | | | |
|
|
|
Medical - HMO — 0.2% | |
UnitedHealth Group, Inc.
Senior Notes
5.25% due 03/15/11 | | | 195,000 | | | | 199,352 | |
WellPoint, Inc.
Senior Notes
5.80% due 08/15/40 | | | 269,000 | | | | 287,379 | |
| | | | | | |
|
|
|
| | | | | | | | 486,731 | |
| | | | | | |
|
|
|
Medical - Hospitals — 0.4% | |
Capella Healthcare, Inc.
Company Guar. Notes
9.25% due 07/01/17* | | | 157,000 | | | | 162,495 | |
Community Health Systems, Inc.
Company Guar. Notes
8.88% due 07/15/15 | | | 196,000 | | | | 203,350 | |
HCA, Inc.
Senior Notes
7.50% due 11/15/95 | | | 214,000 | | | | 162,907 | |
HCA, Inc.
Senior Sec. Notes
8.50% due 04/15/19 | | | 400,000 | | | | 438,500 | |
Select Medical Corp.
Company Guar. Notes
7.63% due 02/01/15 | | | 100,000 | | | | 94,250 | |
| | | | | | |
|
|
|
| | | | | | | | 1,061,502 | |
| | | | | | |
|
|
|
Multimedia — 0.8% | | | | | | | | |
NBC Universal, Inc.
Senior Notes
6.40% due 04/30/40* | | | 460,000 | | | | 515,063 | |
News America, Inc.
Company Guar. Bonds
6.65% due 11/15/37 | | | 265,000 | | | | 306,971 | |
Time Warner Cos., Inc.
Company Guar. Notes
6.95% due 01/15/28 | | | 460,000 | | | | 535,948 | |
| | | | | | | | |
| | |
| Security Description | | Principal
Amount | | | Value
(Note 2) | |
| |
| | | | | | | | | |
Multimedia (continued) | | | | | | | | |
Time Warner Entertainment Co. LP
Senior Notes
8.38% due 07/15/33 | | $ | 256,000 | | | $ | 336,315 | |
Time Warner, Inc.
Bonds
6.63% due 05/15/29 | | | 250,000 | | | | 283,677 | |
| | | | | | |
|
|
|
| | | | | | | | 1,977,974 | |
| | | | | | |
|
|
|
Music — 0.0% | |
WMG Acquisition Corp.
Senior Sec. Notes
9.50% due 06/15/16 | | | 105,000 | | | | 109,725 | |
| | | | | | |
|
|
|
Non - Hazardous Waste Disposal — 0.6% | |
Allied Waste North America, Inc.
Company Guar. Notes
7.13% due 05/15/16 | | | 646,000 | | | | 694,450 | |
Republic Services, Inc.
Company Guar. Notes
5.25% due 11/15/21 | | | 399,000 | | | | 443,303 | |
Republic Services, Inc.
Notes
6.09% due 03/15/35 | | | 75,000 | | | | 81,144 | |
Waste Management, Inc.
Company Guar. Notes
6.13% due 11/30/39 | | | 196,000 | | | | 223,399 | |
| | | | | | |
|
|
|
| | | | | | | | 1,442,296 | |
| | | | | | |
|
|
|
Oil & Gas Drilling — 0.3% | |
Pride International, Inc.
Senior Notes
6.88% due 08/15/20 | | | 371,000 | | | | 389,086 | |
Rowan Cos, Inc.
Senior Notes
5.00% due 09/01/17 | | | 250,000 | | | | 251,436 | |
| | | | | | |
|
|
|
| | | | | | | | 640,522 | |
| | | | | | |
|
|
|
Oil Companies - Exploration & Production — 1.4% | |
Anadarko Petroleum Corp.
Notes
6.20% due 03/15/40 | | | 80,000 | | | | 68,457 | |
Anadarko Petroleum Corp.
Senior Notes
6.38% due 09/15/17 | | | 920,000 | | | | 910,339 | |
Apache Corp.
Senior Notes
5.10% due 09/01/40 | | | 284,000 | | | | 292,867 | |
Atlas Energy Operating Co. LLC/
Atlas Energy Finance Corp.
Company Guar. Notes
10.75% due 02/01/18 | | | 279,000 | | | | 307,597 | |
ATP Oil & Gas Corp.
Senior Sec. Notes
11.88% due 05/01/15* | | | 90,000 | | | | 72,450 | |
Chesapeake Energy Corp.
Company Guar. Notes
6.88% due 08/15/18 | | | 150,000 | | | | 153,000 | |
Chesapeake Energy Corp.
Senior Notes
7.25% due 12/15/18 | | | 100,000 | | | | 104,500 | |
Devon Financing Corp. ULC
Company Guar. Notes
6.88% due 09/30/11 | | | 550,000 | | | | 584,970 | |
Hilcorp Energy I LP
Senior Notes
7.75% due 11/01/15* | | | 206,000 | | | | 208,575 | |
18
VALIC Company II Core Bond Fund
PORTFOLIO OF INVESTMENTS — August 31, 2010 — (continued)
| | | | | | | | |
| | |
| Security Description | | Principal
Amount | | | Value
(Note 2) | |
| |
U.S. CORPORATE BONDS & NOTES (continued) | | | | | | | | |
Oil Companies - Exploration & Production (continued) | |
Kerr - McGee Corp.
Company Guar. Notes
6.95% due 07/01/24 | | $ | 216,000 | | | $ | 218,653 | |
Linn Energy LLC/Linn Energy Finance Corp.
Senior Notes
8.63% due 04/15/20* | | | 200,000 | | | | 211,000 | |
QEP Resources, Inc.
Senior Notes
6.88% due 03/01/21 | | | 125,000 | | | | 130,313 | |
XTO Energy, Inc.
Senior Notes
6.50% due 12/15/18 | | | 92,000 | | | | 117,318 | |
| | | | | | |
|
|
|
| | | | | | | | 3,380,039 | |
| | | | | | |
|
|
|
Oil Companies - Integrated — 0.3% | |
Hess Corp.
Senior Notes
5.60% due 02/15/41 | | | 477,000 | | | | 494,799 | |
Hess Corp.
Senior Notes
7.88% due 10/01/29 | | | 265,000 | | | | 342,867 | |
| | | | | | |
|
|
|
| | | | | | | | 837,666 | |
| | | | | | |
|
|
|
Oil - Field Services — 0.2% | |
Baker Hughes, Inc.
Senior Notes
5.13% due 09/15/40 | | | 282,000 | | | | 294,641 | |
Basic Energy Services, Inc.
Senior Sec. Notes
11.63% due 08/01/14 | | | 95,000 | | | | 103,550 | |
| | | | | | |
|
|
|
| | | | | | | | 398,191 | |
| | | | | | |
|
|
|
Paper & Related Products — 0.3% | |
Georgia - Pacific LLC
Company Guar. Notes
7.13% due 01/15/17* | | | 120,000 | | | | 126,600 | |
Georgia - Pacific LLC
Senior Notes
7.75% due 11/15/29 | | | 130,000 | | | | 132,600 | |
Westvaco Corp.
Bonds
7.95% due 02/15/31 | | | 278,000 | | | | 315,389 | |
Westvaco Corp.
Company Guar. Notes
8.20% due 01/15/30 | | | 175,000 | | | | 194,722 | |
| | | | | | |
|
|
|
| | | | | | | | 769,311 | |
| | | | | | |
|
|
|
Photo Equipment & Supplies — 0.1% | |
Eastman Kodak Co.
Senior Sec. Notes
9.75% due 03/01/18* | | | 118,000 | | | | 112,690 | |
| | | | | | |
|
|
|
Physicians Practice Management — 0.1% | |
US Oncology, Inc.
Senior Sec. Notes
9.13% due 08/15/17 | | | 196,000 | | | | 202,860 | |
| | | | | | |
|
|
|
Pipelines — 1.5% | |
Copano Energy LLC / Copano Energy Finance Corp.
Company Guar. Notes
7.75% due 06/01/18 | | | 105,000 | | | | 105,000 | |
El Paso Corp.
Senior Sub. Notes
6.88% due 06/15/14 | | | 200,000 | | | | 211,625 | |
| | | | | | | | |
| | |
| Security Description | | Principal
Amount | | | Value
(Note 2) | |
| |
| | | | | | | | | |
Pipelines (continued) | |
El Paso Pipeline Partners Operating Co. LLC
Company Guar. Notes
6.50% due 04/01/20 | | $ | 555,000 | | | $ | 592,499 | |
Enterprise Products Operating LLC
Company Guar. Notes
6.45% due 09/01/40 | | | 207,000 | | | | 231,122 | |
Enterprise Products Operating LLC
Company Guar. Bonds
6.50% due 01/31/19 | | | 245,000 | | | | 284,938 | |
MarkWest Energy Partners LP/MarkWest Energy Finance Corp.
Senior Notes
8.75% due 04/15/18 | | | 180,000 | | | | 192,600 | |
Plains All American Pipeline LP
Senior Notes
4.25% due 09/01/12 | | | 126,000 | | | | 131,465 | |
Plains All American Pipeline LP
Company Guar. Notes
5.63% due 12/15/13 | | | 420,000 | | | | 459,017 | |
Regency Energy Partners LP/Regency Energy Finance Corp.
Company Guar. Notes
9.38% due 06/01/16* | | | 145,000 | | | | 157,325 | |
Tennessee Gas Pipeline Co.
Senior Notes
8.00% due 02/01/16 | | | 269,000 | | | | 316,747 | |
The Williams Cos., Inc.
Senior Notes
7.88% due 09/01/21 | | | 230,000 | | | | 279,323 | |
Williams Partners LP
Senior Notes
7.50% due 06/15/11 | | | 583,000 | | | | 610,897 | |
| | | | | | |
|
|
|
| | | | | | | | 3,572,558 | |
| | | | | | |
|
|
|
Printing - Commercial — 0.1% | |
Valassis Communications, Inc.
Senior Notes
8.25% due 03/01/15 | | | 111,000 | | | | 115,718 | |
| | | | | | |
|
|
|
Private Corrections — 0.0% | |
Corrections Corp. of America
Company Guar. Notes
7.75% due 06/01/17 | | | 60,000 | | | | 63,750 | |
| | | | | | |
|
|
|
Publishing - Books — 0.0% | |
TL Acquisitions, Inc.
Senior Notes
10.50% due 01/15/15* | | | 115,000 | | | | 109,825 | |
| | | | | | |
|
|
|
Publishing - Periodicals — 0.1% | |
Nielsen Finance LLC/Nielsen Finance Co.
Company Guar. Notes
11.50% due 05/01/16 | | | 190,000 | | | | 213,038 | |
| | | | | | |
|
|
|
Real Estate Investment Trusts — 0.2% | |
Brandywine Operating Partnership LP
Senior Notes
5.70% due 05/01/17 | | | 217,000 | | | | 219,817 | |
DuPont Fabros Technology LP
Company Guar. Notes
8.50% due 12/15/17 | | | 100,000 | | | | 105,750 | |
Federal Realty Investors Trust
Bonds
5.90% due 04/01/20 | | | 103,000 | | | | 114,764 | |
| | | | | | |
|
|
|
| | | | | | | | 440,331 | |
| | | | | | |
|
|
|
Real Estate Management/Services — 0.0% | |
CB Richard Ellis Services, Inc.
Company Guar. Notes
11.63% due 06/15/17 | | | 79,000 | | | | 89,665 | |
| | | | | | |
|
|
|
19
VALIC Company II Core Bond Fund
PORTFOLIO OF INVESTMENTS — August 31, 2010 — (continued)
| | | | | | | | |
| | |
| Security Description | | Principal
Amount | | | Value
(Note 2) | |
| |
U.S. CORPORATE BONDS & NOTES (continued) | | | | | | | | |
Recycling — 0.0% | |
Aleris International, Inc.
Company Guar. Notes
9.00% due 12/15/14†(7)(9)(10) | | $ | 100,000 | | | $ | 200 | |
| | | | | | |
|
|
|
Rental Auto/Equipment — 0.1% | |
RSC Equipment Rental, Inc.
Notes
9.50% due 12/01/14 | | | 139,000 | | | | 141,780 | |
United Rentals North America, Inc.
Company Guar. Notes
7.75% due 11/15/13 | | | 55,000 | | | | 55,138 | |
| | | | | | |
|
|
|
| | | | | | | | 196,918 | |
| | | | | | |
|
|
|
Retail - Drug Store — 0.4% | |
CVS Caremark Corp.
Senior Notes
6.25% due 06/01/27 | | | 615,000 | | | | 708,283 | |
CVS Pass - Through Trust
Pass Through Certs.
7.51% due 01/10/32* | | | 162,475 | | | | 191,556 | |
Rite Aid Corp.
Senior Sec. Notes
10.25% due 10/15/19 | | | 175,000 | | | | 179,813 | |
| | | | | | |
|
|
|
| | | | | | | | 1,079,652 | |
| | | | | | |
|
|
|
Retail - Propane Distribution — 0.1% | |
Inergy LP/Inergy Finance Corp.
Company Guar. Notes
8.25% due 03/01/16 | | | 110,000 | | | | 115,363 | |
| | | | | | |
|
|
|
Retail - Regional Department Stores — 0.1% | |
JC Penney Corp., Inc.
Senior Notes
6.38% due 10/15/36 | | | 193,000 | | | | 186,245 | |
Macy’s Retail Holdings, Inc.
Company Guar. Notes
6.65% due 07/15/24 | | | 53,000 | | | | 52,867 | |
Macy’s Retail Holdings, Inc.
Company Guar. Notes
6.90% due 04/01/29 | | | 90,000 | | | | 89,550 | |
| | | | | | |
|
|
|
| | | | | | | | 328,662 | |
| | | | | | |
|
|
|
Retail - Restaurants — 0.1% | |
Brinker International, Inc.
Senior Notes
5.75% due 06/01/14 | | | 89,000 | | | | 94,374 | |
Wendy’s/Arby’s Restaurants LLC
Company Guar. Notes
10.00% due 07/15/16 | | | 164,000 | | | | 172,200 | |
| | | | | | |
|
|
|
| | | | | | | | 266,574 | |
| | | | | | |
|
|
|
Retail - Toy Stores — 0.1% | |
Toys R Us Property Co. LLC
Senior Sec. Notes
8.50% due 12/01/17* | | | 165,000 | | | | 171,600 | |
| | | | | | |
|
|
|
Rubber - Tires — 0.1% | |
The Goodyear Tire & Rubber Co.
Senior Notes
9.00% due 07/01/15 | | | 139,000 | | | | 145,603 | |
| | | | | | |
|
|
|
Satellite Telecom — 0.0% | |
Intelsat Corp.
Senior Notes
9.25% due 06/15/16 | | | 25,000 | | | | 26,500 | |
| | | | | | |
|
|
|
| | | | | | | | |
| | |
| Security Description | | Principal
Amount | | | Value
(Note 2) | |
| |
| | | | | | | | | |
Savings & Loans/Thrifts — 0.1% | |
Amsouth Bank NA
Sub. Notes
4.85% due 04/01/13 | | $ | 185,000 | | | $ | 184,784 | |
| | | | | | |
|
|
|
Seismic Data Collection — 0.0% | |
Geokinetics Holdings, Inc.
Senior Sec. Notes
9.75% due 12/15/14* | | | 105,000 | | | | 87,675 | |
| | | | | | |
|
|
|
Special Purpose Entities — 0.5% | |
Capital One Capital V
Ltd. Guar. Notes
10.25% due 08/15/39 | | | 344,000 | | | | 371,520 | |
Chukchansi Economic Development Authority
Senior Notes
8.00% due 11/15/13* | | | 82,000 | | | | 47,560 | |
Goldman Sachs Capital II
Ltd. Guar. Bonds
5.79% due 06/01/12(4)(13) | | | 75,000 | | | | 60,281 | |
Goldman Sachs Capital III
Company Guar. Notes
1.31% due 09/01/12(4)(13) | | | 322,000 | | | | 218,960 | |
OMX Timber Finance Investments I LLC
Sec. Notes
5.42% due 01/29/20* | | | 350,000 | | | | 359,188 | |
Teco Finance, Inc.
Company Guar. Notes
6.57% due 11/01/17 | | | 124,000 | | | | 145,544 | |
Teco Finance, Inc.
Company Guar. Notes
7.00% due 05/01/12 | | | 96,000 | | | | 103,907 | |
| | | | | | |
|
|
|
| | | | | | | | 1,306,960 | |
| | | | | | |
|
|
|
Steel - Producers — 0.2% | |
AK Steel Corp.
Company Guar. Notes
7.63% due 05/15/20 | | | 175,000 | | | | 176,312 | |
Ryerson, Inc.
Senior Sec. Notes
12.00% due 11/01/15 | | | 105,000 | | | | 108,019 | |
Steel Dynamics, Inc.
Company Guar. Notes
7.75% due 04/15/16 | | | 117,000 | | | | 120,803 | |
United States Steel Corp.
Senior Notes
7.38% due 04/01/20 | | | 120,000 | | | | 121,500 | |
| | | | | | |
|
|
|
| | | | | | | | 526,634 | |
| | | | | | |
|
|
|
Storage/Warehousing — 0.0% | |
Mobile Mini, Inc.
Company Guar. Notes
9.75% due 08/01/14 | | | 89,000 | | | | 92,226 | |
| | | | | | |
|
|
|
Telecom Equipment - Fiber Optics — 0.1% | |
Corning, Inc.
Senior Notes
5.75% due 08/15/40 | | | 257,000 | | | | 275,465 | |
| | | | | | |
|
|
|
Telecom Services — 0.5% | |
PAETEC Holding Corp
Company Guar. Notes
8.88% due 06/30/17 | | | 115,000 | | | | 119,025 | |
Qwest Corp.
Senior Notes
7.50% due 10/01/14 | | | 135,000 | | | | 150,356 | |
Qwest Corp.
Senior Notes
8.88% due 03/15/12 | | | 652,000 | | | | 717,200 | |
20
VALIC Company II Core Bond Fund
PORTFOLIO OF INVESTMENTS — August 31, 2010 — (continued)
| | | | | | | | |
| | |
| Security Description | | Principal
Amount | | | Value
(Note 2) | |
| |
U.S. CORPORATE BONDS & NOTES (continued) | | | | | | | | |
Telecom Services (continued) | |
SBA Telecommunications, Inc.
Company Guar. Notes
8.25% due 08/15/19 | | $ | 236,000 | | | $ | 256,060 | |
| | | | | | |
|
|
|
| | | | | | | | 1,242,641 | |
| | | | | | |
|
|
|
Telephone - Integrated — 0.4% | |
Cincinnati Bell, Inc.
Company Guar. Notes
7.00% due 02/15/15 | | | 22,000 | | | | 21,340 | |
Frontier Communications Corp.
Senior Notes
8.25% due 04/15/17 | | | 36,000 | | | | 38,070 | |
Frontier Communications Corp.
Senior Notes
8.50% due 04/15/20 | | | 36,000 | | | | 38,205 | |
Qwest Communications International, Inc.
Company Guar. Notes
8.00% due 10/01/15* | | | 318,000 | | | | 341,850 | |
Sprint Capital Corp.
Company Guar. Notes
6.88% due 11/15/28 | | | 142,000 | | | | 118,570 | |
Sprint Capital Corp.
Company Guar. Notes
8.75% due 03/15/32 | | | 148,000 | | | | 142,635 | |
Verizon Virginia, Inc.
Senior Notes
4.63% due 03/15/13 | | | 155,000 | | | | 165,052 | |
| | | | | | |
|
|
|
| | | | | | | | 865,722 | |
| | | | | | |
|
|
|
Television — 0.2% | |
CBS Corp.
Company Guar. Notes
4.63% due 05/15/18 | | | 381,000 | | | | 399,662 | |
Paxson Communications Corp.
Escrow Notes
7.38% due 01/15/13*†(6)(11) | | | 226,373 | | | | 1,132 | |
Umbrella Acquisition, Inc.
Company Guar. Notes
9.75% due 03/15/15*(10) | | | 140,000 | | | | 126,000 | |
Young Broadcasting, Inc.
Escrow Notes
10.00% due 03/01/11†(6)(11) | | | 105,000 | | | | 1 | |
| | | | | | |
|
|
|
| | | | | | | | 526,795 | |
| | | | | | |
|
|
|
Tools - Hand Held — 0.1% | |
Stanley Black & Decker, Inc.
Company Guar. Notes
5.20% due 09/01/40 | | | 184,000 | | | | 183,862 | |
| | | | | | |
|
|
|
Transport - Air Freight — 0.3% | |
Atlas Air, Inc.
Pass Through Certs.
Series 1991-1, Class A-1
7.20% due 01/02/19 | | | 235,233 | | | | 237,586 | |
Atlas Air, Inc.
Pass Through Certs.
Series 1991-1, Class B
7.63% due 01/02/15 | | | 322,905 | | | | 277,698 | |
Atlas Air, Inc.
Pass Through Certs.
Series 2000-1, Class A
8.71% due 01/02/19 | | | 199,941 | | | | 193,943 | |
| | | | | | |
|
|
|
| | | | | | | | 709,227 | |
| | | | | | |
|
|
|
| | | | | | | | |
| | |
| Security Description | | Principal
Amount | | | Value
(Note 2) | |
| |
| | | | | | | | | |
Transport - Equipment & Leasing — 0.2% | |
GATX Corp.
Senior Notes
4.75% due 10/01/12 | | $ | 257,000 | | | $ | 270,407 | |
GATX Corp.
Senior Notes
4.75% due 05/15/15 | | | 190,000 | | | | 202,716 | |
| | | | | | |
|
|
|
| | | | | | | | 473,123 | |
| | | | | | |
|
|
|
Transport - Rail — 0.1% | |
Union Pacific Corp.
Senior Notes
5.75% due 11/15/17 | | | 235,000 | | | | 274,002 | |
| | | | | | |
|
|
|
Transport - Services — 0.2% | |
Bristow Group, Inc.
Senior Notes
7.50% due 09/15/17 | | | 155,000 | | | | 155,000 | |
Ryder System, Inc.
Notes
3.60% due 03/01/16 | | | 203,000 | | | | 205,323 | |
| | | | | | |
|
|
|
| | | | | | | | 360,323 | |
| | | | | | |
|
|
|
Web Hosting/Design — 0.1% | |
Equinix, Inc.
Senior Notes
8.13% due 03/01/18 | | | 115,000 | | | | 120,175 | |
| | | | | | |
|
|
|
Wireless Equipment — 0.4% | |
Motorola, Inc.
Senior Notes
5.38% due 11/15/12 | | | 467,000 | | | | 493,643 | |
Motorola, Inc.
Debentures
6.50% due 09/01/25 | | | 489,000 | | | | 541,195 | |
| | | | | | |
|
|
|
| | | | | | | | 1,034,838 | |
| | | | | | |
|
|
|
Total U.S. Corporate Bonds & Notes | | | | | | | | |
(cost $70,028,518) | | | | | | | 71,280,913 | |
| | | | | | |
|
|
|
FOREIGN CORPORATE BONDS & NOTES — 4.3% | |
Banks - Commercial — 1.1% | |
ANZ National International, Ltd.
Bank Guar. Notes
2.38% due 12/21/12* | | | 153,000 | | | | 155,046 | |
ANZ National International, Ltd.
Bank Guar. Notes
6.20% due 07/19/13* | | | 215,000 | | | | 239,888 | |
Barclays Bank PLC
Jr. Sub. Bonds
5.93% due 12/15/16*(4)(13) | | | 361,000 | | | | 315,875 | |
Barclays Bank PLC
Sub. Notes
6.05% due 12/04/17* | | | 330,000 | | | | 355,197 | |
Barclays Bank PLC
Jr. Sub. Notes
6.86% due 06/15/32*(4)(13) | | | 201,000 | | | | 176,880 | |
BNP Paribas
Bank Guar. Notes
4.80% due 06/24/15* | | | 215,000 | | | | 230,548 | |
Groupe BPCE
Notes
3.35% due 09/30/10(4)(13) | | | 132,000 | | | | 83,272 | |
Nordea Bank AB
Jr. Sub. Bonds
8.38% due 03/25/15(4)(13) | | | 164,000 | | | | 176,546 | |
21
VALIC Company II Core Bond Fund
PORTFOLIO OF INVESTMENTS — August 31, 2010 — (continued)
| | | | | | | | |
| | |
| Security Description | | Principal
Amount | | | Value
(Note 2) | |
| |
FOREIGN CORPORATE BONDS & NOTES (continued) | |
Banks - Commercial (continued) | |
Sumitomo Mitsui Banking Corp.
Senior Notes
3.15% due 07/22/15* | | $ | 245,000 | | | $ | 254,672 | |
Westpac Banking Corp.
Jr. Sub. Notes
0.62% due 03/31/11(4)(13) | | | 820,000 | | | | 492,000 | |
| | | | | | |
|
|
|
| | | | | | | | 2,479,924 | |
| | | | | | |
|
|
|
Chemicals - Diversified — 0.1% | | | | | | | | |
OXEA Finance/Cy SCA
Senior Sec. Notes
9.50% due 07/15/17* | | | 110,000 | | | | 116,387 | |
| | | | | | |
|
|
|
Chemicals - Plastics — 0.0% | | | | | | | | |
Montell Finance Co. BV
Company Guar. Notes
8.10% due 03/15/27* | | | 10,000 | | | | 9,075 | |
| | | | | | |
|
|
|
Computers - Memory Devices — 0.1% | | | | | | | | |
Seagate HDD Cayman
Company Guar. Notes
6.88% due 05/01/20* | | | 105,000 | | | | 102,900 | |
| | | | | | |
|
|
|
Diversified Banking Institutions — 0.1% | | | | | | | | |
Credit Agricole SA
Jr. Sub. Bonds
6.64% due 05/31/17*(4)(13) | | | 113,000 | | | | 96,050 | |
Natixis
Sub. Notes
0.78% due 01/15/19(4) | | | 150,000 | | | | 133,663 | |
| | | | | | |
|
|
|
| | | | | | | | 229,713 | |
| | | | | | |
|
|
|
Diversified Manufacturing Operations — 0.1% | | | | | | | | |
Tyco International Finance
Company Guar. Notes
3.38% due 10/15/15 | | | 300,000 | | | | 315,167 | |
| | | | | | |
|
|
|
Diversified Minerals — 0.2% | | | | | | | | |
BHP Billiton Finance USA, Ltd.
Company Guar. Notes
6.42% due 03/01/26 | | | 451,000 | | | | 543,312 | |
| | | | | | |
|
|
|
Electric - Integrated — 0.0% | | | | | | | | |
TransAlta Corp.
Senior Notes
4.75% due 01/15/15 | | | 50,000 | | | | 53,786 | |
| | | | | | |
|
|
|
Forestry — 0.0% | | | | | | | | |
Tembec Industries, Inc.
Senior Sec. Notes
11.25% due 12/15/18* | | | 50,000 | | | | 48,000 | |
| | | | | | |
|
|
|
Insurance - Multi-line — 0.2% | | | | | | | | |
Aegon NV
Sub. Notes
3.23% due 07/15/14(4)(13) | | | 104,000 | | | | 63,060 | |
XL Capital, Ltd.
Senior Notes
5.25% due 09/15/14 | | | 297,000 | | | | 315,465 | |
XL Capital, Ltd.
Senior Notes
6.38% due 11/15/24 | | | 194,000 | | | | 209,365 | |
| | | | | | |
|
|
|
| | | | | | | | 587,890 | |
| | | | | | |
|
|
|
Insurance - Reinsurance — 0.1% | | | | | | | | |
Endurance Specialty Holdings, Ltd.
Senior Notes
7.00% due 07/15/34 | | | 215,000 | | | | 210,376 | |
| | | | | | |
|
|
|
| | | | | | | | |
| | |
| Security Description | | Principal
Amount | | | Value
(Note 2) | |
| |
| | | | | | | | | |
Metal - Diversified — 0.1% | | | | | | | | |
Xstrata Canada Corp.
Company Guar. Notes
7.35% due 06/05/12 | | $ | 252,000 | | | $ | 272,692 | |
| | | | | | |
|
|
|
Oil Companies - Exploration & Production — 0.1% | | | | | | | | |
Nexen, Inc.
Senior Notes
5.88% due 03/10/35 | | | 206,000 | | | | 214,767 | |
OPTI Canada, Inc.
Senior Sec. Notes
7.88% due 12/15/14 | | | 159,000 | | | | 122,430 | |
| | | | | | |
|
|
|
| | | | | | | | 337,197 | |
| | | | | | |
|
|
|
Oil Companies - Integrated — 0.5% | | | | | | | | |
BP Capital Markets PLC
Company Guar. Notes
3.88% due 03/10/15 | | | 450,000 | | | | 445,757 | |
Statoil ASA
Company Guar. Notes
7.15% due 11/15/25 | | | 626,000 | | | | 809,988 | |
| | | | | | |
|
|
|
| | | | | | | | 1,255,745 | |
| | | | | | |
|
|
|
Paper & Related Products — 0.0% | | | | | | | | |
PE Paper Escrow GmbH
Senior Sec. Notes
12.00% due 08/01/14* | | | 89,000 | | | | 100,793 | |
| | | | | | |
|
|
|
Pipelines — 0.2% | | | | | | | | |
TransCanada Pipelines, Ltd.
Jr. Sub. Notes
6.35% due 05/15/67(4) | | | 415,000 | | | | 378,787 | |
| | | | | | |
|
|
|
Printing - Commercial — 0.0% | | | | | | | | |
Quebecor World Capital Corp.
Escrow Notes
8.75% due 03/15/16†*(6)(11) | | | 165,000 | | | | 6,806 | |
| | | | | | |
|
|
|
Satellite Telecom — 0.3% | | | | | | | | |
Intelsat Intermediate Holding Co., Ltd.
Company Guar. Bonds
9.50% due 02/01/15(12) | | | 428,000 | | | | 444,050 | |
Intelsat Subsidiary Holding Co., Ltd.
Company Guar. Notes
8.88% due 01/15/15 | | | 159,000 | | | | 164,168 | |
| | | | | | |
|
|
|
| | | | | | | | 608,218 | |
| | | | | | |
|
|
|
Special Purpose Entities — 0.5% | | | | | | | | |
AngloGold Ashanti Holdings PLC
Company Guar. Notes
6.50% due 04/15/40 | | | 290,000 | | | | 306,402 | |
Aries Vermoegensverwaltungs GmbH
Sec. Notes
9.60% due 10/25/14 | | | 500,000 | | | | 655,600 | |
SMFG Preferred Capital, Ltd.
Jr. Sub. Notes
6.08% due 01/25/17*(4)(13) | | | 272,000 | | | | 260,706 | |
| | | | | | |
|
|
|
| | | | | | | | 1,222,708 | |
| | | | | | |
|
|
|
Steel - Producers — 0.1% | | | | | | | | |
Essar Steel Algoma, Inc.
Senior Sec. Notes
9.38% due 03/15/15* | | | 165,000 | | | | 162,938 | |
| | | | | | |
|
|
|
SupraNational Banks — 0.1% | | | | | | | | |
Asian Development Bank
Senior Bonds
5.82% due 06/16/28 | | | 176,000 | | | | 212,327 | |
| | | | | | |
|
|
|
22
VALIC Company II Core Bond Fund
PORTFOLIO OF INVESTMENTS — August 31, 2010 — (continued)
| | | | | | | | |
| | |
| Security Description | | Principal
Amount | | | Value
(Note 2) | |
| |
FOREIGN CORPORATE BONDS & NOTES (continued) | |
Telephone - Integrated — 0.5% | | | | | | | | |
Telecom Italia Capital SA
Company Guar. Bonds
5.25% due 10/01/15 | | $ | 606,000 | | | $ | 645,032 | |
Telefonica Emisiones SAU
Company Guar. Notes
0.77% due 02/04/13(4) | | | 220,000 | | | | 213,882 | |
Telefonos de Mexico SAB de CV
Senior Notes
5.50% due 01/27/15 | | | 207,000 | | | | 228,706 | |
Virgin Media Finance PLC
Company Guar. Notes
8.38% due 10/15/19 | | | 50,000 | | | | 54,500 | |
| | | | | | |
|
|
|
| | | | | | | | 1,142,120 | |
| | | | | | |
|
|
|
Total Foreign Corporate Bonds & Notes | | | | | | | | |
(cost $9,862,525) | | | | | | | 10,396,861 | |
| | | | | | |
|
|
|
FOREIGN GOVERNMENT AGENCIES — 2.8% | | | | | | | | |
Sovereign — 2.8% | | | | | | | | |
Republic of Argentina
Senior Bonds
8.28% due 12/31/33 | | | 385,448 | | | | 295,831 | |
Republic of Colombia
Senior Bonds
6.13% due 01/18/41 | | | 400,000 | | | | 447,000 | |
Republic of Indonesia
Senior Bonds
6.63% due 02/17/37 | | | 850,000 | | | | 1,041,748 | |
Republic of the Philippines
Senior Bonds
6.38% due 10/23/34 | | | 1,000,000 | | | | 1,173,750 | |
Republic of Turkey
Senior Bonds
11.88% due 01/15/30 | | | 650,000 | | | | 1,107,437 | |
Republic of Venezuela
Senior Bonds
9.25% due 09/15/27 | | | 1,410,000 | | | | 1,001,100 | |
Russian Federation
Senior Bonds
7.50% due 03/31/30(12) | | | 736,000 | | | | 874,074 | |
United Mexican States
Notes
5.95% due 03/19/19 | | | 800,000 | | | | 922,000 | |
| | | | | | |
|
|
|
Total Foreign Government Agencies | | | | | | | | |
(cost $6,377,144) | | | | | | | 6,862,940 | |
| | | | | | |
|
|
|
MUNICIPAL BONDS & NOTES — 0.1% | | | | | | | | |
Municipal Bonds — 0.1% | | | | | | | | |
Texas State Transportation Commission
Bonds
Series B
5.18% due 04/01/30
(cost $115,000) | | | 115,000 | | | | 126,487 | |
| | | | | | |
|
|
|
U.S. GOVERNMENT AGENCIES — 34.8% | | | | | | | | |
Federal Home Loan Mtg. Corp. — 17.4% | | | | | | | | |
4.50% due 11/01/18 | | | 290,570 | | | | 310,504 | |
4.50% due 02/01/19 | | | 303,334 | | | | 324,238 | |
4.50% due 01/01/39 | | | 950,006 | | | | 998,297 | |
4.50% due 12/01/39 | | | 2,894,983 | | | | 3,040,335 | |
4.50% due 06/01/40 | | | 2,990,496 | | | | 3,140,643 | |
5.00% due 03/01/19 | | | 123,400 | | | | 132,167 | |
5.00% due 10/01/33 | | | 41,113 | | | | 44,057 | |
5.00% due 06/01/34 | | | 220,286 | | | | 235,717 | |
5.00% due 12/01/34 | | | 278,685 | | | | 298,207 | |
5.00% due 07/01/35 | | | 372,185 | | | | 396,862 | |
5.00% due 08/01/35 | | | 922,352 | | | | 983,507 | |
5.00% due 11/01/35 | | | 564,262 | | | | 601,674 | |
| | | | | | | | |
| | |
| Security Description | | Principal
Amount | | | Value
(Note 2) | |
| |
| | | | | | | | | |
Federal Home Loan Mtg. Corp. (continued) | | | | | | | | |
5.00% due 11/01/36 | | $ | 317,076 | | | $ | 337,306 | |
5.00% due 01/01/37 | | | 338,657 | | | | 360,264 | |
5.00% due 03/01/38 | | | 707,008 | | | | 751,304 | |
5.00% due 08/01/39 | | | 1,420,306 | | | | 1,511,267 | |
5.00% due 10/01/39 | | | 1,343,872 | | | | 1,427,934 | |
5.50% due 11/01/18 | | | 129,076 | | | | 139,326 | |
5.50% due 10/01/33 | | | 316,442 | | | | 341,640 | |
5.50% due 07/01/34 | | | 230,481 | | | | 248,114 | |
5.50% due 02/01/35 | | | 412,940 | | | | 443,500 | |
5.50% due 07/01/35 | | | 10,797 | | | | 11,596 | |
5.50% due 08/01/35 | | | 2,315,572 | | | | 2,486,708 | |
5.50% due 01/01/36 | | | 1,424,523 | | | | 1,529,946 | |
5.50% due 05/01/37 | | | 836,867 | | | | 894,176 | |
5.50% due 09/01/37 | | | 1,175,717 | | | | 1,256,231 | |
5.50% due 10/01/37 | | | 4,578,663 | | | | 4,892,213 | |
5.50% due 07/01/38 | | | 219,442 | | | | 234,470 | |
6.00% due 07/01/35 | | | 327,109 | | | | 353,931 | |
6.00% due 12/01/36 | | | 303,357 | | | | 327,094 | |
6.00% due 08/01/37 | | | 2,024,591 | | | | 2,179,848 | |
6.00% due 02/01/39 | | | 977,950 | | | | 1,052,125 | |
6.00% due 04/01/40 | | | 1,391,635 | | | | 1,497,188 | |
6.50% due 12/01/32 | | | 432,087 | | | | 478,859 | |
6.50% due 02/01/36 | | | 115,185 | | | | 126,160 | |
6.50% due 09/01/36 | | | 3,569 | | | | 3,891 | |
6.50% due 05/01/37 | | | 448,244 | | | | 487,871 | |
6.50% due 11/01/37 | | | 1,392,215 | | | | 1,515,293 | |
7.00% due 11/01/16 | | | 15,887 | | | | 17,113 | |
7.00% due 07/01/32 | | | 39,648 | | | | 44,778 | |
7.50% due 12/01/30 | | | 4,250 | | | | 4,846 | |
7.50% due 04/01/31 | | | 41,572 | | | | 47,427 | |
8.00% due 02/01/30 | | | 4,889 | | | | 5,628 | |
8.00% due 07/01/30 | | | 1,163 | | | | 1,339 | |
Federal Home Loan Mtg. Corp. REMIC | | | | | | | | |
Series 3102, Class PG | | | | | | | | |
5.00% due 11/15/28 | | | 779,000 | | | | 807,683 | |
Series 3317, Class PD | | | | | | | | |
5.00% due 09/15/31 | | | 1,000,000 | | | | 1,053,688 | |
Series 3116, Class PD | | | | | | | | |
5.00% due 10/15/34 | | | 3,355,000 | | | | 3,651,249 | |
Series 3349, Class HB | | | | | | | | |
5.50% due 06/15/31 | | | 1,338,000 | | | | 1,419,087 | |
| | | | | | |
|
|
|
| | | | | | | | 42,447,301 | |
| | | | | | |
|
|
|
Federal National Mtg. Assoc. — 12.5% | | | | | | | | |
2.13% due 01/25/13 | | | 333,000 | | | | 335,097 | |
4.00% due 06/01/39 | | | 1,370,635 | | | | 1,429,556 | |
4.00% due September TBA | | | 4,500,000 | | | | 4,659,610 | |
4.50% due 06/01/18 | | | 69,546 | | | | 74,435 | |
4.50% due 01/01/25 | | | 1,865,593 | | | | 1,980,005 | |
4.50% due 01/01/40 | | | 1,198,873 | | | | 1,274,675 | |
4.50% due 02/01/40 | | | 2,956,940 | | | | 3,143,933 | |
4.50% due 05/01/40 | | | 1,489,258 | | | | 1,570,982 | |
4.50% due 08/01/40 | | | 1,495,314 | | | | 1,572,260 | |
5.00% due 03/15/16 | | | 248,000 | | | | 289,064 | |
5.00% due 09/01/18 | | | 25,319 | | | | 27,102 | |
5.00% due 10/01/18 | | | 22,359 | | | | 23,933 | |
5.00% due 02/01/20 | | | 40,810 | | | | 43,710 | |
5.00% due 06/01/22 | | | 1,099,188 | | | | 1,169,836 | |
5.00% due 10/01/24 | | | 893,268 | | | | 953,613 | |
5.00% due 03/01/37 | | | 324,163 | | | | 344,744 | |
5.00% due 06/01/37 | | | 94,423 | | | | 100,417 | |
5.00% due 07/01/37 | | | 509,692 | | | | 542,052 | |
5.00% due 04/01/40 | | | 3,201,483 | | | | 3,404,244 | |
5.00% due 05/01/40 | | | 2,966,029 | | | | 3,153,878 | |
5.50% due 10/01/17 | | | 47,571 | | | | 51,596 | |
23
VALIC Company II Core Bond Fund
PORTFOLIO OF INVESTMENTS — August 31, 2010 — (continued)
| | | | | | | | |
| | |
| Security Description | | Principal
Amount | | | Value
(Note 2) | |
| |
U.S. GOVERNMENT AGENCIES (continued) | | | | | | | | |
Federal National Mtg. Assoc. (continued) | | | | | | | | |
5.50% due 05/01/18 | | $ | 43,825 | | | $ | 47,533 | |
5.50% due 11/01/19 | | | 47,095 | | | | 51,079 | |
5.50% due 11/01/22 | | | 284,210 | | | | 306,150 | |
5.50% due 12/01/33 | | | 275,604 | | | | 297,852 | |
5.50% due 05/01/34 | | | 135,864 | | | | 146,831 | |
5.50% due 12/01/35 | | | 58,939 | | | | 63,420 | |
5.50% due 11/01/36 | | | 395,708 | | | | 424,312 | |
6.00% due 09/01/16 | | | 67,870 | | | | 73,332 | |
6.00% due 12/01/16 | | | 15,830 | | | | 17,104 | |
6.00% due 12/01/33 | | | 305,056 | | | | 335,027 | |
6.00% due 07/01/34 | | | 263,239 | | | | 287,907 | |
6.00% due 10/01/36 | | | 710,351 | | | | 767,267 | |
6.00% due 10/01/37 | | | 474,394 | | | | 511,663 | |
6.50% due 02/01/17 | | | 25,644 | | | | 27,883 | |
6.50% due 03/01/17 | | | 33,708 | | | | 36,651 | |
6.50% due 04/01/29 | | | 43,487 | | | | 48,276 | |
6.50% due 06/01/29 | | | 106,275 | | | | 117,979 | |
6.50% due 07/01/32 | | | 37,643 | | | | 41,788 | |
6.50% due 02/01/37 | | | 591,201 | | | | 645,498 | |
7.00% due 09/01/31 | | | 91,914 | | | | 104,188 | |
| | | | | | |
|
|
|
| | | | | | | | 30,496,482 | |
| | | | | | |
|
|
|
Government National Mtg. Assoc. — 4.9% | | | | | | | | |
4.50% due 05/15/39 | | | 1,814,698 | | | | 1,940,188 | |
4.50% due 01/15/40 | | | 1,684,598 | | | | 1,799,616 | |
5.00% due 05/15/34 | | | 1,073,822 | | | | 1,161,360 | |
5.00% due 01/15/40 | | | 1,457,693 | | | | 1,579,364 | |
5.50% due 12/15/39 | | | 2,642,859 | | | | 2,865,325 | |
6.00% due 10/15/39 | | | 2,374,291 | | | | 2,588,517 | |
6.50% due 06/15/29 | | | 10,007 | | | | 11,227 | |
7.00% due 09/15/28 | | | 5,296 | | | | 6,051 | |
| | | | | | |
|
|
|
| | | | | | | | 11,951,648 | |
| | | | | | |
|
|
|
Total U.S. Government Agencies | | | | | | | | |
(cost $81,759,107) | | | | | | | 84,895,431 | |
| | | | | | |
|
|
|
U.S. GOVERNMENT TREASURIES — 16.2% | | | | | | | | |
United States Treasury Bonds — 3.2% | | | | | | | | |
4.25% due 05/15/39 | | | 402,000 | | | | 454,071 | |
4.38% due 02/15/38 | | | 674,000 | | | | 779,945 | |
4.38% due 11/15/39 | | | 1,805,000 | | | | 2,079,699 | |
4.38% due 05/15/40 | | | 658,000 | | | | 759,168 | |
4.50% due 05/15/38 | | | 588,000 | | | | 694,208 | |
4.50% due 08/15/39 | | | 1,401,000 | | | | 1,647,489 | |
4.63% due 02/15/40 | | | 284,000 | | | | 340,711 | |
5.25% due 11/15/28 | | | 559,000 | | | | 718,228 | |
8.13% due 08/15/19 | | | 158,000 | | | | 232,309 | |
| | | | | | |
|
|
|
| | | | | | | | 7,705,828 | |
| | | | | | |
|
|
|
United States Treasury Notes — 13.0% | | | | | | | | |
0.88% due 03/31/11 | | | 600,000 | | | | 602,227 | |
0.88% due 02/29/12 | | | 4,000,000 | | | | 4,028,600 | |
1.00% due 07/31/11 | | | 2,000,000 | | | | 2,013,046 | |
1.00% due 07/15/13 | | | 5,410,000 | | | | 5,456,905 | |
1.13% due 01/15/12 | | | 500,000 | | | | 505,078 | |
1.13% due 06/15/13 | | | 3,000,000 | | | | 3,036,570 | |
1.75% due 07/31/15 | | | 250,000 | | | | 255,235 | |
1.88% due 06/30/15 | | | 250,000 | | | | 256,875 | |
2.25% due 05/31/14 | | | 26,000 | | | | 27,255 | |
2.38% due 09/30/14 | | | 141,000 | | | | 148,347 | |
2.38% due 02/28/15 | | | 168,000 | | | | 176,662 | |
2.63% due 02/29/16 | | | 2,750,000 | | | | 2,908,983 | |
2.75% due 02/15/19 | | | 760,000 | | | | 789,866 | |
3.13% due 05/15/19 | | | 262,000 | | | | 279,112 | |
3.38% due 11/15/19 | | | 1,099,000 | | | | 1,187,006 | |
| | | | | | | | |
| | |
| Security Description | | Shares/
Principal
Amount | | | Value
(Note 2) | |
| |
| | | | | | | | | |
United States Treasury Notes (continued) | | | | | | | | |
3.50% due 05/15/20 | | $ | 472,000 | | | $ | 514,296 | |
3.63% due 08/15/19 | | | 78,000 | | | | 86,013 | |
3.63% due 02/15/20 | | | 2,161,000 | | | | 2,378,282 | |
3.75% due 11/15/18 | | | 505,000 | | | | 565,442 | |
3.88% due 05/15/18 | | | 5,000,000 | | | | 5,652,735 | |
4.25% due 08/15/15 | | | 750,000 | | | | 855,176 | |
| | | | | | |
|
|
|
| | | | | | | | 31,723,711 | |
| | | | | | |
|
|
|
Total U.S. Government Treasuries | | | | | | | | |
(cost $37,555,761) | | | | | | | 39,429,539 | |
| | | | | | |
|
|
|
COMMON STOCK — 0.2% | | | | | | | | |
Banks - Commercial — 0.2% | | | | | | | | |
Lloyds Banking Group PLC† | | | 416,870 | | | | 444,273 | |
| | | | | | |
|
|
|
Independent Power Producers — 0.0% | | | | | | | | |
Mirant Corp.† | | | 186 | | | | 1,804 | |
| | | | | | |
|
|
|
Oil Companies - Integrated — 0.0% | | | | | | | | |
CB Simmons Co.†(6)(11) | | | 7,000 | | | | 0 | |
| | | | | | |
|
|
|
Total Common Stock | | | | | | | | |
(cost $255,378) | | | | | | | 446,077 | |
| | | | | | |
|
|
|
PREFERRED STOCK — 1.1% | | | | | | | | |
Banks - Commercial — 0.1% | | | | | | | | |
CoBank ACB
11.00% | | | 7,302 | | | | 402,523 | |
| | | | | | |
|
|
|
Banks - Super Regional — 0.3% | | | | | | | | |
US Bancorp
7.19%(4) | | | 523 | | | | 405,652 | |
Wachovia Capital Trust IX
6.38% | | | 10,650 | | | | 263,587 | |
| | | | | | |
|
|
|
| | | | | | | | 669,239 | |
| | | | | | |
|
|
|
Diversified Banking Institutions — 0.2% | | | | | | | | |
Ally Financial, Inc.
7.00%* | | | 134 | | | | 110,688 | |
HSBC Holdings PLC
8.00% | | | 12,780 | | | | 339,054 | |
| | | | | | |
|
|
|
| | | | | | | | 449,742 | |
| | | | | | |
|
|
|
Diversified Financial Services — 0.1% | | | | | | | | |
General Electric Capital Corp.
4.50%(12) | | | 6,441 | | | | 162,893 | |
| | | | | | |
|
|
|
Finance - Investment Banker/Broker — 0.2% | | | | | | | | |
JPMorgan Chase Capital XXIX
6.70% | | | 21,960 | | | | 554,490 | |
| | | | | | |
|
|
|
Finance - Mortgage Loan/Banker — 0.0% | | | | | | | | |
Federal Home Loan Mtg. Corp.
0.00%(4) | | | 6,900 | | | | 2,277 | |
| | | | | | |
|
|
|
Special Purpose Entity — 0.2% | | | | | | | | |
Structured Repackaged Asset-Backed Trust Securities
3.00%(4) | | | 21,200 | | | | 422,940 | |
| | | | | | |
|
|
|
Total Preferred Stock | | | | | | | | |
(cost $2,741,006) | | | | | | | 2,664,104 | |
| | | | | | |
|
|
|
WARRANTS — 0.0% | | | | | | | | |
Publishing - Periodicals — 0.0% | | | | | | | | |
The Reader’s Digest Association, Inc.
Expires 02/19/14†(6)
(cost $396) | | | 382 | | | | 0 | |
| | | | | | |
|
|
|
Total Long-Term Investment Securities | | | | | | | | |
(cost $227,210,625) | | | | | | | 235,759,163 | |
| | | | | | |
|
|
|
24
VALIC Company II Core Bond Fund
PORTFOLIO OF INVESTMENTS — August 31, 2010 — (continued)
| | | | | | | | |
| | |
| Security Description | | Principal
Amount | | | Value
(Note 2) | |
| |
REPURCHASE AGREEMENT — 4.1% | | | | | | | | |
Agreement with State Street Bank & Trust Co.,
bearing interest at 0.01%, dated 08/31/10, to be repurchased 09/01/10 in the amount of $10,355,003 and collateralized by $9,495,000 of United States Treasury Bonds bearing interest at 3.13%, due 04/30/17 and having an approximate value of $10,357,146
(cost $10,055,000) | | $ | 10,055,000 | | | $ | 10,055,000 | |
| | | | | | |
|
|
|
TOTAL INVESTMENTS | | | | | | | | |
(cost $237,265,625)(14) | | | 100.9 | % | | | 245,814,163 | |
Liabilities in excess of other assets | | | (0.9 | ) | | | (2,236,648 | ) |
| | |
|
|
| |
|
|
|
NET ASSETS — | | | 100.0 | % | | $ | 243,577,515 | |
| | |
|
|
| |
|
|
|
| * | Securities exempt from registration under Rule 144A of the Securities Act of 1933. These securities may be sold in transactions exempt from registration, normally to qualified institutional buyers. The Fund has no right to demand registration of these securities. At August 31, 2010, the aggregate value of these securities was $19,195,776 representing 7.9% of net assets. Unless otherwise indicated these securities are not considered to be illiquid. |
| † | Non-income producing security |
| (1) | Commercial Mortgage Backed Security |
| (2) | Variable Rate Security — the rate reflected is as of August 31, 2010, maturity date reflects the stated maturity date. |
| (3) | Bond is in default and did not pay principal at maturity. |
| (4) | Floating rate security where the rate fluctuates. The rate moves up or down at each reset date. The rate reflected is as of August 31, 2010. |
| (5) | Collateralized Mortgage Obligation |
| (6) | Fair valued security. Securities are classified as Level 3 based on the securities valuation inputs; see Note 2. |
| (8) | Denotes a restricted security that: (a) cannot be offered for public sale without first being registered, or being able to take advantage of an exemption from registration, under the Securities Act of 1933, as amended (the “1933 Act”); (b) is subject to a contractual restriction on public sales; or (c) is otherwise subject to a restriction on sales by operation of applicable law. Restricted securities are valued pursuant to Note 2. Certain restricted securities held by the Fund may not be sold except in exempt transactions or in a public offering registered under the 1933 Act. The Fund has no right to demand registration of these securities. The risk of investing in certain restricted securities is greater than the risk of investing in the securities of widely held, publicly traded companies. To the extent applicable, lack of a secondary market and resale restrictions may result in the inability of a Fund to sell a security at a fair price and may substantially delay the sale of the security. In addition, certain restricted securities may exhibit greater price volatility than securities for which secondary markets exist. As of August 31, 2010, the Core Bond Fund held the following restricted securities: |
| | | | | | | | | | | | | | | | | | | | | | | | |
Name
| | Acquisition
Date
| | | Principal
Amount
| | | Acquisition
Cost
| | | Market
Value
| | | Market
Value
Per Share
| | | Value as a
% of
Net Assets
| |
ICO North America, Inc.
Senior Sec. Notes
7.50% due 08/15/09 | | | 08/11/05 | | | $ | 25,000 | | | $ | 25,000 | | | | | | | | | | | | | |
| | | | 02/15/08 | | | | 1,000 | | | | 1,000 | | | | | | | | | | | | | |
| | | | 09/11/08 | | | | 1,000 | | | | 1,000 | | | | | | | | | | | | | |
| | | | 02/15/09 | | | | 1,000 | | | | 1,000 | | | | | | | | | | | | | |
| | | | | | |
|
|
| |
|
|
| | | | | | | | | | | | |
| | | | | | | $ | 28,000 | | | $ | 28,000 | | | $ | 24,360 | | | $ | 87.00 | | | | 0.01 | % |
| | | | | | |
|
|
| |
|
|
| |
|
|
| | | | | |
|
|
|
| (9) | Company has filed for Chapter 11 bankruptcy protection. |
| (10) | Income may be received in cash or additional shares at the discretion of the issuer. |
| (11) | Illiquid security. At August 31, 2010, the aggregate value of these securities was $32,299 representing 0.0% of net assets. |
| (12) | “Step-up” security where the rate increases (“steps-up”) at a predetermined rate. Rate shown reflects the increased rate. |
| (13) | Perpetual maturity — maturity date reflects the next call date. |
| (14) | See Note 5 for cost of investments on a tax basis. |
TBA—Securities purchased on a forward commitment basis with an approximate principal amount and no definite maturity date. The actual principal and maturity date will be determined upon settlement date.
The following is a summary of the inputs used to value the Fund’s net assets as of August 31, 2010 (see Note 2):
| | | | | | | | | | | | | | | | |
| | | Level 1 - Unadjusted Quoted
Prices
| | | Level 2 - Other Observable
Inputs
| | | Level 3 - Significant
Unobservable Inputs
| | | Total
| |
Long-Term Investment Securities: | | | | | | | | | | | | | | | | |
Asset Backed Securities | | $ | — | | | $ | 19,632,451 | | | $ | — | | | $ | 19,632,451 | |
Convertible Bonds & Notes | | | — | | | | — | | | | 24,360 | | | | 24,360 | |
U.S. Corporate Bonds & Notes | | | — | | | | 70,211,365 | | | | 1,069,548 | | | | 71,280,913 | |
Foreign Corporate Bonds & Notes | | | — | | | | 10,390,055 | | | | 6,806 | | | | 10,396,861 | |
Foreign Government Agencies | | | — | | | | 6,862,940 | | | | — | | | | 6,862,940 | |
Municipal Bonds & Notes | | | — | | | | 126,487 | | | | — | | | | 126,487 | |
U.S. Government Agencies | | | — | | | | 84,895,431 | | | | — | | | | 84,895,431 | |
U.S. Government Treasuries | | | — | | | | 39,429,539 | | | | — | | | | 39,429,539 | |
Common Stock | | | 446,077 | | | | — | | | | 0 | | | | 446,077 | |
Preferred Stock | | | 1,745,241 | | | | 918,863 | | | | — | | | | 2,664,104 | |
Warrants | | | — | | | | — | | | | 0 | | | | 0 | |
Repurchase Agreement | | | — | | | | 10,055,000 | | | | — | | | | 10,055,000 | |
| | |
|
|
| |
|
|
| |
|
|
| |
|
|
|
Total | | $ | 2,191,318 | | | $ | 242,522,131 | | | $ | 1,100,714 | | | $ | 245,814,163 | |
| | |
|
|
| |
|
|
| |
|
|
| |
|
|
|
25
VALIC Company II Core Bond Fund
PORTFOLIO OF INVESTMENTS — August 31, 2010 — (continued)
The following is a reconciliation of Level 3 assets which significant unobservable inputs were used to determine fair value:
| | | | | | | | | | | | | | | | | | | | |
| | | Convertible
Bonds & Notes
| | | U.S. Corporate
Bonds & Notes
| | | Foreign Corporate
Bonds & Notes
| | | Common Stock
| | | Warrants
| |
Balance as of 8/31/2009 | | $ | 9,800 | | | $ | 612,651 | | | $ | — | | | $ | — | | | $ | — | |
Accrued discounts/premiums | | | — | | | | 1,260 | | | | — | | | | — | | | | — | |
Realized gain (loss) | | | — | | | | 37,038 | | | | — | | | | — | | | | — | |
Change in unrealized appreciation (depreciation)(1) | | | 14,560 | | | | 187,666 | | | | 6,806 | | | | — | | | | (396 | ) |
Net purchases (sales) | | | — | | | | 229,801 | | | | 0 | | | | 0 | | | | 396 | |
Transfers in and/or out of Level 3(2) | | | — | | | | 1,132 | | | | — | | | | — | | | | — | |
| | |
|
|
| |
|
|
| |
|
|
| |
|
|
| |
|
|
|
Balance as of 8/31/2010 | | $ | 24,360 | | | $ | 1,069,548 | | | $ | 6,806 | | | $ | 0 | | | $ | 0 | |
| | |
|
|
| |
|
|
| |
|
|
| |
|
|
| |
|
|
|
| (1) | The total change in unrealized appreciation (depreciation) included in the statement of operations attributable to level 3 investments still held at August 31, 2010 includes: |
| | | | | | | | | | | | | | | | | | | | |
| | | Convertible
Bonds & Notes
| | | U.S. Corporate
Bonds & Notes
| | | Foreign Corporate
Bonds & Notes
| | | Common Stock
| | | Warrants
| |
| | | $ | 14,560 | | | $ | 196,780 | | | $ | 6,806 | | | $ | — | | | $ | (396 | ) |
| | |
|
|
| |
|
|
| |
|
|
| |
|
|
| |
|
|
|
| (2) | The Fund’s policy is to recognize transfers in and transfers out as of the end of the reporting period. |
See Notes to Financial Statements
26
VALIC Company II High Yield Bond Fund
PORTFOLIO PROFILE — August 31, 2010 (Unaudited)
Industry Allocation*
| | | | |
Medical — Hospitals | | | 4.0 | % |
Diversified Banking Institutions | | | 3.6 | |
Auto/Truck Parts & Equipment — Original | | | 3.5 | |
Banks — Commercial | | | 3.3 | |
Repurchase Agreements | | | 2.6 | |
Telephone — Integrated | | | 2.6 | |
Special Purpose Entities | | | 2.4 | |
Finance — Auto Loans | | | 2.3 | |
Cable/Satellite TV | | | 2.3 | |
Diversified Manufacturing Operations | | | 2.2 | |
Computer Services | | | 2.2 | |
Auto — Cars/Light Trucks | | | 2.2 | |
Casino Hotels | | | 2.1 | |
Cellular Telecom | | | 1.9 | |
Banks — Super Regional | | | 1.9 | |
Diversified Financial Services | | | 1.9 | |
Retail — Regional Department Stores | | | 1.8 | |
Independent Power Producers | | | 1.7 | |
Theaters | | | 1.7 | |
Telecom Services | | | 1.7 | |
Satellite Telecom | | | 1.6 | |
Electric — Integrated | | | 1.6 | |
Data Processing/Management | | | 1.6 | |
Broadcast Services/Program | | | 1.6 | |
Electric — Generation | | | 1.6 | |
Pipelines | | | 1.5 | |
Casino Services | | | 1.5 | |
Oil Companies — Exploration & Production | | | 1.5 | |
Paper & Related Products | | | 1.4 | |
Transport — Marine | | | 1.3 | |
Electronic Components — Semiconductors | | | 1.2 | |
Web Hosting/Design | | | 1.1 | |
Medical — Drugs | | | 1.1 | |
Publishing — Periodicals | | | 1.1 | |
Auto/Truck Parts & Equipment — Replacement | | | 1.1 | |
Coal | | | 1.0 | |
Oil — Field Services | | | 1.0 | |
Oil Field Machinery & Equipment | | | 1.0 | |
Retail — Drug Store | | | 0.9 | |
Medical Products | | | 0.9 | |
Chemicals — Specialty | | | 0.8 | |
Machinery — Farming | | | 0.8 | |
Food — Meat Products | | | 0.7 | |
Banks — Mortgage | | | 0.7 | |
Medical Information Systems | | | 0.7 | |
Chemicals — Diversified | | | 0.7 | |
Direct Marketing | | | 0.7 | |
Containers — Paper/Plastic | | | 0.7 | |
Diagnostic Kits | | | 0.7 | |
Diversified Operations/Commercial Services | | | 0.6 | |
Computers — Memory Devices | | | 0.6 | |
Investment Companies | | | 0.6 | |
E-Commerce/Services | | | 0.6 | |
Banks — Money Center | | | 0.6 | |
Machinery — General Industrial | | | 0.6 | |
Building Products — Cement | | | 0.6 | |
Rubber — Tires | | | 0.6 | |
Insurance — Multi-line | | | 0.5 | |
Agricultural Chemicals | | | 0.5 | |
Retail — Arts & Crafts | | | 0.5 | |
Medical Labs & Testing Services | | | 0.5 | |
Medical — Outpatient/Home Medical | | | 0.5 | |
Pharmacy Services | | | 0.5 | |
Television | | | 0.5 | |
Storage/Warehousing | | | 0.5 | |
Real Estate Investment Trusts | | | 0.4 | |
Chemicals — Plastics | | | 0.4 | |
Athletic Equipment | | | 0.4 | |
| | | | |
Building Products — Air & Heating | | | 0.4 | |
Retail — Apparel/Shoe | | | 0.4 | |
Metal — Aluminum | | | 0.4 | |
Metal — Diversified | | | 0.4 | |
Commercial Services | | | 0.4 | |
Airlines | | | 0.4 | |
Telecommunication Equipment | | | 0.4 | |
Funeral Services & Related Items | | | 0.3 | |
Finance — Consumer Loans | | | 0.3 | |
Beverages — Wine/Spirits | | | 0.3 | |
Steel Pipe & Tube | | | 0.3 | |
Advertising Services | | | 0.3 | |
Consumer Products — Misc. | | | 0.3 | |
Printing — Commercial | | | 0.3 | |
Office Supplies & Forms | | | 0.3 | |
Diversified Minerals | | | 0.2 | |
Rental Auto/Equipment | | | 0.2 | |
Containers — Metal/Glass | | | 0.2 | |
Enterprise Software/Service | | | 0.2 | |
Multimedia | | | 0.2 | |
Oil & Gas Drilling | | | 0.2 | |
Building & Construction — Misc. | | | 0.1 | |
Firearms & Ammunition | | | 0.1 | |
Hazardous Waste Disposal | | | 0.1 | |
Food — Retail | | | 0.1 | |
Beverages — Non-alcoholic | | | 0.1 | |
Diversified Operations | | | 0.1 | |
Food — Misc. | | | 0.1 | |
Aerospace/Defense | | | 0.1 | |
Building & Construction Products — Misc. | | | 0.1 | |
| | |
|
|
|
| | | | 97.3 | % |
| | |
|
|
|
Credit Quality†#
| | | | |
A | | | 2.3 | % |
BBB | | | 1.0 | |
BB | | | 30.7 | |
B | | | 50.0 | |
CCC | | | 13.9 | |
Not Rated@ | | | 2.1 | |
| | |
|
|
|
| | | | 100.0 | % |
| | |
|
|
|
| * | Calculated as a percentage of net assets. |
| @ | Represents debt issues that either have no rating, or the rating is unavailable from source. |
| † | Source: Standard and Poors |
| # | Calculated as percentage of total debt issues, excluding short-term securities. |
27
VALIC Company II High Yield Bond Fund
PORTFOLIO OF INVESTMENTS — August 31, 2010
| | | | | | | | |
| | |
| Security Description | | Principal
Amount | | | Value
(Note 2) | |
| |
CONVERTIBLE BONDS & NOTES — 0.6% | |
Auto - Cars/Light Trucks — 0.6% | | | | | | | | |
Ford Motor Co. Senior Notes
4.25% due 11/15/16
(cost $1,051,000) | | $ | 1,051,000 | | | $ | 1,458,262 | |
| | | | | | |
|
|
|
U.S. CORPORATE BONDS & NOTES — 80.8% | |
Advertising Services — 0.3% | | | | | | | | |
Visant Holding Corp.
Senior Notes
8.75% due 12/01/13 | | | 85,000 | | | | 86,700 | |
Visant Holding Corp.
Senior Notes
10.25% due 12/01/13(1) | | | 640,000 | | | | 652,800 | |
| | | | | | |
|
|
|
| | | | | | | | 739,500 | |
| | | | | | |
|
|
|
Aerospace/Defense — 0.1% | | | | | | | | |
Esterline Technologies Corp.
Company Guar.
7.00% due 08/01/20* | | | 165,000 | | | | 167,888 | |
| | | | | | |
|
|
|
Agricultural Chemicals — 0.5% | | | | | | | | |
CF Industries, Inc.
Senior Notes
6.88% due 05/01/18 | | | 300,000 | | | | 315,750 | |
CF Industries, Inc.
Senior Notes
7.13% due 05/01/20 | | | 970,000 | | | | 1,040,325 | |
| | | | | | |
|
|
|
| | | | | | | | 1,356,075 | |
| | | | | | |
|
|
|
Airlines — 0.4% | | | | | | | | |
Continental Airlines, Inc.
Senior Notes
4.50% due 01/15/15 | | | 500,000 | | | | 658,750 | |
Continental Airlines, Inc.
Pass Through Certs.
Series 1991, Class A
6.55% due 02/02/19 | | | 308,614 | | | | 316,638 | |
| | | | | | |
|
|
|
| | | | | | | | 975,388 | |
| | | | | | |
|
|
|
Athletic Equipment — 0.4% | | | | | | | | |
Easton-Bell Sports, Inc.
Senior Sec. Notes
9.75% due 12/01/16 | | | 1,075,000 | | | | 1,136,813 | |
| | | | | | |
|
|
|
Auto - Cars/Light Trucks — 1.6% | | | | | | | | |
Ford Motor Co.
Notes
7.45% due 07/16/31 | | | 4,325,000 | | | | 4,216,875 | |
| | | | | | |
|
|
|
Auto/Truck Parts & Equipment - Original — 2.8% | | | | | | | | |
ArvinMeritor, Inc.
Senior Notes
8.13% due 09/15/15 | | | 2,325,000 | | | | 2,330,812 | |
ArvinMeritor, Inc.
Company Guar. Notes
10.63% due 03/15/18 | | | 1,095,000 | | | | 1,188,075 | |
Tenneco, Inc.
Senior Notes
7.75% due 08/15/18* | | | 275,000 | | | | 280,500 | |
Tenneco, Inc.
Company Guar. Notes
8.13% due 11/15/15 | | | 120,000 | | | | 124,650 | |
Tenneco, Inc.
Company Guar. Notes
8.63% due 11/15/14 | | | 530,000 | | | | 543,250 | |
TRW Automotive, Inc.
Company Guar. Notes
7.00% due 03/15/14* | | | 750,000 | | | | 772,500 | |
| | | | | | | | |
| | |
| Security Description | | Principal
Amount | | | Value
(Note 2) | |
| |
| | | | | | | | | |
Auto/Truck Parts & Equipment - Original (continued) | | | | | | | | |
TRW Automotive, Inc.
Company Guar. Notes
7.25% due 03/15/17* | | $ | 2,030,000 | | | $ | 2,075,675 | |
| | | | | | |
|
|
|
| | | | | | | | 7,315,462 | |
| | | | | | |
|
|
|
Auto/Truck Parts & Equipment - Replacement — 1.1% | | | | | | | | |
Affinia Group Holdings, Inc.
Company Guar. Notes
9.00% due 11/30/14 | | | 1,710,000 | | | | 1,752,750 | |
Affinia Group Holdings, Inc.
Senior Sec. Notes
10.75% due 08/15/16* | | | 910,000 | | | | 1,005,550 | |
Exide Corp.
Escrow Notes
10.00% due 03/15/25†(2)(3) | | | 300,000 | | | | 0 | |
| | | | | | |
|
|
|
| | | | | | | | 2,758,300 | |
| | | | | | |
|
|
|
Banks - Commercial — 2.7% | | | | | | | | |
CIT Group, Inc.
Senior Sec. Notes
7.00% due 05/01/13 | | | 300,906 | | | | 298,273 | |
CIT Group, Inc.
Senior Sec. Notes
7.00% due 05/01/14 | | | 451,360 | | | | 439,512 | |
CIT Group, Inc.
Senior Sec. Notes
7.00% due 05/01/15 | | | 451,360 | | | | 433,870 | |
CIT Group, Inc.
Senior Sec. Notes
7.00% due 05/01/16 | | | 2,147,268 | | | | 2,039,905 | |
CIT Group, Inc.
Senior Sec. Notes
7.00% due 05/01/17 | | | 4,073,175 | | | | 3,830,055 | |
| | | | | | |
|
|
|
| | | | | | | | 7,041,615 | |
| | | | | | |
|
|
|
Banks - Money Center — 0.6% | | | | | | | | |
NB Capital Trust IV
Bank Guar. Notes
8.25% due 04/15/27 | | | 1,475,000 | | | | 1,511,415 | |
| | | | | | |
|
|
|
Banks - Mortgage — 0.8% | | | | | | | | |
Provident Funding Associates
Senior Sec. Notes
10.25% due 04/15/17* | | | 1,915,000 | | | | 1,948,512 | |
| | | | | | |
|
|
|
Banks - Super Regional — 1.9% | | | | | | | | |
BAC Capital Trust XI
Ltd. Guar. Notes
6.63% due 05/23/36 | | | 1,575,000 | | | | 1,563,640 | |
Wells Fargo & Co.
Jr. Sub. Bonds
7.98% due 03/15/18(4)(5) | | | 3,250,000 | | | | 3,355,625 | |
| | | | | | |
|
|
|
| | | | | | | | 4,919,265 | |
| | | | | | |
|
|
|
Beverages - Wine/Spirits — 0.3% | | | | | | | | |
Constellation Brands, Inc.
Company Guar. Notes
7.25% due 05/15/17 | | | 750,000 | | | | 785,625 | |
| | | | | | |
|
|
|
Broadcast Services/Program — 1.6% | | | | | | | | |
Clear Channel Worldwide Holdings, Inc.
Company Guar. Notes
Class A
9.25% due 12/15/17 | | | 210,000 | | | | 217,875 | |
Clear Channel Worldwide Holdings, Inc.
Company Guar. Notes
Class B
9.25% due 12/15/17 | | | 830,000 | | | | 870,462 | |
28
VALIC Company II High Yield Bond Fund
PORTFOLIO OF INVESTMENTS — August 31, 2010 — (continued)
| | | | | | | | |
| | |
| Security Description | | Principal
Amount | | | Value
(Note 2) | |
| |
U.S. CORPORATE BONDS & NOTES (continued) | |
Broadcast Services/Program (continued) | | | | | | | | |
Fisher Communications, Inc.
Senior Notes
8.63% due 09/15/14 | | $ | 806,000 | | | $ | 798,948 | |
Liberty Media LLC
Debentures
8.25% due 02/01/30 | | | 1,130,000 | | | | 1,073,500 | |
Liberty Media LLC
Senior Notes
8.50% due 07/15/29 | | | 820,000 | | | | 779,000 | |
Nexstar Broadcasting, Inc.
Company Guar. Notes
0.50% due 01/15/14*(6)(7) | | | 326,183 | | | | 300,088 | |
Nexstar Broadcasting, Inc.
Company Guar. Notes
7.00% due 01/15/14 | | | 108,000 | | | | 105,840 | |
| | | | | | |
|
|
|
| | | | | | | | 4,145,713 | |
| | | | | | |
|
|
|
Building & Construction Products - Misc. — 0.1% | | | | | | | | |
Associated Materials LLC/Associated Materials Finance, Inc.
Senior Sec. Notes
9.88% due 11/15/16 | | | 145,000 | | | | 153,700 | |
| | | | | | |
|
|
|
Building & Construction - Misc. — 0.1% | | | | | | | | |
Esco Corp.
Senior Notes
8.63% due 12/15/13* | | | 335,000 | | | | 342,119 | |
| | | | | | |
|
|
|
Building Products - Air & Heating — 0.4% | | | | | | | | |
Goodman Global Group, Inc.
Senior Notes
0.00% due 12/15/14 | | | 1,740,000 | | | | 1,104,900 | |
| | | | | | |
|
|
|
Building Products - Cement — 0.6% | | | | | | | | |
Cemex Finance LLC
Senior Sec. Notes
9.50% due 12/14/16* | | | 1,550,000 | | | | 1,488,000 | |
| | | | | | |
|
|
|
Cable/Satellite TV — 2.3% | | | | | | | | |
Cablevision Systems Corp.
Senior Notes
8.00% due 04/15/20 | | | 830,000 | | | | 886,025 | |
CCH II LLC/CCH II Capital Corp.
Company Guar. Notes
13.50% due 11/30/16 | | | 1,090,065 | | | | 1,291,727 | |
CCO Holdings LLC/CCO Holdings Capital Corp.
Company Guar. Notes
7.88% due 04/30/18* | | | 400,000 | | | | 414,000 | |
CCO Holdings LLC/CCO Holdings
Capital Corp.
Company Guar. Notes
8.13% due 04/30/20* | | | 315,000 | | | | 331,538 | |
Mediacom LLC / Mediacom Capital Corp.
Notes
9.13% due 08/15/19 | | | 3,015,000 | | | | 3,015,000 | |
| | | | | | |
|
|
|
| | | | | | | | 5,938,290 | |
| | | | | | |
|
|
|
Casino Hotels — 2.1% | | | | | | | | |
Eldorado Casino Corp. (Shreveport)
Sec. Bonds
10.00% due 08/01/12(3)(6) | | | 429,222 | | | | 392,738 | |
Eldorado Resorts LLC
Senior Notes
9.00% due 04/15/14(2)(3) | | | 475,000 | | | | 420,541 | |
Harrah’s Operating Co., Inc.
Senior Sec. Notes
11.25% due 06/01/17 | | | 1,895,000 | | | | 2,027,650 | |
| | | | | | | | |
| | |
| Security Description | | Principal
Amount | | | Value
(Note 2) | |
| |
| | |
Casino Hotels (continued) | | | | | | | | |
MGM Resorts International
Senior Sec. Notes
9.00% due 03/15/20* | | $ | 480,000 | | | $ | 498,000 | |
MGM Resorts International
Senior Sec. Notes
11.13% due 11/15/17 | | | 900,000 | | | | 1,005,750 | |
Wynn Las Vegas LLC/Wynn Las Vegas Capital Corp.
1st Mtg. Notes
7.75% due 08/15/20* | | | 1,165,000 | | | | 1,176,650 | |
| | | | | | |
|
|
|
| | | | | | | | 5,521,329 | |
| | | | | | |
|
|
|
Casino Services — 0.9% | | | | | | | | |
Greektown, Inc. LLC
Escrow Notes
10.75% due 12/01/13†(2)(3) | | | 930,000 | | | | 0 | |
Peninsula Gaming LLC
Senior Sec. Notes
8.38% due 08/15/15 | | | 770,000 | | | | 798,875 | |
Peninsula Gaming LLC
Company Guar. Notes
10.75% due 08/15/17 | | | 460,000 | | | | 483,000 | |
Scientific Games International, Inc.
Company Guar. Notes
9.25% due 06/15/19 | | | 975,000 | | | | 1,033,500 | |
| | | | | | |
|
|
|
| | | | | | | | 2,315,375 | |
| | | | | | |
|
|
|
Cellular Telecom — 1.9% | | | | | | | | |
Cricket Communications, Inc.
Senior Sec. Notes
7.75% due 05/15/16 | | | 750,000 | | | | 774,375 | |
Cricket Communications, Inc.
Company Guar. Notes
10.00% due 07/15/15 | | | 1,705,000 | | | | 1,785,987 | |
Leap Wireless International, Inc.
Senior Notes
4.50% due 07/15/14 | | | 1,246,000 | | | | 1,084,020 | |
MetroPCS Wireless, Inc.
Company Guar. Notes
9.25% due 11/01/14 | | | 904,000 | | | | 940,160 | |
Nextel Communications, Inc.
Senior Notes
7.38% due 08/01/15 | | | 429,000 | | | | 424,710 | |
| | | | | | |
|
|
|
| | | | | | | | 5,009,252 | |
| | | | | | |
|
|
|
Chemicals - Diversified — 0.7% | | | | | | | | |
Lyondell Chemical Co.
Senior Sec. Notes
8.00% due 11/01/17* | | | 215,000 | | | | 230,856 | |
Momentive Performance Materials, Inc.
Company Guar. Notes
9.75% due 12/01/14 | | | 1,180,000 | | | | 1,151,975 | |
Momentive Performance Materials, Inc.
Company Guar. Notes
12.50% due 06/15/14 | | | 403,000 | | | | 448,338 | |
| | | | | | |
|
|
|
| | | | | | | | 1,831,169 | |
| | | | | | |
|
|
|
Chemicals - Plastics — 0.4% | | | | | | | | |
Hexion US Finance Corp.
Sec. Notes
9.75% due 11/15/14 | | | 1,175,000 | | | | 1,154,437 | |
| | | | | | |
|
|
|
Chemicals - Specialty — 0.8% | | | | | | | | |
Ferro Corp.
Senior Notes
7.88% due 08/15/18 | | | 550,000 | | | | 561,000 | |
29
VALIC Company II High Yield Bond Fund
PORTFOLIO OF INVESTMENTS — August 31, 2010 — (continued)
| | | | | | | | |
| | |
| Security Description | | Principal
Amount | | | Value
(Note 2) | |
| |
U.S. CORPORATE BONDS & NOTES (continued) | |
Chemicals - Specialty (continued) | | | | | | | | |
Huntsman International LLC
Senior Sub. Notes
7.38% due 01/01/15 | | $ | 910,000 | | | $ | 887,250 | |
Huntsman International LLC
Company Guar. Notes
7.88% due 11/15/14 | | | 110,000 | | | | 110,825 | |
Tronox Worldwide LLC
Company Guar. Notes
9.50% due 12/01/12†(8)(9) | | | 677,000 | | | | 624,532 | |
| | | | | | |
|
|
|
| | | | | | | | 2,183,607 | |
| | | | | | |
|
|
|
Coal — 1.0% | | | | | | | | |
Drummond Co., Inc.
Senior Notes
9.00% due 10/15/14* | | | 255,000 | | | | 266,794 | |
Peabody Energy Corp.
Company Guar. Notes
6.50% due 09/15/20 | | | 2,321,000 | | | | 2,439,951 | |
| | | | | | |
|
|
|
| | | | | | | | 2,706,745 | |
| | | | | | |
|
|
|
Computer Services — 2.2% | | | | | | | | |
Stream Global Services, Inc.
Senior Sec. Notes
11.25% due 10/01/14 | | | 649,000 | | | | 642,510 | |
SunGard Data Systems, Inc.
Company Guar. Notes
9.13% due 08/15/13 | | | 490,000 | | | | 500,412 | |
SunGard Data Systems, Inc.
Company Guar. Notes
10.25% due 08/15/15 | | | 1,030,000 | | | | 1,081,500 | �� |
SunGard Data Systems, Inc.
Company Guar. Notes
10.63% due 05/15/15 | | | 175,000 | | | | 193,375 | |
Unisys Corp.
Senior Sec. Notes
12.75% due 10/15/14* | | | 1,850,000 | | | | 2,155,250 | |
Unisys Corp.
Senior Sec. Notes
14.25% due 09/15/15* | | | 1,045,000 | | | | 1,222,650 | |
| | | | | | |
|
|
|
| | | | | | | | 5,795,697 | |
| | | | | | |
|
|
|
Consumer Products - Misc. — 0.3% | | | | | | | | |
Yankee Acquisition Corp.
Company Guar. Notes
9.75% due 02/15/17 | | | 715,000 | | | | 729,300 | |
| | | | | | |
|
|
|
Containers - Metal/Glass — 0.2% | | | | | | | | |
Ball Corp.
Company Guar. Notes
7.13% due 09/01/16 | | | 125,000 | | | | 134,063 | |
Ball Corp.
Company Guar. Notes
7.38% due 09/01/19 | | | 185,000 | | | | 198,412 | |
Crown Cork & Seal Co., Inc.
Debentures
7.38% due 12/15/26 | | | 275,000 | | | | 259,875 | |
| | | | | | |
|
|
|
| | | | | | | | 592,350 | |
| | | | | | |
|
|
|
Containers - Paper/Plastic — 0.2% | | | | | | | | |
Graphic Packaging International, Inc.
Company Guar. Notes
9.50% due 06/15/17 | | | 600,000 | | | | 639,000 | |
| | | | | | |
|
|
|
| | | | | | | | |
| | |
| Security Description | | Principal
Amount | | | Value
(Note 2) | |
| |
| | |
Data Processing/Management — 1.6% | | | | | | | | |
Fidelity National Information Services, Inc.
Company Guar. Notes
7.63% due 07/15/17* | | $ | 220,000 | | | $ | 229,350 | |
Fidelity National Information Services, Inc.
Company Guar. Notes
7.88% due 07/15/20* | | | 180,000 | | | | 189,000 | |
First Data Corp.
Company Guar. Notes
9.88% due 09/24/15 | | | 2,335,000 | | | | 1,774,600 | |
First Data Corp.
Company Guar. Notes
10.55% due 09/24/15(6) | | | 2,634,316 | | | | 1,982,323 | |
| | | | | | |
|
|
|
| | | | | | | | 4,175,273 | |
| | | | | | |
|
|
|
Diagnostic Kits — 0.7% | | | | | | | | |
Alere, Inc.
Senior Notes
7.88% due 02/01/16 | | | 1,735,000 | | | | 1,700,300 | |
| | | | | | |
|
|
|
Direct Marketing — 0.7% | | | | | | | | |
Sitel LLC/Sitel Finance Corp.
Senior Notes
11.50% due 04/01/18* | | | 2,350,000 | | | | 1,762,500 | |
| | | | | | |
|
|
|
Diversified Banking Institutions — 3.6% | | | | | | | | |
Citigroup, Inc.
Senior Sub. Notes
5.88% due 02/22/33 | | | 1,005,000 | | | | 950,081 | |
GMAC LLC
Company Guar. Notes
6.88% due 09/15/11 | | | 2,703,000 | | | | 2,750,303 | |
GMAC LLC
Company Guar. Notes
7.50% due 09/15/20* | | | 985,000 | | | | 975,150 | |
GMAC LLC
Sub. Notes
8.00% due 12/31/18 | | | 1,475,000 | | | | 1,421,531 | |
GMAC LLC
Company Guar. Notes
8.00% due 03/15/20* | | | 1,385,000 | | | | 1,419,625 | |
GMAC LLC
Company Guar. Notes
8.00% due 11/01/31 | | | 1,860,000 | | | | 1,832,100 | |
| | | | | | |
|
|
|
| | | | | | | | 9,348,790 | |
| | | | | | |
|
|
|
Diversified Financial Services — 1.5% | | | | | | | | |
CIT Group Funding Co. of Delaware LLC
Senior Sec. Notes
10.25% due 05/01/13 | | | 80,084 | | | | 82,787 | |
CIT Group Funding Co. of Delaware LLC
Senior Sec. Notes
10.25% due 05/01/14 | | | 120,126 | | | | 124,481 | |
CIT Group Funding Co. of Delaware LLC
Senior Sec. Notes
10.25% due 05/01/15 | | | 120,126 | | | | 124,180 | |
CIT Group Funding Co. of Delaware LLC
Senior Sec. Notes
10.25% due 05/01/16 | | | 200,211 | | | | 206,968 | |
CIT Group Funding Co. of Delaware LLC
Senior Sec. Notes
10.25% due 05/01/17 | | | 280,296 | | | | 289,756 | |
Citigroup Capital XXI
Company Guar. Bonds
8.30% due 12/21/57(4) | | | 2,975,000 | | | | 3,086,562 | |
| | | | | | |
|
|
|
| | | | | | | | 3,914,734 | |
| | | | | | |
|
|
|
30
VALIC Company II High Yield Bond Fund
PORTFOLIO OF INVESTMENTS — August 31, 2010 — (continued)
| | | | | | | | |
| | |
| Security Description | | Principal
Amount | | | Value
(Note 2) | |
| |
U.S. CORPORATE BONDS & NOTES (continued) | |
Diversified Manufacturing Operations — 1.2% | | | | | | | | |
Harland Clarke Holdings Corp.
Notes
6.00% due 05/15/15(4) | | $ | 400,000 | | | $ | 336,000 | |
Harland Clarke Holdings Corp.
Notes
9.50% due 05/15/15 | | | 2,590,000 | | | | 2,466,975 | |
SPX Corp.
Senior Notes
7.63% due 12/15/14 | | | 400,000 | | | | 431,000 | |
| | | | | | |
|
|
|
| | | | | | | | 3,233,975 | |
| | | | | | |
|
|
|
Diversified Operations — 0.1% | | | | | | | | |
Reynolds Group DL Escrow, Inc./Reynolds Group Escrow LLC
Senior Sec. Notes
7.75% due 10/15/16* | | | 230,000 | | | | 231,725 | |
| | | | | | |
|
|
|
Diversified Operations/Commercial Services — 0.6% | | | | | | | | |
ARAMARK Corp.
Company Guar. Notes
8.50% due 02/01/15 | | | 1,600,000 | | | | 1,650,000 | |
| | | | | | |
|
|
|
E-Commerce/Services — 0.6% | | | | | | | | |
NetFlix, Inc.
Company Guar. Notes
8.50% due 11/15/17 | | | 235,000 | | | | 256,150 | |
Open Solutions, Inc.
Company Guar. Notes
9.75% due 02/01/15* | | | 1,715,000 | | | | 1,303,400 | |
| | | | | | |
|
|
|
| | | | | | | | 1,559,550 | |
| | | | | | |
|
|
|
Electric - Generation — 1.5% | | | | | | | | |
Edison Mission Energy
Senior Notes
7.63% due 05/15/27 | | | 630,000 | | | | 398,475 | |
Homer City Funding LLC
Senior Notes
8.14% due 10/01/19 | | | 359,100 | | | | 328,576 | |
Midwest Generation LLC
Pass Thru Certs., Series B
8.56% due 01/02/16 | | | 329,738 | | | | 321,495 | |
Reliant Energy Mid-Atlantic Power Holdings LLC
Pass Through Certs., Series B
9.24% due 07/02/17 | | | 509,991 | | | | 530,391 | |
Reliant Energy Mid-Atlantic Power Holdings LLC
Pass Through Certs., Series C
9.68% due 07/02/26 | | | 450,000 | | | | 469,125 | |
The AES Corp.
Senior Notes
8.00% due 10/15/17 | | | 1,175,000 | | | | 1,236,687 | |
The AES Corp.
Senior Notes
8.00% due 06/01/20 | | | 450,000 | | | | 472,500 | |
The AES Corp.
Senior Sec. Notes
8.75% due 05/15/13* | | | 214,000 | | | | 217,478 | |
| | | | | | |
|
|
|
| | | | | | | | 3,974,727 | |
| | | | | | |
|
|
|
Electric - Integrated — 1.4% | | | | | | | | |
Mirant Americas Generation LLC
Senior Notes
8.30% due 05/01/11 | | | 550,000 | | | | 562,375 | |
Mirant Americas Generation LLC
Senior Notes
8.50% due 10/01/21 | | | 1,100,000 | | | | 992,750 | |
| | | | | | | | |
| | |
| Security Description | | Principal
Amount | | | Value
(Note 2) | |
| |
| | |
Electric - Integrated (continued) | | | | | | | | |
Mirant Mid-Atlantic LLC
Pass Through Certs., Series B
9.13% due 06/30/17 | | $ | 328,292 | | | $ | 340,603 | |
Southern Energy, Inc.
Escrow Notes
7.90% due 07/15/09†(2)(3) | | | 1,225,000 | | | | 0 | |
Texas Competitive Electric Holdings Co. LLC
Company Guar. Notes
Series A
10.25% due 11/01/15 | | | 2,060,000 | | | | 1,313,250 | |
Texas Competitive Electric Holdings Co. LLC
Company Guar. Notes
Series B
10.25% due 11/01/15 | | | 110,000 | | | | 70,125 | |
TXU Corp.
Senior Notes
5.55% due 11/15/14 | | | 803,000 | | | | 403,507 | |
| | | | | | |
|
|
|
| | | | | | | | 3,682,610 | |
| | | | | | |
|
|
|
Electronic Components - Semiconductors — 1.2% | | | | | | | | |
Freescale Semiconductor, Inc.
Company Guar. Notes
8.88% due 12/15/14 | | | 2,760,000 | | | | 2,559,900 | |
Freescale Semiconductor, Inc.
Senior Sec. Notes
9.25% due 04/15/18* | | | 565,000 | | | | 566,412 | |
| | | | | | |
|
|
|
| | | | | | | | 3,126,312 | |
| | | | | | |
|
|
|
Enterprise Software/Service — 0.2% | | | | | | | | |
Mantech International Corp.
Company Guar. Notes
7.25% due 04/15/18 | | | 545,000 | | | | 555,900 | |
| | | | | | |
|
|
|
Finance - Auto Loans — 2.3% | | | | | | | | |
Credit Acceptance Corp.
Company Guar. Notes
9.13% due 02/01/17* | | | 1,060,000 | | | | 1,097,100 | |
Ford Motor Credit Co., LLC
Senior Notes
8.13% due 01/15/20 | | | 1,735,000 | | | | 1,897,660 | |
Ford Motor Credit Co., LLC
Senior Notes
8.70% due 10/01/14 | | | 2,725,000 | | | | 2,975,356 | |
| | | | | | |
|
|
|
| | | | | | | | 5,970,116 | |
| | | | | | |
|
|
|
Finance - Consumer Loans — 0.3% | | | | | | | | |
TMX Finance LLC/TitleMax Finance Corp.
Senior Sec. Notes
13.25% due 07/15/15* | | | 825,000 | | | | 866,250 | |
| | | | | | |
|
|
|
Firearms & Ammunition — 0.1% | | | | | | | | |
Freedom Group, Inc.
Senior Sec. Notes
10.25% due 08/01/15* | | | 325,000 | | | | 338,813 | |
| | | | | | |
|
|
|
Food - Meat Products — 0.8% | | | | | | | | |
Smithfield Foods, Inc.
Senior Notes
7.75% due 07/01/17 | | | 1,290,000 | | | | 1,254,525 | |
Smithfield Foods, Inc.
Senior Sec. Notes
10.00% due 07/15/14* | | | 625,000 | | | | 697,656 | |
| | | | | | |
|
|
|
| | | | | | | | 1,952,181 | |
| | | | | | |
|
|
|
Food - Retail — 0.1% | | | | | | | | |
SUPERVALU, Inc.
Senior Notes
8.00% due 05/01/16 | | | 275,000 | | | | 275,688 | |
| | | | | | |
|
|
|
31
VALIC Company II High Yield Bond Fund
PORTFOLIO OF INVESTMENTS — August 31, 2010 — (continued)
| | | | | | | | |
| | |
| Security Description | | Principal
Amount | | | Value
(Note 2) | |
| |
U.S. CORPORATE BONDS & NOTES (continued) | |
Funeral Services & Related Items — 0.3% | | | | | | | | |
Stonemor Operating LLC/Cornerstone
Family Services/Osiris Holdings
Company Guar. Notes
10.25% due 12/01/17* | | $ | 845,000 | | | $ | 889,363 | |
| | | | | | |
|
|
|
Hazardous Waste Disposal — 0.1% | | | | | | | | |
Clean Harbors, Inc.
Senior Sec. Notes
7.63% due 08/15/16 | | | 280,000 | | | | 287,000 | |
| | | | | | |
|
|
|
Independent Power Producers — 1.7% | | | | | | | | |
Calpine Corp.
Escrow Notes
8.75% due 07/15/13†(2)(3) | | | 3,278,000 | | | | 0 | |
Dynegy-Roseton / Danskammer
Pass Through Certs., Series B
7.67% due 11/08/16 | | | 2,085,000 | | | | 1,897,350 | |
NRG Energy, Inc.
Company Guar. Notes
7.38% due 02/01/16 | | | 1,440,000 | | | | 1,450,800 | |
NRG Energy, Inc.
Company Guar. Notes
7.38% due 01/15/17 | | | 550,000 | | | | 554,125 | |
RRI Energy, Inc.
Senior Notes
7.88% due 12/31/17 | | | 690,000 | | | | 636,525 | |
| | | | | | |
|
|
|
| | | | | | | | 4,538,800 | |
| | | | | | |
|
|
|
Insurance - Multi-line — 0.5% | | | | | | | | |
Hartford Financial Services Group, Inc.
Jr. Sub. Notes
8.13% due 06/15/38(4) | | | 1,465,000 | | | | 1,421,050 | |
| | | | | | |
|
|
|
Investment Companies — 0.3% | | | | | | | | |
Fox Acquisition Sub LLC
Senior Notes
13.38% due 07/15/16* | | | 775,000 | | | | 791,469 | |
| | | | | | |
|
|
|
Machinery - Farming — 0.8% | | | | | | | | |
Case New Holland, Inc.
Company Guar. Notes
7.75% due 09/01/13 | | | 1,175,000 | | | | 1,233,750 | |
Case New Holland, Inc.
Senior Notes
7.88% due 12/01/17* | | | 705,000 | | | | 742,012 | |
| | | | | | |
|
|
|
| | | | | | | | 1,975,762 | |
| | | | | | |
|
|
|
Machinery - General Industrial — 0.6% | | | | | | | | |
CPM Holdings, Inc.
Senior Sec. Notes
10.63% due 09/01/14* | | | 1,390,000 | | | | 1,501,200 | |
| | | | | | |
|
|
|
Medical Information Systems — 0.7% | | | | | | | | |
IMS Health, Inc.
Senior Notes
12.50% due 03/01/18* | | | 1,645,000 | | | | 1,906,144 | |
| | | | | | |
|
|
|
Medical Labs & Testing Services — 0.5% | | | | | | | | |
American Renal Holdings
Senior Sec. Notes
8.38% due 05/15/18* | | | 1,270,000 | | | | 1,270,000 | |
| | | | | | |
|
|
|
Medical Products — 0.9% | | | | | | | | |
DJO Finance LLC/DJO Finance Corp.
Company Guar. Notes
10.88% due 11/15/14 | | | 400,000 | | | | 428,500 | |
LVB Acquisition Holding LLC
Company Guar. Notes
10.00% due 10/15/17 | | | 1,133,000 | | | | 1,229,305 | |
| | | | | | | | |
| | |
| Security Description | | Principal
Amount | | | Value
(Note 2) | |
| |
| | |
Medical Products (continued) | | | | | | | | |
LVB Acquisition Holding LLC
Company Guar. Notes
10.38% due 10/15/17(11) | | $ | 636,000 | | | $ | 691,650 | |
| | | | | | |
|
|
|
| | | | | | | | 2,349,455 | |
| | | | | | |
|
|
|
Medical - Drugs — 0.3% | | | | | | | | |
Axcan Intermediate Holdings, Inc.
Senior Notes
9.25% due 03/01/15 | | | 825,000 | | | | 847,688 | |
| | | | | | |
|
|
|
Medical - Hospitals — 4.0% | | | | | | | | |
Community Health Systems, Inc.
Company Guar. Notes
8.88% due 07/15/15 | | | 1,800,000 | | | | 1,867,500 | |
HCA, Inc.
Senior Notes
6.25% due 02/15/13 | | | 900,000 | | | | 900,000 | |
HCA, Inc.
Senior Notes
7.88% due 02/01/11 | | | 725,000 | | | | 735,875 | |
HCA, Inc.
Senior Sec. Notes
7.88% due 02/15/20 | | | 2,370,000 | | | | 2,553,675 | |
HCA, Inc.
Senior Sec. Notes
8.50% due 04/15/19 | | | 750,000 | | | | 822,188 | |
HCA, Inc.
Senior Notes
8.75% due 09/01/10 | | | 360,000 | | | | 360,000 | |
HCA, Inc.
Sec. Notes
9.25% due 11/15/16 | | | 1,189,000 | | | | 1,275,202 | |
Tenet Healthcare Corp.
Senior Sec. Notes
9.00% due 05/01/15 | | | 1,720,000 | | | | 1,831,800 | |
| | | | | | |
|
|
|
| | | | | | | | 10,346,240 | |
| | | | | | |
|
|
|
Medical - Outpatient/Home Medical — 0.5% | | | | | | | | |
Radiation Therapy Services, Inc.
Senior Sub. Notes
9.88% due 04/15/17* | | | 1,290,000 | | | | 1,264,200 | |
| | | | | | |
|
|
|
Multimedia — 0.0% | | | | | | | | |
Haights Cross Operating Co.
Bonds
16.00% due 03/15/14†(2)(3)(4) | | | 100,864 | | | | 97,838 | |
| | | | | | |
|
|
|
Non-Ferrous Metals — 0.0% | | | | | | | | |
Renco Metals, Inc.
Bonds
11.50% due 07/01/03†(2)(3)(10)(12) | | | 210,000 | | | | 0 | |
| | | | | | |
|
|
|
Office Supplies & Forms — 0.3% | | | | | | | | |
ACCO Brands Corp.
Senior Sec. Notes
10.63% due 03/15/15 | | | 625,000 | | | | 687,500 | |
| | | | | | |
|
|
|
Oil & Gas Drilling — 0.2% | | | | | | | | |
Pride International, Inc.
Senior Notes
6.88% due 08/15/20 | | | 385,000 | | | | 403,769 | |
| | | | | | |
|
|
|
Oil Companies - Exploration & Production — 1.5% | | | | | | | | |
Anadarko Petroleum Corp.
Senior Notes
6.38% due 09/15/17 | | | 805,000 | | | | 796,547 | |
32
VALIC Company II High Yield Bond Fund
PORTFOLIO OF INVESTMENTS — August 31, 2010 — (continued)
| | | | | | | | |
| | |
| Security Description | | Principal
Amount | | | Value
(Note 2) | |
| |
U.S. CORPORATE BONDS & NOTES (continued) | |
Oil Companies - Exploration & Production (continued) | | | | | | | | |
Antero Resources Finance Corp.
Company Guar.
9.38% due 12/01/17 | | $ | 825,000 | | | $ | 851,812 | |
Chesapeake Energy Corp.
Senior Notes
9.50% due 02/15/15 | | | 425,000 | | | | 478,125 | |
EXCO Resources, Inc.
Company Guar. Notes
7.25% due 01/15/11 | | | 845,000 | | | | 846,056 | |
Petroleum Development Corp.
Senior Notes
12.00% due 02/15/18 | | | 120,000 | | | | 129,000 | |
Quicksilver Resources, Inc.
Company Guar. Notes
7.13% due 04/01/16 | | | 200,000 | | | | 192,000 | |
Rosetta Resources, Inc.
Company Guar. Notes
9.50% due 04/15/18* | | | 545,000 | | | | 555,900 | |
| | | | | | |
|
|
|
| | | | | | | | 3,849,440 | |
| | | | | | |
|
|
|
Oil Field Machinery & Equipment — 0.6% | | | | | | | | |
Complete Production Services, Inc.
Company Guar. Notes
8.00% due 12/15/16 | | | 40,000 | | | | 40,500 | |
Thermon Industries, Inc.
Senior Sec. Notes
9.50% due 05/01/17* | | | 1,520,000 | | | | 1,573,200 | |
| | | | | | |
|
|
|
| | | | | | | | 1,613,700 | |
| | | | | | |
|
|
|
Oil - Field Services — 1.0% | | | | | | | | |
Aquilex Holdings LLC/Aquilex
Finance Corp.
Senior Notes 11.13% due 12/15/16* | | | 855,000 | | | | 845,381 | |
Basic Energy Services, Inc.
Senior Sec. Notes
11.63% due 08/01/14 | | | 925,000 | | | | 1,008,250 | |
Hornbeck Offshore Services, Inc.
Company Guar. Notes
8.00% due 09/01/17 | | | 830,000 | | | | 780,200 | |
| | | | | | |
|
|
|
| | | | | | | | 2,633,831 | |
| | | | | | |
|
|
|
Paper & Related Products — 1.1% | | | | | | | | |
Caraustar Industries, Inc.
Senior Sec. Notes
10.00% due 08/15/14(2)(3)(11) | | | 180,739 | | | | 177,124 | |
Georgia-Pacific LLC
Company Guar. Notes
7.00% due 01/15/15* | | | 163,000 | | | | 168,705 | |
Georgia-Pacific LLC
Company Guar. Notes
7.13% due 01/15/17* | | | 205,000 | | | | 216,275 | |
Georgia-Pacific LLC
Company Guar. Notes
8.25% due 05/01/16* | | | 550,000 | | | | 602,250 | |
Neenah Paper, Inc.
Senior Notes
7.38% due 11/15/14 | | | 1,325,000 | | | | 1,325,000 | |
NewPage Corp.
Senior Sec. Notes
11.38% due 12/31/14 | | | 505,000 | | | | 410,313 | |
| | | | | | |
|
|
|
| | | | | | | | 2,899,667 | |
| | | | | | |
|
|
|
| | | | | | | | |
| | |
| Security Description | | Principal
Amount | | | Value
(Note 2) | |
| |
| | |
Pharmacy Services — 0.5% | | | | | | | | |
BioScrip, Inc.
Company Guar. Notes
10.25% due 10/01/15 | | $ | 1,240,000 | | | $ | 1,253,950 | |
| | | | | | |
|
|
|
Pipelines — 1.5% | | | | | | | | |
El Paso Corp.
Senior Sub. Notes
6.88% due 06/15/14 | | | 775,000 | | | | 820,045 | |
El Paso Corp.
Senior Notes
7.00% due 06/15/17 | | | 1,590,000 | | | | 1,679,245 | |
MarkWest Energy Partners LP / MarkWest Energy
Finance Corp.
Senior Notes
6.88% due 11/01/14 | | | 600,000 | | | | 606,000 | |
MarkWest Energy Partners LP / MarkWest Energy
Finance Corp.
Company Guar. Notes
8.50% due 07/15/16 | | | 305,000 | | | | 318,725 | |
The Williams Cos., Inc.
Senior Notes
7.88% due 09/01/21 | | | 370,000 | | | | 449,346 | |
| | | | | | |
|
|
|
| | | | | | | | 3,873,361 | |
| | | | | | |
|
|
|
Printing - Commercial — 0.3% | | | | | | | | |
Cenveo Corp.
Company Guar. Notes
7.88% due 12/01/13 | | | 755,000 | | | | 719,138 | |
| | | | | | |
|
|
|
Publishing - Periodicals — 1.1% | | | | | | | | |
Nielsen Finance LLC/Nielsen Finance Co.
Company Guar. Notes
11.50% due 05/01/16(1) | | | 525,000 | | | | 588,656 | |
Nielsen Finance LLC/Nielsen Finance Co.
Company Guar. Bonds
12.50% due 08/01/16 | | | 2,315,000 | | | | 2,294,744 | |
| | | | | | |
|
|
|
| | | | | | | | 2,883,400 | |
| | | | | | |
|
|
|
Real Estate Investment Trusts — 0.4% | | | | | | | | |
DuPont Fabros Technology LP
Company Guar.
8.50% due 12/15/17 | | | 1,100,000 | | | | 1,163,250 | |
| | | | | | |
|
|
|
Recycling — 0.0% | | | | | | | | |
Aleris International, Inc.
Company Guar. Notes
9.00% due 12/15/14†(8)(9)(11) | | | 2,565,000 | | | | 5,130 | |
| | | | | | |
|
|
|
Rental Auto/Equipment — 0.2% | | | | | | | | |
RSC Equipment Rental, Inc./RSC Holdings III LLC
Senior Sec. Notes
10.00% due 07/15/17* | | | 550,000 | | | | 598,125 | |
| | | | | | |
|
|
|
Retail - Apparel/Shoe — 0.4% | | | | | | | | |
Limited Brands, Inc.
Senior Notes
5.25% due 11/01/14 | | | 183,000 | | | | 184,373 | |
Limited Brands, Inc.
Senior Notes
6.95% due 03/01/33 | | | 651,000 | | | | 587,527 | |
Limited Brands, Inc.
Company Guar. Notes
8.50% due 06/15/19 | | | 275,000 | | | | 310,750 | |
| | | | | | |
|
|
|
| | | | | | | | 1,082,650 | |
| | | | | | |
|
|
|
33
VALIC Company II High Yield Bond Fund
PORTFOLIO OF INVESTMENTS — August 31, 2010 — (continued)
| | | | | | | | |
| | |
| Security Description | | Principal
Amount | | | Value
(Note 2) | |
| |
U.S. CORPORATE BONDS & NOTES (continued) | | | | | | | | |
Retail - Arts & Crafts — 0.5% | | | | | | | | |
Michaels Stores, Inc.
Company Guar. Notes
11.38% due 11/01/16 | | $ | 1,235,000 | | | $ | 1,324,537 | |
| | | | | | |
|
|
|
Retail - Drug Store — 0.9% | | | | | | | | |
Rite Aid Corp.
Senior Sec. Notes
9.75% due 06/12/16 | | | 150,000 | | | | 159,375 | |
Rite Aid Corp.
Senior Sec. Notes
10.25% due 10/15/19 | | | 725,000 | | | | 744,938 | |
Rite Aid Corp.
Senior Sec. Notes
10.38% due 07/15/16 | | | 1,475,000 | | | | 1,524,781 | |
| | | | | | |
|
|
|
| | | | | | | | 2,429,094 | |
| | | | | | |
|
|
|
Retail - Music Store — 0.0% | | | | | | | | |
MTS, Inc.
Senior Notes
10.00% due 03/15/09†(2)(3)(8)(9) | | | 15,273 | | | | 153 | |
| | | | | | |
|
|
|
Retail - Regional Department Stores — 1.8% | | | | | | | | |
Macy’s Retail Holdings, Inc.
Company Guar. Notes
5.90% due 12/01/16 | | | 2,522,000 | | | | 2,597,660 | |
Macy’s Retail Holdings, Inc.
Company Guar. Notes
6.38% due 03/15/37 | | | 329,000 | | | | 319,130 | |
Macy’s Retail Holdings, Inc.
Company Guar. Notes
6.65% due 07/15/24 | | | 308,000 | | | | 307,230 | |
Macy’s Retail Holdings, Inc.
Company Guar. Notes
6.90% due 04/01/29 | | | 314,000 | | | | 312,430 | |
The Neiman-Marcus Group, Inc.
Company Guar. Notes
9.75% due 10/15/15(11) | | | 1,205,000 | | | | 1,220,062 | |
| | | | | | |
|
|
|
| | | | | | | | 4,756,512 | |
| | | | | | |
|
|
|
Rubber - Tires — 0.6% | | | | | | | | |
The Goodyear Tire & Rubber Co.
Senior Notes
9.00% due 07/01/15 | | | 500,000 | | | | 523,750 | |
The Goodyear Tire & Rubber Co.
Senior Notes
10.50% due 05/15/16 | | | 825,000 | | | | 915,750 | |
| | | | | | |
|
|
|
| | | | | | | | 1,439,500 | |
| | | | | | |
|
|
|
Rubber/Plastic Products — 0.0% | | | | | | | | |
Venture Holdings Co. LLC
Company Guar. Notes
11.00% due 06/01/07†(2)(3)(10)(12) | | | 50,000 | | | | 0 | |
| | | | | | |
|
|
|
Special Purpose Entity — 0.2% | | | | | | | | |
UCI Holdco, Inc.
Senior Notes
8.54% due 12/15/13(6) | | | 455,350 | | | | 446,243 | |
| | | | | | |
|
|
|
Steel Pipe & Tube — 0.3% | | | | | | | | |
Mueller Water Products, Inc.
Company Guar. Notes
8.75% due 09/01/20* | | | 765,000 | | | | 768,825 | |
| | | | | | |
|
|
|
Storage/Warehousing — 0.5% | | | | | | | | |
Mobile Mini, Inc.
Notes
6.88% due 05/01/15 | | | 535,000 | | | | 509,587 | |
| | | | | | | | |
| | |
| Security Description | | Principal
Amount | | | Value
(Note 2) | |
| |
| | | | | | | | | |
Storage/Warehousing (continued) | | | | | | | | |
Mobile Mini, Inc.
Company Guar. Notes
9.75% due 08/01/14 | | $ | 660,000 | | | $ | 683,925 | |
| | | | | | |
|
|
|
| | | | | | | | 1,193,512 | |
| | | | | | |
|
|
|
Telecom Services — 1.1% | | | | | | | | |
GCI, Inc.
Senior Notes
7.25% due 02/15/14 | | | 460,000 | | | | 466,900 | |
Qwest Corp.
Senior Notes
8.38% due 05/01/16 | | | 425,000 | | | | 495,125 | |
West Corp.
Company Guar. Notes
9.50% due 10/15/14 | | | 1,975,000 | | | | 2,014,500 | |
| | | | | | |
|
|
|
| | | | | | | | 2,976,525 | |
| | | | | | |
|
|
|
Telecommunication Equipment — 0.4% | | | | | | | | |
Sorenson Communications, Inc.
Senior Sec. Notes
10.50% due 02/01/15* | | | 1,920,000 | | | | 916,800 | |
| | | | | | |
|
|
|
Telephone - Integrated — 2.6% | | | | | | | | |
Cincinnati Bell, Inc.
Company Guar. Notes
8.75% due 03/15/18 | | | 2,185,000 | | | | 2,086,675 | |
Frontier Communications Corp.
Senior Notes
7.13% due 03/15/19 | | | 825,000 | | | | 812,625 | |
Frontier Communications Corp.
Senior Notes
8.13% due 10/01/18 | | | 600,000 | | | | 636,000 | |
Frontier Communications Corp.
Senior Notes
8.25% due 04/15/17 | | | 165,000 | | | | 174,488 | |
Frontier Communications Corp.
Senior Notes
8.50% due 04/15/20 | | | 185,000 | | | | 196,331 | |
Qwest Communications International, Inc.
Company Guar. Notes, Series B
7.50% due 02/15/14 | | | 513,000 | | | | 522,619 | |
Qwest Communications International, Inc.
Company Guar. Notes
8.00% due 10/01/15* | | | 375,000 | | | | 403,125 | |
Sprint Capital Corp.
Company Guar. Notes
8.75% due 03/15/32 | | | 1,293,000 | | | | 1,246,129 | |
Valor Telecommunications Enterprises LLC
Company Guar. Notes
7.75% due 02/15/15 | | | 250,000 | | | | 257,500 | |
Windstream Corp.
Company Guar.
8.13% due 09/01/18* | | | 425,000 | | | | 432,437 | |
| | | | | | |
|
|
|
| | | | | | | | 6,767,929 | |
| | | | | | |
|
|
|
Television — 0.5% | | | | | | | | |
Bonten Media Acquisition Co.
Company Guar. Notes
9.75% due 06/01/15*(11) | | | 144,185 | | | | 83,627 | |
LIN Television Corp.
Company Guar.
Notes
8.38% due 04/15/18* | | | 360,000 | | | | 367,650 | |
Paxson Communications Corp.
Escrow Notes
7.38% due 01/15/13*†(2)(3) | | | 1,738,596 | | | | 8,693 | |
34
VALIC Company II High Yield Bond Fund
PORTFOLIO OF INVESTMENTS — August 31, 2010 — (continued)
| | | | | | | | |
| | |
| Security Description | | Principal
Amount | | | Value
(Note 2) | |
| |
U.S. CORPORATE BONDS & NOTES (continued) | | | | | | | | |
Television (continued) | | | | | | | | |
Sinclair Television Group, Inc.
Senior Sec. Notes
9.25% due 11/01/17* | | $ | 745,000 | | | $ | 767,350 | |
Young Broadcasting, Inc.
Escrow Notes
8.75% due 01/15/14†(2)(3) | | | 385,000 | | | | 4 | |
Young Broadcasting, Inc.
Escrow Notes
10.00% due 03/01/11†(2)(3) | | | 540,000 | | | | 6 | |
| | | | | | |
|
|
|
| | | | | | | | 1,227,330 | |
| | | | | | |
|
|
|
Theaters — 1.5% | | | | | | | | |
AMC Entertainment, Inc.
Senior Sub. Notes
8.00% due 03/01/14 | | | 1,558,000 | | | | 1,542,420 | |
AMC Entertainment, Inc.
Senior Notes
8.75% due 06/01/19 | | | 550,000 | | | | 567,875 | |
Marquee Holdings, Inc.
Senior Disc. Notes
9.51% due 08/15/14(1) | | | 1,795,000 | | | | 1,471,900 | |
Regal Entertainment Group
Company Guar. Notes
9.13% due 08/15/18 | | | 415,000 | | | | 425,375 | |
| | | | | | |
|
|
|
| | | | | | | | 4,007,570 | |
| | | | | | |
|
|
|
Transport - Marine — 0.6% | | | | | | | | |
Marquette Transportation Co./Marquette Transportation
Finance Corp.
Senior Sec. Notes
10.88% due 01/15/17* | | | 1,630,000 | | | | 1,662,600 | |
| | | | | | |
|
|
|
Web Hosting/Design — 1.2% | | | | | | | | |
Equinix, Inc.
Senior Notes
8.13% due 03/01/18 | | | 465,000 | | | | 485,925 | |
Terremark Worldwide, Inc.
Senior Sec. Notes
12.00% due 06/15/17 | | | 2,220,000 | | | | 2,508,600 | |
| | | | | | |
|
|
|
| | | | | | | | 2,994,525 | |
| | | | | | |
|
|
|
Total U.S. CORPORATE BONDS & NOTES | | | | | | | | |
(cost $204,383,960) | | | | | | | 210,907,935 | |
| | | | | | |
|
|
|
FOREIGN CORPORATE BONDS & NOTES — 9.8% | | | | | | | | |
Banks - Commercial — 0.4% | | | | | | | | |
Barclays Bank PLC
Sub. Notes
8.55% due 06/15/11*(4)(5) | | | 1,075,000 | | | | 1,080,375 | |
| | | | | | |
|
|
|
Computers - Memory Devices — 0.6% | | | | | | | | |
Seagate Technology HDD Holdings
Company Guar. Notes
6.80% due 10/01/16 | | | 1,575,000 | | | | 1,598,625 | |
| | | | | | |
|
|
|
Diversified Manufacturing Operations — 1.0% | | | | | | | | |
Bombardier, Inc.
Senior Notes
7.50% due 03/15/18* | | | 535,000 | | | | 569,775 | |
Bombardier, Inc.
Senior Notes
7.75% due 03/15/20* | | | 540,000 | | | | 580,500 | |
Bombardier, Inc.
Senior Notes
8.00% due 11/15/14* | | | 1,410,000 | | | | 1,473,450 | |
| | | | | | |
|
|
|
| | | | | | | | 2,623,725 | |
| | | | | | |
|
|
|
| | | | | | | | |
| | |
| Security Description | | Principal
Amount | | | Value
(Note 2) | |
| |
| | | | | | | | | |
Diversified Minerals — 0.2% | | | | | | | | |
Teck Resources, Ltd.
Senior Sec. Notes
10.75% due 05/15/19 | | $ | 500,000 | | | $ | 621,250 | |
| | | | | | |
|
|
|
Electric - Generation — 0.1% | | | | | | | | |
Intergen NV
Sec. Notes
9.00% due 06/30/17* | | | 160,000 | | | | 164,400 | |
| | | | | | |
|
|
|
Independent Power Producers — 0.0% | | | | | | | | |
AES Drax Energy, Ltd.
Sec. Notes
11.50% due 08/30/10†(3)(8)(13) | | | 475,000 | | | | 0 | |
| | | | | | |
|
|
|
Investment Companies — 0.3% | | | | | | | | |
Offshore Group Investments, Ltd.
Senior Sec. Notes
11.50% due 08/01/15* | | | 805,000 | | | | 802,987 | |
| | | | | | |
|
|
|
Medical - Drugs — 0.6% | | | | | | | | |
Elan Corp. PLC
Company Guar. Notes
8.75% due 10/15/16* | | | 720,000 | | | | 698,400 | |
Elan Corp. PLC
Company Guar. Notes
8.88% due 12/01/13 | | | 760,000 | | | | 765,700 | |
| | | | | | |
|
|
|
| | | | | | | | 1,464,100 | |
| | | | | | |
|
|
|
Metal - Aluminum — 0.4% | | | | | | | | |
Novelis, Inc.
Company Guar. Notes
11.50% due 02/15/15 | | | 955,000 | | | | 1,050,500 | |
| | | | | | |
|
|
|
Metal - Diversified — 0.4% | | | | | | | | |
Vedanta Resources PLC
Senior Notes
9.50% due 07/18/18* | | | 1,000,000 | | | | 1,050,000 | |
| | | | | | |
|
|
|
Multimedia — 0.1% | | | | | | | | |
Quebecor Media, Inc.
Senior Notes
7.75% due 03/15/16 | | | 275,000 | | | | 280,500 | |
| | | | | | |
|
|
|
Oil Field Machinery & Equipment — 0.4% | | | | | | | | |
Sevan Marine ASA
Sec. Notes
12.00% due 08/10/15* | | | 900,000 | | | | 913,500 | |
| | | | | | |
|
|
|
Paper & Related Products — 0.2% | | | | | | | | |
Cascades, Inc.
Company Guar. Notes
7.88% due 01/15/20 | | | 575,000 | | | | 590,813 | |
| | | | | | |
|
|
|
Satellite Telecom — 1.7% | | | | | | | | |
Intelsat Intermediate Holding Co., Ltd.
Company Guar. Bonds
9.50% due 02/01/15(1) | | | 759,000 | | | | 787,463 | |
Intelsat Luxembourg SA
Company Guar. Notes
11.50% due 02/04/17(11) | | | 972,188 | | | | 1,001,353 | |
Intelsat Subsidiary Holding Co., Ltd.
Company Guar. Notes
8.50% due 01/15/13 | | | 910,000 | | | | 921,375 | |
Intelsat Subsidiary Holding Co., Ltd.
Company Guar. Notes
8.88% due 01/15/15 | | | 1,531,000 | | | | 1,580,757 | |
| | | | | | |
|
|
|
| | | | | | | | 4,290,948 | |
| | | | | | |
|
|
|
Special Purpose Entities — 2.3% | | | | | | | | |
Fibria Overseas Finance, Ltd.
Company Guar. Notes
7.50% due 05/04/20* | | | 1,671,000 | | | | 1,725,307 | |
35
VALIC Company II High Yield Bond Fund
PORTFOLIO OF INVESTMENTS — August 31, 2010 — (continued)
| | | | | | | | |
| | |
| Security Description | | Principal
Amount | | | Value
(Note 2) | |
| |
FOREIGN CORPORATE BONDS & NOTES (continued) | | | | | | | | |
Special Purpose Entities (continued) | | | | | | | | |
Hellas Telecommunications Luxembourg II
Sub. Notes
0.00% due 01/15/15*†(4)(8)(9) | | $ | 925,000 | | | $ | 11,563 | |
LBG Capital No.1 PLC
Bank Guar. Notes
7.88% due 11/01/20 | | | 4,470,000 | | | | 4,157,100 | |
| | | | | | |
|
|
|
| | | | | | | | 5,893,970 | |
| | | | | | |
|
|
|
Telecom Services — 0.5% | | | | | | | | |
Wind Acquisition Finance SA
Senior Notes
11.75% due 07/15/17* | | | 1,000,000 | | | | 1,100,000 | |
Wind Acquisition Finance SA
Company Guar. Bonds
12.00% due 12/01/15* | | | 252,000 | | | | 265,860 | |
| | | | | | |
|
|
|
| | | | | | | | 1,365,860 | |
| | | | | | |
|
|
|
Transport - Marine — 0.6% | | | | | | | | |
Navios Maritime Holdings, Inc./ Navios Maritime Finance U.S., Inc.
Notes
8.88% due 11/01/17* | | | 1,600,000 | | | | 1,660,000 | |
| | | | | | |
|
|
|
Transport - Rail — 0.0% | | | | | | | | |
TFM SA de CV
Senior Notes
9.38% due 05/01/12 | | | 43,000 | | | | 44,021 | |
| | | | | | |
|
|
|
Total Foreign Corporate Bonds & Notes
(cost $25,173,371) | | | | | | | 25,495,574 | |
| | | | | | |
|
|
|
LOANS(3)(14)(15) — 3.0% | | | | | | | | |
Auto/Truck Parts & Equipment - Original — 0.5% | | | | | | | | |
Federal Mogul Corp.
Term Loan C
2.21% due 12/27/15 | | | 437,303 | | | | 381,937 | |
Federal Mogul Corp.
Tranche B B0
2.21% due 12/27/15 | | | 102,895 | | | | 89,868 | |
Federal Mogul Corp.
Term Loan B A2
2.22% due 12/27/15 | | | 51,447 | | | | 44,934 | |
Federal Mogul Corp.
Tranche B
2.24% due 12/29/14 | | | 808,238 | | | | 705,910 | |
Federal Mogul Corp.
Term Loan B D6
2.24% due 12/27/15 | | | 20,579 | | | | 17,973 | |
Federal Mogul Corp.
Tranche C F1
2.24% due 12/27/15 | | | 64,309 | | | | 56,167 | |
| | | | | | |
|
|
|
| | | | | | | | 1,296,789 | |
| | | | | | |
|
|
|
Beverages - Non-alcoholic — 0.1% | | | | | | | | |
Le-Natures, Inc.
10.25% due 03/01/11†(8)(9) | | | 600,000 | | | | 232,500 | |
| | | | | | |
|
|
|
Building - Residential/Commercial — 0.0% | | | | | | | | |
TOUSA, Inc.
12.25% due 08/15/13 | | | 1,419,838 | | | | 24,847 | |
| | | | | | |
|
|
|
Casino Services — 0.6% | | | | | | | | |
Herbst Gaming, Inc.
Delayed Draw
12.50% due 12/02/11†(8)(9) | | | 718,859 | | | | 403,909 | |
Herbst Gaming, Inc.
Tranche 1
12.50% due 12/02/11†(8)(9) | | | 262,572 | | | | 147,532 | |
| | | | | | | | |
| | |
| Security Description | | Shares/
Principal
Amount | | | Value
(Note 2) | |
| |
| | | | | | | | | |
Casino Services (continued) | | | | | | | | |
Holding Gaming Borrower LP
10.00% due 02/19/13 | | $ | 995,000 | | | $ | 991,269 | |
| | | | | | |
|
|
|
| | | | | | | | 1,542,710 | |
| | | | | | |
|
|
|
Commercial Services — 0.4% | | | | | | | | |
Vertrue, Inc.
7.54% due 08/14/15 | | | 1,215,000 | | | | 984,150 | |
| | | | | | |
|
|
|
Containers - Paper/Plastic — 0.4% | | | | | | | | |
Consolidated Container Company
5.81% due 09/28/14 | | | 1,250,000 | | | | 1,102,084 | |
| | | | | | |
|
|
|
Diversified Financial Services — 0.4% | | | | | | | | |
Wind Finance SL S.A
7.66% due 11/26/14 | | | 1,000,000 | | | | 999,583 | |
| | | | | | |
|
|
|
Electric - Integrated — 0.2% | | | | | | | | |
Texas Competitive Electric Holdings Co. LLC
3.85% due 10/10/14 | | | 672,830 | | | | 509,837 | |
Texas Competitive Electric Holdings Co. LLC
4.03% due 10/22/14 | | | 3,477 | | | | 2,635 | |
| | | | | | |
|
|
|
| | | | | | | | 512,472 | |
| | | | | | |
|
|
|
Medical - Drugs — 0.3% | | | | | | | | |
Triax Pharmaceuticals LLC
16.50% due 08/30/11†(2)(8)(16) | | | 1,088,469 | | | | 678,497 | |
| | | | | | |
|
|
|
Theaters — 0.1% | | | | | | | | |
AMC Entertainment Holdings, Inc.
5.54% due 06/15/12 | | | 375,534 | | | | 369,901 | |
| | | | | | |
|
|
|
Total Loans
(cost $9,900,990) | | | | | | | 7,743,533 | |
| | | | | | |
|
|
|
COMMON STOCK — 0.4% | | | | | | | | |
Banks - Commercial — 0.2% | | | | | | | | |
CIT Group, Inc.† | | | 11,701 | | | | 429,193 | |
| | | | | | |
|
|
|
Building Products-Doors & Windows — 0.0% | | | | | | | | |
Masonite Worldwide Holdings† | | | 754 | | | | 28,652 | |
| | | | | | |
|
|
|
Casino Services — 0.0% | | | | | | | | |
Greektown, Inc.(3) | | | 703 | | | | 0 | |
| | | | | | |
|
|
|
Energy - Alternate Sources — 0.0% | | | | | | | | |
VeraSun Energy Corp.†(2)(3) | | | 65,000 | | | | 0 | |
| | | | | | |
|
|
|
Food - Misc. — 0.1% | | | | | | | | |
Wornick Co.†(2)(3) | | | 3,444 | | | | 210,411 | |
| | | | | | |
|
|
|
Gambling (Non-Hotel) — 0.0% | | | | | | | | |
Shreveport Gaming Holdings, Inc.†(2)(3) | | | 2,501 | | | | 35,527 | |
| | | | | | |
|
|
|
Gas - Distribution — 0.0% | | | | | | | | |
MXEnergy Holdings, Inc.†(2)(3) | | | 96,187 | | | | 89,954 | |
| | | | | | |
|
|
|
Medical - Drugs — 0.0% | | | | | | | | |
Triax Pharmaceuticals LLC†(2)(3)(17) | | | 85,612 | | | | 428 | |
| | | | | | |
|
|
|
Medical - Outpatient/Home Medical — 0.0% | | | | | | | | |
Critical Care Systems International, Inc.†(2)(3) | | | 13,262 | | | | 1,658 | |
| | | | | | |
|
|
|
Multimedia — 0.0% | | | | | | | | |
Haights Cross Communication, Inc.†(2)(3) | | | 10,439 | | | | 28,968 | |
| | | | | | |
|
|
|
Paper & Related Products — 0.1% | | | | | | | | |
Caraustar Industries, Inc.†(2)(3) | | | 80 | | | | 209,997 | |
| | | | | | |
|
|
|
Retail - Music Store — 0.0% | | | | | | | | |
MTS, Inc.†(2)(3) | | | 3,863 | | | | 0 | |
| | | | | | |
|
|
|
Total Common Stock | | | | | | | | |
(cost $2,802,610) | | | | | | | 1,034,788 | |
| | | | | | |
|
|
|
36
VALIC Company II High Yield Bond Fund
PORTFOLIO OF INVESTMENTS — August 31, 2010 — (continued)
| | | | | | | | |
| | |
| Security Description | | Shares/
Principal
Amount | | | Value
(Note 2) | |
| |
PREFERRED STOCK — 0.1% | | | | | | | | |
Auto/Truck Parts & Equipment-Original — 0.1% | | | | | | | | |
Lear Corp. Series A†(3) | | | 4,680 | | | $ | 341,827 | |
| | | | | | |
|
|
|
Medical - Drugs — 0.0% | | | | | | | | |
Triax Pharmaceuticals LLC, Class C(2)(3)(17) | | | 26,118 | | | | 131 | |
| | | | | | |
|
|
|
Total Preferred Stock | | | | | | | | |
(cost $205,950) | | | | | | | 341,958 | |
| | | | | | |
|
|
|
WARRANTS — 0.0% | | | | | | | | |
Auto/Truck Parts & Equipment-Original — 0.0% | | | | | | | | |
Lear Corp.†
Expires 11/09/14 (strike price $.01) | | | 1,164 | | | | 85,112 | |
| | | | | | |
|
|
|
Building Products - Doors & Windows — 0.0% | | | | | | | | |
Masonite Worldwide Holdings†
Expires 06/09/14(3) (strike price $55.31) | | | 3,658 | | | | 10,974 | |
Masonite Worldwide Holdings†
Expires 06/09/16(3) (strike price $55.31) | | | 2,743 | | | | 8,229 | |
| | | | | | |
|
|
|
| | | | | | | | 19,203 | |
| | | | | | |
|
|
|
Oil Companies - Exploration & Production — 0.0% | | | | | | | | |
Transmeridian Exploration, Inc.†
Expires 12/15/10(2)(3) (Strike price $4.31) | | | 13,811 | | | | 0 | |
| | | | | | |
|
|
|
Publishing - Periodicals — 0.0% | | | | | | | | |
The Reader’s Digest Association, Inc.†
Expires 02/19/14(2)(3) | | | 4,508 | | | | 0 | |
| | | | | | |
|
|
|
Total Warrants | | | | | | | | |
(cost $76,972) | | | | | | | 104,315 | |
| | | | | | |
|
|
|
Total Long - Term Investment Securities | | | | | | | | |
(cost $243,594,853) | | | | | | | 247,086,365 | |
| | | | | | |
|
|
|
REPURCHASE AGREEMENT — 2.6% | | | | | | | | |
Agreement with State Street Bank & Trust Co., bearing interest at 0.01%, dated 08/31/10, to be repurchased 09/01/10 in the amount of $6,832,002 and collateralized by $6,890,000 of Federal Home Loan , bearing interest at 4.38% due 09/17/10 and having approximate value of $7,040,202
(cost $6,832,000) | | $ | 6,832,000 | | | | 6,832,000 | |
| | | | | | |
|
|
|
TOTAL INVESTMENTS | | | | | | | | |
(cost $250,426,853)(18) | | | 97.3 | % | | | 253,918,365 | |
Other assets less liabilities | | | 2.7 | | | | 7,131,753 | |
| | |
|
|
| |
|
|
|
NET ASSETS — | | | 100.0 | % | | $ | 261,050,118 | |
| | |
|
|
| |
|
|
|
| * | Securities exempt from registration under Rule 144A of the Securities Act of 1933. These securities may be sold in transactions exempt from registration, normally to qualified institutional buyers. The Fund has no right to demand registration of these securities. At August 31, 2010, the aggregate value of these securities was $55,002,477 representing 21.1% of net assets. Unless otherwise indicated these securities are not considered to be illiquid. |
| † | Non-income producing security |
| (1) | “Step-up” security where the rate increases (“steps-up”) at a predetermined rate. Rate shown reflects the increased rate. |
| (2) | Fair valued security. Securities are classified as Level 3 based on the securities valuation inputs; see Note 2. |
| (3) | Illiquid security. At August 31, 2010, the aggregate value of these securities was $9,778,724 representing 3.7% of net assets. |
| (4) | Floating rate security where the rate fluctuates. The rate moves up or down at each reset date. The rate reflected is as of August 31, 2010. |
| (5) | Perpetual maturity — maturity date reflects the next call date. |
| (6) | PIK (“Payment-in-Kind”) security. Bond or preferred stock that pays interest/dividends in the form of additional bonds or preferred stocks. |
| (7) | “Step-up” security where the rate increases (“steps-up”) at a predetermined rate. The rate reflected is as of August 31, 2010. |
| (9) | Company has filed for Chapter 11 bankruptcy protection. |
| (10) | Bond is in default and did not pay principal at maturity. |
| (11) | Income may be received in cash or additional shares at the discretion of the issuer. |
| (12) | Company has filed for Chapter 7 bankruptcy. |
| (13) | Company has filed bankruptcy in the country of issuance. |
| (14) | The Fund invests in Senior Loans which generally pay interests at rates which are periodically re-determined by reference to a base lending rate plus a premium. These base lending rates are generally either the lending rate offered by one or more major United States banks, or the certificate of deposit rate. Senior Loans are generally considered to be restrictive in that the Fund is ordinarily contractually obligated to receive approval from the Agent Bank and/or borrower prior to the disposition of a Senior Loan. |
| (15) | Senior Loans in the Fund are generally subject to mandatory and/or optional prepayment. Because of these mandatory prepayment conditions and because there may be significant economic incentives for a borrower to prepay, prepayments may occur. As a result, the actual remaining maturity may be substantially less than the stated maturities shown. |
| (16) | A portion of the interest is paid in the form of additional bonds/loans. |
| (17) | Consists of more than one class of securities traded together as a unit. |
| (18) | See Note 5 for cost of investments on a tax basis. |
The following is a summary of the inputs used to value the Fund’s net assets as of August 31, 2010 (see Note 2):
| | | | | | | | | | | | | | | | |
| | | Level 1 - Unadjusted Quoted
Prices
| | | Level 2 - Other Observable
Inputs
| | | Level 3 - Significant
Unobservable Inputs
| | | Total
| |
Long-Term Investment Securities: | | | | | | | | | | | | | | | | |
Convertible Bonds & Notes | | $ | — | | | $ | 1,458,262 | | | $ | — | | | $ | 1,458,262 | |
U.S. Corporate Bonds & Notes | | | — | | | | 209,494,200 | | | | 1,413,735 | | | | 210,907,935 | |
Foreign Corporate Bonds & Notes | | | — | | | | 25,495,574 | | | | 0 | | | | 25,495,574 | |
Loans | | | — | | | | 3,910,928 | | | | 3,832,605 | | | | 7,743,533 | |
Common Stock | | | 457,845 | | | | — | | | | 576,943 | | | | 1,034,788 | |
Preferred Stock | | | 341,827 | | | | — | | | | 131 | | | | 341,958 | |
Warrants | | | 104,315 | | | | — | | | | 0 | | | | 104,315 | |
Repurchase Agreements | | | — | | | | 6,832,000 | | | | — | | | | 6,832,000 | |
| | |
|
|
| |
|
|
| |
|
|
| |
|
|
|
Total | | $ | 903,987 | | | $ | 247,190,964 | | | $ | 5,823,414 | | | $ | 253,918,365 | |
| | |
|
|
| |
|
|
| |
|
|
| |
|
|
|
37
VALIC Company II High Yield Bond Fund
PORTFOLIO OF INVESTMENTS — August 31, 2010 — (continued)
The following is a reconciliation of Level 3 assets which significant unobservable inputs were used to determine fair value:
| | | | | | | | | | | | | | | | | | | | | | | | | | | | |
| | | Convertible
Bonds & Notes
| | | U.S. Corporate
Bonds & Notes
| | | Foreign Corporate
Bonds & Notes
| | | Loans
| | | Common Stock
| | | Preferred Stock
| | | Warrants
| |
Balance as of 8/31/2009 | | $ | 98,350 | | | $ | 3,218,031 | | | $ | — | | | $ | 5,233,524 | | | $ | 348,147 | | | $ | 261 | | | $ | 0 | |
Accrued discounts/premiums | | | — | | | | 1,477 | | | | — | | | | 106,994 | | | | — | | | | — | | | | — | |
Realized gain (loss) | | | (137,690 | ) | | | 322,822 | | | | — | | | | 9,642 | | | | — | | | | — | | | | — | |
Change in unrealized appreciation (depreciation)(1) | | | 182,650 | | | | 43,414 | | | | — | | | | (539,263 | ) | | | (1,007,294 | ) | | | (130 | ) | | | (4,669 | ) |
Net purchases (sales) | | | (143,310 | ) | | | (2,573,449 | ) | | | — | | | | (978,292 | ) | | | 1,236,090 | | | | — | | | | 4,669 | |
Transfers in and/or out of Level 3(2) | | | — | | | | 401,440 | | | | 0 | | | | — | | | | — | | | | — | | | | — | |
| | |
|
|
| |
|
|
| |
|
|
| |
|
|
| |
|
|
| |
|
|
| |
|
|
|
Balance as of 8/31/2010 | | $ | — | | | $ | 1,413,735 | | | $ | 0 | | | $ | 3,832,605 | | | $ | 576,943 | | | $ | 131 | | | $ | 0 | |
| | |
|
|
| |
|
|
| |
|
|
| |
|
|
| |
|
|
| |
|
|
| |
|
|
|
| (1) | The total change in unrealized appreciation (depreciation) included in the statement of operations attributable to level 3 investments still held at August 31, 2010 includes: |
| | | | | | | | | | | | | | | | | | | | | | | | | | | | |
| | | Convertible
Bonds & Notes
| | | U.S. Corporate
Bonds & Notes
| | | Foreign Corporate
Bonds & Notes
| | | Loans
| | | Common Stock
| | | Preferred Stock
| | | Warrants
| |
| | | $ | — | | | $ | 280,298 | | | $ | — | | | $ | (555,349 | ) | | $ | (1,007,294 | ) | | $ | (130 | ) | | $ | (4,669 | ) |
| | |
|
|
| |
|
|
| |
|
|
| |
|
|
| |
|
|
| |
|
|
| |
|
|
|
| (2) | The Fund’s policy is to recognize transfers in and transfers out as of the end of the reporting period. |
See Notes to Financial Statements
38
VALIC Company II International Small Cap Equity Fund
PORTFOLIO PROFILE — August 31, 2010 (Unaudited)
Industry Allocation*
| | | | |
Banks — Commercial | | | 6.9 | % |
Exchange — Traded Funds | | | 4.5 | |
Electronic Components — Misc. | | | 3.6 | |
Diversified Manufacturing Operations | | | 2.5 | |
Machinery — General Industrial | | | 2.4 | |
Auto/Truck Parts & Equipment — Original | | | 2.3 | |
Insurance — Property/Casualty | | | 1.8 | |
Chemicals — Diversified | | | 1.7 | |
Real Estate Operations & Development | | | 1.5 | |
Diversified Operations | | | 1.5 | |
Repurchase Agreements | | | 1.4 | |
Paper & Related Products | | | 1.4 | |
Oil Companies — Exploration & Production | | | 1.4 | |
Transport — Services | | | 1.3 | |
Building & Construction — Misc. | | | 1.3 | |
Distribution/Wholesale | | | 1.2 | |
Electronic Components — Semiconductors | | | 1.2 | |
Airlines | | | 1.2 | |
Medical Products | | | 1.2 | |
Machinery — Electrical | | | 1.2 | |
Building Products — Cement | | | 1.1 | |
Advertising Services | | | 1.1 | |
Building — Heavy Construction | | | 1.0 | |
Chemicals — Specialty | | | 1.0 | |
Audio/Video Products | | | 1.0 | |
Finance — Other Services | | | 1.0 | |
Veterinary Products | | | 0.9 | |
Food — Misc. | | | 0.9 | |
Oil — Field Services | | | 0.9 | |
Television | | | 0.9 | |
Electronics — Military | | | 0.8 | |
Telecom Services | | | 0.8 | |
Food — Retail | | | 0.8 | |
Real Estate Management/Services | | | 0.8 | |
Insurance — Life/Health | | | 0.8 | |
Diagnostic Kits | | | 0.8 | |
Security Services | | | 0.7 | |
Petrochemicals | | | 0.7 | |
Semiconductor Equipment | | | 0.7 | |
Cosmetics & Toiletries | | | 0.7 | |
Auto — Cars/Light Trucks | | | 0.7 | |
Financial Guarantee Insurance | | | 0.7 | |
Internet Content — Information/News | | | 0.7 | |
Retail — Apparel/Shoe | | | 0.7 | |
Auto/Truck Parts & Equipment — Replacement | | | 0.7 | |
Electronic Measurement Instruments | | | 0.6 | |
Beverages — Non-alcoholic | | | 0.6 | |
Computers | | | 0.6 | |
Transport — Marine | | | 0.6 | |
Appliances | | | 0.6 | |
Agricultural Operations | | | 0.6 | |
Investment Companies | | | 0.6 | |
Satellite Telecom | | | 0.6 | |
Insurance — Reinsurance | | | 0.5 | |
Internet Connectivity Services | | | 0.5 | |
Gold Mining | | | 0.5 | |
Engineering/R&D Services | | | 0.5 | |
Cellular Telecom | | | 0.5 | |
Transport — Rail | | | 0.5 | |
Medical — Generic Drugs | | | 0.5 | |
Advanced Materials | | | 0.5 | |
Recreational Vehicles | | | 0.5 | |
Machinery — Material Handling | | | 0.5 | |
Consulting Services | | | 0.5 | |
Building — Maintance & Services | | | 0.5 | |
Building — Residential/Commercial | | | 0.5 | |
Consumer Products — Misc. | | | 0.5 | |
Alternative Waste Technology | | | 0.5 | |
Medical — Drugs | | | 0.5 | |
| | | | |
Commercial Services | | | 0.5 | |
E-Commerce/Services | | | 0.5 | |
Machine Tools & Related Products | | | 0.5 | |
Publishing — Periodicals | | | 0.5 | |
Food — Baking | | | 0.5 | |
Oil Field Machinery & Equipment | | | 0.5 | |
Photo Equipment & Supplies | | | 0.5 | |
Insurance — Multi-line | | | 0.4 | |
Commercial Services — Finance | | | 0.4 | |
Motorcycle/Motor Scooter | | | 0.4 | |
Medical Labs & Testing Services | | | 0.4 | |
Electric Products — Misc. | | | 0.4 | |
Food — Dairy Products | | | 0.4 | |
Pipelines | | | 0.4 | |
Transport — Truck | | | 0.4 | |
Metal — Copper | | | 0.4 | |
Publishing — Newspapers | | | 0.4 | |
Rental Auto/Equipment | | | 0.4 | |
Aerospace/Defense | | | 0.4 | |
Diversified Financial Services | | | 0.4 | |
Gambling (Non — Hotel) | | | 0.4 | |
Computers — Periphery Equipment | | | 0.4 | |
Machinery — Construction & Mining | | | 0.4 | |
Retail — Discount | | | 0.4 | |
Multimedia | | | 0.4 | |
Hotels/Motels | | | 0.4 | |
Electric — Transmission | | | 0.4 | |
Metal — Diversified | | | 0.3 | |
Electric — Integrated | | | 0.3 | |
Athletic Footwear | | | 0.3 | |
Containers — Paper/Plastic | | | 0.3 | |
Extended Service Contracts | | | 0.3 | |
Enterprise Software/Service | | | 0.3 | |
Building Products — Doors & Windows | | | 0.3 | |
Tools — Hand Held | | | 0.3 | |
Internet Infrastructure Software | | | 0.3 | |
Rubber/Plastic Products | | | 0.3 | |
Retail — Restaurants | | | 0.3 | |
Miscellaneous Manufacturing | | | 0.3 | |
Machinery — Print Trade | | | 0.3 | |
Real Estate Investment Trusts | | | 0.3 | |
Optical Supplies | | | 0.3 | |
Retail — Misc./Diversified | | | 0.2 | |
Applications Software | | | 0.2 | |
Finance — Leasing Companies | | | 0.2 | |
Rubber — Tires | | | 0.2 | |
Banks — Money Center | | | 0.2 | |
Apparel Manufacturers | | | 0.2 | |
Computers — Integrated Systems | | | 0.2 | |
Direct Marketing | | | 0.2 | |
Coatings/Paint | | | 0.2 | |
Batteries/Battery Systems | | | 0.2 | |
Transport — Equipment & Leasing | | | 0.2 | |
Power Converter/Supply Equipment | | | 0.2 | |
Wireless Equipment | | | 0.2 | |
Food — Meat Products | | | 0.2 | |
Textile — Products | | | 0.2 | |
Retail — Hypermarkets | | | 0.2 | |
Web Portals/ISP | | | 0.2 | |
Medical Instruments | | | 0.2 | |
Brewery | | | 0.2 | |
Steel — Specialty | | | 0.2 | |
Travel Services | | | 0.2 | |
Building & Construction Products — Misc. | | | 0.2 | |
Coal | | | 0.2 | |
Entertainment Software | | | 0.1 | |
Finance — Credit Card | | | 0.1 | |
Computer Services | | | 0.1 | |
Building Products — Air & Heating | | | 0.1 | |
39
VALIC Company II International Small Cap Equity Fund
PORTFOLIO PROFILE — August 31, 2010 (Unaudited) — (continued)
Industry Allocation* (continued)
| | | | |
Public Thoroughfares | | | 0.1 | % |
Educational Software | | | 0.1 | |
Electronic Connectors | | | 0.1 | |
Retail — Pubs | | | 0.1 | |
Funeral Services & Related Items | | | 0.1 | |
Time Deposits | | | 0.1 | |
Mining Services | | | 0.1 | |
Finance — Investment Banker/Broker | | | 0.1 | |
Tobacco | | | 0.1 | |
Venture Capital | | | 0.1 | |
Beverages — Wine/Spirits | | | 0.1 | |
Retail — Pawn Shops | | | 0.1 | |
Retail — Catalog Shopping | | | 0.1 | |
Metal Processors & Fabrication | | | 0.1 | |
Chemicals — Plastics | | | 0.1 | |
Instruments — Controls | | | 0.1 | |
Schools | | | 0.1 | |
Internet Financial Services | | | 0.1 | |
Steel — Producers | | | 0.1 | |
Water | | | 0.1 | |
Industrial Audio & Video Products | | | 0.1 | |
Retail — Bookstores | | | 0.1 | |
Advertising Agencies | | | 0.1 | |
Platinum | | | 0.1 | |
Industrial Gases | | | 0.1 | |
Internet Content — Entertainment | | | 0.1 | |
Transactional Software | | | 0.1 | |
Energy — Alternate Sources | | | 0.1 | |
Medical Information Systems | | | 0.1 | |
Computer Software | | | 0.1 | |
Investment Management/Advisor Services | | | 0.1 | |
Gas — Distribution | | | 0.1 | |
Capacitors | | | 0.1 | |
Veterinary Diagnostics | | | 0.1 | |
Communications Software | | | 0.1 | |
| | |
|
|
|
| | | | 99.7 | % |
| | |
|
|
|
Country Allocation*
| | | | |
Japan | | | 20.5 | % |
United Kingdom | | | 12.4 | |
France | | | 8.2 | |
United States | | | 4.5 | |
South Korea | | | 4.5 | |
Switzerland | | | 3.8 | |
Cayman Islands | | | 3.2 | |
Ireland | | | 2.9 | |
Spain | | | 2.8 | |
Bermuda | | | 2.6 | |
Netherlands | | | 2.6 | |
Luxembourg | | | 2.3 | |
Australia | | | 2.2 | |
Italy | | | 1.9 | |
Hong Kong | | | 1.9 | |
Austria | | | 1.9 | |
China | | | 1.9 | |
Finland | | | 1.7 | |
Germany | | | 1.6 | |
Taiwan | | | 1.5 | |
Indonesia | | | 1.4 | |
Brazil | | | 1.4 | |
Jersey | | | 1.4 | |
Norway | | | 1.2 | |
Sweden | | | 1.1 | |
Singapore | | | 1.1 | |
Belgium | | | 1.0 | |
Thailand | | | 0.7 | |
Denmark | | | 0.7 | |
India | | | 0.6 | |
Turkey | | | 0.5 | |
Philippines | | | 0.4 | |
Portugal | | | 0.4 | |
Guernsey | | | 0.4 | |
South Africa | | | 0.4 | |
Mexico | | | 0.4 | |
Russia | | | 0.3 | |
Greece | | | 0.2 | |
Chile | | | 0.2 | |
Cyprus | | | 0.2 | |
Panama | | | 0.2 | |
Malaysia | | | 0.1 | |
Czech Republic | | | 0.1 | |
Papua New Guinea | | | 0.1 | |
Mauritius | | | 0.1 | |
Canada | | | 0.1 | |
British Virgin Islands | | | 0.1 | |
| | |
|
|
|
| | | | 99.7 | % |
| | |
|
|
|
| * | Calculated as a percentage of net assets |
40
VALIC Company II International Small Cap Equity Fund
PORTFOLIO OF INVESTMENTS — August 31, 2010
| | | | | | | | |
| | |
| Security Description | | Shares | | | Value
(Note 2) | |
| |
COMMON STOCK — 93.1% | | | | | | | | |
Australia — 2.2% | | | | | | | | |
Bendigo and Adelaide Bank, Ltd. | | | 239,404 | | | $ | 1,795,572 | |
Billabong International, Ltd. | | | 175,275 | | | | 1,178,923 | |
carsales.com.au, Ltd. | | | 255,511 | | | | 1,182,107 | |
Centamin Egypt, Ltd.† | | | 929,886 | | | | 2,538,494 | |
Centennial Coal Co., Ltd. | | | 117,618 | | | | 631,008 | |
Emeco Holdings, Ltd. | | | 2,175,468 | | | | 1,490,346 | |
Mineral Resources, Ltd. | | | 75,000 | | | | 568,518 | |
Premier Investments, Ltd. | | | 160,529 | | | | 935,489 | |
Transfield Services, Ltd. | | | 545,990 | | | | 1,598,175 | |
White Energy Co., Ltd.† | | | 5,415 | | | | 16,621 | |
White Energy Co., Ltd. 2010 Performance Shares(1) | | | 5,863 | | | | 0 | |
White Energy Co., Ltd. 2011 Performance Shares(1) | | | 5,863 | | | | 0 | |
| | | | | | |
|
|
|
| | | | | | | | 11,935,253 | |
| | | | | | |
|
|
|
Austria — 1.9% | | | | | | | | |
Andritz AG | | | 35,800 | | | | 2,177,643 | |
Conwert Immobilien Invest SE | | | 212,219 | | | | 2,456,180 | |
Oesterreichische Post AG | | | 123,186 | | | | 3,184,594 | |
Schoeller - Bleckmann Oilfield Equipment AG | | | 46,720 | | | | 2,454,086 | |
| | | | | | |
|
|
|
| | | | | | | | 10,272,503 | |
| | | | | | |
|
|
|
Belgium — 1.0% | | | | | | | | |
Ackermans & van Haaren NV | | | 32,268 | | | | 2,188,112 | |
Barco NV† | | | 65,209 | | | | 3,002,997 | |
| | | | | | |
|
|
|
| | | | | | | | 5,191,109 | |
| | | | | | |
|
|
|
Bermuda — 2.6% | | | | | | | | |
China Gas Holdings, Ltd. | | | 4,358,000 | | | | 2,218,567 | |
China Yurun Food Group, Ltd. | | | 553,000 | | | | 2,011,879 | |
Digital China Holdings, Ltd.† | | | 822,000 | | | | 1,278,637 | |
Hiscox, Ltd. | | | 100,508 | | | | 565,863 | |
Jardine Matheson Holdings, Ltd. | | | 35,600 | | | | 1,545,040 | |
Kunlun Energy Co., Ltd. | | | 930,000 | | | | 1,152,524 | |
Lancashire Holdings, Ltd. | | | 282,443 | | | | 2,310,956 | |
Midland Holdings, Ltd. | | | 670,000 | | | | 534,019 | |
Omega Insurance Holdings, Ltd. | | | 344,114 | | | | 472,337 | |
Pacific Basin Shipping, Ltd. | | | 935,000 | | | | 635,854 | |
Peace Mark Holdings, Ltd.†(1) | | | 686,000 | | | | 0 | |
Skyworth Digital Holdings, Ltd. | | | 2,322,000 | | | | 1,214,918 | |
Texwinca Holdings, Ltd. | | | 284,000 | | | | 280,760 | |
| | | | | | |
|
|
|
| | | | | | | | 14,221,354 | |
| | | | | | |
|
|
|
Brazil — 1.0% | | | | | | | | |
Aliansce Shopping Centers SA | | | 69,000 | | | | 469,495 | |
Brookfield Incorporacoes SA | | | 90,000 | | | | 464,285 | |
Cia Hering | | | 19,000 | | | | 729,167 | |
EDP - Energias do Brasil SA | | | 26,000 | | | | 555,012 | |
Even Construtora e Incorporadora SA | | | 133,000 | | | | 624,011 | |
Iguatemi Empresa de Shopping Centers SA | | | 25,500 | | | | 490,761 | |
Julio Simoes Logistica SA† | | | 72,000 | | | | 348,470 | |
Localiza Rent a Car SA | | | 33,000 | | | | 460,356 | |
Odontoprev SA | | | 49,000 | | | | 521,458 | |
SEB - Sistema Educacional Brasileiro SA | | | 26,400 | | | | 443,445 | |
Totvs SA | | | 7,600 | | | | 562,562 | |
| | | | | | |
|
|
|
| | | | | | | | 5,669,022 | |
| | | | | | |
|
|
|
British Virgin Islands — 0.1% | | | | | | | | |
Playtech, Ltd. | | | 50,382 | | | | 327,038 | |
| | | | | | |
|
|
|
Canada — 0.1% | | | | | | | | |
C&C Energia, Ltd.† | | | 45,700 | | | | 308,567 | |
Western Coal Corp.† | | | 46,491 | | | | 171,122 | |
| | | | | | |
|
|
|
| | | | | | | | 479,689 | |
| | | | | | |
|
|
|
Cayman Islands — 3.2% | | | | | | | | |
AAC Acoustic Technologies Holdings, Inc. | | | 1,238,000 | | | | 2,259,952 | |
| | | | | | | | |
| | |
| Security Description | | Shares | | | Value
(Note 2) | |
| |
| | | | | | | | | |
Cayman Islands (continued) | | | | | | | | |
Agile Property Holdings, Ltd. | | | 1,388,000 | | | $ | 1,620,188 | |
Charm Communications, Inc. ADR† | | | 49,312 | | | | 401,400 | |
China High Speed Transmission Equipment Group Co., Ltd. | | | 234,000 | | | | 522,223 | |
China Mengniu Dairy Co., Ltd. | | | 521,000 | | | | 1,440,013 | |
Coastal Energy Co.† | | | 29,878 | | | | 114,556 | |
Comba Telecom Systems Holdings, Ltd. | | | 1,042,200 | | | | 1,067,824 | |
Daphne International Holdings, Ltd. | | | 1,842,000 | | | | 1,896,760 | |
E - House China Holdings, Ltd. ADR | | | 9,057 | | | | 145,184 | |
Fufeng Group, Ltd. | | | 1,404,000 | | | | 902,459 | |
HKR International, Ltd. | | | 1,350,400 | | | | 529,483 | |
KWG Property Holding, Ltd. | | | 1,115,000 | | | | 758,264 | |
Lee & Man Paper Manufacturing, Ltd. | | | 1,499,000 | | | | 1,040,604 | |
Li Ning Co., Ltd. | | | 163,750 | | | | 527,326 | |
Mindray Medical International, Ltd. ADR | | | 6,366 | | | | 171,882 | |
NetEase.com, Inc. ADR† | | | 10,900 | | | | 433,057 | |
O - Net Communications Group, Ltd.† | | | 417,000 | | | | 254,636 | |
Shanda Interactive Entertainment, Ltd. ADR† | | | 9,323 | | | | 384,853 | |
Shenguan Holdings Group, Ltd. | | | 1,008,000 | | | | 1,057,404 | |
SINA Corp.† | | | 11,900 | | | | 509,558 | |
SPG Land Holdings, Ltd. | | | 1,518,025 | | | | 657,656 | |
Yingde Gases Group Co., Ltd.† | | | 417,500 | | | | 391,805 | |
| | | | | | |
|
|
|
| | | | | | | | 17,087,087 | |
| | | | | | |
|
|
|
Chile — 0.2% | | | | | | | | |
CAP SA | | | 10,800 | | | | 427,234 | |
Cia Cervecerias Unidas SA | | | 57,500 | | | | 668,671 | |
| | | | | | |
|
|
|
| | | | | | | | 1,095,905 | |
| | | | | | |
|
|
|
China — 1.9% | | | | | | | | |
Bank of China, Ltd. | | | 1,420,000 | | | | 713,765 | |
China Construction Bank Corp. | | | 1,117,000 | | | | 921,888 | |
Guangzhou Automobile Group Co., Ltd.† | | | 389,649 | | | | 457,335 | |
Shandong Chenming Paper Holdings, Ltd. | | | 574,500 | | | | 429,098 | |
Shandong Weigao Group Medical Polymer Co., Ltd. | | | 40,000 | | | | 200,289 | |
Weichai Power Co., Ltd. | | | 422,900 | | | | 3,525,639 | |
Wumart Stores, Inc. | | | 466,000 | | | | 976,481 | |
Zhejiang Expressway Co., Ltd. | | | 818,000 | | | | 728,747 | |
Zhuzhou CSR Times Electric Co., Ltd. | | | 789,000 | | | | 2,048,890 | |
| | | | | | |
|
|
|
| | | | | | | | 10,002,132 | |
| | | | | | |
|
|
|
Cyprus — 0.2% | | | | | | | | |
Globaltrans Investment PLC GDR | | | 73,770 | | | | 1,010,649 | |
| | | | | | |
|
|
|
Czech Republic — 0.1% | | | | | | | | |
Philip Morris CR AS | | | 1,220 | | | | 551,344 | |
| | | | | | |
|
|
|
Denmark — 0.7% | | | | | | | | |
FLSmidth & Co. A/S | | | 38,198 | | | | 2,256,293 | |
SimCorp A/S | | | 426 | | | | 57,505 | |
Tryg A/S | | | 26,442 | | | | 1,417,850 | |
| | | | | | |
|
|
|
| | | | | | | | 3,731,648 | |
| | | | | | |
|
|
|
Finland — 1.7% | | | | | | | | |
Konecranes Oyj | | | 117,208 | | | | 3,572,192 | |
Pohjola Bank PLC, Class A | | | 214,326 | | | | 2,348,023 | |
UPM - Kymmene Oyj | | | 234,472 | | | | 3,217,969 | |
| | | | | | |
|
|
|
| | | | | | | | 9,138,184 | |
| | | | | | |
|
|
|
France — 7.1% | | | | | | | | |
Euler Hermes SA† | | | 47,382 | | | | 3,602,692 | |
Eutelsat Communications | | | 87,089 | | | | 3,131,015 | |
Groupe Eurotunnel SA | | | 243,213 | | | | 1,807,046 | |
Guyenne et Gascogne SA | | | 20,505 | | | | 2,072,301 | |
Havas SA | | | 625,596 | | | | 2,869,888 | |
JC Decaux SA† | | | 120,133 | | | | 2,870,459 | |
Lagardere SCA | | | 53,990 | | | | 1,944,806 | |
41
VALIC Company II International Small Cap Equity Fund
PORTFOLIO OF INVESTMENTS — August 31, 2010 — (continued)
| | | | | | | | |
| | |
| Security Description | | Shares | | | Value
(Note 2) | |
| |
COMMON STOCK (continued) | | | | | | | | |
France (continued) | | | | | | | | |
Sa des Ciments Vicat | | | 20,077 | | | $ | 1,213,993 | |
Safran SA | | | 166,601 | | | | 4,093,717 | |
SCOR SE | | | 112,514 | | | | 2,447,444 | |
SEB SA | | | 44,822 | | | | 3,294,441 | |
SOITEC† | | | 214,137 | | | | 1,816,247 | |
Thales SA | | | 59,795 | | | | 1,911,809 | |
UBISOFT Entertainment† | | | 91,083 | | | | 787,660 | |
Virbac SA | | | 36,241 | | | | 4,294,580 | |
| | | | | | |
|
|
|
| | | | | | | | 38,158,098 | |
| | | | | | |
|
|
|
Germany — 1.6% | | | | | | | | |
Adidas AG | | | 35,712 | | | | 1,817,709 | |
Aixtron AG | | | 64,338 | | | | 1,598,034 | |
Bilfinger Berger AG | | | 57,324 | | | | 3,417,531 | |
Rheinmetall AG | | | 36,507 | | | | 2,020,790 | |
| | | | | | |
|
|
|
| | | | | | | | 8,854,064 | |
| | | | | | |
|
|
|
Greece — 0.2% | | | | | | | | |
Public Power Corp. SA | | | 90,492 | | | | 1,286,665 | |
| | | | | | |
|
|
|
Guernsey — 0.4% | | | | | | | | |
Tetragon Financial Group, Ltd. | | | 536,922 | | | | 2,265,811 | |
| | | | | | |
|
|
|
Hong Kong — 2.3% | | | | | | | | |
Bank of East Asia, Ltd. | | | 33,140 | | | | 124,401 | |
China Everbright International, Ltd. | | | 5,948,000 | | | | 2,660,972 | |
China Taiping Insurance Holdings Co., Ltd.† | | | 688,200 | | | | 2,141,018 | |
Dah Sing Banking Group, Ltd.† | | | 404,800 | | | | 621,348 | |
Hutchison Whampoa, Ltd. | | | 160,000 | | | | 1,183,738 | |
Lenovo Group, Ltd. | | | 2,968,000 | | | | 1,701,723 | |
Shanghai Industrial Holdings, Ltd. | | | 111,000 | | | | 540,820 | |
Techtronic Industries Co. | | | 798,000 | | | | 695,541 | |
West China Cement, Ltd.† | | | 7,033,350 | | | | 1,925,954 | |
Wharf Holdings, Ltd. | | | 121,000 | | | | 650,985 | |
| | | | | | |
|
|
|
| | | | | | | | 12,246,500 | |
| | | | | | |
|
|
|
India — 0.6% | | | | | | | | |
HDFC Bank, Ltd. ADR | | | 7,600 | | | | 1,214,480 | |
Jagran Prakashan, Ltd. | | | 174,905 | | | | 474,073 | |
Sun TV Network, Ltd. | | | 165,224 | | | | 1,678,583 | |
| | | | | | |
|
|
|
| | | | | | | | 3,367,136 | |
| | | | | | |
|
|
|
Indonesia — 1.4% | | | | | | | | |
AKR Corporindo Tbk PT | | | 2,572,392 | | | | 350,199 | |
Bank Mandiri Tbk PT | | | 4,161,500 | | | | 2,717,526 | |
BW Plantation Tbk PT† | | | 25,086,000 | | | | 2,276,759 | |
Perusahaan Gas Negara PT | | | 681,500 | | | | 301,716 | |
United Tractors Tbk PT | | | 987,666 | | | | 2,011,406 | |
| | | | | | |
|
|
|
| | | | | | | | 7,657,606 | |
| | | | | | |
|
|
|
Ireland — 2.1% | | | | | | | | |
DCC PLC (London) | | | 179,562 | | | | 4,516,868 | |
DCC PLC (Dublin) | | | 6,569 | | | | 164,494 | |
FBD Holdings PLC | | | 447,899 | | | | 3,927,793 | |
Glanbia PLC | | | 184,300 | | | | 785,910 | |
Paddy Power PLC | | | 60,103 | | | | 2,035,144 | |
| | | | | | |
|
|
|
| | | | | | | | 11,430,209 | |
| | | | | | |
|
|
|
Isle of Man — 0.0% | | | | | | | | |
Hansard Global PLC | | | 32,202 | | | | 81,488 | |
| | | | | | |
|
|
|
Italy — 1.9% | | | | | | | | |
Banca Popolare di Milano Scarl | | | 470,077 | | | | 2,043,269 | |
Buzzi Unicem SpA | | | 96,430 | | | | 874,959 | |
DiaSorin SpA | | | 87,965 | | | | 3,562,699 | |
Gruppo Editoriale L’Espresso SpA† | | | 872,703 | | | | 1,685,442 | |
Piaggio & C SpA | | | 901,141 | | | | 2,355,316 | |
| | | | | | |
|
|
|
| | | | | | | | 10,521,685 | |
| | | | | | |
|
|
|
| | | | | | | | |
| | |
| Security Description | | Shares | | | Value
(Note 2) | |
| |
| | | | | | | | | |
Japan — 20.5% | | | | | | | | |
Aica Kogyo Co., Ltd. | | | 184,200 | | | $ | 2,061,040 | |
Alpha Systems, Inc. | | | 13,800 | | | | 286,644 | |
Asahi Diamond Industrial Co., Ltd. | | | 114,000 | | | | 1,684,014 | |
Axell Corp. | | | 20,400 | | | | 605,856 | |
Chugoku Marine Paints, Ltd. | | | 167,000 | | | | 1,137,055 | |
COOKPAD, Inc. | | | 6,800 | | | | 361,409 | |
Credit Saison Co., Ltd. | | | 60,200 | | | | 764,592 | |
Dai - ichi Seiko Co., Ltd. | | | 17,500 | | | | 690,543 | |
Daiseki Co., Ltd. | | | 52,400 | | | | 952,444 | |
Dena Co., Ltd. | | | 54,300 | | | | 1,627,513 | |
Disco Corp. | | | 7,000 | | | | 349,542 | |
Don Quijote Co., Ltd. | | | 52,300 | | | | 1,276,840 | |
Doshisha Co., Ltd. | | | 18,600 | | | | 440,590 | |
Eiken Chemical Co., Ltd. | | | 17,600 | | | | 161,524 | |
en - japan, Inc. | | | 620 | | | | 884,871 | |
Enplas Corp. | | | 20,900 | | | | 331,375 | |
EPS Co., Ltd. | | | 449 | | | | 1,125,573 | |
Exedy Corp. | | | 43,200 | | | | 1,245,452 | |
Ferrotec Corp. | | | 42,600 | | | | 460,938 | |
Foster Electric Co., Ltd. | | | 26,700 | | | | 572,393 | |
FP Corp. | | | 33,100 | | | | 1,792,703 | |
Fuji Machine Manufacturing Co., Ltd. | | | 99,100 | | | | 1,568,897 | |
Fujimi, Inc. | | | 108,900 | | | | 1,489,419 | |
GS Yuasa Corp. | | | 63,000 | | | | 371,206 | |
Hajime Construction Co., Ltd. | | | 58,000 | | | | 1,591,358 | |
Harmonic Drive Systems, Inc. | | | 124 | | | | 495,203 | |
HIS Co., Ltd. | | | 39,600 | | | | 845,642 | |
Hitachi Metals, Ltd. | | | 79,000 | | | | 851,030 | |
IDEC Corp. | | | 33,100 | | | | 302,199 | |
Internet Initiative Japan, Inc. | | | 165 | | | | 434,055 | |
Jafco Co., Ltd. | | | 24,300 | | | | 540,032 | |
Japan Petroleum Exploration Co. | | | 16,700 | | | | 602,321 | |
JVC Kenwood Holdings, Inc.† | | | 241,400 | | | | 591,934 | |
Kajima Corp. | | | 838,000 | | | | 1,965,076 | |
Kakaku.com, Inc. | | | 419 | | | | 2,047,369 | |
Kawasaki Kisen Kaisha, Ltd.† | | | 662,000 | | | | 2,466,444 | |
Koito Manufacturing Co., Ltd. | | | 45,000 | | | | 621,355 | |
Komori Corp. | | | 148,000 | | | | 1,416,403 | |
Konica Minolta Holdings, Inc. | | | 278,500 | | | | 2,433,270 | |
Kureha Corp. | | | 223,000 | | | | 1,133,448 | |
Lintec Corp. | | | 54,300 | | | | 1,103,322 | |
M3, Inc. | | | 545 | | | | 2,471,670 | |
Mani, Inc. | | | 19,000 | | | | 654,743 | |
Mazda Motor Corp. | | | 1,059,000 | | | | 2,369,861 | |
Micronics Japan Co., Ltd. | | | 149,100 | | | | 1,561,814 | |
Mitsubishi UFJ Lease & Finance Co., Ltd. | | | 35,230 | | | | 1,253,871 | |
Mori Seiki Co., Ltd. | | | 211,500 | | | | 1,800,054 | |
Moshi Moshi Hotline, Inc. | | | 56,100 | | | | 1,141,900 | |
Nabtesco Corp. | | | 77,000 | | | | 1,156,696 | |
Nichicon Corp. | | | 27,200 | | | | 291,394 | |
Nidec Copal Corp. | | | 43,700 | | | | 676,749 | |
Nihon M&A Center, Inc. | | | 147 | | | | 429,924 | |
Nippon Seiki Co., Ltd. | | | 25,000 | | | | 240,745 | |
Nipro Corp. | | | 26,900 | | | | 529,931 | |
Nishimatsuya Chain Co., Ltd. | | | 75,200 | | | | 653,446 | |
Nissha Printing Co., Ltd. | | | 52,000 | | | | 1,146,959 | |
Nomura Real Estate Holdings, Inc. | | | 39,000 | | | | 516,224 | |
NTT Urban Development Corp. | | | 3,659 | | | | 2,852,809 | |
Ohara, Inc. | | | 96,300 | | | | 1,231,118 | |
Okuma Corp.† | | | 559,000 | | | | 2,708,166 | |
Osaka Securities Exchange Co., Ltd. | | | 270 | | | | 1,311,272 | |
Otsuka Corp. | | | 17,600 | | | | 1,158,529 | |
Pigeon Corp. | | | 15,000 | | | | 551,720 | |
Pioneer Corp.† | | | 900,700 | | | | 2,669,614 | |
Rinnai Corp. | | | 12,200 | | | | 729,008 | |
42
VALIC Company II International Small Cap Equity Fund
PORTFOLIO OF INVESTMENTS — August 31, 2010 — (continued)
| | | | | | | | |
| | |
| Security Description | | Shares | | | Value
(Note 2) | |
| |
COMMON STOCK (continued) | | | | | | | | |
Japan (continued) | | | | | | | | |
Saint Marc Holdings Co., Ltd. | | | 17,600 | | | $ | 679,824 | |
Sakai Chemical Industry Co., Ltd. | | | 38,000 | | | | 143,840 | |
Sanwa Holdings Corp. | | | 593,000 | | | | 1,743,495 | |
Sawai Pharmaceutical Co., Ltd. | | | 10,200 | | | | 1,045,376 | |
SBI Holdings, Inc. | | | 3,466 | | | | 430,310 | |
Shimadzu Corp. | | | 81,000 | | | | 548,613 | |
Shin - Etsu Polymer Co., Ltd. | | | 83,000 | | | | 462,373 | |
Star Micronics Co., Ltd. | | | 325,200 | | | | 2,790,968 | |
Sumco Corp.† | | | 170,600 | | | | 2,901,885 | |
Sumitomo Rubber Industries, Ltd. | | | 138,000 | | | | 1,251,708 | |
Suruga Bank, Ltd. | | | 725,000 | | | | 6,334,365 | |
Sysmex Corp. | | | 5,900 | | | | 372,920 | |
T - Gaia Corp. | | | 270 | | | | 422,950 | |
Taiheiyo Cement Corp.† | | | 2,183,000 | | | | 2,442,590 | |
Taiko Pharmaceutical Co., Ltd. | | | 17,000 | | | | 193,251 | |
Taiyo Ink Manufacturing Co., Ltd. | | | 36,800 | | | | 995,672 | |
The Daiei, Inc.† | | | 288,300 | | | | 1,166,790 | |
The Japan Steel Works, Ltd. | | | 59,000 | | | | 522,509 | |
Tokyo Seimitsu Co., Ltd.† | | | 87,100 | | | | 1,066,848 | |
Tokyu Livable, Inc. | | | 69,500 | | | | 775,991 | |
Toridoll.corp. | | | 450 | | | | 765,445 | |
Toshiba Machine Co., Ltd. | | | 432,000 | | | | 1,383,264 | |
Toshiba Plant Systems & Services Corp. | | | 70,000 | | | | 801,571 | |
Towa Corp.† | | | 70,600 | | | | 389,935 | |
TS Tech Co., Ltd. | | | 79,600 | | | | 1,150,273 | |
Tsugami Corp. | | | 100,000 | | | | 609,451 | |
Union Tool Co. | | | 118,000 | | | | 2,550,744 | |
Village Vanguard Co., Ltd. | | | 142 | | | | 409,047 | |
Works Applications Co., Ltd. | | | 1,398 | | | | 668,131 | |
Yamaguchi Financial Group, Inc. | | | 67,000 | | | | 634,032 | |
Yamaha Motor Co., Ltd.† | | | 203,500 | | | | 2,734,811 | |
Yamatake Corp. | | | 35,900 | | | | 878,163 | |
| | | | | | |
|
|
|
| | | | | | | | 111,058,256 | |
| | | | | | |
|
|
|
Jersey — 1.1% | | | | | | | | |
Beazley PLC | | | 255,889 | | | | 438,753 | |
Charter International PLC | | | 320,437 | | | | 2,997,774 | |
United Business Media, Ltd. | | | 292,923 | | | | 2,479,813 | |
| | | | | | |
|
|
|
| | | | | | | | 5,916,340 | |
| | | | | | |
|
|
|
Luxembourg — 0.9% | | | | | | | | |
Acergy SA | | | 136,194 | | | | 2,091,273 | |
GlobeOp Financial Services | | | 47,289 | | | | 172,246 | |
Millicom International Cellular SA | | | 26,046 | | | | 2,398,316 | |
| | | | | | |
|
|
|
| | | | | | | | 4,661,835 | |
| | | | | | |
|
|
|
Malaysia — 0.1% | | | | | | | | |
IJM Corp. BHD | | | 402,160 | | | | 639,478 | |
| | | | | | |
|
|
|
Mauritius — 0.1% | | | | | | | | |
Golden Agri - Resources, Ltd. | | | 1,195,474 | | | | 493,888 | |
| | | | | | |
|
|
|
Mexico — 0.4% | | | | | | | | |
Corp GEO SAB de CV, Series B† | | | 152,000 | | | | 391,533 | |
Genomma Lab Internacional SA de CV† | | | 321,500 | | | | 572,393 | |
Industrias CH SAB de CV† | | | 142,000 | | | | 500,035 | |
Mexichem SAB de CV | | | 202,000 | | | | 520,786 | |
| | | | | | |
|
|
|
| | | | | | | | 1,984,747 | |
| | | | | | |
|
|
|
Netherlands — 2.6% | | | | | | | | |
Aalberts Industries NV | | | 236,715 | | | | 3,352,245 | |
ASM International NV† | | | 107,977 | | | | 2,385,699 | |
Koninklijke Bam Groep NV | | | 218,138 | | | | 1,091,920 | |
Koninklijke Vopak NV | | | 55,542 | | | | 2,230,873 | |
SBM Offshore NV | | | 157,087 | | | | 2,389,818 | |
| | | | | | | | |
| | |
| Security Description | | Shares | | | Value
(Note 2) | |
| |
| | | | | | | | | |
Netherlands (continued) | | | | | | | | |
SNS Reaal NV† | | | 289,169 | | | $ | 1,222,109 | |
X5 Retail Group NV GDR† | | | 33,000 | | | | 1,201,200 | |
| | | | | | |
|
|
|
| | | | | | | | 13,873,864 | |
| | | | | | |
|
|
|
Norway ��� 1.2% | | | | | | | | |
Aker Solutions ASA | | | 83,856 | | | | 924,665 | |
Orkla ASA | | | 218,000 | | | | 1,823,190 | |
Sparebank 1 SR Bank | | | 453,700 | | | | 3,589,405 | |
| | | | | | |
|
|
|
| | | | | | | | 6,337,260 | |
| | | | | | |
|
|
|
Panama — 0.2% | | | | | | | | |
Copa Holdings SA, Class A | | | 12,000 | | | | 585,360 | |
Intergroup Financial Services Corp. | | | 13,700 | | | | 339,075 | |
| | | | | | |
|
|
|
| | | | | | | | 924,435 | |
| | | | | | |
|
|
|
Papua New Guinea — 0.1% | | | | | | | | |
New Britain Palm Oil, Ltd. | | | 58,804 | | | | 520,817 | |
| | | | | | |
|
|
|
Philippines — 0.4% | | | | | | | | |
Filinvest Land, Inc. | | | 30,610,000 | | | | 776,047 | |
Metro Pacific Investments Corp. | | | 5,639,000 | | | | 418,947 | |
Security Bank Corp. | | | 738,600 | | | | 1,221,230 | |
| | | | | | |
|
|
|
| | | | | | | | 2,416,224 | |
| | | | | | |
|
|
|
Portugal — 0.4% | | | | | | | | |
Portucel Empresa Produtora de Pasta e Papel SA | | | 827,367 | | | | 2,285,689 | |
| | | | | | |
|
|
|
Russia — 0.3% | | | | | | | | |
LSR Group OJSC GDR† | | | 61,300 | | | | 489,174 | |
Pharmstandard GDR† | | | 37,400 | | | | 891,990 | |
| | | | | | |
|
|
|
| | | | | | | | 1,381,164 | |
| | | | | | |
|
|
|
Singapore — 1.1% | | | | | | | | |
Cambridge Industrial Trust | | | 1,787,000 | | | | 672,350 | |
Fortune Real Estate Investment Trust | | | 1,540,000 | | | | 722,610 | |
Goodpack, Ltd. | | | 764,000 | | | | 1,087,805 | |
SIA Engineering Co., Ltd. | | | 205,000 | | | | 624,603 | |
Venture Corp., Ltd. | | | 438,000 | | | | 2,811,214 | |
| | | | | | |
|
|
|
| | | | | | | | 5,918,582 | |
| | | | | | |
|
|
|
South Africa — 0.4% | | | | | | | | |
Aspen Pharmacare Holdings, Ltd.† | | | 117,700 | | | | 1,342,179 | |
Impala Platinum Holdings, Ltd. | | | 17,000 | | | | 401,085 | |
Truworths International, Ltd. | | | 63,300 | | | | 502,537 | |
| | | | | | |
|
|
|
| | | | | | | | 2,245,801 | |
| | | | | | |
|
|
|
South Korea — 4.3% | | | | | | | | |
Cheil Industries, Inc. | | | 35,627 | | | | 3,105,365 | |
Daegu Bank | | | 48,610 | | | | 565,610 | |
Glovis Co., Ltd. | | | 15,863 | | | | 2,169,933 | |
Hyundai Home Shopping Network Corp.†(1) | | | 1,587 | | | | 119,134 | |
Hyundai Mobis | | | 17,341 | | | | 3,138,708 | |
Intelligent Digital Integrated Security | | | 33,905 | | | | 412,889 | |
Korea Investment Holdings Co., Ltd. | | | 24,340 | | | | 638,496 | |
Korean Reinsurance Co. | | | 53,773 | | | | 482,158 | |
LG Chemical Co., Ltd. | | | 10,022 | | | | 2,883,969 | |
LG Electronics, Inc. | | | 2,361 | | | | 189,841 | |
LG Household & Health Care, Ltd. | | | 8,961 | | | | 3,004,689 | |
OCI Materials Co., Ltd. | | | 16,156 | | | | 1,521,405 | |
Samsung Electronics Co., Ltd. | | | 1,992 | | | | 1,256,112 | |
Shinhan Financial Group Co., Ltd. | | | 17,430 | | | | 667,309 | |
Sungwoo Hitech Co., Ltd. | | | 237,397 | | | | 2,316,744 | |
Synopex, Inc.† | | | 117,934 | | | | 323,632 | |
Taewoong Co., Ltd. | | | 11,572 | | | | 468,131 | |
| | | | | | |
|
|
|
| | | | | | | | 23,264,125 | |
| | | | | | |
|
|
|
43
VALIC Company II International Small Cap Equity Fund
PORTFOLIO OF INVESTMENTS — August 31, 2010 — (continued)
| | | | | | | | |
| | |
| Security Description | | Shares | | | Value
(Note 2) | |
| |
COMMON STOCK (continued) | | | | | | | | |
Spain — 2.8% | | | | | | | | |
Antena 3 de Television SA | | | 303,676 | | | $ | 2,058,859 | |
Bankinter SA | | | 410,898 | | | | 2,671,767 | |
Iberia Lineas Aereas de Espana SA† | | | 592,681 | | | | 1,911,487 | |
Obrascon Huarte Lain SA | | | 160,973 | | | | 4,018,664 | |
Red Electrica Corp. SA | | | 46,260 | | | | 1,906,420 | |
Vueling Airlines SA† | | | 237,567 | | | | 2,682,417 | |
| | | | | | |
|
|
|
| | | | | | | | 15,249,614 | |
| | | | | | |
|
|
|
Sweden — 1.1% | | | | | | | | |
AarhusKarlshamn AB | | | 54,271 | | | | 1,068,305 | |
Husqvarna AB, Class B | | | 424,367 | | | | 2,664,512 | |
Intrum Justitia AB | | | 232,822 | | | | 2,362,380 | |
| | | | | | |
|
|
|
| | | | | | | | 6,095,197 | |
| | | | | | |
|
|
|
Switzerland — 3.8% | | | | | | | | |
Acino Holding AG | | | 8,770 | | | | 818,476 | |
Aryzta AG | | | 57,674 | | | | 2,471,134 | |
Banque Cantonale Vaudoise | | | 8,359 | | | | 3,993,219 | |
Clariant AG† | | | 241,381 | | | | 3,105,083 | |
EFG International AG | | | 213,462 | | | | 2,291,786 | |
Gategroup Holding AG† | | | 34,142 | | | | 1,281,271 | |
Sonova Holding AG | | | 26,135 | | | | 3,343,941 | |
Sulzer AG | | | 32,170 | | | | 3,190,858 | |
| | | | | | |
|
|
|
| | | | | | | | 20,495,768 | |
| | | | | | |
|
|
|
Taiwan — 1.5% | | | | | | | | |
Advantech Co., Ltd. | | | 509,000 | | | | 1,153,568 | |
Chicony Electronics Co., Ltd. | | | 261,259 | | | | 468,951 | |
Chimei Innolux Display Corp.† | | | 247,370 | | | | 255,602 | |
China Life Insurance Co., Ltd.† | | | 738,562 | | | | 599,445 | |
Delta Electronics, Inc. | | | 144,000 | | | | 546,170 | |
Hon Hai Precision Industry Co., Ltd. GDR† | | | 82,208 | | | | 608,339 | |
Polaris Securities Co., Ltd. | | | 757,000 | | | | 336,744 | |
Simplo Technology Co., Ltd. | | | 155,760 | | | | 760,955 | |
St Shine Optical Co., Ltd. | | | 140,000 | | | | 1,359,181 | |
Ta Chong Bank Co., Ltd.† | | | 1,634,000 | | | | 411,127 | |
Wistron Corp. | | | 341,346 | | | | 533,853 | |
Yageo Corp.† | | | 2,442,000 | | | | 956,705 | |
| | | | | | |
|
|
|
| | | | | | | | 7,990,640 | |
| | | | | | |
|
|
|
Thailand — 0.7% | | | | | | | | |
BEC World PCL(2) | | | 956,100 | | | | 970,001 | |
Big C Supercenter PCL(2) | | | 392,200 | | | | 726,876 | |
Kasikornbank PCL | | | 326,000 | | | | 1,187,538 | |
Thoresen Thai Agencies PCL | | | 265,630 | | | | 205,408 | |
TMB Bank PCL†(2) | | | 8,949,600 | | | | 772,134 | |
| | | | | | |
|
|
|
| | | | | | | | 3,861,957 | |
| | | | | | |
|
|
|
Turkey — 0.5% | | | | | | | | |
BIM Birlesik Magazalar AS GDR | | | 43,500 | | | | 1,189,303 | |
Turk Hava Yollari† | | | 478,000 | | | | 1,502,505 | |
| | | | | | |
|
|
|
| | | | | | | | 2,691,808 | |
| | | | | | |
|
|
|
United Kingdom — 12.4% | | | | | | | | |
Abbey Protection PLC | | | 222,241 | | | | 276,932 | |
Advanced Medical Solutions Group PLC† | | | 419,180 | | | | 334,295 | |
Afren PLC† | | | 131,587 | | | | 207,459 | |
Alternative Networks PLC | | | 146,180 | | | | 353,098 | |
Amlin PLC | | | 77,193 | | | | 481,125 | |
Aveva Group PLC | | | 17,097 | | | | 374,171 | |
Avocet Mining PLC† | | | 198,522 | | | | 358,506 | |
Axis - Shield PLC† | | | 66,174 | | | | 294,315 | |
Babcock International Group PLC | | | 229,033 | | | | 1,775,602 | |
Brewin Dolphin Holdings PLC | | | 123,300 | | | | 226,919 | |
Britvic PLC | | | 462,633 | | | | 3,422,712 | |
BTG PLC† | | | 168,350 | | | | 518,962 | |
| | | | | | | | |
| | |
| Security Description | | Shares | | | Value
(Note 2) | |
| |
| | | | | | | | | |
United Kingdom (continued) | | | | | | | | |
Caretech Holdings PLC | | | 34,835 | | | $ | 172,295 | |
Carillion PLC | | | 107,384 | | | | 500,327 | |
Chemring Group PLC | | | 95,065 | | | | 3,793,625 | |
Cohort PLC | | | 140,659 | | | | 159,634 | |
CPP Group PLC† | | | 88,874 | | | | 337,347 | |
Croda International PLC | | | 239,892 | | | | 4,709,254 | |
CVS Group PLC† | | | 210,165 | | | | 290,088 | |
Datacash Group PLC | | | 59,275 | | | | 327,266 | |
Davis Service Group PLC | | | 40,471 | | | | 236,170 | |
Dechra Pharmaceuticals PLC | | | 129,090 | | | | 838,441 | |
Devro PLC | | | 48,371 | | | | 177,003 | |
Dignity PLC | | | 59,846 | | | | 650,740 | |
Domino Printing Sciences PLC | | | 118,905 | | | | 838,850 | |
E2V Technologies PLC† | | | 174,211 | | | | 165,651 | |
eaga PLC | | | 211,981 | | | | 331,607 | |
Education Development International PLC | | | 110,000 | | | | 159,423 | |
EMIS Group PLC† | | | 67,761 | | | | 329,691 | |
Fenner PLC | | | 330,580 | | | | 1,032,747 | |
Fidessa Group PLC | | | 20,291 | | | | 426,646 | |
Filtrona PLC | | | 126,917 | | | | 457,808 | |
G4S PLC† | | | 1,035,200 | | | | 4,014,240 | |
Group NBT PLC | | | 40,452 | | | | 203,954 | |
Gulfsands Petroleum PLC† | | | 95,615 | | | | 441,020 | |
H&T Group PLC | | | 115,740 | | | | 515,651 | |
Hargreaves Services PLC | | | 21,843 | | | | 209,372 | |
Hill & Smith Holdings PLC | | | 56,104 | | | | 239,632 | |
Homeserve PLC | | | 255,170 | | | | 1,780,996 | |
Hunting PLC | | | 26,276 | | | | 243,603 | |
IG Group Holdings PLC | | | 463,772 | | | | 3,712,799 | |
Immunodiagnostic Systems Holdings PLC | | | 42,724 | | | | 491,428 | |
Intec Telecom Systems PLC | | | 195,669 | | | | 190,556 | |
James Halstead PLC | | | 30,092 | | | | 291,903 | |
JD Wetherspoon PLC | | | 102,698 | | | | 659,622 | |
Jupiter Fund Management PLC† | | | 102,823 | | | | 317,360 | |
Kazakhmys PLC | | | 121,968 | | | | 2,162,371 | |
Laird PLC | | | 100,769 | | | | 201,217 | |
Latchways PLC | | | 12,500 | | | | 136,111 | |
Marston’s PLC | | | 167,481 | | | | 239,391 | |
May Gurney Integrated Services PLC | | | 189,341 | | | | 530,675 | |
Mears Group PLC | | | 229,510 | | | | 918,689 | |
Melrose PLC | | | 209,849 | | | | 828,725 | |
Micro Focus International PLC | | | 114,793 | | | | 530,622 | |
Microgen PLC | | | 229,674 | | | | 299,404 | |
Millennium & Copthorne Hotels PLC | | | 257,148 | | | | 1,916,663 | |
Mitie Group PLC | | | 236,066 | | | | 706,707 | |
Morson Group PLC | | | 133,571 | | | | 203,827 | |
Mouchel Group PLC | | | 250,899 | | | | 448,282 | |
N Brown Group PLC | | | 149,289 | | | | 512,635 | |
Northgate PLC† | | | 65,625 | | | | 185,188 | |
Pace PLC | | | 131,207 | | | | 413,519 | |
PayPoint PLC | | | 87,675 | | | | 407,422 | |
Phoenix IT Group, Ltd. | | | 137,928 | | | | 419,365 | |
Premier Oil PLC† | | | 153,363 | | | | 3,565,712 | |
PZ Cussons PLC | | | 49,207 | | | | 246,624 | |
RM PLC | | | 273,977 | | | | 550,442 | |
Rotork PLC | | | 18,862 | | | | 455,901 | |
RPS Group PLC | | | 49,659 | | | | 129,547 | |
RWS Holdings PLC | | | 122,935 | | | | 485,489 | |
Salamander Energy PLC† | | | 99,005 | | | | 335,261 | |
SDL PLC† | | | 38,956 | | | | 340,845 | |
Serco Group PLC | | | 165,500 | | | | 1,477,228 | |
Spectris PLC | | | 33,342 | | | | 449,221 | |
Spirax - Sarco Engineering PLC | | | 18,752 | | | | 455,543 | |
St James’s Place PLC | | | 818,917 | | | | 3,208,908 | |
Synergy Health PLC | | | 221,213 | | | | 2,342,614 | |
44
VALIC Company II International Small Cap Equity Fund
PORTFOLIO OF INVESTMENTS — August 31, 2010 — (continued)
| | | | | | | | |
| | |
| Security Description | | Shares | | |
Value
(Note 2) | |
| |
COMMON STOCK (continued) | | | | | | | | |
United Kingdom (continued) | | | | | | | | |
Telecity Group PLC† | | | 89,034 | | | $ | 658,157 | |
Ultra Electronics Holdings PLC | | | 18,241 | | | | 466,908 | |
Valiant Petroleum PLC† | | | 27,383 | | | | 286,622 | |
Vedanta Resources PLC | | | 64,209 | | | | 1,860,177 | |
Victrex PLC | | | 15,775 | | | | 260,320 | |
Xchanging PLC | | | 331,784 | | | | 658,440 | |
YouGov PLC† | | | 211,761 | | | | 127,471 | |
| | | | | | |
|
|
|
| | | | | | | | 67,293,088 | |
| | | | | | |
|
|
|
United States — 1.8% | | | | | | | | |
AsiaInfo - Linkage, Inc.† | | | 93,540 | | | | 1,670,624 | |
Autoliv, Inc. | | | 66,689 | | | | 3,610,542 | |
Central European Distribution Corp.† | | | 23,400 | | | | 535,392 | |
Gran Tierra Energy, Inc.† | | | 53,000 | | | | 333,005 | |
Virgin Media, Inc. | | | 167,487 | | | | 3,485,405 | |
| | | | | | |
|
|
|
| | | | | | | | 9,634,968 | |
| | | | | | |
|
|
|
Total Common Stock | | | | | | | | |
(cost $490,353,364) | | | | | | | 503,817,724 | |
| | | | | | |
|
|
|
EXCHANGE - TRADED FUNDS — 4.5% | | | | | | | | |
France — 1.1% | | | | | | | | |
Lyxor ETF Eastern Europe | | | 76,473 | | | | 1,896,537 | |
Lyxor ETF Russia | | | 107,000 | | | | 3,924,143 | |
| | | | | | |
|
|
|
| | | | | | | | 5,820,680 | |
| | | | | | |
|
|
|
Ireland — 0.8% | | | | | | | | |
iShares MSCI EM Latin America | | | 179,364 | | | | 4,629,385 | |
| | | | | | |
|
|
|
Luxembourg — 1.4% | | | | | | | | |
db x - trackers - MSCI Emerging Latin America TRN Index ETF† | | | 135,000 | | | | 7,608,600 | |
| | | | | | |
|
|
|
United States — 1.2% | | | | | | | | |
iShares MSCI South Africa Index Fund | | | 87,740 | | | | 5,124,016 | |
iShares MSCI Turkey Index Fund | | | 21,617 | | | | 1,306,964 | |
| | | | | | |
|
|
|
| | | | | | | | 6,430,980 | |
| | | | | | |
|
|
|
Total Exchange - Traded Funds | | | | | | | | |
(cost $24,210,100) | | | | | | | 24,489,645 | |
| | | | | | |
|
|
|
PREFERRED STOCK — 0.6% | | | | | | | | |
Brazil — 0.4% | | | | | | | | |
Banco ABC Brasil SA | | | 63,000 | | | | 496,826 | |
Parana Banco SA | | | 72,000 | | | | 420,213 | |
Suzano Papel e Celulose SA | | | 51,000 | | | | 463,465 | |
Ultrapar Participacoes SA | | | 11,000 | | | | 604,413 | |
| | | | | | |
|
|
|
| | | | | | | | 1,984,917 | |
| | | | | | |
|
|
|
| | | | | | | | |
| | |
| Security Description | | Shares/
Principal
Amount | | |
Value
(Note 2) | |
| |
| | | | | | | | | |
South Korea — 0.2% | | | | | | | | |
Hyundai Motor Co. | | | 22,858 | | | $ | 962,823 | |
| | | | | | |
|
|
|
Total Preferred Stock | | | | | | | | |
(cost $2,699,257) | | | | | | | 2,947,740 | |
| | | | | | |
|
|
|
RIGHTS — 0.0% | | | | | | | | |
Australia — 0.0% | | | | | | | | |
White Energy Co., Ltd.
Expires 10/20/10 (strike price 2.50 AUD)†(1)
(cost $0) | | | 13,793 | | | | 0 | |
| | | | | | |
|
|
|
Total Long - Term Investment Securities | | | | | | | | |
(cost $517,262,721) | | | | | | | 531,255,109 | |
| | | | | | |
|
|
|
SHORT - TERM INVESTMENT SECURITIES — 0.1% | | | | | |
Time Deposits — 0.1% | | | | | | | | |
Euro Time Deposit with State Street Bank & Trust Co.
0.01% due 09/01/10
(cost $649,000) | | $ | 649,000 | | | | 649,000 | |
| | | | | | |
|
|
|
REPURCHASE AGREEMENT — 1.4% | | | | | | | | |
Agreement with State Street Bank & Trust Co., bearing interest at 0.01%, dated 08/31/10, to be repurchased 09/01/10 in the amount of $7,608,002 and collateralized by $7,670,000 of Federal Home Loan Bank Bonds, bearing interest at 4.38%, due 09/17/10 and having an approximate value of $7,837,206
(cost $7,608,000) | | | 7,608,000 | | | | 7,608,000 | |
| | | | | | |
|
|
|
TOTAL INVESTMENTS | | | | | | | | |
(cost $525,519,721)(3) | | | 99.7 | % | | | 539,512,109 | |
Other assets less liabilities | | | 0.3 | | | | 1,813,868 | |
| | |
|
|
| |
|
|
|
NET ASSETS — | | | 100.0 | % | | $ | 541,325,977 | |
| | |
|
|
| |
|
|
|
| † | Non-income producing security |
| (1) | Fair valued security. Securities are classified as Level 3 based on the securities valuation inputs; see Note 2. |
| (2) | Fair valued security. Securities are classified as Level 2 based on the securities valuation inputs; see Note 2. |
| (3) | See Note 5 for cost of investments on a tax basis. |
ADR—American Depository Receipt
GDR—Global Depository Receipt
Currency Legend
AUD—Australian Dollar
The following is a summary of the inputs used to value the Fund’s net assets as of August 31, 2010 (see Note 2):
| | | | | | | | | | | | | | | | |
| | | Level 1 - Unadjusted Quoted
Prices
| | | Level 2 - Other Observable
Inputs
| | | Level 3 - Significant
Unobservable Inputs
| | | Total
| |
Long-Term Investment Securities: | | | | | | | | | | | | | | | | |
Common Stock: | | | | | | | | | | | | | | | | |
France | | $ | 38,158,098 | | | $ | — | | | $ | — | | | $ | 38,158,098 | |
Japan | | | 111,058,256 | | | | — | | | | — | | | | 111,058,256 | |
United Kingdom | | | 67,293,088 | | | | — | | | | — | | | | 67,293,088 | |
Other Countries* | | | 284,720,137 | | | | 2,469,011 | | | | 119,134 | | | | 287,308,282 | |
Exchange-Traded Funds | | | 24,489,645 | | | | — | | | | — | | | | 24,489,645 | |
Preferred Stock | | | 2,947,740 | | | | — | | | | — | | | | 2,947,740 | |
Rights | | | — | | | | — | | | | 0 | | | | 0 | |
| * | Sum of all other countries each of which individually has an aggregate market value of less than 5% of net assets. For a detailed presentation of common stocks by country, please refer to the Portfolio of Investments. |
45
VALIC Company II International Small Cap Equity Fund
PORTFOLIO OF INVESTMENTS — August 31, 2010 — (continued)
| | | | | | | | | | | | | | | | |
| | | Level 1 - Unadjusted Quoted
Prices
| | | Level 2 - Other Observable
Inputs
| | | Level 3 - Significant
Unobservable Inputs
| | | Total
| |
Short-Term Investment Securities: | | | | | | | | | | | | | | | | |
Time Deposits | | $ | — | | | $ | 649,000 | | | $ | — | | | $ | 649,000 | |
Repurchase Agreement | | | — | | | | 7,608,000 | | | | — | | | | 7,608,000 | |
| | |
|
|
| |
|
|
| |
|
|
| |
|
|
|
Total | | $ | 528,666,964 | | | $ | 10,726,011 | | | $ | 119,134 | | | $ | 539,512,109 | |
| | |
|
|
| |
|
|
| |
|
|
| |
|
|
|
The following is a reconciliation of Level 3 assets which significant unobservable inputs were used to determine fair value:
| | | | | | | | |
| | | Common Stock
| | | Rights
| |
Balance as of 8/31/2009 | | $ | 16,643 | | | $ | — | |
Accrued discounts/premiums | | | — | | | | — | |
Realized gain (loss) | | | 0 | | | | — | |
Change in unrealized appreciation (depreciation)(1) | | | (258 | ) | | | — | |
Net purchases (sales) | | | 102,749 | | | | 0 | |
Transfers in and/or (out) of Level 3 | | | — | | | | — | |
| | |
|
|
| |
|
|
|
Balance as of 8/31/2010 | | $ | 119,134 | | | $ | 0 | |
| | |
|
|
| |
|
|
|
| (1) | The total change in unrealized appreciation (depreciation) included in the statement of operations attributable to level 3 investments still held at August 31, 2010 includes: |
| | | | |
Common Stock
| | Rights
| |
| $(0) | | $ | — | |
| |
|
|
|
See Notes to Financial Statements
46
VALIC Company II Large Cap Value Fund
PORTFOLIO PROFILE — August 31, 2010 (Unaudited)
Industry Allocation*
| | | | |
Diversified Banking Institutions | | | 8.7 | % |
Oil Companies — Exploration & Production | | | 7.6 | |
Banks — Super Regional | | | 5.0 | |
Medical — Drugs | | | 4.9 | |
Diversified Manufacturing Operations | | | 4.7 | |
Telephone — Integrated | | | 4.4 | |
Oil Companies — Integrated | | | 3.2 | |
Multimedia | | | 2.9 | |
U.S. Government Agencies | | | 2.3 | |
Beverages — Non-alcoholic | | | 2.2 | |
Electric — Integrated | | | 2.0 | |
Applications Software | | | 2.0 | |
Insurance — Life/Health | | | 1.9 | |
Wireless Equipment | | | 1.8 | |
Investment Management/Advisor Services | | | 1.8 | |
Medical — HMO | | | 1.6 | |
Medical Products | | | 1.5 | |
Oil — Field Services | | | 1.4 | |
Retail — Drug Store | | | 1.4 | |
Networking Products | | | 1.4 | |
Insurance Brokers | | | 1.3 | |
Transport — Rail | | | 1.3 | |
Oil Field Machinery & Equipment | | | 1.2 | |
Auto/Truck Parts & Equipment — Original | | | 1.2 | |
Computers | | | 1.2 | |
Retail — Building Products | | | 1.1 | |
Insurance — Property/Casualty | | | 1.1 | |
Advertising Agencies | | | 1.1 | |
Metal — Copper | | | 1.0 | |
Medical — Biomedical/Gene | | | 0.9 | |
Insurance — Reinsurance | | | 0.9 | |
Aerospace/Defense — Equipment | | | 0.8 | |
Medical — Wholesale Drug Distribution | | | 0.8 | |
Agricultural Chemicals | | | 0.8 | |
Tobacco | | | 0.8 | |
Cruise Lines | | | 0.8 | |
Office Automation & Equipment | | | 0.8 | |
Insurance — Multi-line | | | 0.7 | |
Finance — Credit Card | | | 0.7 | |
Machinery — Construction & Mining | | | 0.7 | |
Building — Residential/Commercial | | | 0.7 | |
Web Portals/ISP | | | 0.7 | |
Retail — Discount | | | 0.6 | |
Batteries/Battery Systems | | | 0.6 | |
Enterprise Software/Service | | | 0.6 | |
Instruments — Scientific | | | 0.6 | |
Retail — Apparel/Shoe | | | 0.6 | |
Finance — Investment Banker/Broker | | | 0.6 | |
Banks — Fiduciary | | | 0.5 | |
Medical Instruments | | | 0.5 | |
Food — Misc. | | | 0.5 | |
Engines — Internal Combustion | | | 0.5 | |
Mining | | | 0.5 | |
Aerospace/Defense | | | 0.5 | |
Retail — Regional Department Stores | | | 0.5 | |
Cellular Telecom | | | 0.5 | |
Consumer Products — Misc. | | | 0.5 | |
Computers — Integrated Systems | | | 0.4 | |
Engineering/R&D Services | | | 0.4 | |
Industrial Gases | | | 0.4 | |
Toys | | | 0.4 | |
Gas — Distribution | | | 0.4 | |
Coal | | | 0.3 | |
Chemicals — Diversified | | | 0.3 | |
Electronic Components — Semiconductors | | | 0.3 | |
Retail — Office Supplies | | | 0.3 | |
Auto — Heavy Duty Trucks | | | 0.3 | |
Real Estate Investment Trusts | | | 0.3 | |
Food — Retail | | | 0.3 | |
| | | | |
Paper & Related Products | | | 0.3 | |
Internet Security | | | 0.3 | |
Appliances | | | 0.3 | |
Medical Labs & Testing Services | | | 0.3 | |
Cosmetics & Toiletries | | | 0.3 | |
Retail — Restaurants | | | 0.2 | |
Semiconductor Equipment | | | 0.2 | |
Brewery | | | 0.2 | |
Agricultural Operations | | | 0.2 | |
Computers — Memory Devices | | | 0.2 | |
Banks — Commercial | | | 0.2 | |
Commercial Services — Finance | | | 0.2 | |
Entertainment Software | | | 0.2 | |
Cable/Satellite TV | | | 0.2 | |
Savings & Loans/Thrifts | | | 0.1 | |
Machinery — Farming | | | 0.1 | |
Computer Services | | | 0.1 | |
X-Ray Equipment | | | 0.1 | |
Retail — Major Department Stores | | | 0.1 | |
Pipelines | | | 0.1 | |
Tools — Hand Held | | | 0.1 | |
Forestry | | | 0.1 | |
| | |
|
|
|
| | | | 99.6 | % |
| | |
|
|
|
| * | Calculated as a percentage of net assets |
47
VALIC Company II Large Cap Value Fund
PORTFOLIO OF INVESTMENTS — August 31, 2010
| | | | | | | | |
| | |
| Security Description | | Shares | | | Value (Note 2) | |
| |
COMMON STOCK — 97.3% | | | | | | | | |
Advertising Agencies — 1.1% | | | | | | | | |
Omnicom Group, Inc. | | | 44,240 | | | $ | 1,548,842 | |
| | | | | | |
|
|
|
Aerospace/Defense — 0.5% | | | | | | | | |
Rockwell Collins, Inc. | | | 13,070 | | | | 704,865 | |
| | | | | | |
|
|
|
Aerospace/Defense - Equipment — 0.8% | | | | | | | | |
United Technologies Corp. | | | 18,760 | | | | 1,223,340 | |
| | | | | | |
|
|
|
Agricultural Chemicals — 0.8% | | | | | | | | |
CF Industries Holdings, Inc. | | | 12,860 | | | | 1,189,550 | |
| | | | | | |
|
|
|
Agricultural Operations — 0.2% | | | | | | | | |
Archer - Daniels-Midland Co. | | | 8,760 | | | | 269,633 | |
| | | | | | |
|
|
|
Appliances — 0.3% | | | | | | | | |
Whirlpool Corp. | | | 5,410 | | | | 401,206 | |
| | | | | | |
|
|
|
Applications Software — 2.0% | | | | | | | | |
Microsoft Corp. | | | 121,140 | | | | 2,844,367 | |
| | | | | | |
|
|
|
Auto - Heavy Duty Trucks — 0.3% | | | | | | | | |
PACCAR, Inc. | | | 11,660 | | | | 477,943 | |
| | | | | | |
|
|
|
Auto/Truck Parts & Equipment - Original — 1.2% | | | | | | | | |
Johnson Controls, Inc. | | | 66,190 | | | | 1,756,021 | |
| | | | | | |
|
|
|
Banks - Commercial — 0.2% | | | | | | | | |
BB&T Corp. | | | 10,900 | | | | 241,108 | |
| | | | | | |
|
|
|
Banks - Fiduciary — 0.5% | | | | | | | | |
State Street Corp. | | | 22,740 | | | | 797,719 | |
| | | | | | |
|
|
|
Banks - Super Regional — 5.0% | | | | | | | | |
Capital One Financial Corp. | | | 12,700 | | | | 480,822 | |
Comerica, Inc. | | | 27,800 | | | | 956,598 | |
PNC Financial Services Group, Inc. | | | 25,600 | | | | 1,304,576 | |
SunTrust Banks, Inc. | | | 30,000 | | | | 674,700 | |
US Bancorp | | | 33,300 | | | | 692,640 | |
Wells Fargo & Co. | | | 134,550 | | | | 3,168,652 | |
| | | | | | |
|
|
|
| | | | | | | | 7,277,988 | |
| | | | | | |
|
|
|
Batteries/Battery Systems — 0.6% | | | | | | | | |
Energizer Holdings, Inc.† | | | 14,800 | | | | 933,140 | |
| | | | | | |
|
|
|
Beverages - Non - alcoholic — 2.2% | | | | | | | | |
Dr Pepper Snapple Group, Inc. | | | 13,640 | | | | 502,225 | |
PepsiCo, Inc. | | | 35,780 | | | | 2,296,360 | |
The Coca - Cola Co. | | | 7,800 | | | | 436,176 | |
| | | | | | |
|
|
|
| | | | | | | | 3,234,761 | |
| | | | | | |
|
|
|
Brewery — 0.2% | | | | | | | | |
Molson Coors Brewing Co., Class B | | | 8,000 | | | | 348,480 | |
| | | | | | |
|
|
|
Building - Residential/Commercial — 0.7% | | | | | | | | |
NVR, Inc.† | | | 710 | | | | 428,953 | |
Toll Brothers, Inc.† | | | 31,260 | | | | 540,173 | |
| | | | | | |
|
|
|
| | | | | | | | 969,126 | |
| | | | | | |
|
|
|
Cable/Satellite TV — 0.2% | | | | | | | | |
Comcast Corp., Class A | | | 13,300 | | | | 227,696 | |
| | | | | | |
|
|
|
Cellular Telecom — 0.5% | | | | | | | | |
Vodafone Group PLC ADR | | | 27,900 | | | | 674,622 | |
| | | | | | |
|
|
|
Chemicals - Diversified — 0.3% | | | | | | | | |
The Dow Chemical Co. | | | 20,300 | | | | 494,711 | |
| | | | | | |
|
|
|
Coal — 0.3% | | | | | | | | |
Alpha Natural Resources, Inc.† | | | 6,940 | | | | 257,682 | |
Peabody Energy Corp. | | | 5,890 | | | | 252,092 | |
| | | | | | |
|
|
|
| | | | | | | | 509,774 | |
| | | | | | |
|
|
|
Commercial Services - Finance — 0.2% | | | | | | | | |
The Western Union Co. | | | 15,300 | | | | 239,904 | |
| | | | | | |
|
|
|
| | | | | | | | |
| | |
| Security Description | | Shares | | | Value (Note 2) | |
| |
| | | | | | | | | |
Computer Services — 0.1% | | | | | | | | |
Accenture PLC, Class A | | | 5,200 | | | $ | 190,320 | |
| | | | | | |
|
|
|
Computers — 1.2% | | | | | | | | |
Hewlett - Packard Co. | | | 29,600 | | | | 1,139,008 | |
International Business Machines Corp. | | | 4,900 | | | | 603,827 | |
| | | | | | |
|
|
|
| | | | | | | | 1,742,835 | |
| | | | | | |
|
|
|
Computers - Integrated Systems — 0.4% | | | | | | | | |
Teradata Corp.† | | | 16,400 | | | | 536,936 | |
| | | | | | |
|
|
|
Computers - Memory Devices — 0.2% | | | | | | | | |
EMC Corp.† | | | 13,700 | | | | 249,888 | |
| | | | | | |
|
|
|
Consumer Products - Misc. — 0.5% | | | | | | | | |
Clorox Co. | | | 7,940 | | | | 514,671 | |
Kimberly - Clark Corp. | | | 2,400 | | | | 154,560 | |
| | | | | | |
|
|
|
| | | | | | | | 669,231 | |
| | | | | | |
|
|
|
Cosmetics & Toiletries — 0.3% | | | | | | | | |
The Procter & Gamble Co. | | | 6,200 | | | | 369,954 | |
| | | | | | |
|
|
|
Cruise Lines — 0.8% | | | | | | | | |
Carnival Corp. | | | 36,700 | | | | 1,144,306 | |
| | | | | | |
|
|
|
Diversified Banking Institutions — 8.7% | | | | | | | | |
Bank of America Corp. | | | 270,860 | | | | 3,372,207 | |
Citigroup, Inc.† | | | 249,000 | | | | 926,280 | |
HSBC Holdings PLC ADR | | | 5,900 | | | | 290,280 | |
JPMorgan Chase & Co. | | | 136,520 | | | | 4,963,867 | |
Morgan Stanley | | | 39,100 | | | | 965,379 | |
The Goldman Sachs Group, Inc. | | | 15,860 | | | | 2,171,869 | |
| | | | | | |
|
|
|
| | | | | | | | 12,689,882 | |
| | | | | | |
|
|
|
Diversified Manufacturing Operations — 4.7% | | | | | | | | |
3M Co. | | | 4,500 | | | | 353,475 | |
Dover Corp. | | | 27,830 | | | | 1,245,671 | |
Eaton Corp. | | | 7,030 | | | | 488,444 | |
General Electric Co. | | | 218,420 | | | | 3,162,722 | |
Honeywell International, Inc. | | | 12,350 | | | | 482,761 | |
Illinois Tool Works, Inc. | | | 11,600 | | | | 478,616 | |
Tyco International, Ltd. | | | 17,400 | | | | 648,672 | |
| | | | | | |
|
|
|
| | | | | | | | 6,860,361 | |
| | | | | | |
|
|
|
Electric - Integrated — 2.0% | | | | | | | | |
Entergy Corp. | | | 17,030 | | | | 1,342,645 | |
NextEra Energy, Inc. | | | 26,810 | | | | 1,440,501 | |
Public Service Enterprise Group, Inc. | | | 5,200 | | | | 166,192 | |
| | | | | | |
|
|
|
| | | | | | | | 2,949,338 | |
| | | | | | |
|
|
|
Electronic Components - Semiconductors — 0.3% | | | | | | | | |
Intel Corp. | | | 27,700 | | | | 490,844 | |
| | | | | | |
|
|
|
Engineering/R&D Services — 0.4% | | | | | | | | |
KBR, Inc. | | | 9,400 | | | | 218,080 | |
URS Corp.† | | | 8,700 | | | | 310,329 | |
| | | | | | |
|
|
|
| | | | | | | | 528,409 | |
| | | | | | |
|
|
|
Engines - Internal Combustion — 0.5% | | | | | | | | |
Cummins, Inc. | | | 10,210 | | | | 759,726 | |
| | | | | | |
|
|
|
Enterprise Software/Service — 0.6% | | | | | | | | |
BMC Software, Inc.† | | | 25,520 | | | | 920,251 | |
| | | | | | |
|
|
|
Entertainment Software — 0.2% | | | | | | | | |
Activision Blizzard, Inc. | | | 13,700 | | | | 146,453 | |
Electronic Arts, Inc.† | | | 5,800 | | | | 88,392 | |
| | | | | | |
|
|
|
| | | | | | | | 234,845 | |
| | | | | | |
|
|
|
48
VALIC Company II Large Cap Value Fund
PORTFOLIO OF INVESTMENTS — August 31, 2010 — (continued)
| | | | | | | | |
| | |
| Security Description | | Shares | | | Value (Note 2) | |
| |
COMMON STOCK (continued) | | | | | | | | |
Finance - Credit Card — 0.7% | | | | | | | | |
American Express Co. | | | 12,340 | | | $ | 491,996 | |
Discover Financial Services | | | 36,000 | | | | 522,360 | |
| | | | | | |
|
|
|
| | | | | | | | 1,014,356 | |
| | | | | | |
|
|
|
Finance - Investment Banker/Broker — 0.6% | | | | | | | | |
TD Ameritrade Holding Corp.† | | | 56,900 | | | | 831,309 | |
| | | | | | |
|
|
|
Food - Misc. — 0.5% | | | | | | | | |
General Mills, Inc. | | | 4,000 | | | | 144,640 | |
Kellogg Co. | | | 3,500 | | | | 173,880 | |
Unilever PLC ADR | | | 16,700 | | | | 443,552 | |
| | | | | | |
|
|
|
| | | | | | | | 762,072 | |
| | | | | | |
|
|
|
Food - Retail — 0.3% | | | | | | | | |
Safeway, Inc. | | | 6,800 | | | | 127,840 | |
The Kroger Co. | | | 17,000 | | | | 335,410 | |
| | | | | | |
|
|
|
| | | | | | | | 463,250 | |
| | | | | | |
|
|
|
Forestry — 0.1% | | | | | | | | |
Weyerhaeuser Co. | | | 5,100 | | | | 80,070 | |
| | | | | | |
|
|
|
Gas - Distribution — 0.4% | | | | | | | | |
Questar Corp. | | | 31,550 | | | | 513,634 | |
| | | | | | |
|
|
|
Industrial Gases — 0.4% | | | | | | | | |
Air Products & Chemicals, Inc. | | | 7,090 | | | | 524,873 | |
| | | | | | |
|
|
|
Instruments - Scientific — 0.6% | | | | | | | | |
Thermo Fisher Scientific, Inc.† | | | 21,000 | | | | 884,520 | |
| | | | | | |
|
|
|
Insurance Brokers — 1.3% | | | | | | | | |
AON Corp. | | | 29,670 | | | | 1,075,241 | |
Marsh & McLennan Cos., Inc. | | | 33,640 | | | | 797,941 | |
| | | | | | |
|
|
|
| | | | | | | | 1,873,182 | |
| | | | | | |
|
|
|
Insurance - Life/Health — 1.9% | | | | | | | | |
Prudential Financial, Inc. | | | 55,650 | | | | 2,814,221 | |
| | | | | | |
|
|
|
Insurance - Multi - line — 0.7% | | | | | | | | |
Genworth Financial, Inc., Class A† | | | 43,900 | | | | 475,437 | |
The Allstate Corp. | | | 19,900 | | | | 549,240 | |
| | | | | | |
|
|
|
| | | | | | | | 1,024,677 | |
| | | | | | |
|
|
|
Insurance - Property/Casualty — 1.1% | | | | | | | | |
Chubb Corp. | | | 10,500 | | | | 578,760 | |
Fidelity National Financial, Inc., Class A | | | 32,600 | | | | 473,026 | |
The Progressive Corp. | | | 8,000 | | | | 158,400 | |
The Travelers Cos., Inc. | | | 8,000 | | | | 391,840 | |
| | | | | | |
|
|
|
| | | | | | | | 1,602,026 | |
| | | | | | |
|
|
|
Insurance - Reinsurance — 0.9% | | | | | | | | |
Berkshire Hathaway, Inc., Class B† | | | 8,500 | | | | 669,630 | |
Everest Re Group, Ltd. | | | 4,800 | | | | 379,872 | |
PartnerRe, Ltd. | | | 4,000 | | | | 297,800 | |
| | | | | | |
|
|
|
| | | | | | | | 1,347,302 | |
| | | | | | |
|
|
|
Internet Security — 0.3% | | | | | | | | |
Symantec Corp.† | | | 31,000 | | | | 422,530 | |
| | | | | | |
|
|
|
Investment Management/Advisor Services — 1.8% | | | | | | | | |
Ameriprise Financial, Inc. | | | 37,100 | | | | 1,616,818 | |
Franklin Resources, Inc. | | | 4,000 | | | | 386,040 | |
Invesco, Ltd. | | | 30,500 | | | | 552,050 | |
| | | | | | |
|
|
|
| | | | | | | | 2,554,908 | |
| | | | | | |
|
|
|
Machinery - Construction & Mining — 0.7% | | | | | | | | |
Caterpillar, Inc. | | | 15,560 | | | | 1,013,890 | |
| | | | | | |
|
|
|
Machinery - Farming — 0.1% | | | | | | | | |
Deere & Co. | | | 3,400 | | | | 215,118 | |
| | | | | | |
|
|
|
| | | | | | | | |
| | |
| Security Description | | Shares | | | Value (Note 2) | |
| |
| | | | | | | | | |
Medical Instruments — 0.5% | | | | | | | | |
Beckman Coulter, Inc. | | | 5,100 | | | $ | 232,764 | |
Medtronic, Inc. | | | 7,600 | | | | 239,248 | |
St. Jude Medical, Inc.† | | | 9,100 | | | | 314,587 | |
| | | | | | |
|
|
|
| | | | | | | | 786,599 | |
| | | | | | |
|
|
|
Medical Labs & Testing Services — 0.3% | | | | | | | | |
Laboratory Corp. of America Holdings† | | | 5,100 | | | | 370,362 | |
| | | | | | |
|
|
|
Medical Products — 1.5% | | | | | | | | |
Baxter International, Inc. | | | 12,000 | | | | 510,720 | |
Becton, Dickinson and Co. | | | 5,500 | | | | 375,045 | |
Covidien PLC | | | 9,000 | | | | 318,060 | |
Johnson & Johnson | | | 5,700 | | | | 325,014 | |
Zimmer Holdings, Inc.† | | | 12,820 | | | | 604,719 | |
| | | | | | |
|
|
|
| | | | | | | | 2,133,558 | |
| | | | | | |
|
|
|
Medical - Biomedical/Gene — 0.9% | | | | | | | | |
Amgen, Inc.† | | | 26,550 | | | | 1,355,112 | |
| | | | | | |
|
|
|
Medical - Drugs — 4.9% | | | | | | | | |
Abbott Laboratories | | | 11,300 | | | | 557,542 | |
Eli Lilly & Co. | | | 13,400 | | | | 449,704 | |
Merck & Co., Inc. | | | 67,700 | | | | 2,380,332 | |
Pfizer, Inc. | | | 233,780 | | | | 3,724,115 | |
| | | | | | |
|
|
|
| | | | | | | | 7,111,693 | |
| | | | | | |
|
|
|
Medical - HMO — 1.6% | | | | | | | | |
CIGNA Corp. | | | 24,470 | | | | 788,423 | |
UnitedHealth Group, Inc. | | | 40,330 | | | | 1,279,268 | |
WellPoint, Inc.† | | | 4,400 | | | | 218,592 | |
| | | | | | |
|
|
|
| | | | | | | | 2,286,283 | |
| | | | | | |
|
|
|
Medical - Wholesale Drug Distribution — 0.8% | | | | | | | | |
AmerisourceBergen Corp. | | | 17,780 | | | | 485,038 | |
McKesson Corp. | | | 12,310 | | | | 714,596 | |
| | | | | | |
|
|
|
| | | | | | | | 1,199,634 | |
| | | | | | |
|
|
|
Metal - Copper — 1.0% | | | | | | | | |
Freeport - McMoRan Copper & Gold, Inc. | | | 20,480 | | | | 1,474,150 | |
| | | | | | |
|
|
|
Mining — 0.5% | | | | | | | | |
Goldcorp, Inc. | | | 16,200 | | | | 716,364 | |
| | | | | | |
|
|
|
Multimedia — 2.9% | | | | | | | | |
News Corp., Class A | | | 144,050 | | | | 1,810,709 | |
Time Warner, Inc. | | | 73,040 | | | | 2,189,739 | |
Viacom, Inc., Class B | | | 8,700 | | | | 273,354 | |
| | | | | | |
|
|
|
| | | | | | | | 4,273,802 | |
| | | | | | |
|
|
|
Networking Products — 1.4% | | | | | | | | |
Cisco Systems, Inc.† | | | 98,850 | | | | 1,981,943 | |
| | | | | | |
|
|
|
Office Automation & Equipment — 0.8% | | | | | | | | |
Pitney Bowes, Inc. | | | 58,880 | | | | 1,132,851 | |
| | | | | | |
|
|
|
Oil Companies - Exploration & Production — 7.6% | | | | | | | | |
Anadarko Petroleum Corp. | | | 27,000 | | | | 1,241,730 | |
Apache Corp. | | | 2,700 | | | | 242,595 | |
Comstock Resources, Inc.† | | | 4,500 | | | | 97,965 | |
Devon Energy Corp. | | | 3,500 | | | | 210,980 | |
EOG Resources, Inc. | | | 27,670 | | | | 2,403,693 | |
EQT Corp. | | | 5,000 | | | | 163,000 | |
Forest Oil Corp.† | | | 3,300 | | | | 86,196 | |
Noble Energy, Inc. | | | 6,400 | | | | 446,592 | |
Occidental Petroleum Corp. | | | 64,290 | | | | 4,698,313 | |
QEP Resources, Inc. | | | 39,340 | | | | 1,142,040 | |
Southwestern Energy Co.† | | | 7,000 | | | | 229,040 | |
Ultra Petroleum Corp.† | | | 2,700 | | | | 105,327 | |
| | | | | | |
|
|
|
| | | | | | | | 11,067,471 | |
| | | | | | |
|
|
|
49
VALIC Company II Large Cap Value Fund
PORTFOLIO OF INVESTMENTS — August 31, 2010 — (continued)
| | | | | | | | |
| | |
| Security Description | | Shares | | | Value (Note 2) | |
| |
COMMON STOCK (continued) | | | | | | | | |
Oil Companies - Integrated — 3.2% | | | | | | | | |
ConocoPhillips | | | 38,260 | | | $ | 2,005,972 | |
Exxon Mobil Corp. | | | 37,330 | | | | 2,208,443 | |
Hess Corp. | | | 10,400 | | | | 522,600 | |
| | | | | | |
|
|
|
| | | | | | | | 4,737,015 | |
| | | | | | |
|
|
|
Oil Field Machinery & Equipment — 1.2% | | | | | | | | |
Cameron International Corp.† | | | 40,910 | | | | 1,504,670 | |
National Oilwell Varco, Inc. | | | 7,900 | | | | 296,961 | |
| | | | | | |
|
|
|
| | | | | | | | 1,801,631 | |
| | | | | | |
|
|
|
Oil - Field Services — 1.4% | | | | | | | | |
Schlumberger, Ltd. | | | 38,890 | | | | 2,074,004 | |
| | | | | | |
|
|
|
Paper & Related Products — 0.3% | | | | | | | | |
International Paper Co. | | | 20,700 | | | | 423,522 | |
| | | | | | |
|
|
|
Pipelines — 0.1% | | | | | | | | |
Plains All American Pipeline LP | | | 2,500 | | | | 150,100 | |
| | | | | | |
|
|
|
Real Estate Investment Trusts — 0.3% | | | | | | | | |
Equity Residential | | | 2,300 | | | | 105,409 | |
Public Storage | | | 2,200 | | | | 215,644 | |
Simon Property Group, Inc. | | | 1,700 | | | | 153,765 | |
| | | | | | |
|
|
|
| | | | | | | | 474,818 | |
| | | | | | |
|
|
|
Retail - Apparel/Shoe — 0.6% | | | | | | | | |
Abercrombie & Fitch Co., Class A | | | 14,990 | | | | 518,654 | |
The Gap, Inc. | | | 20,400 | | | | 344,556 | |
| | | | | | |
|
|
|
| | | | | | | | 863,210 | |
| | | | | | |
|
|
|
Retail - Building Products — 1.1% | | | | | | | | |
Home Depot, Inc. | | | 47,890 | | | | 1,331,821 | |
Lowe’s Cos., Inc. | | | 14,400 | | | | 292,320 | |
| | | | | | |
|
|
|
| | | | | | | | 1,624,141 | |
| | | | | | |
|
|
|
Retail - Discount — 0.6% | | | | | | | | |
Target Corp. | | | 3,600 | | | | 184,176 | |
Wal - Mart Stores, Inc. | | | 15,100 | | | | 757,114 | |
| | | | | | |
|
|
|
| | | | | | | | 941,290 | |
| | | | | | |
|
|
|
Retail - Drug Store — 1.4% | | | | | | | | |
CVS Caremark Corp. | | | 74,490 | | | | 2,011,230 | |
| | | | | | |
|
|
|
Retail - Major Department Stores — 0.1% | | | | | | | | |
TJX Cos., Inc. | | | 4,200 | | | | 166,698 | |
| | | | | | |
|
|
|
Retail - Office Supplies — 0.3% | | | | | | | | |
Staples, Inc. | | | 27,130 | | | | 482,100 | |
| | | | | | |
|
|
|
Retail - Regional Department Stores — 0.5% | | | | | | | | |
Kohl’s Corp.† | | | 3,900 | | | | 183,222 | |
Macy’s, Inc. | | | 26,100 | | | | 507,384 | |
| | | | | | |
|
|
|
| | | | | | | | 690,606 | |
| | | | | | |
|
|
|
Retail - Restaurants — 0.2% | | | | | | | | |
McDonald’s Corp. | | | 5,000 | | | | 365,300 | |
| | | | | | |
|
|
|
| | | | | | | | |
| | |
| Security Description | | Shares/
Principal
Amount | | | Value (Note 2) | |
| |
| | | | | | | | | |
Savings & Loans/Thrifts — 0.1% | | | | | | | | |
People’s United Financial, Inc. | | | 17,200 | | | $ | 218,784 | |
| | | | | | |
|
|
|
Semiconductor Equipment — 0.2% | | | | | | | | |
Applied Materials, Inc. | | | 34,700 | | | | 360,533 | |
| | | | | | |
|
|
|
Telephone - Integrated — 4.4% | | | | | | | | |
AT&T, Inc. | | | 164,200 | | | | 4,438,326 | |
CenturyLink, Inc. | | | 11,300 | | | | 408,608 | |
Verizon Communications, Inc. | | | 51,160 | | | | 1,509,732 | |
| | | | | | |
|
|
|
| | | | | | | | 6,356,666 | |
| | | | | | |
|
|
|
Tobacco — 0.8% | | | | | | | | |
Philip Morris International, Inc. | | | 22,980 | | | | 1,182,091 | |
| | | | | | |
|
|
|
Tools - Hand Held — 0.1% | | | | | | | | |
Snap - On, Inc. | | | 3,300 | | | | 136,059 | |
| | | | | | |
|
|
|
Toys — 0.4% | | | | | | | | |
Mattel, Inc. | | | 24,660 | | | | 517,613 | |
| | | | | | |
|
|
|
Transport - Rail — 1.3% | | | | | | | | |
Kansas City Southern† | | | 7,600 | | | | 255,132 | |
Norfolk Southern Corp. | | | 13,380 | | | | 718,238 | |
Union Pacific Corp. | | | 11,810 | | | | 861,422 | |
| | | | | | |
|
|
|
| | | | | | | | 1,834,792 | |
| | | | | | |
|
|
|
Web Portals/ISP — 0.7% | | | | | | | | |
AOL, Inc.† | | | 43,200 | | | | 959,904 | |
| | | | | | |
|
|
|
Wireless Equipment — 1.8% | | | | | | | | |
Motorola, Inc.† | | | 69,480 | | | | 523,184 | |
QUALCOMM, Inc. | | | 56,390 | | | | 2,160,301 | |
| | | | | | |
|
|
|
| | | | | | | | 2,683,485 | |
| | | | | | |
|
|
|
X - Ray Equipment — 0.1% | | | | | | | | |
Hologic, Inc.† | | | 12,900 | | | | 183,051 | |
| | | | | | |
|
|
|
Total Long - Term Investment Securities | | | | | | | | |
(cost $145,177,525) | | | | | | | 141,772,325 | |
| | | | | | |
|
|
|
SHORT - TERM INVESTMENT SECURITIES — 2.3% | | | | | | | | |
U.S. Government Agencies — 2.3% | | | | | | | | |
Federal Home Loan Bank
Disc. Notes
0.10% due 09/01/10
(cost $3,400,000) | | $ | 3,400,000 | | | | 3,400,000 | |
| | | | | | |
|
|
|
TOTAL INVESTMENTS | | | | | | | | |
(cost $148,577,525)(1) | | | 99.6 | % | | | 145,172,325 | |
Other assets less liabilities | | | 0.4 | | | | 605,796 | |
| | |
|
|
| |
|
|
|
NET ASSETS — | | | 100.0 | % | | $ | 145,778,121 | |
| | |
|
|
| |
|
|
|
| † | Non-income producing security |
| (1) | See Note 5 for cost of investments on a tax basis. |
ADR—American Depository Receipt
50
VALIC Company II Large Cap Value Fund
PORTFOLIO OF INVESTMENTS — August 31, 2010 — (continued)
The following is a summary of the inputs used to value the Fund’s net assets as of August 31, 2010 (see Note 2):
| | | | | | | | | | | | | | | | |
| | | Level 1 - Unadjusted Quoted
Prices
| | | Level 2 - Other Observable
Inputs
| | | Level 3 - Significant
Unobservable Inputs
| | | Total
| |
Long-Term Investment Securities: | | | | | | | | | | | | | | | | |
Common Stock: | | | | | | | | | | | | | | | | |
Banks - Super Regional | | $ | 7,277,988 | | | $ | — | | | $ | — | | | $ | 7,277,988 | |
Diversified Banking Institutions | | | 12,689,882 | | | | — | | | | — | | | | 12,689,882 | |
Oil Companies - Exploration & Production | | | 11,067,471 | | | | — | | | | — | | | | 11,067,471 | |
Other Industries* | | | 110,736,984 | | | | — | | | | — | | | | 110,736,984 | |
Short-Term Investment Securities: | | | | | | | | | | | | | | | | |
U.S. Government Agencies | | | — | | | | 3,400,000 | | | | — | | | | 3,400,000 | |
| | |
|
|
| |
|
|
| |
|
|
| |
|
|
|
Total | | $ | 141,772,325 | | | $ | 3,400,000 | | | $ | — | | | $ | 145,172,325 | |
| | |
|
|
| |
|
|
| |
|
|
| |
|
|
|
| * | Sum of all other industries each of which individually has an aggregate market value of less than 5% of net assets. For a detailed presentation of common stocks by industry classification, please refer to the Portfolio of Investments. |
See Notes to Financial Statements
51
VALIC Company II Mid Cap Growth Fund
PORTFOLIO PROFILE — August 31, 2010 (Unaudited)
Industry Allocation*
| | | | |
Repurchase Agreements | | | 9.0 | % |
Electronic Components — Semiconductors | | | 6.4 | |
Oil Companies — Exploration & Production | | | 4.7 | |
Medical — Biomedical/Gene | | | 3.8 | |
Computer Services | | | 3.0 | |
Apparel Manufacturers | | | 2.6 | |
Chemicals — Specialty | | | 2.5 | |
Internet Infrastructure Software | | | 2.3 | |
Casino Hotels | | | 2.2 | |
Hotels/Motels | | | 2.2 | |
Engineering/R&D Services | | | 2.1 | |
Medical — HMO | | | 2.0 | |
Transport — Truck | | | 2.0 | |
Retail — Apparel/Shoe | | | 2.0 | |
Medical Products | | | 1.8 | |
Finance — Credit Card | | | 1.7 | |
Investment Management/Advisor Services | | | 1.6 | |
Real Estate Management/Services | | | 1.5 | |
Commercial Services | | | 1.5 | |
Wireless Equipment | | | 1.5 | |
Retail — Regional Department Stores | | | 1.4 | |
Auto/Truck Parts & Equipment — Original | | | 1.4 | |
Retail — Restaurants | | | 1.4 | |
Schools | | | 1.4 | |
Aerospace/Defense — Equipment | | | 1.4 | |
Food — Confectionery | | | 1.3 | |
Machinery — Electrical | | | 1.3 | |
Dialysis Centers | | | 1.2 | |
Applications Software | | | 1.2 | |
E-Commerce/Services | | | 1.2 | |
Medical — Drugs | | | 1.2 | |
Retail — Perfume & Cosmetics | | | 1.1 | |
Computers — Integrated Systems | | | 1.1 | |
Non — Hazardous Waste Disposal | | | 1.1 | |
Oil — Field Services | | | 1.1 | |
Transport — Services | | | 1.1 | |
Retail — Auto Parts | | | 1.1 | |
Computers — Memory Devices | | | 1.1 | |
Electronic Connectors | | | 1.1 | |
Broadcast Services/Program | | | 1.1 | |
X-Ray Equipment | | | 1.0 | |
Machinery — Pumps | | | 1.0 | |
Auction Houses/Art Dealers | | | 1.0 | |
Internet Content — Information/News | | | 1.0 | |
Medical — Hospitals | | | 0.9 | |
Retail — Automobile | | | 0.9 | |
Research & Development | | | 0.9 | |
Machinery — Construction & Mining | | | 0.9 | |
Machinery — Farming | | | 0.8 | |
Financial Guarantee Insurance | | | 0.8 | |
Telecom Equipment — Fiber Optics | | | 0.8 | |
Machine Tools & Related Products | | | 0.8 | |
Distribution/Wholesale | | | 0.7 | |
Coal | | | 0.7 | |
Medical Instruments | | | 0.7 | |
Private Corrections | | | 0.6 | |
Human Resources | | | 0.6 | |
Cosmetics & Toiletries | | | 0.6 | |
Diversified Manufacturing Operations | | | 0.6 | |
Computer Aided Design | | | 0.6 | |
Soap & Cleaning Preparation | | | 0.5 | |
Internet Security | | | 0.5 | |
Computer Software | | | 0.5 | |
Retirement/Aged Care | | | 0.4 | |
Semiconductor Components — Integrated Circuits | | | 0.3 | |
Electronic Components — Misc. | | | 0.2 | |
Containers — Metal/Glass | | | 0.2 | |
| | |
|
|
|
| | | | 99.2 | % |
| | |
|
|
|
| * | Calculated as a percentage of net assets |
52
VALIC Company II Mid Cap Growth Fund
PORTFOLIO OF INVESTMENTS — August 31, 2010
| | | | | | | | |
| | |
| Security Description | | Shares | | | Value (Note 2) | |
| |
COMMON STOCK — 90.2% | | | | | | | | |
Aerospace/Defense-Equipment — 1.4% | | | | | | | | |
BE Aerospace, Inc.† | | | 84,297 | | | $ | 2,271,804 | |
| | | | | | |
|
|
|
Apparel Manufacturers — 2.6% | | | | | | | | |
Coach, Inc. | | | 53,981 | | | | 1,934,679 | |
Hanesbrands, Inc.† | | | 96,257 | | | | 2,304,393 | |
| | | | | | |
|
|
|
| | | | | | | | 4,239,072 | |
| | | | | | |
|
|
|
Applications Software — 1.2% | | | | | | | | |
Check Point Software Technologies, Ltd.† | | | 57,047 | | | | 1,990,370 | |
| | | | | | |
|
|
|
Auction House/Art Dealers — 1.0% | | | | | | | | |
KAR Auction Services, Inc.† | | | 134,175 | | | | 1,624,859 | |
| | | | | | |
|
|
|
Auto/Truck Parts & Equipment - Original — 1.4% | | | | | | | | |
BorgWarner, Inc.† | | | 53,110 | | | | 2,318,251 | |
| | | | | | |
|
|
|
Broadcast Services/Program — 1.1% | | | | | | | | |
Discovery Communications, Inc., Class A† | | | 45,569 | | | | 1,720,230 | |
| | | | | | |
|
|
|
Casino Hotels — 2.2% | | | | | | | | |
Las Vegas Sands Corp.† | | | 74,119 | | | | 2,099,791 | |
MGM Resorts International† | | | 172,084 | | | | 1,550,477 | |
| | | | | | |
|
|
|
| | | | | | | | 3,650,268 | |
| | | | | | |
|
|
|
Chemicals - Specialty — 2.5% | | | | | | | | |
Albemarle Corp. | | | 49,510 | | | | 1,984,856 | |
Lubrizol Corp. | | | 23,356 | | | | 2,179,348 | |
| | | | | | |
|
|
|
| | | | | | | | 4,164,204 | |
| | | | | | |
|
|
|
Coal — 0.7% | | | | | | | | |
Massey Energy Co. | | | 38,581 | | | | 1,109,204 | |
| | | | | | |
|
|
|
Commercial Services — 1.5% | | | | | | | | |
Alliance Data Systems Corp.† | | | 44,153 | | | | 2,480,957 | |
| | | | | | |
|
|
|
Computer Aided Design — 0.6% | | | | | | | | |
Autodesk, Inc.† | | | 32,769 | | | | 909,340 | |
| | | | | | |
|
|
|
Computer Services — 3.0% | | | | | | | | |
Cognizant Technology Solutions Corp., Class A† | | | 38,609 | | | | 2,224,071 | |
IHS, Inc., Class A† | | | 44,087 | | | | 2,724,136 | |
| | | | | | |
|
|
|
| | | | | | | | 4,948,207 | |
| | | | | | |
|
|
|
Computer Software — 0.5% | | | | | | | | |
Smart Technologies, Inc., Class A† | | | 64,174 | | | | 735,434 | |
| | | | | | |
|
|
|
Computers - Integrated Systems — 1.1% | | | | | | | | |
Teradata Corp.† | | | 56,114 | | | | 1,837,172 | |
| | | | | | |
|
|
|
Computers - Memory Devices — 1.1% | | | | | | | | |
NetApp, Inc.† | | | 43,140 | | | | 1,744,582 | |
| | | | | | |
|
|
|
Containers - Metal/Glass — 0.2% | | | | | | | | |
Crown Holdings, Inc.† | | | 13,213 | | | | 368,114 | |
| | | | | | |
|
|
|
Cosmetics & Toiletries — 0.6% | | | | | | | | |
The Estee Lauder Cos., Inc., Class A | | | 16,419 | | | | 920,613 | |
| | | | | | |
|
|
|
Dialysis Centers — 1.2% | | | | | | | | |
Fresenius Medical Care AG & Co. KGaA | | | 35,981 | | | | 2,037,271 | |
| | | | | | |
|
|
|
Distribution/Wholesale — 0.7% | | | | | | | | |
Fastenal Co. | | | 25,556 | | | | 1,156,920 | |
| | | | | | |
|
|
|
Diversified Manufacturing Operations — 0.6% | | | | | | | | |
Cooper Industries PLC | | | 21,775 | | | | 916,510 | |
| | | | | | |
|
|
|
E - Commerce/Services — 1.2% | | | | | | | | |
Ctrip.com International, Ltd. ADR† | | | 46,513 | | | | 1,883,311 | |
| | | | | | |
|
|
|
Electronic Components - Misc. — 0.2% | | | | | | | | |
Gentex Corp. | | | 22,964 | | | | 403,477 | |
| | | | | | |
|
|
|
Electronic Components - Semiconductors — 6.4% | | | | | | | | |
Altera Corp. | | | 60,665 | | | | 1,496,606 | |
| | | | | | | | |
| | |
| Security Description | | Shares | | | Value (Note 2) | |
| |
| | | | | | | | | |
Electronic Components - Semiconductors (continued) | | | | | | | | |
Avago Technologies, Ltd.† | | | 129,682 | | | $ | 2,613,092 | |
Broadcom Corp., Class A | | | 38,311 | | | | 1,148,181 | |
Cavium Networks, Inc.† | | | 69,717 | | | | 1,682,968 | |
Rovi Corp.† | | | 47,981 | | | | 2,087,653 | |
Xilinx, Inc. | | | 55,712 | | | | 1,345,445 | |
| | | | | | |
|
|
|
| | | | | | | | 10,373,945 | |
| | | | | | |
|
|
|
Electronic Connectors — 1.1% | | | | | | | | |
Amphenol Corp., Class A | | | 42,334 | | | | 1,723,840 | |
| | | | | | |
|
|
|
Engineering/R&D Services — 2.1% | | | | | | | | |
Foster Wheeler AG† | | | 67,489 | | | | 1,439,540 | |
The Shaw Group, Inc.† | | | 60,766 | | | | 1,968,819 | |
| | | | | | |
|
|
|
| | | | | | | | 3,408,359 | |
| | | | | | |
|
|
|
Finance - Credit Card — 1.7% | | | | | | | | |
Discover Financial Services | | | 194,063 | | | | 2,815,854 | |
| | | | | | |
|
|
|
Financial Guarantee Insurance — 0.8% | | | | | | | | |
Assured Guaranty, Ltd. | | | 86,710 | | | | 1,339,670 | |
| | | | | | |
|
|
|
Food - Confectionery — 1.3% | | | | | | | | |
The Hershey Co. | | | 47,189 | | | | 2,192,873 | |
| | | | | | |
|
|
|
Hotels/Motels — 2.2% | | | | | | | | |
Marriott International, Inc., Class A | | | 52,907 | | | | 1,693,553 | |
Orient - Express Hotels, Ltd., Class A† | | | 212,033 | | | | 1,831,965 | |
| | | | | | |
|
|
|
| | | | | | | | 3,525,518 | |
| | | | | | |
|
|
|
Human Resources — 0.6% | | | | | | | | |
Robert Half International, Inc. | | | 46,463 | | | | 1,002,672 | |
| | | | | | |
|
|
|
Internet Content - Information/News — 1.0% | | | | | | | | |
Baidu, Inc. ADR† | | | 20,668 | | | | 1,620,991 | |
| | | | | | |
|
|
|
Internet Infrastructure Software — 2.3% | | | | | | | | |
Akamai Technologies, Inc.† | | | 34,018 | | | | 1,567,209 | |
TIBCO Software, Inc.† | | | 156,694 | | | | 2,270,496 | |
| | | | | | |
|
|
|
| | | | | | | | 3,837,705 | |
| | | | | | |
|
|
|
Internet Security — 0.5% | | | | | | | | |
VeriSign, Inc.† | | | 28,120 | | | | 819,136 | |
| | | | | | |
|
|
|
Investment Management/Advisor Services — 1.6% | | | | | | | | |
Affiliated Managers Group, Inc.† | | | 41,022 | | | | 2,634,023 | |
| | | | | | |
|
|
|
Machine Tools & Related Products — 0.8% | | | | | | | | |
Kennametal, Inc. | | | 49,676 | | | | 1,251,835 | |
| | | | | | |
|
|
|
Machinery - Construction & Mining — 0.9% | | | | | | | | |
Bucyrus International, Inc. | | | 24,513 | | | | 1,409,252 | |
| | | | | | |
|
|
|
Machinery - Electrical — 1.3% | | | | | | | | |
Baldor Electric Co. | | | 61,332 | | | | 2,151,527 | |
| | | | | | |
|
|
|
Machinery - Farming — 0.8% | | | | | | | | |
AGCO Corp.† | | | 41,300 | | | | 1,364,965 | |
| | | | | | |
|
|
|
Machinery - Pumps — 1.0% | | | | | | | | |
Flowserve Corp. | | | 18,736 | | | | 1,674,624 | |
| | | | | | |
|
|
|
Medical Instruments — 0.7% | | | | | | | | |
NuVasive, Inc.† | | | 37,773 | | | | 1,108,638 | |
| | | | | | |
|
|
|
Medical Products — 1.8% | | | | | | | | |
American Medical Systems Holdings, Inc.† | | | 74,778 | | | | 1,362,455 | |
CareFusion Corp.† | | | 70,495 | | | | 1,521,282 | |
| | | | | | |
|
|
|
| | | | | | | | 2,883,737 | |
| | | | | | |
|
|
|
Medical - Biomedical/Gene — 3.8% | | | | | | | | |
Genzyme Corp.† | | | 24,607 | | | | 1,725,197 | |
Human Genome Sciences, Inc.† | | | 52,537 | | | | 1,528,301 | |
Life Technologies Corp.† | | | 35,819 | | | | 1,531,979 | |
53
VALIC Company II Mid Cap Growth Fund
PORTFOLIO OF INVESTMENTS — August 31, 2010 — (continued)
| | | | | | | | |
| | |
| Security Description | | Shares | | | Value (Note 2) | |
| |
COMMON STOCK (continued) | | | | | | | | |
Medical - Biomedical/Gene (continued) | | | | | | | | |
United Therapeutics Corp.† | | | 29,132 | | | $ | 1,346,481 | |
| | | | | | |
|
|
|
| | | | | | | | 6,131,958 | |
| | | | | | |
|
|
|
Medical - Drugs — 1.2% | | | | | | | | |
Furiex Pharmaceuticals, Inc.† | | | 1 | | | | 10 | |
Shire PLC | | | 87,184 | | | | 1,879,960 | |
| | | | | | |
|
|
|
| | | | | | | | 1,879,970 | |
| | | | | | |
|
|
|
Medical - HMO — 2.0% | | | | | | | | |
Aetna, Inc. | | | 42,405 | | | | 1,133,061 | |
AMERIGROUP Corp.† | | | 59,062 | | | | 2,179,388 | |
| | | | | | |
|
|
|
| | | | | | | | 3,312,449 | |
| | | | | | |
|
|
|
Medical - Hospitals — 0.9% | | | | | | | | |
Universal Health Services, Inc., Class B | | | 48,795 | | | | 1,532,163 | |
| | | | | | |
|
|
|
Non-Hazardous Waste Disposal — 1.1% | | | | | | | | |
Republic Services, Inc. | | | 61,923 | | | | 1,822,394 | |
| | | | | | |
|
|
|
Oil Companies - Exploration & Production — 4.7% | | | | | | | | |
Atlas Energy, Inc.† | | | 34,263 | | | | 931,954 | |
Concho Resources, Inc.† | | | 35,747 | | | | 2,088,340 | |
Continental Resources, Inc.† | | | 49,531 | | | | 2,006,996 | |
Oasis Petroleum, Inc.† | | | 66,679 | | | | 1,098,203 | |
Plains Exploration & Production Co.† | | | 67,399 | | | | 1,609,488 | |
| | | | | | |
|
|
|
| | | | | | | | 7,734,981 | |
| | | | | | |
|
|
|
Oil - Field Services — 1.1% | | | | | | | | |
Key Energy Services, Inc.† | | | 225,734 | | | | 1,808,129 | |
| | | | | | |
|
|
|
Private Corrections — 0.6% | | | | | | | | |
Corrections Corp. of America† | | | 45,785 | | | | 1,021,463 | |
| | | | | | |
|
|
|
Real Estate Management/Services — 1.5% | | | | | | | | |
Jones Lang LaSalle, Inc. | | | 33,221 | | | | 2,508,518 | |
| | | | | | |
|
|
|
Research & Development — 0.9% | | | | | | | | |
Pharmaceutical Product Development, Inc. | | | 63,184 | | | | 1,451,336 | |
| | | | | | |
|
|
|
Retail - Apparel/Shoe — 2.0% | | | | | | | | |
American Eagle Outfitters, Inc. | | | 137,598 | | | | 1,739,239 | |
Rue21, Inc.† | | | 69,560 | | | | 1,467,020 | |
| | | | | | |
|
|
|
| | | | | | | | 3,206,259 | |
| | | | | | |
|
|
|
Retail - Auto Parts — 1.1% | | | | | | | | |
O’Reilly Automotive, Inc.† | | | 37,146 | | | | 1,755,891 | |
| | | | | | |
|
|
|
Retail - Automobile — 0.9% | | | | | | | | |
Copart, Inc.† | | | 45,969 | | | | 1,519,275 | |
| | | | | | |
|
|
|
Retail - Perfume & Cosmetics — 1.1% | | | | | | | | |
Ulta Salon Cosmetics & Fragrance, Inc.† | | | 81,212 | | | | 1,839,452 | |
| | | | | | |
|
|
|
Retail - Regional Department Stores — 1.4% | | | | | | | | |
Macy’s, Inc. | | | 119,269 | | | | 2,318,589 | |
| | | | | | |
|
|
|
Retail - Restaurants — 1.4% | | | | | | | | |
Texas Roadhouse, Inc., Class A† | | | 173,152 | | | | 2,295,996 | |
| | | | | | |
|
|
|
| | | | | | | | |
| | |
| Security Description | | Shares/
Principal
Amount | | | Value (Note 2) | |
| |
| | | | | | | | | |
Retirement/Aged Care — 0.4% | | | | | | | | |
Brookdale Senior Living, Inc.† | | | 48,351 | | | $ | 647,903 | |
| | | | | | |
|
|
|
Schools — 1.4% | | | | | | | | |
Grand Canyon Education, Inc.† | | | 66,480 | | | | 1,136,143 | |
ITT Educational Services, Inc.† | | | 21,617 | | | | 1,151,322 | |
| | | | | | |
|
|
|
| | | | | | | | 2,287,465 | |
| | | | | | |
|
|
|
Semiconductor Components - Integrated Circuits — 0.3% | | | | | | | | |
Marvell Technology Group, Ltd.† | | | 27,690 | | | | 441,379 | |
| | | | | | |
|
|
|
Soap & Cleaning Preparation — 0.5% | | | | | | | | |
Church & Dwight Co., Inc. | | | 13,725 | | | | 840,382 | |
| | | | | | |
|
|
|
| | | | | | | | | |
Telecom Equipment - Fiber Optics — 0.8% | | | | | | | | |
Finisar Corp.† | | | 100,228 | | | | 1,281,916 | |
| | | | | | |
|
|
|
Transport - Services — 1.1% | | | | | | | | |
UTi Worldwide, Inc. | | | 127,189 | | | | 1,781,918 | |
| | | | | | |
|
|
|
Transport - Truck — 2.0% | | | | | | | | |
J.B. Hunt Transport Services, Inc. | | | 53,869 | | | | 1,763,671 | |
Knight Transportation, Inc. | | | 79,263 | | | | 1,493,315 | |
| | | | | | |
|
|
|
| | | | | | | | 3,256,986 | |
| | | | | | |
|
|
|
Wireless Equipment — 1.5% | | | | | | | | |
Crown Castle International Corp.† | | | 59,225 | | | | 2,435,332 | |
| | | | | | |
|
|
|
X - Ray Equipment — 1.0% | | | | | | | | |
Hologic, Inc.† | | | 118,529 | | | | 1,681,927 | |
| | | | | | |
|
|
|
Total Long-Term Investment Securities | | | | | | | | |
(cost $140,200,584) | | | | | | | 147,363,365 | |
| | | | | | |
|
|
|
REPURCHASE AGREEMENT — 9.0% | | | | | | | | |
Agreement with State Street Bank & Trust Co., bearing interest at 0.01%, dated 08/31/10, to be repurchased 09/01/10 in the amount of $14,692,004 and collateralized by $14,810,000 of Federal Home Loan Bank Bonds, bearing interest at 4.38% due 09/17/10 and having approximate value of $15,132,858
(cost $14,692,000) | | $ | 14,692,000 | | | | 14,692,000 | |
| | | | | | |
|
|
|
TOTAL INVESTMENTS | | | | | | | | |
(cost $154,892,584)(1) | | | 99.2 | % | | | 162,055,365 | |
Other assets less liabilities | | | 0.8 | | | | 1,308,404 | |
| | |
|
|
| |
|
|
|
NET ASSETS — | | | 100.0 | % | | $ | 163,363,769 | |
| | |
|
|
| |
|
|
|
| † | Non-income producing security |
| (1) | See Note 5 for cost of investments on a tax basis. |
ADR—American Depository Receipt
54
VALIC Company II Mid Cap Growth Fund
PORTFOLIO OF INVESTMENTS — August 31, 2010 — (continued)
The following is a summary of the inputs used to value the Fund’s net assets as of August 31, 2010 (see Note 2):
| | | | | | | | | | | | | | | | |
| | | Level 1 - Unadjusted Quoted
Prices
| | | Level 2 - Other Observable
Inputs
| | | Level 3 - Significant
Unobservable Inputs
| | | Total
| |
Long-Term Investment Securities: | | | | | | | | | | | | | | | | |
Common Stock: | | | | | | | | | | | | | | | | |
Electronic Components - Semiconductors | | $ | 10,373,945 | | | $ | — | | | $ | — | | | $ | 10,373,945 | |
Other Industries* | | | 136,989,420 | | | | — | | | | — | | | | 136,989,420 | |
Repurchase Agreement | | | — | | | | 14,692,000 | | | | — | | | | 14,692,000 | |
| | |
|
|
| |
|
|
| |
|
|
| |
|
|
|
Total | | $ | 147,363,365 | | | $ | 14,692,000 | | | $ | — | | | $ | 162,055,365 | |
| | |
|
|
| |
|
|
| |
|
|
| |
|
|
|
| * | Sum of all other industries each of which individually has an aggregate market value of less than 5% of net assets. For a detailed presentation of common stocks by industry classification, please refer to the Portfolio of Investments. |
See Notes to Financial Statements
55
VALIC Company II Mid Cap Value Fund
PORTFOLIO PROFILE — August 31, 2010
Industry Allocation*
| | | | |
Electric — Integrated | | | 7.1 | % |
Real Estate Investment Trusts | | | 5.2 | |
Oil Companies — Exploration & Production | | | 4.4 | |
Insurance — Reinsurance | | | 3.7 | |
Diversified Manufacturing Operations | | | 3.5 | |
Investment Management/Advisor Services | | | 3.3 | |
Insurance — Life/Health | | | 3.3 | |
Banks — Super Regional | | | 2.7 | |
Gas — Distribution | | | 2.2 | |
Time Deposits | | | 2.0 | |
Chemicals — Diversified | | | 2.0 | |
Containers — Metal/Glass | | | 1.9 | |
Agricultural Chemicals | | | 1.9 | |
Retail — Apparel/Shoe | | | 1.8 | |
Banks — Commercial | | | 1.7 | |
Telecom Services | | | 1.6 | |
Building — Residential/Commercial | | | 1.5 | |
Commercial Services | | | 1.5 | |
Medical — Wholesale Drug Distribution | | | 1.5 | |
Chemicals — Specialty | | | 1.4 | |
Toys | | | 1.4 | |
Television | | | 1.4 | |
Applications Software | | | 1.4 | |
Airlines | | | 1.3 | |
Electronic Connectors | | | 1.3 | |
Electronic Parts Distribution | | | 1.2 | |
Medical — HMO | | | 1.2 | |
Electronic Components — Misc. | | | 1.2 | |
Telephone — Integrated | | | 1.2 | |
Real Estate Operations & Development | | | 1.2 | |
Insurance — Property/Casualty | | | 1.2 | |
Agricultural Operations | | | 1.1 | |
Semiconductor Equipment | | | 1.1 | |
Aerospace/Defense — Equipment | | | 1.1 | |
Repurchase Agreements | | | 1.0 | |
Aerospace/Defense | | | 0.9 | |
Food — Misc. | | | 0.9 | |
Electric Products — Misc. | | | 0.8 | |
Retail — Regional Department Stores | | | 0.8 | |
Non — Hazardous Waste Disposal | | | 0.8 | |
Coal | | | 0.8 | |
Engines — Internal Combustion | | | 0.8 | |
Finance — Credit Card | | | 0.8 | |
Medical — Drugs | | | 0.8 | |
Pipelines | | | 0.7 | |
Drug Delivery Systems | | | 0.7 | |
Medical — Generic Drugs | | | 0.7 | |
Food — Confectionery | | | 0.6 | |
Office Automation & Equipment | | | 0.6 | |
Enterprise Software/Service | | | 0.6 | |
Disposable Medical Products | | | 0.6 | |
Beverages — Non-alcoholic | | | 0.6 | |
Finance — Investment Banker/Broker | | | 0.6 | |
Tools — Hand Held | | | 0.6 | |
Brewery | | | 0.6 | |
Networking Products | | | 0.6 | |
Forestry | | | 0.6 | |
Medical — Hospitals | | | 0.6 | |
Containers — Paper/Plastic | | | 0.6 | |
Machinery — Construction & Mining | | | 0.6 | |
Medical Instruments | | | 0.6 | |
Power Converter/Supply Equipment | | | 0.6 | |
Advertising Agencies | | | 0.6 | |
Oil Field Machinery & Equipment | | | 0.6 | |
Building & Construction — Misc. | | | 0.5 | |
Apparel Manufacturers | | | 0.5 | |
Machinery — Electrical | | | 0.5 | |
Transport — Rail | | | 0.5 | |
Food — Canned | | | 0.5 | |
| | | | |
Real Estate Management/Services | | | 0.5 | |
Retail — Restaurants | | | 0.5 | |
Engineering/R&D Services | | | 0.5 | |
Machinery — Farming | | | 0.5 | |
Metal — Iron | | | 0.4 | |
Cable/Satellite TV | | | 0.4 | |
Oil & Gas Drilling | | | 0.4 | |
Transport — Truck | | | 0.4 | |
Oil — Field Services | | | 0.4 | |
Transport — Marine | | | 0.3 | |
Travel Services | | | 0.3 | |
Computer Graphics | | | 0.3 | |
Human Resources | | | 0.3 | |
Computers — Integrated Systems | | | 0.2 | |
Schools | | | 0.2 | |
Registered Investment Companies | | | 0.2 | |
Medical — Outpatient/Home Medical | | | 0.2 | |
Appliances | | | 0.2 | |
Semiconductor Components — Integrated Circuits | | | 0.2 | |
Savings & Loans/Thrifts | | | 0.1 | |
| | |
|
|
|
| | | | 101.2 | % |
| | |
|
|
|
| * | Calculated as a percentage of net assets |
56
VALIC Company II Mid Cap Value Fund
PORTFOLIO OF INVESTMENTS — August 31, 2010
| | | | | | | | |
| | |
| Security Description | | Shares | | | Value
(Note 2) | |
| |
COMMON STOCK — 98.2% | |
Advertising Agencies — 0.6% | |
The Interpublic Group of Cos., Inc.† | | | 292,676 | | | $ | 2,496,526 | |
| | | | | | |
|
|
|
Aerospace/Defense — 0.9% | |
Esterline Technologies Corp.† | | | 49,800 | | | | 2,290,800 | |
Teledyne Technologies, Inc.† | | | 51,800 | | | | 1,874,124 | |
| | | | | | |
|
|
|
| | | | | | | | 4,164,924 | |
| | | | | | |
|
|
|
Aerospace/Defense - Equipment — 1.1% | |
BE Aerospace, Inc.† | | | 73,602 | | | | 1,983,574 | |
Goodrich Corp. | | | 42,271 | | | | 2,894,718 | |
| | | | | | |
|
|
|
| | | | | | | | 4,878,292 | |
| | | | | | |
|
|
|
Agricultural Chemicals — 1.9% | |
Agrium, Inc. | | | 42,400 | | | | 2,949,768 | |
CF Industries Holdings, Inc. | | | 59,330 | | | | 5,488,025 | |
| | | | | | |
|
|
|
| | | | | | | | 8,437,793 | |
| | | | | | |
|
|
|
Agricultural Operations — 1.1% | |
Bunge, Ltd. | | | 67,340 | | | | 3,569,020 | |
China Agri - Industries Holdings, Ltd. | | | 1,204,000 | | | | 1,464,225 | |
| | | | | | |
|
|
|
| | | | | | | | 5,033,245 | |
| | | | | | |
|
|
|
Airlines — 1.3% | |
Delta Air Lines, Inc.† | | | 572,675 | | | | 5,990,180 | |
| | | | | | |
|
|
|
Apparel Manufacturers — 0.5% | |
VF Corp. | | | 34,300 | | | | 2,422,266 | |
| | | | | | |
|
|
|
Appliances — 0.2% | |
Whirlpool Corp. | | | 12,265 | | | | 909,572 | |
| | | | | | |
|
|
|
Applications Software — 1.4% | |
Check Point Software Technologies, Ltd.† | | | 174,555 | | | | 6,090,224 | |
| | | | | | |
|
|
|
Banks - Commercial — 1.7% | |
BOK Financial Corp. | | | 58,407 | | | | 2,595,607 | |
Popular, Inc.† | | | 518,766 | | | | 1,328,041 | |
Regions Financial Corp. | | | 231,042 | | | | 1,485,600 | |
Susquehanna Bancshares, Inc. | | | 193,200 | | | | 1,528,212 | |
Umpqua Holdings Corp. | | | 82,400 | | | | 856,960 | |
| | | | | | |
|
|
|
| | | | | | | | 7,794,420 | |
| | | | | | |
|
|
|
Banks - Super Regional — 2.7% | |
Comerica, Inc. | | | 188,612 | | | | 6,490,139 | |
Fifth Third Bancorp | | | 269,206 | | | | 2,974,726 | |
Huntington Bancshares, Inc. | | | 202,031 | | | | 1,068,744 | |
SunTrust Banks, Inc. | | | 80,477 | | | | 1,809,928 | |
| | | | | | |
|
|
|
| | | | | | | | 12,343,537 | |
| | | | | | |
|
|
|
Beverages - Non-alcoholic — 0.6% | |
Dr Pepper Snapple Group, Inc. | | | 74,682 | | | | 2,749,791 | |
| | | | | | |
|
|
|
Brewery — 0.6% | |
Molson Coors Brewing Co., Class B | | | 62,200 | | | | 2,709,432 | |
| | | | | | |
|
|
|
Building & Construction - Misc. — 0.5% | |
Multiplan Empreendimentos Imobiliarios SA | | | 129,700 | | | | 2,459,223 | |
| | | | | | |
|
|
|
Building - Residential/Commercial — 1.5% | |
MDC Holdings, Inc. | | | 149,200 | | | | 3,971,704 | |
Toll Brothers, Inc.† | | | 170,600 | | | | 2,947,968 | |
| | | | | | |
|
|
|
| | | | | | | | 6,919,672 | |
| | | | | | |
|
|
|
Cable/Satellite TV — 0.4% | |
Cablevision Systems Corp., Class A | | | 77,087 | | | | 1,934,113 | |
| | | | | | |
|
|
|
Chemicals - Diversified — 2.0% | |
Celanese Corp., Series A | | | 54,115 | | | | 1,444,870 | |
FMC Corp. | | | 67,000 | | | | 4,172,760 | |
PPG Industries, Inc. | | | 50,248 | | | | 3,307,826 | |
| | | | | | |
|
|
|
| | | | | | | | 8,925,456 | |
| | | | | | |
|
|
|
| | | | | | | | |
| | |
| Security Description | | Shares | | | Value
(Note 2) | |
| |
| | | | | | | | | |
Chemicals - Specialty — 1.4% | |
Albemarle Corp. | | | 76,079 | | | $ | 3,050,007 | |
Methanex Corp. | | | 162,000 | | | | 3,458,700 | |
| | | | | | |
|
|
|
| | | | | | | | 6,508,707 | |
| | | | | | |
|
|
|
Coal — 0.8% | |
Consol Energy, Inc. | | | 54,800 | | | | 1,764,560 | |
Walter Energy, Inc. | | | 25,857 | | | | 1,862,738 | |
| | | | | | |
|
|
|
| | | | | | | | 3,627,298 | |
| | | | | | |
|
|
|
Commercial Services — 1.5% | |
PHH Corp.† | | | 369,400 | | | | 6,837,594 | |
| | | | | | |
|
|
|
Computer Graphics — 0.3% | |
Compagnie Generale de Geophysique - Veritas ADR† | | | 83,600 | | | | 1,398,628 | |
| | | | | | |
|
|
|
Computers - Integrated Systems — 0.2% | |
Brocade Communications Systems, Inc.† | | | 198,726 | | | | 997,605 | |
| | | | | | |
|
|
|
Containers - Metal/Glass — 1.9% | |
Greif, Inc., Class A | | | 55,100 | | | | 3,132,435 | |
Owens - Illinois, Inc.† | | | 136,700 | | | | 3,425,702 | |
Rexam PLC | | | 439,808 | | | | 2,041,073 | |
| | | | | | |
|
|
|
| | | | | | | | 8,599,210 | |
| | | | | | |
|
|
|
Containers - Paper/Plastic — 0.6% | |
Packaging Corp. of America | | | 117,049 | | | | 2,609,022 | |
| | | | | | |
|
|
|
Disposable Medical Products — 0.6% | |
C.R. Bard, Inc. | | | 36,475 | | | | 2,802,374 | |
| | | | | | |
|
|
|
Diversified Manufacturing Operations — 3.5% | |
Barnes Group, Inc. | | | 215,000 | | | | 3,270,150 | |
Dover Corp. | | | 56,400 | | | | 2,524,464 | |
Eaton Corp. | | | 40,275 | | | | 2,798,307 | |
Pentair, Inc. | | | 142,400 | | | | 4,286,240 | |
Textron, Inc. | | | 163,600 | | | | 2,792,652 | |
| | | | | | |
|
|
|
| | | | | | | | 15,671,813 | |
| | | | | | |
|
|
|
Drug Delivery Systems — 0.7% | |
Alkermes, Inc.† | | | 241,300 | | | | 3,199,638 | |
| | | | | | |
|
|
|
Electric Products - Misc. — 0.8% | |
AMETEK, Inc. | | | 86,200 | | | | 3,705,738 | |
| | | | | | |
|
|
|
Electric - Integrated — 7.1% | |
CMS Energy Corp. | | | 250,113 | | | | 4,376,977 | |
Edison International | | | 122,554 | | | | 4,136,198 | |
Hawaiian Electric Industries, Inc. | | | 86,594 | | | | 2,079,988 | |
Northeast Utilities | | | 161,400 | | | | 4,675,758 | |
NV Energy, Inc. | | | 404,400 | | | | 5,176,320 | |
Westar Energy, Inc. | | | 85,300 | | | | 2,044,641 | |
Wisconsin Energy Corp. | | | 127,818 | | | | 7,124,575 | |
Xcel Energy, Inc. | | | 100,392 | | | | 2,239,746 | |
| | | | | | |
|
|
|
| | | | | | | | 31,854,203 | |
| | | | | | |
|
|
|
Electronic Components - Misc. — 1.2% | |
Flextronics International, Ltd.† | | | 251,762 | | | | 1,241,187 | |
Kingboard Laminates Holdings, Ltd. | | | 4,210,500 | | | | 4,032,553 | |
| | | | | | |
|
|
|
| | | | | | | | 5,273,740 | |
| | | | | | |
|
|
|
Electronic Connectors — 1.3% | |
Amphenol Corp., Class A | | | 57,506 | | | | 2,341,644 | |
Thomas & Betts Corp.† | | | 94,200 | | | | 3,480,690 | |
| | | | | | |
|
|
|
| | | | | | | | 5,822,334 | |
| | | | | | |
|
|
|
Electronic Parts Distribution — 1.2% | |
Arrow Electronics, Inc.† | | | 245,192 | | | | 5,609,993 | |
| | | | | | |
|
|
|
Engineering/R&D Services — 0.5% | |
URS Corp.† | | | 60,775 | | | | 2,167,844 | |
| | | | | | |
|
|
|
57
VALIC Company II Mid Cap Value Fund
PORTFOLIO OF INVESTMENTS — August 31, 2010 — (continued)
| | | | | | | | |
| | |
| Security Description | | Shares | | | Value
(Note 2) | |
| |
COMMON STOCK (continued) | |
Engines - Internal Combustion — 0.8% | |
Cummins, Inc. | | | 48,105 | | | $ | 3,579,493 | |
| | | | | | |
|
|
|
Enterprise Software/Service — 0.6% | |
BMC Software, Inc.† | | | 80,500 | | | | 2,902,830 | |
| | | | | | |
|
|
|
Finance - Credit Card — 0.8% | |
Discover Financial Services | | | 242,085 | | | | 3,512,653 | |
| | | | | | |
|
|
|
Finance - Investment Banker/Broker — 0.6% | |
TD Ameritrade Holding Corp.† | | | 187,000 | | | | 2,732,070 | |
| | | | | | |
|
|
|
Finance - Other Services — 0.0% | |
Solar Cayman Ltd.†*(1)(2)(3)(4) | | | 120,200 | | | | 52,888 | |
| | | | | | |
|
|
|
Food - Canned — 0.5% | |
Del Monte Foods Co. | | | 172,473 | | | | 2,249,048 | |
| | | | | | |
|
|
|
Food - Confectionery — 0.6% | |
The J.M. Smucker Co. | | | 49,885 | | | | 2,917,275 | |
| | | | | | |
|
|
|
Food - Misc. — 0.9% | |
ConAgra Foods, Inc. | | | 99,721 | | | | 2,152,976 | |
PureCircle, Ltd.† | | | 629,344 | | | | 1,775,957 | |
| | | | | | |
|
|
|
| | | | | | | | 3,928,933 | |
| | | | | | |
|
|
|
Forestry — 0.6% | |
Sino-Forest Corp.†*(1) | | | 84,300 | | | | 1,452,235 | |
Sino-Forest Corp.† | | | 71,900 | | | | 1,238,621 | |
| | | | | | |
|
|
|
| | | | | | | | 2,690,856 | |
| | | | | | |
|
|
|
Gas - Distribution — 2.2% | |
CenterPoint Energy, Inc. | | | 156,528 | | | | 2,315,049 | |
Sempra Energy | | | 75,141 | | | | 3,826,180 | |
UGI Corp. | | | 131,116 | | | | 3,618,801 | |
| | | | | | |
|
|
|
| | | | | | | | 9,760,030 | |
| | | | | | |
|
|
|
Human Resources — 0.3% | |
Team Health Holdings, Inc.† | | | 104,500 | | | | 1,317,745 | |
| | | | | | |
|
|
|
Insurance - Life/Health — 3.3% | |
Lincoln National Corp. | | | 122,951 | | | | 2,872,135 | |
Principal Financial Group, Inc. | | | 133,600 | | | | 3,079,480 | |
Unum Group | | | 440,614 | | | | 8,834,311 | |
| | | | | | |
|
|
|
| | | | | | | | 14,785,926 | |
| | | | | | |
|
|
|
Insurance - Property/Casualty — 1.2% | |
Arch Capital Group, Ltd.† | | | 47,686 | | | | 3,805,343 | |
Fidelity National Financial, Inc., Class A | | | 96,000 | | | | 1,392,960 | |
| | | | | | |
|
|
|
| | | | | | | | 5,198,303 | |
| | | | | | |
|
|
|
Insurance - Reinsurance — 3.7% | |
Everest Re Group, Ltd. | | | 48,544 | | | | 3,841,772 | |
PartnerRe, Ltd. | | | 46,472 | | | | 3,459,840 | |
Platinum Underwriters Holdings, Ltd. | | | 101,555 | | | | 4,083,527 | |
Reinsurance Group of America, Inc. | | | 117,259 | | | | 5,128,909 | |
| | | | | | |
|
|
|
| | | | | | | | 16,514,048 | |
| | | | | | |
|
|
|
Investment Management/Advisor Services — 3.3% | |
Affiliated Managers Group, Inc.† | | | 34,476 | | | | 2,213,704 | |
Ameriprise Financial, Inc. | | | 219,646 | | | | 9,572,173 | |
Invesco, Ltd. | | | 180,400 | | | | 3,265,240 | |
| | | | | | |
|
|
|
| | | | | | | | 15,051,117 | |
| | | | | | |
|
|
|
Machinery - Construction & Mining — 0.6% | |
Terex Corp.† | | | 142,800 | | | | 2,600,388 | |
| | | | | | |
|
|
|
Machinery - Electrical — 0.5% | |
Regal-Beloit Corp. | | | 41,808 | | | | 2,312,819 | |
| | | | | | |
|
|
|
Machinery - Farming — 0.5% | |
AGCO Corp.† | | | 63,200 | | | | 2,088,760 | |
| | | | | | |
|
|
|
| | | | | | | | |
| | |
| Security Description | | Shares | | | Value
(Note 2) | |
| |
| | | | | | | | | |
Medical Instruments — 0.6% | |
St. Jude Medical, Inc.† | | | 73,899 | | | $ | 2,554,688 | |
| | | | | | |
|
|
|
Medical - Drugs — 0.8% | |
Endo Pharmaceuticals Holdings, Inc.† | | | 125,793 | | | | 3,417,796 | |
| | | | | | |
|
|
|
Medical - Generic Drugs — 0.7% | |
Impax Laboratories, Inc.† | | | 199,015 | | | | 3,118,565 | |
| | | | | | |
|
|
|
Medical - HMO — 1.2% | |
CIGNA Corp. | | | 167,800 | | | | 5,406,516 | |
| | | | | | |
|
|
|
Medical - Hospitals — 0.6% | |
Universal Health Services, Inc., Class B | | | 83,603 | | | | 2,625,134 | |
| | | | | | |
|
|
|
Medical - Outpatient/Home Medical — 0.2% | |
Amedisys, Inc.† | | | 41,700 | | | | 964,104 | |
| | | | | | |
|
|
|
Medical - Wholesale Drug Distribution — 1.5% | |
AmerisourceBergen Corp. | | | 249,308 | | | | 6,801,122 | |
| | | | | | |
|
|
|
Metal - Iron — 0.4% | |
Cliffs Natural Resources, Inc. | | | 31,979 | | | | 1,956,795 | |
| | | | | | |
|
|
|
Networking Products — 0.6% | |
Polycom, Inc.† | | | 94,626 | | | | 2,694,948 | |
| | | | | | |
|
|
|
Non-Hazardous Waste Disposal — 0.8% | |
Republic Services, Inc. | | | 124,574 | | | | 3,666,213 | |
| | | | | | |
|
|
|
Office Automation & Equipment — 0.6% | |
Xerox Corp. | | | 345,522 | | | | 2,916,206 | |
| | | | | | |
|
|
|
Oil & Gas Drilling — 0.4% | |
Ensco PLC ADR | | | 45,200 | | | | 1,859,076 | |
| | | | | | |
|
|
|
Oil Companies - Exploration & Production — 4.4% | |
Cabot Oil & Gas Corp. | | | 48,400 | | | | 1,347,456 | |
Cobalt International Energy, Inc.† | | | 115,500 | | | | 942,480 | |
Concho Resources, Inc.† | | | 44,617 | | | | 2,606,525 | |
Newfield Exploration Co.† | | | 138,882 | | | | 6,667,725 | |
Pioneer Natural Resources Co. | | | 38,352 | | | | 2,217,513 | |
Quicksilver Resources, Inc.† | | | 137,900 | | | | 1,682,380 | |
Whiting Petroleum Corp.† | | | 50,666 | | | | 4,298,503 | |
| | | | | | |
|
|
|
| | | | | | | | 19,762,582 | |
| | | | | | |
|
|
|
Oil Field Machinery & Equipment — 0.6% | |
Cameron International Corp.† | | | 67,257 | | | | 2,473,712 | |
| | | | | | |
|
|
|
Oil - Field Services — 0.4% | |
SBM Offshore NV | | | 102,978 | | | | 1,566,639 | |
| | | | | | |
|
|
|
Pipelines — 0.7% | |
Spectra Energy Corp. | | | 161,863 | | | | 3,292,293 | |
| | | | | | |
|
|
|
Power Converter/Supply Equipment — 0.6% | |
Hubbell, Inc., Class B | | | 55,700 | | | | 2,505,386 | |
| | | | | | |
|
|
|
Real Estate Investment Trusts — 5.2% | |
AMB Property Corp. | | | 56,700 | | | | 1,348,893 | |
Boston Properties, Inc. | | | 29,573 | | | | 2,407,242 | |
Chimera Investment Corp. | | | 408,716 | | | | 1,606,254 | |
Duke Realty Corp. | | | 236,300 | | | | 2,648,923 | |
Essex Property Trust, Inc. | | | 29,367 | | | | 3,106,148 | |
Federal Realty Investment Trust | | | 45,237 | | | | 3,586,842 | |
Liberty Property Trust | | | 72,724 | | | | 2,208,628 | |
RioCan Real Estate Investment Trust | | | 48,100 | | | | 941,837 | |
Ventas, Inc. | | | 75,620 | | | | 3,819,566 | |
Vornado Realty Trust | | | 18,906 | | | | 1,532,520 | |
| | | | | | |
|
|
|
| | | | | | | | 23,206,853 | |
| | | | | | |
|
|
|
Real Estate Management/Services — 0.5% | |
BR Malls Participacoes SA | | | 142,900 | | | | 2,237,580 | |
| | | | | | |
|
|
|
58
VALIC Company II Mid Cap Value Fund
PORTFOLIO OF INVESTMENTS — August 31, 2010 — (continued)
| | | | | | | | |
| | |
| Security Description | | Shares/
Principal
Amount | | | Value
(Note 2) | |
| |
COMMON STOCK (continued) | |
Real Estate Operations & Development — 1.2% | |
BR Properties SA | | | 443,100 | | | $ | 3,567,507 | |
Iguatemi Empresa de Shopping Centers SA | | | 85,400 | | | | 1,643,570 | |
| | | | | | |
|
|
|
| | | | | | | | 5,211,077 | |
| | | | | | |
|
|
|
Registered Investment Companies — 0.2% | |
Solar Capital, Ltd.(1)(4) | | | 49,526 | | | | 972,691 | |
| | | | | | |
|
|
|
Retail - Apparel/Shoe — 1.8% | |
American Eagle Outfitters, Inc. | | | 70,800 | | | | 894,912 | |
AnnTaylor Stores Corp.† | | | 167,426 | | | | 2,566,641 | |
Foot Locker, Inc. | | | 122,480 | | | | 1,437,915 | |
Ross Stores, Inc. | | | 64,000 | | | | 3,176,320 | |
| | | | | | |
|
|
|
| | | | | | | | 8,075,788 | |
| | | | | | |
|
|
|
Retail - Regional Department Stores — 0.8% | |
Macy’s, Inc. | | | 190,288 | | | | 3,699,199 | |
| | | | | | |
|
|
|
Retail - Restaurants — 0.5% | |
Darden Restaurants, Inc. | | | 53,683 | | | | 2,214,961 | |
| | | | | | |
|
|
|
Savings & Loans/Thrifts — 0.1% | |
Beneficial Mutual Bancorp, Inc.† | | | 72,204 | | | | 602,181 | |
| | | | | | |
|
|
|
Schools — 0.2% | |
DeVry, Inc. | | | 25,600 | | | | 975,616 | |
| | | | | | |
|
|
|
Semiconductor Components - Integrated Circuits — 0.2% | |
Linear Technology Corp. | | | 28,600 | | | | 819,390 | |
| | | | | | |
|
|
|
Semiconductor Equipment — 1.1% | |
Varian Semiconductor Equipment Associates, Inc.† | | | 198,450 | | | | 4,925,529 | |
| | | | | | |
|
|
|
Telecom Services — 1.6% | |
Virgin Media, Inc. | | | 338,800 | | | | 7,050,428 | |
| | | | | | |
|
|
|
Telephone - Integrated — 1.2% | |
Qwest Communications International, Inc. | | | 467,512 | | | | 2,641,443 | |
Windstream Corp. | | | 223,667 | | | | 2,579,999 | |
| | | | | | |
|
|
|
| | | | | | | | 5,221,442 | |
| | | | | | |
|
|
|
Television — 1.4% | |
CBS Corp., Class B | | | 455,812 | | | | 6,299,322 | |
| | | | | | |
|
|
|
Tools - Hand Held — 0.6% | |
Stanley Black & Decker. Inc. | | | 50,906 | | | | 2,730,598 | |
| | | | | | |
|
|
|
Toys — 1.4% | |
Mattel, Inc. | | | 303,245 | | | | 6,365,113 | |
| | | | | | |
|
|
|
Transport - Marine — 0.3% | |
Overseas Shipholding Group, Inc. | | | 46,200 | | | | 1,487,640 | |
| | | | | | |
|
|
|
Transport - Rail — 0.5% | |
All America Latina Logistica | | | 249,200 | | | | 2,297,252 | |
| | | | | | |
|
|
|
Transport - Truck — 0.4% | |
Werner Enterprises, Inc. | | | 90,329 | | | | 1,801,160 | |
| | | | | | |
|
|
|
Travel Services — 0.3% | |
Thomas Cook Group PLC | | | 511,469 | | | | 1,425,282 | |
| | | | | | |
|
|
|
Total Long - Term Investment Securities | |
(cost $424,810,386) | | | | | | | 442,340,466 | |
| | | | | | |
|
|
|
SHORT - TERM INVESTMENT SECURITIES — 2.0% | | | | | |
Time Deposits — 2.0% | | | | | | | | |
Euro Time Deposit with State Street
Bank & Trust Co.
0.01% due 09/01/10
(cost $9,185,000) | | $ | 9,185,000 | | | | 9,185,000 | |
| | | | | | |
|
|
|
| | | | | | | | |
| | |
| Security Description | |
Principal
Amount | | | Value
(Note 2) | |
| |
REPURCHASE AGREEMENT — 1.0% | | | | | | | | |
Agreement with State Street Bank & Trust Co., bearing interest 0.01%, dated 08/31/10, to be repurchased 09/01/10 in the amount of $4,319,001 and collateralized by $4,355,000 of Federal Home Loan Bank Notes, bearing interest at 4.38%, due 09/17/10 and having an approximate value of $4,449,938
(cost $4,319,000) | | $ | 4,319,000 | | | $ | 4,319,000 | |
| | | | | | |
|
|
|
TOTAL INVESTMENTS | | | | | | | | |
(cost $438,314,386)(5) | | | 101.2 | % | | | 455,844,466 | |
Liabilities in excess of other assets | | | (1.2 | ) | | | (5,266,377 | ) |
| | |
|
|
| |
|
|
|
NET ASSETS — | | | 100.0 | % | | $ | 450,578,089 | |
| | |
|
|
| |
|
|
|
| † | Non-income producing security |
| * | Securities exempt from registration under Rule 144A of the Securities Act of 1933. These securities may be sold in transactions exempt from registration, normally to qualified institutional buyers. The Fund has no right to demand registration of these securities. At August 31, 2010, the aggregate value of these securities was $1,505,123 representing 0.3% of net assets. Unless otherwise indicated these securities are not considered to be illiquid. |
| (1) | Denotes a restricted security that: (a) cannot be offered for public sale without first being registered, or being able to take advantage of an exemption from registration, under the Securities Act of 1933, as amended (the “1933 Act”); (b) is subject to a contractual restriction on public sales; or (c) is otherwise subject to a restriction on sales by operation of applicable law. Restricted securities are valued pursuant to Note 2. Certain restricted securities held by the Fund may not be sold except in exempt transactions or in a public offering registered under the 1933 Act. The Fund has no right to demand registration of these securities. The risk of investing in certain restricted securities is greater than the risk of investing in the securities of widely held, publicly traded companies. To the extent applicable, lack of a secondary market and resale restrictions may result in the inability of a Fund to sell a security at a fair price and may substantially delay the sale of the security. In addition, certain restricted securities may exhibit greater price volatility than securities for which secondary markets exist. As of August 31, 2010, the Mid Cap Value Fund held the following restricted securities: |
| | | | | | | | | | | | | | | | | | | | | | | | |
Name
| | Acquisition
Date
| | | Shares
| | | Acquisition
Cost
| | | Value
| | | Value
Per
Share
| | | % of
Net
Assets
| |
Solar Capital, Ltd. Common Stock | | | 3/9/2007 | | | | 46,243 | | | $ | 1,678,652 | | | | | | | | | | | | | |
| | | | 4/1/2010 | | | | 735 | | | | 16,414 | | | | | | | | | | | | | |
| | | | 6/15/2010 | | | | 1,548 | | | | 30,019 | | | | | | | | | | | | | |
| | | | 8/26/2010 | | | | 1,000 | | | | 19,766 | | | | | | | | | | | | | |
| | | | | | |
|
|
| |
|
|
| | | | | | | | | | | | |
| | | | | | | | 49,526 | | | $ | 1,744,851 | | | $ | 972,691 | | | $ | 19.64 | | | | 0.2 | % |
| | | | | | | | | | |
|
|
| | | | | | | | | | | | |
Solar Cayman, Ltd. Common Stock | | | 3/9/2007 | | | | 120,200 | | | | 1,803,000 | | | | 52,888 | | | | 0.44 | | | | 0.0 | |
Sino-Forest Corp.
Common
Stock | | | 12/11/2009 | | | | 84,300 | | | | 1,338,032 | | | | 1,452,235 | | | | 17.23 | | | | 0.3 | |
| | | | | | | | | | | | | | |
|
|
| | | | | |
|
|
|
| | | | | | | | | | | | | | | $ | 2,477,814 | | | | | | | | 0.5 | % |
| | | | | | | | | | | | | | |
|
|
| | | | | |
|
|
|
| (2) | Fair valued security. Securities are classified as Level 3 based on the securities valuation inputs; see Note 2. |
| (3) | Consists of more than one type of security traded together as a unit. |
| (4) | Illiquid security. At August 31, 2010, the aggregate value of these securities was $972,691 representing 0.2% of net assets. |
| (5) | See Note 5 for cost of investments on a tax basis. |
ADR—American Depository Receipt
59
VALIC Company II Mid Cap Value Fund
PORTFOLIO OF INVESTMENTS — August 31, 2010 — (continued)
The following is a summary of the inputs used to value the Fund’s net assets as of August 31, 2010 (see Note 2):
| | | | | | | | | | | | | | | | |
| | | Level 1 - Unadjusted Quoted
Prices
| | | Level 2 - Other Observable
Inputs
| | | Level 3 - Significant
Unobservable Inputs
| | | Total
| |
Long-Term Investment Securities: | | | | | | | | | | | | | | | | |
Common Stock: | | | | | | | | | | | | | | | | |
Electric - Integrated | | $ | 31,854,203 | | | $ | — | | | $ | — | | | $ | 31,854,203 | |
Real Estate Investments Trusts | | | 23,206,853 | | | | — | | | | — | | | | 23,206,853 | |
Other Industries* | | | 387,226,522 | | | | — | | | | 52,888 | | | | 387,279,410 | |
Short-Term Investment Securities: | | | | | | | | | | | | | | | | |
Time Deposit | | | — | | | | 9,185,000 | | | | — | | | | 9,185,000 | |
Repurchase Agreement | | | — | | | | 4,319,000 | | | | — | | | | 4,319,000 | |
| | |
|
|
| |
|
|
| |
|
|
| |
|
|
|
Total | | $ | 442,287,578 | | | $ | 13,504,000 | | | $ | 52,888 | | | $ | 455,844,466 | |
| | |
|
|
| |
|
|
| |
|
|
| |
|
|
|
| * | Sum of all other industries each of which individually has an aggregate market value of less than 5% of net assets. For a detailed presentation of common stocks by industry classification, please refer to the Portfolio of Investments. |
The following is a reconciliation of Level 3 assets which significant unobservable inputs were used to determine fair value:
| | | | |
| | | Common Stock
| |
Balance as of 8/31/2009 | | $ | 1,121,466 | |
Accrued discounts/premiums | | | — | |
Realized gain (loss) | | | — | |
Change in unrealized appreciation (depreciation)(1) | | | 686,342 | |
Net purchases (sales) | | | (1,754,920 | ) |
Transfers in and/or out of Level 3(2) | | | — | |
| | |
|
|
|
Balance as of 8/31/2010 | | $ | 52,888 | |
| | |
|
|
|
| (1) | The total change in unrealized appreciation (depreciation) included in the statement of operations attributable to level 3 investments still held at August 31, 2010 includes: |
| (2) | The Fund’s policy is to recognize transfers in and transfers out as of the end of the reporting period. |
See Notes to Financial Statements
60
VALIC Company II Moderate Growth Lifestyle Fund
PORTFOLIO PROFILE — August 31, 2010 (Unaudited)
Industry Allocation*
| | | | |
Fixed Income Investment Companies | | | 44.0 | % |
Domestic Equity Investment Companies | | | 41.9 | |
International Equity Investment Companies | | | 9.0 | |
Real Estate Investment Companies | | | 5.0 | |
| | |
|
|
|
| | | | 99.9 | % |
| | |
|
|
|
| * | Calculated as a percentage of net assets |
61
VALIC Company II Moderate Growth Lifestyle Fund
PORTFOLIO OF INVESTMENTS — August 31, 2010
| | | | | | | | |
| | |
| Security Description | | Shares | | | Value (Note 2) | |
| |
AFFILIATED REGISTERED INVESTMENT COMPANIES#(1) — 99.9% | |
Domestic Equity Investment Companies — 41.9% | |
VALIC Co. I Blue Chip Growth Fund | | | 1,011,292 | | | $ | 8,403,834 | |
VALIC Co. I Science & Technology Fund | | | 547,378 | | | | 6,880,545 | |
VALIC Co. I Small Cap Special Values Fund | | | 1,249,409 | | | | 9,058,214 | |
VALIC Co. I Stock Index Fund | | | 815,117 | | | | 17,296,793 | |
VALIC Co. I Value Fund | | | 976,666 | | | | 7,764,493 | |
VALIC Co. II Capital Appreciation Fund | | | 875,615 | | | | 7,013,677 | |
VALIC Co. II Mid Cap Value Fund | | | 1,125,342 | | | | 15,315,902 | |
VALIC Co. II Small Cap Growth Fund† | | | 158,053 | | | | 1,612,139 | |
VALIC Co. II Small Cap Value Fund | | | 728,289 | | | | 7,479,524 | |
| | | | | | |
|
|
|
Total Domestic Equity Investment Companies | |
(cost $72,973,672) | | | | | | | 80,825,121 | |
| | | | | | |
|
|
|
Fixed Income Investment Companies — 44.0% | |
VALIC Co. II Core Bond Fund | | | 2,651,926 | | | | 28,322,571 | |
VALIC Co. II High Yield Bond Fund | | | 3,391,211 | | | | 24,959,312 | |
VALIC Co. II Strategic Bond Fund | | | 2,818,710 | | | | 31,625,923 | |
| | | | | | |
|
|
|
Total Fixed Income Investment Companies | |
(cost $76,346,833) | | | | | | | 84,907,806 | |
| | | | | | |
|
|
|
| | | | | | | | |
| | |
| Security Description | | Shares | | | Value (Note 2) | |
| |
| | | | | | | | | |
International Equity Investment Companies — 9.0% | |
VALIC Co. I Foreign Value Fund | | | 1,015,346 | | | $ | 8,173,538 | |
VALIC Co. I International Equities Fund | | | 1,620,238 | | | | 9,105,743 | |
| | | | | | |
|
|
|
Total International Equity Investment Companies | |
(cost $15,938,484) | | | | | | | 17,279,281 | |
| | | | | | |
|
|
|
Real Estate Investment Companies — 5.0% | |
VALIC Co. I Global Real Estate Fund
(cost $7,206,466) | | | 1,236,435 | | | | 9,730,743 | |
| | | | | | |
|
|
|
TOTAL INVESTMENTS | |
(cost $172,465,455)(2) | | | 99.9 | % | | | 192,742,951 | |
Other assets less liabilities | | | 0.1 | | | | 97,606 | |
| | |
|
|
| |
|
|
|
NET ASSETS — | | | 100.0 | % | | $ | 192,840,557 | |
| | |
|
|
| |
|
|
|
| † | Non-income producing security |
| # | The Moderate Growth Lifestyle Fund invests in various VALIC Company I or VALIC Company II Funds, some of which are not presented in this report. Additional information on the underlying funds including such fund’s prospectuses and shareholder reports is available at our website, www.valic.com. |
| (2) | See Note 5 for cost of investments on a tax basis. |
The following is a summary of the inputs used to value the Fund’s net assets as of August 31, 2010 (see Note 2):
| | | | | | | | | | | | | | | | |
| | | Level 1 - Unadjusted Quoted
Prices
| | | Level 2 - Other Observable
Inputs
| | | Level 3 - Significant
Unobservable Inputs
| | | Total
| |
Affiliated Registered Investment Companies: | | | | | | | | | | | | | | | | |
Domestic Equity Investment Companies | | $ | 80,825,121 | | | $ | — | | | $ | — | | | $ | 80,825,121 | |
Fixed Income Investment Companies | | | 84,907,806 | | | | — | | | | — | | | | 84,907,806 | |
International Equity Investment Companies | | | 17,279,281 | | | | — | | | | — | | | | 17,279,281 | |
Real Estate Investment Companies | | | 9,730,743 | | | | — | | | | — | | | | 9,730,743 | |
| | |
|
|
| |
|
|
| |
|
|
| |
|
|
|
Total | | $ | 192,742,951 | | | $ | — | | | $ | — | | | $ | 192,742,951 | |
| | |
|
|
| |
|
|
| |
|
|
| |
|
|
|
See Notes to Financial Statements
62
VALIC Company II Money Market II Fund
PORTFOLIO PROFILE — August 31, 2010 (Unaudited)
Industry Allocation*
| | | | |
U.S. Government Agencies | | | 59.4 | % |
Repurchase Agreement | | | 10.2 | |
U.S. Government Treasuries | | | 4.4 | |
Money Center Banks | | | 4.4 | |
Commercial Banks — Canadian | | | 4.3 | |
Foreign Bank | | | 3.5 | |
Diversified Financial Services | | | 3.5 | |
Super - Regional Banks — US | | | 3.4 | |
Commercial Banks | | | 2.6 | |
Finance | | | 2.3 | |
Finance — Investment Banker/Broker | | | 2.0 | |
| | |
|
|
|
| | | | 100.0 | % |
| | |
|
|
|
Weighted Average Days to Maturity | | | 52.6 | |
Credit Quality@#
| * | Calculated as a percentage of net assets. |
| @ | Source: Standard & Poors. |
| # | Calculated as a percentage of total debt issues. |
63
VALIC Company II Money Market II Fund
PORTFOLIO OF INVESTMENTS — August 31, 2010
| | | | | | | | |
| | |
| Security Description | | Principal
Amount | | | Value
(Note 2) | |
| |
SHORT - TERM INVESTMENT SECURITIES — 89.8% | | | | | |
Certificates of Deposit — 16.5% | | | | | |
BNP Paribas
0.25% due 09/07/10 | | $ | 3,750,000 | | | $ | 3,750,000 | |
Citibank NA
0.20% due 09/27/10 | | | 3,750,000 | | | | 3,750,000 | |
Citibank NA
0.23% due 10/26/10 | | | 3,750,000 | | | | 3,750,000 | |
Credit Agricole SA
0.23% due 09/24/10 | | | 3,650,000 | | | | 3,650,000 | |
Lloyds Bank PLC
0.30% due 09/01/10 | | | 3,770,000 | | | | 3,770,000 | |
Nordea Bank Finland
0.21% due 09/20/10 | | | 3,700,000 | | | | 3,700,000 | |
Royal Bank of Canada
0.26% due 09/23/10(1) | | | 3,520,000 | | | | 3,520,000 | |
Royal Bank of Canada
0.29% due 09/09/10(1) | | | 3,500,000 | | | | 3,500,000 | |
Royal Bank of Canada
0.30% due 09/07/10(1) | | | 2,200,000 | | | | 2,200,090 | |
State Street Bank & Trust Co.
0.28% due 11/10/10(1) | | | 3,750,000 | | | | 3,750,000 | |
| | | | | | |
|
|
|
Total Certificates of Deposit | | | | | | | | |
(amortized cost $35,340,090) | | | | | | | 35,340,090 | |
| | | | | | |
|
|
|
Commercial Paper — 1.7% | | | | | |
Bank of America Corp.
0.19% due 09/03/10
(amortized cost $3,679,961) | | | 3,680,000 | | | | 3,679,961 | |
| | | | | | |
|
|
|
Medium Term Notes — 5.1% | | | | | |
General Electric Capital Corp.
0.59% due 10/06/10(1) | | | 950,000 | | | | 950,172 | |
General Electric Capital Corp.
0.62% due 10/21/10(1) | | | 250,000 | | | | 250,089 | |
General Electric Capital Corp.
FDIC Guar. Notes
1.17% due 09/09/10(1) | | | 3,500,000 | | | | 3,508,010 | |
General Electric Capital Corp.
FDIC Guar. Notes
1.63% due 01/07/11 | | | 269,000 | | | | 270,307 | |
JPMorgan Chase & Co.
0.86% due 09/24/10(1) | | | 4,000,000 | | | | 4,000,883 | |
Wachovia Bank NA
0.61% due 09/02/10(1) | | | 1,855,000 | | | | 1,854,720 | |
| | | | | | |
|
|
|
Total Medium Term Notes | | | | | | | | |
(amortized cost $10,834,181) | | | | | | | 10,834,181 | |
| | | | | | |
|
|
|
U.S. Corporate Bonds & Notes — 2.7% | | | | | | | | |
Bank of America NA
0.31% due 11/24/10(1) | | | 3,650,000 | | | | 3,650,000 | |
JPMorgan Chase & Co.
FDIC Guar. Notes
0.42% due 11/23/10(1) | | | 1,000,000 | | | | 1,000,000 | |
JPMorgan Chase & Co.
FDIC Guar. Notes
2.63% due 12/01/10 | | | 570,000 | | | | 573,395 | |
Morgan Stanley
FDIC Guar. Notes
2.90% due 12/01/10 | | | 540,000 | | | | 543,582 | |
| | | | | | |
|
|
|
Total U.S. Corporate Bonds & Notes | | | | | | | | |
(amortized cost $5,766,977) | | | | | | | 5,766,977 | |
| | | | | | |
|
|
|
U.S. Government Agencies — 59.4% | | | | | | | | |
Federal Farm Credit Bank
0.33% due 09/27/10(1) | | | 4,000,000 | | | | 3,999,866 | |
5.25% due 09/13/10 | | | 35,000 | | | | 35,049 | |
| | | | | | | | |
| | |
| Security Description | | Principal
Amount | | | Value
(Note 2) | |
| |
| | | | | | | | | |
U.S. Government Agencies (continued) | | | | | | | | |
Federal Home Loan Bank
0.16% due 09/17/10 | | $ | 750,000 | | | $ | 749,947 | |
0.16% due 10/13/10 | | | 3,020,000 | | | | 3,019,436 | |
0.17% due 09/24/10 | | | 2,970,000 | | | | 2,969,677 | |
0.17% due 11/05/10 | | | 3,020,000 | | | | 3,019,073 | |
0.17% due 11/16/10 | | | 3,010,000 | | | | 3,008,920 | |
0.17% due 11/17/10 | | | 3,010,000 | | | | 3,008,906 | |
0.18% due 09/10/10 | | | 3,700,000 | | | | 3,699,833 | |
0.18% due 10/27/10 | | | 3,200,000 | | | | 3,199,104 | |
0.18% due 11/05/10 | | | 2,340,000 | | | | 2,339,261 | |
0.18% due 11/17/10 | | | 3,750,000 | | | | 3,748,556 | |
0.18% due 11/29/10 | | | 3,500,000 | | | | 3,498,442 | |
0.19% due 10/22/10 | | | 1,860,000 | | | | 1,859,499 | |
0.19% due 11/05/10 | | | 3,740,000 | | | | 3,738,751 | |
0.20% due 09/01/10 | | | 1,130,000 | | | | 1,130,000 | |
0.20% due 09/03/10 | | | 3,640,000 | | | | 3,639,960 | |
0.22% due 09/04/10(1) | | | 2,700,000 | | | | 2,699,580 | |
0.25% due 12/27/10 | | | 3,710,000 | | | | 3,706,986 | |
0.25% due 12/28/10 | | | 2,230,000 | | | | 2,229,897 | |
0.27% due 10/29/10 | | | 2,100,000 | | | | 2,099,880 | |
0.28% due 12/15/10 | | | 2,900,000 | | | | 2,897,632 | |
0.39% due 02/25/11 | | | 1,430,000 | | | | 1,427,258 | |
0.41% due 03/17/11 | | | 2,160,000 | | | | 2,155,154 | |
0.48% due 10/08/10(1) | | | 5,000,000 | | | | 5,000,025 | |
0.50% due 10/19/10 | | | 7,600,000 | | | | 7,599,842 | |
0.61% due 05/26/11 | | | 1,410,000 | | | | 1,410,000 | |
5.00% due 09/01/10 | | | 40,000 | | | | 40,000 | |
Federal Home Loan Mtg. Corp.
0.18% due 11/17/10 | | | 900,000 | | | | 899,653 | |
0.18% due 11/22/10 | | | 2,450,000 | | | | 2,448,995 | |
0.20% due 12/01/10 | | | 1,130,000 | | | | 1,129,429 | |
0.21% due 09/08/10 | | | 1,420,000 | | | | 1,419,942 | |
0.22% due 01/11/11 | | | 2,180,000 | | | | 2,178,241 | |
0.23% due 09/30/10 | | | 3,570,000 | | | | 3,569,339 | |
0.28% due 10/26/10 | | | 2,500,000 | | | | 2,498,950 | |
0.32% due 09/14/10 | | | 1,000,000 | | | | 999,884 | |
0.58% due 10/07/10(1) | | | 3,500,000 | | | | 3,499,791 | |
Federal National Mtg. Assoc.
0.17% due 11/03/10 | | | 3,020,000 | | | | 3,019,102 | |
0.18% due 09/22/10 | | | 3,720,000 | | | | 3,719,609 | |
0.18% due 11/17/10 | | | 190,000 | | | | 189,927 | |
0.20% due 11/01/10 | | | 1,300,000 | | | | 1,299,559 | |
0.20% due 11/15/10 | | | 2,520,000 | | | | 2,518,950 | |
0.20% due 01/19/11 | | | 3,000,000 | | | | 2,997,667 | |
0.24% due 12/08/10 | | | 750,000 | | | | 749,510 | |
0.25% due 09/20/10 | | | 2,840,000 | | | | 2,839,625 | |
0.25% due 10/20/10 | | | 3,630,000 | | | | 3,628,765 | |
0.25% due 12/20/10 | | | 7,210,000 | | | | 7,204,492 | |
0.28% due 03/01/11 | | | 2,230,000 | | | | 2,226,861 | |
| | | | | | |
|
|
|
Total U.S. Government Agencies | | | | | | | | |
(amortized cost $126,968,825) | | | | | | | 126,968,825 | |
| | | | | | |
|
|
|
U.S. Government Treasuries — 4.4% | | | | | | | | |
United States Treasury Bills
0.18% due 12/23/10 | | | 2,220,000 | | | | 2,218,746 | |
0.22% due 11/26/10 | | | 3,570,000 | | | | 3,568,124 | |
0.22% due 12/16/10 | | | 3,570,000 | | | | 3,567,687 | |
| | | | | | |
|
|
|
Total U.S. Government Treasuries | | | | | | | | |
(amortized cost $9,354,557) | | | | | | | 9,354,557 | |
| | | | | | |
|
|
|
Total Short - Term Investment Securities — 89.8% | | | | | |
(amortized cost $191,944,591) | | | | | | | 191,944,591 | |
| | | | | | |
|
|
|
64
VALIC Company II Money Market II Fund
PORTFOLIO OF INVESTMENTS — August 31, 2010 — (continued)
| | | | | | | | |
| | |
| Security Description | | Principal
Amount | | | Value
(Note 2) | |
| |
REPURCHASE AGREEMENT — 10.2% | | | | | | | | |
UBS Securities LLC Joint Repurchase Agreement(2)
(amortized cost $21,842,000) | | $ | 21,842,000 | | | $ | 21,842,000 | |
| | | | | | |
|
|
|
TOTAL INVESTMENTS | | | | | | | | |
(amortized cost $213,786,591)(3) | | | 100.0 | % | | | 213,786,591 | |
Other assets less liabilities | | | 0.0 | | | | 20,377 | |
| | |
|
|
| |
|
|
|
NET ASSETS — | | | 100.0 | % | | $ | 213,806,968 | |
| | |
|
|
| |
|
|
|
| (1) | Variable Rate Security - the rate reflected is as of August 31, 2010, maturity date reflects next reset date. |
| (2) | See Note 2 for details of Joint Repurchase Agreements. |
| (3) | See Note 5 for cost of investments on a tax basis. |
FDIC—Federal Deposit Insurance Corp.
The following is a summary of the inputs used to value the Fund’s net assets as of August 31, 2010 (see Note 2):
| | | | | | | | | | | | | | | | |
| | | Level 1 - Unadjusted Quoted
Prices
| | | Level 2 - Other Observable
Inputs
| | | Level 3 - Significant
Unobservable Inputs
| | | Total
| |
Short-Term Investment Securities: | | | | | | | | | | | | | | | | |
Certificates of Deposit | | $ | — | | | $ | 35,340,090 | | | $ | — | | | $ | 35,340,090 | |
Commercial Paper | | | — | | | | 3,679,961 | | | | — | | | | 3,679,961 | |
Medium Term Notes | | | — | | | | 10,834,181 | | | | — | | | | 10,834,181 | |
U.S. Corporate Bonds & Notes | | | — | | | | 5,766,977 | | | | — | | | | 5,766,977 | |
U.S. Government Agencies | | | — | | | | 126,968,825 | | | | — | | | | 126,968,825 | |
U.S. Government Treasuries | | | — | | | | 9,354,557 | | | | — | | | | 9,354,557 | |
Repurchase Agreement | | | — | | | | 21,842,000 | | | | — | | | | 21,842,000 | |
| | |
|
|
| |
|
|
| |
|
|
| |
|
|
|
Total | | $ | — | | | $ | 213,786,591 | | | $ | — | | | $ | 213,786,591 | |
| | |
|
|
| |
|
|
| |
|
|
| |
|
|
|
See Notes to Financial Statements
65
VALIC Company II Small Cap Growth Fund
PORTFOLIO PROFILE — August 31, 2010 (Unaudited)
Industry Allocation*
| | | | |
Enterprise Software/Service | | | 5.2 | % |
Medical — Biomedical/Gene | | | 4.1 | |
Electronic Components — Semiconductors | | | 3.4 | |
Applications Software | | | 3.3 | |
Medical Instruments | | | 2.9 | |
Oil Companies — Exploration & Production | | | 2.9 | |
Medical — HMO | | | 2.8 | |
Apparel Manufacturers | | | 2.3 | |
Building & Construction Products — Misc. | | | 2.3 | |
Transport — Truck | | | 2.3 | |
Medical — Drugs | | | 2.2 | |
Investment Management/Advisor Services | | | 2.1 | |
Retail — Apparel/Shoe | | | 2.1 | |
Patient Monitoring Equipment | | | 1.9 | |
Internet Application Software | | | 1.9 | |
Computers — Integrated Systems | | | 1.8 | |
Banks — Commercial | | | 1.6 | |
Aerospace/Defense — Equipment | | | 1.6 | |
Computer Data Security | | | 1.6 | |
Retail — Convenience Store | | | 1.5 | |
Networking Products | | | 1.4 | |
Retirement/Aged Care | | | 1.4 | |
Medical Imaging Systems | | | 1.4 | |
Internet Security | | | 1.4 | |
Machinery — Electrical | | | 1.4 | |
Building Products — Air & Heating | | | 1.3 | |
Satellite Telecom | | | 1.2 | |
Machinery — Pumps | | | 1.2 | |
Schools | | | 1.2 | |
Retail — Office Supplies | | | 1.2 | |
Wireless Equipment | | | 1.2 | |
Chemicals — Diversified | | | 1.2 | |
Retail — Appliances | | | 1.1 | |
Machinery — General Industrial | | | 1.1 | |
Theaters | | | 1.1 | |
Oil — Field Services | | | 1.1 | |
Web Hosting/Design | | | 1.1 | |
Therapeutics | | | 1.1 | |
Computers — Periphery Equipment | | | 1.0 | |
Rental Auto/Equipment | | | 1.0 | |
Semiconductor Components — Integrated Circuits | | | 1.0 | |
Hotels/Motels | | | 1.0 | |
Batteries/Battery Systems | | | 1.0 | |
Communications Software | | | 1.0 | |
Footwear & Related Apparel | | | 1.0 | |
Drug Delivery Systems | | | 0.9 | |
Investment Companies | | | 0.9 | |
Diversified Manufacturing Operations | | | 0.9 | |
Educational Software | | | 0.9 | |
Power Converter/Supply Equipment | | | 0.9 | |
Retail — Restaurants | | | 0.9 | |
Private Corrections | | | 0.8 | |
Metal Processors & Fabrication | | | 0.8 | |
Semiconductor Equipment | | | 0.8 | |
Auction Houses/Art Dealers | | | 0.8 | |
Time Deposits | | | 0.8 | |
Human Resources | | | 0.8 | |
Insurance — Property/Casualty | | | 0.8 | |
Computer Aided Design | | | 0.8 | |
Retail — Discount | | | 0.8 | |
Medical Labs & Testing Services | | | 0.8 | |
Finance — Investment Banker/Broker | | | 0.8 | |
Decision Support Software | | | 0.7 | |
Lasers — System/Components | | | 0.7 | |
Building — Heavy Construction | | | 0.6 | |
Retail — Perfume & Cosmetics | | | 0.6 | |
Internet Telephone | | | 0.5 | |
| | | | |
Commercial Services — Finance | | | 0.5 | |
Telecom Services | | | 0.5 | |
Advanced Materials | | | 0.5 | |
Retail — Building Products | | | 0.5 | |
Retail — Automobile | | | 0.5 | |
Resorts/Theme Parks | | | 0.4 | |
Internet Content — Information/News | | | 0.4 | |
Savings & Loans/Thrifts | | | 0.4 | |
Seismic Data Collection | | | 0.3 | |
| | |
|
|
|
| | | | 100.2 | % |
| | |
|
|
|
| * | Calculated as a percentage of net assets |
66
VALIC Company II Small Cap Growth Fund
PORTFOLIO OF INVESTMENTS — August 31, 2010
| | | | | | | | |
| | |
| Security Description | | Shares | | | Value
(Note 2) | |
| |
COMMON STOCK — 99.4% | |
Advanced Materials — 0.5% | |
STR Holdings, Inc.† | | | 10,600 | | | $ | 219,102 | |
| | | | | | |
|
|
|
Aerospace/Defense-Equipment — 1.6% | |
HEICO Corp. | | | 18,100 | | | | 750,969 | |
| | | | | | |
|
|
|
Apparel Manufacturers — 2.3% | |
G-III Apparel Group, Ltd.† | | | 14,600 | | | | 352,152 | |
Oxford Industries, Inc. | | | 15,100 | | | | 297,772 | |
Under Armour, Inc., Class A† | | | 13,000 | | | | 466,310 | |
| | | | | | |
|
|
|
| | | | | | | | 1,116,234 | |
| | | | | | |
|
|
|
Applications Software — 3.3% | |
NetSuite, Inc.† | | | 37,450 | �� | | | 711,550 | |
Nuance Communications, Inc.† | | | 41,890 | | | | 614,945 | |
RealPage, Inc.† | | | 14,800 | | | | 248,196 | |
| | | | | | |
|
|
|
| | | | | | | | 1,574,691 | |
| | | | | | |
|
|
|
Auction House/Art Dealers — 0.8% | |
Sotheby’s | | | 14,800 | | | | 393,828 | |
| | | | | | |
|
|
|
Banks-Commercial — 1.6% | |
City National Corp. | | | 7,000 | | | | 339,080 | |
Columbia Banking System, Inc. | | | 23,500 | | | | 418,535 | |
| | | | | | |
|
|
|
| | | | | | | | 757,615 | |
| | | | | | |
|
|
|
Batteries/Battery Systems — 1.0% | |
EnerSys† | | | 21,000 | | | | 463,470 | |
| | | | | | |
|
|
|
Building & Construction Products - Misc. — 2.3% | |
Simpson Manufacturing Co., Inc. | | | 19,670 | | | | 433,527 | |
Trex Co., Inc.† | | | 33,300 | | | | 667,665 | |
| | | | | | |
|
|
|
| | | | | | | | 1,101,192 | |
| | | | | | |
|
|
|
Building Products - Air & Heating — 1.3% | |
Lennox International, Inc. | | | 14,150 | | | | 599,818 | |
| | | | | | |
|
|
|
Building - Heavy Construction — 0.6% | |
Orion Marine Group, Inc.† | | | 27,000 | | | | 302,940 | |
| | | | | | |
|
|
|
Chemicals - Diversified — 1.2% | |
Innospec, Inc.† | | | 44,290 | | | | 549,639 | |
| | | | | | |
|
|
|
Commercial Services - Finance — 0.5% | |
Morningstar, Inc.† | | | 6,190 | | | | 250,386 | |
| | | | | | |
|
|
|
Communications Software — 1.0% | |
SolarWinds, Inc.† | | | 31,920 | | | | 460,286 | |
| | | | | | |
|
|
|
Computer Aided Design — 0.8% | |
ANSYS, Inc.† | | | 9,510 | | | | 368,798 | |
| | | | | | |
|
|
|
Computer Data Security — 1.6% | |
Fortinet, Inc.† | | | 36,800 | | | | 750,352 | |
| | | | | | |
|
|
|
Computers - Integrated Systems — 1.8% | |
NCI, Inc.† | | | 9,830 | | | | 188,244 | |
Riverbed Technology, Inc.† | | | 18,000 | | | | 690,480 | |
| | | | | | |
|
|
|
| | | | | | | | 878,724 | |
| | | | | | |
|
|
|
Computers - Periphery Equipment — 1.0% | |
Compellent Technologies, Inc.† | | | 32,200 | | | | 491,694 | |
| | | | | | |
|
|
|
Decision Support Software — 0.7% | |
MSCI, Inc., Class A† | | | 11,750 | | | | 351,325 | |
| | | | | | |
|
|
|
Diversified Manufacturing Operations — 0.9% | |
Carlisle Cos., Inc. | | | 15,840 | | | | 444,312 | |
| | | | | | |
|
|
|
Drug Delivery Systems — 0.9% | |
Nektar Therapeutics† | | | 35,100 | | | | 449,631 | |
| | | | | | |
|
|
|
Educational Software — 0.9% | |
Blackboard, Inc.† | | | 12,840 | | | | 424,876 | |
| | | | | | |
|
|
|
| | | | | | | | |
| | |
| Security Description | | Shares | | | Value
(Note 2) | |
| |
| | | | | | | | | |
Electronic Components-Semiconductors — 3.4% | |
Cavium Networks, Inc.† | | | 23,000 | | | $ | 555,220 | |
Mellanox Technologies, Ltd.† | | | 32,900 | | | | 546,140 | |
Monolithic Power Systems, Inc.† | | | 32,100 | | | | 526,761 | |
| | | | | | |
|
|
|
| | | | | | | | 1,628,121 | |
| | | | | | |
|
|
|
Enterprise Software/Service — 5.2% | |
Concur Technologies, Inc.† | | | 10,200 | | | | 477,054 | |
MedAssets, Inc.† | | | 33,050 | | | | 655,051 | |
Omnicell, Inc.† | | | 55,760 | | | | 622,003 | |
Taleo Corp., Class A† | | | 28,440 | | | | 728,917 | |
| | | | | | |
|
|
|
| | | | | | | | 2,483,025 | |
| | | | | | |
|
|
|
Finance - Investment Banker/Broker — 0.8% | |
Gleacher & Co., Inc.† | | | 58,800 | | | | 98,784 | |
Greenhill & Co., Inc. | | | 3,700 | | | | 260,591 | |
| | | | | | |
|
|
|
| | | | | | | | 359,375 | |
| | | | | | |
|
|
|
Footwear & Related Apparel — 1.0% | |
CROCS, Inc.† | | | 36,300 | | | | 453,750 | |
| | | | | | |
|
|
|
Hotel/Motels — 1.0% | |
Morgans Hotel Group Co.† | | | 74,800 | | | | 466,752 | |
| | | | | | |
|
|
|
Human Resources — 0.8% | |
Heidrick & Struggles International, Inc. | | | 21,700 | | | | 376,929 | |
| | | | | | |
|
|
|
Insurance - Property/Casualty — 0.8% | |
ProAssurance Corp.† | | | 7,100 | | | | 375,945 | |
| | | | | | |
|
|
|
Internet Application Software — 1.9% | |
Art Technology Group, Inc.† | | | 151,600 | | | | 529,084 | |
DealerTrack Holdings, Inc.† | | | 25,740 | | | | 379,536 | |
| | | | | | |
|
|
|
| | | | | | | | 908,620 | |
| | | | | | |
|
|
|
Internet Content - Information/News — 0.4% | |
Archipelago Learning, Inc.† | | | 20,045 | | | | 209,470 | |
| | | | | | |
|
|
|
Internet Security — 1.4% | |
Sourcefire, Inc.† | | | 25,620 | | | | 649,979 | |
| | | | | | |
|
|
|
Internet Telephone — 0.5% | |
BroadSoft, Inc.† | | | 30,900 | | | | 252,453 | |
| | | | | | |
|
|
|
Investment Companies — 0.9% | |
PennantPark Investment Corp. | | | 45,004 | | | | 444,640 | |
| | | | | | |
|
|
|
Investment Management/Advisor Services — 2.1% | |
Affiliated Managers Group, Inc.† | | | 6,830 | | | | 438,554 | |
Financial Engines, Inc.† | | | 41,300 | | | | 551,768 | |
| | | | | | |
|
|
|
| | | | | | | | 990,322 | |
| | | | | | |
|
|
|
Lasers - System/Components — 0.7% | |
Cymer, Inc.† | | | 11,500 | | | | 338,445 | |
| | | | | | |
|
|
|
Machinery - Electrical — 1.4% | |
Baldor Electric Co. | | | 18,460 | | | | 647,577 | |
| | | | | | |
|
|
|
Machinery - General Industrial — 1.1% | |
Wabtec Corp. | | | 12,800 | | | | 544,384 | |
| | | | | | |
|
|
|
Machinery - Pumps — 1.2% | |
Graco, Inc. | | | 21,000 | | | | 586,110 | |
| | | | | | |
|
|
|
Medical Imaging Systems — 1.4% | |
MELA Sciences, Inc.† | | | 35,000 | | | | 240,800 | |
Vital Images, Inc.† | | | 32,470 | | | | 409,771 | |
| | | | | | |
|
|
|
| | | | | | | | 650,571 | |
| | | | | | |
|
|
|
Medical Instruments — 2.9% | |
Bruker Corp.† | | | 48,050 | | | | 571,314 | |
Micrus Endovascular Corp.† | | | 16,900 | | | | 395,629 | |
Thoratec Corp.† | | | 13,420 | | | | 432,124 | |
| | | | | | |
|
|
|
| | | | | | | | 1,399,067 | |
| | | | | | |
|
|
|
67
VALIC Company II Small Cap Growth Fund
PORTFOLIO OF INVESTMENTS — August 31, 2010 — (continued)
| | | | | | | | |
| | |
| Security Description | | Shares | | | Value
(Note 2) | |
| |
COMMON STOCK (continued) | |
Medical Labs & Testing Services — 0.8% | | | | | | | | |
ICON PLC ADR† | | | 16,430 | | | $ | 361,460 | |
| | | | | | |
|
|
|
Medical - Biomedical/Gene — 4.1% | | | | | | | | |
Acorda Therapeutics, Inc.† | | | 5,900 | | | | 177,708 | |
Alexion Pharmaceuticals, Inc.† | | | 4,790 | | | | 270,491 | |
ARIAD Pharmaceuticals, Inc.† | | | 72,100 | | | | 252,350 | |
AVEO Pharmaceuticals, Inc.† | | | 24,900 | | | | 217,128 | |
Enzo Biochem, Inc.† | | | 76,510 | | | | 270,846 | |
Halozyme Therapeutics, Inc.† | | | 57,330 | | | | 438,001 | |
Incyte Corp., Ltd.† | | | 25,000 | | | | 313,000 | |
| | | | | | |
|
|
|
| | | | | | | | 1,939,524 | |
| | | | | | |
|
|
|
Medical - Drugs — 2.2% | | | | | | | | |
Cumberland Pharmaceuticals, Inc.† | | | 31,200 | | | | 157,560 | |
Idenix Pharmaceuticals, Inc.† | | | 30,400 | | | | 182,704 | |
Pharmasset, Inc.† | | | 7,600 | | | | 184,604 | |
Sucampo Pharmaceuticals, Inc. Class A† | | | 38,620 | | | | 129,377 | |
ViroPharma, Inc.† | | | 31,200 | | | | 391,248 | |
| | | | | | |
|
|
|
| | | | | | | | 1,045,493 | |
| | | | | | |
|
|
|
Medical - HMO — 2.8% | | | | | | | | |
Health Net, Inc.† | | | 27,600 | | | | 659,088 | |
Healthspring, Inc.† | | | 33,230 | | | | 689,855 | |
| | | | | | |
|
|
|
| | | | | | | | 1,348,943 | |
| | | | | | |
|
|
|
Metal Processors & Fabrication — 0.8% | | | | | | | | |
Commercial Metals Co. | | | 30,580 | | | | 398,457 | |
| | | | | | |
|
|
|
Networking Products — 1.4% | | | | | | | | |
LogMeIn, Inc.† | | | 21,000 | | | | 688,170 | |
| | | | | | |
|
|
|
Oil Companies - Exploration & Production — 2.9% | | | | | | | | |
Concho Resources, Inc.† | | | 11,540 | | | | 674,167 | |
Forest Oil Corp.† | | | 27,390 | | | | 715,427 | |
| | | | | | |
|
|
|
| | | | | | | | 1,389,594 | |
| | | | | | |
|
|
|
Oil - Field Services — 1.1% | | | | | | | | |
CARBO Ceramics, Inc. | | | 4,800 | | | | 363,504 | |
Oceaneering International, Inc.† | | | 3,560 | | | | 178,036 | |
| | | | | | |
|
|
|
| | | | | | | | 541,540 | |
| | | | | | |
|
|
|
Patient Monitoring Equipment — 1.9% | | | | | | | | |
Insulet Corp.† | | | 40,690 | | | | 537,922 | |
Masimo Corp. | | | 16,545 | | | | 376,564 | |
| | | | | | |
|
|
|
| | | | | | | | 914,486 | |
| | | | | | |
|
|
|
Power Converter/Supply Equipment — 0.9% | | | | | | | | |
Generac Holdings, Inc.† | | | 34,900 | | | | 422,988 | |
| | | | | | |
|
|
|
Private Corrections — 0.8% | | | | | | | | |
The Geo Group, Inc.† | | | 18,220 | | | | 402,662 | |
| | | | | | |
|
|
|
Rental Auto/Equipment — 1.0% | | | | | | | | |
Avis Budget Group, Inc.† | | | 53,900 | | | | 491,568 | |
| | | | | | |
|
|
|
Resort/Theme Parks — 0.4% | | | | | | | | |
Vail Resorts, Inc.† | | | 6,400 | | | | 211,392 | |
| | | | | | |
|
|
|
Retail - Apparel/Shoe — 2.1% | | | | | | | | |
J Crew Group, Inc.† | | | 7,030 | | | | 214,345 | |
Talbots, Inc.† | | | 38,800 | | | | 387,224 | |
The Children’s Place Retail Stores, Inc.† | | | 8,700 | | | | 379,842 | |
| | | | | | |
|
|
|
| | | | | | | | 981,411 | |
| | | | | | |
|
|
|
Retail - Appliances — 1.1% | | | | | | | | |
Hhgregg, Inc.† | | | 28,900 | | | | 546,210 | |
| | | | | | |
|
|
|
| | | | | | | | |
| | |
| Security Description | | Shares | | | Value (Note 2) | |
| |
| | | | | | | | | |
Retail - Automobile — 0.5% | | | | | | | | |
Rush Enterprises, Inc., Class A† | | | 16,718 | | | $ | 212,235 | |
| | | | | | |
|
|
|
Retail - Building Products — 0.5% | | | | | | | | |
Lumber Liquidators Holdings, Inc.† | | | 10,800 | | | | 216,324 | |
| | | | | | |
|
|
|
Retail - Convenience Store — 1.5% | | | | | | | | |
Susser Holdings Corp.† | | | 61,400 | | | | 712,854 | |
| | | | | | |
|
|
|
Retail - Discount — 0.8% | | | | | | | | |
HSN, Inc.† | | | 13,900 | | | | 365,431 | |
| | | | | | |
|
|
|
Retail - Office Supplies — 1.2% | | | | | | | | |
OfficeMax, Inc.† | | | 56,900 | | | | 554,206 | |
| | | | | | |
|
|
|
Retail - Perfume & Cosmetics — 0.6% | | | | | | | | |
Ulta Salon Cosmetics & Fragrance, Inc.† | | | 12,090 | | | | 273,839 | |
| | | | | | |
|
|
|
Retail - Restaurants — 0.9% | | | | | | | | |
DineEquity, Inc.† | | | 13,000 | | | | 414,960 | |
| | | | | | |
|
|
|
Retirement/Aged Care — 1.4% | | | | | | | | |
Emeritus Corp.† | | | 44,530 | | | | 684,871 | |
| | | | | | |
|
|
|
Satellite Telecom — 1.2% | | | | | | | | |
DigitalGlobe, Inc.† | | | 19,180 | | | | 588,251 | |
| | | | | | |
|
|
|
Savings & Loans/Thrifts — 0.4% | | | | | | | | |
WSFS Financial Corp. | | | 5,240 | | | | 188,483 | |
| | | | | | |
|
|
|
Schools — 1.2% | | | | | | | | |
American Public Education, Inc.† | | | 13,470 | | | | 334,730 | |
Lincoln Educational Services Corp.† | | | 21,310 | | | | 232,705 | |
| | | | | | |
|
|
|
| | | | | | | | 567,435 | |
| | | | | | |
|
|
|
Seismic Data Collection — 0.3% | | | | | | | | |
Global Geophysical Services, Inc.† | | | 25,000 | | | | 147,750 | |
| | | | | | |
|
|
|
Semiconductor Components - Integrated Circuits — 1.0% | | | | | | | | |
Hittite Microwave Corp.† | | | 11,340 | | | | 482,517 | |
| | | | | | |
|
|
|
Semiconductor Equipment — 0.8% | | | | | | | | |
Varian Semiconductor Equipment Associates, Inc.† | | | 15,970 | | | | 396,375 | |
| | | | | | |
|
|
|
Telecom Services — 0.5% | | | | | | | | |
Cbeyond, Inc.† | | | 19,840 | | | | 237,088 | |
| | | | | | |
|
|
|
Theaters — 1.1% | | | | | | | | |
National CineMedia, Inc. | | | 34,190 | | | | 543,279 | |
| | | | | | |
|
|
|
Therapeutics — 1.1% | | | | | | | | |
Onyx Pharmaceuticals, Inc.† | | | 10,500 | | | | 252,945 | |
Theravance, Inc.† | | | 23,010 | | | | 278,191 | |
| | | | | | |
|
|
|
| | | | | | | | 531,136 | |
| | | | | | |
|
|
|
Transport - Truck — 2.3% | | | | | | | | |
Landstar System, Inc. | | | 8,360 | | | | 300,793 | |
Marten Transport, Ltd. | | | 19,900 | | | | 392,229 | |
Old Dominion Freight Line, Inc.† | | | 17,355 | | | | 404,545 | |
| | | | | | |
|
|
|
| | | | | | | | 1,097,567 | |
| | | | | | |
|
|
|
Web Hosting/Design — 1.1% | | | | | | | | |
Rackspace Hosting, Inc.† | | | 27,500 | | | | 541,475 | |
| | | | | | |
|
|
|
Wireless Equipment — 1.2% | | | | | | | | |
Viasat, Inc.† | | | 15,740 | | | | 550,113 | |
| | | | | | |
|
|
|
Total Long-Term Investment Securities | | | | | | | | |
(cost $47,063,552) | | | | | | | 47,455,504 | |
| | | | | | |
|
|
|
68
VALIC Company II Small Cap Growth Fund
PORTFOLIO OF INVESTMENTS — August 31, 2010 — (continued)
| | | | | | | | |
| | |
| Security Description | | Principal
Amount | | | Value
(Note 2) | |
| |
SHORT-TERM INVESTMENT SECURITIES — 0.8% | | | | | | | | |
Time Deposits — 0.8% | | | | | | | | |
Euro Time Deposit with State Street Bank & Trust Co.
0.01% due 09/01/10
(cost $388,000) | | $ | 388,000 | | | $ | 388,000 | |
| | | | | | |
|
|
|
TOTAL INVESTMENTS | | | | | | | | |
(cost $47,451,552)(1) | | | 100.2 | % | | | 47,843,504 | |
Liabilities in excess of other assets | | | (0.2 | ) | | | (86,807 | ) |
| | |
|
|
| |
|
|
|
NET ASSETS | | | 100.0 | % | | $ | 47,756,697 | |
| | |
|
|
| |
|
|
|
| † | Non-income producing security |
| (1) | See Note 5 for cost of investments on a tax basis. |
ADR — American Depository Receipt
The following is a summary of the inputs used to value the Fund’s net assets as of August 31, 2010 (see Note 2):
| | | | | | | | | | | | | | | | |
| | | Level 1 - Unadjusted Quoted
Prices
| | | Level 2 - Other Observable
Inputs
| | | Level 3 - Significant
Unobservable Inputs
| | | Total
| |
Long-Term Investment Securities: | | | | | | | | | | | | | | | | |
Common Stock: | | | | | | | | | | | | | | | | |
Enterprise Software/Service | | $ | 2,483,025 | | | $ | — | | | $ | — | | | $ | 2,483,025 | |
Other Industries* | | | 44,972,479 | | | | — | | | | — | | | | 44,972,479 | |
Short-Term Investment Securities: | | | | | | | | | | | | | | | | |
Time Deposit | | | — | | | | 388,000 | | | | — | | | | 388,000 | |
| | |
|
|
| |
|
|
| |
|
|
| |
|
|
|
Total | | $ | 47,455,504 | | | $ | 388,000 | | | $ | — | | | $ | 47,843,504 | |
| | |
|
|
| |
|
|
| |
|
|
| |
|
|
|
| * | Sum of all other industries each of which individually has an aggregate market value of less than 5% of net assets. For a detailed presentation of common stocks by industry classification, please refer to the Portfolio of Investments. |
See Notes to Financial Statements
69
VALIC Company II Small Cap Value Fund
PORTFOLIO PROFILE — August 31, 2010 (Unaudited)
Industry Allocation*
| | | | |
Banks — Commercial | | | 9.0 | % |
Real Estate Investment Trusts | | | 5.9 | |
Electric — Integrated | | | 3.0 | |
Gold Mining | | | 2.9 | |
Gas — Distribution | | | 2.6 | |
Telecom Services | | | 2.4 | |
Food — Misc. | | | 2.3 | |
Oil Companies — Exploration & Production | | | 2.3 | |
Retail — Apparel/Shoe | | | 2.2 | |
Medical — Biomedical/Gene | | | 2.0 | |
Diversified Minerals | | | 2.0 | |
Semiconductor Equipment | | | 1.9 | |
Distribution/Wholesale | | | 1.8 | |
Transport — Truck | | | 1.7 | |
Time Deposits | | | 1.5 | |
Transport — Marine | | | 1.5 | |
Oil — Field Services | | | 1.4 | |
Retail — Restaurants | | | 1.3 | |
Insurance — Property/Casualty | | | 1.3 | |
Human Resources | | | 1.3 | |
Retail — Automobile | | | 1.2 | |
Insurance — Reinsurance | | | 1.2 | |
Repurchase Agreements | | | 1.2 | |
Finance — Investment Banker/Broker | | | 1.2 | |
Electronic Components — Misc. | | | 1.2 | |
Enterprise Software/Service | | | 1.1 | |
Consumer Products — Misc. | | | 1.1 | |
Machinery — General Industrial | | | 1.1 | |
Apparel Manufacturers | | | 1.1 | |
Savings & Loans/Thrifts | | | 1.0 | |
Diversified Manufacturing Operations | | | 1.0 | |
Telecommunication Equipment | | | 0.9 | |
Retail — Office Supplies | | | 0.9 | |
Insurance — Life/Health | | | 0.9 | |
Data Processing/Management | | | 0.9 | |
Insurance — Multi-line | | | 0.9 | |
Investment Companies | | | 0.8 | |
Computers — Memory Devices | | | 0.8 | |
Telephone — Integrated | | | 0.7 | |
Computers — Periphery Equipment | | | 0.7 | |
Paper & Related Products | | | 0.7 | |
Medical Labs & Testing Services | | | 0.7 | |
Airlines | | | 0.7 | |
Medical — Outpatient/Home Medical | | | 0.7 | |
Investment Management/Advisor Services | | | 0.7 | |
Oil & Gas Drilling | | | 0.6 | |
Consulting Services | | | 0.6 | |
Medical Products | | | 0.6 | |
Collectibles | | | 0.6 | |
Internet Application Software | | | 0.6 | |
Metal — Aluminum | | | 0.5 | |
Finance — Consumer Loans | | | 0.5 | |
Transport — Air Freight | | | 0.5 | |
Rental Auto/Equipment | | | 0.5 | |
Food — Baking | | | 0.5 | |
Computer Software | | | 0.5 | |
Computers — Integrated Systems | | | 0.5 | |
Real Estate Operations & Development | | | 0.5 | |
Home Furnishings | | | 0.5 | |
Metal Processors & Fabrication | | | 0.5 | |
Medical Sterilization Products | | | 0.5 | |
Retail — Major Department Stores | | | 0.4 | |
Auto/Truck Parts & Equipment — Original | | | 0.4 | |
Building — Mobile Home/Manufactured Housing | | | 0.4 | |
Medical — HMO | | | 0.4 | |
Lasers — System/Components | | | 0.4 | |
Building — Residential/Commercial | | | 0.4 | |
Medical — Hospitals | | | 0.4 | |
Wire & Cable Products | | | 0.4 | |
| | | | |
Chemicals — Specialty | | | 0.4 | % |
Engineering/R&D Services | | | 0.4 | |
Non-Ferrous Metals | | | 0.4 | |
Coal | | | 0.4 | |
Diversified Operations/Commercial Services | | | 0.4 | |
Hazardous Waste Disposal | | | 0.4 | |
Aerospace/Defense | | | 0.3 | |
Retail — Regional Department Stores | | | 0.3 | |
Publishing — Newspapers | | | 0.3 | |
Containers — Paper/Plastic | | | 0.3 | |
Electric Products — Misc. | | | 0.3 | |
Financial Guarantee Insurance | | | 0.3 | |
Auction Houses/Art Dealers | | | 0.3 | |
Commercial Services — Finance | | | 0.3 | |
Chemicals — Plastics | | | 0.3 | |
Networking Products | | | 0.3 | |
Rubber — Tires | | | 0.3 | |
U.S. Government Treasuries | | | 0.3 | |
Office Furnishings — Original | | | 0.3 | |
Electronic Components — Semiconductors | | | 0.3 | |
Disposable Medical Products | | | 0.3 | |
Medical — Drugs | | | 0.2 | |
Commercial Services | | | 0.2 | |
Chemicals — Diversified | | | 0.2 | |
Computer Aided Design | | | 0.2 | |
Building & Construction Products — Misc. | | | 0.2 | |
Transactional Software | | | 0.2 | |
Internet Infrastructure Software | | | 0.2 | |
Finance — Auto Loans | | | 0.2 | |
Television | | | 0.2 | |
Toys | | | 0.2 | |
Transport — Equipment & Leasing | | | 0.2 | |
Retail — Bookstores | | | 0.2 | |
Machinery — Material Handling | | | 0.2 | |
Machinery — Farming | | | 0.2 | |
Retail — Home Furnishings | | | 0.2 | |
Industrial Automated/Robotic | | | 0.2 | |
Publishing — Books | | | 0.1 | |
Textile — Apparel | | | 0.1 | |
Food — Wholesale/Distribution | | | 0.1 | |
Metal — Diversified | | | 0.1 | |
Auto/Truck Parts & Equipment — Replacement | | | 0.1 | |
Metal Products — Distribution | | | 0.1 | |
Gambling (Non-Hotel) | | | 0.1 | |
Circuit Boards | | | 0.1 | |
Applications Software | | | 0.1 | |
Oil Field Machinery & Equipment | | | 0.1 | |
Linen Supply & Related Items | | | 0.1 | |
Cosmetics & Toiletries | | | 0.1 | |
Power Converter/Supply Equipment | | | 0.1 | |
Advanced Materials | | | 0.1 | |
Computer Services | | | 0.1 | |
Footwear & Related Apparel | | | 0.1 | |
Telecom Equipment — Fiber Optics | | | 0.1 | |
Water | | | 0.1 | |
Publishing — Periodicals | | | 0.1 | |
Semiconductor Components — Integrated Circuits | | | 0.1 | |
Office Supplies & Forms | | | 0.1 | |
Funeral Services & Related Items | | | 0.1 | |
Retail — Hair Salons | | | 0.1 | |
Multilevel Direct Selling | | | 0.1 | |
Miscellaneous Manufacturing | | | 0.1 | |
Transport — Services | | | 0.1 | |
E-Commerce/Services | | | 0.1 | |
Rubber/Plastic Products | | | 0.1 | |
Independent Power Producers | | | 0.1 | |
Physical Therapy/Rehabilitation Centers | | | 0.1 | |
Diagnostic Equipment | | | 0.1 | |
Auto Repair Centers | | | 0.1 | |
70
VALIC Company II Small Cap Value Fund
PORTFOLIO PROFILE — August 31, 2010 (Unaudited) — (continued)
Industry Allocation* (continued)
| | | | |
Finance — Credit Card | | | 0.1 | % |
Containers — Metal/Glass | | | 0.1 | |
Hotels/Motels | | | 0.1 | |
Internet Telephone | | | 0.1 | |
Steel — Producers | | | 0.1 | |
E-Services/Consulting | | | 0.1 | |
Building Products — Light Fixtures | | | 0.1 | |
Food — Retail | | | 0.1 | |
Entertainment Software | | | 0.1 | |
| | |
|
|
|
| | | | 99.6 | % |
| | |
|
|
|
| * | Calculated as a percentage of net assets |
71
VALIC Company II Small Cap Value Fund
PORTFOLIO OF INVESTMENTS — August 31, 2010
| | | | | | | | |
| | |
| Security Description | | Shares | | | Value
(Note 2) | |
| |
COMMON STOCK — 96.6% | | | | | | | | |
Advanced Materials — 0.1% | | | | | | | | |
Ceradyne, Inc.† | | | 16,900 | | | $ | 369,096 | |
| | | | | | |
|
|
|
Advertising Services — 0.0% | | | | | | | | |
Marchex, Inc., Class B | | | 17,000 | | | | 68,170 | |
| | | | | | |
|
|
|
Aerospace/Defense — 0.3% | | | | | | | | |
Cubic Corp. | | | 31,118 | | | | 1,188,396 | |
| | | | | | |
|
|
|
Agricultural Operations — 0.0% | | | | | | | | |
The Andersons, Inc. | | | 1,400 | | | | 50,162 | |
| | | | | | |
|
|
|
Airlines — 0.7% | | | | | | | | |
Alaska Air Group, Inc.† | | | 7,800 | | | | 344,994 | |
Hawaiian Holdings, Inc.† | | | 14,640 | | | | 71,736 | |
Pinnacle Airlines Corp.† | | | 13,900 | | | | 66,025 | |
Republic Airways Holdings, Inc.† | | | 100,418 | | | | 705,939 | |
Skywest, Inc. | | | 58,080 | | | | 739,939 | |
UAL Corp.† | | | 19,800 | | | | 419,562 | |
| | | | | | |
|
|
|
| | | | | | | | 2,348,195 | |
| | | | | | |
|
|
|
Apparel Manufacturers — 1.1% | | | | | | | | |
Carter’s, Inc.† | | | 64,785 | | | | 1,447,297 | |
Jones Apparel Group, Inc. | | | 37,520 | | | | 577,058 | |
Oxford Industries, Inc. | | | 8,700 | | | | 171,564 | |
Volcom, Inc.† | | | 94,000 | | | | 1,465,460 | |
| | | | | | |
|
|
|
| | | | | | | | 3,661,379 | |
| | | | | | |
|
|
|
Applications Software — 0.1% | | | | | | | | |
EPIQ Systems, Inc. | | | 32,518 | | | | 404,849 | |
| | | | | | |
|
|
|
Auction House/Art Dealers — 0.3% | | | | | | | | |
KAR Auction Services, Inc.† | | | 86,500 | | | | 1,047,515 | |
| | | | | | |
|
|
|
Audio/Video Products — 0.0% | | | | | | | | |
Audiovox Corp., Class A† | | | 6,760 | | | | 42,791 | |
| | | | | | |
|
|
|
Auto Repair Centers — 0.1% | | | | | | | | |
Midas, Inc.† | | | 31,703 | | | | 220,019 | |
| | | | | | |
|
|
|
Auto - Cars/Light Trucks — 0.0% | | | | | | | | |
Tesla Motors, Inc.† | | | 6,000 | | | | 117,840 | |
| | | | | | |
|
|
|
Auto/Truck Parts & Equipment - Original — 0.4% | | | | | | | | |
ArvinMeritor, Inc.† | | | 50,978 | | | | 666,283 | |
Autoliv, Inc. | | | 4,880 | | | | 264,203 | |
Superior Industries International, Inc. | | | 41,300 | | | | 602,154 | |
| | | | | | |
|
|
|
| | | | | | | | 1,532,640 | |
| | | | | | |
|
|
|
Auto/Truck Parts & Equipment - Replacement — 0.1% | | | | | | | | |
ATC Technology Corp.† | | | 14,860 | | | | 358,572 | |
Douglas Dynamics, Inc.† | | | 9,800 | | | | 111,328 | |
| | | | | | |
|
|
|
| | | | | | | | 469,900 | |
| | | | | | |
|
|
|
Banks - Commercial — 9.0% | | | | | | | | |
1st Source Corp. | | | 16,328 | | | | 264,840 | |
1st United Bancorp, Inc.† | | | 22,140 | | | | 130,847 | |
Alliance Financial Corp. | | | 900 | | | | 25,587 | |
Associated Banc - Corp. | | | 158,000 | | | | 1,905,480 | |
Bancfirst Corp. | | | 13,540 | | | | 503,688 | |
Bancorp, Inc.† | | | 11,720 | | | | 75,242 | |
Bank of Hawaii Corp. | | | 27,680 | | | | 1,236,189 | |
Cathay General Bancorp | | | 283,060 | | | | 2,714,546 | |
Centerstate Banks, Inc. | | | 10,000 | | | | 86,200 | |
Central Pacific Financial Corp.† | | | 7,163 | | | | 11,246 | |
Century Bancorp, Inc. Class A | | | 1,318 | | | | 27,678 | |
Chemical Financial Corp. | | | 12,200 | | | | 235,704 | |
Citizens Republic Bancorp† | | | 52,600 | | | | 41,028 | |
City Holding Co. | | | 29,300 | | | | 836,515 | |
Community Bank System, Inc. | | | 23,080 | | | | 521,147 | |
| | | | | | | | |
| | |
| Security Description | | Shares | | | Value
(Note 2) | |
| |
| | | | | | | | | |
Banks - Commercial (continued) | | | | | | | | |
Community Trust Bancorp, Inc. | | | 19,380 | | | $ | 510,469 | |
Cullen/Frost Bankers, Inc. | | | 7,720 | | | | 395,650 | |
CVB Financial Corp. | | | 212,500 | | | | 1,451,375 | |
East West Bancorp, Inc. | | | 171,900 | | | | 2,513,178 | |
F.N.B. Corp. | | | 78,940 | | | | 613,364 | |
Financial Institutions, Inc. | | | 10,200 | | | | 146,472 | |
First BanCorp. Puerto Rico† | | | 143,920 | | | | 52,401 | |
First Busey Corp. | | | 32,980 | | | | 141,154 | |
First Citizens BancShares, Inc., Class A | | | 1,340 | | | | 225,080 | |
First Commonwealth Financial Corp. | | | 191,900 | | | | 949,905 | |
First Community Bancshares, Inc. | | | 7,400 | | | | 95,534 | |
First Financial Bancorp | | | 41,798 | | | | 666,678 | |
First Financial Bankshares, Inc. | | | 4,320 | | | | 192,974 | |
First Interstate BancSystem, Inc. | | | 11,200 | | | | 127,904 | |
First Merchants Corp. | | | 7,580 | | | | 58,593 | |
First South Bancorp, Inc. | | | 3,680 | | | | 36,910 | |
FirstMerit Corp. | | | 67,575 | | | | 1,169,048 | |
Fulton Financial Corp. | | | 439 | | | | 3,635 | |
Heartland Financial USA, Inc. | | | 9,240 | | | | 129,822 | |
Hudson Valley Holding Corp. | | | 324 | | | | 5,268 | |
Lakeland Bancorp, Inc. | | | 14,636 | | | | 115,917 | |
Lakeland Financial Corp. | | | 4,780 | | | | 88,621 | |
MainSource Financial Group, Inc. | | | 17,793 | | | | 108,004 | |
MB Financial, Inc. | | | 20,120 | | | | 301,398 | |
Metro Bancorp, Inc.† | | | 9,900 | | | | 91,575 | |
Nara BanCorp., Inc.† | | | 22,720 | | | | 135,638 | |
Old Second Bancorp, Inc. | | | 1,580 | | | | 1,312 | |
S&T Bancorp, Inc. | | | 3,680 | | | | 62,450 | |
SCBT Financial Corp. | | | 3,020 | | | | 86,825 | |
Sierra Bancorp | | | 2,920 | | | | 33,638 | |
Simmons First National Corp., Class A | | | 16,320 | | | | 414,202 | |
Southwest Bancorp, Inc. | | | 17,680 | | | | 210,569 | |
State Bancorp, Inc. | | | 9,800 | | | | 83,104 | |
Sterling Bancorp | | | 285,700 | | | | 2,485,590 | |
Sterling Bancshares, Inc. | | | 253,000 | | | | 1,254,880 | |
Suffolk Bancorp | | | 2,820 | | | | 66,411 | |
Susquehanna Bancshares, Inc. | | | 66,200 | | | | 523,642 | |
SVB Financial Group† | | | 10,420 | | | | 387,311 | |
TCF Financial Corp. | | | 68,640 | | | | 980,179 | |
The South Financial Group, Inc†. | | | 260,600 | | | | 73,672 | |
Tompkins Financial Corp. | | | 6,648 | | | | 244,248 | |
Trustco Bank Corp. NY | | | 27,200 | | | | 144,704 | |
Trustmark Corp. | | | 24,400 | | | | 465,308 | |
UMB Financial Corp. | | | 31,760 | | | | 1,012,509 | |
Umpqua Holdings Corp. | | | 17,300 | | | | 179,920 | |
United Community Banks, Inc.† | | | 27,240 | | | | 67,555 | |
Washington Trust Bancorp, Inc. | | | 11,180 | | | | 202,246 | |
West Bancorp, Inc.† | | | 3,080 | | | | 18,172 | |
West Coast Bancorp.† | | | 42,600 | | | | 100,536 | |
Westamerica Bancorporation | | | 9,424 | | | | 477,608 | |
Western Alliance Bancorp† | | | 157,241 | | | | 962,315 | |
Whitney Holding Corp. | | | 34,080 | | | | 253,214 | |
Zions Bancorporation | | | 86,000 | | | | 1,584,980 | |
| | | | | | |
|
|
|
| | | | | | | | 31,319,604 | |
| | | | | | |
|
|
|
Broadcast Services/Program — 0.0% | | | | | | | | |
Crown Media Holdings, Inc., Class A† | | | 17,500 | | | | 37,450 | |
| | | | | | |
|
|
|
Building & Construction Products - Misc. — 0.2% | | | | | | | | |
Gibraltar Industries, Inc.† | | | 48,080 | | | | 365,408 | |
Interline Brands, Inc.† | | | 4,900 | | | | 79,184 | |
NCI Building Systems, Inc.† | | | 1,868 | | | | 16,438 | |
Quanex Building Products Corp. | | | 13,520 | | | | 213,616 | |
Trex Co., Inc.† | | | 6,478 | | | | 129,884 | |
| | | | | | |
|
|
|
| | | | | | | | 804,530 | |
| | | | | | |
|
|
|
72
VALIC Company II Small Cap Value Fund
PORTFOLIO OF INVESTMENTS — August 31, 2010 — (continued)
| | | | | | | | |
| | |
| Security Description | | Shares | | | Value
(Note 2) | |
| |
COMMON STOCK (continued) | | | | | | | | |
Building & Construction - Misc. — 0.0% | | | | | | | | |
Dycom Industries, Inc.† | | | 11,400 | | | $ | 91,656 | |
| | | | | | |
|
|
|
Building Products - Light Fixtures — 0.1% | | | | | | | | |
LSI Industries, Inc. | | | 33,400 | | | | 172,010 | |
| | | | | | |
|
|
|
Building - Mobile Home/Manufactured Housing — 0.4% | | | | | |
Thor Industries, Inc. | | | 64,500 | | | | 1,505,430 | |
| | | | | | |
|
|
|
Building - Residential/Commercial — 0.4% | | | | | | | | |
MDC Holdings, Inc. | | | 54,000 | | | | 1,437,480 | |
| | | | | | |
|
|
|
Chemicals - Diversified — 0.2% | | | | | | | | |
Innophos Holdings, Inc. | | | 28,100 | | | | 819,677 | |
| | | | | | |
|
|
|
Chemicals - Plastics — 0.3% | | | | | | | | |
A. Schulman, Inc. | | | 6,765 | | | | 122,920 | |
PolyOne Corp.† | | | 22,020 | | | | 214,695 | |
Spartech Corp.† | | | 75,740 | | | | 676,358 | |
| | | | | | |
|
|
|
| | | | | | | | 1,013,973 | |
| | | | | | |
|
|
|
Chemicals - Specialty — 0.4% | | | | | | | | |
H.B. Fuller Co. | | | 26,818 | | | | 509,274 | |
Minerals Technologies, Inc. | | | 13,880 | | | | 743,968 | |
| | | | | | |
|
|
|
| | | | | | | | 1,253,242 | |
| | | | | | |
|
|
|
Circuit Boards — 0.1% | | | | | | | | |
Park Electrochemical Corp. | | | 18,840 | | | | 450,276 | |
| | | | | | |
|
|
|
Coal — 0.4% | | | | | | | | |
International Coal Group, Inc.† | | | 270,094 | | | | 1,234,330 | |
| | | | | | |
|
|
|
Collectibles — 0.6% | | | | | | | | |
RC2 Corp.† | | | 107,500 | | | | 1,979,075 | |
| | | | | | |
|
|
|
Commerce — 0.0% | | | | | | | | |
SPS Commerce, Inc.† | | | 3,100 | | | | 31,589 | |
| | | | | | |
|
|
|
Commercial Services — 0.2% | | | | | | | | |
PHH Corp.† | | | 44,480 | | | | 823,325 | |
| | | | | | |
|
|
|
Commercial Services - Finance — 0.3% | | | | | | | | |
Advance America Cash Advance Centers, Inc. | | | 38,040 | | | | 127,434 | |
Cardtronics, Inc.† | | | 3,600 | | | | 49,860 | |
Dollar Financial Corp.† | | | 36,038 | | | | 696,975 | |
Global Cash Access Holdings, Inc.† | | | 5,620 | | | | 20,344 | |
Green Dot Corp., Class A† | | | 3,100 | | | | 140,306 | |
| | | | | | |
|
|
|
| | | | | | | | 1,034,919 | |
| | | | | | |
|
|
|
Computer Aided Design — 0.2% | | | | | | | | |
Aspen Technology, Inc.† | | | 84,658 | | | | 811,024 | |
| | | | | | |
|
|
|
Computer Services — 0.1% | | | | | | | | |
CIBER, Inc.† | | | 39,760 | | | | 108,942 | |
Unisys Corp.† | | | 10,946 | | | | 244,753 | |
| | | | | | |
|
|
|
| | | | | | | | 353,695 | |
| | | | | | |
|
|
|
Computer Software — 0.5% | | | | | | | | |
Avid Technology, Inc.† | | | 146,000 | | | | 1,617,680 | |
DynaVox, Inc., Class A† | | | 10,400 | | | | 94,224 | |
| | | | | | |
|
|
|
| | | | | | | | 1,711,904 | |
| | | | | | |
|
|
|
Computers - Integrated Systems — 0.5% | | | | | | | | |
Agilysys, Inc†. | | | 36,160 | | | | 156,934 | |
Brocade Communications Systems, Inc.† | | | 306,000 | | | | 1,536,120 | |
| | | | | | |
|
|
|
| | | | | | | | 1,693,054 | |
| | | | | | |
|
|
|
Computers - Memory Devices — 0.8% | | | | | | | | |
Imation Corp.† | | | 12,500 | | | | 107,000 | |
Quantum Corp.† | | | 560 | | | | 806 | |
STEC, Inc.† | | | 135,600 | | | | 1,513,296 | |
Xyratex, Ltd.† | | | 86,300 | | | | 1,039,052 | |
| | | | | | |
|
|
|
| | | | | | | | 2,660,154 | |
| | | | | | |
|
|
|
| | | | | | | | |
| | |
| Security Description | | Shares | | | Value
(Note 2) | |
| |
| | | | | | | | | |
Computers - Periphery Equipment — 0.7% | | | | | | | | |
Electronics for Imaging, Inc.† | | | 240,720 | | | $ | 2,562,464 | |
| | | | | | |
|
|
|
Consulting Services — 0.6% | | | | | | | | |
FTI Consulting, Inc.† | | | 64,500 | | | | 2,114,310 | |
| | | | | | |
|
|
|
Consumer Products - Misc. — 1.1% | | | | | | | | |
American Greetings Corp., Class A | | | 32,320 | | | | 623,776 | |
Blyth, Inc. | | | 19,792 | | | | 754,471 | |
Central Garden and Pet Co., Class A† | | | 132,960 | | | | 1,241,847 | |
Helen of Troy, Ltd.† | | | 29,120 | | | | 648,066 | |
Jarden Corp. | | | 7,060 | | | | 190,196 | |
Prestige Brands Holdings, Inc.† | | | 61,740 | | | | 456,876 | |
| | | | | | |
|
|
|
| | | | | | | | 3,915,232 | |
| | | | | | |
|
|
|
Containers - Metal/Glass — 0.1% | | | | | | | | |
Silgan Holdings, Inc. | | | 6,976 | | | | 208,513 | |
| | | | | | |
|
|
|
Containers - Paper/Plastic — 0.3% | | | �� | | | | | |
Graham Packaging Co., Inc.† | | | 7,900 | | | | 88,322 | |
Rock - Tenn Co., Class A | | | 21,580 | | | | 1,039,724 | |
| | | | | | |
|
|
|
| | | | | | | | 1,128,046 | |
| | | | | | |
|
|
|
Cosmetics & Toiletries — 0.1% | | | | | | | | |
Inter Parfums, Inc. | | | 23,240 | | | | 381,601 | |
| | | | | | |
|
|
|
Data Processing/Management — 0.9% | | | | | | | | |
Acxiom Corp.† | | | 11,200 | | | | 138,824 | |
CSG Systems International, Inc.† | | | 53,242 | | | | 974,328 | |
Fair Isaac Corp. | | | 18,220 | | | | 407,946 | |
Schawk, Inc. | | | 97,500 | | | | 1,482,000 | |
| | | | | | |
|
|
|
| | | | | | | | 3,003,098 | |
| | | | | | |
|
|
|
Diagnostic Equipment — 0.1% | |
Affymetrix, Inc.† | | | 31,980 | | | | 131,438 | |
GenMark Diagnostics, Inc.† | | | 18,500 | | | | 76,405 | |
Hansen Medical, Inc.† | | | 17,800 | | | | 24,386 | |
| | | | | | |
|
|
|
| | | | | | | | 232,229 | |
| | | | | | |
|
|
|
Disposable Medical Products — 0.3% | |
ICU Medical, Inc.† | | | 24,800 | | | | 883,624 | |
| | | | | | |
|
|
|
Distribution/Wholesale — 1.8% | |
Beacon Roofing Supply, Inc.† | | | 142,200 | | | | 1,980,846 | |
BlueLinx Holdings, Inc.† | | | 14,460 | | | | 49,164 | |
Houston Wire & Cable Co. | | | 1,578 | | | | 14,265 | |
School Specialty, Inc.† | | | 82,000 | | | | 1,068,460 | |
Tech Data Corp.† | | | 14,318 | | | | 518,312 | |
United Stationers, Inc.† | | | 36,200 | | | | 1,625,018 | |
WESCO International, Inc.† | | | 32,758 | | | | 1,057,428 | |
| | | | | | |
|
|
|
| | | | | | | | 6,313,493 | |
| | | | | | |
|
|
|
Diversified Financial Services — 0.0% | |
Doral Financial Corp.† | | | 28,500 | | | | 38,475 | |
| | | | | | |
|
|
|
Diversified Manufacturing Operations — 1.0% | |
Barnes Group, Inc. | | | 33,749 | | | | 513,322 | |
Federal Signal Corp. | | | 103,267 | | | | 544,217 | |
Koppers Holdings, Inc. | | | 11,440 | | | | 228,800 | |
Leggett & Platt, Inc. | | | 50,498 | | | | 968,047 | |
Standex International Corp. | | | 16,200 | | | | 381,186 | |
Tredegar Corp. | | | 42,160 | | | | 692,267 | |
| | | | | | |
|
|
|
| | | | | | | | 3,327,839 | |
| | | | | | |
|
|
|
Diversified Minerals — 2.0% | |
Fronteer Gold, Inc.† | | | 946,836 | | | | 7,025,523 | |
| | | | | | |
|
|
|
Diversified Operations/Commercial Services — 0.4% | |
Chemed Corp. | | | 24,500 | | | | 1,222,550 | |
| | | | | | |
|
|
|
73
VALIC Company II Small Cap Value Fund
PORTFOLIO OF INVESTMENTS — August 31, 2010 — (continued)
| | | | | | | | |
| | |
| Security Description | | Shares | | | Value
(Note 2) | |
| |
COMMON STOCK (continued) | | | | | | | | |
E - Commerce/Services — 0.1% | |
Ancestry.com, Inc.† | | | 6,340 | | | $ | 122,045 | |
United Online, Inc. | | | 23,958 | | | | 118,113 | |
| | | | | | |
|
|
|
| | | | | | | | 240,158 | |
| | | | | | |
|
|
|
E - Services/Consulting — 0.1% | |
Perficient, Inc.† | | | 20,158 | | | | 174,971 | |
| | | | | | |
|
|
|
Electric Products - Misc. — 0.3% | |
AMETEK, Inc. | | | 26,000 | | | | 1,117,740 | |
| | | | | | |
|
|
|
Electric - Integrated — 3.0% | |
Avista Corp. | | | 62,180 | | | | 1,297,697 | |
Black Hills Corp. | | | 12,040 | | | | 366,377 | |
El Paso Electric Co.† | | | 123,500 | | | | 2,834,325 | |
NorthWestern Corp. | | | 51,018 | | | | 1,434,626 | |
Pike Electric Corp.† | | | 188,000 | | | | 1,522,800 | |
Portland General Electric Co. | | | 26,300 | | | | 525,474 | |
Unisource Energy Corp. | | | 18,240 | | | | 593,347 | |
Westar Energy, Inc. | | | 74,500 | | | | 1,785,765 | |
| | | | | | |
|
|
|
| | | | | | | | 10,360,411 | |
| | | | | | |
|
|
|
Electronic Components - Misc. — 1.2% | |
Bel Fuse, Inc., Class B | | | 3,400 | | | | 63,002 | |
CTS Corp. | | | 20,340 | | | | 163,534 | |
Jabil Circuit, Inc. | | | 146,000 | | | | 1,496,500 | |
Methode Electronics, Inc. | | | 40,080 | | | | 357,914 | |
OSI Systems, Inc.† | | | 4,480 | | | | 132,518 | |
Vishay Intertechnology, Inc.† | | | 232,200 | | | | 1,785,618 | |
| | | | | | |
|
|
|
| | | | | | | | 3,999,086 | |
| | | | | | |
|
|
|
Electronic Components - Semiconductors — 0.3% | |
Alpha & Omega Semiconductor, Ltd.† | | | 4,400 | | | | 48,840 | |
DSP Group, Inc.† | | | 19,980 | | | | 134,466 | |
IXYS Corp.† | | | 12,000 | | | | 113,520 | |
Lattice Semiconductor Corp.† | | | 55,580 | | | | 230,657 | |
Microsemi Corp.† | | | 12,300 | | | | 172,200 | |
MIPS Technologies, Inc.† | | | 18,180 | | | | 119,806 | |
Semtech Corp.† | | | 5,120 | | | | 84,966 | |
| | | | | | |
|
|
|
| | | | | | | | 904,455 | |
| | | | | | |
|
|
|
Energy - Alternate Sources — 0.0% | |
Headwaters, Inc.† | | | 9,920 | | | | 30,454 | |
| | | | | | |
|
|
|
Engineering/R&D Services — 0.4% | |
EMCOR Group, Inc.† | | | 55,098 | | | | 1,252,929 | |
| | | | | | |
|
|
|
Engines - Internal Combustion — 0.0% | |
Briggs & Stratton Corp. | | | 6,500 | | | | 117,975 | |
| | | | | | |
|
|
|
Enterprise Software/Service — 1.1% | | | | | | | | |
CDC Software Corp. ADR† | | | 145,187 | | | | 789,818 | |
Lawson Software, Inc.† | | | 351,500 | | | | 2,671,400 | |
MicroStrategy, Inc., Class A† | | | 5,140 | | | | 400,560 | |
QLIK Technologies, Inc.† | | | 4,100 | | | | 76,383 | |
RealD, Inc.† | | | 3,700 | | | | 61,827 | |
| | | | | | |
|
|
|
| | | | | | | | 3,999,988 | |
| | | | | | |
|
|
|
Entertainment Software — 0.1% | |
THQ, Inc.† | | | 45,800 | | | | 162,590 | |
| | | | | | |
|
|
|
Finance - Auto Loans — 0.2% | |
AmeriCredit Corp.† | | | 20,460 | | | | 495,132 | |
Credit Acceptance Corp.† | | | 3,830 | | | | 216,970 | |
| | | | | | |
|
|
|
| | | | | | | | 712,102 | |
| | | | | | |
|
|
|
Finance - Consumer Loans — 0.5% | |
Ocwen Financial Corp.† | | | 26,240 | | | | 238,522 | |
World Acceptance Corp.† | | | 38,458 | | | | 1,567,163 | |
| | | | | | |
|
|
|
| | | | | | | | 1,805,685 | |
| | | | | | |
|
|
|
| | | | | | | | |
| | |
| Security Description | | Shares | | | Value
(Note 2) | |
| |
| | | | | | | | | |
Finance - Credit Card — 0.1% | |
CompuCredit Holdings Corp. | | | 49,067 | | | $ | 214,423 | |
| | | | | | |
|
|
|
Finance - Investment Banker/Broker — 1.2% | |
Gleacher & Co., Inc.† | | | 115,376 | | | | 193,832 | |
Investment Technology Group, Inc.† | | | 15,400 | | | | 204,666 | |
Oppenheimer Holdings, Inc., Class A | | | 10,000 | | | | 233,000 | |
Piper Jaffray Cos., Inc.† | | | 15,560 | | | | 429,767 | |
Raymond James Financial, Inc. | | | 64,000 | | | | 1,477,120 | |
Stifel Financial Corp.† | | | 35,200 | | | | 1,523,456 | |
| | | | | | |
|
|
|
| | | | | | | | 4,061,841 | |
| | | | | | |
|
|
|
Finance - Leasing Companies — 0.0% | |
Marlin Business Services Corp.† | | | 3,840 | | | | 37,440 | |
| | | | | | |
|
|
|
Financial Guarantee Insurance — 0.3% | |
Ambac Financial Group, Inc.† | | | 29,780 | | | | 16,260 | |
The MGIC Investment Corp.† | | | 89,800 | | | | 648,356 | |
PMI Group, Inc.† | | | 84,120 | | | | 259,090 | |
Radian Group, Inc. | | | 26,000 | | | | 164,580 | |
| | | | | | |
|
|
|
| | | | | | | | 1,088,286 | |
| | | | | | |
|
|
|
Food - Baking — 0.5% | |
Flowers Foods, Inc. | | | 67,000 | | | | 1,731,280 | |
| | | | | | |
|
|
|
Food - Misc. — 2.3% | |
B&G Foods, Inc. | | | 215,430 | | | | 2,300,792 | |
Cal - Maine Foods, Inc. | | | 48,300 | | | | 1,433,544 | |
Dole Food Co., Inc.† | | | 39,820 | | | | 344,045 | |
J & J Snack Foods Corp. | | | 27,000 | | | | 1,019,250 | |
M&F Worldwide Corp.† | | | 4,080 | | | | 94,656 | |
RalCorp Holdings, Inc.† | | | 44,000 | | | | 2,624,600 | |
Seaboard Corp. | | | 200 | | | | 322,000 | |
| | | | | | |
|
|
|
| | | | | | | | 8,138,887 | |
| | | | | | |
|
|
|
Food - Retail — 0.1% | |
Great Atlantic & Pacific Tea Co., Inc.† | | | 54,200 | | | | 164,768 | |
| | | | | | |
|
|
|
Food - Wholesale/Distribution — 0.1% | |
Nash Finch Co. | | | 12,320 | | | | 483,806 | |
| | | | | | |
|
|
|
Footwear & Related Apparel — 0.1% | |
The Timberland Co., Class A† | | | 12,040 | | | | 193,483 | |
Wolverine World Wide, Inc. | | | 5,418 | | | | 136,913 | |
| | | | | | |
|
|
|
| | | | | | | | 330,396 | |
| | | | | | |
|
|
|
Funeral Services & Related Items — 0.1% | |
Stewart Enterprises, Inc., Class A | | | 59,620 | | | | 283,791 | |
| | | | | | |
|
|
|
Gambling (Non-Hotel) — 0.1% | |
Isle of Capri Casinos, Inc.† | | | 64,280 | | | | 455,102 | |
| | | | | | |
|
|
|
Gas - Distribution — 2.6% | |
The Laclede Group, Inc. | | | 34,800 | | | | 1,158,840 | |
New Jersey Resources Corp. | | | 9,160 | | | | 340,844 | |
Nicor, Inc. | | | 36,860 | | | | 1,558,809 | |
Piedmont Natural Gas, Inc. | | | 8,260 | | | | 225,333 | |
South Jersey Industries, Inc. | | | 99,800 | | | | 4,689,602 | |
Southwest Gas Corp. | | | 27,140 | | | | 853,553 | |
UGI Corp. | | | 1,980 | | | | 54,648 | |
| | | | | | |
|
|
|
| | | | | | | | 8,881,629 | |
| | | | | | |
|
|
|
Gold Mining — 2.9% | |
Seabridge Gold, Inc.† | | | 204,394 | | | | 6,139,996 | |
US Gold Corp.† | | | 740,934 | | | | 3,830,629 | |
| | | | | | |
|
|
|
| | | | | | | | 9,970,625 | |
| | | | | | |
|
|
|
Hazardous Waste Disposal — 0.4% | |
Sharps Compliance Corp.† | | | 267,187 | | | | 1,213,029 | |
| | | | | | |
|
|
|
74
VALIC Company II Small Cap Value Fund
PORTFOLIO OF INVESTMENTS — August 31, 2010 — (continued)
| | | | | | | | |
| | |
| Security Description | | Shares | | | Value
(Note 2) | |
| |
COMMON STOCK (continued) | | | | | | | | |
Health Care Cost Containment — 0.0% | |
MedQuist, Inc.† | | | 4,100 | | | $ | 30,135 | |
| | | | | | |
|
|
|
Home Furnishings — 0.5% | |
Ethan Allen Interiors, Inc. | | | 75,500 | | | | 1,018,495 | |
Furniture Brands International, Inc.† | | | 72,120 | | | | 335,358 | |
La - Z-Boy, Inc.† | | | 39,700 | | | | 265,990 | |
| | | | | | |
|
|
|
| | | | | | | | 1,619,843 | |
| | | | | | |
|
|
|
Hotel/Motels — 0.1% | |
Wyndham Worldwide Corp. | | | 8,600 | | | | 199,434 | |
| | | | | | |
|
|
|
Housewares — 0.0% | |
Lifetime Brands, Inc† | | | 1,300 | | | | 17,732 | |
| | | | | | |
|
|
|
Human Resources — 1.3% | |
AMN Healthcare Services, Inc.† | | | 242,050 | | | | 1,077,122 | |
Cross Country Healthcare, Inc.† | | | 72,348 | | | | 536,099 | |
Emergency Medical Services Corp., Class A† | | | 3,440 | | | | 165,292 | |
Heidrick & Struggles International, Inc. | | | 41,000 | | | | 712,170 | |
Resources Connection, Inc. | | | 130,500 | | | | 1,447,245 | |
SFN Group, Inc.† | | | 88,580 | | | | 481,875 | |
| | | | | | |
|
|
|
| | | | | | | | 4,419,803 | |
| | | | | | |
|
|
|
Identification Systems — 0.0% | |
Checkpoint Systems, Inc.† | | | 760 | | | | 13,938 | |
| | | | | | |
|
|
|
Independent Power Producers — 0.1% | |
Dynegy, Inc.† | | | 47,900 | | | | 236,147 | |
| | | | | | |
|
|
|
Industrial Automated/Robotic — 0.2% | |
Cognex Corp. | | | 27,940 | | | | 544,830 | |
| | | | | | |
|
|
|
Instruments - Controls — 0.0% | |
Watts Water Technologies, Inc., Class A | | | 3,660 | | | | 109,946 | |
| | | | | | |
|
|
|
Insurance Brokers — 0.0% | |
Crawford & Co., Class B† | | | 24,118 | | | | 64,395 | |
| | | | | | |
|
|
|
Insurance - Life/Health — 0.9% | |
American Equity Investment Life Holding Co. | | | 119,998 | | | | 1,138,781 | |
CNO Financial Group, Inc.† | | | 74,020 | | | | 350,115 | |
Delphi Financial Group, Inc., Class A | | | 39,216 | | | | 874,517 | |
FBL Financial Group, Inc., Class A | | | 4,106 | | | | 94,438 | |
Primerica, Inc. | | | 6,400 | | | | 134,592 | |
StanCorp Financial Group, Inc. | | | 11,558 | | | | 411,811 | |
| | | | | | |
|
|
|
| | | | | | | | 3,004,254 | |
| | | | | | |
|
|
|
Insurance - Multi-line — 0.9% | |
Horace Mann Educators Corp. | | | 181,980 | | | | 2,984,472 | |
| | | | | | |
|
|
|
Insurance - Property/Casualty — 1.3% | |
Arch Capital Group, Ltd.† | | | 6,100 | | | | 486,780 | |
First Mercury Financial Corp. | | | 16,498 | | | | 150,297 | |
Hallmark Financial Services, Inc.† | | | 13,100 | | | | 109,254 | |
Harleysville Group, Inc. | | | 29,260 | | | | 932,809 | |
Meadowbrook Insurance Group, Inc. | | | 18,280 | | | | 157,025 | |
PMA Capital Corp., Class A† | | | 14,560 | | | | 100,610 | |
ProAssurance Corp.† | | | 10,440 | | | | 552,798 | |
Selective Insurance Group, Inc. | | | 145,768 | | | | 2,166,112 | |
| | | | | | |
|
|
|
| | | | | | | | 4,655,685 | |
| | | | | | |
|
|
|
Insurance - Reinsurance — 1.2% | |
Axis Capital Holdings, Ltd. | | | 11,640 | | | | 359,443 | |
Platinum Underwriters Holdings, Ltd. | | | 41,400 | | | | 1,664,694 | |
Validus Holdings, Ltd. | | | 87,621 | | | | 2,231,707 | |
| | | | | | |
|
|
|
| | | | | | | | 4,255,844 | |
| | | | | | |
|
|
|
Internet Application Software — 0.6% | |
DealerTrack Holdings, Inc.† | | | 113,000 | | | | 1,666,185 | |
IntraLinks Holdings, Inc.† | | | 15,100 | | | | 196,300 | |
S1 Corp.† | | | 9,120 | | | | 44,414 | |
| | | | | | |
|
|
|
| | | | | | | | 1,906,899 | |
| | | | | | |
|
|
|
| | | | | | | | |
| | |
| Security Description | | Shares | | | Value
(Note 2) | |
| |
| | | | | | | | | |
Internet Financial Services — 0.0% | | | | | | | | |
Online Resources Corp.† | | | 14,000 | | | $ | 55,300 | |
| | | | | | |
|
|
|
Internet Infrastructure Software — 0.2% | | | | | | | | |
TIBCO Software, Inc.† | | | 50,540 | | | | 732,325 | |
| | | | | | |
|
|
|
Internet Telephone — 0.1% | | | | | | | | |
BroadSoft, Inc.† | | | 23,800 | | | | 194,446 | |
| | | | | | |
|
|
|
Investment Companies — 0.8% | | | | | | | | |
Fifth Street Finance Corp. | | | 206,000 | | | | 2,031,160 | |
Gladstone Capital Corp. | | | 15,540 | | | | 162,082 | |
Gladstone Investment Corp. | | | 13,800 | | | | 81,420 | |
MCG Capital Corp. | | | 62,340 | | | | 329,155 | |
NGP Capital Resources Co. | | | 17,163 | | | | 138,849 | |
| | | | | | |
|
|
|
| | | | | | | | 2,742,666 | |
| | | | | | |
|
|
|
Investment Management/Advisor Services — 0.7% | | | | | | | | |
Affiliated Managers Group, Inc.† | | | 30,120 | | | | 1,934,005 | |
Financial Engines, Inc.† | | | 600 | | | | 8,016 | |
GAMCO Investors, Inc., Class A | | | 6,200 | | | | 218,860 | |
Janus Capital Group, Inc. | | | 12,160 | | | | 110,413 | |
| | | | | | |
|
|
|
| | | | | | | | 2,271,294 | |
| | | | | | |
|
|
|
Lasers - System/Components — 0.4% | | | | | | | | |
Coherent, Inc.† | | | 35,340 | | | | 1,312,881 | |
Newport Corp.† | | | 14,822 | | | | 140,364 | |
| | | | | | |
|
|
|
| | | | | | | | 1,453,245 | |
| | | | | | |
|
|
|
Leisure Products — 0.0% | | | | | | | | |
Brunswick Corp. | | | 9,400 | | | | 119,474 | |
| | | | | | |
|
|
|
Linen Supply & Related Items — 0.1% | | | | | | | | |
G&K Services, Inc., Class A | | | 19,660 | | | | 394,969 | |
| | | | | | |
|
|
|
Machinery - Farming — 0.2% | | | | | | | | |
AGCO Corp.† | | | 17,060 | | | | 563,833 | |
| | | | | | |
|
|
|
Machinery - General Industrial — 1.1% | | | | | | | | |
Applied Industrial Technologies, Inc. | | | 44,600 | | | | 1,195,280 | |
Flow International Corp.† | | | 468,196 | | | | 1,015,985 | |
Wabtec Corp. | | | 38,500 | | | | 1,637,405 | |
| | | | | | |
|
|
|
| | | | | | | | 3,848,670 | |
| | | | | | |
|
|
|
Machinery - Material Handling — 0.2% | | | | | | | | |
Cascade Corp. | | | 3,440 | | | | 107,397 | |
NACCO Industries, Inc., Class A | | | 6,180 | | | | 479,197 | |
| | | | | | |
|
|
|
| | | | | | | | 586,594 | |
| | | | | | |
|
|
|
Machinery - Pumps — 0.0% | | | | | | | | |
Tecumseh Products Co., Class A† | | | 4,380 | | | | 51,290 | |
| | | | | | |
|
|
|
Medical Labs & Testing Services — 0.7% | | | | | | | | |
Covance, Inc.† | | | 65,500 | | | | 2,484,415 | |
| | | | | | |
|
|
|
Medical Laser Systems — 0.0% | | | | | | | | |
LCA - Vision, Inc.† | | | 28,700 | | | | 113,939 | |
| | | | | | |
|
|
|
Medical Products — 0.6% | | | | | | | | |
Greatbatch, Inc.† | | | 36,000 | | | | 790,200 | |
Invacare Corp. | | | 20,400 | | | | 467,160 | |
Teleflex, Inc. | | | 7,580 | | | | 364,295 | |
TomoTherapy, Inc.† | | | 147,740 | | | | 455,039 | |
| | | | | | |
|
|
|
| | | | | | | | 2,076,694 | |
| | | | | | |
|
|
|
Medical Sterilization Products — 0.5% | | | | | | | | |
STERIS Corp. | | | 54,000 | | | | 1,553,580 | |
| | | | | | |
|
|
|
Medical - Biomedical/Gene — 2.0% | | | | | | | | |
Bio - Rad Laboratories, Inc., Class A† | | | 21,200 | | | | 1,749,636 | |
Charles River Laboratories International, Inc.† | | | 50,500 | | | | 1,426,625 | |
Incyte Corp., Ltd.† | | | 244,500 | | | | 3,061,140 | |
75
VALIC Company II Small Cap Value Fund
PORTFOLIO OF INVESTMENTS — August 31, 2010 — (continued)
| | | | | | | | |
| | |
| Security Description | | Shares | | | Value
(Note 2) | |
| |
COMMON STOCK (continued) | | | | | | | | |
Medical - Biomedical/Gene (continued) | | | | | | | | |
Lexicon Pharmaceuticals, Inc.† | | | 20,600 | | | $ | 29,561 | |
Seattle Genetics, Inc.† | | | 7,320 | | | | 83,814 | |
Tengion, Inc.† | | | 19,400 | | | | 58,782 | |
The Medicines Co.† | | | 56,800 | | | | 653,200 | |
| | | | | | |
|
|
|
| | | | | | | | 7,062,758 | |
| | | | | | |
|
|
|
Medical - Drugs — 0.2% | | | | | | | | |
Bionovo, Inc.† | | | 20,844 | | | | 35,643 | |
Idenix Pharmaceuticals, Inc.† | | | 22,900 | | | | 137,629 | |
PharMerica Corp.† | | | 8,940 | | | | 69,375 | |
ViroPharma, Inc.† | | | 47,000 | | | | 589,380 | |
| | | | | | |
|
|
|
| | | | | | | | 832,027 | |
| | | | | | |
|
|
|
Medical - HMO — 0.4% | | | | | | | | |
Magellan Health Services, Inc.† | | | 30,442 | | | | 1,333,664 | |
WellCare Health Plans, Inc.† | | | 5,000 | | | | 124,050 | |
| | | | | | |
|
|
|
| | | | | | | | 1,457,714 | |
| | | | | | |
|
|
|
Medical - Hospitals — 0.4% | | | | | | | | |
Health Management Associates, Inc., Class A† | | | 224,000 | | | | 1,400,000 | |
| | | | | | |
|
|
|
Medical - Outpatient/Home Medical — 0.7% | | | | | | | | |
Amedisys, Inc.† | | | 70,000 | | | | 1,618,400 | |
Res - Care, Inc.† | | | 56,000 | | | | 694,400 | |
| | | | | | |
|
|
|
| | | | | | | | 2,312,800 | |
| | | | | | |
|
|
|
Metal Processors & Fabrication — 0.5% | | | | | | | | |
CIRCOR International, Inc. | | | 3,400 | | | | 94,690 | |
Mueller Industries, Inc. | | | 12,460 | | | | 293,807 | |
Worthington Industries, Inc. | | | 83,840 | | | | 1,192,205 | |
| | | | | | |
|
|
|
| | | | | | | | 1,580,702 | |
| | | | | | |
|
|
|
Metal Products - Distribution — 0.1% | | | | | | | | |
A.M. Castle & Co.† | | | 33,600 | | | | 468,384 | |
| | | | | | |
|
|
|
Metal - Aluminum — 0.5% | | | | | | | | |
Century Aluminum Co.† | | | 184,569 | | | | 1,845,690 | |
| | | | | | |
|
|
|
Metal - Diversified — 0.1% | | | | | | | | |
Hecla Mining Co.† | | | 83,700 | | | | 478,764 | |
| | | | | | |
|
|
|
Miscellaneous Manufacturing — 0.1% | | | | | | | | |
American Railcar Industries, Inc.† . | | | 21,100 | | | | 243,705 | |
| | | | | | |
|
|
|
Multilevel Direct Selling — 0.1% | | | | | | | | |
Nu Skin Enterprises, Inc., Class A | | | 9,540 | | | | 243,938 | |
| | | | | | |
|
|
|
Multimedia — 0.0% | | | | | | | | |
Journal Communications, Inc., Class A† | | | 32,380 | | | | 128,225 | |
| | | | | | |
|
|
|
Networking Products — 0.3% | | | | | | | | |
Anixter International, Inc.† | | | 6,100 | | | | 279,868 | |
Black Box Corp. | | | 19,380 | | | | 546,516 | |
Meru Networks, Inc.† | | | 11,100 | | | | 142,080 | |
| | | | | | |
|
|
|
| | | | | | | | 968,464 | |
| | | | | | |
|
|
|
Non - Ferrous Metals — 0.4% | | | | | | | | |
Uranerz Energy Corp.† | | | 986,059 | | | | 1,242,434 | |
| | | | | | |
|
|
|
Office Furnishings - Original — 0.3% | | | | | | | | |
HNI Corp. | | | 21,220 | | | | 495,912 | |
Knoll, Inc. | | | 9,860 | | | | 132,321 | |
Steelcase, Inc., Class A | | | 45,438 | | | | 282,170 | |
| | | | | | |
|
|
|
| | | | | | | | 910,403 | |
| | | | | | |
|
|
|
Office Supplies & Forms — 0.1% | | | | | | | | |
ACCO Brands Corp.† | | | 34,820 | | | | 202,304 | |
The Standard Register Co. | | | 29,376 | | | | 84,309 | |
| | | | | | |
|
|
|
| | | | | | | | 286,613 | |
| | | | | | |
|
|
|
| | | | | | | | |
| | |
| Security Description | | Shares | | | Value
(Note 2) | |
| |
| | | | | | | | | |
Oil & Gas Drilling — 0.6% | | | | | | | | |
Hercules Offshore, Inc.† | | | 236,680 | | | $ | 506,495 | |
Patterson - UTI Energy, Inc. | | | 105,200 | | | | 1,552,752 | |
Pioneer Drilling Co.† | | | 28,640 | | | | 155,802 | |
| | | | | | |
|
|
|
| | | | | | | | 2,215,049 | |
| | | | | | |
|
|
|
Oil Companies - Exploration & Production — 2.3% | | | | | | | | |
Atlas Energy, Inc.† | | | 54,700 | | | | 1,487,840 | |
Brigham Exploration Co.† | | | 171,400 | | | | 2,625,848 | |
Delta Petroleum Corp.† | | | 5,280 | | | | 3,643 | |
Kodiak Oil & Gas Corp.† | | | 414,500 | | | | 1,019,670 | |
Mariner Energy, Inc.† | | | 12,997 | | | | 297,501 | |
Petroquest Energy, Inc.† | | | 131,200 | | | | 784,576 | |
Stone Energy Corp.† | | | 29,820 | | | | 337,264 | |
Swift Energy Co.† | | | 15,198 | | | | 409,586 | |
Vaalco Energy, Inc.† | | | 69,560 | | | | 395,797 | |
W&T Offshore, Inc. | | | 49,800 | | | | 450,192 | |
| | | | | | |
|
|
|
| | | | | | | | 7,811,917 | |
| | | | | | |
|
|
|
Oil Field Machinery & Equipment — 0.1% | | | | | | | | |
Complete Production Services, Inc.† | | | 22,400 | | | | 395,136 | |
| | | | | | |
|
|
|
Oil Refining & Marketing — 0.0% | | | | | | | | |
Alon USA Energy, Inc. | | | 14,200 | | | | 76,964 | |
| | | | | | |
|
|
|
Oil - Field Services — 1.4% | | | | | | | | |
Cal Dive International, Inc.† | | | 279,460 | | | | 1,277,132 | |
Helix Energy Solutions Group, Inc.† | | | 17,040 | | | | 155,064 | |
Key Energy Services, Inc.† | | | 127,400 | | | | 1,020,474 | |
Oceaneering International, Inc.† | | | 27,000 | | | | 1,350,270 | |
TETRA Technologies, Inc.† | | | 129,000 | | | | 1,082,310 | |
Union Drilling, Inc.† | | | 17,800 | | | | 83,126 | |
| | | | | | |
|
|
|
| | | | | | | | 4,968,376 | |
| | | | | | |
|
|
|
Paper & Related Products — 0.7% | | | | | | | | |
Boise, Inc.† | | | 6,180 | | | | 42,518 | |
Buckeye Technologies, Inc. | | | 12,278 | | | | 145,863 | |
Domtar Corp. | | | 6,420 | | | | 385,328 | |
Glatfelter | | | 124,000 | | | | 1,268,520 | |
Neenah Paper, Inc. | | | 47,440 | | | | 698,317 | |
| | | | | | |
|
|
|
| | | | | | | | 2,540,546 | |
| | | | | | |
|
|
|
Physical Therapy/Rehabilitation Centers — 0.1% | | | | | | | | |
U.S. Physical Therapy, Inc.† | | | 14,600 | | | | 234,038 | |
| | | | | | |
|
|
|
Power Converter/Supply Equipment — 0.1% | | | | | | | | |
Power - One, Inc.† | | | 36,900 | | | | 375,642 | |
| | | | | | |
|
|
|
Printing - Commercial — 0.0% | | | | | | | | |
American Reprographics Co.† | | | 15,500 | | | | 102,300 | |
| | | | | | |
|
|
|
Publishing - Books — 0.1% | | | | | | | | |
Scholastic Corp. | | | 21,600 | | | | 506,088 | |
| | | | | | |
|
|
|
Publishing - Newspapers — 0.3% | | | | | | | | |
The Dolan Media Co.† | | | 125,370 | | | | 1,149,643 | |
| | | | | | |
|
|
|
Publishing - Periodicals — 0.1% | | | | | | | | |
Dex One Corp.† | | | 34,300 | | | | 292,236 | |
| | | | | | |
|
|
|
Radio — 0.0% | | | | | | | | |
Cumulus Media, Inc., Class A† | | | 26,700 | | | | 56,337 | |
Entercom Communications Corp., Class A† | | | 13,340 | | | | 73,370 | |
| | | | | | |
|
|
|
| | | | | | | | 129,707 | |
| | | | | | |
|
|
|
Real Estate Investment Trusts — 5.9% | | | | | | | | |
American Capital Agency Corp. | | | 21,500 | | | | 585,660 | |
Anworth Mortgage Asset Corp. | | | 112,240 | | | | 764,354 | |
Apartment Investment & Management Co., Class A | | | 35,279 | | | | 721,103 | |
Ashford Hospitality Trust, Inc.† | | | 42,380 | | | | 340,311 | |
BioMed Realty Trust, Inc. | | | 16,500 | | | | 281,985 | |
76
VALIC Company II Small Cap Value Fund
PORTFOLIO OF INVESTMENTS — August 31, 2010 — (continued)
| | | | | | | | |
| | |
| Security Description | | Shares | | | Value
(Note 2) | |
| |
COMMON STOCK (continued) | | | | | | | | |
Real Estate Investment Trusts (continued) | | | | | | | | |
Brandywine Realty Trust | | | 6,656 | | | $ | 73,149 | |
Capstead Mortage Corp. | | | 6,900 | | | | 80,178 | |
CBL & Associates Properties, Inc. | | | 31,340 | | | | 382,348 | |
Colonial Properties Trust | | | 7,293 | | | | 115,667 | |
Cypress Sharpridge Investments, Inc. | | | 7,700 | | | | 103,719 | |
DCT Industrial Trust, Inc. | | | 313,940 | | | | 1,453,542 | |
Developers Diversified Realty Corp. | | | 36,960 | | | | 382,906 | |
DiamondRock Hospitality Co.† | | | 57,334 | | | | 502,246 | |
Dupont Fabros Technology, Inc. | | | 7,740 | | | | 191,255 | |
EastGroup Properties, Inc. | | | 4,560 | | | | 160,740 | |
Education Realty Trust, Inc. | | | 106,418 | | | | 727,899 | |
FelCor Lodging Trust, Inc.† | | | 61,100 | | | | 243,178 | |
First Industrial Realty Trust, Inc.† | | | 22,518 | | | | 95,702 | |
Getty Realty Corp. | | | 17,800 | | | | 441,974 | |
Hersha Hospitality Trust | | | 415,058 | | | | 1,967,375 | |
Home Properties, Inc. | | | 15,900 | | | | 802,950 | |
Hospitality Properties Trust | | | 28,140 | | | | 550,137 | |
LaSalle Hotel Properties | | | 14,378 | | | | 302,944 | |
Lexington Realty Trust | | | 128,076 | | | | 854,267 | |
LTC Properties, Inc. | | | 24,320 | | | | 600,218 | |
MFA Financial, Inc. | | | 135,658 | | | | 999,800 | |
Mission West Properties, Inc. | | | 44,360 | | | | 294,550 | |
MPG Office Trust, Inc.† | | | 58,700 | | | | 132,662 | |
Pebblebrook Hotel Trust† | | | 15,200 | | | | 269,648 | |
Pennsylvania Real Estate Investment Trust | | | 45,880 | | | | 479,905 | |
PS Business Parks, Inc. | | | 23,900 | | | | 1,344,853 | |
RAIT Investment Trust† | | | 125,100 | | | | 168,885 | |
Ramco - Gershenson Properties Trust | | | 36,260 | | | | 378,554 | |
Redwood Trust, Inc. | | | 30,400 | | | | 419,824 | |
Resource Capital Corp. | | | 24,600 | | | | 145,632 | |
Saul Centers, Inc. | | | 7,700 | | | | 318,318 | |
Strategic Hotels & Resorts, Inc.† | | | 17,638 | | | | 62,968 | |
Sunstone Hotel Investors, Inc.† | | | 77,968 | | | | 668,186 | |
Taubman Centers, Inc. | | | 18,100 | | | | 750,969 | |
U - Store - It Trust | | | 133,860 | | | | 1,070,880 | |
Universal Health Realty Income Trust | | | 11,120 | | | | 353,727 | |
| | | | | | |
|
|
|
| | | | | | | | 20,585,168 | |
| | | | | | |
|
|
|
Real Estate Management/Services — 0.0% | |
United Capital Corp.† | | | 700 | | | | 14,980 | |
| | | | | | |
|
|
|
Real Estate Operations & Development — 0.5% | |
Forestar Real Estate Group, Inc.† | | | 20,240 | | | | 301,171 | |
Government Properties Income Trust | | | 52,300 | | | | 1,342,541 | |
| | | | | | |
|
|
|
| | | | | | | | 1,643,712 | |
| | | | | | |
|
|
|
Rental Auto/Equipment — 0.5% | |
Electro Rent Corp. | | | 12,000 | | | | 141,960 | |
Rent - A - Center, Inc. | | | 31,040 | | | | 623,283 | |
United Rentals, Inc.† | | | 86,589 | | | | 974,127 | |
| | | | | | |
|
|
|
| | | | | | | | 1,739,370 | |
| | | | | | |
|
|
|
Research & Development — 0.0% | |
Kendle International, Inc.† | | | 12,160 | | | | 95,213 | |
| | | | | | |
|
|
|
Retail - Apparel/Shoe — 2.2% | |
AnnTaylor Stores Corp.† | | | 16,340 | | | | 250,492 | |
Cache, Inc.† | | | 12,300 | | | | 52,767 | |
The Cato Corp., Class A | | | 10,280 | | | | 235,926 | |
Charming Shoppes, Inc.† | | | 61,358 | | | | 206,777 | |
Chico’s FAS, Inc. | | | 256,429 | | | | 2,115,539 | |
Gymboree Corp.† | | | 44,500 | | | | 1,674,535 | |
Liz Claiborne, Inc.† | | | 62,560 | | | | 262,752 | |
Pacific Sunwear of California, Inc.† | | | 66,740 | | | | 251,610 | |
The Finish Line, Inc., Class A | | | 207,096 | | | | 2,733,667 | |
| | | | | | |
|
|
|
| | | | | | | | 7,784,065 | |
| | | | | | |
|
|
|
| | | | | | | | |
| | |
| Security Description | | Shares | | | Value
(Note 2) | |
| |
| | | | | | | | | |
Retail - Automobile — 1.2% | |
Copart, Inc.† | | | 76,500 | | | $ | 2,528,325 | |
Group 1 Automotive, Inc.† | | | 70,000 | | | | 1,766,800 | |
| | | | | | |
|
|
|
| | | | | | | | 4,295,125 | |
| | | | | | |
|
|
|
Retail - Bookstores — 0.2% | |
Borders Group, Inc.† | | | 561,490 | | | | 606,409 | |
| | | | | | |
|
|
|
Retail - Convenience Store — 0.0% | |
The Pantry, Inc.† | | | 8,100 | | | | 152,442 | |
| | | | | | |
|
|
|
Retail - Discount — 0.0% | |
Fred’s, Inc., Class A | | | 2,520 | | | | 27,770 | |
| | | | | | |
|
|
|
Retail - Hair Salons — 0.1% | |
Regis Corp. | | | 15,220 | | | | 255,239 | |
| | | | | | |
|
|
|
Retail - Home Furnishings — 0.2% | |
Haverty Furniture Cos., Inc. | | | 58,258 | | | | 559,859 | |
| | | | | | |
|
|
|
Retail - Jewelry — 0.0% | |
Signet Jewelers, Ltd.† | | | 5,000 | | | | 132,200 | |
| | | | | | |
|
|
|
Retail - Leisure Products — 0.0% | |
MarineMax, Inc.† | | | 12,360 | | | | 81,082 | |
| | | | | | |
|
|
|
Retail - Major Department Stores — 0.4% | |
Saks, Inc.† | | | 195,700 | | | | 1,544,073 | |
| | | | | | |
|
|
|
Retail - Office Supplies — 0.9% | |
OfficeMax, Inc.† | | | 317,000 | | | | 3,087,580 | |
| | | | | | |
|
|
|
Retail - Regional Department Stores — 0.3% | |
Bon - Ton Stores, Inc.† | | | 35,600 | | | | 226,060 | |
Dillard’s, Inc., Class A | | | 43,540 | | | | 952,220 | |
| | | | | | |
|
|
|
| | | | | | | | 1,178,280 | |
| | | | | | |
|
|
|
Retail - Restaurants — 1.3% | |
Biglari Holdings, Inc.† | | | 200 | | | | 58,080 | |
Burger King Holdings, Inc. | | | 123,000 | | | | 2,023,350 | |
O’Charley’s, Inc.† | | | 83,240 | | | | 458,652 | |
Papa John’s International, Inc.† | | | 67,500 | | | | 1,607,175 | |
PF Chang’s China Bistro, Inc. | | | 1,920 | | | | 82,195 | |
Ruby Tuesday, Inc.† | | | 29,120 | | | | 268,195 | |
Ruth’s Hospitality Group, Inc.† | | | 49,272 | | | | 161,120 | |
| | | | | | |
|
|
|
| | | | | | | | 4,658,767 | |
| | | | | | |
|
|
|
Rubber - Tires — 0.3% | |
Cooper Tire & Rubber Co. | | | 58,100 | | | | 940,639 | |
| | | | | | |
|
|
|
Rubber/Plastic Products — 0.1% | |
Myers Industries, Inc. | | | 37,258 | | | | 237,334 | |
| | | | | | |
|
|
|
Savings & Loans/Thrifts — 1.0% | |
Astoria Financial Corp. | | | 42,138 | | | | 508,184 | |
ESB Financial Corp. | | | 3,400 | | | | 41,786 | |
First Financial Holdings, Inc. | | | 3,900 | | | | 35,256 | |
Northwest Bancshares, Inc. | | | 249,300 | | | | 2,679,975 | |
OceanFirst Financial Corp. | | | 9,320 | | | | 105,596 | |
Waterstone Financial, Inc.† | | | 4,200 | | | | 16,128 | |
WSFS Financial Corp. | | | 3,958 | | | | 142,369 | |
| | | | | | |
|
|
|
| | | | | | | | 3,529,294 | |
| | | | | | |
|
|
|
Seismic Data Collection — 0.0% | |
Global Geophysical Services, Inc.† | | | 16,500 | | | | 97,515 | |
| | | | | | |
|
|
|
Semiconductor Components - Integrated Circuits — 0.1% | |
Emulex Corp.† | | | 11,000 | | | | 104,940 | |
Integrated Device Technology, Inc.† | | | 26,160 | | | | 133,939 | |
MaxLinear, Inc., Class A† | | | 4,300 | | | | 49,020 | |
| | | | | | |
|
|
|
| | | | | | | | 287,899 | |
| | | | | | |
|
|
|
77
VALIC Company II Small Cap Value Fund
PORTFOLIO OF INVESTMENTS — August 31, 2010 — (continued)
| | | | | | | | |
| | |
| Security Description | | Shares | | |
Value
(Note 2) | |
| |
COMMON STOCK (continued) | | | | | | | | |
Semiconductor Equipment — 1.9% | |
ATMI, Inc.† | | | 83,500 | | | $ | 1,066,713 | |
Brooks Automation, Inc.† | | | 24,880 | | | | 168,686 | |
Entegris, Inc.† | | | 793,980 | | | | 3,056,823 | |
Novellus Systems, Inc.† | | | 21,060 | | | | 490,698 | |
Photronics, Inc.† | | | 10,600 | | | | 45,580 | |
Rudolph Technologies, Inc.† | | | 6,980 | | | | 55,177 | |
Varian Semiconductor Equipment Associates, Inc.† | | | 73,000 | | | | 1,811,860 | |
| | | | | | |
|
|
|
| | | | | | | | 6,695,537 | |
| | | | | | |
|
|
|
Steel Pipe & Tube — 0.0% | |
Mueller Water Products, Inc., Class A | | | 53,040 | | | | 125,705 | |
| | | | | | |
|
|
|
Steel - Producers — 0.1% | |
Metals USA Holdings Corp.† | | | 15,400 | | | | 180,488 | |
| | | | | | |
|
|
|
Telecom Equipment - Fiber Optics — 0.1% | |
Oplink Communications, Inc.† | | | 20,720 | | | | 325,718 | |
| | | | | | |
|
|
|
Telecom Services — 2.4% | |
Consolidated Communications Holdings, Inc. | | | 28,113 | | | | 487,479 | |
Global Crossing Ltd† | | | 13,500 | | | | 166,050 | |
USA Mobility, Inc. | | | 26,900 | | | | 386,284 | |
Vonage Holdings Corp.† | | | 3,363,336 | | | | 7,264,806 | |
| | | | | | |
|
|
|
| | | | | | | | 8,304,619 | |
| | | | | | |
|
|
|
Telecommunication Equipment — 0.9% | |
Arris Group, Inc.† | | | 35,000 | | | | 285,950 | |
CommScope, Inc.† | | | 18,598 | | | | 348,713 | |
Plantronics, Inc. | | | 96,000 | | | | 2,621,760 | |
| | | | | | |
|
|
|
| | | | | | | | 3,256,423 | |
| | | | | | |
|
|
|
Telephone - Integrated — 0.7% | |
Frontier Communications Corp. | | | 50,122 | | | | 387,443 | |
General Communication, Inc., Class A† | | | 243,130 | | | | 2,190,601 | |
| | | | | | |
|
|
|
| | | | | | | | 2,578,044 | |
| | | | | | |
|
|
|
Television — 0.2% | |
Belo Corp., Class A† | | | 35,518 | | | | 185,759 | |
Sinclair Broadcast Group, Inc., Class A† | | | 86,140 | | | | 515,117 | |
| | | | | | |
|
|
|
| | | | | | | | 700,876 | |
| | | | | | |
|
|
|
Textile - Apparel — 0.1% | |
Perry Ellis International, Inc.† | | | 23,749 | | | | 436,032 | |
Unifi, Inc.† | | | 14,500 | | | | 60,465 | |
| | | | | | |
|
|
|
| | | | | | | | 496,497 | |
| | | | | | |
|
|
|
Theaters — 0.0% | |
Carmike Cinemas, Inc.† | | | 2,400 | | | | 14,520 | |
| | | | | | |
|
|
|
Therapeutics — 0.0% | |
Nabi Biopharmaceuticals† | | | 9,960 | | | | 48,306 | |
| | | | | | |
|
|
|
Toys — 0.2% | |
Jakks Pacific, Inc.† | | | 45,098 | | | | 671,960 | |
| | | | | | |
|
|
|
Transactional Software — 0.2% | |
VeriFone Systems, Inc.† | | | 33,000 | | | | 797,940 | |
| | | | | | |
|
|
|
Transport - Air Freight — 0.5% | |
Atlas Air Worldwide Holdings, Inc.† | | | 40,438 | | | | 1,752,583 | |
| | | | | | |
|
|
|
Transport - Equipment & Leasing — 0.2% | |
Aircastle, Ltd. | | | 28,000 | | | | 218,680 | |
TAL International Group, Inc. | | | 18,300 | | | | 390,156 | |
| | | | | | |
|
|
|
| | | | | | | | 608,836 | |
| | | | | | |
|
|
|
Transport - Marine — 1.5% | |
Baltic Trading, Ltd. | | | 109,900 | | | | 1,228,682 | |
Excel Maritime Carriers, Ltd. .† | | | 37,800 | | | | 189,756 | |
Frontline, Ltd. | | | 99,173 | | | | 2,628,084 | |
| | | | | | | | |
| | |
| Security Description | | Shares/
Principal
Amount | | | Value
(Note 2) | |
| |
| | | | | | | | | |
Transport - Marine (continued) | | | | | | | | |
General Maritime Corp. | | | 28,510 | | | $ | 127,440 | |
Horizon Lines, Inc. Class A | | | 148,820 | | | | 593,792 | |
International Shipholding Corp. | | | 10,478 | | | | 246,547 | |
Overseas Shipholding Group, Inc. | | | 4,460 | | | | 143,612 | |
| | | | | | |
|
|
|
| | | | | | | | 5,157,913 | |
| | | | | | |
|
|
|
Transport - Services — 0.1% | |
Pacer International, Inc.† | | | 47,200 | | | | 241,664 | |
| | | | | | |
|
|
|
Transport - Truck — 1.7% | |
Arkansas Best Corp. | | | 10,320 | | | | 212,799 | |
Celadon Group, Inc.† | | | 8,920 | | | | 104,453 | |
Forward Air Corp. | | | 69,500 | | | | 1,655,490 | |
Heartland Express, Inc. | | | 7,100 | | | | 103,376 | |
Landstar System, Inc. | | | 98,100 | | | | 3,529,638 | |
Saia, Inc.† | | | 14,920 | | | | 174,415 | |
Werner Enterprises, Inc. | | | 13,580 | | | | 270,785 | |
| | | | | | |
|
|
|
| | | | | | | | 6,050,956 | |
| | | | | | |
|
|
|
Water — 0.1% | |
California Water Service Group | | | 5,780 | | | | 201,202 | |
Consolidated Water Co., Inc. | | | 11,400 | | | | 104,994 | |
| | | | | | |
|
|
|
| | | | | | | | 306,196 | |
| | | | | | |
|
|
|
Wire & Cable Products — 0.4% | |
Fushi Copperweld, Inc.† | | | 124,434 | | | | 1,020,359 | |
Insteel Industries, Inc. | | | 29,620 | | | | 234,294 | |
| | | | | | |
|
|
|
| | | | | | | | 1,254,653 | |
| | | | | | |
|
|
|
Wireless Equipment — 0.0% | |
InterDigital, Inc.† | | | 2,880 | | | | 71,194 | |
Powerwave Technologies, Inc.† | | | 27,700 | | | | 47,090 | |
| | | | | | |
|
|
|
| | | | | | | | 118,284 | |
| | | | | | |
|
|
|
Total Common Stock | | | | | | | | |
($353,357,534) | | | | | | | 335,838,280 | |
| | | | | | |
|
|
|
U.S. GOVERNMENT TREASURIES — 0.3% | | | | | | | | |
United States Treasury Notes — 0.3% | | | | | | | | |
1.25% due 11/30/10(1)
(cost $938,593) | | $ | 930,000 | | | | 932,398 | |
| | | | | | |
|
|
|
Total Long - Term Investment Securities | | | | | | | | |
(cost $354,296,127) | | | | | | | 336,770,678 | |
| | | | | | |
|
|
|
SHORT - TERM INVESTMENT SECURITIES — 2.7% | | | | | |
Time Deposits — 1.5% | | | | | | | | |
Euro Time Deposit with State Street Bank & Trust Co.
0.01% due 09/01/10
(cost $5,181,000) | | | 5,181,000 | | | | 5,181,000 | |
| | | | | | |
|
|
|
REPURCHASE AGREEMENTS — 1.2% | | | | | | | | |
Agreement with State Street Bank & Trust Co.,
bearing interest at 0.01%, dated 08/31/10, to be repurchased 09/01/10 in the amount of $1,797,000 and collateralized by $1,815,000 of United States Treasury Bonds bearing interest at 4.38%, due 09/17/10 and having an approximate value of $1,854,567 | | | 1,797,000 | | | | 1,797,000 | |
| | | | | | |
|
|
|
State Street Bank & Trust Co. Joint Repurchase Agreement(2) | | | 2,431,000 | | | | 2,431,000 | |
| | | | | | |
|
|
|
Total Repurchase Agreements | | | | | | | | |
(cost $4,228,000) | | | | | | $ | 4,228,000 | |
| | | | | | |
|
|
|
TOTAL INVESTMENTS | | | | | | | | |
(cost $363,705,127)(3) | | | 99.6 | % | | | 346,179,678 | |
Other assets less liabilities | | | 0.4 | | | | 1,237,095 | |
| | |
|
|
| |
|
|
|
NET ASSETS — | | | 100.0 | % | | $ | 347,416,773 | |
| | |
|
|
| |
|
|
|
78
VALIC Company II Small Cap Value Fund
PORTFOLIO OF INVESTMENTS — August 31, 2010 — (continued)
| † | Non-income producing security |
| (1) | The security or a portion thereof was pledged as collateral to cover margin requirements for open futures contracts. |
| (2) | See Note 2 for details of Joint Repurchase Agreement. |
| (3) | See Note 5 for cost of investments on a tax basis. |
ADR — American Depository Receipt
| | | | | | | | | | | | | | | | | | | | | | |
| Open Futures Contracts | | | | | | | | | | | | | | |
Number of
Contracts | | | Type | | Description | | Expiration
Month | | | Value at
Trade Date | | | Value as of
August 31, 2010 | | | Unrealized
Appreciation
(Depreciation) | |
| | 49 | | | Long | | Russell 2000 Mini Index | | | September 2010 | | | $ | 3,101,468 | | | $ | 2,947,840 | | | $ | (153,628 | ) |
| | | | | | | | | | | | | | | | | | | | |
|
|
|
The following is a summary of the inputs used to value the Fund’s net assets as of August 31, 2010 (see Note 2):
| | | | | | | | | | | | | | | | |
| | | Level 1 - Unadjusted Quoted
Prices
| | | Level 2 - Other Observable
Inputs
| | | Level 3 - Significant
Unobservable Inputs
| | | Total
| |
Long-Term Investment Securities: | | | | | | | | | | | | | | | | |
Common Stock: | | | | | | | | | | | | | | | | |
Banks - Commercial | | $ | 31,319,604 | | | $ | — | | | $ | — | | | $ | 31,319,604 | |
Real Estate Investments Trusts | | | 20,585,168 | | | | — | | | | — | | | | 20,585,168 | |
Other Industries* | | | 283,933,508 | | | | — | | | | — | | | | 283,933,508 | |
U.S. Government Treasuries | | | — | | | | 932,398 | | | | — | | | | 932,398 | |
Short-Term Investment Securities: | | | | | | | | | | | | | | | | |
Time Deposit | | | — | | | | 5,181,000 | | | | — | | | | 5,181,000 | |
Repurchase Agreements | | | — | | | | 4,228,000 | | | | — | | | | 4,228,000 | |
Other Financial Instruments:@ | | | | | | | | | | | | | | | | |
Futures Contracts - Depreciation | | | (153,628 | ) | | | — | | | | — | | | | (153,628 | ) |
| | |
|
|
| |
|
|
| |
|
|
| |
|
|
|
Total | | $ | 335,684,652 | | | $ | 10,341,398 | | | $ | — | | | $ | 346,026,050 | |
| | |
|
|
| |
|
|
| |
|
|
| |
|
|
|
| * | Sum of all other industries each of which individually has an aggregate market value of less than 5% of net assets. For a detailed presentation of common stocks by industry classification, please refer to the Portfolio of Investments. |
| @ | Other financial instruments are derivative instruments not reflected in the Portfolio of Investments, such as futures, forward, swap and written option contracts, which are valued at the unrealized appreciation (depreciation) on the instrument. |
See Notes to Financial Statements
79
VALIC Company II Socially Responsible Fund
PORTFOLIO PROFILE — August 31, 2010 (Unaudited)
Industry Allocation*
| | | | |
Computers | | | 6.5 | % |
Diversified Banking Institutions | | | 4.7 | |
Oil Companies — Integrated | | | 3.8 | |
Cosmetics & Toiletries | | | 3.6 | |
Medical — Drugs | | | 3.5 | |
Food — Misc. | | | 3.1 | |
Oil Companies — Exploration & Production | | | 2.7 | |
Applications Software | | | 2.7 | |
Retail — Discount | | | 2.6 | |
Multimedia | | | 2.6 | |
Beverages — Non-alcoholic | | | 2.5 | |
Medical — Biomedical/Gene | | | 2.5 | |
Telephone — Integrated | | | 2.2 | |
Insurance — Multi-line | | | 2.1 | |
Commercial Services — Finance | | | 2.0 | |
Medical — HMO | | | 1.9 | |
Real Estate Investment Trusts | | | 1.9 | |
Networking Products | | | 1.8 | |
Banks — Super Regional | | | 1.7 | |
Retail — Restaurants | | | 1.7 | |
Industrial Gases | | | 1.7 | |
Web Portals/ISP | | | 1.7 | |
Oil — Field Services | | | 1.7 | |
Wireless Equipment | | | 1.6 | |
Pipelines | | | 1.6 | |
Repurchase Agreements | | | 1.6 | |
Electric — Integrated | | | 1.5 | |
Insurance — Property/Casualty | | | 1.5 | |
Gas — Distribution | | | 1.3 | |
Insurance — Life/Health | | | 1.2 | |
Medical Instruments | | | 1.1 | |
Banks — Fiduciary | | | 1.1 | |
Retail — Drug Store | | | 1.1 | |
Cable/Satellite TV | | | 1.0 | |
Computers — Memory Devices | | | 0.9 | |
Finance — Credit Card | | | 0.9 | |
Investment Management/Advisor Services | | | 0.9 | |
Transport — Services | | | 0.9 | |
Diversified Manufacturing Operations | | | 0.8 | |
Electronic Components — Semiconductors | | | 0.7 | |
E-Commerce/Services | | | 0.7 | |
Banks — Commercial | | | 0.7 | |
Finance — Other Services | | | 0.6 | |
Oil Field Machinery & Equipment | | | 0.6 | |
Machinery — Farming | | | 0.6 | |
Medical Products | | | 0.6 | |
Machinery — Construction & Mining | | | 0.6 | |
Pharmacy Services | | | 0.6 | |
Semiconductor Components — Integrated Circuits | | | 0.6 | |
Transport — Rail | | | 0.6 | |
Retail — Building Products | | | 0.5 | |
Semiconductor Equipment | | | 0.5 | |
E-Commerce/Products | | | 0.5 | |
Consumer Products — Misc. | | | 0.5 | |
U.S. Government Treasuries | | | 0.4 | |
Electric — Generation | | | 0.4 | |
Office Automation & Equipment | | | 0.4 | |
Chemicals — Specialty | | | 0.4 | |
Finance — Investment Banker/Broker | | | 0.4 | |
Cellular Telecom | | | 0.3 | |
Medical — Wholesale Drug Distribution | | | 0.3 | |
Athletic Footwear | | | 0.3 | |
Insurance Brokers | | | 0.3 | |
Cruise Lines | | | 0.3 | |
Food — Wholesale/Distribution | | | 0.3 | |
Engines — Internal Combustion | | | 0.3 | |
Tools — Hand Held | | | 0.3 | |
Diversified Operations | | | 0.3 | |
Hotels/Motels | | | 0.2 | |
| | | | |
Coatings/Paint | | | 0.2 | |
Computer Services | | | 0.2 | |
Advertising Agencies | | | 0.2 | |
Vitamins & Nutrition Products | | | 0.2 | |
Auto — Heavy Duty Trucks | | | 0.2 | |
Metal — Iron | | | 0.2 | |
Retail — Office Supplies | | | 0.2 | |
Broadcast Services/Program | | | 0.2 | |
Distribution/Wholesale | | | 0.2 | |
Airlines | | | 0.2 | |
Data Processing/Management | | | 0.2 | |
Machinery — General Industrial | | | 0.2 | |
Containers — Metal/Glass | | | 0.2 | |
Retail — Major Department Stores | | | 0.2 | |
Oil & Gas Drilling | | | 0.2 | |
Energy — Alternate Sources | | | 0.2 | |
Internet Security | | | 0.1 | |
Food — Confectionery | | | 0.1 | |
Food — Retail | | | 0.1 | |
Quarrying | | | 0.1 | |
Toys | | | 0.1 | |
Forestry | | | 0.1 | |
Finance — Consumer Loans | | | 0.1 | |
Hazardous Waste Disposal | | | 0.1 | |
Printing — Commercial | | | 0.1 | |
Commercial Services | | | 0.1 | |
Machinery — Pumps | | | 0.1 | |
Electronic Forms | | | 0.1 | |
Motorcycle/Motor Scooter | | | 0.1 | |
Internet Infrastructure Software | | | 0.1 | |
Retail — Consumer Electronics | | | 0.1 | |
Apparel Manufacturers | | | 0.1 | |
Containers — Paper/Plastic | | | 0.1 | |
Enterprise Software/Service | | | 0.1 | |
Retail — Regional Department Stores | | | 0.1 | |
Schools | | | 0.1 | |
Computers — Periphery Equipment | | | 0.1 | |
Real Estate Management/Services | | | 0.1 | |
Computer Aided Design | | | 0.1 | |
Retail — Bedding | | | 0.1 | |
Medical — Generic Drugs | | | 0.1 | |
Electronic Components — Misc. | | | 0.1 | |
Filtration/Separation Products | | | 0.1 | |
| | |
|
|
|
| | | | 99.9 | % |
| | |
|
|
|
| * | Calculated as a percentage of net assets |
80
VALIC Company II Socially Responsible Fund
PORTFOLIO OF INVESTMENTS — August 31, 2010
| | | | | | | | |
| | |
| Security Description | | Shares | | | Value (Note 2) | |
| |
COMMON STOCK — 97.9% | | | | | | | | |
Advertising Agencies — 0.2% | | | | | | | | |
Omnicom Group, Inc. | | | 39,691 | | | $ | 1,389,582 | |
The Interpublic Group of Cos., Inc.† | | | 11,577 | | | | 98,752 | |
| | | | | | |
|
|
|
| | | | | | | | 1,488,334 | |
| | | | | | |
|
|
|
Agricultural Chemicals — 0.0% | | | | | | | | |
CF Industries Holdings, Inc. | | | 3,506 | | | | 324,305 | |
| | | | | | |
|
|
|
Airlines — 0.2% | | | | | | | | |
Southwest Airlines Co. | | | 104,332 | | | | 1,152,869 | |
| | | | | | |
|
|
|
Apparel Manufacturers — 0.1% | | | | | | | | |
Coach, Inc. | | | 18,232 | | | | 653,435 | |
| | | | | | |
|
|
|
Applications Software — 2.7% | | | | | | | | |
Citrix Systems, Inc.† | | | 2,013 | | | | 116,633 | |
Microsoft Corp. | | | 732,852 | | | | 17,207,365 | |
Salesforce.com, Inc.† | | | 8,987 | | | | 987,492 | |
| | | | | | |
|
|
|
| | | | | | | | 18,311,490 | |
| | | | | | |
|
|
|
Athletic Footwear — 0.3% | | | | | | | | |
NIKE, Inc., Class B | | | 31,617 | | | | 2,213,190 | |
| | | | | | |
|
|
|
Audio/Video Products — 0.0% | | | | | | | | |
Harman International Industries, Inc.† | | | 6,168 | | | | 192,257 | |
| | | | | | |
|
|
|
Auto - Heavy Duty Trucks — 0.2% | | | | | | | | |
PACCAR, Inc. | | | 31,520 | | | | 1,292,005 | |
| | | | | | |
|
|
|
Banks - Commercial — 0.7% | | | | | | | | |
BB&T Corp. | | | 99,779 | | | | 2,207,111 | |
M&T Bank Corp. | | | 9,265 | | | | 793,455 | |
Marshall & Ilsley Corp. | | | 85,572 | | | | 560,497 | |
Regions Financial Corp. | | | 154,755 | | | | 995,075 | |
Zions Bancorporation | | | 14,250 | | | | 262,627 | |
| | | | | | |
|
|
|
| | | | | | | | 4,818,765 | |
| | | | | | |
|
|
|
Banks - Fiduciary — 1.1% | | | | | | | | |
Northern Trust Corp. | | | 46,760 | | | | 2,157,506 | |
State Street Corp. | | | 63,706 | | | | 2,234,807 | |
The Bank of New York Mellon Corp. | | | 123,596 | | | | 2,999,675 | |
| | | | | | |
|
|
|
| | | | | | | | 7,391,988 | |
| | | | | | |
|
|
|
Banks - Super Regional — 1.7% | | | | | | | | |
Capital One Financial Corp. | | | 52,934 | | | | 2,004,081 | |
Comerica, Inc. | | | 16,350 | | | | 562,604 | |
Huntington Bancshares, Inc. | | | 79,135 | | | | 418,624 | |
KeyCorp | | | 124,135 | | | | 914,875 | |
PNC Financial Services Group, Inc. | | | 53,888 | | | | 2,746,132 | |
SunTrust Banks, Inc. | | | 49,185 | | | | 1,106,171 | |
US Bancorp | | | 189,872 | | | | 3,949,338 | |
| | | | | | |
|
|
|
| | | | | | | | 11,701,825 | |
| | | | | | |
|
|
|
Beverages - Non-alcoholic — 2.5% | | | | | | | | |
Dr Pepper Snapple Group, Inc. | | | 20,677 | | | | 761,327 | |
The Coca-Cola Co. | | | 292,995 | | | | 16,384,280 | |
| | | | | | |
|
|
|
| | | | | | | | 17,145,607 | |
| | | | | | |
|
|
|
Broadcast Services/Program — 0.2% | | | | | | | | |
Discovery Communications, Inc., Class A† | | | 13,446 | | | | 507,586 | |
Scripps Networks Interactive Inc., Class A | | | 17,643 | | | | 708,896 | |
| | | | | | |
|
|
|
| | | | | | | | 1,216,482 | |
| | | | | | |
|
|
|
Cable/Satellite TV — 1.0% | | | | | | | | |
DIRECTV, Class A† | | | 107,690 | | | | 4,083,605 | |
Time Warner Cable, Inc. | | | 52,344 | | | | 2,701,474 | |
| | | | | | |
|
|
|
| | | | | | | | 6,785,079 | |
| | | | | | |
|
|
|
| | | | | | | | |
| | |
| Security Description | | Shares | | | Value (Note 2) | |
| |
| | | | | | | | | |
Cellular Telecom — 0.3% | | | | | | | | |
MetroPCS Communications, Inc.† | | | 53,246 | | | $ | 476,019 | |
Sprint Nextel Corp.† | | | 459,294 | | | | 1,873,920 | |
| | | | | | |
|
|
|
| | | | | | | | 2,349,939 | |
| | | | | | |
|
|
|
Chemicals - Specialty — 0.4% | | | | | | | | |
Eastman Chemical Co. | | | 9,418 | | | | 579,678 | |
Ecolab, Inc. | | | 24,456 | | | | 1,159,214 | |
International Flavors & Fragrances, Inc. | | | 17,401 | | | | 795,052 | |
| | | | | | |
|
|
|
| | | | | | | | 2,533,944 | |
| | | | | | |
|
|
|
Coatings/Paint — 0.2% | | | | | | | | |
The Sherwin-Williams Co. | | | 23,441 | | | | 1,649,778 | |
| | | | | | |
|
|
|
Commercial Services — 0.1% | | | | | | | | |
Iron Mountain, Inc. | | | 32,893 | | | | 667,070 | |
Quanta Services, Inc.† | | | 5,506 | | | | 98,778 | |
| | | | | | |
|
|
|
| | | | | | | | 765,848 | |
| | | | | | |
|
|
|
Commercial Services - Finance — 2.0% | | | | | | | | |
Automatic Data Processing, Inc. | | | 69,583 | | | | 2,686,600 | |
Equifax, Inc. | | | 2,396 | | | | 70,610 | |
H&R Block, Inc. | | | 95,775 | | | | 1,230,709 | |
Mastercard, Inc., Class A | | | 9,272 | | | | 1,839,194 | |
Paychex, Inc. | | | 106,848 | | | | 2,659,447 | |
The Western Union Co. | | | 143,022 | | | | 2,242,585 | |
Visa, Inc., Class A | | | 41,069 | | | | 2,832,939 | |
| | | | | | |
|
|
|
| | | | | | | | 13,562,084 | |
| | | | | | |
|
|
|
Computer Aided Design — 0.1% | | | | | | | | |
Autodesk, Inc.† | | | 14,944 | | | | 414,696 | |
| | | | | | |
|
|
|
Computer Services — 0.2% | | | | | | | | |
Cognizant Technology Solutions Corp., Class A† | | | 26,796 | | | | 1,543,584 | |
| | | | | | |
|
|
|
Computers — 6.5% | | | | | | | | |
Apple, Inc.† | | | 66,694 | | | | 16,231,319 | |
Dell, Inc.† | | | 203,339 | | | | 2,393,300 | |
Hewlett-Packard Co. | | | 222,474 | | | | 8,560,800 | |
International Business Machines Corp. | | | 132,784 | | | | 16,362,972 | |
| | | | | | |
|
|
|
| | | | | | | | 43,548,391 | |
| | | | | | |
|
|
|
Computers - Memory Devices — 0.9% | | | | | | | | |
EMC Corp.† | | | 194,901 | | | | 3,554,994 | |
NetApp, Inc.† | | | 37,359 | | | | 1,510,798 | |
SanDisk Corp.† | | | 22,459 | | | | 746,537 | |
Western Digital Corp.† | | | 19,024 | | | | 459,430 | |
| | | | | | |
|
|
|
| | | | | | | | 6,271,759 | |
| | | | | | |
|
|
|
Computers - Periphery Equipment — 0.1% | | | | | | | | |
Lexmark International, Inc., Class A† | | | 13,107 | | | | 458,614 | |
| | | | | | |
|
|
|
Consumer Products - Misc. — 0.5% | | | | | | | | |
Kimberly-Clark Corp. | | | 48,112 | | | | 3,098,413 | |
| | | | | | |
|
|
|
Containers - Metal/Glass — 0.2% | | | | | | | | |
Owens-Illinois, Inc.† | | | 43,116 | | | | 1,080,487 | |
| | | | | | |
|
|
|
Containers - Paper/Plastic — 0.1% | | | | | | | | |
Pactiv Corp.† | | | 1,141 | | | | 36,603 | |
Sealed Air Corp. | | | 29,215 | | | | 599,200 | |
| | | | | | |
|
|
|
| | | | | | | | 635,803 | |
| | | | | | |
|
|
|
Cosmetics & Toiletries — 3.6% | | | | | | | | |
Colgate-Palmolive Co. | | | 61,489 | | | | 4,540,348 | |
The Estee Lauder Cos., Inc., Class A | | | 11,331 | | | | 635,329 | |
The Procter & Gamble Co. | | | 318,205 | | | | 18,987,292 | |
| | | | | | |
|
|
|
| | | | | | | | 24,162,969 | |
| | | | | | |
|
|
|
81
VALIC Company II Socially Responsible Fund
PORTFOLIO OF INVESTMENTS — August 31, 2010 — (continued)
| | | | | | | | |
| | |
| Security Description | | Shares | | | Value (Note 2) | |
| |
COMMON STOCK (continued) | | | | | |
Cruise Lines — 0.3% | | | | | |
Carnival Corp. | | | 69,540 | | | $ | 2,168,257 | |
| | | | | | |
|
|
|
Data Processing/Management — 0.2% | | | | | |
Fidelity National Information Services, Inc. | | | 43,116 | | | | 1,114,117 | |
| | | | | | |
|
|
|
Distribution/Wholesale — 0.2% | | | | | |
Fastenal Co. | | | 26,290 | | | | 1,190,148 | |
| | | | | | |
|
|
|
Diversified Banking Institutions — 4.7% | | | | | |
Bank of America Corp. | | | 882,960 | | | | 10,992,852 | |
Citigroup, Inc.† | | | 1,892,981 | | | | 7,041,889 | |
JPMorgan Chase & Co. | | | 376,711 | | | | 13,697,212 | |
| | | | | | |
|
|
|
| | | | | | | | 31,731,953 | |
| | | | | | |
|
|
|
Diversified Manufacturing Operations — 0.8% | | | | | |
Danaher Corp. | | | 99,782 | | | | 3,625,080 | |
Parker Hannifin Corp. | | | 32,111 | | | | 1,899,687 | |
| | | | | | |
|
|
|
| | | | | | | | 5,524,767 | |
| | | | | | |
|
|
|
Diversified Operations — 0.3% | | | | | |
Leucadia National Corp.† | | | 85,239 | | | | 1,819,853 | |
| | | | | | |
|
|
|
E-Commerce/Products — 0.5% | | | | | |
Amazon.com, Inc.† | | | 25,332 | | | | 3,162,194 | |
| | | | | | |
|
|
|
E-Commerce/Services — 0.7% | | | | | | | | |
eBay, Inc.† | | | 122,932 | | | | 2,856,940 | |
Expedia, Inc. | | | 40,561 | | | | 927,224 | |
priceline.com, Inc.† | | | 3,756 | | | | 1,094,799 | |
| | | | | | |
|
|
|
| | | | | | | | 4,878,963 | |
| | | | | | |
|
|
|
Electric Products - Misc. — 0.0% | | | | | |
Molex, Inc. | | | 1,058 | | | | 18,674 | |
| | | | | | |
|
|
|
Electric - Generation — 0.4% | | | | | |
The AES Corp.† | | | 274,718 | | | | 2,813,112 | |
| | | | | | |
|
|
|
Electric - Integrated — 1.5% | | | | | |
Northeast Utilities | | | 134,031 | | | | 3,882,878 | |
Pepco Holdings, Inc. | | | 199,721 | | | | 3,584,992 | |
TECO Energy, Inc. | | | 148,715 | | | | 2,510,309 | |
| | | | | | |
|
|
|
| | | | | | | | 9,978,179 | |
| | | | | | |
|
|
|
Electronic Components - Misc. — 0.1% | | | | | |
Jabil Circuit, Inc. | | | 35,618 | | | | 365,084 | |
| | | | | | |
|
|
|
Electronic Components - Semiconductors — 0.7% | | | | | |
Advanced Micro Devices, Inc.† | | | 97,417 | | | | 547,483 | |
Altera Corp. | | | 23,261 | | | | 573,849 | |
Broadcom Corp., Class A | | | 54,059 | | | | 1,620,148 | |
LSI Corp.† | | | 16,338 | | | | 65,679 | |
Microchip Technology, Inc. | | | 52,649 | | | | 1,457,851 | |
NVIDIA Corp.† | | | 78,488 | | | | 732,293 | |
QLogic Corp.† | | | 2,012 | | | | 29,969 | |
| | | | | | |
|
|
|
| | | | | | | | 5,027,272 | |
| | | | | | |
|
|
|
Electronic Forms — 0.1% | | | | | |
Adobe Systems, Inc.† | | | 24,839 | | | | 689,531 | |
| | | | | | |
|
|
|
Energy - Alternate Sources — 0.2% | | | | | |
First Solar, Inc.† | | | 8,024 | | | | 1,025,868 | |
| | | | | | |
|
|
|
Engines - Internal Combustion — 0.3% | | | | | |
Cummins, Inc. | | | 25,159 | | | | 1,872,081 | |
| | | | | | |
|
|
|
Enterprise Software/Service — 0.1% | | | | | |
CA, Inc. | | | 30,994 | | | | 558,202 | |
| | | | | | |
|
|
|
Filtration/Separation Products — 0.1% | | | | | |
Pall Corp. | | | 10,203 | | | | 348,841 | |
| | | | | | |
|
|
|
| | | | | | | | |
| | |
| Security Description | | Shares | | | Value (Note 2) | |
| |
| | | | | | |
Finance - Consumer Loans — 0.1% | | | | | |
SLM Corp.† | | | 77,211 | | | $ | 853,182 | |
| | | | | | |
|
|
|
Finance - Credit Card — 0.9% | | | | | |
American Express Co. | | | 117,732 | | | | 4,693,975 | |
Discover Financial Services | | | 97,570 | | | | 1,415,741 | |
| | | | | | |
|
|
|
| | | | | | | | 6,109,716 | |
| | | | | | |
|
|
|
Finance - Investment Banker/Broker — 0.4% | | | | | |
The Charles Schwab Corp. | | | 193,798 | | | | 2,472,862 | |
| | | | | | |
|
|
|
Finance - Other Services — 0.6% | | | | | |
CME Group, Inc. | | | 10,475 | | | | 2,598,638 | |
NYSE Euronext | | | 62,814 | | | | 1,742,460 | |
| | | | | | |
|
|
|
| | | | | | | | 4,341,098 | |
| | | | | | |
|
|
|
Food - Confectionery — 0.1% | | | | | |
The Hershey Co. | | | 20,585 | | | | 956,585 | |
| | | | | | |
|
|
|
Food - Dairy Products — 0.0% | | | | | |
Dean Foods Co.† | | | 29,634 | | | | 303,156 | |
| | | | | | |
|
|
|
Food - Misc. — 3.1% | | | | | |
ConAgra Foods, Inc. | | | 63,056 | | | | 1,361,379 | |
General Mills, Inc. | | | 71,234 | | | | 2,575,822 | |
H.J. Heinz Co. | | | 46,800 | | | | 2,164,032 | |
Kellogg Co. | | | 34,277 | | | | 1,702,881 | |
Kraft Foods, Inc., Class A | | | 395,592 | | | | 11,847,980 | |
Sara Lee Corp. | | | 82,986 | | | | 1,198,318 | |
| | | | | | |
|
|
|
| | | | | | | | 20,850,412 | |
| | | | | | |
|
|
|
Food - Retail — 0.1% | | | | | |
Safeway, Inc. | | | 10,294 | | | | 193,527 | |
Whole Foods Market, Inc.† | | | 21,490 | | | | 747,637 | |
| | | | | | |
|
|
|
| | | | | | | | 941,164 | |
| | | | | | |
|
|
|
Food - Wholesale/Distribution — 0.3% | | | | | |
Sysco Corp. | | | 69,533 | | | | 1,911,462 | |
| | | | | | |
|
|
|
Forestry — 0.1% | | | | | |
Plum Creek Timber Co., Inc. | | | 25,030 | | | | 862,784 | |
| | | | | | |
|
|
|
Gas - Distribution — 1.3% | | | | | |
CenterPoint Energy, Inc. | | | 257,598 | | | | 3,809,874 | |
Nicor, Inc. | | | 19,597 | | | | 828,757 | |
NiSource, Inc. | | | 218,999 | | | | 3,797,443 | |
| | | | | | |
|
|
|
| | | | | | | | 8,436,074 | |
| | | | | | |
|
|
|
Hazardous Waste Disposal — 0.1% | | | | | |
Stericycle, Inc.† | | | 12,226 | | | | 800,803 | |
| | | | | | |
|
|
|
Home Decoration Products — 0.0% | | | | | |
Newell Rubbermaid, Inc. | | | 19,298 | | | | 289,856 | |
| | | | | | |
|
|
|
Hotels/Motels — 0.2% | | | | | |
Starwood Hotels & Resorts Worldwide, Inc. | | | 20,288 | | | | 948,058 | |
Wyndham Worldwide Corp. | | | 32,146 | | | | 745,466 | |
| | | | | | |
|
|
|
| | | | | | | | 1,693,524 | |
| | | | | | |
|
|
|
Industrial Gases — 1.7% | | | | | | | | |
Air Products & Chemicals, Inc. | | | 62,544 | | | | 4,630,132 | |
Airgas, Inc. | | | 14,602 | | | | 960,812 | |
Praxair, Inc. | | | 66,590 | | | | 5,728,738 | |
| | | | | | |
|
|
|
| | | | | | | | 11,319,682 | |
| | | | | | |
|
|
|
Insurance Brokers — 0.3% | | | | | | | | |
AON Corp. | | | 7,801 | | | | 282,708 | |
Marsh & McLennan Cos., Inc. | | | 80,490 | | | | 1,909,223 | |
| | | | | | |
|
|
|
| | | | | | | | 2,191,931 | |
| | | | | | |
|
|
|
82
VALIC Company II Socially Responsible Fund
PORTFOLIO OF INVESTMENTS — August 31, 2010 — (continued)
| | | | | | | | |
| | |
| Security Description | | Shares | | | Value (Note 2) | |
| |
COMMON STOCK (continued) | | | | | |
Insurance - Life/Health — 1.2% | | | | | | | | |
Aflac, Inc. | | | 48,564 | | | $ | 2,294,649 | |
Lincoln National Corp. | | | 34,689 | | | | 810,335 | |
Principal Financial Group, Inc. | | | 51,848 | | | | 1,195,097 | |
Prudential Financial, Inc. | | | 59,905 | | | | 3,029,396 | |
Torchmark Corp. | | | 2,704 | | | | 133,442 | |
Unum Group | | | 34,981 | | | | 701,369 | |
| | | | | | |
|
|
|
| | | | | | | | 8,164,288 | |
| | | | | | |
|
|
|
Insurance - Multi-line — 2.1% | | | | | | | | |
Assurant, Inc. | | | 18,896 | | | | 690,838 | |
Cincinnati Financial Corp. | | | 55,096 | | | | 1,469,961 | |
Genworth Financial, Inc., Class A† | | | 53,797 | | | | 582,621 | |
Hartford Financial Services Group, Inc. | | | 51,705 | | | | 1,042,373 | |
Loews Corp. | | | 83,118 | | | | 2,920,767 | |
MetLife, Inc. | | | 88,366 | | | | 3,322,562 | |
The Allstate Corp. | | | 104,508 | | | | 2,884,421 | |
XL Group PLC | | | 49,563 | | | | 887,673 | |
| | | | | | |
|
|
|
| | | | | | | | 13,801,216 | |
| | | | | | |
|
|
|
Insurance - Property/Casualty — 1.5% | | | | | | | | |
Chubb Corp. | | | 68,260 | | | | 3,762,491 | |
The Progressive Corp. | | | 123,835 | | | | 2,451,933 | |
The Travelers Cos., Inc. | | | 75,196 | | | | 3,683,100 | |
| | | | | | |
|
|
|
| | | | | | | | 9,897,524 | |
| | | | | | |
|
|
|
Internet Infrastructure Software — 0.1% | | | | | | | | |
Akamai Technologies, Inc.† | | | 14,604 | | | | 672,806 | |
| | | | | | |
|
|
|
Internet Security — 0.1% | | | | | | | | |
Symantec Corp.† | | | 71,118 | | | | 969,338 | |
| | | | | | |
|
|
|
Investment Management/Advisor Services — 0.9% | | | | | | | | |
Ameriprise Financial, Inc. | | | 40,650 | | | | 1,771,527 | |
Franklin Resources, Inc. | | | 18,792 | | | | 1,813,616 | |
Invesco, Ltd. | | | 76,845 | | | | 1,390,895 | |
T. Rowe Price Group, Inc. | | | 24,830 | | | | 1,087,057 | |
| | | | | | |
|
|
|
| | | | | | | | 6,063,095 | |
| | | | | | |
|
|
|
Machinery - Construction & Mining — 0.6% | | | | | | | | |
Caterpillar, Inc. | | | 62,193 | | | | 4,052,496 | |
| | | | | | |
|
|
|
Machinery - Farming — 0.6% | | | | | | | | |
Deere & Co. | | | 66,035 | | | | 4,178,034 | |
| | | | | | |
|
|
|
Machinery - General Industrial — 0.2% | | | | | | | | |
Roper Industries, Inc. | | | 18,751 | | | | 1,089,058 | |
| | | | | | |
|
|
|
Machinery - Pumps — 0.1% | | | | | | | | |
Flowserve Corp. | | | 8,006 | | | | 715,576 | |
| | | | | | |
|
|
|
Medical Instruments — 1.1% | | | | | | | | |
Boston Scientific Corp.† | | | 191,690 | | | | 994,871 | |
Intuitive Surgical, Inc.† | | | 3,762 | | | | 997,043 | |
Medtronic, Inc. | | | 159,190 | | | | 5,011,301 | |
St. Jude Medical, Inc.† | | | 20,727 | | | | 716,533 | |
| | | | | | |
|
|
|
| | | | | | | | 7,719,748 | |
| | | | | | |
|
|
|
Medical Products — 0.6% | | | | | | | | |
CareFusion Corp.† | | | 10,235 | | | | 220,871 | |
Hospira, Inc.† | | | 15,076 | | | | 774,303 | |
Stryker Corp. | | | 38,673 | | | | 1,670,287 | |
Varian Medical Systems, Inc.† | | | 7,863 | | | | 418,626 | |
Zimmer Holdings, Inc.† | | | 22,945 | | | | 1,082,316 | |
| | | | | | |
|
|
|
| | | | | | | | 4,166,403 | |
| | | | | | |
|
|
|
Medical - Biomedical/Gene — 2.5% | | | | | | | | |
Amgen, Inc.† | | | 144,475 | | | | 7,374,004 | |
Biogen Idec, Inc.† | | | 23,464 | | | | 1,262,363 | |
Celgene Corp.† | | | 71,766 | | | | 3,697,384 | |
| | | | | | | | |
| | |
| Security Description | | Shares | | | Value (Note 2) | |
| |
| | | | | | | | | |
Medical - Biomedical/Gene (continued) | | | | | | | | |
Gilead Sciences, Inc.† | | | 109,578 | | | $ | 3,491,155 | |
Life Technologies Corp.† | | | 15,805 | | | | 675,980 | |
| | | | | | |
|
|
|
| | | | | | | | 16,500,886 | |
| | | | | | |
|
|
|
Medical - Drugs — 3.5% | | | | | | | | |
Abbott Laboratories | | | 245,791 | | | | 12,127,328 | |
Allergan, Inc. | | | 36,297 | | | | 2,229,362 | |
Bristol-Myers Squibb Co. | | | 329,115 | | | | 8,583,319 | |
Forest Laboratories, Inc.† | | | 21,682 | | | | 591,702 | |
| | | | | | |
|
|
|
| | | | | | | | 23,531,711 | |
| | | | | | |
|
|
|
Medical - Generic Drugs — 0.1% | | | | | | | | |
Mylan, Inc.† | | | 21,737 | | | | 373,007 | |
| | | | | | |
|
|
|
Medical - HMO — 1.9% | | | | | | | | |
Aetna, Inc. | | | 58,679 | | | | 1,567,903 | |
CIGNA Corp. | | | 55,664 | | | | 1,793,494 | |
Humana, Inc.† | | | 21,751 | | | | 1,039,480 | |
UnitedHealth Group, Inc. | | | 156,738 | | | | 4,971,730 | |
WellPoint, Inc.† | | | 69,709 | | | | 3,463,143 | |
| | | | | | |
|
|
|
| | | | | | | | 12,835,750 | |
| | | | | | |
|
|
|
Medical - Wholesale Drug Distribution — 0.3% | | | | | | | | |
AmerisourceBergen Corp. | | | 24,438 | | | | 666,669 | |
Cardinal Health, Inc. | | | 52,970 | | | | 1,586,981 | |
| | | | | | |
|
|
|
| | | | | | | | 2,253,650 | |
| | | | | | |
|
|
|
Metal - Iron — 0.2% | | | | | | | | |
Cliffs Natural Resources, Inc. | | | 20,692 | | | | 1,266,143 | |
| | | | | | |
|
|
|
Motorcycle/Motor Scooter — 0.1% | | | | | | | | |
Harley-Davidson, Inc. | | | 27,928 | | | | 679,209 | |
| | | | | | |
|
|
|
Multimedia — 2.6% | | | | | | | | |
News Corp., Class A | | | 259,572 | | | | 3,262,820 | |
The Walt Disney Co. | | | 190,862 | | | | 6,220,193 | |
Time Warner, Inc. | | | 170,056 | | | | 5,098,279 | |
Viacom, Inc., Class B | | | 82,215 | | | | 2,583,195 | |
| | | | | | |
|
|
|
| | | | | | | | 17,164,487 | |
| | | | | | |
|
|
|
Networking Products — 1.8% | | | | | | | | |
Cisco Systems, Inc.† | | | 500,275 | | | | 10,030,514 | |
Juniper Networks, Inc.† | | | 73,317 | | | | 1,994,222 | |
| | | | | | |
|
|
|
| | | | | | | | 12,024,736 | |
| | | | | | |
|
|
|
Non-Ferrous Metals — 0.0% | | | | | |
Titanium Metals Corp.† | | | 16,362 | | | | 296,479 | |
| | | | | | |
|
|
|
Office Automation & Equipment — 0.4% | | | | | |
Pitney Bowes, Inc. | | | 63,488 | | | | 1,221,509 | |
Xerox Corp. | | | 180,255 | | | | 1,521,352 | |
| | | | | | |
|
|
|
| | | | | | | | 2,742,861 | |
| | | | | | |
|
|
|
Oil & Gas Drilling — 0.2% | | | | | |
Diamond Offshore Drilling, Inc. | | | 8,489 | | | | 493,890 | |
Helmerich & Payne, Inc. | | | 5,921 | | | | 219,314 | |
Nabors Industries, Ltd.† | | | 20,704 | | | | 324,639 | |
| | | | | | |
|
|
|
| | | | | | | | 1,037,843 | |
| | | | | | |
|
|
|
Oil Companies - Exploration & Production — 2.7% | | | | | |
Apache Corp. | | | 43,625 | | | | 3,919,706 | |
Chesapeake Energy Corp. | | | 79,972 | | | | 1,653,821 | |
Denbury Resources, Inc.† | | | 30,087 | | | | 443,482 | |
Devon Energy Corp. | | | 73,810 | | | | 4,449,267 | |
EOG Resources, Inc. | | | 27,042 | | | | 2,349,139 | |
EQT Corp. | | | 57,402 | | | | 1,871,305 | |
Noble Energy, Inc. | | | 24,848 | | | | 1,733,894 | |
Pioneer Natural Resources Co. | | | 13,377 | | | | 773,458 | |
83
VALIC Company II Socially Responsible Fund
PORTFOLIO OF INVESTMENTS — August 31, 2010 — (continued)
| | | | | | | | |
| | |
| Security Description | | Shares | | | Value (Note 2) | |
| |
COMMON STOCK (continued) | | | | | |
Oil Companies - Exploration & Production (continued) | | | | | |
Southwestern Energy Co.† | | | 36,679 | | | $ | 1,200,137 | |
| | | | | | |
|
|
|
| | | | | | | | 18,394,209 | |
| | | | | | |
|
|
|
Oil Companies - Integrated — 3.8% | | | | | |
Hess Corp. | | | 106,846 | | | | 5,369,012 | |
Marathon Oil Corp. | | | 448,278 | | | | 13,667,996 | |
Murphy Oil Corp. | | | 116,524 | | | | 6,241,025 | |
| | | | | | |
|
|
|
| | | | | | | | 25,278,033 | |
| | | | | | |
|
|
|
Oil Field Machinery & Equipment — 0.6% | | | | | |
Cameron International Corp.† | | | 21,917 | | | | 806,107 | |
FMC Technologies, Inc.† | | | 12,851 | | | | 794,834 | |
National Oilwell Varco, Inc. | | | 69,186 | | | | 2,600,702 | |
| | | | | | |
|
|
|
| | | | | | | | 4,201,643 | |
| | | | | | |
|
|
|
Oil - Field Services — 1.7% | | | | | |
Halliburton Co. | | | 91,023 | | | | 2,567,759 | |
Schlumberger, Ltd. | | | 160,388 | | | | 8,553,492 | |
| | | | | | |
|
|
|
| | | | | | | | 11,121,251 | |
| | | | | | |
|
|
|
Pharmacy Services — 0.6% | | | | | |
Express Scripts, Inc.† | | | 51,200 | | | | 2,181,120 | |
Medco Health Solutions, Inc.† | | | 38,702 | | | | 1,682,763 | |
| | | | | | |
|
|
|
| | | | | | | | 3,863,883 | |
| | | | | | |
|
|
|
Pipelines — 1.6% | | | | | |
El Paso Corp. | | | 243,101 | | | | 2,768,920 | |
Oneok, Inc. | | | 40,100 | | | | 1,720,691 | |
Spectra Energy Corp. | | | 196,207 | | | | 3,990,850 | |
The Williams Cos., Inc. | | | 124,251 | | | | 2,252,671 | |
| | | | | | |
|
|
|
| | | | | | | | 10,733,132 | |
| | | | | | |
|
|
|
Printing - Commercial — 0.1% | | | | | |
R.R. Donnelley & Sons Co. | | | 52,765 | | | | 799,126 | |
| | | | | | |
|
|
|
Publishing - Newspapers — 0.0% | | | | | |
The New York Times Co., Class A† | | | 20,462 | | | | 146,917 | |
| | | | | | |
|
|
|
Quarrying — 0.1% | | | | | |
Vulcan Materials Co. | | | 24,829 | | | | 912,714 | |
| | | | | | |
|
|
|
Real Estate Investment Trusts — 1.9% | | | | | | | | |
AvalonBay Communities, Inc. | | | 8,092 | | | | 851,440 | |
Boston Properties, Inc. | | | 14,329 | | | | 1,166,381 | |
Equity Residential | | | 29,964 | | | | 1,373,250 | |
HCP, Inc. | | | 29,941 | | | | 1,054,522 | |
Host Hotels & Resorts, Inc. | | | 65,755 | | | | 863,363 | |
Kimco Realty Corp. | | | 38,403 | | | | 572,589 | |
ProLogis | | | 65,696 | | | | 712,802 | |
Public Storage | | | 11,799 | | | | 1,156,538 | |
Simon Property Group, Inc. | | | 31,760 | | | | 2,872,692 | |
Ventas, Inc. | | | 13,439 | | | | 678,804 | |
Vornado Realty Trust | | | 17,221 | | | | 1,395,934 | |
| | | | | | |
|
|
|
| | | | | | | | 12,698,315 | |
| | | | | | |
|
|
|
Real Estate Management/Services — 0.1% | | | | | |
CB Richard Ellis Group, Inc., Class A† | | | 25,925 | | | | 425,688 | |
| | | | | | |
|
|
|
Retail - Apparel/Shoe — 0.0% | | | | | |
The Gap, Inc. | | | 10,033 | | | | 169,457 | |
| | | | | | |
|
|
|
Retail - Automobile — 0.0% | | | | | |
CarMax, Inc.† | | | 6,324 | | | | 126,037 | |
| | | | | | |
|
|
|
Retail - Bedding — 0.1% | | | | | |
Bed Bath & Beyond, Inc.† | | | 11,494 | | | | 413,439 | |
| | | | | | |
|
|
|
Retail - Building Products — 0.5% | | | | | |
Lowe’s Cos., Inc. | | | 180,240 | | | | 3,658,872 | |
| | | | | | |
|
|
|
| | | | | | | | |
| | |
| Security Description | | Shares | | | Value (Note 2) | |
| |
| | | | | | | | | |
Retail - Consumer Electronics — 0.1% | | | | | |
Best Buy Co., Inc. | | | 20,952 | | | $ | 657,683 | |
| | | | | | |
|
|
|
Retail - Discount — 2.6% | | | | | |
Costco Wholesale Corp. | | | 4,945 | | | | 279,640 | |
Target Corp. | | | 60,288 | | | | 3,084,334 | |
Wal-Mart Stores, Inc. | | | 277,400 | | | | 13,908,836 | |
| | | | | | |
|
|
|
| | | | | | | | 17,272,810 | |
| | | | | | |
|
|
|
Retail - Drug Store — 1.1% | | | | | |
CVS Caremark Corp. | | | 164,673 | | | | 4,446,171 | |
Walgreen Co. | | | 99,443 | | | | 2,673,028 | |
| | | | | | |
|
|
|
| | | | | | | | 7,119,199 | |
| | | | | | |
|
|
|
Retail - Major Department Stores — 0.2% | | | | | |
Nordstrom, Inc. | | | 16,994 | | | | 491,466 | |
TJX Cos., Inc. | | | 14,053 | | | | 557,764 | |
| | | | | | |
|
|
|
| | | | | | | | 1,049,230 | |
| | | | | | |
|
|
|
Retail - Office Supplies — 0.2% | | | | | |
Staples, Inc. | | | 71,216 | | | | 1,265,508 | |
| | | | | | |
|
|
|
Retail - Regional Department Stores — 0.1% | | | | | |
Macy’s, Inc. | | | 26,711 | | | | 519,262 | |
| | | | | | |
|
|
|
Retail - Restaurants — 1.7% | | | | | |
McDonald’s Corp. | | | 134,791 | | | | 9,847,830 | |
Starbucks Corp. | | | 74,724 | | | | 1,717,905 | |
| | | | | | |
|
|
|
| | | | | | | | 11,565,735 | |
| | | | | | |
|
|
|
Schools — 0.1% | | | | | |
Apollo Group, Inc., Class A† | | | 11,554 | | | | 490,814 | |
| | | | | | |
|
|
|
Semiconductor Components - Integrated Circuits — 0.6% | | | | | |
Analog Devices, Inc. | | | 84,799 | | | | 2,364,196 | |
Linear Technology Corp. | | | 48,300 | | | | 1,383,795 | |
| | | | | | |
|
|
|
| | | | | | | | 3,747,991 | |
| | | | | | |
|
|
|
Semiconductor Equipment — 0.5% | | | | | |
Applied Materials, Inc. | | | 306,989 | | | | 3,189,616 | |
| | | | | | |
|
|
|
Telecom Equipment - Fiber Optics — 0.0% | | | | | | | | |
JDS Uniphase Corp.† | | | 29,927 | | | | 275,029 | |
| | | | | | |
|
|
|
Telephone - Integrated — 2.2% | | | | | | | | |
CenturyLink, Inc. | | | 239,384 | | | | 8,656,126 | |
Frontier Communications Corp. | | | 93,106 | | | | 719,709 | |
Qwest Communications International, Inc. | | | 401,214 | | | | 2,266,859 | |
Windstream Corp. | | | 255,791 | | | | 2,950,549 | |
| | | | | | |
|
|
|
| | | | | | | | 14,593,243 | |
| | | | | | |
|
|
|
Tools - Hand Held — 0.3% | | | | | | | | |
Snap-On, Inc. | | | 7,537 | | | | 310,750 | |
Stanley Black & Decker, Inc. | | | 28,706 | | | | 1,539,790 | |
| | | | | | |
|
|
|
| | | | | | | | 1,850,540 | |
| | | | | | |
|
|
|
Toys — 0.1% | | | | | | | | |
Hasbro, Inc. | | | 6,209 | | | | 250,595 | |
Mattel, Inc. | | | 29,751 | | | | 624,474 | |
| | | | | | |
|
|
|
| | | | | | | | 875,069 | |
| | | | | | |
|
|
|
Transport - Rail — 0.6% | | | | | | | | |
Norfolk Southern Corp. | | | 69,597 | | | | 3,735,967 | |
| | | | | | |
|
|
|
Transport - Services — 0.9% | �� | | | | | | | |
C.H. Robinson Worldwide, Inc. | | | 51,612 | | | | 3,354,264 | |
Expeditors International of Washington, Inc. | | | 62,557 | | | | 2,476,631 | |
| | | | | | |
|
|
|
| | | | | | | | 5,830,895 | |
| | | | | | |
|
|
|
84
VALIC Company II Socially Responsible Fund
PORTFOLIO OF INVESTMENTS — August 31, 2010 — (continued)
| | | | | | | | |
| | |
| Security Description | | Shares/
Principal
Amount | | | Value (Note 2) | |
| |
COMMON STOCK (continued) | | | | | |
Vitamins & Nutrition Products — 0.2% | | | | | | | | |
Mead Johnson Nutrition Co. | | | 26,554 | | | $ | 1,385,853 | |
| | | | | | |
|
|
|
Web Portals/ISP — 1.7% | | | | | | | | |
Google, Inc., Class A† | | | 20,968 | | | | 9,436,020 | |
Yahoo!, Inc.† | | | 132,716 | | | | 1,735,925 | |
| | | | | | |
|
|
|
| | | | | | | | 11,171,945 | |
| | | | | | |
|
|
|
Wireless Equipment — 1.6% | | | | | | | | |
American Tower Corp., Class A† | | | 58,011 | | | | 2,718,395 | |
QUALCOMM, Inc. | | | 217,876 | | | | 8,346,830 | |
| | | | | | |
|
|
|
| | | | | | | | 11,065,225 | |
| | | | | | |
|
|
|
Total Long-Term Investment Securities
(cost $654,429,654) | | | | | | | 658,186,001 | |
| | | | | | |
|
|
|
SHORT-TERM INVESTMENT SECURITIES — 0.4% | | | | | | | | |
U.S. Government Treasuries — 0.4% | | | | | | | | |
United States Treasury Bills
0.17% due 09/16/10(1)
(cost $2,999,787) | | $ | 3,000,000 | | | | 2,999,787 | |
| | | | | | |
|
|
|
| | | | | | | | |
| | |
| Security Description | | Principal
Amount | | | Value (Note 2) | |
| |
REPURCHASE AGREEMENT — 1.6% | | | | | | | | |
State Street Bank & Trust Co. Joint Repurchase Agreement(2)
(cost $10,643,000) | | $ | 10,643,000 | | | $ | 10,643,000 | |
| | | | | | |
|
|
|
TOTAL INVESTMENTS | | | | | | | | |
(cost $668,072,441)(3) | | | 99.9 | % | | | 671,828,788 | |
Other assets less liabilities | | | 0.1 | | | | 736,942 | |
| | |
|
|
| |
|
|
|
NET ASSETS | | | 100.0 | % | | $ | 672,565,730 | |
| | |
|
|
| |
|
|
|
| † | Non-income producing security |
| (1) | The security or a portion thereof was pledged as collateral to cover margin requirements for open futures contracts. |
| (2) | See Note 2 for details of Joint Repurchase Agreements. |
| (3) | See Note 5 for cost of investments on a tax basis. |
| | | | | | | | | | | | | | | | | | | | | | |
| Open Futures Contracts | | | | | | | | | | | | |
Number of
Contracts | | | Type | | Description | | Expiration
Month | | | Value at
Trade Date | | | Value at
August 31, 2010 | | | Unrealized
Appreciation
(Depreciation) | |
| | 270 | | | Long | | S&P 500 E-Mini Index | | | September 2010 | | | $ | 14,259,776 | | | $ | 14,152,050 | | | $ | (107,726 | ) |
| | | | | | | | | | | | | | | | | | | | |
|
|
|
The following is a summary of the inputs used to value the Fund’s net assets as of August 31, 2010 (see Note 2):
| | | | | | | | | | | | | | | | |
| | | Level 1 - Unadjusted Quoted
Prices
| | | Level 2 - Other Observable
Inputs
| | | Level 3 - Significant
Unobservable Inputs
| | | Total
| |
Long-Term Investment Securities: | | | | | | | | | | | | | | | | |
Common Stock: | | | | | | | | | | | | | | | | |
Computers | | $ | 43,548,391 | | | $ | — | | | $ | — | | | $ | 43,548,391 | |
Other Industries* | | | 614,637,610 | | | | — | | | | — | | | | 614,637,610 | |
Short-Term Investment Securities: | | | | | | | | | | | | | | | | |
U.S. Government Treasuries | | | — | | | | 2,999,787 | | | | — | | | | 2,999,787 | |
Repurchase Agreement | | | — | | | | 10,643,000 | | | | — | | | | 10,643,000 | |
Other Financial Instruments:@ | | | | | | | | | | | | | | | | |
Future Contracts - Depreciation | | | (107,726 | ) | | | — | | | | — | | | | (107,726 | ) |
| | |
|
|
| |
|
|
| |
|
|
| |
|
|
|
Total | | $ | 658,078,275 | | | $ | 13,642,787 | | | $ | — | | | $ | 671,721,062 | |
| | |
|
|
| |
|
|
| |
|
|
| |
|
|
|
| * | Sum of all other industries each of which individually has an aggregate market value of less than 5% of net assets. For a detailed presentation of common stocks by industry classification, please refer to the Portfolio of Investments. |
| @ | Other financial instruments are derivative instruments not reflected in the Portfolio of Investments, such as futures, forward, swap and written option contracts, which are valued at the unrealized appreciation (depreciation) on the instrument. |
The following is a reconciliation of Level 3 assets which significant unobservable inputs were used to determine fair value:
| | | | |
| | | Common Stock
| |
Balance as of 8/31/2009 | | $ | 0 | |
Accrued discounts/premiums | | | — | |
Realized gain (loss) | | | — | |
Change in unrealized appreciation (depreciation) | | | — | |
Net purchases (sales) | | | (0 | ) |
Transfers in and/or (out) of Level 3(#) | | | — | |
| | |
|
|
|
Balance as of 8/31/2010 | | $ | — | |
| | |
|
|
|
| (#) | The Fund’s policy is to recognize transfers in and transfers out as of the end of the reporting period. |
See Notes to Financial Statements
85
VALIC Company II Strategic Bond Fund
PORTFOLIO PROFILE — August 31, 2010 (Unaudited)
Industry Allocation*
| | | | |
Sovereign | | | 20.4 | % |
Repurchase Agreements | | | 9.2 | |
Federal Home Loan Mtg. Corp. | | | 5.0 | |
Federal National Mtg. Assoc. | | | 4.9 | |
Diversified Financial Services | | | 4.8 | |
United States Treasury Notes | | | 3.0 | |
Oil Companies — Exploration & Production | | | 2.8 | |
Diversified Banking Institutions | | | 2.0 | |
Medical — Hospitals | | | 1.8 | |
Banks — Commercial | | | 1.7 | |
Telephone — Integrated | | | 1.4 | |
United States Treasury Bonds | | | 1.3 | |
Independent Power Producers | | | 1.3 | |
Banks — Super Regional | | | 1.2 | |
Steel — Producers | | | 1.2 | |
Cable/Satellite TV | | | 1.1 | |
Electric — Generation | | | 1.1 | |
Pipelines | | | 1.0 | |
Paper & Related Products | | | 1.0 | |
Government National Mtg. Assoc. | | | 1.0 | |
Coal | | | 1.0 | |
Telecom Services | | | 0.9 | |
Electric — Integrated | | | 0.9 | |
Special Purpose Entities | | | 0.8 | |
Casino Hotels | | | 0.8 | |
Airlines | | | 0.8 | |
Finance — Auto Loans | | | 0.7 | |
Chemicals — Diversified | | | 0.6 | |
Building — Residential/Commercial | | | 0.6 | |
Chemicals — Plastics | | | 0.5 | |
Insurance — Life/Health | | | 0.5 | |
Retail — Regional Department Stores | | | 0.5 | |
Funeral Services & Related Items | | | 0.5 | |
Rental Auto/Equipment | | | 0.5 | |
Electronic Components — Semiconductors | | | 0.5 | |
Satellite Telecom | | | 0.5 | |
Distribution/Wholesale | | | 0.5 | |
Computer Services | | | 0.5 | |
Insurance — Mutual | | | 0.5 | |
Auto/Truck Parts & Equipment — Original | | | 0.5 | |
Oil Companies — Integrated | | | 0.5 | |
Containers — Metal/Glass | | | 0.4 | |
Computers — Memory Devices | | | 0.4 | |
Retail — Drug Store | | | 0.4 | |
Television | | | 0.4 | |
Gambling (Non-Hotel) | | | 0.4 | |
Finance — Other Services | | | 0.4 | |
Real Estate Investment Trusts | | | 0.4 | |
Gas — Transportation | | | 0.4 | |
Medical — Drugs | | | 0.4 | |
Enterprise Software/Service | | | 0.4 | |
Insurance — Multi-line | | | 0.4 | |
Retail — Restaurants | | | 0.4 | |
Finance — Investment Banker/Broker | | | 0.4 | |
Oil — Field Services | | | 0.3 | |
Non-Hazardous Waste Disposal | | | 0.3 | |
Building & Construction Products — Misc. | | | 0.3 | |
Commercial Services | | | 0.3 | |
Broadcast Services/Program | | | 0.3 | |
Electronic Components — Misc. | | | 0.3 | |
Energy — Alternate Sources | | | 0.3 | |
Physicians Practice Management | | | 0.3 | |
Diversified Manufacturing Operations | | | 0.3 | |
Multimedia | | | 0.3 | |
Containers — Paper/Plastic | | | 0.3 | |
Cellular Telecom | | | 0.3 | |
Transport — Air Freight | | | 0.3 | |
Retail — Toy Stores | | | 0.3 | |
Transport — Services | | | 0.3 | |
Medical — Biomedical/Gene | | | 0.3 | |
Cosmetics & Toiletries | | | 0.2 | |
Hazardous Waste Disposal | | | 0.2 | |
Firearms & Ammunition | | | 0.2 | |
Photo Equipment & Supplies | | | 0.2 | |
Food — Misc. | | | 0.2 | |
| | | | |
Beverages — Wine/Spirits | | | 0.2 | |
Web Hosting/Design | | | 0.2 | |
Auto — Heavy Duty Trucks | | | 0.2 | |
Publishing — Books | | | 0.2 | |
Retail — Propane Distribution | | | 0.2 | |
Music | | | 0.2 | |
Building — Heavy Construction | | | 0.2 | |
Machinery — Farming | | | 0.2 | |
Food — Retail | | | 0.2 | |
Real Estate Operations & Development | | | 0.2 | |
Advertising Services | | | 0.2 | |
Import/Export | | | 0.2 | |
Printing — Commercial | | | 0.2 | |
Decision Support Software | | | 0.2 | |
Aerospace/Defense | | | 0.2 | |
Food — Meat Products | | | 0.2 | |
Seismic Data Collection | | | 0.2 | |
Building Products — Cement | | | 0.2 | |
Capacitors | | | 0.2 | |
Medical Products | | | 0.2 | |
Private Corrections | | | 0.2 | |
Retail — Apparel/Shoe | | | 0.2 | |
Medical Instruments | | | 0.1 | |
Direct Marketing | | | 0.1 | |
Storage/Warehousing | | | 0.1 | |
Financial Guarantee Insurance | | | 0.1 | |
Wireless Equipment | | | 0.1 | |
Radio | | | 0.1 | |
Real Estate Management/Services | | | 0.1 | |
Home Furnishings | | | 0.1 | |
Wire & Cable Products | | | 0.1 | |
Transport — Rail | | | 0.1 | |
Publishing — Newspapers | | | 0.1 | |
Casino Services | | | 0.1 | |
Mining Services | | | 0.1 | |
Petrochemicals | | | 0.1 | |
Investment Companies | | | 0.1 | |
Gas — Distribution | | | 0.1 | |
Diversified Minerals | | | 0.1 | |
Transport — Equipment & Leasing | | | 0.1 | |
Consumer Products — Misc. | | | 0.1 | |
Circuit Boards | | | 0.1 | |
Banks — Fiduciary | | | 0.1 | |
Forestry | | | 0.1 | |
Medical — HMO | | | 0.1 | |
Warehousing & Harbor Transportation Services | | | 0.1 | |
Finance — Commercial | | | 0.1 | |
Engineering/R&D Services | | | 0.1 | |
Applications Software | | | 0.1 | |
Transport — Marine | | | 0.1 | |
Brewery | | | 0.1 | |
| | |
|
|
|
| | | | 98.6 | % |
| | |
|
|
|
Credit Quality†#
| | | | |
Government — Agency | | | 11.9 | % |
Government — Treasury | | | 4.9 | |
AAA | | | 5.0 | |
AA | | | 2.0 | |
A | | | 5.3 | |
BBB | | | 17.0 | |
BB | | | 24.4 | |
B | | | 21.3 | |
CCC | | | 4.2 | |
C | | | 0.3 | |
Below C | | | 0.1 | |
Not Rated@ | | | 3.6 | |
| | |
|
|
|
| | | | 100.0 | % |
| | |
|
|
|
| * | Calculated as a percentage of net assets. |
| @ | Represent debt issues that either have no rating, or the rating is unavailable from the data source. |
| † | Source: Standard and Poors |
| # | Calculated as percentage of total debt issues, excluding short-term securities. |
86
VALIC Company II Strategic Bond Fund
PORTFOLIO OF INVESTMENTS — August 31, 2010
| | | | | | | | |
| | |
| Security Description | | Principal
Amount(12) | | | Value
(Note 2) | |
| |
ASSET BACKED SECURITIES — 3.9% | | | | | | | | |
Diversified Financial Services — 3.9% | | | | | | | | |
Bank One Issuance Trust
Series 2003-C3, Class C3
4.77% due 02/16/16 | | $ | 233,000 | | | $ | 247,290 | |
Bear Stearns Commercial Mtg. Securities, Inc.
Series 2007-PW17, Class AM
5.92% due 06/11/50(1)(2) | | | 1,700,000 | | | | 1,520,822 | |
Carrington Mtg. Loan Trust
Series 2006-NC3, Class A2
0.36% due 08/25/36(3) | | | 1,823,565 | | | | 1,412,419 | |
Commercial Mtg. Pass Through Certs.
Series 2006-CN2A, Class A2FL
0.52% due 02/05/19*(1)(3) | | | 550,000 | | | | 490,067 | |
Commercial Mtg. Pass Through Certs.
Series 2006-C7, Class AM
5.99% due 06/10/46(1)(2) | | | 500,000 | | | | 487,401 | |
Dominos Pizza Master Issuer LLC
Series 2007-1, Class A2
5.26% due 04/25/37* | | | 275,000 | | | | 267,391 | |
FDIC Structured Sale Guaranteed Notes
Series 2010-S1, Class 2A
3.25% due 04/25/38*(4) | | | 2,815,448 | | | | 2,886,944 | |
GMAC Mortgage Corp Loan Trust
Series 2010-1, Class A
4.25% due 07/25/40*(4) | | | 408,859 | | | | 416,678 | |
GS Mortgage Securities Trust
Series 2007-GG10, Class A4
6.00% due 08/10/45(1)(2) | | | 1,000,000 | | | | 1,033,538 | |
GSAMP Trust
Series 2007-FM2, Class A2A
0.32% due 01/25/37(3) | | | 1,710,137 | | | | 1,594,816 | |
JP Morgan Chase Commercial Mtg. Securities Corp.
Series 2007-LD11, Class A4
6.01% due 06/15/49(1)(2) | | | 1,000,000 | | | | 1,023,988 | |
Merrill Lynch/Countrywide Commercial Mtg. Trust
Series 2007-8, Class AJ
6.18% due 08/12/49(1)(2) | | | 2,500,000 | | | | 1,806,218 | |
Morgan Stanley Capital I
Series 2007-IQ14, Class A4
5.69% due 04/15/49(1)(2) | | | 2,500,000 | | | | 2,537,823 | |
Morgan Stanley Capital I Pass Through Certs.
Series 2006-HQ9, Class B
5.83% due 07/12/44(1)(2) | | | 500,000 | | | | 379,981 | |
Morgan Stanley Capital I,
Series 2006-HQ9, Class AJ
5.79% due 07/12/44(1)(2) | | | 1,000,000 | | | | 873,681 | |
Sonic Capital LLC
Series 2006-1A, Class A2
5.10% due 12/20/31* | | | 280,025 | | | | 277,430 | |
Soundview Home Equity Loan Trust
Series 2007-OPT1, Class 2A1
0.34% due 06/25/37(3) | | | 746,625 | | | | 652,628 | |
| | | | | | |
|
|
|
Total Asset Backed Securities | | | | | | | | |
(cost $17,336,934) | | | | | | | 17,909,115 | |
| | | | | | |
|
|
|
CONVERTIBLE BONDS & NOTES — 0.0% | | | | | | | | |
Telecom Services — 0.0% | | | | | | | | |
ICO North America, Inc.
Senior Sec. Notes
7.50% due 08/15/09†(5)(6)(7)(15)(17)
(cost $140,000) | | | 140,000 | | | | 121,800 | |
| | | | | | |
|
|
|
| | | | | | | | |
| | |
| Security Description | | Principal
Amount(12) | | | Value
(Note 2) | |
| |
U.S. CORPORATE BONDS & NOTES — 42.6% | | | | | | | | |
Advertising Services — 0.2% | | | | | | | | |
Visant Holding Corp.
Senior Notes
10.25% due 12/01/13(8) | | $ | 863,000 | | | $ | 880,260 | |
| | | | | | |
|
|
|
Aerospace/Defense — 0.2% | | | | | | | | |
Spirit Aerosystems, Inc.
Company Guar. Notes
7.50% due 10/01/17 | | | 795,000 | | | | 816,863 | |
| | | | | | |
|
|
|
Agricultural Chemicals — 0.0% | | | | | | | | |
Incitec Pivot Finance LLC
Company Guar. Notes
6.00% due 12/10/19* | | | 30,000 | | | | 31,906 | |
| | | | | | |
|
|
|
Airlines — 0.8% | | | | | | | | |
Continental Airlines, Inc.
Pass Through Certs.
Series 1991, Class A
6.55% due 02/02/19 | | | 166,177 | | | | 170,497 | |
Continental Airlines, Inc.
Pass Through Certs.
Series 2000-2, Class C
8.31% due 04/02/11 | | | 29,437 | | | | 29,584 | |
Delta Air Lines, Inc.
Pass Through Certs.
6.82% due 02/10/24 | | | 1,218,838 | | | | 1,246,262 | |
Delta Air Lines, Inc.
Senior Sec. Notes
9.50% due 09/15/14* | | | 925,000 | | | | 992,063 | |
Delta Air Lines, Inc.
Senior Sec. Notes
12.25% due 03/15/15* | | | 175,000 | | | | 192,281 | |
United AirLines, Inc.
Pass Through Certs.
Series 2009-2, Class A
9.75% due 01/15/17 | | | 904,139 | | | | 994,553 | |
| | | | | | |
|
|
|
| | | | | | | | 3,625,240 | |
| | | | | | |
|
|
|
Applications Software — 0.1% | | | | | | | | |
SS&C Technologies, Inc.
Company Guar. Notes
11.75% due 12/01/13 | | | 250,000 | | | | 262,188 | |
| | | | | | |
|
|
|
Auto - Heavy Duty Trucks — 0.2% | | | | | | | | |
Navistar International Corp.
Company Guar. Notes
8.25% due 11/01/21 | | | 915,000 | | | | 958,463 | |
| | | | | | |
|
|
|
Auto/Truck Parts & Equipment - Original — 0.5% | | | | | | | | |
Cooper - Standard Automotive, Inc.
Senior Notes
8.50% due 05/01/18* | | | 930,000 | | | | 950,925 | |
Lear Corp.
Company Guar. Notes
8.13% due 03/15/20 | | | 1,120,000 | | | | 1,162,000 | |
| | | | | | |
|
|
|
| | | | | | | | 2,112,925 | |
| | | | | | |
|
|
|
Auto/Truck Parts & Equipment - Replacement — 0.0% | | | | | | | | |
Exide Corp.
Escrow Notes
10.00% due 04/15/05†(5)(7) | | | 150,000 | | | | 0 | |
| | | | | | |
|
|
|
Banks - Commercial — 0.5% | | | | | | | | |
Branch Banking & Trust Co.
Sub. Notes
0.64% due 05/23/17(3) | | | 168,000 | | | | 149,900 | |
CIT Group, Inc.
Senior Sec. Notes
7.00% due 05/01/17 | | | 1,028,138 | | | | 966,770 | |
87
VALIC Company II Strategic Bond Fund
PORTFOLIO OF INVESTMENTS — August 31, 2010 — (continued)
| | | | | | | | |
| | |
| Security Description | | Principal
Amount(12) | | | Value
(Note 2) | |
| |
U.S. CORPORATE BONDS & NOTES (continued) | | | | | | | | |
Banks - Commercial (continued) | | | | | | | | |
Credit Suisse New York
Sub. Notes
6.00% due 02/15/18 | | $ | 463,000 | | | $ | 504,808 | |
KeyBank NA
Sub. Notes
7.41% due 10/15/27 | | | 52,000 | | | | 58,269 | |
Regions Financial Corp.
Senior Notes
5.75% due 06/15/15 | | | 167,000 | | | | 169,628 | |
US Bank NA
Sub. Notes
3.78% due 04/29/20(3) | | | 135,000 | | | | 140,237 | |
Wachovia Bank NA
Sub. Notes
6.00% due 11/15/17 | | | 238,000 | | | | 268,570 | |
| | | | | | |
|
|
|
| | | | | | | | 2,258,182 | |
| | | | | | |
|
|
|
Banks - Fiduciary — 0.1% | | | | | | | | |
State Street Capital Trust IV
Ltd. Guar. Notes
1.54% due 06/15/37(3) | | | 454,000 | | | | 335,632 | |
| | | | | | |
|
|
|
Banks - Super Regional — 1.1% | | | | | | | | |
BAC Capital Trust XIII
Ltd. Guar. Notes
0.94% due 03/15/12(3)(9) | | | 575,000 | | | | 365,621 | |
BAC Capital Trust XV
Ltd. Guar. Notes
1.34% due 06/01/56(3) | | | 160,000 | | | | 98,877 | |
Fifth Third Capital Trust IV
Bank Guar. Notes
6.50% due 04/15/67(3) | | | 625,000 | | | | 539,062 | |
JPMorgan Chase Bank NA
Sub. Notes
6.00% due 10/01/17 | | | 279,000 | | | | 314,736 | |
SunTrust Banks, Inc.
Senior Notes
6.00% due 09/11/17 | | | 135,000 | | | | 148,020 | |
SunTrust Banks, Inc.
Sub. Notes
6.00% due 02/15/26 | | | 28,000 | | | | 27,190 | |
USB Capital IX
Ltd. Guar. Notes
6.19% due 04/15/11(3)(9) | | | 90,000 | | | | 70,200 | |
Wachovia Capital Trust III
Ltd. Guar. Notes
5.80% due 03/15/11(3)(9) | | | 3,810,000 | | | | 3,228,975 | |
Wells Fargo & Co.
Jr. Sub. Bonds
7.98% due 03/15/18(3)(9) | | | 150,000 | | | | 154,875 | |
Wells Fargo Bank NA
Sub. Notes
5.75% due 05/16/16 | | | 146,000 | | | | 163,074 | |
| | | | | | |
|
|
|
| | | | | | | | 5,110,630 | |
| | | | | | |
|
|
|
Beverages - Wine/Spirits — 0.2% | | | | | | | | |
Constellation Brands, Inc.
Company Guar. Notes
7.25% due 05/15/17 | | | 935,000 | | | | 979,412 | |
| | | | | | |
|
|
|
Brewery — 0.1% | | | | | | | | |
Anheuser - Busch InBev Worldwide, Inc.
Company Guar. Notes
7.75% due 01/15/19* | | | 185,000 | | | | 236,942 | |
| | | | | | |
|
|
|
| | | | | | | | |
| | |
| Security Description | | Principal
Amount(12) | | | Value
(Note 2) | |
| |
| | | | | | | | | |
Broadcast Services/Program — 0.3% | | | | | | | | |
Clear Channel Communications, Inc.
Company Guar. Notes
10.75% due 08/01/16 | | $ | 525,000 | | | $ | 387,188 | |
Fisher Communications, Inc.
Senior Notes
8.63% due 09/15/14 | | | 562,000 | | | | 557,082 | |
Nexstar Broadcasting, Inc./Mission Broadcasting, Inc.
Senior Sec. Notes
8.88% due 04/15/17* | | | 550,000 | | | | 558,937 | |
| | | | | | |
|
|
|
| | | | | | | | 1,503,207 | |
| | | | | | |
|
|
|
Building & Construction Products - Misc. — 0.1% | | | | | | | | |
Interline Brands, Inc.
Senior Sub. Notes
8.13% due 06/15/14 | | | 400,000 | | | | 407,000 | |
| | | | | | |
|
|
|
Building Products - Cement — 0.1% | | | | | | | | |
Cemex Finance LLC
Senior Sec. Notes
9.50% due 12/14/16 | | | 430,000 | | | | 412,800 | |
| | | | | | |
|
|
|
Building - Heavy Construction — 0.2% | | | | | | | | |
New Enterprise Stone & Lime Co.
Senior Notes
11.00% due 09/01/18* | | | 925,000 | | | | 920,375 | |
| | | | | | |
|
|
|
Building - Residential/Commercial — 0.6% | | | | | | | | |
KB Home
Company Guar. Notes
9.10% due 09/15/17 | | | 400,000 | | | | 404,000 | |
Lennar Corp.
Company Guar. Notes
6.95% due 06/01/18* | | | 650,000 | | | | 574,437 | |
Standard Pacific Corp.
Company Guar. Notes
7.00% due 08/15/15 | | | 800,000 | | | | 736,000 | |
Standard Pacific Corp.
Sec. Notes
8.38% due 05/15/18 | | | 990,000 | | | | 952,875 | |
| | | | | | |
|
|
|
| | | | | | | | 2,667,312 | |
| | | | | | |
|
|
|
Cable/Satellite TV — 1.1% | |
Comcast Corp.
Company Guar. Notes
5.90% due 03/15/16 | | | 800,000 | | | | 924,037 | |
Comcast Corp.
Company Guar. Notes
6.45% due 03/15/37 | | | 140,000 | | | | 159,409 | |
COX Communications, Inc.
Notes
7.13% due 10/01/12 | | | 125,000 | | | | 138,988 | |
CSC Holdings LLC
Senior Notes
8.63% due 02/15/19 | | | 750,000 | | | | 836,250 | |
DIRECTV Holdings LLC/DIRECTV Financing Co, Inc.
Company Guar. Notes
3.13% due 02/15/16 | | | 135,000 | | | | 134,556 | |
DIRECTV Holdings LLC/DIRECTV Financing Co., Inc.
Company Guar. Notes
6.38% due 06/15/15 | | | 135,000 | | | | 139,725 | |
DIRECTV Holdings LLC/DIRECTV Financing Co., Inc.
Company Guar. Notes
7.63% due 05/15/16 | | | 135,000 | | | | 148,837 | |
DISH DBS Corp.
Company Guar. Notes
7.75% due 05/31/15 | | | 1,305,000 | | | | 1,363,725 | |
88
VALIC Company II Strategic Bond Fund
PORTFOLIO OF INVESTMENTS — August 31, 2010 — (continued)
| | | | | | | | |
| | |
| Security Description | | Principal
Amount(12) | | | Value
(Note 2) | |
| |
U.S. CORPORATE BONDS & NOTES (continued) | | | | | | | | |
Cable/Satellite TV (continued) | |
Echostar DBS Corp.
Company Guar. Notes
7.13% due 02/01/16 | | $ | 1,025,000 | | | $ | 1,048,062 | |
Time Warner Cable, Inc.
Company Guar. Notes
5.85% due 05/01/17 | | | 204,000 | | | | 232,657 | |
| | | | | | |
|
|
|
| | | | | | | | 5,126,246 | |
| | | | | | |
|
|
|
Capacitors — 0.2% | |
Kemet Corp.
Sec. Notes
10.50% due 05/01/18* | | | 725,000 | | | | 757,625 | |
| | | | | | |
|
|
|
Casino Hotels — 0.8% | |
Eldorado Casino Corp. (Shreveport)
Sec. Bonds
10.00% due 08/01/12(7)(10) | | | 362,426 | | | | 331,620 | |
Eldorado Resorts LLC
Senior Notes
9.00% due 04/15/14(5)(7) | | | 250,000 | | | | 221,338 | |
Harrah’s Operating Co., Inc.
Senior Sec. Notes
11.25% due 06/01/17 | | | 935,000 | | | | 1,000,450 | |
MGM Mirage, Inc.
Company Guar. Notes
6.75% due 04/01/13 | | | 350,000 | | | | 305,375 | |
MGM Resorts International
Senior Sec. Notes
11.13% due 11/15/17 | | | 925,000 | | | | 1,033,687 | |
Turning Stone Resort Casino Enterprise
Senior Notes
9.13% due 09/15/14* | | | 920,000 | | | | 929,200 | |
| | | | | | |
|
|
|
| | | | | | | | 3,821,670 | |
| | | | | | |
|
|
|
Casino Services — 0.1% | |
FireKeepers Development Authority
Senior Notes
13.88% due 05/15/15* | | | 420,000 | | | | 487,200 | |
| | | | | | |
|
|
|
Cellular Telecom — 0.2% | |
Nextel Communications, Inc.
Senior Notes
7.38% due 08/01/15 | | | 750,000 | | | | 742,500 | |
| | | | | | |
|
|
|
Chemicals - Diversified — 0.4% | |
Momentive Performance Materials, Inc.
Company Guar. Notes
9.75% due 12/01/14 | | | 875,000 | | | | 854,218 | |
Solutia, Inc.
Company Guar. Notes
7.88% due 03/15/20 | | | 945,000 | | | | 987,525 | |
Union Carbide Corp.
Senior Notes
7.75% due 10/01/96 | | | 99,000 | | | | 88,729 | |
| | | | | | |
|
|
|
| | | | | | | | 1,930,472 | |
| | | | | | |
|
|
|
Chemicals - Plastics — 0.3% | |
Hexion US Finance Corp./Hexion Nova Scotia Finance ULC
Senior Sec. Notes
8.88% due 02/01/18 | | | 1,675,000 | | | | 1,549,375 | |
| | | | | | |
|
|
|
Chemicals - Specialty — 0.0% | |
Chemtura Corp.
Company Guar. Notes
7.88% due 09/01/18* | | | 175,000 | | | | 178,719 | |
| | | | | | |
|
|
|
| | | | | | | | |
| | |
| Security Description | | Principal
Amount(12) | | | Value
(Note 2) | |
| |
| | | | | | | | | |
Circuit Boards — 0.1% | |
Viasystems, Inc.
Senior Sec. Notes
12.00% due 01/15/15* | | $ | 310,000 | | | $ | 337,125 | |
| | | | | | |
|
|
|
Coal — 0.8% | |
Arch Coal, Inc.
Company Guar. Notes
8.75% due 08/01/16 | | | 825,000 | | | | 893,062 | |
Consol Energy, Inc.
Company Guar. Notes
8.00% due 04/01/17* | | | 225,000 | | | | 237,375 | |
Consol Energy, Inc.
Company Guar. Notes
8.25% due 04/01/20* | | | 830,000 | | | | 880,837 | |
Drummond Co., Inc.
Senior Notes
9.00% due 10/15/14* | | | 190,000 | | | | 198,788 | |
Foresight Energy LLC/Foresight Energy Corp.
Company Guar. Notes
9.63% due 08/15/17* | | | 825,000 | | | | 818,812 | |
Patriot Coal Corp.
Company Guar. Notes
8.25% due 04/30/18 | | | 475,000 | | | | 471,438 | |
| | | | | | |
|
|
|
| | | | | | | | 3,500,312 | |
| | | | | | |
|
|
|
Commercial Services — 0.3% | |
Ceridian Corp.
Company Guar. Notes
11.25% due 11/15/15 | | | 1,625,000 | | | | 1,505,156 | |
| | | | | | |
|
|
|
Computer Services — 0.5% | |
Affiliated Computer Services, Inc.
Senior Notes
5.20% due 06/01/15 | | | 156,000 | | | | 168,619 | |
Compucom Systems, Inc.
Senior Sub. Notes
12.50% due 10/01/15* | | | 670,000 | | | | 704,337 | |
International Business Machines Corp.
Senior Notes
6.22% due 08/01/27 | | | 280,000 | | | | 339,572 | |
SunGard Data Systems, Inc.
Company Guar. Notes
9.13% due 08/15/13 | | | 931,000 | | | | 950,784 | |
| | | | | | |
|
|
|
| | | | | | | | 2,163,312 | |
| | | | | | |
|
|
|
Computers - Periphery Equipment — 0.0% | |
Lexmark International, Inc.
Senior Notes
6.65% due 06/01/18 | | | 56,000 | | | | 63,421 | |
| | | | | | |
|
|
|
Consumer Products - Misc. — 0.1% | |
SC Johnson & Son, Inc.
Senior Notes
4.80% due 09/01/40* | | | 350,000 | | | | 342,300 | |
| | | | | | |
|
|
|
Containers - Metal/Glass — 0.4% | |
Ball Corp.
Company Guar. Notes
7.38% due 09/01/19 | | | 866,000 | | | | 928,785 | |
Crown Cork & Seal Co., Inc.
Debentures
7.38% due 12/15/26 | | | 1,205,000 | | | | 1,138,725 | |
| | | | | | |
|
|
|
| | | | | | | | 2,067,510 | |
| | | | | | |
|
|
|
Containers - Paper/Plastic — 0.3% | |
Berry Plastics Corp.
Senior Sec. Notes
8.25% due 11/15/15 | | | 325,000 | | | | 325,000 | |
89
VALIC Company II Strategic Bond Fund
PORTFOLIO OF INVESTMENTS — August 31, 2010 — (continued)
| | | | | | | | |
| | |
| Security Description | | Principal
Amount(12) | | | Value
(Note 2) | |
| |
U.S. CORPORATE BONDS & NOTES (continued) | | | | | | | | |
Containers - Paper/Plastic (continued) | |
Berry Plastics Corp.
Senior Sec. Notes
8.88% due 09/15/14 | | $ | 25,000 | | | $ | 23,750 | |
Berry Plastics Corp.
Senior Sec. Notes
9.50% due 05/15/18* | | | 675,000 | | | | 621,000 | |
Graphic Packaging International, Inc.
Company Guar. Notes
9.50% due 06/15/17 | | | 400,000 | | | | 426,000 | |
| | | | | | |
|
|
|
| | | | | | | | 1,395,750 | |
| | | | | | |
|
|
|
Cosmetics & Toiletries — 0.2% | |
Revlon Consumer Products Corp.
Notes
9.75% due 11/15/15 | | | 1,100,000 | | | | 1,142,625 | |
| | | | | | |
|
|
|
Decision Support Software — 0.2% | |
Vangent, Inc.
Company Guar. Notes
9.63% due 02/15/15 | | | 895,000 | | | | 821,163 | |
| | | | | | |
|
|
|
Direct Marketing — 0.1% | |
Affinity Group, Inc.
Company Guar. Notes
9.00% due 02/15/12 | | | 901,000 | | | | 673,498 | |
| | | | | | |
|
|
|
Distribution/Wholesale — 0.5% | |
American Tire Distributors, Inc.
Senior Sec. Notes
9.75% due 06/01/17* | | | 1,025,000 | | | | 1,071,125 | |
Ingram Micro, Inc.
Senior Notes
5.25% due 09/01/17 | | | 135,000 | | | | 137,989 | |
McJunkin Red Man Corp.
Senior Sec. Notes
9.50% due 12/15/16* | | | 1,100,000 | | | | 970,750 | |
| | | | | | |
|
|
|
| | | | | | | | 2,179,864 | |
| | | | | | |
|
|
|
Diversified Banking Institutions — 1.5% | |
Bank of America Corp.
Sub. Notes
5.42% due 03/15/17 | | | 6,000 | | | | 6,142 | |
Bank of America Corp.
Sub. Notes
7.25% due 10/15/25 | | | 49,000 | | | | 54,109 | |
Bank of America Corp.
Jr. Sub. Bonds
8.00% due 01/30/18(3)(9) | | | 2,420,000 | | | | 2,468,642 | |
Bank of America Corp.
Jr. Sub. Notes
8.13% due 05/15/18(3)(9) | | | 1,005,000 | | | | 1,025,200 | |
Citigroup, Inc.
Sub. Notes
5.00% due 09/15/14 | | | 145,000 | | | | 148,988 | |
Citigroup, Inc.
Notes
5.38% due 08/09/20 | | | 290,000 | | | | 292,675 | |
Citigroup, Inc.
Sub. Notes
5.50% due 02/15/17 | | | 485,000 | | | | 498,321 | |
Citigroup, Inc.
Senior Notes
6.00% due 12/13/13 | | | 135,000 | | | | 145,644 | |
Citigroup, Inc.
Global Sub. Notes
6.00% due 10/31/33 | | | 140,000 | | | | 133,054 | |
| | | | | | | | |
| | |
| Security Description | | Principal
Amount(12) | | | Value
(Note 2) | |
| |
| | | | | | | | | |
Diversified Banking Institutions (continued) | |
GMAC, Inc.
Company Guar. Notes
8.30% due 02/12/15* | | $ | 965,000 | | | $ | 1,003,600 | |
JP Morgan Chase & Co.
Sub. Notes
4.89% due 09/01/15(3) | | | 162,000 | | | | 161,079 | |
JP Morgan Chase & Co.
Jr. Sub Notes
7.90% due 04/30/18(3)(9) | | | 150,000 | | | | 157,758 | |
Morgan Stanley
Senior Notes
5.55% due 04/27/17 | | | 351,000 | | | | 367,764 | |
Morgan Stanley
Senior Notes
5.63% due 09/23/19 | | | 195,000 | | | | 198,444 | |
The Goldman Sachs Group, Inc.
Senior Notes
5.13% due 01/15/15 | | | 144,000 | | | | 154,744 | |
The Goldman Sachs Group, Inc.
Sub. Notes
5.63% due 01/15/17 | | | 162,000 | | | | 169,786 | |
The Goldman Sachs Group, Inc.
Sub. Notes
6.75% due 10/01/37 | | | 143,000 | | | | 146,044 | |
| | | | | | |
|
|
|
| | | | | | | | 7,131,994 | |
| | | | | | |
|
|
|
Diversified Financial Services — 0.9% | | | | | | | | |
Citigroup Capital XXI
Company Guar. Bonds
8.30% due 12/21/57(3) | | | 2,895,000 | | | | 3,003,562 | |
General Electric Capital Corp.
Senior Notes
2.80% due 01/08/13 | | | 270,000 | | | | 277,585 | |
General Electric Capital Corp.
Senior Notes
5.88% due 01/14/38 | | | 162,000 | | | | 166,576 | |
General Electric Capital Corp.
Senior Notes
6.15% due 08/07/37 | | | 740,000 | | | | 786,580 | |
| | | | | | |
|
|
|
| | | | | | | | 4,234,303 | |
| | | | | | |
|
|
|
Diversified Manufacturing Operations — 0.3% | | | | | | | | |
General Electric Co.
Senior Notes
5.25% due 12/06/17 | | | 85,000 | | | | 95,353 | |
Harland Clarke Holdings Corp.
Notes
9.50% due 05/15/15 | | | 740,000 | | | | 704,850 | |
SPX Corp.
Company Guar. Notes
6.88% due 09/01/17* | | | 445,000 | | | | 458,350 | |
| | | | | | |
|
|
|
| | | | | | | | 1,258,553 | |
| | | | | | |
|
|
|
E-Commerce/Services — 0.0% | | | | | | | | |
Expedia, Inc.
Company Guar. Notes
5.95% due 08/15/20* | | | 188,000 | | | | 191,995 | |
| | | | | | |
|
|
|
Electric - Generation — 1.1% | | | | | | | | |
Allegheny Energy Supply Co. LLC
Senior Notes
6.75% due 10/15/39* | | | 518,000 | | | | 528,961 | |
Edison Mission Energy
Senior Notes
7.00% due 05/15/17 | | | 1,450,000 | | | | 989,625 | |
90
VALIC Company II Strategic Bond Fund
PORTFOLIO OF INVESTMENTS — August 31, 2010 — (continued)
| | | | | | | | |
| | |
| Security Description | | Principal
Amount(12) | | | Value
(Note 2) | |
| |
U.S. CORPORATE BONDS & NOTES (continued) | | | | | | | | |
Electric - Generation (continued) | | | | | | | | |
Edison Mission Energy
Senior Notes
7.63% due 05/15/27 | | $ | 370,000 | | | $ | 234,025 | |
Homer City Funding LLC
Senior Notes
8.14% due 10/01/19 | | | 227,500 | | | | 208,163 | |
Midwest Generation LLC
Pass Thru Certs.,
Series B
8.56% due 01/02/16 | | | 225,610 | | | | 219,970 | |
Reliant Energy Mid-Atlantic Power Holdings LLC
Pass Through Certs.,
Series B
9.24% due 07/02/17 | | | 487,325 | | | | 506,818 | |
Reliant Energy Mid-Atlantic Power Holdings LLC
Pass Through Certs.,
Series C
9.68% due 07/02/26 | | | 300,000 | | | | 312,750 | |
Sithe/Independence Funding Corp.
Senior Notes
9.00% due 12/30/13 | | | 814,278 | | | | 839,065 | |
The AES Corp.
Senior Notes
8.00% due 10/15/17 | | | 815,000 | | | | 857,787 | |
The AES Corp.
Senior Notes
8.00% due 06/01/20 | | | 400,000 | | | | 420,000 | |
| | | | | | |
|
|
|
| | | | | | | | 5,117,164 | |
| | | | | | |
|
|
|
Electric - Integrated — 0.8% | | | | | | | | |
Ameren Energy Generating Co.
Senior Notes
6.30% due 04/01/20 | | | 196,000 | | | | 196,980 | |
CenterPoint Energy Houston Electric LLC
General Refunding Mtg.
7.00% due 03/01/14 | | | 208,000 | | | | 246,484 | |
Dominion Resources, Inc.
Senior Notes
2.25% due 09/01/15 | | | 55,000 | | | | 55,075 | |
Dominion Resources, Inc.
Senior Notes
5.25% due 08/01/33 | | | 336,000 | | | | 376,121 | |
Georgia Power Co.
Senior Notes
4.75% due 09/01/40 | | | 124,000 | | | | 123,508 | |
Great Plains Energy, Inc.
Senior Notes
2.75% due 08/15/13 | | | 135,000 | | | | 135,353 | |
Idaho Power Co.
1st Mtg. Bonds
4.85% due 08/15/40 | | | 103,000 | | | | 103,326 | |
Mirant Americas Generation LLC
Senior Notes
8.50% due 10/01/21 | | | 680,000 | | | | 613,700 | |
Mirant Mid-Atlantic LLC
Pass Through Certs., Series B
9.13% due 06/30/17 | | | 237,050 | | | | 245,939 | |
Southern California Edison Co.
1st Mtg. Bonds
4.50% due 09/01/40 | | | 93,000 | | | | 93,076 | |
Southern Energy, Inc.
Escrow Notes
7.90% due 07/15/09†(5)(7) | | | 725,000 | | | | 0 | |
Texas Competitive Electric Holdings Co. LLC
Company Guar. Notes, Series A
10.25% due 11/01/15 | | | 1,480,000 | | | | 943,500 | |
| | | | | | | | |
| | |
| Security Description | | Principal
Amount(12) | | | Value
(Note 2) | |
| |
| | | | | | | | | |
Electric - Integrated (continued) | | | | | | | | |
Texas Competitive Electric Holdings Co. LLC
Company Guar. Notes
11.25% due 11/01/16(11) | | $ | 636,346 | | | $ | 369,081 | |
| | | | | | |
|
|
|
| | | | | | | | 3,502,143 | |
| | | | | | |
|
|
|
Electronic Components - Misc. — 0.3% | | | | | | | | |
Jabil Circuit, Inc.
Senior Notes
7.75% due 07/15/16 | | | 975,000 | | | | 1,050,562 | |
Jabil Circuit, Inc.
Senior Notes
8.25% due 03/15/18 | | | 400,000 | | | | 435,000 | |
| | | | | | |
|
|
|
| | | | | | | | 1,485,562 | |
| | | | | | |
|
|
|
Electronic Components - Semiconductors — 0.5% | | | | | | | | |
Freescale Semiconductor, Inc.
Company Guar. Notes
9.13% due 12/15/14(11) | | | 500,000 | | | | 463,750 | |
Freescale Semiconductor, Inc.
Senior Sec. Notes
9.25% due 04/15/18* | | | 1,255,000 | | | | 1,258,137 | |
Freescale Semiconductor, Inc.
Senior Sec. Notes
10.13% due 03/15/18* | | | 450,000 | | | | 462,375 | |
| | | | | | |
|
|
|
| | | | | | | | 2,184,262 | |
| | | | | | |
|
|
|
Energy - Alternate Sources — 0.3% | | | | | | | | |
Headwaters, Inc.
Senior Sec. Notes
11.38% due 11/01/14 | | | 1,375,000 | | | | 1,450,625 | |
| | | | | | |
|
|
|
Engineering/R&D Services — 0.1% | | | | | | | | |
Alion Science and Technology Corp.
Company Guar. Notes
10.25% due 02/01/15 | | | 350,000 | | | | 266,438 | |
| | | | | | |
|
|
|
Enterprise Software/Service — 0.4% | | | | | | | | |
JDA Software Group, Inc.
Senior Notes
8.00% due 12/15/14* | | | 625,000 | | | | 651,563 | |
Mantech International Corp.
Company Guar. Notes
7.25% due 04/15/18 | | | 850,000 | | | | 867,000 | |
Oracle Corp.
Senior Notes
5.38% due 07/15/40* | | | 155,000 | | | | 168,018 | |
| | | | | | |
|
|
|
| | | | | | | | 1,686,581 | |
| | | | | | |
|
|
|
Finance - Auto Loans — 0.7% | | | | | | | | |
Ford Motor Credit Co. LLC
Senior Notes
8.00% due 12/15/16 | | | 2,270,000 | | | | 2,465,072 | |
Ford Motor Credit Co LLC
Senior Notes
12.00% due 05/15/15 | | | 650,000 | | | | 768,183 | |
| | | | | | |
|
|
|
| | | | | | | | 3,233,255 | |
| | | | | | |
|
|
|
Finance - Commercial — 0.1% | | | | | | | | |
Textron Financial Corp.
Senior Notes
5.40% due 04/28/13 | | | 260,000 | | | | 272,082 | |
| | | | | | |
|
|
|
Finance - Investment Banker/Broker — 0.3% | | | | | | | | |
JP Morgan Chase Capital XXIII
Ltd. Guar. Bonds
1.38% due 05/15/77(3) | | | 65,000 | | | | 46,605 | |
91
VALIC Company II Strategic Bond Fund
PORTFOLIO OF INVESTMENTS — August 31, 2010 — (continued)
| | | | | | | | |
| | |
| Security Description | | Principal
Amount(12) | | | Value
(Note 2) | |
| |
U.S. CORPORATE BONDS & NOTES (continued) | | | | | | | | |
Finance - Investment Banker/Broker (continued) | | | | | | | | |
Lehman Brothers Holdings Capital Trust VII
Ltd. Guar. Notes
0.00% due 05/31/12†(3)(9)(16)(17) | | $ | 101,000 | | | $ | 10 | |
Lehman Brothers Holdings, Inc.
Senior Notes
5.50% due 04/04/16†(16)(17) | | | 97,000 | | | | 20,370 | |
Lehman Brothers Holdings, Inc.
Sub. Notes
6.75% due 12/28/17†(16)(17) | | | 111,000 | | | | 35 | |
Lehman Brothers Holdings, Inc.
Sub. Notes
7.50% due 05/11/38†(16)(17) | | | 143,000 | | | | 44 | |
Merrill Lynch & Co., Inc.
Sub. Notes
6.05% due 05/16/16 | | | 606,000 | | | | 641,916 | |
Merrill Lynch & Co., Inc.
Senior Notes
6.88% due 11/15/18 | | | 203,000 | | | | 230,668 | |
TD Ameritrade Holding Corp.
Company Guar. Notes
4.15% due 12/01/14 | | | 298,000 | | | | 314,287 | |
| | | | | | |
|
|
|
| | | | | | | | 1,253,935 | |
| | | | | | |
|
|
|
Finance - Other Services — 0.2% | | | | | | | | |
Cantor Fitzgerald LP
Notes
6.38% due 06/26/15* | | | 140,000 | | | | 143,399 | |
SquareTwo Financial Corp.
Senior Sec. Notes
11.63% due 04/01/17* | | | 840,000 | | | | 741,300 | |
| | | | | | |
|
|
|
| | | | | | | | 884,699 | |
| | | | | | |
|
|
|
Financial Guarantee Insurance — 0.1% | | | | | | | | |
MBIA, Inc.
Senior Notes
5.70% due 12/01/34 | | | 1,000,000 | | | | 655,807 | |
| | | | | | |
|
|
|
Firearms & Ammunition — 0.2% | | | | | | | | |
Freedom Group, Inc.
Senior Sec. Notes
10.25% due 08/01/15* | | | 986,000 | | | | 1,027,905 | |
| | | | | | |
|
|
|
Food - Confectionery — 0.0% | | | | | | | | |
WM Wrigley Jr Co.
Company Guar. Notes
3.70% due 06/30/14* | | | 140,000 | | | | 145,084 | |
| | | | | | |
|
|
|
Food - Meat Products — 0.2% | |
Smithfield Foods, Inc.
Senior Sec. Notes
10.00% due 07/15/14* | | | 725,000 | | | | 809,281 | |
| | | | | | |
|
|
|
Food - Misc. — 0.2% | |
Kraft Foods, Inc.
Senior Notes
6.50% due 02/09/40 | | | 414,000 | | | | 491,107 | |
Kraft Foods, Inc.
Senior Notes
6.75% due 02/19/14 | | | 208,000 | | | | 241,263 | |
Sara Lee Corp.
Senior Notes
4.10% due 09/15/20 | | | 145,000 | | | | 145,831 | |
| | | | | | |
|
|
|
| | | | | | | | 878,201 | |
| | | | | | |
|
|
|
| | | | | | | | |
| | |
| Security Description | | Principal
Amount(12) | | | Value
(Note 2) | |
| |
| | | | | | | | | |
Food - Retail — 0.2% | |
Ahold Finance USA LLC
Company Guar. Notes
6.88% due 05/01/29 | | $ | 241,000 | | | $ | 294,727 | |
Ingles Markets, Inc.
Senior Notes
8.88% due 05/15/17 | | | 400,000 | | | | 418,500 | |
SUPERVALU, Inc.
Senior Notes
8.00% due 05/01/16 | | | 200,000 | | | | 200,500 | |
| | | | | | |
|
|
|
| | | | | | | | 913,727 | |
| | | | | | |
|
|
|
Funeral Services & Related Items — 0.5% | |
Carriage Services, Inc.
Senior Notes
7.88% due 01/15/15 | | | 1,225,000 | | | | 1,200,500 | |
Service Corp. International
Senior Notes
8.00% due 11/15/21 | | | 1,175,000 | | | | 1,239,625 | |
| | | | | | |
|
|
|
| | | | | | | | 2,440,125 | |
| | | | | | |
|
|
|
Gambling (Non-Hotel) — 0.4% | |
Downstream Development Authority
Senior Sec. Notes
12.00% due 10/15/15* | | | 1,555,000 | | | | 1,485,025 | |
Waterford Gaming LLC
Senior Notes
8.63% due 09/15/14* | | | 589,000 | | | | 265,050 | |
| | | | | | |
|
|
|
| | | | | | | | 1,750,075 | |
| | | | | | |
|
|
|
Gas - Distribution — 0.0% | |
MXEnergy Holdings, Inc.
Senior Sec. Notes
13.25% due 08/01/14*(5)(7) | | | 104,000 | | | | 93,080 | |
| | | | | | |
|
|
|
Gas - Transportation — 0.4% | |
Sabine Pass LNG LP
Company Guar. Senior Notes
7.25% due 11/30/13 | | | 435,000 | | | | 408,900 | |
Sabine Pass LNG LP
Senior Sec. Notes
7.50% due 11/30/16 | | | 1,455,000 | | | | 1,289,494 | |
| | | | | | |
|
|
|
| | | | | | | | 1,698,394 | |
| | | | | | |
|
|
|
Hazardous Waste Disposal — 0.2% | |
Clean Harbors, Inc.
Senior Sec. Notes
7.63% due 08/15/16 | | | 1,060,000 | | | | 1,086,500 | |
| | | | | | |
|
|
|
Health Care Cost Containment — 0.0% | |
Team Health, Inc.
Company Guar. Notes
11.25% due 12/01/13 | | | 139,000 | | | | 144,734 | |
| | | | | | |
|
|
|
Home Furnishings — 0.1% | |
Norcraft Cos LP/Norcraft Finance Corp.
Senior Sec. Notes
10.50% due 12/15/15 | | | 550,000 | | | | 567,875 | |
| | | | | | |
|
|
|
Independent Power Producers — 1.3% | |
Calpine Corp.
Senior Sec. Notes
7.88% due 07/31/20* | | | 995,000 | | | | 997,488 | |
Calpine Corp.
Escrow Notes
8.75% due 07/15/13†(5)(7) | | | 1,615,000 | | | | 0 | |
92
VALIC Company II Strategic Bond Fund
PORTFOLIO OF INVESTMENTS — August 31, 2010 — (continued)
| | | | | | | | |
| | |
| Security Description | | Principal
Amount(12) | | | Value
(Note 2) | |
| |
U.S. CORPORATE BONDS & NOTES (continued) | | | | | | | | |
Independent Power Producers (continued) | |
Dynegy - Roseton/Danskammer
Pass Through Certs.,
Series B
7.67% due 11/08/16 | | $ | 2,050,000 | | | $ | 1,865,500 | |
NGC Corp. Capital Trust I
Company Guar. Bonds
8.32% due 06/01/27 | | | 700,000 | | | | 283,500 | |
NRG Energy, Inc.
Company Guar. Notes
7.38% due 02/01/16 | | | 1,115,000 | | | | 1,123,362 | |
NRG Energy, Inc.
Company Guar. Notes
8.25% due 09/01/20* | | | 925,000 | | | | 930,781 | |
RRI Energy, Inc.
Senior Notes
7.88% due 12/31/17 | | | 950,000 | | | | 876,375 | |
| | | | | | |
|
|
|
| | | | | | | | 6,077,006 | |
| | | | | | |
|
|
|
Insurance - Life/Health — 0.5% | |
Jefferson - Pilot Corp.
Senior Notes
4.75% due 01/30/14 | | | 145,000 | | | | 153,167 | |
Lincoln National Corp.
Jr. Sub. Bonds
7.00% due 05/17/66(3) | | | 1,675,000 | | | | 1,524,250 | |
Nationwide Financial Services, Inc.
Senior Notes
5.90% due 07/01/12 | | | 187,000 | | | | 198,202 | |
Principal Life Income Funding Trusts
Senior Sec. Notes
0.60% due 11/08/13(3) | | | 213,000 | | | | 209,930 | |
Protective Life Corp.
Senior Notes
8.45% due 10/15/39 | | | 396,000 | | | | 438,518 | |
| | | | | | |
|
|
|
| | | | | | | | 2,524,067 | |
| | | | | | |
|
|
|
Insurance - Multi-line — 0.3% | |
Genworth Financial, Inc.
Senior Notes
4.95% due 10/01/15 | | | 150,000 | | | | 149,085 | |
Hartford Financial Services Group, Inc.
Senior Notes
5.50% due 10/15/16 | | | 160,000 | | | | 168,389 | |
MetLife, Inc.
Senior Notes
6.75% due 06/01/16 | | | 250,000 | | | | 296,813 | |
Metropolitan Life Global Funding I
Notes
2.88% due 09/17/12* | | | 280,000 | | | | 288,117 | |
Nationwide Mutual Insurance Co.
Notes
9.38% due 08/15/39* | | | 280,000 | | | | 340,125 | |
| | | | | | |
|
|
|
| | | | | | | | 1,242,529 | |
| | | | | | |
|
|
|
Insurance - Mutual — 0.5% | |
Liberty Mutual Group, Inc.
Notes
5.75% due 03/15/14* | | | 135,000 | | | | 141,592 | |
Liberty Mutual Group, Inc.
Senior Notes
6.50% due 03/15/35* | | | 182,000 | | | | 166,835 | |
Liberty Mutual Group, Inc.
Company Guar. Notes
7.80% due 03/07/87* | | | 295,000 | | | | 259,600 | |
| | | | | | | | |
| | |
| Security Description | | Principal
Amount(12) | | | Value
(Note 2) | |
| |
| | | | | | | | | |
Insurance - Mutual (continued) | |
Liberty Mutual Group, Inc.
Company Guar. Bonds
10.75% due 06/15/58*(3) | | $ | 1,415,000 | | | $ | 1,574,187 | |
| | | | | | |
|
|
|
| | | | | | | | 2,142,214 | |
| | | | | | |
|
|
|
Investment Companies — 0.1% | |
Fox Acquisition Sub LLC
Senior Notes
13.38% due 07/15/16* | | | 375,000 | | | | 382,969 | |
| | | | | | |
|
|
|
Machinery - Farming — 0.2% | |
Case New Holland, Inc.
Senior Notes
7.88% due 12/01/17* | | | 745,000 | | | | 784,113 | |
CNH America LLC
Notes
7.25% due 01/15/16 | | | 130,000 | | | | 134,225 | |
| | | | | | |
|
|
|
| | | | | | | | 918,338 | |
| | | | | | |
|
|
|
Medical Instruments — 0.1% | |
Accellent, Inc.
Senior Sec. Notes
8.38% due 02/01/17 | | | 525,000 | | | | 522,375 | |
Medtronic, Inc.
Senior Notes
3.00% due 03/15/15 | | | 145,000 | | | | 153,190 | |
| | | | | | |
|
|
|
| | | | | | | | 675,565 | |
| | | | | | |
|
|
|
Medical Products — 0.2% | |
Johnson & Johnson
Senior Notes
4.50% due 09/01/40 | | | 141,000 | | | | 147,677 | |
Universal Hospital Services, Inc.
Senior Sec. Notes
8.50% due 06/01/15(11) | | | 600,000 | | | | 603,000 | |
| | | | | | |
|
|
|
| | | | | | | | 750,677 | |
| | | | | | |
|
|
|
Medical - Biomedical/Gene — 0.3% | |
Bio-Rad Laboratories, Inc.
Senior Sub. Notes
8.00% due 09/15/16 | | | 1,090,000 | | | | 1,169,025 | |
| | | | | | |
|
|
|
Medical - Drugs — 0.4% | |
Schering - Plough Corp
Senior Notes
6.00% due 09/15/17 | | | 191,000 | | | | 232,234 | |
Valeant Pharmaceuticals International
Company Guar. Notes
8.38% due 06/15/16 | | | 1,290,000 | | | | 1,464,150 | |
| | | | | | |
|
|
|
| | | | | | | | 1,696,384 | |
| | | | | | |
|
|
|
Medical - HMO — 0.1% | |
UnitedHealth Group, Inc.
Senior Notes
5.25% due 03/15/11 | | | 145,000 | | | | 148,236 | |
WellPoint, Inc.
Senior Notes
5.80% due 08/15/40 | | | 137,000 | | | | 146,361 | |
| | | | | | |
|
|
|
| | | | | | | | 294,597 | |
| | | | | | |
|
|
|
Medical - Hospitals — 1.8% | |
Capella Healthcare, Inc.
Company Guar. Notes
9.25% due 07/01/17* | | | 1,000,000 | | | | 1,035,000 | |
Community Health Systems, Inc.
Company Guar. Notes
8.88% due 07/15/15 | | | 1,595,000 | | | | 1,654,812 | |
93
VALIC Company II Strategic Bond Fund
PORTFOLIO OF INVESTMENTS — August 31, 2010 — (continued)
| | | | | | | | |
| | |
| Security Description | | Principal
Amount(12) | | | Value
(Note 2) | |
| |
U.S. CORPORATE BONDS & NOTES (continued) | | | | | | | | |
Medical - Hospitals (continued) | |
HCA, Inc.
Senior Notes
7.50% due 11/15/95 | | $ | 1,850,000 | | | $ | 1,408,313 | |
HCA, Inc.
Senior Sec. Notes
8.50% due 04/15/19 | | | 3,160,000 | | | | 3,464,150 | |
Select Medical Corp.
Company Guar. Notes
7.63% due 02/01/15 | | | 1,000,000 | | | | 942,500 | |
| | | | | | |
|
|
|
| | | | | | | | 8,504,775 | |
| | | | | | |
|
|
|
Mining Services — 0.1% | |
Noranda Aluminum Acquisition Corp.
Company Guar. Notes
5.37% due 11/15/14(3)(11) | | | 563,622 | | | | 442,443 | |
| | | | | | |
|
|
|
Multimedia — 0.3% | |
Haights Cross Operating Co.
Bonds
16.00% due 03/15/14(3)(5)(7) | | | 57,636 | | | | 55,907 | |
NBC Universal, Inc.
Senior Notes
6.40% due 04/30/40* | | | 384,000 | | | | 429,966 | |
News America, Inc.
Company Guar. Bonds
6.65% due 11/15/37 | | | 145,000 | | | | 167,965 | |
Time Warner Cos., Inc.
Company Guar. Notes
6.95% due 01/15/28 | | | 286,000 | | | | 333,220 | |
Time Warner Entertainment Co. LP
Senior Notes
8.38% due 07/15/33 | | | 87,000 | | | | 114,294 | |
Time Warner, Inc.
Bonds
6.63% due 05/15/29 | | | 140,000 | | | | 158,859 | |
| | | | | | |
|
|
|
| | | | | | | | 1,260,211 | |
| | | | | | |
|
|
|
Music — 0.2% | |
WMG Acquisition Corp.
Senior Sec. Notes
9.50% due 06/15/16 | | | 890,000 | | | | 930,050 | |
| | | | | | |
|
|
|
Non-Ferrous Metals — 0.0% | |
Renco Metals, Inc.
Bonds
11.50% due 07/01/03†(5)(7)(15)(18) | | | 75,000 | | | | 0 | |
| | | | | | |
|
|
|
Non-Hazardous Waste Disposal — 0.3% | |
Allied Waste North America, Inc.
Company Guar. Notes
7.13% due 05/15/16 | | | 435,000 | | | | 467,625 | |
Casella Waste Systems, Inc.
Senior Sec. Notes
11.00% due 07/15/14 | | | 525,000 | | | | 573,563 | |
Republic Services, Inc.
Company Guar. Notes
5.25% due 11/15/21 | | | 216,000 | | | | 239,984 | |
Waste Management, Inc.
Company Guar. Notes
6.13% due 11/30/39 | | | 235,000 | | | | 267,850 | |
| | | | | | |
|
|
|
| | | | | | | | 1,549,022 | |
| | | | | | |
|
|
|
Oil & Gas Drilling — 0.0% | |
Rowan Cos, Inc.
Senior Notes
5.00% due 09/01/17 | | | 135,000 | | | | 135,776 | |
| | | | | | |
|
|
|
| | | | | | | | |
| | |
| Security Description | | Principal
Amount(12) | | | Value
(Note 2) | |
| |
| | | | | | | | | |
Oil Companies - Exploration & Production — 2.2% | |
Anadarko Petroleum Corp.
Notes
6.20% due 03/15/40 | | $ | 46,000 | | | $ | 39,363 | |
Apache Corp.
Senior Notes
5.10% due 09/01/40 | | | 155,000 | | | | 159,839 | |
Atlas Energy Operating Co. LLC/Atlas Energy Finance Corp.
Company Guar. Notes
10.75% due 02/01/18 | | | 680,000 | | | | 749,700 | |
ATP Oil & Gas Corp.
Senior Sec. Notes
11.88% due 05/01/15* | | | 575,000 | | | | 462,875 | |
Belden & Blake Corp.
Company Guar. Sec. Notes
8.75% due 07/15/12 | | | 80,000 | | | | 77,200 | |
Brigham Exploration Co.
Company Guar. Notes
9.63% due 05/01/14 | | | 780,000 | | | | 807,300 | |
Chaparral Energy, Inc.
Company Guar. Notes
8.50% due 12/01/15 | | | 985,000 | | | | 935,750 | |
Chesapeake Energy Corp.
Company Guar. Notes
6.63% due 08/15/20 | | | 300,000 | | | | 301,125 | |
Chesapeake Energy Corp.
Company Guar. Notes
6.88% due 08/15/18 | | | 500,000 | | | | 510,000 | |
Chesapeake Energy Corp.
Senior Notes
7.25% due 12/15/18 | | | 275,000 | | | | 287,375 | |
Chesapeake Energy Corp.
Senior Notes
9.50% due 02/15/15 | | | 325,000 | | | | 365,625 | |
Encore Acquisition Co.
Senior Notes
9.50% due 05/01/16 | | | 490,000 | | | | 534,100 | |
Hilcorp Energy I LP
Senior Notes
7.75% due 11/01/15* | | | 670,000 | | | | 678,375 | |
Hilcorp Energy I LP
Senior Notes
9.00% due 06/01/16* | | | 200,000 | | | | 208,000 | |
Kerr - McGee Corp.
Company Guar. Notes
6.95% due 07/01/24 | | | 251,000 | | | | 254,083 | |
Linn Energy LLC/Linn Energy Finance Corp.
Senior Notes
8.63% due 04/15/20* | | | 1,850,000 | | | | 1,951,750 | |
Plains Exploration & Production Co.
Company Guar. Notes
7.75% due 06/15/15 | | | 250,000 | | | | 253,750 | |
Plains Exploration & Production Co.
Company Guar. Notes
10.00% due 03/01/16 | | | 325,000 | | | | 355,875 | |
QEP Resources, Inc.
Senior Notes
6.88% due 03/01/21 | | | 725,000 | | | | 755,812 | |
Range Resources Corp.
Company Guar.
6.75% due 08/01/20 | | | 95,000 | | | | 95,713 | |
SandRidge Energy, Inc.
Company Guar. Notes
8.75% due 01/15/20* | | | 455,000 | | | | 432,250 | |
94
VALIC Company II Strategic Bond Fund
PORTFOLIO OF INVESTMENTS — August 31, 2010 — (continued)
| | | | | | | | |
| | |
| Security Description | | Principal
Amount(12) | | | Value
(Note 2) | |
| |
U.S. CORPORATE BONDS & NOTES (continued) | | | | | | | | |
Oil Companies - Exploration & Production (continued) | |
XTO Energy, Inc.
Senior Notes
6.50% due 12/15/18 | | $ | 111,000 | | | $ | 141,547 | |
| | | | | | |
|
|
|
| | | | | | | | 10,357,407 | |
| | | | | | |
|
|
|
Oil Companies - Integrated — 0.2% | |
Hess Corp.
Senior Notes
5.60% due 02/15/41 | | | 261,000 | | | | 270,739 | |
Hess Corp.
Senior Notes
7.88% due 10/01/29 | | | 330,000 | | | | 426,966 | |
| | | | | | |
|
|
|
| | | | | | | | 697,705 | |
| | | | | | |
|
|
|
Oil Refining & Marketing — 0.0% | | | | | | | | |
Western Refining, Inc.
Senior Sec. Notes
11.25% due 06/15/17* | | | 225,000 | | | | 204,750 | |
| | | | | | |
|
|
|
Oil - Field Services — 0.3% | | | | | | | | |
Baker Hughes, Inc.
Senior Notes
5.13% due 09/15/40 | | | 148,000 | | | | 154,635 | |
Basic Energy Services, Inc.
Senior Sec. Notes
11.63% due 08/01/14 | | | 685,000 | | | | 746,650 | |
Helix Energy Solutions Group, Inc.
Company Guar. Notes
9.50% due 01/15/16* | | | 700,000 | | | | 689,500 | |
| | | | | | |
|
|
|
| | | | | | | | 1,590,785 | |
| | | | | | |
|
|
|
Paper & Related Products — 0.9% | | | | | | | | |
Caraustar Industries, Inc.
Senior Sec. Notes
10.00% due 08/15/14(5)(7)(11) | | | 95,776 | | | | 93,860 | |
Cellu Tissue Holdings, Inc.
Senior Sec. Notes
11.50% due 06/01/14 | | | 400,000 | | | | 433,500 | |
Georgia - Pacific LLC
Senior Notes
7.75% due 11/15/29 | | | 1,840,000 | | | | 1,876,800 | |
Verso Paper Holdings LLC/Verso Paper, Inc.
Senior Sec. Notes
9.13% due 08/01/14 | | | 125,000 | | | | 120,313 | |
Verso Paper Holdings LLC/Verso Paper, Inc.
Senior Sec. Notes
11.50% due 07/01/14 | | | 300,000 | | | | 316,500 | |
Westvaco Corp.
Bonds
7.95% due 02/15/31 | | | 156,000 | | | | 176,981 | |
Westvaco Corp.
Company Guar. Notes
8.20% due 01/15/30 | | | 1,150,000 | | | | 1,279,600 | |
| | | | | | |
|
|
|
| | | | | | | | 4,297,554 | |
| | | | | | |
|
|
|
Photo Equipment & Supplies — 0.2% | | | | | | | | |
Eastman Kodak Co.
Senior Sec. Notes
9.75% due 03/01/18* | | | 1,040,000 | | | | 993,200 | |
| | | | | | |
|
|
|
Physicians Practice Management — 0.3% | | | | | | | | |
US Oncology, Inc.
Senior Sec. Notes
9.13% due 08/15/17 | | | 1,400,000 | | | | 1,449,000 | |
| | | | | | |
|
|
|
| | | | | | | | |
| | |
| Security Description | | Principal
Amount(12) | | | Value
(Note 2) | |
| |
| | | | | | | | | |
Pipelines — 1.0% | | | | | | | | |
Copano Energy LLC/Copano Energy Finance Corp.
Company Guar. Notes
7.75% due 06/01/18 | | $ | 600,000 | | | $ | 600,000 | |
Crosstex Energy LP/Crosstex Energy Finance Corp.
Company Guar. Notes
8.88% due 02/15/18 | | | 450,000 | | | | 464,625 | |
El Paso Corp.
Senior Sub. Notes
6.88% due 06/15/14 | | | 580,000 | | | | 613,711 | |
El Paso Corp.
Senior Notes
12.00% due 12/12/13 | | | 100,000 | | | | 120,250 | |
Enterprise Products Operating LLC
Company Guar. Notes
5.20% due 09/01/20 | | | 90,000 | | | | 97,055 | |
Enterprise Products Operating LLC
Company Guar. Notes
6.45% due 09/01/40 | | | 212,000 | | | | 236,704 | |
Enterprise Products Operating LLC
Company Guar. Bonds
6.50% due 01/31/19 | | | 140,000 | | | | 162,822 | |
MarkWest Energy Partners LP/MarkWest Energy Finance Corp.
Company Guar. Notes
8.50% due 07/15/16 | | | 300,000 | | | | 313,500 | |
MarkWest Energy Partners LP/MarkWest Energy Finance Corp.
Senior Notes
8.75% due 04/15/18 | | | 565,000 | | | | 604,550 | |
Plains All American Pipeline LP
Senior Notes
4.25% due 09/01/12 | | | 94,000 | | | | 98,077 | |
Plains All American Pipeline LP
Company Guar. Notes
5.63% due 12/15/13 | | | 260,000 | | | | 284,154 | |
Regency Energy Partners LP/Regency Energy Finance Corp.
Company Guar. Notes
9.38% due 06/01/16* | | | 400,000 | | | | 434,000 | |
Southern Star Central Corp.
Senior Notes
6.75% due 03/01/16 | | | 350,000 | | | | 352,625 | |
Williams Partners LP
Senior Notes
7.50% due 06/15/11 | | | 363,000 | | | | 380,370 | |
| | | | | | |
|
|
|
| | | | | | | | 4,762,443 | |
| | | | | | |
|
|
|
Printing - Commercial — 0.2% | | | | | | | | |
Valassis Communications, Inc.
Senior Notes
8.25% due 03/01/15 | | | 805,000 | | | | 839,213 | |
| | | | | | |
|
|
|
Private Corrections — 0.2% | | | | | | | | |
Corrections Corp. of America
Company Guar. Notes
7.75% due 06/01/17 | | | 700,000 | | | | 743,750 | |
| | | | | | |
|
|
|
Publishing - Books — 0.2% | | | | | | | | |
TL Acquisitions, Inc.
Senior Notes
10.50% due 01/15/15* | | | 990,000 | | | | 945,450 | |
| | | | | | |
|
|
|
Publishing - Newspapers — 0.1% | | | | | | | | |
Gannett Co., Inc.
Company Guar. Notes
8.75% due 11/15/14* | | | 275,000 | | | | 296,313 | |
95
VALIC Company II Strategic Bond Fund
PORTFOLIO OF INVESTMENTS — August 31, 2010 — (continued)
| | | | | | | | |
| | |
| Security Description | | Principal
Amount(12) | | | Value
(Note 2) | |
| |
U.S. CORPORATE BONDS & NOTES (continued) | | | | | | | | |
Publishing - Newspapers (continued) | | | | | | | | |
Gannett Co., Inc.
Company Guar. Notes
9.38% due 11/15/17* | | $ | 175,000 | | | $ | 191,625 | |
| | | | | | |
|
|
|
| | | | | | | | 487,938 | |
| | | | | | |
|
|
|
Radio — 0.1% | | | | | | | | |
Salem Communications Corp.
Senior Sec. Notes
9.63% due 12/15/16 | | | 612,000 | | | | 637,245 | |
| | | | | | |
|
|
|
Real Estate Investment Trusts — 0.4% | | | | | | | | |
Brandywine Operating Partnership LP
Senior Notes
5.70% due 05/01/17 | | | 134,000 | | | | 135,740 | |
Developers Diversified Realty Corp.
Senior Notes
7.88% due 09/01/20 | | | 525,000 | | | | 534,153 | |
DuPont Fabros Technology LP
Company Guar. Notes
8.50% due 12/15/17 | | | 925,000 | | | | 978,187 | |
Federal Realty Investors Trust
Bonds
5.90% due 04/01/20 | | | 65,000 | | | | 72,424 | |
| | | | | | |
|
|
|
| | | | | | | | 1,720,504 | |
| | | | | | |
|
|
|
Real Estate Management/Services — 0.1% | | | | | | | | |
CB Richard Ellis Services, Inc.
Company Guar. Notes
11.63% due 06/15/17 | | | 525,000 | | | | 595,875 | |
| | | | | | |
|
|
|
Recycling — 0.0% | | | | | | | | |
Aleris International, Inc.
Company Guar. Notes
9.00% due 12/15/14†(11)(16)(17) | | | 1,625,000 | | | | 3,250 | |
| | | | | | |
|
|
|
Rental Auto/Equipment — 0.5% | | | | | | | | |
Avis Budget Car Rental LLC/Avis Budget Finance, Inc.
Company Guar. Notes
9.63% due 03/15/18 | | | 650,000 | | | | 679,250 | |
RSC Equipment Rental, Inc.
Notes
9.50% due 12/01/14 | | | 990,000 | | | | 1,009,800 | |
United Rentals North America, Inc.
Company Guar. Notes
7.75% due 11/15/13 | | | 735,000 | | | | 736,837 | |
| | | | | | |
|
|
|
| | | | | | | | 2,425,887 | |
| | | | | | |
|
|
|
Retail - Apparel/Shoe — 0.2% | | | | | | | | |
Limited Brands, Inc.
Senior Notes
6.95% due 03/01/33 | | | 470,000 | | | | 424,175 | |
Limited Brands, Inc.
Company Guar. Notes
7.00% due 05/01/20 | | | 75,000 | | | | 78,375 | |
Limited Brands, Inc.
Company Guar. Notes
8.50% due 06/15/19 | | | 210,000 | | | | 237,300 | |
| | | | | | |
|
|
|
| | | | | | | | 739,850 | |
| | | | | | |
|
|
|
Retail - Drug Store — 0.4% | | | | | | | | |
CVS Caremark Corp.
Senior Notes
6.25% due 06/01/27 | | | 355,000 | | | | 408,846 | |
CVS Pass-Through Trust
Pass Through Certs.
7.51% due 01/10/32* | | | 122,847 | | | | 144,835 | |
| | | | | | | | |
| | |
| Security Description | | Principal
Amount(12) | | | Value
(Note 2) | |
| |
| | | | | | | | | |
Retail - Drug Store (continued) | | | | | | | | |
Rite Aid Corp.
Senior Sec. Notes
10.25% due 10/15/19 | | $ | 975,000 | | | $ | 1,001,813 | |
Rite Aid Corp.
Senior Sec. Notes
10.38% due 07/15/16 | | | 350,000 | | | | 361,813 | |
| | | | | | |
|
|
|
| | | | | | | | 1,917,307 | |
| | | | | | |
|
|
|
Retail - Music Store — 0.0% | | | | | | | | |
MTS, Inc.
Senior Notes
10.00% due 03/15/09†(5)(6)(7)(15)(17) | | | 15,273 | | | | 153 | |
| | | | | | |
|
|
|
Retail - Propane Distribution — 0.2% | | | | | | | | |
Ferrellgas LP/Ferrellgas Finance Corp.
Senior Notes
6.75% due 05/01/14 | | | 350,000 | | | | 351,750 | |
Ferrellgas Partners LP
Senior Notes
6.75% due 05/01/14 | | | 50,000 | | | | 50,250 | |
Inergy LP/Inergy Finance Corp.
Company Guar. Notes
8.25% due 03/01/16 | | | 515,000 | | | | 540,106 | |
| | | | | | |
|
|
|
| | | | | | | | 942,106 | |
| | | | | | |
|
|
|
Retail - Regional Department Stores — 0.5% | | | | | | | | |
JC Penney Corp., Inc.
Senior Notes
6.38% due 10/15/36 | | | 109,000 | | | | 105,185 | |
Macy’s Retail Holdings, Inc.
Company Guar. Notes
6.38% due 03/15/37 | | | 225,000 | | | | 218,250 | |
Macy’s Retail Holdings, Inc.
Company Guar. Notes
6.65% due 07/15/24 | | | 440,000 | | | | 438,900 | |
Macy’s Retail Holdings, Inc.
Company Guar. Notes
6.90% due 04/01/29 | | | 1,365,000 | | | | 1,358,175 | |
Macy’s Retail Holdings, Inc.
Company Guar. Notes
7.45% due 10/15/16 | | | 360,000 | | | | 379,800 | |
| | | | | | |
|
|
|
| | | | | | | | 2,500,310 | |
| | | | | | |
|
|
|
Retail - Restaurants — 0.4% | | | | | | | | |
Games Merger Corp.
Senior Notes
11.00% due 06/01/18* | | | 250,000 | | | | 262,500 | |
Landry’s Restaurants, Inc.
Senior Sec. Notes
11.63% due 12/01/15 | | | 870,000 | | | | 902,625 | |
Wendy’s/Arby’s Restaurants LLC
Company Guar. Notes
10.00% due 07/15/16 | | | 450,000 | | | | 472,500 | |
| | | | | | |
|
|
|
| | | | | | | | 1,637,625 | |
| | | | | | |
|
|
|
Retail - Toy Stores — 0.3% | | | | | | | | |
Toys R Us Property Co. LLC
Senior Sec. Notes
8.50% due 12/01/17* | | | 1,200,000 | | | | 1,248,000 | |
| | | | | | |
|
|
|
Rubber/Plastic Products — 0.0% | | | | | | | | |
Venture Holdings Co. LLC
Company Guar. Notes
11.00% due 06/01/07†(5)(7)(15)(18) | | | 25,000 | | | | 0 | |
| | | | | | |
|
|
|
96
VALIC Company II Strategic Bond Fund
PORTFOLIO OF INVESTMENTS — August 31, 2010 — (continued)
| | | | | | | | |
| | |
| Security Description | | Principal
Amount(12) | | | Value
(Note 2) | |
| |
U.S. CORPORATE BONDS & NOTES (continued) | | | | | | | | |
Savings & Loans/Thrifts — 0.0% | | | | | | | | |
Amsouth Bank NA
Sub. Notes
4.85% due 04/01/13 | | $ | 140,000 | | | $ | 139,836 | |
| | | | | | |
|
|
|
Seismic Data Collection — 0.2% | | | | | | | | |
Geokinetics Holdings, Inc.
Senior Sec. Notes
9.75% due 12/15/14* | | | 745,000 | | | | 622,075 | |
Seitel, Inc.
Senior Notes
9.75% due 02/15/14 | | | 185,000 | | | | 164,419 | |
| | | | | | |
|
|
|
| | | | | | | | 786,494 | |
| | | | | | |
|
|
|
Special Purpose Entities — 0.6% | | | | | | | | |
Capital One Capital V
Ltd. Guar. Notes
10.25% due 08/15/39 | | | 1,025,000 | | | | 1,107,000 | |
Chukchansi Economic Development Authority
Senior Notes
8.00% due 11/15/13* | | | 715,000 | | | | 414,700 | |
Goldman Sachs Capital II
Ltd. Guar. Bonds
5.79% due 06/01/12(3)(9) | | | 550,000 | | | | 442,063 | |
Goldman Sachs Capital III
Company Guar. Notes
1.31% due 09/01/12(3)(9) | | | 178,000 | | | | 121,040 | |
Local TV Finance LLC
Senior Notes
10.00% due 06/15/15*(11) | | | 260,808 | | | | 228,207 | |
OMX Timber Finance Investments I LLC
Sec. Notes
5.42% due 01/29/20* | | | 196,000 | | | | 201,145 | |
Teco Finance, Inc.
Company Guar. Notes
6.57% due 11/01/17 | | | 96,000 | | | | 112,679 | |
Teco Finance, Inc.
Company Guar. Notes
7.00% due 05/01/12 | | | 63,000 | | | | 68,189 | |
| | | | | | |
|
|
|
| | | | | | | | 2,695,023 | |
| | | | | | |
|
|
|
Steel - Producers — 0.9% | | | | | | | | |
AK Steel Corp.
Company Guar. Notes
7.63% due 05/15/20 | | | 950,000 | | | | 957,125 | |
Ryerson, Inc.
Senior Sec. Notes
12.00% due 11/01/15(2) | | | 450,000 | | | | 462,938 | |
Steel Dynamics, Inc.
Company Guar. Notes
6.75% due 04/01/15 | | | 750,000 | | | | 766,875 | |
Steel Dynamics, Inc.
Company Guar. Notes
7.75% due 04/15/16 | | | 895,000 | | | | 924,087 | |
United States Steel Corp.
Senior Notes
7.38% due 04/01/20 | | | 950,000 | | | | 961,875 | |
| | | | | | |
|
|
|
| | | | | | | | 4,072,900 | |
| | | | | | |
|
|
|
Storage/Warehousing — 0.1% | | | | | | | | |
Mobile Mini, Inc.
Company Guar. Notes
9.75% due 08/01/14 | | | 645,000 | | | | 668,381 | |
| | | | | | |
|
|
|
| | | | | | | | |
| | |
| Security Description | | Principal
Amount(12) | | | Value
(Note 2) | |
| |
| | | | | | | | | |
Telecom Equipment - Fiber Optics — 0.0% | | | | | | | | |
Corning, Inc.
Senior Notes
5.75% due 08/15/40 | | $ | 142,000 | | | $ | 152,203 | |
| | | | | | |
|
|
|
Telecom Services — 0.8% | | | | | | | | |
Cincinnati Bell Telephone Co. LLC
Company Guar. Notes
7.18% due 12/15/23 | | | 25,000 | | | | 18,875 | |
Cincinnati Bell Telephone Co. LLC
Company Guar. Notes
7.20% due 11/29/23 | | | 125,000 | | | | 94,375 | |
Cincinnati Bell Telephone Co. LLC
Company Guar. Notes
7.27% due 12/11/23 | | | 250,000 | | | | 188,750 | |
PAETEC Holding Corp
Company Guar. Notes
8.88% due 06/30/17 | | | 425,000 | | | | 439,875 | |
Qwest Corp.
Senior Notes
8.88% due 03/15/12 | | | 950,000 | | | | 1,045,000 | |
SBA Telecommunications, Inc.
Company Guar. Notes
8.25% due 08/15/19 | | | 1,675,000 | | | | 1,817,375 | |
| | | | | | |
|
|
|
| | | | | | | | 3,604,250 | |
| | | | | | |
|
|
|
Telephone - Integrated — 1.0% | | | | | | | | |
Frontier Communications Corp.
Senior Notes
8.13% due 10/01/18 | | | 625,000 | | | | 662,500 | |
Frontier Communications Corp.
Senior Notes
8.25% due 04/15/17 | | | 250,000 | | | | 264,375 | |
Frontier Communications Corp.
Senior Notes
8.50% due 04/15/20 | | | 250,000 | | | | 265,312 | |
Level 3 Financing, Inc.
Company Guar. Notes
10.00% due 02/01/18 | | | 700,000 | | | | 603,750 | |
Qwest Communications International, Inc.
Company Guar. Notes, Series B
7.50% due 02/15/14 | | | 105,000 | | | | 106,969 | |
Qwest Communications International, Inc.
Company Guar. Notes
7.50% due 02/15/14 | | | 120,000 | | | | 122,250 | |
Qwest Communications International, Inc.
Company Guar. Notes
8.00% due 10/01/15* | | | 885,000 | | | | 951,375 | |
Sprint Capital Corp.
Company Guar. Notes
6.88% due 11/15/28 | | | 975,000 | | | | 814,125 | |
Sprint Capital Corp.
Company Guar. Notes
8.75% due 03/15/32 | | | 525,000 | | | | 505,969 | |
Verizon Virginia, Inc.
Senior Notes
4.63% due 03/15/13 | | | 125,000 | | | | 133,107 | |
Windstream Corp.
Bonds
7.88% due 11/01/17 | | | 250,000 | | | | 253,750 | |
| | | | | | |
|
|
|
| | | | | | | | 4,683,482 | |
| | | | | | |
|
|
|
Television — 0.3% | | | | | | | | |
Allbritton Communications Co.
Senior Notes
8.00% due 05/15/18 | | | 225,000 | | | | 221,625 | |
97
VALIC Company II Strategic Bond Fund
PORTFOLIO OF INVESTMENTS — August 31, 2010 — (continued)
| | | | | | | | |
| | |
| Security Description | | Principal
Amount(12) | | | Value
(Note 2) | |
| |
U.S. CORPORATE BONDS & NOTES (continued) | | | | | | | | |
Television (continued) | | | | | | | | |
Bonten Media Acquisition Co.
Company Guar. Notes
9.75% due 06/01/15*(11) | | $ | 63,440 | | | $ | 36,795 | |
CBS Corp.
Company Guar. Notes
4.63% due 05/15/18 | | | 219,000 | | | | 229,727 | |
Paxson Communications Corp.
Escrow Notes
7.38% due 01/15/13†*(5)(7) | | | 895,500 | | | | 4,478 | |
Umbrella Acquisition, Inc.
Company Guar. Notes
10.50% due 03/15/15*(11) | | | 980,187 | | | | 882,168 | |
Young Broadcasting, Inc.
Escrow Notes
8.75% due 01/15/14†(5)(7) | | | 230,000 | | | | 2 | |
Young Broadcasting, Inc.
Escrow Notes
10.00% due 03/01/11†(5)(7) | | | 510,000 | | | | 5 | |
| | | | | | |
|
|
|
| | | | | | | | 1,374,800 | |
| | | | | | |
|
|
|
Tools - Hand Held — 0.0% | | | | | | | | |
Stanley Black & Decker, Inc.
Company Guar. Notes
5.20% due 09/01/40 | | | 109,000 | | | | 108,918 | |
| | | | | | |
|
|
|
Transport - Air Freight — 0.3% | | | | | | | | |
Atlas Air, Inc.
Pass Through Certs.
Series 1991-1, Class A-2
6.88% due 01/02/11 | | | 84,921 | | | | 81,525 | |
Atlas Air, Inc.
Pass Through Certs.
Series 1991-1, Class A-1
7.20% due 01/02/19 | | | 395,914 | | | | 399,873 | |
Atlas Air, Inc.
Pass Through Certs.
Series 1991-1, Class B
7.63% due 01/02/15 | | | 409,604 | | | | 352,260 | |
Atlas Air, Inc.
Pass Through Certs.
Series 2000-1, Class A
8.71% due 01/02/19 | | | 499,853 | | | | 484,857 | |
| | | | | | |
|
|
|
| | | | | | | | 1,318,515 | |
| | | | | | |
|
|
|
Transport - Equipment & Leasing — 0.1% | | | | | | | | |
GATX Corp.
Senior Notes
4.75% due 10/01/12 | | | 199,000 | | | | 209,381 | |
GATX Corp.
Senior Notes
4.75% due 05/15/15 | | | 125,000 | | | | 133,366 | |
| | | | | | |
|
|
|
| | | | | | | | 342,747 | |
| | | | | | |
|
|
|
Transport - Marine — 0.1% | | | | | | | | |
Overseas Shipholding Group, Inc.
Senior Notes
8.13% due 03/30/18 | | | 255,000 | | | | 260,738 | |
| | | | | | |
|
|
|
Transport - Rail — 0.0% | | | | | | | | |
Union Pacific Corp.
Senior Notes
5.75% due 11/15/17 | | | 135,000 | | | | 157,405 | |
| | | | | | |
|
|
|
Transport - Services — 0.3% | | | | | | | | |
Bristow Group, Inc.
Senior Notes
7.50% due 09/15/17 | | | 1,055,000 | | | | 1,055,000 | |
| | | | | | | | |
| | |
| Security Description | | Principal
Amount(12) | | | Value
(Note 2) | |
| |
| | | | | | | | | |
Transport - Services (continued) | | | | | | | | |
Ryder System, Inc.
Notes
3.60% due 03/01/16 | | $ | 117,000 | | | $ | 118,339 | |
| | | | | | |
|
|
|
| | | | | | | | 1,173,339 | |
| | | | | | |
|
|
|
Web Hosting/Design — 0.2% | | | | | | | | |
Equinix, Inc.
Senior Notes
8.13% due 03/01/18 | | | 925,000 | | | | 966,625 | |
| | | | | | |
|
|
|
Wire & Cable Products — 0.1% | | | | | | | | |
Coleman Cable, Inc.
Company Guar. Notes
9.00% due 02/15/18 | | | 550,000 | | | | 561,688 | |
| | | | | | |
|
|
|
Wireless Equipment — 0.1% | | | | | | | | |
Motorola, Inc.
Senior Notes
5.38% due 11/15/12 | | | 297,000 | | | | 313,944 | |
Motorola, Inc.
Debentures
6.50% due 09/01/25 | | | 308,000 | | | | 340,875 | |
| | | | | | |
|
|
|
| | | | | | | | 654,819 | |
| | | | | | |
|
|
|
Total U.S. Corporate Bonds & Notes | | | | | | | | |
(cost $193,999,464) | | | | | | | 196,824,677 | |
| | | | | | |
|
|
|
FOREIGN CORPORATE BONDS & NOTES — 6.5% | | | | | | | | |
Banks - Commercial — 1.0% | | | | | | | | |
Akbank TAS
Senior Notes
5.13% due 07/22/15* | | | 850,000 | | | | 837,250 | |
ANZ National International, Ltd.
Bank Guar. Notes
2.38% due 12/21/12* | | | 329,000 | | | | 333,399 | |
ANZ National International, Ltd.
Bank Guar. Notes
6.20% due 07/19/13* | | | 140,000 | | | | 156,206 | |
ATF Bank JSC
Bank Guar. Notes
9.25% due 02/21/14 | | | 400,000 | | | | 422,000 | |
Banco ABC Brasil SA
Bonds
7.88% due 04/08/20* | | | 430,000 | | | | 442,900 | |
Banco Bradesco SA
Sub. Notes
5.90% due 01/16/21* | | | 400,000 | | | | 405,500 | |
Barclays Bank PLC
Jr. Sub. Bonds
5.93% due 12/15/16*(3)(9) | | | 225,000 | | | | 196,875 | |
Barclays Bank PLC
Sub. Notes
6.05% due 12/04/17* | | | 140,000 | | | | 150,690 | |
Barclays Bank PLC
Jr. Sub. Notes
6.86% due 06/15/32*(3)(9) | | | 124,000 | | | | 109,120 | |
BNP Paribas
Bank Guar. Notes
4.80% due 06/24/15* | | | 135,000 | | | | 144,763 | |
BOM Capital PLC
Senior Notes
6.70% due 03/11/15* | | | 470,000 | | | | 478,789 | |
Groupe BPCE
Notes
3.35% due 09/30/10(3)(9) | | | 78,000 | | | | 49,206 | |
98
VALIC Company II Strategic Bond Fund
PORTFOLIO OF INVESTMENTS — August 31, 2010 — (continued)
| | | | | | | | |
| | |
| Security Description | | Principal
Amount(12) | | | Value
(Note 2) | |
| |
FOREIGN CORPORATE BONDS & NOTES (continued) | | | | | | | | |
Banks - Commercial (continued) | | | | | | | | |
Nordea Bank AB
Jr. Sub. Bonds
8.38% due 03/25/15(3)(9) | | $ | 120,000 | | | $ | 129,180 | |
Sumitomo Mitsui Banking Corp.
Senior Notes
3.15% due 07/22/15* | | | 140,000 | | | | 145,527 | |
The Royal Bank of Scotland PLC
Company Guar. Notes
5.63% due 08/24/20 | | | 204,000 | | | | 209,416 | |
Westpac Banking Corp.
Jr. Sub. Notes
0.62% due 03/31/11(3)(9) | | | 570,000 | | | | 342,000 | |
| | | | | | |
|
|
|
| | | | | | | | 4,552,821 | |
| | | | | | |
|
|
|
Building & Construction Products - Misc. — 0.2% | | | | | | | | |
Corp GEO SAB de CV
Company Guar. Notes
9.25% due 06/30/20* | | | 240,000 | | | | 265,800 | |
Desarrolladora Homex SAB de CV
Company Guar. Notes
9.50% due 12/11/19* | | | 440,000 | | | | 487,300 | |
Urbi Desarrollos Urbanos SAB de CV
Company Guar. Notes
9.50% due 01/21/20* | | | 330,000 | | | | 365,887 | |
| | | | | | |
|
|
|
| | | | | | | | 1,118,987 | |
| | | | | | |
|
|
|
Building Products - Cement — 0.1% | | | | | | | | |
Rearden G Holdings EINS GmbH
Company Guar. Notes
7.88% due 03/30/20* | | | 330,000 | | | | 346,913 | |
| | | | | | |
|
|
|
Cellular Telecom — 0.1% | | | | | | | | |
MTS International Funding, Ltd.
Senior Sec. Notes
8.63% due 06/22/20* | | | 550,000 | | | | 622,875 | |
| | | | | | |
|
|
|
Chemicals - Diversified — 0.2% | | | | | | | | |
OXEA Finance/Cy SCA
Senior Sec. Notes
9.50% due 07/15/17* | | | 745,000 | | | | 788,259 | |
| | | | | | |
|
|
|
Chemicals - Plastics — 0.2% | | | | | | | | |
Montell Finance Co. BV
Company Guar. Notes
8.10% due 03/15/27* | | | 1,175,000 | | | | 1,066,312 | |
| | | | | | |
|
|
|
Coal — 0.2% | | | | | | | | |
Adaro Indonesia PT
Company Guar. Notes
7.63% due 10/22/19 | | | 380,000 | | | | 405,650 | |
Indo Integrated Energy II BV
Company Guar. Notes
9.75% due 11/05/16* | | | 400,000 | | | | 443,000 | |
| | | | | | |
|
|
|
| | | | | | | | 848,650 | |
| | | | | | |
|
|
|
Computers - Memory Devices — 0.4% | | | | | | | | |
Seagate HDD Cayman
Company Guar. Notes
6.88% due 05/01/20* | | | 975,000 | | | | 955,500 | |
Seagate Technology HDD Holdings
Company Guar. Notes
6.80% due 10/01/16 | | | 960,000 | | | | 974,400 | |
| | | | | | |
|
|
|
| | | | | | | | 1,929,900 | |
| | | | | | |
|
|
|
Diversified Banking Institutions — 0.1% | | | | | | | | |
Credit Agricole SA
Jr. Sub. Bonds
6.64% due 05/31/17*(3)(9) | | | 46,000 | | | | 39,100 | |
| | | | | | | | |
| | |
| Security Description | | Principal
Amount(12) | | | Value
(Note 2) | |
| |
| | | | | | | | | |
Diversified Banking Institutions (continued) | | | | | | | | |
Natixis Sub.
Notes
0.78% due 01/15/19(3) | | $ | 100,000 | | | $ | 89,109 | |
Royal Bank of Scotland Group PLC
Bonds
7.64% due 09/29/17†(3)(9)(20) | | | 725,000 | | | | 478,500 | |
| | | | | | |
|
|
|
| | | | | | | | 606,709 | |
| | | | | | |
|
|
|
Diversified Manufacturing Operations — 0.0% | | | | | | | | |
Tyco International Finance
Company Guar. Notes
3.38% due 10/15/15 | | | 170,000 | | | | 178,595 | |
| | | | | | |
|
|
|
Diversified Minerals — 0.1% | | | | | | | | |
BHP Billiton Finance USA, Ltd.
Company Guar. Notes
6.42% due 03/01/26 | | | 299,000 | | | | 360,200 | |
| | | | | | |
|
|
|
Electric - Integrated — 0.1% | | | | | | | | |
TransAlta Corp.
Senior Notes
4.75% due 01/15/15 | | | 226,000 | | | | 243,112 | |
| | | | | | |
|
|
|
Electronic Components - Semiconductors — 0.0% | | | | | | | | |
STATS ChipPAC, Ltd.
Company Guar. Notes
7.50% due 08/12/15* | | | 215,000 | | | | 223,600 | |
| | | | | | |
|
|
|
Finance - Other Services — 0.2% | | | | | | | | |
Biz Finance PLC for Ukreximbank
Senior Notes
8.38% due 04/27/15 | | | 380,000 | | | | 392,350 | |
DTEK Finance BV
Company Guar. Notes
9.50% due 04/28/15* | | | 440,000 | | | | 444,180 | |
| | | | | | |
|
|
|
| | | | | | | | 836,530 | |
| | | | | | |
|
|
|
Forestry — 0.1% | | | | | | | | |
Tembec Industries, Inc.
Senior Sec. Notes
11.25% due 12/15/18* | | | 315,000 | | | | 302,400 | |
| | | | | | |
|
|
|
Gas - Distribution — 0.1% | | | | | | | | |
Grupo Petrotemex SA de CV
Senior Notes
9.50% due 08/19/14* | | | 215,000 | | | | 234,081 | |
| | | | | | |
|
|
|
Import/Export — 0.2% | | | | | | | | |
Marfrig Overseas, Ltd.
Company Guar. Notes
9.50% due 05/04/20* | | | 420,000 | | | | 430,500 | |
Minerva Overseas II, Ltd.
Company Guar. Notes
10.88% due 11/15/19* | | | 420,000 | | | | 446,635 | |
| | | | | | |
|
|
|
| | | | | | | | 877,135 | |
| | | | | | |
|
|
|
Independent Power Producers — 0.0% | | | | | | | | |
AES Drax Energy, Ltd.
Sec. Notes
11.50% due 08/30/10†(5)(7)(15)(19) | | | 175,000 | | | | 0 | |
| | | | | | |
|
|
|
Insurance - Multi-line — 0.1% | | | | | | | | |
Aegon NV
Sub. Notes
3.23% due 07/15/14(3)(9) | | | 62,000 | | | | 37,594 | |
XL Capital, Ltd.
Senior Notes
5.25% due 09/15/14 | | | 219,000 | | | | 232,616 | |
99
VALIC Company II Strategic Bond Fund
PORTFOLIO OF INVESTMENTS — August 31, 2010 — (continued)
| | | | | | | | |
| | |
| Security Description | | Principal
Amount(12) | | | Value
(Note 2) | |
| |
FOREIGN CORPORATE BONDS & NOTES (continued) | | | | | | | | |
Insurance - Multi-line (continued) | | | | | | | | |
XL Capital, Ltd.
Senior Notes
6.38% due 11/15/24 | | $ | 142,000 | | | $ | 153,246 | |
| | | | | | |
|
|
|
| | | | | | | | 423,456 | |
| | | | | | |
|
|
|
Insurance - Reinsurance — 0.0% | | | | | | | | |
Endurance Specialty Holdings, Ltd.
Senior Notes
7.00% due 07/15/34 | | | 135,000 | | | | 132,097 | |
| | | | | | |
|
|
|
Metal - Diversified — 0.0% | | | | | | | | |
Xstrata Canada Corp.
Company Guar. Notes
7.35% due 06/05/12 | | | 196,000 | | | | 212,094 | |
| | | | | | |
|
|
|
Multimedia — 0.0% | | | | | | | | |
Quebecor Media, Inc.
Senior Notes
7.75% due 03/15/16 | | | 125,000 | | | | 127,500 | |
| | | | | | |
|
|
|
Oil Companies - Exploration & Production — 0.6% | | | | | | | | |
Alliance Oil Co., Ltd.
Senior Notes
9.88% due 03/11/15* | | | 420,000 | | | | 434,175 | |
Compton Petroleum Finance Corp.
Company Guar. Notes
7.63% due 12/01/13 | | | 945,000 | | | | 817,425 | |
Gaz Capital SA
Bonds
8.15% due 04/11/18 | | | 390,000 | | | | 453,375 | |
Nexen, Inc.
Senior Notes
5.88% due 03/10/35 | | | 193,000 | | | | 201,214 | |
OPTI Canada, Inc.
Senior Sec. Notes
7.88% due 12/15/14 | | | 1,215,000 | | | | 935,550 | |
OPTI Canada, Inc.
Senior Notes
8.25% due 12/15/14 | | | 235,000 | | | | 183,300 | |
| | | | | | |
|
|
|
| | | | | | | | 3,025,039 | |
| | | | | | |
|
|
|
Oil Companies - Integrated — 0.3% | | | | | | | | |
BP Capital Markets PLC
Company Guar. Notes
3.88% due 03/10/15 | | | 265,000 | | | | 262,502 | |
Petroleum Co. of Trinidad & Tobago, Ltd.
Senior Notes
9.75% due 08/14/19* | | | 500,000 | | | | 600,000 | |
Statoil ASA
Company Guar. Notes
7.15% due 11/15/25 | | | 387,000 | | | | 500,743 | |
| | | | | | |
|
|
|
| | | | | | | | 1,363,245 | |
| | | | | | |
|
|
|
Paper & Related Products — 0.1% | | | | | | | | |
PE Paper Escrow GmbH
Senior Sec. Notes
12.00% due 08/01/14* | | | 275,000 | | | | 311,438 | |
| | | | | | |
|
|
|
Petrochemicals — 0.1% | | | | | | | | |
Braskem Finance, Ltd.
Company Guar. Notes
7.00% due 05/07/20* | | | 410,000 | | | | 428,450 | |
| | | | | | |
|
|
|
Pipelines — 0.0% | |
TransCanada Pipelines, Ltd.
Jr. Sub. Notes
6.35% due 05/15/67(3) | | | 222,000 | | | | 202,628 | |
| | | | | | |
|
|
|
| | | | | | | | |
| | |
| Security Description | | Principal
Amount(12) | | | Value
(Note 2) | |
| |
| | | | | | | | | |
Printing - Commercial — 0.0% | |
Quebecor World Capital Corp.
Escrow Notes
8.75% due 03/15/16†(5)(7) | | $ | 800,000 | | | $ | 33,000 | |
| | | | | | |
|
|
|
Real Estate Operations & Development — 0.2% | |
Atlantic Finance Ltd.
Company Guar. Notes
8.75% due 05/27/14 | | | 320,000 | | | | 344,800 | |
Country Garden Holdings Co.
Senior Notes
11.25% due 04/22/17* | | | 570,000 | | | | 568,575 | |
| | | | | | |
|
|
|
| | | | | | | | 913,375 | |
| | | | | | |
|
|
|
Satellite Telecom — 0.5% | |
Intelsat Intermediate Holding Co., Ltd.
Company Guar. Bonds
9.50% due 02/01/15(8) | | | 2,245,000 | | | | 2,329,187 | |
| | | | | | |
|
|
|
Special Purpose Entities — 0.2% | |
AngloGold Ashanti Holdings PLC
Company Guar. Notes
6.50% due 04/15/40 | | | 178,000 | | | | 188,067 | |
Hellas Telecommunications Luxembourg II
Sub. Notes
0.00% due 01/15/15†*(3)(16)(17) | | | 560,000 | | | | 7,000 | |
LBG Capital No.1 PLC
Bank Guar. Notes
8.00% due 06/15/20*(3)(9) | | | 850,000 | | | | 743,750 | |
SMFG Preferred Capital, Ltd.
Jr. Sub. Notes
6.08% due 01/25/17*(3)(9) | | | 121,000 | | | | 115,976 | |
| | | | | | |
|
|
|
| | | | | | | | 1,054,793 | |
| | | | | | |
|
|
|
Steel - Producers — 0.3% | |
Essar Steel Algoma, Inc.
Senior Sec. Notes
9.38% due 03/15/15* | | | 925,000 | | | | 913,437 | |
Evraz Group SA
Notes
8.88% due 04/24/13 | | | 300,000 | | | | 313,125 | |
| | | | | | |
|
|
|
| | | | | | | | 1,226,562 | |
| | | | | | |
|
|
|
SupraNational Banks — 0.0% | |
Asian Development Bank
Senior Bonds
5.82% due 06/16/28 | | | 112,000 | | | | 135,117 | |
| | | | | | |
|
|
|
Telecom Services — 0.1% | |
Indosat Palapa Co., BV
Company Guar. Notes
7.38% due 07/29/20* | | | 215,000 | | | | 231,663 | |
| | | | | | |
|
|
|
Telephone - Integrated — 0.4% | |
Axtel SAB de CV
Company Guar. Notes
9.00% due 09/22/19 | | | 360,000 | | | | 325,800 | |
British Telecommunications PLC
Bonds
9.88% due 12/15/30 | | | 170,000 | | | | 233,276 | |
Telecom Italia Capital SA
Company Guar. Bonds
5.25% due 10/01/15 | | | 423,000 | | | | 450,245 | |
Telefonica Emisiones SAU
Company Guar. Notes
0.77% due 02/04/13(3) | | | 135,000 | | | | 131,246 | |
100
VALIC Company II Strategic Bond Fund
PORTFOLIO OF INVESTMENTS — August 31, 2010 — (continued)
| | | | | | | | |
| | |
| Security Description | | Principal
Amount(12) | | | Value
(Note 2) | |
| |
FOREIGN CORPORATE BONDS & NOTES (continued) | | | | | | | | |
Telephone - Integrated (continued) | |
Telefonos de Mexico SAB de CV
Senior Notes
5.50% due 01/27/15 | | $ | 136,000 | | | $ | 150,261 | |
Virgin Media Finance PLC
Company Guar. Notes
8.38% due 10/15/19 | | | 420,000 | | | | 457,800 | |
| | | | | | |
|
|
|
| | | | | | | | 1,748,628 | |
| | | | | | |
|
|
|
Television — 0.1% | |
Myriad International Holding BV
Company Guar. Notes
6.38% due 07/28/17* | | | 425,000 | | | | 435,115 | |
| | | | | | |
|
|
|
Transport - Rail — 0.1% | |
Canadian Pacific Railway Co.
Notes
6.50% due 05/15/18 | | | 300,000 | | | | 354,075 | |
| | | | | | |
|
|
|
Warehousing & Harbor Transportation Services — 0.1% | |
DP World, Ltd.
Notes
6.85% due 07/02/37 | | | 310,000 | | | | 279,116 | |
| | | | | | |
|
|
|
Total Foreign Corporate Bonds & Notes | | | | | | | | |
(cost $29,287,661) | | | | | | | 30,103,657 | |
| | | | | | |
|
|
|
FOREIGN GOVERNMENT AGENCIES — 20.4% | | | | | | | | |
Sovereign — 20.4% | | | | | | | | |
Dominican Republic
Bonds
7.50% due 05/06/21* | | | 330,000 | | | | 363,000 | |
Federal Republic of Brazil
Notes
5.88% due 01/15/19 | | | 650,000 | | | | 750,750 | |
Federal Republic of Brazil
Bonds
6.00% due 01/17/17 | | | 840,000 | | | | 968,100 | |
Federal Republic of Brazil
Senior Bonds
7.13% due 01/20/37 | | | 1,010,000 | | | | 1,307,950 | |
Federal Republic of Brazil
Notes
8.00% due 01/15/18 | | | 1,508,333 | | | | 1,791,146 | |
Federal Republic of Brazil
Bonds
8.25% due 01/20/34 | | | 1,300,000 | | | | 1,862,250 | |
Federal Republic of Brazil
Notes
8.75% due 02/04/25 | | | 1,410,000 | | | | 2,009,250 | |
Federal Republic of Brazil
Senior Bonds
8.88% due 10/14/19 | | | 670,000 | | | | 919,575 | |
Federal Republic of Brazil
Notes
11.00% due 08/17/40 | | | 570,000 | | | | 781,185 | |
Federal Republic of Germany
Bonds
4.25% due 07/04/39 | | EUR | 665,000 | | | | 1,113,109 | |
Government of Australia
Bonds
5.75% due 06/15/11 | | AUD | 950,000 | | | | 854,732 | |
Government of Australia
Bonds
6.00% due 02/15/17 | | AUD | 550,000 | | | | 527,215 | |
Government of Barbados
Notes
7.00% due 08/04/22* | | | 660,000 | | | | 686,201 | |
| | | | | | | | |
| | |
| Security Description | | Principal
Amount(12) | | | Value
(Note 2) | |
| |
| | | | | | | | | |
Sovereign (continued) | | | | | | | | |
Government of Bermuda
Senior Notes
5.60% due 07/20/20* | | AUD | 265,000 | | | $ | 290,776 | |
Government of Canada
Bonds
1.25% due 06/01/11 | | CAD | 2,310,000 | | | | 2,171,034 | |
Government of Canada
Bonds
4.25% due 06/01/18 | | CAD | 800,000 | | | | 842,845 | |
Government of Canada
Bonds
5.75% due 06/01/29 | | CAD | 940,000 | | | | 1,168,206 | |
Government of Finland
Bonds
4.38% due 07/04/19 | | EUR | 175,000 | | | | 259,764 | |
Government of Japan
Bonds
2.10% due 03/20/27 | | JPY | 183,600,000 | | | | 2,374,935 | |
Government of United Kingdom
Bonds
4.00% due 09/07/16 | | GBP | 1,310,000 | | | | 2,232,010 | |
Kingdom of Bahrain
Senior Notes
5.50% due 03/31/20* | | | 335,000 | | | | 352,058 | |
Kingdom of Norway
Bonds
5.00% due 05/15/15 | | NOK | 25,010,000 | | | | 4,430,200 | |
Kingdom of Sweden
Bonds
4.25% due 03/12/19 | | SEK | 5,200,000 | | | | 817,094 | |
Kingdom of Sweden
Bonds
5.39% due 08/12/15 | | SEK | 13,225,000 | | | | 2,016,470 | |
New South Wales Treasury Corp.
Government Guar. Bonds
6.00% due 05/01/12 | | AUD | 1,790,000 | | | | 1,630,255 | |
Republic of Argentina
Notes
2.50% due 12/31/38(13) | | | 1,972,637 | | | | 748,616 | |
Republic of Argentina
Senior Bonds
8.28% due 12/31/33 | | | 1,270,694 | | | | 975,257 | |
Republic of Colombia
Notes
7.38% due 01/27/17 | | | 270,000 | | | | 325,350 | |
Republic of Colombia
Notes
7.38% due 03/18/19 | | | 657,000 | | | | 816,323 | |
Republic of Colombia
Bonds
7.38% due 09/18/37 | | | 1,600,000 | | | | 2,072,000 | |
Republic of Colombia
Bonds
8.13% due 05/21/24 | | | 250,000 | | | | 331,250 | |
Republic of El Salvador
Senior Bonds
7.38% due 12/01/19 | | | 660,000 | | | | 734,250 | |
Republic of El Salvador
Senior Bonds
7.75% due 01/24/23 | | | 432,000 | | | | 484,920 | |
Republic of El Salvador
Bonds
8.25% due 04/10/32 | | | 300,000 | | | | 342,000 | |
101
VALIC Company II Strategic Bond Fund
PORTFOLIO OF INVESTMENTS — August 31, 2010 — (continued)
| | | | | | | | |
| | |
| Security Description | | Principal
Amount(12) | | | Value
(Note 2) | |
| |
FOREIGN GOVERNMENT AGENCIES (continued) | | | | | | | | |
Sovereign (continued) | | | | | | | | |
Republic of Georgia
Bonds
7.50% due 04/15/13 | | $ | 770,000 | | | $ | 761,915 | |
Republic of Indonesia
Senior Bonds
6.63% due 02/17/37 | | | 1,970,000 | | | | 2,414,404 | |
Republic of Indonesia
Senior Bonds
8.50% due 10/12/35 | | | 810,000 | | | | 1,181,628 | |
Republic of Indonesia
Bonds
11.63% due 03/04/19 | | | 670,000 | | | | 1,025,100 | |
Republic of Italy
Bonds
4.00% due 09/01/20 | | EUR | 500,000 | | | | 647,882 | |
Republic of Peru
Bonds
6.55% due 03/14/37 | | | 490,000 | | | | 583,100 | |
Republic of Peru
Notes
7.35% due 07/21/25 | | | 1,079,000 | | | | 1,383,817 | |
Republic of Peru
Senior Bonds
8.75% due 11/21/33 | | | 380,000 | | | | 564,300 | |
Republic of Philippines
Bonds
6.50% due 01/20/20 | | | 1,660,000 | | | | 1,971,250 | |
Republic of Serbia
Notes
6.75% due 11/01/24(13) | | | 791,700 | | | | 791,573 | |
Republic of South Africa
Bonds
6.88% due 05/27/19 | | | 425,000 | | | | 515,844 | |
Republic of South Korea
Bonds
7.13% due 04/16/19 | | | 700,000 | | | | 888,623 | |
Republic of the Philippines
Bonds
7.75% due 01/14/31 | | | 480,000 | | | | 642,000 | |
Republic of the Philippines
Senior Notes
9.50% due 02/02/30 | | | 905,000 | | | | 1,402,750 | |
Republic of the Philippines
Notes
10.63% due 03/16/25 | | | 795,000 | | | | 1,281,937 | |
Republic of Turkey
Bonds
6.75% due 05/30/40 | | | 1,570,000 | | | | 1,723,075 | |
Republic of Turkey
Notes
6.88% due 03/17/36 | | | 2,820,000 | | | | 3,130,200 | |
Republic of Turkey
Bonds
7.00% due 09/26/16 | | | 465,000 | | | | 535,913 | |
Republic of Turkey
Notes
7.00% due 06/05/20 | | | 810,000 | | | | 934,538 | |
Republic of Turkey
Notes
7.38% due 02/05/25 | | | 1,100,000 | | | | 1,303,500 | |
Republic of Turkey
Bonds
7.50% due 11/07/19 | | | 1,435,000 | | | | 1,711,237 | |
| | | | | | | | |
| | |
| Security Description | | Principal
Amount(12) | | | Value
(Note 2) | |
| |
| | | | | | | | | |
Sovereign (continued) | | | | | | | | |
Republic of Turkey
Notes
8.00% due 02/14/34 | | $ | 467,000 | | | $ | 582,583 | |
Republic of Turkey
Senior Bonds
11.88% due 01/15/30 | | | 575,000 | | | | 979,656 | |
Republic of Uruguay
Bonds
6.88% due 09/28/25 | | | 200,000 | | | | 245,000 | |
Republic of Uruguay
Notes
7.63% due 03/21/36 | | | 890,000 | | | | 1,148,100 | |
Republic of Venezuela
Bonds
5.75% due 02/26/16 | | | 910,000 | | | | 609,700 | |
Republic of Venezuela
Bonds
7.65% due 04/21/25 | | | 360,000 | | | | 207,900 | |
Republic of Venezuela
Notes
8.50% due 10/08/14 | | | 1,000,000 | | | | 825,000 | |
Republic of Venezuela
Senior Bonds
9.25% due 09/15/27 | | | 2,862,000 | | | | 2,032,020 | |
Republic of Venezuela
Bonds
9.25% due 05/07/28 | | | 980,000 | | | | 629,650 | |
Russian Federation
Bonds
5.00% due 04/29/20* | | | 1,700,000 | | | | 1,734,000 | |
Russian Federation
Senior Bonds
7.50% due 03/31/30(13) | | | 7,199,000 | | | | 8,549,532 | |
Russian Federation
Notes
12.75% due 06/24/28 | | | 1,440,000 | | | | 2,596,464 | |
State of Qatar
Senior Notes
6.40% due 01/20/40* | | | 370,000 | | | | 445,850 | |
Swiss Confederation
Bonds
3.00% due 05/12/19 | | CHF | 1,075,000 | | | | 1,225,207 | |
United Mexican States
Senior Notes
5.13% due 01/15/20 | | | 2,278,000 | | | | 2,471,630 | |
United Mexican States
Notes
5.95% due 03/19/19 | | | 858,000 | | | | 988,845 | |
United Mexican States
Senior Notes
6.05% due 01/11/40 | | | 750,000 | | | | 851,250 | |
United Mexican States
Notes
6.75% due 09/27/34 | | | 785,000 | | | | 979,288 | |
United Mexican States
Bonds
7.50% due 04/08/33 | | | 340,000 | | | | 453,900 | |
United Mexican States
Notes
8.13% due 12/30/19 | | | 770,000 | | | | 1,024,100 | |
United Mexican States
Bonds
8.30% due 08/15/31 | | | 860,000 | | | | 1,234,100 | |
| | | | | | |
|
|
|
Total Foreign Government Agencies | | | | | | | | |
(cost $85,340,777) | | | | | | | 94,558,437 | |
| | | | | | |
|
|
|
102
VALIC Company II Strategic Bond Fund
PORTFOLIO OF INVESTMENTS — August 31, 2010 — (continued)
| | | | | | | | |
| | |
| Security Description | | Principal
Amount(12) | | | Value
(Note 2) | |
| |
MUNICIPAL BONDS & NOTES — 0.0% | | | | | | | | |
Municipal Bonds — 0.0% | | | | | | | | |
Texas State Transportation Commission
Bonds
Series B
5.18% due 04/01/30
(cost $65,000) | | $ | 65,000 | | | $ | 71,493 | |
| | | | | | |
|
|
|
U.S. GOVERNMENT AGENCIES — 10.9% | | | | | | | | |
Federal Home Loan Mtg. Corp. — 5.0% | | | | | | | | |
4.50% due 02/01/20 | | | 227,419 | | | | 242,594 | |
4.50% due 08/01/20 | | | 90,651 | | | | 96,700 | |
4.50% due 03/01/23 | | | 684,654 | | | | 725,312 | |
4.50% due 01/01/39 | | | 475,003 | | | | 499,149 | |
4.50% due 06/01/40 | | | 1,378,617 | | | | 1,447,835 | |
5.00% due 09/01/18 | | | 293,198 | | | | 313,845 | |
5.00% due 07/01/20 | | | 200,363 | | | | 214,285 | |
5.00% due 05/01/34 | | | 434,307 | | | | 467,492 | |
5.00% due 02/01/35 | | | 58,036 | | | | 62,102 | |
5.00% due 07/01/35 | | | 221,817 | | | | 236,523 | |
5.00% due 11/01/35 | | | 580,214 | | | | 618,684 | |
5.00% due 03/01/38 | | | 428,841 | | | | 455,709 | |
5.00% due 03/01/39 | | | 1,435,884 | | | | 1,527,934 | |
5.00% due 08/01/39 | | | 3,550,765 | | | | 3,778,168 | |
5.50% due 06/01/22 | | | 352,946 | | | | 379,815 | |
5.50% due 07/01/35 | | | 182,642 | | | | 196,158 | |
5.50% due 05/01/37 | | | 405,992 | | | | 433,794 | |
5.50% due 06/01/37 | | | 15,782 | | | | 16,863 | |
5.50% due 10/01/37 | | | 2,224,841 | | | | 2,377,200 | |
5.50% due 12/01/37 | | | 280,899 | | | | 300,135 | |
5.50% due 01/01/38 | | | 369,382 | | | | 395,564 | |
5.50% due 02/01/38 | | | 419,953 | | | | 448,711 | |
6.00% due 01/01/30 | | | 17,514 | | | | 19,279 | |
6.00% due 02/01/32 | | | 82,913 | | | | 91,060 | |
6.00% due 05/01/37 | | | 13,104 | | | | 14,109 | |
6.00% due 10/01/37 | | | 227,302 | | | | 244,733 | |
6.00% due 10/01/39 | | | 2,031,340 | | | | 2,185,210 | |
6.50% due 07/01/29 | | | 2,604 | | | | 2,885 | |
6.50% due 12/01/35 | | | 568 | | | | 622 | |
6.50% due 02/01/36 | | | 85,278 | | | | 93,404 | |
6.50% due 11/01/37 | | | 303,977 | | | | 330,850 | |
6.88% due 09/15/10 | | | 772,000 | | | | 774,058 | |
7.00% due 06/01/29 | | | 12,685 | | | | 14,377 | |
Federal Home Loan Mtg. Corp. REMIC | | | | | | | | |
Series 3102, Class PG | | | | | | | | |
5.00% due 11/15/28 | | | 280,000 | | | | 290,310 | |
Series 3317, Class PD | | | | | | | | |
5.00% due 09/15/31 | | | 360,000 | | | | 379,328 | |
Series 3116, Class PD | | | | | | | | |
5.00% due 10/15/34 | | | 1,310,000 | | | | 1,425,674 | |
Series 3349, Class HB | | | | | | | | |
5.50% due 06/15/31 | | | 642,000 | | | | 680,907 | |
Series 2626, Class SP | | | | | | | | |
6.37% due 02/15/18(3) | | | 15,014,392 | | | | 1,353,045 | |
| | | | | | |
|
|
|
| | | | | | | | 23,134,423 | |
| | | | | | |
|
|
|
Federal National Mtg. Assoc. — 4.9% | | | | | | | | |
2.13% due 01/25/13 | | | 243,000 | | | | 244,530 | |
4.00% due 06/01/39 | | | 913,757 | | | | 953,037 | |
4.00% due September TBA | | | 1,000,000 | | | | 1,035,469 | |
4.50% due 06/01/19 | | | 201,347 | | | | 215,297 | |
4.50% due 01/01/39 | | | 214,678 | | | | 225,859 | |
4.50% due 12/01/39 | | | 2,883,527 | | | | 3,041,515 | |
4.50% due 04/01/40 | | | 4,693,767 | | | | 4,936,034 | |
4.50% due 07/01/40 | | | 998,546 | | | | 1,050,554 | |
4.75% due 12/15/10 | | | 251,000 | | | | 254,444 | |
5.00% due 03/15/16 | | | 163,000 | | | | 189,990 | |
5.00% due 01/01/23 | | | 465,836 | | | | 495,730 | |
| | | | | | | | |
| | |
| Security Description | | Principal
Amount(12) | | | Value
(Note 2) | |
| |
| | | | | | | | | |
Federal National Mtg. Assoc. (continued) | | | | | | | | |
5.00% due 04/01/23 | | $ | 363,695 | | | $ | 387,034 | |
5.00% due 01/01/37 | | | 78,219 | | | | 83,185 | |
5.00% due 03/01/37 | | | 105,528 | | | | 112,228 | |
5.00% due 05/01/37 | | | 19,719 | | | | 20,971 | |
5.00% due 06/01/37 | | | 298,834 | | | | 317,807 | |
5.00% due 07/01/37 | | | 431,176 | | | | 458,551 | |
5.00% due 09/01/39 | | | 2,472,332 | | | | 2,628,913 | |
5.00% due 05/01/40 | | | 988,676 | | | | 1,051,293 | |
5.50% due 03/01/18 | | | 10,980 | | | | 11,909 | |
5.50% due 11/01/22 | | | 144,079 | | | | 155,201 | |
5.50% due 01/01/29 | | | 40,704 | | | | 43,977 | |
5.50% due 05/01/29 | | | 13,765 | | | | 14,876 | |
5.50% due 06/01/34 | | | 223,675 | | | | 241,241 | |
5.50% due 09/01/36 | | | 1,269,264 | | | | 1,361,015 | |
5.50% due 11/01/36 | | | 34,217 | | | | 36,690 | |
5.50% due 04/01/37 | | | 296,761 | | | | 317,686 | |
5.50% due 03/01/38 | | | 388,044 | | | | 415,405 | |
6.00% due 02/01/32 | | | 51,506 | | | | 56,759 | |
6.00% due 10/01/34 | | | 1,962 | | | | 2,141 | |
6.00% due 07/01/37 | | | 125,131 | | | | 134,962 | |
6.00% due 08/01/37 | | | 415,391 | | | | 448,024 | |
6.00% due 10/01/37 | | | 459,202 | | | | 495,277 | |
6.50% due 12/01/31 | | | 45,623 | | | | 50,647 | |
6.50% due 02/01/35 | | | 70,241 | | | | 77,065 | |
6.50% due 07/01/36 | | | 147,524 | | | | 161,073 | |
6.50% due 11/01/37 | | | 631,016 | | | | 687,786 | |
8.50% due 08/01/31 | | | 5,210 | | | | 6,067 | |
| | | | | | |
|
|
|
| | | | | | | | 22,420,242 | |
| | | | | | |
|
|
|
Government National Mtg. Assoc. — 1.0% | | | | | | | | |
5.50% due 08/15/39 | | | 1,882,315 | | | | 2,040,761 | |
6.00% due 08/15/39 | | | 2,375,703 | | | | 2,590,056 | |
| | | | | | |
|
|
|
| | | | | | | | 4,630,817 | |
| | | | | | |
|
|
|
Total U.S. Government Agencies | | | | | | | | |
(cost $48,245,806) | | | | | | | 50,185,482 | |
| | | | | | |
|
|
|
U.S. GOVERNMENT TREASURIES — 4.3% | | | | | | | | |
United States Treasury Bonds — 1.3% | | | | | | | | |
4.38% due 02/15/38 | | | 204,000 | | | | 236,066 | |
4.38% due 11/15/39 | | | 1,490,000 | | | | 1,716,760 | |
4.38% due 05/15/40 | | | 384,000 | | | | 443,040 | |
4.50% due 05/15/38 | | | 503,000 | | | | 593,854 | |
4.50% due 08/15/39 | | | 1,112,000 | | | | 1,307,643 | |
4.63% due 02/15/40 | | | 161,000 | | | | 193,150 | |
5.25% due 11/15/28 | | | 1,127,000 | | | | 1,448,019 | |
8.13% due 08/15/19 | | | 117,000 | | | | 172,027 | |
| | | | | | |
|
|
|
| | | | | | | | 6,110,559 | |
| | | | | | |
|
|
|
United States Treasury Notes — 3.0% | | | | | | | | |
0.88% due 05/31/11 | | | 1,000,000 | | | | 1,004,688 | |
1.75% due 07/31/15 | | | 1,145,000 | | | | 1,168,976 | |
2.00% due 11/30/13 | | | 328,000 | | | | 340,812 | |
2.38% due 09/30/14 | | | 112,000 | | | | 117,836 | |
2.38% due 02/28/15 | | | 104,000 | | | | 109,362 | |
2.38% due 07/31/17 | | | 2,000,000 | | | | 2,061,250 | |
2.63% due 02/29/16 | | | 1,000,000 | | | | 1,057,812 | |
2.75% due 02/28/13 | | | 105,000 | | | | 110,718 | |
2.75% due 11/30/16 | | | 5,000 | | | | 5,292 | |
2.75% due 02/15/19 | | | 860,000 | | | | 893,796 | |
3.25% due 05/31/16 | | | 2,000,000 | | | | 2,181,250 | |
3.38% due 07/31/13 | | | 449,000 | | | | 484,359 | |
3.38% due 11/15/19 | | | 246,000 | | | | 265,699 | |
3.50% due 02/15/18 | | | 234,000 | | | | 258,442 | |
3.50% due 05/15/20 | | | 274,000 | | | | 298,553 | |
103
VALIC Company II Strategic Bond Fund
PORTFOLIO OF INVESTMENTS — August 31, 2010 — (continued)
| | | | | | | | |
| | |
| Security Description | | Shares/
Principal
Amount(12) | | | Value
(Note 2) | |
| |
U.S. GOVERNMENT TREASURIES (continued) | | | | | | | | |
United States Treasury Notes (continued) | | | | | | | | |
3.63% due 12/31/12 | | $ | 400,000 | | | $ | 428,750 | |
3.63% due 08/15/19 | | | 52,000 | | | | 57,342 | |
3.63% due 02/15/20 | | | 1,359,000 | | | | 1,495,643 | |
3.88% due 05/15/18 | | | 57,000 | | | | 64,441 | |
4.00% due 02/15/15 | | | 500,000 | | | | 561,719 | |
4.25% due 08/15/15 | | | 90,000 | | | | 102,621 | |
4.50% due 11/15/15 | | | 536,000 | | | | 621,007 | |
4.63% due 11/15/16 | | | 130,000 | | | | 152,466 | |
| | | | | | |
|
|
|
| | | | | | | | 13,842,834 | |
| | | | | | |
|
|
|
Total U.S. Government Treasuries | | | | | | | | |
(cost $18,891,461) | | | | | | | 19,953,393 | |
| | | | | | |
|
|
|
COMMON STOCK — 0.1% | | | | | | | | |
Banks - Commercial — 0.1% | | | | | | | | |
Lloyds Banking Group PLC† | | | 219,033 | | | | 233,431 | |
| | | | | | |
|
|
|
Energy - Alternate Sources — 0.0% | | | | | | | | |
VeraSun Energy Corp.†(5)(7) | | | 50,000 | | | | 0 | |
| | | | | | |
|
|
|
Food - Misc. — 0.0% | | | | | | | | |
Wornick Co.†(5)(6)(7) | | | 1,722 | | | | 105,206 | |
| | | | | | |
|
|
|
Gambling (Non-Hotel) — 0.0% | | | | | | | | |
Shreveport Gaming Holdings, Inc.†(5)(6)(7) | | | 1,280 | | | | 18,182 | |
| | | | | | |
|
|
|
Gas - Distribution — 0.0% | | | | | | | | |
MXEnergy Holdings, Inc.†(5)(7) | | | 52,368 | | | | 48,974 | |
| | | | | | |
|
|
|
Medical - Outpatient/Home Medical — 0.0% | | | | | | | | |
Critical Care Systems International, Inc.†(5)(6)(7) | | | 5,372 | | | | 671 | |
| | | | | | |
|
|
|
Multimedia — 0.0% | | | | | | | | |
Haights Cross Communication, Inc.†(5)(6)(7) | | | 5,965 | | | | 16,553 | |
| | | | | | |
|
|
|
Oil Companies - Integrated — 0.0% | | | | | | | | |
CB Simmons Co.†(5)(7) | | | 45,000 | | | | 0 | |
| | | | | | |
|
|
|
Paper & Related Products — 0.0% | | | | | | | | |
Caraustar Industries, Inc.†(5)(7) | | | 43 | | | | 112,874 | |
| | | | | | |
|
|
|
Retail - Music Store — 0.0% | | | | | | | | |
MTS, Inc.†(5)(6)(7) | | | 3,863 | | | | 0 | |
| | | | | | |
|
|
|
Total Common Stock | | | | | | | | |
(cost $547,809) | | | | | | | 535,891 | |
| | | | | | |
|
|
|
PREFERRED STOCK — 0.7% | | | | | | | | |
Banks - Commercial — 0.1% | | | | | | | | |
CoBank ACB
11.00%* | | | 5,396 | | | | 297,455 | |
| | | | | | |
|
|
|
Banks - Super Regional — 0.1% | | | | | | | | |
US Bancorp
7.19%(3) | | | 373 | | | | 289,308 | |
Wachovia Capital Trust IX
6.38% | | | 4,350 | | | | 107,663 | |
| | | | | | |
|
|
|
| | | | | | | | 396,971 | |
| | | | | | |
|
|
|
Diversified Banking Institutions — 0.4% | | | | | | | | |
Ally Financial, Inc.
7.00%* | | | 1,855 | | | | 1,532,288 | |
HSBC Holdings PLC
8.00% | | | 7,200 | | | | 191,016 | |
| | | | | | |
|
|
|
| | | | | | | | 1,723,304 | |
| | | | | | |
|
|
|
Diversified Financial Services — 0.0% | | | | | | | | |
General Electric Capital Corp.
4.50%(8) | | | 6,436 | | | | 162,766 | |
| | | | | | |
|
|
|
| | | | | | | | |
| | |
| Security Description | | Shares/
Principal
Amount(12) | | | Value
(Note 2) | |
| |
| | | | | | | | | |
Finance - Investment Banker/Broker — 0.1% | | | | | | | | |
JPMorgan Chase Capital XXIX
6.70% | | | 13,680 | | | $ | 345,420 | |
| | | | | | |
|
|
|
Finance - Mortgage Loan/Banker — 0.0% | | | | | | | | |
Federal Home Loan Mtg. Corp.
0.00%(3) | | | 5,100 | | | | 1,683 | |
| | | | | | |
|
|
|
Special Purpose Entity — 0.0% | | | | | | | | |
Structured Repackaged Asset-Backed Trust Securities
3.00%(3) | | | 9,200 | | | | 183,540 | |
| | | | | | |
|
|
|
Total Preferred Stock | | | | | | | | |
(cost $3,143,941) | | | | | | | 3,111,139 | |
| | | | | | |
|
|
|
WARRANTS — 0.0% | | | | | | | | |
Oil Companies - Exploration & Production — 0.0% | | | | | | | | |
Transmeridian Exploration, Inc.
Expires 12/15/10
(Strike price $4.31)†(5)(7) | | | 6,905 | | | | 0 | |
| | | | | | |
|
|
|
Publishing - Periodicals — 0.0% | | | | | | | | |
The Reader’s Digest Association, Inc.
Expires 02/19/14†(5)(7) | | | 3,043 | | | | 0 | |
| | | | | | |
|
|
|
Total Warrants | | | | | | | | |
(cost $22,141) | | | | | | | 0 | |
| | | | | | |
|
|
|
Total Long-Term Investment Securities | | | | | | | | |
(cost $397,020,994) | | | | | | | 413,375,084 | |
| | | | | | |
|
|
|
REPURCHASE AGREEMENT — 9.2% | | | | | | | | |
Agreement with State Street Bank & Trust Co., bearing interest at 0.01%, dated 08/31/10, to be repurchased 09/01/10 in the amount of $42,698,012 and collateralized by $40,320,000 of United States Treasury Bonds, bearing interest at 3.13%, due 04/30/17 and having an approximate value of $43,981,056
(cost $42,698,000) | | $ | 42,698,000 | | | | 42,698,000 | |
| | | | | | |
|
|
|
TOTAL INVESTMENTS | | | | | | | | |
(cost $439,718,994)(14) | | | 98.6 | % | | | 456,073,084 | |
Other assets less liabilities | | | 1.4 | | | | 6,545,914 | |
| | |
|
|
| |
|
|
|
NET ASSETS — | | | 100.0 | % | | $ | 462,618,998 | |
| | |
|
|
| |
|
|
|
| * | Securities exempt from registration under Rule 144A of the Securities Act of 1933. These securities may be sold in transactions exempt from registration, normally to qualified institutional buyers. The Fund has no right to demand registration of these securities. At August 31, 2010, the aggregate value of these securities was $67,934,399 representing 14.7% of net assets. Unless otherwise indicated these securities are not considered to be illiquid. |
| † | Non-income producing security |
| (1) | Commercial Mortgage Backed Security |
| (2) | Variable Rate Security — the rate reflected is as of August 31, 2010, maturity date reflects the stated maturity date. |
| (3) | Floating rate security where the rate fluctuates. The rate moves up or down at each reset date. The rate reflected is as of August 31, 2010. |
| (4) | Collateralized Mortgage Obligation |
| (5) | Fair valued security. Securities are classified as Level 3 based on the securities valuation inputs; see Note 2. |
| (6) | Denotes a restricted security that: (a) cannot be offered for public sale without first being registered, or being able to take advantage of an exemption from registration, under the Securities Act of 1933, as amended (the “1933 Act”); (b) is subject to a contractual restriction on public sales; or (c) is otherwise subject to a restriction on sales by operation of applicable law. Restricted securities are valued pursuant to Note 2. Certain restricted securities held by the Fund may not be sold except in exempt transactions or in a public offering registered under the 1933 Act. The Fund has no right to demand registration of these securities. The risk of investing in certain restricted securities is greater than the risk of investing in the securities of widely held, publicly traded companies. To the extent applicable, lack of a secondary market and resale restrictions may result in the inability of |
104
VALIC Company II Strategic Bond Fund
PORTFOLIO OF INVESTMENTS — August 31, 2010 — (continued)
| | a Fund to sell a security at a fair price and may substantially delay the sale of the security. In addition, certain restricted securities may exhibit greater price volatility than securities for which secondary markets exist. As of August 31, 2010, the Strategic Bond Fund held the following restricted securities: |
| | | | | | | | | | | | | | | | | | | | | | | | |
Name
| | Acquisition
Date
| | | Principal
Amount/
Shares
| | | Acquisition
Cost
| | | Market
Value
| | | Market
Value
Per Share
| | | Value as a
% of
Net Assets
| |
Critical Care Systems International, Inc.
Common Stock | | | 06/17/04 | | | | 635 | | | $ | 0 | | | | | | | | | | | | | |
| | | | 11/09/04 | | | | 4,737 | | | | 0 | | | | | | | | | | | | | |
| | | | | | |
|
|
| |
|
|
| | | | | | | | | | | | |
| | | | | | | | 5,372 | | | | 0 | | | $ | 671 | | | $ | 0.12 | | | | 0.00 | % |
| | | | | | |
|
|
| |
|
|
| | | | | | | | | | | | |
Haights Cross Communication, Inc.
Common Stock | | | 03/26/10 | | | | 2,983 | | | | 23,474 | | | | | | | | | | | | | |
| | | | 03/26/10 | | | | 1,491 | | | | 11,737 | | | | | | | | | | | | | |
| | | | 03/26/10 | | | | 1,491 | | | | 11,737 | | | | | | | | | | | | | |
| | | | | | |
|
|
| |
|
|
| | | | | | | | | | | | |
| | | | | | | | 5,965 | | | | 46,948 | | | | 16,553 | | | | 2.78 | | | | 0.00 | |
| | | | | | |
|
|
| |
|
|
| | | | | | | | | | | | |
| | | | | | |
ICO North America, Inc.
Senior Sec. Notes
7.50% due 08/15/09 | | | 08/11/05 | | | $ | 125,000 | | | | 125,000 | | | | | | | | | | | | | |
| | | | 02/15/08 | | | | 5,000 | | | | 5,000 | | | | | | | | | | | | | |
| | | | 09/11/08 | | | | 5,000 | | | | 5,000 | | | | | | | | | | | | | |
| | | | 02/15/09 | | | | 5,000 | | | | 5,000 | | | | | | | | | | | | | |
| | | | | | |
|
|
| |
|
|
| | | | | | | | | | | | |
| | | | | | | | 140,000 | | | | 140,000 | | | | 121,800 | | | | 87.00 | | | | 0.03 | |
| | | | | | |
|
|
| |
|
|
| | | | | | | | | | | | |
| | | | | | |
MTS, Inc.
Senior Notes
10.00% due 03/15/09 | | | 03/16/04 | | | | 12,337 | | | | 44,410 | | | | | | | | | | | | | |
| | | | 09/03/04 | | | | 681 | | | | 681 | | | | | | | | | | | | | |
| | | | 03/19/05 | | | | 715 | | | | 143 | | | | | | | | | | | | | |
| | | | 09/04/05 | | | | 751 | | | | 195 | | | | | | | | | | | | | |
| | | | 03/04/06 | | | | 789 | | | | 205 | | | | | | | | | | | | | |
| | | | | | |
|
|
| |
|
|
| | | | | | | | | | | | |
| | | | | | | | 15,273 | | | | 45,634 | | | | 153 | | | | 1.00 | | | | 0.00 | |
| | | | | | |
|
|
| |
|
|
| | | | | | | | | | | | |
| | | | | | |
MTS, Inc.
Common Stock | | | 03/16/04 | | | | 3,863 | | | | 0 | | | | 0 | | | | 0.00 | | | | 0.00 | |
| | | | | | |
Shreveport Gaming Holdings, Inc.
Common Stock | | | 07/21/05 | | | | 257 | | | | 5,885 | | | | | | | | | | | | | |
| | | | 07/29/05 | | | | 1,023 | | | | 23,552 | | | | | | | | | | | | | |
| | | | | | |
|
|
| |
|
|
| | | | | | | | | | | | |
| | | | | | | | 1,280 | | | | 29,437 | | | | 18,182 | | | | 14.20 | | | | 0.01 | |
| | | | | | |
|
|
| |
|
|
| | | | | | | | | | | | |
| | | | | | | | | | | | | | | | | | | | | | | | |
Name
| | Acquisition
Date
| | | Principal
Amount/
Shares
| | | Acquisition
Cost
| | | Market
Value
| | | Market
Value
Per Share
| | | Value as a
% of
Net Assets
| |
Wornick Co.
Common Stock | | | 08/08/08 | | | | 1,722 | | | $ | 225,265 | | | $ | 105,206 | | | $ | 61.10 | | | | 0.02 | % |
| | | | | | | | | | | | | | |
|
|
| | | | | |
|
|
|
| | | | | | | | | | | | | | | $ | 262,565 | | | | | | | | 0.06 | % |
| | | | | | | | | | | | | | |
|
|
| | | | | |
|
|
|
| (7) | Illiquid security. At August 31, 2010, the aggregate value of these securities was $1,257,703 representing 0.3% of net assets. |
| (8) | “Step-up” security where the rate increases (“steps-up”) at a predetermined rate. Rate shown reflects the increased rate. |
| (9) | Perpetual maturity — maturity date reflects the next call date. |
| (10) | PIK (“Payment-in-Kind”) security. Bond or preferred stock that pays interest/dividends in the form of additional bonds or preferred stocks. |
| (11) | Income may be received in cash or additional bonds at the discretion of the issuer. |
| (12) | Denominated in United States dollars unless otherwise indicated. |
| (13) | “Step-up” security where the rate increases (“steps-up”) at a predetermined rate. Rate shown reflects the stated rate. |
| (14) | See Note 5 for cost of investments on a tax basis. |
| (15) | Bond is in default and did not pay principal at maturity. |
| (17) | Company has filed Chapter 11 bankruptcy protection. |
| (18) | Company has filed Chapter 7 bankruptcy protection. |
| (19) | Company has filed bankruptcy in country of issuance. |
| (20) | Effective April 30, 2010, interest payments were suspended for twenty-four months according to an agreement with the European Commission. |
REMIC—Real Estate Mortgage Investment Conduit
TBA—Securities purchased on a forward commitment basis with an approximate principal amount and no definite maturity date. The actual principal and maturity date will be determined upon settlement date.
Currency Legend
AUD—Australian Dollar
CAD—Canadian Dollar
CHF—Swiss Franc
EUR—Euro Dollar
GBP—British Pound
JPY—Japanese Yen
NOK—Norwegian Krone
SEK—Swedish Krona
The following is a summary of the inputs used to value the Fund’s net assets as of August 31, 2010 (see Note 2):
| | | | | | | | | | | | | | | | |
| | | Level 1 - Unadjusted Quoted
Prices
| | | Level 2 - Other Observable
Inputs
| | | Level 3 - Significant
Unobservable Inputs
| | | Total
| |
Long-Term Investment Securities: | | | | | | | | | | | | | | | | |
Asset Backed Securities | | $ | — | | | $ | 17,909,115 | | | $ | — | | | $ | 17,909,115 | |
Convertible Bonds & Notes | | | — | | | | — | | | | 121,800 | | | | 121,800 | |
U.S. Corporate Bonds & Notes | | | — | | | | 193,058,231 | | | | 3,766,446 | | | | 196,824,677 | |
Foreign Corporate Bonds & Notes | | | — | | | | 30,070,657 | | | | 33,000 | | | | 30,103,657 | |
Foreign Government Agencies | | | — | | | | 94,558,437 | | | | — | | | | 94,558,437 | |
Municipal Bonds & Notes | | | — | | | | 71,493 | | | | — | | | | 71,493 | |
U.S. Government Agencies | | | — | | | | 50,185,482 | | | | — | | | | 50,185,482 | |
U.S. Government Treasuries | | | — | | | | 19,953,393 | | | | — | | | | 19,953,393 | |
Common Stock | | | 233,431 | | | | — | | | | 302,460 | | | | 535,891 | |
Preferred Stock | | | 992,088 | | | | 2,119,051 | | | | — | | | | 3,111,139 | |
Warrants | | | — | | | | — | | | | 0 | | | | 0 | |
Repurchase Agreements | | | — | | | | 42,698,000 | | | | — | | | | 42,698,000 | |
| | |
|
|
| |
|
|
| |
|
|
| |
|
|
|
Total | | $ | 1,225,519 | | | $ | 450,623,859 | | | $ | 4,223,706 | | | $ | 456,073,084 | |
| | |
|
|
| |
|
|
| |
|
|
| |
|
|
|
105
VALIC Company II Strategic Bond Fund
PORTFOLIO OF INVESTMENTS — August 31, 2010 — (continued)
The following is a reconciliation of Level 3 assets which significant unobservable inputs were used to determine fair value:
| | | | | | | | | | | | | | | | | | | | |
| | | Convertible
Bonds & Notes
| | | U.S. Corporate
Bonds & Notes
| | | Foreign Corporate
Bonds & Notes
| | | Common Stock
| | | Warrants
| |
Balance as of 8/31/2009 | | $ | 49,000 | | | $ | 3,125,234 | | | $ | — | | | $ | 177,128 | | | $ | 0 | |
Accrued discounts/premiums | | | — | | | | (36 | ) | | | — | | | | — | | | | — | |
Realized gain (loss) | | | — | | | | 259,599 | | | | — | | | | — | | | | — | |
Change in unrealized appreciation (depreciation)(1) | | | 72,800 | | | | 356,449 | | | | 33,000 | | | | (33,593 | ) | | | (3,151 | ) |
Net purchases (sales) | | | — | | | | (310,905 | ) | | | 0 | | | | 158,925 | | | | 3,151 | |
Transfers in and/or out of Level 3(2) | | | — | | | | 336,105 | | | | 0 | | | | — | | | | — | |
| | |
|
|
| |
|
|
| |
|
|
| |
|
|
| |
|
|
|
Balance as of 8/31/2010 | | $ | 121,800 | | | $ | 3,766,446 | | | $ | 33,000 | | | $ | 302,460 | | | $ | 0 | |
| | |
|
|
| |
|
|
| |
|
|
| |
|
|
| |
|
|
|
| (1) | The total change in unrealized appreciation (depreciation) included in the statement of operations attributable to level 3 investments still held at August 31, 2010 includes: |
| | | | | | | | | | | | | | | | | | | | |
| | | Convertible
Bonds & Notes
| | | U.S. Corporate
Bonds & Notes
| | | Foreign Corporate
Bonds & Notes
| | | Common Stock
| | | Warrants
| |
| | | $ | 72,800 | | | $ | 494,170 | | | $ | 33,000 | | | $ | (33,593 | ) | | $ | (3,151 | ) |
| | |
|
|
| |
|
|
| |
|
|
| |
|
|
| |
|
|
|
| (2) | The Fund’s policy is to recognize transfers in and transfers out as of the end of the reporting period. |
See Notes to Financial Statements
106
VALIC Company II
STATEMENTS OF ASSETS AND LIABILITIES — August 31, 2010
| | | | | | | | | | | | | | | | | | | | | | | | |
| | | AGGRESSIVE
GROWTH
LIFESTYLE
FUND | | | CAPITAL
APPRECIATION
FUND | | | CONSERVATIVE
GROWTH
LIFESTYLE
FUND | | | CORE BOND
FUND | | | HIGH YIELD
BOND FUND | | | INTERNATIONAL
SMALL CAP
EQUITY | |
ASSETS: | | | | | | | | | | | | | | | | | | | | | | | | |
Investments at value (unaffiliated)*
| | $ | – | | | $ | 41,562,963 | | | $ | – | | | $ | 235,759,163 | | | $ | 247,086,365 | | | $ | 531,904,109 | |
Investments at value (affiliated)* | | | 122,557,707 | | | | – | | | | 82,443,160 | | | | – | | | | – | | | | – | |
Repurchase agreements (cost approximates value) | | | – | | | | – | | | | – | | | | 10,055,000 | | | | 6,832,000 | | | | 7,608,000 | |
| | |
|
|
| |
|
|
| |
|
|
| |
|
|
| |
|
|
| |
|
|
|
Total Investments | | | 122,557,707 | | | | 41,562,963 | | | | 82,443,160 | | | | 245,814,163 | | | | 253,918,365 | | | | 539,512,109 | |
| | |
|
|
| |
|
|
| |
|
|
| |
|
|
| |
|
|
| |
|
|
|
Cash | | | 131,141 | | | | 96 | | | | 107,701 | | | | 31 | | | | 38,646 | | | | 1,156 | |
Foreign cash* | | | – | | | | – | | | | – | | | | – | | | | | | | | 2,071,299 | |
Receivable for: | | | | | | | | | | | | | | | | | | | | | | | | |
Trust shares sold | | | 143,970 | | | | 680 | | | | 16,156 | | | | 514,607 | | | | 273,242 | | | | 147 | |
Dividends and interest | | | – | | | | 74,688 | | | | – | | | | 2,097,419 | | | | 5,342,147 | | | | 803,003 | |
Investments sold | | | – | | | | 745,193 | | | | 166,099 | | | | 1,826,135 | | | | 2,051,441 | | | | 9,076 | |
Prepaid expenses and other assets | | | 4,674 | | | | 7,860 | | | | 4,263 | | | | 8,327 | | | | 7,822 | | | | 15,025 | |
Due from investment adviser for expense reimbursements/fee waivers | | | 18,829 | | | | 10,244 | | | | 12,616 | | | | 34,760 | | | | 26,564 | | | | 255,276 | |
Variation margin on futures contracts | | | – | | | | – | | | | – | | | | – | | | | – | | | | – | |
| | |
|
|
| |
|
|
| |
|
|
| |
|
|
| |
|
|
| |
|
|
|
TOTAL ASSETS | | | 122,856,321 | | | | 42,401,724 | | | | 82,749,995 | | | | 250,295,442 | | | | 261,658,227 | | | | 542,667,091 | |
| | |
|
|
| |
|
|
| |
|
|
| |
|
|
| |
|
|
| |
|
|
|
LIABILITIES: | | | | | | | | | | | | | | | | | | | | | | | | |
Payable for: | | | | | | | | | | | | | | | | | | | | | | | | |
Trust shares reacquired | | | 41,690 | | | | 35,496 | | | | 182,255 | | | | 141,715 | | | | 4,450 | | | | 276,480 | |
Investments purchased | | | 102,280 | | | | 1,668,015 | | | | – | | | | 6,329,535 | | | | 233,493 | | | | 157,033 | |
Investment advisory and management fees | | | 10,485 | | | | 19,761 | | | | 6,925 | | | | 101,543 | | | | 138,719 | | | | 387,274 | |
Shareholder services | | | – | | | | 8,982 | | | | – | | | | 51,694 | | | | 55,146 | | | | 118,369 | |
Administrative service fees | | | – | | | | 2,515 | | | | – | | | | 14,474 | | | | 15,441 | | | | 33,143 | |
Transfer agent fees and expenses | | | 608 | | | | 1,105 | | | | 662 | | | | 1,129 | | | | 1,121 | | | | 1,009 | |
Trustees’ fees and expenses | | | 2,654 | | | | 11,019 | | | | 5,704 | | | | 5,920 | | | | 5,945 | | | | 13,821 | |
Other accrued expenses | | | 43,183 | | | | 53,459 | | | | 46,061 | | | | 71,917 | | | | 153,794 | | | | 143,083 | |
Accrued foreign tax on capital gains | | | – | | | | – | | | | – | | | | – | | | | – | | | | 210,902 | |
| | |
|
|
| |
|
|
| |
|
|
| |
|
|
| |
|
|
| |
|
|
|
TOTAL LIABILITIES | | | 200,900 | | | | 1,800,352 | | | | 241,607 | | | | 6,717,927 | | | | 608,109 | | | | 1,341,114 | |
| | |
|
|
| |
|
|
| |
|
|
| |
|
|
| |
|
|
| |
|
|
|
NET ASSETS | | $ | 122,655,421 | | | $ | 40,601,372 | | | $ | 82,508,388 | | | $ | 243,577,515 | | | $ | 261,050,118 | | | $ | 541,325,977 | |
| | |
|
|
| |
|
|
| |
|
|
| |
|
|
| |
|
|
| |
|
|
|
NET ASSETS REPRESENTED BY: | | | | | | | | | | | | | | | | | | | | | | | | |
Trust shares at par value of $0.01 per share | | $ | 165,485 | | | $ | 50,693 | | | $ | 80,014 | | | $ | 228,099 | | | $ | 354,524 | | | $ | 482,050 | |
Additional paid in capital | | | 146,710,333 | | | | 63,113,801 | | | | 81,791,333 | | | | 230,369,484 | | | | 282,421,439 | | | | 746,372,251 | |
Accumulated undistributed net investment income (loss) | | | 3,189,827 | | | | 168,205 | | | | 2,695,043 | | | | 8,162,034 | | | | 18,940,666 | | | | 2,713,203 | |
Accumulated undistributed net realized gain (loss) on investments, futures contracts, options contracts, securities sold short, foreign exchange transactions and capital gain distributions received from underlying funds | | | (38,767,268 | ) | | | (23,421,899 | ) | | | (9,358,573 | ) | | | (3,730,640 | ) | | | (44,158,023 | ) | | | (222,031,343 | ) |
Unrealized appreciation (depreciation) on investments | | | 11,357,044 | | | | 690,572 | | | | 7,300,571 | | | | 8,548,538 | | | | 3,491,512 | | | | 13,992,388 | |
Unrealized appreciation (depreciation) on futures contracts and options contracts | | | – | | | | – | | | | – | | | | – | | | | – | | | | – | |
Unrealized foreign exchange gain (loss) on other assets and liabilities | | | – | | | | – | | | | – | | | | – | | | | – | | | | 8,330 | |
Accrued capital gains tax on unrealized appreciation (depreciation) | | | – | | | | – | | | | – | | | | – | | | | – | | | | (210,902 | ) |
| | |
|
|
| |
|
|
| |
|
|
| |
|
|
| |
|
|
| |
|
|
|
NET ASSETS | | $ | 122,655,421 | | | $ | 40,601,372 | | | $ | 82,508,388 | | | $ | 243,577,515 | | | $ | 261,050,118 | | | $ | 541,325,977 | |
| | |
|
|
| |
|
|
| |
|
|
| |
|
|
| |
|
|
| |
|
|
|
SHARES OF BENEFICIAL INTEREST: | | | | | | | | | | | | | | | | | | | | | | | | |
Authorized (Par value $0.01 per share) | | | 1,000,000,000 | | | | 1,000,000,000 | | | | 1,000,000,000 | | | | 1,000,000,000 | | | | 1,000,000,000 | | | | 1,000,000,000 | |
Outstanding | | | 16,548,534 | | | | 5,069,257 | | | | 8,001,413 | | | | 22,809,939 | | | | 35,452,447 | | | | 48,204,996 | |
NET ASSET VALUE, OFFERING AND REDEMPTION PRICE PER SHARE | | $ | 7.41 | | | $ | 8.01 | | | $ | 10.31 | | | $ | 10.68 | | | $ | 7.36 | | | $ | 11.23 | |
| | |
|
|
| |
|
|
| |
|
|
| |
|
|
| |
|
|
| |
|
|
|
*Cost | | | | | | | | | | | | | | | | | | | | | | | | |
Investments (unaffiliated) | | $ | – | | | $ | 40,872,391 | | | $ | – | | | $ | 227,210,625 | | | $ | 243,594,853 | | | $ | 517,911,721 | |
| | |
|
|
| |
|
|
| |
|
|
| |
|
|
| |
|
|
| |
|
|
|
Investments (affiliated) | | $ | 111,200,663 | | | $ | – | | | $ | 75,142,589 | | | $ | – | | | $ | – | | | $ | – | |
| | |
|
|
| |
|
|
| |
|
|
| |
|
|
| |
|
|
| |
|
|
|
Foreign cash | | $ | – | | | $ | – | | | $ | – | | | $ | – | | | $ | – | | | $ | 2,069,119 | |
| | |
|
|
| |
|
|
| |
|
|
| |
|
|
| |
|
|
| |
|
|
|
See Notes to Financial Statements
107
VALIC Company II
STATEMENTS OF ASSETS AND LIABILITIES — August 31, 2010 — (continued)
| | | | | | | | | | | | | | | | | | | | |
| | | LARGE CAP
VALUE FUND | | | MID CAP GROWTH
FUND | | | MID CAP VALUE
FUND | | | MODERATE
GROWTH
LIFESTYLE
FUND | | | MONEY MARKET II
FUND | |
ASSETS: | | | | | | | | | | | | | | | | | | | | |
Investments at value (unaffiliated)* | | $ | 145,172,325 | | | $ | 147,363,365 | | | $ | 451,525,466 | | | $ | – | | | $ | 191,944,591 | |
Investments at value (affiliated)* | | | — | | | | – | | | | – | | | | 192,742,951 | | | | – | |
Repurchase agreements (cost approximates value) | | | — | | | | 14,692,000 | | | | 4,319,000 | | | | – | | | | 21,842,000 | |
| | |
|
|
| |
|
|
| |
|
|
| |
|
|
| |
|
|
|
Total Investments | | | 145,172,325 | | | | 162,055,365 | | | | 455,844,466 | | | | 192,742,951 | | | | 213,786,591 | |
| | |
|
|
| |
|
|
| |
|
|
| |
|
|
| |
|
|
|
Cash | | | 161,738 | | | | 197 | | | | 431 | | | | 141,387 | | | | 250,453 | |
Foreign cash* | | | — | | | | 2 | | | | 44,599 | | | | – | | | | – | |
Receivable for: | | | | | | | | | | | | | | | | | | | | |
Trust shares sold | | | 46,791 | | | | 11,098 | | | | 10,273 | | | | 57,459 | | | | 202,744 | |
Dividends and interest | | | 460,343 | | | | 86,784 | | | | 507,596 | | | | – | | | | 62,707 | |
Investments sold | | | 193,317 | | | | 3,168,349 | | | | 1,552,145 | | | | – | | | | – | |
Prepaid expenses and other assets | | | 11,395 | | | | 12,096 | | | | 34,894 | | | | 5,811 | | | | 10,542 | |
Due from investment adviser for expense reimbursements/fee waivers | | | 63,562 | | | | 51,169 | | | | 58,460 | | | | 20,258 | | | | 105,275 | |
Variation margin on futures contracts | | | – | | | | – | | | | – | | | | – | | | | – | |
| | |
|
|
| |
|
|
| |
|
|
| |
|
|
| |
|
|
|
TOTAL ASSETS | | | 146,109,471 | | | | 165,385,060 | | | | 458,052,864 | | | | 192,967,866 | | | | 214,418,312 | |
| | |
|
|
| |
|
|
| |
|
|
| |
|
|
| |
|
|
|
LIABILITIES: | | | | | | | | | | | | | | | | | | | | |
Payable for: | | | | | | | | | | | | | | | | | | | | |
Trust shares reacquired | | | 5,014 | | | | 58,313 | | | | 75,012 | | | | 11,897 | | | | 180,622 | |
Investments purchased | | | 121,880 | | | | 1,739,413 | | | | 6,856,367 | | | | 45,562 | | | | 250,264 | |
Investment advisory and management fees | | | 64,443 | | | | 107,803 | | | | 279,853 | | | | 16,421 | | | | 46,070 | |
Shareholder services | | | 32,221 | | | | 36,226 | | | | 97,294 | | | | – | | | | 46,071 | |
Administrative service fees | | | 9,022 | | | | 10,143 | | | | 27,243 | | | | – | | | | 12,900 | |
Transfer agent fees and expenses | | | 999 | | | | 971 | | | | 3,523 | | | | 608 | | | | 427 | |
Trustees’ fees and expenses | | | 16,589 | | | | 4,815 | | | | 16,369 | | | | 4,242 | | | | 9,316 | |
Other accrued expenses | | | 81,182 | | | | 63,607 | | | | 119,114 | | | | 48,579 | | | | 65,674 | |
Accrued foreign tax on capital gains | | | – | | | | – | | | | – | | | | – | | | | – | |
| | |
|
|
| |
|
|
| |
|
|
| |
|
|
| |
|
|
|
TOTAL LIABILITIES | | | 331,350 | | | | 2,021,291 | | | | 7,474,775 | | | | 127,309 | | | | 611,344 | |
| | |
|
|
| |
|
|
| |
|
|
| |
|
|
| |
|
|
|
NET ASSETS | | $ | 145,778,121 | | | $ | 163,363,769 | | | $ | 450,578,089 | | | $ | 192,840,557 | | | $ | 213,806,968 | |
| | |
|
|
| |
|
|
| |
|
|
| |
|
|
| |
|
|
|
NET ASSETS REPRESENTED BY: | | | | | | | | | | | | | | | | | | | | |
Trust shares at par value of $0.01 per share | | $ | 157,511 | | | $ | 260,124 | | | $ | 330,967 | | | $ | 178,325 | | | $ | 2,141,512 | |
Additional paid in capital | | | 267,183,074 | | | | 202,320,406 | | | | 554,461,788 | | | | 200,822,622 | | | | 212,038,861 | |
Accumulated undistributed net investment income (loss) | | | 2,044,297 | | | | (3,148 | ) | | | 2,223,378 | | | | 5,793,902 | | | | (5,309 | ) |
Accumulated undistributed net realized gain (loss) on investments, futures contracts, options contracts, securities sold short, foreign exchange transactions and capital gain distributions received from underlying funds | | | (120,201,561 | ) | | | (46,376,366 | ) | | | (123,968,700 | ) | | | (34,231,788 | ) | | | (368,096 | ) |
Unrealized appreciation (depreciation) on investments | | | (3,405,200 | ) | | | 7,162,781 | | | | 17,530,080 | | | | 20,277,496 | | | | – | |
Unrealized appreciation (depreciation) on futures contracts and options contracts | | | – | | | | – | | | | – | | | | – | | | | – | |
Unrealized foreign exchange gain (loss) on other assets and liabilities | | | – | | | | (28 | ) | | | 576 | | | | – | | | | – | |
Accrued capital gains tax in unrealized appreciation (depreciation) | | | – | | | | – | | | | – | | | | – | | | | – | |
| | |
|
|
| |
|
|
| |
|
|
| |
|
|
| |
|
|
|
NET ASSETS | | $ | 145,778,121 | | | $ | 163,363,769 | | | $ | 450,578,089 | | | $ | 192,840,557 | | | $ | 213,806,968 | |
| | |
|
|
| |
|
|
| |
|
|
| |
|
|
| |
|
|
|
SHARES OF BENEFICIAL INTEREST: | | | | | | | | | | | | | | | | | | | | |
Authorized (Par value $0.01 per share) | | | 1,000,000,000 | | | | 1,000,000,000 | | | | 1,000,000,000 | | | | 1,000,000,000 | | | | 1,000,000,000 | |
Outstanding | | | 15,751,112 | | | | 26,012,422 | | | | 33,096,699 | | | | 17,832,480 | | | | 214,151,151 | |
NET ASSET VALUE, OFFERING AND REDEMPTION PRICE PER SHARE | | $ | 9.26 | | | $ | 6.28 | | | $ | 13.61 | | | $ | 10.81 | | | $ | 1.00 | |
| | |
|
|
| |
|
|
| |
|
|
| |
|
|
| |
|
|
|
*Cost | | | | | | | | | | | | | | | | | | | | |
Investments (unaffiliated) | | $ | 148,577,525 | | | $ | 140,200,584 | | | $ | 433,995,386 | | | $ | – | | | $ | 191,944,591 | |
| | |
|
|
| |
|
|
| |
|
|
| |
|
|
| |
|
|
|
Investments (affiliated) | | $ | – | | | $ | – | | | $ | – | | | $ | 172,465,455 | | | $ | – | |
| | |
|
|
| |
|
|
| |
|
|
| |
|
|
| |
|
|
|
Foreign cash | | $ | – | | | $ | 2 | | | $ | 44,571 | | | $ | – | | | $ | – | |
| | |
|
|
| |
|
|
| |
|
|
| |
|
|
| |
|
|
|
See Notes to Financial Statements
108
VALIC Company II
STATEMENTS OF ASSETS AND LIABILITIES — August 31, 2010 — (continued)
| | | | | | | | | | | | | | | | |
| | | SMALL CAP
GROWTH FUND | | | SMALL CAP
VALUE FUND | | | SOCIALLY
RESPONSIBLE
FUND | | | STRATEGIC
BOND FUND | |
ASSETS: | | | | | | | | | | | | | | | | |
Investments at value (unaffiliated)* | | $ | 47,843,504 | | | $ | 341,951,678 | | | $ | 661,185,788 | | | $ | 413,375,084 | |
Investments at value (affiliated)* | | | — | | | | — | | | | — | | | | — | |
Repurchase agreements (cost approximates value) | | | — | | | | 4,228,000 | | | | 10,643,000 | | | | 42,698,000 | |
| | |
|
|
| |
|
|
| |
|
|
| |
|
|
|
Total Investments | | | 47,843,504 | | | | 346,179,678 | | | | 671,828,788 | | | | 456,073,084 | |
| | |
|
|
| |
|
|
| |
|
|
| |
|
|
|
Cash | | | 170 | | | | 1,703 | | | | 849 | | | | 828,127 | |
Foreign cash* | | | — | | | | — | | | | — | | | | 1,171,888 | |
Receivable for: | | | | | | | | | | | | | | | | |
Trust shares sold | | | 6,538 | | | | 18,042 | | | | 22,218 | | | | 104,156 | |
Dividends and interest | | | 11,650 | | | | 266,822 | | | | 1,142,615 | | | | 6,711,577 | |
Investments sold | | | 124,563 | | | | 2,734,698 | | | | — | | | | 1,522,096 | |
Prepaid expenses and other assets | | | 7,729 | | | | 18,558 | | | | 51,154 | | | | 9,420 | |
Due from investment adviser for expense reimbursements/fee waivers | | | 9,543 | | | | 262,552 | | | | 60,592 | | | | 49,357 | |
Variation margin on futures contracts | | | — | | | | 3,920 | | | | 43,200 | | | | — | |
| | |
|
|
| |
|
|
| |
|
|
| |
|
|
|
TOTAL ASSETS | | | 48,003,697 | | | | 349,485,973 | | | | 673,149,416 | | | | 466,469,705 | |
| | |
|
|
| |
|
|
| |
|
|
| |
|
|
|
LIABILITIES: | | | | | | | | | | | | | | | | |
Payable for: | | | | | | | | | | | | | | | | |
Trust shares reacquired | | | 19,863 | | | | 41,786 | | | | 120,768 | | | | 119,681 | |
Investments purchased | | | 121,421 | | | | 1,589,599 | | | | — | | | | 3,289,183 | |
Investment advisory and management fees | | | 35,835 | | | | 204,506 | | | | 148,165 | | | | 211,210 | |
Shareholder services | | | 10,540 | | | | 77,023 | | | | 148,165 | | | | 97,111 | |
Administrative service fees | | | 2,951 | | | | 21,567 | | | | 41,486 | | | | 27,191 | |
Transfer agent fees and expenses | | | 1,138 | | | | 962 | | | | 1,090 | | | | 1,943 | |
Trustee’s fees and expenses | | | 5,510 | | | | 9,073 | | | | 15,312 | | | | 9,739 | |
Other accrued expenses | | | 49,742 | | | | 124,684 | | | | 108,700 | | | | 94,649 | |
Accrued foreign tax capital gains | | | — | | | | — | | | | — | | | | — | |
| | |
|
|
| |
|
|
| |
|
|
| |
|
|
|
TOTAL LIABILITIES | | | 247,000 | | | | 2,069,200 | | | | 583,686 | | | | 3,850,707 | |
| | |
|
|
| |
|
|
| |
|
|
| |
|
|
|
NET ASSETS | | $ | 47,756,697 | | | $ | 347,416,773 | | | $ | 672,565,730 | | | $ | 462,618,998 | |
| | |
|
|
| |
|
|
| |
|
|
| |
|
|
|
NET ASSETS REPRESENTED BY: | | | | | | | | | | | | | | | | |
Trust shares at par value of $0.01 per share | | $ | 46,812 | | | $ | 338,253 | | | $ | 720,224 | | | $ | 412,489 | |
Additional paid in capital | | | 54,894,458 | | | | 402,080,578 | | | | 938,592,095 | | | | 445,855,256 | |
Accumulated undistributed net investment income (loss) | | | (2,046 | ) | | | 2,153,338 | | | | 8,187,030 | | | | 24,504,200 | |
Accumulated undistributed net realized gain (loss) on investments, futures contracts, options contracts, securities sold short, foreign exchange transactions and capital gain distributions received from underlying funds | | | (7,574,479 | ) | | | (39,476,319 | ) | | | (278,582,240 | ) | | | (24,529,460 | ) |
Unrealized appreciation (depreciation) on investments | | | 391,952 | | | | (17,525,449 | ) | | | 3,756,347 | | | | 16,354,090 | |
Unrealized appreciation (depreciation) on futures contracts and options contracts | | | — | | | | (153,628 | ) | | | (107,726 | ) | | | — | |
Unrealized foreign exchange gain (loss) on other assets and liabilities | | | — | | | | — | | | | — | | | | 22,423 | |
Accrued capital gains tax on unrealized appreciation (depreciation) | | | — | | | | — | | | | — | | | | — | |
| | |
|
|
| |
|
|
| |
|
|
| |
|
|
|
NET ASSETS | | $ | 47,756,697 | | | $ | 347,416,773 | | | $ | 672,565,730 | | | $ | 462,618,998 | |
| | |
|
|
| |
|
|
| |
|
|
| |
|
|
|
SHARES OF BENEFICIAL INTEREST: | | | | | | | | | | | | | | | | |
Authorized (Par value $0.01 per share) | | | 1,000,000,000 | | | | 1,000,000,000 | | | | 1,000,000,000 | | | | 1,000,000,000 | |
Outstanding | | | 4,681,171 | | | | 33,825,307 | | | | 72,022,376 | | | | 41,248,865 | |
NET ASSET VALUE, OFFERING AND REDEMPTION PRICE PER SHARE | | $ | 10.20 | | | $ | 10.27 | | | $ | 9.34 | | | $ | 11.22 | |
| | |
|
|
| |
|
|
| |
|
|
| |
|
|
|
*Cost | | | | | | | | | | | | | | | | |
Investments (unaffiliated) | | $ | 47,451,552 | | | $ | 359,477,127 | | | $ | 657,429,441 | | | $ | 397,020,994 | |
| | |
|
|
| |
|
|
| |
|
|
| |
|
|
|
Investments (affiliated) | | $ | — | | | $ | — | | | $ | — | | | $ | — | |
| | |
|
|
| |
|
|
| |
|
|
| |
|
|
|
Foreign cash | | $ | — | | | $ | — | | | $ | — | | | $ | 1,152,611 | |
| | |
|
|
| |
|
|
| |
|
|
| |
|
|
|
See Notes to Financial Statements
109
VALIC Company II
STATEMENTS OF OPERATIONS — For the Year Ended August 31, 2010
| | | | | | | | | | | | | | | | | | | | |
| | | AGGRESSIVE
GROWTH
LIFESTYLE FUND | | | CAPITAL
APPRECIATION
FUND | | | CONSERVATIVE
GROWTH
LIFESTYLE FUND | | | CORE BOND
FUND | | | HIGH YIELD BOND FUND | |
INVESTMENT INCOME: | | | | | | | | | | | | | | | | | | | | |
Dividends (unaffiliated) | | $ | – | | | $ | 618,450 | | | $ | – | | | $ | 108,521 | | | $ | 10,070 | |
Dividends (affiliated) | | | 3,366,461 | | | | – | | | | 2,822,881 | | | | – | | | | – | |
Interest (unaffiliated) | | | 39 | | | | 60 | | | | 33 | | | | 9,623,976 | | | | 22,078,968 | |
| | |
|
|
| |
|
|
| |
|
|
| |
|
|
| |
|
|
|
Total investment income* | | | 3,366,500 | | | | 618,510 | | | | 2,822,914 | | | | 9,732,497 | | | | 22,089,038 | |
| | |
|
|
| |
|
|
| |
|
|
| |
|
|
| |
|
|
|
EXPENSES: | | | | | | | | | | | | | | | | | | | | |
Investment advisory and management fees | | | 111,624 | | | | 241,363 | | | | 69,976 | | | | 969,266 | | | | 1,483,988 | |
Administrative service fee | | | – | | | | 30,719 | | | | – | | | | 136,282 | | | | 164,382 | |
Shareholder services fee | | | – | | | | 109,710 | | | | – | | | | 486,722 | | | | 587,078 | |
Transfer agent fees and expenses | | | 1,762 | | | | 2,789 | | | | 1,762 | | | | 2,789 | | | | 2,789 | |
Custodian and accounting fees | | | 23,139 | | | | 21,566 | | | | 23,119 | | | | 61,135 | | | | 55,320 | |
Reports to shareholders | | | 14,866 | | | | 7,102 | | | | 9,224 | | | | 11,095 | | | | 77,103 | |
Audit and tax fees | | | 21,009 | | | | 21,821 | | | | 16,633 | | | | 30,058 | | | | 28,407 | |
Legal fees | | | 24,376 | | | | 18,735 | | | | 21,286 | | | | 29,309 | | | | 39,451 | |
Trustees’ fees and expenses | | | 11,797 | | | | 1,940 | | | | 2,727 | | | | 6,952 | | | | 27,262 | |
Interest expense | | | – | | | | 557 | | | | – | | | | – | | | | – | |
Other expenses | | | 15,933 | | | | 18,968 | | | | 15,363 | | | | 18,070 | | | | 18,746 | |
| | |
|
|
| |
|
|
| |
|
|
| |
|
|
| |
|
|
|
Total expenses before fee waivers, expense reimbursements, and fees paid indirectly | | | 224,506 | �� | | | 475,270 | | | | 160,090 | | | | 1,751,678 | | | | 2,484,526 | |
| | |
|
|
| |
|
|
| |
|
|
| |
|
|
| |
|
|
|
Fees waived and expenses reimbursed by investment advisor (Note 3) | | | (112,883 | ) | | | (102,255 | ) | | | (90,114 | ) | | | (252,575 | ) | | | (209,240 | ) |
Fees paid indirectly (Note 7) | | | – | | | | – | | | | – | | | | – | | | | – | |
| | |
|
|
| |
|
|
| |
|
|
| |
|
|
| |
|
|
|
Net expenses | | | 111,623 | | | | 373,015 | | | | 69,976 | | | | 1,499,103 | | | | 2,275,286 | |
| | |
|
|
| |
|
|
| |
|
|
| |
|
|
| |
|
|
|
Net investment income (loss) | | | 3,254,877 | | | | 245,495 | | | | 2,752,938 | | | | 8,233,394 | | | | 19,813,752 | |
| | |
|
|
| |
|
|
| |
|
|
| |
|
|
| |
|
|
|
NET REALIZED AND UNREALIZED GAIN (LOSS) ON INVESTMENTS AND FOREIGN CURRENCIES: | | | | | | | | | | | | | | | | | | | | |
Net realized gain (loss) on investments (unaffiliated)** | | | – | | | | 1,395,367 | | | | – | | | | 6,435,977 | | | | 3,135,730 | |
Net realized gain (loss) on investments (affiliated) | | | 5,762,319 | | | | – | | | | 3,935,466 | | | | – | | | | – | |
Net realized gain (loss) from capital gain distributions from underlying funds (affiliated) | | | 321,851 | | | | – | | | | 68,261 | | | | – | | | | – | |
Net realized gain (loss) on futures contracts | | | – | | | | – | | | | – | | | | – | | | | – | |
Net realized foreign exchange gain (loss) on other assets and liabilities | | | – | | | | – | | | | – | | | | – | | | | – | |
Net increase from payment by affiliates (Note 3) | |
| –
|
| |
| –
|
| |
| –
|
| |
| –
|
| | | – | |
| | |
|
|
| |
|
|
| |
|
|
| |
|
|
| |
|
|
|
Net realized gain (loss) on investments and foreign currencies | | | 6,084,170 | | | | 1,395,367 | | | | 4,003,727 | | | | 6,435,977 | | | | 3,135,730 | |
| | |
|
|
| |
|
|
| |
|
|
| |
|
|
| |
|
|
|
Change in unrealized appreciation (depreciation) on investments (unaffiliated) | | | – | | | | 1,733,969 | | | | – | | | | 9,424,385 | | | | 14,191,558 | |
Change in unrealized appreciation (depreciation) on investments (affiliated) | | | (2,055,308 | ) | | | – | | | | (246,147 | ) | | | – | | | | – | |
Change in unrealized appreciation (depreciation) on futures contracts | | | – | | | | – | | | | – | | | | – | | | | – | |
Change in unrealized foreign exchange gain (loss) on other assets and liabilities | | | – | | | | – | | | | – | | | | – | | | | – | |
Change in accrued capital gains tax on unrealized appreciation (depreciation) | | | – | | | | – | | | | – | | | | – | | | | – | |
| | |
|
|
| |
|
|
| |
|
|
| |
|
|
| |
|
|
|
Net unrealized gain (loss) on investments and foreign currencies | | | (2,055,308 | ) | | | 1,733,969 | | | | (246,147 | ) | | | 9,424,385 | | | | 14,191,558 | |
| | |
|
|
| |
|
|
| |
|
|
| |
|
|
| |
|
|
|
Net realized and unrealized gain (loss) on investments and foreign currencies | | | 4,028,862 | | | | 3,129,336 | | | | 3,757,580 | | | | 15,860,362 | | | | 17,327,288 | |
| | |
|
|
| |
|
|
| |
|
|
| |
|
|
| |
|
|
|
NET INCREASE (DECREASE) IN NET ASSETS RESULTING FROM OPERATIONS | | $ | 7,283,739 | | | $ | 3,374,831 | | | $ | 6,510,518 | | | $ | 24,093,756 | | | $ | 37,141,040 | |
| | |
|
|
| |
|
|
| |
|
|
| |
|
|
| |
|
|
|
*Net of foreign withholding taxes on interest and dividends of | | $ | – | | | $ | – | | | $ | – | | | $ | 5,152 | | | $ | (1,173 | ) |
| | |
|
|
| |
|
|
| |
|
|
| |
|
|
| |
|
|
|
**Net of foreign withholding taxes on capital gains of | | $ | – | | | $ | – | | | $ | – | | | $ | – | | | $ | – | |
| | |
|
|
| |
|
|
| |
|
|
| |
|
|
| |
|
|
|
See Notes to Financial Statements
110
VALIC Company II
STATEMENTS OF OPERATIONS — For the Year Ended August 31, 2010 — (continued)
| | | | | | | | | | | | | | | | | | | | | | | | |
| | | INTERNATIONAL
SMALL CAP
EQUITY | | | LARGE CAP
VALUE FUND | | | MID CAP
GROWTH
FUND | | | MID CAP
VALUE FUND | | | MODERATE
GROWTH
LIFESTYLE FUND | | | MONEY MARKET
II FUND | |
INVESTMENT INCOME: | | | | | | | | | | | | | | | | | | | | | | | | |
Dividends (unaffiliated) | | $ | 11,340,278 | | | $ | 3,514,906 | | | $ | 928,721 | | | $ | 8,150,060 | | | $ | – | | | $ | – | |
Dividends (affiliated) | | | – | | | | 145 | | | | – | | | | – | | | | 6,075,348 | | | | – | |
Interest (unaffiliated) | | | 2,809 | | | | 993 | | | | 696 | | | | 699 | | | | 40 | | | | 843,865 | |
| | |
|
|
| |
|
|
| |
|
|
| |
|
|
| |
|
|
| |
|
|
|
Total investment income* | | | 11,343,087 | | | | 3,516,044 | | | | 929,417 | | | | 8,150,759 | | | | 6,075,388 | | | | 843,865 | |
| | |
|
|
| |
|
|
| |
|
|
| |
|
|
| |
|
|
| |
|
|
|
EXPENSES: | | | | | | | | | | | | | | | | | | | | | | | | |
Investment advisory and management fees | | | 4,767,088 | | | | 792,842 | | | | 1,326,551 | | | | 3,666,839 | | | | 171,190 | | | | 561,634 | |
Administrative service fee | | | 408,370 | | | | 110,998 | | | | 125,155 | | | | 358,465 | | | | – | | | | 157,257 | |
Shareholder services fee | | | 1,458,465 | | | | 396,421 | | | | 446,983 | | | | 1,280,231 | | | | – | | | | 561,634 | |
Transfer agent fees and expenses | | | 2,447 | | | | 2,447 | | | | 2,447 | | | | 7,241 | | | | 1,762 | | | | 1,076 | |
Custodian and accounting fees | | | 339,197 | | | | 30,900 | | | | 19,880 | | | | 132,804 | | | | 26,719 | | | | – | |
Reports to shareholders | | | 131,860 | | | | 50,229 | | | | 30,602 | | | | 80,178 | | | | 22,311 | | | | 8,553 | |
Audit and tax fees | | | 26,741 | | | | 22,642 | | | | 22,411 | | | | 22,624 | | | | 21,009 | | | | 23,603 | |
Legal fees | | | 72,214 | | | | 33,810 | | | | 29,127 | | | | 54,308 | | | | 28,421 | | | | 26,446 | |
Trustees’ fees and expenses | | | 75,615 | | | | 8,580 | | | | 29,344 | | | | 53,445 | | | | 13,219 | | | | 1,005 | |
Interest expense | | | 2,778 | | | | – | | | | – | | | | 778 | | | | – | | | | – | |
Other expenses | | | 48,057 | | | | 21,116 | | | | 22,971 | | | | 34,371 | | | | 16,326 | | | | 84,775 | |
| | |
|
|
| |
|
|
| |
|
|
| |
|
|
| |
|
|
| |
|
|
|
Total expenses before fee waivers, expense reimbursements, and fees paid indirectly | | | 7,332,832 | | | | 1,469,985 | | | | 2,055,471 | | | | 5,691,284 | | | | 300,957 | | | | 1,425,983 | |
| | |
|
|
| |
|
|
| |
|
|
| |
|
|
| |
|
|
| |
|
|
|
Fees waived and expenses reimbursed by investment advisor (Note 3) | | | (1,498,971 | ) | | | (185,586 | ) | | | (535,730 | ) | | | (314,314 | ) | | | (129,768 | ) | | | (604,713 | ) |
Fees paid indirectly (Note 7) | | | – | | | | (6,291 | ) | | | (21,962 | ) | | | (91,565 | ) | | | – | | | | – | |
| | |
|
|
| |
|
|
| |
|
|
| |
|
|
| |
|
|
| |
|
|
|
Net expenses | | | 5,833,861 | | | | 1,278,108 | | | | 1,497,779 | | | | 5,285,405 | | | | 171,189 | | | | 821,270 | |
| | |
|
|
| |
|
|
| |
|
|
| |
|
|
| |
|
|
| |
|
|
|
Net investment income (loss) | | | 5,509,226 | | | | 2,237,936 | | | | (568,362 | ) | | | 2,865,354 | | | | 5,904,199 | | | | 22,595 | |
| | |
|
|
| |
|
|
| |
|
|
| |
|
|
| |
|
|
| |
|
|
|
NET REALIZED AND UNREALIZED GAIN (LOSS) ON INVESTMENTS AND FOREIGN CURRENCIES: | | | | | | | | | | | | | | | | | | | | | | | | |
Net realized gain (loss) on investments (unaffiliated)** | | | 81,530,323 | | | | 11,673,492 | | | | 22,983,818 | | | | 36,991,207 | | | | – | | | | 22,367 | |
Net realized gain (loss) on investments (affiliated) | | | – | | | | – | | | | – | | | | – | | | | 9,422,366 | | | | – | |
Net realized gain (loss) from capital gain distributions from underlying funds (affiliated) | | | – | | | | – | | | | – | | | | – | | | | 323,631 | | | | – | |
Net realized gain (loss) on futures contracts | | | – | | | | – | | | | – | | | | – | | | | – | | | | – | |
Net realized foreign exchange gain (loss) on other assets and liabilities | | | (1,958,813 | ) | | | – | | | | 11,932 | | | | (84,723 | ) | | | – | | | | – | |
Net increase from payment by affiliates (Note 3) | | | – | | | | – | | | | – | | | | – | | | | – | | | | 221,000 | |
| | |
|
|
| |
|
|
| |
|
|
| |
|
|
| |
|
|
| |
|
|
|
Net realized gain (loss) on investments and foreign currencies | | | 79,571,510 | | | | 11,673,492 | | | | 22,995,750 | | | | 36,906,484 | | | | 9,745,997 | | | | 243,367 | |
| | |
|
|
| |
|
|
| |
|
|
| |
|
|
| |
|
|
| |
|
|
|
Change in unrealized appreciation (depreciation) on investments (unaffiliated) | | | (62,017,748 | ) | | | (12,582,893 | ) | | | (7,926,921 | ) | | | 3,201,495 | | | | – | | | | – | |
Change in unrealized appreciation (depreciation) on investments (affiliated) | |
| –
|
| |
| –
|
| |
| –
|
| |
| –
|
| |
| (2,751,076
| )
| |
| –
|
|
Change in unrealized appreciation (depreciation) on futures contracts | | | – | | | | – | | | | – | | | | – | | | | – | | | | – | |
Change in unrealized foreign exchange gain (loss) on other assets and liabilities | | | 63,457 | | | | – | | | | (192 | ) | | | (1,453 | ) | | | – | | | | – | |
Change in accrued capital gains tax on unrealized appreciation (depreciation) | | | (210,902 | ) | | | – | | | | – | | | | – | | | | – | | | | – | |
| | |
|
|
| |
|
|
| |
|
|
| |
|
|
| |
|
|
| |
|
|
|
Net unrealized gain (loss) on investments and foreign currencies | | | (62,165,193 | ) | | | (12,582,893 | ) | | | (7,927,113 | ) | | | 3,200,042 | | | | (2,751,076 | ) | | | – | |
| | |
|
|
| |
|
|
| |
|
|
| |
|
|
| |
|
|
| |
|
|
|
Net realized and unrealized gain (loss) on investments and foreign currencies | | | 17,406,317 | | | | (909,401 | ) | | | 15,068,637 | | | | 40,106,526 | | | | 6,994,921 | | | | 243,367 | |
| | |
|
|
| |
|
|
| |
|
|
| |
|
|
| |
|
|
| |
|
|
|
NET INCREASE (DECREASE) IN NET ASSETS RESULTING FROM OPERATIONS | | $ | 22,915,543 | | | $ | 1,328,535 | | | $ | 14,500,275 | | | $ | 42,971,880 | | | $ | 12,899,120 | | | $ | 265,962 | |
| | |
|
|
| |
|
|
| |
|
|
| |
|
|
| |
|
|
| |
|
|
|
*Net of foreign withholding taxes on interest and dividends of | | $ | 1,051,455 | | | $ | 109 | | | $ | 6,558 | | | $ | 15,245 | | | $ | – | | | $ | – | |
| | |
|
|
| |
|
|
| |
|
|
| |
|
|
| |
|
|
| |
|
|
|
**Net of foreign withholding taxes on capital gains of | | $ | 4,024 | | | $ | – | | | $ | – | | | $ | – | | | $ | – | | | $ | – | |
| | |
|
|
| |
|
|
| |
|
|
| |
|
|
| |
|
|
| |
|
|
|
See Notes to Financial Statements
111
VALIC Company II
STATEMENTS OF OPERATIONS — For the Year Ended August 31, 2010 — (continued)
| | | | | | | | | | | | | | | | |
| | | SMALL CAP
GROWTH
FUND | | | SMALL CAP
VALUE FUND | | | SOCIALLY
RESPONSIBLE
FUND | | | STRATEGIC
BOND FUND | |
INVESTMENT INCOME: | | | | | | | | | | | | | | | | |
Dividends (unaffiliated) | | $ | 165,897 | | | $ | 5,567,449 | | | $ | 12,488,630 | | | $ | 90,946 | |
Dividends (affiliated) | | | – | | | | – | | | | – | | | | – | |
Interest (unaffiliated) | | | 118 | | | | 21,474 | | | | 13,725 | | | | 26,815,218 | |
| | |
|
|
| |
|
|
| |
|
|
| |
|
|
|
Total investment income* | | | 166,015 | | | | 5,588,923 | | | | 12,502,355 | | | | 26,906,164 | |
| | |
|
|
| |
|
|
| |
|
|
| |
|
|
|
EXPENSES: | | | | | | | | | | | | | | | | |
Investment advisory and management fees | | | 422,022 | | | | 2,523,653 | | | | 1,778,652 | | | | 2,257,680 | |
Administrative service fee | | | 34,755 | | | | 266,394 | | | | 498,023 | | | | 288,075 | |
Shareholder services fee | | | 124,124 | | | | 951,405 | | | | 1,778,652 | | | | 1,028,840 | |
Transfer agent fees and expenses | | | 2,789 | | | | 2,447 | | | | 2,447 | | | | 4,500 | |
Custodian and accounting fees | | | 30,947 | | | | 156,051 | | | | 70,386 | | | | 112,570 | |
Reports to shareholders | | | – | | | | 276,765 | | | | 84,020 | | | | 48,004 | |
Audit and tax fees | | | 24,824 | | | | 22,634 | | | | 22,642 | | | | 28,407 | |
Legal fees | | | 18,157 | | | | 44,796 | | | | 84,516 | | | | 46,998 | |
Trustees’ fees and expenses | | | 120 | | | | 60,002 | | | | 105,530 | | | | 60,336 | |
Interest expense | | | – | | | | – | | | | – | | | | – | |
Other expenses | | | 17,957 | | | | 45,021 | | | | 38,473 | | | | 21,276 | |
| | |
|
|
| |
|
|
| |
|
|
| |
|
|
|
Total expenses before fee waivers, expense reimbursements, and fees paid indirectly | | | 675,695 | | | | 4,349,168 | | | | 4,463,341 | | | | 3,896,686 | |
| | |
|
|
| |
|
|
| |
|
|
| |
|
|
|
Fees waived and expenses reimbursed by investment advisor (Note 3) | | | (99,759 | ) | | | (733,829 | ) | | | (479,160 | ) | | | (234,019 | ) |
Fees paid indirectly (Note 7) | | | (7,084 | ) | | | (24,574 | ) | | | – | | | | – | |
| | |
|
|
| |
|
|
| |
|
|
| |
|
|
|
Net expenses | | | 568,852 | | | | 3,590,765 | | | | 3,984,181 | | | | 3,662,667 | |
| | |
|
|
| |
|
|
| |
|
|
| |
|
|
|
Net investment income (loss) | | | (402,837 | ) | | | 1,998,158 | | | | 8,518,174 | | | | 23,243,497 | |
| | |
|
|
| |
|
|
| |
|
|
| |
|
|
|
NET REALIZED AND UNREALIZED GAIN (LOSS) ON INVESTMENTS AND FOREIGN CURRENCIES: | | | | | | | | | | | | | | | | |
Net realized gain (loss) on investments (unaffiliated)** | | | 4,847,195 | | | | 4,663,523 | | | | 32,849,984 | | | | 16,128,312 | |
Net realized gain (loss) on investments (affiliated) | | | – | | | | – | | | | – | | | | – | |
Net realized gain (loss) from capital gain distributions from underlying funds (affiliated) | | | – | | | | – | | | | – | | | | – | |
Net realized gain (loss) on futures contracts | | | – | | | | 1,532,054 | | | | 5,806,321 | | | | – | |
Net realized foreign exchange gain (loss) on other assets and liabilities | | | – | | | | – | | | | – | | | | 62,307 | |
Net increase from payment by affiliates (Note 3) | | | – | | | | – | | | | – | | | | – | |
| | |
|
|
| |
|
|
| |
|
|
| |
|
|
|
Net realized gain (loss) on investments and foreign currencies | | | 4,847,195 | | | | 6,195,577 | | | | 38,656,305 | | | | 16,190,619 | |
| | |
|
|
| |
|
|
| |
|
|
| |
|
|
|
Change in unrealized appreciation (depreciation) on investments (unaffiliated) | | | (285,735 | ) | | | 12,749,903 | | | | (1,832,910 | ) | | | 15,280,978 | |
Change in unrealized appreciation (depreciation) on investments (affiliated) | |
| –
|
| | | – | | | | – | | | | – | |
Change in unrealized appreciation (depreciation) on futures contracts | | | – | | | | (943,617 | ) | | | (3,204,489 | ) | | | – | |
Change in unrealized foreign exchange gain (loss) on other assets and liabilities | | | – | | | | – | | | | – | | | | (25,413 | ) |
Change in accrued capital gains tax on unrealized appreciation (depreciation) | | | – | | | | – | | | | – | | | | – | |
| | |
|
|
| |
|
|
| |
|
|
| |
|
|
|
Net unrealized gain (loss) on investments and foreign currencies | | | (285,735 | ) | | | 11,806,286 | | | | (5,037,399 | ) | | | 15,255,565 | |
| | |
|
|
| |
|
|
| |
|
|
| |
|
|
|
Net realized and unrealized gain (loss) on investments and foreign currencies | | | 4,561,460 | | | | 18,001,863 | | | | 33,618,906 | | | | 31,446,184 | |
| | |
|
|
| |
|
|
| |
|
|
| |
|
|
|
NET INCREASE (DECREASE) IN NET ASSETS RESULTING FROM OPERATIONS | | $ | 4,158,623 | | | $ | 20,000,021 | | | $ | 42,137,080 | | | $ | 54,689,681 | |
| | |
|
|
| |
|
|
| |
|
|
| |
|
|
|
*Net of foreign withholding taxes on interest and dividends of | | $ | – | | | $ | 281 | | | $ | – | | | $ | 14,026 | |
| | |
|
|
| |
|
|
| |
|
|
| |
|
|
|
**Net of foreign withholding taxes on capital gains of | | $ | – | | | $ | – | | | $ | – | | | $ | – | |
| | |
|
|
| |
|
|
| |
|
|
| |
|
|
|
See Notes to Financial Statements
112
VALIC Company II
STATEMENTS OF CHANGES IN NET ASSETS
| | | | | | | | | | | | | | | | | | | | | | | | | | | | | | | | |
| | | AGGRESSIVE GROWTH
LIFESTYLE FUND
| | | CAPITAL
APPRECIATION FUND
| | | CONSERVATIVE GROWTH
LIFESTYLE FUND
| | | CORE BOND FUND
| |
| | | For the
Year Ended
August 31,
2010
| | | For the
Year Ended
August 31,
2009
| | | For the
Year Ended
August 31,
2010
| | | For the
Year Ended
August 31,
2009
| | | For the
Year Ended
August 31,
2010
| | | For the
Year Ended
August 31,
2009
| | | For the
Year Ended
August 31,
2010
| | | For the
Year Ended
August 31,
2009
| |
INCREASE (DECREASE) IN NET ASSETS | | | | | | | | | | | | | | | | | | | | | | | | | | | | | | | | |
OPERATIONS: | | | | | | | | | | | | | | | | | | | | | | | | | | | | | | | | |
Net investment income (loss) | | $ | 3,254,877 | | | $ | 1,626,204 | | | $ | 245,495 | | | $ | 443,377 | | | $ | 2,752,938 | | | $ | 1,939,547 | | | $ | 8,233,394 | | | $ | 8,701,792 | |
Net realized gain (loss) on investments and
foreign currencies | | | 6,084,170 | | | | (28,254,881 | ) | | | 1,395,367 | | | | (16,022,420 | ) | | | 4,003,727 | | | | (11,567,742 | ) | | | 6,435,977 | | | | (6,920,989 | ) |
Net unrealized gain (loss) on investments and foreign currencies | | | (2,055,308 | ) | | | 18,732,132 | | | | 1,733,969 | | | | (10,135,724 | ) | | | (246,147 | ) | | | 8,830,618 | | | | 9,424,385 | | | | 6,557,132 | |
| | |
|
|
| |
|
|
| |
|
|
| |
|
|
| |
|
|
| |
|
|
| |
|
|
| |
|
|
|
Net increase (decrease) in net assets resulting from operations | | | 7,283,739 | | | | (7,896,545 | ) | | | 3,374,831 | | | | (25,714,767 | ) | | | 6,510,518 | | | | (797,577 | ) | | | 24,093,756 | | | | 8,337,935 | |
| | |
|
|
| |
|
|
| |
|
|
| |
|
|
| |
|
|
| |
|
|
| |
|
|
| |
|
|
|
DISTRIBUTIONS TO SHAREHOLDERS FROM: | | | | | | | | | | | | | | | | | | | | | | | | | | | | | | | | |
Net investment income | | | (1,628,806 | ) | | | (1,922,321 | ) | | | (458,586 | ) | | | (56,733 | ) | | | (1,939,732 | ) | | | (1,434,347 | ) | | | (8,876,771 | ) | | | (11,242,372 | ) |
Net realized gain on securities | | | – | | | | (16,646,026 | ) | | | – | | | | – | | | | – | | | | (936,600 | ) | | | – | | | | – | |
| | |
|
|
| |
|
|
| |
|
|
| |
|
|
| |
|
|
| |
|
|
| |
|
|
| |
|
|
|
Total distributions to shareholders | | | (1,628,806 | ) | | | (18,568,347 | ) | | | (458,586 | ) | | | (56,733 | ) | | | (1,939,732 | ) | | | (2,370,947 | ) | | | (8,876,771 | ) | | | (11,242,372 | ) |
| | |
|
|
| |
|
|
| |
|
|
| |
|
|
| |
|
|
| |
|
|
| |
|
|
| |
|
|
|
Net increase (decrease) in net assets resulting from
capital share transactions (Note 6) | | | 23,304,679 | | | | 28,696,809 | | | | (10,824,776 | ) | | | (15,492,949 | ) | | | 20,279,022 | | | | 2,382,030 | | | | 68,389,328 | | | | (46,176,230 | ) |
| | |
|
|
| |
|
|
| |
|
|
| |
|
|
| |
|
|
| |
|
|
| |
|
|
| |
|
|
|
TOTAL INCREASE (DECREASE) IN NET ASSETS | | | 28,959,612 | | | | 2,231,917 | | | | (7,908,531 | ) | | | (41,264,449 | ) | | | 24,849,808 | | | | (786,494 | ) | | | 83,606,313 | | | | (49,080,667 | ) |
NET ASSETS: | | | | | | | | | | | | | | | | | | | | | | | | | | | | | | | | |
Beginning of period | | | 93,695,809 | | | | 91,463,892 | | | | 48,509,903 | | | | 89,774,352 | | | | 57,658,580 | | | | 58,445,074 | | | | 159,971,202 | | | | 209,051,869 | |
| | |
|
|
| |
|
|
| |
|
|
| |
|
|
| |
|
|
| |
|
|
| |
|
|
| |
|
|
|
End of period† | | $ | 122,655,421 | | | $ | 93,695,809 | | | $ | 40,601,372 | | | $ | 48,509,903 | | | $ | 82,508,388 | | | $ | 57,658,580 | | | $ | 243,577,515 | | | $ | 159,971,202 | |
| | |
|
|
| |
|
|
| |
|
|
| |
|
|
| |
|
|
| |
|
|
| |
|
|
| |
|
|
|
†Includes accumulated undistributed net
investment income (loss) of | | $ | 3,189,827 | | | $ | 1,563,756 | | | $ | 168,205 | | | $ | 378,294 | | | $ | 2,695,043 | | | $ | 1,881,837 | | | $ | 8,162,034 | | | $ | 8,162,034 | |
| | |
|
|
| |
|
|
| |
|
|
| |
|
|
| |
|
|
| |
|
|
| |
|
|
| |
|
|
|
See Notes to Financial Statements
113
VALIC Company II
STATEMENTS OF CHANGES IN NET ASSETS — (continued)
| | | | | | | | | | | | | | | | | | | | | | | | | | | | | | | | |
| | | HIGH YIELD BOND FUND
| | | INTERNATIONAL
SMALL CAP EQUITY FUND
| | | LARGE CAP VALUE FUND
| | | MID CAP GROWTH FUND
| |
| | | For the
Year Ended
August 31,
2010
| | | For the
Year Ended
August 31,
2009
| | | For the
Year Ended
August 31,
2010
| | | For the
Year Ended
August 31,
2009
| | | For the
Year Ended
August 31,
2010
| | | For the
Year Ended
August 31,
2009
| | | For the
Year Ended
August 31,
2010
| | | For the
Year Ended
August 31,
2009
| |
INCREASE (DECREASE) IN NET ASSETS | | | | | | | | | | | | | | | | | | | | | | | | | | | | | | | | |
OPERATIONS: | | | | | | | | | | | | | | | | | | | | | | | | | | | | | | | | |
Net investment income (loss) | | $ | 19,813,752 | | | $ | 18,036,157 | | | $ | 5,509,226 | | | $ | 8,347,935 | | | $ | 2,237,936 | | | $ | 2,786,979 | | | $ | (568,362 | ) | | $ | (328,925 | ) |
Net realized gain (loss) on investments and foreign currencies | | | 3,135,730 | | | | (41,463,781 | ) | | | 79,571,510 | | | | (238,697,487 | ) | | | 11,673,492 | | | | (93,421,179 | ) | | | 22,995,750 | | | | (55,323,978 | ) |
Net unrealized gain (loss) on investments and foreign currencies | | | 14,191,558 | | | | 10,085,121 | | | | (62,165,193 | ) | | | 121,474,799 | | | | (12,582,893 | ) | | | 20,093,536 | | | | (7,927,113 | ) | | | 8,449,095 | |
| | |
|
|
| |
|
|
| |
|
|
| |
|
|
| |
|
|
| |
|
|
| |
|
|
| |
|
|
|
Net increase (decrease) in net assets resulting from operations | | | 37,141,040 | | | | (13,342,503 | ) | | | 22,915,543 | | | | (108,874,753 | ) | | | 1,328,535 | | | | (70,540,664 | ) | | | 14,500,275 | | | | (47,203,808 | ) |
| | |
|
|
| |
|
|
| |
|
|
| |
|
|
| |
|
|
| |
|
|
| |
|
|
| |
|
|
|
DISTRIBUTIONS TO SHAREHOLDERS FROM: | | | | | | | | | | | | | | | | | | | | | | | | | | | | | | | | |
Net investment income | | | (18,592,117 | ) | | | (16,902,354 | ) | | | (8,411,268 | ) | | | (7,222,320 | ) | | | (2,822,618 | ) | | | (5,298,743 | ) | | | – | | | | – | |
Net realized gain on securities | | | – | | | | – | | | | – | | | | (37,148,329 | ) | | | – | | | | – | | | | – | | | | (869,715 | ) |
| | |
|
|
| |
|
|
| |
|
|
| |
|
|
| |
|
|
| |
|
|
| |
|
|
| |
|
|
|
Total distributions to shareholders | | | (18,592,117 | ) | | | (16,902,354 | ) | | | (8,411,268 | ) | | | (44,370,649 | ) | | | (2,822,618 | ) | | | (5,298,743 | ) | | | – | | | | (869,715 | ) |
| | |
|
|
| |
|
|
| |
|
|
| |
|
|
| |
|
|
| |
|
|
| |
|
|
| |
|
|
|
Net increase (decrease) in net assets resulting from capital share transactions (Note 6) | | | 51,255,186 | | | | 14,778,758 | | | | (35,903,630 | ) | | | 89,619,614 | | | | (10,438,605 | ) | | | (75,085,149 | ) | | | (9,977,544 | ) | | | (7,285,965 | ) |
| | |
|
|
| |
|
|
| |
|
|
| |
|
|
| |
|
|
| |
|
|
| |
|
|
| |
|
|
|
TOTAL INCREASE (DECREASE) IN NET ASSETS | | | 69,804,109 | | | | (15,466,099 | ) | | | (21,399,355 | ) | | | (63,625,788 | ) | | | (11,932,688 | ) | | | (150,924,556 | ) | | | 4,522,731 | | | | (55,359,488 | ) |
NET ASSETS: | | | | | | | | | | | | | | | | | | | | | | | | | | | | | | | | |
Beginning of period | | $ | 191,246,009 | | | | 206,712,108 | | | $ | 562,725,332 | | | | 626,351,120 | | | $ | 157,710,809 | | | | 308,635,365 | | | $ | 158,841,038 | | | | 214,200,526 | |
| | |
|
|
| |
|
|
| |
|
|
| |
|
|
| |
|
|
| |
|
|
| |
|
|
| |
|
|
|
End of period† | | $ | 261,050,118 | | | $ | 191,246,009 | | | $ | 541,325,977 | | | $ | 562,725,332 | | | $ | 145,778,121 | | | $ | 157,710,809 | | | $ | 163,363,769 | | | $ | 158,841,038 | |
| | |
|
|
| |
|
|
| |
|
|
| |
|
|
| |
|
|
| |
|
|
| |
|
|
| |
|
|
|
†Includes accumulated undistributed net
investment income (loss) of | | $ | 18,940,666 | | | $ | 17,716,611 | | | $ | 2,713,203 | | | $ | 6,587,486 | | | $ | 2,044,297 | | | $ | 2,644,385 | | | $ | (3,148 | ) | | $ | (123,818 | ) |
| | |
|
|
| |
|
|
| |
|
|
| |
|
|
| |
|
|
| |
|
|
| |
|
|
| |
|
|
|
See Notes to Financial Statements
114
VALIC Company II
STATEMENTS OF CHANGES IN NET ASSETS — (continued)
| | | | | | | | | | | | | | | | | | | | | | | | | | | | | | | | |
| | | MID CAP VALUE FUND
| | | MODERATE GROWTH
LIFESTYLE FUND
| | | MONEY MARKET II FUND
| | | SMALL CAP GROWTH FUND
| |
| | | For the
Year Ended
August 31,
2010
| | | For the
Year Ended
August 31,
2009
| | | For the
Year Ended
August 31,
2010
| | | For the
Year Ended
August 31,
2009
| | | For the
Year Ended
August 31,
2010
| | | For the
Year Ended
August 31,
2009
| | | For the
Year Ended
August 31,
2010
| | | For the
Year Ended
August 31,
2009
| |
INCREASE (DECREASE) IN NET ASSETS | | | | | | | | | | | | | | | | | | | | | | | | | | | | | | | | |
OPERATIONS: | | | | | | | | | | | | | | | | | | | | | | | | | | | | | | | | |
Net investment income (loss) | | $ | 2,865,354 | | | $ | 4,985,357 | | | $ | 5,904,199 | | | $ | 3,392,468 | | | $ | 22,595 | | | $ | 2,812,658 | | | $ | (402,837 | ) | | $ | (303,461 | ) |
Net realized gain (loss) on investments and foreign currencies | | | 36,906,484 | | | | (133,818,351 | ) | | | 9,745,997 | | | | (39,633,255 | ) | | | 243,367 | | | | 122,315 | | | | 4,847,195 | | | | (10,731,731 | ) |
Net unrealized gain (loss) on investments and
foreign currencies | | | 3,200,042 | | | | 31,672,785 | | | | (2,751,076 | ) | | | 28,745,258 | | | | – | | | | – | | | | (285,735 | ) | | | 3,158,863 | |
| | |
|
|
| |
|
|
| |
|
|
| |
|
|
| |
|
|
| |
|
|
| |
|
|
| |
|
|
|
Net increase (decrease) in net assets resulting from operations | | | 42,971,880 | | | | (97,160,209 | ) | | | 12,899,120 | | | | (7,495,529 | ) | | | 265,962 | | | | 2,934,973 | | | | 4,158,623 | | | | (7,876,329 | ) |
| | |
|
|
| |
|
|
| |
|
|
| |
|
|
| |
|
|
| |
|
|
| |
|
|
| |
|
|
|
DISTRIBUTIONS TO SHAREHOLDERS FROM: | | | | | | | | | | | | | | | | | | | | | | | | | | | | | | | | |
Net investment income | | | (5,491,988 | ) | | | (2,455,687 | ) | | | (3,392,906 | ) | | | (3,304,776 | ) | | | (22,595 | ) | | | (2,812,871 | ) | | | – | | | | – | |
Net realized gain on securities | | | – | | | | (10,286,997 | ) | | | – | | | | (3,892,788 | ) | | | – | | | | – | | | | – | | | | (493,157 | ) |
| | |
|
|
| |
|
|
| |
|
|
| |
|
|
| |
|
|
| |
|
|
| |
|
|
| |
|
|
|
Total distributions to shareholders | | | (5,491,988 | ) | | | (12,742,684 | ) | | | (3,392,906 | ) | | | (7,197,564 | ) | | | (22,595 | ) | | | (2,812,871 | ) | | | – | | | | (493,157 | ) |
| | |
|
|
| |
|
|
| |
|
|
| |
|
|
| |
|
|
| |
|
|
| |
|
|
| |
|
|
|
Net increase (decrease) in net assets resulting from capital share transactions (Note 6) | | | (65,359,042 | ) | | | (29,789,926 | ) | | | 41,548,016 | | | | 10,774,203 | | | | (39,678,241 | ) | | | (76,092,412 | ) | | | 1,288,170 | | | | 2,618,493 | |
| | |
|
|
| |
|
|
| |
|
|
| |
|
|
| |
|
|
| |
|
|
| |
|
|
| |
|
|
|
TOTAL INCREASE (DECREASE) IN NET ASSETS | | | (27,879,150 | ) | | | (139,692,819 | ) | | | 51,054,230 | | | | (3,918,890 | ) | | | (39,434,874 | ) | | | (75,970,310 | ) | | | 5,446,793 | | | | (5,750,993 | ) |
NET ASSETS: | | | | | | | | | | | | | | | | | | | | | | | | | | | | | | | | |
Beginning of period | | | 478,457,239 | | | | 618,150,058 | | | | 141,786,327 | | | | 145,705,217 | | | | 253,241,842 | | | | 329,212,152 | | | | 42,309,904 | | | | 48,060,897 | |
| | |
|
|
| |
|
|
| |
|
|
| |
|
|
| |
|
|
| |
|
|
| |
|
|
| |
|
|
|
End of period† | | $ | 450,578,089 | | | $ | 478,457,239 | | | $ | 192,840,557 | | | $ | 141,786,327 | | | $ | 213,806,968 | | | $ | 253,241,842 | | | $ | 47,756,697 | | | $ | 42,309,904 | |
| | |
|
|
| |
|
|
| |
|
|
| |
|
|
| |
|
|
| |
|
|
| |
|
|
| |
|
|
|
†Includes accumulated undistributed net
investment income (loss) of | | $ | 2,223,378 | | | $ | 4,668,055 | | | $ | 5,793,902 | | | $ | 3,282,609 | | | $ | (5,309 | ) | | $ | 26,499 | | | $ | (2,046 | ) | | $ | (70,938 | ) |
| | |
|
|
| |
|
|
| |
|
|
| |
|
|
| |
|
|
| |
|
|
| |
|
|
| |
|
|
|
See Notes to Financial Statements
115
VALIC Company II
STATEMENTS OF CHANGES IN NET ASSETS — (continued)
| | | | | | | | | | | | | | | | | | | | | | | | |
| | | SMALL CAP VALUE FUND
| | | SOCIALLY RESPONSIBLE FUND
| | | STRATEGIC BOND FUND
| |
| | | For the
Year Ended
August 31,
2010
| | | For the
Year Ended
August 31,
2009
| | | For the
Year Ended
August 31,
2010
| | | For the
Year Ended
August 31,
2009
| | | For the
Year Ended
August 31,
2010
| | | For the
Year Ended
August 31,
2009
| |
INCREASE (DECREASE) IN NET ASSETS | | | | | | | | | | | | | | | | | | | | | | | | |
OPERATIONS: | | | | | | | | | | | | | | | | | | | | | | | | |
Net investment income (loss) | | $ | 1,998,158 | | | $ | 3,675,071 | | | $ | 8,518,174 | | | $ | 10,999,413 | | | $ | 23,243,497 | | | $ | 20,218,947 | |
Net realized gain (loss) on investments and foreign currencies | | | 6,195,577 | | | | (43,503,747 | ) | | | 38,656,305 | | | | (232,648,466 | ) | | | 16,190,619 | | | | (35,974,202 | ) |
Net unrealized gain (loss) on investments and foreign currencies | | | 11,806,286 | | | | (6,787,341 | ) | | | (5,037,399 | ) | | | 40,630,250 | | | | 15,255,565 | | | | 16,463,585 | |
| | |
|
|
| |
|
|
| |
|
|
| |
|
|
| |
|
|
| |
|
|
|
Net Increase (decrease) in net assets resulting from operations | | | 20,000,021 | | | | (46,616,017 | ) | | | 42,137,080 | | | | (181,018,803 | ) | | | 54,689,681 | | | | 708,330 | |
| | |
|
|
| |
|
|
| |
|
|
| |
|
|
| |
|
|
| |
|
|
|
DISTRIBUTIONS TO SHAREHOLDERS FROM: | | | | | | | | | | | | | | | | | | | | | | | | |
Net investment income | | | (3,699,201 | ) | | | (2,764,873 | ) | | | (11,153,884 | ) | | | (14,145,313 | ) | | | (19,122,627 | ) | | | (24,084,315 | ) |
Net realized gain on securities | | | – | | | | (14,835,780 | ) | | | – | | | | (2,733,593 | ) | | | – | | | | – | |
| | |
|
|
| |
|
|
| |
|
|
| |
|
|
| |
|
|
| |
|
|
|
Total distributions to shareholders | | | (3,699,201 | ) | | | (17,600,653 | ) | | | (11,153,884 | ) | | | (16,878,906 | ) | | | (19,122,627 | ) | | | (24,084,315 | ) |
| | |
|
|
| |
|
|
| |
|
|
| |
|
|
| |
|
|
| |
|
|
|
Net increase (decrease) in net assets resulting from capital share transactions
(Note 6) | | | (14,435,451 | ) | | | 103,411,217 | | | | (14,549,650 | ) | | | (58,962,191 | ) | | | 75,554,122 | | | | 19,978,350 | |
| | |
|
|
| |
|
|
| |
|
|
| |
|
|
| |
|
|
| |
|
|
|
TOTAL INCREASE (DECREASE) IN NET ASSETS | | | 1,865,369 | | | | 39,194,547 | | | | 16,433,546 | | | | (256,859,900 | ) | | | 111,121,176 | | | | (3,397,635 | ) |
NET ASSETS: | | | | | | | | | | | | | | | | | | | | | | | | |
Beginning of period | | | 345,551,404 | | | | 306,356,857 | | | | 656,132,184 | | | | 912,992,084 | | | | 351,497,822 | | | | 354,895,457 | |
| | |
|
|
| |
|
|
| |
|
|
| |
|
|
| |
|
|
| |
|
|
|
End of period† | | $ | 347,416,773 | | | $ | 345,551,404 | | | $ | 672,565,730 | | | $ | 656,132,184 | | | $ | 462,618,998 | | | $ | 351,497,822 | |
| | |
|
|
| |
|
|
| |
|
|
| |
|
|
| |
|
|
| |
|
|
|
†Includes accumulated undistributed net investment income (loss) of | | $ | 2,153,338 | | | $ | 3,540,183 | | | $ | 8,187,030 | | | $ | 10,826,622 | | | $ | 24,504,200 | | | $ | 17,992,786 | |
| | |
|
|
| |
|
|
| |
|
|
| |
|
|
| |
|
|
| |
|
|
|
See Notes to Financial Statements
116
VALIC Company II
NOTES TO FINANCIAL STATEMENTS
Note 1 — Organization
VALIC Company II (the “Series” or “VC II”) was organized as a Delaware business trust on May 6, 1998, by The Variable Annuity Life Insurance Company (“VALIC” or the “Adviser”). VALIC, the investment adviser to VC II, is an indirect wholly-owned subsidiary of American International Group, Inc. (“AIG”). VC II is registered under the Investment Company Act of 1940, as amended (the “1940 Act”), as an open-end, management investment company. The Series consists of 15 separate mutual funds (collectively the “Funds” or each a “Fund”), each of which issues its own class of shares of beneficial interest:
| | |
| Aggressive Growth Lifestyle Fund* | | Mid Cap Value Fund |
| Capital Appreciation Fund | | Moderate Growth Lifestyle Fund* |
| Conservative Growth Lifestyle Fund* | | Money Market II Fund |
| Core Bond Fund | | Small Cap Growth Fund |
| High Yield Bond Fund | | Small Cap Value Fund |
| International Small Cap Equity Fund | | Socially Responsible Fund |
| Large Cap Value Fund | | Strategic Bond Fund |
| Mid Cap Growth Fund | | |
| * | The Lifestyle Funds represent “Fund of Funds” which invest in either the VALIC Company I (“VC I”) or VC II Mutual Funds. |
Each Fund is diversified with the exception of Aggressive Growth Lifestyle Fund, Conservative Growth Lifestyle Fund and Moderate Growth Lifestyle Fund, which are non-diversified as defined by the 1940 Act.
Indemnifications. Under VC II’s organizational documents, its officers and trustees are indemnified against certain liabilities arising out of the performance of their duties to the Funds. In addition, in the normal course of business, VC II enters into contracts that contain the obligation to indemnify others. The Funds maximum exposure under these arrangements is unknown. Currently, however, VC II expects the risk of loss to be remote.
Note 2 — Significant Accounting Policies
The preparation of financial statements in accordance with U.S. generally accepted accounting principles (“GAAP”) requires management to make estimates and assumptions that affect the reported amounts and disclosures in the financial statements. Actual results could differ from these estimates and those differences could be significant. The following is a summary of the significant accounting policies followed by the Funds in the preparation of their financial statements:
A. Security Valuation
Stocks are generally valued based upon closing sales prices reported on recognized securities exchanges. Stocks listed on the NASDAQ are valued using the NASDAQ Official Closing Price (“NOCP”). Generally, the NOCP will be the last sale price unless the reported trade for the stock is outside the range of the bid/ask price. In such cases, the NOCP will be normalized to the nearer of the bid or ask price. For listed securities having no sales reported and for unlisted securities, such securities will be valued based upon the last reported bid price.
As of the close of regular trading on the New York Stock Exchange, securities traded primarily on security exchanges outside the United States are valued at the last sale price on such exchanges on the day of valuation, or if there is no sale on the day of valuation, at the last-reported bid price. If a security’s price is available from more than one exchange, the Fund uses the exchange that is the primary market for the security. However, depending on the foreign market, closing prices may be up to 15 hours old when they are used to price the Fund’s shares, and the Fund may determine that certain closing prices do not reflect the fair value of securities. This determination will be based on review of a number of factors, including developments in foreign markets, the performance of U.S. securities markets, and the performance of instruments trading in U. S. markets that represent foreign securities and baskets of foreign securities. If the Fund determines that closing prices do not reflect the fair value of the securities, the Fund will adjust the previous closing prices in accordance with pricing procedures approved by the Board to reflect what it believes to be the fair value of the securities as of the close of regular trading on the New York Stock Exchange. The Fund may also fair value securities in other situations, for example, when a particular foreign market is closed but the Fund is open. For foreign equity securities, the Fund uses an outside pricing service to provide it with closing market prices and information used for adjusting those prices.
Non-convertible bonds and debentures, other long-term debt securities, and short term debt securities with maturities in excess of 60 days, are valued at bid prices obtained for the day of valuation from a bond pricing service, when such prices are available. The pricing services may use valuation models or matrix pricing which considers information with respect to comparable bond and note transactions, quotations from bond dealers, or by reference to other securities that are considered comparable in such characteristics as rating, interest rate, and maturity date, option adjusted spreads models, prepayments projections, interest rate spreads, and yield curves to determine current value. If a vendor quote is unavailable, the securities may be priced at the mean of two independent quotes obtained from brokers.
Short-term securities with 60 days or less to maturity are amortized to maturity based on their cost to the Fund if acquired within 60 days of maturity or, if already held by the Fund on the 60th day, are amortized to maturity based on the value determined on the 61st day.
Senior Secured Floating Rate Loans (“Loans”) for which an active secondary market exists to a reliable degree, will be valued at the mean of the last available bid and ask prices in the market for such Loans, as provided by a third party pricing service.
Futures contracts and options traded on national securities exchanges are valued as of the close of the exchange upon which they trade. Forward contracts are valued at the 4:00 p.m. eastern time forward rate. Other securities are valued on the basis of last sale or bid price (if a last sale price is not available) in what is, in the opinion of the Adviser, the broadest and most representative market, that may be either a securities exchange or the over-the-counter market.
117
VALIC Company II
NOTES TO FINANCIAL STATEMENTS — (continued)
Investments in open-end and closed-end registered investment companies that do not trade on an exchange are valued at the end of day net asset value per share. Investments in open-end and closed-end registered investment companies that trade on an exchange are valued at the last sales price or official closing price as of the close of the customary trading session on the exchange where the security is principally traded.
For the Money Market II Fund, securities are valued at amortized cost, which approximates market value. The amortized cost method involves valuing a security at its cost on the date of purchase and thereafter assuming a constant amortization to maturity of any discount or premium. In accordance with rule 2a-7 under the 1940 Act, VC II’s Board of Trustees (the “Board” or the “Trustees”) has adopted procedures intended to stabilize the Money Market II Fund’s net asset value per share at $1.00. These procedures include the determination, at such intervals as the Board deems appropriate and reasonable in light of current market conditions, of the extent, if any, to which the Money Market II Fund’s market-based net asset value per share deviates from the Fund’s amortized cost per share. The calculation of such deviation is referred to as “shadow pricing.” For purposes of these market-based valuations, securities for which market quotations are not readily available are fair valued, as determined pursuant to procedures adopted in good faith by the Board.
Securities for which market quotations are not readily available or if a development/significant event occurs that may significantly impact the value of the security, then these securities are valued, as determined pursuant to procedures adopted in good faith by the Board. There is no single standard for making fair value determinations, which may result in prices that vary from those of other funds.
The various inputs that may be used to determine the value of the Funds’ investments are summarized into three broad levels listed below:
Level 1 — Unadjusted quoted prices in active markets for identical securities
Level 2 — Other significant observable inputs (including quoted prices for similar securities, interest rates, prepayment speeds, credit risk, referenced indicies, quoted prices in inactive markets, adjusted quoted prices in active markets, adjusted quoted prices on foreign equity securities that were adjusted in accordance with pricing procedures approved by the Board, etc.)
Level 3 — Significant unobservable inputs (includes inputs that reflect the Funds’ own assumptions about the assumptions market participants would use in pricing the security, developed based on the best information available under the circumstances)
The inputs or methodology used for valuing securities are not necessarily an indication of the risk associated with investing in those securities.
The summary of the inputs used to value the Funds’ net assets as of August 31, 2010 are reported on a schedule following the Portfolio of Investments.
B. Derivative Instruments
The following tables present the value of derivatives held as of August 31, 2010, by their primary underlying risk exposure and respective location on the Statement of Assets and Liabilities and the effect of derivatives on the Statement of Operations for the year ending August 31, 2010:
| | | | | | | | | | | | |
| | | Small Cap Value Fund
| |
| | | Asset Derivatives 2010
| | | Liability Derivatives 2010
| |
Derivative Contracts(1)
| | Statements of Assets and Liabilities Location
| | Fair Value
| | | Statements of Assets and Liabilities Location
| | Fair Value
| |
Equity contracts(2)(3) | | Variation margin on futures contracts | | $ | 3,920 | | | Variation margin on futures contracts | | $ | — | |
| | | | |
|
|
| | | |
|
|
|
| | | | | | | | | | |
Derivative Contracts(1)
| | Location of Gain (Loss) on
Derivatives Recognized in
Statement of Operations
| | Realized Gain (Loss) on
Derivatives Recognized in
Statement of Operations
| | | Change in Unrealized
Appreciation
(Depreciation) on
Derivatives Recognized
in Statement of
Operations
| |
Equity contracts(2)(3) | | Net realized gain (loss) on futures contracts/Change in unrealized appreciation (depreciation) on futures contracts | | $ | 1,532,054 | | | $ | (943,617 | ) |
| | | | |
|
|
| |
|
|
|
| (1) | The Fund’s derivative contracts held during the year ended August 31, 2010, are not accounted for as hedging instruments under accounting principles generally accepted in the United States of America. |
| (2) | The average notional amount outstanding for equity futures contracts was $10,742. |
| (3) | The variation margin on futures contracts is included in the cumulative appreciation (depreciation) of $(153,628) as reported in the Portfolio of Investments. |
118
VALIC Company II
NOTES TO FINANCIAL STATEMENTS — (continued)
| | | | | | | | | | | | |
| | | Socially Responsible Fund
| |
| | | Asset Derivatives 2010
| | | Liability Derivatives 2010
| |
Derivative Contracts(1)
| | Statements of Assets and Liabilities Location
| | Fair Value
| | | Statements of Assets and Liabilities Location
| | Fair Value
| |
Equity contracts(2)(3) | | Variation margin on futures contracts | | $ | 43,200 | | | Variation margin on futures contracts | | $ | — | |
| | | | |
|
|
| | | |
|
|
|
| | | | | | | | | | |
Derivative Contracts(1)
| | Location of Gain (Loss) on
Derivatives Recognized in
Statement of Operations
| | Realized Gain (Loss) on
Derivatives Recognized in
Statement of Operations
| | | Change in Unrealized
Appreciation
(Depreciation) on
Derivatives Recognized
in Statement of
Operations
| |
Equity contracts(2)(3) | | Net realized gain (loss) on futures contracts/Change in unrealized appreciation (depreciation) on futures contracts | | $ | 5,806,321 | | | $ | (3,204,489 | ) |
| | | | |
|
|
| |
|
|
|
| (1) | The Fund’s derivative contracts held during the year ended August 31, 2010, are not accounted for as hedging instruments under accounting principles generally accepted in the United States of America. |
| (2) | The average notional amount outstanding for equity futures contracts was $19,329. |
| (3) | The variation margin on futures is included in the cumulative appreciation (depreciation) of $(107,726) as reported in the Portfolio of Investments. |
Forward Foreign Currency Contracts. Certain Funds may enter into forward foreign currency contracts (“forward contracts”) for various purposes, including to facilitate settlement of foreign currency denominated Fund transactions, to attempt to protect securities and related receivables and payables against changes in future foreign exchange rates or to enhance return. As of August 31, 2010, none of the Funds had open forward contracts.
A forward contract is an agreement between two parties to buy or sell currency at a set price on a future date. The market value of the contract will fluctuate with changes in currency exchange rates. The contract is marked-to-market daily using the forward rate and the change in market value is recorded by the Fund as unrealized gain or loss on the Statement of Assets and Liabilities. On the settlement date, the Fund records either realized gains or losses equal to the difference between the value of the contract at the time it was opened and the value at the time it was closed.
Risks to the Funds of entering into forward contracts include counterparty risk and market risk. Counterparty risk arises upon entering into these contracts from the potential inability of counterparties to meet the terms of their contracts. Market risk is the risk that the value of the forward contract will depreciate due to unfavorable changes in the exchange rates. These contracts may involve market risk in excess of the unrealized gain or loss reflected on the Statement of Assets and Liabilities. Currency transactions are also subject to risks different from those of other Fund transactions. Because currency control is of great importance to the issuing governments and influences economic planning and policy, purchases and sales of currency and related instruments can be adversely affected by government exchange controls, limitations or restrictions on repatriation of currency, and manipulations or exchange restrictions imposed by governments.
Futures Contracts. Certain of the Funds may enter into futures contracts for various purposes, including to increase or decrease exposure to equity or bond markets, or to hedge against changes in interest rates, prices of stocks, bonds or other instruments, or currency rates, or to enhance income or total return. During the year ended August 31, 2010, the Small Cap Value Fund and Socially Responsible Fund used equity futures contracts to increase exposure to equity markets. As of August 31, 2010, the following Funds had open futures contracts: Small Cap Value Fund and Socially Responsible Fund, which are reported on a schedule following each Fund’s Portfolio of Investments.
A futures contract is an agreement between two parties to buy and sell a financial instrument at a set price on a future date. Upon entering into a futures transaction, a Fund will be required to segregate an initial margin payment of cash or other liquid securities with the Futures Commission Merchant (the “broker”). Common futures contracts include interest rate futures, single stock futures, stock index futures and currency futures. An interest rate futures contract is a contract to buy or sell specified debt securities at a future time for a fixed price. A single stock futures contract is a contract to buy a single stock at a future time for a fixed price. A stock index futures contract is similar in economic effect to a single stock futures contract, except that rather than being based on a specific security it is based on a specified index of stocks and not the stocks themselves. A currency futures contract is a contract to buy or sell a specific foreign currency at a future time for a fixed price.
A Fund’s participation in the futures markets involves certain risks, including imperfect correlation between movements in the price of futures contracts and movements in the price of the securities hedged or used for cover. Pursuant to a contract, the Funds agree to receive from or pay to the broker an amount of cash equal to the daily fluctuation in the value of the contract. Such receipts or payments are known as “variation margin” and are recorded by the Funds as unrealized appreciation or depreciation on the Statement of Assets and Liabilities. When a contract is closed, the Funds record a realized gain or loss equal to the difference between the value of the contract at the time it was opened and the value at the time it was closed. Futures contracts are generally conducted through regulated exchanges, which minimize counterparty credit risks.
The primary risk to the Funds of entering into futures contracts is market risk. Market risk is the risk that there will be an unfavorable change in the interest rate, value or currency rate of the underlying security(ies). Futures contracts involve, to varying degrees, risk of loss in excess of the variation margin disclosed on the Statement of Assets and Liabilities.
C. Structured Securities
Certain of the Funds may invest in structured securities for various purposes, including managing exposure to fluctuations in currency exchange rates, interest rates, commodity prices, indices or other financial indicators or for speculation. As of August 31, 2010, the Core Bond Fund held one structured security.
Structured securities include notes, bonds or debentures that provide for the payment of principal of, and/or interest in, amounts determined by reference to changes in the value of specific currencies, interest rates, commodities, indices or other financial indicators (the “Reference”) or the relative change in two or more References. The interest rate or the principal amount payable upon maturity or redemption may be increased or decreased depending upon changes in the applicable Reference. The terms of structured securities may provide that under certain circumstances no principal is due at maturity and, therefore, may result in the loss of a Fund’s entire investment in the structured security.
119
VALIC Company II
NOTES TO FINANCIAL STATEMENTS — (continued)
Structured securities may be positively or negatively indexed, so that appreciation of the Reference may produce an increase or decrease in the interest rate or value of the security at maturity. In addition, the change in interest rate or the value of the security at maturity may be a multiple of the change in the value of the Reference (i.e. leveraged structured securities). Consequently, leveraged structured securities entail a greater degree of market risk than other types of debt obligations. Structured securities may also be more volatile, less liquid and more difficult to accurately price than less complex fixed income investments (i.e. investment grade corporate bonds).
The risks of investing in a particular structured security will depend on the terms of the investment; however, structured securities generally will expose the Fund to counterparty risk, illiquidity risk and market risk. Counterparty risk arises from the potential inability of counterparties to meet the terms of their contract. Structured securities are typically sold in private placement transactions with no active trading market. Market risk is the risk that there will be an unfavorable change in the Reference. Investments in structured securities may be more volatile than their underlying instruments; however, generally any loss is limited to the amount of the original investment.
D. Repurchase Agreements
The Funds along with other affiliated registered investment companies, pursuant to exemptive relief granted by the Securities and Exchange Commission, may transfer uninvested cash balances into a single joint account, the daily aggregate balance of which is invested in one or more repurchase agreements collateralized by U.S. Treasury or federal agency obligations. For repurchase agreements and joint repurchase agreements, the Funds’ custodian takes possession of the collateral pledged for investments in such repurchase agreements. The underlying collateral is valued daily on a mark-to-market basis, plus accrued interest, to ensure that the value, at the time the agreement is entered into, is equal to at least 102% of the repurchase price, including accrued interest. In the event of default of the obligation to repurchase, a Fund has the right to liquidate the collateral and apply the proceeds in satisfaction of the obligation. If the seller defaults and the value of the collateral declines or if bankruptcy proceedings are commenced with respect to the seller of the security, realization of the collateral by the Fund may be delayed or limited.
As of August 31, 2010, the following funds held an undivided interest in the joint repurchase agreement with State Street Bank & Trust Co.:
| | | | | | | | |
Fund
| | Percentage
Ownership
| | | Principal
Amount
| |
Small Cap Value | | | 0.80 | % | | $ | 2,431,000 | |
Socially Responsible | | | 3.51 | % | | | 10,643,000 | |
As of such date, the repurchase agreement in that joint account and the collateral therefore were as follows:
State Street Bank & Trust Co., dated August 31, 2010, bearing interest at a rate of 0.01% per annum, with a principal amount of $303,234,000, a repurchase price of $303,234,084, and a maturity date of September 1, 2010. The repurchase agreement is collateralized by the following:
| | | | | | | | | | | | | | | | |
Type of Collateral
| | Interest
Rate
| | | Maturity
Date
| | | Principal
Amount
| | | Market Value
| |
U.S. Treasury Notes | | | 2.50 | % | | | 04/30/15 | | | $ | 290,315,000 | | | $ | 309,301,601 | |
As of August 31, 2010, the following funds held an undivided interest in the joint repurchase agreement with UBS Securities, LLC:
| | | | | | | | |
Fund
| | Percentage
Ownership
| | | Principal
Amount
| |
Money Market II Fund | | | 10.92 | % | | $ | 21,842,000 | |
As of such date, the repurchase agreement in that joint account and the collateral therefore were as follows:
UBS Securities LLC, dated August 31, 2010, bearing interest at a rate of 0.22% per annum, with a principal amount of $200,000,000, a repurchase price of $200,001,222, and a maturity date of September 1, 2010. The repurchase agreement is collateralized by the following:
| | | | | | | | | | | | | | | | |
Type of Collateral
| | Interest
Rate
| | | Maturity
Date
| | | Principal
Amount
| | | Market
Value
| |
U.S. Treasury Inflation Index Notes | | | 3.63 | % | | | 04/15/28 | | | $ | 112,011,000 | | | $ | 204,000,034 | |
E. Foreign Currency Translation
The books and records of the Series are maintained in U.S. dollars. Assets and liabilities denominated in foreign currencies and commitments under forward foreign currency contracts are translated into U.S. dollars based on the exchange rate of such currencies against U.S. dollars on the date of valuation.
The Series does not isolate that portion of the results of operations arising as a result of changes in the foreign exchange rates from the changes in the market prices of securities held at the end of the period. Similarly, the Series does not isolate the effect of changes in foreign exchange rates from the changes in the market prices of portfolio securities sold during the period.
Realized foreign exchange gains and losses on other assets and liabilities and change in unrealized foreign exchange gains and losses on other assets and liabilities located in the Statement of Operations include realized foreign exchange gains and losses from currency gains or losses between the trade and the settlement dates of securities transactions, the difference between the amounts of interest, dividends and foreign withholding taxes recorded on the Series books and the U.S. dollar equivalent amounts actually received or paid and changes in the unrealized foreign exchange gains and losses relating to the other assets and liabilities arising as a result of changes in the exchange rate.
F. Securities Transactions, Investment Income, Expenses, Dividends and Distributions to Shareholders
Security transactions are recorded on a trade date basis. Realized gains and losses on securities sold are determined on the basis of identified cost. Dividend income and capital gain distributions received are recorded on the ex-dividend date except for certain dividends from foreign securities, which are recorded as soon as the Funds are informed
120
VALIC Company II
NOTES TO FINANCIAL STATEMENTS — (continued)
after the ex-dividend date. Distributions received from the Fund’s investments in U.S. real estate investment trusts (“REITS”) often include a “return of capital” which is recorded by the Funds as a reduction to the cost basis of the securities held. Interest income is accrued daily except when collection is not expected. For financial statement purposes, the Funds amortize all premiums and accrete all discounts on fixed income securities. Funds which earn foreign income and capital gains may be subject to foreign withholding taxes and capital gains taxes at various rates. Under applicable foreign law, a withholding of tax may be imposed on interest, dividends and capital gains at various rates. India, Thailand and certain other countries tax regulations require that taxes be paid on capital gains realized by the Fund.
Common expenses incurred by the Series are allocated among the Funds based upon relative net assets or other appropriate allocation methods. In all other respects, expenses are charged to each Fund as incurred on a specific identification basis. For the Lifestyle Funds, the expenses included in the accompanying financial statements reflect the expenses of the Lifestyle Funds and do not include any expenses associated with the underlying Funds.
Dividends from net investment income, if any, are normally declared and paid annually, except for the Money Market II Fund, which declares daily and pays monthly. Distributions from net realized capital gains, if any, are normally declared and paid annually.
The Funds record dividends and distributions to their shareholders on the ex-dividend date. The amount of dividends and distributions from net investment income and net realized gains are determined and presented in accordance with federal income tax regulations, which may differ from U.S. generally accepted accounting principles. These “book/ tax” differences are either considered temporary or permanent in nature. To the extent these differences are permanent in nature, such amounts are reclassified within the capital accounts at fiscal year end based on their federal tax-basis treatment; temporary differences do not require reclassification. Net investment income (loss), net realized gain (loss) and net assets are not affected by these reclassifications.
Each Fund intends to comply with the requirements of the Internal Revenue Code, as amended, applicable to regulated investment companies and distribute all of its taxable income, including any net realized gain on investments, to its shareholders. Therefore, no federal tax provision is required. Each Fund is considered a separate entity for tax purposes. The Funds file U.S. federal and certain state income tax returns. With few exceptions, the Funds are no longer subject to U.S. federal and state tax examinations by tax authorities for returns ending before 2006.
Note 3 — Advisory Fees and Other Transactions with Affiliates
VALIC, serves as investment adviser to VC II. Certain officers and trustees of VC II are officers and directors of VALIC or affiliates of VALIC. VALIC receives from VC II a monthly fee based on each Fund’s average daily net asset value at the following annual rates:
| | |
| Aggressive Growth Lifestyle Fund | | 0.10% |
| Capital Appreciation Fund† | | 0.55% on first $1 billion |
| | | 0.525% on asset over $1 billion |
| Conservative Growth Lifestyle Fund | | 0.10% |
| Core Bond Fund | | 0.50% on the first $200 million |
| | | 0.45% on the next $300 million |
| | | 0.40% on assets over $500 million |
| High Yield Bond Fund | | 0.65% on the first $150 million |
| | | 0.60% on the next $350 million |
| | | 0.55% on assets over $500 million |
| International Small Cap Equity Fund* | | 0.90% on the first $100 million |
| | | 0.80% on the next $650 million |
| | | 0.75% on assets over $750 million |
| Large Cap Value Fund†† | | 0.50% on the first $500 million |
| | | 0.475% on assets over $500 million |
| Mid Cap Growth Fund | | 0.80% on the first $50 million |
| | | 0.75% on the next $50 million |
| | | 0.70% on the next $150 million |
| | | 0.65% on the next $250 million |
| | | 0.60% on assets over $500 million |
| Mid Cap Value Fund | | 0.75% on the first $100 million |
| | | 0.725% on the next $150 million |
| | | 0.70% on the next $250 million |
| | | 0.675% on the next $250 million |
| | | 0.65% on the assets over $750 million |
| Moderate Growth Lifestyle Fund | | 0.10% |
| Money Market II Fund@ | | 0.25% |
121
VALIC Company II
NOTES TO FINANCIAL STATEMENTS — (continued)
| | |
| Small Cap Growth Fund | | 0.85% on the first $100 million |
| | | 0.80% on assets over $100 million |
| Small Cap Value Fund | | 0.75% on the first $50 million |
| | | 0.65% on the assets over $50 million |
| Socially Responsible Fund** | | 0.25% on the first $1 billion |
| | | 0.24% on assets over $1 billion |
| Strategic Bond Fund | | 0.60% on the first $200 million |
| | | 0.50% on the next $300 million |
| | | 0.45% on assets over $500 million |
| * | Prior to December 14, 2009, the advisory fee for International Small Cap Equity Fund was 0.90% on the first $100 million and 0.80% on assets over $100 million. |
| ** | Prior to December 1, 2009, the advisory fee for Socially Responsible Fund was 0.25% on all assets. |
| † | Prior to June 1, 2010, the Capital Appreciation Fund’s advisory fee rate was 0.55% on all assets. |
| †† | Prior to June 7, 2010, the Large Cap Value Fund’s advisory fee rate was 0.50% on all assets. |
| @ | The Advisor may voluntarily waive investment advisory fees to avoid a negative yield on the Money Market II Fund. The voluntary waivers may be terminated at any time at the option of VALIC. The exact amount of the voluntary waivers may change on a day-to-day basis. There is no guarantee that the Money Market II Fund will be able to avoid a negative yield. For the year ended August 31, 2010, the amount of investment advisory fees waived were $459,255. |
VALIC entered into sub-advisory agreements with the following:
Bridgeway Capital Management, Inc.—subadviser for the Capital Appreciation Fund.
FAF Advisors, Inc.—subadviser for a portion of the Mid Cap Value Fund.
Invesco Advisers, Inc.(2) —subadviser for the Mid Cap Growth Fund and a portion of International Small Cap Equity Fund.
Janus Capital Management, LLC (“Janus”)(4)—subadviser for a portion of the Large Cap Value Fund.
J.P. Morgan Investment Management, Inc. (“JPMIM”)—subadviser for the Small Cap Growth Fund and a portion of the Small Cap Value Fund.
Metropolitan West Capital Management, LLC (“MetWest Capital”)(1)—subadviser for a portion of the Small Cap Value Fund.
PineBridge Investments, LLC (“PineBridge”)†—subadviser for the Strategic Bond Fund, Core Bond Fund, Aggressive, Moderate and Conservative Growth Lifestyle Funds and a portion of the International Small Cap Equity Fund.
The Boston Co. Asset Management, LLC (“The Boston Co.”)(4)—subadviser for a portion of the Large Cap Value Fund.
SunAmerica Asset Management Corp. (“SunAmerica”)(1)(3)—subadviser for the Money Market II Fund, Socially Responsible Fund, and a portion of the Small Cap Value Fund.
Wellington Management Co. LLP—subadviser for the High Yield Bond Fund and a portion of the Mid Cap Value Fund.
| † | Formerly known as AIG Global Investment Corp. |
| (1) | Effective February 8, 2010, MetWest Capital and SunAmerica became subadvisers for the Small Cap Value Fund, each managing a portion of the assets of the Fund. JPMIM continues to manage a portion of the assets of the Small Cap Value Fund. |
| (2) | Effective December 14, 2009, Invesco Advisers became a sub-adviser for a portion of International Small Cap Equity Fund, managing a portion of the assets of the Fund. PineBridge continues to manage a portion of the assets of the International Small Cap Equity Fund. |
| (3) | Effective December 1, 2009, SunAmerica replaced PineBridge as subadviser for a portion of the Socially Responsible Fund. |
| (4) | Effective June 7, 2010, the Boston Co. and Janus replaced SSgA Funds Management, Inc. as subadvisers for the Large Cap Value Fund, each managing a portion of the assets of the Fund. |
The subadvisers are compensated for their services by VALIC.
VALIC contractually agreed to waive fees and/or reimburse expenses, if necessary, at or below the following percentages of each Fund’s average net assets through December 31, 2010. For the purposes of waived fee and/or reimbursed expense calculations, annual fund operating expenses shall not include extraordinary expenses, as determined under generally accepted accounting principles, or acquired fund fees and expenses. The contractual expense waivers and fee reimbursements will continue indefinitely, subject to termination by the Board, including a majority of the Trustees who are not deemed to be interested persons of the Fund or VALIC as defined by Section 2(a)(19) of the 1940 Act (“the Disinterested Directors”).
| | | | |
Fund
| | Maximum Expense
Limitation
| |
Aggressive Growth Lifestyle | | | 0.10 | % |
Capital Appreciation | | | 0.85 | % |
Conservative Growth Lifestyle | | | 0.10 | % |
Core Bond | | | 0.77 | % |
High Yield Bond† | | | 0.96 | % |
International Small Cap Equity | | | 1.00 | % |
122
VALIC Company II
NOTES TO FINANCIAL STATEMENTS — (continued)
| | | | |
Fund
| | Maximum Expense
Limitation
| |
Large Cap Value | | | 0.81 | % |
Mid Cap Growth | | | 0.85 | % |
Mid Cap Value | | | 1.05 | % |
Moderate Growth Lifestyle | | | 0.10 | % |
Money Market II | | | 0.55 | % |
Small Cap Growth | | | 1.16 | % |
Small Cap Value | | | 0.95 | % |
Socially Responsible | | | 0.56 | % |
Strategic Bond | | | 0.89 | % |
| † | Effective January 1, 2010 the expense limitation for High Yield Bond Fund was changed from 0.99% to 0.96%. |
For the period ended August 31, 2010, VALIC reimbursed expenses as follows:
| | | | |
Fund
| | Amount
| |
Aggressive Growth Lifestyle | | $ | 112,883 | |
Capital Appreciation | | | 102,255 | |
Conservative Growth Lifestyle | | | 90,114 | |
Core Bond | | | 252,575 | |
High Yield Bond | | | 209,240 | |
International Small Cap Equity | | | 1.498,971 | |
Large Cap Value | | | 185,586 | |
Mid Cap Growth | | | 535,730 | |
Mid Cap Value | | | 314,314 | |
Moderate Growth Lifestyle | | | 129,768 | |
Money Market II | | | 145,458 | |
Small Cap Growth | | | 99,759 | |
Small Cap Value | | | 733,829 | |
Socially Responsible | | | 479,160 | |
Strategic Bond | | | 234,019 | |
VC II, on behalf of each Fund, other than the Lifestyle Funds, has entered into an Administrative Services Agreement with SunAmerica (“Administrator”). SunAmerica receives from each Fund, other than the Lifestyle Funds, an annual fee of 0.07% based on the average daily net asset value of the Fund. Pursuant to the Administrative Services Agreement, SunAmerica provides administrative services to the Board, regulatory reporting, internal legal and compliance services, fund accounting and related portfolio accounting services, all necessary office space, equipment, personnel, compensation and facilities for handling the affairs of the Funds and other services. Without limiting the generality of the foregoing, the Administrator (or its appointed service provider): assists with the preparation of prospectuses, statements of additional information, registration statements, and proxy materials; develops and prepares communications to shareholders, including the annual and semi-annual reports to shareholders; coordinates and supervises the preparation and filing of Fund tax returns; assists with the design, development, and operation of the Funds; prepares the Funds’ financial statements; determines the net asset value of the Funds’ shares; supervises the Funds’ transfer agent with respect to the payment of dividends and other distributions to shareholders; and calculates performance data of the Funds. During the period ended August 31, 2010, VC II accrued $2,578,875 for accounting and administrative services.
VC II, on behalf of each Fund, has entered into a Transfer Agency and Services Agreement with VALIC. VALIC receives from the Series and VCI an annual fee of $132,510, which is allocated to each Fund based on shareholder accounts. Under this agreement, VALIC provides services which include the issuance and redemption of shares, payment of dividends between VC II and their “Institutional” shareholders and certain shareholder reporting services including confirmation of transactions, statements of accounts and tax reporting. In addition to the above, VALIC provides “Blue Sky” registration and reporting for the Fund to offer shares in applicable states and to effect and maintain, as the case may be, including but not limited to, the qualification of shares of the Fund that are sold outside of the variable annuity or variable universal life and are for sale under the securities laws of the jurisdictions to qualified plans. For the period ended August 31, 2010, VC II accrued $41,494 in transfer agency and services fees.
VC II, on behalf of each Fund, other than the Lifestyle Funds, has entered into a Shareholder Services Agreement with VALIC. Under the agreement, VALIC provides record keeping, account maintenance, and other administrative and shareholder services for contract owners and participants. VALIC receives from each Fund, other than the Lifestyle Funds, an annual fee of 0.25% based on average daily net assets of the Fund. For the period ended August 31, 2010, VC II accrued $9,210,265 in shareholder service expenses.
On January 23, 2001, the Board ratified a Deferred Compensation Plan for its independent trustees who are not officers, directors, or employees of VALIC, or an affiliate of VALIC. The effective date of the plan was January 1, 2001. The first deferred payment was made in March of 2001. Under the deferred compensation plan, Trustees may elect to defer all or a portion of their compensation. Amounts deferred may be invested in up to six different affiliated mutual funds that are specified in the plan as selected by the trustees. Obligations under the deferred compensation plan represents unsecured claims against the general assets of the Funds. For the period ended August 31, 2010, VC II has deferred $13,599 of trustee compensation.
123
VALIC Company II
NOTES TO FINANCIAL STATEMENTS — (continued)
On January 23, 2001, the Board approved a retirement plan for its independent trustees who are not officers, directors, or employees of VALIC or an affiliate of VALIC. The Series and VC I are responsible for the payment of the retirement benefits, as well as all administration expenses of the plan. Generally, benefits vested under the plan are payable for a ten-year period upon retirement and are based upon each Trustee’s years of service. In the event of a Trustee’s death prior to complete distribution of benefits, the Trustee’s beneficiary or estate will be entitled to receive installment payments or a discounted lump-sum payments of the remaining benefits.
Effective April 27, 2009, the Retirement Plan was terminated. As a result of terminating the retirement plan, (1) the Retirement Plan was frozen as to future accruals for active Participants as of December 31, 2008, and (2) permits active Participants to elect to receive a distribution of their entire Retirement Plan account balance in 2010. On May 24, 2010, VC II made lump sum payments to the Directors in accordance with the terms of the Retirement Plan.
The following amounts for the retirement plan liability are included in the Trustees’ fees and expenses line on the Statement of Assets and Liabilities and the amounts for the retirement plan expenses are included in the Trustees’ fees and expenses on the Statement of Operations:
| | | | | | | | | | | | |
| | | Retirement Plan
Liability as of
August 31,
2010
| | | Retirement Plan
Expense
| | | Retirement Plan
Payments
| |
Fund
| | | For the period ended
August 31, 2010
| |
Aggressive Growth Lifestyle | | $ | — | | | $ | 1,070 | | | $ | 64,916 | |
Capital Appreciation | | | 83 | | | | — | | | | 66,186 | |
Conservative Growth Lifestyle | | | — | | | | — | | | | 46,476 | |
Core Bond | | | 362 | | | | — | | | | 135,520 | |
High Yield Bond | | | 439 | | | | 7,329 | | | | 127,420 | |
International Small Cap Equity | | | 1,119 | | | | 18,094 | | | | 356,996 | |
Large Cap Value | | | 300 | | | | — | | | | 177,771 | |
Mid Cap Growth | | | 347 | | | | 6,010 | | | | 99,898 | |
Mid Cap Value | | | 998 | | | | — | | | | 379,234 | |
Moderate Growth Lifestyle | | | — | | | | — | | | | 103,507 | |
Money Market II | | | 428 | | | | — | | | | 187,226 | |
Small Cap Growth | | | 91 | | | | — | | | | 54,297 | |
Small Cap Value | | | 733 | | | | 21,282 | | | | 183,096 | |
Socially Responsible | | | 1,371 | | | | 24,403 | | | | 424,948 | |
Strategic Bond | | | 791 | | | | 18,818 | | | | 209,313 | |
At August 31, 2010, VALIC, through its insurance company separate accounts, owned over five percent of the outstanding shares of the following Funds:
| | | | |
Fund
| | VALIC
| |
Aggressive Growth Lifestyle | | | 100.00% | |
Capital Appreciation | | | 100.00% | |
Conservative Growth Lifestyle | | | 100.00% | |
Core Bond | | | 100.00% | |
High Yield Bond | | | 99.92% | |
International Small Cap Equity | | | 100.00% | |
Large Cap Value | | | 100.00% | |
Mid Cap Growth | | | 100.00% | |
Mid Cap Value | | | 98.96% | |
Moderate Growth Lifestyle | | | 100.00% | |
Money Market II | | | 100.00% | |
Small Cap Growth | | | 100.00% | |
Small Cap Value | | | 100.00% | |
Socially Responsible | | | 100.00% | |
Strategic Bond | | | 99.82% | |
As disclosed in the portfolio of investments, certain Funds own securities issued by AIG or an affiliate thereof. As of August 31, 2010, the following Funds recorded realized gains (losses) and income on security transactions of AIG and subsidiaries of AIG as follows:
| | | | | | | | | | |
Fund
| | Security
| | Income
| | | Capital Gain
Distribution
Received
| |
Aggressive Growth Lifestyle | | Various VC I and II Funds* | | $ | 3,366,461 | | | $ | 321,851 | |
Conservative Growth Lifestyle | | Various VC I and II Funds* | | | 2,822,881 | | | | 68,261 | |
Large Cap Value | | VC I Money Market Fund | | | 145 | | | | — | |
Moderate Growth Lifestyle | | Various VC I and II Funds* | | | 6,075,348 | | | | 323,631 | |
124
VALIC Company II
NOTES TO FINANCIAL STATEMENTS — (continued)
| | | | | | | | | | | | | | | | | | | | | | | | | | |
Fund
| | Security
| | Market Value
at 08/31/09
| | | Cost of
Purchases
| | | Proceeds
from Sales
| | | Realized
Gain/(Loss)
| | | Change in
Unrealized
Gain/(Loss)
| | | Market Value
at 08/31/10
| |
Aggressive Growth Lifestyle | | Various VCI and VC II Funds* | | $ | 93,779,196 | | | $ | 72,540,605† | | | $ | 47,469,105 | | | $ | 5,762,319 | | | | (2,055,308 | ) | | $ | 122,557,707 | |
Conservative Growth Lifestyle | | Various VCI and VC II Funds* | | | 57,736,775 | | | | 49,291,644† | | | | 28,274,578 | | | | 3,935,466 | | | | (246,147 | ) | | $ | 82,443,160 | |
Large Cap Value | | VC I Money Market Fund | | | 958,928 | | | | 12,001,008 | | | | 12,959,936 | | | | — | | | | — | | | | — | |
Moderate Growth Lifestyle | | Various VCI and VC II Funds* | | | 141,931,692 | | | | 101,334,255† | | | | 57,194,286 | | | | 9,422,366 | | | | (2,751,076 | ) | | $ | 192,742,951 | |
| * | See Portfolio of Investments for details. |
| † | Includes reinvestment of distributions paid. |
As a result of losses on medium-term notes issued by Cheyne Finance LLC, that were previously held in the Money Market II Fund, VALIC made capital contributions to the Money Market II Fund in the amount of $221,000 for the year ended August 31, 2010.
On March 4, 2009, AIG, the ultimate parent of VALIC, the Funds’ investment adviser, American General Distributors, Inc., the Funds’ distributor and SunAmerica, the subadvisor to the Money Market II Fund, Small Cap Value Fund and Socially Responsible Fund and the Funds’ administrator issued and sold to the AIG Credit Facility Trust, a trust established for the sole benefit of the United States Treasury (the “Trust”), 100,000 shares of AIG’s Series C Perpetual, Convertible, Participating Preferred Stock (the “Stock”) for an aggregate purchase price of $500,000, with an understanding that additional and independently sufficient consideration was also furnished to AIG by the Federal Reserve Bank of New York (the “FRBNY”) in the form of its lending commitment (the “Credit Facility”) under the Credit Agreement, dated as of September 22, 2008, between AIG and the FRBNY. The Stock has preferential liquidation rights over AIG common stock, and, to the extent permitted by law, votes with AIG’s common stock on all matters submitted to AIG’s shareholders. As of September 30, 2010, the Trust had approximately 79.8% of the aggregate voting power of AIG’s common stock and is entitled to approximately 79.8% of all dividends paid on AIG’s common stock, in each case treating the Stock as if converted.
Note 4 — Investment Activity
The cost of purchases and proceeds from sales and maturities of long-term investments, during the period ended August 31, 2010, were as follows:
| | | | | | | | | | | | | | | | |
Fund
| | Purchases of
Investment
Securities
(Excluding U.S.
Government
Securities)
| | | Sales of
Investment
Securities
(Excluding U.S.
Government
Securities)
| | | Purchase of U.S.
Government
Securities
| | | Sales of U.S.
Government
Securities
| |
Aggressive Growth Lifestyle | | $ | 72,540,605 | | | $ | 47,469,105 | | | $ | — | | | $ | — | |
Capital Appreciation | | | 25,907,769 | | | | 37,090,315 | | | | — | | | | — | |
Conservative Growth Lifestyle | | | 49,291,644 | | | | 28,274,578 | | | | — | | | | — | |
Core Bond | | | 312,307,486 | | | | 286,381,481 | | | | 99,219,584 | | | | 47,893,330 | |
High Yield Bond | | | 166,310,358 | | | | 106,002,998 | | | | — | | | | — | |
International Small Cap Equity | | | 710,666,311 | | | | 734,124,181 | | | | — | | | | — | |
Large Cap Value | | | 344,765,948 | | | | 358,820,135 | | | | — | | | | — | |
Mid Cap Growth | | | 126,628,936 | | | | 151,954,888 | | | | — | | | | — | |
Mid Cap Value | | | 401,887,346 | | | | 472,766,116 | | | | — | | | | — | |
Moderate Growth Lifestyle | | | 101,334,255 | | | | 57,194,287 | | | | — | | | | — | |
Small Cap Growth | | | 40,338,290 | | | | 38,575,250 | | | | — | | | | — | |
Small Cap Value | | | 476,878,602 | | | | 484,519,272 | | | | 938,593 | | | | 1,505,000 | |
Socially Responsible | | | 674,553,576 | | | | 667,754,798 | | | | — | | | | — | |
Strategic Bond | | | 560,371,851 | | | | 490,000,088 | | | | 51,271,561 | | | | 42,100,556 | |
Note 5 — Federal Income Taxes
The following tables detail the tax basis of distributions as well as the components of distributable earnings. The tax basis components of distributable earnings differ from the amounts reflected in the Statements of Assets and Liabilities due to temporary book/tax differences primarily arising from wash sales, post October losses, investments in passive foreign investment companies, and derivative transactions. Also included in the following tables are the capital loss carryforwards at August 31, 2010.
The information in the following table is presented on the basis of cost for federal income tax purposes at August 31, 2010:
| | | | | | | | | | | | | | | | |
Fund
| | Identified Cost
of Investments
Owned
| | | Gross
Unrealized
Appreciation
| | | Gross
Unrealized
Depreciation
| | | Net Unrealized
Appreciation
(Depreciation)
| |
Aggressive Growth Lifestyle | | $ | 137,958,000 | | | $ | 12,836,193 | | | $ | (28,236,486 | ) | | $ | (15,400,293 | ) |
Capital Appreciation | | | 40,888,046 | | | | 3,875,957 | | | | (3,201,040 | ) | | | 674,917 | |
Conservative Growth Lifestyle | | | 78,216,000 | | | | 7,753,645 | | | | (3,526,485 | ) | | | 4,227,160 | |
Core Bond | | | 237,656,848 | | | | 10,568,527 | | | | (2,411,212 | ) | | | 8,157,315 | |
High Yield Bond | | | 252,377,150 | | | | 17,111,024 | | | | (15,569,809 | ) | | | 1,541,215 | |
International Small Cap Equity | | | 529,640,355 | | | | 57,290,957 | | | | (47,419,203 | ) | | | 9,871,754 | |
125
VALIC Company II
NOTES TO FINANCIAL STATEMENTS — (continued)
| | | | | | | | | | | | | | | | |
Fund
| | Identified Cost
of Investments
Owned
| | | Gross
Unrealized
Appreciation
| | | Gross
Unrealized
Depreciation
| | | Net Unrealized
Appreciation
(Depreciation)
| |
Large Cap Value | | $ | 154,358,160 | | | $ | 3,817,516 | | | $ | (13,003,351 | ) | | $ | (9,185,835 | ) |
Mid Cap Growth | | | 155,249,725 | | | | 18,463,564 | | | | (11,657,924 | ) | | | 6,805,640 | |
Mid Cap Value | | | 445,711,827 | | | | 45,442,342 | | | | (35,309,703 | ) | | | 10,132,639 | |
Moderate Growth Lifestyle | | | 188,780,368 | | | | 21,718,281 | | | | (17,755,698 | ) | | | 3,962,583 | |
Money Market II | | | 213,786,591 | | | | — | | | | — | | | | — | |
Small Cap Growth | | | 48,476,291 | | | | 6,032,406 | | | | (6,665,193 | ) | | | (632,787 | ) |
Small Cap Value | | | 371,004,339 | | | | 22,635,863 | | | | (47,460,524 | ) | | | (24,824,661 | ) |
Socially Responsible | | | 708,548,536 | | | | 46,515,615 | | | | (83,235,363 | ) | | | (36,719,748 | ) |
Strategic Bond | | | 441,508,585 | | | | 23,793,467 | | | | (9,228,968 | ) | | | 14,564,499 | |
The tax character of distributions paid may differ from the Statement of Changes in Net Assets due to short-term capital gains being treated as ordinary income distributions for tax purposes. The tax basis distributable earnings at August 31, 2010 and the tax character of distributions paid during the year ended August 31, 2010 were as follows:
| | | | | | | | | | | | | | | | | | | | |
| | | Distributable Earnings
| | | Tax Distributions
| |
Fund
| | Ordinary
Income
| | | Long-Term Gains/
Capital Loss
Carryover And
Other Losses
| | | Unrealized
Appreciation
(Depreciation)*
| | | Ordinary
Income
| | | Long-Term
Capital
Gains
| |
Aggressive Growth Lifestyle | | $ | 3,191,507 | | | $ | (11,799,124 | ) | | $ | (15,400,293 | ) | | $ | 1,628,806 | | | $ | — | |
Capital Appreciation | | | 170,287 | | | | (23,406,244 | ) | | | 674,917 | | | | 458,586 | | | | — | |
Conservative Growth Lifestyle | | | 2,696,341 | | | | (6,227,414 | ) | | | 4,227,160 | | | | 1,939,732 | | | | — | |
Core Bond | | | 8,197,945 | | | | (3,339,416 | ) | | | 8,157,315 | | | | 8,876,771 | | | | — | |
High Yield Bond | | | 20,097,831 | | | | (40,555,956 | ) | | | 1,541,215 | | | | 18,592,117 | | | | — | |
International Small Cap Equity | | | 6,066,669 | | | | (219,901,505 | ) | | | 9,669,182 | | | | 8,411,268 | | | | — | |
Large Cap Value | | | 2,048,446 | | | | (107,900,299 | ) | | | (9,185,835 | ) | | | 2,822,618 | | | | — | |
Mid Cap Growth | | | — | | | | (46,019,225 | ) | | | 6,805,611 | | | | — | | | | — | |
Mid Cap Value | | | 3,681,651 | | | | (117,945,422 | ) | | | 10,133,401 | | | | 5,491,988 | | | | — | |
Moderate Growth Lifestyle | | | 5,796,656 | | | | (17,916,871 | ) | | | 3,962,583 | | | | 3,392,906 | | | | — | |
Money Market II | | | — | | | | (367,854 | ) | | | — | | | | 22,595 | | | | — | |
Small Cap Growth | | | — | | | | (6,285,157 | ) | | | (632,787 | ) | | | — | | | | — | |
Small Cap Value | | | 4,667,231 | | | | (7,690,530 | ) | | | (24,824,661 | ) | | | 3,699,201 | | | | — | |
Socially Responsible | | | 8,195,892 | | | | (218,370,738 | ) | | | (36,719,748 | ) | | | 11,153,884 | | | | — | |
Strategic Bond | | | 24,935,131 | | | | (22,778,196 | ) | | | 14,586,922 | | | | 19,122,627 | | | | — | |
| * | Unrealized appreciation (depreciation) includes amounts for derivatives and other assets and liabilities denominated in foreign currency. |
The tax character of distributions paid during the year ended August 31, 2009 were as follows:
| | | | | | | | |
| | | Tax Distributions
| |
Fund
| | Ordinary
Income
| | | Long-Term
Capital Gains
| |
Aggressive Growth Lifestyle | | $ | 14,114,539 | | | $ | 4,453,808 | |
Capital Appreciation | | | 56,733 | | | | — | |
Conservative Growth Lifestyle | | | 1,451,543 | | | | 919,404 | |
Core Bond | | | 11,242,372 | | | | — | |
High Yield Bond | | | 16,902,354 | | | | — | |
International Small Cap Equity | | | 19,860,497 | | | | 24,510,152 | |
Large Cap Value | | | 5,298,743 | | | | — | |
Mid Cap Growth | | | — | | | | 869,715 | |
Mid Cap Value | | | 3,026,404 | | | | 9,716,280 | |
Moderate Growth Lifestyle | | | 3,320,144 | | | | 3,877,420 | |
Money Market II | | | 2,812,871 | | | | — | |
Small Cap Growth | | | — | | | | 493,157 | |
Small Cap Value | | | 4,356,332 | | | | 13,244,321 | |
Socially Responsible | | | 14,145,314 | | | | 2,733,592 | |
Strategic Bond | | | 24,084,315 | | | | — | |
126
VALIC Company II
NOTES TO FINANCIAL STATEMENTS — (continued)
As of August 31, 2010, the Funds indicated below have capital loss carryforwards, which expire in the year indicated and are available to offset future capital gains, if any:
| | | | | | | | | | | | | | | | | | | | | | | | | | | | | | | | |
| | | Capital Loss Carryforward
| |
Fund
| | 2011
| | | 2012
| | | 2013
| | | 2014
| | | 2015
| | | 2016
| | | 2017
| | | 2018
| |
Aggressive Growth Lifestyle | | $ | — | | | $ | — | | | $ | — | | | $ | — | | | $ | — | | | $ | — | | | $ | 1,066,859 | | | $ | 10,732,265 | |
Capital Appreciation | | | 6,282,529 | | | | 2,100,734 | | | | 408,479 | | | | — | | | | — | | | | — | | | | 2,028,851 | | | | 12,585,651 | |
Conservative Growth Lifestyle | | | — | | | | — | | | | — | | | | — | | | | — | | | | — | | | | 1,938,895 | | | | 4,288,519 | |
Core Bond | | | — | | | | — | | | | — | | | | — | | | | — | | | | — | | | | 3,339,416 | | | | — | |
High Yield Bond | | | — | | | | — | | | | — | | | | — | | | | — | | | | 463,115 | | | | 7,727,996 | | | | 32,364,845 | |
International Small Cap Equity | | | — | | | | — | | | | — | | | | — | | | | — | | | | — | | | | 92,725,555 | | | | 127,175,950 | |
Large Cap Value | | | — | | | | — | | | | — | | | | — | | | | — | | | | 4,785,556 | | | | 57,169,847 | | | | 45,944,896 | |
Mid Cap Growth | | | — | | | | — | | | | — | | | | — | | | | — | | | | — | | | | 26,766,815 | | | | 19,252,410 | |
Mid Cap Value | | | — | | | | — | | | | — | | | | — | | | | — | | | | — | | | | 64,571,883 | | | | 53,373,539 | |
Moderate Growth Lifestyle | | | — | | | | — | | | | — | | | | — | | | | — | | | | — | | | | 2,577,826 | | | | 15,339,045 | |
Money Market II | | | — | | | | — | | | | — | | | | — | | | | — | | | | — | | | | 367,854 | | | | — | |
Small Cap Growth | | | — | | | | — | | | | — | | | | — | | | | — | | | | — | | | | 2,808,475 | | | | 3,476,682 | |
Small Cap Value | | | — | | | | — | | | | — | | | | — | | | | — | | | | — | | | | 5,812,436 | | | | 1,878,094 | |
Socially Responsible | | | — | | | | — | | | | — | | | | — | | | | — | | | | — | | | | 98,423,478 | | | | 119,947,260 | |
Strategic Bond | | | — | | | | — | | | | — | | | | — | | | | — | | | | 87,486 | | | | 9,412,743 | | | | 13,277,967 | |
The Funds indicated below utilized capital loss carryforwards, which offset net taxable gains realized in the current year. Additionally, the Funds indicated the following capital loss carryforwards expired during the current year.
| | | | | | | | |
Fund
| | Capital Loss
Carryforward
Utilized
| | | Capital Loss
Carryforward
Expired
| |
Aggressive Growth Lifestyle | | $ | — | | | $ | — | |
Capital Appreciation | | | — | | | | 1,614,514 | |
Conservative Growth Lifestyle | | | — | | | | — | |
Core Bond | | | 2,063,548 | | | | — | |
High Yield Bond | | | — | | | | — | |
International Small Cap Equity | | | — | | | | — | |
Large Cap Value | | | — | | | | — | |
Mid Cap Growth | | | — | | | | — | |
Mid Cap Value | | | — | | | | — | |
Moderate Growth Lifestyle | | | — | | | | — | |
Money Market II | | | 243,609 | | | | — | |
Small Cap Growth | | | — | | | | — | |
Small Cap Value | | | — | | | | — | |
Socially Responsible | | | — | | | | — | |
Strategic Bond | | | — | | | | — | |
Under the tax law, capital losses related to securities and foreign currency realized after October 31 and prior to the Fund’s fiscal year end may be deferred as occurring on the first day of the following year. For the fiscal year ended August 31, 2010, the Funds elected to defer capital losses as follows:
| | | | | | | | |
Fund
| | Deferred Post-October
Capital Loss
| | | Deferred Post-October
Currency Loss
| |
Aggressive Growth Lifestyle | | $ | 210,807 | | | $ | — | |
Capital Appreciation | | | — | | | | — | |
Conservative Growth Lifestyle | | | 57,748 | | | | — | |
Core Bond | | | — | | | | — | |
High Yield Bond | | | 1,644,330 | | | | — | |
International Small Cap Equity | | | — | | | | 1,343,645 | |
Large Cap Value | | | 6,520,626 | | | | — | |
Mid Cap Growth | | | — | | | | — | |
Mid Cap Value | | | — | | | | 73,876 | |
Moderate Growth Lifestyle | | | — | | | | — | |
Money Market II | | | 242 | | | | — | |
Small Cap Growth | | | 264,583 | | | | — | |
Small Cap Value | | | 27,148,456 | | | | — | |
Socially Responsible | | | 19,843,134 | | | | — | |
Strategic Bond | | | — | | | | — | |
127
VALIC Company II
NOTES TO FINANCIAL STATEMENTS — (continued)
For the period ended August 31, 2010, the reclassifications arising from book/tax differences resulted in increases (decreases) that were primarily due to tax treatment of net investment losses, principal paydown adjustments, non-deductible expenses, disposition of passive foreign investment companies securities, dispositions of partnership interests, expired capital loss carryforwards, and foreign currency transactions to the components of net assets as follows:
| | | | | | | | | | | | |
Fund
| | Accumulated
Undistributed Net
Investment Income
(Loss)
| | | Accumulated
Undistributed Net
Realized Gain
(Loss)
| | | Capital
Paid-in
| |
Aggressive Growth Lifestyle | | $ | — | | | $ | — | | | $ | — | |
Capital Appreciation | | | 3,002 | | | | 1,611,512 | | | | (1,614,514 | ) |
Conservative Growth Lifestyle | | | — | | | | — | | | | — | |
Core Bond | | | 161,263 | | | | (161,263 | ) | | | — | |
High Yield Bond | | | 2,420 | | | | (2,420 | ) | | | — | |
International Small Cap Equity | | | (972,241 | ) | | | 972,241 | | | | — | |
Large Cap Value | | | (15,406 | ) | | | — | | | | 15,406 | |
Mid Cap Growth | | | 689,032 | | | | (19,901 | ) | | | (669,131 | ) |
Mid Cap Value | | | 181,957 | | | | (182,928 | ) | | | 971 | |
Moderate Growth Lifestyle | | | — | | | | — | | | | — | |
Money Market II | | | (31,808 | ) | | | — | | | | 31,808 | |
Small Cap Growth | | | 471,729 | | | | — | | | | (471,729 | ) |
Small Cap Value | | | 314,198 | | | | (373,143 | ) | | | 58,945 | |
Socially Responsible | | | (3,882 | ) | | | — | | | | 3,882 | |
Strategic Bond | | | 2,390,544 | | | | (2,390,544 | ) | | | — | |
Note 6 — Capital Share Transactions
Transactions in capital shares of each Fund were as follows:
| | | | | | | | | | | | | | | | | | | | | | | | | | | | | | | | |
| | | Aggressive Growth Lifestyle
| | | Capital Appreciation
| |
| | | For the year ended
August 31, 2010
| | | For the year ended
August 31, 2009
| | | For the year ended
August 31, 2010
| | | For the year ended
August 31, 2009
| |
| | | Shares
| | | Amount
| | | Shares
| | | Amount
| | | Shares
| | | Amount
| | | Shares
| | | Amount
| |
Shares sold | | | 4,506,202 | | | $ | 33,912,710 | | | | 3,637,116 | | | $ | 24,145,585 | | | | 483,753 | | | $ | 4,069,383 | | | | 6,042,880 | | | $ | 42,025,732 | |
Reinvested dividends | | | 217,464 | | | | 1,628,806 | | | | 3,246,215 | | | | 18,568,347 | | | | 54,464 | | | | 458,586 | | | | 9,077 | | | | 56,733 | |
Shares redeemed | | | (1,629,542 | ) | | | (12,236,837 | ) | | | (2,031,987 | ) | | | (14,017,123 | ) | | | (1,925,286 | ) | | | (15,352,745 | ) | | | (8,358,861 | ) | | | (57,575,414 | ) |
| | |
|
|
| |
|
|
| |
|
|
| |
|
|
| |
|
|
| |
|
|
| |
|
|
| |
|
|
|
Net increase (decrease) | | | 3,094,124 | | | $ | 23,304,679 | | | | 4,851,344 | | | $ | 28,696,809 | | | | (1,387,069 | ) | | $ | (10,824,776 | ) | | | (2,306,904 | ) | | $ | (15,492,949 | ) |
| | |
|
|
| |
|
|
| |
|
|
| |
|
|
| |
|
|
| |
|
|
| |
|
|
| |
|
|
|
| | |
| | | Conservative Growth Lifestyle
| | | Core Bond
| |
| | | For the year ended
August 31, 2010
| | | For the year ended
August 31, 2009
| | | For the year ended
August 31, 2010
| | | For the year ended
August 31, 2009
| |
| | | Shares
| | | Amount
| | | Shares
| | | Amount
| | | Shares
| | | Amount
| | | Shares
| | | Amount
| |
Shares sold | | | 3,149,945 | | | $ | 32,073,737 | | | | 2,324,504 | | | $ | 20,426,844 | | | | 10,107,278 | | | $ | 103,315,190 | | | | 8,848,969 | | | $ | 81,631,099 | |
Reinvested dividends | | | 194,362 | | | | 1,939,732 | | | | 283,606 | | | | 2,370,947 | | | | 903,948 | | | | 8,876,771 | | | | 1,273,202 | | | | 11,242,372 | |
Shares redeemed | | | (1,346,849 | ) | | | (13,734,447 | ) | | | (2,318,797 | ) | | | (20,415,761 | ) | | | (4,255,199 | ) | | | (43,802,633 | ) | | | (14,798,816 | ) | | | (139,049,701 | ) |
| | |
|
|
| |
|
|
| |
|
|
| |
|
|
| |
|
|
| |
|
|
| |
|
|
| |
|
|
|
Net increase (decrease) | | | 1,997,458 | | | $ | 20,279,022 | | | | 289,313 | | | $ | 2,382,030 | | | | 6,756,027 | | | $ | 68,389,328 | | | | (4,676,645 | ) | | $ | (46,176,230 | ) |
| | |
|
|
| |
|
|
| |
|
|
| |
|
|
| |
|
|
| |
|
|
| |
|
|
| |
|
|
|
| | |
| | | High Yield Bond
| | | International Small Cap Equity
| |
| | | For the year ended
August 31, 2010
| | | For the year ended
August 31, 2009
| | | For the year ended
August 31, 2010
| | | For the year ended
August 31, 2009
| |
| | | Shares
| | | Amount
| | | Shares
| | | Amount
| | | Shares
| | | Amount
| | | Shares
| | | Amount
| |
Shares sold | | | 8,347,737 | | | $ | 59,667,841 | | | | 8,118,492 | | | $ | 48,446,436 | | | | 3,076,691 | | | $ | 35,253,517 | | | | 12,654,204 | | | $ | 130,918,500 | |
Reinvested dividends | | | 2,714,178 | | | | 18,592,117 | | | | 3,394,047 | | | | 16,902,354 | | | | 742,389 | | | | 8,411,268 | | | | 4,935,556 | | | | 44,370,649 | |
Shares redeemed | | | (3,798,023 | ) | | | (27,004,772 | ) | | | (7,839,847 | ) | | | (50,570,032 | ) | | | (7,002,879 | ) | | | (79,568,415 | ) | | | (9,157,588 | ) | | | (85,669,535 | ) |
| | |
|
|
| |
|
|
| |
|
|
| |
|
|
| |
|
|
| |
|
|
| |
|
|
| |
|
|
|
Net increase (decrease) | | | 7,263,892 | | | $ | 51,255,186 | | | | 3,672,692 | | | $ | 14,778,758 | | | | (3,183,799 | ) | | $ | (35,903,630 | ) | | | 8,432,172 | | | $ | 89,619,614 | |
| | |
|
|
| |
|
|
| |
|
|
| |
|
|
| |
|
|
| |
|
|
| |
|
|
| |
|
|
|
128
VALIC Company II
NOTES TO FINANCIAL STATEMENTS — (continued)
| | | | | | | | | | | | | | | | | | | | | | | | | | | | | | | | |
| | |
| | | Large Cap Value
| | | Mid Cap Growth
| |
| | | For the year ended
August 31, 2010
| | | For the year ended
August 31, 2009
| | | For the year ended
August 31, 2010
| | | For the year ended
August 31, 2009
| |
| | | Shares
| | | Amount
| | | Shares
| | | Amount
| | | Shares
| | | Amount
| | | Shares
| | | Amount
| |
Shares sold | | | 1,301,568 | | | $ | 12,848,212 | | | | 3,410,696 | | | $ | 31,880,879 | | | | 1,948,812 | | | $ | 12,614,830 | | | | 3,834,838 | | | $ | 18,810,279 | |
Reinvested dividends | | | 288,611 | | | | 2,822,618 | | | | 616,133 | | | | 5,298,743 | | | | — | | | | — | | | | 198,113 | | | | 869,715 | |
Shares redeemed | | | (2,664,449 | ) | | | (26,109,435 | ) | | | (11,876,207 | ) | | | (112,264,771 | ) | | | (3,391,298 | ) | | | (22,592,374 | ) | | | (5,451,442 | ) | | | (26,965,959 | ) |
| | |
|
|
| |
|
|
| |
|
|
| |
|
|
| |
|
|
| |
|
|
| |
|
|
| |
|
|
|
Net increase (decrease) | | | (1,074,270 | ) | | $ | (10,438,605 | ) | | | (7,849,378 | ) | | $ | (75,085,149 | ) | | | (1,442,486 | ) | | $ | (9,977,544 | ) | | | (1,418,491 | ) | | $ | (7,285,965 | ) |
| | |
|
|
| |
|
|
| |
|
|
| |
|
|
| |
|
|
| |
|
|
| |
|
|
| |
|
|
|
| | |
| | | Mid Cap Value
| | | Moderate Growth Lifestyle
| |
| | | For the year ended
August 31, 2010
| | | For the year ended
August 31, 2009
| | | For the year ended
August 31, 2010
| | | For the year ended
August 31, 2009
| |
| | | Shares
| | | Amount
| | | Shares
| | | Amount
| | | Shares
| | | Amount
| | | Shares
| | | Amount
| |
Shares sold | | | 2,861,185 | | | $ | 39,379,374 | | | | 6,510,404 | | | $ | 70,686,565 | | | | 5,415,994 | | | $ | 58,823,311 | | | | 3,243,677 | | | $ | 29,608,043 | |
Reinvested dividends | | | 397,394 | | | | 5,491,988 | | | | 1,308,284 | | | | 12,742,684 | | | | 315,913 | | | | 3,392,906 | | | | 847,770 | | | | 7,197,564 | |
Shares redeemed | | | (7,796,237 | ) | | | (110,230,404 | ) | | | (10,556,581 | ) | | | (113,219,175 | ) | | | (1,908,130 | ) | | | (20,668,201 | ) | | | (2,866,116 | ) | | | (26,031,404 | ) |
| | |
|
|
| |
|
|
| |
|
|
| |
|
|
| |
|
|
| |
|
|
| |
|
|
| |
|
|
|
Net increase (decrease) | | | (4,537,658 | ) | | $ | (65,359,042 | ) | | | (2,737,893 | ) | | $ | (29,789,926 | ) | | | 3,823,777 | | | $ | 41,548,016 | | | | 1,225,331 | | | $ | 10,774,203 | |
| | |
|
|
| |
|
|
| |
|
|
| |
|
|
| |
|
|
| |
|
|
| |
|
|
| |
|
|
|
| | |
| | | Money Market II
| | | Small Cap Growth
| |
| | | For the year ended
August 31, 2010
| | | For the year ended
August 31, 2009
| | | For the year ended
August 31, 2010
| | | For the year ended
August 31, 2009
| |
| | | Shares
| | | Amount
| | | Shares
| | | Amount
| | | Shares
| | | Amount
| | | Shares
| | | Amount
| |
Shares sold | | | 64,832,762 | | | $ | 64,832,914 | | | | 141,264,763 | | | $ | 141,264,763 | | | | 1,206,011 | | | $ | 12,383,987 | | | | 1,577,913 | | | $ | 12,168,853 | |
Reinvested dividends | | | 22,595 | | | | 22,595 | | | | 2,812,871 | | | | 2,812,871 | | | | — | | | | — | | | | 68,781 | | | | 493,157 | |
Shares redeemed | | | (104,533,734 | ) | | | (104,533,750 | ) | | | (220,170,046 | ) | | | (220,170,046 | ) | | | (1,070,476 | ) | | | (11,095,817 | ) | | | (1,295,696 | ) | | | (10,043,517 | ) |
| | |
|
|
| |
|
|
| |
|
|
| |
|
|
| |
|
|
| |
|
|
| |
|
|
| |
|
|
|
Net increase (decrease) | | | (39,678,377 | ) | | $ | (39,678,241 | ) | | | (76,092,412 | ) | | $ | (76,092,412 | ) | | | 135,535 | | | $ | 1,288,170 | | | | 350,998 | | | $ | 2,618,493 | |
| | |
|
|
| |
|
|
| |
|
|
| |
|
|
| |
|
|
| |
|
|
| |
|
|
| |
|
|
|
| | |
| | | Small Cap Value
| | | Socially Responsible
| |
| | | For the year ended
August 31, 2010
| | | For the year ended
August 31, 2009
| | | For the year ended
August 31, 2010
| | | For the year ended
August 31, 2009
| |
| | | Shares
| | | Amount
| | | Shares
| | | Amount
| | | Shares
| | | Amount
| | | Shares
| | | Amount
| |
Shares sold | | | 3,022,790 | | | $ | 32,659,181 | | | | 13,117,309 | | | $ | 109,310,853 | | | | 5,329,875 | | | $ | 51,833,705 | | | | 7,569,714 | | | $ | 60,850,253 | |
Reinvested dividends | | | 347,343 | | | | 3,699,201 | | | | 2,133,412 | | | | 17,600,653 | | | | 1,141,646 | | | | 11,153,884 | | | | 2,309,016 | | | | 16,878,906 | |
Shares redeemed | | | (4,526,247 | ) | | | (50,793,833 | ) | | | (2,543,446 | ) | | | (23,500,289 | ) | | | (7,928,619 | ) | | | (77,537,239 | ) | | | (16,526,587 | ) | | | (136,691,350 | ) |
| | |
|
|
| |
|
|
| |
|
|
| |
|
|
| |
|
|
| |
|
|
| |
|
|
| |
|
|
|
Net increase (decrease) | | | (1,156,114 | ) | | $ | (14,435,451 | ) | | | 12,707,275 | | | $ | 103,411,217 | | | | (1,457,098 | ) | | $ | (14,549,650 | ) | | | (6,647,857 | ) | | $ | (58,962,191 | ) |
| | |
|
|
| |
|
|
| |
|
|
| |
|
|
| |
|
|
| |
|
|
| |
|
|
| |
|
|
|
| | | | | |
| | | Strategic Bond
| | | | | | | | | | | | | |
| | | For the year ended
August 31, 2010
| | | For the year ended
August 31, 2009
| | | | | | | | | | | | | |
| | | Shares
| | | Amount
| | | Shares
| | | Amount
| | | | | | | | | | | | | |
Shares sold | | | 8,058,740 | | | $ | 86,339,594 | | | | 8,671,352 | | | $ | 83,320,957 | | | | | | | | | | | | | | | | | |
Reinvested dividends | | | 1,845,813 | | | | 19,122,627 | | | | 2,843,485 | | | | 24,084,315 | | | | | | | | | | | | | | | | | |
Shares redeemed | | | (2,799,571 | ) | | | (29,908,099 | ) | | | (9,334,223 | ) | | | (87,426,922 | ) | | | | | | | | | | | | | | | | |
| | |
|
|
| |
|
|
| |
|
|
| |
|
|
| | | | | | | | | | | | | | | | |
Net increase (decrease) | | | 7,104,982 | | | $ | 75,554,122 | | | | 2,180,614 | | | $ | 19,978,350 | | | | | | | | | | | | | | | | | |
| | |
|
|
| |
|
|
| |
|
|
| |
|
|
| | | | | | | | | | | | | | | | |
Note 7 — Expense Reductions
Through expense offset arrangements, resulting from broker commission recapture, a portion of the Fund’s expenses have been reduced. For the period ended August 31, 2010, the amount of expense reductions received by each fund, used to offset the Fund’s non-affiliated expenses, were as follows:
| | | | |
Fund
| | Expense Reductions
| |
Large Cap Value | | $ | 6,291 | |
Mid Cap Growth | | | 21,962 | |
Mid Cap Value | | | 91,565 | |
Small Cap Growth | | | 7,084 | |
Small Cap Value | | | 24,574 | |
129
VALIC Company II
NOTES TO FINANCIAL STATEMENTS — (continued)
Note 8 — Investment Concentration
The High Yield Bond Fund’s investment in high yield securities, whether rated or unrated, may be considered speculative and subject to greater market fluctuations and risk of loss of income and principal than lower-yielding, higher-rated, fixed-income securities. The risk of loss due to default by the issuer may be significantly greater for the holders of high yield securities, because such securities are generally unsecured and are often subordinated to other creditors of the issuer.
The Funds may invest in obligations issued by agencies and instrumentalities of the U.S. Government that may vary in the level of support they receive from the government. The government may choose not to provide financial support to government sponsored agencies or instrumentalities if it is not legally obligated to do so. In this case, if the issuer defaulted, the fund holding securities of such issuer might not be able to recover its investment from the U.S. Government. As a result of the Core Bond Fund, Money Market II Fund and Strategic Bond Fund’s concentration in such investments, it may be subject to risks associated with the U.S. Government agencies or instrumentalities. At the end of the period, the Funds had 34.8%, 59.4% and 10.9%, respectively, of their total net assets invested in such securities.
Some of the Funds may invest internationally, including in “emerging market” countries. Emerging market securities involve risks not typically associated with investing in securities of issuers in more developed markets. These investments are subject to various risk factors including market, credit, exchange rate and sovereign risk. The markets in which these securities trade can be volatile and at times illiquid. These securities may be denominated in currencies other than U.S. dollars. While investing internationally may reduce portfolio risk by increasing the diversification of portfolio investments, the value of the investment may be affected by fluctuating currency values, changing local and regional economic, political and social conditions, and greater market volatility. These risks are primary risks of the International Small Cap Equity Fund. At the end of the period, the International Small Cap Equity Fund had 20.5% of its net assets invested in equity securities domiciled in Japan.
Each Fund, except the Money Market II Fund, the Lifestyle Funds and the Small Cap Value Fund, may invest in international bonds, which include U.S. dollar-denominated bonds issued by foreign corporations for which the primary trading market is in the United States (“Yankee Bonds”), or for which the primary trading market is abroad (“Euro Bonds”). International bonds may involve special risks and considerations not typically associated with investing in U.S. companies, including differences in accounting, auditing and financial reporting standards; generally higher commission rates on foreign portfolio transactions; the possibility of nationalization, expropriation or confiscatory taxation; adverse changes in investment or exchange control regulations (which may include suspension of the ability to transfer currency from a country); and political instability which could affect U.S. investments in foreign countries. As a result of the Strategic Bond Fund’s concentration in such investments, it may be subject to risks associated with the international bonds. At the end of the period, the Fund had 20.4% of its total net assets invested in such securities.
Note 9 — Lines of Credit
The Series and VCI have established an $85 million committed and $40 million uncommitted line of credit with State Street Bank & Trust Company, the Funds’ custodian. Interest is currently payable at the greater of (i) Federal Funds Rate plus 125 basis points or (ii) overnight LIBOR plus 125 basis points on the committed line and State Street’s discretionary bid rate on the uncommitted line of credit. Prior to October 16, 2009, the interest was payable at the Federal Funds Rate plus 50 basis points on the committed line and State Street Bank and Trust Company’s discretionary bid rate on the uncommitted line of credit. There is also a commitment fee of 15 basis points per annum for the daily unused portion of the committed line of credit, paid quarterly in arrears, which is included in other expenses on the Statement of Operations. Prior to October 16, 2009, the commitment fee was 10 basis points per annum on the daily unused portion of the committed line of credit. Borrowings under the line of credit will commence when the Fund’s shortfall exceeds $100,000.
For the period ended August 31, 2010, the following Funds had borrowings:
| | | | | | | | | | | | | | | | |
Fund
| | Days
Outstanding
| | | Interest
Charges
| | | Average
Debt
Utilized
| | | Weighted
Average
Interest
| |
Capital Appreciation | | | 24 | | | $ | 557 | | | $ | 1,231,798 | | | | 1.36 | % |
International Small Cap Equity | | | 125 | | | | 2,778 | | | | 538,698 | | | | 1.52 | % |
Mid Cap Value | | | 27 | | | | 778 | | | | 678,253 | | | | 1.53 | % |
As of August 31, 2010, none of the Funds had outstanding borrowings.
Note 10 — Interfund Lending Agreement
Pursuant to the exemptive relief granted by the Securities and Exchange Commission, the Funds are permitted to participate in an interfund lending program among investment companies advised by VALIC or an affiliate. The interfund lending program allows the participating Funds to borrow money from and lend money to each other for temporary or emergency purposes. An interfund loan will be made under this facility only if the participating funds receive a more favorable interest rate than would otherwise be available from a typical bank for a comparable transaction. For the period ended August 31, 2010, none of the Funds participated in this program.
130
VALIC Company II
NOTES TO FINANCIAL STATEMENTS — (continued)
Note 11 — Security Transactions with Affiliated Portfolios
The Funds are permitted to transfer securities by purchasing from and/or selling to other affiliated Funds under certain conditions approved by the Board of Trustees of VALIC Company II. The affiliated Funds involved in such transactions must have a common investment adviser (or affiliated investment adviser), common Trustees, and/or common officers in compliance with Rule 17a-7 of the 1940 Act. Pursuant to the Act, such a transaction must be either a purchase or a sale, for no consideration other than cash payment against prompt delivery of the security at the current market price.
For the period ended August 31, 2010, the following Funds engaged in security transactions with affiliated Funds:
| | | | | | | | | | | | |
Fund
| | Cost of
Purchases
| | | Proceed
from Sales
| | | Realized
Gain/Loss
| |
Core Bond | | $ | 2,095,086 | | | $ | — | | | $ | — | |
Mid Cap Growth | | | 8,334,474 | | | | 4,561,292 | | | | 1,172,349 | |
Mid Cap Value | | | 257,932 | | | | — | | | | — | |
During the period, the following Funds incurred brokerage commissions with affiliated brokers which are affiliates of a sub-advisor.
| | | | |
| | | Large Cap Value
| |
Perishing, LLC | | $ | 380 | |
Note 12 — Subsequent Event
Mid Cap Growth Fund. At a meeting on October 25-26, 2010, the Board of VALIC Company II (“VC II”) approved the termination of Invesco Advisers, Inc. as the sub-adviser to the Mid Cap Growth Fund (the “Fund”) and approved the engagement of Columbia Management Investment Advisers, LLC (“Columbia”) as sub-adviser to the Fund. The Board approved a new investment sub-advisory agreement between VALIC and Columbia (the “Columbia Sub-advisory Agreement”). With respect to the Columbia Sub-advisory Agreement, the Board has authority, pursuant to an exemptive order granted by the Securities and Exchange Commission, to enter into sub-advisory agreements without a shareholder vote; however, an information statement explaining the change of sub-adviser will be mailed to the shareholders of the Fund. The effective date of the Columbia Sub-advisory Agreement will occur on or about December 1, 2010.
Mid Cap Value Fund. The current sub-adviser of the Mid Cap Value Fund (the “Fund”), FAF Advisors, Inc. (“FAF”), along with its parent, U.S. Bank National Association, has entered into an agreement whereby Nuveen Investments, Inc. will acquire FAF’s long-term asset management business (the “Transaction”). FAF’s long-term asset management business will be combined with the asset management business of Nuveen Asset Management, Inc. (“Nuveen”), which is a subsidiary of Nuveen Investments, Inc.
Upon the closing of the Transaction, a change of control of FAF will constitute an “assignment”, as such term is defined by Section 2(a)(4) of the 1940 Act. As required by Section 15(a)(4) of the 1940 Act, the existing investment sub-advisory agreement between VALIC and FAF provides for automatic termination upon assignment, and pursuant to the terms of an exemptive order for the Securities and Exchange Commission, VALIC is permitted, under certain conditions and subject to board approval, to continue the employment of existing subadvisers and to enter into new subadvisory agreements with such subadvisers without obtaining shareholder approval.
Effective October 26, 2010, the Board of VC II approved a new investment sub-advisory agreement between VALIC and Nuveen (or a subsidiary of Nuveen) (the “Nuveen Sub-advisory Agreement”). The Nuveen Sub-advisory Agreement will become effective upon the closing of the Transaction, which is anticipated to close by December 31, 2010.
131
VALIC Company II
FINANCIAL HIGHLIGHTS
Per share data is for a share of beneficial interest outstanding throughout the period. Total return includes reinvestment of distributions on the reinvestment date.
| | | | | | | | | | | | | | | | | | | | | | | | | | | | | | | | | | | | | | | | |
| | | Aggressive Growth Lifestyle Fund
| | | Capital Appreciation Fund
| |
| | | Year Ended August 31,
| | | Year Ended August 31,
| |
| | | 2010
| | | 2009
| | | 2008
| | | 2007
| | | 2006
| | | 2010
| | | 2009
| | | 2008
| | | 2007
| | | 2006
| |
| | | | | | | | | | |
PER SHARE DATA | | | | | | | | | | | | | | | | | | | | | | | | | | | | | | | | | | | | | | | | |
Net asset value at beginning of period | | $ | 6.96 | | | $ | 10.63 | | | $ | 12.59 | | | $ | 11.71 | | | $ | 10.98 | | | $ | 7.51 | | | $ | 10.24 | | | $ | 10.83 | | | $ | 8.90 | | | $ | 8.90 | |
| | |
|
|
| |
|
|
|
Income (loss) from investment operations: | | | | | | | | | | | | | | | | | | | | | | | | | | | | | | | | | | | | | | | | |
Net investment income (loss)(d) | | | 0.22 | | | | 0.14 | | | | 0.24 | | | | 0.23 | | | | 0.15 | | | | 0.05 | | | | 0.05 | | | | 0.01 | | | | 0.04 | | | | 0.02 | |
Net realized and unrealized gain (loss) on investments and foreign currencies | | | 0.35 | | | | (1.71 | ) | | | (1.25 | ) | | | 1.64 | | | | 1.00 | | | | 0.54 | | | | (2.77 | ) | | | (0.57 | ) | | | 1.91 | | | | (0.01 | ) |
Net increase from payments by affiliates | | | – | | | | – | | | | – | | | | – | | | | – | | | | – | | | | – | | | | – | | | | 0.00 | | | | – | |
| | |
|
|
| |
|
|
|
Total income (loss) from investment operations | | | 0.57 | | | | (1.57 | ) | | | (1.01 | ) | | | 1.87 | | | | 1.15 | | | | 0.59 | | | | (2.72 | ) | | | (0.56 | ) | | | 1.95 | | | | 0.01 | |
| | |
|
|
| |
|
|
|
Distributions from: | | | | | | | | | | | | | | | | | | | | | | | | | | | | | | | | | | | | | | | | |
Net investment income | | | (0.12 | ) | | | (0.22 | ) | | | (0.19 | ) | | | – | | | | (0.18 | ) | | | (0.09 | ) | | | (0.01 | ) | | | (0.03 | ) | | | (0.02 | ) | | | (0.01 | ) |
Net realized gain on securities | | | – | | | | (1.88 | ) | | | (0.76 | ) | | | (0.99 | ) | | | (0.24 | ) | | | – | | | | – | | | | – | | | | – | | | | – | |
| | |
|
|
| |
|
|
|
Total distributions | | | (0.12 | ) | | | (2.10 | ) | | | (0.95 | ) | | | (0.99 | ) | | | (0.42 | ) | | | (0.09 | ) | | | (0.01 | ) | | | (0.03 | ) | | | (0.02 | ) | | | (0.01 | ) |
| | |
|
|
| |
|
|
|
Net asset value at end of period | | $ | 7.41 | | | $ | 6.96 | | | $ | 10.63 | | | $ | 12.59 | | | $ | 11.71 | | | $ | 8.01 | | | $ | 7.51 | | | $ | 10.24 | | | $ | 10.83 | | | $ | 8.90 | |
| | |
|
|
| |
|
|
|
TOTAL RETURN(a) | | | 8.11 | % | | | (10.48 | )% | | | (8.92 | )% | | | 16.53 | % | | | 10.65 | % | | | 7.79 | % | | | (26.59 | )% | | | (5.18 | )% | | | 21.90 | %(e) | | | 0.06 | % |
| | |
|
|
| |
|
|
|
| | | | | | | | | | |
RATIOS/SUPPLEMENTAL DATA | | | | | | | | | | | | | | | | | | | | | | | | | | | | | | | | | | | | | | | | |
Ratio of expenses to average net assets(b) | | | 0.10 | %(f) | | | 0.10 | %(f) | | | 0.10 | %(f) | | | 0.10 | %(f) | | | 0.10 | %(f) | | | 0.85 | % | | | 0.85 | % | | | 0.85 | % | | | 0.85 | % | | | 0.85 | % |
Ratio of expenses to average net assets(c) | | | 0.20 | %(f) | | | 0.26 | %(f) | | | 0.23 | %(f) | | | 0.23 | %(f) | | | 0.29 | %(f) | | | 1.08 | % | | | 1.06 | % | | | 1.01 | % | | | 1.03 | % | | | 1.03 | % |
Ratio of expense reductions to average net assets | | | – | | | | – | | | | – | | | | – | | | | – | | | | – | | | | – | | | | – | | | | 0.00 | % | | | – | |
Ratio of net investment income (loss) to average net assets(b) | | | 2.92 | %(f) | | | 2.16 | %(f) | | | 2.15 | %(f) | | | 1.93 | %(f) | | | 1.31 | %(f) | | | 0.56 | % | | | 0.74 | % | | | 0.05 | % | | | 0.38 | % | | | 0.21 | % |
Ratio of net investment income (loss) to average net assets(c) | | | 2.81 | %(f) | | | 2.01 | %(f) | | | 2.02 | %(f) | | | 1.80 | %(f) | | | 1.12 | %(f) | | | 0.33 | % | | | 0.53 | % | | | (0.11 | )% | | | 0.19 | % | | | 0.03 | % |
Portfolio turnover rate | | | 43 | % | | | 151 | % | | | 119 | % | | | 53 | % | | | 79 | % | | | 61 | % | | | 54 | % | | | 57 | % | | | 32 | % | | | 169 | % |
Number of shares outstanding at end of period (000’s) | | | 16,549 | | | | 13,454 | | | | 8,603 | | | | 6,530 | | | | 4,612 | | | | 5,069 | | | | 6,456 | | | | 8,763 | | | | 7,779 | | | | 7,797 | |
Net assets at the end of period (000’s) | | $ | 122,655 | | | $ | 93,696 | | | $ | 91,464 | | | $ | 82,221 | | | $ | 53,987 | | | $ | 40,601 | | | $ | 48,510 | | | $ | 89,774 | | | $ | 84,269 | | | $ | 69,412 | |
| (a) | Total return is not annualized. It does include, if any, expense reimbursements and expense reductions. The effect of fees and charges incurred at the separate account level are not reflected in these performance figures. If such expenses had been included, the total return would have been lower for each period presented. |
| (b) | Includes expense reimbursements, but excludes expense reductions. |
| (c) | Excludes expense reimbursements and expense reductions. |
| (d) | The per share amounts are calculated using the average share method. |
| (e) | The Fund’s performance was increased by less than 0.01% from a reimbursement by an affiliate. |
| (f) | Does not include underlying fund expenses that the Fund bears indirectly. |
132
VALIC Company II
FINANCIAL HIGHLIGHTS — (continued)
Per share data is for a share of beneficial interest outstanding throughout the period. Total return includes reinvestment of distributions on the reinvestment date.
| | | | | | | | | | | | | | | | | | | | | | | | | | | | | | | | | | | | | | | | |
| | | Conservative Growth Lifestyle Fund
| | | Core Bond Fund
| |
| | | Year Ended August 31,
| | | Year Ended August 31,
| |
| | | 2010
| | | 2009
| | | 2008
| | | 2007
| | | 2006
| | | 2010
| | | 2009
| | | 2008
| | | 2007
| | | 2006
| |
| | | | | | | | | | |
PER SHARE DATA | | | | | | | | | | | | | | | | | | | | | | | | | | | | | | | | | | | | | | | | |
Net asset value at beginning of period | | $ | 9.60 | | | $ | 10.23 | | | $ | 11.29 | | | $ | 10.70 | | | $ | 10.81 | | | $ | 9.96 | | | $ | 10.08 | | | $ | 10.17 | | | $ | 10.09 | | | $ | 10.06 | |
| | |
|
|
| |
|
|
|
Income (loss) from investment operations: | | | | | | | | | | | | | | | | | | | | | | | | | | | | | | | | | | | | | | | | |
Net investment income (loss)(d) | | | 0.39 | | | | 0.33 | | | | 0.27 | | | | 0.19 | | | | 0.15 | | | | 0.42 | | | | 0.51 | | | | 0.51 | | | | 0.48 | | | | 0.49 | |
Net realized and unrealized gain (loss) on investments and foreign currencies | | | 0.63 | | | | (0.53 | ) | | | (0.72 | ) | | | 0.99 | | | | 0.42 | | | | 0.82 | | | | 0.09 | | | | (0.28 | ) | | | (0.11 | ) | | | (0.31 | ) |
Net increase from payments by affiliates | | | – | | | | – | | | | – | | | | – | | | | – | | | | – | | | | – | | | | – | | | | – | | | | – | |
| | |
|
|
| |
|
|
|
Total income (loss) from investment operations | | | 1.02 | | | | (0.20 | ) | | | (0.45 | ) | | | 1.18 | | | | 0.57 | | | | 1.24 | | | | 0.60 | | | | 0.23 | | | | 0.37 | | | | 0.18 | |
| | |
|
|
| |
|
|
|
Distributions from: | | | | | | | | | | | | | | | | | | | | | | | | | | | | | | | | | | | | | | | | |
Net investment income | | | (0.31 | ) | | | (0.26 | ) | | | (0.16 | ) | | | – | | | | (0.18 | ) | | | (0.52 | ) | | | (0.72 | ) | | | (0.32 | ) | | | (0.29 | ) | | | (0.13 | ) |
Net realized gain on securities | | | – | | | | (0.17 | ) | | | (0.45 | ) | | | (0.59 | ) | | | (0.50 | ) | | | – | | | | – | | | | – | | | | – | | | | (0.02 | ) |
| | |
|
|
| |
|
|
|
Total distributions | | | (0.31 | ) | | | (0.43 | ) | | | (0.61 | ) | | | (0.59 | ) | | | (0.68 | ) | | | (0.52 | ) | | | (0.72 | ) | | | (0.32 | ) | | | (0.29 | ) | | | (0.15 | ) |
| | |
|
|
| |
|
|
|
Net asset value at end of period | | $ | 10.31 | | | $ | 9.60 | | | $ | 10.23 | | | $ | 11.29 | | | $ | 10.70 | | | $ | 10.68 | | | $ | 9.96 | | | $ | 10.08 | | | $ | 10.17 | | | $ | 10.09 | |
| | |
|
|
| |
|
|
|
TOTAL RETURN(a) | | | 10.69 | % | | | (1.36 | )% | | | (4.36 | )% | | | 11.28 | % | | | 5.50 | % | | | 12.95 | % | | | 6.87 | % | | | 2.24 | % | | | 3.67 | % | | | 1.82 | % |
| | |
|
|
| |
|
|
|
| | | | | | | | | | |
RATIOS/SUPPLEMENTAL DATA | | | | | | | | | | | | | | | | | | | | | | | | | | | | | | | | | | | | | | | | |
Ratio of expenses to average net assets(b) | | | 0.10 | %(e) | | | 0.10 | %(e) | | | 0.10 | %(e) | | | 0.10 | %(e) | | | 0.10 | %(e) | | | 0.77 | % | | | 0.77 | % | | | 0.77 | % | | | 0.77 | % | | | 0.77 | % |
Ratio of expenses to average net assets(c) | | | 0.23 | %(e) | | | 0.31 | %(e) | | | 0.27 | %(e) | | | 0.28 | %(e) | | | 0.33 | %(e) | | | 0.90 | % | | | 0.98 | % | | | 0.93 | % | | | 0.93 | % | | | 1.03 | % |
Ratio of expense reductions to average net assets | | | – | | | | – | | | | – | | | | – | | | | – | | | | – | | | | – | | | | – | | | | – | | | | – | |
Ratio of net investment income (loss) to average net assets(b) | | | 3.93 | %(e) | | | 3.84 | %(e) | | | 2.58 | %(e) | | | 1.75 | %(e) | | | 1.38 | %(e) | | | 4.23 | % | | | 5.38 | % | | | 4.97 | % | | | 4.84 | % | | | 4.91 | % |
Ratio of net investment income (loss) to average net assets(c) | | | 3.81 | %(e) | | | 3.63 | %(e) | | | 2.40 | %(e) | | | 1.57 | %(e) | | | 1.15 | %(e) | | | 4.10 | % | | | 5.17 | % | | | 4.80 | % | | | 4.68 | % | | | 4.66 | % |
Portfolio turnover rate | | | 40 | % | | | 180 | % | | | 107 | % | | | 75 | % | | | 81 | % | | | 178 | % | | | 134 | % | | | 158 | % | | | 180 | %(f) | | | 206 | %(f) |
Number of shares outstanding at end of period (000’s) | | | 8,001 | | | | 6,004 | | | | 5,715 | | | | 4,332 | | | | 3,488 | | | | 22,810 | | | | 16,054 | | | | 20,731 | | | | 20,671 | | | | 10,802 | |
Net assets at the end of period (000’s) | | $ | 82,508 | | | $ | 57,659 | | | $ | 58,445 | | | $ | 48,897 | | | $ | 37,309 | | | $ | 243,578 | | | $ | 159,971 | | | $ | 209,052 | | | $ | 210,322 | | | $ | 109,007 | |
| (a) | Total return is not annualized. It does include, if any, expense reimbursements and expense reductions. The effect of fees and charges incurred at the separate account level are not reflected in these performance figures. If such expenses had been included, the total return would have been lower for each period presented. |
| (b) | Includes expense reimbursements, but excludes expense reductions. |
| (c) | Excludes expense reimbursements and expense reductions. |
| (d) | The per share amounts are calculated using the average share method. |
| (e) | Does not include underlying fund expenses that the Fund bears indirectly. |
| (f) | Portfolio turnover includes “to be announced” (“TBA”) transactions. Previously, portfolio turnover was calculated prior to including TBA transactions and was as follows: |
| | | | | | | | |
Fund
| | 2007
| | | 2006
| |
Core Bond | | | 155 | % | | | 202 | % |
133
VALIC Company II
FINANCIAL HIGHLIGHTS — (continued)
Per share data is for a share of beneficial interest outstanding throughout the period. Total return includes reinvestment of distributions on the reinvestment date.
| | | | | | | | | | | | | | | | | | | | | | | | | | | | | | | | | | | | | | | | |
| | | High Yield Bond Fund
| | | International Small Cap Equity Fund
| |
| | | Year Ended August 31,
| | | Year Ended August 31,
| |
| | | 2010
| | | 2009
| | | 2008
| | | 2007
| | | 2006
| | | 2010
| | | 2009
| | | 2008
| | | 2007
| | | 2006
| |
| | | | | | | | | | |
PER SHARE DATA | | | | | | | | | | | | | | | | | | | | | | | | | | | | | | | | | | | | | | | | |
Net asset value at beginning of period | | $ | 6.78 | | | $ | 8.43 | | | $ | 9.10 | | | $ | 9.32 | | | $ | 8.87 | | | $ | 10.95 | | | $ | 14.58 | | | $ | 19.78 | | | $ | 16.80 | | | $ | 14.05 | |
| | |
|
|
| |
|
|
|
Income (loss) from investment operations: | | | | | | | | | | | | | | | | | | | | | | | | | | | | | | | | | | | | | | | | |
Net investment income (loss)(d) | | | 0.60 | | | | 0.68 | | | | 0.72 | | | | 0.69 | | | | 0.63 | | | | 0.11 | | | | 0.16 | | | | 0.16 | | | | 0.16 | | | | 0.11 | |
Net realized and unrealized gain (loss) on investments and foreign currencies | | | 0.60 | | | | (1.61 | ) | | | (0.87 | ) | | | (0.26 | ) | | | 0.07 | | | | 0.33 | | | | (2.92 | ) | | | (3.62 | ) | | | 3.68 | | | | 2.87 | |
Net increase from payments by affiliates | | | – | | | | – | | | | – | | | | – | | | | 0.00 | | | | – | | | | – | | | | – | | | | 0.00 | | | | 0.00 | |
| | |
|
|
| |
|
|
|
Total income (loss) from investment operations | | | 1.20 | | | | (0.93 | ) | | | (0.15 | ) | | | 0.43 | | | | 0.70 | | | | 0.44 | | | | (2.76 | ) | | | (3.46 | ) | | | 3.84 | | | | 2.98 | |
| | |
|
|
| |
|
|
|
Distributions from: | | | | | | | | | | | | | | | | | | | | | | | | | | | | | | | | | | | | | | | | |
Net investment income | | | (0.62 | ) | | | (0.72 | ) | | | (0.50 | ) | | | (0.44 | ) | | | (0.16 | ) | | | (0.16 | ) | | | (0.14 | ) | | | (0.11 | ) | | | (0.06 | ) | | | (0.03 | ) |
Net realized gain on securities | | | – | | | | – | | | | (0.02 | ) | | | (0.21 | ) | | | (0.09 | ) | | | – | | | | (0.73 | ) | | | (1.63 | ) | | | (0.80 | ) | | | (0.20 | ) |
| | |
|
|
| |
|
|
|
Total distributions | | | (0.62 | ) | | | (0.72 | ) | | | (0.52 | ) | | | (0.65 | ) | | | (0.25 | ) | | | (0.16 | ) | | | (0.87 | ) | | | (1.74 | ) | | | (0.86 | ) | | | (0.23 | ) |
| | |
|
|
| |
|
|
| |
|
|
| |
|
|
|
Net asset value at end of period | | $ | 7.36 | | | $ | 6.78 | | | $ | 8.43 | | | $ | 9.10 | | | $ | 9.32 | | | $ | 11.23 | | | $ | 10.95 | | | $ | 14.58 | | | $ | 19.78 | | | $ | 16.80 | |
| | |
|
|
| |
|
|
|
TOTAL RETURN(a) | | | 18.42 | % | | | (7.97 | )% | | | (1.79 | )% | | | 4.62 | % | | | 8.16 | %(f) | | | 4.04 | % | | | (17.61 | )% | | | (18.68 | )% | | | 23.44 | %(g) | | | 21.36 | %(e) |
| | |
|
|
| |
|
|
|
| | | | | | | | | | |
RATIOS/SUPPLEMENTAL DATA | | | | | | | | | | | | | | | | | | | | | | | | | | | | | | | | | | | | | | | | |
Ratio of expenses to average net assets(b) | | | 0.97 | % | | | 0.99 | % | | | 0.99 | % | | | 0.99 | % | | | 0.99 | % | | | 1.00 | % | | | 1.00 | % | | | 1.00 | % | | | 1.00 | % | | | 1.00 | % |
Ratio of expenses to average net assets(c) | | | 1.06 | % | | | 1.16 | % | | | 1.13 | % | | | 1.16 | % | | | 1.19 | % | | | 1.26 | % | | | 1.32 | % | | | 1.31 | % | | | 1.29 | % | | | 1.37 | % |
Ratio of expense reductions to average net assets | | | – | | | | – | | | | – | | | | – | | | | – | | | | – | | | | – | | | | – | | | | – | | | | – | |
Ratio of net investment income (loss) to average net assets(b) | | | 8.44 | % | | | 11.11 | % | | | 8.25 | % | | | 7.63 | % | | | 7.07 | % | | | 0.94 | % | | | 1.71 | % | | | 0.97 | % | | | 0.84 | % | | | 0.72 | % |
Ratio of net investment income (loss) to average net assets(c) | | | 8.35 | % | | | 10.94 | % | | | 8.12 | % | | | 7.46 | % | | | 6.87 | % | | | 0.69 | % | | | 1.40 | % | | | 0.66 | % | | | 0.55 | % | | | 0.35 | % |
Portfolio turnover rate | | | 47 | % | | | 91 | % | | | 57 | % | | | 47 | % | | | 53 | % | | | 126 | % | | | 132 | % | | | 101 | % | | | 72 | % | | | 69 | % |
Number of shares outstanding at end of period (000’s) | | | 35,452 | | | | 28,189 | | | | 24,516 | | | | 21,225 | | | | 11,377 | | | | 48,205 | | | | 51,389 | | | | 42,957 | | | | 37,205 | | | | 25,445 | |
Net assets at the end of period (000’s) | | $ | 261,050 | | | $ | 191,246 | | | $ | 206,712 | | | $ | 193,127 | | | $ | 106,070 | | | $ | 541,326 | | | $ | 562,725 | | | $ | 626,351 | | | $ | 735,844 | | | $ | 427,437 | |
| (a) | Total return is not annualized. It does include, if any, expense reimbursements and expense reductions. The effect of fees and charges incurred at the separate account level are not reflected in these performance figures. If such expenses had been included, the total return would have been lower for each period presented. |
| (b) | Includes expense reimbursements, but excludes expense reductions. |
| (c) | Excludes expense reimbursements and expense reductions. |
| (d) | The per share amounts are calculated using the average share method. |
| (e) | The Fund’s performance figure was increased by less than 0.01% from reimbursements for losses realized on the disposal of investments in violation of investment restrictions. |
| (f) | The Fund’s performance figure was increased by less than 0.01% from a reimbursement by an affiliate. |
| (g) | The Fund’s performance figure was increased by 0.06% from a reimbursement for losses realized on the disposal of investments in violation of investment restrictions. |
134
VALIC Company II
FINANCIAL HIGHLIGHTS — (continued)
Per share data is for a share of beneficial interest outstanding throughout the period. Total return includes reinvestment of distributions on the reinvestment date.
| | | | | | | | | | | | | | | | | | | | | | | | | | | | | | | | | | | | | | | | |
| | | Large Cap Value Fund
| | | Mid Cap Growth Fund
| |
| | | Year Ended August 31,
| | | Year Ended August 31,
| |
| | | 2010
| | | 2009
| | | 2008
| | | 2007
| | | 2006
| | | 2010
| | | 2009
| | | 2008
| | | 2007
| | | 2006
| |
| | | | | | | | | | |
PER SHARE DATA | | | | | | | | | | | | | | | | | | | | | | | | | | | | | | | | | | | | | | | | |
Net asset value at beginning of period | | $ | 9.37 | | | $ | 12.51 | | | $ | 15.74 | | | $ | 14.58 | | | $ | 13.72 | | | $ | 5.79 | | | $ | 7.42 | | | $ | 9.36 | | | $ | 8.15 | | | $ | 7.56 | |
| | |
|
|
| |
|
|
|
Income (loss) from investment operations: | | | | | | | | | | | | | | | | | | | | | | | | | | | | | | | | | | | | | | | | |
Net investment income (loss)(d) | | | 0.14 | | | | 0.15 | | | | 0.20 | | | | 0.18 | | | | 0.21 | | | | (0.02 | ) | | | (0.01 | ) | | | (0.02 | ) | | | (0.02 | ) | | | (0.01 | ) |
Net realized and unrealized gain (loss) on investments and foreign currencies | | | (0.07 | ) | | | (3.00 | ) | | | (2.51 | ) | | | 1.67 | | | | 1.50 | | | | 0.51 | | | | (1.59 | ) | | | (0.97 | ) | | | 1.80 | | | | 0.60 | |
Net increase from payments by affiliates | | | – | | | | – | | | | – | | | | – | | | | 0.00 | | | | – | | | | – | | | | – | | | | – | | | | – | |
| | |
|
|
| |
|
|
|
Total income (loss) from investment operations | | | 0.07 | | | | (2.85 | ) | | | (2.31 | ) | | | 1.85 | | | | 1.71 | | | | 0.49 | | | | (1.60 | ) | | | (0.99 | ) | | | 1.78 | | | | 0.59 | |
| | |
|
|
| |
|
|
|
Distributions from: | | | | | | | | | | | | | | | | | | | | | | | | | | | | | | | | | | | | | | | | |
Net investment income | | | (0.18 | ) | | | (0.29 | ) | | | (0.14 | ) | | | (0.07 | ) | | | (0.06 | ) | | | – | | | | – | | | | – | | | | – | | | | – | |
Net realized gain on securities | | | – | | | | – | | | | (0.78 | ) | | | (0.62 | ) | | | (0.79 | ) | | | – | | | | (0.03 | ) | | | (0.95 | ) | | | (0.57 | ) | | | – | |
| | |
|
|
| |
|
|
|
Total distributions | | | (0.18 | ) | | | (0.29 | ) | | | (0.92 | ) | | | (0.69 | ) | | | (0.85 | ) | | | – | | | | (0.03 | ) | | | (0.95 | ) | | | (0.57 | ) | | | – | |
| | |
|
|
| |
|
|
|
Net asset value at end of period | | $ | 9.26 | | | $ | 9.37 | | | $ | 12.51 | | | $ | 15.74 | | | $ | 14.58 | | | $ | 6.28 | | | $ | 5.79 | | | $ | 7.42 | | | $ | 9.36 | | | $ | 8.15 | |
| | |
|
|
| |
|
|
|
TOTAL RETURN(a) | | | 0.61 | % | | | (22.55 | )% | | | (15.47 | )% | | | 12.89 | % | | | 12.98 | %(e) | | | 8.46 | % | | | (21.43 | )% | | | (11.98 | )% | | | 22.57 | % | | | 7.80 | % |
| | |
|
|
| |
|
|
|
| | | | | | | | | | |
RATIOS/SUPPLEMENTAL DATA | | | | | | | | | | | | | | | | | | | | | | | | | | | | | | | | | | | | | | | | |
Ratio of expenses to average net assets(b) | | | 0.81 | % | | | 0.81 | % | | | 0.81 | % | | | 0.81 | % | | | 0.81 | % | | | 0.85 | % | | | 0.85 | % | | | 0.85 | % | | | 0.85 | % | | | 0.85 | % |
Ratio of expenses to average net assets(c) | | | 0.93 | % | | | 0.97 | % | | | 0.92 | % | | | 0.89 | % | | | 0.97 | % | | | 1.15 | % | | | 1.25 | % | | | 1.17 | % | | | 1.25 | % | | | 1.34 | % |
Ratio of expense reductions to average net assets | | | 0.00 | % | | | 0.01 | % | | | 0.01 | % | | | – | | | | – | | | | 0.01 | % | | | 0.05 | % | | | 0.02 | % | | | 0.01 | % | | | – | |
Ratio of net investment income (loss) to average net assets(b) | | | 1.41 | % | | | 1.70 | % | | | 1.41 | % | | | 1.16 | % | | | 1.54 | % | | | (0.33 | )% | | | (0.29 | )% | | | (0.28 | )% | | | (0.26 | )% | | | (0.15 | )% |
Ratio of net investment income (loss) to average net assets(c) | | | 1.29 | % | | | 1.53 | % | | | 1.30 | % | | | 1.08 | % | | | 1.38 | % | | | (0.63 | )% | | | (0.69 | )% | | | (0.60 | )% | | | (0.66 | )% | | | (0.64 | )% |
Portfolio turnover rate | | | 224 | % | | | 182 | % | | | 183 | % | | | 105 | % | | | 103 | % | | | 76 | % | | | 116 | % | | | 125 | % | | | 121 | % | | | 142 | % |
Number of shares outstanding at end of period (000’s) | | | 15,751 | | | | 16,825 | | | | 24,675 | | | | 26,589 | | | | 12,192 | | | | 26,012 | | | | 27,455 | | | | 28,873 | | | | 9,052 | | | | 7,929 | |
Net assets at the end of period (000’s) | | $ | 145,778 | | | $ | 157,711 | | | $ | 308,635 | | | $ | 418,508 | | | $ | 177,737 | | | $ | 163,364 | | | $ | 158,841 | | | $ | 214,201 | | | $ | 84,765 | | | $ | 64,583 | |
| (a) | Total return is not annualized. It does include, if any, expense reimbursements and expense reductions. The effect of fees and charges incurred at the separate account level are not reflected in these performance figures. If such expenses had been included, the total return would have been lower for each period presented. |
| (b) | Includes expense reimbursements, but excludes expense reductions. |
| (c) | Excludes expense reimbursements and expense reductions. |
| (d) | The per share amounts are calculated using the average share method. |
| (e) | The Fund’s performance figure was increased by less than 0.01% from reimbursements for losses realized on the disposal of investments in violation of investment restrictions. |
135
VALIC Company II
FINANCIAL HIGHLIGHTS — (continued)
Per share data is for a share of beneficial interest outstanding throughout the period. Total return includes reinvestment of distributions on the reinvestment date.
| | | | | | | | | | | | | | | | | | | | | | | | | | | | | | | | | | | | | | | | |
| | | Mid Cap Value Fund
| | | Moderate Growth Lifestyle Fund
| |
| | | Year Ended August 31,
| | | Year Ended August 31,
| |
| | | 2010
| | | 2009
| | | 2008
| | | 2007
| | | 2006
| | | 2010
| | | 2009
| | | 2008
| | | 2007
| | | 2006
| |
| | | | | | | | | | |
PER SHARE DATA | | | | | | | | | | | | | | | | | | | | | | | | | | | | | | | | | | | | | | | | |
Net asset value at beginning of period | | $ | 12.71 | | | $ | 15.31 | | | $ | 20.09 | | | $ | 18.75 | | | $ | 18.27 | | | $ | 10.12 | | | $ | 11.40 | | | $ | 13.04 | | | $ | 12.44 | | | $ | 12.04 | |
| | |
|
|
| |
|
|
|
Income (loss) from investment operations: | | | | | | | | | | | | | | | | | | | | | | | | | | | | | | | | | | | | | | | | |
Net investment income (loss)(d) | | | 0.08 | | | | 0.13 | | | | 0.07 | | | | 0.10 | | | | 0.08 | | | | 0.37 | | | | 0.25 | | | | 0.29 | | | | 0.21 | | | | 0.16 | |
Net realized and unrealized gain (loss) on investments and foreign currencies | | | 0.97 | | | | (2.40 | ) | | | (3.11 | ) | | | 3.14 | | | | 1.79 | | | | 0.55 | | | | (0.96 | ) | | | (1.08 | ) | | | 1.49 | | | | 0.70 | |
Net increase from payments by affiliates | | | – | | | | – | | | | – | | | | – | | | | – | | | | – | | | | – | | | | – | | | | – | | | | – | |
| | |
|
|
| |
|
|
|
Total income (loss) from investment operations | | | 1.05 | | | | (2.27 | ) | | | (3.04 | ) | | | 3.24 | | | | 1.87 | | | | 0.92 | | | | (0.71 | ) | | | (0.79 | ) | | | 1.70 | | | | 0.86 | |
| | |
|
|
| |
|
|
|
Distributions from: | | | | | | | | | | | | | | | | | | | | | | | | | | | | | | | | | | | | | | | | |
Net investment income | | | (0.15 | ) | | | (0.06 | ) | | | (0.09 | ) | | | (0.07 | ) | | | (0.01 | ) | | | (0.23 | ) | | | (0.26 | ) | | | (0.17 | ) | | | (0.12 | ) | | | (0.06 | ) |
Net realized gain on securities | | | – | | | | (0.27 | ) | | | (1.65 | ) | | | (1.83 | ) | | | (1.38 | ) | | | – | | | | (0.31 | ) | | | (0.68 | ) | | | (0.98 | ) | | | (0.40 | ) |
| | |
|
|
| |
|
|
|
Total distributions | | | (0.15 | ) | | | (0.33 | ) | | | (1.74 | ) | | | (1.90 | ) | | | (1.39 | ) | | | (0.23 | ) | | | (0.57 | ) | | | (0.85 | ) | | | (1.10 | ) | | | (0.46 | ) |
| | |
|
|
| |
|
|
|
Net asset value at end of period | | $ | 13.61 | | | $ | 12.71 | | | $ | 15.31 | | | $ | 20.09 | | | $ | 18.75 | | | $ | 10.81 | | | $ | 10.12 | | | $ | 11.40 | | | $ | 13.04 | | | $ | 12.44 | |
| | |
|
|
| |
|
|
|
TOTAL RETURN(a) | | | 8.21 | % | | | (14.17 | )% | | | (16.05 | )% | | | 18.15 | % | | | 10.74 | % | | | 9.07 | % | | | (5.33 | )% | | | (6.70 | )% | | | 14.18 | % | | | 7.21 | % |
| | |
|
|
| |
|
|
|
| | | | | | | | | | |
RATIOS/SUPPLEMENTAL DATA | | | | | | | | | | | | | | | | | | | | | | | | | | | | | | | | | | | | | | | | |
Ratio of expenses to average net assets(b) | | | 1.05 | % | | | 1.05 | % | | | 1.05 | % | | | 1.05 | % | | | 1.05 | % | | | 0.10 | %(e) | | | 0.10 | %(e) | | | 0.10 | %(e) | | | 0.10 | %(e) | | | 0.10 | %(e) |
Ratio of expenses to average net assets(c) | | | 1.11 | % | | | 1.17 | % | | | 1.13 | % | | | 1.11 | % | | | 1.20 | % | | | 0.18 | %(e) | | | 0.22 | %(e) | | | 0.20 | %(e) | | | 0.20 | %(e) | | | 0.24 | %(e) |
Ratio of expense reductions to average net assets | | | 0.02 | % | | | 0.03 | % | | | 0.01 | % | | | 0.02 | % | | | 0.01 | % | | | – | | | | – | | | | – | | | | – | | | | – | |
Ratio of net investment income (loss) to average net assets(b) | | | 0.54 | % | | | 1.22 | % | | | 0.43 | % | | | 0.47 | % | | | 0.40 | % | | | 3.45 | %(e) | | | 2.81 | %(e) | | | 2.42 | %(e) | | | 1.64 | %(e) | | | 1.35 | %(e) |
Ratio of net investment income (loss) to average net assets(c) | | | 0.48 | % | | | 1.10 | % | | | 0.35 | % | | | 0.41 | % | | | 0.25 | % | | | 3.37 | %(e) | | | 2.69 | %(e) | | | 2.32 | %(e) | | | 1.54 | %(e) | | | 1.21 | %(e) |
Portfolio turnover rate | | | 81 | % | | | 84 | % | | | 72 | % | | | 59 | % | | | 76 | % | | | 34 | % | | | 175 | % | | | 108 | % | | | 64 | % | | | 70 | % |
Number of shares outstanding at end of period (000’s) | | | 33,097 | | | | 37,634 | | | | 40,372 | | | | 26,139 | | | | 19,331 | | | | 17,832 | | | | 14,009 | | | | 12,783 | | | | 9,401 | | | | 7,122 | |
Net assets at the end of period (000’s) | | $ | 450,578 | | | $ | 478,457 | | | $ | 618,150 | | | $ | 525,119 | | | $ | 362,379 | | | $ | 192,841 | | | $ | 141,786 | | | $ | 145,705 | | | $ | 122,551 | | | $ | 88,558 | |
| (a) | Total return is not annualized. It does include, if any, expense reimbursements and expense reductions. The effect of fees and charges incurred at the separate account level are not reflected in these performance figures. If such expenses had been included, the total return would have been lower for each period presented. |
| (b) | Includes expense reimbursements, but excludes expense reductions. |
| (c) | Excludes expense reimbursements and expense reductions. |
| (d) | The per share amounts are calculated using the average share method. |
| (e) | Does not include underlying fund expenses that the Fund bears indirectly. |
136
VALIC Company II
FINANCIAL HIGHLIGHTS — (continued)
Per share data is for a share of beneficial interest outstanding throughout the period. Total return includes reinvestment of distributions on the reinvestment date.
| | | | | | | | | | | | | | | | | | | | | | | | | | | | | | | | | | | | | | | | |
| | | Money Market II Fund
| | | Small Cap Growth Fund
| |
| | | Year Ended August 31,
| | | Year Ended August 31,
| |
| | | 2010
| | | 2009
| | | 2008
| | | 2007
| | | 2006
| | | 2010
| | | 2009
| | | 2008
| | | 2007
| | | 2006
| |
| | | | | | | | | | |
PER SHARE DATA | | | | | | | | | | | | | | | | | | | | | | | | | | | | | | | | | | | | | | | | |
Net asset value at beginning of period | | $ | 1.00 | | | $ | 1.00 | | | $ | 1.00 | | | $ | 1.00 | | | $ | 1.00 | | | $ | 9.31 | | | $ | 11.46 | | | $ | 14.59 | | | $ | 12.68 | | | $ | 12.19 | |
| | |
|
|
| |
|
|
|
Income (loss) from investment operations: | | | | | | | | | | | | | | | | | | | | | | | | | | | | | | | | | | | | | | | | |
Net investment income (loss)(d) | | | 0.00 | | | | 0.01 | | | | 0.03 | | | | 0.05 | | | | 0.04 | | | | (0.08 | ) | | | (0.07 | ) | | | (0.09 | ) | | | (0.09 | ) | | | (0.07 | ) |
Net realized and unrealized gain (loss) on investments and foreign currencies | | | 0.00 | | | | (0.00 | ) | | | (0.00 | ) | | | – | | | | – | | | | 0.97 | | | | (1.96 | ) | | | (2.20 | ) | | | 2.00 | | | | 0.56 | |
Net increase from payments by affiliates | | | 0.00 | | | | – | | | | – | | | | – | | | | – | | | | – | | | | – | | | | – | | | | – | | | | – | |
| | |
|
|
| |
|
|
|
Total income (loss) from investment operations | | | 0.00 | | | | 0.01 | | | | 0.03 | | | | 0.05 | | | | 0.04 | | | | 0.89 | | | | (2.03 | ) | | | (2.29 | ) | | | 1.91 | | | | 0.49 | |
| | |
|
|
| |
|
|
|
Distributions from: | | | | | | | | | | | | | | | | | | | | | | | | | | | | | | | | | | | | | | | | |
Net investment income | | | (0.00 | ) | | | (0.01 | ) | | | (0.03 | ) | | | (0.05 | ) | | | (0.04 | ) | | | – | | | | – | | | | – | | | | – | | | | – | |
Net realized gain on securities | | | – | | | | – | | | | – | | | | – | | | | – | | | | – | | | | (0.12 | ) | | | (0.84 | ) | | | – | | | | – | |
| | |
|
|
| |
|
|
|
Total distributions | | | (0.00 | ) | | | (0.01 | ) | | | (0.03 | ) | | | (0.05 | ) | | | (0.04 | ) | | | – | | | | (0.12 | ) | | | (0.84 | ) | | | – | | | | – | |
| | |
|
|
| |
|
|
|
Net asset value at end of period | | $ | 1.00 | | | $ | 1.00 | | | $ | 1.00 | | | $ | 1.00 | | | $ | 1.00 | | | $ | 10.20 | | | $ | 9.31 | | | $ | 11.46 | | | $ | 14.59 | | | $ | 12.68 | |
| | |
|
|
| |
|
|
|
TOTAL RETURN(a) | | | 0.01 | %(e) | | | 0.89 | % | | | 3.08 | % | | | 4.88 | % | | | 4.09 | % | | | 9.56 | % | | | (17.44 | )% | | | (16.52 | )% | | | 15.06 | % | | | 4.02 | % |
| | |
|
|
| |
|
|
|
| | | | | | | | | | |
RATIOS/SUPPLEMENTAL DATA | | | | | | | | | | | | | | | | | | | | | | | | | | | | | | | | | | | | | | | | |
Ratio of expenses to average net assets(b) | | | 0.37 | % | | | 0.55 | % | | | 0.55 | % | | | 0.55 | % | | | 0.56 | % | | | 1.16 | % | | | 1.16 | % | | | 1.16 | % | | | 1.16 | % | | | 1.16 | % |
Ratio of expenses to average net assets(c) | | | 0.64 | % | | | 0.75 | % | | | 0.67 | % | | | 0.64 | % | | | 0.67 | % | | | 1.36 | % | | | 1.49 | % | | | 1.39 | % | | | 1.35 | % | | | 1.40 | % |
Ratio of expense reduction to average net assets | | | – | | | | – | | | | – | | | | – | | | | – | | | | 0.01 | % | | | 0.01 | %. | | | 0.00 | % | | | 0.01 | % | | | – | |
Ratio of net investment income (loss) to average net assets(b) | | | 0.01 | % | | | 0.94 | % | | | 3.04 | % | | | 4.78 | % | | | 4.13 | % | | | (0.83 | )% | | | (0.88 | )% | | | (0.75 | )% | | | (0.67 | )% | | | (0.55 | )% |
Ratio of net investment income (loss) to average net assets(c) | | | (0.26 | )% | | | 0.73 | % | | | 2.93 | % | | | 4.69 | % | | | 4.02 | % | | | (1.03 | )% | | | (1.21 | )% | | | (0.98 | )% | | | (0.86 | )% | | | (0.79 | )% |
Portfolio turnover rate | | | N/A | | | | N/A | | | | N/A | | | | N/A | | | | N/A | | | | 80 | % | | | 83 | % | | | 158 | % | | | 58 | % | | | 69 | % |
Number of shares outstanding at end of period (000’s) | | | 214,151 | | | | 253,830 | | | | 329,922 | | | | 337,050 | | | | 151,326 | | | | 4,681 | | | | 4,546 | | | | 4,195 | | | | 3,884 | | | | 3,892 | |
Net assets at the end of period (000’s) | | $ | 213,807 | | | $ | 253,242 | | | $ | 329,212 | | | $ | 337,050 | | | $ | 151,326 | | | $ | 47,757 | | | $ | 42,310 | | | $ | 48,061 | | | $ | 56,678 | | | $ | 49,354 | |
| (a) | Total return is not annualized. It does include, if any, expense reimbursements and expense reductions. The effect of fees and charges incurred at the separate account level are not reflected in these performance figures. If such expenses had been included, the total return would have been lower for each period presented. |
| (b) | Includes expense reimbursements, but excludes expense reductions. |
| (c) | Excludes expense reimbursements and expense reductions. |
| (d) | The per share amounts are calculated using the average share method. |
| (e) | The Fund’s performance figure was increased by less than 0.01% from the effect of payments by an affiliate (Note 3). |
137
VALIC Company II
FINANCIAL HIGHLIGHTS — (continued)
Per share data is for a share of beneficial interest outstanding throughout the period. Total return includes reinvestment of distributions on the reinvestment date.
| | | | | | | | | | | | | | | | | | | | | | | | | | | | | | | | | | | | | | | | |
| | | Small Cap Value Fund
| | | Socially Responsible Fund
| |
| | | Year Ended August 31,
| | | Year Ended August 31,
| |
| | | 2010
| | | 2009
| | | 2008
| | | 2007
| | | 2006
| | | 2010
| | | 2009
| | | 2008
| | | 2007
| | | 2006
| |
| | | | | | | | | | |
PER SHARE DATA | | | | | | | | | | | | | | | | | | | | | | | | | | | | | | | | | | | | | | | | |
Net asset value at beginning of period | | $ | 9.88 | | | $ | 13.75 | | | $ | 15.35 | | | $ | 15.06 | | | $ | 15.61 | | | $ | 8.93 | | | $ | 11.39 | | | $ | 13.49 | | | $ | 12.06 | | | $ | 11.21 | |
| | |
|
|
| |
|
|
|
Income (loss) from investment operations: | | | | | | | | | | | | | | | | | | | | | | | | | | | | | | | | | | | | | | | | |
Net investment income (loss)(d) | | | 0.06 | | | | 0.15 | | | | 0.17 | | | | 0.12 | | | | 0.11 | | | | 0.12 | | | | 0.14 | | | | 0.18 | | | | 0.19 | | | | 0.17 | |
Net realized and unrealized gain (loss) on investments and foreign currencies | | | 0.43 | | | | (3.28 | ) | | | (0.98 | ) | | | 1.27 | | | | 1.25 | | | | 0.44 | | | | (2.37 | ) | | | (1.46 | ) | | | 1.51 | | | | 0.96 | |
Net increase from payments by affiliates | | | – | | | | – | | | | – | | | | 0.00 | | | | – | | | | – | | | | – | | | | – | | | | 0.00 | | | | – | |
| | |
|
|
| |
|
|
|
Total income (loss) from investment operations | | | 0.49 | | | | (3.13 | ) | | | (0.81 | ) | | | 1.39 | | | | 1.36 | | | | 0.56 | | | | (2.23 | ) | | | (1.28 | ) | | | 1.70 | | | | 1.13 | |
| | |
|
|
| |
|
|
|
Distributions from: | | | | | | | | | | | | | | | | | | | | | | | | | | | | | | | | | | | | | | | | |
Net investment income | | | (0.10 | ) | | | (0.12 | ) | | | (0.09 | ) | | | (0.07 | ) | | | (0.02 | ) | | | (0.15 | ) | | | (0.19 | ) | | | (0.12 | ) | | | (0.06 | ) | | | (0.05 | ) |
Net realized gain on securities | | | – | | | | (0.62 | ) | | | (0.70 | ) | | | (1.03 | ) | | | (1.89 | ) | | | – | | | | (0.04 | ) | | | (0.70 | ) | | | (0.21 | ) | | | (0.23 | ) |
| | |
|
|
| |
|
|
|
Total distributions | | | (0.10 | ) | | | (0.74 | ) | | | (0.79 | ) | | | (1.10 | ) | | | (1.91 | ) | | | (0.15 | ) | | | (0.23 | ) | | | (0.82 | ) | | | (0.27 | ) | | | (0.28 | ) |
| | |
|
|
| |
|
|
|
Net asset value at end of period | | $ | 10.27 | | | $ | 9.88 | | | $ | 13.75 | | | $ | 15.35 | | | $ | 15.06 | | | $ | 9.34 | | | $ | 8.93 | | | $ | 11.39 | | | $ | 13.49 | | | $ | 12.06 | |
| | |
|
|
| |
|
|
|
TOTAL RETURN(a) | | | 4.96 | % | | | (21.71 | )% | | | (5.23 | )% | | | 9.22 | %(e) | | | 9.69 | % | | | 6.23 | % | | | (19.20 | )% | | | (10.04 | )% | | | 14.22 | %(f) | | | 10.16 | % |
| | |
|
|
| |
|
|
|
| | | | | | | | | | |
RATIOS/SUPPLEMENTAL DATA | | | | | | | | | | | | | | | | | | | | | | | | | | | | | | | | | | | | | | | | |
Ratio of expenses to average net assets(b) | | | 0.95 | % | | | 0.95 | % | | | 0.95 | % | | | 0.95 | % | | | 0.95 | % | | | 0.56 | % | | | 0.56 | % | | | 0.56 | % | | | 0.56 | % | | | 0.56 | % |
Ratio of expenses to average net assets(c) | | | 1.14 | % | | | 1.11 | % | | | 1.11 | % | | | 1.11 | % | | | 1.21 | % | | | 0.63 | % | | | 0.69 | % | | | 0.65 | % | | | 0.63 | % | | | 0.71 | % |
Ratio of expense reductions to average net assets | | | 0.01 | % | | | 0.00 | % | | | 0.01 | % | | | 0.00 | % | | | – | | | | – | | | | 0.02 | % | | | 0.02 | % | | | 0.03 | % | | | – | |
Ratio of net investment income (loss) to average net assets(b) | | | 0.52 | % | | | 1.77 | % | | | 1.02 | % | | | 0.77 | % | | | 0.74 | % | | | 1.20 | % | | | 1.79 | % | | | 1.46 | % | | | 1.45 | % | | | 1.52 | % |
Ratio of net investment income (loss) to average net assets(c) | | | 0.33 | % | | | 1.60 | % | | | 0.86 | % | | | 0.61 | % | | | 0.49 | % | | | 1.13 | % | | | 1.67 | % | | | 1.37 | % | | | 1.38 | % | | | 1.37 | % |
Portfolio turnover rate | | | 132 | % | | | 32 | % | | | 39 | % | | | 33 | % | | | 58 | % | | | 98 | % | | | 86 | % | | | 120 | % | | | 152 | % | | | 172 | % |
Number of shares outstanding at end of period (000’s) | | | 33,825 | | | | 34,981 | | | | 22,274 | | | | 16,918 | | | | 7,622 | | | | 72,022 | | | | 73,479 | | | | 80,127 | | | | 68,651 | | | | 24,486 | |
Net assets at the end of period (000’s) | | $ | 347,417 | | | $ | 345,551 | | | $ | 306,357 | | | $ | 259,704 | | | $ | 114,809 | | | $ | 672,566 | | | $ | 656,132 | | | $ | 912,992 | | | $ | 925,906 | | | $ | 295,231 | |
| (a) | Total return is not annualized. It does include, if any, expense reimbursements and expense reductions. The effect of fees and charges incurred at the separate account level are not reflected in these performance figures. If such expenses had been included, the total return would have been lower for each period presented. |
| (b) | Includes expense reimbursements, but excludes expense reductions. |
| (c) | Excludes expense reimbursements and expense reductions. |
| (d) | The per share amounts are calculated using the average share method. |
| (e) | The Fund’s performance figure was increased by less than 0.01% from a gain realized on the disposal of investments in violation of investment restrictions. |
| (f) | The Fund’s performance was increased by less than 0.01% from a reimbursement by an affiliate. |
138
VALIC Company II
FINANCIAL HIGHLIGHTS — (continued)
Per share data is for a share of beneficial interest outstanding throughout the period. Total return includes reinvestment of distributions on the reinvestment date.
| | | | | | | | | | | | | | | | | | | | |
| | | Strategic Bond Fund
| |
| | | Year Ended August 31,
| |
| | | 2010
| | | 2009
| | | 2008
| | | 2007
| | | 2006
| |
| | | | | |
PER SHARE DATA | | | | | | | | | | | | | | | | | | | | |
Net asset value at beginning of period | | $ | 10.29 | | | $ | 11.10 | | | $ | 11.33 | | | $ | 11.36 | | | $ | 11.08 | |
| | |
|
|
|
Income (loss) from investment operations: | | | | | | | | | | | | | | | | | | | | |
Net investment income (loss)(d) | | | 0.60 | | | | 0.66 | | | | 0.65 | | | | 0.61 | | | | 0.58 | |
Net realized and unrealized gain (loss) on investments and foreign currencies | | | 0.85 | | | | (0.60 | ) | | | (0.29 | ) | | | (0.12 | ) | | | 0.04 | |
Net increase from payments by affiliates | | | – | | | | – | | | | – | | | | – | | | | 0.00 | |
| | |
|
|
|
Total income (loss) from investment operations | | | 1.45 | | | | 0.06 | | | | 0.36 | | | | 0.49 | | | | 0.62 | |
| | |
|
|
|
Distributions from: | | | | | | | | | | | | | | | | | | | | |
Net investment income | | | (0.52 | ) | | | (0.87 | ) | | | (0.51 | ) | | | (0.40 | ) | | | (0.16 | ) |
Net realized gain on securities | | | – | | | | – | | | | (0.08 | ) | | | (0.12 | ) | | | (0.18 | ) |
| | |
|
|
|
Total distributions | | | (0.52 | ) | | | (0.87 | ) | | | (0.59 | ) | | | (0.52 | ) | | | (0.34 | ) |
| | |
|
|
|
Net asset value at end of period | | $ | 11.22 | | | $ | 10.29 | | | $ | 11.10 | | | $ | 11.33 | | | $ | 11.36 | |
| | |
|
|
|
TOTAL RETURN(a) | | | 14.51 | % | | | 2.23 | % | | | 3.13 | % | | | 4.32 | % | | | 5.75 | %(e) |
| | |
|
|
|
| | | | | |
RATIOS/SUPPLEMENTAL DATA | | | | | | | | | | | | | | | | | | | | |
Ratio of expenses to average net assets(b) | | | 0.89 | % | | | 0.89 | % | | | 0.89 | % | | | 0.89 | % | | | 0.89 | % |
Ratio of expenses to average net assets(c) | | | 0.95 | % | | | 1.05 | % | | | 1.00 | % | | | 1.02 | % | | | 1.12 | % |
Ratio of expense reductions to average net assets | | | – | | | | – | | | | – | | | | – | | | | – | |
Ratio of net investment income (loss) to average net assets(b) | | | 5.65 | % | | | 7.01 | % | | | 5.81 | % | | | 5.49 | % | | | 5.38 | % |
Ratio of net investment income (loss) to average net assets(c) | | | 5.59 | % | | | 6.85 | % | | | 5.70 | % | | | 5.35 | % | | | 5.16 | % |
Portfolio turnover rate | | | 141 | % | | | 129 | % | | | 127 | % | | | 126 | %(f) | | | 105 | %(f) |
Number of shares outstanding at end of period (000’s) | | | 41,249 | | | | 34,144 | | | | 31,963 | | | | 25,743 | | | | 17,195 | |
Net assets at the end of period (000’s) | | $ | 462,619 | | | $ | 351,498 | | | $ | 354,895 | | | $ | 291,727 | | | $ | 195,413 | |
| (a) | Total return is not annualized. It does include, if any, expense reimbursements and expense reductions. The effect of fees and charges incurred at the separate account level are not reflected in these performance figures. If such expenses had been included, the total return would have been lower for each period presented. |
| (b) | Includes expense reimbursements, but excludes expense reductions. |
| (c) | Excludes expense reimbursements and expense reductions. |
| (d) | The per share amounts are calculated using the average share method. |
| (e) | The Fund’s performance figure was increased by less than 0.01% from a reimbursement by an affiliate. |
| (f) | Portfolio turnover includes “to be announced” (“TBA”) transactions. Previously, portfolio turnover was calculated prior to including TBA transactions and was as follows: |
| | | | | | | | |
Fund
| | 2007
| | | 2006
| |
Strategic Bond | | | 120 | % | | | 104 | % |
139
VALIC Company II
REPORT OF INDEPENDENT REGISTERED PUBLIC ACCOUNTING FIRM
To the Board of Trustees and Shareholders of
VALIC Company II:
In our opinion, the accompanying statements of assets and liabilities, including the portfolios of investments, and the related statements of operations and of changes in net assets and the financial highlights present fairly, in all material respects, the financial position of each of the fifteen funds constituting VALIC Company II (hereafter referred to as the “Series”) at August 31, 2010, the results of each of their operations for the year then ended, the changes in each of their net assets for each of the two years in the period then ended and the financial highlights for each of the three years in the period then ended, in conformity with accounting principles generally accepted in the United States of America. These financial statements and financial highlights (hereafter referred to as “financial statements”) are the responsibility of the Series’ management; our responsibility is to express an opinion on these financial statements based on our audits. We conducted our audits of these financial statements in accordance with the standards of the Public Company Accounting Oversight Board (United States). Those standards require that we plan and perform the audit to obtain reasonable assurance about whether the financial statements are free of material misstatement. An audit includes examining, on a test basis, evidence supporting the amounts and disclosures in the financial statements, assessing the accounting principles used and significant estimates made by management, and evaluating the overall financial statement presentation. We believe that our audits, which included confirmation of securities at August 31, 2010 by correspondence with the custodian and brokers and application of alternative auditing procedures where securities purchased had not been received, provide a reasonable basis for our opinion. The financial highlights for each of the years ended on or before August 31, 2007 were audited by another independent registered public accounting firm whose report, dated October 25, 2007, expressed an unqualified opinion on those financial highlights.
PricewaterhouseCoopers LLP
Houston, Texas
October 28, 2010
140
VALIC Company II
APPROVAL OF ADVISORY AGREEMENTS (Unaudited)
April 26-27, 2010 Board of Trustees Meeting
At a meeting held on April 26-27, 2010, the Board of Trustees of VC II (the “Board”) , including a majority of the Trustees who are not “interested persons” of VC II (“Independent Trustees”), as such term is defined by the Investment Company Act of 1940, as amended (the “1940 Act”), approved with respect to the Small Cap Value Fund (the “Fund”) the engagement of The Boston Company Asset Management, LLC (“Boston Company”) and Janus Capital Management, LLC (“Janus”) pursuant to investment sub-advisory agreements with VALIC (the “Boston Company Sub-Advisory Agreement” and the “Janus Sub-Advisory Agreement,” respectively). The Board considered that Janus/Perkins and Boston Company would become co-sub-advisers of the Fund and that they would replace SSgA Funds Management, Inc. (“SSgA FM”) as sub-adviser of the Fund.
The Board also approved Janus’ engagement of Perkins Investment Management LLC (“Perkins”) as a sub-sub-adviser to the Fund, pursuant to an investment sub-sub-advisory agreement between Janus and Perkins (the “Perkins Sub-Sub-Advisory Agreement”). The Boston Company Sub-Advisory Agreement, Janus Sub-Advisory Agreement and Perkins Sub-Sub-Advisory Agreement are collectively referred to as the “Advisory Contracts.”
The Board received materials relating to certain factors the Board considered in determining to approve the Advisory Contracts. Those factors included: (1) the nature, extent and quality of services to be provided by Janus/Perkins, Boston Company and VALIC; (2) Janus’/Perkins’ and Boston Company’s sub-advisory fee rate compared to the sub-advisory fee rates of a peer group of funds with similar investment objectives (“Subadvisory Expense Group”), as selected by an independent third-party provider of investment company data; (3) the investment performance of the Fund compared to performance of comparable funds in its Morningstar Large Value category (“Performance Group”) and against the Fund’s current benchmark, the Russell 1000® Value Index (“Benchmark”) and the investment performance of comparable funds managed by Janus/Perkins and Boston Company against the Performance Group, Benchmark and the Fund’s performance; (4) the costs of services and the benefits potentially to be derived by Janus/Perkins, Boston Company and VALIC, (5) whether the Fund will benefit from possible economies of scale by engaging Janus/Perkins and Boston Company as sub-advisers; (6) the profitability of VALIC, Janus and Boston Company; and (7) the terms of the Advisory Contracts.
The Independent Trustees were separately represented by counsel that is independent of VALIC in connection with their consideration of the approval of the Advisory Contracts. The matters discussed below were also considered separately by the Independent Trustees in executive session.
Nature, Extent and Quality of Services. The Board considered the nature, extent and quality of services to be provided to the Fund by Janus/Perkins and Boston Company. The Board also considered that Janus/Perkins’ and Boston Company’s management of the Fund is subject to the oversight of VALIC and the Board, and the Fund must be managed in accordance with the investment objectives, policies and restrictions as set forth in the Fund’s prospectus and statement of additional information. The Board noted that the proposed addition of Janus/Perkins and Boston Company as sub-advisers would not result in a result in a change to the Fund’s principal investment objective, principal investment strategy or principal investment risks. The Board considered that management proposed initially that 70% of the assets would be managed by Boston Company and 30% of the assets would be managed by Janus/Perkins.
The Board considered information provided to them regarding the services to be provided by Janus/Perkins and Boston Company. The Board considered the qualifications, background and responsibilities of Janus/Perkins’ and Boston Company’s investment and compliance personnel who would be responsible for providing investment management services to the Fund. The Board also took into account the financial condition of Janus/Perkins and Boston Company and their respective affiliates.
The Board, including a majority of the Independent Trustees, concluded that the scope and quality of advisory services to be provided by Janus/Perkins and Boston Company under their respective Sub-Advisory Agreements would be satisfactory.
Fees and Expenses; Investment Performance. The Board received and reviewed information regarding the Fund’s advisory fee rate compared against other funds in its peer group. The Board considered that the Fund’s current advisory fee rate was below the median of its peer group. It noted that with the addition of breakpoints the effective fee rate payable to VALIC would begin to decline once Fund assets exceeded $500 million and that the Fund’s current assets were approximately $167 million.
The Board also received and reviewed the Fund’s sub-advisory fee rates compared against the Subadvisory Expense Group. The Board noted that the Fund’s sub-advisory fees were currently at the median of its Subadvisory Expense Group, and that they would be at the median of the Subadvisory Expense Group following the change of sub-advisers. The Board took into account that the sub-advisory fee rate payable to Janus and Boston Company contain breakpoints whereas the fee rate payable to SSgA FM did not contain breakpoints. The Board also considered that the sub-advisory fees are paid by VALIC out of the advisory fees it receives from the Fund and that they are not paid by the Fund. It was also noted that any fees paid to Perkins pursuant to the Perkins Sub-Sub-Advisory Agreement would be paid by Janus. The Board noted that although VALIC would retain a greater percentage of its advisory fee payable by the Fund, such increase would not materially impact VALIC’s profit margin and in addition, VALIC had proposed to implement a breakpoint in its advisory fee. The Board concluded that the advisory fees and sub-advisory fees for the Fund are fair and reasonable in light of the usual and customary charges made for services of the same nature and quality and the other factors considered.
The Trustees then considered the performance of the Fund as compared to its Performance Group and Benchmark. It was noted that the Fund underperformed the average of its Performance Group and its Benchmark for the one- and three-year periods ended February 28, 2010. The Trustees also noted that comparable funds managed by Janus/Perkins and Boston Company outperformed the Performance Group, Benchmark and the Fund for such periods. The Trustees also noted that they review regularly detailed performance information about the Fund. The Board concluded that management was addressing the Fund’s performance by proposing the addition of Janus and Boston Company as sub-advisers to the Fund.
Cost of Services and Benefits Derived and Profitability/Economies of Scale. The Board was provided information related to the cost of services and benefits derived in connection with the Sub-Advisory Agreements. Management reported that it believed that any indirect costs are inconsequential to the analysis of the adequacy of the advisory and sub-advisory fees and that any collateral benefits derived as a result of providing advisory services to the Fund are de minimis. Because sub-advisory fees are paid by VALIC and not by the Fund, the Trustees determined that the costs of the services to be provided by Janus and Boston Company and the profitability to Janus and Boston Company from their relationship with the Fund was not a material factor in their deliberations with respect to consideration of approval of the Sub-Advisory Agreements. For similar reasons, the Board also concluded that the potential for economies of scale in Janus/Perkins’ and Boston Company’s management of the Fund was not a material factor in approving the
141
VALIC Company II
APPROVAL OF ADVISORY AGREEMENTS (Unaudited) — (continued)
Sub-Advisory Agreements although the Board noted that the proposed sub-advisory fees had breakpoints and the proposed amendment to the Advisory Agreement would add a breakpoint to the advisory fee to generally reflect the breakpoints at the sub-advisory fee level.
Terms of the Sub-Advisory Agreements. The Board reviewed the terms of the Sub-Advisory Agreements, including the duties and responsibilities undertaken by Janus/Perkins and Boston Company. It was noted that there were no material differences between the terms of the Sub-Advisory Agreements and the SSgA FM Sub-Advisory Agreement. The Board concluded that the terms of the Sub-Advisory Agreements were reasonable.
Conclusions. In reaching its decision to approve the Advisory Contracts, the Board did not identify any single factor as being controlling, but based its recommendation on each of the factors it considered. Each Trustee may have contributed different weight to the various factors. Based upon the materials it reviewed, the representations made to it, the considerations described above, and their deliberations, the Board, including a majority of the Independent Trustees, concluded that it was in the best interests of the Fund and its shareholders to approve the Advisory Contracts.
August 2-3, 2010 Board of Trustees Meeting
At a meeting held on August 2-3, 2010, the Board of Trustees (the “Board”), including the Trustees that are not interested persons of VC II, as such term is defined in the Investment Company Act of 1940, as amended (the “1940 Act”) (the “Independent Trustees”), approved with respect to each Fund the Investment Advisory Agreement between The Variable Annuity Life Insurance Company (“VALIC”) and VC II (the “Advisory Agreement”) and the investment sub-advisory agreements between VALIC and each of the following sub-advisers (collectively, the “Sub-advisory Agreements”): Bridgeway Capital Management, Inc. (“Bridgeway Capital”); FAF Advisors, Inc. (“FAF”); Invesco Advisers, Inc. (“Invesco”); JPMorgan Investment Management, Inc. (“JPMIM”); SunAmerica Asset Management Corp. (“SAAMCo”); and Wellington Management Company, LLP (“Wellington Management”) (collectively referred to as the “Sub-advisers”).
The Investment Advisory Agreement and Investment Sub-advisory Agreements are collectively referred to as the “Advisory Contracts.”
In connection with the approval of the Advisory Contracts, the Board received materials related to certain factors the Board considered in determining to renew such Advisory Contracts. Those factors included: (1) the nature, extent and quality of services provided by VALIC and the Sub-advisers; (2) the investment performance of the Funds compared to performance of comparable funds as selected by an independent third-party provider of investment company data (“Performance Group/Universe”) and against each Fund’s benchmarks; (3) the costs of services and the benefits potentially derived by VALIC and the Sub-advisers; (4) whether the Funds will benefit from possible economies of scale from engaging the Sub-advisers; (5) the profitability of VALIC and the Sub-advisers and their affiliates; (6) the advisory fee and sub-advisory fees charged in connection with VALIC’s and the Sub-advisers’ management of the Funds, compared to advisory fee rates and sub-advisory fee rates of a group of funds with similar investment objectives (respectively, the “Expense Group/Universe” and the “Sub-Adviser Expense Group/Universe”), as selected an independent third-party provider of investment company data; (7) the terms of the Advisory Contracts, and (8) information regarding VALIC’s and the Sub-advisers’ compliance and regulatory history.
The Independent Trustees were separately represented by counsel that is independent of VALIC in connection with their consideration of approval of the Advisory Contracts. The matters discussed below were also considered separately by the Independent Trustees in executive sessions during which such independent counsel provided guidance to the Independent Trustees.
The continuation of all Advisory Contracts were approved at the August 2010 for a one-year term beginning September 1, 2010 and ending August 31, 2011, with the exception of the Century Capital Sub-Advisory Agreement, which was approved for an initial two-year term.
Nature, Extent and Quality of Services. The Board considered the nature, quality and extent of services to be provided to the Funds by VALIC and the Sub-advisers. The Board reviewed information provided by VALIC relating to its operations and personnel. The Board also took into account their familiarity with VALIC’s management through Board meetings, discussions and reports during the preceding year and through their long history of service to the Funds. The Board considered that VALIC is responsible for the management of the day-to-day operations of the Funds, including but not limited to, general supervision of and coordination of the services provided by the Sub-advisers, and is also responsible for monitoring and reviewing the activities of the Sub-advisers and other third-party service providers. The Board also noted that VALIC’s and the Sub-advisers’ management of the Funds is subject to the oversight of the Board, and must be made in accordance with the investment objectives, policies and restrictions set forth in the Funds’ prospectus and statement of additional information.
The Board noted that VALIC personnel meet on a regular basis to discuss the performance of the Funds, as well as the positioning of the insurance products, employer-sponsored retirement plans and the Funds generally vis-à-vis competitors. The Board also considered VALIC’s financial condition and whether it had the financial wherewithal to provide the services under the Investment Advisory Agreement with respect to each Fund.
With respect to the services provided by the Sub-advisers, the Board considered information provided to them regarding the services provided by each Sub-adviser, including information presented throughout the previous year. The Board noted that each Sub-adviser (i) determines the securities to be purchased or sold on behalf of the Funds it manages as may be necessary in connection therewith; (ii) provides VALIC with records concerning its activities, which VALIC or the Funds are required to maintain; and (iii) renders regular reports to VALIC and to officers and Trustees of the Funds concerning its discharge of the foregoing responsibilities. The Board reviewed each Sub-adviser’s history and investment experience as well as information regarding the qualifications, background and responsibilities of the Sub-advisers investment and compliance personnel who provide services to the Funds. The Board also took into account the financial condition of each Sub-adviser. The Board also reviewed each Sub-adviser’s brokerage practices.
The Board reviewed VALIC’s and SAAMCo’s compliance program and personnel. It was noted that SAAMCo is an affiliated company of VALIC. The Board also considered VALIC’s and each Sub-adviser’s regulatory history, including information regarding whether it was currently involved in any regulatory actions or investigations as well as material litigation.
The Board concluded that the scope and quality of the advisory services provided by VALIC and Sub-advisers were satisfactory and that there was a reasonable basis on which to conclude that each would provide a high quality of investment services to the Funds.
142
VALIC Company II
APPROVAL OF ADVISORY AGREEMENTS (Unaudited)
Fees and Expenses; Investment Performance. The Board received and reviewed information regarding each Fund’s total expenses, advisory and sub-advisory fees, and other expenses compared against the expenses and fees of the funds in its Expense Group, Expense Universe and Subadvisor Expense Group and, in some cases as noted below, the Subadvisor Expense Universe. It was noted that VALIC negotiates the sub-advisory fees with each of the unaffiliated Sub-advisers at arms-length. The Board also considered that the sub-advisory fees are paid by VALIC out of its advisory fees it receives from the Funds and is not paid by the Funds, and that sub-advisory fees may vary widely within the Subadvisor Expense Group/Universe for various reasons, including market pricing demands, existing relationships, experience and success, and individual client needs. The Board noted the affiliation of the Sub-adviser to certain of the Funds with VALIC, noting any potential conflicts of interest. The Board also noted that VALIC annually waives a portion of its advisory fee and/or reimburses the expenses of several Funds as noted below.
The Sub-advisers provided and the Board also considered expense information of comparable accounts managed by the Sub-advisers, which included one or more of the following types of accounts: retail mutual funds, mutual funds sold through variable annuity and variable insurance products, and other institutional-type accounts.
The total expense information, advisory fee information, and sub-advisory fee information considered by the Board, among other fee and expense data, is summarized below. It was noted that expense ratio data included in the independent third-party reports was based on unaudited data from the semi-annual report dated February 28, 2010.
The Board received and reviewed information prepared by management and by an independent third-party regarding the Funds’ investment performance compared against their benchmarks and their respective Performance Groups/Universes. It was noted that performance information provided by the independent third party was for the period ended April 30, 2010 and that benchmark information presented by management was through the period June 30, 2010.
| | • | | Aggressive Growth Lifestyle Fund (sub-advised by PineBridge). The Board considered that the Fund’s actual advisory fees were at the median of the Expense Group and above the median of the Expense Universe. In addition, the Board considered that the Fund’s total expenses were below the medians of its Expense Group/Universe. The Board also noted that the Fund’s actual sub-advisory fees were above the medians of its Subadvisor Expense Group/Universe. The Board also noted that the expense limitation on total expenses would be extended contractually through December 31, 2011. |
The Board considered that the Fund’s performance was above the medians of its Performance Group/Universe for the one-, three- and five-year periods. In addition, the Board considered that the Fund outperformed the Lipper VUF Mixed Asset Target Allocation Growth Index and its blended benchmark for the one-, three- and five-year periods. The blended benchmark consists of the Russell 3000 Index (“Russell 3000”) (54%), Barclays Capital U.S. Aggregate Bond Index (25%), the Morgan Stanley Capital International Europe, Australasia, Far East Index (“MSCI EAFE Index”) (13%), and the FTSE European Public Real Estate Association (“EPRA”) / National Association of Real Estate Investment Trusts (“NAREIT”) Global Real Estate Index (8%). The Board concluded that the Fund’s performance was satisfactory.
| | • | | Capital Appreciation Fund (sub-advised by Bridgeway Capital). The Board considered that the Fund’s actual advisory fees and total expenses were below the medians of its Expense Group/Universe. The Board also noted that the Fund’s actual sub-advisory fees were below the medians of its Subadvisor Expense Group/Universe. The Board also noted that the expense limitation on total expenses would be extended contractually through December 31, 2011. Additionally, the Board considered that effective June 1, 2010, breakpoints were implemented to the Fund’s advisory and sub-advisory fee schedules. |
The Board considered that the Fund was above the medians of its Performance Group/Universe and outperformed the Lipper VUF Large-Cap Growth Index for the one-year period but was below the medians and underperformed the Index for the three- and five-year periods. The Board considered that the Fund outperformed its benchmark, the Russell 1000® Growth Index, for the one-year period but trailed the Index for the three- and five-year periods. The Board took into account management’s discussion of the Fund’s performance and its plans to address the Fund’s performance. The Board also noted the Fund’s improved more recent performance. The Board concluded that appropriate action has been taken to address the Fund’s performance.
| | • | | Conservative Growth Lifestyle Fund (sub-advised by PineBridge). The Board considered that the Fund’s actual advisory fees were below the median of its Expense Group and at the median of its Expense Universe, and that the Fund’s total expenses were below the medians of its Expense Group/Universe. The Board also noted that the expense limitation on total expenses would be extended contractually through December 31, 2011. |
The Board considered that the Fund’s performance was above the median of its Performance Group for the one- and five-year periods and below the median of its Performance Group for the three-year period. The Board also considered that the Fund’s performance was above the median of its Performance Universe and outperformed the Lipper VUF Mixed Asset Target Allocation Conservative Index for the one-, three- and five-year periods. The Board noted that the Fund outperformed its blended benchmark for the one- and five- year periods, and underperformed for the three-year period. The Fund’s blended benchmark consists of the Russell 3000 Index (24%), Barclays Capital U.S. Aggregate Bond Index (65%), the MSCI EAFE Index (8%), and the FTSE EPRA/NAREIT Global Real Estate Index (3%). The Board concluded that the Fund’s performance was satisfactory in light of all factors considered.
| | • | | Core Bond Fund (sub-advised by PineBridge). The Board considered that the Fund’s actual advisory fees were above the medians of its Expense Group/Universe and that the Fund’s total expenses were below the median of its Expense Group and above the median of its Expense Universe. In addition, the Board noted that the Fund’s actual sub-advisory fees were above the medians of its Subadvisor Expense Group/Universe. The Board also noted that the expense limitation on total expenses would be extended contractually through December 31, 2011. |
The Board noted that the Fund was above the medians of its Performance Group/Universe for the one- and five-year periods, and below the medians of its Performance Group/Universe for the three-year period. The Board also noted that the Fund outperformed the Lipper VUF Corporate A-Rated Bond Index for the one-, three- and five-year periods. The Board also noted that the Fund outperformed its benchmark, Barclays Capital U.S. Aggregate Index, for the one-year period and underperformed the benchmark for the three- and five-year periods. The Board took into account management’s discussion of the Fund’s performance, changes to the Fund’s investment strategy in prior years, and concluded that the Fund’s performance was satisfactory in light of all factors considered.
| | • | | High Yield Bond Fund (sub-advised by Wellington Management). The Board considered that the Fund’s actual advisory fees were at the median of its Expense Group and above the median of its Expense Universe, and that the Fund’s total expenses were above the medians of its Expense Group/Universe. The Board considered that the |
143
VALIC Company II
APPROVAL OF ADVISORY AGREEMENTS (Unaudited) — (continued)
| | Fund’s actual sub-advisory fees were above the medians of its Subadvisor Expense Group/Universe. The Board took into account management’s discussion of the Fund’s expenses and also noted that the expense limitation on total expenses would be extended contractually through December 31, 2011. In addition, the Board noted that the Fund’s advisory fee was reduced in July 2009. |
The Board considered that the Fund’s performance was at the median of its Performance Group for the one- year period and below the median of its Performance Group for the three- and five- year periods. The Board also considered that the Fund’s performance was above the median of its Performance Universe for the one- year period and below the median of its Performance Universe for the three- and five- year periods. The Board also considered that the Fund outperformed the Lipper VUF High Yield Bond Index for the one-year period and underperformed the Index for the three- and five-year periods. The Board noted that the Fund underperformed its benchmark, the Citigroup High Yield Market Index for the one-, three- and five-year periods. The Board took into account management’s discussion of the Fund’s performance. The Board noted that Wellington Management had only been managing the Fund since July 2009 and that performance beyond the one-year period was attributable to the prior sub-adviser. The Board concluded that the Fund’s performance was satisfactory in light of all factors considered.
| | • | | International Small Cap Equity Fund (sub-advised by PineBridge and Invesco). The Board considered that the Fund’s actual advisory fees were below the median of its Expense Group and above the median of its Expense Universe and that the Fund’s total expenses were below the medians of its Expense Group/Universe. The Board also noted that the Fund’s actual sub-advisory fees were above the medians of its Subadvisor Expense Group/Universe. The Board also noted that the expense limitation on total expenses would be extended contractually through December 31, 2011. Additionally, the Board noted that the Fund’s advisory fee was reduced in December 2009, and that breakpoints were implemented to PineBridge’s sub-advisory fee in March 2010. |
The Board considered that the Fund’s performance was above the medians of its Performance Group/Universe and outperformed the Lipper VUF International Core Index for the one-year period. The Board also considered that the Fund’s performance was at the median of its Performance Group and below the median of its Performance Universe for the three-year period and above the medians of its Performance Group/Universe for the five-year period. The Board noted that the Fund underperformed the Index for the three-year period and outperformed the Index for the five-year period. The Board took into consideration that Lipper’s comparative Index focused on international multi-cap growth funds and not on international small-cap core funds. The Board further noted that the Fund underperformed its benchmark, the MSCI EAFE Small Cap Index, for the one- and three-year periods and outperformed the benchmark for the five-year period. The Board noted that Invesco was engaged in December 2009 as a co-sub-adviser to the Fund. The Board took into account management’s discussion of the Fund’s performance and concluded that the Fund’s performance was satisfactory in light of all factors considered.
| | • | | Large Cap Value Fund (sub-advised by TBCAM and Janus/Perkins). The Board considered that the Fund’s actual advisory fees and total expenses were below the medians of its Expense Group/Universe. The Board also noted that the Fund’s actual sub-advisory fees were at the median of its Subadvisory Expense Group and below the median of its Subadvisor Expense Universe. The Board also noted that the expense limitation on total expenses would be extended contractually through December 31, 2011. |
The Board considered that TBCAM and Janus/Perkins began managing the Fund in June 2010 and that all performance presented was attributable to the prior sub-adviser. The Board considered that, under the prior sub-adviser’s management, the Fund was below the medians of its Performance Group/Universe and underperformed the Lipper VUF Multi-Cap Value Index and its benchmark, the Russell 1000® Value Index, for the one-, three- and five-year periods. The Board also noted management’s discussion of the Fund’s performance and concluded that the underperformance was being addressed.
| | • | | Mid Cap Growth Fund (sub-advised by Invesco). The Board considered that the Fund’s actual advisory fees and total expenses were below the medians of its Expense Group/Universe. The Board also noted that the Fund’s actual sub-advisory fees were below the median of its Subadvisor Expense Group and above the median of its Subadvisor Expense Universe. The Board also noted that the expense limitation on total expenses would be extended contractually through December 31, 2011. |
The Board also considered that the Fund’s performance was below the medians of its Performance Group/Universe and the Lipper VUF Mid-Cap Growth Index and its benchmark, the Russell Midcap® Growth Index, for the one-, three- and five-year periods. The Board took into account management’s discussion of the Fund’s performance, including plans to improve the Fund’s performance, as well as its continued monitoring of the Fund. The Board concluded that management is taking appropriate action with respect to the Fund.
| | • | | Mid Cap Value Fund (sub-advised by FAF and Wellington). The Board considered that the Fund’s actual advisory fees were at the median of its Expense Group and below the median of its Expense Universe and that the Fund’s total expenses were above the medians of its Expense Group/Universe. The Board also noted that the Fund’s actual sub-advisory fees were above the medians of its Subadvisor Expense Group/Universe. The Board took into account management’s discussion of the Fund’s expenses. The Board also noted that the expense limitation on total expenses would be extended contractually through December 31, 2011. |
The Board considered that the Fund’s performance was below the medians of its Performance Group/Universe for the one-year period, at the median of its Performance Group and below the median of its Performance Universe for the three-year period, and above the medians of its Performance Group/Universe for the five-year period. The Board also considered that the Fund underperformed the Lipper VUF Mid Cap Value Index for the one-year period, and outperformed the Index for the three- and five-year periods. In addition, the Board noted that the Fund underperformed its benchmark, the Russell 2500® Value Index, for the one- and three-year periods and outperformed the benchmark for the five-year period. The Board took into account management’s discussion of the Fund’s performance, and concluded that the Fund’s overall performance was satisfactory in light of all factors considered.
| | • | | Moderate Growth Lifestyle Fund (sub-advised by AIGGIC). The Board considered that the Fund’s actual advisory fees were above the median of its Expense Group and at the median of its Expense Universe. The Board also considered that the Fund’s total expenses were below the medians of its Expense Group/Universe. The Board also considered that the Fund’s actual sub-advisory fees were above the medians of its Subadvisor Expense Group/Universe. The Board also noted that the expense limitation on total expenses would be extended contractually through December 31, 2011. |
The Board considered that the Fund’s performance was above the medians of its Performance Group/Universe and outperformed the Lipper VUF Mixed-Asset Target Allocation Moderate Index for the one-, three- and five-year periods. In addition, the Board noted that the Fund outperformed its blended benchmark for the one- and
144
VALIC Company II
APPROVAL OF ADVISORY AGREEMENTS (Unaudited) — (continued)
five-year periods and underperformed the benchmark for the three- year period. The Fund’s blended benchmark consists of the Russell 3000 (40%), Barclays Capital U.S. Aggregate Bond Index (45%) and the MSCI EAFE Index (10%) and the FTSE EPRA/NAREIT Global Real Estate Index (5%). The Board concluded that the Fund’s performance has been satisfactory in light of all factors considered.
| | • | | Money Market II Fund (sub-advised by SAAMCo). The Board considered that the Fund’s actual advisory fees were at the median of its Expense Group and below the median of its Expense Universe. The Board also noted that the Fund’s total expenses were below the medians of its Expense Group/Universe. The Board also noted that the Fund’s actual sub-advisory fees were above the median of its Subadvisor Expense Universe. The Board also noted that the expense limitation on total expenses would be extended contractually through December 31, 2011. |
The Board considered that the Fund’s performance was above the median of its Performance Group for the one-, three- and five-year periods. The Board also considered that the Fund’s performance was above the median of its Performance Universe for the one-year period, and below the median of its Performance Universe for the three- and five- year periods. The Board also noted that the Fund underperformed the Lipper VUF Money Market Index for the one-, three- and five- year periods. The Board also considered that the Fund underperformed its benchmark, the Treasury Bill 3 Month Index, for the one-year period, and outperformed its benchmark for the three- and five-year periods. The Board took into account the relatively small range in performance returns among the Performance Group/Universe. The Board concluded that the Fund’s performance was satisfactory in light of all factors considered.
| | • | | Small Cap Growth Fund (sub-advised by JPMIM). The Board considered that the Fund’s actual advisory fees were below the median of its Expense Group and above the median of its Expense Universe, and that the Fund’s total expenses were below the median of its Expense Group and above the median of its Expense Universe. The Board also noted that the Fund’s actual sub-advisory fees were above the medians of its Subadvisor Expense Group/Universe. The Board also noted that the expense limitation on total expenses would be extended contractually through December 31, 2011. |
The Board noted that the Fund’s performance was above the median of its Performance Group for the one- and three-year periods and below the median of its Performance Group for the five-year period, and that the Fund’s performance was above the median of its Performance Universe and outperformed the Lipper VUF Small Cap Growth Index and its benchmark, the Russell 2000® Growth Index, for the one-year period and below the median and underperformed the Index and benchmark for the three- and five-year periods. The Board concluded that the Fund’s performance was satisfactory in light of all factors considered.
| | • | | Small Cap Value Fund (sub-advised by SAAMCo, MetWest and JPMIM). The Board considered that the Fund’s actual advisory fees and total expenses were below the medians of its Expense Group/Universe. The Board also noted that the Fund’s actual sub-advisory fees were below the median of its Subadvisor Expense Universe. The Board also noted that the expense limitation on total expenses would be extended contractually through December 31, 2011. |
The Board considered that the Fund’s performance was below the medians of its Performance Group/Universe for the one-, three- and five-year periods. The Board also considered that the Fund outperformed the Lipper VUF Small Cap Value Index for the one-, three- and five- year periods. The Board also noted that the Fund outperformed its benchmark, the Russell 2000® Value Index, for the one-, three- and five-year periods. The Board also noted that SAAMCo and MetWest were added as additional sub-advisers in February 2010. The Board noted management’s discussion of the Fund’s performance, including the engagement of the new sub-advisers, and concluded that the Fund’s performance is being addressed.
| | • | | Socially Responsible Fund (sub-advised by AIGGIC). The Board considered that the Fund’s actual advisory fees and total expenses were below the medians of its Expense Group/Universe. The Board also noted that the Fund’s actual sub-advisory fees were below the medians of its Subadvisor Expense Group/Universe. The Board also noted that the expense limitation on total expenses would be extended contractually through December 31, 2011. |
The Board noted that the Fund’s performance was above the medians of its Performance Group/Universe, and outperformed its benchmark, the S&P 500® Index for the one-, three- and five- year periods. The Board also noted that the Fund outperformed the Lipper VUF Large Cap Core Index for the one-year period and underperformed the Index for the three- and five-year periods. The Board took into consideration management’s discussion of its peer group and index noting the social criteria to which the Fund must adhere and concluded that the Fund’s performance was satisfactory in light of all factors considered.
| | • | | Strategic Bond Fund (sub-advised by AIGGIC). The Board noted that the Fund’s actual advisory fees were below the medians of its Expense Group/Universe. The Board also considered that the Fund’s total expenses were below the median of its Expense Group and above the median of its Expense Universe. In addition, the Board considered that the Fund’s actual sub-advisory fees were at the median of its Subadvisor Expense Group and above the median of its Subadvisor Expense Universe. The Board also noted that the expense limitation on total expenses would be extended contractually through December 31, 2011. |
The Board considered that the Fund’s performance was below the median of its Performance Group for the one- and three-year periods and above the median for the five-year period. The Board also considered that the Fund’s performance was above the median of its Performance Universe for the one- and five-year periods, and below the median for the three-year period. In addition, the Board considered that the Fund outperformed the Lipper VUF General Bond Index for the one- and five-year periods, and underperformed the Index for the three-year period. The Board also noted that the Fund outperformed its benchmark, the Barclays Capital Aggregate Bond Index, for the one-year period, and underperformed the benchmark for the three- and five- year periods. The Board took into account management’s discussion of the Fund’s performance. The Board noted that management was closely monitoring the Fund and concluded that the Fund’s performance was satisfactory in light of all factors considered.
The Board concluded that the advisory fee and sub-advisory fee for each Fund are fair and reasonable in light of the usual and customary charges made for services of the same nature and quality and the other factors considered.
Cost of Services and Indirect Benefits/Profitability. The Board was provided information related to the cost of services and profits realized in connection with the Advisory Agreement. The Board considered the costs that are borne by the Funds. For its services, VALIC receives a fee, payable monthly from each Fund in an amount that is calculated as a percentage of the average daily net assets of the respective Fund.
145
VALIC Company II
APPROVAL OF ADVISORY AGREEMENTS (Unaudited) — (continued)
It was noted that VALIC reviewed a number of factors in determining appropriate fee levels for the Funds as well as the fee VALIC pays each Sub-adviser. Such factors include review of (1) style class peers primarily within the variable annuity and qualified plan universe; (2) key competitor analysis; (3) clone fund analysis; (4) product suitability; and (5) special considerations such as competitor sub-account characteristics, uniqueness of the product and prestige of the manager.
The Board considered that VALIC will receive benefits in addition to the advisory fee to be paid by the Funds, which include transfer agency fees paid or to be paid by the Funds. The Board considered that VC II also pays VALIC a fee for the provision of record keeping and shareholder services to contract owners and participants, which is provided at cost. Such payment is allocated to each Fund based on the number of accounts serviced. Finally, it was noted that the Funds pay SAAMCo, an affiliate of VALIC, an annual fee of approximately 0.07% based on each Fund’s average daily net assets, for the provision of certain accounting and administrative services. Out of the fee SAAMCo receives from the Funds, SAAMCo compensates VALIC for certain administrative services (0.02% of daily net assets), and the Funds’ custodian, State Street Bank and Trust Company for calculation of the daily net asset value (0.01% of daily net assets). The Board also considered that VC II pays VALIC an annual fee of 0.25% on average daily net assets of each Fund (other than the Lifestyle Funds) pursuant to a Shareholder Services Agreement.
The Board also considered that VALIC may exclude from its taxable income a portion of the ordinary dividends paid by underlying U.S. equities in the Funds to the same extent the Funds receive certain dividends with respect to shares of stock issued by domestic corporations, subject to applicable tax laws and regulations. In addition, it was noted that VALIC may receive foreign tax credits with respect to certain foreign securities held or to be held in certain Funds that benefit VALIC. These benefits can be material.
In considering the profitability to VALIC and its affiliates in connection with their relationship with the Funds, the Board reviewed information provided by VALIC setting forth the revenues and other benefits, both direct and indirect, received by VALIC and its affiliates attributable to managing each Fund, the cost of providing such services and the resulting profitability to VALIC and its affiliates from these relationships. The Board also reviewed VALIC’s profitability on a Fund-by-Fund basis. The Board received and reviewed information prepared by VALIC that reflects an allocation of costs that result in a reasonable determination of profitability of VALIC, as adviser and transfer agent and as the shareholder servicing agent. In addition, the Board considered the profitability of SAAMCo in its role as the administrator of the Funds and as sub-adviser to certain Funds. The Board concluded that the profitability to VALIC and its affiliates from their relationship with the Funds was reasonable.
In considering the profitability to the Sub-advisers in connection with their relationship to the Funds, the Trustees noted that the fees under the Sub-Advisory Agreements are paid by VALIC out of the advisory fees that VALIC receives under the Advisory Agreement. With respect to the unaffiliated Sub-advisers, the Board also relied on the ability of VALIC to negotiate the Sub-Advisory Agreements and the fees thereunder at arm’s length.
For each of the above reasons, the Trustees determined that the profitability to the Sub-advisers from their relationship with the Funds was not a material factor in their deliberations with respect to consideration of approval of the Investment Sub-Advisory Agreements.
Economies of Scale. The Board noted that the advisory fee rate and sub-advisory fee rates payable to VALIC and each of the Sub-advisers with respect to most of the Funds contain breakpoints, which allows the Funds to participate in any economies of scale. The Board also took into account management’s discussion of the Funds’ advisory fee and sub-advisory fee structure, including with respect to those Funds that do not currently have breakpoints. The Board also considered the effect of each Fund’s growth and size on its performance and fees, noting that it the Funds’ assets increase over time, the Funds may realize other economies of scale if assets increase proportionally more than expenses. The Board concluded that no changes to the advisory fee structure of the Funds were necessary.
For similar reasons as stated above with respect to the Sub-advisers’ profitability and the costs of their providing services, the Board concluded that the potential for economies of scale in the Sub-advisers’ management of the Funds are not a material factor to the approval of the Sub-advisory Agreements, although it was noted that most of the Funds have breakpoints at the sub-advisory fee level.
Terms of the Advisory Contracts. The Board reviewed the terms of the Advisory Contracts including the duties and responsibilities undertaken. The Board also reviewed the terms of payment for services rendered by VALIC and the Sub-advisers and noted that VALIC would compensate the Sub-advisers out of the advisory fees it receives from the Funds. The Board noted that the Sub-Advisory Agreements provide that each Sub-adviser will pay all of its own expenses in connection with the performance of their respective duties as well as the cost of maintaining the staff and personnel as necessary for it to perform its obligations. The Board also considered the termination and liability provisions of the Advisory Contracts and other terms contained therein.
The Board reviewed the terms of the Century Capital Sub-Advisory Agreement, including the duties and responsibilities undertaken by Century Capital. It also noted that the Century Capital Sub-Advisory Agreement was the same in all material respects as the Sub-Advisory Agreement with Wells Capital, except for the name of the sub-adviser, the term of the agreements and the sub-advisory fee rate.
The Board concluded that the terms of each of the Advisory Contracts were reasonable.
Compliance. The Board reviewed VALIC’s and the Sub-advisers’ compliance personnel, regulatory history, including information whether it was currently involved in any regulatory actions or investigations. In addition, the Board reviewed information concerning each entities’ compliance staff that would be responsible for providing compliance functions on behalf of the Fund and concluded that there was no information provided that would have a material adverse effect on their abilities to provide services to the Funds.
Conclusions. In reaching its decision to approve the Advisory Contracts, the Board did not identify any single factor as being controlling, but based its recommendation on each of the factors it considered and each Trustee may have contributed different weight to the various factors. Based upon the materials it reviewed, the representations made to it and the considerations described above, and as part of their deliberations, the Board, including the Independent Trustees, concluded that VALIC and each Sub-adviser possess the capability and resources to perform the duties required of them under their respective Advisory Contracts.
Further, based upon its review of the Advisory Contracts, the materials provided, and the considerations described above, the Board, including the Independent Trustees, concluded that (1) the terms of the Advisory Contracts are reasonable, fair and in the best interests of each of the Funds and its respective shareholders, and (2) the fee rates payable under the Advisory Contracts are fair and reasonable in light of the usual and customary charges made for services of the same nature and quality.
146
VALIC Company II
TRUSTEES AND OFFICERS INFORMATION (Unaudited) — August 31, 2010
| | | | | | | | | | | | | | |
Name, Birth Date
and Address*
| | Position
Held With
VALIC Complex | | Term of Office
and Length of
Time Served(4) | | | Principal Occupations During Past Five Years | | Number of
Funds in
Fund Complex
Overseen by
Director(2) | | | Other Directorships
Held by Director(3) |
Independent Directors | | | | | | | | | | | | | | |
Thomas J. Brown
DOB: December 24, 1945 | | Trustee | |
| 2005-
Present
|
| | Retired. | | | 48 | | | None. |
Dr. Judith L. Craven
DOB: October 6, 1945 | | Trustee | |
| 1998-
Present |
| | Retired Administrator. | | | 78 | | | Director, Hilton Hotel (1998-Present); Director, Belo Corporation, a media company (1992-Present); Director SYSCO Corporation, a food marketing and distribution company (1996-Present). Director, Luby’s Inc., a restaurant chain (1998-Present). |
William F. Devin
DOB: December 30, 1938 | | Chairman and Trustee(5) | |
| 2001-
Present |
| | Retired. | | | 78 | | | Director, Boston Options Exchange (2001-Present) |
Dr. Timothy J. Ebner
DOB: July 15, 1949 | | Trustee | |
| 1998-
Present |
| | Professor and Head, Department of Neuroscience (1980-Present), and Visscher Chair of Physiology, University of Minnesota (1999-Present); Scientific Director, Society for Research on the Cerabellum (2008-Present). | | | 48 | | | Trustee, Minnesota Medical Foundation (2005-Present). |
Judge Gustavo E. Gonzales, Jr.
DOB: July 27, 1940 | | Trustee | |
| 1998-
Present |
| | Attorney At Law, Criminal Defense and General Practice (2005-Present) Formerly, Municipal Court Judge, Dallas, TX (1995-2004) | | | 48 | | | None. |
Dr. John Wm. Lancaster
DOB: December 15, 1923 | | Trustee | |
| 1998-
Present |
| | Pastor Emeritus (1990-Present) and formerly Director of Planned Giving (1997-2005), First Presbyterian Church, Houston, TX. | | | 48 | | | None. |
Kenneth J. Lavery
DOB: December 30, 1949 | | Trustee | |
| 2001-
Present |
| | Vice President, Massachusetts Capital Resources Co. (1982-Present). | | | 48 | | | None. |
Dr. John E. Maupin, Jr.
DOB: October 28, 1946 | | Trustee | |
| 1998-
Present |
| | President, Morehouse School of Medicine, Atlanta, Georgia (2006-Present). Formerly, President, Meharry Medical College, Nashville, Tennessee (1994-2006). | | | 48 | | | Director, LifePoint Hospitals, Inc. (1999-Present); Director, HealthSouth Corp. (2004-Present); and Director, Regions Financial Corp. (2007-Present). |
Interested Directors | | | | | | | | | | | | | | |
Peter A. Harbeck(1)
DOB: January 23, 1954 | | Trustee | |
| 2001-
Present |
| | President, CEO and Director, SAAMCo (1995-Present); Director, SunAmerica Capital Services, Inc. (“SACS”) (1993-Present); Chairman, President and CEO, Advisor Group, Inc. (2004-Present) | | | 87 | | | None. |
Officers | | | | | | | | | | | | | | |
Kurt Bernlohr
DOB: May 27, 1961 | | President and Principal Executive Officer | |
| 2009-
Present |
| | President VALIC Financial Advisors, Inc. (2009-Present); President, VALIC Retirement Services Company (2009-Present); Senior Vice President (2009-Present), Vice President (2004-2009) and Associate General Counsel (2000-2004), VALIC | | | N/A | | | N/A |
147
VALIC Company II
TRUSTEES AND OFFICERS INFORMATION (Unaudited) — August 31, 2010 — (continued)
| | | | | | | | | | | | | | |
Name, Birth Date
and Address*
| | Position Held With
VALIC Complex | | Term of Office
and Length of
Time Served(4) | | | Principal Occupations During Past Five Years | | Number of
Funds in
Fund Complex
Overseen by
Director(2) | | | Other Directorships
Held by Director(3) |
Officers | | | | | | | | | | | | | | |
John Packs DOB: December 9, 1955 | | Vice President and Senior Investment Officer | |
| 2001-
Present |
| | Senior Investment Officer, VALIC (2001-Present). | | | N/A | | | N/A |
Gregory R. Kingston
DOB: January 18, 1966 | | Treasurer and Principal Financial Officer | |
| 2000-
Present |
| | Vice President, SAAMCo (2001-Present). | |
| N/A
|
| | N/A
|
Nori L. Gabert
DOB: August 15, 1953 | | Vice President, Chief Legal Officer and Secretary | |
| 2000-
Present |
| | Vice President and Deputy General Counsel, SAAMCo (2005-Present);
Vice President and Senior Counsel SAAMCo (2001-2005). | | | N/A | | | N/A |
Gregory N. Bressler DOB: November 17, 1966 | | Vice President | |
| 2005-
Present |
| | Senior Vice President and General Counsel, SAAMCo (2005 to Present); Formerly Vice President and Director of U.S. Asset Management Compliance, Goldman Sachs Asset Management (2004 to 2005); Deputy General Counsel, Credit Suisse Asset Management LLC (2002-2004). | | | N/A | | | N/A |
Cynthia A. Gibbons-Skrehot DOB: December 6, 1967 | | Vice President and Chief Compliance Officer (“CCO”) | |
| 2002-
Present
|
| | Vice President, SAAMCo and VALIC (2002-Present). | | | N/A | | | N/A |
Matthew J. Hackethal DOB: December 31, 1971 | | Anti-Money Laundering (“AML”) Compliance Officer | |
| 2007-
Present |
| | Chief Compliance Manager, SAAMCo (2006-Present); AML Compliance Officer, SunAmerica Fund Complex (2006-Present); VP (2001-2006) and CCO (2005-2006), Credit Suisse Alternative Funds Asset Management Division Formerly Vice President, Credit Suisse Asset Management (2001 to 2006); CCO, Credit Suisse Alternative Funds (2005 to 2006); Credit Suisse Asset Management Securities, LLC (2004 to 2005) | | | N/A | | | N/A |
Donna M. Handel DOB: June 25, 1966 | | Vice President and Assistant Treasurer | |
| 2001-
Present |
| | Senior Vice President, SAAMCo (2004-Present); Vice President, SAAMCo (1997-2004). | | | N/A | | | N/A |
Thomas M. Ward DOB: November 7, 1966 | | Vice President | |
| 2008-
Present |
| | VP (2009-Present) and Director (2005-2009), VALIC; VP, VALIC Financial Advisers, Inc. (2009-Present) | | | N/A | | | N/A |
| * | The business address for each Trustee and Officer is 2929 Allen Parkway, Houston, TX, 77019. |
| (1) | Interested Trustee, as defined within the Investment Company Act of 1940 (the “1940 Act”), because of current employment with SAAMCo, an affiliated company with VALIC. |
| (2) | The “Fund Complex” consists of all registered investment company portfolios for which VALIC or an affiliated person of VALIC serves as investment adviser or administrator. The “Fund Complex” includes the SunAmerica Speciality Series (3 funds), SunAmerica Equity Funds (3 funds), SunAmerica Income Funds (5 funds), SunAmerica Money Market Funds, Inc. (2 funds), SunAmerica Senior Floating Rate Fund, Inc. (1 fund), SunAmerica Focused Series, Inc. (14 portfolios), SunAmerica Focused Alpha Growth Fund, Inc. (1 fund), SunAmerica Focused Alpha LargeCap Fund, Inc. (1 fund), Anchor Series Trust (9 portfolios), Seasons Series Trust (21 portfolios), SunAmerica Series Trust (35 portfolios), VALIC Company I (33 funds) and VALIC Company II (15 funds). |
| (3) | Directorships of companies required to report to the Securities and Exchange Commission under the Securities Exchange Act of 1934 (i.e. “public companies”) or other investment companies registered under the 1940 Act. |
| (4) | Trustees serve until their successors are duly elected and qualified. |
| (5) | Effective July 27, 2005, Mr. Devin became Chairman of the Board. |
Additional Information concerning the Trustees and Officers is contained in the Statement of Additional Information and is available without charge by calling 1-800-448-2542.
148
VALIC Company II
SHAREHOLDERS TAX INFORMATION — August 31, 2010 (Unaudited)
Certain tax information regarding the VALIC Company II is required to be provided to the shareholders based upon each Fund’s income and capital gain distributions for the taxable year ended August 31, 2010
The information and distributions reported herein may differ from the information and distributions taxable to the shareholders for the calendar year ending December 31, 2010, which will be made available after the end of the calendar year.
During the year ended August 31, 2010 the Funds paid the following long-term capital gains along with the percentage of ordinary income dividends that qualified for the 70% dividends received deductions for corporations:
| | | | | | | | | | | | | | | | |
Fund
| | Net
Long-Term
Capital Gains
| | | Foreign
Tax Credit*
| | | Foreign
Source Income
| | | Qualifying % for the
70% Dividends
Received Deduction
| |
Aggressive Growth Lifestyle | | $ | — | | | $ | — | | | $ | — | | | | 29.07 | % |
Capital Appreciation | | | — | | | | — | | | | — | | | | 100.00 | |
Conservative Growth Lifestyle | | | — | | | | — | | | | — | | | | 10.95 | |
Core Bond | | | — | | | | — | | | | — | | | | 0.92 | |
High Yield Bond | | | — | | | | — | | | | — | | | | 0.22 | |
International Small Cap Equity | | | — | | | | 961,094 | | | | 12,305,595 | | | | — | |
Large Cap Value | | | — | | | | — | | | | — | | | | 100.00 | |
Mid Cap Growth | | | — | | | | — | | | | — | | | | — | |
Mid Cap Value | | | — | | | | — | | | | — | | | | 100.00 | |
Moderate Growth Lifestyle | | | — | | | | — | | | | — | | | | 16.92 | |
Money Market II | | | — | | | | — | | | | — | | | | — | |
Small Cap Growth | | | — | | | | — | | | | — | | | | — | |
Small Cap Value | | | — | | | �� | — | | | | — | | | | 100.00 | |
Socially Responsible | | | — | | | | — | | | | — | | | | 100.00 | |
Strategic Bond | | | — | | | | — | | | | — | | | | 0.38 | |
| * | The Funds make an election under the Internal Revenue Code Section 853 to pass through foreign taxes paid to the shareholders. |
149
VALIC Company II
COMPARISONS: FUNDS VS. INDEXES (Unaudited)
In the following pages, we have included graphs that compare the Fund’s performance with certain market indices. These graphs show the hypothetical growth of a $10,000 investment in each Fund versus the same $10,000 investment in comparable market indices. Descriptions of these market indices are provided below the individual graphs. It is important to note that the VC II Funds are professionally managed mutual funds while the indices are not available for investment and are unmanaged.
Please note that the graphs and tables that accompany the following investment comments include all fund expenses, but do not reflect the charges imposed by the variable annuity contract or variable life insurance policy (collectively, the “Contracts”), a qualifying employer-sponsored retirement plan (the “Plans”), or Individual Retirement Accounts (“IRAs”). All dividends are assumed to be reinvested. No expenses are deducted from the performance of the indices.
Investments in stocks and bonds are subject to risk, including stock market and interest rate fluctuations. Investments in non-U.S. stocks are subject to additional risks, including political and social instability, differing securities regulations and accounting standards, and limited public information. Mortgage-backed securities are subject to prepayment, which can result in reinvestment of principal at lower yields. Money market instruments generally offer stability and income, but an investment in these securities, like investments in other portfolios, are not guaranteed by the U.S. government or any other federal government entity. Lower rated high yield, high-risk securities generally involve more credit risk. These securities may also be subject to greater market price fluctuations than lower yielding, higher rated debt securities. The common stocks of medium-sized companies may be more volatile than those of larger, more established companies. Investing in real estate involves special risks, which may not be associated with investing in stocks, including possible declines in real estate values, adverse economic conditions, and changes in interest rates. Investments in small capitalization and emerging growth companies involve greater than average risk. Such securities may have limited marketability and the issuers may have limited product lines, markets and financial resources. The value of such investments may fluctuate more widely than investments in larger, more established companies. The technology industry can be significantly affected by obsolescence, short product cycles, falling prices and profits, and competition from new market participants. Funding choices that primarily invest in one sector are more volatile than those that diversify across many industry sectors and companies.
150
VALIC Company II Aggressive Growth Lifestyle Fund
COMPARISON: FUND VS. INDEX (Unaudited)
MANAGEMENT OVERVIEW
A discussion with PineBridge Investments, LLC
For the twelve months ending August 31, 2010, the Aggressive Growth Lifestyle Fund returned 8.11%, compared to 4.91% for the S&P 500® Index and 6.61% for the Blended Index.
Over the course of the year, the Russell 3000 Index returned 5.64%, the Morgan Stanley Capital International Europe, Australasia, and Far East (“MSCI EAFE”) Index (gross) lost -1.93%, the Financial Times Stock Exchange European Public Real Estate Association/National Association of Real Estate Investment Trusts (“FTSE/EPRA NAREIT”) Developed Index returned 15.11%, and the Barclay’s Capital U.S. Aggregate Bond Index (“BarCap US Aggregate Bond”) Index returned 9.18%. The first half of this fiscal year was marked by the first stage of economic recovery from the recession. The second half of the year was far more volatile, though with an overall downward trend as fears of a double-dip recession crept into markets worldwide.
The Fund began the year with a very significant underweight to Fixed Income, taking advantage of the economic recovery that was feeding hungry equity markets. It held overweights in both US and International Equities, and a more modest overweight in Real Estate. The risk of a bubble forming in US Equities caused the fund to go underweight there in the fall of 2009. It was shifted largely out of Large Cap Growth stocks and into promising opportunities in Fixed Income, primarily High Yield bonds. International Equities were also trimmed down to a neutral position. Concerns were justified in early 2010 when the Greek debt crisis caused a shock to capital markets worldwide. From March through August 2010, the fund was held neutral to peers in overall equity positions, which dictated being underweight versus the blended benchmark. Beginning in August, the fund increased US Equity holdings in expectation of a second stage of the recovery. While positioned aggressively versus aggressive growth fund peers, the Fund is still underweight in US and International equity versus benchmark.
151
VALIC Company II Aggressive Growth Lifestyle Fund
COMPARISON: FUND VS. INDEX (Unaudited) — (continued)
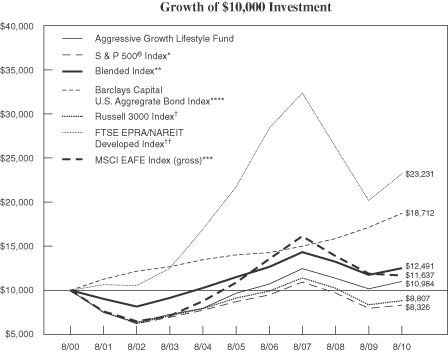
For the year ended August 31, 2010, the Aggressive Growth Lifestyle Fund returned 8.11% compared to 4.91% for the S&P 500® Index and 6.61% for the Blended Index.
| * | The S&P 500® Index consists of 500 stocks chosen for market size, liquidity, and industry group representation. It is a market-value weighted index, with each stock’s percentage in the Index in proportion to its market value. |
| ** | The Fund’s blended index consists of the Russell 3000 Index (54%), MSCI EAFE Index (gross) (13%), the BarCap US Aggregate Bond Index (25%) and the FTSE/EPRA NAREIT Developed Index (8%). |
| *** | The MSCI EAFE Index (gross) is a free float-adjusted market capitalization index that is designed to measure the equity market performance of developed markets, excluding the US & Canada. The gross index approximates the maximum possible dividend reinvestment and assumes that the amount reinvested is the entire dividend distributed to individuals resident in the country of the company, but does not include tax credits. |
| **** | The BarCap US Aggregate Bond Index is an unmanaged index that is composed of securities from Barclays Capital Government/Corporate Bond Index, Mortgage-Backed Securities Index, and the Asset-Backed Securities Index. |
| † | The Russell 3000 Index follows the 3,000 largest U.S. companies, based on total market capitalization. |
| †† | The FTSE EPRA/NAREIT Developed Index (formerly, the FTSE EPRA/NAREIT Global Real Estate Index) is designed to track the performance of listed real estate companies and REITs worldwide. The series acts as a performance measure of the overall market. |
| | | | |
| Average Annual Total Return |
| 1 Year | | 5 Years | | 10 Years |
| 8.11% | | 2.59% | | 0.94% |
Past performance is not predictive of future performance. The performance data quoted represents past performance; past performance does not guarantee future results; the investment return and principal value of an investment will fluctuate so that an investor’s shares, when redeemed, may be worth more or less than their original cost; current performance may be lower or higher than the performance data quoted.
The Fund’s returns reflect investment management fees and other Fund expenses. The Fund’s returns do not reflect charges included in the Variable Contract, Plan or IRA for mortality and expense guarantees, administrative fees or surrender charges.
152
VALIC Company II Capital Appreciation Fund
COMPARISON: FUND VS. INDEX (Unaudited)
MANAGEMENT OVERVIEW
A discussion with Bridgeway Capital Management, Inc.
The Capital Appreciation Fund posted a return of 7.79% for the twelve-month period ending August 31, 2010, compared to a return of 6.14% for the Russell 1000® Growth Index.
In the aftermath of the dramatic downturn of the prior fiscal year, the breadth of the market “bounceback” was demonstrated by the diversity of sectors represented within the Fund’s top contributors to performance. The Consumer Discretionary sector contributed the most to both absolute and relative performance during the fiscal year, with more than four-and-a-half percent of the Fund’s returns and almost all of the Fund’s outperformance attributed to this sector. Not only were stocks chosen well within this sector, but this high performing sector was also overweighted relative to the benchmark. TRW Automotive Holdings Corp and McDonalds were the largest contributors in this sector.
While the two top contributors to performance for the fiscal year were both Information Technology companies, Salesforce.com and Apple, three of the five largest detractors from performance, Seagate Technology, Micron Technology and Sandisk Corp, were also in this sector.
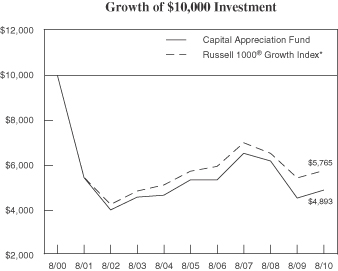
For the year ended August 31, 2010, the Capital Appreciation Fund returned 7.79% compared to 6.14% for the Russell 1000® Growth Index.
| * | The Russell 1000® Growth Index measures the performance of those Russell 1000 companies with higher price-to-book ratios and higher forecasted growth values. |
| | | | |
| Average Annual Total Return |
| 1 Year | | 5 Years | | 10 Years |
| 7.79% | | -1.76% | | -6.90% |
Past performance is not predictive of future performance. The performance data quoted represents past performance; past performance does not guarantee future results; the investment return and principal value of an investment will fluctuate so that an investor’s shares, when redeemed, may be worth more or less than their original cost; current performance may be lower or higher than the performance data quoted.
The Fund’s returns reflect investment management fees and other Fund expenses. The Fund’s returns do not reflect charges included in the Variable Contract, Plan or IRA for mortality and expense guarantees, administrative fees or surrender charges.
153
VALIC Company II Conservative Growth Lifestyle Fund
COMPARISON: FUND VS. INDEX (Unaudited)
MANAGEMENT OVERVIEW
A discussion with PineBridge Investments, LLC
For the twelve months ending August 31, 2010, the Conservative Growth Lifestyle Fund returned 10.69%, compared to 4.91% for the S&P 500® Index and 8.00% for the Blended Index.
Over the course of the year, the Russell 3000 Index returned 5.64%, the Morgan Stanley Capital International Europe, Australasia, and Far East (“MSCI EAFE”) Index (gross) lost -1.93%, the Financial Times Stock Exchange European Public Real Estate Association/National Association of Real Estate Investment Trusts (“FTSE/EPRA NAREIT”) Developed Index returned 15.11%, and the Barclay’s Capital U.S. Aggregate Bond Index (“BarCap US Aggregate Bond”) Index returned 9.18%. The first half of this fiscal year was marked by the first stage of economic recovery from the recession. The second half of the year was far more volatile, though with an overall downward trend as fears of a double-dip recession crept into markets worldwide.
The Fund began the year with a significant overweight in stocks to take advantage of the prevailing market strength. As calendar year 2009 drew to a close, concerns arose that the pace of economic recovery was becoming so fast that central banks would have to apply the brakes in the form of higher interest rates. The Fund began to reduce U.S. Equity back toward neutral to the benchmark. As equity exposures were reduced, the Fund favored higher yielding fixed income assets, as corporate balance sheets had become buoyed by profits during the recovery and bond markets were on sound footing. When it became clear in May that the greatest risk was in Europe as a result of the Greek debt crisis, the Fund also pulled International Equity to an underweight position, again to the benefit of higher yielding fixed income assets. The Fund closed the year on an optimistic note, raising U.S. Equity to an overweight position, while International Equity and Real Estate remain underweight. Fixed Income is also modestly underweight and tilted toward high yield bonds.
154
VALIC Company II Conservative Growth Lifestyle Fund
COMPARISON: FUND VS. INDEX (Unaudited) — (continued)
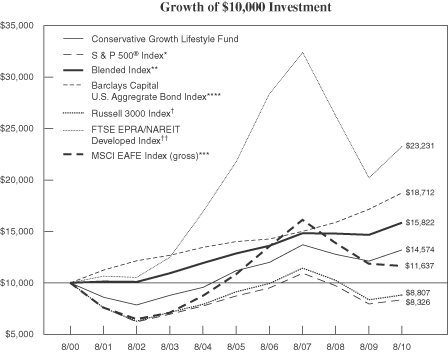
For the year ended August 31, 2010, the Conservative Growth Lifestyle Fund returned 10.69% compared to 4.91% for the S&P 500® Index and 8.00% for the Blended Index.
| * | The S&P 500® Index consists of 500 stocks chosen for market size, liquidity, and industry group representation. It is a market-value weighted index, with each stock’s percentage in the Index in proportion to its market value. |
| ** | The Fund’s blended index consists of the Russell 3000 Index (24%), MSCI EAFE Index (gross) (8%), the BarCap US Aggregate Bond Index (65%) and the FTSE EPRA/NAREIT Developed Index (3%). |
| *** | The MSCI EAFE Index (gross) is a free float-adjusted market capitalization index that is designed to measure the equity market performance of developed markets, excluding the US & Canada. The gross index approximates the maximum possible dividend reinvestment and assumes that the amount reinvested is the entire dividend distributed to individuals resident in the country of the company, but does not include tax credits. |
| **** | The BarCap US Aggregate Bond Index is an unmanaged index that is composed of securities from Barclays Capital Government/Corporate Bond Index, Mortgage-Backed Securities Index, and the Asset-Backed Securities Index. |
| † | The Russell 3000 Index follows the 3,000 largest U.S. companies, based on total market capitalization. |
| †† | The FTSE EPRA/NAREIT Developed Index (formerly, the FTSE EPRA/NAREIT Global Real Estate Index) is designed to track the performance of listed real estate companies and REITs worldwide. The series acts as a performance measure of the overall market. |
| | | | |
| Average Annual Total Return |
| 1 Year | | 5 Years | | 10 Years |
| 10.69% | | 4.16% | | 3.84% |
Past performance is not predictive of future performance. The performance data quoted represents past performance; past performance does not guarantee future results; the investment return and principal value of an investment will fluctuate so that an investor’s shares, when redeemed, may be worth more or less than their original cost; current performance may be lower or higher than the performance data quoted.
The Fund’s returns reflect investment management fees and other Fund expenses. The Fund’s returns do not reflect charges included in the Variable Contract, Plan or IRA for mortality and expense guarantees, administrative fees or surrender charges.
155
VALIC Company II Core Bond Fund
COMPARISON: FUND VS. INDEX (Unaudited)
MANAGEMENT OVERVIEW
A discussion with PineBridge Investments, LLC
The Core Bond Fund posted a return of 12.95% for the twelve-month period ending August 31, 2010, compared to 9.18% for the Barclay’s Capital U.S. Aggregate Bond Index (“BarCap US Aggregate Bond”) Index.
Sector selection was one of the largest contributors to the relative outperformance of the Fund versus the benchmark over the fiscal year. In particular, an overweight in the Banking and Financial sectors served the Fund well, as clarity surrounding financial regulation resulted in price appreciation for the securities.
Specific security holdings, most notably several Treasury bond positions, had a positive impact on Fund performance. Treasury positions in the Fund performed well given the large rally in interest rates that occurred as the Fund’s fiscal year came to a close. Furthermore, several Collateralized Mortgage Backed Securities (“CMBS”) positions, including issuance from JP Morgan and Bank of America contributed strongly to performance.
The top individual detractors were Freddie Gold Mortgage (“FHGLD”) Pool #G03, United States Treasury Notes due 07/31/2011, and United States Treasury Notes due 12/15/2011. The top individual contributors were United States Treasury Notes due 05/15/2018, United States Treasury Notes due 11/15/2039, and GS Mortgage Securities Trust due 08/10/2045.
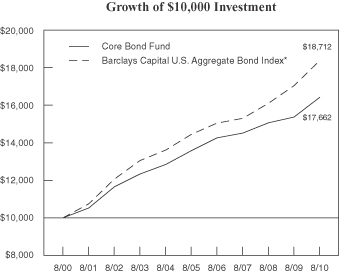
For the year ended August 31, 2010, the Core Bond Fund returned 12.95% compared to 9.18% for the BarCap US Aggregate Bond Index.
| * | The BarCap US Aggregate Bond Index is an unmanaged index that is composed of securities from Barclays Capital Government/Corporate Bond Index, Mortgage-Backed Securities Index, and the Asset-Backed Securities Index. |
| | | | |
| Average Annual Total Return |
| 1 Year | | 5 Years | | 10 Years |
| 12.95% | | 5.43% | | 5.85% |
Past performance is not predictive of future performance. The performance data quoted represents past performance; past performance does not guarantee future results; the investment return and principal value of an investment will fluctuate so that an investor’s shares, when redeemed, may be worth more or less than their original cost; current performance may be lower or higher than the performance data quoted.
The Fund’s returns reflect investment management fees and other Fund expenses. The Fund’s returns do not reflect charges included in the Variable Contract, Plan or IRA for mortality and expense guarantees, administrative fees or surrender charges.
156
VALIC Company II High Yield Bond Fund
COMPARISON: FUND VS. INDEX (Unaudited)
MANAGEMENT OVERVIEW
A discussion with Wellington Management Co., LLP
The High Yield Bond Fund posted a return of 18.42% for the twelve-month period ended August 31, 2010, compared to a return of 20.68% for the Citigroup High-Yield Market Index.
During the period, the best performing sectors of the Index were Airlines, Broadcast/Outdoor, and Finance. The worst performing sectors were Utilities, Environmental Services and Leisure.
Security selection was the primarily driver of underperformance during the period, due primarily to results in the Technology, Media NonCable, and Pharmaceuticals sectors. The Fund was also hurt by an underweight to the Specialty Finance sector and an overweight to the Technology sector. The Fund benefitted from strong security selection and an overweight to the Automotive sector, security selection in Chemicals, and an overweight to banks. During the period, CCC-rated securities outperformed all other quality segments while B- and BB-rated names lagged. An underweight to B- and BB-rated names was additive to performance.

For the year ended August 31, 2010, the High Yield Bond Fund returned 18.42% compared to 20.68% for the Citigroup High-Yield Market Index.
| * | The Citigroup High-Yield Market Index measures the performance of below investment grade debt issued by corporations domiciled in the United States or Canada. All of the bonds in such index are publicly placed, have a fixed coupon, and are nonconvertible. |
| | | | |
| Average Annual Total Return |
| 1 Year | | 5 Years | | 10 Years |
| 18.42% | | 3.88% | | 6.33% |
Past performance is not predictive of future performance. The performance data quoted represents past performance; past performance does not guarantee future results; the investment return and principal value of an investment will fluctuate so that an investor’s shares, when redeemed, may be worth more or less than their original cost; current performance may be lower or higher than the performance data quoted.
The Fund’s returns reflect investment management fees and other Fund expenses. The Fund’s returns do not reflect charges included in the Variable Contract, Plan or IRA for mortality and expense guarantees, administrative fees or surrender charges.
157
VALIC Company II International Small Cap Equity Fund
COMPARISON: FUND VS. INDEX (Unaudited)
MANAGEMENT OVERVIEW
The International Small Cap Equity Fund posted a return of 4.04% for the twelve-month period ended August 31, 2010, compared to a return of 2.11% for the Morgan Stanley Capital International Europe, Australasia, and Far East (“MSCI EAFE”) Small Cap Index (gross).
Effective December 9, 2009 Invesco Advisers, Inc (through a sub-sub advisory arrangement with Invesco Asset Management, Ltd) was added as a sub-adviser to the Fund.
A discussion with PineBridge Investments, LLC regarding their portion of the Fund (the “portfolio”)
Sector selection contributed positively to performance. Overweight positions in the Materials, Telecom and Healthcare sectors contributed positively to performance as did an underweight in Industrials. Conversely, an underweight position in Consumer Discretionary, Information Technology and Energy detracted from performance.
Stock selection had a positive impact on performance. The securities that contributed the most to performance were Croda International, Virgin Mediam Dena Co Ltd, Sonova Holding and Acergy. The stocks that detracted the most from performance were EFG International, Gruppo Editoriale L’Espresso, Wirecard, Enterprise Inns and Irish Life & Premiums.
The countries that made the strongest contribution to performance were the United Kingdom, Japan, South Korea, China and the Netherlands. The following countries detracted from performance, Germany, Italy, Singapore, Ireland and France. The country weights are determined through stock selection.
A discussion with Invesco Advisers, Inc/Invesco Asset Management, Ltd regarding their portion of the Fund (the “portfolio”)
On a relative basis, holdings in Asia and Latin America were the best performing for the portfolio, while stock selection in the Middle East & Africa and Eastern Europe also added to the portfolio’s outperformance. By contrast, stock selection in Europe and Japan detracted from the portfolio’s returns.
At the sector level, Consumer Staples (e.g. Aryzta and Wumart Stores) and Financials (e.g. BQE Cant Vaudoise) were among the top performing sectors for the portfolio. By contrast, overweight positions in the poor performing Industrials sector (e.g. Nissha Printing and Koninklijke Bam Groep) and the Information Technology sector (e.g. Micronics Japan) hindered the portfolio’s performance.
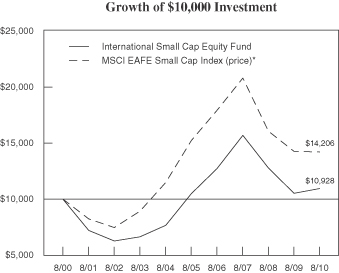
For the year ended August 31, 2010, the International Small Cap Equity Fund returned 4.04% compared to 2.11% for the MSCI EAFE Small Cap Index (gross).
| * | The MSCI EAFE Small Cap Index (gross) is made up of 40% of the full market capitalization of the eligible small cap universe within each industry group, within each country in the MSCI EAFE Index. MSCI defines the small cap universe as all listed securities that have a market capitalization in the range of US $200 million to $1.5 billion. The gross index approximates the maximum possible dividend reinvestment and assumes that the amount reinvested is the entire dividend distributed to individuals resident in the country of the company, but does not include tax credits (10 year history is not available for the gross returns therefore price-only returns were used in the graph). |
| | | | |
| Average Annual Total Return |
| 1 Year | | 5 Years | | 10 Years |
| 4.04% | | 0.85% | | 0.89% |
Past performance is not predictive of future performance. The performance data quoted represents past performance; past performance does not guarantee future results; the investment return and principal value of an investment will fluctuate so that an investor’s shares, when redeemed, may be worth more or less than their original cost; current performance may be lower or higher than the performance data quoted.
The Fund’s returns reflect investment management fees and other Fund expenses. The Fund’s returns do not reflect charges included in the Variable Contract, Plan or IRA for mortality and expense guarantees, administrative fees or surrender charges.
158
VALIC Company II Large Cap Value Fund
COMPARISON: FUND VS. INDEX (Unaudited)
MANAGEMENT OVERVIEW
The Large Cap Value Fund posted a return of 0.61% for the twelve-month period ended August 31, 2010, compared to a return of 4.96% for the Russell 1000® Value Index.
Effective June 7, 2010 The Boston Company Asset Management, LLC and Janus Capital Management, LLC (through a sub-sub advisory arrangement with Perkins Investment Management, LLC) replaced SSgA Funds Management, Inc. as sub-advisers to the Fund.
A discussion with The Boston Company Asset Management. LLC regarding their portion of the Fund (the “portfolio”)
Underperformance versus the Index was driven by allocation in the Utilities, Consumer Staples, Consumer Discretionary, and Telecommunications sectors. Other factors detracting from performance were stock selection in Financials, Energy, and Healthcare. Several of the portfolio’s financial holdings detracted most from relative returns, including Bank of America Corp., Wells Fargo & Co., and Prudential Financial, Inc.
Some of the portfolio’s underperformance was offset by positive stock selection in Materials, Industrials, Utilities, and Information Technology. The portfolio outperformed by the widest margin in the Materials sector. Several Materials holdings were among the portfolio’s leading contributors to performance, and included CF Industries Holdings Inc. and Freeport-McMoRan Copper & Gold, Inc. Other top individual contributors included AT&T Inc., Pfizer Inc., and Anadarko Petroleum Corp.
A discussion with Janus Capital Management, LLC and Perkins Investment Management, LLC regarding their portion of the Fund (the “portfolio”)
During the nearly three-month period, the portfolio underperformed its benchmark, the Russell 1000® Value Index. Stock selection in the Healthcare and Energy sectors and allocation in the Utilities and Information Technology sectors had the largest negative impact on results. Meanwhile, Financial Services and Telecommunications were favorable to performance.
A discussion with SSgA Funds Management, Inc.
Stock selection was the main driver of underperformance during the period. At a sector level the portfolio underperformed in seven of ten sectors. Stock selection was weakest within the Financials, Industrials, Healthcare, and Energy sectors. Within Financials, overweights to insurer Unum Group and Goldman Sachs Group, Inc. pressured results. Among Industrials, an underweight to Boeing Co. detracted from relative results as the stock had a healthy gain over the time period. Rounding out with Healthcare, an overweight position to healthcare benefits provider UnitedHealth Group Inc. was a notable laggard.
These results were partially offset by sector allocation in Consumer Discretionary, Utilities, and Telecommunications. Additional contributions to performance included strong stock selection within Consumer Staples, Consumer Discretionary, and Utilities. Stock selection in Consumer Staples was led by overweight positions in Del Monte Foods Co. and Dr. Pepper Snapple Group Inc., while Consumer Discretionary benefited from overweight positions in clothing retailers Limited Brands Inc. and Ross Stores Inc., which was not a benchmark component.
While overall stock selection in the Financial Services sector was positive, the largest individual detractor was Bank of America Corp. Other banks Wells Fargo & Co. and PNC Financial Corp. also detracted from performance during the period. The portfolio’s two top contributors both in the telecommunications sector were Vodafone Group PLC and AT&T Inc. Diversified holding company Berkshire Hathaway (B Shares) was another top contributor.
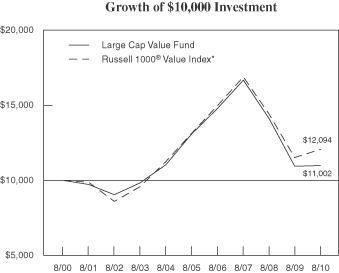
For the year ended August 31, 2010, the Large Cap Value Fund returned 0.61% as compared to 4.96% for the Russell 1000® Value Index.
| * | The Russell 1000® Value Index measures the performance of those Russell 1000 companies with lower price-to-book ratios and lower forecasted growth values. |
| | | | |
| Average Annual Total Return |
| 1 Year | | 5 Years | | 10 Years |
| 0.61% | | -3.45% | | 0.96% |
Past performance is not predictive of future performance. The performance data quoted represents past performance; past performance does not guarantee future results; the investment return and principal value of an investment will fluctuate so that an investor’s shares, when redeemed, may be worth more or less than their original cost; current performance may be lower or higher than the performance data quoted.
The Fund’s returns reflect investment management fees and other Fund expenses. The Fund’s returns do not reflect charges included in the Variable Contract, Plan or IRA for mortality and expense guarantees, administrative fees or surrender charges.
159
VALIC Company II Mid Cap Growth Fund
COMPARISON: FUND VS. INDEX (Unaudited)
MANAGEMENT OVERVIEW
A discussion with Invesco Advisers, Inc.
The Mid Cap Growth Fund posted a return of 8.46% for the twelve-month period ended August 31, 2010, compared to a return of 11.58% for the Russell MidCap® Growth Index.
The U.S. economy provided signs of improvement during the Fund’s fiscal year, potentially indicating that the economy has transitioned from a contraction phase into an expansionary phase. Nevertheless, the pace of recovery remained modest and the transition from government stimulus-induced growth to private economic recovery was uncertain.
The Fund underperformed by the widest margin in the Consumer Discretionary sector, driven by stock selection. Examples of holdings that were key detractors to performance included for profit education services provider ITT Educational Services Inc. and casino operator MGM Resorts International. The Fund also underperformed in Information Technology, Industrials, and Financials. Underperformance in each of these sectors was driven primarily by stock selection. An overweight position in the Energy sector also detracted from performance.
Some of this underperformance was offset in other sectors, including Healthcare, Utilities, Consumer Staples and Telecom. The Fund outperformed by the widest margin in the Healthcare sector, due to stock selection. One Healthcare holding that was among the Fund’s top contributors to performance was Genzyme Corp. In the Consumer Staples sector, Estee Lauder Companies was among the fund’s top contributors to performance.

For the year ended August 31, 2010, the Mid Cap Growth Fund returned 8.46% compared to 11.58% for the Russell MidCap® Growth Index.
| * | The Russell MidCap® Growth Index measures the performance of those Russell Midcap® companies with higher price-to-book ratios and higher forecasted growth values. The stocks are also members of the Russell 1000® Growth Index. |
| | | | |
| Average Annual Total Return |
| 1 Year | | 5 Years | | 10 Years |
| 8.46% | | -0.18% | | -4.36% |
Past performance is not predictive of future performance. The performance data quoted represents past performance; past performance does not guarantee future results; the investment return and principal value of an investment will fluctuate so that an investor’s shares, when redeemed, may be worth more or less than their original cost; current performance may be lower or higher than the performance data quoted.
The Fund’s returns reflect investment management fees and other Fund expenses. The Fund’s returns do not reflect charges included in the Variable Contract, Plan or IRA for mortality and expense guarantees, administrative fees or surrender charges.
160
VALIC Company II Mid Cap Value Fund
COMPARISON: FUND VS. INDEX (Unaudited)
MANAGEMENT OVERVIEW
The Mid Cap Value Fund posted a return of 8.21% for the twelve-month period ended August 31, 2010, compared to a return of 9.82%. for the Russell 2500® Value Index.
A discussion with FAF Advisors, Inc. regarding their portion of the Fund (the “portfolio”)
Sector selection was a detractor from performance, mainly due to the portfolio’s overweight position in the lagging Consumer Discretionary area and underweight allocation to Utilities, which outperformed. Stock selection contributed to performance, as positive stock selection in the Energy, Financials, Telecommunications, and Industrials areas offset negative stock selection in the Technology, Healthcare, Utilities, Materials, and Consumer areas.
Energy related stocks that had a positive impact on performance include Pioneer Natural Resources, Alpha Natural Resources, Newfield Exploration, and EOG Resources. Financial companies Comerica and Ameriprise Financial advanced during the period. Within Telecommunications, Windstream Corp and Qwest Communications were strong performers.
The largest individual detractors from performance were Unum Corp., AnnTaylor Stores, URS Corp., and Gannett Co.
A discussion with Wellington Management Co., LLP regarding their portion of the Fund (the “portfolio”)
Security selection added to overall performance. Strong stock selection in the Telecom & Media, Healthcare, Industrials, and Materials sectors was partially offset by weaker selection in the Consumer Staples, Energy, Consumer Discretionary, and Financials sectors. Impax Lab and Amerisource Bergen were among the top contributors on an individual basis in the Healthcare sector and in the overall portfolio. Telecom & Media name Virgin Media was also among the top relative contributors to portfolio performance. Within the Industrials sector, our positions in Delta Airlines and Ametek helped performance. Among the top relative detractors from performance were MDC Holdings in the Consumer Discretionary sector, and Arrow Electronics and Varian Semiconductor Equipment in the Information Technology sector.
Overall, sector allocation detracted from relative results, hurt by an underweight to the Utilities sector and an overweight to the Industrials Sector. These more than offset positive contributions from underweights to the lagging consumer discretionary and financials sectors.
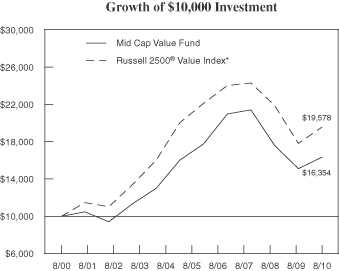
For the year ended August 31, 2010, the Mid Cap Value Fund returned 8.21% compared to 9.82% for the Russell 2500® Value Index.
| * | The Russell 2500® Value Index measures the performance of those Russell 2500® companies (the 2500 smallest companies, by market capitalization in the Russell 3000® Index) with lower price-to-book ratios and lower forecasted growth values. |
| | | | |
| Average Annual Total Return |
| 1 Year | | 5 Years | | 10 Years |
| 8.21% | | 0.40% | | 5.04% |
Past performance is not predictive of future performance. The performance data quoted represents past performance; past performance does not guarantee future results; the investment return and principal value of an investment will fluctuate so that an investor’s shares, when redeemed, may be worth more or less than their original cost; current performance may be lower or higher than the performance data quoted.
The Fund’s returns reflect investment management fees and other Fund expenses. The Fund’s returns do not reflect charges included in the Variable Contract, Plan or IRA for mortality and expense guarantees, administrative fees or surrender charges.
161
VALIC Company II Moderate Growth Lifestyle Fund
COMPARISON: FUND VS. INDEX (Unaudited)
MANAGEMENT OVERVIEW
A discussion with PineBridge Investments, LLC
For the twelve months ending August 31, 2010, the Moderate Growth Lifestyle Fund returned 9.07%, compared to 4.91% for the S&P 500® Index and 7.37% for the Blended Index.
Over the course of the year, the Russell 3000 Index returned 5.64%, the Morgan Stanley Capital International Europe, Australasia, and Far East (“MSCI EAFE”) Index (gross) lost -1.93%, the Financial Times Stock Exchange European Public Real Estate Association/National Association of Real Estate Investment Trusts (“FTSE EPRA/ NAREIT”) Developed Index returned 15.11%, and the Barclay’s Capital U.S. Aggregate Bond Index (“BarCap US Aggregate Bond”) Index returned 9.18%. The first half of this fiscal year was marked by the first stage of economic recovery from the recession. The second half of the year was far more volatile, though with an overall downward trend as fears of a double-dip recession crept into markets worldwide.
The Fund began the year with overweight positions in both US and International Equity asset classes, as well as in Real Estate. Growing market sentiment of an overheated recovery began to take form in 2009, and the Fund started narrowing positions in Growth equities, reducing Growth holdings in the US and eliminating its position in the International Growth Fund. Fears were realized in May 2010 with shocks to both US and European stock markets. In response, the Fund reduced its International equity positions overall and brought Real Estate down to neutral. The Fund closed the fiscal year cautiously optimistic, holding an overweight position in US equity with a recent move into Mid Cap Value, and an underweight in both International Equity and Fixed Income.
162
VALIC Company II Moderate Growth Lifestyle Fund
COMPARISON: FUND VS. INDEX (Unaudited) — (continued)
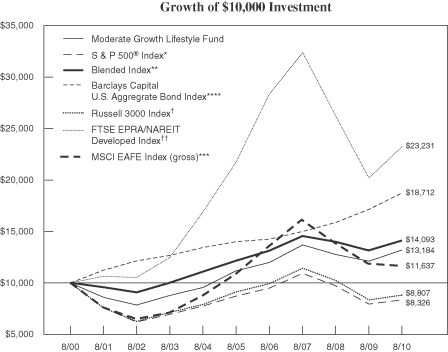
For the year ended August 31, 2010, the Moderate Growth Lifestyle Fund returned 9.07% compared to 4.91% for the S&P 500® Index and 7.37% for the Blended Index.
| * | The S&P 500® Index consists of 500 stocks chosen for market size, liquidity, and industry group representation. It is a market-value weighted index, with each stock’s percentage in the Index in proportion to its market value. |
| ** | The blended index consists of the Russell 3000 Index (40%), MSCI EAFE Index (gross) (10%), the BarCap US Aggregate Bond Index (45%) and the FTSE EPRA/NAREIT Developed Index (5%). |
| *** | The MSCI EAFE Index (gross) is a free float-adjusted market capitalization index that is designed to measure the equity market performance of developed markets, excluding the US & Canada. The gross index approximates the maximum possible dividend reinvestment and assumes that the amount reinvested is the entire dividend distributed to individuals resident in the country of the company, but does not include tax credits. |
| **** | The BarCap US Aggregate Bond Index is an unmanaged index that is composed of securities from Barclays Capital Government/Corporate Bond Index, Mortgage-Backed Securities Index, and the Asset-Backed Securities Index. |
| † | The Russell 3000 Index follows the 3,000 largest U.S. companies, based on total market capitalization. |
| †† | The FTSE EPRA/NAREIT Developed Index (formerly, the FTSE EPRA/NAREIT Global Real Estate Index) is designed to track the performance of listed real estate companies and REITs worldwide. The series acts as a performance measure of the overall market. |
| | | | |
| Average Annual Total Return |
| 1 Year | | 5 Years | | 10 Years |
| 9.07% | | 3.35% | | 2.80% |
Past performance is not predictive of future performance. The performance data quoted represents past performance; past performance does not guarantee future results; the investment return and principal value of an investment will fluctuate so that an investor’s shares, when redeemed, may be worth more or less than their original cost; current performance may be lower or higher than the performance data quoted.
The Fund’s returns reflect investment management fees and other Fund expenses. The Fund’s returns do not reflect charges included in the Variable Contract, Plan or IRA for mortality and expense guarantees, administrative fees or surrender charges.
163
VALIC Company II Money Market II Fund
COMPARISON: FUND VS. INDEX (Unaudited)
MANAGEMENT OVERVIEW
A discussion with SunAmerica Asset Management Corp.
The Money Market II Fund posted a return of 0.01% for the twelve-month period ending August 31, 2010, compared to a return of 0.09% for the T-Bill Three-Month Index.
During the course of 2010, the Federal Open Market Committee (“FOMC”) maintained a Fed Funds Target Rate range of 0.00% to 0.25%. Throughout the period, the FOMC commented at its regularly scheduled meetings that the economy was in a recovery period. Although the economic recovery is still underway, it is more modest in the second half of 2010. The FOMC also noted consistently that inflation was subdued.
At the end of period, the Federal Reserve began signaling that it is prepared to enter into a second round of Quantitative Easing (QE). The committee will continue to monitor the economic outlook and financial developments and will employ its policy tools as necessary to promote economic recovery and price stability.
Additionally, yields on money market securities decreased steadily throughout the period with one-month CDs yielding approximately 0.19% at August 31, 2010, down from roughly 0.25% at August 31, 2009. In order to preserve yields, value was added through active management of the Fund’s duration, specifically by purchasing longer-dated fixed rate instruments as well as floating rate notes.
Sector selection had an impact on the portfolio. Given the outlook for a continued low level in the federal funds rate, the Fund continued to emphasize longer fixed rate and floating rate securities while selectively purchasing short-dated securities when relative value opportunities were discovered. In these challenging times, the Fund puts an emphasis on maintaining liquidity while striving to preserve yield.
| | | | |
| Average Annual Total Return |
| 1 Year | | 5 Years | | 10 Years |
| 0.01% | | 2.57% | | 2.29% |
Past performance is not predictive of future performance. The performance data quoted represents past performance; past performance does not guarantee future results; the investment return and principal value of an investment will fluctuate so that an investor’s shares, when redeemed, may be worth more or less than their original cost; current performance may be lower or higher than the performance data quoted.
The Fund’s returns reflect investment management fees and other Fund expenses. The Fund’s returns do not reflect charges included in the Variable Contract, Plan or IRA for mortality and expense guarantees, administrative fees or surrender charges.
164
VALIC Company II Small Cap Growth Fund
COMPARISON: FUND VS. INDEX (Unaudited)
MANAGEMENT OVERVIEW
A discussion with J.P. Morgan Investment Management Inc.
The Small Cap Growth Fund returned 9.56% for the twelve month period ending August 31, 2010, outperforming its benchmark, the Russell 2000® Growth Index, which returned 7.16% for the period.
Stock selection was the primary contributor to performance. Specifically, stock selection in the Energy and Consumer Discretionary sectors contributed to results. Stock selection in the Technology and Utilities sectors negatively impacted returns.
One of the largest contributors to performance was Coinstar, Inc, a provider of automated retail solutions. Ann Taylor Stores also contributed to performance.
On the negative side, Cumberland Pharmaceuticals Inc detracted from results. Another top detractor was Neutral Tandem Inc, which provides tandem interconnection services to wireless, wireline, cable, and broadband telephone companies in the United States.
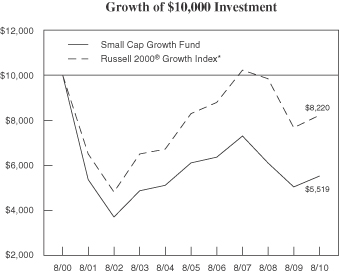
For the year ended August 31, 2010, the Small Cap Growth Fund returned 9.56% compared to 7.16% for the Russell 2000® Growth Index.
| * | The Russell 2000® Growth Index measures the performance of those Russell 2000® companies with higher price-to-book ratios and higher forecasted growth values. |
| | | | |
| Average Annual Total Return |
| 1 Year | | 5 Years | | 10 Years |
| 9.56% | | -2.00% | | -5.77% |
Past performance is not predictive of future performance. The performance data quoted represents past performance; past performance does not guarantee future results; the investment return and principal value of an investment will fluctuate so that an investor’s shares, when redeemed, may be worth more or less than their original cost; current performance may be lower or higher than the performance data quoted.
The Fund’s returns reflect investment management fees and other Fund expenses. The Fund’s returns do not reflect charges included in the Variable Contract, Plan or IRA for mortality and expense guarantees, administrative fees or surrender charges.
165
VALIC Company II Small Cap Value Fund
COMPARISON: FUND VS. INDEX (Unaudited)
MANAGEMENT OVERVIEW
The Small Cap Value Fund posted a return of 4.96% for the twelve-month period ended August 31, 2010, compared to a return of 6.06% for the Russell 2000® Value Index.
Effective February 8, 2010 Metropolitan West Capital Management, LLC and SunAmerica Asset Management Corp. were added as additional sub-advisers to the Fund.
A discussion with J.P. Morgan Investment Management Inc. regarding their portion of the Fund (the “portfolio”)
Stock selection drove outperformance of the portfolio during the period. Specifically, selection in the Semiconductor, Industrial Cyclical, and Finance sectors contributed most to results. On the other hand, Stock Selection in the energy, basic materials, and retail sectors became the worst detractors from performance. Sector allocation was a slight detractor from performance.
An overweight in small loan consumer finance company World Acceptance Corporation contributed to performance. In addition, an overweight position in micro-chip maker Cirrus Logic continued to aid performance. An overweight position in offshore construction contractor Cal Dive detracted from performance during the period. In addition, an overweight position in drilling and marine service provider Hercules Offshore hurt performance.
A discussion with Metropolitan West Capital Management, LLC regarding their portion of the Fund (the “portfolio”)
The majority of the underperformance during the period resulted from security selection rather than sector weighting differences relative to the Index. Stock selection in the Healthcare sector was the main detractor from performance. Security selection coupled with overweights in both Consumer Discretionary and Information Technology subtracted additional value relative to the Index, as those sectors were the two of the three worst performers. Also, an underweight to the positive performing Utilities sector dragged on performance.
Within Healthcare, AMN Healthcare Services, Inc. and Amedisys, Inc. detracted the most value. In Consumer Discretionary, School Specialty, Inc. and OfficeMax, Inc. subtracted the most value. Within Information Technology, Jabil Circuit, Inc. was the largest detractor from performance.
Stock selection in Telecommunication Services added the most value relative to the index. General Communications, Inc. was the sole contributor to outperformance in this sector. Positive stock selection in Financials also added to performance. The top contributor from this sector was Horace Mann Educators Corp. In the Consumer Discretionary sector, a strong gain by Rc2 Corp. benefited performance.
A discussion with SunAmerica Asset Management Corp. LLC regarding their portion of the Fund (the “portfolio”)
Overweight allocations and stock selection in the Materials and Telecom Services sectors were the primary driver of outperformance for the portfolio during the period. Stock selection in the financial and utilities groups also helped relative performance. Detracting from portfolio returns were stock selection in the Industrial, Information Technology, and Consumer Discretionary groups; as well as, overweight exposure to the weak Energy sector.
Gold exploration companies US Gold Corp. and Fronteer Gold Inc. headed the list of top contributors during the period. Vonage Holdings Corp., United Rentals Inc., and South Jersey Industries Inc., also performed well. Alternatively, Jaguar Mining Inc., Sanmina-SCI Corp., CDC Software Corp. (ADS), Entergris Inc., and Chico’s FAS Inc. were leading detractors within the portfolio.
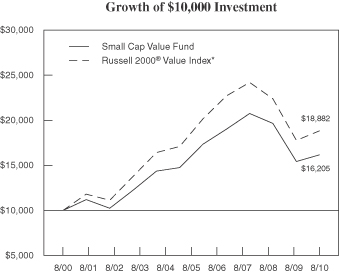
For the year ended August 31, 2010, the Small Cap Value Fund returned 4.96% compared to 6.06% for the Russell 2000® Value Index.
| * | The Russell 2000® Value Index measures the performance of those Russell 2000 companies with lower price-to-book ratios and lower forecasted growth values. |
| | | | |
| Average Annual Total Return |
| 1 Year | | 5 Years | | 10 Years |
| 4.96% | | -1.38% | | 4.95% |
Past performance is not predictive of future performance. The performance data quoted represents past performance; past performance does not guarantee future results; the investment return and principal value of an investment will fluctuate so that an investor’s shares, when redeemed, may be worth more or less than their original cost; current performance may be lower or higher than the performance data quoted.
The Fund’s returns reflect investment management fees and other Fund expenses. The Fund’s returns do not reflect charges included in the Variable Contract, Plan or IRA for mortality and expense guarantees, administrative fees or surrender charges.
166
VALIC Company II Socially Responsible Fund
COMPARISON: FUND VS. INDEX (Unaudited)
MANAGEMENT OVERVIEW
The Socially Responsible Fund posted a return of 6.23% for the twelve month period ending August 31, 2010, compared with a return of 4.91% for the S&P 500® Index.
Effective December 1, 2009, SunAmerica Asset Management Corp. replaced PineBridge Investments, LLC as sub-adviser to the Fund. Concurrent with that change the Fund’s ‘research enhanced’ indexing strategy was replaced with a traditional index strategy. The social investing constraints of the Fund remained the same.
A discussion with SunAmerica Asset Management Corp.
The Fund is currently passively managed to create an optimized portfolio designed to closely track the S&P 500® Index by investing in a stock universe that is composed of the members of the S&P 500® Index, less those companies deemed to be socially irresponsible. Therefore, in addition to performance discrepancies due to trading, cash, and pricing effects normally experienced by index funds, the Fund experiences discrepancies due to the restricted number of available securities.
The Fund had overall positive performance in eight of ten sectors. Allocation overweights and underweights contributed positively in five sectors and detracted in five sectors. Telecommunication Services was the best performing sector for the Fund while Information Technology was the worst. Overall, an underweight allocation and good stock selection in the Energy sector was the largest contributor to return while an overweight allocation and poor stock selection in Information Technology was the largest detractor.
In terms of portfolio return, the top three performing securities were Qwest Communications International, Inc., Cummins, Inc., and Salesforce.com., Inc. The bottom three performing securities were NVIDIA Corp, Western Digital Corp., and Advanced Micro Devices, Inc.
A discussion with PineBridge Investments, LLC
The Fund’s outperformance of the benchmark can be attributed primarily to stock selection. This was partially offset by sector exposure which was an overall detractor from performance. The sector exposure which helped the Fund most was an underweight position in Utilities, which was one of the worst performing sectors for the fiscal quarter ending November 30, 2009. An overweight position in Financials was the largest detracting sector. The largest contributing stocks on a stock selection basis were Information Technology stocks Google, Inc. and Microsoft Corp. The weakest performing stock in the Fund on a stock selection basis was CVS Corp.
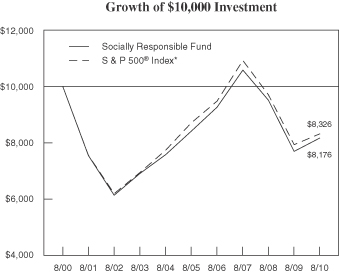
For the year ended August 31, 2010, the Socially Responsible Fund returned 6.23% compared to 4.91% for the S&P 500® Index.
| * | The S&P 500® Index consists of 500 stocks chosen for market size, liquidity, and industry group representation. It is a market-value weighted index (stock price times number of shares outstanding), with each stock’s weight in the index proportionate to its market value. |
| | | | |
| Average Annual Total Return |
| 1 Year | | 5 Years | | 10 Years |
| 6.23% | | -0.58% | | -1.99% |
Past performance is not predictive of future performance. The performance data quoted represents past performance; past performance does not guarantee future results; the investment return and principal value of an investment will fluctuate so that an investor’s shares, when redeemed, may be worth more or less than their original cost; current performance may be lower or higher than the performance data quoted.
The Fund’s returns reflect investment management fees and other Fund expenses. The Fund’s returns do not reflect charges included in the Variable Contract, Plan or IRA for mortality and expense guarantees, administrative fees or surrender charges.
167
VALIC Company II Strategic Bond Fund
COMPARISON: FUND VS. INDEX (Unaudited)
MANAGEMENT OVERVIEW
A discussion with PineBridge Investments, LLC
The Strategic Bond Fund posted a return of 14.51% for the twelve-month period ending August 31, 2010, compared to 9.18% for the Barclay’s Capital U.S. Aggregate Bond Index (“BarCap US Aggregate Bond”) Index.
Sector selection was one of the largest contributors to the relative outperformance of the Fund versus the benchmark over the course of the fiscal year. In particular, an overweight in the Industrial and Financial sectors served the fund well, as clarity surrounding financial regulation helped take spreads tighter.
Several Collateralized Mortgage Backed Securities (“CMBS”) positions, including issuance from Goldman Sachs and Citigroup contributed strongly to performance. In addition, sovereign Emerging Market bonds held in the Fund including issues from Russia, Argentina and Colombia were among the top performers.
Country selection, most notably currency exposure to the Australian and Canadian dollar, had a positive impact on the performance of the Fund.
On a sector basis, the Fund underperformed in Government Mortgages (Fannie Mae, Ginnie Mae and Freddie Mac).
Top individual contributors included Russian Federation due 3/31/2030, Republic of Argentina due 12/31/2033, and GS Mortgage Securities Trust due 08/10/2045. Top individual detractors included Kingdom of Norway due 05/15/2015, United Airlines, Inc. due 3/01/2013, and Republic of Poland due 10/24/2015.
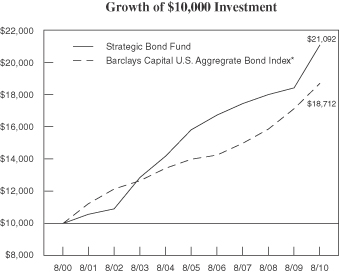
For the year ended August 31, 2010, the Strategic Bond Fund returned 14.51% compared to 9.18% for the BarCap US Aggregate Bond Index.
| * | The BarCap US Aggregate Bond Index is an unmanaged index that is composed of securities from Barclays Capital Government/Corporate Bond Index, Mortgage-Backed Securities Index, and the Asset-Backed Securities Index. |
| | | | |
| Average Annual Total Return |
| 1 Year | | 5 Years | | 10 Years |
| 14.51% | | 5.90% | | 7.75% |
Past performance is not predictive of future performance. The performance data quoted represents past performance; past performance does not guarantee future results; the investment return and principal value of an investment will fluctuate so that an investor’s shares, when redeemed, may be worth more or less than their original cost; current performance may be lower or higher than the performance data quoted.
The Fund’s returns reflect investment management fees and other Fund expenses. The Fund’s returns do not reflect charges included in the Variable Contract, Plan or IRA for mortality and expense guarantees, administrative fees or surrender charges.
168
VALIC Company II
SUPPLEMENTS TO PROSPECTUS (Unaudited)
Supplement to the Prospectus dated January 1, 2010
With respect to the Fund Fact Sheet of the Money Market II Fund, the “Investment Strategy” section is amended to reflect that the Fund may invest in illiquid and restricted securities up to 5% of its net assets (change from the previous limit of 10%).
Date: June 1, 2010
Supplement to the Prospectus dated January 1, 2010
Core Bond Fund and Strategic Bond Fund. Effective September 22, 2010, in the section titled “About VC II’s Management – Investment Sub-Advisers – AIGGIC” (now PineBridge Investments, LLC), the disclosure with respect to Bryan Petermann is deleted in its entirety. All other portfolio managers of the Core Bond Fund and the Strategic Bond Fund currently named in the Prospectus will continue to serve as portfolio managers of the respective fund.
Date: September 23, 2010
Supplement to the Prospectus dated January 1, 2010
Mid Cap Growth Fund. At a meeting on October 25-26, 2010, the Board of Trustees (the “Board”) of VALIC Company II (“VC II”) approved the termination of Invesco Advisers, Inc. (“Invesco”) as the sub-adviser to the Mid Cap Growth Fund (the “Fund”) and approved the engagement of Columbia Management Investment Advisers, LLC (“Columbia”) as sub-adviser to the Fund. The Board approved a new investment sub-advisory agreement between The Variable Annuity Life Insurance Company (“VALIC”) and Columbia (the “Columbia Sub-advisory Agreement”). With respect to the Columbia Sub-advisory Agreement, the Board has authority, pursuant to an exemptive order granted by the Securities and Exchange Commission, to enter into sub-advisory agreements without a shareholder vote; however, an information statement explaining the change of sub-adviser will be mailed to the shareholders of the Fund. The effective date of the Columbia Sub-advisory Agreement will occur on or about December 1, 2010.
Investment Strategy. Upon the effectiveness of the Columbia Sub-advisory Agreement, the “Investment Strategy” section of the Fund’s Fact Sheet is deleted in its entirety and replaced with the following:
This Fund invests, under normal circumstances, at least 80% of net assets in the equity securities and equity related instruments of medium capitalization companies. Generally, mid-cap companies will include companies whose market capitalizations, at the time of purchase, range from the market capitalization of the smallest company included in the Russell Midcap Index to the market capitalization of the largest company in the Russell Midcap Index during the most recent 12-month period. As of the most recent annual reconstitution of the Russell Midcap Index on June 28, 2010, the market capitalization range of the companies in the Index was $1.3 billion to $14.1 billion.
The Fund invests primarily in common stocks of companies that the sub-adviser believes have the potential for long-term, above-average earnings growth.
The sub-adviser combines fundamental and quantitative analysis with risk management in identifying investment opportunities and constructing the Fund’s portfolio. The sub-adviser considers, among other factors:
| | • | | overall economic and market conditions; and |
| | • | | the financial condition and management of a company, including its competitive position, the quality of its balance sheet and earnings, its future prospects, and the potential for growth and stock price appreciation. |
The sub-adviser may sell a security when the security’s price reaches a target set by the sub-adviser. If the sub-adviser believes that there is deterioration in the issuer’s financial circumstances or fundamental prospects, or that other investments are more attractive; or for other reasons.
Up to 20% of the Fund’s net assets may be invested in other domestic equity securities, including common and preferred stocks, convertible securities and bonds. In addition, the Fund may invest in equity securities of small capitalization companies. The Fund, from time to time, may have significant investments in one or more particular sectors.
The Fund may invest up to 25% of its net assets in foreign securities. The Fund may invest directly in foreign securities or indirectly through depository receipts. Depository receipts are receipts issued by a bank or trust company and evidence ownership of underlying securities issued by foreign companies. The Fund does not consider American Depository Receipts or Canadian securities to be foreign securities.
The Fund may also invest in convertible securities, including preferred stock, warrants and debentures. The Fund may invest in special situations such as companies involved in initial public offerings, tender offers, mergers and other corporate restructurings, and in companies involved in management changes or companies developing new technologies.
The Fund may engage in active and frequent trading of portfolio securities to achieve its investment objective.
Investment Risks. Upon the effectiveness of the Columbia Sub-advisory Agreement, the Investment Risks section of the Prospectus is amended to reflect the removal of “Derivatives Risk” as a principal risk and the addition of the following principal risks:
Convertible Securities Risk: Convertible security values may be affected by market interest rates, issuer defaults and underlying common stock values; security values may fall if market interest rates rise and rise if market interest rates fall. Additionally, an issuer may have the right to buy back the securities at a time unfavorable to the Fund.
Small Company Risk: Investing primarily in small capitalization companies carries the risk that due to current market conditions these companies may be out of favor with investors. Small companies often are in the early stages of development with limited product lines, markets, or financial resources and managements lacking depth and
VALIC Company II
SUPPLEMENTS TO PROSPECTUS (Unaudited) — (continued)
experience, which may cause their stock prices to be more volatile than those of larger companies. Small company stocks may be less liquid yet subject to abrupt or erratic price movements. It may take a substantial period of time before the Fund realizes a gain on an investment in a small-cap company, if it realizes any gain at all.
Fund Management. Upon the effectiveness of the Columbia Sub-advisory Agreement, in the section titled About VC II’s Management – Investment Sub-Advisers, all references to Invesco as the sub-adviser of the Mid Cap Growth Fund are deleted in their entirety, and the following disclosure is added regarding Columbia:
Columbia Management Investment Advisers, LLC (“Columbia”)
100 Federal Street, Boston, MA 02110
Columbia is a registered investment adviser and a wholly-owned subsidiary of Ameriprise Financial, Inc., which is a financial planning and financial services company that has been offering solutions for clients’ asset accumulation, income management and protection needs for more than 110 years. Columbia’s management experience covers all major asset classes, including equity securities, fixed-income securities and money market instruments. In addition to serving as an investment adviser to mutual funds, Columbia acts as an investment manager for itself, its affiliates, individuals, corporations, retirement plans, private investment companies and financial intermediaries.
The Mid Cap Growth Fund is managed by George J. Myers, Wayne M. Collette, Lawrence W. Lin and Brian D. Neigut. Mr. Myers, CFA, is a Portfolio Manager of Columbia. From 2004 until joining Columbia in May 2010 upon Ameriprise Financial, Inc.’s acquisition of the long-term asset management business of Columbia Management Advisors, LLC (“CMA”). Mr. Myers was associated with CMA or its predecessors as an investment professional. Mr. Myers began his investment career in 1998. Mr. Collette, CFA, is a Portfolio Manager of Columbia. From 2001 until joining Columbia in May 2010, Mr. Collette was associated with CMA or its predecessors as an investment professional. Mr. Collette began his investment career in 1996. Mr. Lin, CFA, is a Portfolio Manager of Columbia. From December 2006 until joining Columbia in May 2010, Mr. Lin was associated with CMA as an investment professional. Prior to 2006, Mr. Lin was a research analyst at Primarius Capital from May 2006 to December 2006, and at Engemann Asset Management from July 1998 to April 2006. Mr. Lin began his investment career in 1998. Mr. Neigut is a Portfolio Manager of Columbia. From February 2007 until joining Columbia in May 2010, Mr. Neigut was associated with CMA or its predecessor as an investment professional. Prior to 2007, Mr. Neigut was a portfolio manager at Kern Capital Management LLC from February 2006 to February 2007, and at OppenheimerFunds Inc. from November 2003 to February 2006. Mr. Neigut began his investment career in 1996.
Mid Cap Value Fund. The current sub-adviser of the Mid Cap Value Fund (the “Fund”), FAF Advisors, Inc. (“FAF”), along with its parent, U.S. Bank National Association, has entered into an agreement whereby Nuveen Investments, Inc. will acquire FAF’s long-term asset management business (the “Transaction”). FAF’s long-term asset management business will be combined with the asset management business of Nuveen Asset Management, Inc. (“Nuveen”), which is a subsidiary of Nuveen Investments, Inc.
Upon the closing of the Transaction, a change of control of FAF will constitute an “assignment”, as such term is defined by Section 2(a)(4) of the Investment Company Act of 1940, as amended (the “1940 Act”). As required by Section 15(a)(4) of the 1940 Act, the existing investment sub-advisory agreement between VALIC and FAF provides for automatic termination upon assignment, and pursuant to the terms of an exemptive order for the Securities and Exchange Commission, VALIC is permitted, under certain conditions and subject to board approval, to continue the employment of existing subadvisers and to enter into new subadvisory agreements with such subadvisers without obtaining shareholder approval.
Effective October 26, 2010, the Board of VC II approved a new investment sub-advisory agreement between VALIC and Nuveen (or a subsidiary of Nuveen) (the “Nuveen Sub-advisory Agreement”). The Nuveen Sub-advisory Agreement will become effective upon the closing of the Transaction, which is anticipated to close by December 31, 2010.
No modifications are expected as a result of the change in control of FAF in regard to the investment objective, principal investment strategies, portfolio managers, or the advisory or subadvisory fees.
Date: October 26, 2010
VALIC Company II
PROXY VOTE
PROXY VOTING RESULTS—SPECIAL MEETING OF THE SHAREHOLDERS
A special joint meeting of the shareholders of VALIC Company II (“VC II”) Aggressive Growth Lifestyle Fund, Conservative Growth Lifestyle Fund, Core Bond Fund, International Small Cap Equity Fund, Moderate Growth Lifestyle Fund, Strategic Bond Fund and Socially Responsible Fund was held on March 26, 2010. The Funds adopted the following proposals:
1. A new investment sub-advisory agreement between VALIC and PineBridge Investments LLC (“PineBridge”), which provides that PineBridge will manage the assets of the Aggressive Growth Lifestyle Fund, Conservative Growth Lifestyle Fund, Core Bond Fund, International Small Cap Equity Fund, Moderate Growth Lifestyle Fund and the Strategic Bond Fund of VC II.
| | | | |
Aggressive Growth Lifestyle Fund
| | | |
Votes in Favor | | | 11,923,455.318 | |
Votes Against | | | 622,179.639 | |
Votes Abstained | | | 314,419.101 | |
| |
Conservative Growth Lifestyle Fund
| | | |
Votes in Favor | | | 5,332,592.186 | |
Votes Against | | | 453,840.800 | |
Votes Abstained | | | 307,899.634 | |
| |
Core Bond Fund
| | | |
Votes in Favor | | | 15,650,998.757 | |
Votes Against | | | 544,783.426 | |
Votes Abstained | | | 689,849.868 | |
| |
International Small Cap Equity Fund
| | | |
Votes in Favor | | | 42,723,378.354 | |
Votes Against | | | 3,120,876.446 | |
Votes Abstained | | | 1,987,063.037 | |
| |
Moderate Growth Lifestyle Fund
| | | |
Votes in Favor | | | 11,193,107.086 | |
Votes Against | | | 1,052,292.468 | |
Votes Abstained | | | 1,659,770.961 | |
| |
Strategic Bond Fund
| | | |
Votes in Favor | | | 30,057,398.609 | |
Votes Against | | | 3,138,777.061 | |
Votes Abstained | | | 2,366,862.235 | |
2. A new investment sub-advisory agreement between VALIC and SunAmerica Asset Management Corp. (“SAAMCo”), which provides that SAAMCo will manage the assets of the Socially Responsible Fund of VC II.
| | | | |
Socially Responsible Fund
| | | |
Votes in Favor | | | 69,050,697.096 | |
Votes Against | | | 2,557,790.574 | |
Votes Abstained | | | 2,066,411.999 | |
171
VALIC Company II
BOARD OF TRUSTEES
Thomas J. Brown
Judith L. Craven
William F. Devin
Timothy J. Ebner
Gustavo E. Gonzales, Jr.
Peter A. Harbeck
John W. Lancaster
Kenneth J. Lavery
John E. Maupin, Jr.
CUSTODIAN
State Street Bank and Trust Company
225 Franklin Street
Boston, Massachusetts 02110
INVESTMENT ADVISER
The Variable Annuity
Life Insurance Company (VALIC)
2929 Allen Parkway
Houston, Texas 77019
INVESTMENT SUBADVISERS
Bridgeway Capital Management, Inc.
5615 Kirby Dr., Suite 518
Houston, Texas 77005
FAF Advisors, Inc.
800 Nicollet Mall
Minneapolis, Minnesota 55402
Invesco Advisers, Inc.
1555 Peachtree Street, N.F.
Atlanta, Georgia 30309
J.P. Morgan Investment Management Inc.
245 Park Avenue
New York, New York 10167
Janus Capital Management, LLC
151 Detroit Street
Denver, Colorado 80206
Metropolitan West Capital Management, LLC
610 Newport Center Drive, Suite 100
Newport Beach, CA 92660
PineBridge Investments LLC
70 Pine Street
New York, NY 10270
SunAmerica Asset Management Corp.
Haborside Financial Center
3200 Plaza 5
Jersey City, New Jersey 07311
The Boston Company Asset Management, LLC
BNY Melton Center
201 Washington St.
Boston, MA 02108
Wellington Management Co. LLP
75 State Street
Boston, Massachusetts 02109
INDEPENDENT REGISTERED PUBLIC ACCOUNTING FIRM
PricewaterhouseCoopers LLP
1201 Louisiana Street, Suite 2900
Houston, Texas 77002
TRANSFER AND SHAREHOLDER SERVICE AGENT
The Variable Annuity
Life Insurance Company (VALIC)
2929 Allen Parkway
Houston, Texas 77019
OFFICERS
Kurt Bernlohr,
President and Principal Executive Officer
John Packs,
Vice President and Senior Investment Officer
Gregory R. Kingston,
Treasurer and Principal Financial Officer
Nori L. Gabert,
Vice President, Chief Legal Officer and Secretary
Gregory N. Bressler,
Vice President
Cynthia A. Gibbons-Skrehot,
Vice President and Chief Compliance Officer
Donna Handel,
Vice President and Assistant Treasurer
Diedre L. Shepherd,
Assistant Treasurer
Mark Matthes,
Assistant Secretary
Matthew J. Hackethal,
Anti-Money Laundering Compliance Officer
Thomas M. Ward,
Vice President
DISCLOSURE OF QUARTERLY FUND PORTFOLIO HOLDINGS
VC II is required to file its complete schedule of portfolio holdings with the U.S. Securities and Exchange Commission for its first and third fiscal quarters on Form N-Q. VC II’s Forms N-Q are available on the U.S. Securities and Exchange Commission’s website at www.sec.gov. You can also review and obtain copies of Forms N-Q at the U.S. Securities and Exchange Commission’s Public Reference Room in Washington, DC (information on the operation of the Public Reference Room may be obtained by calling 1-800-SEC-0330).
VOTING PROXIES ON VALIC COMPANY II PORTFOLIO SECURITIES
A description of the policies and procedures that VC II uses to determine how to vote proxies related to securities held in the Fund’s portfolios, which is available in VC II’s Statement of Additional Information, may be obtained without charge upon request, by calling 800-448-2542. This information is also available from the EDGAR database on the U.S. Securities and Exchange Commission’s website at http://www.sec.gov.
PROXY VOTING RECORD ON VALIC COMPANY II PORTFOLIO SECURITIES
Information regarding how VC II voted proxies relating to securities held in the VC II Funds portfolios during the most recent twelve month period ended June 30, is available, once filed with the U.S. Securities and Exchange Commission without charge, upon request, by calling 800-448-2542 or on the U.S. Securities and Exchange Commission’s website at http://www.sec.gov.
This report is for the information of the shareholders and variable contract owners investing in VC II. It is authorized for distribution to other persons only when preceded or accompanied by an effective prospectus which contains information on how to purchase shares and other pertinent information.
If you would like further information about this material or products issued by VALIC or American General Life Insurance Company, please contact your financial professional.
172
VALIC ONLINE
Account Access
| | |
You must establish a
Unique User Identification
(ID) and Password; create your security profile by using
the online account services. By using a numeric Personal Identification Number (PIN)
you can also access
VALIC’s toll-free
automated phone line
at 800.448.2542 to obtain
24-hour access to your account. | | Manage your account on the Web through VALIC Online! Enjoy quick, easy and secure access — now or anytime. Go to www.valic.com and click on Access Your Account in the “Links to Login” section. You’ll find these powerful features: •View your account portfolio including values, graphs and charts •View, download or print account, transaction confirmation and tax statements •View current and historical fund performance and unit values •View personal performance for your account •View transaction history •Download transaction history to Quicken using Direct ConnectSM •View your financial advisor’s contact information •Reset your Password and update the information on your security profile •Change your contact information such as telephone, address or e-mail •Update your Investor Profile •Initiate account transactions including: > Allocation changes > Transfer money among investment options > Rebalance account to your desired allocation mix > Change contributions •Review account information on your cell phone or mobile device •Request forms for a variety of services •Display information from other accounts in addition to VALIC accounts using the Account Aggregation Feature •Enroll in the electronic document delivery service (Personal Deliver-e®) Start exploring VALIC Online today! To set up access to VALIC Online: •Go to www.valic.com •Click on Access Your Account in the “Links to Login” section •Click “Register Now” to begin the registration process •Enter the information to set up your security profile •Click “I Agree” to accept VALIC’s access agreement (required) •Verify and/or update your address, e-mail and telephone number •Click “Continue” to update your record and proceed to the Summary screen You can also access your account using VALIC’s toll-free automated account information line by calling 800-448-2542. |
| | |
VALIC Company II P.O. Box 3206 Houston, TX 77253-3206 | | PRSRT STD U.S. POSTAGE PAID SAN DIEGO, CA PERMIT NO. 1482 |
VC 11288 (08/2010) J74500
VALIC Company II (“the registrant”) has adopted a Code of Ethics applicable to its Principal Executive and Principal Accounting Officers pursuant to Section 406 of the Sarbanes-Oxley Act of 2002. During the fiscal year 2010, there were no reportable amendments, waivers, or implicit waivers to a provision of the code of ethics that applies to the registrant’s Principle Executive and Principal Accounting Officers.
| Item 3. | Audit Committee Financial Expert. |
The registrant’s Board of Trustees has determined that Thomas J. Brown qualifies as an audit committee financial expert, as defined in instructions to Item 3(a) of Form N-CSR. Mr. Brown is considered to be “independent” for purposes of Item 3(a)(2) of Form N-CSR.
| Item 4. | Principal Accountant Fees and Services. |
(a) - (d) Aggregate fees billed to the registrant for the last two fiscal years for professional services rendered by the registrant’s principal accountant were as follows:
| | | | | | | | |
| | | 2010 | | | 2009 | |
(a) Audit Fees | | $ | 299,470 | | | $ | 289,500 | |
(b) Audit-Related Fees | | $ | 0 | | | $ | 0 | |
(c) Tax Fees | | $ | 0 | | | $ | 2,281 | |
(d) All Other Fees | | $ | 0 | | | $ | 0 | |
Audit Fees include amounts related to the audit of the registrant’s annual financial statements and services normally provided by the principal accountant in connection with statutory and regulatory filings. Tax Fees principally include tax advice and tax planning.
Aggregate fees billed to the investment adviser and Adviser Affiliates (as defined below in Item 4(e)) that are required to be pre-approved pursuant to paragraph (c)(7)(ii) of Rule 2-01 of Regulation S-X for the last two fiscal years for services rendered by the registrant’s principal accountant were as follows:
| | | | | | | | |
| | | 2010 | | | 2009 | |
(b) Audit-Related Fees | | $ | 0 | | | $ | 0 | |
(c) Tax Fees | | $ | 0 | | | $ | 0 | |
(d) All Other Fees | | $ | 126,566 | | | $ | 0 | |
In addition, Ernst & Young, LLP is performing tax services for the Series. For the fiscal years ended 2010 and 2009, the fees for these tax services were $126,216 and $133,456, respectively.
| | (e) (1) | The registrant’s audit committee pre-approves all audit services provided by the registrant’s principal accountant for the registrant and all non-audit services provided by the registrant’s principal accountant for the |
| | registrant, its investment adviser and any entity controlling, controlled by, or under common control with the investment adviser (“Adviser Affiliates”) that provides ongoing services to the registrant, if the engagement by the investment adviser or Adviser Affiliate relates directly to the operations and financial reporting of the registrant. The audit committee has not presently established any pre-approval policies and procedures that permit the pre-approval of the above services other than by the full audit committee. Certain de minimis exceptions are allowed for non-audit services in accordance with Rule 2-01(c)(7)(i)(C) of Regulation S-X as set forth in the registrant's audit committee charter. |
| | (2) | No services included in (b) - (d) above in connection with fees billed to the registrant or the investment adviser or Adviser Affiliates were approved pursuant to paragraph (c)(7)(i)(C) of Rule 2-01 of Regulation S-X. |
| | (g) | The aggregate fees billed for the most recent fiscal year and the preceding fiscal year by the registrant’s principal accountant for non-audit services rendered to the registrant, its investment adviser, and Adviser Affiliates that provides ongoing services to the registrant for 2010 and 2009 were $584,441 and $814,461, respectively. |
| | (h) | Non-audit services rendered to the registrant’s investment adviser and any Adviser Affiliates that provides ongoing services to the registrant that were not pre-approved pursuant to paragraph (c)(7)(ii) of Rule 2-01 of Regulation S-X were considered by the registrant’s audit committee as to whether they were compatible with maintaining the principal accountant’s independence. |
| Item 5. | Audit Committee of Listed Registrants. |
Not applicable.
Included in Item 1 to the Form.
| Item 7. | Disclosure of Proxy Voting Policies and Procedures for Closed-End Management Investment Companies. |
Not applicable.
| Item 8. | Portfolio Managers of Closed-End Management Investment Companies. |
Not applicable.
| Item 9. | Purchases of Equity Securities by Closed-End Management Investment Company and Affiliated Purchasers. |
Not applicable.
| Item 10. | Submission of Matters to a Vote of Security Holders. |
There were no material changes to the procedures by which shareholders may recommend nominees to the registrant’s Board of Trustees that were implemented after the registrant last provided disclosure in response to the requirements of Item 407(c)(2)(iv) of Regulation S-K (17 CFR 229.407) (as required by 22(b)(15)) of Schedule 14A (17 CFR 240.14a-101), or this Item 10.
| Item 11. | Controls and Procedures. |
| | (a) | An evaluation was performed within 90 days of the filing of this report, under the supervision and with the participation of the registrant’s management, including the President and Treasurer, of the effectiveness of the design and operation of the registrant’s disclosure controls and procedures (as defined under Rule 30a-3(c) under the Investment Company Act of 1940 (17 CFR 270.30a-3(c))). Based on that evaluation, the registrant’s management, including the President and Treasurer, concluded that the registrant’s disclosure controls and procedures are effective. |
| | (b) | There was no change in the registrant’s internal control over financial reporting (as defined in Rule 30a-3(d) under the Investment Company Act of 1940 (17 CFR 270.3a-3(d))) that occurred during the registrant’s last fiscal quarter of the period covered by this report that has materially affected, or is reasonably likely to materially affect, the registrant’s internal control over financial reporting. |
| | (a) | (1) Code of Ethics applicable to its Principal Executive and Principal Accounting Officers pursuant to Section 406 of the Sarbanes-Oxley Act of 2002 attached hereto as Exhibit 99.406.Code of Ethics. |
| | | (2) Certifications pursuant to Rule 30a-2(a) under the Investment Company Act of 1940 (17 CFR 270.30a-2(a)) attached hereto as Exhibit 99.CERT. |
| | (b) | Certification pursuant to Rule 30a-2 (b) under the Investment Company Act of 1940 (17 CFR 270.30a-2 (a)) and Section 906 of the Sarbanes-Oxley Act of 2002 attached hereto as Exhibit 99.906.CERT. |
SIGNATURES
Pursuant to the requirements of the Securities Exchange Act of 1934 and the Investment Company Act of 1940, the registrant has duly caused this report to be signed on its behalf by the undersigned, thereunto duly authorized.
| | |
| VALIC Company II |
| |
| By: | | /s/ Kurt W. Bernlohr |
| | Kurt W. Bernlohr |
| | President |
Date: November 8, 2010
Pursuant to the requirements of the Securities Exchange Act of 1934 and the Investment Company Act of 1940, this report has been signed below by the following persons on behalf of the registrant and in the capacities and on the dates indicated.
| | |
| By: | | /s/ Kurt W. Bernlohr |
| | Kurt W. Bernlohr |
| | President |
Date: November 8, 2010
| | |
| By: | | /s/ Gregory R. Kingston |
| | Gregory R. Kingston |
| | Treasurer |
Date: November 8, 2010