UNITED STATES
SECURITIES AND EXCHANGE COMMISSION
Washington, D.C. 20549
FORM N-CSR
CERTIFIED SHAREHOLDER REPORT OF REGISTERED MANAGEMENT INVESTMENT
COMPANIES
Investment Company Act file number: 811-08797 and 811-09049
Name of Fund: BlackRock Small Cap Growth Fund II of BlackRock Series, Inc. and BlackRock Master Small Cap Growth Portfolio of BlackRock Master LLC
Fund Address: 100 Bellevue Parkway, Wilmington, DE 19809
Name and address of agent for service: John M. Perlowski, Chief Executive Officer, BlackRock Small Cap Growth
Fund II of BlackRock Series, Inc. and BlackRock Master Small Cap Growth Portfolio of BlackRock Master LLC, 55 East 52nd Street, New York, NY 10055
Registrants’ telephone number, including area code: (800) 441-7762
Date of fiscal year end: 05/31/2015
Date of reporting period: 05/31/2015
Item 1 – Report to Stockholders
MAY 31, 2015
ANNUAL REPORT
| BLACKROCK® |
| BlackRock Disciplined Small Cap Core Fund | of BlackRock FundsSM |
| BlackRock Small Cap Growth Fund II | of BlackRock Series, Inc. |
| Not FDIC Insured ¡ May Lose Value ¡ No Bank Guarantee |
|
| Page | ||||
| 3 | ||||
Annual Report: | ||||
| 4 | ||||
| 8 | ||||
| 8 | ||||
| 8 | ||||
Fund Financial Statements: | ||||
Schedule of Investments: BlackRock Disciplined Small Cap Core Fund | 9 | |||
| 14 | ||||
| 16 | ||||
| 17 | ||||
| 18 | ||||
| 24 | ||||
Fund Report of Independent Registered Public Accounting Firm | 35 | |||
| 35 | ||||
Master Portfolio Information: BlackRock Master Small Cap Growth Portfolio | 36 | |||
Master Portfolio Financial Statements: | ||||
| 37 | ||||
| 44 | ||||
| 45 | ||||
| 46 | ||||
| 46 | ||||
| 47 | ||||
Master Portfolio Report of Independent Registered Public Accounting Firm | 53 | |||
| 54 | ||||
| 59 | ||||
| 63 |
|
Shareholders can sign up for e-mail notifications of quarterly statements, annual and semi-annual shareholder reports and prospectuses by enrolling in the electronic delivery program. Electronic copies of shareholder reports and prospectuses are also available on BlackRock’s website.
TO ENROLL IN ELECTRONIC DELIVERY:
Shareholders Who Hold Accounts with Investment Advisors, Banks or Brokerages: Please contact your financial advisor. Please note that not all investment advisors, banks or brokerages may offer this service.
Shareholders Who Hold Accounts Directly with BlackRock: 1. Access the BlackRock website at blackrock.com 2. Select “Access Your Account” 3. Next, select “eDelivery” in the “Related Resources” box and follow the sign-up instructions |

| 2 | ANNUAL REPORT | MAY 31, 2015 |
| The Markets in Review |
Dear Shareholder,
During the 12-month period ended May 31, 2015, market volatility increased from the remarkably low levels seen in recent years, while remaining below the historical average. As the U.S. Federal Reserve (the “Fed”) gradually reduced its bond-buying program in 2014 (which ultimately ended in October), U.S. interest rates surprisingly trended lower and stock prices forged ahead despite high valuations on the back of a multi-year bull market. Around mid-year, geopolitical tensions intensified in Ukraine and the Middle East and oil prices became highly volatile, stoking worries about economic growth outside the United States. As the U.S. economy continued to post stronger data, investors grew concerned that the Fed would raise short-term rates sooner than previously anticipated. The U.S. dollar appreciated and global credit markets tightened, ultimately putting a strain on investor flows, and financial markets broadly weakened in the third quarter.
U.S. growth picked up considerably in the fourth quarter while the broader global economy showed signs of slowing. U.S. markets significantly outperformed international markets during this period even as the European Central Bank (“ECB”) and the Bank of Japan eased monetary policy, which drove further strengthening in the U.S. dollar. Oil prices plummeted due to a global supply-and-demand imbalance, sparking a selloff in energy-related assets and stress in emerging markets. Fixed income investors piled into U.S. Treasuries as their persistently low yields became attractive as compared to even lower yields on international sovereign debt.
Equity markets reversed in early 2015, with U.S. stocks underperforming international markets. Investors had held high expectations for the U.S. economy, but a harsh winter brought disappointing first-quarter data and high valuations took their toll on U.S. stocks. Bond yields fell to extreme lows. Although U.S. economic momentum had broadly weakened, the labor market showed signs of improving, which kept investors wondering when to expect the first interest rate hike. In contrast, economic reports in Europe and Asia easily beat investors’ very low expectations, and accommodative policies from central banks in those regions helped international equities rebound. The ECB’s asset purchase program was the largest in scale and effect on the markets. However, bouts of higher volatility ensued as Greece’s continued membership in the eurozone again came into question. Oil prices stabilized, allowing emerging market stocks to rebound, although a stronger U.S. dollar continued to be a headwind.
Toward the end of the 12-month period, U.S stock valuations became relatively appealing given the recent strong rally in European shares. Mixed economic data on both sides of the Atlantic drove high volatility in global bond yields. U.S. interest rates returned from the unsustainably low levels reached earlier in 2015, but remained below the historical norm.
At BlackRock, we believe investors need to think globally, extend their scope across a broad array of asset classes and be prepared to move freely as market conditions change over time. We encourage you to talk with your financial advisor and visit blackrock.com for further insight about investing in today’s markets.
Sincerely,

Rob Kapito
President, BlackRock Advisors, LLC

Rob Kapito
President, BlackRock Advisors, LLC
| Total Returns as of May 31, 2015 | ||||
| 6-month | 12-month | |||
U.S. large cap equities | 2.97% | 11.81% | ||
U.S. small cap equities | 6.94 | 11.32 | ||
International equities | 4.84 | (0.48) | ||
Emerging market | 0.82 | (0.01) | ||
3-month Treasury bill | 0.01 | 0.02 | ||
U.S. Treasury securities | 1.81 | 5.48 | ||
U.S. investment-grade | 1.09 | 3.03 | ||
Tax-exempt municipal | 0.88 | 3.25 | ||
U.S. high yield bonds | 2.57 | 1.96 | ||
| Past performance is no guarantee of future results. Index performance is shown for illustrative purposes only. You cannot invest directly in an index. | ||||
| THIS PAGE NOT PART OF YOUR FUND REPORT | 3 |
| Fund Summary as of May 31, 2015 | BlackRock Disciplined Small Cap Core Fund |
| Investment Objective |
BlackRock Disciplined Small Cap Core Fund’s (the “Fund”) investment objective is to seek capital appreciation over the long term.
| Portfolio Management Commentary |
How did the Fund perform?
| • | For the 12-month period ended May 31, 2015, the Fund underperformed its benchmark, the Russell 2000® Index. |
What factors influenced performance?
| • | The Fund’s underperformance was attributable mostly to stock selection within the industrials and energy sectors. Within industrials, a position in MRC Global, Inc., a global distributor of pipes, valves and fittings predominantly for the oil and natural gas industry, detracted most from performance. MRC Global, Inc.’s shares fell considerably along with crude oil and natural gas prices, given weakening investor expectations for global economic growth, cuts in oil demand forecasts and increasing oil supply from U.S. shale reserves. As a result, the company cut its capital spending and lowered its revenue estimates in anticipation of a challenging 2015. Within energy, a position in exploration & production company BPZ Resources, Inc. fell sharply as falling crude prices and company revenues forced the company to search for strategic alternatives to satisfy interest payments. BPZ Resources, Inc. and several other independent oil & gas exploration companies failed to secure additional financing and filed for bankruptcy protection during the period. |
| • | Stock selection within the consumer discretionary and information technology (“IT”) sectors contributed the most to performance. Within consumer |
| discretionary, a position in footwear retailer Skechers U.S.A., Inc. rose substantially on very strong quarterly earnings, revenues and forward guidance. The company has observed record revenue from accelerated growth in both international and domestic demand for lifestyle, performance and children’s footwear. Within IT, a position in supply chain technology provider Manhattan Associates, Inc. appreciated significantly on consistently better-than-expected earnings, revenues and forward growth outlooks. The company has achieved several record quarterly results along with a third consecutive year of record revenue and earnings, and expects to extend its market leadership position. |
Describe recent portfolio activity.
| • | During the 12-month period, the Fund increased its overall weightings in the consumer discretionary and health care sectors and decreased its overall weightings in the industrials and energy sectors. |
Describe portfolio positioning at period end.
| • | Relative to the Russell 2000® Index, the Fund ended the period with its largest sector overweight in consumer discretionary and its most significant underweight in industrials. |
The views expressed reflect the opinions of BlackRock as of the date of this report and are subject to change based on changes in market, economic or other conditions. These views are not intended to be a forecast of future events and are no guarantee of future results.
| Portfolio Information |
| Ten Largest Holdings | Percent of Long-Term Investments | ||||
Skechers U.S.A., Inc., Class A | 2% | ||||
LogMeIn, Inc. | 2 | ||||
Continental Building Products, Inc. | 2 | ||||
RPX Corp. | 2 | ||||
Umpqua Holdings Corp. | 2 | ||||
The GEO Group, Inc. | 2 | ||||
Health Net, Inc. | 2 | ||||
DuPont Fabros Technology, Inc. | 2 | ||||
Burlington Stores, Inc. | 2 | ||||
RLJ Lodging Trust | 2 | ||||
| Sector Allocation | Percent of Long-Term Investments | |
Financials | 24% | |
Health Care | 18 | |
Information Technology | 17 | |
Consumer Discretionary | 16 | |
Industrials | 11 | |
Materials | 4 | |
Energy | 4 | |
Consumer Staples | 2 | |
Utilities | 2 | |
Telecommunication Services | 2 |
For Fund compliance purposes, the Fund’s sector classifications refer to any one or more of the sector sub-classifications used by one or more widely recognized market indexes or ratings group indexes, and/or as defined by the investment advisor. These definitions may not apply for purposes of this report, which may combine such sector sub-classifications for reporting ease.
| 4 | ANNUAL REPORT | MAY 31, 2015 |
| BlackRock Disciplined Small Cap Core Fund |
| Total Return Based on a $10,000 Investment |
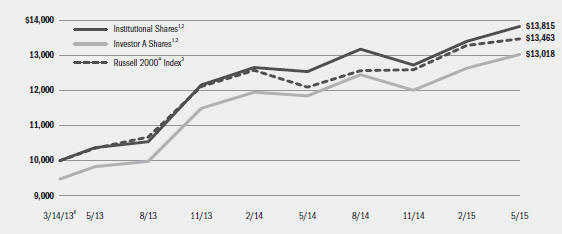
| 1 | Assuming maximum sales charges, if any, transaction costs and other operating expenses, including investment advisory fees. Institutional Shares do not have a sales charge. |
| 2 | Under normal circumstances, the Fund seeks to invest at least 80% of its net assets plus any borrowings for investment purposes in equity securities or other financial instruments that are components of, or have market capitalizations similar to, the securities included in the Russell 2000® Index. |
| 3 | An unmanaged index that is a subset of the Russell 3000® Index representing approximately 10% of the total market capitalization of that index. It includes approximately 2000 of the smallest securities based on a combination of their market cap and current index membership. |
| 4 | Commencement of operations. |
| Performance Summary for the Period Ended May 31, 2015 | ||||||||||
| Average Annual Total Returns5 | ||||||||||
| 1 Year | Since Inception6 | |||||||||
6-Month Total Returns | w/o sales charge | w/sales charge | w/o sales charge | w/sales charge | ||||||
Institutional | 8.62% | 10.24% | N/A | 15.72% | N/A | |||||
Investor A | 8.50 | 9.96 | 4.19% | 15.43 | 12.65% | |||||
Investor C | 8.04 | 9.22 | 8.23 | 14.56 | 14.56 | |||||
Russell 2000® Index | 6.94 | 11.32 | N/A | 14.39 | N/A | |||||
| 5 | Assuming maximum sales charges, if any. Average annual total returns with and without sales charges reflect reductions for distribution and service fees. See “About Fund Performance” on page 8 for a detailed description of share classes, including any related sales charges and fees. |
| 6 | The Fund commenced operations on March 14, 2013. |
| N/A — Not applicable as share class and index do not have a sales charge. |
| Past performance is not indicative of future results. |
| Expense Example | ||||||||||||||
Actual | Hypothetical8 | |||||||||||||
Beginning Account Value December 1, 2014 | Ending Account Value May 31, 2015 | Expenses Paid During the Period7 | Beginning Account Value December 1, 2014 | Ending Account Value May 31, 2015 | Expenses Paid During the Period7 | Annualized Expense Ratio | ||||||||
Institutional | $1,000.00 | $1,086.20 | $3.64 | $1,000.00 | $1,021.44 | $3.53 | 0.70% | |||||||
Investor A | $1,000.00 | $1,085.00 | $4.94 | $1,000.00 | $1,020.19 | $4.78 | 0.95% | |||||||
Investor C | $1,000.00 | $1,080.40 | $8.82 | $1,000.00 | $1,016.45 | $8.55 | 1.70% | |||||||
| 7 | For each class of the Fund, expenses are equal to the annualized expense ratio for the class, multiplied by the average account value over the period, multiplied by 182/365 (to reflect the one-half year period shown). |
| 8 | Hypothetical 5% annual return before expenses is calculated by prorating the number of days in the most recent fiscal half year divided by 365. |
| See “Disclosure of Expenses” on page 8 for further information on how expenses were calculated. |
| ANNUAL REPORT | MAY 31, 2015 | 5 |
| Fund Summary as of May 31, 2015 | BlackRock Small Cap Growth Fund II |
| Investment Objective |
BlackRock Small Cap Growth Fund II’s (the “Fund”) investment objective is to seek long-term capital growth. In other words, the Fund tries to choose investments that will increase in value. Current income from dividends and interest will not be an important consideration in selecting portfolio securities.
| Portfolio Management Commentary |
How did the Fund perform?
| • | For the 12-month period ended May 31, 2015, through its investment in BlackRock Master Small Cap Growth Portfolio (the “Master Portfolio”), the Fund underperformed its benchmark, the Russell 2000® Growth Index. |
What factors influenced performance?
| • | The underperformance of the Master Portfolio was attributable mostly to stock selection within the industrials and energy sectors. Within industrials, a position in MRC Global Inc., a global distributor of pipes, valves and fittings predominantly for the oil and natural gas industry, detracted most from performance. MRC Global, Inc.’s shares fell considerably along with crude oil and natural gas prices, given weakening investor expectations for global economic growth, cuts in oil demand forecasts and increasing oil supply from U.S. shale reserves. As a result, the company cut its capital spending and lowered its revenue estimates in anticipation of a challenging 2015. Within energy, a position in domestic oil and natural gas producer Bonanza Creek Energy, Inc. fell considerably on multiple disappointing quarterly earnings and revenue results. The company has had to sell its oil and gas production at significantly lower prices, leading to a sharp decline in its year-over-year revenues. |
| • | Conversely, stock selection within the consumer discretionary and information technology (“IT”) sectors contributed to performance. Within |
consumer discretionary, a position in footwear retailer Skechers U.S.A., Inc. rose substantially on very strong quarterly earnings, revenues and forward guidance. The company has observed record revenue from accelerated growth in both international and domestic demand for lifestyle, performance and children’s footwear. Within IT, a position in Ambarella, Inc., a producer of high-definition chips for video cameras, appreciated considerably. The company has released several quarterly earnings and revenues results that were above expectations, based on very strong chip demand from producers of high-definition wearable cameras, wireless security cameras and dashboard and rear-view cameras for automobiles. Ambarella, Inc. is the exclusive chip supplier to wearable sports camera leader GoPro, which accounts for about one-third of the company’s revenues. |
Describe recent portfolio activity.
| • | During the 12-month period, the Master Portfolio increased its overall weightings in the health care and financials sectors and decreased its overall weightings in the industrials and energy sectors. |
Describe portfolio positioning at period end.
| • | Relative to the Russell 2000® Growth Index, the Master Portfolio ended the period with its largest sector overweight in consumer discretionary and its most significant underweight in IT. |
The views expressed reflect the opinions of BlackRock as of the date of this report and are subject to change based on changes in market, economic or other conditions. These views are not intended to be a forecast of future events and are no guarantee of future results.
| 6 | ANNUAL REPORT | MAY 31, 2015 |
| BlackRock Small Cap Growth Fund II |
| Total Return Based on a $10,000 Investment |
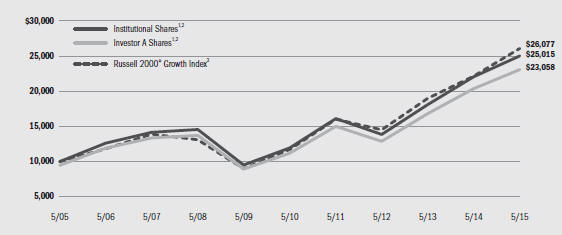
| 1 | Assuming maximum sales charges, if any, transaction costs and other operating expenses, including administration fees, if any. Institutional Shares do not have a sales charge. |
| 2 | The Fund invests all of its assets in the Master Portfolio. The Master Portfolio will, under normal circumstances, invest at least 80% of its net assets (plus any borrowings for investment purposes) in equity securities of small cap companies and at least 80% of its net assets (plus any borrowings for investment purposes) in securities or instruments of issuers located in the United States. |
| 3 | An unmanaged index that measures performance of the small-cap growth segment of the U.S. equity universe. It includes those Russell 2000 Index companies with higher price-to-value ratios and higher forecasted growth values. |
| Performance Summary for the Period Ended May 31, 2015 | ||||||||||||||
| Average Annual Total Returns4 | ||||||||||||||
| 1 Year | 5 Years | 10 Years | ||||||||||||
6-Month Total Returns | w/o sales charge | w/sales charge | w/o sales charge | w/sales charge | w/o sales charge | w/sales charge | ||||||||
Institutional | 10.65% | 13.44% | N/A | 15.93% | N/A | 9.60% | N/A | |||||||
Investor A | 10.53 | 13.24 | 7.30% | 15.57 | 14.33% | 9.30 | 8.71% | |||||||
Investor B | 10.19 | 12.06 | 7.74 | 14.38 | 14.15 | 8.36 | 8.36 | |||||||
Investor C | 10.06 | 12.24 | 11.28 | 14.55 | 14.55 | 8.31 | 8.31 | |||||||
Class R | 10.43 | 12.84 | N/A | 15.25 | N/A | 8.94 | N/A | |||||||
Russell 2000® Growth Index | 10.48 | 17.73 | N/A | 17.37 | N/A | 10.06 | N/A | |||||||
| 4 | Assuming maximum sales charges, if any. Average annual total returns with and without sales charges reflect reductions for distribution and service fees. See “About Fund Performance” on page 8 for a detailed description of share classes, including any related sales charges and fees. |
| N/A — Not applicable as share class and index do not have a sales charge. |
| Past performance is not indicative of future results. |
| Expense Example | ||||||||||||||
Actual | Hypothetical6 | |||||||||||||
Beginning Account Value December 1, 2014 | Ending Account Value May 31, 2015 | Expenses Paid During the Period5 | Beginning Account Value December 1, 2014 | Ending Account Value May 31, 2015 | Expenses Paid During the Period5 | Annualized Expense Ratio | ||||||||
Institutional | $1,000.00 | $1,106.50 | $ 6.04 | $1,000.00 | $1,019.20 | $ 5.79 | 1.15% | |||||||
Investor A | $1,000.00 | $1,105.30 | $ 7.03 | $1,000.00 | $1,018.25 | $ 6.74 | 1.34% | |||||||
Investor B | $1,000.00 | $1,101.90 | $11.74 | $1,000.00 | $1,013.76 | $11.25 | 2.24% | |||||||
Investor C | $1,000.00 | $1,100.60 | $11.94 | $1,000.00 | $1,013.56 | $11.45 | 2.28% | |||||||
Class R | $1,000.00 | $1,104.30 | $ 9.02 | $1,000.00 | $1,016.36 | $ 8.65 | 1.72% | |||||||
| 5 | For each class of the Fund, expenses are equal to the annualized expense ratio for the class, multiplied by the average account value over the period, multiplied by 182/365 (to reflect the one-half year period shown). Because the Fund invests all of its assets in the Master Portfolio, the expense table reflects the net expenses of both the Fund and the Master Portfolio in which it invests. |
| 6 | Hypothetical 5% annual return before expenses is calculated by prorating the number of days in the most recent fiscal half year divided by 365. |
| See “Disclosure of Expenses” on page 8 for further information on how expenses were calculated. |
| ANNUAL REPORT | MAY 31, 2015 | 7 |
| About Fund Performance |
| • | Institutional Shares are not subject to any sales charge. These shares bear no ongoing distribution or service fees and are available only to certain eligible investors. |
| • | Investor A Shares are subject to a maximum initial sales charge (front-end load) of 5.25% and a service fee of 0.25% per year (but no distribution fee). Certain redemptions of these shares may be subject to a contingent deferred sales charge (“CDSC”) where no initial sales charge was paid at the time of purchase. These shares are generally available through financial intermediaries. |
| • | Investor B Shares (available only in BlackRock Small Cap Growth Fund II) are subject to a maximum CDSC of 4.50%, declining to 0% after six years. In addition, these shares are subject to a distribution fee of 0.75% per year and a service fee of 0.25% per year. These shares automatically convert to Investor A Shares after approximately eight years. (There is no initial sales charge for automatic share conversions.) All returns for periods greater than eight years reflect this conversion. These shares are only available through exchanges and distribution reinvestments by current holders and for purchase by certain employer-sponsored retirement plans. On February 11, 2015, the Board of Trustees of the Trust (the “Board”) approved the conversion of all of the issued and outstanding Investor B Shares of BlackRock Small Cap Growth Fund II into Investor A Shares of BlackRock Small Cap Growth Fund II, which will be effective on or about the close of business on June 23, 2015. |
| • | Investor C Shares are subject to a 1.00% CDSC if redeemed within one year of purchase. In addition, these shares are subject to a distribution fee of 0.75% per year and a service fee of 0.25% per year. These shares are generally available through financial intermediaries. |
| • | Class R Shares (available only in BlackRock Small Cap Growth Fund II) are not subject to any sales charge. These shares are subject to a distribution fee of 0.25% per year and a service fee of 0.25% per year. These shares are available only to certain employer-sponsored retirement plans. |
Performance information reflects past performance and does not guarantee future results. Current performance may be lower or higher than the performance data quoted. Refer to www.blackrock.com/funds to obtain performance data current to the most recent month end. Performance results do not reflect the deduction of taxes that a shareholder would pay on fund distributions or the redemption of fund shares. Figures shown in the performance tables on the previous pages assume reinvestment of all distributions, if any, at net asset value (“NAV”) on the ex-dividend date. Investment return and principal value of shares will fluctuate so that shares, when redeemed, may be worth more or less than their original cost. Distributions paid to each class of shares will vary because of the different levels of service, distribution and transfer agency fees applicable to each class, which are deducted from the income available to be paid to shareholders.
BlackRock Advisors, LLC (the “Manager”), BlackRock Disciplined Small Cap Core Fund’s investment advisor, has contractually agreed to waive and/or reimburse a portion of the Fund’s expenses. Without such waiver and/or reimbursement, the Fund’s performance would have been lower. The Manager is under no obligation to continue waiving and/or reimbursing its fees after the applicable termination date of such agreement. See Note 5 of the Notes to Financial Statements for additional information on waivers and/or reimbursements.
| Disclosure of Expenses |
Shareholders of the Funds may incur the following charges: (a) transactional expenses, such as sales charges; and (b) operating expenses, including investment advisory fees, administration fees, service and distribution fees, including 12b-1 fees, acquired fund fees and expenses, and other Fund expenses. The expense examples on the previous pages (which are based on a hypothetical investment of $1,000 invested on December 1, 2014 and held through May 31, 2015) are intended to assist shareholders both in calculating expenses based on an investment in each Fund and in comparing these expenses with similar costs of investing in other mutual funds.
The expense examples provide information about actual account values and actual expenses. In order to estimate the expenses a shareholder paid during the period covered by this report, shareholders can divide their account value by $1,000 and then multiply the result by the number corresponding to their Fund and share class under the headings entitled “Expenses Paid During the Period.”
The expense examples also provide information about hypothetical account values and hypothetical expenses based on a Fund’s actual expense ratio and an assumed rate of return of 5% per year before expenses. In order to assist shareholders in comparing the ongoing expenses of investing in these Funds and other funds, compare the 5% hypothetical examples with the 5% hypothetical examples that appear in shareholder reports on other funds.
The expenses shown in the expense examples are intended to highlight shareholders’ ongoing costs only and do not reflect any transactional expenses, such as sales charges, if any. Therefore, the hypothetical examples are useful in comparing ongoing expenses only, and will not help shareholders determine the relative total expenses of owning different funds. If these transactional expenses were included, shareholder expenses would have been higher.
| Derivative Financial Instruments |
BlackRock Disciplined Small Cap Core Fund and the Master Portfolio may invest in various derivative financial instruments. Derivative financial instruments are used to obtain exposure to a security, index and/or market without owning or taking physical custody of securities or to manage market, equity, credit, interest rate, foreign currency exchange rate, commodity and/or other risks. Derivative financial instruments may give rise to a form of economic leverage. Derivative financial instruments also involve risks, including the imperfect correlation between the value of a derivative financial instrument and the underlying asset, possible default of the counterparty to the transaction or illiquidity of the derivative
financial instrument. The Fund’s and Master Portfolio’s ability to use a derivative financial instrument successfully depends on the investment advisor’s ability to predict pertinent market movements accurately, which cannot be assured. The use of derivative financial instruments may result in losses greater than if they had not been used, may limit the amount of appreciation the Fund and Master Portfolio can realize on an investment and/or may result in lower distributions paid to shareholders. The Fund’s and Master Portfolio’s investments in these instruments are discussed in detail in the Fund’s and Master Portfolio’s Notes to Financial Statements.
| 8 | ANNUAL REPORT | MAY 31, 2015 |
| Schedule of Investments May 31, 2015 | BlackRock Disciplined Small Cap Core Fund | |||
| (Percentages shown are based on Net Assets) |
| Common Stocks | Shares | Value | ||||||
Aerospace & Defense — 0.4% | ||||||||
Vectrus, Inc. (a) | 1,432 | $ | 35,929 | |||||
Airlines — 1.1% | ||||||||
American Airlines Group, Inc. | 609 | 25,803 | ||||||
JetBlue Airways Corp. (a) | 3,309 | 66,709 | ||||||
Virgin America, Inc. (a) | 356 | 10,125 | ||||||
|
| |||||||
| 102,637 | ||||||||
Auto Components — 2.1% | ||||||||
American Axle & Manufacturing Holdings, Inc. (a) | 214 | 5,374 | ||||||
Lear Corp. | 190 | 22,044 | ||||||
Tenneco, Inc. (a) | 1,772 | 104,052 | ||||||
Tower International, Inc. (a) | 2,244 | 61,732 | ||||||
|
| |||||||
| 193,202 | ||||||||
Banks — 6.4% | ||||||||
Banco Latinoamericano de Comercio Exterior SA | 260 | 7,886 | ||||||
BancorpSouth, Inc. | 842 | 20,368 | ||||||
C&F Financial Corp. | 149 | 5,468 | ||||||
Cathay General Bancorp | 188 | 5,681 | ||||||
Central Pacific Financial Corp. | 427 | 10,000 | ||||||
Financial Institutions, Inc. | 240 | 5,537 | ||||||
First Busey Corp. | 10,260 | 64,433 | ||||||
First Interstate BancSystem, Inc., Class A | 99 | 2,697 | ||||||
First Midwest Bancorp, Inc. | 507 | 9,004 | ||||||
German American Bancorp, Inc. | 124 | 3,598 | ||||||
Glacier Bancorp, Inc. | 3,042 | 85,602 | ||||||
Green Bancorp, Inc. (a) | 3,168 | 44,954 | ||||||
Opus Bank | 150 | 4,739 | ||||||
Prosperity Bancshares, Inc. | 1,093 | 58,552 | ||||||
Sierra Bancorp | 325 | 5,479 | ||||||
Texas Capital Bancshares, Inc. (a) | 1,183 | 64,355 | ||||||
Umpqua Holdings Corp. | 8,463 | 148,864 | ||||||
Veritex Holdings, Inc. (a) | 144 | 2,016 | ||||||
Wintrust Financial Corp. | 691 | 34,619 | ||||||
|
| |||||||
| 583,852 | ||||||||
Biotechnology — 6.5% | ||||||||
Acorda Therapeutics, Inc. (a) | 802 | 24,445 | ||||||
Adamas Pharmaceuticals, Inc. (a) | 988 | 17,774 | ||||||
Ardelyx, Inc. (a) | 988 | 10,819 | ||||||
BioSpecifics Technologies Corp. (a) | 409 | 19,485 | ||||||
Bluebird Bio, Inc. (a) | 52 | 10,101 | ||||||
Blueprint Medicines Corp. (a) | 662 | 18,993 | ||||||
Cepheid, Inc. (a) | 119 | 6,565 | ||||||
Cerulean Pharma, Inc. (a) | 2,745 | 16,333 | ||||||
China Biologic Products, Inc. (a) | 169 | 18,899 | ||||||
Dyax Corp. (a) | 1,234 | 32,504 | ||||||
Eleven Biotherapeutics, Inc. (a) | 1,338 | 3,760 | ||||||
Emergent Biosolutions, Inc. (a) | 736 | 23,449 | ||||||
Enanta Pharmaceuticals, Inc. (a) | 502 | 20,522 | ||||||
Enzon Pharmaceuticals, Inc. | 8,756 | 11,470 | ||||||
FibroGen, Inc. (a) | 1,060 | 19,303 | ||||||
Five Prime Therapeutics, Inc. (a) | 878 | 22,512 | ||||||
Genocea Biosciences, Inc. (a) | 571 | 6,058 | ||||||
Genomic Health, Inc. (a) | 751 | 20,345 | ||||||
Ignyta, Inc. (a) | 1,778 | 15,966 | ||||||
Immune Design Corp. (a) | 836 | 18,250 | ||||||
| Common Stocks | Shares | Value | ||||||
Biotechnology (concluded) | ||||||||
Infinity Pharmaceuticals, Inc. (a) | 1,252 | $ | 16,226 | |||||
Isis Pharmaceuticals, Inc. (a) | 872 | 58,703 | ||||||
Ligand Pharmaceuticals, Inc. (a) | 297 | 26,169 | ||||||
Loxo Oncology, Inc. (a) | 814 | 10,045 | ||||||
Neurocrine Biosciences, Inc. (a) | 84 | 3,684 | ||||||
OncoGenex Pharmaceutical, Inc. (a) | 1,222 | 2,591 | ||||||
Oncothyreon, Inc. (a) | 2,320 | 7,934 | ||||||
Ophthotech Corp. (a) | 420 | 21,008 | ||||||
OPKO Health, Inc. (a) | 230 | 4,066 | ||||||
Osiris Therapeutics, Inc. (a) | 201 | 3,739 | ||||||
PDL BioPharma, Inc. | 3,589 | 23,974 | ||||||
Puma Biotechnology, Inc. (a) | 54 | 10,554 | ||||||
Receptos, Inc. (a) | 30 | 4,947 | ||||||
Rigel Pharmaceuticals, Inc. (a) | 4,634 | 16,173 | ||||||
Synageva BioPharma Corp. (a) | 52 | 11,097 | ||||||
TetraLogic Pharmaceuticals Corp. (a) | 1,213 | 2,814 | ||||||
Trevena, Inc. (a) | 2,683 | 18,674 | ||||||
United Therapeutics Corp. (a) | 87 | 15,984 | ||||||
|
| |||||||
| 595,935 | ||||||||
Building Products — 1.7% | ||||||||
Continental Building Products, Inc. (a) | 6,948 | 154,940 | ||||||
Capital Markets — 0.4% | ||||||||
Medley Management, Inc., Class A | 418 | 4,840 | ||||||
Pzena Investment Management, Inc., Class A | 3,217 | 28,503 | ||||||
Westwood Holdings Group, Inc. | 64 | 3,632 | ||||||
|
| |||||||
| 36,975 | ||||||||
Chemicals — 1.0% | ||||||||
KMG Chemicals, Inc. | 1,784 | 53,003 | ||||||
OM Group, Inc. | 464 | 12,315 | ||||||
Stepan Co. | 350 | 18,011 | ||||||
Trecora Resources (a) | 172 | 2,363 | ||||||
Trinseo SA (a) | 118 | 3,447 | ||||||
|
| |||||||
| 89,139 | ||||||||
Commercial Services & Supplies — 0.7% | ||||||||
ABM Industries, Inc. | 88 | 2,855 | ||||||
ARC Document Solutions, Inc. (a) | 4,110 | 30,784 | ||||||
Atento SA (a) | 900 | 11,727 | ||||||
InnerWorkings, Inc. (a) | 498 | 3,167 | ||||||
Knoll, Inc. | 559 | 12,723 | ||||||
Quad/Graphics, Inc. | 142 | 2,904 | ||||||
|
| |||||||
| 64,160 | ||||||||
Communications Equipment — 0.8% | ||||||||
Calix, Inc. (a) | 4,624 | 36,992 | ||||||
PC-Tel, Inc. | 4,058 | 30,029 | ||||||
Polycom, Inc. (a) | 278 | 3,745 | ||||||
|
| |||||||
| 70,766 | ||||||||
Consumer Finance — 0.4% | ||||||||
Consumer Portfolio Services, Inc. (a) | 6,277 | 36,971 | ||||||
| Portfolio Abbreviations | ||||
| CVR | Contingent Value Rights | |||
| REIT | Real Estate Investment Trust | |||
See Notes to Financial Statements.
| ANNUAL REPORT | MAY 31, 2015 | 9 |
| Schedule of Investments (continued) | BlackRock Disciplined Small Cap Core Fund | |||
| (Percentages shown are based on Net Assets) |
| Common Stocks | Shares | Value | ||||||
Containers & Packaging — 1.0% | ||||||||
Berry Plastics Group, Inc. (a) | 710 | $ | 23,764 | |||||
Graphic Packaging Holding Co. | 5,018 | 71,456 | ||||||
|
| |||||||
| 95,220 | ||||||||
Distributors — 1.3% | ||||||||
Core-Mark Holding Co., Inc. | 2,133 | 114,563 | ||||||
Diversified Consumer Services — 1.0% | ||||||||
Collectors Universe, Inc. | 991 | 21,188 | ||||||
LifeLock, Inc. (a) | 3,973 | 60,469 | ||||||
National American University Holdings, Inc. | 2,052 | 6,382 | ||||||
|
| |||||||
| 88,039 | ||||||||
Diversified Financial Services — 0.0% | ||||||||
Marlin Business Services Corp. | 234 | 4,182 | ||||||
Diversified Telecommunication Services — 2.0% | ||||||||
Inteliquent, Inc. | 7,232 | 127,500 | ||||||
Premiere Global Services, Inc. (a) | 5,125 | 51,763 | ||||||
|
| |||||||
| 179,263 | ||||||||
Electric Utilities — 0.5% | ||||||||
Cleco Corp. | 304 | 16,492 | ||||||
Portland General Electric Co. | 728 | 25,451 | ||||||
|
| |||||||
| 41,943 | ||||||||
Electrical Equipment — 0.1% | ||||||||
Polypore International, Inc. (a) | 227 | 13,600 | ||||||
Electronic Equipment, Instruments & Components — 2.7% | ||||||||
DTS, Inc. (a) | 298 | 9,456 | ||||||
Electro Rent Corp. | 1,788 | 18,363 | ||||||
Kemet Corp. (a) | 635 | 1,962 | ||||||
Multi-Fineline Electronix, Inc. (a) | 1,200 | 30,072 | ||||||
Newport Corp. (a) | 821 | 15,509 | ||||||
OSI Systems, Inc. (a) | 772 | 55,769 | ||||||
Radisys Corp. (a) | 28,599 | 82,937 | ||||||
Vishay Precision Group, Inc. (a) | 2,769 | 36,551 | ||||||
|
| |||||||
| 250,619 | ||||||||
Energy Equipment & Services — 1.9% | ||||||||
Dawson Geophysical Co. (a) | 8,252 | 44,643 | ||||||
Enservco Corp. (a) | 6,653 | 10,312 | ||||||
Exterran Holdings, Inc. | 2,772 | 91,642 | ||||||
Pacific Drilling SA (a) | 1,464 | 5,490 | ||||||
PHI, Inc. (a) | 580 | 18,873 | ||||||
|
| |||||||
| 170,960 | ||||||||
Food & Staples Retailing — 0.8% | ||||||||
SpartanNash Co. | 160 | 5,002 | ||||||
SUPERVALU, Inc. (a) | 7,297 | 64,432 | ||||||
|
| |||||||
| 69,434 | ||||||||
Food Products — 1.5% | ||||||||
Lancaster Colony Corp. | 124 | 11,066 | ||||||
Lifeway Foods, Inc. (a) | 524 | 9,359 | ||||||
Omega Protein Corp. (a) | 2,190 | 30,113 | ||||||
Pilgrim’s Pride Corp. (b) | 996 | 25,478 | ||||||
Sanderson Farms, Inc. (b) | 305 | 24,867 | ||||||
Seaboard Corp. (a) | 10 | 34,300 | ||||||
|
| |||||||
| 135,183 | ||||||||
Gas Utilities — 0.7% | ||||||||
Gas Natural, Inc. | 628 | 6,280 | ||||||
Southwest Gas Corp. | 986 | 53,698 | ||||||
|
| |||||||
| 59,978 | ||||||||
Health Care Equipment & Supplies — 3.8% | ||||||||
Align Technology, Inc. (a) | 135 | 8,190 | ||||||
Alphatec Holdings, Inc. (a) | 5,424 | 7,322 | ||||||
| Common Stocks | Shares | Value | ||||||
Health Care Equipment & Supplies (concluded) | ||||||||
Anika Therapeutics, Inc. (a) | 248 | $ | 8,365 | |||||
Bellerophon Therapeutics, Inc. (a) | 362 | 3,359 | ||||||
ICU Medical, Inc. (a) | 141 | 13,677 | ||||||
iRadimed Corp. (a) | 120 | 2,315 | ||||||
Merit Medical Systems, Inc. (a) | 2,870 | 59,007 | ||||||
Orthofix International NV (a) | 1,039 | 34,048 | ||||||
RTI Surgical, Inc. (a) | 6,601 | 42,708 | ||||||
STERIS Corp. | 1,788 | 119,492 | ||||||
Symmetry Surgical, Inc. (a) | 4,972 | 43,903 | ||||||
Synergetics U.S.A., Inc. (a) | 717 | 3,169 | ||||||
|
| |||||||
| 345,555 | ||||||||
Health Care Providers & Services — 4.6% | ||||||||
Alliance HealthCare Services, Inc. (a) | 2,762 | 50,793 | ||||||
Centene Corp. (a) | 168 | 12,657 | ||||||
Health Net, Inc. (a) | 2,274 | 141,534 | ||||||
National Research Corp., Class A | 1,019 | 14,246 | ||||||
Surgical Care Affiliates, Inc. (a) | 777 | 29,518 | ||||||
Team Health Holdings, Inc. (a) | 1,811 | 105,907 | ||||||
VCA, Inc. (a) | 1,195 | 62,690 | ||||||
|
| |||||||
| 417,345 | ||||||||
Health Care Technology — 0.0% | ||||||||
Omnicell, Inc. (a) | 84 | 3,106 | ||||||
Hotels, Restaurants & Leisure — 3.5% | ||||||||
BFC Financial Corp., Class A (a) | 5,961 | 22,652 | ||||||
Brinker International, Inc. | 2,102 | 115,988 | ||||||
Eldorado Resorts, Inc. (a) | 899 | 7,336 | ||||||
Intrawest Resorts Holdings, Inc. (a) | 8,342 | 104,775 | ||||||
Isle of Capri Casinos, Inc. (a) | 3,167 | 45,003 | ||||||
Jack in the Box, Inc. | 313 | 27,172 | ||||||
|
| |||||||
| 322,926 | ||||||||
Household Durables — 0.3% | ||||||||
ZAGG, Inc. (a) | 2,894 | 26,943 | ||||||
Insurance — 2.8% | ||||||||
American National Insurance Co. | 19 | 1,961 | ||||||
CNO Financial Group, Inc. | 1,176 | 21,168 | ||||||
Fidelity & Guaranty Life | 3,940 | 86,522 | ||||||
Maiden Holdings Ltd. | 8,491 | 118,704 | ||||||
National Western Life Insurance Co., Class A | 67 | 16,414 | ||||||
Symetra Financial Corp. | 426 | 10,420 | ||||||
Universal Insurance Holdings, Inc. | 139 | 3,549 | ||||||
|
| |||||||
| 258,738 | ||||||||
Internet & Catalog Retail — 0.4% | ||||||||
1-800-Flowers.com, Inc., Class A (a) | 879 | 8,359 | ||||||
Liberty Ventures, Series A (a) | 385 | 15,977 | ||||||
U.S. Auto Parts Network, Inc. (a) | 5,809 | 13,070 | ||||||
|
| |||||||
| 37,406 | ||||||||
Internet Software & Services — 2.8% | ||||||||
Apigee Corp. (a) | 751 | 10,552 | ||||||
Bankrate, Inc. (a) | 1,322 | 16,128 | ||||||
Constant Contact, Inc. (a) | 1,198 | 32,657 | ||||||
IntraLinks Holdings, Inc. (a) | 399 | 4,241 | ||||||
LogMeIn, Inc. (a) | 2,610 | 165,657 | ||||||
New Relic, Inc. (a) | 12 | 393 | ||||||
NIC, Inc. | 399 | 6,723 | ||||||
QuinStreet, Inc. (a) | 332 | 1,969 | ||||||
Spark Networks, Inc. (a) | 3,215 | 9,741 | ||||||
support.com, Inc. (a) | 7,210 | 10,382 | ||||||
|
| |||||||
| 258,443 | ||||||||
IT Services — 1.0% | ||||||||
Forrester Research, Inc. | 160 | 5,442 | ||||||
See Notes to Financial Statements.
| 10 | ANNUAL REPORT | MAY 31, 2015 |
| Schedule of Investments (continued) | BlackRock Disciplined Small Cap Core Fund | |||
| (Percentages shown are based on Net Assets) |
| Common Stocks | Shares | Value | ||||||
IT Services (concluded) | ||||||||
Global Cash Access Holdings, Inc. (a) | 8,254 | $ | 63,803 | |||||
NCI, Inc., Class A | 214 | 2,268 | ||||||
Net 1 UEPS Technologies, Inc. (a) | 1,333 | 19,329 | ||||||
PRGX Global, Inc. (a) | 426 | 1,811 | ||||||
|
| |||||||
| 92,653 | ||||||||
Leisure Products — 0.7% | ||||||||
Brunswick Corp. | 1,187 | 60,584 | ||||||
Nautilus, Inc. (a) | 290 | 6,125 | ||||||
|
| |||||||
| 66,709 | ||||||||
Life Sciences Tools & Services — 0.3% | ||||||||
PRA Health Sciences, Inc. (a) | 877 | 29,344 | ||||||
Machinery — 2.0% | ||||||||
Blount International, Inc. (a) | 1,905 | 22,041 | ||||||
Global Brass & Copper Holdings, Inc. | 3,540 | 60,994 | ||||||
The Greenbrier Cos., Inc. (b) | 651 | 39,210 | ||||||
Hyster-Yale Materials Handling, Inc. | 249 | 17,669 | ||||||
Jason Industries, Inc. (a) | 1,090 | 7,368 | ||||||
Miller Industries, Inc. | 203 | 4,164 | ||||||
Supreme Industries, Inc., Class A | 4,197 | 33,576 | ||||||
|
| |||||||
| 185,022 | ||||||||
Media — 0.1% | ||||||||
Tribune Publishing Co. | 846 | 12,622 | ||||||
Metals & Mining — 0.5% | ||||||||
Kaiser Aluminum Corp. | 586 | 47,542 | ||||||
Multiline Retail — 1.4% | ||||||||
Burlington Stores, Inc. (a) | 2,457 | 129,656 | ||||||
Oil, Gas & Consumable Fuels — 1.9% | ||||||||
Evolution Petroleum Corp. | 10,625 | 73,313 | ||||||
Hallador Energy Co. | 3,998 | 33,983 | ||||||
MV Oil Trust | 591 | 6,731 | ||||||
Par Petroleum Corp. (a) | 1,938 | 44,186 | ||||||
Rosetta Resources, Inc. (a) | 372 | 8,690 | ||||||
U.S. Energy Corp. Wyoming (a) | 4,367 | 4,214 | ||||||
Voc Energy Trust | 928 | 5,596 | ||||||
|
| |||||||
| 176,713 | ||||||||
Paper & Forest Products — 1.3% | ||||||||
Boise Cascade Co. (a) | 2,465 | 87,360 | ||||||
Domtar Corp. | 663 | 28,655 | ||||||
|
| |||||||
| 116,015 | ||||||||
Pharmaceuticals — 2.8% | ||||||||
Cumberland Pharmaceuticals, Inc. (a) | 1,621 | 10,958 | ||||||
Endo International PLC (a) | 56 | 4,691 | ||||||
Furiex Pharmaceuticals, Inc. - CVR (a) | 11 | 110 | ||||||
Lannett Co., Inc. (a) | 1,130 | 62,862 | ||||||
Prestige Brands Holdings, Inc. (a) | 2,404 | 105,584 | ||||||
SciClone Pharmaceuticals, Inc. (a) | 1,359 | 12,584 | ||||||
Sucampo Pharmaceuticals, Inc., Class A (a) | 3,543 | 57,503 | ||||||
|
| |||||||
| 254,292 | ||||||||
Professional Services — 2.8% | ||||||||
GP Strategies Corp. (a) | 63 | 1,966 | ||||||
Kforce, Inc. | 722 | 15,891 | ||||||
RPX Corp. (a) | 9,413 | 149,761 | ||||||
TrueBlue, Inc. (a) | 3,218 | 91,649 | ||||||
|
| |||||||
| 259,267 | ||||||||
Real Estate Investment Trusts (REITs) — 8.4% | ||||||||
American Assets Trust, Inc. | 360 | 14,166 | ||||||
Arbor Realty Trust, Inc. | 3,419 | 24,241 | ||||||
Armada Hoffler Properties, Inc. | 268 | 2,838 | ||||||
Associated Estates Realty Corp. | 290 | 8,291 | ||||||
| Common Stocks | Shares | Value | ||||||
Real Estate Investment Trusts (REITs) (concluded) | ||||||||
Chatham Lodging Trust | 1,619 | $ | 45,235 | |||||
Chesapeake Lodging Trust | 1,762 | 54,745 | ||||||
CIM Commercial Trust Corp. | 141 | 2,616 | ||||||
CyrusOne, Inc. | 122 | 3,937 | ||||||
DuPont Fabros Technology, Inc. | 4,025 | 129,766 | ||||||
Equity LifeStyle Properties, Inc. | 515 | 28,217 | ||||||
The GEO Group, Inc. | 3,732 | 141,555 | ||||||
Great Ajax Corp. | 161 | 2,191 | ||||||
Invesco Mortgage Capital, Inc. | 323 | 5,126 | ||||||
LaSalle Hotel Properties | 656 | 23,918 | ||||||
Lexington Realty Trust | 3,701 | 33,975 | ||||||
New Residential Investment Corp. | 1,816 | 30,981 | ||||||
NorthStar Realty Finance Corp. | 902 | 16,362 | ||||||
Pebblebrook Hotel Trust | 140 | 6,003 | ||||||
PS Business Parks, Inc. | 782 | 57,164 | ||||||
RLJ Lodging Trust | 4,229 | 127,843 | ||||||
Western Asset Mortgage Capital Corp. | 977 | 14,850 | ||||||
|
| |||||||
| 774,020 | ||||||||
Real Estate Management & Development — 1.9% | ||||||||
Marcus & Millichap, Inc. (a) | 2,431 | 114,038 | ||||||
RE/MAX Holdings, Inc., Class A | 1,871 | 62,585 | ||||||
|
| |||||||
| 176,623 | ||||||||
Road & Rail — 1.8% | ||||||||
Quality Distribution, Inc. (a) | 137 | 2,167 | ||||||
Ryder System, Inc. | 761 | 69,746 | ||||||
Swift Transportation Co. (a) | 4,104 | 95,500 | ||||||
|
| |||||||
| 167,413 | ||||||||
Semiconductors & Semiconductor Equipment — 4.6% | ||||||||
Alpha & Omega Semiconductor Ltd. (a) | 131 | 1,074 | ||||||
Ambarella, Inc. (a) | 238 | 21,470 | ||||||
Amkor Technology, Inc. (a) | 4,236 | 28,635 | ||||||
Cirrus Logic, Inc. (a) | 1,533 | 57,871 | ||||||
FormFactor, Inc. (a) | 1,327 | 12,354 | ||||||
Integrated Device Technology, Inc. (a) | 1,844 | 43,620 | ||||||
IXYS Corp. | 944 | 11,507 | ||||||
OmniVision Technologies, Inc. (a) | 282 | 7,603 | ||||||
Pericom Semiconductor Corp. | 2,484 | 32,516 | ||||||
Qorvo, Inc. (a) | 1,235 | 101,455 | ||||||
Tessera Technologies, Inc. | 2,609 | 100,577 | ||||||
|
| |||||||
| 418,682 | ||||||||
Software — 4.1% | ||||||||
Advent Software, Inc. | 259 | 11,334 | ||||||
Aspen Technology, Inc. (a) | 1,458 | 62,402 | ||||||
AVG Technologies NV (a) | 3,257 | 79,862 | ||||||
ePlus, Inc. (a) | 682 | 52,957 | ||||||
Exa Corp. (a) | 5,102 | 58,775 | ||||||
Manhattan Associates, Inc. (a) | 1,730 | 94,891 | ||||||
Verint Systems, Inc. (a) | 177 | 11,447 | ||||||
|
| |||||||
| 371,668 | ||||||||
Specialty Retail — 2.2% | ||||||||
Aaron’s, Inc. (a) | 1,633 | 57,204 | ||||||
Citi Trends, Inc. (a) | 1,317 | 31,674 | ||||||
Kirkland’s, Inc. (a) | 202 | 5,307 | ||||||
Murphy U.S.A., Inc. (a) | 701 | 40,819 | ||||||
Sears Hometown and Outlet Stores, Inc. (a) | 1,926 | 13,578 | ||||||
Stage Stores, Inc. | 3,089 | 50,011 | ||||||
|
| |||||||
| 198,593 | ||||||||
Technology Hardware, Storage & Peripherals — 0.8% | ||||||||
Avid Technology, Inc. (a) | 4,220 | 75,158 | ||||||
See Notes to Financial Statements.
| ANNUAL REPORT | MAY 31, 2015 | 11 |
| Schedule of Investments (continued) | BlackRock Disciplined Small Cap Core Fund | |||
| (Percentages shown are based on Net Assets) |
Common Stocks | Shares | Value | ||||||
Textiles, Apparel & Luxury Goods — 2.5% | ||||||||
Culp, Inc. | 449 | $ | 11,831 | |||||
Deckers Outdoor Corp. (a) | 638 | 43,480 | ||||||
Skechers U.S.A., Inc., Class A (a) | 1,685 | 178,391 | ||||||
|
| |||||||
| 233,702 | ||||||||
Thrifts & Mortgage Finance — 3.1% | ||||||||
Anchor BanCorp Wisconsin, Inc. (a) | 850 | 31,459 | ||||||
EverBank Financial Corp. | 6,886 | 126,978 | ||||||
Ladder Capital Corp. | 617 | 10,964 | ||||||
Meta Financial Group, Inc. | 916 | 36,759 | ||||||
MGIC Investment Corp. (a) | 797 | 8,647 | ||||||
Northwest Bancshares, Inc. | 4,917 | 59,496 | ||||||
Radian Group, Inc. | 434 | 7,777 | ||||||
Walker & Dunlop, Inc. (a) | 246 | 6,056 | ||||||
|
| |||||||
| 288,136 | ||||||||
Trading Companies & Distributors — 0.3% | ||||||||
Neff Corp., Class A (a) | 512 | 5,253 | ||||||
Watsco, Inc. | 165 | 20,777 | ||||||
Willis Lease Finance Corp. (a) | 314 | 5,746 | ||||||
|
| |||||||
| 31,776 | ||||||||
Water Utilities — 0.9% | ||||||||
California Water Service Group | 3,279 | 78,335 | ||||||
Wireless Telecommunication Services — 0.0% | ||||||||
Leap Wireless International, Inc. - CVR (a) | 216 | 544 | ||||||
Total Common Stocks — 98.6% | 9,042,437 | |||||||
| Other Interests (c) | Beneficial Interest (000) | Value | ||||||
Professional Services — 0.0% | ||||||||
The Dolan Co., Escrow (a) | $ 2 | $ 39 | ||||||
Total Other Interests — 0.0% | 39 | |||||||
Total Long-Term Investments | ||||||||
(Cost — $8,150,156) — 98.6% | 9,042,476 | |||||||
| Short-Term Securities | Shares | |||||||
BlackRock Liquidity Funds, TempFund, Institutional Class, 0.08% (d)(e) | 161,872 | 161,872 | ||||||
| Beneficial Interest (000) | ||||||||
BlackRock Liquidity Series, LLC, Money Market Series, 0.19% (d)(e)(f) | $130 | 129,625 | ||||||
Total Short-Term Securities (Cost — $291,497) — 3.2% | 291,497 | |||||||
Total Investments (Cost — $8,441,653) — 101.8% | 9,333,973 | |||||||
Liabilities in Excess of Other Assets — (1.8)% | (163,481 | ) | ||||||
|
| |||||||
Net Assets — 100.0% | $9,170,492 | |||||||
|
| |||||||
| Notes to Schedule of Investments |
| (a) | Non-income producing security. |
| (b) | Security, or a portion of security, is on loan. |
| (c) | Other interests represent beneficial interests in liquidation trusts and other reorganization or private entities. |
| (d) | During the year ended May 31, 2015, investments in issuers considered to be affiliates of the Fund for purposes of Section 2(a)(3) of the Investment Company Act of 1940, as amended, were as follows: |
| Affiliate | Shares/ Beneficial Held at 2014 | Net Activity | Shares/ Held at May 31, 2015 | Income | ||||||||||||
BlackRock Liquidity Funds, TempFund, Institutional Class | 116,410 | 45,462 | 161,872 | $ | 93 | |||||||||||
BlackRock Liquidity Series, LLC, Money Market Series | $ | 2,821 | $ | 126,804 | $ | 129,625 | $ | 8,774 | 1 | |||||||
| 1 | Represents securities lending income earned from the reinvestment of cash collateral from loaned securities, net of fees, and other payments to and from borrowers of securities, and less the collateral investment expenses. |
| (e) | Represents the current yield as of report date. |
| (f) | Security was purchased with the cash collateral from loaned securities. The Fund may withdraw up to 25% of its investment daily, although the manager of the BlackRock Liquidity Series, LLC, Money Market Series, in its sole discretion, may permit an investor to withdraw more than 25% on any one day. |
| • | For Fund compliance purposes, the Fund’s industry classifications refer to any one or more of the industry sub-classifications used by one or more widely recognized market indexes or ratings group indexes, and/or as defined by the investment advisor. These definitions may not apply for purposes of this report, which may combine such industry sub-classifications for reporting ease. |
| • | As of May 31, 2015, financial futures contracts outstanding were as follows: |
Contracts Long | Issue | Exchange | Expiration | Notional Value | Unrealized Depreciation | |||||||||||
| 1 | E-Mini Russell 2000 Futures | InterContinental Exchange | June 2015 | $124,430 | $ | (2) | ||||||||||
See Notes to Financial Statements.
| 12 | ANNUAL REPORT | MAY 31, 2015 |
| Schedule of Investments (concluded) | BlackRock Disciplined Small Cap Core Fund |
| • | Fair Value Measurements — Various inputs are used in determining the fair value of investments and derivative financial instruments. These inputs to valuation techniques are categorized into a disclosure hierarchy consisting of three broad levels for financial statement purposes. The hierarchy gives the highest priority to unadjusted quoted prices in active markets for identical assets or liabilities (Level 1 measurements) and the lowest priority to unobservable inputs (Level 3 measurements). Accordingly, the degree of judgment exercised in determining fair value is greatest for instruments categorized in Level 3. The inputs used to measure fair value may fall into different levels of the fair value hierarchy. In such cases, for disclosure purposes, the fair value hierarchy classification is determined based on the lowest level input that is significant to the fair value measurement in its entirety. The categorization of a value determined for investments and derivative financial instruments is based on the pricing transparency of the investment and derivative financial instruments and is not necessarily an indication of the risks associated with investing in those securities. The three levels of the fair value hierarchy are as follows: |
| • | Level 1 – unadjusted quoted prices in active markets/exchanges for identical assets or liabilities that the Fund has the ability to access |
| • | Level 2 – other observable inputs (including, but not limited to, quoted prices for similar assets or liabilities in markets that are active, quoted prices for identical or similar assets or liabilities in markets that are not active, inputs other than quoted prices that are observable for the assets or liabilities (such as interest rates, yield curves, volatilities, prepayment speeds, loss severities, credit risks and default rates) or other market–corroborated inputs) |
| • | Level 3 – unobservable inputs based on the best information available in the circumstances, to the extent observable inputs are not available (including the Fund’s own assumptions used in determining the fair value of investments and derivative financial instruments) |
Changes in valuation techniques may result in transfers into or out of an assigned level within the disclosure hierarchy. In accordance with the Fund’s policy, transfers between different levels of the fair value disclosure hierarchy are deemed to have occurred as of the beginning of the reporting period. For information about the Fund’s policy regarding valuation of investments and derivative financial instruments, refer to Note 2 of the Notes to Financial Statements.
As of May 31, 2015, the following tables summarize the Fund’s investments and derivative financial instruments categorized in the disclosure hierarchy:
| Level 1 | Level 2 | Level 3 | Total | |||||||||||||||||
Assets: | ||||||||||||||||||||
Investments: | ||||||||||||||||||||
Long-Term Investments1 | $ | 9,041,783 | — | $ | 693 | $ | 9,042,476 | |||||||||||||
Short-Term Securities | 161,872 | $ | 129,625 | — | 291,497 | |||||||||||||||
|
| |||||||||||||||||||
Total | $ | 9,203,655 | $ | 129,625 | $ | 693 | $ | 9,333,973 | ||||||||||||
|
| |||||||||||||||||||
1 See above Schedule of Investments for values in each industry. Investments categorized as Level 3 are included in Pharmaceuticals, Wireless Telecommunications Services and Other Interests. |
| |||||||||||||||||||
| Level 1 | Level 2 | Level 3 | Total | |||||||||||||||||
Derivative Financial Instruments2 | ||||||||||||||||||||
Liabilities: | ||||||||||||||||||||
Equity contracts | $ | (2 | ) | — | — | $ | (2 | ) | ||||||||||||
2 Derivative financial instruments are financial futures contracts, which are valued at the unrealized appreciation (depreciation) on the instrument. |
| |||||||||||||||||||
| The Fund may hold assets and/or liabilities in which the fair value approximates the carrying amount for financial statement purposes. As of May 31, 2015, such assets and/or liabilities are categorized within the disclosure hierarchy as follows: | ||||||||||||||||||||
| Level 1 | Level 2 | Level 3 | Total | |||||||||||||||||
Assets: | ||||||||||||||||||||
Cash pledged for financial futures contracts | $ | 5,100 | — | — | $ | 5,100 | ||||||||||||||
Liabilities: | ||||||||||||||||||||
Collateral on securities loaned at value | — | $ | (129,625 | ) | — | (129,625 | ) | |||||||||||||
|
| |||||||||||||||||||
Total | $ | 5,100 | $ | (129,625 | ) | — | $ | (124,525 | ) | |||||||||||
|
| |||||||||||||||||||
During the year ended May 31, 2015, there were no transfers between levels.
See Notes to Financial Statements.
| ANNUAL REPORT | MAY 31, 2015 | 13 |
| Statements of Assets and Liabilities |
| May 31, 2015 | BlackRock Disciplined Small Cap Core Fund | BlackRock Small Cap Growth Fund II | ||||||
| Assets | ||||||||
Investments at value — unaffiliated (including securities loaned at value of $125,810) (cost — $8,150,156) | $ | 9,042,476 | — | |||||
Investments at value — affiliated (cost — $291,497) | 291,497 | — | ||||||
Investments at value — Master Portfolio (cost — $189,594,941) | — | $ | 219,343,781 | |||||
Cash pledged for financial futures contracts | 5,100 | — | ||||||
Receivables: | ||||||||
Investments sold | 169,247 | — | ||||||
Securities lending income — affiliated | 736 | — | ||||||
Capital shares sold | 32,336 | 262,386 | ||||||
Dividends — unaffiliated | 5,507 | — | ||||||
From the Manager | 25,065 | — | ||||||
Prepaid expenses | 24,548 | 21,750 | ||||||
|
| |||||||
Total assets | 9,596,512 | 219,627,917 | ||||||
|
| |||||||
| Liabilities | ||||||||
Collateral on securities loaned at value | 129,625 | — | ||||||
Payables: | ||||||||
Investments purchased | 183,009 | — | ||||||
Administration fees | — | 37,424 | ||||||
Capital shares redeemed | — | 235,803 | ||||||
Contributions to the Master Portfolio | — | 26,583 | ||||||
Officer’s and Trustees’/Directors’ fees | — | 94 | ||||||
Other affiliates | �� | — | 2,233 | |||||
Professional fees | 67,498 | 37,234 | ||||||
Service and distribution fees | 780 | 64,273 | ||||||
Transfer agent fees | 809 | 145,332 | ||||||
Variation margin payable on financial futures contracts | 860 | — | ||||||
Other accrued expenses payable | 43,439 | 25,598 | ||||||
|
| |||||||
Total liabilities | 426,020 | 574,574 | ||||||
|
| |||||||
Net Assets | $ | 9,170,492 | $ | 219,053,343 | ||||
|
| |||||||
| Net Assets Consist of | ||||||||
Paid-in capital | $ | 8,157,550 | $ | 179,594,942 | ||||
Undistributed net investment income | 21,861 | 10,139 | ||||||
Undistributed net realized gain | 98,763 | — | ||||||
Undistributed net realized gain allocated from the Master Portfolio | — | 9,699,422 | ||||||
Net unrealized appreciation (depreciation) | 892,318 | — | ||||||
Net unrealized appreciation (depreciation) allocated from the Master Portfolio | — | 29,748,840 | ||||||
|
| |||||||
Net Assets | $ | 9,170,492 | $ | 219,053,343 | ||||
|
| |||||||
See Notes to Financial Statements.
| 14 | ANNUAL REPORT | MAY 31, 2015 |
| Statements of Assets and Liabilities (concluded) |
| May 31, 2015 | BlackRock Disciplined Small Cap Core Fund | BlackRock Small Cap Growth Fund II | ||||||
| Net Asset Value | ||||||||
Institutional | ||||||||
Net assets | $ | 6,122,156 | $ | 73,607,656 | ||||
|
| |||||||
Shares outstanding | 521,547 | 1 | 5,033,337 | 2 | ||||
|
| |||||||
Net asset value | $ | 11.74 | $ | 14.62 | ||||
|
| |||||||
Investor A | ||||||||
Net assets | $ | 2,735,579 | $ | 76,423,434 | ||||
|
| |||||||
Shares outstanding | 233,634 | 1 | 5,525,163 | 2 | ||||
|
| |||||||
Net asset value | $ | 11.71 | $ | 13.83 | ||||
|
| |||||||
Investor B | ||||||||
Net assets | — | $ | 261,881 | |||||
|
| |||||||
Shares outstanding | — | 23,141 | 2 | |||||
|
| |||||||
Net asset value | — | $ | 11.32 | |||||
|
| |||||||
Investor C | ||||||||
Net assets | $ | 312,757 | $ | 44,179,394 | ||||
|
| |||||||
Shares outstanding | 26,970 | 1 | 3,933,482 | 2 | ||||
|
| |||||||
Net asset value | $ | 11.60 | $ | 11.23 | ||||
|
| |||||||
Class R | ||||||||
Net assets | — | $ | 24,580,978 | |||||
|
| |||||||
Shares outstanding | — | 1,940,575 | 2 | |||||
|
| |||||||
Net asset value | — | $ | 12.67 | |||||
|
| |||||||
| 1 | Unlimited number of shares authorized, $0.001 par value. |
| 2 | 100 million shares authorized, $0.0001 par value. |
See Notes to Financial Statements.
| ANNUAL REPORT | MAY 31, 2015 | 15 |
| Statements of Operations |
| Year Ended May 31, 2015 | BlackRock Disciplined Small Cap Core Fund | BlackRock Small Cap Growth Fund II | ||||||
| Investment Income | ||||||||
Dividends — unaffiliated | $ | 95,624 | — | |||||
Securities lending — affiliated — net | 7,485 | — | ||||||
Other income — affiliated | 1,289 | — | ||||||
Dividends — affiliated | 93 | — | ||||||
Foreign taxes withheld | (12 | ) | — | |||||
Net investment income allocated from the Master Portfolio: | ||||||||
Dividends — unaffiliated | — | $ | 1,486,116 | |||||
Securities lending — affiliated — net | — | 461,765 | ||||||
Dividends — affiliated | — | 1,032 | ||||||
Foreign taxes withheld | — | (68 | ) | |||||
Expenses | — | (1,784,356 | ) | |||||
Fees waived | — | 362,418 | ||||||
|
| |||||||
Total income | 104,479 | 526,907 | ||||||
|
| |||||||
| Expenses | ||||||||
Professional | 97,582 | 61,906 | ||||||
Registration | 37,370 | 71,525 | ||||||
Investment advisory | 34,346 | — | ||||||
Printing | 28,068 | 49,433 | ||||||
Custodian | 24,855 | — | ||||||
Pricing | 14,561 | — | ||||||
Accounting services | 6,277 | — | ||||||
Service and distribution — class specific | 5,512 | 780,028 | ||||||
Administration | 4,601 | 450,776 | ||||||
Transfer agent — class specific | 3,663 | 565,549 | ||||||
Officer and Trustees/Directors | 3,348 | 139 | ||||||
Administration — class specific | 1,734 | — | ||||||
Miscellaneous | 6,138 | 16,416 | ||||||
|
| |||||||
Total expenses | 268,055 | 1,995,772 | ||||||
Less fees waived and/or reimbursed by the Manager | (199,095 | ) | — | |||||
Less administration fees waived | (4,601 | ) | — | |||||
Less administration fees waived — class specific | (1,667 | ) | — | |||||
Less transfer agent fees reimbursed — class specific | (3,462 | ) | — | |||||
|
| |||||||
Total expenses after fees waived and/or reimbursed | 59,230 | 1,995,772 | ||||||
|
| |||||||
Net investment income (loss) | 45,249 | (1,468,865 | ) | |||||
|
| |||||||
| Realized and Unrealized Gain (Loss) | ||||||||
Net realized gain from: | ||||||||
Investments | 289,051 | — | ||||||
Financial futures contracts | 18,227 | — | ||||||
Investments and financial futures contracts allocated from the Master Portfolio | — | 19,291,678 | ||||||
|
| |||||||
| 307,278 | 19,291,678 | |||||||
|
| |||||||
Net change in unrealized appreciation (depreciation) on: | ||||||||
Investments | 414,021 | — | ||||||
Financial futures contracts | (2,029 | ) | — | |||||
Investments and financial futures contracts allocated from the Master Portfolio | — | 9,638,941 | ||||||
|
| |||||||
| 411,992 | 9,638,941 | |||||||
|
| |||||||
Net realized and unrealized gain | 719,270 | 28,930,619 | ||||||
|
| |||||||
Net Increase in Net Assets Resulting from Operations | $ | 764,519 | $ | 27,461,754 | ||||
|
| |||||||
See Notes to Financial Statements.
| 16 | ANNUAL REPORT | MAY 31, 2015 |
| Statements of Changes in Net Assets |
| BlackRock Disciplined Small Cap Core Fund | BlackRock Small Cap Growth Fund II | |||||||||||||||||
| Year Ended May 31, | Year Ended May 31, | |||||||||||||||||
| Increase (Decrease) in Net Assets: | 2015 | 2014 | 2015 | 2014 | ||||||||||||||
| Operations | ||||||||||||||||||
Net investment income (loss) | $ | 45,249 | $ | 34,302 | $ | (1,468,865 | ) | $ | (2,058,841 | ) | ||||||||
Net realized gain | 307,278 | 730,831 | 19,291,678 | 47,784,879 | ||||||||||||||
Net change in unrealized appreciation (depreciation) | 411,992 | 352,393 | 9,638,941 | (1,607,784 | ) | |||||||||||||
|
|
|
| |||||||||||||||
Net increase in net assets resulting from operations | 764,519 | 1,117,526 | 27,461,754 | 44,118,254 | ||||||||||||||
|
|
|
| |||||||||||||||
| Distributions to Shareholders From1 | ||||||||||||||||||
Net investment income: | ||||||||||||||||||
Institutional | (19,895 | ) | (74,355 | ) | — | — | ||||||||||||
Investor A | (2,806 | ) | (1,244 | ) | — | — | ||||||||||||
Investor C | — | (401 | ) | — | — | |||||||||||||
Net realized gain: | ||||||||||||||||||
Institutional | (581,949 | ) | (275,293 | ) | (9,205,191 | ) | (15,959,070 | ) | ||||||||||
Investor A | (98,084 | ) | (5,149 | ) | (9,863,810 | ) | (18,003,108 | ) | ||||||||||
Investor B | — | — | (165,249 | ) | (505,040 | ) | ||||||||||||
Investor C | (11,182 | ) | (2,615 | ) | (6,724,128 | ) | (11,680,736 | ) | ||||||||||
Class R | — | — | (3,743,363 | ) | (7,688,189 | ) | ||||||||||||
|
|
|
| |||||||||||||||
Decrease in net assets resulting from distributions to shareholders | (713,916 | ) | (359,057 | ) | (29,701,741 | ) | (53,836,143 | ) | ||||||||||
|
|
|
| |||||||||||||||
| Capital Share Transactions | ||||||||||||||||||
Net increase (decrease) in net assets derived from capital share transactions | 2,024,918 | 1,114,412 | (10,300,360 | ) | 25,396,774 | |||||||||||||
|
|
|
| |||||||||||||||
| Net Assets | ||||||||||||||||||
Total increase (decrease) in net assets | 2,075,521 | 1,872,881 | (12,540,347 | ) | 15,678,885 | |||||||||||||
Beginning of year | 7,094,971 | 5,222,090 | 231,593,690 | 215,914,805 | ||||||||||||||
|
|
|
| |||||||||||||||
End of year | $ | 9,170,492 | $ | 7,094,971 | $ | 219,053,343 | $ | 231,593,690 | ||||||||||
|
|
|
| |||||||||||||||
Undistributed (distributions in excess of) net investment income, end of year | $ | 21,861 | $ | (1,100 | ) | $ | 10,139 | $ | 11,930 | |||||||||
|
|
|
| |||||||||||||||
| 1 | Distributions for annual periods determined in accordance with federal income tax regulations. |
See Notes to Financial Statements.
| ANNUAL REPORT | MAY 31, 2015 | 17 |
| Financial Highlights | BlackRock Disciplined Small Cap Core Fund |
| Institutional | Investor A | Investor C | ||||||||||||||||||||||||||||||||||||||
Period March 14, 20131 to May 31, 2013 | Period March 14, 20131 to May 31, 2013 | Period March 14, 20131 to May 31, 2013 | ||||||||||||||||||||||||||||||||||||||
| Year Ended May 31, | Year Ended May 31, | Year Ended May 31, | ||||||||||||||||||||||||||||||||||||||
| 2015 | 2014 | 2015 | 2014 | 2015 | 2014 | |||||||||||||||||||||||||||||||||||
| Per Share Operating Performance | ||||||||||||||||||||||||||||||||||||||||
Net asset value, beginning of period | $ | 11.80 | $ | 10.37 | $ | 10.00 | $ | 11.78 | $ | 10.37 | $ | 10.00 | $ | 11.71 | $ | 10.35 | $ | 10.00 | ||||||||||||||||||||||
|
|
|
|
|
| |||||||||||||||||||||||||||||||||||
Net investment income (loss)2 | 0.08 | 0.07 | 0.02 | 0.05 | (0.01 | ) | 0.01 | (0.04 | ) | (0.06 | ) | (0.00 | )3 | |||||||||||||||||||||||||||
Net realized and unrealized gain | 1.02 | 2.06 | 0.35 | 1.01 | 2.10 | 0.36 | 1.02 | 2.05 | 0.35 | |||||||||||||||||||||||||||||||
|
|
|
|
|
| |||||||||||||||||||||||||||||||||||
Net increase from investment operations | 1.10 | 2.13 | 0.37 | 1.06 | 2.09 | 0.37 | 0.98 | 1.99 | 0.35 | |||||||||||||||||||||||||||||||
|
|
|
|
|
| |||||||||||||||||||||||||||||||||||
Distributions from:4 | ||||||||||||||||||||||||||||||||||||||||
Net investment income | (0.04 | ) | (0.15 | ) | — | (0.02 | ) | (0.13 | ) | — | — | (0.08 | ) | — | ||||||||||||||||||||||||||
Net realized gain | (1.12 | ) | (0.55 | ) | — | (1.11 | ) | (0.55 | ) | — | (1.09 | ) | (0.55 | ) | — | |||||||||||||||||||||||||
|
|
|
|
|
| |||||||||||||||||||||||||||||||||||
Total distributions | (1.16 | ) | (0.70 | ) | — | (1.13 | ) | (0.68 | ) | — | (1.09 | ) | (0.63 | ) | — | |||||||||||||||||||||||||
|
|
|
|
|
| |||||||||||||||||||||||||||||||||||
Net asset value, end of period | $ | 11.74 | $ | 11.80 | $ | 10.37 | $ | 11.71 | $ | 11.78 | $ | 10.37 | $ | 11.60 | $ | 11.71 | $ | 10.35 | ||||||||||||||||||||||
|
|
|
|
|
| |||||||||||||||||||||||||||||||||||
| Total Return5 | ||||||||||||||||||||||||||||||||||||||||
Based on net asset value | 10.24 | % | 20.85 | % | 3.70 | %6 | 9.96 | % | 20.49 | % | 3.70 | %6 | 9.22 | % | 19.53 | % | 3.50 | %6 | ||||||||||||||||||||||
|
|
|
|
|
| |||||||||||||||||||||||||||||||||||
| Ratios to Average Net Assets | ||||||||||||||||||||||||||||||||||||||||
Total expenses | 3.43 | % | 6.26 | % | 7.68 | %7,8 | 3.70 | % | 8.25 | % | 8.16 | %7,8 | 4.56 | % | 7.86 | % | 8.91 | %7,8 | ||||||||||||||||||||||
|
|
|
|
|
| |||||||||||||||||||||||||||||||||||
Total expenses after fees waived and/or reimbursed | 0.70 | % | 0.71 | %9 | 0.70 | %7 | 0.95 | % | 0.95 | % | 0.95 | %7 | 1.70 | % | 1.71 | %9 | 1.70 | %7 | ||||||||||||||||||||||
|
|
|
|
|
| |||||||||||||||||||||||||||||||||||
Net investment income (loss) | 0.66 | % | 0.61 | % | 0.93 | %7 | 0.43 | % | (0.11 | )% | 0.67 | %7 | (0.36 | )% | (0.53 | )% | (0.08 | )%7 | ||||||||||||||||||||||
|
|
|
|
|
| |||||||||||||||||||||||||||||||||||
| Supplemental Data | ||||||||||||||||||||||||||||||||||||||||
Net assets, end of period (000) | $ | 6,122 | $ | 6,095 | $ | 5,181 | $ | 2,736 | $ | 899 | $ | 21 | $ | 313 | $ | 101 | $ | 21 | ||||||||||||||||||||||
|
|
|
|
|
| |||||||||||||||||||||||||||||||||||
Portfolio turnover rate | 148 | % | 145 | % | 67 | % | 148 | % | 145 | % | 67 | % | 148 | % | 145 | % | 67 | % | ||||||||||||||||||||||
|
|
|
|
|
| |||||||||||||||||||||||||||||||||||
| 1 | Commencement of operations. |
| 2 | Based on average shares outstanding. |
| 3 | Amount is greater than $(0.005) per share. |
| 4 | Distributions for annual periods determined in accordance with federal income tax regulations. |
| 5 | Where applicable, excludes the effects of any sales charges and assumes the reinvestment of distributions. |
| 6 | Aggregate total return. |
| 7 | Annualized. |
| 8 | Organization costs were not annualized in the calculation of the expense ratios. If these expenses were annualized, the total expenses for Institutional, Investor A and Investor C would have been 8.75%, 9.23% and 9.98%, respectively. |
| 9 | Includes certain tax expenses. Excluding such tax expenses, total expenses after fees waived and/or reimbursed would have been 0.70% and 1.70% for Institutional and Investor C, respectively. |
See Notes to Financial Statements.
| 18 | ANNUAL REPORT | MAY 31, 2015 |
| Financial Highlights | BlackRock Small Cap Growth Fund II |
| Institutional | ||||||||||||||||||||
| Year Ended May 31, | ||||||||||||||||||||
| 2015 | 2014 | 2013 | 2012 | 2011 | ||||||||||||||||
| Per Share Operating Performance | ||||||||||||||||||||
Net asset value, beginning of year | $ | 14.63 | $ | 15.20 | $ | 13.22 | $ | 15.67 | $ | 11.64 | ||||||||||
|
| |||||||||||||||||||
Net investment loss1 | (0.04 | ) | (0.06 | ) | (0.01 | ) | (0.12 | ) | (0.13 | ) | ||||||||||
Net realized and unrealized gain (loss) | 1.79 | 3.00 | 3.72 | (2.03 | ) | 4.16 | 2 | |||||||||||||
|
| |||||||||||||||||||
Net increase (decrease) from investment operations | 1.75 | 2.94 | 3.71 | (2.15 | ) | 4.03 | ||||||||||||||
|
| |||||||||||||||||||
Distributions from net realized gain3 | (1.76 | ) | (3.51 | ) | (1.73 | ) | (0.30 | ) | — | |||||||||||
|
| |||||||||||||||||||
Net asset value, end of year | $ | 14.62 | $ | 14.63 | $ | 15.20 | $ | 13.22 | $ | 15.67 | ||||||||||
|
| |||||||||||||||||||
| Total Return4 | ||||||||||||||||||||
Based on net asset value | 13.44 | % | 21.70 | % | 30.95 | % | (13.97 | )% | 34.62 | %5 | ||||||||||
|
| |||||||||||||||||||
| Ratios to Average Net Assets6 | ||||||||||||||||||||
Total expenses | 1.14 | %7 | 1.14 | %7 | 1.26 | %8 | 1.29 | %9 | 1.24 | %9 | ||||||||||
|
| |||||||||||||||||||
Net investment loss | (0.28 | )% | (0.41 | )% | (0.04 | )% | (0.84 | )% | (0.99 | )% | ||||||||||
|
| |||||||||||||||||||
| Supplemental Data | ||||||||||||||||||||
Net assets, end of year (000) | $ | 73,608 | $ | 74,962 | $ | 65,186 | $ | 58,673 | $ | 155,169 | ||||||||||
|
| |||||||||||||||||||
Portfolio turnover rate of the Master Portfolio | 140 | % | 152 | % | 165 | % | 143 | % | 127 | % | ||||||||||
|
| |||||||||||||||||||
| 1 | Based on average shares outstanding. |
| 2 | Includes redemption fees, which are less than $0.005 per share. |
| 3 | Distributions for annual periods determined in accordance with federal income tax regulations. |
| 4 | Where applicable, assumes the reinvestment of distributions. |
| 5 | Includes redemption fees received by the Fund, which had no impact on the Fund’s total return. |
| 6 | Includes the Fund’s share of the Master Portfolio’s allocated net expenses and/or net investment loss. |
| 7 | Includes the Fund’s share of the Master Portfolio’s allocated fees waived of 0.16%. |
| 8 | Includes the Fund’s share of the Master Portfolio’s allocated fees waived of 0.01%. |
| 9 | Includes the Fund’s share of the Master Portfolio’s allocated fees waived of less than 0.01%. |
See Notes to Financial Statements.
| ANNUAL REPORT | MAY 31, 2015 | 19 |
| Financial Highlights (continued) | BlackRock Small Cap Growth Fund II |
| Investor A | ||||||||||||||||||||
| Year Ended May 31, | ||||||||||||||||||||
| 2015 | 2014 | 2013 | 2012 | 2011 | ||||||||||||||||
| Per Share Operating Performance | ||||||||||||||||||||
Net asset value, beginning of year | $ | 13.93 | $ | 14.63 | $ | 12.81 | $ | 15.22 | $ | 11.34 | ||||||||||
|
| |||||||||||||||||||
Net investment loss1 | (0.07 | ) | (0.13 | ) | (0.05 | ) | (0.14 | ) | (0.16 | ) | ||||||||||
Net realized and unrealized gain (loss) | 1.70 | 2.88 | 3.57 | (1.97 | ) | 4.04 | 2 | |||||||||||||
|
| |||||||||||||||||||
Net increase (decrease) from investment operations | 1.63 | 2.75 | 3.52 | (2.11 | ) | 3.88 | ||||||||||||||
|
| |||||||||||||||||||
Distributions from net realized gain3 | (1.73 | ) | (3.45 | ) | (1.70 | ) | (0.30 | ) | — | |||||||||||
|
| |||||||||||||||||||
Net asset value, end of year | $ | 13.83 | $ | 13.93 | $ | 14.63 | $ | 12.81 | $ | 15.22 | ||||||||||
|
| |||||||||||||||||||
| Total Return4 | ||||||||||||||||||||
Based on net asset value | 13.24 | % | 21.08 | % | 30.45 | % | (14.12 | )% | 34.22 | %5 | ||||||||||
|
| |||||||||||||||||||
| Ratios to Average Net Assets6 | ||||||||||||||||||||
Total expenses | 1.36 | %7 | 1.62 | %7 | 1.62 | %8 | 1.57 | %9 | 1.53 | %9 | ||||||||||
|
| |||||||||||||||||||
Net investment loss | (0.49 | )% | (0.88 | )% | (0.34 | )% | (1.11 | )% | (1.28 | )% | ||||||||||
|
| |||||||||||||||||||
| Supplemental Data | ||||||||||||||||||||
Net assets, end of year (000) | $ | 76,423 | $ | 80,144 | $ | 73,799 | $ | 75,467 | $ | 219,005 | ||||||||||
|
| |||||||||||||||||||
Portfolio turnover rate of the Master Portfolio | 140 | % | 152 | % | 165 | % | 143 | % | 127 | % | ||||||||||
|
| |||||||||||||||||||
| 1 | Based on average shares outstanding. |
| 2 | Includes redemption fees, which are less than $0.005 per share. |
| 3 | Distributions for annual periods determined in accordance with federal income tax regulations. |
| 4 | Where applicable, excludes the effects of any sales charges and assumes the reinvestment of distributions. |
| 5 | Includes redemption fees received by the Fund, which had no impact on the Fund’s total return. |
| 6 | Includes the Fund’s share of the Master Portfolio’s allocated net expenses and/or net investment loss. |
| 7 | Includes the Fund’s share of the Master Portfolio’s allocated fees waived of 0.16%. |
| 8 | Includes the Fund’s share of the Master Portfolio’s allocated fees waived of 0.02%. |
| 9 | Includes the Fund’s share of the Master Portfolio’s allocated fees waived of less than 0.01%. |
See Notes to Financial Statements.
| 20 | ANNUAL REPORT | MAY 31, 2015 |
| Financial Highlights (continued) | BlackRock Small Cap Growth Fund II |
| Investor B | ||||||||||||||||||||
| Year Ended May 31, | ||||||||||||||||||||
| 2015 | 2014 | 2013 | 2012 | 2011 | ||||||||||||||||
| Per Share Operating Performance | ||||||||||||||||||||
Net asset value, beginning of year | $ | 11.80 | $ | 12.79 | $ | 11.43 | $ | 13.77 | $ | 10.38 | ||||||||||
|
| |||||||||||||||||||
Net investment loss1 | (0.17 | ) | (0.19 | ) | (0.17 | ) | (0.27 | ) | (0.28 | ) | ||||||||||
Net realized and unrealized gain (loss) | 1.40 | 2.48 | 3.14 | (1.77 | ) | 3.67 | 2 | |||||||||||||
|
| |||||||||||||||||||
Net increase (decrease) from investment operations | 1.23 | 2.29 | 2.97 | (2.04 | ) | 3.39 | ||||||||||||||
|
| |||||||||||||||||||
Distributions from net realized gain3 | (1.71 | ) | (3.28 | ) | (1.61 | ) | (0.30 | ) | — | |||||||||||
|
| |||||||||||||||||||
Net asset value, end of year | $ | 11.32 | $ | 11.80 | $ | 12.79 | $ | 11.43 | $ | 13.77 | ||||||||||
|
| |||||||||||||||||||
| Total Return4 | ||||||||||||||||||||
Based on net asset value | 12.06 | % | 20.29 | % | 28.99 | % | (15.12 | )% | 32.66 | %5 | ||||||||||
|
| |||||||||||||||||||
| Ratios to Average Net Assets6 | ||||||||||||||||||||
Total expenses | 2.40 | %7 | 2.40 | %7 | 2.79 | %8 | 2.72 | %9 | 2.71 | %9 | ||||||||||
|
| |||||||||||||||||||
Net investment loss | (1.54 | )% | (1.53 | )% | (1.50 | )% | (2.30 | )% | (2.46 | )% | ||||||||||
|
| |||||||||||||||||||
| Supplemental Data | ||||||||||||||||||||
Net assets, end of year (000) | $ | 262 | $ | 1,217 | $ | 2,350 | $ | 4,587 | $ | 8,363 | ||||||||||
|
| |||||||||||||||||||
Portfolio turnover rate of the Master Portfolio | 140 | % | 152 | % | 165 | % | 143 | % | 127 | % | ||||||||||
|
| |||||||||||||||||||
| 1 | Based on average shares outstanding. |
| 2 | Includes redemption fees, which are less than $0.005 per share. |
| 3 | Distributions for annual periods determined in accordance with federal income tax regulations. |
| 4 | Where applicable, excludes the effects of any sales charges and assumes the reinvestment of distributions. |
| 5 | Includes redemption fees received by the Fund, which had no impact on the Fund’s total return. |
| 6 | Includes the Fund’s share of the Master Portfolio’s allocated net expenses and/or net investment loss. |
| 7 | Includes the Fund’s share of the Master Portfolio’s allocated fees waived of 0.16%. |
| 8 | Includes the Fund’s share of the Master Portfolio’s allocated fees waived of 0.01%. |
| 9 | Includes the Fund’s share of the Master Portfolio’s allocated fees waived of less than 0.01%. |
See Notes to Financial Statements.
| ANNUAL REPORT | MAY 31, 2015 | 21 |
| Financial Highlights (continued) | BlackRock Small Cap Growth Fund II |
| Investor C | ||||||||||||||||||||
| Year Ended May 31, | ||||||||||||||||||||
| 2015 | 2014 | 2013 | 2012 | 2011 | ||||||||||||||||
| Per Share Operating Performance | ||||||||||||||||||||
Net asset value, beginning of year | $ | 11.71 | $ | 12.79 | $ | 11.44 | $ | 13.76 | $ | 10.35 | ||||||||||
|
| |||||||||||||||||||
Net investment loss1 | (0.15 | ) | (0.19 | ) | (0.15 | ) | (0.25 | ) | (0.26 | ) | ||||||||||
Net realized and unrealized gain (loss) | 1.38 | 2.47 | 3.15 | (1.77 | ) | 3.67 | 2 | |||||||||||||
|
| |||||||||||||||||||
Net increase (decrease) from investment operations | 1.23 | 2.28 | 3.00 | (2.02 | ) | 3.41 | ||||||||||||||
|
| |||||||||||||||||||
Distributions from net realized gain3 | (1.71 | ) | (3.36 | ) | (1.65 | ) | (0.30 | ) | — | |||||||||||
|
| |||||||||||||||||||
Net asset value, end of year | $ | 11.23 | $ | 11.71 | $ | 12.79 | $ | 11.44 | $ | 13.76 | ||||||||||
|
| |||||||||||||||||||
| Total Return4 | ||||||||||||||||||||
Based on net asset value | 12.24 | % | 20.24 | % | 29.31 | % | (14.98 | )% | 32.95 | %5 | ||||||||||
|
| |||||||||||||||||||
| Ratios to Average Net Assets6 | ||||||||||||||||||||
Total expenses | 2.29 | %7 | 2.30 | %7 | 2.52 | %8 | 2.52 | %9 | 2.48 | %9 | ||||||||||
|
| |||||||||||||||||||
Net investment loss | (1.42 | )% | (1.55 | )% | (1.29 | )% | (2.10 | )% | (2.24 | )% | ||||||||||
|
| |||||||||||||||||||
| Supplemental Data | ||||||||||||||||||||
Net assets, end of year (000) | $ | 44,179 | $ | 45,686 | $ | 43,649 | $ | 40,529 | $ | 62,040 | ||||||||||
|
| |||||||||||||||||||
Portfolio turnover rate of the Master Portfolio | 140 | % | 152 | % | 165 | % | 143 | % | 127 | % | ||||||||||
|
| |||||||||||||||||||
| 1 | Based on average shares outstanding. |
| 2 | Includes redemption fees, which are less than $0.005 per share. |
| 3 | Distributions for annual periods determined in accordance with federal income tax regulations. |
| 4 | Where applicable, excludes the effects of any sales charges and assumes the reinvestment of distributions. |
| 5 | Includes redemption fees received by the Fund, which had no impact on the Fund’s total return. |
| 6 | Includes the Fund’s share of the Master Portfolio’s allocated net expenses and/or net investment loss. |
| 7 | Includes the Fund’s share of the Master Portfolio’s allocated fees waived of 0.16%. |
| 8 | Includes the Fund’s share of the Master Portfolio’s allocated fees waived of 0.02%. |
| 9 | Includes the Fund’s share of the Master Portfolio’s allocated fees waived of less than 0.01%. |
See Notes to Financial Statements.
| 22 | ANNUAL REPORT | MAY 31, 2015 |
| Financial Highlights (concluded) | BlackRock Small Cap Growth Fund II |
| Class R | ||||||||||||||||||||
| Year Ended May 31, | ||||||||||||||||||||
| 2015 | 2014 | 2013 | 2012 | 2011 | ||||||||||||||||
| Per Share Operating Performance | ||||||||||||||||||||
Net asset value, beginning of year | $ | 12.95 | $ | 13.80 | $ | 12.19 | $ | 14.55 | $ | 10.88 | ||||||||||
|
| |||||||||||||||||||
Net investment loss1 | (0.10 | ) | (0.12 | ) | (0.08 | ) | (0.19 | ) | (0.20 | ) | ||||||||||
Net realized and unrealized gain (loss) | 1.55 | 2.70 | 3.38 | (1.87 | ) | 3.87 | 2 | |||||||||||||
|
| |||||||||||||||||||
Net increase (decrease) from investment operations | 1.45 | 2.58 | 3.30 | (2.06 | ) | 3.67 | ||||||||||||||
|
| |||||||||||||||||||
Distributions from net realized gain3 | (1.73 | ) | (3.43 | ) | (1.69 | ) | (0.30 | ) | — | |||||||||||
|
| |||||||||||||||||||
Net asset value, end of year | $ | 12.67 | $ | 12.95 | $ | 13.80 | $ | 12.19 | $ | 14.55 | ||||||||||
|
| |||||||||||||||||||
| Total Return4 | ||||||||||||||||||||
Based on net asset value | 12.84 | % | 21.07 | % | 30.05 | % | (14.43 | )% | 33.73 | %5 | ||||||||||
|
| |||||||||||||||||||
| Ratios to Average Net Assets6 | ||||||||||||||||||||
Total expenses | 1.73 | %7 | 1.67 | %7 | 1.89 | %8 | 1.91 | %9 | 1.90 | %9 | ||||||||||
|
| |||||||||||||||||||
Net investment loss | (0.86 | )% | (0.92 | )% | (0.60 | )% | (1.49 | )% | (1.65 | )% | ||||||||||
|
| |||||||||||||||||||
| Supplemental Data | ||||||||||||||||||||
Net assets, end of year (000) | $ | 24,581 | $ | 29,585 | $ | 30,932 | $ | 37,237 | $ | 59,251 | ||||||||||
|
| |||||||||||||||||||
Portfolio turnover rate of the Master Portfolio | 140 | % | 152 | % | 165 | % | 143 | % | 127 | % | ||||||||||
|
| |||||||||||||||||||
| 1 | Based on average shares outstanding. |
| 2 | Includes redemption fees, which are less than $0.005 per share. |
| 3 | Distributions for annual periods determined in accordance with federal income tax regulations. |
| 4 | Where applicable, assumes the reinvestment of distributions. |
| 5 | Includes redemption fees received by the Fund, which had no impact on the Fund’s total return. |
| 6 | Includes the Fund’s share of the Master Portfolio’s allocated net expenses and/or net investment loss. |
| 7 | Includes the Fund’s share of the Master Portfolio’s allocated fees waived of 0.16%. |
| 8 | Includes the Fund’s share of the Master Portfolio’s allocated fees waived of 0.01%. |
| 9 | Includes the Fund’s share of the Master Portfolio’s allocated fees waived of less than 0.01%. |
See Notes to Financial Statements.
| ANNUAL REPORT | MAY 31, 2015 | 23 |
| Notes to Financial Statements |
1. Organization:
BlackRock Disciplined Small Cap Core Fund (“Disciplined Small Cap Core Fund”), a series of BlackRock FundsSM (the “Trust”), and BlackRock Small Cap Growth Fund II (“Small Cap Growth Fund II”), a series of BlackRock Series, Inc. (the “Corporation”) (collectively, the “Funds” or individually, a “Fund”), are each registered under the Investment Company Act of 1940, as amended (the “1940 Act”), as a diversified, open-end management investment company. The Trust is organized as a Massachusetts business trust. The Corporation is organized as a Maryland corporation. Small Cap Growth Fund II seeks to achieve its investment objective by investing all of its assets in BlackRock Master Small Cap Growth Portfolio (the “Master Portfolio”) of BlackRock Master LLC (the “Master LLC”), an affiliate of Small Cap Growth Fund II, which has the same investment objective and strategies as Small Cap Growth Fund II. The value of Small Cap Growth Fund II’s investment in the Master Portfolio reflects Small Cap Growth Fund II’s proportionate interest in the net assets of the Master Portfolio. The performance of Small Cap Growth Fund II is directly affected by the performance of the Master Portfolio. At May 31, 2015, the percentage of the Master Portfolio owned by Small Cap Growth Fund II was 100%. The financial statements of the Master Portfolio, including the Schedule of Investments, are included elsewhere in this report and should be read in conjunction with Small Cap Growth Fund II’s financial statements.
Each Fund offers multiple classes of shares. All classes of shares have identical voting, dividend, liquidation and other rights and are subject to the same terms and conditions, except that certain classes bear expenses related to the shareholder servicing and distribution of such shares. Institutional Shares are sold only to certain eligible investors. Investor B Shares are only available through exchanges and distribution reinvestments by current holders and for purchase by certain employer-sponsored retirement plans. Investor A and Investor C Shares are generally available through financial intermediaries. Class R Shares are available only to certain employer-sponsored retirement plans. Each class has exclusive voting rights with respect to matters relating to its shareholder servicing and distribution expenditures (except that Investor B shareholders may vote on material changes to the Investor A distribution and service plan).
| Share Class | Initial Sales Charge | CDSC | Conversion Privilege | |||
Institutional and Class R Shares | No | No | None | |||
Investor A Shares | Yes | No1 | None | |||
Investor B Shares | No | Yes | To Investor A Shares after approximately 8 years | |||
Investor C Shares | No | Yes | None |
| 1 | Investor A Shares may be subject to a CDSC where no initial sales charge was paid at the time of purchase. |
Disciplined Small Cap Core Fund, together with certain other registered investment companies advised by the Manager or its affiliates, is included in a complex of open-end funds referred to as the Equity-Liquidity Complex.
2. Significant Accounting Policies:
The Funds’ financial statements are prepared in conformity with accounting principles generally accepted in the United States of America (“U.S. GAAP”), which may require management to make estimates and assumptions that affect the reported amounts of assets and liabilities in the financial statements and the reported amounts of increases and decreases in net assets from operations during the reporting period. Actual results could differ from those estimates. Each Fund is considered an investment company under U.S. GAAP and follows the accounting and reporting guidance applicable to investment companies. The following is a summary of significant accounting policies followed by the Funds:
Valuation: Disciplined Small Cap Core Fund’s investments are valued at fair value as of the close of trading on the New York Stock Exchange (“NYSE”) (generally 4:00 p.m., Eastern time) (or if the reporting date falls on a day the NYSE is closed, investments are valued at fair value as of the report date). U.S. GAAP defines fair value as the price Disciplined Small Cap Core Fund would receive to sell an asset or pay to transfer a liability in an orderly transaction between market participants at the measurement date. Disciplined Small Cap Core Fund determines the fair values of its financial instruments at market value using independent dealers or pricing services under policies approved by the Board of Trustees of the Trust (the “Board”). The BlackRock Global Valuation Methodologies Committee (the “Global Valuation Committee”) is the committee formed by management to develop global pricing policies and procedures and to provide oversight of the pricing function for Disciplined Small Cap Core Fund for all financial instruments.
Small Cap Growth Fund II’s policy is to fair value its financial instruments at market value. Small Cap Growth Fund II records its investment in the Master Portfolio at fair value based on Small Cap Growth Fund II’s proportionate interest in the net assets of the Master Portfolio. Valuation of securities held by the Master Portfolio is discussed in Note 2 of the Master Portfolio’s Notes to Financial Statements, which are included elsewhere in this report.
Disciplined Small Cap Core Fund’s equity investments traded on a recognized securities exchange are valued at the official close price each day, if available. For equity investments traded on more than one exchange, the official close price on the exchange where the stock is primarily traded is used. Equity investments traded on a recognized exchange for which there were no sales on that day may be valued at the last available bid (long positions) or ask (short positions) price. Financial futures contracts traded on exchanges are valued at their last sale price. Investments in open-end registered investment companies are valued at NAV each business day.
| 24 | ANNUAL REPORT | MAY 31, 2015 |
| Notes to Financial Statements (continued) |
Disciplined Small Cap Core Fund values its investment in BlackRock Liquidity Series, LLC, Money Market Series (the “Money Market Series”) at fair value, which is ordinarily based upon its pro rata ownership in the underlying fund’s net assets. The Money Market Series seeks current income consistent with maintaining liquidity and preserving capital. Although the Money Market Series is not registered under the 1940 Act, its investments will follow the parameters of investments by a money market fund that is subject to Rule 2a-7 under the 1940 Act. Disciplined Small Cap Core Fund may withdraw up to 25% of its investment daily, although the manager of the Money Market Series, in its sole discretion, may permit an investor to withdraw more than 25% on any one day.
In the event that the application of these methods of valuation results in a price for an investment that is deemed not to be representative of the market value of such investment, or if a price is not available, the investment will be valued by the Global Valuation Committee, or its delegate, in accordance with a policy approved by the Board as reflecting fair value (“Fair Value Investments”). When determining the price for Fair Value Investments, the Global Valuation Committee, or its delegate, seeks to determine the price that Disciplined Small Cap Core Fund might reasonably expect to receive or pay from the current sale or purchase of that asset or liability in an arm’s-length transaction. Fair value determinations shall be based upon all available factors that the Global Valuation Committee, or its delegate, deems relevant consistent with the principles of fair value measurement, which include the market approach, income approach and/or in the case of recent investments, the cost approach, as appropriate. The market approach generally consists of using comparable market transactions. The income approach generally is used to discount future cash flows to present value and is adjusted for liquidity as appropriate. These factors include but are not limited to: (i) attributes specific to the investment or asset; (ii) the principal market for the investment or asset; (iii) the customary participants in the principal market for the investment or asset; (iv) data assumptions by market participants for the investment or asset, if reasonably available; (v) quoted prices for similar investments or assets in active markets; and (vi) other factors, such as future cash flows, interest rates, yield curves, volatilities, prepayment speeds, loss severities, credit risks, recovery rates, liquidation amounts and/or default rates. Due to the inherent uncertainty of valuations of such investments, the fair values may differ from the values that would have been used had an active market existed. The Global Valuation Committee, or its delegate, employs various methods for calibrating valuation approaches for investments where an active market does not exist, including regular due diligence of Disciplined Small Cap Core Fund’s pricing vendors, regular reviews of key inputs and assumptions, transactional back-testing or disposition analysis to compare unrealized gains and losses to realized gains and losses, reviews of missing or stale prices and large movements in market values and reviews of any market related activity. The pricing of all Fair Value Investments is subsequently reported to the Board or a committee thereof on a quarterly basis.
Segregation and Collateralization: In cases where Disciplined Small Cap Core Fund enters into certain investments (e.g., financial futures contracts) that would be “senior securities” for 1940 Act purposes, Disciplined Small Cap Core Fund may segregate or designate on its books and records cash or liquid securities having a market value at least equal to the amount of Disciplined Small Cap Core Fund’s future obligations under such investments. Doing so allows the investment to be excluded from treatment as a “senior security.” Furthermore, if required by an exchange or counterparty agreement, Disciplined Small Cap Core Fund may be required to deliver/deposit cash and/or securities to/with an exchange, or broker-dealer or custodian as collateral for certain investments or obligations.
Investment Transactions and Investment Income: For Disciplined Small Cap Core Fund, for financial reporting purposes, investment transactions are recorded on the dates the transactions are entered into (the trade dates). Realized gains and losses on investment transactions are determined on the identified cost basis. Dividend income is recorded on the ex-dividend date. Dividends from foreign securities where the ex-dividend date may have passed are subsequently recorded when Disciplined Small Cap Core Fund is informed of the ex-dividend date. Under the applicable foreign tax laws, a withholding tax at various rates may be imposed on capital gains, dividends and interest. Upon notification from issuers, some of the dividend income received from a real estate investment trust may be redesignated as a reduction of cost of the related investment and/or realized gain. For Small Cap Growth Fund II, for financial reporting purposes, contributions to and withdrawals from the Master Portfolio are accounted on a trade date basis. Small Cap Growth Fund II records daily its proportionate share of the Master Portfolio’s income, expenses and realized and unrealized gains and losses. In addition, Small Cap Growth Fund II accrues its own expenses. Income, expenses and realized and unrealized gains and losses are allocated daily to each class based on its relative net assets.
Distributions: Distributions paid by the Funds are recorded on the ex-dividend date. The character and timing of distributions are determined in accordance with federal income tax regulations, which may differ from U.S. GAAP.
Recent Accounting Standard: In June 2014, the Financial Accounting Standards Board issued guidance to improve the financial reporting of reverse repurchase agreements and other similar transactions. The guidance will require expanded disclosure for entities that enter into reverse repurchase agreements and similar transactions accounted for as secured borrowings. It is effective for financial statements with fiscal years beginning on or after December 15, 2014 and for interim periods beginning after March 15, 2015. Management is evaluating the impact, if any, of this guidance on the Funds’ financial statement disclosures.
Other: Expenses directly related to a Fund or its classes are charged to that Fund or the applicable class. Other operating expenses shared by several funds, including other funds managed by the Manager, are prorated among those funds on the basis of relative net assets or other appropriate methods. Expenses directly related to the Funds and other shared expenses prorated to the Funds are allocated daily to each class based on its relative net assets or other appropriate methods.
| ANNUAL REPORT | MAY 31, 2015 | 25 |
| Notes to Financial Statements (continued) |
Disciplined Small Cap Core Fund has an arrangement with its custodian whereby fees may be reduced by credits earned on uninvested cash balances, which, if applicable, are shown as fees paid indirectly in the Statements of Operations. The custodian imposes fees on overdrawn cash balances, which can be offset by accumulated credits earned or may result in additional custody charges.
3. Securities and Other Investments:
Securities Lending: Disciplined Small Cap Core Fund may lend its securities to approved borrowers, such as brokers, dealers and other financial institutions. The borrower pledges and maintains with Disciplined Small Cap Core Fund collateral consisting of cash, an irrevocable letter of credit issued by a bank, or securities issued or guaranteed by the U.S. Government. The initial collateral received by Disciplined Small Cap Core Fund is required to have a value of at least 102% of the current value of the loaned securities for securities traded on U.S. exchanges and a value of at least 105% for all other securities. The collateral is maintained thereafter at a value equal to at least 100% of the current market value of the securities on loan. The market value of the loaned securities is determined at the close of each business day of Disciplined Small Cap Core Fund and any additional required collateral is delivered to Disciplined Small Cap Core Fund on the next business day. During the term of the loan, Disciplined Small Cap Core Fund is entitled to all distributions made on or in respect of the loaned securities. Loans of securities are terminable at any time and the borrower, after notice, is required to return borrowed securities within the standard time period for settlement of securities transactions.
The market value of securities on loan and the value of the related collateral are shown separately in the Statements of Assets and Liabilities as a component of investments at value – unaffiliated, and collateral on securities loaned at value, respectively. As of May 31, 2015, any securities on loan were collateralized by cash. The cash collateral invested by the securities lending agent, BlackRock Investment Management, LLC (“BIM”), if any, is disclosed in the Schedule of Investments.
Securities lending transactions are entered into by Disciplined Small Cap Core Fund under Master Securities Lending Agreements (each, an “MSLA”) which provide the right, in the event of default (including bankruptcy or insolvency), for the non-defaulting party to liquidate the collateral and calculate a net exposure to the defaulting party or request additional collateral. In the event that a borrower defaults, Disciplined Small Cap Core Fund, as lender, would offset the market value of the collateral received against the market value of the securities loaned. When the value of the collateral is greater than that of the market value of the securities loaned, the lender is left with a net amount payable to the defaulting party. However, bankruptcy or insolvency laws of a particular jurisdiction may impose restrictions on or prohibitions against such a right of offset in the event of an MSLA counterparty’s bankruptcy or insolvency. Under the MSLA, the borrower can resell or re-pledge the loaned securities, and Disciplined Small Cap Core Fund can reinvest cash collateral, or, upon an event of default, resell or re-pledge the collateral.
As of May 31, 2015, the following table is a summary of Disciplined Small Cap Core Fund’s securities lending agreements by counterparty, which are subject to offset under an MSLA:
| Counterparty | Securities Loaned at Value | Cash Collateral Received1 | Net Amount | ||||||||||||
Deutsche Bank Securities, Inc. | $ | 75,653 | $ | (75,653 | ) | — | |||||||||
JP Morgan Securities LLC | 25,222 | (25,222 | ) | — | |||||||||||
Morgan Stanley | 24,935 | (24,935 | ) | — | |||||||||||
Total | $ | 125,810 | $ | (125,810 | ) | — | |||||||||
| 1 | Collateral with a value of $129,625 has been received in connection with securities lending agreements. Collateral received in excess of the value of securities loaned from the individual counterparty is not shown for financial reporting purposes. |
The risks of securities lending include the risk that the borrower may not provide additional collateral when required or may not return the securities when due. To mitigate these risks, Disciplined Small Cap Core Fund benefits from a borrower default indemnity provided by BIM. BIM’s indemnity allows for full replacement of the securities loaned if the collateral received does not cover the value on the securities loaned in the event of borrower default. Disciplined Small Cap Core Fund could suffer a loss if the value of an investment purchased with cash collateral falls below the market value of loaned securities or if the value of an investment purchased with cash collateral falls below the value of the original cash collateral received.
4. Derivative Financial Instruments:
Disciplined Small Cap Core Fund engages in various portfolio investment strategies using derivative contracts both to increase the returns of Disciplined Small Cap Core Fund and/or to manage economically its exposure to certain risks such as equity risk. These contracts may be transacted on an exchange or over-the-counter (“OTC”).
Financial Futures Contracts: Disciplined Small Cap Core Fund invests in long and/or short positions in financial futures contracts to gain exposure to, or economically hedge against, changes in the value of equity securities (equity risk). Financial futures contracts are agreements between Disciplined Small Cap Core Fund and a counterparty to buy or sell a specific quantity of an underlying instrument at a specified price and at a specified date. Depending on the terms of the particular contract, financial futures contracts are settled either through physical delivery of the underlying instrument on the settlement date or by payment of a cash settlement amount on the settlement date.
| 26 | ANNUAL REPORT | MAY 31, 2015 |
| Notes to Financial Statements (continued) |
Upon entering into a financial futures contract, Disciplined Small Cap Core Fund is required to deposit initial margin with the broker in the form of cash or securities in an amount that varies depending on a contract’s size and risk profile. The initial margin deposit must then be maintained at an established level over the life of the contract. Securities deposited as initial margin are designated on the Schedule of Investments and cash deposited, if any, is recorded on the Statements of Assets and Liabilities as cash pledged for financial futures contracts. Pursuant to the contract, Disciplined Small Cap Core Fund agrees to receive from or pay to the broker an amount of cash equal to the daily fluctuation in value of the contract. Such receipts or payments are known as variation margin. Variation margin is recorded by Disciplined Small Cap Core Fund as unrealized appreciation (depreciation) and, if applicable, as a receivable or payable for variation margin in the Statements of Assets and Liabilities.
When the contract is closed, Disciplined Small Cap Core Fund records a realized gain or loss equal to the difference between the value of the contract at the time it was opened and the value at the time it was closed. The use of financial futures contracts involves the risk of an imperfect correlation in the movements in the price of financial futures contracts and the underlying assets.
The following is a summary of Disciplined Small Cap Core Fund’s derivative financial instruments categorized by risk exposure:
| Fair Values of Derivative Financial Instruments as of May 31, 2015 | ||||||
| Value | ||||||
Statements of Assets and Liabilities Location | Derivative Liabilities | |||||
Equity contracts | Net unrealized appreciation (depreciation)1 | $(2) | ||||
1 Includes cumulative appreciation (depreciation) on financial futures contracts, if any, as reported in the Schedule of Investments. Only current day’s variation margin is reported within the Statements of Assets and Liabilities.
| ||||||
The Effect of Derivative Financial Instruments in the Statements of Operations Year Ended May 31, 2015 | ||||||
| Net Realized Gain from | Net Change in Unrealized Appreciation (Depreciation) on | |||||
Equity contracts: | $18,227 | $(2,029) | ||||
For the year ended May 31, 2015, the average quarterly balances of outstanding derivative financial instruments for Disciplined Small Cap Core Fund were as follows:
Financial futures contracts: | $ | 120,523 |
Counterparty Credit Risk: A derivative contract may suffer a mark-to-market loss if the value of the contract decreases due to an unfavorable change in the market rates or values of the underlying instrument. Losses can also occur if the counterparty does not perform under the contract.
Disciplined Small Cap Core Fund’s risk of loss from counterparty credit risk on OTC derivatives is generally limited to the aggregate unrealized gain less the value of any collateral held by Disciplined Small Cap Core Fund.
With exchange-traded futures, there is less counterparty credit risk to Disciplined Small Cap Core Fund since the exchange or clearinghouse, as counterparty to such instrument, guarantees against a possible default. The clearinghouse stands between the buyer and the seller of the contract; therefore, credit risk is limited to failure of the clearinghouse. While offset rights may exist under applicable law, Disciplined Small Cap Core Fund does not have a contractual right of offset against a clearing broker or clearinghouse in the event of a default (including the bankruptcy or insolvency) of the clearing broker or clearinghouse. Additionally, credit risk exists in exchange-traded futures with respect to initial and variation margin that is held in a clearing broker’s customer accounts. While clearing brokers are required to segregate customer margin from their own assets, in the event that a clearing broker becomes insolvent or goes into bankruptcy and at that time there is a shortfall in the aggregate amount of margin held by the clearing broker for all its clients, typically the shortfall would be allocated on a pro rata basis across all the clearing broker’s customers, potentially resulting in losses to Disciplined Small Cap Core Fund.
5. Investment Advisory Agreement and Other Transactions with Affiliates:
The PNC Financial Services Group, Inc. is the largest stockholder and an affiliate of BlackRock, Inc. (“BlackRock”) for 1940 Act purposes.
The Trust, on behalf of Disciplined Small Cap Core Fund, entered into an Investment Advisory Agreement with the Manager, Disciplined Small Cap Core Fund’s investment advisor, an indirect, wholly owned subsidiary of BlackRock, to provide investment advisory services. The Manager is responsible for the management of Disciplined Small Cap Core Fund’s portfolio and provides the necessary personnel, facilities, equipment and certain other services
| ANNUAL REPORT | MAY 31, 2015 | 27 |
| Notes to Financial Statements (continued) |
to the operations of Disciplined Small Cap Core Fund. For such services, Disciplined Small Cap Core Fund pays the Manager a monthly fee based on a percentage of Disciplined Small Cap Core Fund’s average daily net assets at the following annual rates:
| Average Daily Net Assets | Investment Advisory Fee | |
First $1 Billion | 0.45% | |
$1 Billion - $3 Billion | 0.42% | |
$3 Billion - $5 Billion | 0.41% | |
$5 Billion - $10 Billion | 0.39% | |
Greater than $10 Billion | 0.38% |
The Manager voluntarily agreed to waive its investment advisory fees by the amount of investment advisory fees Disciplined Small Cap Core Fund pays to the Manager indirectly through its investment in affiliated money market funds. This amount is included in fees waived and/or reimbursed by the Manager in the Statements of Operations. However, the Manager does not waive its investment advisory fees by the amount of investment advisory fees paid in connection with Disciplined Small Cap Core Fund’s investments in other affiliated investment companies, if any. For the year ended May 31, 2015, the amount waived was $102.
With respect to Disciplined Small Cap Core Fund, prior to July 1, 2014, BlackRock Fund Advisors (“BFA”), an affiliate of the Manager, served as a sub-advisor to Disciplined Small Cap Core Fund pursuant to a sub-advisory agreement with the Manager, and received for its services a monthly fee from the Manager at an annual rate equal to a percentage of the investment advisory fees paid by Disciplined Small Cap Core Fund to the Manager under the Investment Advisory Agreement. Effective July 1, 2014, the sub-advisory agreement between the Manager and BFA, with respect to the Fund, was terminated.
The Corporation, on behalf of Small Cap Growth Fund II, entered into an Administration Agreement with BlackRock Advisors, LLC (in such capacity, the “Administrator”), an indirect, wholly owned subsidiary of BlackRock, to provide administrative services (other than investment advice and related portfolio activities). For such services, Small Cap Growth Fund II pays the Administrator a monthly fee at an annual rate of 0.20% of the average daily value of Small Cap Growth Fund II’s net assets. Small Cap Growth Fund II does not pay an investment advisory fee or investment management fee.
Each Fund entered into a Distribution Agreement and a Distribution and Service Plan with BlackRock Investments, LLC (“BRIL”), an affiliate of the Manager/Administrator. Pursuant to the Distribution and Service Plan and in accordance with Rule 12b-1 under the 1940 Act, the Funds pay BRIL ongoing service and distribution fees. The fees are accrued daily and paid monthly at annual rates based upon the average daily net assets of the relevant share class of each Fund as follows:
| Investor A | Investor B | Investor C | Class R | |||||
Service Fee | 0.25% | 0.25% | 0.25% | 0.25% | ||||
Distribution Fee | — | 0.75% | 0.75% | 0.25% |
Pursuant to sub-agreements with BRIL, broker-dealers and BRIL provide shareholder servicing and distribution services to each Fund. The ongoing service and/or distribution fee compensates BRIL and each broker-dealer for these services to Investor A, Investor B, Investor C and Class R shareholders.
For the year ended May 31, 2015, the following table shows the class specific service and distribution fees borne directly by each class of each Fund:
| Investor A | Investor B | Investor C | Class R | Total | ||||||||||||||||
Disciplined Small Cap Core Fund | $ 3,867 | — | $ 1,645 | — | $ 5,512 | |||||||||||||||
Small Cap Growth Fund II | $192,351 | $9,650 | $446,054 | $131,973 | $780,028 | |||||||||||||||
Pursuant to written agreements, certain financial intermediaries, some of which may be affiliates, provide the Funds with sub-accounting, recordkeeping, sub-transfer agency and other administrative services with respect to sub-accounts they service. For these services, these entities receive an asset based fee or an annual fee per shareholder account, which will vary depending on share class and/or net assets.
The Manager maintains a call center, which is responsible for providing certain shareholder services to the Funds, such as responding to shareholder inquiries and processing transactions based upon instructions from shareholders with respect to the subscription and redemption of Fund shares. For the year ended May 31, 2015, each Fund reimbursed the Manager the following amounts for costs incurred in running the call center, which are included in transfer agent – class specific in the Statements of Operations:
| Institutional | Investor A | Investor B | Investor C | Class R | Total | |||||||
Disciplined Small Cap Core Fund | $91 | $ 196 | — | $ 64 | — | $ 351 | ||||||
Small Cap Growth Fund II | $69 | $1,456 | $43 | $562 | $58 | $2,188 |
| 28 | ANNUAL REPORT | MAY 31, 2015 |
| Notes to Financial Statements (continued) |
For the year ended May 31, 2015, the following table shows the class specific transfer agent fees borne directly by each class of each Fund:
| Institutional | Investor A | Investor B | Investor C | Class R | Total | |||||||||||||||||||
Disciplined Small Cap Core Fund | $ 503 | $ 2,716 | — | $ 444 | — | $ 3,663 | ||||||||||||||||||
Small Cap Growth Fund II | $171,380 | $145,678 | $4,647 | $163,137 | $80,707 | $565,549 | ||||||||||||||||||
Effective January 1, 2015, the Trust, on behalf of Disciplined Small Cap Core Fund, entered into an Administration Agreement with the Manager, an indirect, wholly owned subsidiary of BlackRock, to provide administrative services. For these services, the Manager receives an administration fee computed daily and payable monthly, based on a percentage of the average daily net assets of Disciplined Small Cap Core Fund. The administration fee, which is shown as administration in the Statements of Operations, is paid at the annual rates below.
| Average Daily Net Assets | Administration Fee | |
First $500 Million | 0.0425% | |
$500 Million — $1 Billion | 0.0400% | |
$1 Billion — $2 Billion | 0.0375% | |
$2 Billion — $4 Billion | 0.0350% | |
$4 Billion — $13 Billion | 0.0325% | |
Greater than $13 Billion | 0.0300% |
In addition, the Manager charges each of the share classes an administration fee, which is shown as administration – class specific in the Statements of Operations, at an annual rate of 0.02% of the average daily net assets of each respective class.
Prior to January 1, 2015, BNY Mellon Investment Servicing (US) Inc. (“BNYMIS”) and the Manager acted as co-administrators for Disciplined Small Cap Core Fund. For these services, the co-administrators receive an administration fee computed daily and payable monthly to each administrator pursuant to separate fee arrangements, based on a percentage of the average daily net assets of Disciplined Small Cap Core Fund. The combined administration fee, which is shown as administration in the Statements of Operations, is paid at the following annual rates. In addition, each of Disciplined Small Cap Core Fund’s share classes is charged an administration fee, which is shown as administration – class specific in the Statements of Operations, based on the following percentages of average daily net assets of each respective class:
| Average Daily Net Assets | Administration Fee | Administration Fee — Class Specific | ||
First $500 Million | 0.075% | 0.025% | ||
$500 Million - $1 Billion | 0.065% | 0.015% | ||
Greater than $1 Billion | 0.055% | 0.005% |
For the year ended May 31, 2015, the following table shows the class specific administration fees borne directly by each class of Disciplined Small Cap Core Fund:
| Institutional | Investor A | Investor C | Total | |||||
| $ 1,357 | $ 341 | $ 36 | $ | 1,734 | ||||
BNYMIS and the Manager may have, at their discretion, voluntarily waived all or any portion of their administration fees for Disciplined Small Cap Core Fund or a share class, which are included in administration fees waived and administration fees waived – class specific in the Statements of Operations.
With respect to Disciplined Small Cap Core Fund, the Manager contractually agreed to waive and/or reimburse fees or expenses in order to limit expenses, excluding interest expense, dividend expense, tax expense, acquired fund fees and expenses and certain other fund expenses, which constitute extraordinary expenses not incurred in the ordinary course of Disciplined Small Cap Core Fund’s business. The expense limitations as a percentage of average daily net assets are as follows: 0.70% for Institutional; 0.95% for Investor A and 1.70% for Investor C. The Manager has agreed not to reduce or discontinue this contractual waiver or reimbursement prior to October 1, 2015 unless approved by the Board, including a majority of the independent Trustees.
These amounts waived or reimbursed are included in fees waived and/or reimbursed by Manager, and shown as administration fees waived, administration fees waived – class specific and transfer agent fees reimbursed – class specific, respectively, in the Statements of Operations. For the year ended May 31, 2015, the amount included in fees waived and/or reimbursed by Manager was $198,993 for Disciplined Small Cap Core Fund.
| ANNUAL REPORT | MAY 31, 2015 | 29 |
| Notes to Financial Statements (continued) |
Class specific waivers and reimbursements are as follows for Disciplined Small Cap Core Fund:
| Institutional | Investor A | Investor C | Total | |||||
Administration Fees Waived | $1,290 | $ 341 | $ 36 | $1,667 | ||||
Transfer Agent Fees Reimbursed | $ 370 | $2,658 | $434 | $3,462 |
If during Disciplined Small Cap Core Fund’s fiscal year the operating expenses of a share class, that at any time during the prior two fiscal years received a waiver or reimbursement from the Manager, are less than the expense limit for that share class, the Manager is entitled to be reimbursed by such share class up to the lesser of (a) the amount of fees waived or expenses reimbursed during those prior two fiscal years under the agreement and (b) the amount by which the expense limit for that share class exceeds the operating expenses of the share class for the current fiscal year, provided that: (1) Disciplined Small Cap Core Fund has more than $50 million in assets for the fiscal year and (2) the Manager or an affiliate continues to serve as Disciplined Small Cap Core Fund’s investment advisor or administrator. In the event the expense limit for a share class is changed subsequent to a fiscal year in which the Manager becomes entitled to reimbursement for fees waived or reimbursed, the amount available to reimburse the Manager shall be calculated by reference to the expense limit for that share class in effect at the time the Manager became entitled to receive such reimbursement, rather than the subsequently changed expense limit for that share class.
On May 31, 2015, Disciplined Small Cap Core Fund’s Fund level and class specific waivers and/or reimbursements subject to possible future recoupment under the expense limitation agreement are as follows:
| Expiring May 31, | ||||||||
| 2016 | 2017 | |||||||
Fund Level | $ | 342,873 | $ | 203,594 | ||||
Institutional | $ | 1,565 | $ | 1,660 | ||||
Investor A | $ | 378 | $ | 2,999 | ||||
Investor C | $ | 123 | $ | 470 | ||||
The following Disciplined Small Cap Core Fund’s Fund level and class specific waivers and/or reimbursements previously recorded by Disciplined Small Cap Core Fund, which were subject to recoupment by the Manager, expired on May 31, 2015:
Fund Level | $ | 71,590 | ||
Institutional | $ | 252 | ||
Investor A | $ | 11 | ||
Investor C | $ | 11 |
For the year ended May 31, 2015, affiliates earned underwriting discounts, direct commissions and dealer concessions on sales of Disciplined Small Cap Core Fund’s Investor A Shares of $584 and Small Cap Growth Fund II’s Investor A Shares of $6,116.
For the year ended May 31, 2015, affiliates received CDSCs in the amount of $108 for Disciplined Small Cap Core Fund’s Investor C Shares and $187, $116 and $2,173 for Small Cap Growth Fund II’s Investor A, Investor B and Investor C Shares, respectively.
The U.S. Securities and Exchange Commission has issued an exemptive order which permits BIM, an affiliate of the Manager, to serve as securities lending agent for Disciplined Small Cap Core Fund, subject to applicable conditions. As securities lending agent, BIM bears all operational costs directly related to securities lending. Disciplined Small Cap Core Fund is responsible for expenses in connection with the investment of cash collateral received for securities on loan (the “collateral investment expenses”). The cash collateral is invested in a private investment company managed by the Manager or its affiliates. However, BIM has agreed to cap the collateral investment expenses of the private investment company to an annual rate of 0.04%. The investment advisor to the private investment company will not charge any advisory fees with respect to shares purchased by Disciplined Small Cap Core Fund.
Securities lending income is equal to the total of income earned from the reinvestment of cash collateral, net of fees and other payments to and from borrowers of securities, and less the collateral investment expenses. Disciplined Small Cap Core Fund retains a portion of securities lending income and remits a remaining portion to BIM as compensation for its services as securities lending agent. Pursuant to a securities lending agreement, BIM may lend securities only when the difference between the borrower rebate rate and the risk free rate exceeds a certain level (such securities, the “specials only securities”).
Pursuant to such agreement, Disciplined Small Cap Core Fund retains 80% of securities lending income. In addition, commencing the business day following the date that the aggregate securities lending income earned across certain funds in the Equity-Liquidity Complex in a calendar year exceeds a specified threshold, Disciplined Small Cap Core Fund, pursuant to the securities lending agreement, will retain for the remainder of the calendar year securities lending income in an amount equal to 85% of securities lending income.
The share of securities lending income earned by Disciplined Small Cap Core Fund is shown as securities lending — affiliated — net in the Statements of Operations. For the year ended May 31, 2015, Disciplined Small Cap Core Fund paid BIM $1,794 for securities lending agent services.
| 30 | ANNUAL REPORT | MAY 31, 2015 |
| Notes to Financial Statements (continued) |
Disciplined Small Cap Core Fund recorded a payment from an affiliate to compensate for foregone securities lending revenue, which is shown as other income – affiliated in the Statements of Operations.
Certain officers and/or trustees/directors of the Trust/Corporation are officers and/or directors of BlackRock or its affiliates. The Funds reimburse the Manager/Administrator for a portion of the compensation paid to the Trust’s/Corporation’s Chief Compliance Officer, which is included in officer and trustees/directors in the Statements of Operations.
6. Purchases and Sales:
For the year ended May 31, 2015, purchases and sales of investments, excluding short-term securities, were $12,495,837 and $11,165,437, respectively, for Disciplined Small Cap Core Fund.
7. Income Tax Information:
It is the Funds’ policy to comply with the requirements of the Internal Revenue Code of 1986, as amended, applicable to regulated investment companies, and to distribute substantially all of their taxable income to their shareholders. Therefore, no federal income tax provision is required.
Each Fund files U.S. federal and various state and local tax returns. No income tax returns are currently under examination. The statute of limitations on Small Cap Growth Fund II’s U.S. federal tax returns remains open for each of the four years ended May 31, 2015. The statutes of limitations on Disciplined Small Cap Core Fund’s U.S. federal, state and local tax returns remain open for the two years ended May 31, 2015 and the period ended May 31, 2013. The statutes of limitations on Small Cap Growth Fund II’s state and local tax returns may remain open for an additional year depending upon the jurisdiction.
Management has analyzed tax laws and regulations and their application to the Funds as of May 31, 2015, inclusive of the open tax return years, and does not believe there are any uncertain tax positions that require recognition of a tax liability in the Funds’ financial statements.
U.S. GAAP requires that certain components of net assets be adjusted to reflect permanent differences between financial and tax reporting. These reclassifications have no effect on net assets or net asset values per share. As of May 31, 2015, the following permanent differences attributable to the sale of stock of passive foreign investment companies and net operating losses were reclassified to the following accounts:
| Disciplined Small Cap Core Fund | Small Cap Growth Fund II | |||||||||
Undistributed net investment income | $ 413 | $ 1,467,074 | ||||||||
Undistributed net realized gain | $ (413 | ) | — | |||||||
Undistributed net realized gain allocated from the Master Portfolio | — | $ (1,467,074 | ) | |||||||
| The tax character of distributions paid was as follows: | ||||||||||
| Disciplined Small Cap Core Fund | Small Cap Growth Fund II | |||||||||
Ordinary income | ||||||||||
5/31/15 | $463,159 | $11,168,366 | ||||||||
5/31/14 | $350,634 | $18,694,651 | ||||||||
Long-term capital gains | ||||||||||
5/31/15 | 250,757 | 18,533,375 | ||||||||
5/31/14 | 8,423 | 35,141,492 | ||||||||
Total | ||||||||||
5/31/15 | $713,916 | $29,701,741 | ||||||||
5/31/14 | $359,057 | $53,836,143 | ||||||||
| As of May 31, 2015, the tax components of accumulated net earnings were as follows: | ||||||||||
| Disciplined Small Cap Core Fund | Small Cap Growth Fund II | |||||||||
Undistributed ordinary income | $ 54,675 | $ 1,996,103 | ||||||||
Undistributed long-term capital gains | 95,928 | 9,225,826 | ||||||||
Net unrealized gains1 | 862,339 | 28,236,472 | ||||||||
Total | $ 1,012,942 | $ 39,458,401 | ||||||||
| 1 | The difference between book-basis and tax-basis net unrealized gains was attributable primarily to the tax deferral of losses on wash sales and the realization for tax purposes of unrealized gains/losses on certain futures contracts. |
| ANNUAL REPORT | MAY 31, 2015 | 31 |
| Notes to Financial Statements (continued) |
As of May 31, 2015, gross unrealized appreciation and depreciation based on cost for federal income tax purposes for Disciplined Small Cap Core Fund were as follows:
Tax cost | $8,471,632 | |||
|
| |||
Gross unrealized appreciation | $1,131,961 | |||
Gross unrealized depreciation | (269,620 | ) | ||
|
| |||
Net unrealized appreciation | $ 862,341 | |||
|
|
8. Bank Borrowings:
The Funds, along with certain other funds managed by the Manager and its affiliates (“Participating Funds”), is a party to a 364-day, $2.1 billion credit agreement with a group of lenders, under which the Funds may borrow to fund shareholder redemptions. Excluding commitments designated for certain individual funds, the Participating Funds, including the Funds, can borrow up to an aggregate commitment amount of $1.6 billion, subject to asset coverage and other limitations as specified in the agreement. The credit agreement has the following terms: a fee of 0.06% per annum on unused commitment amounts and interest at a rate equal to the higher of (a) one-month LIBOR (but, in any event, not less than 0.00%) on the date the loan is made plus 0.80% per annum or (b) the Fed Funds rate (but, in any event, not less than 0.00%) in effect from time to time plus 0.80% per annum on amounts borrowed. The agreement expires in April 2016 unless extended or renewed. Prior to November 25, 2014, the aggregate commitment amount was $1.1 billion, of which the Participating Funds, including the Funds, could borrow up to $650 million at any time outstanding, subject to asset coverage and other limitations as specified in the agreement. Participating Funds paid administration, legal and arrangement fees, which are included in miscellaneous expenses in the Statements of Operations, and along with commitment fees, were allocated among such funds based upon portions of the aggregate commitment available to them and relative net assets of Participating Funds. During the year ended May 31, 2015, the Funds did not borrow under the credit agreement.
9. Principal Risks:
In the normal course of business, Disciplined Small Cap Core Fund invests in securities and enters into transactions where risks exist due to fluctuations in the market (market risk) or failure of the issuer of a security to meet all its obligations, including to pay principal and interest when due (issuer credit risk). The value of securities held by Disciplined Small Cap Core Fund may decline in response to certain events, including those directly involving the issuers whose securities are owned by Disciplined Small Cap Core Fund; conditions affecting the general economy; overall market changes; local, regional or global political, social or economic instability; and currency and interest rate and price fluctuations. Similar to issuer credit risk, Disciplined Small Cap Core Fund may be exposed to counterparty credit risk, or the risk that an entity with which Disciplined Small Cap Core Fund has unsettled or open transactions may fail to or be unable to perform on its commitments. Disciplined Small Cap Core Fund manages counterparty credit risk by entering into transactions only with counterparties that the Manager believes have the financial resources to honor their obligations and by monitoring the financial stability of those counterparties. Financial assets, which potentially expose Disciplined Small Cap Core Fund to market, issuer and counterparty credit risks, consist principally of financial instruments and receivables due from counterparties. The extent of Disciplined Small Cap Core Fund’s exposure to market, issuer and counterparty credit risks with respect to these financial assets is generally approximated by their value recorded in the Statements of Assets and Liabilities, less any collateral held by Disciplined Small Cap Core Fund.
As of May 31, 2015, Disciplined Small Cap Core Fund invested a significant portion of its assets in securities in the financials sector. Changes in economic conditions affecting such sector would have a greater impact on Disciplined Small Cap Core Fund and could affect the value, income and/or liquidity of positions in such securities.
| 32 | ANNUAL REPORT | MAY 31, 2015 |
| Notes to Financial Statements (continued) |
10. Capital Share Transactions:
Transactions in capital shares for each class were as follows:
| Year Ended May 31, 2015 | Year Ended May 31, 2014 | |||||||||||||||||
| Disciplined Small Cap Core Fund | Shares | Amount | Shares | Amount | ||||||||||||||
Institutional | ||||||||||||||||||
Shares sold | 5,401 | $ | 62,833 | 18,667 | $ | 218,938 | ||||||||||||
Shares issued in reinvestment of distributions | 2,385 | 26,151 | 311 | 3,499 | ||||||||||||||
Shares redeemed | (2,843 | ) | (33,145 | ) | (1,894 | ) | (23,046 | ) | ||||||||||
|
|
|
| |||||||||||||||
Net increase | 4,943 | $ | 55,839 | 17,084 | $ | 199,391 | ||||||||||||
|
|
|
| |||||||||||||||
Investor A | ||||||||||||||||||
Shares sold | 172,856 | $ | 1,936,647 | 80,009 | $ | 907,645 | ||||||||||||
Shares issued in reinvestment of distributions | 9,046 | 98,613 | 447 | 5,029 | ||||||||||||||
Shares redeemed | (24,615 | ) | (275,559 | ) | (6,109 | ) | (71,358 | ) | ||||||||||
|
|
|
| |||||||||||||||
Net increase | 157,287 | $ | 1,759,701 | 74,347 | $ | 841,316 | ||||||||||||
|
|
|
| |||||||||||||||
Investor C | ||||||||||||||||||
Shares sold | 22,030 | $ | 249,581 | 6,592 | $ | 73,119 | ||||||||||||
Shares issued in reinvestment of distributions | 830 | 8,996 | 156 | 1,749 | ||||||||||||||
Shares redeemed | (4,534 | ) | (49,199 | ) | (104 | ) | (1,163 | ) | ||||||||||
|
|
|
| |||||||||||||||
Net increase | 18,326 | $ | 209,378 | 6,644 | $ | 73,705 | ||||||||||||
|
|
|
| |||||||||||||||
Total Net Increase | 180,556 | $ | 2,024,918 | 98,075 | $ | 1,114,412 | ||||||||||||
|
|
|
| |||||||||||||||
| ANNUAL REPORT | MAY 31, 2015 | 33 |
| Notes to Financial Statements (concluded) |
| Year Ended May 31, 2015 | Year Ended May 31, 2014 | |||||||||||||||||
| Small Cap Growth Fund II | Shares | Amount | Shares | Amount | ||||||||||||||
Institutional | ||||||||||||||||||
Shares sold | 1,357,054 | $ | 18,837,252 | 1,426,953 | $ | 21,322,564 | ||||||||||||
Shares issued in reinvestment of distributions | 641,647 | 8,548,838 | 1,061,970 | 14,965,230 | ||||||||||||||
Shares redeemed | (2,089,980 | ) | (29,234,714 | ) | (1,652,073 | ) | (24,682,147 | ) | ||||||||||
|
|
|
| |||||||||||||||
Net increase (decrease) | (91,279 | ) | $ | (1,848,624 | ) | 836,850 | $ | 11,605,647 | ||||||||||
|
|
|
| |||||||||||||||
Investor A | ||||||||||||||||||
Shares sold and automatic conversion of shares | 1,253,475 | $ | 16,515,474 | 1,513,268 | $ | 21,501,182 | ||||||||||||
Shares issued in reinvestment of distributions | 747,480 | 9,406,206 | 1,268,035 | 17,099,291 | ||||||||||||||
Shares redeemed | (2,229,258 | ) | (29,243,032 | ) | (2,071,749 | ) | (29,406,267 | ) | ||||||||||
|
|
|
| |||||||||||||||
Net increase (decrease) | (228,303 | ) | $ | (3,321,352 | ) | 709,554 | $ | 9,194,206 | ||||||||||
|
|
|
| |||||||||||||||
Investor B | ||||||||||||||||||
Shares sold | 7,715 | $ | 118,484 | 25,505 | $ | 313,310 | ||||||||||||
Shares issued in reinvestment of distributions | 15,217 | 158,129 | 40,034 | 461,097 | ||||||||||||||
Shares redeemed and automatic conversion of shares | (102,983 | ) | (1,128,381 | ) | (145,996 | ) | (1,776,191 | ) | ||||||||||
|
|
|
| |||||||||||||||
Net decrease | (80,051 | ) | $ | (851,768 | ) | (80,457 | ) | $ | (1,001,784 | ) | ||||||||
|
|
|
| |||||||||||||||
Investor C | ||||||||||||||||||
Shares sold | 556,168 | $ | 6,018,188 | 654,324 | $ | 7,904,289 | ||||||||||||
Shares issued in reinvestment of distributions | 589,715 | 6,084,229 | 900,979 | 10,337,401 | ||||||||||||||
Shares redeemed | (1,113,071 | ) | (11,963,035 | ) | (1,067,161 | ) | (12,844,888 | ) | ||||||||||
|
|
|
| |||||||||||||||
Net increase | 32,812 | $ | 139,382 | 488,142 | $ | 5,396,802 | ||||||||||||
|
|
|
| |||||||||||||||
Class R | ||||||||||||||||||
Shares sold | 473,726 | $ | 5,716,765 | 796,132 | $ | 10,621,900 | ||||||||||||
Shares issued in reinvestment of distributions | 322,982 | 3,743,117 | 611,265 | 7,687,705 | ||||||||||||||
Shares redeemed | (1,141,216 | ) | (13,877,880 | ) | (1,363,036 | ) | (18,107,702 | ) | ||||||||||
|
|
|
| |||||||||||||||
Net increase (decrease) | (344,508 | ) | $ | (4,417,998 | ) | 44,361 | $ | 201,903 | ||||||||||
|
|
|
| |||||||||||||||
Total Net Increase (Decrease) | (711,329 | ) | $ | (10,300,360 | ) | 1,998,450 | $ | 25,396,774 | ||||||||||
|
|
|
| |||||||||||||||
At May 31, 2015, 496,000 Institutional Shares, 2,000 Investor A Shares and 2,000 Investor C Shares of Disciplined Small Cap Core Fund were owned by affiliates.
11. Subsequent Events:
Management’s evaluation of the impact of all subsequent events on the Funds’ financial statements was completed through the date the financial statements were issued and the following item was noted:
At the close of business on June 23, 2015, all issued and outstanding Investor B Shares of BlackRock Small Cap Growth Fund II were converted into Investor A Shares with the same relative aggregate net asset value.
| 34 | ANNUAL REPORT | MAY 31, 2015 |
| Report of Independent Registered Public Accounting Firm |
To the Shareholders of BlackRock Disciplined Small Cap Core Fund and Board of Trustees of BlackRock FundsSM and the Shareholders of BlackRock Small Cap Growth Fund II and Board of Directors of BlackRock Series, Inc.:
We have audited the accompanying statement of assets and liabilities of BlackRock Disciplined Small Cap Core Fund, including the schedule of investments, as of May 31, 2015, and the related statement of operations for the year then ended, the statements of changes in net assets for each of the two years in the period then ended, and the financial highlights for the periods presented. We have also audited the accompanying statement of assets and liabilities of BlackRock Small Cap Growth Fund II (collectively, with BlackRock Disciplined Small Cap Core Fund, the “Funds”), as of May 31, 2015, and the related statement of operations for the year then ended, the statements of changes in net assets for each of the two years in the period then ended, and the financial highlights for each of the five years in the period then ended. These financial statements and financial highlights are the responsibility of the Funds’ management. Our responsibility is to express an opinion on these financial statements and financial highlights based on our audits.
We conducted our audits in accordance with the standards of the Public Company Accounting Oversight Board (United States). Those standards require that we plan and perform the audit to obtain reasonable assurance about whether the financial statements and financial highlights are free of material misstatement. The Funds are not required to have, nor were we engaged to perform, an audit of their internal control over financial reporting. Our audits included consideration of internal control over financial reporting as a basis for designing audit procedures that are appropriate in the circumstances, but not for the purpose of expressing an opinion on the effectiveness of the Funds’ internal control over financial reporting. Accordingly, we express no such opinion. An audit also includes examining, on a test basis, evidence supporting the amounts and disclosures in the financial statements, assessing the accounting principles used and significant estimates made by management, as well as evaluating the overall financial statement presentation. Our procedures included confirmation of securities owned as of May 31, 2015, by correspondence with the custodian and brokers; where replies were not received from brokers, we performed other auditing procedures. We believe that our audits provide a reasonable basis for our opinion.
In our opinion, the financial statements and financial highlights referred to above present fairly, in all material respects, the respective financial position of BlackRock Disciplined Small Cap Core Fund and BlackRock Small Cap Growth Fund II as of May 31, 2015, and as to BlackRock Disciplined Small Cap Core Fund the results of its operations for the year then ended, and the changes in its net assets for each of the two years in the period then ended, and financial highlights for the periods presented, and as to BlackRock Small Cap Growth Fund II the results of its operations for the year then ended, the changes in its net assets for each of the two years in the period then ended, and the financial highlights for each of the five years in the period then ended, in conformity with accounting principles generally accepted in the United States of America.
Deloitte & Touche LLP
Philadelphia, Pennsylvania
July 23, 2015
| Important Tax Information (Unaudited) |
The following information is provided with respect to the ordinary income distributions paid during the fiscal year ended May 31, 2015:
| Payable Date | Qualified Dividend Income for Individuals1 | Dividends Qualifying for the | Qualified Short-Term Gains for Non-U.S. Residents2 | |||||||||||||||||
Disciplined Small Cap Core Fund | 7/18/14 | 2.07 | % | 2.09 | % | 100.00 | % | |||||||||||||
| 12/15/14 | 100.00 | % | 100.00 | % | — | |||||||||||||||
Small Cap Growth Fund II | 7/18/14 | 0.03 | % | — | 100.00 | % | ||||||||||||||
| 1 | The Funds hereby designate the percentage indicated above or the maximum amount allowable by law. |
| 2 | Represents the portion of the taxable ordinary income dividends eligible for exemptions from U.S. withholding tax for nonresident aliens and foreign corporations. |
Additionally, Disciplined Small Cap Core Fund distributed long-term capital gains of $0.106808 per share and $0.287135 per share and Small Cap Growth Fund II distributed long-term capital gains of $0.722444 per share and $0.353227 per share to shareholders of record on July 16, 2014 and December 11, 2014, respectively.
| ANNUAL REPORT | MAY 31, 2015 | 35 |
| Master Portfolio Information | BlackRock Master Small Cap Growth Portfolio |
| As of May 31, 2015 |
| Ten Largest Holdings | Percent of Long-Term Investments | ||||
Manhattan Associates, Inc. | 2% | ||||
Qorvo, Inc. | 2 | ||||
STERIS Corp. | 2 | ||||
LogMeIn, Inc. | 2 | ||||
Skechers U.S.A., Inc., Class A | 2 | ||||
Burlington Stores, Inc. | 2 | ||||
Tenneco, Inc. | 2 | ||||
JetBlue Airways Corp. | 2 | ||||
Tower International, Inc. | 2 | ||||
RPX Corp. | 2 | ||||
| Sector Allocation | Percent of Long-Term Investments | ||||
Health Care | 27% | ||||
Information Technology | 25 | ||||
Consumer Discretionary | 17 | ||||
Industrials | 13 | ||||
Financials | 9 | ||||
Consumer Staples | 3 | ||||
Materials | 3 | ||||
Energy | 2 | ||||
Telecommunication Services | 1 | ||||
For Master Portfolio compliance purposes, the Master Portfolio’s sector classifications refer to any one or more of the sector sub-classifications used by one or more widely recognized market indexes or ratings group indexes, and/or as defined by the investment advisor. These definitions may not apply for purposes of this report, which may combine such sector sub-classifications for reporting ease.
| 36 | ANNUAL REPORT | MAY 31, 2015 |
| Schedule of Investments May 31, 2015 | BlackRock Master Small Cap Growth Portfolio | |||
| (Percentages shown are based on Net Assets) |
| Common Stocks | Shares | Value | ||||||
Aerospace & Defense — 0.6% | ||||||||
Ducommun, Inc. (a) | 21,411 | $ | 498,662 | |||||
Vectrus, Inc. (a) | 28,331 | 710,825 | ||||||
|
| |||||||
| 1,209,487 | ||||||||
Airlines — 1.9% | ||||||||
American Airlines Group, Inc. | 3,371 | 142,829 | ||||||
JetBlue Airways Corp. (a) | 171,174 | 3,450,868 | ||||||
Virgin America, Inc. (a) | 19,928 | 566,752 | ||||||
|
| |||||||
| �� | 4,160,449 | |||||||
Auto Components — 3.3% | ||||||||
American Axle & Manufacturing Holdings, Inc. (a) | 10,784 | 270,786 | ||||||
Lear Corp. | 810 | 93,976 | ||||||
Tenneco, Inc. (a) | 60,683 | 3,563,306 | ||||||
Tower International, Inc. (a) | 121,745 | 3,349,205 | ||||||
|
| |||||||
| 7,277,273 | ||||||||
Banks — 0.5% | ||||||||
First Midwest Bancorp, Inc. | 5,993 | 106,436 | ||||||
Texas Capital Bancshares, Inc. (a) | 10,202 | 554,989 | ||||||
Umpqua Holdings Corp. | 21,041 | 370,111 | ||||||
|
| |||||||
| 1,031,536 | ||||||||
Biotechnology — 11.8% | ||||||||
ACADIA Pharmaceuticals, Inc. (a) | 11,831 | 487,437 | ||||||
Acorda Therapeutics, Inc. (a) | 16,669 | 508,071 | ||||||
Adamas Pharmaceuticals, Inc. (a) | 13,247 | 238,314 | ||||||
Agios Pharmaceuticals, Inc. (a) | 1,829 | 223,175 | ||||||
Alder Biopharmaceuticals, Inc. (a) | 5,733 | 243,767 | ||||||
Amicus Therapeutics, Inc. (a) | 12,151 | 149,579 | ||||||
Ardelyx, Inc. (a) | 19,743 | 216,186 | ||||||
ARIAD Pharmaceuticals, Inc. (a) | 63,264 | 580,763 | ||||||
BIND Therapeutics, Inc. (a) | 23,650 | 140,954 | ||||||
BioSpecifics Technologies Corp. (a) | 5,726 | 272,787 | ||||||
Bluebird Bio, Inc. (a) | 4,703 | 913,558 | ||||||
Blueprint Medicines Corp. (a) | 7,596 | 217,929 | ||||||
Cara Therapeutics, Inc. (a) | 15,403 | 146,637 | ||||||
Celldex Therapeutics, Inc. (a) | 13,634 | 393,614 | ||||||
Cepheid, Inc. (a) | 12,942 | 714,010 | ||||||
Cerulean Pharma, Inc. (a) | 34,682 | 206,358 | ||||||
Chimerix, Inc. (a) | 2,393 | 100,147 | ||||||
China Biologic Products, Inc. (a) | 2,113 | 236,297 | ||||||
Clovis Oncology, Inc. (a) | 3,604 | 333,154 | ||||||
Coherus Biosciences, Inc. (a) | 3,551 | 87,248 | ||||||
Concert Pharmaceuticals, Inc. (a) | 4,425 | 70,756 | ||||||
Cytokinetics, Inc. (a) | 18,982 | 120,915 | ||||||
Dyax Corp. (a) | 42,259 | 1,113,102 | ||||||
Eleven Biotherapeutics, Inc. (a)(b) | 18,478 | 51,923 | ||||||
Emergent Biosolutions, Inc. (a) | 7,987 | 254,466 | ||||||
Enanta Pharmaceuticals, Inc. (a) | 7,974 | 325,977 | ||||||
Enzon Pharmaceuticals, Inc. | 144,320 | 189,059 | ||||||
EPIRUS Biopharmaceuticals, Inc. (a) | 17,224 | 92,837 | ||||||
Exact Sciences Corp. (a)(b) | 12,950 | 349,779 | ||||||
FibroGen, Inc. (a) | 14,383 | 261,914 | ||||||
Five Prime Therapeutics, Inc. (a) | 14,444 | 370,344 | ||||||
Genocea Biosciences, Inc. (a) | 2,066 | 21,920 | ||||||
Genomic Health, Inc. (a) | 11,675 | 316,276 | ||||||
Halozyme Therapeutics, Inc. (a) | 15,608 | 270,799 | ||||||
| Common Stocks | Shares | Value | ||||||
Biotechnology (concluded) | ||||||||
Harvard Apparatus Regenerative Technology, Inc. (a) | 11,802 | $ | 21,716 | |||||
Ignyta, Inc. (a) | 23,653 | 212,404 | ||||||
Immune Design Corp. (a) | 11,099 | 242,291 | ||||||
Infinity Pharmaceuticals, Inc. (a) | 26,150 | 338,904 | ||||||
Insmed, Inc. (a) | 5,856 | 128,481 | ||||||
Intrexon Corp. (a) | 4,759 | 200,449 | ||||||
Ironwood Pharmaceuticals, Inc. (a) | 14,677 | 207,092 | ||||||
Isis Pharmaceuticals, Inc. (a) | 30,650 | 2,063,358 | ||||||
Keryx Biopharmaceuticals, Inc. (a)(b) | 4,575 | 47,580 | ||||||
Kindred Biosciences, Inc. (a) | 18,689 | 120,544 | ||||||
Ligand Pharmaceuticals, Inc. (a) | 7,163 | 631,132 | ||||||
Lion Biotechnologies, Inc. (a) | 18,409 | 205,997 | ||||||
Loxo Oncology, Inc. (a) | 4,914 | 60,639 | ||||||
MacroGenics, Inc. (a) | 3,647 | 117,980 | ||||||
MannKind Corp. (a)(b) | 15,848 | 82,093 | ||||||
Merrimack Pharmaceuticals, Inc. (a) | 35,463 | 418,463 | ||||||
MiMedx Group, Inc. (a) | 16,155 | 167,204 | ||||||
Momenta Pharmaceuticals, Inc. (a) | 22,912 | 454,803 | ||||||
Neurocrine Biosciences, Inc. (a) | 15,403 | 675,576 | ||||||
NewLink Genetics Corp. (a) | 5,371 | 231,759 | ||||||
Novavax, Inc. (a) | 40,376 | 363,384 | ||||||
OncoGenex Pharmaceutical, Inc. (a) | 45,778 | 97,049 | ||||||
Oncothyreon, Inc. (a) | 46,399 | 158,685 | ||||||
Ophthotech Corp. (a) | 7,781 | 389,206 | ||||||
OPKO Health, Inc. (a)(b) | 34,525 | 610,402 | ||||||
Orexigen Therapeutics, Inc. (a) | 69,500 | 340,550 | ||||||
Osiris Therapeutics, Inc. (a) | 15,868 | 295,145 | ||||||
PDL BioPharma, Inc. | 70,786 | 472,850 | ||||||
Peregrine Pharmaceuticals, Inc. (a)(b) | 34,523 | 48,677 | ||||||
Portola Pharmaceuticals, Inc. (a) | 5,756 | 240,716 | ||||||
PTC Therapeutics, Inc. (a) | 1,549 | 89,981 | ||||||
Puma Biotechnology, Inc. (a) | 4,763 | 930,928 | ||||||
Raptor Pharmaceutical Corp. (a) | 21,675 | 266,819 | ||||||
Receptos, Inc. (a) | 6,464 | 1,065,849 | ||||||
Repligen Corp. (a) | 2,809 | 114,495 | ||||||
Retrophin, Inc. (a) | 12,566 | 397,588 | ||||||
Rigel Pharmaceuticals, Inc. (a) | 53,056 | 185,165 | ||||||
Sangamo Biosciences, Inc. (a) | 23,412 | 286,797 | ||||||
Sarepta Therapeutics, Inc. (a) | 1,976 | 50,625 | ||||||
Sorrento Therapeutics, Inc. (a) | 12,143 | 167,452 | ||||||
Spectrum Pharmaceuticals, Inc. (a) | 36,823 | 230,880 | ||||||
Synageva BioPharma Corp. (a) | 4,520 | 964,613 | ||||||
TESARO, Inc. (a) | 1,529 | 89,844 | ||||||
Trevena, Inc. (a) | 30,511 | 212,357 | ||||||
United Therapeutics Corp. (a) | 1,005 | 184,639 | ||||||
Verastem, Inc. (a) | 24,805 | 214,563 | ||||||
Versartis, Inc. (a) | 6,086 | 94,576 | ||||||
Vitae Pharmaceuticals, Inc. (a) | 16,843 | 206,495 | ||||||
Xencor, Inc. (a) | 17,106 | 310,303 | ||||||
|
| |||||||
| 25,929,150 | ||||||||
Building Products — 0.9% | ||||||||
Continental Building Products, Inc. (a) | 83,956 | 1,872,219 | ||||||
Trex Co., Inc. (a) | 2,941 | 148,815 | ||||||
|
| |||||||
| 2,021,034 | ||||||||
Capital Markets — 0.2% | ||||||||
Westwood Holdings Group, Inc. | 7,033 | 399,123 | ||||||
| Portfolio Abbreviations | ||
| ADR | American Depositary Receipts | |
| CVR | Contingent Value Rights | |
| REIT | Real Estate Investment Trust | |
See Notes to Financial Statements.
| ANNUAL REPORT | MAY 31, 2015 | 37 |
| Schedule of Investments (continued) | BlackRock Master Small Cap Growth Portfolio | |||
| (Percentages shown are based on Net Assets) |
| Common Stocks | Shares | Value | ||||||
Chemicals — 0.4% | ||||||||
OM Group, Inc. | 3,068 | $ | 81,425 | |||||
Trinseo SA (a) | 25,686 | 750,288 | ||||||
|
| |||||||
| 831,713 | ||||||||
Commercial Services & Supplies — 0.4% | ||||||||
ARC Document Solutions, Inc. (a) | 45,017 | 337,177 | ||||||
Atento SA (a) | 28,530 | 371,746 | ||||||
Quad/Graphics, Inc. | 4,370 | 89,367 | ||||||
|
| |||||||
| 798,290 | ||||||||
Communications Equipment — 0.8% | ||||||||
Black Box Corp. | 2,495 | 50,050 | ||||||
Calix, Inc. (a) | 78,220 | 625,760 | ||||||
Polycom, Inc. (a) | 16,617 | 223,831 | ||||||
ShoreTel, Inc. (a) | 120,670 | 830,210 | ||||||
|
| |||||||
| 1,729,851 | ||||||||
Consumer Finance — 0.2% | ||||||||
Consumer Portfolio Services, Inc. (a) | 9,255 | 54,512 | ||||||
The JG Wentworth Co., Class A (a) | 38,547 | 361,571 | ||||||
|
| |||||||
| 416,083 | ||||||||
Containers & Packaging — 1.6% | ||||||||
Berry Plastics Group, Inc. (a) | 43,538 | 1,457,217 | ||||||
Graphic Packaging Holding Co. | 143,600 | 2,044,864 | ||||||
|
| |||||||
| 3,502,081 | ||||||||
Distributors — 0.9% | ||||||||
Core-Mark Holding Co., Inc. | 37,138 | 1,994,682 | ||||||
Diversified Consumer Services — 1.4% | ||||||||
Ascent Capital Group, Inc., Class A (a) | 4,321 | 174,266 | ||||||
Collectors Universe, Inc. | 19,531 | 417,573 | ||||||
K12, Inc. (a) | 5,846 | 80,032 | ||||||
LifeLock, Inc. (a) | 114,399 | 1,741,153 | ||||||
ServiceMaster Global Holdings, Inc. (a) | 19,604 | 658,498 | ||||||
|
| |||||||
| 3,071,522 | ||||||||
Diversified Telecommunication Services — 1.4% | ||||||||
IDT Corp., Class B | 12,846 | 231,100 | ||||||
Inteliquent, Inc. | 125,586 | 2,214,081 | ||||||
Premiere Global Services, Inc. (a) | 57,037 | 576,074 | ||||||
|
| |||||||
| 3,021,255 | ||||||||
Electrical Equipment — 0.6% | ||||||||
EnerSys, Inc. | 10,368 | 690,924 | ||||||
Polypore International, Inc. (a) | 10,503 | 629,235 | ||||||
|
| |||||||
| 1,320,159 | ||||||||
Electronic Equipment, Instruments & Components — 2.6% |
| |||||||
Cognex Corp. | 4,066 | 205,211 | ||||||
DTS, Inc. (a) | 4,816 | 152,812 | ||||||
Electro Rent Corp. | 8,941 | 91,824 | ||||||
Methode Electronics, Inc. | 7,953 | 373,234 | ||||||
Multi-Fineline Electronix, Inc. (a) | 3,801 | 95,253 | ||||||
Newport Corp. (a) | 111,921 | 2,114,188 | ||||||
OSI Systems, Inc. (a) | 16,488 | 1,191,093 | ||||||
RealD, Inc. (a) | 89,955 | 1,135,232 | ||||||
Rogers Corp. (a) | 3,208 | 231,778 | ||||||
|
| |||||||
| 5,590,625 | ||||||||
Energy Equipment & Services — 0.6% | ||||||||
C&J Energy Services Ltd. (a) | 22,795 | 342,609 | ||||||
CHC Group Ltd. (a) | 85,483 | 113,692 | ||||||
Exterran Holdings, Inc. | 5,871 | 194,095 | ||||||
Matrix Service Co. (a) | 17,266 | 291,277 | ||||||
Pacific Drilling SA (a) | 72,172 | 270,645 | ||||||
| Common Stocks | Shares | Value | ||||||
Energy Equipment & Services (concluded) | ||||||||
PHI, Inc. (a) | 2,719 | $ | 88,476 | |||||
|
| |||||||
| 1,300,794 | ||||||||
Food & Staples Retailing — 1.2% | ||||||||
SUPERVALU, Inc. (a) | 298,273 | 2,633,751 | ||||||
Food Products — 0.9% | ||||||||
Omega Protein Corp. (a) | 18,890 | 259,737 | ||||||
Pilgrim’s Pride Corp. (b) | 29,176 | 746,322 | ||||||
Sanderson Farms, Inc. | 10,751 | 876,529 | ||||||
Seaboard Corp. (a) | 31 | 106,330 | ||||||
|
| |||||||
| 1,988,918 | ||||||||
Health Care Equipment & Supplies — 5.1% | ||||||||
Align Technology, Inc. (a) | 23,270 | 1,411,791 | ||||||
Anika Therapeutics, Inc. (a) | 33,650 | 1,135,015 | ||||||
Cyberonics, Inc. (a) | 6,265 | 401,023 | ||||||
DexCom, Inc. (a) | 7,400 | 530,728 | ||||||
ICU Medical, Inc. (a) | 11,943 | 1,158,471 | ||||||
Merit Medical Systems, Inc. (a) | 3,877 | 79,711 | ||||||
Natus Medical, Inc. (a) | 4,238 | 165,536 | ||||||
NuVasive, Inc. (a) | 12,042 | 608,723 | ||||||
Orthofix International NV (a) | 5,123 | 167,881 | ||||||
RTI Surgical, Inc. (a) | 25,865 | 167,347 | ||||||
STERIS Corp. | 63,933 | 4,272,642 | ||||||
SurModics, Inc. (a) | 17,325 | 427,581 | ||||||
Symmetry Surgical, Inc. (a) | 47,396 | 418,507 | ||||||
Thoratec Corp. (a) | 4,610 | 209,248 | ||||||
|
| |||||||
| 11,154,204 | ||||||||
Health Care Providers & Services — 4.3% | ||||||||
Alliance HealthCare Services, Inc. (a) | 7,018 | 129,061 | ||||||
AMN Healthcare Services, Inc. (a) | 22,086 | 587,267 | ||||||
BioTelemetry, Inc. (a) | 5,760 | 55,584 | ||||||
CorVel Corp. (a) | 11,252 | 403,947 | ||||||
Five Star Quality Care, Inc. (a) | 42,656 | 197,497 | ||||||
Health Net, Inc. (a) | 46,041 | 2,865,592 | ||||||
HealthSouth Corp. | 20,485 | 884,133 | ||||||
Molina Healthcare, Inc. (a) | 22,169 | 1,612,573 | ||||||
Surgical Care Affiliates, Inc. (a) | 15,477 | 587,971 | ||||||
Team Health Holdings, Inc. (a) | 36,301 | 2,122,882 | ||||||
|
| |||||||
| 9,446,507 | ||||||||
Health Care Technology — 0.8% | ||||||||
Omnicell, Inc. (a) | 48,524 | 1,794,417 | ||||||
Hotels, Restaurants & Leisure — 2.3% | ||||||||
Brinker International, Inc. | 24,616 | 1,358,311 | ||||||
Isle of Capri Casinos, Inc. (a) | 27,121 | 385,389 | ||||||
Jack in the Box, Inc. | 38,127 | 3,309,805 | ||||||
|
| |||||||
| 5,053,505 | ||||||||
Household Durables — 0.2% | ||||||||
ZAGG, Inc. (a) | 57,183 | 532,374 | ||||||
Insurance — 0.1% | ||||||||
Hallmark Financial Services, Inc. (a) | 18,069 | 200,566 | ||||||
Maiden Holdings Ltd. | 7,559 | 105,675 | ||||||
|
| |||||||
| 306,241 | ||||||||
Internet & Catalog Retail — 0.2% | ||||||||
1-800-Flowers.com, Inc., Class A (a) | 18,286 | 173,900 | ||||||
HSN, Inc. | 2,089 | 140,193 | ||||||
U.S. Auto Parts Network, Inc. (a) | 20,165 | 45,371 | ||||||
|
| |||||||
| 359,464 | ||||||||
Internet Software & Services — 5.0% | ||||||||
Apigee Corp. (a) | 19,602 | 275,408 | ||||||
See Notes to Financial Statements.
| 38 | ANNUAL REPORT | MAY 31, 2015 |
| Schedule of Investments (continued) | BlackRock Master Small Cap Growth Portfolio | |||
| (Percentages shown are based on Net Assets) |
| Common Stocks | Shares | Value | ||||||
Internet Software & Services (concluded) | ||||||||
Apigee Corp. (Acquired 4/13/15, | 4,065 | $ | 54,258 | |||||
Bankrate, Inc. (a) | 102,298 | 1,248,036 | ||||||
Carbonite, Inc. (a) | 4,281 | 47,005 | ||||||
Constant Contact, Inc. (a) | 65,493 | 1,785,339 | ||||||
LendingClub Corp. (Acquired 12/11/14, | 33,316 | 608,000 | ||||||
Limelight Networks, Inc. (a) | 69,864 | 305,306 | ||||||
LivePerson, Inc. (a) | 27,564 | 263,787 | ||||||
LogMeIn, Inc. (a) | 65,182 | 4,137,102 | ||||||
New Relic, Inc. (a) | 362 | 11,848 | ||||||
NIC, Inc. | 98,546 | 1,660,500 | ||||||
Spark Networks, Inc. (a)(b) | 20,043 | 60,730 | ||||||
support.com, Inc. (a) | 62,112 | 89,441 | ||||||
Travelzoo, Inc. (a) | 16,685 | 201,221 | ||||||
United Online, Inc. (a) | 6,199 | 107,181 | ||||||
XO Group, Inc. (a) | 2,783 | 45,196 | ||||||
|
| |||||||
| 10,900,358 | ||||||||
IT Services — 1.8% | ||||||||
Forrester Research, Inc. | 1,754 | 59,654 | ||||||
Global Cash Access Holdings, Inc. (a) | 123,181 | 952,189 | ||||||
The Hackett Group, Inc. | 5,267 | 62,309 | ||||||
Heartland Payment Systems, Inc. | 1,695 | 90,598 | ||||||
Lionbridge Technologies, Inc. (a) | 54,666 | 301,756 | ||||||
Luxoft Holding, Inc. (a) | 1,027 | 54,975 | ||||||
NCI, Inc., Class A | 1,192 | 12,635 | ||||||
Net 1 UEPS Technologies, Inc. (a) | 41,571 | 602,779 | ||||||
Science Applications International Corp. | 33,571 | 1,779,263 | ||||||
Syntel, Inc. (a) | 1,013 | 48,128 | ||||||
|
| |||||||
| 3,964,286 | ||||||||
Leisure Products — 1.4% | ||||||||
Brunswick Corp. | 47,350 | 2,416,744 | ||||||
Nautilus, Inc. (a) | 34,206 | 722,431 | ||||||
|
| |||||||
| 3,139,175 | ||||||||
Life Sciences Tools & Services — 0.6% |
| |||||||
Cambrex Corp. (a) | 9,020 | 360,980 | ||||||
Harvard Bioscience, Inc. (a) | 55,729 | 312,082 | ||||||
PRA Health Sciences, Inc. (a) | 22,395 | 749,337 | ||||||
|
| |||||||
| 1,422,399 | ||||||||
Machinery — 3.4% | ||||||||
Blount International, Inc. (a) | 120,797 | 1,397,621 | ||||||
Briggs & Stratton Corp. | 9,360 | 178,682 | ||||||
Global Brass & Copper Holdings, Inc. | 71,059 | 1,224,347 | ||||||
The Greenbrier Cos., Inc. (b) | 19,918 | 1,199,661 | ||||||
Hyster-Yale Materials Handling, Inc. | 11,097 | 787,443 | ||||||
Luxfer Holdings PLC - ADR | 105,399 | 1,279,544 | ||||||
Wabash National Corp. (a) | 96,900 | 1,312,026 | ||||||
|
| |||||||
| 7,379,324 | ||||||||
Media — 0.3% | ||||||||
Crown Media Holdings, Inc., Class A (a) | 49,162 | 200,581 | ||||||
Tribune Publishing Co. | 30,652 | 457,328 | ||||||
|
| |||||||
| 657,909 | ||||||||
Multiline Retail — 1.7% | ||||||||
Burlington Stores, Inc. (a) | 69,567 | 3,671,051 | ||||||
Oil, Gas & Consumable Fuels — 1.1% | ||||||||
Carrizo Oil & Gas, Inc. (a) | 7,004 | 351,321 | ||||||
Delek US Holdings, Inc. | 9,756 | 369,362 | ||||||
Evolution Petroleum Corp. | 23,691 | 163,468 | ||||||
Jones Energy, Inc., Class A (a) | 5,873 | 57,027 | ||||||
Northern Oil and Gas, Inc. (a) | 18,852 | 128,759 | ||||||
Par Petroleum Corp. (a) | 4,840 | 110,352 | ||||||
| Common Stocks | Shares | Value | ||||||
Oil, Gas & Consumable Fuels (concluded) | ||||||||
REX American Resources Corp. (a) | 4,161 | $ | 265,763 | |||||
Rosetta Resources, Inc. (a) | 2,231 | 52,116 | ||||||
Swift Energy Co. (a)(b) | 23,394 | 49,595 | ||||||
VAALCO Energy, Inc. (a) | 33,238 | 74,121 | ||||||
W&T Offshore, Inc. (b) | 11,776 | 63,708 | ||||||
Western Refining, Inc. | 17,898 | 787,154 | ||||||
|
| |||||||
| 2,472,746 | ||||||||
Paper & Forest Products — 0.8% | ||||||||
Boise Cascade Co. (a) | 52,482 | 1,859,962 | ||||||
Pharmaceuticals — 3.5% | ||||||||
Durata Therapeutics, Inc. - CVR (a) | 1,930 | 309 | ||||||
Furiex Pharmaceuticals, Inc. - CVR (a) | 1,957 | 19,570 | ||||||
Lannett Co., Inc. (a) | 37,012 | 2,058,978 | ||||||
Phibro Animal Health Corp., Class A | 3,034 | 105,067 | ||||||
POZEN, Inc. (a) | 7,426 | 47,898 | ||||||
Prestige Brands Holdings, Inc. (a) | 63,375 | 2,783,430 | ||||||
Sagent Pharmaceuticals, Inc. (a) | 11,885 | 265,392 | ||||||
SciClone Pharmaceuticals, Inc. (a) | 82,491 | 763,867 | ||||||
Sucampo Pharmaceuticals, Inc., Class A (a) | 97,620 | 1,584,373 | ||||||
|
| |||||||
| 7,628,884 | ||||||||
Professional Services — 3.3% | ||||||||
Insperity, Inc. | 9,781 | 514,676 | ||||||
Kforce, Inc. | 103,429 | 2,276,472 | ||||||
On Assignment, Inc. (a) | 3,482 | 130,540 | ||||||
RPX Corp. (a) | 210,083 | 3,342,420 | ||||||
TrueBlue, Inc. (a) | 32,632 | 929,359 | ||||||
|
| |||||||
| 7,193,467 | ||||||||
Real Estate Investment Trusts (REITs) — 4.3% | ||||||||
Chatham Lodging Trust | 8,142 | 227,487 | ||||||
CoreSite Realty Corp. | 1,434 | 67,685 | ||||||
DuPont Fabros Technology, Inc. | 98,679 | 3,181,411 | ||||||
FelCor Lodging Trust, Inc. | 6,466 | 69,445 | ||||||
LaSalle Hotel Properties | 34,906 | 1,272,673 | ||||||
Lexington Realty Trust | 66,027 | 606,128 | ||||||
Pebblebrook Hotel Trust | 6,283 | 269,415 | ||||||
PS Business Parks, Inc. | 11,492 | 840,065 | ||||||
RLJ Lodging Trust | 87,629 | 2,649,025 | ||||||
Strategic Hotels & Resorts, Inc. (a) | 16,198 | 195,672 | ||||||
|
| |||||||
| 9,379,006 | ||||||||
Real Estate Management & Development — 1.6% |
| |||||||
Forestar Group, Inc. (a) | 48,447 | 646,767 | ||||||
Marcus & Millichap, Inc. (a) | 59,579 | 2,794,851 | ||||||
RE/MAX Holdings, Inc., Class A | 3,269 | 109,348 | ||||||
|
| |||||||
| 3,550,966 | ||||||||
Road & Rail — 1.0% | ||||||||
Swift Transportation Co. (a) | 96,743 | 2,251,210 | ||||||
Semiconductors & Semiconductor Equipment — 6.4% |
| |||||||
Alpha & Omega Semiconductor Ltd. (a) | 3,275 | 26,855 | ||||||
Ambarella, Inc. (a) | 12,726 | 1,148,012 | ||||||
Amkor Technology, Inc. (a) | 59,291 | 400,807 | ||||||
Cirrus Logic, Inc. (a) | 65,081 | 2,456,808 | ||||||
FormFactor, Inc. (a) | 5,179 | 48,216 | ||||||
Integrated Device Technology, Inc. (a) | 115,936 | 2,742,466 | ||||||
Intermolecular, Inc. (a) | 74,858 | 140,733 | ||||||
Pericom Semiconductor Corp. | 13,930 | 182,344 | ||||||
Qorvo, Inc. (a) | 52,962 | 4,350,828 | ||||||
Tessera Technologies, Inc. | 63,933 | 2,464,617 | ||||||
|
| |||||||
| 13,961,686 | ||||||||
See Notes to Financial Statements.
| ANNUAL REPORT | MAY 31, 2015 | 39 |
| Schedule of Investments (continued) | BlackRock Master Small Cap Growth Portfolio | |||
| (Percentages shown are based on Net Assets) |
| Common Stocks | Shares | Value | ||||||
Software — 6.9% | ||||||||
Advent Software, Inc. | 12,015 | $ | 525,776 | |||||
Aspen Technology, Inc. (a) | 51,731 | 2,214,087 | ||||||
AVG Technologies NV (a) | 117,476 | 2,880,511 | ||||||
Aware, Inc. | 11,686 | 49,549 | ||||||
ePlus, Inc. (a) | 9,404 | 730,221 | ||||||
FleetMatics Group PLC (a) | 1,591 | 66,520 | ||||||
Gigamon, Inc. (a) | 5,358 | 164,812 | ||||||
Infoblox, Inc. (a) | 35,321 | 917,993 | ||||||
Manhattan Associates, Inc. (a) | 87,298 | 4,788,295 | ||||||
Mentor Graphics Corp. | 9,997 | 261,022 | ||||||
Monotype Imaging Holdings, Inc. | 4,858 | 126,016 | ||||||
Pegasystems, Inc. | 4,877 | 106,611 | ||||||
Proofpoint, Inc. (a) | 2,642 | 156,221 | ||||||
Qlik Technologies, Inc. (a) | 6,275 | 226,967 | ||||||
TiVo, Inc. (a) | 56,580 | 595,787 | ||||||
VASCO Data Security International, Inc. (a)(b) | 8,765 | 233,500 | ||||||
Verint Systems, Inc. (a) | 15,645 | 1,011,762 | ||||||
Viggle, Inc. (a) | 3,779 | 4,289 | ||||||
Zix Corp. (a) | 19,966 | 91,644 | ||||||
|
| |||||||
| 15,151,583 | ||||||||
Specialty Retail — 2.1% | ||||||||
Aaron’s, Inc. (a) | 42,151 | 1,476,550 | ||||||
ANN, Inc. (a) | 13,147 | 614,622 | ||||||
Haverty Furniture Cos., Inc. | 9,098 | 191,149 | ||||||
Kirkland’s, Inc. (a) | 24,673 | 648,160 | ||||||
New York & Co., Inc. (a) | 21,065 | 53,505 | ||||||
Outerwall, Inc. | 15,951 | 1,222,804 | ||||||
Select Comfort Corp. (a) | 7,599 | 236,709 | ||||||
Stage Stores, Inc. | 11,007 | 178,203 | ||||||
|
| |||||||
| 4,621,702 | ||||||||
Technology Hardware, Storage & Peripherals — 0.8% |
| |||||||
Avid Technology, Inc. (a) | 43,274 | 770,710 | ||||||
Quantum Corp. (a) | 514,906 | 1,050,408 | ||||||
|
| |||||||
| 1,821,118 | ||||||||
Textiles, Apparel & Luxury Goods — 3.2% |
| |||||||
Culp, Inc. | 6,249 | 164,661 | ||||||
Deckers Outdoor Corp. (a) | 24,033 | 1,637,849 | ||||||
Iconix Brand Group, Inc. (a) | 47,751 | 1,232,931 | ||||||
Skechers U.S.A., Inc., Class A (a) | 35,501 | 3,758,491 | ||||||
Vince Holding Corp. (a) | 16,479 | 262,346 | ||||||
|
| |||||||
| 7,056,278 | ||||||||
Thrifts & Mortgage Finance — 2.3% |
| |||||||
Anchor BanCorp Wisconsin, Inc. (a) | 3,891 | 144,006 | ||||||
EverBank Financial Corp. | 159,822 | 2,947,118 | ||||||
HomeStreet, Inc. (a) | 47,151 | 1,086,359 | ||||||
Meta Financial Group, Inc. | 17,585 | 705,686 | ||||||
MGIC Investment Corp. (a) | 12,197 | 132,337 | ||||||
Northwest Bancshares, Inc. | 5,025 | 60,803 | ||||||
|
| |||||||
| 5,076,309 | ||||||||
Tobacco — 0.8% | ||||||||
Vector Group Ltd. | 78,072 | 1,726,172 | ||||||
Trading Companies & Distributors — 0.5% | ||||||||
Neff Corp., Class A (a) | 7,503 | 76,981 | ||||||
Watsco, Inc. | 8,282 | 1,042,869 | ||||||
Willis Lease Finance Corp. (a) | 3,171 | 58,029 | ||||||
|
| |||||||
| 1,177,879 | ||||||||
Wireless Telecommunication Services — 0.0% |
| |||||||
Leap Wireless International, Inc. - CVR (a) | 3,374 | 8,502 | ||||||
Total Common Stocks — 98.0% | 214,946,460 | |||||||
| Other Interests (d) | Beneficial Interest (000) | Value | ||||||
Professional Services — 0.0% | ||||||||
The Dolan Co., Escrow (a) | $ | 9 | $ | 177 | ||||
Total Other Interests — 0.0% | 177 | |||||||
| Preferred Stocks | Shares | |||||||
Household Durables — 0.1% | ||||||||
AliphCom (Acquired 6/03/14, | 22,187 | 245,546 | ||||||
Software — 0.6% | ||||||||
Illumio Inc., Series C (Acquired 3/10/15, | 15,558 | 250,005 | ||||||
MongoDB: | ||||||||
Series C (Acquired 12/19/13, | 15,128 | 314,360 | ||||||
Series D (Acquired 12/19/13, | 4,706 | 97,791 | ||||||
Series E (Acquired 12/19/13, | 166 | 3,449 | ||||||
Palantir Technologies, Inc., | 81,566 | 725,122 | ||||||
Total Preferred Stocks — 0.7% | 1,636,273 | |||||||
| Warrants (e) | ||||||||
Pharmaceuticals — 0.0% | ||||||||
Alexza Pharmaceuticals, Inc. (Issued/Exercisable 5/06/11, 1 Share for 1 Warrant, Expires 5/06/16, | 222,516 | — | ||||||
Total Warrants — 0.0% | — | |||||||
Total Long-Term Investments (Cost — $186,825,573) — 98.7% | 216,582,910 | |||||||
| Short-Term Securities | ||||||||
BlackRock Liquidity Funds, TempFund, Institutional Class, 0.08% (f)(g) | 2,469,135 | 2,469,135 | ||||||
| Beneficial Interest (000) | ||||||||
BlackRock Liquidity Series, LLC, Money Market | $3,200 | 3,200,215 | ||||||
Total Short-Term Securities (Cost — $5,669,350) — 2.6% |
| 5,669,350 | ||||||
Total Investments (Cost — $192,494,923) — 101.3% |
| 222,252,260 | ||||||
Liabilities in Excess of Other Assets — (1.3)% | (2,908,479 | ) | ||||||
|
| |||||||
Net Assets — 100.0% | $ | 219,343,781 | ||||||
|
| |||||||
See Notes to Financial Statements.
| 40 | ANNUAL REPORT | MAY 31, 2015 |
| Schedule of Investments (continued) | BlackRock Master Small Cap Growth Portfolio |
| Notes to Schedule of Investments |
| (a) | Non-income producing security. |
| (b) | Security, or a portion of security, is on loan. |
| (c) | Restricted security as to resale. As of report date, the Master Portfolio held 1.0% of its net assets, with a current value of $2,298,531 and an original cost of $1,930,810 in this security. |
| (d) | Other interests represent beneficial interests in liquidation trusts and other reorganization or private entities. |
| (e) | Warrants entitle the Master Portfolio to purchase a predetermined number of shares of common stock and are non-income producing. The purchase price and number of shares are subject to adjustment under certain conditions until the expiration date of the warrants, if any. |
| (f) | During the year ended May 31, 2015, investments in issuers considered to be affiliates of the Master Portfolio for purposes of Section 2(a)(3) of the Investment Company Act of 1940, as amended, were as follows: |
| Affiliate | Shares/ Beneficial Held at 2014 | Net Activity | Shares/ Held at 2015 | Income | ||||||||||||
BlackRock Liquidity Funds, TempFund, Institutional Class | 5,280,302 | (2,811,167 | ) | 2,469,135 | $ | 1,032 | ||||||||||
BlackRock Liquidity Series, LLC, Money Market Series | $ | 3,271,075 | $ | (70,860 | ) | $ | 3,200,215 | $ | 461,765 | 1 | ||||||
| 1 | Represents securities lending income earned from the reinvestment of cash collateral from loaned securities, net of fees, and other payments to and from borrowers of securities, and less the collateral investment expenses. |
| (g) | Represents the current yield as of report date. |
| (h) | Security was purchased with the cash collateral from loaned securities. The Master Portfolio may withdraw up to 25% of its investment daily, although the manager of the BlackRock Liquidity Series, LLC, Money Market Series, in its sole discretion, may permit an investor to withdraw more than 25% on any one day. |
| • | For Master Portfolio compliance purposes, the Master Portfolio’s industry classifications refer to any one or more of the industry sub-classifications used by one or more widely recognized market indexes or ratings group indexes, and/or as defined by the investment advisor. These definitions may not apply for purposes of this report, which may combine such industry sub-classifications for reporting ease. |
| • | As of May 31, 2015, financial futures contracts outstanding were as follows: |
Contracts Long | Issue | Exchange | Expiration | Notional Value | Unrealized Depreciation | |||||||||
| 23 | E-Mini Russell 2000 Futures | InterContinental Exchange | June 2015 | $ | 2,861,890 | $(8,497) | ||||||||
| • | Fair Value Measurements — Various inputs are used in determining the fair value of investments and derivative financial instruments. These inputs to valuation techniques are categorized into a disclosure hierarchy consisting of three broad levels for financial statement purposes. The hierarchy gives the highest priority to unadjusted quoted prices in active markets for identical assets or liabilities (Level 1 measurements) and the lowest priority to unobservable inputs (Level 3 measurements). Accordingly, the degree of judgment exercised in determining fair value is greatest for instruments categorized in Level 3. The inputs used to measure fair value may fall into different levels of the fair value hierarchy. In such cases, for disclosure purposes, the fair value hierarchy classification is determined based on the lowest level input that is significant to the fair value measurement in its entirety. The categorization of a value determined for investments and derivative financial instruments is based on the pricing transparency of the investment and derivative financial instruments and is not necessarily an indication of the risks associated with investing in those securities. The three levels of the fair value hierarchy are as follows: |
| • | Level 1 – unadjusted quoted prices in active markets/exchanges for identical assets or liabilities that the Master Portfolio has the ability to access |
| • | Level 2 – other observable inputs (including, but not limited to, quoted prices for similar assets or liabilities in markets that are active, quoted prices for identical or similar assets or liabilities in markets that are not active, inputs other than quoted prices that are observable for the assets or liabilities (such as interest rates, yield curves, volatilities, prepayment speeds, loss severities, credit risks and default rates) or other market–corroborated inputs) |
| • | Level 3 – unobservable inputs based on the best information available in the circumstances, to the extent observable inputs are not available (including the Master Portfolio’s own assumptions used in determining the fair value of investments and derivative financial instruments) |
Changes in valuation techniques may result in transfers into or out of an assigned level within the disclosure hierarchy. In accordance with the Master Portfolio’s policy, transfers between different levels of the fair value disclosure hierarchy are deemed to have occurred as of the beginning of the reporting period. For information about the Master Portfolio’s policy regarding valuation of investments and derivative financial instruments, refer to Note 2 of the Notes to Financial Statements.
See Notes to Financial Statements.
| ANNUAL REPORT | MAY 31, 2015 | 41 |
| Schedule of Investments (continued) | BlackRock Master Small Cap Growth Portfolio |
As of May 31, 2015, the following tables summarize the Master Portfolio’s investments and derivative financial instruments categorized in the disclosure hierarchy:
| Level 1 | Level 2 | Level 3 | Total | |||||||||||||
Assets: | ||||||||||||||||
Investments: | ||||||||||||||||
Long-Term Investments: | ||||||||||||||||
Common Stocks: | ||||||||||||||||
Aerospace & Defense | $ | 1,209,487 | — | — | $ | 1,209,487 | ||||||||||
Airlines | 4,160,449 | — | — | 4,160,449 | ||||||||||||
Auto Components | 7,277,273 | — | — | 7,277,273 | ||||||||||||
Banks | 1,031,536 | — | — | 1,031,536 | ||||||||||||
Biotechnology | 25,929,150 | — | — | 25,929,150 | ||||||||||||
Building Products | 2,021,034 | — | — | 2,021,034 | ||||||||||||
Capital Markets | 399,123 | — | — | 399,123 | ||||||||||||
Chemicals | 831,713 | — | — | 831,713 | ||||||||||||
Commercial Services & Supplies | 798,290 | — | — | 798,290 | ||||||||||||
Communications Equipment | 1,729,851 | — | — | 1,729,851 | ||||||||||||
Consumer Finance | 416,083 | — | — | 416,083 | ||||||||||||
Containers & Packaging | 3,502,081 | — | — | 3,502,081 | ||||||||||||
Distributors | 1,994,682 | — | — | 1,994,682 | ||||||||||||
Diversified Consumer Services | 3,071,522 | — | — | 3,071,522 | ||||||||||||
Diversified Telecommunication Services | 3,021,255 | — | — | 3,021,255 | ||||||||||||
Electrical Equipment | 1,320,159 | — | — | 1,320,159 | ||||||||||||
Electronic Equipment, Instruments & Components | 5,590,625 | — | — | 5,590,625 | ||||||||||||
Energy Equipment & Services | 1,300,794 | — | — | 1,300,794 | ||||||||||||
Food & Staples Retailing | 2,633,751 | — | — | 2,633,751 | ||||||||||||
Food Products | 1,988,918 | — | — | 1,988,918 | ||||||||||||
Health Care Equipment & Supplies | 11,154,204 | — | — | 11,154,204 | ||||||||||||
Health Care Providers & Services | 9,446,507 | — | — | 9,446,507 | ||||||||||||
Health Care Technology | 1,794,417 | — | — | 1,794,417 | ||||||||||||
Hotels, Restaurants & Leisure | 5,053,505 | — | — | 5,053,505 | ||||||||||||
Household Durables | 532,374 | — | — | 532,374 | ||||||||||||
Insurance | 306,241 | — | — | 306,241 | ||||||||||||
Internet & Catalog Retail | 359,464 | — | — | 359,464 | ||||||||||||
Internet Software & Services | 10,238,100 | $ | 662,258 | — | 10,900,358 | |||||||||||
IT Services | 3,964,286 | — | — | 3,964,286 | ||||||||||||
Leisure Products | 3,139,175 | — | — | 3,139,175 | ||||||||||||
Life Sciences Tools & Services | 1,422,399 | — | — | 1,422,399 | ||||||||||||
Machinery | 7,379,324 | — | — | 7,379,324 | ||||||||||||
Media | 657,909 | — | — | 657,909 | ||||||||||||
Multiline Retail | 3,671,051 | — | — | 3,671,051 | ||||||||||||
Oil, Gas & Consumable Fuels | 2,472,746 | — | — | 2,472,746 | ||||||||||||
Paper & Forest Products | 1,859,962 | — | — | 1,859,962 | ||||||||||||
Pharmaceuticals | 7,609,005 | — | $ | 19,879 | 7,628,884 | |||||||||||
Professional Services | 7,193,467 | — | — | 7,193,467 | ||||||||||||
Real Estate Investment Trusts (REITs) | 9,379,006 | — | — | 9,379,006 | ||||||||||||
Real Estate Management & Development | 3,550,966 | — | — | 3,550,966 | ||||||||||||
Road & Rail | 2,251,210 | — | — | 2,251,210 | ||||||||||||
Semiconductors & Semiconductor Equipment | 13,961,686 | — | — | 13,961,686 | ||||||||||||
Software | 15,147,294 | — | 4,289 | 15,151,583 | ||||||||||||
Specialty Retail | 4,621,702 | — | — | 4,621,702 | ||||||||||||
Technology Hardware, Storage & Peripherals | 1,821,118 | — | — | 1,821,118 | ||||||||||||
Textiles, Apparel & Luxury Goods | 7,056,278 | — | — | 7,056,278 | ||||||||||||
Thrifts & Mortgage Finance | 5,076,309 | — | — | 5,076,309 | ||||||||||||
Tobacco | 1,726,172 | — | — | 1,726,172 | ||||||||||||
Trading Companies & Distributors | 1,177,879 | — | — | 1,177,879 | ||||||||||||
Wireless Telecommunication Services | — | — | 8,502 | 8,502 | ||||||||||||
Other Interests | — | — | 177 | 177 | ||||||||||||
Preferred Stocks | — | — | 1,636,273 | 1,636,273 | ||||||||||||
Warrants | — | — | — | — | ||||||||||||
Short-Term Securities | 2,469,135 | 3,200,215 | — | 5,669,350 | ||||||||||||
|
| |||||||||||||||
Total | $ | 216,720,667 | $ | 3,862,473 | $ | 1,669,120 | $ | 222,252,260 | ||||||||
|
| |||||||||||||||
See Notes to Financial Statements.
| 42 | ANNUAL REPORT | MAY 31, 2015 |
| Schedule of Investments (concluded) | BlackRock Master Small Cap Growth Portfolio |
| Level 1 | Level 2 | Level 3 | Total | |||||||||||||
Derivative Financial Instruments2 | ||||||||||||||||
Liabilities: | ||||||||||||||||
Equity contracts | $ | (8,497 | ) | — | — | $ | (8,497 | ) | ||||||||
2 Derivative financial instruments are financial futures contracts, which are valued at the unrealized appreciation (depreciation) on the instrument. |
| |||||||||||||||
The Master Portfolio may hold assets and/or liabilities in which the fair value approximates the carrying amount for financial statement purposes. As of May 31, 2015, such assets and/or liabilities are categorized within the disclosure hierarchy as follows: |
| |||||||||||||||
| Level 1 | Level 2 | Level 3 | Total | |||||||||||||
Assets: | ||||||||||||||||
Cash pledged for financial futures contracts | $ | 91,800 | — | — | $ | 91,800 | ||||||||||
Liabilities: | ||||||||||||||||
Bank overdraft | — | $ | (15,670 | ) | — | (15,670 | ) | |||||||||
Collateral on securities loaned at value | — | (3,200,215 | ) | — | (3,200,215 | ) | ||||||||||
|
| |||||||||||||||
Total | $ | 91,800 | $ | (3,215,885 | ) | — | $ | (3,124,085 | ) | |||||||
|
| |||||||||||||||
During the year ended May 31, 2015, there were no transfers between levels.
See Notes to Financial Statements.
| ANNUAL REPORT | MAY 31, 2015 | 43 |
| Statement of Assets and Liabilities | BlackRock Master Small Cap Growth Portfolio |
| May 31, 2015 | ||||
| Assets | ||||
Investments at value — unaffiliated (including securities loaned at value of $ 3,112,207) (cost — $186,825,573) | $ | 216,582,910 | ||
Investments at value — affiliated (cost — $ 5,669,350) | 5,669,350 | |||
Cash pledged for financial futures contracts | 91,800 | |||
Receivables: | ||||
Investments sold | 3,174,254 | |||
Securities lending income — affiliated | 30,877 | |||
Contributions from investors | 26,583 | |||
Dividends — affiliated | 117 | |||
Dividends — unaffiliated | 61,429 | |||
Prepaid expenses | 571 | |||
|
| |||
Total assets | 225,637,891 | |||
|
| |||
| Liabilities | ||||
Bank overdraft | 15,670 | |||
Collateral on securities loaned at value | 3,200,215 | |||
Payables: | ||||
Investments purchased | 2,875,754 | |||
Directors’ fees | 878 | |||
Investment advisory fees | 101,077 | |||
Other affiliates | 968 | |||
Variation margin payable on financial futures contracts | 15,039 | |||
Other accrued expenses payable | 84,509 | |||
|
| |||
Total liabilities | 6,294,110 | |||
|
| |||
Net Assets | $ | 219,343,781 | ||
|
| |||
| Net Assets Consist of | ||||
Investors’ capital | $ | 189,594,941 | ||
Net unrealized appreciation (depreciation) | 29,748,840 | |||
|
| |||
Net Assets | $ | 219,343,781 | ||
|
| |||
See Notes to Financial Statements.
| 44 | ANNUAL REPORT | MAY 31, 2015 |
| Statement of Operations | BlackRock Master Small Cap Growth Portfolio |
Year Ended May 31, 2015
| ||||
| Investment Income | ||||
Dividends — unaffiliated | $ | 1,486,116 | ||
Securities lending — affiliated — net | 461,765 | |||
Dividends — affiliated | 1,032 | |||
Foreign taxes withheld | (68 | ) | ||
|
| |||
Total income | 1,948,845 | |||
|
| |||
| Expenses | ||||
Investment advisory | 1,579,593 | |||
Custodian | 59,798 | |||
Accounting services | 58,543 | |||
Professional | 52,054 | |||
Directors | 9,345 | |||
Printing | 7,863 | |||
Miscellaneous | 17,160 | |||
|
| |||
Total expenses | 1,784,356 | |||
Less fees waived by the Manager | (362,418 | ) | ||
|
| |||
Total expenses after fees waived | 1,421,938 | |||
|
| |||
Net investment income | 526,907 | |||
|
| |||
| Realized and Unrealized Gain (Loss) | ||||
Net realized gain from: | ||||
Investments | 19,072,114 | |||
Financial futures contracts | 219,564 | |||
|
| |||
| 19,291,678 | ||||
|
| |||
Net change in unrealized appreciation (depreciation) on: | ||||
Investments | 9,783,559 | |||
Financial futures contracts | (144,618 | ) | ||
|
| |||
| 9,638,941 | ||||
|
| |||
Net realized and unrealized gain | 28,930,619 | |||
|
| |||
Net Increase in Net Assets Resulting from Operations | $ | 29,457,526 | ||
|
| |||
See Notes to Financial Statements.
| ANNUAL REPORT | MAY 31, 2015 | 45 |
| Statements of Changes in Net Assets | BlackRock Master Small Cap Growth Portfolio |
| Year Ended May 31, | ||||||||
| Increase (Decrease) in Net Assets: | 2015 | 2014 | ||||||
| Operations | ||||||||
Net investment income | $ | 526,907 | $ | 238,333 | ||||
Net realized gain | 19,291,678 | 47,784,879 | ||||||
Net change in unrealized appreciation (depreciation) | 9,638,941 | (1,607,784 | ) | |||||
|
| |||||||
Net increase in net assets resulting from operations | 29,457,526 | 46,415,428 | ||||||
|
| |||||||
| Capital Transactions | ||||||||
Proceeds from contributions | 47,206,163 | 61,663,245 | ||||||
Value of withdrawals | (89,207,603 | ) | (92,380,088 | ) | ||||
|
| |||||||
Net decrease in net assets derived from capital transactions | (42,001,440 | ) | (30,716,843 | ) | ||||
|
| |||||||
| Net Assets | ||||||||
Total increase (decrease) in net assets | (12,543,914 | ) | 15,698,585 | |||||
Beginning of year | 231,887,695 | 216,189,110 | ||||||
|
| |||||||
End of year | $ | 219,343,781 | $ | 231,887,695 | ||||
|
| |||||||
| Financial Highlights | BlackRock Master Small Cap Growth Portfolio |
| Year Ended May 31, | ||||||||||||||||||||
| 2015 | 2014 | 2013 | 2012 | 2011 | ||||||||||||||||
| Total Return | ||||||||||||||||||||
Total return | 14.11% | 22.22% | 31.47% | (13.48)% | 35.13% | |||||||||||||||
|
| |||||||||||||||||||
| Ratios to Average Net Assets | ||||||||||||||||||||
Total expenses | 0.79% | 0.80% | 0.79% | 0.77% | 0.76% | |||||||||||||||
|
| |||||||||||||||||||
Total expenses after fees waived | 0.63% | 0.64% | 0.77% | 0.77% | 0.76% | |||||||||||||||
|
| |||||||||||||||||||
Net investment income (loss) | 0.23% | 0.10% | 0.47% | (0.32)% | (0.51)% | |||||||||||||||
|
| |||||||||||||||||||
| Supplemental Data | ||||||||||||||||||||
Net assets, end of year (000) | $ | 219,344 | $ | 231,888 | $ | 216,189 | $ | 216,838 | $ | 504,292 | ||||||||||
|
| |||||||||||||||||||
Portfolio turnover rate | 140% | 152% | 165% | 143% | 127% | |||||||||||||||
|
| |||||||||||||||||||
See Notes to Financial Statements.
| 46 | ANNUAL REPORT | MAY 31, 2015 |
| Notes to Financial Statements | BlackRock Master Small Cap Growth Portfolio |
1. Organization:
BlackRock Master Small Cap Growth Portfolio (the “Master Portfolio”), a series of BlackRock Master LLC (the “Master LLC”), is registered under the Investment Company Act of 1940, as amended (the “1940 Act”), as a diversified, open-end management investment company. The Master LLC is organized as a Delaware limited liability company. The Limited Liability Company Agreement of the Master LLC permits the Board of Directors of the Master LLC (the “Board”) to issue non-transferable interests in the Master LLC, subject to certain limitations.
The Master Portfolio, together with certain other registered investment companies advised by BlackRock Advisors, LLC (the “Manager”) or its affiliates, is included in a complex of open-end funds referred to as the Equity-Liquidity Complex.
2. Significant Accounting Policies:
The Master Portfolio’s financial statements are prepared in conformity with accounting principles generally accepted in the United States of America (“U.S. GAAP”), which may require management to make estimates and assumptions that affect the reported amounts of assets and liabilities in the financial statements and the reported amounts of increases and decreases in net assets from operations during the reporting period. Actual results could differ from those estimates. The Master Portfolio is considered an investment company under U.S. GAAP and follows the accounting and reporting guidance applicable to investment companies. The following is a summary of significant accounting policies followed by the Master Portfolio:
Valuation: The Master Portfolio’s investments are valued at fair value as of the close of trading on the New York Stock Exchange (“NYSE”) (generally 4:00 p.m., Eastern time) (or if the reporting date falls on a day the NYSE is closed, investments are valued at fair value as of the report date). U.S. GAAP defines fair value as the price the Master Portfolio would receive to sell an asset or pay to transfer a liability in an orderly transaction between market participants at the measurement date. The Master Portfolio determines the fair values of its financial instruments at market value using independent dealers or pricing services under policies approved by the Board. The BlackRock Global Valuation Methodologies Committee (the “Global Valuation Committee”) is the committee formed by management to develop global pricing policies and procedures and to provide oversight of the pricing function for the Master Portfolio for all financial instruments.
Equity investments traded on a recognized securities exchange are valued at the official close each day, if available. For equity investments traded on more than one exchange, the official close price on the exchange where the stock is primarily traded is used. Equity investments traded on a recognized exchange for which there were no sales on that day may be valued at the last available bid (long positions) or ask (short positions) price. Financial futures contracts traded on exchanges are valued at their last sale price. Investments in open-end registered investment companies are valued at NAV each business day.
The Master Portfolio values its investment in BlackRock Liquidity Series, LLC, Money Market Series (the “Money Market Series”) at fair value, which is ordinarily based upon its pro rata ownership in the underlying fund’s net assets. The Money Market Series seeks current income consistent with maintaining liquidity and preserving capital. Although the Money Market Series is not registered under the 1940 Act, its investments will follow the parameters of investments by a money market fund that is subject to Rule 2a-7 under the 1940 Act. The Master Portfolio may withdraw up to 25% of its investment daily, although the manager of the Money Market Series, in its sole discretion, may permit an investor to withdraw more than 25% on any one day.
In the event that the application of these methods of valuation results in a price for an investment that is deemed not to be representative of the market value of such investment, or if a price is not available, the investment will be valued by the Global Valuation Committee, or its delegate, in accordance with a policy approved by the Board as reflecting fair value (“Fair Value Investments”). When determining the price for Fair Value Investments, the Global Valuation Committee, or its delegate, seeks to determine the price that the Master Portfolio might reasonably expect to receive or pay from the current sale or purchase of that asset or liability in an arm’s-length transaction. Fair value determinations shall be based upon all available factors that the Global Valuation Committee, or its delegate, deems relevant consistent with the principles of fair value measurement, which include the market approach, income approach and/or in the case of recent investments, the cost approach, as appropriate. The market approach generally consists of using comparable market transactions. The income approach generally is used to discount future cash flows to present value and is adjusted for liquidity as appropriate. These factors include but are not limited to: (i) attributes specific to the investment or asset; (ii) the principal market for the investment or asset; (iii) the customary participants in the principal market for the investment or asset; (iv) data assumptions by market participants for the investment or asset, if reasonably available; (v) quoted prices for similar investments or assets in active markets; and (vi) other factors, such as future cash flows, interest rates, yield curves, volatilities, prepayment speeds, loss severities, credit risks, recovery rates, liquidation amounts and/or default rates. Due to the inherent uncertainty of valuations of such investments, the fair values may differ from the values that would have been used had an active market existed. The Global Valuation Committee, or its delegate, employs various methods for calibrating valuation approaches for investments where an active market does not exist, including regular due diligence of the Master Portfolio’s pricing vendors, regular reviews of key inputs and assumptions, transactional back-testing or disposition analysis to compare unrealized gains and losses to realized gains and losses, reviews of missing or stale prices and large movements in market values and reviews of any market related activity. The pricing of all Fair Value Investments is subsequently reported to the Board or a committee thereof on a quarterly basis.
| ANNUAL REPORT | MAY 31, 2015 | 47 |
| Notes to Financial Statements (continued) | BlackRock Master Small Cap Growth Portfolio |
Segregation and Collateralization: In cases where the Master Portfolio enters into certain investments (e.g., financial futures contracts) that would be “senior securities” for 1940 Act purposes, the Master Portfolio may segregate or designate on its books and records cash or liquid securities having a market value at least equal to the amount of the Master Portfolio’s future obligations under such investments. Doing so allows the investment to be excluded from treatment as a “senior security.” Furthermore, if required by an exchange or counterparty agreement, the Master Portfolio may be required to deliver/deposit cash and/or securities to/with an exchange, or broker-dealer or custodian as collateral for certain investments or obligations.
Investment Transactions and Investment Income: For financial reporting purposes, investment transactions are recorded on the dates the transactions are entered into (the trade dates). Realized gains and losses on investment transactions are determined on the identified cost basis. Dividend income is recorded on the ex-dividend date. Dividends from foreign securities where the ex-dividend date may have passed are subsequently recorded when the Master Portfolio is informed of the ex-dividend date. Under the applicable foreign tax laws, a withholding tax at various rates may be imposed on capital gains, dividends and interest. Upon notification from issuers, some of the dividend income received from a real estate investment trust may be redesignated as a reduction of cost of the related investment and/or realized gain.
Recent Accounting Standard: In June 2014, the Financial Accounting Standards Board issued guidance to improve the financial reporting of reverse repurchase agreements and other similar transactions. The guidance will require expanded disclosure for entities that enter into reverse repurchase agreements and similar transactions accounted for as secured borrowings. It is effective for financial statements with fiscal years beginning on or after December 15, 2014 and for interim periods beginning after March 15, 2015. Management is evaluating the impact, if any, of this guidance on the Master Portfolio’s financial statement disclosures.
Other: Expenses directly related to the Master Portfolio are charged to the Master Portfolio. Other operating expenses shared by several funds are prorated among those funds on the basis of relative net assets or other appropriate methods.
The Master Portfolio has an arrangement with the custodian whereby fees may be reduced by credits earned on uninvested cash balances, which, if applicable, are shown as fees paid indirectly in the Statement of Operations. The custodian imposes fees on overdrawn cash balances, which can be offset by accumulated credits earned or may result in additional custody charges.
3. Securities and Other Investments:
Preferred Stock: The Master Portfolio may invest in preferred stock. Preferred stock has a preference over common stock in liquidation (and generally in receiving dividends as well) but is subordinated to the liabilities of the issuer in all respects. As a general rule, the market value of preferred stock with a fixed dividend rate and no conversion element varies inversely with interest rates and perceived credit risk, while the market price of convertible preferred stock generally also reflects some element of conversion value. Because preferred stock is junior to debt securities and other obligations of the issuer, deterioration in the credit quality of the issuer will cause greater changes in the value of a preferred stock than in a more senior debt security with similar stated yield characteristics. Unlike interest payments on debt securities, preferred stock dividends are payable only if declared by the issuer’s board of directors. Preferred stock also may be subject to optional or mandatory redemption provisions.
Securities Lending: The Master Portfolio may lend its securities to approved borrowers, such as brokers, dealers and other financial institutions. The borrower pledges and maintains with the Master Portfolio collateral consisting of cash, an irrevocable letter of credit issued by a bank, or securities issued or guaranteed by the U.S. Government. The initial collateral received by the Master Portfolio is required to have a value of at least 102% of the current value of the loaned securities for securities traded on U.S. exchanges and a value of at least 105% for all other securities. The collateral is maintained thereafter at a value equal to at least 100% of the current market value of the securities on loan. The market value of the loaned securities is determined at the close of each business day of the Master Portfolio and any additional required collateral is delivered to the Master Portfolio on the next business day. During the term of the loan, the Master Portfolio is entitled to all distributions made on or in respect of the loaned securities. Loans of securities are terminable at any time and the borrower, after notice, is required to return borrowed securities within the standard time period for settlement of securities transactions.
The market value of securities on loan and the value of the related collateral are shown separately in the Statement of Assets and Liabilities as a component of investments at value – unaffiliated, and collateral on securities loaned at value, respectively. As of May 31, 2015, any securities on loan were collateralized by cash. The cash collateral invested by the securities lending agent, BlackRock Investment Management, LLC (“BIM”), if any, is disclosed in the Schedule of Investments.
Securities lending transactions are entered into by the Master Portfolio under Master Securities Lending Agreements (each, an “MSLA”) which provide the right, in the event of default (including bankruptcy or insolvency), for the non-defaulting party to liquidate the collateral and calculate a net exposure to the defaulting party or request additional collateral. In the event that a borrower defaults, the Master Portfolio, as lender, would offset the market value of the collateral received against the market value of the securities loaned. When the value of the collateral is greater than that of the market value of the securities loaned, the lender is left with a net amount payable to the defaulting party. However, bankruptcy or insolvency laws of a particular jurisdiction may impose restrictions on or prohibitions against such a right of offset in the event of an MSLA counterparty’s bankruptcy or insolvency.
| 48 | ANNUAL REPORT | MAY 31, 2015 |
| Notes to Financial Statements (continued) | BlackRock Master Small Cap Growth Portfolio |
Under the MSLA, the borrower can resell or re-pledge the loaned securities, and the Master Portfolio can reinvest cash collateral, or, upon an event of default, resell or re-pledge the collateral.
As of May 31, 2015, the following table is a summary of the Master Portfolio’s securities lending agreements by counterparty, which are subject to offset under an MSLA:
| Counterparty | Securities Loaned at Value1 | Cash Collateral Received2 | Net Amount | |||||||
Barclays Capital, Inc. | $ 20,202 | $ (20,202) | — | |||||||
BNP Paribas S.A. | 1,833 | (1,833) | — | |||||||
Citigroup Global Markets, Inc. | 691,883 | (691,883) | — | |||||||
Credit Suisse Securities (USA) LLC | 103,258 | (103,258) | — | |||||||
Deutsche Bank Securities, Inc. | 16,640 | (16,640) | — | |||||||
Goldman Sachs & Co. | 411,068 | (411,068) | — | |||||||
JP Morgan Securities LLC | 1,257,246 | (1,257,246) | — | |||||||
Merrill Lynch, Pierce, Fenner & Smith, Inc. | 239,246 | (239,246) | — | |||||||
Morgan Stanley | 364,165 | (364,165) | — | |||||||
National Financial Services LLC | 6,666 | (6,666) | — | |||||||
|
| |||||||||
Total | $3,112,207 | $(3,112,207) | — | |||||||
|
| |||||||||
| 1 | Securities loaned with a value of $45,928 have been sold and are pending settlement as of May 31, 2015. |
| 2 | Collateral with a value of $3,200,215 has been received in connection with securities lending agreements. Collateral received in excess of the value of securities loaned from the individual counterparty is not shown for financial reporting purposes. |
The risks of securities lending include the risk that the borrower may not provide additional collateral when required or may not return the securities when due. To mitigate these risks, the Master Portfolio benefits from a borrower default indemnity provided by BIM. BIM’s indemnity allows for full replacement of the securities loaned if the collateral received does not cover the value on the securities loaned in the event of borrower default. The Master Portfolio could suffer a loss if the value of an investment purchased with cash collateral falls below the market value of loaned securities or if the value of an investment purchased with cash collateral falls below the value of the original cash collateral received.
4. Derivative Financial Instruments:
The Master Portfolio engages in various portfolio investment strategies using derivative contracts both to increase the returns of the Master Portfolio and/or to manage economically its exposure to certain risks such as equity risk. These contracts may be transacted on an exchange or over-the-counter (“OTC”).
Financial Futures Contracts: The Master Portfolio invests in long and/or short positions in financial futures contracts to gain exposure to, or economically hedge against, changes in the value of equity securities (equity risk). Financial futures contracts are agreements between the Master Portfolio and a counterparty to buy or sell a specific quantity of an underlying instrument at a specified price and at a specified date. Depending on the terms of the particular contract, financial futures contracts are settled either through physical delivery of the underlying instrument on the settlement date or by payment of a cash settlement amount on the settlement date.
Upon entering into a financial futures contract, the Master Portfolio is required to deposit initial margin with the broker in the form of cash or securities in an amount that varies depending on a contract’s size and risk profile. The initial margin deposit must then be maintained at an established level over the life of the contract. Securities deposited as initial margin are designated on the Schedule of Investments and cash deposited, if any, is recorded on the Statement of Assets and Liabilities as cash pledged for financial futures contracts. Pursuant to the contract, the Master Portfolio agrees to receive from or pay to the broker an amount of cash equal to the daily fluctuation in value of the contract. Such receipts or payments are known as variation margin. Variation margin is recorded by the Master Portfolio as unrealized appreciation (depreciation) and, if applicable, as a receivable or payable for variation margin in the Statement of Assets and Liabilities.
When the contract is closed, the Master Portfolio records a realized gain or loss equal to the difference between the value of the contract at the time it was opened and the value at the time it was closed. The use of financial futures contracts involves the risk of an imperfect correlation in the movements in the price of financial futures contracts and the underlying assets.
| ANNUAL REPORT | MAY 31, 2015 | 49 |
| Notes to Financial Statements (continued) | BlackRock Master Small Cap Growth Portfolio |
The following is a summary of the Master Portfolio’s derivative financial instruments categorized by risk exposure:
| Fair Values of Derivative Financial Instruments as of May 31, 2015 | ||||||||
| Value | ||||||||
| Statement of Assets and Liabilities Location | Derivative Liabilities | |||||||
Equity contracts | Net unrealized appreciation (depreciation)1 | $(8,497) | ||||||
| 1 | Includes cumulative appreciation (depreciation) on financial futures contracts, if any, as reported in the Schedule of Investments. Only current day’s variation margin is reported within the Statement of Assets and Liabilities. |
The Effect of Derivative Financial Instruments in the Statement of Operations Year Ended May 31, 2015 | ||||
| Net Realized Gain From | Net Change in Unrealized Appreciation (Depreciation) on | |||
Equity contracts: | ||||
Financial futures contracts | $219,564 | $(144,618) | ||
For the year ended May 31, 2015, the average quarterly balances of outstanding derivative financial instruments were as follows:
Financial futures contracts: | ||||
Average notional value of contracts - long | $ | 2,563,898 |
Counterparty Credit Risk: A derivative contract may suffer a mark-to-market loss if the value of the contract decreases due to an unfavorable change in the market rates or values of the underlying instrument. Losses can also occur if the counterparty does not perform under the contract.
The Master Portfolio’s risk of loss from counterparty credit risk on OTC derivatives is generally limited to the aggregate unrealized gain less the value of any collateral held by such the Master Portfolio.
With exchange-traded futures, there is less counterparty credit risk to the Master Portfolio since the exchange or clearinghouse, as counterparty to such instruments, guarantees against a possible default. The clearinghouse stands between the buyer and the seller of the contract; therefore, credit risk is limited to failure of the clearinghouse. While offset rights may exist under applicable law, the Master Portfolio does not have a contractual right of offset against a clearing broker or clearinghouse in the event of a default (including the bankruptcy or insolvency) of the clearing broker or clearinghouse. Additionally, credit risk exists in exchange-traded futures with respect to initial and variation margin that is held in a clearing broker’s customer accounts. While clearing brokers are required to segregate customer margin from their own assets, in the event that a clearing broker becomes insolvent or goes into bankruptcy and at that time there is a shortfall in the aggregate amount of margin held by the clearing broker for all its clients, typically the shortfall would be allocated on a pro rata basis across all the clearing broker’s customers, potentially resulting in losses to the Master Portfolio.
5. Investment Advisory Agreement and Other Transactions with Affiliates:
The PNC Financial Services Group, Inc. is the largest stockholder and an affiliate of BlackRock, Inc. (“BlackRock”) for 1940 Act purposes.
The Master LLC, on behalf of the Master Portfolio, entered into an Investment Advisory Agreement with the Manager, the Master Portfolio’s investment advisor, an indirect, wholly owned subsidiary of BlackRock, to provide investment advisory and administration services. The Manager is responsible for the management of the Master Portfolio’s portfolio and provides the necessary personnel, facilities, equipment and certain other services to the operations of the Master Portfolio. For such services, the Master Portfolio pays the Manager a monthly fee based on a percentage of the Master Portfolio’s average daily net assets at the following annual rates:
| Average Daily Net Assets | Investment Advisory Fee | |
First $1 Billion | 0.70% | |
$1 Billion - $3 Billion | 0.66% | |
$3 Billion - $5 Billion | 0.63% | |
$5 Billion - $10 Billion | 0.61% | |
Greater than $10 Billion | 0.60% |
The Manager entered into a contractual agreement to waive 0.16% of its investment advisory fees as a percentage of the Master Portfolio’s average daily net assets until October 1, 2015. The contractual agreement may be terminated upon 90 days’ notice by a majority of the independent Directors of the Master LLC or by a vote of a majority of the outstanding voting securities of the Master Portfolio. For the year ended May 31, 2015, the Manager waived $361,133 of investment advisory fees, which is included in fees waived by the Manager in the Statement of Operations.
The Manager voluntarily agreed to waive its investment advisory fees by the amount of investment advisory fees the Master Portfolio pays to the Manager indirectly through its investment in affiliated money market funds. This amount is included in fees waived by the Manager in the Statement of Operations. However, the Manager does not waive its investment advisory fees by the amount of investment advisory fees paid in connection with the Master Portfolio’s investments in other affiliated investment companies, if any. For the year ended May 31, 2015, the amount waived was $1,285.
| 50 | ANNUAL REPORT | MAY 31, 2015 |
| Notes to Financial Statements (continued) | BlackRock Master Small Cap Growth Portfolio |
Prior to July 1, 2014, BlackRock Capital Management (“BCM”), an affiliate of the Manager, served as a sub-advisor to the Master Portfolio pursuant to a sub-advisory agreement with the Manager, and received for its services a monthly fee from the Manager at an annual rate equal to a percentage of the investment advisory fees paid by the Master Portfolio to the Manager under the Investment Advisory Agreement. Effective July 1, 2014, the sub-advisory agreement between the Manager and BCM, with respect to the Master Portfolio, expired.
For the year ended May 31, 2015, the Master Portfolio reimbursed the Manager $2,286 for certain accounting services, which is included in accounting services in the Statement of Operations.
The U.S. Securities and Exchange Commission has issued an exemptive order which permits BIM, an affiliate of the Manager, to serve as securities lending agent for the Master Portfolio, subject to applicable conditions. As securities lending agent, BIM bears all operational costs directly related to securities lending. The Master Portfolio is responsible for expenses in connection with the investment of cash collateral received for securities on loan (the “collateral investment expenses”). The cash collateral is invested in a private investment company managed by the Manager or its affiliates. However, BIM has agreed to cap the collateral investment expenses of the private investment company to an annual rate of 0.04%. The investment advisor to the private investment company will not charge any advisory fees with respect to shares purchased by the Master Portfolio.
Securities lending income is equal to the total of income earned from the reinvestment of cash collateral, net of fees and other payments to and from borrowers of securities, and less the collateral investment expenses. The Master Portfolio retains a portion of securities lending income and remits a remaining portion to BIM as compensation for its services as securities lending agent. Pursuant to a securities lending agreement, BIM may lend securities only when the difference between the borrower rebate rate and the risk free rate exceeds a certain level (such securities, the “specials only securities”).
Pursuant to such agreement, the Master Portfolio retains 80% of securities lending income. In addition, commencing the business day following the date that the aggregate securities lending income earned across certain funds in the Equity-Liquidity Complex in a calendar year exceeds a specified threshold, the Master Portfolio, pursuant to the securities lending agreement, will retain for the remainder of the calendar year securities lending income in an amount equal to 85% of securities lending income.
The share of securities lending income earned by the Master Portfolio is shown as securities lending – affiliated – net in the Statement of Operations. For the year ended May 31, 2015, the Master Portfolio paid BIM $104,856 for securities lending agent services.
Certain officers and/or directors of the Master LLC are officers and/or directors of BlackRock or its affiliates.
6. Purchases and Sales:
For the year ended May 31, 2015, purchases and sales of investments, excluding short-term securities were $313,070,747 and $351,678,140, respectively.
7. Income Tax Information:
The Master Portfolio is disregarded as an entity separate from its owner for tax purposes. As such, the owner of the Master Portfolio is treated as the owner of the net assets, income, expenses and realized and unrealized gains and losses of the Master Portfolio. Therefore, no federal income tax provision is required. It is intended that the Master LLC’s assets will be managed so an investor in the Master Portfolio can satisfy the requirements of Subchapter M of the Internal Revenue Code of 1986, as amended.
As of May 31, 2015, gross unrealized appreciation and gross unrealized depreciation based on cost for federal income tax purposes were as follows:
Tax cost | $194,015,788 | |||
|
| |||
Gross unrealized appreciation | $ 36,963,005 | |||
Gross unrealized depreciation | (8,726,533 | ) | ||
|
| |||
Net unrealized appreciation | $ 28,236,472 | |||
|
|
8. Bank Borrowings:
The Master Portfolio, along with certain other funds managed by the Manager and its affiliates (“Participating Funds”), is a party to a 364-day, $2.1 billion credit agreement with a group of lenders, under which the Master Portfolio may borrow to fund shareholder redemptions. Excluding commitments designated for certain individual funds, the Participating Funds, including the Master Portfolio, can borrow up to an aggregate commitment amount of $1.6 billion, subject to asset coverage and other limitations as specified in the agreement. The credit agreement has the following terms: a fee of 0.06% per annum on unused commitment amounts and interest at a rate equal to the higher of (a) one-month LIBOR (but, in any event, not less than 0.00%) on the date the loan is made plus 0.80% per annum or (b) the Fed Funds rate (but, in any event, not less than 0.00%) in effect from time to time plus 0.80% per annum on amounts borrowed. The agreement expires in April 2016 unless extended or renewed. Prior to November 25, 2014, the aggregate commitment amount was $1.1 billion, of which the Participating Funds, including the Master Portfolio, could borrow up to $650
| ANNUAL REPORT | MAY 31, 2015 | 51 |
| Notes to Financial Statements (concluded) | BlackRock Master Small Cap Growth Portfolio |
million at any time outstanding, subject to asset coverage and other limitations as specified in the agreement. Participating Funds paid administration, legal and arrangement fees, which are included in miscellaneous expenses in the Statement of Operations, and along with commitment fees, were allocated among such funds based upon portions of the aggregate commitment available to them and relative net assets of Participating Funds. During the year ended May 31, 2015, the Master Portfolio did not borrow under the credit agreement.
9. Principal Risks:
In the normal course of business, the Master Portfolio invests in securities and enters into transactions where risks exist due to fluctuations in the market (market risk) or failure of the issuer of a security to meet all its obligations, including to pay principal and interest when due (issuer credit risk). The value of securities held by the Master Portfolio may decline in response to certain events, including those directly involving the issuers whose securities are owned by the Master Portfolio; conditions affecting the general economy; overall market changes; local, regional or global political, social or economic instability; and currency and interest rate and price fluctuations. Similar to issuer credit risk, the Master Portfolio may be exposed to counterparty credit risk, or the risk that an entity with which the Master Portfolio has unsettled or open transactions may fail to or be unable to perform on its commitments. The Master Portfolio manages counterparty credit risk by entering into transactions only with counterparties that the Manager believes have the financial resources to honor their obligations and by monitoring the financial stability of those counterparties. Financial assets, which potentially expose the Master Portfolio to market, issuer and counterparty credit risks, consist principally of financial instruments and receivables due from counterparties. The extent of the Master Portfolio’s exposure to market, issuer and counterparty credit risks with respect to these financial assets is generally approximated by their value recorded in the Statement of Assets and Liabilities, less any collateral held by the Master Portfolio.
As of May 31, 2015, the Master Portfolio invested a significant portion of its assets in securities in the health care and information technology sectors. Changes in economic conditions affecting such sectors would have a greater impact on the Master Portfolio and could affect the value, income and/or liquidity of positions in such securities.
10. Subsequent Events:
Management has evaluated the impact of all subsequent events on the Master Portfolio through the date the financial statements were issued and has determined that there were no subsequent events requiring adjustment or additional disclosure in the financial statements.
| 52 | ANNUAL REPORT | MAY 31, 2015 |
| Report of Independent Registered Public Accounting Firm | BlackRock Master Small Cap Growth Portfolio |
To the Investor of BlackRock Master Small Cap Growth Portfolio and Board of Directors of BlackRock Master LLC:
We have audited the accompanying statement of assets and liabilities, including the schedule of investments, of BlackRock Master Small Cap Growth Portfolio (the “Master LLC”) as of May 31, 2015, and the related statement of operations for the year then ended, the statements of changes in net assets for each of the two years in the period then ended, and the financial highlights for each of the five years in the period then ended. These financial statements and financial highlights are the responsibility of the Master LLC’s management. Our responsibility is to express an opinion on these financial statements and financial highlights based on our audits.
We conducted our audits in accordance with the standards of the Public Company Accounting Oversight Board (United States). Those standards require that we plan and perform the audit to obtain reasonable assurance about whether the financial statements and financial highlights are free of material misstatement. The Master LLC is not required to have, nor were we engaged to perform, an audit of its internal control over financial reporting. Our audits included consideration of internal control over financial reporting as a basis for designing audit procedures that are appropriate in the circumstances, but not for the purpose of expressing an opinion on the effectiveness of the Master LLC’s internal control over financial reporting. Accordingly, we express no such opinion. An audit also includes examining, on a test basis, evidence supporting the amounts and disclosures in the financial statements, assessing the accounting principles used and significant estimates made by management, as well as evaluating the overall financial statement presentation. Our procedures included confirmation of securities owned as of May 31, 2015, by correspondence with the custodian and brokers; where replies were not received from brokers, we performed other auditing procedures. We believe that our audit provides a reasonable basis for our opinion.
In our opinion, the financial statements and financial highlights referred to above present fairly, in all material respects, the financial position of BlackRock Master Small Cap Growth Portfolio as of May 31, 2015, the results of its operations for the year then ended, the changes in its net assets for each of the two years in the period then ended, and the financial highlights for each of the five years in the period then ended, in conformity with accounting principles generally accepted in the United States of America.
Deloitte & Touche LLP
Philadelphia, Pennsylvania
July 23, 2015
| ANNUAL REPORT | MAY 31, 2015 | 53 |
| Disclosure of Investment Advisory Agreements |
The Board of Trustees of BlackRock FundsSM (the “Trust”) met in person on April 21, 2015 and May 18-20, 2015 to consider the approval of the Trust’s investment advisory agreement (the “Trust Advisory Agreement”) with BlackRock Advisors, LLC (the “Manager” or “BlackRock”), the Trust’s investment advisor, on behalf of BlackRock Disciplined Small Cap Core Fund (“Disciplined Small Cap Core Fund”), a portfolio of the Trust.
The Board of Directors of BlackRock Master LLC (the “Master LLC”) met in person on April 21, 2015 and May 18-20, 2015 to consider the approval of the Master LLC’s investment advisory agreement (the “Master LLC Advisory Agreement”) with the Manager, the Master LLC’s investment advisor, on behalf of BlackRock Master Small Cap Growth Portfolio (the “Master Portfolio”), a series of the Master LLC. BlackRock Small Cap Growth Fund II (“Small Cap Growth Fund II”), a series of BlackRock Series, Inc. (the “Corporation”), is a “feeder” fund that invests all of its investable assets in the Master Portfolio. Accordingly, the Board of Directors of the Corporation also considered the approval of the Master LLC Advisory Agreement.
Disciplined Small Cap Core Fund, Small Cap Growth Fund II, the Master LLC (with respect to the Master Portfolio) and the Corporation (with respect to Small Cap Growth Fund II) are referred to herein, as pertinent, individually as a “Fund” or collectively as the “Funds.” The Trust Advisory Agreement and the Master LLC Advisory Agreement are referred to herein as the “Agreements.” For simplicity: (a) the Board of Trustees of the Trust, the Board of Directors of the Master LLC and the Board of Directors of the Corporation are referred to herein individually as the “Board” and collectively as the “Boards,” and the members are referred to as “Board Members;” (b) the shareholders of Disciplined Small Cap Core Fund and Small Cap Growth Fund II and the interest holders of the Master Portfolio are referred to as “shareholders;” and (c) the meetings held on April 21, 2015 are referred to as the “April Meeting” and the meetings held on May 18-20, 2015 are referred to as the “May Meeting.”
Activities and Composition of the Boards
On the date of the May Meeting, each Board consisted of fourteen individuals, thirteen of whom were not “interested persons” of the pertinent Fund as defined in the Investment Company Act of 1940, as amended (the “1940 Act”) (the “Independent Board Members”). The Board Members are responsible for the oversight of the operations of the pertinent Fund and perform the various duties imposed on the directors of investment companies by the 1940 Act. The Independent Board Members have retained independent legal counsel to assist them in connection with their duties. The Chair of each Board is an Independent Board Member. Each Board has established five standing committees: an Audit Committee, a Governance and Nominating Committee, a Compliance Committee, a Performance Oversight and Contract Committee and an Executive Committee, each of which is chaired by an Independent Board Member and composed of Independent Board Members (except for the Executive Committee, which also has one interested Board Member).
The Agreements
Pursuant to the 1940 Act, each Board is required to consider the continuation of the pertinent Agreement on an annual basis. The Boards have four quarterly meetings per year, each extending over two days, a fifth one-day meeting to consider specific information surrounding the consideration of renewing the pertinent Agreement, and additional in-person and telephonic meetings as needed. In connection with this year-long deliberative process, the Boards assessed, among other things, the nature, extent and quality of the services provided to the Funds by BlackRock, BlackRock’s personnel and affiliates, including (as applicable) investment management services; administrative and shareholder services; the oversight of fund service providers; marketing services; risk oversight; compliance; and ability to meet applicable legal and regulatory requirements.
The Boards, acting directly and through their committees, consider at each of their meetings, and from time to time as appropriate, factors that are relevant to their annual consideration of the renewal of the Agreements, including the services and support provided by BlackRock to the Funds and their shareholders. Among the matters the Boards considered, with respect to each Fund, as pertinent, were: (a) investment performance for one-year, three-year, five-year and/or since inception periods, as applicable, against peer funds, applicable benchmarks, and performance metrics, as applicable, as well as senior management’s and portfolio managers’ analysis of the reasons for any over performance or underperformance relative to its peers, benchmark, and other performance metrics, as applicable; (b) fees, including advisory, administration, if applicable, and other amounts paid to BlackRock and its affiliates by the Fund for services, such as marketing and distribution, call center and fund accounting; (c) the Fund’s operating expenses and how BlackRock allocates expenses to the Fund; (d) the resources devoted to, risk oversight of, and compliance reports relating to, implementation of the Fund’s investment objective(s), policies and restrictions, and meeting new regulatory requirements; (e) the Fund’s compliance with its compliance policies and procedures; (f) the nature, cost and character of non-investment management services provided by BlackRock and its affiliates; (g) BlackRock’s and other service providers’ internal controls and risk and compliance oversight mechanisms; (h) BlackRock’s implementation of the proxy voting policies approved by the Board; (i) the use of brokerage commissions and execution quality of portfolio transactions; (j) BlackRock’s implementation of the Fund’s valuation and liquidity procedures; (k) an analysis of management fees for products with similar investment mandates across the open-end fund, exchange-traded fund (“ETF”), closed-end fund and institutional account product channels, as applicable, and the similarities and differences between these products and the services provided as compared to the Fund; (l) BlackRock’s compensation methodology for its investment professionals and the incentives it creates, along with investment professionals’ investments in the fund(s) they manage; and (m) periodic updates on BlackRock’s business.
The Boards have engaged in an ongoing strategic review with BlackRock of opportunities to consolidate funds and of BlackRock’s commitment to investment performance. BlackRock also furnished information to the Boards in response to specific questions. These questions covered issues such
| 54 | ANNUAL REPORT | MAY 31, 2015 |
| Disclosure of Investment Advisory Agreements (continued) |
as: BlackRock’s profitability; investment performance; sub-advisory and advisory relationships with other clients (including mutual funds sponsored by third parties); the viability of specific funds; fund size and manager capacity; BlackRock’s research capabilities; portfolio managers’ investments in funds they manage; funds’ portfolio risk targets; and management fee levels and breakpoints. The Boards further discussed with BlackRock: BlackRock’s management structure; portfolio turnover, execution quality and use of soft dollars; BlackRock’s portfolio manager compensation and performance accountability; marketing support for the funds; services provided to the funds by BlackRock affiliates; and BlackRock’s oversight of relationships with third party service providers.
Board Considerations in Approving the Agreements
The Approval Process: Prior to the April Meeting, the Boards requested and received materials specifically relating to the Agreements. The Boards are continuously engaged in a process with their independent legal counsel and BlackRock to review the nature and scope of the information provided to better assist their deliberations. The materials provided in connection with the April Meeting included (a) information independently compiled and prepared by Lipper, Inc. (“Lipper”) on fees and expenses of each Fund as compared with a peer group of funds as determined by Lipper (“Expense Peers”) and the investment performance of Disciplined Small Cap Core Fund and Small Cap Growth Fund II, as applicable, as compared with a peer group of funds as determined by Lipper;1 (b) information on the profits realized by BlackRock and its affiliates pursuant to the Agreements and a discussion of fall-out benefits to BlackRock and its affiliates; (c) a general analysis provided by BlackRock concerning investment management fees charged to other clients, such as institutional clients, sub-advised mutual funds, ETFs and closed-end funds, under similar investment mandates, as well as the performance of such other clients, as applicable; (d) review of non-management fees; (e) the existence, impact and sharing of potential economies of scale; (f) a summary of aggregate amounts paid by each Fund to BlackRock; (g) sales and redemption data regarding the shares of Disciplined Small Cap Core Fund and Small Cap Growth Fund II, as applicable; and (h) if applicable, a comparison of management fees to similar BlackRock open-end funds, as classified by Lipper.
At the April Meeting, each Board reviewed materials relating to its consideration of the pertinent Agreement. As a result of the discussions that occurred during the April Meeting, and as a culmination of each Board’s year-long deliberative process, the Boards presented BlackRock with questions and requests for additional information. BlackRock responded to these requests with additional written information in advance of the May Meeting.
At the May Meeting, (a) the Board of the Trust, including the Independent Board Members, approved the continuation of the Trust Advisory Agreement between the Manager and the Trust with respect to Disciplined Small Cap Core Fund for a one-year term ending June 30, 2016; and (b) the Board of the Master LLC, including the Independent Board Members, approved the continuation of the Master LLC Advisory Agreement between the Manager and the Master LLC with respect to the Master Portfolio for a one-year term ending June 30, 2016. The Board of the Corporation, including the Independent Board Members, also considered the continuation of the Master LLC Advisory Agreement with respect to the Master Portfolio and found the Master LLC Advisory Agreement to be satisfactory. In approving the continuation of the pertinent Agreement, each Board considered, with respect to the applicable Fund: (a) the nature, extent and quality of the services provided by BlackRock; (b) the investment performance of the Fund and BlackRock; (c) the advisory fee and the cost of the services and profits to be realized by BlackRock and its affiliates from their relationship with the Fund; (d) the costs of Disciplined Small Cap Core Fund and Small Cap Growth Fund II, as applicable, to investors compared to the costs of the relevant Expense Peers and performance compared to the relevant performance comparison as previously discussed; (e) the sharing of potential economies of scale; (f) fall-out benefits to BlackRock and its affiliates as a result of its relationship with the Fund; and (g) other factors deemed relevant by the Board Members.
Each Board also considered other matters it deemed important to the approval process, such as payments made to BlackRock or its affiliates relating to the distribution of the shares of Disciplined Small Cap Core Fund and Small Cap Growth Fund II, as applicable, securities lending and cash management, services related to the valuation and pricing of portfolio holdings of the applicable Fund, direct and indirect benefits to BlackRock and its affiliates from their relationship with the applicable Fund and advice from independent legal counsel with respect to the review process and materials submitted for the Board’s review. Each Board noted the willingness of BlackRock personnel to engage in open, candid discussions with the Board. The Boards did not identify any particular information as determinative, and each Board Member may have attributed different weights to the various items considered.
A. Nature, Extent and Quality of the Services Provided by BlackRock: Each Board, including the Independent Board Members, reviewed the nature, extent and quality of services provided by BlackRock, including the investment advisory services and the resulting performance of the applicable Fund. Throughout the year, each Board compared Fund performance to the performance of a comparable group of mutual funds, relevant benchmark, and performance metrics, as applicable. The Boards met with BlackRock’s senior management personnel responsible for investment activities, including the senior investment officers. Each Board also reviewed the materials provided by the applicable Fund’s portfolio management team discussing the Fund’s performance and the Fund’s investment objective(s), strategies and outlook.
Each Board considered, among other factors, with respect to BlackRock: the number, education and experience of investment personnel generally and the applicable Fund’s portfolio management team; BlackRock’s research capabilities; investments by portfolio managers in the funds they manage;
1 Funds are ranked by Lipper in quartiles, ranging from first to fourth, where first is the most desirable quartile position and fourth is the least desirable.
| ANNUAL REPORT | MAY 31, 2015 | 55 |
| Disclosure of Investment Advisory Agreements (continued) |
portfolio trading capabilities; use of technology; commitment to compliance; credit analysis capabilities; risk analysis and oversight capabilities; and the approach to training and retaining portfolio managers and other research, advisory and management personnel. Each Board engaged in a review of BlackRock’s compensation structure with respect to the applicable Fund’s portfolio management team and BlackRock’s ability to attract and retain high-quality talent and create performance incentives.
In addition to advisory services, the Boards considered the quality of the administrative and other non-investment advisory services provided to the Funds. BlackRock and its affiliates provide the Funds with certain administrative, shareholder and other services (in addition to any such services provided to the Funds by third parties) and officers and other personnel as are necessary for the operations of the Funds. In particular, BlackRock and its affiliates provide the Funds with the following administrative services, including, among others: (i) preparing disclosure documents, such as the prospectus, the summary prospectus (as applicable), the statement of additional information and periodic shareholder reports; (ii) oversight of daily accounting and pricing; (iii) overseeing and coordinating the activities of other service providers; (iv) organizing Board meetings and preparing the materials for such Board meetings; (v) providing legal and compliance support; (vi) furnishing analytical and other support to assist the Boards in their consideration of strategic issues such as the merger, consolidation or repurposing of certain open-end funds; and (vii) performing other administrative functions necessary for the operation of the Funds, such as tax reporting, fulfilling regulatory filing requirements and call center services. The Boards reviewed the structure and duties of BlackRock’s fund administration, shareholder services, legal and compliance departments and considered BlackRock’s policies and procedures for assuring compliance with applicable laws and regulations.
B. The Investment Performance of the Funds and BlackRock: The Boards, including the Independent Board Members, also reviewed and considered the performance history of Disciplined Small Cap Core Fund and the Master Portfolio and Small Cap Growth Fund II, as applicable. The Boards of each of the Master LLC and the Corporation noted that Small Cap Growth Fund II’s investment results correspond directly to the investment results of the Master Portfolio. In preparation for the April Meeting, the Boards worked with their independent legal counsel, BlackRock and Lipper to develop a template for, and were provided with, reports independently prepared by Lipper, which included a comprehensive analysis of the performance of Disciplined Small Cap Core Fund and Small Cap Growth Fund II, as applicable. The Boards also reviewed a narrative and statistical analysis of the Lipper data that was prepared by BlackRock. In connection with their review, the Boards received and reviewed information regarding the investment performance of Disciplined Small Cap Core Fund and Small Cap Growth Fund II as compared to other funds in the Fund’s applicable Lipper category. The Boards were provided with a description of the methodology used by Lipper to select peer funds and periodically meet with Lipper representatives to review its methodology. Each Board and its Performance Oversight and Contract Committee regularly review, and meet with Fund management to discuss, the performance of the pertinent Fund throughout the year.
In evaluating performance, the Boards recognized that the performance data reflects a snapshot of a period or as of a particular date and that selecting a different performance period could produce significantly different results. Further, the Boards recognized that it is possible that long-term performance can be adversely affected by even one period of significant underperformance so that a single investment decision or theme has the ability to affect long-term performance disproportionately.
The Board of the Trust noted that for each of the one-year and since-inception periods reported, Disciplined Small Cap Core Fund ranked in the second quartile against its Lipper Performance Universe.
The Boards of each of the Master LLC and the Corporation noted that for the one-, three- and five-year periods reported, Small Cap Growth Fund II ranked in the third, third and fourth quartiles, respectively, against its Lipper Performance Universe. These Boards and BlackRock reviewed and discussed the reasons for Small Cap Growth Fund II’s underperformance during these periods. BlackRock informed the Boards that, among other things, the primary detractor of performance during the one-year period can be attributed to an overweight position in the energy sector and an overweight position to energy beneficiary companies in the industrial, chemical, transportation, and technology industries. During the three-year period, the Fund had significant underperformance in the fourth quarter of 2012 due to an overweight in the healthcare sector. Impacting five-year performance, a number of factors affected performance in 2010, the most significant being poor stock selection within the consumer discretionary sector.
The Boards of each of the Master LLC and the Corporation and BlackRock also discussed BlackRock’s strategy for improving the Master Portfolio’s/ Small Cap Growth Fund II’s performance and BlackRock’s commitment to providing the resources necessary to assist the Master Portfolio’s portfolio managers in seeking to do so. BlackRock and these Boards previously had concurred, given the Master Portfolio’s/Small Cap Growth Fund II’s poor historical performance, in changing the portfolio management team. Both BlackRock and the Boards are hopeful that the change in portfolio management will result in improved performance going forward, although there can be no assurance that will be the case. The Boards will continue to monitor the Master Portfolio’s/Small Cap Growth Fund II’s performance.
C. Consideration of the Advisory/Management Fees and the Cost of the Services and Profits to be Realized by BlackRock and its Affiliates from their Relationship with the Funds: The Boards, including the Independent Board Members, reviewed, as pertinent, the contractual management fee rate of Disciplined Small Cap Core Fund and the Master Portfolio/Small Cap Growth Fund II compared with the other funds in the applicable Fund’s Lipper category. The contractual management fee rate represents a combination of the advisory fee and any administrative fees, before taking into account any reimbursements or fee waivers. The Boards also compared, as pertinent, the total expense ratio of Disciplined Small Cap Core Fund and Small Cap
| 56 | ANNUAL REPORT | MAY 31, 2015 |
| Disclosure of Investment Advisory Agreements (continued) |
Growth Fund II, as well as the actual management fee rate of Disciplined Small Cap Core Fund and the Master Portfolio/Small Cap Growth Fund II, to those of other funds in the applicable Fund’s Lipper category. The total expense ratio represents a fund’s total net operating expenses, including any 12b-1 or non-12b-1 service fees. The total expense ratio gives effect to any expense reimbursements or fee waivers that benefit a fund, and the actual management fee rate gives effect to any management fee reimbursements or waivers that benefit a fund. The Boards considered the services provided and the fees charged by BlackRock and its affiliates to other types of clients with similar investment mandates, as applicable, including institutional accounts and sub-advised mutual funds.
The Boards received and reviewed statements relating to BlackRock’s financial condition. Each Board reviewed BlackRock’s profitability methodology and was also provided with a profitability analysis that detailed the revenues earned and the expenses incurred by BlackRock for services provided to the Funds. The Boards reviewed BlackRock’s profitability with respect to the Funds and other funds the Board currently oversees for the year ended December 31, 2014 compared to available aggregate profitability data provided for the two prior years. The Boards reviewed BlackRock’s profitability with respect to certain other U.S. fund complexes managed by the Manager and/or its affiliates. The Boards reviewed BlackRock’s assumptions and methodology of allocating expenses in the profitability analysis, noting the inherent limitations in allocating costs among various advisory products. The Boards recognized that profitability may be affected by numerous factors including, among other things, fee waivers and expense reimbursements by the Manager, the types of funds managed, precision of expense allocations and business mix. As a result, calculating and comparing profitability at individual fund levels is difficult.
The Boards noted that, in general, individual fund or product line profitability of other advisors is not publicly available. The Boards reviewed BlackRock’s overall operating margin, in general, compared to that of certain other publicly-traded asset management firms. The Boards considered the differences between BlackRock and these other firms, including the contribution of technology at BlackRock, BlackRock’s expense management, and the relative product mix.
In addition, each Board considered the cost of the services provided to the applicable Fund by BlackRock, and BlackRock’s and its affiliates’ profits relating to the management and distribution of the applicable Fund and the other funds advised by BlackRock and its affiliates. As part of its analysis, each Board reviewed BlackRock’s methodology in allocating its costs to the management of the applicable Fund. Each Board also considered whether BlackRock has the financial resources necessary to attract and retain high quality investment management personnel to perform its obligations under the pertinent Agreement and to continue to provide the high quality of services that is expected by that Board. The Boards further considered factors including but not limited to BlackRock’s commitment of time, assumption of risk and liability profile in servicing the Funds in contrast to what is required of BlackRock with respect to other products with similar investment mandates across the open-end fund, ETF, closed-end fund, sub-advised mutual fund and institutional account product channels, as applicable.
The Board of the Trust noted that Disciplined Small Cap Core Fund’s contractual management fee rate ranked in the first quartile, and that the actual management fee rate and total expense ratio each ranked in the first quartile, relative to the Fund’s Expense Peers. The Board of the Trust also noted that Disciplined Small Cap Core Fund has an advisory fee arrangement that includes breakpoints that adjust the fee rate downward as the size of the Fund increases above certain contractually specified levels. The Board further noted that BlackRock has contractually agreed to a cap on Disciplined Small Cap Core Fund’s total expenses as a percentage of the Fund’s average daily net assets on a class-by-class basis.
The Boards of each of the Master LLC and the Corporation noted that the Master Portfolio’s/Small Cap Growth Fund II’s contractual management fee rate ranked in the second quartile, and that the actual management fee rate and Small Cap Growth Fund II’s total expense ratio ranked in the first and third quartiles, respectively, relative to the Fund’s Expense Peers. The Boards determined that Small Cap Growth Fund II’s total expense ratio was appropriate in light of the median total expense ratio paid by the Fund’s Expense Peers. The Boards of each of the Master LLC and the Corporation also noted that the Master Portfolio has an advisory fee arrangement that includes breakpoints that adjust the fee rate downward as the size of the Master Portfolio increases above certain contractually specified levels. Additionally, the Boards noted that BlackRock has contractually agreed to waive a portion of the advisory fee for the Master Portfolio.
D. Economies of Scale: Each Board, including the Independent Board Members, considered the extent to which economies of scale might be realized as the assets of the applicable Fund increase, as well as the existence of expense caps, as applicable. Each Board also considered the extent to which the applicable Fund benefits from such economies and whether there should be changes in the advisory fee rate or breakpoint structure in order to enable the Fund to participate in these economies of scale, for example through the use of revised breakpoints in the advisory fee based upon the asset level of Disciplined Small Cap Core Fund or, in the case of the Master Portfolio and Small Cap Growth Fund II, the asset level of the Master Portfolio. In their consideration, the Board Members took into account the existence of any expense caps and further considered the continuation and/or implementation, as applicable, of such caps.
E. Other Factors Deemed Relevant by the Board Members: Each Board, including the Independent Board Members, also took into account other ancillary or “fall-out” benefits that BlackRock or its affiliates may derive from their respective relationships with the applicable Fund, both tangible and intangible, such as BlackRock’s ability to leverage its investment professionals who manage other portfolios and risk management personnel, an increase in BlackRock’s profile in the investment advisory community, and the engagement of BlackRock’s affiliates as service providers to the Fund,
| ANNUAL REPORT | MAY 31, 2015 | 57 |
| Disclosure of Investment Advisory Agreements (concluded) |
including for administrative, distribution, securities lending and cash management services. The Boards also considered BlackRock’s overall operations and its efforts to expand the scale of, and improve the quality of, its operations. The Boards also noted that BlackRock may use and benefit from third party research obtained by soft dollars generated by certain registered fund transactions to assist in managing all or a number of its other client accounts. Each Board further noted that it had considered the investment by BlackRock’s funds in affiliated ETFs without any offset against the management fees payable by the funds to BlackRock.
In connection with their consideration of the Agreements, the Boards also received information regarding BlackRock’s brokerage and soft dollar practices. The Boards received reports from BlackRock which included information on brokerage commissions and trade execution practices throughout the year.
The Boards noted the competitive nature of the open-end fund marketplace, and that shareholders are able to redeem their Fund shares if they believe that the pertinent Fund’s fees and expenses are too high or if they are dissatisfied with the performance of the Fund.
Conclusion
The Board of the Trust, including the Independent Board Members, approved the continuation of the Trust Advisory Agreement between the Manager and the Trust with respect to Disciplined Small Cap Core Fund for a one-year term ending June 30, 2016. The Board of the Master LLC, including the Independent Board Members, approved the continuation of the Master LLC Advisory Agreement between the Manager and the Master LLC with respect to the Master Portfolio for a one-year term ending June 30, 2016.
Based upon its evaluation of all of the aforementioned factors in their totality, each of the Board of the Trust and the Board of the Master LLC, including the Independent Board Members, was satisfied that the terms of the pertinent Agreement were fair and reasonable and in the best interest of the applicable Fund and its shareholders. The Board of the Corporation, including the Independent Board Members, also considered the continuation of the Master LLC Advisory Agreement with respect to the Master Portfolio and found the Master LLC Advisor Agreement to be satisfactory. In arriving at its decision to approve the applicable Agreement, the Board of the Trust and the Board of the Master LLC did not identify any single factor or group of factors as all-important or controlling, but considered all factors together, and different Board Members may have attributed different weights to the various factors considered. The Independent Board Members were also assisted by the advice of independent legal counsel in making this determination. The contractual fee arrangements for the Trust and the Master LLC reflect the results of several years of review by the respective Board Members and predecessor Board Members, and discussions between such Board Members (and predecessor Board Members) and BlackRock. As a result, the Board Members’ conclusions may be based in part on their consideration of these arrangements in prior years.
| 58 | ANNUAL REPORT | MAY 31, 2015 |
| Officers and Directors/Trustees |
Name, Address1, and Year of Birth
| Position(s)
| Length of Time Served as a Director/
| Principal Occupation(s) During Past 5 Years
| Number of BlackRock-
| Public
| |||||
| Independent Directors/Trustees2 | ||||||||||
Rodney D. Johnson 1941 | Chair of the Board and Director/Trustee | Since 2007 | President, Fairmount Capital Advisors, Inc. from 1987 to 2013; Member of the Archdiocesan Investment Committee of the Archdiocese of Philadelphia from 2004 to 2012; Director, The Committee of Seventy (civic) from 2006 to 2012; Director, Fox Chase Cancer Center from 2004 to 2011. | 33 RICs consisting of 158 Portfolios | None | |||||
David O. Beim 1940 | Director/Trustee | Since 2007 | Professor of Professional Practice at the Columbia University Graduate School of Business since 1991; Trustee, Phillips Exeter Academy from 2002 to 2012; Chairman, Wave Hill, Inc. (public garden and cultural center) from 1990 to 2006. | 33 RICs consisting of 158 Portfolios | None | |||||
Collette Chilton 1958 | Director/Trustee | Since 2015 | Chief Investment Officer, Williams College since 2006; Chief Investment Officer, Lucent Asset Management Corporation from 1998 to 2006. | 33 RICs consisting of 158 Portfolios | None | |||||
Frank J. Fabozzi 1948 | Director/Trustee | Since 2014 | Editor of and Consultant for The Journal of Portfolio Management since 2006; Professor of Finance, EDHEC Business School since 2011; Visiting Professor, Princeton University from 2013 to 2014; Professor in the Practice of Finance and Becton Fellow, Yale University School of Management from 2006 to 2011. | 109 RICs consisting of 234 Portfolios | None | |||||
Dr. Matina S. Horner 1939 | Director/Trustee | Since 2007 | Executive Vice President of Teachers Insurance and Annuity Association and College Retirement Equities Fund from 1989 to 2003. | 33 RICs consisting of 158 Portfolios | NSTAR (electric and gas utility) | |||||
Herbert I. London 1939 | Director/Trustee | Since 2007 | Professor Emeritus, New York University since 2005; President London Center for Policy Research since 2012; John M. Olin Professor of Humanities, New York University from 1993 to 2005 and Professor thereof from 1980 to 2005; President Emeritus, Hudson Institute (policy research organization) from 2011 to 2012, President thereof from 1997 to 2011 and Trustee from 1980 to 2012; Chairman of the Board of Trustees for Grantham University since 2006; Director, InnoCentive, Inc. (global internet service) since 2005; Director, Cerego, LLC (educational software) since 2005; Director, Cybersettle (online adjudication) since 2009; Director, AIMS Worldwide, Inc. (marketing) from 2007 to 2012. | 33 RICs consisting of 158 Portfolios | None | |||||
Cynthia A. Montgomery 1952 | Director/Trustee | Since 2007 | Professor, Harvard Business School since 1989; Director, McLean Hospital from 2005 to 2012; Director, Harvard Business School Publishing from 2005 to 2010. | 33 RICs consisting of 158 Portfolios | Newell Rubbermaid, Inc. (manufacturing) | |||||
Joseph P. Platt 1947 | Director/Trustee | Since 2007 | Director, Jones and Brown (Canadian insurance broker) since 1998; General Partner, Thorn Partners, LP (private investments) since 1998; Director, WQED Multi-Media (public broadcasting not-for-profit) since 2001; Director, The West Penn Allegheny Health System (a not-for-profit health system) from 2008 to 2013; Partner, Amarna Corporation, LLC (private investment company) from 2002 to 2008. | 33 RICs consisting of 158 Portfolios | Greenlight Capital Re, Ltd. (reinsurance company) | |||||
Robert C. Robb, Jr. 1945 | Director/Trustee | Since 2007 | Partner, Lewis, Eckert, Robb and Company (management and financial consulting firm) since 1981. | 33 RICs consisting of 158 Portfolios | None | |||||
Toby Rosenblatt 1938 | Director/Trustee | Since 2007 | President, Founders Investments Ltd. (private investments) since 1999; Director, Forward Management, LLC since 2007; Director, College Futures Foundation (philanthropic foundation) since 2009; Director, The James Irvine Foundation (philanthropic foundation) from 1998 to 2008. | 33 RICs consisting of 158 Portfolios | None | |||||
| ANNUAL REPORT | MAY 31, 2015 | 59 |
| Officers and Directors/Trustees (continued) |
Name, Address1, and Year of Birth
| Position(s)
| Length of Time a Director/
| Principal Occupation(s) During Past 5 Years
| Number of BlackRock-
| Public
| |||||
| Independent Directors/Trustees2 (concluded) | ||||||||||
Mark Stalnecker 1951 | Director/Trustee | Since 2015 | Chief Investment Officer, University of Delaware from 1999 to 2013; Trustee, Winterthur Museum and Country Estate since 2001; Member of the Investment Committee, Delaware Public Employees’ Retirement System since 2002; Member of the Investment Committee, Christiana Care Health System since 2009; Member of the Investment Committee, Delaware Community Foundation from 2013 to 2014. | 33 RICs consisting of 158 Portfolios | None | |||||
Kenneth L. Urish 1951 | Director/Trustee | Since 2007 | Managing Partner, Urish Popeck & Co., LLC (certified public accountants and consultants) since 1976; Immediate past-Chairman of the Professional Ethics Committee of the Pennsylvania Institute of Certified Public Accountants and Committee Member thereof since 2007; Member of External Advisory Board, The Pennsylvania State University Accounting Department since 2001; Principal, UP Strategic Wealth Investment Advisors, LLC since 2013; Trustee, The Holy Family Institute from 2001 to 2010; President and Trustee, Pittsburgh Catholic Publishing Associates from 2003 to 2008; Director, Inter-Tel from 2006 to 2007. | 33 RICs consisting of 158 Portfolios | �� | None | ||||
Frederick W. Winter 1945 | Director/Trustee | Since 2007 | Director, Alkon Corporation (pneumatics) since 1992; Professor and Dean Emeritus of the Joseph M. Katz School of Business, University of Pittsburgh from 2005 to 2013 and Dean thereof from 1997 to 2005; Director, Tippman Sports (recreation) from 2005 to 2013; Director, Indotronix International (IT services) from 2004 to 2008. | 33 RICs consisting of 158 Portfolios | None | |||||
1 The address of each Director/Trustee is c/o BlackRock, 55 East 52nd Street, New York, NY 10055.
2 Independent Directors/Trustees serve until their resignation, removal or death, or until December 31 of the year in which they turn 75. The Board has determined to extend the terms of Independent Directors/Trustees on a case-by-case basis, as appropriate.
3 Date shown is the earliest date a person has served for the Trust/Corporation/Master LLC. Following the combination of Merrill Lynch Investment Managers, L.P. (“MLIM”) and BlackRock, Inc. (“BlackRock”) in September 2006, the various legacy MLIM and legacy BlackRock fund boards were realigned and consolidated into three new fund boards in 2007. As a result, although the chart shows certain Directors/Trustees as joining the Trust’s/ Corporation’s/Master LLC’s board in 2007, those Directors/Trustees first became members of the boards of other legacy MLIM or legacy BlackRock funds as follows: David O. Beim, 1998; Dr. Matina S. Horner, 2004; Rodney D. Johnson, 1995; Herbert I. London, 1987; Cynthia A. Montgomery, 1994; Joseph P. Platt, 1999; Robert C. Robb, Jr., 1998; Toby Rosenblatt, 2005; Kenneth L. Urish, 1999; and Frederick W. Winter, 1999. Frank J. Fabozzi first became a member of the boards of other funds advised by BlackRock Advisors, LLC or its affiliates in 1988.
| ||||||||||
| Interested Director/Trustee4 | ||||||||||
Barbara G. Novick 1960 | Director/Trustee | Since 2015 | Vice Chairman of BlackRock since 2006; Chair of BlackRock’s Government Relations Steering Committee since 2009; Head of the Global Client Group of BlackRock from 1988 to 2008. | 109 RICs consisting of 234 Portfolios | None | |||||
4 Ms. Novick is an “interested person,” as defined in the 1940 Act, of the Trust/Corporation/Master LLC based on her positions with BlackRock and its affiliates. | ||||||||||
| 60 | ANNUAL REPORT | MAY 31, 2015 |
| Officers and Directors/Trustees (continued) |
Name, Address1, and Year of Birth
| Position(s) Corporation/ Master LLC
| Length of Time
| Principal Occupation(s) During Past 5 Years
| |||
| Officers2 | ||||||
John M. Perlowski 1964 | President and Chief Executive Officer | Since 2010 | Managing Director of BlackRock since 2009; Global Head of BlackRock Fund Services since 2009; Managing Director and Chief Operating Officer of the Global Product Group at Goldman Sachs Asset Management, L.P. from 2003 to 2009; Treasurer of Goldman Sachs Mutual Funds from 2003 to 2009 and Senior Vice President thereof from 2007 to 2009; Director of Goldman Sachs Offshore Funds from 2002 to 2009; Director of Family Resource Network (charitable foundation) since 2009. | |||
Richard Hoerner, CFA 1958 | Vice President | Since 2009 | Managing Director of BlackRock since 2000; Head of the Global Cash Group since 2013; Co-head of the Global Cash and Securities Lending Group from 2010 to 2013; Member of the Cash Management Group Executive Committee since 2005. | |||
Jennifer McGovern 1977 | Vice President | Since 2014 | Director of BlackRock since 2011; Head of Product Structure and Oversight for BlackRock’s U.S. Wealth Advisory Group since 2013; Vice President of BlackRock from 2008 to 2010. | |||
Neal Andrews 1966 | Chief Financial Officer | Since 2007 | Managing Director of BlackRock since 2006; Senior Vice President and Line of Business Head of Fund Accounting and Administration at PNC Global Investment Servicing (U.S.) Inc. from 1992 to 2006. | |||
Jay Fife 1970 | Treasurer | Since 2007 | Managing Director of BlackRock since 2007; Director of BlackRock in 2006; Assistant Treasurer of the MLIM and Fund Asset Management, L.P. advised funds from 2005 to 2006; Director of MLIM Fund Services Group from 2001 to 2006. | |||
Charles Park 1967 | Chief Compliance Officer | Since 2014 | Anti-Money Laundering Compliance Officer for the BlackRock-advised Funds in the Equity-Bond Complex, the Equity-Liquidity Complex and the Closed-End Complex from 2014 to 2015; Chief Compliance Officer of BlackRock Advisors, LLC and the BlackRock-advised Funds in the Equity-Bond Complex, the Equity-Liquidity Complex and the Closed-End Complex since 2014; Principal of and Chief Compliance Officer for iShares® Delaware Trust Sponsor LLC since 2012 and BlackRock Fund Advisors (“BFA”) since 2006; Chief Compliance Officer for the BFA-advised iShares exchange traded funds since 2006; Chief Compliance Officer for BlackRock Asset Management International Inc. since 2012. | |||
Fernanda Piedra 1969 | Anti-Money Laundering Compliance Officer | Since 2015 | Director of BlackRock since 2014; Anti-Money Laundering Compliance Officer and Regional Head of Financial Crime for the Americas at BlackRock since 2014; Head of Regulatory Changes and Remediation for the Asset Wealth Management Division of Deutsche Bank from 2010 to 2014; Vice President of Goldman Sachs (Anti-Money Laundering/Suspicious Activities Group) from 2004 to 2010. | |||
Benjamin Archibald 1975 | Secretary | Since 2012 | Managing Director of BlackRock since 2014; Director of BlackRock from 2010 to 2013; Assistant Secretary to the BlackRock-advised funds from 2010 to 2012; General Counsel and Chief Operating Officer of Uhuru Capital Management from 2009 to 2010; Executive Director and Counsel of Goldman Sachs Asset Management from 2005 to 2009. | |||
1 The address of each Officer is c/o BlackRock, 55 East 52nd Street, New York, NY 10055.
2 Officers of the Trust/Corporation/Master LLC serve at the pleasure of the Board.
| ||||||
Further information about the Trust’s/Corporation’s/Master LLC’s Officers and Directors/Trustees is available in the Trust’s/Corporation’s/Master LLC’s Statement of Additional Information, which can be obtained without charge by calling 1-800-441-7762. | ||||||
Effective March 1, 2015, Charles Park resigned as Anti-Money Laundering Officer of the Trust/Corporation/Master LLC and Fernanda Piedra became Anti-Money Laundering Compliance Officer of the Trust/Corporation/Master LLC.
Effective May 18, 2015, Ian MacKinnon resigned as a Director/Trustee of the Trust/Corporation/Master LLC.
| ANNUAL REPORT | MAY 31, 2015 | 61 |
| Officers and Directors/Trustees (concluded) |
Investment Advisor and Administrator | Accounting Agent and Transfer Agent | Independent Registered Public Accounting Firm | Address of the Funds 100 Bellevue Parkway | |||
BlackRock Advisors, LLC Wilmington, DE 19809 | BNY Mellon Investment Servicing (US) Inc. Wilmington, DE 19809 | Deloitte & Touche LLP Philadelphia, PA 19103 | Wilmington, DE 19809 | |||
| Custodians | Distributor | Legal Counsel | ||||
Brown Brothers Harriman & Co.1 Boston, MA 02109 | BlackRock Investments, LLC New York, NY 10022 | Sidley Austin LLP New York, NY 10019 | ||||
The Bank of New York Mellon2 New York, NY 10286 |
| 1 | For BlackRock Master Small Cap Growth Portfolio. |
| 2 | For BlackRock Disciplined Small Cap Core Fund. |
| 62 | ANNUAL REPORT | MAY 31, 2015 |
| Additional Information |
| General Information |
Householding
The Funds will mail only one copy of shareholder documents, including prospectuses, annual and semi-annual reports and proxy statements, to shareholders with multiple accounts at the same address. This practice is commonly called “householding” and is intended to reduce expenses and eliminate duplicate mailings of shareholder documents. Mailings of your shareholder documents may be householded indefinitely unless you instruct us otherwise. If you do not want the mailing of these documents to be combined with those for other members of your household, please call the Funds at (800) 441-7762.
Availability of Quarterly Schedule of Investments
The Funds file their complete schedule of portfolio holdings with the SEC for the first and third quarters of each fiscal year on Form N-Q. The Funds’ Forms N-Q are available on the SEC’s website at http://www.sec.gov and may also be reviewed and copied at the SEC’s Public Reference Room in Washington, D.C. Information on how to access documents on the SEC’s website without charge may be obtained by calling (800) SEC-0330. The Funds’ Forms N-Q may also be obtained upon request and without charge by calling (800) 441-7762.
Availability of Proxy Voting Policies and Procedures
A description of the policies and procedures that the Funds use to determine how to vote proxies relating to portfolio securities is available upon request and without charge (1) by calling (800) 441-7762; (2) at http://www.blackrock.com; and (3) on the SEC’s website at http://www.sec.gov.
Availability of Proxy Voting Record
Information about how the Funds voted proxies relating to securities held in the Funds’ portfolios during the most recent 12-month period ended June 30 is available upon request and without charge (1) at http://www.blackrock.com or by calling (800) 441-7762 and (2) on the SEC’s website at http://www.sec.gov.
BlackRock’s Mutual Fund Family
BlackRock offers a diverse lineup of open-end mutual funds crossing all investment styles and managed by experts in equity, fixed income and tax-exempt investing. Visit http://www.blackrock.com for more information.
| Shareholder Privileges |
Account Information
Call us at (800) 441-7762 from 8:00 AM to 6:00 PM EST on any business day to get information about your account balances, recent transactions and share prices. You can also reach us on the Web at http://www.blackrock.com/funds.
Automatic Investment Plans
Investor Class shareholders who want to invest regularly can arrange to have $50 or more automatically deducted from their checking or savings account and invested in any of the BlackRock funds.
Systematic Withdrawal Plans
Investor Class shareholders can establish a systematic withdrawal plan and receive periodic payments of $50 or more from their BlackRock funds, as long as their account balance is at least $10,000.
Retirement Plans
Shareholders may make investments in conjunction with Traditional, Rollover, Roth, Coverdell, Simple IRAs, SEP IRAs and 403(b) Plans.
| ANNUAL REPORT | MAY 31, 2015 | 63 |
| Additional Information (concluded) |
| BlackRock Privacy Principles |
BlackRock is committed to maintaining the privacy of its current and former fund investors and individual clients (collectively, “Clients”) and to safeguarding their non-public personal information. The following information is provided to help you understand what personal information BlackRock collects, how we protect that information and why in certain cases we share such information with select parties.
If you are located in a jurisdiction where specific laws, rules or regulations require BlackRock to provide you with additional or different privacy-related rights beyond what is set forth below, then BlackRock will comply with those specific laws, rules or regulations.
BlackRock obtains or verifies personal non-public information from and about you from different sources, including the following: (i) information we receive from you or, if applicable, your financial intermediary, on applications, forms or other documents; (ii) information about your transactions with us, our affiliates, or others; (iii) information we receive from a consumer reporting agency; and (iv) from visits to our websites.
BlackRock does not sell or disclose to non-affiliated third parties any non-public personal information about its Clients, except as permitted by law or as is necessary to respond to regulatory requests or to service Client accounts. These non-affiliated third parties are required to protect the confidentiality and security of this information and to use it only for its intended purpose.
We may share information with our affiliates to service your account or to provide you with information about other BlackRock products or services that may be of interest to you. In addition, BlackRock restricts access to non-public personal information about its Clients to those BlackRock employees with a legitimate business need for the information. BlackRock maintains physical, electronic and procedural safeguards that are designed to protect the non-public personal information of its Clients, including procedures relating to the proper storage and disposal of such information.
| 64 | ANNUAL REPORT | MAY 31, 2015 |
This report is intended for current holders. It is not authorized for use as an offer of sale or a solicitation of an offer to buy shares of the Funds unless preceded or accompanied by that Fund’s current prospectus. Past performance results shown in this report should not be considered a representation of future performance. Investment returns and principal value of shares will fluctuate so that shares, when redeemed, may be worth more or less than their original cost. Statements and other information herein are as dated and are subject to change.

SC2-5/15-AR |  | |
| Item 2 – | Code of Ethics – Each registrant (or “Fund”) has adopted a code of ethics, as of the end of the period covered by this report, applicable to the registrant’s principal executive officer, principal financial officer, principal accounting officer or controller, or persons performing similar functions. During the period covered by this report, the code of ethics was amended to update certain information and to make other non-material changes. During the period covered by this report, there have been no waivers granted under the code of ethics. A copy of the code of ethics is available without charge at www.blackrock.com. |
| Item 3 – | Audit Committee Financial Expert – Each registrant’s board of directors (the “board of directors”), has determined that (i) the registrant has the following audit committee financial expert serving on its audit committee and (ii) each audit committee financial expert is independent: |
| Kenneth L. Urish |
Under applicable securities laws, a person determined to be an audit committee financial expert will not be deemed an “expert” for any purpose, including without limitation for the purposes of Section 11 of the Securities Act of 1933, as a result of being designated or identified as an audit committee financial expert. The designation or identification of a person as an audit committee financial expert does not impose on such person any duties, obligations, or liabilities greater than the duties, obligations, and liabilities imposed on such person as a member of the audit committee and board of directors in the absence of such designation or identification.
| Item 4 – | Principal Accountant Fees and Services |
The following table presents fees billed by Deloitte & Touche LLP (“D&T”) in each of the last two fiscal years for the services rendered to the Funds:
| (a) Audit Fees | (b) Audit-Related Fees1 | (c) Tax Fees2 | (d) All Other Fees3 | |||||||||||||
| Entity Name | Current Fiscal Year End | Previous Year End | Current Year End | Previous Year End | Current Year End | Previous Year End | Current Year End | Previous Year End | ||||||||
| BlackRock Small Cap Growth Fund II of BlackRock Series, Inc. | $7,263 | $7,263 | $0 | $0 | $13,107 | $12,850 | $0 | $0 | ||||||||
| BlackRock Master Small Cap Growth Portfolio of BlackRock Master LLC | $32,288 | $32,288 | $0 | $0 | $0 | $0 | $0 | $0 | ||||||||
The following table presents fees billed by D&T that were required to be approved by each registrant’s audit committee (each a “Committee”) for services that relate directly to the operations or financial reporting of the Fund and that are rendered on behalf of BlackRock Advisors, LLC (“Investment Adviser” or “BlackRock”) and entities controlling, controlled by, or under common control with BlackRock (not including any sub-adviser whose role is primarily portfolio management and is subcontracted with or overseen by another investment adviser) that provide ongoing services to the Fund (“Fund Service Providers”):
| Current Fiscal Year End | Previous Fiscal Year End | |||||||
(b) Audit-Related Fees1 | $0 | $0 | ||||||
(c) Tax Fees2 | $0 | $0 | ||||||
(d) All Other Fees3 | $2,391,000 | $2,555,000 |
1 The nature of the services includes assurance and related services reasonably related to the performance of the audit of financial statements not included in Audit Fees.
2 The nature of the services includes tax compliance, tax advice and tax planning.
3 Aggregate fees borne by BlackRock in connection with the review of compliance procedures and attestation thereto performed by D&T with respect to all of the registered closed-end funds and some of the registered open-end funds advised by BlackRock.
2
(e)(1) Audit Committee Pre-Approval Policies and Procedures:
Each Committee has adopted policies and procedures with regard to the pre-approval of services. Audit, audit-related and tax compliance services provided to the registrant on an annual basis require specific pre-approval by the registrant’s Committee. The Committee also must approve other non-audit services provided to the registrant and those non-audit services provided to the Investment Adviser and Fund Service Providers that relate directly to the operations and the financial reporting of the registrant. Certain of these non-audit services that the Committee believes are (a) consistent with the SEC’s auditor independence rules and (b) routine and recurring services that will not impair the independence of the independent accountants may be approved by the Committee without consideration on a specific case-by-case basis (“general pre-approval”). The term of any general pre-approval is 12 months from the date of the pre-approval, unless the Committee provides for a different period. Tax or other non-audit services provided to the registrants which have a direct impact on the operations or financial reporting of the registrant will only be deemed pre-approved provided that any individual project does not exceed $10,000 attributable to the registrant or $50,000 per project. For this purpose, multiple projects will be aggregated to determine if they exceed the previously mentioned cost levels.
Any proposed services exceeding the pre-approved cost levels will require specific pre-approval by the registrant’s Committee, as will any other services not subject to general pre-approval (e.g., unanticipated but permissible services). The Committee is informed of each service approved subject to general pre-approval at the next regularly scheduled in-person board meeting. At this meeting, an analysis of such services is presented to the Committee for ratification. The Committee may delegate to the Committee Chairman the authority to approve the provision of and fees for any specific engagement of permitted non-audit services, including services exceeding pre-approved cost levels.
(e)(2) None of the services described in each of Items 4(b) through (d) were approved by either Committee pursuant to the de minimus exception in paragraph (c)(7)(i)(C) of Rule 2-01 of Regulation S-X.
(f) Not Applicable
(g) The aggregate non-audit fees paid to the accountant for services rendered by the accountant to the registrant, the Investment Adviser and the Fund Service Providers were:
| Entity Name | Current Fiscal Year End | Previous Fiscal Year End | ||
| BlackRock Small Cap Growth Fund II of BlackRock Series, Inc. | $13,107 | $12,850 | ||
| BlackRock Master Small Cap Growth Portfolio of BlackRock Master LLC | $0 | $0 |
Additionally, SSAE 16 Review (Formerly, SAS No. 70) fees for the current and previous fiscal years of $2,391,000 and $2,555,000, respectively, were billed by D&T to the Investment Adviser.
(h) Each Committee has considered and determined that the provision of non-audit services that were rendered to the Investment Adviser and the Fund Service Providers that were not pre-approved pursuant to paragraph (c)(7)(ii) of
Rule 2-01 of Regulation S-X is compatible with maintaining the principal accountant’s independence.
| Item 5 – | Audit Committee of Listed Registrants – Not Applicable |
3
| Item 6 – | Investments |
(a) The registrants’ Schedules of Investments are included as part of the Report to Stockholders filed under Item 1 of this Form.
(b) Not Applicable due to no such divestments during the semi-annual period covered since the previous Form N-CSR filing.
| Item 7 – | Disclosure of Proxy Voting Policies and Procedures for Closed-End Management Investment Companies – Not Applicable |
| Item 8 – | Portfolio Managers of Closed-End Management Investment Companies – Not Applicable |
| Item 9 – | Purchases of Equity Securities by Closed-End Management Investment Company and Affiliated Purchasers – Not Applicable |
| Item 10 – | Submission of Matters to a Vote of Security Holders – There have been no material changes to these procedures. |
| Item 11 – | Controls and Procedures |
(a) – The registrants’ principal executive and principal financial officers, or persons performing similar functions, have concluded that the registrants’ disclosure controls and procedures (as defined in Rule 30a-3(c) under the Investment Company Act of 1940, as amended (the “1940 Act”)) are effective as of a date within 90 days of the filing of this report based on the evaluation of these controls and procedures required by Rule 30a-3(b) under the 1940 Act and Rule 15(d)-15(b) under the Securities Exchange Act of 1934, as amended.
(b) – There were no changes in the registrants’ internal control over financial reporting (as defined in Rule 30a-3(d) under the 1940 Act) that occurred during the second fiscal quarter of the period covered by this report that have materially affected, or are reasonably likely to materially affect, the registrants’ internal control over financial reporting.
| Item 12 – | Exhibits attached hereto |
(a)(1) – Code of Ethics – See Item 2
(a)(2) – Certifications – Attached hereto
(a)(3) – Not Applicable
(b) – Certifications – Attached hereto
4
Pursuant to the requirements of the Securities Exchange Act of 1934 and the Investment Company Act of 1940, each registrant has duly caused this report to be signed on its behalf by the undersigned, thereunto duly authorized.
BlackRock Small Cap Growth Fund II of BlackRock Series, Inc. and BlackRock Master Small Cap Growth Portfolio of BlackRock Master LLC
By: | /s/ John M. Perlowski | |||||
| John M. Perlowski | ||||||
Chief Executive Officer (principal executive officer) of BlackRock Small Cap Growth Fund II of BlackRock Series, Inc. and BlackRock Master Small Cap Growth Portfolio of BlackRock Master LLC | ||||||
Date: July 29, 2015
Pursuant to the requirements of the Securities Exchange Act of 1934 and the Investment Company Act of 1940, this report has been signed below by the following persons on behalf of each registrant and in the capacities and on the dates indicated.
By: | /s/ John M. Perlowski | |||||
| John M. Perlowski | ||||||
Chief Executive Officer (principal executive officer) of BlackRock Small Cap Growth Fund II of BlackRock Series, Inc. and BlackRock Master Small Cap Growth Portfolio of BlackRock Master LLC | ||||||
Date: July 29, 2015
By: | /s/ Neal J. Andrews | |||||
| Neal J. Andrews | ||||||
Chief Financial Officer (principal financial officer) of BlackRock Small Cap Growth Fund II of BlackRock Series, Inc. and BlackRock Master Small Cap Growth Portfolio of BlackRock Master LLC | ||||||
Date: July 29, 2015
5