UNITED STATES
SECURITIES AND EXCHANGE COMMISSION
Washington, D.C. 20549
FORM N-CSR
CERTIFIED SHAREHOLDER REPORT OF REGISTERED MANAGEMENT INVESTMENT COMPANIES
Investment Company Act file number: 811-08797 and 811-09049
Name of Fund: BlackRock Small Cap Growth Fund II of BlackRock Series, Inc. and BlackRock Master Small Cap Growth Portfolio of BlackRock Master LLC
Fund Address: 100 Bellevue Parkway, Wilmington, DE 19809
Name and address of agent for service: John M. Perlowski, Chief Executive Officer, BlackRock Small Cap Growth
Fund II of BlackRock Series, Inc. and BlackRock Master Small Cap Growth Portfolio of BlackRock Master
LLC, 55 East 52nd Street, New York, NY 10055
Registrants’ telephone number, including area code: (800) 441-7762
Date of fiscal year end: 05/31/2016
Date of reporting period: 05/31/2016
Item 1 – Report to Stockholders
MAY 31, 2016
ANNUAL REPORT
| BLACKROCK® |
| BlackRock Disciplined Small Cap Core Fund | of BlackRock FundsSM |
| BlackRock Small Cap Growth Fund II | of BlackRock Series, Inc. |
| Not FDIC Insured ¡ May Lose Value ¡ No Bank Guarantee |
| Table of Contents |
| Page | ||||
| 3 | ||||
Annual Report: | ||||
| 4 | ||||
| 8 | ||||
| 8 | ||||
| 9 | ||||
Fund Financial Statements: | ||||
Schedule of Investments: BlackRock Disciplined Small Cap Core Fund | 10 | |||
| 17 | ||||
| 19 | ||||
| 20 | ||||
| 21 | ||||
| 29 | ||||
Fund Report of Independent Registered Public Accounting Firm | 40 | |||
| 40 | ||||
Master Portfolio Information: BlackRock Master Small Cap Growth Portfolio | 41 | |||
Master Portfolio Financial Statements: | ||||
| 42 | ||||
| 51 | ||||
| 52 | ||||
| 53 | ||||
| 53 | ||||
| 54 | ||||
Master Portfolio Report of Independent Registered Public Accounting Firm | 60 | |||
| 61 | ||||
| 66 | ||||
| 69 |
|
Shareholders can sign up for e-mail notifications of quarterly statements, annual and semi-annual shareholder reports and prospectuses by enrolling in the electronic delivery program. Electronic copies of shareholder reports and prospectuses are also available on BlackRock’s website.
TO ENROLL IN ELECTRONIC DELIVERY:
Shareholders Who Hold Accounts with Investment Advisors, Banks or Brokerages: Please contact your financial advisor. Please note that not all investment advisors, banks or brokerages may offer this service.
Shareholders Who Hold Accounts Directly with BlackRock: 1. Access the BlackRock website at blackrock.com 2. Select “Access Your Account” 3. Next, select “eDelivery” in the “Related Resources” box and follow the sign-up instructions |

| 2 | ANNUAL REPORT | MAY 31, 2016 |
| The Markets in Review |
Dear Shareholder,
Diverging monetary policies and shifting economic outlooks across regions have been the overarching themes driving financial markets over the past couple of years. Investors spent most of 2015 anticipating the end of the Federal Reserve’s (the “Fed”) near-zero interest rate policy as U.S. growth outpaced other developed markets. The Fed ultimately hiked rates in December, whereas the European Central Bank and the Bank of Japan took additional steps to stimulate growth, even introducing negative interest rates. The U.S. dollar had strengthened considerably ahead of these developments, causing profit challenges for U.S. companies that generate revenues overseas, and pressuring emerging market currencies and commodities prices.
Global market volatility increased in the latter part of 2015 and spilled over into early 2016. Oil prices were a key factor behind the instability after collapsing in mid-2015 due to excess global supply. China, one of the world’s largest consumers of oil, was another notable source of stress for financial markets. Signs of slowing economic growth, a depreciating yuan and declining confidence in the country’s policymakers stoked investors’ worries about the potential impact of China’s weakness on the global economy. Risk assets (such as equities and high yield bonds) suffered in this environment.
After a painful start to the new year, fears of a global recession began to fade as the first quarter wore on, allowing markets to calm and risk assets to rebound. Central bank stimulus in Europe and Japan, combined with a more tempered outlook for rate hikes in the United States, helped bolster financial markets. A softening in U.S. dollar strength offered some relief to U.S. exporters and emerging market economies. Oil prices found firmer footing as global supply showed signs of leveling off.
By the end of the 12-month period, stock valuations appeared elevated and easy central bank policies, particularly in Europe and Japan, had pushed global yields to ever-lower levels. Given generally high prices across most asset classes, investors remained wary of a resurgence in volatility against a backdrop of looming global risks — notably, uncertainty leading up to the United Kingdom’s referendum on the nation’s membership in the European Union.
At BlackRock, we believe investors need to think globally, extend their scope across a broad array of asset classes and be prepared to adjust accordingly as market conditions change over time. We encourage you to talk with your financial advisor and visit blackrock.com for further insight about investing in today’s markets.
Sincerely,

Rob Kapito
President, BlackRock Advisors, LLC

Rob Kapito
President, BlackRock Advisors, LLC
| Total Returns as of May 31, 2016 | ||||||||
| 6-month | 12-month | |||||||
U.S. large cap equities | 1.93 | % | 1.72 | % | ||||
U.S. small cap equities | (2.86 | ) | (5.97 | ) | ||||
International equities | (2.44 | ) | (9.68 | ) | ||||
Emerging market equities | 0.04 | (17.63 | ) | |||||
3-month Treasury bills | 0.14 | 0.15 | ||||||
U.S. Treasury securities | 4.20 | 3.97 | ||||||
U.S. investment-grade | 3.12 | 2.99 | ||||||
Tax-exempt municipal | 3.40 | 5.72 | ||||||
U.S. high yield bonds | 5.34 | (0.77 | ) | |||||
| Past performance is no guarantee of future results. Index performance is shown for illustrative purposes only. You cannot invest directly in an index. | ||||||||
| THIS PAGE NOT PART OF YOUR FUND REPORT | 3 |
| Fund Summary as of May 31, 2016 | BlackRock Disciplined Small Cap Core Fund |
| Investment Objective |
BlackRock Disciplined Small Cap Core Fund’s (the “Fund”) investment objective is to seek capital appreciation over the long term.
| Portfolio Management Commentary |
How did the Fund perform?
| • | For the 12-month period ended May 31, 2016, the Fund outperformed its benchmark, the Russell 2000® Index. |
What factors influenced performance?
| • | Positive contributions were led by an overweight position in the provider of enterprise storage and data management solutions Dot Hill Systems Corp., which rose sharply as it was acquired by storage hardware manufacturer Seagate Technology for a substantial premium. An overweight position in the airline JetBlue Airways Corp. also contributed to performance, on the back of several company-specific and industry tailwinds. These included a maturing flight route network, little exposure to international markets that have been affected by currency dislocations, solid domestic travel demand, notable traffic and capacity growth, and lower fuel prices. |
| • | The most significant detractor from the Fund’s performance was an overweight position in the reprographic technology and services company ARC Document Solutions, Inc., which saw its shares fall after the company missed earnings and revenue estimates and lowered its earnings |
forecasts. The company cited implementation delays in large contracts and reduced sales for large-format printing as driving the weakened results. An overweight position in the identity theft protection company LifeLock, Inc. also detracted from performance. The company’s shares declined on a statement by the U.S. Federal Trade Commission (“FTC”) asserting the company had violated terms of a prior settlement by continuing to make deceptive claims about its services and by failing to take steps required to protect user data. The company issued lowered forward earnings guidance noting the impact of negative publicity stemming from the new FTC charges. |
Describe recent portfolio activity.
| • | During the 12-month period, the Fund decreased its overall weightings in the health care and telecom sectors and increased its overall weightings in industrials and information technology. |
Describe portfolio positioning at period end.
| • | Relative to the Russell 2000® Index, the Fund ended the period with its largest sector overweight in materials and its most significant underweight in financials. |
The views expressed reflect the opinions of BlackRock as of the date of this report and are subject to change based on changes in market, economic or other conditions. These views are not intended to be a forecast of future events and are no guarantee of future results.
| Portfolio Information |
| Ten Largest Holdings | Percent of Net Assets | |
PS Business Parks, Inc. | 2% | |
Prestige Brands Holdings, Inc. | 2 | |
Umpqua Holdings Corp. | 1 | |
Wintrust Financial Corp. | 1 | |
Western Alliance Bancorp | 1 | |
South State Corp. | 1 | |
First Defiance Financial Corp. | 1 | |
West Pharmaceutical Services, Inc. | 1 | |
Vail Resorts, Inc. | 1 | |
Central Pacific Financial Corp. | 1 |
| Sector Allocation | Percent of Net Assets | |
Financials | 26% | |
Information Technology | 18 | |
Consumer Discretionary | 14 | |
Health Care | 14 | |
Industrials | 13 | |
Materials | 5 | |
Energy | 3 | |
Utilities | 3 | |
Consumer Staples | 2 | |
Telecommunication Services | 1 | |
Short-Term Securities | 2 | |
Liabilities in Excess of Other Assets | (1) |
For Fund compliance purposes, the Fund’s sector classifications refer to any one or more of the sector sub-classifications used by one or more widely recognized market indexes or ratings group indexes, and/or as defined by the investment advisor. These definitions may not apply for purposes of this report, which may combine such sector sub-classifications for reporting ease.
| 4 | ANNUAL REPORT | MAY 31, 2016 |
BlackRock Disciplined Small Cap Core Fund |
| Total Return Based on a $10,000 Investment |
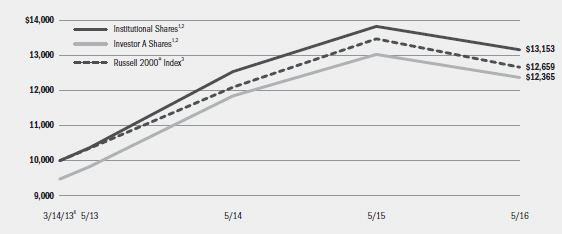
| 1 | Assuming maximum sales charges, if any, transaction costs and other operating expenses, including investment advisory fees and administration fees, if any. Institutional Shares do not have a sales charge. |
| 2 | Under normal circumstances, the Fund seeks to invest at least 80% of its net assets plus any borrowings for investment purposes in equity securities or other financial instruments that are components of, or have market capitalizations similar to, the securities included in the Russell 2000® Index. |
| 3 | An unmanaged index that is a subset of the Russell 3000® Index representing approximately 10% of the total market capitalization of that index. It includes approximately 2,000 of the smallest securities based on a combination of their market cap and current index membership. |
| 4 | Commencement of operations. |
| Performance Summary for the Period Ended May 31, 2016 | ||||||||||
| Average Annual Total Returns5 | ||||||||||
| 1 Year | Since Inception6 | |||||||||
| 6-Month Total Returns | w/o sales charge | w/ sales charge | w/o sales charge | w/ sales charge | ||||||
Institutional | (2.33)% | (4.80)% | N/A | 8.90% | N/A | |||||
Investor A | (2.47) | (5.02) | (10.00)% | 8.64 | 6.83% | |||||
Investor C | (2.71) | (5.71) | (6.61)% | 7.83 | 7.83% | |||||
Class K7 | (2.20) | (4.63) | N/A | 9.04 | N/A | |||||
Russell 2000® Index | (2.86) | (5.97) | N/A | 7.62 | N/A | |||||
| 5 | Assuming maximum sales charges, if any. Average annual total returns with and without sales charges reflect reductions for distribution and service fees. See “About Fund Performance” on page 8 for a detailed description of share classes, including any related sales charges and fees. |
| 6 | The Fund commenced operations on March 14, 2013. |
| 7 | Class K commenced operations on March 28, 2016. |
| N/A — Not applicable as share class and index do not have a sales charge. |
| Past performance is not indicative of future results. |
| Expense Example |
| Actual | Hypothetical9 | |||||||||||||
| Beginning Account Value December 1, 2015 | Ending Account Value May 31, 2016 | Expenses Paid During the Period8 | Beginning Account Value December 1, 2016 | Ending Account Value May 31, 2016 | Expenses Paid During the Period8 | Annualized Ratio | ||||||||
Institutional | $1,000.00 | $976.70 | $3.31 | $1,000.00 | $1,021.65 | $3.39 | 0.67% | |||||||
Investor A | $1,000.00 | $975.30 | $4.69 | $1,000.00 | $1,020.25 | $4.80 | 0.95% | |||||||
Investor C | $1,000.00 | $972.90 | $8.38 | $1,000.00 | $1,016.50 | $8.57 | 1.70% | |||||||
Class K | $1,000.00 | $978.00 | $2.97 | $1,000.00 | $1,022.00 | $3.03 | 0.60% | |||||||
| 8 | For each class of the Fund, expenses are equal to the annualized expense ratio for the class, multiplied by the average account value over the period, multiplied by 183/ 366 (to reflect the one-half year period shown). For Class K Shares, expenses are equal to the annualized expense ratio for the class, multiplied by the average account value over the period, multiplied by 64/366 (to reflect the period from March 28, 2016, the commencement of operations, to May 31, 2016). |
| 9 | Hypothetical 5% annual return before expenses is calculated by prorating the number of days in the most recent fiscal half year divided by 366. |
| See “Disclosure of Expenses” on page 8 for further information on how expenses were calculated. |
| ANNUAL REPORT | MAY 31, 2016 | 5 |
| Fund Summary as of May 31, 2016 | BlackRock Small Cap Growth Fund II |
| Investment Objective |
BlackRock Small Cap Growth Fund II’s (the “Fund”) investment objective is to seek long-term capital growth. In other words, the Fund tries to choose investments that will increase in value. Current income from dividends and interest will not be an important consideration in selecting portfolio securities.
| Portfolio Management Commentary |
On June 23, 2015, the Fund’s Investor B Shares converted to Investor A Shares.
How did the Fund perform?
| • | For the 12-month period ended May 31, 2016, through its investment in BlackRock Master Small Cap Growth Portfolio (the “Master Portfolio”), the Fund underperformed its benchmark, the Russell 2000® Growth Index. |
What factors influenced performance?
| • | The most significant detractor from the Master Portfolio’s performance was an overweight position in the storage hardware and systems company Quantum Corp., which was impacted by the challenging environment for enterprise storage vendors. The company saw its revenues decline on continued weakness in sales of data protection and disk backup products, and reported below-estimate quarterly earnings. An overweight position in the patent risk management provider RPX Corp. also detracted from performance. The company’s shares fell on news of an all-cash acquisition of legal discovery management servicer Inventus. Investors were surprised by the size of the deal, which followed downside revenue guidance, in relation to RPX Corp.’s market capitalization and net cash. |
| • | Conversely, the largest contributor to performance was an overweight position in the supply chain technology provider Manhattan Associates, Inc. The company’s shares appreciated on record earnings along with above consensus forward guidance, which cited strong sales results from associates and strong demand for the company’s omni-channel, store and distribution management solutions. Also contributing to performance was an overweight position in the packaged goods and store supplies distributor Core-Mark Holding Co., Inc. The company’s shares rose on the outlook for enhanced revenue from both a five-year primary supplier agreement with national gasoline station retailer Murphy USA and the acquisition of Pine State Convenience. |
Describe recent portfolio activity.
| • | During the 12-month period, the Master Portfolio increased its overall weightings in the information technology and energy sectors and decreased its overall weightings in financials and consumer discretionary. |
Describe portfolio positioning at period end.
| • | Relative to the Russell 2000® Growth Index, the Master Portfolio ended the period with its largest sector overweight in information technology and its most significant underweight in consumer staples. |
The views expressed reflect the opinions of BlackRock as of the date of this report and are subject to change based on changes in market, economic or other conditions. These views are not intended to be a forecast of future events and are no guarantee of future results.
| 6 | ANNUAL REPORT | MAY 31, 2016 |
BlackRock Small Cap Growth Fund II |
| Total Return Based on a $10,000 Investment |
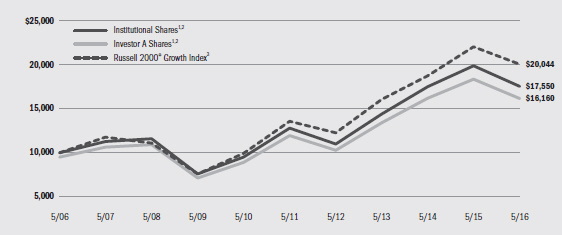
| 1 | Assuming maximum sales charges, if any, transaction costs and other operating expenses, including administration fees, if any. Institutional Shares do not have a sales charge. |
| 2 | The Fund invests all of its assets in the Master Portfolio. The Master Portfolio will, under normal circumstances, invest at least 80% of its net assets (plus any borrowings for investment purposes) in equity securities of small cap companies and at least 80% of its net assets (plus any borrowings for investment purposes) in securities or instruments of issuers located in the United States. |
| 3 | An unmanaged index that measures the performance of the small cap growth segment of the U.S. equity universe. It includes those Russell 2000® Index companies with higher price-to-value ratios and higher forecasted growth values. |
| Performance Summary for the Period Ended May 31, 2016 | ||||||||||
| Average Annual Total Returns4 | ||||||||||||||||||||||||||
| 1 Year | 5 Years | 10 Years | ||||||||||||||||||||||||
6-Month Total Returns | w/o sales charge | w/ sales charge | w/o sales charge | w/ sales charge | w/o sales charge | w/ sales charge | ||||||||||||||||||||
Institutional | (6.65)% | (11.66 | )% | N/A | 6.56 | % | N/A | 5.79 | % | N/A | ||||||||||||||||
Investor A | (6.78) | (11.91 | ) | (16.53 | )% | 6.24 | 5.10 | % | 5.48 | 4.92 | % | |||||||||||||||
Investor C | (7.20) | (12.66 | ) | (13.46 | ) | 5.32 | 5.32 | 4.52 | 4.52 | |||||||||||||||||
Class R | (6.85) | (12.13 | ) | N/A | 5.96 | N/A | 5.13 | N/A | ||||||||||||||||||
Russell 2000® Growth Index | (5.85) | (9.13 | ) | N/A | 8.15 | N/A | 7.20 | N/A | ||||||||||||||||||
| 4 | Assuming maximum sales charges, if any. Average annual total returns with and without sales charges reflect reductions for distribution and service fees. See “About Fund Performance” on page 8 for a detailed description of share classes, including any related sales charges and fees. |
| N/A — Not applicable as share class and index do not have a sales charge. |
| Past performance is not indicative of future results. |
| Expense Example |
| Actual | Hypothetical6 | |||||||||||||
| Beginning Account Value December 1, 2015 | Ending Account Value May 31, 2016 | Expenses Paid During the Period5 | Beginning Account Value December 1, 2015 | Ending Account Value May 31, 2016 | Expenses Paid During the Period5 | Annualized Expense Ratio | ||||||||
Institutional | $1,000.00 | $933.50 | $ 6.28 | $1,000.00 | $1,018.50 | $ 6.56 | 1.30% | |||||||
Investor A | $1,000.00 | $932.20 | $ 7.39 | $1,000.00 | $1,017.35 | $ 7.72 | 1.53% | |||||||
Investor C | $1,000.00 | $928.00 | $11.71 | $1,000.00 | $1,012.85 | $12.23 | 2.43% | |||||||
Class R | $1,000.00 | $931.50 | $ 8.55 | $1,000.00 | $1,016.15 | $ 8.92 | 1.77% | |||||||
| 5 | For each class of the Fund, expenses are equal to the annualized expense ratio for the class, multiplied by the average account value over the period, multiplied by 183/ 366 (to reflect the one-half year period shown). Because the Fund invests all of its assets in the Master Portfolio, the expense example reflects the net expenses of both the Fund and the Master Portfolio in which it invests. |
| 6 | Hypothetical 5% annual return before expenses is calculated by prorating the number of days in the most recent fiscal half year divided by 366. |
| See “Disclosure of Expenses” on page 8 for further information on how expenses were calculated. |
| ANNUAL REPORT | MAY 31, 2016 | 7 |
| About Fund Performance |
| • | Institutional and Class K Shares (Class K Shares available only in BlackRock Disciplined Small Cap Core Fund) are not subject to any sales charge. These shares bear no ongoing distribution or service fees and are available only to certain eligible investors. Prior to March 28, 2016, (commencement of operations) Class K Shares performance results are those of Institutional Shares, restated to reflect Class K Shares fees. |
| • | Investor A Shares are subject to a maximum initial sales charge (front-end load) of 5.25% and a service fee of 0.25% per year (but no distribution fee). Certain redemptions of these shares may be subject to a contingent deferred sales charge (“CDSC”) where no initial sales charge was paid at the time of purchase. These shares are generally available through financial intermediaries. |
| On June 23, 2015, all issued and outstanding Investor B Shares, which were previously available only in BlackRock Small Cap Growth Fund II, were converted into Investor A Shares with the same relative aggregate net asset value (“NAV”). |
| • | Investor C Shares are subject to a 1.00% CDSC if redeemed within one year of purchase. In addition, these shares are subject to a distribution fee of 0.75% per year and a service fee of 0.25% per year. These shares are generally available through financial intermediaries. |
| • | Class R Shares (available only in BlackRock Small Cap Growth Fund II) are not subject to any sales charge. These shares are subject to a distribution fee of 0.25% per year and a service fee of 0.25% per year. These shares are available only to certain employer-sponsored retirement plans. |
Performance information reflects past performance and does not guarantee future results. Current performance may be lower or higher than the performance data quoted. Refer to www.blackrock.com/funds to obtain performance data current to the most recent month end. Performance results do not reflect the deduction of taxes that a shareholder would pay on fund distributions or the redemption of fund shares. Figures shown in the performance tables on the previous pages assume reinvestment of all distributions, if any, at NAV on the ex-dividend date. Investment return and principal value of shares will fluctuate so that shares, when redeemed, may be worth more or less than their original cost. Distributions paid to each class of shares will vary because of the different levels of service, distribution and transfer agency fees applicable to each class, which are deducted from the income available to be paid to shareholders.
BlackRock Advisors, LLC (the “Manager”), BlackRock Disciplined Small Cap Core Fund’s investment advisor, has contractually agreed to waive and/or reimburse a portion of the Fund’s expenses. Without such waiver and/or reimbursement, the Fund’s performance would have been lower. The Manager is under no obligation to continue waiving and/or reimbursing its fees after the applicable termination date of such agreement. See Note 6 of the Notes to Financial Statements for additional information on waivers and/or reimbursements.
|
Shareholders of these Funds may incur the following charges: (a) transactional expenses, such as sales charges; and (b) operating expenses, including investment advisory fees, administration fees, service and distribution fees, including 12b-1 fees, acquired fund fees and expenses, and other fund expenses. The expense examples on the previous pages (which are based on a hypothetical investment of $1,000 invested on December 1, 2015 and held through May 31, 2016, except with respect to Class K Shares which are based on a hypothetical investment of $1,000 invested on March 28, 2016 (commencement of operations) and held through May 31, 2016) are intended to assist shareholders both in calculating expenses based on an investment in each Fund and in comparing these expenses with similar costs of investing in other mutual funds.
The expense examples provide information about actual account values and actual expenses. In order to estimate the expenses a shareholder paid during the period covered by this report, shareholders can divide their account value by $1,000 and then multiply the result by the number corresponding to their Fund and share class under the headings entitled “Expenses Paid During the Period.”
The expense examples also provide information about hypothetical account values and hypothetical expenses based on a Fund’s actual expense ratio and an assumed rate of return of 5% per year before expenses. In order to assist shareholders in comparing the ongoing expenses of investing in these Funds and other funds, compare the 5% hypothetical examples with the 5% hypothetical examples that appear in shareholder reports of other funds.
The expenses shown in the expense examples are intended to highlight shareholders’ ongoing costs only and do not reflect any transactional expenses, such as sales charges, if any. Therefore, the hypothetical examples are useful in comparing ongoing expenses only, and will not help shareholders determine the relative total expenses of owning different funds. If these transactional expenses were included, shareholder expenses would have been higher.
| 8 | ANNUAL REPORT | MAY 31, 2016 |
| Derivative Financial Instruments |
BlackRock Disciplined Small Cap Core Fund and the Master Portfolio may invest in various derivative financial instruments. These instruments are used to obtain exposure to a security, commodity, index, market and/or other asset without owning or taking physical custody of securities, commodities and/or other referenced assets or to manage market, equity, credit, interest rate, foreign currency exchange rate, commodity and/or other risks. Derivative financial instruments may give rise to a form of economic leverage and also involve risks, including the imperfect correlation between the value of a derivative financial instrument and the underlying asset, possible default of the counterparty to the transac-
tion or illiquidity of the instrument. The Fund’s and Master Portfolio’s successful use of a derivative financial instrument depends on the investment advisor’s ability to predict pertinent market movements accurately, which cannot be assured. The use of these instruments may result in losses greater than if they had not been used, may limit the amount of appreciation the Fund and Master Portfolio can realize on an investment and/or may result in lower distributions paid to shareholders. The Fund’s and Master Portfolio’s investments in these instruments, if any, are discussed in detail in the Fund’s and Master Portfolio’s Notes to Financial Statements.
| ANNUAL REPORT | MAY 31, 2016 | 9 |
| Schedule of Investments May 31, 2016 | BlackRock Disciplined Small Cap Core Fund | |
| (Percentages shown are based on Net Assets) |
| Common Stocks | Shares | Value | ||||||
Aerospace & Defense — 0.9% | ||||||||
Aerojet Rocketdyne Holdings, Inc. (a) | 949 | $ | 16,361 | |||||
DigitalGlobe, Inc. (a) | 896 | 18,753 | ||||||
Ducommun, Inc. (a) | 90 | 1,521 | ||||||
HEICO Corp., Class A | 576 | 31,778 | ||||||
LMI Aerospace, Inc. (a) | 162 | 1,364 | ||||||
Vectrus, Inc. (a) | 2,039 | 51,811 | ||||||
|
| |||||||
| 121,588 | ||||||||
Air Freight & Logistics — 1.0% | ||||||||
Hub Group, Inc., Class A (a) | 3,016 | 120,700 | ||||||
Park-Ohio Holdings Corp. | 412 | 12,587 | ||||||
Radiant Logistics, Inc. (a) | 4,359 | 14,297 | ||||||
|
| |||||||
| 147,584 | ||||||||
Airlines — 0.2% | ||||||||
Hawaiian Holdings, Inc. (a) | 755 | 30,547 | ||||||
Auto Components — 1.9% | ||||||||
American Axle & Manufacturing Holdings, Inc. (a) | 1,477 | 24,622 | ||||||
Cooper Standard Holding, Inc. (a) | 97 | 8,337 | ||||||
Cooper Tire & Rubber Co. | 1,027 | 32,997 | ||||||
Drew Industries, Inc. | 450 | 34,812 | ||||||
Lear Corp. | 250 | 29,690 | ||||||
Tenneco, Inc. (a) | 2,228 | 119,688 | ||||||
Tower International, Inc. | 522 | 11,312 | ||||||
|
| |||||||
| 261,458 | ||||||||
Banks — 10.3% | ||||||||
Banc of California, Inc. | 568 | 11,394 | ||||||
Cascade Bancorp (a) | 5,396 | 30,487 | ||||||
Central Pacific Financial Corp. | 6,063 | 145,330 | ||||||
Eagle Bancorp, Inc. (a) | 305 | 15,704 | ||||||
Enterprise Financial Services Corp. | 106 | 3,032 | ||||||
Fidelity Southern Corp. | 3,313 | 54,201 | ||||||
First Busey Corp. | 572 | 12,693 | ||||||
First Internet Bancorp | 370 | 9,468 | ||||||
Glacier Bancorp, Inc. | 85 | 2,324 | ||||||
Great Western Bancorp, Inc. | 2,625 | 89,303 | ||||||
Home BancShares, Inc. | 1,362 | 59,860 | ||||||
MBT Financial Corp. | 2,215 | 17,565 | ||||||
Pacific Continental Corp. | 149 | 2,472 | ||||||
Republic Bancorp, Inc., Class A | 2,087 | 57,872 | ||||||
Seacoast Banking Corp. (a) | 3,493 | 58,822 | ||||||
Sierra Bancorp | 3,091 | 53,382 | ||||||
South State Corp. | 2,277 | 165,060 | ||||||
TriCo Bancshares | 880 | 24,781 | ||||||
Umpqua Holdings Corp. | 12,196 | 195,014 | ||||||
Webster Financial Corp. | 2,080 | 81,453 | ||||||
West Bancorporation, Inc. | 233 | 4,385 | ||||||
Western Alliance Bancorp (a) | 4,759 | 179,414 | ||||||
Wintrust Financial Corp. | 3,433 | 182,876 | ||||||
|
| |||||||
| 1,456,892 | ||||||||
Beverages — 0.4% | ||||||||
Primo Water Corp. (a) | 5,586 | 63,401 | ||||||
Biotechnology — 4.5% | ||||||||
ACADIA Pharmaceuticals, Inc. (a) | 115 | 4,074 | ||||||
Achillion Pharmaceuticals, Inc. (a) | 306 | 2,861 | ||||||
| Common Stocks | Shares | Value | ||||||
Biotechnology (continued) | ||||||||
Acorda Therapeutics, Inc. (a) | 1,025 | $ | 29,161 | |||||
AMAG Pharmaceuticals, Inc. (a) | 184 | 3,945 | ||||||
Anacor Pharmaceuticals, Inc. (a) | 147 | 14,597 | ||||||
Applied Genetic Technologies Corp. (a) | 1,131 | 19,453 | ||||||
aTyr Pharma, Inc. (a) | 4,433 | 14,673 | ||||||
Catalyst Biosciences, Inc. | 579 | 892 | ||||||
Cepheid, Inc. (a) | 1,621 | 45,404 | ||||||
Cidara Therapeutics, Inc. (a) | 1,089 | 12,872 | ||||||
Corvus Pharmaceuticals, Inc. (a) | 425 | 5,971 | ||||||
Cytokinetics, Inc. (a) | 1,111 | 9,055 | ||||||
CytomX Therapeutics, Inc. (a) | 382 | 4,126 | ||||||
Dyax Corp. — CVR (a) | 835 | 927 | ||||||
Emergent BioSolutions, Inc. (a) | 728 | 31,945 | ||||||
Enanta Pharmaceuticals, Inc. (a) | 87 | 2,134 | ||||||
Enzon Pharmaceuticals, Inc. | 8,159 | 3,231 | ||||||
Fate Therapeutics, Inc. (a) | 3,246 | 4,966 | ||||||
FibroGen, Inc. (a) | 1,915 | 35,734 | ||||||
Five Prime Therapeutics, Inc. (a) | 830 | 37,948 | ||||||
Genomic Health, Inc. (a) | 1,236 | 33,125 | ||||||
Halozyme Therapeutics, Inc. (a) | 406 | 4,084 | ||||||
Ignyta, Inc. (a) | 681 | 4,621 | ||||||
Insys Therapeutics, Inc. (a) | 87 | 1,362 | ||||||
Kindred Biosciences, Inc. (a) | 5,872 | 23,958 | ||||||
Kura Oncology, Inc. (a) | 768 | 2,273 | ||||||
Ligand Pharmaceuticals, Inc. (a) | 374 | 44,727 | ||||||
MiMedx Group, Inc. (a) | 312 | 2,455 | ||||||
Myriad Genetics, Inc. (a) | 1,374 | 46,565 | ||||||
Neurocrine Biosciences, Inc. (a) | 278 | 13,803 | ||||||
Nivalis Therapeutics, Inc. (a) | 1,825 | 9,107 | ||||||
PDL BioPharma, Inc. | 10,021 | 35,975 | ||||||
Pfenex, Inc. (a) | 954 | 6,640 | ||||||
Repligen Corp. (a) | 1,407 | 33,712 | ||||||
Rigel Pharmaceuticals, Inc. (a) | 6,764 | 17,451 | ||||||
Spectrum Pharmaceuticals, Inc. (a) | 707 | 5,295 | ||||||
Strongbridge Biopharma PLC (a) | 492 | 2,386 | ||||||
Tobira Therapeutics, Inc. (a) | 1,071 | 9,907 | ||||||
Ultragenyx Pharmaceutical, Inc. (a) | 19 | 1,389 | ||||||
United Therapeutics Corp. (a) | 90 | 10,716 | ||||||
Vanda Pharmaceuticals, Inc. (a) | 2,114 | 21,986 | ||||||
Verastem, Inc. (a) | 2,049 | 3,053 | ||||||
Voyager Therapeutics, Inc. (a) | 655 | 9,091 | ||||||
vTv Therapeutics, Inc., Class A (a) | 938 | 5,590 | ||||||
Xencor, Inc. (a) | 119 | 1,708 | ||||||
|
| |||||||
| 634,948 | ||||||||
Building Products — 1.9% | ||||||||
Apogee Enterprises, Inc. | 828 | 37,442 | ||||||
Continental Building Products, Inc. (a) | 1,163 | 26,644 | ||||||
Insteel Industries, Inc. | 1,040 | 28,829 | ||||||
Masonite International Corp. (a) | 578 | 40,362 | ||||||
NCI Building Systems, Inc. (a) | 826 | 13,299 | ||||||
Ply Gem Holdings, Inc. (a) | 944 | 14,198 | ||||||
Universal Forest Products, Inc. | 1,312 | 110,129 | ||||||
|
| |||||||
| 270,903 | ||||||||
Capital Markets — 0.1% | ||||||||
Hennessy Advisors, Inc. | 276 | 9,180 | ||||||
| Portfolio Abbreviations | ||
| CVR | Contingent Value Rights | |
| REIT | Real Estate Investment Trust | |
See Notes to Financial Statements.
| 10 | ANNUAL REPORT | MAY 31, 2016 |
| Schedule of Investments (continued) | BlackRock Disciplined Small Cap Core Fund | |
| Common Stocks | Shares | Value | ||||||
Capital Markets (continued) | ||||||||
Stifel Financial Corp. (a) | 147 | $ | 5,554 | |||||
|
| |||||||
| 14,734 | ||||||||
Chemicals — 2.7% | ||||||||
Axiall Corp. | 452 | 10,527 | ||||||
Chemtura Corp. (a) | 1,514 | 40,393 | ||||||
KMG Chemicals, Inc. | 56 | 1,203 | ||||||
Kraton Performance Polymers, Inc. (a) | 888 | 24,145 | ||||||
OMNOVA Solutions, Inc. (a) | 7,593 | 52,316 | ||||||
PolyOne Corp. | 3,019 | 113,122 | ||||||
Rayonier Advanced Materials, Inc. | 235 | 3,046 | ||||||
Stepan Co. | 1,250 | 72,113 | ||||||
Trinseo SA (a) | 1,374 | 64,702 | ||||||
|
| |||||||
| 381,567 | ||||||||
Commercial Services & Supplies — 2.7% | ||||||||
ARC Document Solutions, Inc. (a) | 10,624 | 45,046 | ||||||
Herman Miller, Inc. | 1,453 | 46,002 | ||||||
InnerWorkings, Inc. (a) | 1,771 | 15,266 | ||||||
Knoll, Inc. | 5,526 | 137,155 | ||||||
Quad/Graphics, Inc. | 1,099 | 21,112 | ||||||
Steelcase, Inc., Class A | 5,805 | 92,648 | ||||||
Tetra Tech, Inc. | 918 | 28,091 | ||||||
|
| |||||||
| 385,320 | ||||||||
Communications Equipment — 1.4% | ||||||||
Ciena Corp. (a) | 548 | 9,568 | ||||||
Digi International, Inc. (a) | 1,902 | 20,998 | ||||||
MRV Communications, Inc. (a) | 422 | 4,566 | ||||||
NETGEAR, Inc. (a) | 1,317 | 59,265 | ||||||
Plantronics, Inc. | 1,038 | 46,212 | ||||||
ShoreTel, Inc. (a) | 362 | 2,389 | ||||||
Ubiquiti Networks, Inc. (a) | 1,331 | 53,054 | ||||||
|
| |||||||
| 196,052 | ||||||||
Construction & Engineering — 0.8% | ||||||||
Ameresco, Inc., Class A (a) | 1,629 | 7,624 | ||||||
Comfort Systems U.S.A., Inc. | 2,439 | 78,048 | ||||||
EMCOR Group, Inc. | 483 | 22,967 | ||||||
|
| |||||||
| 108,639 | ||||||||
Construction Materials — 0.2% | ||||||||
Headwaters, Inc. (a) | 475 | 9,020 | ||||||
Summit Materials, Inc., Class A (a) | 646 | 14,051 | ||||||
|
| |||||||
| 23,071 | ||||||||
Consumer Finance — 0.5% | ||||||||
Consumer Portfolio Services, Inc. (a) | 5,267 | 20,594 | ||||||
Emergent Capital, Inc. (a) | 2,180 | 8,720 | ||||||
Enova International, Inc. (a) | 2,758 | 20,078 | ||||||
Nelnet, Inc., Class A | 430 | 15,772 | ||||||
|
| |||||||
| 65,164 | ||||||||
Containers & Packaging — 0.7% | ||||||||
Berry Plastics Group, Inc. (a) | 922 | 36,115 | ||||||
Greif, Inc., Class A | 1,835 | 65,803 | ||||||
|
| |||||||
| 101,918 | ||||||||
Distributors — 0.4% | ||||||||
Core-Mark Holding Co., Inc. | 612 | 52,399 | ||||||
Diversified Consumer Services — 0.4% | ||||||||
Apollo Education Group Inc. (a) | 804 | 7,389 | ||||||
Cambium Learning Group, Inc. (a) | 2,937 | 13,540 | ||||||
K12, Inc. (a) | 2,577 | 30,589 | ||||||
Regis Corp. (a) | 145 | 1,891 | ||||||
Weight Watchers International, Inc. (a) | 146 | 2,213 | ||||||
|
| |||||||
| 55,622 | ||||||||
| Common Stocks | Shares | Value | ||||||
Diversified Financial Services — 0.3% | ||||||||
Marlin Business Services Corp. | 2,894 | $ | 43,873 | |||||
Diversified Telecommunication Services — 0.8% | ||||||||
FairPoint Communications, Inc. (a) | 2,652 | 35,935 | ||||||
Inteliquent, Inc. | 3,398 | 56,815 | ||||||
Ooma, Inc. (a) | 184 | 1,270 | ||||||
Vonage Holdings Corp. (a) | 3,865 | 17,818 | ||||||
|
| |||||||
| 111,838 | ||||||||
Electric Utilities — 1.4% | ||||||||
El Paso Electric Co. | 336 | 15,006 | ||||||
IDACORP, Inc. | 1,525 | 111,645 | ||||||
Portland General Electric Co. | 1,205 | 49,622 | ||||||
Spark Energy, Inc., Class A | 842 | 25,336 | ||||||
|
| |||||||
| 201,609 | ||||||||
Electronic Equipment, Instruments & Components — 3.7% | ||||||||
Belden, Inc. | 235 | 15,197 | ||||||
Coherent, Inc. (a) | 388 | 36,713 | ||||||
Control4 Corp. (a) | 661 | 5,189 | ||||||
Electro Scientific Industries, Inc. (a) | 2,593 | 18,073 | ||||||
Fabrinet (a) | 969 | 34,399 | ||||||
FEI Co. | 112 | 12,034 | ||||||
II-VI, Inc. (a) | 3,241 | 66,052 | ||||||
Key Tronic Corp. (a) | 3,413 | 30,410 | ||||||
Kimball Electronics, Inc. (a) | 749 | 8,441 | ||||||
Multi-Fineline Electronix, Inc. (a) | 78 | 1,725 | ||||||
PC Connection, Inc. | 1,057 | 24,300 | ||||||
Radisys Corp. (a) | 4,303 | 19,148 | ||||||
Rofin-Sinar Technologies, Inc. (a) | 239 | 7,636 | ||||||
Sanmina Corp. (a) | 4,883 | 130,816 | ||||||
SYNNEX Corp. | 125 | 11,387 | ||||||
Tech Data Corp. (a) | 998 | 75,419 | ||||||
Vishay Precision Group, Inc. (a) | 2,182 | 29,479 | ||||||
|
| |||||||
| 526,418 | ||||||||
Energy Equipment & Services — 1.1% | ||||||||
Archrock, Inc. | 1,267 | 9,667 | ||||||
Aspen Aerogels, Inc. (a) | 2,955 | 11,850 | ||||||
C&J Energy Services Ltd. (a) | 1,045 | 556 | ||||||
Dawson Geophysical Co. (a) | 6,164 | 44,504 | ||||||
Exterran Corp. (a) | 825 | 10,337 | ||||||
Gulf Island Fabrication, Inc. | 3,390 | 23,459 | ||||||
Independence Contract Drilling, Inc. (a) | 803 | 3,212 | ||||||
Matrix Service Co. (a) | 1,109 | 18,376 | ||||||
McDermott International, Inc. (a) | 1,425 | 6,769 | ||||||
PHI, Inc. (a) | 1,405 | 24,025 | ||||||
|
| |||||||
| 152,755 | ||||||||
Food & Staples Retailing — 0.7% | ||||||||
Casey’s General Stores, Inc. | 384 | 46,161 | ||||||
Natural Grocers by Vitamin Cottage, Inc. (a) | 582 | 7,711 | ||||||
Performance Food Group Co. (a) | 1,633 | 40,547 | ||||||
|
| |||||||
| 94,419 | ||||||||
Food Products — 1.1% | ||||||||
Amplify Snack Brands, Inc. (a) | 427 | 5,572 | ||||||
Cal-Maine Foods, Inc. (b) | 1,274 | 56,693 | ||||||
Dean Foods Co. | 3,457 | 63,194 | ||||||
Omega Protein Corp. (a) | 279 | 5,507 | ||||||
Post Holdings, Inc. (a) | 93 | 7,069 | ||||||
Seneca Foods Corp., Class A (a) | 655 | 20,449 | ||||||
|
| |||||||
| 158,484 | ||||||||
Gas Utilities — 1.1% | ||||||||
New Jersey Resources Corp. | 190 | 6,679 | ||||||
See Notes to Financial Statements.
| ANNUAL REPORT | MAY 31, 2016 | 11 |
| Schedule of Investments (continued) | BlackRock Disciplined Small Cap Core Fund | |
| Common Stocks | Shares | Value | ||||||
Gas Utilities (continued) | ||||||||
Southwest Gas Corp. | 2,080 | $ | 144,414 | |||||
|
| |||||||
| 151,093 | ||||||||
Health Care Equipment & Supplies — 4.0% | ||||||||
AngioDynamics, Inc. (a) | 448 | 5,380 | ||||||
Cantel Medical Corp. | 613 | 40,722 | ||||||
Cutera, Inc. (a) | 2,885 | 30,235 | ||||||
Cynosure, Inc., Class A (a) | 886 | 42,324 | ||||||
Exactech, Inc. (a) | 421 | 10,390 | ||||||
ICU Medical, Inc. (a) | 547 | 56,882 | ||||||
Lantheus Holdings, Inc. (a) | 8,533 | 16,639 | ||||||
LeMaitre Vascular, Inc. | 1,886 | 26,347 | ||||||
Masimo Corp. (a) | 1,126 | 56,007 | ||||||
NuVasive, Inc. (a) | 231 | 12,559 | ||||||
Orthofix International NV (a) | 1,160 | 51,307 | ||||||
RTI Surgical, Inc. (a) | 5,322 | 20,064 | ||||||
STERIS PLC | 465 | 32,285 | ||||||
SurModics, Inc. (a) | 138 | 3,041 | ||||||
Symmetry Surgical, Inc. (a) | 497 | 6,441 | ||||||
West Pharmaceutical Services, Inc. | 2,117 | 158,944 | ||||||
|
| |||||||
| 569,567 | ||||||||
Health Care Providers & Services — 2.1% | ||||||||
Alliance HealthCare Services, Inc. (a) | 332 | 2,407 | ||||||
American Renal Associates Holdings, Inc. (a) | 548 | 15,338 | ||||||
AMN Healthcare Services, Inc. (a) | 1,143 | 42,680 | ||||||
Diplomat Pharmacy, Inc. (a) | 287 | 9,350 | ||||||
Five Star Quality Care, Inc. (a) | 6,684 | 13,435 | ||||||
Hanger, Inc. (a) | 2,132 | 13,709 | ||||||
Molina Healthcare, Inc. (a) | 204 | 9,880 | ||||||
National HealthCare Corp. | 334 | 20,685 | ||||||
Owens & Minor, Inc. | 221 | 8,241 | ||||||
VCA, Inc. (a) | 1,891 | 122,783 | ||||||
WellCare Health Plans, Inc. (a) | 384 | 38,945 | ||||||
|
| |||||||
| 297,453 | ||||||||
Health Care Technology — 0.2% | ||||||||
Vocera Communications, Inc. (a) | 1,905 | 22,003 | ||||||
Hotels, Restaurants & Leisure — 3.5% | ||||||||
Bloomin’ Brands, Inc. | 315 | 6,001 | ||||||
Bravo Brio Restaurant Group, Inc. (a) | 4,330 | 32,129 | ||||||
Carrols Restaurant Group, Inc. (a) | 2,565 | 31,088 | ||||||
Century Casinos, Inc. (a) | 5,369 | 30,603 | ||||||
Cheesecake Factory, Inc. | 2,059 | 102,682 | ||||||
Del Frisco’s Restaurant Group, Inc. (a) | 385 | 5,952 | ||||||
Denny’s Corp. (a) | 2,014 | 21,610 | ||||||
Eldorado Resorts, Inc. (a) | 1,883 | 28,057 | ||||||
J. Alexander’s Holdings, Inc. (a) | 3,368 | 35,027 | ||||||
Lindblad Expeditions Holdings, Inc. (a) | 788 | 7,880 | ||||||
Monarch Casino & Resort, Inc. (a) | 89 | 1,880 | ||||||
Papa John’s International, Inc. | 83 | 5,257 | ||||||
RCI Hospitality Holdings, Inc. | 1,812 | 19,678 | ||||||
Red Robin Gourmet Burgers, Inc. (a) | 60 | 3,043 | ||||||
Texas Roadhouse, Inc. | 45 | 2,016 | ||||||
Vail Resorts, Inc. | 1,188 | 155,925 | ||||||
|
| |||||||
| 488,828 | ||||||||
Household Durables — 1.1% | ||||||||
Century Communities, Inc. (a) | 710 | 12,858 | ||||||
La-Z-Boy, Inc. | 1,644 | 43,533 | ||||||
LGI Homes, Inc. (a) | 1,048 | 28,317 | ||||||
Libbey, Inc. | 156 | 2,666 | ||||||
TRI Pointe Group, Inc. (a) | 5,301 | 61,810 | ||||||
ZAGG, Inc. (a) | 602 | 2,914 | ||||||
|
| |||||||
| 152,098 | ||||||||
| Common Stocks | Shares | Value | ||||||
Household Products — 0.0% | ||||||||
Central Garden & Pet Co., Class A (a) | 143 | $ | 2,607 | |||||
Independent Power and Renewable Electricity Producers — 0.3% |
| |||||||
Abengoa Yield PLC | 774 | 13,916 | ||||||
Dynegy, Inc. (a) | 458 | 8,629 | ||||||
Ormat Technologies, Inc. | 429 | 18,709 | ||||||
|
| |||||||
| 41,254 | ||||||||
Insurance — 1.5% | ||||||||
American Equity Investment Life Holding Co. | 1,711 | 27,735 | ||||||
CNO Financial Group, Inc. | 2,434 | 49,386 | ||||||
Employers Holdings, Inc. | 188 | 5,612 | ||||||
Hallmark Financial Services, Inc. (a) | 2,161 | 21,113 | ||||||
Maiden Holdings Ltd. | 243 | 3,188 | ||||||
National General Holdings Corp. | 584 | 12,106 | ||||||
Primerica, Inc. | 455 | 25,530 | ||||||
Selective Insurance Group, Inc. | 630 | 23,405 | ||||||
State National Cos., Inc. | 2,962 | 31,901 | ||||||
Universal Insurance Holdings, Inc. | 709 | 13,783 | ||||||
|
| |||||||
| 213,759 | ||||||||
Internet & Catalog Retail — 0.1% | ||||||||
EVINE Live, Inc. (a) | 1,805 | 2,771 | ||||||
Shutterfly, Inc. (a) | 356 | 17,195 | ||||||
|
| |||||||
| 19,966 | ||||||||
Internet Software & Services — 3.1% | ||||||||
Bankrate, Inc. (a) | 2,063 | 18,753 | ||||||
Brightcove, Inc. (a) | 1,940 | 12,998 | ||||||
Carbonite, Inc. (a) | 534 | 4,934 | ||||||
Cvent, Inc. (a) | 107 | 3,832 | ||||||
Demand Media, Inc. (a) | 1,830 | 9,626 | ||||||
EarthLink Holdings Corp. | 19,351 | 126,943 | ||||||
Everyday Health, Inc. (a) | 6,262 | 42,143 | ||||||
LogMeIn, Inc. (a) | 978 | 59,922 | ||||||
NIC, Inc. | 1,479 | 29,358 | ||||||
QuinStreet, Inc. (a) | 11,556 | 42,757 | ||||||
SciQuest, Inc. (a) | 509 | 8,979 | ||||||
Tremor Video, Inc. (a) | 2,927 | 5,298 | ||||||
Web.com Group, Inc. (a) | 3,969 | 67,354 | ||||||
Wix.com Ltd. (a) | 197 | 5,449 | ||||||
|
| |||||||
| 438,346 | ||||||||
IT Services — 1.7% | ||||||||
CACI International, Inc., Class A (a) | 376 | 37,889 | ||||||
Computer Task Group, Inc. | 4,385 | 23,197 | ||||||
Convergys Corp. | 549 | 15,476 | ||||||
Euronet Worldwide, Inc. (a) | 585 | 46,689 | ||||||
EVERTEC, Inc. | 624 | 9,553 | ||||||
Global Payments, Inc. | 192 | 14,916 | ||||||
Hackett Group, Inc. | 570 | 8,333 | ||||||
Lionbridge Technologies, Inc. (a) | 4,273 | 18,588 | ||||||
MoneyGram International, Inc. (a) | 343 | 2,226 | ||||||
Net 1 UEPS Technologies, Inc. (a) | 1,344 | 14,771 | ||||||
Planet Payment, Inc. (a) | 5,181 | 22,330 | ||||||
Science Applications International Corp. | 95 | 5,184 | ||||||
Travelport Worldwide Ltd. | 842 | 11,148 | ||||||
Unisys Corp. (a) | 1,722 | 14,534 | ||||||
|
| |||||||
| 244,834 | ||||||||
Leisure Products — 1.0% | ||||||||
Brunswick Corp. | 870 | 41,647 | ||||||
Johnson Outdoors, Inc., Class A | 1,591 | 41,939 | ||||||
Marine Products Corp. | 2,028 | 17,562 | ||||||
MCBC Holdings, Inc. (a) | 903 | 13,888 | ||||||
Nautilus, Inc. (a) | 1,180 | 24,343 | ||||||
|
| |||||||
| 139,379 | ||||||||
See Notes to Financial Statements.
| 12 | ANNUAL REPORT | MAY 31, 2016 |
| Schedule of Investments (continued) | BlackRock Disciplined Small Cap Core Fund | |
| Common Stocks | Shares | Value | ||||||
Life Sciences Tools & Services — 0.7% | ||||||||
INC Research Holdings, Inc., Class A (a) | 347 | $ | 15,098 | |||||
PAREXEL International Corp. (a) | 1,024 | 64,399 | ||||||
PRA Health Sciences, Inc. (a) | 477 | 22,529 | ||||||
|
| |||||||
| 102,026 | ||||||||
Machinery — 3.8% | ||||||||
Accuride Corp. (a) | 5,023 | 7,936 | ||||||
Briggs & Stratton Corp. | 1,176 | 26,248 | ||||||
Commercial Vehicle Group, Inc. (a) | 8,967 | 33,178 | ||||||
Douglas Dynamics, Inc. | 617 | 13,401 | ||||||
Federal Signal Corp. | 670 | 8,717 | ||||||
Global Brass & Copper Holdings, Inc. | 3,551 | 96,907 | ||||||
Greenbrier Cos., Inc. | 1,217 | 34,928 | ||||||
Hardinge, Inc. | 2,223 | 23,208 | ||||||
John Bean Technologies Corp. | 1,592 | 96,603 | ||||||
Lydall, Inc. (a) | 365 | 13,819 | ||||||
Miller Industries, Inc. | 2,057 | 43,937 | ||||||
Supreme Industries, Inc., Class A | 4,708 | 62,146 | ||||||
Wabash National Corp. (a) | 4,425 | 62,747 | ||||||
Xerium Technologies, Inc. (a) | 1,744 | 11,022 | ||||||
|
| |||||||
| 534,797 | ||||||||
Marine — 0.2% | ||||||||
Matson, Inc. | 952 | 31,730 | ||||||
Media — 1.0% | ||||||||
DreamWorks Animation SKG, Inc., Class A (a) | 150 | 6,036 | ||||||
Entercom Communications Corp., Class A | 2,675 | 33,973 | ||||||
Entravision Communications Corp., Class A | 339 | 2,448 | ||||||
Gray Television, Inc. (a) | 1,016 | 12,009 | ||||||
Harte-Hanks, Inc. | 1,394 | 1,378 | ||||||
Lee Enterprises, Inc. (a) | 2,125 | 4,144 | ||||||
Meredith Corp. | 312 | 15,444 | ||||||
New Media Investment Group, Inc. | 496 | 8,645 | ||||||
Sinclair Broadcast Group, Inc., Class A | 1,594 | 50,418 | ||||||
Townsquare Media, Inc., Class A (a) | 1,374 | 12,132 | ||||||
|
| |||||||
| 146,627 | ||||||||
Metals & Mining — 1.0% | ||||||||
Cliffs Natural Resources, Inc. (a) | 1,505 | 6,441 | ||||||
Coeur Mining, Inc. (a) | 692 | 5,211 | ||||||
Commercial Metals Co. | 81 | 1,391 | ||||||
Ferroglobe PLC | 193 | 1,760 | ||||||
Hecla Mining Co. | 6,095 | 24,746 | ||||||
Kaiser Aluminum Corp. | 444 | 38,055 | ||||||
Real Industry, Inc. (a) | 552 | 3,740 | ||||||
SunCoke Energy, Inc. | 1,498 | 9,063 | ||||||
Worthington Industries, Inc. | 1,337 | 49,950 | ||||||
|
| |||||||
| 140,357 | ||||||||
Multiline Retail — 0.3% | ||||||||
Big Lots, Inc. | 810 | 42,363 | ||||||
Multi-Utilities — 0.2% | ||||||||
Avista Corp. | 520 | 20,914 | ||||||
Black Hills Corp. | 31 | 1,877 | ||||||
|
| |||||||
| 22,791 | ||||||||
Oil, Gas & Consumable Fuels — 2.3% | ||||||||
Bill Barrett Corp. (a) | 183 | 1,301 | ||||||
Callon Petroleum Co. (a) | 1,086 | 12,369 | ||||||
Carrizo Oil & Gas, Inc. (a) | 207 | 7,969 | ||||||
DHT Holdings, Inc. | 5,750 | 31,395 | ||||||
Eclipse Resources Corp. (a) | 1,162 | 3,102 | ||||||
Enviva Partners LP | 348 | 7,962 | ||||||
Evolution Petroleum Corp. | 3,085 | 17,245 | ||||||
Gener8 Maritime, Inc. (a) | 3,703 | 26,773 | ||||||
Halcon Resources Corp. (b) | 2,711 | 825 | ||||||
| Common Stocks | Shares | Value | ||||||
Oil, Gas & Consumable Fuels (continued) | ||||||||
Hallador Energy Co. | 758 | $ | 3,237 | |||||
Isramco, Inc. (a) | 37 | 3,448 | ||||||
Matador Resources Co. (a) | 1,040 | 23,629 | ||||||
Nordic American Tankers Ltd. (b) | 1,762 | 27,082 | ||||||
Northern Oil and Gas, Inc. (a) | 342 | 1,491 | ||||||
Oasis Petroleum, Inc. (a) | 1,169 | 11,737 | ||||||
Parsley Energy, Inc., Class A (a) | 1,665 | 43,406 | ||||||
PDC Energy, Inc. (a) | 353 | 20,492 | ||||||
Rex Energy Corp. (b) | 3,776 | 2,795 | ||||||
Ring Energy, Inc. (a) | 1,743 | 14,101 | ||||||
Scorpio Tankers, Inc. | 4,442 | 26,119 | ||||||
Ship Finance International Ltd. | 1,245 | 19,957 | ||||||
Triangle Petroleum Corp. (b) | 5,793 | 898 | ||||||
Western Refining, Inc. | 977 | 20,751 | ||||||
|
| |||||||
| 328,084 | ||||||||
Paper & Forest Products — 0.2% | ||||||||
Boise Cascade Co. (a) | 1,014 | 23,281 | ||||||
Domtar Corp. | 95 | 3,671 | ||||||
Neenah Paper, Inc. | 53 | 3,678 | ||||||
|
| |||||||
| 30,630 | ||||||||
Personal Products — 0.4% | ||||||||
Lifevantage Corp. (a) | 789 | 9,847 | ||||||
Medifast, Inc. | 471 | 15,030 | ||||||
Natural Health Trends Corp. (b) | 32 | 955 | ||||||
Nutraceutical International Corp. (a) | 122 | 2,890 | ||||||
USANA Health Sciences, Inc. (a) | 172 | 20,752 | ||||||
|
| |||||||
| 49,474 | ||||||||
Pharmaceuticals — 2.3% | ||||||||
Achaogen, Inc. (a) | 998 | 3,273 | ||||||
Heska Corp. (a) | 88 | 3,192 | ||||||
Innoviva, Inc. | 1,210 | 13,649 | ||||||
Juniper Pharmaceuticals, Inc. (a) | 4,749 | 32,816 | ||||||
Prestige Brands Holdings, Inc. (a) | 3,940 | 212,918 | ||||||
Sagent Pharmaceuticals, Inc. (a) | 3,348 | 43,323 | ||||||
Sucampo Pharmaceuticals, Inc., Class A (a) | 927 | 10,901 | ||||||
|
| |||||||
| 320,072 | ||||||||
Professional Services — 1.5% | ||||||||
Insperity, Inc. | 1,693 | 121,845 | ||||||
Kelly Services, Inc., Class A | 1,564 | 30,998 | ||||||
Kforce, Inc. | 359 | 6,713 | ||||||
On Assignment, Inc. (a) | 481 | 18,119 | ||||||
RPX Corp. (a) | 2,852 | 28,663 | ||||||
|
| |||||||
| 206,338 | ||||||||
Real Estate Investment Trusts (REITs) — 9.4% | ||||||||
American Assets Trust, Inc. | 239 | 9,562 | ||||||
Arbor Realty Trust, Inc. | 5,386 | 37,594 | ||||||
Ares Commercial Real Estate Corp. | 223 | 2,671 | ||||||
Armada Hoffler Properties, Inc. | 1,997 | 24,164 | ||||||
Chatham Lodging Trust | 2,262 | 49,063 | ||||||
Cherry Hill Mortgage Investment Corp. | 1,280 | 19,930 | ||||||
Chesapeake Lodging Trust | 5,658 | 134,887 | ||||||
Colony Capital, Inc., Class A | 2,929 | 53,659 | ||||||
CubeSmart | 2,334 | 74,315 | ||||||
DCT Industrial Trust, Inc. | 2,369 | 102,175 | ||||||
DiamondRock Hospitality Co. | 377 | 3,370 | ||||||
EPR Properties | 1,002 | 71,423 | ||||||
Equity LifeStyle Properties, Inc. | 577 | 42,294 | ||||||
FelCor Lodging Trust, Inc. | 867 | 5,731 | ||||||
Hersha Hospitality Trust | 1,271 | 22,522 | ||||||
InfraREIT, Inc. (a) | 1,198 | 20,570 | ||||||
LaSalle Hotel Properties | 659 | 15,229 | ||||||
National Storage Affiliate Trust | 705 | 14,699 | ||||||
See Notes to Financial Statements.
| ANNUAL REPORT | MAY 31, 2016 | 13 |
| Schedule of Investments (continued) | BlackRock Disciplined Small Cap Core Fund | |
| Common Stocks | Shares | Value | ||||||
Real Estate Investment Trusts (REITs) (continued) | ||||||||
Pebblebrook Hotel Trust | 376 | $ | 9,483 | |||||
PS Business Parks, Inc. | 2,627 | 259,364 | ||||||
RLJ Lodging Trust | 3,404 | 69,748 | ||||||
Ryman Hospitality Properties, Inc. | 1,108 | 54,358 | ||||||
Sovran Self Storage, Inc. | 580 | 62,797 | ||||||
Summit Hotel Properties, Inc. | 9,051 | 105,897 | ||||||
Sunstone Hotel Investors, Inc. | 4,741 | 57,082 | ||||||
Winthrop Realty Trust | 402 | 3,948 | ||||||
|
| |||||||
| 1,326,535 | ||||||||
Real Estate Management & Development — 0.8% | ||||||||
Altisource Portfolio Solutions SA (a) | 623 | 17,400 | ||||||
AV Homes, Inc. (a) | 1,482 | 18,614 | ||||||
FRP Holdings, Inc. (a) | 115 | 3,519 | ||||||
Marcus & Millichap, Inc. (a) | 2,138 | 54,348 | ||||||
RMR Group, Inc., Class A | 578 | 17,132 | ||||||
|
| |||||||
| 111,013 | ||||||||
Road & Rail — 0.3% | ||||||||
ArcBest Corp. | 1,294 | 22,296 | ||||||
Roadrunner Transportation Systems, Inc. (a) | 262 | 2,109 | ||||||
Saia, Inc. (a) | 179 | 4,666 | ||||||
YRC Worldwide, Inc. (a) | 1,481 | 13,640 | ||||||
|
| |||||||
| 42,711 | ||||||||
Semiconductors & Semiconductor Equipment — 3.1% | ||||||||
Advanced Energy Industries, Inc. (a) | 215 | 8,207 | ||||||
Advanced Micro Devices, Inc. (a) | 1,223 | 5,589 | ||||||
Alpha & Omega Semiconductor Ltd. (a) | 3,151 | 43,137 | ||||||
Amkor Technology, Inc. (a) | 1,180 | 7,446 | ||||||
Cascade Microtech, Inc. (a) | 2,194 | 45,372 | ||||||
Cirrus Logic, Inc. (a) | 168 | 6,048 | ||||||
Entegris, Inc. (a) | 1,608 | 22,930 | ||||||
Fairchild Semiconductor International, Inc. (a) | 976 | 19,393 | ||||||
Integrated Device Technology, Inc. (a) | 510 | 11,909 | ||||||
Intersil Corp., Class A | 1,307 | 17,671 | ||||||
MaxLinear, Inc., Class A (a) | 954 | 19,767 | ||||||
Microsemi Corp. (b) | 2,151 | 72,768 | ||||||
Nanometrics, Inc. (a) | 330 | 6,145 | ||||||
Power Integrations, Inc. | 300 | 14,967 | ||||||
Semtech Corp. (a) | 442 | 10,405 | ||||||
Tessera Technologies, Inc. | 3,873 | 124,982 | ||||||
Ultra Clean Holdings, Inc. (a) | 431 | 2,457 | ||||||
|
| |||||||
| 439,193 | ||||||||
Software — 4.6% | ||||||||
A10 Networks, Inc. (a) | 4,299 | 27,771 | ||||||
American Software, Inc., Class A | 455 | 4,386 | ||||||
Aspen Technology, Inc. (a) | 2,827 | 107,765 | ||||||
Ellie Mae, Inc. (a) | 121 | 10,250 | ||||||
Exa Corp. (a) | 351 | 4,247 | ||||||
Fair Isaac Corp. | 20 | 2,229 | ||||||
Gigamon, Inc. (a) | 1,103 | 34,358 | ||||||
Imperva, Inc. (a) | 94 | 3,589 | ||||||
Infoblox, Inc. (a) | 1,228 | 23,099 | ||||||
Manhattan Associates, Inc. (a) | 1,957 | 129,025 | ||||||
Mentor Graphics Corp. | 391 | 8,383 | ||||||
MicroStrategy, Inc., Class A (a) | 230 | 42,904 | ||||||
Monotype Imaging Holdings, Inc. | 1,938 | 46,279 | ||||||
Pegasystems, Inc. | 2,006 | 52,898 | ||||||
Qlik Technologies, Inc. (a) | 320 | 9,184 | ||||||
Silver Spring Networks, Inc. (a) | 287 | 3,745 | ||||||
Take-Two Interactive Software, Inc. (a) | 2,624 | 102,100 | ||||||
Zix Corp. (a) | 8,881 | 35,702 | ||||||
|
| |||||||
| 647,914 | ||||||||
| Common Stocks | Shares | Value | ||||||
Specialty Retail — 3.0% | ||||||||
Aaron’s, Inc. (a) | 104 | $ | 2,610 | |||||
American Eagle Outfitters, Inc. | 2,832 | 44,292 | ||||||
Asbury Automotive Group, Inc. (a) | 979 | 54,922 | ||||||
Ascena Retail Group, Inc. (a) | 119 | 859 | ||||||
Burlington Stores, Inc. (a) | 884 | 53,358 | ||||||
Children’s Place, Inc. | 493 | 34,747 | ||||||
Express, Inc. (a) | 5,575 | 81,061 | ||||||
Francesca’s Holdings Corp. (a) | 127 | 1,323 | ||||||
Group 1 Automotive, Inc. | 126 | 7,835 | ||||||
Haverty Furniture Cos., Inc. | 362 | 6,730 | ||||||
Lithia Motors, Inc., Class A | 53 | 4,364 | ||||||
New York & Co., Inc. (a) | 7,476 | 13,158 | ||||||
Sonic Automotive, Inc., Class A | 3,104 | 55,437 | ||||||
Tilly’s, Inc., Class A (a) | 859 | 5,068 | ||||||
TravelCenters of America LLC (a) | 2,173 | 15,363 | ||||||
West Marine, Inc. (a) | 4,517 | 41,466 | ||||||
|
| |||||||
| 422,593 | ||||||||
Technology Hardware, Storage & Peripherals — 0.1% |
| |||||||
Immersion Corp. (a) | 411 | 2,630 | ||||||
Super Micro Computer, Inc. (a) | 348 | 9,131 | ||||||
|
| |||||||
| 11,761 | ||||||||
Textiles, Apparel & Luxury Goods — 1.2% | ||||||||
Culp, Inc. | 1,275 | 35,050 | ||||||
Delta Apparel, Inc. (a) | 890 | 18,281 | ||||||
Oxford Industries, Inc. | 605 | 38,339 | ||||||
Perry Ellis International, Inc. (a) | 1,740 | 33,686 | ||||||
Skechers U.S.A., Inc., Class A (a) | 1,378 | 42,952 | ||||||
|
| |||||||
| 168,308 | ||||||||
Thrifts & Mortgage Finance — 2.6% | ||||||||
Essent Group Ltd. (a) | 1,369 | 29,926 | ||||||
EverBank Financial Corp. | 4,205 | 64,421 | ||||||
First Defiance Financial Corp. | 4,005 | 161,682 | ||||||
Flagstar Bancorp, Inc. (a) | 2,811 | 68,139 | ||||||
MGIC Investment Corp. (a) | 872 | 6,148 | ||||||
Nationstar Mortgage Holdings, Inc. (a) | 105 | 1,340 | ||||||
NMI Holdings, Inc., Class A (a) | 1,060 | 6,614 | ||||||
Radian Group, Inc. | 415 | 5,150 | ||||||
United Community Financial Corp. | 3,905 | 23,781 | ||||||
|
| |||||||
| 367,201 | ||||||||
Tobacco — 0.0% | ||||||||
Vector Group Ltd. | 138 | 2,963 | ||||||
Trading Companies & Distributors — 0.1% | ||||||||
Beacon Roofing Supply, Inc. (a) | 465 | 20,065 | ||||||
Water Utilities — 0.2% | ||||||||
SJW Corp. | 1,002 | 34,559 | ||||||
Wireless Telecommunication Services — 0.0% | ||||||||
Leap Wireless International, Inc. - CVR (a) | 216 | 544 | ||||||
Spok Holdings, Inc. | 340 | 5,964 | ||||||
|
| |||||||
| 6,508 | ||||||||
Total Long-Term Investments (Cost — $13,107,517) — 99.1% | 13,999,003 | |||||||
See Notes to Financial Statements.
| 14 | ANNUAL REPORT | MAY 31, 2016 |
| Schedule of Investments (continued) | BlackRock Disciplined Small Cap Core Fund |
| Short-Term Securities | Shares | Value | ||||||
BlackRock Liquidity Funds, TempFund, Institutional Class, 0.39% (c)(d) | 164,601 | $164,601 | ||||||
| Beneficial Interest (000) | ||||||||
BlackRock Liquidity Series, LLC, Money Market | $ 154 | 153,939 | ||||||
| Value | ||||
Total Short-Term Securities (Cost — $ 318,540) — 2.2% | $ | 318,540 | ||
Total Investments (Cost — $ 13,426,057) — 101.3% | 14,317,543 | |||
Liabilities in Excess of Other Assets — (1.3)% | (187,364 | ) | ||
|
| |||
Net Assets — 100.0% | $ | 14,130,179 | ||
|
| |||
| Notes to Schedule of Investments |
| (a) | Non-income producing security. |
| (b) | Security, or a portion of security, is on loan. |
| (c) | Current yield as of period end. |
| (d) | During the year ended May 31, 2016, investments in issuers considered to be affiliates of the Fund for purposes of Section 2(a)(3) of the Investment Company Act of 1940, as amended, were as follows: |
| Affiliate | Shares/ Beneficial Interest Held at May 31, 2015 | Net Activity | Shares/ Beneficial Interest Held at May 31, 2016 | Value at May 31, 2016 | Income | Realized Gain | ||||||||||||||||||
BlackRock Liquidity Funds, TempFund, Institutional Class | 161,872 | 2,729 | 164,601 | $ | 164,601 | $ | 451 | $ | 4 | |||||||||||||||
BlackRock Liquidity Series, LLC, Money Market Series | $ | 129,625 | $ | 24,314 | $ | 153,939 | 153,939 | 7,136 | 1 | — | ||||||||||||||
Total | $ | 318,540 | $ | 7,587 | $ | 4 | ||||||||||||||||||
|
| |||||||||||||||||||||||
| 1 | Represents securities lending income earned from the reinvestment of cash collateral from loaned securities, net of fees, and other payments to and from borrowers of securities. |
| (e) | Security was purchased with the cash collateral from loaned securities. The Fund may withdraw up to 25% of its investment daily, although the manager of the BlackRock Liquidity Series, LLC, Money Market Series, in its sole discretion, may permit an investor to withdraw more than 25% on any one day. |
| • | For Fund compliance purposes, the Fund’s industry classifications refer to any one or more of the industry sub-classifications used by one or more widely recognized market indexes or ratings group indexes, and/or as defined by the investment advisor. These definitions may not apply for purposes of this report, which may combine such industry sub-classifications for reporting ease. |
| Derivative Financial Instruments Outstanding as of Period End |
| Futures Contracts | ||||||||||||
Contracts Long | Issue | Expiration | Notional Value | Unrealized Appreciation | ||||||||
| 2 | Russell 2000 Mini Index | June 2016 | $230,680 | $5,204 | ||||||||
| Derivative Financial Instruments Categorized by Risk Exposure |
As of period end, fair values of derivative financial instruments located in the Statements of Assets and Liabilities were as follows:
| Commodity Contracts | Credit Contracts | Equity Contracts | Foreign Currency Exchange Contracts | Interest Rate Contracts | Other Contracts | Total | ||||||||||||||||||||||||
Assets - Derivative Financial Instruments | ||||||||||||||||||||||||||||||
Futures contracts | Net unrealized appreciation1 | — | — | $5,204 | — | — | — | $5,204 | ||||||||||||||||||||||
| 1 | Includes cumulative appreciation (depreciation) on futures contracts, if any, as reported in the Schedule of Investments. Only current day’s variation margin is reported within the Statements of Assets and Liabilities. |
See Notes to Financial Statements.
| ANNUAL REPORT | MAY 31, 2016 | 15 |
| Schedule of Investments (concluded) | BlackRock Disciplined Small Cap Core Fund |
For the year ended May 31, 2016, the effect of derivative financial instruments in the Statements of Operations were as follows:
| Net Realized Loss from: | Commodity Contracts | Credit Contracts | Equity Contracts | Foreign Currency Exchange Contracts | Interest Rate Contracts | Other Contracts | Total | |||||||||||||||||||||
Futures contracts | — | — | $(20,969) | — | — | — | $(20,969) | |||||||||||||||||||||
Net Change in Unrealized Appreciation (Depreciation) on: | ||||||||||||||||||||||||||||
Futures contracts | — | — | $ 5,206 | — | — | — | $ 5,206 | |||||||||||||||||||||
| Average Quarterly Balances of Outstanding Derivative Financial Instruments |
Futures contracts: | ||||
Average notional value of contract - long | $ | 219,675 |
For more information about the Fund’s investment risks regarding derivative financial instruments, refer to the Notes to Financial Statements.
| Fair Value Hierarchy as of Period End |
Various inputs are used in determining the fair value of investments and derivative financial instruments. For information about the Fund’s policy regarding valuation of investments and derivative financial instruments, refer to the Notes to Financial Statements.
The following tables summarize the Fund’s investments and derivative financial instruments categorized in the disclosure hierarchy:
| Level 1 | Level 2 | Level 3 | Total | |||||||||||||
Assets: | ||||||||||||||||
Investments: | ||||||||||||||||
Long-Term Investments1 | $ | 13,997,532 | — | $ | 1,471 | $ | 13,999,003 | |||||||||
Short-Term Securities | 164,601 | $ | 153,939 | — | 318,540 | |||||||||||
|
| |||||||||||||||
Total | $ | 14,162,133 | $ | 153,939 | $ | 1,471 | $ | 14,317,543 | ||||||||
|
| |||||||||||||||
| ||||||||||||||||
Derivative Financial Instruments2 | ||||||||||||||||
Assets: | ||||||||||||||||
Equity contracts | $ | 5,204 | — | — | $ | 5,204 | ||||||||||
| ||||||||||||||||
1 See above Schedule of Investments for values in each industry. Investments categorized as Level 3 are included in Biotechnology and Wireless Telecommunications Services. |
| |||||||||||||||
2 Derivative financial instruments are futures contracts, which are valued at the unrealized appreciation (depreciation) on the instrument. |
| |||||||||||||||
| The Fund may hold assets and/or liabilities in which the fair value approximates the carrying amount for financial statement purposes. As of period end, such assets and/or liabilities are categorized within the disclosure hierarchy as follows: | ||||||||||||||||
| Level 1 | Level 2 | Level 3 | Total | |||||||||||||
Assets: | ||||||||||||||||
Cash pledged for futures contracts | $ | 6,000 | — | — | $ | 6,000 | ||||||||||
Liabilities: | ||||||||||||||||
Collateral on securities loaned at value | — | $ | (153,939 | ) | — | (153,939 | ) | |||||||||
|
| |||||||||||||||
Total | $ | 6,000 | $ | (153,939 | ) | — | $ | (147,939 | ) | |||||||
|
| |||||||||||||||
During the year ended May 31, 2016, there were no transfers between levels.
See Notes to Financial Statements.
| 16 | ANNUAL REPORT | MAY 31, 2016 |
| Statements of Assets and Liabilities |
| May 31, 2016 | BlackRock Disciplined Small Cap Core Fund | BlackRock Small Cap Growth Fund II | ||||||
| Assets | ||||||||
Investments at value — unaffiliated (including securities loaned at value of $143,344) (cost — $13,107,517) | $ | 13,999,003 | — | |||||
Investments at value — affiliated (cost — $318,540) | 318,540 | — | ||||||
Investments at value — Master Portfolio (cost — $163,203,264) | — | $ | 168,971,875 | |||||
Cash pledged for futures contracts | 6,000 | — | ||||||
Receivables: | ||||||||
Investments sold | 319,396 | — | ||||||
Securities lending income — affiliated | 1,230 | — | ||||||
Capital shares sold | — | 92,895 | ||||||
Dividends | 8,926 | — | ||||||
From the Manager | 49,436 | — | ||||||
Variation margin on futures contracts | 337 | — | ||||||
Withdrawals from the Master Portfolio | — | 525,728 | ||||||
Prepaid expenses | 21,372 | 22,752 | ||||||
|
| |||||||
Total assets | 14,724,240 | 169,613,250 | ||||||
|
| |||||||
| Liabilities | ||||||||
Collateral on securities loaned at value | 153,939 | — | ||||||
Payables: | ||||||||
Investments purchased | 256,208 | — | ||||||
Administration fees | 141 | 27,915 | ||||||
Capital shares redeemed | 42,510 | 618,623 | ||||||
Offering costs | 13,516 | — | ||||||
Officer’s and Trustees’/Directors’ fees | 1,387 | 236 | ||||||
Other accrued expenses | 27,310 | 20,615 | ||||||
Other affiliates | 11 | 1,087 | ||||||
Professional fees | 95,466 | 27,674 | ||||||
Service and distribution fees | 983 | 46,265 | ||||||
Transfer agent fees | 2,590 | 125,695 | ||||||
|
| |||||||
Total liabilities | 594,061 | 868,110 | ||||||
|
| |||||||
Net Assets | $ | 14,130,179 | $ | 168,745,140 | ||||
|
| |||||||
| Net Assets Consist of | ||||||||
Paid-in capital | $ | 13,870,522 | $ | 173,762,706 | ||||
Undistributed (accumulated) net investment income (loss) | 14,744 | (487,498 | ) | |||||
Undistributed net realized loss | (651,777 | ) | — | |||||
Undistributed net realized loss allocated from the Master Portfolio | — | (10,298,679 | ) | |||||
Net unrealized appreciation (depreciation) | 896,690 | — | ||||||
Net unrealized appreciation (depreciation) allocated from the Master Portfolio | — | 5,768,611 | ||||||
|
| |||||||
Net Assets | $ | 14,130,179 | $ | 168,745,140 | ||||
|
| |||||||
See Notes to Financial Statements.
| ANNUAL REPORT | MAY 31, 2016 | 17 |
| Statements of Assets and Liabilities (concluded) |
| May 31, 2016 | BlackRock Disciplined Small Cap Core Fund | BlackRock Small Cap Growth Fund II | ||||||
| Net Asset Value | ||||||||
Institutional | ||||||||
Net assets | $ | 10,302,397 | $ | 58,948,285 | ||||
|
| |||||||
Shares outstanding | 972,548 | 1 | 4,987,993 | 2 | ||||
|
| |||||||
Net asset value | $ | 10.59 | $ | 11.82 | ||||
|
| |||||||
Investor A | ||||||||
Net assets | $ | 3,190,624 | $ | 58,236,468 | ||||
|
| |||||||
Shares outstanding | 302,061 | 1 | 5,231,299 | 2 | ||||
|
| |||||||
Net asset value | $ | 10.56 | $ | 11.13 | ||||
|
| |||||||
Investor C | ||||||||
Net assets | $ | 422,677 | $ | 32,252,236 | ||||
|
| |||||||
Shares outstanding | 40,499 | 1 | 3,627,796 | 2 | ||||
|
| |||||||
Net asset value | $ | 10.44 | $ | 8.89 | ||||
|
| |||||||
Class K | ||||||||
Net assets | $ | 214,481 | — | |||||
|
| |||||||
Shares outstanding | 20,243 | 1 | — | |||||
|
| |||||||
Net asset value | $ | 10.60 | — | |||||
|
| |||||||
Class R | ||||||||
Net assets | — | $ | 19,308,151 | |||||
|
| |||||||
Shares outstanding | — | 1,904,330 | 2 | |||||
|
| |||||||
Net asset value | — | $ | 10.14 | |||||
|
| |||||||
| 1 | Unlimited number of shares authorized, $0.001 par value. |
| 2 | 100 million shares authorized, $0.0001 par value. |
See Notes to Financial Statements.
| 18 | ANNUAL REPORT | MAY 31, 2016 |
| Statements of Operations |
| Year Ended May 31, 2016 | BlackRock Disciplined Small Cap Core Fund | BlackRock Small Cap Growth Fund II | ||||||
| Investment Income | ||||||||
Dividends — unaffiliated | $ | 138,839 | — | |||||
Securities lending — affiliated — net | 7,136 | — | ||||||
Dividends — affiliated | 451 | — | ||||||
Net investment income allocated from the Master Portfolio: | ||||||||
Dividends — unaffiliated | — | $ | 1,658,521 | |||||
Securities lending — affiliated — net | — | 203,553 | ||||||
Dividends — affiliated | — | 3,997 | ||||||
Expenses | — | (1,528,787 | ) | |||||
Fees waived | — | 302,614 | ||||||
|
| |||||||
Total income | 146,426 | 639,898 | ||||||
|
| |||||||
| Expenses | ||||||||
Professional | 102,819 | 48,733 | ||||||
Investment advisory | 43,898 | — | ||||||
Registration | 43,685 | 62,649 | ||||||
Custodian | 28,846 | — | ||||||
Printing | 26,269 | 36,688 | ||||||
Offering | 13,763 | — | ||||||
Service and distribution — class specific | 11,373 | 638,385 | ||||||
Officer and Trustees/Directors | 9,504 | 141 | ||||||
Accounting services | 9,493 | — | ||||||
Transfer agent — class specific | 9,000 | 567,667 | ||||||
Administration | 4,146 | 374,979 | ||||||
Administration — class specific | 1,940 | — | ||||||
Miscellaneous | 20,858 | 14,142 | ||||||
|
| |||||||
Total expenses | 325,594 | 1,743,384 | ||||||
Less: | ||||||||
Fees waived and/or reimbursed by the Manager | (232,714 | ) | — | |||||
Administration fees waived | (4,146 | ) | — | |||||
Administration fees waived — class specific | (1,663 | ) | — | |||||
Transfer agent fees reimbursed — class specific | (8,141 | ) | — | |||||
|
| |||||||
Total expenses after fees waived and/or reimbursed | 78,930 | 1,743,384 | ||||||
|
| |||||||
Net investment income (loss) | 67,496 | (1,103,486 | ) | |||||
|
| |||||||
| Realized and Unrealized Gain (Loss) | ||||||||
Net realized gain (loss) from: | ||||||||
Investments | (310,688 | ) | — | |||||
Capital gain distributions received from affiliated investment companies | 4 | — | ||||||
Futures contracts | (20,969 | ) | — | |||||
Investments, capital gain distributions received from affiliated investment companies and futures contracts allocated from the Master Portfolio | — | (876,361 | ) | |||||
|
| |||||||
| (331,653 | ) | (876,361 | ) | |||||
|
| |||||||
Net change in unrealized appreciation (depreciation) on: | ||||||||
Investments | (834 | ) | — | |||||
Futures contracts | 5,206 | — | ||||||
Investments and futures contracts allocated from the Master Portfolio | — | (23,980,229 | ) | |||||
|
| |||||||
| 4,372 | (23,980,229 | ) | ||||||
|
| |||||||
Net realized and unrealized loss | (327,281 | ) | (24,856,590 | ) | ||||
|
| |||||||
Net Decrease in Net Assets Resulting from Operations | $ | (259,785 | ) | $ | (25,960,076 | ) | ||
|
| |||||||
See Notes to Financial Statements.
| ANNUAL REPORT | MAY 31, 2016 | 19 |
| Statements of Changes in Net Assets |
| BlackRock Disciplined Small Cap Core Fund | BlackRock Small Cap Growth Fund II | |||||||||||||||||||
| Year Ended May 31, | Year Ended May 31, | |||||||||||||||||||
| Increase (Decrease) in Net Assets: | 2016 | 2015 | 2016 | 2015 | ||||||||||||||||
| Operations | ||||||||||||||||||||
Net investment income (loss) | $ | 67,496 | $ | 45,249 | $ | (1,103,486 | ) | $ | (1,468,865 | ) | ||||||||||
Net realized gain (loss) | (331,653 | ) | 307,278 | (876,361 | ) | 19,291,678 | ||||||||||||||
Net change in unrealized appreciation (depreciation) | 4,372 | 411,992 | (23,980,229 | ) | 9,638,941 | |||||||||||||||
|
|
|
| |||||||||||||||||
Net increase (decrease) in net assets resulting from operations | (259,785 | ) | 764,519 | (25,960,076 | ) | 27,461,754 | ||||||||||||||
|
|
|
| |||||||||||||||||
| Distributions to Shareholders1 | ||||||||||||||||||||
From net investment income: | ||||||||||||||||||||
Institutional | (52,090 | ) | (19,895 | ) | — | — | ||||||||||||||
Investor A | (22,127 | ) | (2,806 | ) | — | — | ||||||||||||||
Investor C | (435 | ) | — | — | — | |||||||||||||||
From net realized gain: | ||||||||||||||||||||
Institutional | (258,484 | ) | (581,949 | ) | (6,065,296 | ) | (9,205,191 | ) | ||||||||||||
Investor A | (143,693 | ) | (98,084 | ) | (6,456,533 | ) | (9,863,810 | ) | ||||||||||||
Investor B | — | — | — | (165,249 | ) | |||||||||||||||
Investor C | (16,671 | ) | (11,182 | ) | (3,904,273 | ) | (6,724,128 | ) | ||||||||||||
Class R | — | — | (2,089,789 | ) | (3,743,363 | ) | ||||||||||||||
|
|
|
| |||||||||||||||||
Decrease in net assets resulting from distributions to shareholders | (493,500 | ) | (713,916 | ) | (18,515,891 | ) | (29,701,741 | ) | ||||||||||||
|
|
|
| |||||||||||||||||
| Capital Share Transactions | ||||||||||||||||||||
Net increase (decrease) in net assets derived from capital share transactions | 5,712,972 | 2,024,918 | (5,832,236 | ) | (10,300,360 | ) | ||||||||||||||
|
|
|
| |||||||||||||||||
| Net Assets | ||||||||||||||||||||
Total increase (decrease) in net assets | 4,959,687 | 2,075,521 | (50,308,203 | ) | (12,540,347 | ) | ||||||||||||||
Beginning of year | 9,170,492 | 7,094,971 | 219,053,343 | 231,593,690 | ||||||||||||||||
|
|
|
| |||||||||||||||||
End of year | $ | 14,130,179 | $ | 9,170,492 | $ | 168,745,140 | $ | ,053,343 | ||||||||||||
|
|
|
| |||||||||||||||||
Undistributed (accumulated) net investment income (loss), end of year | $ | 14,744 | $ | 21,861 | $ | (487,498 | ) | $ | 10,139 | |||||||||||
|
|
|
| |||||||||||||||||
| 1 | Distributions for annual periods determined in accordance with federal income tax regulations. |
See Notes to Financial Statements.
| 20 | ANNUAL REPORT | MAY 31, 2016 |
| Financial Highlights | BlackRock Disciplined Small Cap Core Fund |
| Institutional | ||||||||||||||||||||
| Period | ||||||||||||||||||||
| Year Ended May 31, | March 14, 20131 | |||||||||||||||||||
| 2016 | 2015 | 2014 | to May 31, 2013 | |||||||||||||||||
| Per Share Operating Performance | ||||||||||||||||||||
Net asset value, beginning of period | $ | 11.74 | $ | 11.80 | $ | 10.37 | $ | 10.00 | ||||||||||||
|
| |||||||||||||||||||
Net investment income2 | 0.08 | 0.08 | 0.07 | 0.02 | ||||||||||||||||
Net realized and unrealized gain (loss) | (0.64 | ) | 1.02 | 2.06 | 0.35 | |||||||||||||||
|
| |||||||||||||||||||
Net increase (decrease) from investment operations | (0.56 | ) | 1.10 | 2.13 | 0.37 | |||||||||||||||
|
| |||||||||||||||||||
Distributions:3 | ||||||||||||||||||||
From net investment income | (0.10 | ) | (0.04 | ) | (0.15 | ) | — | |||||||||||||
From net realized gain | (0.49 | ) | (1.12 | ) | (0.55 | ) | — | |||||||||||||
|
| |||||||||||||||||||
Total distributions | (0.59 | ) | (1.16 | ) | (0.70 | ) | — | |||||||||||||
|
| |||||||||||||||||||
Net asset value, end of period | $ | 10.59 | $ | 11.74 | $ | 11.80 | $ | 10.37 | ||||||||||||
|
| |||||||||||||||||||
| Total Return4 | ||||||||||||||||||||
Based on net asset value | (4.80 | )% | 10.24 | % | 20.85 | % | 3.70 | %5 | ||||||||||||
|
| |||||||||||||||||||
| Ratios to Average Net Assets | ||||||||||||||||||||
Total expenses | 3.15 | % | 3.43 | % | 6.26 | % | 7.68 | %6,7 | ||||||||||||
|
| |||||||||||||||||||
Total expenses after fees waived and/or reimbursed | 0.69 | % | 0.70 | % | 0.71 | %8 | 0.70 | %6 | ||||||||||||
|
| |||||||||||||||||||
Net investment income | 0.80 | % | 0.66 | % | 0.61 | % | 0.93 | %6 | ||||||||||||
|
| |||||||||||||||||||
| Supplemental Data | ||||||||||||||||||||
Net assets, end of period (000) | $ | 10,302 | $ | 6,122 | $ | 6,095 | $ | 5,181 | ||||||||||||
|
| |||||||||||||||||||
Portfolio turnover rate | 171 | % | 148 | % | 145 | % | 67 | % | ||||||||||||
|
| |||||||||||||||||||
| 1 | Commencement of operations. |
| 2 | Based on average shares outstanding. |
| 3 | Distributions for annual periods determined in accordance with federal income tax regulations. |
| 4 | Where applicable, assumes the reinvestment of distributions. |
| 5 | Aggregate total return. |
| 6 | Annualized. |
| 7 | Organization costs were not annualized in the calculation of the expense ratios. If these expenses were annualized, the total expenses would have been 8.75%. |
| 8 | Includes certain tax expenses. Excluding such tax expenses, total expenses after fees waived and/or reimbursed would have been 0.70%. |
See Notes to Financial Statements.
| ANNUAL REPORT | MAY 31, 2016 | 21 |
| Financial Highlights (continued) | BlackRock Disciplined Small Cap Core Fund |
| Investor A | ||||||||||||||||||||
| Period | ||||||||||||||||||||
| Year Ended May 31, | March 14, 20131 | |||||||||||||||||||
| 2016 | 2015 | 2014 | to May 31, 2013 | |||||||||||||||||
| Per Share Operating Performance | ||||||||||||||||||||
Net asset value, beginning of period | $ | 11.71 | $ | 11.78 | $ | 10.37 | $ | 10.00 | ||||||||||||
|
| |||||||||||||||||||
Net investment income (loss)2 | 0.06 | 0.05 | (0.01 | ) | 0.01 | |||||||||||||||
Net realized and unrealized gain (loss) | (0.65 | ) | 1.01 | 2.10 | 0.36 | |||||||||||||||
|
| |||||||||||||||||||
Net increase (decrease) from investment operations | (0.59 | ) | 1.06 | 2.09 | 0.37 | |||||||||||||||
|
| |||||||||||||||||||
Distributions:3 | ||||||||||||||||||||
From net investment income | (0.07 | ) | (0.02 | ) | (0.13 | ) | — | |||||||||||||
From net realized gain | (0.49 | ) | (1.11 | ) | (0.55 | ) | — | |||||||||||||
|
| |||||||||||||||||||
Total distributions | (0.56 | ) | (1.13 | ) | (0.68 | ) | — | |||||||||||||
|
| |||||||||||||||||||
Net asset value, end of period | $ | 10.56 | $ | 11.71 | $ | 11.78 | $ | 10.37 | ||||||||||||
|
| |||||||||||||||||||
| Total Return4 | ||||||||||||||||||||
Based on net asset value | (5.02 | )% | 9.96 | % | 20.49 | % | 3.70 | %5 | ||||||||||||
|
| |||||||||||||||||||
| Ratios to Average Net Assets | ||||||||||||||||||||
Total expenses | 3.60 | % | 3.70 | % | 8.25 | % | 8.16 | %6,7 | ||||||||||||
|
| |||||||||||||||||||
Total expenses after fees waived and/or reimbursed | 0.95 | % | 0.95 | % | 0.95 | % | 0.95 | %7 | ||||||||||||
|
| |||||||||||||||||||
Net investment income (loss) | 0.58 | % | 0.43 | % | (0.11 | )% | 0.67 | %7 | ||||||||||||
|
| |||||||||||||||||||
| Supplemental Data | ||||||||||||||||||||
Net assets, end of period (000) | $ | 3,191 | $ | 2,736 | $ | 899 | $ | 21 | ||||||||||||
|
| |||||||||||||||||||
Portfolio turnover rate | 171 | % | 148 | % | 145 | % | 67 | % | ||||||||||||
|
| |||||||||||||||||||
| 1 | Commencement of operations. |
| 2 | Based on average shares outstanding. |
| 3 | Distributions for annual periods determined in accordance with federal income tax regulations. |
| 4 | Where applicable, excludes the effects of any sales charges and assumes the reinvestment of distributions. |
| 5 | Aggregate total return. |
| 6 | Organization costs were not annualized in the calculation of the expense ratios. If these expenses were annualized, the total expenses would have been 9.23%. |
| 7 | Annualized. |
See Notes to Financial Statements.
| 22 | ANNUAL REPORT | MAY 31, 2016 |
| Financial Highlights (continued) | BlackRock Disciplined Small Cap Core Fund |
| Investor C | ||||||||||||||||||||
| Period | ||||||||||||||||||||
| Year Ended May 31, | March 14, 20131 | |||||||||||||||||||
| 2016 | 2015 | 2014 | to May 31, 2013 | |||||||||||||||||
| Per Share Operating Performance | ||||||||||||||||||||
Net asset value, beginning of period | $ | 11.60 | $ | 11.71 | $ | 10.35 | $ | 10.00 | ||||||||||||
|
| |||||||||||||||||||
Net investment loss2 | (0.02 | ) | (0.04 | ) | (0.06 | ) | (0.00 | )3 | ||||||||||||
Net realized and unrealized gain (loss) | (0.64 | ) | 1.02 | 2.05 | 0.35 | |||||||||||||||
|
| |||||||||||||||||||
Net increase (decrease) from investment operations | (0.66 | ) | 0.98 | 1.99 | 0.35 | |||||||||||||||
|
| |||||||||||||||||||
Distributions:4 | ||||||||||||||||||||
From net investment income | (0.01 | ) | — | (0.08 | ) | — | ||||||||||||||
From net realized gain | (0.49 | ) | (1.09 | ) | (0.55 | ) | — | |||||||||||||
|
| |||||||||||||||||||
Total distributions | (0.50 | ) | (1.09 | ) | (0.63 | ) | — | |||||||||||||
|
| |||||||||||||||||||
Net asset value, end of period | $ | 10.44 | $ | 11.60 | $ | 11.71 | $ | 10.35 | ||||||||||||
|
| |||||||||||||||||||
| Total Return5 | ||||||||||||||||||||
Based on net asset value | (5.71 | )% | 9.22 | % | 19.53 | % | 3.50 | %6 | ||||||||||||
|
| |||||||||||||||||||
| Ratios to Average Net Assets | ||||||||||||||||||||
Total expenses | 4.41 | % | 4.56 | % | 7.86 | % | 8.91 | %7,8 | ||||||||||||
|
| |||||||||||||||||||
Total expenses after fees waived and/or reimbursed | 1.70 | % | 1.70 | % | 1.71 | %9 | 1.70 | %7 | ||||||||||||
|
| |||||||||||||||||||
Net investment loss | (0.19 | )% | (0.36 | )% | (0.53 | )% | (0.08 | )%7 | ||||||||||||
|
| |||||||||||||||||||
| Supplemental Data | ||||||||||||||||||||
Net assets, end of period (000) | $ | 423 | $ | 313 | $ | 101 | $ | 21 | ||||||||||||
|
| |||||||||||||||||||
Portfolio turnover rate | 171 | % | 148 | % | 145 | % | 67 | % | ||||||||||||
|
| |||||||||||||||||||
| 1 | Commencement of operations. |
| 2 | Based on average shares outstanding. |
| 3 | Amount is greater than $(0.005) per share. |
| 4 | Distributions for annual periods determined in accordance with federal income tax regulations. |
| 5 | Where applicable, excludes the effects of any sales charges and assumes the reinvestment of distributions. |
| 6 | Aggregate total return. |
| 7 | Annualized. |
| 8 | Organization costs were not annualized in the calculation of the expense ratios. If these expenses were annualized, the total expenses would have been 9.98%. |
| 9 | Includes certain tax expenses. Excluding such tax expenses, total expenses after fees waived and/or reimbursed would have been 1.70%. |
See Notes to Financial Statements.
| ANNUAL REPORT | MAY 31, 2016 | 23 |
| Financial Highlights (concluded) | BlackRock Disciplined Small Cap Core Fund |
| Class K | ||||
Period March 28, 20161 to May 31, 2016 | ||||
| Per Share Operating Performance | ||||
Net asset value, beginning of period | $ | 9.88 | ||
|
| |||
Net investment income2 | 0.02 | |||
Net realized and unrealized gain | 0.70 | |||
|
| |||
Net increase from investment operations | 0.72 | |||
|
| |||
Net asset value, end of period | $ | 10.60 | ||
|
| |||
| Total Return3 | ||||
Based on net asset value | 7.29 | %4 | ||
|
| |||
| Ratios to Average Net Assets | ||||
Total expenses5 | 3.59 | % | ||
|
| |||
Total expenses after fees waived and/or reimbursed5 | 0.60 | % | ||
|
| |||
Net investment income5 | 0.83 | % | ||
|
| |||
| Supplemental Data | ||||
Net assets, end of period (000) | $ | 214 | ||
|
| |||
Portfolio turnover rate6 | 171 | % | ||
|
| |||
| 1 | Commencement of operations. |
| 2 | Based on average shares outstanding. |
| 3 | Where applicable, assumes the reinvestment of distributions. |
| 4 | Aggregate total return. |
| 5 | Annualized. |
| 6 | Portfolio turnover is representative of the Fund for the entire year. |
See Notes to Financial Statements.
| 24 | ANNUAL REPORT | MAY 31, 2016 |
| Financial Highlights | BlackRock Small Cap Growth Fund II |
| Institutional | ||||||||||||||||||||
| Year Ended May 31, | ||||||||||||||||||||
| 2016 | 2015 | 2014 | 2013 | 2012 | ||||||||||||||||
| Per Share Operating Performance | ||||||||||||||||||||
Net asset value, beginning of year | $ | 14.62 | $ | 14.63 | $ | 15.20 | $ | 13.22 | $ | 15.67 | ||||||||||
|
| |||||||||||||||||||
Net investment loss1 | (0.03 | ) | (0.04 | ) | (0.06 | ) | (0.01 | ) | (0.12 | ) | ||||||||||
Net realized and unrealized gain (loss) | (1.56 | ) | 1.79 | 3.00 | 3.72 | (2.03 | ) | |||||||||||||
|
| |||||||||||||||||||
Net increase (decrease) from investment operations | (1.59 | ) | 1.75 | 2.94 | 3.71 | (2.15 | ) | |||||||||||||
|
| |||||||||||||||||||
Distributions from net realized gain2 | (1.21 | ) | (1.76 | ) | (3.51 | ) | (1.73 | ) | (0.30 | ) | ||||||||||
|
| |||||||||||||||||||
Net asset value, end of year | $ | 11.82 | $ | 14.62 | $ | 14.63 | $ | 15.20 | $ | 13.22 | ||||||||||
|
| |||||||||||||||||||
| Total Return3 | ||||||||||||||||||||
Based on net asset value | (11.66 | )% | 13.44 | % | 21.70 | % | 30.95 | % | (13.97 | )% | ||||||||||
|
| |||||||||||||||||||
| Ratios to Average Net Assets4 | ||||||||||||||||||||
Total expenses | 1.23 | %5 | 1.14 | %5 | 1.14 | %5 | 1.26 | %6 | 1.29 | %7 | ||||||||||
|
| |||||||||||||||||||
Net investment loss | (0.23 | )% | (0.28 | )% | (0.41 | )% | (0.04 | )% | (0.84 | )% | ||||||||||
|
| |||||||||||||||||||
| Supplemental Data | ||||||||||||||||||||
Net assets, end of year (000) | $ | 58,948 | $ | 73,608 | $ | 74,962 | $ | 65,186 | $ | 58,673 | ||||||||||
|
| |||||||||||||||||||
Portfolio turnover rate of the Master Portfolio | 115 | % | 140 | % | 152 | % | 165 | % | 143 | % | ||||||||||
|
| |||||||||||||||||||
| 1 | Based on average shares outstanding. |
| 2 | Distributions for annual periods determined in accordance with federal income tax regulations. |
| 3 | Where applicable, assumes the reinvestment of distributions. |
| 4 | Includes the Fund’s share of the Master Portfolio’s allocated net expenses and/or net investment loss. |
| 5 | Includes the Fund’s share of the Master Portfolio’s allocated fees waived of 0.16%. |
| 6 | Includes the Fund’s share of the Master Portfolio’s allocated fees waived of 0.01%. |
| 7 | Includes the Fund’s share of the Master Portfolio’s allocated fees waived of less than 0.01%. |
See Notes to Financial Statements.
| ANNUAL REPORT | MAY 31, 2016 | 25 |
| Financial Highlights (continued) | BlackRock Small Cap Growth Fund II |
| Investor A | ||||||||||||||||||||
| Year Ended May 31, | ||||||||||||||||||||
| 2016 | 2015 | 2014 | 2013 | 2012 | ||||||||||||||||
| Per Share Operating Performance | ||||||||||||||||||||
Net asset value, beginning of year | $ | 13.83 | $ | 13.93 | $ | 14.63 | $ | 12.81 | $ | 15.22 | ||||||||||
|
| |||||||||||||||||||
Net investment loss1 | (0.06 | ) | (0.07 | ) | (0.13 | ) | (0.05 | ) | (0.14 | ) | ||||||||||
Net realized and unrealized gain (loss) | (1.48 | ) | 1.70 | 2.88 | 3.57 | (1.97 | ) | |||||||||||||
|
| |||||||||||||||||||
Net increase (decrease) from investment operations | (1.54 | ) | 1.63 | 2.75 | 3.52 | (2.11 | ) | |||||||||||||
|
| |||||||||||||||||||
Distributions from net realized gain2 | (1.16 | ) | (1.73 | ) | (3.45 | ) | (1.70 | ) | (0.30 | ) | ||||||||||
|
| |||||||||||||||||||
Net asset value, end of year | $ | 11.13 | $ | 13.83 | $ | 13.93 | $ | 14.63 | $ | 12.81 | ||||||||||
|
| |||||||||||||||||||
| Total Return3 | ||||||||||||||||||||
Based on net asset value | (11.91 | )% | 13.24 | % | 21.08 | % | 30.45 | % | (14.12 | )% | ||||||||||
|
| |||||||||||||||||||
| Ratios to Average Net Assets4 | ||||||||||||||||||||
Total expenses | 1.46 | %5 | 1.36 | %5 | 1.62 | %5 | 1.62 | %6 | 1.57 | %7 | ||||||||||
|
| |||||||||||||||||||
Net investment loss | (0.47 | )% | (0.49 | )% | (0.88 | )% | (0.34 | )% | (1.11 | )% | ||||||||||
|
| |||||||||||||||||||
| Supplemental Data | ||||||||||||||||||||
Net assets, end of year (000) | $ | 58,236 | $ | 76,423 | $ | 80,144 | $ | 73,799 | $ | 75,467 | ||||||||||
|
| |||||||||||||||||||
Portfolio turnover rate of the Master Portfolio | 115 | % | 140 | % | 152 | % | 165 | % | 143 | % | ||||||||||
|
| |||||||||||||||||||
| 1 | Based on average shares outstanding. |
| 2 | Distributions for annual periods determined in accordance with federal income tax regulations. |
| 3 | Where applicable, excludes the effects of any sales charges and assumes the reinvestment of distributions. |
| 4 | Includes the Fund’s share of the Master Portfolio’s allocated net expenses and/or net investment loss. |
| 5 | Includes the Fund’s share of the Master Portfolio’s allocated fees waived of 0.16%. |
| 6 | Includes the Fund’s share of the Master Portfolio’s allocated fees waived of 0.02%. |
| 7 | Includes the Fund’s share of the Master Portfolio’s allocated fees waived of less than 0.01%. |
See Notes to Financial Statements.
| 26 | ANNUAL REPORT | MAY 31, 2016 |
| Financial Highlights (continued) | BlackRock Small Cap Growth Fund II |
| Investor C | ||||||||||||||||||||
| Year Ended May 31, | ||||||||||||||||||||
| 2016 | 2015 | 2014 | 2013 | 2012 | ||||||||||||||||
| Per Share Operating Performance | ||||||||||||||||||||
Net asset value, beginning of year | $ | 11.23 | $ | 11.71 | $ | 12.79 | $ | 11.44 | $ | 13.76 | ||||||||||
|
| |||||||||||||||||||
Net investment loss1 | (0.13 | ) | (0.15 | ) | (0.19 | ) | (0.15 | ) | (0.25 | ) | ||||||||||
Net realized and unrealized gain (loss) | (1.19 | ) | 1.38 | 2.47 | 3.15 | (1.77 | ) | |||||||||||||
|
| |||||||||||||||||||
Net increase (decrease) from investment operations | (1.32 | ) | 1.23 | 2.28 | 3.00 | (2.02 | ) | |||||||||||||
|
| |||||||||||||||||||
Distributions from net realized gain2 | (1.02 | ) | (1.71 | ) | (3.36 | ) | (1.65 | ) | (0.30 | ) | ||||||||||
|
| |||||||||||||||||||
Net asset value, end of year | $ | 8.89 | $ | 11.23 | $ | 11.71 | $ | 12.79 | $ | 11.44 | ||||||||||
|
| |||||||||||||||||||
| Total Return3 | ||||||||||||||||||||
Based on net asset value | (12.66 | )% | 12.24 | % | 20.24 | % | 29.31 | % | (14.98 | )% | ||||||||||
|
| |||||||||||||||||||
| Ratios to Average Net Assets4 | ||||||||||||||||||||
Total expenses | 2.34 | %5 | 2.29 | %5 | 2.30 | %5 | 2.52 | %6 | 2.52 | %7 | ||||||||||
|
| |||||||||||||||||||
Net investment loss | (1.35 | )% | (1.42 | )% | (1.55 | )% | (1.29 | )% | (2.10 | )% | ||||||||||
|
| |||||||||||||||||||
| Supplemental Data | ||||||||||||||||||||
Net assets, end of year (000) | $ | 32,252 | $ | 44,179 | $ | 45,686 | $ | 43,649 | $ | 40,529 | ||||||||||
|
| |||||||||||||||||||
Portfolio turnover rate of the Master Portfolio | 115 | % | 140 | % | 152 | % | 165 | % | 143 | % | ||||||||||
|
| |||||||||||||||||||
| 1 | Based on average shares outstanding. |
| 2 | Distributions for annual periods determined in accordance with federal income tax regulations. |
| 3 | Where applicable, excludes the effects of any sales charges and assumes the reinvestment of distributions. |
| 4 | Includes the Fund’s share of the Master Portfolio’s allocated net expenses and/or net investment loss. |
| 5 | Includes the Fund’s share of the Master Portfolio’s allocated fees waived of 0.16%. |
| 6 | Includes the Fund’s share of the Master Portfolio’s allocated fees waived of 0.02%. |
| 7 | Includes the Fund’s share of the Master Portfolio’s allocated fees waived of less than 0.01%. |
See Notes to Financial Statements.
| ANNUAL REPORT | MAY 31, 2016 | 27 |
| Financial Highlights (concluded) | BlackRock Small Cap Growth Fund II |
| Class R | ||||||||||||||||||||
| Year Ended May 31, | ||||||||||||||||||||
| 2016 | 2015 | 2014 | 2013 | 2012 | ||||||||||||||||
| Per Share Operating Performance | ||||||||||||||||||||
Net asset value, beginning of year | $ | 12.67 | $ | 12.95 | $ | 13.80 | $ | 12.19 | $ | 14.55 | ||||||||||
|
| |||||||||||||||||||
Net investment loss1 | (0.08 | ) | (0.10 | ) | (0.12 | ) | (0.08 | ) | (0.19 | ) | ||||||||||
Net realized and unrealized gain (loss) | (1.35 | ) | 1.55 | 2.70 | 3.38 | (1.87 | ) | |||||||||||||
|
| |||||||||||||||||||
Net increase (decrease) from investment operations | (1.43 | ) | 1.45 | 2.58 | 3.30 | (2.06 | ) | |||||||||||||
|
| |||||||||||||||||||
Distributions from net realized gain2 | (1.10 | ) | (1.73 | ) | (3.43 | ) | (1.69 | ) | (0.30 | ) | ||||||||||
|
| |||||||||||||||||||
Net asset value, end of year | $ | 10.14 | $ | 12.67 | $ | 12.95 | $ | 13.80 | $ | 12.19 | ||||||||||
|
| |||||||||||||||||||
| Total Return3 | ||||||||||||||||||||
Based on net asset value | (12.13 | )% | 12.84 | % | 21.07 | % | 30.05 | % | (14.43 | )% | ||||||||||
|
| |||||||||||||||||||
| Ratios to Average Net Assets4 | ||||||||||||||||||||
Total expenses | 1.72 | %5 | 1.73 | %5 | 1.67 | %5 | 1.89 | %6 | 1.91 | %7 | ||||||||||
|
| |||||||||||||||||||
Net investment loss | (0.72 | )% | (0.86 | )% | (0.92 | )% | (0.60 | )% | (1.49 | )% | ||||||||||
|
| |||||||||||||||||||
| Supplemental Data | ||||||||||||||||||||
Net assets, end of year (000) | $ | 19,308 | $ | 24,581 | $ | 29,585 | $ | 30,932 | $ | 37,237 | ||||||||||
|
| |||||||||||||||||||
Portfolio turnover rate of the Master Portfolio | 115 | % | 140 | % | 152 | % | 165 | % | 143 | % | ||||||||||
|
| |||||||||||||||||||
| 1 | Based on average shares outstanding. |
| 2 | Distributions for annual periods determined in accordance with federal income tax regulations. |
| 3 | Where applicable, assumes the reinvestment of distributions. |
| 4 | Includes the Fund’s share of the Master Portfolio’s allocated net expenses and/or net investment loss. |
| 5 | Includes the Fund’s share of the Master Portfolio’s allocated fees waived of 0.16%. |
| 6 | Includes the Fund’s share of the Master Portfolio’s allocated fees waived of 0.01%. |
| 7 | Includes the Fund’s share of the Master Portfolio’s allocated fees waived of less than 0.01%. |
See Notes to Financial Statements.
| 28 | ANNUAL REPORT | MAY 31, 2016 |
| Notes to Financial Statements |
1. Organization:
BlackRock Disciplined Small Cap Core Fund (“Disciplined Small Cap Core Fund”), a series of BlackRock FundsSM (the “Trust”), and BlackRock Small Cap Growth Fund II (“Small Cap Growth Fund II”), a series of BlackRock Series, Inc. (the “Corporation”) (collectively, the “Funds” or individually, a “Fund”), are each registered under the Investment Company Act of 1940, as amended (the “1940 Act”), as a diversified, open-end management investment company. The Trust is organized as a Massachusetts business trust. The Corporation is organized as a Maryland corporation. Small Cap Growth Fund II seeks to achieve its investment objective by investing all of its assets in BlackRock Master Small Cap Growth Portfolio (the “Master Portfolio”), a series of BlackRock Master LLC (the “Master LLC”), an affiliate of Small Cap Growth Fund II, which has the same investment objective and strategies as Small Cap Growth Fund II. The value of Small Cap Growth Fund II’s investment in the Master Portfolio reflects Small Cap Growth Fund II’s proportionate interest in the net assets of the Master Portfolio. The performance of Small Cap Growth Fund II is directly affected by the performance of the Master Portfolio. At May 31, 2016, the percentage of the Master Portfolio owned by Small Cap Growth Fund II was 100%. The financial statements of the Master Portfolio, including the Schedule of Investments, are included elsewhere in this report and should be read in conjunction with Small Cap Growth Fund II’s financial statements.
Each Fund offers multiple classes of shares. All classes of shares have identical voting, dividend, liquidation and other rights and are subject to the same terms and conditions, except that certain classes bear expenses related to the shareholder servicing and distribution of such shares. Institutional and Class K Shares are sold only to certain eligible investors. Class R Shares are available only to certain employer-sponsored retirement plans. Investor A and Investor C Shares are generally available through financial intermediaries. Each class has exclusive voting rights with respect to matters relating to its shareholder servicing and distribution expenditures.
| Share Class | Initial Sales Charge | CDSC | Conversion Privilege | |||
Institutional, Class K and Class R Shares | No | No | None | |||
Investor A Shares | Yes | No1 | None | |||
Investor C Shares | No | Yes | None |
| 1 | Investor A Shares may be subject to a contingent deferred sales charge (“CDSC”) for certain redemptions where no initial sales charge was paid at the time of purchase. |
On June 23, 2015, all of the issued and outstanding Investor B Shares of Small Cap Growth Fund II were converted into Investor A Shares with the same relative aggregate net asset value (“NAV”).
The Funds, together with certain other registered investment companies advised by the BlackRock Advisors, LLC (the “Manager”) or its affiliates, are included in a complex of open-end funds referred to as the Equity-Liquidity Complex.
2. Significant Accounting Policies:
The financial statements are prepared in conformity with accounting principles generally accepted in the United States of America (“U.S. GAAP”), which may require management to make estimates and assumptions that affect the reported amounts of assets and liabilities in the financial statements, disclosure of contingent assets and liabilities at the date of the financial statements and the reported amounts of increases and decreases in net assets from operations during the reporting period. Actual results could differ from those estimates. Each Fund is considered an investment company under U.S. GAAP and follows the accounting and reporting guidance applicable to investment companies. Below is a summary of significant accounting policies:
Segregation and Collateralization: In cases where Disciplined Small Cap Core Fund enters into certain investments (e.g., futures contracts) that would be treated as “senior securities” for 1940 Act purposes, Disciplined Small Cap Core Fund may segregate or designate on its books and records cash or liquid assets having a market value at least equal to the amount of its future obligations under such investments. Doing so allows the investment to be excluded from treatment as a “senior security.” Furthermore, if required by an exchange or counterparty agreement, Disciplined Small Cap Core Fund may be required to deliver/deposit cash and/or securities to/with an exchange, or broker-dealer or custodian as collateral for certain investments or obligations.
Investment Transactions and Investment Income: For Disciplined Small Cap Core Fund, for financial reporting purposes, investment transactions are recorded on the dates the transactions are entered into (the trade dates). Realized gains and losses on investment transactions are determined on the identified cost basis. Dividend income is recorded on the ex-dividend date. Upon notification from issuers, some of the dividend income received from a real estate investment trust may be redesignated as a reduction of cost of the related investment and/or realized gain. For Small Cap Growth Fund II, for financial reporting purposes, contributions to and withdrawals from the Master Portfolio are accounted on a trade date basis. Small Cap Growth Fund II records daily its proportionate share of the Master Portfolio’s income, expenses and realized and unrealized gains and losses. In addition, Small Cap Growth Fund II accrues its own expenses. Income, expenses and realized and unrealized gains and losses are allocated daily to each class based on its relative net assets.
Distributions: Distributions paid by the Funds are recorded on the ex-dividend date. The character and timing of distributions are determined in accordance with federal income tax regulations, which may differ from U.S. GAAP.
| ANNUAL REPORT | MAY 31, 2016 | 29 |
| Notes to Financial Statements (continued) |
Offering Costs: Offering costs are amortized over a 12-month period beginning with the commencement of operations.
Indemnifications: In the normal course of business, a Fund enters into contracts that contain a variety of representations that provide general indemnification. A Fund’s maximum exposure under these arrangements is unknown because it involves future potential claims against a Fund, which cannot be predicted with any certainty.
Other: Expenses directly related to a Fund or its classes are charged to that Fund or the applicable class. Other operating expenses shared by several funds, including other funds managed by the Manager, are prorated among those funds on the basis of relative net assets or other appropriate methods. Expenses directly related to the Funds and other shared expenses prorated to the Funds are allocated daily to each class based on its relative net assets or other appropriate methods.
Disciplined Small Cap Core Fund has an arrangement with its custodian whereby fees may be reduced by credits earned on uninvested cash balances, which, if applicable, are shown as fees paid indirectly in the Statements of Operations. The custodian imposes fees on overdrawn cash balances, which can be offset by accumulated credits earned or may result in additional custody charges.
3. Investment Valuation and Fair Value Measurements:
Investment Valuation Policies: Disciplined Small Cap Core Fund’s investments are valued at fair value (also referred to as “market value” within the financial statements) as of the close of trading on the New York Stock Exchange (“NYSE”) (generally 4:00 p.m., Eastern time). U.S. GAAP defines fair value as the price Disciplined Small Cap Core Fund would receive to sell an asset or pay to transfer a liability in an orderly transaction between market participants at the measurement date. Disciplined Small Cap Core Fund determines the fair values of its financial instruments using various independent dealers or pricing services under policies approved by the Board of Trustees of the Trust (the “Board”). The BlackRock Global Valuation Methodologies Committee (the “Global Valuation Committee”) is the committee formed by management to develop global pricing policies and procedures and to oversee the pricing function for all financial instruments.
Small Cap Growth Fund II’s policy is to fair value its financial instruments at fair value. Small Cap Growth Fund II records its investment in the Master Portfolio at fair value based on Small Cap Growth Fund II’s proportionate interest in the net assets of the Master Portfolio. Valuation of securities held by the Master Portfolio is discussed in Note 3 of the Master Portfolio’s Notes to Financial Statements, which are included elsewhere in this report.
Fair Value Inputs and Methodologies: The following methods (or “techniques”) and inputs are used to establish the fair value of Disciplined Small Cap Core Fund’s assets and liabilities:
| • | Equity investments traded on a recognized securities exchange are valued at the official close price each day, if available. For equity investments traded on more than one exchange, the official close price on the exchange where the stock is primarily traded is used. Equity investments traded on a recognized exchange for which there were no sales on that day may be valued at the last available bid (long positions) or ask (short positions) price. |
| • | Investments in open-end U.S. mutual funds are valued at NAV each business day. |
| • | Disciplined Small Cap Core Fund values its investment in BlackRock Liquidity Series, LLC, Money Market Series (the “Money Market Series”) at fair value, which is ordinarily based upon its pro rata ownership in the underlying fund’s net assets. The Money Market Series seeks current income consistent with maintaining liquidity and preserving capital. Although the Money Market Series is not registered under the 1940 Act, its investments will follow the parameters of investments by a money market fund that is subject to Rule 2a-7 under the 1940 Act. Disciplined Small Cap Core Fund may withdraw up to 25% of its investment daily, although the manager of the Money Market Series, in its sole discretion, may permit an investor to withdraw more than 25% on any one day. |
| • | Futures contracts traded on exchanges are valued at their last sale price. |
If events (e.g., a company announcement, market volatility or a natural disaster) occur that are expected to materially affect the value of such instruments, or in the event that the application of these methods of valuation results in a price for an investment that is deemed not to be representative of the market value of such investment, or if a price is not available, the investment will be valued by the Global Valuation Committee, or its delegate, in accordance with a policy approved by the Board as reflecting fair value (“Fair Valued Investments”). When determining the price for Fair Valued Investments, the Global Valuation Committee, or its delegate, seeks to determine the price that Disciplined Small Cap Core Fund might reasonably expect to receive or pay from the current sale or purchase of that asset or liability in an arm’s-length transaction. Fair value determinations shall be based upon all available factors that the Global Valuation Committee, or its delegate, deems relevant consistent with the principles of fair value measurement, which include the market approach, income approach and/or in the case of recent investments, the cost approach, as appropriate. The market approach generally consists of using comparable market transactions. The income approach generally is used to discount future cash flows to present value and is adjusted for liquidity as appropriate. These factors include but are not limited to: (i) attributes specific to the investment or asset; (ii) the principal market for the investment or asset; (iii) the customary participants in the principal market for the investment or asset; (iv) data assumptions by market participants for the investment or asset, if reasonably available; (v) quoted prices for similar investments or assets in active markets; and (vi) other factors, such as future cash flows, interest rates, yield curves, volatilities, prepayment speeds, loss severities, credit risks, recovery rates,
| 30 | ANNUAL REPORT | MAY 31, 2016 |
| Notes to Financial Statements (continued) |
liquidation amounts and/or default rates. Due to the inherent uncertainty of valuations of such investments, the fair values may differ from the values that would have been used had an active market existed. The Global Valuation Committee, or its delegate, employs various methods for calibrating valuation approaches for investments where an active market does not exist, including regular due diligence of Disciplined Small Cap Core Fund’s pricing vendors, regular reviews of key inputs and assumptions, transactional back-testing or disposition analysis to compare unrealized gains and losses to realized gains and losses, reviews of missing or stale prices and large movements in market values and reviews of any market related activity. The pricing of all Fair Valued Investments is subsequently reported to the Board or a committee thereof on a quarterly basis.
Fair Value Hierarchy: Various inputs are used in determining the fair value of investments and derivative financial instruments. These inputs to valuation techniques are categorized into a fair value hierarchy consisting of three broad levels for financial statement purposes as follows:
| • | Level 1 — unadjusted price quotations in active markets/exchanges for identical assets or liabilities that Disciplined Small Cap Core Fund has the ability to access |
| • | Level 2 — other observable inputs (including, but not limited to, quoted prices for similar assets or liabilities in markets that are active, quoted prices for identical or similar assets or liabilities in markets that are not active, inputs other than quoted prices that are observable for the assets or liabilities (such as interest rates, yield curves, volatilities, prepayment speeds, loss severities, credit risks and default rates) or other market–corroborated inputs) |
| • | Level 3 — unobservable inputs based on the best information available in the circumstances, to the extent observable inputs are not available (including Disciplined Small Cap Core Fund’s own assumptions used in determining the fair value of investments and derivative financial instruments) |
The hierarchy gives the highest priority to unadjusted quoted prices in active markets for identical assets or liabilities (Level 1 measurements) and the lowest priority to unobservable inputs (Level 3 measurements). Accordingly, the degree of judgment exercised in determining fair value is greatest for instruments categorized in Level 3. The inputs used to measure fair value may fall into different levels of the fair value hierarchy. In such cases, for disclosure purposes, the fair value hierarchy classification is determined based on the lowest level input that is significant to the fair value measurement in its entirety. The significant unobservable inputs used by the Global Valuation Committee in determining the price for Fair Valued Investments are typically categorized as Level 3. The fair value hierarchy for Disciplined Small Cap Core Fund’s investments and derivative financial instruments have been included in the Schedule of Investments.
Changes in valuation techniques may result in transfers into or out of an assigned level within the hierarchy. In accordance with Disciplined Small Cap Core Fund’s policy, transfers between different levels of the fair value hierarchy are deemed to have occurred as of the beginning of the reporting period. The categorization of a value determined for investments and derivative financial instruments is based on the pricing transparency of the investments and derivative financial instruments and is not necessarily an indication of the risks associated with investing in those securities.
4. Securities and Other Investments:
Securities Lending: Disciplined Small Cap Core Fund may lend its securities to approved borrowers, such as brokers, dealers and other financial institutions. The borrower pledges and maintains with Disciplined Small Cap Core Fund collateral consisting of cash, an irrevocable letter of credit issued by a bank, or securities issued or guaranteed by the U.S. Government. The initial collateral received by Disciplined Small Cap Core Fund is required to have a value of at least 102% of the current value of the loaned securities for securities traded on U.S. exchanges and a value of at least 105% for all other securities. The collateral is maintained thereafter at a value equal to at least 100% of the current market value of the securities on loan. The market value of the loaned securities is determined at the close of each business day of Disciplined Small Cap Core Fund and any additional required collateral is delivered to Disciplined Small Cap Core Fund, or excess collateral returned by Disciplined Small Cap Core Fund, on the next business day. During the term of the loan, Disciplined Small Cap Core Fund is entitled to all distributions made on or in respect of the loaned securities. Loans of securities are terminable at any time and the borrower, after notice, is required to return borrowed securities within the standard time period for settlement of securities transactions.
The market value of securities on loan, all of which were classified as common stocks in Disciplined Small Cap Core Fund’s Schedule of Investments, and the value of any related collateral are shown separately in the Statements of Assets and Liabilities as a component of investments at value — unaffiliated, and collateral on securities loaned at value, respectively. As of period end, any securities on loan were collateralized by cash. The cash collateral invested by the securities lending agent, BlackRock Investment Management, LLC (“BIM”), if any, is disclosed in the Schedule of Investments.
Securities lending transactions are entered into by Disciplined Small Cap Core Fund under Master Securities Lending Agreements (each, an “MSLA”), which provide the right, in the event of default (including bankruptcy or insolvency), for the non-defaulting party to liquidate the collateral and calculate a net exposure to the defaulting party or request additional collateral. In the event that a borrower defaults, Disciplined Small Cap Core Fund, as lender, would offset the market value of the collateral received against the market value of the securities loaned. When the value of the collateral
| ANNUAL REPORT | MAY 31, 2016 | 31 |
| Notes to Financial Statements (continued) |
is greater than that of the market value of the securities loaned, the lender is left with a net amount payable to the defaulting party. However, bankruptcy or insolvency laws of a particular jurisdiction may impose restrictions on or prohibitions against such a right of offset in the event of an MSLA counterparty’s bankruptcy or insolvency. Under the MSLA, absent an event of default the borrower can resell or re-pledge the loaned securities, and Disciplined Small Cap Core Fund can reinvest cash collateral received in connection with loaned securities. Upon an event of default, the parties’ obligations to return the securities or collateral to the other party are extinguished, and the parties can resell or re-pledge the loaned securities or the collateral received in connection with the loaned securities in order to satisfy the defaulting party’s net payment obligation for all transactions under the MSLA. The defaulting party remains liable for any deficiency.
As of period end, the following table is a summary of Disciplined Small Cap Core Fund’s securities lending agreements by counterparty, which are subject to offset under an MSLA:
| Counterparty | Securities Loaned at Value | Cash Collateral Received1 | Net Amount | ||||||||||||
Deutsche Bank Securities, Inc. | $ 20,606 | $ (20,606) | — | ||||||||||||
JP Morgan Clearing Corp. | 48,900 | (48,900) | — | ||||||||||||
Morgan Stanley & Co. LLC | 73,838 | (73,838) | — | ||||||||||||
Total | $143,344 | $(143,344) | — | ||||||||||||
| 1 | Collateral with a value of $153,939 has been received in connection with securities lending agreements. Collateral received in excess of the value of securities loaned from the individual counterparty is not shown for financial reporting purposes in the table above. |
The risks of securities lending include the risk that the borrower may not provide additional collateral when required or may not return the securities when due. To mitigate these risks, Disciplined Small Cap Core Fund benefits from a borrower default indemnity provided by BIM. BIM’s indemnity allows for full replacement of the securities loaned if the collateral received does not cover the value on the securities loaned in the event of borrower default. Disciplined Small Cap Core Fund could suffer a loss if the value of an investment purchased with cash collateral falls below the market value of loaned securities or if the value of an investment purchased with cash collateral falls below the value of the original cash collateral received.
5. Derivative Financial Instruments:
Disciplined Small Cap Core Fund engages in various portfolio investment strategies using derivative contracts both to increase the returns of Disciplined Small Cap Core Fund and/or to manage its exposure to certain risks such as credit risk, equity risk, interest rate risk, foreign currency exchange rate risk, commodity price risk or other risks (e.g., inflation risk). Derivative financial instruments categorized by risk exposure are included in the Schedule of Investments. These contracts may be transacted on an exchange.
Futures Contracts: Disciplined Small Cap Core Fund invests in long and/or short positions in futures contracts to gain exposure to, or manage exposure to, changes in the value of equity securities (equity risk).
Futures contracts are agreements between Disciplined Small Cap Core Fund and a counterparty to buy or sell a specific quantity of an underlying instrument at a specified price and at a specified date. Depending on the terms of a contract, it is settled either through physical delivery of the underlying instrument on the settlement date or by payment of a cash amount on the settlement date. Upon entering into a futures contract, Disciplined Small Cap Core Fund is required to deposit initial margin with the broker in the form of cash or securities in an amount that varies depending on a contract’s size and risk profile. The initial margin deposit must then be maintained at an established level over the life of the contract.
Securities deposited as initial margin are designated in the Schedule of Investments and cash deposited, if any, is shown as cash pledged for futures contracts in the Statements of Assets and Liabilities. Pursuant to the contract, Disciplined Small Cap Core Fund agrees to receive from or pay to the broker an amount of cash equal to the daily fluctuation in market value of the contract (“variation margin”). Variation margin is recorded as unrealized appreciation (depreciation) and, if any, shown as variation margin receivable (or payable) on futures contracts in the Statements of Assets and Liabilities. When the contract is closed, a realized gain or loss is recorded in the Statements of Operations equal to the difference between the value of the contract at the time it was opened and the value at the time it was closed. The use of futures contracts involves the risk of an imperfect correlation in the movements in the price of futures contracts and interest, foreign currency exchange rates or underlying assets.
6. Investment Advisory Agreement and Other Transactions with Affiliates:
The PNC Financial Services Group, Inc. is the largest stockholder and an affiliate of BlackRock, Inc. (“BlackRock”) for 1940 Act purposes.
Investment Advisory and Administration
The Trust, on behalf of Disciplined Small Cap Core Fund, entered into an Investment Advisory Agreement with the Manager, Disciplined Small Cap Core Fund’s investment advisor, an indirect, wholly owned subsidiary of BlackRock, to provide investment advisory services. The Manager is responsible for the management of Disciplined Small Cap Core Fund’s portfolio and provides the personnel, facilities, equipment and certain other services necessary to the operations of Disciplined Small Cap Core Fund. For such services, Disciplined Small Cap Core Fund pays the Manager a monthly fee,
| 32 | ANNUAL REPORT | MAY 31, 2016 |
| Notes to Financial Statements (continued) |
which is determined by calculating a percentage of Disciplined Small Cap Core Fund’s average daily net assets, based on the following annual rates:
| Average Daily Net Assets | Investment Advisory Fee | |
First $1 Billion | 0.45% | |
$1 Billion - $3 Billion | 0.42% | |
$3 Billion - $5 Billion | 0.41% | |
$5 Billion - $10 Billion | 0.39% | |
Greater than $10 Billion | 0.38% |
The Corporation, on behalf of Small Cap Growth Fund II, entered into an Administration Agreement with BlackRock Advisors, LLC (in such capacity, the “Administrator”), an indirect, wholly owned subsidiary of BlackRock, to provide administrative services (other than investment advice and related portfolio activities). For such services, Small Cap Growth Fund II pays the Administrator a monthly fee at an annual rate of 0.20% of the average daily net assets of Small Cap Growth Fund II. Small Cap Growth Fund II does not pay an investment advisory fee or investment management fee.
Service and Distribution Fees
The Corporation and the Trust, on behalf of the Funds, entered into a Distribution Agreement and a Distribution and Service Plan with BlackRock Investments, LLC (“BRIL”), an affiliate of the Manager/Administrator. Pursuant to the Distribution and Service Plan and in accordance with
Rule 12b-1 under the 1940 Act, each Fund pays BRIL ongoing service and distribution fees. The fees are accrued daily and paid monthly at annual rates based upon the average daily net assets of the relevant share class of each Fund as follows:
| Investor A | Investor B1 | Investor C | Class R | |||||
Service Fee | 0.25% | 0.25% | 0.25% | 0.25% | ||||
Distribution Fee | — | 0.75% | 0.75% | 0.25% |
| 1 | On June 23, 2015, Investor B Shares of Small Cap Growth Fund II converted to Investor A Shares. |
BRIL and broker-dealers, pursuant to sub-agreements with BRIL, provide shareholder servicing and distribution services to the Funds. The ongoing service and/or distribution fee compensates BRIL and each broker-dealer for providing shareholder servicing and/or distribution related services to the shareholders.
For the year ended May 31, 2016, the following table shows the class specific service and distribution fees borne directly by each share class of each Fund:
| Investor A | Investor B1 | Investor C | Class R | Total | ||||||||||||||||
Disciplined Small Cap Core Fund | $ | 7,750 | — | $ | 3,623 | — | $ | 11,373 | ||||||||||||
Small Cap Growth Fund II | $ | 165,654 | $ | 165 | $ | 367,333 | $ | 105,233 | $ | 638,385 | ||||||||||
| 1 | On June 23, 2015, Investor B Shares of Small Cap Growth Fund II converted to Investor A Shares. |
Administration
The Trust, on behalf of Disciplined Small Cap Core Fund, entered into an Administration Agreement with the Manager, an indirect, wholly owned subsidiary of BlackRock, to provide administrative services. For these services, the Manager receives an administration fee computed daily and payable monthly, based on a percentage of the average daily net assets of Disciplined Small Cap Core Fund. The administration fee, which is shown as administration in the Statements of Operations, is paid at the annual rates below.
| Average Daily Net Assets | Administration Fee | |
First $500 Million | 0.0425% | |
$500 Million - $1 Billion | 0.0400% | |
$1 Billion - $2 Billion | 0.0375% | |
$2 Billion - $4 Billion | 0.0350% | |
$4 Billion - $13 Billion | 0.0325% | |
Greater than $13 Billion | 0.0300% |
In addition, the Manager charges each of the share classes an administration fee, which is shown as administration — class specific in the Statements of Operations, at an annual rate of 0.02% of the average daily net assets of each respective class.
| ANNUAL REPORT | MAY 31, 2016 | 33 |
| Notes to Financial Statements (continued) |
For the year ended May 31, 2016, the following table shows the class specific administration fees borne directly by each share class of Disciplined Small Cap Core Fund:
| Institutional | Investor A | Investor C | Class K | Total | ||||
| $ 1,240 | $ 620 | $ 73 | $ 7 | $1,940 |
Transfer Agent
Pursuant to written agreements, certain financial intermediaries, some of which may be affiliates, provide the Funds with sub-accounting, recordkeeping, sub-transfer agency and other administrative services with respect to sub-accounts they service. For these services, these entities receive an asset based fee or an annual fee per shareholder account, which will vary depending on share class and/or net assets.
The Manager maintains a call center, that is responsible for providing certain shareholder services to the Funds. Shareholder services include responding to inquiries and processing subscriptions and redemptions based upon instructions from shareholders. For the year ended May 31, 2016, each Fund reimbursed the Manager the following amounts for costs incurred in running the call center, which are included in transfer agent — class specific in the Statements of Operations:
| Institutional | Investor A | Investor B1 | Investor C | Class R | Total | |||||||||||||||||||||||||
Disciplined Small Cap Core Fund | $ 75 | $ 454 | — | $176 | — | $ 705 | ||||||||||||||||||||||||
Small Cap Growth Fund II | $181 | $1,284 | $5 | $688 | $59 | $2,217 | ||||||||||||||||||||||||
1 On June 23, 2015, Investor B Shares of Small Cap Growth Fund II converted to Investor A Shares.
For the year ended May 31, 2016, the following table shows the class specific transfer agent fees borne directly by each class of each Fund:
|
| |||||||||||||||||||||||||||||
| Institutional | Investor A | Investor B1 | Investor C | Class R | Total | |||||||||||||||||||||||||
Disciplined Small Cap Core Fund | $ 556 | $ 7,395 | — | $ 1,049 | — | $ 9,000 | ||||||||||||||||||||||||
Small Cap Growth Fund II | $180,895 | $181,170 | $254 | $147,403 | $57,945 | $567,667 | ||||||||||||||||||||||||
| 1 | On June 23, 2015, Investor B Shares of Small Cap Growth Fund II converted to Investor A Shares. |
Other Fees
For the year ended May 31, 2016, affiliates earned underwriting discounts, direct commissions and dealer concessions on sales of Disciplined Small Cap Core Fund’s Investor A Shares of $272 and Small Cap Growth Fund II’s Investor A Shares of $3,605.
For the year ended May 31, 2016, affiliates received CDSCs in the amount of $170 for Disciplined Small Cap Core Fund’s Investor C Shares and $167 and $1,917 for Small Cap Growth Fund II’s Investor A Shares and Investor C Shares, respectively.
Expense Limitations, Waivers, Reimbursements and Recoupments
The Manager, with respect to Disciplined Small Cap Core Fund, contractually agreed to waive and/or reimburse fees or expenses in order to limit expenses, excluding interest expense, dividend expense, tax expense, acquired fund fees and expenses and certain other fund expenses, which constitute extraordinary expenses not incurred in the ordinary course of Disciplined Small Cap Core Fund’s business. The expense limitations as a percentage of average daily net assets are as follows:
| Institutional | Investor A | Investor C | Class K | |||||||||
| 0.70% | 0.95 | % | 1.70 | % | 0.60 | % | ||||||
The Manager has agreed not to reduce or discontinue this contractual expense limitations prior to October 1, 2017, unless approved by the Board, including a majority of the Independent Trustees or by a vote of a majority of the outstanding voting securities of Disciplined Small Cap Core Fund.
The Manager, with respect to Disciplined Small Cap Core Fund, voluntarily agreed to waive its investment advisory fees by the amount of investment advisory fees Disciplined Small Cap Core Fund pays to the Manager indirectly through its investment in affiliated money market funds. This amount is included in fees waived and/or reimbursed by the Manager in the Statements of Operations. However, the Manager does not waive its investment advisory fees by the amount of investment advisory fees paid in connection with Disciplined Small Cap Core Fund’s investment in other affiliated investment companies, if any. For the year ended May 31, 2016, the amount waived was $169.
These amounts waived and/or reimbursed are included in fees waived and/or reimbursed by the Manager, and shown as administration fees waived, administration fees waived — class specific and transfer agent fees reimbursed — class specific, respectively, in the Statements of Operations. For the year ended May 31, 2016, the amount included in fees waived and/or reimbursed by the Manager was $232,545 for Disciplined Small Cap Core Fund.
| 34 | ANNUAL REPORT | MAY 31, 2016 |
| Notes to Financial Statements (continued) |
Class specific waivers and/or reimbursements are as follows for Disciplined Small Cap Core Fund:
| Institutional | Investor A | Investor C | Class K | Total | ||||||||||||||||
Administration Fees Waived | $ | 963 | $ | 620 | $ | 73 | $ | 7 | $ | 1,663 | ||||||||||
Transfer Agent Fees Reimbursed | $ | 382 | $ | 6,797 | $ | 962 | — | $ | 8,141 | |||||||||||
If during Disciplined Small Cap Core Fund’s fiscal year the operating expenses of a share class, that at any time during the prior two fiscal years received a waiver or reimbursement from the Manager, are less than the expense limit for that share class, the Manager is entitled to be reimbursed by such share class up to the lesser of the following expenses:
| (a) | The amount of fees waived and/or expenses reimbursed during those prior two fiscal years under the agreement. |
| (b) | The amount by which the expense limit for that share class exceeds the operating expenses of the share class for the current fiscal year, provided that: |
| • | Disciplined Small Cap Core Fund, of which the share class is a part, has more than $50 million in assets for the fiscal year. |
| • | The Manager or an affiliate continues to serve as Disciplined Small Cap Core Fund’s investment advisor or administrator. |
In the event the expense limit for a share class is changed subsequent to a fiscal year in which the Manager becomes entitled to reimbursement for fees waived and/or reimbursed, the amount available to reimburse the Manager shall be calculated by reference to the expense limit for that share class in effect at the time the Manager became entitled to receive such reimbursement, rather than the subsequently changed expense limit for that share class.
On May 31, 2016, the fund level and class specific waivers and/or reimbursements subject to possible future recoupment under the expense limitation agreement for Disciplined Small Cap Core Fund are as follows:
| Expiring May 31, | ||||||||
| 2017 | 2018 | |||||||
Fund Level | $ | 203,594 | $ | 236,691 | ||||
Institutional | $ | 1,660 | $ | 1,345 | ||||
Investor A | $ | 2,999 | $ | 7,417 | ||||
Investor C | $ | 470 | $ | 1,035 | ||||
Class K | — | $ | 7 | |||||
The following Disciplined Small Cap Core Fund’s fund level and class specific waivers and/or reimbursements previously recorded by Disciplined Small Cap Core Fund, which were subject to recoupment by the Manager, expired on May 31, 2016:
Fund Level | $ | 342,873 | ||
Institutional | $ | 1,565 | ||
Investor A | $ | 378 | ||
Investor C | $ | 123 |
Securities Lending
The U.S. Securities and Exchange Commission has issued an exemptive order which permits BIM, an affiliate of the Manager, to serve as securities lending agent for Disciplined Small Cap Core Fund, subject to applicable conditions. As securities lending agent, BIM bears all operational costs directly related to securities lending. Disciplined Small Cap Core Fund is responsible for expenses in connection with the investment of cash collateral received for securities on loan (the “collateral investment expenses”). The cash collateral is invested in a private investment company managed by the Manager or its affiliates. However, BIM has agreed to cap the collateral investment expenses of the private investment company to an annual rate of 0.04%. The investment advisor to the private investment company will not charge any advisory fees with respect to shares purchased by Disciplined Small Cap Core Fund.
Securities lending income is equal to the total of income earned from the reinvestment of cash collateral, net of fees and other payments to and from borrowers of securities, and less the collateral investment expenses. Disciplined Small Cap Core Fund retains a portion of securities lending income and remits a remaining portion to BIM as compensation for its services as securities lending agent. Pursuant to a securities lending agreement, BIM may lend securities only when the difference between the borrower rebate rate and the risk free rate exceeds a certain level (such securities, the “specials only securities”).
| ANNUAL REPORT | MAY 31, 2016 | 35 |
| Notes to Financial Statements (continued) |
Pursuant to such agreement, Disciplined Small Cap Core Fund retains 80% of securities lending income. In addition, commencing the business day following the date that the aggregate securities lending income earned across certain funds in the Equity-Liquidity Complex in a calendar year exceeds a specified threshold, Disciplined Small Cap Core Fund, pursuant to the securities lending agreement, will retain for the remainder of the calendar year securities lending income in an amount equal to 85% of securities lending income.
The share of securities lending income earned by Disciplined Small Cap Core Fund is shown as securities lending – affiliated – net in the Statements of Operations. For the year ended May 31, 2016, Disciplined Small Cap Core Fund paid BIM $1,715 for securities lending agent services.
Officers and Trustees/Directors
Certain officers and/or trustees/directors of the Trust/Corporation are officers and/or trustees/directors of BlackRock or its affiliates. The Funds reimburse the Manager/Administration for a portion of the compensation paid to the Trust’s/Corporation’s Chief Compliance Officer, which is included in Officer and Trustees/Directors in the Statements of Operations.
7. Purchases and Sales:
For the year ended May 31, 2016, purchases and sales of investments, excluding short-term securities, were $22,021,498 and $16,736,442, respectively, for Disciplined Small Cap Core Fund.
8. Income Tax Information:
It is the Funds’ policy to comply with the requirements of the Internal Revenue Code of 1986, as amended, applicable to regulated investment companies, and to distribute substantially all of their taxable income to their shareholders. Therefore, no federal income tax provision is required.
Each Fund files U.S. federal and various state and local tax returns. No income tax returns are currently under examination. The statute of limitations on Small Cap Growth Fund II’s U.S. federal tax returns remains open for each of the four years ended May 31, 2016. The statutes of limitations on Disciplined Small Cap Core Fund’s U.S. federal, state and local tax returns remain open for the three years ended May 31, 2016 and the period ended May 31, 2013. The statutes of limitations on Small Cap Growth Fund II’s state and local tax returns may remain open for an additional year depending upon the jurisdiction.
Management has analyzed tax laws and regulations and their application to the Funds as of May 31, 2016, inclusive of the open tax return years, and does not believe that there are any uncertain tax positions that require recognition of a tax liability in the Funds’ financial statements.
U.S. GAAP requires that certain components of net assets be adjusted to reflect permanent differences between financial and tax reporting. These reclassifications have no effect on net assets or net asset values per share. As of period end, the following permanent differences attributable to the timing and recognition of partnership income and net operating losses were reclassified to the following accounts:
| Disciplined Small Cap Core Fund | Small Cap Growth Fund II | |||||||||
Undistributed (accumulated) net investment income (loss) | $ | 39 | $ | (605,849 | ) | |||||
Undistributed net realized loss | $ | (39 | ) | — | ||||||
Undistributed net realized loss allocated from the Master Portfolio | — | $ | 605,849 | |||||||
The tax character of distributions paid was as follows:
| ||||||||||
Disciplined Small Cap Core Fund | Small Cap Growth Fund II | |||||||||
Ordinary income | ||||||||||
5/31/16 | $ | 195,644 | $ | 4,397,306 | ||||||
5/31/15 | $ | 463,159 | $ | 11,168,366 | ||||||
Long-term capital gains | ||||||||||
5/31/16 | 297,856 | 14,118,585 | ||||||||
5/31/15 | 250,757 | 18,533,375 | ||||||||
Total | ||||||||||
5/31/16 | $ | 493,500 | $ | 18,515,891 | ||||||
5/31/15 | $ | 713,916 | $ | 29,701,741 | ||||||
| 36 | ANNUAL REPORT | MAY 31, 2016 |
| Notes to Financial Statements (continued) |
As of period end, the tax components of accumulated net earnings (losses) were as follows:
Disciplined Small Cap Core Fund | Small Cap Growth Fund II | |||||||||
Undistributed ordinary income | $ 14,264 | — | ||||||||
Net unrealized gains1 | 777,284 | $ 3,812,012 | ||||||||
Qualified late-year losses 2 | (531,891) | (8,829,578) | ||||||||
Total | $ 259,657 | $(5,017,566) | ||||||||
| 1 | The difference between book-basis and tax-basis net unrealized gains was attributable primarily to the tax deferral of losses on wash sales, the timing and recognition of partnership income and the realization for tax purposes of unrealized gains/losses on certain futures contracts. |
| 2 | The Funds have elected to defer certain qualified late-year losses and recognize such losses in the next taxable year. |
As of May 31, 2016, gross unrealized appreciation and depreciation based on cost for federal income tax purposes for Disciplined Small Cap Core Fund were as follows:
Tax cost | $ | 13,540,364 | ||
Gross unrealized appreciation | $ | 1,208,531 | ||
Gross unrealized depreciation | (431,352 | ) | ||
Net unrealized appreciation | $ | 777,179 |
9. Bank Borrowings:
The Trust/Corporation, on behalf of the Funds, along with certain other funds managed by the Manager and its affiliates (“Participating Funds”), is a party to a 364-day, $2.1 billion credit agreement with a group of lenders. Under this agreement, the Funds may borrow to fund shareholder redemptions. Excluding commitments designated for certain individual funds, the Participating Funds, including the Funds, can borrow up to an aggregate commitment amount of $1.6 billion at any time outstanding, subject to asset coverage and other limitations as specified in the agreement. The credit agreement has the following terms: a fee of 0.12% per annum on unused commitment amounts and interest at a rate equal to the higher of (a) one-month LIBOR (but, in any event, not less than 0.00%) on the date the loan is made plus 0.80% per annum or (b) the Fed Funds rate (but, in any event, not less than 0.00%) in effect from time to time plus 0.80% per annum on amounts borrowed. The agreement expires in April 2017 unless extended or renewed. Prior to April 21, 2016, the credit agreement had a fee per annum of 0.06% on unused commitment amounts and interest at a rate equal to the higher of (a) one-month LIBOR (but, in any event, not less than 0.00%) on the date the loan is made plus 0.80% per annum or (b) the Fed Funds rate (but, in any event, not less than 0.00%) in effect from time to time plus 0.80% per annum on amounts borrowed. Participating Funds paid administration, legal and arrangement fees, which, if applicable, are included in miscellaneous expenses in the Statements of Operations. These fees were allocated among such funds based upon portions of the aggregate commitment available to them and relative net assets of Participating Funds. During the year ended May 31, 2016, the Funds did not borrow under the credit agreement.
10. Principal Risks:
In the normal course of business, Disciplined Small Cap Core Fund invests in securities and enters into transactions where risks exist due to fluctuations in the market (market risk) or failure of the issuer to meet all its obligations, including the ability to pay principal and interest when due (issuer credit risk). The value of securities held by Disciplined Small Cap Core Fund may decline in response to certain events, including those directly involving the issuers of securities owned by Disciplined Small Cap Core Fund. Changes arising from the general economy, the overall market and local, regional or global political and/or social instability, as well as currency, interest rate and price fluctuations, may also affect the securities’ value.
Counterparty Credit Risk: Similar to issuer credit risk, Disciplined Small Cap Core Fund may be exposed to counterparty credit risk, or the risk that an entity may fail to or be unable to perform on its commitments related to unsettled or open transactions. Disciplined Small Cap Core Fund manages counterparty credit risk by entering into transactions only with counterparties that the Manager believes have the financial resources to honor their obligations and by monitoring the financial stability of those counterparties. Financial assets, which potentially expose Disciplined Small Cap Core Fund to market, issuer and counterparty credit risks, consists principally of financial instruments and receivables due from counterparties. The extent of Disciplined Small Cap Core Fund’s exposure to market, issuer and counterparty credit risks with respect to these financial assets is approximately their value recorded in the Statements of Assets and Liabilities, less any collateral held by Disciplined Small Cap Core Fund.
A derivative contract may suffer a mark-to-market loss if the value of the contract decreases due to an unfavorable change in the market rates or values of the underlying instrument. Losses can also occur if the counterparty does not perform under the contract.
With exchange-traded futures, there is less counterparty credit risk to Disciplined Small Cap Core Fund since the exchange or clearinghouse, as counterparty to such instruments, guarantees against a possible default. The clearinghouse stands between the buyer and the seller of the contract; therefore, credit risk is limited to failure of the clearinghouse. While offset rights may exist under applicable law, Disciplined Small Cap Core Fund does not have a contractual right of offset against a clearing broker or clearinghouse in the event of a default (including the bankruptcy or insolvency). Additionally, credit risk exists in exchange-traded futures with respect to initial and variation margin that is held in a clearing broker’s customer accounts.
| ANNUAL REPORT | MAY 31, 2016 | 37 |
| Notes to Financial Statements (continued) |
While clearing brokers are required to segregate customer margin from their own assets, in the event that a clearing broker becomes insolvent or goes into bankruptcy and at that time there is a shortfall in the aggregate amount of margin held by the clearing broker for all its clients, typically the shortfall would be allocated on a pro rata basis across all the clearing broker’s customers, potentially resulting in losses to Disciplined Small Cap Core Fund.
Concentration Risk: As of period end, Disciplined Small Cap Core Fund invested a significant portion of its assets in securities in the financials sector. Changes in economic conditions affecting such sector would have a greater impact on Disciplined Small Cap Core Fund and could affect the value, income and/or liquidity of positions in such securities.
11. Capital Share Transactions:
Transactions in capital shares for each class were as follows:
| Year Ended May 31, 2016 | Year Ended May 31, 2015 | |||||||||||||||||||
| Disciplined Small Cap Core Fund | Shares | Amount | Shares | Amount | ||||||||||||||||
Institutional | ||||||||||||||||||||
Shares sold | 449,991 | $ | 4,546,708 | 5,401 | $ | 62,833 | ||||||||||||||
Shares issued in reinvestment of distributions | 1,759 | 18,713 | 2,385 | 26,151 | ||||||||||||||||
Shares redeemed | (749 | ) | (7,861 | ) | (2,843 | ) | (33,145 | ) | ||||||||||||
|
|
|
| |||||||||||||||||
Net increase | 451,001 | $ | 4,557,560 | 4,943 | $ | 55,839 | ||||||||||||||
|
|
|
| |||||||||||||||||
Investor A | ||||||||||||||||||||
Shares sold | 179,397 | $ | 1,863,594 | 172,856 | $ | 1,936,647 | ||||||||||||||
Shares issued in reinvestment of distributions | 15,507 | 164,691 | 9,046 | 98,613 | ||||||||||||||||
Shares redeemed | (126,477 | ) | (1,219,888 | ) | (24,615 | ) | (275,559 | ) | ||||||||||||
|
|
|
| |||||||||||||||||
Net increase | 68,427 | $ | 808,397 | 157,287 | $ | 1,759,701 | ||||||||||||||
|
|
|
| |||||||||||||||||
Investor C | ||||||||||||||||||||
Shares sold | 14,824 | $ | 160,501 | 22,030 | $ | 249,581 | ||||||||||||||
Shares issued in reinvestment of distributions | 1,530 | 16,104 | 830 | 8,996 | ||||||||||||||||
Shares redeemed | (2,825 | ) | (29,590 | ) | (4,534 | ) | (49,199 | ) | ||||||||||||
|
|
|
| |||||||||||||||||
Net increase | 13,529 | $ | 147,015 | 18,326 | $ | 209,378 | ||||||||||||||
|
|
|
| |||||||||||||||||
| Period March 28, 20161 to May 31, 2016 | ||||||||||||||||||||
Class K | ||||||||||||||||||||
Shares sold | 20,243 | $ | 200,000 | — | — | |||||||||||||||
Shares redeemed | — | — | — | — | ||||||||||||||||
|
|
|
| |||||||||||||||||
Net increase | 20,243 | $ | 200,000 | — | — | |||||||||||||||
|
|
|
| |||||||||||||||||
Total Net Increase | 553,200 | $ | 5,712,972 | 180,556 | $ | 2,024,918 | ||||||||||||||
|
|
|
| |||||||||||||||||
| 1 | Commencement of operations. |
| 38 | ANNUAL REPORT | MAY 31, 2016 |
| Notes to Financial Statements (concluded) |
| Year Ended May 31, 2016 | Year Ended May 31, 2015 | |||||||||||||||||||
| Small Cap Growth Fund II | Shares | Amount | Shares | Amount | ||||||||||||||||
Institutional | ||||||||||||||||||||
Shares sold | 1,420,622 | $ | 17,733,067 | 1,357,054 | $ | 18,837,252 | ||||||||||||||
Shares issued in reinvestment of distributions | 402,378 | 5,371,450 | 641,647 | 8,548,838 | ||||||||||||||||
Shares redeemed | (1,868,344 | ) | (23,256,927 | ) | (2,089,980 | ) | (29,234,714 | ) | ||||||||||||
|
|
|
| |||||||||||||||||
Net decrease | (45,344 | ) | $ | (152,410 | ) | (91,279 | ) | $ | (1,848,624 | ) | ||||||||||
|
|
|
| |||||||||||||||||
Investor A | ||||||||||||||||||||
Shares received from conversion1 | 10,222 | $ | 146,887 | — | — | |||||||||||||||
Shares sold and automatic conversion of shares | 1,106,703 | 13,319,117 | 1,253,475 | $ | 16,515,474 | |||||||||||||||
Shares issued in reinvestment of distributions | 492,795 | 6,190,518 | 747,480 | 9,406,206 | ||||||||||||||||
Shares redeemed | (1,903,584 | ) | (22,168,524 | ) | (2,229,258 | ) | (29,243,032 | ) | ||||||||||||
|
|
|
|
|
| |||||||||||||||
Net decrease | (293,864 | ) | $ | (2,512,002 | ) | (228,303 | ) | $ | (3,321,352 | ) | ||||||||||
|
|
|
| |||||||||||||||||
Investor B | ||||||||||||||||||||
Shares sold | 476 | $ | 5,459 | 7,715 | $ | 118,484 | ||||||||||||||
Shares issued in reinvestment of distributions | — | — | 15,217 | 158,129 | ||||||||||||||||
Shares converted1 | (12,512 | ) | (146,887 | ) | — | — | ||||||||||||||
Shares redeemed and automatic conversion of shares | (11,105 | ) | (129,938 | ) | (102,983 | ) | (1,128,381 | ) | ||||||||||||
|
|
|
| |||||||||||||||||
Net decrease | (23,141 | ) | $ | (271,366 | ) | (80,051 | ) | $ | (851,768 | ) | ||||||||||
|
|
|
| |||||||||||||||||
Investor C | ||||||||||||||||||||
Shares sold | 421,544 | $ | 3,924,237 | 556,168 | $ | 6,018,188 | ||||||||||||||
Shares issued in reinvestment of distributions | 350,338 | 3,545,995 | 589,715 | 6,084,229 | ||||||||||||||||
Shares redeemed | (1,077,568 | ) | (10,066,102 | ) | (1,113,071 | ) | (11,963,035 | ) | ||||||||||||
|
|
|
| |||||||||||||||||
Net increase (decrease) | (305,686 | ) | $ | (2,595,870 | ) | 32,812 | $ | 139,382 | ||||||||||||
|
|
|
| |||||||||||||||||
Class R | ||||||||||||||||||||
Shares sold | 574,655 | $ | 6,181,331 | 473,726 | $ | 5,716,765 | ||||||||||||||
Shares issued in reinvestment of distributions | 182,433 | 2,089,635 | 322,982 | 3,743,117 | ||||||||||||||||
Shares redeemed | (793,333 | ) | (8,571,554 | ) | (1,141,216 | ) | (13,877,880 | ) | ||||||||||||
|
|
|
| |||||||||||||||||
Net decrease | (36,245 | ) | $ | (300,588 | ) | (344,508 | ) | $ | (4,417,998 | ) | ||||||||||
|
|
|
| |||||||||||||||||
Total Net Decrease | (704,280 | ) | $ | (5,832,236 | ) | (711,329 | ) | $ | (10,300,360 | ) | ||||||||||
|
|
|
| |||||||||||||||||
| 1 | On June 23, 2015, Investor B Shares converted to Investor A Shares. |
At May 31, 2016, 496,000 Institutional Shares, 2,000 Investor A Shares, 2,000 Investor C Shares and 20,243 Class K Shares of Disciplined Small Cap Core Fund were owned by BlackRock HoldCo 2, Inc., an affiliate of Disciplined Small Cap Core Fund.
12. Subsequent Events:
Management has evaluated the impact of all subsequent events on the Funds through the date the financial statements were issued and has determined that there were no subsequent events requiring adjustment or additional disclosure in the financial statements.
| ANNUAL REPORT | MAY 31, 2016 | 39 |
| Report of Independent Registered Public Accounting Firm |
To the Shareholders of BlackRock Disciplined Small Cap Core Fund and Board of Trustees of BlackRock FundsSM and the Shareholders of BlackRock Small Cap Growth Fund II and Board of Directors of BlackRock Series, Inc.:
We have audited the accompanying statement of assets and liabilities of BlackRock Disciplined Small Cap Core Fund, including the schedule of investments, as of May 31, 2016, and the related statement of operations for the year then ended, the statements of changes in net assets for each of the two years in the period then ended, and the financial highlights for each of the periods presented. We have also audited the accompanying statement of assets and liabilities of BlackRock Small Cap Growth Fund II (collectively, with BlackRock Disciplined Small Cap Core Fund, the “Funds”), as of May 31, 2016, and the related statement of operations for the year then ended, the statements of changes in net assets for each of the two years in the period then ended, and the financial highlights for each of the five years in the period then ended. These financial statements and financial highlights are the responsibility of the Funds’ management. Our responsibility is to express an opinion on these financial statements and financial highlights based on our audits.
We conducted our audits in accordance with the standards of the Public Company Accounting Oversight Board (United States). Those standards require that we plan and perform the audit to obtain reasonable assurance about whether the financial statements and financial highlights are free of material misstatement. The Funds are not required to have, nor were we engaged to perform, an audit of their internal control over financial reporting. Our audits included consideration of internal control over financial reporting as a basis for designing audit procedures that are appropriate in the circumstances, but not for the purpose of expressing an opinion on the effectiveness of the Funds’ internal control over financial reporting. Accordingly, we express no such opinion. An audit also includes examining, on a test basis, evidence supporting the amounts and disclosures in the financial statements, assessing the accounting principles used and significant estimates made by management, as well as evaluating the overall financial statement presentation. Our procedures included confirmation of securities owned as of May 31, 2016, by correspondence with the custodian and brokers; where replies were not received from brokers, we performed other auditing procedures. We believe that our audits provide a reasonable basis for our opinion.
In our opinion, the financial statements and financial highlights referred to above present fairly, in all material respects, the respective financial position of BlackRock Disciplined Small Cap Core Fund and BlackRock Small Cap Growth Fund II as of May 31, 2016, and as to BlackRock Disciplined Small Cap Core Fund the results of its operations for the year then ended, and the changes in net assets for each of the two years in the period then ended, and financial highlights for the periods presented, and as to BlackRock Small Cap Growth Fund II the results of its operations for the year then ended, the changes in its net assets for each of the two years in the period then ended, and the financial highlights for each of the five years in the period then ended, in conformity with accounting principles generally accepted in the United States of America.
Deloitte & ToucheLLP
Philadelphia, Pennsylvania
July 26, 2016
| Important Tax Information (Unaudited) |
The following information is provided with respect to the ordinary income distributions paid during the fiscal year ended May 31, 2016:
| Payable Date | Qualified Dividend Income for Individuals1 | Dividends Qualifying for the | Qualified Residents2 | |||||||||||||||||
Disciplined Small Cap Core Fund | 7/16/15 | 70.25 | % | 71.11 | % | 60.40 | % | |||||||||||||
| 12/14/15 | 43.10 | % | 43.94 | % | 62.40 | % | ||||||||||||||
Small Cap Growth Fund II | 7/16/15 | 54.56 | % | 55.34 | % | 100.00 | % | |||||||||||||
| 12/14/15 | 36.56 | % | 36.61 | % | 100.00 | % | ||||||||||||||
| 1 | The Funds hereby designate the percentage indicated above or the maximum amount allowable by law. |
| 2 | Represents the portion of the taxable ordinary income dividends eligible for exemptions from U.S. withholding tax for nonresident aliens and foreign corporations. |
Additionally, Disciplined Small Cap Core Fund distributed long-term capital gains of $0.120989 per share and $0.227845 per share and Small Cap Growth Fund II distributed long-term capital gains of $0.566704 per share and $0.299384 per share to shareholders of record on July 15, 2015 and December 10, 2015, respectively.
| 40 | ANNUAL REPORT | MAY 31, 2016 |
| Master Portfolio Information | BlackRock Master Small Cap Growth Portfolio |
| As of Period End |
| Ten Largest Holdings | Percent of Net Assets | |
Manhattan Associates, Inc. | 2% | |
Prestige Brands Holdings, Inc. | 2 | |
Vail Resorts, Inc. | 2 | |
PS Business Parks, Inc. | 2 | |
Tessera Technologies, Inc. | 2 | |
Masimo Corp. | 1 | |
LogMeIn, Inc. | 1 | |
Aspen Technology, Inc. | 1 | |
ICU Medical, Inc. | 1 | |
Insperity, Inc. | 1 |
| Sector Allocation | Percent of Net Assets | |
Information Technology | 26% | |
Health Care | 24 | |
Consumer Discretionary | 17 | |
Industrials | 15 | |
Financials | 8 | |
Materials | 4 | |
Consumer Staples | 2 | |
Energy | 1 | |
Telecommunication Services | 1 | |
Short-Term Securities | 2 |
For Master Portfolio compliance purposes, the Master Portfolio’s sector classifications refer to any one or more of the sector sub-classifications used by one or more widely recognized market indexes or ratings group indexes, and/or as defined by the investment advisor. These definitions may not apply for purposes of this report, which may combine such sector sub-classifications for reporting ease.
| ANNUAL REPORT | MAY 31, 2016 | 41 |
| Schedule of Investments May 31, 2016 | BlackRock Master Small Cap Growth Portfolio | |
| (Percentages shown are based on Net Assets) |
| Common Stocks | Shares | Value | ||||||
Aerospace & Defense — 1.0% | ||||||||
DigitalGlobe, Inc. (a) | 16,508 | $ | 345,512 | |||||
HEICO Corp., Class A | 10,049 | 554,403 | ||||||
Vectrus, Inc. (a) | 32,536 | 826,740 | ||||||
|
| |||||||
| 1,726,655 | ||||||||
Air Freight & Logistics — 0.9% | ||||||||
Hub Group, Inc., Class A (a) | 36,615 | 1,465,332 | ||||||
Airlines — 0.5% | ||||||||
Hawaiian Holdings, Inc. (a) | 17,795 | 719,986 | ||||||
JetBlue Airways Corp. (a) | 5,064 | 90,798 | ||||||
|
| |||||||
| 810,784 | ||||||||
Auto Components — 2.3% | ||||||||
American Axle & Manufacturing Holdings, Inc. (a) | 32,434 | 540,675 | ||||||
Cooper Tire & Rubber Co. | 5,903 | 189,663 | ||||||
Cooper-Standard Holding, Inc. (a) | 7,094 | 609,729 | ||||||
Drew Industries, Inc. | 1,310 | 101,342 | ||||||
Horizon Global Corp. (a) | 10,828 | 126,146 | ||||||
Lear Corp. | 745 | 88,476 | ||||||
Tenneco, Inc. (a) | 22,709 | 1,219,927 | ||||||
Tower International, Inc. | 43,489 | 942,407 | ||||||
|
| |||||||
| 3,818,365 | ||||||||
Banks — 2.0% | ||||||||
Central Pacific Financial Corp. | 47,299 | 1,133,757 | ||||||
Fidelity Southern Corp. | 33,200 | 543,152 | ||||||
Great Western Bancorp, Inc. | 1,863 | 63,379 | ||||||
Umpqua Holdings Corp. | 65,595 | 1,048,864 | ||||||
Western Alliance Bancorp (a) | 13,215 | 498,206 | ||||||
Wintrust Financial Corp. | 1,836 | 97,804 | ||||||
|
| |||||||
| 3,385,162 | ||||||||
Beverages — 0.3% | ||||||||
Primo Water Corp. (a) | 40,547 | 460,208 | ||||||
Biotechnology — 9.0% | ||||||||
ACADIA Pharmaceuticals, Inc. (a) | 11,686 | 414,035 | ||||||
Acceleron Pharma, Inc. (a) | 526 | 17,994 | ||||||
Achillion Pharmaceuticals, Inc. (a) | 24,174 | 226,027 | ||||||
Acorda Therapeutics, Inc. (a) | 13,775 | 391,899 | ||||||
Aduro Biotech, Inc. (a) | 9,023 | 110,893 | ||||||
AMAG Pharmaceuticals, Inc. (a) | 13,122 | 281,336 | ||||||
Amicus Therapeutics, Inc. (a) | 5,158 | 36,519 | ||||||
Anacor Pharmaceuticals, Inc. (a) | 7,065 | 701,555 | ||||||
Applied Genetic Technologies Corp. (a) | 8,360 | 143,792 | ||||||
Ardelyx, Inc. (a) | 11,104 | 101,602 | ||||||
ARIAD Pharmaceuticals, Inc. (a) | 15,259 | 135,042 | ||||||
Array BioPharma, Inc. (a) | 18,566 | 69,994 | ||||||
aTyr Pharma, Inc. (a) | 44,542 | 147,434 | ||||||
Avexis, Inc. (a) | 2,754 | 118,367 | ||||||
BioSpecifics Technologies Corp. (a) | 4,505 | 169,073 | ||||||
Cara Therapeutics, Inc. (a) | 10,845 | 70,059 | ||||||
Catalyst Pharmaceuticals, Inc. (a) | 56,223 | 34,577 | ||||||
Cepheid, Inc. (a) | 20,744 | 581,039 | ||||||
Cerulean Pharma, Inc. (a) | 24,096 | 58,312 | ||||||
ChemoCentryx, Inc. (a) | 34,391 | 185,367 | ||||||
China Biologic Products, Inc. (a) | 252 | 29,726 | ||||||
Clovis Oncology, Inc. (a) | 1,899 | 31,960 | ||||||
| Common Stocks | Shares | Value | ||||||
Biotechnology (continued) | ||||||||
Concert Pharmaceuticals, Inc. (a) | 11,899 | $ | 158,376 | |||||
Corvus Pharmaceuticals, Inc. (a) | 6,197 | 87,068 | ||||||
Cytokinetics, Inc. (a) | 19,856 | 161,826 | ||||||
Dyax Corp. — CVR (a) | 35,077 | 38,935 | ||||||
Eagle Pharmaceuticals, Inc. (a) | 2,218 | 105,422 | ||||||
Editas Medicine, Inc. (b) | 1,261 | 46,770 | ||||||
Emergent BioSolutions, Inc. (a) | 8,308 | 364,555 | ||||||
Enanta Pharmaceuticals, Inc. (a) | 9,298 | 228,080 | ||||||
Enzon Pharmaceuticals, Inc. | 116,013 | 45,941 | ||||||
EPIRUS Biopharmaceuticals, Inc. (a) | 12,121 | 7,413 | ||||||
Exelixis, Inc. (a) | 22,131 | 143,630 | ||||||
FibroGen, Inc. (a) | 17,725 | 330,749 | ||||||
Five Prime Therapeutics, Inc. (a) | 8,428 | 385,328 | ||||||
Flexion Therapeutics, Inc. (a) | 6,251 | 109,017 | ||||||
Genomic Health, Inc. (a) | 10,084 | 270,251 | ||||||
Halozyme Therapeutics, Inc. (a) | 34,949 | 351,587 | ||||||
Ignyta, Inc. (a) | 15,293 | 103,763 | ||||||
Immune Design Corp. (a) | 10,534 | 132,202 | ||||||
ImmunoGen, Inc. (a) | 8,129 | 45,848 | ||||||
Infinity Pharmaceuticals, Inc. (a) | 8,849 | 46,900 | ||||||
Insys Therapeutics, Inc. (b) | 10,256 | 160,506 | ||||||
Ionis Pharmaceuticals, Inc. (a) | 724 | 16,428 | ||||||
Ironwood Pharmaceuticals, Inc. (a) | 34,591 | 432,042 | ||||||
Kindred Biosciences, Inc. (a) | 18,689 | 76,251 | ||||||
Kite Pharma, Inc. (a) | 3,643 | 186,704 | ||||||
Ligand Pharmaceuticals, Inc. (a) | 4,999 | 597,830 | ||||||
Lion Biotechnologies, Inc. (a) | 6,278 | 37,040 | ||||||
MacroGenics, Inc. (a) | 1,072 | 27,400 | ||||||
Merrimack Pharmaceuticals, Inc. (a) | 9,903 | 66,053 | ||||||
MiMedx Group, Inc. (a) | 41,794 | 328,919 | ||||||
Momenta Pharmaceuticals, Inc. (a) | 10,755 | 126,694 | ||||||
Myriad Genetics, Inc. (a) | 18,888 | 640,114 | ||||||
Neurocrine Biosciences, Inc. (a) | 15,982 | 793,506 | ||||||
NewLink Genetics Corp. (a) | 5,913 | 69,359 | ||||||
Novavax, Inc. (a) | 27,998 | 170,508 | ||||||
Oncothyreon, Inc. (a) | 24,464 | 28,378 | ||||||
Ophthotech Corp. (a) | 7,238 | 388,681 | ||||||
OPKO Health, Inc. (b) | 8,303 | 88,261 | ||||||
PDL BioPharma, Inc. | 49,546 | 177,870 | ||||||
Peregrine Pharmaceuticals, Inc. (a) | 103,560 | 43,682 | ||||||
Pfenex, Inc. (a) | 8,818 | 61,373 | ||||||
Portola Pharmaceuticals, Inc. (a) | 15,381 | 422,670 | ||||||
Progenics Pharmaceuticals, Inc. (a) | 10,778 | 54,159 | ||||||
Prothena Corp. PLC (a) | 3,544 | 172,026 | ||||||
PTC Therapeutics, Inc. (a) | 12,837 | 104,750 | ||||||
Radius Health, Inc. (a) | 2,569 | 93,152 | ||||||
Raptor Pharmaceutical Corp. (a) | 41,554 | 229,794 | ||||||
Repligen Corp. (a) | 13,219 | 316,727 | ||||||
Retrophin, Inc. (a) | 11,899 | 211,564 | ||||||
Rigel Pharmaceuticals, Inc. (a) | 77,587 | 200,174 | ||||||
Sangamo BioSciences, Inc. (a) | 34,411 | 237,436 | ||||||
Sarepta Therapeutics, Inc. (b) | 3,494 | 73,129 | ||||||
Strongbridge Biopharma PLC (a) | 7,322 | 35,512 | ||||||
TESARO, Inc. (a) | 1,618 | 74,913 | ||||||
Threshold Pharmaceuticals, Inc. (a) | 54,537 | 25,496 | ||||||
Tobira Therapeutics, Inc. (b) | 2,400 | 22,200 | ||||||
Tonix Pharmaceuticals Holding Corp. (a) | 8,120 | 19,813 | ||||||
Trevena, Inc. (a) | 21,473 | 157,182 | ||||||
| Portfolio Abbreviations | ||
| ADR | American Depositary Receipts | |
| CVR | Contingent Value Rights | |
| REIT | Real Estate Investment Trust | |
See Notes to Financial Statements.
| 42 | ANNUAL REPORT | MAY 31, 2016 |
| Schedule of Investments (continued) | BlackRock Master Small Cap Growth Portfolio | |
| Common Stocks | Shares | Value | ||||||
Biotechnology (continued) | ||||||||
Ultragenyx Pharmaceutical, Inc. (a) | 5,717 | $ | 417,913 | |||||
United Therapeutics Corp. (a) | 892 | 106,210 | ||||||
Vanda Pharmaceuticals, Inc. (a) | 13,049 | 135,710 | ||||||
Verastem, Inc. (a) | 20,553 | 30,624 | ||||||
vTv Therapeutics, Inc., Class A (a) | 9,148 | 54,522 | ||||||
Xencor, Inc. (a) | 10,424 | 147,291 | ||||||
ZIOPHARM Oncology, Inc. (a) | 19,262 | 150,051 | ||||||
|
| |||||||
| 15,230,880 | ||||||||
Building Products — 2.1% | ||||||||
Apogee Enterprises, Inc. | 7,194 | 325,313 | ||||||
Continental Building Products, Inc. (a) | 40,440 | 926,480 | ||||||
Gibraltar Industries, Inc. (a) | 9,980 | 298,202 | ||||||
Insteel Industries, Inc. | 9,503 | 263,423 | ||||||
Masonite International Corp. (a) | 9,624 | 672,044 | ||||||
NCI Building Systems, Inc. (a) | 5,125 | 82,513 | ||||||
Universal Forest Products, Inc. | 11,064 | 928,712 | ||||||
|
| |||||||
| 3,496,687 | ||||||||
Capital Markets — 0.2% | ||||||||
BGC Partners, Inc., Class A | 12,403 | 115,224 | ||||||
Westwood Holdings Group, Inc. | 3,702 | 212,199 | ||||||
|
| |||||||
| 327,423 | ||||||||
Chemicals — 1.9% | ||||||||
Advanced Emissions Solutions, Inc. (a) | 15,738 | 118,822 | ||||||
AgroFresh Solutions, Inc. (a) | 15,993 | 80,285 | ||||||
Chemtura Corp. (a) | 4,599 | 122,701 | ||||||
Innophos Holdings, Inc. | 1,164 | 44,628 | ||||||
Innospec, Inc. | 7,587 | 368,425 | ||||||
Koppers Holdings, Inc. (a) | 5,853 | 148,139 | ||||||
Kraton Performance Polymers, Inc. (a) | 995 | 27,054 | ||||||
OMNOVA Solutions, Inc. (a) | 10,275 | 70,795 | ||||||
PolyOne Corp. | 17,983 | 673,823 | ||||||
Sensient Technologies Corp. | 1,367 | 93,257 | ||||||
Stepan Co. | 12,735 | 734,682 | ||||||
Trinseo SA (a) | 14,681 | 691,328 | ||||||
|
| |||||||
| 3,173,939 | ||||||||
Commercial Services & Supplies — 2.3% | ||||||||
ABM Industries, Inc. | 5,074 | 173,379 | ||||||
ARC Document Solutions, Inc. (a) | 106,938 | 453,417 | ||||||
Herman Miller, Inc. | 46,951 | 1,486,469 | ||||||
Interface, Inc. | 11,370 | 192,835 | ||||||
Knoll, Inc. | 56,674 | 1,406,649 | ||||||
Steelcase, Inc., Class A | 6,640 | 105,974 | ||||||
|
| |||||||
| 3,818,723 | ||||||||
Communications Equipment — 1.8% | ||||||||
Calix, Inc. (a) | 26,413 | 178,552 | ||||||
Ciena Corp. (a) | 15,522 | 271,014 | ||||||
Infinera Corp. (a) | 11,660 | 152,863 | ||||||
Ixia (a) | 42,081 | 427,543 | ||||||
Lumentum Holdings, Inc. (a) | 10,594 | 268,452 | ||||||
NETGEAR, Inc. (a) | 8,321 | 374,445 | ||||||
PC-Tel, Inc. | 8,560 | 38,606 | ||||||
Plantronics, Inc. | 4,925 | 219,261 | ||||||
ShoreTel, Inc. (a) | 99,965 | 659,769 | ||||||
Ubiquiti Networks, Inc. (a) | 9,844 | 392,382 | ||||||
|
| |||||||
| 2,982,887 | ||||||||
Construction & Engineering — 1.1% | ||||||||
Comfort Systems U.S.A., Inc. | 43,749 | 1,399,968 | ||||||
Dycom Industries, Inc. (a) | 6,196 | 525,978 | ||||||
|
| |||||||
| 1,925,946 | ||||||||
| Common Stocks | Shares | Value | ||||||
Construction Materials — 0.3% |
| |||||||
Headwaters, Inc. (a) | 12,788 | $ | 242,844 | |||||
Summit Materials, Inc., Class A (a) | 15,479 | 336,668 | ||||||
|
| |||||||
| 579,512 | ||||||||
Consumer Finance — 0.3% | ||||||||
Consumer Portfolio Services, Inc. (a) | 43,968 | 171,915 | ||||||
Emergent Capital, Inc. (a) | 74,474 | 297,896 | ||||||
Enova International, Inc. (a) | 4,185 | 30,467 | ||||||
Nicholas Financial, Inc. (a) | 800 | 8,640 | ||||||
|
| |||||||
| 508,918 | ||||||||
Containers & Packaging — 0.6% | ||||||||
Berry Plastics Group, Inc. (a) | 14,084 | 551,670 | ||||||
Greif, Inc., Class A | 11,900 | 426,734 | ||||||
|
| |||||||
| 978,404 | ||||||||
Distributors — 0.4% | ||||||||
Core-Mark Holding Co., Inc. | 7,325 | 627,167 | ||||||
Pool Corp. | 626 | 57,323 | ||||||
|
| |||||||
| 684,490 | ||||||||
Diversified Consumer Services — 0.5% | ||||||||
Bright Horizons Family Solutions, Inc. (a) | 1,331 | 86,235 | ||||||
Collectors Universe, Inc. | 15,213 | 296,045 | ||||||
Grand Canyon Education, Inc. (a) | 1,083 | 45,226 | ||||||
K12, Inc. (a) | 18,645 | 221,316 | ||||||
Regis Corp. (a) | 3,741 | 48,783 | ||||||
Weight Watchers International, Inc. (b) | 5,249 | 79,575 | ||||||
|
| |||||||
| 777,180 | ||||||||
Diversified Financial Services — 0.0% | ||||||||
MarketAxess Holdings, Inc. | 152 | 21,271 | ||||||
Marlin Business Services Corp. | 4,288 | 65,006 | ||||||
|
| |||||||
| 86,277 | ||||||||
Diversified Telecommunication Services — 0.4% | ||||||||
FairPoint Communications, Inc. (a) | 6,147 | 83,292 | ||||||
Inteliquent, Inc. | 36,669 | 613,106 | ||||||
|
| |||||||
| 696,398 | ||||||||
Electric Utilities — 0.1% | ||||||||
IDACORP, Inc. | 934 | 68,378 | ||||||
Spark Energy, Inc., Class A | 1,044 | 31,414 | ||||||
|
| |||||||
| 99,792 | ||||||||
Electrical Equipment — 0.2% | ||||||||
Encore Wire Corp. | 2,345 | 91,432 | ||||||
Energy Focus, Inc. (a) | 1,825 | 11,461 | ||||||
LSI Industries, Inc. | 24,082 | 268,514 | ||||||
|
| |||||||
| 371,407 | ||||||||
Electronic Equipment, Instruments & Components — 2.3% |
| |||||||
Belden, Inc. | 6,590 | 426,175 | ||||||
Benchmark Electronics, Inc. (a) | 6,297 | 130,537 | ||||||
Coherent, Inc. (a) | 1,563 | 147,891 | ||||||
Fabrinet (a) | 7,441 | 264,156 | ||||||
FEI Co. | 6,308 | 677,795 | ||||||
II-VI, Inc. (a) | 6,180 | 125,948 | ||||||
Littelfuse, Inc. | 2,738 | 313,583 | ||||||
PC Connection, Inc. | 498 | 11,449 | ||||||
Rofin-Sinar Technologies, Inc. (a) | 694 | 22,173 | ||||||
Sanmina Corp. (a) | 36,258 | 971,352 | ||||||
SYNNEX Corp. | 1,704 | 155,234 | ||||||
Tech Data Corp. (a) | 8,938 | 675,445 | ||||||
Vishay Precision Group, Inc. (a) | 2,698 | 36,450 | ||||||
|
| |||||||
| 3,958,188 | ||||||||
See Notes to Financial Statements.
| ANNUAL REPORT | MAY 31, 2016 | 43 |
| Schedule of Investments (continued) | BlackRock Master Small Cap Growth Portfolio | |
| Common Stocks | Shares | Value | ||||||
Energy Equipment & Services — 0.3% | ||||||||
Archrock, Inc. | 25,553 | $ | 194,969 | |||||
Aspen Aerogels, Inc. (a) | 10,192 | 40,870 | ||||||
Exterran Corp. (a) | 9,635 | 120,727 | ||||||
Matrix Service Co. (a) | 5,452 | 90,340 | ||||||
PHI, Inc. (a) | 1,288 | 22,025 | ||||||
|
| |||||||
| 468,931 | ||||||||
Food & Staples Retailing — 0.7% | ||||||||
Casey’s General Stores, Inc. | 8,626 | 1,036,931 | ||||||
Ingles Markets, Inc., Class A | 1,447 | 53,944 | ||||||
Performance Food Group Co. (a) | 5,869 | 145,727 | ||||||
|
| |||||||
| 1,236,602 | ||||||||
Food Products — 0.9% | ||||||||
Amplify Snack Brands, Inc. (a) | 2,409 | 31,437 | ||||||
Cal-Maine Foods, Inc. (b) | 17,193 | 765,089 | ||||||
Dean Foods Co. | 35,422 | 647,514 | ||||||
J&J Snack Foods Corp. | 343 | 36,187 | ||||||
|
| |||||||
| 1,480,227 | ||||||||
Gas Utilities — 0.1% | ||||||||
Southwest Gas Corp. | 2,169 | 150,594 | ||||||
Health Care Equipment & Supplies — 6.1% | ||||||||
ABIOMED, Inc. (a) | 3,509 | 348,479 | ||||||
AngioDynamics, Inc. (a) | 7,112 | 85,415 | ||||||
Anika Therapeutics, Inc. (a) | 4,804 | 227,325 | ||||||
Atrion Corp. | 130 | 51,055 | ||||||
Cantel Medical Corp. | 9,446 | 627,498 | ||||||
Cutera, Inc. (a) | 245 | 2,568 | ||||||
Cynosure, Inc., Class A (a) | 7,904 | 377,574 | ||||||
ICU Medical, Inc. (a) | 16,181 | 1,682,662 | ||||||
Insulet Corp. (a) | 3,526 | 105,851 | ||||||
iRadimed Corp. (a) | 1,704 | 31,592 | ||||||
LeMaitre Vascular, Inc. | 3,872 | 54,092 | ||||||
LivaNova PLC (a) | 2,754 | 134,423 | ||||||
Masimo Corp. (a) | 44,321 | 2,204,527 | ||||||
Merit Medical Systems, Inc. (a) | 18,578 | 348,709 | ||||||
NuVasive, Inc. (a) | 14,479 | 787,223 | ||||||
NxStage Medical, Inc. (a) | 4,983 | 94,179 | ||||||
Orthofix International NV (a) | 5,123 | 226,590 | ||||||
RTI Surgical, Inc. (a) | 148,808 | 561,006 | ||||||
SeaSpine Holdings Corp. (a) | 19,080 | 190,418 | ||||||
STERIS PLC | 12,596 | 874,540 | ||||||
SurModics, Inc. (a) | 13,088 | 288,460 | ||||||
Symmetry Surgical, Inc. (a) | 6,272 | 81,285 | ||||||
West Pharmaceutical Services, Inc. | 12,084 | 907,267 | ||||||
|
| |||||||
| 10,292,738 | ||||||||
Health Care Providers & Services — 3.9% | ||||||||
Air Methods Corp. (a) | 4,875 | 165,116 | ||||||
Alliance HealthCare Services, Inc. (a) | 7,018 | 50,881 | ||||||
American Renal Associates Holdings, Inc. (a) | 4,837 | 135,388 | ||||||
AMN Healthcare Services, Inc. (a) | 36,044 | 1,345,883 | ||||||
Amsurg Corp. (a) | 813 | 60,804 | ||||||
BioTelemetry, Inc. (a) | 9,525 | 165,926 | ||||||
Capital Senior Living Corp. (a) | 13,670 | 250,024 | ||||||
Chemed Corp. | 196 | 25,560 | ||||||
Cross Country Healthcare, Inc. (a) | 1,351 | 18,401 | ||||||
Diplomat Pharmacy, Inc. (a) | 9,218 | 300,322 | ||||||
ExamWorks Group, Inc. (a) | 4,351 | 151,893 | ||||||
Five Star Quality Care, Inc. (a) | 61,307 | 123,227 | ||||||
Hanger, Inc. (a) | 3,678 | 23,650 | ||||||
HealthSouth Corp. | 17,410 | 701,971 | ||||||
LHC Group, Inc. (a) | 1,237 | 51,954 | ||||||
Molina Healthcare, Inc. (a) | 9,443 | 457,324 | ||||||
National HealthCare Corp. | 3,398 | 210,438 | ||||||
| Common Stocks | Shares | Value | ||||||
Health Care Providers & Services (continued) | ||||||||
Owens & Minor, Inc. | 6,667 | $ | 248,612 | |||||
Surgical Care Affiliates, Inc. (a) | 12,915 | 578,205 | ||||||
Team Health Holdings, Inc. (a) | 11,447 | 549,113 | ||||||
U.S. Physical Therapy, Inc. | 372 | 21,490 | ||||||
WellCare Health Plans, Inc. (a) | 9,315 | 944,727 | ||||||
|
| |||||||
| 6,580,909 | ||||||||
Health Care Technology — 0.3% | ||||||||
Medidata Solutions, Inc. (a) | 5,544 | 254,691 | ||||||
Omnicell, Inc. (a) | 3,769 | 121,927 | ||||||
Vocera Communications, Inc. (a) | 4,608 | 53,222 | ||||||
|
| |||||||
| 429,840 | ||||||||
Hotels, Restaurants & Leisure — 5.6% | ||||||||
BJ’s Restaurants, Inc. (a) | 2,898 | 129,830 | ||||||
Bloomin’ Brands, Inc. | 16,325 | 310,991 | ||||||
Bravo Brio Restaurant Group, Inc. (a) | 14,337 | 106,381 | ||||||
Carrols Restaurant Group, Inc. (a) | 15,288 | 185,291 | ||||||
Century Casinos, Inc. (a) | 20,381 | 116,172 | ||||||
Cheesecake Factory, Inc. | 30,361 | 1,514,103 | ||||||
Chuy’s Holdings, Inc. (a) | 561 | 18,485 | ||||||
Cracker Barrel Old Country Store, Inc. | 7,099 | 1,075,357 | ||||||
Dave & Buster’s Entertainment, Inc. (a) | 12,123 | 473,161 | ||||||
Denny’s Corp. (a) | 3,663 | 39,304 | ||||||
Eldorado Resorts, Inc. (a) | 23,343 | 347,811 | ||||||
Intrawest Resorts Holdings, Inc. (a) | 21,675 | 235,607 | ||||||
Isle of Capri Casinos, Inc. (a) | 31,501 | 500,551 | ||||||
J. Alexander’s Holdings, Inc. (a) | 24,854 | 258,482 | ||||||
Papa John’s International, Inc. | 8,172 | 517,614 | ||||||
Red Robin Gourmet Burgers, Inc. (a) | 1,006 | 51,014 | ||||||
Ruth’s Hospitality Group, Inc. | 1,303 | 21,643 | ||||||
SeaWorld Entertainment, Inc. | 4,535 | 79,181 | ||||||
Texas Roadhouse, Inc. | 5,973 | 267,650 | ||||||
Vail Resorts, Inc. | 23,914 | 3,138,713 | ||||||
|
| |||||||
| 9,387,341 | ||||||||
Household Durables — 0.6% | ||||||||
Ethan Allen Interiors, Inc. | 1,907 | 64,399 | ||||||
Installed Building Products, Inc. (a) | 2,616 | 87,453 | ||||||
La-Z-Boy, Inc. | 24,493 | 648,575 | ||||||
LGI Homes, Inc. (b) | 3,014 | 81,438 | ||||||
ZAGG, Inc. (a) | 41,411 | 200,429 | ||||||
|
| |||||||
| 1,082,294 | ||||||||
Household Products — 0.0% | ||||||||
Central Garden & Pet Co., Class A (a) | 4,522 | 82,436 | ||||||
Insurance — 0.5% | ||||||||
American Equity Investment Life Holding Co. | 6,390 | 103,582 | ||||||
CNO Financial Group, Inc. | 4,012 | 81,403 | ||||||
Hallmark Financial Services, Inc. (a) | 6,947 | 67,872 | ||||||
National General Holdings Corp. | 3,173 | 65,776 | ||||||
State National Cos., Inc. | 12,299 | 132,460 | ||||||
Universal Insurance Holdings, Inc. | 16,234 | 315,589 | ||||||
|
| |||||||
| 766,682 | ||||||||
Internet & Catalog Retail — 0.4% | ||||||||
1-800-Flowers.com, Inc., Class A (a) | 11,329 | 91,312 | ||||||
Liberty TripAdvisor Holdings, Inc., Class A (a) | 6,888 | 158,217 | ||||||
Shutterfly, Inc. (a) | 8,865 | 428,180 | ||||||
|
| |||||||
| 677,709 | ||||||||
Internet Software & Services — 4.3% | ||||||||
Apigee Corp. (a) | 4,319 | 46,775 | ||||||
Bankrate, Inc. (a) | 21,942 | 199,453 | ||||||
Brightcove, Inc. (a) | 6,588 | 44,140 | ||||||
Carbonite, Inc. (a) | 4,050 | 37,422 | ||||||
Cvent, Inc. (a) | 4,843 | 173,428 | ||||||
See Notes to Financial Statements.
| 44 | ANNUAL REPORT | MAY 31, 2016 |
| Schedule of Investments (continued) | BlackRock Master Small Cap Growth Portfolio | |
| Common Stocks | Shares | Value | ||||||
Internet Software & Services (continued) | ||||||||
EarthLink Holdings Corp. | 85,477 | $ | 560,729 | |||||
Everyday Health, Inc. (a) | 6,685 | 44,990 | ||||||
Five9, Inc. (a) | 11,454 | 116,716 | ||||||
IntraLinks Holdings, Inc. (a) | 4,891 | 38,345 | ||||||
j2 Global, Inc. | 7,875 | 527,389 | ||||||
Limelight Networks, Inc. (a) | 112,423 | 164,138 | ||||||
LogMeIn, Inc. (a) | 34,777 | 2,130,787 | ||||||
NIC, Inc. | 20,395 | 404,841 | ||||||
QuinStreet, Inc. (a) | 194,009 | 717,833 | ||||||
SciQuest, Inc. (a) | 3,223 | 56,854 | ||||||
Support.com, Inc. (a) | 48,921 | 38,648 | ||||||
United Online, Inc. (a) | 6,179 | 67,536 | ||||||
Web.com Group, Inc. (a) | 62,291 | 1,057,078 | ||||||
Wix.com Ltd. (a) | 3,591 | 99,327 | ||||||
XO Group, Inc. (a) | 42,647 | 722,014 | ||||||
|
| |||||||
| 7,248,443 | ||||||||
IT Services — 2.8% | ||||||||
CACI International, Inc., Class A (a) | 2,357 | 237,515 | ||||||
Convergys Corp. | 1,301 | 36,675 | ||||||
CSG Systems International, Inc. | 5,400 | 229,554 | ||||||
Datalink Corp. (a) | 35,033 | 282,716 | ||||||
Euronet Worldwide, Inc. (a) | 12,922 | 1,031,305 | ||||||
Everi Holdings, Inc. (a) | 88,057 | 125,922 | ||||||
ExlService Holdings, Inc. (a) | 7,095 | 367,521 | ||||||
Global Payments, Inc. | 5,026 | 390,470 | ||||||
Hackett Group, Inc. | 6,389 | 93,407 | ||||||
Higher One Holdings, Inc. (a) | 7,054 | 26,523 | ||||||
Lionbridge Technologies, Inc. (a) | 65,812 | 286,282 | ||||||
Net 1 UEPS Technologies, Inc. (a) | 34,183 | 375,671 | ||||||
Planet Payment, Inc. (a) | 20,262 | 87,329 | ||||||
Science Applications International Corp. | 17,622 | 961,633 | ||||||
Travelport Worldwide Ltd. | 15,759 | 208,649 | ||||||
|
| |||||||
| 4,741,172 | ||||||||
Leisure Products — 1.1% | ||||||||
Brunswick Corp. | 22,334 | 1,069,129 | ||||||
Johnson Outdoors, Inc., Class A | 3,260 | 85,934 | ||||||
MCBC Holdings, Inc. (a) | 915 | 14,073 | ||||||
Nautilus, Inc. (a) | 36,995 | 763,207 | ||||||
|
| |||||||
| 1,932,343 | ||||||||
Life Sciences Tools & Services — 1.5% | ||||||||
Cambrex Corp. (a) | 12,463 | 609,565 | ||||||
Harvard Bioscience, Inc. (a) | 37,642 | 137,393 | ||||||
INC Research Holdings, Inc., Class A (a) | 19,089 | 830,562 | ||||||
PAREXEL International Corp. (a) | 10,918 | 686,633 | ||||||
PRA Health Sciences, Inc. (a) | 7,203 | 340,198 | ||||||
|
| |||||||
| 2,604,351 | ||||||||
Machinery — 3.3% | ||||||||
Briggs & Stratton Corp. | 13,585 | 303,217 | ||||||
Commercial Vehicle Group, Inc. (a) | 18,240 | 67,488 | ||||||
Federal Signal Corp. | 1,329 | 17,290 | ||||||
Global Brass & Copper Holdings, Inc. | 37,216 | 1,015,625 | ||||||
Greenbrier Cos., Inc. | 22,438 | 643,971 | ||||||
Hyster-Yale Materials Handling, Inc. | 2,039 | 125,011 | ||||||
John Bean Technologies Corp. | 19,348 | 1,174,037 | ||||||
Luxfer Holdings PLC - ADR | 83,500 | 1,103,870 | ||||||
SPX Corp. | 6,178 | 102,369 | ||||||
Supreme Industries, Inc., Class A | 6,550 | 86,460 | ||||||
Wabash National Corp. (a) | 68,345 | 969,132 | ||||||
|
| |||||||
| 5,608,470 | ||||||||
Marine — 0.3% | ||||||||
Matson, Inc. | 16,111 | 536,980 | ||||||
| Common Stocks | Shares | Value | ||||||
Media — 0.7% | ||||||||
Entercom Communications Corp., Class A (a) | 9,874 | $ | 125,400 | |||||
Gray Television, Inc. (a) | 20,784 | 245,667 | ||||||
Harte-Hanks, Inc. | 88,092 | 87,114 | ||||||
IMAX Corp. (a) | 2,830 | 94,352 | ||||||
Nexstar Broadcasting Group, Inc., Class A | 1,288 | 68,547 | ||||||
Sinclair Broadcast Group, Inc., Class A | 12,447 | 393,699 | ||||||
Tribune Publishing Co. | 10,796 | 126,529 | ||||||
|
| |||||||
| 1,141,308 | ||||||||
Metals & Mining — 0.4% | ||||||||
Coeur Mining, Inc. (a) | 2,370 | 17,846 | ||||||
Hecla Mining Co. | 45,257 | 183,743 | ||||||
Worthington Industries, Inc. | 13,762 | 514,148 | ||||||
|
| |||||||
| 715,737 | ||||||||
Multiline Retail — 0.4% | ||||||||
Big Lots, Inc. | 14,578 | 762,429 | ||||||
Oil, Gas & Consumable Fuels — 1.1% | ||||||||
DHT Holdings, Inc. (a) | 77,843 | 425,023 | ||||||
Evolution Petroleum Corp. | 28,131 | 157,252 | ||||||
Gener8 Maritime, Inc. (a) | 49,324 | 356,613 | ||||||
Matador Resources Co. (a) | 3,753 | 85,268 | ||||||
Nordic American Tankers Ltd. (b) | 14,096 | 216,656 | ||||||
Parsley Energy, Inc., Class A (a) | 9,257 | 241,330 | ||||||
PDC Energy, Inc. (a) | 1,287 | 74,710 | ||||||
Scorpio Tankers, Inc. (a) | 30,231 | 177,758 | ||||||
Western Refining, Inc. | 7,174 | 152,376 | ||||||
|
| |||||||
| 1,886,986 | ||||||||
Paper & Forest Products — 0.6% | ||||||||
Boise Cascade Co. (a) | 10,274 | 235,891 | ||||||
Clearwater Paper Corp. (a) | 11,101 | 695,034 | ||||||
Neenah Paper, Inc. | 524 | 36,360 | ||||||
|
| |||||||
| 967,285 | ||||||||
Personal Products — 0.2% | ||||||||
Natural Health Trends Corp. (b) | 1,235 | 36,865 | ||||||
USANA Health Sciences, Inc. (a) | 2,122 | 256,019 | ||||||
|
| |||||||
| 292,884 | ||||||||
Pharmaceuticals — 3.6% | ||||||||
Catalent, Inc. (a) | 9,874 | 277,657 | ||||||
Durata Therapeutics, Inc. - CVR | 1,930 | 309 | ||||||
Flex Pharma, Inc. (a) | 3,150 | 39,407 | ||||||
Impax Laboratories, Inc. (a) | 13,247 | 452,385 | ||||||
Innoviva, Inc. | 11,569 | 130,498 | ||||||
Juniper Pharmaceuticals, Inc. (a) | 24,958 | 172,460 | ||||||
Lannett Co., Inc. (a) | 5,626 | 137,218 | ||||||
Marinus Pharmaceuticals, Inc. (a) | 6,801 | 38,086 | ||||||
Pacira Pharmaceuticals, Inc. (a) | 2,219 | 103,206 | ||||||
Phibro Animal Health Corp., Class A | 1,796 | 34,106 | ||||||
Prestige Brands Holdings, Inc. (a) | 59,894 | 3,236,672 | ||||||
Sagent Pharmaceuticals, Inc. (a) | 21,446 | 277,511 | ||||||
SciClone Pharmaceuticals, Inc. (a) | 65,171 | 922,170 | ||||||
Sucampo Pharmaceuticals, Inc., Class A (a) | 21,652 | 254,628 | ||||||
|
| |||||||
| 6,076,313 | ||||||||
Professional Services — 2.4% | ||||||||
Insperity, Inc. | 21,402 | 1,540,302 | ||||||
Kforce, Inc. | 50,192 | 938,590 | ||||||
On Assignment, Inc. (a) | 8,905 | 335,451 | ||||||
RPX Corp. (a) | 119,316 | 1,199,126 | ||||||
TrueBlue, Inc. (a) | 4,981 | 98,674 | ||||||
|
| |||||||
| 4,112,143 | ||||||||
Real Estate Investment Trusts (REITs) — 3.4% | ||||||||
American Assets Trust, Inc. | 6,842 | 273,748 | ||||||
See Notes to Financial Statements.
| ANNUAL REPORT | MAY 31, 2016 | 45 |
| Schedule of Investments (continued) | BlackRock Master Small Cap Growth Portfolio | |
| Common Stocks | Shares | Value | ||||||
Real Estate Investment Trusts (REITs) (continued) | ||||||||
Chatham Lodging Trust | 24,524 | $ | 531,926 | |||||
CubeSmart | 14,891 | 474,129 | ||||||
FelCor Lodging Trust, Inc. | 5,541 | 36,626 | ||||||
Hersha Hospitality Trust | 5,434 | 96,290 | ||||||
InfraREIT, Inc. (a) | 19,137 | 328,582 | ||||||
PS Business Parks, Inc. | 25,559 | 2,523,440 | ||||||
RLJ Lodging Trust | 49,296 | 1,010,075 | ||||||
Ryman Hospitality Properties, Inc. | 4,591 | 225,234 | ||||||
Sovran Self Storage, Inc. | 1,255 | 135,879 | ||||||
Summit Hotel Properties, Inc. | 1,318 | 15,421 | ||||||
Sunstone Hotel Investors, Inc. | 8,553 | 102,978 | ||||||
|
| |||||||
| 5,754,328 | ||||||||
Real Estate Management & Development — 0.6% | ||||||||
AV Homes, Inc. (a) | 2,413 | 30,307 | ||||||
Marcus & Millichap, Inc. (a) | 30,126 | 765,803 | ||||||
RE/MAX Holdings, Inc., Class A | 1,122 | 45,318 | ||||||
RMR Group, Inc., Class A (a) | 4,269 | 126,533 | ||||||
|
| |||||||
| 967,961 | ||||||||
Road & Rail — 0.2% | ||||||||
ArcBest Corp. | 1,225 | 21,107 | ||||||
Roadrunner Transportation Systems, Inc. (a) | 7,230 | 58,202 | ||||||
YRC Worldwide, Inc. (a) | 21,151 | 194,801 | ||||||
|
| |||||||
| 274,110 | ||||||||
Semiconductors & Semiconductor Equipment — 4.4% | ||||||||
Advanced Energy Industries, Inc. (a) | 4,568 | 174,361 | ||||||
Advanced Micro Devices, Inc. (a) | 14,938 | 68,267 | ||||||
Alpha & Omega Semiconductor Ltd. (a) | 25,847 | 353,845 | ||||||
Ambarella, Inc. (a) | 1,806 | 74,660 | ||||||
Axcelis Technologies, Inc. (a) | 8,802 | 23,765 | ||||||
Cascade Microtech, Inc. (a) | 16,176 | 334,520 | ||||||
Cavium, Inc. (a) | 770 | 38,308 | ||||||
Cirrus Logic, Inc. (a) | 11,588 | 417,168 | ||||||
Inphi Corp. (a) | 3,203 | 99,902 | ||||||
Integrated Device Technology, Inc. (a) | 48,739 | 1,138,056 | ||||||
MaxLinear, Inc., Class A (a) | 33,372 | 691,468 | ||||||
Microsemi Corp. (a) | 38,077 | 1,288,145 | ||||||
NeoPhotonics Corp. (a) | 7,704 | 69,413 | ||||||
Power Integrations, Inc. | 539 | 26,891 | ||||||
Synaptics, Inc. (a) | 4,530 | 307,270 | ||||||
Tessera Technologies, Inc. | 74,438 | 2,402,114 | ||||||
|
| |||||||
| 7,508,153 | ||||||||
Software — 8.9% | ||||||||
A10 Networks, Inc. (a) | 15,425 | 99,645 | ||||||
Aspen Technology, Inc. (a) | 49,653 | 1,892,772 | ||||||
AVG Technologies NV (a) | 18,935 | 363,931 | ||||||
Ellie Mae, Inc. (a) | 5,887 | 498,688 | ||||||
Exa Corp. (a) | 13,614 | 164,729 | ||||||
Fair Isaac Corp. | 3,242 | 361,256 | ||||||
Fleetmatics Group PLC (a) | 8,618 | 352,476 | ||||||
Gigamon, Inc. (a) | 27,882 | 868,524 | ||||||
Guidewire Software, Inc. (a) | 3,484 | 204,511 | ||||||
Imperva, Inc. (a) | 8,614 | 328,883 | ||||||
Infoblox, Inc. (a) | 40,740 | 766,319 | ||||||
Manhattan Associates, Inc. (a) | 51,941 | 3,424,470 | ||||||
MicroStrategy, Inc., Class A (a) | 5,414 | 1,009,928 | ||||||
Monotype Imaging Holdings, Inc. | 23,881 | 570,278 | ||||||
Pegasystems, Inc. | 30,987 | 817,127 | ||||||
Proofpoint, Inc. (a) | 6,881 | 403,364 | ||||||
Qlik Technologies, Inc. (a) | 12,830 | 368,221 | ||||||
Rubicon Project, Inc. (a) | 951 | 13,932 | ||||||
Silver Spring Networks, Inc. (a) | 3,246 | 42,360 | ||||||
Synchronoss Technologies, Inc. (a) | 11,515 | 406,134 | ||||||
Take-Two Interactive Software, Inc. (a) | 32,395 | 1,260,489 | ||||||
| Common Stocks | Shares | Value | ||||||
Software (continued) | ||||||||
TiVo, Inc. (a) | 40,018 | $ | 398,179 | |||||
Verint Systems, Inc. (a) | 8,751 | 288,695 | ||||||
Zix Corp. (a) | 48,143 | 193,535 | ||||||
|
| |||||||
| 15,098,446 | ||||||||
Specialty Retail — 3.7% | ||||||||
Aaron’s, Inc. (a) | 21,884 | 549,288 | ||||||
American Eagle Outfitters, Inc. | 47,543 | 743,573 | ||||||
Asbury Automotive Group, Inc. (a) | 9,785 | 548,939 | ||||||
Burlington Stores, Inc. (a) | 23,328 | 1,408,078 | ||||||
Chico’s FAS, Inc. | 49,085 | 532,572 | ||||||
Children’s Place, Inc. | 4,613 | 325,124 | ||||||
Citi Trends, Inc. | 5,617 | 87,344 | ||||||
Express, Inc. (a) | 54,504 | 792,488 | ||||||
Francesca’s Holdings Corp. (a) | 6,729 | 70,116 | ||||||
Group 1 Automotive, Inc. | 6,906 | 429,415 | ||||||
Haverty Furniture Cos., Inc. | 9,098 | 169,132 | ||||||
Lithia Motors, Inc., Class A | 1,888 | 155,458 | ||||||
New York & Co., Inc. (a) | 21,065 | 37,074 | ||||||
Sonic Automotive, Inc., Class A | 15,701 | 280,420 | ||||||
Stage Stores, Inc. | 11,281 | 62,384 | ||||||
TravelCenters of America LLC (a) | 11,527 | 81,496 | ||||||
|
| |||||||
| 6,272,901 | ||||||||
Technology Hardware, Storage & Peripherals — 0.5% | ||||||||
Avid Technology, Inc. (a) | 21,096 | 125,521 | ||||||
Cray, Inc. (a) | 618 | 20,592 | ||||||
Electronics for Imaging, Inc. (a) | 5,068 | 222,130 | ||||||
Immersion Corp. (a) | 22,452 | 143,693 | ||||||
Quantum Corp. (a) | 415,176 | 158,473 | ||||||
Super Micro Computer, Inc. (a) | 4,780 | 125,427 | ||||||
|
| |||||||
| 795,836 | ||||||||
Textiles, Apparel & Luxury Goods — 1.5% | ||||||||
Columbia Sportswear Co. | 2,386 | 126,864 | ||||||
Culp, Inc. | 36,952 | 1,015,810 | ||||||
Deckers Outdoor Corp. (a) | 2,410 | 126,742 | ||||||
Delta Apparel, Inc. (a) | 541 | 11,112 | ||||||
Oxford Industries, Inc. | 6,254 | 396,316 | ||||||
Skechers U.S.A., Inc., Class A (a) | 26,082 | 812,976 | ||||||
Steven Madden Ltd. (a) | 1,575 | 54,038 | ||||||
|
| |||||||
| 2,543,858 | ||||||||
Thrifts & Mortgage Finance — 1.3% | ||||||||
Essent Group Ltd. (a) | 1,118 | 24,439 | ||||||
EverBank Financial Corp. | 80,291 | 1,230,058 | ||||||
First Defiance Financial Corp. | 4,638 | 187,236 | ||||||
Flagstar Bancorp, Inc. (a) | 25,022 | 606,533 | ||||||
MGIC Investment Corp. (a) | 8,352 | 58,882 | ||||||
United Community Financial Corp. | 2,703 | 16,461 | ||||||
|
| |||||||
| 2,123,609 | ||||||||
Tobacco — 0.3% | ||||||||
Vector Group Ltd. | 23,408 | 502,570 | ||||||
Trading Companies & Distributors — 0.1% | ||||||||
Beacon Roofing Supply, Inc. (a) | 966 | 41,683 | ||||||
CAI International, Inc. (a) | 10,014 | 76,908 | ||||||
Neff Corp., Class A (a) | 9,938 | 92,125 | ||||||
|
| |||||||
| 210,716 | ||||||||
Water Utilities — 0.0% | ||||||||
California Water Service Group | 2 | 58 | ||||||
See Notes to Financial Statements.
| 46 | ANNUAL REPORT | MAY 31, 2016 |
| Schedule of Investments (continued) | BlackRock Master Small Cap Growth Portfolio | |
| Common Stocks | Shares | Value | ||||||
Wireless Telecommunication Services — 0.0% | ||||||||
Leap Wireless International, Inc. — CVR (a) | 3,374 | $ | 8,502 | |||||
Total Common Stocks — 97.5% | 164,687,752 | |||||||
| Preferred Stocks | ||||||||
Household Durables — 0.0% | ||||||||
AliphCom: | ||||||||
Series 6 (Acquired 6/03/14, | 2,066 | 15 | ||||||
Series 8 (Acquired 8/31/15, | 49,410 | 361 | ||||||
|
| |||||||
| 376 | ||||||||
Software — 0.8% | ||||||||
Illumio Inc., Series C (Acquired 3/10/15, | 77,790 | 208,291 | ||||||
MongoDB: | ||||||||
Series C (Acquired 12/19/13, | 15,128 | 308,762 | ||||||
Series D (Acquired 12/19/13, | 4,706 | 96,049 | ||||||
Series E (Acquired 12/19/13, | 166 | 3,388 | ||||||
Palantir Technologies, Inc., Series I (Acquired 2/06/14, | 81,566 | 782,218 | ||||||
|
| |||||||
| 1,398,708 | ||||||||
Total Preferred Stocks — 0.8% | 1,399,084 | |||||||
| Value | ||||||||
Total Long-Term Investments (Cost — $160,378,984) — 98.3% | $ | 166,086,836 | ||||||
| Short-Term Securities | Shares | |||||||
BlackRock Liquidity Funds, TempFund, Institutional Class, 0.39% (d)(e) | 1,508,954 | 1,508,954 | ||||||
| Beneficial Interest (000) | ||||||||
BlackRock Liquidity Series, LLC, Money Market | $ | 1,601 | 1,600,704 | |||||
Total Short-Term Securities (Cost — $3,109,658) — 1.8% |
| 3,109,658 | ||||||
Total Investments (Cost — $163,488,642) — 100.1% |
| 169,196,494 | ||||||
Liabilities in Excess of Other Assets — (0.1)% |
| (224,619 | ) | |||||
|
| |||||||
Net Assets — 100.0% |
| $ | 168,971,875 | |||||
|
| |||||||
| Notes to Schedule of Investments |
| (a) | Non-income producing security. |
| (b) | Security, or a portion of security, is on loan. |
| (c) | Restricted security as to resale, excluding 144A securities. As of period end, the Master Portfolio held restricted securities with a current value of $1,399,084 and an original cost of $1,547,037, which was 0.8% of its net assets. |
| (d) | During the year ended May 31, 2016, investments in issuers considered to be affiliates of the Master Portfolio for purposes of Section 2(a)(3) of the Investment Company Act of 1940, as amended, were as follows: |
| Affiliate | Shares/ Held at May 31, | Net Activity | Shares/ Held at 2016 | Value at 2016 | Income | Realized Gain | ||||||||||||||||||
BlackRock Liquidity Funds, TempFund, Institutional Class | 2,469,135 | (960,181 | ) | 1,508,954 | $ | 1,508,954 | $ | 3,997 | $ | 37 | ||||||||||||||
BlackRock Liquidity Series, LLC, Money Market Series | $ | 3,200,215 | $ | (1,599,511 | ) | $ | 1,600,704 | 1,600,704 | 203,553 | 1 | — | |||||||||||||
Total | $ | 3,109,658 | $ | 207,550 | $ | 37 | ||||||||||||||||||
|
| |||||||||||||||||||||||
| 1 | Represents securities lending income earned from the reinvestment of cash collateral from loaned securities, net of fees and collateral investment expenses, and other payments to and from borrowers of securities. |
| (e) | Current yield as of period end. |
| (f) | Security was purchased with the cash collateral from loaned securities. The Master Portfolio may withdraw up to 25% of its investment daily, although the manager of the BlackRock Liquidity Series, LLC, Money Market Series, in its sole discretion, may permit an investor to withdraw more than 25% on any one day. |
| • | For Master Portfolio compliance purposes, the Master Portfolio’s industry classifications refer to any one or more of the industry sub-classifications used by one or more widely recognized market indexes or ratings group indexes, and/or as defined by the investment advisor. These definitions may not apply for purposes of this report, which may combine such industry sub-classifications for reporting ease. |
See Notes to Financial Statements.
| ANNUAL REPORT | MAY 31, 2016 | 47 |
| Schedule of Investments (continued) | BlackRock Master Small Cap Growth Portfolio |
| Derivative Financial Instruments Outstanding as of Period End |
| Futures Contracts | ||||||||||||||||
| Contracts Long | Issue | Expiration | Notional Value | Unrealized Appreciation | ||||||||||||
| 30 | Russell 2000 Mini Index | June 2016 | $ | 3,460,200 | $60,759 | |||||||||||
| Derivative Financial Instruments Categorized by Risk Exposure |
As of period end, fair values of derivative financial instruments located in the Statement of Assets and Liabilities were as follows:
| Commodity Contracts | Credit Contracts | Equity Contracts | Foreign Currency Exchange Contracts | Interest Rate Contracts | Other Contracts | Total | ||||||||||||||||||||||||
Assets - Derivative Financial Instruments | ||||||||||||||||||||||||||||||
Futures contracts | Net unrealized appreciation1 | — | — | $60,759 | — | — | — | $60,759 | ||||||||||||||||||||||
| 1 | Includes cumulative appreciation (depreciation) on futures contracts, if any, as reported in the Schedule of Investments. Only current day’s variation margin is reported within the Statement of Assets and Liabilities. |
For the year ended May 31, 2016, the effect of derivative financial instruments in the Statement of Operations were as follows:
| Net Realized Loss from: | Commodity Contracts | Credit Contracts | Equity Contracts | Foreign Currency Exchange Contracts | Interest Rate Contracts | Other Contracts | Total | |||||||||||||||||
Futures contracts | — | — | $(138,578) | — | — | — | $(138,578) | |||||||||||||||||
Net Change in Unrealized Appreciation (Depreciation) on: | ||||||||||||||||||||||||
Futures contracts | — | — | $ 69,256 | — | — | — | $ 69,256 | |||||||||||||||||
| Average Quarterly Balances of Outstanding Derivative Financial Instruments: |
Futures contracts: | ||||
Average notional value of contracts - long | $ | 2,311,928 |
For more information about the Master Portfolio’s investment risks regarding derivative financial instruments, refer to the Notes to Financial Statements.
| Fair Value Hierarchy as of Period End |
Various inputs are used in determining the fair value of investments and derivative financial instruments. For information about the Master Portfolio’s policy regarding valuation of investments and derivative financial instruments, refer to the Notes to Financial Statements.
The following tables summarize the Master Portfolio’s investments and derivative financial instruments categorized in the disclosure hierarchy:
| Level 1 | Level 2 | Level 3 | Total | |||||||||||||
Assets: | ||||||||||||||||
Investments: | ||||||||||||||||
Long-Term Investments: | ||||||||||||||||
Common Stocks: | ||||||||||||||||
Aerospace & Defense | $ | 1,726,655 | — | — | $ | 1,726,655 | ||||||||||
Air Freight & Logistics | 1,465,332 | — | — | 1,465,332 | ||||||||||||
Airlines | 810,784 | — | — | 810,784 | ||||||||||||
Auto Components | 3,818,365 | — | — | 3,818,365 | ||||||||||||
Banks | 3,385,162 | — | — | 3,385,162 | ||||||||||||
Beverages | 460,208 | — | — | 460,208 | ||||||||||||
Biotechnology | 15,191,945 | — | $ | 38,935 | 15,230,880 | |||||||||||
Building Products | 3,496,687 | — | — | 3,496,687 | ||||||||||||
Capital Markets | 327,423 | — | — | 327,423 | ||||||||||||
Chemicals | 3,173,939 | — | — | 3,173,939 | ||||||||||||
Commercial Services & Supplies | 3,818,723 | — | — | 3,818,723 | ||||||||||||
Communications Equipment | 2,982,887 | — | — | 2,982,887 | ||||||||||||
See Notes to Financial Statements.
| 48 | ANNUAL REPORT | MAY 31, 2016 |
| Schedule of Investments (continued) | BlackRock Master Small Cap Growth Portfolio |
| Level 1 | Level 2 | Level 3 | Total | |||||||||||||
Construction & Engineering | $ | 1,925,946 | — | — | $ | 1,925,946 | ||||||||||
Construction Materials | 579,512 | — | — | 579,512 | ||||||||||||
Consumer Finance | 508,918 | — | — | 508,918 | ||||||||||||
Containers & Packaging | 978,404 | — | — | 978,404 | ||||||||||||
Distributors | 684,490 | — | — | 684,490 | ||||||||||||
Diversified Consumer Services | 777,180 | — | — | 777,180 | ||||||||||||
Diversified Financial Services | 86,277 | — | — | 86,277 | ||||||||||||
Diversified Telecommunication Services | 696,398 | — | — | 696,398 | ||||||||||||
Electric Utilities | 99,792 | — | — | 99,792 | ||||||||||||
Electrical Equipment | 371,407 | — | — | 371,407 | ||||||||||||
Electronic Equipment, Instruments & Components | 3,958,188 | — | — | 3,958,188 | ||||||||||||
Energy Equipment & Services | 468,931 | — | — | 468,931 | ||||||||||||
Food & Staples Retailing | 1,236,602 | — | — | 1,236,602 | ||||||||||||
Food Products | 1,480,227 | — | — | 1,480,227 | ||||||||||||
Gas Utilities | 150,594 | — | — | 150,594 | ||||||||||||
Health Care Equipment & Supplies | 10,292,738 | — | — | 10,292,738 | ||||||||||||
Health Care Providers & Services | 6,580,909 | — | — | 6,580,909 | ||||||||||||
Health Care Technology | 429,840 | — | — | 429,840 | ||||||||||||
Hotels, Restaurants & Leisure | 9,387,341 | — | — | 9,387,341 | ||||||||||||
Household Durables | 1,082,294 | — | — | 1,082,294 | ||||||||||||
Household Products | 82,436 | — | — | 82,436 | ||||||||||||
Insurance | 766,682 | — | — | 766,682 | ||||||||||||
Internet & Catalog Retail | 677,709 | — | — | 677,709 | ||||||||||||
Internet Software & Services | 7,248,443 | — | — | 7,248,443 | ||||||||||||
IT Services | 4,741,172 | — | — | 4,741,172 | ||||||||||||
Leisure Products | 1,932,343 | — | — | 1,932,343 | ||||||||||||
Life Sciences Tools & Services | 2,604,351 | — | — | 2,604,351 | ||||||||||||
Machinery | 5,608,470 | — | — | 5,608,470 | ||||||||||||
Marine | 536,980 | — | — | 536,980 | ||||||||||||
Media | 1,141,308 | — | — | 1,141,308 | ||||||||||||
Metals & Mining | 715,737 | — | — | 715,737 | ||||||||||||
Multiline Retail | 762,429 | — | — | 762,429 | ||||||||||||
Oil, Gas & Consumable Fuels | 1,886,986 | — | — | 1,886,986 | ||||||||||||
Paper & Forest Products | 967,285 | — | — | 967,285 | ||||||||||||
Personal Products | 292,884 | — | — | 292,884 | ||||||||||||
Pharmaceuticals | 6,076,004 | — | $ | 309 | 6,076,313 | |||||||||||
Professional Services | 4,112,143 | — | — | 4,112,143 | ||||||||||||
Real Estate Investment Trusts (REITs) | 5,754,328 | — | — | 5,754,328 | ||||||||||||
Real Estate Management & Development | 967,961 | — | — | 967,961 | ||||||||||||
Road & Rail | 274,110 | — | — | 274,110 | ||||||||||||
Semiconductors & Semiconductor Equipment | 7,508,153 | — | — | 7,508,153 | ||||||||||||
Software | 15,098,446 | — | — | 15,098,446 | ||||||||||||
Specialty Retail | 6,272,901 | — | — | 6,272,901 | ||||||||||||
Technology Hardware, Storage & Peripherals | 795,836 | — | — | 795,836 | ||||||||||||
Textiles, Apparel & Luxury Goods | 2,543,858 | — | — | 2,543,858 | ||||||||||||
Thrifts & Mortgage Finance | 2,123,609 | — | — | 2,123,609 | ||||||||||||
Tobacco | 502,570 | — | — | 502,570 | ||||||||||||
Trading Companies & Distributors | 210,716 | — | — | 210,716 | ||||||||||||
Water Utilities | 58 | — | — | 58 | ||||||||||||
Wireless Telecommunication Services | — | — | 8,502 | 8,502 | ||||||||||||
Preferred Stocks | — | — | 1,399,084 | 1,399,084 | ||||||||||||
Short-Term Securities | 1,508,954 | $ | 1,600,704 | — | 3,109,658 | |||||||||||
|
| |||||||||||||||
Total | $ | 166,148,960 | $ | 1,600,704 | $ | 1,446,830 | $ | 169,196,494 | ||||||||
|
| |||||||||||||||
Derivative Financial Instruments1 | ||||||||||||||||
Assets: | ||||||||||||||||
Equity contracts | $ | 60,759 | — | — | $ | 60,759 | ||||||||||
1 Derivative financial instruments are futures contracts, which are valued at the unrealized appreciation (depreciation) on the instrument. |
| |||||||||||||||
See Notes to Financial Statements.
| ANNUAL REPORT | MAY 31, 2016 | 49 |
| Schedule of Investments (continued) | BlackRock Master Small Cap Growth Portfolio |
| The Master Portfolio may hold assets and/or liabilities in which the fair value approximates the carrying amount for financial statement purposes. As of period end, such assets and/or liabilities are categorized within the disclosure hierarchy as follows: | ||||||||||||||||
| Level 1 | Level 2 | Level 3 | Total | |||||||||||||
Assets: | ||||||||||||||||
Cash | $ | 13,131 | — | — | $ | 13,131 | ||||||||||
Cash pledged for futures contracts | 81,200 | — | — | 81,200 | ||||||||||||
Liabilities: | ||||||||||||||||
Collateral on securities loaned at value | — | $ | (1,600,704 | ) | — | (1,600,704 | ) | |||||||||
|
| |||||||||||||||
Total | $ | 94,331 | $ | (1,600,704 | ) | — | $ | (1,506,373 | ) | |||||||
|
| |||||||||||||||
During the year ended May 31, 2016, there were no transfers between levels.
See Notes to Financial Statements.
| 50 | ANNUAL REPORT | MAY 31, 2016 |
| Statement of Assets and Liabilities | BlackRock Master Small Cap Growth Portfolio |
| May 31, 2016 | ||||
| Assets | ||||
Investments at value — unaffiliated (including securities loaned at value of $ 1,488,817) (cost — $ 160,378,984) | $ | 166,086,836 | ||
Investments at value — affiliated (cost — $ 3,109,658) | 3,109,658 | |||
Cash | 13,131 | |||
Cash pledged for futures contracts | 81,200 | |||
Receivables: | ||||
Investments sold | 3,669,634 | |||
Securities lending income — affiliated | 22,358 | |||
Dividends | 94,559 | |||
Variation margin on futures contracts | 4,750 | |||
Prepaid expenses | 412 | |||
|
| |||
Total assets | 173,082,538 | |||
|
| |||
| Liabilities | ||||
Collateral on securities loaned at value | 1,600,704 | |||
Payables: | ||||
Investments purchased | 1,809,758 | |||
Directors’ fees | 2,570 | |||
Investment advisory fees | 75,380 | |||
Other accrued expenses | 95,652 | |||
Other affiliates | 871 | |||
Withdrawals to investors | 525,728 | |||
|
| |||
Total liabilities | 4,110,663 | |||
|
| |||
Net Assets | $ | 168,971,875 | ||
|
| |||
| Net Assets Consist of | ||||
Investors’ capital | $ | 163,203,264 | ||
Net unrealized appreciation (depreciation) | 5,768,611 | |||
|
| |||
Net Assets | $ | 168,971,875 | ||
|
| |||
See Notes to Financial Statements.
| ANNUAL REPORT | MAY 31, 2016 | 51 |
| Statement of Operations | BlackRock Master Small Cap Growth Portfolio |
Year Ended May 31, 2016
| ||||
| Investment Income | ||||
Dividends — unaffiliated | $ | 1,658,521 | ||
Securities lending — affiliated — net | 203,553 | |||
Dividends — affiliated | 3,997 | |||
|
| |||
Total income | 1,866,071 | |||
|
| |||
| Expenses | ||||
Investment advisory | 1,314,342 | |||
Custodian | 73,786 | |||
Professional | 53,081 | |||
Accounting services | 47,180 | |||
Directors | 14,295 | |||
Printing | 2,996 | |||
Miscellaneous | 23,107 | |||
|
| |||
Total expenses | 1,528,787 | |||
Less fees waived by the Manager | (302,614 | ) | ||
|
| |||
Total expenses after fees waived | 1,226,173 | |||
|
| |||
Net investment income | 639,898 | |||
|
| |||
| Realized and Unrealized Gain (Loss) | ||||
Net realized gain (loss) from: | ||||
Investments | (737,820 | ) | ||
Capital gain distributions received from affiliated investment companies | 37 | |||
Futures contracts | (138,578 | ) | ||
|
| |||
| (876,361 | ) | |||
|
| |||
Net change in unrealized appreciation (depreciation) on: | ||||
Investments | (24,049,485 | ) | ||
Futures contracts | 69,256 | |||
|
| |||
| (23,980,229 | ) | |||
|
| |||
Net realized and unrealized loss | (24,856,590 | ) | ||
|
| |||
Net Decrease in Net Assets Resulting from Operations | $ | (24,216,692 | ) | |
|
| |||
See Notes to Financial Statements.
| 52 | ANNUAL REPORT | MAY 31, 2016 |
| Statements of Changes in Net Assets | BlackRock Master Small Cap Growth Portfolio |
| Year Ended May 31, | ||||||||
| Decrease in Net Assets: | 2016 | 2015 | ||||||
| Operations | ||||||||
Net investment income | $ | 639,898 | $ | 526,907 | ||||
Net realized gain (loss) | (876,361 | ) | 19,291,678 | |||||
Net change in unrealized appreciation (depreciation) | (23,980,229 | ) | 9,638,941 | |||||
|
| |||||||
Net increase (decrease) in net assets resulting from operations | (24,216,692 | ) | 29,457,526 | |||||
|
| |||||||
| Capital Transactions | ||||||||
Proceeds from contributions | 41,163,211 | 47,206,163 | ||||||
Value of withdrawals | (67,318,425 | ) | (89,207,603 | ) | ||||
|
| |||||||
Net decrease in net assets derived from capital transactions | (26,155,214 | ) | (42,001,440 | ) | ||||
|
| |||||||
| Net Assets | ||||||||
Total decrease in net assets | (50,371,906 | ) | (12,543,914 | ) | ||||
Beginning of year | 219,343,781 | 231,887,695 | ||||||
|
| |||||||
End of year | $ | 168,971,875 | $ | 219,343,781 | ||||
|
| |||||||
| Financial Highlights | BlackRock Master Small Cap Growth Portfolio |
| Year Ended May 31, | ||||||||||||||||||||
| 2016 | 2015 | 2014 | 2013 | 2012 | ||||||||||||||||
| Total Return | ||||||||||||||||||||
Total return | (11.09 | )% | 14.11 | % | 22.22 | % | 31.47 | % | (13.48 | )% | ||||||||||
|
| |||||||||||||||||||
| Ratios to Average Net Assets | ||||||||||||||||||||
Total expenses | 0.81 | % | 0.79 | % | 0.80 | % | 0.79 | % | 0.77 | % | ||||||||||
|
| |||||||||||||||||||
Total expenses after fees waived | 0.65 | % | 0.63 | % | 0.64 | % | 0.77 | % | 0.77 | % | ||||||||||
|
| |||||||||||||||||||
Net investment income (loss) | 0.34 | % | 0.23 | % | 0.10 | % | 0.47 | % | (0.32 | )% | ||||||||||
|
| |||||||||||||||||||
| Supplemental Data | ||||||||||||||||||||
Net assets, end of year (000) | $ | 168,972 | $ | 219,344 | $ | 231,888 | $ | 216,189 | $ | 216,838 | ||||||||||
|
| |||||||||||||||||||
Portfolio turnover rate | 115 | % | 140 | % | 152 | % | 165 | % | 143 | % | ||||||||||
|
| |||||||||||||||||||
See Notes to Financial Statements.
| ANNUAL REPORT | MAY 31, 2016 | 53 |
| Notes to Financial Statements | BlackRock Master Small Cap Growth Portfolio |
1. Organization:
BlackRock Master Small Cap Growth Portfolio (the “Master Portfolio”), a series of BlackRock Master LLC (the “Master LLC”), is registered under the Investment Company Act of 1940, as amended (the “1940 Act”), as a diversified, open-end management investment company. The Master LLC is organized as a Delaware limited liability company. The Limited Liability Company Agreement of the Master LLC permits the Board of Directors of the Master LLC (the “Board”) to issue non-transferable interests in the Master LLC, subject to certain limitations.
The Master Portfolio, together with certain other registered investment companies advised by BlackRock Advisors, LLC (the “Manager”) or its affiliates, is included in a complex of open-end funds referred to as the Equity-Liquidity Complex.
2. Significant Accounting Policies:
The financial statements are prepared in conformity with accounting principles generally accepted in the United States of America (“U.S. GAAP”), which may require management to make estimates and assumptions that affect the reported amounts of assets and liabilities in the financial statements, disclosure of contingent assets and liabilities at the date of the financial statements and the reported amounts of increases and decreases in net assets from operations during the reporting period. Actual results could differ from those estimates. The Master Portfolio is considered an investment company under U.S. GAAP and follows the accounting and reporting guidance applicable to investment companies. Below is a summary of significant accounting policies:
Segregation and Collateralization: In cases where the Master Portfolio enters into certain investments (e.g., futures contracts) that would be treated as “senior securities” for 1940 Act purposes, the Master Portfolio may segregate or designate on its books and records cash or liquid assets having a market value at least equal to the amount of its future obligations under such investments. Doing so allows the investment to be excluded from treatment as a “senior security.” Furthermore, if required by an exchange or counterparty agreement, the Master Portfolio may be required to deliver/deposit cash and/or securities to/with an exchange, or broker-dealer or custodian as collateral for certain investments or obligations.
Investment Transactions and Investment Income: For financial reporting purposes, investment transactions are recorded on the dates the transactions are entered into (the trade dates). Realized gains and losses on investment transactions are determined on the identified cost basis. Dividend income is recorded on the ex-dividend date. Upon notification from issuers, some of the dividend income received from a real estate investment trust may be redesignated as a reduction of cost of the related investment and/or realized gain.
Indemnification: In the normal course of business, the Master Portfolio enters into contracts that contain a variety of representations that provide general indemnification. The Master Portfolio’s maximum exposure under these arrangements is unknown because it involves future potential claims against the Master Portfolio, which cannot be predicted with any certainty.
Other: Expenses directly related to the Master Portfolio are charged to the Master Portfolio. Other operating expenses shared by several funds, including other funds managed by the Manager, are prorated among those funds on the basis of relative net assets or other appropriate methods.
The Master Portfolio has an arrangement with its custodian whereby fees may be reduced by credits earned on uninvested cash balances, which, if applicable, are shown as fees paid indirectly in the Statement of Operations. The custodian imposes fees on overdrawn cash balances, which can be offset by accumulated credits earned or may result in additional custody charges.
3. Investment Valuation and Fair Value Measurements:
Investment Valuation Policies: The Master Portfolio’s investments are valued at fair value (also referred to as “market value” within the financial statements) as of the close of trading on the New York Stock Exchange (“NYSE”) (generally 4:00 p.m., Eastern time). U.S. GAAP defines fair value as the price the Master Portfolio would receive to sell an asset or pay to transfer a liability in an orderly transaction between market participants at the measurement date. The Master Portfolio determines the fair values of its financial instruments using various independent dealers or pricing services under policies approved by the Board. The BlackRock Global Valuation Methodologies Committee (the “Global Valuation Committee”) is the committee formed by management to develop global pricing policies and procedures and to oversee the pricing function for all financial instruments.
Fair Value Inputs and Methodologies: The following methods (or “techniques”) and inputs are used to establish the fair value of the Master Portfolio’s assets and liabilities:
| • | Equity investments traded on a recognized securities exchange are valued at the official close price each day, if available. For equity investments traded on more than one exchange, the official close price on the exchange where the stock is primarily traded is used. Equity investments traded on a recognized exchange for which there were no sales on that day may be valued at the last available bid (long positions) or ask (short positions) price. |
| • | Investments in open-end U.S. mutual funds are valued at net asset value each business day. |
| 54 | ANNUAL REPORT | MAY 31, 2016 |
| Notes to Financial Statements (continued) | BlackRock Master Small Cap Growth Portfolio |
| • | The Master Portfolio values its investment in BlackRock Liquidity Series, LLC, Money Market Series (the “Money Market Series”) at fair value, which is ordinarily based upon its pro rata ownership in the underlying fund’s net assets. The Money Market Series seeks current income consistent with maintaining liquidity and preserving capital. Although the Money Market Series is not registered under the 1940 Act, its investments will follow the parameters of investments by a money market fund that is subject to Rule 2a-7 under the 1940 Act. The Master Portfolio may withdraw up to 25% of its investment daily, although the manager of the Money Market Series, in its sole discretion, may permit an investor to withdraw more than 25% on any one day. |
| • | Futures contracts traded on exchanges are valued at their last sale price. |
If events (e.g., a company announcement, market volatility or a natural disaster) occur that are expected to materially affect the value of such instruments, or in the event that the application of these methods of valuation results in a price for an investment that is deemed not to be representative of the market value of such investment, or if a price is not available, the investment will be valued by the Global Valuation Committee, or its delegate, in accordance with a policy approved by the Board as reflecting fair value (“Fair Valued Investments”). When determining the price for Fair Valued Investments, the Global Valuation Committee, or its delegate, seeks to determine the price that the Master Portfolio might reasonably expect to receive or pay from the current sale or purchase of that asset or liability in an arm’s-length transaction. Fair value determinations shall be based upon all available factors that the Global Valuation Committee, or its delegate, deems relevant consistent with the principles of fair value measurement, which include the market approach, income approach and/or in the case of recent investments, the cost approach, as appropriate. The market approach generally consists of using comparable market transactions. The income approach generally is used to discount future cash flows to present value and is adjusted for liquidity as appropriate. These factors include but are not limited to: (i) attributes specific to the investment or asset; (ii) the principal market for the investment or asset; (iii) the customary participants in the principal market for the investment or asset; (iv) data assumptions by market participants for the investment or asset, if reasonably available; (v) quoted prices for similar investments or assets in active markets; and (vi) other factors, such as future cash flows, interest rates, yield curves, volatilities, prepayment speeds, loss severities, credit risks, recovery rates, liquidation amounts and/or default rates. Due to the inherent uncertainty of valuations of such investments, the fair values may differ from the values that would have been used had an active market existed. The Global Valuation Committee, or its delegate, employs various methods for calibrating valuation approaches for investments where an active market does not exist, including regular due diligence of the Master Portfolio’s pricing vendors, regular reviews of key inputs and assumptions, transactional back-testing or disposition analysis to compare unrealized gains and losses to realized gains and losses, reviews of missing or stale prices and large movements in market values and reviews of any market related activity. The pricing of all Fair Valued Investments is subsequently reported to the Board or a committee thereof on a quarterly basis.
Fair Value Hierarchy: Various inputs are used in determining the fair value of investments and derivative financial instruments. These inputs to valuation techniques are categorized into a fair value hierarchy consisting of three broad levels for financial statement purposes as follows:
| • | Level 1 – unadjusted price quotations in active markets/exchanges for identical assets or liabilities that the Master Portfolio has the ability to access |
| • | Level 2 – other observable inputs (including, but not limited to, quoted prices for similar assets or liabilities in markets that are active, quoted prices for identical or similar assets or liabilities in markets that are not active, inputs other than quoted prices that are observable for the assets or liabilities (such as interest rates, yield curves, volatilities, prepayment speeds, loss severities, credit risks and default rates) or other market–corroborated inputs) |
| • | Level 3 – unobservable inputs based on the best information available in the circumstances, to the extent observable inputs are not available (including the Master Portfolio’s own assumptions used in determining the fair value of investments and derivative financial instruments) |
The hierarchy gives the highest priority to unadjusted quoted prices in active markets for identical assets or liabilities (Level 1 measurements) and the lowest priority to unobservable inputs (Level 3 measurements). Accordingly, the degree of judgment exercised in determining fair value is greatest for instruments categorized in Level 3. The inputs used to measure fair value may fall into different levels of the fair value hierarchy. In such cases, for disclosure purposes, the fair value hierarchy classification is determined based on the lowest level input that is significant to the fair value measurement in its entirety. The significant unobservable inputs used by the Global Valuation Committee in determining the price for Fair Valued Investments are typically categorized as Level 3. The fair value hierarchy for the Master Portfolio’s investments and derivative financial instruments have been included in the Schedule of Investments.
Changes in valuation techniques may result in transfers into or out of an assigned level within the hierarchy. In accordance with the Master Portfolio’s policy, transfers between different levels of the fair value hierarchy are deemed to have occurred as of the beginning of the reporting period. The categorization of a value determined for investments and derivative financial instruments is based on the pricing transparency of the investments and derivative financial instruments and is not necessarily an indication of the risks associated with investing in those securities.
| ANNUAL REPORT | MAY 31, 2016 | 55 |
| Notes to Financial Statements (continued) | BlackRock Master Small Cap Growth Portfolio |
4. Securities and Other Investments:
Preferred Stock: Preferred stock has a preference over common stock in liquidation (and generally in receiving dividends as well) but is subordinated to the liabilities of the issuer in all respects. As a general rule, the market value of preferred stock with a fixed dividend rate and no conversion element varies inversely with interest rates and perceived credit risk, while the market price of convertible preferred stock generally also reflects some element of conversion value. Because preferred stock is junior to debt securities and other obligations of the issuer, deterioration in the credit quality of the issuer will cause greater changes in the value of a preferred stock than in a more senior debt security with similar stated yield characteristics. Unlike interest payments on debt securities, preferred stock dividends are payable only if declared by the issuer’s board of directors. Preferred stock also may be subject to optional or mandatory redemption provisions.
Securities Lending: The Master Portfolio may lend its securities to approved borrowers, such as brokers, dealers and other financial institutions. The borrower pledges and maintains with the Master Portfolio collateral consisting of cash, an irrevocable letter of credit issued by a bank, or securities issued or guaranteed by the U.S. Government. The initial collateral received by the Master Portfolio is required to have a value of at least 102% of the current value of the loaned securities for securities traded on U.S. exchanges and a value of at least 105% for all other securities. The collateral is maintained thereafter at a value equal to at least 100% of the current market value of the securities on loan. The market value of the loaned securities is determined at the close of each business day of the Master Portfolio and any additional required collateral is delivered to the Master Portfolio, or excess collateral returned by the Master Portfolio, on the next business day. During the term of the loan, the Master Portfolio is entitled to all distributions made on or in respect of the loaned securities. Loans of securities are terminable at any time and the borrower, after notice, is required to return borrowed securities within the standard time period for settlement of securities transactions.
The market value of securities on loan, all of which were classified as common stocks in the Master Portfolio’s Schedule of Investments, and the value of any related collateral are shown separately in the Statement of Assets and Liabilities as a component of investments at value — unaffiliated, and collateral on securities loaned at value, respectively. As of period end, any securities on loan were collateralized by cash. The cash collateral invested by the securities lending agent, BlackRock Investment Management, LLC (“BIM”), if any, is disclosed in the Schedule of Investments.
Securities lending transactions are entered into by the Master Portfolio under Master Securities Lending Agreements (each, an “MSLA”), which provide the right, in the event of default (including bankruptcy or insolvency), for the non-defaulting party to liquidate the collateral and calculate a net exposure to the defaulting party or request additional collateral. In the event that a borrower defaults, the Master Portfolio, as lender, would offset the market value of the collateral received against the market value of the securities loaned. When the value of the collateral is greater than that of the market value of the securities loaned, the lender is left with a net amount payable to the defaulting party. However, bankruptcy or insolvency laws of a particular jurisdiction may impose restrictions on or prohibitions against such a right of offset in the event of an MSLA counterparty’s bankruptcy or insolvency. Under the MSLA, absent an event of default the borrower can resell or re-pledge the loaned securities, and the Master Portfolio can reinvest cash collateral received in connection with loaned securities. Upon an event of default, the parties’ obligations to return the securities or collateral to the other party are extinguished, and the parties can resell or re-pledge the loaned securities or the collateral received in connection with the loaned securities in order to satisfy the defaulting party’s net payment obligation for all transactions under the MSLA. The defaulting party remains liable for any deficiency.
As of period end, the following table is a summary of the Master Portfolio’s securities lending agreements by counterparty, which are subject to offset under an MSLA:
| Counterparty | Securities Loaned at Value | Cash Collateral Received1 | Net Amount | |||||||
Credit Suisse Securities (USA) LLC | $ 53,400 | $ (53,400) | — | |||||||
Deutsche Bank Securities, Inc | 94,400 | (94,400) | — | |||||||
Goldman Sachs & Co | 297,575 | (297,575) | — | |||||||
Merrill Lynch, Pierce, Fenner & Smith | 300,549 | (300,549) | — | |||||||
Morgan Stanley & Co. LLC. | 495,018 | (495,018) | — | |||||||
National Financial Services LLC | 102,350 | (102,350) | — | |||||||
SG Americas Securities LLC | 64,864 | (64,864) | — | |||||||
UBS Securities LLC | 80,661 | (80,661) | — | |||||||
|
| |||||||||
Total | $ | 1,488,817 | $(1,488,817) | — | ||||||
|
| |||||||||
| 1 | Collateral with a value of $1,600,704 has been received in connection with securities lending agreements. Collateral received in excess of the value of securities loaned from the individual counterparty is not shown for financial reporting purposes in the table above. |
The risks of securities lending include the risk that the borrower may not provide additional collateral when required or may not return the securities when due. To mitigate these risks, the Master Portfolio benefits from a borrower default indemnity provided by BIM. BIM’s indemnity allows for full replacement of the securities loaned if the collateral received does not cover the value on the securities loaned in the event of borrower default. The Master Portfolio could suffer a loss if the value of an investment purchased with cash collateral falls below the market value of loaned securities or if the value of an investment purchased with cash collateral falls below the value of the original cash collateral received.
| 56 | ANNUAL REPORT | MAY 31, 2016 |
| Notes to Financial Statements (continued) | BlackRock Master Small Cap Growth Portfolio |
5. Derivative Financial Instruments:
The Master Portfolio engages in various portfolio investment strategies using derivative contracts both to increase the returns of the Master Portfolio and/or to manage its exposure to certain risks such as credit risk, equity risk, interest rate risk, foreign currency exchange rate risk, commodity price risk or other risks (e.g., inflation risk). Derivative financial instruments categorized by risk exposure are included in the Schedule of Investments. These contracts may be transacted on an exchange.
Futures Contracts: The Master Portfolio invests in long and/or short positions in futures contracts to gain exposure to, or manage exposure to, changes in the value of equity securities (equity risk).
Futures contracts are agreements between the Master Portfolio and a counterparty to buy or sell a specific quantity of an underlying instrument at a specified price and at a specified date. Depending on the terms of a contract, it is settled either through physical delivery of the underlying instrument on the settlement date or by payment of a cash amount on the settlement date. Upon entering into a futures contract, the Master Portfolio is required to deposit initial margin with the broker in the form of cash or securities in an amount that varies depending on a contract’s size and risk profile. The initial margin deposit must then be maintained at an established level over the life of the contract.
Securities deposited as initial margin are designated in the Schedule of Investments and cash deposited, if any, is shown as cash pledged for futures contracts in the Statement of Assets and Liabilities. Pursuant to the contract, the Master Portfolio agrees to receive from or pay to the broker an amount of cash equal to the daily fluctuation in market value of the contract (“variation margin”).Variation margin is recorded as unrealized appreciation (depreciation) and, if any, shown as variation margin receivable (or payable) on futures contracts in the Statement of Assets and Liabilities. When the contract is closed, a realized gain or loss is recorded in the Statement of Operations equal to the difference between the value of the contract at the time it was opened and the value at the time it was closed. The use of futures contracts involves the risk of an imperfect correlation in the movements in the price of futures contracts and interest, foreign currency exchange rates or underlying assets.
6. Investment Advisory Agreement and Other Transactions with Affiliates:
The PNC Financial Services Group, Inc. is the largest stockholder and an affiliate of BlackRock, Inc. (“BlackRock”) for 1940 Act purposes.
Investment Advisory
The Master LLC, on behalf of the Master Portfolio, entered into an Investment Advisory Agreement with the Manager, the Master Portfolio’s investment advisor, an indirect, wholly owned subsidiary of BlackRock, to provide investment advisory and administration services. The Manager is responsible for the management of the Master Portfolio’s portfolio and provides the personnel, facilities, equipment and certain other services necessary to the operations of the Master Portfolio. For such services, the Master Portfolio pays the Manager a monthly fee, which is determined by calculating a percentage of the Master Portfolio’s average daily net assets, based on the following annual rates:
| Average Daily Net Assets | Investment Advisory Fee | |
First $1 Billion | 0.70% | |
$1 Billion - $3 Billion | 0.66% | |
$3 Billion - $5 Billion | 0.63% | |
$5 Billion - $10 Billion | 0.61% | |
Greater than $10 Billion | 0.60% |
Expense Limitations, Waivers and Reimbursements
The Manager, with respect to the Master Portfolio, has contractually agreed to waive 0.16% of its investment advisory fees as a percentage of the Master Portfolio’s average daily net assets until October 1, 2016. The contractual agreement may be terminated upon 90 days’ notice by a majority of the independent Directors of the Master LLC or by a vote of a majority of the outstanding voting securities of the Master Portfolio. For the year ended May 31, 2016, the Manager waived $300,421 of investment advisory fees, which is included in fees waived by the Manager in the Statement of Operations.
The Manager, with respect to the Master Portfolio, voluntarily agreed to waive its investment advisory fees by the amount of investment advisory fees the Master Portfolio pays to the Manager indirectly through its investment in affiliated money market funds. This amount is included in fees waived by the Manager in the Statement of Operations. However, the Manager does not waive its investment advisory fees by the amount of investment advisory fees paid in connection with the Master Portfolio’s investments in other affiliated investment companies, if any. For the year ended May 31, 2016, the amount waived was $2,193.
For the year ended May 31, 2016, the Master Portfolio reimbursed the Manager $2,118 for certain accounting services, which is included in accounting services in the Statement of Operations.
| ANNUAL REPORT | MAY 31, 2016 | 57 |
| Notes to Financial Statements (continued) | BlackRock Master Small Cap Growth Portfolio |
Securities Lending
The U.S. Securities and Exchange Commission has issued an exemptive order which permits BIM, an affiliate of the Manager, to serve as securities lending agent for the Master Portfolio, subject to applicable conditions. As securities lending agent, BIM bears all operational costs directly related to securities lending. The Master Portfolio is responsible for expenses in connection with the investment of cash collateral received for securities onloan (the “collateral investment expenses”). The cash collateral is invested in a private investment company managed by the Manager or its affiliates. However, BIM has agreed to cap the collateral investment expenses of the private investment company to an annual rate of 0.04%. The investment advisor to the private investment company will not charge any advisory fees with respect to shares purchased by the Master Portfolio.
Securities lending income is equal to the total of income earned from the reinvestment of cash collateral, net of fees and other payments to and from borrowers of securities, and less the collateral investment expenses. The Master Portfolio retains a portion of securities lending income and remitsa remaining portion to BIM as compensation for its services as securities lending agent. Pursuant to a securities lending agreement, BIM may lend securities only when the difference between the borrower rebate rate and the risk free rate exceeds a certain level (such securities, the “specials only securities”).
Pursuant to such agreement, the Master Portfolio retains 80% of securities lending income. In addition, commencing the business day following the date that the aggregate securities lending income earned across certain funds in the Equity-Liquidity Complex in a calendar year exceeds a specified threshold, the Master Portfolio, pursuant to the securities lending agreement, will retain for the remainder of the calendar year securities lending income in an amount equal to 85% of securities lending income.
The share of securities lending income earned by the Master Portfolio is shown as securities lending — affiliated — net in the Statement of Operations. For the year ended May 31, 2016, the Master Portfolio paid BIM $48,480 for securities lending agent services.
Officer and Directors
Certain officers and/or directors of the Master LLC are officers and/or directors of BlackRock or its affiliates.
7. Purchases and Sales:
For the year ended May 31, 2016, purchases and sales of investments, excluding short-term securities, were $214,501,131 and $240,072,957, respectively.
8. Income Tax Information:
The Master Portfolio is disregarded as an entity separate from its owner for tax purposes. As such, the owner of the Master Portfolio is treated as the owner of the net assets, income, expenses and realized and unrealized gains and losses of the Master Portfolio. Therefore, no federal income tax provision is required. It is intended that the Master Portfolio’s assets will be managed so the owner of the Master Portfolio can satisfy the requirements of Subchapter M of the Internal Revenue Code of 1986, as amended.
As of May 31, 2016, gross unrealized appreciation and depreciation based on cost for federal income tax purposes were as follows:
Tax cost | $165,392,406 | |||
|
| |||
Gross unrealized appreciation | $ 18,452,009 | |||
Gross unrealized depreciation | (14,647,921 | ) | ||
|
| |||
Net unrealized appreciation | $ 3,804,088 | |||
|
|
9. Bank Borrowings:
The Master LLC, on behalf of the Master Portfolio, along with certain other funds managed by the Manager and its affiliates (“Participating Funds”), is a party to a 364-day, $2.1 billion credit agreement with a group of lenders. Under this agreement, the Master Portfolio may borrow to fund shareholder redemptions. Excluding commitments designated for certain individual funds, the Participating Funds, including the Master Portfolio, can borrow up to an aggregate commitment amount of $1.6 billion at any time outstanding, subject to asset coverage and other limitations as specified in the agreement. The credit agreement has the following terms: a fee of 0.12% per annum on unused commitment amounts and interest at a rate equal to the higher of (a) one-month LIBOR (but, in any event, not less than 0.00%) on the date the loan is made plus 0.80% per annum or (b) the Fed Funds rate (but, in any event, not less than 0.00%) in effect from time to time plus 0.80% per annum on amounts borrowed. The agreement expires in April 2017 unless extended or renewed. Prior to April 21, 2016, the credit agreement had a fee per annum of 0.06% on unused commitment amounts and interest at a rate equal to the higher of (a) one-month LIBOR (but, in any event, not less than 0.00%) on the date the loan is made plus 0.80% per annum
| 58 | ANNUAL REPORT | MAY 31, 2016 |
| Notes to Financial Statements (concluded) | BlackRock Master Small Cap Growth Portfolio |
or (b) the Fed Funds rate (but, in any event, not less than 0.00%) in effect from time to time plus 0.80% per annum on amounts borrowed. Participating Funds paid administration, legal and arrangement fees, which, if applicable, are included in miscellaneous expenses in the Statement of Operations. These fees, were allocated among such funds based upon portions of the aggregate commitment available to them and relative net assets of Participating Funds. During the year ended May 31, 2016, the Master Portfolio did not borrow under the credit agreement.
10. Principal Risks:
In the normal course of business, the Master Portfolio invests in securities and enters into transactions where risks exist due to fluctuations in the market (market risk) or failure of the issuer to meet all its obligations, including the ability to pay principal and interest when due (issuer credit risk). The value of securities held by the Master Portfolio may decline in response to certain events, including those directly involving the issuers of securities owned by the Master Portfolio. Changes arising from the general economy, the overall market and local, regional or global political and/ or social instability, as well as currency, interest rate and price fluctuations, may also affect the securities’ value.
Counterparty Credit Risk: Similar to issuer credit risk, the Master Portfolio may be exposed to counterparty credit risk, or the risk that an entity may fail to or be unable to perform on its commitments related to unsettled or open transactions. The Master Portfolio manages counterparty credit risk by entering into transactions only with counterparties that the Manager believes have the financial resources to honor their obligations and by monitoring the financial stability of those counterparties. Financial assets, which potentially expose the Master Portfolio to market, issuer and counterparty credit risks, consist principally of financial instruments and receivables due from counterparties. The extent of the Master Portfolio’s exposure to market, issuer and counterparty credit risks with respect to these financial assets is approximately their value recorded in the Statement of Assets and Liabilities, less any collateral held by the Master Portfolio.
A derivative contract may suffer a mark-to-market loss if the value of the contract decreases due to an unfavorable change in the market rates or values of the underlying instrument. Losses can also occur if the counterparty does not perform under the contract.
With exchange-traded futures, there is less counterparty credit risk to the Master Portfolio since the exchange or clearinghouse, as counterparty to such instruments, guarantees against a possible default. The clearinghouse stands between the buyer and the seller of the contract; therefore, credit risk is limited to failure of the clearinghouse. While offset rights may exist under applicable law, the Master Portfolio does not have a contractual right of offset against a clearing broker or clearinghouse in the event of a default (including the bankruptcy or insolvency). Additionally, credit risk exists in exchange-traded futures with respect to initial and variation margin that is held in a clearing broker’s customer accounts. While clearing brokers are required to segregate customer margin from their own assets, in the event that a clearing broker becomes insolvent or goes into bankruptcy and at that time there is a shortfall in the aggregate amount of margin held by the clearing broker for all its clients, typically the shortfall would be allocated on a pro rata basis across all the clearing broker’s customers, potentially resulting in losses to the Master Portfolio.
Concentration Risk: As of period end, the Master Portfolio invested a significant portion of its assets in securities in the health care and information technology sectors. Changes in economic conditions affecting such sectors would have a greater impact on the Master Portfolio and could affect the value, income and/or liquidity of positions in such securities.
11. Subsequent Events:
Management has evaluated the impact of all subsequent events on the Master Portfolio through the date the financial statements were issued and has determined that there were no subsequent events requiring adjustment or additional disclosure in the financial statements.
| ANNUAL REPORT | MAY 31, 2016 | 59 |
| Report of Independent Registered Public Accounting Firm | BlackRock Master Small Cap Growth Portfolio |
To the Investor of BlackRock Master Small Cap Growth Portfolio and Board of Directors of BlackRock Master LLC:
We have audited the accompanying statement of assets and liabilities, including the schedule of investments, of Master Small Cap Growth Portfolio (the “Master LLC”) as of May 31, 2016, and the related statement of operations for the year then ended, the statements of changes in net assets for each of the two years in the period then ended and the financial highlights for each of the five years in the period then ended. These financial statements and financial highlights are the responsibility of the Master LLC’s management. Our responsibility is to express an opinion on these financial statements and financial highlights based on our audits.
We conducted our audits in accordance with the standards of the Public Company Accounting Oversight Board (United States). Those standards require that we plan and perform the audit to obtain reasonable assurance about whether the financial statements and financial highlights are free of material misstatement. The Master LLC is not required to have, nor were we engaged to perform, an audit of its internal control over financial reporting. Our audits included consideration of internal control over financial reporting as a basis for designing audit procedures that are appropriate in the circumstances, but not for the purpose of expressing an opinion on the effectiveness of the Fund’s internal control over financial reporting. Accordingly, we express no such opinion. An audit also includes examining, on a test basis, evidence supporting the amounts and disclosures in the financial statements, assessing the accounting principles used and significant estimates made by management, as well as evaluating the overall financial statement presentation. Our procedures included confirmation of securities owned as of May 31, 2016, by correspondence with the custodian and brokers; where replies were not received from brokers, we performed other auditing procedures. We believe that our audit provide a reasonable basis for our opinion.
In our opinion, the financial statements and financial highlights referred to above present fairly, in all material respects, the financial position of BlackRock Master Small Cap Growth Portfolio as of May 31, 2016, the results of its operations for the year then ended, the changes in its net assets for each of the two years in the period then ended, and the financial highlights for each of the five years in the period then ended, in conformity with accounting principles generally accepted in the United States of America.
Deloitte & Touche LLP
Philadelphia, Pennsylvania
July 26, 2016
| 60 | ANNUAL REPORT | MAY 31, 2016 |
| Disclosure of Investment Advisory Agreements |
The Board of Trustees of BlackRock FundsSM (the “Trust”) met in person on April 21, 2016 and May 18-20, 2016 to consider the approval of the Trust’s investment advisory agreement (the “Trust Advisory Agreement”) with BlackRock Advisors, LLC (the “Manager” or “BlackRock”), the Trust’s investment advisor, on behalf of BlackRock Disciplined Small Cap Core Fund (“Disciplined Small Cap Core Fund”), a portfolio of the Trust.
The Board of Directors of BlackRock Master LLC (the “Master LLC”) met in person on April 21, 2016 and May 18-20, 2016 to consider the approval of the Master LLC’s investment advisory agreement (the “Master LLC Advisory Agreement”) with the Manager, the Master LLC’s investment advisor, on behalf of BlackRock Master Small Cap Growth Portfolio (the “Master Portfolio”), a series of the Master LLC. BlackRock Small Cap Growth Fund II (“Small Cap Growth Fund II”), a series of BlackRock Series, Inc. (the “Corporation”), is a “feeder” fund that invests all of its investable assets in the Master Portfolio. Accordingly, the Board of Directors of the Corporation also considered the approval of the Master LLC Advisory Agreement.
Disciplined Small Cap Core Fund, Small Cap Growth Fund II, the Master LLC (with respect to the Master Portfolio) and the Corporation (with respect to Small Cap Growth Fund II) are referred to herein, as pertinent, individually as a “Fund” or collectively as the “Funds.” The Trust Advisory Agreement and the Master LLC Advisory Agreement are referred to herein as the “Agreements.” For simplicity: (a) the Board of Trustees of the Trust, the Board of Directors of the Master LLC and the Board of Directors of the Corporation are referred to herein individually as the “Board” and collectively as the “Boards,” and the members are referred to as “Board Members;” (b) the shareholders of Disciplined Small Cap Core Fund and Small Cap Growth Fund II and the interest holders of the Master Portfolio are referred to as “shareholders;” and (c) the meetings held on April 21, 2016 are referred to as the “April Meeting” and the meetings held on May 18-20, 2016 are referred to as the “May Meeting.”
Activities and Composition of the Boards
On the date of the May Meeting, each Board consisted of fifteen individuals, thirteen of whom were not “interested persons” of the pertinent Fund as defined in the Investment Company Act of 1940, as amended (the “1940 Act”) (the “Independent Board Members”). The Board Members are responsible for the oversight of the operations of the pertinent Fund and perform the various duties imposed on the directors of investment companies by the 1940 Act. The Independent Board Members have retained independent legal counsel to assist them in connection with their duties. The Chair of each Board is an Independent Board Member. Each Board has established five standing committees: an Audit Committee, a Governance and Nominating Committee, a Compliance Committee, a Performance Oversight and Contract Committee and an Executive Committee, each of which is chaired by an Independent Board Member and composed of Independent Board Members (except for the Executive Committee, which also has one interested Board Member).
The Agreements
Pursuant to the 1940 Act, each Board is required to consider the continuation of the pertinent Agreement on an annual basis. The Boards have four quarterly meetings per year, each extending over two days, a fifth one-day meeting to consider specific information surrounding the consideration of renewing the pertinent Agreement, and additional in-person and telephonic meetings as needed. In connection with this year-long deliberative process, the Boards assessed, among other things, the nature, extent and quality of the services provided to the Funds by BlackRock, BlackRock’s personnel and affiliates, including (as applicable) investment management; administrative and shareholder services; the oversight of fund service providers; marketing; risk oversight; compliance; and ability to meet applicable legal and regulatory requirements.
The Boards, acting directly and through their committees, consider at each of their meetings, and from time to time as appropriate, factors that are relevant to their annual consideration of the renewal of the Agreements, including the services and support provided by BlackRock to the Funds and their shareholders. BlackRock also furnished additional information to the Boards in response to specific questions from the Boards. This additional information is discussed further below in the section titled “Board Considerations in Approving the Agreements.” Among the matters the Boards considered, with respect to each Fund, as pertinent, were: (a) investment performance for one-year, three-year, five-year, ten-year and/or since inception periods, as applicable, against peer funds, applicable benchmark, and performance metrics, as applicable, as well as senior management’s and portfolio managers’ analysis of the reasons for any over-performance or underperformance relative to its peers, benchmarks, and other performance metrics, as applicable; (b) fees, including advisory, administration, if applicable, and other amounts paid to BlackRock and its affiliates by the Fund for services; (c) the Fund’s operating expenses and how BlackRock allocates expenses to the Fund; (d) the resources devoted to, risk oversight of, and compliance reports relating to, implementation of the Fund’s investment objective(s), policies and restrictions, and meeting regulatory requirements; (e) the Fund’s compliance with its compliance policies and procedures; (f) the nature, cost and character of non-investment management services provided by BlackRock and its affiliates; (g) BlackRock’s and other service providers’ internal controls and risk and compliance oversight mechanisms; (h) BlackRock’s implementation of the proxy voting policies approved by the Board; (i) the use of brokerage commissions and execution quality of portfolio transactions; (j) BlackRock’s implementation of the Fund’s valuation and liquidity procedures; (k) an analysis of management fees for products with similar investment mandates across the open-end fund, exchange-traded fund (“ETF”), closed-end fund and institutional account product channels, as applicable, and the similarities and differences between these products and the services provided as compared to the Fund; (l) BlackRock’s compensation methodology for its investment professionals and the incentives and accountability it creates, along with investment professionals’ investments in the fund(s) they manage; and (m) periodic updates on BlackRock’s business.
| ANNUAL REPORT | MAY 31, 2016 | 61 |
| Disclosure of Investment Advisory Agreements (continued) |
Board Considerations in Approving the Agreements
The Approval Process: Prior to the April Meeting, the Boards requested and received materials specifically relating to the Agreements. The Boards are continuously engaged in a process with their independent legal counsel and BlackRock to review the nature and scope of the information provided to better assist their deliberations. The materials provided in connection with the April Meeting included (a) information independently compiled and prepared by Broadridge Financial Solutions, Inc. (“Broadridge”) on fees and expenses of each Fund as compared with a peer group of funds as determined by Broadridge (“Expense Peers”) and the investment performance of Disciplined Small Cap Core Fund and Small Cap Growth Fund II, as applicable, as compared with a peer group of funds as determined by Broadridge1; (b) information on the profits realized by BlackRock and its affiliates pursuant to the Agreements and a discussion of fall-out benefits to BlackRock and its affiliates; (c) a general analysis provided by BlackRock concerning investment management fees charged to other clients, such as institutional clients, sub-advised mutual funds, ETFs and closed-end funds, under similar investment mandates, as well as the performance of such other clients, as applicable; (d) review of non-management fees; (e) the existence, impact and sharing of potential economies of scale; (f) a summary of aggregate amounts paid by each Fund to BlackRock; and (g) sales and redemption data regarding the shares of Disciplined Small Cap Core Fund and Small Cap Growth Fund II, as applicable.
At the April Meeting, each Board reviewed materials relating to its consideration of the pertinent Agreement. As a result of the discussions that occurred during the April Meeting, and as a culmination of each Board’s year-long deliberative process, the Boards presented BlackRock with questions and requests for additional information. BlackRock responded to these requests with additional written information in advance of the May Meeting.
At the May Meeting, (a) the Board of the Trust, including the Independent Board Members, approved the continuation of the Trust Advisory Agreement between the Manager and the Trust with respect to Disciplined Small Cap Core Fund for a one-year term ending June 30, 2017; and (b) the Board of the Master LLC, including the Independent Board Members, approved the continuation of the Master LLC Advisory Agreement between the Manager and the Master LLC with respect to the Master Portfolio for a one-year term ending June 30, 2017. The Board of the Corporation, including the Independent Board Members, also considered the continuation of the Master LLC Advisory Agreement with respect to the Master Portfolio and found the Master LLC Advisory Agreement to be satisfactory. In approving the continuation of the pertinent Agreement, each Board considered, with respect to the applicable Fund: (a) the nature, extent and quality of the services provided by BlackRock; (b) the investment performance of the Fund and BlackRock; (c) the advisory fee and the cost of the services and profits to be realized by BlackRock and its affiliates from their relationship with the Fund; (d) the costs of Disciplined Small Cap Core Fund and Small Cap Growth Fund II, as applicable, to investors compared to the costs of the relevant Expense Peers and performance compared to the relevant performance comparison as previously discussed; (e) the sharing of potential economies of scale; (f) fall-out benefits to BlackRock and its affiliates as a result of its relationship with the Fund; and (g) other factors deemed relevant by the Board Members.
Each Board also considered other matters it deemed important to the approval process, such as other payments made to BlackRock or its affiliates, securities lending and cash management, services related to the valuation and pricing of portfolio holdings of the applicable Fund, and advice from independent legal counsel with respect to the review process and materials submitted for the Board’s review. Each Board noted the willingness of BlackRock personnel to engage in open, candid discussions with the Board. The Boards did not identify any particular information as determinative, and each Board Member may have attributed different weights to the various items considered.
A. Nature, Extent and Quality of the Services Provided by BlackRock: Each Board, including the Independent Board Members, reviewed the nature, extent and quality of services provided by BlackRock, including the investment advisory services and the resulting performance of the applicable Fund. Throughout the year, each Board compared Fund performance to the performance of a comparable group of mutual funds, relevant benchmark, and performance metrics, as applicable. The Boards met with BlackRock’s senior management personnel responsible for investment activities, including the senior investment officers. Each Board also reviewed the materials provided by the applicable Fund’s portfolio management team discussing the Fund’s performance and the Fund’s investment objective(s), strategies and outlook.
Each Board considered, among other factors, with respect to BlackRock: the number, education and experience of investment personnel generally and the applicable Fund’s portfolio management team; BlackRock’s research capabilities; investments by portfolio managers in the funds they manage; portfolio trading capabilities; use of technology; commitment to compliance; credit analysis capabilities; risk analysis and oversight capabilities; and the approach to training and retaining portfolio managers and other research, advisory and management personnel. Each Board engaged in a review of BlackRock’s compensation structure with respect to the applicable Fund’s portfolio management team and BlackRock’s ability to attract and retain high-quality talent and create performance incentives.
| 1 | Funds are ranked by Broadridge in quartiles, ranging from first to fourth, where first is the most desirable quartile position and fourth is the least desirable. |
| 62 | ANNUAL REPORT | MAY 31, 2016 |
| Disclosure of Investment Advisory Agreements (continued) |
In addition to investment advisory services, the Boards considered the quality of the administrative and other non-investment advisory services provided to the Funds. BlackRock and its affiliates provide the Funds with certain administrative, shareholder and other services (in addition to any such services provided to the Funds by third parties) and officers and other personnel as are necessary for the operations of the Funds. In particular, BlackRock and its affiliates provide the Funds with administrative services including, among others: (i) preparing disclosure documents, such as the prospectus, the summary prospectus (as applicable), the statement of additional information and periodic shareholder reports; (ii) oversight of daily accounting and pricing; (iii) preparing periodic filings with regulators; (iv) overseeing and coordinating the activities of other service providers; (v) organizing Board meetings and preparing the materials for such Board meetings; (vi) providing legal and compliance support; (vii) furnishing analytical and other support to assist the Boards in their consideration of strategic issues such as the merger, consolidation or repurposing of certain open-end funds; and (viii) performing other administrative functions necessary for the operation of the Funds, such as tax reporting, fulfilling regulatory filing requirements and call center services. The Boards reviewed the structure and duties of BlackRock’s fund administration, shareholder services, and legal & compliance departments and considered BlackRock’s policies and procedures for assuring compliance with applicable laws and regulations.
B. The Investment Performance of the Funds and BlackRock: The Boards, including the Independent Board Members, also reviewed and considered the performance history of Disciplined Small Cap Core Fund and the Master Portfolio and Small Cap Growth Fund II, as applicable. The Boards of each of the Master LLC and the Corporation noted that Small Cap Growth Fund II’s investment results correspond directly to the investment results of the Master Portfolio. In preparation for the April Meeting, the Boards were provided with reports independently prepared by Broadridge, which included a comprehensive analysis of the performance of Disciplined Small Cap Core Fund and Small Cap Growth Fund II, as applicable. The Boards also reviewed a narrative and statistical analysis of the Broadridge data that was prepared by BlackRock. In connection with their review, the Boards received and reviewed information regarding the investment performance of Disciplined Small Cap Core Fund and Small Cap Growth Fund II as compared to other funds in the Fund’s applicable Broadridge category. The Boards were provided with a description of the methodology used by Broadridge to select peer funds and periodically meet with Broadridge representatives to review its methodology. Each Board was provided with information on the composition of the Broadridge performance universes and expense universes. Each Board and its Performance Oversight and Contract Committee regularly review, and meet with Fund management to discuss, the performance of the pertinent Fund, throughout the year.
In evaluating performance, the Boards recognized that the performance data reflects a snapshot of a period as of a particular date and that selecting a different performance period could produce significantly different results. Further, the Boards recognized that it is possible that long-term performance can be adversely affected by even one period of significant underperformance so that a single investment decision or theme has the ability to affect long-term performance disproportionately.
The Board of the Trust noted that for the one-year and since-inception periods reported Disciplined Small Cap Core Fund ranked in the second and first quartiles, respectively, against its Broadridge Performance Universe.
The Boards of each of the Master LLC and the Corporation noted that for each of the one-, three- and five-year periods reported, Small Cap Growth Fund II ranked in the third quartile against its Broadridge Performance Universe. These Boards and BlackRock reviewed and discussed the reasons for Small Cap Growth Fund II’s underperformance during these periods. The Boards were informed that, among other things, an overweight position in the energy sector and overweight exposure to energy beneficiary companies in the industrial, chemical, transportation, and technology industries were the primary drivers of underperformance over the one- and three-year periods. During the five-year period, the Fund had significant underperformance in the fourth quarter of 2012 due to an overweight position in the healthcare sector.
The Board of the Master LLC, the Board of the Corporation and BlackRock also discussed BlackRock’s strategy for improving the Master Portfolio’s/ Small Cap Growth Fund II’s investment performance. Discussions covered topics, for the Master Portfolio and Small Cap Growth Fund II, as applicable, such as: investment risks undertaken; performance attribution; the investment personnel; and the resources appropriate to support investment processes. These Boards and BlackRock also discussed BlackRock’s active equity platform, and it was noted that BlackRock has recruited a Head of Global Active Equity, and has appointed a Chief Performance Officer to provide analysis of investment performance to senior management and the Boards.
C. Consideration of the Advisory/Management Fees and the Cost of the Services and Profits to be Realized by BlackRock and its Affiliates from their Relationship with the Funds: The Boards, including the Independent Board Members, reviewed, as pertinent, the contractual management fee rate of Disciplined Small Cap Core Fund and the Master Portfolio/Small Cap Growth Fund II compared with the other funds in the applicable Fund’s Broadridge category. The contractual management fee rate represents a combination of the advisory fee and any administrative fees, before taking into account any reimbursements or fee waivers. The Boards also compared, as pertinent, the total expense ratio of Disciplined Small Cap Core Fund and Small Cap Growth Fund II, as well as the actual management fee rate of Disciplined Small Cap Core Fund and the Master Portfolio/Small Cap Growth Fund II, to those of other funds in the applicable Fund’s Broadridge category. The total expense ratio represents a fund’s total net operating expenses, including any 12b-1 or non 12b-1 service fees. The total expense ratio gives effect to any expense reimbursements or fee waivers that benefit a fund, and the actual management fee rate gives effect to any management fee reimbursements or waivers that benefit a fund. The Boards considered the services provided and the fees charged by BlackRock and its affiliates to other types of clients with similar investment mandates, as applicable, including institutional accounts and sub-advised mutual funds (including mutual funds sponsored by third parties).
| ANNUAL REPORT | MAY 31, 2016 | 63 |
| Disclosure of Investment Advisory Agreements (continued) |
The Boards received and reviewed statements relating to BlackRock’s financial condition. Each Board reviewed BlackRock’s profitability methodology and was also provided with a profitability analysis that detailed the revenues earned and the expenses incurred by BlackRock for services provided to the Funds. The Boards reviewed BlackRock’s profitability with respect to the Funds and other funds the Board currently oversees for the year ended December 31, 2015 compared to available aggregate profitability data provided for the prior two years. The Boards reviewed BlackRock’s profitability with respect to certain other U.S. fund complexes managed by the Manager and/or its affiliates. The Boards reviewed BlackRock’s assumptions and methodology of allocating expenses in the profitability analysis, noting the inherent limitations in allocating costs among various advisory products. The Boards recognized that profitability may be affected by numerous factors including, among other things, fee waivers and expense reimbursements by the Manager, the types of funds managed, precision of expense allocations and business mix. As a result, calculating and comparing profitability at individual fund levels is difficult.
The Boards noted that, in general, individual fund or product line profitability of other advisors is not publicly available. The Boards reviewed BlackRock’s overall operating margin, in general, compared to that of certain other publicly-traded asset management firms. The Boards considered the differences between BlackRock and these other firms, including the contribution of technology at BlackRock, BlackRock’s expense management, and the relative product mix.
In addition, each Board considered the cost of the services provided to the applicable Fund by BlackRock, and BlackRock’s and its affiliates’ profits relating to the management and distribution of the applicable Fund and the other funds advised by BlackRock and its affiliates. As part of its analysis, each Board reviewed BlackRock’s methodology in allocating its costs of managing each Fund, to the applicable Fund. The Boards may receive and review information from independent third parties as part of their annual evaluation. Each Board considered whether BlackRock has the financial resources necessary to attract and retain high quality investment management personnel to perform its obligations under the pertinent Agreement and to continue to provide the high quality of services that is expected by that Board. The Boards further considered factors including but not limited to BlackRock’s commitment of time, assumption of risk and liability profile in servicing the Funds in contrast to what is required of BlackRock with respect to other products with similar investment mandates across the open-end fund, ETF, closed-end fund, sub-advised mutual fund and institutional account product channels, as applicable.
The Board of the Trust noted that Disciplined Small Cap Core Fund’s contractual management fee rate ranked in the first quartile, and that the actual management fee rate and total expense ratio each ranked in the first quartile, relative to the Fund’s Expense Peers. The Board of the Trust also noted that Disciplined Small Cap Core Fund has an advisory fee arrangement that includes breakpoints that adjust the fee rate downward as the size of the Fund increases above certain contractually specified levels. The Board further noted that BlackRock has contractually agreed to a cap on Disciplined Small Cap Core Fund’s total expenses as a percentage of the Fund’s average daily net assets on a class-by-class basis.
The Boards of each of the Master LLC and the Corporation noted that the Master Portfolio’s/Small Cap Growth Fund II’s contractual management fee rate ranked in the third quartile, and that the actual management fee rate and Small Cap Growth Fund II’s total expense ratio ranked in the first and fourth quartiles, respectively, relative to the Fund’s Expense Peers. The Boards of each of the Master LLC and the Corporation also noted that the Master Portfolio has an advisory fee arrangement that includes breakpoints that adjust the fee rate downward as the size of the Master Portfolio increases above certain contractually specified levels. The Boards further noted that BlackRock has contractually agreed to waive a portion of the advisory fee for the Master Portfolio. In addition, after discussion between these Boards, including the independent Board Members, and BlackRock, the Boards and BlackRock agreed to a contractual administration fee waiver for Small Cap Growth Fund II. The waiver was implemented on June 15, 2016.
D. Economies of Scale: Each Board, including the Independent Board Members, considered the extent to which economies of scale might be realized as the assets of the applicable Fund increase, as well as the existence of expense caps, as applicable. Each Board also considered the extent to which the applicable Fund benefits from such economies in a variety of ways and whether there should be changes in the advisory fee rate or breakpoint structure in order to enable the Fund to more fully participate in these economies of scale. The Board considered the Master Portfolio’s asset levels and whether the current fee schedule was appropriate. In their consideration, the Board Members took into account the existence of any expense caps and further considered the continuation and/or implementation, as applicable, of such caps.
E. Other Factors Deemed Relevant by the Board Members: Each Board, including the Independent Board Members, also took into account other ancillary or “fall-out” benefits that BlackRock or its affiliates may derive from their respective relationships with the applicable Fund, both tangible and intangible, such as BlackRock’s ability to leverage its investment professionals who manage other portfolios and risk management personnel, an increase in BlackRock’s profile in the investment advisory community, and the engagement of BlackRock’s affiliates as service providers to the Fund, including for administrative, distribution, securities lending and cash management services. The Boards also considered BlackRock’s overall operations and its efforts to expand the scale of, and improve the quality of, its operations. The Boards also noted that BlackRock may use and benefit from third party research obtained by soft dollars generated by certain registered fund transactions to assist in managing all or a number of its other client accounts. Each Board further noted that it had considered the investment by BlackRock’s funds in affiliated ETFs without any offset against the management fees payable by the funds to BlackRock.
| 64 | ANNUAL REPORT | MAY 31, 2016 |
| Disclosure of Investment Advisory Agreements (concluded) |
In connection with their consideration of the Agreements, the Boards also received information regarding BlackRock’s brokerage and soft dollar practices. The Boards received reports from BlackRock which included information on brokerage commissions and trade execution practices throughout the year.
The Boards noted the competitive nature of the open-end fund marketplace, and that shareholders are able to redeem their Fund shares if they believe that the pertinent Fund’s fees and expenses are too high or if they are dissatisfied with the performance of the Fund.
Conclusion
The Board of the Trust, including the Independent Board Members, approved the continuation of the Trust Advisory Agreement between the Manager and the Trust with respect to Disciplined Small Cap Core Fund for a one-year term ending June 30, 2017. The Board of the Master LLC, including the Independent Board Members, approved the continuation of the Master LLC Advisory Agreement between the Manager and the Master LLC with respect to the Master Portfolio for a one-year term ending June 30, 2017.
Based upon its evaluation of all of the aforementioned factors in their totality, as well as other information, each of the Board of the Trust and the Board of the Master LLC, including the Independent Board Members, was satisfied that the terms of the pertinent Agreement were fair and reasonable and in the best interest of the applicable Fund and its shareholders. The Board of the Corporation, including the Independent Board Members, also considered the continuation of the Master LLC Advisory Agreement with respect to the Master Portfolio and found the Master LLC Advisory Agreement to be satisfactory. In arriving at its decision to approve the applicable Agreement, the Board of the Trust and the Board of the Master LLC did not identify any single factor or group of factors as all-important or controlling, but considered all factors together, and different Board Members may have attributed different weights to the various factors considered. The Independent Board Members were also assisted by the advice of independent legal counsel in making this determination. The contractual fee arrangements for the Trust and the Master LLC reflect the results of several years of review by the respective Board Members and predecessor Board Members, and discussions between such Board Members (and predecessor Board Members) and BlackRock. As a result, the Board Members’ conclusions may be based in part on their consideration of these arrangements in prior years.
| ANNUAL REPORT | MAY 31, 2016 | 65 |
| Officers and Directors/Trustees |
Name, Address1 and Year of Birth | Position(s) Held with Trust/ Corporation/ Master LLC | Length of Time Served3 | Principal Occupation(s) During Past Five Years | Number of BlackRock- Advised Registered Investment Companies (“RICs”) Consisting of Investment Portfolios (“Portfolios”) Overseen | Public Company and Other Investment Company Directorships Held During Past Five Years | |||||
| Independent Directors/Trustees2 | ||||||||||
Rodney D. Johnson 1941 | Chair of the Board and Director/Trustee | Since 2007 | President, Fairmount Capital Advisors, Inc. from 1987 to 2013; Member of the Archdiocesan Investment Committee of the Archdiocese of Philadelphia from 2004 to 2012; Director, The Committee of Seventy (civic) from 2006 to 2012; Director, Fox Chase Cancer Center from 2004 to 2011; Director, The Mainstay (non-profit) since 2016. | 33 RICs consisting of 153 Portfolios | None | |||||
David O. Beim 1940 | Director/Trustee | Since 2007 | Professor of Professional Practice at the Columbia University Graduate School of Business from 1991 to 2014; Trustee, Phillips Exeter Academy from 2002 to 2012; Chairman, Wave Hill, Inc. (public garden and cultural center) from 1990 to 2006. | 33 RICs consisting of 153 Portfolios | None | |||||
Susan J. Carter 1956 | Director/Trustee | Since 2016 | Director, Pacific Pension Institute since 2014; Advisory Board Member, Center for Private Equity and Entrepreneurship at Tuck School of Business since 1997; Senior Advisor, Commonfund Capital, Inc. (“CCI”) (investment adviser) in 2015; Chief Executive Officer, CCI from 2013 to 2014; President & Chief Executive Officer, CCI from 1997 to 2013; Advisory Board Member, Girls Who Invest since 2015; Advisory Board Member, Bridges Ventures since 2016. | 33 RICs consisting of 153 Portfolios | None | |||||
Collette Chilton 1958 | Director/Trustee | Since 2015 | Chief Investment Officer, Williams College since 2006; Chief Investment Officer, Lucent Asset Management Corporation from 1998 to 2006. | 33 RICs consisting of 153 Portfolios | None | |||||
Neil A. Cotty 1954 | Director/Trustee | Since 2016 | Bank of America Corporation from 1996 to 2015, serving in various senior finance leadership roles, including Chief Accounting Officer, from 2009 to 2015, Chief Financial Officer of Global Banking, Markets and Wealth Management from 2008 to 2009, Chief Accounting Officer from 2004 to 2008, Chief Financial Officer of Consumer Bank from 2003 to 2004, Chief Financial Officer of Global Corporate Investment Bank from 1999 to 2002. | 33 RICs consisting of 153 Portfolios | None | |||||
Dr. Matina S. Horner 1939 | Director/Trustee | Since 2007 | Executive Vice President, Teachers Insurance and Annuity Association and College Retirement Equities Fund from 1989 to 2003. | 33 RICs consisting of 153 Portfolios | NSTAR (electric and gas utility) | |||||
Cynthia A. Montgomery 1952 | Director/Trustee | Since 2007 | Professor, Harvard Business School since 1989; Director, McLean Hospital from 2005 to 2012. | 33 RICs consisting of 153 Portfolios | Newell Rubbermaid, Inc. (manufacturing) | |||||
Joseph P. Platt 1947 | Director/Trustee | Since 2007 | General Partner, Thorn Partners, LP (private investments) since 1998; Director, WQED Multi-Media (public broadcasting not-for- profit) since 2001; Chair, Basic Health International (non-profit) since 2015. | 33 RICs consisting of 153 Portfolios | Greenlight Capital Re, Ltd. (reinsurance company); Consol Energy Inc. | |||||
Robert C. Robb, Jr. 1945 | Director/Trustee | Since 2007 | Partner, Lewis, Eckert, Robb and Company (management and financial consulting firm) since 1981 and Principal since 2010. | 33 RICs consisting of 153 Portfolios | None | |||||
Mark Stalnecker 1951 | Director/Trustee | Since 2015 | Chief Investment Officer, University of Delaware from 1999 to 2013; Trustee, Winterthur Museum and Country Estate from 2001 to 2015; Member of the Investment Committee, Delaware Public Employees’ Retirement System since 2002; Member of the Investment Committee, Christiana Care Health System since 2009; Member of the Investment Committee, Delaware Community Foundation from 2013 to 2014; Director, SEI Private Trust Co. from 2001 to 2014. | 33 RICs consisting of 153 Portfolios | None | |||||
| 66 | ANNUAL REPORT | MAY 31, 2016 |
| Officers and Directors/Trustees (continued) |
Name, Address1 and Year of Birth | Position(s) Held with Trust/ Corporation/ Master LLC | Length of Time Served3 | Principal Occupation(s) During Past Five Years | Number of BlackRock- Advised Registered Investment Companies (“RICs”) Consisting of Investment Portfolios (“Portfolios”) Overseen | Public Company and Other Investment Company Directorships Held During Past Five Years | |||||
| Independent Directors/Trustees2 (concluded) | ||||||||||
Kenneth L. Urish 1951 | Director/Trustee | Since 2007 | Managing Partner, Urish Popeck & Co., LLC (certified public accountants and consultants) since 1976; Past-Chairman of the Professional Ethics Committee of the Pennsylvania Institute of Certified Public Accountants and Committee Member thereof since 2007; Member of External Advisory Board, The Pennsylvania State University Accounting Department since founding in 2001; Principal, UP Strategic Wealth Investment Advisors, LLC since 2013; Trustee, The Holy Family Institute from 2001 to 2010; President and Trustee, Pittsburgh Catholic Publishing Associates from 2003 to 2008; Director, Inter-Tel from 2006 to 2007. | 33 RICs consisting of 153 Portfolios | None | |||||
Claire A. Walton 1957 | Director/Trustee | Since 2016 | Chief Operating Officer and Chief Financial Officer of Liberty Square Asset Management, LP from 1998 to 2015; General Partner of Neon Liberty Capital Management, LLC since 2003; Director, Boston Hedge Fund Group since 2009; Director, Woodstock Ski Runners since 2013; Director, Massachusetts Council on Economic Education from 2013 to 2015. | 33 RICs consisting of 153 Portfolios | None | |||||
Frederick W. Winter 1945 | Director/Trustee | Since 2007 | Director, Alkon Corporation since 1992; Dean Emeritus of the Joseph M. Katz School of Business, University of Pittsburgh, Dean and Professor from 1997 to 2005, Professor until 2013. | 33 RICs consisting of 153 Portfolios | None | |||||
| Interested Director/Trustee4 | ||||||||||
Barbara G. Novick 1960 | Director/Trustee | Since 2015 | Vice Chairman of BlackRock since 2006; Chair of BlackRock’s Government Relations Steering Committee since 2009; Head of the Global Client Group of BlackRock from 1988 to 2008. | 107 RICs consisting of 227 Portfolios | None | |||||
John M. Perlowski 1964 | Director/ Trustee, President and Chief Executive Officer | Since 2015 (Director/ Trustee); Since 2010 (President and Chief Executive Officer) | Managing Director of BlackRock since 2009; Head of BlackRock Global Fund Services since 2009; Managing Director and Chief Operating Officer of the Global Product Group at Goldman Sachs Asset Management, L.P. from 2003 to 2009; Treasurer of Goldman Sachs Mutual Funds from 2003 to 2009 and Senior Vice President thereof from 2007 to 2009; Director of Goldman Sachs Offshore Funds from 2002 to 2009; Director of Family Resource Network (charitable foundation) since 2009. | 135 RICs consisting of 325 Portfolios | None | |||||
1 The address of each Director/Trustee is c/o BlackRock, Inc., 55 East 52nd Street, New York, NY 10055.
2 Independent Directors/Trustees serve until their resignation, retirement, removal or death, or until December 31 of the year in which they turn 75. The Board has determined to extend the terms of Independent Directors/Trustees on a case-by-case basis, as appropriate. The Board has unanimously approved extending the mandatory retirement age for David O. Beim and Dr. Matina S. Horner until December 31, 2016, which the Board believes is in the best interests of shareholders of the Trust/Corporation/Master LLC.
3 Following the combination of Merrill Lynch Investment Managers, L.P. (“MLIM”) and BlackRock, Inc. (“BlackRock”) in September 2006, the various legacy MLIM and legacy BlackRock fund boards were realigned and consolidated into three new fund boards in 2007. As a result, although the chart shows certain Independent Directors/Trustees as joining the Trust’s/ Corporation’s/Master LLC’s board in 2007, those Independent Directors/Trustees first became members of the boards of other legacy MLIM or legacy BlackRock funds as follows: David O. Beim, 1998; Dr. Matina S. Horner, 2004; Rodney D. Johnson, 1995; Cynthia A. Montgomery, 1994; Joseph P. Platt, 1999; Robert C. Robb, Jr., 1999; Kenneth L. Urish, 1999; and Frederick W. Winter, 1999.
4 Ms. Novick and Mr. Perlowski are both “interested persons,” as defined in the 1940 Act, of the Trust/Corporation/Master LLC based on their positions with BlackRock and its affiliates. Mr. Perlowski and Ms. Novick are also board members of certain complexes of BlackRock registered open-end and closed-end funds. Mr. Perlowski is also a board member of the BlackRock Equity-Bond Complex and the BlackRock Closed-End Complex, and Ms. Novick is a board member of the BlackRock Closed-End Complex. | ||||||||||
| ANNUAL REPORT | MAY 31, 2016 | 67 |
| Officers and Directors/Trustees (concluded) |
Name, Address1 and Year of Birth | Position(s) Held with Trust/ Corporation/ Master LLC | Length of Time Served | Principal Occupation(s) During Past Five Years | |||
| Officers Who Are Not Directors/Trustees2 | ||||||
Richard Hoerner, CFA 1958 | Vice President | Since 2009 | Managing Director of BlackRock since 2000; Head of the Global Cash Group since 2013; Co-head of the Global Cash and Securities Lending Group from 2010 to 2013; Member of the Cash Management Group Executive Committee since 2005. | |||
Jennifer McGovern 1977 | Vice President | Since 2014 | Managing Director of BlackRock since 2016; Director of BlackRock from 2011 to 2015; Head of Product Structure and Oversight for BlackRock’s U.S. Wealth Advisory Group since 2013; Vice President of BlackRock from 2008 to 2010. | |||
Neal J. Andrews 1966 | Chief Financial Officer | Since 2007 | Managing Director of BlackRock since 2006; Senior Vice President and Line of Business Head of Fund Accounting and Administration at PNC Global Investment Servicing (U.S.) Inc. from 1992 to 2006. | |||
Jay M. Fife 1970 | Treasurer | Since 2007 | Managing Director of BlackRock since 2007; Director of BlackRock in 2006; Assistant Treasurer of the MLIM and Fund Asset Management, L.P. advised funds from 2005 to 2006; Director of MLIM Fund Services Group from 2001 to 2006. | |||
Charles Park 1967 | Chief Compliance Officer | Since 2014 | Anti-Money Laundering Compliance Officer for the BlackRock-advised Funds in the Equity-Bond Complex, the Equity-Liquidity Complex and the Closed-End Complex from 2014 to 2015; Chief Compliance Officer of BlackRock Advisors, LLC and the BlackRock-advised Funds in the Equity-Bond Complex, the Equity-Liquidity Complex and the Closed-End Complex since 2014; Principal of and Chief Compliance Officer for iShares® Delaware Trust Sponsor LLC since 2012 and BlackRock Fund Advisors (“BFA”) since 2006; Chief Compliance Officer for the BFA-advised iShares exchange traded funds since 2006; Chief Compliance Officer for BlackRock Asset Management International Inc. since 2012. | |||
Fernanda Piedra 1969 | Anti-Money Laundering Compliance Officer | Since 2015 | Director of BlackRock since 2014; Anti-Money Laundering Compliance Officer and Regional Head of Financial Crime for the Americas at BlackRock since 2014; Head of Regulatory Changes and Remediation for the Asset Wealth Management Division of Deutsche Bank from 2010 to 2014; Vice President of Goldman Sachs (Anti-Money Laundering/Suspicious Activities Group) from 2004 to 2010. | |||
Benjamin Archibald 1975 | Secretary | Since 2012 | Managing Director of BlackRock since 2014; Director of BlackRock from 2010 to 2013; Secretary of the iShares exchange traded funds since 2015; Secretary of the BlackRock-advised mutual funds since 2012. | |||
1 The address of each Officer is c/o BlackRock Inc., 55 East 52nd Street, New York, NY 10055.
2 Officers of the Trust/Corporation/Master LLC serve at the pleasure of the Board. | ||||||
Further information about the Trust’s/Corporation’s/Master LLC’s Officers and Directors/Trustees is available in the Trust’s/Corporation’s/Master LLC’s Statement of Additional Information, which can be obtained without charge by calling 1-800-441-7762. | ||||||
Effective December 31, 2015, Herbert I. London and Toby Rosenblatt retired as Directors/Trustees of the Trust/Corporation/Master LLC.
Effective February 5, 2016, Frank J. Fabozzi resigned as a Director/Trustee of the Trust/Corporation/Master LLC.
Effective February 8, 2016, Susan J. Carter, Neil A. Cotty and Claire A. Walton were elected to serve as Directors/Trustees of the Trust/Corporation/ Master LLC.
Investment Advisor and Administrator | Accounting Agent and Transfer Agent | Independent Registered Public Accounting Firm | Address of the Funds | |||
100 Bellevue Parkway Wilmington, DE 19809 | ||||||
BlackRock Advisors, LLC Wilmington, DE 19809 | BNY Mellon Investment Servicing (US) Inc. | Deloitte & Touche LLP Philadelphia, PA 19103 | ||||
| Wilmington, DE 19809 | ||||||
| Custodians | Distributor | Legal Counsel | ||||
Brown Brothers Harriman & Co.1 Boston, MA 02109
The Bank of New York Mellon2 New York, NY 10286 | BlackRock Investments, LLC New York, NY 10022 | Sidley Austin LLP New York, NY 10019 |
| 1 | For BlackRock Master Small Cap Growth Portfolio. |
| 2 | For BlackRock Disciplined Small Cap Core Fund. |
| 68 | ANNUAL REPORT | MAY 31, 2016 |
| Additional Information |
| Proxy Results |
A Special Meeting of Shareholders was held on February 8, 2016 for shareholders of record on December 11, 2015, to elect a Board of Trustees of the BlackRock Funds.
| Votes For | Votes Withheld | |||||||||||||
Approved the Trustees* as follows: | David O. Beim | 3,327,629,620 | 22,971,395 | |||||||||||
| Susan J. Carter | 3,329,237,692 | 21,363,323 | ||||||||||||
| Collette Chilton | 3,329,179,365 | 21,421,650 | ||||||||||||
| Neil A. Cotty | 3,328,526,288 | 22,074,727 | ||||||||||||
| Matina S. Horner | 3,326,965,973 | 23,635,042 | ||||||||||||
| Rodney D. Johnson | 3,327,844,311 | 22,756,704 | ||||||||||||
| Cynthia A. Montgomery | 3,328,882,847 | 21,718,168 | ||||||||||||
| Joseph P. Platt | 3,327,563,553 | 23,037,462 | ||||||||||||
| Robert C. Robb, Jr. | 3,327,822,475 | 22,778,540 | ||||||||||||
| Mark Stalnecker | 3,327,691,900 | 22,909,115 | ||||||||||||
| Kenneth L. Urish | 3,324,875,151 | 25,725,864 | ||||||||||||
| Claire A. Walton | 3,329,000,010 | 21,601,005 | ||||||||||||
| Frederick W. Winter | 3,327,879,107 | 22,721,908 | ||||||||||||
| Barbara G. Novick | 3,327,607,976 | 22,993,039 | ||||||||||||
| John M. Perlowski | 3,326,473,221 | 24,127,794 | ||||||||||||
* Denotes Trust-wide proposal and voting results. |
| |||||||||||||
A Special Meeting of Shareholders was held on February 8, 2016 for shareholders of record on December 11, 2015, to elect a Board of Directors of the BlackRock Series, Inc.
|
| |||||||||||||
| Votes For | Votes Withheld | |||||||||||||
Approved the Directors* as follows: | David O. Beim | 52,163,496 | 912,634 | |||||||||||
| Susan J. Carter | 52,063,358 | 1,012,771 | ||||||||||||
| Collette Chilton | 52,199,513 | 876,617 | ||||||||||||
| Neil A. Cotty | 52,060,403 | 1,015,726 | ||||||||||||
| Matina S. Horner | 52,137,641 | 938,489 | ||||||||||||
| Rodney D. Johnson | 52,193,064 | 883,066 | ||||||||||||
| Cynthia A. Montgomery | 52,212,754 | 863,376 | ||||||||||||
| Joseph P. Platt | 52,206,335 | 869,795 | ||||||||||||
| Robert C. Robb, Jr. | 52,193,638 | 882,492 | ||||||||||||
| Mark Stalnecker | 52,211,872 | 864,258 | ||||||||||||
| Kenneth L. Urish | 52,190,285 | 885,845 | ||||||||||||
| Claire A. Walton | 52,048,369 | 1,027,761 | ||||||||||||
| Frederick W. Winter | 52,192,518 | 883,612 | ||||||||||||
| Barbara G. Novick | 52,194,910 | 881,220 | ||||||||||||
| John M. Perlowski | 52,209,508 | 866,622 | ||||||||||||
| * | Denotes Company-wide proposal and voting results. |
| ANNUAL REPORT | MAY 31, 2016 | 69 |
| Additional Information (continued) |
A Special Meeting of Shareholders was held on February 8, 2016 for shareholders of record on December 11, 2015, to elect a Board of Directors of the Master LLC.
| ||||||||||
| Votes For | Votes Withheld | |||||||||
Approved the Directors* as follows: | David O. Beim | 720,498,013 | 14,307,475 | |||||||
| Susan J. Carter | 719,864,797 | 14,940,691 | ||||||||
| Collette Chilton | 721,128,457 | 13,677,030 | ||||||||
| Neil A. Cotty | 718,747,640 | 16,057,847 | ||||||||
| Matina S. Horner | 719,830,816 | 14,974,672 | ||||||||
| Rodney D. Johnson | 720,781,599 | 14,023,888 | ||||||||
| Cynthia A. Montgomery | 721,439,221 | 13,366,267 | ||||||||
| Joseph P. Platt | 721,518,012 | 13,287,475 | ||||||||
| Robert C. Robb, Jr. | 721,459,991 | 13,345,497 | ||||||||
| Mark Stalnecker | 720,811,832 | 13,993,656 | ||||||||
| Kenneth L. Urish | 721,088,103 | 13,717,384 | ||||||||
| Claire A. Walton | 712,025,822 | 22,779,666 | ||||||||
| Frederick W. Winter | 721,159,325 | 13,646,163 | ||||||||
| Barbara G. Novick | 720,539,115 | 14,266,373 | ||||||||
| John M. Perlowski | 720,799,702 | 14,005,786 | ||||||||
* Denotes Company-wide proposal and voting results. | ||||||||||
| General Information |
Householding
The Funds will mail only one copy of shareholder documents, including prospectuses, annual and semi-annual reports and proxy statements, to shareholders with multiple accounts at the same address. This practice is commonly called “householding” and is intended to reduce expenses and eliminate duplicate mailings of shareholder documents. Mailings of your shareholder documents may be householded indefinitely unless you instruct us otherwise. If you do not want the mailing of these documents to be combined with those for other members of your household, please call the Funds at (800) 441-7762.
Availability of Quarterly Schedule of Investments
The Funds/Master Portfolio file their complete schedule of portfolio holdings with the SEC for the first and third quarters of each fiscal year on Form N-Q. The Funds’/Master Portfolio’s Forms N-Q are available on the SEC’s website at http://www.sec.gov and may also be reviewed and copied at the SEC’s Public Reference Room in Washington, D.C. Information on the operation of the Public Reference Room or how to access documents on the SEC’s website without charge may be obtained by calling (800) SEC-0330. The Funds’/Master Portfolio’s Forms N-Q may also be obtained upon request and without charge by calling (800) 441-7762.
Availability of Proxy Voting Policies and Procedures
A description of the policies and procedures that the Funds/Master Portfolio use to determine how to vote proxies relating to portfolio securities is available upon request and without charge (1) by calling (800) 441-7762; (2) at http://www.blackrock.com; and (3) on the SEC’s website at http://www.sec.gov.
Availability of Proxy Voting Record
Information about how the Funds/Master Portfolio voted proxies relating to securities held in the Funds’/Master Portfolio’s portfolios during the most recent 12-month period ended June 30 is available upon request and without charge (1) at http://www.blackrock.com or by calling (800) 441-7762 and (2) on the SEC’s website at http://www.sec.gov.
BlackRock’s Mutual Fund Family
BlackRock offers a diverse lineup of open-end mutual funds crossing all investment styles and managed by experts in equity, fixed income and tax-exempt investing. Visit http://www.blackrock.com for more information.
| 70 | ANNUAL REPORT | MAY 31, 2016 |
| Additional Information (concluded) |
| Shareholder Privileges |
Account Information
Call us at (800) 441-7762 from 8:00 AM to 6:00 PM EST on any business day to get information about your account balances, recent transactions and share prices. You can also reach us on the Web at http://www.blackrock.com/funds.
Automatic Investment Plans
Investor Class shareholders who want to invest regularly can arrange to have $50 or more automatically deducted from their checking or savings account and invested in any of the BlackRock funds.
Systematic Withdrawal Plans
Investor Class shareholders can establish a systematic withdrawal plan and receive periodic payments of $50 or more from their BlackRock funds, as long as their account balance is at least $10,000.
Retirement Plans
Shareholders may make investments in conjunction with Traditional, Rollover, Roth, Coverdell, Simple IRAs, SEP IRAs and 403(b) Plans.
| BlackRock Privacy Principles |
BlackRock is committed to maintaining the privacy of its current and former fund investors and individual clients (collectively, “Clients”) and to safeguarding their non-public personal information. The following information is provided to help you understand what personal information BlackRock collects, how we protect that information and why in certain cases we share such information with select parties.
If you are located in a jurisdiction where specific laws, rules or regulations require BlackRock to provide you with additional or different privacy-related rights beyond what is set forth below, then BlackRock will comply with those specific laws, rules or regulations.
BlackRock obtains or verifies personal non-public information from and about you from different sources, including the following: (i) information we receive from you or, if applicable, your financial intermediary, on applications, forms or other documents; (ii) information about your transactions with us, our affiliates, or others; (iii) information we receive from a consumer reporting agency; and (iv) from visits to our websites.
BlackRock does not sell or disclose to non-affiliated third parties any non-public personal information about its Clients, except as permitted by law or as is necessary to respond to regulatory requests or to service Client accounts. These non-affiliated third parties are required to protect the confidentiality and security of this information and to use it only for its intended purpose.
We may share information with our affiliates to service your account or to provide you with information about other BlackRock products or services that may be of interest to you. In addition, BlackRock restricts access to non-public personal information about its Clients to those BlackRock employees with a legitimate business need for the information. BlackRock maintains physical, electronic and procedural safeguards that are designed to protect the non-public personal information of its Clients, including procedures relating to the proper storage and disposal of such information.
| ANNUAL REPORT | MAY 31, 2016 | 71 |
This report is intended for current holders. It is not authorized for use as an offer of sale or a solicitation of an offer to buy shares of the Funds unless preceded or accompanied by the Fund’s current prospectus. Past performance results shown in this report should not be considered a representation of future performance. Investment returns and principal value of shares will fluctuate so that shares, when redeemed, may be worth more or less than their original cost. Statements and other information herein are as dated and are subject to change.

SC2-5/16-AR |  | |
| Item 2 – | Code of Ethics – Each registrant (or “Fund”) has adopted a code of ethics, as of the end of the period covered by this report, applicable to the registrant’s principal executive officer, principal financial officer, principal accounting officer or controller, or persons performing similar functions. During the period covered by this report, the code of ethics was amended to update certain information and to make other non-material changes. During the period covered by this report, there have been no waivers granted under the code of ethics. Each registrant undertakes to provide a copy of the code of ethics to any person upon request, without charge, by calling 1-800-441-7762. | |
| Item 3 – | Audit Committee Financial Expert – Each registrant’s board of directors (the “board of directors”), has determined that (i) the registrant has the following audit committee financial expert serving on its audit committee and (ii) each audit committee financial expert is independent: | |
| Kenneth L. Urish | ||
| Under applicable securities laws, a person determined to be an audit committee financial expert will not be deemed an “expert” for any purpose, including without limitation for the purposes of Section 11 of the Securities Act of 1933, as a result of being designated or identified as an audit committee financial expert. The designation or identification of a person as an audit committee financial expert does not impose on such person any duties, obligations, or liabilities greater than the duties, obligations, and liabilities imposed on such person as a member of the audit committee and board of directors in the absence of such designation or identification. | ||
| Item 4 – | Principal Accountant Fees and Services | |
| The following table presents fees billed by Deloitte & Touche LLP (“D&T”) in each of the last two fiscal years for the services rendered to the Funds: | ||
| (a) Audit Fees | (b) Audit-Related Fees1 | (c) Tax Fees2 | (d) All Other Fees3 | |||||||||||||
| Entity Name | Current Year End | Previous Fiscal End | Current Fiscal | Previous Fiscal Year End | Current Fiscal | Previous Fiscal | Current Fiscal | Previous Fiscal Year End | ||||||||
| BlackRock Small Cap Growth Fund II of BlackRock Series, Inc. | $7,263 | $7,263 | $0 | $0 | $13,107 | $13,107 | $0 | $0 | ||||||||
| BlackRock Master Small Cap Growth Portfolio of BlackRock Master LLC | $32,288 | $32,288 | $0 | $0 | $0 | $0 | $0 | $0 | ||||||||
The following table presents fees billed by D&T that were required to be approved by each registrant’s audit committee (each a “Committee”) for services that relate directly to the operations or financial reporting of the Fund and that are rendered on behalf of BlackRock Advisors, LLC (“Investment Adviser” or “BlackRock”) and entities controlling, controlled by, or under common control with BlackRock (not including any sub-adviser whose role is primarily portfolio management and is subcontracted with or overseen by another investment adviser) that provide ongoing services to the Fund (“Fund Service Providers”):
| Current Fiscal Year End | Previous Fiscal Year End | |||
(b) Audit-Related Fees1 | $0 | $0 | ||
(c) Tax Fees2 | $0 | $0 | ||
(d) All Other Fees3 | $2,129,000 | $2,391,000 |
1 The nature of the services includes assurance and related services reasonably related to the performance of the audit of financial statements not included in Audit Fees.
2
2 The nature of the services includes tax compliance, tax advice and tax planning.
3 Aggregate fees borne by BlackRock in connection with the review of compliance procedures and attestation thereto performed by D&T with respect to all of the registered closed-end funds and some of the registered open-end funds advised by BlackRock.
(e)(1) Audit Committee Pre-Approval Policies and Procedures:
Each Committee has adopted policies and procedures with regard to the pre-approval of services. Audit, audit-related and tax compliance services provided to the registrant on an annual basis require specific pre-approval by the registrant’s Committee. The Committee also must approve other non-audit services provided to the registrant and those non-audit services provided to the Investment Adviser and Fund Service Providers that relate directly to the operations and the financial reporting of the registrant. Certain of these non-audit services that the Committee believes are (a) consistent with the SEC’s auditor independence rules and (b) routine and recurring services that will not impair the independence of the independent accountants may be approved by the Committee without consideration on a specific case-by-case basis (“general pre-approval”). The term of any general pre-approval is 12 months from the date of the pre-approval, unless the Committee provides for a different period. Tax or other non-audit services provided to the registrants which have a direct impact on the operations or financial reporting of the registrant will only be deemed pre-approved provided that any individual project does not exceed $10,000 attributable to the registrant or $50,000 per project. For this purpose, multiple projects will be aggregated to determine if they exceed the previously mentioned cost levels.
Any proposed services exceeding the pre-approved cost levels will require specific pre-approval by the registrant’s Committee, as will any other services not subject to general pre-approval (e.g., unanticipated but permissible services). The Committee is informed of each service approved subject to general pre-approval at the next regularly scheduled in-person board meeting. At this meeting, an analysis of such services is presented to the Committee for ratification. The Committee may delegate to the Committee Chairman the authority to approve the provision of and fees for any specific engagement of permitted non-audit services, including services exceeding pre-approved cost levels.
(e)(2) None of the services described in each of Items 4(b) through (d) were approved by either Committee pursuant to the de minimus exception in paragraph (c)(7)(i)(C) of Rule 2-01 of Regulation S-X.
(f) Not Applicable
(g) The aggregate non-audit fees paid to the accountant for services rendered by the accountant to the registrant, the Investment Adviser and the Fund Service Providers were:
| Entity Name | Current Fiscal Year End | Previous Fiscal Year End | ||
| BlackRock Small Cap Growth Fund II of BlackRock Series, Inc. | $13,107 | $13,107 | ||
| BlackRock Master Small Cap Growth Portfolio of BlackRock Master LLC | $0 | $0 |
Additionally, SSAE 16 Review (Formerly, SAS No. 70) fees for the current and previous fiscal years of $2,129,000 and $2,391,000, respectively, were billed by D&T to the Investment Adviser.
(h) Each Committee has considered and determined that the provision of non-audit services that were rendered to the Investment Adviser and the Fund Service Providers that were not pre-approved pursuant to paragraph (c)(7)(ii) of Rule 2-01 of Regulation S-X is compatible with maintaining the principal accountant’s independence.
| Item 5 – | Audit Committee of Listed Registrants – Not Applicable |
3
| Item 6 – | Investments | |
| (a) The registrants’ Schedules of Investments are included as part of the Report to Stockholders filed under Item 1 of this Form. | ||
| (b) Not Applicable due to no such divestments during the semi-annual period covered since the previous Form N-CSR filing. | ||
| Item 7 – | Disclosure of Proxy Voting Policies and Procedures for Closed-End Management Investment Companies – Not Applicable | |
| Item 8 – | Portfolio Managers of Closed-End Management Investment Companies – Not Applicable | |
| Item 9 – | Purchases of Equity Securities by Closed-End Management Investment Company and Affiliated Purchasers – Not Applicable | |
| Item 10 – | Submission of Matters to a Vote of Security Holders – There have been no material changes to these procedures. | |
| Item 11 – | Controls and Procedures | |
| (a) – The registrants’ principal executive and principal financial officers, or persons performing similar functions, have concluded that the registrants’ disclosure controls and procedures (as defined in Rule 30a-3(c) under the Investment Company Act of 1940, as amended (the “1940 Act”)) are effective as of a date within 90 days of the filing of this report based on the evaluation of these controls and procedures required by Rule 30a-3(b) under the 1940 Act and Rule 15(d)-15(b) under the Securities Exchange Act of 1934, as amended. | ||
| (b) – There were no changes in the registrants’ internal control over financial reporting (as defined in Rule 30a-3(d) under the 1940 Act) that occurred during the second fiscal quarter of the period covered by this report that have materially affected, or are reasonably likely to materially affect, the registrants’ internal control over financial reporting. | ||
| Item 12 – | Exhibits attached hereto | |
| (a)(1) – Code of Ethics – See Item 2 | ||
| (a)(2) – Certifications – Attached hereto | ||
| (a)(3) – Not Applicable | ||
| (b) – Certifications – Attached hereto | ||
4
Pursuant to the requirements of the Securities Exchange Act of 1934 and the Investment Company Act of 1940, each registrant has duly caused this report to be signed on its behalf by the undersigned, thereunto duly authorized.
BlackRock Small Cap Growth Fund II of BlackRock Series, Inc. and BlackRock Master Small Cap Growth Portfolio of BlackRock Master LLC
By: /s/ John M. Perlowski
John M. Perlowski
Chief Executive Officer (principal executive officer) of
BlackRock Small Cap Growth Fund II of BlackRock Series, Inc. and BlackRock Master Small Cap Growth Portfolio of BlackRock Master LLC
Date: August 4, 2016
Pursuant to the requirements of the Securities Exchange Act of 1934 and the Investment Company Act of 1940, this report has been signed below by the following persons on behalf of each registrant and in the capacities and on the dates indicated.
By: /s/ John M. Perlowski
John M. Perlowski
Chief Executive Officer (principal executive officer) of
BlackRock Small Cap Growth Fund II of BlackRock Series, Inc. and BlackRock Master Small Cap Growth Portfolio of BlackRock Master LLC
Date: August 4, 2016
By: /s/ Neal J. Andrews
Neal J. Andrews
Chief Financial Officer (principal financial officer) of
BlackRock Small Cap Growth Fund II of BlackRock Series, Inc. and BlackRock Master Small Cap Growth Portfolio of BlackRock Master LLC
Date: August 4, 2016
5